IR 05000341-13-008; 07/08/2013 - 09/06/2013; Fermi Power Plant ...
Upload
khangminh22Category
view
3download
0
City of Santa BarbaraAdopted Two-Year Financial Plan for Fiscal Years 2006 and 2007Including the Operating and Capital Budget for Fiscal Year 2006


C I T Y O F S A N T A B A R B A R A
A D O P T E D T W O - Y E A R F I N A N C I A L P L A N F O R F I S C A L Y E A R S
2 0 0 6 A N D 2 0 0 7
~ ∂ ~
A D O P T E D O P E R A T I N G
A N D C A P I T A L B U D G E T F O R F I S C A L Y E A R 2 0 0 6

Cover Photo: The Presidio, Santa Barbara Photographer: Damian Gadal
Inside Photos: City of Santa Barbara Graphics Library

T A B L E O F C O N T E N T S
i
TABLE OF CONTENTS . . . . . . . . . . . . . . . . . . . . . . . . . . . . . . . . . . . . . . . . . . . . . . . . . . . . . . . . . . . . . . . . . . . . . . . . . . . . . . . . . . . . . . . . . . . . i GFOA Distinguished Budget Presentation Award .. . . . . . . . . . . . . . . . . . . . . . . . . . . . . . . . . . . . . . . . . . . . . . . vi
BUDGET MESSAGE
City Administrator's Budget Message.... . . . . . . . . . . . . . . . . . . . . . . . . . . . . . . . . . . . . . . . . . . . . . . . . . . . . . . . . . . . . . . A-1
COMMUNITY PROFILE Directory of City Off icials . . . . . . . . . . . . . . . . . . . . . . . . . . . . . . . . . . . . . . . . . . . . . . . . . . . . . . . . . . . . . . . . . . . . . . . . . . . . . . . . . B-1
City of Santa Barbara Organizational Chart . . . . . . . . . . . . . . . . . . . . . . . . . . . . . . . . . . . . . . . . . . . . . . . . . . . . . . . . B-2
Area Map ... . . . . . . . . . . . . . . . . . . . . . . . . . . . . . . . . . . . . . . . . . . . . . . . . . . . . . . . . . . . . . . . . . . . . . . . . . . . . . . . . . . . . . . . . . . . . . . . . . . . . . B-3
About the City of Santa Barbara .. . . . . . . . . . . . . . . . . . . . . . . . . . . . . . . . . . . . . . . . . . . . . . . . . . . . . . . . . . . . . . . . . . . . . . . B-4
Miscellaneous Statist ics .. . . . . . . . . . . . . . . . . . . . . . . . . . . . . . . . . . . . . . . . . . . . . . . . . . . . . . . . . . . . . . . . . . . . . . . . . . . . . . . . . . B-5
Demographics .. . . . . . . . . . . . . . . . . . . . . . . . . . . . . . . . . . . . . . . . . . . . . . . . . . . . . . . . . . . . . . . . . . . . . . . . . . . . . . . . . . . . . . . . . . . . . . . . B-7
SUMMARY SCHEDULES
Summary of Sources and Uses of Funds for Fiscal Year 2006 ... . . . . . . . . . . . . . . . . . . . . . . . . . . C-2
Summary of Sources and Uses of Funds for Fiscal Year 2007 ... . . . . . . . . . . . . . . . . . . . . . . . . . . C-4
Summary of Revenues by Fund .. . . . . . . . . . . . . . . . . . . . . . . . . . . . . . . . . . . . . . . . . . . . . . . . . . . . . . . . . . . . . . . . . . . . . . . . C-6
Summary of Appropriations by Fund .. . . . . . . . . . . . . . . . . . . . . . . . . . . . . . . . . . . . . . . . . . . . . . . . . . . . . . . . . . . . . . . . . C-10
CAPITAL PROGRAM
Capital Budget (by Fund) for Fiscal Year 2006 . . . . . . . . . . . . . . . . . . . . . . . . . . . . . . . . . . . . . . . . . . . . . . . . . D-1
Capital Budget (by Fund) for Fiscal Year 2007 . . . . . . . . . . . . . . . . . . . . . . . . . . . . . . . . . . . . . . . . . . . . . . . . . D-9
AUTHORIZED POSITIONS
Posit ions by Department . . . . . . . . . . . . . . . . . . . . . . . . . . . . . . . . . . . . . . . . . . . . . . . . . . . . . . . . . . . . . . . . . . . . . . . . . . . . . . . . E-1
Summary of Posit ion Changes . . . . . . . . . . . . . . . . . . . . . . . . . . . . . . . . . . . . . . . . . . . . . . . . . . . . . . . . . . . . . . . . . . . . . . . . E-1
Posit ions by Fund for Fiscal Year 2006 .. . . . . . . . . . . . . . . . . . . . . . . . . . . . . . . . . . . . . . . . . . . . . . . . . . . . . . . . . . . . E-2
Posit ions by Fund for Fiscal Year 2007 . . . . . . . . . . . . . . . . . . . . . . . . . . . . . . . . . . . . . . . . . . . . . . . . . . . . . . . . . . . . E-2
DEPARTMENTS
Administrative Services Summary . . . . . . . . . . . . . . . . . . . . . . . . . . . . . . . . . . . . . . . . . . . . . . . . . . . . . . . . . . . . . . . . . . F-1 City Clerk’s Off ice .. . . . . . . . . . . . . . . . . . . . . . . . . . . . . . . . . . . . . . . . . . . . . . . . . . . . . . . . . . . . . . . . . . . . . . . . . . . . . . . . . . . F-4 Human Resources .. . . . . . . . . . . . . . . . . . . . . . . . . . . . . . . . . . . . . . . . . . . . . . . . . . . . . . . . . . . . . . . . . . . . . . . . . . . . . . . . . . . F-6 Desktop Information Systems ... . . . . . . . . . . . . . . . . . . . . . . . . . . . . . . . . . . . . . . . . . . . . . . . . . . . . . . . . . . . . . . . . . F-10 Financial Information Systems ... . . . . . . . . . . . . . . . . . . . . . . . . . . . . . . . . . . . . . . . . . . . . . . . . . . . . . . . . . . . . . . . . F-12
Airport Summary . . . . . . . . . . . . . . . . . . . . . . . . . . . . . . . . . . . . . . . . . . . . . . . . . . . . . . . . . . . . . . . . . . . . . . . . . . . . . . . . . . . . . . . . . . . . F-15 Administrat ion .. . . . . . . . . . . . . . . . . . . . . . . . . . . . . . . . . . . . . . . . . . . . . . . . . . . . . . . . . . . . . . . . . . . . . . . . . . . . . . . . . . . . . . . . . F-18 Business and Property Management .. . . . . . . . . . . . . . . . . . . . . . . . . . . . . . . . . . . . . . . . . . . . . . . . . . . . . . . . . . F-20 Marketing and Communications .. . . . . . . . . . . . . . . . . . . . . . . . . . . . . . . . . . . . . . . . . . . . . . . . . . . . . . . . . . . . . . . . F-22

T A B L E O F C O N T E N T S
ii
Airport (continued) Facil i t ies Maintenance .. . . . . . . . . . . . . . . . . . . . . . . . . . . . . . . . . . . . . . . . . . . . . . . . . . . . . . . . . . . . . . . . . . . . . . . . . . . . . F-24 Air Operations Area Maintenance .. . . . . . . . . . . . . . . . . . . . . . . . . . . . . . . . . . . . . . . . . . . . . . . . . . . . . . . . . . . . . F-26 Airport Security . . . . . . . . . . . . . . . . . . . . . . . . . . . . . . . . . . . . . . . . . . . . . . . . . . . . . . . . . . . . . . . . . . . . . . . . . . . . . . . . . . . . . . . . F-28 Airport Certi f ication and Operations .. . . . . . . . . . . . . . . . . . . . . . . . . . . . . . . . . . . . . . . . . . . . . . . . . . . . . . . . . . F-30 Facil i ty Planning and Development .. . . . . . . . . . . . . . . . . . . . . . . . . . . . . . . . . . . . . . . . . . . . . . . . . . . . . . . . . . . F-32
City Administrator Summary . . . . . . . . . . . . . . . . . . . . . . . . . . . . . . . . . . . . . . . . . . . . . . . . . . . . . . . . . . . . . . . . . . . . . . . . . . F-35 Administrat ion .. . . . . . . . . . . . . . . . . . . . . . . . . . . . . . . . . . . . . . . . . . . . . . . . . . . . . . . . . . . . . . . . . . . . . . . . . . . . . . . . . . . . . . . . . F-38 Employee Relations .. . . . . . . . . . . . . . . . . . . . . . . . . . . . . . . . . . . . . . . . . . . . . . . . . . . . . . . . . . . . . . . . . . . . . . . . . . . . . . . . . F-40 City TV – Channel 18 .. . . . . . . . . . . . . . . . . . . . . . . . . . . . . . . . . . . . . . . . . . . . . . . . . . . . . . . . . . . . . . . . . . . . . . . . . . . . . . F-42
City Attorney Summary . . . . . . . . . . . . . . . . . . . . . . . . . . . . . . . . . . . . . . . . . . . . . . . . . . . . . . . . . . . . . . . . . . . . . . . . . . . . . . . . . . F-45 City Attorney .. . . . . . . . . . . . . . . . . . . . . . . . . . . . . . . . . . . . . . . . . . . . . . . . . . . . . . . . . . . . . . . . . . . . . . . . . . . . . . . . . . . . . . . . . . F-48
Community Development Summary . . . . . . . . . . . . . . . . . . . . . . . . . . . . . . . . . . . . . . . . . . . . . . . . . . . . . . . . . . . . . . . . . F-51 Administrat ion .. . . . . . . . . . . . . . . . . . . . . . . . . . . . . . . . . . . . . . . . . . . . . . . . . . . . . . . . . . . . . . . . . . . . . . . . . . . . . . . . . . . . . . . . . F-54 Economic Development .. . . . . . . . . . . . . . . . . . . . . . . . . . . . . . . . . . . . . . . . . . . . . . . . . . . . . . . . . . . . . . . . . . . . . . . . . . . . F-56 CDBG and Human Services Administration .. . . . . . . . . . . . . . . . . . . . . . . . . . . . . . . . . . . . . . . . . . . . . . . . F-58 CDBG – Rental Housing Mediation Task Force .. . . . . . . . . . . . . . . . . . . . . . . . . . . . . . . . . . . . . . . . . . . F-60 CDBG – Housing Rehabil i tat ion Loan Program ... . . . . . . . . . . . . . . . . . . . . . . . . . . . . . . . . . . . . . . . . . F-62 Redevelopment Agency .. . . . . . . . . . . . . . . . . . . . . . . . . . . . . . . . . . . . . . . . . . . . . . . . . . . . . . . . . . . . . . . . . . . . . . . . . . . F-64 Housing Development and Preservation Program ... . . . . . . . . . . . . . . . . . . . . . . . . . . . . . . . . . . . . . F-66 Long Range Planning and Special Studies .. . . . . . . . . . . . . . . . . . . . . . . . . . . . . . . . . . . . . . . . . . . . . . . . . F-68 Development / Environmental Review ... . . . . . . . . . . . . . . . . . . . . . . . . . . . . . . . . . . . . . . . . . . . . . . . . . . . . . . F-70 Zoning: Ordinance, Information, and Enforcement .. . . . . . . . . . . . . . . . . . . . . . . . . . . . . . . . . . . . . F-74 Design Review and Historic Preservation .. . . . . . . . . . . . . . . . . . . . . . . . . . . . . . . . . . . . . . . . . . . . . . . . . . . F-78 Building Inspection and Code Enforcement .. . . . . . . . . . . . . . . . . . . . . . . . . . . . . . . . . . . . . . . . . . . . . . . . F-80 Records, Archives, and Clerical Services .. . . . . . . . . . . . . . . . . . . . . . . . . . . . . . . . . . . . . . . . . . . . . . . . . . F-82 Building Counter and Plan Review ... . . . . . . . . . . . . . . . . . . . . . . . . . . . . . . . . . . . . . . . . . . . . . . . . . . . . . . . . . . F-84
Finance Summary . . . . . . . . . . . . . . . . . . . . . . . . . . . . . . . . . . . . . . . . . . . . . . . . . . . . . . . . . . . . . . . . . . . . . . . . . . . . . . . . . . . . . . . . . . F-87 Administrat ion .. . . . . . . . . . . . . . . . . . . . . . . . . . . . . . . . . . . . . . . . . . . . . . . . . . . . . . . . . . . . . . . . . . . . . . . . . . . . . . . . . . . . . . . . . F-90 Revenue & Cash Management .. . . . . . . . . . . . . . . . . . . . . . . . . . . . . . . . . . . . . . . . . . . . . . . . . . . . . . . . . . . . . . . . . . F-92 Cashiering & Collections .. . . . . . . . . . . . . . . . . . . . . . . . . . . . . . . . . . . . . . . . . . . . . . . . . . . . . . . . . . . . . . . . . . . . . . . . . . F-94 Licenses & Permits .. . . . . . . . . . . . . . . . . . . . . . . . . . . . . . . . . . . . . . . . . . . . . . . . . . . . . . . . . . . . . . . . . . . . . . . . . . . . . . . . . F-96 Budget Management .. . . . . . . . . . . . . . . . . . . . . . . . . . . . . . . . . . . . . . . . . . . . . . . . . . . . . . . . . . . . . . . . . . . . . . . . . . . . . . . . F-98 Accounting Services .. . . . . . . . . . . . . . . . . . . . . . . . . . . . . . . . . . . . . . . . . . . . . . . . . . . . . . . . . . . . . . . . . . . . . . . . . . . . . . . . F-100 Payroll . . . . . . . . . . . . . . . . . . . . . . . . . . . . . . . . . . . . . . . . . . . . . . . . . . . . . . . . . . . . . . . . . . . . . . . . . . . . . . . . . . . . . . . . . . . . . . . . . . . . F-102 Accounts Payable .. . . . . . . . . . . . . . . . . . . . . . . . . . . . . . . . . . . . . . . . . . . . . . . . . . . . . . . . . . . . . . . . . . . . . . . . . . . . . . . . . . . . F-104 City Bil l ing and Customer Service .. . . . . . . . . . . . . . . . . . . . . . . . . . . . . . . . . . . . . . . . . . . . . . . . . . . . . . . . . . . . . F-106 Purchasing . . . . . . . . . . . . . . . . . . . . . . . . . . . . . . . . . . . . . . . . . . . . . . . . . . . . . . . . . . . . . . . . . . . . . . . . . . . . . . . . . . . . . . . . . . . . . F-108 Central Warehouse .. . . . . . . . . . . . . . . . . . . . . . . . . . . . . . . . . . . . . . . . . . . . . . . . . . . . . . . . . . . . . . . . . . . . . . . . . . . . . . . . . . F-110 Meter Reading . . . . . . . . . . . . . . . . . . . . . . . . . . . . . . . . . . . . . . . . . . . . . . . . . . . . . . . . . . . . . . . . . . . . . . . . . . . . . . . . . . . . . . . . F-112 Duplications .. . . . . . . . . . . . . . . . . . . . . . . . . . . . . . . . . . . . . . . . . . . . . . . . . . . . . . . . . . . . . . . . . . . . . . . . . . . . . . . . . . . . . . . . . . . F-114 Mail Courier Services .. . . . . . . . . . . . . . . . . . . . . . . . . . . . . . . . . . . . . . . . . . . . . . . . . . . . . . . . . . . . . . . . . . . . . . . . . . . . . . F-116 Risk Management – Workers’ Compensation .. . . . . . . . . . . . . . . . . . . . . . . . . . . . . . . . . . . . . . . . . . . . . . F-118 Risk Management – Liabil i ty . . . . . . . . . . . . . . . . . . . . . . . . . . . . . . . . . . . . . . . . . . . . . . . . . . . . . . . . . . . . . . . . . . . . . . F-120 Risk Management – Occupational Safety and Health .. . . . . . . . . . . . . . . . . . . . . . . . . . . . . . . . . . . F-122

T A B L E O F C O N T E N T S
iii
Finance (continued)
Risk Management – Administrative Operations .. . . . . . . . . . . . . . . . . . . . . . . . . . . . . . . . . . . . . . . . . . . F-124
Fire Summary . . . . . . . . . . . . . . . . . . . . . . . . . . . . . . . . . . . . . . . . . . . . . . . . . . . . . . . . . . . . . . . . . . . . . . . . . . . . . . . . . . . . . . . . . . . . . . . . F-127 Administrat ion... . . . . . . . . . . . . . . . . . . . . . . . . . . . . . . . . . . . . . . . . . . . . . . . . . . . . . . . . . . . . . . . . . . . . . . . . . . . . . . . . . . . . . . . . F-130 Fire Prevention .. . . . . . . . . . . . . . . . . . . . . . . . . . . . . . . . . . . . . . . . . . . . . . . . . . . . . . . . . . . . . . . . . . . . . . . . . . . . . . . . . . . . . . . F-132 Public Education .. . . . . . . . . . . . . . . . . . . . . . . . . . . . . . . . . . . . . . . . . . . . . . . . . . . . . . . . . . . . . . . . . . . . . . . . . . . . . . . . . . . . . F-134 Operations .. . . . . . . . . . . . . . . . . . . . . . . . . . . . . . . . . . . . . . . . . . . . . . . . . . . . . . . . . . . . . . . . . . . . . . . . . . . . . . . . . . . . . . . . . . . . . F-136 Aircraft Rescue and Firefighting (ARFF) ... . . . . . . . . . . . . . . . . . . . . . . . . . . . . . . . . . . . . . . . . . . . . . . . . . . . F-138
Library Summary . . . . . . . . . . . . . . . . . . . . . . . . . . . . . . . . . . . . . . . . . . . . . . . . . . . . . . . . . . . . . . . . . . . . . . . . . . . . . . . . . . . . . . . . . . . F-141 Administrat ion .. . . . . . . . . . . . . . . . . . . . . . . . . . . . . . . . . . . . . . . . . . . . . . . . . . . . . . . . . . . . . . . . . . . . . . . . . . . . . . . . . . . . . . . . . F-144 Public Services ... . . . . . . . . . . . . . . . . . . . . . . . . . . . . . . . . . . . . . . . . . . . . . . . . . . . . . . . . . . . . . . . . . . . . . . . . . . . . . . . . . . . . . . F-146 Support Services .. . . . . . . . . . . . . . . . . . . . . . . . . . . . . . . . . . . . . . . . . . . . . . . . . . . . . . . . . . . . . . . . . . . . . . . . . . . . . . . . . . . . . F-148 County Libraries .. . . . . . . . . . . . . . . . . . . . . . . . . . . . . . . . . . . . . . . . . . . . . . . . . . . . . . . . . . . . . . . . . . . . . . . . . . . . . . . . . . . . . . F-150
Mayor and Council Summary . . . . . . . . . . . . . . . . . . . . . . . . . . . . . . . . . . . . . . . . . . . . . . . . . . . . . . . . . . . . . . . . . . . . . . . . . . . F-153 Mayor and City Council . . . . . . . . . . . . . . . . . . . . . . . . . . . . . . . . . . . . . . . . . . . . . . . . . . . . . . . . . . . . . . . . . . . . . . . . . . . . . F-156
Non-Departmental Summary . . . . . . . . . . . . . . . . . . . . . . . . . . . . . . . . . . . . . . . . . . . . . . . . . . . . . . . . . . . . . . . . . . . . . . . . . . . . F-159 Community Promotions .. . . . . . . . . . . . . . . . . . . . . . . . . . . . . . . . . . . . . . . . . . . . . . . . . . . . . . . . . . . . . . . . . . . . . . . . . . . . F-162 General Government .. . . . . . . . . . . . . . . . . . . . . . . . . . . . . . . . . . . . . . . . . . . . . . . . . . . . . . . . . . . . . . . . . . . . . . . . . . . . . . . F-164
Parks and Recreation Summary . . . . . . . . . . . . . . . . . . . . . . . . . . . . . . . . . . . . . . . . . . . . . . . . . . . . . . . . . . . . . . . . . . . . . . . F-167 Administrat ion... . . . . . . . . . . . . . . . . . . . . . . . . . . . . . . . . . . . . . . . . . . . . . . . . . . . . . . . . . . . . . . . . . . . . . . . . . . . . . . . . . . . . . . . . F-170 Project Management Team ... . . . . . . . . . . . . . . . . . . . . . . . . . . . . . . . . . . . . . . . . . . . . . . . . . . . . . . . . . . . . . . . . . . . . . F-172 Business Services ... . . . . . . . . . . . . . . . . . . . . . . . . . . . . . . . . . . . . . . . . . . . . . . . . . . . . . . . . . . . . . . . . . . . . . . . . . . . . . . . . . . F-174 Recreation Program Management ... . . . . . . . . . . . . . . . . . . . . . . . . . . . . . . . . . . . . . . . . . . . . . . . . . . . . . . . . . . . . F-176 Facil i t ies and Reservation Services ... . . . . . . . . . . . . . . . . . . . . . . . . . . . . . . . . . . . . . . . . . . . . . . . . . . . . . . . . . F-178 Cultural Arts .. . . . . . . . . . . . . . . . . . . . . . . . . . . . . . . . . . . . . . . . . . . . . . . . . . . . . . . . . . . . . . . . . . . . . . . . . . . . . . . . . . . . . . . . . . . F-180 Youth Activit ies .. . . . . . . . . . . . . . . . . . . . . . . . . . . . . . . . . . . . . . . . . . . . . . . . . . . . . . . . . . . . . . . . . . . . . . . . . . . . . . . . . . . . . . . F-182 Teen Program ... . . . . . . . . . . . . . . . . . . . . . . . . . . . . . . . . . . . . . . . . . . . . . . . . . . . . . . . . . . . . . . . . . . . . . . . . . . . . . . . . . . . . . . . F-184 Active Adults and Classes .. . . . . . . . . . . . . . . . . . . . . . . . . . . . . . . . . . . . . . . . . . . . . . . . . . . . . . . . . . . . . . . . . . . . . . . . F-186 Aquatics ... . . . . . . . . . . . . . . . . . . . . . . . . . . . . . . . . . . . . . . . . . . . . . . . . . . . . . . . . . . . . . . . . . . . . . . . . . . . . . . . . . . . . . . . . . . . . . . . . F-190 Sports ... . . . . . . . . . . . . . . . . . . . . . . . . . . . . . . . . . . . . . . . . . . . . . . . . . . . . . . . . . . . . . . . . . . . . . . . . . . . . . . . . . . . . . . . . . . . . . . . . . . . F-192 Tennis ... . . . . . . . . . . . . . . . . . . . . . . . . . . . . . . . . . . . . . . . . . . . . . . . . . . . . . . . . . . . . . . . . . . . . . . . . . . . . . . . . . . . . . . . . . . . . . . . . . . F-196 Community Services .. . . . . . . . . . . . . . . . . . . . . . . . . . . . . . . . . . . . . . . . . . . . . . . . . . . . . . . . . . . . . . . . . . . . . . . . . . . . . . . . F-198 Creeks Restoration and Water Quality Improvement ... . . . . . . . . . . . . . . . . . . . . . . . . . . . . . . . . . . F-200 Golf Course ... . . . . . . . . . . . . . . . . . . . . . . . . . . . . . . . . . . . . . . . . . . . . . . . . . . . . . . . . . . . . . . . . . . . . . . . . . . . . . . . . . . . . . . . . . . . F-204 Park Operations Management ... . . . . . . . . . . . . . . . . . . . . . . . . . . . . . . . . . . . . . . . . . . . . . . . . . . . . . . . . . . . . . . . . . . F-208 Grounds and Facil i t ies Maintenance .. . . . . . . . . . . . . . . . . . . . . . . . . . . . . . . . . . . . . . . . . . . . . . . . . . . . . . . . . . F-210 Forestry .. . . . . . . . . . . . . . . . . . . . . . . . . . . . . . . . . . . . . . . . . . . . . . . . . . . . . . . . . . . . . . . . . . . . . . . . . . . . . . . . . . . . . . . . . . . . . . . . . F-212 Beach Maintenance .. . . . . . . . . . . . . . . . . . . . . . . . . . . . . . . . . . . . . . . . . . . . . . . . . . . . . . . . . . . . . . . . . . . . . . . . . . . . . . . . . F-214 Chase Palm Park .. . . . . . . . . . . . . . . . . . . . . . . . . . . . . . . . . . . . . . . . . . . . . . . . . . . . . . . . . . . . . . . . . . . . . . . . . . . . . . . . . . . . F-216
Police Summary . . . . . . . . . . . . . . . . . . . . . . . . . . . . . . . . . . . . . . . . . . . . . . . . . . . . . . . . . . . . . . . . . . . . . . . . . . . . . . . . . . . . . . . . . . . . . F-219 Chief’s Staff . . . . . . . . . . . . . . . . . . . . . . . . . . . . . . . . . . . . . . . . . . . . . . . . . . . . . . . . . . . . . . . . . . . . . . . . . . . . . . . . . . . . . . . . . . . . . F-222 Support Services .. . . . . . . . . . . . . . . . . . . . . . . . . . . . . . . . . . . . . . . . . . . . . . . . . . . . . . . . . . . . . . . . . . . . . . . . . . . . . . . . . . . . . F-224 Records Bureau .. . . . . . . . . . . . . . . . . . . . . . . . . . . . . . . . . . . . . . . . . . . . . . . . . . . . . . . . . . . . . . . . . . . . . . . . . . . . . . . . . . . . . . F-226 Community Services Division ... . . . . . . . . . . . . . . . . . . . . . . . . . . . . . . . . . . . . . . . . . . . . . . . . . . . . . . . . . . . . . . . . . . F-228

T A B L E O F C O N T E N T S
iv
Police (continued)
Crime Analysis ... . . . . . . . . . . . . . . . . . . . . . . . . . . . . . . . . . . . . . . . . . . . . . . . . . . . . . . . . . . . . . . . . . . . . . . . . . . . . . . . . . . . . . . . F-230 Property Room .... . . . . . . . . . . . . . . . . . . . . . . . . . . . . . . . . . . . . . . . . . . . . . . . . . . . . . . . . . . . . . . . . . . . . . . . . . . . . . . . . . . . . . . F-232 Training and Recruitment .. . . . . . . . . . . . . . . . . . . . . . . . . . . . . . . . . . . . . . . . . . . . . . . . . . . . . . . . . . . . . . . . . . . . . . . . . F-234 Range ... . . . . . . . . . . . . . . . . . . . . . . . . . . . . . . . . . . . . . . . . . . . . . . . . . . . . . . . . . . . . . . . . . . . . . . . . . . . . . . . . . . . . . . . . . . . . . . . . . . . F-236
Beat Coordinators / D.A.R.E. . . . . . . . . . . . . . . . . . . . . . . . . . . . . . . . . . . . . . . . . . . . . . . . . . . . . . . . . . . . . . . . . . . . . . F-238 Information Technology .. . . . . . . . . . . . . . . . . . . . . . . . . . . . . . . . . . . . . . . . . . . . . . . . . . . . . . . . . . . . . . . . . . . . . . . . . . . F-240 Investigative Division .. . . . . . . . . . . . . . . . . . . . . . . . . . . . . . . . . . . . . . . . . . . . . . . . . . . . . . . . . . . . . . . . . . . . . . . . . . . . . . F-242 Crime Lab .. . . . . . . . . . . . . . . . . . . . . . . . . . . . . . . . . . . . . . . . . . . . . . . . . . . . . . . . . . . . . . . . . . . . . . . . . . . . . . . . . . . . . . . . . . . . . . F-244 Patrol Division .. . . . . . . . . . . . . . . . . . . . . . . . . . . . . . . . . . . . . . . . . . . . . . . . . . . . . . . . . . . . . . . . . . . . . . . . . . . . . . . . . . . . . . . . F-246 Traff ic .. . . . . . . . . . . . . . . . . . . . . . . . . . . . . . . . . . . . . . . . . . . . . . . . . . . . . . . . . . . . . . . . . . . . . . . . . . . . . . . . . . . . . . . . . . . . . . . . . . . . . F-248 Special Events .. . . . . . . . . . . . . . . . . . . . . . . . . . . . . . . . . . . . . . . . . . . . . . . . . . . . . . . . . . . . . . . . . . . . . . . . . . . . . . . . . . . . . . . . F-250 Tactical Patrol Force .. . . . . . . . . . . . . . . . . . . . . . . . . . . . . . . . . . . . . . . . . . . . . . . . . . . . . . . . . . . . . . . . . . . . . . . . . . . . . . . F-252 Nightl i fe Enforcement .. . . . . . . . . . . . . . . . . . . . . . . . . . . . . . . . . . . . . . . . . . . . . . . . . . . . . . . . . . . . . . . . . . . . . . . . . . . . . . F-254 Parking Enforcement .. . . . . . . . . . . . . . . . . . . . . . . . . . . . . . . . . . . . . . . . . . . . . . . . . . . . . . . . . . . . . . . . . . . . . . . . . . . . . . . F-256 Combined Communications Center .. . . . . . . . . . . . . . . . . . . . . . . . . . . . . . . . . . . . . . . . . . . . . . . . . . . . . . . . . . . . . F-258 Animal Control . . . . . . . . . . . . . . . . . . . . . . . . . . . . . . . . . . . . . . . . . . . . . . . . . . . . . . . . . . . . . . . . . . . . . . . . . . . . . . . . . . . . . . . . . . F-260 Emergency Services .. . . . . . . . . . . . . . . . . . . . . . . . . . . . . . . . . . . . . . . . . . . . . . . . . . . . . . . . . . . . . . . . . . . . . . . . . . . . . . . . F-262
Public Works Summary . . . . . . . . . . . . . . . . . . . . . . . . . . . . . . . . . . . . . . . . . . . . . . . . . . . . . . . . . . . . . . . . . . . . . . . . . . . . . . . . . . F-265 Administrat ion .. . . . . . . . . . . . . . . . . . . . . . . . . . . . . . . . . . . . . . . . . . . . . . . . . . . . . . . . . . . . . . . . . . . . . . . . . . . . . . . . . . . . . . . . . F-270 Engineering Services ... . . . . . . . . . . . . . . . . . . . . . . . . . . . . . . . . . . . . . . . . . . . . . . . . . . . . . . . . . . . . . . . . . . . . . . . . . . . . . . F-272 Land Development .. . . . . . . . . . . . . . . . . . . . . . . . . . . . . . . . . . . . . . . . . . . . . . . . . . . . . . . . . . . . . . . . . . . . . . . . . . . . . . . . . . F-274 Environmental Services .. . . . . . . . . . . . . . . . . . . . . . . . . . . . . . . . . . . . . . . . . . . . . . . . . . . . . . . . . . . . . . . . . . . . . . . . . . . F-276 Solid Waste .. . . . . . . . . . . . . . . . . . . . . . . . . . . . . . . . . . . . . . . . . . . . . . . . . . . . . . . . . . . . . . . . . . . . . . . . . . . . . . . . . . . . . . . . . . . . F-278 Traff ic Operations .. . . . . . . . . . . . . . . . . . . . . . . . . . . . . . . . . . . . . . . . . . . . . . . . . . . . . . . . . . . . . . . . . . . . . . . . . . . . . . . . . . . F-280 Transportation Planning and Alternative Transportation ... . . . . . . . . . . . . . . . . . . . . . . . . . . . . . F-282 Transportation and Drainage Systems Maintenance .... . . . . . . . . . . . . . . . . . . . . . . . . . . . . . . . . . . F-286 Street Sweeping . . . . . . . . . . . . . . . . . . . . . . . . . . . . . . . . . . . . . . . . . . . . . . . . . . . . . . . . . . . . . . . . . . . . . . . . . . . . . . . . . . . . . . F-290 Traff ic Signals .. . . . . . . . . . . . . . . . . . . . . . . . . . . . . . . . . . . . . . . . . . . . . . . . . . . . . . . . . . . . . . . . . . . . . . . . . . . . . . . . . . . . . . . . F-292 Streets Capital . . . . . . . . . . . . . . . . . . . . . . . . . . . . . . . . . . . . . . . . . . . . . . . . . . . . . . . . . . . . . . . . . . . . . . . . . . . . . . . . . . . . . . . . . . F-294 Downtown Parking ... . . . . . . . . . . . . . . . . . . . . . . . . . . . . . . . . . . . . . . . . . . . . . . . . . . . . . . . . . . . . . . . . . . . . . . . . . . . . . . . . . . F-296 Building Maintenance ... . . . . . . . . . . . . . . . . . . . . . . . . . . . . . . . . . . . . . . . . . . . . . . . . . . . . . . . . . . . . . . . . . . . . . . . . . . . . . F-298 Motor Pool . . . . . . . . . . . . . . . . . . . . . . . . . . . . . . . . . . . . . . . . . . . . . . . . . . . . . . . . . . . . . . . . . . . . . . . . . . . . . . . . . . . . . . . . . . . . . . . F-300 Communications Systems .... . . . . . . . . . . . . . . . . . . . . . . . . . . . . . . . . . . . . . . . . . . . . . . . . . . . . . . . . . . . . . . . . . . . . . . F-304 Custodial Services .. . . . . . . . . . . . . . . . . . . . . . . . . . . . . . . . . . . . . . . . . . . . . . . . . . . . . . . . . . . . . . . . . . . . . . . . . . . . . . . . . . F-306 Water Resources Management ... . . . . . . . . . . . . . . . . . . . . . . . . . . . . . . . . . . . . . . . . . . . . . . . . . . . . . . . . . . . . . . . . F-308 Recycled Water ... . . . . . . . . . . . . . . . . . . . . . . . . . . . . . . . . . . . . . . . . . . . . . . . . . . . . . . . . . . . . . . . . . . . . . . . . . . . . . . . . . . . . . . F-310 Water Distr ibution .. . . . . . . . . . . . . . . . . . . . . . . . . . . . . . . . . . . . . . . . . . . . . . . . . . . . . . . . . . . . . . . . . . . . . . . . . . . . . . . . . . . F-312 Water Treatment .. . . . . . . . . . . . . . . . . . . . . . . . . . . . . . . . . . . . . . . . . . . . . . . . . . . . . . . . . . . . . . . . . . . . . . . . . . . . . . . . . . . . . F-314 Water Supply Management ... . . . . . . . . . . . . . . . . . . . . . . . . . . . . . . . . . . . . . . . . . . . . . . . . . . . . . . . . . . . . . . . . . . . . . . F-316 Water Resources Laboratories... . . . . . . . . . . . . . . . . . . . . . . . . . . . . . . . . . . . . . . . . . . . . . . . . . . . . . . . . . . . . . . . . . F-318 Water Capital Program .... . . . . . . . . . . . . . . . . . . . . . . . . . . . . . . . . . . . . . . . . . . . . . . . . . . . . . . . . . . . . . . . . . . . . . . . . . . F-320 Wastewater Collection .. . . . . . . . . . . . . . . . . . . . . . . . . . . . . . . . . . . . . . . . . . . . . . . . . . . . . . . . . . . . . . . . . . . . . . . . . . . . . F-322 Wastewater Treatment ... . . . . . . . . . . . . . . . . . . . . . . . . . . . . . . . . . . . . . . . . . . . . . . . . . . . . . . . . . . . . . . . . . . . . . . . . . . . . F-324 Wastewater Capital Program ... . . . . . . . . . . . . . . . . . . . . . . . . . . . . . . . . . . . . . . . . . . . . . . . . . . . . . . . . . . . . . . . . . . F-326

T A B L E O F C O N T E N T S
v
Waterfront Summary . . . . . . . . . . . . . . . . . . . . . . . . . . . . . . . . . . . . . . . . . . . . . . . . . . . . . . . . . . . . . . . . . . . . . . . . . . . . . . . . . . . . . . F-329 Administrative Support and Community Relations .. . . . . . . . . . . . . . . . . . . . . . . . . . . . . . . . . . . . . . . F-332 Property Management ... . . . . . . . . . . . . . . . . . . . . . . . . . . . . . . . . . . . . . . . . . . . . . . . . . . . . . . . . . . . . . . . . . . . . . . . . . . . . . F-334 Financial Management ... . . . . . . . . . . . . . . . . . . . . . . . . . . . . . . . . . . . . . . . . . . . . . . . . . . . . . . . . . . . . . . . . . . . . . . . . . . . . F-336 Parking Services ... . . . . . . . . . . . . . . . . . . . . . . . . . . . . . . . . . . . . . . . . . . . . . . . . . . . . . . . . . . . . . . . . . . . . . . . . . . . . . . . . . . . . F-338 Harbor Patrol . . . . . . . . . . . . . . . . . . . . . . . . . . . . . . . . . . . . . . . . . . . . . . . . . . . . . . . . . . . . . . . . . . . . . . . . . . . . . . . . . . . . . . . . . . . . F-340 Marina Management .. . . . . . . . . . . . . . . . . . . . . . . . . . . . . . . . . . . . . . . . . . . . . . . . . . . . . . . . . . . . . . . . . . . . . . . . . . . . . . . . F-342 Facil i t ies Management .. . . . . . . . . . . . . . . . . . . . . . . . . . . . . . . . . . . . . . . . . . . . . . . . . . . . . . . . . . . . . . . . . . . . . . . . . . . . . F-344 Facil i t ies Design and Capital Programs ... . . . . . . . . . . . . . . . . . . . . . . . . . . . . . . . . . . . . . . . . . . . . . . . . . . . F-346
APPENDICES
Description of Funds .. . . . . . . . . . . . . . . . . . . . . . . . . . . . . . . . . . . . . . . . . . . . . . . . . . . . . . . . . . . . . . . . . . . . . . . . . . . . . . . . . . . . . . . G-1
Legal Requirements and the Budgetary Process .. . . . . . . . . . . . . . . . . . . . . . . . . . . . . . . . . . . . . . . . . . . . . . . . G-6
Budget Policies .. . . . . . . . . . . . . . . . . . . . . . . . . . . . . . . . . . . . . . . . . . . . . . . . . . . . . . . . . . . . . . . . . . . . . . . . . . . . . . . . . . . . . . . . . . . . . . G-10
Annual Budget Calendar . . . . . . . . . . . . . . . . . . . . . . . . . . . . . . . . . . . . . . . . . . . . . . . . . . . . . . . . . . . . . . . . . . . . . . . . . . . . . . . . . . G-12
Gann Appropriation Limit . . . . . . . . . . . . . . . . . . . . . . . . . . . . . . . . . . . . . . . . . . . . . . . . . . . . . . . . . . . . . . . . . . . . . . . . . . . . . . . . . G-17
Debt Obligations . . . . . . . . . . . . . . . . . . . . . . . . . . . . . . . . . . . . . . . . . . . . . . . . . . . . . . . . . . . . . . . . . . . . . . . . . . . . . . . . . . . . . . . . . . . . G-18
Glossary .. . . . . . . . . . . . . . . . . . . . . . . . . . . . . . . . . . . . . . . . . . . . . . . . . . . . . . . . . . . . . . . . . . . . . . . . . . . . . . . . . . . . . . . . . . . . . . . . . . . . . . . . G-21
List of Acronyms ... . . . . . . . . . . . . . . . . . . . . . . . . . . . . . . . . . . . . . . . . . . . . . . . . . . . . . . . . . . . . . . . . . . . . . . . . . . . . . . . . . . . . . . . . . . G-25

The Government Finance Officers Association of the United States and Canada (GFOA) presented an award of Distinguished Presentation to City of Santa Barbara for its one-year financial plan and annual budget for the fiscal year beginning July 1, 2004. In order to receive this award, a governmental unit must publish a budget document that meets program criteria as a policy document, as an operations guide, as a financial plan, and as a communications device. This award is valid for a period of one year. We believe our current budget continues to conform to program requirements, and we have submitted it to GFOA to determine its eligibility for another award.
vi

I N T R O D U C T I O N
C i t y A d m i n i s t r a t o r ’ s B u d g e t M e s s a g e
A-1
O V E R V I E W
K e y I n d i c a t o r s S h o w i n g L o c a l E c o n o m y i s G e t t i n g B a c k o n T r a c k After a dif f icult national recession and amid a cont inuing State budget crisis, the economic recovery that began last year appears to be holding steady. This is ref lected in several key indicators of local economic health, many of which are t ied to tourist and visitor counts.
One of the most favorable trends is the steady increase in airport passenger counts over the last two years. In f iscal year 2002, passenger counts fel l to just under 700,000 from 781,000 due to the events of September 11, 2001. In f iscal year 2004, passenger counts reached 796,000, f inally exceeding pre-September 11 levels. In May 2005, passenger counts were 9.9% above the same month last year, well above the national average of 4.7%. For f iscal year 2005, passenger counts are up 8.3% through
May 2005, represent ing strong overall growth in passenger volumes. Another good measure of local economic health is the level of act ivity at local hotels. After a 3% decl ine in f iscal year 2002, transient occupancy tax (TOT) revenues remained f lat in f iscal year 2003, but rebounded for a 5.1% increase in f iscal year 2004. Through May 2005, TOT revenues have grown 5.7%. 4.5% and 5% growth rates are projected for f iscal years 2006 and 2007, respectively. And f inal ly, we look to our sales tax revenues as a key indicator of local spending, which is heavi ly inf luenced by the number of visitors and tourists coming to the City. After several years of stel lar performances, sales tax revenues decl ined 2.6% in f iscal year 2002, the f irst decl ine in approximately 10 years. Since then, sales tax revenues grew by 1% in f iscal year 2003 and 4.1% in f iscal year 2004. Through March 31, 2005, nine months into the f iscal year, sales tax revenues have increased 2.8%.
P r o p o s i t i o n 1 A P r o v i d e s M e a s u r e o f R e l i e f In connection with the State budget, the Governor and a coalit ion of local government off icials reached an historic agreement, which led to placement of Proposit ion 1A on the November 2004 bal lot. The measure, overwhelmingly approved by the voters, provides enhanced Const itut ional protect ion to local government revenues, preventing the State from taking local

I N T R O D U C T I O N
C i t y A d m i n i s t r a t o r ’ s B u d g e t M e s s a g e
A-2
government revenues in the future. The State would sti l l be able to borrow property taxes from local governments, but only i f : (1) the Governor proclaims a “signif icant State f iscal hardship,” (2) the Legislature approves the borrowing with a 2/3 vote, and (3) the State repays any outstanding loans from local government, with interest. In return for this protect ion of local revenues, the budget agreement calls for cit ies, counties, special distr icts, and redevelopment agencies to endure two years of revenues losses. Specif ical ly, $1.3 bil l ion in local property tax revenues wil l be shifted to the State in the current f iscal year and next f iscal year (f iscal years 2005 and 2006). Statewide, cit ies wi l l share in a $350 mil l ion loss. The City of Santa Barbara’s annual share of this shif t is approximately $1.25 mil l ion, and our Redevelopment Agency wil l lose approximately $1.3 mil l ion. The adopted budget for f iscal year 2006 has been adjusted for these losses. Despite this histor ic agreement, the $105 bil l ion f iscal year 2005 State budget continues to rely heavi ly on borrowing and does not resolve the State’s cont inuing structural deficit . Although Proposit ion 1A provides signif icant protect ion against future raids on local revenues, i t does not provide absolute protect ion. The State may f ind other ways to address their deficits that have an impact on local government. C o n t r o l l i n g C o s t S t i l l a M a j o r C h a l l e n g e Over the last few years, the single biggest chal lenge facing most Cal ifornia cit ies has been the impacts of increased costs of health insurance, property and l iabi l i ty insurance, workers’ compensation, and ret irement. The most dramatic increase has been increased contr ibut ions to the Public Employee Retirement System (PERS). In large part due to the stock market losses from 2001 through 2003, required contr ibutions for the General Fund increased by $6.7 mil l ion from f iscal year 2003 to 2005. Another $1.5 mil l ion increase is projected in f iscal year 2006. In the General Fund, where salaries and benefits make up approximately 75% of total operat ing costs, recently negot iated and approved salary and benefit increases have added stress to the overal l balancing of the fund. Although the City Council has expressed the importance of keeping salaries in l ine with the local market to ensure the City can attract and retain qual ity personnel, part icular ly in l ight of the extraordinary housing prices in the tr i-County area, the challenge is f inding a way to fund these addit ional costs when the General Fund is st i l l facing budget deficits.

I N T R O D U C T I O N
C i t y A d m i n i s t r a t o r ’ s B u d g e t M e s s a g e
A-3
A d d i t i o n a l R e s e r v e s N e e d e d t o B a l a n c e G e n e r a l F u n d B u d g e t Over the last three years, the City has budgeted for the use of reserves to balance the General Fund operating budget. This long-term strategy was developed to address the operating budget deficits created by the impacts of “9-11”, the increases in costs, and the State’s raid on local revenues. In addit ion to the use of reserves, the strategy included cuts to departmental budgets and adjustments to fees to keep pace with the cost of providing services. The goal was to minimize the impacts on the organization as it transit ions to a smaller organization, and to resolve the structural imbalance by f iscal year 2009. Although the use of reserves through f iscal year 2009 was contemplated when the strategy was developed several years ago, recent ly completed labor negot iat ions have increased the structural deficit and projected use of reserves beyond the amounts anticipated. As a result , City General Fund departments wil l be asked immediately in f iscal year 2006 to reduce operat ing expenditures by $1 mil l ion. We wil l also immediately begin planning for addit ional adjustments total ing $1.3 mil l ion for f iscal year 2007, for a total of $2.3 mil l ion annually. I t is cr it ical we implement these addit ional changes to the General Fund in order to minimize the long-term use of General Fund reserves. F o r e c a s t S h o w s G e n e r a l F u n d B a l a n c e d b y F i s c a l Y e a r 2 0 0 9 In the development of the budget each year, staff updates the General Fund mult i-year forecast, a f inancial planning document that plays a vital role in budgetary decisions. The forecast undergoes ongoing review by the Finance Committee and Council, and is updated several t imes throughout the budget development process. The table on the fol lowing page is a summary version of the most current General Fund mult i-year forecast. The forecast includes the expected results for f iscal year 2005 (current year); the adopted and proposed budgets for f iscal years 2006 and 2007; and project ions for f iscal years 2008 and 2009.

I N T R O D U C T I O N
C i t y A d m i n i s t r a t o r ’ s B u d g e t M e s s a g e
A-4
FY 2005 FY 2006 FY 2007 FY 2008 FY 2009Expected Adopted Proposed Projected Projected
Operating Revenues 84,438,876$ 88,510,646$ 93,587,465$ 97,121,623$ 100,937,869$ Operating Expenses 87,547,417 95,754,589 98,648,031 102,145,470 105,653,619
Operating Gain (Loss) (3,108,541) (7,243,943) (5,060,566) (5,023,847) (4,715,750) Anticipated Year-End Variance 2,626,423 2,872,638 2,959,441 3,064,364 3,169,609
Net Operating Gain (Loss) (482,118) (4,371,305) (2,101,125) (1,959,483) (1,546,141) Capital Program (1,177,400) (623,700) (977,000) (750,000) (750,000)
Total Projected Use of Reserves (1,659,518) (4,995,005) (3,078,125) (2,709,483) (2,296,141)
Required Budgetary Adjustments - 1,000,000 1,300,000 - - Cumulative Budgetary Adjustments - 1,000,000 2,300,000 2,300,000 2,300,000
Adjusted Use of Reserves (1,659,518)$ (3,995,005)$ (778,125)$ (409,483)$ 3,859$
Two-Year Financial Plan
CITY OF SANTA BARBARAGeneral Fund Multi-Year Forecast
As shown in the mult i-year forecast above, operating revenues are insuff icient to fund operat ing expenditures in each year of the forecast, result ing in operat ing deficits ranging from almost $7.2 mil l ion in f iscal year 2006 to approximately $4.7 mil l ion in f iscal year 2009. Because favorable year-end variances are typical ly real ized each year, the forecast includes an “Anticipated Year-End Variance” amount, est imated at 3% of operating expenditures, in each year. Although unbudgeted, these anticipated year-end variances ( i.e., revenues over budget and expenditures under budget) are important for f inancial planning purposes as they provide considerable rel ief, i f realized, to the overall use of reserves. Thus, the “Net Operating Loss” for f iscal year 2006 drops to approximately $4.4 mil l ion, and down to sl ight ly over $1.5 mil l ion by f iscal year 2009. When capital program expenditures are included, however, the use of reserves increases each year by the est imated amount of the capital program. Therefore, the balance, shown as the “Total Projected Use of Reserves”, represents total def icit of the General Fund. By f iscal year 2009, this total projected def icit decreases to approximately $2.3 mil l ion, which is the amount establ ished as the “structural def icit” that needs to be addressed. Accordingly, the mult i-year forecast ident if ies a total of $2.3 mil l ion of adjustments ( i.e. , expenditure reductions or revenue enhancements) to be implemented in the next two f iscal

I N T R O D U C T I O N
C i t y A d m i n i s t r a t o r ’ s B u d g e t M e s s a g e
A-5
years in order to br ing the General Fund into balance by f iscal year 2009. I t is anticipated that the majority of the adjustments wi l l be in the form of expenditure reductions through the further downsizing of the City organizat ion via attr i t ion. Staff is committed to minimizing service del ivery impacts whenever possible, but some service impacts are inevitable. In accordance with Counci l-adopted pol icy, the General Fund should have 25% of i ts operat ing budget set aside in reserves: 10% designated to cover budgetary shortfal ls, and 15% designated to respond to natural disasters. In addit ion, a f ixed amount of $1 mil l ion is designated as a capital reserve. The fol lowing table shows the reserves needed to ful ly fund General Fund reserves in accordance with City pol icy, and the projected reserve balances based on the mult i-year forecast from f iscal year 2005 to 2009. As shown in the table below, the f irst year that “pol icy reserves” are used is in f iscal year 2005, in the amount of $655,822. Each year thereafter, the gap between the pol icy reserve balances and the actual reserve balances grows, reaching almost $9.1 mil l ion in f iscal year 2009. However, with the structural deficit cured by this same year as forecasted, no addit ional reserves wil l be needed to balance the General Fund operating budget. Having “turned the corner”, we expect, over t ime, to begin replenishing the reserves back to the pol icy levels over t ime.
FY 2004 FY 2005 FY 2006 FY 2007 FY 2008 FY 2009
Budget Reserve (10%) 8,754,742$ 9,575,459$ 9,814,803$ 10,099,547$ 10,405,983$ 10,767,323$ Disaster Reserve (15%) 13,132,113 14,363,188 14,722,205 15,149,321 15,608,975 16,150,984 Capital 1,000,000 1,000,000 1,000,000 1,000,000 1,000,000 1,000,000
Total Policy Reserves 22,886,855 24,938,647 25,537,008 26,248,868 27,014,958 27,918,307
Actual/Projected Reserves 25,942,343 24,282,825 20,150,155 19,234,366 18,824,883 18,828,741
Over (Under) 3,055,488$ (655,822)$ (5,386,853)$ (7,014,502)$ (8,190,075)$ (9,089,566)$
CITY OFSANTA BARBARASummary of Projected and Policy Reserves

I N T R O D U C T I O N
C i t y A d m i n i s t r a t o r ’ s B u d g e t M e s s a g e
A-6
C I T Y W I D E G O A L S A N D P R I O R I T I E S
P r e s e r v i n g t h e Q u a l i t y o f L i f e a T o p P r i o r i t y We are fortunate to l ive in one of the most beaut iful cit ies in the world. I t is a city that boasts a breathtaking coastl ine, great beaches, and a mild cl imate, al l within a picturesque sett ing
bordered by mountains to the north and the ocean to the south. I t is a destinat ion point for both domestic and internat ional travelers, attracted by the exclusive shopping and dining, nearby wineries, cultural events and attract ions, such as the Old Spanish Days and the Santa Barbara Internat ional Film Festival, and a relaxed beachfront atmosphere. The preservation of this wonderful community has long been
a priority of the City and its residents. The qual ity of l i fe we enjoy encompasses the environment, the qual ity and safety of our neighborhoods, the economic vital i ty of the downtown and waterfront areas, and the cultural and recreat ional elements of the City.
C i t y C o n t i n u e s E f f o r t s t o I m p r o v e t h e E n v i r o n m e n t Some of the efforts aimed at improving the environment include restoration of local creeks that wi l l help improve the overall qual i ty of the waters f lowing into local beaches. The concern over water qual i ty led to the passage of Measure B in November of 2000, which increased the City’s transient occupancy tax from 10% to 12%. Measure B has provided over $2 mil l ion per year in revenues, supplemented by various federal and state grants, to address water qual ity issues. Examples of such efforts include the restoration of Old Mission Creek and the Arroyo Burro estuary. The implementat ion of a watershed act ion plan is currently underway that wi l l identify community prior it ies and long-term strategies for storm water and urban runoff reduction, and creek habitat and water qual ity capital improvement needs. In terms of solid waste management, the City continues to implement strategies in order to reach its goal of divert ing 70% of i ts solid waste from the local landf i l l . Some of the efforts aimed at reaching this goal have included introducing recycl ing bins in al l City parks to convey the message that recycl ing is always a part of waste disposal - at home, at work, and at play. Trash cans in al l City off ices have also been replaced with a recycling/trash combo, with the trash container being signif icantly smaller than the recycl ing container.

I N T R O D U C T I O N
C i t y A d m i n i s t r a t o r ’ s B u d g e t M e s s a g e
A-7
In this environmentally conscious community, waste diversion goes beyond basic recycl ing and green waste bins. The City has launched a publ ic outreach program to give residents information on recycl ing, reuse, or proper disposal of commonly recycled items as well as non-tradit ional materials such as CD’s, plast ic bags, construct ion waste, electronic waste, hazardous wastes, appliances, and furniture. In an effort to reach out to al l members of the community, the City has developed a Hispanic outreach program that features Spanish television commercials, recycl ing brochures in Spanish, and a bi l ingual newsletter that wi l l premier on Earth Day. On a larger scale, the City extended its contract to MarBorg Industr ies for waste disposal in order to help them f inance a new state of the art recycl ing faci l i ty that wi l l increase local waste diversion. The Publ ic Work’s Environmental Services Program is also complet ing a strategic plan that sets a road map for increasing diversion through food waste composting, diversion in schools, recycl ing of construct ion wastes, increased business and mult i-family recycl ing, green bui lding, and procurement of recycled products.
M o r e N e i g h b o r h o o d I m p r o v e m e n t s P l a n n e d
Last year, the City implemented the Neighborhood Improvement Program in response to a growing awareness that the del ivery of City services needed to be restructured to improve the safety and quality of l i fe in our neighborhoods. The goals of the program include increasing the effect iveness and eff iciency of services provided by City departments, creating more posit ive impacts in higher-density neighborhoods, engaging neighborhood residents and community groups to improve the
qual ity of l i fe in their neighborhoods, and increasing bui lding and zoning enforcement efforts. As a result of this program, a number of improvements and neighborhood clean-up efforts have been completed. For example, the City’s Recreation Division Job Apprent iceship Program, with part ial funding from Santa Barbara Beautiful, cleaned up a port ion of Old Mission Creek. Youth apprentices worked al l through August to clean up the site. Other efforts include:
In September of 2004, City streets maintenance staff , along with the Pol ice Department and Union Pacif ic Railroad, removed 18,000 pounds of trash from under the Las Positas Bridge at Highway 101. About 20 gal lons of paint were used to cover graff i t t i on both sides of the underpass.

I N T R O D U C T I O N
C i t y A d m i n i s t r a t o r ’ s B u d g e t M e s s a g e
A-8
Renovation of the Community Gardens, including the Rancheria, Yanonali and Pi lgr im Terrace Gardens, is scheduled for complet ion in June 2005. Garden plot borders have been installed at the three sites, storage sheds have been del ivered and wi l l be permanently located, irr igat ion systems are being repaired, and information kiosks have been ordered for instal lat ion.
The City is el igible to receive up to $473,500 from the
State Street Workforce Incentive Grant Program for addit ional neighborhood improvement projects, including the Montecito Street Pedestrian Light ing Improvement Project; the Junipero Pedestr ian Bridge Light ing Project; and Punta Gorda Street curbs, gutters, and sidewalks.
On March 15, 2005, the City Counci l approved $425,375 in funding from the Community
Development Block Grant Program for f ive projects that are part of the Neighborhood Improvement Program. They include $64,225 for Clean and Safe Neighborhoods; $42,000 for the Frankl in Center/Library; $125,000 for the Coronel Pocket Park; $85,000 for Ortega Park Improvements; and $109,150 for Montecito Street Light ing.
Another major effort is the West Downtown Neighborhood Improvement Project, one of several projects funded by the Redevelopment Agency’s 2003 Tax Allocation Bonds. Improvements wi l l include upgrading pedestr ian amenit ies, general landscaping improvements, and addit ional l ight ing where appropriate. Improvement of this area wil l strengthen the pedestr ian connection between the west downtown and downtown. D o w n t o w n a n d W a t e r f r o n t S l a t e d f o r M a j o r R e n o v a t i o n s Maintaining the physical, cultural, and aesthetic features in the downtown and waterfront areas is cr it ical to the economic vital i ty of the City. Over the last several years, the Redevelopment Agency (RDA) and business owners joint ly funded the Downtown Sidewalk and Landscaping Project. The Project was broken up into phases, beginning with the 1000-1200 blocks, each carrying the same improvements further south on State Street. The goals of the Project are to improve pedestr ian circulat ion and safety, improve business visibi l i ty, maintain and enhance landscape diversity, acknowledge signif icant architectural features of bui ldings, provide amenit ies for the comforts and

I N T R O D U C T I O N
C i t y A d m i n i s t r a t o r ’ s B u d g e t M e s s a g e
A-9
convenience of pedestr ians, and thereby provide a pedestr ian fr iendly State Street Plaza. Phase IV of the Project, covering the 400-500 blocks, is scheduled to begin in January 2006. While the majority of the development in the downtown has been focused on State Street over the last 30 years, Chapala Street is emerging as a focus of pr ivate redevelopment. Redevelopment Agency (RDA) staff, in col laborat ion with the Planning Division and Transportation Division of Publ ic Works, recently completed a design guidelines process to develop a cohesive streetscape design theme to be used by both pr ivate developers and the City. The product of this process wil l be guidel ines similar to the State Street Landscaping Guidelines, including text and renderings. The RDA has now funded $835,000 for various improvements to Chapala Street in conformance with the Design Guidel ines.
In the waterfront area, over $5 mil l ion has been allocated towards sidewalk and other pedestr ian improvements. The East Cabri l lo Boulevard Sidewalk Improvement Project wi l l repair and replace the exist ing sidewalk from Stearns Wharf to Milpas Street. The Project wi l l also include landscaping enhancements where appropriate and the addit ion of pedestr ian amenit ies. The West Side Pedestr ian Improvements Project wi l l provide sidewalk and landscaping improvements from Stearns Wharf to the Santa Barbara Harbor, and wi l l
focus on improving the pedestr ian connection between the wharf and harbor. The Granada Garage, which is being built on Parking Lot No. 6 on Anacapa Street (between Anapamu and Victor ia Streets), is now under construction. When completed, the Granada Garage wil l be a six- level parking structure with 575 parking spaces. The architecture of the garage is Mediterranean in style and the garage wil l feature new paseos and landscaping surrounding the structure. The garage wil l provide much needed parking in the Cultural Distr ict north of Carr i l lo, and help maintain the economic vital i ty of this important area. R e n o v a t i o n s t o C u l t u r a l a n d R e c r e a t i o n a l V e n u e s i n t h e W o r k s A number of separate efforts are underway to develop or renovate major performing arts venues. One of the major efforts currently underway is the renovation of the histor ic Granada Theater. The Santa Barbara Center for the Performing Arts (SBCPA) has acquired the theater, with the goal of improving and expanding it to provide up to 1,600 seats. A major fundraising campaign is currently underway. The City’s Redevelopment Agency wil l be providing a $3 mil l ion grant towards construct ion, which is expected to begin in f iscal year 2006.

I N T R O D U C T I O N
C i t y A d m i n i s t r a t o r ’ s B u d g e t M e s s a g e
A-10
The Ensemble Theater has also proposed a new theater in response to the Performing Arts Feasibi l i ty Study conducted by the Santa Barbara Center for Performing Arts and partial ly funded by the Redevelopment Agency (RDA). The RDA has al located $2.5 mil l ion in funding from the proceeds of the 2001 Tax Al locations Bonds for a potential grant or loan to Ensemble Theater for predevelopment or construct ion costs, as well as instal lat ion by the RDA of publ ic paseos around the theater. The Carri l lo Recreation Center, located at the corner of Carri l lo Boulevard and Anacapa Street, is scheduled for a $3.5 mil l ion renovation next year. This heavi ly-used histor ic landmark wil l receive upgrades to its electr ical and plumbing and aesthetic improvements. A f f o r d a b l e H o u s i n g R e c e i v e s B o o s t i n F u n d i n g For many years our City has made the provision of affordable housing a high priority. In partnership with the Santa Barbara Housing Authority and other non-prof it housing developers, the City and Redevelopment Agency have provided funding for the development of many affordable units in the City. Current ly, 12% of the City’s housing stock is under restrict ions to ensure its affordabi l i ty.
The Redevelopment Agency (RDA) recent ly approved $2.3 mil l ion in funding towards a project at 617 Garden Street for a Mental Health Associat ion (MHA) administrat ive and program center, which wil l include 50 units of affordable housing. Twenty-f ive of the units would be for very-low-income MHA cl ients, and 25 for low-income, downtown workers. The RDA also recent ly al located $2 mil l ion for future affordable housing projects, and an addit ional $4 mil l ion for property acquisit ion, some or al l of which could be
used for acquir ing property for housing.
In addit ion, the Redevelopment Agency provided approximately $17 mil l ion in a combination of loans and grants toward the largest affordable housing development to be bui lt on the South Coast. Mercy Housing California and St. Vincent's Inst itut ion are developing 75 low-income family apartments and 95 low-income senior apartments on the 19-acre St. Vincent 's School campus at Highway 154 and Calle Real. The development is also f inancial ly supported by the County of Santa Barbara as a regional response to affordable housing needs.
C i t y F o c u s i n g o n W o r k i n g S m a r t e r Over the last several years, the City has faced unprecedented f inancial chal lenges on many fronts, including the impacts of September 11, 2001, and the ensuing economic downturn on

I N T R O D U C T I O N
C i t y A d m i n i s t r a t o r ’ s B u d g e t M e s s a g e
A-11
City revenues; the sharp r ise in costs; and the raid on local revenues by the State. Because of these factors, the City has been forced to tr im costs and reduce staff ing through attr i t ion. Even with the staff reduct ions over the last several years, and the potent ial for further reductions over the next two years, the demand for City services has not diminished. Consequently, i t has become more important than ever for the City to work more eff iciently to ensure the qual ity services our residents and businesses currently enjoy are unaffected. One of the init iat ives designed to create a more eff icient City government is the implementation of a performance measurement program two years ago, called the Paradise Performance Program (or “P3”). For each operat ing program, specif ic measurable object ives are created to better plan work efforts and identify results. Addit ional ly, performance indicators have been developed for each program to measure both effect iveness and eff iciency. Although sti l l evolving, the P3 program has already made signif icant improvements in City operations. One of the ongoing chal lenges affect ing City operat ions is the high cost of l iv ing on the south coast, which has made it dif f icult to attract and retain quali ty staff. This wi l l become even more acute as a large number of baby boomers reach ret irement age in the next f ive years. In response to this chal lenge, last year the City implemented a comprehensive training program for employees, cal led Learning for Excel lence and Achievement Program (“LEAP”). Employees are provided training opportunit ies in a number of topics, ranging from employment law to improving communication ski l ls. This is an important investment in our employees that wi l l generate dividends on a long-term basis as we look to our own personnel to f i l l key management and supervisory posit ions. M a j o r P l a n n i n g E f f o r t s U n d e r w a y Next year staff wi l l begin work to update the City’s General Plan, which contains many important goals and policies for growth management and land use planning in our community. Measure E, which in 1989 amended the City’s Charter that provides the basis for the City's Growth Management Strategies, has a 2010 expirat ion date. This effort wi l l require considerable t ime and resources over the next 5 years. When complete, we wil l have the framework for land use decisions through 2030.

I N T R O D U C T I O N
C i t y A d m i n i s t r a t o r ’ s B u d g e t M e s s a g e
A-12
Staff is currently working on Phase I of the General Plan Update (GPU). The primary objective of Phase I is to produce a series of background reports (“Condit ions, Trends & Issues”) for each of the key resource constraints to growth. These reports wi l l serve as both the foundation for the community discussion and decision making in the next phases, as well as an educat ional tool. Phase II , which wil l begin in early f iscal year 2006, wi l l formally kick-off the publ ic part ic ipat ion effort, the resident ial development analysis, as well as the environmental review. This process wil l develop and conf irm the community’s vision for future growth and development, as well as work through a set of specif ic growth scenarios, culminat ing in a single preferred growth option. The focus of Phase III , scheduled to begin in f iscal year 2007, wil l be the development, analysis and community debate of the various growth options and their associated environmental impacts. In working towards a preferred growth option, formal environmental review wil l play a key role in framing the discussions and eventual decisions. Phase IV wil l conf irm the preferred option through a ballot measure, and wil l be fol lowed by a series of General Plan Element and Zoning Ordinance implementation efforts.
B U D G E T H I G H L I G H T S C i t y C o n t i n u e s t o P r o v i d e d F u l l S c o p e o f S e r v i c e s The City of Santa Barbara is a ful l service City providing a broad range of services, including pol ice and f ire protection, parks and recreation, l ibrary, planning, streets maintenance, water, wastewater and refuse, a regional airport, a harbor and waterfront. The f iscal year 2006 adopted budget includes a total operat ing budget of approximately $189.8 mil l ion and a citywide capital program of $20.6 mil l ion. The General Fund, where services tradit ional ly associated with local government are accounted for, includes a $95.8 mil l ion operat ing budget and a $623,700 capital program.
Operating Budget by Fund Type
General Fund45%
SpecialRevenue
Funds17%
EnterpriseFunds30%
InternalService Funds
8%

I N T R O D U C T I O N
C i t y A d m i n i s t r a t o r ’ s B u d g e t M e s s a g e
A-13
In addit ion to the General Fund, the City has a number of other funds used to account for the many services and activi t ies provided (see chart). Special revenue funds, total ing $45.5 mil l ion (17%), are used to account for revenues legal ly restr icted for a specif ic purpose. Internal service funds, total ing $17.3 mil l ion (8%) are used to account for services provided internally to City departments and programs, such as Information Systems and Risk Management ( i .e., Self-Insurance) services. Enterprise funds, total ing $64.5 mil l ion (30%), are used to account for the activi t ies of the City operated in a manner similar to the private sector. The City’s enterprise funds include the Water, Wastewater, Downtown Parking, Waterfront, Golf and Airport Funds. Each rel ies on a unique set of fees and charges to fund its operat ing and capital costs. As with the General Fund, they have been affected by the increased costs over the last several years in insurance and employee retirement costs. However, al l of the enterprise funds are in good f inancial health and are balanced in f iscal years 2006 and 2007. K e y G e n e r a l F u n d R e v e n u e s R e f l e c t M o d e r a t e G r o w t h Key General Fund revenues are now posting increases consistent with histor ical growth averages. Between 1992 and 1995, the nat ional, state and local economies suffered through an economic recession. City revenues at that t ime were f lat and, in some cases decl ined. This period was then fol lowed by one of the strongest periods of growth in recent history, which lasted through the last half of the decade and through 2000. Correspondingly, City tax revenues real ized extraordinary growth, ranging from 6 to 9%. However, for the decade, total General Fund revenues real ized an average growth of just 3.5%, and tax revenues ( i.e., sales, property, transient occupancy, etc.) grew an average of just 4.3%. These long-term growth averages give perspective and understanding to current growth trends of General Fund revenues and the project ions for the next two years. The table below provides a summary of key General Fund revenues for f iscal year 2005 (est imated year-end project ions), and budgeted estimates for f iscal years 2006 and 2007. The largest growth has been, and continues to be, in property tax revenues. Between 1997 and 2004, property tax revenues grew an average of 9% per year. In the last three years, despite the impacts of the recession on other key revenues, property values appreciated considerably. For both f iscal year 2005 and 2006, as shown in the table, we estimate a 7% growth in property tax revenues; a 6% growth is projected for f iscal year 2007.

I N T R O D U C T I O N
C i t y A d m i n i s t r a t o r ’ s B u d g e t M e s s a g e
A-14
CITY OF SANTA BARBARASummary of Key General Fund Revenue Estimates
Est. Est. Est.FY 2005 Growth FY 2006 Growth FY 2007 Growth
Projected % Estimate % Estimate %
Sales Tax * 18,629,754$ 3.0% 19,374,944$ 4.0% 20,149,942$ 4.0%Property Tax * 11,981,583 7.0% 12,820,294 7.0% 13,589,512 6.0%Transient Occupancy Tax 10,780,310 4.0% 11,504,200 6.7% 12,079,400 5.0%Utility Users Tax 5,837,700 4.8% 6,071,200 4.0% 6,253,300 3.0%Franchise Fees 2,074,964 1.0% 2,170,200 4.6% 2,275,100 4.8%
49,304,311$ 51,940,838$ 54,347,254$
* Amounts do not include adjustments for recent change in allocation pursuant to State budget provisions: a. Sales tax does not include Prop. 172 1/2 cent sales tax. b. 25% of sales tax revenues replaced them with an equal amount of "property tax in-lieu". c. Replacement of approximately 90% of Vehicle License Fees with an equal amount of property taxes. d. State take away in both FY 2005 and 2006 of over $1.2 million in property taxes ("ERAF shift").
A ctualF iscal G row th
Year R ate1999 6.4%2000 5.8%2001 5.4%2002 -4.1%2003 2.2%2004 2.8%
2005 (Est.) 3 .0% 2006 (Est.) 4 .0% 2007 (Est.) 4 .0%
C ity of Santa B arbaraSales Tax R evenue G row th
As shown in the preceding table, sales tax, the largest General Fund revenue, is projected to grow 3% in f iscal year 2005, and 4% in f iscal years 2006 and 2007. Although the growth rates are consistent with histor ical averages, they are above the growth rates of the previous three years. The table to the right shows the actual growth rates for sales tax revenues since 1999 through 2004, and the estimates for f iscal years 2005 through 2007. The economic recovery of the late 1990’s generated strong growth through f iscal year 2001. However, revenues decl ined in f iscal year 2002 by 4.1%, and grew less than 3% in f iscal years 2003 and 2004. Our projected growth rate for f iscal years 2006 and 2007 of 4% essent ial ly ref lect an expectation that the economy wil l cont inue on this posit ive trend. This is consistent with economic indicators and general economic project ions at both the state and national levels. Through May 2005, transient occupancy tax revenues are 5.7% above last year, and are projected to cont inue at this rate through remainder of the f iscal year. A 6.7% increase is est imated for f iscal year 2006, which assumes a normal growth rate of 4.5% plus addit ional

I N T R O D U C T I O N
C i t y A d m i n i s t r a t o r ’ s B u d g e t M e s s a g e
A-15
revenues due to the recent opening of the Andalucia Hotel. Based on recent trends, a 5% growth is est imated for f iscal year 2007. As shown in the table below, growth in franchise fees has been fair ly unstable over the last few years. This is due to a number of factors, including: (1) f luctuation in the prices of natural gas and electric ity rate reductions; (2) overpayments of franchise fees on natural gas received in one year, adjusted in the subsequent year; a rebate to customers in f iscal year 2004 on electr ic charges; and a change in funding for publ ic access and educat ional programming whereby the City received an addit ional 1.5% in franchise fees from the City’s cable provider, offset by City contr ibutions to the South Coast Community Media Access Center. The table also shows the percentage change in franchise fee revenue from f iscal year 2002 through 2004, and the project ions for f iscal years 2005 through 2007. Even with the volat i l i ty of the past few years, we are now seeing more stabil i ty. For f iscal year 2005, we expect revenues to grow just 1%. In f iscal years 2006 and 2007, the projected growth is 4.6% and 4.8%, respectively. The increases in f iscal year 2006 and 2007 are largely attr ibutable to increases to cable franchise fees, from 4.5% to 5% approved by Counci l in May 2005. Although the effect ive date could be as early as end of July 2005, we have only factored in six months of addit ional revenues in f iscal year 2006, with the ful l impact of the fee increase ref lected in f iscal year 2007 revenues.
The City Counci l has also approved an increase in the electric franchise fee, from 1% to 2%. The fee increase could generate approximately $600,000 of addit ional revenues, half of which wil l be restr icted to fund under-grounding of electr ic power l ines. The proposed increase has recent ly been approved by the Public Ut i l i t ies Commission (PUC); however, the implementation date is st i l l uncertain given the substantial effort required to effect this change. Therefore, no addit ional revenues have been included in this adopted two- year f inancial plan for the impacts of the increase in franchise fees.
ActualFiscal GrowthYear Amount Rate2002 1,797,590$ 15.9%2003 1,769,584 -1.6%2004 2,055,864 16.2%
2005 (Est.) 2,074,964 1.0% 2006 (Est.) 2,170,200 4.6% 2007 (Est.) 2,275,100 4.8%
Franchise Fee GrowthCity of Santa Barbara
E n t e r p r i s e F u n d s F o c u s i n g o n M a j o r C a p i t a l I m p r o v e m e n t s
The Airport is moving forward with the expansion of the air l ine terminal. The growth in passenger volumes over the last ten years and the addit ional security needs have resulted in severe overcrowding and lack of space for air l ine and airport operations.
The Air l ine Terminal Improvement Project wi l l be funded from a combination of federal grants, bond f inancing and airport revenues. A feasibi l i ty study determined that the Airport 's f inancial

I N T R O D U C T I O N
C i t y A d m i n i s t r a t o r ’ s B u d g e t M e s s a g e
A-16
capacity is $55 mil l ion for the entire project, which includes the terminal expansion, roadway improvements, increased parking faci l i t ies, and an aircraft-parking ramp.
In February of 2005, Airport staff and the project management team init iated meetings with stakeholders. These “kick-off” meetings focused on the process of developing a Program Criter ia Document (PCD), which wil l contain the key elements for design of a new Air l ine Terminal Complex. Over the next several months, addit ional meetings with a subcommittee of the stakeholders wi l l be held to provide ongoing input to design elements. When complete, the PCD wil l set forth the project budget, the bui lding size, al l technical information on square footage, space for the various uses in the terminal, and parking gate layout. The PCD process enables the City Council , boards and commission members, and affected users to have their concerns and needs addressed prior to design. Completion of the PCD is expected for the fal l of 2005.
The Golf Course is planning major capital improvements to address a number of safety issues and to improve the overall playabi l i ty of the course. A Master Plan has been approved by the Golf Advisory Committee, the Parks and Recreation Commission, and City Counci l. The Master Plan wil l guide future capital improvement projects and wil l outl ine methods of improving the course in an orderly manner over the next few years.
The Downtown Parking Fund is currently evaluating alternative parking fee structures to fund an increase to its capital program for maintenance of the aging parking facil i t ies. Although no addit ional parking structures are proposed, other than the Granada Garage, the aging facil i t ies are demanding more maintenance efforts to ensure cont inued service to both shoppers and commuters.
In the Water Fund, major improvements to the Wil l iam B. Cater Water Treatment Plant began two years ago and wil l continue over the next several years, at a total cost of approximately $20 mil l ion. The plant, which was bui lt in 1964, supplies water to the City of Santa Barbara, Montecito Water Distr ict and Carpinter ia Valley Water Distr ict. In the Wastewater Fund, a strategic plan for the rehabil i tat ion of the El Estero Wastewater Treatment Plant was completed in January 2003. Nine projects costing $18.5 mil l ion, ident if ied as having the highest pr ior ity, began this f iscal year and wil l continue into the next two years. These projects wi l l be funded through long-term debt issued in June 2004, which wil l be repaid over 25 years.

I N T R O D U C T I O N
C i t y A d m i n i s t r a t o r ’ s B u d g e t M e s s a g e
A-17
The Sheff ield Reservoir Project in nearing completion. The main elements of this project are the construct ion of two buried 6.5 mil l ion gal lon capacity concrete reservoirs and conversion of
the parcel to a passive open space. The exist ing open reservoir has been demolished, and construct ion of the new tanks has been completed, and the temporary above ground steel bolted tanks are being dismantled. The area around the water tanks is being backfi l led for the planting of trees and plants this fal l . In the last few months, work consisted of br inging the two buried tanks on l ine, beginning backfi l l and compacting operations, erect ing the roof of the Filtrat ion Bui lding, and removal
of the l iner of the water main running under the Filt rat ion Building and under Mountain Drive. The project is approximately 72% complete and is scheduled to be completed at the end of this calendar year.
C O N C L U S I O N Despite many dif f icult chal lenges ahead, the adopted two-year f inancial plan envisions a br ight future for our community: improvements to protect our fragile environment, major enhancements to a mult i tude of faci l i t ies and our crit ical infrastructure, development of a new General Plan to guide future land use decisions, and the cont inued del ivery of quality services to our residents. This truly is an excit ing t ime to be a part of Santa Barbara City government.
Over the next two years we need to have the courage to address the f inancial issues our City faces. This issue is not complex and the budget shortfal l we face is certainly less severe than other f iscal crises faced by Santa Barbara over the past 155 years. I am conf ident that our organizat ion has the talent and the dedicat ion to solve the problems we face and continue to move our City forward in a posit ive direct ion.
On behalf of the City staff , I would also l ike to express our appreciation to the City Counci l for your leadership and support as we implement the work envisioned in this budget. Our City is the type of community it is today because cit izen leaders are wi l l ing to contr ibute their t ime and skil ls to make Santa Barbara special.

[This page intent ional ly le f t b lank. ]
A-18

C O M M U N I T Y P R O F I L E
Di rec to ry o f C i ty Of f ic ia l s
B-1
Marty Blum Mayor
Dan B. Secord, M.D. Helene Schneider Councilmember Councilmember
Brian B. Barnwell Roger L. Horton Councilmember Councilmember
Iya G. Falcone Das Williams Councilmember Councilmember
James L. Armstrong Stephen P. Wiley City Administrator, City Clerk, City Attorney and City Treasurer
Joan M. Kent Assistant City Administrator
Robert D. Peirson Karen S. Ramsdell Finance Director Airport Director
Nancy L. Rapp Carol L. Keator Acting Parks and Recreation Director Library Director
Camerino Sanchez Mitchell B. Vaughn Police Chief Acting Fire Chief
Paul A. Casey Anthony J. Nisich Community Development Director Public Works Director
John N. Bridley Waterfront Director

ELECTORATE CITY OF SANTA BARBARAORGANIZATION CHART
CITY ATTORNEYS. WILEY
BOARDS, COMMISSIONS& COMMITTEES
CITY ADMINISTRATOR/CLERK/TREASURERJ. ARMSTRONG
CITY CLERK LABOR RELATIONS INFO. SYSTEMSHUMAN RESOURCES
ADMINISTRATIVE SERVICESJ. KENT, DIRECTOR
ASSISTANT CITY ADMINISTRATOR
MAYOR AND COUNCIL
City Budget Org. Chart 07_05
REDEVELOPMENT AGENCYJ. ARMSTRONG, EXECUTIVE DIRECTOR
P. CASEY, DEPUTY DIRECTORASSISTANT TO THE CITY ADMINISTRATOR
ASSISTANT TO THE CITY ADMINISTRATOR/ORGANIZATION AND DEVELOPMENT
CITY TV
ADMINISTRATION
MAINTENANCEPATROL
AIRPORTK. RAMSDELL, DIRECTOR
ADMINISTRATION
OPERATIONS FACILITY MAINT.
WATERFRONTJ. BRIDLEY, DIRECTOR
COUNTYBRANCHES
CITYBRANCHES
LIBRARYC. KEATOR, DIRECTOR
ADMINISTRATION
ACCOUNTING RISK MANAGEMENT
GENERAL SERVICES
FINANCER. PEIRSON, DIRECTOR
TREASURY
ENGINEERING TRANSPORTATIONPLANNING
STREETS, PARKING &TRANSPORTATION OPERS.
ADMINISTRATION
PUBLIC WORKSA. NISICH, DIRECTOR
WATER RESOURCESMANAGEMENT
WATER SUPPLYMANAGEMENT
FACILITIES(INTRA-CITY SERVICES)
ADMINISTRATION
URBAN FORESTRY
GOLF
RECREATION &COMMUNITY SERVICES
OPEN SPACE &PARKS OPERATIONS
PARKS & RECREATIONN. RAPP, ACTING DIRECTOR
CREEKS PROGRAM
ADMINISTRATION,PLANNING &
BUSINESS SERVICES
HOUSING &REDEVELOPMENT
BUILDING &SAFETYPLANNING
ADMINISTRATION
COMMUNITY DEVELOPMENTP. CASEY, DIRECTOR
FIREM. VAUGHN, ACTING FIRE CHIEF
OPERATIONSPREVENTION/
PUBLIC EDUCATION
ADMINISTRATION
POLICEC. SANCHEZ, CHIEF
OFFICE OFEMERGENCY SERVICES
COMMUNITY SERVICESSUPPORT SERVICES
INVESTIGATIVEPATROL

C O M M U N I T Y P R O F I L E
Santa Barbara Area Map
B-3

C O M M U N I T Y P R O F I L E
About the C i ty o f San ta Barbara
B-4
The Ci ty of Santa Barbara is located
approximately 90 mi les north of Los Angeles of f
of U.S. Highway 101, and is geographical ly
shel tered by mountains on the north and the
Paci f ic Ocean on the south. The Ci ty of Goleta
and the unincorporated area of Monteci to border
the Ci ty on the west and east, respect ively.
Unt i l the late 1700’s, the area current ly known as
“Santa Barbara” was occupied by the Chumash
Indians. The Chumash l ived in smal l v i l lages
along the coast and on the Channel Is lands,
l iv ing comfortably for thousands of years thanks
to the abundance of wi ld l i fe and natural
resources.
In 1542, Portuguese explorer Juan Cabri l lo
entered the Channel and claimed the land for
Spain. In 1602, three fr igates under the
command of Sebast ian Vizcaino entered the
Santa Barbara Channel. One of the Carmel i te
f r iars on board named the bay and nearby shore
af ter Saint Barbara.
In 1782, a group led by Father Junipero Serra,
Captain Jose Ortegas, and Governor Fel ipe de
Neve establ ished a mi l i tary presidio and, three
years later, a mission. Spain governed the area
unt i l 1822, when Cal i fornia became a Mexican
terr i tory. Just 24 years later, in 1846, Colonel
John Fremont and his soldiers took Santa
Barbara for the United States.
The Ci ty of Santa Barbara ( the pr imary
government) was incorporated on August 26,
1850. The Ci ty is a charter c i ty under the laws of
the State of Cal i fornia and operates under a
Counci l -Administ rator form of government. The
Counci l consists of s ix counci l members and a
mayor, al l of whom are elected at- large. The
current Ci ty Charter was adopted on May 2, 1967
and provides for the fol lowing services: publ ic
safety (pol ice and f i re) , construct ion and
maintenance of highways and st reets , sani tat ion,
cul ture and recreat ion, publ ic improvements,
planning, zoning and general administ rat ion.
Enterpr ise funds, operated in a manner s imi lar to
a pr ivate business, include water, wastewater,
ai rport , park ing, gol f and waterf ront.
The Redevelopment Agency of the City of Santa
Barbara, a blended component uni t of the City,
was establ ished in 1968 and is a separate
governmental ent i ty as prescr ibed in the State of
Cal i fornia’s Community Redevelopment Law as
set forth in the State’s Heal th and Safety Code.
The City Counci l o f the Ci ty of Santa Barbara and
the Board of Directors of the Agency are legal ly
separate boards; however, they share common
membership. The Ci ty also provides al l support
staf f and performs al l administ rat ive funct ions for
the Agency under the terms of a wri t ten
agreement between the two ent i t ies.

C O M M U N I T Y P R O F I L E
Misce l laneous S ta t i s t ics
B-5
General City Information: Date of incorporation .. . . . . . . . . . . . . . . . . . . . . . . . . . . . . . . . . . . . . . . . . . . . . . . . . . . . . . . . . . . . . . . . . . . . . August 26, 1850 Form of government .. . . . . . . . . . . . . . . . . . . . . . . . . . . . . . . . . . . . . . . . . . . . . . . . . . . . . . . . . . . . . . . . . . . . . . Council-Administrator Land area in square miles .. . . . . . . . . . . . . . . . . . . . . . . . . . . . . . . . . . . . . . . . . . . . . . . . . . . . . . . . . . . . . . . . . . . . . . . . . . . . . . . . 21.1 Miles of streets .. . . . . . . . . . . . . . . . . . . . . . . . . . . . . . . . . . . . . . . . . . . . . . . . . . . . . . . . . . . . . . . . . . . . . . . . . . . . . . . . . . . . . . . . . . . . . . . 280 Number of t raff ic intersections .. . . . . . . . . . . . . . . . . . . . . . . . . . . . . . . . . . . . . . . . . . . . . . . . . . . . . . . . . . . . . . . . . . . . . . . . . 104
Community Forest, Beaches and Gardens: Number of park and open space trees .. . . . . . . . . . . . . . . . . . . . . . . . . . . . . . . . . . . . . . . . . . . . . . . . . . . . . . . . . . . . . . . 12,000 Number of street trees .. . . . . . . . . . . . . . . . . . . . . . . . . . . . . . . . . . . . . . . . . . . . . . . . . . . . . . . . . . . . . . . . . . . . . . . . . . . . . . . . . . . . . 23,500 Linear miles of city-owned beaches .. . . . . . . . . . . . . . . . . . . . . . . . . . . . . . . . . . . . . . . . . . . . . . . . . . . . . . . . . . . . . . . . . . 3.4 Community gardens .. . . . . . . . . . . . . . . . . . . . . . . . . . . . . . . . . . . . . . . . . . . . . . . . . . . . . . . . . . . . . . . . . . . . . . . . . . . . . . . . . . . . . . . . . 4
Airport: Number of terminals .. . . . . . . . . . . . . . . . . . . . . . . . . . . . . . . . . . . . . . . . . . . . . . . . . . . . . . . . . . . . . . . . . . . . . . . . . . . . . . . . . . . . . . . . 1 Number of commercial carriers .. . . . . . . . . . . . . . . . . . . . . . . . . . . . . . . . . . . . . . . . . . . . . . . . . . . . . . . . . . . . . . . . . . . . . . . . . 5 Number of t icketed passengers annually . . . . . . . . . . . . . . . . . . . . . . . . . . . . . . . . . . . . . . . . . . . . . . . . . . . . . . . . . . . . 796,162 Number of runways .. . . . . . . . . . . . . . . . . . . . . . . . . . . . . . . . . . . . . . . . . . . . . . . . . . . . . . . . . . . . . . . . . . . . . . . . . . . . . . . . . . . . . . . . . 3 Total airport acreage .. . . . . . . . . . . . . . . . . . . . . . . . . . . . . . . . . . . . . . . . . . . . . . . . . . . . . . . . . . . . . . . . . . . . . . . . . . . . . . . . . . . . . . . 950 Commercial / industr ial acreage .. . . . . . . . . . . . . . . . . . . . . . . . . . . . . . . . . . . . . . . . . . . . . . . . . . . . . . . . . . . . . . . . . . . . . . . 95 Number of leased buildings .. . . . . . . . . . . . . . . . . . . . . . . . . . . . . . . . . . . . . . . . . . . . . . . . . . . . . . . . . . . . . . . . . . . . . . . . . . . . . . 76 Goleta Slough Ecological Reserve wetlands acreage .. . . . . . . . . . . . . . . . . . . . . . . . . . . . . . . . . . . . . . . . . . 400
Hospitals:
Number of hospitals . . . . . . . . . . . . . . . . . . . . . . . . . . . . . . . . . . . . . . . . . . . . . . . . . . . . . . . . . . . . . . . . . . . . . . . . . . . . . . . . . . . . . . . . . 1 Number of patient beds .. . . . . . . . . . . . . . . . . . . . . . . . . . . . . . . . . . . . . . . . . . . . . . . . . . . . . . . . . . . . . . . . . . . . . . . . . . . . . . . . . . . . 366
Libraries:
Number of city l ibraries .. . . . . . . . . . . . . . . . . . . . . . . . . . . . . . . . . . . . . . . . . . . . . . . . . . . . . . . . . . . . . . . . . . . . . . . . . . . . . . . . . . . . 2 Number of bookmobiles .. . . . . . . . . . . . . . . . . . . . . . . . . . . . . . . . . . . . . . . . . . . . . . . . . . . . . . . . . . . . . . . . . . . . . . . . . . . . . . . . . . . 1 Number of county l ibraries .. . . . . . . . . . . . . . . . . . . . . . . . . . . . . . . . . . . . . . . . . . . . . . . . . . . . . . . . . . . . . . . . . . . . . . . . . . . . . . . 6 Total volumes .. . . . . . . . . . . . . . . . . . . . . . . . . . . . . . . . . . . . . . . . . . . . . . . . . . . . . . . . . . . . . . . . . . . . . . . . . . . . . . . . . . . . . . . . . . . . . . . . . 431,800
Municipal Water Department: Gallons of potable water treated and distr ibuted annually . . . . . . . . . . . . . . . . . . . . . . . . . . . . . . . . . . . . 4.37 bi l l ion Gallons of reclaimed water treated and distr ibuted annually . . . . . . . . . . . . . . . . . . . . . . . . . . . . . . . . . 260 mil l ion Number of reservoirs .. . . . . . . . . . . . . . . . . . . . . . . . . . . . . . . . . . . . . . . . . . . . . . . . . . . . . . . . . . . . . . . . . . . . . . . . . . . . . . . . . . . . . . . 13 Number of pump stat ions .. . . . . . . . . . . . . . . . . . . . . . . . . . . . . . . . . . . . . . . . . . . . . . . . . . . . . . . . . . . . . . . . . . . . . . . . . . . . . . . . . 11 Number of t reatment plants .. . . . . . . . . . . . . . . . . . . . . . . . . . . . . . . . . . . . . . . . . . . . . . . . . . . . . . . . . . . . . . . . . . . . . . . . . . . . . . 4 Number of wells . . . . . . . . . . . . . . . . . . . . . . . . . . . . . . . . . . . . . . . . . . . . . . . . . . . . . . . . . . . . . . . . . . . . . . . . . . . . . . . . . . . . . . . . . . . . . . . 9 Number of water reclamation faci l i t ies .. . . . . . . . . . . . . . . . . . . . . . . . . . . . . . . . . . . . . . . . . . . . . . . . . . . . . . . . . . . . . . . 1

C O M M U N I T Y P R O F I L E
Misce l laneous S ta t i s t ics
B-6
Municipal Wastewater Department: Number of t reatment plants .. . . . . . . . . . . . . . . . . . . . . . . . . . . . . . . . . . . . . . . . . . . . . . . . . . . . . . . . . . . . . . . . . . . . . . . . . . . . . . 1 Number of l i f t stat ions .. . . . . . . . . . . . . . . . . . . . . . . . . . . . . . . . . . . . . . . . . . . . . . . . . . . . . . . . . . . . . . . . . . . . . . . . . . . . . . . . . . . . . 11 Gallons of water treated annually . . . . . . . . . . . . . . . . . . . . . . . . . . . . . . . . . . . . . . . . . . . . . . . . . . . . . . . . . . . . . . . . . . . . . . 3.01 bi l l ion
Parks and Recreation:
Park acreage .. . . . . . . . . . . . . . . . . . . . . . . . . . . . . . . . . . . . . . . . . . . . . . . . . . . . . . . . . . . . . . . . . . . . . . . . . . . . . . . . . . . . . . . . . . . . . . . . . . 1,764 Number of developed parks .. . . . . . . . . . . . . . . . . . . . . . . . . . . . . . . . . . . . . . . . . . . . . . . . . . . . . . . . . . . . . . . . . . . . . . . . . . . . . . 38 Number of undeveloped parks .. . . . . . . . . . . . . . . . . . . . . . . . . . . . . . . . . . . . . . . . . . . . . . . . . . . . . . . . . . . . . . . . . . . . . . . . . . 21 Number of park playgrounds .. . . . . . . . . . . . . . . . . . . . . . . . . . . . . . . . . . . . . . . . . . . . . . . . . . . . . . . . . . . . . . . . . . . . . . . . . . . . . 22 Number of swimming and wading pools .. . . . . . . . . . . . . . . . . . . . . . . . . . . . . . . . . . . . . . . . . . . . . . . . . . . . . . . . . . . . . 4 Number of community centers .. . . . . . . . . . . . . . . . . . . . . . . . . . . . . . . . . . . . . . . . . . . . . . . . . . . . . . . . . . . . . . . . . . . . . . . . . . 14 Number of sports faci l i t ies .. . . . . . . . . . . . . . . . . . . . . . . . . . . . . . . . . . . . . . . . . . . . . . . . . . . . . . . . . . . . . . . . . . . . . . . . . . . . . . . 11 Number of municipal golf courses (18 holes) . . . . . . . . . . . . . . . . . . . . . . . . . . . . . . . . . . . . . . . . . . . . . . . . . . . . . 1
Public Safety:
Number of pol ice stat ions .. . . . . . . . . . . . . . . . . . . . . . . . . . . . . . . . . . . . . . . . . . . . . . . . . . . . . . . . . . . . . . . . . . . . . . . . . . . . . . . . 1 Number of pol ice off icers and other sworn personnel . . . . . . . . . . . . . . . . . . . . . . . . . . . . . . . . . . . . . . . . . . . 143 Number of law violations
Total arrests .. . . . . . . . . . . . . . . . . . . . . . . . . . . . . . . . . . . . . . . . . . . . . . . . . . . . . . . . . . . . . . . . . . . . . . . . . . . . . . . . . . . . . . . . . . . . . 13,754 Traff ic citat ions . . . . . . . . . . . . . . . . . . . . . . . . . . . . . . . . . . . . . . . . . . . . . . . . . . . . . . . . . . . . . . . . . . . . . . . . . . . . . . . . . . . . . . . . . 10,633 Parking citat ions .. . . . . . . . . . . . . . . . . . . . . . . . . . . . . . . . . . . . . . . . . . . . . . . . . . . . . . . . . . . . . . . . . . . . . . . . . . . . . . . . . . . . . . . . 103,270
Number of f i re stat ions .. . . . . . . . . . . . . . . . . . . . . . . . . . . . . . . . . . . . . . . . . . . . . . . . . . . . . . . . . . . . . . . . . . . . . . . . . . . . . . . . . . . . 8 Number of f i ref ighters and off icers .. . . . . . . . . . . . . . . . . . . . . . . . . . . . . . . . . . . . . . . . . . . . . . . . . . . . . . . . . . . . . . . . . . . . 99
Public Schools: Elementary schools .. . . . . . . . . . . . . . . . . . . . . . . . . . . . . . . . . . . . . . . . . . . . . . . . . . . . . . . . . . . . . . . . . . . . . . . . . . . . . . . . . . . . . . . . . 14
Annual enrol lment .. . . . . . . . . . . . . . . . . . . . . . . . . . . . . . . . . . . . . . . . . . . . . . . . . . . . . . . . . . . . . . . . . . . . . . . . . . . . . . . . . . . . . . 6,024 Secondary schools .. . . . . . . . . . . . . . . . . . . . . . . . . . . . . . . . . . . . . . . . . . . . . . . . . . . . . . . . . . . . . . . . . . . . . . . . . . . . . . . . . . . . . . . . . . 9
Annual enrol lment . . . . . . . . . . . . . . . . . . . . . . . . . . . . . . . . . . . . . . . . . . . . . . . . . . . . . . . . . . . . . . . . . . . . . . . . . . . . . . . . . . . . . . . 10,598 Colleges .. . . . . . . . . . . . . . . . . . . . . . . . . . . . . . . . . . . . . . . . . . . . . . . . . . . . . . . . . . . . . . . . . . . . . . . . . . . . . . . . . . . . . . . . . . . . . . . . . . . . . . . . . 1
Enrol lment per semester . . . . . . . . . . . . . . . . . . . . . . . . . . . . . . . . . . . . . . . . . . . . . . . . . . . . . . . . . . . . . . . . . . . . . . . . . . . . . 17,014
Waterfront: Acreage of city-managed t idelands and submerged lands .. . . . . . . . . . . . . . . . . . . . . . . . . . . . . . . . . . . 252 Wharf length in feet . . . . . . . . . . . . . . . . . . . . . . . . . . . . . . . . . . . . . . . . . . . . . . . . . . . . . . . . . . . . . . . . . . . . . . . . . . . . . . . . . . . . . . . . . . 1,978 Acreage of wharf decking .. . . . . . . . . . . . . . . . . . . . . . . . . . . . . . . . . . . . . . . . . . . . . . . . . . . . . . . . . . . . . . . . . . . . . . . . . . . . . . . . . 3.8 Number of marinas .. . . . . . . . . . . . . . . . . . . . . . . . . . . . . . . . . . . . . . . . . . . . . . . . . . . . . . . . . . . . . . . . . . . . . . . . . . . . . . . . . . . . . . . . . . 4 Number of commercial and pleasure vessel sl ips .. . . . . . . . . . . . . . . . . . . . . . . . . . . . . . . . . . . . . . . . . . . . . . . 1,133 Number of waterfront property leases .. . . . . . . . . . . . . . . . . . . . . . . . . . . . . . . . . . . . . . . . . . . . . . . . . . . . . . . . . . . . . . . 60

C O M M U N I T Y P R O F I L E
Demograph ics
B-7
Regional Population
City of Santa Barbara .............................. 90,569
Santa Barbara County ............................ 419,260
San Luis Obispo County ......................... 246,681
Ventura County ....................................... 753,197
Area (in square miles)
Land area ...................................................... 21.1
Water area ...................................................... 22.0
Total area ...................................................... 43.1
Gender # %
Male ........................................... 45,960 50.8 Female ....................................... 44,513 49.2
Age Median age (in years) .................................... 35.8
Population Demographics (1) # %
Households ............................... 35,605 100.0
Family households ..................... 18,954 53.2 Married couples ...................... 14,163 39.8 Male householder .................. 1,415 3.9 Female householder .............. 3,376 9.5
Non-family households ............... 16,651 46.8
Households with individuals under 18 years ............................ 9,578 26.9
Households with individuals 65 years and over ....................... 8,871 24.9
Average household size ............. 2.49 (X) Average family size .................... 3.17 (X)
Housing
Median home price (2003) .......................... $925,000
# %
Total housing units ..................... 37,076 100.0 Occupied housing units ........... 35,605 96.0 Vacant housing units ............... 1,471 4.0
Seasonal, recreational, or occasional use housing ... 525 1.4
Homeowner vacancy rate ........... (X) 0.7 Rental vacancy rate..................... (X) 2.3
Housing Tenure Occupied housing units .............. 35,605 100.0
Owner-occupied units ............. 14,957 42.0 Renter-occupied units ............. 20,648 58.0
Avg. household size of owner-occupied units ................. 2.51 (X)
Avg. household size of renter-occupied units .................. 2.43 (X)
Race and Ethnicity %
White .............................................................. 74.0
Black or African American .............................. 1.5
American Indian/Alaska Native ....................... 1.1
Asian-Pacific Islander ...................................... 2.8
Some other race ............................................. 16.8
Two or more races .......................................... 3.8
Hispanic or Latino (of any race) ......................... 35.0
Education (2) %
High school graduate ..................................... 84.1
College Graduates (2 year) ............................ 12.0
College Graduates (4 year) ............................ 25.5
Graduate Degrees ......................................... 15.0

C O M M U N I T Y P R O F I L E
Demograph ics
B-8
Income (3)
Average household income $76,606 Median family household income $53,682 Income per capita $29,985 Employment (4) %
Work population (16 yrs and older) .................... 82.1
Residents by major profession: Management, professional and related .......... 40.9 Sales and office occupation ............................ 25.3 Service ............................................................ 18.7
Construction, maintenance, production and transportation ................................................ 14.6
Other ............................................................. 0.5
Economic Demographics (5)
Service Industry Number of Number of (private & non-profit) Businesses Employees
Retail trade ....................... 655 7,589
Professional, scientific, and technical services .... 520 2,950
Healthcare and social assistance ...................... 416 3,277
Foodservice and lodging ............................ 386 7,570
Real estate and rental & leasing ............................ 256 1,277
Other services (except public administration) ..... 205 1,130
Administrative and support, waste management, and remediation services ...... 162 3,331
Wholesale trade ............... 157 1,145 Manufacturing .................. 155 2,204
Arts, entertainment, and recreation ....................... 43 395
Educational services ........ 26 165
Leading Area Employers, Public and Private (with industry) (4)
University of California, Santa Barbara (public administration-education)................. 9,678
County of Santa Barbara (public administration) ................................. 4,140
Santa Barbara School District Admin and Schools (public administration-education) ... 3,509
Santa Barbara Cottage Hospital (healthcare) ................................................ 2,562
Santa Barbara City College (public administration-education) ................ 2,111
Raytheon Electronic Systems (manufacturing) .......................................... 1,939
City of Santa Barbara (public administration) (6) ............................. 1,693
Sansum-Santa Barbara Medical Clinic (healthcare) ................................................ 1,100
Santa Barbara Bank and Trust (banking services) ....................................... 870
U.S. Postal Service (postal services) ......................................... 864
(1) Source: U.S. Bureau of the Census, 2000 Census (2) Source: , as of March 1, 2005 www.bestplaces.net
(3) Source: USCB Economic Outlook 2005 (Reported for 2004) (4) Source: Santa Barbara Chamber of Commerce, January 2005 (5) Source: U.S. Bureau of the Census, 1997 Economic Census (6) Includes permanent full-time equivalent positions & hourly employees

C-1
[This page intent ional ly le f t b lank. ]

S U M M A R Y O F S O U R C E S
C-2
Use of Estimated TotalReserves Revenues Sources
General FundOperating 7,243,943$ 88,510,646$ 95,754,589 Capital Outlay 623,700 - 623,700
Special Revenue FundsCommunity Dev. Block Grant - 1,893,765 1,893,765 County Library - 1,640,583 1,640,583 Creeks Restoration and Water Quality - 2,430,158 2,430,158 HOME Grant - 868,002 868,002 Miscellaneous Grants - 293,900 293,900 Police Asset Forfeiture and Grants - 60,000 60,000 Redevelopment Agency - 11,743,000 11,743,000 Redevelopment Agency Housing - 3,315,000 3,315,000 Solid Waste - 15,415,840 15,415,840 Street Sweeping 6,426 1,222,649 1,229,075 Streets 58,091 10,268,617 10,326,708 Supplemental Law Enforcement - 135,232 135,232 Traffic Safety - 555,000 555,000 Transportation Development Act - 55,000 55,000 Transportation Sales Tax 159,032 4,650,000 4,809,032
Enterprise FundsAirport 398,257 11,504,005 11,902,262 Airport Capital Grants (FAA/PFC) - 4,329,900 4,329,900 Downtown Parking 386,097 6,170,000 6,556,097 Golf 226,710 2,279,400 2,506,110 Wastewater 1,931,576 12,533,250 14,464,826 Water 3,184,044 29,131,563 32,315,607 Waterfront 1,134,007 10,395,704 11,529,711
Internal Service FundsDuplications - 385,063 385,063 Information Systems 86,140 2,092,976 2,179,116 Intra-City Service - 9,285,233 9,285,233 Self-Insurance - 7,407,408 7,407,408
Citywide Subtotal 15,438,023 238,571,894 254,009,917
Less: Interfund Transactions - 33,620,054 33,620,054
Citywide Total 15,438,023$ 204,951,840$ 220,389,863$
S O U R C E SFY 2006 Adopted Budget

A N D U S E S O F F U N D S
C-3
Operating Capital TotalBudget Program Uses Surplus
95,754,589$ -$ 95,754,589$ -$ - 623,700 623,700 -
1,893,765 - 1,893,765 - 1,640,583 - 1,640,583 - 1,799,696 450,000 2,249,696 180,462
868,002 - 868,002 - 186,515 - 186,515 107,385 60,000 - 60,000 -
11,713,477 - 11,713,477 29,523 690,252 - 690,252 2,624,748
15,361,404 - 15,361,404 54,436 1,229,075 - 1,229,075 - 6,404,708 3,922,000 10,326,708 -
135,232 - 135,232 - 555,000 - 555,000 -
- 55,000 55,000 - 2,976,032 1,833,000 4,809,032 -
11,116,262 786,000 11,902,262 - - 2,964,900 2,964,900 1,365,000
5,426,297 879,800 6,306,097 250,000 2,002,110 504,000 2,506,110 -
11,079,826 3,385,000 14,464,826 - 25,035,247 7,280,360 32,315,607 - 9,849,711 1,680,000 11,529,711 -
385,063 - 385,063 - 2,145,116 34,000 2,179,116 - 7,410,143 1,675,000 9,085,143 200,090 7,407,408 - 7,407,408 -
223,125,513 26,072,760 249,198,273 4,811,644
33,620,054 - 33,620,054 -
189,505,459$ 26,072,760$ 215,578,219$ 4,811,644$
U S E S

S U M M A R Y O F S O U R C E S
C-4
Use of Estimated TotalReserves Revenues Sources
General FundOperating 5,060,566$ 93,587,465$ 98,648,031$ Capital Outlay 977,000 - 977,000
Special Revenue FundsCommunity Dev. Block Grant - 1,893,765 1,893,765 County Library 35,210 1,640,583 1,675,793 Creeks Restoration and Water Quality - 2,555,209 2,555,209 HOME Grant - 868,002 868,002 Miscellaneous Grants - 299,348 299,348 Police Asset Forfeiture and Grants - 60,000 60,000 Redevelopment Agency - 12,203,000 12,203,000 Redevelopment Agency Housing - 3,430,000 3,430,000 Solid Waste - 15,883,170 15,883,170 Street Sweeping 8,171 1,232,329 1,240,500 Streets 68,726 14,764,900 14,833,626 Supplemental Law Enforcement - 135,232 135,232 Traffic Safety - 580,000 580,000 Transportation Development Act - 55,000 55,000 Transportation Sales Tax 201,974 4,850,000 5,051,974
Enterprise FundsAirport 731,917 11,447,182 12,179,099 Airport Capital Grants (FAA/PFC) - 15,847,000 15,847,000 Downtown Parking - 7,375,000 7,375,000 Golf 19,080 2,369,431 2,388,511 Wastewater 1,162,927 13,044,748 14,207,675 Water 2,198,057 30,162,526 32,360,583 Waterfront 993,695 10,590,130 11,583,825
Internal Service FundsDuplications - 391,966 391,966 Information Systems 14,149 2,096,654 2,110,803 Intra-City Service - 9,526,422 9,526,422 Self-Insurance - 7,622,623 7,622,623
Citywide Subtotal 11,471,472 264,511,685 275,983,157
Less: Interfund Transactions - 34,560,732 34,560,732
Citywide Total 11,471,472$ 229,950,953$ 241,422,425$
S O U R C E SFY 2007 P roposed Budget

A N D U S E S O F F U N D S
C-5
Operating Capital TotalBudget Program Uses Surplus
98,648,031$ -$ 98,648,031$ -$ - 977,000 977,000 -
1,893,765 - 1,893,765 - 1,675,793 - 1,675,793 - 1,966,916 525,000 2,491,916 63,293
868,002 - 868,002 - 191,963 - 191,963 107,385 60,000 - 60,000 -
10,471,993 - 10,471,993 1,731,007 717,043 - 717,043 2,712,957
15,876,361 - 15,876,361 6,809 1,240,500 - 1,240,500 - 6,425,626 8,408,000 14,833,626 -
135,232 - 135,232 - 580,000 - 580,000 -
- 55,000 55,000 - 3,091,974 1,960,000 5,051,974 -
11,276,099 903,000 12,179,099 - - 14,482,000 14,482,000 1,365,000
5,519,763 944,425 6,464,188 910,812 2,071,251 317,260 2,388,511 -
11,391,325 2,816,350 14,207,675 - 26,109,911 6,250,672 32,360,583 - 9,888,825 1,695,000 11,583,825 -
391,966 - 391,966 - 2,110,803 - 2,110,803 - 7,654,662 1,450,000 9,104,662 421,760 7,622,623 - 7,622,623 -
227,880,427 40,783,707 268,664,134 7,319,023
34,560,732 - 34,560,732 -
193,319,695$ 40,783,707$ 234,103,402$ 7,319,023$
U S E S

S U M M A R Y S C H E D U L E S
Summary o f Revenues
C-6
GENERAL FUNDFY 2004Actual
FY 2005 Amended
FY 2005Projected
FY 2006Adopted
FY 2007Proposed
TaxesSales and Use 18,419,580$ 18,994,900$ 18,979,750$ 19,738,900$ 20,528,500$ Utility Users 5,498,925 5,837,700 5,837,700 6,071,200 6,253,300 Property 11,197,742 10,637,763 15,773,200 16,964,100 19,294,800 Transient Occupancy 10,365,683 10,684,900 10,780,300 11,504,200 12,079,400 Business License 1,925,832 1,982,500 2,002,900 2,062,950 2,124,800 Real Property Transfer 708,746 618,000 618,000 618,000 618,000 Total Taxes 48,116,508 48,755,763 53,991,850 56,959,350 60,898,800
Fines and ForfeituresLibrary 140,546 133,000 135,000 143,000 145,685 Municipal Court Fines 301,641 225,000 200,000 200,000 200,000 Parking Violations 2,185,694 2,277,245 2,277,245 2,348,982 2,348,982 Total Fines and Forfeitures 2,627,881 2,635,245 2,612,245 2,691,982 2,694,667
Use of Money and PropertyInvestment Income 371,730 1,150,000 1,187,100 1,200,000 1,300,000 Rents and Concessions 408,847 479,810 381,738 389,778 418,109 Total Use of Money and Property 780,577 1,629,810 1,568,838 1,589,778 1,718,109
IntergovernmentalLibrary Grants 61,324 92,609 92,609 86,409 91,409 Miscellaneous Grants 221,657 1,417,921 - - - Motor Vehicle License Fee 4,352,206 5,815,500 1,928,200 474,000 488,100 SB 90 Reimbursements 13 - - - - Other 635,300 560,416 668,917 474,900 474,900 Total Intergovernmental 5,270,500 7,886,446 2,689,726 1,035,309 1,054,409
Service Charges City Attorney - - - - - Administrative Services 1,410 - - - - Finance 735,520 677,500 753,000 793,000 816,000 Community Development 3,560,844 4,245,951 3,837,554 4,576,851 4,840,909 Fire 79,347 187,379 128,785 215,246 225,365 Police 571,600 570,190 567,367 602,150 621,199 Public Works 343,837 349,952 241,000 605,865 533,774 Library 608,736 648,241 648,241 709,649 739,200 Parks and Recreation 2,119,690 2,129,856 1,954,218 2,019,016 2,088,791 Miscellaneous 218 - 1,150 - - Total Service Charges 8,021,202 8,809,069 8,131,315 9,521,777 9,865,238
Interfund Charges andReimbursements 11,255,081 11,714,314 11,894,875 13,215,608 13,724,338
Interfund Transfers 485,954 475,000 525,000 525,000 550,000
Other RevenuesDonations 62,757 63,000 63,000 64,000 64,000 Franchise Fees 2,055,863 2,106,600 2,075,000 2,170,200 2,275,100 Library Gift Funds 401,474 250,000 250,000 207,838 210,000 Miscellaneous 629,166 490,010 352,104 529,804 532,804 Total Other Revenue 3,149,260 2,909,610 2,740,104 2,971,842 3,081,904
TOTAL GENERAL FUND 79,706,963$ 84,815,257$ 84,153,953$ 88,510,646$ 93,587,465$

S U M M A R Y S C H E D U L E S
Summary o f Revenues ( c o n t i n u e d )
C-7
FY 2004Actual
FY 2005 Amended
FY 2005Projected
FY 2006Adopted
FY 2007Proposed
CAPITAL AND SPECIAL REVENUE FUNDS
Community Dev. Block Grant 1,234,960 3,206,008 2,069,000 1,893,765 1,893,765 County Library 1,583,118 1,434,537 1,433,895 1,640,583 1,640,583 Creeks Restoration/Water Quality 2,581,957 3,314,313 2,604,100 2,430,158 2,555,209 Home Administration 783,281 1,029,496 912,000 868,002 868,002 Miscellaneous Grants 1,034,732 1,253,913 1,162,168 293,900 299,348 Police Asset Forfeiture and Grants - 187,947 187,947 60,000 60,000 Redevelopment Agency (RDA) 10,660,928 11,199,000 11,217,000 11,743,000 12,203,000 RDA Housing 3,001,921 3,300,000 3,140,200 3,315,000 3,430,000 Solid Waste 893,110 1,721,346 1,422,105 15,415,840 15,883,170 Street Sweeping - 1,184,151 1,204,151 1,222,649 1,232,329 Streets 10,309,668 13,011,633 7,893,625 10,268,617 14,764,900 Supplemental Law Enforcement 134,679 135,232 133,436 135,232 135,232 Traffic Safety 518,714 505,000 555,000 555,000 580,000 Transportation Development 64,776 55,000 55,825 55,000 55,000 Transportation Sales Tax 4,603,865 5,340,000 4,640,000 4,650,000 4,850,000
TOTAL SPECIAL REVENUE 37,405,709$ 46,877,576$ 38,630,452$ 54,546,746$ 60,450,538$
ENTERPRISE FUNDS
Airport FundLeases - Commercial 3,932,712 3,568,441 3,896,047 3,983,214 3,670,009 Leases - Non-Commercial 1,202,411 1,205,467 1,126,080 1,192,384 1,230,314 Leases - Terminal 3,819,811 3,847,750 4,209,962 3,946,260 4,063,213 Leases - Commerical Aviation 1,717,421 1,784,150 1,888,155 1,807,562 1,903,098 Intergovernmental 69,643 250,000 10,000 - - Interest Income 99,642 301,553 398,544 350,950 351,000 Miscellaneous 330,231 240,913 223,197 223,635 229,548
Subtotal 11,171,871 11,198,274 11,751,985 11,504,005 11,447,182
Airport Capital Grants Fund 6,368,071 25,781,215 12,894,470 4,329,900 15,847,000
Downtown Parking FundPBIA Assessment 764,445$ 675,000$ 775,000$ 750,000$ 775,000$ Hourly Parking 3,386,477 2,850,000 3,170,000 3,945,000 4,820,000 Other Parking Fees 407,807 465,000 445,000 810,000 1,070,000 Lobero Garage 88,568 120,000 130,000 180,000 225,000 Commuter Lots 177,367 175,000 205,000 220,000 220,000 Interest Income 61,362 200,000 225,000 250,000 250,000 Miscellaneous 19,607 25,000 15,000 15,000 15,000
Subtotal 4,905,633 4,510,000 4,965,000 6,170,000 7,375,000
Golf FundGreens Fees 1,768,565 1,852,213 1,800,000 1,963,000 2,050,000 Food Concession 275,720 275,000 275,000 277,000 277,000 Interest Income 9,373 26,897 35,178 39,400 42,431 Miscellaneous 1,517 - - - -
Subtotal 2,055,175 2,154,110 2,110,178 2,279,400 2,369,431

S U M M A R Y S C H E D U L E S
Summary o f Revenues ( c o n t i n u e d )
C-8
ENTERPRISE FUNDS (cont.)FY 2004Actual
FY 2005 Amended
FY 2005Projected
FY 2006Adopted
FY 2007Proposed
Wastewater FundService Charges 9,643,385$ 11,040,000 11,200,000 11,650,000 12,116,000 Connection Fees 180,708 193,000 167,500 170,000 172,000 Mission Canyon Charges 274,221 275,000 272,500 283,250 291,748 Interest Income 110,900 375,000 365,000 405,000 440,000 Miscellaneous 22,332 27,770 5,000 25,000 25,000
Subtotal 10,231,546 11,910,770 12,010,000 12,533,250 13,044,748
Water FundMetered Sales 23,127,138 25,125,000 25,125,000 26,004,375 26,914,528 New Service 243,358 120,000 250,000 170,000 190,000 Water Turn On Fees 102,714 100,000 100,000 100,000 110,000 Water Tap Fees 151,621 135,000 175,000 175,000 180,000 J.P.A. Reimbursement 1,446,950 1,358,000 1,500,000 1,880,188 1,907,998 Creeks Reimbursement 8,736 42,000 10,000 42,000 42,000 Interest Income 154,282 450,000 636,000 710,000 760,000 Miscellaneous 101,017 53,860 90,000 50,000 58,000
Subtotal 25,335,816 27,383,860 27,886,000 29,131,563 30,162,526
Waterfront Fund1,156,861 1,134,285 1,150,878 1,223,153 1,235,172 2,109,219 2,167,000 2,222,590 2,267,042 2,312,383
228,957 254,524 241,290 245,407 249,606 Interest Income 165,473 160,000 272,397 294,451 311,040 State Grants 83,300 195,300 60,000 - - Parking Fees 1,368,750 1,331,000 1,299,618 1,325,610 1,352,123 Parking Permits 288,088 255,000 270,100 320,100 370,100 Slip Rentals 3,172,794 3,127,821 3,174,000 3,269,220 3,269,220 Visitor Fees 439,512 370,000 454,761 463,856 473,133 Slip Transfer Fees 422,624 390,000 525,651 530,000 555,000 Liveaboard Fees 129,450 190,000 179,488 180,000 180,000 Miscellaneous fees 191,415 161,388 164,164 166,523 169,804 Miscellaneous 117,153 1,785,000 97,184 110,342 112,549
Subtotal 9,873,596 11,521,318 10,112,121 10,395,704 10,590,130
TOTAL ENTERPRISE FUNDS 69,941,708$ 94,459,547$ 81,729,754$ 76,343,822$ 90,836,017$
INTERNAL SERVICE FUNDS
Duplications Fund Service Charges 208,351 233,950 183,810 180,000 175,000 Allocation Receipts 125,978 131,528 131,528 205,063 216,966
Subtotal 334,329 365,478 315,338 385,063 391,966
Information Systems ICS Fund Service Charges 1,896,371 2,271,082 2,271,082 2,092,976 2,096,654
Subtotal 1,896,371 2,271,082 2,271,082 2,092,976 2,096,654
Leases - Other
Leases - CommercialLeases - Food Service

S U M M A R Y S C H E D U L E S
Summary o f Revenues ( c o n t i n u e d )
C-9
INTERNAL SERVICE FUNDSFY 2004Actual
FY 2005 Amended
FY 2005Projected
FY 2006Adopted
FY 2007Proposed
Intra-City Services Fund Rents - Equipment 1,427,675 1,957,296 1,957,296 1,942,705 1,952,435 Interest Income - - - 80,000 85,000 Maintenance - Equipment 2,367,866 2,341,582 2,341,582 2,411,830 2,484,185 Maintenance - Facilities 2,665,774 2,792,815 2,792,815 3,174,453 3,279,771 ICS Communications 508,027 644,774 644,774 664,130 684,053 Custodial Services 801,019 934,093 934,093 962,115 990,978 Miscellaneous 159,812 50,000 71,000 50,000 50,000
Subtotal 7,930,173 8,720,560 8,741,560 9,285,233 9,526,422
Self-Insurance FundWorkers' Compensation Premiums 3,374,303 3,370,716 3,370,716 3,747,010 3,875,260 Property/Liability Insurance Premiums 2,554,741 2,650,000 2,650,000 3,235,236 3,271,446 ACCEL Premium Rebate 1,310,753 190,000 - - - Occupational Safety and Health Charges 217,076 228,744 228,744 253,162 289,917 Interest Income 36,579 120,000 155,476 172,000 186,000 Miscellaneous 139,877 - - - -
Subtotal 7,633,329 6,559,460 6,404,936 7,407,408 7,622,623
TOTAL INT. SERVICE FUNDS 17,794,202$ 17,916,580$ 17,732,916$ 19,170,680$ 19,637,665$
TOTAL CITYWIDE REVENUE 204,848,582 244,068,960 222,247,075 238,571,894 264,511,685
Less: All Interfund Transactions (30,497,949) (32,135,091) (32,135,091) (33,620,054) (34,560,732)
CITYWIDE REVENUE (NET) 174,350,633$ 211,933,869$ 190,111,984$ 204,951,840$ 229,950,953$
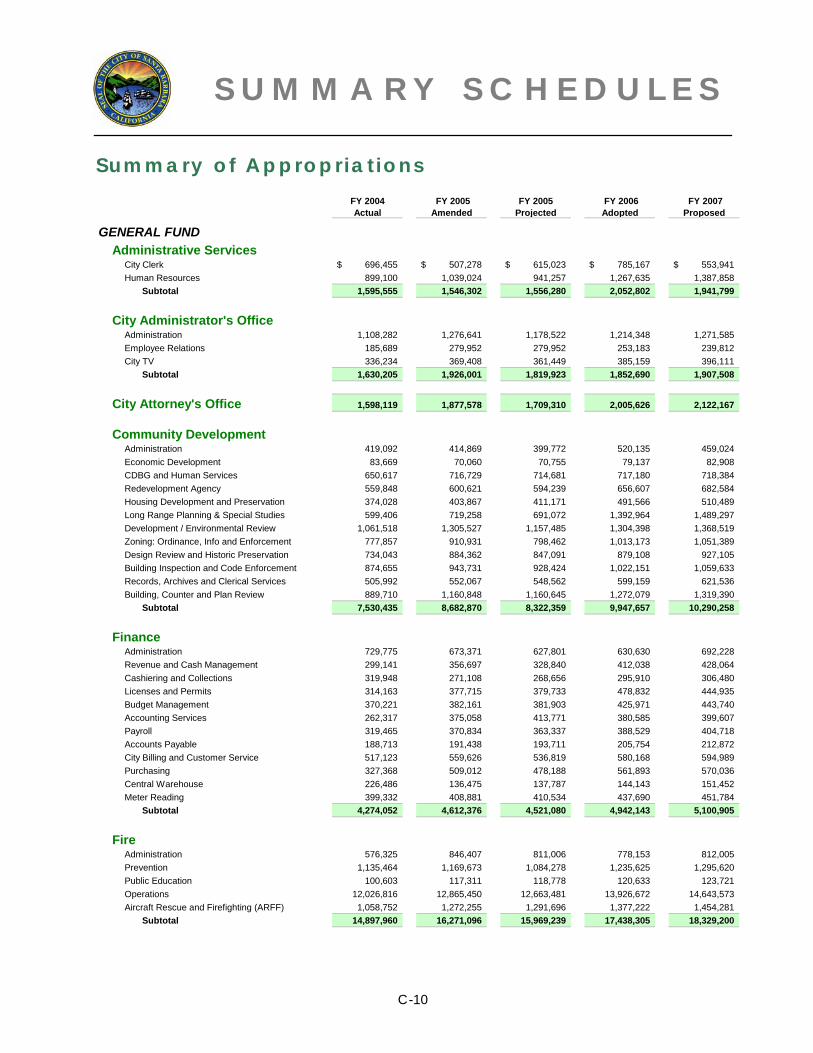
S U M M A R Y S C H E D U L E S
Summary o f Appropr ia t ions
C-10
FY 2004Actual
FY 2005Amended
FY 2005Projected
FY 2006Adopted
FY 2007Proposed
GENERAL FUNDAdministrative Services
City Clerk 696,455$ 507,278$ 615,023$ 785,167$ 553,941$ Human Resources 899,100 1,039,024 941,257 1,267,635 1,387,858 Subtotal 1,595,555 1,546,302 1,556,280 2,052,802 1,941,799
City Administrator's OfficeAdministration 1,108,282 1,276,641 1,178,522 1,214,348 1,271,585 Employee Relations 185,689 279,952 279,952 253,183 239,812 City TV 336,234 369,408 361,449 385,159 396,111 Subtotal 1,630,205 1,926,001 1,819,923 1,852,690 1,907,508
City Attorney's Office 1,598,119 1,877,578 1,709,310 2,005,626 2,122,167
Community DevelopmentAdministration 419,092 414,869 399,772 520,135 459,024 Economic Development 83,669 70,060 70,755 79,137 82,908 CDBG and Human Services 650,617 716,729 714,681 717,180 718,384 Redevelopment Agency 559,848 600,621 594,239 656,607 682,584 Housing Development and Preservation 374,028 403,867 411,171 491,566 510,489 Long Range Planning & Special Studies 599,406 719,258 691,072 1,392,964 1,489,297 Development / Environmental Review 1,061,518 1,305,527 1,157,485 1,304,398 1,368,519 Zoning: Ordinance, Info and Enforcement 777,857 910,931 798,462 1,013,173 1,051,389 Design Review and Historic Preservation 734,043 884,362 847,091 879,108 927,105 Building Inspection and Code Enforcement 874,655 943,731 928,424 1,022,151 1,059,633 Records, Archives and Clerical Services 505,992 552,067 548,562 599,159 621,536 Building, Counter and Plan Review 889,710 1,160,848 1,160,645 1,272,079 1,319,390 Subtotal 7,530,435 8,682,870 8,322,359 9,947,657 10,290,258
FinanceAdministration 729,775 673,371 627,801 630,630 692,228 Revenue and Cash Management 299,141 356,697 328,840 412,038 428,064 Cashiering and Collections 319,948 271,108 268,656 295,910 306,480 Licenses and Permits 314,163 377,715 379,733 478,832 444,935 Budget Management 370,221 382,161 381,903 425,971 443,740 Accounting Services 262,317 375,058 413,771 380,585 399,607 Payroll 319,465 370,834 363,337 388,529 404,718 Accounts Payable 188,713 191,438 193,711 205,754 212,872 City Billing and Customer Service 517,123 559,626 536,819 580,168 594,989 Purchasing 327,368 509,012 478,188 561,893 570,036 Central Warehouse 226,486 136,475 137,787 144,143 151,452 Meter Reading 399,332 408,881 410,534 437,690 451,784 Subtotal 4,274,052 4,612,376 4,521,080 4,942,143 5,100,905
FireAdministration 576,325 846,407 811,006 778,153 812,005 Prevention 1,135,464 1,169,673 1,084,278 1,235,625 1,295,620 Public Education 100,603 117,311 118,778 120,633 123,721 Operations 12,026,816 12,865,450 12,663,481 13,926,672 14,643,573 Aircraft Rescue and Firefighting (ARFF) 1,058,752 1,272,255 1,291,696 1,377,222 1,454,281 Subtotal 14,897,960 16,271,096 15,969,239 17,438,305 18,329,200

S U M M A R Y S C H E D U L E S
Summary o f Appropr ia t ions ( c o n t i n u e d )
C-11
FY 2004Actual
FY 2005Amended
FY 2005Projected
FY 2006Adopted
FY 2007Proposed
GENERAL FUND (continued)Library
Administration 289,058 296,010 299,148 339,909 354,000 Public Services 2,075,676 2,264,818 2,263,112 2,341,563 2,406,693 Support Services 1,331,151 1,516,635 1,503,006 1,549,283 1,583,842 Subtotal 3,695,885 4,077,463 4,065,266 4,230,755 4,344,535
Mayor and City Council 557,493 529,528 516,975 774,145 790,124
NondepartmentalCommunity Promotion 2,186,417 2,483,143 2,385,264 2,197,084 2,197,084 General Government 487,338 987,178 1,005,563 846,778 821,420 Subtotal 2,673,755 3,470,321 3,390,827 3,043,862 3,018,504
Parks and RecreationParks and Recreation Administration 396,330 361,524 225,458 271,977 288,725 Project Management Team - - - 322,524 336,919 Business Services 428,274 457,507 399,979 476,943 491,310
PARKSPark Operations Management 1,003,718 1,084,966 1,012,686 1,033,987 1,063,145 Grounds and Facilities Maintenance 3,213,662 3,401,938 3,377,260 3,639,535 3,762,049 Forestry 974,726 1,039,157 1,041,562 1,135,112 1,164,678 Beach Maintenance 96,049 101,851 101,007 122,940 125,988 Chase Palm Park 587,380 552,993 508,724 537,504 551,981
RECREATIONRecreation Program Management 590,309 577,838 580,323 558,965 551,734 Registration and Reservation Services 321,003 350,871 342,176 372,955 385,226 Cultural Arts 484,798 541,090 570,934 431,808 445,646 Youth Activities 712,792 977,374 952,670 691,325 706,791 Teen Programs 258,726 11,752 11,378 254,569 258,027 Active Adults and Classes 640,209 689,092 621,439 778,638 799,545 Aquatics 1,107,541 1,067,960 1,080,191 1,110,372 1,128,560 Sports 354,634 281,621 269,030 410,932 413,947 Tennis 256,703 293,681 276,680 255,925 268,670 Community Services 803,187 835,161 854,363 878,298 909,885 Subtotal 12,230,041 12,626,376 12,225,860 13,284,309 13,652,826
PoliceChief's Staff 934,726 750,901 753,611 828,910 863,529 Support Services 591,803 667,288 604,204 703,008 593,434 Records Bureau 1,278,030 1,376,036 1,297,478 1,483,337 1,541,938 Community Services Division 850,914 971,855 861,433 883,885 923,550 Crime Analysis 58,688 20,427 18,968 64,453 69,653 Property Room 138,628 159,398 154,267 174,994 181,152 Training and Recruitment 305,174 351,926 317,449 362,908 382,753 Shooting Range 913,858 990,083 999,530 1,069,123 1,098,648 Beat Coordinators / D.A.R.E. 1,079,319 1,037,359 1,000,398 1,112,495 1,142,140 Information Technology 702,520 841,040 831,879 853,016 863,519 Investigative Division 3,596,142 3,925,327 3,901,333 4,346,245 4,471,459 Crime Lab 160,402 188,030 174,861 206,077 210,974 Patrol Division 10,267,461 10,757,237 10,569,070 11,623,597 11,947,127

S U M M A R Y S C H E D U L E S
Summary o f Appropr ia t ions ( c o n t i n u e d )
C-12
GENERAL FUND (continued)FY 2004Actual
FY 2005Amended
FY 2005Projected
FY 2006Adopted
FY 2007Proposed
Police (continued)Traffic 1,002,186 1,147,312 1,015,770 1,003,419 1,023,332 Special Events 513,629 236,183 306,617 518,245 533,978 Tactical Patrol Force 465,809 501,177 498,178 547,561 560,918 Nightlife Enforcement 436,520 463,448 469,631 519,435 533,464 Parking Enforcement 913,474 1,087,378 940,708 1,175,537 1,235,904 Combined Communications Center 1,666,902 1,917,500 1,745,451 2,097,188 2,194,294 Animal Control 414,098 473,240 422,963 451,484 462,351 Emergency Services 91,567 31,803 16,293 140,357 130,939 Subtotal 26,381,850 27,894,948 26,900,092 30,165,274 30,965,056
Public WorksAdministration 588,972 622,078 609,438 742,771 769,219 Engineering Services 2,834,123 3,165,665 3,170,094 3,502,085 3,649,099 Land Development 876,421 1,025,866 980,786 1,245,375 1,139,207 Environmental Programs 235,390 242,801 92,254 526,790 627,624 Subtotal 4,534,906 5,056,410 4,852,572 6,017,021 6,185,149
TOTAL GENERAL FUND 81,600,256$ 88,571,269$ 85,849,783$ 95,754,589$ 98,648,031$
SPECIAL REVENUE FUNDSCommunity Development Block Grant 1,234,959 3,206,009 2,812,756 1,893,765 1,893,765 County Library 1,604,446 1,655,354 1,654,637 1,640,583 1,675,793 Creeks Restoration & Water Quality 906,487 2,138,628 1,790,393 1,799,696 1,966,916 HOME Grant 783,280 1,029,496 450,017 868,002 868,002 Miscellaneous Grants 1,176,497 1,455,208 1,408,995 186,515 191,963 Police Asset Forfeiture Funds and Grants - 429,207 415,813 60,000 60,000 Redevelopment Agency 10,901,206 12,903,223 11,752,891 11,713,477 10,471,993 Redevelopment Agency Housing 3,352,287 7,379,098 6,403,219 690,252 717,043 Solid Waste 694,109 2,067,689 1,235,049 15,361,404 15,876,361 Street Sweeping - 1,184,764 1,176,880 1,229,075 1,240,500 Streets 5,765,403 6,024,745 5,743,057 6,404,708 6,425,626 Supplemental Law Enforcement 134,679 135,232 133,436 135,232 135,232 Traffic Safety 518,714 505,000 555,000 555,000 580,000 Transportation Sales Tax 2,518,664 3,726,420 3,571,599 2,976,032 3,091,974
TOTAL SPECIAL REVENUE 29,590,731$ 43,840,073$ 39,103,742$ 45,513,741$ 45,195,168$
ENTERPRISE FUNDSAirport
Administration 1,341,163 1,704,534 1,487,424 1,512,248 1,552,012 Business and Property Management 1,116,836 1,240,553 1,202,093 1,364,510 1,319,306 Marketing and Communications 310,284 425,988 392,651 497,213 450,861 Facilities Maintenance 2,113,259 2,704,552 2,227,512 2,598,766 2,612,893 Air Operations Area Maintenance 654,058 674,754 549,306 718,481 736,597 Airport Security 1,218,863 1,377,326 1,486,639 1,668,265 1,784,696 Airport Certification and Operations 1,566,586 1,825,921 1,827,007 2,081,796 2,123,410 Facility Planning and Development 519,459 615,410 567,435 674,983 696,324 Subtotal 8,840,508 10,569,038 9,740,067 11,116,262 11,276,099
Downtown Parking 3,980,904 4,881,996 4,388,651 5,426,297 5,519,763
Municipal Golf Course 1,688,839 1,941,757 1,878,079 2,002,110 2,071,251

S U M M A R Y S C H E D U L E S
Summary o f Appropr ia t ions ( c o n t i n u e d )
C-13
ENTERPRISE FUNDS (continued)FY 2004Actual
FY 2005Amended
FY 2005Projected
FY 2006Adopted
FY 2007Proposed
Wastewater Water Resources Management 1,173,316 3,111,261 1,823,976 2,762,691 2,848,398 Wastewater Collection 2,200,917 2,477,217 2,338,825 2,861,655 2,947,605 Water Resources Laboratories 373,973 517,103 388,370 561,472 611,490 Wastewater Treatment 4,007,633 4,484,697 4,124,988 4,894,008 4,983,832 Subtotal 7,755,839 10,590,278 8,676,159 11,079,826 11,391,325
WaterWater Resources Management 4,898,359 5,620,020 5,535,449 6,761,437 7,519,365 Recycled Water 506,562 819,284 794,875 842,456 880,262 Water Distribution 4,669,611 5,121,914 5,253,106 5,407,803 5,603,699 Water Treatment 2,108,511 3,127,103 2,716,752 2,991,704 3,110,255 Water Supply Management 7,519,204 8,152,601 8,090,973 8,383,123 8,323,879 Water Resources Laboratories 455,039 582,072 437,709 648,724 672,451 Subtotal 20,157,286 23,422,994 22,828,864 25,035,247 26,109,911
WaterfrontAdmin. Support and Comm. Relations 2,347,906 3,099,050 2,928,759 3,313,324 3,329,550 Property Management 225,223 301,336 300,634 265,063 277,779 Financial Management 140,562 150,729 153,972 165,242 172,239 Parking Services 804,449 845,997 840,319 852,456 841,860 Harbor Patrol 1,315,928 1,411,461 1,411,976 1,520,507 1,600,832 Marina Management 250,019 267,206 280,109 273,364 279,556 Facilities Maintenance 2,678,155 3,367,373 3,027,653 3,234,914 3,149,648 Facilities Design and Capital Program 156,874 209,476 178,593 224,841 237,361 Subtotal 7,919,116 9,652,628 9,122,015 9,849,711 9,888,825
TOTAL ENTERPRISE FUNDS 50,342,492$ 61,058,691$ 56,633,835$ 64,509,453$ 66,257,174$
INTERNAL SERVICE FUNDSDuplications
Duplicating 321,990 298,855 276,835 297,558 302,727 Mail Courier Services 42,608 66,870 70,404 87,505 89,239 Subtotal 364,598 365,725 347,239 385,063 391,966
Information Systems Desktop Information Systems 1,464,808 1,645,952 1,445,242 1,675,785 1,624,168 Financial Information Systems 433,209 456,269 427,303 469,331 486,635 Subtotal 1,898,017 2,102,221 1,872,545 2,145,116 2,110,803
Intra-City ServicesBuilding Maintenance 2,787,833 2,952,727 2,891,298 3,174,453 3,279,771 Motorpool 2,797,895 3,037,958 2,763,761 2,588,498 2,665,617 Communications Systems 571,374 644,851 641,812 698,126 721,378 Custodial Services 880,363 934,843 985,972 949,066 987,896 Subtotal 7,037,465 7,570,379 7,282,843 7,410,143 7,654,662
Self InsuranceWorkers' Compensation 2,866,855 3,437,734 3,342,571 3,747,010 3,875,260 Liability 480,979 1,327,512 1,257,893 1,560,366 1,562,694 Occupational Safety and Health 101,156 249,364 167,926 253,162 289,917 Administrative Operations 2,227,265 1,693,366 1,534,441 1,846,870 1,894,752 Subtotal 5,676,255 6,707,976 6,302,831 7,407,408 7,622,623
TOTAL INT. SERVICE FUNDS 14,976,335$ 16,746,301$ 15,805,458$ 17,347,730$ 17,780,054$

S U M M A R Y S C H E D U L E S
Summary o f Appropr ia t ions ( c o n t i n u e d )
C-14
FY 2004Actual
FY 2005Amended
FY 2005Projected
FY 2006Adopted
FY 2007Proposed
CITYWIDE APPROPRIATIONS 176,509,814 210,216,334 197,392,818 223,125,513 227,880,427
Less: All Interfund Transactions (30,497,949) (32,135,091) (32,135,091) (33,620,054) (34,560,732)
CITY OPERATING BUDGET (NET) 146,011,865 178,081,243 165,257,727 189,505,459 193,319,695
Add: Capital Program - All Funds 42,877,146 114,554,055 N/A 26,072,760 40,783,707
CITYWIDE TOTAL (NET) 188,889,011$ 292,635,298$ 165,257,727$ 215,578,219$ 234,103,402$

C A P I T A L P R O G R A M
Capital Budget for F iscal Year 2006
D-1
GENERAL FUND CAPITAL PROGRAM Project Title
Oak Park and Dwight Murphy Playground Replacement Parks and Recreation Department
Replace outdated playgrounds at Oak Park and Dwight Murphy Field to meet al l current State safety and accessibi l i ty s tandards and ensure safe play structures for chi ldren. New playgrounds wi l l include equivalent p lay value with improved fal l sur facing.
FUNDING: General Fund reserves
230,000
Los Banos Pool Leak and Basement Wall Repairs Parks and Recreation Department / Public Works Building Maintenance ICS
Invest igate cause of pool leak and evaluate st ructural integri ty of basement wal l . Funding wi l l be used to ei ther make necessary repairs or provide construct ion design and cost est imate for repai rs needed.
FUNDING: General Fund reserves
250,000
Leaking Underground Fuel Tank Remediation Public Works Department
Leaking underground fuel tank removal and si te preparat ion to comply with soi l and groundwater s tandards regulated by the County of Santa Barbara.
FUNDING: General Fund reserves
143,700
Total General Fund Capital $623,700
INFORMATION SYSTEMS FUND Project Title
Geographic Information System (GIS) Master Plan Update Update the 1999 GIS Master Plan to accurately ident i fy the scope and funding needs for a central ized GIS project .
$34,000
Total Information Systems Fund $34,000
STREETS CAPITAL PROGRAM Project Title
Street Overlay Program Perform pavement over lay and resurfac ing as part of the ci ty ’s annual pavement maintenance program.
FUNDING: Ut i l i ty Users ’ Tax (Streets Fund - $594,800) and Transportat ion Sales Tax (Measure D Fund - $1,062,900)
1,657,700

C A P I T A L P R O G R A M
Capital Budget for F iscal Year 2006
D-2
Haley/De La Vina Bridge Replacement at Mission Creek Firs t year of funding for a two year pro ject to replace and widen the br idge over Mission Creek at the intersect ion of Haley and de La Vina st reets in coordinat ion wi th the Mission Creek Flood Control Project .
FUNDING: Ut i l i ty Users ’ Tax (Streets Fund - $100,000) and Federal Highway Bridge Replacement and Rehabi l i tat ion (HBRR) Funds (Streets Fund - $1,000,000)
1,100,000
Cabrillo Boulevard Bridge Replacement at Mission Creek Replace the vehicular and beach-way br idge over Mission Creek on Cabr i l lo Boulevard due to deter iorat ion.
FUNDING: Ut i l i ty Users ’ Tax (Streets Fund - $127,200) and Federal Highway Bridge Replacement and Rehabi l i tat ion (HBRR) Funds (Streets Fund - $500,000)
627,200
Carrillo Pedestrian Walkway Construct missing s idewalk l inks on Carr i l lo Street between San Andreas Street to Cl i f f Drive. This is funding for the f i rs t year of a two year project .
FUNDING: Transportat ion Enhancement Funds (Streets Fund)
465,000
Sidewalk Infill Program Annual instal lat ion of approximately 3,000 l inear feet of missing sidewalk l inks in the ci tywide s idewalk network.
FUNDING: Transportat ion Sales Tax (Measure D Fund – $288,400) and Transpor-tat ion Development Act Funds (TDA Fund - $55,000)
343,400
Drainage System Improvements Annual program to maintain, improve and construct c i tywide publ ic drainage faci l i t ies.
FUNDING: Ut i l i ty Users ’ Tax (Streets Fund)
318,100
Sidewalk Maintenance Program Replace exis t ing upl i f ted or depressed sidewalks due to t ree roots or other damage.
FUNDING: Transportat ion Sales Tax (Measure D Fund)
254,500
Streetlight Installation Program Instal l and maintain street l ights and poles under the ci ty ’s annual Street l ight Instal lat ion Program.
FUNDING: Ut i l i ty Users ’ Tax (Streets Fund)
246,000
Citywide Power Lines Replacement Ongoing program to replace underground 6.6 KVA power l ines.
FUNDING: Ut i l i ty Users ’ Tax (Streets Fund)
233,300

C A P I T A L P R O G R A M
Capital Budget for F iscal Year 2006
D-3
Loma Alta Drive Sidewalk Construct s idewalk on Loma Alta Drive from Canon Perdido Street to Coronel Street. This is funding for the f i rs t year of a two year project.
FUNDING: Transportat ion Enhancement Funds (Streets Fund)
100,000
Traffic Safety and Capacity Improvement Annual replacement program for t raf f ic s ignals, in tersect ions and signage at speci f ic locat ions in the Ci ty.
FUNDING: Ut i l i ty Users ’ Tax (Streets Fund)
127,200
School Zone Safety Improvements Improve t raf f ic safety in school zones through improved signage, pavement markings, and other t raf f ic calming devices to reduce speeding and unsafe behavior in school zones.
FUNDING: Transportat ion Sales Tax (Measure D Fund)
127,200
Streets Engineering Provide ongoing engineering support to al l Streets capi tal programs and projects, including surveying, publ ic r ight-of -way t ransact ions, automated mapping updates
FUNDING: Ut i l i ty Users ’ Tax (Streets Fund)
110,400
State Route 225 Relinquishment Improvements Determine ongoing maintenance and future capi tal costs associated with the potent ia l annexat ion of county-maintained State Route 225 and, i f appropr iate, in i t ia te annexat ion of port ions to the ci ty .
FUNDING: Transportat ion Sales Tax (Measure D Fund)
100,000
Total Streets Capital Program $5,810,000
CREEKS RESTORATION AND WATER QUALITY IMPROVEMENT Project Title
Restoration of Arroyo Burro Creek at Las Positas Final design and permit t ing costs to implement creek bank stabi l i zat ion and restorat ion of a r ipar ian habitat and wet land within a ci ty-owned six-acre parcel along Arroyo Burro Creek.
$150,000
Old Mission Creek – West Figueroa Wetland Final project design and permit t ing costs to restore and enhance the wet land funct ion of Old Mission Creek in the West Figueroa area.
150,000

C A P I T A L P R O G R A M
Capital Budget for F iscal Year 2006
D-4
Watershed Action Plan Implementation Undertake var ious watershed improvement projects as recommended by the Watershed Act ion Plan, current ly underway, to reduce storm water and urban runoff pol lut ion, restore creeks, and improve local water qual i ty.
150,000
Total Creeks Restoration & Water Quality Improvement $450,000
AIRPORT CAPITAL PROGRAM Project Title
AOA Pavement Maintenance Annual maintenance program for pavement to include crack seal ing, s lurry seal , overlay, and reconstruct ion.
200,000
Street Resurfacing Program Overlay and repai r var ious Airport s t reets and parking lots .
200,000
Airport Infrastructure Annual maintenance program for Ai rport infrastructure to inc lude water, sewer, and wastewater faci l i t ies repai r and replacement.
150,000
Leased Building Maintenance for Lease Properties Annual maintenance and improvements of leased faci l i t ies, inc luding paint ing and replacement of roofs, HVAC systems, and windows.
150,000
Airport Hazardous Materials Program Annual monitor ing and report ing for hazardous mater ia ls s i tes to ensure si tes are clean and in compl iance with County and State regulat ions.
50,000
Botello Road Parking Lot Reconstruct the Reson parking lot on Botel lo Road to conform to c i ty s tandards, including demol i t ion of exist ing pavement, grading, drainage improvements, new pavement and landscaping. This is funding for the f i rst year of a two year project .
36,000
Total Airport Operating Fund Capital $786,000
AIRPORT GRANTS CAPITAL PROGRAM Project Title
Airfield Safety Projects Part ia l funding for ongoing capi tal projects to enhance safety for Airport users, including runway safety area construct ion, runway, taxiway and approach l ight ing relocat ion, and creat ion of a new 48-acre wet land area to mit igate project impacts.
FUNDING: FAA Grant Capi tal
$2,964,900
Total Airport Grants Capital Program $2,964,900

C A P I T A L P R O G R A M
Capital Budget for F iscal Year 2006
D-5
DOWNTOWN PARKING FUND Project Title
Downtown Parking Lot Maintenance Perform ongoing maintenance in the Downtown Parking Lots, including paint , s lurry seals, and landscaping.
$262,000
Concrete Maintenance for Parking Structures Prevent ive maintenance for s labs, beams, columns, g i rders and dr ive ais les in the four concrete parking st ructures, and replacement of cornices at Ortega Garage.
292,800
Bike Station Furnishings for Granada Garage Purchase and instal l equipment for the new bike stat ion in Granada Garage.
125,000
Granada Garage Refuse Management Equipment Purchase a compactor and baler for the Granada Garage central refuse enclosure.
100,000
Downtown Parking Staff Office Furnishings and Equipment Furni ture, of f ice equipment, te lephone system, and alarm system for staf f of f ices in Granada Garage.
100,000
Total Downtown Parking Fund Capital $879,800
GOLF FUND Project Title
Golf Course Safety Improvement Master Plan Projects Implement Phase I I of the Golf Course Safety Improvement Master Plan, including safety improvements to bunkers, fencing, tees, greens, and cart paths.
$400,000
Power Turf Equipment Annual replacement of power tur f equipment.
104,000
Total Golf Fund Capital $504,000
INTRA-CITY SERVICES FUND Project Title
General Fund Vehicle Replacement Program Annual replacement of General Fund Fleet Vehicles scheduled for replacement based upon complet ion of thei r assigned l i fe cycle.
$1,075,000
Enterprise Fund Vehicle Replacement Program Annual replacement of Enterpr ise Fleet Vehicles scheduled for replacement based upon complet ion of thei r assigned l i fe cycle.
600,000
Total Intra-City Services Fund Capital $1,675,000

C A P I T A L P R O G R A M
Capital Budget for F iscal Year 2006
D-6
WASTEWATER FUND Project Title
Sanitary Sewer Overflow Compliance Program Undertake a var iety of projects to ensure compl iance with the Sani tary Sewer Overf low Rule requi rements, including annual replacement or rehabi l i tat ion of 1% of the sewer col lect ion l ines and manholes, replacement of l i f t s tat ion force mains, and other studies and projects to mainta in overf low compl iance.
$1,945,000
El Estero Treatment Plant Maintenance Program An annual program to ensure that El Estero Wastewater Treatment Plant remains ful ly operat ional . Includes electr ical and mechanical equipment replacement, integrat ion of plant processes into the SCADA system, and pipe replacement throughout the plant.
680,000
El Estero Strategic Plan Rehabi l i ta t ion and replacement of the major equipment and process components at the El Estero Wastewater Treatment Plant . Includes rehabi l i tat ion of cr i t ical faci l i t ies including odor control systems, bel t f i l ter presses, and aerat ion blowers.
400,000
El Estero Wetlands Restoration Mit igate envi ronmental ly sensi t ive habi tat and the smal l wet land adjacent to the wastewater t reatment plant due to the discovery of elevated levels of contaminants during the c lear ing stage of the wet lands restorat ion project .
250,000
Lift Station Maintenance Program Annual program of capi tal maintenance projects to keep the Ci ty ’s wastewater l i f t stat ions ful ly operat ional . Includes replacement of motor control centers, pumps, water level sensors, and other equipment to prevent l i f t stat ion fai lures.
110,000
Total Wastewater Fund Capital $3,385,000
WATER FUND Project Title
Groundwater Supply Program Annual program for basel ine wel l system component maintenance and rehabi l i tat ion of the Ortega Groundwater Treatment plant and ci ty wel ls.
$4,234,090
Cater Plant Maintenance Program Annual program for basel ine t reatment plant maintenance, including scheduled f i l ter media replacement, Supervisory Control and Data Acquis i t ion (SCADA) maintenance and upgrades, and aerat ion and sedimentat ion basin improvements.
1,360,090
Cater Strategic Plan Continue implementat ion of the 1999 Cater 10-Year Strategic Plan, speci f ical ly Phase I I I , the study and pre-design phases for determining compl iance with Phase I I of the Dis infectant/Dis infect ion By-Products Rule. This is funding for the f i rs t year of implementat ion of Phase I I I of the Cater Strategic Plan.
650,000

C A P I T A L P R O G R A M
Capital Budget for F iscal Year 2006
D-7
Water Distribution Pump Station Program Annual program for maintenance, repair and upgrades to water fac i l i t ies and equipment at c i ty ’s water distr ibut ion pump stat ions.
602,090
Water Distribution Reservoir Program Annual program developed to fund maintenance, rehabi l i tat ion and replacement of major equipment and faci l i t ies at the Ci ty ’s fourteen water storage reservoi rs and Gibral tar Dam.
184,090
Metron Meter Installation Program Continue ci tywide instal lat ion of high-eff ic iency Metron water meters.
250,000
Total Water Fund Capital $7,280,360
WATERFRONT FUND Project Title
Interior Harbor Dredging Dredge inter ior harbor along the Breakwater to Marina 1 due to sediment inf i l t rat ion.
$350,000
Stearns Wharf Annual Repair Program Annual wharf pi le dr iv ing and t imber replacement program to ensure st ructural integri ty of Stearns Wharf .
300,000
Fish Float North and Gangway Replacement Replace the 25-year-old Fish Float North structure and aluminum gangway.
315,000
Marina Maintenance Annual Repair Program Annual repai r and replacement of Waterfront equipment, including f loats , fasteners, ut i l i t ies, dock boxes, gangways, and cleats.
250,000
Ice House Equipment Replacement Replace ice machine due to heavy usage and exposure to harsh marine envi ronment.
110,000
Travel Lift Pier Timber Replacement Replace and rebui ld sect ions of the pier legs, pi les, p i le caps and deckboards that hold the t ravel l i f t hoist to widen opening to al low hoist ing of larger vessels and ensure st ructural stabi l i ty of the pier.
100,000
Utility Upgrade for 125 Harbor Way Building Upgrade electr ical system at the Marine Center Bui ld ing at 125 Harbor Way to meet exist ing electr ical demand in this mult i - tenant bui ld ing.
50,000
Seawall Sink Hole Repair Repair seawal l s ink hole created by t idal act ion that washes out soi l and creates void spaces under s idewalks & roadway.
50,000

C A P I T A L P R O G R A M
Capital Budget for F iscal Year 2006
D-8
Parking Lot Maintenance Program Maintenance to the eight Waterfront area parking lots, including slurry and crack seal ing, paint ing and traf f ic str ip ing.
45,000
Harbor Restroom Interior Repair Refurbish the publ ic restrooms at Sea Landing to br ing into ADA compl iance.
45,000
Upgrade Marina 1 Electrical Transformers Upgrade electr ical t ransformers, switch panel and cont inuous condui t for aging transformers on Marina 1.
25,000
Replace Stearns Wharf Compressors Replace the a ir compressors at the sewer l i f t s tat ion on Stearns Wharf .
20,000
107/117 Harbor Way Concept Design Concept design costs for Waterfront fountain and s idewalk improvements at 107 and 117 Harbor Way.
20,000
Total Waterfront Fund Capital $1,680,000
Total Capital $26,072,760

C A P I T A L P R O G R A M
Capital Budget for F iscal Year 2007
D-9
GENERAL FUND CAPITAL PROGRAM Project Title
Police Combined Communications Center Radio Replacement Police Department
Replace the publ ic safety communicat ions radio system in the Combined Communicat ions Center to meet current industry standards. The replacement wi l l include al l in ternal console components, server, l icensing training and maintenance.
FUNDING: General Fund reserves
$527,000
Bohnett, Ortega and Los Banos Parks Playground Replacement Parks and Recreation Department
Replace outdated playgrounds at Bohnet t Park, Ortega Park and Los Banos Pool to meet al l current State safety and accessibi l i ty standards and ensure safe play structures for chi ldren.
FUNDING: General Fund reserves
230,000
Restroom Refurbishment at Oak Park Parks and Recreation Department
Refurbish exist ing restrooms at the Sycamore Picnic area at Oak Park and instal lat ion of a handicap path to the picnic area.
FUNDING: General Fund reserves
120,000
Leaking Underground Fuel Tank Remediation Public Works Department
Leaking underground fuel tank removal and si te preparat ion to comply with soi l and groundwater s tandards regulated by the County of Santa Barbara.
FUNDING: General Fund reserves
100,000
Total General Fund Capital $977,000
STREETS CAPITAL PROGRAM Project Title
Street Overlay Program Perform pavement over lay and resurfac ing as part of the ci ty ’s annual pavement maintenance program.
FUNDING: Ut i l i ty Users ’ Tax (Streets Fund - $678,300), State Transportat ion Improvement Project Funds (Streets Fund $1,540,000), and Transportat ion Sales Tax (Measure D Fund - $1,106,600)
3,324,900

C A P I T A L P R O G R A M
Capital Budget for F iscal Year 2007
D-10
Haley/De La Vina Bridge Replacement at Mission Creek Second year of funding for a two year project to replace and widen the br idge over Mission Creek at the intersect ion of Haley and de La Vina st reets in coordinat ion wi th the Mission Creek Flood Control Project .
FUNDING: Federal Highway Bridge Replacement and Rehabi l i tat ion (HBRR) Funds (Streets Fund - $2,030,000)
2,030,000
Cabrillo Boulevard Bridge Replacement at Mission Creek Second year of funding for a four year project to replace the vehicular and beach-way br idge over Mission Creek on Cabri l lo Boulevard due to deter iorat ion.
FUNDING: Ut i l i ty Users ’ Tax (Streets Fund - $181,400) and Federal Highway Bridge Replacement and Rehabi l i tat ion (HBRR) Funds (Streets Fund - $500,000)
681,400
Loma Alta Drive Sidewalk Construct s idewalk on Loma Alta Drive from Canon Perdido Street to Coronel Street. This is funding for the second year of a two year project .
FUNDING: Transportat ion Enhancement Funds (Streets Fund)
942,000
Mission Interchange Bicycle and Pedestrian Improvements Provide bicycle lanes f rom Modoc Road to Cast i l lo Street, construct access ramps and improve pedestr ian condit ions through the Mission Interchange. This is funding for the second year of a two year project .
FUNDING: Transportat ion Improvement Project Funds (Streets Fund)
947,000
Cota Street Bridge Replacement at Mission Creek Replace and increase the water conveyance of the br idge over Mission Creek at Cota Street in coordinat ion with the Lower mission Creek Flood Control Project . This is funding for the second year of a two year project.
FUNDING: Ut i l i ty Users ’ Tax (Streets Fund - $217,600) and Federal Highway Bridge Replacement and Rehabi l i tat ion (HBRR) Funds (Streets Fund - $288,000)
505,600
Sidewalk Infill Program Annual instal lat ion of approximately 3,000 l inear feet of missing sidewalk l inks in the ci tywide s idewalk network.
FUNDING: Ut i l i ty Users ’ Tax (Streets Fund - $100,000), Transportat ion Sales Tax (Measure D Fund – $200,000) and Transportat ion Development Act Funds (TDA Fund - $55,000)
355,000
Sidewalk Maintenance Program Replace exis t ing upl i f ted or depressed sidewalks due to t ree roots or other damage.
FUNDING: Transportat ion Sales Tax (Measure D Fund)
281,400
Citywide Power Lines Replacement Ongoing program to replace underground 6.6 KVA power l ines.
FUNDING: Ut i l i ty Users ’ Tax (Streets Fund)
272,000

C A P I T A L P R O G R A M
Capital Budget for F iscal Year 2007
D-11
Ortega Bridge Replacement at Mission Creek Year one funding for a two year project to replace and increase the water conveyance of the br idge over Mission Creek at Ortega Street in coordinat ion wi th the Lower Mission Creek Flood Control Project.
FUNDING: Ut i l i ty Users ’ Tax (Streets Fund)
181,400
Streetlight Installation Program Instal l and maintain street l ights and poles under the ci ty ’s annual Street l ight Instal lat ion Program.
FUNDING: Ut i l i ty Users ’ Tax (Streets Fund)
181,400
Traffic Safety and Capacity Improvement Annual replacement program for t raf f ic s ignals, in tersect ions and signage at speci f ic locat ions in the Ci ty.
FUNDING: Transportat ion Sales Tax (Measure D Fund)
136,000
School Zone Safety Improvements Improve t raf f ic safety in school zones through improved signage, pavement markings, and other t raf f ic calming devices to reduce speeding and unsafe behavior in school zones.
FUNDING: Transportat ion Sales Tax (Measure D Fund)
136,000
Carrillo Pedestrian Walkway Construct missing s idewalk l inks on Carr i l lo Street between San Andreas Street to Cl i f f Dr ive. This is funding for the second year of a two year project .
FUNDING: Transportat ion Enhancement Funds (Streets Fund)
131,000
Streets Engineering Provide ongoing engineering support to al l Streets capi tal programs and projects, including surveying, publ ic r ight-of -way t ransact ions, automated mapping updates
FUNDING: Ut i l i ty Users ’ Tax (Streets Fund)
117,900
Drainage System Improvements Annual program to maintain, improve and construct c i tywide publ ic drainage faci l i t ies.
FUNDING: Transportat ion Sales Tax (Measure D Fund)
100,000
State Route 225 Relinquishment Improvements Determine ongoing maintenance and future capi tal costs associated with the potent ia l annexat ion of county-maintained State Route 225 and, i f appropr iate, in i t ia te annexat ion of port ions to the ci ty .
FUNDING: Ut i l i ty Users ’ Tax (Streets Fund)
100,000

C A P I T A L P R O G R A M
Capital Budget for F iscal Year 2007
D-12
Total Streets Capital Program $10,423,000
CREEKS RESTORATION AND WATER QUALITY IMPROVEMENT Project Title
Restoration of Arroyo Burro Creek at Las Positas Begin construct ion phase for creek bank stabi l i zat ion and restorat ion of a r ipar ian habi tat and wet land wi thin a ci ty-owned six-acre parcel along Arroyo Burro Creek.
$300,000
Old Mission Creek – West Figueroa Wetland Begin construct ion phase of project to restore and enhance the wet land funct ion of Old Miss ion Creek in the West Figueroa area.
150,000
Watershed Action Plan Implementation Continue var ious watershed improvement projects as recommended by the Watershed Act ion Plan, current ly underway, to reduce storm water and urban runoff pol lut ion, restore creeks, and improve local water qual i ty.
75,000
Total Creeks Restoration & Water Quality Improvement $525,000
AIRPORT CAPITAL PROGRAM Project Title
Botello Road Parking Lot Reconstruct the Reson parking lot on Botel lo Road to conform to c i ty s tandards, including demol i t ion of exist ing pavement, grading, drainage improvements, new pavement and landscaping. This is funding for the second year of a two year project .
253,000
AOA Pavement Maintenance Annual maintenance program for pavement to include crack seal ing, s lurry seal , overlay, and reconstruct ion.
200,000
Street Resurfacing Program Overlay and repai r var ious Airport s t reets and parking lots .
200,000
Leased Building Maintenance for Lease Properties Annual maintenance and improvements of leased faci l i t ies, inc luding paint ing and replacement of roofs, HVAC systems, and windows.
150,000
Airport Infrastructure Annual maintenance program for Ai rport infrastructure to inc lude water, sewer, and wastewater faci l i t ies repai r and replacement.
50,000
Airport Hazardous Materials Program Annual monitor ing and report ing for hazardous mater ia ls s i tes to ensure si tes are clean and incompl iance with County and State regulat ions. .
50,000

C A P I T A L P R O G R A M
Capital Budget for F iscal Year 2007
D-13
Total Airport Operating Fund Capital $903,000
AIRPORT GRANTS CAPITAL PROGRAM Project Title
Airfield Safety Projects Part ia l funding for ongoing capi tal projects to enhance safety for Airport users, including runway safety area construct ion, runway, taxiway and approach l ight ing relocat ion, and creat ion of a new 48-acre wet land area to mit igate project impacts.
FUNDING: FAA Grant Capi tal
$14,482,000
Total Airport Grants Capital Program $14,482,000
DOWNTOWN PARKING FUND Project Title
Downtown Parking Lot Maintenance Perform ongoing maintenance in the Downtown Parking Lots, including paint , s lurry seals, and landscaping.
$304,000
Concrete Maintenance for Parking Structures Prevent ive maintenance for s labs, beams, columns, g i rders and dr ive ais les in the four concrete parking st ructures, and replacement of cornices at Ortega Garage.
565,425
Replacement of Parking Revenue Control System Scheduled replacement of the exis t ing parking revenue control system. Advanced technology on new equipment wi l l help staf f provide bet ter customer service and more accurate revenue control . This is funding for the f i rs t year of a three year project .
75,000
Total Downtown Parking Fund Capital $944,425
GOLF FUND Project Title
Golf Course Improvement Projects Re-bui ld tees and greens, repair and add cart paths, and make other course improvements under the mul t i -year Gol f Course Improvement Plan.
$196,260
Power Turf Equipment Annual replacement of power tur f equipment.
121,000
Total Golf Fund Capital $317,260

C A P I T A L P R O G R A M
Capital Budget for F iscal Year 2007
D-14
INTRA-CITY SERVICES FUND Project Title
General Fund Vehicle Replacement Program Annual replacement of General Fund Fleet Vehicles scheduled for replacement based upon complet ion of thei r assigned l i fe cycle.
$750,000
Enterprise Fund Vehicle Replacement Program Annual replacement of Enterpr ise Fleet Vehicles scheduled for replacement based upon complet ion of thei r assigned l i fe cycle.
700,000
Total Intra-City Services Fund Capital $1,450,000
WASTEWATER FUND Project Title
Sanitary Sewer Overflow Compliance Program Undertake a var iety of projects to ensure compl iance with the Sani tary Sewer Overf low Rule requi rements, including annual replacement or rehabi l i tat ion of 1% of the sewer col lect ion l ines and manholes, replacement of l i f t s tat ion force mains, and other studies and projects to mainta in overf low compl iance.
$1,691,350
El Estero Treatment Plant Maintenance Program An annual program to ensure that El Estero Wastewater Treatment Plant remains ful ly operat ional . Includes electr ical and mechanical equipment replacement, integrat ion of plant processes into the SCADA system, and pipe replacement throughout the plant.
525,000
El Estero Strategic Plan Rehabi l i ta t ion and replacement of the major equipment and process components at the El Estero Wastewater Treatment Plant . Includes rehabi l i tat ion of cr i t ical faci l i t ies including odor control systems, bel t f i l ter presses, and aerat ion blowers.
315,000
Hydro-Jetter Sewer Cleaning Vehicle Purchase an addit ional hydro- jet ter sewer c leaning vehicle dedicated to rout ine pipe cleaning operat ions, necessary for l ine inspect ions.
175,000
Lift Station Maintenance Program Annual program of capi tal maintenance projects to keep the Ci ty ’s wastewater l i f t stat ions ful ly operat ional . Includes replacement of motor control centers, pumps, water level sensors, and other equipment to prevent l i f t stat ion fai lures.
110,000
Total Wastewater Fund Capital $2,816,350
WATER FUND Project Title
Water Main Replacement Program Annual program to replace 1%, or approximately 16,000 feet, of the ci ty ’s water d istr ibut ion pip ing system.
$2,400,000

C A P I T A L P R O G R A M
Capital Budget for F iscal Year 2007
D-15
Cater Plant Maintenance Program Annual program for basel ine t reatment plant maintenance, including scheduled f i l ter media replacement, Supervisory Control and Data Acquis i t ion (SCADA) maintenance and upgrades, and aerat ion and sedimentat ion basin improvements.
1,336,273
Groundwater Supply Program Annual program for basel ine wel l system component maintenance and rehabi l i tat ion of the Ortega Groundwater Treatment plant and ci ty wel ls.
804,273
Water Distribution Reservoir Program Annual program developed to fund maintenance, rehabi l i tat ion and replacement of major equipment and faci l i t ies at the ci ty ’s fourteen water storage reservoirs and Gibral tar Dam.
704,273
Cater Strategic Plan Continue implementat ion of the 1999 Cater 10-Year Strategic Plan, speci f ical ly Phase I I I , the study and pre-design phases for determining compl iance with Phase I I of the Disinfectant/Dis infect ion By-Products Rule. This is funding for the second year of implementat ion of Phase I I I of the Cater Strategic Plan.
500,000
Water Distribution Pump Station Program Annual program for maintenance, repair and upgrades to water fac i l i t ies and equipment at c i ty ’s water distr ibut ion pump stat ions.
385,853
Escondido Reservoir Roof Replacement Replacement of the Escondido Reservoir roof. This is funding for the f i rst year of a two year project.
70,000
Recycled Water Program Rehabi l i tat ion of the recycled water system tert iary f i l ters .
50,000
Total Water Fund Capital $6,250,672
WATERFRONT FUND Project Title
Breakwater Concrete Repairs Wall and sidewalk repairs to sect ions of the 25-year-old concrete breakwater “cap”.
$500,000
Interior Harbor Dredging Dredge inter ior harbor along the seawal l adjacent to Marinas 2, 3 and 4 due to sediment in f i l t rat ion.
400,000
Stearns Wharf Annual Repair Program Annual wharf pi le dr iv ing and t imber replacement program to ensure st ructural integri ty of Stearns Wharf .
400,000
Marina Maintenance Annual Repair Program Annual repai r and replacement of Waterfront equipment, including f loats , fasteners, ut i l i t ies, dock boxes, gangways, and cleats.
250,000

C A P I T A L P R O G R A M
Capital Budget for F iscal Year 2007
D-16
Parking Lot Maintenance Program Maintenance to the eight Waterfront area parking lots, including slurry and crack seal ing, paint ing and traf f ic str ip ing.
55,000
Marina 1 Main Walkway Replacement Design and permit t ing costs for the 30-year-old Marina 1 main walkway replacement project .
50,000
Fish Hoist Replacement Replace motor, davi t and f rame of one f ish hoist used by commercia l f ishermen.
25,000
Marina 1 Restroom Sump Pump Replacement Replace the sump pump that pumps f rom the f loat ing restroom on Marina 1 to the sewer lateral on land.
15,000
Total Waterfront Fund Capital $1,695,000
Total Capital $40,783,707

S U M M A R Y O F P O S I T I O N S
E-1
Posi t ions by Department Department Actual
FY 2004 Adopted FY 2005
Amended FY 2005
Adopted FY 2006
Proposed FY 2007
Administ rat ive Services 28.30 27.30 27.30 28.80 28.80 Airport 50.00 50.00 53.00 53.00 53.00
City Administ rator ’s Off ice 11.40 11.30 12.30 11.30 11.30
City Attorney’s Off ice 11.50 12.00 12.00 12.00 12.00
Community Development 83.80 84.70 84.70 87.70 87.70
Finance 47.00 46.00 46.00 46.00 46.00
Fire 113.00 112.00 112.00 112.00 112.00
Library 49.25 48.25 48.25 48.25 48.25
Mayor and City Counci l 9.00 9.00 9.00 9.00 9.00
Parks and Recreat ion 97.80 92.10 102.00 100.20 99.20
Pol ice 223.00 220.00 222.00 221.00 220.00
Publ ic Works 278.60 278.60 284.60 285.60 285.60
Waterfront 45.00 45.00 46.00 46.00 46.00
CITY TOTAL (FTEs) 1,047.65 1,036.25 1,059.15 1060.85 1058.85
Summary of Pos i t ion Changes Position Change
(FTEs) Posit ion Change (FTEs)
FISCAL YEAR 2006
Administrative Services Parks and Recreation (cont inued)
Human Resources Analyst 1.0 Recreat ion Program Leader (1.0)*
Senior Of f ice Special ist 0.5 Water Resources Special ist 1.5
City Administrator’s Office Police
Ci ty Special Projects Manager (1.0) Animal Contro l Off icer (1.0)
Community Development Public Works
Project Planner 2.0 Project Engineer I I 1.0
Project Planner (Cottage Hospi tal ) (1.0) FY 2006 POSITION CHANGES 1.7
Recording Secretary 1.0
Senior Plans Examiner 1.0
Parks and Recreation FISCAL YEAR 2007
Account ing Coordinator (1.0) Parks and Recreation
Asst. Parks and Recreat ion Di r . (1.0) Recreat ion Supervisor (1.0)
Engineer ing Technician I I 0.5 Police
Lead Park Ranger (1.0) Pol ice Business Manager (1.0)
Park Ranger 0.2 FY 2007 POSITION CHANGES (2.0)
* 2 Recreation Program Leaders, each at 0.5 FTEs, deleted in 2006.

S U M M A R Y O F P O S I T I O N S
E-2
Posi t ions by Fund F iscal Year 2006 Fund Adopted Fund Adopted
General Fund Creeks Restoration & Water Quali ty 7.00
Administ rat ive Services 16.00 Downtown Parking 20.50
City Administ rator 11.30 Duplications 3.10
City Attorney 12.00 Golf 13.70
Community Development 81.58 HOME Grant .85
Finance 37.70 Information Systems 12.80
Fire 112.00 Intra-City Services 52.50
Library 35.45 Miscellaneous Grants 1.57
Mayor and Counci l 9.00 Self- Insurance 5.20
Parks and Recreat ion 79.50 Solid Waste 3.00
Pol ice 217.00 Street Sweeping 6.25
Publ ic Works 46.06 Streets 31.93
GENERAL FUND SUBTOTAL 657.59 Supplemental Law Enforcement 3.00
Transportation Sales Tax 11.75
Airport 53.00 Wastewater 49.40
Community Dev. Block Grant 4.70 Water 64.21
County Library 12.80 Waterfront 46.00
CITY TOTAL (FTEs) 1,060.85
Posi t ions by Fund F iscal Year 2007 Fund Proposed Fund Proposed
General Fund Creeks Restoration & Water Quali ty 7.00
Administ rat ive Services 16.00 Downtown Parking 20.50
City Administ rator 11.30 Duplications 3.10
City Attorney 12.00 Golf 13.70
Community Development 81.58 HOME Grant .85
Finance 37.70 Information Systems 12.80
Fire 112.00 Intra-City Services 52.50
Library 35.45 Miscellaneous Grants 1.57
Mayor and Counci l 9.00 Self- Insurance 5.20
Parks and Recreat ion 78.50 Solid Waste 3.00
Pol ice 216.00 Street Sweeping 6.25
Publ ic Works 46.06 Streets 31.93
GENERAL FUND SUBTOTAL 655.59 Supplemental Law Enforcement 3.00
Transportation Sales Tax 11.75
Airport 53.00 Wastewater 49.40
Community Dev. Block Grant 4.70 Water 64.21
County Library 12.80 Waterfront 46.00
CITY TOTAL (FTEs) 1,058.85

D E P A R T M E N T S U M M A R Y
Administrat ive Services
F-1
Provide effective support services that encompass preparing the official city record, conducting elections, and providing human resources and information system services.
A b o u t A d m i n i s t r a t i v e S e r v i c e s
F i s c a l Y e a r 2 0 0 6
B u d g e t H i g h l i g h t s
The Administrat ive Services Department consists of four programs: Ci ty Clerk, Human Resources, Desktop Information Systems and Financia l Information Systems. The Department provides important services to over 1,060 c i ty employees and the community.
City Clerk will conduct
November 2005 election
and coordinate citywide
records management pro-
gram.
The City Clerk provides answers to quest ions f rom the publ ic regarding c i ty services and maintains the of f ic ia l c i ty counci l meeting minutes and records.
Human Resources recrui ts employees, develops pol ic ies and administers benef i t and train ing programs.
Human Resources will
assume management of
LEAP employee training and
development program. Information Systems programs provide technical , maintenance and user support for over 680 desktop computers and a f inancial management system.
Information Systems will
implement automated soft-
ware updates and spyware
protection.

D E P A R T M E N T S U M M A R Y
Administrat ive Services
F-2
D e p a r t m e n t F i n a n c i a l a n d S t a f f i n g S u m m a r y
Actual Amended Projected Adopted Proposed
FY 2004 FY 2005 FY 2005 FY 2006 FY 2007
Authorized Positions 28.30 27.30 27.30 28.80 28.80Hourly Employee Hours N/A 0 500 0 0
RevenuesFees and Service Charges 1,897,740$ 2,271,082$ 2,271,082$ 2,092,976$ 2,096,654$ Overhead Allocation Recovery N/A 521,350 521,350 630,765 655,996 Other Revenue 5,123 - - - - General Fund Subsidy 1,589,063 1,024,952 1,034,930 1,422,037 1,285,803 Total Department Revenue 3,491,926$ 3,817,384$ 3,827,362$ 4,145,778$ 4,038,453$
ExpendituresSalaries and Benefits 2,223,790$ 2,312,090$ 2,156,857$ 2,630,680$ 2,749,460$ Supplies and Services 772,367 868,313 832,837 939,278 956,234 Special Projects 239,582 78,749 184,086 305,000 55,000 Non-Capital Equipment 257,833 335,177 255,045 312,517 206,686 Capital Equipment - - - - 75,000 Appropriated Reserve - 54,194 - 10,443 10,222 Total Operating Expenditures 3,493,572$ 3,648,523$ 3,428,825$ 4,197,918$ 4,052,602$
Capital Program 107,877 471,393 N/A 34,000 -
Total Department Expenditures 3,601,449$ 4,119,916$ 3,428,825$ 4,231,918$ 4,052,602$
Addition to (Use of) Reserves (109,523)$ (302,532)$ 398,537$ (86,140)$ (14,149)$
D e p a r t m e n t F u n d C o m p o s i t i o n
Department Revenues by Fund
Information Systems
51%
General Fund Departmental
Revenues15%
General Fund Subsidy
34%
Department Appropriations by Fund
General Fund49%
Information Systems
51%

D E P A R T M E N T S U M M A R Y
Administrat ive Services
F-3
Organizational Program Chart
Administrative Services
City Clerk Human Resources
Information Systems
Desktop Information
Systems
Financial Information
Systems

City of Santa Barbara Two-Year Financial Plan & Annual Budget
ADMINISTRATIVE SERVICES PROGRAMS
City Clerk’s Office Human Resources Desktop Information Systems Financial Information Systems
RECENT PROGRAM ACHIEVEMENTS Two Deputy City Clerks attained the designation of Certified Municipal Clerk by the International Institute of Municipal Clerks.
P R O G R A M S & S E R V I C E S
F-4
City Clerk’s Office
( P r o g r a m N o . 1 5 2 1 ) M i s s i o n S t a t e m e n t Ensure the integrity and preservat ion of the City Counci l ’s record, coordinate citywide records management policies and procedures, and connect residents with their government by providing information in a courteous and t imely manner.
P r o g r a m A c t i v i t i e s Prepare agendas and minutes for al l City Counci l and Redevelopment
Agency meetings and periodic adjourned and special meetings.
Process City Counci l approved ordinances, resolut ions, agreements, contracts, and deeds and cert ify the administrat ive record of Council act ions.
Provide publ ic information services and publ ish Municipal Code updates.
Coordinate the Records Management Program.
Administer municipal elect ions.
Oversee compliance with the Poli t ical Reform Act as it relates to f i l ing of Campaign Statements and Statements of Economic Interests.
Coordinate the recruitment and appointment process for City advisory groups.
K e y O b j e c t i v e s f o r F i s c a l Y e a r 2 0 0 6 Complete 100% of customer service requests within 2 working days or
by the requested deadline.
Maintain 90% timely f i l ing rate for Statements of Economic Interests.
Complete 90% of Counci l/Redevelopment Agency minutes accurately within 5 working days.
Coordinate the Records Management Program and report annual ly on each department’s progress in meeting the program’s goals.
Coordinate the recruitment and appointment process for City advisory groups, including an orientat ion and training.
Administer the November 8, 2005 General Municipal Elect ion for the purpose of elect ing the Mayor and three Counci lmembers.
Develop a secure posting system for Counci l and Redevelopment Agency regular, special and adjourned meetings.

F i n a n c i a l a n d S t a f f i n g I n f o r m a t i o n
Actual Amended Projected Adopted Proposed
FY 2004 FY 2005 FY 2005 FY 2006 FY 2007
Authorized Positions 6.00 5.00 5.00 5.00 5.00
Hourly Employee Hours N/A 0 0 0 0
RevenuesFees and Service Charges 1,410$ -$ -$ -$ -$ Overhead Allocation Recovery N/A 212,866 212,866 188,834 196,387 Other Revenue 4,917 - - - - General Fund Subsidy 690,128 294,412 402,157 596,333 357,554 Total Revenue 696,455$ 507,278$ 615,023$ 785,167$ 553,941$
ExpendituresSalaries and Benefits 404,782$ 382,018$ 340,000$ 428,599$ 448,371$ Supplies and Services 84,974 96,620 123,088 105,368 105,570 Special Projects 206,699 28,640 151,335 250,000 - Non-Capital Equipment - - 600 1,200 - Total Expenditures 696,455$ 507,278$ 615,023$ 785,167$ 553,941$
P r o g r a m P e r f o r m a n c e M e a s u r e s
Actual Projected Adopted FY 2004 FY 2005 FY 2006
Percent of customer service requests completed within 2 working days or by the requested deadline 100% 100% 100%
Statements of economic interests filed 413 400 400
Percent of timely filings of Statements of Economic Interests 96% 90% 90%
Percent of Council and Redevelopment Agency minutes accurately prepared within 5 working days and presented for Council and Redevelopment Agency approval
N/A N/A 90%
Council agenda items and related documents processed 1,109 900 1,050
Pages of Council and Redevelopment Agency minutes accurately prepared within 5 working days and presented for Council and Redevelopment Agency approval
625 600 600
Staff hours spent in support of 29 City Advisory Groups composed of 201 members 223.5 300 360
Customer service requests completed within 2 working days or by the requested deadline 657 600 700
F-5

City of Santa Barbara Two-Year Financial Plan & Annual Budget
ADMINISTRATIVE SERVICES PROGRAMS City Clerk’s Office
Human Resources Desktop Information Systems Financial Information Systems
RECENT PROGRAM ACHIEVEMENTS Initiated quarterly supervisor/manager orientation program. Implemented computerized police/fire dispatcher examination. Improved & reorganized HR website for easier use.
P R O G R A M S & S E R V I C E S
F-6
Human Resources
( P r o g r a m N o s . 1 5 3 1 , 1 5 3 3 ) M i s s i o n S t a t e m e n t Develop effect ive pol icies and assist departments in the recruitment, development, and retent ion of quality employees in order for the City to provide a high standard of service to the community.
P r o g r a m A c t i v i t i e s Provide a central ized program of personnel administrat ion for over
1,060 regular employees.
Provide guidance and personnel related information to employees and departments.
Establ ish job descript ions and compensation levels for 360 classif icat ions.
Recruit, test, and cert i fy appl icants for City posit ions.
Coordinate and assist departments on discipl inary act ions, performance issues, and complaints.
Administer employee benefit programs including health insurance, l i fe insurance, long and short-term disabi l i ty, deferred compensation and ret irement.
Administer leave programs and track employees who are on a leave of absence.
Conduct new employee orientat ion programs.
Coordinate the citywide Learning for Excel lence and Achievement Program (LEAP) training program.
Provide staff support to the Civi l Service Commission.
K e y O b j e c t i v e s f o r F i s c a l Y e a r 2 0 0 6 Ensure that City supervisors and managers complete 90% of
employee performance evaluations on t ime.
Provide 95% of classif icat ion recommendations to the requesting department within 45 working days of receiving the completed Posit ion Descript ion Form from the department.
Complete 100% of benef it enrol lment processing for new employees within 31 calendar days of employee’s hir ing date.
Complete internal (promotional) recruitments within an average of 39 working days.
Complete external (open) recruitments within an average of 49 working days.

F-7
K e y O b j e c t i v e s f o r F i s c a l Y e a r 2 0 0 6 ( c o n t i n u e d )
Hold quarterly training updates with department representat ives on pert inent issues related to Human Resources, such as Family Medical Leave Act, Personal Action Forms (PAFs), etc.
By December 31, 2005 conduct an employee satisfact ion survey related to the services provided by the Human Resources staff.
By March 31, 2006, conduct an employee satisfact ion survey related to the services provided by the Benef its staff.
F i n a n c i a l a n d S t a f f i n g I n f o r m a t i o n
Actual Amended Projected Adopted Proposed
FY 2004 FY 2005 FY 2005 FY 2006 FY 2007
Authorized Positions 9.50 9.50 9.50 11.00 11.00
Hourly Employee Hours N/A 0 500 0 0
RevenuesOverhead Allocation Recovery N/A 308,484$ 308,484$ 441,931$ 459,609$ Other Revenue 165 - - - - General Fund Subsidy 898,935 730,540 632,773 825,704 928,249 Total Revenue 899,100$ 1,039,024$ 941,257$ 1,267,635$ 1,387,858$
ExpendituresSalaries and Benefits 678,364$ 753,646$ 673,366$ 918,939$ 969,740$ Supplies and Services 187,853 235,269 235,140 293,346 298,118 Special Projects 32,883 50,109 32,751 45,000 45,000 Non-Capital Equipment - - - 10,350 - Capital Equipment - - - - 75,000 Total Expenditures 899,100$ 1,039,024$ 941,257$ 1,267,635$ 1,387,858$

P R O G R A M S & S E R V I C E S
F-8
City of Santa Barbara Two-Year Financial Plan & Annual Budget
Human Resources
( C o n t i n u e d ) P r o g r a m P e r f o r m a n c e M e a s u r e s
Actual Projected Adopted FY 2004 FY 2005 FY 2006
Percent of evaluations completed on time 95% 85% 90%
Percent of classification studies completed within 45 working days of department completing the Position Description Form 75% 95%% 95%
Percent of new employees hired / benefit enrollment completed within 31 calendar days 100% 100% 100%
Working days to certify promotional recruitment list 31 39 39
Working days to certify open recruitment list 49 49 49
Training updates held N/A 4 4
Applications processed 1,345 1,200 1,200
Recruitments conducted 62 60 60
Employees (regular and hourly) hired 553 500 500
Turnover rate of regular employees 6.48% 6.2% 6%
Personnel actions, such as new hires, promotions, resignations, merit increases, etc. processed by HR staff 3,356 3,000 3,000
Percent of hires for management positions as internal promotions N/A N/A 50%
Percent of hires for supervisory positions as internal promotions N/A N/A 50%
Supervisor / manager requests for assistance regarding disciplinary issues N/A N/A 900
Employees making benefit changes during Open Enrollment N/A N/A 300
Employee requests for assistance regarding benefits N/A N/A 3,000
Percent of employees using the Educational Reimbursement Program N/A N/A 5%
Total LEAP training hours provided to employees N/A N/A 840
Average number of LEAP training hours attended per employee N/A N/A 16

[This page intent ional ly le f t b lank. ]
F-9

City of Santa Barbara Two-Year Financial Plan & Annual Budget
ADMINISTRATIVE SERVICES PROGRAMS City Clerk’s Office Human Resources
Desktop Information Systems Financial Information Systems
RECENT PROGRAM ACHIEVEMENTS Converted to Native 2000 Mode-Microsoft Active Directory. Deployed automatic anti-virus updates. Implemented secure isolated new web server.
P R O G R A M S & S E R V I C E S
F-10
Desktop Information Systems
( P r o g r a m N o . 1 5 4 1 ) M i s s i o n S t a t e m e n t Provide technical leadership, maintenance, and user support for computing and networking services to City staff to enhance the qual ity and effect iveness of City operat ions.
P r o g r a m A c t i v i t i e s Operate and maintain the City’s 17 Local Area Networks.
Provide maintenance and support to over 680 desktop computers.
Establ ish and maintain standards for hardware and software.
Coordinate the City’s computer training program.
Establ ish standards and provide oversight of the City’s Web page.
Operate, maintain, and ensure the reliable operat ion of the citywide Intranet.
Perform systems analysis, integrat ion, and implementation.
K e y O b j e c t i v e s f o r F i s c a l Y e a r 2 0 0 6 Resolve 87% of Help Desk phone cal l requests at t ime of call and 92%
within 1 business day.
Resolve 98% of Out of Service requests rated as crit ical within 1 business day.
Maintain an uptime of 99.8% on the City’s Wide Area Network and crit ical f i le and appl icat ion servers.
Ensure 99% of employees report the training provided wil l result in improvements in their abi l i ty to use desktop appl icat ions.
Implement Spyware/Pop-up protect ion Citywide via automated distr ibution by March 31, 2006.
Implement password change requirements every 60 days on al l workstat ions by September 30, 2005.
Implement ful ly managed and monitored network and server status and alerts by June 30, 2006.
Convert City Intranet to a more f lexible and easi ly maintained appl ication using Microsoft Portal Server technology by December 31, 2005.
Implement automated software and updates deployment using Microsoft Software Management System (SMS) by December 31, 2005.
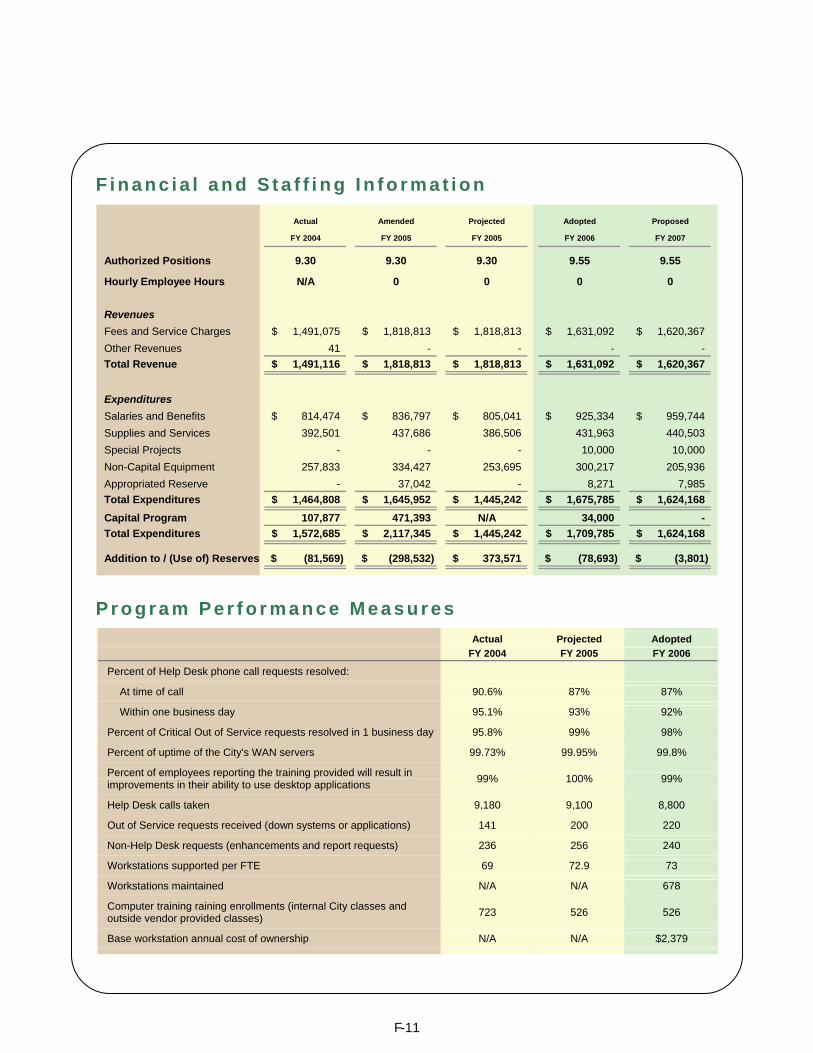
F i n a n c i a l a n d S t a f f i n g I n f o r m a t i o n
Actual Amended Projected Adopted Proposed
FY 2004 FY 2005 FY 2005 FY 2006 FY 2007
Authorized Positions 9.30 9.30 9.30 9.55 9.55
Hourly Employee Hours N/A 0 0 0 0
RevenuesFees and Service Charges 1,491,075$ 1,818,813$ 1,818,813$ 1,631,092$ 1,620,367$ Other Revenues 41 - - - - Total Revenue 1,491,116$ 1,818,813$ 1,818,813$ 1,631,092$ 1,620,367$
ExpendituresSalaries and Benefits 814,474$ 836,797$ 805,041$ 925,334$ 959,744$ Supplies and Services 392,501 437,686 386,506 431,963 440,503 Special Projects - - - 10,000 10,000 Non-Capital Equipment 257,833 334,427 253,695 300,217 205,936 Appropriated Reserve - 37,042 - 8,271 7,985 Total Expenditures 1,464,808$ 1,645,952$ 1,445,242$ 1,675,785$ 1,624,168$ Capital Program 107,877 471,393 N/A 34,000 - Total Expenditures 1,572,685$ 2,117,345$ 1,445,242$ 1,709,785$ 1,624,168$
Addition to / (Use of) Reserves (81,569)$ (298,532)$ 373,571$ (78,693)$ (3,801)$
P r o g r a m P e r f o r m a n c e M e a s u r e s
Actual Projected Adopted FY 2004 FY 2005 FY 2006
Percent of Help Desk phone call requests resolved:
At time of call 90.6% 87% 87%
Within one business day 95.1% 93% 92%
Percent of Critical Out of Service requests resolved in 1 business day 95.8% 99% 98%
Percent of uptime of the City's WAN servers 99.73% 99.95% 99.8%
Percent of employees reporting the training provided will result in improvements in their ability to use desktop applications 99% 100% 99%
Help Desk calls taken 9,180 9,100 8,800
Out of Service requests received (down systems or applications) 141 200 220
Non-Help Desk requests (enhancements and report requests) 236 256 240
Workstations supported per FTE 69 72.9 73
Workstations maintained N/A N/A 678
Computer training raining enrollments (internal City classes and outside vendor provided classes) 723 526 526
Base workstation annual cost of ownership N/A N/A $2,379
F-11

City of Santa Barbara Two-Year Financial Plan & Annual Budget
ADMINISTRATIVE SERVICES PROGRAMS City Clerk’s Office Human Resources Desktop Information Systems
Financial Information Systems
RECENT PROGRAM ACHIEVEMENTS Implemented a centralized Maintenance Management System. Developed a Decision Support System for the Financial Management System.
P R O G R A M S & S E R V I C E S
F-12
Financial Information
Systems
( P r o g r a m N o . 1 5 4 2 ) M i s s i o n S t a t e m e n t Provide f inancial management systems and related services to City staff and their customers, to maintain data integri ty, and enable f inancial accountabi l i ty and compliance with f inancial standards.
P r o g r a m A c t i v i t i e s Support 17 appl icat ions on the Financial Management System (FMS).
Provide a secure environment for information and computer systems.
Provide maintenance and support to the FMS and its customers.
Provide systems analysis, software development, and training services.
Perform report ing services and data exportation to support the analysis and inquiry needs of City staff.
Provide consult ing services to al l departments from researching business problems to implementing solut ions.
Maintain a plan of future goals and projects.
K e y O b j e c t i v e s f o r F i s c a l Y e a r 2 0 0 6 Maintain an uptime of 99.8% on the central computer system support ing
the FMS.
Maintain a 90% customer sat isfact ion rat ing on service requests.
Complete 98% of urgent requests to export data or generate special reports within 1 business day.
Create an Information Technology Plan in support of citywide technology projects for f iscal year 2007 and publish by December 31, 2005.
Expand the FMDSS data Warehouse to include addit ional FMS modules and standard reports by June 30, 2006.
Determine the City’s highest pr ior ity needs for providing onl ine payments via the Internet and develop an implementation plan by September 30, 2005.
Perform a needs analysis and develop a project specif ication and implementation plan to add a Cost Accounting module to the FMS by December 31, 2005.

F i n a n c i a l a n d S t a f f i n g I n f o r m a t i o n
Actual Amended Projected Adopted Proposed
FY 2004 FY 2005 FY 2005 FY 2006 FY 2007
Authorized Positions 3.50 3.50 3.50 3.25 3.25
Hourly Employee Hours N/A 0 0 0 0
RevenuesFees and Service Charges 405,255$ 452,269$ 452,269$ 461,884$ 476,287$ Total Revenue 405,255$ 452,269$ 452,269$ 461,884$ 476,287$
ExpendituresSalaries and Benefits 326,170$ 339,629$ 338,450$ 357,808$ 371,605$ Supplies and Services 107,039 98,738 88,103 108,601 112,043 Non-Capital Equipment - 750 750 750 750 Appropriated Reserve - 17,152 - 2,172 2,237 Total Expenditures 433,209$ 456,269$ 427,303$ 469,331$ 486,635$
Addition to / (Use of) Reserves (27,954)$ (4,000)$ 24,966$ (7,447)$ (10,348)$
P r o g r a m P e r f o r m a n c e M e a s u r e s
Actual Projected Adopted FY 2004 FY 2005 FY 2006
Percent uptime on the central computer system supporting the Financial Management System 99.9% 99.8% 99.8%
Percent of customers surveyed reporting a satisfactory rating on services received 93% 90% 90%
Percent of urgent requests to export data or generate special reports completed within 1 business day. 97% 94% 98%
Major application improvement requests completed 13 15 15
Total application improvement requests completed 92 89 89
Application program errors fixed, number of requests for general assistance, and data changes completed 197 199 199
Requests for reports and data exports completed 126 125 125
Financial Management System users supported per program FTE N/A 101 108
F-13

[This page intent ional ly left blank.]
F-14

D E P A R T M E N T S U M M A R Y
Airport
F-15
Provide the region with safe, modern, convenient facilities to access the national air transportation system. A b o u t A i r p o r t
Santa Barbara Munic ipal Airport is the busiest commercia l service airport on the Cal i fornia coast between San Jose and Los Angeles and has been owned and operated by the Ci ty s ince 1941. The mission of the Airport Department is to provide the community wi th faci l i t ies necessary for access to the Nat ional Air Transportat ion System, to provide property management and maintenance services for the leased business/ industr ia l fac i l i t ies on the Airport , and to provide f iscal management of a irpor t funding sources to sustain the Airport as a sel f-suf f ic ient ent i ty and a v i ta l economic contr ibutor to the community.
F i s c a l Y e a r 2 0 0 6
B u d g e t H i g h l i g h t s
The Airport Department will:
• Begin construction of Airfield
Safety Projects.
• Begin final design of the Airline
Terminal Improvement Project.
The Airport is composed of 950 acres: 400 acres are wet lands (Goleta Slough Ecological Reserve) and 95 acres have been establ ished as the Airport 's commercia l / industr ia l area. The Airport is located approximately 10 mi les f rom downtown Santa Barbara and neighbors the Ci ty of Goleta and the Universi ty of Cal i fornia. The pr imary market area for the Airport encompasses Santa Barbara County.
• Finalize lease agreement for
Parcel 22.
The Airport Department has begun implementat ion of i ts Aviat ion Faci l i t ies Plan. Two pr ior i ty projects that are underway are creat ion of FAA standard safety areas for Runway 7/25 and the Air l ine Terminal Improvement Project . As part of the Runway Safety Area Project , the Airport wi l l restore approximately 39 acres of wetland habi tat at a cost of about $8 mi l l ion.
The Airport is sel f-support ing and receives no local tax dol lars for i ts operat ions. The revenues generated by the Airport are from tenant rents and user fees. These revenues are spent on Airport operat ions, maintenance, and capita l /major construct ion projects as required by federal law. The Federal Aviat ion Administrat ion (FAA) provides grant funding for capi ta l improvements.

D E P A R T M E N T S U M M A R Y
Airport
F-16
Actual Amended Projected Adopted Proposed
FY 2004 FY 2005 FY 2005 FY 2006 FY 2007
Authorized Positions 50.00 50.00 50.00 53.00 53.00
Hourly Employee Hours N/A 3,164 3,164 5,148 5,148
RevenuesFAA Grants 5,079,509$ 23,991,824$ 11,389,800$ 2,964,900$ 14,482,000$ Passenger Facility Charges 1,269,037 1,724,391 1,421,704 1,300,000 1,300,000 Intergovernmental 282,583 440,913 200,913 196,635 202,548 Lease Income 10,672,355 10,405,808 11,120,244 10,929,420 10,866,634 Interest Income 442,690 366,553 481,510 415,950 416,000 Market Valuation (323,524) - - - - Other Revenue 117,292 50,000 32,284 27,000 27,000 Total Department Revenue 17,539,942$ 36,979,489$ 24,646,455$ 15,833,905$ 27,294,182$
ExpendituresSalaries and Benefits 3,429,892$ 3,750,865$ 3,653,424$ 4,284,154$ 4,486,294$ Supplies and Services 5,271,142 6,161,155 5,562,604 6,245,678 6,211,842 Special Projects 61,356 331,309 331,810 386,374 386,374 Non-Capital Equipment 51,102 142,524 123,231 144,936 84,999 Capital Equipment 27,016 38,230 38,175 - 50,000 Appropriated Reserve - 114,132 - 55,120 56,590 Total Operating Expenditures 8,840,508$ 10,538,215$ 9,709,244$ 11,116,262$ 11,276,099$
Capital Program 6,577,062 31,546,536 7,556,834 3,750,900 15,385,000
Total Department Expenditures 15,417,570$ 42,084,751$ 17,266,078$ 14,867,162$ 26,661,099$
Addition to (Use of) Reserves 2,122,372$ (5,105,262)$ 7,380,377$ 966,743$ 633,083$
Department Appropriations by Fund
Airport Operating
75% Airport Capital Grants20%
Airport Capital
5%
Department Revenues by Fund
Airport Operating
74%
Airport Capital Grants 26%
D e p a r t m e n t F i n a n c i a l a n d S t a f f i n g S u m m a r y
D e p a r t m e n t F u n d C o m p o s i t i o n

D E P A R T M E N T S U M M A R Y
Airport
F-17
Program Organizational Chart
Airport Administration
Facilities Planning and Development
Business and Property
Management
Airport Certification and
Operations
Marketing and Communications
Airport Parking Airport Security Facilities Maintenance
Grounds/ Landscape
Maintenance
Airport Custodial Maintenance
Air Operations Area
Maintenance

City of Santa Barbara Two-Year Financial Plan & Annual Budget
AIRPORT PROGRAMS
Administration
Business and Property Management
Marketing and Communications Facilities Maintenance Air Operations Area
Maintenance Airport Security Airport Certification and
Operations Facility Planning and
Development
RECENT PROGRAM ACHIEVEMENTS Began work on the program criteria document (design guidelines) for the Airline Terminal Improvement Project. The City Council addressed key design issues in April 2005.
P R O G R A M S & S E R V I C E S
F-18
Administration
( P r o g r a m N o . 7 4 1 1 ) M i s s i o n S t a t e m e n t Provide vision and leadership to Airport Department programs to provide the region with a safe, modern, and convenient gateway to the national air transportat ion system.
P r o g r a m A c t i v i t i e s Oversee management of al l operat ing divisions within the Department.
Implement City pol icies establ ished by City Administrator and City Counci l.
Develop procedures, rules, and regulat ions for Airport operat ions.
Provide pr imary staff support to Airport Commission.
K e y O b j e c t i v e s f o r F i s c a l Y e a r 2 0 0 6 Accomplish 90% of the department program object ives.
Conduct at least 2 publ ic workshops to inform the community about the Airport ’s Air l ine Terminal Improvement Project.
Encourage Airport staff to attend at least 48 total hours of professional development, LEAP or IIPP training.
Finalize the Air l ine Terminal Improvement Project Program Criter ia Document (PCD) for City Council approval by December 31, 2005 based on City needs and input from Airport advisory groups.

F-19
F i n a n c i a l a n d S t a f f i n g I n f o r m a t i o n
Actual Amended Projected Adopted Proposed
FY 2004 FY 2005 FY 2005 FY 2006 FY 2007
Authorized Positions 3.25 2.45 2.45 2.45 2.45
Hourly Employee Hours N/A 0 0 0 0
RevenuesFAA Grants 5,079,509$ 23,991,824$ 11,389,800$ 2,964,900$ 14,482,000$ Passenger Facility Charges 1,269,037 1,724,391 1,421,704 1,300,000 1,300,000 Intergovernmental 69,643 250,000 10,000 - - Interest Income 442,690 366,553 481,510 415,950 416,000 Market Valuation (323,524) - - - - Other Revenue 73,507 - - - - Total Revenue 6,610,862$ 26,332,768$ 13,303,014$ 4,680,850$ 16,198,000$
ExpendituresSalaries and Benefits 382,451$ 363,620$ 365,449$ 330,583$ 345,595$ Supplies and Services 954,436 1,163,259 1,066,447 1,121,545 1,144,827 Non-Capital Equipment 4,276 32,700 24,705 5,000 5,000 Appropriated Reserve - 114,132 - 55,120 56,590 Total Operating Expenditures 1,341,163$ 1,673,711$ 1,456,601$ 1,512,248$ 1,552,012$ Capital Program 6,577,062 31,546,536 7,556,834 3,750,900 15,385,000 Total Expenditures 7,918,225$ 33,220,247$ 9,013,435$ 5,263,148$ 16,937,012$
Addition to (Use of ) Reserves (1,307,363)$ (6,887,479)$ 4,289,579$ (582,298)$ (739,012)$
P r o g r a m P e r f o r m a n c e M e a s u r e s
Actual Projected Adopted FY 2004 FY 2005 FY 2006
Percent of department objectives achieved 82.4% 90% 90%
Airline Terminal public workshops hosted N/A N/A 2
Hours of training received per employee N/A N/A 48
Total annual passengers 796,162 823,000 850,000
Annual aircraft operations for airlines and general aviation 147,471 160,000 160,000
Annual tons of airfreight 3,207 3,100 3,100
OSHA lost work hours 400 150 ≤200

City of Santa Barbara Two-Year Financial Plan & Annual Budget
AIRPORT PROGRAMS
Administration
Business and Property Management
Marketing and Communications Facilities Maintenance Air Operations Area
Maintenance Airport Security Airport Certification and
Operations Facility Planning and
Development
RECENT PROGRAM ACHIEVEMENTS The City Council authorized Airport Commission to approve Airport leases with terms less than five years, reducing City Council Agenda workload.
P R O G R A M S & S E R V I C E S
F-20
Business and Property
Management
( P r o g r a m N o s . 7 4 1 2 , 7 4 1 4 ) M i s s i o n S t a t e m e n t Manage f ixed assets to ensure the Airport ’s economic self-suff iciency, and maintain a strong f inancial posit ion through prudent f iscal management pract ices.
P r o g r a m A c t i v i t i e s Manage the Airport 's commercial and industr ial propert ies and aviat ion
uses and act ivit ies.
Insure the Airport 's economic self-suff iciency through ful l use and occupancy of Airport faci l i t ies.
Monitor Airport property leases for compliance.
Supervise the accounting and f inancial management functions of the Department.
Administer the management contract for the publ ic parking faci l i t ies at the Air l ine Terminal.
K e y O b j e c t i v e s f o r F i s c a l Y e a r 2 0 0 6 Maintain air l ine cost per enplaned passenger with the maximum not to
exceed the median rate of the 6 benchmark airports.
Maximize Air l ine Terminal concession revenue per enplaned passenger.
Maintain annual lease revenue at budget target through effect ive management of commercial and industrial lease assets.
Col lect 95% of base rents col lected by due date in lease.
Complete lease negot iat ions for Parcel 22 development.
Complete a feasibi l i ty study for a consolidated rental car faci l i ty.

F i n a n c i a l a n d S t a f f i n g I n f o r m a t i o n
Actual Amended Projected Adopted Proposed
FY 2004 FY 2005 FY 2005 FY 2006 FY 2007
Authorized Positions 3.75 3.75 3.75 3.75 3.75
Hourly Employee Hours N/A 0 0 0 0
RevenuesLease Income 8,954,934$ 8,621,658$ 9,232,089$ 9,121,858$ 8,963,536$ Other Revenue 39,214 50,000 32,284 27,000 27,000 Total Revenue 8,994,148$ 8,671,658$ 9,264,373$ 9,148,858$ 8,990,536$
ExpendituresSalaries and Benefits 258,400$ 296,078$ 262,853$ 335,426$ 354,982$ Supplies and Services 857,239 617,220 617,538 647,710 582,950 Special Projects - 311,755 311,755 378,374 378,374 Non-Capital Equipment 1,197 15,500 9,947 3,000 3,000 Total Expenditures 1,116,836$ 1,240,553$ 1,202,093$ 1,364,510$ 1,319,306$
Addition to (Use of ) Reserves 7,877,312$ 7,431,105$ 8,062,280$ 7,784,348$ 7,671,230$
P r o g r a m P e r f o r m a n c e M e a s u r e s
Actual Projected Adopted FY 2004 FY 2005 FY 2006
Airline airport facility lease and landing fees per enplaned passenger $4.19 $4.43 $5.58
Airline Terminal restaurant and gift shop revenue per enplaned passenger N/A N/A $0.35
Lease revenue $3,932,712 $3,771,197 $3,763,214
Percent of base rents collected by due date 97.39% 96% 95%
Land leased (in square feet) 3,940,470 3,897,182 3,956,530
Land space occupancy rate 98.3% 98.5% 95%
Building space leased (in square feet) 354,771 342,912 353,518
Building space occupancy rate 97.1% 97% 95%
F-21

City of Santa Barbara Two-Year Financial Plan & Annual Budget
AIRPORT PROGRAMS
Administration Business and Property
Management Marketing and Communications
Facilities Maintenance Air Operations Area
Maintenance Airport Security Airport Certification and
Operations Facility Planning and
Development
RECENT PROGRAM ACHIEVEMENTS Experienced the second highest passenger count year in the history of the Airport due to the quality of air service options available, including 10 non-stop destinations served by 5 major airlines.
P R O G R A M S & S E R V I C E S
F -22
Marketing and
Communications
( P r o g r a m N o . 7 4 1 3 ) M i s s i o n S t a t e m e n t Plan and implement comprehensive marketing and communications projects to increase local traveler awareness of Santa Barbara Airport air transportation services, and work with nat ional air l ine corporations to preserve existing service and attract new service.
P r o g r a m A c t i v i t i e s Develop and implement air service strategic plans to sustain and
improve air service levels.
Enhance awareness of Airport projects and services while encouraging and maintaining community goodwil l through public information, aviat ion educat ion and economic development act ivit ies.
Develop information for media communications regarding Airport programs and operat ions.
K e y O b j e c t i v e s f o r F i s c a l Y e a r 2 0 0 6 Capture at least 55% of the regional (San Luis Obispo, Santa Maria,
Santa Barbara and Oxnard Airports) air service market share based on number of dai ly departures.
Maintain a 90% rate of news releases that el ic it coverage by at least one media format.
Achieve a 70% satisfact ion rat ing of air service options avai lable at Santa Barbara Airport.
Provide educat ional information to students (ages 3-18) through the Airport ’s Aviation Educat ion Program.
Accomplish object ives associated with one-year air service plan goals.
Develop a communications plan for the dissemination of publ ic information for the Air l ine Terminal Improvement Project.

F i n a n c i a l a n d S t a f f i n g I n f o r m a t i o n
Actual Amended Projected Adopted Proposed
FY 2004 FY 2005 FY 2005 FY 2006 FY 2007
Authorized Positions 1.50 1.50 1.50 1.50 1.50
Hourly Employee Hours N/A 1,040 1,040 990 990
ExpendituresSalaries and Benefits 127,629$ 138,289$ 140,625$ 148,347$ 153,932$ Supplies and Services 172,398 253,447 217,397 330,035 280,129 Special Projects 7,603 19,000 19,501 8,000 8,000 Non-Capital Equipment 2,654 15,252 15,128 10,831 8,800 Total Expenditures 310,284$ 425,988$ 392,651$ 497,213$ 450,861$
Addition to (Use of ) Reserves (310,284)$ (425,988)$ (392,651)$ (497,213)$ (450,861)$
P r o g r a m P e r f o r m a n c e M e a s u r e s
Actual Projected Adopted FY 2004 FY 2005 FY 2006
Regional (tri-county) air service market share 59.5% 55% 55%
Percent of news releases eliciting media coverage 100% 90% 90%
Percent rating of air service options as satisfactory N/A 70% 70%
Students receiving educational information 8,409 6,500 7,000
Website sessions N/A N/A 130,000
F-23

City of Santa Barbara Two-Year Financial Plan & Annual Budget
AIRPORT PROGRAMS
Administration Business and Property
Management Marketing and Communications
Facilities Maintenance Air Operations Area
Maintenance Airport Security Airport Certification and
Operations Facility Planning and
Development
RECENT PROGRAM ACHIEVEMENTS Implemented passenger comment card survey effort at the Airline Terminal.
P R O G R A M S & S E R V I C E S
F-24
Facilities Maintenance
( P r o g r a m N o s . 7 4 2 1 , 7 4 2 2 , 7 4 2 4 ) M i s s i o n S t a t e m e n t Provide airport tenants and the public with well-maintained facil i t ies and infrastructure through an eff ic ient and effect ive faci l i t ies maintenance program.
P r o g r a m A c t i v i t i e s Provide 24-hour maintenance service for 56 Airport buildings, as well
as Airport water mains, f ire hydrants, sewer mains, manholes, and road and parking areas.
Inspect and maintain one t idal gate to prevent f looding.
Perform custodial services for the Air l ine Terminal Complex and rental car off ices.
Maintain landscaped areas at leased propert ies, roadway medians and Love Park on Airport property, including planting, mowing, weed abatement, and rodent control.
Maintain Airport bui ldings, infrastructure and grounds to minimize unit costs.
K e y O b j e c t i v e s f o r F i s c a l Y e a r 2 0 0 6 Complete 90% of al l work orders by the established target date.
Maintain 85% customer satisfact ion rat ing for the Air l ine Terminal facil i t ies cleanl iness.
Maintain an 80% tenant sat isfact ion rat ing for maintenance services.
Track and establish benchmarks for numbers of work orders by type (rout ine, emergencies, planned maintenance, and capital projects).

F i n a n c i a l a n d S t a f f i n g I n f o r m a t i o n
Actual Amended Projected Adopted Proposed
FY 2004 FY 2005 FY 2005 FY 2006 FY 2007
Authorized Positions 16.03 15.88 15.88 15.88 15.88
Hourly Employee Hours N/A 408 408 408 408
ExpendituresSalaries and Benefits 885,526$ 1,009,687$ 896,242$ 1,066,075$ 1,108,910$ Supplies and Services 1,198,445 1,664,018 1,299,939 1,468,823 1,479,915 Special Projects 23,783 - - - - Non-Capital Equipment 5,505 30,847 31,331 63,868 9,068 Capital Equipment - - - - 15,000 Total Expenditures 2,113,259$ 2,704,552$ 2,227,512$ 2,598,766$ 2,612,893$
Addition to (Use of ) Reserves (2,113,259)$ (2,704,552)$ (2,227,512)$ (2,598,766)$ (2,612,893)$
P r o g r a m P e r f o r m a n c e M e a s u r e s
Actual Projected Adopted FY 2004 FY 2005 FY 2006
Percent of work orders completed by established target date 99.9% 94.8% 90%
Percent of customers satisfied with cleanliness of Airline Terminal facilities 90.5% 85% 85%
Percent of tenants satisfied with maintenance services 89% 80% 89%
Total cost per square foot for building maintenance $1.30 $2.50 $2.50
Cost per passenger for Terminal custodial services $0.46 $0.55 $0.55
Cost per acre of landscape maintenance services $5,286 $4,562 $4,562
Water and sewer system maintenance cost per lineal foot $1.86 $0.66 $0.92
Work orders completed 2,269 2,200 1,650
Buildings maintained 58 57 57
Work related injuries 1 1 ≤ 1
F-25

City of Santa Barbara Two-Year Financial Plan & Annual Budget
AIRPORT PROGRAMS
Administration Business and Property
Management Marketing and Communications Facilities Maintenance
Air Operations Area Maintenance
Airport Security Airport Certification and
Operations Facility Planning and
Development
RECENT PROGRAM ACHIEVEMENTS Implemented quarterly preventive maintenance cleaning of the air carrier ramp.
P R O G R A M S & S E R V I C E S
F-26
Air Operations Area
Maintenance
( P r o g r a m N o . 7 4 2 3 ) M i s s i o n S t a t e m e n t Maintain Air Operat ions Area in compliance with appl icable regulat ions, through an eff icient and effect ive maintenance program.
P r o g r a m A c t i v i t i e s Inspect, maintain and repair 5.6 mil l ion square feet of Airf ield
Operations Area (AOA) pavement (runways/taxiways/ramp), pavement markings, l ighting and signage.
Comply with Airport cert if icat ion requirements relat ing to airf ield grading, mowing of safety areas, and rodent control.
K e y O b j e c t i v e s f o r F i s c a l Y e a r 2 0 0 6 Achieve 100% compliance with Federal Air Regulat ions (FAR) Part 139
airf ield maintenance requirements.
Complete 95% of Airf ield Operations Area (AOA) maintenance work orders generated from airf ield safety inspections within 24 hours of receiving report.
Complete 90% of al l work orders by the established target dates.
Complete quarterly cleanings of the air carr ier ramp as a storm water pol lut ion prevention plan best management practice.
Implement new maintenance management system software.
Track and establish benchmarks for numbers of work orders by type (rout ine, emergencies, planned maintenance, and capital projects).

F i n a n c i a l a n d S t a f f i n g I n f o r m a t i o n
Actual Amended Projected Adopted Proposed
FY 2004 FY 2005 FY 2005 FY 2006 FY 2007
Authorized Positions 5.90 5.90 5.90 5.90 5.90
Hourly Employee Hours N/A 0 0 0 0
ExpendituresSalaries and Benefits 383,375$ 412,344$ 338,980$ 445,229$ 461,338$ Supplies and Services 246,557 253,235 201,151 265,123 267,459 Non-Capital Equipment - 6,000 6,000 8,129 7,800 Capital Equipment 24,126 3,175 3,175 - - Total Expenditures 654,058$ 674,754$ 549,306$ 718,481$ 736,597$
Addition to (Use of ) Reserves (654,058)$ (674,754)$ (549,306)$ (718,481)$ (736,597)$
P r o g r a m P e r f o r m a n c e M e a s u r e s
Actual Projected Adopted FY 2004 FY 2005 FY 2006
Compliance with Federal airfield maintenance regulations 100% 100% 100%
Percent of AOA work orders resulting from airfield safety inspections completed within 24 hours of receipt 97.5% 95% 95%
Percent of work orders completed by established target date 97% 90% 90%
Carrier ramp cleanings completed N/A N/A 4
Total AOA maintenance cost per acre $470.12 $450 $450
AOA work orders completed 572 550 550
Total acres of unpaved airfield surface maintained 311 311 311
F-27

City of Santa Barbara Two-Year Financial Plan & Annual Budget
AIRPORT PROGRAMS
Administration Business and Property
Management Marketing and Communications Facilities Maintenance Air Operations Area
Maintenance Airport Security
Airport Certification and Operations
Facility Planning and Development
RECENT PROGRAM ACHIEVEMENTS During calendar year 2004, officers responded to calls for service that resulted in 39 cite and release arrests, completion of 271 field contact cards, 146 crime incident reports, and 9 aircraft incident reports.
P R O G R A M S & S E R V I C E S
F-28
Airport Security
( P r o g r a m N o . 7 4 3 1 ) M i s s i o n S t a t e m e n t Provide a secure environment for the traveling publ ic, air l ines, Airport tenants, and cit izens by providing essent ial security services in a t imely manner and in compliance with Transportat ion Security Administrat ion regulat ions.
P r o g r a m A c t i v i t i e s Provide Airport Patrol Off icers to comply with Transportat ion Security
Administrat ion (TSA) airport securi ty regulat ions regarding security inspections, security access control, and FAA-required Airf ield Inspection Program.
Provide 24-hour roving security patrol of Airport industr ial propert ies and provide peak hour vehicular traff ic control at the Airl ine Terminal.
K e y O b j e c t i v e s f o r F i s c a l Y e a r 2 0 0 6 Respond to 100% of calls for service from security checkpoints within 5
minutes, as required by the Transportat ion Security Administrat ion.
Respond to 100% of reports of unauthorized persons in most sensit ive security areas within 5 minutes of the unauthorized person being reported.
Conduct 100% of the Airport perimeter inspections required by Transportation Security Administrat ion (TSA) regulat ions.
Respond to 100% of reports of unauthorized persons in the Airf ield Operations Area (AOA).
Respond to 95% of non-emergency calls from air l ines, other airport tenants, airport patrons, or any other person on the airport within 15 minutes.
Complete the fol lowing, 80% of the t ime:
• The scheduled number of dai ly Air l ine Terminal inspections.
• The scheduled number of daily Security Identif icat ion Display Area (SIDA) ramp inspections.
• The scheduled number of AOA patrols.
• The scheduled number of dai ly airport property patrols.
• The scheduled number of dai ly patrols of sensit ive areas.
Develop training calendar for patrol division employees.
Develop procedure manual for the Security Operations Center.

F i n a n c i a l a n d S t a f f i n g I n f o r m a t i o n
Actual Amended Projected Adopted Proposed
FY 2004 FY 2005 FY 2005 FY 2006 FY 2007
Authorized Positions 15.33 18.33 18.33 18.33 18.33
Hourly Employee Hours N/A 1,716 1,716 3,750 3,750
RevenuesOther Revenue 4,571$ -$ -$ -$ -$ Total Revenue 4,571$ -$ -$ -$ -$
ExpendituresSalaries and Benefits 1,051,970$ 1,140,098$ 1,276,582$ 1,451,573$ 1,531,535$ Supplies and Services 154,567 190,373 164,425 199,324 200,793 Non-Capital Equipment 9,436 11,800 10,632 17,368 17,368 Capital Equipment 2,890 35,055 35,000 - 35,000 Total Expenditures 1,218,863$ 1,377,326$ 1,486,639$ 1,668,265$ 1,784,696$
Addition to (Use of ) Reserves (1,214,292)$ (1,377,326)$ (1,486,639)$ (1,668,265)$ (1,784,696)$
P r o g r a m P e r f o r a n c e M e a s u r e s
m
Actual P rojected A dopted FY 2004 FY 2005 FY 2006
Percent of responses to calls 100% 100% 100%
Percent response to reports of unauthorized persons in the Security Identification Display Area (SIDA) within five minutes 100% 100% 100%
Percentage compliance with TSA perimeter security inspection requirements 102% 100% 100%
Percent of Law Enforcement responses to reports of unauthorized persons in the AOA 100% 100% 100%
Percent of responses to non-emergency calls within 15 minutes 99% 99% 95%
Percent of days scheduled Airline Terminal inspections were conducted N/A N/A 80%
Percent of days scheduled SIDA ramp inspections were conducted N/A N/A 80%
Percent of days scheduled AOA patrols were conducted N/A N/A 80%
Percent of days scheduled airport property patrols were conducted N/A N/A 80%
Percent of days scheduled patrols of sensitive areas were conducted N/A N/A 80%
Access control system alarms 48,896 45,000 45,000
Airfield safety inspections 1,150 1,095 1,095
Emergency calls received 68 100 60
Non-emergency calls received 3,700 3,200 4,000
Terminal building inspections / SIDA ramps inspection N/A N/A 5,475
AOA patrols / Airport property patrols N/A N/A 3,285
Patrols of sensitive areas N/A N/A 5,480
F-29

City of Santa Barbara Two-Year Financial Plan & Annual Budget
AIRPORT PROGRAMS
Administration Business and Property
Management Marketing and Communications Facilities Maintenance Air Operations Area
Maintenance Airport Security
Airport Certification and Operations
Facility Planning and Development
RECENT PROGRAM ACHIEVEMENTS Completed review and rewrite of the Airport’s Certification Manual per new federal requirements.
P R O G R A M S & S E R V I C E S
F-30
Airport Certif ication and
Operations
( P r o g r a m N o . 7 4 4 1 ) M i s s i o n S t a t e m e n t Operate Airport pursuant to safety guidel ines as outl ined in Federal Aviat ion Regulat ion (FAR) Part 139 and minimize noise impacts of Airport operat ions on the communit ies surrounding the Airport by promoting noise abatement procedures.
P r o g r a m A c t i v i t i e s Assure compliance with FAA airport cert i f icat ion mandates which
govern airports served by commercial air carr iers.
Provide emergency planning and response which includes Aircraft Rescue and Firef ighting (ARFF) services and other safety requirements.
Minimize adverse impacts of aircraft noise on communit ies around the Airport through pi lot educat ion and other noise abatement programs.
Administer the Storm Water Pollut ion Prevent ion Plan as part of the Airport ’s National Pol lut ion Discharge El iminat ion System (NPDES) Storm Water Discharge Permit.
K e y O b j e c t i v e s f o r F i s c a l Y e a r 2 0 0 6 Promote a safe Airport by achieving 95% compliance with FAR Part 139
Airport Cert i f ication Requirements.
Ensure the safe condit ion of the airf ield by achieving 100% compliance with FAR Part 139 daily airf ield inspection requirements.
Respond to 90% of periodic emergency response dri l ls within Federal Aviat ion Administrat ion (FAA) required t ime parameters.
Host at least nine Noise Abatement Committee meetings.
Correspond with 100% of aircraft operators who fai led to comply with noise abatement procedures in which a noise complaint resulted.
Complete al l required projects to begin implementation of FAR Part 150 Noise Compatibi l i ty Program recommendations under the Noise Abatement Measures and Program Management Elements of the study.
Conduct one Airport Emergency Plan tabletop exercise.

F i n a n c i a l a n d S t a f f i n g I n f o r m a t i o n
Actual Amended Projected Adopted Proposed
FY 2004 FY 2005 FY 2005 FY 2006 FY 2007
Authorized Positions 1.74 2.59 2.59 2.59 2.59
Hourly Employee Hours N/A 0 0 0 0
RevenuesLease Income 1,717,421$ 1,784,150$ 1,888,155$ 1,807,562$ 1,903,098$ Intergovernmental 212,940 190,913 190,913 196,635 202,548 Total Revenue 1,930,361$ 1,975,063$ 2,079,068$ 2,004,197$ 2,105,646$
ExpendituresSalaries and Benefits 144,751$ 158,684$ 150,173$ 251,879$ 261,009$ Supplies and Services 1,399,543 1,649,772 1,660,109 1,816,817 1,849,233 Non-Capital Equipment 22,292 17,465 16,725 13,100 13,168 Total Expenditures 1,566,586$ 1,825,921$ 1,827,007$ 2,081,796$ 2,123,410$
Addition to (Use of ) Reserves 363,775$ 149,142$ 252,061$ (77,599)$ (17,764)$
P r o g r a m P e r f o r m a n c e M e a s u r e s
Actual Projected Adopted FY 2004 FY 2005 FY 2006
Percent compliance on annual Federal Airport Certification Inspections 100% TBA 95%
Percent compliance with Certification Manual daily airfield inspection requirements 100% 100% 100%
Percent of Aircraft Rescue and Firefighting drill responses completed within time requirements 90% 90% 90%
Noise Abatement Committee meetings hosted 9 10 9
Percent of aircraft owners notified regarding failure to use noise abatement procedures when possible 100% 100% 100%
Noise complaints received 708 1,000 750
F-31

City of Santa Barbara Two-Year Financial Plan & Annual Budget
AIRPORT PROGRAMS
Administration Business and Property
Management Marketing and Communications Facilities Maintenance Air Operations Area
Maintenance Airport Security Airport Certification and
Operations Facility Planning and
Development
RECENT PROGRAM ACHIEVEMENTS In fiscal year 2005, Facilities Planning and Development staff completed construction of two major drainage improvement projects and a new Airfield Electrical Vault.
P R O G R A M S & S E R V I C E S
F-32
Facil ity Planning and
Development
( P r o g r a m N o . 7 4 5 1 ) M i s s i o n S t a t e m e n t Plan, design, permit and construct bui ldings and infrastructure in a t imely and cost-effect ive manner to provide the region with a safe, modern, and convenient airport.
P r o g r a m A c t i v i t i e s Implement the Aviat ion Facil i t ies Plan.
Implement the Airport ’s Capital Improvement Program.
Provide engineering and other technical services for project design and construct ion, including cost est imating, to support the preparation of FAA grant appl icat ions.
Obtain al l necessary project permits and procure al l reports and studies necessary for project approvals.
Coordinate with regulatory agencies including negotiat ing project condit ions.
Maintain compliance with environmental regulat ions and project condit ions.
K e y O b j e c t i v e s f o r F i s c a l Y e a r 2 0 0 6 Achieve 75% on-t ime complet ion of Capital Improvement Program (CIP)
and Aviat ion Facil i t ies Plan (AFP) annual project milestones.
Achieve 95% compliance with permit condit ions of approval pertaining to project development, environmental monitoring, and maintenance act ivit ies.
Achieve total annual construction contract bid averages within 10% of the total engineer’s est imates for the 30% complete design packages.
Limit the total annual value of construct ion change orders on CIP and AFP projects to less than 7% of the total value of construct ion contracts awarded.
Cont inue development of the Airport Geographic Information System (GIS) by implementing ArcIMS and training users, mapping the precise boundaries of exist ing avigat ion easements, and creating a l inkage between ArcView and the exist ing property management Access database.

F i n a n c i a l a n d S t a f f i n g I n f o r m a t i o n
Actual Amended Projected Adopted Proposed
FY 2004 FY 2005 FY 2005 FY 2006 FY 2007
Authorized Positions 2.50 2.60 2.60 2.60 2.60
Hourly Employee Hours N/A 0 0 0 0
ExpendituresSalaries and Benefits 195,790$ 232,065$ 222,520$ 255,042$ 268,993$ Supplies and Services 287,957 369,831 335,598 396,301 406,536 Special Projects 29,970 554 554 - - Non-Capital Equipment 5,742 12,960 8,763 23,640 20,795 Total Expenditures 519,459$ 615,410$ 567,435$ 674,983$ 696,324$
Addition to (Use of ) Reserves (519,459)$ (615,410)$ (567,435)$ (674,983)$ (696,324)$
P r o g r a m P e r f o r m a n c e M e a s u r e s
Actual Projected Adopted FY 2004 FY 2005 FY 2006
Percent on-time completion of Capital Improvement Program and Aviation Facilities Plan project annual milestones 66% 85-95% 75%
Percent compliance with permit conditions of approval pertaining to project development, environmental monitoring, and maintenance activities
100% 100% 95%
Total value of CIP, AFP and non-CIP construction contracts bid averages as a percentage of the total value of the preliminary design estimates
- 3% +/- 10% +/- 10%
Total change order cost as a percentage of awarded contract value 6% < 7% < 7%
Total estimated value of projects in active design and construction $91,700,000 $98,000,000 $98,000,000
Total number of projects under active planning, design, construction, and monitoring 15 22 22
F-33

[This page intent ional ly le f t b lank. ]
F-34

D E P A R T M E N T S U M M A R Y
City Administrator’s Off ice
F-35
Responsible for the overall management and administration of the City of Santa Barbara, based upon the City Charter and the policy direction provided by the City Council.
A b o u t C i t y A d m i n i s t r a t o r ’ s O f f i c e The City Administrator ’s Off ice is composed of three programs: Administrat ion, Ci ty TV (Channel 18), and Employee Relat ions. F i s c a l Y e a r
2 0 0 6 B u d g e t
H i g h l i g h t s City Administrator's Office will
help the organization become
more effective and efficient.
The Office will be engaged in
labor negotiations with two
labor groups. Neighborhood
improvements will be made
with an overall goal to
systematically and routinely
correct and prevent
neighborhood problems.
Administrat ion provides for the management of a l l af fai rs of Ci ty government and services, d irect control of the administrat ive branch of Ci ty government, and oversight of and direct ion to departments.
Ci ty TV is responsible for producing al l publ ic informat ion programming on the c i ty ’s government access cable televis ion stat ion, Channel 18, including Ci ty Counci l and var ious board and commission meet ings and Ins ide Santa Barbara.
The Employee Relat ions program works wi th over 1,000 fu l l - t ime and part- t ime employees and several hundred hour ly employees and their respect ive labor associat ions, regarding employee relat ions, contract negot iat ions, and current employee pol ic ies.

D E P A R T M E N T S U M M A R Y
City Administrator’s Off ice
F-36
D e p a r t m e n t F i n a n c i a l a n d S t a f f i n g S u m m a r y
Actual Amended Projected Adopted Proposed
FY 2004 FY 2005 FY 2005 FY 2006 FY 2007
Authorized Positions 11.40 12.20 12.20 11.20 11.20 Hourly Employee Hours N/A 3,500 3,099 3,898 3,898
Revenues
Overhead Allocation Recovery N/A 783,439$ 783,439$ 873,231$ 908,160$ Other Revenue 52,040 71,844 69,889 69,900 69,900 General Fund Subsidy 1,578,165 1,070,718 966,595 909,559 929,448 Total Department Revenue 1,630,205$ 1,926,001$ 1,819,923$ 1,852,690$ 1,907,508$
ExpendituresSalaries and Benefits 1,282,771$ 1,369,715$ 1,311,652$ 1,492,122$ 1,563,120$ Supplies and Services 296,795 475,830 439,134 305,568 289,388 Special Projects 8,243 35,858 25,000 20,000 20,000 Non-Capital Equipment 42,396 44,598 44,137 35,000 35,000 Total Department Expenditures 1,630,205$ 1,926,001$ 1,819,923$ 1,852,690$ 1,907,508$
D e p a r t m e n t F u n d C o m p o s i t i o n
Department Appropriations by Fund
General Fund100%
Department Revenues by Fund
General Fund Departmental
Revenue51%
General Fund Subsidy
49%

D E P A R T M E N T S U M M A R Y
City Administrator’s Off ice
F-37
Program Organizational Chart
City Administrator’s
Office
Administration
Employee Relations
City TV –
Channel 18

City of Santa Barbara Two-Year Financial Plan & Annual Budget
CITY ADMINISTRATORPROGRAMS
Administration Employee Relations City TV – Channel 18
RECENT PROGRAM ACHIEVEMENTS The Learning for Excellence and Achievement Program (LEAP) was expanded to provide employee development and training opportunities to all city employees in January 2005.
P R O G R A M S & S E R V I C E S
F-38
Administration
( P r o g r a m N o . 1 3 1 1 ) M i s s i o n S t a t e m e n t Provide leadership, direct ion, and oversight to City departments to accomplish goals and object ives approved by the City Council, in accordance with the City Charter.
P r o g r a m A c t i v i t i e s Manage operat ions in ten City departments with approximately 1,060
ful l- and part-t ime employees.
Assist the Mayor and Counci l in strategic planning efforts, policy development, and implementation.
Coordinate internal and external communication efforts.
Coordinate a performance management program in al l City programs.
Coordinate legislat ive advocacy and intergovernmental relat ions.
Provide support to the Ordinance Committee, Committee on Legislation, and the Committee on Youth and Children.
K e y O b j e c t i v e s f o r F i s c a l Y e a r 2 0 0 6 Ensure that City departments achieve 80% of program object ives.
Ensure that 95% of service requests are referred to departments within 8 work hours.
Present a balanced budget for f iscal year 2007 for Counci l considerat ion by May 2006, in accordance with Counci l policy.
Review program status reports for performance object ives on a quarterly basis and submit a year end report to Counci l.
Hold a Council work session to help Counci lmembers prior i t ize goals and receive updates on high priority projects.
Recommend Counci l adoption of a legislat ive platform that provides the foundation for legislat ive advocacy.
Prepare and del iver the State of the City Report by March 2006.
Issue City Administrator Reports to communicate with Council , Boards, and Commissions and maintain frequent communication with City employees, part icular ly on signif icant budget issues.
Coordinate the development of the City’s Neighborhood Improvement Program.

F i n a n c i a l a n d S t a f f i n g I n f o r m a t i o n
Actual Amended Projected Adopted Proposed
FY 2004 FY 2005 FY 2005 FY 2006 FY 2007
Authorized Positions 8.15 8.00 8.00 7.00 7.00
Hourly Employee Hours N/A 0 999 1,998 1,998
RevenuesOverhead Allocation Recovery N/A 602,875$ 602,875$ 651,015$ 677,055$ General Fund Subsidy 1,108,282 673,766 575,647 563,333 594,530 Total Revenue 1,108,282$ 1,276,641$ 1,178,522$ 1,214,348$ 1,271,585$
ExpendituresSalaries and Benefits 959,461$ 999,788$ 946,068$ 1,058,723$ 1,109,571$ Supplies and Services 140,090 240,534 207,454 135,625 142,014 Special Projects 8,243 35,858 25,000 20,000 20,000 Non-Capital Equipment 488 461 - - - Total Expenditures 1,108,282$ 1,276,641$ 1,178,522$ 1,214,348$ 1,271,585$
P r o g r a m P e r f o r m a n c e M e a s u r e s
Actual Projected Adopted FY 2004 FY 2005 FY 2006
Percent of City performance objectives achieved 75% 80% 80%
Percent of service requests referred within 8 working hours 94.8% 95% 95%
Staff recommendations forwarded to Council 689 700 700
Citizen service requests received 134 120 120
F-39

City of Santa Barbara Two-Year Financial Plan & Annual Budget
CITY ADMINISTRATORPROGRAMS Administration
Employee Relations City TV – Channel 18
RECENT PROGRAM ACHIEVEMENTS Concluded negotiations with seven bargaining units, including four, four-year agreements.
P R O G R A M S & S E R V I C E S
F-40
Employee Relations
( P r o g r a m N o . 1 3 1 2 ) M i s s i o n S t a t e m e n t Negotiate labor agreements, implement workplace pol ic ies, and resolve issues in ways that create posit ive employer-employee relat ions.
P r o g r a m A c t i v i t i e s Negotiate and administer labor contracts with 7 employee bargaining
groups: Pol ice, Fire, General, Treatment and Patrol, Hourly Employees, Supervisors, and Police Managers.
Work with employees, employee representat ives, and unions to resolve employee issues, including discrimination and harassment complaints and grievances.
Review, update, and ensure compliance with workplace pol icies.
Promote posit ive employee and employer relat ions.
K e y O b j e c t i v e s f o r F i s c a l Y e a r 2 0 0 6 Negotiate a new labor agreement with the Hourly Employees
Bargaining Unit, S.E.I.U. Local 620, in accordance with Counci l parameters. (Prior agreement expires on October 30, 2005.)
Negotiate a new labor agreement with the Santa Barbara Pol ice Off icers Association, in accordance with Council parameters. (Prior agreement expires on June 30, 2006.)
Cont inue comprehensive redraft of Tit le 3 of the Santa Barbara Municipal Code and submit to the City Attorney for review and approval. Seek input from labor organizations as necessary, and present recommendations to the Ordinance Committee and/or City Counci l by June 30, 2006.

F i n a n c i a l a n d S t a f f i n g I n f o r m a t i o n
Actual Amended Projected Adopted Proposed
FY 2004 FY 2005 FY 2005 FY 2006 FY 2007
Authorized Positions 1.25 1.20 1.20 1.20 1.20
Hourly Employee Hours N/A 0 0 0 0
RevenuesOverhead Allocation Recovery N/A 67,355$ 67,355$ 76,430$ 79,487$ General Fund Subsidy 185,689 212,597 212,597 176,753 160,325 Total Revenue 185,689$ 279,952$ 279,952$ 253,183$ 239,812$
ExpendituresSalaries and Benefits 130,548$ 149,878$ 149,878$ 177,460$ 186,981$ Supplies and Services 55,141 130,074 130,074 75,723 52,831 Total Expenditures 185,689$ 279,952$ 279,952$ 253,183$ 239,812$
P r o g r a m P e r f o r m a n c e M e a s u r e s
Actual Projected Adopted FY 2004 FY 2005 FY 2006
Formal grievances under labor agreement 1 4 2
F-41

City of Santa Barbara Two-Year Financial Plan & Annual Budget
CITY ADMINISTRATORPROGRAMS Administration Employee Relations
City TV – Channel 18
RECENT PROGRAM ACHIEVEMENTS CITY TV was awarded two 2004 NATOA Programming Awards, receiving first place for “El Estero: Keeping Santa Barbara Clean and Healthy” and third place for “Inside Santa Barbara.”
P R O G R A M S & S E R V I C E S
F-42
City TV – Channel 18
( P r o g r a m N o . 1 3 1 3 ) M i s s i o n S t a t e m e n t Produce informational videos and audio-visual presentations to inform and educate the publ ic about City programs and services.
P r o g r a m A c t i v i t i e s Televise public meetings, including City Council, Planning Commission,
Historic Landmarks Commission, Architectural Board of Review, Transportation and Circulat ion Committee, Harbor Commission, Parks and Recreation Commission, Creeks Advisory Committee, and Airport Commission.
Produce monthly news magazine show, Inside Santa Barbara.
Produce monthly Spanish language show, Nuestra Ciudad.
Provide videotape dupl ication services of City meetings to members of the public and staff.
Maintain an electronic City Calendar to inform the publ ic of City program information, City job opportunit ies, and non-profit organizat ion events.
K e y O b j e c t i v e s f o r F i s c a l Y e a r 2 0 0 6 Complete 95% of tape dupl icat ion requests within 3 business days.
Complete 75% of department requests for video production services within the requested t ime period.
Achieve an average product ion cost of $82 per hour.
Maintain 98.6% television broadcast system uptime out of 24 hours, 7 days per week.
Design and bui ld a portable mult i-camera system for taping remote meetings.
Wire the Faulkner Gallery for video, audio and communications to televise events and meetings l ive from that locat ion.

F i n a n c i a l a n d S t a f f i n g I n f o r m a t i o n
Actual Amended Projected Adopted Proposed
FY 2004 FY 2005 FY 2005 FY 2006 FY 2007
Authorized Positions 2.00 3.00 3.00 3.00 3.00
Hourly Employee Hours N/A 3,500 2,100 1,900 1,900
RevenuesOverhead Allocation Recovery N/A 113,209$ 113,209$ 145,786$ 151,618$ Other Revenue 52,040 71,844 69,889 69,900 69,900 General Fund Subsidy 284,194 184,355 178,351 169,473 174,593 Total Revenue 336,234$ 369,408$ 361,449$ 385,159$ 396,111$
ExpendituresSalaries and Benefits 192,762$ 220,049$ 215,706$ 255,939$ 266,568$ Supplies and Services 101,564 105,222 101,606 94,220 94,543 Non-Capital Equipment 41,908 44,137 44,137 35,000 35,000 Total Expenditures 336,234$ 369,408$ 361,449$ 385,159$ 396,111$
P r o g r a m P e r f o r m a n c e M e a s u r e s
Actual Projected Adopted FY 2004 FY 2005 FY 2006
Percent of videotape duplication requests completed for public and staff within 3 business days 96% 96% 95%
Percent of department video production requests completed N/A N/A 75%
Average cost per production hour $133 $81 $82
Television broadcast system uptime N/A 100% 98.6%
Videotape/DVD duplications completed 339 318 300
Public meetings televised 196 208 180
First run televised meeting hours 713 694 600
Percent of total available airtime devoted to video programming 55% 54% 60%
City TV original productions 35 48 30
F-43

[This page intent ional ly le f t b lank. ]
F-44

D E P A R T M E N T S U M M A R Y
City Attorney
F-45
Provide correct, helpful, timely and cost-effective legal representation and advice to the City Council and City departments in matters of law pertaining to the functioning of the City.
A b o u t C i t y A t t o r n e y
The Ci ty At torney Department is responsible for representat ion and advice to the Ci ty Counci l , the Redevelopment Agency, Boards, Commissions and al l Ci ty of f icers and staf f in a l l matters of law perta in ing to the Ci ty.
F i s c a l Y e a r 2 0 0 6
B u d g e t H i g h l i g h t s
The City Attorney‘s Office will
provide legal support to the City
Council, City Administrator and
departments in pursuit of their
objectives, among other things:
• General Plan Update.
• Airport Aviation Facilities
Plan.
• Granada Garage Construc-
tion.
• Code Enforcement.
• Zoning Law Revisions.
• Defenses of Litigation Claims
and Prosecution of City
Claims.
• Planning Issues.
• Employment Law Issues.
These responsibi l i t ies include, but are not l imi ted to: at tending Ci ty Counci l , Planning Commission and other board and commission meet ings as needed; handl ing over 1,000 annual opinion requests and other assignments involving necessary legal work; and weekly agenda preparat ion and review of i tems that come before Ci ty Counci l and Planning Commission. In addi t ion, the off ice is responsible for a l l Ci ty code enforcement and l i t igat ion services. The of f ice is staf fed by s ix attorneys ( the Ci ty At torney and f ive assistants) and f ive c ler ical s taf f , which funct ion as a c lose team. Many assignments cross over into several departments (e.g. , Publ ic Works, Community Development, Risk Management, Parks and Recreat ion, Pol ice and Fire departments) . At torneys work cooperat ively on complex matters such as the negot iat ions for Airport property development, major land use, environmental and water law issues, and complex l i t igat ion.

[Th is page in ten t iona l l y l e f t b lank . ]
F-46

D E P A R T M E N T S U M M A R Y
City Attorney
F-47
D e p a r t m e n t F i n a n c i a l a n d S t a f f i n g S u m m a r y
Actual Amended Projected Adopted Proposed
FY 2004 FY 2005 FY 2005 FY 2006 FY 2007
Authorized Positions 11.50 12.00 12.00 12.00 12.00 Hourly Employee Hours N/A 832 2,680 832 832
RevenuesRDA Reimbursement 67,568$ 157,581$ 205,525$ 175,589$ 182,613$ Overhead Allocation Recovery N/A 322,636 322,636 296,445 308,304 Other Revenue 95,826 - 30,300 - - General Fund Subsidy 1,434,725 1,397,361 1,150,849 1,533,592 1,631,250 Total Department Revenue 1,598,119$ 1,877,578$ 1,709,310$ 2,005,626$ 2,122,167$
ExpendituresSalaries and Benefits 1,182,700$ 1,405,074$ 1,255,656$ 1,595,368$ 1,709,771$ Supplies and Services 415,419 472,504 453,654 405,258 412,396 Non-Capital Equipment - - - 5,000 - Total Department Expenditures 1,598,119$ 1,877,578$ 1,709,310$ 2,005,626$ 2,122,167$
D e p a r t m e n t F u n d C o m p o s i t i o n
Department Appropriations by Fund
General Fund100%
Department Revenues by Fund
General Fund Subsidy
76%
General Fund Departmental
Revenue24%

City of Santa Barbara Two-Year Financial Plan & Annual Budget
CITY ATTORNEY PROGRAM
City Attorney
RECENT PROGRAM ACHIEVEMENTS The City Attorney’s Office continued to provide cost effective, legal services concerning all City and Redevelopment issues.
P R O G R A M S & S E R V I C E S
F-48
City Attorney
( P r o g r a m N o . 1 2 1 1 ) M i s s i o n S t a t e m e n t Provide correct, helpful, t imely and cost-effect ive legal representat ion and advice to the City Counci l and all City off icers and staff in al l matters of law pertaining to the functioning of the City.
P r o g r a m A c t i v i t i e s Represent and advise the City Council, the Redevelopment Agency,
Boards, Commissions, and al l City off icers in al l matters of law pertaining to their off ices.
Attend all meetings of the City Council, and give advice or opinions oral ly or in wri t ing whenever requested to do so by the City Counci l or by any of the commissions, boards, or off icers of the City.
Represent and appear for the City in al l act ions or proceedings in which the City is concerned or is a party, and represent and appear for any City off icer or employee, in al l civi l act ions for any act arising out of his or her employment or by reasons of their off icial capacity.
Prosecute on behalf of the people all cr iminal cases arising from violat ion of the provisions of the City Charter or of City ordinances.
Approve the form of al l City contracts and bonds issued by the City.
Prepare proposed ordinances and City Counci l resolut ions and related amendments.
Perform such legal funct ions and duties pertaining to the execut ion of responsibi l i t ies mandated by the City Charter.
K e y O b j e c t i v e s f o r F i s c a l Y e a r 2 0 0 6 Resolve 80% of al l Code Enforcement referrals within 120 days of
receipt of referral.
Summarize al l new State and Federal laws and regulat ions, which may impact the City and provide the summary to al l Departments pr ior to March 31, 2006.
Prepare instruct ional memos on various aspects of the fol lowing State laws regarding municipalit ies: the Brown Act, the Public Records Act, the Pol it ical Reform Act, Government Code Section 1090 et seq., CEQA, and Prop. 218.
Provide staff seminars on the requirements of the fol lowing state laws regarding municipal it ies: the Brown Act, the Public Records Act, the Polit ical Reform Act, Government Code Section 1090 et seq., CEQA, and Prop. 218.

K e y O b j e c t i v e s f o r F i s c a l Y e a r 2 0 0 6 ( c o n t i n u e d )
Develop a standardized City contract format for the fol lowing contract situations: a) long-term leases (retai l and non-retai l s ituations), b) professional services contracts for State l icensed professionals, c) professional services contracts for non-l icensed professionals, d) ut i l i ty franchises, e) grant agreements, f) loan agreements, and g) affordabil i ty covenants.
Work with Community Development and Public Works Land Development Team to develop various sets of standardized City condit ions of approval for each of the dif ferent types of Tit le 28 Development Plan and other project approval situations.
Provide legal advice and code enforcement staff ing for the Neighborhood Improvement Task Force.
F i n a n c i a l a n d S t a f f i n g I n f o r m a t i o n
Actual Amended Projected Adopted Proposed
FY 2004 FY 2005 FY 2005 FY 2006 FY 2007
Authorized Positions 11.50 12.00 12.00 12.00 12.00
Hourly Employee Hours N/A 832 2,680 832 832
RevenuesRDA Reimbursement 67,568$ 157,581$ 205,525$ 175,589$ 182,613$ Overhead Allocation Recovery N/A 322,636 322,636 296,445 308,304 Other Revenue 95,826 - 30,300 - - General Fund Subsidy 1,434,725 1,397,361 1,150,849 1,533,592 1,631,250 Total Revenue 1,598,119$ 1,877,578$ 1,709,310$ 2,005,626$ 2,122,167$
ExpendituresSalaries and Benefits 1,182,700$ 1,405,074$ 1,255,656$ 1,595,368$ 1,709,771$ Supplies and Services 415,419 472,504 453,654 405,258 412,396 Non-Capital Equipment - - - 5,000 - Total Expenditures 1,598,119$ 1,877,578$ 1,709,310$ 2,005,626$ 2,122,167$
P r o g r a m P e r f o r m a n c e M e a s u r e s
Actual Projected Adopted FY 2004 FY 2005 FY 2006
Percent of code enforcement referrals resolved within 120 days of referral
N/A 80% 80%
F-49

[This page intent ional ly le f t b lank. ]
F-50

D E P A R T M E N T S U M M A R Y
Community Development
F-51
Assist the public in managing the development of the community in order to protect and preserve the quality of life, promote a sound economic base and appropriate design, and ensure safe construction, all in balance with the constraints of the City’s environment and resources.
A b o u t C o m m u n i t y D e v e l o p m e n t
F i s c a l Y e a r 2 0 0 6 B u d g e t
H i g h l i g h t s
The Community Development Department is responsible for managing the development of the community. To accompl ish th is miss ion, the Department is d iv ided into four funct ional d iv is ions: Administrat ion, Bui ld ing and Safety, Housing and Redevelopment, and Planning.
Housing Programs Staff continues to
encourage and assist the
development of affordable rental and
ownership housing. Each div is ion manages several programs consist ing of pol icy formulat ion, economic vi ta l i ty and redevelopment, inspect ions and enforcement, maintain ing publ ic heal th, safety and wel fare, records management services, housing programs, home rehabi l i tat ion loans, a l locat ion of Community Development Block Grant dol lars, review of development p lans, support to the Planning Commission, Archi tectural Board of Review, Histor ic Landmarks Commission, and Sign Commit tee, and long range planning with the community.
Redevelopment Agency Staff will be
working on implementing the recently
approved RDA Capital Program with
over $67 million worth of projects.
The Planning Division will begin the
City’s General Plan Update Public
Participation phase. Staff will soon be
implementing the Staff Hearing
Officer position to streamline the
development review process and
updating the Single Family Design
Guidelines through the Neighborhood
Preservation Ordinance.
Continued participation in the
Neighborhood Improvement Task
Force will be a highlight for Building
and Safety Staff as well as our Zoning
and Enforcement Program.

D E P A R T M E N T S U M M A R Y
Community Development
F-52
D e p a r t m e n t F i n a n c i a l a n d S t a f f i n g S u m m a r y
Actual Amended Projected Adopted Proposed
FY 2004 FY 2005 FY 2005 FY 2006 FY 2007
Authorized Positions 83.80 84.80 84.80 87.80 87.80 Hourly Employee Hours N/A 4,000 7,288 2,000 2,000
RevenuesFees and Service Charges 3,637,689$ 4,333,005$ 3,924,608$ 4,662,641$ 4,926,709$ Intergovernmental 2,002,392 4,204,428 2,942,193 2,717,967 2,717,967 Property Taxes 12,945,066 13,750,000 13,750,000 14,400,000 14,975,000 Rents 24,000 24,000 42,000 48,000 48,000 Special Assessments 129,558 - - - - Interest Income 692,019 725,000 565,000 610,000 610,000 Market Valuation (140,763) - - - - Interfund Reimbursements 918,291 1,004,488 1,006,103 1,148,173 1,193,073 Other Revenue 130,411 119,891 60,938 19,740 20,740 Overhead Allocation Recovery - 13,318 13,318 21,795 22,667 General Fund Subsidy 2,922,401 3,303,027 3,405,339 4,181,108 4,212,869 Total Department Revenue 23,261,064$ 27,477,157$ 25,709,499$ 27,809,424$ 28,727,025$
ExpendituresSalaries and Benefits 6,415,224$ 7,163,742$ 6,818,653$ 8,010,370$ 8,389,403$ Supplies and Services 2,758,608 3,528,099 3,359,765 4,047,353 4,160,276 Special Projects 1,206,481 6,278,587 5,666,339 1,856,832 528,500 Transfers Out - 54,770 54,770 52,300 52,300 Debt Service 8,259,926 8,300,000 8,300,000 8,250,000 8,250,000 Housing Activity 4,511,808 13,065,312 4,799,085 2,050,963 2,022,810 Human Services Grants 618,570 681,110 681,110 678,895 678,895 Non-Capital Equipment 65,889 54,816 38,127 57,122 51,559 Capital Equipment 7,168 - - 15,000 13,000 Miscellaneous 44,265 11,500 11,500 11,500 11,500 Appropriated Reserve - 134,217 50,000 124,818 124,818 Total Department Expenditures 23,887,939$ 39,272,153$ 29,779,349$ 25,155,153$ 24,283,061$ Capital Program 122,984 69,412,262 N/A - -
Total Department Expenditures 24,010,923$ 108,684,415$ 29,779,349$ 25,155,153$ 24,283,061$
Addition to (Use of) Reserves (749,859)$ (81,207,258)$ (4,069,850)$ 2,654,271$ 4,443,964$

D E P A R T M E N T S U M M A R Y
Community Development
F-53
D e p a r t m e n t F u n d C o m p o s i t i o n
Department Revenues by Fund Department Appropriations by Fund
General Fund40%
Redevelopment Agency
46%
RDA Housing3%
HOME 3%
CDBG8%Misc. Grants
0%
RDA Housing12%
Redevelopment Agency
42%
General Fund Subsidy
15%
HOME 3%Misc. Grants
0%
General Fund Departmental
Revenue21%
CDBG7%
Program Organizational Chart
Administration
Planning Economic Development
Housing and Redevelopment
Building and Safety
Long Range Planning and
Special Studies
Development and Environmental
Review
Economic Development
CDBG Administration
and Human Services
Redevelopment Agency
Housing Development and
Preservation Program
CDBG – Rental Housing
Mediation
Building Inspection and
Code Enforcement
Records, Archives and
Clerical Services
Zoning: Ordinance,
Information and Enforcement
CDBG – Housing Rehabilitation Loan Program
Building Counter and Plan Review
Design Review and Historic Preservation

City of Santa Barbara Two-Year Financial Plan & Annual Budget
COMMUNITY DEVELOPMENT PROGRAMS
Administration
Economic Development CDBG Administration and
Human Services CDBG - Rental Housing
Mediation Task Force CDBG - Housing Rehabilitation
Loan Program Redevelopment Agency Housing Development and
Preservation Program Long Range Planning and
Special Studies Development / Environmental
Review Zoning: Ordinance, Information,
and Enforcement Design Review and Historic
Preservation Building Inspection and Code
Enforcement Records, Archives, and Clerical
Services Building Counter and Plan
Review
RECENT PROGRAM ACHIEVEMENTS Completed refined Time Tracking Study for Planning and Land Development Team fees and revenues.
P R O G R A M S & S E R V I C E S
F-54
Administration
( P r o g r a m N o . 2 1 1 1 ) M i s s i o n S t a t e m e n t Provide leadership, policy direct ion, and support to the Community Development divisions in order to assist them in achieving their goals and object ives.
P r o g r a m A c t i v i t i e s Manage, administer, and support the Bui lding and Safety, Housing &
Redevelopment, and Planning divisions of the Community Development Department.
Coordinate and implement programs to enhance community economic vital i ty.
Assist City Administrat ion with pol icy formulat ion and implementation of City Council direction.
Provide i l lustrat ion, computerized graphic support, and training to the divisions of the Community Development Department and other City departments upon request.
Implement technological advancement for the Department ( i .e., mapping, interact ive web appl ications, project tracking, etc.).
K e y O b j e c t i v e s f o r F i s c a l Y e a r 2 0 0 6 Ensure divisions meet 75% of their program object ives.
Ensure al l division budgets are within budget and that proper accounting procedures are fol lowed.
Prepare mid-year budget review for Fiscal Year 2006, and develop (revise/ref ine) Fiscal Year 2007 budget, including all auxil iary items such as new fee schedules, revenue project ions, l ine items, etc.
Prepare a report to City Counci l on options for providing Green Bui lding Incentives and implement Council ’s recommendations by the end of September 2005.

F i n a n c i a l a n d S t a f f i n g I n f o r m a t i o n
Actual Amended Projected Adopted Proposed
FY 2004 FY 2005 FY 2005 FY 2006 FY 2007
Authorized Positions 3.40 3.40 3.40 3.40 3.40
Hourly Employee Hours N/A 0 0 0 0
RevenuesOverhead Allocation Recovery N/A 13,318$ 13,318$ 21,795$ 22,667$ General Fund Subsidy 419,092 401,551 386,454 498,340 436,357 Total Revenue 419,092$ 414,869$ 399,772$ 520,135$ 459,024$
ExpendituresSalaries and Benefits 296,743$ 319,586$ 305,246$ 343,495$ 359,431$ Supplies and Services 117,863 91,833 91,076 142,646 95,116 Special Projects - - - 28,332 - Non-Capital Equipment 4,486 3,450 3,450 5,662 4,477 Total Expenditures 419,092$ 414,869$ 399,772$ 520,135$ 459,024$
P r o g r a m P e r f o r m a n c e M e a s u r e s
Actual Projected Adopted FY 2004 FY 2005 FY 2006
Percent of division program objectives achieved 56% 76% 75%
Percent of divisions within budget (four divisions reporting) 75% 100% 100%
F-55

City of Santa Barbara Two-Year Financial Plan & Annual Budget
COMMUNITY DEVELOPMENT PROGRAMS
Administration
Economic Development CDBG Administration and
Human Services CDBG - Rental Housing
Mediation Task Force CDBG - Housing Rehabilitation
Loan Program Redevelopment Agency Housing Development and
Preservation Program Long Range Planning and
Special Studies Development / Environmental
Review Zoning: Ordinance, Information,
and Enforcement Design Review and Historic
Preservation Building Inspection and Code
Enforcement Records, Archives, and Clerical
Services Building Counter and Plan
Review
RECENT PROGRAM ACHIEVEMENTS The economic breakfast meeting with the Lodging industry has led to greater participation by that industry in the City budget dialogue regarding uses of the Transient Occupancy Tax.
P R O G R A M S & S E R V I C E S
F-56
Economic Development
( P r o g r a m N o . 2 1 1 2 ) M i s s i o n S t a t e m e n t Coordinate implementat ion of the City’s Economic Development Plan and the City’s response to economic development efforts in the community.
P r o g r a m A c t i v i t i e s Coordinate economic development planning and analysis with other
City departments.
Work with the Santa Barbara Region Economic Community Project, Chamber of Commerce, Downtown Organizat ion, merchant groups, Metropol itan Transit Distr ict, and the County of Santa Barbara Economic Development Advisory Committee to implement projects and programs.
Communicate and part icipate with stakeholders (Mayor, Counci lmembers, staff , businesses, and individuals) to bui ld consensus in the City’s role in external economic development act ivit ies.
Cont inue to evaluate the permitt ing and development process for eff iciencies and effect iveness.
K e y O b j e c t i v e s f o r F i s c a l Y e a r 2 0 0 6 Hold quarterly economic development meetings with Mayor and City
Counci l representat ives and members of the business community to ensure retention and foster expansion.

F i n a n c i a l a n d S t a f f i n g I n f o r m a t i o n
Actual Amended Projected Adopted Proposed
FY 2004 FY 2005 FY 2005 FY 2006 FY 2007
Authorized Positions 0.50 0.50 0.50 0.50 0.50
Hourly Employee Hours N/A 0 0 0 0
RevenuesGeneral Fund Subsidy 83,669$ 70,060$ 70,755$ 79,137$ 82,908$ Total Revenue 83,669$ 70,060$ 70,755$ 79,137$ 82,908$
ExpendituresSalaries and Benefits 61,513$ 62,343$ 63,053$ 71,280$ 75,038$ Supplies and Services 1,156 1,717 1,702 1,857 1,870 Special Projects 21,000 6,000 6,000 6,000 6,000 Total Expenditures 83,669$ 70,060$ 70,755$ 79,137$ 82,908$
P r o g r a m P e r f o r m a n c e M e a s u r e s
Actual Projected Adopted FY 2004 FY 2005 FY 2006
Economic development meetings with the business community 4 4 4
F-57

City of Santa Barbara Two-Year Financial Plan & Annual Budget
COMMUNITY DEVELOPMENT PROGRAMS
Administration Economic Development
CDBG Administration and Human Services
CDBG - Rental Housing Mediation Task Force
CDBG - Housing Rehabilitation Loan Program
Redevelopment Agency Housing Development and
Preservation Program Long Range Planning and
Special Studies Development / Environmental
Review Zoning: Ordinance, Information,
and Enforcement Design Review and Historic
Preservation Building Inspection and Code
Enforcement Records, Archives, and Clerical
Services Building Counter and Plan
Review
RECENT PROGRAM ACHIEVEMENTS The Department of Housing and Urban Development’s review of our Consolidated Annual Performance and Evaluation Report (CAPER) included no findings. This is the best evaluation given.
P R O G R A M S & S E R V I C E S
F-58
CDBG Administration and
Human Services
( P r o g r a m N o s . 2 1 2 1 , 2 1 2 4 ) M i s s i o n S t a t e m e n t Ensure that the Federal Community Development Block Grant (CDBG) and City General Fund Human Services programs meet the basic human needs of low-income individuals through non-prof it human service agencies and the departments.
P r o g r a m A c t i v i t i e s Coordinate City Human Services funding process and contracts.
Administer the Federal Community Development Block Grant (CDBG) Program and various State, County, and local grant programs.
Work with cit izens, community groups, and City Council to establ ish sound pol ic ies for al locating Human Service funds among various social services agencies serving the community, as well as al locating CDBG funds, meeting Federal requirements that benefit programs/projects for low and moderate-income persons.
Provide Fair Housing Enforcement that includes investigation of reported cases of housing discr iminat ion.
K e y O b j e c t i v e s f o r F i s c a l Y e a r 2 0 0 6 Expend 95% of Human Services funds within the program year funds
were committed.
Ensure that 90% of agencies successful ly complete funded goals annual ly, by providing technical support and project monitoring to these agencies on an ongoing basis.
Ensure that less than 2% of al l appl icants appeal the Community Development/Human Services Committee (CDHSC) recommendations to the City Counci l by providing staff support to the CDHSC and applicants in the annual process of recommending funding commitments.
Develop, with publ ic input, the Consol idated Annual Performance Evaluation Report (CAPER) and the Consolidated Annual Performance Plan and submit to HUD by September 30, 2005 and May 15, 2006, respect ively.
Comply with al l federal CDBG regulat ions and deadlines including submittal, documentat ion, and record keeping regarding administrat ion of CDBG funds.

K e y O b j e c t i v e s f o r F i s c a l Y e a r 2 0 0 6 ( c o n t i n u e d )
Work with the County of Santa Barbara to develop a 10-Year Plan to end chronic homelessness.
Provide support to the City’s effort to oppose Federal proposals to major changes and cuts to the CDBG Program.
F i n a n c i a l a n d S t a f f i n g I n f o r m a t i o n
Actual Amended Projected Adopted Proposed
FY 2004 FY 2005 FY 2005 FY 2006 FY 2007
Authorized Positions 1.62 1.62 1.62 1.62 1.62
Hourly Employee Hours N/A 0 0 0 0
RevenuesGeneral Fund Subsidy 650,617$ 716,729$ 714,681$ 717,180$ 718,384$ Total Revenue 650,617$ 716,729$ 714,681$ 717,180$ 718,384$
ExpendituresSalaries and Benefits 150,835$ 164,333$ 163,276$ 178,966$ 186,985$ Supplies and Services 54,545 78,486 73,642 64,127 65,414 Transfers Out - 1,818 1,818 - - Human Services 618,570 681,110 681,110 678,895 678,895 Housing Activity 346,372 750,914 354,764 - - Non-Capital Equipment - 1,000 1,332 2,568 1,000 Appropriated Reserve - 8,182 - 11,818 11,818 Total Expenditures 1,170,322$ 1,685,843$ 1,275,942$ 936,374$ 944,112$
P r o g r a m P e r f o r m a n c e M e a s u r e s
Actual Projected Adopted FY 2004 FY 2005 FY 2006
Percent of Human Services funds expended within the program year 100% 95% 95%
Percent of agencies successfully completing funded goals 87% 90% 90%
Percent of applicants appealing funding decisions < 2% < 2% < 2%
CDBG/Human Services grant applications received 56 69 65
CDBG/Human Services grant recipients awarded 45 54 47
Homeless persons served by funded agencies for services such as shelter, food, case management, supportive, and others N/A N/A 3,000
Seniors served by funded agencies for services including day care, counseling, in-home support, and others N/A N/A 3,500
Children and youth served by funded agencies for services including child care, counseling, advocacy, gang prevention, after-school care, and others
N/A N/A 5,000
F-59

City of Santa Barbara Two-Year Financial Plan & Annual Budget
COMMUNITY DEVELOPMENT PROGRAMS
Administration Economic Development CDBG Administration and
Human Services CDBG - Rental Housing Mediation
Task Force CDBG - Housing Rehabilitation
Loan Program Redevelopment Agency Housing Development and
Preservation Program Long Range Planning and
Special Studies Development / Environmental
Review Zoning: Ordinance, Information,
and Enforcement Design Review and Historic
Preservation Building Inspection and Code
Enforcement Records, Archives, and Clerical
Services Building Counter and Plan
Review
RECENT PROGRAM ACHIEVEMENTS 87% of rental housing dispute cases receiving mediation services were successfully resolved last year.
P R O G R A M S & S E R V I C E S
F-60
CDBG - Rental Housing Mediation Task Force
( P r o g r a m N o . 2 1 2 2 ) M i s s i o n S t a t e m e n t Provide mediat ion services and information on landlord and tenant r ights and responsibi l i t ies to help resolve rental-housing disputes.
P r o g r a m A c t i v i t i e s Resolve rental-housing disputes through the provision of basic housing
law information and mediation services.
Educate tenants and landlords about their r ights and responsibi l i t ies.
K e y O b j e c t i v e s f o r F i s c a l Y e a r 2 0 0 6 Successfully mediate 85% of al l disputes complet ing mediat ion.
Provide 10 outreach and educat ion presentations to tenants, landlords, and community groups on rental housing r ights and responsibil i t ies.
Provide 2,700 residents with information and mediat ion services.
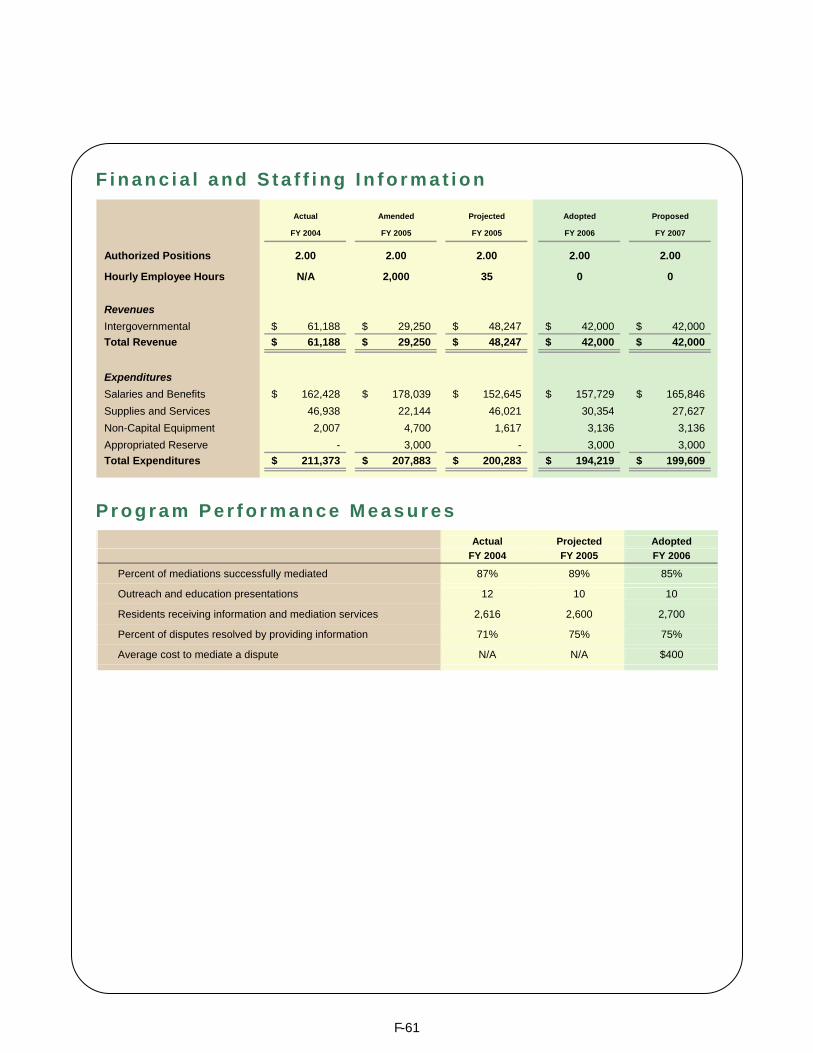
F i n a n c i a l a n d S t a f f i n g I n f o r m a t i o n
Actual Amended Projected Adopted Proposed
FY 2004 FY 2005 FY 2005 FY 2006 FY 2007
Authorized Positions 2.00 2.00 2.00 2.00 2.00
Hourly Employee Hours N/A 2,000 35 0 0
RevenuesIntergovernmental 61,188$ 29,250$ 48,247$ 42,000$ 42,000$ Total Revenue 61,188$ 29,250$ 48,247$ 42,000$ 42,000$
ExpendituresSalaries and Benefits 162,428$ 178,039$ 152,645$ 157,729$ 165,846$ Supplies and Services 46,938 22,144 46,021 30,354 27,627 Non-Capital Equipment 2,007 4,700 1,617 3,136 3,136 Appropriated Reserve - 3,000 - 3,000 3,000 Total Expenditures 211,373$ 207,883$ 200,283$ 194,219$ 199,609$
P r o g r a m P e r f o r m a n c e M e a s u r e s
Actual Projected Adopted FY 2004 FY 2005 FY 2006
Percent of mediations successfully mediated 87% 89% 85%
Outreach and education presentations 12 10 10
Residents receiving information and mediation services 2,616 2,600 2,700
Percent of disputes resolved by providing information 71% 75% 75%
Average cost to mediate a dispute N/A N/A $400
F-61

City of Santa Barbara Two-Year Financial Plan & Annual Budget
COMMUNITY DEVELOPMENT PROGRAMS
Administration Economic Development CDBG Administration and
Human Services CDBG - Rental Housing
Mediation Task Force CDBG - Housing Rehabilitation
Loan Program Redevelopment Agency Housing Development and
Preservation Program Long Range Planning and
Special Studies Development / Environmental
Review Zoning: Ordinance, Information,
and Enforcement Design Review and Historic
Preservation Building Inspection and Code
Enforcement Records, Archives, and Clerical
Services Building Counter and Plan
Review
RECENT PROGRAM ACHIEVEMENTS Rehabilitated the 31-unit Hotel de Riviera, a residence for low-income, mentally disabled veterans.
P R O G R A M S & S E R V I C E S
F-62
CDBG – Housing
Rehabil itation Loan Program
( P r o g r a m N o . 2 1 2 3 ) M i s s i o n S t a t e m e n t Finance and faci l i tate the improvement of housing for low-income homeowners and renters in order to provide safe, desirable and stable l iv ing condit ions, and enhance neighborhoods.
P r o g r a m A c t i v i t i e s Provide loans to improve neighborhoods and assist low-income
residents.
Administer rehabil i tat ion loan funds and portfol io.
Establ ish and maintain prudent lending and contract ing pract ices to encourage rehabil i tat ion projects.
Assist cl ients in the rehabil i tat ion process.
K e y O b j e c t i v e s f o r F i s c a l Y e a r 2 0 0 6 Loan and grant at least 95% of avai lable funds, including new
Community Development Block Grant (CDBG) loan funds and loan repayments received.
Correct deficiencies and el iminate lead-based paint hazards in 7 single-family homes owned by low-income households.
Correct deficiencies and el iminate lead-based paint hazards in 20 apartment units occupied by low-income households.
Complete construct ion on single-family rehabi l i tat ions within an average of 52 weeks of appl icat ion approval.

F i n a n c i a l a n d S t a f f i n g I n f o r m a t i o n
Actual Amended Projected Adopted Proposed
FY 2004 FY 2005 FY 2005 FY 2006 FY 2007
Authorized Positions 1.95 2.00 2.00 2.00 2.00
Hourly Employee Hours N/A 0 91 0 0
RevenuesIntergovernmental 1,234,772$ 3,232,736$ 2,069,000$ 1,893,765$ 1,893,765$ Total Revenue 1,234,772$ 3,232,736$ 2,069,000$ 1,893,765$ 1,893,765$
ExpendituresSalaries and Benefits 146,815$ 179,083$ 147,906$ 170,774$ 177,326$ Supplies and Services 61,166 79,211 67,713 70,800 77,708 Housing Loans and Grants 353,269 1,774,930 1,869,700 1,266,778 1,241,394 Non-Capital Equipment 28,362 4,000 4,000 4,000 4,000 Appropriated Reserve - 23,035 - 10,000 10,000 Total Expenditures 589,612$ 2,060,259$ 2,089,319$ 1,522,352$ 1,510,428$
P r o g r a m P e r f o r m a n c e M e a s u r e s
Actual Projected Adopted FY 2004 FY 2005 FY 2006
Percent of available CDBG loan funds and repayment funds loaned and granted 80% 98% 95%+
Single-family homes rehabilitated 7 7 7
Apartment units rehabilitated 25 25 20
Average number of weeks from application to completion of construction on single-family rehabilitations (excluding plans preparation)
47 46 ≤ 52
F-63

City of Santa Barbara Two-Year Financial Plan & Annual Budget
COMMUNITY DEVELOPMENT PROGRAMS
Administration Economic Development CDBG Administration and
Human Services CDBG - Rental Housing
Mediation Task Force CDBG - Housing Rehabilitation
Loan Program Redevelopment Agency
Housing Development and Preservation Program
Long Range Planning and Special Studies
Development / Environmental Review
Zoning: Ordinance, Information, and Enforcement
Design Review and Historic Preservation
Building Inspection and Code Enforcement
Records, Archives, and Clerical Services
Building Counter and Plan Review
RECENT PROGRAM ACHIEVEMENTS The Carrillo Sidewalk Improvement Project is complete. Based on the approved contract amount, the project came in 11.53% under the originally approved construction contract budget.
P R O G R A M S & S E R V I C E S
F-64
Redevelopment Agency
( P r o g r a m N o s . 2 1 2 5 , 2 1 2 6 , 2 6 1 1 , 2 7 1 1 ) M i s s i o n S t a t e m e n t Revital ize the Redevelopment Project Area by el iminat ing the physical and economic condit ions of bl ight through publ ic and private partnerships in an effort to create an economical ly vibrant and environmental ly balanced Project Area for al l residents.
P r o g r a m A c t i v i t i e s The Redevelopment Agency is governed by City Counci lmembers
sit t ing as the Redevelopment Agency Board, a separate dist inct legal enti ty.
The Redevelopment Agency receives incremental property tax revenues generated by the Agency’s revital izat ion projects and f inances redevelopment act ivity by issuing bonds that are repaid solely by these tax increment revenues.
By implementing the Central City Redevelopment Plan, the Redevelopment Agency str ives to maintain the Downtown as the principal center of commerce for Santa Barbara’s South Coast region and to enhance the Downtown as the cultural and entertainment center for the County’s South Coast Region.
By implementing these goals, the Redevelopment Agency st imulates new job opportunit ies, as well as new cultural, retai l , recreational, and housing act ivit ies in the city.
K e y O b j e c t i v e s f o r F i s c a l Y e a r 2 0 0 6 Complete 75% of Agency-budgeted Capital Improvement Projects
without exceeding the or iginal budget by more than 10%.
Ensure that 100% of Redevelopment Agency grant funds are spent on redevelopment el igible act ivit ies and in compliance with grant agreements.
Extend the Redevelopment Agency’s Sunset Date to 2015 by June 1, 2006, based on State legislat ion passed as part of the State budget approval.
Set aside at least 20% of Agency funds for Affordable Housing through the Housing Development and Preservat ion Program in compliance with State-mandated set-aside requirements.
Update the Agency’s Long Range Capital Improvement Program by March 1, 2006.
Submit the State Control ler ’s Annual Report by December 31, 2005, and comply with al l appl icable State rules, regulat ions, and report ing requirements.

F i n a n c i a l a n d S t a f f i n g I n f o r m a t i o n
Actual Amended Projected Adopted Proposed
FY 2004 FY 2005 FY 2005 FY 2006 FY 2007
Authorized Positions 9.97 10.77 10.77 10.77 10.77
Hourly Employee Hours N/A 0 0 0 0
RevenuesSpecial Assessments 129,558$ -$ -$ -$ -$ Market Valuation (140,763) - - - - Interest Income 692,019 725,000 565,000 610,000 610,000 Property Taxes 12,945,066 13,750,000 13,750,000 14,400,000 14,975,000 Interfund Reimbursements 918,291 1,004,488 1,006,103 1,148,173 1,193,073 Rents 24,000 24,000 42,000 48,000 48,000 Other Revenue 1,510 - 200 - - General Fund Subsidy 15,585 - - - - Total Revenue 14,585,266$ 15,503,488$ 15,363,303$ 16,206,173$ 16,826,073$
ExpendituresSalaries and Benefits 932,018$ 1,004,488$ 1,005,410$ 1,148,173$ 1,193,073$ Supplies and Services 1,629,579 2,028,566 1,904,953 2,205,429 2,285,436 Special Projects 1,180,713 5,665,179 5,652,339 1,812,500 512,500 Transfers Out - 2,952 2,952 2,300 2,300 Debt Service 8,259,926 8,300,000 8,300,000 8,250,000 8,250,000 Housing Activity 3,113,554 10,179,972 2,215,125 - - Non-Capital Equipment 20,146 30,557 19,241 22,000 27,300 Capital Equipment 7,168 - - - - Miscellaneous 44,265 11,500 11,500 11,500 11,500 Appropriated Reserve - 100,000 50,000 100,000 100,000 Total Operating Expenditures 15,187,369$ 27,323,214$ 19,161,520$ 13,551,902$ 12,382,109$ Capital Program 122,984 69,412,262 N/A - - Total Expenditures 15,310,353$ 96,735,476$ 19,161,520$ 13,551,902$ 12,382,109$
Addition to (Use of ) Reserves (725,087)$ (81,231,988)$ (3,798,217)$ 2,654,271$ 4,443,964$
P r o g r a m P e r f o r m a n c e M e a s u r e s
Actual Projected Adopted FY 2004 FY 2005 FY 2006
Percent of Agency-budgeted Capital Improvement Projects completed without exceeding original budget by more than 10% N/A N/A 75%
Percent of grant funds spent on redevelopment eligible activities and in compliance with grant agreement N/A N/A 100%
F-65

City of Santa Barbara Two-Year Financial Plan & Annual Budget
COMMUNITY DEVELOPMENT PROGRAMS
Administration Economic Development CDBG Administration and
Human Services CDBG - Rental Housing
Mediation Task Force CDBG - Housing Rehabilitation
Loan Program Redevelopment Agency
Housing Development and Preservation Program
Long Range Planning and Special Studies
Development / Environmental Review
Zoning: Ordinance, Information, and Enforcement
Design Review and Historic Preservation
Building Inspection and Code Enforcement
Records, Archives, and Clerical Services
Building Counter and Plan Review
RECENT PROGRAM ACHIEVEMENTS Ground was broken on the 75 unit low-income family rental project at the St. Vincent’s site, for which the City’s Redevelopment Agency provided a loan of $8.7 million.
P R O G R A M S & S E R V I C E S
F-66
Housing Development and
Preservation Program
( P r o g r a m N o . 2 1 2 7 ) M i s s i o n S t a t e m e n t Promote and facil i tate the development and preservation of housing pr imari ly for low- and moderate- income households to foster an inclusive and balanced community.
P r o g r a m A c t i v i t i e s Administer Redevelopment Agency funds and other housing funds to
facil i tate development of affordable housing.
Establ ish and maintain prudent lending and management practices for development and operation of affordable housing stock.
Maintain inventory of affordable projects and manage loan portfol io.
Coordinate with local housing providers to develop affordable housing projects.
Administer federal HOME Program funds to faci l i tate development of affordable housing and assure compliance with federal occupancy and rent requirements.
Coordinate with local Community Housing Development Organizat ions (CHDOs) to develop affordable housing.
K e y O b j e c t i v e s f o r F i s c a l Y e a r 2 0 0 6 Provide approximately $3 mil l ion in Redevelopment Agency, State, and
Federal funds for affordable housing projects in accordance with State and Federal regulat ions.
Assist in the development and preservation of 40 affordable units using density bonus, below-market rate f inancing, and other development incent ives.
Commit 100% of Federal HOME funding to el igible affordable housing projects within 2 years of receipt.
Cert ify compliance of at least 95% of 307 owner-occupied units to assure that 100% of those units are in compliance with the City’s affordabil i ty and occupancy requirements.
Cert ify compliance of at least 95% of 1,165 rental units to assure that 100% of those units are in compliance with City requirements.
Assure compliance with City requirements for 100% of ini t ial sales, resales, and ref inancings of affordable ownership units.

K e y O b j e c t i v e s f o r F i s c a l Y e a r 2 0 0 6 ( c o n t i n u e d )
Process funding request and secure bond and other f inancing for the Santa Barbara Mental Health Association affordable housing project at 617 Garden Street.
F i n a n c i a l a n d S t a f f i n g I n f o r m a t i o n
Actual Amended Projected Adopted Proposed
FY 2004 FY 2005 FY 2005 FY 2006 FY 2007
Authorized Positions 1.10 0.85 0.85 0.85 0.85
Hourly Employee Hours N/A 0 0 0 0
RevenuesIntergovernmental 706,432$ 942,442$ 824,946$ 782,202$ 782,202$ Fees and Service Charges 76,849 87,054 87,054 85,800 85,800 Total Revenue 783,281$ 1,029,496$ 912,000$ 868,002$ 868,002$
ExpendituresSalaries and Benefits 84,668$ 87,054$ 90,521$ 83,817$ 86,586$ Housing Activity 698,613 359,496 359,496 784,185 781,416 Special Projects - 582,946 - - - Total Expenditures 783,281$ 1,029,496$ 450,017$ 868,002$ 868,002$
P r o g r a m P e r f o r m a n c e M e a s u r e s
Actual Projected Adopted FY 2004 FY 2005 FY 2006
City and Redevelopment Agency funding committed $7,400,000 $3,500,000 $3,000,000
Affordable housing units for which financing is committed or density bonus approved 101 50 40
Percent of HOME funds committed within 2 years of receipt 100% 100% 100%
Percent of affordable rental units certified for compliance 98% 98% 95%
Percent of affordable ownership units certified for compliance 98% 98% 95%
Percent of affordable ownership units that are sold or refinanced for which the City has assured compliance N/A N/A 100%
Initial sales of new affordable units which Housing Programs staff certified for conformance with housing policies N/A N/A 12
Resales of existing affordable units which Housing Programs staff certified for conformance with housing policies N/A N/A 9
Refinancings of existing affordable units which Housing Programs staff certified for conformance with housing policies N/A N/A 3
F-67

City of Santa Barbara Two-Year Financial Plan & Annual Budget
COMMUNITY DEVELOPMENT PROGRAMS
Administration Economic Development CDBG Administration and
Human Services CDBG - Rental Housing
Mediation Task Force CDBG - Housing Rehabilitation
Loan Program Redevelopment Agency Housing Development and
Preservation Program Long Range Planning and Special
Studies Development / Environmental
Review Zoning: Ordinance, Information,
and Enforcement Design Review and Historic
Preservation Building Inspection and Code
Enforcement Records, Archives, and Clerical
Services Building Counter and Plan
Review
RECENT PROGRAM ACHIEVEMENTS Received State Certification of the Housing Element Update in September 2004; The Local Coast Plan Amendment was adopted and certified for the Interior Waterfront in February 2005.
P R O G R A M S & S E R V I C E S
F-68
Long Range Planning and
Special Studies
( P r o g r a m N o . 2 1 3 1 ) M i s s i o n S t a t e m e n t Develop publ ic pol icies that ref lect the community’s vision, in order to manage the City’s physical growth within exist ing resources and to protect Santa Barbara’s unique qual ity of l i fe for the entire community.
P r o g r a m A c t i v i t i e s Develop and implement goals, pol icies, and action plans related to
community issues such as affordable housing, land use, growth management, resource conservation, open space, transportat ion, and circulation.
Prepare studies to update City policies, part icular ly the General Plan, in response to State law, resource avai labi l i ty, and community goals.
Monitor the amount and type of development to ensure compliance with City Charter goals and growth restr ict ions, as specif ied under Section 1508, and to inform the publ ic and decision-makers about development patterns and trends.
Facil i tate publ ic part icipation and community involvement in planning issues.
Part ic ipate in the development and review of regional studies prepared by the Santa Barbara County Associat ion of Governments such as the Regional Growth Forecast, the Regional Housing Needs Assessment, and the Highway 101 Implementat ion Plan.
Support City Counci l and City Administrat ion in addressing regional governance and planning issues.
K e y O b j e c t i v e s f o r F i s c a l Y e a r 2 0 0 6 Establ ish and complete General Plan Phase II publ ic part icipat ion
object ives, i .e., define steering committee, conduct surveys, interviews, prepare newsletters, workshops, etc. by June 30, 2006.
Select General Plan Environmental Impact Report (EIR) consultant and issue Notice of Preparation by June 30, 2006.
Define Housing Element implementation approach to commercial and mult i- family development standards update, including relat ionship to General Plan growth scenarios by June 30, 2006.
Present Jobs Housing Linkage Study to Council by June 30, 2006.
Present Tenant Protection Ordinance to Council by June 30, 2006.

K e y O b j e c t i v e s f o r F i s c a l Y e a r 2 0 0 6 ( c o n t i n u e d )
Present the Reasonable Accommodation Ordinance or functional equivalent to Counci l by June 30, 2006.
Part ic ipate in Highway 101 in Motion Plan through the Technical Advisory Group and formal publ ic meetings and workshops.
Present bi-annual Measure E updates to the Planning Commission.
Prepare bi-annual update data regarding the Congestion Management Plan for the Santa Barbara County Association of Governments.
Provide an annual Housing Act ivity report to the State Department of Finance.
F i n a n c i a l a n d S t a f f i n g I n f o r m a t i o n
Actual Amended Projected Adopted Proposed
FY 2004 FY 2005 FY 2005 FY 2006 FY 2007
Authorized Positions 6.74 6.49 6.49 7.64 7.64
Hourly Employee Hours N/A 0 1,119 0 0
RevenuesFees and Services Charges -$ 147,000$ 61,000$ 100,000$ 100,000$ General Fund Subsidy 599,406 572,258 630,072 1,292,964 1,389,297 Total Revenue 599,406$ 719,258$ 691,072$ 1,392,964$ 1,489,297$
ExpendituresSalaries and Benefits 518,771$ 588,606$ 566,317$ 785,818$ 822,569$ Supplies and Services 80,635 128,652 123,755 602,776 665,228 Non-Capital Equipment - 2,000 1,000 4,370 1,500 Total Expenditures 599,406$ 719,258$ 691,072$ 1,392,964$ 1,489,297$
F-69

City of Santa Barbara Two-Year Financial Plan and Annual Budget
COMMUNITY DEVELOPMENT PROGRAMS
Administration Economic Development CDBG Administration and
Human Services CDBG - Rental Housing
Mediation Task Force CDBG - Housing Rehabilitation
Loan Program Redevelopment Agency Housing Development and
Preservation Program Long Range Planning and
Special Studies Development / Environmental
Review Zoning: Ordinance, Information,
and Enforcement Design Review and Historic
Preservation Building Inspection and Code
Enforcement Records, Archives, and Clerical
Services Building Counter and Plan
Review
RECENT PROGRAM ACHIEVEMENTS Approved 51 affordable units as part of the Santa Barbara Mental Health Association project and approved a 61 unit Single Room Occupancy project for the City Housing Authority.
P R O G R A M S & S E R V I C E S
F-70
Development/Environmental
Review ( P r o g r a m N o . 2 1 3 2 )
M i s s i o n S t a t e m e n t Manage the development and environmental review process, including stakeholder involvement, in order to protect and preserve the City’s resources and qual ity of l i fe.
P r o g r a m A c t i v i t i e s Provide support to City Counci l, Planning Commission, Architectural
Board of Review, Historic Landmarks Commission, and Modif icat ion Hearings.
Review, analyze, and make recommendations on project proposals by pr ivate property owners and government agencies. Review takes place through al l stages of development including pre-appl icat ion, staff analysis, public hearings, plan check, construct ion, and future monitor ing.
Administer environmental review process in compliance with the Cal ifornia Environmental Quali ty Act (CEQA).
Provide public information and permit services at the publ ic counter and in phone calls and meetings with members of the publ ic, interested in projects.
K e y O b j e c t i v e s f o r F i s c a l Y e a r 2 0 0 6 Work with appl icants to submit complete appl icat ions within the
second 30-day review, at least 70% of the t ime, to improve customer service and reduce workload.
Encourage at least 50% of projects to receive a Pre-Applicat ion Review Team (PRT) review, in order to provide early advice to project proponents and minimize applicat ions that cannot be supported.
Present al l appl icat ions to decision-makers for act ion within 3 months of exemption, 6 months of negative declaration, and 1 year of an EIR.
Achieve 75% on-t ime completion of major milestones for environmental and project review of City projects.
Implement process improvements that reduce the amount of t ime spent to review projects whi le maintaining the qual ity of the City and better managing staff workload, including updating the Planning Commission staff report template and improving the Consent Calendar process by October 2005, as wel l as creating an evaluat ion form for Planning Commission projects.
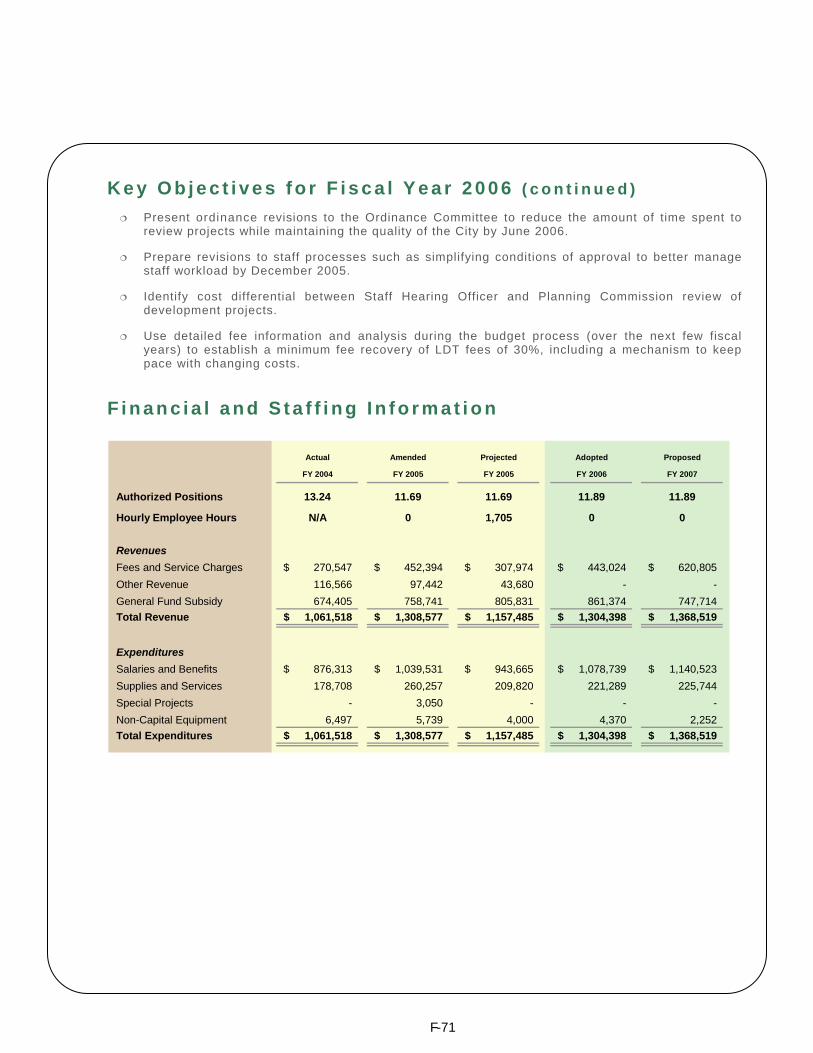
K e y O b j e c t i v e s f o r F i s c a l Y e a r 2 0 0 6 ( c o n t i n u e d ) Present ordinance revisions to the Ordinance Committee to reduce the amount of time spent to
review projects while maintaining the quality of the City by June 2006.
Prepare revisions to staff processes such as simplifying conditions of approval to better manage staff workload by December 2005.
Identify cost differential between Staff Hearing Officer and Planning Commission review of development projects.
Use detailed fee information and analysis during the budget process (over the next few fiscal years) to establish a minimum fee recovery of LDT fees of 30%, including a mechanism to keep pace with changing costs.
F i n a n c i a l a n d S t a f f i n g I n f o r m a t i o n
Actual Amended Projected Adopted Proposed
FY 2004 FY 2005 FY 2005 FY 2006 FY 2007
Authorized Positions 13.24 11.69 11.69 11.89 11.89
Hourly Employee Hours N/A 0 1,705 0 0
RevenuesFees and Service Charges 270,547$ 452,394$ 307,974$ 443,024$ 620,805$ Other Revenue 116,566 97,442 43,680 - - General Fund Subsidy 674,405 758,741 805,831 861,374 747,714 Total Revenue 1,061,518$ 1,308,577$ 1,157,485$ 1,304,398$ 1,368,519$
ExpendituresSalaries and Benefits 876,313$ 1,039,531$ 943,665$ 1,078,739$ 1,140,523$ Supplies and Services 178,708 260,257 209,820 221,289 225,744 Special Projects - 3,050 - - - Non-Capital Equipment 6,497 5,739 4,000 4,370 2,252 Total Expenditures 1,061,518$ 1,308,577$ 1,157,485$ 1,304,398$ 1,368,519$
F-71

City of Santa Barbara Two-Year Financial Plan and Annual Budget
P R O G R A M S & S E R V I C E S
F-72
Development/Environmental
Review ( C o n t i n u e d )
P r o g r a m P e r f o r m a n c e M e a s u r e s
Actual Projected Adopted FY 2004 FY 2005 FY 2006
Percent of applications deemed complete within 2nd DART process 77% 55% 70%
Percent of DART applications that receive PRT 56% 50-55% 50%
Percent of environmental determinations on PC agendas completed within the required timelines 100% 99% 100%
Percent of milestones achieved for City project review N/A 90% 75%
Development applications submitted, including re-submittals 144 130 130
Pre-application reviews received 50 50 40
Hearings on development projects at Planning Commission N/A 90 150
Minor work sessions, trainings, and discussion items at Planning Commission N/A 25 30
Major work sessions, trainings, and discussion items at Planning Commission N/A 30 30
Minutes and resolutions approved by the Planning Commission within four weeks of PC meetings 70% 70% 80%
Planning Commission appeals N/A 8 5
Environmental Analyst hours spent on City Projects 1,620.5 750 1,800
Planning staff hours devoted to projects that include affordable housing 1,212 1,500 900
Affordable housing units approved at Planning Commission N/A 70 35
Value of staff time spent at Planning Commission meetings on development review projects N/A N/A $20,000

[This page intent ional ly le f t b lank. ]
F-73

City of Santa Barbara Two-Year Financial Plan & Annual Budget
COMMUNITY DEVELOPMENT PROGRAMS
Administration Economic Development CDBG Administration and
Human Services CDBG - Rental Housing
Mediation Task Force CDBG - Housing Rehabilitation
Loan Program Redevelopment Agency Housing Development and
Preservation Program Long Range Planning and
Special Studies Development / Environmental
Review Zoning: Ordinance, Information,
and Enforcement Design Review and Historic
Preservation Building Inspection and Code
Enforcement Records, Archives, and Clerical
Services Building Counter and Plan
Review
RECENT PROGRAM ACHIEVEMENTS Reduced the Zoning Enforcement case backlog by 84%.
P R O G R A M S & S E R V I C E S
F-74
Zoning: Ordinance,
Information, & Enforcement
( P r o g r a m N o . 2 1 3 3 ) M i s s i o n S t a t e m e n t
Protect and improve Santa Barbara’s qual ity of l i fe by providing information regarding the City’s Planning and Zoning regulat ions to the community and ensuring that exist ing and new developments comply with those regulat ions.
P r o g r a m A c t i v i t i e s Answer questions from community members about land use and zoning
requirements, the review process, and other land development issues.
Review plans for proposed development for compliance with zoning requirements.
Prepare Zoning Information Reports for residential real estate transactions.
Invest igate zoning and sign complaints and enforce zoning and sign violat ions.
Prepare amendments to the Zoning Ordinance and Zone Map as necessary.
Administer Geographic Information System (GIS) software and data.
Maintain and update the City’s permit tracking database.
Add funct ional ity to the project tracking database and the GIS system as requested.
K e y O b j e c t i v e s f o r F i s c a l Y e a r 2 0 0 6 Perform 80% of init ial site inspections within 21 days of receipt of the
complaint.
Perform 75% of init ial actions (send warning letters or close case) within 10 days of the init ial site inspection.
Complete 65% of init ial zoning plan checks within the target t imelines.
Complete 70% of re-submittal zoning plan checks within the target t imelines.
Complete 95% of preliminary plan checks for Architectural Board of Review (ABR), Histor ic Landmarks Commission (HLC), and Planning Commission (PC) within 3 days of receipt by Zoning staff.
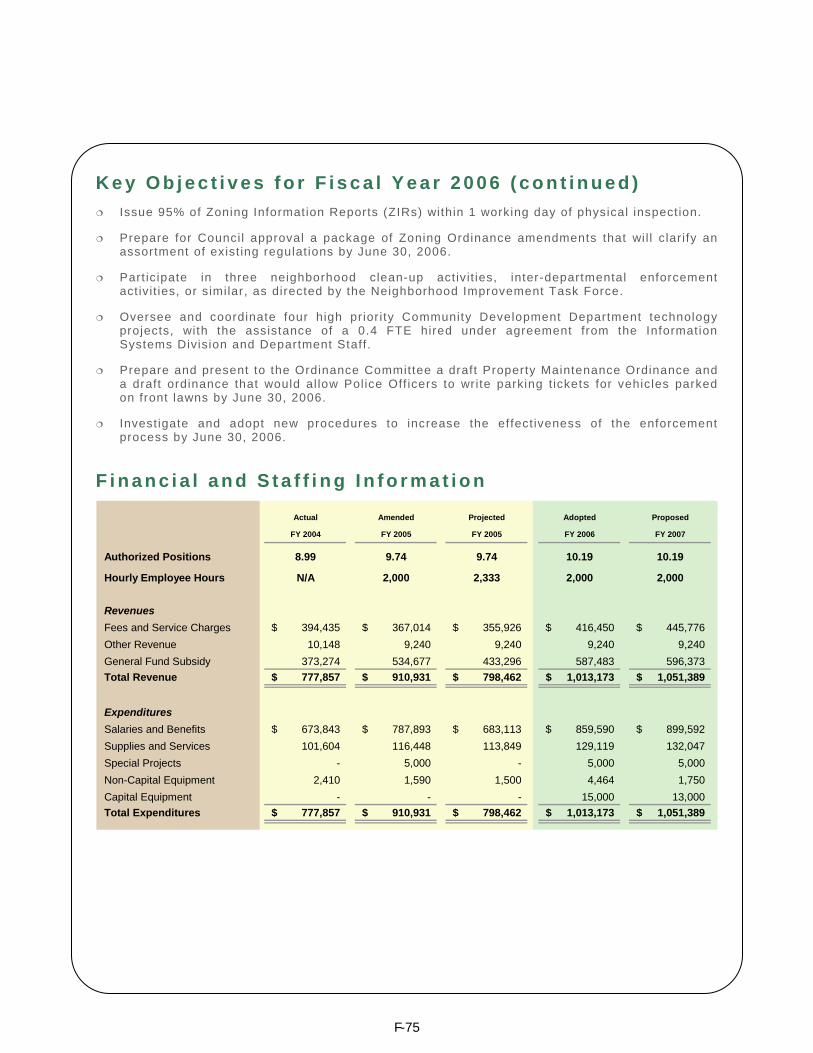
K e y O b j e c t i v e s f o r F i s c a l Y e a r 2 0 0 6 ( c o n t i n u e d )
Issue 95% of Zoning Information Reports (ZIRs) within 1 working day of physical inspection.
Prepare for Counci l approval a package of Zoning Ordinance amendments that wi l l clar ify an assortment of exist ing regulat ions by June 30, 2006.
Part ic ipate in three neighborhood clean-up act ivit ies, inter-departmental enforcement act ivit ies, or similar, as directed by the Neighborhood Improvement Task Force.
Oversee and coordinate four high prior ity Community Development Department technology projects, with the assistance of a 0.4 FTE hired under agreement from the Information Systems Division and Department Staff.
Prepare and present to the Ordinance Committee a draft Property Maintenance Ordinance and a draft ordinance that would al low Pol ice Off icers to write parking t ickets for vehicles parked on front lawns by June 30, 2006.
Investigate and adopt new procedures to increase the effect iveness of the enforcement process by June 30, 2006.
F i n a n c i a l a n d S t a f f i n g I n f o r m a t i o n
Actual Amended Projected Adopted Proposed
FY 2004 FY 2005 FY 2005 FY 2006 FY 2007
Authorized Positions 8.99 9.74 9.74 10.19 10.19
Hourly Employee Hours N/A 2,000 2,333 2,000 2,000
RevenuesFees and Service Charges 394,435$ 367,014$ 355,926$ 416,450$ 445,776$ Other Revenue 10,148 9,240 9,240 9,240 9,240 General Fund Subsidy 373,274 534,677 433,296 587,483 596,373 Total Revenue 777,857$ 910,931$ 798,462$ 1,013,173$ 1,051,389$
ExpendituresSalaries and Benefits 673,843$ 787,893$ 683,113$ 859,590$ 899,592$ Supplies and Services 101,604 116,448 113,849 129,119 132,047 Special Projects - 5,000 - 5,000 5,000 Non-Capital Equipment 2,410 1,590 1,500 4,464 1,750 Capital Equipment - - - 15,000 13,000 Total Expenditures 777,857$ 910,931$ 798,462$ 1,013,173$ 1,051,389$
F-75

City of Santa Barbara Two-Year Financial Plan & Annual Budget
P R O G R A M S & S E R V I C E S
Zoning: Ordinance,
Information, & Enforcement
( C o n t i n u e d )
P r o g r a m P e r f o r m a n c e M e a s u r e s
Actual Projected Adopted FY 2004 FY 2005 FY 2006
Percent of enforcement cases where initial inspections are performed within 21 days of the receipt of the complaint N/A N/A 80%
Percent of enforcement cases where a warning letter is sent or the case is closed within 10 days of the initial site inspection 59% 75% 75%
Percent of initial zoning plan checks completed by the target date 59% 60% 65%
Percent of re-submittal zoning plan checks completed by the target date 74% 70% 70%
Percent of preliminary plan checks for ABR, HLC, and PC completed within 3 days of receipt 96% 95% 95%
Percent of ZIRs issued within 1 working day of the inspection 96% 95% 95%
Zoning enforcement cases received 330 426 400
Warning letters sent N/A 220 200
First citations sent N/A 64 60
Zoning enforcement cases closed 313 534 350
Zoning plan checks completed – initial review 1,411 1,156 1,250
Zoning plan checks completed – re-submittal 1,037 1,058 1,000
Preliminary plan checks completed 365 296 300
ZIRs prepared 1,053 1,000 950
People served at the Planning and Zoning Counter N/A 12,000 16,000
Technology-related requests for assistance from staff and the public N/A N/A 150
Items heard by the Modification Hearing Officer or Staff Hearing Officer N/A N/A 145
Average cost of ZIRs per resident unit N/A N/A $79
F-76

[This page intent ional ly le f t b lank. ]
F-77

City of Santa Barbara Two-Year Financial Plan & Annual Budget
COMMUNITY DEVELOPMENT PROGRAMS
Administration Economic Development CDBG Administration and
Human Services CDBG - Rental Housing
Mediation Task Force CDBG - Housing Rehabilitation
Loan Program Redevelopment Agency Housing Development and
Preservation Program Long Range Planning and
Special Studies Development / Environmental
Review Zoning: Ordinance, Information,
and Enforcement Design Review and Historic
Preservation Building Inspection and Code
Enforcement Records, Archives, and Clerical
Services Building Counter and Plan
Review
RECENT PROGRAM ACHIEVEMENTS Completion of the Demolition Review Ordinance.
P R O G R A M S & S E R V I C E S
F-78
Design Review and Historic
Preservation
( P r o g r a m N o . 2 1 3 4 ) M i s s i o n S t a t e m e n t Ensure the design and development of bui ldings, structures, and signs comply with adopted design guidel ines and ordinances; and assist the community in preserving and protect ing the City’s natural beauty, character, heritage, and establ ished architectural tradit ions.
P r o g r a m A c t i v i t i e s Provide staff ing support to Counci l, Planning Commission, Architectural
Board of Review (ABR), Histor ic Landmarks Commission (HLC) and Sign Committee.
Review, analyze, approve or make recommendations on design review proposals pertaining to development appl ications by pr ivate and publ ic property owners.
Prepare and review Architectural Board of Review, Historic Landmarks Commission and Sign Committee agendas, minutes, and noticing.
Update and prepare guidelines, ordinance amendments, and conduct special studies to maintain qual ity design standards.
Administer the City’s Histor ic Preservat ion Work Program involving the identif icat ion and protect ion of histor ic resources. Review and analyze alterat ions to historic resources, complet ion of surveys, and historic resource designations.
Provide publ ic information and permit services at the public counter.
K e y O b j e c t i v e s f o r F i s c a l Y e a r 2 0 0 6 Complete 80% of the Master Environmental Assessments (MEAs) on
Design Review appl icat ions within 20 days of appl icat ion receipt.
Present 50% of design review appl icat ions (ABR/HLC) to decision makers for review within 30 days of acceptance.
Present Neighborhood Preservation Ordinance (NPO) and Single Family Resident ial Design Guidelines to City Counci l for adoption by June 30, 2006.
Develop Solar Design Guidelines and present to City Counci l for adoption by June 30, 2006.
Implement f inal recommendations for potent ial histor ic resources based on results from the Lower Riviera and Waterfront surveys.
Present ordinance amendments to reduce the number of projects required to be reviewed by the Architectural Board of Review and Historic Landmarks Commission by June 30, 2006.

F i n a n c i a l a n d S t a f f i n g I n f o r m a t i o n
Actual Amended Projected Adopted Proposed
FY 2004 FY 2005 FY 2005 FY 2006 FY 2007
Authorized Positions 9.19 9.24 9.24 9.44 9.44
Hourly Employee Hours N/A 0 1,875 0 0
RevenuesFees and Service Charges 183,799$ 208,346$ 222,051$ 239,223$ 254,436$ General Fund Subsidy 550,244 676,771 625,040 639,885 672,669 Total Revenue 734,043$ 885,117$ 847,091$ 879,108$ 927,105$
ExpendituresSalaries and Benefits 625,064$ 694,932$ 637,377$ 766,147$ 810,786$ Supplies and Services 106,829 180,480 208,062 111,961 115,217 Special Projects 1,490 9,305 1,000 - - Non-Capital Equipment 700 400 652 1,000 1,102 Total Expenditures 734,083$ 885,117$ 847,091$ 879,108$ 927,105$
P r o g r a m P e r f o r m a n c e M e a s u r e s
Actual Projected Adopted FY 2004 FY 2005 FY 2006
Percent of MEAs completed within established timelines N/A 75% 80%
Percent of design review applications presented to decision makers within 30 days of acceptance
N/A N/A 50%
Design Review applications received 810 860 820
ABR agenda items scheduled 1,302 1,200 1,200
HLC agenda items scheduled 462 402 400
Sign Committee agenda items scheduled 216 180 200
Conforming Sign Review items scheduled 144 80 100
Administrative Staff Review items 238 220 240
Meeting hours of ABR, HLC and Sign Committee N/A 400 375
Mailed notices prepared for Design Review public hearings 163 225 220
Staff hours assisting the Development and Environmental Review section 330 245 275
Staff hours staffing the Planning and Zoning Counter 1,128 1,000 1,080
Historic Resource Evaluations N/A 180 225
Staff hours completing Historic Resource Evaluations 314 240 320
Appeals heard by City Council N/A 2 6
Appeals withdrawn prior to being heard by City Council N/A N/A 3
Cost to provide mailed public notices N/A N/A $27,940
F-79

City of Santa Barbara Two-Year Financial Plan & Annual Budget
COMMUNITY DEVELOPMENT PROGRAMS
Administration Economic Development CDBG Administration and
Human Services CDBG - Rental Housing
Mediation Task Force CDBG - Housing Rehabilitation
Loan Program Redevelopment Agency Housing Development and
Preservation Program Long Range Planning and
Special Studies Development / Environmental
Review Zoning: Ordinance, Information,
and Enforcement Design Review and Historic
Preservation Building Inspection and Code
Enforcement Records, Archives, and Clerical
Services Building Counter and Plan
Review
RECENT PROGRAM ACHIEVEMENTS The timely resolution of code enforcement cases greatly improved in the second quarter of fiscal year 2005 due to procedural changes which resulted in staff meeting their annual target.
P R O G R A M S & S E R V I C E S
F-80
Building Inspection and
Code Enforcement
( P r o g r a m N o . 2 1 4 1 ) M i s s i o n S t a t e m e n t Review and inspect construct ion projects and abate substandard housing condit ions and i l legal dwell ing units to ensure safe housing through compliance with al l appl icable bui lding codes and City ordinances.
P r o g r a m A c t i v i t i e s Provide inspection and code enforcement resources to the publ ic.
Perform over 10,100 bui lding inspect ions each year for compliance with approved plans, design review detai ls, and condit ions.
Perform more than 1,300 investigat ions and fol low-up investigations in response to cit izen and other-agency complaints regarding sub-standard and/or dangerous structures.
Respond to natural and man-made disasters by providing technical assistance in est imating the safety of damaged structures and real property.
K e y O b j e c t i v e s f o r F i s c a l Y e a r 2 0 0 6 Respond to 100% of inspection requests on the day scheduled for
permitted work.
Respond to 95% of code enforcement complaints within 5 working days from receipt of complaint.
Perform 93% Specialty/Commercial plan reviews (electr ical, plumbing and mechanical) within 4 working days.
Ident ify 240 propert ies in targeted neighborhoods with bui lding code violat ions or spot bl ight condit ions and give correction not ice to the owners, using the newly created neighborhood Code Enforcement Off icer posit ion as part of the Neighborhood Improvement Task Force Program.
Resolve 85% of code enforcement cases within 8 months from issuance of Not ice and Order.
Make a determinat ion on whether the City should assume bui lding permit jur isdict ion for mobile homes in the City of Santa Barbara by June 2006.

F i n a n c i a l a n d S t a f f i n g I n f o r m a t i o n
Actual Amended Projected Adopted Proposed
FY 2004 FY 2005 FY 2005 FY 2006 FY 2007
Authorized Positions 8.95 9.69 9.69 9.69 9.69
Hourly Employee Hours N/A 0 0 0 0
RevenuesFees and Service Charges 874,655$ 943,731$ 928,424$ 1,022,151$ 1,059,633$ Total Revenue 874,655$ 943,731$ 928,424$ 1,022,151$ 1,059,633$
ExpendituresSalaries and Benefits 748,282$ 806,743$ 797,946$ 878,860$ 914,566$ Supplies and Services 126,373 136,988 130,478 141,464 143,745 Non-Capital Equipment - - - 1,827 1,322 Total Expenditures 874,655$ 943,731$ 928,424$ 1,022,151$ 1,059,633$
P r o g r a m P e r f o r m a n c e M e a s u r e s
Actual Projected Adopted FY 2004 FY 2005 FY 2006
Percent of inspection requests completed on the day scheduled for permitted work 100% 100% 100%
Percent of code complaints responded to within 5 working days 92% 95% 95%
Percent of specialty/commercial plan checks completed within 4 working days 93% 93% 93%
Property owners given notice that their properties have been identified with building code violations or spot blight conditions N/A N/A 240
Percent of code enforcement cases closed within 8 months of issuance of Notice and Order N/A N/A 85%
Building inspections completed 11,698 12,000 14,440
Code enforcements completed 354 400 400
Specialty/commercial plan reviews completed 610 700 700
Expired permit inspections or site visits performed 502 600 480
Total cost to perform specialty plan reviews N/A N/A $40,000
F-81

City of Santa Barbara Two-Year Financial Plan & Annual Budget
COMMUNITY DEVELOPMENT PROGRAMS
Administration Economic Development CDBG Administration and
Human Services CDBG - Rental Housing
Mediation Task Force CDBG - Housing Rehabilitation
Loan Program Redevelopment Agency Housing Development and
Preservation Program Long Range Planning and
Special Studies Development / Environmental
Review Zoning: Ordinance, Information,
and Enforcement Design Review and Historic
Preservation Building Inspection and Code
Enforcement Records, Archives, and Clerical
Services Building Counter and Plan
Review
RECENT PROGRAM ACHIEVEMENTS Records Staff has recently re-tagged and re-jacketed all oversized plans located in the Archive facility within the six month time frame we set to finish this project.
P R O G R A M S & S E R V I C E S
F-82
Records, Archives, and
Clerical Services
( P r o g r a m N o . 2 1 4 2 ) M i s s i o n S t a t e m e n t Provide organized solut ions for the preservation and accessibi l i ty of recorded property development history for the community and staff in adherence with State law and City Counci l pol icies.
P r o g r a m A c t i v i t i e s Provide reception services to the Community Development and Public
Works departments, as well as the Pro-Youth Coalit ion, Redevelopment Agencies, and Fire Plan Check.
Provide cashiering services to the publ ic for al l Land Development transactions.
Coordinate and provide for the imaging, storage, archival, and review of al l Land Development documents, whi le providing access via the Internet.
Provide cler ical support for Building and Safety administration.
K e y O b j e c t i v e s f o r F i s c a l Y e a r 2 0 0 6 Respond to 100% of bui lding and planning f i le document demands
within 1 hour of receipt.
Respond to 100% of commercial plan viewing requests within 48 hours of receipt.
Ensure 95% of building and planning documents are processed within ten days of receipt.
Ensure 100% Land Development Team cash receipts are balanced to 100% accuracy on a dai ly basis.
Purge, inventory, and re-label al l Administrat ion boxes housed at Mackenzie Storage Faci l i ty by December 31, 2005.
Transfer al l Airport street and planning f i les from the Record Center shelves to Mackenzie Storage Faci l i ty by September 30, 2005.

F i n a n c i a l a n d S t a f f i n g I n f o r m a t i o n
Actual Amended Projected Adopted
FY 2004 FY 2005 FY 2005 FY 2006
Authorized Positions 6.80 7.13 7.13 7.13 7.
Hourly Employee Hours N/
Proposed
FY 2007
13
A 0 130 0
RevenuesFees and Service Charges 505,990$ 548,549$ 545,044$ 598,159$ Other Revenue - 3,518 3,518 1,000 General Fund SubsidyTotal Revenue 505,990$ 552,067$ 548,562$ 599,159$
ExpendituresSalaries and Benefits 408,087$ 436,841$ 429,005$ 479,290$ Supplies and Services 93,880 106,739 111,222 114,004 Special Projects 3,278 7,107 7,000 5,000 Non-Capital Equipment 747 1,380 1,335 865 Total Expenditures 505,992$ 552,067$ 548,562$ 599,159$
0
619,536$ 2,000
621,536$
500,407$ 115,269
5,000 860
621,536$
P r o g r a m P e r f o r m a n c e M e a s u r e s
Actual Projected Adopted FY 2004 FY 2005 FY 2006
Percent of requests filled for files delivered within 1 hour of receipt 100% 100% 100%
Percent of viewing request appointments for commercial plans filled within 48 hours of receipt 100% 100% 100%
Percent of documents prepared, scanned, and stored within 10 days of receipt N/A N/A 95%
Percent of cash receipts received and in balance with Advantage Cashiering Reports 100% 100% 100%
Document requests processed 9,127 9,150 9,500
Commercial and residential plan viewings 1,058 1,100 1,050
Documents scanned and archived 136,283 145,786 145,000
LDT register transactions 10,462 9,450 10,000
Cost to prepare and enter claims N/A N/A $4,375
F-83

City of Santa Barbara Two-Year Financial Plan & Annual Budget
COMMUNITY DEVELOPMENT PROGRAMS
Administration Economic Development CDBG Administration and
Human Services CDBG - Rental Housing
Mediation Task Force CDBG - Housing Rehabilitation
Loan Program Redevelopment Agency Housing Development and
Preservation Program Long Range Planning and
Special Studies Development / Environmental
Review Zoning: Ordinance, Information,
and Enforcement Design Review and Historic
Preservation Building Inspection and Code
Enforcement Records, Archives, and Clerical
Services Building Counter and Plan
Review
RECENT PROGRAM ACHIEVEMENTS Introduced new matrix guideline to identify complexity of projects and assign review timelines as appropriate.
P R O G R A M S & S E R V I C E S
F-84
Building Counter and
Plan Review
( P r o g r a m N o . 2 1 4 3 ) M i s s i o n S t a t e m e n t Provide project review, permit issuance, and customer service for the community and internal customers to ensure a safely built environment in accordance with State and local laws.
P r o g r a m A c t i v i t i e s Review over 2,000 engineering and architectural plans for compliance
with State laws and ordinances including the California Bui lding Code, State Tit le 24 Energy and Disabled Access Regulat ions, and health and safety codes.
Issue over 1,500 “over-the-counter” bui lding permits each year for various minor projects.
Review and prepare more than 3,000 bui lding permits each year.
Prepare and maintain reference materials for publ ic and staff use in both hard copy and electronic formats.
Manage and maintain the permit t ing process and permit tracking software.
Provide building code expert ise, interpretat ion, and guidance for the architectural and engineering communit ies, as well as the general publ ic and City staff for al l types of construct ion-related issues.
K e y O b j e c t i v e s f o r F i s c a l Y e a r 2 0 0 6 Complete 70% of bui lding permit Init ial Reviews within the promised
t imelines.
Complete 70% of building permit Re-submittals and Revisions within the promised t imelines.
Meet with the local Architectural Associat ion at least twice per year to help foster open communicat ion and identify places of concern and sat isfact ion.

F i n a n c i a l a n d S t a f f i n g I n f o r m a t i o n
Actual Amended Projected Adopted Proposed
FY 2004 FY 2005 FY 2005 FY 2006 FY 2007
Authorized Positions 9.35 9.68 9.68 10.68 10.68
Hourly Employee Hours N/A 0 0 0 0
RevenuesFees and Service Charges 1,331,414$ 1,578,917$ 1,417,135$ 1,757,834$ 1,740,723$ Other Revenue 2,187 9,691 4,300 9,500 9,500 Total Revenue 1,333,601$ 1,588,608$ 1,421,435$ 1,767,334$ 1,750,223$
ExpendituresSalaries and Benefits 729,844$ 814,270$ 833,173$ 1,007,692$ 1,056,675$ Supplies and Services 159,332 296,578 277,472 211,527 209,855 Non-Capital Equipment 534 - - 2,860 2,860 Indirect Overhead 443,891 427,760 260,790 495,255 430,833 Transfers Out - 50,000 50,000 50,000 50,000 Total Expenditures 1,333,601$ 1,588,608$ 1,421,435$ 1,767,334$ 1,750,223$
P r o g r a m P e r f o r m a n c e M e a s u r e s
Actual Projected Adopted FY 2004 FY 2005 FY 2006
Percent of initial reviews completed within the promised timeline 64% 60% 70%
Percent of re-submittals and revisions completed within the promised timeline N/A N/A 70%
Total permits issued 2,921 3,000 3,000
Staff hours devoted to PRT and DART reviews 655 500 500
Plan reviews and re-submittals completed 2,642 3,000 3,000
“Over-the-counter” permits issued at the Building and Safety Counter 1,841 1,900 2,000
New permit applications made to the Building and Safety Division N/A 3,000 3,000
F-85

[This page intent ional ly le f t b lank. ]
F-86

D E P A R T M E N T S U M M A R Y
Finance
F-87
Provide financial guidance to City Council and departments and manage the City’s financial operations.
A b o u t F i n a n c e F i s c a l Y e a r
2 0 0 6 B u d g e t
H i g h l i g h t s
The Finance Department is responsible for provid ing f inancial expert ise and guidance to the Ci ty Counci l and departments, managing the City ’s dai ly f inancial operat ions, and maintain ing the f inancial integr i ty of the Ci ty. The department’s major funct ional areas inc lude account ing, revenue management, budget, payrol l , purchasing, and investment management. The department a lso administers two internal service funds: The Risk Management Fund manages the Ci ty ’s insurance port fo l io and sel f- insured workers’ compensat ion program, and the Dupl icat ions and Mai l Services Fund operates a fu l l -service pr int shop and provides mai l service to a l l Ci ty departments and fac i l i t ies.
The Finance Department will
be expanding its revenue
audit program beginning
next fiscal year. The
proposed fiscal years 2006
and 2007 budgets include
funding for additional audits
of hotels in the city for
compliance with the city’s
Transient Occupancy Tax
Ordinance. In addition,
Treasury Division staff has
recently subscribed to a
Franchise Tax Board program
that provides data to identify
businesses that have not
obtained a city business
license.
The fiscal year 2006 proposed
budget includes funding to
replace the business license
system to address data
retention and reporting
capabilities.

D E P A R T M E N T S U M M A R Y
Finance
F-88
D e p a r t m e n t F i n a n c i a l a n d S t a f f i n g S u m m a r y
Actual Amended Projected Adopted Proposed
FY 2004 FY 2005 FY 2005 FY 2006 FY 2007
Authorized Positions 47.00 45.60 46.00 46.00 46.00
Hourly Employee Hours N/A 490 490 490 490
RevenuesFees and Services Charges 214,792$ 233,950$ 183,810$ 180,000$ 175,000$ Franchise Fees - Cable 367,582 382,161 326,873 342,618 359,749 Licenses 22,968 2,500 3,000 5,000 5,000 Workers Comp. Premiums 3,374,303 3,370,716 3,370,716 3,747,010 3,875,260 Insurance Premiums 2,554,741 2,650,000 2,650,000 3,235,236 3,271,446 Occup. Safety and Health Fees 217,076 228,744 228,744 253,162 289,917 ACCEL- Return of Premium 1,310,753 190,000 - - - Interest Income 136,532 120,000 155,476 172,000 186,000 Market Valuation (99,953) - - - - Other Revenue 266,154 131,528 131,528 205,063 216,966 Overhead Allocation Recovery N/A 2,494,760 2,494,760 2,937,516 3,055,018 General Fund Subsidy 3,876,762 1,732,955 1,696,447 1,657,009 1,681,138 Total Department Revenue 12,241,710$ 11,537,314$ 11,241,354$ 12,734,614$ 13,115,494$
ExpendituresSalaries and Benefits 3,247,381$ 3,634,520$ 3,577,104$ 4,039,331$ 4,207,650$ Supplies and Services 6,629,457 7,616,906 7,196,697 8,275,839 8,486,095 Special Projects 406,268 407,354 367,873 392,618 389,749 Transfers Out - 1,368 1,368 1,378 - Non-Capital Equipment 18,228 14,429 16,608 11,200 15,500 Equipment Capital - - - 2,748 5,000 Tax Expense 13,571 11,500 11,500 11,500 11,500 Total Department Expenditures 10,314,905$ 11,686,077$ 11,171,150$ 12,734,614$ 13,115,494$
Addition to (Use of) Reserves 1,926,805$ (148,763)$ 70,204$ -$ -$
D e p a r t m e n t F u n d C o m p o s i t i o n
Department Appropriations by Fund
General Fund39%
Self Insurance
Fund 58%
Duplications Fund3%
Department Revenues by Fund
Self Insurance Fund58%
General Fund Subsidy
13%
Duplications Fund3%
General Fund Departmental
Revenues26%

D E P A R T M E N T S U M M A R Y
Finance
F-89
P r o g r a m O r g a n i z a t i o n a l C h a r t
Administration
Treasury Accounting General Services
Risk Management
Revenue and Cash Mgmt.
Cashiering and Collections
Licenses and Permits
Accounting Services
Accounts Payable
Payroll
City Billing andCustomer Svc.
Purchasing
Central Warehouse
Duplications
Meter Reading
Mail Courier Services
Worker’s Compensation
Liability
Occupational Safety & Health
Administrative Operations
Budget Management

City of Santa Barbara Two-Year Financial Plan & Annual Budget
FINANCE PROGRAMS
Administration
Revenue & Cash Management Cashiering & Collections Licenses & Permits Budget Management Accounting Services Payroll Accounts Payable City Billing & Customer Service Purchasing Central Warehouse Meter Reading Duplications Mail Courier Services Risk Management – Workers’
Compensation Risk Management – Liability Risk Management –
Occupational Safety & Health Risk Management –
Administrative Operations
RECENT PROGRAM ACHIEVEMENTS In fiscal year 2005, Administration staff obtained an additional $1 million funding authorization for the Employee Mortgage Loan Assistance Program (EMLAP) and updated the EMLAP program guidelines.
P R O G R A M S & S E R V I C E S
F-90
Administration
( P r o g r a m N o . 1 4 1 1 ) M i s s i o n S t a t e m e n t Provide management and administrat ive support to Finance programs and provide the City Counci l and departments with responsive f inancial information, analysis, and expert ise.
P r o g r a m A c t i v i t i e s Manage the operat ions of the department.
Ensure management and the City Counci l are informed of al l matters material ly affect ing the f inancial health of the City.
Assist with pol icy formulat ion and implementation of Council direct ion.
Provide staff support to the City Council Finance Committee.
Provide f inancial and budgetary support and guidance to al l City departments.
Provide oversight of the City’s $140 mil l ion investment portfol io.
Manage the City’s long-term debt, including new-money and refunding debt.
Manage the City’s Employee Mortgage Loan Assistance Program (EMLAP).
Administer the City’s cable television franchise.
K e y O b j e c t i v e s f o r F i s c a l Y e a r 2 0 0 6 Ensure that Finance programs meet 75% of program object ives.

F i n a n c i a l a n d S t a f f i n g I n f o r m a t i o n
Actual Amended Projected Adopted Proposed
FY 2004 FY 2005 FY 2005 FY 2006 FY 2007
Authorized Positions 2.20 1.95 1.95 1.95 1.95
Hourly Employee Hours N/A 0 0 0 0
RevenuesFranchise Fees - Cable 367,582$ 382,161$ 326,873$ 342,618$ 359,749$ Overhead Allocation Recovery N/A 115,902 115,902 130,324 135,539 General Fund Subsidy 362,193 175,308 185,026 157,688 196,940 Total Revenue 729,775$ 673,371$ 627,801$ 630,630$ 692,228$
ExpendituresSalaries and Benefits 223,199$ 210,816$ 211,578$ 242,742$ 256,956$ Supplies and Services 78,705 36,786 47,642 31,770 32,023 Special Projects 402,726 407,165 352,873 342,618 389,749 Non-Capital Equipment 11,574 7,104 4,208 2,000 2,000 Tax Expense 13,571 11,500 11,500 11,500 11,500 Total Expenditures 729,775$ 673,371$ 627,801$ 630,630$ 692,228$
P r o g r a m P e r f o r m a n c e M e a s u r e s
Actual Projected Adopted FY 2004 FY 2005 FY 2006
Percent of Finance program objectives met 73.3% 75% 75%
EMLAP loans administered 17 22 28
F-91

City of Santa Barbara Two-Year Financial Plan & Annual Budget
FINANCE PROGRAMS
Administration
Revenue & Cash Management Cashiering & Collections Licenses & Permits Budget Management Accounting Services Payroll Accounts Payable City Billing & Customer Service Purchasing Central Warehouse Meter Reading Duplications Mail Courier Services Risk Management – Workers’
Compensation Risk Management – Liability Risk Management –
Occupational Safety & Health Risk Management –
Administrative Operations
RECENT PROGRAM ACHIEVEMENTS Implemented an improved cash management process whereby cleared check data is transmitted and posted daily rather than monthly.
P R O G R A M S & S E R V I C E S
F-92
Revenue & Cash
Management
( P r o g r a m N o . 1 4 1 2 ) M i s s i o n S t a t e m e n t Invest publ ic funds in a manner that wi l l provide maximum security, adequate l iquidity and suff icient yield, while conforming to relevant statutes and regulations, and ensure al l revenues are received t imely and recorded properly.
P r o g r a m A c t i v i t i e s Manage investment portfol io of approximately $136 mil l ion.
Prepare and present monthly investment reports to Finance Committee and City Counci l.
Manage the City’s banking relat ionships.
Ensure t imely reconci l iat ion of al l cash transactions.
Assist departments in establ ishing appropriate controls and procedures for the receipt of cash and for petty cash disbursements.
Provide ongoing analysis of City revenues.
Forecast and manage cash to ensure adequate l iquidity for expenditure requirements.
O b j e c t i v e s f o r F i s c a l Y e a r 2 0 0 6 Maintain a minimum average “AA” credit qual ity for securit ies in the
portfol io.
Meet or exceed the Local Agency Investment Fund (LAIF) book rate of return on an annual basis.
Submit 100% of monthly investment reports to City Counci l within 30 days of month-end.
On a quarterly basis, review newly issued business l icenses for resale permit status; submit f indings to State Board of Equal ization.
Conduct a monthly analysis of al l City revenues.
Provide a comprehensive analysis of General Fund revenues to the Finance Committee on a quarterly basis.
Purchase investments for the City and Redevelopment Agency that are consistent with investment object ives.
Provide investment information and data on City’s website by September 30, 2005.

K e y O b j e c t i v e s f o r F i s c a l Y e a r 2 0 0 6 ( c o n t i n u e d )
Submit annual Statement of Investment Policy by June 30, 2006.
Prepare comprehensive Investment Pol ic ies and Procedures Manual by September 30, 2005.
Cross-train staff in the banking and investment functions by December 31, 2005.
Prepare request for proposal for Investment Custodial Services by September 30, 2005.
F i n a n c i a l a n d S t a f f i n g I n f o r m a t i o n
Actual Amended Projected Adopted Proposed
FY 2004 FY 2005 FY 2005 FY 2006 FY 2007
Authorized Positions 2.05 2.05 2.05 2.55 2.55
Hourly Employee Hours N/A 0 0 0 0
RevenuesOverhead Allocation Recovery N/A 169,610$ 169,610$ 198,843$ 206,796$ General Fund Subsidy 299,141 187,087 159,230 213,195 221,268 Total Revenue 299,141$ 356,697$ 328,840$ 412,038$ 428,064$
ExpendituresSalaries and Benefits 172,589$ 188,529$ 182,162$ 250,309$ 262,046$ Supplies and Services 126,552 168,168 146,678 159,029 161,018 Non-Capital Equipment - - - 2,700 5,000 Total Expenditures 299,141$ 356,697$ 328,840$ 412,038$ 428,064$
P r o g r a m P e r f o r m a n c e M e a s u r e s
Actual Projected Adopted FY 2004 FY 2005 FY 2006
Credit rating of portfolio holdings AA AA AA
Portfolio book rate of return compared to LAIF > 1.44 > LAIF > LAIF
Months in which investment report is submitted within 30 days 12 12 12
Submittals to State Board of Equalization N/A N/A 4
Average portfolio balance $139 million $135 million $135 million
Average days to maturity of portfolio 478 478 500
Average daily dollar amount of bank credits $977,000 $1,242,000 $1,242,000
Average daily dollar amount of bank debits $1,006,000 $1,238,000 $1,238,000
F-93

City of Santa Barbara Two-Year Financial Plan & Annual Budget
FINANCE PROGRAMS
Administration Revenue & Cash Management
Cashiering & Collections Licenses & Permits Budget Management Accounting Services Payroll Accounts Payable City Billing & Customer Service Purchasing Central Warehouse Meter Reading Duplications Mail Courier Services Risk Management – Workers’
Compensation Risk Management – Liability Risk Management –
Occupational Safety & Health Risk Management –
Administrative Operations
RECENT PROGRAM ACHIEVEMENTS Credit card payment option for customers was implemented at City Hall, Library and Police Departments.
P R O G R A M S & S E R V I C E S
F-94
Cashiering & Collections
( P r o g r a m N o . 1 4 1 3 ) M i s s i o n S t a t e m e n t Central ly process monies, ensuring funds are received when due, properly accounted for, and safeguarded and provide prompt, courteous customer service.
P r o g r a m A c t i v i t i e s Operate a City Hal l cashier ing funct ion.
Process payments received from the publ ic and City departments and process bank wires and transfers.
Prepare dai ly deposits and related accounting documents.
Verify payment data from the uti l i ty bi l l ing lock-box operat ion.
Record and reconci le major sources of revenue.
Audit petty cash claims and assist departments in petty cash procedures.
K e y O b j e c t i v e s f o r F i s c a l Y e a r 2 0 0 6 Accurately process 99% of treasury receipts on the day received.
Accurately prepare deposit summary and daily bank deposit with less than 25 correct ing entr ies needed.
Implement electronic payment capabil i ty for selected application(s) by June 30, 2006.

F i n a n c i a l a n d S t a f f i n g I n f o r m a t i o n
Actual Amended Projected Adopted Proposed
FY 2004 FY 2005 FY 2005 FY 2006 FY 2007
Authorized Positions 4.50 3.75 3.75 3.75 3.75
Hourly Employee Hours N/A 0 0 0 0
RevenuesOverhead Allocation Recovery N/A 239,347$ 239,347$ 261,731$ 272,201$ Other Revenue (43) - - - - General Fund Subsidy 319,991 31,761 29,309 34,179 34,279 Total Revenue 319,948$ 271,108$ 268,656$ 295,910$ 306,480$
ExpendituresSalaries and Benefits 283,188$ 235,057$ 232,250$ 257,585$ 267,508$ Supplies and Services 35,566 35,262 36,406 38,325 38,972 Special Projects - 189 - - - Non-Capital Equipment 1,194 600 - - - Total Expenditures 319,948$ 271,108$ 268,656$ 295,910$ 306,480$
P r o g r a m P e r f o r m a n c e M e a s u r e s
Actual Projected Adopted FY 2004 FY 2005 FY 2006
Percentage of treasury receipts processed each day 99% 99.95% 99%
Correcting entries needed N/A < 25 < 25
Payments processed at public counter 54,059 55,000 55,000
Utility billing lockbox payments processed 235,689 239,000 230,000
Transient Occupancy Tax (TOT) payments recorded and reconciled monthly 68 67 68
Utility Users Tax (UUT) payments recorded and reconciled monthly 130 128 130
Petty cash audits performed 55 33 33
F-95

City of Santa Barbara Two-Year Financial Plan & Annual Budget
FINANCE PROGRAMS
Administration Revenue & Cash Management Cashiering & Collections
Licenses & Permits Budget Management Accounting Services Payroll Accounts Payable City Billing & Customer Service Purchasing Central Warehouse Meter Reading Duplications Mail Courier Services Risk Management – Workers’
Compensation Risk Management – Liability Risk Management –
Occupational Safety & Health Risk Management –
Administrative Operations
RECENT PROGRAM ACHIEVEMENTS Completed five Transient Occupancy Tax audits in fiscal year 2005.
P R O G R A M S & S E R V I C E S
F-96
Licenses & Permits
( P r o g r a m N o . 1 4 1 4 ) M i s s i o n S t a t e m e n t Administer the col lect ion and audit of business taxes, permits, and assessments to ensure compliance with the Santa Barbara Municipal Code (SBMC).
P r o g r a m A c t i v i t i e s Manage the Business Tax and Permit Program.
Administer the bi l l ing and collect ion of Transient Occupancy Tax, Parking and Business Improvement Area (PBIA) assessments, Old Town and Downtown Business Improvement Distr ict assessments and Fire Inspection fees.
Process delinquency notices and init iate collect ion efforts for past due accounts.
Process and issue over 13,000 City l icenses and permits.
Process appl icat ions for exemption from Uti l i ty Users Tax on water bi l l ings and coordinate with other ut i l i t ies for this exemption.
Review outside sources and publicat ions to identify unl icensed businesses.
K e y O b j e c t i v e s f o r F i s c a l Y e a r 2 0 0 6 Locate 100 unl icensed businesses as a result of the f ield inspection
program.
Locate 300 unlicensed businesses using periodicals, Franchise Tax Board, and State Board of Equal ization sources.
Evaluate Business License Software package(s) for improved bi l l ing and report ing opt ions by September 30, 2005.
Complete 5 Transient Occupancy Tax (TOT) audits.
Present fee recommendations for issuing miscel laneous l icenses and permits to City Counci l Apri l 15, 2006.

F i n a n c i a l a n d S t a f f i n g I n f o r m a t i o n
Actual Amended Projected Adopted Proposed
FY 2004 FY 2005 FY 2005 FY 2006 FY 2007
Authorized Positions 4.20 4.45 4.45 4.45 4.45
Hourly Employee Hours N/A 0 0 0 0
RevenuesLicenses 22,968$ 2,500$ 3,000$ 5,000$ 5,000$ Fees and Service Charges 6,441 - - - - Overhead Allocation Recovery N/A 79,183 79,183 88,427 91,964 Other Revenue 342 - - - - General Fund Subsidy 284,412 296,032 297,550 385,405 347,971 Total Revenue 314,163$ 377,715$ 379,733$ 478,832$ 444,935$
ExpendituresSalaries and Benefits 237,347$ 295,848$ 299,785$ 329,925$ 344,792$ Supplies and Services 76,816 81,267 79,948 98,907 100,143 Special Projects - - - 50,000 - Non-Capital Equipment - 600 - - - Total Expenditures 314,163$ 377,715$ 379,733$ 478,832$ 444,935$
P r o g r a m P e r f o r m a n c e M e a s u r e s
Actual Projected Adopted FY 2004 FY 2005 FY 2006
New businesses located from field inspection 154 100 100
New businesses located from reference sources N/A 175 300
New business licenses issued 1,969 1,900 1,900
Business license renewals 10,879 10,200 10,600
Business license delinquency notices 2,540 2,550 2,650
Percent of business licenses paid by due date 77% 75% 75%
Assessment district billings 3,216 4,000 4,000
Assessment district delinquency notices 774 1,000 1,000
Percent of PBIA assessments paid by due date 76% 75% 75%
Percent of accounts sent to collections 2% 2% 2%
F-97

City of Santa Barbara Two-Year Financial Plan & Annual Budget
FINANCE PROGRAMS
Administration Revenue & Cash Management Cashiering & Collections Licenses & Permits
Budget Management Accounting Services Payroll Accounts Payable City Billing & Customer Service Purchasing Central Warehouse Meter Reading Duplications Mail Courier Services Risk Management – Workers’
Compensation Risk Management – Liability Risk Management –
Occupational Safety & Health Risk Management –
Administrative Operations
RECENT PROGRAM ACHIEVEMENTS Received the Government Finance Officers Association Distinguished Budget Award for the FY 2005 Adopted Budget, reflecting production of a document that achieves national program criteria.
P R O G R A M S & S E R V I C E S
F-98
Budget Management
( P r o g r a m N o . 1 4 1 5 ) M i s s i o n S t a t e m e n t Manage the development and implementat ion of the City’s Two-Year Financial Plan and Annual Budget to support effect ive decision-making and publ ic communicat ion.
P r o g r a m A c t i v i t i e s Manage the City’s annual budget process, including training and
providing support to departments, analysis of department budget requests, and public presentation of the recommended budget.
Project non-departmental revenue estimates and provide guidance to departments on departmental revenue est imates.
Provide expert ise to City Counci l and departments on economic and f inancial condit ions and pol icy issues affect ing the budget.
Provide ongoing budgetary guidance and support to al l City departments in implementing the annual budget throughout the f iscal year.
Publish the City’s Two-Year Financial Plan and Annual Budget and the Budget-at-a-Glance, including CD-ROM and posting on the City’s web site.
K e y O b j e c t i v e s f o r F i s c a l Y e a r 2 0 0 6 Complete 80% of al l budget journal entr ies to record Counci l-approved
budget amendments within 7 working days of approval.
Receive the Government Finance Off icers Associat ion (GFOA) Dist inguished Budget Award.
Project General Fund non-departmental revenues within a 2% margin in relat ion to mid-year project ions.
Submit the FY 2007 Proposed Mid-Cycle Budget to Counci l and City Clerk by due date.
Post the FY 2007 Proposed Mid-Cycle Budget on the Internet within 5 days fol lowing f i l ing date.
Produce the FY 2006-07 Two-Year Financial Plan within 30 days after pr ior year-end.
Ensure that pol icy reserves are calculated each year.

F i n a n c i a l a n d S t a f f i n g I n f o r m a t i o n
Actual Amended Projected Adopted Proposed
FY 2004 FY 2005 FY 2005 FY 2006 FY 2007
Authorized Positions 2.85 2.80 2.80 2.80 2.80
Hourly Employee Hours N/A 0 0 0 0
RevenuesOverhead Allocation Recovery N/A 186,833$ 186,833$ 234,507$ 243,887$ General Fund Subsidy 370,221 195,328 195,070 191,464 199,853 Total Revenue 370,221$ 382,161$ 381,903$ 425,971$ 443,740$
ExpendituresSalaries and Benefits 306,635$ 305,145$ 306,397$ 346,284$ 362,833$ Supplies and Services 63,160 77,016 75,506 77,687 78,907 Non-Capital Equipment 426 - - 2,000 2,000 Total Expenditures 370,221$ 382,161$ 381,903$ 425,971$ 443,740$
P r o g r a m P e r f o r m a n c e M e a s u r e s
Actual Projected Adopted FY 2004 FY 2005 FY 2006
Percent of budget journal entries completed within 7 days 60% 85% 85%
Consecutive GFOA Distinguished Budget Awards / Number of submissions for award 4 / 4 5 / 5 6 / 6
Number of budget adjustments N/A 130 130
Days to produce the adopted budget document after fiscal year-end 95 30 30
Days to post the proposed budget to Internet 0 5 5
F-99

City of Santa Barbara Two-Year Financial Plan & Annual Budget
FINANCE PROGRAMS
Administration Revenue & Cash Management Cashiering & Collections Licenses & Permits Budget Management
Accounting Services Payroll Accounts Payable City Billing & Customer Service Purchasing Central Warehouse Meter Reading Duplications Mail Courier Services Risk Management – Workers’
Compensation Risk Management – Liability Risk Management –
Occupational Safety & Health Risk Management –
Administrative Operations
RECENT PROGRAM ACHIEVEMENTS Published an interactive version of the City’s Comprehensive Annual Financial Report (CAFR) on the Finance Internet web page for the first time.
P R O G R A M S & S E R V I C E S
F-100
Accounting Services
( P r o g r a m N o . 1 4 3 1 ) M i s s i o n S t a t e m e n t Maintain and ensure the integrity of the City’s f inancial records and audits and report f inancial information to Counci l, the publ ic, and state and federal regulatory agencies in an accurate and t imely manner.
P r o g r a m A c t i v i t i e s Establ ish and maintain an accounting system of funds, accounts, and
internal controls in accordance with Governmental Accounting Standards Board standards and General ly Accepted Accounting Principles.
Prepare year-end closing entr ies, balance, and reconci le al l funds and accounts, coordinate and communicate with City’s independent auditors, and prepare the Comprehensive Annual Financial Reports for the City and the Redevelopment Agency.
Prepare and submit f iscal reports, including compliance audits of grant funds to State and Federal agencies in an accurate and t imely manner.
Provide f inancial analysis and f iscal information to department users, management, and the City Counci l as needed.
K e y O b j e c t i v e s f o r F i s c a l Y e a r 2 0 0 6 Compile, produced, and issue the annual Comprehensive Annual
Financial Reports (CAFRs) for the City and the Redevelopment Agency within 150 days of f iscal year-end.
Receive an unqualif ied audit opinion for the annual f inancial statement audit.
Receive Government Finance Off icers Associat ion (GFOA) and Cali fornia Municipal Finance Off icers (CSMFO) awards for achievement in f inancial report ing for the City’s CAFR.
Complete 92% of monthly bank reconcil iat ions within 30 days of receiving bank statements.
Complete 92% of general ledger monthly closings within 5 working days of month-end.
Complete and submit 91% of monthly inter im f inancial reports to City Counci l within 45 days of month-end.
Reduce the number of bound copies of the RDA and City CAFRs printed for distr ibut ion by 25% by issuing electronic versions of the reports (via CD, email, or Internet access).
Complete and f i le the required annual disclosure reports for al l debt issues prior to February 15.

K e y O b j e c t i v e s f o r F i s c a l Y e a r 2 0 0 6 ( c o n t i n u e d )
Publish City and RDA CAFRs on the City’s Internet web page within 7 days of presentation to City Council.
Complete infrastructure asset capital izat ion by June 30, 2006, as required by GASB 34.
Conduct at least one training workshop for employees to improve their knowledge of analyzing f inancial data and/or f inancial report ing.
F i n a n c i a l a n d S t a f f i n g I n f o r m a t i o n
Actual Amended Projected Adopted Proposed
FY 2004 FY 2005 FY 2005 FY 2006 FY 2007
Authorized Positions 2.20 2.85 2.85 2.20 2.20
Hourly Employee Hours N/A 0 0 0 0
RevenuesOverhead Allocation Recovery N/A 213,958$ 213,958$ 229,958$ 239,157$ General Fund Subsidy 262,317 161,100 199,813 150,627 160,450 Total Revenue 262,317$ 375,058$ 413,771$ 380,585$ 399,607$
ExpendituresSalaries and Benefits 129,714$ 254,122$ 272,697$ 257,431$ 273,028$ Supplies and Services 131,527 120,936 126,074 120,154 121,579 Special Projects - - 15,000 - - Non-Capital Equipment 1,076 - - 3,000 5,000 Total Expenditures 262,317$ 375,058$ 413,771$ 380,585$ 399,607$
P r o g r a m P e r f o r m a n c e M e a s u r e s
Actual Projected Adopted FY 2004 FY 2005 FY 2006
Days after June 30 to issue City and RDA CAFRs 148 146 150
Unqualified audit opinions 1 1 1
Awards for achievement in financial reporting 1 2 2
Percent of bank statements completed within 30 days 17% 92% 92%
Percent of general ledger closings completed within 5 working days of month-end N/A 92% 92%
Percent of interim reports submitted to Council within 45 days N/A N/A 91%
Audit adjustments required by independent auditor 3 2 3
Journal entries posted N/A N/A 480
Bound copies of the CAFR distributed N/A N/A 135
Electronic copies of the CAFR distributed N/A N/A 45
F-101

City of Santa Barbara Two-Year Financial Plan & Annual Budget
FINANCE PROGRAMS
Administration Revenue & Cash Management Cashiering & Collections Licenses & Permits Budget Management Accounting Services
Payroll Accounts Payable City Billing & Customer Service Purchasing Central Warehouse Meter Reading Duplications Mail Courier Services Risk Management – Workers’
Compensation Risk Management – Liability Risk Management –
Occupational Safety & Health Risk Management –
Administrative Operations
RECENT PROGRAM ACHIEVEMENTS Direct Deposit form improved and added to Intranet. Separate Family Sick Leave/Sick Leave calculations modified and added to pay stubs. Social Security Numbers eliminated from 6 department reports.
P R O G R A M S & S E R V I C E S
F-102
Payroll
( P r o g r a m N o . 1 4 3 2 ) M i s s i o n S t a t e m e n t Pay City employees and benefit providers accurately and t imely, and ensure compliance with federal and state laws and regulat ions.
P r o g r a m A c t i v i t i e s Perform audit and data entry of t imesheets.
Make tax payments and f i le quarterly tax reports.
Reconci le payroll deductions and benefits payable to the general ledger.
Reconci le bi l l ing statements with receivables and payroll withholdings by person for current and former employees and ret irees.
Pay benef it providers.
Process payments to the Public Employees Retirement System (PERS) and reconci le to reports and payroll withholdings.
Maintain the payrol l system to ref lect annual changes in tax tables, employee contracts, dues, or other i tems for paycheck accuracy.
Perform electronic fund transfers for direct deposits, PERS, deferred compensation, and taxes.
Provide customer service to al l City employees, departments, and benefit providers.
Implement technological enhancements to improve payrol l processing eff iciency.
K e y O b j e c t i v e s f o r F i s c a l Y e a r 2 0 0 6 Process and pay payrol l accurately and t imely 99.9% of the t ime.
Achieve a 94% accuracy rate of submitted t imesheets during the f iscal year.
Reconci le 60% of insurance bil l ings within 30 days of receipt from company.
Audit and, i f necessary, update 52 of 92 payrol l reports to improve effect iveness and usefulness of reports.
Determine the feasibi l i ty and cost effect iveness of using electronic t imesheets for citywide payroll t imecard entry.

K e y O b j e c t i v e s f o r F i s c a l Y e a r 2 0 0 6 ( c o n t i n u e d )
Implement two new automated procedures as requested by employees in the February 2004 payroll survey.
Prepare 2005 W-2 forms for distr ibution by January 17, 2006.
Reconci le al l payroll tax and l iabi l i ty accounts and adjust the general ledger as necessary by June 30, 2006.
F i n a n c i a l a n d S t a f f i n g I n f o r m a t i o n
Actual Amended Projected Adopted Proposed
FY 2004 FY 2005 FY 2005 FY 2006 FY 2007
Authorized Positions 2.45 2.45 2.45 2.45 2.45
Hourly Employee Hours N/A 0 0 0 0
RevenuesOverhead Allocation Recovery N/A 115,048$ 115,048$ 156,225$ 162,474$ General Fund Subsidy 319,465 255,786 248,289 232,304 242,244 Total Revenue 319,465$ 370,834$ 363,337$ 388,529$ 404,718$
ExpendituresSalaries and Benefits 173,600$ 186,617$ 179,101$ 200,137$ 211,101$ Supplies and Services 145,865 184,217 184,236 188,392 193,617 Total Expenditures 319,465$ 370,834$ 363,337$ 388,529$ 404,718$
P r o g r a m P e r f o r m a n c e M e a s u r e s
Actual Projected Adopted FY 2004 FY 2005 FY 2006
Accuracy rate of timesheet data entry 99.92% 99.91% 99.9%
Accuracy rate of timecards submitted by departments N/A 95% 94%
Percent of insurance billings balanced within 30 days N/A N/A 60%
Dollar value of benefits and withholding accounts reconciled bi-weekly per payroll staff member $2,836,000 $3,200,000 $3,300,000
City employees per payroll staff 770 653 655
Program cost per paycheck issued $7.80 $8.65 $8.75
Program cost per timesheet processed N/A N/A $8.50
W-2's issued annually 2,032 2,072 2,100
Percent of staff hours worked per quarter N/A 83.5% 85%
F-103

City of Santa Barbara Two-Year Financial Plan & Annual Budget
FINANCE PROGRAMS
Administration Revenue & Cash Management Cashiering & Collections Licenses & Permits Budget Management Accounting Services Payroll
Accounts Payable City Billing & Customer Service Purchasing Central Warehouse Meter Reading Duplications Mail Courier Services Risk Management – Workers’
Compensation Risk Management – Liability Risk Management –
Occupational Safety & Health Risk Management –
Administrative Operations
RECENT PROGRAM ACHIEVEMENTS Accounts Payable dataset was updated to change primary payment address to vendor selection address. Annual 1099-MISC forms were printed and distributed on January 11, 2005.
P R O G R A M S & S E R V I C E S
F-104
Accounts Payable
( P r o g r a m N o . 1 4 3 3 ) M i s s i o n S t a t e m e n t Process and issue payments to City vendors to ensure t imely and accurate payment for materials, suppl ies, and services received.
P r o g r a m A c t i v i t i e s Perform audit and data entry of claims submitted for payment.
Make State sales tax payments and f i le quarterly reports.
Init iate monthly independent contractor report ing by diskette.
Review claims for accounts payable and purchasing policy compliance.
Maintain f i les for al l City payments to vendors.
Review and adjust claims for vendor discounts when available.
Provide customer service to departments and vendors.
Perform dai ly ‘Posit ive Pay’ check disbursement reports to the bank.
K e y O b j e c t i v e s f o r F i s c a l Y e a r 2 0 0 6 Issue 99% of vendor payments within 2 working days of receipt of claim
for payment.
Issue 99% of payments error free to vendors.
Audit and, i f necessary, update 5 addit ional accounts payable reports to improve effect iveness and usefulness of reports.
Complete an audit/analysis of accounts payable processing and procedures to determine the potent ial for enhancements, and implement enhancement f indings by working with the Information Systems Division.
Prepare 2005 1099-MISC forms for distr ibution by January 17, 2006.
Develop and conduct an accounts payable departmental user training survey to determine City-wide training needs and provide training.

F i n a n c i a l a n d S t a f f i n g I n f o r m a t i o n
Actual Amended Projected Adopted Proposed
FY 2004 FY 2005 FY 2005 FY 2006 FY 2007
Authorized Positions 1.75 1.75 1.75 1.75 1.75
Hourly Employee Hours N/A 0 0 0 0
RevenuesOverhead Allocation Recovery N/A 115,198$ 115,198$ 114,470$ 119,049$ General Fund Subsidy 188,713 76,240 78,513 91,284 93,823 Total Revenue 188,713$ 191,438$ 193,711$ 205,754$ 212,872$
ExpendituresSalaries and Benefits 112,368$ 120,187$ 118,961$ 130,398$ 135,670$ Supplies and Services 76,345 71,251 74,750 75,356 77,202 Total Expenditures 188,713$ 191,438$ 193,711$ 205,754$ 212,872$
P r o g r a m P e r f o r m a n c e M e a s u r e s
Actual Projected Adopted FY 2004 FY 2005 FY 2006
Percent of payments issued within 2 working days after receipt of claim N/A 100% 99%
Percent of payments issued error free to vendors N/A 99.5% 99%
Invoices processed N/A 58,600 59,000
Program cost per payment issued $7.39 $8.25 $8.50
Percentage of available discounts taken by departments 28.18% 15.3% 15%
Percentage of discounts taken by A/P staff 63.06% 60.85% 62%
Total value of discounts available N/A N/A $9,200
Total value of discounts utilized N/A N/A $7,000
F-105

City of Santa Barbara Two-Year Financial Plan & Annual Budget
FINANCE PROGRAMS
Administration Revenue & Cash Management Cashiering & Collections Licenses & Permits Budget Management Accounting Services Payroll Accounts Payable
City Billing & Customer Service Purchasing Central Warehouse Meter Reading Duplications Mail Courier Services Risk Management – Workers’
Compensation Risk Management – Liability Risk Management –
Occupational Safety & Health Risk Management –
Administrative Operations
RECENT PROGRAM ACHIEVEMENTS Successfully conducted a customer satisfaction survey and learned that 95% of our customers expressed an overall positive experience when dealing with our office.
P R O G R A M S & S E R V I C E S
F-106
City Bil l ing & Customer
Service
( P r o g r a m N o . 1 4 3 4 ) M i s s i o n S t a t e m e n t Accurately bi l l customers on behalf of City departments, ensure the t imely collect ion of related revenues, and respond to customer inquir ies in a courteous and professional manner.
P r o g r a m A c t i v i t i e s Prepare and mail annually approximately 360,000 consol idated ut i l i ty
bi l ls for water, wastewater, and refuse col lect ion services.
Prepare and mail approximately 27,000 addit ional bi l ls for a variety of City fees, services and reimbursements annually, working closely with other City departments.
Provide customer service by handling approximately 25,000 customer inquir ies annually via telephone and walk-in counter support.
Maintain and manage an automatic payment option for customers to have their bi l ls paid automatical ly from their checking account.
Process approximately 10,000 service orders to ut i l i ty customer accounts, including customer updates, water meter reading verif icat ion, bi l l col lect ion efforts, and water service changes.
K e y O b j e c t i v e s f o r F i s c a l Y e a r 2 0 0 6 Issue 90% of refunds due on closed water accounts within 30 days.
Accurately input 95% newly created auto-payment account information for ut i l i ty bi l l ing and harbor sl ip customers.
Notify Extraordinary Water use appl icants of credit determination within 45 days of appl icat ion’s receipt.
Complete an analysis of Extraordinary Water Use applicat ions received and quantify the f inancial impact of the credits granted.
Assess the number and dol lar amount of del inquent customer accounts sent to our collect ion agency and perform analysis of the recovered dol lar amount.
Develop a tracking method for monitor ing Ut i l i ty Bi l l ing accuracy by February 28, 2006.

F i n a n c i a l a n d S t a f f i n g I n f o r m a t i o n
Actual Amended Projected Adopted Proposed
FY 2004 FY 2005 FY 2005 FY 2006 FY 2007
Authorized Positions 3.60 3.60 3.60 3.75 3.75
Hourly Employee Hours N/A 0 0 0 0
RevenuesOverhead Allocation Recovery N/A 559,653$ 559,653$ 607,061$ 631,343$ General Fund Subsidy 517,123 - - - - Total Revenue 517,123$ 559,653$ 559,653$ 607,061$ 631,343$
ExpendituresSalaries and Benefits 206,790$ 252,745$ 257,958$ 291,556$ 302,118$ Supplies and Services 310,087 306,881 278,861 288,612 292,871 Special Projects 246 - - - - Total Expenditures 517,123$ 559,626$ 536,819$ 580,168$ 594,989$
P r o g r a m P e r f o r m a n c e M e a s u r e s
Actual Projected Adopted FY 2004 FY 2005 FY 2006
Percentage of water refunds issued within 30 days of account being closed N/A 90% 90%
Accuracy rate of customer account auto-payment data entry N/A 95% 95%
Percent of Extraordinary Water Use applicants notified of credit determination within 45 days of receipt N/A N/A 95%
Bills issued monthly 32,111 32,000 31,980
Cost per bill issued $1.33 $1.42 $1.63
Service orders prepared monthly 1,062 1,088 1,000
Phone calls received from customers monthly 2,288 2,350 2,600
Customers on automatic pay including utility bills and harbor slips 3,977 4,400 4,300
F-107

City of Santa Barbara Two-Year Financial Plan & Annual Budget
FINANCE PROGRAMS
Administration Revenue & Cash Management Cashiering & Collections Licenses & Permits Budget Management Accounting Services Payroll Accounts Payable City Billing & Customer Service
Purchasing Central Warehouse Meter Reading Duplications Mail Courier Services Risk Management – Workers’
Compensation Risk Management – Liability Risk Management –
Occupational Safety & Health Risk Management –
Administrative Operations
RECENT PROGRAM ACHIEVEMENTS Purchasing staff bid 84% of Blanket Purchase Orders exceeding $50,000 to ensure that the City was receiving competitively priced services and materials.
P R O G R A M S & S E R V I C E S
F-108
Purchasing
( P r o g r a m N o . 1 4 4 1 )
M i s s i o n S t a t e m e n t Competit ively purchase qual ity goods and services that meet department specif ications in a t imely and cost effect ive manner in accordance with the Municipal Code.
P r o g r a m A c t i v i t i e s Prepare Quick Quote, Bid, and Proposal packages, and advert ise and
solicit for competit ive bids to supply goods, materials and services to meet the City’s needs.
Uti l ize State contracts for cooperat ive purchases when State goods and materials meet department specif icat ions and needs.
Rout inely review warehouse stock for quant ity re-order levels and adjust as appropriate.
Dispose of surplus City property.
K e y O b j e c t i v e s f o r F i s c a l Y e a r 2 0 0 6 Re-bid 85% of Blanket Purchase Orders over $50,000 to ensure that
the City is receiving competit ively pr iced services and materials.
Process informal requests into purchase orders within an average of 30 calendar days.
Process formal requests into purchase orders within an average of 75 calendar days.
Achieve an 80% customer satisfact ion rat ing for purchasing operat ions.
Evaluate Purchasing Code revisions to determine if raising the bid thresholds would be eff ic ient.
Provide a purchasing training workshop to employees as part of the City’s Learning for Excel lence an Achievement Program (LEAP) through quarterly orientat ions and an annual course.
Develop a computerized “Bidder’s List.”

F i n a n c i a l a n d S t a f f i n g I n f o r m a t i o n
Actual Amended Projected Adopted Proposed
FY 2004 FY 2005 FY 2005 FY 2006 FY 2007
Authorized Positions 5.75 4.75 4.75 4.75 4.75
Hourly Employee Hours N/A 300 300 300 300
RevenuesOverhead Allocation Recovery N/A 230,894$ 230,894$ 361,587$ 376,051$ General Fund Subsidy 327,368 278,118 247,294 200,306 193,985 Total Revenue 327,368$ 509,012$ 478,188$ 561,893$ 570,036$
ExpendituresSalaries and Benefits 257,801$ 430,654$ 402,231$ 473,425$ 477,134$ Supplies and Services 69,567 78,358 75,957 85,720 87,902 Equipment Capital - - - 2,748 5,000 Total Expenditures 327,368$ 509,012$ 478,188$ 561,893$ 570,036$
P r o g r a m P e r f o r m a n c e M e a s u r e s
Actual Projected Adopted FY 2004 FY 2005 FY 2006
Percent of Blanket Purchase Orders over $50,000 re-bid 0% 85% 85%
Days to process informal requisitions into purchase orders N/A N/A 30
Days to process formal requisitions into purchase orders N/A N/A 75
Customer satisfaction rating for Purchasing Services N/A N/A 80%
Purchase Orders (all categories) issued, including change orders 6,151 6,300 5,000
Cash Purchase Orders (CPO) issued for routine services and supplies under $500 1,368 1,850 550
Purchase Orders (PO) issued for routine services and supplies over $500 1,955 1,800 1,800
Blanket Purchase Orders (BPO) issued for ordinary services and supplies
1,383 1,200 1,200
Purchase Orders (PS) issued for Professional Services 297 350 350
Change Orders (CO) issued 1,148 1,150 1,150
Request for Proposals/Qualifications (RFPs/RFQs) advertised 7 8 8
Bids for Ordinary Services and/or Materials N/A 90 90
Average Purchase Orders processed per Buyer (3 Buyers) 1,947 2,100 1,675
F-109

City of Santa Barbara Two-Year Financial Plan & Annual Budget
FINANCE PROGRAMS
Administration Revenue & Cash Management Cashiering & Collections Licenses & Permits Budget Management Accounting Services Payroll Accounts Payable City Billing & Customer Service Purchasing
Central Warehouse Meter Reading Duplications Mail Courier Services Risk Management – Workers’
Compensation Risk Management – Liability Risk Management –
Occupational Safety & Health Risk Management –
Administrative Operations
RECENT PROGRAM ACHIEVEMENTS All inventory shelves were labeled with stock numbers, product description, and assigned an aisle number.
P R O G R A M S & S E R V I C E S
F-110
Central Warehouse
( P r o g r a m N o . 1 4 4 2 ) M i s s i o n S t a t e m e n t Competit ively purchase inventory and issue qual ity goods that meet department specif icat ions in support of routine and emergency City operat ions, and dispose of City surplus in accordance with the Municipal Code.
P r o g r a m A c t i v i t i e s Prepare Quick Quote, Bid and Proposal packages, advert ise and solici t
for competit ive bids to supply goods, materials and services to meet the City’s needs.
Uti l ize State contracts for cooperat ive purchases when State goods and materials meet department specif icat ions and needs.
Rout inely review warehouse stock for quant ity re-order levels and adjust as appropriate.
Dispose of surplus City property.
K e y O b j e c t i v e s f o r F i s c a l Y e a r 2 0 0 6 Maintain the accuracy of the monthly inventory count within 2%.
Process and f i l l 98% of issue requisit ions within the promised t imeframe.
Complete monthly inventory within 1 working day.
Evaluate the impact, feasibi l i ty, and cost savings of direct shipments of custodial suppl ies by vendors to City facil i t ies.

F i n a n c i a l a n d S t a f f i n g I n f o r m a t i o n
Actual Amended Projected Adopted Proposed
FY 2004 FY 2005 FY 2005 FY 2006 FY 2007
Authorized Positions 1.55 1.65 1.65 1.65 1.65
Hourly Employee Hours N/A 0 0 0 0
RevenuesOverhead Allocation Recovery N/A 90,991$ 90,991$ 105,389$ 109,604$ General Fund Subsidy 226,486 45,484 46,796 38,754 41,848 Total Revenue 226,486$ 136,475$ 137,787$ 144,143$ 151,452$
ExpendituresSalaries and Benefits 194,743$ 103,581$ 104,753$ 112,180$ 118,775$ Supplies and Services 28,447 32,894 33,034 31,963 32,677 Special Projects 3,296 - - - - Total Expenditures 226,486$ 136,475$ 137,787$ 144,143$ 151,452$
P r o g r a m P e r f o r m a n c e M e a s u r e s
Actual Projected Adopted FY 2004 FY 2005 FY 2006
Accuracy percentage of monthly inventory N/A N/A 98%
Issue requisitions processed within the promised timeframe N/A 98% 98%
Monthly inventories completed within 1 working day N/A 10 10
F-111
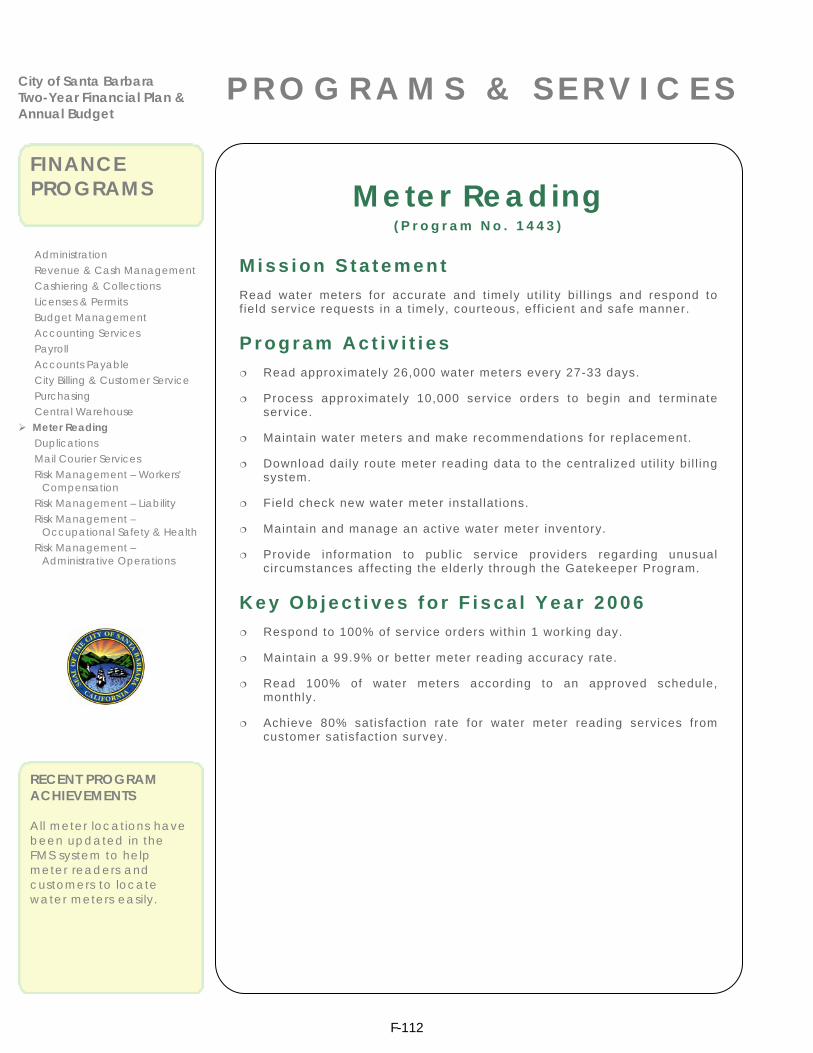
City of Santa Barbara Two-Year Financial Plan & Annual Budget
FINANCE PROGRAMS
Administration Revenue & Cash Management Cashiering & Collections Licenses & Permits Budget Management Accounting Services Payroll Accounts Payable City Billing & Customer Service Purchasing Central Warehouse
Meter Reading Duplications Mail Courier Services Risk Management – Workers’
Compensation Risk Management – Liability Risk Management –
Occupational Safety & Health Risk Management –
Administrative Operations
RECENT PROGRAM ACHIEVEMENTS All meter locations have been updated in the FMS system to help meter readers and customers to locate water meters easily.
P R O G R A M S & S E R V I C E S
F-112
Meter Reading
( P r o g r a m N o . 1 4 4 3 ) M i s s i o n S t a t e m e n t Read water meters for accurate and t imely ut i l i ty bi l l ings and respond to f ield service requests in a t imely, courteous, eff icient and safe manner.
P r o g r a m A c t i v i t i e s Read approximately 26,000 water meters every 27-33 days.
Process approximately 10,000 service orders to begin and terminate service.
Maintain water meters and make recommendations for replacement.
Download dai ly route meter reading data to the central ized ut i l i ty bi l l ing system.
Field check new water meter instal lat ions.
Maintain and manage an act ive water meter inventory.
Provide information to public service providers regarding unusual circumstances affect ing the elderly through the Gatekeeper Program.
K e y O b j e c t i v e s f o r F i s c a l Y e a r 2 0 0 6 Respond to 100% of service orders within 1 working day.
Maintain a 99.9% or better meter reading accuracy rate.
Read 100% of water meters according to an approved schedule, monthly.
Achieve 80% satisfaction rate for water meter reading services from customer sat isfact ion survey.

F i n a n c i a l a n d S t a f f i n g I n f o r m a t i o n
Actual Amended Projected Adopted Proposed
FY 2004 FY 2005 FY 2005 FY 2006 FY 2007
Authorized Positions 5.60 5.65 5.65 5.65 5.65
Hourly Employee Hours N/A 0 0 0 0
RevenuesOverhead Allocation Recovery N/A 378,143$ 378,143$ 448,994$ 466,953$ General Fund Subsidy 399,332 30,738 32,391 - - Total Revenue 399,332$ 408,881$ 410,534$ 448,994$ 466,953$
ExpendituresSalaries and Benefits 355,275$ 360,556$ 360,207$ 381,729$ 394,551$ Supplies and Services 44,057 48,325 50,327 55,961 57,233 Total Expenditures 399,332$ 408,881$ 410,534$ 437,690$ 451,784$
P r o g r a m P e r f o r m a n c e M e a s u r e s
Actual Projected Adopted FY 2004 FY 2005 FY 2006
Percent of service calls responded to within 1 working day 100% 100% 100%
Accuracy rate of meters read 99% 99% 99.9%
Percent of meters read according to schedule 100% 100% 100%
Satisfaction rating of customers N/A N/A 80%
Percent of missed reads completed within two working days 100% 100% 100%
Return visits for missed reads annually N/A 800 800
Meters turned off for non-payment 1,078 1,200 1,200
Meters read annually 310,680 310,680 312,660
Meters read per month per meter reader N/A 5,178 5,211
Cost per meter read N/A N/A $12.30
F-113

City of Santa Barbara Two-Year Financial Plan & Annual Budget
FINANCE PROGRAMS
Administration Revenue & Cash Management Cashiering & Collections Licenses & Permits Budget Management Accounting Services Payroll Accounts Payable City Billing & Customer Service Purchasing Central Warehouse Meter Reading
Duplications Mail Courier Services Risk Management – Workers’
Compensation Risk Management – Liability Risk Management –
Occupational Safety & Health Risk Management –
Administrative Operations
RECENT PROGRAM ACHIEVEMENTS Processed a high percentage of orders in-house reducing the time between ordering and completion as well as cost effective means for our customers.
P R O G R A M S & S E R V I C E S
F-114
Duplications
( P r o g r a m N o . 1 4 5 1 ) M i s s i o n S t a t e m e n t Provide quality, ful l-service print ing, copying, and post-press services through a combinat ion of both in-house and contract resources in a t imely, conf idential, and cost-effect ive manner.
P r o g r a m A c t i v i t i e s Provide typesett ing, design, and layout services.
Produce brochures, f lyers, forms, manuals, and stat ionery for al l city departments.
Perform f inishing operations such as folding, col lat ing, stapl ing, dr i l l ing, and binding.
Write specif icat ions for printing orders sent to outside vendors.
Prepare cost est imates and bi l l departments for services provided.
Print ut i l i ty bi l l ings and prepare them for mail ing.
Review informational brochure outl ining services provided by Duplications and update as necessary.
K e y O b j e c t i v e s f o r F i s c a l Y e a r 2 0 0 6 Process at least 97% of service requests in-house to ensure effect ive
uti l ization of duplicating staff.
Complete 95% of print ing and copying orders within the promised t imeframe.
Update the f iscal year 2007 fee schedule for dupl icat ing services by June 15, 2006.
Implement service improvements for dupl icating services based on comments received from a customer satisfact ion survey.

F i n a n c i a l a n d S t a f f i n g I n f o r m a t i o n
Actual Amended Projected Adopted Proposed
FY 2004 FY 2005 FY 2005 FY 2006 FY 2007
Authorized Positions 2.10 2.00 2.00 2.00 2.00 Hourly Employee Hours N/A 0 0 0 0
RevenuesFees and Service Charges 208,351$ 233,950$ 183,810$ 180,000$ 175,000$ Other Revenue 66,132 64,658 64,658 117,558 127,727 Total Revenue 274,483$ 298,608$ 248,468$ 297,558$ 302,727$
ExpendituresSalaries and Benefits 147,860$ 144,175$ 144,529$ 158,738$ 164,654$ Supplies and Services 174,130 154,680 132,306 138,820 138,073 Total Expenditures 321,990$ 298,855$ 276,835$ 297,558$ 302,727$
Addition to (Use of) Reserves (47,507)$ (247)$ (28,367)$ -$ -$
P r o g r a m P e r f o r m a n c e M e a s u r e s
Actual Projected Adopted FY 2004 FY 2005 FY 2006
Percent of service requests processed in-house 98% 97% 97%
Percent of printing and copying orders completed within promised timeframe 96% 95% 95%
Average cost per black and white copy (single-sided / double-sided) $ 0.03 / 0.06 $ 0.03 / 0.06 $ 0.03 / 0.06
Average cost per color copy (single-sided / double-sided) $ 0.30 / 0.60 $ 0.30 / 0.60 $ 0.30 / 0.60
Average days to complete service orders 2.9 3.0 3
Duplications service requests and total number of copies 1,729/ 2,400,000
1,400/ 1,700,000
1,400/ 2,000,000
Utility billing mailings and total number of pieces processed 850/ 402,687
725/ 412,000
720/ 410,000
F-115

City of Santa Barbara Two-Year Financial Plan & Annual Budget
FINANCE PROGRAMS
Administration Revenue & Cash Management Cashiering & Collections Licenses & Permits Budget Management Accounting Services Payroll Accounts Payable City Billing & Customer Service Purchasing Central Warehouse Meter Reading Duplications
Mail Courier Services Risk Management – Workers’
Compensation Risk Management – Liability Risk Management –
Occupational Safety & Health Risk Management –
Administrative Operations
RECENT PROGRAM ACHIEVEMENTS Increased the number of presorted mail sent, increasing the financial savings to the City.
P R O G R A M S & S E R V I C E S
F-116
Mail Courier Services
( P r o g r a m N o . 1 4 5 2 ) M i s s i o n S t a t e m e n t Collect and distr ibute U.S. Postal Service and interdepartmental mail to al l City departments for eff iciency, convenience, and savings real ized through bulk and presort mail rates.
P r o g r a m A c t i v i t i e s Col lect the City’s United States Postal Service (U.S.P.S.) mail from the
U.S. Post Off ice twice daily.
Provide interoff ice mail courier service to City off ices and selected outside agencies.
Process outgoing U.S.P.S. mail dai ly, ut i l iz ing pre-sort standards on mail qual ifying for discount rates.
Review informational brochure outl ining mail courier services and update as necessary.
K e y O b j e c t i v e s f o r F i s c a l Y e a r 2 0 0 6 Send 85% of outgoing U.S.P.S. mail at the discounted presort rate.
Provide mail courier services according to an approved mail service schedule 98% of the t ime.
Track savings to the City through the use of other del ivery services (UPS).
Complete an evaluation of the effect iveness of merging the Mail Courier Services program with the Warehouse program.
Implement service improvements for mail courier services based on comments received from a customer sat isfact ion service survey.

F i n a n c i a l a n d S t a f f i n g I n f o r m a t i o n
Actual Amended Projected Adopted Proposed
FY 2004 FY 2005 FY 2005 FY 2006 FY 2007
Authorized Positions 1.00 1.10 1.10 1.10 1.10
Hourly Employee Hours N/A 0 0 0 0
RevenuesOther Revenue 59,846$ 66,870$ 66,870$ 87,505$ 89,239$ Total Revenue 59,846$ 66,870$ 66,870$ 87,505$ 89,239$
ExpendituresSalaries and Benefits 30,140$ 49,405$ 52,507$ 59,699$ 63,868$ Supplies and Services 12,468 17,465 17,897 27,806 25,371 Total Expenditures 42,608$ 66,870$ 70,404$ 87,505$ 89,239$
P r o g r a m P e r f o r m a n c e M e a s u r e s
Actual Projected Adopted FY 2004 FY 2005 FY 2006
Percent of mail processed at presort rates 75% 83% 85%
Percent of mail stops completed 98% 99% 98%
Pieces of outgoing U.S.P.S. mail processed 516,757 650,000 650,000
Pieces of interoffice mail and correspondence 26,430 26,000 25,000
Dollar savings to City using presort mailings $13,407 $25,000 $24,000
Labor cost per piece of outgoing U.S.P.S. mail $0.07 $0.05 $0.10
F-117

City of Santa Barbara Two-Year Financial Plan & Annual Budget
FINANCE PROGRAMS
Administration Revenue & Cash Management Cashiering & Collections Licenses & Permits Budget Management Accounting Services Payroll Accounts Payable City Billing & Customer Service Purchasing Central Warehouse Meter Reading Duplications Mail Courier Services
Risk Management – Workers’ Compensation
Risk Management – Liability Risk Management –
Occupational Safety & Health Risk Management –
Administrative Operations
RECENT PROGRAM ACHIEVEMENTS TBA Reduced medical costs paid by 54%. Reduced indemnity claim costs by over $300,000. Closed 215 claims. Reduced excess insurance premium by 30% over 2 fiscal years.
P R O G R A M S & S E R V I C E S
F-118
Workers’ Compensation
( P r o g r a m N o . 1 4 6 1 ) M i s s i o n S t a t e m e n t Provide workers’ compensation benefits to el igible employees, ensure compliance with federal and state regulat ions, and minimize associated costs.
P r o g r a m A c t i v i t i e s Col lect, maintain, and analyze loss data.
Ensure compliance with federal and California laws; monitor legislat ion, legal opinions, and case law for changes.
Invest igate, evaluate, and authorize al l new lost t ime claims.
Approve the use of salary cont inuat ion.
Approve expenditures, evaluate and recommend sett lement proposals, and obtain approval for sett lement payments.
Ensure that the third party administrator completes al l required elements of contracts.
Assist outside legal counsel to defend claims and coordinate subrogat ion recovery.
Notify management of any permanent work restr ict ion for injured employees and evaluate industr ial disabi l i ty ret irement applicat ions.
Assist managers and supervisors to return an injured employee to regular or modif ied duty and develop a modif ied duty contract.
Respond to employee, supervisor, and management inquir ies; provide training on workers’ compensation.
K e y O b j e c t i v e s f o r F i s c a l Y e a r 2 0 0 6 Conduct semi-annual claim reviews with the four departments with the
highest claim frequency during f iscal year 2005 and annually with the remaining departments.
Increase the use of modif ied work duty to 625 days.
Complete the investigation on 50% of the industr ial injur ies with lost t ime within 45 days of knowledge.
Complete contract audit of Third Party Administrator by December 31, 2005.
Conduct two Risk Awareness classes for the LEAP Program by June 30, 2006.

K e y O b j e c t i v e s f o r F i s c a l Y e a r 2 0 0 6 ( c o n t i n u e d ) Ensure that claim administrator sends loss data to nationwide publ ic entity stat ist ical
clearinghouse to part ic ipate in nat ional benchmarking effort by June 30, 2006.
Complete the evaluation on the merits of implementing a Medical Panel Network.
F i n a n c i a l a n d S t a f f i n g I n f o r m a t i o n
Actual Amended Projected Adopted Proposed
FY 2004 FY 2005 FY 2005 FY 2006 FY 2007
Authorized Positions 1.75 1.55 1.55 1.55 1.55
Hourly Employee Hours N/A 80 80 80 80
RevenuesWorkers Compensation Premiums 3,374,303$ 3,370,716$ 3,370,716$ 3,747,010$ 3,875,260$ Other Revenue 126,148 - - - - Total Revenue 3,500,451$ 3,370,716$ 3,370,716$ 3,747,010$ 3,875,260$
ExpendituresSalaries and Benefits 161,083$ 158,084$ 158,355$ 151,434$ 157,120$ Supplies and Services 2,704,815 3,276,782 3,182,248 3,595,576 3,718,140 Transfers Out - 1,368 1,368 - - Non-Capital Equipment 957 1,500 600 - - Total Expenditures 2,866,855$ 3,437,734$ 3,342,571$ 3,747,010$ 3,875,260$
Addition to (Use of) Reserves 633,596$ (67,018)$ 28,145$ -$ -$
P r o g r a m P e r f o r m a n c e M e a s u r e s
Actual Projected Adopted FY 2004 FY 2005 FY 2006
Review of open claims conducted with the department N/A 8 17
Temporary Total Disability days not paid N/A 600 625
Percent of industrial injuries, with lost work time, investigated within 45 days of knowledge 59% 50% 50%
Total annual claim costs (paid and reserved) $1,630,328 $1,280,000 $1,319,513
Annual gross amount of medical costs billed (all open claims) $2,387,244 $2,100,000 $2,252,867
Annual gross medical amount of costs paid (all open claims) $915,471 $1,250,000 $969,818
Annual cost of professional medical bill review services (all open claims) $114,597 $101,000 $102,654
Claims filed 193 205 195
Open claims all years at fiscal year end 238 225 214
Litigation Ratio (active litigated claims/number of open claims; all years) N/A 20% 20%
Percent of claims filed without lost time 44% 40% 45%
Percent of eligible industrial injury employees on modified duty 76% 65% 70%
F-119

City of Santa Barbara Two-Year Financial Plan & Annual Budget
FINANCE PROGRAMS
Administration Revenue & Cash Management Cashiering & Collections Licenses & Permits Budget Management Accounting Services Payroll Accounts Payable City Billing & Customer Service Purchasing Central Warehouse Meter Reading Duplications Mail Courier Services Risk Management – Workers’
Compensation Risk Management – Liability
Risk Management – Occupational Safety & Health
Risk Management – Administrative Operations
RECENT PROGRAM ACHIEVEMENTS The number of claims filed and costs incurred decreased from fiscal year 2003 to fiscal year 2004. The number of City vehicle accidents and costs incurred for City related vehicle accidents also decreased during the same period.
P R O G R A M S & S E R V I C E S
F-120
Liabil ity
( P r o g r a m N o . 1 4 6 2 ) M i s s i o n S t a t e m e n t Prudently investigate City incidents and adjust damage claims, correct potent ial hazards, and provide loss prevention training.
P r o g r a m A c t i v i t i e s Administer incident and claims procedures.
Investigate departmental act ivit ies relat ive to claimed damages.
Pay or deny claims and communicate f indings to claimants.
Represent the City in small c laims court.
Request and track hazard mit igation throughout City act ivit ies.
Provide tai lored loss prevention classes to City personnel.
Consult with departments to assess workplace security needs.
Obtain preventabil i ty reports of vehicle and equipment damage from appropriate departments.
Organize defensive driving classes and materials.
Report loss amounts monthly and annually.
Assess and provide needed loss prevention training.
Respond to cit izen and publ ic requests for assistance.
K e y O b j e c t i v e s f o r F i s c a l Y e a r 2 0 0 6 Complete 90% of claim investigat ions within 45 days.
Route 90% of public hazard concerns to appropriate department within 2 working days.
Reduce preventable f leet coll is ions from 71 (FY 04) to 67.
Conduct two departmental workplace security assessments and implement recommendations.
Conduct two Risk Management classes for the LEAP program by June 30, 2006.
Ensure that claim administrator sends loss data to nationwide publ ic entity claim stat ist ic clearinghouse by June 30, 2006 to part icipate in benchmarking study.
Update f leet l iabil i ty I l lness Prevention Program sections by March 31, 2006.

F-121
F i n a n c i a l a n d S t a f f i n g I n f o r m a t i o n
Actual Amended Projected Adopted Proposed
FY 2004 FY 2005 FY 2005 FY 2006 FY 2007
Authorized Positions 1.30 1.10 1.10 1.10 1.10
Hourly Employee Hours N/A 80 80 80 80
RevenuesLiability Insurance Premiums 766,050$ 1,224,163$ 1,224,163$ 1,560,366$ 1,562,694$ ACCEL- Return of Premium 16,140 - - - - Other Revenue 13,710 - - - - Total Revenue 795,900$ 1,224,163$ 1,224,163$ 1,560,366$ 1,562,694$
ExpendituresSalaries and Benefits 110,898$ 125,989$ 124,976$ 121,530$ 126,384$ Supplies and Services 368,092 1,199,898 1,132,317 1,437,458 1,436,310 Transfers Out - - - 1,378 - Non-Capital Equipment 1,989 1,625 600 - - Total Expenditures 480,979$ 1,327,512$ 1,257,893$ 1,560,366$ 1,562,694$
Addition to (Use of) Reserves 314,921$ (103,349)$ (33,730)$ -$ -$
P r o g r a m P e r f o r m a n c e M e a s u r e s
Actual Projected Adopted FY 2004 FY 2005 FY 2006
Percentage of claims acted upon within 45 days of receipt 90% 90% 90%
Percentage of public hazard complaints routed to appropriate departments, within 2 working days of receipt N/A N/A 90%
Preventable City vehicle collisions N/A N/A 67
Liability claims filed during the quarter 156 170 160
Total current open claims N/A 100 100
Total annual claim costs paid N/A $75,000 $75,000
Percent of annual claims filed resulting in litigation N/A 10% 10%
Percent of open claims litigated (all years) 13% 18% 15%
Percentage of claims closed within 11 months of filing 93% 85% 85%
Loss prevention class attendees, including Defensive Driver Classes 336 170 210
Reported vehicle incidents 139 130 130
Percent of vehicle collisions resulting in claims 9% 10% 10%
Amount paid for preventable accidents N/A $30,000 $30,000

City of Santa Barbara Two-Year Financial Plan & Annual Budget
FINANCE PROGRAMS
Administration Revenue & Cash Management Cashiering & Collections Licenses & Permits Budget Management Accounting Services Payroll Accounts Payable City Billing & Customer Service Purchasing Central Warehouse Meter Reading Duplications Mail Courier Services Risk Management – Workers’
Compensation Risk Management – Liability
Risk Management – Occupational Safety & Health
Risk Management – Administrative Operations
RECENT PROGRAM ACHIEVEMENTS Loss work days reduced by 15% in fiscal year 2005. Conducted a citywide facility safety inspection.
P R O G R A M S & S E R V I C E S
F-122
Occupational Safety &
Health
( P r o g r a m N o . 1 4 6 3 ) M i s s i o n S t a t e m e n t Ensure a safe work environment for the City’s employees and preserve the City’s f inancial resources through training, medical screening, and safety analysis.
P r o g r a m A c t i v i t i e s Review and update the Injury and I l lness Prevention Program (IIPP) to
conform with Occupational Safety and Health Act (OSHA) regulatory changes.
Maintain and schedule master I IPP compliance act ivit ies and other safety training regulat ions according to state law.
Provide training guidance and resources to supervisors.
Conduct a job safety analysis for job classif icat ions with most frequent work injur ies.
Respond to hazards and safety concerns identif ied by employees.
Provide loss data for monthly and annual reports.
Conduct departmental safety audits for program compliance.
Ident ify job task hazards that cause the most frequent work injur ies and recommend corrective actions.
Maintain network of internal occupational safety and health trainers.
K e y O b j e c t i v e s f o r F i s c a l Y e a r 2 0 0 6 Reduce occupational injur ies by 5%.
Maintain compliance with state and federal Occupational Safety and Health Association (OSHA) mandates.
Conduct two departmental safety audits to examine loss prevention management and organization.
Conduct Fal l Protection Training.
Coordinate department facil i ty safety inspection to identify potent ial physical hazards.

F i n a n c i a l a n d S t a f f i n g I n f o r m a t i o n
Actual Amended Projected Adopted Proposed
FY 2004 FY 2005 FY 2005 FY 2006 FY 2007
Authorized Positions 1.30 1.70 1.70 1.70 1.70
Hourly Employee Hours N/A 30 30 30 30
RevenuesOccupational Health and Safety F 217,076$ 228,744$ 228,744$ 253,162$ 289,917$ Total Revenue 217,076$ 228,744$ 228,744$ 253,162$ 289,917$
ExpendituresSalaries and Benefits 61,045$ 121,818$ 76,465$ 170,482$ 180,259$ Supplies and Services 39,850 126,046 80,861 82,680 109,658 Non-Capital Equipment 261 1,500 10,600 - - Total Expenditures 101,156$ 249,364$ 167,926$ 253,162$ 289,917$
P r o g r a m P e r f o r m a n c e M e a s u r e s
Actual Projected Adopted FY 2004 FY 2005 FY 2006
Occupational injury claims filed N/A 205 195
Percent compliance with state and federal OSHA mandates N/A < 100% <100%
Employees attending Injury and Illness Prevention Program training sessions 1,000 1,000 1,000
Ergonomic evaluations conducted 40 15 20
Safety audits conducted 0 2 2
Loss work days due to occupational injuries 3,596 3,300 3,000
Occupational Safety Trainers 130 94 94
F-123

City of Santa Barbara Two-Year Financial Plan & Annual Budget
FINANCE PROGRAMS
Administration Revenue & Cash Management Cashiering & Collections Licenses & Permits Budget Management Accounting Services Payroll Accounts Payable City Billing & Customer Service Purchasing Central Warehouse Meter Reading Duplications Mail Courier Services Risk Management – Workers’
Compensation Risk Management – Liability Risk Management –
Occupational Safety & Health Risk Management –
Administrative Operations
RECENT PROGRAM ACHIEVEMENTS Created on-line work injury reporting. Updated the Risk cost allocation plan.
P R O G R A M S & S E R V I C E S
F-124
Administrative Operations
( P r o g r a m N o . 1 4 6 4 ) M i s s i o n S t a t e m e n t Manage Risk Management division programs and assist operating departments to assess exposures to loss.
P r o g r a m A c t i v i t i e s Create and maintain r isk management information system.
Review and execute contracts, agreements, leases, and grants.
Ident ify, evaluate, and rate al l r isks of accidental loss.
Respond to employee, supervisor, and management requests for assistance.
Market and negot iate placement of commercial insurance pol icies.
Init iate investigation and recovery of costs for loss or damage to City property caused by insurable peri ls or a negl igent third party.
Notarize City and employee documents.
K e y O b j e c t i v e s f o r F i s c a l Y e a r 2 0 0 6 Ensure complet ion of 80% of Risk Management Division program
objectives.
Compile and distr ibute monthly and annual loss data reports to operat ing departments.
Create on-demand workers’ compensat ion and l iabi l i ty loss run reports for operat ing departments.
Convert Risk Management Access training database to new Learning Management System by June 30, 2006.

F i n a n c i a l a n d S t a f f i n g I n f o r m a t i o n
Actual Amended Projected Adopted Proposed
FY 2004 FY 2005 FY 2005 FY 2006 FY 2007
Authorized Positions 0.85 0.85 0.85 0.85 0.85 Hourly Employee Hours N/A 0 0 0 0
RevenuesInterest Income 136,532$ 120,000$ 155,476$ 172,000$ 186,000$ Market Valuation (99,953) - - - - Property Insurance Allocation 1,788,691 1,425,837 1,425,837 1,674,870 1,708,752 ACCEL- Return of Premium 1,294,613 190,000 - - - Other Revenue 19 - - - - Total Revenue 3,119,902$ 1,735,837$ 1,581,313$ 1,846,870$ 1,894,752$
ExpendituresSalaries and Benefits 83,106$ 91,192$ 92,192$ 103,747$ 108,853$ Supplies and Services 2,143,408 1,600,674 1,441,649 1,741,623 1,784,399 Non-Capital Equipment 751 1,500 600 1,500 1,500 Total Expenditures 2,227,265$ 1,693,366$ 1,534,441$ 1,846,870$ 1,894,752$
Addition to (Use of) Reserves 892,637$ 42,471$ 46,872$ -$ -$
P r o g r a m P e r f o r m a n c e M e a s u r e s
Actual Projected Adopted FY 2004 FY 2005 FY 2006
Percent of division objectives accomplished N/A 80% 80%
Loss data reports N/A 13 13
Dollar value of property damage and workers’ compensation expenses recovered from negligent third parties $100,000 $100,000 $100,000
Total cost of risk as percentage of total City operating and capital expenditures 3% 3% 3%
Public hazard concerns received 72 72 70
F-125

[This page intent ional ly le f t b lank. ]
F-126

D E P A R T M E N T S U M M A R Y
Fire
F-127
Provide fire protection, emergency medical rescue, and related life safety service to Santa Barbara’s citizens and visitors.
A b o u t F i r e
F i s c a l Y e a r 2 0 0 6
B u d g e t H i g h l i g h t s
With the delivery of the new
Squad-Rescue Vehicle, the
Department will be certified as
a Type 1 Urban Search and
Rescue Team by the State
Office of Emergency Services.
The certification is based on
an extensive equipment
inventory, acquired with 2
federal grants, and a rigorous
training curriculum.
The Fire Department is responsible for the protect ion of Santa Barbara from f i re and a long l is t of natural and man-made catastrophes. The Fire Department has provided cont inuous, uninterrupted service for over 123 years.
Santa Barbara is served by eight f i re stat ions and the Ci ty’s f i ref ighters respond to more than 7,000 emergency inc idents each year.
Employees conduct over 3,000 f i re inspect ions each year as part of the department ’s commitment to a f i re safe community. Plan reviews and inspect ions of a l l new construct ion help ensure the future f i re safety of Santa Barbara.
The department’s special ly t rained Airport f i ref ighters operate specif ical ly designed equipment and protect the f ly ing publ ic at the Santa Barbara Airport.

D E P A R T M E N T S U M M A R Y
Fire
F-128
D e p a r t m e n t F i n a n c i a l a n d S t a f f i n g S u m m a r y
Actual Amended Projected Adopted ProposedFY 2004 FY 2005 FY 2005 FY 2006 FY 2007
Authorized Positions 113.00 112.00 112.00 112.00 112.00Hourly Employee Hours N/A 1,040 1,040 1,016 1,016
RevenuesInterfund Reimbursements 1,153,893$ 1,352,461$ 1,392,461$ 1,466,631$ 1,546,418$ Fees and Service Charges 79,106 187,379 128,785 215,246 225,365 Grants 55,000 60,000 121,199 - - Miscellaneous 4,456 15,000 12,150 152,664 152,664 Mutual Aid Reimbursements 418,265 343,416 390,683 257,900 257,900 Prop. 172 Sales Tax - - - 133,600 139,000 General Fund Subsidy 13,247,240 14,312,840 13,923,961 15,212,264 16,007,853 Total Department Revenue 14,957,960$ 16,271,096$ 15,969,239$ 17,438,305$ 18,329,200$
ExpendituresSalaries and Benefits 13,037,573$ 14,367,959$ 14,053,359$ 15,398,428$ 16,265,465$ Supplies and Services 1,758,703 1,809,196 1,816,229 1,954,918 1,978,776 Special Projects 81,331 5,455 3,585 - - Non-Capital Equipment 80,353 88,486 96,066 84,959 84,959 Total Department Expenditures 14,957,960$ 16,271,096$ 15,969,239$ 17,438,305$ 18,329,200$
D e p a r t m e n t F u n d C o m p o s i t i o n
Department Revenues by Fund
General Fund Departmental
Revenues13%
General Fund Subsidy
87%
Department Appropriations by Fund
General Fund 100%

D E P A R T M E N T S U M M A R Y
Fire
F-129
Program Organizational Chart
Administration
Prevention
Operations
Aircraft Rescue and Firefighting
Public
Education

City of Santa Barbara Two-Year Financial Plan & Annual Budget
FIRE PROGRAMS
Administration
Fire Prevention Public Education Operations Aircraft Rescue and Firefighting
(ARFF)
RECENT PROGRAM ACHIEVEMENTS The Department of Homeland Security awarded the Fire Department a $272,861 grant for firefighter safety equipment.
P R O G R A M S & S E R V I C E S
F-130
Administration
( P r o g r a m N o . 3 1 1 1 ) M i s s i o n S t a t e m e n t Provide leadership, pol icy direct ion, and administrat ive support to the entire department.
P r o g r a m A c t i v i t i e s
Provide administrat ive direct ion and support for the entire department.
Prepare department payrol l, personnel act ions, purchasing requisit ions, and correspondence.
Manage department computer and telecommunications networks.
Manage department budget preparation and monitor department expenditures and revenues.
K e y O b j e c t i v e s f o r F i s c a l Y e a r 2 0 0 6 Ensure that at least 80% of the department’s program objectives are
accomplished.
Stabil ize t ime lost due to injury at 8,000 or fewer hours.
Submit 90% of invoices to the U.S. Forest Service within 15 working days of complet ion of mutual aid assignment.
Maintain annual f ire loss ($) at or below average of previous 3 years.
Complete the design of the Station 1 Remodel Project.

F i n a n c i a l a n d S t a f f i n g I n f o r m a t i o n
Actual Amended Projected Adopted Proposed
FY 2004 FY 2005 FY 2005 FY 2006 FY 2007
Authorized Positions 5.00 7.00 7.00 6.00 6.00
Hourly Employee Hours N/A 1,040 1,040 1,016 1,016
RevenuesProp. 172 Sales Tax -$ -$ -$ 133,600$ 139,000$ Interfund Reimbursement 95,141 80,206 100,765 89,409 92,137 General Fund Subsidy 481,184 766,201 710,241 555,144 580,868 Total Revenue 576,325$ 846,407$ 811,006$ 778,153$ 812,005$
ExpendituresSalaries and Benefits 512,640$ 756,561$ 722,440$ 686,555$ 718,705$ Supplies and Services 63,685 89,846 88,566 91,598 93,300 Total Expenditures 576,325$ 846,407$ 811,006$ 778,153$ 812,005$
P r o g r a m P e r f o r m a n c e M e a s u r e s
Actual Projected Adopted FY 2004 FY 2005 FY 2006
Percent of department program objectives accomplished 69% 75% 80%
Hours lost due to injury 7,125 5,500 8,000
Mutual aid reimbursements $418,265 $390,683 $257,900
Percent of invoices generated within 15 working days of completion of mutual aid assignment
95% 93% 90%
Annual fire loss $778,374 $1,500,000 $1,086,113
F-131

City of Santa Barbara Two-Year Financial Plan & Annual Budget
FIRE PROGRAMS
Administration
Fire Prevention Public Education Operations Aircraft Rescue and Firefighting
(ARFF)
RECENT PROGRAM ACHIEVEMENTS With Council adoption in April, implementation of the Wildland Fire Plan began. The program is designed to mitigate the impact of wildfire in the community.
P R O G R A M S & S E R V I C E S
F-132
Fire Prevention
( P r o g r a m N o . 3 1 2 1 ) M i s s i o n S t a t e m e n t Protect l i fe, property and the environment from f ire, hazardous materials, and disasters through proactive code enforcement, modern f ire prevention methods, f i re and arson investigat ion, and progressive publ ic safety educat ion.
P r o g r a m A c t i v i t i e s Part ic ipate in the Community Development Land Development Team
(LDT).
Conduct l i fe safety inspections of hazardous materials faci l i t ies.
Conduct f ire and arson investigat ions.
Conduct state mandated l icensed faci l i ty inspections.
Reduce the impact of wi ldland f ire in the community through hazard reduction, publ ic education, and code enforcement.
Conduct f ire code enforcement compliance inspections.
Oversee f ire prevent ion at the Airport in compliance with the Federal Aviat ion Administrat ion regulat ions.
Oversee Business Self-Inspect ion Program (BSIP).
K e y O b j e c t i v e s f o r F i s c a l Y e a r 2 0 0 6 Complete 95% of the 137 Hazardous Materials Faci l i ty inspections
within the prescribed 3 year cycle.
Complete 95% of 133 State Mandated Licensed Faci l i ty Inspect ions within the prescribed schedule.
Conduct 95% of new construction-related inspections within two working days of init ial request.
Complete 90% of al l plan reviews submitted to the Community Development Department within the t ime al lotted.
Determine cause of 80% of f i res investigated within the City.
Respond to 95% of code enforcement complaints within 5 working days from receipt of complaint.
Attend 80% of al l joint LDT meetings for Development Applicat ion Review Team (DART) and Pre-Applicat ion Review Team (PRT) submittals.
Resolve 85% of code enforcement cases within 3 months of case.
Complete 7 miles of vegetat ion road clearance.
Ident ify funding to implement the Wildland Fire Plan and implement a benefit assessment distr ict, i f approved.
Complete abatement of the f ire hazard issues on Loma Alta.
Complete abatement of f i re hazards at Deluxe Trailer Park.

F i n a n c i a l a n d S t a f f i n g I n f o r m a t i o n
Actual Amended Projected Adopted Proposed
FY 2004 FY 2005 FY 2005 FY 2006 FY 2007
Authorized Positions 10.00 9.00 9.00 9.00 9.00
Hourly Employee Hours N/A 0 0 0 0
RevenuesFees and Service Charges 76,990$ 170,200$ 116,785$ 198,067$ 208,186$ State Grants 55,000 - - - - Miscellaneous 300 - - - - General Fund Subsidy 1,003,174 999,473 967,493 1,037,558 1,087,434 Total Revenue 1,135,464$ 1,169,673$ 1,084,278$ 1,235,625$ 1,295,620$
ExpendituresSalaries and Benefits 885,990$ 981,055$ 910,107$ 1,044,388$ 1,102,241$ Supplies and Services 165,018 183,393 171,421 186,012 188,154 Special Projects 81,331 - - - - Non-Capital Equipment 3,125 5,225 2,750 5,225 5,225 Total Expenditures 1,135,464$ 1,169,673$ 1,084,278$ 1,235,625$ 1,295,620$
P r o g r a m P e r f o r m a n c e M e a s u r e s
Actual Projected Adopted FY 2004 FY 2005 FY 2006
Percent of 137 Hazardous Materials Facilities inspected within prescribed 3 year cycle 86% 98% 95%
Percent of 133 State Mandated Licensed Facility inspections completed annually 56% 95% 95%
Title 19 inspections conducted N/A 137 137 New construction-related inspections N/A 400 400 Percent of new construction-related inspections conducted within 2 working days of request 100% 98% 95%
Plan reviews conducted N/A 1,200 1,200 Percent of plan reviews completed within time allotted 99% 95% 90% Fire investigations conducted N/A 90 100 Percent of causes determined of fires investigated 91% 84% 80% Code enforcement complaints received N/A 70 70 Enforcement cases resolved N/A 60 60 Percent of code enforcement complaints receiving initial response within five working days 92% 95% 95%
Percent of enforcements resolved within 3 months of initiation 92% 95% 95% LDT meetings attended N/A 360 288 Percent of joint LDT meetings attended N/A N/A 80% Average cost to provide PRT/DRT review per project N/A N/A $576 Miles of road vegetation clearance N/A 7 7 Average cost per mile of road vegetation clearance N/A N/A $2,700 High Fire Hazard Area Public Education contacts N/A 6,500 6,500
F-133

City of Santa Barbara Two-Year Financial Plan & Annual Budget
FIRE PROGRAMS
Administration Fire Prevention
Public Education Operations Aircraft Rescue and Firefighting
(ARFF)
RECENT PROGRAM ACHIEVEMENTS Providing CERT Training in the high-risk, Spanish speaking community in collaboration with SBPD. Two trainings provided to: Milagros de La Ladera Apartments and Guadalupe Church.
P R O G R A M S & S E R V I C E S
F-134
Public Education
( P r o g r a m N o . 3 1 2 2 ) M i s s i o n S t a t e m e n t Reduce injuries and loss of l i fe and property by offer ing a comprehensive progressive f ire and l i fe safety education program to the community.
P r o g r a m A c t i v i t i e s Provide a variety of safety programs with age appropriate curr iculums
to school age children.
Conduct Community Emergency Response Team (CERT) training.
Target safety education to identif ied high-r isk populat ions, including seniors, children, Spanish-speakers, and persons with disabi l i t ies.
Col laborate with other emergency service providers to give comprehensive l i fe safety information to the community.
Provide business owners with the latest f ire prevention and disaster mit igat ion information.
Offer publ ic education programs to the community in a variety of mediums in both English and Spanish.
K e y O b j e c t i v e s f o r F i s c a l Y e a r 2 0 0 6 Achieve 90% of f ire safety class partic ipants reporting improved safety
ski l ls.
Target 50% of public education programs at high-r isk individuals.
Achieve 90% of CERT class part icipants report ing improved disaster preparedness skil ls.
Achieve 75% of Fire Safety House Program part icipants report ing that children shared f ire safety information learned with their famil ies.
Coordinate and part ic ipate in the “Teaming up for Safety” Safety Fair.
Implement bicycle helmet safety program and secure on-going funding.
Develop Wildland Fire Prevention Program public educat ion component and present program to homeowners.

F i n a n c i a l a n d S t a f f i n g I n f o r m a t i o n
Actual Amended Projected Adopted Proposed
FY 2004 FY 2005 FY 2005 FY 2006 FY 2007
Authorized Positions 1.00 1.00 1.00 1.00 1.00
Hourly Employee Hours N/A 0 0 0 0
RevenuesMiscellaneous 1,330$ -$ 1,150$ -$ -$ General Fund Subsidy 99,273 117,311 117,628 120,633 123,721 Total Revenue 100,603$ 117,311$ 118,778$ 120,633$ 123,721$
ExpendituresSalaries and Benefits 76,457$ 81,820$ 84,401$ 85,277$ 88,168$ Supplies and Services 24,146 35,491 34,377 35,356 35,553 Total Expenditures 100,603$ 117,311$ 118,778$ 120,633$ 123,721$
P r o g r a m P e r f o r m a n c e M e a s u r e s
Actual Projected Adopted FY 2004 FY 2005 FY 2006
Percent of fire safety participants that reported improved safety skills N/A 90% 90%
Percent of public education programs reaching high-risk individuals N/A 35% 50%
Percent of CERT participants that reported improved disaster preparedness skills N/A 90% 90%
Percent of Fire Safety House participants that reported they shared fire safety information with family members N/A 75% 75%
Public Education presentations 305 320 275
Individuals reached through public safety programs N/A 10,000 10,000
High-risk individuals reached through public safety programs N/A N/A 5,000
Students participating in the Fire Safety House programs 1,075 1,000 1,000
Community Emergency Response Team (CERT) Trainings 3 3 3
Fire Safety House cost per participant N/A N/A $16.66
F-135

City of Santa Barbara Two-Year Financial Plan & Annual Budget
FIRE PROGRAMS
Administration Fire Prevention Public Education
Operations Aircraft Rescue and Firefighting
(ARFF)
RECENT PROGRAM ACHIEVEMENTS The department completed the upgrade of our secondary radio frequency (Green 2) with the assistance of Public Works Electronic Maintenance staff.
P R O G R A M S & S E R V I C E S
F-136
Operations
( P r o g r a m N o . 3 1 3 1 ) M i s s i o n S t a t e m e n t Save and protect l ives, property, and the environment of the Santa Barbara community by prevent ing the impact of future events through proact ive planning, publ ic education, and occupancy f ire code inspections.
P r o g r a m A c t i v i t i e s Prepare for and respond to a mult i tude of emergency situations.
Provide ongoing training to department members that are required by local, state, and federal regulations.
Conduct Fire Safety Inspections in order to reduce and prevent f ire loss and injur ies.
Provide publ ic educat ion programs to help inform the residents of f i re and other l i fe-safety hazards within our community.
K e y O b j e c t i v e s f o r F i s c a l Y e a r 2 0 0 6 Ensure an average response t ime for al l emergencies within jur isdict ion
in 4 minutes or less from unit receipt of alarm.
Contain 90% of al l structure f ires to area or room of origin.
Conduct an Engine Company level Fire and Safety Inspection on 95% of business and residential occupancies as required once during designated two year periods.
Conduct 90% of prevention re-inspections within three weeks of init ial inspection.
Ensure staff attends 17,500 hours of training to reduce injuries and improve performance.
Provide 100% of al l required and mandated training class to department personnel each calendar year.
Provide 1,000 staff hours of public education annually.
Achieve Type 1 cert if icat ion (highest level) for the Urban Search and Rescue Vehicle from the State Off ice of Emergency Services.

F i n a n c i a l a n d S t a f f i n g I n f o r m a t i o n
Actual Amended Projected Adopted Proposed
FY 2004 FY 2005 FY 2005 FY 2006 FY 2007
Authorized Positions 88.00 85.20 85.20 86.20 86.20
Hourly Employee Hours N/A 0 0 0 0
RevenuesFees and Service Charges 2,116$ 17,179$ 12,000$ 17,179$ 17,179$ Mutual Aid Reimbursements 418,265 343,416 390,683 257,900 257,900 Grants - 60,000 121,199 - - Miscellaneous 2,826 15,000 11,000 152,664 152,664 General Fund Subsidy 11,663,609 12,429,855 12,128,599 13,498,929 14,215,830 Total Revenue 12,086,816$ 12,865,450$ 12,663,481$ 13,926,672$ 14,643,573$
ExpendituresSalaries and Benefits 10,513,833$ 11,284,796$ 11,053,243$ 12,214,037$ 12,911,186$ Supplies and Services 1,495,755 1,491,938 1,513,337 1,632,901 1,652,653 Special Projects - 5,455 3,585 - - Non-Capital Equipment 77,228 83,261 93,316 79,734 79,734 Total Expenditures 12,086,816$ 12,865,450$ 12,663,481$ 13,926,672$ 14,643,573$
P r o g r a m P e r f o r m a n c e M e a s u r e s
Actual Projected Adopted FY 2004 FY 2005 FY 2006
Average response time for calls for service N/A N/A ≤ 4 min.
Percent of fires that do not extend from area of origin 92% 95% 90%
Percent of business and residential occupancies inspected on a 2-year cycle 94% 35% 95%
Percent of re-inspections conducted on notices of violation within 3 weeks of initial inspection 90% 90% 90%
Total hours of safety training 18,392 16,462 17,500
Total percent of training sessions completed 100% 100% 100%
Staff hours utilized presenting public education 1,424 1,000 1,000
Medical emergency calls received 4,529 4,438 4,458
Fire calls received 283 334 329
Hazardous condition calls received 465 530 488
Miscellaneous calls received 1,608 1,726 1,658
Engine Company fire and safety inspections N/A 750 1,067
Revenue for engine company inspections N/A N/A $87,535
F-137

City of Santa Barbara Two-Year Financial Plan & Annual Budget
FIRE PROGRAMS
Administration Fire Prevention Public Education Operations
Aircraft Rescue and Firefighting (ARFF)
RECENT PROGRAM ACHIEVEMENTS All 27 ARFF trained personnel will now receive structured, supervised training in conjunction with their annual FAA Live Burn certification, exceeding FAA minimum requirements.
P R O G R A M S & S E R V I C E S
F-138
Aircraft Rescue and
Firefighting (ARFF)
( P r o g r a m N o . 3 1 4 1 ) M i s s i o n S t a t e m e n t Save and protect l ives, property, and the environment at the City of Santa Barbara Airport by preventing the impact of future events through proact ive planning, publ ic education and occupancy f ire code inspections.
P r o g r a m A c t i v i t i e s Respond to al l aircraft-related emergencies at the Airport.
Comply with al l Federal Aviat ion Administrat ion (FAA) standards for training and proficiency.
Inspect al l aircraft fueling vehicles for compliance with FAA standards.
Receive reimbursements from the Airport Fund for al l costs of the Aircraft Rescue and Firefight ing (ARFF) Program.
K e y O b j e c t i v e s f o r F i s c a l Y e a r 2 0 0 6 Respond to 100% of al l emergencies on the aircraft operational area
(AOA) within 3 minutes.
Ensure that 100% of ARFF-cert if ied personnel reach mandated training goals during each quarter and calendar year per FAA standards.
Complete 95% of assigned building and fuel handl ing inspections annually.

F i n a n c i a l a n d S t a f f i n g I n f o r m a t i o n
Actual Amended Projected Adopted Proposed
FY 2004 FY 2005 FY 2005 FY 2006 FY 2007
Authorized Positions 9.00 9.80 9.80 9.80 9.80
Hourly Employee Hours N/A 0 0 0 0
RevenuesInterfund Reimbursement 1,058,752$ 1,272,255$ 1,291,696$ 1,377,222$ 1,454,281$ Total Revenue 1,058,752$ 1,272,255$ 1,291,696$ 1,377,222$ 1,454,281$
ExpendituresSalaries and Benefits 1,048,653$ 1,263,727$ 1,283,168$ 1,368,171$ 1,445,165$ Supplies and Services 10,099 8,528 8,528 9,051 9,116 Total Expenditures 1,058,752$ 1,272,255$ 1,291,696$ 1,377,222$ 1,454,281$
P r o g r a m P e r f o r m a n c e M e a s u r e s
Actual Projected Adopted FY 2004 FY 2005 FY 2006
Percent of emergency responses on the aircraft operational area under 3 minutes 100% 100% 100%
Percent of mandated training classes attended 100% 100% 100%
Percent of assigned building and fuel handling inspections completed 104% 100% 95%
Emergency responses in aircraft operational area (AOA) 26 34 26
Building and fuel handling inspections 87 68 67
F-139

[This page intent ional ly le f t b lank. ]
F-140

D E P A R T M E N T S U M M A R Y
Library
F-141
Provide information services, reading materials, and educational resources to residents of all ages from the Santa Ynez Valley to Carpinteria.
A b o u t t h e L i b r a r y
The Library Department is responsible for provid ing a fu l l range of contemporary l ibrary services to over 228,140 residents of southern Santa Barbara County. The largest components of the department are areas of publ ic service at the Central and branch l ibrar ies, including c irculat ion, reference, youth services, per iodi-cals and reserve mater ia ls.
F i s c a l Y e a r 2 0 0 6
B u d g e t H i g h l i g h t s
Addit ional act iv i t ies in support of direct service inc lude an adult l i teracy program, inter l ibrary loan and borrowing, acquis i t ion of mater ials in a var iety of formats, cataloging and processing of col lect ion mater ia ls, del ivery of suppl ies and mater ia ls throughout the l ibrary system, overs ight of the automated computer system, Internet stat ions and website, and maintenance and repair of l ibrary fac i l i t ies.
Branches of the Santa Barbara Publ ic L ibrary System outs ide the Ci ty of Santa Barbara are owned and funded by the County of Santa Barbara and administered under an agreement wi th the City.
Funding for Library programs,
staffing, collections, and
services remains at a status
quo level for fiscal year 2006,
allowing for continued
acquisition of print and non-
print materials, a full range of
children’s programs and story
times, reading-readiness for
children and literacy tutoring
for adults, and online access
to the library catalog and
information databases. Dona-
tions from individuals and
Friends of the Library groups
will provide wireless Internet
access at each Library facility.
In partnership with other tri-
county Libraries, the Santa
Barbara Public Library System
will emphasize outreach to
schools, assistance to
teachers, and homework help
for students in fiscal year 2006.
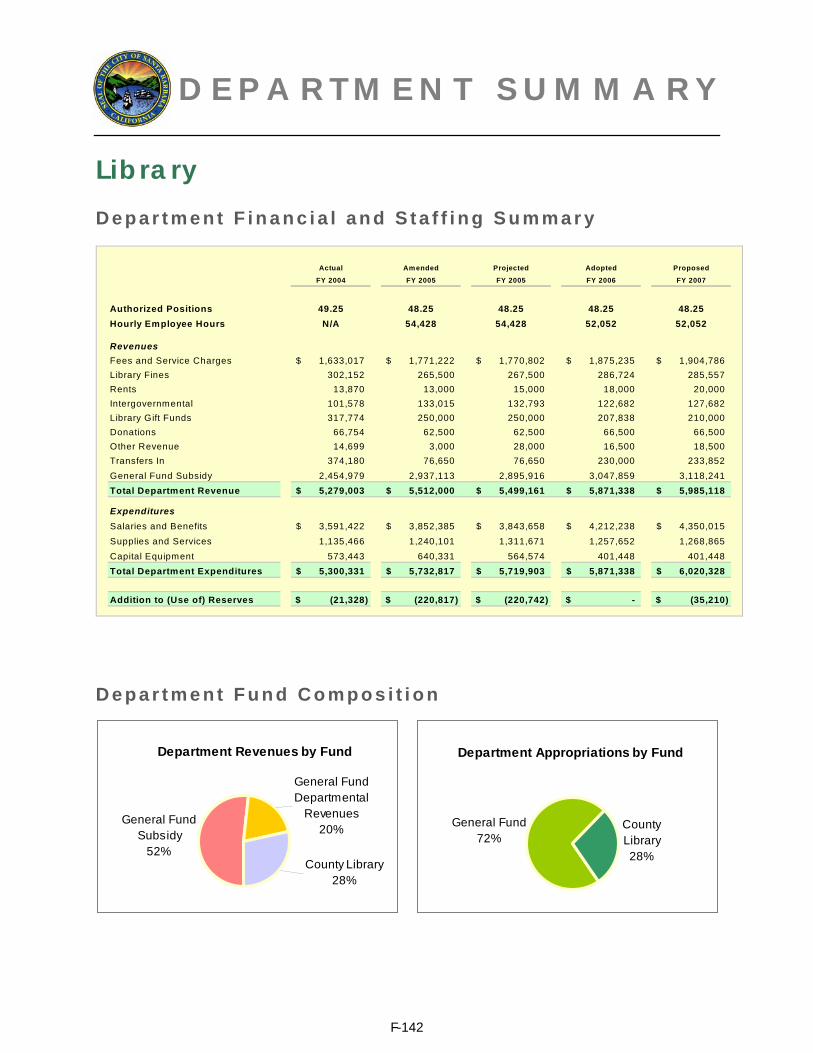
D E P A R T M E N T S U M M A R Y
Library
F-142
D e p a r t m e n t F i n a n c i a l a n d S t a f f i n g S u m m a r y
Actual Amended Projected Adopted Proposed
FY 2004 FY 2005 FY 2005 FY 2006 FY 2007
Authorized Positions 49.25 48.25 48.25 48.25 48.25 Hourly Employee Hours N/A 54,428 54,428 52,052 52,052
RevenuesFees and Service Charges 1,633,017$ 1,771,222$ 1,770,802$ 1,875,235$ 1,904,786$ Library Fines 302,152 265,500 267,500 286,724 285,557 Rents 13,870 13,000 15,000 18,000 20,000 Intergovernmental 101,578 133,015 132,793 122,682 127,682 Library Gift Funds 317,774 250,000 250,000 207,838 210,000 Donations 66,754 62,500 62,500 66,500 66,500 Other Revenue 14,699 3,000 28,000 16,500 18,500 Transfers In 374,180 76,650 76,650 230,000 233,852 General Fund Subsidy 2,454,979 2,937,113 2,895,916 3,047,859 3,118,241 Total Department Revenue 5,279,003$ 5,512,000$ 5,499,161$ 5,871,338$ 5,985,118$
ExpendituresSalaries and Benefits 3,591,422$ 3,852,385$ 3,843,658$ 4,212,238$ 4,350,015$ Supplies and Services 1,135,466 1,240,101 1,311,671 1,257,652 1,268,865 Capital Equipment 573,443 640,331 564,574 401,448 401,448 Total Department Expenditures 5,300,331$ 5,732,817$ 5,719,903$ 5,871,338$ 6,020,328$
Addition to (Use of) Reserves (21,328)$ (220,817)$ (220,742)$ -$ (35,210)$
D e p a r t m e n t F u n d C o m p o s i t i o n
Department Revenues by Fund
General Fund Departmental
Revenues20%
County Library28%
General Fund Subsidy
52%
Department Appropriations by Fund
General Fund72%
County Library28%
D E P A R T M E N T S U M M A R Y
Library
F-143
Program Organizational Chart
Administration
County Libraries
Public Services
Support Services

City of Santa Barbara Two-Year Financial Plan & Annual Budget
LIBRARY PROGRAMS
Administration
Public Services Support Services County Libraries
RECENT PROGRAM ACHIEVEMENTS Established LEAP VIP (Very Informed Person) resource lending program for City and County employees.
P R O G R A M S & S E R V I C E S
F-144
Administration
( P r o g r a m N o . 5 1 1 1 ) M i s s i o n S t a t e m e n t Provide system-wide leadership, planning and direct ion, anticipating and addressing the l ibrary services needs of residents.
P r o g r a m A c t i v i t i e s Direct program and staff providing l ibrary services to 228,140 residents
of southern Santa Barbara County.
Prepare budget, payrol l, correspondence, publ ic relat ions materials, reports, documents, accounts, and purchase orders.
Coordinate the volunteer program.
Part ic ipate in act ivit ies of l ibrary organizations, cit izen groups, state and local government boards, committees, and counci ls.
Coordinate use of City Libraries publ ic meeting rooms by over 90 local organizations and over 25,000 residents annually.
K e y O b j e c t i v e s f o r F i s c a l Y e a r 2 0 0 6 Ensure accomplishment of at least 75% of department program
objectives.
Increase the number of residents using Central and Eastside meeting rooms to 30,000.
Design and conduct a survey to measure use of l ibrary services by elementary school teachers and determine unmet needs.
Manage budget preparat ion and oversee revenues and expenditures to ensure expenditures are within budget.
Conduct annual Santa Barbara Reads program to promote reading and increase awareness of al l l ibrary services.

F i n a n c i a l a n d S t a f f i n g I n f o r m a t i o n
Actual Amended Projected Adopted Proposed
FY 2004 FY 2005 FY 2005 FY 2006 FY 2007
Authorized Positions 3.00 3.00 3.00 3.00 3.00
Hourly Employee Hours N/A 0 0 0 0
RevenuesFees and Service Charges 87,168$ 98,635$ 98,635$ 148,159$ 152,126$ Other Revenue 83 - - - - General Fund Subsidy 201,807 197,375 200,513 191,750 201,874 Total Revenue 289,058$ 296,010$ 299,148$ 339,909$ 354,000$
ExpendituresSalaries and Benefits 281,073$ 287,449$ 290,587$ 330,767$ 344,839$ Supplies and Services 7,985 8,561 8,561 9,142 9,161 Total Expenditures 289,058$ 296,010$ 299,148$ 339,909$ 354,000$
P r o g r a m P e r f o r m a n c e M e a s u r e s
Actual Projected Adopted FY 2004 FY 2005 FY 2006
Percent of department program objectives met 70% 78% 75%
Residents using meeting rooms 29,205 29,745 30,000
State and local government expenditure per capita for library services for City residents $36.41 $35.94 $35.25
State and local government expenditure per capita for library services for County service area residents $7.63 $8.80 $9.05
F-145

City of Santa Barbara Two-Year Financial Plan & Annual Budget
LIBRARY PROGRAMS
Administration
Public Services Support Services County Libraries
RECENT PROGRAM ACHIEVEMENTS Installed new public access computers with a net gain of six workstations and increased functionality in response to public requests.
P R O G R A M S & S E R V I C E S
F-146
Public Services
( P r o g r a m N o . 5 1 1 2 ) M i s s i o n S t a t e m e n t Provide information services, programming, and equal access to materials for al l residents of Santa Barbara in order to promote reading and l i felong learning.
P r o g r a m A c t i v i t i e s Provide in-depth reference service for patrons in the l ibrary, by
telephone and online via the l ibrary’s website.
Provide a variety of programs, including story t imes, puppet shows, crafts, movies and coordination of the system-wide Summer Reading Program to encourage the City’s youth to read.
Provide access to the Library’s collect ions using an automated circulation system, including checkout and return of materials, payment of f ines and fees, and pickup of reserve materials.
Maintain the l ibrary’s website, providing remote access to information about l ibrary services, and to the l ibrary’s onl ine catalog and information databases.
Provide Bookmobile service to locations on Santa Barbara’s Westside and Lower Westside.
K e y O b j e c t i v e s f o r F i s c a l Y e a r 2 0 0 6 Maintain a level of 120,000 reference contacts with the City’s
residents.
Maintain a circulat ion total of at least 700,000 items checked out from City l ibraries.
Increase the number of visits to the l ibrary’s website by 3%.
Maintain at least 29,000 contacts with City youth (under 18 years of age).
Create and maintain Library website resources support ing local book discussion groups.
Investigate and make a determinat ion on the desirabi l i ty of adding receipt printers to check out stat ions to improve service to the public.

F i n a n c i a l a n d S t a f f i n g I n f o r m a t i o n
Actual Amended Projected Adopted Proposed
FY 2004 FY 2005 FY 2005 FY 2006 FY 2007
Authorized Positions 22.70 21.70 21.70 21.70 21.70
Hourly Employee Hours N/A 25,224 25,224 22,968 22,968
RevenuesFees and Service Charges 521,568$ 549,606$ 549,606$ 561,490$ 587,074$ Library Fines 140,546 133,000 135,000 143,000 145,685 Rents 13,870 13,000 15,000 18,000 20,000 State PLF Grant 61,113 60,609 60,609 54,409 59,409 Library Gift Funds 317,774 250,000 250,000 207,838 210,000 Other Revenue 14,616 3,000 28,000 16,500 18,500 General Fund Subsidy 1,006,189 1,255,603 1,224,897 1,340,326 1,366,025 Total Revenue 2,075,676$ 2,264,818$ 2,263,112$ 2,341,563$ 2,406,693$
ExpendituresSalaries and Benefits 1,606,231$ 1,731,291$ 1,730,177$ 1,911,134$ 1,975,633$ Supplies and Services 124,108 104,770 104,935 98,981 99,612 Equipment Capital 345,337 428,757 428,000 331,448 331,448 Total Expenditures 2,075,676$ 2,264,818$ 2,263,112$ 2,341,563$ 2,406,693$
P r o g r a m P e r f o r m a n c e M e a s u r e s
Actual Projected Adopted FY 2004 FY 2005 FY 2006
Reference contacts with City residents 131,209 127,000 120,000
Items checked out 790,732 776,500 770,000
Visits to Library website 450,851 520,550 536,000
Contacts with City youth 28,399 28,685 29,000
Circulation per capita for City residents 8.83 8.6 8.6
Reference questions answered at City libraries 115,910 108,846 106,000
Public computer sessions in City libraries N/A 158,447 161,000
Users receiving information technology training 15,299 13,252 14,000
Subscription database searches (SBPL systems) N/A N/A 95,000
Visits to Central and Eastside libraries 660,509 637,984 645,000
Percent of City residents that are active registered borrowers 37.22% 37.25% 37.25%
Cost to circulate an item N/A N/A $.80
F-147
City of Santa Barbara Two-Year Financial Plan & Annual Budget
LIBRARY PROGRAMS
Administration Public Services
Support Services County Libraries
RECENT PROGRAM ACHIEVEMENTS The Adult Literacy Program received a one-year grant providing four AmeriCorps workers to assist with literacy outreach to families and at-risk youth, including programming and learner recruitment.
P R O G R A M S & S E R V I C E S
F-148
Support Services
( P r o g r a m N o . 5 1 1 3 ) M i s s i o n S t a t e m e n t Provide operat ional support to acquire, process and catalog col lect ions, support technology hardware and software, maintain facil i t ies and coordinate l i teracy efforts within the service area.
P r o g r a m A c t i v i t i e s Process books and other collect ion materials.
Coordinate tutoring services for the Adult Literacy program.
Maintain public and staff computer hardware and software.
Maintain online database of holdings of the Santa Barbara Public Library (SBPL) System.
Borrow materials from other l ibraries to f i l l user requests.
Maintain safe and clean environment for publ ic and staff.
K e y O b j e c t i v e s f o r F i s c a l Y e a r 2 0 0 6 Reduce processing t ime of new books to an average of 10 days from
receipt to publ ic avai labil i ty.
Reduce processing t ime of new audiovisual materials to an average of 15 days.
Maintain col lection materials per capita rat io of 3.05 in terms per city resident.
Ensure that 37% of col lect ion materials in science and technology are less than 7 years old.
Resolve 75% of technology service calls within eight work hours.
Help Adult Literacy learners in the Adult and Family Literacy Program (ALP) meet 40% of their personal object ives.

F i n a n c i a l a n d S t a f f i n g I n f o r m a t i o n
Actual Amended Projected Adopted Proposed
FY 2004 FY 2005 FY 2005 FY 2006 FY 2007
Authorized Positions 10.75 10.75 10.75 10.75 10.75
Hourly Employee Hours N/A 6,780 6,780 6,780 6,780
RevenuesState Grants 211$ 32,000$ 32,000$ 32,000$ 32,000$ Donations 257 500 500 1,500 1,500 Transfers In 83,700 - - - - General Fund Subsidy 1,246,983 1,484,135 1,470,506 1,515,783 1,550,342 Total Revenue 1,331,151$ 1,516,635$ 1,503,006$ 1,549,283$ 1,583,842$
ExpendituresSalaries and Benefits 664,260$ 741,797$ 731,010$ 818,179$ 845,951$ Supplies and Services 666,415 702,264 699,422 731,104 737,891 Equipment Capital 476 72,574 72,574 - - Total Expenditures 1,331,151$ 1,516,635$ 1,503,006$ 1,549,283$ 1,583,842$
P r o g r a m P e r f o r m a n c e M e a s u r e s
Actual Projected Adopted FY 2004 FY 2005 FY 2006
Average number of days from receipt to public availability for new books 13 12 10
Average number of days from receipt to public availability for audiovisual materials N/A 20 15
Materials owned per capita City resident 3.05 3.05 3.05
Percent of science and technology collection materials that are 7 years old or less 38.45% 35% 37%
Percent of technology calls resolved within 8 hours 54.5% 70% 75%
Percent of objectives met by learners in the Adult Literacy Program N/A N/A 40%
Books and AV materials processed by technical services 38,338 20,000 20,000
Cost to process an item for checkout N/A N/A $2.51
Requests filled 91,110 90,000 90,000
New items purchased for science and technology collections 423 200 200
Expenditure per capita for library materials for SBPL System $2.10 $1.60 $1.60
Average cost per learner in the Adult Literacy Program $319 $333 $333
Adult Literacy learners 141 140 140
F-149

City of Santa Barbara Two-Year Financial Plan & Annual Budget
LIBRARY PROGRAMS
Administration Public Services Support Services
County Libraries
RECENT PROGRAM ACHIEVEMENTS Wireless Internet access is now available to the public at all County branch libraries.
P R O G R A M S & S E R V I C E S
F-150
County Libraries
( P r o g r a m N o s . 5 1 2 2 , 5 1 2 3 , 5 1 2 5 ) M i s s i o n S t a t e m e n t Provide a ful l range of l ibrary services to residents outside the City of Santa Barbara, in the area extending from the Santa Ynez Val ley to Carpinter ia.
P r o g r a m A c t i v i t i e s Circulate col lect ion materials, col lect f ines and fees, f i l l reserve
requests, and provide information on use of the l ibrary.
Offer a variety of programs, including story t imes, puppet shows, crafts, movies, and a Summer Reading Program to encourage the youth in the County service area to maintain their reading ski l ls.
Answer reference questions for patrons in the l ibrary and by telephone.
Provide meeting room and exhibit space for community use.
Del iver supplies, materials and col lect ion items to all branches of SBPL system.
K e y O b j e c t i v e s f o r F i s c a l Y e a r 2 0 0 6 Maintain a circulat ion total of at least 815,000 items checked out from
County branches.
Increase the number of audiovisual i tems owned to 104 audiobooks, videos, and DVDs per 1,000 County service area residents.
Ensure that 37.0% of col lect ion materials in science and technology are less than 7 years old.
Maintain the number of contacts with County youth at 22,000 for the f iscal year.
Maintain at 10,000 the number of residents using the meeting rooms at Goleta branch and the homework center at Carpinter ia branch.
Provide at least 120,000 publ ic computer sessions at County branches.

F i n a n c i a l a n d S t a f f i n g I n f o r m a t i o n
Actual Amended Projected Adopted Proposed
FY 2004 FY 2005 FY 2005 FY 2006 FY 2007
Authorized Positions 12.80 12.80 12.80 12.80 12.80
Hourly Employee Hours N/A 22,424 22,424 22,304 22,304
RevenuesFees and Service Charges 1,024,281$ 1,122,981$ 1,122,561$ 1,165,586$ 1,165,586$ Library Fines 161,606 132,500 132,500 143,724 139,872 State PLF Grant 40,254 40,406 40,184 36,273 36,273 Donations 66,497 62,000 62,000 65,000 65,000 Transfers In 290,480 76,650 76,650 230,000 233,852 Total Revenue 1,583,118$ 1,434,537$ 1,433,895$ 1,640,583$ 1,640,583$
ExpendituresSalaries and Benefits 1,039,858$ 1,091,848$ 1,091,884$ 1,152,158$ 1,183,592$ Supplies and Services 336,958 424,506 498,753 418,425 422,201 Equipment Capital 227,630 139,000 64,000 70,000 70,000Total Expenditures 1,604,446$ 1,655,354$ 1,654,637$ 1,640,583$ 1,675,793$
Addition to (Use of) Reserves (21,328)$ (220,817)$ (220,742)$ -$ (35,210)$
P r o g r a m P e r f o r m a n c e M e a s u r e s
Actual Projected Adopted FY 2004 FY 2005 FY 2006
Items checked out 739,119 810,000 815,000
Audiovisual items per 1,000 County residents in service area 96.03 101.5 104
Percent of science and technology materials less than 7 years old 36.21% 35% 37%
Youth under 18 attending library programs or contacted through outreach 26,409 22,000 22,000
Residents using library meeting rooms and homework center 10,963 10,000 10,000
Public computer sessions in County libraries N/A N/A 120,000
County circulation per capita 5.77 5.9 5.9
Percent of County residents that are active registered borrowers 30.54% 31% 31%
F-151

[This page intent ional ly le f t b lank. ]
F-152

D E P A R T M E N T S U M M A R Y
Mayor and City Council
F-153
Establish policy, approve programs, and oversee the financial affairs of the City to govern the City of Santa Barbara.
A b o u t M a yo r a n d C i t y C o u n c i l
F i s c a l Y e a r 2 0 0 6
B u d g e t H i g h l i g h t s
The Mayor and Council will oversee
the following initiatives:
• Airport staff will continue
implementation of the Aviation
Facilities Plan.
• Granada Garage will be
constructed with 575 parking
spaces.
• The update of the General Plan
will be initiated.
• A community education and
visioning process will be
completed to develop
Watershed Action Plans for
Mission, Arroyo Burro, and
Sycamore Creeks.
• Council will consider a long-term
plan to divert solid waste from
local landfills.
• The City's fiscal condition will be
monitored closely.
The Off ice of the Mayor and s ix Ci ty Counci lmembers comprise the Ci ty Counci l . The Mayor presides over the Ci ty Counci l meet ings held weekly in open publ ic session in the Counci l Chamber.
The seven-member governmental body serves the Ci ty at large. I ts dut ies under the City Charter inc lude approval of the Annual Budget and oversight of the f inancial af fa irs of the Ci ty. The Mayor and City Counci lmembers appoint the City Administrator and the City Attorney. The Ci ty Counci l has the power to adopt ordinances and resolut ions; make appointments to advisory boards and commissions; establ ish pol icy and approve programs; act on program and administrat ive recommendations of Ci ty staf f ; appropr iate funds and approve contracts; and respond to concerns and needs of residents.
The Mayor and Counci lmembers serve as the Board Members of the Redevelopment Agency. Indiv idual ly, Counci lmembers may represent the Ci ty by serving on state and regional boards and local c iv ic organizat ions.
Staf f to the Mayor and City Counci lmembers assist in responding to numerous cal ls and let ters f rom c i t izens each week, including conduct ing research and draft ing responses.
The Mayor and Ci ty Counci l oversee and evaluate the programs and accomplishments of departments.

[Th is page in ten t iona l l y l e f t b lank . ]
F-154

D E P A R T M E N T S U M M A R Y
Mayor and City Counci l
F-155
D e p a r t m e n t F i n a n c i a l a n d S t a f f i n g S u m m a r y
Actual Amended Projected Adopted Proposed
FY 2004 FY 2005 FY 2005 FY 2006 FY 2007
Authorized Positions 9.00 9.00 9.00 9.00 9.00 Hourly Employee Hours N/A 3,300 2,100 2,100 2,100
RevenuesOverhead Allocation Recovery N/A 372,005$ 372,005$ 477,762$ 496,872$ General Fund Subsidy 557,493$ 157,523$ 144,970$ 296,383$ 293,252$ Total Department Revenue 557,493$ 529,528$ 516,975$ 774,145$ 790,124$
ExpendituresSalaries and Benefits 302,219$ 312,411$ 302,720$ 547,520$ 561,585$ Supplies and Services 251,930 216,117 214,255 225,625 227,539 Special Projects 3,344 1,000 - 1,000 1,000 Total Department Expenditures 557,493$ 529,528$ 516,975$ 774,145$ 790,124$
D e p a r t m e n t F u n d C o m p o s i t i o n
Department Appropriations by Fund
General Fund100%
Department Revenues by Fund
General Fund Subsidy
38%
General Fund Departmental
Revenues62%

City of Santa Barbara Two-Year Financial Plan & Annual Budget
MAYOR AND CITY COUNCIL PROGRAM
Mayor and City Council
RECENT PROGRAM ACHIEVEMENTS The City Council adopted the fiscal year 2006 budget within the established timeline.
P R O G R A M S & S E R V I C E S
F-156
Mayor and City Council
( P r o g r a m N o . 1 1 1 1 ) M i s s i o n S t a t e m e n t Establ ish policy, approve programs, and oversee the f inancial affairs of the City to govern the City of Santa Barbara.
P r o g r a m A c t i v i t i e s Respond to the needs and concerns of cit izens.
Establ ish policy and approve programs.
Oversee the City’s f inances.
Oversee and evaluate the programs and accomplishments of departments.
Serve as l iaisons on all City boards, commissions, and advisory groups and appointees on regional, state, and national committees.
Advise staff on pending l i t igat ion and personnel issues.
Create City Counci l Goals to guide department budget and program decisions.
K e y O b j e c t i v e s f o r F i s c a l Y e a r 2 0 0 6 Adopt the Fiscal Year 2007 budget by June 30, 2006.
Act on staff and advisory boards and commission recommendations at weekly Counci l meetings.
Appoint members to the City advisory boards and commissions twice annually.

F i n a n c i a l a n d S t a f f i n g I n f o r m a t i o n
Actual Amended Projected Adopted Proposed
FY 2004 FY 2005 FY 2005 FY 2006 FY 2007
Authorized Positions 9.00 9.00 9.00 9.00 9.00
Hourly Employee Hours N/A 3,300 2,100 2,100 2,100
RevenuesOverhead Allocation Recovery N/A 372,005$ 372,005$ 477,762$ 496,872$ General Fund Subsidy 557,493 157,523 144,970 296,383 293,252 Total Revenue 557,493$ 529,528$ 516,975$ 774,145$ 790,124$
ExpendituresSalaries and Benefits 302,219$ 312,411$ 302,720$ 547,520$ 561,585$ Supplies and Services 251,930 216,117 214,255 225,625 227,539 Special Projects 3,344 1,000 - 1,000 1,000 Total Expenditures 557,493$ 529,528$ 516,975$ 774,145$ 790,124$
P r o g r a m P e r f o r m a n c e M e a s u r e s
Actual Projected Adopted FY 2004 FY 2005 FY 2006
Council meetings 61 60 52
F-157

[This page intent ional ly le f t b lank. ]
F-158

D E P A R T M E N T S U M M A R Y
Non-Departmental
F-159
A b o u t N o n - D e p a r t m e n t a l
F i s c a l Y e a r 2 0 0 6
B u d g e t H i g h l i g h t s
The City’s direct funding for
community promotions for
fiscal years 2006 and 2007 is
the same as fiscal year 2005
with the exception a 3.5% CPI
adjustment to funding
provided to the Santa Barbara
Conference and Visitor’s
Bureau. However, funding for
Police Department overtime
costs associated with Summer
Solstice, Fourth of July and Old
Spanish Days have been
moved out of the Non-
Departmental budget to the
Police Department’s budget,
into the Special Events
Program.
The General Fund capital
program for fiscal year 2006
totals $623,700 and is
comprised of three projects:
playground equipment
replacements, leak repairs at
Los Banos Pool and
remediation of abandoned
leaking under-ground fuel
tanks that are discovered in
the public right-of-way or on
other City owned property.
The Non-Departmental “department” is used to account for costs not d irect ly related to any speci f ic department. I t consists of two programs: the General Government program and the Community Promotions program.
The General Government program includes funding for debt service on General Fund long-term debt, the General Fund capita l program and the appropr iated reserves establ ished each year pursuant to Ci ty reserve pol ic ies.
The Community Promotions program inc ludes funding for a number of non-prof i t organizat ions wi th in the Ci ty that coordinate fest ivals and events throughout the year, including Fiesta, the Fourth of July f i reworks show, the Spir i t of ’76 Parade, Semana Nautica, Summer Solst ice, and many others.
The Ci ty a lso provides funding to the Santa Barbara Conference and Vis i tor ’s Bureau to support their market ing ef for ts designed to at tract v is i tors to the South Coast and funding to the Chamber of Commerce Vis i tor ’s Center .

[Th is page in ten t iona l l y l e f t b lank . ]
F-160

D E P A R T M E N T S U M M A R Y
Non-Departmental
F-161
D e p a r t m e n t F i n a n c i a l a n d S t a f f i n g S u m m a r y
A c t u a l A m e nd e d P ro je c t e d A d o pt e d P ro p o s e d
F Y 2 0 0 4 F Y 2 0 0 5 F Y 2 0 0 5 F Y 2 0 0 6 F Y 2 0 0 7
Authorized Positions N/A N/A N/A N/A N/AHourly Em ployee Hours N/A N/A N/A N/A N/A
RevenuesGeneral Fund Subs idy 3,688,907 3,897,721 3,818,227 3,667,562 3,995,504
Total Department Revenue 3,688,907$ 3,897,721$ 3,818,227$ 3,667,562$ 3,995,504$
ExpendituresSupplies and Services 72,563$ 111,688$ 72,563$ 72,563$ 72,563$
Special Projects 2,138,556 2,440,355 2,331,757 2,144,521 2,144,521
Trans fers Out 461,136 590,444 561,507 376,778 351,420
Mis cellaneous 1,500 327,834 425,000 450,000 450,000
Total Department Expenditures 2,673,755$ 3,470,321$ 3,390,827$ 3,043,862$ 3,018,504$ General Fund Capital Program 1,015,152 427,400 N/A 623,700 977,000
Total Operating and Capital 3,688,907$ 3,897,721$ 3,390,827$ 3,667,562$ 3,995,504$
D e p a r t m e n t F u n d C o m p o s i t i o n Department Appropriations by Fund
General Fund
Capital17%
General Fund
Operating83%
Department Revenues by Fund
General Fund
Subsidy100%

City of Santa Barbara Two-Year Financial Plan & Annual Budget
NON-DEPARTMENTAL PROGRAMS
Community Promotions
General Government
RECENT PROGRAM ACHIEVEMENTS Continue to develop and produce a DVD and print brochure to focus on the City’s Public Art collection and the history behind the art and artists represented.
P R O G R A M S & S E R V I C E S
F-162
Community Promotions
( P r o g r a m N o . 9 3 3 1 ) M i s s i o n S t a t e m e n t Provide grants to various organizations to promote art, events, and fest ivals and to enhance tourism in the City of Santa Barbara.
P r o g r a m A c t i v i t i e s Administer contracts between the City and various grantees that
enhance tourism and promote art, events, and fest ivals.
Provide funding to the Santa Barbara County Arts Commission for administrat ion of the Arts and Events Programs.
Provide grant funding to art and community organizat ions for arts and events.
Provide funding for the Downtown Cultural Distr ict Programs Development administered by the Arts Advisory Committee.
Provide funding to community organizations to support market ing of Santa Barbara and to enhance tourism.
Provide funding towards the maintenance of the Santa Barbara Zoo gardens.
K e y O b j e c t i v e s f o r F i s c a l Y e a r 2 0 0 6 Ensure that 90% of awarded grant funds are disbursed in the current
f iscal year.
Ensure that grant payments are made within 15 working days of receiving invoices.
Link City arts web pages to websites of f ive other organizat ions involved in cultural and economic development in the City.
Hold monthly committee meetings and ensure that al l notices, agendas, and meeting minutes are properly f i led.
Produce Channing Peake Gallery exhibit ion in cooperat ion with other cultural organizations.
Ident ify and promote 2 cultural events that help foster the identity of the Cultural Arts Distr ict.

F i n a n c i a l a n d S t a f f i n g I n f o r m a t i o n
Actual Amended Projected Adopted Proposed
FY 2004 FY 2005 FY 2005 FY 2006 FY 2007
Authorized Positions N/A N/A N/A N/A N/A
Hourly Employee Hours N/A N/A N/A N/A N/A
RevenuesGeneral Fund Subsidy 2,186,417$ 2,483,143$ 2,385,264$ 2,197,084$ 2,197,084$ Total Revenue 2,186,417$ 2,483,143$ 2,385,264$ 2,197,084$ 2,197,084$
ExpendituresSupplies and Services 72,563$ 111,688$ 72,563$ 72,563$ 72,563$ Special Projects 2,113,854 2,371,455 2,312,701 2,124,521 2,124,521 Total Expenditures 2,186,417$ 2,483,143$ 2,385,264$ 2,197,084$ 2,197,084$
P r o g r a m P e r f o r m a n c e M e a s u r e s
Actual Projected Adopted FY 2004 FY 2005 FY 2006
Percent of grant funds disbursed during the fiscal year 97% 95% 90%
Percent of grant payments disbursed within 15 days of receiving the invoice 100% 100% 100%
Arts pages linked to other web sites 3 5 5
Community Events and Festivals Grant applications received 18 18 18
Organizational Development Grant applications received 27 27 27
Community Arts Grant applications received 19 19 19
Monthly Visual Arts in Public Places (VAPP) and Arts Advisory Committee meetings held 9 10 12
F-163
City of Santa Barbara Two-Year Financial Plan & Annual Budget
NON-DEPARTMENTAL PROGRAMS
Community Promotions
General Government
P R O G R A M S & S E R V I C E S
F-164
General Government
( P r o g r a m N o . 9 9 1 1 ) M i s s i o n S t a t e m e n t Fund debt service and capital, and account for required appropriated reserve balances.
P r o g r a m A c t i v i t i e s Establ ish, track, and adjust as necessary the required appropriated
reserve balances.
Establ ish the funding level, pursuant to Council act ion, for the General Fund capital program.
Establ ish the required funding level for debt service based on debt service schedules associated with outstanding General Fund indebtedness.
K e y O b j e c t i v e s f o r F i s c a l Y e a r 2 0 0 6 Ensure that appropriated reserves are established in accordance with
Counci l policy.
Ensure that the use of appropriated reserves is consistent with Counci l pol icy.
Ensure that the use of funds establ ished for capital is consistent with the approved funding.

F i n a n c i a l a n d S t a f f i n g I n f o r m a t i o n
Actual Amended Projected Adopted Proposed
FY 2004 FY 2005 FY 2005 FY 2006 FY 2007
Authorized Positions N/A N/A N/A N/A N/A
Hourly Employee Hours N/A N/A N/A N/A N/A
RevenuesGeneral Fund Subsidy 1,502,490$ 1,414,578$ 1,005,563$ 1,470,478$ 1,798,420$ Total Revenue 1,502,490$ 1,414,578$ 1,005,563$ 1,470,478$ 1,798,420$
ExpendituresSpecial Projects 24,702$ 68,900$ 19,056$ 20,000$ 20,000$ Transfers Out 461,136 590,444 561,507 376,778 351,420 Miscellaneous 1,500 327,834 425,000 450,000 450,000 Total Operating Expenditures 487,338$ 987,178$ 1,005,563$ 846,778$ 821,420$ General Fund Capital Program 1,015,152 427,400 N/A 623,700 977,000 Total Operating and Capital 1,502,490$ 1,414,578$ 1,005,563$ 1,470,478$ 1,798,420$
P r o g r a m P e r f o r m a n c e M e a s u r e s
Actual Projected Adopted FY 2004 FY 2005 FY 2006
Capital funding as a percent of total General Fund operating budget 2.5% 2.0% 1.5%
Long-term debt as a percent of total General Fund operating budget 10% 9% 3.9%
F-165

[This page intent ional ly le f t b lank. ]
F-166

D E P A R T M E N T S U M M A R Y
Parks and Recreation
F-167
Provide residents and visitors with diverse open space, parks, beaches and community forest resources, creek restoration and water quality enhancements, and enrich people’s lives with diverse recreation and community services. A b o u t P a r k s a n d R e c r e a t i o n F i s c a l Y e a r
2 0 0 6 B u d g e t
H i g h l i g h t s
The Department manages a diverse and unique park and recreat ion system, which provides c i t izens and vis i tors with c lean and safe open spaces, parks, beaches, recreat ion programs and faci l i t ies, and community services. Open space and parkland totals 1,765 acres with a tota l of 59 park and open space areas. Developed parkland consists of 588 acres wi th the balance of 1,177 acres in open space. Sports areas are managed by the Department and include, for example, 28 tennis courts, 2 swimming pools, beach vol leybal l courts, sports f ie lds, lawn bowling greens, a gol f course, and a skateboard fac i l i ty. The community forest consists of 23,000 street t rees and 12,000 park and open space trees. Other resources inc lude 14 community bui ld ings, 4 community gardens, 22 accessible p laygrounds, beach access areas, and numerous trai l systems.
Increase participation in programs through creative and effective marketing strategies.
Implement a project management team to ensure the completion of capital and special projects on time and within budget.
Complete Microbial Source Tracking research studies to determine sources of bacterial pollution in City creeks.
Evaluate success of Master Plan Safety Improvements at golf course in fall 2005 and plan additional safety projects as needed.
Re-organize how Adapted Recreation Services are provided to facilitate continued participation by the disabled community.
The Department is responsible for managing the Creeks Restorat ion and Water Qual i ty Improvement Program in col laborat ion with the Publ ic Works and Community Development Departments.
Continue to implement the Integrated Pest Management Strategy and reduce use of toxic pesticides in city parks.
Recreat ion Programs provide a wide var iety of recreat ional opportuni t ies for people of a l l ages and abi l i t ies in sports, c lasses, tennis, aquat ics, cul tural ar ts and more. Special ized programs provide services for youth, teens, act ive adults, low- income fami l ies, and people l iv ing wi th disabi l i t ies. With a focus on community recreat ion, some of the more popular annual programs inc lude the summer Concerts in the Parks ser ies, Sunday Arts & Crafts Show, Tournament of Champions youth sports competi t ion, summer day camps, af ter-school recreat ion programs, beach vol leybal l tournaments, and act ive adult programs. A strong commitment to col laborat ions, par tnerships and volunteers enhances recreat ion opportuni t ies for the community.
Complete the Louise Lowry Davis Center remodel and open the new Teen Center at 1235 Chapala Street.

D E P A R T M E N T S U M M A R Y
Parks and Recreation
F-168
D e p a r t m e n t F i n a n c i a l a n d S t a f f i n g S u m m a r y
Actual Amended Projected Adopted Proposed
FY 2004 FY 2005 FY 2005 FY 2006 FY 2007
Authorized Positions 97.80 102.00 102.00 100.20 99.20 Hourly Employee Hours N/A 135,315 135,315 101,991 101,991
RevenuesFees and Service Charges 2,182,966$ 2,181,756$ 2,006,128$ 2,051,772$ 2,124,779$ Golf Fees 1,768,565 1,852,213 1,800,000 1,963,000 2,050,000 Leases and Rents 530,964 596,110 553,088 554,878 578,409 Transient Occupancy Tax 2,073,155 2,137,970 2,156,000 2,300,800 2,415,900 Interfund Reimbursements 744,576 744,579 744,579 781,808 813,080 Interest Income 131,404 76,897 150,178 168,758 181,740 Market Valuation (96,449) - - - - Intergovernmental 537,476 1,325,343 529,000 - - Other Revenue 338,784 400,777 397,877 137,100 141,384 Donations 262,669 377,181 377,181 114,521 114,521 General Fund Subsidy 8,900,830 9,106,664 8,930,808 9,988,251 10,224,674 Total Department Revenue 17,374,940$ 18,799,490$ 17,644,839$ 18,060,888$ 18,644,487$
ExpendituresSalaries and Benefits 8,637,437$ 9,016,776$ 8,596,164$ 9,220,423$ 9,509,572$ Supplies and Services 6,334,868 7,352,364 7,037,841 6,968,971 7,196,876 Special Projects 188,662 848,666 789,190 324,531 418,002 Non-Capital Equipment 39,064 87,206 78,139 128,250 117,068 Capital Equipment - 40,000 40,000 50,000 50,000 Transfers Out 20,730 155,052 155,052 265,375 269,703 Debt Service 78,173 184,418 184,418 184,452 184,418 Appropriated Reserve - 8,451 - 11,134 12,375 Total Operating Expenditures 15,298,934$ 17,692,933$ 16,880,804$ 17,153,136$ 17,758,014$
Capital Program 959,781 3,267,298 1,122,155 954,000 842,260
Total Department Expenditures 16,258,715$ 20,960,231$ 18,002,959$ 18,107,136$ 18,600,274$
Addition to (Use of) Reserves 1,116,225$ (2,160,741)$ (358,120)$ (46,248)$ 44,213$

D E P A R T M E N T S U M M A R Y
Parks and Recreation
F-169
D e p a r t m e n t F u n d C o m p o s i t i o n
Department Appropriations by Fund
General Fund74%
Misc. Grants0%
Creeks & Water Quality
12%
Golf14%
Department Revenues by Fund
Misc. Grants0%
Creeks & Water Quality
13%
Golf13%
General Fund Departmental
Revenue18%
General Fund Subsidy
56%
P r o g r a m O r g a n i z a t i o n a l C h a r t
Administration
Business Services
Project Management Team
Golf Course Recreation Program Mana
Parks Operation Mana
Creeks Restoration and Water Qualitgement gement y
Cultural Arts Facilities and Re
Grounds and Facilities Maintenancegistration Services
Teen Program Forestry Youth Activities Program
Aquatics Beach Maintenance Active Adults and Classes
Sports Tennis Chase Palm Park
Community Services

City of Santa Barbara Two-Year Financial Plan & Annual Budget
PARKS AND RECREATION PROGRAMS
Administration
Project Management Team Business Services Recreation Program
Management Facilities and Reservation
Services Cultural Arts Youth Activities Teen Programs Active Adults and Classes Aquatics Sports Tennis Community Services Creeks Restoration and Water
Quality Improvement Golf Course Park Operations Management Grounds and Facilities
Maintenance Forestry Beach Maintenance Chase Palm Park
RECENT PROGRAM ACHIEVEMENTS The Douglas Family Preserve Management Plan and Dogs Off-Leash policy was adopted by Council in June 2004 and represented a significant effort by staff.
P R O G R A M S & S E R V I C E S
F-170
Administration
( P r o g r a m N o . 6 8 1 1 ) M i s s i o n S t a t e m e n t Provide policy direct ion, strategic planning, administrat ive support and oversight for f ive divisions and project planning, design and construct ion projects.
P r o g r a m A c t i v i t i e s Provide administrat ive direct ion and support for Parks Division, Creeks
Restoration and Water Quality Improvement, Recreat ion Division, Golf Division, Project Management Team.
Coordinate and provide staff support for Park and Recreation Commission and fourteen Advisory Committees.
Oversee open space, park and recreation master planning.
Oversee park design, rehabil i tat ion, and refurbishment.
Build community partnerships and agreements with other agencies and community organizat ions to enhance and expand resources.
Col laborate with the Parks and Recreation Community (PARC) Foundation.
K e y O b j e c t i v e s f o r F i s c a l Y e a r 2 0 0 6 Maintain $325,000 in cash and non-cash donations and grants from
public and private resources.
Maintain $300,000 in volunteer support to enhance department resources.
Ensure 75% or greater of Parks and Recreation program objectives are met or exceeded.
Maintain $250,000 in volunteer support to enhance department resources.
Ensure al l division budgets are within expenditure and revenue budget appropriat ions for f iscal year 2006, and that any revenue shortfal ls are met by equal expenditure savings.
Complete budget within t imelines establ ished by the Finance Department, with input from Parks and Recreation divisions for the f iscal year 2007 mid-cycle budget.

F i n a n c i a l a n d S t a f f i n g I n f o r m a t i o n
Actual Amended Projected Adopted Proposed
FY 2004 FY 2005 FY 2005 FY 2006 FY 2007
Authorized Positions 2.80 3.80 3.80 1.80 1.80
Hourly Employee Hours N/A 0 0 0 0
RevenuesGeneral Fund Subsidy 396,330 361,524 225,458 271,977 288,725 Total Revenue 396,330$ 361,524$ 225,458$ 271,977$ 288,725$
ExpendituresSalaries and Benefits 348,564$ 313,413$ 182,837$ 220,199$ 236,362$ Supplies and Services 47,766 48,111 42,621 51,778 52,363 Total Expenditures 396,330$ 361,524$ 225,458$ 271,977$ 288,725$
P r o g r a m P e r f o r m a n c e M e a s u r e s
Actual Projected Adopted FY 2004 FY 2005 FY 2006
Donations and grants received $1,081,481 $350,000 $325,000
Value of volunteer support $320,336 $300,000 $300,000
F-171

City of Santa Barbara Two-Year Financial Plan & Annual Budget
PARKS AND RECREATION PROGRAMS
Administration
Project Management Team Business Services Recreation Program
Management Facilities and Reservation
Services Cultural Arts Youth Activities Teen Programs Active Adults and Classes Aquatics Sports Tennis Community Services Creeks Restoration and Water
Quality Improvement Golf Course Park Operations Management Grounds and Facilities
Maintenance Forestry Beach Maintenance Chase Palm Park
RECENT PROGRAM ACHIEVEMENTS Received grant funding in the amount of $450,000 for the Franceschi Park improvements from the State Department of Parks and Recreation.
P R O G R A M S & S E R V I C E S
F-172
Project Management Team
( P r o g r a m N o . 6 8 1 3 ) M i s s i o n S t a t e m e n t Plan, design, and implement capital projects for the Parks and Recreation Department.
P r o g r a m A c t i v i t i e s Develop scope of work and prel iminary budget for department capital
improvement and special projects.
Manage and oversee consultant and design teams aff i l iated with act ive projects.
Oversee all required permits and discretionary reviews for projects.
Oversee projects budgets and t ime schedules.
Monitor and report project status to managers and Park and Recreation Commission.
K e y O b j e c t i v e s f o r F i s c a l Y e a r 2 0 0 6 Achieve 75% of project milestones from the department’s f iscal year
2006 Capital Projects Program.
Complete 3 out of 4 capital improvement projects: Oak Park Bridge Replacement, Los Banos Sewer Discharge Connection, Los Banos Leaking Wall Study, and the Teen Center.
Ensure that 75% of capital improvement projects are completed within the approved budget.

F i n a n c i a l a n d S t a f f i n g I n f o r m a t i o n
Actual Amended Projected Adopted Proposed
FY 2004 FY 2005 FY 2005 FY 2006 FY 2007
Authorized Positions 0.00 0.00 0.00 3.50 3.50
Hourly Employee Hours N/A 0 0 0 0
RevenuesFees and Service Charges -$ -$ -$ 47,756$ 50,988$ General Fund Subsidy - - - 274,768 285,931 Total Revenue -$ -$ -$ 322,524$ 336,919$
ExpendituresSalaries and Benefits -$ -$ -$ 319,949$ 334,344$ Supplies and Services - - - 2,575 2,575 Total Expenditures -$ -$ -$ 322,524$ 336,919$
P r o g r a m P e r f o r m a n c e M e a s u r e s
Actual Projected Adopted FY 2004 FY 2005 FY 2006
Percent of capital project milestones complete N/A N/A 75%
Capital improvement projects completed N/A N/A 3
Percent capital projects completed on budget N/A N/A 75%
F-173

City of Santa Barbara Two-Year Financial Plan & Annual Budget
PARKS AND RECREATION PROGRAMS
Administration Project Management Team
Business Services Recreation Program
Management Facilities and Reservation
Services Cultural Arts Youth Activities Teen Programs Active Adults and Classes Aquatics Sports Tennis Community Services Creeks Restoration and Water
Quality Improvement Golf Course Park Operations Management Grounds and Facilities
Maintenance Forestry Beach Maintenance Chase Palm Park
RECENT PROGRAM ACHIEVEMENTS Implemented advertising of programs in the Metropolitan Theatres. Held successful Open House with free classes for one week at Carrillo Recreation Center, with 161 new registrations to the classes.
P R O G R A M S & S E R V I C E S
F-174
Business Services
( P r o g r a m N o . 6 8 1 5 ) M i s s i o n S t a t e m e n t Manage the department’s f inancial process for budget, revenue, capital improvement projects, contracts, leases, grants, market ing and communications, and customer service to assist staff in effect ively and eff icient ly serving the publ ic.
P r o g r a m A c t i v i t i e s Oversee the department’s f inancial business for budget, revenue,
contracts, leases, grants, and capital improvement projects.
Provide market ing and design services that al low the public to easi ly access department information through print, broadcast, and electronic medium.
Manage the Santa Barbara Golf Club professional and food concession contracts.
Provide f inancial analysis and produce a variety of reports for the department staff which depict the f inancial status of the department, both monthly and annually.
Manage the technology system in the department, through l iaison with the Information Systems Division, and coordinate implementat ion and training as technological appl ications broaden in the department.
K e y O b j e c t i v e s f o r F i s c a l Y e a r 2 0 0 6 Complete al l annual expenditure, revenue and capital improvement
project development, budget development, and other f inancial reports within establ ished deadlines.
Maintain the total number of camp registrat ions completed on the Internet at 20%.
Maintain non-camp registrat ions completed on the Internet at 15%.
Implement a comprehensive media campaign to increase recreation program visibi l i ty and increase program part ic ipat ion.
Increase program registrat ion by direct mail ing the Activity Guide to al l postal route customers in City of Santa Barbara.
Develop and implement a marketing plan for the Santa Barbara Golf Club to increase use by out-of-city golfers.
Create a market ing plan to increase visibi l i ty and rentals of al l facil i t ies, through web site presence and a four-color brochure.

K e y O b j e c t i v e s f o r F i s c a l Y e a r 2 0 0 6 ( c o n t i n u e d )
Ensure compliance on department contracts by maintaining a contract and agreement tracking system for insurance cert if icate, terms of contracts and renewals, and distr ibuting reports to staff quarterly.
F i n a n c i a l a n d S t a f f i n g I n f o r m a t i o n
Actual Amended Projected Adopted Proposed
FY 2004 FY 2005 FY 2005 FY 2006 FY 2007
Authorized Positions 3.30 4.30 4.30 2.80 2.80
Hourly Employee Hours N/A 1,500 1,500 1,500 1,500
RevenuesFees and Service Charges 28,842$ -$ -$ -$ -$ General Fund Subsidy 399,432 457,507 399,979 476,943 491,310 Total Revenue 428,274$ 457,507$ 399,979$ 476,943$ 491,310$
ExpendituresSalaries and Benefits 286,839$ 315,338$ 260,122$ 302,780$ 314,831$ Supplies and Services 117,264 135,131 135,551 173,163 175,479 Special Projects 22,319 5,338 2,606 - - Non-Capital Equipment 1,852 1,700 1,700 1,000 1,000 Total Expenditures 428,274$ 457,507$ 399,979$ 476,943$ 491,310$
P r o g r a m P e r f o r m a n c e M e a s u r e s
Actual Projected Adopted FY 2004 FY 2005 FY 2006
Expenditure and revenue budget projection forecasts provided to department managers 12 12 12
Percent of camp registrations completed on the Internet 53% 20% 20%
Percent of non-camp registrations completed on the Internet 16% 15% 15%
User visits to Parks and Recreation web site pages N/A 13,000 13,000
User visits to eRecreation web site pages N/A 12,000 13,000
New email addresses on CLASS database N/A 2,500 1,500
Visits to SummerFun web site N/A N/A 3,500
F-175

City of Santa Barbara Two-Year Financial Plan & Annual Budget
PARKS AND RECREATION PROGRAMS
Administration Project Management Team Business Services
Recreation Program Management
Facilities and Reservation Services
Cultural Arts Youth Activities Teen Programs Active Adults and Classes Aquatics Sports Tennis Community Services Creeks Restoration and Water
Quality Improvement Golf Course Park Operations Management Grounds and Facilities
Maintenance Forestry Beach Maintenance Chase Palm Park
RECENT PROGRAM ACHIEVEMENTS Completion of Senior Program Strategy Plan and Arts and Crafts Show Task Force Report.
P R O G R A M S & S E R V I C E S
F-176
Recreation Program
Management
( P r o g r a m N o . 6 1 1 1 ) M i s s i o n S t a t e m e n t Manage Recreation Division resources and foster col laborations to provide high qual ity and diverse recreation activit ies that enrich people’s l ives and promote healthy l i festyles.
P r o g r a m A c t i v i t i e s Provide administrat ive oversight to the Recreation Division, including
budget and faci l i ty management, planning, day-to-day operat ions, program development and evaluation, and customer service.
Develop and administer a wide variety of structured recreation programs.
Facil i tate sponsorship and partnership agreements with community organizations to enhance publ ic recreation opportunit ies.
Manage revenues produced from activity fees, facil i ty rentals, grants and partnerships.
Provide training for the successful integrat ion of individuals with disabi l i t ies into department programs.
Facil i tate sports and social recreation act ivit ies specif ical ly adapted for children and adults with developmental and physical disabil i t ies.
K e y O b j e c t i v e s f o r F i s c a l Y e a r 2 0 0 6 Manage division programs to achieve 80% of performance objectives.
Maintain expenditure recovery through user fee revenue at 40% for Recreation Division.
Negotiate and complete 20 annual co-sponsorship agreements to enhance recreation opportunit ies.
Achieve a minimum of 30,000 volunteer hours to supplement City resources.
Complete implementation of Adapted Programs transit ion to other program sections by Apri l 2006.

F i n a n c i a l a n d S t a f f i n g I n f o r m a t i o n
Actual Amended Projected Adopted Proposed
FY 2004 FY 2005 FY 2005 FY 2006 FY 2007
Authorized Positions 3.00 2.82 2.82 2.75 1.75
Hourly Employee Hours N/A 6,248 6,248 4,121 4,121
RevenuesGeneral Fund Subsidy 579,476 568,344 568,763 558,965 551,734 Total Revenue 579,476$ 568,344$ 568,763$ 558,965$ 551,734$
ExpendituresSalaries and Benefits 469,841$ 492,300$ 500,694$ 400,529$ 328,755$ Supplies and Services 145,817 139,510 135,010 157,436 160,287 Special Projects - - - - 61,692 Non-Capital Equipment - 1,409 - 1,000 1,000 Total Expenditures 615,658$ 633,218$ 635,703$ 558,965$ 551,734$
P r o g r a m P e r f o r m a n c e M e a s u r e s
Actual Projected Adopted FY 2004 FY 2005 FY 2006
Percent of division performance objectives achieved 75% 80% 80%
Percent of actual expenditure recovered by user fee revenue 41% 41% 40%
Co-sponsorship agreements completed 21 22 20
Volunteer hours 31,777 30,000 30,000
Employee injuries 6 7 6
Vehicle accidents 4 3 0
Individuals served through the Inclusion Program 31 30 30
F-177

City of Santa Barbara Two-Year Financial Plan & Annual Budget
PARKS AND RECREATION PROGRAMS
Administration Project Management Team Business Services Recreation Program
Management Facilities and Reservation
Services Cultural Arts Youth Activities Teen Programs Active Adults and Classes Aquatics Sports Tennis Community Services Creeks Restoration and Water
Quality Improvement Golf Course Park Operations Management Grounds and Facilities
Maintenance Forestry Beach Maintenance Chase Palm Park
RECENT PROGRAM ACHIEVEMENTS Developed a more accessible way for customers to view each facility’s amenities by creating active links on the Facilities Rental List on t.
P R O G R A M S & S E R V I C E S
F-178
Facil it ies and Reservation
Services
( P r o g r a m N o . 6 1 2 1 ) M i s s i o n S t a t e m e n t Provide good customer service, reservat ion and registrat ion services, and clean, safe indoor and outdoor rental facil i t ies to the publ ic.
P r o g r a m A c t i v i t i e s Provide customer recept ion and services at department administrat ive
off ice, and serve as pr imary source of information on department programs and services to the publ ic.
Provide activity registrat ion services to the public, in-person, and on the Internet.
Promote public use of City parks, beaches, open space, and other venues through faci l i ty reservat ions services and event coordination.
Protect the integrity of publ ic space by informing the publ ic of rules and guidel ines for use and by monitor ing act ivit ies.
Provide the public with opportunit ies to gain cultural awareness by co-sponsoring the Oak Park fest ivals and similar community events.
K e y O b j e c t i v e s f o r F i s c a l Y e a r 2 0 0 6 Process 90% of faci l i ty rental appl icat ions, received via mail, fax, or e-
mail, in 3 working days or less.
Process 95% of facil i ty rental appl icat ions while the customer is present.
Achieve 80% “good to very good rat ing” from public special events for “customer overall satisfaction” with their faci l i ty rental experience.
Increase wedding ceremonies booked in City parks or beaches by 10%.
Work with community organizations to faci l i tate 95 publ ic special events held in park facil i t ies.
Plan and coordinate City-sponsored major special events (Fiesta, Summer Solst ice, Oak Park, Ethnic Fest ivals and 4th of July).
Modify faci l i ty content in CLASS to better serve the eRecreation rental customer by providing a greater level of details by March 31, 2006.

F i n a n c i a l a n d S t a f f i n g I n f o r m a t i o n
Actual Amended Projected Adopted Proposed
FY 2004 FY 2005 FY 2005 FY 2006 FY 2007
Authorized Positions 2.00 2.00 2.00 2.80 2.80
Hourly Employee Hours N/A 3,450 3,450 1,273 1,273
RevenuesFees and Service Charges 190,460$ 240,542$ 227,598$ 238,648$ 245,808$ Other Revenue (138) - - - - General Fund Subsidy 130,681 110,329 114,578 134,307 139,418 Total Revenue 321,003$ 350,871$ 342,176$ 372,955$ 385,226$
ExpendituresSalaries and Benefits 158,910$ 169,538$ 163,016$ 207,328$ 216,716$ Supplies and Services 156,906 157,333 155,160 142,627 145,510 Non-Capital Equipment 5,187 24,000 24,000 23,000 23,000 Total Expenditures 321,003$ 350,871$ 342,176$ 372,955$ 385,226$
P r o g r a m P e r f o r m a n c e M e a s u r e s
Actual Projected Adopted FY 2004 FY 2005 FY 2006
Facility permits received via mail and processed 141 140 120
Percent of facility rental applications received via mail, fax, or e-mail processed in 3 working days or less 96.75% 85% 90%
Facility permits processed while the customer is present 716 500 500
Percent of facility rental applications processed while the customer is present 99.25% 95% 95%
Percent of customers that rate the rental facilities “good” to “very good” N/A 75% 80%
Ceremonies booked N/A N/A 115
Public special events held N/A N/A 95
Special event applications processed 75 95 95
F-179

City of Santa Barbara Two-Year Financial Plan & Annual Budget
PARKS AND RECREATION PROGRAMS
Administration Project Management Team Business Services Recreation Program
Management Facilities and Reservation
Services Cultural Arts
Youth Activities Teen Programs Active Adults and Classes Aquatics Sports Tennis Community Services Creeks Restoration and Water
Quality Improvement Golf Course Park Operations Management Grounds and Facilities
Maintenance Forestry Beach Maintenance Chase Palm Park
RECENT PROGRAM ACHIEVEMENTS The Concerts in the Parks series served over 40,000 Santa Barbara area residents in the summer of 2004, and over $20,000 in grants and donations were received to support the program.
P R O G R A M S & S E R V I C E S
F-180
Cultural Arts
( P r o g r a m N o . 6 1 3 1 ) M i s s i o n S t a t e m e n t Promote involvement in cultural arts through a variety of events and programs, and provide quality publ ic rental facil i t ies with responsive customer service.
P r o g r a m A c t i v i t i e s Coordinate use, market ing and rental operat ions of three premier beach
area facil i t ies, including the Cabri l lo Pavi l ion Arts Center, Chase Palm Park Recreation Center and Casa Las Palmas, for community, recreational, educat ional, and cultural act ivit ies.
Provide a variety of cultural arts events through col laboration with community groups.
Coordinate the 40th Annual Santa Barbara Arts and Crafts Show, held every Sunday along Cabri l lo Boulevard.
Coordinate large special events such as the Concerts in the Parks program and the 75th Annual Chi ldren’s Fiesta Parade.
K e y O b j e c t i v e s f o r F i s c a l Y e a r 2 0 0 6 Achieve 95% “good” to “excellent” survey response rat ings for overall
customer sat isfact ion with rental facil i t ies.
Achieve $16,000 in grants and f inancial sponsorship for the Concerts in the Parks program.
Maintain current level of vendors at the Santa Barbara Arts and Crafts Show.
Maintain an average occupancy of 0.77 rentals per day at the Cabri l lo Pavil ion Arts Center.
Implement Arts and Crafts Show Task Force recommendations by December 2005.
Complete Request for Proposal and select vendor for the snack bar space at Chase Palm Park by March 31, 2006.
Cont inue to oversee the construct ion and grand opening of the Teen Center project, in col laboration with the Teen Programs Supervisor by January 2006.

F i n a n c i a l a n d S t a f f i n g I n f o r m a t i o n
Actual Amended Projected Adopted Proposed
FY 2004 FY 2005 FY 2005 FY 2006 FY 2007
Authorized Positions 3.00 3.00 3.00 2.25 2.25
Hourly Employee Hours N/A 4,842 4,842 5,761 5,761
RevenuesFees and Service Charges 408,242$ 432,680$ 439,500$ 331,300$ 345,070$ Donations 11,500 24,000 24,000 - - Other Revenue (1) - - - - General Fund Subsidy 76,557 108,410 131,434 100,508 100,576 Total Revenue 496,298$ 565,090$ 594,934$ 431,808$ 445,646$
ExpendituresSalaries and Benefits 198,827$ 252,474$ 273,912$ 222,690$ 231,635$ Supplies and Services 297,784 315,095 324,001 207,118 212,011 Non-Capital Equipment 2,451 2,000 1,500 2,000 2,000 Total Expenditures 499,062$ 569,569$ 599,413$ 431,808$ 445,646$
P r o g r a m P e r f o r m a n c e M e a s u r e s
Actual Projected Adopted FY 2004 FY 2005 FY 2006
Percent of customers rating rental facilities as "good" to “excellent" 100% 98% 95%
Annual amount for grants and financial sponsorships for program $13,075 $16,000 $16,000
Vendors registered with the Santa Barbara Arts and Crafts Show 242 240 240
Facility rental revenue N/A $162,800 $167,000
Facility reservations processed for the Cabrillo Pavilion Arts Center N/A 300 300
Participants in Concerts in the Parks program N/A N/A 30,000
Participants in Children’s Fiesta Parade N/A N/A 2,000
F-181
City of Santa Barbara Two-Year Financial Plan & Annual Budget
PARKS AND RECREATION PROGRAMS
Administration Project Management Team Business Services Recreation Program
Management Facilities and Reservation
Services Cultural Arts
Youth Activities Teen Programs Active Adults and Classes Aquatics Sports Tennis Community Services Creeks Restoration and Water
Quality Improvement Golf Course Park Operations Management Grounds and Facilities
Maintenance Forestry Beach Maintenance Chase Palm Park
RECENT PROGRAM ACHIEVEMENTS 1,450 children participated in after-school programs as a result of $120,000 additional after-school funding provided by the City and Santa Barbara School Districts.
P R O G R A M S & S E R V I C E S
F-182
Youth Activit ies
( P r o g r a m N o . 6 1 4 1 ) M i s s i o n S t a t e m e n t Provide safe youth recreational opportunit ies in a posit ive and nurtur ing environment for chi ldren ages 4 through 17 to promote enriching and healthy l i festyles.
P r o g r a m A c t i v i t i e s Provide after-school sports and recreation programs at 10 elementary
and 4 junior high schools, and City recreation faci l i t ies.
Provide four youth summer camps and junior counselor training program. Provide summer drop-in recreation programs at 3 elementary schools located in low-income neighborhoods.
Foster col laborations with other youth service agencies, non-profits and school distr icts to maximize resources and programming for youth.
K e y O b j e c t i v e s f o r F i s c a l Y e a r 2 0 0 6 Maintain Recreation After-school Program (RAP) part ic ipat ion at 70%
for 270 available spaces.
Achieve 75% “good” to “excellent” survey response rat ing for overal l part icipant satisfact ion with Recreation After-School Programs (RAP).
Achieve 80% part ic ipat ion in after-school sports at 4 Junior High Schools with a maximum of 1,920 spaces avai lable.
Achieve 75% “good” to “excellent” survey response rat ing for overal l part icipant satisfact ion with Junior High After-School Sports program.
Provide recreation services for 520 part ic ipants at After-School Opportunit ies for Kids! (A-OK!) at 5 elementary school sites.
Achieve 75% “good” to “excellent” survey response rat ing for overal l part icipant sat isfact ion with the recreation services component of the After-School Opportunit ies for Kids! program.
Provide summer camps and cl inics for 450 part ic ipants at 3 youth camps.
Achieve 75% “good” to “excellent” survey response rat ing for overal l part icipant satisfact ion with summer camps and cl inics.
Provide summer drop-in recreation programs for 300 unduplicated youth at 3 elementary school sites.
Develop and offer a new youth camp for summer 2006.

F-183
F i n a n c i a l a n d S t a f f i n g I n f o r m a t i o n
Actual Amended Projected Adopted Proposed
FY 2004 FY 2005 FY 2005 FY 2006 FY 2007
Authorized Positions 4.80 5.80 5.80 3.00 3.00
Hourly Employee Hours N/A 24,786 24,786 13,005 13,005
RevenuesFees and Service Charges 142,956$ 217,616$ 163,561$ 100,260$ 103,268$ Intergovernmental - 50,000 50,000 - - Other Revenue 203,754 287,777 287,777 - - Donations - 8,000 8,000 - - General Fund Subsidy 522,381 652,373 681,724 591,065 603,523 Total Revenue 869,091$ 1,215,766$ 1,191,062$ 691,325$ 706,791$
ExpendituresSalaries and Benefits 734,915$ 952,015$ 938,262$ 339,014$ 350,862$ Supplies and Services 178,737 370,428 359,477 243,926 247,544 Special Projects 2,825 - - - - Transfers Out - - - 107,385 107,385 Non-Capital Equipment - 2,961 2,961 1,000 1,000 Total Expenditures 916,477$ 1,325,404$ 1,300,700$ 691,325$ 706,791$
P r o g r a m P e r f o r m a n c e M e a s u r e s
Actual Projected Adopted FY 2004 FY 2005 FY 2006
Percent of RAP registration of maximum spaces available N/A N/A 70%
Percent of participants that rate satisfaction with RAP as “good” to “excellent” N/A N/A 75%
Percent of Jr. High participants of maximum spaces available N/A N/A 80%
Percent of participants that rate satisfaction with Jr. High sports as “good” to “excellent” N/A N/A 75%
Average A-OK! participants 528 520 520
Percent of participants that rate satisfaction with A-OK! as “good” to “excellent” N/A N/A 75%
Percent of summer camp and clinic registrations N/A N/A 450
Percent of participants that rate satisfaction with summer camps and clinics as “good” to “excellent” N/A N/A 75%
Summer drop-in registrations N/A N/A 300
Percent of staff with all required certifications N/A N/A 100%
Percent of staff attending required trainings N/A N/A 95%
RAP unduplicated participants 162 153 189
Jr. High sports participants 419 1,118 1,150

City of Santa Barbara Two-Year Financial Plan & Annual Budget
PARKS AND RECREATION PROGRAMS
Administration Project Management Team Business Services Recreation Program
Management Facilities and Reservation
Services Cultural Arts Youth Activities
Teen Programs Active Adults and Classes Aquatics Sports Tennis Community Services Creeks Restoration and Water
Quality Improvement Golf Course Park Operations Management Grounds and Facilities
Maintenance Forestry Beach Maintenance Chase Palm Park
RECENT PROGRAM ACHIEVEMENTS Plans to open a Teen Center at 1235 Chapala Street moved forward with the opening scheduled by January 2006.
P R O G R A M S & S E R V I C E S
F-184
Teen Programs
( P r o g r a m N o . 6 1 4 2 ) M i s s i o n S t a t e m e n t Provide recreational educational and leadership training act ivit ies in a posit ive and nurtur ing environment for teens, including entertainment, substance-free leisure and personal development act ivit ies to promote enriching and healthy l i festyles for community youth.
P r o g r a m A c t i v i t i e s Provide recreation, l i fe-skil ls, and leadership training activit ies for
junior high and high school teens to encourage healthy, productive l i festyles and reduce involvement with drugs, alcohol, and negat ive social behaviors.
Coordinate and supervise the act ivit ies of the Santa Barbara Youth Counci l to provide a forum for teens to discuss and make recommendations on topics of concern.
Foster col laborations with other youth service agencies, non-prof its, and school distr icts to maximize resources and programming for teens.
Operate a Teen Center to provide interest ing leisure, drop-in, and personal development act ivit ies, and a variety of classes.
K e y O b j e c t i v e s f o r F i s c a l Y e a r 2 0 0 6 Achieve an annual part ic ipat ion of 2,200 teens in Teen Programs’
act ivit ies.
At least two t imes per month, provide an entertaining, safe and drug free recreational act ivity for teens.
Conduct or co-sponsor at least 6 leadership/personal development act ivit ies for teens.
Achieve 1,500 part ic ipants at junior and senior high school dances.
Coordinate or co-sponsor 63 recreational or enriching act ivit ies to encourage part ic ipat ion by teens in a safe, substance free environment.
Maintain a 95% overal l sat isfact ion rate of “good” or better for teen programs’ events and services.
Track and provide services such as advising, homework assistance, mentoring and referrals to 12 teens to realize individual impact of teen services.
Coordinate the televising of the Youth Council meetings on Government Channel 18 by working with production staff by September 30, 2005.

F-185
K e y O b j e c t i v e s f o r F i s c a l Y e a r 2 0 0 6 ( c o n t i n u e d ) Establ ish an on-campus teen club on at least one Santa Barbara School Distr ict Junior High
or High School campus by September 30, 2005.
Complete the development and opening of the new Teen center by January 2006.
Conduct at least 2 Youth Speak Out events on issues important to youth, teens, and the community.
F i n a n c i a l a n d S t a f f i n g I n f o r m a t i o n
Actual Amended Projected Adopted Proposed
FY 2004 FY 2005 FY 2005 FY 2006 FY 2007
Authorized Positions 1.00 0.05 0.05 1.00 1.00
Hourly Employee Hours N/A 405 405 3,476 3,476
RevenuesFees and Service Charges 19,159$ 4,149$ 5,051$ 23,625$ 24,334$ Intergovernmental 49,246 - - - - Donations 20,860 14,280 14,280 - - General Fund Subsidy 243,598 11,136 10,629 230,944 233,693 Total Revenue 332,864$ 29,565$ 29,960$ 254,569$ 258,027$
ExpendituresSalaries and Benefits 200,447$ 11,428$ 11,072$ 161,813$ 165,920$ Supplies and Services 105,578 3,890 3,899 91,256 90,607 Non-Capital Equipment 2,127 27 - 1,500 1,500 Total Expenditures 308,152$ 15,345$ 14,971$ 254,569$ 258,027$
P r o g r a m P e r f o r m a n c e M e a s u r e s
Actual Projected Adopted FY 2004 FY 2005 FY 2006
Teen participants N/A 2,205 2,200
Teen events N/A 24 24
Leadership/personal development activities 6 6 6
Dance participants 1,173 1,400 1,500
Teen activities offered N/A 63 63
Overall satisfaction rate achieved with teen events through program evaluations 91% 95% 95%
Teens mentored successfully N/A N/A 12
Formal Youth Council meetings held 22 22 22
Teen participants at Teen Center N/A N/A 6,000
Percent of teens reporting they have gained knowledge or skills through participation in leadership programs N/A N/A 85%

City of Santa Barbara Two-Year Financial Plan & Annual Budget
PARKS AND RECREATION PROGRAMS
Administration Project Management Team Business Services Recreation Program
Management Facilities and Reservation
Services Cultural Arts Youth Activities Teen Programs
Active Adults and Classes Aquatics Sports Tennis Community Services Creeks Restoration and Water
Quality Improvement Golf Course Park Operations Management Grounds and Facilities
Maintenance Forestry Beach Maintenance Chase Palm Park
RECENT PROGRAM ACHIEVEMENTS Completion of Senior Program Strategy and renovation of Carrillo courtyard
P R O G R A M S & S E R V I C E S
F-186
Active Adults and Classes
( P r o g r a m N o . 6 1 6 1 ) M i s s i o n S t a t e m e n t Provide recreation, social, and wellness activit ies for adults 50 years of age and older to promote a healthy l i festyle in an act ive senior community.
P r o g r a m A c t i v i t i e s Manage a tour and travel program with opportunit ies ranging from
in-town out ings to oversea excursions.
Provide publ ic dance programs for swing, ballroom, and contra dancing at the histor ic Carri l lo Ballroom.
Offer f i tness and wellness classes for a wide range of interests and abi l i ty levels.
Coordinate volunteer- led social programs including br idge, potlucks, and peer support groups.
Provide sports act ivit ies including badminton, table tennis, and basketbal l.
Operate an information and referral service to connect seniors with local resources.
For youth and adult, provide a wide variety of classes through collaboration with community groups and use of independent contractors.
Provide site management of the Carri l lo Recreation Center, Carri l lo Street Gym, Santa Barbara Lawn Bowls Club, and MacKenzie Park Lawn Bowls Club.
K e y O b j e c t i v e s f o r F i s c a l Y e a r 2 0 0 6 Achieve 600 part icipants in the Senior Recreation Services tour
program.
Maintain a minimum 90% “good” or better rat ing in overal l customer sat isfact ion in the tour program.
Serve 10,500 part ic ipants through the Swing, Ballroom, and Contra dance programs.
Achieve 90% “good” to “excellent” survey response rat ings for overall customer sat isfact ion with contract classes.
Increase youth and adult contract class registrat ions by 5%.
Achieve 90% or more program part ic ipants report ing improved qual ity of l i fe through part icipation in programs designed for seniors.

K e y O b j e c t i v e s f o r F i s c a l Y e a r 2 0 0 6 ( c o n t i n u e d ) Foster volunteerism through leadership and involvement in programs with a minimum of 90
volunteers.
Increase community use of Carr i l lo Recreation Center and Carri l lo Street Gym by 3%.
Implement a minimum five of the recommendations from the 2005 Program Audit by June 2006.
F i n a n c i a l a n d S t a f f i n g I n f o r m a t i o n
Actual Amended Projected Adopted Proposed
FY 2004 FY 2005 FY 2005 FY 2006 FY 2007
Authorized Positions 2.00 2.00 2.00 3.00 3.00
Hourly Employee Hours N/A 6,981 6,981 6,252 6,252
RevenuesFees and Service Charges 215,812$ 284,500$ 157,555$ 277,700$ 286,031$ Interest Income 10 - - - - Donations 8,000 - - - - General Fund Subsidy 424,387 404,592 463,884 500,938 513,514 Total Revenue 648,209$ 689,092$ 621,439$ 778,638$ 799,545$
ExpendituresSalaries and Benefits 221,110$ 230,400$ 196,453$ 294,663$ 303,495$ Supplies and Services 427,099 457,692 423,986 482,975 495,050 Non-Capital Equipment - 1,000 1,000 1,000 1,000 Total Expenditures 648,209$ 689,092$ 621,439$ 778,638$ 799,545$
F-187

City of Santa Barbara Two-Year Financial Plan & Annual Budg
P R O G R A M S & S E R V I C E S
F-188
et
Active Adults and Classes
( C o n t i n u e d ) P r o g r a m P e r f o r m a n c e M e a s u r e s
Actual Projected Adopted FY 2004 FY 2005 FY 2006
Tour registrations 1,042 600 600
Percent of participants who rate tour experience as “good” or "excellent" on program evaluations 87% 90% 90%
Participants in Ballroom, Swing, and Contra dance programs 10,779 10,200 10,500
Percent of participants that rate customer satisfaction with contract classes as “good” to “excellent” 98% 93% 90%
Number of contract class registrations 2,740 2,500 2,625
Percent of program participants who indicate that participation in senior programs has improved their quality of life 93% 90% 90%
Volunteers registered with senior programs 90 90 90
Facility use hours N/A 9,000 9,476
Senior Recreation Services members N/A 740 800
Participations in health and fitness programs N/A 14,250 14,000
Participations in social and recreational programs N/A 52,000 50,000
Facility reservations processed for the Carrillo Recreation Center N/A 1,800 1,800
Facility reservations processed for the Carrillo St. Gym N/A 990 900
Percent of cost recovery on Saturday night Ballroom Dance program N/A N/A 55%
Percent of cost recovery on facility rentals N/A N/A 68%

[This page intent ional ly le f t b lank. ]
F-189

City of Santa Barbara Two-Year Financial Plan & Annual Budget
PARKS AND RECREATION PROGRAMS
Administration Project Management Team Business Services Recreation Program
Management Facilities and Reservation
Services Cultural Arts Youth Activities Teen Programs Active Adults and Classes
Aquatics Sports Tennis Community Services Creeks Restoration and Water
Quality Improvement Golf Course Park Operations Management Grounds and Facilities
Maintenance Forestry Beach Maintenance Chase Palm Park
RECENT PROGRAM ACHIEVEMENTS Oak Park wading pool deck replacement completed. Implemented CLASS Membership System to replace paper punchcard system. Completed five aquatic training manuals.
P R O G R A M S & S E R V I C E S
F-190
Aquatics
( P r o g r a m N o . 6 1 7 1 ) M i s s i o n S t a t e m e n t Provide safe and high quality aquatic programs and services that encourage ski l l development and promote swimming as a l i fet ime sport for swimmers of al l ages.
P r o g r a m A c t i v i t i e s Provide safe and clean community swimming and wading pools for
exercise and healthy enjoyment.
Provide professional l i feguard services at City beaches and pools to ensure that two mil l ion visitors and cit izens enjoy the sun, surf, and sand in a safe environment.
Provide swim lessons and water safety training to safeguard against drowning accidents, provide job cert i f icat ions, and enhance community awareness for responsible swimming.
Provide aquatic opportunit ies for youth including Junior Lifeguards, Aquacamp, Beach Vol leybal l Camp, and new avenues for aquatics-related personal growth.
Manage two year-round, mult i-use aquatic faci l i t ies, Los Banos del Mar Swimming Pool and Cabri l lo Bathhouse, and three seasonal pool faci l i t ies.
K e y O b j e c t i v e s f o r F i s c a l Y e a r 2 0 0 6 Maintain high-quality and sanitary publ ic swimming pool faci l i t ies
result ing in zero mandated pool closures.
Maintain 95% “Good” to “Excel lent” overall customer satisfact ion rate with aquatics programs.
Maintain current level of registrat ions in 3 aquatic summer camps.
Maintain 590 youth swim lesson registrat ions.
Provide 63 scholarships to aquatic camp programs.
Complete Los Banos wastewater connection to sanitary sewer by June 2006.

F i n a n c i a l a n d S t a f f i n g I n f o r m a t i o n
Actual Amended Projected Adopted Proposed
FY 2004 FY 2005 FY 2005 FY 2006 FY 2007
Authorized Positions 3.00 3.00 3.00 2.00 2.00
Hourly Employee Hours N/A 25,328 25,328 27,009 27,009
RevenuesFees and Service Charges 619,060$ 550,915$ 578,120$ 592,133$ 609,898$ Other Revenue (2) - - - - Donations 10,000 - - - - General Fund Subsidy 488,483 517,045 502,071 518,239 518,662 Total Revenue 1,117,541$ 1,067,960$ 1,080,191$ 1,110,372$ 1,128,560$
ExpendituresSalaries and Benefits 541,693$ 537,708$ 527,795$ 514,137$ 527,126$ Supplies and Services 555,023 500,939 523,863 563,735 568,934 Special Projects 11,154 25,000 25,000 25,000 25,000 Non-Capital Equipment 5,704 8,280 7,500 7,500 7,500 Total Expenditures 1,113,574$ 1,071,927$ 1,084,158$ 1,110,372$ 1,128,560$
P r o g r a m P e r f o r m a n c e M e a s u r e s
Actual Projected Adopted FY 2004 FY 2005 FY 2006
Mandated pool closures by the Santa Barbara County Health Department 0 0 0
Percent of participants rating overall customer satisfaction "Good" to "Excellent" 91% 99% 95%
Registrations for 3 aquatic summer camps 1,329 1,488 1,488
Youth swim lesson registrations 698 590 590
Scholarships awarded for aquatic summer camps 51 62 63
Training hours provided for aquatics staff N/A N/A 131
Percent of cost recovery for all aquatics programs N/A N/A 53%
Participation at Los Banos swimming pool 46,873 45,000 45,000
Attendance at Ortega Park swimming pool N/A 5,066 5,066
Attendance at Oak Park wading pool N/A 4,420 4,420
Attendance at West Beach wading pool N/A 3,530 3,530
F-191

City of Santa Barbara Two-Year Financial Plan & Annual Budget
PARKS AND RECREATION PROGRAMS
Administration Project Management Team Business Services Recreation Program
Management Facilities and Reservation
Services Cultural Arts Youth Activities Teen Programs Active Adults and Classes Aquatics
Sports Tennis Community Services Creeks Restoration and Water
Quality Improvement Golf Course Park Operations Management Grounds and Facilities
Maintenance Forestry Beach Maintenance Chase Palm Park
RECENT PROGRAM ACHIEVEMENTS Introduced two successful new adult leagues: Coed Soccer and Ultimate Frisbee.
P R O G R A M S & S E R V I C E S
F-192
Sports
( P r o g r a m N o . 6 1 8 1 ) M i s s i o n S t a t e m e n t Provide adults and youth of al l abil i ty levels the opportunity to part icipate in competit ive sports by working towards personal development by promoting healthy and active l i festyles, and coordinate and facil i tate use of sports f ields.
P r o g r a m A c t i v i t i e s Provide sports leagues for adults and youth in vol leybal l, basketball, t-
bal l, soccer, ult imate fr isbee, and other sports of community interest.
Manage City contract to provide community softbal l program at City faci l i t ies.
Promote and faci l i tate community use of City sports f ields for soccer, softbal l , baseball , and other sports.
Coordinate training for sports off ic ials, coaches, volunteers, and staff to promote sportsmanship, safety, and compliance with policies and procedures.
Facil i tate the Cal ifornia Beach Vol leybal l Tournament Series which includes youth and adult tournaments.
Schedule and coordinate sport ing events at City parks, beach, and sports f ields.
Under agreement with Santa Barbara School Distr ict, coordinate f ield reservat ions and use of Franklin Elementary, La Colina, La Cumbre and Santa Barbara Junior High sports f ields.
K e y O b j e c t i v e s f o r F i s c a l Y e a r 2 0 0 6 Maintain 748 part icipants in 6 youth sports programs.
Maintain 527 part icipants in 4 adult sports programs.
Provide 150 scholarships totaling $10,000 for youth sports league part icipants.
Achieve 90% customer sat isfact ion with sports f ields reservat ion processing.
Facil i tate community use of 26,200 programmable hours at 7 City sports f ields and 10 school distr ict sports f ields.
Provide 4 adult and 5 youth beach volleybal l tournaments.
Refine co-sponsorship agreements with PONY Baseball and the Santa Barbara Youth Soccer Coalit ion to achieve better programming for youth sports by June 2006.

K e y O b j e c t i v e s f o r F i s c a l Y e a r 2 0 0 6 ( c o n t i n u e d )
Develop, organize and implement a tr iathlon camp for the summer of 2006.
Maintain a working relat ionship with both Santa Barbara City College and the Santa Barbara School Distr ict by meeting quarterly with staff to discuss joint-use faci l i t ies.
F i n a n c i a l a n d S t a f f i n g I n f o r m a t i o n
Actual Amended Projected Adopted Proposed
FY 2004 FY 2005 FY 2005 FY 2006 FY 2007
Authorized Positions 3.00 2.13 2.13 2.00 2.00
Hourly Employee Hours N/A 2,115 2,115 4,188 4,188
RevenuesFees and Service Charges 252,298$ 176,952$ 153,609$ 160,617$ 167,443$ Donations 32,169 50,111 50,111 - - General Fund Subsidy 173,565 113,748 125,807 250,315 246,504 Total Revenue 458,031$ 340,811$ 329,527$ 410,932$ 413,947$
ExpendituresSalaries and Benefits 223,812$ 202,269$ 202,829$ 223,250$ 238,184$ Supplies and Services 175,776 112,608 99,521 186,682 174,763 Special Projects - 31,006 31,006 - - Non-Capital Equipment - 3,065 3,000 1,000 1,000 Total Expenditures 399,588$ 348,948$ 336,356$ 410,932$ 413,947$
F-193

City of Santa Barbara Two-Year Financial Plan & Annual Budg
P R O G R A M S & S E R V I C E S
F-194
et
Sports
( C o n t i n u e d ) P r o g r a m P e r f o r m a n c e M e a s u r e s
Actual Projected Adopted FY 2004 FY 2005 FY 2006
Youth league participants N/A N/A 748
Adult league participants N/A N/A 527
Scholarships for youth sports leagues N/A N/A 150
Percent of participants rating customer satisfaction with sports fields reservation processing as “satisfactory” or above. 83% 90% 90%
Field hours reserved 6,321 8,000 8,000
Beach volleyball tournaments 9 9 9
Participants in adult basketball league N/A N/A 232
Participants in adult volleyball league N/A N/A 136
Participants in adult co-ed soccer league N/A N/A 75
Participants in adult Ultimate Frisbee league N/A 85 84
Participants in adult youth flag football league N/A N/A 215
Participants in youth biddy basketball league N/A N/A 48
Participants in youth basketball league N/A N/A 225
Participants in youth t- ball league N/A N/A 98
Participants in youth t- ball clinic N/A N/A 63
Participants in girls softball league N/A N/A 99

[This page intent ional ly le f t b lank. ]
F-195

City of Santa Barbara Two-Year Financial Plan & Annual Budget
PARKS AND RECREATION PROGRAMS
Administration Project Management Team Business Services Recreation Program
Management Facilities and Reservation
Services Cultural Arts Youth Activities Teen Programs Active Adults and Classes Aquatics Sports
Tennis Community Services Creeks Restoration and Water
Quality Improvement Golf Course Park Operations Management Grounds and Facilities
Maintenance Forestry Beach Maintenance Chase Palm Park
RECENT PROGRAM ACHIEVEMENTS Positive response was received from A-OK! (After-School Opportunities for Kids) program participants and staff with tennis outreach program with Tennis Patrons.
P R O G R A M S & S E R V I C E S
F-196
Tennis
( P r o g r a m N o . 6 1 8 2 ) M i s s i o n S t a t e m e n t Offer reasonably priced, quali ty tennis classes, leagues, cl inics and tournaments in wel l-maintained facil i t ies, and promote tennis as a l i fet ime sport.
P r o g r a m A c t i v i t i e s Provide community tennis programs consist ing of group and private
lessons, leagues, summer youth tennis programs, and tournaments.
Maintain and coordinate use of 32 tennis courts at f ive faci l i t ies, including 17 l ighted courts, showers, and locker rooms.
Manage a tennis court user-fee permit system, including sales of dai ly and annual tennis permits.
Col laborate with local schools, non-prof it agencies, and national tennis associat ions to promote adult and youth part ic ipation in tennis.
K e y O b j e c t i v e s f o r F i s c a l Y e a r 2 0 0 6 Provide group tennis lessons for 550 part icipants annually.
Sell 4,300 dai ly Tennis Permits.
Sell 279 Annual Tennis Permits.
Maintain an 80% customer sat isfact ion rate for tennis facil i ty and court maintenance.
Resurface 2 tennis courts at Oak Park.
Revise annual survey to permit holders to include questions regarding the demographics of customers.

F i n a n c i a l a n d S t a f f i n g I n f o r m a t i o n
Actual Amended Projected Adopted Proposed
FY 2004 FY 2005 FY 2005 FY 2006 FY 2007
Authorized Positions 0.80 0.80 0.80 0.80 0.80
Hourly Employee Hours N/A 2,712 2,712 2,712 2,712
RevenuesFees and Service Charges 170,759$ 161,333$ 133,317$ 136,123$ 141,084$ Other Revenue 25 - - - - General Fund Subsidy 85,919 132,348 143,363 119,802 127,586 Total Revenue 256,703$ 293,681$ 276,680$ 255,925$ 268,670$
ExpendituresSalaries and Benefits 79,611$ 89,549$ 89,549$ 99,525$ 102,312$ Supplies and Services 170,921 150,589 133,888 130,400 135,358 Special Projects 7,457 52,543 52,543 25,000 30,000 Non-Capital Equipment - 1,000 700 1,000 1,000 Total Expenditures 257,989$ 293,681$ 276,680$ 255,925$ 268,670$
P r o g r a m P e r f o r m a n c e M e a s u r e s
Actual Projected Adopted FY 2004 FY 2005 FY 2006
Registered participants 766 550 550
Daily permits sold 4,506 4,300 4,300
Annual permits sold 264 279 279
Percent of annual permit holders who rate maintenance and cleanliness at “satisfactory” or better 82% 80% 80%
Cost recovery for all tennis programs and facility maintenance 67% 52% 50%
Mix and Match participants 2,360 2,368 2,370
Contractor rental hours for private lessons 907 810 810
F-197
City of Santa Barbara Two-Year Financial Plan & Annual Budget
PARKS AND RECREATION PROGRAMS
Administration Project Management Team Business Services Recreation Program
Management Facilities and Reservation
Services Cultural Arts Youth Activities Teen Programs Active Adults and Classes Aquatics Sports Tennis
Community Services Creeks Restoration and Water
Quality Improvement Golf Course Park Operations Management Grounds and Facilities
Maintenance Forestry Beach Maintenance Chase Palm Park
RECENT PROGRAM ACHIEVEMENTS Community Services successfully renovated the City’s Community Gardens to make them safer and more accessible to senior citizens and the disabled.
P R O G R A M S & S E R V I C E S
F-198
Community Services
( P r o g r a m N o . 6 1 9 2 ) M i s s i o n S t a t e m e n t Strengthen famil ies and neighborhoods by operat ing three community centers and one recreat ion center, through which City-related information and social services are provided to low-income populations.
P r o g r a m A c t i v i t i e s Operate four neighborhood centers, located in densely populated, low-
income and cultural ly diverse neighborhoods: Franklin Community Center, Westside Community Center, Lower Westside Community Center, and Louise Lowry Davis Center.
Provide leasable off ice space at below-market rates for direct social services del ivery by non-profit agencies.
Provide facil i t ies for various recreation and community programs and private and publ ic events.
Facil i tate social service referrals and direct services in areas of community relat ions, publ ic educat ion programs, information referral, and youth diversion programs.
Coordinate annual rental of garden plots at Yanonali, Rancheria, and Pilgrim Terrace community gardens.
K e y O b j e c t i v e s f o r F i s c a l Y e a r 2 0 0 6 Maintain 95% “sat isfactory” to “above sat isfactory” rat ing for
sat isfact ion with facil i t ies and customer service in 4 neighborhood social service and recreation centers.
Maintain 100% occupancy of 11 leasable off ice spaces by non-prof it social service agencies.
Process 1,000 faci l i ty reservat ions for community, pr ivate and publ ic events at 4 community bui ldings.
Respond to 13,500 community resident requests for services, information, and referrals regarding City services and community social services.
Provide 17,000 units of service to meet specif ic neighborhood needs such as renters/homeowners assistance, tax preparation, health screening, food distr ibut ion, and other social services.
Coordinate the appl icat ion select ion process to have 75% of the 172 garden plots available at community gardens by October 1, 2005.
Coordinate, prepare, and submit by January 2006 a minimum of two Community Development Block Grant proposals as part of the f iscal year 2007 Neighborhood Improvement Program.

K e y O b j e c t i v e s f o r F i s c a l Y e a r 2 0 0 6 ( c o n t i n u e d )
Ensure compliance of the terms and condit ions of the Lower Westside Center lease agreement with the Community Housing Corporation.
Coordinate the Neighborhood Improvement Program Action Plan for Community Center Request for Services Processes, and respond to advisory committees with proposed plan by December 2005.
F i n a n c i a l a n d S t a f f i n g I n f o r m a t i o n
Actual Amended Projected Adopted Proposed
FY 2004 FY 2005 FY 2005 FY 2006 FY 2007
Authorized Positions 4.50 5.30 5.30 5.30 5.30
Hourly Employee Hours N/A 2,736 2,736 858 858
RevenuesRents 248,835$ 311,110$ 271,848$ 271,878$ 295,209$ Fees and Service Charges 18,105 11,100 12,504 11,880 12,355 Other Revenue 10 - - - - General Fund Subsidy 538,863 515,451 572,511 594,540 602,321 Total Revenue 805,813$ 837,661$ 856,863$ 878,298$ 909,885$
ExpendituresSalaries and Benefits 326,067$ 369,443$ 378,224$ 404,996$ 424,072$ Supplies and Services 479,175 480,587 495,008 469,302 481,813 Special Projects 2,085 7,548 7,548 - - Non-Capital Equipment 743 4,000 - 4,000 4,000 Total Expenditures 808,070$ 861,578$ 880,780$ 878,298$ 909,885$
P r o g r a m P e r f o r m a n c e M e a s u r e s
Actual Projected Adopted FY 2004 FY 2005 FY 2006
User approval rating for 3 neighborhood social service centers 93% 99% 95%
Occupancy rate for leasable office space 99% 100% 100%
Facility reservations for community, private, and public events 2,440 832 1,000
Information and referrals contacts to residents 14,764 13,756 13,500
Units of service 22,628 22,000 17,000
Operating costs for community centers N/A N/A $11.50/ft2
Free or low cost meals to senior citizens 14,764 13,756 9,000
Youth and adults mentored through the Job Apprenticeship Program 73 45 45
F-199

City of Santa Barbara Two-Year Financial Plan & Annual Budget
PARKS AND RECREATION PROGRAMS
Administration Project Management Team Business Services Recreation Program
Management Facilities and Reservation
Services Cultural Arts Youth Activities Teen Programs Active Adults and Classes Aquatics Sports Tennis Community Services
Creeks Restoration and Water Quality Improvement
Golf Course Park Operations Management Grounds and Facilities
Maintenance Forestry Beach Maintenance Chase Palm Park
RECENT PROGRAM ACHIEVEMENTS Completion of first phase of Arroyo Burro, Mission and Sycamore Watershed Action Plans.
P R O G R A M S & S E R V I C E S
F-200
Creeks Restoration and
Water Quality Improvement
( P r o g r a m N o . 6 5 1 1 ) M i s s i o n S t a t e m e n t Improve creek and ocean water qual ity and restore natural creek systems with the implementation of storm water and urban runoff pollut ion reduct ion, creek restorat ion, and community education programs.
P r o g r a m A c t i v i t i e s Monitor creek and ocean water qual ity.
Oversee clean water operations, including creek cleanups and storm drain f i l ters.
Enforce storm water and urban runoff code.
Develop and implement creek restoration projects and watershed restorat ion plans.
Oversee storm water treatment control projects.
Coordinate community information and clean water business assistance programs.
K e y O b j e c t i v e s f o r F i s c a l Y e a r 2 0 0 6 Maintain 95% response rate to enforcement calls within 3 working days.
Conduct weekly creek clean-ups to remove contaminants.
Perform 95% of the scheduled maintenance of the storm water treatment system.
Achieve part ic ipat ion of an addit ional 10 businesses in cert i f ied Clean Water Business program.
Provide six bi l ingual information programs on clean water and creeks issues.
Provide 132 youth watershed education programs to school-age children in Santa Barbara.
Train employees in 8 operations divisions to develop and implement pol lut ion prevention plans.
Complete second phase of community education and visioning for the development of Watershed Action Plans by Spring 2006.
Complete f inal design for the Las Positas/Golf Club storm water detent ion system.
Complete construct ion of the Westside Ultra Violet Light facil i ty.

F-201
K e y O b j e c t i v e s f o r F i s c a l Y e a r 2 0 0 6 ( c o n t i n u e d )
Complete construct ion of the diversion projects in the Hope Ave. and Haley St. storm drains.
Complete construct ion of the Arroyo Burro Estuary and Mesa Creek Restorat ion Project by December 2005.
Submit Final Storm Water Management Program by August 2005 and receive Regional Board approval by June 2006.
Complete prel iminary design plans for the restorat ion of Old Mission Creek at West Figueroa.
Conduct 4 community creek stewardship and clean-up projects. (These projects are Neighborhood Task Force projects as they are geared toward improving creek areas in neighborhoods.)
Develop scope and funding parameters for a Watershed Resident and Business Technical Assistance Program.
Complete f irst phase of Microbial Source Tracking research studies to determine sources of bacterial pol lut ion in City creeks by December 2005.
Maintain restoration sites to meet permit condit ions, and conduct water quality and habitat analyses to determine success of restorat ion and water treatment projects.
Ensure compliance with al l Creeks education, restorat ion, and water qual ity contracts.
F i n a n c i a l a n d S t a f f i n g I n f o r m a t i o n
Actual Amended Projected Adopted
FY 2004 FY 2005 FY 2005 FY 2006
Authorized Positions 5.00 5.00 5.00 7.00 7.
Hourly Employee Hours N/A 2,900 2,900 500
RevenuesTransient Occupancy Tax 2,073,155$ 2,137,970$ 2,156,000$ 2,300,800$ Intergovernmental 483,230 1,121,343 325,000 - Interest Income 96,806 50,000 115,000 129,358 Market Valuation (71,234) - - - Other Revenue - 5,000 8,100 - Total Revenue 2,581,957$ 3,314,313$ 2,604,100$ 2,430,158$
ExpendituresSalaries and Benefits 412,429$ 514,305$ 514,080$ 634,654$ Supplies and Services 464,299 1,368,849 1,032,590 869,568 Special Projects 4,090 82,577 79,577 117,500 Non-Capital Equipment 4,939 9,778 9,778 9,250 Transfers Out 20,730 154,368 154,368 157,590 Appropriated Reserve - 8,451 - 11,134 Total Operating Expenditures 906,487$ 2,138,328$ 1,790,393$ 1,799,696$ Capital Program 875,625 2,894,008 823,000 450,000
Proposed
FY 2007
00
500
2,415,900$ -
139,309 - -
2,555,209$
671,936$ 1,000,287
117,500 2,500
162,318 12,375
1,966,916$ 525,000
Total Expenditures 1,782,112$ 5,032,336$ 2,613,393$ 2,249,696$ 2,491,916$
Addition to (Use of ) Reserves 799,845$ (1,718,023)$ (9,293)$ 180,462$ 63,293$

City of Santa Barbara Two-Year Financial Plan & Annual Bu et
P R O G R A M S & S E R V I C E S
F-202
dg
Creeks Restoration and
Water Quality Improvement
( C o n t i n u e d ) P r o g r a m P e r f o r m a n c e M e a s u r e s
Actual Projected Adopted FY 2004 FY 2005 FY 2006
Enforcement calls receiving response within 3 working days 100% 94% 95%
Creek cleanups 52 52 52
Percent scheduled maintenance completed 96.5% 99% 95%
Businesses certified through the Clean Water Business program N/A 10 10
Bilingual information programs 2 6 6
Schools, summer camps and field trips for watershed education 80 110 132
Divisions/employees trained in pollution prevention 7 / 119 4 / TBA 8 / 150
Percent program revenues matched with grant funds 33% 6% 10%
Avg. weekly creek, ocean, & storm samples collected and analyzed N/A 20 20

[This page intent ional ly le f t b lank. ]
F-203

City of Santa Barbara Two-Year Financial Plan & Annual Budget
PARKS AND RECREATION PROGRAMS
Administration Project Management Team Business Services Recreation Program
Management Facilities and Reservation
Services Cultural Arts Youth Activities Teen Programs Active Adults and Classes Aquatics Sports Tennis Community Services Creeks Restoration and Water
Quality Improvement Golf Course
Park Operations Management Grounds and Facilities
Maintenance Forestry Beach Maintenance Chase Palm Park
RECENT PROGRAM ACHIEVEMENTS Program staff are developing and improving the Integrated Pest Management Program at the municipal golf course.
P R O G R A M S & S E R V I C E S
F-204
Golf Course
( P r o g r a m N o . 6 7 1 1 ) M i s s i o n S t a t e m e n t Provide a qual ity and affordable golf experience for al l ages and abil i t ies, through the collect ion of golf greens fees to support operational costs.
P r o g r a m A c t i v i t i e s Coordinate golf services, including daily play, tournaments, lessons,
equipment rental, dr iv ing range, and food service.
Maintain 108 acres of land (85 acres of developed golf area).
Oversee the maintenance of equipment.
Maintain faci l i t ies, including the Pro Shop, parking lot, and walkways.
Implement capital improvement projects.
K e y O b j e c t i v e s f o r F i s c a l Y e a r 2 0 0 6 Achieve greens fee revenue per round of $22.00.
Achieve Golf Course faci l i ty use of 87,000 rounds of golf .
Achieve sales of 2,800 resident discounts and
Achieve sales of 700 total “Frequent User” seven-day play discounts.
Maintain $26.20 maintenance cost per round of golf .
Maintain the number of reportable injur ies at 1 or less by holding monthly co-worker safety meetings.
Monthly vehicle inspect ion report completed by each employee.
Complete 90% of maintenance act ivit ies in accordance with Golf Division Maintenance Standards, ut i l iz ing dai ly job tasking and work schedules.
Complete pesticide usage reports on-t ime required by the County Agricultural Commissioner on a monthly basis.
Ensure compliance of contract terms and condit ions for golf conces-sionaires.
I rr igate golf course using dai ly 24-hour evapotranspirat ion data and track dai ly usage using irr igation log pr intouts.
Evaluate results of Master Plan Safety Improvements – Phase II by March 31, 2006.
Develop a comprehensive evaluation of Player Assistant (Course Marshal) Program by January 1, 2006.

K e y O b j e c t i v e s f o r F i s c a l Y e a r 2 0 0 6 ( c o n t i n u e d )
Evaluate impact of City Integrated Pest Management (IPM) Strategy as it relates to turf qual ity, golfer sat isfact ion and increased manpower usage. Prepare monthly impact report.
Survey golfers to evaluate success of Master Plan Safety Improvements during and after construct ion by November 2005.
Develop Phase II I construct ion plans for 2007 by June 30, 2006.
F i n a n c i a l a n d S t a f f i n g I n f o r m a t i o n
Actual Amended Projected Adopted Proposed
FY 2004 FY 2005 FY 2005 FY 2006 FY 2007
Authorized Positions 12.90 13.70 13.70 13.70 13.70
Hourly Employee Hours N/A 5,260 5,260 3,700 3,700
RevenuesGolf Fees 1,768,565$ 1,852,213$ 1,800,000$ 1,963,000$ 2,050,000$ Donations 17,353 - - 17,021 17,021 Interest Income 34,588 26,897 35,178 39,400 42,431 Market Valuation (25,215) - - - - Other Revenue 1,517 - - - - Rents (Concessions) 275,720 275,000 275,000 277,000 277,000 Total Revenue 2,072,528$ 2,154,110$ 2,110,178$ 2,296,421$ 2,386,452$
ExpendituresSalaries and Benefits 925,411$ 995,930$ 1,003,032$ 1,100,504$ 1,143,536$ Supplies and Services 613,242 661,109 645,945 655,744 659,940 Special Projects 65,891 85,816 32,000 67,031 93,810 Non-Capital Equipment 6,122 13,800 12,000 11,000 6,568 Transfers Out - 684 684 400 - Debt Service 78,173 184,418 184,418 184,452 184,418 Total Operating Expenditures 1,688,839$ 1,941,757$ 1,878,079$ 2,019,131$ 2,088,272$ Capital Program 84,156 373,290 299,155 504,000 317,260 Total Expenditures 1,772,995$ 2,315,047$ 2,177,234$ 2,523,131$ 2,405,532$
Addition to (Use of ) Reserves 299,533$ (160,937)$ (67,056)$ (226,710)$ (19,080)$
F-205

City of Santa Barbara Two-Year Financial Plan & Annual Budget
P R O G R A M S & S E R V I C E S
Golf Course
( C o n t i n u e d ) P r o g r a m P e r f o r m a n c e M e a s u r e s
Actual Projected Adopted FY 2004 FY 2005 FY 2006
Average greens fee revenue per round $20.64 $21.00 $22.00
Rounds of golf 86,404 87,000 87,000
Resident discounts sold 3,584 3,000 2,800
Seven-day discounts sold 883 700 700
Cost per round N/A N/A $26.20
Reportable injuries 1 1 1
Monthly vehicle inspection reports N/A N/A 276
Percent of all acceptable recyclable materials collected N/A 85% 85%
Golf concessionaire revenue $275,720 $275,000 $277,000
Facility inspections of clubhouse and maintenance facilities N/A 12 12
Unplanned annual days of sick leave by Golf Staff N/A N/A 72
F-206

[This page intent ional ly le f t b lank. ]
F-207

City of Santa Barbara Two-Year Financial Plan & Annual Budg
PARKS AND RECREATION PROGRAMS
Administration Project Management Team Business Services Recreation Program
Management Facilities and Reservation
Services Cultural Arts Youth Activities Teen Programs Active Adults and Classes Aquatics Sports Tennis Community Services Creeks Restoration and Water
Quality Improvement Golf Course
Park Operations Management Grounds and Facilities
Maintenance Forestry Beach Maintenance Chase Palm Park
et
RECENT PROGRAM ACHIEVEMENTS Implemented citywide program following adoption of the Integrated Pest Management (IPM) Strategy by City Council in 2004.
P R O G R A M S & S E R V I C E S
F-208
Park Operations
Management
( P r o g r a m N o . 6 9 1 1 )
M i s s i o n S t a t e m e n t Manage maintenance operations for park and street tree resources, recreation facil i t ies landscaping, capital projects, secure grants, and monitor safety programs, division budget, and overal l ordinance compliance related to parks and street trees.
P r o g r a m A c t i v i t i e s Oversee long range planning, set goals, and manage budget resources
for parks and open space.
Respond to cit izen inquir ies regarding park operations, street tree operat ions, and record keeping.
Coordinate park project planning and inter-departmental efforts.
Work with the School Distr ict staff on issues related to the Joint Use Agreement between the City and School Distr ict.
K e y O b j e c t i v e s f o r F i s c a l Y e a r 2 0 0 6 Achieve 80% of Parks Division object ives.
Maintain 365 acres of developed parkland at a cost of $8,530 per acre.
Maintain 1,180 acres of open space at a cost of $293 per acre.

F i n a n c i a l a n d S t a f f i n g I n f o r m a t i o n
Actual Amended Projected Adopted Proposed
FY 2004 FY 2005 FY 2005 FY 2006 FY 2007
Authorized Positions 5.00 4.00 4.00 3.00 3.00
Hourly Employee Hours N/A 650 650 730 730
RevenuesIntergovernmental -$ 144,000$ 144,000$ -$ -$ Other Revenue 30,000 - - 30,000 30,000 Donations 70,287 158,290 158,290 - - General Fund Subsidy 1,003,718 1,084,966 1,012,686 1,033,987 1,063,145 Total Revenue 1,104,005$ 1,387,256$ 1,314,976$ 1,063,987$ 1,093,145$
ExpendituresSalaries and Benefits 355,763$ 372,103$ 295,125$ 347,941$ 361,131$ Supplies and Services 670,829 718,260 722,958 713,546 729,514 Special Projects 57,060 334,359 334,359 - - Non-Capital Equipment 2,197 2,500 2,500 2,500 2,500 Total Expenditures 1,085,849$ 1,427,222$ 1,354,942$ 1,063,987$ 1,093,145$
P r o g r a m P e r f o r m a n c e M e a s u r e s
Actual Projected Adopted FY 2004 FY 2005 FY 2006
Parks Division objectives achieved 69% 80% 80%
Cost to maintain an acre of parkland $7,916 $8,000 $8,530
Cost to maintain an acre of open space $272 $280 $293
F-209

City of Santa Barbara Two-Year Financial Plan & Annual Budg
PARKS AND RECREATION PROGRAMS
Administration Project Management Team Business Services Recreation Program
Management Facilities and Reservation
Services Cultural Arts Youth Activities Teen Programs Active Adults and Classes Aquatics Sports Tennis Community Services Creeks Restoration and Water
Quality Improvement Golf Course Park Operations Management
Grounds and Facilities Maintenance
Forestry Beach Maintenance Chase Palm Park
et
RECENT PROGRAM ACHIEVEMENTS Renovated two rose flowerbeds at the Mission Rose Garden and planted 125 rose bushes.
P R O G R A M S & S E R V I C E S
F-210
Grounds and Facil it ies
Maintenance
( P r o g r a m N o . 6 9 1 2 ) M i s s i o n S t a t e m e n t Provide safe and high qual ity open space, parks, sports f ields, street medians and r ight-of-way landscaping, bui lding landscaping and restrooms.
P r o g r a m A c t i v i t i e s Repair and reconstruct exist ing park features such as softbal l
backstops, signs, benches, hardscape and other park amenit ies.
Maintain 25 restroom facil i t ies to highest standards.
Manage 21 playgrounds including routine safety inspection and fol low-up, replacements, modif icat ions for universal access, and user safety.
Oversee grounds maintenance, including l i t ter control, trash removal, hardscape cleaning, pruning, planting, and fert i l iz ing landscape plants, mowing, turf management and sports f ield maintenance.
Coordinate water use management, irr igat ion repair, replacement, and performance management.
Administer Park Ranger Program for public safety and enjoyment of parks and school facil i t ies.
Maintain 1,200 acres of open space in eleven areas and oversee vegetat ive fuels management of open space parks.
K e y O b j e c t i v e s f o r F i s c a l Y e a r 2 0 0 6 Make al l reported safety issues safe within an average of 8 work hours
of not if ication.
Maintain a “good” or better rat ing on 70% of restroom surveys from restroom users.
Maintain a “good” or better rat ing on 80% of park qual ity surveys from park users.
Complete 100% of monthly parks safety inspections.
Provide walkthrough inspections with Downtown Organization for 12 blocks of State Street four t imes per year to ensure conformance to standards and contract specif ications.
Complete 100 non-safety work orders annually.
Complete design and instal lat ion of Irr igation System at Stevens Park by June 30, 2006.
Part ic ipate in four Neighborhood Improvement Programs projects.

F i n a n c i a l a n d S t a f f i n g I n f o r m a t i o n
Actual Amended Projected Adopted Proposed
FY 2004 FY 2005 FY 2005 FY 2006 FY 2007
Authorized Positions 25.80 28.30 28.30 27.50 27.50
Hourly Employee Hours N/A 29,840 29,840 13,798 13,798
RevenuesIntergovernmental 5,000$ 10,000$ 10,000$ -$ -$ Fees and Service Charges 3,750 - - - - Other Revenue 101,868 108,000 102,000 107,100 111,384 Donations 20,000 60,000 60,000 25,000 25,000 General Fund Subsidy 3,108,044 3,293,938 3,275,260 3,527,435 3,645,665 Total Revenue 3,238,662$ 3,471,938$ 3,447,260$ 3,659,535$ 3,782,049$
ExpendituresSalaries and Benefits 1,965,312$ 2,009,386$ 1,870,594$ 2,135,399$ 2,227,993$ Supplies and Services 1,248,695 1,231,096 1,345,138 1,326,136 1,356,056 Special Projects 15,781 224,479 224,551 90,000 90,000 Non-Capital Equipment 7,429 8,000 8,000 58,000 58,000 Capital Equipment - 40,000 40,000 50,000 50,000 Total Expenditures 3,237,217$ 3,512,961$ 3,488,283$ 3,659,535$ 3,782,049$
P r o g r a m P e r f o r m a n c e M e a s u r e s
Actual Projected Adopted FY 2004 FY 2005 FY 2006
Average hours to ensure completion of all safety related issues N/A N/A 8
Percentage of satisfactory or better responses from restroom surveys N/A N/A 70%
Percentage of “satisfactory” or better responses from park surveys N/A N/A 80%
Park safety inspections completed 504 504 504
Walkthrough inspections completed 4 4 4
Safety work orders 43 53 60
Non-safety work orders completed N/A N/A 100
Total restroom cleanings 0 0 $15,000
Average cost of restroom cleaning N/A N/A $10
Hours spent on medians, under/over passes, and easements N/A N/A 800
Hours spent on Neighborhood Improvement Program N/A N/A 400
F-211

City of Santa Barbara Two-Year Financial Plan & Annual Budget
PARKS AND RECREATION PROGRAMS
Administration Project Management Team Business Services Recreation Program
Management Facilities and Reservation
Services Cultural Arts Youth Activities Teen Programs Active Adults and Classes Aquatics Sports Tennis Community Services Creeks Restoration and Water
Quality Improvement Golf Course Park Operations Management Grounds and Facilities
Maintenance Forestry
Beach Maintenance Chase Palm Park
RECENT PROGRAM ACHIEVEMENTS Completed street sweeper clearance on 1,300 trees in Samarkand, Upper Eastside and Lower Eastside sweeping routes.
P R O G R A M S & S E R V I C E S
F-212
Forestry
( P r o g r a m N o . 6 9 1 3 ) M i s s i o n S t a t e m e n t Plant and maintain street trees, park, and City faci l i ty trees for the benef it of residents and to ensure a safe and healthy community forest.
P r o g r a m A c t i v i t i e s Manage 23,500 street trees and 5,300 park trees.
Oversee stump and root management.
Coordinate young tree planting and management.
Inspect potential ly hazardous trees.
Communicate City pol icies and ordinances regarding tree issues and coordinate cit izen requests for tree planting.
Respond to cit izen tree maintenance and removal requests and schedule block pruning.
Enforce street tree and front yard setback tree ordinance.
K e y O b j e c t i v e s f o r F i s c a l Y e a r 2 0 0 6 Achieve an average 5-year pruning cycle by pruning 21% of al l street
trees.
Achieve an average 6-year pruning cycle by pruning 10% of al l park and faci l i ty trees.
Maintain a tree replacement program by planting 50% more trees than the average loss of trees.
Complete 90% of service inspections requested within 10 working days.
Inspect and act on 100% of tree ordinance violat ions within 30 days.
Maintain average tree pruning by staff at a cost of $130 per tree.
Maintain average tree pruning by contract at a cost of $54 per tree.
Part ic ipate in four Neighborhood Improvement Program projects.

F i n a n c i a l a n d S t a f f i n g I n f o r m a t i o n
Actual Amended Projected Adopted Proposed
FY 2004 FY 2005 FY 2005 FY 2006 FY 2007
Authorized Positions 11.00 11.00 11.00 11.00 11.00
Hourly Employee Hours N/A 1,300 1,300 1,302 1,302
RevenuesInterfund Reimbursement 744,576$ 744,579$ 744,579$ 781,808$ 813,080$ Donations 10,000 - - 10,000 10,000 Other Revenues 600 - - - - General Fund Subsidy 229,550 294,578 296,983 343,304 341,598 Total Revenue 984,726$ 1,039,157$ 1,041,562$ 1,135,112$ 1,164,678$
ExpendituresSalaries and Benefits 748,888$ 772,073$ 781,114$ 859,530$ 885,196$ Supplies and Services 235,838 265,584 258,948 274,082 277,982 Non-Capital Equipment - 1,500 1,500 1,500 1,500 Total Expenditures 984,726$ 1,039,157$ 1,041,562$ 1,135,112$ 1,164,678$
P r o g r a m P e r f o r m a n c e M e a s u r e s
Actual Projected Adopted FY 2004 FY 2005 FY 2006
Street trees pruned 5,068 5,400 5,100
Park and facility trees pruned 578 530 530
Trees planted 305 300 300
Service inspections requested completed within 10 working days 94.25% 90% 90%
Percent of ordinance violations acted on within 30 days 100% 100% 100%
Cost per tree pruned by staff N/A $130 $130
Cost per tree pruned by contract N/A $200 $54
Service inspections 630 900 900
Ordinance violations reported N/A 30 30
Neighborhood Improvement Program staff hours N/A N/A 800
F-213

City of Santa Barbara Two-Year Financial Plan & Annual Budget
PARKS AND RECREATION PROGRAMS
Administration Project Management Team Business Services Recreation Program
Management Facilities and Reservation
Services Cultural Arts Youth Activities Teen Programs Active Adults and Classes Aquatics Sports Tennis Community Services Creeks Restoration and Water
Quality Improvement Golf Course Park Operations Management Grounds and Facilities
Maintenance Forestry
Beach Maintenance Chase Palm Park
RECENT PROGRAM ACHIEVEMENTS Cleaned debris off of two miles of beach area from Leadbetter to East Beach after January 2005 major storm event.
P R O G R A M S & S E R V I C E S
F-214
Beach Maintenance
( P r o g r a m N o . 6 9 1 4 ) M i s s i o n S t a t e m e n t Clean, grade, and groom beaches to maintain clean and safe beaches for the enjoyment of residents and visitors.
P r o g r a m A c t i v i t i e s Perform maintenance duties of raking, sand grooming, and minor
grading of the beaches.
Dispose and remove of kelp, l i t ter and storm debris, and dead sea animals.
Oversee creek outlet cleaning, maintenance, and annual installat ion and removal of l i feguard towers.
Dispose of beached boats or vessels that have been abandoned.
K e y O b j e c t i v e s f o r F i s c a l Y e a r 2 0 0 6 Groom beach sand on Leadbetter, West, and East beaches 12 t imes
between May and October.
Rake beach sand on Leadbetter, West, and East beaches 12 t imes between November and Apri l .
Hand clean the perimeter of Mission Creek Lagoon on East Beach an average of twice per week.

F i n a n c i a l a n d S t a f f i n g I n f o r m a t i o n
Actual Amended Projected Adopted Proposed
FY 2004 FY 2005 FY 2005 FY 2006 FY 2007
Authorized Positions 1.00 1.00 1.00 1.00 1.00
Hourly Employee Hours N/A 750 750 711 711
RevenuesOther Revenue 1,151$ -$ -$ -$ -$ General Fund Subsidy 94,898 101,851 101,007 122,940 125,988 Total Revenue 96,049$ 101,851$ 101,007$ 122,940$ 125,988$
ExpendituresSalaries and Benefits 67,420$ 72,063$ 70,369$ 79,846$ 81,928$ Supplies and Services 28,629 29,788 30,638 43,094 44,060 Total Expenditures 96,049$ 101,851$ 101,007$ 122,940$ 125,988$
P r o g r a m P e r f o r m a n c e M e a s u r e s
Actual Projected Adopted FY 2004 FY 2005 FY 2006
Beach groom cycles 12 12 12
Beach rake cycles 13 12 12
Mission Creek Lagoon perimeter hand-cleanings 105 104 104
Beach debris and animals removed 23 50 30
F-215

City of Santa Barbara Two-Year Financial Plan & Annual Budget
PARKS AND RECREATION PROGRAMS
Administration Project Management Team Business Services Recreation Program
Management Facilities and Reservation
Services Cultural Arts Youth Activities Teen Programs Active Adults and Classes Aquatics Sports Tennis Community Services Creeks Restoration and Water
Quality Improvement Golf Course Park Operations Management Grounds and Facilities
Maintenance Forestry Beach Maintenance
Chase Palm Park
RECENT PROGRAM ACHIEVEMENTS Improved appearance of Chase Palm Park Expansion parkland area along Cabrillo Boulevard by replanting with new plant material
P R O G R A M S & S E R V I C E S
F-216
Chase Palm Park
( P r o g r a m N o . 6 9 1 7 ) M i s s i o n S t a t e m e n t Provide high quality park maintenance and recreation services at Chase Palm Park.
P r o g r a m A c t i v i t i e s Maintain the park landscaping and faci l i t ies of Chase Palm, a popular
venue for leisure visits, corporate and community events, and concerts.
Maintain and oversee Skater’s Pojnt skateboard park.
Provide grounds maintenance including mowing, pruning, trash pick-up, and l i t ter control.
Coordinate restroom cleaning and maintenance.
Provide safety oversight and maintenance of playground equipment and water features.
Provide repairs and maintenance to hardscape elements.
Develop and coordinate recreation programming for the park.
Schedule and coordinate rentals of indoor and outdoor reservable sites.
Facil i tate community special events at the park.
Provide on-site staff on a dai ly basis to oversee publ ic use of the Chase Palm Park, provide information, and check out recreational equipment at no charge to the publ ic.
K e y O b j e c t i v e s f o r F i s c a l Y e a r 2 0 0 6 Maintain an 85% “very good” to “excel lent” rat ing for overal l customer
sat isfact ion with outdoor rental faci l i t ies.
Maintain 49 permits to rent outdoor faci l i t ies on an annual basis.
Maintain revenue for Chase Palm Park at $199,230, including indoor and outdoor facil i ty rentals, concessions and payment from hotel.
Ensure that 80% of park grounds inspections meet established park maintenance standards.
Clean and inspect Skater’s Point skateboard park dai ly.
Maintain 23 acres at a cost of $23,006 per acre.

F i n a n c i a l a n d S t a f f i n g I n f o r m a t i o n
Actual Amended Projected Adopted Proposed
FY 2004 FY 2005 FY 2005 FY 2006 FY 2007
Authorized Positions 3.90 4.00 4.00 4.00 4.00
Hourly Employee Hours N/A 13,512 13,512 11,095 11,095
RevenuesFees and Service Charges 113,523$ 101,969$ 135,313$ 131,730$ 138,500$ Donations 62,500 62,500 62,500 62,500 62,500 Rents-Concessions 6,409 10,000 6,240 6,000 6,200 General Fund Subsidy 404,948 378,524 304,671 337,274 344,781 Total Revenue 587,380$ 552,993$ 508,724$ 537,504$ 551,981$
ExpendituresSalaries and Benefits 371,578$ 345,041$ 337,085$ 351,676$ 363,238$ Supplies and Services 215,489 205,765 169,639 183,828 186,743 Non-Capital Equipment 313 2,187 2,000 2,000 2,000 Total Expenditures 587,380$ 552,993$ 508,724$ 537,504$ 551,981$
P r o g r a m P e r f o r m a n c e M e a s u r e s
Actual Projected Adopted FY 2004 FY 2005 FY 2006
Percent of overall customer satisfaction surveys rated "good" to "very good" 96% 85% 85%
Permits issued for rental of outdoor facilities 53 49 49
Outdoor facility rental and other income $182,431 $204,053 $199,230
Percent of park grounds inspections in compliance with established park maintenance standards 90% 85% 80%
Skateboard Park inspections/cleanings 366 365 365
Cost to maintain an acre of parkland $21,989 $19,000 $23,006
Revenue for outdoor facility rentals $11,295 $16,598 $17,964
Facility reservations processed at Chase Palm Park Recreation Center N/A 330 300
Facility reservations processed at Casa Las Palmas N/A 74 85
F-217

[This page intent ional ly le f t b lank. ]
F-218

D E P A R T M E N T S U M M A R Y
Pol ice
F-219
Operating under a Community Oriented Policing philosophy, create and maintain a safe community where people can live in peace, without the fear of crime.
A b o u t P o l i c e
F i s c a l Y e a r 2 0 0 6
B u d g e t H i g h l i g h t s
The Pol ice Department is responsible for provid ing law enforcement services to the Ci ty of Santa Barbara. Working in partnership wi th the community, qual i ty and professional law enforcement serv ices are provided in a fa ir and ef f ic ient manner.
The Santa Barbara Police
Department continues to serve
hundreds of local youth through
the Police Activities League
(PAL). This program is a non-profit
collaboration funded through
private donations, federal grants
and the City of Santa Barbara.
The Patrol Divis ion provides pol ice services to the community that inc ludes 24-hour patrol assignments, traf f ic enforcement, safety programs, animal control act iv i t ies, special event planning, cr is is response teams and a chaplaincy program.
The Invest igat ive Divis ion conducts fo l low-up invest igat ions from ini t ia l cr ime reports that include cr imes against persons, property, narcot ics vio lat ions, school resource of f icers and forensic invest igat ions.
Patrol Officers will respond to
37,949 calls for service over a
twelve-month-period of time. Of
those calls, over 1,900 are
emergencies in progress.
The Community Services Divis ion provides support services to the ent ire organizat ion that include managing the bui ld ing and maintain ing equipment, provid ing cr ime analysis , tra in ing and recrui tment and community or iented problem solving programs and services.
The Santa Barbara Police
Department relies on a Citizen’s
Advisory Committee to be the
eyes and ears of the community
while using their knowledge in
committee work to resolve
community issues. Our motto “Dedicated to Serve” captures our commitment to ensure a safe and secure place for people to l ive, work and enjoy our community.

D E P A R T M E N T S U M M A R Y
Pol ice
F-220
D e p a r t m e n t F i n a n c i a l a n d S t a f f i n g S u m m a r y
Actual Amended Projected Adopted Proposed
FY 2004 FY 2005 FY 2005 FY 2006 FY 2007
Authorized Positions 223.00 222.00 222.00 221.00 220.00
Hourly Employee Hours N/A 18,320 18,320 18,320 18,320
RevenuesParking Violations 2,185,694$ 2,277,245$ 2,277,245$ 2,348,982$ 2,348,982$ Traffic Safety 518,714 505,000 555,000 555,000 580,000 Prop. 172 Sales Tax - - - 230,400 239,600 Fines & Forfeitures 301,641 225,000 200,000 200,000 200,000 Fees and Services Charges 765,836 779,710 776,887 898,848 933,986 Intergovernmental 693,843 729,686 727,925 412,232 412,232 Other Revenue 246,250 70,000 70,541 80,000 80,000 General Fund Subsidy 22,219,122 23,880,044 22,837,181 25,742,538 26,478,430 Total Department Revenue 26,931,100$ 28,466,685$ 27,444,779$ 30,468,000$ 31,273,230$
ExpendituresSalaries and Benefits 23,093,223$ 24,366,761$ 23,551,541$ 26,189,472$ 26,911,309$ Supplies and Services 3,483,060 3,732,405 3,544,496 4,068,566 4,170,154 Special Projects 129,198 463,960 462,024 60,000 60,000 Transfers 99,998 4,394 - - - Non-Capital Equipment 188,419 183,006 157,165 149,962 131,767 Total Department Expenditures 26,993,898$ 28,750,526$ 27,715,226$ 30,468,000$ 31,273,230$
D e p a r t m e n t F u n d C o m p o s i t i o n
Department Revenues by Fund
General Fund Subsidy
85%
Misc. Grants0%
Suppl. Law Enforcem't
0%
Police AssetForf & Grants
0%
Traffic Safety2%
General Fund Dept. Revenue
13%
Department Appropriations by Fund
General Fund98%
Traffic Safety2%
Misc. Grants0%
Suppl. Law Enforcem't
0%
AssetForfeiture & Grants
0%

D E P A R T M E N T S U M M A R Y
Pol ice
F-221
Program Organizational Chart
Chief’s Staff
Community Services Division
Investigative Division Patrol Division
Crime Analysis
Property Room
Training and Recruitment
Range
Beat Coordinators / D.A.R.E.
Information Technology
Crime Lab Traffic
Special Events
Tactical Patrol Force
Nightlife Enforcement Team
Parking Enforcement
Combined Comm. Center
Animal Control
Emergency Services
Support Services
Records Bureau

City of Santa Barbara Two-Year Financial Plan & Annual Budget
POLICE PROGRAMS
Chief’s Staff
Support Services Records Bureau Community Services Division Crime Analysis Property Room Training and Recruitment Range Beat Coordinators/D.A.R.E. Information Technology Investigative Division Crime Lab Patrol Division Traffic Special Events Tactical Patrol Force Nightlife Enforcement Parking Enforcement Combined Communications
Center Animal Control Emergency Services
RECENT PROGRAM ACHIEVEMENTS Implemented Restorative Policing to more effectively serve the mentally ill in our community.
P R O G R A M S & S E R V I C E S
F-222
Chief’s Staff
( P r o g r a m N o . 3 4 1 1 ) M i s s i o n S t a t e m e n t Ensure that the organization is operating in a professional manner at al l levels with a sol id and consistent focus on community pol ic ing through team approaches and employee accountabil i ty.
P r o g r a m A c t i v i t i e s Manage, oversee, and monitor the operat ions of the Santa Barbara
Police Department, which includes three divisions that provide public safety for the Santa Barbara Community and focus on qual ity of l i fe issues.
Investigate and evaluate al l complaints related to the performance and conduct of the members of the pol ice department.
Assist other city departments in gathering information related to publ ic l iabi l i ty claims and other personnel matters.
Investigate special requests from City Hall and respond with information in a t imely manner.
K e y O b j e c t i v e s f o r F i s c a l Y e a r 2 0 0 6 Achieve 80% of the department program objectives.
Invest igate formal and informal cit izen complaints and respond to 90% of the report ing part ies with f inal act ion taken within 60 days of complaint.
Respond to 90% of special requests from City Counci lmembers, cit izen inquir ies, and outside agencies within 24 hours of being assigned to advice t imeline of completion.
Respond to 90% of City Attorney and Risk Management requests for investigat ion within 24 hours to advice t imeline of complet ion.
Complete a 12-year Strategic Plan to implement a work space solut ion, to include an upgrade and change of focus to the 1999 work space study.
Develop and implement a Comstat strategy for Command Staff.

F i n a n c i a l a n d S t a f f i n g I n f o r m a t i o n
Actual Amended Projected Adopted Proposed
FY 2004 FY 2005 FY 2005 FY 2006 FY 2007
Authorized Positions 5.00 4.00 4.00 4.00 4.00
Hourly Employee Hours N/A 0 0 0 0
RevenuesProp. 172 Sales Tax -$ -$ -$ 230,400$ 239,600$ Parking Violations 2,185,694 2,277,245 2,277,245 2,348,982 2,348,982 Intergovernmental 217,035 217,000 217,035 217,000 217,000 Fees and Service Charges 359,512 305,000 327,400 320,000 335,000 Other Revenue 21,863 5,000 541 5,000 5,000 Total Revenue 2,784,104$ 2,804,245$ 2,822,221$ 3,121,382$ 3,145,582$
ExpendituresSalaries and Benefits 869,294$ 703,645$ 710,566$ 779,296$ 813,443$ Supplies and Services 63,569 47,256 43,045 49,614 50,086 Special Projects 28 3,797 3,797 - - Transfers 3,797 - - - - Non-Capital Equipment 11,638 25,254 - - - Total Expenditures 948,326$ 779,952$ 757,408$ 828,910$ 863,529$
P r o g r a m P e r f o r m a n c e M e a s u r e s
Actual Projected Adopted FY 2004 FY 2005 FY 2006
Percent of performance objectives met 77.4% 80% 80%
Percent of ongoing citizen’s complaint investigations completed within 60 days N/A N/A 90%
Special requests from City Hall, citizen inquiries, and outside agencies N/A 80 80
Percent of requests from Council, citizens, and outside agencies responded to within 24 hours N/A 90% 90%
City Attorney and Risk Management requests N/A 24 24
Percent of requests from City Attorney and Risk Management responded to within 24 hours N/A 100% 90%
Ongoing formal and informal citizen complaints N/A N/A 40
Pitchess Motions N/A 15 15
Ongoing administrative complaints N/A 12 12
F-223

City of Santa Barbara Two-Year Financial Plan & Annual Budget
POLICE PROGRAMS
Chief’s Staff
Support Services Records Bureau Community Services Division Crime Analysis Property Room Training and Recruitment Range Beat Coordinators/D.A.R.E. Information Technology Investigative Division Crime Lab Patrol Division Traffic Special Events Tactical Patrol Force Nightlife Enforcement Parking Enforcement Combined Communications
Center Animal Control Emergency Services
RECENT PROGRAM ACHIEVEMENTS Successful completion of job tasks including preparation of fiscal year 2006 and 2007 budgets, after reorganization of Business Office duties and personnel.
P R O G R A M S & S E R V I C E S
F-224
Support Services
( P r o g r a m N o . 3 4 1 3 ) M i s s i o n S t a t e m e n t Perform the administrat ive and f iscal functions for the Police Department, including purchasing, payrol l, and revenue collect ion while providing f iscal support and oversight to al l department divisions.
P r o g r a m A c t i v i t i e s Administer the preparation, implementation, and management of the
department’s budget.
Provide t imely management and support on al l matters related to personnel and payrol l act ions.
Process al l department purchasing, accounts payable, and receivable act ions.
Manage the Parking Collect ion Section, including payments, reviews and tows.
K e y O b j e c t i v e s f o r F i s c a l Y e a r 2 0 0 6 Achieve a 99% accuracy rate in processing employee t imesheets
Achieve a 99% completion rate for al l purchasing and accounts payable transactions within 2 business days of receipt
Achieve a clearance rate of 87% for parking citat ions
Notify al l interested part ies of vehicles towed for unlicensed driver within 1 business day.
Develop the annual budget within target and administer wi thin f iscal constraints and pol ic ies.

F i n a n c i a l a n d S t a f f i n g I n f o r m a t i o n
Actual Amended Projected Adopted Proposed
FY 2004 FY 2005 FY 2005 FY 2006 FY 2007
Authorized Positions 8.00 8.00 8.00 8.00 7.00
Hourly Employee Hours N/A 0 0 0 0
RevenuesGeneral Fund Subsidy 591,803$ 667,288$ 604,204$ 703,008$ 593,434$ Total Revenue 591,803$ 667,288$ 604,204$ 703,008$ 593,434$
ExpendituresSalaries and Benefits 504,554$ 576,098$ 520,527$ 604,321$ 494,138$ Supplies and Services 86,892 91,190 83,677 97,919 98,528 Non-Capital Equipment 357 - - 768 768 Total Expenditures 591,803$ 667,288$ 604,204$ 703,008$ 593,434$
P r o g r a m P e r f o r m a n c e M e a s u r e s
Actual Projected Adopted FY 2004 FY 2005 FY 2006
Timesheets processed 6,538 6,556 6,500
Errors reported on timesheets by Payroll 15 18 25
Percent of timesheets processed error free 99.8% 99% 99%
Purchasing transactions processed 520 396 400
Accounts payable transactions processed 951 880 850
Percent of purchasing and accounts payable transactions completed within 2 business days 100% 99% 99%
Parking citations issued 97,315 103,332 99,000
Parking citations paid 57,193 75,475 77,220
Percent of parking citations paid 88.4% 85.6% 87%
Vehicles towed for unlicensed driver 1,480 1,316 1,315
Percent of interested parties notified of tows for unlicensed driver 100% 100% 100%
F-225

City of Santa Barbara Two-Year Financial Plan & Annual Budget
POLICE PROGRAMS
Chief’s Staff Support Services
Records Bureau Community Services Division Crime Analysis Property Room Training and Recruitment Range Beat Coordinators/D.A.R.E. Information Technology Investigative Division Crime Lab Patrol Division Traffic Special Events Tactical Patrol Force Nightlife Enforcement Parking Enforcement Combined Communications
Center Animal Control Emergency Services
RECENT PROGRAM ACHIEVEMENTS The Records Bureau has recently hired a new Records Manager to assist in the processing of backlogged work and evaluating program efficiency.
P R O G R A M S & S E R V I C E S
F-226
Records Bureau
( P r o g r a m N o . 3 4 1 4 ) M i s s i o n S t a t e m e n t Process and disseminate pol ice reports while providing quality customer service to cit izens.
P r o g r a m A c t i v i t i e s Process, maintain, and track al l pol ice crime reports, arrest reports,
traff ic accident reports, and traff ic citat ions.
Provide the t imely processing of subpoenas for off icer and civi l ian personnel, declarations, and requests for records.
Assist the general public and police off icers by taking and completing counter reports.
Process and maintain the monthly Uniform Crime Report stat ist ics for the Department of Justice.
Fingerprint using Live Scan or rol l ing pr ints for the pol ice department, city employees, bookings, registrants, city permits and publ ic.
Transcribe pol ice reports that are dictated by off icers to ensure the reports are correct, standardized and legible.
K e y O b j e c t i v e s f o r F i s c a l Y e a r 2 0 0 6 Complete and distr ibute 99% of al l in-custody adult and juveni le arrest
reports pr ior to 10:00 a.m. the fol lowing court day.
Complete 95% of data entry for part one cr imes by the 5th day of the month.
Seal 95% of juvenile records within 60 days of receipt to comply with court orders.
Complete and forward 99.5% of court disposit ions of convict ion within 30 days of receipt.
Scan 15,000 backlogged property release records at a rate of 3,750 per quarter.
Administer 150 hours of Cal ifornia Law Enforcement Telecommunications System Training “CLETS” to Records Bureau team members in compliance with Department of Just ice regulations.
Administer “Single Point of Entry” training to 18 Records Bureau team members to more eff iciently track, store, and access police records.
Implement Total Awareness Cross Training program “TACT” with al l Records Bureau staff to enhance excel lent customer service ski l ls and increase the abi l i ty to meet team object ives.

F i n a n c i a l a n d S t a f f i n g I n f o r m a t i o n
Actual Amended Projected Adopted Proposed
FY 2004 FY 2005 FY 2005 FY 2006 FY 2007
Authorized Positions 20.00 20.00 20.00 20.00 20.00
Hourly Employee Hours N/A 2,080 2,080 2,080 2,080
RevenuesGeneral Fund Subsidy 1,278,030$ 1,376,036$ 1,297,478$ 1,483,337$ 1,541,938$ Total Revenue 1,278,030$ 1,376,036$ 1,297,478$ 1,483,337$ 1,541,938$
ExpendituresSalaries and Benefits 1,185,339$ 1,257,426$ 1,183,795$ 1,354,082$ 1,412,533$ Supplies and Services 92,691 118,240 113,683 129,255 129,405 Non-Capital Equipment - 370 - - - Total Expenditures 1,278,030$ 1,376,036$ 1,297,478$ 1,483,337$ 1,541,938$
P r o g r a m P e r f o r m a n c e M e a s u r e s
Actual Projected Adopted FY 2004 FY 2005 FY 2006
Percent of in-custody reports processed by 10:00 a.m. the following court day 99% 99% 99%
Percent of part one crimes data entry completed by the 5th of each month 94% 94% 95%
Percent of juvenile records sealed within 60 days of receipt 52.5% 90% 95%
Percent of court dispositions processed within 30 days 100% 100% 99.5%
Percent of property release records processed within promised time frame N/A N/A 100%
Reports from officers processed 20,213 20,000 20,000
Traffic citations processed, without case numbers 10,761 11,000 11,000
Subpoenas processed 2,414 2,400 2,400
Total reports taken by Records N/A N/A 4,500
Total people fingerprinted by LiveScan and rolled fingerprints 4,967 4,800 4,800
Total police reports transcribed 11,279 10,800 10,800
Total number of 180’s processed 3,800 4,000 4,000
Total juvenile records sealed by court order N/A N/A 200
Total restraining orders processed N/A N/A 450
Cost of transcription services for police reports N/A N/A $18.87
F-227

City of Santa Barbara Two-Year Financial Plan & Annual Budget
POLICE PROGRAMS
Chief’s Staff Support Services Records Bureau
Community Services Division Crime Analysis Property Room Training and Recruitment Range Beat Coordinators/D.A.R.E. Information Technology Investigative Division Crime Lab Patrol Division Traffic Special Events Tactical Patrol Force Nightlife Enforcement Parking Enforcement Combined Communications
Center Animal Control Emergency Services
RECENT PROGRAM ACHIEVEMENTS The Police Activities League (PAL) sponsored seventeen after school/summer programs and held thirty-four special events.
P R O G R A M S & S E R V I C E S
F-228
Community Services
Division
( P r o g r a m N o . 3 4 2 1 ) M i s s i o n S t a t e m e n t Provide leadership, direct ion, and administrat ive guidance for the Community Services division.
P r o g r a m A c t i v i t i e s Coordinate and oversee the Police Department facil i t ies maintenance
needs with the Public Works Department.
Ensure the delegation of the Community Oriented Pol icing efforts, throughout the department, that or iginate in the Community Services division.
Work closely with the Business Off ice to eff iciently administer the Community Services Division Budget.
Maintain a working relat ionship with the landlord of the Police Annex Building.
Provide outreach to local youth through the Pol ice Activit ies League (PAL) to strengthen relat ionships between the Pol ice Department and youth.
K e y O b j e c t i v e s f o r F i s c a l Y e a r 2 0 0 6 Ensure Community Services program owners complete 80% of program
objectives.
Cont inue to identify, secure, and track non-tradit ional funding sources to support the Police Activit ies League.
Submit a f inal f iscal year 2007 budget proposal to the Police Activit ies League (PAL) Board of Directors by Apri l 1, 2006.

F i n a n c i a l a n d S t a f f i n g I n f o r m a t i o n
Actual Amended Projected Adopted Proposed
FY 2004 FY 2005 FY 2005 FY 2006 FY 2007
Authorized Positions 4.00 4.00 4.00 4.00 4.00
Hourly Employee Hours N/A 0 0 0 0
RevenuesFees and Service Charges 26,050$ 82,000$ 75,000$ 159,494$ 164,942$ Intergovernmental - 16,822 16,822 - - Other Revenue 35 - - - - General Fund Subsidy 824,829 889,855 786,433 801,885 841,550 Total Revenue 850,914$ 988,677$ 878,255$ 961,379$ 1,006,492$
ExpendituresSalaries and Benefits 460,794$ 558,774$ 463,811$ 554,013$ 581,936$ Supplies and Services 390,120 413,081 397,622 407,366 424,556 Special Projects - 16,822 16,822 - - Total Expenditures 850,914$ 988,677$ 878,255$ 961,379$ 1,006,492$
P r o g r a m P e r f o r m a n c e M e a s u r e s
Actual Projected Adopted FY 2004 FY 2005 FY 2006
Percent of program objectives completed 88% 82% 80%
Police Activity League (PAL) programs and events 31 38 45
Youths participating in PAL 1057 702 500
Youths participating in the Campership Alliance program N/A N/A 466
F-229

City of Santa Barbara Two-Year Financial Plan & Annual Budget
POLICE PROGRAMS
Chief’s Staff Support Services Records Bureau Community Services Division
Crime Analysis Property Room Training and Recruitment Range Beat Coordinators/D.A.R.E. Information Technology Investigative Division Crime Lab Patrol Division Traffic Special Events Tactical Patrol Force Nightlife Enforcement Parking Enforcement Combined Communications
Center Animal Control Emergency Services
RECENT PROGRAM ACHIEVEMENTS Crime Analysis staff recently completed class at U. C. Riverside towards obtaining a Crime Analysis Certificate.
P R O G R A M S & S E R V I C E S
F-230
Crime Analysis
( P r o g r a m N o . 3 4 2 2 ) M i s s i o n S t a t e m e n t Analyze data to ident ify cr ime series, patterns, trends, and criminal offenders to assist in cr iminal investigations and citywide reports.
P r o g r a m A c t i v i t i e s Provide t imely and pert inent information relat ive to cr ime and arrest
data to Police Department personnel, other City departments, outside law enforcement agencies, and the general public for resource al location, budgeting act ivit ies, and community policing.
Furnish crime analysis services to Pol ice Department personnel through the identif icat ion of cr ime patterns and/or series, suspect identif icat ion and forecasting future cr ime occurrences.
Manage the City’s alarm permit ordinance, and provide false alarm and registrat ion revenue reports to the City’s Finance Department.
K e y O b j e c t i v e s f o r F i s c a l Y e a r 2 0 0 6 Ensure 80% of the requests for cr ime data/stat ist ics are provided within
two working days.
Enter 90% of part one, qual ifying part two, and DUI offenses in Crime Summary and ABC databases within 3 working days.
Complete implementation of comprehensive Compstat stat ist ical report ing system and transfer to affected personnel.

F i n a n c i a l a n d S t a f f i n g I n f o r m a t i o n
Actual Amended Projected Adopted Proposed
FY 2004 FY 2005 FY 2005 FY 2006 FY 2007
Authorized Positions 1.00 0.00 0.00 1.00 1.00
Hourly Employee Hours N/A 0 0 0 0
RevenuesGeneral Fund Subsidy 58,688$ 20,427$ 18,968$ 64,453$ 69,653$ Total Revenue 58,688$ 20,427$ 18,968$ 64,453$ 69,653$
ExpendituresSalaries and Benefits 51,022$ 9,798$ 8,908$ 54,369$ 58,634$ Supplies and Services 6,096 10,629 10,060 10,084 11,019 Non-Capital Equipment 1,570 - - - - Total Expenditures 58,688$ 20,427$ 18,968$ 64,453$ 69,653$
P r o g r a m P e r f o r m a n c e M e a s u r e s
Actual Projected Adopted FY 2004 FY 2005 FY 2006
Percent or crime data requests provided within 2 working days >89% 80% 80%
Percent of crime summary offenses entered within 3 working days 95.5% 90% 90%
Crime data or statistics requests 905 820 780
Crime reports entered into Crime Summary Module for analysis 2,461 2,750 2,500
F-231

City of Santa Barbara Two-Year Financial Plan & Annual Budget
POLICE PROGRAMS
Chief’s Staff Support Services Records Bureau Community Services Division Crime Analysis
Property Room Training and Recruitment Range Beat Coordinators/D.A.R.E. Information Technology Investigative Division Crime Lab Patrol Division Traffic Special Events Tactical Patrol Force Nightlife Enforcement Parking Enforcement Combined Communications
Center Animal Control Emergency Services
RECENT PROGRAM ACHIEVEMENTS Property Officers fully implemented a bar-code system for property/evidence collection and subsequent purging of cases beyond statute of limitations.
P R O G R A M S & S E R V I C E S
F-232
Property Room
( P r o g r a m N o . 3 4 2 3 ) M i s s i o n S t a t e m e n t Track and store al l property and evidence received for court proceedings or return to r ightful owners.
P r o g r a m A c t i v i t i e s Catalog and store al l i tems of evidence.
Ident ify and dispose of evidence associated with closed cases.
Provide legal access to items of evidence for Santa Barbara Police Department employees and off icers of the courts.
Not ify the publ ic how and when their property is avai lable for retr ieval from the property room.
Catalog, track, and ensure the disposal of al l weapons and drugs in a t imely manner.
Coordinate the del ivery and retr ieval of evidence for analysis with the State Crime Lab.
Prepare and catalog al l i tems to be released by way of auction.
K e y O b j e c t i v e s f o r F i s c a l Y e a r 2 0 0 6 Catalog, barcode, and store 98% of property within one working day.
Conduct quarterly property audits to ensure accountabil i ty.
Ensure purging of 40 cases beyond statutory l imitat ions or with disposit ions per week.
Cont inue to train new Off icers, employees, and other agencies in the use of the Bar Coding System.
Purge 98% of al l misdemeanor cases by June 2006 that are not barcode.

F i n a n c i a l a n d S t a f f i n g I n f o r m a t i o n
Actual Amended Projected Adopted Proposed
FY 2004 FY 2005 FY 2005 FY 2006 FY 2007
Authorized Positions 2.00 2.00 2.00 2.00 2.00
Hourly Employee Hours N/A 0 0 0 0
RevenuesGeneral Fund Subsidy 138,628$ 159,398$ 154,267$ 174,994$ 181,152$ Total Revenue 138,628$ 159,398$ 154,267$ 174,994$ 181,152$
ExpendituresSalaries and Benefits 127,156$ 144,986$ 142,707$ 159,263$ 165,235$ Supplies and Services 11,078 14,412 11,560 15,731 15,917 Non-Capital Equipment 394 - - - - Total Expenditures 138,628$ 159,398$ 154,267$ 174,994$ 181,152$
P r o g r a m P e r f o r m a n c e M e a s u r e s
Actual Projected Adopted FY 2004 FY 2005 FY 2006
Percentage of cases bar-coded and stored 100% 100% 98%
Property audits 1 3 4
Property cases purged N/A 1,000 2,080
Bulk property cases cataloged and stored 340 400 400
Bulk property cases released 205 324 325
Cases received, released, and purged N/A N/A 9,021
Cost of receiving, releasing, and purging property per item N/A N/A $14.00
F-233

City of Santa Barbara Two-Year Financial Plan & Annual Budget
POLICE PROGRAMS
Chief’s Staff Support Services Records Bureau Community Services Division Crime Analysis Property Room
Training and Recruitment Range Beat Coordinators/D.A.R.E. Information Technology Investigative Division Crime Lab Patrol Division Traffic Special Events Tactical Patrol Force Nightlife Enforcement Parking Enforcement Combined Communications
Center Animal Control Emergency Services
RECENT PROGRAM ACHIEVEMENTS An annual training calendar has been established to ensure that police officers maintain compliance with POST requirements.
P R O G R A M S & S E R V I C E S
F-234
Training and Recruitment
( P r o g r a m N o . 3 4 2 4 ) M i s s i o n S t a t e m e n t Recruit and hire qualif ied personnel and provide state-mandated training for al l Pol ice Department employees.
P r o g r a m A c t i v i t i e s Conduct thorough background investigat ions on al l prospective Police
Department employees.
Conduct background investigat ions for other city departments such as Fire, Parks and Recreation, Airport, and Waterfront.
Conduct recruit ing act ivit ies with Human Resources personnel to recruit a diverse candidate pool.
Review training records of al l employees legal ly mandated to comply with Police Off icer Standards Training (POST) requirements.
Facil i tate new employee orientat ions.
Supervise pol ice off icer trainees while at the Police Academy.
Oversee and supervise the property room and range personnel.
Oversee the department’s Mentoring and Training Committee programs.
K e y O b j e c t i v e s f o r F i s c a l Y e a r 2 0 0 6 Maintain an average staff ing level of 95% of authorized posit ions.
Complete 85% of background investigations on prospective Pol ice Department employees within 45 days of a condit ional job offer.
Maintain 95% compliance of state mandated training for Sworn/Reserve Off icers.
Update the procedure for conducting background investigat ions of Police Department employees and present to staff for approval.

F i n a n c i a l a n d S t a f f i n g I n f o r m a t i o n
Actual Amended Projected Adopted Proposed
FY 2004 FY 2005 FY 2005 FY 2006 FY 2007
Authorized Positions 2.00 2.00 2.00 2.00 2.00
Hourly Employee Hours N/A 3,000 3,000 3,000 3,000
RevenuesOther Revenue 344$ General Fund Subsidy 304,830 351,926 317,449 362,908 382,753 Total Revenue 305,174$ 351,926$ 317,449$ 362,908$ 382,753$
ExpendituresSalaries and Benefits 262,815$ 317,486$ 291,641$ 327,922$ 336,021$ Supplies and Services 42,359 34,440 25,808 34,749 46,541 Non-Capital Equipment - - - 237 191 Total Expenditures 305,174$ 351,926$ 317,449$ 362,908$ 382,753$
P r o g r a m P e r f o r m a n c e M e a s u r e s
Actual Projected Adopted FY 2004 FY 2005 FY 2006
Percent of authorized positions staffed in department 96.5% 95% 95%
Percent of employees in compliance with POST 98% 95% 95%
Employees hired 15 15 15
Outside agency recruitment trips and job fairs 2 2 3
Advertisements and promotions for diverse workforce 4 3 5
Training Committee meetings N/A 3 4
Background investigations for other City employees 7 5 10
Background investigations for Police Department employees 27 25 25
Percent of backgrounds checks completed within 45 days 83% 85% 85%
Cost to conduct a background investigation N/A N/A $659
F-235

City of Santa Barbara Two-Year Financial Plan & Annual Budget
POLICE PROGRAMS
Chief’s Staff Support Services Records Bureau Community Services Division Crime Analysis Property Room Training and Recruitment
Range Beat Coordinators/D.A.R.E. Information Technology Investigative Division Crime Lab Patrol Division Traffic Special Events Tactical Patrol Force Nightlife Enforcement Parking Enforcement Combined Communications
Center Animal Control Emergency Services
RECENT PROGRAM ACHIEVEMENTS A body armor rotation program has been established to ensure that police officers have current ballistic protection.
P R O G R A M S & S E R V I C E S
F-236
Range
( P r o g r a m N o . 3 4 2 5 ) M i s s i o n S t a t e m e n t Provide f irearms training to insure compliance for al l off icers and oversee the maintenance and issuance of operat ive, wel l-maintained safety equipment and vehicles.
P r o g r a m A c t i v i t i e s Oversee primary weapon qualif icat ion for al l regular and reserve
off icers, Harbor Patrol, and Airport Patrol.
Provide a safety off icer at requested SWAT trainings.
Manage al l requests for repairs for department f leet vehicles.
Monitor al l manufacturer recalls on department vehicles and schedule vehicles for routine preventive maintenance.
Issue al l safety equipment to newly hired personnel and replace safety equipment to al l off icers as requested.
Oversee day-to-day minor bui lding maintenance requests.
K e y O b j e c t i v e s f o r F i s c a l Y e a r 2 0 0 6 Maintain 98% quarter ly compliance for weapons qualif ication for
off icers available to quali fy.
Respond to 100% of vehicle repair requests within two business days.
Ensure that 100% of al l equipment meets department requirements.
Ensure cleaning of 25% of al l department duty weapons each quarter.
Ensure 25% of patrol long r if les cleaned each quarter.

F i n a n c i a l a n d S t a f f i n g I n f o r m a t i o n
Actual Amended Projected Adopted Proposed
FY 2004 FY 2005 FY 2005 FY 2006 FY 2007
Authorized Positions 1.00 1.00 1.00 1.00 1.00
Hourly Employee Hours N/A 0 0 0 0
RevenuesGeneral Fund Subsidy 913,858$ 990,083$ 999,530$ 1,069,123$ 1,098,648$ Total Revenue 913,858$ 990,083$ 999,530$ 1,069,123$ 1,098,648$
ExpendituresSalaries and Benefits 68,917$ 74,281$ 72,618$ 81,213$ 84,253$ Supplies and Services 844,941 915,802 926,912 950,598 973,630 Non-Capital Equipment - - - 37,312 40,765 Total Expenditures 913,858$ 990,083$ 999,530$ 1,069,123$ 1,098,648$
P r o g r a m P e r f o r m a n c e M e a s u r e s
Actual Projected Adopted FY 2004 FY 2005 FY 2006
Officers trained in primary weapon (4 times per year) 675 744 744
Officers trained in long rifle (4 times per year) 604 636 636
Percent of officers qualified N/A N/A 98%
Safety equipment pieces issued 248 200 150
Percent of safety equipment pieces within department standards issued 100% 100% 100%
Duty weapons cleaned 0 177 186
Percent of duty weapons cleaned N/A 100% 100%
Long rifles cleaned 0 35 35
Percent of long rifles cleaned N/A 100% 100%
Vehicles repair requests 239 200 180
Percent of vehicle requests completed within two business days 100% 100% 100%
Preventive maintenance vehicles repaired 246 200 180
F-237

City of Santa Barbara Two-Year Financial Plan & Annual Budget
POLICE PROGRAMS
Chief’s Staff Support Services Records Bureau Community Services Division Crime Analysis Property Room Training and Recruitment Range
Beat Coordinators/D.A.R.E. Information Technology Investigative Division Crime Lab Patrol Division Traffic Special Events Tactical Patrol Force Nightlife Enforcement Parking Enforcement Combined Communications
Center Animal Control Emergency Services
RECENT PROGRAM ACHIEVEMENTS The Santa Barbara Police Department public access television show, “SBPD Live”, was recognized as Studio Production of the Year for 2004.
P R O G R A M S & S E R V I C E S
F-238
Beat Coordinators/D.A.R.E.
( P r o g r a m N o . 3 4 2 7 ) M i s s i o n S t a t e m e n t Uti l ize community or iented pol icing programs and partnerships to resolve specif ic neighborhood problems affect ing qual ity of l i fe issues.
P r o g r a m A c t i v i t i e s Coordinate a citywide approach to Community Oriented Problem-
Solving (COPS) philosophy.
Uti l ize problem-solving techniques to resolve specif ic neighborhood problems.
Conduct presentat ions on crime prevention topics.
Provide information to the public on pol ice procedures through the Cit izen’s, Spanish and Youth Academies.
Provide direct ion to the Cit izen’s Advisory Committee.
Guide, mentor, and assist members of the Explorer Post to help develop their l i fe ski l ls and self-conf idence.
Provide in-classroom Drug Abuse Resistance Educat ion (D.A.R.E.) instruct ion for elementary school age children.
Provide training to school off icials and parents on current issues and counsel school chi ldren on personal issues and safety t ips.
K e y O b j e c t i v e s f o r F i s c a l Y e a r 2 0 0 6 Respond within 3 working days to 95% of al l requests for attendance at
publ ic education presentat ions.
Ensure that 3 Cit izen Academies are conducted, alternating between English and Spanish, with a satisfaction rate of 95%.
Contact 90% of complainants within 3 working days of receipt of community problem or issue.
Recruit new members for the Explorer Post to bring the total number to 22.
Provide Drug Abuse Resistance Education to 5th and 6th grade students at 7 elementary schools.
Produce the cable television show, “SBPD Live”, on a weekly basis.
Part ic ipate in Neighborhood Improvement Task Force projects on a monthly basis.

F-239
F i n a n c i a l a n d S t a f f i n g I n f o r m a t i o n
Actual Amended Projected Adopted Proposed
FY 2004 FY 2005 FY 2005 FY 2006 FY 2007
Authorized Positions 9.00 8.00 8.00 8.00 8.00
Hourly Employee Hours N/A 0 0 0 0
RevenuesGeneral Fund Subsidy 1,079,319$ 1,037,359$ 1,000,398$ 1,112,495$ 1,142,140$ Total Revenue 1,079,319$ 1,037,359$ 1,000,398$ 1,112,495$ 1,142,140$
ExpendituresSalaries and Benefits 1,035,587$ 975,083$ 946,203$ 1,048,753$ 1,074,638$ Supplies and Services 43,732 62,276 54,195 63,742 67,502 Total Expenditures 1,079,319$ 1,037,359$ 1,000,398$ 1,112,495$ 1,142,140$
P r o g r a m P e r f o r m a n c e M e a s u r e s
Actual Projected Adopted FY 2004 FY 2005 FY 2006
Public education presentations N/A N/A 120
Percent of requests for public education presentations responded to within 3 working days N/A N/A 95%
Spanish speaking presentations N/A N/A 60
Participants in Citizen Academies N/A N/A 60
Satisfaction Rate from Academy participants N/A N/A 95%
Percent of requests for assistance responded to within 3 working days 90% 90% 90%
Explorer Post members 20 22 22
Elementary schools with D.A.R.E. instruction 13 13 13
Students participating in the D.A.R.E. Program 827 750 800
Complaints/C.O.P.S. Projects 620 700 700
COPS projects utilizing other city departments 131 60 160
Hours filling patrol assignments 540 480 400
Explorer meetings 48 48 48
Citizen’s Advisory Committee meetings N/A N/A 10

City of Santa Barbara Two-Year Financial Plan & Annual Budget
POLICE PROGRAMS
Chief’s Staff Support Services Records Bureau Community Services Division Crime Analysis Property Room Training and Recruitment Range Beat Coordinators/D.A.R.E.
Information Technology Investigative Division Crime Lab Patrol Division Traffic Special Events Tactical Patrol Force Nightlife Enforcement Parking Enforcement Combined Communications
Center Animal Control Emergency Services
RECENT PROGRAM ACHIEVEMENTS Staff recently implemented a property evidence bar coding system for the Police property room inventory and a comprehensive false alarm billing system.
P R O G R A M S & S E R V I C E S
F-240
Information Technology
( P r o g r a m N o . 3 4 2 8 ) M i s s i o n S t a t e m e n t Design, create, implement, and maintain automated systems, and provide 24-hour technical support to system users, in order to enhance publ ic safety.
P r o g r a m A c t i v i t i e s Provide network security for al l Pol ice systems.
Design and implement automated systems to enhance publ ic safety, user workf low, and provide crit ically needed law enforcement information in a t imely manner.
Administer the Joint Powers Agreement (JPA) network, providing law enforcement agencies in Santa Barbara and San Luis Obispo counties with access to local, state, national and internat ional databases.
Maintain the Santa Barbara Pol ice Department web page, provide user training, maintain al l PCs and mobile computers and related software, and provide 24-hour user support for law enforcement systems.
K e y O b j e c t i v e s f o r F i s c a l Y e a r 2 0 0 6 Provide system avai labi l i ty for cr it ical systems at a rate exceeding 99%
uptime.
Complete 100% of Department of Justice (DOJ) mandated updates within required t imeframe in support of the Joint Powers Agreement (JPA) network.
Complete 97% of Joint Powers Agreement (JPA) user requests for system access and workstat ion conf igurations within 5 working days.
Respond to 80% of Mobile Data Computer (MDC) repair requests within f ive (5) business days.
Research infrastructure replacement options for Mobile Data Computers; evaluate costs and funding resources; make replacement proposal.

F i n a n c i a l a n d S t a f f i n g I n f o r m a t i o n
Actual Amended Projected Adopted Proposed
FY 2004 FY 2005 FY 2005 FY 2006 FY 2007
Authorized Positions 5.00 5.00 5.00 5.00 5.00
Hourly Employee Hours N/A 0 0 0 0
RevenuesFees and Service Charges 54,042$ 56,063$ 63,142$ 68,250$ 70,204$ Other Revenue 1,927 - - - - General Fund Subsidy 646,551 784,977 768,737 784,766 793,315 Total Revenue 702,520$ 841,040$ 831,879$ 853,016$ 863,519$
ExpendituresSalaries and Benefits 498,023$ 566,319$ 559,871$ 649,242$ 670,512$ Supplies and Services 102,725 132,495 129,782 114,463 114,849 Non-Capital Equipment 101,772 142,226 142,226 89,311 78,158 Total Expenditures 702,520$ 841,040$ 831,879$ 853,016$ 863,519$
P r o g r a m P e r f o r m a n c e M e a s u r e s
Actual Projected Adopted FY 2004 FY 2005 FY 2006
Rate of critical system uptime >99% >99% >99%
Mobile Data Computers (MDCs) maintained 42 42 35
Percent of MDC repair requests completed within 5 business days N/A N/A 80%
Percent of DOJ updates completed within required timeframe 100% 100% 100%
Percent of JPA user requests completed within 5 working days 100% 100% 97%
PC workstations maintained 141 141 141
Printers maintained 29 28 29
JPA workstations maintained 421 420 420
User help requests completed 2,618 2,000 3,500
F-241

City of Santa Barbara Two-Year Financial Plan & Annual Budget
POLICE PROGRAMS
Chief’s Staff Support Services Records Bureau Community Services Division Crime Analysis Property Room Training and Recruitment Range Beat Coordinators/D.A.R.E. Information Technology
Investigative Division Crime Lab Patrol Division Traffic Special Events Tactical Patrol Force Nightlife Enforcement Parking Enforcement Combined Communications
Center Animal Control Emergency Services
RECENT PROGRAM ACHIEVEMENTS The Investigative division was able to increase asset forfeiture in narcotics investigations by 11% over the previous fiscal year.
P R O G R A M S & S E R V I C E S
F-242
Investigative Division
( P r o g r a m N o . 3 4 3 1 ) M i s s i o n S t a t e m e n t Investigate or resolve al l act ive unsolved assigned criminal cases to a successful conclusion or unti l al l leads are exhausted.
P r o g r a m A c t i v i t i e s Invest igate act ive, unsolved cr iminal cases.
Serve as a l iaison with the Distr ict Attorney to ensure successful prosecut ion of cr iminal offenders.
Serve as a l iaison with community-based organizations and outside law enforcement agencies.
Process requests for taxi, massage, and dance permits.
Proactively invest igate narcot ic violat ions.
Extradite fugit ives and transport wanted subjects back to Santa Barbara County for prosecut ion.
Conduct department surveys to evaluate off icer effect iveness.
K e y O b j e c t i v e s f o r F i s c a l Y e a r 2 0 0 6 Achieve a 20% clearance rate by arrest, warrant, or referral for al l
assigned cases.
Complete 80% of investigations 90 days after being assigned.
Complete 90% of taxi permit and dance permit investigations within two weeks of appl icat ion.
Complete 75% of fol low-up requests from the Distr ict Attorney's off ice by due date.
Ensure 25% yearly update of hardware software in high tech crime lab.
Implement changes to exist ing Santa Barbara Municipal Code dance ordinance to facil i tate safer environment in nightl i fe distr ict.
Implement the newly adopted municipal code sections relat ing to false burglary and robbery alarms.

F i n a n c i a l a n d S t a f f i n g I n f o r m a t i o n
Actual Amended Projected Adopted Proposed
FY 2004 FY 2005 FY 2005 FY 2006 FY 2007
Authorized Positions 27.00 28.00 28.00 29.00 29.00
Hourly Employee Hours N/A 0 0 0 0
RevenuesFees and Service Charges 142$ 27,127$ 11,009$ 41,900$ 43,995$ Intergovernmental 106,004 90,000 90,000 60,000 60,000 Other Revenue 100 - - - - General Fund Subsidy 3,595,900 3,898,200 3,890,324 4,304,345 4,427,464 Total Revenue 3,702,146$ 4,015,327$ 3,991,333$ 4,406,245$ 4,531,459$
ExpendituresSalaries and Benefits 3,367,407$ 3,688,505$ 3,680,510$ 4,068,044$ 4,188,316$ Supplies and Services 247,971 245,822 220,823 278,201 283,143 Special Projects 110,472 167,927 167,927 60,000 60,000 Transfers 96,201 - - - - Non-Capital Equipment 7,388 - - - - Total Expenditures 3,829,439$ 4,102,254$ 4,069,260$ 4,406,245$ 4,531,459$
P r o g r a m P e r f o r m a n c e M e a s u r e s
Actual Projected Adopted FY 2004 FY 2005 FY 2006
Arrests, warrants, and referrals 641 698 698
Percent of cases closed by arrest, warrant, or referral 20.3% 20% 20%
Cases assigned for follow-up 1,193 1,462 1,462
Percent of investigations completed in 90 days 66.66% 82% 80%
Taxi, pedicab, and dance permits issued 205 210 210
Percent of taxi and dance permits completed within two weeks 96.9% 98% 90%
Taxi, pedicab, and dance permits denied or held for further investigation 4 26 26
Requests for follow-up from the District Attorney’s Office 170 78 78
Percent of District Attorney follow-ups by due date 60% 70% 75%
Percent of hi-tech hardware and software updated 25% 25% 25%
Arrests by division personnel 268 N/A N/A
Narcotic investigations 126 104 104
Computer forensic examinations conducted by high tech crimes unit N/A 92 92
Customer surveys distributed N/A 240 240
Cal Gang training classes N/A 12 12
F-243

City of Santa Barbara Two-Year Financial Plan & Annual Budget
POLICE PROGRAMS
Chief’s Staff Support Services Records Bureau Community Services Division Crime Analysis Property Room Training and Recruitment Range Beat Coordinators/D.A.R.E. Information Technology Investigative Division
Crime Lab Patrol Division Traffic Special Events Tactical Patrol Force Nightlife Enforcement Parking Enforcement Combined Communications
Center Animal Control Emergency Services
RECENT PROGRAM ACHIEVEMENTS New Drager PAS devices implemented for breathalyzer tests and exceeded objective for calibration.
P R O G R A M S & S E R V I C E S
F-244
Crime Lab
( P r o g r a m N o . 3 4 3 2 ) M i s s i o n S t a t e m e n t Collect and process forensic evidence to assist in criminal invest igat ions.
P r o g r a m A c t i v i t i e s Respond to crime scenes to identify, document, collect, and preserve
physical evidence for future examinations.
Examine and analyze evidence in the laboratory, including the identif icat ion of suspected control led, trace evidence ( i.e. hairs, f ibers, physiological f luids), and the evaluation of various types of physical evidence.
Perform various photographic assignments, including maintaining the digital image archive of cr ime scene photos, and perform departmental photographic work, including developing and print ing a variety of f i lms used for evidence and court displays.
Process evidence for latent f ingerprints, examine latent f ingerprints, and conduct f ingerprint comparisons.
Attend autopsies in cr iminal cases for evidence col lect ion, documentat ion, and evaluation.
Examine evidence to determine if further forensic analysis is required by forensic scientists at the Department of Justice (DOJ) or Federal Bureau of Invest igations (FBI). These include: serology, DNA, hair and f iber comparisons, footwear and t ire track exams, ball ist ics, and document examinat ions.
Prepare reports that document crime scenes and results of evidence examinat ions.
Provide expert test imony in court regarding the examinations and evaluat ions performed.
K e y O b j e c t i v e s f o r F i s c a l Y e a r 2 0 0 6 Process 97.5% of photographic evidence submitted by crime scene
investigators and detect ives within 2 working days.
Submit 90% of al l CAL-ID qual ity latent f ingerprints to Department of Just ice within 1 working day.
Ensure 90% of evidence processing requests by investigators and Distr ict Attorney's Off ice be completed within 3 working days.
Ensure that 95% of the Drager E-PAS intoxil izer devices successful ly pass accuracy testing & calibrat ion to meet Tit le 17 requirements.
Ensure 95% of in custody arrest reports are del ivered to the Santa Barbara County Distr ict Attorney’s Off ice within 1 working day.

F i n a n c i a l a n d S t a f f i n g I n f o r m a t i o n
Actual Amended Projected Adopted Proposed
FY 2004 FY 2005 FY 2005 FY 2006 FY 2007
Authorized Positions 2.00 2.00 2.00 2.00 2.00
Hourly Employee Hours N/A 0 0 0 0
RevenuesGeneral Fund Subsidy 160,402$ 188,030$ 174,861$ 206,077$ 210,974$ Total Revenue 160,402$ 188,030$ 174,861$ 206,077$ 210,974$
ExpendituresSalaries and Benefits 158,668$ 172,611$ 168,922$ 189,427$ 196,578$ Supplies and Services 1,734 15,419 5,939 12,762 12,796 Non-Capital Equipment - - - 3,888 1,600 Total Expenditures 160,402$ 188,030$ 174,861$ 206,077$ 210,974$
P r o g r a m P e r f o r m a n c e M e a s u r e s
Actual Projected Adopted FY 2004 FY 2005 FY 2006
Percent of photographic evidence processed within 2 working days 98.75% 100% 97.5%
Latent prints submitted to CAL-ID 34,848 27,000 28,000
Cost to submit each latent print to CAL-ID N/A N/A $3.70
Percent of CAL-ID latents submitted to DOJ within 1 working day 96.25% 96% 90%
Percent of evidence processing requests completed within 3 working days 100% 90% 90%
Percent of EPAS devices that pass accuracy testing & calibration 90.3% 100% 95%
Percent of arrest reports delivered to the District Attorney’s Office within one working day N/A N/A 95%
Physical evidence cases processed by lab 328 190 200
Cost for each physical evidence case processed N/A N/A $86.31
Crime scene responses by lab 145 80 80
Cost of crime scene response by lab personnel only N/A N/A $215.76
F-245

City of Santa Barbara Two-Year Financial Plan & Annual Budget
POLICE PROGRAMS
Chief’s Staff Support Services Records Bureau Community Services Division Crime Analysis Property Room Training and Recruitment Range Beat Coordinators/D.A.R.E. Information Technology Investigative Division Crime Lab
Patrol Division Traffic Special Events Tactical Patrol Force Nightlife Enforcement Parking Enforcement Combined Communications
Center Animal Control Emergency Services
RECENT PROGRAM ACHIEVEMENTS In December 2004, all officers attended a 10 hour POST approved class in Racial Profiling and Domestic Violence.
P R O G R A M S & S E R V I C E S
F-246
Patrol Division
( P r o g r a m N o . 3 4 4 1 ) M i s s i o n S t a t e m e n t Respond to community needs through the enforcement of public safety laws and provide expedient responses to calls for service.
P r o g r a m A c t i v i t i e s Provide uniform patrol 24 hours a day, seven days a week to prevent
and deter cr ime.
Respond to all felony cal ls, cr imes in progress, and selected misdemeanors.
Conduct init ial investigat ions and complete cr ime reports.
Enforce state and local statutes and traff ic regulat ions.
Facil i tate the safe and eff ic ient movement of motor vehicles, bicycl ists, and pedestr ians on city streets and thoroughfares.
Develop and implement community pol icing strategies to reduce crime and enhance qual ity of l i fe within our community.
K e y O b j e c t i v e s f o r F i s c a l Y e a r 2 0 0 6 Maintain an average response t ime under 6:50 minutes to al l prior ity
one cal ls for service from the t ime the call is received to the t ime of arr ival.
Maintain an average response t ime under 14:30 minutes to al l pr ior ity two calls for service from the t ime the call is received to the t ime of arr ival.
Maintain an average response t ime under 37:00 minutes to al l pr ior ity three cal ls for service from the t ime the cal l is received to the t ime of arr ival.
Maintain minimum patrol staff ing levels 24 hours per day, 7 days per week.
Submit to transcribers 99% of in-custody arrests within 24 hours of arrest t ime.
Implement service improvements based on survey results to improve employee awareness, community relat ions, and patrol response.
Develop a system of measurement to quant ify the number of patrol off icer hours spent managing issues related to the homeless.

F i n a n c i a l a n d S t a f f i n g I n f o r m a t i o n
Actual Amended Projected Adopted Proposed
FY 2004 FY 2005 FY 2005 FY 2006 FY 2007
Authorized Positions 82.00 83.00 83.00 81.40 81.40
Hourly Employee Hours N/A 0 0 0 0
RevenuesTraffic Safety Fines 518,714$ 505,000$ 555,000$ 555,000$ 580,000$ Fines & Forfeitures 301,641 225,000 200,000 200,000 200,000 Intergovernmental 370,804 405,864 404,068 135,232 135,232 Fees and Service Charges 99,607 50,000 35,000 35,000 35,000 Other Revenue 42,192 - - - - General Fund Subsidy 9,364,149 10,007,237 9,809,070 10,863,597 11,162,127 Total Revenue 10,697,107$ 11,193,101$ 11,003,138$ 11,788,829$ 12,112,359$
ExpendituresSalaries and Benefits 9,623,858$ 10,071,530$ 9,937,040$ 10,624,759$ 10,920,185$ Supplies and Services 1,001,368 1,044,007 988,534 1,153,948 1,185,455 Special Projects 3,091 270,084 270,084 - - Transfers - 4,394 - - - Non-Capital Equipment 4,295 - - 10,122 6,719 Total Expenditures 10,632,612$ 11,390,015$ 11,195,658$ 11,788,829$ 12,112,359$
W o r k l o a d I n d i c a t o r s
Actual Projected Adopted FY 2004 FY 2005 FY 2006
Average response time to all priority one calls for service N/A N/A 6:50
Average response time to all priority two calls for service N/A N/A 14:30
Average response time to all priority three calls for service N/A N/A 37:00
Percent of days with minimum level of patrol officers for 911 response N/A 98% 100%
Percentage of reports submitted to transcribers within 24 hours N/A N/A 99%
Felony arrests 2,112 1,725 1,725
Misdemeanor arrests 6,234 4,100 4,100
Emergency calls for service 1,949 1,949 1,949
Medium and low priority calls for service N/A 36,000 36,000
Municipal Code citations written 5,072 4,625 4,625
Arrest reports submitted to Records for transcription N/A 5,825 5,825
Hours lost injuries on duty (IOD) 12,193 11,722 11,722
F-247

City of Santa Barbara Two-Year Financial Plan & Annual Budg
POLICE PROGRAMS
Chief’s Staff Support Services Records Bureau Community Services Division Crime Analysis Property Room Training and Recruitment Range Beat Coordinators/D.A.R.E. Information Technology Investigative Division Crime Lab Patrol Division
Traffic Special Events Tactical Patrol Force Nightlife Enforcement Parking Enforcement Combined Communications
Center Animal Control Emergency Services
et
RECENT PROGRAM ACHIEVEMENTS In 2004 the Traffic Program obtained $239,000 in grant funding to conduct DUI education and enforcement and $30,000 in grant funding to conduct seatbelt education and enforcement.
P R O G R A M S & S E R V I C E S
F-248
Traff ic
( P r o g r a m N o . 3 4 4 2 ) M i s s i o n S t a t e m e n t Reduce traff ic coll is ions and facil i tate the safe and orderly f low of traff ic through educat ion and enforcement.
P r o g r a m A c t i v i t i e s Enforce traff ic laws for motorists, pedestr ians, and bicyclists.
Invest igate traff ic coll is ions.
Provide publ ic educat ion about traff ic issues.
Conduct Driving Under the Inf luence (DUI) and Seatbelt Checkpoints to promote motorist safety and reduce coll is ions.
Administer Off ice of Traff ic Safety grants to improve traff ic safety.
K e y O b j e c t i v e s f o r F i s c a l Y e a r 2 0 0 6 Maintain the total number of DUI traf f ic coll is ions at or below the most
recent three-year average.
Maintain the total number of injury traff ic coll is ions at or below the most recent three-year average.
Maintain the total number of traff ic coll is ions at or below the most recent three-year average.
Achieve a 20% clearance rate by arrest, warrant, civi l or referral for al l assigned traff ic coll is ion cases.
Apply for and receive continued grant funding for special enforcement programs.

F i n a n c i a l a n d S t a f f i n g I n f o r m a t i o n
Actual Amended Projected Adopted Proposed
FY 2004 FY 2005 FY 2005 FY 2006 FY 2007
Authorized Positions 8.00 9.00 9.00 8.00 8.00
Hourly Employee Hours N/A 0 0 0 0
RevenuesGeneral Fund Subsidy 1,002,186$ 1,147,312$ 1,015,770$ 1,003,419$ 1,023,332$ Total Revenue 1,002,186$ 1,147,312$ 1,015,770$ 1,003,419$ 1,023,332$
ExpendituresSalaries and Benefits 974,677$ 1,107,718$ 979,760$ 948,802$ 972,076$ Supplies and Services 27,509 39,594 36,010 53,117 51,256 Non-Capital Equipment - - - 1,500 - Total Expenditures 1,002,186$ 1,147,312$ 1,015,770$ 1,003,419$ 1,023,332$
P r o g r a m P e r f o r m a n c e M e a s u r e s
Actual Projected Adopted FY 2004 FY 2005 FY 2006
DUI traffic collisions 140 141 148
Injury traffic collisions 647 622 627
Traffic collisions 1,993 1,978 1,977
Percent of cases cleared N/A N/A 20%
Active grants for special traffic enforcement programs 3 1 N/A
Total traffic citations issued by department 11,175 8,440 10,412
Pedestrians involved traffic collisions 81 70 80
Bicycles involved traffic accidents 122 134 122
F-249

City of Santa Barbara Two-Year Financial Plan & Annual Budget
POLICE PROGRAMS
Chief’s Staff Support Services Records Bureau Community Services Division Crime Analysis Property Room Training and Recruitment Range Beat Coordinators/D.A.R.E. Information Technology Investigative Division Crime Lab Patrol Division Traffic
Special Events Tactical Patrol Force Nightlife Enforcement Parking Enforcement Combined Communications
Center Animal Control Emergency Services
RECENT PROGRAM ACHIEVEMENTS The Reserve Corps located the whereabouts of the sexual registrants residing in the City of Santa Barbara as reported in the recently released Department of Justice website.
P R O G R A M S & S E R V I C E S
F-250
Special Events
( P r o g r a m N o . 3 4 4 3 ) M i s s i o n S t a t e m e n t Monitor special events within the City of Santa Barbara to ensure the safety of event organizers, part ic ipants, and the general publ ic.
P r o g r a m A c t i v i t i e s Process al l Special Event appl icat ions in accordance with rules and
regulat ions outl ined in the Municipal Code.
Process business-related f i lm and photo appl ications in accordance with rules and regulations out l ined in the Municipal Code.
Prepare and implement tact ical plans for al l events l ikely to require a pol ice presence beyond the scope of day-to-day operat ions.
Supervise, coordinate, and direct the act ivit ies of the Police Department’s Reserve Corps, Volunteer Corps, and Chaplain Program.
K e y O b j e c t i v e s f o r F i s c a l Y e a r 2 0 0 6 Process 95% of completed Special Event applicat ions within three
working days.
Process 95% of completed Film/Photo appl ications within two working days.
Reduce part one crimes by 20% as compared to the pr ior three-year average within venue areas during Solst ice, July 4th, and Fiesta.
Increase the number of hours volunteered by the Reserve Corps, Volunteer Corps, and Chaplains by 10%, as compared to the previous year.

F i n a n c i a l a n d S t a f f i n g I n f o r m a t i o n
Actual Amended Projected Adopted Proposed
FY 2004 FY 2005 FY 2005 FY 2006 FY 2007
Authorized Positions 1.00 1.00 1.00 1.00 1.00
Hourly Employee Hours N/A 0 0 0 0
RevenuesOther Revenue 163,809$ 65,000$ 70,000$ 75,000$ 75,000$ General Fund Subsidy 349,820 171,183 236,617 443,245 458,978 Total Revenue 513,629$ 236,183$ 306,617$ 518,245$ 533,978$
ExpendituresSalaries and Benefits 436,149$ 209,635$ 294,044$ 402,619$ 423,395$ Supplies and Services 77,480 26,548 12,573 115,626 110,583 Total Expenditures 513,629$ 236,183$ 306,617$ 518,245$ 533,978$
P r o g r a m P e r f o r m a n c e M e a s u r e s
Actual Projected Adopted FY 2004 FY 2005 FY 2006
Percent of Special Event applications processed within three working days 93% 90% 95%
Percent of Film/Photo applications completed within two working days 100% 95% 95%
Part one crimes within venues area during Solstice, July 4th, and Fiesta 55 16 27
Hours volunteered by the Reserve Corps, Volunteer Corps, and Chaplains 5,916 5,600 6,160
Special Event applications processed 201 200 200
Film/Photo applications processed 79 75 75
Complaints generated by permitted events 11 5 10
Hours donated by Reserve Corps 3,845 3,875 4,260
Hours donated by Volunteer Corps 1,287 1,000 1,100
Hours donated by Chaplains 784 725 800
Cost of providing Police services for the July 4th Celebration N/A N/A $25,515
Cost of providing Police services for the Old Spanish Days Celebration N/A N/A $278,265
Cost of providing Police services for the Solstice Celebration N/A N/A $23,503
F-251

City of Santa Barbara Two-Year Financial Plan & Annual Budget
POLICE PROGRAMS
Chief’s Staff Support Services Records Bureau Community Services Division Crime Analysis Property Room Training and Recruitment Range Beat Coordinators/D.A.R.E. Information Technology Investigative Division Crime Lab Patrol Division Traffic Special Events
Tactical Patrol Force Nightlife Enforcement Parking Enforcement Combined Communications
Center Animal Control Emergency Services
RECENT PROGRAM ACHIEVEMENTS In 2004 members of the Tactical Patrol Force collaborated with Santa Barbara County’s Mental Health and Public Health departments to develop the Restorative Policing Program.
P R O G R A M S & S E R V I C E S
F-252
Tactical Patrol Force
( P r o g r a m N o . 3 4 4 4 ) M i s s i o n S t a t e m e n t Maintain a proact ive pol ice presence in the downtown and waterfront areas to reduce street cr ime through the ut i l izat ion of unique strategies and partnerships.
P r o g r a m A c t i v i t i e s Provide uniformed foot and bicycle patrol off icers downtown to deter
street cr ime, maintain a highly visible pol ice presence, and encourage interaction with the publ ic.
Maintain a dai ly proactive enforcement effort against alcohol, narcot ics, panhandling, loiter ing, and i l legal vending violat ions in the downtown and waterfront areas.
Conduct plainclothes enforcement to target specif ic problems.
Provide security at City Counci l meetings with a uniformed off icer.
Monitor activity at the labor l ine.
Provide bicycle patrol training to SBPD off icers and outside agencies.
Work with representat ives of the Downtown Organizat ion, Old Town Merchants, and County Mental Health to solve problems.
K e y O b j e c t i v e s f o r F i s c a l Y e a r 2 0 0 6 Maintain enforcement at the Labor Line 208 days per year.
Maintain uniformed pol ice presence at 100% of City Council meetings.
Provide enforcement coverage for al l unscheduled demonstrat ions, marches, and problems throughout the city as requested.
Manage Neighborhood Improvement Program projects along the freeway corr idor and coordinate quarterly clean-up efforts with Caltrans, other agencies, and city departments.
Manage Neighborhood Improvement Program projects along the rai lroad corr idor and coordinate bi-annual clean-up efforts with Union Pacif ic, Amtrak, other agencies, and city departments.

F i n a n c i a l a n d S t a f f i n g I n f o r m a t i o n
Actual Amended Projected Adopted Proposed
FY 2004 FY 2005 FY 2005 FY 2006 FY 2007
Authorized Positions 4.00 4.00 4.00 4.00 4.00
Hourly Employee Hours N/A 0 0 0 0
RevenuesGeneral Fund Subsidy 465,809$ 501,177$ 498,178$ 547,561$ 560,918$ Total Revenue 465,809$ 501,177$ 498,178$ 547,561$ 560,918$
ExpendituresSalaries and Benefits 455,920$ 486,428$ 484,628$ 530,191$ 545,599$ Supplies and Services 9,889 13,251 12,052 14,525 13,745 Non-Capital Equipment - 1,498 1,498 2,845 1,574 Total Expenditures 465,809$ 501,177$ 498,178$ 547,561$ 560,918$
W o r k l o a d I n d i c a t o r s
Actual Projected Adopted FY 2004 FY 2005 FY 2006
Daily premise checks conducted at the labor line 209 210 208
Percent of City Council meetings attended 100% 98% 100%
Public intoxication arrests 95 124 110
Citations issued for open container / public consumption of alcohol (9.05.010 SBMC) 1,250 1,846 1,610
Narcotics arrests 192 346 225
Panhandling, loitering, and illegal vending citations 129 164 175
Citations issued for solicitation on a public right-of-way (9.140.020 SBMC)
70 228 145
Arrests 304 498 370
Citations issued 1,876 3,040 2,600
Restorative policing cases monitored N/A N/A 70
F-253

City of Santa Barbara Two-Year Financial Plan & Annual Budget
POLICE PROGRAMS
Chief’s Staff Support Services Records Bureau Community Services Division Crime Analysis Property Room Training and Recruitment Range Beat Coordinators/D.A.R.E. Information Technology Investigative Division Crime Lab Patrol Division Traffic Special Events Tactical Patrol Force
Nightlife Enforcement Parking Enforcement Combined Communications
Center Animal Control Emergency Services
RECENT PROGRAM ACHIEVEMENTS Implemented the Alcoholic Beverage Control Grant by conducting the Trapdoor, Shoulder Trap, and Minor Decoy program.
P R O G R A M S & S E R V I C E S
F-254
Nightl i fe Enforcement
( P r o g r a m N o . 3 4 4 8 ) M i s s i o n S t a t e m e n t Ensure public safety on weekend nights in the downtown corr idor through enforcement, educat ion, and intervention with the downtown bar and restaurant owners and the cit izens of Santa Barbara.
P r o g r a m A c t i v i t i e s Conduct premise checks on downtown bars and nightclubs.
Conduct responsible beverage server training every month to prevent the sale of alcohol to minors and reduce alcohol-related incidents.
Assist with Zona Seca classes monthly to provide alcohol awareness training and educat ion to individuals with alcohol-related violat ions.
Provide security training for nightclub and bar staff.
Refer al l alcohol, bar, and restaurant violat ions to Alcohol and Beverage Control (ABC).
K e y O b j e c t i v e s f o r F i s c a l Y e a r 2 0 0 6 Conduct premise checks on 100% of downtown bars and restraints with
dance permits, Wednesday through Saturday, and check locations outside the downtown corridor at least twice per month.
Conduct Responsible Beverage Server Trainings every month.
Refer 100% of alcohol violat ions in bars and restaurants to Alcohol ic Beverage Control (ABC).
Complete and submit al l recommendations on Dance/ABC permit appl ications to the Pol ice and Fire technician within 4 working days.
Increase compliance of sales of alcohol to minors from “off-sale” l icensees to 80%.
Develop a training program for Bar Security personnel.
Research and apply for the f iscal year 2006 Alcohol ic Beverage Control Grant.

F i n a n c i a l a n d S t a f f i n g I n f o r m a t i o n
Actual Amended Projected Adopted Proposed
FY 2004 FY 2005 FY 2005 FY 2006 FY 2007
Authorized Positions 4.00 4.00 4.00 4.00 4.00
Hourly Employee Hours N/A 0 0 0 0
RevenuesGeneral Fund Subsidy 436,520$ 463,448$ 469,631$ 519,435$ 533,464$ Total Revenue 436,520$ 463,448$ 469,631$ 519,435$ 533,464$
ExpendituresSalaries and Benefits 424,562$ 448,265$ 455,325$ 504,980$ 518,829$ Supplies and Services 11,958 15,183 14,306 14,455 14,635 Total Expenditures 436,520$ 463,448$ 469,631$ 519,435$ 533,464$
P r o g r a m P e r f o r m a n c e M e a s u r e s
Actual Projected Adopted FY 2004 FY 2005 FY 2006
Responsible Beverage Server training sessions conducted NA 15 12
Premise checks conducted 1,896 1,900 2,075
Percent of premise checks conducted of bar and restaurants with dance permits N/A N/A 100%
Violations referred to ABC N/A N/A 110
Percentage of alcohol violations in bars and restaurants referred to Alcoholic Beverage Control 100% 100% 100%
Rate of compliance of “off-sale” licensees N/A N/A 80%
Alcohol related incidents involving minors N/A 50 60
Incidents involving the use of false identifications for entry into “21 and over” premises N/A N/A 180
Dance permits/ABC recommendations made to Police and Fire Commission 37 35 50
Percent of permit recommendations submitted within 4 working days 100% 100% 100%
F-255

City of Santa Barbara Two-Year Financial Plan & Annual Budget
POLICE PROGRAMS
Chief’s Staff Support Services Records Bureau Community Services Division Crime Analysis Property Room Training and Recruitment Range Beat Coordinators/D.A.R.E. Information Technology Investigative Division Crime Lab Patrol Division Traffic Special Events Tactical Patrol Force Nightlife Enforcement
Parking Enforcement Combined Communications
Center Animal Control Emergency Services
RECENT PROGRAM ACHIEVEMENTS Developed a permanent enforcement program for the expanded citywide street sweeping program.
P R O G R A M S & S E R V I C E S
F-256
Parking Enforcement
( P r o g r a m N o s . 3 4 4 7 , 3 4 4 9 ) M i s s i o n S t a t e m e n t Enforce parking regulat ions in the City of Santa Barbara to ensure avai labi l i ty of l imited parking resources.
P r o g r a m A c t i v i t i e s Enforce t ime zone restr ict ions, residential parking regulat ions and
other Municipal Code, and California Vehicle Code Regulat ions.
Issue warnings and tow vehicles stored on City streets and other City owned or maintained property.
Locate and impound vehicles owned or operated by habitual parking offenders (H.O.P.E.) that have f ive or more outstanding parking violat ions.
Maintain a Crossing Guard Program to provide crossing guard coverage for local elementary schools.
K e y O b j e c t i v e s f o r F i s c a l Y e a r 2 0 0 6 Locate 53 vehicles per month that have f ive or more unpaid parking
citat ions (H.O.P.E. vehicles).
Maintain 97.5% dai ly crossing guard coverage for sixteen school intersections during the normal school year.
Design and implement a new computer program for tracking data on vehicles entered into the street storage system.

F i n a n c i a l a n d S t a f f i n g I n f o r m a t i o n
Actual Amended Projected Adopted Proposed
FY 2004 FY 2005 FY 2005 FY 2006 FY 2007
Authorized Positions 13.00 13.00 13.00 13.00 13.00
Hourly Employee Hours N/A 13,240 13,240 13,240 13,240
RevenuesFees and Service Charges 168,204$ 209,520$ 209,520$ 219,204$ 229,845$ General Fund Subsidy 745,270 877,858 731,188 956,333 1,006,059 Total Revenue 913,474$ 1,087,378$ 940,708$ 1,175,537$ 1,235,904$
ExpendituresSalaries and Benefits 782,206$ 1,014,653$ 874,250$ 1,104,631$ 1,149,991$ Supplies and Services 71,268 72,725 66,458 70,906 85,913 Non-Capital Equipment 60,000 - - - - Total Expenditures 913,474$ 1,087,378$ 940,708$ 1,175,537$ 1,235,904$
W o r k l o a d I n d i c a t o r s
Actual Projected Adopted FY 2004 FY 2005 FY 2006
H.O.P.E. vehicles located 668 666 636
Percent of crossing guard positions covered 96.9% 97% 97.5%
Parking citations issued by the Parking Enforcement Unit 63,152 74,000 75,000
Street sweeping citations issued by the Parking Enforcement Unit 23,741 28,900 27,700
Street storage requests investigated by the Parking Enforcement Unit 4,356 4,375 4,350
Street storage requests found “gone on arrival” (GOA) on initial contact by a parking enforcement officer 1,191 919 914
Street storage vehicles moved after being warned or tagged by a parking enforcement officer 2,445 2,494 2,480
Street storage vehicles towed after being warned or tagged by a parking enforcement officer 580 525 522
Cost per parking citation issued by a parking enforcement officer (excluding street sweeping parking citations) N/A N/A $10.79
Cost per street sweeping parking citation issued by a parking enforcement officer N/A N/A $5.74
F-257

City of Santa Barbara Two-Year Financial Plan & Annual Budget
POLICE PROGRAMS
Chief’s Staff Support Services Records Bureau Community Services Division Crime Analysis Property Room Training and Recruitment Range Beat Coordinators/D.A.R.E. Information Technology Investigative Division Crime Lab Patrol Division Traffic Special Events Tactical Patrol Force Nightlife Enforcement Parking Enforcement
Combined Communications Center
Animal Control Emergency Services
RECENT PROGRAM ACHIEVEMENTS Implemented a software- based testing system, as part of the dispatcher hiring process, to measure the ability of applicants to perform necessary computer tasks related to the position.
P R O G R A M S & S E R V I C E S
F-258
Combined
Communications Center
( P r o g r a m N o . 3 4 5 1 ) M i s s i o n S t a t e m e n t Receive all calls for service and dispatch publ ic safety resources in an expedient manner.
P r o g r a m A c t i v i t i e s Provide radio communication for Police, Fire, and rescue personnel
during emergency, routine, and disaster situat ions, 24-hours a day.
Receive init ial requests for emergency and non-emergency incidents requir ing police, f ire and medical personnel, determine appropriate response, and dispatch units accordingly.
Receive requests from the FAA Air Traff ic Control lers and respond with appropriate emergency equipment to aircraft emergencies at the Santa Barbara Airport.
Coordinate publ ic safety act ivity with Police, Fire, al l ied agencies, and other city department staff.
Provide Emergency Medical Dispatch services to the community.
Maintain cert i f ications for communicat ions staff in compliance with Police Off icer Standards and Training and Emergency Medical Dispatching.
Coordinate and comply with discovery requests from the Court Liaison Off icer and Distr ict Attorney’s Off ice.
Provide continuous training and support through communications training to develop and retain publ ic safety dispatchers.
K e y O b j e c t i v e s f o r F i s c a l Y e a r 2 0 0 6 Ensure that al l 911 cal ls for service are answered within an average of
4 seconds.
Minimize the total hours worked by sworn off icers in the Combined Communicat ion Center to less than 3,600.
Maintain 100% compliance of state-mandated training for publ ic safety dispatchers.
Purchase and implement emergency radio system upgrade for the Communicat ions Center and coordinate training for personnel.

F i n a n c i a l a n d S t a f f i n g I n f o r m a t i o n
Actual Amended Projected Adopted Proposed
FY 2004 FY 2005 FY 2005 FY 2006 FY 2007
Authorized Positions 20.00 19.00 19.00 19.00 19.00
Hourly Employee Hours N/A 0 0 0 0
RevenuesOther Revenue 15,607$ -$ -$ -$ -$ General Fund Subsidy 1,651,295 1,917,500 1,745,451 2,097,188 2,194,294 Total Revenue 1,666,902$ 1,917,500$ 1,745,451$ 2,097,188$ 2,194,294$
ExpendituresSalaries and Benefits 1,404,724$ 1,620,535$ 1,457,643$ 1,775,269$ 1,864,646$ Supplies and Services 246,163 279,276 272,055 319,927 327,656 Special Projects 15,607 5,330 3,394 - - Non-Capital Equipment 408 12,359 12,359 1,992 1,992 Total Expenditures 1,666,902$ 1,917,500$ 1,745,451$ 2,097,188$ 2,194,294$
P r o g r a m P e r f o r m a n c e M e a s u r e s
Actual Projected Adopted FY 2004 FY 2005 FY 2006
Average ring time in seconds 2.75 4 4
Hours worked by officers in communications 3,580 3,500 3,600
Percent of employees in compliance with POST N/A N/A 100%
911 calls for service 34,174 34,000 49,000
Emergency medical dispatch instructions given 894 1,004 1,200
Priority one calls for service N/A 2,630 2,500
Priority two calls for service N/A 32,400 32,400
Priority three calls for service N/A 9,900 9,900
Fire priority one calls for service 6,358 6,460 6,604
Fire priority two calls for service 1,336 1,460 1,375
Calls to seven-digit telephone lines 64,871 56,100 64,000
California Highway Patrol transfer calls 11,961 10,000 12,800
F-259

City of Santa Barbara Two-Year Financial Plan & Annual Budget
POLICE PROGRAMS
Chief’s Staff Support Services Records Bureau Community Services Division Crime Analysis Property Room Training and Recruitment Range Beat Coordinators/D.A.R.E. Information Technology Investigative Division Crime Lab Patrol Division Traffic Special Events Tactical Patrol Force Nightlife Enforcement Parking Enforcement Combined Communications
Center Animal Control
Emergency Services
RECENT PROGRAM ACHIEVEMENTS Nine local veterinarians are selling dog licenses to their clients to improve dog licensing compliance.
P R O G R A M S & S E R V I C E S
F-260
Animal Control
( P r o g r a m N o . 3 4 6 1 ) M i s s i o n S t a t e m e n t Provide law enforcement and respond to calls for service for neighborhood and health concerns related to domestic and wild animals.
P r o g r a m A c t i v i t i e s Investigate reports of possible rabies exposure from animal bites to
humans and wildl i fe bites to domestic-owned animals.
Quarant ine animals as required or submit specimen for lab test ing.
Enforce state Humane Laws under the Penal Code, California Code of Regulat ions, Civi l Code, Fish and Game Code, Food and Agriculture Code, Health and Safety Code, Government Code, and Tit le 6 of the Santa Barbara Municipal Code.
Impound stray, abused, neglected, injured, sick, abandoned, dead, and aggressive animals.
Deal patiently and effect ively with fr ightened, fract ious, and injured animals and humanely capture, control, carry, or subdue.
Respond to calls for service regarding animal complaints seven days a week and provide standby service for emergencies after regular work hours.
Promote good public relat ions by educat ing pet owners on laws pertaining to the care and control of animals, spaying, neutering, vaccinat ing, and l icensing of pets.
K e y O b j e c t i v e s f o r F i s c a l Y e a r 2 0 0 6 Respond to 100% of animal control calls for service within 24 hours.
Quarant ine 90% of animals involved in bites to humans or contact with wi ldl i fe within 24 hours of notif icat ion.
Ensure 100% of impounded animals are handled in accordance with state laws.
Through a partnership with local veterinarians develop a measure of effect iveness to ensure dog l icensing compliance to comply with California Business & Professions Code which requires veterinarians to disclose cl ient information to animal control off icers.

F i n a n c i a l a n d S t a f f i n g I n f o r m a t i o n
Actual Amended Projected Adopted Proposed
FY 2004 FY 2005 FY 2005 FY 2006 FY 2007
Authorized Positions 5.00 5.00 5.00 4.00 4.00
Hourly Employee Hours N/A 0 0 0 0
RevenuesFees and Service Charges 58,279$ 50,000$ 55,816$ 55,000$ 55,000$ Other Revenue 373 General Fund Subsidy 355,446 423,240 367,147 396,484 407,351 Total Revenue 414,098$ 473,240$ 422,963$ 451,484$ 462,351$
ExpendituresSalaries and Benefits 326,317$ 362,985$ 318,772$ 336,894$ 346,504$ Supplies and Services 87,184 109,607 103,760 114,590 115,847 Non-Capital Equipment 597 648 431 - - Total Expenditures 414,098$ 473,240$ 422,963$ 451,484$ 462,351$
P r o g r a m P e r f o r m a n c e M e a s u r e s
Actual Projected Adopted FY 2004 FY 2005 FY 2006
Calls for service 4,346 4,000 3,375
Percent of animal control calls receiving a response within 24 hours 100% 100% 100%
Percent of animals involved in bites to humans quarantined in 24 hours 96% 90% 90%
Animals impounded live, injured, or dead 3,213 3,300 2,505
Percent of animals impounded handled in accordance with state law 100% 100% 100%
Animals involved in bite incidents 165 154 154
Animals quarantined 161 120 120
Educational presentations 15 12 11
Citations issued N/A N/A 900
Cost to respond to each call for service N/A N/A $88.98
Dog licenses issued N/A N/A 6,500
F-261
City of Santa Barbara Two-Year Financial Plan & Annual Budget
POLICE PROGRAMS
Chief’s Staff Support Services Records Bureau Community Services Division Crime Analysis Property Room Training and Recruitment Range Beat Coordinators/D.A.R.E. Information Technology Investigative Division Crime Lab Patrol Division Traffic Special Events Tactical Patrol Force Nightlife Enforcement Parking Enforcement Combined Communications
Center Animal Control
Emergency Services
RECENT PROGRAM ACHIEVEMENTS The Emergency Operations Center was opened and staffed to successfully manage the incidents connected with the winter storms of 2005.
P R O G R A M S & S E R V I C E S
F-262
Emergency Services
( P r o g r a m N o . 3 4 7 1 ) M i s s i o n S t a t e m e n t Coordinate citywide emergency planning and services, including training, to ensure a rapid response to a disaster or other emergency.
P r o g r a m A c t i v i t i e s Provide Standardized Emergency Management Systems (SEMS)
training to al l city employees.
Maintain city readiness to deal with disasters and other major emergencies.
Monitor levels of training for city managers and department heads in emergency management procedures.
Review and update act ion plans and emergency response manuals.
K e y O b j e c t i v e s f o r F i s c a l Y e a r 2 0 0 6 Ensure 95% of ful l t ime city employees have received training in
Standardized Emergency Management Systems (SEMS).
Ensure 95% of pr imary Emergency Operations Center (EOC) personnel have received training in SEMS and emergency operations.
Exceed State of Cal ifornia guidel ines in conducting at least two citywide disaster exercises.
Complete review of al l ci ty department plans for disaster response.
Update cont ingency plans for disasters outl ined in the Santa Barbara Police Department’s Unusual Occurrence Manual.

F i n a n c i a l a n d S t a f f i n g I n f o r m a t i o n
Actual Amended Projected Adopted Proposed
FY 2004 FY 2005 FY 2005 FY 2006 FY 2007
Authorized Positions 0.00 0.00 0.00 0.60 0.60
Hourly Employee Hours N/A 0 0 0 0
RevenuesGeneral Fund Subsidy 91,567$ 31,803$ 16,293$ 140,357$ 130,939$ Total Revenue 91,567$ 31,803$ 16,293$ 140,357$ 130,939$
ExpendituresSalaries and Benefits 75,234$ -$ -$ 91,382$ 93,847$ Supplies and Services 16,333 31,152 15,642 46,988 37,092 Non-Capital Equipment - 651 651 1,987 - Total Expenditures 91,567$ 31,803$ 16,293$ 140,357$ 130,939$
P r o g r a m P e r f o r m a n c e M e a s u r e s
Actual Projected Adopted FY 2004 FY 2005 FY 2006
Percent of City management staff receiving SEMS training N/A N/A 95%
Percent of EOC staff receiving SEMS training N/A N/A 95%
F-263

[This page intent ional ly le f t b lank. ]
F-264

D E P A R T M E N T S U M M A R Y
Publ ic Works
F-265
Provide for the public’s needs relative to transportation, water, wastewater, and refuse collection services.
A b o u t P u b l i c W o r k s
The Publ ic Works Department is responsible for an annual budget of near ly $100 mi l l ion, represent ing approximately 48% of the Ci ty of Santa Barbara’s total budget, and the 286.6 permanent posi t ions represent approximately 27% of the City 's tota l permanent work force. Publ ic Works programs generate approximately $95 mi l l ion in revenue from a var iety of sources to of fset the expendi tures. The department organizat ion supports 30 City programs.
F i s c a l Y e a r 2 0 0 6
B u d g e t H i g h l i g h t s
• Provide over $1.5M in Measure
D funds for Transit Support to
Downtown.
• Initiate Bridge Replacement
projects at Haley/De La Vina
and Cabrillo Boulevard over
Mission Creek.
Publ ic Works responsibi l i t ies include the design and construct ion of the City ’s capita l program projects, management and planning of a Ci ty t ransportat ion system, treatment and rel iable distr ibut ion of h igh qual i ty water at a reasonable pr ice, col lect ion and treatment of wastewater at a reasonable pr ice, and cost ef fect ive construct and maintenance Ci ty streets, publ ic drainage faci l i t ies, s treet l ights, t raf f ic s ignals and other Ci ty infrastructure fac i l i t ies.
• Continue multi-million dollar
project to rehabilitate Ortega
Groundwater Treatment Plant
and city wells.
While the main of f ice for Publ ic Works is located at 630 Garden Street, the department is a lso responsible for operat ing the City 's El Estero Wastewater Treatment Faci l i ty on Yanonal i Street and the Cater Water Treatment Faci l i ty on San Roque Road, which provide basic water and sewer service to over 100,000 customers.

D E P A R T M E N T S U M M A R Y
Public Works
F-266
D e p a r t m e n t F i n a n c i a l a n d S t a f f i n g S u m m a r y
Actual Amended Projected Adopted Proposed
FY 2004 FY 2005 FY 2005 FY 2006 FY 2007
Authorized Positions 278.60 284.60 284.60 285.60 285.Hourly Employee Hours N/A 167,513 167,513 169,150 170,850RevenuesDonations 60,200$ 80,000$ 80,000$ 80,000$ 90,000$ Fees and Service Charges 39,040,329 42,572,528 43,071,593 59,938,751 62,936,378 Franchise Fees - Refuse 327,393 352,500 372,000 385,944 395,572 Gas Tax 1,678,700 1,725,000 1,735,624 1,725,000 1,725,000 General Fund Subsidy 1,230,011 1,161,520 876,009 1,309,193 1,420,548 Interest Income 1,387,127 1,170,000 1,371,825 1,600,000 1,710,000 Market Valuation (1,012,481) - - - - Interfund Reimbursements 10,330,669 11,691,726 11,841,227 12,523,493 12,842,752 Intergovernmental 810,981 3,723,001 70,105 2,091,000 6,404,000 JPA Reimbursements 1,721,161 1,633,000 1,772,500 2,163,438 2,199,746 Loan Proceeds 13,817,126 20,282,417 - - - Other Revenue 269,681 135,000 181,000 140,000 148,000 Overhead Allocation Recovery N/A 503,954 503,954 747,354 777,248 Parking Violations 402,209 650,000 670,000 750,000 750,000 PBIA Assessment 764,445 675,000 775,000 750,000 775,000 Transfer In - 7,770 - - - Transportation Dev. Funds 63,367 50,000 50,000 50,000 50,000 Measure D Sales Tax 4,558,143 5,200,000 4,500,000 4,500,000 4,680,000 Utility Users Tax 5,498,857 5,837,731 5,800,000 5,995,000 6,175,000 Total Department Revenue 80,947,918$ 97,451,147$ 73,670,837$ 94,749,173$ 103,079,244$
ExpendituresSalaries and Benefits 22,179,290$ 24,301,626$ 23,349,572$ 27,245,090$ 28,449,122$ Supplies and Services 17,021,130 18,458,463 17,204,078 33,498,188 34,133,315 Special Projects 3,269,474 6,319,292 5,360,166 5,260,091 5,396,950 Debt Service 2,202,321 4,101,943 3,858,000 4,869,985 5,521,127 Non-Capital Equipment 116,482 296,188 249,387 373,449 348,189 Capital Equipment 104,328 605,786 144,498 248,000 221,122 Transfers - 1,765,612 1,678,784 1,827,202 1,867,945 Water Supply Purchases 6,926,750 7,418,730 7,418,730 7,361,995 7,301,809 Miscellaneous 17,987 846,501 3,628 255,753 255,692 Total Operating Expenditures 51,837,762$ 64,114,141$ 59,266,843$ 80,939,753$ 83,495,271$ Capital Program 30,753,097 74,041,971 23,553,989 19,030,160 21,884,447
Total Department Expenditures 82,590,859$ 138,156,112$ 82,820,832$ 99,969,913$ 105,379,718$
Addition to (Use of) Reserves (1,642,941)$ (40,704,965)$ (9,149,995)$ (5,220,740)$ (2,300,474)$
60

D E P A R T M E N T S U M M A R Y
Public Works
F-267
D e p a r t m e n t F u n d C o m p o s i t i o n
Department Revenues by Fund
Streets11%
Downtown Parking
7%
Water31%
Measure D5%
Wastewater13%
TDA0%
Street Sweeping
1%
Solid Waste16%General
Fund6%
ICS10%
Department Appropriations by Fund
Downtown Parking
6%
Wastewater14%
Streets10%
Measure D5%
Water33%
ICS9% TDA
0%
General Fund6%
Solid Waste16%
Street Sweepin1%
g

D E P A R T M E N T S U M M A R Y
Public Works
F-268
Program Organizational Chart
Public Works Administration
Engineering
Facilities
Maintenance
Water Resources
Streets, Parking Transportation
Operations
Engineering
Services
Land
Development
Wastewater
Capital Program
Environmental
Services
Building
Maintenance
Motorpool
Communications
Systems
Custodial Services
Water Resources Management
Recycled Water
Water
Distribution
Water Treatment
Water Supply Management
Water Resources Laboratories
Water Capital
Program
Wastewater Collection
Wastewater Treatment
Downtown
Parking
Traffic
Operations
Transportation Planning & Alternative
Transportation
Transportation and Drainage
Systems Maintenance
Traffic Signals
Streets Capital
Program
Street Sweeping
Solid Waste

[This page intent ional ly le f t b lank. ]
F-269

City of Santa Barbara Two-Year Financial Plan & Annual Budget
PUBLIC WORKS PROGRAMS
Administration
Engineering Services Land Development Environmental Services Solid Waste Traffic Operations Transportation Planning &
Alternative Transportation Transportation and Drainage
Systems Maintenance Street Sweeping Traffic Signals Streets Capital Downtown Parking Building Maintenance Motor Pool Communications Systems Custodial Services Water Resources Management Recycled Water Water Distribution Water Treatment Water Supply Management Water Resources Laboratories Water Capital Program Wastewater Collection Wastewater Treatment Wastewater Capital Program
RECENT PROGRAM ACHIEVEMENTS This program continues to successfully manage over 50% of the City’s operating budget within guidelines and has ensured financially solvent and strong funds in Water, Wastewater and Parking.
P R O G R A M S & S E R V I C E S
F-270
Administration
( P r o g r a m N o . 4 1 1 1 ) M i s s i o n S t a t e m e n t Provide administrat ive, personnel and f inancial management support to division staff in order to attain eff icient and organizat ional day-to-day operat ions by the department.
P r o g r a m A c t i v i t i e s Direct the act ivit ies of the Public Works division managers and provide
interface and support to other City department heads.
Develop and coordinate al l department revenues including water and wastewater rate sett ing.
Monitor and coordinate the department’s budget act ivit ies, ensuring that al l expenditures are within appropriat ion.
Coordinate t imely and responsive input for the department for the development of the two-year f inancial plan and annual budget.
Administer the City Hall telephone exchange and coordinate central ized payment of department uti l i ty bi l ls.
Process all departmental correspondence, Counci l reports, departmental claims and requisit ions as well as al l personnel documentat ion and evaluations for the department, ensuring t imeliness and accuracy.
K e y O b j e c t i v e s f o r F i s c a l Y e a r 2 0 0 6 Ensure 80% or greater of al l Public Works program object ives are met
or exceeded.
Ensure posit ive annual appropriat ion balance for al l assigned Public Works funds.
Ensure annual revenues attained by fund are within 5% of f iscal year est imates.
For assigned Enterprise Funds, ensure Council pol icy reserve level goals are met or exceeded annually.
Reduce electr ic ity use in major Public Works faci l i t ies by 1% from 2005 usage.

F i n a n c i a l a n d S t a f f i n g I n f o r m a t i o n
Actual Amended Projected Adopted Proposed
FY 2004 FY 2005 FY 2005 FY 2006 FY 2007
Authorized Positions 4.00 5.00 5.00 5.00 5.00
Hourly Employee Hours N/A 350 350 350 350
RevenuesInterfund Reimbursement 112,128$ 112,125$ 112,125$ 112,125$ 112,125$ Fees and Service Charges 3,682 10,375 1,000 - - Overhead Allocation Recovery N/A 503,954 503,954 747,354 777,248 General Fund Subsidy 473,162 - - - - Total Revenue 588,972$ 626,454$ 617,079$ 859,479$ 889,373$
ExpendituresSalaries and Benefits 457,798$ 486,708$ 484,103$ 552,095$ 578,104$ Supplies and Services 121,771 122,339 112,304 175,676 176,115 Special Projects 8,136 3,188 3,188 - - Non-Capital Equipment 788 9,843 9,843 15,000 15,000 Capital Equipment 466 - - - - Miscellaneous 13 - - - - Total Expenditures 588,972$ 622,078$ 609,438$ 742,771$ 769,219$
P r o g r a m P e r f o r m a n c e M e a s u r e s
Actual Projected Adopted FY 2004 FY 2005 FY 2006
Percent of objectives met or exceeded 78% 80% 80%
Percent expended for Public Works expenditures 91.3% 93% < 100%
Percent of revenues received to date 100.2% 100% 95% - 100%
Policy reserve levels met or exceeded 100% 100% 100%
Council Agenda Reports processed N/A 156 144
Kilowatt-hours of energy used in major Public Works facilities 8.1M KWH 6.3M KWH 6.1M KWH
F-271

City of Santa Barbara Two-Year Financial Plan & Annual Budget
PUBLIC WORKS PROGRAMS
Administration
Engineering Services Land Development Environmental Services Solid Waste Traffic Operations Transportation Planning &
Alternative Transportation Transportation and Drainage
Systems Maintenance Street Sweeping Traffic Signals Streets Capital Downtown Parking Building Maintenance Motor Pool Communications Systems Custodial Services Water Resources Management Recycled Water Water Distribution Water Treatment Water Supply Management Water Resources Laboratories Water Capital Program Wastewater Collection Wastewater Treatment Wastewater Capital Program
RECENT PROGRAM ACHIEVEMENTS Managed the completion of the $18M Cater Treatment Plant on schedule and the start of the $26M Granada Garage start of construction on schedule and with cost saving as promised to the Council.
P R O G R A M S & S E R V I C E S
F-272
Engineering Services
( P r o g r a m N o . 4 2 1 1 ) M i s s i o n S t a t e m e n t Provide professional engineering and management support for City departments and al l capital projects to maintain and improve the City’s infrastructure.
P r o g r a m A c t i v i t i e s Manage the construct ion of the City’s Capital Improvement Program.
Provide professional engineering services for planning, designing, surveying, inspecting, and managing the City’s Capital Program.
Provide long-range master planning and engineering support for the City’s capital infrastructure, in addit ion to general engineering services for al l City projects as requested.
Track and bi l l engineering services to user departments or capital improvement projects for design and construct ion.
K e y O b j e c t i v e s f o r F i s c a l Y e a r 2 0 0 6 Complete 75% of budgeted Capital Program project milestones
assigned to Engineering.
Limit engineering services (staff and consultant) costs to average less than 25% of total project costs.
Limit engineering services costs to less than 25% of the total project cost on 60% of al l capital projects.
Limit the cost of construct ion contract change orders in the Capital Program to less than 9% of the total annual value of construct ion awarded.
Limit al l construct ion contract change orders to the init ial maximum of the Counci l authorized change order al lowance.
Achieve construction bid averages for the City’s capital program to be within 10% of prel iminary design cost est imates for work assigned to Engineering Division.
Meet or exceed the budget’s engineering work order revenue projections.
Ensure that 100% of program employees attend career development associated training.
Conduct a survey of cl ients to determine satisfact ion with engineering services.

F i n a n c i a l a n d S t a f f i n g I n f o r m a t i o n
Actual Amended Projected Adopted Proposed
FY 2004 FY 2005 FY 2005 FY 2006 FY 2007
Authorized Positions 34.30 35.60 35.60 36.60 36.60
Hourly Employee Hours N/A 2,704 2,704 1,550 1,550
RevenuesInterfund Reimbursements 2,520,916$ 2,650,000$ 2,850,000$ 2,974,000$ 3,072,970$ Measure D Sales Tax 571,365 606,944 551,873 667,575 690,802 General Fund Subsidy 313,207 515,665 320,094 528,085 576,129 Total Revenue 3,405,488$ 3,772,609$ 3,721,967$ 4,169,660$ 4,339,901$
ExpendituresSalaries and Benefits 2,970,308$ 3,313,742$ 3,215,187$ 3,725,924$ 3,890,449$ Supplies and Services 428,975 441,739 490,115 435,736 441,452 Special Projects 159 7,500 7,440 2,000 2,000 Non-Capital Equipment 6,046 9,628 9,225 6,000 6,000 Total Expenditures 3,405,488$ 3,772,609$ 3,721,967$ 4,169,660$ 4,339,901$
P r o g r a m P e r f o r m a n c e M e a s u r e s
Adopted Projected Adopted FY 2004 FY 2004 FY 2005
Percent of budgeted annual Capital Program project milestones assigned to Engineering 66% 75% 75%
Percent of engineering services costs to total project costs 21% 22% < 25%
Percent of projects with engineering service costs under 25% of total project costs N/A 65% 60%
Percent of Change Order cost to annual value of construction awarded 4% 7% < 9%
Projects exceeding maximum Change Order Allowance 0 1 0
Percent of construction contract awards within 10% of preliminary cost estimate 75% 90% 80%
Total project cost of filed Notice of Completions $6.89 Million $20 Million $20 Million
Filed project Notice of Completions 10 18 18
F-273

City of Santa Barbara Two-Year Financial Plan & Annual Budget
PUBLIC WORKS PROGRAMS
Administration Engineering Services
Land Development Environmental Services Solid Waste Traffic Operations Transportation Planning &
Alternative Transportation Transportation and Drainage
Systems Maintenance Street Sweeping Traffic Signals Streets Capital Downtown Parking Building Maintenance Motor Pool Communications Systems Custodial Services Water Resources Management Recycled Water Water Distribution Water Treatment Water Supply Management Water Resources Laboratories Water Capital Program Wastewater Collection Wastewater Treatment Wastewater Capital Program
RECENT PROGRAM ACHIEVEMENTS The Engineering Website has been updated and includes additional Land Development related handouts and application information.
P R O G R A M S & S E R V I C E S
F-274
Land Development
( P r o g r a m N o . 4 2 1 2 ) M i s s i o n S t a t e m e n t Manage the publ ic r ight-of-way and City-owned lands, protect the interests of the general publ ic, and process private development review applicat ions and permits.
P r o g r a m A c t i v i t i e s Ensure land development projects comply with appl icable regulat ions
including the Subdivision Map Act, sound engineering practices, and City policies and guidelines.
Manage and operate the Public Works permit counter, which issues over the counter Public Works permits, and part icipate in the review of over 3,000 bui lding construct ion permits annually.
Review and process pr ivate land development project applicat ions and coordinate a unif ied department response from all department divisions.
Coordinate department review and permitt ing of private land development projects.
Manage and maintain a monthly inventory of the City's real property interests, including City ut i l i ty easements.
Acquire r ights-of-way and associated easements as required for City-init iated publ ic improvement projects fol lowing appl icable federal, state, and local statutes.
Manage and maintain the Public Works l ibrary of record drawings and digital geospatial data.
Manage and provide enforcement of the Outdoor Dining Program for permits issued for outdoor dining on City sidewalks.
K e y O b j e c t i v e s f o r F i s c a l Y e a r 2 0 0 6 Meet 100% of Land Development Team discret ionary land development
project review deadl ines.
Meet 91% of the target response dates for staff review of specif ied bui lding permits at the Public Works Permit Counter.
Provide quarter ly updates to 90% of the appl icants regarding their submitted complete appl icat ions for real property-related tasks.

F i n a n c i a l a n d S t a f f i n g I n f o r m a t i o n
Actual Amended Projected Adopted Proposed
FY 2004 FY 2005 FY 2005 FY 2006 FY 2007
Authorized Positions 9.50 10.45 10.45 10.45 10.45
Hourly Employee Hours N/A 400 400 400 400
RevenuesInterfund Reimbursement 297,636$ 243,484$ 243,484$ 243,484$ 243,484$ Fees and Service Charges 343,837 349,952 241,000 605,865 533,774 Other Revenue 400 - - - - General Fund Subsidy 234,548 432,430 496,302 396,026 361,949 Total Revenue 876,421$ 1,025,866$ 980,786$ 1,245,375$ 1,139,207$
ExpendituresSalaries and Benefits 793,574$ 885,048$ 836,746$ 1,003,195$ 1,048,170$ Supplies and Services 81,144 138,818 142,040 241,180 90,037 Non-Capital Equipment 1,703 2,000 2,000 1,000 1,000 Total Expenditures 876,421$ 1,025,866$ 980,786$ 1,245,375$ 1,139,207$
P r o g r a m P e r f o r m a n c e M e a s u r e s
Actual Projected Adopted FY 2004 FY 2005 FY 2006
Percent of LDT project deadlines met 100% 100% 100%
Percent of building permits review timelines met 92% 91% 91%
Percent of real property related applicants receiving a quarterly update N/A N/A 90%
Public Works permits issued 1,351 1,632 1,351
Building permit applications reviewed 1,231 1,164 1,231
Land Development discretionary development projects reviewed 193 186 193
Real property tasks completed, including acquisitions, abandonments and developments 45 52 45
Current number of real property leases and outdoor dining licenses managed 53 48 53
Value of securities received from private development to bond for public improvements in the public right-of-way $2,560,193 N/A $2,560,193
F-275

City of Santa Barbara Two-Year Financial Plan & Annual Budget
PUBLIC WORKS PROGRAMS
Administration Engineering Services Land Development
Environmental Services Solid Waste Traffic Operations Transportation Planning &
Alternative Transportation Transportation and Drainage
Systems Maintenance Street Sweeping Traffic Signals Streets Capital Downtown Parking Building Maintenance Motor Pool Communications Systems Custodial Services Water Resources Management Recycled Water Water Distribution Water Treatment Water Supply Management Water Resources Laboratories Water Capital Program Wastewater Collection Wastewater Treatment Wastewater Capital Program
RECENT PROGRAM ACHIEVEMENTS Leaking Underground Fuel Tanks were removed from the City’s right-of-way at 21 West Carrillo Street and 436 State Street in fiscal year 2005.
P R O G R A M S & S E R V I C E S
F-276
Environmental Services
( P r o g r a m N o . 4 2 1 3 ) M i s s i o n S t a t e m e n t Properly manage and dispose of hazardous waste and keep the City in compliance with state regulat ions applying to City-owned and operated Leaking Underground Fuel Tank (LUFT) sites.
P r o g r a m A c t i v i t i e s Assess and oversee remediat ion of soi l and groundwater contaminat ion
from leaking underground fuel tank (LUFT) sites to comply with regulatory agency requirements.
Prepare reports for al l LUFT sites as required by regulatory agencies.
Apply for State UST Reimbursement funds for work done at LUFT sites with contaminated soil and groundwater.
Provide vector control services in City creeks and the publ ic r ight-of-way and provide vector control information to cit izens regarding mosquitoes, bees, mice, and rats.
Provide for the proper disposal of hazardous waste found in the public r ight-of-way.
Coordinate the removal of contaminated soil identif ied during project development and construct ion of capital projects.
Perform asbestos studies and abate condit ions in City faci l i t ies.
K e y O b j e c t i v e s f o r F i s c a l Y e a r 2 0 0 6 Maintain 100% of the planned schedule for removal of LUFTs and site
remediat ion efforts per work plan approved by the Local Enforcement Agency of the California Water Quality Control Board.
Respond to 98% of Hazardous Materials Emergency Response spil ls within 1 hour of call.
Resolve 98% of vector control requests in creeks and public r ight-of-way for mosquitoes, bees, mice and rats within 5 working days.
Obtain closure approval from the Local Enforcement Agency of the Regional Water Quality Control Board at two site mit igation unit (SMU) sites with groundwater and soi l contaminat ion.
Bring al l City reimbursement claims up to date with the Water Quality Control Board’s Underground Storage Tank Reimbursement Fund.
Coordinate with the South Coast Vector Control Distr ict in developing a comprehensive plan to reduce rodent populat ions on lower State Street and Coast Vi l lage Road.

F i n a n c i a l a n d S t a f f i n g I n f o r m a t i o n
Actual Amended Projected Adopted Proposed
FY 2004 FY 2005 FY 2005 FY 2006 FY 2007
Authorized Positions 1.60 1.00 1.00 1.00 1.00
Hourly Employee Hours N/A 1,000 1,000 1,500 1,500
RevenuesInterfund Reimbursement 24,996$ 25,000$ 25,000$ 25,000$ 25,000$ Other Revenue 1,300 - - - - General Fund Subsidy 209,094 217,801 67,254 501,790 602,624 Total Revenue 235,390$ 242,801$ 92,254$ 526,790$ 627,624$
ExpendituresSalaries and Benefits 127,761$ 123,143$ 17,139$ 127,195$ 131,830$ Supplies and Services 13,410 23,569 21,387 19,739 19,819 Special Projects 94,219 54,128 53,728 258,739 351,575 Transfers - - - 121,117 124,400 Capital Equipment - 41,961 - - - Total Expenditures 235,390$ 242,801$ 92,254$ 526,790$ 627,624$
P r o g r a m P e r f o r m a n c e M e a s u r e s
Actual Projected Adopted FY 2004 FY 2005 FY 2006
Percent of required LUFT Site reports completed on schedule 100% 90% 100%
Percent of hazardous materials emergency response spills responded to within 1 hour of call 99% 100% 98%
Percent of vector control requests resolved within 5 working days N/A 99% 98%
Spilled hazardous materials properly disposed N/A 10 15
Vector control requests received N/A 130 120
Cost to respond to vector control requests N/A N/A $61,500
F-277

City of Santa Barbara Two-Year Financial Plan & Annual Budget
PUBLIC WORKS PROGRAMS
Administration Engineering Services Land Development Environmental Services
Solid Waste Traffic Operations Transportation Planning &
Alternative Transportation Transportation and Drainage
Systems Maintenance Street Sweeping Traffic Signals Streets Capital Downtown Parking Building Maintenance Motor Pool Communications Systems Custodial Services Water Resources Management Recycled Water Water Distribution Water Treatment Water Supply Management Water Resources Laboratories Water Capital Program Wastewater Collection Wastewater Treatment Wastewater Capital Program
RECENT PROGRAM ACHIEVEMENTS Color-coordinated recycling/trash containers installed in all City work stations, conference rooms and offices; recycling containers installed at all City parks and open space.
P R O G R A M S & S E R V I C E S
F-278
Solid Waste
( P r o g r a m N o . 4 2 1 4 ) M i s s i o n S t a t e m e n t Provide rel iable, cost-effect ive col lect ion of resident ial and commercial municipal sol id waste, recyclables and green waste through contracted haulers, with a pr imary focus on maximizing recycling and landfi l l diversion levels.
P r o g r a m A c t i v i t i e s Develop a cost-effect ive sol id waste management system that wi l l al low
the City to maintain ult imate control of i ts waste stream, pursue long-term disposal options, and cont inuously reduce the volume of material disposed in landfi l ls through aggressive recycl ing and other diversion strategies.
Maintain the City’s compliance with state sol id waste mandates.
Manage al l components of the City’s waste management system.
Design solid waste programs that protect publ ic health and the environment and minimize the City’s exposure to l iabi l i ty.
Provide information to the publ ic and respond to concerns about haul ing services.
Ensure contract compliance with haulers.
Part ic ipate in regional solid waste forums such as the Mult i-Jurisdict ional Solid Waste Task Group (MJSWTG) and the Sol id Waste Local Task Force (LTF).
K e y O b j e c t i v e s f o r F i s c a l Y e a r 2 0 0 6 Increase overal l diversion from landfi l ls by approximately 2% (4,000
tons) per year.
Respond to hauler service complaints within 2 business days.
Add 15 new commercial recycl ing accounts per month.
Respond to 98% of code enforcement calls within 1 business day.
Implement diversion projects, programs, and system modif icat ions as proposed in the Sol id Waste Strategic Plan.
Assist the Santa Barbara School Distr icts with the implementation of distr ict-wide recycling programs.

F-279
F i n a n c i a l a n d S t a f f i n g I n f o r m a t i o n
Actual Amended Projected Adopted Proposed
FY 2004 FY 2005 FY 2005 FY 2006 FY 2007
Authorized Positions 2.90 3.00 3.00 3.00 3.00
Hourly Employee Hours N/A 2,857 2,857 3,500 4,000
RevenuesFranchise Fees - Refuse 327,393$ 352,500$ 372,000$ 385,944$ 395,572$ Fees and Service Charges 348,784 927,608 900,000 14,923,896 15,371,598 Intergovernmental 156,933 361,238 70,105 26,000 26,000 Donations 60,000 80,000 80,000 80,000 90,000 Total Revenue 893,110$ 1,721,346$ 1,422,105$ 15,415,840$ 15,883,170$
ExpendituresSalaries and Benefits 271,299$ 288,586$ 338,128$ 352,662$ 385,902$ Supplies and Services 20,405 93,351 100,076 14,021,825 14,442,711 Special Projects 402,405 1,551,999 774,395 968,717 1,031,148 Transfers - 450 450 - - Non-Capital Equipment - 3,600 - 8,200 6,600 Capital Equipment - 22,000 22,000 - - Miscellaneous - 107,703 - 10,000 10,000 Total Expenditures 694,109$ 2,067,689$ 1,235,049$ 15,361,404$ 15,876,361$
P r o g r a m P e r f o r m a n c e M e a s u r e s
Actual Projected Adopted FY 2004 FY 2005 FY 2006
Approximate total diversion for City N/A N/A 50%
Percent of hauler service complaints responded to within 2 business days 98% 99% 98%
Commercial recycling accounts 2,540 2,720 2,900
Percent of code enforcement calls responded to within 1 business day N/A 99.5% 98%
Residential recycling, greenwaste and trash accounts 17,062 17,300 17,500
Commercial recycling, greenwaste and trash accounts 3,020 3,100 3,200
Hauler general service complaints received 184 120 100
Hauler complaints received regarding commingling refuse with recyclables and/or greenwaste N/A N/A 25

City of Santa Barbara Two-Year Financial Plan & Annual Budget
PUBLIC WORKS PROGRAMS
Administration Engineering Services Land Development Environmental Services Solid Waste
Traffic Operations Transportation Planning &
Alternative Transportation Transportation and Drainage
Systems Maintenance Street Sweeping Traffic Signals Streets Capital Downtown Parking Building Maintenance Motor Pool Communications Systems Custodial Services Water Resources Management Recycled Water Water Distribution Water Treatment Water Supply Management Water Resources Laboratories Water Capital Program Wastewater Collection Wastewater Treatment Wastewater Capital Program
RECENT PROGRAM ACHIEVEMENTS Prepared a new speed survey documentation process that is comprehensive and readily understood by members of the public.
P R O G R A M S & S E R V I C E S
F-280
Traff ic Operations
( P r o g r a m N o . 4 3 1 1 ) M i s s i o n S t a t e m e n t Manage the transportat ion network and develop improvements that are responsive to the needs of al l travel modes so that people and goods can move safely and eff ic ient ly throughout the City.
P r o g r a m A c t i v i t i e s Col lect, analyze, and interpret traff ic information needed to optimize
the transportat ion system to meet travel demand and City pol icy for equality between al l modes of travel.
Monitor traff ic coll is ions to identify high col l is ion locations and prevent coll is ions by collaborat ing with the Pol ice Department.
Respond to publ ic requests, suggestions, and inquir ies for changes in parking and traff ic control.
Provide direct ion in the design and construction of public and private improvements to ensure traff ic safety and minimize travel impacts.
Col lect and process traff ic data for transportat ion planning and land development review activit ies.
Operate a coordinated traff ic signal system to maximize safety, minimize delay, and be responsive to pedestr ian, cyclist and motor vehicle needs.
Review coll isions involving pedestr ians, bicycl ists and vehicles and take correct ive act ion as necessary to reduce coll is ion rates to be equal or lower than statewide averages.
K e y O b j e c t i v e s f o r F i s c a l Y e a r 2 0 0 6 Complete traff ic signal t iming studies along Santa Barbara Street,
Anacapa Street and Chapala Street.
Maintain Level of Service D or better at 80% of signal ized intersections during peak hours.
Investigate and resolve 85% of traff ic related concerns, complaints and requests within 30 calendar days.
Update annual warrant l ists to determine the need for mult i-way stops and traff ic signals and present them to Council by March 31, 2006.
Construct a transportat ion operations improvement l ist based on base traff ic count, coll is ion and speed survey data for a bi-annual report to Counci l by January 31, 2006.

K e y O b j e c t i v e s f o r F i s c a l Y e a r 2 0 0 6 ( c o n t i n u e d )
Complete a review of curb markings in the downtown core by December 31, 2005 and develop a plan for the review of curb markings citywide by June 30, 2006.
F i n a n c i a l a n d S t a f f i n g I n f o r m a t i o n
Actual Amended Projected Adopted Proposed
FY 2004 FY 2005 FY 2005 FY 2006 FY 2007
Authorized Positions 4.00 3.95 3.95 3.95 3.95
Hourly Employee Hours N/A 0 0 0 0
RevenuesUtility Users Tax 1,586,434$ 629,378$ 546,716$ 623,328$ 614,267$ Fees and Service Charges 8,856 - - Total Revenue 1,595,290$ 629,378$ 546,716$ 623,328$ 614,267$
ExpendituresSalaries and Benefits 342,212$ 349,562$ 346,762$ 390,168$ 404,741$ Supplies and Services 1,247,677 57,227 48,454 56,500 57,026 Transfers - 220,089 150,000 150,000 150,000 Non-Capital Equipment 5,401 2,500 1,500 6,660 2,500 Capital Equipment - - - 20,000 - Total Expenditures 1,595,290$ 629,378$ 546,716$ 623,328$ 614,267$
P r o g r a m P e r f o r m a n c e M e a s u r e s
Actual Projected Adopted FY 2004 FY 2005 FY 2006
Corridors where signal timing is studied 3 3 3
Intersections at Level of Service D or better N/A 75% 80%
Percent of complaints resolved within 30 calendar days N/A 75% 85%
F-281

City of Santa Barbara Two-Year Financial Plan & Annual Budget
PUBLIC WORKS PROGRAMS
Administration Engineering Services Land Development Environmental Services Solid Waste Traffic Operations
Transportation Planning & Alternative Transportation
Transportation and Drainage Systems Maintenance
Street Sweeping Traffic Signals Streets Capital Downtown Parking Building Maintenance Motor Pool Communications Systems Custodial Services Water Resources Management Recycled Water Water Distribution Water Treatment Water Supply Management Water Resources Laboratories Water Capital Program Wastewater Collection Wastewater Treatment Wastewater Capital Program
RECENT PROGRAM ACHIEVEMENTS Completed the Pedestrian Master Plan as directed by the Circulation Element. Completed Oak Park Neighborhood Transportation Management Plan.
P R O G R A M S & S E R V I C E S
F-282
Transportation Planning & Alternative Transportation
( P r o g r a m N o s . 4 3 1 2 a n d 4 3 1 4 ) M i s s i o n S t a t e m e n t Review private land development and plan public transportat ion facil i t ies and policy so that people can move within the City with equality of convenience and access among all modes of transportat ion; and,
Plan and coordinate projects and programs that promote alternative modes of transportation and are widely avai lable and attract ive to the publ ic.
P r o g r a m A c t i v i t i e s Support regional transportat ion planning decision making.
Ident ify and compete for state and federal money for transportat ion system development.
Work direct ly with community groups to address neighborhood and business transportat ion concerns, and develop appropriate programs or projects.
Review all site plans for conformance with transportat ion and parking alternat ive transportat ion pol icies, regulat ion, and pract ices.
Fund the construct ion of new or improved pedestr ian and bicycle faci l i t ies.
Fund the construct ion of new faci l i t ies serving various alternat ive transportat ion modes.
Fund the operation of energy eff icient, non-pollut ing electr ic shutt le buses.
Develop funding programs for Transit Capital and operat ing assistance.
Subsidize the operat ion of various transit assistance programs.
Plan auto related, non-auto, and auto alternat ive improvements to the City’s transportat ion system consistent with policies of the Circulat ion Element, Bicycle Master Plan, and others.
Work with Community Development to implement the Circulat ion Element.
Work with neighborhoods and other Public Works divisions to develop Neighborhood Traff ic Management Programs and Projects.
Meet 95% of al l Land Development Team (LTD) Pre-Application Review Team (PRT) and Development Appl icat ion Review Team (DART) deadlines.

K e y O b j e c t i v e s f o r F i s c a l Y e a r 2 0 0 6
Review and act within deadl ines on 75% of al l Development Plan Agreement (DPA), Architectural Board of Review (ABR), Historic Landmarks Commission (HLC), building permit, modif icat ion, and garage waiver requests.
Represent the City’s interests and the Circulat ion Element on the U.S. Highway 101 Technical Advisory Group in determining project alternat ives for 101 in Motion.
Revise the Parking Design Standards.
Ident ify sidewalk pr iorit ies and provide oversight for the sidewalk inf i l l program to construct 1% of the missing sidewalk l inks (approximately 2,000 l inear feet of sidewalk).
Submit 1 grant appl icat ion annually for capital improvement projects that wi l l improve the avai labi l i ty and/or attractiveness of alternative modes of transportation.
Locate and install 100 new bicycle hitching posts.
Complete employee survey to determine current mode share and identify program to increase use of alternative modes of transportation.
Complete design for the Carri l lo Hi l l Sidewalk.
Construct Cornel l Street Pocket Park.
Complete design for the West Downtown Improvements.
Complete conceptual design for the Shorel ine Drive Bike Path Extension to Harbor Way.
F i n a n c i a l a n d S t a f f i n g I n f o r m a t i o n
Actual Amended Projected Adopted Proposed
FY 2004 FY 2005 FY 2005 FY 2006 FY 2007
Authorized Positions 6.35 5.90 5.90 5.90 5.90
Hourly Employee Hours N/A 600 600 1,000 1,000
RevenuesUtility Users Tax 416,843$ 509,733$ 535,771$ 639,694$ 628,740$ Measure D Sales Tax 1,038,284 1,960,457 1,960,160 1,297,800 1,336,734 Fees and Service Charges - 7,500 8,000 7,500 7,500 Interfund Reimbursements 300,000 300,000 300,000 300,000 300,000 Intergovernmental - 125,000 - - - Donations 200 - - - - Total Revenue 1,755,327$ 2,902,690$ 2,803,931$ 2,244,994$ 2,272,974$
ExpendituresSalaries and Benefits 361,763$ 410,403$ 382,694$ 563,256$ 578,532$ Supplies and Services 37,206 43,657 33,431 45,234 45,708 Special Projects 1,354,793 2,446,630 2,385,306 1,629,800 1,646,734 Non-Capital Equipment - 2,000 2,500 6,704 2,000 Total Expenditures 1,753,762$ 2,902,690$ 2,803,931$ 2,244,994$ 2,272,974$
F-283

City of Santa Barbara Two-Year Financial Plan & Annual Budget
P R O G R A M S & S E R V I C E S
Transportation Planning & Alternative Transportation
( C o n t i n u e d )
P r o g r a m P e r f o r m a n c e M e a s u r e s
Actual Projected Adopted FY 2004 FY 2005 FY 2006
Percent of LDT PRT and DART applications reviewed within the deadline 90% 97% 95%
Percent of DPA, ABR, HLC, building permit, modification, and garage waiver requests reviewed within required deadlines 74% 80% 75%
PRT and DART applications reviewed 217 200 200
DPA, ABR, HLC, building permit, modification, and garage waiver requests reviewed 620 600 600
Linear feet of sidewalk completed 3,500 5,500 2,000
Grant applications submitted 2 2 1
MTD Downtown/Waterfront Shuttle riders 596,965 520,000 526,200
Cross-town Shuttle riders 154,373 160,000 160,900
Commuter Lot Shuttle riders 21,347 20,000 19,800
F-284

[This page intent ional ly le f t b lank. ]
F-285

City of Santa Barbara Two-Year Financial Plan & Annual Budget
PUBLIC WORKS PROGRAMS
Administration Engineering Services Land Development Environmental Services Solid Waste Traffic Operations Transportation Planning &
Alternative Transportation Transportation and Drainage
Systems Maintenance Street Sweeping Traffic Signals Streets Capital Downtown Parking Building Maintenance Motor Pool Communications Systems Custodial Services Water Resources Management Recycled Water Water Distribution Water Treatment Water Supply Management Water Resources Laboratories Water Capital Program Wastewater Collection Wastewater Treatment Wastewater Capital Program
RECENT PROGRAM ACHIEVEMENTS The Sign and Paint crew installed over 900 new parking restriction signs and poles for the expansion of the Street Sweeping Program into five additional neighborhoods of the City.
P R O G R A M S & S E R V I C E S
F - 286
Transportation and Drainage
Systems Maintenance
( P r o g r a m N o s . 4 4 1 1 , 4 4 1 3 , 4 4 1 5 ) M i s s i o n S t a t e m e n t Clean, maintain, and repair transportat ion and drainage system infrastructure to enhance community mobil i ty and preserve creek and water qual ity.
P r o g r a m A c t i v i t i e s Maintain 250 curb miles of streets, over 3.5 mil l ion square feet of
sidewalk, 792,000 l inear feet of curb and gutter, and 100 miles of roadside vegetat ion, using a variety of maintenance techniques.
Repair or replace damaged or deteriorated storm drain faci l i t ies.
Clean and haul away debris from the storm drain system annually.
Operate and maintain storm water pump stat ions and respond to storm condit ions or emergencies to protect property.
Instal l , revise and repaint over one mil l ion l inear feet of str iping, instal l and maintain over 45,000 square feet of pavement legends and maintain over 40,000 units of traff ic and parking signs.
K e y O b j e c t i v e s f o r F i s c a l Y e a r 2 0 0 6 Repair 50,000 square feet of streets and sidewalk with asphalt,
including potholes, skin patching, sidewalk padding, and overlays.
Replace 13,500 square feet of concrete sidewalks, curbs, and gutter.
Respond to 90% of publ ic requests for removal of debris and large trash items within 24 hours.
Develop a schedule to inspect and clean storm drains by December 31, 2005.
Clean catch basin f i l ters identif ied by the Creeks Restoration and Water Quality Improvement Program on a monthly basis.
Develop a schedule to repaint pavement str iping, including double yel low l ines, skipped l ines, and curbs, and pavement legends by December 31, 2005.
Replace 100% of cr it ical, damaged traff ic signs within 8 work hours.
Part ic ipate in quarterly neighborhood clean-ups on City property.
Abate graff i t i in rai lroad corridor four t imes per year.

K e y O b j e c t i v e s f o r F i s c a l Y e a r 2 0 0 6 ( c o n t i n u e d )
Remove 75% of graff i t i f rom publ ic property within three working days of notice.
Develop act ion plan with non-City agencies (state, county, and rai lroad) to take responsibi l i ty to maintain their property that l ies within the City l imits, to an agreed upon maintenance standard.
Develop and implement an act ion plan to maintain median str ips to an agreed upon maintenance standard.
F i n a n c i a l a n d S t a f f i n g I n f o r m a t i o n
Actual Amended Projected Adopted Proposed
FY 2004 FY 2005 FY 2005 FY 2006 FY 2007
Authorized Positions 29.33 27.84 27.84 27.84 27.84
Hourly Employee Hours N/A 2,620 2,620 9,250 10,250
RevenuesMeasure D Sales Tax 684,257$ 1,019,013$ 919,565$ 860,657 894,438 Utility Users Tax 1,966,540 2,381,907 2,264,166 2,522,449 2,543,519 Gas Tax - 1,095,622 1,188,908 1,101,672 1,110,733 Interfund Reimbursement 51,618 48,499 30,000 161,117 164,400 Interest Income 170,406 140,000 140,000 150,000 170,000 Market Valuation (124,684) - - - - Total Revenue 2,748,137$ 4,685,041$ 4,542,639$ 4,795,895$ 4,883,090$
ExpendituresSalaries and Benefits 1,564,606$ 1,827,395$ 1,849,289$ 2,112,737$ 2,232,167$ Supplies and Services 1,170,302 1,349,683 1,342,767 1,214,357 1,180,619 Special Projects 7,508 50,000 50,000 119,121 84,400 Transfers - 1,292,407 1,291,942 1,327,476 1,363,700 Non-Capital Equipment 2,602 8,641 8,641 22,204 22,204 Capital Equipment 3,119 53,039 - - - Miscellaneous - 103,876 - - - Total Expenditures 2,748,137$ 4,685,041$ 4,542,639$ 4,795,895$ 4,883,090$
F - 287

City of Santa Barbara Two-Year Financial Plan & Annual Budget
P R O G R A M S & S E R V I C E S
Transportation and Drainage
Systems Maintenance
( C o n t i n u e d )
P r o g r a m P e r f o r m a n c e M e a s u r e s
Actual Projected Adopted FY 2004 FY 2005 FY 2006
Square feet of street and sidewalk surfaces repaired N/A 35,000 50,000
Square feet of concrete installed N/A 12,100 13,500
Percent of large trash removed within 24 hours 90% 90% 90%
Drains inspected and/or cleaned N/A 2,500 2,500
Catch basin filters cleaned N/A 1,200 1,200
Linear feet of pavement striping painted N/A 360,000 360,000
Square feet of legends installed N/A 20,000 20,000
Percent of critical, damaged signs replaced within 8 hours of notice 100% 100% 100%
Neighborhood cleanups performed N/A N/A 4
Railroad corridor graffiti incidents abated N/A N/A 4
Percent of reports of graffiti on public property removed within 3 days N/A N/A 75%
Potholes filled N/A 500 1,000
Requests from public for abandoned furniture and trash removal referred to BFI and Marborg N/A 296 300
Special event set-ups completed N/A 30 30
Average cost to remove and install one square foot of concrete sidewalk N/A N/A $16
Average cost to repair one square foot of asphalt pavement with asphalt overlay N/A N/A $12
F - 288

[This page intent ional ly le f t b lank. ]
F-289

City of Santa Barbara Two-Year Financial Plan & Annual Budget
PUBLIC WORKS PROGRAMS
Administration Engineering Services Land Development Environmental Services Solid Waste Traffic Operations Transportation Planning &
Alternative Transportation Transportation and Drainage
Systems Maintenance Street Sweeping
Traffic Signals Streets Capital Downtown Parking Building Maintenance Motor Pool Communications Systems Custodial Services Water Resources Management Recycled Water Water Distribution Water Treatment Water Supply Management Water Resources Laboratories Water Capital Program Wastewater Collection Wastewater Treatment Wastewater Capital Program
RECENT PROGRAM ACHIEVEMENTS Began sweeping routes in five residential neighborhoods on October 1, 2004, and added 70 miles of streets to the established weekly sweeping program.
P R O G R A M S & S E R V I C E S
F-290
Street Sweeping
( P r o g r a m N o s . 4 4 1 2 , 4 4 1 8 ) M i s s i o n S t a t e m e n t Clean streets to improve community appearance and water qual ity in urban creeks.
P r o g r a m A c t i v i t i e s Mechanical ly sweep 104 miles of residential streets, in conjunction with
the City’s Clean Sweep Program.
Mechanical ly sweep 32 miles of business and commercial area streets (primari ly in the downtown and Milpas Street areas) seven days a week.
K e y O b j e c t i v e s f o r F i s c a l Y e a r 2 0 0 6 Ensure that 14,700 curb miles of established commercial and
resident ial routes in the Consolidated Street Sweeping Program are swept on schedule, except in inclement weather condit ions.
Develop a plan to expand the Street Sweeping Program by December 31, 2005.

F i n a n c i a l a n d S t a f f i n g I n f o r m a t i o n
Actual Amended Projected Adopted Proposed
FY 2004 FY 2005 FY 2005 FY 2006 FY 2007
Authorized Positions 0.00 3.25 3.25 3.25 3.25
Hourly Employee Hours N/A 0 0 100 100
RevenuesParking Violations 402,209$ 650,000$ 670,000$ 750,000$ 750,000$ Interfund Reimbursements - 534,151 534,151 472,649 482,329 Utility Users Tax 184,371 - - - - Measure D Sales Tax 182,155 - - - - Total Revenue 768,735$ 1,184,151$ 1,204,151$ 1,222,649$ 1,232,329$
ExpendituresSalaries and Benefits 210,336$ 268,947$ 256,663$ 258,690$ 271,068$ Supplies and Services 557,896 549,678 554,078 606,181 602,138 Special Projects 503 156,619 156,619 145,000 137,449 Transfers - 209,520 209,520 219,204 229,845 Total Expenditures 768,735$ 1,184,764$ 1,176,880$ 1,229,075$ 1,240,500$
P r o g r a m P e r f o r m a n c e M e a s u r e s
Actual Projected Adopted FY 2004 FY 2005 FY 2006
Curb miles swept N/A 14,700 14,700
Tons of debris collected by street sweepers N/A N/A 2,640
Cost (contracted) to sweep one curb mile N/A N/A $14.95
F-291

City of Santa Barbara Two-Year Financial Plan & Annual Budget
PUBLIC WORKS PROGRAMS
Administration Engineering Services Land Development Environmental Services Solid Waste Traffic Operations Transportation Planning &
Alternative Transportation Transportation and Drainage
Systems Maintenance Street Sweeping
Traffic Signals Streets Capital Downtown Parking Building Maintenance Motor Pool Communications Systems Custodial Services Water Resources Management Recycled Water Water Distribution Water Treatment Water Supply Management Water Resources Laboratories Water Capital Program Wastewater Collection Wastewater Treatment Wastewater Capital Program
RECENT PROGRAM ACHIEVEMENTS The Traffic Signals program has purchased amber LED’s for all signalized intersections. Installation is ongoing.
P R O G R A M S & S E R V I C E S
F-292
Traff ic Signals
( P r o g r a m N o . 4 5 3 2 ) M i s s i o n S t a t e m e n t Maintain a safe, eff icient, and rel iable Citywide Traff ic Signal System Network and provide funding for electr ical energy for street l ights and traff ic signals.
P r o g r a m A c t i v i t i e s Provide maintenance and repair support for the City’s 104 signalized
intersect ions.
Maintain the computerized control l ing network for each intersection.
Ensure proper video and analog vehicle detect ion at signal ized intersect ions.
Manage the Fire Department’s Opticom preemption system to coordinate signal t iming with emergency vehicle response.
Provide funding for al l electr ical costs for both traff ic signals and street l ights.
K e y O b j e c t i v e s f o r F i s c a l Y e a r 2 0 0 6 Complete 99% of scheduled preventive maintenance work orders on the
Traff ic Signal Network monthly, in accordance with an approved preventive maintenance plan.
Respond to 100% of emergency calls within 1 working hour of not if icat ion on weekdays.
Respond to al l non-emergency unscheduled repair work orders within 24 working hours on the Traff ic Signal Network.

F i n a n c i a l a n d S t a f f i n g I n f o r m a t i o n
Actual Amended Projected Adopted Proposed
FY 2004 FY 2005 FY 2005 FY 2006 FY 2007
Authorized Positions 3.30 3.00 3.00 3.00 3.00
Hourly Employee Hours N/A 1,450 1,450 0 200
RevenuesUtility Users Tax 704,903$ 732,664$ 722,736$ 1,033,948$ 1,041,467$ Fees and Service Charges 17,978 20,000 20,000 15,000 15,000 Interfund Reimbursement 20,730 - - - - Total Revenue 743,611$ 752,664$ 742,736$ 1,048,948$ 1,056,467$
ExpendituresSalaries and Benefits 213,187$ 233,272$ 233,044$ 247,999$ 261,099$ Supplies and Services 525,855 512,263 502,563 723,449 741,511 Non-Capital Equipment 4,569 7,129 7,129 7,500 12,000 Capital Equipment - - - 70,000 41,857 Total Expenditures 743,611$ 752,664$ 742,736$ 1,048,948$ 1,056,467$
P r o g r a m P e r f o r m a n c e M e a s u r e s
Actual Projected Adopted FY 2004 FY 2005 FY 2006
Percent of scheduled preventive maintenance work orders completed 99.37% 99% 99%
Percent of emergency work orders responded to within 1 working hour 100% 100% 100%
Percent of unscheduled repairs responded to within 24 working hours of notification 100% 100% 100%
Emergency work orders 224 173 173
Unscheduled work orders completed 552 660 660
Maintenance and operations cost per traffic intersection per month N/A $3,000 $3,000
F-293

City of Santa Barbara Two-Year Financial Plan & Annual Budget
PUBLIC WORKS PROGRAMS
Administration Engineering Services Land Development Environmental Services Solid Waste Traffic Operations Transportation Planning &
Alternative Transportation Transportation and Drainage
Systems Maintenance Street Sweeping Traffic Signals
Streets Capital Downtown Parking Building Maintenance Motor Pool Communications Systems Custodial Services Water Resources Management Recycled Water Water Distribution Water Treatment Water Supply Management Water Resources Laboratories Water Capital Program Wastewater Collection Wastewater Treatment Wastewater Capital Program
RECENT PROGRAM ACHIEVEMENTS Received neighborhood consensus for Milpas Street Beautification Project. This project is slated for start of construction near the end of summer 2005.
P R O G R A M S & S E R V I C E S
F - 294
Streets Capital
( P r o g r a m N o . 4 4 1 7 ) M i s s i o n S t a t e m e n t Manage the maintenance, repair, and improvements to the publ ic r ight-of-way infrastructure in accordance with the goals of the City Counci l and the Circulat ion Element, providing the publ ic with safe, eff ic ient, functional, high quali ty, and cost-effect ive transportat ion and drainage systems.
P r o g r a m A c t i v i t i e s Adequately fund projects to maintain, repair, and improve the City’s
infrastructure assets for streets, sidewalks, br idges, storm drains, traff ic signals, and pavement str iping and markings.
Plan, pr iorit ize, and balance funding for capital expenditures between mult i-model transportat ion and street r ight-of-way infrastructure maintenance, repair and improvements (which include streets, br idges, storm drains, traff ic signals, streetl ights, traff ic markings and sidewalks).
Apply for grant funding from a variety of sources for capital projects to leverage City funds.
Ident ify, study, and address publ ic drainage issues to maximize the benefit from the avai lable funds.
Provide courtesy review and coordination of Caltrans init iated roadway projects.
Provide staff support to division managers and supervisors associated with streets capital projects.
K e y O b j e c t i v e s f o r F i s c a l Y e a r 2 0 0 6 Slurry seal, overlay, or reconstruct 90% of lane miles of City asphalt
concrete roadways for the next scheduled pavement maintenance zone in accordance with recommendations of the latest Pavement Management Systems report.
Maintain an average asphalt concrete City Street Pavement Quality Index (PQI) of greater than 71 or greater (as evaluated by the City’s Pavement Management System).
Reduce the percentage of asphalt concrete streets with a PQI of less than 20 from 1.8% to 1.5%.
Award a pavement maintenance construct ion contract in 1 of the 6 City pavement maintenance areas for slurry seal and asphalt concrete overlay.

F i n a n c i a l a n d S t a f f i n g I n f o r m a t i o n
Actual Amended Projected Adopted Proposed
FY 2004 FY 2005 FY 2005 FY 2006 FY 2007
Authorized Positions 0.00 0.00 0.00 0.00 0.00
Hourly Employee Hours N/A 0 0 0 0
RevenuesUtility Users Tax 639,766$ 1,584,049$ 1,730,611$ 1,175,581$ 1,347,007$ Measure D Sales Tax 2,082,082 1,613,586 1,068,402 1,673,968 1,758,026 Gas Tax 1,678,700 629,378 546,716 623,328 614,267 Intergovernmental 644,889 3,222,903 - 2,065,000 6,378,000 Transportation Dev. Funds 63,367 50,000 50,000 50,000 50,000 Interest Income 5,194 5,000 5,825 5,000 5,000 Market Valuation (3,785) - - - - Other Revenue 6,930 - - - - Total Revenue 5,117,143$ 7,104,916$ 3,401,554$ 5,592,877$ 10,152,300$
ExpendituresCapital Program 6,728,685 15,685,643 8,223,003 5,810,000 10,423,000 Total Expenditures 6,728,685$ 15,685,643$ 8,223,003$ 5,810,000$ 10,423,000$
P r o g r a m P e r f o r m a n c e M e a s u r e s
Actual Projected Adopted FY 2004 FY 2005 FY 2006
Lane miles of asphalt concrete roads slurry sealed, overlaid or reconstructed divided by the total lane miles of asphalt concrete roads within the pavement maintenance zone
N/A N/A 90%
Average asphalt concrete pavement PQI 77 74 71
Asphalt concrete streets with a PQI of less than 20 1.8% 1.8% 1.5%
Current number of streets Capital Program professional engineering services contracts managed N/A N/A 8
Lane miles of asphalt concrete roadway slurry sealed, overlaid or reconstructed N/A N/A 75
Square feet of new City sidewalk installed 38,031 29,000 TBD
Access ramps installed 68 50 TBD
F-295

City of Santa Barbara Two-Year Financial Plan & Annual Budget
PUBLIC WORKS PROGRAMS
Administration Engineering Services Land Development Environmental Services Solid Waste Traffic Operations Transportation Planning &
Alternative Transportation Transportation and Drainage
Systems Maintenance Street Sweeping Traffic Signals Streets Capital
Downtown Parking Building Maintenance Motor Pool Communications Systems Custodial Services Water Resources Management Recycled Water Water Distribution Water Treatment Water Supply Management Water Resources Laboratories Water Capital Program Wastewater Collection Wastewater Treatment Wastewater Capital Program
RECENT PROGRAM ACHIEVEMENTS MyRide bus passes were issued in 2004 to Santa Barbara County employees and employees around the Granada Garage, as well as all City employees.
P R O G R A M S & S E R V I C E S
F-296
Downtown Parking
( P r o g r a m N o s . 4 3 1 5 , 4 3 1 6 , 4 3 1 7 ) M i s s i o n S t a t e m e n t Operate and maintain the City’s parking faci l i t ies and on-street parking supply in order to maximize use by customers and employees that shop and work in the Downtown Business Distr ict, thereby enhancing the economic vital i ty of the Downtown area.
P r o g r a m A c t i v i t i e s Operate and maintain ten surface customer parking lots and four
parking structures containing over 3,300 parking stalls.
Administer customer and commuter parking programs.
Provide parking faci l i t ies for over f ive mil l ion vehicles per year.
Administer the Parking and Business Improvement Area, providing for 75-minute free parking program.
Provide customer accounting and bi l l ing services.
Plan, fund and implement long-term capital maintenance programs.
Manage on-street resources for resident parking in the Downtown, City College, and upper Modoc areas.
Fund and administer Downtown employee MTD bus pass programs.
K e y O b j e c t i v e s f o r F i s c a l Y e a r 2 0 0 6 Perform a routine cleaning of al l City parking lots Monday through
Friday.
Check parking lot equipment per approved schedule to reduce breakdowns.
Respond to 90% of al l equipment malfunction cal ls within 15 minutes.
Ensure that 98.5% of al l cash drawers are balanced each day.
Increase the use of MTD bus passes by downtown employees by 10%.
Issue 10,100 MyRide bus passes before the Granada Garage opens.
Add 5 new car pools to the Transportat ion Management Program.
Make 200 new downtown merchant contacts each year to increase the awareness of Public Transportat ion options.
Develop a measure of effect iveness for the MyRide program.
Perform regular cleaning of al l Parking-maintained publ ic restrooms each day and ensure that al l contractor-maintained portable restrooms are kept cleaned and well supplied.
Implement asset management software to track maintenance activit ies.

F i n a n c i a l a n d S t a f f i n g I n f o r m a t i o n
Actual Amended Projected Adopted Proposed
FY 2004 FY 2005 FY 2005 FY 2006 FY 2007
Authorized Positions 20.51 20.50 20.50 20.50 20.50
Hourly Employee Hours N/A 134,300 134,300 134,200 134,200
RevenuesFees and Service Charges 4,067,239$ 3,610,000$ 3,950,000$ 5,155,000$ 6,335,000$ PBIA Assessments 764,445 675,000 775,000 750,000 775,000 Interest Income 230,049 200,000 225,000 250,000 250,000 Market Valuation (168,687) - - - - Other Revenue 12,587 25,000 15,000 15,000 15,000 Total Revenue 4,905,633$ 4,510,000$ 4,965,000$ 6,170,000$ 7,375,000$
ExpendituresSalaries and Benefits 2,700,809$ 2,871,913$ 2,559,142$ 3,066,554$ 3,147,488$ Supplies and Services 989,623 1,501,129 1,459,671 1,691,437 1,700,339 Special Projects 274,407 460,735 346,738 590,120 592,126 Transfers - 4,104 4,100 986 - Non-Capital Equipment 15,915 19,115 19,000 27,200 29,810 Miscellaneous 150 25,000 - 50,000 50,000 Total Operating Expenditures 3,980,904$ 4,881,996$ 4,388,651$ 5,426,297$ 5,519,763$ Capital Program 289,752 3,814,146 2,634,873 879,800 944,425 Total Expenditures 4,270,656$ 8,696,142$ 7,023,524$ 6,306,097$ 6,464,188$
Surplus / (Deficit) 634,977$ (4,186,142)$ (2,058,524)$ (136,097)$ 910,812$
P r o g r a m P e r f o r m a n c e M e a s u r e s
Actual Projected Adopted FY 2004 FY 2005 FY 2006
Daily parking lot cleanings before 10:00 a.m. (Monday through Friday) 5,054 5,054 5,054 Percent of preventive maintenance inspections done each day per the approved schedule 100% 100% 100%
Percent of responses to equipment breakdowns made within 15 minutes 90% 90% 90%
Percent of daily booth transactions completed and balanced successfully 100% 100% 98.5%
Bus passes issued from the beginning of the fiscal year N/A 1,235 1,358 MyRide bus passes issued before December 31, 2005 N/A N/A 10,100 Car pools in Transportation Management Program N/A 52 57 Downtown merchants contacted for public transportation options N/A N/A 200 Percent of parking maintained public restrooms cleaned each day per the approved schedule N/A N/A 100%
Percent of all portable restrooms checked by Parking staff each day per the approved schedule N/A N/A 100%
Vehicles parked in City lots 4,395,778 5,000,000 5,000,000 Maintenance calls 2,200 2,400 2,400
F-297

City of Santa Barbara Two-Year Financial Plan & Annual Budget
PUBLIC WORKS PROGRAMS
Administration Engineering Services Land Development Environmental Services Solid Waste Traffic Operations Transportation Planning &
Alternative Transportation Transportation and Drainage
Systems Maintenance Street Sweeping Traffic Signals Streets Capital Downtown Parking
Building Maintenance Motor Pool Communications Systems Custodial Services Water Resources Management Recycled Water Water Distribution Water Treatment Water Supply Management Water Resources Laboratories Water Capital Program Wastewater Collection Wastewater Treatment Wastewater Capital Program
RECENT PROGRAM ACHIEVEMENTS Re-carpeted Council Chambers and Conference Room 15 in City Hall and installed additional communication conduits in the floors of those rooms during Christmas Holiday 2004.
P R O G R A M S & S E R V I C E S
F-298
Building Maintenance
( P r o g r a m N o . 4 5 1 1 ) M i s s i o n S t a t e m e n t Provide operations, maintenance, and construct ion services to City-owned facil i t ies to maintain a clean, safe and functional environment in which to conduct City business.
P r o g r a m A c t i v i t i e s Manage the maintenance, replacement, and upgrade of the City's
bui ldings and 2,250 City-owned streetl ights.
Uti l ize trades personnel, in conjunction with service and construction contractors, to augment and support the accomplishment of the planned maintenance and special bui lding project programs.
Provide project management support for capital improvement special projects in various departments.
K e y O b j e c t i v e s f o r F i s c a l Y e a r 2 0 0 6 Complete 90% of customer requested work orders by due date.
Complete 100% of mandatory maintenance work orders by the due date.
Complete 90% of preventive maintenance work orders by due date.
Complete 95% of City-owned street l ight work orders within 5 working days of issuance.
Achieve a 90% satisfact ion rate on the Bui lding Maintenance customer sat isfact ion survey.
Purchase and populate an asset management module to track assets in General Fund facil i t ies by December 31, 2005.
Complete construct ion of the Bui lding Maintenance off ice addit ion and reorganize al l work spaces to achieve more eff iciency.
Complete the 6.6 amp underground street l ight circuit on Chapala Street.

F i n a n c i a l a n d S t a f f i n g I n f o r m a t i o n
Actual Amended Projected Adopted Proposed
FY 2004 FY 2005 FY 2005 FY 2006 FY 2007
Authorized Positions 16.45 16.45 16.45 16.45 16.45
Hourly Employee Hours N/A 3,000 3,000 2,800 2,800
RevenuesInterfund Reimbursements 2,665,774$ 2,792,815$ 2,792,815$ 3,174,453$ 3,279,771$ Other Revenue 6,842 - - - - Total Revenue 2,672,616$ 2,792,815$ 2,792,815$ 3,174,453$ 3,279,771$
ExpendituresSalaries and Benefits 1,320,331$ 1,389,174$ 1,336,816$ 1,499,176$ 1,556,170$ Supplies and Services 431,856 412,734 406,352 453,934 474,185 Special Projects 832,820 960,158 960,500 1,174,894 1,203,818 Transfers - 3,187 3,187 1,444 - Non-Capital Equipment 7,796 14,773 13,573 15,200 19,500 Capital Equipment 8,559 10,000 100 10,000 10,000 Miscellaneous - 8,600 - 19,805 16,098 Total Operating Expenditures 2,601,362$ 2,798,626$ 2,720,528$ 3,174,453$ 3,279,771$ Capital Program 186,471 154,101 170,770 - - Total Expenditures 2,787,833$ 2,952,727$ 2,891,298$ 3,174,453$ 3,279,771$
P r o g r a m P e r f o r m a n c e M e a s u r e s
Actual Projected Adopted FY 2004 FY 2005 FY 2006
Customer requested work orders issued 3,134 3,200 3,200 Percent of customer requested work orders completed by due date 94% 85% 90% Mandatory maintenance services work orders issued 212 215 215 Percent of mandatory maintenance work orders completed by due date 98% 100% 100%
Preventive maintenance work orders issued 811 815 815 Percent of preventive maintenance work orders completed by due date 93% 85% 90%
City-owned street light work orders issued 542 550 550 Percent of City-owned street light work orders completed within 5 days 98% 95% 95%
Overall satisfaction with Building Maintenance service N/A N/A 90% Capital and special project work orders issued 256 260 260 Work orders issued 4,955 5,035 5,035 Percent of work orders completed within the specified time frame 95% 95% 95%
F-299
City of Santa Barbara Two-Year Financial Plan & Annual Budget
PUBLIC WORKS PROGRAMS
Administration Engineering Services Land Development Environmental Services Solid Waste Traffic Operations Transportation Planning &
Alternative Transportation Transportation and Drainage
Systems Maintenance Street Sweeping Traffic Signals Streets Capital Downtown Parking Building Maintenance
Motor Pool Communications Systems Custodial Services Water Resources Management Recycled Water Water Distribution Water Treatment Water Supply Management Water Resources Laboratories Water Capital Program Wastewater Collection Wastewater Treatment Wastewater Capital Program
RECENT PROGRAM ACHIEVEMENTS Established a program that tracks funds collected over the life of a vehicle, to ensure that sufficient funds are available to replace every vehicle at the end of each vehicle’s life cycle.
P R O G R A M S & S E R V I C E S
F-300
Motor Pool
( P r o g r a m N o . 4 5 2 1 , 4 5 2 2 ) M i s s i o n S t a t e m e n t Manage motorized f leet and f leet support services to cost effect ively provide safe, rel iable vehicles, and equipment for al l City departments.
P r o g r a m A c t i v i t i e s Maintain and repair the City's f leet of 529 vehicles and heavy
equipment and administer, test and cert ify vehicles and equipment in compliance with federal and state mandates.
Maintain 15 Emergency Power Generators in a state of readiness.
Maintain automated fuel del ivery system and re-fuel ing infrastructure.
Fund and maintain a vehicle replacement program that ensures the orderly and t imely replacement of the City’s f leet.
Provide engineering services to develop specif ications for purchasing of vehicles and equipment.
Maintain a vehicle pool car program for shared vehicle use.
K e y O b j e c t i v e s f o r F i s c a l Y e a r 2 0 0 6 Complete 95% of preventive maintenance services on schedule in
accordance with manufacturers’ recommendations.
Complete 100% of the fol lowing mandated inspect ions and cert i f ications: a) aerial equipment cert i f icat ion, b) smog inspections and cert i f ications, c) diesel smoke testing and certi f icat ions, d) youth bus inspections and cert if icat ions, and e) commercial vehicle maintenance and inspect ions.
Ensure that 65% of maintenance and repair services are for planned and scheduled work.
Maintain 90% avai labi l i ty for the identif ied 5 classes of vehicles.
Implement a f leet ut i l izat ion program by September 30, 2005.
Prepare a vehicle replacement report by January 31, 2006 and develop specif ications and establ ish purchase contracts for the procurement of every vehicle approved for replacement.
Init iate a customer survey to gauge customer satisfact ion with Motor Pool’s vehicle maintenance services.
Replace the City’s fuel management system at Motor Pool and the Airport with a modern system that val idates vehicles and employees authorized to fuel, and allocates the fuel costs to the proper program in real t ime.

F i n a n c i a l a n d S t a f f i n g I n f o r m a t i o n
Actual Amended Projected Adopted
FY 2004 FY 2005 FY 2005 FY 2006
Authorized Positions 15.45 16.45 16.45 16.45 16.
Hourly Employee Hours N/A 2,400 2,400 3,300
RevenuesInterfund Reimbursements 3,820,108$ 4,298,878$ 4,298,878$ 4,354,535$ Interest Income - - - 80,000 Other Revenue 127,955 50,000 71,000 50,000 Total Revenue 3,948,063$ 4,348,878$ 4,369,878$ 4,484,535$
ExpendituresSalaries and Benefits 1,168,191$ 1,219,037$ 1,129,232$ 1,402,515$ Supplies and Services 1,171,738 1,237,058 1,039,763 1,110,011 Special Projects 81,807 381,845 381,780 50,000 Transfers - 3,186 3,186 - Non-Capital Equipment - 28,324 18,500 19,024 Miscellaneous 14,455 85,523 - 6,948 Total Operating Expenditures 2,436,191$ 2,954,973$ 2,572,461$ 2,588,498$ Capital Program 1,632,501 2,774,791 82,619 1,675,000 Total Expenditures 4,068,692$ 5,729,764$ 2,655,080$ 4,263,498$
Proposed
FY 2007
45
3,300
4,436,620$ 85,000 50,000
4,571,620$
1,454,569$ 1,138,626
50,000 -
16,828 5,594
2,665,617$ 1,450,000 4,115,617$
P r o g r a m P e r f o r m a n c e M e a s u r e s
Actual Projected Adopted FY 2004 FY 2005 FY 2006
Percent of preventive maintenance services on schedule 99% 98% 95%
Aerial Equipment Certifications 100% 100% 100%
Smog Inspections and Certifications 100% 100% 100%
Diesel Smoke Testing and Certifications 100% 100% 100%
Bus Inspections and Certifications completed for 7 units 100% 100% 100%
Commercial Vehicle Maintenance and Inspection completed for 23 units 100% 100% 100%
Percent of maintenance and repair services that are for planned and scheduled work 68% 69% 65%
The percentage of time a class of vehicles is available for service (fire pumpers, police interceptors, ¾ ton trucks, backhoe/loaders, non-emergency sedans)
N/A N/A 90%
Vehicles in the fleet maintained 526 511 511
Commercial vehicle inspections performed 127 118 59
Annual aerial lift inspections performed 8 9 9
F-301

P R O G R A M S & S E R V I C E S
F-302
City of Santa Barbara Two-Year Financial Plan & Annual
Motor Pool
( P r o g r a m N o . 4 5 2 1 , 4 5 2 2 ) P r o g r a m P e r f o r m a n c e M e a s u r e s ( c o n t i n u e d )
Work orders written for repairs with one or more repair requests 2320 2,200 2,200
Preventive maintenance services performed 1262 1,202 1,200
Bus inspections performed 24 24 24
Smog tests performed 102 103 105
Smoke tests performed 61 61 64
Invoices processed for payment N/A N/A TBD
Average maintenance cost per fire pumper N/A N/A $18,540
Average maintenance cost per police interceptor N/A N/A $7,226
Average maintenance cost per ¾ ton truck N/A N/A $2,486
Average maintenance cost per backhoe/loader N/A N/A $7,751
Average maintenance cost per non-emergency sedan N/A N/A $1,935
Average maintenance cost per mile for fire pumpers N/A N/A $5.59
Average maintenance cost per mile for police interceptors N/A N/A $0.30
Average maintenance cost per mile for ¾ ton trucks N/A N/A $0.53
Average maintenance cost per hour for backhoes and loaders N/A N/A $32.07
Average maintenance cost per mile for non-emergency sedans N/A N/A $0.47
Total annual maintenance & repair costs budgeted $2,343,383 $2,190,681 $2,461,830

[This page intent ional ly le f t b lank. ]
F-303

City of Santa Barbara Two-Year Financial Plan & Annual Budget
PUBLIC WORKS PROGRAMS
Administration Engineering Services Land Development Environmental Services Solid Waste Traffic Operations Transportation Planning &
Alternative Transportation Transportation and Drainage
Systems Maintenance Street Sweeping Traffic Signals Streets Capital Downtown Parking Building Maintenance Motor Pool
Communications Systems Custodial Services Water Resources Management Recycled Water Water Distribution Water Treatment Water Supply Management Water Resources Laboratories Water Capital Program Wastewater Collection Wastewater Treatment Wastewater Capital Program
RECENT PROGRAM ACHIEVEMENTS
Completed upgrade of Voicemail system for all users on the City Hall switch.
P R O G R A M S & S E R V I C E S
F-304
Communications Systems
( P r o g r a m N o . 4 5 3 1 ) M i s s i o n S t a t e m e n t Provide and maintain the citywide radio, telephone, microwave, Combined Communicat ion Center (911), and associated electronic communication systems to ensure uninterrupted high qual ity communication operat ions.
P r o g r a m A c t i v i t i e s Provide maintenance and support act ivity for al l communication
equipment within the City, including repeaters, voters, mobile, and portable radios.
Ensure the maintenance and operabi l i ty of the Combined Communicat ions Center, the City’s 911 emergency call center.
Maintain the City’s microwave l inks.
Manage the telephone system maintenance contract.
Respond to al l telephone and voicemail problems.
Maintain computerized cal l accounting and name display databases.
Perform radio, computer and electronics instal lations in al l City-owned vehicles.
Install telecommunications cables in City-owned bui ldings.
K e y O b j e c t i v e s f o r F i s c a l Y e a r 2 0 0 6 Complete 99% of scheduled preventive maintenance work orders
monthly on the combined communication and al l other communication equipment per the manufacturers’ suggested specif ications.
Complete 95% of al l unscheduled repairs to portable and mobile radios within 24 working hours.
Complete 100% of al l scheduled manufacturers’ suggested maintenance as contracted for citywide telephone systems.
Respond to 90% of al l unscheduled work orders for the citywide telephone system within 4 working hours of the reported outage.
Maintain the Combined Communicat ions Center at 100% operational readiness.

F i n a n c i a l a n d S t a f f i n g I n f o r m a t i o n
Actual Amended Projected Adopted Proposed
FY 2004 FY 2005 FY 2005 FY 2006 FY 2007
Authorized Positions 4.25 6.05 6.05 6.05 6.05
Hourly Employee Hours N/A 630 630 0 0
RevenuesInterfund Reimbursements 508,027$ 644,774$ 644,774$ 664,130$ 684,053$ Total Revenue 508,027$ 644,774$ 644,774$ 664,130$ 684,053$
ExpendituresSalaries and Benefits 387,053$ 441,171$ 440,445$ 525,135$ 552,722$ Supplies and Services 176,690 192,680 190,367 161,378 160,656 Special Projects 3,234 - - - - Non-Capital Equipment 2,774 7,000 7,000 7,613 8,000 Capital Equipment 1,623 4,000 4,000 4,000 - Total Expenditures 571,374$ 644,851$ 641,812$ 698,126$ 721,378$
P r o g r a m P e r f o r m a n c e M e a s u r e s
Actual Projected Adopted FY 2004 FY 2005 FY 2006
Percent of preventive maintenance work orders completed 96.33% 93% 99%
Percent of unscheduled work orders completed on radios within 24 working hours 98.44% 95% 95%
Percent of preventive maintenance work orders completed on telephone system by contractor 100% 97% 100%
Percent of unscheduled repairs responded to within 4 working hours of reported outage 98.6% 90% 90%
Percent of operational readiness for the Combined Communications Center 100% 100% 100%
Combined total of all scheduled preventive maintenance 256 322 322
Combined total of all routine work orders for the Communication Section 1,909 2,300 2,300
Total costs to manage and maintain the city telecommunications system N/A N/A $166,000
F-305

City of Santa Barbara Two-Year Financial Plan & Annual Budget
PUBLIC WORKS PROGRAMS
Administration Engineering Services Land Development Environmental Services Solid Waste Traffic Operations Transportation Planning &
Alternative Transportation Transportation and Drainage
Systems Maintenance Street Sweeping Traffic Signals Streets Capital Downtown Parking Building Maintenance Motor Pool Communications Systems
Custodial Services Water Resources Management Recycled Water Water Distribution Water Treatment Water Supply Management Water Resources Laboratories Water Capital Program Wastewater Collection Wastewater Treatment Wastewater Capital Program
RECENT PROGRAM ACHIEVEMENTS All schedule contracted services were completed on target and on time.
P R O G R A M S & S E R V I C E S
F-306
Custodial Services
( P r o g r a m N o . 4 5 4 1 ) M i s s i o n S t a t e m e n t Provide custodial services to specif ied City-owned faci l i t ies to ensure a clean and safe work environment for the staff and the public.
P r o g r a m A c t i v i t i e s Perform daily and routine cleaning of approximately 280,000 square
feet of City-owned faci l i t ies.
Provide emergency custodial services to City-owned faci l i t ies.
Manage contracted services and maintain a schedule for cleaning windows, carpets, and awnings.
K e y O b j e c t i v e s f o r F i s c a l Y e a r 2 0 0 6 Ensure complet ion of 100% of scheduled contracted services in City
bui ldings for f loors, windows, and awnings according to an approved schedule.
Respond to 100% of custodial emergencies within 1 hour during normal business hours.
Achieve an 80% satisfact ion rate from an employee survey on the cleanl iness of City faci l i t ies.
Maintain an annual average cost of $3.40, or less, per square foot cleaned.
Complete the special monitoring tasks assigned to Custodial Services for Fiesta act ivit ies in a t imely and eff icient manner.
Complete the annual Counci l Chamber and Room 15 special cleaning project prior to City Counci l convening in January 2006.
Ensure that 50% of cleaning agents used for general cleaning are environmental ly fr iendly (green products).
Using the Computerized Work Order System, identify, record, and track al l special service requests for meeting setups, special cleaning, changing out lamps and bulbs, and special event coverage (Fiesta not included).

F i n a n c i a l a n d S t a f f i n g I n f o r m a t i o n
Actual Amended Projected Adopted Proposed
FY 2004 FY 2005 FY 2005 FY 2006 FY 2007
Authorized Positions 13.55 13.55 13.55 13.55 13.55
Hourly Employee Hours N/A 417 417 0 0
RevenuesFees and Service Charges 801,019$ 934,093$ 934,093$ 962,115$ 990,978$ Other Revenue 448 - - - - Total Revenue 801,467$ 934,093$ 934,093$ 962,115$ 990,978$
ExpendituresSalaries and Benefits 738,229$ 780,062$ 831,764$ 804,242$ 839,040$ Supplies and Services 142,134 152,781 152,208 142,824 146,796 Capital Equipment - 2,000 2,000 2,000 2,060 Total Expenditures 880,363$ 934,843$ 985,972$ 949,066$ 987,896$
P r o g r a m P e r f o r m a n c e M e a s u r e s
Actual Projected Adopted FY 2004 FY 2005 FY 2006
Percent of cleaning services scheduled and completed 115 100 100
Percent of emergency responses within one hour 100% 100% 100%
Returned surveys rated satisfactory or better N/A 80% 80%
Cost per square foot cleaned N/A N/A < $3.40
Special cleaning requests handled N/A N/A 240
Special meeting setups completed N/A N/A 360
Custodial emergencies responses N/A N/A 60
F-307

City of Santa Barbara Two-Year Financial Plan & Annual Budg
PUBLIC WORKS PROGRAMS
Administration Engineering Services Land Development Environmental Services Solid Waste Traffic Operations Transportation Planning &
Alternative Transportation Transportation and Drainage
Systems Maintenance Street Sweeping Traffic Signals Streets Capital Downtown Parking Building Maintenance Motor Pool Communications Systems Custodial Services
Water Resources Management Recycled Water Water Distribution Water Treatment Water Supply Management Water Resources Laboratories Water Capital Program Wastewater Collection Wastewater Treatment Wastewater Capital Program
et
RECENT PROGRAM ACHIEVEMENTS The Solid Waste and Environmental Services Programs have been integrated into the Water Resources Division.
P R O G R A M S & S E R V I C E S
F-308
Water Resources
Management
( P r o g r a m N o s . 4 6 1 1 , 4 6 1 2 ) M i s s i o n S t a t e m e n t Provide support and direct ion to staff in order to ensure that City water, wastewater, and hazardous and sol id waste systems are rel iable, comply with al l permits and regulat ions, protect publ ic health and the environment, and are cost eff icient.
P r o g r a m A c t i v i t i e s Manage the City water, wastewater and recycled water, storage,
treatment, distr ibution and col lect ion systems, the sol id waste collect ion systems and the Long Term Water Supply Program.
Ensure compliance of water, wastewater, recycled water, hazardous waste, and solid waste collect ion systems, and the National Pol lutant Discharge El iminat ion System (NPDES) Stormwater Management Program with extensive local, State, and Federal regulat ions.
Develop short and long range water and wastewater resources and solid waste collect ion plans and capital programs.
Provide staff support to the Public Works Director, City Administrator, Board of Water Commissioners, and City Council concerning water resources, hazardous waste and solid waste issues.
Develop annual Water, Wastewater and Solid Waste Fund budgets and ensure that expenditures remain within adopted budget amounts.
Provide ongoing budgetary guidance and support to al l Water Resources Division sections, including Solid Waste and Environmental Services.
K e y O b j e c t i v e s f o r F i s c a l Y e a r 2 0 0 6 Ensure that 80% of Water Resources Division program object ives are
met.
Comply with El Estero Wastewater Treatment Plant NPDES discharge requirements.
Comply with California Department of Health Services dr inking water regulat ions.
Increase overal l diversion from landfi l ls by approximately 2% (or 4,000 tons) per year.

F i n a n c i a l a n d S t a f f i n g I n f o r m a t i o n
Actual Amended Projected Adopted Proposed
FY 2004 FY 2005 FY 2005 FY 2006 FY 2007
Authorized Positions 3.75 4.50 4.50 4.50 4.50
Hourly Employee Hours N/A 1,000 1,000 0 0
RevenuesFees and Service Charges 23,624,831$ 25,480,000$ 25,650,000$ 26,449,375$ 27,394,528$ JPA Reimbursements 1,446,950 1,358,000 1,500,000 1,880,188 1,907,998 Interest Income 570,610 450,000 636,000 710,000 760,000 Market Valuation (416,328) - - - - Intergovernmental - 13,860 - - - Other Revenue 90,887 40,000 90,000 50,000 58,000 Total Revenue 25,316,950$ 27,341,860$ 27,876,000$ 29,089,563$ 30,120,526$
ExpendituresSalaries and Benefits 359,023$ 465,186$ 219,615$ 418,299$ 446,787$ Supplies and Services 3,501,160 3,550,358 3,204,967 4,048,801 4,214,318 Special Projects 347 52,016 50,000 - - Debt Service 2,202,321 4,101,943 3,858,000 4,869,985 5,521,127 Transfers - 32,669 16,399 6,975 - Non-Capital Equipment 5,455 10,310 6,816 11,068 11,531 Capital Equipment - 3,000 - - - Miscellaneous 3,369 515,799 3,628 169,000 174,000 Total Expenditures 6,071,675$ 8,731,281$ 7,359,425$ 9,524,128$ 10,367,763$
P r o g r a m P e r f o r m a n c e M e a s u r e s
Actual Projected Adopted FY 2004 FY 2005 FY 2006
Percent of Water Resources Division program objectives met 92% 90% 80%
Percent of discharge requirements met 99.9% 99% 99%
Percent of drinking water regulations met 100% 100% 100%
Approximate total diversion for City N/A N/A 50%
F-309

City of Santa Barbara Two-Year Financial Plan & Annual Budget
PUBLIC WORKS PROGRAMS
Administration Engineering Services Land Development Environmental Services Solid Waste Traffic Operations Transportation Planning &
Alternative Transportation Transportation and Drainage
Systems Maintenance Street Sweeping Traffic Signals Streets Capital Downtown Parking Building Maintenance Motor Pool Communications Systems Custodial Services Water Resources Management
Recycled Water Water Distribution Water Treatment Water Supply Management Water Resources Laboratories Water Capital Program Wastewater Collection Wastewater Treatment Wastewater Capital Program
RECENT PROGRAM ACHIEVEMENTS Distributed 260,800,000 gallons (800 acre feet) of recycled water for irrigation and interior restroom use.
P R O G R A M S & S E R V I C E S
F-310
Recycled Water
( P r o g r a m N o . 4 6 2 1 ) M i s s i o n S t a t e m e n t Provide cost eff icient treatment and distr ibut ion of recycled water in accordance with State regulations in order to conserve City potable water supplies.
P r o g r a m A c t i v i t i e s Provide reclaimed water to 75 service connect ions.
Provide publ ic educat ion and assistance on the use of reclaimed water.
Implement required agreements and ensure compliance with State regulat ions for users on the reclamation distr ibut ion system.
Provide guidance, training educat ion materials, and signage for landscape and toi let f lushing uses of reclaimed water.
K e y O b j e c t i v e s f o r F i s c a l Y e a r 2 0 0 6 Perform inspections on all recycled water sites to meet the annual
State inspection requirement.
Provide one class for recycled water users to meet the annual State training requirement.

F i n a n c i a l a n d S t a f f i n g I n f o r m a t i o n
Actual Amended Projected Adopted Proposed
FY 2004 FY 2005 FY 2005 FY 2006 FY 2007
Authorized Positions 4.50 5.00 5.00 5.00 5.00
Hourly Employee Hours N/A 0 0 0 0
ExpendituresSalaries and Benefits 297,371$ 355,464$ 349,644$ 436,026$ 458,742$ Supplies and Services 252,590 463,820 445,231 401,430 416,520 Special Projects 1,129 - - 5,000 5,000 Total Expenditures 551,090$ 819,284$ 794,875$ 842,456$ 880,262$
P r o g r a m P e r f o r m a n c e M e a s u r e s
Actual Projected Adopted FY 2004 FY 2005 FY 2006
Inspections performed 80 80 80
Classes for recycled water users 1 1 1
Million gallons of recycled water used 262 261 260.8
Cost per million gallons of recycled water used $2,793 $1,914 $2,791
F-311

City of Santa Barbara Two-Year Financial Plan & Annual Budget
PUBLIC WORKS PROGRAMS
Administration Engineering Services Land Development Environmental Services Solid Waste Traffic Operations Transportation Planning &
Alternative Transportation Transportation and Drainage
Systems Maintenance Street Sweeping Traffic Signals Streets Capital Downtown Parking Building Maintenance Motor Pool Communications Systems Custodial Services Water Resources Management Recycled Water
Water Distribution Water Treatment Water Supply Management Water Resources Laboratories Water Capital Program Wastewater Collection Wastewater Treatment Wastewater Capital Program
RECENT PROGRAM ACHIEVEMENTS As a part of the Sheffield Water Quality Project, two newly constructed 6.5 million gallon reservoirs have been placed in operation.
P R O G R A M S & S E R V I C E S
F-312
Water Distr ibution
( P r o g r a m N o . 4 6 3 1 ) M i s s i o n S t a t e m e n t Convey water to customers in a rel iable and cost-eff ic ient manner and provide drinking water that meets al l state and federal regulations.
P r o g r a m A c t i v i t i e s Operate and maintain the City’s water distr ibut ion system comprised of
Gibraltar Lake and Dam, 299 miles of pipel ines, 12 water pumping stat ions, 13 reservoirs, 16 pressure reducing stat ions, and 25,780 service connections and meters.
Operate and maintain the groundwater well system.
Distr ibute 13,200 acre feet (4.3 bil l ion gal lons) of potable water to the City’s residents.
Operate and maintain the City’s reclaimed water distr ibution system comprised of 14 miles of pipel ines, one pumping stat ion, 1.5 mil l ion gal lon reservoir, three pressure reducing stat ions and 75 service connections.
Operate and maintain the reclamation distr ibution system, which has the capacity to treat and deliver 1,200 acre feet per year; current demand is approximately 800 acre feet per year.
Provide 24-hour emergency response services for al l City departments through the emergency service unit.
K e y O b j e c t i v e s f o r F i s c a l Y e a r 2 0 0 6 Operate the water distr ibution system to meet 100% of al l appl icable
State and Federal requirements.
Exercise 35% of the valves in the water distr ibut ion system annually.
Flush 80% of the f ire hydrants and transmission mains annually.
Restore water service within 8 hours of the t ime of shutdown 75% of the t ime.
Clean 80% of al l water distr ibution reservoirs annually.
Instal l 200 new Metron meters in the water distr ibution system.

F i n a n c i a l a n d S t a f f i n g I n f o r m a t i o n
Actual Amended Projected Adopted Proposed
FY 2004 FY 2005 FY 2005 FY 2006 FY 2007
Authorized Positions 33.41 33.16 33.16 33.16 33.16
Hourly Employee Hours N/A 6,600 6,600 4,000 4,000
RevenuesInterest Income 971$ -$ -$ -$ -$ Total Revenue 971$ -$ -$ -$ -$
ExpendituresSalaries and Benefits 2,594,961$ 2,628,392$ 2,729,572$ 2,997,926$ 3,123,964$ Supplies and Services 1,873,225 2,231,745 2,263,284 2,164,964 2,240,953 Special Projects 149,075 100,000 100,000 90,000 95,000 Non-Capital Equipment 24,226 76,166 75,250 84,913 70,982 Capital Equipment 28,124 85,611 85,000 70,000 72,800 Total Expenditures 4,669,611$ 5,121,914$ 5,253,106$ 5,407,803$ 5,603,699$
P r o g r a m P e r f o r m a n c e M e a s u r e s
Actual Projected Adopted FY 2004 FY 2005 FY 2006
Percent of state and federal requirements achieved 100% 100% 100%
Water of valves exercised 3,639 2,600 2,600
Fire hydrants and transmission main blow off valves flushed 2,025 / 13 N/A / 13 1,797 / 13
Percent of water service shutdowns restored within 8 hours 88.8% 73% 75%
Water distribution reservoirs cleaned 11 10 > 9
Metron meters installed N/A 200 200
Water main breaks 68 77 90
Installation cost per Metron meter N/A N/A TBD
F-313

City of Santa Barbara Two-Year Financial Plan & Annual Budget
PUBLIC WORKS PROGRAMS
Administration Engineering Services Land Development Environmental Services Solid Waste Traffic Operations Transportation Planning &
Alternative Transportation Transportation and Drainage
Systems Maintenance Street Sweeping Traffic Signals Streets Capital Downtown Parking Building Maintenance Motor Pool Communications Systems Custodial Services Water Resources Management Recycled Water Water Distribution
Water Treatment Water Supply Management Water Resources Laboratories Water Capital Program Wastewater Collection Wastewater Treatment Wastewater Capital Program
RECENT PROGRAM ACHIEVEMENTS Maintained regulatory compliance and continuous water service during construction of the two-year Cater Improvement Project.
P R O G R A M S & S E R V I C E S
F-314
Water Treatment
( P r o g r a m N o s . 4 6 4 1 , 4 6 4 2 ) M i s s i o n S t a t e m e n t Provide safe dr inking water that is treated in a cost eff ic ient manner and complies with state and federal regulat ions.
P r o g r a m A c t i v i t i e s Operate and maintain the Cater Water Treatment Faci l i ty to achieve
compliance with state and federal dr inking water regulat ions.
Provide regional water treatment for the City of Santa Barbara, Montecito Water Distr ict and Carpinter ia Valley Water Distr ict, supplying drinking water to the communit ies of Santa Barbara, Montecito, Summerland, and Carpinteria.
Maintain the C. Meyer Desal ination Faci l i ty in long-term storage to supplement exist ing water suppl ies.
K e y O b j e c t i v e s f o r F i s c a l Y e a r 2 0 0 6 Perform 100% of prevent ive maintenance for the Cater Water
Treatment Plant, in accordance with the annual preventive maintenance plan.
Perform 100% of preventive maintenance for the C. Meyer Desalinat ion Facil i ty, in accordance with the annual preventive maintenance plan.
Maintain 100% compliance with Cal ifornia Department of Health Services Water Quality Regulations.
Maintain C. Meyer Desalinat ion Facil i ty in long-term storage for reactivat ion within 2 years, when required to supplement exist ing water supplies.
Complete pilot-scale study of alternate treatment technology in preparat ion of Phase III of the Cater Strategic Plan.
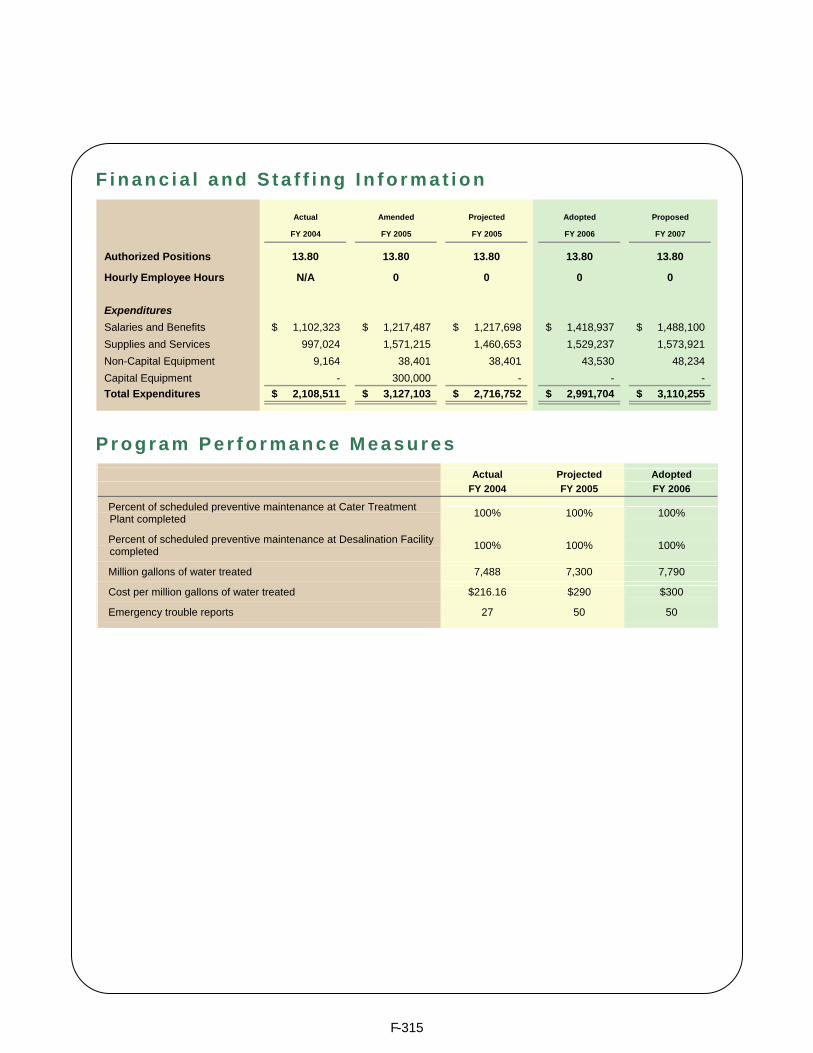
F i n a n c i a l a n d S t a f f i n g I n f o r m a t i o n
Actual Amended Projected Adopted Proposed
FY 2004 FY 2005 FY 2005 FY 2006 FY 2007
Authorized Positions 13.80 13.80 13.80 13.80 13.80
Hourly Employee Hours N/A 0 0 0 0
ExpendituresSalaries and Benefits 1,102,323$ 1,217,487$ 1,217,698$ 1,418,937$ 1,488,100$ Supplies and Services 997,024 1,571,215 1,460,653 1,529,237 1,573,921 Non-Capital Equipment 9,164 38,401 38,401 43,530 48,234 Capital Equipment - 300,000 - - - Total Expenditures 2,108,511$ 3,127,103$ 2,716,752$ 2,991,704$ 3,110,255$
P r o g r a m P e r f o r m a n c e M e a s u r e s
Actual Projected Adopted FY 2004 FY 2005 FY 2006
Percent of scheduled preventive maintenance at Cater Treatment Plant completed 100% 100% 100%
Percent of scheduled preventive maintenance at Desalination Facility completed 100% 100% 100%
Million gallons of water treated 7,488 7,300 7,790
Cost per million gallons of water treated $216.16 $290 $300
Emergency trouble reports 27 50 50
F-315

City of Santa Barbara Two-Year Financial Plan & Annual Budget
PUBLIC WORKS PROGRAMS
Administration Engineering Services Land Development Environmental Services Solid Waste Traffic Operations Transportation Planning &
Alternative Transportation Transportation and Drainage
Systems Maintenance Street Sweeping Traffic Signals Streets Capital Downtown Parking Building Maintenance Motor Pool Communications Systems Custodial Services Water Resources Management Recycled Water Water Distribution Water Treatment
Water Supply Management Water Resources Laboratories Water Capital Program Wastewater Collection Wastewater Treatment Wastewater Capital Program
RECENT PROGRAM ACHIEVEMENTS Prior to winter storms, staff conducted a drought response planning effort demonstrating the adequacy of City water supplies, even under a weather scenario drier than any in recorded history.
P R O G R A M S & S E R V I C E S
F-316
Water Supply Management
( P r o g r a m N o . 4 6 5 1 ) M i s s i o n S t a t e m e n t Provide an adequate supply of water by implementing the Long Term Water Supply Program, which includes a cost effect ive water conservation element and a diverse portfol io of suppl ies.
P r o g r a m A c t i v i t i e s Implement the Long Term Water Supply Program.
Provide up to 8,277 acre-feet of water per year from the Cachuma Project and up to 3,000 acre-feet of water per year from the State Water Project.
Advise on optimal use of the City's diverse sources of water supplies.
Provide information on City water supplies and water conservation via the City Internet site, with quarterly or more frequent updates and prompt responses to inquir ies.
Maintain and protect surface water suppl ies from the Santa Ynez River.
Manage a cost-eff ic ient customer-response based water conservation program that meets federal and state requirements.
K e y O b j e c t i v e s f o r F i s c a l Y e a r 2 0 0 6 Accumulate at least 3,000 acre-feet of end-of-year carryover in Lake
Cachuma by the third year fol lowing each Cachuma spil l .
Achieve a 95% customer sat isfact ion rate for home water check-ups.
Implement condit ions from State Water Resources Control Board to maintain Cachuma Project water r ights.
Present annual Water Supply Management Report for the previous water year to Council for adoption by January 15, 2006.
Ensure that water deliveries are not reduced by more than 10% during severe drought.
Achieve 100% compliance with Cal i fornia Urban Water Conservat ion Counci l Best Management Practices.
Ensure that funding of the Water Purchases Program stays within budgeted amounts and meets payment schedules.
Submit 2005 updated “Urban Water Management Plan” to the Department of Water Resources by December 31, 2005.
Prepare an updated unit cost analysis for City’s water supply sources.

F i n a n c i a l a n d S t a f f i n g I n f o r m a t i o n
Actual Amended Projected Adopted Proposed
FY 2004 FY 2005 FY 2005 FY 2006 FY 2007
Authorized Positions 4.25 5.75 5.75 5.75 5.75
Hourly Employee Hours N/A 1,000 1,000 200 200
RevenuesIntergovernmental 9,159$ -$ -$ -$ -$ Interfund Reimbursements 8,736 42,000 10,000 42,000 42,000 Total Revenue 17,895$ 42,000$ 10,000$ 42,000$ 42,000$
ExpendituresSalaries and Benefits 417,488$ 455,605$ 456,067$ 610,879$ 642,985$ Supplies and Services 112,729 193,982 147,002 245,049 226,885 Water Supply Purchases 6,926,750 7,418,730 7,418,730 7,361,995 7,301,809 Special Projects 58,932 72,774 58,914 150,700 127,700 Non-Capital Equipment 2,045 11,510 10,260 14,500 24,500 Capital Equipment 1,260 - - - - Total Expenditures 7,519,204$ 8,152,601$ 8,090,973$ 8,383,123$ 8,323,879$
P r o g r a m P e r f o r m a n c e M e a s u r e s
Actual Projected Adopted FY 2004 FY 2005 FY 2006
End of year (September 30) Cachuma carryover N/A N/A 3,000 AF
Satisfaction as measured by percent responding “4” (“Very Good”) or better on “Overall Satisfaction” survey item 100% 100% 95%
Water purchases budget $6.9 Million $7.4 Million $7.4 Million
Home water checkups 376 370 350
F-317

City of Santa Barbara Two-Year Financial Plan & Annual Budget
PUBLIC WORKS PROGRAMS
Administration Engineering Services Land Development Environmental Services Solid Waste Traffic Operations Transportation Planning &
Alternative Transportation Transportation and Drainage
Systems Maintenance Street Sweeping Traffic Signals Streets Capital Downtown Parking Building Maintenance Motor Pool Communications Systems Custodial Services Water Resources Management Recycled Water Water Distribution Water Treatment Water Supply Management
Water Resources Laboratories Water Capital Program Wastewater Collection Wastewater Treatment Wastewater Capital Program
RECENT PROGRAM ACHIEVEMENTS Completed special processing and analysis of samples for redesign of the Ortega Well Treatment Plant.
P R O G R A M S & S E R V I C E S
F-318
Water Resources
Laboratories
( P r o g r a m N o s . 4 6 6 1 , 4 6 6 2 ) M i s s i o n S t a t e m e n t Provide cost eff icient analyt ical test ing services and high qual ity data to meet the test ing requirements of the water and wastewater systems.
P r o g r a m A c t i v i t i e s Perform all required test ing in accordance with Environmental
Protect ion Agency (EPA) approved analyt ical methods.
Provide laboratory services and conduct water and wastewater sampling for special projects and research.
Perform and complete water pol lut ion and water supply proficiency test ing.
Provide and submit regulatory report to the California Regional Water Quality Control Board, and California Department of Health Services.
Maintain al l major analyt ical instrumentation in accordance with the Good Laboratory Practice Protocols.
Provide ongoing technical t raining to al l staff.
K e y O b j e c t i v e s f o r F i s c a l Y e a r 2 0 0 6 Complete 100% of required test ing in accordance with EPA-approved
analyt ical methods.
Complete sampling in a t imely manner to ensure reports are submitted to the Environmental Protect ion Agency (EPA), the California Regional Water Quality Control Board (RWQBC), and the California Department of Health Services (CA-DHS), in compliance with report ing deadl ines.
Complete an evaluat ion of the effect iveness of the Laboratory Information Management System (LIMS) by September 30, 2005.
Obtain cert i f icat ion for the Induct ively Coupled Plasma Mass Spectroscopy (ICPMS) instrument by September 30, 2005.
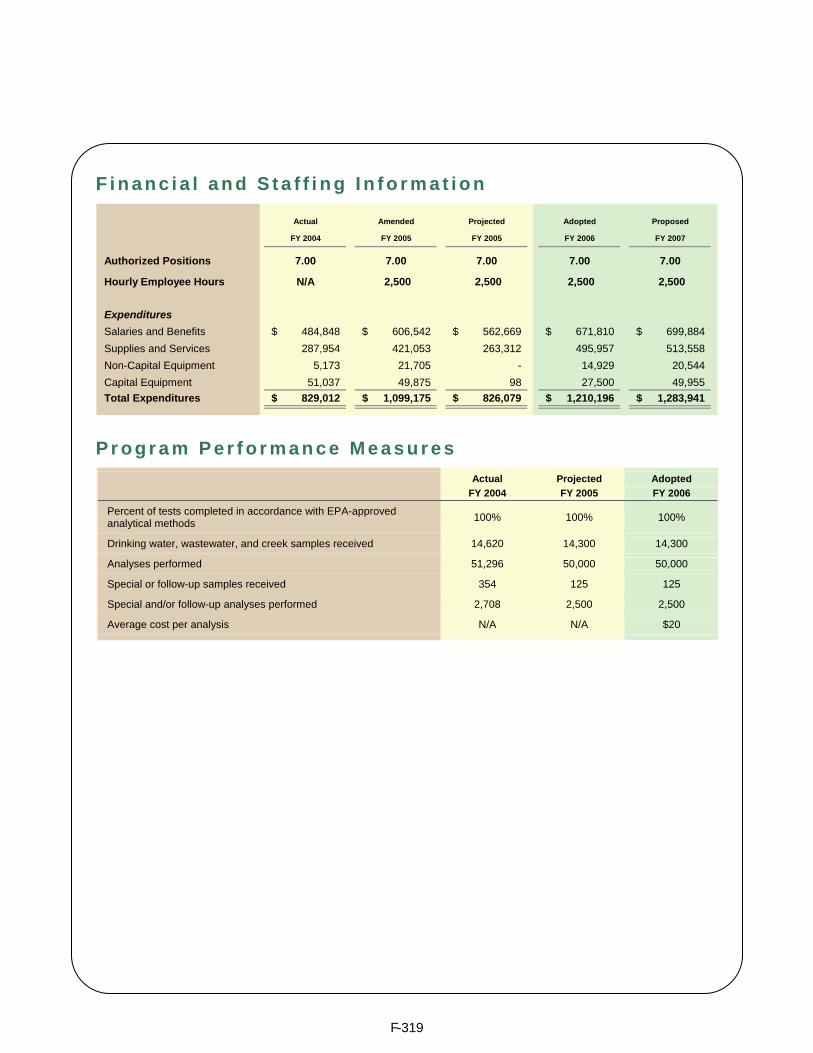
F i n a n c i a l a n d S t a f f i n g I n f o r m a t i o n
Actual Amended Projected Adopted Proposed
FY 2004 FY 2005 FY 2005 FY 2006 FY 2007
Authorized Positions 7.00 7.00 7.00 7.00 7.00
Hourly Employee Hours N/A 2,500 2,500 2,500 2,500
ExpendituresSalaries and Benefits 484,848$ 606,542$ 562,669$ 671,810$ 699,884$ Supplies and Services 287,954 421,053 263,312 495,957 513,558 Non-Capital Equipment 5,173 21,705 - 14,929 20,544 Capital Equipment 51,037 49,875 98 27,500 49,955 Total Expenditures 829,012$ 1,099,175$ 826,079$ 1,210,196$ 1,283,941$
P r o g r a m P e r f o r m a n c e M e a s u r e s
Actual Projected Adopted FY 2004 FY 2005 FY 2006
Percent of tests completed in accordance with EPA-approved analytical methods 100% 100% 100%
Drinking water, wastewater, and creek samples received 14,620 14,300 14,300
Analyses performed 51,296 50,000 50,000
Special or follow-up samples received 354 125 125
Special and/or follow-up analyses performed 2,708 2,500 2,500
Average cost per analysis N/A N/A $20
F-319

City of Santa Barbara Two-Year Financial Plan & Annual Budget
PUBLIC WORKS PROGRAMS
Administration Engineering Services Land Development Environmental Services Solid Waste Traffic Operations Transportation Planning &
Alternative Transportation Transportation and Drainage
Systems Maintenance Street Sweeping Traffic Signals Streets Capital Downtown Parking Building Maintenance Motor Pool Communications Systems Custodial Services Water Resources Management Recycled Water Water Distribution Water Treatment Water Supply Management Water Resources Laboratories
Water Capital Program Wastewater Collection Wastewater Treatment Wastewater Capital Program
RECENT PROGRAM ACHIEVEMENTS Completed the Cater Improvement Project during fiscal year 2005 both under budget and ahead of contracted schedule.
P R O G R A M S & S E R V I C E S
F-320
Water Capital Program
( P r o g r a m N o . 4 6 7 1 ) M i s s i o n S t a t e m e n t Develop, fund, design and construct projects that wi l l maintain, upgrade, and enhance the City's water system infrastructure in order to ensure a cont inual supply of safe water for both domestic and f ire protect ion purposes.
P r o g r a m A c t i v i t i e s Determine the work required to maintain and upgrade the City’s water
supply, treatment and distr ibut ion, and recycled water infrastructure.
Develop the necessary funding to faci l i tate the Water Capital Program.
Approve the design, plans, and specif ications for construct ing Water Fund capital projects.
Assist the Public Works Engineering Division in moving projects through the City’s planning, environmental, and permitt ing process, when appropriate.
Assist Engineering staff in the bid, award, monitoring, and inspection of Water Fund capital projects through completion of construction, when appropriate.
K e y O b j e c t i v e s f o r F i s c a l Y e a r 2 0 0 6 Complete the Sheff ield Water Quality Project by June 30, 2006.
Ensure that the San Roque and Santa Barbara High School Well projects are in operation by December 31, 2005.
Complete the Ortega Treatment Plant Rehabil i tat ion Project permitt ing, environmental, and design phases by June 30, 2006.
Facil i tate the complet ion of the f iscal year 2006 Water Capital Program projects within the approved funding level.

F i n a n c i a l a n d S t a f f i n g I n f o r m a t i o n
Actual Amended Projected Adopted Proposed
FY 2004 FY 2005 FY 2005 FY 2006 FY 2007
Authorized Positions 0.00 0.00 0.00 0.00 0.00
Hourly Employee Hours N/A 0 0 0 0
RevenuesLoan Proceeds 13,817,126$ 20,282,417$ -$ -$ -$ Total Revenue 13,817,126$ 20,282,417$ -$ -$ -$
ExpendituresCapital Program 18,553,420$ 26,213,238$ 9,442,376$ 7,280,360$ 6,250,672$ Total Expenditures 18,553,420$ 26,213,238$ 9,442,376$ 7,280,360$ 6,250,672$
F-321

City of Santa Barbara Two-Year Financial Plan & Annual Budget
PUBLIC WORKS PROGRAMS
Administration Engineering Services Land Development Environmental Services Solid Waste Traffic Operations Transportation Planning &
Alternative Transportation Transportation and Drainage
Systems Maintenance Street Sweeping Traffic Signals Streets Capital Downtown Parking Building Maintenance Motor Pool Communications Systems Custodial Services Water Resources Management Recycled Water Water Distribution Water Treatment Water Supply Management Water Resources Laboratories Water Capital Program
Wastewater Collection Wastewater Treatment Wastewater Capital Program
RECENT PROGRAM ACHIEVEMENTS Staff inspected 18” and above large diameter mains (56,000 ft.) identified 3,000 feet requiring cleaning and completed this project in December of 2004.
P R O G R A M S & S E R V I C E S
F-322
Wastewater Collection
( P r o g r a m N o . 4 6 3 2 ) M i s s i o n S t a t e m e n t Convey wastewater to the treatment plant in a rel iable and cost eff icient manner, meet al l applicable state and federal regulations, and protect the environment.
P r o g r a m A c t i v i t i e s Maintain wastewater col lect ion system to prevent sewer overf lows.
Respond to stoppage and overf low cal ls and contain overf lows in a t imely manner.
Manage the preventive maintenance program for the wastewater col lect ion system and l i f t stat ions.
Conduct a sanitary sewer smoke-test ing program to identify areas of inf low and infi l t rat ion.
Operate wastewater col lect ion system to comply with state and federal report ing requirements.
Enhance col lect ion system performance by maintaining system hydraul ic capacity to al low system to operate at i ts design capacity.
K e y O b j e c t i v e s f o r F i s c a l Y e a r 2 0 0 6 Limit number of reportable overf lows that are considered preventable
through increased maintenance to 15 or less per year.
Complete 90% of System Evaluation and Inf low/Inf i l t rat ion Reduction Program measures.
Respond to and resolve 98% of stoppages and overf low cal ls in a safe, t imely and professional manner within two hours of receiving notif icat ion, and reduce impacts should they occur.
Comply with al l state and federal report ing requirements for wastewater collect ion as specif ied in the National Pol lut ion Discharge Eliminat ion Standards permit issued for the El Estero Wastewater Treatment Plant.
Clean 100% of al l pipe sections l isted on the annual preventive maintenance l ist at the assigned frequency.

F i n a n c i a l a n d S t a f f i n g I n f o r m a t i o n
Actual Amended Projected Adopted Proposed
FY 2004 FY 2005 FY 2005 FY 2006 FY 2007
Authorized Positions 22.40 17.65 17.65 17.65 17.65
Hourly Employee Hours N/A 2,685 2,685 3,000 3,000 RevenuesTransfers In -$ 7,770$ -$ -$ -$ Total Revenue -$ 7,770$ -$ -$ -$
ExpendituresSalaries and Benefits 1,569,292$ 1,763,290$ 1,682,258$ 1,909,980$ 2,002,423$ Supplies and Services 623,150 705,459 645,335 869,417 860,054 Special Projects - - 10,558 60,000 60,000 Non-Capital Equipment 8,475 5,468 674 7,258 9,678 Capital Equipment - 3,000 - 15,000 15,450 Total Expenditures 2,200,917$ 2,477,217$ 2,338,825$ 2,861,655$ 2,947,605$
P r o g r a m P e r f o r m a n c e M e a s u r e s
Actual Projected Adopted FY 2004 FY 2005 FY 2006
Preventable overflows 11 17 < 15
Non-preventable overflows N/A N/A 5
Miles of wastewater collection system pipes cleaned 270 200 200
Miles of pipe smoke tested 57 50 50
Percent of calls responded to and resolved within two hours 100% 99% 98%
Blockages in the collection system 43 56 ≤ 65
Miles of pipeline inspected using the closed circuit television N/A 17 50
Average cost per foot of closed circuit television inspections N/A N/A TBD
Manholes inspected N/A N/A 1,000
Frame and covers replaced N/A N/A 125
Average cleaning cost per foot N/A N/A TBD
F-323

City of Santa Barbara Two-Year Financial Plan & Annual Budget
PUBLIC WORKS PROGRAMS
Administration Engineering Services Land Development Environmental Services Solid Waste Traffic Operations Transportation Planning &
Alternative Transportation Transportation and Drainage
Systems Maintenance Street Sweeping Traffic Signals Streets Capital Downtown Parking Building Maintenance Motor Pool Communications Systems Custodial Services Water Resources Management Recycled Water Water Distribution Water Treatment Water Supply Management Water Resources Laboratories Water Capital Program Wastewater Collection
Wastewater Treatment Wastewater Capital Program
RECENT PROGRAM ACHIEVEMENTS Staff has integrated approximately 65% of all plant processes into the Supervisory Control and Data Acquisition program and implemented a computerized system to allow remote monitoring and operation of critical processes.
P R O G R A M S & S E R V I C E S
F-324
Wastewater Treatment
( P r o g r a m N o . 4 7 1 1 ) M i s s i o n S t a t e m e n t Provide cost eff icient wastewater treatment, protect ocean water qual i ty and public health, and comply with National Pollut ion Discharge El iminat ion System (NPDES) permit requirements.
P r o g r a m A c t i v i t i e s Operate the El Estero Wastewater Treatment Plant to comply with
discharge l imitat ions as required by the Regional Water Quali ty Control Board.
Operate the El Estero Wastewater Treatment Plant to assure air emission compliance with the Santa Barbara Air Pol lut ion Control Distr ict Permit.
Operate Pretreatment Program to inspect and sample industr ial dischargers to the City’s wastewater col lect ion system.
Maintain El Estero Wastewater Treatment Plant using predict ive and preventive maintenance methods.
Cont inue publ ic outreach and educat ion to inform the publ ic of environmental benefits of the El Estero Wastewater Treatment Plant process.
K e y O b j e c t i v e s f o r F i s c a l Y e a r 2 0 0 6 Achieve at least 99% compliance with discharge l imitat ions for
wastewater treatment as l isted in the Wastewater Discharge permit issued by Regional Water Quality Control Board toward a goal of 100%.
Achieve 100% compliance with local air emission standards as specif ied in the Santa Barbara Air Pol lut ion Control Distr ict permit requirements.
Achieve at least 99% compliance with discharge l imitat ions for water reclamation treatment as l isted in the Water Reclamation Discharge permit issued by the Regional Water Quality Control Board towards a goal of 100%.
Complete a total of 649 maintenance work orders on wastewater treatment faci l i t ies.
Complete al l work orders generated from preventat ive maintenance inspection in the t ime period during which they are generated.
Develop a work plan and t ime for implementing consultant recommendations for maintenance pract ices.

F i n a n c i a l a n d S t a f f i n g I n f o r m a t i o n
Actual Amended Projected Adopted Proposed
FY 2004 FY 2005 FY 2005 FY 2006 FY 2007
Authorized Positions 24.00 25.75 25.75 25.75 25.75
Hourly Employee Hours N/A 1,000 1,000 1,500 1,500
RevenuesFees and Service Charges 9,824,103$ 11,233,000$ 11,367,500$ 11,820,000$ 12,288,000$ Mission Canyon - JPA 274,211 275,000 272,500 283,250 291,748 Interest Income 409,897 375,000 365,000 405,000 440,000 Market Valuation (298,997) - - - - Other Revenue 22,332 20,000 5,000 25,000 25,000 Total Revenue 10,231,546$ 11,903,000$ 12,010,000$ 12,533,250$ 13,044,748$
ExpendituresSalaries and Benefits 1,726,527$ 1,921,497$ 1,874,895$ 2,149,690$ 2,254,186$ Supplies and Services 2,256,616 2,492,125 2,178,718 2,643,872 2,669,368 Special Projects - 21,700 21,000 16,000 10,000 Non-Capital Equipment 14,350 18,075 19,075 54,946 21,278 Capital Equipment 10,140 31,300 31,300 29,500 29,000 Total Expenditures 4,007,633$ 4,484,697$ 4,124,988$ 4,894,008$ 4,983,832$
P r o g r a m P e r f o r m a n c e M e a s u r e s
Actual Projected Proposed Adopted FY 2005 FY 2006
Percent of samples in compliance with NPDES permit limits 99.94% 99.85% 99%
Percent of air samples in compliance with SBAPCD permit requirements 100% 100% 100%
Percent of samples in compliance with Water Reclamation Discharge Standards 99.71% 99.85% 99%
Maintenance work orders completed 568 649 649
Millions of gallons of wastewater treated 3,038.4 3,100 3,100
Average cost per million gallons treated $1,260 $1,265 $1,300
Millions of gallons of reclaimed water treated N/A N/A 292
Average cost per million gallons of recycled water treated N/A N/A $1,000
Preventive maintenance work orders performed as a percent of total work orders N/A N/A 10%
F-325

City of Santa Barbara Two-Year Financial Plan & Annual Budget
PUBLIC WORKS PROGRAMS
Administration Engineering Services Land Development Environmental Services Solid Waste Traffic Operations Transportation Planning &
Alternative Transportation Transportation and Drainage
Systems Maintenance Street Sweeping Traffic Signals Streets Capital Downtown Parking Building Maintenance Motor Pool Communications Systems Custodial Services Water Resources Management Recycled Water Water Distribution Water Treatment Water Supply Management Water Resources Laboratories Water Capital Program Wastewater Collection Wastewater Treatment
Wastewater Capital Program
RECENT PROGRAM ACHIEVEMENTS Placed in service two 250 kw fuel cells to provide power to El Estero. The fuel cells use methane produced by the plant to provide affordable power, heat for the digesters, and reduce air emissions.
P R O G R A M S & S E R V I C E S
F-326
Wastewater Capital
Program
( P r o g r a m N o . 4 7 7 1 ) M i s s i o n S t a t e m e n t Expedite the development, design and construct ion of wastewater-related projects that wi l l maintain, upgrade and enhance the infrastructure of the wastewater system in order to meet NPDES requirements and protect the environment.
P r o g r a m A c t i v i t i e s Determine the work required to maintain and upgrade the City’s
Wastewater Treatment and Collect ion System infrastructure.
Develop the necessary funding to facil i tate the Wastewater Capital Program.
Review and approve plans and specif icat ions developed for construct ing Wastewater Capital Projects.
Assist Engineering Division staff in moving Wastewater Capital Projects through the City’s planning, environmental, and permitt ing process, when appropriate.
Assist Engineering Division staff in the bid, award and inspect ion of Wastewater Capital Projects, when appropriate.
Monitor and expedite projects in the El Estero Strategic Plan.
K e y O b j e c t i v e s f o r F i s c a l Y e a r 2 0 0 6 Secure funding and Counci l act ion for proceeding with the second year
of the USGS bacter ial contaminat ion investigat ion.
Provide suff ic ient locker space to accommodate the El Estero work force by June 30, 2006.
Achieve approval of a plan to mit igate environmental issues at the El Estero Drain from the City’s Planning Commission and Santa Barbara County Environmental Health Services by June 30, 2006.
Develop a private lateral inspection ordinance and present i t to Counci l for adoption by June 30, 2006.
Develop a work plan for reducing wet weather overf lows with $2 mil l ion from the recent wastewater debt issuance by December 31, 2005.

F i n a n c i a l a n d S t a f f i n g I n f o r m a t i o n
Actual Amended Projected Adopted Proposed
FY 2004 FY 2005 FY 2005 FY 2006 FY 2007
Authorized Positions 0.00 0.00 0.00 0.00 0.00
Hourly Employee Hours N/A 0 0 0 0
ExpendituresCapital Program 3,362,268$ 25,400,052$ 3,000,348$ 3,385,000$ 2,816,350$ Total Expenditures 3,362,268$ 25,400,052$ 3,000,348$ 3,385,000$ 2,816,350$
P r o g r a m P e r f o r m a n c e M e a s u r e s
Actual Projected Adopted FY 2004 FY 2005 FY 2006
Average cost per foot of sewer line rehabilitation N/A N/A $50
Average cost per foot of sewer line replacement N/A N/A $150
F-327

[This page intentionally left blank.]
F-328

D E P A R T M E N T S U M M A R Y
Waterfront
F-329
F i s c a l Y e a r 2 0 0 6
B u d g e t H i g h l i g h t s
Waterfront Department will fund
$1,680,000 in capital improvement
projects, including pile replacement
and timber repairs to Stearns Wharf
and the Travel Hoist Pier,
refurbishment of the commercial ice
machine on the City Pier, and
replacement of the commercial
fishing dock on the north side of the
City Pier. Capital projects will also
include dredging the interior harbor
between the breakwater and
Marina One, as well as dredging
sand buildup along the seawall
between Marinas Two, Three, and
Four.
After capital projects are funded,
Waterfront Department reserves will
be maintained between $5.2 and
$5.9 million during fiscal years
2006/2007.
The Department does not receive
any tax revenues and is entirely
dependent upon fees generated
from its operations. In order to
balance the department’s operating
budget, fund capital projects, and
maintain reserves at required levels,
slip rentals, parking permits, and slip
transfer fees will increase on July 1,
2005.
Provide the community with a quality Waterfront for recreation and commercial use, along with mooring and landside services for boating activities.
A b o u t W a t e r f r o n t
The Waterfront Department is responsible for managing approximately 252 acres of t idelands and submerged lands encompassing the Harbor and Stearns Wharf . The Waterfront Department is an enterpr ise fund and operates from revenues generated from the resources i t manages; pr imar i ly lease revenue, s l ip fees, and parking fees.
There are a total of 1,133 s l ips in the Harbor, about 19% of which are used by commercia l f ishermen and 81% by recreat ional boaters and others, are al l subject to s l ip permits. The Harbor business/commercia l area inc ludes nine major bui ld ings, a l l of which are owned by the Ci ty, including the Waterfront Center, the largest bui ld ing in the area.
Whi le the Harbor area is a mixture of ocean dependent, ocean related and vis i tor-serving uses, the Wharf ’s pr imary commercia l uses include restaurants, reta i l shops, a bai t and tackle store, and l imi ted of f ice space.
The Waterfront Department also operates nine park ing lots a long Cabr i l lo Boulevard between Leadbetter Beach and East Beach.

D E P A R T M E N T S U M M A R Y
Waterfront
F-330
Department Appropriations by Fund
Waterfront Operating
86%
Waterfront Capital
14%
Department Revenues by Fund
Waterfront100%
D e p a r t m e n t F i n a n c i a l a n d S t a f f i n g S u m m a r y
D e p a r t m e n t F u n d C o m p o s i t i o n
Actual Amended Projected Adopted Proposed
FY 2004 FY 2005 FY 2005 FY 2006 FY 2007
Authorized Positions 45.00 46.00 46.00 46.00 46.00 Hourly Employee Hours N/A 66,941 66,941 56,710 56,710
RevenuesFees and Service Charges 6,012,633$ 5,825,209$ 6,067,782$ 6,255,309$ 6,369,380$ Leases 3,495,037 3,555,809 3,614,758 3,735,602 3,797,161 Interest Income 396,134 160,000 272,397 294,451 311,040 Market Valuation (230,661) - - - - Loan Proceeds - 1,700,000 - - - State Grants 83,300 195,300 60,000 - - Other Revenue 117,153 85,000 97,184 110,342 112,549 Total Department Revenue 9,873,596$ 11,521,318$ 10,112,121$ 10,395,704$ 10,590,130$
ExpendituresSalaries and Benefits 4,093,449$ 4,413,310$ 4,400,166$ 4,870,396$ 5,072,923$ Supplies and Services 2,781,523 3,502,573 3,107,886 3,163,334 3,037,489 Transfers Out - 9,325 9,325 1,918 - Debt Service 914,938 1,476,138 1,476,138 1,599,063 1,595,913 Non-Capital Equipment 129,206 160,607 128,500 95,000 82,500 Appropriated Reserve - 90,675 - 120,000 100,000 Total Department Operating 7,919,116$ 9,652,628$ 9,122,015$ 9,849,711$ 9,888,825$ Capital Program 2,181,698 4,676,473 3,340,680 1,680,000 1,695,000
Total Department Expenditures 10,100,814$ 14,329,101$ 12,462,695$ 11,529,711$ 11,583,825$
Addition to (Use of) Reserves (227,218)$ (2,807,783)$ (2,350,574)$ (1,134,007)$ (993,695)$

D E P A R T M E N T S U M M A R Y
Waterfront
F-331
Program Organizational Chart
Waterfront Department
Business Services Division
Harbor Operations
Facilities Division
Facilities Maintenance
Facilities Design and Capital Programs
Harbor Patrol
Marina Management
Admin. Support & Community Relations
Property Management
Financial Management
Parking Services

City of Santa Barbara Two-Year Financial Plan & Annual Budget
WATERFRONT PROGRAMS
Administrative Support and
Community Relations Property Management Financial Management Parking Services Harbor Patrol Marina Management Facilities Maintenance Facilities Design and Capital
Programs
RECENT PROGRAM ACHIEVEMENTS Waterfront Department received $1.4 million of federal funding for the annual maintenance dredging of the Federal Channel in Santa Barbara Harbor.
P R O G R A M S & S E R V I C E S
F-332
Administrative Support and
Community Relations
( P r o g r a m N o . 8 1 1 1 ) M i s s i o n S t a t e m e n t Provide direct ion and support to Waterfront Department Staff, along with effect ive communication and representat ion before federal and state agencies, the local harbor community, residents, and businesses.
P r o g r a m A c t i v i t i e s Provide overal l direct ion for the Waterfront Department.
Provide information about the Department to the publ ic.
Provide staff support to the Harbor Commission.
Provide representat ion before local, state, and federal agencies.
K e y O b j e c t i v e s f o r F i s c a l Y e a r 2 0 0 6 Ensure 80% of department program objectives are achieved.
Implement a comprehensive publ ic information and community relat ions program which includes sponsored Waterfront Events, Publ ished Department Communicat ion, Navy Ship and Cruise Ship visits, and sponsored publ ic/media meetings.

F-333
F i n a n c i a l a n d S t a f f i n g I n f o r m a t i o n
Actual Amended Projected Adopted Proposed
FY 2004 FY 2005 FY 2005 FY 2006 FY 2007
Authorized Positions 4.60 4.60 4.60 4.60 4.60
Hourly Employee Hours N/A 0 0 0 0
ExpendituresSalaries and Benefits 467,947$ 451,456$ 456,128$ 519,616$ 544,057$ Supplies and Services 931,145 1,041,456 964,668 1,052,727 1,074,580 Transfers Out - 9,325 9,325 1,918 - Debt Service 914,938 1,476,138 1,476,138 1,599,063 1,595,913 Non-Capital Equipment 33,876 30,000 22,500 20,000 15,000 Appropriated Reserve - 90,675 - 120,000 100,000 Total Expenditures 2,347,906$ 3,099,050$ 2,928,759$ 3,313,324$ 3,329,550$
P r o g r a m P e r f o r m a n c e M e a s u r e s
Actual Projected Adopted FY 2004 FY 2005 FY 2006
Percent of department program objectives completed 94% 80% 80%

City of Santa Barbara Two-Year Financial Plan & Annual Budget
WATERFRONT PROGRAMS
Administrative Support and
Community Relations Property Management
Financial Management Parking Services Harbor Patrol Marina Management Facilities Maintenance Facilities Design and Capital
Programs
RECENT PROGRAM ACHIEVEMENTS Completed implementation of improved tracking method for tenant payments for FY 2005-2006.
P R O G R A M S & S E R V I C E S
F-334
Property Management
( P r o g r a m N o . 8 1 1 2 ) M i s s i o n S t a t e m e n t Manage Waterfront leases ensuring the publ ic receives a high level of services and the department receives market value rents.
P r o g r a m A c t i v i t i e s Administer leases and other business agreements.
Negotiate agreements with new and exist ing tenants on Stearns Wharf and in the Harbor commercial area.
Assure tenants receive the services entit led under their agreements.
K e y O b j e c t i v e s f o r F i s c a l Y e a r 2 0 0 6 Audit 25% of percentage rent leases.
Renew 95% of Business Activity Permits within 30 days of permit expirat ion.
Reduce cost to audit percentage rent leases by 10%.
Ensure that 95% of tenants are in compliance with major lease provisions.
Track identif ied advert is ing or promotional program costs designed to enhance Waterfront tenant revenues.
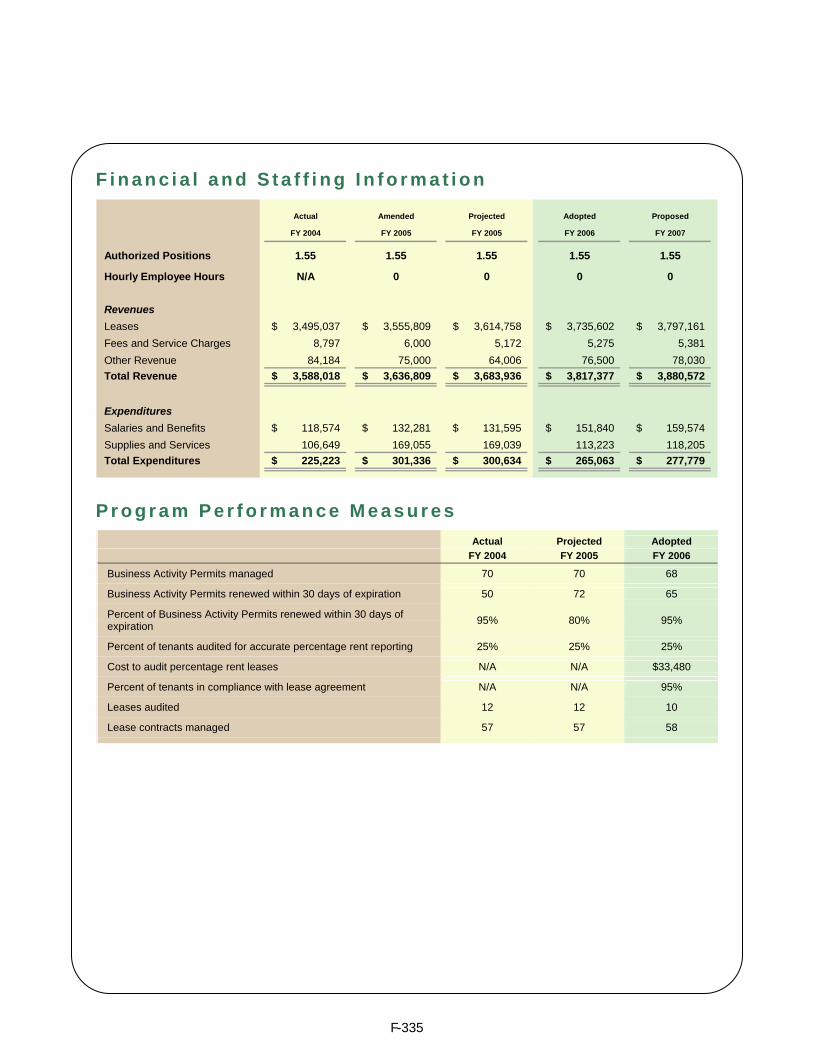
F-335
F i n a n c i a l a n d S t a f f i n g I n f o r m a t i o n
Actual Amended Projected Adopted Proposed
FY 2004 FY 2005 FY 2005 FY 2006 FY 2007
Authorized Positions 1.55 1.55 1.55 1.55 1.55
Hourly Employee Hours N/A 0 0 0 0
RevenuesLeases 3,495,037$ 3,555,809$ 3,614,758$ 3,735,602$ 3,797,161$ Fees and Service Charges 8,797 6,000 5,172 5,275 5,381 Other Revenue 84,184 75,000 64,006 76,500 78,030 Total Revenue 3,588,018$ 3,636,809$ 3,683,936$ 3,817,377$ 3,880,572$
ExpendituresSalaries and Benefits 118,574$ 132,281$ 131,595$ 151,840$ 159,574$ Supplies and Services 106,649 169,055 169,039 113,223 118,205 Total Expenditures 225,223$ 301,336$ 300,634$ 265,063$ 277,779$
P r o g r a m P e r f o r m a n c e M e a s u r e s
Actual Projected Adopted FY 2004 FY 2005 FY 2006
Business Activity Permits managed 70 70 68
Business Activity Permits renewed within 30 days of expiration 50 72 65
Percent of Business Activity Permits renewed within 30 days of expiration 95% 80% 95%
Percent of tenants audited for accurate percentage rent reporting 25% 25% 25%
Cost to audit percentage rent leases N/A N/A $33,480
Percent of tenants in compliance with lease agreement N/A N/A 95%
Leases audited 12 12 10
Lease contracts managed 57 57 58

City of Santa Barbara Two-Year Financial Plan & Annual Budget
WATERFRONT PROGRAMS
Administrative Support and
Community Relations Property Management
Financial Management Parking Services Harbor Patrol Marina Management Facilities Maintenance Facilities Design and Capital
Programs
RECENT PROGRAM ACHIEVEMENTS Negotiated an agreement with Santa Barbara Bank & Trust for installing an Automatic Teller Machine on Stearns Wharf.
P R O G R A M S & S E R V I C E S
F-336
Financial Management
( P r o g r a m N o . 8 1 1 3 ) M i s s i o n S t a t e m e n t Support the Waterfront Department with staying within budget and processing revenue and expenditures accurately.
P r o g r a m A c t i v i t i e s Prepare f inancial plan for department revenues and expenditures.
Approve and facil i tate payment of department expenses.
Receive and process fees col lected by department.
Monitor and analyze department revenues and expenses.
K e y O b j e c t i v e s f o r F i s c a l Y e a r 2 0 0 6 Process revenues with 90% deposit error resolut ion within three
working days.
Process 85% of requisit ions and claims within 21 days of receipt.
Prepare department bi l l ing with 90% resolut ion of bi l l ing errors within 2 bi l l ing cycles.
Complete budget within t imeline set by the Finance Department.
Ensure program expenditures are within budget.
Ensure that 99% of Business Off ice cash drawers are balanced daily.

F-337
F i n a n c i a l a n d S t a f f i n g I n f o r m a t i o n
Actual Amended Projected Adopted Proposed
FY 2004 FY 2005 FY 2005 FY 2006 FY 2007
Authorized Positions 1.75 1.75 1.75 1.75 1.75
Hourly Employee Hours N/A 0 0 0 0
RevenuesInterest Income 281,750$ 160,000$ 272,397$ 294,451$ 311,040$ Market Valuation (148,120) - - - - Total Revenue 133,630$ 160,000$ 272,397$ 294,451$ 311,040$
ExpendituresSalaries and Benefits 119,095$ 132,306$ 133,668$ 146,021$ 151,486$ Supplies and Services 21,467 18,423 20,304 19,221 20,753 Total Expenditures 140,562$ 150,729$ 153,972$ 165,242$ 172,239$
P r o g r a m P e r f o r m a n c e M e a s u r e s
Actual Projected Adopted FY 2004 FY 2005 FY 2006
Percent deposit errors resolved within 3 working days N/A N/A 90%
Percent of requisitions and claims processed within 21 days N/A N/A 85%
Percent of resolution of billing errors within 2 billing cycles N/A N/A 90%
Deposits processed 1,043 850 865
Requisitions and claims processed 2,358 2,000 2,025
Billing accounts processed 14,478 14,000 13,000

City of Santa Barbara Two-Year Financial Plan & Annual Budget
WATERFRONT PROGRAMS
Administrative Support and
Community Relations Property Management Financial Management
Parking Services Harbor Patrol Marina Management Facilities Maintenance Facilities Design and Capital
Programs
RECENT PROGRAM ACHIEVEMENTS Waterfront Parking expanded the Honor Fee System to the Garden Street Parking Lot on January 24, 2005.
P R O G R A M S & S E R V I C E S
F-338
Parking Services
( P r o g r a m N o . 8 1 2 1 ) M i s s i o n S t a t e m e n t Provide competit ively pr iced parking that is convenient, clean, and meets the needs of the community and its visitors.
P r o g r a m A c t i v i t i e s Staff and operate nine parking lots throughout the Waterfront area.
Monitor and collect revenue at four Honor Fee col lection sites.
Staff and operate one 24-hour parking lot 365 days per year.
Ensure audit procedures are being fol lowed.
K e y O b j e c t i v e s f o r F i s c a l Y e a r 2 0 0 6 Maintain annual parking permit revenues of at least $300,000.
Maintain an annual operating expense of not more than 55% of revenue collected.
Achieve an 85% annual col lect ion rate on parking fee collect ion envelopes issued.
Maintain a quarterly cash drawer accuracy rate of 98% for al l attendant-staffed parking lots.
Maintain an annual operating labor cost of not more than 33% of revenue col lected from Stearns Wharf.

F-339
F i n a n c i a l a n d S t a f f i n g I n f o r m a t i o n
Actual Amended Projected Adopted Proposed
FY 2004 FY 2005 FY 2005 FY 2006 FY 2007
Authorized Positions 3.10 3.10 3.10 3.10 3.10
Hourly Employee Hours N/A 36,521 36,521 36,598 36,598
RevenuesFees and Service Charges 1,643,515$ 1,571,000$ 1,560,457$ 1,636,264$ 1,712,588$ Other Revenue 5 - - - - Total Revenue 1,643,520$ 1,571,000$ 1,560,457$ 1,636,264$ 1,712,588$
ExpendituresSalaries and Benefits 657,388$ 631,567$ 675,873$ 695,557$ 697,697$ Supplies and Services 83,105 116,717 89,446 111,899 106,663 Non-Capital Equipment 63,956 97,713 75,000 45,000 37,500 Total Expenditures 804,449$ 845,997$ 840,319$ 852,456$ 841,860$
P r o g r a m P e r f o r m a n c e M e a s u r e s
Actual Projected Adopted FY 2004 FY 2005 FY 2006
Total permit revenue $288,112 $230,000 $300,000
Operating expenses as a percent of revenue collected 47.15% 55% 55%
Annual collection rate on parking fee collection envelopes issued 86.5% 85% 85%
Accuracy rate of cash drawers N/A N/A 98%
Annual operating labor cost as a percentage of revenue collected from Stearns Wharf N/A N/A 33%
Collection envelopes collected 5,982 12,000 12,000
Wharf tickets distributed 259,590 271,700 271,700
Harbor tickets distributed 132,173 147,900 147,900
Boat trailer tickets distributed N/A 11,500 15,000
Outer Lot tickets distributed 261,632 289,500 289,500

City of Santa Barbara Two-Year Financial Plan & Annual Budget
WATERFRONT PROGRAMS
Administrative Support and
Community Relations Property Management Financial Management Parking Services
Harbor Patrol Marina Management Facilities Maintenance Facilities Design and Capital
Programs
RECENT PROGRAM ACHIEVEMENTS Completed U.S. Coast Guard approved Facilities Security Plan for cruise ship visits.
P R O G R A M S & S E R V I C E S
F-340
Harbor Patrol
( P r o g r a m N o . 8 1 3 1 ) M i s s i o n S t a t e m e n t Enforce laws, educate the public, and provide emergency f ire, medical and ocean response services to facil i tate the safe and orderly use of the Waterfront area.
P r o g r a m A c t i v i t i e s Provide emergency response seven days a week, 24 hours a day within
the Waterfront jurisdict ion.
Provide security and law enforcement in the Waterfront by patrol l ing the ocean and land areas.
Enforce state and local laws.
Coordinate operat ions with U.S. Coast Guard, Santa Barbara Pol ice, Santa Barbara Fire, Cal ifornia Department of Fish and Game, and County Sherif f department.
Provide search and rescue, towing, and dewatering service to ocean users.
Provide f ire response and prevention services.
K e y O b j e c t i v e s f o r F i s c a l Y e a r 2 0 0 6 Respond to 90% of in-harbor emergencies within 5 minutes.
Achieve a minimum average of 110 hours of training per Harbor Patrol Off icer.
Enhance public relat ions by conducting a minimum of 45 class tours or other public relat ions events.
Limit t ime lost due to injury to 410 or fewer hours.
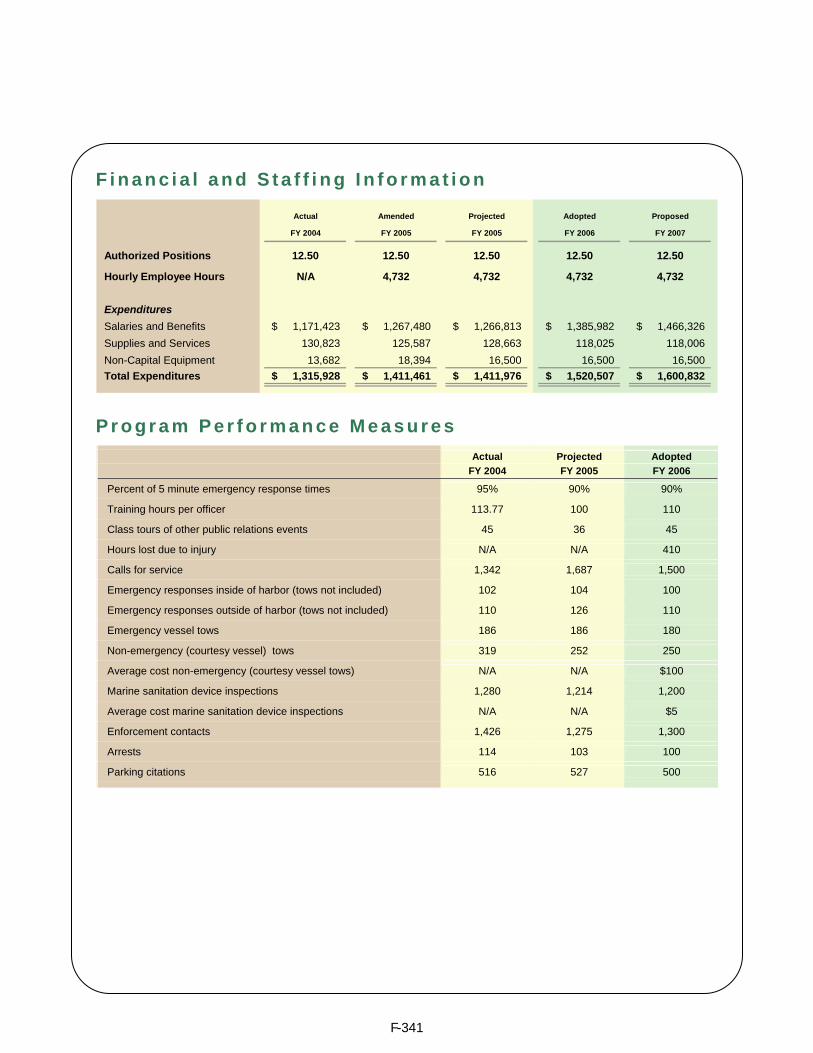
F-341
F i n a n c i a l a n d S t a f f i n g I n f o r m a t i o n
Actual Amended Projected Adopted Proposed
FY 2004 FY 2005 FY 2005 FY 2006 FY 2007
Authorized Positions 12.50 12.50 12.50 12.50 12.50
Hourly Employee Hours N/A 4,732 4,732 4,732 4,732
ExpendituresSalaries and Benefits 1,171,423$ 1,267,480$ 1,266,813$ 1,385,982$ 1,466,326$ Supplies and Services 130,823 125,587 128,663 118,025 118,006 Non-Capital Equipment 13,682 18,394 16,500 16,500 16,500 Total Expenditures 1,315,928$ 1,411,461$ 1,411,976$ 1,520,507$ 1,600,832$
P r o g r a m P e r f o r m a n c e M e a s u r e s
Actual Projected Adopted FY 2004 FY 2005 FY 2006
Percent of 5 minute emergency response times 95% 90% 90%
Training hours per officer 113.77 100 110
Class tours of other public relations events 45 36 45
Hours lost due to injury N/A N/A 410
Calls for service 1,342 1,687 1,500
Emergency responses inside of harbor (tows not included) 102 104 100
Emergency responses outside of harbor (tows not included) 110 126 110
Emergency vessel tows 186 186 180
Non-emergency (courtesy vessel) tows 319 252 250
Average cost non-emergency (courtesy vessel tows) N/A N/A $100
Marine sanitation device inspections 1,280 1,214 1,200
Average cost marine sanitation device inspections N/A N/A $5
Enforcement contacts 1,426 1,275 1,300
Arrests 114 103 100
Parking citations 516 527 500

City of Santa Barbara Two-Year Financial Plan & Annual Budget
WATERFRONT PROGRAMS
Administrative Support and
Community Relations Property Management Financial Management Parking Services Harbor Patrol
Marina Management Facilities Maintenance Facilities Design and Capital
Programs
RECENT PROGRAM ACHIEVEMENTS Proposed berthing standards for Santa Barbara Harbor approved by Harbor Commission in January 2005.
P R O G R A M S & S E R V I C E S
F-342
Marina Management
( P r o g r a m N o . 8 1 4 1 ) M i s s i o n S t a t e m e n t Eff iciently manage and administer ful l professional services to the boating publ ic, harbor users, sl ip permittees, f ishermen, visi tors, and the community at large.
P r o g r a m A c t i v i t i e s Manage a 1,133 sl ip marina and associated faci l i t ies.
Coordinate Waterfront events including Parade of Lights, Harbor Fest ival, Fourth of July, and U.S. Navy ship visits.
Pursue measures and undertake activit ies directed at maintaining a clean ocean environment in the Harbor.
Measure vessels, faci l i tate sl ip assignments and sl ip transfers, and accommodate visitors.
Administer permit process for skif f , catamarans, outr igger canoes, and small sai lboats.
Maintain off ice space and staff to facil i tate services to the boat ing publ ic, harbor users, and visitors.
K e y O b j e c t i v e s f o r F i s c a l Y e a r 2 0 0 6 Process 90% of sl ip trades, transfers, l iveaboard permits, or wait- l ist
assignments within 10 working days of application complet ion or notice of acceptance.
Process 90% of visitor sl ip assignments within 30 minutes of vessel arr ival at the harbor.
Assign 90% of avai lable West Beach permits.
Assign 95% of avai lable catamaran permits.
Implement the Clean Marina Program by completing Marina 1 port-a-potty dump station and pursuing analysis of harbor sediments.
Implement a permit system for vessels moored east of Stearns Wharf.
Implement a berthing standards program to augment navigabi l i ty standards and deter berthing of derelict craft in Santa Barbara Harbor.

F-343
F i n a n c i a l a n d S t a f f i n g I n f o r m a t i o n
Actual Amended Projected Adopted Proposed
FY 2004 FY 2005 FY 2005 FY 2006 FY 2007
Authorized Positions 2.50 2.50 2.50 2.50 2.50
Hourly Employee Hours N/A 2,028 2,028 988 988
RevenuesFees and Service Charges 4,360,321$ 4,248,209$ 4,502,153$ 4,613,770$ 4,651,411$ Other Revenue 32,964 10,000 33,178 33,842 34,519 Total Revenue 4,393,285$ 4,258,209$ 4,535,331$ 4,647,612$ 4,685,930$
ExpendituresSalaries and Benefits 185,759$ 205,705$ 218,129$ 215,920$ 222,172$ Supplies and Services 64,260 61,501 61,980 57,444 57,384 Total Expenditures 250,019$ 267,206$ 280,109$ 273,364$ 279,556$
P r o g r a m P e r f o r m a n c e M e a s u r e s
Actual Projected Adopted FY 2004 FY 2005 FY 2006
Trades, transfers, permits or assignments processed 201 200 150
Percent of trades, transfers, permits, or assignments processed within 10 days 96.6% 90% 90%
Percent of visitor slip assignments processed within 30 minutes 93.9% 90% 90%
West Beach permits sold N/A N/A 45
Percent of West Beach permits assigned N/A N/A 90%
Catamaran permits sold N/A N/A 62
Percent of catamaran permits assigned N/A N/A 95%
Visitor occupancy days per year 19,185 19,500 17,000
Vessels aground or sunk in East Beach anchorage N/A N/A 10
Cost to dispose of vessels beached on East Beach N/A N/A $13,000

City of Santa Barbara Two-Year Financial Plan & Annual Budget
WATERFRONT PROGRAMS
Administrative Support and
Community Relations Property Management Financial Management Parking Services Harbor Patrol Marina Management
Facilities Maintenance Facilities Design and Capital
Programs
RECENT PROGRAM ACHIEVEMENTS Staff was able to maintain all 4 of the Harbor Patrol vessels, keeping them in-service 69% of the time in fiscal year 2004, despite several engine failures.
P R O G R A M S & S E R V I C E S
F-344
Facil it ies Maintenance
( P r o g r a m N o s . 8 1 5 1 , 8 1 5 2 ) M i s s i o n S t a t e m e n t Provide clean and safe commercial and recreational faci l i t ies for tenants and visitors at the Harbor and Stearns Wharf.
P r o g r a m A c t i v i t i e s Maintain and repair the Harbor, Stearns Wharf and Waterfront
Parking lots, including bui ldings, ocean structures, pavement, ut i l i t ies, vessels, and equipment.
Use tracking system to analyze preventive maintenance program effect iveness.
K e y O b j e c t i v e s f o r F i s c a l Y e a r 2 0 0 6 Achieve 70% of in-service days for the Harbor Patrol f leet through
preventive maintenance and services.
Accomplish 90% of the preventive maintenance tasks for Waterfront faci l i t ies.
Minimize t ime lost due to injury at 3,500 or fewer hours.
Achieve an 80% satisfact ion rate from commercial and restaurant tenants based on cleanl iness, safety, and response t ime.

F-345
F i n a n c i a l a n d S t a f f i n g I n f o r m a t i o n
Actual Amended Projected Adopted Proposed
FY 2004 FY 2005 FY 2005 FY 2006 FY 2007
Authorized Positions 16.50 17.30 17.30 17.30 17.30
Hourly Employee Hours N/A 23,660 23,660 14,392 14,392
RevenuesGrants -$ 60,000$ 60,000$ -$ -$ Total Revenue -$ 60,000$ 60,000$ -$ -$
ExpendituresSalaries and Benefits 1,231,146$ 1,396,627$ 1,345,774$ 1,543,561$ 1,606,545$ Supplies and Services 1,429,317 1,956,246 1,667,379 1,677,853 1,529,603 Non-Capital Equipment 17,692 14,500 14,500 13,500 13,500 Total Expenditures 2,678,155$ 3,367,373$ 3,027,653$ 3,234,914$ 3,149,648$
P r o g r a m P e r f o r m a n c e M e a s u r e s
Actual Projected Adopted FY 2004 FY 2005 FY 2006
Percent of in-service days for Harbor Patrol fleet 69% 70% 70%
Percent of preventative maintenance tasks completed 90% 90% 90%
Lost staff hours due to injury N/A N/A 3,500
Rate of tenant satisfaction N/A N/A 80%
Labor cost for vessel maintenance N/A N/A $65,000
Labor cost of preventive maintenance tasks N/A N/A $250,000
Labor and equipment cost for holiday and special events N/A N/A $70,000
Labor hours per dock box installation N/A N/A 3 hours

City of Santa Barbara Two-Year Financial Plan & Annual Budget
WATERFRONT PROGRAMS
Administrative Support and
Community Relations Property Management Financial Management Parking Services Harbor Patrol Marina Management Facilities Maintenance
Facilities Design and Capital Programs
RECENT PROGRAM ACHIEVEMENTS The Breakwater Cap Repair Project was completed and the Chandlery Remodel Project is being constructed according to the schedule.
P R O G R A M S & S E R V I C E S
F-346
Facil it ies Design and
Capital Programs
( P r o g r a m N o . 8 1 6 1 ) M i s s i o n S t a t e m e n t Plan, design, and execute needed construct ion and repair act ivit ies for Waterfront Faci l i t ies.
P r o g r a m A c t i v i t i e s Plan and design construct ion projects for Waterfront faci l i t ies in the
Harbor, Stearns Wharf, and Waterfront parking lots.
Develop contract specif ications for Waterfront faci l i ty projects.
Manage capital improvement projects including inspection, scheduling and publ ic notif icat ion.
K e y O b j e c t i v e s f o r F i s c a l Y e a r 2 0 0 6 Complete 80% of minor capital projects under $100,000, in FY 2006,
according to the approved schedule.
Complete 70% of minor capital projects under $100,000 according to the approved budget.
Obtain required permits for the Sediment Management Plan to achieve ideal beach conf igurat ions.
Complete interior dredging between breakwater and Marina 1 as part of the Sediment Management Plan to improve navigabi l i ty.
Act as department l iaison for the annual Corps of Engineers’ Federal Channel Dredging to ensure the navigation channel is dredged to al low safe vessel transit in and out of the Harbor.
Complete design and obtain permits for the Fish Float North Replacement Project.
Complete design and obtain permits for the Marina 4B Reconf igurat ion Project.

F-347
F i n a n c i a l a n d S t a f f i n g I n f o r m a t i o n
Actual Amended Projected Adopted Proposed
FY 2004 FY 2005 FY 2005 FY 2006 FY 2007
Authorized Positions 2.50 2.70 2.70 2.70 2.70
Hourly Employee Hours N/A 0 0 0 0
RevenuesState Grants 83,300$ 135,300$ -$ -$ -$ Interest Income 114,384 - - - - Market Valuation (82,541) - - - - Loan Proceeds - 1,700,000 - - - Total Revenue 115,143$ 1,835,300$ -$ -$ -$
ExpendituresSalaries and Benefits 142,117$ 195,888$ 172,186$ 211,899$ 225,066$ Supplies and Services 14,757 13,588 6,407 12,942 12,295 Total Expenditures 156,874$ 209,476$ 178,593$ 224,841$ 237,361$ Capital Program 2,181,698 4,676,473 3,340,680 1,680,000 1,695,000 Total Expenditures 2,338,572$ 4,885,949$ 3,519,273$ 1,904,841$ 1,932,361$
Addition to (Use of ) Reserves (2,223,429)$ (3,050,649)$ (3,519,273)$ (1,904,841)$ (1,932,361)$
P r o g r a m P e r f o r m a n c e M e a s u r e s
Actual Projected Adopted FY 2004 FY 2005 FY 2006
Percent of minor capital projects completed on schedule 88.5% 70.5% 80%
Percent of minor capital projects completed within budget 77.5% 100% 70%

[This page intentionally left blank.]
F-348

APPENDIX: Descr ipt ion of Funds A fund is defined as a fiscal and accounting entity with a self-balancing set of accounts, segregated for the purpose of carrying on specific activities, or complying with special regulations, restrictions, or limitations. The following provides a description of all accounting funds used by the City of Santa Barbara, including those for which a budget is not adopted. GOVERNMENTAL FUNDS The measurement focus for governmental funds is on current spendable resources, and as such, the balance sheets for these types of funds include only current assets and current l iabi l i t ies. Governmental funds are accounted for on a modif ied accrual basis, thus revenues are recognized when measurable and avai lable, and expendi tures are recorded when the related l iabi l i ty is incurred.
General Fund The City 's General Fund accounts for act iv i t ies and services t radi t ional ly associated with governments, such as pol ice and f i re, which are f inanced pr imari ly through tax-generated revenues and not requi red to be accounted for in another fund.
Special Revenue Funds Special revenue funds are used to account for the proceeds f rom speci f ic revenue sources, other than trusts or major capi tal pro jects that are legal ly or contractual ly restr icted to expenditures for speci f ic purposes.
1995 Floods Fund For costs incurred as a resul t of the two federal ly declared disasters in January 1995 and February 1998. 2005 Floods Fund For costs incurred as a resul t of the federal ly declared disaster in January 2005. Community Development Block Grant Fund For receipt and disbursement of the City 's federal block grant funds. County Library For funds received and expended for l ibrary services on behalf of Santa Barbara County (non-City) residents. Creeks Restoration and Water Quality Improvement (Measure B) Fund For the receipt and disbursement of the creeks-related share of t ransient occupancy tax (2%), generated by the passage of Measure B in October 2000. These funds may only be used for operat ions and capi tal projects related to creeks restorat ion, c leanup and maintenance, and for creeks- and ocean-water qual i ty improvement projects and act iv i t ies.
HOME Grant Fund For receipt and disbursement of federal HOME Investment Partnership Program funds which faci l i tate the development of af fordable housing projects in the City.
Miscellaneous Grants Fund For resources received from various grant ing agencies. Police Asset Forfeiture and Grants Fund For assets conf iscated by pol ice special operat ions and restr icted for use in support of pol ice operat ions and miscel laneous grants. Police Local Law Enforcement Block Grant Fund For Federal grants funds received for local law enforcement act iv i t ies.
G-1

APPENDIX: Descr ipt ion of Funds
Police Supplemental Law Enforcement Fund For State voter-approved funds (AB 3229), restr ic ted to publ ic safety and law enforcement. Redevelopment Agency Fund For operat ions of the Redevelopment Agency. Tax increment revenues pr imari ly support th is fund. Solid Waste Fund For City operat ions related to sol id waste in support of State AB 939. Streets For receipt and disbursement of st reets-restr icted ut i l i ty users’ tax for act iv i t ies related to st reets and roads. Fi f ty percent of the Ci ty’s ut i l i ty users’ tax is restr icted for th is purpose. Street Sweeping Fund For receipt and disbursement of st reet sweeping parking violat ions revenue in connect ion wi th the City’s Consol idated Clean Sweep Program which provides for sweeping of Ci ty s treets in both commercial and resident ial neighborhoods. Traffic Safety Fund For receipt of f ines col lected pursuant to the Cal i fornia Vehicle Code. The State of Cal i fornia Government Code restr ic ts use of these funds to t raf f ic control devices, equipment and suppl ies related to t raf f ic control or t raf f ic safety, and maintenance of publ ic streets . The funds may not be used to pay compensat ion to t raf f ic or pol ice of f icers . Transportation Development Act Fund For receipt and disbursement of the Ci ty 's share of gasol ine sales tax and Transportat ion Development Act of 1971. These funds may be used only for capi tal projects pertaining to st reets , roads and bikeways. Transportation Sales Tax (Measure D) Fund For funds received f rom a one-hal f cent sales tax levied by the Santa Barbara County Associat ion of Governments. The proceeds are restr icted to t ransportat ion uses. Measure D was approved by the voters of Santa Barbara County in an elect ion held on November 7, 1989. The tax became effect ive on Apri l 1, 1990.
Debt Service Funds Debt service funds are used to account for debt service expenditures on general long-term debt.
2002 Municipal Refunding Certificates of Participation For the accumulat ion of funds for the payment of the General Fund's port ion of the 2002 municipal improvement cert i f icates of part ic ipat ion. These cert i f icates mature in annual instal lments of $65,000 to $360,000, wi th f inal matur i ty in 2018. 1995 Redevelopment Agency Refunding Tax Allocation Bonds Series A and B For the accumulat ion of funds for the payment of the 1995 Refunding Tax Al locat ion Bonds, Ser ies A and B. These bonds mature in annual pr incipal insta l lments of $2,300,000 to $4,705,000 through 2008.
2001 Redevelopment Agency Tax Allocation Bonds – Series 2001A For the accumulat ion of funds for the payment of the 2001 Redevelopment Tax Al locat ion Refunding Bonds, Ser ies A. These bonds mature in annual pr incipal instal lments on ser ial bonds range from $2,785,000 to $4,340,000 through 2019.
2003 Redevelopment Agency Tax Allocation Bonds – Series 2003A For the accumulat ion of funds for the payment of the 2003 Redevelopment Tax Al locat ion Refunding Bonds, Ser ies A. These bonds mature in annual pr incipal instal lments on ser ial bonds range from $1,140,000 to $2,835,000 through 2019.
G-2
APPENDIX: Descr ipt ion of Funds
1994 Water Refunding Revenue Bonds For the accumulat ion of funds for the payment of the 1994 Water Revenue Refunding Serial Bonds. These bonds mature in annual pr incipal instal lments of $420,000 to $510,000 through 2008
2004 Sewer Revenue Bonds For the accumulat ion of funds for the payment of the 2004 Sewer Revenue Bonds. These bonds mature in annual pr incipal instal lments of $525,000 to $1,290,000 through 2029.
Capital Projects Funds Capital projects funds are used to account for f inancial resources used for the acquisi t ion or construct ion of major capi ta l fac i l i t ies (other than those f inanced by proprietary and trust funds).
Capital Outlay Fund For al l capi tal projects f inanced by the General Fund. Redevelopment Agency Capital Projects Funds For expendi tures funded f rom the proceeds of the Agency’s Tax Al locat ion Bonds.
PROPRIETARY FUNDS Proprietary funds account for operat ions that are f inanced and operated in a manner s imi lar to pr ivate sector enterpr ises, in that goods and services are provided to the general publ ic (external users) or other c i ty departments ( in ternal users) , and the costs are f inanced or recovered pr imari ly through fees and service charges charged di rect ly to the users of the goods and services. Propr ietary funds use the accrual basis of account ing.
Enterprise Funds Enterpr ise funds are used to report act iv i t ies for which service charges or fees are charged to external users. Enterpr ise funds are f inanced and operated in a manner s imi lar to pr ivate sector enterpr ises.
Airport Fund For operat ions of the municipal airport and the administ rat ion of leases on ai rport property. Al l act iv i t ies necessary to provide such services are accounted for in this fund including, but not l imi ted to, administ rat ion, operat ions, maintenance, capi tal acquis i t ion and construct ion, f inancing and related debt service, and the bi l l ing and col lect ion of fees. Downtown Parking Fund For the provis ion of parking services in the downtown area of the Ci ty. Al l act iv i t ies necessary to provide such services are accounted for in th is fund, including, but not l imi ted to, administ rat ion, operat ions, maintenance, capi tal acquisi t ion and construct ion, f inancing and related debt serv ice, and the bi l l ing and col lect ion of fees. Golf Fund For the operat ion of a municipal gol f course. Al l act iv i t ies necessary to provide such services are accounted for in th is fund including, but not l imi ted to, administ rat ion, operat ions, maintenance, capi tal acquisi t ion and construct ion, f inancing and related debt service, and the bi l l ing and col lect ion of fees. Wastewater Fund For the provis ion of sewer services to the residents of the City and some residents of the County. Al l act iv i t ies necessary to provide such services are accounted for in th is fund including, but not l imi ted to, administ rat ion, operat ions, maintenance, capi tal acquis i t ion and construct ion, f inancing and related debt service, and the bi l l ing and col lect ion of fees. Water Fund For the provis ion of water services to the residents of the Ci ty and some residents of the County. Al l act iv i t ies necessary to provide such services are accounted for in th is fund including, but not l imi ted to, administ rat ion, operat ions, maintenance, capi tal acquis i t ion and construct ion, f inancing and related debt service, and the bi l l ing and col lect ion of fees.
G-3

APPENDIX: Descr ipt ion of Funds
Waterfront Fund For the operat ions of the Ci ty-managed water front, the assets of which are part of the State of Cal i fornia Tideland Trust . Operat ions inc lude: (1) a publ ic wharf providing faci l i t ies for , and services to, leaseholders, restaurants, retai l shops and other recreat ional act iv i t ies; (2) a smal l watercraf t harbor for commercial f ishing, tour and pr ivately-owned boats; and (3) the operat ion of a l l parking fac i l i t ies in the waterf ront area.
Internal Service Funds Internal service funds are used to report act iv i t ies for which service charges or fees are charged to internal users. These funds are used to account for the f inancing of goods or serv ices provided by one City department to other City departments on a cost reimbursement basis.
Duplications Fund For the costs of operat ing the Ci ty pr int shop that provides dupl icat ing services to al l Ci ty departments. Intra-City Service Fund For the costs of operat ing a Ci ty maintenance faci l i ty for automobi les and other vehic les used by al l Ci ty departments and scheduled replacement of the motor pool . This fund also accounts for the ci tywide bui ld ing maintenance operat ion, custodial and electronics maintenance operat ions. Self-Insurance Fund For the cost of providing workers’ compensat ion, unemployment, l iabi l i ty and employee heal th insurance coverage on a c i tywide basis. Information Systems Intra-City Service Fund For the costs of the Informat ion Systems operat ions for c i tywide computer and network maintenance and replacement.
FIDUCIARY FUNDS Funds that account for resources held in a t rustee, custodial or agency capaci ty for others.
Pension Trust Funds Pension trust funds are used to account for the accumulat ion of resources for the local ly administered safety ret i rement programs.
Safety Retirement Fund For the accumulat ion of resources to be used for ret i rement benef i ts for those pol ice and f i re employees hired between May 17, 1937 and May 28, 1965. Service Retirement Fund For the accumulat ion of resources to be used for ret i rement benef i ts for those pol ice and f i re employees hired between May 17, 1937 and May 28, 1965, and who were disabled due to job related in jur ies.
Non-Expendable Trust Funds Non-expendable t rust funds are used to account for t rust resources, wherein the City, in accordance with the terms of the trust agreement, can expend interest earnings of the trust , but the pr inc ipal must remain intact . L ike propr ietary funds, non-expendable trust funds use the accrual basis of account ing.
Expendable Trust Funds Expendable trust funds are used to account for t rust resources, wherein the Ci ty, in accordance with the terms of the trust agreement, can expend the Trust 's pr incipal and interest earnings.
Library Gifts Fund For gi f ts and bequests made to the Ci ty l ibrary. Funds are used for book replacement.
G-4

APPENDIX: Descr ipt ion of Funds
Agency Funds Agency funds are used to account for resources for which the Ci ty acts as an agent , or custodian, for other governmental uni ts, pr ivate organizat ions, or indiv iduals.
California Law Enforcement Telecommunications System (CLETS) Fund For monies received f rom var ious part ic ipat ing publ ic agencies for the purchase of computer equipment for communicat ion with the Cal i fornia Law Enforcement Tracking System (CLETS). Revolving Rehabilitation Loan Fund For rehabi l i tat ion loans made by the City through the use of var ious funding sources Seismic Safety Assessment Fund For the f inancial act iv i t ies of the Seismic Assessment Distr ict #1.
G-5
APPENDIX: Legal Requirements and the Budgetary Process
G-6
Authoritative Basis for the Annual Budget
The authori tat ive basis for the development of the annual budget is provided in Art ic le XII , Fiscal Administ rat ion, Sect ion 1200 et. a l . o f the City of Santa Barbara Charter . Sect ion 1200 speci f ical ly requires that “… at least s ixty (60) days pr ior to the beginning of each f iscal year, the Ci ty Administ rator shal l submit to the Ci ty Counci l the proposed budget as prepared by him (or her) .” Budgetary Roles and Responsibilities
The Budget Of f icer and the Finance Department , dur ing budget pre-development, determine departmental revenue targets for use dur ing budget development and develop cycle-speci f ic informat ion, such as debt service requi rements and al located costs. The Budget Of f icer works wi th the Treasury Manager f rom Finance throughout the ent i re budget development process to develop the base budget requirements for the next f iscal year through analysis of revenue est imates.
The Treasury Manager develops prel iminary revenue est imates for departments during budget pre-development, and works with departments throughout the budget development process in revis ing the prel iminary est imates for departmental revenues in order to reach f inal , revised est imates.
The Budget Manager develops overhead cost al locat ions and works wi th the Publ ic Works Department in prepar ing pre l iminary cost al locat ions for bui ld ing maintenance, custodial and electronic maintenance services, and the Ci ty 's Motor Pool . The Budget Manager also works wi th Informat ion Systems to determine cost al locat ions for the desktop maintenance and replacement program, as wel l as cost al locat ions related to the City’s f inancial management system.
Finance managers assis t departmental budget s taf f wi th the review of budgets to ensure that departmental budget submit tals are complete, technical ly correct and submit ted in a t imely manner. Dur ing the budget review phase, Finance managers analyze requested budgets to determine that departments met their revenue target, and ver i fy the accuracy of l ine- i tem budgets. They present f indings and recommendat ions to the City Administ rator dur ing the indiv idual departmental meet ings wi th the departments.
The Assistant Ci ty Administrator for Organizat ional Development works wi th al l departmental Program Owners, Managers and Department Heads to ensure that the performance object ives contained in the Programs and Services narrat ives are measurable, act ionable, speci f ic and adequately cover the day-to-day act iv i t ies of c i ty operat ions, as wel l as any one-t ime projects or in i t iat ives planned for the budget year.
The Budget Steer ing Committee provides oversight to the ent i re budget process, wi th di rect ion from the City Administ rator, to ensure that Counci l goals and other c i tywide pr ior i t ies are addressed throughout development of the budgets.
Departmental Staf f develop l ine- i tem operat ing budgets and capi tal requests. Ant ic ipated program adjustments are incorporated and communicated to the Finance Department for revis ing departmental revenue targets.
The Ci ty Administ rator provides oversight of the Budget Steer ing Commit tee throughout the ent i re budget process. The City Administrator meets wi th Department Heads, Program Owners, Departmental Budget Staf f and Budget Liaisons to review al l departmental operat ing and capi tal requests and makes funding decis ions for the recommended budget, ensur ing that Counci l goals and the Steer ing Committee 's budget pr ior i t ies are addressed. Also at these budget meet ings, the City Adminis trator approves al l operat ional goals and object ives for the coming f iscal year that are la id out in the Programs and Services narrat ives. Al l recommendat ions and adjustments are incorporated into the City Administ rator 's recommended budget that is f i led wi th the City Clerk and presented to City Counci l for approval in Apr i l of each year.
Mayor and Ci ty Counci l review the Ci ty Administ rator 's recommended budget , a long wi th any speci f ic recommendat ions from the Counci l Finance Committee, approve or adjust as necessary, and adopt the f inal operat ing and capi tal budget. Budgetary Basis and the Budgetary Level of Control Governmental funds are budgeted using the modif ied accrual basis , consis tent wi th the basis of account ing. Br ief ly, th is means that expenditures are recognized when the related l iabi l i ty is incurred; revenues are recognized to the degree that they are avai lable to f inance expenditures of the current per iod. The only except ion is the budget ing of capi tal projects, in which the ent i re cost of the capi tal project is budgeted in the f i rst year, and subsequent ly carr ied over unt i l project complet ion.

APPENDIX: Legal Requirements and the Budgetary Process
G-7
Simi lar ly, Propr ietary Funds use the modif ied accrual basis of budget ing, but use the accrual basis of account ing. Di f ferences ar ise between the two bases for several i tems: deprec iat ion expense is recorded on a GAAP basis only; debt service ret i rement , including pr incipal and interest payments, are budgeted as expendi tures; and, l ike governmental funds, al l costs of capi tal projects are included in the budget for the f i rst year of the project .
Budgets are moni tored at varying levels of c lassi f icat ion detai l . However, expenditures cannot exceed total appropriat ions at the department level for the General Fund, and at the fund level for al l legal ly budgeted funds (proprietary funds).
Speci f ical ly, the budget is control led at the fol lowing levels:
1. Departments are authorized to t ransfer amounts between indiv idual l ine- i tem expendi ture categor ies wi thin a part icular major object account group.
2. The City Administ rator is authorized to t ransfer amounts wi thin indiv idual departmental budgets, both between programs and between major object groupings.
3. Ci ty Counci l must authorize al l budget amendments that al ter the total appropr iat ions of a part icular department or fund.
Two-Year Budget Cycle
On November 27, 1984, the City Counci l adopted Resolut ion No. 84-182, approving the concept of a two-year budget cyc le for the Ci ty of Santa Barbara. This act ion provided that:
1. Ci ty Counci l would approve a two-year program and f inancial p lan at the beginning of each two-year cycle; and
2. Consistent wi th City Charter requi rements, the City Counci l would adopt a budget for the program on an annual basis.
Signi f icant character is t ics of a two-year budget process, in addi t ion to the i tems noted above, are:
Budget preparat ion and analysis wi l l be for two years, occurr ing in the f iscal year immediately preceding the two-year cycle.
Mid-cycle adjustments wi l l be managed as mid-year adjustments are managed; that is , outs ide of the budget development process, but subject to Ci ty Counci l approval .
The two-year budget cycle wi l l be developed in conjunct ion with the establ ishment of the City Counci l two-year goals and act ion p lan.
Implementat ion of a two-year budget cyc le does not preclude adjustments at mid-cycle or modi f icat ions to the second year recommendat ions due to special c i rcumstances or s igni f icant changes in revenue project ions. I t does, however, el iminate much of the repet i t ive and t ime-consuming aspects associated with the development of budget est imates, part icular ly for those programs that tend to remain constant . In addi t ion, because the Ci ty Counci l is a l ready focusing on a two-year commitment, the two-year budget process faci l i tates a long-term, program and f inancial p lanning approach.

APPENDIX: Legal Requirements and the Budgetary Process
G-8
The fol lowing summarizes the City of Santa Barbara 's two-year budget process. Budget Process - Year One
Pre-Development Activities Counci l goals and program pr ior i t ies are developed.
Finance Department develops prel iminary revenue project ion.
Revenue targets are developed by City Administ rator and dis tr ibuted to departments.
The Finance and Publ ic Works departments develop al located costs.
Departments submit capi tal project requests to Capital Improvement Program Coordinator.
Ant ic ipated program adjustments are communicated to the Finance Department . Budget Preparation
Cycle-speci f ic informat ion is dis t r ibuted to each department.
Departments develop l ine- i tem budget est imates, document text informat ion, and annual performance plans for each program.
Edit and Review of Departmental Submittals
Finance Department Budget Liaisons performs prel iminary review of departmental l ine- i tem submit tals.
Budget Liaisons review department l ine- i tem and text submit tals.
Ci ty Administ rator holds meet ings with each department.
Production and Publication of Budget Document
Finance Director and staf f develop the tables, charts and graphs, prepare summary schedules and fund overviews, and compi le, review and publ ish the document, as wel l as post the Recommended Budget to the Internet.
Ci ty Administ rator and staf f prepare "City Adminis trator 's Budget Message" and review annual performance plans included in the program narrat ives.
The Recommended Budget is f i led with the Ci ty Clerk’s Of f ice. Public Review
Boards and Commissions review the Recommended Budget.
Ci ty Counci l and Finance Commit tee review the Recommended Budget , including Capital Program and Fee Resolut ions.
Ci ty Counci l approves and/or adjusts the City Administ rator ’s Recommended Budget, as appropr iate.
Publ ic hearings are held.
Budget overview and department presentat ions are held.
Budget in format ion made avai lable in accordance wi th Publ ic Informat ion Plan.

APPENDIX: Legal Requirements and the Budgetary Process
G-9
Budget Adoption
City Counci l adopts, by resolut ion, the two-year f inancial p lan and the operat ing and capi tal program budgets for year one of the two-year f inancial p lan.
Finance Department updates and publ ishes the budget document, and post to the Internet . Budget Process - Year Two
Mid-Cycle Review
Finance Department updates the revenue project ions for year two of the two-year f inancial p lan.
Year two recommendat ions are revised, i f necessary.
I f necessary, an addendum to the two-year plan is prepared by the City Administ rator. Presentation and Adoption
City Administ rator presents addendum and a summary of the proposed budget for year two to the City Counci l . This document ident i f ies the fol lowing:
Changes to the two-year f inancial p lan approved at mid-cycle.
Any changes to the Ci ty Administ rator ’s second year recommendat ions.
The progress of the Ci ty Counci l ’s two-year goals and act ion plan.
A summary of the second year’s budget by program.
City Counci l reviews the addendum informat ion and approves and/or adjusts the changes made by the Ci ty Administ rator, as appropriate.
A publ ic hearing is held.
Counci l adopts, by resolut ion, the operat ing and capi ta l budget for year two of the two-year f inancia l p lan.

APPENDIX: Budget Pol ic ies
G-10
General Policies
All current operat ing expenditures wi l l be f inanced with current revenues.
Budgetary emphasis wi l l focus on provid ing high qual i ty municipal services, recognizing the fundamental importance to the publ ic of publ ic safety and proper ly maintained inf rastructure.
The budget wi l l provide suf f ic ient funding for adequate maintenance and orderly replacement of capi ta l p lant and equipment.
The budget wi l l ref lect a higher pr ior i ty for maintenance of exist ing faci l i t ies than for acquis i t ion of new faci l i t ies.
Future maintenance needs for al l new capi tal faci l i t ies wi l l be ful ly costed out, and added costs wi l l be recognized and inc luded in future year budget project ions.
Strong customer service and product iv i ty improvements, wi th a focus on cost savings, remain important budgetary goals.
Product iv i ty improvements resul t ing in cost reduct ion wi l l remain an important budgetary goal . Revenue Policies A diversi f ied and stable revenue system wi l l be maintained to shel ter the Ci ty f rom short-run f luctuat ions in any single revenue source.
Revenues wi l l be conservat ively est imated, wi l l be projected for the next four years and wi l l be updated at least annual ly.
Intergovernmental assistance in the form of grants and loans wi l l be used to f inance only:
Capi tal improvements that are consis tent wi th the Six-Year Capital Program prior i t ies and can be maintained and operated over t ime; and
Operat ing programs which ei ther can be sustained over t ime or have a l imited hor izon.
One-t ime revenues wi l l be used for operat ing programs only af ter an examinat ion determines whether they are subsidiz ing an imbalance between operat ing revenues and expenditures, and then only i f a long-term forecast shows that the operat ing def ic i t wi l l not cont inue. In general , one-t ime revenues wi l l be used only to support capi ta l or other non-recurr ing expendi tures.
Al l fees and charges for each enterpr ise fund wi l l be set at a level that fu l ly supports the direct and indirect cost of the enterpr ise. Reserve Policies An Appropriated Reserve wi l l be included in each operat ing fund’s adopted budget to provide for unant ic ipated expendi tures or to meet unexpected smal l increases in service del ivery costs wi th in the f iscal year. This reserve wi l l be budgeted up to ½ of 1% of the operat ing budget and any unused port ion wi l l be returned to fund balance at the end of the f iscal year.
Each operat ing fund wi l l establ ish a Capi tal Reserve funded to at least 5% of the value of i ts capi ta l assets. In the al ternat ive, the amount may be establ ished at an amount equal to the average of the adopted capi tal program budgets for the previous f ive years. The goal for the General Fund Capital Reserve shal l be set to at least $1 mi l l ion. Appropriat ions f rom these reserves wi l l be to fund major capi ta l costs .
For each operat ing fund there wi l l be a reserve equal to 15% of i ts annual operat ing budget for the purpose of responding to emergencies. I t may take more than one year to meet the 15% goal i f these emergency reserves do not present ly meet the 15% goal.
Each operat ing fund wi l l establ ish and maintain a reserve equal to 10% of i ts annual operat ing budget for the purpose of providing for unique one-t ime costs and maintenance of Ci ty services and permit order ly budget adjustments dur ing per iods of reduct ions. Appropr iat ion of these reserves to operat ing budgets should, when feasible, be accompanied by a plan for the replenishment within a reasonable per iod of t ime.

APPENDIX: Budget Pol ic ies
G-11
Funding of reserves wi l l come general ly f rom one-t ime revenues, excess fund balance and projected revenues in excess of projected expendi tures. They wi l l general ly be reserved in the fol lowing pr ior i ty order:
Reserve for Economic Cont ingency/Emergencies
Reserve for Capital
Reserve for Future Years ’ Budgets
However, f lexibi l i ty wi l l be retained to al locate avai lable funds among the reserves based on the current c i rcumstances and needs of the City’s var ious operat ing funds.
Appropriat ion or use of funds f rom any of these reserves wi l l requi re Counci l act ion.
Debt Policy
I t is the intent of the City of Santa Barbara to issue debt in a manner that adheres to state and federal laws, exist ing bond covenants and prudent f inancial management. A summary of exist ing debt obl igat ions by fund and a summary of total annual debt service requi rements is provided in th is sect ion under "Debt Obl igat ions".
The General Fund current ly does not have any general obl igat ion bonds and does not ant ic ipate issuing such debt . Exist ing General Fund debt includes cert i f icates of part ic ipat ion for capi tal improvements to City faci l i t ies. As of June 30, 2004, the outstanding balance is $3,725,700 and annual debt service requirement is $357,987.
With respect to f inancing of future capi tal improvements, General Fund annual budgeted expendi tures provide for funding of general capi tal improvements. In addi t ion, current Ci ty pol icy provides for the use of accumulated reserves in excess of pol icy requirements for one-t ime costs, including major capi ta l projects.
Restr ic t ions af fect ing the issuance of debt relate to exist ing bond covenants associated with the outstanding Water and Wastewater Fund Revenue Bonds. Speci f ical ly, exis t ing bond covenants requi re that net system revenues (operat ing revenues less operat ing expenses, excluding depreciat ion) must be at least 125% of the annual debt service requirements (maximum).
Based on these restr ic t ions and exist ing annual debt service requi rements, total annual debt service capaci ty for the Water Fund and Wastewater Fund is approximately $5.6 mi l l ion and $1.8 mi l l ion, respect ively, based on operat ing resul ts for the year ended June 30, 2004. For f iscal year 2005, the current total debt service requi rement for a l l exist ing debt is approximately $2.3 mi l l ion and $1,355,000 for the Water Fund and Wastewater Fund, respect ively.
Based on a net assessed value of property of approximately $10.73 bi l l ion, the legal debt l imi t is $1,073 mi l l ion (10%). Current ly, there is no outs tanding debt subject to l imi tat ion.
No other restr ict ions exist . Investment Policy
I t is the pol icy of the City to invest publ ic funds in a manner that wi l l provide maximum secur i ty, adequate l iquidi ty, and suff ic ient y ield, whi le meet ing the dai ly cash f low demands of the City and conforming to al l statues and regulat ions governing the investment of publ ic funds.
The pr imary object ives of the Ci ty’s investment act iv i t ies are safety, l iquidi ty, and yield. Safety, the preservat ion of capi tal in the port fo l io, is the foremost object ive of the investment program. In order to mit igate credi t and interest rate r isk, the Ci ty diversi f ies i ts investments by invest ing funds among several f inancial inst i tut ions and a var iety of secur i t ies o f fer ing independent returns. The l iquid i ty object ive maintains that the port fo l io should remain suf f ic ient ly l iquid to enable the City meet al l cash requi rements that can be reasonably ant ic ipated without requi r ing a sale of secur i t ies. A port ion of the port fol io is placed in money market mutual funds or LAIF which of fer same-day l iquidi ty for short - term holdings to meet unant ic ipated cash needs. Yield, or return on investment , is the f inal object ive of the investment program and states that the port fol io should at tain a benchmark rate of return, throughout budgetary and economic cycles, commensurate wi th the investment r isk constraints and the l iquidi ty requirements of the port fo l io. Yield is of secondary importance to safety and l iquidi ty, and the core of investments is l imi ted to relat ively low r isk secur i t ies in ant ic ipat ion of earning a fai r return relat ive to the r isk being assumed.
Except for cash in certain restr ic ted and special funds, the investment pol icy provides for consol idat ing, or pool ing, cash balances f rom al l funds to maximize investment earnings. Investment earnings are then al located back to the var ious funds in accordance with ident i f ied investment procedures and general ly accepted account ing pr inciples.

APPENDIX: Annual Budget Calendar for FY 06
G-12

APPENDIX: Annual Budget Calendar for FY 06
G-13

APPENDIX: Annual Budget Calendar for FY 06
G-14

APPENDIX: Annual Budget Calendar for FY 06
G-15

APPENDIX: Annual Budget Calendar for FY 06
G-16

APPENDIX: Gann Appropr iat ion L imi t Article XIIIB of the California State Constitution, commonly referred to as the “Gann Appropriation Limit”, was adopted by the California voters in 1980. The Gann Limit places a limit on the amount of tax proceeds that government agencies can receive and appropriate each year. The Gann Appropriation Limit is based on actual appropriations during the 1979 fiscal year, and is adjusted each year using the growth in population and inflation. The City’s limit is adopted by resolution each year by the City Council. In 1990, Proposition 111 made changes to the manner in which the Appropriation Limit is calculated by allowing government agencies a choice of annual growth factors. Proposition 111 also provides for the exclusion from the calculation of capital expenditures for fixed assets of $100,000 or more in value that have a useful life of ten years or more. The fiscal year 2006 Gann Appropriation Limit is calculated as follows:
Appropriations Subject to Limitation
Fiscal year 2005 adopted revenues 93,676,414$
Less:Nonproceeds of tax (30,517,906) Qualified Capital Outlay (5,213,723) Federal Mandates:
Medicare (516,252) FLSA - Fire Department (495,226) (1,011,478)
Plus: User fees in excess of costs -
Total Appropriations Subject to Limitation 56,933,307$
Appropriation LimitFiscal year 2005 appropriation limit, adopted 82,424,009$
A. Inflation adjustment, CPI 1.0526
B. Population adjustment 1.0114
Change factor (A X B) 1.0646
Increase in appropriation limit 5,324,561
Fiscal year 2006 appropriation limit 87,748,570$
G-17

APPENDIX: Debt Obl igat ions
G-18
REVENUE BONDS
Water Fund: Outstanding at
June 30, 2004 $9,780,000 – 1994A Water Revenue Refunding Serial Bonds. Remaining annual installments ranging from $420,000 to $510,000 through September 1, 2008, term bonds of $3,835,000 due on September 1, 2014, interest at 4.4% to 5.1% due semi-annually. Bonds maturing on or after September 1, 2004, shall be subject to redemption, at the option of the City, upon at least 45 days prior written notice to the Trustee specifying the date and amount of such redemption, on or after September 1, 2003, in whole or in part on any date (by lot within any maturity and among maturities as specified by the City). Bonds maturing on September 1, 2014 shall be subject to mandatory redemption, on each date that a sinking installment payment for such Term Bonds is payable from sinking installment, by lot, in an amount equal to such sinking installment payments, plus accrued interest to the redemption date and without premium.
$ 6,255,000
Total Revenue Bonds
$ 6,225,000
TAX ALLOCATION BONDS
Redevelopment Agency: Outstanding at June 30, 2004
$34,810,000 – 2003 Redevelopment Agency Tax Allocation Refunding Bonds, Series A. Remaining annual principal installments on serial bonds range from $1,140,000 to $2,835,000 beginning March 1, 2004 through March 1, 2019. Interest rates range from 2.0% to 5.0% payable semi-annually on September 1 and March 1.
$ 32,725,000
$38,855,000 – 2001 Redevelopment Agency Tax Allocation Refunding Bonds, Series A. Remaining annual principal installments on serial bonds range from $2,785,000 to $4,340,000 beginning March 1, 2009 through March 1, 2019. Interest rates range from 4.0% to 5.0% payable semi-annually on September 1 and March 1.
38,305,000
$28,170,000 - 1995 Redevelopment Agency Tax Allocation Refunding Bonds, Series A. Remaining annual principal installments on serial bonds range from $1,935,000 to $2,330,000 through March 1, 2005. Term bonds of $7,235,000 are due March 1, 2008. Interest rates range from 3.65% to 6.0% payable semi-annually.
9,080,000
$6,845,000 – 1995 Redevelopment Agency Tax Allocation Refunding Bonds, Series B. $2,545,000 term bonds are due March 1, 2007. Interest rates range from 4.375% to 6.35% payable semi-annually.
1,925,000
Total Tax Allocation Bonds
$ 82,035,000

APPENDIX: Debt Obl igat ions
G-19
CERTIFICATES OF PARTICIPATION
General Fund: Outstanding at June 30, 2004
$4,184,400 – 2002 Refunding Municipal Certificates of Participation, remaining annual installments range from $204,600 to $339,000 beginning August 1, 2003 through 2017. Interest rates range from 3.0% to 4.625% payable semi-annually.
$3,725,700
Tidelands Trust - Waterfront: $19,405,000 - 2002 Waterfront Refunding Certificates of Participation. Remaining annual installments range from $490,000 to $1,230,000 beginning October 1, 2002 through 2027. Term certificates of $16,090,000 are due in October 2027. Interest rates range from 3.75% to 6.75% payable semi-annually. Certificates maturing on or after October 1, 2004, are subject to optional prepayment prior to maturity on or after October 1, 2003. The Certificates are subject to mandatory prepayment prior to maturity on any date, in inverse order of maturity and by lot within a maturity, from the net proceeds of insurance or condemnation awards.
18,195,000 Golf Fund: $2,155,600 - 2002 Refunding Municipal Certificates of Participation. Remaining annual installments range from $105,400 to $175,100 beginning August 1, 2003 through 2017. Interest rates range from 3.0% to 4.625% payable semi-annually.
1,919,300 Water Fund: $15,535,000 - 2002 Refunding Water Certificates of Participation. Remaining annual installments range from $380,000 to $675,000 beginning September 1, 2003 through 2027. Interest rates range from 3.0% to 4.75% payable semi-annually. 14,620,000
Total Certificates of Participation $ 38,460,000
LOANS PAYABLE
Outstanding at June 30, 2004
Water Fund: $2,000,000 - State Department of Water Resources Loan. Due in 20 annual payments of $150,894 each on April 30. Interest is 4.0128% per annum. The final payment is due April 30, 2009.
$ 684,249
$5,000,000 - State Department of Water Resources Loan. Due in 20 annual payments of $342,477 on April 30. Interest is 3.1% per annum. The final payment is due November 30, 2011.
2,286,992
$15,965,705 – State Department of Water Resources Loan. Due in semi-annual payments commencing January 1, 2006. Interest is 2.5132% per annum. The final payment is due July 1, 2025.
15,965,705
$2,961,877 – State Department of Water Resources Loan. Due in semi-annual payments commencing January 1, 2007. Interest is 2.7934% per annum. The final payment is due July 1, 2026.
2,961,877
Total Loans Payable
$ 21,898,823

APPENDIX: Debt Obl igat ions
G-20
The annual requirements to amortize all debts outstanding as of June 30, 2004 are as follows:
Tax CertificatesFiscal Year Revenue Allocation of Other
Ending Bonds Bonds Participation Loans Total2005 435,000 4,535,000 1,210,000 395,016 6,575,016 2006 460,000 4,720,000 1,250,000 1,031,579 7,461,579 2007 480,000 4,920,000 1,275,000 1,437,837 8,112,837 2008 510,000 4,405,000 1,330,000 1,860,819 8,105,819 2009 535,000 4,645,000 1,375,000 1,929,331 8,484,331
2010 - 2014 3,115,000 26,115,000 7,370,000 5,489,401 42,089,401 2015 - 2019 720,000 32,695,000 8,550,000 4,103,690 46,068,690 2020 - 2024 - - 8,580,000 4,649,519 13,229,519 2025 - 2029 - - 7,520,000 1,001,630 8,521,630
Princpal payments outstanding 6,255,000 82,035,000 38,460,000 21,898,822 148,648,822
Fiscal YearEnding Total2005 289,800 3,699,984 1,550,956 98,355 5,639,095 2006 268,320 3,511,284 1,523,956 482,341 5,785,901 2007 245,760 3,313,884 1,493,506 732,089 5,785,239 2008 222,000 3,106,884 1,458,686 965,106 5,752,676 2009 196,920 2,871,084 1,595,237 912,156 5,575,397
2010 - 2014 562,200 11,454,692 5,691,128 1,526,863 19,234,883 2015 - 2019 17,280 4,871,260 5,268,219 999,053 11,155,812 2020 - 2024 - - 3,090,434 884,580 3,975,014 2025 - 2029 - - 671,897 18,919 690,816
Interest payments outstanding 1,802,280 32,829,072 22,344,019 6,619,462 63,594,833 Total Debt Service Obligation 8,057,280$ 114,864,072$ 60,804,019$ 28,518,284$ 212,243,655$
Principal Payments
Interest Payments

APPENDIX: Budget Glossary
G-21
Accrual Basis of Accounting: Proprietary and non-expendable trust fund types ut i l ize the accrual basis of account ing. Under this method, revenues are recorded when earned, and expenses are recorded at the t ime l iabi l i t ies are incurred, such that revenues and expendi tures are recognized when the underly ing event or t ransact ion takes place. Appropriation: An author izat ion granted by the legis lat ive body of a government, which permits of f ic ia ls to incur obl igat ions against and to make expendi tures of governmental resources. Appro-pr iat ions are usual ly made for f ixed amounts and are typical ly granted for a one-year per iod by the Ci ty Counci l . Non-operat ing appropriat ions, i .e. , capi tal and special projects, cont inue in force through a budget re-appropr iat ion (or carryover) unt i l fu l ly expended or unt i l the City has accompl ished or abandoned the purpose for which Counci l or ig inal ly granted the appropriat ion. Appropriation Resolution: The of f ic ia l enact-ment by the legis lat ive body establ ishing the legal authori ty for of f ic ia ls to obl igate and expend resources. Assessed Value: The value placed on real and other property as a basis for levying property taxes. For al l agencies in the State of Cal i fornia, assessed value is establ ished by the County for the secured and unsecured property tax rol ls ; the State Board of Equal izat ion establ ishes assessed value of ut i l i ty property tax ro l ls . Balance Sheet: A statement purport ing to present the f inancial posi t ion of an ent i ty by disclosing the value of i ts assets, l iabi l i t ies, and equi t ies as of a speci f ic date. Basis of Accounting: The t iming of recogni t ion, that is, when the ef fects of t ransact ions or events are recognized for f inancial report ing or budget ing purposes. The three bases of account ing for governmental agencies are: (1) cash basis (when cash is received or paid) , (2) accrual basis (when the underly ing transact ion or event takes place) and, (3) modif ied accrual basis (revenues recognized in the account ing period in which they become avai lable and measurable and expendi tures recognized in the account ing period in which the fund l iabi l i ty in incurred). Bond: A wri t ten promise to pay (debt) a speci f ied sum of money (pr incipal or face value) on a speci f ic future date ( the matur i ty date) along with per iodic interest paid at a speci f ied percentage of the pr incipal ( in terest rate) . Bonds are typical ly used for long-term debt to f inance large-scale capi tal projects such as bui ld ings, br idges, s treets, and ut i l i ty inf rastructure. Bond Rating: An evaluat ion of a bond issuer ’s credi t qual i ty and perceived abi l i ty to pay the pr inc ipal and interest on t ime and in ful l . Two agencies regular ly review ci ty bonds and generate bond rat ing: Moody’s Investors Service and Standard and Poor’s Rat ings Group.
Budget: A p lan for the expenditure of f inancial resources cover ing a speci f ic t ime per iod, usual ly one year, which, by adopt ion, const i tutes legal author i ty to spend. The City of Santa Barbara adopts an annual budget f rom July 1 – June 30. The budget contains appropr iat ions needed to cont inue the City’s operat ions for the year and the revenues ant ic ipated to f inance them. Budget Amendment: Under the Ci ty Charter , the Ci ty Counci l has the sole responsibi l i ty for adopt ing the City 's budget, and may amend or supplement the budget at any t ime after adopt ion by a major i ty vote. The City Administ rator has the authori ty to approve administ rat ive adjustments to the budget, as long as the adjustments wi l l not have a s igni f icant pol icy impact, or af fect the bottom-l ine appropr iat ions for any given department. Budget Calendar: A schedule of key dates and mi lestones that a government fol lows in the preparat ion and adopt ion of the budget . Budgetary Basis of Accounting: The method of account ing appl ied to the budgetary accounts and the process used to determine when revenues and expendi tures are recognized for budgetary purposes. The Ci ty of Santa Barbara uses the modi f ied accrual basis for budget ing a l l funds, inc luding proprietary funds. Budgetary Control: The control or management of a government or enterpr ise in accordance wi th an approved budget for the purpose of keeping expendi tures wi thin the l imitat ions of appropriat ions and avai lable revenues. The level of budgetary control for Ci ty Counci l is at the department level . For the City Administ rator, budgetary control is wi thin a department, at the program level and at the major object level (groupings of indiv idual l ine- i tem expendi ture categor ies, for example, salar ies and benef i ts, suppl ies and services, special projects , and non-capi tal equipment categories) . For departments , budgetary control is at the l ine- i tem level wi thin a part icular major object group. Budget Message: A general discussion of the budget presented in wri t ing as a part of , or supplement to, the budget document. The budget message explains the pr inc ipal issues against the background of f inancial t rends and the pr ior i t ies set forth in the budget. Capital Asset: A tangible, f ixed asset that is long-term in nature, of s igni f icant value, and obtained or control led as a resul t of past t ransact ions, events or c i rcumstances. Fixed assets include land, bui ld ings, equipment, improvements to bui ld ings, and inf rastructure ( i .e. , s treets, highways, br idges and other immovable assets). A capi tal asset is def ined as an asset wi th a useful l i fe extending beyond a single account ing per iod. The capi tal izat ion threshold for the City of Santa Barbara is $10,000. Capital Expenditure: An amount expended for f ixed asset acquisi t ions and improvements. The capi tal izat ion threshold for the Ci ty of Santa

APPENDIX: Budget Glossary
G-22
Barbara is $10,000. Capital Budget: A plan of capi tal expenditures and the means of f inancing them. The capi tal budget is adopted as part of the complete annual budget, inc luding both operat ing and capi tal out lays. Capital Improvement Plan (CIP): A formal long-term (mult i -year) plan for the acquisi t ion and improvement of major assets, such as land, bui ld ings, machinery and equipment, and inf rastructure ( i .e. , streets, highways, br idges, and other immovable assets). The CIP ident i f ies the expected beginning and ending date for each project , the amount to be expended in each, and the method of f inancing those expendi tures. The Ci ty of Santa Barbara prepares a s ix-year CIP and the threshold for inclusion in the CIP is $25,000. Capital Lease: An agreement that conveys the r ights to use property, plant or equipment, usual ly for a s tated per iod of t ime. Capital Projects Fund: A governmental fund type used to account for f inancial resources used for the acquis i t ion or construct ion of major capi tal faci l i t ies (other than those f inanced by propr ietary and t rust funds). See also Governmental Fund . Carryover: Expendi ture or ig inal ly planned in the current year but, because of delays, is postponed to the fol lowing f iscal year. Certi f icate of Participation: A form of lease-purchase f inancing used to construct or acqui re capi ta l faci l i t ies and equipment. Change in Service: A change in the nature, type or level of service provided by a Ci ty program from that provided in the pr ior f iscal year’s adopted budget, as amended. Community Development Block Grant (CDBG): Grant funds a l located by the federal government to the Ci ty of Santa Barbara to use for the prevent ion and removal of s lum and bl ight, and to benef i t low- and moderate- income persons. The City disburses these funds through an annual appl icat ion process open to al l nonprof i t organizat ions and Ci ty departments. Contingency: An appropriat ion of funds to cover unforeseen events that occur during the f iscal year, such as short fa l ls in revenue and simi lar eventual i t ies, natural d isasters, and federal mandates, Contractual Services: Expendi tures for Ci ty services performed by f i rms, indiv iduals or other c i ty departments. Cost-Reimbursement Basis: The sett ing of service charges and fees such that costs are systematical ly recovered on a break-even basis over t ime. This term is used in connect ion wi th internal service funds. Debt Instrument: A vehic le for borrowing funds,
inc luding general obl igat ion bonds, revenue bonds, lease/purchase agreements, lease-revenue bonds, tax al locat ion bonds, cer t i f icates of part ic ipat ion, and assessment dis tr ict bonds. See also Bond . Debt Service: Payment of interest and repayment of pr incipal to holders of a government 's debt instruments. Debt Service Fund: A governmental fund type used to account for the payment and accumulat ion of resources related to general long-term debt pr incipal and interest; debt service payments related to enterpr ise operat ions are di rect ly accounted for in the enterpr ise fund i tsel f . See also Governmental Fund . Debt Service Requirement: The amount of money requi red to pay interest and pr incipal on outs tanding debt and the requi red contr ibut ions to accumulate monies for future ret i rement of long-term bonds. Department: An operat ional and budgetary uni t designated by the Ci ty Counci l to def ine and organize Ci ty operat ions, or a group of related operat ions within a funct ional area. Encumbrance: Legal commitments related to unperformed (executory) contracts for goods and services. At year-end, encumbrances represent a reservat ion on fund balance. Enterprise Fund: A proprietary fund type used to account for operat ions that are f inanced and operated in a manner s imi lar to pr ivate sector enterpr ises, such that the costs of providing goods and services to the general publ ic are f inanced or recovered pr imari ly through fees charged di rect ly to the users of the goods or services prov ided. The City of Santa Barbara has ten enterpr ise funds, including Airport Operat ing and Capital , Golf , Downtown Parking, Water Operat ing and Capital , Wastewater Operat ing and Capi tal , and Waterf ront Operat ing and Capi tal Funds. See also Proprietary Fund . Enterprise Fund Accounting: Account ing used for government operat ions that are f inanced and operated in a manner s imi lar to pr ivate sector enterpr ises, and for which preparat ion of an income statement is desirable. Enterpr ise Funds use the accrual basis of account ing. Estimated Revenue: The budgeted projected revenues, which are expected and real izable dur ing the budget f iscal year, to f inance al l or part of planned expendi tures. Expenditure: The outf low of funds paid, or to be paid, for goods and services received dur ing the current per iod. Note: an encumbrance is not expendi ture; rather i t represents a reservat ion on fund balance. Expense: The incurrence of l iabi l i t ies or the consumption of assets ar is ing f rom the del ivery or product ion of goods, rendering serv ices or carrying out other act iv i t ies that const i tutes the ent i ty ’s ongoing major or central operat ion. This

APPENDIX: Budget Glossary
G-23
term appl ies to the Ci ty’s Enterpr ise and Internal Service Funds. Fiduciary Fund: A major fund type used to account for assets held by the Ci ty in a trustee, agency or custodial capaci ty for others. The City of Santa Barbara has pension trust , expendable trust , non-expendable trust , and agency funds wi thin the f iduciary fund type. Expendable t rust funds are accounted for in the same manner as governmental funds, using the modi f ied accrual basis of account ing. Pension t rust and non-expendable t rust funds use the accrual basis of account ing. An agency fund is custodial in nature in that i t does not measure resul ts of operat ions and the assets equal l iabi l i t ies ( i .e. , a l l assets are held solely for the benef i t o f others) . Fiscal Year: The 12-month per iod to which the annual operat ing budget appl ies, at the end of which a government determines i ts f inancial posi t ion and the resul ts of i ts operat ions. The Ci ty of Santa Barbara operates on a f iscal year f rom July 1 through June 30. Fixed Asset: See Capital Asset . Full -Time Equivalent (FTE): The standardized uni t of measurement of s taf f ing equal to 2,080 hours of work per year. Fund: A separate f iscal and account ing ent i ty wi th a sel f -balancing set of accounts in which cash and other f inancial resources, al l re lated l iabi l i t ies and residual equi t ies, or balances and changes therein are recorded and segregated to carry on speci f ic act iv i t ies or at ta in certain object ives in accordance wi th special regulat ions, restr ic t ions or l imitat ions. There are three major fund types: governmental , propr ietary, and f iduciary. Fund Balance: From a st r ict account ing perspect ive, fund balance represents the excess of assets over l iabi l i t ies. I t a lso represents the cumulat ive ef fect of revenues and other f inancing sources over expenditures, and other f inancing uses that are avai lable for reservat ion, designat ion or appropr iat ion. A negat ive fund balance is cal led a fund def ic i t . General Fund: The pr imary operat ing fund of a governmental organizat ion that accounts for act iv i t ies and services not requi red to be accounted for in another fund, and t radi t ional ly associated wi th governments, such as pol ice and f i re service, which are f inanced pr imari ly through tax, intergovernmental and other non-exchange revenues. General Obligation Bond: A bond sold to generate f inancing for var ious purposes, and to be repaid wi th normal, unrestr ic ted operat ing revenue, usual ly f rom the General Fund. Generally Accepted Accounting Principles (GAAP): Uniform minimum standards and guidel ines for account ing and report ing. These standards govern the form and content of the annual f inancial statements of an ent i ty. The
pr imary authori tat ive body on the appl icat ion of GAAP to state and local governments is the Governmental Account ing Standards Board (GASB). Governmental Activi t ies: Act iv i t ies general ly f inanced through taxes, intergovernmental revenues, and other non-exchange revenues, and usual ly reported in governmental and internal service funds. Governmental Fund: A major fund type general ly used to account for tax-supported act iv i t ies. Governmental funds use the modif ied accrual basis of account ing. The Ci ty of Santa Barbara uses four types of governmental funds: general , special revenue, debt service, and capi tal projects funds. Grant: Contr ibut ions of cash or other assets donated f rom one governmental agency or organizat ion to another, and usual ly restr icted for a speci f ic purpose. Typical ly, these contr ibut ions are made to local governments f rom state and federal governments. Infrastructure: Faci l i t ies that support the dai ly l i fe and growth of the City, for example, roads, water l ines, sewers, publ ic bui ld ings, parks and airports . Interfund Reimbursements: Payments f rom one fund to another to reimburse costs to the recipient fund. Interfund Transfers: Payments f rom one fund to another to f inance the operat ions of the recipient fund. Internal Service Fund: Funds used to account for the f inancing of goods or services provided by one department or agency to other departments or agencies of a government on a cost-reimbursement basis. See also Proprietary Fund . Liabil i ty: Debt or other legal obl igat ions ar is ing out of t ransact ions in the past that must be l iquidated, renewed or refunded at some future date. Note: the term does not include encumbrances. Line-Item Budget: A budget that l is ts detai led expendi tures categories separately, a long wi th the amount budgeted for each speci f ied category. The Ci ty of Santa Barbara uses program rather than l ine- i tem budget ing; however, detai led l ine-i tem accounts are maintained and recorded for f inancial report ing and control purposes. Major Object: Categor ized groupings of indiv idual l ine- i tem expendi tures that are s imi lar in nature. For example, the Ci ty 's major object categor ies inc lude salar ies and benef i ts, suppl ies and services, special projects, non-capi tal equipment, capi tal equipment, and miscel laneous. Mandate: Legis lat ion passed by the state or federal government requi r ing act ion or provis ion of services and/or programs. Examples include the Americans wi th Disabi l i t ies Act , which requi res act ions such as physical faci l i ty

APPENDIX: Budget Glossary
G-24
improvements and provis ion of special ized transportat ion services. Modified Accrual Basis of Accounting: Under the modif ied accrual basis, revenues are recognized when suscept ible to accrual ( i .e. , when they become measurable and avai lable) . "Measurable" means the amount of the transact ion that can be determined, and "avai lable" means col lect ib le wi thin the current per iod or soon enough thereafter to be used to pay l iabi l i t ies of the current period. Those revenues suscept ible to accrual include property taxes remit ted wi thin 60 days af ter year-end, interest on investments, and certain intergovernmental and other revenues. Expendi tures are recorded when the related fund l iabi l i ty is incurred. Pr incipal and interest on general long-term debt are recorded as fund l iabi l i t ies when due, or when amounts have been accumulated in the debt service fund for payments to be made ear ly in the fol lowing year. Al l governmental fund types, expendable t rust funds and agency funds use the modi f ied accrual basis of account ing. Objective: Quant i f ied, outcome-based statements of what wi l l be accompl ished during the budget year. These annual performance goals are speci f ic , measurable, t ime-bound, and real ist ic, yet chal lenging. Object ives cover day-to-day act iv i t ies as wel l as one-t ime in i t iat ives. Operating Budget: A plan of f inancial operat ions embodying an est imate of planned expendi tures for a given period ( typical ly a f iscal year) and the proposed means for f inancing them (revenue est imates). The annual operat ing budget, as dist inguished from the capi tal program budget, is the pr imary means by which most of the f inancing, acquis i t ion, spending and service del ivery act iv i t ies of a government are control led. The City of Santa Barbara general ly adopts a two-year f inancial p lan that includes the adopt ion of actual budget appropr iat ions for the f i rst year of the f inancial p lan, and recommendat ions for year two. Operating Deficit : The def ic iency of operat ing revenues under expendi tures during a s ingle account ing period. Operating Surplus: The excess of operat ing revenues over operat ing expendi tures during a s ingle account ing period. Ordinance: A formal legis lat ive enactment by the Ci ty Counci l . I f i t is not in conf l ic t wi th any higher form of law, such as a state statute or const i tu t ional provis ion, i t has the ful l force and effect of law within the boundaries of the ci ty. Outstanding Bonds: Bonds not yet ret i red through pr incipal and interest payments. Performance Measure: Quant i f iable indicators that measure program workload or progress in achieving program object ives.
Program: A group of act iv i t ies, operat ions or organizat ional uni ts organized to accompl ish speci f ic purposes, goals or object ives. I t is a dist inct funct ional uni t wi thin a department, consist ing of a s igni f icant service provided using Ci ty resources. Program Budgeting: A method of budget ing that focuses on services provided to customers at the funct ional (or program) level . Proposed Budget: This refers to the status of an annual budget, which has been submit ted by the City Administ rator and is pending publ ic review and Ci ty Counci l adopt ion. Proprietary Fund: A major fund type used to account for operat ions that are f inanced and operated in a manner s imi lar to pr ivate sector enterpr ises, in that goods and serv ices are provided to the general publ ic (external users) or other Ci ty departments ( in ternal users), and the costs of which are f inanced or recovered pr imari ly through fees and service charges charged di rect ly to the users of the goods and services. Propr ietary funds use the accrual basis of account ing. Reserves: Accumulated funds legal ly restr icted or otherwise designated by management and/or Ci ty Counci l for speci f ic purposes. See a lso Fund Balance . Revenue Bond: A bond sold to construct a project that wi l l produce revenues pledged for the repayment of pr incipal and related interest. Revenues: Total amount of income received, earned, or otherwise avai lable for appropr iat ion. Self- Insurance: A term often used to describe the retent ion by an ent i ty of a r isk of loss ar is ing out of the ownership of property or the act iv i ty of the agency. Service Charge: See User Fee . Special Revenue Fund: A governmental fund type used to account for the proceeds f rom speci f ic revenue sources, other than trusts or major capi tal projects , that are legal ly restr ic ted to expendi tures for speci f ic purposes. See also Governmental Fund . Transient Occupancy Tax (TOT): Tax col lected by hotel operators and imposed on hotel guests for t ransient lodging (30 days or less) wi thin the City. The current TOT rate is 12%, 2% of which is legal ly restr icted for creeks restorat ion and creeks and ocean water qual i ty improvement pursuant to voter-approved Measure B, ef fect ive January 1, 2001. User Fee: The voluntary payment of a fee for direct receipt of a publ ic service by the party direct ly benef i t ing f rom serv ice.

APPENDIX: L is t of Acronyms
G-25
A-OK! After-School Opportunities for Kids! ABC Alcoholic Beverage Control ABOP Antifreeze, Batteries, Oil and Paint ABR Architectural Board of Review ACCEL Authority of California Cities Excess
Liability AF Acre Feet AFP Aviation Facilities Plan ALP Adult (and Family) Literacy Program AOA Airfield Operations Area A/P Accounts Payable ARFF Aircraft Rescue and Firefighting BFI Browning-Ferris Industries (a wholly
owned subsidiary of Allied Waste Industries, Inc.)
BPO Blanket Purchase Order BSIP Business Self Inspection Program CA-DHS California Department of Health
Services CAFR Comprehensive Annual Financial
Report CAPER Consolidated Annual Performance
Report CCC Combined Communications Center CDBG Community Development Block
Grant CEQA California Environmental Quality Act CERT Citizens Emergency Response
Training CHDO Community Housing Development
Organization CIP Capital Improvement Program CLETS California Law Enforcement
Telecommunications System COPS Community Oriented Problem Solving CPO Cash Purchase Order CSMFO California Society of Municipal
Finance Officers DA District Attorney D.A.R.E. Drug Awareness Resistance
Education DART Development Application Review
Team DOJ Department of Justice DPA Development Plan Agreement DUI Driving Under the Influence EIR Environmental Impact Report EMLAP Employee Mortgage Loan Assistance
Program EOC Emergency Operations Center EPA Environmental Protection Agency ERAF Educational Revenue Augmentation
Fund FAA Federal Aviation Administration FAR Federal Air Regulation FBI Federal Bureau of Investigation FMDSS Financial Management Decision
Support System FMS Financial Management System FTE Full-time Equivalent Job Position FY Fiscal Year FYE Fiscal Year End GASB 34 Governmental Accounting Standards
Board Statement No. 34 GASB Governmental Accounting Standards
Board GFOA Government Finance Officers’
Association GIS Geographical Information Systems GOA Gone on Arrival GPU General Plan Update HLC Historic Landmarks Commission HOME Federal Home Investment
Partnership Program HUD Housing and Urban Development ICS Intra-City Services IIPP Injury and Illness Prevention Program IOD Injury on Duty IPM Integrated Pest Management ICPMS Inductively Coupled Plasma Mass
Spectroscopy JPA Joint Powers Authority LAIF Local Agency Investment Fund LDT Land Development Team LEAP Learning for Excellence &
Achievement Program LTF Local Task Force LUFT Leaking Underground Fuel Tank MDC Mobile Data Computer MHA Mental Health Association MJSWTG Multi-Jurisdictional Solid Waste Task
Group MTD Metropolitan Transit District NPDES National Pollution Discharge
Elimination System

APPENDIX: L is t of Acronyms
G-26
NPO Neighborhood Preservation Ordinance
OSHA Occupational Safety and Health Administration
P3 Paradise Performance Program PAF Personnel Action Form PAL Police Activities League PARC Parks and Recreation Community
Foundation PBIA Parking and Business Improvement
Area (Assessment) PC Planning Commission PCD Program Criteria Document PERS Public Employee Retirement System PFC Passenger Facility Charge PLF Public Library Fund PM Planned Maintenance PO Purchase Order POST Police Officers Standards and
Training PQI Pavement Quality Index PRT Pre-Application Review Team PSA Public Service Announcement PUC Public Utilities Commission RAP Recreation After-School Program RDA Redevelopment Agency RFP Request for Proposal RFQ Request for Qualifications RWQCB California Regional Water Quality
Control Board SBAPCD Santa Barbara Air Pollution Control
District SBCAG Santa Barbara County Association of
Governments SBCPA Santa Barbara Center for the
Performing Arts SBMC Santa Barbara Municipal Code SBPD Santa Barbara Police Department SBPL Santa Barbara Public Library SEIU Service Employee International Union
(Local 620) SEMS Standardized Emergency
Management Systems SIDA Security Identification Display Area SMS (Microsoft) Software Management
System SMU Site Mitigation Unit TACT Total Awareness Cross Training TDA Transportation Development Act
TOT Transient Occupancy Tax TSA Transportation Security
Administration USGS U.S. Geological Services USPS United States Postal Service UUT Utility Users’ Tax VAPP Visual Arts and Public Places WAN Wide Area Network ZIR Zoning Information Report
Copyright © 2022 FDOKUMEN