FY16 Proposed Budget Document City of Eugene
195
Cover Image and Cover Design Credits: Cover Image courtesy of Rowell Brokaw Architects. Cover Design courtesy of Bryan Mumme. PROPOSED BUDGET FY16 Mayor Kitty Piercy Budget Committee Councilors Citizen Members George Brown (Ward 1) Laura Illig, Chair Betty Taylor (Ward 2) Ken Beeson, Vice Chair Alan Zelenka (Ward 3) Robert Clarke George Poling (Ward 4) Chelsea Clinton Mike Clark (Ward 5) Jill Fetherstonhaugh Greg Evans (Ward 6) Will Shaver Claire Syrett (Ward 7) Joshua Skov Chris Pryor (Ward 8) Marshall Wilde City Manager Jon Ruiz Executive Management Team Sarah Medary, Assistant City Manager and Planning and Development Glenn Klein, City Attorney Kristie Hammitt, Central Services Randy Groves, Fire and EMS Renee Grube, Library, Recreation and Cultural Services Pete Kerns, Police Kurt Corey, Public Works Finance Director Sue Cutsogeorge Finance Staff Maurizio Bottalico Jamie Garner Larry Hill Andrea Jobanek Doug Lauderbach Twylla Miller Jessica Mumme Vicki Silvers Mike Streepey Debbie Wydra
-
Upload
khangminh22 -
Category
Documents
-
view
0 -
download
0
Transcript of FY16 Proposed Budget Document City of Eugene

Cover Image and Cover Design Credits: Cover Image courtesy of Rowell Brokaw Architects. Cover Design courtesy of Bryan Mumme.
PROPOSED BUDGET FY16
Mayor Kitty Piercy
Budget Committee Councilors Citizen Members George Brown (Ward 1) Laura Illig, Chair Betty Taylor (Ward 2) Ken Beeson, Vice Chair Alan Zelenka (Ward 3) Robert Clarke George Poling (Ward 4) Chelsea Clinton Mike Clark (Ward 5) Jill Fetherstonhaugh Greg Evans (Ward 6) Will Shaver Claire Syrett (Ward 7) Joshua Skov Chris Pryor (Ward 8) Marshall Wilde
City Manager Jon Ruiz
Executive Management Team
Sarah Medary, Assistant City Manager and Planning and Development Glenn Klein, City Attorney
Kristie Hammitt, Central Services Randy Groves, Fire and EMS
Renee Grube, Library, Recreation and Cultural Services Pete Kerns, Police
Kurt Corey, Public Works
Finance Director Sue Cutsogeorge
Finance Staff
Maurizio Bottalico Jamie Garner
Larry Hill Andrea Jobanek
Doug Lauderbach Twylla Miller
Jessica Mumme Vicki Silvers
Mike Streepey Debbie Wydra

How You Can Get Involved Review of FY16 Budget
How You Can Get Involved Members of the public are encouraged to express their views on the proposed budget. All meetings of the Budget Committee and City Council are open to the public and most of them include a public comment period. Citizens may testify at the Budget Committee public hearing on Tuesday, May 5, 2015, and the City Council public hearing on Monday, June 22, 2015. Copies of the proposed budget are available for review at the City of Eugene Finance Division. Copies of the proposed budget document can be purchased from the Finance Division or provided on a CD free of charge. In addition, you can download or view the proposed budget from the City’s website at www.eugene-or.gov/budget. How to Provide Comments or Testify: 1. Send a written statement to the Budget Committee or City Council,
c/o City of Eugene Finance Division, 100 W. 10th Avenue, Suite 400, Eugene, OR 97401, 2. Submit a written statement at the meeting or public hearing, 3. Send an e-mail to [email protected], or 4. Speak to the Budget Committee or City Council at the public comment times or public
hearings. City of Eugene Budget Meetings
City Manager’s FY16 Proposed Budget Presentation Wednesday, April 29, 2015 • 6:00 pm
Eugene Downtown Public Library Bascom-Tykeson Room, 100 West 10th Avenue
Budget Committee Public Hearing, Deliberation and Action on FY16 Proposed Budget
Tuesday, May 5, 2015 • 5:30 pm Eugene Downtown Public Library
Bascom-Tykeson Room, 100 West 10th Avenue
Sustainable Budget Meeting Tuesday, May 12, 2015 • 5:30 pm Eugene Downtown Public Library
Bascom-Tykeson Room, 100 West 10th Avenue
City Council Public Hearing and Action on FY16 Budget Monday, June 22, 2015 • 7:30 pm
Lane County Public Service Building Harris Hall, 125 East 8th Avenue
Budget Committee and City Council meetings are televised on MetroTV, Channel 21; webcasts of the meetings are available on the City of Eugene website. Meeting materials are available at www.eugene-or.gov/budget.

How You Can Get Involved Review of FY16 Budget
All meetings are held in wheelchair accessible rooms. For individuals who are hearing impaired, an interpreter or an assistive listening device can be provided with one week notice prior to the meeting. Materials can be made available in alternative formats if requested in advance. To arrange for these services, or for more information, please contact Finance Division staff at 541-682-5512.


Table of Contents
BUDGET MESSAGE ............................................................................................................................................................ 1 FY16 Proposed Budget Message Attachment A – General Fund Forecast Attachment B – FY16 General Fund Changes Attachment C – FY16 Other Fund Changes General Fund Reserves
BUDGET SUMMARY ........................................................................................................................................................ 11 Budget Summary Full Time Equivalent (FTE) Summary FINANCIAL POLICIES ..................................................................................................................................................... 25 Financial Management Goals and Policies DEPARTMENT VIEW ...................................................................................................................................................... 37 Central Services Fire and Emergency Medical Services Library, Recreation, and Cultural Services Planning and Development Police Public Works FUND SUMMARY .............................................................................................................................................................. 55 Financial Structure Fund Structure Fund Types Fund Matrix Fund Schedules DEBT SERVICE AND TAX INFORMATION ............................................................................................................ 91 Debt Service Property Tax Rates and Tax Levy URBAN RENEWAL AGENCY ........................................................................................................................................ 99 Urban Renewal Agency Overview Urban Renewal Agency Fund Schedules Urban Renewal Agency Debt Services APPENDIX Multi-Year Financial Plan FY16-21


City of Eugene, Oregon FY16 Proposed Budget Message
April 29, 2015
Budget Committee, Mayor Piercy, Colleagues, and Members of the Eugene Community:
As a result of the economic downturn, over the past six years we have had to fill a General Fund budget gap totaling $30 million or 24% of the General Fund. Our approach has been to minimize the impact on community services and employees, and develop a financially stable budget. We have harnessed the innovation and optimism of many people to not only survive, but to thrive. Through it all, we retained a full range of robust municipal services and served our community well. We have also been able to move the organization and the community forward in key areas by making strategic investments, such as:
Improved downtown public safety; Continued progress on homelessness issues; Constructed the Washington Jefferson skate park; Advanced Envision Eugene; Revitalized Downtown; Implemented the Eugene-Springfield Fire Merger; Secured safe, cost effective facilities for the Police Department and Municipal Court; Organized the 2014 Neighborhoods USA conference; Implemented the Triple Bottom Line framework for decision making; and Hosted international track and field competitions.
These are just a few of the many accomplishments we have realized together over the past several years.
This year, I am pleased to present a proposed budget that does not have a long-term budget gap, as can be seen in the General Fund Forecast (Attachment A). The hard work by staff, executive team, Budget Committee, community partners and elected officials over the last six years has been successful in creating a stable budget that provides funding for our current level of services while ensuring ongoing funding for the Sheldon Branch Library and maintaining a responsible reserve. This work was difficult and we resisted the temptation to fund ongoing services with one-time dollars. If the economic recovery continues as forecast, we expect our budget to remain stable with no gap to fill, but also little, if any funding to add programs or services. Most funds are stable and we are no longer drawing down reserves to pay for ongoing operations in the Facilities, Fleet, Information Technology, Risk and Health Funds.
The FY16 Proposed Budget includes some recommended changes which are highlighted on Attachment B for the General Fund and Attachment C for Other Funds. The General Fund changes reflect City Council priorities related to sick leave for temporary employees, Sheldon Branch Library funding, and Human Services Commission funding, as well as funds to address the evidence backlog in the Police Department.
Other fund changes address energy efficiency, increasing capacity in the building permits area as the economy has improved, grounds maintenance at the wastewater plant and funding for the replacement of technology and core business software.
1

City of Eugene, Oregon FY16 Proposed Budget Message
Looking to the future, we must continue to exercise fiscal discipline. We may be tempted to increase expenses to restore services that were reduced in recent years. Instead, let us look ahead towards what the community wants for the future, rather than look backwards at what has been changed. In this way, we can achieve the community’s best outcomes for libraries of the future, development and maintenance of community and neighborhood parks, economic prosperity, and a justice system that offers hope, accountability and protection. These explorations may require new revenue sources to expand and sustain these vital services.
As the economy strengthens so does our outlook for new opportunities and renewed partnerships; redeveloping the EWEB riverfront property, constructing Whole Foods downtown, moving 365 homeless veterans into housing and rebuilding City Hall refresh our optimism as we emerge from the fiscal storm. While we work in a stronger fiscal environment on these and other opportunities, we must stay diligent and be thoughtful about the choices we make.
Sincerely,
Jon R. Ruiz City Manager
2

General Fund Forecast Attachment A
General Fund (main subfund) Six-Year Financial Forecast FY16 to FY21 The General Fund Forecast is a tool that projects how much the City will spend and receive over the next six years. This tool assists policy makers with developing strategies to meet future challenges. Many factors affect the forecast. While assumptions are made using the most current information available, the one constant is that things will change in the future. The FY16 Proposed Budget forecast was developed as our economy shifts, coming out of the recession. While we look to operate in a more stable economic climate, we recognize a shift in key forecast variables such as increased property tax revenues. The forecast shows a less conservative and more optimistic outlook than in the past few years, but there continue to be areas of uncertainty that will be monitored including long-term property tax revenue growth, the impact of legislation on central assessment, PERS costs and the future rate of inflation. The forecast is used to understand the long-term impact of current decisions and to make appropriate adjustments to the budget as new information becomes known. The City also monitors changes to the forecast to see how close we are in meeting two important financial goals: are we living within our means (are revenues greater than or equal to expenditures) and do we have an adequate savings account (are we maintaining an adequate level of reserves). Over the past six years when the proposed budget forecast has been presented we have shown a budget gap which represented the annualized shortfall if no action was taken to live within our means. The General Fund Forecast has been updated with the most current information available and incorporates the FY16 Proposed Budget changes which includes on-going funding for the Sheldon Branch Library, funding to implement sick leave for temporary employees as well as limited duration funding for Evidence Control Unit staffing and the Human Services Commission discretionary funding (see FY16 General Fund Changes, Attachment B, for more information). After incorporating these service adjustments and the updated forecast assumptions, the forecast shows that the service system is stable with most years of the forecast having revenues that are greater than or equal to expenditures over the forecast period. The City maintains two key reserves: the Unappropriated Ending Fund Balance (UEFB) and the Reserve for Revenue Shortfall (RRSF). The UEFB is budgeted at two months of operating expenses to allow the City to pay bills and make payroll between the start of the fiscal year in July until November when property tax revenue is received. The Reserve for Revenue Shortfall is in essence the savings account for the General Fund and is a key measure of the City’s fiscal health. The target level for the Reserve for Revenue Shortfall is 8% of General Fund expenditures. On average, the target level is approximately $12 million per year over the forecast period.
8% RRSF Target
$135
$140
$145
$150
$155
$160
$165
FY16 FY17 FY18 FY19 FY20 FY21
Mil
lio
ns
Revenues
Expenditures
Revenues vs Expenditures
3

General Fund Forecast Attachment A
The Reserve for Revenue Shortfall drops from 6.8% in FY16 to 3.9% by the end of the forecast period after incorporating FY16 Proposed Budget changes and anticipated changes around major forecast drivers. The forecast assumes use of the Reserve for Revenue Shortfall to help offset anticipated PERS rate increases in FY16 and FY18. As we move forward, it will be important to identify one-time resources that can be used to bring the Reserve for Revenue Shortfall back up to target levels so the organization will have the ability to respond in a thoughtful way to unanticipated future events.
There are several areas of risk to the forecast that will be monitored moving forward:
Property Tax Revenues – assessed value growth returned to pre-recession levels in FY15 at 4.3% and the FY16 Proposed Budget includes a moderate growth rate of 4% throughout the forecast period. If the assessed value growth rate is reduced to 3% over the forecast period, property tax revenues are reduced by $3.4 million on average annually.
PERS Rates – the FY16 Proposed Budget includes PERS rate increases in FY16 and FY18. Factors that could impact rate increases in FY18 and beyond include the outcome of pending litigation and how the financial markets perform over time.
Inflation – interest rates are anticipated to increase in the short-term and could potentially impact the low inflationary factors that have been present for some time. Changes in the rate of inflation can have a large impact on the forecast. An increase of 0.5% over the inflation rates assumed in the FY16 Proposed Budget forecast would increase costs an additional $7million over the forecast period.
Legislation – legislation was passed this session that increases exemptions for centrally assessed properties which will likely reduce property tax revenue to the City. The full impact to the City of Eugene has not yet been determined. This legislation takes effect in FY17.
Forecast Variables Assessed Value – FY15 assessed value of property grew by 4.3%. The FY16 assessed value growth rate is projected to be 4.0% and is forecast to remain at that level through the forecast period, which aligns with the growth levels seen before the economic downturn.
$0
$5
$10
$15
FY06 FY08 FY10 FY12 FY14 FY16 FY18 FY20
Mil
lio
ns
Reserve for Revenue Shortfall (RRSF)
RRSF - FY16 Proposed Budget Forecast
RRSF - Adopted Budget
8% RRSF Target
4

General Fund Forecast Attachment A
Property Tax Collection Rate – The projected property tax collection rate is estimated at 94.6% for FY15, and is set at 94.3% in FY16 and the out years of the forecast. The actual collection rates for FY13 and FY14 were 94.3% and 94.4%, respectively. These collection rates are applied against the gross taxes levied by the Lane County Assessor and incorporate the 3% early payment discount available to taxpayers for making full payment of taxes in November. Property Tax Revenue – Total property tax revenue, including current and delinquent taxes, is projected at $88.7 million in FY15, $91.8 million in FY16 and $112.3 million by FY21, after taking into account the assessed value changes and property tax collection rates explained above. EWEB Contributions-in-lieu-of-taxes (CILT) – Revenue from EWEB is projected by EWEB staff at $13.0 million in FY16 and continues to build to $14 million annually by the end of the forecast. These estimates incorporate the new methodology approved last year and future anticipated rate increases in the out years of the forecast. Licenses and Permits – Right-of-way use fees from Century Link, Northwest Natural Gas, Comcast and other providers are included at $6.2 million in FY16, increasing to $6.9 million annually by FY21. Interest Earnings – Portfolio interest earnings are projected at 0.3% in FY15, 0.75% in FY16 and increasing in the out years of the forecast to 4.0% by FY21. This reflects an outlook of rising rates in the near future. State Shared Revenues – This revenue is projected to increase from $4.5 million to $5.9 million over the forecast period. Inflation Rates – Inflation rates beginning in FY17 are pegged at the inflation percentages used by the State Office of Economic Analysis in their February 2015 forecast. The FY16 rate is 1.3%. In FY17 the rate is 2.3%, increasing to a high of 2.5% by the end of the forecast period. Cost of Living Adjustments – If a labor contract is in place, the forecast includes the COLA per the contract. If no contract is in place for a particular year, the forecast assumes the State Office of Economic Analysis inflation projections from their February 2015 forecast. Materials and Services – The FY16 rate is 1.3%, and increases beginning in FY17 are tied to the inflation percentages used by the State Office of Economic Analysis in their February 2015 forecast. Health Benefits – The forecast includes a health benefits inflation rate of 7.0% in FY16. Based on preliminary projections from the City’s actuary, the cost of health benefits are expected to rise 7% in FY16 with the growth rate dropping to 6.5% in FY17 and 6% in FY18 and beyond. Retirement Costs – The forecast includes a PERS Tier 1 and Tier 2 rate increase of 3.4% of payroll in FY16 and 3.0% in FY18 based on the actuarial valuation from calendar year 2013 data and subsequent anecdotal PERS actuary information. An OPSRP General Service rate increase of 0.79% of payroll is projected in FY16 and an additional 3% in FY18 and an OPSRP Police/Fire rate increase of 2.17% in FY16 and an additional 3% in FY18. There are no additional increases in PERS Tier 1 and Tier 2 or OPSRP rates built in this forecast for FY20.
5

General Fund Forecast Attachment A
Projected Proposed Budget
FY13 FY14 FY15 FY16 FY17 FY18 FY19 FY20 FY21
Resources
Beginning Working Capital 38,065,592$ 35,415,888$ 38,503,285$ 33,990,404$ 33,241,000$ 33,383,000$ 32,767,000$ 32,880,000$ 33,066,000$
Current Revenues 126,729,969 131,743,389 134,314,955 137,517,842 142,836,000 149,038,000 154,227,000 159,208,000 164,410,000
Total Resources 164,795,561 167,159,277 172,818,240 171,508,246 176,077,000 182,421,000 186,994,000 192,088,000 197,476,000
Requirements
Departmental Expenditures
Personnel 91,268,603 91,250,712 95,657,352 102,850,741 105,968,000 110,889,000 114,348,000 118,304,000 121,568,000
Materials & Services 30,462,227 30,268,581 34,830,552 30,304,834 31,397,000 32,310,000 33,149,000 33,937,000 34,820,000
Departmental Sub Total 121,730,830 121,519,293 130,487,905 133,155,575 137,365,000 143,199,000 147,497,000 152,241,000 156,388,000
Non-Departmental Expenditures 7,648,844 7,136,699 8,339,931 5,111,300 5,329,000 6,455,000 6,617,000 6,781,000 6,950,000
Total Expenditures 129,379,673 128,655,993 138,827,836 138,266,875 142,694,000 149,654,000 154,114,000 159,022,000 163,338,000
Change in UEFB (1) - - - 1,370,000 737,000 1,160,000 743,000 818,000 720,000
Total Expenditures plus Change in UEFB 129,379,673 128,655,993 138,827,836 139,636,875 143,431,000 150,814,000 154,857,000 159,840,000 164,058,000
Annual Operating Surplus/(Deficit) (2) (2,649,704) 3,087,396 (4,512,881) (2,119,033) (595,000) (1,776,000) (630,000) (632,000) 352,000
Ending Fund Balance
UEFB at June 30 (3) 21,150,000 21,670,000 21,710,000 23,040,000 23,777,000 24,937,000 25,680,000 26,498,000 27,218,000
Reserves
Reserve for Revenue Shortfall (RRSF) (4) 10,597,727 5,480,301 6,532,237 9,451,371 9,106,000 7,330,000 6,700,000 6,068,000 6,420,000 Other Reserves (5) 1,000,000 1,000,000 1,000,000 750,000 500,000 500,000 500,000 500,000 500,000
Total Reserves 11,597,727 6,480,301 7,532,237 10,201,371 9,606,000 7,830,000 7,200,000 6,568,000 6,920,000
Mid Year Adjustments or Experience Estimates (6) (1,849,710) 1,609,437 4,748,167
Reserve For Encumbrance For the Next Fiscal Year (7) 1,556,669 1,714,021
Marginal Beginning Working Capital For The Next Fiscal Year (8) 2,961,202 7,029,526
Total Ending Fund Balance 35,415,888 38,503,285 33,990,404 33,241,371 33,383,000 32,767,000 32,880,000 33,066,000 34,138,000
Total Requirements 164,795,561 167,159,278 172,818,240 171,508,246 176,077,000 182,421,000 186,994,000 192,088,000 197,476,000
Notes:
(1) Increase necessary to keep Unappropriated Ending Fund Balance at Council adopted policy level of two months of operating expenditures, excluding reserves and contingency.
(2) Annual Operating Surplus/Deficit equals Current Revenues less Total Expenditures plus Change in UEFB.
(3) Per Council policy UEFB equals two months operating expenses (total department & non-department expenditures).
(4) RRSF as budgeted for actual and budgeted years. Forecast assumes any annual surpluses are set aside in RRSF and used to fully or partially fund any future operating deficits.
(5) Other Reserves includes reserves for property tax appeals.
(6) Mid year adjustments include supplemental budget actions, experience estimates for revenues/expenditures and adjustments to BWC to enact the adopted budget
(7) Reserve for encumbrance represents a reserve for uncompleted contracts carried over to the next fiscal year.
(8) Marginal Beginning Working Capital represents the audited difference between estimated Beginning Working Capital and actual BWC. Marginal Beginning Working Capital is appropriated by City Council on supplemental budget in December each year.
Reserve For Revenue Shortfall (RRSF) as a % of Actual or
Projected Expenditures 8.2% 4.3% 4.7% 6.8% 6.4% 4.9% 4.3% 3.8% 3.9%
Reserve For Revenue Shortfall (RRSF) as a % of Expenditures
per the Adopted Budget; Target is 8% 6.2% 3.8% 4.7%
Forecast
Executive Summary: Resources and Requirements
GENERAL FUND SIX-YEAR FINANCIAL FORECAST (MAIN SUBFUND 011), FY16 THROUGH FY21
FY16 Proposed Budget
April 29, 2015
6

General Fund Changes Attachment B
FY16 Proposed General Fund Budget Changes
Proposed On-Going Funding FTE Amount
Sheldon Branch Funding 2.55 $315,000
Sick Leave Pay For Employees 0 $300,000
Sick Leave Ordinance - BOLI Contract 0 $35,000
Total 2.55 $650,000
Proposed Limited Duration Funding
Property Control Unit Staffing (FY16 & FY17) 0 $250,000
Human Services Commission Discretionary Payment (FY16) 0 $250,000
Total 0 $500,000
Sheldon Branch – Provide on-going funding for the Sheldon Branch Library at current service
levels; open 26 hours, five days per week.
Sick Leave Pay For Temporary Employees – Provide on-going funding to pay sick leave costs for
temporary City of Eugene employees once Ordinance 20537 goes into effect on July 1, 2015.
Sick Leave Ordinance, BOLI Contract – Provide on-going funding for the BOLI contract for
education, outreach and enforcement activities related to Ordinance 20537.
Evidence Control Unit (formerly Property Control) Staffing – Provide funding for two years as
additional resources for the Evidence Control Unit to comply with audit recommendations.
Human Services Commission Discretionary Payment – Provide funding for an additional year
to the Human Services Commission (HSC) to support social services at the same level as provided
in FY15.
7

Other Fund Changes Attachment C
FY16 Other Fund Budget Changes
Road Fund (Fund 131) FTE Amount
LED Street Lighting Retrofit Phase One 0.0 $1,700,000
Construction Permits Fund (Fund 135)
Building Permit Inspectors 2.0 $240,000
Structural Engineer Plans Reviewer 1.0 $140,000
Parking Fund (Fund 520)
Parking Citation and Permit Software System 0.0 $250,000
Wastewater Utility Fund (Fund 533)
Wastewater Grounds Maintenance 0.0 $292,000
Information Systems and Services Fund (Fund 610)
Core Business Software Replacement $6,277,000
Total 3.0 $8,899,000
Road Fund
LED Street Lighting Retrofit Phase One – Provides funding for a project to replace non-
decorative 70-watt and 100-watt high pressure sodium (HPS) street lighting currently funded
by the Road fund. Through reduction of energy usage this project will reduce total greenhouse
gas emissions from City fixtures by approximately 4%.
Construction Permits Fund
Building Permit Inspectors – Provides funding for 2 Building and Permit Services inspectors for
the Building Inspection Team. The number of inspections performed in Eugene has increased
11% since FY10 while the number of FTE has decreased by 24%. Additional inspectors will
enable the City to complete scheduled inspections within 24 hours as required by state code
without having to receive assistance from other jurisdictions or delay inspections.
Structural Engineer Plans Reviewer – Provides funding for an in-house plans reviewer to
address the increased demand and complexity of commercial developments in Eugene that
have occurred as the economy has rebounded. This increased demand exceeds the current
service capacity for Building and Permit services.
Parking Fund
Parking Citation and Permit Software System – Provides funding for a citation and permit
issuing software and hardware system to replace the current system that was purchased in
1991 and was last upgraded in the early 2000’s. The new system would utilize current
technology such as cell phone apps, Bluetooth printers for citations and “live” information on
monthly permit parkers to greatly increase efficiency and move towards e-parking permits.
8

Other Fund Changes Attachment C
Wastewater Utility Fund
Wastewater Ground Maintenance – Provides funding for additional grounds maintenance activities. Significant landscaping and riparian improvements were required as part of the Metropolitan Wastewater Management Commission’s Facility Plan to increase plant capacity. In FY16, the Wastewater Division will assume responsibility from MWMC for this work.
Information Systems and Services Fund
Core Business Software Replacement – Provides partial funding for replacement of the software systems that manage and automate City administrative and business processes including accounts payable, human resources, payroll, general ledger, budget, receivables and purchasing. Funding comes from several sources, including savings from discontinuing maintenance on existing system, contributions from Central Services operations, General Fund contribution from SB#1 in December 2014, Telecom Fund and Assessment Fund.
9

General Fund (Main Subfund) Reserves
General Fund (Main Subfund) reserves are a way that the City plans for financial flexibility to handle unexpected events and allow the City to pay for regular operations until property taxes are received. Maintenance of adequate reserve levels is a critical factor in the City’s “Aa1” bond rating from Moody’s Investors Service. A high credit rating translates into lower borrowing costs on street bonds and other borrowings, saving taxpayer dollars. For the FY16 Proposed Budget, reserves are projected to increase by $4.4 million, or 15.2%, from the FY15 Adopted Budget levels (excluding reserve for encumbrance). The projected increase in FY16 budget reserves is primarily due to three main factors: (i) the audited actual carry-over balance from FY14 was higher than anticipated when the FY15 Adopted Budget was prepared; (ii) FY15 projected revenues are moderately higher than budgeted; and (iii) FY15 projected expenditures are less than budgeted. FY16 Proposed Budget reserves are, however, less than targeted reserve levels. There are three components of the FY16 Proposed Budget reserves. The first reserve is the Unappropriated Ending Fund Balance (UEFB) which equals $23.0 million, or two months of expenditures in the FY16 Proposed Budget. This reserve enables the City to pay bills and make payroll between the start of the fiscal year in July until November when property tax revenue is received. The UEFB allows the City to operate during that time without borrowing money. By utilizing this reserve the City does not have to pay borrowing costs to provide services prior to property tax collection and is also able to earn interest on reserve balances. The next reserve, called the Reserve for Revenue Shortfall (RRSF), is set at $9.5 million in the FY16 Proposed Budget, or about 6.8% of expenditures. The target for this reserve is set at 8% of General Fund expenditures, so the FY16 Proposed Budget level is below the target. Finally, the third reserve is designed to buffer the potential impacts from large property tax appeals, and it is set at $0.75 million. All together, these three reserves total about three months or 23.9% of General Fund expenditures. To put this in perspective, three months of expenditures is on the low end of what financial experts recommend as a best practice for families to keep in their emergency savings account. Adopted Budget FY11 FY12 FY13 FY14 FY15 FY16 Prop. UEFB $20,153,224 $21,260,000 $21,150,000 $21,670,000 $21,710,000 $23,040,000 RRSF 10,422,039 7,945,638 10,428,107 4,895,575 6,134,237 9,451,371 Other 200,000 1,000,000 1,000,000 1,000,000 1,000,000 750,000 Encumbrance* 1,281,555 2,111,101 2,188,759 1,556,669 1,714,021 0 Total $32,056,818 $32,316,739 $34,766,866 $29,122,244 $30,558,258 $33,241,371 As a % of Expenditures
UEFB 16.5% 16.7% 16.7% 16.7% 16.7% 16.6% RRSF 8.6% 6.2% 8.2% 3.8% 4.7% 6.8%
*The FY16 Reserve for Encumbrance will be determined at the time of FY16 budget adoption.
10
Budget Summary All Funds
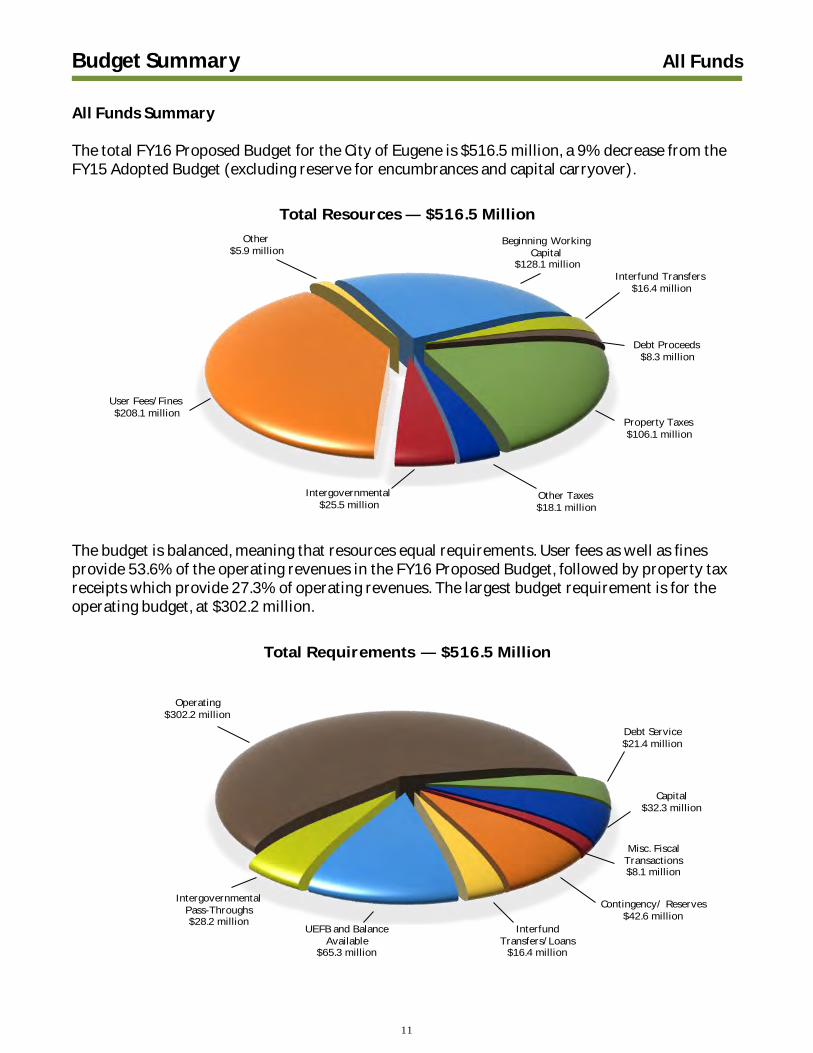
All Funds Summary The total FY16 Proposed Budget for the City of Eugene is $516.5 million, a 9% decrease from the FY15 Adopted Budget (excluding reserve for encumbrances and capital carryover).
Property Taxes$106.1 million
Other Taxes$18.1 million
Intergovernmental$25.5 million
User Fees/Fines$208.1 million
Other$5.9 million
Beginning Working Capital
$128.1 million Interfund Transfers
$16.4 million
Debt Proceeds$8.3 million
Total Resources — $516.5 Million
The budget is balanced, meaning that resources equal requirements. User fees as well as fines provide 53.6% of the operating revenues in the FY16 Proposed Budget, followed by property tax receipts which provide 27.3% of operating revenues. The largest budget requirement is for the operating budget, at $302.2 million.
Debt Service$21.4 million
Capital$32.3 million
Misc. Fiscal Transactions$8.1 million
Contingency/ Reserves$42.6 million
Interfund Transfers/Loans
$16.4 million
UEFB and Balance Available
$65.3 million
Intergovernmental Pass-Throughs$28.2 million
Operating$302.2 million
Total Requirements — $516.5 Million
11

Budget Summary All Funds
The FY16 Proposed Operating Budget totals $302.2 million funds to date, with Central Services comprising the largest share at, 27.6%. Central Services is the largest department this year, exceeding Public Works, primarily due to approximately $6.3 million in anticipated expenditures related to replacement of the core business software system.
Central Services27.6%
Fire and EMS11.8%
Police17.5%
Planning and Development
6.5%
LRCS9.2%
Public Works27.5%
FY16 Proposed Operating Budget by Department — $302.2 Million All Funds
The operating budget has three components: Personnel Services, Materials and Services, and Capital Outlay. Personnel Services is the largest share, at 57.2%.
Personnel Services57.2%
Materials and Services40.0%
Capital Outlay2.8%
FY16 Proposed Operating Budget — $302.2 MillionAll Funds
12

Budget Summary All Funds
Personnel Services Personnel Services expenses, which are comprised primarily of wages and fringe benefits, account for 57.2% of operating expenses in the total City budget and 76.3% in the General Fund operating budget. Employee Wages Budgeted wages are determined by contracts for represented employees and by the Executive Management Team for non-represented employees. Represented employees are budgeted to receive wage increases pursuant to their specific bargaining agreements. At the time of the FY16 Proposed Budget publication, the American Federation of State, County, and Municipal Employees (AFSCME), Eugene Police Employee Association (EPEA), and a new union, the International Association of Firefighters (IAFF), Battalion Chiefs, Local 851, were the bargaining units with contracts in place for FY16. The other bargaining units, including the International Association of Fire Fighters (IAFF), and International Alliance of Theatrical Stage Employees (IATSE) did not have contracts in place covering FY16 cost of living adjustments (COLAs).
Bargaining Unit FY16 COLA AFSCME (American Federation of State, County, and Municipal Employees)
Per contract, minimum 2.0%, maximum 4.0% COLA on 7/1/15
EPEA (Eugene Police Employee Association) Per contract, 2.0% COLA on 7/1/15
IAFF (International Association of Fire Fighters) 2.0% COLA assumed based on general rate of inflation
IAFF, Battalion Chiefs Equivalent to COLAs for respective positions
IATSE (International Alliance of Theatrical Stage Employees)
2.0% COLA assumed for regular performance rates
Any COLA for non-represented employees will be determined by the City Manager prior to the start of the fiscal year. Employee Retirement Plan Expenses Retirement plan expenses are projected to be $26.3 million in FY16, the second largest component of Personnel Services costs after wages and health care costs. The Oregon Public Employee Retirement System (PERS) expenses for Tier 1 and Tier 2 employees (those hired before August 29, 2003) continue to be the largest category, but retirement costs also include payment on the pension bonds. The State legislature determines pension system benefit levels and the PERS Board sets employer contribution rates. These rates are adjusted every other year by PERS, leaving the City very little control over its retirement costs. For Tier 1 and 2 employees, the employer contribution rates are expected to increase in FY16 to 17.5% of gross wages from 14.1% in FY15, based on projections prepared by PERS.
13

Budget Summary All Funds
The Oregon Public Service Retirement Plan (OPSRP) was created by the Oregon state legislature for public employees hired on or after August 29, 2003, and is administered by the PERS Board. OPSRP is a hybrid retirement plan with two components: a Pension Program (defined benefit) and an Individual Account Program (defined contribution). Approximately 47% of the City’s employees are currently in the OPSRP system. For sworn public safety employees, the FY16 OPSRP employer contribution rate is 14.16% of gross wages. For general service employees, the OPSRP employer contribution rate is 10.05% of gross wages. The FY16 Proposed Budget assumes a 0.25% increase in the pension bond rate, bringing the FY16 pension bond rate to 6.00%. The City’s pension obligation bonds were issued in FY02 to pay off the estimated unfunded PERS actuarial liability at that time. The overall FY16 increase in retirement costs for all funds is $2.7 million, which represents an 11.6% increase from the FY15 Adopted Budget level. Of this amount, $1.6 million is in the main subfund of the General Fund, and the remaining $1.1 million is in other funds. The increase in FY16 retirement costs is primarily due to increases in PERS employer contribution rates for Tier 1 and 2 employees, as well as public safety OPSRP employees. The City continues to address retirement costs by stabilizing the number of full-time employees (FTEs) and through a changing workforce that is shifting from PERS to OPSRP enrollment by either attrition and/or new hire personnel replacement. Employee Health Care Health benefits, budgeted at $25.9 million in FY16, are the third largest component of Personnel Services expenses after wages. The FY16 Proposed Budget for health benefits represents an increase of $1.7 million, or 7.2%, from the FY15 Adopted Budget due to the increases in health insurance premiums. City employees contribute to the cost of health insurance. The table on the following page summarizes FY16 employee contributions towards health care costs by bargaining unit.
14

Budget Summary All Funds
Employee Group
FY16 Employee Share of Health Insurance Premium
AFSCME (American Federation of State, County, and Municipal Employees)
8% of health insurance premium
EPEA (Eugene Police Employees Association)
5% of health insurance premium with a maximum based on a tiered rate (single, two-party and family)
IAFF* (International Association of Fire Fighters)
5% of health insurance premium with a maximum based on a tiered rate (single, two-party and family)
IAFF Battalion Chiefs (International Association of Fire Fighters)
5% of health insurance premium based on a tiered rate (single, two-party and family)
IATSE* (International Alliance of Theatrical Stage Employees)
4% of health insurance premium for the City Health Plan (PPO) and the City Managed Care Plan (POS) or 4% of the premium for the City Hybrid Plan (POS), based on a tiered rate (single, two-party and family)
Non-Represented Employees 8% of health insurance premium for the City Health Plan (PPO) and the City Managed Care Plan (POS), or 4% of the premium for the City Hybrid Plan (POS)
* IAFF and IATSE did not have contracts in place covering FY16 at the time of Proposed Budget development. The FY16 Employee Share of Health Insurance Premiums for these groups are assumptions based on current contract provisions.
Materials and Services Inflation The inflation increase for Materials and Services is projected to be 1.3% in FY16. This increase is based on the State of Oregon forecast for the FY16 Consumer Price Index for All Urban Consumers (CPI-U). The total departmental materials and services budget for FY16 for all funds is $120.8 million. This is $3.6 million or approximately 3.0% greater than the FY15 Adopted Budget. For the General Fund, Materials and Services is projected to increase by $1.5 million or 4.7%, largely due to increases in internal service fund rates and professional services for various projects. Capital Outlay Capital Outlay is budgeted at $8.5 million for FY16, which is approximately $0.6 million or 7.0% more than the FY15 Adopted Budget. Additional Capital Outlay spending in FY16 is mostly attributable to increases for Wastewater Collection and Treatment. Capital Outlay is best defined as budgeted departmental expenditures for materials and supplies with a useful life of more than one year and a cost greater than $5,000, such as specialized computer equipment.
15

Budget Summary Capital
Capital Budget Preparation of the Proposed Capital Budget is guided by the City’s Capital Improvement Program (CIP). The CIP forecasts the City’s capital needs over a six-year period based on various long-range plans, goals, and policies, as well as projected availability of funding from various sources. The CIP is updated every two years and is reviewed by citizens, the Budget Committee, and the City Council. The FY16 Proposed Capital Budget is based on the first year of the FY16-21 CIP that was approved by the City Council on March 9, 2015. The FY16 Proposed Budget for new capital projects, including funding secured and identified, is $32.3 million, an increase of $5.7 million from the FY15 Adopted Budget, excluding prior year carryovers. Capital projects are usually budgeted in their entirety in their first year, and unspent appropriation balances are carried forward from year to year for those projects that require multiple years to complete. Capital spending can change dramatically from year to year due to the size of projects initiated, the length of time to complete the projects, and the resources available, especially those from Federal and State sources. Capital projects are organized into six main project categories. Transportation and Airport categories comprise two-thirds of the FY16 Proposed Capital Budget:
Wastewater8.2%
Buildings and Facilities8.3%
Parks and Open Space6.8%
Stormwater9.8%
Transportation41.9%
Airport25.0%
FY16 Proposed Capital Budget — $32.3 MillionAll Funds
16

Budget Summary Capital
The total Proposed Capital Budget by category and some of the larger FY16 capital projects are as follows:
Airport - $8.1 million, including $6.4 million for the terminal building expansion, $1 million for the 2016 master plan update, $400,000 for ramp rehabilitation, and $250,000 in various improvement projects.
Parks and Open Space - $2.2 million, including $882,000 for site renovation and rehabilitation projects, $575,000 in park land acquisition, $500,000 for the EWEB Riverfront park planning and development, and $150,000 for ADA park improvements.
Public Buildings and Facilities - $2.7 million, including $1.2 million dedicated to the preservation of existing facilities, $681,000 for building service systems, and $463,000 on health, safety and welfare.
Stormwater - $3.2 million, including $1.1 million for stormwater rehabilitation activities, $500,000 for underground injection control facility removal, $500,000 for street and alley preservation, and $350,000 for stream bank stabilization.
Transportation - $13.5 million, including $7.8 million for street rehabilitation related to the 2012 street bonds, $3.3 million for street and alley preservation, $926,000 for the Commerce to Connector path, and $516,000 for work on bike paths.
Wastewater - $2.7 million, including $1.8 million for rehabilitation of the wastewater system and $450,000 for pump station rehabilitation.
17

Budget Summary Impact on Taxpayers
Permanent Tax Rate – The City of Eugene levies its permanent tax rate of $7.0058 per $1,000 of taxable assessed value; although the effective tax rate paid in FY16 is expected to be about $6.90 per $1,000 of assessed value due to the impact of the urban renewal tax increment calculation on overlapping tax rates. In addition, voters have approved other special property tax levies described below: Debt Levies – Voters have authorized the following General Obligation bonds that are repaid with property taxes:
In November 2012, a five-year street repair bond issue in the amount of $43 million was approved to fix 76 streets and provide funding for bicycle and pedestrian projects. FY15 was the first year taxes were levied for this purpose.
In November 2006, $27.5 million was approved for parks, athletic fields, and open space preservation.
In May 2002, $8.7 million was approved for construction of a downtown fire station located at 13th Avenue and Willamette Street.
In November 1998, $25.3 million was approved for parks and open space projects. In September 1995, $19 million was approved for construction of the Emergency Services
Center located at 2nd Avenue and Chambers Street and other public safety projects.
The estimated tax rate to pay this debt in FY16 is $1.10 per $1,000 of taxable assessed value, slightly higher than the debt tax rate for FY15. The estimated total taxes for the City of Eugene and the Eugene Urban Renewal Agency for a typical single-family home, which include voter approved levies and the Urban Renewal Districts, are expected to increase by $46 in FY16. This increase is due to projected growth in the assessed taxable value of a typical single-family home. Total Taxes
City and Urban Renewal Taxes for a Typical Single-Family Home FY16
FY15 Estimate City Permanent Operating Levy $1,268 $1,306 City Debt Taxes 201 207 Total City Taxes 1,469 1,513 Urban Renewal Agency Taxes 50 52 Total Taxes $1,519 $1,565 Assessed taxable value of a typical single-family home in Eugene* $183,945 $189,463
*FY15 value provided by Lane County Assessment & Taxation. Assumed increase of 3% for FY16.
The tax bill includes the Downtown and Riverfront Urban Renewal districts. These are not added costs to taxpayers, but represent a redistribution of taxes from other overlapping districts.
18

Budget Summary General Fund
The General Fund is made up of three subfunds: the main subfund ($171.5 million), the Cultural Services subfund ($7.4 million), and the Equipment Replacement subfund ($0.7 million). Property taxes continue to remain the largest revenue source in the General Fund, representing 51.2% of General Fund total resources, and 64.1% of revenues (excluding carryover balance):
Other Taxes$15.2 million
Property Taxes$91.8 million
Licenses/Permits$6.2 million
Intergovernmental$4.6 million
Rental and Miscellaneous
$0.6 million
Fines/Forfeitures$2.5 million
Charges for Services$13.0 million
Interfund Transfers$9.5 million
Beginning Working Capital
$36.1 million
Total General Fund Resources — $179.5 Million All Subfunds
The total FY16 Proposed General Fund budget of $179.5 million is $13 million higher than the FY15 Adopted Budget, excluding the $2.1 million reserve for encumbrances for comparison.
Contingency and Reserves
$12.3 million
Interfund Transfers$4.4 million
UEFB$23.0 million Pass-Throughs
$0.7 million
Fire and Emergency Medical Services
$27.6 million
Police$49.6 million
Library, Recreation and Cultural Services
$27.3 million
Public Works$5.8 million Planning and
Development$5.9 million
Central Services$22.9 million
Total General Fund Requirements — $179.5 Million All Subfunds
19

Budget Summary General Fund
The FY16 Proposed Budget also includes a reserve for revenue shortfall budgeted at $9.5 million and a reserve for property tax appeals budgeted at $750,000 (both are included in Contingency and Reserves). The reserve for revenue shortfall at $9.5 million represents approximately 6.8% of expenditures, which is below the target for this reserve of 8% of expenditures. The FY16 Proposed General Fund departmental operating budget is $139.1 million, which is approximately $8.4 million more than the FY15 Adopted Budget. The increase is due to normal inflationary budget increases such as cost of living adjustments and increases in health benefit premiums, as well as increases in PERS and OPSRP rates and an anticipated increase to personnel costs associated with an arbitration award related to union contract negotiations. Also included are costs associated with the City’s sick leave ordinance and on-going restoration of services at the Sheldon Library branch, Evidence Control Unit staffing, as well as one-time funding for the Human Services Commission. Additionally, as the City recovers from the recent recession, some of the internal service funds increased rates to more sustainable levels rather than relying on drawing down available balances to cover costs. The services provided by the City rely heavily on employees who are firefighters, police officers, librarians, planners, and so on. As a result, personnel services costs comprise 76.3% of the FY16 proposed operating budget for the General Fund, as seen in the following chart:
Personnel Services76.3%
Materials and Services23.6%
Capital Outlay0.1%
FY16 General Fund Proposed Operating Budget — $139.1 MillionAll Subfunds
20

Budget Summary General Fund
The largest use of General Fund dollars is for the Police Department, which accounts for $49.6 million, followed by the Fire and Emergency Medical Services Department at $27.6 million. Together, these two public safety departments represent 55% of the total General Fund operating budget.
$0
$10
$20
$30
$40
$50
$60
$70
$80
$90
Culture and Leisure Infrastructure andPlanning
Public Safety Central BusinessFunctions
Mil
lio
ns
Service Budget Comparison General Fund — All Subfunds
FY15 Adopted FY16 Proposed
The FY16 General Fund proposed budget represents a continued effort to create a stable and sustainable budget that provides quality public services while maintaining a prudent reserve. The increase to internal service fund rates for facility, fleet, risk and information technology allows those funds to discontinue the use of reserves to maintain services, but does result in cost increases to the General Fund.
General Fund Operating Budget Summary by Department
Department
FY15 Adopted
Budget
FY16 Proposed
Budget
FY15-FY16
Change
Central Services $21,551,815 $22,851,243 6.0%
Fire and EMS $26,036,523 27,594,830 6.0%
Library, Recreation and Cultural Services $25,749,255 27,348,754 6.2%
Planning and Development $5,729,842 5,919,055 3.3%
Police $46,194,367 49,611,910 7.4%
Public Works $5,430,730 5,790,248 6.6%
Total $130,692,532 $139,116,040 6.4%
21

Budget Summary FTE Summary
Because personnel services expenditures comprising 76.3% of the General Fund operating budget, reducing the organizational footprint has been one of the main strategies for realizing ongoing savings and achieving a stable budget. Between FY09 and FY15, the City reduced its organizational footprint by over 100 Full-Time Equivalents (FTEs) through a variety of approaches, including elimination of vacancies, voluntary severances, streamlining operations, service level reductions and changes in service delivery models. Some examples of different approaches to service delivery include contracting custodial services at the downtown public library and consolidation of the Fire and Emergency Medical Services (EMS) with the City of Springfield. Even as the population and corresponding demand for municipal services grew by 4.0% from FY09 to FY15, the City’s position count was reduced by 7.1% over this period. The FY16 Proposed Budget includes 5.0 additional FTE positions. Building and Permit services has proposed 3.0 additional FTE positions, which are backed by revenues generated from increased construction activity. Fire and EMS has proposed 1.0 additional FTE maintenance position that will be funded by the City of Springfield to better streamline the Fire services merger. Finally, Public Works has proposed 1.0 additional FTE for a landscape designer position within Parks and Open Space that will be backed by non-general funds. Eugene FTE per 1,000
Year Population FTE Population Major Staffing Changes FY12 157,010 1,458.03 9.3 Mid-year deauthorizations FY13 158,335 1,446.88 9.1 Library, court and parks reductions;
eliminate vacant positions FY14 159,580 1,449.21 9.1 Airport Fund added 3.0 FTE mid-year
FY15 Current 160,755 1,440.11 9.0 Civic leadership and community engagement services, parks maintenance and downtown library reductions
FY16 Proposed 162,664 1,445.11 8.9 Planning and Development Department proposed an additional 3.0 FTE in the Construction Permits Fund, Fire and EMS proposed 1.0 additional FTE in the General Fund, Public Works proposed 1.0 additional FTE in the Professional Services Fund
22

Budget Summary FTE Summary
Over the past 10 years, the ratio of City FTEs per 1,000 of population has declined from a high point of 10.4 in FY07 to 8.9 in the FY16 Proposed Budget. With the service area population growing and the City’s organizational footprint shrinking, the number of City FTE per 1,000 population is now lower than at any point in the past 30 years:
The FY16 Proposed Budget (all funds) includes a total increase from FY15 current levels, of 5.0 FTE, consisting of 3.0 additional revenue-backed positions in Planning and Development, 1.0 new maintenance position backed by the City of Springfield in Fire and EMS and 1.0 additional landscape designer position in Parks and Open Space backed by non-general funds. The following summary provides a breakdown of FTE changes by department since FY12:
10.4 10.1 10.0 9.6 9.4 9.3 9.1 9.1 9.0 8.9
0.0
2.0
4.0
6.0
8.0
10.0
12.0
FY07 FY08 FY09 FY10 FY11 FY12 FY13 FY14 FY15 FY16
FT
E P
er
1,0
00
Po
pu
lati
on
Fiscal Year
FTE per 1,000 Population
FY12 FY13 FY14 FY15 FY16 Change
Department Actual Actual Actual Current Proposed FY12-FY16
220.17 218.67 220.00 217.50 217.50 -1.2%
205.00 205.00 205.00 205.00 206.00 0.5%
185.40 177.25 177.25 172.80 172.80 -6.8%
Planning and Development 97.05 97.05 97.55 95.40 98.40 1.4%
330.66 327.16 327.16 328.16 328.16 -0.8%
419.75 421.75 422.25 421.25 422.25 0.6%
TOTAL 1,458.03 1,446.88 1,449.21 1,440.11 1,445.11 -0.9%
Library, Recreation and Cultural Services
Police
Public Works
Central Services
Fire and Emergency Medical Services
23

24

Financial Policies Financial Management Goals and Policies
Basis of Budgeting and Budgeting Principles A legally-adopted budget is required by state law for all funds of the City. The legal level of budgetary control within each fund is at the following levels: current departmental requirements, debt service, capital projects, interfund transfers, interfund loans, intergovernmental expenditures, and special payments. Expenditures cannot legally exceed appropriations at these control levels. Council may amend the budget by adopting supplemental budgetary appropriations during the course of the year. The City of Eugene maintains accounting records on a budget-basis as well as a Generally Accepted Accounting Principles (GAAP) basis. Budgets for all City funds are essentially prepared on a modified accrual basis consistent with GAAP, except to the extent they also include various revenues and expenditures which, according to state law, are required to be accounted for on a basis other than GAAP. Under the GAAP modified accrual basis of accounting, revenues are recorded when both measurable and collectible during the current period (or shortly after the end of the period). Modified accrual expenditures are generally recognized when the liability is incurred, with the notable exception of interest on general long-term debt. For transactions which were initially recorded in compliance with Oregon Local Budget Law, adjustments may be required for GAAP-basis reporting. For example, disbursements for prepaid expenditures and for the acquisition of proprietary fund capital assets are considered expenditures under Oregon Local Budget Law but would not be reported as current-year GAAP expenditures. Conversely, receipts of proceeds of proprietary fund debt financing and principal payments received on interfund loans are examples of budgetary resources which would not be reported as revenues under GAAP. Encumbrance accounting is employed for administrative control in all funds. Encumbrances are established for the estimated purchase amounts prior to the release of purchase orders to vendors and for construction contracts upon bid award. Purchase orders which would result in budgetary over expenditures are not released until budgetary authority has been arranged, as appropriate. Encumbrances outstanding at year end do not constitute expenditures or liabilities. Such encumbrances are cancelled and, if appropriate, are then re-encumbered against the new year’s budget, based on allowable appropriations. Financial Management It is the responsibility of City staff, in particular the Finance Division, to monitor the City's financial status. Revenues and expenditures are monitored continually to determine whether resources are materializing as projected and to ensure that expenditures do not exceed allowable limits. Supplemental budgets are designed to facilitate the review and adjustment process nec-essary to ensure expenditures do not exceed legal spending limits. City staff takes an active role in investing available cash balances. The City has an investment policy that is designed to ensure that the public’s monies are invested in a manner that is safe and secure and available when they are needed, yet at the same time are yielding market rates of return.
25

Financial Policies Financial Management Goals and Policies
Debt Management The City issues both short-term and long-term debt. Short-term notes or a line of credit are issued for construction-period financing for some capital improvements. The notes are repaid from the sale of long-term bonds or from property tax levies for general obligation bonds. The City does not borrow on a short-term basis to support on-going operations. The Non-Departmental Debt Service Section and the Financial Summaries Section provide further details regarding the City’s outstanding debt. The Financial Management Goals and Policies for the City of Eugene provide the framework and direction for financial planning and decision making by the City Council, City Boards, Commissions and Committees, and City staff. They are designed to ensure the financial integrity of the City and a service delivery system that addresses the needs and desires of Eugene’s citizens and policies are periodically updated to reflect changes in Council policy, legal and professional requirements, and changes in accepted industry practices. Prudent management of Eugene's financial resources allows for the continued ability to provide municipal services, both operating services and infrastructure maintenance and enhancement. The management of municipal resources is complex. Competent financial management is needed to make effective and efficient use of City resources and ensure the security of City assets. An important process for assuring that financial management is both consistent and rational is through the adoption of financial management goals and policies. NOTE: If the City Council chooses to deviate from any policy, it will propose at one meeting and adopt at a subsequent meeting a motion waiving the particular policy in question related to a specific issue and stating the reason for the waiver. Any waiver will be communicated to the Budget Committee with appropriate background material. This process was adopted by the City Council on April 8, 1996. A. Resource Planning and Allocation Policies Policy A.1. (City Council Goals and Policies)
The City budget will support City Council goals and policies, Council adopted long-range plans and service needs of the community.
Policy A.2. (Reporting and Control) The City will maintain financial systems which will develop budgets, provide control, and report revenues and expenditures at the line-item detail.
Policy A.3. (Service Budgeting)
The City will budget and report actual expenditures by service as well as by fund and organizational unit.
Policy A.4. (Service Priorities)
Operating and Capital budgets which reflect Council adopted service levels, will be prepared by the City Manager and reviewed by the Budget Committee consistent with the following municipal service priorities:
26

Financial Policies Financial Management Goals and Policies
a. Service Level 1. Preserve the public safety system, which includes the police, fire and emergency services, Municipal Court, and the Intergovernmental Human Services program.
b. Service Level 2. Maintain and replace the City's fixed assets, which include
equipment, infrastructure, and facilities so as to optimize their life. c. Service Level 3. Maintain and enhance efficiency of the administrative support and
community planning systems in order to provide efficient and effective business management service and orderly community growth.
d. Service Level 4. Provide affordable housing, specialized services for the less
advantaged population, land use permits, and cultural, educational and recreational services.
e. Service Level 5. Address the balance of municipal services when required for the
preservation of health, safety or quality of life in the community, or community demand for incremental services.
Policy A.5. (Operating and Capital Budgets) The relationship between the Operating and Capital budgets will be explicitly recognized and incorporated into the budget process. Funding for the Operating and Capital budgets shall be sufficient to provide for operating services and maintenance or enhancement of fixed assets needed to support City services.
Policy A.6. (Revenue and Expenditure Projections)
Revenues, operating and capital expenditures, and debt service will be projected each year for at least the succeeding six years.
Policy A.7. (New Program Funding)
Prior to authorizing funds for a new program, Council will receive an estimate of fiscal impact from the City Manager.
B. Accounting and Financial Practices Policies Policy B.1. (Accounting and Financial Reporting System)
The City will maintain an accounting and financial reporting system that allows reporting in conformance with Generally Accepted Accounting Principles and Oregon Local Budget Law, and will issue a Comprehensive Annual Financial Report each fiscal year.
Policy B.2. (Fund Management)
The City will manage its funds as independent financial entities in accordance with legal, administrative, and Generally Accepted Accounting Principles and will ensure that funds are not co-mingled.
Policy B.3. (Cost Allocation Plan)
The City will annually prepare an internal Cost Allocation Plan (CAP). The CAP's purpose is to determine the cost of providing central business management services, or indirect costs,
27

Financial Policies Financial Management Goals and Policies
to the City's various funds. These indirect costs will be recovered from Non-General funds through the Central Services Allocation (CSA). This practice ensures the cost of General Fund central business management services are paid by Non-General funds receiving those services.
Policy B.4. (Enterprise Funds)
Whenever financially feasible, business type activities which receive their funding principally through user charges, will be established as Enterprise Funds if doing so will facilitate rate setting for cost recovery and provide information to determine the efficiency and effectiveness of operations.
Policy B.5. (Contingency Funds)
Each fund, as appropriate, will maintain a contingency account to meet unanticipated requirements during the budget year.
Policy B.6. (Cash Balance and Financing)
Each fund will maintain an adequate cash balance, borrow internally from another City fund, or, as a last resort, borrow externally to provide for cash flow requirements. Policy B.7. (Unappropriated Ending Fund Balance) In order to maintain a prudent level of reserves in the General Fund and any local option levy funds, the target amount of Unappropriated Ending Fund Balance (UEFB) to be budgeted shall be at least two months of operating expenses (excluding reserves and contingency).
Policy B.8. (Replacement Accounts)
The City will develop and fund replacement accounts for the City's fixed assets.
Policy B.9. (Non-Dedicated Revenues) With the exception of grants or earmarked donations, the City will not normally earmark revenue for specific public purposes in general service funds such as the General Fund.
Policy B.10. (Reserve Accounts, Non-Departmental)
Non-Departmental Reserve accounts will be used for non-departmental resources designated for specific purposes. Appropriation by City Council is required prior to expenditure of funds.
Policy B.11. (Marginal Beginning Working Capital)
The highest priorities for use of Marginal Beginning Working Capital (difference between Actual Ending Working Capital in the prior year and Budgeted Beginning Working Capital in the current year) are: General Capital Projects Fund; Unappropriated Ending Fund Balance (up to target amount as defined in Policy B.7); General Fund Contingency, (not in priority order).
C. Revenue and Collection Policies Policy C.1. (Revenue Base)
The City will work to diversify the supporting revenue base in the General Fund.
28

Financial Policies Financial Management Goals and Policies
Policy C.2. (Cost Recovery – Fee Supported Services) The City Council will establish cost recovery policies for fee supported services which consider the relative public/private benefits received from the services being provided and/or the desirability of providing access to services for specialized populations. These policies will determine the percent range of full service costs to be recovered through fees. The level of cost recovery will be routinely adjusted to ensure that rates are current, equitable, and competitive and cover that percentage of the total cost deemed appropriate.
Policy C.3. (Serial Tax Levies)
To the maximum extent possible, serial tax levies will be used only for time-limited operating services or for capital improvements subject to the rate limitation for non-school governments.
Policy C.4. (Dedicated Revenue – Capital Projects)
To the maximum extent possible, the City will secure a dedicated revenue source to fund general and storm sewer capital projects.
Policy C.5. (Foreclosure on Delinquent Accounts) Properties foreclosed under the Assessment Program and other programs which use foreclosure as a collection device, such as the Systems Development Charges Program, will be managed and disposed of in such a manner so as to attempt to reimburse the program for all direct and indirect costs incurred and so as not to disrupt the private real estate marketplace.
Policy C.6. (Non-Recurring Revenue)
Except for local option levies approved by the voters, the City will use non-recurring revenue on limited-duration services, capital projects, equipment requirements, or services that can be terminated without significant disruption to the community or City organization.
D. Capital Improvements Policies Policy D.1. (Capital Improvement Program)
The City will plan for capital improvements over a multi-year period of time. The Capital Improvements Program will directly relate to the long-range plans and policies of the City. Operating funds to maintain capital improvements and to fund additional staff and service needs will be estimated and identified prior to making the decision to undertake specific capital improvements.
Policy D.2. (Revenue Bonds – Capital Projects) Whenever a service is an enterprise or utility-based operation and where the ratepayer directly benefits, the City will work to finance capital improvements by using self-supporting revenue bonds, which could be General Obligation backed.
Policy D.3. (General Obligation Bonds – Capital Projects)
Use of General Obligation bonds will be limited to major capital construction or improvements as defined in ORS 310.140 in support of general municipal services.
29

Financial Policies Financial Management Goals and Policies
Policy D.4. (Assessments Bonds – Capital Projects) Financing of infrastructure improvements through use of Assessment bonds will be limited to those projects where the required assessed value-to-assessment ratio is met and to the extent the City's financial position permits the use of this financing device.
Policy D.5. (City’s Physical Assets)
To maintain the City's physical assets, a current inventory of all of the City's physical assets and their condition and maintenance costs will be maintained.
Policy D.6. (Sinking Funds)
Council will make a specific determination whether to establish a replacement reserve sinking fund when creating an asset with a value in excess of $1 million and a useful life in excess of 10 years.
E. Debt and Investment Management Policies Policy E.1. (Bond Rating)
The City will seek to maintain, and, if possible, improve its current Aa1 bond rating so its borrowing costs are minimized and its access to credit is preserved.
Policy E.2. (Debt Issuance Guidelines)
The City will have a specific set of debt issuance guidelines consistent with Federal, State, and local laws and policies.
Policy E.3. (Investments)
When making investments, the City will follow State law and local investment guidelines, and shall abide by the following criteria in priority order:
a. Preservation of capital
b. Maintenance of a liquid position c. Maximum yield F. Organizational Policies Policy F.1. (Organizational Structure Reviews)
The City Manager will review the organizational structure at frequent intervals to assure that it is responsive to current conditions and minimizes service duplication in the organization and with other local government jurisdictions.
Policy F.2. (City Employment Force Funding)
The City will provide adequate funding to stabilize the City employment force to minimize uncertainty about the continuity of the service delivery system.
Policy F.3. (Staffing Levels)
The City will match job classifications and number of positions to the service delivery system and will communicate service and staff adjustments to the public and parties affected by changes.
30

Financial Policies Financial Management Goals and Policies
Policy F.4. (Service Levels and Performance Standards) The City Council will adopt service levels and performance standards which reflect community expectations and requirements set by other levels of government. The City is committed to examining how it provides services so that service levels and performance standards are met or exceeded at the least cost to the public. Policy F.5. (Market Based Employee Compensation) Consistent with available resources, employee compensation will be market based, comparable to public and private sector compensation paid in the relevant recruiting area.
Policy F.6. (Evaluation of Service Delivery System)
The City will routinely evaluate both its administrative and direct service delivery systems, according to established efficiency and effectiveness criteria, to determine whether a service should be provided by the City, or by agreement with another provider, or eliminated due to changes in community requirements. Policy F.7. (Intergovernmental Contracts) The City will evaluate its use of intergovernmental service contracts to prevent duplication of services in overlapping jurisdictions and to assure an effective and efficient service delivery system to the community.
Policy F.8. (Multi-Agency Service Reviews)
The City will participate in multi-agency reviews (including local government, public utilities, school districts, and not-for-profit agencies) to evaluate and change service systems to ensure optimal use of public funds.
G. Other Policies Policy G.1. (Compliance with Laws and Standards)
The City will comply with mandatory Federal, State, and local laws and regulations and, when appropriate, will comply with industry and professional requirements or standards.
Policy G.2. (Budget Committee)
A Budget Committee will be appointed in conformance with ORS 294.335 and Eugene Code 2.013. Lay members of the Budget Committee serve for terms of three years. The Budget Committee's chief purpose is to review the City Manager's Proposed Budget and prepare a recommendation for Council consideration. The Budget Committee may consider and develop recommendations on other financial issues at the direction of City Council.
Policy G.3. (Supplemental Budgets) After adoption of the City's annual budget, the Council will process supplemental budgets in compliance with ORS 294.480 as needed to keep the budget reflective of the current service environment and to ensure that the appropriations are as current as possible.
Policy G.4. (Related Entities)
Entities established or sanctioned by the City Council for which the City is deemed to be ‘financially accountable’, will comply with the Eugene Code and City Council-adopted
31

Financial Policies Financial Management Goals and Policies
policies and procedures and will be accountable for operational and financial compliance and reporting standards as established by the Council or its designee.
Debt Issuance Guidelines (Revisions Approved by City Council on May 14, 2007) The following debt issuance guidelines apply to debt issued by the City of Eugene and the Eugene Urban Renewal Agency. Credit Worthiness 1. The City will seek to maintain and, when feasible, improve its credit rating so its borrowing
costs are minimized and its access to credit is preserved and enhanced. 2. The City will maintain good communications about its financial condition with credit rating
agencies and the credit market. 3. The City will follow a policy of full disclosure that meets or exceeds the disclosure guidelines
developed by the Government Finance Officers Association and the Governmental Accounting Standards Board.
Purposes for Borrowing 1. The City will not fund current operations from externally borrowed funds, except to meet
short term cash flow requirements. 2. The City may borrow on a short-term basis for capital improvements in anticipation of issuing
long-term debt or for cash flow purposes during a construction project. 3. The City will confine long-term borrowing to capital improvements or projects that cannot be
fully funded from current revenues. 4. The City will encourage the use of pay-as-you-go financing for capital improvements when
feasible and affordable. 5. Assessment bonds may be issued for local improvements in accordance with the City’s
assessment policies. 6. The City may refund existing debt according to the policies set out under “Refunding Debt”
section below. 7. The City may act as a conduit issuer according to the policies set out under “Conduit
Financings” section below. Refunding Debt 1. Borrowing externally to fund the unfunded accrued liability of the Public Employees
Retirement System (PERS) is considered refunding of an existing liability to PERS. 2. The City will issue advance refunding bonds (as defined by federal tax law) when
advantageous, legally permissible, prudent and when the net present value savings is a minimum of three percent of the refunding par amount, as required by state law.
3. The City will issue current refunding bonds (as defined by federal tax law) when advantageous, legally permissible, prudent and when the net present value savings exceed $100,000.
4. Refundings may also be undertaken for other reasons when legally permissible, prudent and when in the best interests of the City.
32

Financial Policies Financial Management Goals and Policies
Security for Debt Issues 1. Approval to use the general obligation pledge will be sought from voters only for projects that
cannot be self-supporting and that provide a general benefit to City residents. 2. The City’s full faith and credit (i.e., the General Fund) may be pledged as a primary or
secondary source of repayment of long-term debt obligations when it is determined that this pledge is in the best interests of the City. Debt secured by the City’s full faith and credit should be supported by predictable revenues. In addition, the City may require administrative measures designed to protect the City’s General Fund, such as internal rate covenants and reserves. These internal administrative measures will not be pledged to bondholders.
3. Enterprise funds and other revenue-backed bond issues will maintain the highest level of debt service coverage ratios and reserves as possible, balanced against the cost of such measures, the need to preserve equity and a desire to maintain affordability in user fees.
4. Credit enhancement should be considered for debt issues where the cost of the enhancement is expected to be less than the savings in interest over the life of the issue.
5. Prior to issuing Bond Anticipation Notes, the City will have secured authority for the permanent bond financing that will be used to repay the notes.
Financing Methods 1. The City will analyze the various financing methods available for any proposed borrowing and
choose the method that is most cost effective, that is appropriate from a risk perspective, and that is legally and administratively feasible. Financing methods examined could include, but are not limited to, general obligation bonds, full faith and credit securities, revenue bonds, notes, lines of credit, commercial paper, lease or lease purchase transactions, grants, federal or state loans, intergovernmental agreements, or partnerships with the private sector.
2. Lease purchase debt, including certificates of participation, will be considered as an alternative financing method for capital projects or long-term vendor leases when cost effective and when the City does not want to seek the General Obligation pledge from voters.
Administration of City Debt 1. The City will consider affordability prior to entering into any new borrowing program. The
debt ratio guidelines contained in this policy define the affordable level of debt for the City. 2. When the City issues long-term debt, it will repay the debt within a period not to exceed the
useful life of the improvements or equipment. 3. The City will repay debt rapidly to recapture its credit capacity for future use and to minimize
interest costs. For major capital projects, repayment on such debt will not exceed 21 years. Assessment debt will mature over a 10-year period. Debt issued to fund a pension obligation may be for a longer period of time to match the amortization schedule used by PERS in determining the City’s annual payment obligation.
4. Revenues dedicated to make bond payments are to be budgeted for debt service payments before they are appropriated for any other purpose.
5. All voter-approved general obligation debt will be sold through competitive bids. Exceptions may be made for refunding bond issues or where the City is issuing bonds with different security pledges at the same time as the general obligation debt. Non-general obligation debt may be sold on a negotiated basis if the City determines that it offers significant advantages in marketing the issue.
33

Financial Policies Financial Management Goals and Policies
6. Private placement of debt may be appropriate under certain circumstances. The costs of private placement of debt will be compared to market financing before recommending this method.
Conduit Financings 1. Conduit financings are financings that the City provides for the benefit of non-governmental
entities to allow those non-governmental entities to obtain low cost, tax-exempt financing. Conduit financings are not secured by any revenues or assets of the City except revenues and assets provided by the non-governmental entities that benefit from the conduit financings. The United States Internal Revenue Code substantially limits the ability of the City to provide conduit financing; conduit financings are only available for small manufacturing facilities, facilities used by qualified 501(c)(3) organizations, certain kinds of low income housing projects, and other projects that can be financed with “qualified bonds” as defined in the Internal Revenue Code.
2. Recognizing that the City is able to issue debt for broad purposes, it may be appropriate to enter into a conduit financing on behalf of another party when the City Council determines that the proposed project will provide a general benefit to City residents and/or the City economy.
3. Conduit financing will be considered only when a project is consistent with the city’s overall service and policy objectives.
4. The City should not incur any moral or financial obligation under a conduit borrowing. 5. The City will only consider conduit financings that will insulate the City from any credit risk. 6. Any financing issued through the City must qualify for an investment grade rating by one of the
nationally recognized statistical rating agencies or provide alternative credit enhancement from a third party satisfactory to the City or a corporate guaranty if the corporation carries an investment grade rating.
7. All expenses related to conduit financing will be borne by the third-party applicant for whom the debt is being issued.
8. The City will establish review procedures of the requesting party for projects, including adherence to public contracting requirements, development of a financial feasibility study of the project, and submission of annual financial statements to ensure the ability to repay the debt.
Key Debt Ratios The City’s ability to issue general obligation debt is limited by state statutes to 3% of real market value. This level of outstanding debt would be financially burdensome and not considered a prudent amount of debt by credit analysts and bond investors. There are several key debt ratios that investors and financial analysts use when reviewing a city's credit worthiness. The City of Eugene has established this set of debt ratio guidelines that are to be used as a measure of the affordability of a new debt program. These guidelines are periodically reviewed by the Investment Advisory Board, and are listed below. 1. Net direct debt as a percentage of real market value shall be a maximum of 1.0%. 2. A minimum of 50% of net direct debt shall be retired within 10 years. 3. Maximum annual debt service on all General Fund-backed debt shall be limited to 10% of
General Fund expenditures in the year in which the debt is issued. Of this amount, long-term
34

Financial Policies Financial Management Goals and Policies
debt that has a primary pledge of General Fund resources shall be no more than 5% of General Fund expenditures.
The following definitions apply to the City’s debt ratio guidelines: Net direct debt includes all debt that is repaid from taxes (excluding URA tax increment
revenues), such as General Obligation bonds and bonds backed by the City’s full faith and credit pledge. Debt secured solely by revenues and Urban Renewal Agency debt are excluded from the City’s net direct debt.
Debt that includes a General Obligation or full faith and credit pledge may be excluded from the calculation of net direct debt as self-supporting debt where it can be demonstrated that there are other non-tax revenues available that are sufficient to make the debt service payments.
Pension obligation debt will be excluded from the City’s calculation of net direct debt in order to provide a debt statement comparable to other jurisdictions. This debt does not represent a new obligation of the City; rather, it represents replacement of an existing obligation that the City had in the form of an unfunded pension obligation that had previously been paid in installments to PERS.
Short-term debt and leases that are subject to appropriation are not included in the statement of gross direct debt or net direct debt.
The definition of net direct debt may change as the revenues supporting a debt issue change, or as new types of debt are added to the City’s debt position. In categorizing debt on the statement of net direct debt, the City will attempt to mirror the calculation prepared by the bond rating agencies that rate the City’s debt.
General Fund-backed debt is debt that has a primary or secondary security pledge from the City’s General Fund, such as limited tax assessment bonds, Library Full Faith and Credit Obligations, Broadway Place Limited Tax Bonds, and Atrium Full Faith and Credit Obligations. Voter-approved General Obligation bonds and the pension obligation bonds are excluded from the definition of General Fund debt.
The General Fund expenditures used for the purpose of measuring debt service to expenditures will be those in the main General Fund, excluding any subfunds.
Extraordinarily high debt service on a bond issue in the first or last year (such as a long first interest payment or a balloon payment at the end) shall not be subject to the debt service to expenditures policy.
35

36

Department View Central Services
Department Financial Summary
FY15 FY15 FY16
FY13 FY14 Adopted Budget ProposedActual Actual Budget 12/31/2014 Budget
PERSONNEL-FTE 218.67 220.00 217.50 217.50 217.50
Personnel Services $20,632,876 $20,257,233 $22,427,047 $22,460,347 $23,876,179
Materials and Services 47,734,484 47,026,484 51,926,169 53,744,570 59,075,686
Capital Outlay 447,354 188,933 773,132 2,537,586 387,132
TOTAL EXPENDITURES $68,814,714 $67,472,650 $75,126,348 $78,742,503 $83,338,997
FUND SUMMARY
General $20,985,831 $20,822,224 $21,551,815 $23,788,354 $22,851,243
Special Assessment Mgt. 77,100 78,914 91,157 91,157 130,758
Telecom Reg./Licensing 2,398,084 1,700,943 3,302,259 4,712,755 2,328,100
Solid Waste/Recycling 50,000 49,455 0 0 0
Community Development 0 0 6,000 6,000 0
Parking Services 290,710 266,069 320,011 320,011 428,331
Facilities Services 8,066,122 8,479,222 8,646,238 8,642,834 9,201,325
Info. Systems and Services 6,104,242 7,228,931 7,235,662 7,208,186 13,115,172
Risk and Benefits 30,842,625 28,846,892 33,973,206 33,973,206 35,284,068
TOTAL $68,814,714 $67,472,650 $75,126,348 $78,742,503 $83,338,997
Service Budget View for FY16
Revenue Expenditures FTE
General Fund General Fund Other Funds All Funds All Funds
Infrastructure and Planning Services
Parking $0 $0 $423,731 $423,731 3.55
Public Buildings and Facilities 6,000 588,497 9,205,925 9,794,422 57.50
Subtotal 6,000 588,497 9,629,656 10,218,153 61.05
Public Safety Services
Animal Services 602,602 602,602 0 602,602 3.50
Municipal Court 2,019,000 4,851,359 0 4,851,359 18.70
Subtotal 2,621,602 5,453,961 0 5,453,961 22.20
Central Business Functions
Financial Services 84,000 3,640,698 195,005 3,835,703 26.00
Civic Leadership and Collab. Svcs. 0 4,250,666 0 4,250,666 23.50
Human Resources Services 5,000 1,939,241 35,233,253 37,172,494 28.35
Information Technology 0 5,349,552 15,429,840 20,779,392 48.25
Community Engagement Services 0 797,596 0 797,596 5.15
Central Services Admin. 0 831,032 0 831,032 3.00
Subtotal 89,000 16,808,785 50,858,098 67,666,883 134.25
Total $2,716,602 $22,851,243 $60,487,754 $83,338,997 217.50
37

Department View Central Services
Division Financial Summary
FY15 FY15 FY16
FY13 FY14 Adopted Budget Proposed
Administration Actual Actual Budget 12/31/2014 Budget
PERSONNEL-FTE 3.00 3.00 3.00 3.00 3.00
Personnel Services $426,611 $377,476 $410,208 $410,208 $712,268
Materials and Services 196,408 32,488 45,466 160,466 118,764
Capital Outlay 0 0 0 0 0
TOTAL EXPENDITURES $623,019 $409,964 $455,674 $570,674 $831,032
FUND SUMMARY
General $623,019 $409,964 $455,674 $570,674 $831,032
City Manager's Office
PERSONNEL-FTE 35.40 35.15 32.65 32.65 32.65
Personnel Services $3,886,845 $3,798,940 $3,996,622 $4,029,922 $4,205,393
Materials and Services 1,958,492 1,799,962 1,606,575 2,167,994 1,649,259
TOTAL EXPENDITURES $5,845,337 $5,598,902 $5,603,197 $6,197,916 $5,854,652
FUND SUMMARY
General $5,795,337 $5,549,447 $5,603,197 $6,197,916 $5,854,652
Solid Waste/Recycling 50,000 49,455 0 0 0
TOTAL $5,845,337 $5,598,902 $5,603,197 $6,197,916 $5,854,652
City Prosecutor's Office
PERSONNEL-FTE 0.00 0.00 0.00 0.00 0.00
Personnel Services $0 $0 $0 $0 $0
Materials and Services 2,908 0 0 0 0
TOTAL EXPENDITURES $2,908 $0 $0 $0 $0
FUND SUMMARY
General $2,908 $0 $0 $0 $0
Note: Mid FY12, City Prosecutor's Office merged with the City Manager's Office.
Facilities
PERSONNEL-FTE 56.00 56.00 56.00 57.50 57.50
Personnel Services $4,279,488 $4,344,929 $4,756,585 $4,858,989 $5,132,902
Materials and Services 4,111,120 4,488,633 4,173,636 4,462,924 4,661,520
Capital Outlay 53,129 31,890 100,000 100,000 0
TOTAL EXPENDITURES $8,443,737 $8,865,452 $9,030,221 $9,421,913 $9,794,422
FUND SUMMARY
General $364,892 $382,951 $373,173 $518,269 $588,497
Facilities Services* 8,066,122 8,479,222 8,646,238 8,642,834 9,201,325
Info. Systems and Services* 0 0 0 250,000 0
Parking Services 12,723 3,279 10,810 10,810 4,600
TOTAL $8,443,737 $8,865,452 $9,030,221 $9,421,913 $9,794,422
Note: *Mid FY15, Courier Services is transitioning from Facilities to ISD.
38

Department View Central Services
FY15 FY15 FY16
FY13 FY14 Adopted Budget Proposed
Finance Actual Actual Budget 12/31/2014 Budget
PERSONNEL-FTE 25.84 25.84 25.84 26.00 26.00
Personnel Services $2,462,270 $2,445,267 $2,705,746 $2,705,746 $2,848,113
Materials and Services 735,890 1,184,987 952,074 1,381,183 987,590
TOTAL EXPENDITURES $3,198,160 $3,630,254 $3,657,820 $4,086,929 $3,835,703
FUND SUMMARY
General $3,077,163 $3,506,891 $3,512,326 $3,941,435 $3,640,698
Special Assessment Mgt. 77,100 78,914 91,157 91,157 130,758
Community Development 0 0 6,000 6,000 0
Risk and Benefits 43,897 44,449 48,337 48,337 50,815
Telecom. Reg./Licensing 0 0 0 0 13,432
TOTAL $3,198,160 $3,630,254 $3,657,820 $4,086,929 $3,835,703
Human Resources
PERSONNEL-FTE 14.85 14.85 14.85 14.85 14.85
Personnel Services $1,244,666 $1,275,431 $1,514,510 $1,514,510 $1,567,906
Materials and Services 325,114 356,461 358,994 430,023 371,335
TOTAL EXPENDITURES $1,569,780 $1,631,892 $1,873,504 $1,944,533 $1,939,241
FUND SUMMARY
General $1,569,780 $1,631,892 $1,873,504 $1,944,533 $1,939,241
Information Services
PERSONNEL-FTE 49.16 50.16 50.16 48.50 48.50
Personnel Services $5,179,253 $4,984,438 $5,707,139 $5,604,735 $5,889,298
Materials and Services 8,162,228 8,899,493 9,507,742 9,672,941 14,534,471
Capital Outlay 394,225 157,043 673,132 2,437,586 387,132
TOTAL EXPENDITURES $13,735,706 $14,040,974 $15,888,013 $17,715,262 $20,810,901
FUND SUMMARY
General $5,204,180 $5,081,749 $5,319,640 $6,013,869 $5,349,552
Telecom. Reg./Licensing 2,398,084 1,700,943 3,302,259 4,712,755 2,314,668
Info. Systems and Services 6,104,242 7,228,931 7,235,662 6,958,186 13,115,172
Risk and Benefits 29,200 29,351 30,452 30,452 31,509
TOTAL $13,735,706 $14,040,974 $15,888,013 $17,715,262 $20,810,901
39

Department View Central Services
FY15 FY15 FY16
FY13 FY14 Adopted Budget Proposed
Municipal Court Actual Actual Budget 12/31/2014 Budget
PERSONNEL-FTE 19.42 18.75 18.75 18.75 18.75
Personnel Services $1,572,800 $1,399,438 $1,558,569 $1,558,569 $1,608,240
Materials and Services 2,655,755 2,726,404 2,724,552 2,911,909 3,003,966
TOTAL EXPENDITURES $4,228,555 $4,125,842 $4,283,121 $4,470,478 $4,612,206
FUND SUMMARY
General $3,950,568 $3,863,052 $3,973,920 $4,161,277 $4,188,475
Parking Services 277,987 262,790 309,201 309,201 423,731
TOTAL $4,228,555 $4,125,842 $4,283,121 $4,470,478 $4,612,206
Police Auditor
PERSONNEL-FTE 3.00 3.00 3.00 3.00 3.00
Personnel Services $335,422 $336,306 $366,917 $366,917 $386,712
Materials and Services 62,561 59,973 73,464 73,464 72,384
TOTAL EXPENDITURES $397,983 $396,279 $440,381 $440,381 $459,096
FUND SUMMARY
General $397,983 $396,279 $440,381 $440,381 $459,096
Risk Services
PERSONNEL-FTE 12.00 13.25 13.25 13.25 13.25
Personnel Services $1,245,521 $1,295,007 $1,410,751 $1,410,751 $1,525,347
Materials and Services 29,524,008 27,478,084 32,483,666 32,483,666 33,676,397
TOTAL EXPENDITURES $30,769,529 $28,773,091 $33,894,417 $33,894,417 $35,201,744
FUND SUMMARY
Risk and Benefits $30,769,529 $28,773,091 $33,894,417 $33,894,417 $35,201,744
40

Department View Fire and Emergency Medical Services
Department Financial Summary
FY15 FY15 FY16
FY13 FY14 Adopted Budget Proposed
Actual Actual Budget 12/31/2014 Budget
PERSONNEL-FTE 205.00 205.00 205.00 205.00 206.00
Personnel Services $26,610,428 $27,817,074 $29,325,635 $29,325,635 $31,209,176
Materials and Services 5,733,931 4,354,042 4,544,877 5,341,753 4,310,045
Capital Outlay 99,319 678,358 0 377,482 0
TOTAL EXPENDITURES $32,443,678 $32,849,474 $33,870,512 $35,044,870 $35,519,221
FUND SUMMARY
General $25,274,995 $25,421,463 $26,036,523 $26,833,399 $27,594,830
Construction and Rental Housing 244,728 261,138 291,175 291,175 303,275
Municipal Airport 783,010 743,310 805,760 805,760 848,932
Ambulance Transport 6,140,945 6,423,563 6,737,054 7,114,536 6,772,184
TOTAL $32,443,678 $32,849,474 $33,870,512 $35,044,870 $35,519,221
Service Budget View for FY16
Revenue Expenditures FTE
General Fund General Fund Other Funds All Funds All Funds
Infrastructure and Planning Services
Airport $0 $0 $848,932 $848,932 5.26
Construction and Rental Housing 0 0 303,275 303,275 2.00
Subtotal 0 0 1,152,207 1,152,207 7.26
Public Safety Services
Fire and Emergency Medical Services 2,357,523 26,831,649 5,981,276 32,812,925 188.24
Fire and EMS Department Admin. 0 763,181 790,908 1,554,089 10.50
Subtotal 2,357,523 27,594,830 6,772,184 34,367,014 198.74
Total $2,357,523 $27,594,830 $7,924,391 $35,519,221 206.00
41

Department View Fire and Emergency Medical Services
Division Financial Summary
FY15 FY15 FY16FY13 FY14 Adopted Budget Proposed
Office of the Chief Actual Actual Budget 12/31/2014 Budget
PERSONNEL-FTE 2.00 2.00 2.00 10.06 10.06
Personnel Services $288,636 $296,303 $348,968 $950,700 $1,099,658
Materials and Services 34,956 30,990 30,260 418,481 409,113
Capital Outlay 8,147 0 0 0 0
TOTAL EXPENDITURES $331,739 $327,293 $379,228 $1,369,181 $1,508,771
FUND SUMMARY
General $331,739 $327,293 $379,228 $657,481 $763,181
Ambulance Transport 0 0 0 711,700 745,590
TOTAL $331,739 $327,293 $379,228 $1,369,181 $1,508,771
Note: See note under Fire Marshal's Office
Shift Operations
PERSONNEL-FTE 170.00 170.00 170.00 170.00 170.00
Personnel Services $22,400,581 $23,369,635 $24,707,980 $24,707,980 $26,435,356
Materials and Services 2,217,354 1,910,920 1,908,373 1,908,523 1,723,565
Capital Outlay 69,976 576,265 0 0 0
TOTAL EXPENDITURES $24,687,911 $25,856,820 $26,616,353 $26,616,503 $28,158,921
FUND SUMMARY
General $19,533,568 $20,519,296 $21,205,471 $21,205,621 $22,617,793
Municipal Airport 783,010 743,310 805,760 805,760 848,932
Ambulance Transport 4,371,333 4,594,214 4,605,122 4,605,122 4,692,196
TOTAL $24,687,911 $25,856,820 $26,616,353 $26,616,503 $28,158,921
Special Operations
PERSONNEL-FTE 14.00 14.00 14.00 15.94 16.94
Personnel Services $2,087,404 $2,242,259 $2,213,954 $2,559,030 $2,470,129
Materials and Services 382,487 410,171 356,968 2,733,048 2,054,486
Capital Outlay 10,000 70,000 0 377,482 0
TOTAL EXPENDITURES $2,479,891 $2,722,430 $2,570,922 $5,669,560 $4,524,615
FUND SUMMARYGeneral $2,218,972 $2,453,158 $2,264,573 $3,871,846 $3,190,217
Construction and Rental Housing 244,728 261,138 291,175 0 0
Ambulance Transport 16,191 8,134 15,174 1,797,714 1,334,398
TOTAL $2,479,891 $2,722,430 $2,570,922 $5,669,560 $4,524,615
Note: See note under Fire Marshal's Office
42

Department View Fire and Emergency Medical Services
FY15 FY15 FY16
FY13 FY14 Adopted Budget Proposed
Fire Marshal's Office Actual Actual Budget 12/31/2014 Budget
PERSONNEL-FTE 19.00 19.00 19.00 9.00 9.00
Personnel Services $1,833,807 $1,908,877 $2,054,733 $1,107,925 $1,204,033
Materials and Services 3,099,134 2,001,961 2,249,276 281,701 122,881
Capital Outlay 11,196 32,093 0 0 0
TOTAL EXPENDITURES $4,944,137 $3,942,931 $4,304,009 $1,389,626 $1,326,914
FUND SUMMARY
General $3,190,716 $2,121,715 $2,187,251 $1,098,451 $1,023,639
Construction and Rental Housing 0 0 0 291,175 303,275
Ambulance Transport 1,753,421 1,821,216 2,116,758 0 0
TOTAL $4,944,137 $3,942,931 $4,304,009 $1,389,626 $1,326,914
Note: Mid FY15, the department underwent a re-organization of divisions. Administration was moved to Office of the Chief,
Support Services was merged into Special Operations, and the Fire Marshal’s Office moved out of Special Operations to become a
standalone division. FTE count and budgets reflect these changes beginning in the FY15 12/31/2014 budget.
43

Department View Library, Recreation and Cultural Services
Department Financial Summary
FY15 FY15 FY16
FY13 FY14 Adopted Budget Proposed
Actual Actual Budget 12/31/2014 Budget
PERSONNEL-FTE 177.25 177.25 172.80 172.80 172.80
Personnel Services $15,929,127 $15,920,557 $17,025,872 $17,142,872 $18,378,037
Materials and Services 7,982,157 8,093,230 9,066,383 8,786,687 9,312,717
Capital Outlay 0 0 430,000 1,530,000 45,000
TOTAL EXPENDITURES $23,911,284 $24,013,787 $26,522,255 $27,459,559 $27,735,754
FUND SUMMARY
General $23,628,152 $23,771,270 $25,749,255 $26,686,559 $27,348,754
General Capital Projects 0 1,000 20,000 20,000 20,000
Library, Parks and Rec. Spec. Rev. 283,132 241,517 753,000 753,000 367,000
TOTAL $23,911,284 $24,013,787 $26,522,255 $27,459,559 $27,735,754
Service Budget View for FY16
Revenue Expenditures FTE
General Fund General Fund Other Funds All Funds All Funds
Culture and Recreation Services
Adaptive Recreation $122,000 $799,840 $19,000 $818,840 4.36
Adult and Senior Services 258,000 1,078,091 59,000 1,137,091 6.20
Aquatics 932,000 3,149,743 4,000 3,153,743 10.85
Athletics 410,000 556,555 0 556,555 3.11
Cultural Services 3,447,100 6,110,314 20,000 6,130,314 31.25
Library 568,540 10,347,710 267,000 10,614,710 86.60
Youth and Family Recreation 1,206,000 4,308,974 18,000 4,326,974 27.43
LRCS Department Admin. 0 997,527 0 997,527 3.00
Total $6,943,640 $27,348,754 $387,000 $27,735,754 172.80
44

Department View Library, Recreation and Cultural Services
Division Financial Summary
FY15 FY15 FY16
FY13 FY14 Adopted Budget Proposed
Administration Actual Actual Budget 12/31/2014 Budget
PERSONNEL-FTE 4.00 4.00 4.00 3.00 3.00
Personnel Services $491,581 $468,836 $512,747 $512,747 $554,794
Materials and Services 277,277 253,209 585,660 595,660 442,733
TOTAL EXPENDITURES $768,858 $722,045 $1,098,407 $1,108,407 $997,527
FUND SUMMARY
General $768,858 $722,045 $1,098,407 $1,108,407 $997,527
Cultural Services
PERSONNEL-FTE 29.25 29.25 29.25 31.25 31.25
Personnel Services $2,500,973 $2,538,672 $3,011,769 $3,011,769 $3,533,561
Materials and Services 1,722,612 1,771,509 1,934,195 1,994,895 2,551,753
Capital Outlay 0 0 30,000 330,000 45,000
TOTAL EXPENDITURES $4,223,585 $4,310,181 $4,975,964 $5,336,664 $6,130,314
FUND SUMMARY
General $4,223,585 $4,309,181 $4,955,964 $5,316,664 $6,110,314
General Capital Projects 0 1,000 20,000 20,000 20,000
TOTAL $4,223,585 $4,310,181 $4,975,964 $5,336,664 $6,130,314
Library
PERSONNEL-FTE 91.05 91.05 86.60 86.60 86.60
Personnel Services $7,140,407 $6,963,852 $7,165,506 $7,165,506 $7,557,079
Materials and Services 2,816,579 2,831,468 3,471,571 3,093,675 3,057,631
Capital Outlay 0 0 400,000 1,200,000 0
TOTAL EXPENDITURES $9,956,986 $9,795,320 $11,037,077 $11,459,181 $10,614,710
FUND SUMMARY
General $9,714,927 $9,578,976 $10,384,077 $10,806,181 $10,347,710
Library, Parks and Rec. Spec. Rev. 242,059 216,344 653,000 653,000 267,000
TOTAL $9,956,986 $9,795,320 $11,037,077 $11,459,181 $10,614,710
Recreation
PERSONNEL-FTE 52.95 52.95 52.95 51.95 51.95
Personnel Services $5,796,166 $5,949,198 $6,335,850 $6,452,850 $6,732,603
Materials and Services 3,165,689 3,237,043 3,074,957 3,102,457 3,260,600
TOTAL EXPENDITURES $8,961,855 $9,186,241 $9,410,807 $9,555,307 $9,993,203
FUND SUMMARY
General $8,920,782 $9,161,068 $9,310,807 $9,455,307 $9,893,203
Library, Parks and Rec. Spec. Rev. 41,073 25,173 100,000 100,000 100,000
TOTAL $8,961,855 $9,186,241 $9,410,807 $9,555,307 $9,993,203
45

Department View Planning and Development
Department Financial Summary
FY15 FY15 FY16
FY13 FY14 Adopted Budget Proposed
Actual Actual Budget 12/31/2014 Budget
PERSONNEL-FTE 97.05 97.55 97.55 95.40 98.40
Personnel Services $9,397,791 $9,409,608 $10,412,139 $10,823,097 $11,249,254
Materials and Supplies 7,069,339 7,351,788 9,377,904 11,033,819 8,273,319
Capital Outlay 29,990 5,081 0 70,000 0
TOTAL EXPENDITURES $16,497,120 $16,766,477 $19,790,043 $21,926,916 $19,522,573
FUND SUMMARY
General $5,653,942 $5,464,560 $5,729,842 $6,734,967 $5,919,055
Solid Waste/Recycling 752,888 652,215 745,968 845,968 731,644
Construction and Rental Housing 5,049,658 5,100,250 5,861,862 5,861,862 6,363,314
Community Development 1,671,466 1,925,027 3,647,304 4,644,052 1,864,039
System Dev. Capital Proj. 45,704 41,594 83,518 83,518 114,035
Parking Services 3,083,452 3,343,007 3,435,768 3,470,768 4,187,280
Facilities Services 240,010 239,824 285,781 285,781 343,206
TOTAL $16,497,120 $16,766,477 $19,790,043 $21,926,916 $19,522,573
Service Budget View for FY16
Revenue Expenditures FTE
General Fund General Fund Other Funds All Funds All Funds
Public Safety Services
Social Services $0 $949,000 $521,129 $1,470,129 0.00
Infrastructure and Planning Services
Affordable Housing and Job Creation 31,947 557,603 1,263,960 1,821,563 11.23
Construction and Rental Housing 0 0 6,477,349 6,477,349 42.95
Greater Downtown Services 398,000 770,900 78,950 849,850 1.62
Land Use Planning 207,500 1,170,418 0 1,170,418 8.70
Metro and Community Planning 0 1,012,898 0 1,012,898 6.30
Parking 0 0 4,187,280 4,187,280 14.50
Public Buildings and Facilities 0 0 343,206 343,206 0.30
Solid Waste and Recycling 71,500 65,226 731,644 796,870 4.95
Zoning and Nuisance Admin. 17,600 552,396 0 552,396 4.55
Planning and Develop. Dept. Admin. 15,700 840,614 0 840,614 3.30
Subtotal 742,247 4,970,055 13,082,389 18,052,444 98.40
Total $742,247 $5,919,055 $13,603,518 $19,522,573 98.40
46

Department View Planning and Development
Division Financial Summary
FY15 FY15 FY16
FY13 FY14 Adopted Budget Proposed
Administration and Parking Actual Actual Budget 12/31/2014 Budget
PERSONNEL-FTE 16.50 16.60 16.60 16.60 16.60
Personnel Services $1,369,607 $1,454,744 $1,522,962 $1,602,962 $1,708,108
Materials and Supplies 2,769,236 2,744,613 2,752,200 3,131,800 3,454,096
Capital Outlay 0 0 0 70,000 0
TOTAL EXPENDITURES $4,138,843 $4,199,357 $4,275,162 $4,804,762 $5,162,204
FUND SUMMARY
General $849,938 $675,885 $682,486 $1,177,086 $812,827
Facilities Services 240,010 239,824 285,781 285,781 343,206
Parking Services 3,048,895 3,283,648 3,306,895 3,341,895 4,006,171
TOTAL $4,138,843 $4,199,357 $4,275,162 $4,804,762 $5,162,204
Building and Permit Services
PERSONNEL-FTE 50.55 51.55 51.55 49.45 52.45
Personnel Services $5,199,901 $5,118,920 $5,558,687 $5,552,642 $6,053,050
Materials and Supplies 1,246,194 1,296,806 1,861,295 1,832,197 1,791,652
Capital Outlay 29,990 0 0 0 0
TOTAL EXPENDITURES $6,476,085 $6,415,726 $7,419,982 $7,384,839 $7,844,702
FUND SUMMARY
General $627,835 $621,667 $728,634 $593,491 $635,709
Construction and Rental Housing 5,049,658 5,100,250 5,861,862 5,861,862 6,363,314
Solid Waste/Recycling 752,888 652,215 745,968 845,968 731,644
Systems Dev. Cap. Proj. 45,704 41,594 83,518 83,518 114,035
TOTAL $6,476,085 $6,415,726 $7,419,982 $7,384,839 $7,844,702
Community Development
PERSONNEL-FTE 12.50 12.40 12.40 14.35 14.35
Personnel Services $1,281,869 $1,239,103 $1,343,193 $1,689,791 $1,654,013
Materials and Supplies 2,572,185 2,939,127 4,414,622 5,573,301 2,668,638
TOTAL EXPENDITURES $3,854,054 $4,178,230 $5,757,815 $7,263,092 $4,322,651
FUND SUMMARY
General $2,148,031 $2,193,844 $1,981,638 $2,490,167 $2,277,503
Community Development 1,671,466 1,925,027 3,647,304 4,644,052 1,864,039
Parking Services 34,557 59,359 128,873 128,873 181,109
TOTAL $3,854,054 $4,178,230 $5,757,815 $7,263,092 $4,322,651
Planning
PERSONNEL-FTE 17.50 17.00 17.00 15.00 15.00
Personnel Services $1,546,413 $1,596,840 $1,987,297 $1,977,702 $1,834,083
Materials and Supplies 481,725 371,243 349,787 496,521 358,933
Capital Outlay 0 5,081 0 0 0
TOTAL EXPENDITURES $2,028,138 $1,973,164 $2,337,084 $2,474,223 $2,193,016
FUND SUMMARYGeneral $2,028,138 $1,973,164 $2,337,084 $2,474,223 $2,193,016
47

Department View Police
Department Financial Summary
FY15 FY15 FY16
FY13 FY14 Adopted Budget Proposed
Actual Actual Budget 12/31/2014 Budget
PERSONNEL-FTE 327.16 327.16 328.16 328.16 328.16
Personnel Services $38,776,295 $38,643,069 $39,987,738 $40,586,437 $43,194,149
Materials and Services 9,833,117 9,369,109 9,668,033 10,336,713 9,727,634
Capital Outlay 186,006 81,923 10,250 1,750,684 10,000
TOTAL EXPENDITURES $48,795,418 $48,094,101 $49,666,021 $52,673,834 $52,931,783
FUND SUMMARY
General $45,365,823 $44,745,581 $46,194,367 $48,588,352 $49,611,910
Public Safety Communications 2,969,162 2,818,065 2,941,650 3,555,478 2,768,666
Municipal Airport 460,433 530,455 530,004 530,004 551,207
TOTAL $48,795,418 $48,094,101 $49,666,021 $52,673,834 $52,931,783
Service Budget View for FY16
Revenue Expenditures FTE
General Fund General Fund Other Funds All Funds All Funds
Public Safety Services
Animal Services $231,000 $830,863 $0 $830,863 3.00
Call Taking/Dispatch 1,000,000 6,605,850 2,768,666 9,374,516 58.69
Police Investigations 15,000 7,897,737 0 7,897,737 47.66
Police Records Mgmt. and Analysis 32,000 2,444,653 0 2,444,653 25.50
Police Patrol Services 1,082,000 30,591,669 0 30,591,669 183.50
Police Department Admin. 1,500 1,241,138 0 1,241,138 6.81
Subtotal 2,361,500 49,611,910 2,768,666 52,380,576 325.16
Infrastructure and Planning Services
Airport 0 0 551,207 551,207 3.00
Total $2,361,500 $49,611,910 $3,319,873 $52,931,783 328.16
48

Department View Police
Division Financial Summary
FY15 FY15 FY16
FY13 FY14 Adopted Budget Proposed
East Police Operations Actual Actual Budget 12/31/2014 Budget
PERSONNEL-FTE 116.00 115.00 116.00 114.00 114.00
Personnel Services $15,092,079 $14,702,698 $14,978,786 $15,442,693 $16,018,815
Materials and Services 3,888,725 3,730,769 4,532,497 4,267,077 4,111,552
Capital Outlay 6,112 9,600 0 225,324 0
TOTAL EXPENDITURES $18,986,916 $18,443,067 $19,511,283 $19,935,094 $20,130,367
FUND SUMMARY
General $18,526,483 $17,912,612 $18,981,279 $19,405,090 $19,579,160
Municipal Airport 460,433 530,455 530,004 530,004 551,207
TOTAL $18,986,916 $18,443,067 $19,511,283 $19,935,094 $20,130,367
Office of the Chief
PERSONNEL-FTE 15.50 16.00 16.00 17.00 17.00
Personnel Services $1,709,843 $1,790,052 $1,921,578 $1,921,578 $2,185,122
Materials and Services 156,511 157,732 372,448 400,614 377,769
TOTAL EXPENDITURES $1,866,354 $1,947,784 $2,294,026 $2,322,192 $2,562,891
FUND SUMMARY
General $1,866,354 $1,947,784 $2,294,026 $2,322,192 $2,562,891
Operations Support
PERSONNEL-FTE 13.50 12.50 12.50 12.50 12.50
Personnel Services $1,519,421 $1,367,272 $1,439,404 $1,492,362 $1,581,380
Materials and Services 2,195,436 1,615,592 1,756,156 2,078,579 1,820,225
Capital Outlay 187,984 61,770 0 125,649 0
TOTAL EXPENDITURES $3,902,841 $3,044,634 $3,195,560 $3,696,590 $3,401,605
FUND SUMMARY
General $3,881,653 $3,029,453 $3,171,713 $3,672,743 $3,376,927
Public Safety Communications 21,188 15,181 23,847 23,847 24,678
TOTAL $3,902,841 $3,044,634 $3,195,560 $3,696,590 $3,401,605
Technical Services
PERSONNEL-FTE 83.50 84.00 84.00 84.00 84.00
Personnel Services $7,992,958 $8,072,190 $8,777,120 $8,877,120 $9,462,781
Materials and Services 2,636,734 2,801,524 2,527,655 2,617,851 2,331,710
Capital Outlay -8,090 10,553 0 1,389,461 0
TOTAL EXPENDITURES $10,621,602 $10,884,267 $11,304,775 $12,884,432 $11,794,491
FUND SUMMARY
General $7,673,628 $8,081,383 $8,386,972 $9,352,801 $9,050,503Public Safety Communications 2,947,974 2,802,884 2,917,803 3,531,631 2,743,988
TOTAL $10,621,602 $10,884,267 $11,304,775 $12,884,432 $11,794,491
49

Department View Police
FY15 FY15 FY16
FY13 FY14 Adopted Budget Proposed
West Police Operations Actual Actual Budget 12/31/2014 Budget
PERSONNEL-FTE 98.66 99.66 99.66 100.66 100.66
Personnel Services $12,461,994 $12,710,856 $12,870,850 $12,852,684 $13,946,051
Materials and Services 955,711 1,063,493 479,277 972,592 1,086,378
Capital Outlay 0 0 10,250 10,250 10,000
TOTAL EXPENDITURES $13,417,705 $13,774,349 $13,360,377 $13,835,526 $15,042,429
FUND SUMMARY
General $13,417,705 $13,774,349 $13,360,377 $13,835,526 $15,042,429
50

Department View Public Works
Department Financial Summary
FY15 FY15 FY16
FY13 FY14 Adopted Budget Proposed
Actual Actual Budget 12/31/2014 Budget
PERSONNEL-FTE 421.75 422.25 420.25 421.25 422.25
Personnel Services $37,941,198 $38,120,043 $42,449,254 $42,728,181 $44,938,243
Materials and Services 24,330,194 25,263,626 32,689,072 28,308,841 30,134,760
Capital Outlay 5,456,725 5,156,441 6,733,220 10,893,618 8,061,082
TOTAL EXPENDITURES $67,728,117 $68,540,110 $81,871,546 $81,930,640 $83,134,085
FUND SUMMARY
General $6,107,475 $5,758,492 $5,430,730 $5,963,201 $5,790,248
Road 10,021,883 10,251,366 11,089,068 10,985,703 12,816,891
Construction and Rental Housing 383,096 380,346 420,792 420,792 440,639
Systems Devel. Cap. Proj. 211,679 228,012 300,431 335,821 373,340
Municipal Airport 5,905,571 6,331,224 6,638,532 6,405,731 6,748,356
Parking Services 39,019 54,049 49,912 49,912 50,237
Wastewater Utility 18,556,426 17,876,245 23,250,306 22,628,367 24,942,655
Stormwater Utility 11,595,455 12,031,883 14,595,592 14,227,457 14,497,433
Fleet Services 10,338,366 10,488,336 14,453,823 15,071,296 11,521,535
Professional Services 4,569,147 5,140,157 5,642,360 5,842,360 5,952,751
TOTAL $67,728,117 $68,540,110 $81,871,546 $81,930,640 $83,134,085
Service Budget View for FY16
Revenue Expenditures FTE
General Fund General Fund Other Funds All Funds All Funds
Infrastructure and Planning Services
Airport $0 $0 $6,748,356 $6,748,356 37.41
Construction and Rental Housing 0 0 1,411,845 1,411,845 11.45
Parks and Open Space 118,252 4,073,517 211,318 4,284,835 27.90
Parking 0 0 50,237 50,237 0.00
Infrastructure Project and Info. Mgt. 0 0 5,952,751 5,952,751 41.54
Stormwater 0 0 12,982,336 12,982,336 76.88
Transportation 0 195,463 12,134,993 12,330,456 57.00
Urban Forestry 0 6,555 1,556,032 1,562,587 10.13
Wastewater Collection and Treatment 0 0 24,774,434 24,774,434 121.34
Public Works Department Admin. 0 1,431,761 0 1,431,761 7.65
Subtotal 118,252 5,707,296 65,822,302 71,529,598 391.30
Culture and Recreation Services
Athletics 0 82,952 0 82,952 0.75
Central Business Functions
Fleet and Radio Communication Srvcs. 0 0 11,521,535 11,521,535 30.20
Total $118,252 $5,790,248 $77,343,837 $83,134,085 422.25
51

Department View Public Works
Division Financial Summary
FY15 FY15 FY16
FY13 FY14 Adopted Budget Adopted
Administration Actual Actual Budget 12/31/2014 Budget
PERSONNEL-FTE 17.00 16.00 16.00 16.00 16.00
Personnel Services $1,733,789 $1,659,802 $1,845,572 $1,845,572 $1,978,012
Materials and Services 2,617,677 2,685,053 3,242,247 3,125,289 3,344,826
TOTAL EXPENDITURES $4,351,466 $4,344,855 $5,087,819 $4,970,861 $5,322,838
FUND SUMMARY
General $1,133,368 $1,052,744 $1,334,672 $1,235,414 $1,431,761
Road 119,367 110,719 163,228 163,228 170,095
Wastewater Utility 1,364,675 1,438,351 1,549,824 1,549,824 1,606,008
Stormwater Utility 1,549,354 1,550,660 1,809,076 1,791,376 1,873,894
Professional Services 184,702 192,381 231,019 231,019 241,080
TOTAL $4,351,466 $4,344,855 $5,087,819 $4,970,861 $5,322,838
Airport
PERSONNEL-FTE 33.00 36.00 36.00 37.00 37.00
Personnel Services $3,224,932 $3,359,175 $3,573,224 $3,573,224 $3,791,794
Materials and Services 2,644,847 2,926,304 2,959,083 2,637,515 2,850,512
Capital Outlay 0 0 63,000 151,767 60,024
TOTAL EXPENDITURES $5,869,779 $6,285,479 $6,595,307 $6,362,506 $6,702,330
FUND SUMMARY
Municipal Airport $5,869,779 $6,285,479 $6,586,307 $6,353,506 $6,693,330
Professional Services 0 0 9,000 9,000 9,000
TOTAL $5,869,779 $6,285,479 $6,595,307 $6,362,506 $6,702,330
Engineering
PERSONNEL-FTE 78.60 76.60 76.60 75.60 75.60
Personnel Services $7,240,372 $7,612,219 $8,564,710 $8,564,710 $8,774,306
Materials and Services 1,800,176 1,679,853 2,530,111 2,720,789 4,029,704
Capital Outlay 39,794 148,910 0 200,000 0
TOTAL EXPENDITURES $9,080,342 $9,440,982 $11,094,821 $11,485,499 $12,804,010
FUND SUMMARY
General $89,985 $50,679 $60,148 $160,148 $62,801
Road 1,970,744 1,854,861 1,987,856 2,121,775 3,678,134
Construction and Rental Housing 278,499 274,181 315,263 315,263 329,200
System Devel. Cap. Proj. 156,629 153,970 210,152 245,542 253,340
Wastewater Utility 935,831 934,505 1,414,770 1,377,513 1,415,431
Stormwater Utility 1,556,213 1,490,328 2,154,851 2,113,477 1,961,257
Fleet Services 8,891 9,754 18,648 18,648 19,364
Professional Services 4,083,550 4,672,704 4,933,133 5,133,133 5,084,483
TOTAL $9,080,342 $9,440,982 $11,094,821 $11,485,499 $12,804,010
52

Department View Public Works
FY15 FY15 FY16
FY13 FY14 Adopted Budget Proposed
Maintenance Actual Actual Budget 12/31/2014 Budget
PERSONNEL-FTE 130.25 130.25 130.25 131.25 131.25
Personnel Services $10,929,597 $10,946,677 $12,618,864 $12,618,864 $13,466,925
Materials and Services 10,718,165 10,609,335 14,450,457 11,489,167 11,593,143
Capital Outlay 4,160,863 4,452,180 4,697,320 7,964,609 4,091,458
TOTAL EXPENDITURES $25,808,625 $26,008,192 $31,766,641 $32,072,640 $29,151,526
FUND SUMMARY
General $141,111 $139,175 $132,599 $132,739 $133,924
Road 6,675,826 6,841,727 7,494,444 7,287,605 7,501,052
Construction and Rental Housing 104,596 106,165 105,529 105,529 111,439
Municipal Airport 35,791 45,746 52,225 52,225 55,026
Parking Services 39,019 54,049 49,912 49,912 50,237
Wastewater Utility 4,227,047 4,110,311 4,775,639 4,745,639 4,900,531
Stormwater Utility 4,152,092 4,141,534 4,574,769 4,499,994 4,747,122
Fleet Services 10,329,475 10,478,582 14,435,175 15,052,648 11,502,171
Professional Services 103,668 90,903 146,349 146,349 150,024
TOTAL $25,808,625 $26,008,192 $31,766,641 $32,072,640 $29,151,526
Parks and Open Space
PERSONNEL-FTE 79.40 79.90 77.90 77.90 78.90
Personnel Services $6,890,798 $6,819,239 $7,321,482 $7,600,409 $7,963,912
Materials and Services 3,293,452 3,789,831 3,977,236 3,960,469 3,637,488
Capital Outlay 0 8,425 0 10,162 0
TOTAL EXPENDITURES $10,184,250 $10,617,495 $11,298,718 $11,571,040 $11,601,400
FUND SUMMARY
General $4,743,013 $4,515,893 $3,903,311 $4,434,900 $4,161,762
Road 1,255,946 1,444,060 1,443,540 1,413,095 1,467,610
System Devel. Cap. Proj. 55,050 74,041 90,279 90,279 120,000
Wastewater Utility 8,210 1,713 7,644 7,644 7,743
Stormwater Utility 3,924,804 4,397,619 5,531,085 5,302,263 5,376,121
Professional Services 197,227 184,169 322,859 322,859 468,164
TOTAL $10,184,250 $10,617,495 $11,298,718 $11,571,040 $11,601,400
Wastewater
PERSONNEL-FTE 83.50 83.50 83.50 83.50 83.50
Personnel Services $7,921,711 $7,722,932 $8,525,402 $8,525,402 $8,963,294
Materials and Services 3,255,875 3,573,251 5,529,938 4,375,612 4,679,087
Capital Outlay 1,256,069 546,925 1,972,900 2,567,080 3,909,600
TOTAL EXPENDITURES $12,433,655 $11,843,108 $16,028,240 $15,468,094 $17,551,981
FUND SUMMARY
Wastewater Utility $12,020,663 $11,391,365 $15,502,429 $14,947,747 $17,012,942
Stormwater Utility 412,992 451,743 525,811 520,347 539,039
TOTAL $12,433,655 $11,843,108 $16,028,240 $15,468,094 $17,551,981
53

54

Fund Summary Financial Structure
Policy Direction The Financial Management Goals and Policies provide the framework and direction for financial planning and decision-making by the City Council and City staff. They are designed to ensure the financial integrity of the City and facilitate a service delivery system that addresses the needs and desires of its citizens.
Fund Accounting Governmental accounting is distinctly different from accounting in private businesses. Business’ financial reports are used as a tool to generate profits for owners and shareholders. The focus of governmental accounting and financial reporting is to control the use of public resources and disclose financial results of spending and service delivery decisions made by elected officials and government executives. To accomplish this, a fund accounting system is used. The fund accounting system groups revenues and expenditures together into accounting entities, called “funds,” which are segregated for the purpose of carrying on specific activities. Each fund is a set of accounts, recording all assets, liabilities, and residual equities, within the fund. Since there are legal, administrative, and political constraints on the use of resources, they are grouped into respective funds for the purpose of monitoring and controlling expenditures. Fund accounting is a system that allows for specific control over the varied resources of the City. The reports generated from the fund accounting system present information according to Oregon Local Budget Law and Generally Accepted Accounting Principles (GAAP) for governments. Munici-palities may incur expenditures only for the purposes and amounts approved by the governing body. The various funds of the City are grouped into two categories, as follows: Governmental Fund Types – Governmental Funds are those through which most governmental functions of the City are financed including the General Fund, special revenue funds, capital project funds, and debt service funds. The financial measurement focus for governmental funds is on determination of the change in current financial resources rather than determination of net income. Proprietary Fund Types – Proprietary Funds are used to account for the City’s ongoing activities that are similar to those in the private sector, including enterprise funds and internal service funds. The financial measurement focus for proprietary funds is on the determination of net income. Although monies may be transferred or loaned from one fund to another, the overall objective is to maintain the independence of each fund as much as possible. Fund accounting allows the City to maintain the appropriate controls over fund expenditures and provides for reporting fund activities to interested citizens. The diagrams on the following pages provide additional details
55

Fund Summary Financial Structure
regarding the various types of funds. The Fund Matrix Section in this document includes more specific information about the City’s funds, including their purpose, primary revenue sources and expenditures, and restrictions.
56
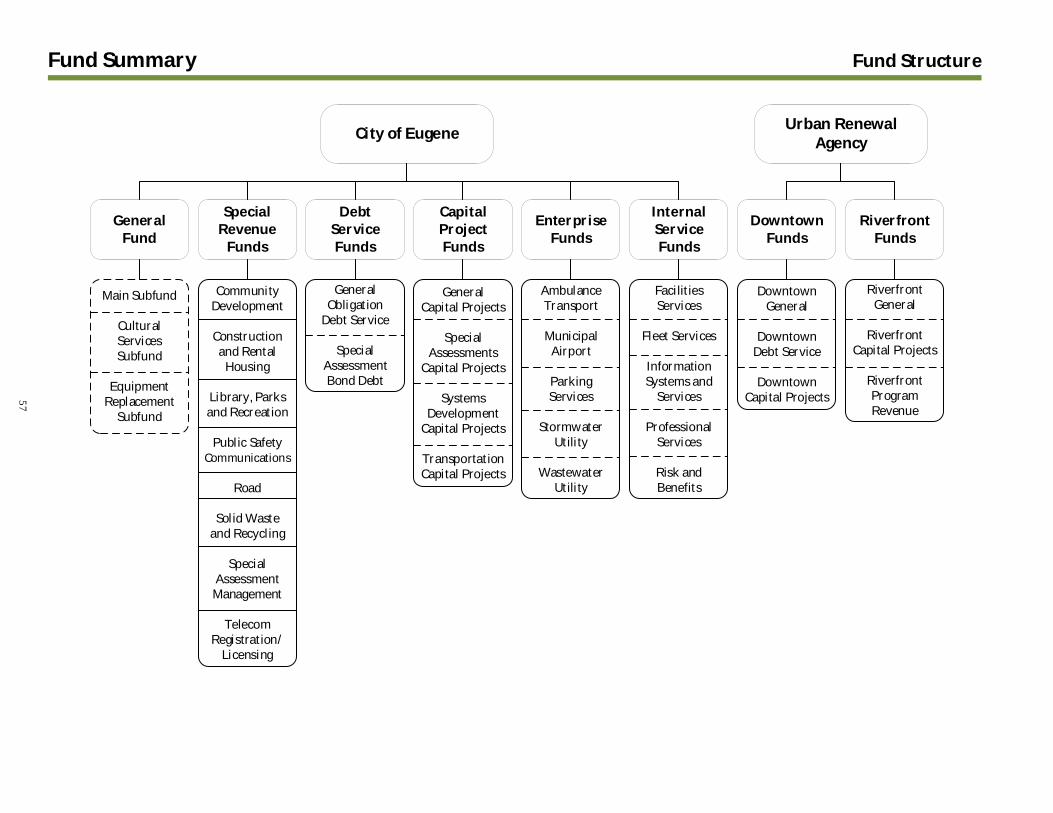
Fund Summary Fund Structure
GeneralFund
SpecialRevenue
Funds
DebtServiceFunds
CapitalProjectFunds
EnterpriseFunds
InternalServiceFunds
DowntownFunds
City of Eugene
Main Subfund
Cultural Services Subfund
Equipment Replacement
Subfund
RiverfrontFunds
Urban RenewalAgency
General Obligation
Debt Service
Special Assessment Bond Debt
GeneralCapital Projects
Special Assessments
Capital Projects
Systems Development
Capital Projects
Transportation Capital Projects
Ambulance Transport
Municipal Airport
Parking Services
Stormwater Utility
Wastewater Utility
Facilities Services
Fleet Services
Information Systems and
Services
Professional Services
Risk and Benefits
Downtown General
DowntownDebt Service
Downtown Capital Projects
Riverfront General
Riverfront Capital Projects
Riverfront Program Revenue
Community Development
Construction and Rental
Housing
Library, Parks and Recreation
Public Safety Communications
Road
Solid Wasteand Recycling
Special Assessment
Management
Telecom Registration/
Licensing
57

Fund Summary Fund Types
GOVERNMENTAL FUND TYPESGovernmental Funds are those through which most governmental functions of the City are financed. The financial measurement focus for these funds is on determination of the change in current financial resources rather than determination of net income.
PROPRIETARY FUND TYPESProprietary Funds are used to account for the City’s ongoing activities that are similar to those in the private sector. The financial measurement focus for these funds is on the determination of net income.
General FundRecords financial activities not
accounted for in other funds. These resources support most central business services, public safety
services, cultural/leisure services, and some public development services.
Special Revenue FundsAccount for restricted resources
designated for specific uses such as Telecom Registration/Licensing
revenues or the Road Fund.
Debt Service FundsAccount for resources used for the
payment of debt, includingprincipal and interest.
Capital Project FundsAccount for financial resources for the
acquisition, construction, and maintenance of capital facilities.
Enterprise FundsAccount for goods or services which are provided on a continuing basis to the general public and are financed primarily through user charges. An
enterprise fund is managed much like a business in that it is self-supporting
in nature such as the Airport or Wastewater Funds.
Internal Service Funds Account for goods or services furnished internally from one
Division to another such as Fleet or Facility Services. The goal of these
programs is to appropriately apportion the costs of the programs and services across City Divisions.
58

Fund Summary Fund Matrix
Subfund Name and
NumberPurpose Primary Funding Sources Primary Expenditures Spending Restrictions
FY16
Proposed
Budget
Document
Reference
Reporting Fund (010) Fund 010 is the General Fund reporting
fund. The subfunds (011, 031, 041)
"roll up" to this fund for reporting
purposes.
Page 65
Main Subfund (011) General purpose government
operations.
Property tax revenues, contributions
in lieu of tax and user fees.
Police and fire services, library and
recreation services, parks maintenance
services, planning services and general
administration.
Most revenues are unrestricted; grant funds are
restricted by granting agency. Some funds are pass
throughs to other governments.
Page 66
Cultural Services Subfund
(031)
To account for the operation of the
Hult Center, community events, public
art and Cuthbert Amphitheater.
Transient room tax revenue, rental,
ticket office and patron user fees.
Operation and management of the Hult
Center and Cuthbert Amphitheater.
State statute requires that 100% of revenue from the
City's 4.5% transient room tax is used to promote
tourism and tourism-related facilities.
Page N/A
Equipment Replacement
Subfund (041)
To account for resources associated
with future replacement of General
Fund equipment other than vehicles.
General Fund transfer and
Department matching funds.
General Fund equipment including fire
turnouts, fire self-contained breathing
apparatus (SCBA), police weapons and
forensic equipment, generators and
library materials handling system.
Revenue source is unrestricted, however, Departments
must contribute 50% match to access equipment
replacement funds, and typically the item must total at
least $20,000.
Page N/A
General Fund (GF) - used to account for financial activities not reported in another fund
59

Fund Summary Fund Matrix
Reporting Fund Name
and Number
(listed alphabetically)
Purpose Primary Funding Sources Primary Expenditures Spending Restrictions
FY16
Proposed
Budget
Document
Reference
Community Development
Fund (170)
To account for grant revenues
received from the federal government
related to economic development and
affordable housing.
Federal grants and loan repayments. Eligible capital projects, Broadway
Commerce Center, low income housing,
loans for historic properties and
commercial revitalization.
Community Development Block Grant (CDBG) and
HOME funds must meet the federal government
criteria of benefiting low to moderate income
individuals' needs, eliminating slums and blight and
addressing an urgent need.
Page 67
Construction and Rental
Housing Fund (150)
To account for construction permit
activities and collection of rental
housing fund program activities.
Construction permit fees and annual
fees from rental housing program.
Program activities including land use
enforcement, structural integrity and
safety.
City Code 7.300 and 8.440 - Recover all of the City’s
costs related to processing the application for the
permit and inspecting the work during and after
completion of the work; to provide a reasonable
return to the public for the permitted on-going use of
the public way; and offsetting the costs to the City
associated with the enforcement of rental housing
code.
Page 68
Library, Parks and
Recreation Fund (180)
To account for contributions from
private donors to support the public
library and City-owned parks and
recreation facilities and the Arts.
Private donations. Per the designation of the donor. Designation upon receipt of donation. Page 69
Public Safety
Communications Fund
(130)
To account for the operation of 9-1-1
call taking and the operations and
maintenance of the regional radio
system.
Telephone excise tax,
intergovernmental revenue and
revenues from other governments
who subscribe to the
communications systems.
9-1-1 call taking center and operations
and maintenance of the public safety
regional radio system.
Oregon Revised Statutes (ORS) 403 restricts use of
state 9-1-1 tax funds to 9-1-1 operations and an
Intergovernmental Agreement (IGA) between
participating jurisdictions limits use of those revenues
to funding of the regional radio system.
Page 70
Road Fund (131) To account for the operations and
maintenance of the City's street
transportation system.
State Highway Trust Fund
allocations, revenue from the utility
systems for the use and occupancy of
the City's right-of-way and other
grants, fees and permits.
Street surface repair, street lighting,
signing and striping, traffic signal
maintenance, transportation planning
and engineering and street tree
maintenance.
Funding must be used for road related purposes
defined by ORS 366.785-366.820, 366.514, and Article
IX, section 3a, of the Oregon Constitution and may be
limited to specific projects stated in each grant award.
Page 71
Solid Waste and Recycling
Fund (155)
To account for activity associated with
solid waste and recycling efforts.
Solid waste hauler license fees. Regulation of solid waste collection
services and development/promotion
of waste prevention and green building
efforts.
City Code 3.250(1)(g) - Fees that allow the City, at a
minimum, to recover regulatory and enforcement
costs associated with solid waste and/or recycling
collection.
Page 72
Special Assessment
Management Fund (110)
To account for activities related to
support of the special assessment
program and assessment deferral
programs.
Assessment bond proceeds and fees
paid by property owners.
Collection activities for principal and
interest on contracts; collection
activities for transient room taxes.
(Deferral of assessments for low
income property owners and low
income senior property owners under
City Code 7.195)
Council authorized programs for property owners to
finance assessments and participate in deferral
programs; funding is unrestricted but used for these
purposes.
Page 73
Telecom
Registration/Licensing
Fund (135)
To account for revenues and
expenditures associated with the 2%
registration fee/business privilege tax
for providers of telecommunications
services in Eugene.
2% of registrants' gross revenues
derived from their
telecommunication activities within
the city.
City telecom-related projects and
activities that benefit the community.
Program administration and telecom projects that
benefit the community. Funds will not be used to
replace property tax revenue: City Code 3.415 and
Ordinance 20083 Findings #13 and #15.
Page 74
Special Revenue Funds - used to account for the proceeds of certain revenue sources that are legally restricted to expenditure for specific purposes
60

Fund Summary Fund Matrix
Reporting Fund Name
and Number
(listed alphabetically)
Purpose Primary Funding Sources Primary Expenditures Spending Restrictions
FY16
Proposed
Budget
Document
Reference
General Obligation Debt
Service Fund (211)
To account for revenues and
expenditures related to voter-
approved general obligation bonds
issued by the City.
Property tax revenues. Payments of principal and interest on
outstanding general obligation bonds
approved by voters.
ORS 294.388 requires a separate fund to be set up for
payment of general obligation bonds. ORS 287A.140
states that the City may not divert funds while
principal or interest on G.O. bonds remain unpaid.
Page 75
Special Assessment Bond
Debt Fund (250)
To pay principal and interest on bonds
issued to pay for property owner
assessment financing contracts.
Assessment bond proceeds and fees
paid by property owners.
Payments of principal and interest to
bond holders.
Bond covenants restrict property owner payments to
paying off principal and interest on assessment bonds
issued by the City.
Page 76
Debt Service Funds - used to account for the accumulation of resources and payment of long-term debt principal and interest
61

Fund Summary Fund Matrix
Reporting Fund Name
and Number
(listed alphabetically)
Purpose Funding Sources Primary Expenditures Spending Restrictions
FY16
Proposed
Budget
Document
Reference
General Capital Projects
Fund (310)
To account for financing, construction
and preservation of capital facilities
not financed by proprietary or other
capital projects funds and affordable
housing.
General Fund transfer, bond
proceeds, grants and loan
repayments.
Preservation and major repairs of
General Fund buildings, public art, City
Hall replacement and park and open
space land acquisitions.
Funding provided by bond proceeds (including
interest earnings) are restricted by the terms of the
bond measure approved by voters. Grants are usually
restricted to a specific project or type of project.
General Fund transfers are unrestricted. Fund 314 is
restricted by Council Policy to provide capital funding
for affordable housing projects. The revenue generated
from loan repayment is designated for future
affordable housing projects.
Page 77
Special Assessments Capital
Projects Fund (350)
To account for interim financing and
related costs of construction for public
improvements which primarily benefit
the property owners against whose
properties special assessments are
levied.
Debt issuance and repayment. Construction of public improvements. State law restricts assessments to the specific
improvement constructed.
Page 78
Systems Development
Capital Projects Fund (330)
To account for Systems Development
Charge (SDC) revenues and
expenditures in four major
infrastructure systems.
SDC fees paid when permits are
issued.
Capacity-enhancing projects for the
following systems: transportation,
wastewater, stormwater and parks.
ORS 223.297 to 223.314 restricts expenditures to
capacity-enhancing projects for the four systems.
Page 79
Transportation Capital
Projects Fund (340)
To account for revenues from
dedicated sources and related non-
development transportation capital
project expenditures.
State and federal transportation
grants, a $0.05 per gallon local motor
vehicle fuel tax and the 2012 voter-
approved Street Bond.
Pavement preservation program fixing
streets and funding bicycle and
pedestrian projects.
Funding provided by bond proceeds (including
interest earnings) are restricted by the terms of the
bond measure approved by voters. Grants are usually
restricted to a specific project or type of project. Gas
tax revenues are dedicated to the preservation and
maintenance of the street system per Oregon State
Constitution, Article 9, Section 3a; ORS 366 and 367
and City Code 3.489 (2).
Page 80
Capital Projects Funds - used to account for financial resources to be used for the acquisition or construction of major capital facilities
62

Fund Summary Fund Matrix
Reporting Fund Name
and Number
(listed alphabetically)
Purpose Primary Funding Sources Primary Expenditures Spending Restrictions
FY16
Proposed
Budget
Document
Reference
Ambulance Transport Fund
(592)
To account for the operations of
ambulance transportation services and
associated pre-hospital life support
care.
User fees and subscription program
membership fees.
Costs related to ambulance transport
and associated pre-hospital life support
care.
The proceeds of user fees are retained in the fund for
operating the service.
Page 81
Municipal Airport Fund
(510)
To account for the operation of the
municipal airport.
Airline, parking and concession
revenues, Airport Improvement
Program (AIP) grant monies and
Passenger Facility Charges (PFC).
Airport operations and capital
improvements.
Revenues are restricted for use in financing airport
operations and eligible airport projects as determined
by FAA regulation.
Page 82
Parking Services Fund
(520)
To account for operations of the City's
municipal parking program.
Parking fees, fines, and commercial
space rentals.
To maintain parking assets and
operations as well as a transfer to the
General Fund to pay for a portion of a
dedicated downtown police unit.
Proceeds are retained in the fund for operating the
municipal parking program.
Page 83
Stormwater Utility Fund
(539)
To account for activities related to the
stormwater system and providing
wetland mitigation credits.
Stormwater user fees and mitigation
credit sales.
For the operation, construction and
maintenance of the stormwater system
and the wetland resource protection
and enhancement program.
As allowed under state statute, the proceeds of user
fees are retained in the fund for planning, constructing
and/or operating the system. Wetland mitigation
credits are restricted to appropriate projects within
the wetland bank service area.
Page 84
Wastewater Utility Fund
(530)
To account for activities related to the
wastewater collection and treatment
system.
Wastewater user fees. For the construction, operation and
maintenance of the wastewater
collection and treatment system.
Partial restriction for outstanding regional wastewater
system debt payments. As allowed under state statute,
the proceeds of user fees are retained in the fund for
planning, constructing and/or operating the system.
Per IGA, all regional revenues are required to be passed
through to the Metropolitan Wastewater Management
Commission (MWMC).
Page 85
Enterprise Funds - used to account for operations that are financed and operated in a similar manner as a private business; intended to be self-supporting
63

Fund Summary Fund Matrix
Reporting Fund Name
and Number
(listed alphabetically)
Purpose Primary Funding Sources Primary Expenditures Spending Restrictions
FY16
Proposed
Budget
Document
Reference
Facilities Services Fund
(615)
To account for the different aspects of
operation and maintenance of City-
owned facilities.
Lease payments, facility maintenance
rates, charges to capital funds and
postage reimbursement.
Facility maintenance for Atrium
Building; debt service on Atrium bonds,
general facility maintenance for City
buildings, and architectural and project
management services performed by
Facility Management Division
personnel, postage expenditures.
Limited to the participating and benefiting funds that
incurred the fees and charges for services, consistent
with the cost-reimbursement goal of internal service
funds. The Atrium Fund has an internal debt covenant
to maintain a prudent debt reserve. There are no
restrictions for the Facilities Maintenance and
Facilities Professional Services subfunds.
Page 86
Fleet Services Fund (600) To provide for a way to systematically
set aside funding for the purchase of
vehicles, equipment and radio
infrastructure and maintenance.
Fleet and radio user charges. Vehicle and radio purchases and
equipment maintenance.
Limited to the participating and benefiting funds that
incurred the fees and charges for services, consistent
with the cost-reimbursement goal of internal service
funds. For the General Fund there are no restrictions.
For Non-General Funds, see restrictions for all funds,
including: Municipal Airport Fund, Road Fund,
Stormwater Utility Fund and Wastewater Utility Fund.
The proceeds of department charges are retained in
the fund to operate and maintain the system.
Page 87
Information Systems and
Services Fund (610)
To account for the activity related to
information systems and services for
City departments, information systems
for public safety and central business
software applications.
User charges to other City funds for
software support, hardware support,
network services, telephones,
printing, copying and postage and
records management system charges
to the City of Springfield.
Data processing and reproduction,
equipment purchases and maintenance,
postage, telephone and printing
services, Public Safety and Justice
software systems, and the purchase of
central business software.
Limited to the participating and benefiting funds that
incurred the fees and charges for services, consistent
with the cost-reimbursement goal of internal service
funds. Resources associated with the Records
Management System (RMS) project may not be
transferred out of this fund or otherwise used for
other purposes under an IGA with the City of
Springfield.
Page 88
Professional Services Fund
(630)
To account for professional
engineering services performed by
Public Works personnel for other City
funds and outside agencies.
User charges. Engineering services. Limited to the participating and benefiting funds that
incurred the fees and charges for services, consistent
with the cost-reimbursement goal of internal service
funds.
Page 89
Risk and Benefits Fund
(620)
To account for cost of the City's self-
insurance programs including risk
management, employee health and
benefits, pension bond and other post-
employee benefits.
Rates charged to all City funds and
payment for insurance plans from
active employees and retirees.
Property and liability insurance and
claims, current and previous employee
health and benefits, principal and
interest on pension bonds, workers
compensation and unemployment
insurance.
Resources placed into the Employee Health and
Benefits subfund may not be transferred out of this
subfund or otherwise used for other purposes
according to ORS 731.036(6). Expenditures from the
Risk subfund are limited under EC 2.585. Pension bond
reserves are prudent internal reserves to ensure
payment of principal and interest on pension bonds.
Reserves constitute funds from both the General Fund
and non-General Funds. See restrictions on non-
General Funds.
Page 90
Internal Service Funds - used to account for fiscal activities when goods or services are furnished internally to other departments on a cost reimbursement basis
64

General Fund (010) Reporting Fund
FY15 FY15 FY16
FY13 FY14 Adopted Budget FY15 ProposedActual Actual Budget 12/31/2014 Projections Budget
Revenues
Taxes 96,049,499 99,063,832 100,348,500 100,348,500 103,183,820 106,999,000
Licenses/Permits 5,800,117 6,827,650 6,049,250 6,049,250 5,990,500 6,170,000
Intergovernmental 5,438,925 5,072,898 4,150,803 4,980,568 5,024,148 4,560,357
Rental 118,269 121,745 108,040 108,040 106,040 127,040
Charges for Services 11,291,868 12,070,614 11,235,781 12,074,526 12,225,532 13,112,253
Fines/Forfeitures 2,251,846 2,286,976 2,272,000 2,379,936 2,570,883 2,474,200
Miscellaneous 1,566,052 1,396,136 331,400 373,462 506,501 477,947
Interfund Transfers 9,320,241 9,767,993 9,654,131 9,654,131 9,654,131 9,519,145
Total Revenues 131,836,817 136,607,844 134,149,905 135,968,413 139,261,555 143,439,942
Expenditures
Central Services 20,985,831 20,822,224 21,551,815 23,788,354 23,433,779 22,851,243
Fire and Emerg. Med. Srvcs. 25,274,995 25,421,463 26,036,523 26,833,399 26,442,860 27,594,830
Library, Rec. and Cultural Srvcs. 23,628,152 23,771,270 25,749,255 26,686,559 26,370,822 27,348,754
Planning and Development 5,653,942 5,464,560 5,729,842 6,734,967 6,633,942 5,919,055
Police 45,365,823 44,745,581 46,194,367 48,588,352 48,401,551 49,611,910
Public Works 6,107,476 5,758,492 5,430,730 5,963,201 5,873,753 5,790,248
Debt Service 231,663 223,600 0 0 0 0
Interfund Transfers 6,430,025 6,295,350 4,382,368 7,487,931 7,639,931 4,379,300
Special Payments 987,156 617,749 800,000 800,000 700,000 700,000
Total Expenditures 134,665,063 133,120,289 135,874,900 146,882,763 145,496,638 144,195,340
Excess (deficiency) of revenues over expenditures (2,828,246) 3,487,555 (1,724,995) (10,914,350) (6,235,083) (755,398)
Beginning Working Capital
(Fund Balance), July 1 41,673,438 38,845,192 34,471,236 42,538,332 42,332,747 36,097,664Ending Working Capital
(Fund Balance), June 30 38,845,192 42,332,747 32,746,241 31,623,982 36,097,664 35,342,266
Reconciliation of Total Resources and Requirements
Resources Beginning Working Capital
(Fund Balance) 41,673,438 38,845,192 34,471,236 42,538,332 42,332,747 36,097,664
Total Revenues 131,836,817 136,607,844 134,149,905 135,968,413 139,261,555 143,439,942
Total Resources 173,510,255 175,453,036 168,621,141 178,506,745 181,594,302 179,537,606
Requirements
Total Expenditures 134,665,063 133,120,289 135,874,900 146,882,763 145,496,638 144,195,340 Ending Working Capital
(Fund Balance) 38,845,192 42,332,747 32,746,241 31,623,982 36,097,664 35,342,266
Total Requirements 173,510,255 175,453,036 168,621,141 178,506,745 181,594,302 179,537,606
Reserves (Budgeted amounts only)
Contingency 0 47,000 47,000 37,000 37,000 32,000
Reserve 14,337,463 8,861,491 10,989,241 9,876,982 9,876,982 12,270,266
UEFB* 21,150,000 21,670,000 21,710,000 21,710,000 21,710,000 23,040,000
Total Reserves 35,487,463 30,578,491 32,746,241 31,623,982 31,623,982 35,342,266
* Unappropriated Ending Fund Balance
Note: SB2 will correct error in Beginning Working Capital for FY15 Budget 12/31/2014.
65

General Fund (011) Main Subfund
FY15 FY15 FY16
FY13 FY14 Adopted Budget FY15 Proposed
Actual Actual Budget 12/31/2014 Projections Budget
Revenues
Taxes 94,302,218 97,165,368 98,568,500 98,568,500 101,283,820 104,949,000
Licenses/Permits 5,800,117 6,827,650 6,049,250 6,049,250 5,990,500 6,170,000
Intergovernmental 4,575,125 5,072,898 4,150,803 4,980,568 5,024,148 4,560,357
Rental 118,269 121,745 108,040 108,040 106,040 127,040
Charges for Services 9,343,592 9,669,186 8,689,281 9,528,026 9,689,032 9,665,153
Fines/Forfeitures 2,251,846 2,286,976 2,272,000 2,379,936 2,570,883 2,474,200
Miscellaneous 1,418,562 1,356,574 306,400 348,462 471,401 452,947
Interfund Transfers 8,920,241 9,242,993 9,254,131 9,179,131 9,179,131 9,119,145
Total Revenues 126,729,970 131,743,390 129,398,405 131,141,913 134,314,955 137,517,842
Expenditures
Central Services 20,835,831 20,660,224 21,401,815 23,638,354 23,283,779 22,701,243
Fire and Emerg. Med. Svcs. 24,125,225 25,309,475 25,866,523 26,035,902 25,645,363 27,594,830
Library, Rec. and Cultural Srvcs. 19,657,776 19,609,433 20,500,111 21,049,215 20,733,478 21,576,889
Planning and Development 5,653,942 5,464,560 5,729,842 6,734,967 6,633,942 5,919,055
Police 45,350,580 44,717,110 46,155,517 48,504,391 48,317,590 49,573,310
Public Works 6,107,476 5,758,492 5,430,730 5,963,201 5,873,753 5,790,248
Debt Service 231,663 223,600 0 0 0 0
Interfund Transfers 6,430,025 6,295,350 4,382,368 7,487,931 7,639,931 4,379,300
Special Payments 987,156 617,749 800,000 800,000 700,000 700,000
Total Expenditures 129,379,674 128,655,993 130,266,906 140,213,961 138,827,836 138,234,875
Excess (deficiency) of
revenues over expenditures (2,649,704) 3,087,397 (868,501) (9,072,048) (4,512,881) (717,033)
Beginning Working Capital
(Fund Balance), July 1 38,065,592 35,415,888 31,473,759 38,708,870 38,503,285 33,990,404
Ending Working Capital
(Fund Balance), June 30 35,415,888 38,503,285 30,605,258 29,636,822 33,990,404 33,273,371
Reconciliation of Total Resources and Requirements
Resources
Beginning Working Capital
(Fund Balance) 38,065,592 35,415,888 31,473,759 38,708,870 38,503,285 33,990,404
Total Revenues 126,729,970 131,743,390 129,398,405 131,141,913 134,314,955 137,517,842
Total Resources 164,795,562 167,159,278 160,872,164 169,850,783 172,818,240 171,508,246
Requirements
Total Expenditures 129,379,674 128,655,993 130,266,906 140,213,961 138,827,836 138,234,875
Ending Working Capital
(Fund Balance) 35,415,888 38,503,285 30,605,258 29,636,822 33,990,404 33,273,371
Total Requirements 164,795,562 167,159,278 160,872,164 169,850,783 172,818,240 171,508,246
Reserves (Budgeted amounts only)
Contingency 0 47,000 47,000 37,000 37,000 32,000
Reserve 11,597,727 6,480,301 8,848,258 7,889,822 7,889,822 10,201,371
UEFB* 21,150,000 21,670,000 21,710,000 21,710,000 21,710,000 23,040,000
Total Reserves 32,747,727 28,197,301 30,605,258 29,636,822 29,636,822 33,273,371
* Unappropriated Ending Fund Balance
Note: SB2 will correct error in Beginning Working Capital for FY15 Budget 12/31/2014.
66

Community Development Fund (170) Special Revenue Funds
FY15 FY15 FY16
FY13 FY14 Adopted Budget FY15 ProposedActual Actual Budget 12/31/2014 Projections Budget
Revenues
Intergovernmental 2,191,434 2,416,330 3,974,661 8,015,687 5,416,225 4,728,957
Charges for Services 13,696 3,772 83,950 83,950 5,000 83,950
Miscellaneous 581,978 361,834 645,180 645,180 350,978 515,670
Principal on Notes/Loans 1,168,036 1,607,083 2,727,750 2,827,750 3,219,613 2,748,600
Interfund Transfers 0 30,000 0 0 0 0
Total Revenues 3,955,144 4,419,019 7,431,541 11,572,567 8,991,816 8,077,177
Expenditures
Central Services 0 0 6,000 6,000 0 0
Planning and Development 1,671,466 1,925,027 3,647,304 4,644,052 3,200,063 1,864,039
Capital 598,379 6,024 869,718 1,640,858 1,641,335 0
Debt Service 173,370 163,626 368,000 368,000 1,551,769 368,000
Interfund Transfers 124,000 124,000 140,000 140,000 140,000 123,000
Special Payments 1,760,547 946,317 7,233,519 7,083,838 2,610,094 7,981,938
Total Expenditures 4,327,762 3,164,994 12,264,541 13,882,748 9,143,261 10,336,977
Excess (deficiency) of revenues over expenditures (372,618) 1,254,025 (4,833,000) (2,310,181) (151,445) (2,259,800)
Beginning Working Capital
(Fund Balance), July 1 2,719,838 2,347,220 5,825,266 3,601,245 3,601,245 3,449,800Ending Working Capital
(Fund Balance), June 30 2,347,220 3,601,245 992,266 1,291,064 3,449,800 1,190,000
Reconciliation of Total Resources and Requirements
Resources Beginning Working Capital
(Fund Balance) 2,719,838 2,347,220 5,825,266 3,601,245 3,601,245 3,449,800
Total Revenues 3,955,144 4,419,019 7,431,541 11,572,567 8,991,816 8,077,177
Total Resources 6,674,982 6,766,239 13,256,807 15,173,812 12,593,061 11,526,977
Requirements
Total Expenditures 4,327,762 3,164,994 12,264,541 13,882,748 9,143,261 10,336,977 Ending Working Capital
(Fund Balance) 2,347,220 3,601,245 992,266 1,291,064 3,449,800 1,190,000
Total Requirements 6,674,982 6,766,239 13,256,807 15,173,812 12,593,061 11,526,977
Reserves (Budgeted amounts only)
Reserve 826,000 809,266 992,266 992,056 992,056 1,190,000
Balance Available 196,146 2,413 0 299,008 299,008 0
Total Reserves 1,022,146 811,679 992,266 1,291,064 1,291,064 1,190,000
67

Construction and Rental Housing Fund (150) Special Revenue Funds
FY15 FY15 FY16
FY13 FY14 Adopted Budget FY15 ProposedActual Actual Budget 12/31/2014 Projections Budget
Revenues
Licenses/Permits 2,960,193 4,276,796 3,406,414 3,406,414 3,671,279 3,598,529
Charges for Services 3,477,417 5,312,739 4,045,976 4,045,976 4,095,593 4,362,554
Fines/Forfeitures 32,529 19,910 42,125 42,125 13,600 41,103
Miscellaneous 28,347 27,788 352,851 352,851 32,300 281,150
Total Revenues 6,498,486 9,637,233 7,847,366 7,847,366 7,812,772 8,283,336
Expenditures
Fire and Emerg. Med. Svcs. 244,728 261,138 291,175 291,175 289,574 303,275
Planning and Development 5,049,658 5,100,251 5,861,862 5,861,862 5,402,408 6,363,314
Public Works 383,096 380,346 420,792 420,792 416,882 440,639
Interfund Transfers 630,000 677,000 744,000 744,000 744,000 820,000
Special Payments 483,515 647,407 640,000 640,000 633,000 800,000
Total Expenditures 6,790,997 7,066,142 7,957,829 7,957,829 7,485,864 8,727,228
Excess (deficiency) of revenues over expenditures (292,511) 2,571,091 (110,463) (110,463) 326,908 (443,892)
Beginning Working Capital
(Fund Balance), July 1 2,521,255 2,228,744 3,719,476 4,799,835 4,799,835 5,126,743Ending Working Capital
(Fund Balance), June 30 2,228,744 4,799,835 3,609,013 4,689,372 5,126,743 4,682,851
Reconciliation of Total Resources and Requirements
Resources Beginning Working Capital
(Fund Balance) 2,521,255 2,228,744 3,719,476 4,799,835 4,799,835 5,126,743
Total Revenues 6,498,486 9,637,233 7,847,366 7,847,366 7,812,772 8,283,336
Total Resources 9,019,741 11,865,977 11,566,842 12,647,201 12,612,607 13,410,079
Requirements
Total Expenditures 6,790,997 7,066,142 7,957,829 7,957,829 7,485,864 8,727,228 Ending Working Capital
(Fund Balance) 2,228,744 4,799,835 3,609,013 4,689,372 5,126,743 4,682,851
Total Requirements 9,019,741 11,865,977 11,566,842 12,647,201 12,612,607 13,410,079
Reserves (Budgeted amounts only)
Balance Available 2,366,990 1,901,993 3,609,013 4,689,372 4,689,372 4,682,851
Total Reserves 2,366,990 1,901,993 3,609,013 4,689,372 4,689,372 4,682,851
68
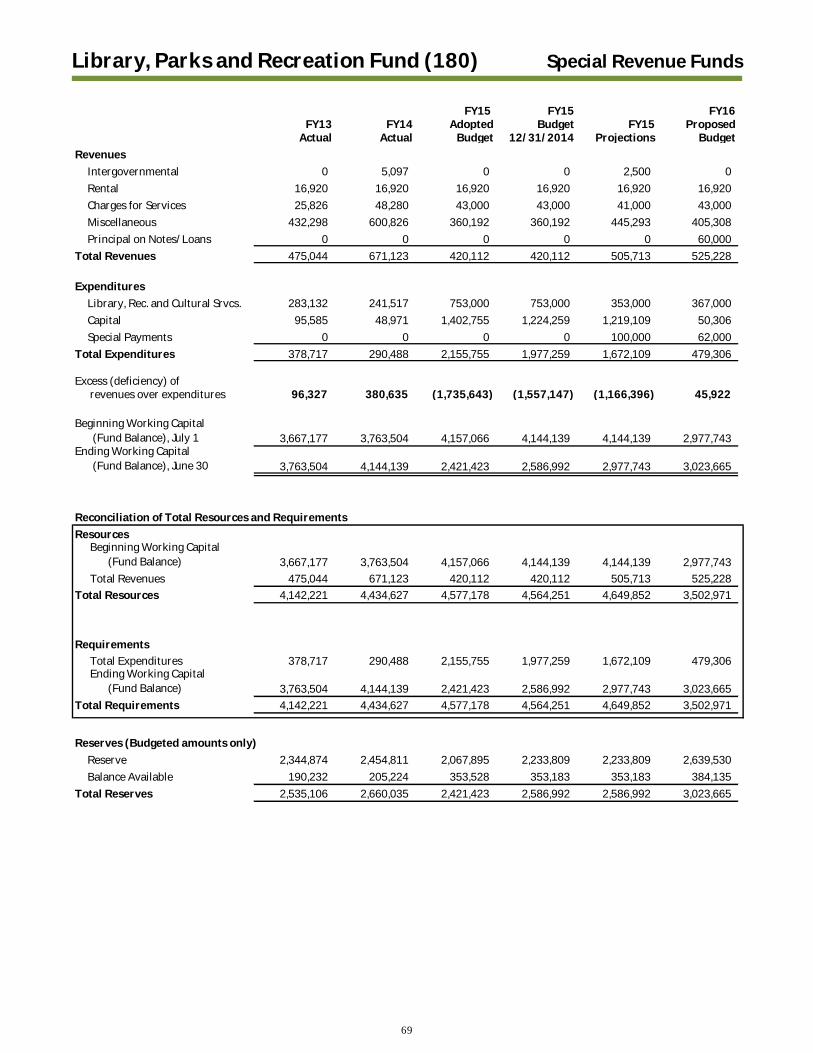
Library, Parks and Recreation Fund (180) Special Revenue Funds
FY15 FY15 FY16
FY13 FY14 Adopted Budget FY15 ProposedActual Actual Budget 12/31/2014 Projections Budget
Revenues
Intergovernmental 0 5,097 0 0 2,500 0
Rental 16,920 16,920 16,920 16,920 16,920 16,920
Charges for Services 25,826 48,280 43,000 43,000 41,000 43,000
Miscellaneous 432,298 600,826 360,192 360,192 445,293 405,308
Principal on Notes/Loans 0 0 0 0 0 60,000
Total Revenues 475,044 671,123 420,112 420,112 505,713 525,228
Expenditures
Library, Rec. and Cultural Srvcs. 283,132 241,517 753,000 753,000 353,000 367,000
Capital 95,585 48,971 1,402,755 1,224,259 1,219,109 50,306
Special Payments 0 0 0 0 100,000 62,000
Total Expenditures 378,717 290,488 2,155,755 1,977,259 1,672,109 479,306
Excess (deficiency) of revenues over expenditures 96,327 380,635 (1,735,643) (1,557,147) (1,166,396) 45,922
Beginning Working Capital
(Fund Balance), July 1 3,667,177 3,763,504 4,157,066 4,144,139 4,144,139 2,977,743Ending Working Capital
(Fund Balance), June 30 3,763,504 4,144,139 2,421,423 2,586,992 2,977,743 3,023,665
Reconciliation of Total Resources and Requirements
Resources Beginning Working Capital
(Fund Balance) 3,667,177 3,763,504 4,157,066 4,144,139 4,144,139 2,977,743
Total Revenues 475,044 671,123 420,112 420,112 505,713 525,228
Total Resources 4,142,221 4,434,627 4,577,178 4,564,251 4,649,852 3,502,971
Requirements
Total Expenditures 378,717 290,488 2,155,755 1,977,259 1,672,109 479,306 Ending Working Capital
(Fund Balance) 3,763,504 4,144,139 2,421,423 2,586,992 2,977,743 3,023,665
Total Requirements 4,142,221 4,434,627 4,577,178 4,564,251 4,649,852 3,502,971
Reserves (Budgeted amounts only)
Reserve 2,344,874 2,454,811 2,067,895 2,233,809 2,233,809 2,639,530
Balance Available 190,232 205,224 353,528 353,183 353,183 384,135
Total Reserves 2,535,106 2,660,035 2,421,423 2,586,992 2,586,992 3,023,665
69

Public Safety Communications Fund (130) Special Revenue Funds
FY15 FY15 FY16
FY13 FY14 Adopted Budget FY15 ProposedActual Actual Budget 12/31/2014 Projections Budget
Revenues
Intergovernmental 754,020 753,218 801,551 801,551 801,551 809,571
Charges for Services 2,818,755 2,379,071 2,401,433 2,401,433 2,039,741 2,155,495
Miscellaneous 10,870 9,138 9,100 9,100 9,443 4,590
Interfund Transfers 80,725 81,050 121,068 121,068 121,068 0
Total Revenues 3,664,370 3,222,477 3,333,152 3,333,152 2,971,803 2,969,656
Expenditures
Police 2,969,162 2,818,065 2,941,650 3,555,478 3,191,610 2,768,666
Interfund Transfers 173,000 188,000 186,000 186,000 186,000 197,000
Special Payments 0 500,000 354,559 354,559 201,443 0
Total Expenditures 3,142,162 3,506,065 3,482,209 4,096,037 3,579,053 2,965,666
Excess (deficiency) of revenues over expenditures 522,208 (283,588) (149,057) (762,885) (607,250) 3,990
Beginning Working Capital
(Fund Balance), July 1 1,870,338 2,392,546 1,982,503 2,108,958 2,108,958 1,501,708Ending Working Capital
(Fund Balance), June 30 2,392,546 2,108,958 1,833,446 1,346,073 1,501,708 1,505,698
Reconciliation of Total Resources and Requirements
Resources Beginning Working Capital
(Fund Balance) 1,870,338 2,392,546 1,982,503 2,108,958 2,108,958 1,501,708
Total Revenues 3,664,370 3,222,477 3,333,152 3,333,152 2,971,803 2,969,656
Total Resources 5,534,708 5,615,023 5,315,655 5,442,110 5,080,761 4,471,364
Requirements
Total Expenditures 3,142,162 3,506,065 3,482,209 4,096,037 3,579,053 2,965,666 Ending Working Capital
(Fund Balance) 2,392,546 2,108,958 1,833,446 1,346,073 1,501,708 1,505,698
Total Requirements 5,534,708 5,615,023 5,315,655 5,442,110 5,080,761 4,471,364
Reserves (Budgeted amounts only)
Reserve 1,097,776 1,188,070 1,414,185 900,357 900,357 903,409
Balance Available 624,364 598,734 419,261 445,716 445,716 602,289
Total Reserves 1,722,140 1,786,804 1,833,446 1,346,073 1,346,073 1,505,698
70

Road Fund (131) Special Revenue Funds
FY15 FY15 FY16
FY13 FY14 Adopted Budget FY15 ProposedActual Actual Budget 12/31/2014 Projections Budget
Revenues
Licenses/Permits 1,667,204 1,775,365 1,710,000 1,710,000 1,789,550 1,796,500
Intergovernmental 8,725,273 9,456,140 9,307,000 9,307,000 9,133,167 9,132,000
Rental 67,819 67,340 55,482 55,482 140,483 55,000
Charges for Services 51,367 97,636 74,500 74,500 75,055 76,000
Fines/Forfeitures 71 0 0 0 2,800 0
Miscellaneous 131,390 215,637 116,000 116,000 189,166 182,500
Interfund Transfers 1,132,000 0 0 0 0 0
Total Revenues 11,775,124 11,612,118 11,262,982 11,262,982 11,330,221 11,242,000
Expenditures
Public Works 10,021,883 10,251,366 11,089,068 10,985,703 10,985,703 12,816,891
Interfund Transfers 721,000 779,000 703,000 1,032,752 1,032,752 863,000
Total Expenditures 10,742,883 11,030,366 11,792,068 12,018,455 12,018,455 13,679,891
Excess (deficiency) of revenues over expenditures 1,032,241 581,752 (529,086) (755,473) (688,234) (2,437,891)
Beginning Working Capital
(Fund Balance), July 1 2,453,154 3,485,395 3,362,767 4,067,147 4,067,147 3,378,913Ending Working Capital
(Fund Balance), June 30 3,485,395 4,067,147 2,833,681 3,311,674 3,378,913 941,022
Reconciliation of Total Resources and Requirements
Resources Beginning Working Capital
(Fund Balance) 2,453,154 3,485,395 3,362,767 4,067,147 4,067,147 3,378,913
Total Revenues 11,775,124 11,612,118 11,262,982 11,262,982 11,330,221 11,242,000
Total Resources 14,228,278 15,097,513 14,625,749 15,330,129 15,397,368 14,620,913
Requirements
Total Expenditures 10,742,883 11,030,366 11,792,068 12,018,455 12,018,455 13,679,891 Ending Working Capital
(Fund Balance) 3,485,395 4,067,147 2,833,681 3,311,674 3,378,913 941,022
Total Requirements 14,228,278 15,097,513 14,625,749 15,330,129 15,397,368 14,620,913
Reserves (Budgeted amounts only)
Balance Available 2,011,523 2,485,895 2,833,681 3,311,674 3,311,674 941,022
Total Reserves 2,011,523 2,485,895 2,833,681 3,311,674 3,311,674 941,022
71

Solid Waste and Recycling Fund (155) Special Revenue Funds
FY15 FY15 FY16
FY13 FY14 Adopted Budget FY15 ProposedActual Actual Budget 12/31/2014 Projections Budget
Revenues
Licenses/Permits 656,021 827,375 839,468 839,468 837,114 850,133
Intergovernmental (8,967) 4,276 7,000 7,000 7,000 0
Charges for Services 1,856 32 0 0 12 0
Fines/Forfeitures 3,010 0 0 0 0 0
Miscellaneous 5,044 3,547 3,000 3,000 8,500 5,000
Total Revenues 656,964 835,230 849,468 849,468 852,626 855,133
Expenditures
Central Services 50,000 49,455 0 0 0 0
Planning and Development 752,888 652,215 745,968 845,968 756,120 731,644
Interfund Transfers 97,000 77,000 104,000 104,000 104,000 74,000
Total Expenditures 899,888 778,670 849,968 949,968 860,120 805,644
Excess (deficiency) of revenues over expenditures (242,924) 56,560 (500) (100,500) (7,494) 49,489
Beginning Working Capital
(Fund Balance), July 1 701,395 458,471 458,971 615,030 515,030 507,536Ending Working Capital
(Fund Balance), June 30 458,471 515,031 458,471 514,530 507,536 557,025
Reconciliation of Total Resources and Requirements
Resources Beginning Working Capital
(Fund Balance) 701,395 458,471 458,971 615,030 515,030 507,536
Total Revenues 656,964 835,230 849,468 849,468 852,626 855,133
Total Resources 1,358,359 1,293,701 1,308,439 1,464,498 1,367,656 1,362,669
Requirements
Total Expenditures 899,888 778,670 849,968 949,968 860,120 805,644 Ending Working Capital
(Fund Balance) 458,471 515,031 458,471 514,530 507,536 557,025
Total Requirements 1,358,359 1,293,701 1,308,439 1,464,498 1,367,656 1,362,669
Reserves (Budgeted amounts only)
Balance Available 425,864 407,909 458,471 514,530 514,530 557,025
Total Reserves 425,864 407,909 458,471 514,530 514,530 557,025
Note: SB2 will correct error in Beginning Working Capital for FY15 Budget 12/31/2014.
72

Special Assessment Management Fund (110) Special Revenue Funds
FY15 FY15 FY16
FY13 FY14 Adopted Budget FY15 ProposedActual Actual Budget 12/31/2014 Projections Budget
Revenues
Charges for Services 40,865 37,443 45,220 45,220 45,220 45,380
Miscellaneous 32,284 25,049 11,050 11,050 18,100 49,671
Interfund Transfers 1,230 0 30,000 30,000 10,000 30,000
Principal on Assessements 13,160 14,338 3,000 3,000 7,400 3,000
Prin. on Assmts. - Finance Fee 7,781 6,546 2,000 2,000 2,800 1,900
Total Revenues 95,320 83,376 91,270 91,270 83,520 129,951
Expenditures
Central Services 77,100 78,914 91,157 91,157 91,157 130,758
Interfund Transfers 6,000 8,000 9,000 9,000 9,000 7,000
Special Payments 9,637 0 30,000 30,000 10,000 30,000
Total Expenditures 92,737 86,914 130,157 130,157 110,157 167,758
Excess (deficiency) of revenues over expenditures 2,583 (3,538) (38,887) (38,887) (26,637) (37,807)
Beginning Working Capital
(Fund Balance), July 1 1,243,964 1,246,547 1,237,985 1,243,009 1,243,009 1,216,372Ending Working Capital
(Fund Balance), June 30 1,246,547 1,243,009 1,199,098 1,204,122 1,216,372 1,178,565
Reconciliation of Total Resources and Requirements
Resources Beginning Working Capital
(Fund Balance) 1,243,964 1,246,547 1,237,985 1,243,009 1,243,009 1,216,372
Total Revenues 95,320 83,376 91,270 91,270 83,520 129,951
Total Resources 1,339,284 1,329,923 1,329,255 1,334,279 1,326,529 1,346,323
Requirements
Total Expenditures 92,737 86,914 130,157 130,157 110,157 167,758 Ending Working Capital
(Fund Balance) 1,246,547 1,243,009 1,199,098 1,204,122 1,216,372 1,178,565
Total Requirements 1,339,284 1,329,923 1,329,255 1,334,279 1,326,529 1,346,323
Reserves (Budgeted amounts only)
Reserve 50,000 50,000 50,000 50,000 50,000 50,000
Balance Available 1,206,741 1,163,608 1,149,098 1,154,122 1,154,122 1,128,565
Total Reserves 1,256,741 1,213,608 1,199,098 1,204,122 1,204,122 1,178,565
73

Telecom Registration/Licensing Fund (135) Special Revenue Funds
FY15 FY15 FY16
FY13 FY14 Adopted Budget FY15 ProposedActual Actual Budget 12/31/2014 Projections Budget
Revenues
Licenses/Permits 2,987,038 2,938,581 2,900,000 2,900,000 2,940,000 2,950,000
Miscellaneous 38,306 31,185 0 0 30,000 32,000
Total Revenues 3,025,344 2,969,766 2,900,000 2,900,000 2,970,000 2,982,000
Expenditures
Central Services 2,398,084 1,700,943 3,302,259 4,712,755 4,712,755 2,328,100
Capital 2,593 12,134 181,984 169,850 169,850 0
Interfund Transfers 456,000 2,490,000 490,000 490,000 490,000 1,493,000
Total Expenditures 2,856,677 4,203,077 3,974,243 5,372,605 5,372,605 3,821,100
Excess (deficiency) of revenues over expenditures 168,667 (1,233,311) (1,074,243) (2,472,605) (2,402,605) (839,100)
Beginning Working Capital
(Fund Balance), July 1 7,561,512 7,730,179 6,133,117 6,496,868 6,496,868 4,094,263Ending Working Capital
(Fund Balance), June 30 7,730,179 6,496,868 5,058,874 4,024,263 4,094,263 3,255,163
Reconciliation of Total Resources and Requirements
Resources Beginning Working Capital
(Fund Balance) 7,561,512 7,730,179 6,133,117 6,496,868 6,496,868 4,094,263
Total Revenues 3,025,344 2,969,766 2,900,000 2,900,000 2,970,000 2,982,000
Total Resources 10,586,856 10,699,945 9,033,117 9,396,868 9,466,868 7,076,263
Requirements
Total Expenditures 2,856,677 4,203,077 3,974,243 5,372,605 5,372,605 3,821,100 Ending Working Capital
(Fund Balance) 7,730,179 6,496,868 5,058,874 4,024,263 4,094,263 3,255,163
Total Requirements 10,586,856 10,699,945 9,033,117 9,396,868 9,466,868 7,076,263
Reserves (Budgeted amounts only)
Reserve 276,907 340,907 340,907 340,907 340,907 340,907
Balance Available 4,263,879 3,041,915 4,717,967 3,683,356 3,683,356 2,914,256
Total Reserves 4,540,786 3,382,822 5,058,874 4,024,263 4,024,263 3,255,163
74

General Obligation Debt Service Fund (211) Debt Service Funds
FY15 FY15 FY16
FY13 FY14 Adopted Budget FY15 ProposedActual Actual Budget 12/31/2014 Projections Budget
Revenues
Taxes 13,430,780 13,706,731 13,645,596 13,645,596 13,980,000 14,268,159
Miscellaneous 25,594 14,824 10,000 10,000 14,400 12,000
Total Revenues 13,456,374 13,721,555 13,655,596 13,655,596 13,994,400 14,280,159
Expenditures
Debt Service 13,606,235 14,046,093 13,699,263 13,731,833 14,031,833 14,318,963
Total Expenditures 13,606,235 14,046,093 13,699,263 13,731,833 14,031,833 14,318,963
Excess (deficiency) of revenues over expenditures (149,861) (324,538) (43,667) (76,237) (37,433) (38,804)
Beginning Working Capital
(Fund Balance), July 1 550,636 400,775 43,667 76,237 76,237 38,804Ending Working Capital
(Fund Balance), June 30 400,775 76,237 0 0 38,804 0
Reconciliation of Total Resources and Requirements
Resources Beginning Working Capital
(Fund Balance) 550,636 400,775 43,667 76,237 76,237 38,804
Total Revenues 13,456,374 13,721,555 13,655,596 13,655,596 13,994,400 14,280,159
Total Resources 14,007,010 14,122,330 13,699,263 13,731,833 14,070,637 14,318,963
Requirements
Total Expenditures 13,606,235 14,046,093 13,699,263 13,731,833 14,031,833 14,318,963 Ending Working Capital
(Fund Balance) 400,775 76,237 0 0 38,804 0
Total Requirements 14,007,010 14,122,330 13,699,263 13,731,833 14,070,637 14,318,963
Reserves (Budgeted amounts only)
Reserve 0 0 0 0 0 0
Total Reserves 0 0 0 0 0 0
75

Special Assessment Bond Debt Fund (250) Debt Service Funds
FY15 FY15 FY16
FY13 FY14 Adopted Budget FY15 ProposedActual Actual Budget 12/31/2014 Projections Budget
Revenues
Miscellaneous 44,013 29,148 47,900 47,900 30,320 49,500
Principal on Assessments 209,675 141,221 350,900 350,900 90,500 320,900
Prin. on Assmts. - Finance Fee 28,942 (40,523) 0 0 (11,296) 0
Total Revenues 282,630 129,846 398,800 398,800 109,524 370,400
Expenditures
Debt Service 251,238 164,613 412,910 412,694 126,000 367,502
Interfund Transfers 1,230 0 10,000 10,000 10,000 363,535
Total Expenditures 252,468 164,613 422,910 422,694 136,000 731,037
Excess (deficiency) of revenues over expenditures 30,162 (34,767) (24,110) (23,894) (26,476) (360,637)
Beginning Working Capital
(Fund Balance), July 1 448,436 478,598 419,504 443,831 443,831 417,355Ending Working Capital
(Fund Balance), June 30 478,598 443,831 395,394 419,937 417,355 56,718
Reconciliation of Total Resources and Requirements
Resources Beginning Working Capital
(Fund Balance) 448,436 478,598 419,504 443,831 443,831 417,355
Total Revenues 282,630 129,846 398,800 398,800 109,524 370,400
Total Resources 731,066 608,444 818,304 842,631 553,355 787,755
Requirements
Total Expenditures 252,468 164,613 422,910 422,694 136,000 731,037 Ending Working Capital
(Fund Balance) 478,598 443,831 395,394 419,937 417,355 56,718
Total Requirements 731,066 608,444 818,304 842,631 553,355 787,755
Reserves (Budgeted amounts only)
Reserve 428,136 452,546 395,394 419,937 419,937 56,718
Total Reserves 428,136 452,546 395,394 419,937 419,937 56,718
76

General Capital Projects Fund (310) Capital Projects Funds
FY15 FY15 FY16
FY13 FY14 Adopted Budget FY15 ProposedActual Actual Budget 12/31/2014 Projections Budget
Revenues
Intergovernmental 501 0 0 0 0 0
Rental 22,863 20,172 15,000 15,000 500 15,000
Miscellaneous 24,685 18,555 9,150 2,229,150 2,237,550 15,000
Interfund Transfers 3,819,300 14,989,300 2,869,300 6,607,461 6,607,461 3,509,300
Draws on Line of Credit 1,075,000 1,050,000 0 0 1,500,000 0
Gen. Obligation Bonds Issued 0 0 0 9,561,325 8,100,000 0
Total Revenues 4,942,349 16,078,027 2,893,450 18,412,936 18,445,511 3,539,300
Expenditures
Library, Rec. and Cultural Srvcs. 0 1,000 20,000 20,000 20,000 20,000
Capital 5,809,015 5,476,280 30,881,235 33,545,367 33,545,367 2,979,905
Debt Service 5,138 12,741 50,000 50,000 50,000 50,000
Interfund Transfers 0 30,000 0 0 0 0
Total Expenditures 5,814,153 5,520,021 30,951,235 33,615,367 33,615,367 3,049,905
Excess (deficiency) of revenues over expenditures (871,804) 10,558,006 (28,057,785) (15,202,431) (15,169,856) 489,395
Beginning Working Capital
(Fund Balance), July 1 6,216,408 5,344,604 28,715,203 15,902,610 15,902,610 732,754Ending Working Capital
(Fund Balance), June 30 5,344,604 15,902,610 657,418 700,179 732,754 1,222,149
Reconciliation of Total Resources and Requirements
Resources Beginning Working Capital
(Fund Balance) 6,216,408 5,344,604 28,715,203 15,902,610 15,902,610 732,754
Total Revenues 4,942,349 16,078,027 2,893,450 18,412,936 18,445,511 3,539,300
Total Resources 11,158,757 21,422,631 31,608,653 34,315,546 34,348,121 4,272,054
Requirements
Total Expenditures 5,814,153 5,520,021 30,951,235 33,615,367 33,615,367 3,049,905 Ending Working Capital
(Fund Balance) 5,344,604 15,902,610 657,418 700,179 732,754 1,222,149
Total Requirements 11,158,757 21,422,631 31,608,653 34,315,546 34,348,121 4,272,054
Reserves (Budgeted amounts only)
Reserve 27,560 27,560 26,560 26,560 26,560 566,560
Balance Available 590,119 643,812 630,858 673,619 673,619 655,589
Total Reserves 617,679 671,372 657,418 700,179 700,179 1,222,149
77

Special Assessments Capital Projects Fund (350) Capital Projects Funds
FY15 FY15 FY16
FY13 FY14 Adopted Budget FY15 ProposedActual Actual Budget 12/31/2014 Projections Budget
Revenues
Charges for Services 0 155,429 0 0 0 0
Miscellaneous 21,142 17,284 17,700 17,700 17,700 11,600
Principal on Assessments 40,881 35,594 11,500 11,500 15,300 11,900
Total Revenues 62,023 208,307 29,200 29,200 33,000 23,500
Expenditures
Capital 0 0 67,064 67,064 0 0
Interfund Transfers 0 0 20,000 20,000 0 630,291
Total Expenditures 0 0 87,064 87,064 0 630,291
Excess (deficiency) of revenues over expenditures 62,023 208,307 (57,864) (57,864) 33,000 (606,791)
Beginning Working Capital
(Fund Balance), July 1 1,291,660 1,353,683 1,442,347 1,561,990 1,561,990 1,594,990Ending Working Capital
(Fund Balance), June 30 1,353,683 1,561,990 1,384,483 1,504,126 1,594,990 988,199
Reconciliation of Total Resources and Requirements
Resources Beginning Working Capital
(Fund Balance) 1,291,660 1,353,683 1,442,347 1,561,990 1,561,990 1,594,990
Total Revenues 62,023 208,307 29,200 29,200 33,000 23,500
Total Resources 1,353,683 1,561,990 1,471,547 1,591,190 1,594,990 1,618,490
Requirements
Total Expenditures 0 0 87,064 87,064 0 630,291 Ending Working Capital
(Fund Balance) 1,353,683 1,561,990 1,384,483 1,504,126 1,594,990 988,199
Total Requirements 1,353,683 1,561,990 1,471,547 1,591,190 1,594,990 1,618,490
Reserves (Budgeted amounts only)
Balance Available 1,581,668 1,305,619 1,384,483 1,504,126 1,504,126 988,199
Total Reserves 1,581,668 1,305,619 1,384,483 1,504,126 1,504,126 988,199
78

Systems Development Capital Projects Fund (330) Capital Projects Funds
FY15 FY15 FY16
FY13 FY14 Adopted Budget FY15 ProposedActual Actual Budget 12/31/2014 Projections Budget
Revenues
Intergovernmental 0 175,205 0 173,800 0 0
Rental 111,791 121,412 100,000 100,000 125,400 138,840
Charges for Services 4,495,031 7,970,220 2,963,400 2,963,400 4,664,191 3,903,500
Miscellaneous 120,689 146,662 93,200 93,200 161,725 73,172
Total Revenues 4,727,511 8,413,499 3,156,600 3,330,400 4,951,316 4,115,512
Expenditures
Planning and Development 45,704 41,594 83,518 83,518 83,518 114,035
Public Works 211,679 228,012 300,431 335,821 353,103 373,340
Capital 1,052,740 3,380,246 5,888,756 6,755,184 7,261,913 3,367,000
Interfund Transfers 30,000 42,000 34,000 34,000 34,000 39,000
Total Expenditures 1,340,123 3,691,852 6,306,705 7,208,523 7,732,534 3,893,375
Excess (deficiency) of revenues over expenditures 3,387,388 4,721,647 (3,150,105) (3,878,123) (2,781,218) 222,137
Beginning Working Capital
(Fund Balance), July 1 8,897,668 12,285,056 14,629,124 17,006,703 17,006,703 14,225,485Ending Working Capital
(Fund Balance), June 30 12,285,056 17,006,703 11,479,019 13,128,580 14,225,485 14,447,622
Reconciliation of Total Resources and Requirements
Resources Beginning Working Capital
(Fund Balance) 8,897,668 12,285,056 14,629,124 17,006,703 17,006,703 14,225,485
Total Revenues 4,727,511 8,413,499 3,156,600 3,330,400 4,951,316 4,115,512
Total Resources 13,625,179 20,698,555 17,785,724 20,337,103 21,958,019 18,340,997
Requirements
Total Expenditures 1,340,123 3,691,852 6,306,705 7,208,523 7,732,534 3,893,375 Ending Working Capital
(Fund Balance) 12,285,056 17,006,703 11,479,019 13,128,580 14,225,485 14,447,622
Total Requirements 13,625,179 20,698,555 17,785,724 20,337,103 21,958,019 18,340,997
Reserves (Budgeted amounts only)
Balance Available 5,664,654 7,970,859 11,479,019 13,128,580 13,128,580 14,447,622
Total Reserves 5,664,654 7,970,859 11,479,019 13,128,580 13,128,580 14,447,622
79

Transportation Capital Projects Fund (340) Capital Projects Funds
FY15 FY15 FY16
FY13 FY14 Adopted Budget FY15 ProposedActual Actual Budget 12/31/2014 Projections Budget
Revenues
Taxes 2,908,491 2,868,768 2,940,000 2,940,000 2,975,000 2,880,000
Intergovernmental 2,701,301 466,059 0 2,577,550 2,638,389 1,433,645
Rental 40,347 35,597 30,000 30,000 1,000 0
Charges for Services 136,748 92,610 10,000 15,134 261,081 10,000
Miscellaneous 22,131 19,376 0 0 12,000 10,000
Draws on Line of Credit 8,420,000 9,530,000 8,010,000 8,342,733 8,309,221 8,300,000
Interfund Transfers 30,000 30,000 30,000 224,752 224,752 30,000
Total Revenues 14,259,018 13,042,410 11,020,000 14,130,169 14,421,443 12,663,645
Expenditures
Capital 13,528,720 14,105,996 19,366,812 18,809,944 18,809,944 12,825,070
Debt Service 6,011 15,987 10,000 10,000 10,000 10,000
Interfund Transfers 1,132,000 0 0 0 0 0
Total Expenditures 14,666,731 14,121,983 19,376,812 18,819,944 18,819,944 12,835,070
Excess (deficiency) of revenues over expenditures (407,713) (1,079,573) (8,356,812) (4,689,775) (4,398,501) (171,425)
Beginning Working Capital
(Fund Balance), July 1 6,431,342 6,023,629 8,453,824 4,944,056 4,944,056 545,555Ending Working Capital
(Fund Balance), June 30 6,023,629 4,944,056 97,012 254,281 545,555 374,130
Reconciliation of Total Resources and Requirements
Resources Beginning Working Capital
(Fund Balance) 6,431,342 6,023,629 8,453,824 4,944,056 4,944,056 545,555
Total Revenues 14,259,018 13,042,410 11,020,000 14,130,169 14,421,443 12,663,645
Total Resources 20,690,360 19,066,039 19,473,824 19,074,225 19,365,499 13,209,200
Requirements
Total Expenditures 14,666,731 14,121,983 19,376,812 18,819,944 18,819,944 12,835,070 Ending Working Capital
(Fund Balance) 6,023,629 4,944,056 97,012 254,281 545,555 374,130
Total Requirements 20,690,360 19,066,039 19,473,824 19,074,225 19,365,499 13,209,200
Reserves (Budgeted amounts only)
Balance Available 1,788,936 186,516 97,012 254,281 254,281 374,130
Total Reserves 1,788,936 186,516 97,012 254,281 254,281 374,130
80

Ambulance Transport Fund (592) Enterprise Funds
FY15 FY15 FY16
FY13 FY14 Adopted Budget FY15 ProposedActual Actual Budget 12/31/2014 Projections Budget
Revenues
Intergovernmental 0 25,671 0 377,482 377,482 0
Charges for Services 6,391,697 6,557,226 6,541,915 6,541,915 6,886,371 7,279,494
Miscellaneous 119,200 107,676 102,399 102,399 74,270 75,758
Total Revenues 6,510,897 6,690,573 6,644,314 7,021,796 7,338,123 7,355,252
Expenditures
Fire and Emerg. Med. Srvcs. 6,140,945 6,423,563 6,737,054 7,114,536 7,114,536 6,772,184
Interfund Transfers 833,988 898,418 947,031 947,031 947,031 932,390
Total Expenditures 6,974,933 7,321,981 7,684,085 8,061,567 8,061,567 7,704,574
Excess (deficiency) of revenues over expenditures (464,036) (631,408) (1,039,771) (1,039,771) (723,444) (349,322)
Beginning Working Capital
(Fund Balance), July 1 2,170,219 1,706,183 1,091,719 1,074,775 1,074,775 351,331Ending Working Capital
(Fund Balance), June 30 1,706,183 1,074,775 51,948 35,004 351,331 2,009
Reconciliation of Total Resources and Requirements
Resources Beginning Working Capital
(Fund Balance) 2,170,219 1,706,183 1,091,719 1,074,775 1,074,775 351,331
Total Revenues 6,510,897 6,690,573 6,644,314 7,021,796 7,338,123 7,355,252
Total Resources 8,681,116 8,396,756 7,736,033 8,096,571 8,412,898 7,706,583
Requirements
Total Expenditures 6,974,933 7,321,981 7,684,085 8,061,567 8,061,567 7,704,574 Ending Working Capital
(Fund Balance) 1,706,183 1,074,775 51,948 35,004 351,331 2,009
Total Requirements 8,681,116 8,396,756 7,736,033 8,096,571 8,412,898 7,706,583
Reserves (Budgeted amounts only)
Balance Available 1,292,936 618,876 51,948 35,004 35,004 2,009
Total Reserves 1,292,936 618,876 51,948 35,004 35,004 2,009
81
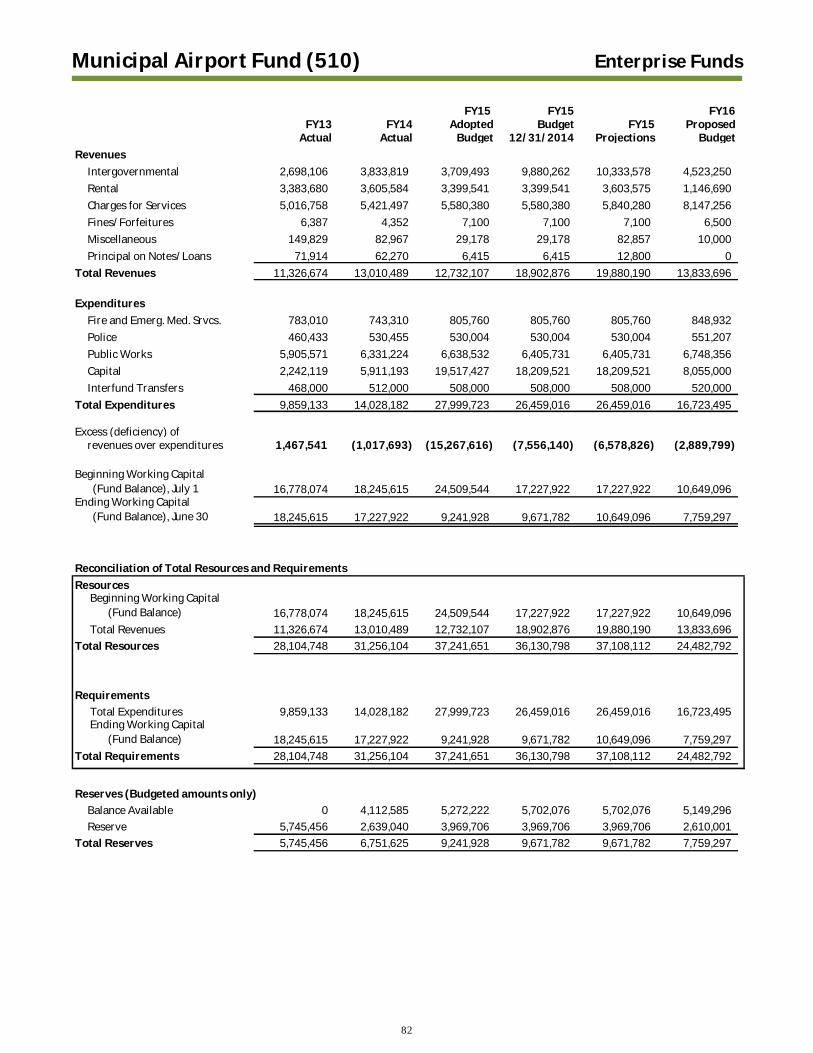
Municipal Airport Fund (510) Enterprise Funds
FY15 FY15 FY16
FY13 FY14 Adopted Budget FY15 ProposedActual Actual Budget 12/31/2014 Projections Budget
Revenues
Intergovernmental 2,698,106 3,833,819 3,709,493 9,880,262 10,333,578 4,523,250
Rental 3,383,680 3,605,584 3,399,541 3,399,541 3,603,575 1,146,690
Charges for Services 5,016,758 5,421,497 5,580,380 5,580,380 5,840,280 8,147,256
Fines/Forfeitures 6,387 4,352 7,100 7,100 7,100 6,500
Miscellaneous 149,829 82,967 29,178 29,178 82,857 10,000
Principal on Notes/Loans 71,914 62,270 6,415 6,415 12,800 0
Total Revenues 11,326,674 13,010,489 12,732,107 18,902,876 19,880,190 13,833,696
Expenditures
Fire and Emerg. Med. Srvcs. 783,010 743,310 805,760 805,760 805,760 848,932
Police 460,433 530,455 530,004 530,004 530,004 551,207
Public Works 5,905,571 6,331,224 6,638,532 6,405,731 6,405,731 6,748,356
Capital 2,242,119 5,911,193 19,517,427 18,209,521 18,209,521 8,055,000
Interfund Transfers 468,000 512,000 508,000 508,000 508,000 520,000
Total Expenditures 9,859,133 14,028,182 27,999,723 26,459,016 26,459,016 16,723,495
Excess (deficiency) of revenues over expenditures 1,467,541 (1,017,693) (15,267,616) (7,556,140) (6,578,826) (2,889,799)
Beginning Working Capital
(Fund Balance), July 1 16,778,074 18,245,615 24,509,544 17,227,922 17,227,922 10,649,096Ending Working Capital
(Fund Balance), June 30 18,245,615 17,227,922 9,241,928 9,671,782 10,649,096 7,759,297
Reconciliation of Total Resources and Requirements
Resources Beginning Working Capital
(Fund Balance) 16,778,074 18,245,615 24,509,544 17,227,922 17,227,922 10,649,096
Total Revenues 11,326,674 13,010,489 12,732,107 18,902,876 19,880,190 13,833,696
Total Resources 28,104,748 31,256,104 37,241,651 36,130,798 37,108,112 24,482,792
Requirements
Total Expenditures 9,859,133 14,028,182 27,999,723 26,459,016 26,459,016 16,723,495 Ending Working Capital
(Fund Balance) 18,245,615 17,227,922 9,241,928 9,671,782 10,649,096 7,759,297
Total Requirements 28,104,748 31,256,104 37,241,651 36,130,798 37,108,112 24,482,792
Reserves (Budgeted amounts only)
Balance Available 0 4,112,585 5,272,222 5,702,076 5,702,076 5,149,296
Reserve 5,745,456 2,639,040 3,969,706 3,969,706 3,969,706 2,610,001
Total Reserves 5,745,456 6,751,625 9,241,928 9,671,782 9,671,782 7,759,297
82

Parking Services Fund (520) Enterprise Funds
FY15 FY15 FY16
FY13 FY14 Adopted Budget FY15 ProposedActual Actual Budget 12/31/2014 Projections Budget
Revenues
Intergovernmental 0 459 0 0 0 0
Rental 481,493 553,598 482,000 482,000 553,400 513,400
Charges for Services 3,678,964 3,897,205 3,721,680 3,756,680 4,332,638 4,222,780
Fines/Forfeitures 681,996 1,041,078 967,500 967,500 971,600 1,340,600
Miscellaneous 239,710 14,995 624,611 624,611 9,168 8,000
Total Revenues 5,082,163 5,507,335 5,795,791 5,830,791 5,866,806 6,084,780
Expenditures
Central Services 290,710 266,069 320,011 320,011 291,475 428,331
Planning and Development 3,083,452 3,343,006 3,435,768 3,470,768 3,341,895 4,187,280
Public Works 39,019 54,049 49,912 49,912 49,912 50,237
Capital 21,907 28,557 108,000 34,801 34,801 50,000
Interfund Transfers 1,775,253 1,984,575 1,940,100 1,940,100 1,940,100 1,502,755
Total Expenditures 5,210,341 5,676,256 5,853,791 5,815,592 5,658,183 6,218,603
Excess (deficiency) of revenues over expenditures (128,178) (168,921) (58,000) 15,199 208,623 (133,823)
Beginning Working Capital
(Fund Balance), July 1 310,063 181,885 58,000 12,964 12,964 221,587Ending Working Capital
(Fund Balance), June 30 181,885 12,964 0 28,163 221,587 87,764
Reconciliation of Total Resources and Requirements
Resources Beginning Working Capital
(Fund Balance) 310,063 181,885 58,000 12,964 12,964 221,587
Total Revenues 5,082,163 5,507,335 5,795,791 5,830,791 5,866,806 6,084,780
Total Resources 5,392,226 5,689,220 5,853,791 5,843,755 5,879,770 6,306,367
Requirements
Total Expenditures 5,210,341 5,676,256 5,853,791 5,815,592 5,658,183 6,218,603 Ending Working Capital
(Fund Balance) 181,885 12,964 0 28,163 221,587 87,764
Total Requirements 5,392,226 5,689,220 5,853,791 5,843,755 5,879,770 6,306,367
Reserves (Budgeted amounts only)
Balance Available 259,994 224,209 0 28,163 28,163 87,764
Total Reserves 259,994 224,209 0 28,163 28,163 87,764
83

Stormwater Utility Fund (539) Enterprise Funds
FY15 FY15 FY16
FY13 FY14 Adopted Budget FY15 ProposedActual Actual Budget 12/31/2014 Projections Budget
Revenues
Licenses/Permits 91,192 133,521 108,500 108,500 110,500 108,500
Intergovernmental 472,463 764,185 0 1,181,482 1,377,499 35,000
Rental 33,365 29,567 30,000 30,000 4,000 4,000
Charges for Services 14,763,734 14,893,739 15,495,348 15,495,348 15,555,238 16,607,135
Fines/Forfeitures 640 0 0 0 3,360 0
Miscellaneous 49,253 41,693 22,600 22,600 51,312 28,000
Interfund Transfers 5,000 0 0 0 0 0
Total Revenues 15,415,647 15,862,705 15,656,448 16,837,930 17,101,909 16,782,635
Expenditures
Public Works 11,595,455 12,031,883 14,595,592 14,227,457 12,427,457 14,497,433
Interfund Transfers 975,000 934,000 870,000 1,005,000 1,005,000 1,086,000
Capital 3,363,513 2,678,342 7,316,815 7,756,368 7,615,383 2,815,000
Special Payments 200 300 15,000 15,000 15,000 15,000
Total Expenditures 15,934,168 15,644,525 22,797,407 23,003,825 21,062,840 18,413,433
Excess (deficiency) of revenues over expenditures (518,521) 218,180 (7,140,959) (6,165,895) (3,960,931) (1,630,798)
Beginning Working Capital
(Fund Balance), July 1 7,606,618 7,088,097 9,106,039 7,306,277 7,306,277 3,345,346Ending Working Capital
(Fund Balance), June 30 7,088,097 7,306,277 1,965,080 1,140,382 3,345,346 1,714,548
Reconciliation of Total Resources and Requirements
Resources Beginning Working Capital
(Fund Balance) 7,606,618 7,088,097 9,106,039 7,306,277 7,306,277 3,345,346
Total Revenues 15,415,647 15,862,705 15,656,448 16,837,930 17,101,909 16,782,635
Total Resources 23,022,265 22,950,802 24,762,487 24,144,207 24,408,186 20,127,981
Requirements
Total Expenditures 15,934,168 15,644,525 22,797,407 23,003,825 21,062,840 18,413,433 Ending Working Capital
(Fund Balance) 7,088,097 7,306,277 1,965,080 1,140,382 3,345,346 1,714,548
Total Requirements 23,022,265 22,950,802 24,762,487 24,144,207 24,408,186 20,127,981
Reserves (Budgeted amounts only)
Balance Available 1,492,216 1,396,732 1,965,080 1,140,382 1,140,382 1,714,548
Total Reserves 1,492,216 1,396,732 1,965,080 1,140,382 1,140,382 1,714,548
84

Wastewater Utility Fund (530) Enterprise Funds
FY15 FY15 FY16
FY13 FY14 Adopted Budget FY15 ProposedActual Actual Budget 12/31/2014 Projections Budget
Revenues
Intergovernmental 0 8,147 0 0 0 0
Rental 22,816 20,314 0 0 5,549 0
Charges for Services 43,749,917 45,068,991 49,973,886 51,104,723 47,644,266 54,063,221
Fines/Forfeitures 3,956 6,225 5,000 5,000 2,000 5,000
Miscellaneous 49,925 44,037 24,000 24,000 44,826 30,000
Total Revenues 43,826,614 45,147,714 50,002,886 51,133,723 47,696,641 54,098,221
Expenditures
Public Works 18,556,426 17,876,245 23,250,306 22,628,367 20,289,039 24,942,655
Capital 2,433,252 2,032,692 4,526,088 4,309,197 4,309,197 2,140,000
Interfund Transfers 1,492,000 1,408,000 1,357,000 1,492,000 1,492,000 1,520,000
Special Payments 21,815,133 23,531,509 25,490,500 25,490,500 24,129,000 26,644,900
Total Expenditures 44,296,811 44,848,446 54,623,894 53,920,064 50,219,236 55,247,555
Excess (deficiency) of revenues over expenditures (470,197) 299,268 (4,621,008) (2,786,341) (2,522,595) (1,149,334)
Beginning Working Capital
(Fund Balance), July 1 4,596,629 4,126,432 5,614,103 4,425,700 4,425,700 1,903,105Ending Working Capital
(Fund Balance), June 30 4,126,432 4,425,700 993,095 1,639,359 1,903,105 753,771
Reconciliation of Total Resources and Requirements
Resources Beginning Working Capital
(Fund Balance) 4,596,629 4,126,432 5,614,103 4,425,700 4,425,700 1,903,105
Total Revenues 43,826,614 45,147,714 50,002,886 51,133,723 47,696,641 54,098,221
Total Resources 48,423,243 49,274,146 55,616,989 55,559,423 52,122,341 56,001,326
Requirements
Total Expenditures 44,296,811 44,848,446 54,623,894 53,920,064 50,219,236 55,247,555 Ending Working Capital
(Fund Balance) 4,126,432 4,425,700 993,095 1,639,359 1,903,105 753,771
Total Requirements 48,423,243 49,274,146 55,616,989 55,559,423 52,122,341 56,001,326
Reserves (Budgeted amounts only)
Balance Available 1,206,354 1,115,832 993,095 1,639,359 1,639,359 753,771
Total Reserves 1,206,354 1,115,832 993,095 1,639,359 1,639,359 753,771
85

Facilities Services Fund (615) Internal Service Funds
FY15 FY15 FY16
FY13 FY14 Adopted Budget FY15 ProposedActual Actual Budget 12/31/2014 Projections Budget
Revenues
Intergovernmental 0 4,793 0 0 0 0
Rental 616,478 563,314 615,100 615,100 527,802 510,205
Charges for Services 8,189,797 8,253,323 8,502,034 8,502,034 8,466,832 9,442,898
Miscellaneous 67,546 144,341 6,000 6,000 21,470 6,000
Interfund Transfers 1,000,000 1,500,000 0 0 0 0
Principal on Notes/Loans 300,000 0 0 0 0 0
Total Revenues 10,173,821 10,465,771 9,123,134 9,123,134 9,016,104 9,959,103
Expenditures
Central Services 8,066,122 8,479,222 8,646,238 8,642,834 8,404,652 9,201,325
Planning and Development 240,010 239,824 285,781 285,781 285,781 343,206
Debt Service 202,160 204,255 206,000 206,000 206,000 211,700
Capital 289,696 51,620 525,610 524,448 524,448 0
Interfund Transfers 1,077,000 10,187,000 432,000 524,598 524,598 433,000
Total Expenditures 9,874,988 19,161,921 10,095,629 10,183,661 9,945,479 10,189,231
Excess (deficiency) of revenues over expenditures 298,833 (8,696,150) (972,495) (1,060,527) (929,375) (230,128)
Beginning Working Capital
(Fund Balance), July 1 12,192,457 12,491,290 13,445,395 3,795,140 3,795,140 2,867,765Ending Working Capital
(Fund Balance), June 30 12,491,290 3,795,140 12,472,900 2,734,613 2,865,765 2,637,637
Reconciliation of Total Resources and Requirements
Resources Beginning Working Capital
(Fund Balance) 12,192,457 12,491,290 13,445,395 3,795,140 3,795,140 2,867,765
Total Revenues 10,173,821 10,465,771 9,123,134 9,123,134 9,016,104 9,959,103
Total Resources 22,366,278 22,957,061 22,568,529 12,918,274 12,811,244 12,826,868
Requirements
Total Expenditures 9,874,988 19,161,921 10,095,629 10,183,661 9,945,479 10,189,231 Ending Working Capital
(Fund Balance) 12,491,290 3,795,140 12,472,900 2,734,613 2,865,765 2,637,637
Total Requirements 22,366,278 22,957,061 22,568,529 12,918,274 12,811,244 12,826,868
Reserves (Budgeted amounts only)
Balance Available 2,856,622 2,631,935 2,104,293 2,192,613 2,192,613 2,095,637
Reserve 8,484,923 542,000 10,368,607 542,000 542,000 542,000
Total Reserves 11,341,545 3,173,935 12,472,900 2,734,613 2,734,613 2,637,637
86

Fleet Services Fund (600) Internal Service Funds
FY15 FY15 FY16
FY13 FY14 Adopted Budget FY15 ProposedActual Actual Budget 12/31/2014 Projections Budget
Revenues Intergovernmental 0 139 0 0 0 0
Rental 24,208 21,358 25,000 25,000 300 25,000
Charges for Services 8,685,203 8,715,690 9,357,201 9,357,201 9,569,676 9,552,702
Miscellaneous 346,838 461,940 346,500 346,500 320,000 322,000
Interfund Transfers 1,313,000 1,515,000 1,362,000 1,362,000 1,362,000 1,380,000
Total Revenues 10,369,249 10,714,127 11,090,701 11,090,701 11,251,976 11,279,702
Expenditures
Public Works 10,338,366 10,488,336 14,453,823 15,071,296 14,036,660 11,521,535
Interfund Transfers 362,000 364,000 343,000 343,000 343,000 356,000
Total Expenditures 10,700,366 10,852,336 14,796,823 15,414,296 14,379,660 11,877,535
Excess (deficiency) of revenues over expenditures (331,117) (138,209) (3,706,122) (4,323,595) (3,127,684) (597,833)
Beginning Working Capital
(Fund Balance), July 1 16,406,193 16,075,076 20,131,394 15,936,867 15,936,867 12,809,183Ending Working Capital
(Fund Balance), June 30 16,075,076 15,936,867 16,425,272 11,613,272 12,809,183 12,211,350
Reconciliation of Total Resources and Requirements
Resources Beginning Working Capital
(Fund Balance) 16,406,193 16,075,076 20,131,394 15,936,867 15,936,867 12,809,183
Total Revenues 10,369,249 10,714,127 11,090,701 11,090,701 11,251,976 11,279,702
Total Resources 26,775,442 26,789,203 31,222,095 27,027,568 27,188,843 24,088,885
Requirements
Total Expenditures 10,700,366 10,852,336 14,796,823 15,414,296 14,379,660 11,877,535 Ending Working Capital
(Fund Balance) 16,075,076 15,936,867 16,425,272 11,613,272 12,809,183 12,211,350
Total Requirements 26,775,442 26,789,203 31,222,095 27,027,568 27,188,843 24,088,885
Reserves (Budgeted amounts only)
Reserve 11,446,309 11,844,781 16,332,215 11,402,272 11,402,272 11,755,102
Balance Available 37,917 147,809 93,057 211,000 211,000 456,248
Total Reserves 11,484,226 11,992,590 16,425,272 11,613,272 11,613,272 12,211,350
87

Information Systems and Services Fund (610) Internal Service Funds
FY15 FY15 FY16
FY13 FY14 Adopted Budget FY15 ProposedActual Actual Budget 12/31/2014 Projections Budget
Revenues
Charges for Services 6,201,455 7,506,316 7,408,285 7,608,285 6,893,217 7,374,248
Miscellaneous 111,988 96,306 20,300 20,300 28,792 29,600
Interfund Transfers 932,000 0 0 0 0 1,963,826
Total Revenues 7,245,443 7,602,622 7,428,585 7,628,585 6,922,009 9,367,674
Expenditures
Central Services 6,104,242 7,228,931 7,235,662 7,208,186 7,100,706 13,115,172
Interfund Transfers 217,000 247,000 259,000 259,000 259,000 299,000
Total Expenditures 6,321,242 7,475,931 7,494,662 7,467,186 7,359,706 13,414,172
Excess (deficiency) of revenues over expenditures 924,201 126,691 (66,077) 161,399 (437,697) (4,046,498)
Beginning Working Capital
(Fund Balance), July 1 4,819,389 5,743,590 4,054,782 5,870,281 5,870,281 5,432,584Ending Working Capital
(Fund Balance), June 30 5,743,590 5,870,281 3,988,705 6,031,680 5,432,584 1,386,086
Reconciliation of Total Resources and Requirements
Resources Beginning Working Capital
(Fund Balance) 4,819,389 5,743,590 4,054,782 5,870,281 5,870,281 5,432,584
Total Revenues 7,245,443 7,602,622 7,428,585 7,628,585 6,922,009 9,367,674
Total Resources 12,064,832 13,346,212 11,483,367 13,498,866 12,792,290 14,800,258
Requirements
Total Expenditures 6,321,242 7,475,931 7,494,662 7,467,186 7,359,706 13,414,172 Ending Working Capital
(Fund Balance) 5,743,590 5,870,281 3,988,705 6,031,680 5,432,584 1,386,086
Total Requirements 12,064,832 13,346,212 11,483,367 13,498,866 12,792,290 14,800,258
Reserves (Budgeted amounts only)
Reserve 2,687,168 2,744,199 2,945,985 3,823,962 3,823,962 755,599
Balance Available 1,596,580 734,281 1,042,720 2,207,718 2,207,718 630,487
Total Reserves 4,283,748 3,478,480 3,988,705 6,031,680 6,031,680 1,386,086
88

Professional Services Fund (630) Internal Service Funds
FY15 FY15 FY16
FY13 FY14 Adopted Budget FY15 ProposedActual Actual Budget 12/31/2014 Projections Budget
Revenues
Licenses/Permits 0 0 500 500 500 500
Charges for Services 5,629,386 5,507,416 5,690,993 5,690,993 5,874,814 5,996,066
Miscellaneous 22,679 33,599 1,000 1,000 22,300 800
Total Revenues 5,652,065 5,541,015 5,692,493 5,692,493 5,897,614 5,997,366
Expenditures
Public Works 4,569,147 5,140,157 5,642,360 5,842,360 5,833,360 5,952,751
Interfund Transfers 471,000 488,000 436,000 571,000 571,000 665,000
Total Expenditures 5,040,147 5,628,157 6,078,360 6,413,360 6,404,360 6,617,751
Excess (deficiency) of revenues over expenditures 611,918 (87,142) (385,867) (720,867) (506,746) (620,385)
Beginning Working Capital
(Fund Balance), July 1 4,032,044 4,643,962 4,852,177 4,556,820 4,556,820 4,050,074Ending Working Capital
(Fund Balance), June 30 4,643,962 4,556,820 4,466,310 3,835,953 4,050,074 3,429,689
Reconciliation of Total Resources and Requirements
Resources Beginning Working Capital
(Fund Balance) 4,032,044 4,643,962 4,852,177 4,556,820 4,556,820 4,050,074
Total Revenues 5,652,065 5,541,015 5,692,493 5,692,493 5,897,614 5,997,366
Total Resources 9,684,109 10,184,977 10,544,670 10,249,313 10,454,434 10,047,440
Requirements
Total Expenditures 5,040,147 5,628,157 6,078,360 6,413,360 6,404,360 6,617,751 Ending Working Capital
(Fund Balance) 4,643,962 4,556,820 4,466,310 3,835,953 4,050,074 3,429,689
Total Requirements 9,684,109 10,184,977 10,544,670 10,249,313 10,454,434 10,047,440
Reserves (Budgeted amounts only)
Reserve 270,000 2,580,085 2,503,270 2,168,270 2,168,270 2,225,204
Balance Available 3,118,487 1,396,821 1,963,040 1,667,683 1,667,683 1,204,485
Total Reserves 3,388,487 3,976,906 4,466,310 3,835,953 3,835,953 3,429,689
89

Risk and Benefits Fund (620) Internal Service Funds
FY15 FY15 FY16
FY13 FY14 Adopted Budget FY15 ProposedActual Actual Budget 12/31/2014 Projections Budget
Revenues
Intergovernmental 289,509 248,937 249,686 249,686 366,452 229,275
Charges for Services 33,472,818 35,299,657 37,784,987 37,784,987 37,466,047 39,754,385
Miscellaneous 2,068,218 1,349,819 472,146 472,146 266,682 111,397
Total Revenues 35,830,545 36,898,413 38,506,819 38,506,819 38,099,181 40,095,057
Expenditures
Central Services 30,842,626 28,846,891 33,973,206 33,973,206 32,536,860 35,284,068
Debt Service 5,244,373 5,509,373 5,784,500 5,784,500 5,784,500 6,069,400
Interfund Transfers 162,000 180,000 152,000 152,000 152,000 129,000
Total Expenditures 36,248,999 34,536,264 39,909,706 39,909,706 38,473,360 41,482,468
Excess (deficiency) of revenues over expenditures (418,454) 2,362,149 (1,402,887) (1,402,887) (374,179) (1,387,411)
Beginning Working Capital
(Fund Balance), July 1 9,022,932 8,604,478 7,518,462 10,966,627 10,966,627 10,592,448Ending Working Capital
(Fund Balance), June 30 8,604,478 10,966,627 6,115,575 9,563,740 10,592,448 9,205,037
Reconciliation of Total Resources and Requirements
Resources Beginning Working Capital
(Fund Balance) 9,022,932 8,604,478 7,518,462 10,966,627 10,966,627 10,592,448
Total Revenues 35,830,545 36,898,413 38,506,819 38,506,819 38,099,181 40,095,057
Total Resources 44,853,477 45,502,891 46,025,281 49,473,446 49,065,808 50,687,505
Requirements
Total Expenditures 36,248,999 34,536,264 39,909,706 39,909,706 38,473,360 41,482,468 Ending Working Capital
(Fund Balance) 8,604,478 10,966,627 6,115,575 9,563,740 10,592,448 9,205,037
Total Requirements 44,853,477 45,502,891 46,025,281 49,473,446 49,065,808 50,687,505
Reserves (Budgeted amounts only)
Reserve 7,173,213 6,637,177 5,273,394 6,799,591 6,799,591 6,703,895
Balance Available 401,635 1,094,398 842,181 2,764,149 2,764,149 2,501,142
Total Reserves 7,574,848 7,731,575 6,115,575 9,563,740 9,563,740 9,205,037
90

Debt Service and Tax Information Debt Service
Debt service appropriations provide for the payment of principal and interest on bonds, notes, and lines of credit, as well as some debt issuance costs. The City relies on property tax-supported bonds and full faith and credit obligations for most debt. The City does not borrow externally on a short-term basis to support operations. General Obligation bonds that are secured by property taxes must be approved by the voters. Full faith and credit obligations are backed by the City's General Fund and may be repaid from another revenue source such as rental charges; these bonds do not require voter approval. Certain public improvements, such as streets, sewers, and sidewalks, may be financed in the assessment program. A short-term line of credit is used to pay the initial construction costs for assessment projects prior to long-term debt issuance. Long-term assessment bonds have a limited tax pledge and are secured by placing a lien against the benefitting properties. In addition, the City maintains reserves to cover assessment payment deficiencies. The City has one outstanding note payable. A loan from the Department of Housing and Urban Development (HUD) was used to purchase property at the corner of Broadway and Willamette for redevelopment of the Broadway Commerce Center and is repaid from developer payments. The City's general obligation debt is rated "Aa1" by Moody's Investors Service and the full faith and credit debt is rated “Aa2”. The limited tax debt (pension obligation bonds) is part of a pooled issuance and was downgraded by Moody’s to an “A3” rating in conjunction with a rating methodology change related to pool financings in January 2014. The City has held a double-A rating on its debt since 1957. Outstanding Indebtedness – The City’s indebtedness as of July 1, 2014, is listed below:
Interest Rates on Original Maturity Outstanding
Outstanding Bonds Amount Date Principal
Voter Approved General Obligation Bonds:
Parks and Open Spaces, Series 2004 4.000% to 4.650% $6,305,000 6/1/2023 $2,720,000
Refunding, Series 2006 * 4.000% to 4.125% 24,990,000 3/1/2019 9,815,000
Street Bonds, Series 2012 Line of Credit variable 8,000,000 6/1/2017 2,700,000
Refunding, Series 2011 ** 2.000% to 3.000% 10,975,000 6/1/2022 8,010,000
23,245,000
Self -Supporting General Fund Secured Debt:
Improvement, Series 2006 5.100% 1,036,427 6/1/2016 76,745
Improvement, Series 2011 7.050% 580,000 12/1/2026 305,604
Atrium Full Faith and Credit, Series 1998 4.750% to 6.200% 2,400,000 6/1/2018 735,000
Pension Obligation, Series 2002 6.850% to 7.410% 68,015,710 6/1/2028 53,878,466
54,995,815
Notes Payable:
HUD 108 variable 7,895,000 8/1/2030 7,639,000
Total Outstanding Debt as of July 1, 2014 $85,879,815
* The 2006 Refunding refinanced the 1996 Public Safety Bonds and a portion of the 1999 Parks and Open Space Bonds.
** The 2011 Refunding refinanced the 2002 Fire Projects, 2008 Parks Athletic Fields and Open Space Bonds, and a portion
of the 2008 Parks Athletic Fields and Open Space Line of Credit.
91

Debt Service and Tax Information Debt Service
Legal Debt Limits Under Oregon statutes, the City is limited in the amount of general obligation bonds outstanding to 3% of real market value of property. The statutory limit specifically excludes assessment, sewer, and off-street parking debt. In addition, there is a separate limitation of 3% on the amount of bonds that can be outstanding for the assessment program. Full faith and credit obligations are not limited by statute. The following schedule depicts the City's legal debt capacity and indicates the amount of marginal capacity available:
General Obligation Debt Assessment Debt *
Real Market Value $20,739,271,458 $20,739,271,458
Debt Capacity - 3% of Real Market Value 622,178,144 622,178,144
Outstanding Debt (23,245,000) (382,349)
Debt reserve 76,235 442,399
Net Debt Subject to 3% Limitation (23,168,765) 60,050
Marginal Capacity $599,009,379 $622,238,194
Statutory Debt Capacity Percent 96% 100%
* Totals may not tie due to rounding.
City of Eugene
Statutory Debt Limitation Calculation
as of July 1, 2014
Overlapping Debt The following schedule indicates the amount of the outstanding debt for jurisdictions that overlap with the City:
City of Eugene
Overlapping Debt as of July 1, 2014
Total Percent OverlappingOverlapping District Debt Overlapping Debt
Lane Community College $121,170,456 45.33% $54,926,083
Lane County 97,317,273 46.06% 44,827,158
Lane Education Service District 7,285,000 46.12% 3,359,806
School District 4J (Eugene) 197,610,402 77.90% 153,941,467
School District 19 (Springfield) 100,710,372 0.00% 403
School District 52 (Bethel) 58,681,166 77.95% 45,742,732
River Road Park and Recreation District 225,000 0.03% 66
Total Net Direct Overlapping Debt $302,797,715
92

Debt Service and Tax Information Debt Service
Debt to Real Market Value The ratio of debt to real market value is projected to be 0.09% by the end of FY16. The City has an adopted policy limiting net direct debt to no more than 1.0% of real market value.
0.00
0.05
0.10
0.15
0.20
FY10 FY11 FY12 FY13 FY14 Est. FY15 Proj. FY16
City of EugeneRatio of Net Direct Debt to Real Market Value*
* Excludes self-supporting debt and pension bonds.
%o
f R
ea
l M
ark
et
Va
lue
Debt Per Capita The net direct debt per capita ratio is projected to be $121 by June 2016.
$0
$100
$200
$300
FY10 FY11 FY12 FY13 FY14 Est. FY15 Proj. FY16
$ P
er
Ca
pit
a T
ax
City of EugeneNet Direct Debt Per Capita*
* Excludes self-supporting debt and pension bonds.
* Excludes self-supporting debt and pension bonds.
93

Debt Service and Tax Information Debt Service
Debt Service Budget – All Funds Below is a chart that sets out the budget for principal and interest on all City debt, as well as debt issuance costs.
FY15 FY15
FY13 FY14 Adopted 12/31/2014 FY16
Debt Payments Actual Actual Budget Budget Proposed
General $231,663 $223,600 $0 $0 $0
Community Development 173,370 163,626 368,000 368,000 368,000
G.O. Debt Service 13,606,235 14,046,093 13,699,263 13,731,833 14,318,963
Special Assessment Bond 251,238 164,613 412,910 412,694 367,502
Facilities Services 202,160 204,255 206,000 206,000 211,700
Risk and Benefits 5,244,373 5,509,373 5,784,500 5,784,500 6,069,400
Total $19,709,039 $20,311,559 $20,470,673 $20,503,027 $21,335,565
FY15 FY15
FY13 FY14 Adopted 12/31/2014 FY16
Debt Issuance Costs Actual Actual Budget Budget Proposed
G.O. Debt Service $0 $0 $0 $0 $0
Special Assessment Bond 0 0 0 0 0
General Capital Projects 5,138 12,741 50,000 50,000 50,000
Transportation Capital Projects 6,011 15,987 10,000 10,000 10,000
Total $11,149 $28,728 $60,000 $60,000 $60,000
Authorized But Unissued Debt and Future Debt Plans In November 2006, voters approved $27,490,000 of General Obligation bonds for parks, athletic fields and preservation of open space. As of March 31, 2015, the City had issued $18,770,000 of debt under this authorization, leaving $8,720,000 authorized but unissued. In November 2012, voters approved $43,000,000 of General Obligation bonds to fix streets. As of March 31, 2015, the City has issued $8,900,000 of debt under this authorization, leaving $34,100,000 remaining unissued. For both bonds referenced above, the City expects to issue debt to fund these projects as spending occurs in the form of a short-term line of credit repaid from the property tax levies authorized by voters.
* Excludes self-supporting debt and pension bonds.
94

Debt Service and Tax Information Debt Service
Projected Debt Activity The chart below sets out principal and interest payments on outstanding debt as well as projected new issuance during FY16.
Outstanding Outstanding
Principal Principal
Balance New Principal Balance
FUND/BOND OR LOAN ISSUE 7/1/2015 Issuance Payments Interest 6/30/2016
COMMUNITY DEVELOPMENT FUND
HUD 108 Loan $6,078,000 $0 $248,000 $120,000 $5,830,000
GENERAL OBLIGATION DEBT SERVICE FUND
G.O. Parks & Open Spaces, Series 2004 2,390,000 0 330,000 114,675 2,060,000
G.O. Parks, Athletic Fields and Open Space LOC * 0 700,000 700,000 160,000 0
G.O. Refunding, Series 2006 7,145,000 0 2,785,000 291,013 4,360,000
G.O. Street Bonds LOC * 0 8,290,000 8,290,000 170,000 0
G.O. Refunding, Series 2011 6,745,000 0 1,295,000 183,275 5,450,000
TOTAL G.O. DEBT SERVICE FUND 16,280,000 8,990,000 13,400,000 918,963 11,870,000
ASSESSMENT BOND FUND
Limited Tax, Series 2006 ** 60,502 0 60,502 7,000 0
Limited Tax, Series 2011 ** 260,000 0 260,000 40,000 0
TOTAL ASSESSMENT BOND FUND 320,502 0 320,502 47,000 0
FACILITIES SERVICES FUND
Atrium Full Faith and Credit, Series 1998 A and B 570,000 0 180,000 31,700 390,000
RISK AND BENEFITS FUND
Pension Obligation Bonds, Series 2002 52,899,605 0 1,003,922 5,065,500 51,895,683
TOTAL ALL FUNDS $76,148,107 $8,990,000 $15,152,424 $6,183,163 $69,985,683
* These revolving line of credit facilities will be drawn down as needed to pay for project costs and those draws will be repaid
within the same fiscal year. Actual activity may differ.
** The City remits all assessment proceeds to pay the assessment bonds twice each year. Actual activity may differ.
95

Debt Service and Tax Information Property Tax Rates and Tax Levy
Property Taxes Levied Property taxes represent the single largest revenue source in the City’s budget at just over $100 million annually. The chart below sets out the projected General Fund and General Obligation Bond Fund levies, along with the revenues budgeted as a result.
Actual Estimated Budgeted
Current Tax Current Tax Less Discount, Current Tax
Receipts Receipts Gross Levy Delinquency, and Receipts
FY14 FY15 Current Levy Classification FY16 Compression FY16
OPERATING LEVY
$82,671,247 $86,400,000 Property Taxes - Perm. Operating Levy* $94,950,159 $5,412,159 $89,538,000
DEBT SERVICE LEVY
13,329,514 13,620,000 General Obligation Bonds 15,098,790 860,631 14,238,159
96,000,761 100,020,000 GRAND TOTAL PROPERTY TAX 110,048,949 6,272,790 103,776,159
Source: City of Eugene Finance Division
* A permanent tax rate of $7.0058 per $1,000 of assessed taxable value is the City's base operating levy. The applied rate may be less due to urban renewal adjustments. FY16 amounts are estimates.
Property Tax Collections The City does not receive 100% of taxes levied for two primary reasons. First, taxpayers can take advantage of an early payment discount of up to 3%. Second, not everyone pays their taxes on time and thus taxes become delinquent. However, even throughout the most recent recession, collection rates have remained strong, as seen below.
Total
Total City Current Percent Delinquent Collections
Tax Levy Tax of Levy Tax Total Tax as Percent of
Fiscal Year Imposed Collections Collected* Collections Collections Current Levy
FY07 $86,591,620 $82,190,214 94.9% $1,905,371 $84,155,443 97.2%
FY08 83,045,097 78,122,713 94.1% 1,008,182 79,130,895 95.3%
FY09 86,233,674 81,354,720 94.3% 1,934,233 83,288,953 96.6%
FY10 98,139,027 93,616,166 95.4% 2,196,405 95,812,571 97.6%
FY11 98,139,027 92,557,680 94.3% 2,712,680 95,270,361 97.1%
FY12 97,004,407 91,801,363 94.6% 1,654,934 93,456,297 96.3%
FY13 98,930,968 93,319,364 94.3% 2,652,663 95,972,027 97.0%
FY14 101,659,370 96,000,761 94.4% 2,714,108 98,714,869 97.1%
FY15 Estimate 105,675,104 100,020,000 94.6% 2,660,000 102,680,000 97.2%
FY16 Proposed 110,048,949 103,776,159 94.3% 2,330,000 106,106,159 96.4%
Source: Lane County Assessment & Taxation for historic information; City of Eugene Finance Division for budget year estimates.
* Collection percentage of total amount levied by the Lane County Tax Assessor. The collection rate takes into account early payment discounts up to 3%, which reduce the amount of City tax receipts expected.
96

Debt Service and Tax Information Property Tax Rates and Tax Levy
Tax Rate History City tax rates consist of an operating rate used to pay for General Fund services, plus any bonds or local option levies approved by voters. A 10-year history is shown below.
Fiscal Year Operating2 Library
Youth and
School
Debt
Service
Total
City
Total City
Tax Levy
Imposed3
Assessed
Valuation4
FY07 $6.90 $0.48 $0.86 $0.36 $8.60 $86,591,620 $10,105,025,458
FY0856.90 0.25 0.55 7.70 83,045,097 10,616,633,066
FY09 6.90 0.24 0.58 7.72 86,233,674 10,994,414,109
FY1066.91 0.23 1.18 8.32 96,751,699 11,466,487,764
FY11 6.90 0.23 1.20 8.33 98,139,027 11,613,161,618
FY1276.90 1.14 8.04 97,004,407 11,884,137,444
FY13 6.90 1.12 8.02 98,930,968 12,144,046,177
FY14 6.90 1.11 8.01 101,659,370 12,491,549,584
FY1566.90 1.09 7.99 105,675,104 13,029,838,380
FY16 Proposed 6.90 1.10 8.00 110,048,949 13,553,000,000
Tax Rates1
Source: Lane County Assessment & Taxation for historic information; City of Eugene Finance Division for budget year estimates.
(1) These are the typical rates applied to tax bills for a majority of the City’s taxpayers, per $1,000 of assessed taxable value. Small variances in rate calculations are due to additional variables used by Lane County for generating the rates. Totals may differ slightly from the sum of individual rates due to rounding. (2) The permanent tax rate of $7.0058 is adjusted each year due to urban renewal tax increment calculations. (3) Net of gains and losses from individual extensions and compression losses. (4) Net of urban renewal incremental value. (5) The four-year Local Option Property Tax Levy for Library Operations renewed at a reduced amount of $10.8 million starting in FY08 and ending in FY11. In November 2006, voters approved $27.5 million in General Obligation bonds for parks, athletic fields, and open space preservation. The debt tax rate starting in FY08 reflects a portion of that bond authorization. (6) In November 2008 voters approved a $35.9 million five-year General Obligation bond measure for street repairs. The debt tax rate starting in FY10 reflects a portion of that bond authorization. In November 2012 voters approved a new $43 million five-year General Obligation bond measure for street repairs. The taxes to repay the new authorization started in FY15, after the 2008 street bond taxes ended. (7) In December 2011, the City refinanced certain General Obligation bond issues in order to achieve interest rate savings.
97

98

Urban Renewal Agency Overview
Mission Statement The purpose of urban renewal is to stimulate economic development through private investment to provide public benefit in a specific area of the community in compliance with ORS Chapter 457. It is a means to support economic development and civic improvement by financing needed improvements within designated districts such as infrastructure, public open spaces, public plazas, public parking garages, land acquisition, renovation and façade improvements, or environmental improvements. The City currently manages two urban renewal districts: the Downtown District and the Riverfront District. Governance The City of Eugene Urban Renewal Agency (Agency) is a separate budgetary entity authorized by State statutes. The Agency was established in 1958 as a separate corporate body. In 1982, the City Council assumed the role of the Agency Board and delegated budget review to the City’s Budget Committee. The Agency has two urban renewal districts and each one has its own adopted plan. Public Involvement The Riverfront Urban Renewal Plan calls for a committee to advise on the activities of the district. The Eugene Redevelopment Advisory Committee was formed as a Department Advisory Committee in 2004. The Expenditure Review Panel (ERP) was created as part of the Downtown District 2010 Plan amendment (the Plan). The Plan states that the Agency shall convene not less than once each year a committee to report to the Agency Director on the activities for the previous fiscal year, and whether expenditure of tax increment dollars was limited to projects authorized by the Plan. City Council formed a five-member panel in January 2012. The ERP’s first three reviews of Downtown District tax increment expenditures were completed in March 2012, March 2013, and June 2014. The fourth review was completed in April 2015. The ERP’s reports can be found on the City’s website at http://www.eugene-or.gov/downtownplanning. Agency Management The City’s Planning and Development Department manages Agency activities. Staff and most material and service costs that support Agency projects are recorded in the City of Eugene General Fund. The operating budgets of each Agency district reimburse the City’s General Fund for these costs. As a result, these expenses are shown twice, once as operating expenses in the City’s General Fund budget for the department, and again in the Agency budget as Planning and Development operating expenses to reimburse the City’s General Fund.
Library and LCC Downtown Campus
99

Urban Renewal Agency Overview
Downtown District The Downtown District was established in 1968 to redevelop 17 blocks in the downtown core. The current boundaries of the district are shown in the map below. The original project goals involved land acquisition, building rehabilitation, and construction of public improvements. An update of the 1968 Plan was approved by voters in 1990. The update aligned the Plan with Metro Plan policies, revised the goals and activities, and set an expiration date for the district of FY10. In June 1998, the City Council chose one of the options provided by Measure 50 legislation that allowed for a City-wide special levy as well as dividing the taxes collected within the district. The Council limited expenditures of new funds to completing existing projects and construction of a new main library (100 West 10th Avenue). They also approved a plan to reduce district administration. In FY05, City Council amended the Plan to allow funding for other activities including economic revitalization strategies and to extend the termination date to June 30, 2024. In response to the last recession, City Council embarked on a discussion of economic development with the community in early 2009. A three-pronged local economic stimulus strategy was developed: (i) maximize use of federal economic stimulus dollars; (ii) support local projects that create jobs and promote sustainability; and (iii) create a regional economic plan. Based on Council discussions, planning documents, public input from the downtown survey and previous public involvement initiatives, four strategies for revitalizing downtown and boosting the local economy emerged: create jobs and support redevelopment; improve safety; improve parking; and enhance amenities and attractions. After considering options for providing public financial support to boost the local economy and revitalize downtown, the City Council amended the Downtown Urban Renewal Plan in May 2010.
Downtown Urban Renewal District
100

Urban Renewal Agency Overview
The 2010 Plan amendment made the following changes:
1. Increased the spending limit (“maximum indebtedness”) by $13.6 million, to a total of $46.6 million.
2. Specified three project activities to be undertaken (described below) and removed language that allowed for flexibility in project selection.
3. Required an annual review of spending by a panel of community members (ERP).
4. Provided for termination of the district after
sufficient funds have been accumulated to pay for the projects.
The three specific projects included in the 2010 Plan are: Lane Community College (LCC) New Downtown Campus: The Agency Board approved
expenditure of funds to support LCC’s development of a new Downtown Campus at 10th and Charnelton, across from the library. Specifically, the Plan called for a grant of $8 million to be funded from a combination of cash on hand plus issuance of debt. The new state-of-the-art Downtown Campus includes a 90,000 square foot, $35 million education building and a 75,000 square foot, $20 million student housing facility. The student housing facility is five floors to accommodate 256 students. Both buildings are LEED certified. Students moved in during September 2012 and the first classes in the new building began in January 2013.
Broadway Place Garages and Public Safety Improvements: Assistance in funding the
Broadway Place Garages ensures that the garages remain available and in good condition to support other development and redevelopment in downtown (and, at the same time, enables improvements to downtown public safety). The Downtown District is parking exempt, which means that property owners are not required to provide parking, yet parking availability is critical to the economic success of downtown. As such, the Agency participated in several projects to provide structured parking opportunities. Given City budgetary issues, continued operation and stability of the Broadway Place Garages is enhanced by the Agency paying on the debt for the garages. It also makes it possible for the Parking Fund to provide financial support for increased downtown safety services.
Public safety improvements are key to creating a vibrant and economically healthy downtown. Increasing public safety services and coordinating with other agencies makes downtown a more welcoming place for everyone. Downtown public safety, including additional police officers, is funded from dollars freed up by using up to $4.9 million of urban renewal funds to pay off the debt (excluding interest) on the Broadway Place Garages. The Agency issued debt in 2011 to refinance the City’s debt for the Broadway Place Garages, which resulted in savings from lower interest costs.
Farmers’ Market in the Park Blocks
101

Urban Renewal Agency Overview
Park Blocks Improvements for the Farmers’ Market: Infrastructure improvements to the
Park Blocks along 8th Avenue to make the location more attractive and functional for the Farmers’ Market will support a cornerstone of downtown activity and one of the most significant public event venues in the city. Up to $500,000 of urban renewal funds may be used for this project.
Riverfront District The Riverfront District was created in 1985 to assist in financing public infrastructure. The original district encompassed nearly 148 acres adjacent to and including the University of Oregon’s Riverfront Research Park. In FY04, the City Council amended the boundaries of the district to add another 30 acres, bringing the total area to approximately 178 acres. The current boundaries of the district are shown in the map below. The Riverfront Plan was reviewed and amended by the City Council in March 2004. Major changes in the amendment included extending the termination date to 2024, expanding and revising the list of project activities, providing new cost estimates of the projects to be undertaken, establishing a spending limit (“maximum indebtedness”) of $34.8 million, expanding the existing boundary, and providing other information about the impact of the amendments. Major goals in the Riverfront District are to: Stimulate appropriate redevelopment in the riverfront area for the EWEB Riverfront Master
Plan implementation; Promote redevelopment of public and private properties in the area around the Wayne Morse
Federal Courthouse; Improve connections between the core of downtown, the riverfront area, and the University of
Oregon; and Protect or enhance the riparian area.
102
Urban Renewal Agency Overview
Expenditure Summary The Urban Renewal Agency’s primary goal is to promote redevelopment within the districts. In doing so, funds are expended among the following activities: District Management: Promotion of redevelopment projects, oversight of district owned
property, and general administration. Costs are initially incurred in the City’s General Fund and then reimbursed by each district at the end of the fiscal year.
Loan Disbursements: Funding of Downtown Revitalization Loan Program (DRLP) loans to business and property owners, encouraging redevelopment in the Downtown District.
Capital Projects: Public space improvements and infrastructure enhancements in the Downtown and Riverfront Districts.
Description of Funds The two urban renewal districts have separate budgets and account for activities in separate funds. The Downtown District operates three funds: the Downtown General Fund, the Downtown Debt Service Fund, and the Downtown Capital Projects Fund. URA Downtown General Fund (Fund 817): This fund receives revenue from DRLP
repayments (principal and interest on outstanding loans), property sales and leases, interest on cash balances, and interfund transfers from the Downtown Debt Service Fund. These revenues are used to: Provide funding for DRLP loans for property improvements in the district boundaries; Reimburse the City’s General Fund for district management costs; and Pay other operating costs, including property management expenses.
URA Downtown Debt Service Fund (Fund 812): This fund receives all of the Downtown
District tax increment revenues and uses those resources to: Provide funding for the principal and interest payments on the URA’s debt; Provide funding (through interfund transfers) to the Downtown General Fund for district
management costs and other operating expenses; and Provide funding (through interfund transfers) to the Downtown Capital Projects Fund for
specific capital improvements. URA Downtown Capital Projects Fund (Fund 813): This fund accounts for capital projects in
the Downtown District. The Downtown Debt Service Fund uses resources to pay for specific, approved capital expenditures charged to this fund.
103

Urban Renewal Agency Overview
The Riverfront District currently operates three funds: the Riverfront General Fund, the Riverfront Capital Projects Fund, and the Riverfront Program Revenue Fund. The Riverfront Program Revenue Fund is newly created in FY16. URA Riverfront General Fund (Fund 821): This fund receives the Riverfront District tax
increment revenues and uses those resources to: Reimburse the City's General Fund for district management costs; Pay other operating costs, including property management expenses; and Provide funding (through interfund transfers) to the Riverfront Capital Projects Fund for
specific capital projects and development loans. URA Riverfront Capital Projects Fund (Fund 823): This fund accounts for capital projects in
the Riverfront District. The Riverfront General Fund transfers resources to this fund to pay for specific, approved capital expenditures.
URA Riverfront Program Revenue Fund (Fund 824): This fund will contain program revenue
from the Riverfront District. Program revenues are funds that have been derived from non-property tax sources and can be used for different purposes than tax increment dollars.
104

Urban Renewal Agency Downtown General Fund (817)
FY15 FY15 FY16FY13 FY14 Adopted Budget FY15 Proposed
Actual Actual Budget 12/31/2014 Projections Budget
Revenues
Intergovernmental 275,000 0 0 0 0 0
Rental 29,700 27,800 5,700 5,700 0 0
Charges for Services 6,257 0 0 0 0 0
Miscellaneous 12,275 57,617 63,000 63,000 56,000 55,000
Interfund Transfers 253,304 155,893 105,000 105,000 111,000 126,000
Principal on Notes/Loans 191,723 442,129 450,000 450,000 765,000 450,000
Total Revenues 768,259 683,439 623,700 623,700 932,000 631,000
Expenditures
Planning and Development 241,664 155,893 105,000 105,000 111,000 134,654
Special Payments 492,803 7,961 1,321,200 1,336,085 1,336,085 793,854
Total Expenditures 734,467 163,854 1,426,200 1,441,085 1,447,085 928,508
Excess (deficiency) of revenues over expenditures 33,792 519,585 (802,500) (817,385) (515,085) (297,508)
Beginning Working Capital
(Fund Balance), July 1 281,658 315,450 820,150 835,035 835,035 319,950Ending Working Capital
(Fund Balance), June 30 315,450 835,035 17,650 17,650 319,950 22,442
Reconciliation of Total Resources and Requirements
Resources Beginning Working Capital
(Fund Balance) 281,658 315,450 820,150 835,035 835,035 319,950
Total Revenues 768,259 683,439 623,700 623,700 932,000 631,000
Total Resources 1,049,917 998,889 1,443,850 1,458,735 1,767,035 950,950
Requirements
Total Expenditures 734,467 163,854 1,426,200 1,441,085 1,447,085 928,508 Ending Working Capital
(Fund Balance) 315,450 835,035 17,650 17,650 319,950 22,442
Total Requirements 1,049,917 998,889 1,443,850 1,458,735 1,767,035 950,950
Reserves (Budgeted amounts only)
Balance Available 60,000 35,000 17,650 17,650 17,650 22,442
Total Reserves 60,000 35,000 17,650 17,650 17,650 22,442
105

Urban Renewal Agency Downtown Debt Service Fund (812)
FY15 FY15 FY16FY13 FY14 Adopted Budget FY15 Proposed
Actual Actual Budget 12/31/2014 Projections Budget
Revenues
Taxes 1,819,122 1,868,426 1,900,000 1,900,000 1,895,000 1,985,000
Miscellaneous 9,451 8,707 9,000 9,000 11,000 11,000
Interfund Transfers 0 134,593 0 0 0 0
Total Revenues 1,828,573 2,011,726 1,909,000 1,909,000 1,906,000 1,996,000
Expenditures
Debt Service 1,127,516 1,628,090 2,130,000 2,130,000 2,130,000 2,253,000
Interfund Transfers 253,304 155,893 105,000 105,000 111,000 126,000
Total Expenditures 1,380,820 1,783,983 2,235,000 2,235,000 2,241,000 2,379,000
Excess (deficiency) of revenues over expenditures 447,753 227,743 (326,000) (326,000) (335,000) (383,000)
Beginning Working Capital
(Fund Balance), July 1 922,821 1,370,574 1,489,767 1,598,317 1,598,317 1,263,317Ending Working Capital
(Fund Balance), June 30 1,370,574 1,598,317 1,163,767 1,272,317 1,263,317 880,317
Reconciliation of Total Resources and Requirements
Resources Beginning Working Capital
(Fund Balance) 922,821 1,370,574 1,489,767 1,598,317 1,598,317 1,263,317
Total Revenues 1,828,573 2,011,726 1,909,000 1,909,000 1,906,000 1,996,000
Total Resources 2,751,394 3,382,300 3,398,767 3,507,317 3,504,317 3,259,317
Requirements
Total Expenditures 1,380,820 1,783,983 2,235,000 2,235,000 2,241,000 2,379,000 Ending Working Capital
(Fund Balance) 1,370,574 1,598,317 1,163,767 1,272,317 1,263,317 880,317
Total Requirements 2,751,394 3,382,300 3,398,767 3,507,317 3,504,317 3,259,317
Reserves (Budgeted amounts only)
Balance Available 169,821 1,416,767 1,163,767 1,272,317 1,272,317 880,317
Total Reserves 169,821 1,416,767 1,163,767 1,272,317 1,272,317 880,317
106

Urban Renewal Agency Downtown Capital Projects Fund (813)
FY15 FY15 FY16FY13 FY14 Adopted Budget FY15 Proposed
Actual Actual Budget 12/31/2014 Projections Budget
Revenues
Miscellaneous 3,701 2,767 2,000 2,000 3,000 3,000
Total Revenues 3,701 2,767 2,000 2,000 3,000 3,000
Expenditures
Capital 34,388 22,460 540,972 518,512 518,512 0
Interfund Transfers 0 134,593 0 0 0 0
Total Expenditures 34,388 157,053 540,972 518,512 518,512 0
Excess (deficiency) of revenues over expenditures (30,687) (154,286) (538,972) (516,512) (515,512) 3,000
Beginning Working Capital
(Fund Balance), July 1 721,011 690,324 558,731 536,038 536,038 20,526Ending Working Capital
(Fund Balance), June 30 690,324 536,038 19,759 19,526 20,526 23,526
Reconciliation of Total Resources and Requirements
Resources Beginning Working Capital
(Fund Balance) 721,011 690,324 558,731 536,038 536,038 20,526
Total Revenues 3,701 2,767 2,000 2,000 3,000 3,000
Total Resources 724,712 693,091 560,731 538,038 539,038 23,526
Requirements
Total Expenditures 34,388 157,053 540,972 518,512 518,512 0 Ending Working Capital
(Fund Balance) 690,324 536,038 19,759 19,526 20,526 23,526
Total Requirements 724,712 693,091 560,731 538,038 539,038 23,526
Reserves (Budgeted amounts only)
Balance Available 13,058 16,759 19,759 19,526 19,526 23,526
Total Reserves 13,058 16,759 19,759 19,526 19,526 23,526
107

Urban Renewal Agency Riverfront General Fund (821)
FY15 FY15 FY16FY13 FY14 Adopted Budget FY15 Proposed
Actual Actual Budget 12/31/2014 Projections Budget
Revenues
Taxes 936,006 1,221,694 1,280,000 1,280,000 1,235,500 1,415,500
Rental 63,000 63,000 63,000 63,000 63,000 63,000
Miscellaneous 29,462 27,017 21,164 21,164 35,100 40,100
Total Revenues 1,028,468 1,311,711 1,364,164 1,364,164 1,333,600 1,518,600
Expenditures
Planning and Development 186,992 172,751 237,164 237,164 237,164 333,360
Interfund Transfers 0 0 0 0 0 2,990,000
Total Expenditures 186,992 172,751 237,164 237,164 237,164 3,323,360
Excess (deficiency) of revenues over expenditures 841,476 1,138,960 1,127,000 1,127,000 1,096,436 (1,804,760)
Beginning Working Capital
(Fund Balance), July 1 5,080,690 5,922,166 7,054,654 7,061,126 7,061,126 8,157,562Ending Working Capital
(Fund Balance), June 30 5,922,166 7,061,126 8,181,654 8,188,126 8,157,562 6,352,802
Reconciliation of Total Resources and Requirements
Resources Beginning Working Capital
(Fund Balance) 5,080,690 5,922,166 7,054,654 7,061,126 7,061,126 8,157,562
Total Revenues 1,028,468 1,311,711 1,364,164 1,364,164 1,333,600 1,518,600
Total Resources 6,109,158 7,233,877 8,418,818 8,425,290 8,394,726 9,676,162
Requirements
Total Expenditures 186,992 172,751 237,164 237,164 237,164 3,323,360 Ending Working Capital
(Fund Balance) 5,922,166 7,061,126 8,181,654 8,188,126 8,157,562 6,352,802
Total Requirements 6,109,158 7,233,877 8,418,818 8,425,290 8,394,726 9,676,162
Reserves (Budgeted amounts only)
Balance Available 5,860,289 6,780,428 8,181,654 8,188,126 8,188,126 6,352,802
Total Reserves 5,860,289 6,780,428 8,181,654 8,188,126 8,188,126 6,352,802
108

Urban Renewal Agency Riverfront Capital Projects Fund (823)
FY15 FY15 FY16FY13 FY14 Adopted Budget FY15 Proposed
Actual Actual Budget 12/31/2014 Projections Budget
Revenues
Miscellaneous 1,234,118 4,258 2,195 2,195 4,000 4,000
Total Revenues 1,234,118 4,258 2,195 2,195 4,000 4,000
Expenditures
Capital 247,088 271,255 159,156 153,156 153,156 0
Total Expenditures 247,088 271,255 159,156 153,156 153,156 0
Excess (deficiency) of revenues over expenditures 987,030 (266,997) (156,961) (150,961) (149,156) 4,000
Beginning Working Capital
(Fund Balance), July 1 164,355 1,151,385 890,900 884,388 884,388 735,232Ending Working Capital
(Fund Balance), June 30 1,151,385 884,388 733,939 733,427 735,232 739,232
Reconciliation of Total Resources and Requirements
Resources Beginning Working Capital
(Fund Balance) 164,355 1,151,385 890,900 884,388 884,388 735,232
Total Revenues 1,234,118 4,258 2,195 2,195 4,000 4,000
Total Resources 1,398,473 1,155,643 893,095 886,583 888,388 739,232
Requirements
Total Expenditures 247,088 271,255 159,156 153,156 153,156 0 Ending Working Capital
(Fund Balance) 1,151,385 884,388 733,939 733,427 735,232 739,232
Total Requirements 1,398,473 1,155,643 893,095 886,583 888,388 739,232
Reserves (Budgeted amounts only)
Balance Available 724,358 726,974 733,939 733,427 733,427 739,232
Total Reserves 724,358 726,974 733,939 733,427 733,427 739,232
109

Urban Renewal Agency Riverfront Program Revenue Fund (824)
FY15 FY15 FY16FY13 FY14 Adopted Budget FY15 Proposed
Actual Actual Budget 12/31/2014 Projections Budget
Revenues
Miscellaneous 0 0 0 0 0 5,000
Interfund Transfers 0 0 0 0 0 2,990,000
Total Revenues 0 0 0 0 0 2,995,000
Expenditures
Special Payments 0 0 0 0 0 1,000,000
Total Expenditures 0 0 0 0 0 1,000,000
Excess (deficiency) of revenues over expenditures 0 0 0 0 0 1,995,000
Beginning Working Capital
(Fund Balance), July 1 0 0 0 0 0 0Ending Working Capital
(Fund Balance), June 30 0 0 0 0 0 1,995,000
Reconciliation of Total Resources and Requirements
Resources Beginning Working Capital
(Fund Balance) 0 0 0 0 0 0
Total Revenues 0 0 0 0 0 2,995,000
Total Resources 0 0 0 0 0 2,995,000
Requirements
Total Expenditures 0 0 0 0 0 1,000,000 Ending Working Capital
(Fund Balance) 0 0 0 0 0 1,995,000
Total Requirements 0 0 0 0 0 2,995,000
Reserves (Budgeted amounts only)
Reserve 0 0 0 0 0 1,995,000
Total Reserves 0 0 0 0 0 1,995,000
Note: New fund beginning in FY16
110

Urban Renewal Agency Debt Service
Debt service appropriations provide for the payment of principal and interest on URA bonds. The URA issues tax increment bonds to finance major projects within its boundaries. These bonds are serviced by tax increment revenues. When an urban renewal district is first created, the assessed property value within the district boundaries is established as a “frozen base”. The URA receives property taxes related to the incremental increase in the property value that is in excess of the “frozen base”. This income is the “tax increment” revenue that is used to repay the debt.
On May 25, 2011, the Agency issued $7,900,000 of Downtown Urban Renewal District Tax Increment Bonds, Series 2011 A, bearing a fixed interest rate of 5.2% and maturing on June 1, 2020. The proceeds of the bonds were used to refund (at a lower interest rate) $4.4 million in debt associated with the City’s Broadway Garages limited tax bonds, and to grant $3.5 million in financial assistance to Lane Community College for construction of their new Downtown Campus. During FY14, the URA made an early prepayment of $500,000 on the bonds. In FY15, an early prepayment of $1 million is expected. The FY16 budget includes potential early prepayment of $1.2 million.
Original Interest Ending balanceissuance rates (%) 6/30/2016
Tax increment bonds:
URA Tax Increment Bonds, Series 2011 A $7,900,000 5.200% $1,222,000
Total tax increment bonds $7,900,000 $1,222,000
111

112

City of Eugene
Multi-Year Financial Plan
FY16 to FY21
April 29, 2015

This page intentionally left blank

Table of Contents
EXECUTIVE SUMMARY…………………………………………………………………………………………………………. 5 Executive Team Priorities…………….………………………..………………..………………………………………………… 5
Figure 1: Total Unfunded Costs FY 16 – 21 by Service Category……………………………………………... 8 Figure 2: Total Unfunded Costs FY 16 – 21 by MYFP Category……………………………………………….. 9 Figure 3: Total Unfunded Costs by Type of Cost and Fiscal Year…………………………………………... 10
ALL ITEMS Table 1: All Items Listed Alphabetically…...…………………………………………………………………………. 13 Table 2: All Items by Service Category………………………………………………………………………………... 15 Table 3: All Items by Type of Cost………………………………………………………………………….…………… 16
MULTI-YEAR FINANCIAL PLAN PROJECT DESCRIPTIONS BY SERVICE CATEGORY……………… 17
ANIMAL CONTROL Animal Shelter Facility………………………………………………………………………………………………………. 17
COMMUNITY CENTERS Amazon Community Center Renovation……………………………...………………………………………….…... 18 Campbell Community Center Renovation…………………………………………………………………….……... 19 Petersen Barn Community Center Renovation…………………….……………………………………….……... 20 Riverhouse Renovation………………………………...………………………………………………………….………… 21 Santa Clara Community Center, Pool and Branch Library……………………………………….……………. 22 Sheldon Community Center and Pool Renovation ………………….………………………………….………... 23 Whiteaker/Skinner Butte Community and Aquatics Center……………………………………..………….. 24 Willow Creek/Churchill Community Center, Pool and Library……………………………………………... 25
CONSTRUCTION PERMITS Building Permit Tracking System……………………………………………………………………………………….. 26 Commercial Digital Plans Software……………………………………………………………………………………...27
EMERGENCY MEDICAL/FIRE SVCS Ambulance Transport Fund Shortfall………………………………………………………………………………….. 28 Emergency Medic Unit Staffing…………………………………………………………………………………………... 29 Fire Stations: Land Purchase – New West Side Station…………………………………………………........... 30 New West Side Fire Station………………………………….…………………………………………………………….. 31
FLEET AND RADIO COMMUNICATIONS Fleet Maintenance Facility………….……………………………………………………………………………………… 32
GOVERNMENTAL SERVICES Equipment Replacement……………………………………………………………………………………………………. 33
HULT/CUTHBERT AMPHITHEATER Cuthbert Amphitheater Renovations…………………….……………………………………………………………. 34
City of Eugene 2016 - 2021 Multi-Year Financial Plan Page 1

Table of Contents Continued
INFORMATION TECHNOLOGY Community Livability Software Replacement……………………………….…………………………………….. 35 Public Safety and Justice Information System Replacement…………………………………………………. 36
LIBRARY Library of the Future Enhancements.…………………………………………………………………………………..37
METRO AND COMMUNITY PLANNING Envision Eugene Implementation…………………………………….………………………………………………… 38 Planning Division Staffing………………………………………………………………………………………………….. 39
MUNICIPAL COURT Jail Bed Additions – Lane County………………………………….……………………………………………….……. 40
PARKING Broadway South and North Garages – Deferred Maintenance……………...………………………….…… 41 Credit Card Meter Replacement…………………………………………………………………………………………. 42 Downtown Parking Wayfinding and Garage Signage………..……………………….………………….……… 43 Hult Garage – Deferred Maintenance……………….…….…………………………………………………………… 44 Overpark Garage – Deferred Maintenance …………………………………………………………………………. 45 Parcade Garage – Deferred Maintenance ……………………………………………………………….…………… 46 Parking Garage Access System Replacement…………………….………………………………………………… 47 Parking Garage Lighting Retrofit……………………………………...………………………………………………… 48 Parking Structure Elevator Modernization……….………………………………………………….………………49 Parking Structure Security Cameras…….……………………………………………………………….…………….. 50 Parking Structure Seismic Upgrade.…………………………………………………………………….……………... 51 Pearl Street Garage – Deferred Maintenance ……………………………………………………………………… 52
PARKS AND OPEN SPACE Develop Water Play Features………........................................................................................................................ 53 Parks and Open Space Maintenance and Operations Capacity…………………….……………………...… 54 Trail System Development……………………………………..…………………………………………………….……..55
POLICE INVESTIGATIONS Evidence Control Unit Staffing……………………………………………………………………………………………. 56
POLICE SERVICES Police HQ Building/Parking Enhancements………………………………………………………………………… 57 Police Special Operations Facility….……………………………………………………………………………………. 58 Police Technology Equipment…….……………………………………………………………………………………… 59 83 Public Safety Answering Point (PSAP) Funding Shortfall……………………………………………………... 60 Regional Radio System………………………………………………………………………………………………………. 61 Street Crimes Team…………………………………………………………………………………………………………… 62
City of Eugene 2016 - 2021 Multi-Year Financial Plan Page 2

Table of Contents Continued
PUBLIC BUILDINGS AND FACILITIES City Hall Phase I – 4th Floor Tenant Improvements…………………………………………………………….. 63 City Hall Project Phase II……………………………………………………………………………………………………. 64 Echo Hollow/Sheldon Pool Systems Preservation………………….……………………………………………. 65 Public Building Deferred Maintenance……………………………………………………………………………….. 66
SOCIAL SERVICES Homelessness Initiative……………………….…………………………………………………………………………….. 67
SPECIAL EVENTS Major Track and Field Events…………………………………….………………………………………………………..68
STORMWATER AND WETLANDS MGMT Alton Baker Canoe Canal Renovation……………….…………………………………………………………………. 69
TRANSPORTATION Eugene Bike Share………………………………………………………....…………………………………………………...70 Franklin Boulevard Multiway Boulevard Improvements………...…………………………………………… 71 Pavement Preservation Program – Funding for Project Backlog……………..……………………………. 72 Railroad Quiet Zone……………………………………………………..……………………………………………………. 73
YOUTH AND FAMILY RECREATION SVCS Youth After-School Health Lifestyle Education...………………………………………………………………….. 74
ZONING AND NUISANCE ADMIN Livability Staffing………………………………………………………………………………………………………………. 75
City of Eugene 2016 - 2021 Multi-Year Financial Plan Page 3

This page intentionally left blank
City of Eugene 2016 - 2021 Multi-Year Financial Plan Page 4

Executive Summary Background The Multi-Year Financial Plan (MYFP) is a compilation of significant unfunded financial challenges and opportunities that the City of Eugene is expected to encounter over the next six fiscal years. This MYFP covers fiscal years 2016 to 2021 and includes 59 items with total estimated unfunded costs of about $450 million. For the past six years, the focus of City staff and policymakers has been on solving budget gaps, while continuing to identify opportunities, allowing City and community priorities to advance and progress under constrained resources. Many planned projects of the organization and the community have not been implemented due to relatively slow growth in the economy and the prolonged period of budget shortfalls. The City Manager has indicated that the General Fund budget is now in a stable position for FY16 and the foreseeable future. With greater fiscal stability attained, the City can concentrate on developing a sustainable budget that allows service levels to keep pace with growth in the community. Now we can begin discussions necessary for achieving libraries of the future, providing maintenance and development of our neighborhood parks, creating a justice system that delivers outcomes without sacrificing accountability and protection, as well as a number of other important City services. Some of these conversations will also require citizens and policymakers to consider new sources of revenue to expand what is achievable given the City’s current fiscal situation. As the City moves towards a sustainable budget environment, the items presented in this MYFP can foster policy-level discussions that weigh and address service levels, examine revenue alternatives and build citywide strategies that nurture long-term community growth. The MYFP can also serve as an advance detection system for potential funding gaps and fiscal challenges that lie ahead for the City. After six years of budgetary realignment, this MYFP clearly depicts major unmet needs that have been put on hold while the economic recovery has taken root. The MYFP needs must now be considered within the fiscal context of current operations and be integrated into the City’s efforts for budget sustainability moving forward. Executive Team Priorities As a starting point for this conversation, the City’s Executive Management Team has identified priorities to focus on over the next several years. While the FY16-21 MYFP contains 59 unfunded items, the initiatives that fall into the following categories are those the Executive Team has identified as high priority funding needs in the near to intermediate timeframe. Parks and Recreation System: A funding shortfall continues to grow for both the parks system and recreation programs and facilities. Several years of budget reductions paired with servicing a growing community have left deficiencies in current operations and maintenance levels. As the community continues to grow there will be additional service gaps in program areas that can be addressed through the creation of new and renovated facilities and programs. City Council recently had a work session to discuss funding of parks and open space maintenance and operations funding, and staff is in the process of completing the Parks and Recreation System Plan, which will establish a ten-year vision to guide the development and operation of Eugene’s parks, trails, and recreation facilities and sports fields. The two-year planning effort is a collaboration
City of Eugene 2016 - 2021 Multi-Year Financial Plan Page 5

between the Parks and Open Space and Recreation Divisions and will replace the 2006 PROS Comprehensive Plan. Public Safety: Public safety needs include funding shortfalls for operational programs, contracted services, equipment, software and systems upgrades. These unfunded challenges impact Fire and EMS, Municipal Court and Police services. Buildings and Facilities: A growing level of deferred maintenance related to City buildings exists across the organization. These include community centers, parking garages, cultural facilities and pools, as well as other facilities. It remains a priority to preserve and maintain existing City assets in order to continue delivering quality services to the community. Additional projects related to City Hall are also a priority, including tenant improvements to the 4th floor of Phase I and the development of Phase II. Equipment and Technology: City staff relies on many different types of equipment, software and other technology to provide services to the community. Funds to maintain and replace these hi-tech items are insufficient to keep up with the demand. Additionally, as technology advances, there aren’t reliable funding mechanisms to ensure continued benefit from this rapidly changing field. Library Services: Based on conversations with the community, the Eugene Public Library has developed a vision for the Library of the Future. City Council has discussed this vision and is currently working on consideration of a property tax levy to enhance access and service levels. Transportation: While much progress has been made in the Pavement Preservation Program over the past several years, a significant backlog of critical infrastructure projects still remains unfunded. A portion of the backlog is currently being funded by five-year General Obligation (G.O.) Bonds, but this funding source will expire in FY19, leaving a larger funding gap in FY20. Revenue Options for Sustainable Budget Priorities and Projects in the MYFP As part of the FY 15 budget process, the Budget Committee appointed a subcommittee, the Revenue Team, to explore the City’s options for generating additional revenue. The Revenue Team produced a report with 24 potential revenue alternatives, which could stimulate discussions regarding options for sustainable budget priorities and MYFP projects. Given the level of unmet needs in the MYFP, it is clear that new, ongoing revenue should continue to be considered as a viable option to help fully fund identified projects. The Revenue Team report includes a number of factors to be considered while looking at new revenue sources such as legal authority and restrictions, yield and stability of potential revenues, administrative efforts required, equity and fairness implications, receptivity of voters and political feasibility. While the Revenue Team’s report was focused on revenues that could be used to support General Fund services, the list of unfunded needs in the MYFP could use a broader range of funding sources. For instance, for large capital projects, the City can borrow money by issuing General Obligation (G.O.) Bonds. Funds necessary for the repayment of G.O. bonds are raised by a voter approved property tax that is levied upon all taxable property in the city.
City of Eugene 2016 - 2021 Multi-Year Financial Plan Page 6

The City currently has outstanding G.O. bonds that have previously been approved by voters for parks and open space projects, street repair projects and several public safety facility projects. Some of the City’s bonds are structured with 20-year repayment schedules that will be fully repaid in the next several years. This provides an opportunity to consider asking voters to authorize additional bonds for new projects as the previous debt is paid off without increasing their tax bill. This presents an emerging opportunity to consider as the MYFP items are discussed. In FY17, the principal payments scheduled for bonds issued for public safety facilities in 1996 and for parks and open spaces in 1999 will decrease, freeing up $1.5 million in debt service capacity annually. At today’s interest rates, that amount of annual funding would support $18 million of G.O. bonds repaid over 20 years. An additional $18 million in debt capacity will be available when the final payment for these bonds is made in FY19. The MYFP may be used to understand and weigh alternative uses for the City’s available financial resources, as well as to evaluate the need for possible new revenue. If the City decided to act on a particular item, whether it is a service or a capital project, the item’s entire estimated unfunded costs can be considered and addressed as part of the decision-making process. In this way, the MYFP helps to move towards Council’s goal for “Fair, Stable and Adequate Resources” to support the City’s services and facilities. The MYFP is particularly useful to the Budget Committee to help understand the long-term context and financial impacts of current budget decisions. It will also help Council plan for local option levies and G.O. bonding. Consideration of these and other factors may lead to some of the projects on the MYFP list moving forward due to these emerging opportunities such as General Obligation debt capacity. However, other factors may also impact debt issuance decisions such as potential competition on the ballot from measures put forth by Lane County or Eugene 4J School District, as well as Measure 5 tax rate compression. The projects highlighted in this current plan will undoubtedly need to be discussed with the City’s larger fiscal environment in mind. Summary of Projects As seen in Figure 1, some of the largest unfunded costs by service category include $133.9 million for Community Centers, $82.7 million for Transportation, $59.1 million for Public Buildings and Facilities, $35.1 million for Emergency Medical/Fire Services, $32.8 million for Municipal Court and $25.1 million for Fleet and Radio Communications. Throughout the MYFP, costs are categorized by four different MYFP categories. Figure 2 depicts the breakdown of costs in these categories. More than half of the projects ($250 million) are projects that would implement an adopted plan or policy. Estimated costs are also shown for each item, whether capital costs, facility operating costs or program operating costs. Figure 3 shows the breakdown by type of cost by fiscal year. By the end of the MYFP time horizon, the ongoing costs for facility operating and program operating costs would exceed $30 million annually. Additionally, large capital costs are anticipated for FY18 and FY21.
City of Eugene 2016 - 2021 Multi-Year Financial Plan Page 7

Figure 1
*Service category has placeholder.
Throughout the MYFP, items are organized by service category. For each item, the following detail is provided:
1. MYFP category – Items in the MYFP fall within four descriptive categories: Continuing Current Services; Preserving and Maintaining Existing Assets; Implementing Adopted Plans or Policies; Improved or Expanded Services Not Part of an Adopted Plan.
2. Service category – City-wide service area categories. 3. Project title. 4. Project description. 5. Project status – whether it is in progress or is not yet started, and whether it has
appeared in a previous Capital Improvement Program (CIP) or MYFP. 6. Funding status – “Funding not identified” indicates the item has reasonably firm
cost estimates but the source of possible funding has not been identified, while “Placeholder” indicates an item that has only tentative cost estimates.
7. Type of unfunded cost – whether for capital, facility operations or program operations.
8. Funds likely to be impacted.
$0.0 $0.0
$0.6
$1.0
$2.1
$2.2
$2.3
$2.4
$3.0
$3.4 $4.7
$5.0
$11.8
$11.8
$14.3
$15.9
$25.1
$32.8
$35.1
$59.1 $82.7
$133.9
$0.0 $20.0 $40.0 $60.0 $80.0 $100.0 $120.0 $140.0
Animal Control*
Special Events*
Social Services
Police Investigations
Youth & Family Recreation Svcs
Governmental Services
Zoning & Nuisance Admin.
Construction Permits
Hult/Cuthbert Amphitheater
Metro and Community Planning
Information Technology Service
Stormwater & Wetlands Mgmt
Library
Parking
Parks and Open Space
Police Services
Fleet & Radio Communications
Municipal Court
Emergency Medical/Fire Svcs
Public Buildings & Facilities
Transportation
Community Centers
Millions
Unfunded Costs FY 16 - 21 by Service Category
Total Unfunded Costs FY 16 – 21 $449.4 Million
City of Eugene 2016 - 2021 Multi-Year Financial Plan Page 8

9. Total estimated annual costs (in thousands) for FY16 through FY21. Unfunded costs as well as funded costs, if any, are clearly shown.
10. Appearance in the CIP (either funded or unfunded). 11. Neighborhoods and wards that will be affected. 12. Specific plans or policies related to the item.
Figure 2
Method for Compiling the MYFP The MYFP is assembled by City staff and reviewed by City Executive Managers. Each department identifies significant unfunded opportunities and challenges that may arise within the next six fiscal years. Department staff submits estimates for costs for each year of the six-year planning period. Supporting policies, documents or processes for each item are also identified. The compiled items are then reviewed and discussed by the Executive Managers, who make a final determination on which items will be included. The completed MYFP then serves as a reference tool and planning document for the year’s discussions on financial matters by the Budget Committee, City Council, Executive Managers and members of the public. To be considered significant and be included in the MYFP, an individual item must have an unfunded cost of at least $250,000 in any one year of the six-year period. Placeholder projects with a significant but undetermined unfunded cost that is likely to be $250,000 or more in any year may also be included.
$37.9 Million Continuing Current
Services
$96.7 Million Preserving and
Maintaining Existing Assets
$250.4 Million Implenting Adopted
Plans and Policies
$64.3 Million Improved or
Expanded Services Not Part of an Adopted Plan
Unfunded Costs FY16 - 21 by MYFP Category
Total Unfunded Costs
FY 16 – 21 $449.4 Million
City of Eugene 2016 - 2021 Multi-Year Financial Plan Page 9

Three types of costs may be shown for an item:
Capital costs are those costs that would be incurred by a capital project, which is the acquisition or extension of the useful life of a fixed asset with a life expectancy greater than one year.
Facility Operating costs are the costs of operating a building, site improvement or other fixed asset. This usually includes ongoing maintenance costs and the cost of utilities servicing the asset. Some minimum level of facility costs is unavoidable for every City asset. New capital projects imply additional facility costs.
Program Operating costs include the cost of performing program activity and delivering particular City services. New or continuing program costs may or may not be associated with capital projects and facility costs.
Figure 3
Coordination with the Capital Improvement Program The FY16-21 Capital Improvement Program (CIP) document contains information that supplements the information in the MYFP. Please refer to the CIP for descriptions of specific plans, processes, funding sources and restrictions associated with capital projects, a summary of the City’s Financial Management Goals and Policies that apply to capital projects and review of the City’s debt capacity and debt policies.
$8.5
$15.9
$134.0
$18.2 $19.9
$110.3
$15.1 $17.2 $20.3
$26.7 $22.7
$27.0
$0.0 $0.1 $1.2 $3.0 $3.1 $6.0
$0.0
$20.0
$40.0
$60.0
$80.0
$100.0
$120.0
$140.0
FY 2016 FY 2017 FY 2018 FY 2019 FY 2020 FY 2021
Mil
lio
ns
Total Unfunded Costs by Type of Cost and Fiscal Year
Capital Operating: Program Operating: FacilityTotal Unfunded Costs FY 16 – 21 $449.4 Million
City of Eugene 2016 - 2021 Multi-Year Financial Plan Page 10

Collection of information and development of the CIP and the MYFP are closely coordinated but have different uses. The different roles of the CIP and the MYFP can be summarized as follows:
The CIP is reviewed by the Budget Committee and formally adopted by the City Council. It then provides the basis for preparation of the City’s Capital Budget for the following two years. It also serves as a long-term planning tool for unfunded small or large capital projects. The CIP is prepared only in even-numbered years and includes capital projects, together with associated facility preservation and maintenance costs.
The MYFP is presented by the City’s Executive Managers to the Budget Committee. It serves
as a comprehensive, flexible planning resource and tool to support strategic thinking and planning for both capital and non-capital needs.
A number of projects appear in both the MYFP and CIP. The MYFP is also prepared in even-numbered years and includes unfunded non-capital items as well as items with unfunded capital costs. When a project is included in both the CIP and MYFP, there will be a statement on the project page noting that under the item’s estimated cost.
City of Eugene 2016 - 2021 Multi-Year Financial Plan Page 11

This page intentionally left blank
City of Eugene 2016 - 2021 Multi-Year Financial Plan Page 12

Table 1: All Items Listed Alphabetically Only Unfunded Costs are Shown
in thousands of dollars (e.g. 1,000=$1 million)
NOTE: Projects showing "1" are placeholder projects.
Project
2016 2017 2018 2019 2020 2021 Grand Total
Alton Baker Canoe Canal Renovation 2,500 2,500 5,000
Amazon Community Center Renovation 4,100 4,100
Ambulance Transport Fund Shortfall 780 924 1,081 1,281 1,457 5,523
Animal Shelter Facility 1 1 1 1 1 1 6
Broadway South and North Garages - Deferred Maintenance 887 887
Building Permit Tracking System 500 500 500 110 120 130 1,860
Campbell Community Center Renovation 4,050 52 53 55 4,210
City Hall Phase I - 4th Floor Tenant Improvements 1,589 91 92 94 96 1,962
City Hall Project Phase II 41,000 1,020 1,041 1,064 44,125
Commercial Digital Plans Software 350 200 550
Community Livability Software Replacement 600 630 1,230
Credit Card Meter Replacement 508 508
Cuthbert Amphitheater Renovations 3,000 3,000
Develop Water Play Features 200 210 220 230 240 1,100
Downtown Parking Wayfinding and Garage Signage 600 600
Echo Hollow/Sheldon Pool Systems Preservation 1,500 1,500
Emergency Medic Unit Staffing 1,455 1,499 3,087 3,180 3,275 3,341 15,837
Envision Eugene Implementation 160 160 160 160 160 160 960
Equipment Replacement 501 840 413 118 326 2,198
Eugene Bike Share 1,431 1,431
Evidence Control Unit Staffing 250 250 250 250 1,000
Fire Stations: Land Purchase - New West Side Station 500 500
Fleet Maintenance Facility 25,000 46 47 48 25,141
Franklin Boulevard Multiway Boulevard Improvements 17,200 17,200
Homeless Initiative 100 100 100 100 100 100 600
Hult Garage - Deferred Maintenance 443 443
Jail Bed Additions - Lane County 5,200 5,304 5,411 5,518 5,629 5,741 32,803
Library of the Future Enhancements 1,820 1,875 1,931 1,989 2,048 2,110 11,773
Livability Staffing 350 360 370 380 390 400 2,250
Major Track and Field Events 1 1
New West Side Fire Station 6,500 2,695 2,023 2,068 13,286
Overpark Garage - Deferred Maintenance 791 791
Parking Garage - Deferred Maintenance 2,439 2,439
Parking Garage Access System Replacement 363 363
Parking Garage Lighting Retrofit 300 300
Parking Structure Elevator Modernization 975 975
Parking Structure Security Cameras 300 300
Parking Structures Seismic Upgrade 3,641 3,641
Estimated Costs by Fiscal Year
City
of E
ugene 2
016 - 2
021 M
ulti-Y
ear F
inancia
l Pla
nP
age 1
3

Table 1: All Items Listed Alphabetically ContinuedOnly Unfunded Costs are Shown
in thousands of dollars (e.g. 1,000=$1 million)
NOTE: Projects showing "1" are placeholder projects.
Project
2016 2017 2018 2019 2020 2021 Grand Total
Parks & Open Space Maintenance & Operations Capacity 2,000 2,000 2,000 2,000 2,000 2,000 12,000
Pavement Preservation Program - Funding for Project Backlog 6,560 6,260 5,950 8,630 14,850 14,850 57,100
Pearl Street Garage - Deferred Maintenance 568 568
Petersen Barn Community Center Renovation 2,050 52 53 55 2,210
Planning Division Staffing 360 375 390 410 430 450 2,415
Police HQ Building/Parking Enhancements 250 250 250 250 250 1,250
Police Special Operations Facility 1 1 1 1 1 1 6
Police Technology Equipment 250 250 250 250 250 250 1,500
Public Building Deferred Maintenance 1,845 1,873 1,902 1,933 1,966 1,979 11,498
Public Safety and Justice Information System Replacement 500 3,000 3,500
Public Safety Answering Point (PSAP) Fund Shortfall 7 216 470 743 1,436
Railroad Quiet Zone 3,000 1,000 1,000 1,000 1,000 7,000
Regional Radio System 195 1,033 1,346 1,396 3,970
Riverhouse Renovation 2,025 26 27 2,078
Santa Clara Community Center, Pool & Branch Library 38,500 38,500
Sheldon Community Center and Pool Renovation 4,100 103 106 4,309
Street Crimes Team 1,500 1,250 1,250 1,250 1,250 1,250 7,750
Trail System Development 125 332 152 152 332 152 1,245
Whiteaker/Skinner Butte Community and Aquatics Center 32,750 32,750
Willow Creek/Churchill Community Center, Pool and Library 35,000 3,500 3,585 3,672 45,757
Youth After-School Healthy Lifestyle Education 400 412 424 437 450 2,123
Grand Total 23,672 33,223 155,555 47,896 45,709 143,303 449,358
Estimated Costs by Fiscal Year
City
of E
ugene 2
016 - 2
021 M
ulti-Y
ear F
inancia
l Pla
nP
age 1
4

Table 2: All Items by Service CategoryOnly Unfunded Costs are Shown
in thousands of dollars (e.g. 1,000=$1 million)
NOTE: Projects showing "1" are placeholder projects.
Service Category
2016 2017 2018 2019 2020 2021 Grand Total
Animal Control 1 1 1 1 1 1 6
Community Centers 41,100 9,729 3,820 79,265 133,914
Construction Permits 850 700 500 110 120 130 2,410
Emergency Medical/Fire Svcs 1,455 2,279 11,011 6,956 6,579 6,866 35,146
Fleet & Radio Communications 25,000 46 47 48 25,141
Governmental Services 501 840 413 118 326 2,198
Hult/Cuthbert Amphitheater 3,000 3,000
Information Technology Service 600 630 500 3,000 4,730
Library 1,820 1,875 1,931 1,989 2,048 2,110 11,773
Metro and Community Planning 520 535 550 570 590 610 3,375
Municipal Court 5,200 5,304 5,411 5,518 5,629 5,741 32,803
Parking 300 9,669 1,846 11,815
Parks and Open Space 2,125 2,532 2,362 2,372 2,562 2,392 14,345
Police Investigations 250 250 250 250 1,000
Police Services 1,946 2,784 3,104 3,363 2,221 2,494 15,912
Public Buildings & Facilities 1,845 3,462 42,993 3,045 3,101 4,639 59,085
Social Services 100 100 100 100 100 100 600
Special Events 1 1
Stormwater & Wetlands Mgmt 2,500 2,500 5,000
Transportation 6,560 9,260 6,950 9,630 15,850 34,481 82,731
Youth & Family Recreation Svcs 400 412 424 437 450 2,123
Zoning & Nuisance Admin. 350 360 370 380 390 400 2,250
Grand Total 23,672 33,223 155,555 47,896 45,709 143,303 449,358
Estimated Costs by Fiscal Year
City
of E
ugene 2
016 - 2
021 M
ulti-Y
ear F
inancia
l Pla
nP
age 1
5

Table 3: All Items by Type of CostOnly Unfunded Costs are Shown
in thousands of dollars (e.g. 1,000=$1 million)
NOTE: Projects showing "1" are placeholder projects.
Type of Cost
2016 2017 2018 2019 2020 2021 Grand Total
Capital 8,527 15,912 134,020 18,162 19,933 110,319 306,873
Operating: Facility 5 94 1,206 2,997 3,084 6,026 13,412
Operating: Program 15,140 17,217 20,329 26,737 22,692 26,958 129,073
Grand Total 23,672 33,223 155,555 47,896 45,709 143,303 449,358
Estimated Costs by Fiscal Year
City
of E
ugene 2
016 - 2
021 M
ulti-Y
ear F
inancia
l Pla
nP
age 1
6

MYFP Category: Preserving and Maintaining Existing Assets
Service Category: Animal Control
Animal Shelter Facility
Project Description: The Animal Shelter Facility was built in the 1970's and is jointly owned by the City of
Eugene, the City of Springfield, and Lane County. The building houses the City of Eugene Spay/Neuter Clinic
and First Avenue Shelter, which provides animal sheltering, lost & found services and adoption services
under contracts between Greenhill Humane Society and the cities of Eugene and Springfield, and Lane
County. The Eugene Police Department Animal Welfare Unit utilizes First Avenue Shelter services
extensively.The City of Eugene currently has de facto responsibility for the facility. There is no
intergovernmental agreement currently in effect that will adress the long -term capital maintenance and repair
of the Animal Shelter Facility. This is a placeholder to flag future building management issues and long-term
strategic planning for facility needs.
Project Status: Not Started - This item has previously appeared in the MYFP.
Placeholder
Estimated cost by year not yet determined for this placeholder project.
Estimated Costs ($ in thousands)
Neighborhood: West Eugene
Ward: Ward 8
The 1st Avenue Shelter facility is jointly owned by the
cities of Eugene and Springfield and Lane County.
Specific Plans/Policies Related to this Project:
Eugene Police Dept. Strategic Plan
City of Eugene 2016 - 2021 Multi-Year Financial Plan Page 17

MYFP Category: Implementing Adopted Plans or Policies
Service Category: Community Centers
Amazon Community Center Renovation
Project Description: This project would renovate the Amazon Community Center to make it more efficient
and better serve the community.
Project Status: Not Started - This is a new project in the FY16-21 CIP and MYFP. Funding for facility
operating costs associated with this project has not yet been identified.
Total20172016 2018 2019 2020 2021
Funding Not Identified
Capital
$0 $0 $4,000General Capital Projects $4,000$0 $0 $0
Operating: Facility
$0 $0 $100Facilities Maintenance $100$0 $0 $0
$0 $0Total $4,100$0 $4,100$0 $0
Estimated Costs ($ in thousands)
Neighborhood: South University
Ward: Ward 1
This project is included in the 2016-21 Capital Improvement Program.
A community center program.
Specific Plans/Policies Related to this Project:
Council Goal - Accessible and Thriving Culture and
Recreation
PROS (Parks, Recreation and Open Space)
Comprehensive Plan
PROS Project and Priority Plan
City of Eugene 2016 - 2021 Multi-Year Financial Plan Page 18

MYFP Category: Implementing Adopted Plans or Policies
Service Category: Community Centers
Campbell Community Center Renovation
Project Description: Update and remodel Campbell Center and add fitness area to current facility to meet
the needs of growing senior population. This is also part of the Campbell Center Health and Fitness Center
Study completed in 2003.
Project Status: Not Started - This item has previously appeared in the MYFP. PROS May 2006 priority
listing moved this project to FY17-21.
Total20172016 2018 2019 2020 2021
Funding Not Identified
Capital
$4,000 $0 $4,000General Capital Projects $0$0 $0 $0
Operating: Facility
$50 $53 $210Facilities Maintenance $55$0 $0 $52
$52 $53Total $4,210$4,050 $55$0 $0
Estimated Costs ($ in thousands)
Neighborhood: Downtown
Ward: Ward 7
This project is included in the 2016-21 Capital Improvement Program.
Campbell Center.
Specific Plans/Policies Related to this Project:
Celeste Campbell Senior Center Health and Fitness
Expansion Study
Council Goal - Accessible and Thriving Culture and
Recreation
PROS (Parks, Recreation and Open Space)
Comprehensive Plan
PROS Project and Priority Plan
City of Eugene 2016 - 2021 Multi-Year Financial Plan Page 19

MYFP Category: Implementing Adopted Plans or Policies
Service Category: Community Centers
Petersen Barn Community Center Renovation
Project Description: This project would renovate the Petersen Barn Community Center to make it more
efficient and better serve the community.
Project Status: Not Started - This item is new in the FY16-21 CIP and MYFP.
Total20172016 2018 2019 2020 2021
Funding Not Identified
Capital
$2,000 $0 $2,000General Capital Projects $0$0 $0 $0
Operating: Facility
$50 $53 $210Facilities Maintenance $55$0 $0 $52
$52 $53Total $2,210$2,050 $55$0 $0
Estimated Costs ($ in thousands)
Neighborhood: Bethel
Ward: Ward 6
This project is included in the 2016-21 Capital Improvement Program.
We are Bethel celebration at the Petersen Barn
Community Center.
Specific Plans/Policies Related to this Project:
Council Goal - Accessible and Thriving Culture and
Recreation
PROS (Parks, Recreation and Open Space)
Comprehensive Plan
PROS Project and Priority Plan
City of Eugene 2016 - 2021 Multi-Year Financial Plan Page 20

MYFP Category: Implementing Adopted Plans or Policies
Service Category: Community Centers
Riverhouse Renovation
Project Description: Remodel and expand current facility for class and community rooms and additional
parking area.
Project Status: Not Started - This item has previously appeared in the MYFP. The final 2006 PROS
priority plan listed completion of the Riverhouse Master Plan as an FY22-FY26 project.
Total20172016 2018 2019 2020 2021
Funding Not Identified
Capital
$0 $0 $2,000General Capital Projects $0$0 $0 $2,000
Operating: Facility
$0 $26 $78Facilities Maintenance $27$0 $0 $25
$2,025 $26Total $2,078$0 $27$0 $0
Estimated Costs ($ in thousands)
Neighborhood: Whiteaker
Ward: Ward 7
This project is included in the 2016-21 Capital Improvement Program.
Riverhouse Canoe Storage.
Specific Plans/Policies Related to this Project:
Council Goal - Accessible and Thriving Culture and
Recreation
PROS (Parks, Recreation and Open Space)
Comprehensive Plan
PROS Project and Priority Plan
City of Eugene 2016 - 2021 Multi-Year Financial Plan Page 21

MYFP Category: Implementing Adopted Plans or Policies
Service Category: Community Centers
Santa Clara Community Center, Pool & Branch Library
Project Description: This project would consist of a 40,000-50,000 square foot community center, aquatics
facility and branch library in northwest Eugene. Capital construction costs for this project could be funded
with new GO Bond proceeds.
Project Status: Not Started - This item is new in the FY16-21 CIP.
Total20172016 2018 2019 2020 2021
Funding Not Identified
Capital
$0 $0 $35,000New GO Bond $35,000$0 $0 $0
Operating: Facility
$0 $0 $1,500Facilities Maintenance $1,500$0 $0 $0
Operating: Program
$0 $0 $2,000General $2,000$0 $0 $0
$0 $0Total $38,500$0 $38,500$0 $0
Estimated Costs ($ in thousands)
Neighborhood: Santa Clara
Ward: Ward 7
This project is included in the 2016-21 Capital Improvement Program.
Youth program at a community center.
Specific Plans/Policies Related to this Project:
Council Goal - Accessible and Thriving Culture and
Recreation
PROS (Parks, Recreation and Open Space)
Comprehensive Plan
PROS Project and Priority Plan
City of Eugene 2016 - 2021 Multi-Year Financial Plan Page 22

MYFP Category: Implementing Adopted Plans or Policies
Service Category: Community Centers
Sheldon Community Center and Pool Renovation
Project Description: Implement the Sheldon Community Center & Pool master plan that includes
expanding interior space to the current exterior courtyard area.
Project Status: Not Started - This item has previously appeared in the CIP and MYFP.
Total20172016 2018 2019 2020 2021
Funding Not Identified
Capital
$0 $0 $4,000General Capital Projects $0$0 $0 $4,000
Operating: Facility
$0 $103 $309Facilities Maintenance $106$0 $0 $100
$4,100 $103Total $4,309$0 $106$0 $0
Estimated Costs ($ in thousands)
Neighborhood: Cal Young
Ward: Ward 4
This project is included in the 2016-21 Capital Improvement Program.
Program at the Sheldon Community Center.
Specific Plans/Policies Related to this Project:
Council Goal - Accessible and Thriving Culture and
Recreation
PROS (Parks, Recreation and Open Space)
Comprehensive Plan
PROS Project and Priority Plan
Sheldon Pool Conceptual Master Plan
City of Eugene 2016 - 2021 Multi-Year Financial Plan Page 23

MYFP Category: Implementing Adopted Plans or Policies
Service Category: Community Centers
Whiteaker/Skinner Butte Community and Aquatics Center
Project Description: This project would create an approximately 30,000 square foot multi-cultural and
aquatics center in the Whiteaker neighborhood. This facility would support activities reflecting the diversity of
Eugene's citizens, and meet the need for an aquatic center for downtown neighborhoods.
Project Status: Not Started - This item has previously appeared in the CIP and MYFP.
Total20172016 2018 2019 2020 2021
Funding Not Identified
Capital
$0 $0 $30,000New GO Bond $30,000$0 $0 $0
Operating: Facility
$0 $0 $1,250Facilities Maintenance $1,250$0 $0 $0
Operating: Program
$0 $0 $1,500General $1,500$0 $0 $0
$0 $0Total $32,750$0 $32,750$0 $0
Estimated Costs ($ in thousands)
Neighborhood: Whiteaker
Ward: Multiple Wards
This project is included in the 2016-21 Capital Improvement Program.
Water polo.
Specific Plans/Policies Related to this Project:
Council Goal - Accessible and Thriving Culture and
Recreation
PROS (Parks, Recreation and Open Space)
Comprehensive Plan
PROS Project and Priority Plan
City of Eugene 2016 - 2021 Multi-Year Financial Plan Page 24

MYFP Category: Implementing Adopted Plans or Policies
Service Category: Community Centers
Willow Creek/Churchill Community Center, Pool and Library
Project Description: This project would consist of a 40,000-50,000 square foot community center, aquatics
facility and branch library in southwest Eugene. Capital construction costs for this project could be funded
with new GO Bond revenue.
Project Status: Not Started - This item has previously appeared in the CIP and MYFP. The 2006 PROS
Project Priority and Plan list includes a new west-side community center and aquatics facility as a
FY12-FY16 project.
Total20172016 2018 2019 2020 2021
Funding Not Identified
Capital
$35,000 $0 $35,000New GO Bond $0$0 $0 $0
Operating: Facility
$0 $1,545 $4,636Facilities Maintenance $1,591$0 $0 $1,500
Operating: Program
$0 $2,040 $6,121General $2,081$0 $0 $2,000
$3,500 $3,585Total $45,757$35,000 $3,672$0 $0
Estimated Costs ($ in thousands)
Neighborhood: Churchill
Ward: Ward 8
This project is included in the 2016-21 Capital Improvement Program.
Amazon Community Center, shown here, is an
example of a City facility providing a wide range of
recreational opportunities.
Specific Plans/Policies Related to this Project:
Council Goal - Accessible and Thriving Culture and
Recreation
PROS (Parks, Recreation and Open Space)
Comprehensive Plan
PROS Project and Priority Plan
City of Eugene 2016 - 2021 Multi-Year Financial Plan Page 25

MYFP Category: Continuing Current Services
Service Category: Construction Permits
Building Permit Tracking System
Project Description: This project would replace the current building permit tracking system, which was
written 16 years ago and is still currently in use by the City. This project would directly impact local
construction, enhance business growth, and streamline the process for developers seeking to build in
Eugene. Annual cost estimates include permitting system software as well as ongoing resources for
maintenance and data storage. The project contributes to strengthening the 7th pillar of Envision Eugene -
Metrics. There may be additional costs incurred by Information Services related to data storage and
maintenance of this system.
Project Status: Not Started - This item is new in the FY16-21 MYFP.
Total20172016 2018 2019 2020 2021
Funding Not Identified
Operating: Program
$500 $120 $1,860Construction Permits Fund $130$500 $500 $110
$110 $120Total $1,860$500 $130$500 $500
Estimated Costs ($ in thousands)
Neighborhood: Citywide
Ward: Citywide
The building permit tracking system is an important
tool that tracks over 1,000,000 documents.
Specific Plans/Policies Related to this Project:
Envision Eugene
City of Eugene 2016 - 2021 Multi-Year Financial Plan Page 26

MYFP Category: Continuing Current Services
Service Category: Construction Permits
Commercial Digital Plans Software
Project Description: State regulations mandate the maintenance of existing commercial plans by
municipalities. In response, the Planning & Devlelopment Department keeps these plans for every
commercial building in Eugene and the Urban Transition area. This information is physically stored in the
form of microfilmed images of construction documents. Building and Permit Services seeks to digitize these
films and enhance the image quality significantly. Further, the creation of a fully indexed and searchable
database with a strong User Interface (UI) would provide direct community benefit in the form of markedly
increased accessibility as well as an invaluable asset to emergency response providers. A digitized system
with quality UI would additionally nearly eliminate the staff time required to perform record searches which
are an ongoing drain on staff time. There may be additional costs incurred by Information Services related to
data storage and maintenance of this system.
Project Status: Not Started - This item is new in the FY16-21 MYFP. Project is in concept stage.
Total20172016 2018 2019 2020 2021
Funding Not Identified
Operating: Program
$0 $0 $550Construction Permits Fund $0$350 $200 $0
$0 $0Total $550$0 $0$350 $200
Estimated Costs ($ in thousands)
Neighborhood: Citywide
Ward: Citywide
An example of accessible integral plans data.
Specific Plans/Policies Related to this Project:
Oregon Revised Statutes (ORS)
City of Eugene 2016 - 2021 Multi-Year Financial Plan Page 27

MYFP Category: Continuing Current Services
Service Category: Emergency Medical/Fire Svcs
Ambulance Transport Fund Shortfall
Project Description: The Ambulance Transport Fund is currently operating at an annual financial deficit ,
primarily due to reduced levels of reimbursement from Medicare and Medicaid. These account for about 65%
of current transports and the fund is not fully recovering costs. The federal Balanced Budget Act of 1997
shifted much of the financial burden for covered patient transports from the federal government to local
providers. The Medicare Modernization Act of 2003 further reduced reimbursements. Medicare HMO
capitated payments pay only about half of the standard fee and federal law does not allow billing the patient
beyond what is allowable under Medicare and Medicaid.
The fund also provides transport services to other patients who are unable to pay. A large portion of these
unpaid accounts are sent to collections, but only about 3% is recovered. Additionally, current law states that
patients must be notified of the cost of the ambulance transport prior to the service being rendered, thus
reducing transport call volume due to those choosing to be transported by private vehicle. In late FY09 and
FY14, ambulance transport rates were increased, which temporarily balanced the fund. In FY 11 and FY12,
the General Fund provided $450,000 and $610,300, respectively, for ambulance fleet replacement. Future
year's shortfall projections include the annual contributions to Medic Unit replacement. The fund's reserves
are projected to be spent by FY17.
Project Status: In Progress - This item has previously appeared in the MYFP.
Total20172016 2018 2019 2020 2021
Funding Not Identified
Operating: Program
$924 $1,281 $5,523Emergency Medical Service $1,457$0 $780 $1,081
$1,081 $1,281Total $5,523$924 $1,457$0 $780
Estimated Costs ($ in thousands)
Neighborhood: Citywide
Ward: Citywide
The Ambulance Transport Fund balance will be
exhausted in FY16 and significant annual shortfalls
are projected in future years.
Specific Plans/Policies Related to this Project:
Fire & EMS Standards of Response
Fire & EMS Strategic Plan
Fire 2011-2015 Work Plan
City of Eugene 2016 - 2021 Multi-Year Financial Plan Page 28

MYFP Category: Continuing Current Services
Service Category: Emergency Medical/Fire Svcs
Emergency Medic Unit Staffing
Project Description: Adds one additional medic unit (8 FTE) in FY16 and a second unit (8 FTE) in FY18.
The ambulance transport system is experiencing a major revenue shortfall and current staffing levels
covering the community's transport needs are not sustainable. The Fire Department has been staffing an
additional medic unit during peak times with a crew normally assigned to a fire suppression engine company.
The fire engine is out-of-service while the crew is on a medical transport call, increasing the fire response
risk. In addition, the medical workforce is experiencing acute and chronic fatigue due to the number of
medical calls and reduction of staff available to respond from midnight to 7 AM.
The department has contracted with a private ambulance provider to transport basic life support transfers
between facilities. However, the unit-hour utilization is still greater than acceptable. Adding capacity equal to
24 hour per day coverage will reduce the number of times the engine crew has to respond on a medic
transport call as well as equalize the number of calls per medic daily. The request for FY18 is for an
additional medic crew to provide services for a projected increase in the aging population as well as
population growth. Costs for FY16-21 include personnel, fringe, backfill, heart monitor, fleet maintenance
cost, and misc materials and supplies. Cost for FY18 includes an additional 24-hour medic crew plus a
one-time expenditure of a medic unit. Addition of these units will improve quality of current service but is not
expected to cause an increase in calls for service and revenue is not expected to change from current
projections.
Project Status: Not Started - This item has previously appeared in the MYFP.
Total20172016 2018 2019 2020 2021
Funding Not Identified
Operating: Program
$3,087 $3,275 $15,837Emergency Medical Service $3,341$1,455 $1,499 $3,180
$3,180 $3,275Total $15,837$3,087 $3,341$1,455 $1,499
Estimated Costs ($ in thousands)
Neighborhood: Citywide
Ward: Citywide
Eugene Springfield medics in action.
Specific Plans/Policies Related to this Project:
Fire & EMS Standards of Response
Fire & EMS Strategic Plan
Fire 2011-2015 Work Plan
City of Eugene 2016 - 2021 Multi-Year Financial Plan Page 29

MYFP Category: Implementing Adopted Plans or Policies
Service Category: Emergency Medical/Fire Svcs
Fire Stations: Land Purchase - New West Side Station
Project Description: Purchase land on the west side of the city to construct a new fire station to serve the
growing Greenhill, Willow Creek areas and the area between Roosevelt Boulevard and West 11 th. Request
is for purchase of land by 2018. Funding could be accomplished through a new GO bond.
Project Status: Not Started - This item has previously appeared in the CIP and MYFP.
Total20172016 2018 2019 2020 2021
Funding Not Identified
Capital
$500 $0 $500New GO Bond $0$0 $0 $0
$0 $0Total $500$500 $0$0 $0
Estimated Costs ($ in thousands)
Neighborhood: Multiple Neighborhoods
Ward: Ward 8
This project is included in the 2016-21 Capital Improvement Program.
Fire Station 11, shown here, is an example of a
modern station.
Specific Plans/Policies Related to this Project:
Fire & EMS Standards of Response
Fire & EMS Strategic Plan
City of Eugene 2016 - 2021 Multi-Year Financial Plan Page 30

MYFP Category: Implementing Adopted Plans or Policies
Service Category: Emergency Medical/Fire Svcs
New West Side Fire Station
Project Description: This project is to design and construct a new fire station to serve the growing
Greenhill and Willow Creek areas and the area between Roosevelt Boulevard and West 11th Avenue . In
2018 $6.5 million would be needed to build a new fire station on the west side of the City. Capital costs of this
project could be funded with new GO Bond revenue or grant revenue.
Project Status: Not Started - This project previously appeared in the CIP and MYFP.
Total20172016 2018 2019 2020 2021
Funding Not Identified
Capital
$6,500 $0 $6,500New GO Bond $0$0 $0 $0
Operating: Facility
$0 $87 $261General $89$0 $0 $85
Operating: Program
$0 $1,936 $6,525General $1,979$0 $0 $2,610
$2,695 $2,023Total $13,286$6,500 $2,068$0 $0
Estimated Costs ($ in thousands)
Neighborhood: Multiple Neighborhoods
Ward: Ward 8
This project is included in the 2016-21 Capital Improvement Program.
Example of a New Fire Station: Santa Clara Fire
Station #11.
Specific Plans/Policies Related to this Project:
Fire & EMS Standards of Response
Fire & EMS Strategic Plan
Fire 2011-2015 Work Plan
City of Eugene 2016 - 2021 Multi-Year Financial Plan Page 31
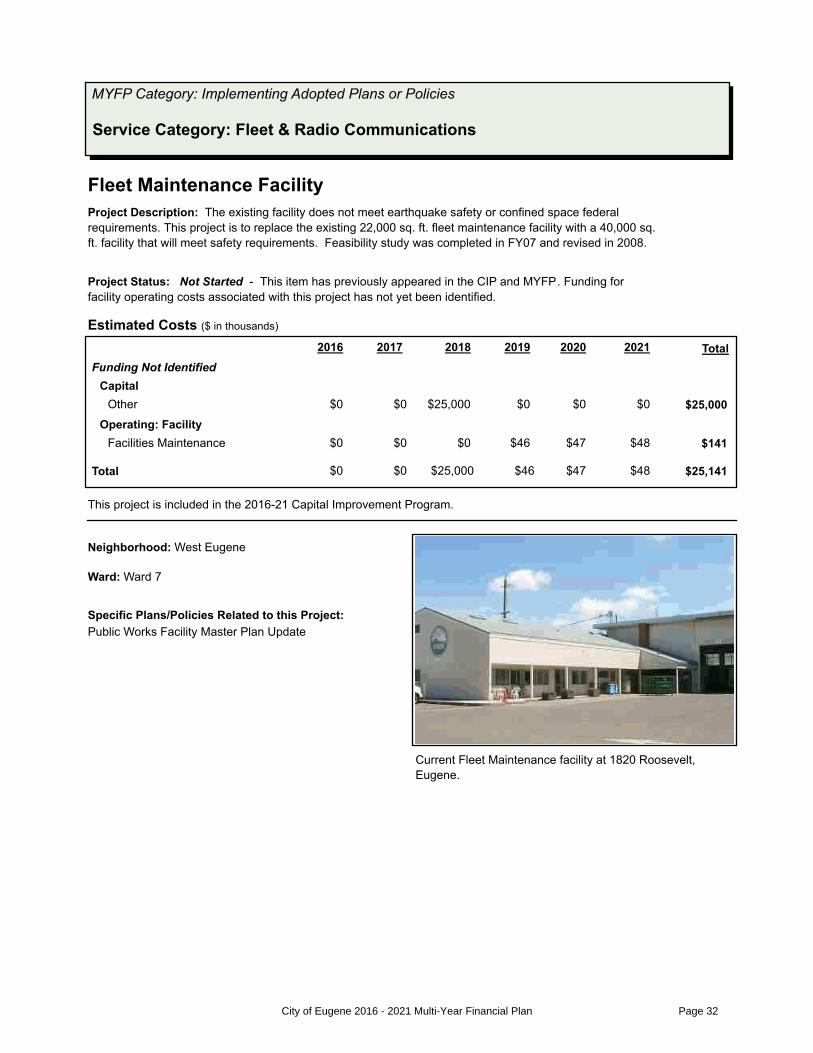
MYFP Category: Implementing Adopted Plans or Policies
Service Category: Fleet & Radio Communications
Fleet Maintenance Facility
Project Description: The existing facility does not meet earthquake safety or confined space federal
requirements. This project is to replace the existing 22,000 sq. ft. fleet maintenance facility with a 40,000 sq.
ft. facility that will meet safety requirements. Feasibility study was completed in FY07 and revised in 2008.
Project Status: Not Started - This item has previously appeared in the CIP and MYFP. Funding for
facility operating costs associated with this project has not yet been identified.
Total20172016 2018 2019 2020 2021
Funding Not Identified
Capital
$25,000 $0 $25,000Other $0$0 $0 $0
Operating: Facility
$0 $47 $141Facilities Maintenance $48$0 $0 $46
$46 $47Total $25,141$25,000 $48$0 $0
Estimated Costs ($ in thousands)
Neighborhood: West Eugene
Ward: Ward 7
This project is included in the 2016-21 Capital Improvement Program.
Current Fleet Maintenance facility at 1820 Roosevelt,
Eugene.
Specific Plans/Policies Related to this Project:
Public Works Facility Master Plan Update
City of Eugene 2016 - 2021 Multi-Year Financial Plan Page 32

MYFP Category: Continuing Current Services
Service Category: Governmental Services
Equipment Replacement
Project Description: The Telecom program currently funds telecom related equipment replacement at
$500,000 per year. This amount is not projected to keep pace with telecom related equipment replacement
needs over the next five fiscal years. This project would provide adequate funds for the unfunded portion of
the non-fleet, equipment replacement needs of the Telecom Fund.
Fire and EMS non-fleet equipment includes zodiac cardiac monitors, portable radios and mobile data
terminals. Police non-fleet equipment replacement includes mobile data terminals, 911 Comm Center
recorder equipment, and in-car equipment. Projected costs also includes the replacement of the Hult ADA
listening system, portable radios and organization-wide server replacement over the six year period.
Project Status: Not Started - This item has previously appeared in the MYFP.
Total20172016 2018 2019 2020 2021
Funding Not Identified
Operating: Program
$840 $118 $2,198Telecom Registration/Licensing $326$0 $501 $413
Funding Identified
Operating: Program
$500 $588 $3,746Telecom Registration/Licensing $500$841 $817 $500
$913 $706Total $5,944$1,340 $826$841 $1,318
Estimated Costs ($ in thousands)
Neighborhood: Citywide
Ward: Citywide
Zoll Cardiac Monitors are an example of equipment
that must be regularly replaced.
Specific Plans/Policies Related to this Project:
Financial Management Goals and Policies
City of Eugene 2016 - 2021 Multi-Year Financial Plan Page 33
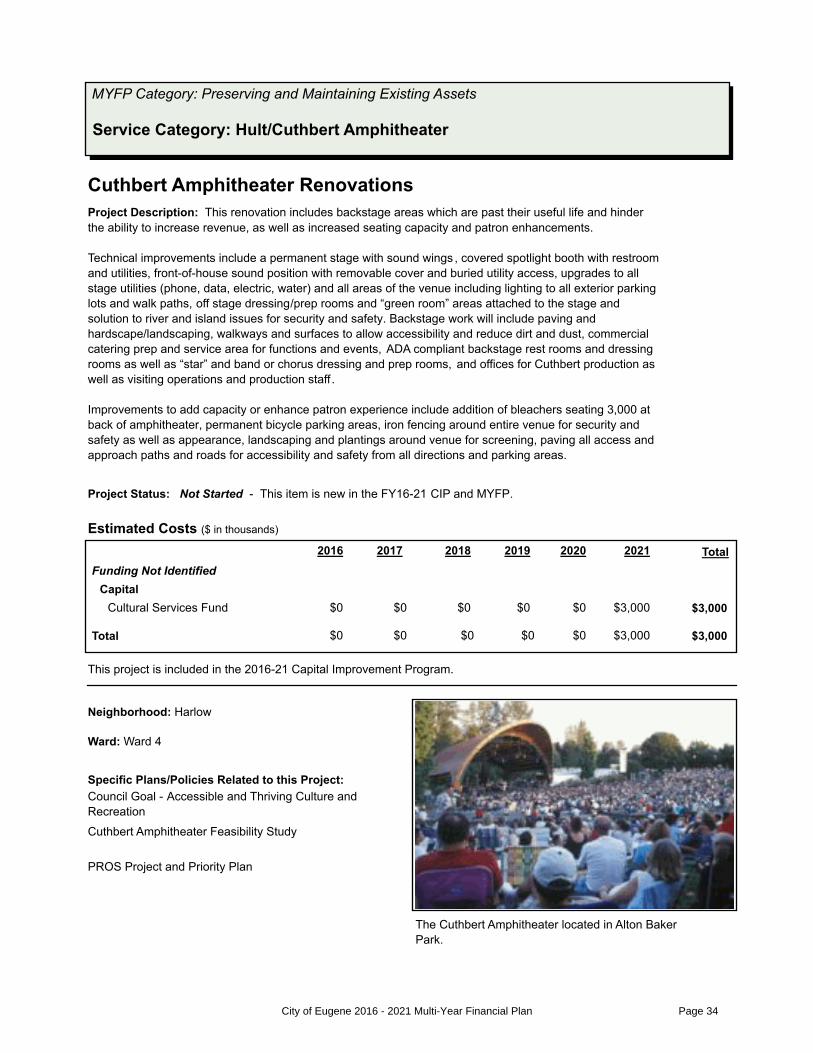
MYFP Category: Preserving and Maintaining Existing Assets
Service Category: Hult/Cuthbert Amphitheater
Cuthbert Amphitheater Renovations
Project Description: This renovation includes backstage areas which are past their useful life and hinder
the ability to increase revenue, as well as increased seating capacity and patron enhancements.
Technical improvements include a permanent stage with sound wings , covered spotlight booth with restroom
and utilities, front-of-house sound position with removable cover and buried utility access, upgrades to all
stage utilities (phone, data, electric, water) and all areas of the venue including lighting to all exterior parking
lots and walk paths, off stage dressing/prep rooms and “green room” areas attached to the stage and
solution to river and island issues for security and safety. Backstage work will include paving and
hardscape/landscaping, walkways and surfaces to allow accessibility and reduce dirt and dust, commercial
catering prep and service area for functions and events, ADA compliant backstage rest rooms and dressing
rooms as well as “star” and band or chorus dressing and prep rooms, and offices for Cuthbert production as
well as visiting operations and production staff .
Improvements to add capacity or enhance patron experience include addition of bleachers seating 3,000 at
back of amphitheater, permanent bicycle parking areas, iron fencing around entire venue for security and
safety as well as appearance, landscaping and plantings around venue for screening, paving all access and
approach paths and roads for accessibility and safety from all directions and parking areas.
Project Status: Not Started - This item is new in the FY16-21 CIP and MYFP.
Total20172016 2018 2019 2020 2021
Funding Not Identified
Capital
$0 $0 $3,000Cultural Services Fund $3,000$0 $0 $0
$0 $0Total $3,000$0 $3,000$0 $0
Estimated Costs ($ in thousands)
Neighborhood: Harlow
Ward: Ward 4
This project is included in the 2016-21 Capital Improvement Program.
The Cuthbert Amphitheater located in Alton Baker
Park.
Specific Plans/Policies Related to this Project:
Council Goal - Accessible and Thriving Culture and
Recreation
Cuthbert Amphitheater Feasibility Study
PROS Project and Priority Plan
City of Eugene 2016 - 2021 Multi-Year Financial Plan Page 34

MYFP Category: Continuing Current Services
Service Category: Information Technology Service
Community Livability Software Replacement
Project Description: This project is to replace and update software systems that are the platform on which
community livability compliance work is based, tracked, and maintained. These systems provide
transparency to the community reguarding compliance actions and livability work underway. The current
software has exceeded its lifespan and requires replacement. Funding would allow for staffing and
development of this software. These important systems continually fall behind more urgent needs of our
business environment. It has reached a critical stage and requires replacement. There may be additional
costs incurred by Information Services related to data storage and maintenance of this system.
Project Status: Not Started - This item is new in the FY16-21 MYFP.
Total20172016 2018 2019 2020 2021
Funding Not Identified
Operating: Program
$0 $0 $1,230General $0$600 $630 $0
$0 $0Total $1,230$0 $0$600 $630
Estimated Costs ($ in thousands)
Neighborhood: Citywide
Ward: Citywide
Rhis project will transition community livability systems
to current technology.
Specific Plans/Policies Related to this Project:
Envision Eugene
City of Eugene 2016 - 2021 Multi-Year Financial Plan Page 35

MYFP Category: Continuing Current Services
Service Category: Information Technology Service
Public Safety and Justice Information System Replacement
Project Description: The current Public Safety and Justice (PSJ) information system was implemented
jointly by the City of Eugene and the City of Springfield in 2013. The two jurisdictions jointly negotiated a
contract with SunGard for the new records management and computer aided dispatch system (RMS/CAD).
The City of Eugene has also implemented Tyler records management system to provide enhanced
functionality to the Eugene Municipal Court. There may be additional costs incurred by Information Services
related to data storage and maintenance of this system. SunGard implementation allowed the Eugene and
Springfield Police and Fire & EMS Departments to streamline business processes and eliminate duplicate
data entry, increased police officers' and firefighters' access to information in the field to help them respond
safely and effectively, provided map-based satellite vehicle location that improves the efficiency of dispatch
services, improved functionality to analyze criminal activity information and support data-led policing,
provided new electronic reporting tools, and offered other functionality enhancements over the AIRS system.
SunGard and Tyler systems are both projected to require an upgrade or replacement in FY 18 or FY19. $3.5
million represents a preliminary estimate of the total costs associated with the upgrade or replacement of
both systems.There may be additional costs incurred by Information Services related to data storage and
maintenance of this system. A more detailed cost estimate will be developed by staff in the future when
technology options are more fully known.
Project Status: Not Started - This item is new in the FY16-21 MYFP.
Total20172016 2018 2019 2020 2021
Funding Not Identified
Operating: Program
$500 $0 $3,500Telecom Registration/Licensing $0$0 $0 $3,000
$3,000 $0Total $3,500$500 $0$0 $0
Estimated Costs ($ in thousands)
Neighborhood: Citywide
Ward: Citywide
Staff from several City Departments received Mayor's
2014 employee recognition award for the initial
implementation of the Public Safety and Justice (PSJ)
information system.
Specific Plans/Policies Related to this Project:
Council Goal - Safe Community
City of Eugene 2016 - 2021 Multi-Year Financial Plan Page 36

MYFP Category: Improved or Expanded Services Not Part of an Adopted Plan
Service Category: Library
Library of the Future Enhancements
Project Description: This project will include proposed enhancements to programs/services based on
community input and need.
Project Status: Not Started - This item previously appeared in the MYFP as Restoration of Library
Services.
Total20172016 2018 2019 2020 2021
Funding Not Identified
Operating: Program
$1,931 $2,048 $11,773General $2,110$1,820 $1,875 $1,989
$1,989 $2,048Total $11,773$1,931 $2,110$1,820 $1,875
Estimated Costs ($ in thousands)
Neighborhood: Citywide
Ward: Citywide
Youth using library technology.
Specific Plans/Policies Related to this Project:
Council Goal - Accessible and Thriving Culture and
Recreation
City of Eugene 2016 - 2021 Multi-Year Financial Plan Page 37

MYFP Category: Implementing Adopted Plans or Policies
Service Category: Metro and Community Planning
Envision Eugene Implementation
Project Description: For the past three years, the Planning Division has stretched salary savings from
short-term vacancies to pay for needed consulting fees and other expenses related to Envision Eugene
adoption. Despite a highly efficient use of funds, General Fund budget allocated for this work in FY13 and
FY14 was not sufficient to cover the actual need. This trend continues; we are currently seeing a gap of
approximately $200k in contract and material expenditures for FY15. In future years, an ongoing, annual
budget gap of $80,000 - $160,000 for necessary consulting work is anticipated. This item addresses
consulting needs and does not address planning staffing . See the Planning Division Staffing item for
additional staffing needs.
Project Status: In Progress - This item has previously appeared in the MYFP.
Total20172016 2018 2019 2020 2021
Funding Not Identified
Operating: Program
$160 $160 $960General $160$160 $160 $160
$160 $160Total $960$160 $160$160 $160
Estimated Costs ($ in thousands)
Neighborhood: Citywide
Ward: Citywide
Envision Eugene logo.Specific Plans/Policies Related to this Project:
Council Goal - Sustainable Development
Envision Eugene
Periodic Review Process
City of Eugene 2016 - 2021 Multi-Year Financial Plan Page 38
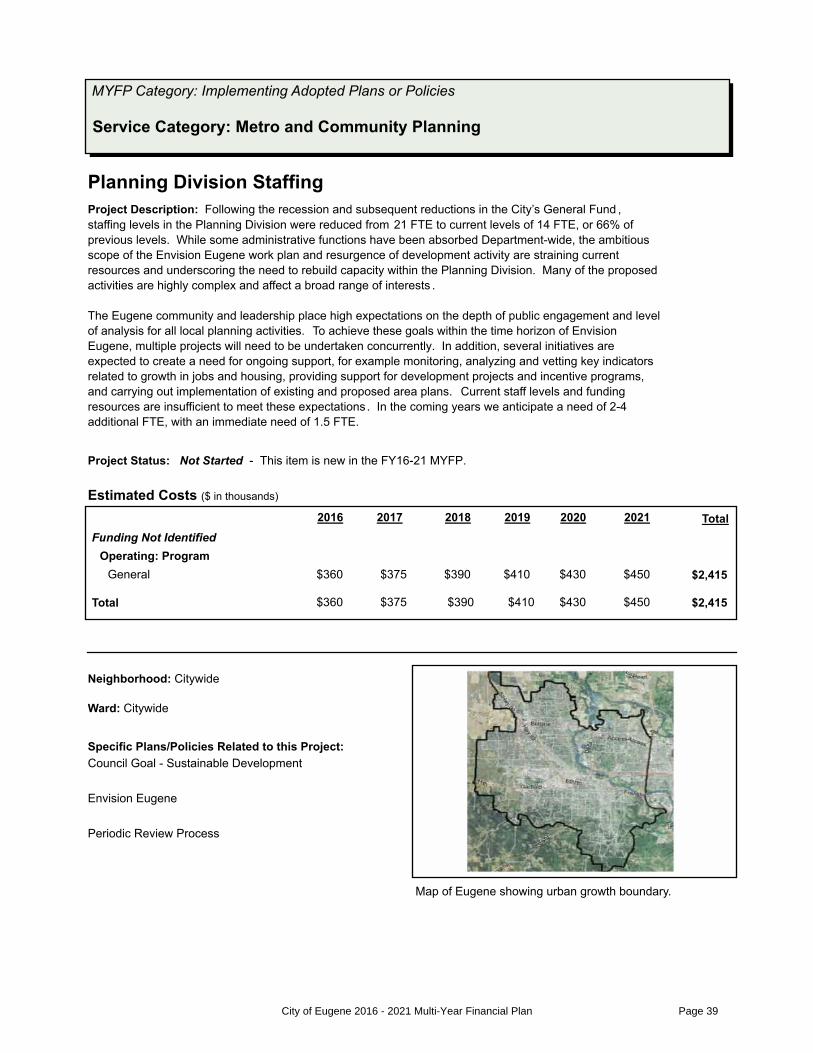
MYFP Category: Implementing Adopted Plans or Policies
Service Category: Metro and Community Planning
Planning Division Staffing
Project Description: Following the recession and subsequent reductions in the City’s General Fund ,
staffing levels in the Planning Division were reduced from 21 FTE to current levels of 14 FTE, or 66% of
previous levels. While some administrative functions have been absorbed Department-wide, the ambitious
scope of the Envision Eugene work plan and resurgence of development activity are straining current
resources and underscoring the need to rebuild capacity within the Planning Division. Many of the proposed
activities are highly complex and affect a broad range of interests .
The Eugene community and leadership place high expectations on the depth of public engagement and level
of analysis for all local planning activities. To achieve these goals within the time horizon of Envision
Eugene, multiple projects will need to be undertaken concurrently. In addition, several initiatives are
expected to create a need for ongoing support, for example monitoring, analyzing and vetting key indicators
related to growth in jobs and housing, providing support for development projects and incentive programs,
and carrying out implementation of existing and proposed area plans. Current staff levels and funding
resources are insufficient to meet these expectations. In the coming years we anticipate a need of 2-4
additional FTE, with an immediate need of 1.5 FTE.
Project Status: Not Started - This item is new in the FY16-21 MYFP.
Total20172016 2018 2019 2020 2021
Funding Not Identified
Operating: Program
$390 $430 $2,415General $450$360 $375 $410
$410 $430Total $2,415$390 $450$360 $375
Estimated Costs ($ in thousands)
Neighborhood: Citywide
Ward: Citywide
Map of Eugene showing urban growth boundary.
Specific Plans/Policies Related to this Project:
Council Goal - Sustainable Development
Envision Eugene
Periodic Review Process
City of Eugene 2016 - 2021 Multi-Year Financial Plan Page 39
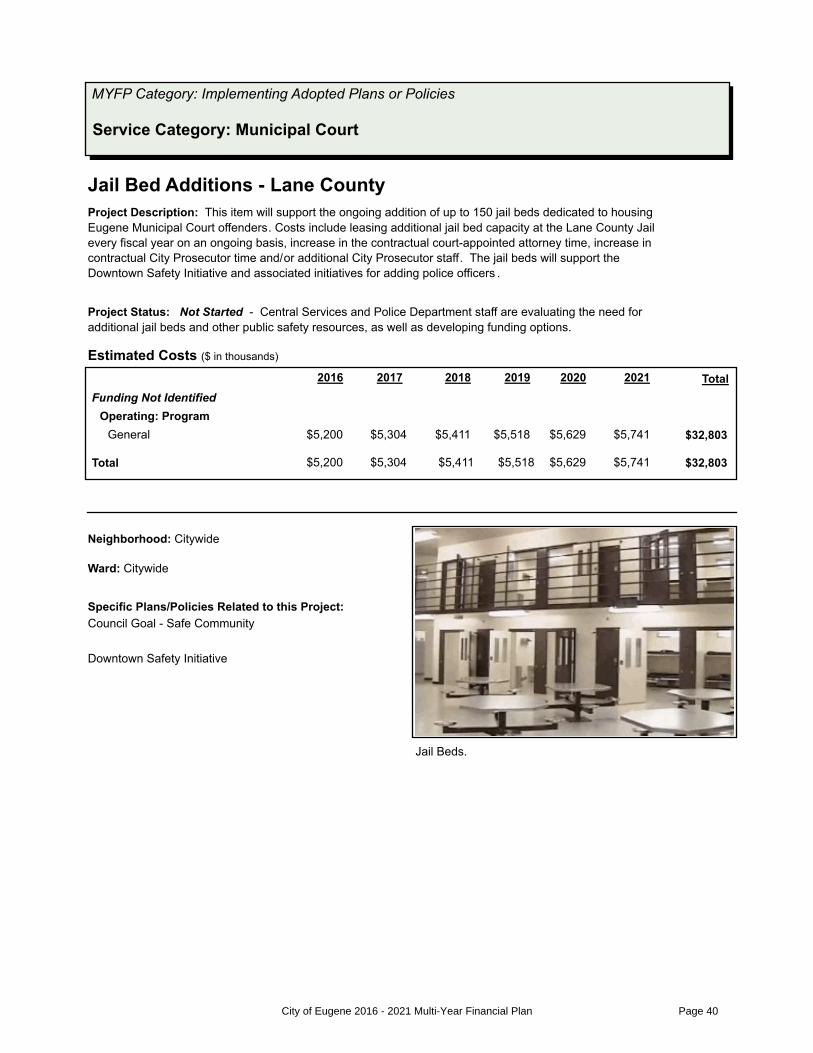
MYFP Category: Implementing Adopted Plans or Policies
Service Category: Municipal Court
Jail Bed Additions - Lane County
Project Description: This item will support the ongoing addition of up to 150 jail beds dedicated to housing
Eugene Municipal Court offenders. Costs include leasing additional jail bed capacity at the Lane County Jail
every fiscal year on an ongoing basis, increase in the contractual court-appointed attorney time, increase in
contractual City Prosecutor time and/or additional City Prosecutor staff. The jail beds will support the
Downtown Safety Initiative and associated initiatives for adding police officers .
Project Status: Not Started - Central Services and Police Department staff are evaluating the need for
additional jail beds and other public safety resources, as well as developing funding options.
Total20172016 2018 2019 2020 2021
Funding Not Identified
Operating: Program
$5,411 $5,629 $32,803General $5,741$5,200 $5,304 $5,518
$5,518 $5,629Total $32,803$5,411 $5,741$5,200 $5,304
Estimated Costs ($ in thousands)
Neighborhood: Citywide
Ward: Citywide
Jail Beds.
Specific Plans/Policies Related to this Project:
Council Goal - Safe Community
Downtown Safety Initiative
City of Eugene 2016 - 2021 Multi-Year Financial Plan Page 40

MYFP Category: Preserving and Maintaining Existing Assets
Service Category: Parking
Broadway South and North Garages - Deferred Maintenance
Project Description: Repair loose bricks in stairs, reseal all joints, repair and replace insulation damaged
by birds, epoxy inject all floor cracks and fix water ponding issues on P3 level.
Project Status: Not Started - This item has previously appeared in the CIP and MYFP as parking
deferred maintenance.
Total20172016 2018 2019 2020 2021
Funding Not Identified
Capital
$887 $0 $887Parking $0$0 $0 $0
$0 $0Total $887$887 $0$0 $0
Estimated Costs ($ in thousands)
Neighborhood: Downtown
Ward: Ward 7
This project is included in the 2016-21 Capital Improvement Program.
Broadway North Garage - Cracks in pour joint on level
P1.
Specific Plans/Policies Related to this Project:
Parking Structure Condition Analysis (PSCA)
City of Eugene 2016 - 2021 Multi-Year Financial Plan Page 41

MYFP Category: Continuing Current Services
Service Category: Parking
Credit Card Meter Replacement
Project Description: Replacement of University of Oregon campus credit card accepting parking meters
installed in 2010 after completion of 10 year lifecycle.
Project Status: Not Started - This item has previously appeared in the MYFP.
Total20172016 2018 2019 2020 2021
Funding Not Identified
Operating: Program
$0 $508 $508Parking $0$0 $0 $0
$0 $508Total $508$0 $0$0 $0
Estimated Costs ($ in thousands)
Neighborhood: Downtown
Ward: Multiple Wards
Campus credit card parking meters.
Specific Plans/Policies Related to this Project:
Parking Structure Condition Analysis (PSCA)
City of Eugene 2016 - 2021 Multi-Year Financial Plan Page 42

MYFP Category: Implementing Adopted Plans or Policies
Service Category: Parking
Downtown Parking Wayfinding and Garage Signage
Project Description: This project is a wholesale review of how downtown parking information is
communicated, with the implementation of the final communication plan. It includes street wayfinding signs
directing visitors to parking locations, marketing program of the City of Eugene parking program, and
standardizes all signs/communications in the garages. When Portland implemented their "SmartPark"
communication system, customer usage increased 32% in the first year.
Project Status: Not Started - This item has previously appeared in the CIP and MYFP.
Total20172016 2018 2019 2020 2021
Funding Not Identified
Operating: Program
$600 $0 $600Parking $0$0 $0 $0
$0 $0Total $600$600 $0$0 $0
Estimated Costs ($ in thousands)
Neighborhood: Downtown
Ward: Ward 7
Current communication in garages.
Specific Plans/Policies Related to this Project:
Parking Structure Condition Analysis (PSCA)
City of Eugene 2016 - 2021 Multi-Year Financial Plan Page 43

MYFP Category: Preserving and Maintaining Existing Assets
Service Category: Parking
Hult Garage - Deferred Maintenance
Project Description: This project would provide funding to seal the exterior façade and interior face of roof
level parapet walls, power wash the structure, repair soffit spalls, replace seals and re-caulk, and repair
cracks in structural beams and parking decks.
Project Status: Not Started - This item has previously appeared in the MYFP and CIP as parking
deferred maintenance.
Total20172016 2018 2019 2020 2021
Funding Not Identified
Capital
$443 $0 $443Parking $0$0 $0 $0
$0 $0Total $443$443 $0$0 $0
Estimated Costs ($ in thousands)
Neighborhood: Downtown
Ward: Ward 7
This project is included in the 2016-21 Capital Improvement Program.
Hult Garage, showing spall in exterior wall.
Specific Plans/Policies Related to this Project:
Parking Structure Condition Analysis (PSCA)
City of Eugene 2016 - 2021 Multi-Year Financial Plan Page 44

MYFP Category: Preserving and Maintaining Existing Assets
Service Category: Parking
Overpark Garage - Deferred Maintenance
Project Description: Funding for deck coating in the Overpark Garage, penetrating sealer applied to
exterior perimeter walls and interior face of roof level walls, and pressure washing garage walls.
Project Status: Not Started - This item has previously appeared in the MYFP.
Total20172016 2018 2019 2020 2021
Funding Not Identified
Capital
$791 $0 $791Parking $0$0 $0 $0
$0 $0Total $791$791 $0$0 $0
Estimated Costs ($ in thousands)
Neighborhood: Downtown
Ward: Ward 7
This project is included in the 2016-21 Capital Improvement Program.
Example of wear on Overpark deck.
Specific Plans/Policies Related to this Project:
Parking Structure Condition Analysis (PSCA)
City of Eugene 2016 - 2021 Multi-Year Financial Plan Page 45

MYFP Category: Preserving and Maintaining Existing Assets
Service Category: Parking
Parcade Garage - Deferred Maintenance
Project Description: Replace parking deck coating, seal exterior faces of walls, including interior face of
roof level parapet, repair cracks and spalling, power wash.
Project Status: Not Started - This item has previously appeared in the MYFP and CIP as parking
deferred maintenance.
Total20172016 2018 2019 2020 2021
Funding Not Identified
Capital
$2,439 $0 $2,439Parking $0$0 $0 $0
$0 $0Total $2,439$2,439 $0$0 $0
Estimated Costs ($ in thousands)
Neighborhood: Downtown
Ward: Ward 7
This project is included in the 2016-21 Capital Improvement Program.
Water leak in wall of Parcade Garage.
Specific Plans/Policies Related to this Project:
Parking Structure Condition Analysis (PSCA)
City of Eugene 2016 - 2021 Multi-Year Financial Plan Page 46

MYFP Category: Preserving and Maintaining Existing Assets
Service Category: Parking
Parking Garage Access System Replacement
Project Description: Equipment reserve to replace existing access control system in the Parcade &
Overpark garages. Equipment was replaced in 2011 with a 10 year life cycle.
Project Status: Not Started - This item has previously appeared in the MYFP.
Total20172016 2018 2019 2020 2021
Funding Not Identified
Capital
$0 $363 $363Parking $0$0 $0 $0
$0 $363Total $363$0 $0$0 $0
Estimated Costs ($ in thousands)
Neighborhood: Downtown
Ward: Multiple Wards
This project is included in the 2016-21 Capital Improvement Program.
The Overpark Garage(aboven)and Parcade each
utilize a parking access control system.
Specific Plans/Policies Related to this Project:
Parking Structure Condition Analysis (PSCA)
City of Eugene 2016 - 2021 Multi-Year Financial Plan Page 47

MYFP Category: Preserving and Maintaining Existing Assets
Service Category: Parking
Parking Garage Lighting Retrofit
Project Description: This project would replace the outdated light fixtures in the Overpark, Parcade, and
Pearl Street Garages with higher efficiency lighting, such as LEDs, to provide energy cost savings, better
lighting for customers, and a safer environment for visitors.
Project Status: Not Started - This item has previously appeared in the MYFP.
Total20172016 2018 2019 2020 2021
Funding Not Identified
Capital
$300 $0 $300Parking $0$0 $0 $0
$0 $0Total $300$300 $0$0 $0
Estimated Costs ($ in thousands)
Neighborhood: Downtown
Ward: Ward 7
This project is included in the 2016-21 Capital Improvement Program.
Overpark Garage circa 1969.
Specific Plans/Policies Related to this Project:
Parking Structure Condition Analysis (PSCA)
City of Eugene 2016 - 2021 Multi-Year Financial Plan Page 48

MYFP Category: Preserving and Maintaining Existing Assets
Service Category: Parking
Parking Structure Elevator Modernization
Project Description: There are seven elevators in the Overpark, Parcade, Pearl Street, and Hult Center
Parking Garage facilities. The average age of these facilities is over 25 years and repair/replacement parts
are becoming more difficult to acquire. These upgrades are recommended by the 2003 Elevator
Modernization Report in a effort to anticipate and avoid breakdowns .
Project Status: Not Started - This item is new in the FY16-21 CIP and MYFP.
Total20172016 2018 2019 2020 2021
Funding Not Identified
Capital
$0 $975 $975Parking $0$0 $0 $0
$0 $975Total $975$0 $0$0 $0
Estimated Costs ($ in thousands)
Neighborhood: Downtown
Ward: Multiple Wards
This project is included in the 2016-21 Capital Improvement Program.
Elevator in the Overpark Garage.
Specific Plans/Policies Related to this Project:
Elevator Modernization Report
Parking Structure Condition Analysis (PSCA)
City of Eugene 2016 - 2021 Multi-Year Financial Plan Page 49

MYFP Category: Continuing Current Services
Service Category: Parking
Parking Structure Security Cameras
Project Description: The Parking Fund has spent $250,000 to $500,000 per year on downtown parking
garage security, depending on current security concerns. This proposal is to move to a fixed camera security
model and away from security company patrols of the parking structures to achieve long-term cost savings.
Cost shown is for installation of cameras and related cabling and monitoring equipment in six parking
structures. The Parking Fund should experience a net savings in future years in comparison to current
security contract costs.
Project Status: Not Started - This item has previously appeared in the MYFP.
Total20172016 2018 2019 2020 2021
Funding Not Identified
Operating: Program
$0 $0 $300Parking $0$300 $0 $0
$0 $0Total $300$0 $0$300 $0
Estimated Costs ($ in thousands)
Neighborhood: Downtown
Ward: Multiple Wards
Form used to alert parking customers of valuables
visible in vehicle. Form is mailed to the vehicle owner
on file.
Specific Plans/Policies Related to this Project:
Downtown Safety Initiative
City of Eugene 2016 - 2021 Multi-Year Financial Plan Page 50

MYFP Category: Preserving and Maintaining Existing Assets
Service Category: Parking
Parking Structures Seismic Upgrade
Project Description: An initial seismic study of 45 City buildings was completed in February 1995 by Berry
Architects. The cost of seismic upgrades of the Parcade and Overpark Garages was estimated at $1.1
million in 1995. Cost estimate have been inflated to 2018 dollars.
Project Status: Not Started - This item has previously appeared in the MYFP.
Total20172016 2018 2019 2020 2021
Funding Not Identified
Capital
$3,641 $0 $3,641Parking $0$0 $0 $0
$0 $0Total $3,641$3,641 $0$0 $0
Estimated Costs ($ in thousands)
Neighborhood: Downtown
Ward: Ward 7
This project is included in the 2016-21 Capital Improvement Program.
Overpark Garage in downtown Eugene.
Specific Plans/Policies Related to this Project:
Facility Condition Report
City of Eugene 2016 - 2021 Multi-Year Financial Plan Page 51

MYFP Category: Preserving and Maintaining Existing Assets
Service Category: Parking
Pearl Street Garage - Deferred Maintenance
Project Description: Prepare faces of perimeter concrete elements (walls, cornices, spandrels, etc.) at all
levels and apply wall coating to exterior face and penetrating sealer to interior face of top level. Pressure
wash entire structure.
Project Status: Not Started - This item has previously appeared in the MYFP and CIP as parking
deferred maintenance.
Total20172016 2018 2019 2020 2021
Funding Not Identified
Capital
$568 $0 $568Parking $0$0 $0 $0
$0 $0Total $568$568 $0$0 $0
Estimated Costs ($ in thousands)
Neighborhood: Downtown
Ward: Ward 3
This project is included in the 2016-21 Capital Improvement Program.
Pearl Street Garage - Spall in Column.
Specific Plans/Policies Related to this Project:
Parking Structure Condition Analysis (PSCA)
City of Eugene 2016 - 2021 Multi-Year Financial Plan Page 52

MYFP Category: Implementing Adopted Plans or Policies
Service Category: Parks and Open Space
Develop Water Play Features
Project Description: Design and construct new spray play features in priority locations. This project may
include other redevelopment approaches to closed wading pools based on assessment of needs and
options.
Project Status: Not Started - This item has previously appeared in the CIP and MYFP. Funded at
$30,000 in the FY12 capital budget.
Total20172016 2018 2019 2020 2021
Funding Not Identified
Capital
$200 $200 $1,000Parks SDC $200$0 $200 $200
Operating: Facility
$10 $30 $100General $40$0 $0 $20
$220 $230Total $1,100$210 $240$0 $200
Estimated Costs ($ in thousands)
Neighborhood: Citywide
Ward: Citywide
This project is included in the 2016-21 Capital Improvement Program.
Spray play features are a popular replacement for
wading pools that have been closed.
Specific Plans/Policies Related to this Project:
PROS (Parks, Recreation and Open Space)
Comprehensive Plan
PROS Project and Priority Plan
City of Eugene 2016 - 2021 Multi-Year Financial Plan Page 53

MYFP Category: Preserving and Maintaining Existing Assets
Service Category: Parks and Open Space
Parks & Open Space Maintenance & Operations Capacity
Project Description: Over the past 16 years, Eugene’s park and natural area system has benefited from a
tremendous amount of community support through the passage of two voter-approved park bond measures
and a successful donations program, as well as funding from parks System Development Charges (SDCs).
These dollars have brought lasting changes to Eugene’s landscape including new parks in 17
neighborhoods, expanded and increased connectivity among Eugene’s natural areas , and future park sites
ready for a growing community. Although Eugene’s park and natural area system has increased significantly
in just over a decade, the operations and maintenance (O&M) resources needed to maintain these assets
have not kept pace with this growth.
The large addition of assets to the park and natural area system without the sufficient O &M funding to
maintain these assets has put a strain on the park system. In recent years, POS has been deferring
maintenance throughout the system by spreading resources over a much larger area, the result being a
rapidly growing number of assets across the system getting less and less attention.
Project Status: Not Started - This item has previously appeared in the MYFP.
Total20172016 2018 2019 2020 2021
Funding Not Identified
Operating: Program
$2,000 $2,000 $12,000General $2,000$2,000 $2,000 $2,000
$2,000 $2,000Total $12,000$2,000 $2,000$2,000 $2,000
Estimated Costs ($ in thousands)
Neighborhood: Citywide
Ward: Citywide
The need for park & open space maintenance has
grown significantly.
Specific Plans/Policies Related to this Project:
Council Goal - Accessible and Thriving Culture and
Recreation
City of Eugene 2016 - 2021 Multi-Year Financial Plan Page 54

MYFP Category: Implementing Adopted Plans or Policies
Service Category: Parks and Open Space
Trail System Development
Project Description: Renovation of existing trails to expand usability and extend season of use, and
addition of new trails and trailhead kiosks. Targets high priority locations in the ridgeline system and existing
running trails, including key linkages between existing trails and deteriorating trails that have decreased
usability. High priority sites for new trail segments include Suzanne Arlie Park , Wild Iris Ridge, and South
Eugene Meadows. Priority trails for major enhancement include portions of the Ridgeline Trail and the
Skinner Butte Trail system. Ongoing maintenance and preservation costs shown as funded by General
Capital Priojects fund.
Project Status: In Progress - This item has previously appeared in the CIP and MYFP. Funds are
budgeted under this program and then are transferred to specific projects as they are identified and
developed. Funded in capital budget at $150,000 in FY14 and $175,000 in FY15.
Total20172016 2018 2019 2020 2021
Funding Not Identified
Capital
$27 $27 $135General Capital Projects $27$0 $27 $27
$120 $300 $1,080Parks SDC $120$120 $300 $120
Operating: Facility
$5 $5 $30General $5$5 $5 $5
$152 $332Total $1,245$152 $152$125 $332
Estimated Costs ($ in thousands)
Neighborhood: Citywide
Ward: Citywide
This project is included in the 2016-21 Capital Improvement Program.
Hikers on the popular Ridgeline Trail.
Specific Plans/Policies Related to this Project:
Council Goal - Accessible and Thriving Culture and
Recreation
PROS Project and Priority Plan
Ridgeline Area Open Space Vision & Action Plan
Rivers to Ridges Metropolitan Regional Parks & Open
Space Study
City of Eugene 2016 - 2021 Multi-Year Financial Plan Page 55

MYFP Category: Continuing Current Services
Service Category: Police Investigations
Evidence Control Unit Staffing
Project Description: The EPD Property Control Unit (PCU) conducted an extensive audit with an outside
consultant in April of 2012. The executive summary recommended that the PCU needed 3 additional staff
which would include a full-time Supervisor (currently supervision is shared), an additional PCU Specialist,
and an additional Admin Aide. Typical staff costs related to training, computers, and other materials and
service costs are included in this proposal. This need was identified based on the current backlog of
evidence and the current level of evidence entering the system. Funding has been identified for FY16 and
FY17. Future years remain unfunded.
Project Status: Not Started - This item has previously appeared in the MYFP.
Total20172016 2018 2019 2020 2021
Funding Not Identified
Operating: Program
$250 $250 $1,000General $250$0 $0 $250
$250 $250Total $1,000$250 $250$0 $0
Estimated Costs ($ in thousands)
Neighborhood: Citywide
Ward: Citywide
Storage at the Property Control Unit.
Specific Plans/Policies Related to this Project:
Eugene Police Dept. Strategic Plan
City of Eugene 2016 - 2021 Multi-Year Financial Plan Page 56

MYFP Category: Preserving and Maintaining Existing Assets
Service Category: Police Services
Police HQ Building/Parking Enhancements
Project Description: Future development and improvements at 300 Country Club. Police Headquarters
moved into the retrofitted building in August of 2012. During the course of the move, the department
identified several unfunded improvement needs such as covered parking for Patrol cars, extending the fence
for security purposes, solar heat, and development of space for rental purposes.
Project Status: Not Started - This item has previously appeared in the CIP and MYFP.
Total20172016 2018 2019 2020 2021
Placeholder
Capital
$250 $250 $1,250Facilities Maintenance $250$0 $250 $250
$250 $250Total $1,250$250 $250$0 $250
Estimated Costs ($ in thousands)
Neighborhood: Cal Young
Ward: Ward 5
This project is included in the 2016-21 Capital Improvement Program.
New Police Headquarters at 300 Country Club Rd.
Specific Plans/Policies Related to this Project:
Eugene Police Dept. Strategic Plan
City of Eugene 2016 - 2021 Multi-Year Financial Plan Page 57

MYFP Category: Implementing Adopted Plans or Policies
Service Category: Police Services
Police Special Operations Facility
Project Description: Renovate existing Lincoln Yard facility to improve functionality for Police Special
Operations. A recent seismic inspection revealed there is no rebar in the concrete structure of the facility .
To make the facility compliant, a major renovation or complete reconstruction would be required. The Lincoln
Yard houses our SWAT team, Metro Explosives Unit, and Crisis Negotiation Team. These units require the
storage of heavy vehicles that include the Command Bus, SWAT vehicles, and bomb truck.
Project Status: In Progress - This item has previously appeared in the MYFP. This is a placeholder,
pending property sale.
Placeholder
Estimated cost by year not yet determined for this placeholder project.
Estimated Costs ($ in thousands)
Neighborhood: Downtown
Ward: Ward 7
Eugene Police vehicle.
Specific Plans/Policies Related to this Project:
Eugene Police Dept. Strategic Plan
City of Eugene 2016 - 2021 Multi-Year Financial Plan Page 58

MYFP Category: Improved or Expanded Services Not Part of an Adopted Plan
Service Category: Police Services
Police Technology Equipment
Project Description: The body camera combines a tactical computer with video of officers working in the
field. With a body camera, officers have the ability to show how a situation unfolds, from the visual
perspective of the officer. Ideal systems have 30 second pre-event recording capabilities as well as
maximum camera angles. Our current pilot system proves to be adequate but additional requirements would
be a much added enhancement. Our current pilot body cameras have demonstrated their effectiveness as
they are used by the Downtown team and Traffic Enforcement Unit officers . The cameras have changed the
behaviors of people we engage with, provide video evidence, and resolved complaints. Body worn cameras
will be the industry standard in the coming years. Costs estimates include the need for storage of records
from the cameras and the need for staff to process evidence and manage storage .
In addition to Body Cams, EPD has multiple unfunded growing technology needs as trends in data-led
policing emerge. These equipment needs include unidentified record management system expenses, in-car
video needs, mobile data computer needs, radio issues both on Patrol and Traffic Enforcement Unit , on duty
program, servers, storage, and related technology training.
Project Status: In Progress - This item has previously appeared in the MYFP.
Total20172016 2018 2019 2020 2021
Funding Not Identified
Operating: Program
$250 $250 $1,500General $250$250 $250 $250
$250 $250Total $1,500$250 $250$250 $250
Estimated Costs ($ in thousands)
Neighborhood:
Ward: Citywide
Example of Police body camera technology.
Specific Plans/Policies Related to this Project:
Eugene Police Dept. Strategic Plan
City of Eugene 2016 - 2021 Multi-Year Financial Plan Page 59

MYFP Category: Continuing Current Services
Service Category: Police Services
Public Safety Answering Point (PSAP) Fund Shortfall
Project Description: The Public Safety Answering Point Fund (PSAP) accounts for the operation of 9-1-1
call taking in the emergency dispatch center. The revenue is from State of Oregon telephone excise taxes
and is received via the Oregon Office of Emergency Management . Oregon law restricts the use of the 9-1-1
tax revenues distributed to Public Safety Answering Points; it may be used only for emergency network and
9-1-1 call taking and processing. Tax distribution is being impacted by the timing of tax revenues collected
and the potential diversion of revenues by the state. Decreased subscribers and devices, and the potential
for fund diversion will have a significant impact on future tax revenues. The PSAP Fund balance will be
exhausted in FY18 and significant annual shortfalls are projected in future years.
Increases in costs continue to outpace growth in revenue and are further challenged by state and federal
legislation. PSAP Board members and City of Eugene staff will continue to develop long term strategies to
rebuild reserves and respond to legislative changes. The NET 911 Improvement Act of 2008 includes federal
plan development at a national level to ensure the 9-1-1 network is capable of responding to all types of
citizen contact and improve information sharing among all emergency response entities. This network
capability includes receiving text messages, and sending photos or video content through 9-1-1 initial call
routing. Technical challenges to receive these calls from non-traditional sources will require new equipment,
standard operating procedures, and additional technical staff as well as significant training for call taking and
dispatch staff. The Oregon Office of Emergency Management 9-1-1 Program estimates next generation
technology could be in place statewide within 12 to 24 months.
Project Status: Not Started - This project is new in the FY16-21 MYFP.
Total20172016 2018 2019 2020 2021
Funding Not Identified
Operating: Program
$7 $470 $1,436Public Safety Answering Point $743$0 $0 $216
$216 $470Total $1,436$7 $743$0 $0
Estimated Costs ($ in thousands)
Neighborhood: Citywide
Ward: Citywide
9-1-1 call taking and emergency dispatch center.
Specific Plans/Policies Related to this Project:
Council Goal - Safe Community
Eugene Police Dept. Strategic Plan
City of Eugene 2016 - 2021 Multi-Year Financial Plan Page 60

MYFP Category: Continuing Current Services
Service Category: Police Services
Regional Radio System
Project Description: The Regional Radio System managed by the Eugene Police Department potentially
includes other subscribers and other City Departments as users of the system. This complex digital system
needs to have updated dispatch consoles, and all related equipment, radio systems, and towers need
updating and maintenance. The Lane Regional Information Group (LRIG), including the cities of Eugene,
Springfield, Lane County and Eugene Water and Electric Board, oversees the interoperability of the regional
radio system among these jurisdictions.
Project Status: Not Started - This item has previously appeared in the MYFP.
Total20172016 2018 2019 2020 2021
Funding Not Identified
Operating: Program
$1,346 $0 $3,970General $0$195 $1,033 $1,396
$1,396 $0Total $3,970$1,346 $0$195 $1,033
Estimated Costs ($ in thousands)
Neighborhood: Citywide
Ward: Citywide
911 Call Taker/Dispatcher. Technology provided by
the regional radio system.
Specific Plans/Policies Related to this Project:
Eugene Police Dept. Strategic Plan
City of Eugene 2016 - 2021 Multi-Year Financial Plan Page 61

MYFP Category: Implementing Adopted Plans or Policies
Service Category: Police Services
Street Crimes Team
Project Description: Adds new team of 1 Sgt., 7 Officers, 1 Crime Prevention Specialist, 1 Crime Analyst, 1
Admin Aide and the one time purchases of 1 Sgt. vehicle, 5 Patrol vehicles, 1 Crime Prevention vehicle, and
related set up costs to develop a new Street Crimes Team. This unit is a realistic approach to current EPD
Strategic Goals and replaces the earlier plan originating from previous Police Executive Research Forum
(PERF) and International City/County Management Association (ICMA) studies that required staffing
structures that current economics will not allow.
Project Status: Not Started - This item has previously appeared in the MYFP.
Total20172016 2018 2019 2020 2021
Funding Not Identified
Operating: Program
$1,250 $1,250 $7,750General $1,250$1,500 $1,250 $1,250
$1,250 $1,250Total $7,750$1,250 $1,250$1,500 $1,250
Estimated Costs ($ in thousands)
Neighborhood: Citywide
Ward: Citywide
Historical Patrol Team. Street Crimes Team not
implemented yet.
Specific Plans/Policies Related to this Project:
Eugene Police Dept. Strategic Plan
City of Eugene 2016 - 2021 Multi-Year Financial Plan Page 62

MYFP Category: Improved or Expanded Services Not Part of an Adopted Plan
Service Category: Public Buildings & Facilities
City Hall Phase I - 4th Floor Tenant Improvements
Project Description: This project is to fund tenant improvements on the 4th floor of the new City Hall
(Phase 1). This project includes building offices, restrooms, wiring, the HVAC system, and interior finishes on
the 4th floor of the new City Hall (Phase 1). The improvements will cover a total area of 9,000 square feet.
Project Status: Not Started - This item is new in the FY 2016-2021 MYFP.
Total20172016 2018 2019 2020 2021
Funding Not Identified
Capital
$0 $0 $1,500General Capital Projects $0$0 $1,500 $0
Operating: Facility
$91 $94 $462Facilities Maintenance $96$0 $89 $92
$92 $94Total $1,962$91 $96$0 $1,589
Estimated Costs ($ in thousands)
Neighborhood: Downtown
Ward: Ward 1
Conceptual drawing of the front entrance to the new
Eugene City Hall.
Specific Plans/Policies Related to this Project:
Council Priority Issue
Council Specific Direction
City of Eugene 2016 - 2021 Multi-Year Financial Plan Page 63

MYFP Category: Improved or Expanded Services Not Part of an Adopted Plan
Service Category: Public Buildings & Facilities
City Hall Project Phase II
Project Description: This project is a continuation of the City Hall project beyond phase 1. Phase 2 would
include construction of a new office building totaling 60,000 to 80,000 square feet and an underground
parking for approximtaely 50 vehicles on the west side of the existing City Hall block. Ongoing facility costs
associated with this project have not yet been determined. Facility maintenance costs will depend on final
square footage of project, but estimate for 80,000 square feet is shown.
Project Status: Not Started - This item is new in the FY16-21 MYFP.
Total20172016 2018 2019 2020 2021
Placeholder
Capital
$40,000 $0 $40,000General Capital Projects $0$0 $0 $0
Operating: Facility
$1,000 $1,041 $4,125Facilities Maintenance $1,064$0 $0 $1,020
$1,020 $1,041Total $44,125$41,000 $1,064$0 $0
Estimated Costs ($ in thousands)
Neighborhood: Downtown
Ward: Ward 1
City Hall Project Phase 2 conceptual drawing.
Specific Plans/Policies Related to this Project:
Council Specific Direction
City of Eugene 2016 - 2021 Multi-Year Financial Plan Page 64

MYFP Category: Preserving and Maintaining Existing Assets
Service Category: Public Buildings & Facilities
Echo Hollow/Sheldon Pool Systems Preservation
Project Description: Major repair/replacement of pool water supply piping and gutter drain systems at Echo
Hollow Pool and stabilization of deteriorating pool shells at both Echo Hollow and Sheldon.
Project Status: Not Started - This project has previously appeared in the CIP and MYFP. Sheldon Pool
water supply and gutter drain systems were replaced in FY12-FY13. This reduced the total cost of this
project by $1 million from the FY12-17 CIP level.
Total20172016 2018 2019 2020 2021
Funding Not Identified
Capital
$0 $0 $1,500General Capital Projects $1,500$0 $0 $0
$0 $0Total $1,500$0 $1,500$0 $0
Estimated Costs ($ in thousands)
Neighborhood: Multiple Neighborhoods
Ward: Multiple Wards
This project is included in the 2016-21 Capital Improvement Program.
Echo Hollow Pool.
Specific Plans/Policies Related to this Project:
Council Goal - Accessible and Thriving Culture and
Recreation
Echo Hollow Pool Conceptual Master Plan
Facility Condition Report
Sheldon Pool Conceptual Master Plan
City of Eugene 2016 - 2021 Multi-Year Financial Plan Page 65

MYFP Category: Preserving and Maintaining Existing Assets
Service Category: Public Buildings & Facilities
Public Building Deferred Maintenance
Project Description: The General Fund supports 100+ buildings and structures totaling over 900,000
square feet, with a replacement value of about $354 million. Deferred maintenance in General Fund
buildings is currently estimated at approximately $30 million. The deferred maintenance amount will continue
to increase based on anticipated funding levels, which are inadequate.
Project Status: Not Started - This project has previously in the CIP and MYFP.
Total20172016 2018 2019 2020 2021
Funding Not Identified
Capital
$1,902 $1,966 $11,498General $1,979$1,845 $1,873 $1,933
$1,933 $1,966Total $11,498$1,902 $1,979$1,845 $1,873
Estimated Costs ($ in thousands)
Neighborhood: Multiple Neighborhoods
Ward: Citywide
This project is included in the 2016-21 Capital Improvement Program.
Eugene Fire and EMS headquarters is one of many
buildings maintained by the General Fund.
Specific Plans/Policies Related to this Project:
Council Goal - Effective, Accountable Municipal
Government
Facility Condition Report
Financial Management Goals and Policies
City of Eugene 2016 - 2021 Multi-Year Financial Plan Page 66

MYFP Category: Improved or Expanded Services Not Part of an Adopted Plan
Service Category: Social Services
Homeless Initiative
Project Description: Council has asked Community Development staff to manage a growing portfolio of
homelessness initiatives. Current General Fund levels are not sufficient to implement and manage these
initiatives. Due to a significant increase in federal compliance requirements, staff time and federal resources
cannot be utilized to meet this need.
Project Status: In Progress - This item has previously appeared in the MYFP.
Total20172016 2018 2019 2020 2021
Funding Not Identified
Operating: Program
$100 $100 $600General $100$100 $100 $100
$100 $100Total $600$100 $100$100 $100
Estimated Costs ($ in thousands)
Neighborhood: Citywide
Ward: Citywide
First Place Family Center provides services to many
homeless families.
Specific Plans/Policies Related to this Project:
Council Priority Issue
City of Eugene 2016 - 2021 Multi-Year Financial Plan Page 67

MYFP Category: Improved or Expanded Services Not Part of an Adopted Plan
Service Category: Special Events/Eug Celebration
Major Track and Field Events
Project Description: This is a placeholder project to indicate the need for funding related to major track and
field events. Projected costs are not yet determined.
Project Status: Not Started - This item is new in the FY16-21 MYFP.
Placeholder
Estimated cost by year not yet determined for this placeholder project.
Estimated Costs ($ in thousands)
Neighborhood: Multiple Neighborhoods
Ward: Ward 3
Youth starting block program offered at USA Olympic
Track & Field Championships.
Specific Plans/Policies Related to this Project:
Council Goal - Accessible and Thriving Culture and
Recreation
City of Eugene 2016 - 2021 Multi-Year Financial Plan Page 68

MYFP Category: Implementing Adopted Plans or Policies
Service Category: Stormwater & Wetlands Mgmt
Alton Baker Canoe Canal Renovation
Project Description: Funding would allow complete restoration of canoe canal, ponds, and development of
related park facilities. Improvements will address natural resources enhancements, recreation
improvements, and safety needs. More specifically, improvements would include: (a) improving conditions
for paddling in the canoe canal (e.g., less required portages); (b) increasing shading of the canoe canal to
reduce water temperatures; (c) reducing bacteria in the canoe canal to improve water quality; (d) enhancing
habitat conditions for spring Chinook salmon, (e) improving boating access and providing path
improvements, and (f) renovating landscaping. This project has high potential for garnering state and federal
grants for the natural resources enhancements.
Project Status: Not Started - This project has previously appeared in the CIP and MYFP.
Total20172016 2018 2019 2020 2021
Funding Not Identified
Capital
$500 $0 $1,000General $0$0 $500 $0
$1,000 $0 $2,000Grants $0$0 $1,000 $0
$1,000 $0 $2,000Stormwater Utility - Capital $0$0 $1,000 $0
$0 $0Total $5,000$2,500 $0$0 $2,500
Estimated Costs ($ in thousands)
Neighborhood: Harlow
Ward: Ward 4
This project is included in the 2016-21 Capital Improvement Program.
Large numbers of geese and ducks create water
quality issues (e.g., high bacteria loads) in Alton Baker
Canoe Canal.
Specific Plans/Policies Related to this Project:
Council Goal - Accessible and Thriving Culture and
Recreation
PROS Project and Priority Plan
City of Eugene 2016 - 2021 Multi-Year Financial Plan Page 69

MYFP Category: Implementing Adopted Plans or Policies
Service Category: Transportation
Eugene Bike Share
Project Description: Bike share is an innovative transportation program, whereby system subscribers have
access to public bicycles through self-service kiosk locations throughout the community. The system is
accessed through low-cost subscriptions ranging from one-day access to annual membership. This project
helps accomplish the goal of the Pedestrian & Bicycle Master plan (PBMP): "By the year 2031 Eugene will
double the percentage of trips made on foot and by bicycle from 2011 levels." This project constructs kiosks
and purchases bikes to implement a bike share system in Eugene. Costs shown are net of $909,000 grant
awarded in FY15.
Project Status: Not Started - This is a new project in the FY16-21 CIP. Funding for program operating
costs associated with this project has not yet been identified.
Total20172016 2018 2019 2020 2021
Funding Not Identified
Capital
$0 $0 $964Federal Funds $964$0 $0 $0
$0 $0 $227General Capital Projects $227$0 $0 $0
Operating: Program
$0 $0 $240Other $240$0 $0 $0
$0 $0Total $1,431$0 $1,431$0 $0
Estimated Costs ($ in thousands)
Neighborhood: Citywide
Ward: Citywide
This project is included in the 2016-21 Capital Improvement Program.
Bike share system riders.
Specific Plans/Policies Related to this Project:
City of Eugene Transportation System Plan (formerly
Transplan)
Eugene Pedestrian and Bicycle Master Plan
City of Eugene 2016 - 2021 Multi-Year Financial Plan Page 70

MYFP Category: Implementing Adopted Plans or Policies
Service Category: Transportation
Franklin Boulevard Multiway Boulevard Improvements
Project Description: Reconstruct Franklin between approximately 400 feet east of Walnut Street to Onyx
Street to reconfigure into a multiway boulevard with two through lanes each direction, turn lanes, local access
lanes, curbs and gutters, wide sidewalks, medians, street trees, modified or new traffic signals and street
lights, and an additional Bus Rapid Transit (BRT) lane. Also includes, the addition of a second BRT lane from
Onyx to Walnut, and sidewalk improvements between E 11th Avenue and Alder Street.
Project Status: Not Started - This item has previously appeared in the CIP and MYFP.
Total20172016 2018 2019 2020 2021
Funding Not Identified
Capital
$0 $0 $17,200Other $17,200$0 $0 $0
$0 $0Total $17,200$0 $17,200$0 $0
Estimated Costs ($ in thousands)
Neighborhood: Multiple Neighborhoods
Ward: Ward 3
This project is included in the 2016-21 Capital Improvement Program.
Franklin Multi-way Boulevard Improvements.
Specific Plans/Policies Related to this Project:
Regional Transportation Plan
City of Eugene 2016 - 2021 Multi-Year Financial Plan Page 71

MYFP Category: Preserving and Maintaining Existing Assets
Service Category: Transportation
Pavement Preservation Program - Funding for Project Backlog
Project Description: In May 2007, the Council Subcommittee on Transportation Funding Solutions
recommended a total yearly pavement preservation funding target of $18 million. Unfunded amount shown is
net of local motor vehicle fuel tax revenue, Transportation SDC reimbursement revenue, and 2012 Street
Bond revenue.
Project Status: In Progress - This item has previously appeared in the CIP and MYFP.
Total20172016 2018 2019 2020 2021
Funding Not Identified
Capital
$5,950 $14,850 $57,100Pavement Preservation Capital $14,850$6,560 $6,260 $8,630
$8,630 $14,850Total $57,100$5,950 $14,850$6,560 $6,260
Estimated Costs ($ in thousands)
Neighborhood: Citywide
Ward: Citywide
This project is included in the 2016-21 Capital Improvement Program.
Capital pavement overlay project in progress.
Specific Plans/Policies Related to this Project:
City of Eugene Transportation System Plan (formerly
Transplan)
Pavement Management Program
City of Eugene 2016 - 2021 Multi-Year Financial Plan Page 72

MYFP Category: Implementing Adopted Plans or Policies
Service Category: Transportation
Railroad Quiet Zone
Project Description: This project provides safety improvements and changes that could be made to the
railroad crossings at Van Buren, Monroe, Madison, Jefferson, Washington, Lawrence, Lincoln, Pearl, High
and Hilyard streets to obtain a regulatory Quiet Zone from the Federal Railroad Administration . The Quiet
Zone will stop routine crossing train horns, but warning and emergency horns will continue. Potential safety
improvements at individual crossings include quad gates, median or channelizing islands, and/or conversion
of the street to one way. Planning with the neighborhoods is complete. Depending on the alternatives
selected, the total project cost will vary. Potential funding sources are the General Fund, CDBG funds, Urban
Renewal funds, SDC funds and assessments levied through a local improvement district.
Project Status: Not Started - This project has previously appeared in the MYFP.
Total20172016 2018 2019 2020 2021
Funding Not Identified
Capital
$1,000 $1,000 $7,000Other $1,000$0 $3,000 $1,000
$1,000 $1,000Total $7,000$1,000 $1,000$0 $3,000
Estimated Costs ($ in thousands)
Neighborhood: Multiple Neighborhoods
Ward: Multiple Wards
This project is included in the 2016-21 Capital Improvement Program.
Locations of railroad crossings within proposed Quiet
Zone.
Specific Plans/Policies Related to this Project:
City of Eugene Transportation System Plan (formerly
Transplan)
Council Goal - Safe Community
Council Specific Direction
City of Eugene 2016 - 2021 Multi-Year Financial Plan Page 73

MYFP Category: Improved or Expanded Services Not Part of an Adopted Plan
Service Category: Youth & Family Recreation Svcs
Youth After-School Healthy Lifestyle Education
Project Description: This programmatic funding would go toward expanding Recreation Services for
current youth after-school programming. This funding would expand the service to 12-15 middle and
elementary schools throughout the City. The programming would focus on modeling healthy habits by
focusing on nutrition and outdoor activities.
Project Status: Not Started - This item has previously appeared in the MYFP as Youth After-School
Continuation Funding.
Total20172016 2018 2019 2020 2021
Funding Not Identified
Operating: Program
$412 $437 $2,123General $450$0 $400 $424
$424 $437Total $2,123$412 $450$0 $400
Estimated Costs ($ in thousands)
Neighborhood: Citywide
Ward: Citywide
Youth using climbing wall.
Specific Plans/Policies Related to this Project:
Council Goal - Accessible and Thriving Culture and
Recreation
City of Eugene 2016 - 2021 Multi-Year Financial Plan Page 74

MYFP Category: Improved or Expanded Services Not Part of an Adopted Plan
Service Category: Zoning & Nuisance Admin.
Livability Staffing
Project Description: PDD has an ongoing need for additional staffing to address livability as the City
continues to densify in line with how the community Envision(s) Eugene. Specifically, this spans building
code, nuisance, zoning and an element of business licensing. Minimal staffing is currently funded but is not
adequate to address community needs. A total of three additional staff are necessary to adequately provide
outreach and proactive education to shift from reactive to more proactive compliance.
Project Status: Not Started - This item is new in the FY16-21 MYFP.
Total20172016 2018 2019 2020 2021
Funding Not Identified
Operating: Program
$370 $390 $2,250General $400$350 $360 $380
$380 $390Total $2,250$370 $400$350 $360
Estimated Costs ($ in thousands)
Neighborhood: Citywide
Ward: Citywide
Managing the consequences of density.
Specific Plans/Policies Related to this Project:
Council Goal - Sustainable Development
Envision Eugene
City of Eugene 2016 - 2021 Multi-Year Financial Plan Page 75