2022 Budget Book Publication - City of Fort Wayne
158
City of Fort Wayne 2022 Budget Table of Contents Page Expense Budget Overview ......................................................................................................................... 1 Revenue Budget Overview ........................................................................................................................ 5 Capital Improvement Plan .......................................................................................................................... 13 Debt Service ................................................................................................................................................. 35 Salary Ordinances ....................................................................................................................................... 37 American Rescue Plan Act (ARPA) .......................................................................................................... 55 Animal Control .............................................................................................................................................. 57 Benefits.......................................................................................................................................................... 61 Cable Fund ................................................................................................................................................... 63 City Clerk....................................................................................................................................................... 65 City Council ................................................................................................................................................... 67 Communications .......................................................................................................................................... 69 Community Development ........................................................................................................................... 71 Cumulative Capital Funds .......................................................................................................................... 75 Domestic Violence ....................................................................................................................................... 79 Finance & Administration ............................................................................................................................ 81 Fire ................................................................................................................................................................. 85 Fleet Management ....................................................................................................................................... 89 Internal Audit ................................................................................................................................................. 93 Law................................................................................................................................................................. 95 LIT-CEDIT ..................................................................................................................................................... 97 Mayor’s Office .............................................................................................................................................. 99 Metro .............................................................................................................................................................. 103 Parking Administration ................................................................................................................................ 107 Parks & Recreation...................................................................................................................................... 111 Pensions........................................................................................................................................................ 115 Police ............................................................................................................................................................. 121 Public Works ................................................................................................................................................. 129 Redevelopment ............................................................................................................................................ 139 Risk Management ........................................................................................................................................ 141 Street Department ....................................................................................................................................... 143 Street Project Management ....................................................................................................................... 147 Traffic Engineering....................................................................................................................................... 151 Unsafe Building ............................................................................................................................................ 155 During the budget hearings, additional data will be available, either as presented by the administration, or as requested.
-
Upload
khangminh22 -
Category
Documents
-
view
2 -
download
0
Transcript of 2022 Budget Book Publication - City of Fort Wayne

City of Fort Wayne2022 Budget
Table of Contents
PageExpense Budget Overview ......................................................................................................................... 1Revenue Budget Overview ........................................................................................................................ 5Capital Improvement Plan .......................................................................................................................... 13Debt Service ................................................................................................................................................. 35Salary Ordinances ....................................................................................................................................... 37American Rescue Plan Act (ARPA) .......................................................................................................... 55Animal Control .............................................................................................................................................. 57Benefits .......................................................................................................................................................... 61Cable Fund ................................................................................................................................................... 63City Clerk ....................................................................................................................................................... 65City Council ................................................................................................................................................... 67Communications .......................................................................................................................................... 69Community Development ........................................................................................................................... 71Cumulative Capital Funds .......................................................................................................................... 75Domestic Violence ....................................................................................................................................... 79Finance & Administration ............................................................................................................................ 81Fire ................................................................................................................................................................. 85Fleet Management ....................................................................................................................................... 89Internal Audit ................................................................................................................................................. 93Law ................................................................................................................................................................. 95LIT-CEDIT ..................................................................................................................................................... 97Mayor’s Office .............................................................................................................................................. 99Metro .............................................................................................................................................................. 103Parking Administration ................................................................................................................................ 107Parks & Recreation ...................................................................................................................................... 111Pensions ........................................................................................................................................................ 115Police ............................................................................................................................................................. 121Public Works ................................................................................................................................................. 129Redevelopment ............................................................................................................................................ 139Risk Management ........................................................................................................................................ 141Street Department ....................................................................................................................................... 143Street Project Management ....................................................................................................................... 147Traffic Engineering ....................................................................................................................................... 151Unsafe Building ............................................................................................................................................ 155
During the budget hearings, additional data will be available, either as presented by the administration, or as requested.

[This page intentionally left blank]

2020 ACTUAL
2021ACTUAL
THRU30-Jun-2021
2021REVISED
BUDGET THRU 30-Jun-2021
2022SUBMITTED
$ INCREASE (DECREASE)
FROM REVISED TO 2022
% CHANGE FROM REV
TO 2022Mayor 2,411,766 1,227,246 2,552,408 2,621,792 69,384 2.72 %Finance & Administration 12,283,329 4,856,516 12,421,781 13,555,283 1,133,502 9.13 %City Clerk 741,487 363,570 793,832 805,372 11,540 1.45 %City Council 573,161 308,138 722,730 746,828 24,098 3.33 %Metro 761,755 389,166 798,175 816,229 18,054 2.26 %Public Works 8,716,763 4,338,111 11,467,617 10,765,300 (702,317) -6.12 %CD 5,214,798 2,483,578 5,404,697 5,275,874 (128,823) -2.38 %Law 692,924 373,021 687,749 710,572 22,823 3.32 %Internal Audit 278,067 127,518 359,423 358,291 (1,132) -0.31 %Police Merit 2,770 3,460 14,950 2,560 (12,390) -82.88 %Police 61,991,942 33,596,491 67,613,727 69,449,441 1,835,714 2.72 %Animal Control 3,278,818 1,739,033 3,446,429 3,625,554 179,125 5.20 %Communications 3,680,729 793,429 3,173,716 3,173,716 — 0.00 %Total General Fund 100,628,309 50,599,276 109,457,234 111,906,812 2,449,578 2.24 %
Fire 45,154,744 24,101,080 50,049,282 51,512,267 1,462,985 2.92 %Parks & Recreation 18,178,035 7,814,891 19,719,328 20,184,078 464,750 2.36 %Redevelopment - General 701,634 357,696 751,160 768,066 16,906 2.25 %Sanitary Officer's Pension 486,973 251,078 509,840 551,372 41,532 8.15 %Cumulative Capital Development 3,408,268 1,838,258 3,300,000 4,800,000 1,500,000 45.45 %Domestic Violence 7,300 — 7,150 7,150 — 0.00 %
TOTAL PROPERTY TAX SUPPORTED 168,565,263 84,962,278 183,793,994 189,729,745 5,935,751 3.23 %
Public Safety LIT 6,276,773 3,415,340 6,818,429 6,615,826 (202,603) -2.97 %TOTAL PS-LIT SUPPORTED 6,276,773 3,415,340 6,818,429 6,615,826 (202,603) -2.97 %
Fire Pension 6,209,112 3,229,992 6,562,584 6,841,824 279,240 4.26 %Police Pension 7,510,024 3,943,862 8,579,074 8,707,360 128,286 1.50 %
TOTAL STATE FUNDED PENSIONS 13,719,136 7,173,854 15,141,658 15,549,184 407,526 2.69 %
Street Project Management 1,258,754 701,388 1,448,005 1,458,312 10,307 0.71 %Street Department / MVH Restricted 20,840,820 11,288,971 24,552,978 22,808,389 (1,744,589) -7.11 %
TOTAL MOTOR VEHICLE HIGHWAY (MVH) 22,099,574 11,990,359 26,000,983 24,266,701 (1,734,282) -6.67 %
Traffic Engineering 5,126,733 2,860,294 8,138,759 5,763,906 (2,374,853) -29.18 %TOTAL LOCAL ROAD & STREET (LR&S) 5,126,733 2,860,294 8,138,759 5,763,906 (2,374,853) -29.18 %
Cumulative Capital Improvement 294,567 53,867 684,450 535,000 (149,450) -21.84 %TOTAL CUMULATIVE CAPITAL IMPROVEMENT 294,567 53,867 684,450 535,000 (149,450) -21.84 %
Parking Administration 759,815 422,599 931,595 943,938 12,343 1.32 %Law Enforcement Training 119,790 53,608 244,000 268,000 24,000 9.84 %Cable TV 763,978 213,907 865,000 861,900 (3,100) -0.36 %Unsafe Building — — — 2,021,505 2,021,505 0.00 %
TOTAL FEE SUPPORTED 1,643,583 690,114 2,040,595 4,095,343 2,054,748 100.69 %
TOTAL 2022 DEPARTMENTAL BUDGETS 217,725,629 111,146,106 242,618,868 246,555,705 3,936,837 1.62 %
Municipal Surtax 4,321,491 512,390 5,442,266 4,522,337 (919,929) -16.90 %Municipal Wheel Tax 624,114 — 577,663 577,663 — 0.00 %
TOTAL MUNICIPAL SURTAX / WHEEL TAX 4,945,605 512,390 6,019,929 5,100,000 (919,929) -15.28 %
American Rescue Plan Act (ARPA) — — — 33,229,961 33,229,961 0.00 %TOTAL AMERICAN RESCUE PLAN ACT (ARPA) — — — 33,229,961 33,229,961 0.00 %
City of Fort Wayne2022 BUDGETExpense Comparison
1

2020 ACTUAL
ACTUAL THRU
30-Jun-2021
REVISED BUDGET THRU
30-Jun-20212022
SUBMITTED
(DECREASE) FROM REVISED
TO 2022
% CHANGE FROM REV
TO 2022Benefits 340,686 173,336 288,068 292,359 4,291 1.49 %Risk Management 2,486,807 1,038,043 1,733,408 1,741,859 8,451 0.49 %
TOTAL SELF INSURANCE 2,827,493 1,211,379 2,021,476 2,034,218 12,742 0.63 %
Fleet 6,452,649 3,388,563 7,105,326 7,420,220 314,894 4.43 %TOTAL FLEET 6,452,649 3,388,563 7,105,326 7,420,220 314,894 4.43 %
City of Fort Wayne2022 BUDGETExpense Comparison
2
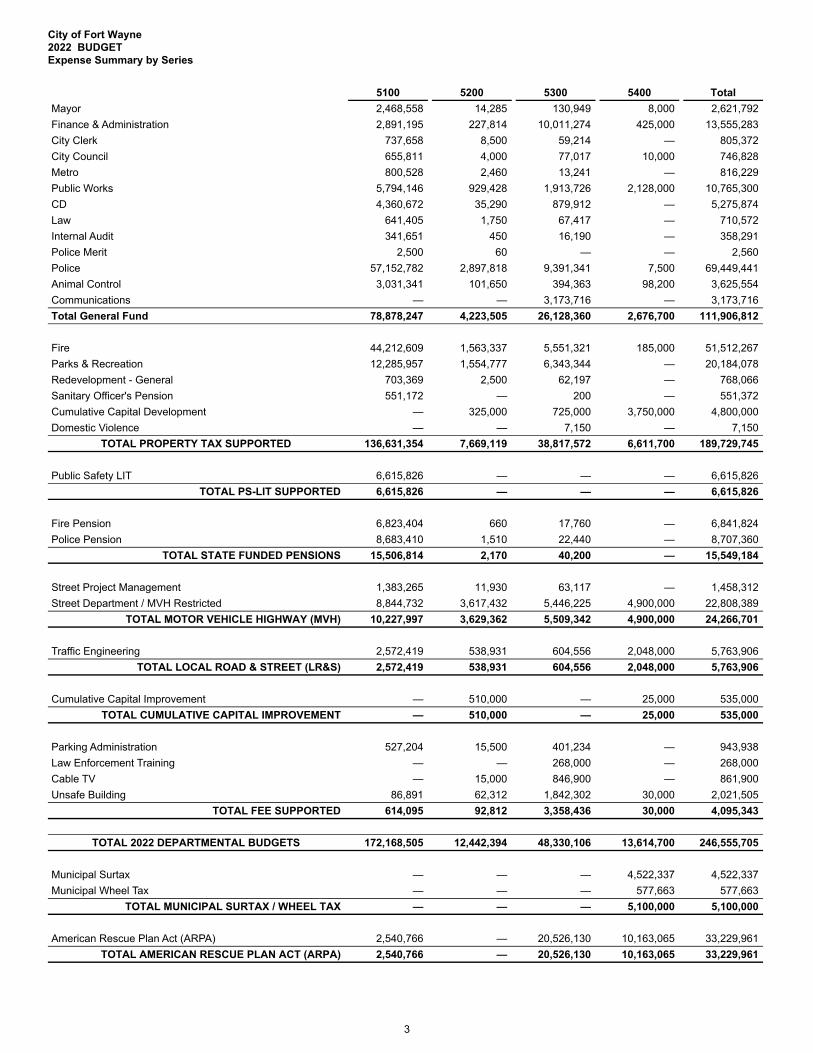
5100 5200 5300 5400 TotalMayor 2,468,558 14,285 130,949 8,000 2,621,792 Finance & Administration 2,891,195 227,814 10,011,274 425,000 13,555,283 City Clerk 737,658 8,500 59,214 — 805,372 City Council 655,811 4,000 77,017 10,000 746,828 Metro 800,528 2,460 13,241 — 816,229 Public Works 5,794,146 929,428 1,913,726 2,128,000 10,765,300 CD 4,360,672 35,290 879,912 — 5,275,874 Law 641,405 1,750 67,417 — 710,572 Internal Audit 341,651 450 16,190 — 358,291 Police Merit 2,500 60 — — 2,560 Police 57,152,782 2,897,818 9,391,341 7,500 69,449,441 Animal Control 3,031,341 101,650 394,363 98,200 3,625,554 Communications — — 3,173,716 — 3,173,716 Total General Fund 78,878,247 4,223,505 26,128,360 2,676,700 111,906,812
Fire 44,212,609 1,563,337 5,551,321 185,000 51,512,267 Parks & Recreation 12,285,957 1,554,777 6,343,344 — 20,184,078 Redevelopment - General 703,369 2,500 62,197 — 768,066 Sanitary Officer's Pension 551,172 — 200 — 551,372 Cumulative Capital Development — 325,000 725,000 3,750,000 4,800,000 Domestic Violence — — 7,150 — 7,150
TOTAL PROPERTY TAX SUPPORTED 136,631,354 7,669,119 38,817,572 6,611,700 189,729,745
Public Safety LIT 6,615,826 — — — 6,615,826 TOTAL PS-LIT SUPPORTED 6,615,826 — — — 6,615,826
Fire Pension 6,823,404 660 17,760 — 6,841,824 Police Pension 8,683,410 1,510 22,440 — 8,707,360
TOTAL STATE FUNDED PENSIONS 15,506,814 2,170 40,200 — 15,549,184
Street Project Management 1,383,265 11,930 63,117 — 1,458,312 Street Department / MVH Restricted 8,844,732 3,617,432 5,446,225 4,900,000 22,808,389
TOTAL MOTOR VEHICLE HIGHWAY (MVH) 10,227,997 3,629,362 5,509,342 4,900,000 24,266,701
Traffic Engineering 2,572,419 538,931 604,556 2,048,000 5,763,906 TOTAL LOCAL ROAD & STREET (LR&S) 2,572,419 538,931 604,556 2,048,000 5,763,906
Cumulative Capital Improvement — 510,000 — 25,000 535,000 TOTAL CUMULATIVE CAPITAL IMPROVEMENT — 510,000 — 25,000 535,000
Parking Administration 527,204 15,500 401,234 — 943,938 Law Enforcement Training — — 268,000 — 268,000 Cable TV — 15,000 846,900 — 861,900 Unsafe Building 86,891 62,312 1,842,302 30,000 2,021,505
TOTAL FEE SUPPORTED 614,095 92,812 3,358,436 30,000 4,095,343
TOTAL 2022 DEPARTMENTAL BUDGETS 172,168,505 12,442,394 48,330,106 13,614,700 246,555,705
Municipal Surtax — — — 4,522,337 4,522,337 Municipal Wheel Tax — — — 577,663 577,663
TOTAL MUNICIPAL SURTAX / WHEEL TAX — — — 5,100,000 5,100,000
American Rescue Plan Act (ARPA) 2,540,766 — 20,526,130 10,163,065 33,229,961 TOTAL AMERICAN RESCUE PLAN ACT (ARPA) 2,540,766 — 20,526,130 10,163,065 33,229,961
City of Fort Wayne2022 BUDGETExpense Summary by Series
3

5100 5200 5300 5400 TotalBenefits 238,992 — 53,367 — 292,359 Risk Management 494,110 21,435 1,226,314 — 1,741,859
TOTAL SELF INSURANCE 733,102 21,435 1,279,681 — 2,034,218
Fleet 2,721,977 3,616,826 1,043,172 38,245 7,420,220 TOTAL FLEET 2,721,977 3,616,826 1,043,172 38,245 7,420,220
City of Fort Wayne2022 BUDGETExpense Summary by Series
4

City of Fort WayneProperty Tax and Assessed Valuation History
(Last 35 years)
Year
NetAssessedValuation1
%Change
Total CityDollar Levy
LevyGrowth
Effect ofCircuit Breaker
NetCity Levy
Total CityTax Rate
2022E 10,788,225,378 3.00 % 157,804,180 4.3 % (18,926,100) 138,878,080 $ 1.4647 2021A 10,474,005,221 7.19 % 151,325,340 4.2 % (18,409,933) 132,915,407 $ 1.4469 2020A 9,771,852,283 5.75 % 144,938,093 3.5 % (18,803,691) 126,134,402 $ 1.4943 2019A 9,240,489,844 6.10 % 140,017,116 3.4 % (18,165,507) 121,851,609 $ 1.5277 2018A 8,709,370,259 3.16 % 135,467,628 4.0 % (19,107,625) 116,360,003 $ 1.5674 2017A 8,442,987,593 2.05 % 130,338,417 3.8 % (19,385,574) 110,952,843 $ 1.5565 2016A 8,273,698,615 2.22 % 125,688,689 2.6 % (18,991,799) 106,696,890 $ 1.5312 2015A 8,093,724,951 1.06 % 121,205,513 2.7 % (18,570,414) 102,635,099 $ 1.5106 2014A 8,008,561,561 0.30 % 116,765,804 2.6 % (16,724,107) 100,041,697 $ 1.4716 2013A 7,984,553,514 (0.96) % 106,014,996 2.8 % (15,129,369) 90,885,627 $ 1.3411 2012A 8,062,225,389 (0.81) % 106,017,165 2.9 % (13,588,058) 92,429,107 $ 1.3274 2011A 8,128,378,487 (4.55) % 106,024,105 2.9 % (13,069,432) 92,954,673 $ 1.3149 2010A 8,515,625,766 (2.26) % 103,327,209 3.8 % (9,339,561) 93,987,648 $ 1.2238 2009A 8,712,264,335 (13.52) % 99,532,973 4.0 % (1,927,920) 97,605,053 $ 1.1515 2008A 10,074,509,442 2.55 % 99,440,267 3.7 % — 99,440,267 $ 0.9941 2007A 9,824,189,539 27.35 % 99,440,911 4.0 % — 99,440,911 $ 1.0195 2006A 7,714,274,681 3.14 % 82,560,277 3.9 % — 82,560,277 $ 1.0795 2005A 4 7,479,525,039 (5.48) % 77,554,663 4.4 % — 77,554,663 $ 1.0460 2004A 3 7,913,564,614 6.49 % 73,735,533 4.7 % — 73,735,533 $ 0.9421 2003A 7,431,358,261 32.55 % 64,440,411 — % — 64,440,411 $ 0.8779 2002A 2 5,606,420,503 8.32 % 61,329,995 — % — 61,329,995 $ 1.1100 2001A 5,175,714,390 1.13 % 56,602,688 — % — 56,602,688 $ 1.1100 2000A 5,117,670,534 1.75 % 56,091,816 — % — 56,091,816 $ 1.1101 1999A 5,029,657,395 3.75 % 55,392,559 — % — 55,392,559 $ 1.1153 1998A 4,847,899,938 2.83 % 53,230,788 — % — 53,230,788 $ 1.1161 1997A 4,714,700,151 1.27 % 51,009,051 — % — 51,009,051 $ 1.0966 1996A 4,655,386,671 15.64 % 45,728,549 — % — 45,728,549 $ 0.9933 1995A 4,025,871,519 0.16 % 44,122,186 — % — 44,122,186 $ 1.0987 1994A 4,019,625,630 2.98 % 44,068,252 — % — 44,068,252 $ 1.0987 1993A 3,903,420,549 2.94 % 42,834,955 — % — 42,834,955 $ 1.0987 1992A 3,792,084,402 3.08 % 40,910,375 — % — 40,910,375 $ 1.0798 1991A 3,678,662,505 2.06 % 39,859,116 — % — 39,859,116 $ 1.0844 1990A 3,604,245,582 32.83 % 39,054,244 — % — 39,054,244 $ 1.0844 1989A 2,713,456,710 3.58 % 36,598,852 — % — 36,598,852 $ 1.3508 1988A 2,619,608,940 3.65 % 33,690,886 — % — 33,690,886 $ 1.2813 1987A 2,527,320,420 5.20 % 31,898,630 — % — 31,898,630 $ 1.2440
A=Actual; E=Estimated
1 Assessed Value is for the General Fund. The City has different AVs for Park and Fire District.
2 In 2002, the State of Indiana adopted a fair value system to assess property values. Prior years have been restated.
3 Certified Assessed Value includes an estimated reduction of $92 million of excluded interstate commerce inventory.
4 Certified Assessed Value includes an estimated reduction for excluded estimated inventory of $385 million. (source: Allen County Auditor)
5

MAJOR REVENUE SOURCES
Alcohol Gallonage Tax – Income generated from a state-imposed tax on every gallon of alcoholic beverages sold.
Auto Excise Tax – Income derived, in lieu of personal property tax, on all motor vehicles, except those that fall under the commercial vehicle excise tax classification.
Cable TV Franchise Fees – The City receives a percentage, currently 5%, of either the gross annual subscriber receipts or the franchisee’s gross annual receipts, whichever is greater.
Commercial Vehicle Excise Tax – Revenue based on the weight of the vehicle and is paid at the time of registration. The base for this tax is commercial vehicles such as tractors and trailers that were subject to the property tax.
Financial Institutions Tax – This tax is based upon a combination of the net income and the personal property of financial institutions.
Fuel Tax – Taxes generated from the sale of gasoline and other fuels.
General Tobacco Tax – Revenue received from the taxation of all cigarettes sold, used, consumed, handled or distributed with the state.
Interest Income – Revenue earned as the City invests its idle funds in various investment vehicles.
Liquor Excise Tax – Income generated from the sale and renewal of liquor licenses.
Local Income Tax – The Local Income Tax is divided into three components: Expenditure Rate, Property Tax Relief Rate and the Special Purpose Rate. The Special Purpose Rate is not applicable to Allen County. The breakout is as follows:
• Expenditure Rate – 1.1121%◦ Certified Shares Distribution – .4821%◦ Public Safety Distribution – .1%◦ Economic Development Distribution – .53% (.13% to be deposited in a non-reverting fund)
• Property Tax Relief Rate – .3679%
Municipal Surtax/Wheel Tax – Taxes generated from all registered vehicles licensed in the City of Fort Wayne and is effective January 1, 2017.
Property Tax – The largest source of City revenues. This tax results from the tax rate applied against the assessed value of the property.
Other sources of revenue include, but are not limited to: animal control licenses, payments in lieu of taxes, ordinance violations, rental property, zoning fees, engineering and technical service fees, grants and other contributions.
6

TAXES BASED ON INCOME
In March of 1989, the Common Council of the City of Fort Wayne enacted the County Option Income Tax (COIT), one of three local option income taxes available to counties under State statutes in Indiana, as part of a tax reform package. Also, available to counties under Indiana law was the County Adjusted Gross Income Tax (CAGIT) and the County Economic Development Income Tax (CEDIT). The Common Council controlled enactment of the tax at that time based on the fact that the City comprised 58.5% of the population of Allen County, even though the Allen County Income Tax Council (ACITC) actually enacts the tax.
The tax reform effort involved two primary strategies. One, it was appropriate to tax those citizens who live outside the City but use City services such as roads and streets, fire protection, and police protection while they work in Fort Wayne. To a modest extent, COIT accomplished that. Two, adding a different tax base into the picture, income as opposed to property, broadened and distributed the total tax burden in a fairer manner. COIT accomplished that as well.
The tax reform package also included an increase in the Homestead Property Tax Credit from 4% to 12% by 1992 and a flat property tax rate through 1992. The COIT tax began on July 1, 1989 at a rate of .2% on Indiana adjusted gross income. Because of fluctuations in the base upon which COIT is computed, revenue could vary more from year to year than does property tax revenue.
COIT increased to .3% on July 1, 1990, where it remained frozen until July 1, 1992. In March of 1992, the Common Council removed a self-imposed freeze on the COIT tax and allowed it to go to .4% effective July 1, 1992. The Common Council increased COIT to .5% effective July 1, 1993 and to .6% effective July 1, 1994. The City receives revenues from the State of Indiana on a delayed basis.
In March of 1993, the Common Council enacted the County Economic Development Income Tax (CEDIT) for Allen County at a level of .2% effective July 1, 1993. Use of these funds was restricted to projects related to economic development, infrastructure improvements, parks and public safety capital expenditures or payment on bonds to fund any of these types of projects. In March of 1998, Common Council voted to increase the rate to .4% effective July 1, 1998.
The ACITC in June of 2013 approved a Property Tax Relief (PTR) Local Option Income Tax (LOIT) of .25% and a Public Safety (PS) LOIT of .10%, which went into effect October 1, 2013. The base for this tax was the same as the County Option Income Tax (COIT), individual Indiana taxable income in Allen County.
To simplify the LOIT system, in 2015, Indiana General Assembly passed House Bill 1485 that provides for a transition from the County Adjusted Gross Income Tax (CAGIT), the County Option Income Tax (COIT), the County Economic Development Income Tax (CEDIT), and the various local income taxes for special purposes and special projects to a single local income tax with three rate components: Expenditure Rate, Property Tax Relief Rate and Special Purpose Rate. The adopting body will have the authority to set the rates and the uses for Expenditures and Property Tax Relief. The maximum rate for Expenditures is 2.5%. The adopting body dictates how the Expenditure Rate will be used by all units in the County – either for public safety, economic development or certified shares. The maximum rate for Property Tax Relief is 1.25%.
In July 2017, ACITC voted to increase the Economic Development Distribution portion of the Local Income Tax - Expenditure Rate to .53% effective October 1, 2017 and the additional tax revenue to be deposited in a Local Income Tax – Economic Development Non-Reverting Fund to finance Riverfront Development, Sidewalks and Alleys capital projects. Also, effective January 1, 2017, .1179% was redistributed from Local Income Tax – Certified Shares Distribution to Local Income Tax – Property Tax Relief Rate, bringing the total Local Income Tax – Expenditure Rate to 1.1121% and the Local Income Tax – Property Tax Relief Rate to .3679%.
Under the new system, the local taxes adopted by Allen County Income Tax Council transitioned as follows:
1. Local Income Tax – Expenditure Rate – 1.1121%, formerly 1.1%a. Local Income Tax – Certified Shares Distribution (LIT-CS) – .4821%, formerly COIT – .6%;b. Local Income Tax – Public Safety Distribution (LIT-PS) – .1%, formerly PS-LOIT – .1%;c. Local Income Tax – Economic Development Distribution (LIT-ED) – .53%, including the .13% to be
deposited in a non-reverting fund (LIT-EDNR), formerly CEDIT – .4%2. Local Income Tax – Property Tax Relief Rate – .3679%, formerly PTR-LOIT – .25%
7
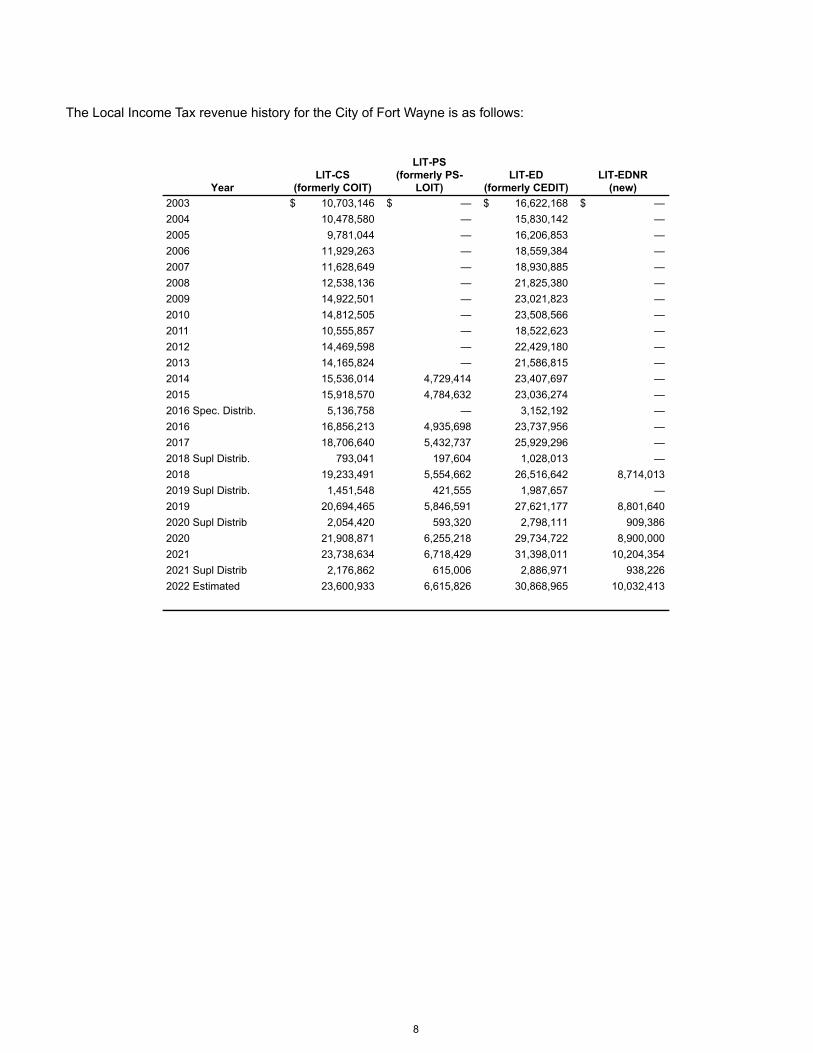
The Local Income Tax revenue history for the City of Fort Wayne is as follows:
YearLIT-CS
(formerly COIT)
LIT-PS(formerly PS-
LOIT)LIT-ED
(formerly CEDIT)LIT-EDNR
(new)2003 $ 10,703,146 $ — $ 16,622,168 $ — 2004 10,478,580 — 15,830,142 — 2005 9,781,044 — 16,206,853 — 2006 11,929,263 — 18,559,384 — 2007 11,628,649 — 18,930,885 — 2008 12,538,136 — 21,825,380 — 2009 14,922,501 — 23,021,823 — 2010 14,812,505 — 23,508,566 — 2011 10,555,857 — 18,522,623 — 2012 14,469,598 — 22,429,180 — 2013 14,165,824 — 21,586,815 — 2014 15,536,014 4,729,414 23,407,697 — 2015 15,918,570 4,784,632 23,036,274 — 2016 Spec. Distrib. 5,136,758 — 3,152,192 — 2016 16,856,213 4,935,698 23,737,956 — 2017 18,706,640 5,432,737 25,929,296 — 2018 Supl Distrib. 793,041 197,604 1,028,013 — 2018 19,233,491 5,554,662 26,516,642 8,714,013 2019 Supl Distrib. 1,451,548 421,555 1,987,657 — 2019 20,694,465 5,846,591 27,621,177 8,801,640 2020 Supl Distrib 2,054,420 593,320 2,798,111 909,386 2020 21,908,871 6,255,218 29,734,722 8,900,000 2021 23,738,634 6,718,429 31,398,011 10,204,354 2021 Supl Distrib 2,176,862 615,006 2,886,971 938,226 2022 Estimated 23,600,933 6,615,826 30,868,965 10,032,413
8

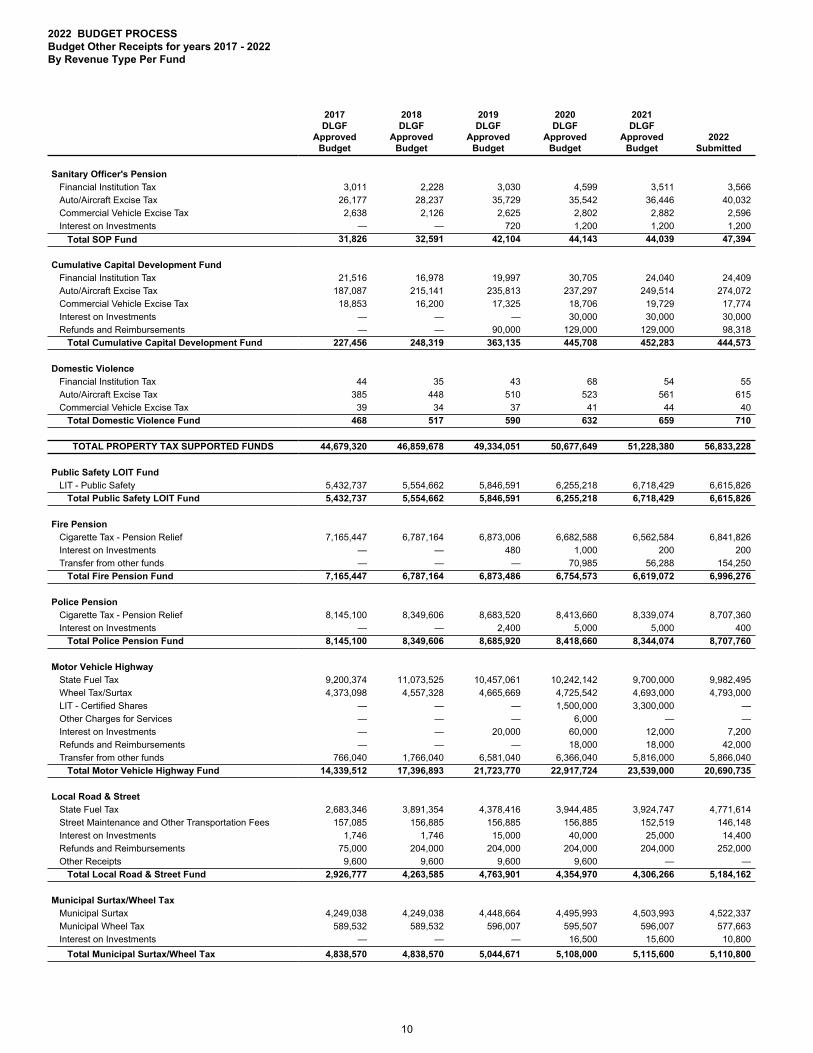
GeneralLIT - Certified Shares 18,286,640 18,813,491 20,274,465 19,988,871 20,018,634 23,180,933 Liquor Excise Tax 129,345 129,345 129,345 129,345 120,839 130,000 Gaming Tax 1,502,834 1,502,833 1,502,842 1,502,834 1,502,834 1,502,834 Cigarette Tax 180,121 157,288 142,066 164,850 155,008 146,655 Financial Institution Tax 321,063 275,495 311,159 512,712 364,914 370,549 Auto/Aircraft Excise Tax 2,791,675 3,491,105 3,669,387 3,962,441 3,787,569 4,160,335 Payments in Lieu of Taxes (PILOT) 9,256,678 9,770,528 9,911,461 9,679,508 10,969,904 12,268,996 Economic Development Fees 7,500 7,500 7,500 — — — Commercial Vehicle Excise Tax 281,327 262,885 269,587 312,365 299,480 269,824 Alcohol Beverage Gallonage Tax 545,436 522,599 578,416 554,601 575,534 600,015 Zoning Fees 3,200 2,400 — 2,800 2,800 3,600 Right of Way Permits 270,000 270,000 400,000 499,992 555,000 605,000 Animal Control Licenses 125,625 130,450 132,250 130,850 134,200 114,720 Licenses & Permits 13,300 13,270 8,500 3,960 5,964 18,000 Cable Franchise Fees 1,716,000 1,716,000 1,716,000 1,566,000 1,450,000 1,450,000 Document and Copy Fees 33,250 43,050 10 206 206 169 Rental of Property 150,384 144,888 479,836 479,840 479,840 507,600 Reimbursement for Services 298,793 329,331 328,158 216,078 187,500 211,500 Other Charges for Services 300,450 311,700 402,450 377,107 326,556 325,250 Court Costs and Fees 229,800 210,000 214,000 89,825 89,825 89,825 Other Court and Clerk Receipts 49,000 45,440 41,000 104,153 123,144 146,000 Interest on Investments 600 600 120,000 300,000 300,000 300,000 Refunds and Reimbursements 184,000 89,413 232,367 130,521 141,400 114,000 Transfer from Other Funds 322,500 110,500 80,500 95,000 44,000 34,200 Other Receipts 415,175 505,825 521,960 418,920 386,965 330,065 CU Services Reimbursements 1,539,699 1,565,601 1,394,388 1,551,210 1,547,352 1,537,343
Total General Fund 38,954,395 40,421,537 42,867,647 42,773,989 43,569,468 48,417,413
FireFinancial Institution Tax 256,596 210,800 209,575 294,708 278,642 282,944 Auto/Aircraft Excise Tax 2,053,844 2,636,211 2,433,176 2,940,761 2,892,122 3,176,760 Commercial Vehicle Excise Tax 198,202 201,150 181,578 236,228 228,678 191,434 Document and Copy Fees 120 — 75 75 75 75 Fire Protection Contracts 1,452 5,107 5,107 317,807 318,880 544,065 Other Court and Clerk Receipts 3,800 4,200 6,500 6,500 26,980 26,980 Interest on Investments — — — 25,000 25,000 25,000 Refunds and Reimbursements — — — 10,407 7,775 18,000 Other Receipts 5,500 10,400 65,800 112,800 120,800 120,800
Total Fire Fund 2,519,514 3,067,868 2,901,811 3,944,286 3,898,952 4,386,058
Parks & RecreationLIT - Certified Shares 420,000 420,000 420,000 420,000 420,000 420,000 Financial Institution Tax 91,935 78,658 80,642 109,733 89,625 105,816 Auto/Aircraft Excise Tax 754,302 989,919 943,195 1,103,221 925,849 1,173,873 Commercial Vehicle Excise Tax 73,670 75,058 69,870 87,956 73,554 77,052 Other Licenses & Permits 23,600 23,600 24,000 24,000 54,000 24,000 Park and Recreation Receipts 1,408,500 1,319,500 1,432,200 1,509,950 1,458,200 1,488,200 Rental of Property 34,000 36,000 30,000 30,000 40,000 40,000 Interest on Investments — — 12,000 18,000 18,000 18,000 Refunds and Reimbursements 20,000 20,000 20,000 22,000 22,000 22,000 Donations, Gifts and Bequests 78,000 78,000 82,500 82,500 82,500 82,500 Other Receipts — — — — — 399
Total Parks & Recreation Fund 2,904,007 3,040,735 3,114,407 3,407,360 3,183,728 3,451,840
Redevelopment - GeneralFinancial Institution Tax 3,940 3,289 3,160 6,290 6,266 6,365 Auto/Aircraft Excise Tax 34,261 41,683 37,260 48,609 65,042 71,443 Commercial Vehicle Excise Tax 3,453 3,139 2,737 3,832 5,143 4,632 Interest on Investments — — 1,200 2,800 2,800 2,800
Total Redevelopment Fund 41,654 48,111 44,357 61,531 79,251 85,240
2017DLGF
ApprovedBudget
2018DLGF
ApprovedBudget
2019DLGF
ApprovedBudget
2020DLGF
ApprovedBudget
2021DLGF
ApprovedBudget
2022 Submitted
2022 BUDGET PROCESSBudget Other Receipts for years 2017 - 2022By Revenue Type Per Fund
9
Sanitary Officer's PensionFinancial Institution Tax 3,011 2,228 3,030 4,599 3,511 3,566 Auto/Aircraft Excise Tax 26,177 28,237 35,729 35,542 36,446 40,032 Commercial Vehicle Excise Tax 2,638 2,126 2,625 2,802 2,882 2,596 Interest on Investments — — 720 1,200 1,200 1,200
Total SOP Fund 31,826 32,591 42,104 44,143 44,039 47,394
Cumulative Capital Development FundFinancial Institution Tax 21,516 16,978 19,997 30,705 24,040 24,409 Auto/Aircraft Excise Tax 187,087 215,141 235,813 237,297 249,514 274,072 Commercial Vehicle Excise Tax 18,853 16,200 17,325 18,706 19,729 17,774 Interest on Investments — — — 30,000 30,000 30,000 Refunds and Reimbursements — — 90,000 129,000 129,000 98,318
Total Cumulative Capital Development Fund 227,456 248,319 363,135 445,708 452,283 444,573
Domestic ViolenceFinancial Institution Tax 44 35 43 68 54 55 Auto/Aircraft Excise Tax 385 448 510 523 561 615 Commercial Vehicle Excise Tax 39 34 37 41 44 40
Total Domestic Violence Fund 468 517 590 632 659 710
TOTAL PROPERTY TAX SUPPORTED FUNDS 44,679,320 46,859,678 49,334,051 50,677,649 51,228,380 56,833,228
Public Safety LOIT FundLIT - Public Safety 5,432,737 5,554,662 5,846,591 6,255,218 6,718,429 6,615,826
Total Public Safety LOIT Fund 5,432,737 5,554,662 5,846,591 6,255,218 6,718,429 6,615,826
Fire PensionCigarette Tax - Pension Relief 7,165,447 6,787,164 6,873,006 6,682,588 6,562,584 6,841,826 Interest on Investments — — 480 1,000 200 200 Transfer from other funds — — — 70,985 56,288 154,250
Total Fire Pension Fund 7,165,447 6,787,164 6,873,486 6,754,573 6,619,072 6,996,276
Police PensionCigarette Tax - Pension Relief 8,145,100 8,349,606 8,683,520 8,413,660 8,339,074 8,707,360 Interest on Investments — — 2,400 5,000 5,000 400
Total Police Pension Fund 8,145,100 8,349,606 8,685,920 8,418,660 8,344,074 8,707,760
Motor Vehicle HighwayState Fuel Tax 9,200,374 11,073,525 10,457,061 10,242,142 9,700,000 9,982,495 Wheel Tax/Surtax 4,373,098 4,557,328 4,665,669 4,725,542 4,693,000 4,793,000 LIT - Certified Shares — — — 1,500,000 3,300,000 — Other Charges for Services — — — 6,000 — — Interest on Investments — — 20,000 60,000 12,000 7,200 Refunds and Reimbursements — — — 18,000 18,000 42,000 Transfer from other funds 766,040 1,766,040 6,581,040 6,366,040 5,816,000 5,866,040
Total Motor Vehicle Highway Fund 14,339,512 17,396,893 21,723,770 22,917,724 23,539,000 20,690,735
Local Road & StreetState Fuel Tax 2,683,346 3,891,354 4,378,416 3,944,485 3,924,747 4,771,614 Street Maintenance and Other Transportation Fees 157,085 156,885 156,885 156,885 152,519 146,148 Interest on Investments 1,746 1,746 15,000 40,000 25,000 14,400 Refunds and Reimbursements 75,000 204,000 204,000 204,000 204,000 252,000 Other Receipts 9,600 9,600 9,600 9,600 — —
Total Local Road & Street Fund 2,926,777 4,263,585 4,763,901 4,354,970 4,306,266 5,184,162
Municipal Surtax/Wheel TaxMunicipal Surtax 4,249,038 4,249,038 4,448,664 4,495,993 4,503,993 4,522,337 Municipal Wheel Tax 589,532 589,532 596,007 595,507 596,007 577,663 Interest on Investments — — — 16,500 15,600 10,800
Total Municipal Surtax/Wheel Tax 4,838,570 4,838,570 5,044,671 5,108,000 5,115,600 5,110,800
2017DLGF
ApprovedBudget
2018DLGF
ApprovedBudget
2019DLGF
ApprovedBudget
2020DLGF
ApprovedBudget
2021DLGF
ApprovedBudget
2022 Submitted
2022 BUDGET PROCESSBudget Other Receipts for years 2017 - 2022By Revenue Type Per Fund
10

Cumulative Capital ImprovementCigarette Tax 662,134 575,874 520,062 604,450 568,362 537,737 Interest on Investments — — 240 3,000 3,000 3,000
Total Cumulative Capital Improvement Fund 662,134 575,874 520,302 607,450 571,362 540,737
American Rescue Plan Act (ARPA)Federal Grant — — — — — 25,407,663
Total American Rescue Plan Act (ARPA) — — — — — 25,407,663
Parking ControlParking Meter Collections 300,000 272,038 514,000 552,000 552,000 552,000 Bagged Meter Collections 5,000 49,184 49,184 49,184 48,000 48,000 Parking Violations 245,000 460,900 480,000 480,000 480,000 480,000 Interest on Investments — — 600 6,000 5,000 5,000 Parking Leases — 18,000 18,000 18,000 18,000 18,000 Other Receipts — 350 350 350 9,000 12,000
Total Parking Control Fund 550,000 800,472 1,062,134 1,105,534 1,112,000 1,115,000
CableCable Franchise Fees 1,144,000 1,144,000 1,168,000 1,134,000 1,050,000 842,100 Interest on Investments — — 600 2,000 2,000 2,000
Total Cable Fund 1,144,000 1,144,000 1,168,600 1,136,000 1,052,000 844,100
Law Enforcement TrainingLicenses & Permits 123,500 112,000 98,304 90,000 90,000 — Document and Copy Fees 215,000 206,160 237,894 188,000 186,500 192,000 Interest on Investments — — 15,616 25,000 28,800 26,400 Other Receipts — 25,500 24,263 28,800 28,200 50,400
Total Law Enforcement Training 338,500 343,660 376,077 331,800 333,500 268,800
Unsafe BuildingWeed Cutting Other Local Gov — — — — — 40,000 Weed Cutting Private Source — — — — — 40,000 NCED Civil Penalties — — — — — 500,000 Cost Recovery - Min Housing — — — — — 200,000 Other Receipts — — — — — 20,000
Total Unsafe Building — — — — — 800,000
TOTAL NON PT SUPPORTED FUNDS 45,542,777 50,054,486 56,065,452 56,989,929 57,711,303 82,281,859
LIT-ECONOMIC DEVELOPMENT (CEDIT)LIT - Economic Development 25,929,296 26,516,642 27,621,177 29,734,722 31,398,011 30,868,965 Interest on Investments 7,200 12,000 60,000 75,000 90,000 72,000 Sale of Land — — — — — 500,000
TOTAL LIT-ED FUND 25,936,496 26,528,642 27,681,177 29,809,722 31,488,011 31,440,965
ECON DEV ALLOCATION NON REVERTINGLIT - Economic Development — 8,714,011 8,801,634 8,900,000 10,204,354 10,032,414 Interest on Investments — 1,000 12,000 50,000 75,000 75,000 Donations and Contributions — — — — — 112,500 TOTAL ECON DEV ALLOC NON REVERTING FUND — 8,715,011 8,813,634 8,950,000 10,279,354 10,219,914
GRAND TOTAL ALL Other Receipts 116,158,593 132,157,817 141,894,314 146,427,300 150,707,048 180,775,966
2017DLGF
ApprovedBudget
2018DLGF
ApprovedBudget
2019DLGF
ApprovedBudget
2020DLGF
ApprovedBudget
2021DLGF
ApprovedBudget
2022 Submitted
2022 BUDGET PROCESSBudget Other Receipts for years 2017 - 2022By Revenue Type Per Fund
11

[This page intentionally left blank]
12
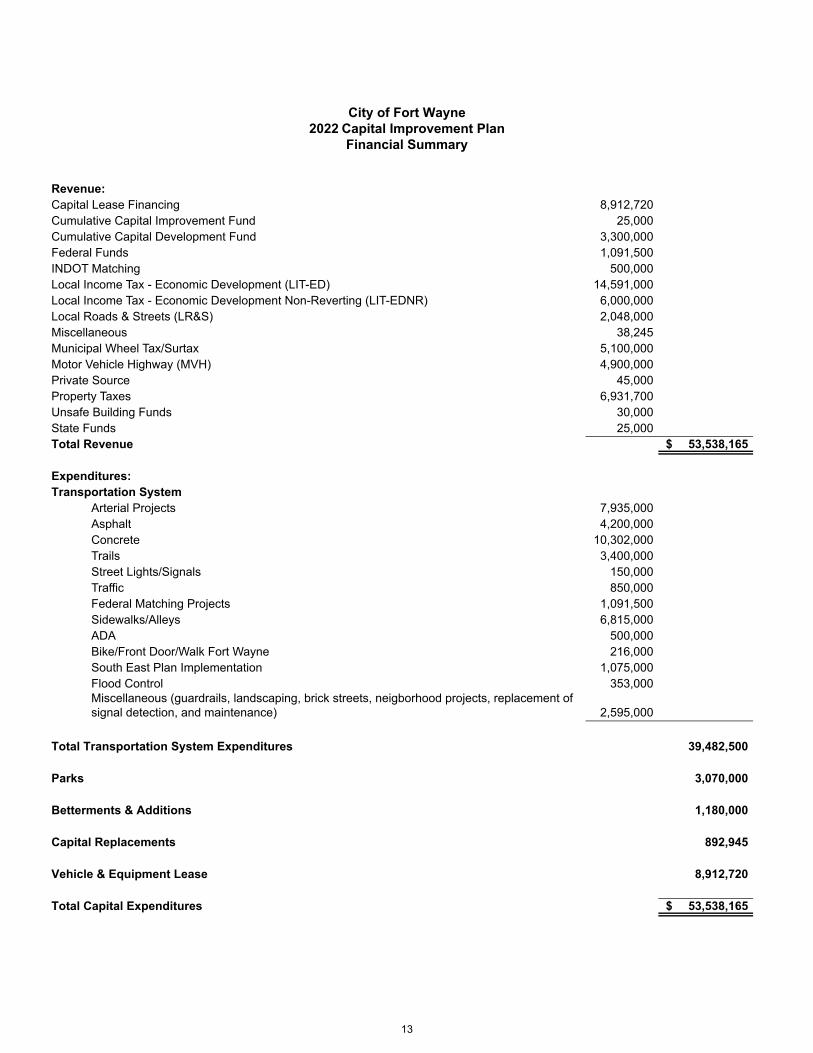
City of Fort Wayne2022 Capital Improvement Plan
Financial Summary
Revenue:Capital Lease Financing 8,912,720 Cumulative Capital Improvement Fund 25,000 Cumulative Capital Development Fund 3,300,000 Federal Funds 1,091,500 INDOT Matching 500,000 Local Income Tax - Economic Development (LIT-ED) 14,591,000 Local Income Tax - Economic Development Non-Reverting (LIT-EDNR) 6,000,000 Local Roads & Streets (LR&S) 2,048,000 Miscellaneous 38,245 Municipal Wheel Tax/Surtax 5,100,000 Motor Vehicle Highway (MVH) 4,900,000 Private Source 45,000 Property Taxes 6,931,700 Unsafe Building Funds 30,000 State Funds 25,000 Total Revenue $ 53,538,165
Expenditures:Transportation System
Arterial Projects 7,935,000 Asphalt 4,200,000 Concrete 10,302,000 Trails 3,400,000 Street Lights/Signals 150,000 Traffic 850,000 Federal Matching Projects 1,091,500 Sidewalks/Alleys 6,815,000 ADA 500,000 Bike/Front Door/Walk Fort Wayne 216,000 South East Plan Implementation 1,075,000 Flood Control 353,000 Miscellaneous (guardrails, landscaping, brick streets, neigborhood projects, replacement of signal detection, and maintenance) 2,595,000
Total Transportation System Expenditures 39,482,500
Parks 3,070,000
Betterments & Additions 1,180,000
Capital Replacements 892,945
Vehicle & Equipment Lease 8,912,720
Total Capital Expenditures $ 53,538,165
13

Animal Care and Control2022-2026 Capital Improvement Program
FUNDING SOURCE CODE:PT - Property TaxLE - Capital Lease Financing
Item # Project Title & DescriptionFundingSource
Expenditure2022 2023 2024 2025 2026
1 Vehicle Replacements: 130,490 105,654 112,275 121,923 169,869 Vans - including equipment 22-2, 23-2, 24-2, 25-2 LE 100,490 105,654 112,275 121,923 137,869
Crossover 22-1, 26-1 LE 30,000 — — — 32,000 2 Capital Replacements: 20,000 22,500 19,500 10,000 9,000
Grate Replacements in Wards PT — — — — —
Replace Existing lighting to LED options PT 10,000 10,000 — — —
Desk replacements PT 10,000 3,000 — — — Washer/Dryer/Water Heater replacement PT — 9,500 9,500 — 5,000 Off Site cage replacements PT — — 10,000 — — Off Site cage replacements PT — — — 10,000 —
Replace Vaccine Refrigerators (2) PT — — — — 4,000 3 Betterments & Additions: 78,200 — 30,000 8,500 10,000
Painting in Wards and non-public spaces PT 24,000 — — — —
Architectural and Engineering Costs for build PT 54,200 — — — — Demolish upstairs closet space & create proper storage area PT — — 15,000 — —
Replace faux paneling with drywall in 2 spaces PT — — 15,000 — —
Repair and resurface garage flooring PT — — — 8,500 — Repair and resurface freezer flooring & Evidence PT — — — — 10,000
TOTAL 228,690 128,154 151,775 140,423 188,869
14

City Council2022-2026 Capital Improvement Program
FUNDING SOURCE CODE:PT - Property Tax
Item # Project Title & DescriptionFundingSource
Expenditure2022 2023 2024 2025 2026
1 Betterments & Additions 10,000 — — — — Council Office Remodel PT 10,000 — — — —
TOTAL 10,000 — — — —
15

Community Development - Transportation System2022-2026 Capital Improvement Program
FUNDING SOURCE CODE:LIT-ED - Local Income Tax Economic Development
Item # Project Title & DescriptionFundingSource
Expenditure2022 2023 2024 2025 2026
1 Front Door/Bike/Walk Fort Wayne 216,000 1,121,000 756,000 506,000 206,000 Bike Racks/Lockers/Shed LIT-ED 30,000 20,000 70,000 20,000 20,000 Downtown Underpass Improvement/Lighting LIT-ED 36,000 176,000 86,000 86,000 86,000 Anthony Bump Out - Cody to Crescent LIT-ED — 250,000 — — — Fairfield Lighting Ph2 LIT-ED 150,000 — — — — Fairfield Streetscape LIT-ED — — — 300,000 — Lower Huntington/Bluffton Rd Sidewalk Design LIT-ED — 75,000 — — — Lower Huntington Rd Construction LIT-ED — 200,000 300,000 — — Urban Trail LIT-ED — 400,000 300,000 — —
Winchester Rd Sidewalk Construction LIT-ED — — — 100,000 100,000 2 South East Plan Implementation 1,075,000 2,225,000 975,000 200,000 —
Anthony Traffic Flow LIT-ED — — 200,000 200,000 —
Anthony Streetscape LIT-ED 75,000 750,000 — — —
Creighton Streetscape LIT-ED — 400,000 325,000 — — Oxford Streetscape - Hanna to Anthony LIT-ED — 1,000,000 — — — Oxford Streetscape - Lafayette to Hanna LIT-ED — 75,000 450,000 — —
Pontiac Street Construction LIT-ED 1,000,000 — — — — TOTAL 1,291,000 3,346,000 1,731,000 706,000 206,000
16
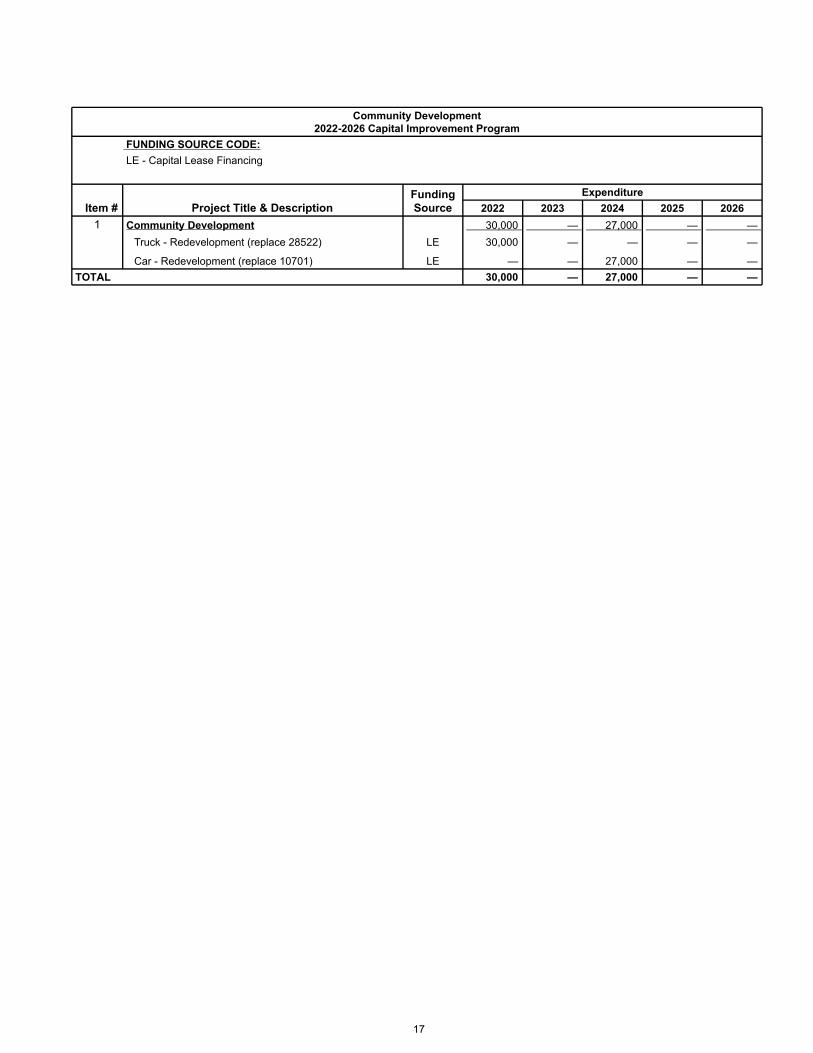
Community Development2022-2026 Capital Improvement Program
FUNDING SOURCE CODE:LE - Capital Lease Financing
Item # Project Title & DescriptionFundingSource
Expenditure2022 2023 2024 2025 2026
1 Community Development 30,000 — 27,000 — — Truck - Redevelopment (replace 28522) LE 30,000 — — — —
Car - Redevelopment (replace 10701) LE — — 27,000 — — TOTAL 30,000 — 27,000 — —
17

Cumulative Capital Improvement2022-2026 Capital Improvement Program
FUNDING SOURCE CODE:CCIF - Cumulative Capital Improvement Fund
Item # Project Title & DescriptionFundingSource
Expenditure2022 2023 2024 2025 2026
1 Information Technology 25,000 25,000 25,000 25,000 25,000 Purchase of Computer Equipment CCIF 25,000 25,000 25,000 25,000 25,000
TOTAL 25,000 25,000 25,000 25,000 25,000
18

Finance and Administration2022-2026 Capital Improvement Program
FUNDING SOURCE CODE:PT - Property TaxLE - Capital Lease Financing
Item # Project Title & DescriptionFundingSource
Expenditure2022 2023 2024 2025 2026
1 Information Technology: 325,000 175,000 80,000 180,000 80,000 Network Upgrades PT 100,000 50,000 — 50,000 —
Windows 7 Replacements PT 75,000 75,000 80,000 80,000 80,000
Data Storage PT 150,000 50,000 — 50,000 — 2 Property Management: 137,000 — — — —
Risk Training Room PT 100,000 — — — — Purchase of Vehicle LE 37,000 — — — —
TOTAL 462,000 175,000 80,000 180,000 80,000
19

Fire2022-2026 Capital Improvement Program
FUNDING SOURCE CODE:PT - Property TaxLE - Capital Lease Financing
Item # Project Title & DescriptionFundingSource
Expenditure2022 2023 2024 2025 2026
1 Station Betterments - 5369: 1,070,000 574,380 581,981 521,000 2,223,700 Concrete Replacement St# 1, 2, 5, 13, 15 PT 246,000 253,380 260,981 200,000 — Entry/Garage Door Repairs St# 6, 8 PT 11,000 11,000 11,000 11,000 11,000 Station Replacements PT — — — — 1,900,000 Furnace/AC Repairs St# 12, 17, 19 PT 93,000 90,000 90,000 90,000 92,700 Bathroom Repairs/Upgrades Various Stations PT 100,000 100,000 100,000 100,000 100,000 Windows and Siding St# 12, 16, 18, 19, Shop PT 120,000 120,000 120,000 120,000 120,000
Kitchen Hood Systems St# PT 500,000 — — — — 2 Equipment: 185,000 26,000 26,000 26,000 26,000
RAE PPB Meters PT 14,000 — — — — Scott Thermal Image Camera PT — — — — — Compressors ST# 1, 12 PT 145,000 — — — — Extractor Replacement PT 26,000 26,000 26,000 26,000 26,000
3 Apparatus Equipment: 13,699 14,110 26,222 14,969 27,819 2022: (1) Combi tool (Battery Powered) LE 13,699 — — — — 2023: (1) Combi tool (Battery Powered) LE — 14,110 — — — 2024: (1) Full Set LE — — 26,222 — — 2025: (1) Combi Tool (battery powered) LE — — — 14,969 — 2026: (1) Full Set LE — — — — 27,819
4 Fire Apparatus Replacement: 1,154,063 1,536,112 594,342 630,538 649,454
2022: (2) Engines LE 1,154,063 — — — —
2023: (1) Ladder Truck LE — 1,536,112 — — —
2024: (1) Engine LE — — 594,342 — — 2025: (1) Engine LE — — — 630,538 — 2026: (1) Engine LE — — — — 649,454
5 Vehicle Replacement: 112,445 144,414 143,459 226,252 270,955
2022: (2) SUV, (1) Compact SUV LE 112,445 — — — —
2023: (2) SUV, (1) Pickup, (1) Compact SUV LE — 144,414 — — —
2024: (1) SUV, (1) Pickup, (1) Compact SUV LE — — 143,459 — —
2025: (2) Compact SUV, (2) SUV, (1) Pickup LE — — — 226,252 —
2026: (1) Pickup, (1) SUV, (2) Compact SUV LE — — — — 270,955 TOTAL 2,535,207 2,295,016 1,372,004 1,418,759 3,197,928
20

Fleet Management2022-2026 Capital Improvement Program
FUNDING SOURCE CODE:LE - Capital Lease FinancingMISC - Fleet budget, which is charged back to all departments
Item # Project Title & DescriptionFundingSource
Expenditure2022 2023 2024 2025 2026
1 Fleet 78,245 70,000 60,000 60,000 60,000 Vehicle Replacement LE 40,000 40,000 40,000 40,000 40,000 Shop Equipment, computer, software, Radio’s MISC 38,245 30,000 20,000 20,000 20,000
TOTAL 78,245 70,000 60,000 60,000 60,000
21

Mayor2022-2026 Capital Improvement Program
FUNDING SOURCE CODE: PT - Property Tax
Item # Project Title & DescriptionFundingSource
Expenditure2022 2023 2024 2025 2026
1 Purchase of Equipment: 8,000 — — — — Replacement ID System - Human Resources PT 8,000 — — — —
TOTAL 8,000 — — — —
22

Parking Administration2022-2026 Capital Improvement Program
FUNDING SOURCE CODE:LE - Capital Lease Financing
Item # Project Title & DescriptionFundingSource
Expenditure2022 2023 2024 2025 2026
1 Vehicle Replacement: 26,000 — — — — Cmax #14361 2022 LE 26,000 — — — —
TOTAL 26,000 — — — —
23

Parks and Recreation2022-2026 Capital Improvement Program
FUNDING SOURCE CODE:PS - Private SourcePT - Property TaxST - State Source
ITEM # PROJECT TITLE & DESCRIPTION FundingSource
Expenditure2022 2023 2024 2025 2026
1 Master Lease Program - Trucks, Light Duty Vehicles & Equipment PT 731,151 700,000 700,000 700,000 700,000
2 ADA Improvements PT 60,000 60,000 60,000 60,000 60,000 3 Computer Equipment PT 30,000 30,000 30,000 30,000 30,000 4 Office Equipment PT 10,000 10,000 10,000 10,000 10,000 5 Betterments & Additions PT 300,000 360,000 350,000 350,000 440,000
6 Resurfacing Roads\Parking Lots\Tennis Courts\Basketball Courts PT 318,849 390,000 380,000 360,000 440,000
7 Playground Site Equipment-Various Parks PT 80,000 80,000 100,000 100,000 100,000 PS 25,000 25,000 25,000 25,000 25,000
8 Landscaping Parks & Boulevards PT 60,000 60,000 60,000 60,000 60,000 9 Various Parks - Park Signage PT — 30,000 30,000 30,000 30,000 10 Street Tree (EAB - Emerald Ash Borer Treatment) PT 30,000 30,000 30,000 30,000 30,000 11 Street Tree Planting PT 100,000 100,000 100,000 100,000 100,000
ST 25,000 25,000 25,000 25,000 25,000 12 Street Tree Planting (Citizen Request Match) PT 35,000 35,000 35,000 35,000 35,000 13 Park Tree Planting (Canopy Recovery & EAB) PT 45,000 45,000 45,000 45,000 45,000
PS 20,000 20,000 20,000 20,000 20,000 14 Botanical Conservatory - Glass Replacement PT 50,000 50,000 50,000 50,000 50,000 15 Various Parks - Shelter/Pavilion Renovations PT 120,000 40,000 40,000 60,000 60,000 16 Various Parks - Site Furnishing Replacement PT 30,000 30,000 30,000 30,000 30,000 17 Various Parks - Energy Conservation PT 50,000 50,000 50,000 50,000 50,000 18 Community Center Roof Replacement PT 290,000 — — — — 19 Kreager Park - Safety Surfacing of Taylor's Dream PT 260,000 — — — — 20 Kreager Park - Soccer Fields PT — — — 200,000 200,000 21 Land Acquisition PT — 250,000 250,000 — — 22 Memorial Park - Various Improvements PT 50,000 — — — — 23 Monument Restoration PT 50,000 50,000 50,000 50,000 50,000 24 Neighborhood Facilities - Improvements and
Renovations PT 50,000 50,000 50,000 50,000 50,000
25 Recreation Facilities - Improvements and Renovations PT 50,000 50,000 50,000 50,000 50,000 26 Salomon Farm - Master Plan Implementation PT 50,000 50,000 50,000 50,000 50,000 27 Salomon Farm - Various Maintenance PT 50,000 50,000 50,000 50,000 50,000 28 Foster Park Golf Course Improvements PT — — — — 180,000 29 Swinney Park - Mechanic Street Bridge Improvements PT — 300,000 300,000 — — 30 Botanical Conservatory HVAC Improvements PT — — — 350,000 — 31 Children’s Zoo Improvements PT 100,000 100,000 100,000 100,000 100,000
SubtotalsPT (Property Tax) 3,000,000 3,000,000 3,000,000 3,000,000 3,000,000 ST (State Source) 25,000 25,000 25,000 25,000 25,000 PS (Private Source) 45,000 45,000 45,000 45,000 45,000
TOTAL 3,070,000 3,070,000 3,070,000 3,070,000 3,070,000
24

Police2022-2026 Capital Improvement Program
FUNDING SOURCE CODE:LE - Capital Lease FinancingPT - Property Tax
Item # Project Title & DescriptionFundingSource
Expenditure2022 2023 2024 2025 2026
1 Purchase/Replacement of Vehicles 3,338,533 5,686,530 5,723,173 5,840,644 5,585,627 Marked including equipment
2022(60);2023(80);2024(80);2025(80);2026(80) LE 2,600,899 3,966,470 4,088,242 4,213,807 4,343,284 Unmarked (full police vehicle) with lighting packages; equipment
2022(0);2023(10);2024(10);2025(10);2026(10) LE — 436,134 449,218 462,694 476,575
Pick Up Truck - Crime Scene/Radio Shop
2022(1);2023(0);2024(1);2025(1);2026(1) LE 49,549 — 52,566 54,143 55,768
4x4 SUV Tahoe (EST)
2022(10);2023(10);2024(6);2025(0);2026(0) LE 528,084 543,927 336,147 — —
Raid Van LE — 30,000 32,000 — —
ASU Tactical Vehicle LE — 340,000 — — —
EST Tactical Oper Center TOC LE — — — — 200,000
Mobile Data Computers Replacements - out of warranty
2022(20);2023(20);2024(139);2025(208);2026(88) LE 100,000 310,000 695,000 1,040,000 440,000
V/N Unmarked - Used
2022(3);2023(3);2024(3);2025(3);2026(3) LE 60,000 60,000 70,000 70,000 70,000 2 Other Equipment - 5444 467,037 675,200 2,946,750 259,205 604,475
K9 replacements -2022(1);2023(2);2024(3);2025(3);2026(4) PT 7,500 16,000 24,000 24,000 36,000 DR X-Ray System (New) - 2022(0);2023(3);2024(2);2025(1);2026(0) LE — 145,200 96,800 48,400 — CR X-Ray System (Replacement) 2023(3) LE 105,000 — — — CR X-Ray - New (NBSCAB requirement) LE — 45,000 — — — Bomb Suit - (EOD) replacement 2022(1);2026(1) LE 40,000 — — — 44,770 Tactical Vest (EOD) 2022(2);2026(9) LE 12,000 — — — 54,000 Fireworks/Ammunition Disposal Vessel (EOD) LE — 40,000 — — — JetScan iFX 135 Money Counter LE 7,562 — — — — SCBA (EOD) 2023(2) LE — 10,000 — — — PAN Disrupter (EOD) 2023(1) LE — 6,500 — — — WASP(Wide Area Surveillance Platform) System VN LE — 15,000 — — — Ultra LITE Ultra Turbo Kit (CSU) LE — 6,000 — — — Rugged All-Weather Drone (ASU) LE — — — 50,000 — Fixed Winged-VTOL(ASU) LE — 150,000 — — — OSCR360 (CSU) Enhance processing of scenes in and outdoors LE — 12,400 — — — DRACO Gas System (EST) 2023(1);2024(1) LE 18,000 20,000 — — — Robot Replacement for Vanguard (EOD) LE 65,000 — — — — Replacement of SWAT body Armor(EST) LE — — — — 292,800 Replacement First Responder UAS Kits (ASU) LE 70,000 — 75,000 — 80,000 Indoor Drone-BRINC(ASU) LE 9,000 9,100 9,200 9,300 9,400 Drangonfish Drone (ASU) LE 130,950 — — — — DGI300 Level Payload Capable Drone(ASU) LE — 45,000 — — —
25

Police2022-2026 Capital Improvement Program
FUNDING SOURCE CODE:LE - Capital Lease FinancingPT - Property Tax
Item # Project Title & DescriptionFundingSource
Expenditure2022 2023 2024 2025 2026
FLIR AN/PVS-27 MUNS Night Vision Scope (EST) LE 14,000 — — — — FLIR T70 Advanced Combat Thermal Sight (Short Range) (EST) LE 15,000 — — — —
Alternate Light Source (Lab) LE — 20,000 — — —
Throw Phone System (CRT) LE 15,025 30,000 — — 30,000
Laser Shot Upgrade(Academy) LE 28,000 — — — —
Shields (Academy) 2022(5) LE 35,000 — — — —
Remote Fire Set (EOD) LE — — 35,000 — —
Remote Cutting Tool (EOD) LE — — — 75,000 —
Bomb Suit Communications System (EOD) LE — — — — 45,000
CyanoSafe Chamber (Lab) LE — — 6,750 — —
Labconco Paramount Ductless Powder Hoods (Lab) LE — — — 12,505 12,505
Counter-UAS Platform (ASU) LE — — — 40,000 —
Replacement of Motorola hand-held radios LE — — 2,700,000 — — 3 Computer Equipment - 5445 21,453 — 18,000 — —
Dell Precision Workstation Real Crime Center 2022(3) LE 21,453 — — — —
CRT Interior Vehicle Computer Replacement LE — — 18,000 — —
Radio Shop1 Purchase/Replacement of Vehicles — 38,500 38,500 — —
Vehicle Replacement - 28358 LE — 38,500 — — —
Vehicle Replacement - 28357 LE — — 38,500 — —
2 Other Equipment - 5444 115,000 — — — —
Diagonstix System Replacement LE 115,000 — — — —
3 Betterments and Additions - 5454 — 4,000,000 — — —
Purchase of new Radio Shop PT — 4,000,000 — — —
TOTAL 3,942,023 10,400,230 8,726,423 6,099,849 6,190,102
26
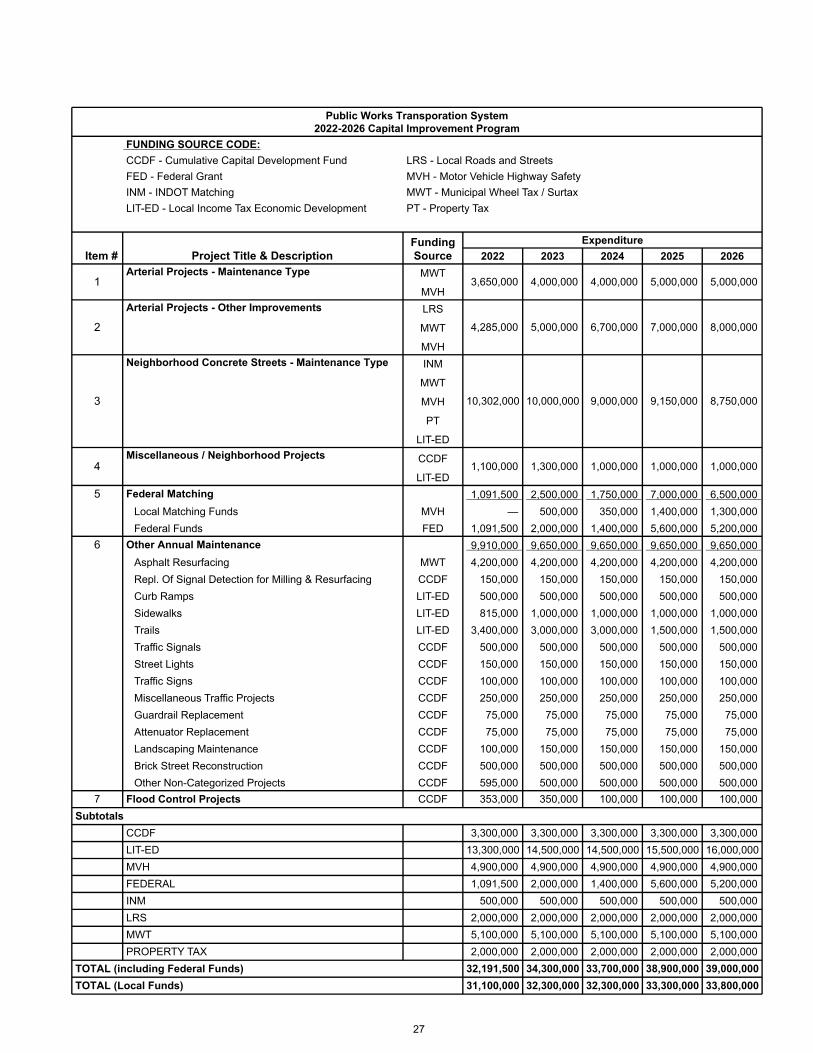
Public Works Transporation System2022-2026 Capital Improvement Program
FUNDING SOURCE CODE:CCDF - Cumulative Capital Development Fund LRS - Local Roads and StreetsFED - Federal Grant MVH - Motor Vehicle Highway SafetyINM - INDOT Matching MWT - Municipal Wheel Tax / SurtaxLIT-ED - Local Income Tax Economic Development PT - Property Tax
Item # Project Title & DescriptionFundingSource
Expenditure2022 2023 2024 2025 2026
1Arterial Projects - Maintenance Type MWT
3,650,000 4,000,000 4,000,000 5,000,000 5,000,000 MVH
2
Arterial Projects - Other Improvements LRS
4,285,000 5,000,000 6,700,000 7,000,000 8,000,000 MWT
MVH
3
Neighborhood Concrete Streets - Maintenance Type INM
10,302,000 10,000,000 9,000,000 9,150,000 8,750,000
MWT
MVH
PT
LIT-ED
4Miscellaneous / Neighborhood Projects CCDF
1,100,000 1,300,000 1,000,000 1,000,000 1,000,000 LIT-ED
5 Federal Matching 1,091,500 2,500,000 1,750,000 7,000,000 6,500,000 Local Matching Funds MVH — 500,000 350,000 1,400,000 1,300,000 Federal Funds FED 1,091,500 2,000,000 1,400,000 5,600,000 5,200,000
6 Other Annual Maintenance 9,910,000 9,650,000 9,650,000 9,650,000 9,650,000 Asphalt Resurfacing MWT 4,200,000 4,200,000 4,200,000 4,200,000 4,200,000 Repl. Of Signal Detection for Milling & Resurfacing CCDF 150,000 150,000 150,000 150,000 150,000 Curb Ramps LIT-ED 500,000 500,000 500,000 500,000 500,000 Sidewalks LIT-ED 815,000 1,000,000 1,000,000 1,000,000 1,000,000 Trails LIT-ED 3,400,000 3,000,000 3,000,000 1,500,000 1,500,000 Traffic Signals CCDF 500,000 500,000 500,000 500,000 500,000 Street Lights CCDF 150,000 150,000 150,000 150,000 150,000 Traffic Signs CCDF 100,000 100,000 100,000 100,000 100,000 Miscellaneous Traffic Projects CCDF 250,000 250,000 250,000 250,000 250,000 Guardrail Replacement CCDF 75,000 75,000 75,000 75,000 75,000 Attenuator Replacement CCDF 75,000 75,000 75,000 75,000 75,000 Landscaping Maintenance CCDF 100,000 150,000 150,000 150,000 150,000 Brick Street Reconstruction CCDF 500,000 500,000 500,000 500,000 500,000 Other Non-Categorized Projects CCDF 595,000 500,000 500,000 500,000 500,000
7 Flood Control Projects CCDF 353,000 350,000 100,000 100,000 100,000 Subtotals
CCDF 3,300,000 3,300,000 3,300,000 3,300,000 3,300,000 LIT-ED 13,300,000 14,500,000 14,500,000 15,500,000 16,000,000 MVH 4,900,000 4,900,000 4,900,000 4,900,000 4,900,000 FEDERAL 1,091,500 2,000,000 1,400,000 5,600,000 5,200,000 INM 500,000 500,000 500,000 500,000 500,000 LRS 2,000,000 2,000,000 2,000,000 2,000,000 2,000,000 MWT 5,100,000 5,100,000 5,100,000 5,100,000 5,100,000 PROPERTY TAX 2,000,000 2,000,000 2,000,000 2,000,000 2,000,000
TOTAL (including Federal Funds) 32,191,500 34,300,000 33,700,000 38,900,000 39,000,000 TOTAL (Local Funds) 31,100,000 32,300,000 32,300,000 33,300,000 33,800,000
27

Public Works Transportation Systems2022-2026 Capital Improvement Program
FUNDING SOURCE CODE:LIT-EDNR - Local Income Tax Economic Development Non-Reverting
Item # Project Title & Description
FundingSource
Expenditure2022 2023 2024 2025 2026
1 Sidewalks LIT-EDNR 3,500,000 2,500,000 2,500,000 1,500,000 1,500,000 2 Alleys LIT-EDNR 2,500,000 2,500,000 2,500,000 1,500,000 1,500,000
TOTAL 6,000,000 5,000,000 5,000,000 3,000,000 3,000,000
28

Public Works2022-2026 Capital Improvement Program
FUNDING SOURCE CODE:LE - Capital Lease FinancingPT - Property Tax
Item # Project Title & DescriptionFundingSource
Expenditure2022 2023 2024 2025 2026
Transportation Administration1 Vehicle Replacement: 73,000 75,000 80,000 80,000 80,000
ROW Pickup Replacement LE 35,000 — — — — ROW Pickup Replacement LE — 35,000 — — — ROW SUV Escape Replacement LE — — 40,000 — — ROW Pickup Replacement LE — — — 40,000 — ROW Pickup Replacement LE — — — — 40,000
TES Pickup Replacements LE 38,000 40,000 40,000 40,000 40,000 2 Equipment: 61,000 — — — —
ROW Trailer LE 15,000 — — — —
ROW Sidewalk Grinder/Plainer Electric LE 14,000 — — — —
TES Landscape Equipment PT 32,000 — — — — Flood Control
1 Equipment: 80,000 80,000 80,000 125,000 30,000
8" Godwin Pump PT — — — 95,000 —
Pump Station Telemetry PT 30,000 30,000 30,000 30,000 30,000
SCADA System Upgrade (Early Flood Warning System) PT 50,000 50,000 50,000 — — Street Lighting
1 Vehicle Replacements: 40,000 85,000 100,000 85,000 160,000
Pickup Replacement LE — 45,000 — 45,000 —
2013 Ford F150 LE 40,000 40,000 — — —
2009 Ford Escape LE — — 30,000 — —
2000 Komatsu Fork Lift LE — — 70,000 — —
2016 Ford F550 Bucket Truck LE — — — — 160,000
Utility Pole Trailer LE — — — 40,000 — 2 Equipment: 16,000 16,000 14,000 16,000 11,000
Locator PT 7,000 8,000 8,000 8,000 8,000
Generator PT — — 6,000 — —
Pole Extractor PT 9,000 — — — —
Truck Electronics PT — — — 8,000 3,000
Wire Trailer PT — 8,000 — — — TOTAL 270,000 256,000 274,000 306,000 281,000
29

Street Department2022-2026 Capital Improvement Program
FUNDING SOURCE CODE:LE - Capital Lease Financing
Item # Project Title & DescriptionFundingSource
Expenditure2022 2023 2024 2025 2026
1 Vehicle Replacements: 1,930,000 1,925,000 1,925,000 1,925,000 1,925,000 Tandem Dump and snow equipment (2) replacements LE 560,000 560,000 560,000 560,000 560,000 Single Axel dump and snow equipment (4) replacements LE 1,000,000 1,000,000 1,000,000 1,000,000 1,000,000 Crew cab dump (2) replacements LE 290,000 285,000 285,000 285,000 285,000
Pickups 4x4 (2) replacements LE 80,000 80,000 80,000 80,000 80,000 2 Equipment: 1,229,500 259,000 627,500 195,000 604,500
Loader (1) replacement LE 270,500 — 27,500 — 27,500
Zero turn mowers (2) replacements LE 14,000 15,000 — 36,000 36,000
Salters tandems V boxes (2) LE 100,000 53,000 53,000 54,000 54,000
Backhoe replacement LE — 95,000 — 105,000 —
Tractor Enclosed replacement LE 45,000 — 45,000 — 45,000
Track skid loader replacement unit LE — — 60,000 — 60,000
Slope mower LE — 45,000 — — —
Sweeper skid steer replacement LE — — 12,000 — 12,000
Street sweeper replacement LE 350,000 — 350,000 — 350,000
Asphalt Patcher trailer box LE 80,000 — 80,000 — — Brush Chipper replacement LE — 36,000 — — — Woods Mower (3) replacements LE 20,000 15,000 — — 20,000
Etynre chip spreader LE 350,000 — — — — TOTAL 3,159,500 2,184,000 2,552,500 2,120,000 2,529,500
30

Street Project Management2022-2026 Capital Improvement Program
FUNDING SOURCE CODE:LE - Capital Lease Financing
Item # Project Title & DescriptionFundingSource
Expenditure2022 2023 2024 2025 2026
1 Vehicle Replacements: — 32,000 33,000 35,000 35,000 Pickup replacement #23852 LE — 32,000 — — — Pickup replacement #23851 LE — — 33,000 — — Pickup replacement #24372 LE — — — 35,000 — Pickup replacement #24331 LE — — — — 35,000
Pickup replacement #24332 LE — — — — — TOTAL — 32,000 33,000 35,000 35,000
31

Traffic Engineering2022-2026 Capital Improvement Program
FUNDING SOURCE CODE:LE - Capital Lease FinancingLRS - Local Roads & Streets
Item # Project Title & DescriptionFundingSource
Expenditure2022 2023 2024 2025 2026
1 Vehicle Replacements: 133,000 180,000 275,000 220,000 350,000 1999 Sign Arrow Truck Ford F-250 LE 38,000 — — — — 2000 Ford Challenger Lift LE — 140,000 — — — 2008 Ford Expedition LE — — 40,000 — — 1998 Skid Loader LE — — 85,000 — — 2000 Ford F250 Signal Pickup TE 30 LE 55,000 — — — — 2002 Ford F250 Crewcab Sign Pickup LE 40,000 — — — — 2006 Ford F450 Sign Truck LE — — — 120,000 — 1999 Ford F250 4x4 Sign Pickup LE — 40,000 — — — 2011 F550 Bucket Truck LE — — 150,000 — — 2010 Ford F450 Dump Truck LE — — — 100,000 — 2004 International 4300 Line Truck LE — — — — 350,000
2 Equipment: 48,000 23,000 31,000 29,000 18,000
Air Compressor/Generator LRS 40,000 — — — —
Paint Machine LRS — 15,000 — — 15,000
Loop Saw LRS — — — 10,000 —
Locator LRS 8,000 8,000 9,000 — —
Grinder LRS — — 10,000 — — Sign Printer LRS — — 12,000 — — Truck Electronics LRS — — — 7,000 3,000
Sign Printing Software LRS — — — 12,000 — TOTAL 181,000 203,000 306,000 249,000 368,000
32

Unsafe Building2022-2026 Capital Improvement Program
FUNDING SOURCE CODE:UNSF - Unsafe Building Funds
Item # Project Title & DescriptionFundingSource
Expenditure2022 2023 2024 2025 2026
1 Equipment: 30,000 60,000 30,000 30,000 60,000 Vehicle Purchase - NCE UNSF 30,000 30,000 30,000 30,000 30,000 Vehicle Purchase - NCE UNSF — 30,000 — — 30,000
TOTAL 30,000 60,000 30,000 30,000 60,000
33

[This page intentionally left blank]
34

OBLIGATION Term
1/1/2022 Outstanding
Principal Balance
2022Payment
Total
1/1/2023 Outstanding
PrincipalBalance
2023Payment
Total
1/1/2024Outstanding
PrincipalBalance
2024Payment
Total
1/1/2025Outstanding
PrincipalBalance
PRIMARY GOVERNMENT
GOVERNMENTAL ACTIVITIES
General Obligation Bonds
Series 2017 Park District Bonds 12yr $ 3,805,000 $ 814,404 $ 3,075,000 $ 812,337 $ 2,330,000 $ 809,863 $ 1,570,000
Total Current General Obligation Bonds $ 3,805,000 $ 814,404 $ 3,075,000 $ 812,337 $ 2,330,000 $ 809,863 $ 1,570,000
Special Obligation Bonds
LIT Refunding Rev Bonds 2019A 25yr $ 8,635,000 $ 864,309 $ 8,080,000 $ 863,925 $ 7,505,000 $ 867,722 $ 6,905,000
LIT Refunding Rev Bonds 2019B 25yr 8,760,000 878,768 8,195,000 878,020 7,610,000 871,635 7,010,000
Total Current Special Obligation Bonds $ 17,395,000 $ 1,743,077 $ 16,275,000 $ 1,741,945 $ 15,115,000 $ 1,739,357 $ 13,915,000
First Mortgage Bonds:
Series 2006 Amended - Public Safety Academy 17yr $ 1,850,000 $ 1,942,685 $ — $ — $ — $ — $ —
Series 2020 City Hall Project Refunding Bonds 10yr 7,410,000 566,100 6,990,000 1,075,150 6,050,000 1,076,200 5,090,000
Total Current First Mortgage Bonds $ 9,260,000 $ 2,508,785 $ 6,990,000 $ 1,075,150 $ 6,050,000 $ 1,076,200 $ 5,090,000
Other Special Obligation Bonds
Series 2014 Infrastructure CEDIT Bond 8yr $ 2,340,000 $ 2,368,431 $ — $ — $ — $ — $ —
Series 2012 Rdv Auth Refunding Bds - GW Ctr 16yr 12,255,000 2,150,350 10,605,000 2,007,850 9,025,000 2,023,450 7,365,000
Series 2014 Rdv Auth Refunding Bds - Stadium 19.5yr 20,815,000 3,393,887 18,380,000 3,392,637 15,825,000 3,373,387 13,160,000
Series 2014A Rdv Auth - Downtown Dev. Pking. 20yr 14,860,000 1,436,776 13,870,000 1,506,251 12,780,000 1,552,801 11,610,000
Series 2016 Rdv Auth Skyline Residential Tower 14yr 2,890,000 379,662 2,570,000 363,112 2,260,000 317,212 1,990,000
Series 2021 Rdv Auth - Eletric Works 25yr 43,165,000 1,433,800 43,165,000 1,433,800 43,165,000 1,433,800 43,165,000
Total Other Special Obligation Bonds $ 96,325,000 $ 11,162,906 $ 88,590,000 $ 8,703,650 $ 83,055,000 $ 8,700,650 $ 77,290,000
Capital Leases:
2016 Equipment Lease 7yr $ 2,167,357 $ 1,470,366 $ 728,780 $ 735,183 $ — $ — $ —
2017 Equipment Lease 7yr 3,765,626 1,552,950 2,282,410 1,552,952 768,586 776,476 —
2018 Equipment Lease 7yr 5,211,479 1,581,811 3,778,748 1,581,812 2,301,694 1,581,810 778,948
2019 Equipment Lease 7yr 6,774,862 1,608,343 5,338,913 1,608,344 3,864,136 1,608,344 2,349,479
2020 Equipment Lease 7yr 10,393,354 1,959,773 8,555,188 1,959,773 6,694,454 1,959,773 4,810,875
2021 Equipment Lease 7yr 11,086,133 1,786,006 9,442,125 1,786,004 7,776,180 1,786,005 6,088,004
Total Current Capital Leases $ 39,398,811 $ 9,959,249 $ 30,126,164 $ 9,224,068 $ 21,405,050 $ 7,712,408 $ 14,027,306
New Capital Leases
2022 Equipment Lease 7yr $ 9,550,000 $ 747,814 $ 8,921,561 $ 1,495,628 $ 7,641,018 $ 1,495,628 $ 6,328,261
Total New Capital Leases $ 9,550,000 $ 747,814 $ 8,921,561 $ 1,495,628 $ 7,641,018 $ 1,495,628 $ 6,328,261
PRIMARY GOVERNMENT
Other Loans Payable
2008 A CERC of Indiana 20yr $ 2,400,000 $ 526,360 $ 2,000,000 $ 503,840 $ 1,600,000 $ 485,080 $ 1,200,000
2013 CERC of Indiana 20yr 1,300,000 131,958 1,210,000 129,752 1,120,000 127,233 1,030,000
Total Current Other Loans Payable $ 3,700,000 $ 658,318 $ 3,210,000 $ 633,592 $ 2,720,000 $ 612,313 $ 2,230,000
DISCRETELY PRESENTED COMPONENT UNITS
Series 2012 Rdv Auth Refunding Bds - GW Ctr 16yr $ 11,430,000 $ 2,119,000 $ 9,815,000 $ 2,051,500 $ 8,195,000 $ 2,052,000 $ 6,510,000
Total Current Lease Rental Rev Bds $ 11,430,000 $ 2,119,000 $ 9,815,000 $ 2,051,500 $ 8,195,000 $ 2,052,000 $ 6,510,000
Series 2019A Parking Garage Revenue Bonds 30yr $ 7,890,000 $ 274,219 $ 7,860,000 $ 273,319 $ 7,830,000 $ 272,419 $ 7,800,000
Total Revenue Bonds $ 7,890,000 $ 274,219 $ 7,860,000 $ 273,319 $ 7,830,000 $ 272,419 $ 7,800,000
*For the City’s legal debt limit, see the City’s Annual Comprehensive Financial Report.
CIVIL CITY BUDGETED DEBTFOR KNOWN ANTICIPATED DEBT
AS OF 08/31/2021
35

[This page intentionally left blank]
36

BILL NO. S
SPECIAL ORDINANCE NO. S- AN ORDINANCE fixing the salaries of
each and every appointed officer, employee, deputy assistant, departmental
and institutional head of the Civil City and City Utilities of the City
of Fort Wayne, Indiana for the year 2022
WHEREAS, the Mayor and the Common Council of the City of Fort Wayne, Indiana, have according to the powers outlined in IC 36-4-7-3 assigned to each employee of the Civil City of Fort Wayne and of City Utilities of Fort Wayne a job classification under the City Classification System, which job classification should accurately reflect the duties and responsibilities of said employees, and
WHEREAS, the Mayor of the City of Fort Wayne has recommended a maximum salary level for each job classification should accurately reflect the duties and responsibilities of said employees, and
WHEREAS, the Clerk of the City of Fort Wayne, the Board of Park Commissioners, and the Metropolitan Human Relations Commission have recommended job classification designations for positions within their respective jurisdictions, and
WHEREAS, the Common Council must assure that salaries reflect the duties and responsibilities assigned to each employee, and to be certain that such salaries are fair and equitable and
WHEREAS, the funds of such salaries are to be provided for the 2022 City Budget and from City Utilities operating funds and other sources as may be specified by Common Council.
NOW THEREFORE, BE IT ORDAINED BY THE COMMON COUNCIL OF THE CITY OF FORT WAYNE, INDIANA:
SECTION 1. That all employees of the Civil City of Fort Wayne and of City Utilities, shall be classified by the division/department, job classification, and titles.
SECTION 2. That the following Grid is hereby fixed and authorized as a scale for approved job classifications. Consistent with our compensation philosophy, it is the City's policy that no employee shall be paid below the minimum and the maximum should not be exceeded, except for approved special occupations, shift differentials, approved longevity pay, approved overtime pay, approved technical skill pay, approved clothing allowance, approved previously accrued vacation payoff, sick time, FLSA earned compensatory time, approved car allowance or approved productivity bonus, as outlined in the City's approved work rules.
SEE EXHIBIT "A" ATTACHED HERETO AND MADE A PART HEREOF IN IT'S ENTIRETY
This Grid, as reflected on Exhibit "A", is an attempt to maintain an orderly, consistent and competitive pay policy that includes a "bonus" program for superior performance and a "Grid System" that represents the actual market range for positions within the City of Fort Wayne and City Utilities.
SECTION 3. The following job classifications are a true and complete listing of all Civil City and City Utilities positions by division/department, job classification, and titles.
37

DIVISION/DEPARTMENT GRID CLASSIFICATION TITLE
City ClerkCOMOT ADMINISTRATIVE ASSISTANTPAT ASSISTANT DEPUTY CLERKPAT ASSISTANT DEPUTY CLERK – VIOLATIONSLTC ASSISTANT METER REPAIRPAT DEPUTY CLERKLTC METER REPAIR PERSONLTC PARKING CONTROL OFFICERPAT PARKING CONTROL SUPERVISORCOMOT VIOLATIONS BUREAU SPECIALIST
City CouncilCOMOT CITIZEN SERVICES COORDINATORPAT CITY COUNCIL ADMINISTRATORUC CITY COUNCIL ATTORNEY
City UtilitiesPAT ACCOUNTANTCOMOT ACCOUNTING ASSISTANTCOMOT ADMINISTRATIVE ASSISTANTPAT ANALYTICAL CHEMISTEXE ASSOCIATE CITY ATTORNEYPAT ASSISTANT MANAGER OF FINANCIAL OPERATIONSPAT ASSISTANT MANAGERPAT ASSISTANT PROGRAM MANAGERLTC ASSISTANT STOREKEEPERPAT ASSISTANT SUPERINTENDENTLTC BIO-SOLID EQUIPMENT OPERATORPAT BUSINESS SERVICES COORDINATORLTC CHIEF ELECTRICIANLTC CHIEF PLANT OPERATORLTC CHIEF RELIEF PLANT OPERATORPAT CMMS ADMINISTRATORCOMOT CMMS INTERNLTC COMBINATION REPAIRER/TRUCK DRIVERPAT CONSTRUCTION CONTRACT MANAGERLTC CONSTRUCTION SUPERVISORLTC CREW SUPERVISORPAT CUSTOMER SUPPORT & BILLING MANAGERCOMOT CUSTOMER SUPPORT INFORMATION SPECIALISTCOMOT CUSTOMER SUPPORT INFORMATION ANALYSTCOMOT CUSTOMER SUPPORT REPRESENTATIVEPAT CUSTOMER SUPPORT SUPERVISORCOMOT CUSTOMER SUPPORT TEAM LEADSO DEPUTY DIRECTORPAT DESIGNEREXE DIRECTOR OF CITY UTILITIESCOMOT DISPATCHERCOMOT DISPATCHER/BUILDING ATTENDANTLTC ELECTRICIANLTC ELECTRONICS TECHNICIANSO ENGINEERPAT ENGINEERING ASSOCIATESO ENGINEERING PROGRAM MANAGERPAT ENGINEERING REPRESENTATIVEPAT EXECUTIVE ASSISTANT
38
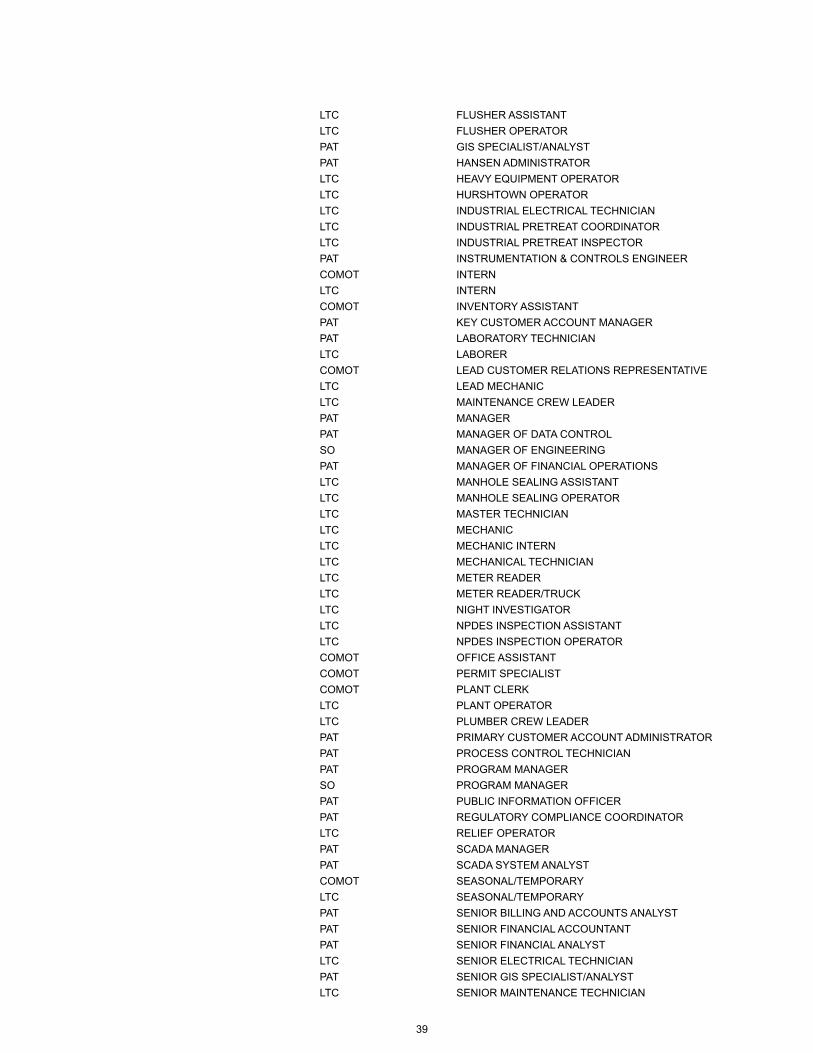
LTC FLUSHER ASSISTANTLTC FLUSHER OPERATORPAT GIS SPECIALIST/ANALYSTPAT HANSEN ADMINISTRATORLTC HEAVY EQUIPMENT OPERATORLTC HURSHTOWN OPERATORLTC INDUSTRIAL ELECTRICAL TECHNICIANLTC INDUSTRIAL PRETREAT COORDINATORLTC INDUSTRIAL PRETREAT INSPECTORPAT INSTRUMENTATION & CONTROLS ENGINEERCOMOT INTERNLTC INTERNCOMOT INVENTORY ASSISTANTPAT KEY CUSTOMER ACCOUNT MANAGERPAT LABORATORY TECHNICIANLTC LABORERCOMOT LEAD CUSTOMER RELATIONS REPRESENTATIVELTC LEAD MECHANICLTC MAINTENANCE CREW LEADERPAT MANAGERPAT MANAGER OF DATA CONTROLSO MANAGER OF ENGINEERINGPAT MANAGER OF FINANCIAL OPERATIONSLTC MANHOLE SEALING ASSISTANTLTC MANHOLE SEALING OPERATORLTC MASTER TECHNICIANLTC MECHANICLTC MECHANIC INTERNLTC MECHANICAL TECHNICIANLTC METER READERLTC METER READER/TRUCKLTC NIGHT INVESTIGATORLTC NPDES INSPECTION ASSISTANTLTC NPDES INSPECTION OPERATORCOMOT OFFICE ASSISTANTCOMOT PERMIT SPECIALISTCOMOT PLANT CLERKLTC PLANT OPERATORLTC PLUMBER CREW LEADERPAT PRIMARY CUSTOMER ACCOUNT ADMINISTRATORPAT PROCESS CONTROL TECHNICIANPAT PROGRAM MANAGERSO PROGRAM MANAGERPAT PUBLIC INFORMATION OFFICERPAT REGULATORY COMPLIANCE COORDINATORLTC RELIEF OPERATORPAT SCADA MANAGERPAT SCADA SYSTEM ANALYSTCOMOT SEASONAL/TEMPORARYLTC SEASONAL/TEMPORARYPAT SENIOR BILLING AND ACCOUNTS ANALYSTPAT SENIOR FINANCIAL ACCOUNTANTPAT SENIOR FINANCIAL ANALYSTLTC SENIOR ELECTRICAL TECHNICIANPAT SENIOR GIS SPECIALIST/ANALYSTLTC SENIOR MAINTENANCE TECHNICIAN
39

LTC SENIOR OPERATORLTC SERVICE TECHNICIANPAT SEWER & STORMWATER PROGRAM MANAGERLTC SEWER PROJECT MANAGERLTC SEWER SYSTEM INSPECTORLTC SPECIAL INVESTIGATORLTC STOREKEEPEREXE SUPERINTENDENTPAT SUPERVISORLTC SUPERVISORCOMOT SYSTEM PROCESS SPECIALISTPAT TEAM LEADERLTC TANDEM DRIVERLTC TV/VACUUM ASSISTANTLTC TV/VACUUM OPERATORPAT UTILITY ENGINEERING ASSOCIATE TECHNICIANPAT UTILITY ENGINEERING TECHNICIANLTC UTILITY MAINTENANCE WORKERPAT UTILITY SERVICES MANAGERPAT WEEKEND ANALYTICAL CHEMISTLTC WORKING FOREMANLTC WORKING LEADER
Community DevelopmentCOMOT ABANDONED VEHICLE SPECIALISTCOMOT ABANDONED VEHICLE SPECIALIST/TRAINING FACILITATORPAT ACCOUNTANTCOMOT ADMINISTRATIVE ASSISTANTPAT ASSISTANT TO COMMUNITY LIAISONCOMOT CASE SYSTEM SPECIALISTPAT CD ADMINISTRATORPAT CD MANAGERPAT CD SPECIALISTPAT CODE COMPLIANCE OFFICERPAT COMMUNITY LIAISONCOMOT COMPLIANCE RECORDS SPECIALISTCOMOT COMPLIANCE SERVICE SPECIALIST/DISPATCHPAT CONSTRUCTION SPECIALISTEXE DEPUTY DIRECTOREXE DIRECTOREXE DIRECTOR OF COMMUNITY DEVELOPMENTPAT DIRECTOR OF FINANCEPOLE FIELD SUPERVISORCOMOT INTERNPAT OFFICE SUPERVISORCOMOT SEASONAL/TEMPORARYPAT SENIOR LOAN SPECIALISTCOMOT WEED PROGRAM INSPECTOR
Finance and AdministrationPAT ACCOUNTANTCOMOT ADMINISTRATIVE ASSISTANTPAT ASSISTANT DIRECTORPAT ASSISTANT PROPERTY MANAGERPAT BENEFITS & WELLNESS COORDINATORCOMOT BUYEREXE CHIEF INFORMATION OFFICEREXE CITY CONTROLLER
40

PAT COMPLIANCE OFFICEREXE DEPUTY CONTROLLERPAT DEPUTY DIRECTORPAT DIRECTORPAT DIRECTOR OF PURCHASING SERVICESPAT HR & BENEFITS MANAGERCOMOT INTERNLTC MAINTENANCE TECHNICIANPAT MANAGERPAT PAYROLL COORDINATORPAT PAYROLL MANAGERPAT PROPERTY MANAGERPAT PURCHASING SUPERVISORCOMOT SEASONAL/TEMPORARYPAT SENIOR ACCOUNTANT/ANALYSTCOMOT SENIOR BUYERPAT SENIOR PAYROLL COORDINATORPAT SUPERVISORPAT SYSTEMS DIRECTOR
Mayor's OfficePAT 311 MANAGERPAT 311 SPECIALISTCOMOT ADMINISTRATIVE ASSISTANTEXE ASSOCIATE CITY ATTORNEYEXE CITY ATTORNEYPAT COMMUNITY LIAISONEXE DEPUTY MAYOREXE DIRECTOR OF HUMAN RESOURCESEXE DIRECTOR INTERGOVERNMENTAL AFFAIRSEXE DIRECTOR OF INTERNAL AUDITPAT DIRECTOR OF PUBLIC INFORMATIONPAT DIRECTOR OF RISK MANAGEMENTCOMOT EXECUTIVE ASSISTANTPAT HR COORDINATORPAT HR GENERALISTCOMOT HR SPECIALISTCOMOT INTERNPAT INTERNAL AUDITORPAT LABOR & EMPLOYEE RELATIONS MANAGERPAT LEGISLATIVE & BUSINESS LIAISONPAT MANAGERPAT PUBLIC INFORMATION OFFICER COMOT RECORDS MANAGEMENT ASSISTANT PAT RISK MANAGEMENT SPECIALISTPAT SAFETY CLAIMS/INVESTIGATORPAT SAFETY CLAIMS/INVESTIGATOR SUPERVISORCOMOT SEASONAL/TEMPORARYPAT SENIOR HR COORDINATOR
Metro Human Relation Commission
COMOT ADMINISTRATIVE ASSISTANTEXE EXECUTIVE DIRECTORPAT INVESTIGATORCOMOT SEASONAL/TEMPORARYPAT SENIOR INVESTIGATORPAT STAFF COUNSEL
41

Parks and RecreationCOMOT ADMINISTRATIVE ASSISTANTLTC ASSISTANT GOLF SUPERINTENDENTCOMOT ASSISTANT SUPERVISORPAT ASSISTANT SUPERVISORCOMOT CLERICALCOMOT COURIER/STOREROOM HELPEREXE DEPUTY DIRECTOREXE DIRECTOR OF PARKS & RECREATIONLTC FLEET MECHANICLTC GARDEN HELPERLTC GARDENERPAT GOLF COURSE PRO/MANAGERPAT GOLF GREEN SUPERINTENDENTLTC GREENHOUSE GARDENERLTC GREENHOUSE HELPERLTC GROUNDS EQUIPMENT OPERATORLTC GROUNDS MAINTENANCE ALTC HEAVY EQUIPMENT OPERATORLTC HIGH RANGER OPERATORPAT LANDSCAPE ARCHITECTLTC LANDSCAPE GARDENERLTC MAINTENANCE TECHNICIANCOMOT MAINTRAC COORDINATORPAT MANAGERPAT OUTDOOR RECREATION COORDINATORLTC PARK PERSON CPAT PROGRAM FACILITY COORDINATORPAT PROJECT MANAGEMENT TECHNICIANPAT PUBLIC INFORMATION OFFICERLTC RELIEF PERSONLTC SMALL MOTOR MECHANICLTC SECURITY PERSONPAT SENIOR PROGRAM FACILITY COORDINATORLTC STOREKEEPERPAT SUPERINTENDENTPAT SUPERVISORLTC SUPERVISORLTC WORKING LEADERCOMOT AQUATIC CENTER MANAGERCOMOT AQUATIC SUPERVISORCOMOT ASSISTANT GOLF PRO MANAGERCOMOT ASSISTANT SUPERVISORPAT ASSISTANT SUPERVISORLTC ASSISTANT SUPERVISORCOMOT BASKETBALL PROGRAM COORDINATORCOMOT BASKETBALL SITE SUPERVISORCOMOT BASKETBALL STAFFPAT CAMP ASSISTANT SUPERVISORLTC CAMP COUNSELORPAT CAMP SUPERVISORLTC CAPTAINLTC DECK HANDLTC DOCENTLTC FIRST MATECOMOT FOOD SERVICE ASSISTANT
42

LTC GOLF ASSISTANT GREEN SUPERINTENDENTCOMOT GOLF CASHIER/STARTERLTC GOLF COURSE MAINTENANCELTC HEAD LIFEGUARDCOMOT HURSHTOWN ATTENDANTCOMOT HURSHTOWN ASSISTANT SUPERVISORPAT HURSHTOWN SUPERVISORCOMOT INTERNLTC LIFEGUARDCOMOT LIFETIME SPORTS ACADEMY COORDINATORCOMOT LIFETIME SPORTS ACADEMY SUPERVISORLTC MAINTENANCE-SEASONALLTC NATURALISTCOMOT PLAYGROUND COORDINATORCOMOT PLAYGROUND LEADERCOMOT PLAYGROUND STAFFPAT PLAYGROUND SUPERVISORCOMOT POOL STAFF (NON-CERTIFIED)COMOT PRESCHOOL/YOUTH SPORTS COORDINATORCOMOT PRESCHOOL/YOUTH SPORTS INSTRUCTORCOMOT PRESCHOOL/YOUTH SITE SUPERVISORPAT PROGRAM COORDINATORPAT PROJECT MANAGEMENT TECHNICIANCOMOT RECREATION CENTER COORDINATORPAT RECREATION CENTER LEADER SUPERVISORPAT RECREATION CENTER LEADERCOMOT RECREATION COORDINATORCOMOT RECREATION LEADERCOMOT RECREATION SPECIALISTCOMOT RENTAL COORDINATORPAT RENTAL COORDINATORLTC SEASONAL GARDENERCOMOT SEASONAL/TEMPORARYLTC SEASONAL/TEMPORARYCOMOT SEASONAL RIVERFRONTLTC SEASONAL RIVERFRONTCOMOT SPECIAL EVENTS COORDINATORCOMOT SUPERVISORPAT SUPERVISORLTC SUPERVISORLTC TENNIS INSTRUCTORLTC TENNIS PROGRAM COORDINATORPAT THEATRE BOX OFFICE LEADPAT THEATRE BOX OFFICE STAFFPAT THEATRE CUSTOMER SERVICE ASSISTANT MANAGERPAT THEATRE HOUSE LEADLTC THEATRE MAINTENANCE LEADPAT THEATRE MANAGERPAT THEATRE OPERATIONS ASSISTANT MANAGERPAT THEATRE PARKING LOT LEADLTC THEATRE PARKING LOT ATTENDANTLTC THEATRE PRODUCTION LEADLTC THEATRE TECHNICIANPAT THEATRE UTILITY LEADLTC THEATRE UTILITY WORKER
43

COMOT WEEKEND/EVENING RECEPTIONIST/HOST(ESS)
Public WorksPAT ACCOUNTANTCOMOT ADMINISTRATIVE AIDECOMOT ADMINISTRATIVE ASSISTANTLTC ASPHALT PLANT OPERATORPAT ASSISTANT CITY ENGINEERLTC ASSISTANT STREET COMMISSIONERPAT ASSISTANT TRAFFIC ENGINEERPAT BOARD OF PUBLIC WORKS MANAGERLTC BUILDING SERVICE PERSONEXE CITY ENGINEERCOMOT CLERICALCOMOT CLERK TO BOARDCOMOT COMMUNICATIONS OPERATORCOMOT COST ACCOUNTANTLTC CULVER & DRAINAGE REPAIREREXE DEPUTY DIRECTORPAT DESIGN COORDINATORPAT DIRECTOR OF FINANCEPAT DIRECTOR FLEET MANAGEMENTEXE DIRECTOR OF PUBLIC WORKSPAT DIRECTOR TRAFFIC OPERATIONSPAT DIRECTOR OF TRANSPORTATION ADMINISTRATION AND
SUPPORTPAT ENFORCEMENT OFFICER/INSPECTORLTC ENGINEERING TECHLTC ENTRY LEVEL TECHNICIANPAT FINANCE MANAGERPAT FLEET SYSTEM ANALYSTPAT FLOOD CONTROL MANAGERPAT FLOOD MAINTENANCE MANAGERLTC GENERAL FOREMANPAT GREENWAYS MANAGERCOMOT INTERNLTC INTERNPAT INSPECTOR TECHNICIANLTC LABORERLTC LABORER APAT LAND ACQUISITION AGENTPAT LAND SURVEYORLTC LEAF PICK-UP LABORERLTC LIGHTING DIVISION SEASONALLTC LIGHTING FOREMANLTC MAINTENANCELTC MAINTENANCE SUPERVISORPAT MANAGERLTC MANAGERPAT MASTER GARDENERLTC MASTER LEVEL TECHNICIANLTC MASTER PARTS CLERKLTC MATERIALS CONTROL/OFFICE COORDINATORLTC MID LEVEL TECHNICIANPAT OFFICE MANAGERLTC OPERATOR ALTC OPERATOR B
44

LTC OPERATOR/REPAIR PERSONLTC PARTS MANAGERLTC PARTS SPECIALISTCOMOT PAYROLL CLERK/TYPISTCOMOT PERMIT ASSISTANTCOMOT PERMIT COORDINATORPAT PROGRAM MANAGERCOMOT PROGRAM MANAGERLTC PROJECT COORDINATORPAT PROJECT COORDINATORPAT PROJECT MANAGERPAT PUBLIC OUTREACH COORDINATORCOMOT PUBLIC WORKS MANAGERPAT RIGHT OF WAY MANAGERLTC ROUTE DRIVERCOMOT SEASONAL/TEMPORARYLTC SEASONAL/TEMPORARYCOMOT SECRETARY VIIPAT SENIOR FLEET SYSTEM ANALYSTPAT SENIOR LAND ACQUISITION AGENTLTC SENIOR MASTER LEVEL TECHNICIANPAT SERVICE WRITERPAT SHOP SUPERVISORLTC SIGN DIVISION SEASONALLTC SIGN FABRICATORLTC SIGN & MARKING FOREMANLTC SIGN & MARKING SPECIALIST/ ELECTRICAL TECHNICIANLTC SIGN & MARKING SUPERVISORLTC SIGNAL DIVISION SEASONALLTC SIGNAL FOREMANEXE STREET COMMISSIONERPAT SUPERVISORLTC SUPERVISORLTC SURVEY TECHNICIANLTC SWEEPER OPERATORCOMOT TECHNICIANPAT TRAFFIC ENGINEERLTC TRAFFIC OPERATIONS ELECTRICIANLTC TRAFFIC OPERATIONS SUPERVISORPAT TRAFFIC SYSTEM SPECIALISTLTC TRUCK DRIVERLTC UTILITY MAINTENANCE PERSONLTC WELDER/FABRICATORCOMOT WORKING LEADERLTC WORKING LEADERPAT WORKING LEADER
SECTION. 4. Pursuant to State Statute economic conditions must be approved by the Common Council. Such economic conditions include, but are not limited to, base pay and monetary fringe benefits, as outlined in the City's approved work rules.
SECTION 5. In addition to the compensation for positions listed herein the City shall contribute 3% of employees' salary to the Indiana Public Retirement System (INPRS).
45

SECTION 6. That, in addition to the compensation provided for herein: The City of Fort Wayne Law Department shall receive not more than $6,500 for services performed in connection with the operations of the municipally owned utilities pursuant to I.C. 36-4-74 which additional compensation shall be paid from the revenues of the appropriate utility or function. The City of Fort Wayne Law Department shall also receive an additional sum not to exceed $13,000 for services provided in connection with the City Self-Insurance Program involving matters not in litigation.
Any and all payments to be made hereunder for extraordinary services shall be subject to the final approval by the City Controller. Nothing in this agreement shall prevent the use of other attorneys or firms to perform extraordinary services, subject, however, to the provisions of IC 36-4-9-12.
SECTION 7. From and after the first day of January, 2022 all appointed officers, employees, deputies, assistants, Departmental, and institutional heads of the Civil City and City Utilities will be paid according to this, the above and following provisions of this ordinance, subject to budgetary limitations, future changes or amendments enacted by Common Council.
SECTION 8. That all Departments subject to this Ordinance will conform to the Official City's Personnel Policies and Procedures relating to hiring, pay, and other related practices, approved by the Mayor and administered by the City's Human Resources Department.
SECTION 9. If any section, clause, sentence, paragraph or part or provisions of this Ordinance be found invalid or void by a Court of competent jurisdiction, it shall be conclusively presumed that this ordinance would have passed by the Common Council without such invalid section, clauses, paragraph, part or provisions, and the remaining parts of the Ordinance will remain in effect.
SECTION 10. The Municipal Code of the City of Fort Wayne references, in codification form, salary ordinances previously adopted by the City Council for past years. Such salary ordinances have a duration of one year and thus, with the exception of the 2021 salary ordinances, have expired.
Commencing January 1, 2022, any conflict between the terms and conditions hereof and any previous ordinance shall be resolved in favor of the most recently enacted ordinance.
SECTION 11. Two copies of all attachments and Exhibits referred to in this Ordinance shall be kept on file with the City Clerk of Fort Wayne for the purpose of public inspection.
SECTION 12. This ordinance shall be in full force and effect from and after its passage and approval by the Mayor.
Council Member
APPROVED AS TO FORM AND LEGALITY
Carol Helton, City Attorney
46

BILL NO. SSPECIAL ORDINANCE NO. S-
AN ORDINANCE fixing the salaries of all members of the Division of Public Safety
of the City of Fort Wayne, Indianafor the year 2022.
WHEREAS, the Mayor and Common Council of the City of Fort Wayne, Indiana have, according to the powers outlined in IC 36-8-3-3-(d), assigned to all members of the Police and Fire Departments of the City of Fort Wayne a job classification under the City Classification System, which classifications should accurately reflect the duties, and
WHEREAS, the Mayor of the City of Fort Wayne has recommended a maximum salary level for each job category in a systematic way, and
WHEREAS, the Common Council must assure that salaries reflect the duties and responsibilities assigned to each employee, and to be certain that such salaries are fair and equitable, and
WHEREAS, the funds of such salaries are to be provided by the 2022 City Budget operating funds and other sources as may be specified by the Common Council.
NOW, THEREFORE, BE IT ORDAINED BY THE COMMON COUNCIL OF THE CITY OF FORT WAYNE, INDIANA:
SECTION 1. That all members of the Police and Fire Departments of the City of Fort Wayne, shall be classified by division/department, job classification and titles herein designated, and that no changes be made in any job classification without the specific approval of the Common Council except for those brought about by collective bargaining with authorized representatives of City employees in accordance with the existing collective bargaining agreements.
SECTION 2. That the following grid of salaries is fixed and authorized as the grid for approved job classifications. Consistent with our compensation philosophy, it is the City's objective that no employee shall be paid below their job classification and the maximum should not be exceeded, except for approved shift differentials, approved longevity pay, approved overtime pay, approved technical skill pay, approved educational bonus, and approved clothing allowance, as outlined in the City’s approved work rules.
47

SEE EXHIBIT "A" ATTACHED HERETO AND MADE A PART HEREOF IN ITS ENTIRETY
The grid, as reflected on Exhibit "A" is an attempt to maintain an orderly, consistent and competitive pay policy that includes a "Grid System" that represents the actual market range for the Non-Union positions within City Government. Any general increase to the Grid shall only occur should the actual market range for a Job Classification increase.
A. That all Fire Command shall be eligible, as determined by the Fire Chief, for any additional benefits afforded the International Association of Fire Fighters. That all Fire Command shall receive the same percentage pay increases as afforded the International Association of Fire Fighters.
B. That all Police Command shall be eligible, as determined by the Police Chief to any additional benefits afforded the Fraternal Order of Police. That all Police Command, Captains and above, shall receive the same percentage pay increases as afforded the Fraternal Order of Police.
SECTION 3. The following is a true and complete listing of all members of the Police and Fire Departments of the City of Fort Wayne non-bargaining unit positions by division/department, job classification, and titles. It does not include those positions which are specified as part of a bargaining unit having a written economic agreement with the City negotiated by the City Attorney and approved by Common Council.
DIVISION/DEPARTMENT GRID CLASSIFICATION TITLE
Fire DepartmentFire Command
PAT ASSISTANT CHIEFEXE DEPUTY CHIEFEXE FIRE CHIEF
Fire CiviliansCOMOT ADMINISTRATIVE ASSISTANTLTC BUILDING MAINTENANCE ASSISTANTPAT BUILDING MAINTENANCE MANAGERLTC BUILDING SYSTEMS MANAGERPAT DIRECTOR OF FINANCECOMOT INTERNPAT EMS COORDINATOREXE DIRECTOR OF EMS OPERATIONSPOLE RECRUIT FIREFIGHTERCOMOT SEASONAL/TEMPORARYCOMOT SUPPLY OFFICERCOMOT SURVIVE ALIVE TEACHING ASSISTANT
Police DepartmentPolice Command
EXE ASSISTANT CHIEF OF POLICEPOLE CAPTAINEXE CHIEF OF POLICEPOLE DEPUTY CHIEF
Police CiviliansCOMOT ADMINISTRATIVE ASSISTANTPOLE ADMINISTRATIVE VICTIM ADVOCATEPOLE ADULT GUARDCOMOT CIVILIAN PROPERTY MANAGERCOMOT CONFIDENTIAL STENO TYPISTPOLE COORDINATOR OF CRIME STOPPERS
48

POLE CRIME ANALYSTPAT CRIME LAB MANAGERCOMOT DETECTIVE BUREAU DESK PERSONCOMOT DIGITAL EVIDENCE SPECIALISTPAT DIRECTOR OF FINANCEPOLE DIRECTOR OF VICTIM ASSISTANCEPOLE FIREARMS EVIDENCE TECHNICIANPAT FORENSIC SCIENTISTCOMOT INTERNCOMOT INVESTIGATIVE DIVISION GENERAL ASSISTANTPAT LEAD SOCIAL WORKERPOLE MANAGER OF PROPERTY ROOMPOLE PAL COORDINATORPAT PROGRAM MANAGERPOLE PROPERTY/EVIDENCE SPECIALISTPAT RESEARCH & GRANTS MANAGERPOLE RECRUIT PATROL OFFICERCOMOT SEASONAL/TEMPORARYPOLE SENIOR CRIME ANALYSTPOLE SENIOR VICTIM ADVOCATEPAT SOCIAL WORKERCOMOT TAXI CAB PERMIT COORDINATOR POLE VICTIM ADVOCATE
Radio ShopCOMOT ADMINISTRATIVE ASSISTANTCOMOT ELECTRONICS/RADIO INSTALLERPOLE RADIO SHOP SUPERVISORPAT TECHNICAL DIRECTORSO TWO-WAY RADIO ELECTRONICS TECHNICIAN
Police RecordsCOMOT INFORMATION/COMPUTER INPUT TECHNICIANCOMOT QUALITY ASSURANCE TECHNICIANPOLE RECORDS SUPERVISORCOMOT RECORDS TECHNICIAN
Animal Care and ControlCOMOT ADMINISTRATIVE CLERKCOMOT ADOPTION ASSISTANTCOMOT ANIMAL CARE COORDINATORPOLE ANIMAL CARE SPECIALISTPOLE ANIMAL CONTROL OFFICERPOLE ANIMAL CONTROL OFFICER – FIELD COORDINATORPAT ANIMAL PROGRAMS SUPERVISORLTC BUILDING MAINTENANCEPAT COMMUNITY RELATIONS & EDUCATION SPECIALISTPOLE DEPUTY DIRECTOREXE DIRECTOR OF ANIMAL CARE & CONTROLCOMOT DISPATCHERPAT FOSTER COORDINATORCOMOT FOSTER – TRANSPORT ASSISTANTCOMOT HUMANE EDUCATION ASSISTANTCOMOT KENNEL ATTENDANTPAT MANAGERPAT MARKETING AND SOCIAL MEDIA MANAGERPAT OFFICE SUPERVISORPAT OPERATIONS MANAGERPAT SHELTER VET
49
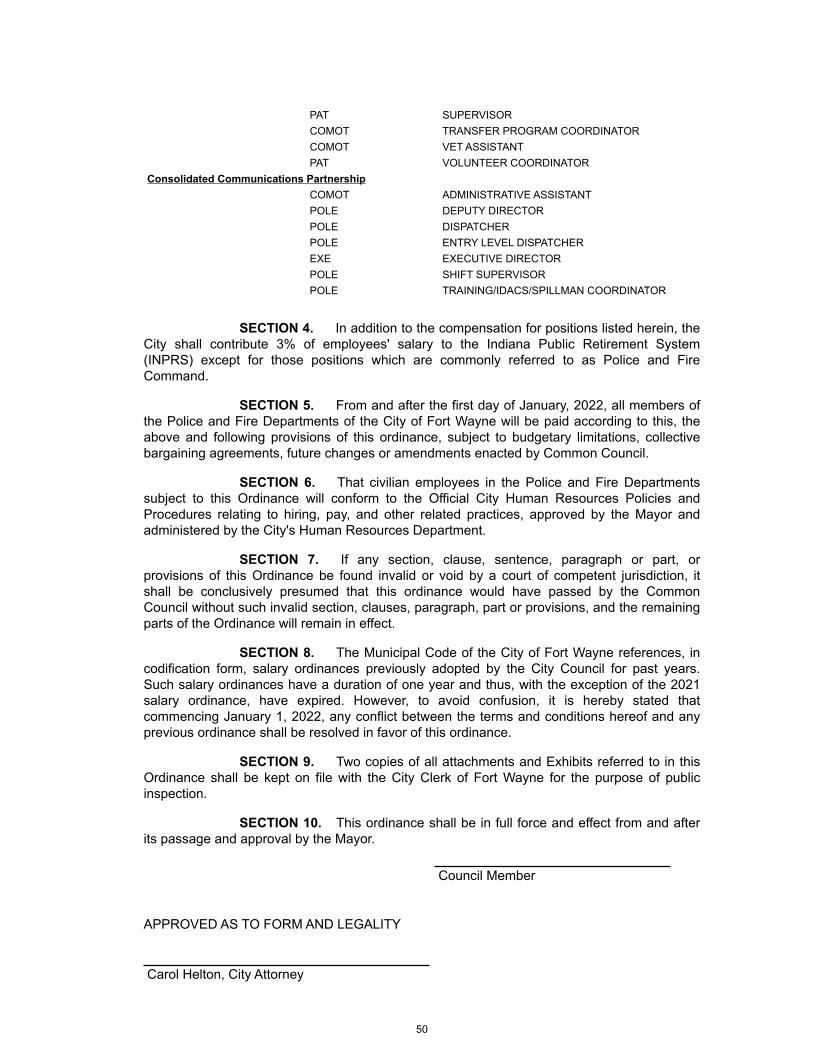
PAT SUPERVISORCOMOT TRANSFER PROGRAM COORDINATORCOMOT VET ASSISTANTPAT VOLUNTEER COORDINATOR
Consolidated Communications PartnershipCOMOT ADMINISTRATIVE ASSISTANTPOLE DEPUTY DIRECTORPOLE DISPATCHERPOLE ENTRY LEVEL DISPATCHEREXE EXECUTIVE DIRECTORPOLE SHIFT SUPERVISORPOLE TRAINING/IDACS/SPILLMAN COORDINATOR
SECTION 4. In addition to the compensation for positions listed herein, the City shall contribute 3% of employees' salary to the Indiana Public Retirement System (INPRS) except for those positions which are commonly referred to as Police and Fire Command.
SECTION 5. From and after the first day of January, 2022, all members of the Police and Fire Departments of the City of Fort Wayne will be paid according to this, the above and following provisions of this ordinance, subject to budgetary limitations, collective bargaining agreements, future changes or amendments enacted by Common Council.
SECTION 6. That civilian employees in the Police and Fire Departments subject to this Ordinance will conform to the Official City Human Resources Policies and Procedures relating to hiring, pay, and other related practices, approved by the Mayor and administered by the City's Human Resources Department.
SECTION 7. If any section, clause, sentence, paragraph or part, or provisions of this Ordinance be found invalid or void by a court of competent jurisdiction, it shall be conclusively presumed that this ordinance would have passed by the Common Council without such invalid section, clauses, paragraph, part or provisions, and the remaining parts of the Ordinance will remain in effect.
SECTION 8. The Municipal Code of the City of Fort Wayne references, in codification form, salary ordinances previously adopted by the City Council for past years. Such salary ordinances have a duration of one year and thus, with the exception of the 2021 salary ordinance, have expired. However, to avoid confusion, it is hereby stated that commencing January 1, 2022, any conflict between the terms and conditions hereof and any previous ordinance shall be resolved in favor of this ordinance.
SECTION 9. Two copies of all attachments and Exhibits referred to in this Ordinance shall be kept on file with the City Clerk of Fort Wayne for the purpose of public inspection.
SECTION 10. This ordinance shall be in full force and effect from and after its passage and approval by the Mayor.
Council Member
APPROVED AS TO FORM AND LEGALITY
Carol Helton, City Attorney
50

2022 SALARY GRID EXHIBIT "A"
JOB CLASSIFICATION MIN MAX
COMOT (Hourly) $ 7.25/hr $ 32.6227/hrCOMOT (Annually) $ 15,080.00 $ 67,855.24
POLE (Hourly) $ 7.25/hr $ 53.0335/hrPOLE (Annually) $ 15,080.00 $ 110,309.74
LTC (Hourly) $ 7.25/hr $36.9335/hrLTC (Annually) $ 15,080.00 $ 76,821.61
PAT (Hourly) $ 7.25/hr $ 48.2146/hrPAT (Annually) $ 15,080.00 $ 100,286.30
EXE $ 89,088.40 $ 165,807.23
SO $ 66,009.74 $ 113,291.44
51
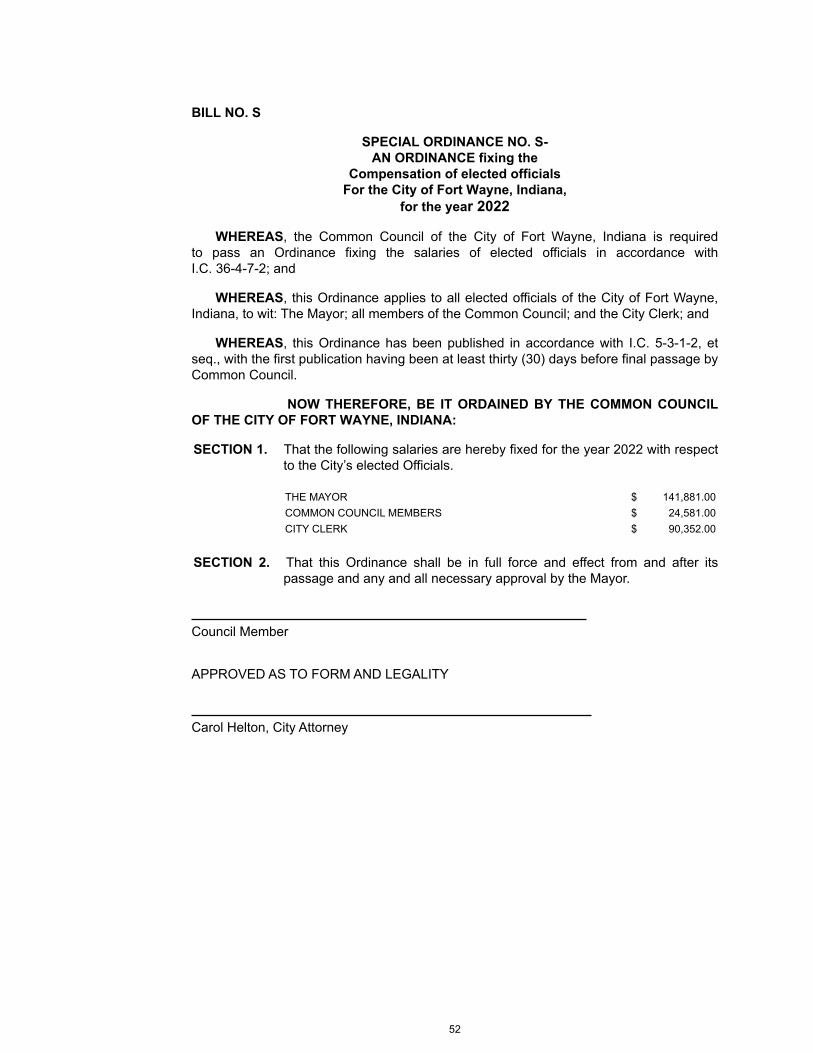
BILL NO. S
SPECIAL ORDINANCE NO. S-AN ORDINANCE fixing the
Compensation of elected officials For the City of Fort Wayne, Indiana,
for the year 2022
WHEREAS, the Common Council of the City of Fort Wayne, Indiana is required to pass an Ordinance fixing the salaries of elected officials in accordance with I.C. 36-4-7-2; and
WHEREAS, this Ordinance applies to all elected officials of the City of Fort Wayne, Indiana, to wit: The Mayor; all members of the Common Council; and the City Clerk; and
WHEREAS, this Ordinance has been published in accordance with I.C. 5-3-1-2, et seq., with the first publication having been at least thirty (30) days before final passage by Common Council.
NOW THEREFORE, BE IT ORDAINED BY THE COMMON COUNCIL OF THE CITY OF FORT WAYNE, INDIANA:
SECTION 1. That the following salaries are hereby fixed for the year 2022 with respect to the City’s elected Officials.
THE MAYOR $ 141,881.00 COMMON COUNCIL MEMBERS $ 24,581.00 CITY CLERK $ 90,352.00
SECTION 2. That this Ordinance shall be in full force and effect from and after its passage and any and all necessary approval by the Mayor.
Council Member
APPROVED AS TO FORM AND LEGALITY
Carol Helton, City Attorney
52

CITY OF FORT WAYNE APPROVED STAFFING LEVELS
DEPARTMENTS 2015 2016 2017 2018 2019 2020 2021 2022
Office of the Mayor:Internal Audit 3.00 3.00 3.00 3.00 3.00 3.00 3.00 3.00
Law 4.00 5.00 5.00 5.00 5.00 5.00 5.00 5.00 Human Resources 8.00 6.00 6.00 6.00 6.00 7.00 7.00 7.00
Mayor 10.00 10.00 10.00 10.00 10.00 10.00 10.00 10.00 311 Call Center 11.00 12.00 12.00 10.00 10.00 9.00 9.00 9.00
Total 36.00 36.00 36.00 34.00 34.00 34.00 34.00 34.00
Finance and Administration:Controller 10.00 10.00 11.00 11.00 11.00 11.00 11.00 11.00
Payroll 3.00 3.00 3.00 3.00 3.00 3.00 3.00 3.00 Property Manager 3.00 3.00 3.00 4.00 4.00 4.00 3.00 4.00
Purchasing 7.00 7.00 6.00 6.00 6.00 6.00 6.00 6.00 Information Systems 1.00 1.00 1.00 1.00 1.00 1.00 1.00 1.00
Citizens Square 2.00 2.00 2.00 2.00 2.00 2.00 2.00 2.00 Benefits 2.00 2.00 2.00 2.00 2.00 2.00 2.00 2.00
Risk Management 5.00 5.00 5.00 5.00 5.00 5.00 5.00 5.00 Total 33.00 33.00 33.00 34.00 34.00 34.00 33.00 34.00
Community & Economic Development:Community Development 20.00 20.00 20.00 23.00 23.00 23.00 23.00 23.00
Neighborhood Code Enforcement 24.00 24.00 24.00 24.00 24.00 24.00 24.00 24.00 Redevelopment 7.00 7.00 7.00 7.00 7.00 7.00 7.00 7.00
Total 51.00 51.00 51.00 54.00 54.00 54.00 54.00 54.00
City Clerk/Council:City Clerk 7.00 7.00 8.00 8.00 8.00 8.00 8.00 8.00
Parking Administration 8.00 7.00 6.00 7.00 7.00 7.00 7.00 7.00 City Council 11.00 11.00 11.00 11.00 11.00 11.00 12.00 12.00
Total 26.00 25.00 25.00 26.00 26.00 26.00 27.00 27.00
Public Works:Board of Works Admin 6.00 6.00 6.00 6.00 6.00 6.00 6.00 6.00
Flood Control 2.00 2.00 2.00 2.00 2.00 2.00 2.00 2.00 Street Light Operations 8.00 10.00 10.00 16.00 16.00 16.00 16.00 16.00
Transportation Administration Support 27.50 27.50 27.50 30.00 30.00 30.00 31.00 31.00 Street Department 102.50 100.50 99.50 100.00 100.00 100.00 100.00 100.00
Trans Eng Service/Street Project Mgmt 12.00 12.00 12.00 12.00 12.00 12.00 12.00 12.00 Traffic Engineering 31.00 31.00 31.00 31.00 31.00 31.00 31.00 31.00
Fleet Management/Garage 3.00 3.00 3.00 3.00 29.00 29.00 29.00 29.00 Total 192.00 192.00 191.00 200.00 226.00 226.00 227.00 227.00
Parks & Recreation 117.00 118.00 123.00 123.00 124.80 126.00 126.00 126.00
Metro Human Relations 12.00 12.00 12.00 12.00 12.00 12.00 12.00 12.00
SUB-TOTAL NON-PUBLIC SAFETY: 467.00 467.00 471.00 483.00 510.80 512.00 513.00 514.00
Public Safety:Police 494.50 494.50 498.50 499.50 508.50 515.00 516.00 517.00
Records 28.00 28.00 28.00 28.00 28.00 28.00 28.00 28.00 Radio 9.00 9.00 9.00 9.00 9.00 9.00 9.00 9.00
Fire 385.00 385.00 385.00 385.00 385.00 385.00 385.00 385.00 Animal Control 35.00 35.00 36.00 36.00 36.00 36.00 36.00 36.00
Weights & Measures 2.00 2.00 2.00 2.00 2.00 2.00 2.00 — SUB-TOTAL PUBLIC SAFETY: 953.50 953.50 958.50 959.50 968.50 975.00 976.00 975.00
TOTAL CIVIL CITY: 1,420.50 1,420.50 1,429.50 1,442.50 1,479.30 1,487.00 1,489.00 1,489.00
53

[This page intentionally left blank]
54

AMERICAN RESCUE PLAN ACT (ARPA)
Executive Summary
The City of Fort Wayne, Indiana was allocated $50,815,327 from the American Rescue Plan Act (ARPA) State and Local Fiscal Recovery Funds (SLFRF) (“Recovery Funds”). The City received 50% of the allocated funds in late May 2021. To ensure compliance with U.S. Department of the Treasury (“Treasury”) regulations regarding the spending of these funds, the City has contracted outside assistance as well as created an internal Grant Administrator position to assist in the development of a plan that will help the City in its response to the COVID-19 emergency and economic recovery. The City intends to create a plan that is effective, efficient, and equitable in helping our community respond to the COVID-19 pandemic and promote a healthy economic recovery. Uses of funds will target the seven expenditure categories (combined as the "four eligible uses" in the Interim Final Rule) laid out by Treasury: public health; negative economic impacts; services to disproportionately impacted communities; premium pay; water, sewer, and broadband infrastructure; revenue replacement; and, administrative. Key outcome goals will be delineated after more extensive public input. Noteworthy challenges primarily center around evolving information related to Treasury regulations and requirements. Noteworthy opportunities include early positive intentions across the community for a high degree of collaboration.
Uses of Funds
In order to support a strong and equitable recovery from the COVID-19 pandemic and economic downturn, the City intends to strategically address needs across all expenditure areas as defined by Treasury. Furthermore, the Fort Wayne Common Council has outlined the following allocation percentages for each of the four eligible uses for Recovery Funds:
a. No less than 5% of each allocation of the Recovery Funds shall be spent on premium pay to eligible workers/employees of the City of Fort Wayne who performed or who are performing essential work during the pandemic; and
b. No less than 20% of each allocation of the Recovery Funds shall be spent on necessary investments in water, sewer, or broadband infrastructure; and
c. No less than 20% of each allocation of Recovery Funds shall be spent to respond to negative economic impacts by providing assistance to households, small businesses, and non-profits, or as aid to impacted industries such as tourism, travel, and hospitality; and
d. No less than 20% of each allocation of the Recovery Funds shall be spent to replace reduction in revenue due to the pandemic for government services, relative to revenues collected in the most recent full fiscal year prior to the emergency.
Efforts will be made to support various communities, populations, and individuals in their recovery as well as leverage Recovery Funds to maximize programmatic support and to explore other avenues of federal recovery funds for which the City may be eligible.
55

2020 ACTUAL
2021ACTUAL
THRU30-Jun-2021
2021REVISED
BUDGET THRU 30-Jun-2021
2022SUBMITTED
$ INCREASE (DECREASE)
FROM REVISED TO 2022
% CHANGE FROM REV
TO 20225111 WAGES — — 2,540,766 2,540,766 Total 5100 $ — $ — $ — $ 2,540,766 $ 2,540,766 0.00 %Total 5200 $ — $ — $ — $ — $ — 5314 CONSULTANT SERVICES — — 200,000 200,000 5395 GRANTS SUBSIDIES & LOANS — — 10,163,065 10,163,065 5399 OTHER SERVICES AND CHARGES — — 10,163,065 10,163,065 Total 5300 $ — $ — $ — $ 20,526,130 $ 20,526,130 0.00 %5431 CONSTRUCTION FEES - GROUND & S — — 10,163,065 10,163,065 Total 5400 $ — $ — $ — $ 10,163,065 $ 10,163,065 0.00 %
Total $ — $ — $ — $ 33,229,961 $ 33,229,961 0.00 %
AMERICAN RESCUE PLAN ACT (ARPA)Dept # 00022022 BUDGET COMPARISON
56

DEPARTMENT OF ANIMAL CARE & CONTROL
Fort Wayne Animal Care and Control (FWACC) face the public health and safety issues involving animals using a proactive approach. Protection of citizens and animals, animal rescue, and efforts to minimize euthanasia of unwanted animals through spay/neuter promotion all strongly reflect the neighborhood and community driven origins of this department. Local and state legislation is used to address cruelty or violence issues involving animals, pet overpopulation, and responsible pet ownership issues. The success of the approach would not be possible without positive community outreach and education.
The city ordinance delineates the laws to be enforced and the responsibilities of the department toward achieving an overall professional and quality program. The ordinance is seen as a model in the country and this department has been recognized nationally as a leader in the field, with multiple employees who have been national instructors in specific areas of the profession. FWACC will continue to provide high levels of service in all areas and continue enforcement aimed at the protection and assistance of both community residents and animals. We will strive to increase promotion of responsible animal ownership to increase the safety levels in our community and to combat pet overpopulation and its resulting euthanasia of domestic animals.
Programming and InitiativesAs the area’s only open admission animal shelter we have an obligation to take in every animal brought to our doors. We care for over 8,000 of our community’s animals annually, for many we are their last option. In an effort to manage expenses and increase our lifesaving capabilities in accordance with the wishes of our citizens, we are working to manage the population in our care by providing alternatives to intake where possible.
We are working to provide more resources than ever before to help keep animals in the homes where they’re already loved and to ensure we’re doing everything we can to promote humane pet ownership. In 2020 we had 1,006 appointments for surrender and were able to provide resources and never take in 26% of those animals.
Through marketing initiatives as well as low cost microchipping and id tags we have been able to achieve one of the highest return to home rates for lost animals in the country. Our officers have continued to increase efforts to return animals in the field without ever having to bring the animal into the shelter.
Our behavior certificate program works to provide struggling owners with resources to seek out a certified dog trainer who can assist with behavior modification or management techniques to increase safety in the home while improving the human/ animal bond. We continue to expand our humane education program and hosted 6 summer camps in 2021 as well as fall break camps. These offer a unique opportunity for children to learn about humane care for animals.
We have continued to expand our efforts to reduce pet overpopulation in our community by growing our medical program with 2020 seeing a 28% increase in surgeries over the prior year. We are on track to exceed those numbers in 2021. We have held two no cost Rabies vaccination clinics in the communities from which we most commonly see lost pet and have seized the opportunity to develop a positive relationship with owners who may be struggling.
Goals and ObjectivesFWACC Mission: It is our mission to serve our community in a humane, public safety capacity while working to keep pets with loving families by providing education opportunities and resources or facilitating re-homing or adoption when necessary. FWACC Vision: It is our vision to promote a humane community and find a positive outcome for each healthy, safe and treatable animal in our care.
1. Protect both citizens and animals using modern ordinances and state laws to reach compliance when necessary. Aggressively pursue advanced cases of animal cruelty, neglect, and abuse.
2. Encourage responsible pet ownership and to reduce the number of unwanted domestic animals in Fort Wayne, subsequently reducing the number of related safety issues and the number of animals currently being euthanized.
3. Increase the volume of spayed and neutered animals, thus reducing animal related problems at the neighborhood level, indiscriminate breeding of animals in the city, and euthanasia.
57

4. Increase education levels of both children and adults relative to safety, humane care and treatment of animals, responsible pet ownership and the plight of unwanted animals.
5. Promote all local available opportunities for families unable to afford spay / neuter surgery for pets.6. Increase contacts with owners regarding proper identification and registration of their pets for safe return
and to increase the volume of pets returned directly to their homes in the field.
Services Provided1. Enforcement of state and local laws relative to animals. Full investigation for both human and animal
protection.2. Process cases through the city court system and the Allen County Prosecutor’s Office for local and state
violations involving safety issues with animals, animal cruelty, and animal neglect.3. Administration of the State Health Codes, investigations, and prosecutions relative to animal bites,
quarantines and specimen shipments for rabies examination.4. Promotion and administration of all license and permit programs relative to animals. Monitor special
events in the community involving animals.5. Administer Humane Education programs through advanced technology applications and in person in the
Fort Wayne Community School System, for local scout troops, and adult groups regarding Animal Control and responsible care of animals.
6. Provide a pet adoption resource of safe animals for community residents.7. Provide shelter to animals of all species in need of safe haven until reclaim or abandonment by owners.
Provide care, sanitation, medical attention, exercise and daily maintenance for all animals admitted.8. Emergency pick up of sick and injured animals, wild and domestic. Rescue’s as needed.9. Live trap rental program for nuisance cat problems.10. Emergency impound of animals involved with owner tragedy, arrest, or unforeseen emergency
circumstances.11. Pick up of stray animals, both confined and unconfined with enforcement of animal at large laws.12. Respond to neighbor complaints regarding nuisance violations.13. Euthanasia of unwanted, unclaimed, unsafe, and surplus animals. Euthanasia of animals by owners
request due to illness, injury, and age.
ANIMAL CARE AND CONTROL: ACTIVITY INDICATORS 2020Animals Handled (total all species) 10,308
Dogs handled 3,285Cats handled 4,743
County Animals Handled (known) 1,315New Haven Animals Handled (known) 371Out of County (known) 984Animals Rehomed 4,727Animals Returned to Owner 1,766Dogs Euthanized Non-Owner Requested 493Cats Euthanized Non-Owner Requested 731Field Service Activities (runs by officers) 17,714Bite Cases 1,233Registrations Sold 9,066Citations Issued 2,106Court Cases Filed 1,001Volunteers (active at year end) 308Outreach and Education
Media Contacts/Interviews 49Website & Facebook Reach 4,609,162Videos Produced for City TV 23Youth & Adult Program Participants 953Fund Raisers for the Department 3
58

2020 ACTUAL
2021ACTUAL
THRU30-Jun-2021
2021REVISED
BUDGET THRU 30-Jun-2021
2022SUBMITTED
$ INCREASE (DECREASE)
FROM REVISED TO 2022
% CHANGE FROM REV
TO 20225111 WAGES 1,799,865 1,940,940 2,044,734 103,794 5125 OVERTIME PREMIUM 27,663 20,020 20,020 — 5131 PERF - EMPLOYERS SHARE 194,731 205,265 215,484 10,219 5132 FICA 135,026 149,446 157,632 8,186 5134 LIFE MEDICAL & HEALTH INSURAN 510,000 525,000 490,000 (35,000) 5135 EMPLOYEE MEDICAL EXPENSES 6,689 3,927 4,349 422 5136 UNEMPLOYMENT COMPENSATION 1,878 1,954 2,058 104 5137 WORKERS COMP INSURANCE 8,426 8,426 9,560 1,134 5138 CLOTHING ALLOWANCE 12,504 15,875 15,875 — 513A PERF - EMPLOYEES/PD BY CITY 52,160 54,982 57,629 2,647 513R RETIREES HEALTH INSURANCE 15,000 15,000 14,000 (1,000) 5162 ACCRUED WAGES ADJ 20,757 — — — Total 5100 $ 2,784,699 $ 1,482,375 $ 2,940,835 $ 3,031,341 $ 90,506 3.08 %5213 COMPUTER SUPPLIES 218 600 600 — 5219 OTHER OFFICE SUPPLIES 4,574 5,200 5,200 — 5231 GASOLINE 34,442 40,423 40,423 — 5241 MEDICAL & SURGICAL SUPPLIES 18,406 15,458 15,458 — 5242 ANIMAL SUPPLIES 10,023 4,069 4,069 — 5246 HOUSEHOLD & CLEANING SUPPLIES 12,186 11,000 11,000 — 524M MICROCHIPS 18,586 19,400 19,400 — 5299 OTHER MATERIALS & SUPPLIES 9,551 5,500 5,500 — Total 5200 $ 107,986 $ 61,511 $ 101,650 $ 101,650 $ — 0.00 %5312 MEDICAL SERVICES 42,223 24,520 24,520 — 5319 VETERINARY SERVICES 6,078 14,250 14,250 — 531H BANK SERVICE CHARGES 14,398 10,000 10,000 — 531N PUBLIC EDUCATION SERVICES 3,502 3,500 3,500 — 5321 FREIGHT EXPRESS & DRAYAGE 11,920 10,055 10,055 — 5322 POSTAGE 7,812 7,500 7,500 — 532C CELL PHONE 1,170 — — — 532V VERIZON AIR CARDS 7,727 7,200 11,313 4,113 5331 PRINTING OTHER THAN OFFC SUPPL 1,488 2,500 2,500 — 5342 LIABILITY INSURANCE 21,325 21,325 20,519 (806) 5351 ELECTRICITY 46,552 42,500 42,500 — 5352 NATURAL GAS 8,687 11,500 10,200 (1,300) 5353 WATER 12,231 12,000 12,000 — 5356 SOLID WASTE DISPOSAL 18,552 20,207 20,207 — 5361 CONTRACTED BLDG & STRUCT REPAI 12,667 9,124 9,124 — 5363 CONTRACTED OTHER EQUIPMT REPAI 5,303 2,700 4,800 2,100 5369 CONTRACTED SERVICE 11,866 8,000 8,000 — 536A MAINT. AGREEMENT - HARDWARE 1,208 — 2,254 2,254 536T FLEET SERVICES 35,438 56,760 60,677 3,917 5377 CC BUILDING PARKING 6 25 25 — 5390 PERMIT REMBURSEMENT 6,613 6,500 6,500 — 5391 SUBSCRIPTIONS AND DUES 1,669 1,475 1,500 25 5399 OTHER SERVICES AND CHARGES 1,558 330 330 — 539B MASTER LEASE 73,828 91,948 112,089 20,141 Total 5300 $ 353,821 $ 192,042 $ 363,919 $ 394,363 $ 30,444 8.37 %5454 BETTERMENTS & ADDITIONS 32,313 40,025 98,200 58,175 Total 5400 $ 32,313 $ 3,105 $ 40,025 $ 98,200 $ 58,175 145.35 %
Total $ 3,278,818 $ 1,739,033 $ 3,446,429 $ 3,625,554 $ 179,125 5.20 %
ANIMAL CONTROLDept # 00172022 BUDGET COMPARISON
59

[This page intentionally left blank]
60

BENEFITS ADMINISTRATION DEPARTMENT
Mission Statement
The mission of Benefits Administration is to promote the health and well-being of City employees, retirees, and their families, by providing excellent customer service through the administration of City benefits programs.
Benefits Administration is part of the Human Resources Department. This allows Benefits Administration to partner with the Human Resources staff to promote a positive working environment and improve communications to all City employees and departments. Benefits Administration continues to work closely with the Controller’s Office and the Payroll Department in many aspects that are necessary to administer City benefits programs.
Goals and Objectives
The goals for Benefits Administration are:
• Provide excellent customer service to employees, retirees and their dependents.
• Act as a liaison between providers, and employees and retirees, to resolve benefits issues.
• Review benefit programs and make recommendations for change and/or improvement.
• Maintain accurate records of employees and retirees relating to: health insurance, COBRA administration, life insurance, long-term disability, short-term disability, flexible spending accounts, and FMLA.
• Monitor provider billings to detect errors and contain costs.
• Continue to maintain and develop the Flexible Spending Account program in order to save employees and the City of Fort Wayne on taxable income. Flexible Spending Accounts are tax-favored accounts that allow employees to set aside money pretax for eligible Medical and Dependent Care costs. Claims are processed through the Benefits office and reimbursed on employee payroll checks bi-weekly. As an employer, the City of Fort Wayne saves on every dollar that passes through the Flex program by reducing its FICA liability.
• Develop and implement wellness programs for employees, retirees and their families, to improve the quality of life of these individuals and mitigate benefit costs, including but not limited to annual Health Fairs, monthly wellness seminars and a Smoking Cessation Program.
• Develop, maintain and comply with a benefits administration procedure manual.
• Develop and maintain good working relationships with benefit providers, HR Department, Payroll Department, Controller’s Office and departmental payroll clerks in order to foster cooperation and provide good customer service to employees, retirees and family members.
61

2020 ACTUAL
2021ACTUAL
THRU30-Jun-2021
2021REVISED
BUDGET THRU 30-Jun-2021
2022SUBMITTED
$ INCREASE (DECREASE)
FROM REVISED TO 2022
% CHANGE FROM REV
TO 20225111 WAGES 126,957 130,766 135,997 5,231 5131 PERF - EMPLOYERS SHARE 14,219 14,653 15,237 584 5132 FICA 9,024 10,012 10,404 392 5134 LIFE MEDICAL & HEALTH INSURAN 30,000 30,000 28,000 (2,000) 5136 UNEMPLOYMENT COMPENSATION 127 131 136 5 5137 WORKERS COMP INSURANCE 129 129 134 5 513A PERF - EMPLOYEES/PD BY CITY 3,809 3,928 4,084 156 5143 EMPLOYEE ASSISTANCE PROGRAM 43,594 45,000 45,000 — 5162 ACCRUED WAGES ADJ 997 — — — Total 5100 $ 228,856 $ 112,877 $ 234,619 $ 238,992 $ 4,373 1.86 %5219 OTHER OFFICE SUPPLIES 183 — — — Total 5200 $ 183 $ 99 $ — $ — $ — 0.00 %5322 POSTAGE 1,302 1,500 1,500 — 5342 LIABILITY INSURANCE 933 929 847 (82) 5369 CONTRACTED SERVICE 46,147 50,000 50,000 — 5374 OTHER EQUIPMENT RENTAL 910 1,020 1,020 — 539A OPERATING TRANSFER OUT 130,000 — — — 5399 OTHER SERVICES AND CHARGES (67,644) — — — Total 5300 $ 111,647 $ 60,360 $ 53,449 $ 53,367 $ (82) -0.15 %Total 5400 $ — $ — $ — $ — $ —
Total $ 340,686 $ 173,336 $ 288,068 $ 292,359 $ 4,291 1.49 %
BENEFITSDept # 0002 - BENF2022 BUDGET COMPARISON
62

CABLE FUND
Mission Statement
The primary purpose of the cable fund is to enhance public, educational, and government access television within the City of Fort Wayne through the effective use of cable television franchise fee receipts.
1. Effectively and efficiently administer the grant program.2. Monitor the cable provider’s compliance with the franchise agreement.3. Respond to citizen complaints regarding cable television service and resolve any cable television issues
as quickly and equitably as possible.
General Information
60% of the franchise fee revenues collected by Comcast Cablevision and Frontier Communications are deposited directly into the General Fund. The remaining 40% are applied to the Cable Fund, and their use is detailed below.
In the previous four quarters ending June 30, 2021, $1,298,403.28 was disbursed to the General Fund and $865,602.15 was disbursed to the Cable Fund.
Franchise fee based disbursements from the Cable Fund are allocated based on a formula, as established by ordinance G-27-95.
The Cable Fund supports these programs:
Access originator grants: General ordinance G-27-95 stipulates that 80% of the cable franchise fees receipted to the Cable Fund be disbursed, as recommended by the Cable Fund Access Board, to the four access channel originators in our community. Those originators are college access television, operated by Indiana University/Purdue University; public access, operated by the Allen County Public Library; government access, managed by the City of Fort Wayne with daily operations subcontracted to the Allen County Public Library; and educational access, operated by Fort Wayne Community Schools.
Access Originator Grants are disbursed quarterly. In the four quarters ending June 30 2021, each access originator received $173,120.43, for a total of $692,481.73. The 2022 program (166ACTR) budget is $681,700.
The amount budgeted does not affect the amount granted, as the amount granted is set by ordinance as a fixed percentage of franchise fee revenue. To avoid revising the budget, the amount budgeted should be safely above the last years revenue receipts.
Non-access originator grants: G-27-95 specifies that 10% of franchise fees receipted to the Cable Fund be available as grants to not-for-profit and educational organizations located within Fort Wayne that do not originate an access station, for the purpose of enhancing local access. These grants are used to improve local access television and enhance public access. Per ordinance, these grants can be used to reimburse personnel expenses, overhead costs, production costs, operation expenses, and equipment expenses. For 2022, $100,000 has been budgeted (166NFPG) for these grants.
City administrative expenses: The remaining 10% of franchise fees receipted to the Cable Fund are used to offset administrative expenses related to the grant program, cable television franchising issues, and information dissemination. For 2022, $16,000 has been budgeted for closed captioning and $30,000 related to information dissemination, supplies, advertising, copy costs, hardware and software. An operating transfer of $34,200 has been budgeted to reimburse the General Fund salary expenses associated with the Cable Franchise and Cable Board, the processing the purchase orders relating to grant awards, and general accounting functions related to the Cable Fund
63
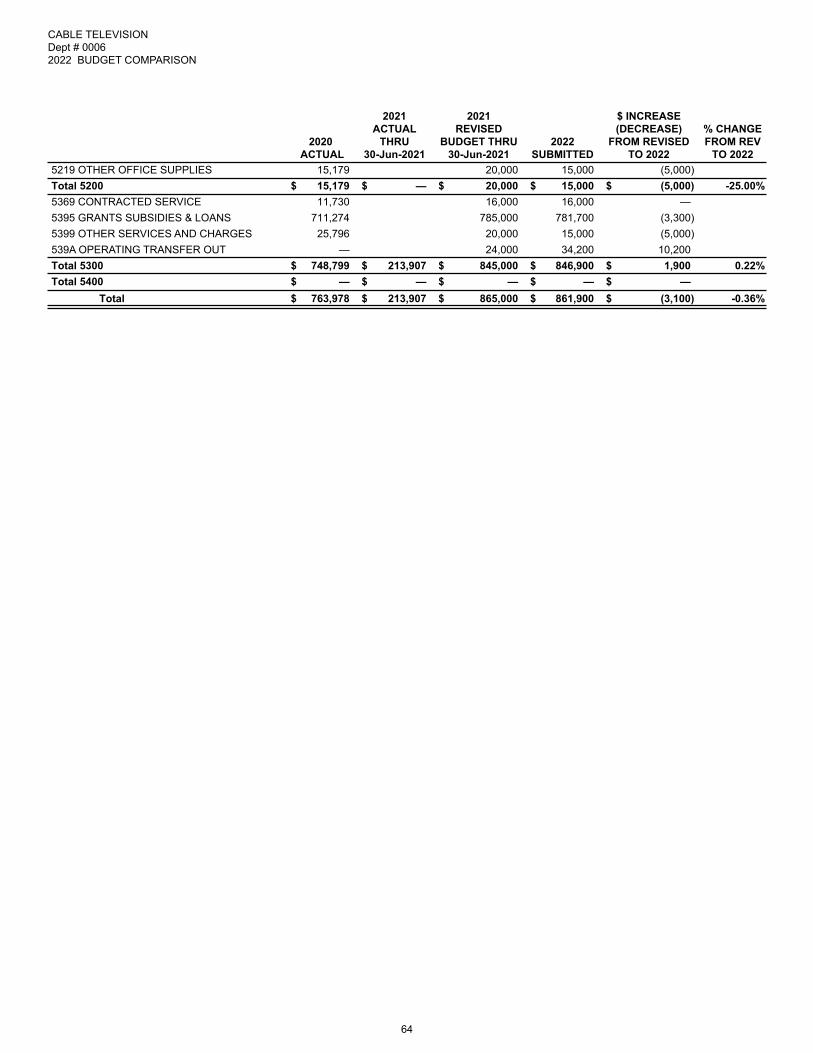
2020 ACTUAL
2021ACTUAL
THRU30-Jun-2021
2021REVISED
BUDGET THRU 30-Jun-2021
2022SUBMITTED
$ INCREASE (DECREASE)
FROM REVISED TO 2022
% CHANGE FROM REV
TO 20225219 OTHER OFFICE SUPPLIES 15,179 20,000 15,000 (5,000) Total 5200 $ 15,179 $ — $ 20,000 $ 15,000 $ (5,000) -25.00 %5369 CONTRACTED SERVICE 11,730 16,000 16,000 — 5395 GRANTS SUBSIDIES & LOANS 711,274 785,000 781,700 (3,300) 5399 OTHER SERVICES AND CHARGES 25,796 20,000 15,000 (5,000) 539A OPERATING TRANSFER OUT — 24,000 34,200 10,200 Total 5300 $ 748,799 $ 213,907 $ 845,000 $ 846,900 $ 1,900 0.22 %Total 5400 $ — $ — $ — $ — $ —
Total $ 763,978 $ 213,907 $ 865,000 $ 861,900 $ (3,100) -0.36 %
CABLE TELEVISIONDept # 00062022 BUDGET COMPARISON
64

CITY CLERK
The City Clerk is a position elected by the citizens of Ft. Wayne and serves as a liaison between the citizens of Ft. Wayne and the Common Council. The City Clerk has the responsibility to keep all documents & books entrusted to him or her by statute or ordinance. The City Clerk also serves as the administrator of the City of Fort Wayne Violation’s Bureau; Director of the Parking Enforcement Officers of the City of Fort Wayne; and responsible for the operation of the Municipal Violation Deferral Program.
Mission Statement
The mission of the City Clerk’s office is to provide quality services to the citizens of Fort Wayne, elected officials, and other City Departments in an efficient, ethical, professional, transparent, and timely manner.
Services Provided
• Provide copies of ordinances and/or resolutions passed by City Council to Department Heads and general public;
• Update ordinances as passed by City Council with the publisher American Legal on internet website;• Schedule all meetings of Common Council and provide Agenda for these meetings;• Administer oath to police and fire officers and all appointments made by Mayor and City Council;• Schedule use of Council Chambers and Conference Room for various department meetings;• Provide supplements of City Code to Department heads and City Council;• Distribute all correspondence to members of City Council;• Provide notification of meetings to News Media;• Collection of all violations paid through Violations Bureau for the city’s general fund;• Filing, processing and collection of fees for street and alley vacations;• Filing and processing enrollment in the Municipal Violation Deferral Program;• Maintains website with information concerning City Clerk’s Office, Violations Bureau, including agenda for
City Council meetings, and needed forms;• Able to perform wedding ceremonies;
65

2020 ACTUAL
2021ACTUAL
THRU30-Jun-2021
2021REVISED
BUDGET THRU 30-Jun-2021
2022SUBMITTED
$ INCREASE (DECREASE)
FROM REVISED TO 2022
% CHANGE FROM REV
TO 20225111 WAGES 440,189 459,860 478,254 18,394 5131 PERF - EMPLOYERS SHARE 49,301 51,504 53,564 2,060 5132 FICA 31,794 35,179 36,586 1,407 5134 LIFE MEDICAL & HEALTH INSURAN 120,000 120,000 112,000 (8,000) 5136 UNEMPLOYMENT COMPENSATION 446 460 478 18 5137 WORKERS COMP INSURANCE 452 452 428 (24) 513A PERF - EMPLOYEES/PD BY CITY 13,205 13,796 14,348 552 513R RETIREES HEALTH INSURANCE 45,000 45,000 42,000 (3,000) 5162 ACCRUED WAGES ADJ 4,597 — — — Total 5100 $ 704,984 $ 345,720 $ 726,251 $ 737,658 $ 11,407 1.57 %5211 OFFICIAL RECORDS — 4,500 4,500 — 5212 STATIONERY & PRINTED FORMS 181 — — — 5213 COMPUTER SUPPLIES 97 — — — 5219 OTHER OFFICE SUPPLIES 3,886 4,000 4,000 — 5299 OTHER MATERIALS & SUPPLIES 664 — — — Total 5200 $ 4,828 $ 1,428 $ 8,500 $ 8,500 $ — 0.00 %5311 LEGAL SERVICES — 15,000 15,000 — 531H BANK SERVICE CHARGES 6,964 6,000 6,000 — 531K SEMINAR FEES 324 800 800 — 5322 POSTAGE 11,465 15,000 15,000 — 5324 TRAVEL EXPENSES — 2,000 2,000 — 5326 MILEAGE — 600 600 — 532C CELL PHONE 585 1,080 1,080 — 5331 PRINTING OTHER THAN OFFC SUPPL 623 6,000 6,000 — 5332 PUBLIC OF LEGAL NOTICES/ADVTER 4,909 4,000 4,000 — 5342 LIABILITY INSURANCE 3,251 3,251 3,384 133 5363 CONTRACTED OTHER EQUIPMT REPAI 1,006 1,000 1,000 — 5374 OTHER EQUIPMENT RENTAL 1,587 1,850 1,850 — 5391 SUBSCRIPTIONS AND DUES 961 1,000 1,000 — 5399 OTHER SERVICES AND CHARGES — 1,500 1,500 — Total 5300 $ 31,674 $ 16,422 $ 59,081 $ 59,214 $ 133 0.23 %Total 5400 $ — $ — $ — $ — $ — Total $ 741,487 $ 363,570 $ 793,832 $ 805,372 $ 11,540 1.45 %
CITY CLERKDept # 00042022 BUDGET COMPARISON
66

FORT WAYNE CITY COUNCIL
The Fort Wayne City Council is comprised of nine elected officials. Six members are elected to represent specific districts each with an approximate population of 42,000 citizens; three members are elected as representatives to the community at large. Each member serves a four-year term and members are not term limited.
City Council is the Legislative Branch of the city government and therefore is responsible for scrutiny of the fiscal health of the government on behalf of the taxpayer. The board discusses and votes on ordinances and resolutions including the city’s annual budget, appropriations and large city contracts. Council is the body which passes Annexation, Zoning and Regulation ordinances and controls city properties.
As elected officials, these members pledge to ensure the safety and security of all Fort Wayne citizens; their duty is to work to maintain and/or enhance the quality of life through wise deliberation in the use of taxpayer money.
The City Council office is open to the public with access in the Citizen Square building. Staff includes a full time administrator and part time Council attorney.
Services Provided• Provide constituents with swift and complete communication• Work with and for the constituency in all matters of their concern• Work with the City Administration and other units of government• Provide communication through the media
Council Members• Paul Ensley, 1st District• Russell Jehl, 2nd District• Tom Didier, 3rd District• Jason Arp, 4th District• Geoff Paddock, 5th District• Sharon Tucker, 6th District• Michelle Chambers, At-Large• Tom Freistroffer, At-Large• Glynn Hines, At-Large
67

2020 ACTUAL
2021ACTUAL
THRU30-Jun-2021
2021REVISED
BUDGET THRU 30-Jun-2021
2022SUBMITTED
$ INCREASE (DECREASE)
FROM REVISED TO 2022
% CHANGE FROM REV
TO 20225111 WAGES 304,107 384,318 399,691 15,373 5131 PERF - EMPLOYERS SHARE 34,060 43,044 44,766 1,722 5132 FICA 21,318 29,400 30,576 1,176 5134 LIFE MEDICAL & HEALTH INSURAN 165,000 180,000 168,000 (12,000) 5136 UNEMPLOYMENT COMPENSATION 304 384 400 16 5137 WORKERS COMP INSURANCE 308 308 388 80 513A PERF - EMPLOYEES/PD BY CITY 9,124 11,529 11,990 461 5162 ACCRUED WAGES ADJ 4,202 — — — Total 5100 $ 538,422 $ 297,272 $ 648,983 $ 655,811 $ 6,828 1.05 %5212 STATIONERY & PRINTED FORMS 283 300 3,500 3,200 5219 OTHER OFFICE SUPPLIES 379 400 500 100 Total 5200 $ 661 $ 26 $ 700 $ 4,000 $ 3,300 471.43 %5322 POSTAGE 22 250 250 — 5324 TRAVEL EXPENSES 580 4,000 7,000 3,000 5326 MILEAGE — — 500 500 532C CELL PHONE 450 1,940 1,940 — 5332 PUBLIC OF LEGAL NOTICES/ADVTER 232 250 250 — 5342 LIABILITY INSURANCE 5,107 5,107 5,077 (30) 5363 CONTRACTED OTHER EQUIPMT REPAI 333 — — — 5369 CONTRACTED SERVICE 24,952 60,000 60,000 — 5374 OTHER EQUIPMENT RENTAL — 1,500 1,500 — 5391 SUBSCRIPTIONS AND DUES — — 500 500 5395 GRANTS SUBSIDIES & LOANS 2,400 — — — 5399 OTHER SERVICES AND CHARGES — — — — Total 5300 $ 34,077 $ 10,840 $ 73,047 — $ 77,017 $ 3,970 5.43 %5454 BETTERMENTS & ADDITIONS — — 10,000 10,000 Total 5400 $ — $ — $ — $ 10,000 $ 10,000 0.00 %
Total $ 573,161 $ 308,138 $ 722,730 $ 746,828 $ 24,098 3.33 %
CITY COUNCILDept # CNCL2022 BUDGET COMPARISON
68

2020 ACTUAL
2021ACTUAL
THRU30-Jun-2021
2021REVISED
BUDGET THRU 30-Jun-2021
2022SUBMITTED
$ INCREASE (DECREASE)
FROM REVISED TO 2022
% CHANGE FROM REV
TO 2022Total 5100 $ — $ — $ — $ — $ — Total 5200 $ — $ — $ — $ — $ — 539A OPERATING TRANSFER OUT 3,680,729 3,173,716 3,173,716 — Total 5300 $ 3,680,729 $ 793,429 $ 3,173,716 $ 3,173,716 $ — 0.00 %Total 5400 $ — $ — $ — $ — $ —
Total $ 3,680,729 $ 793,429 $ 3,173,716 $ 3,173,716 $ — 0.00 %
COMMUNICATIONSDept # 00182022 BUDGET COMPARISON
69

[This page intentionally left blank]
70

COMMUNITY DEVELOPMENT DIVISION
Vision Statement“To foster a vibrant, prosperous and growing Fort Wayne through extraordinary community development.”
Mission Statement“To develop and implement creative community-based strategies to enhance economic opportunity, build strong neighborhoods, and ensure a dynamic framework for quality growth and development.”
Director’s OfficeThe Director’s Office provides coordination and overall direction for the Division comprised of by the following departments: Finance, Planning & Policy, Community Development Corporation of Northeast Indiana, Redevelopment, Housing Programs, Grants Administration, Neighborhood Revitalization, and Neighborhood Code Enforcement.
The division’s departments work collaboratively to coordinate and carry out activities based on the following operating principles:
Community-Based Planning - Ensure Community based planning as the foundation for all projects, resource allocation and collaboration.
Aggressive Implementation - Create and sustain an aggressive implementation strategy for all planning efforts.
Support Businesses - Sustain strong and aggressive support for business and investment and job creation.
Strategic Projects - Encourage and facilitate strategic projects that will develop, revitalize, and strengthen the Fort Wayne Community.
Community Collaboration - Pursue a stronger commitment with citizens, neighborhoods, businesses and organizations to collaborate as strategic partners in achieving community development goals.
High Performance Organization - Foster a work environment that encourages and provides for sustained personal and professional development and a commitment to innovation and excellence.
Deputy Director of Planning & PolicyWorking under the Division Director, this Director oversees the implementation of integrated strategic and operational planning initiatives that enhance development opportunities and efficiencies for the City of Fort Wayne. The Deputy Director oversees the daily operations of the following departments:
Special Projects/GIS provides strategic research to assist in the direction of Division resources, management of special projects and develops/leads implementation of the Division technology strategy. It provides data, analysis, and GIS support to the Division.
Strategic Planning works to promote good stewardship of City resources through various land and planning studies, visioning initiatives, Comprehensive Plan updates, transportation studies and the promotion for orderly, fiscally sound expansion of the City through annexation.
Historic Preservation, a sub-area within this department, manages the historic and aesthetic resources of the community, working with property owners, city agencies and other groups to coordinate improvement efforts, provide technical assistance and cost- effective design solutions.
71

Deputy Director of Housing and Neighborhood ServicesWorking under the Division Director, this Director oversees the implementation of initiatives to attract and support housing investment and reinvestment in the City to promote community development and expand access to desirable housing. The Deputy Director oversees the strategic investment of public funds in neighborhood revitalization-oriented projects and programs which leverage significantly higher levels of private investment through the following departments:
HANDS is a quasi-public not-for-profit Corporation of the city organized under chapter 246 of the Indiana Acts of 1921.
Housing Programs administers the City’s Home Investment Partnerships Act (HOME) Program from the federal department of Housing and Urban Development (HUD).
Grants Administration administers the City’s Community Development Block Grant (CDBG) and Emergency Shelter Grant (ESG) programs from the federal department of Housing and Urban Development (HUD). Also administers the City’s lead grant programs from the federal department of Housing and Urban Development Office of Lead Hazard and Control and Health Homes and the state lead grant program from the state department of Indiana Housing and Community Development Authority.
Neighborhood Revitalization plans, coordinates and directs the City's neighborhood revitalization implementation program and ancillary projects.
Director of Neighborhood Code EnforcementWorking under the Division Director, this Director oversees the daily operations of Neighborhood Code Enforcement. NCE works towards the goal of ensuring maintenance standards are met on both commercial and residential properties by cleaning up blighted areas, securing vacant structures and eliminating unsafe structures, which enhances our citizen’s property values and encourages investment and development in our community.
Executive Director of RedevelopmentWorking under the Division Director, this Executive Director of Redevelopment works in conjunction with the Redevelopment Commission to promote and implement opportunity projects, acting as a catalyst to develop areas that have shown a cessation of growth and lack of development. This is done through techniques including real estate acquisition, site preparation and/or providing public infrastructure to the site. Financing resources generally used are Tax Incremental Financing (TIF) and Redevelopment General Obligation Bonds.
CD Economic Development ManagerWorking under the Division Director, this Manager oversees the implementation of an aggressive development partnership between the public and private sectors. The Manager also oversees the activities of the following:
Community Development Corporation of Northeast Indiana (CDC) is a city-sponsored, 501 c (6) not-for-profit business development organization. Its primary objective is to promote the growth and development of small commercial and industrial businesses in the Fort Wayne area and a nine-county area in northeast Indiana through creative business loan programs.
Greater Fort Wayne, Inc. – Liaison/SupportForeign Trade Zone – Support to the FWAC Airport AuthorityTax Abatement and Economic Development Bonds Issuance for private business Fort Wayne Urban Enterprise Area
72

2020 ACTUAL
2021ACTUAL
THRU30-Jun-2021
2021REVISED
BUDGET THRU 30-Jun-2021
2022SUBMITTED
$ INCREASE (DECREASE)
FROM REVISED TO 2022
% CHANGE FROM REV
TO 20225111 WAGES 2,755,274 2,938,746 2,985,331 46,585 5131 PERF - EMPLOYERS SHARE 291,915 315,851 331,726 15,875 5132 FICA 199,297 224,205 227,770 3,565 5134 LIFE MEDICAL & HEALTH INSURAN 705,000 705,000 657,996 (47,004) 5136 UNEMPLOYMENT COMPENSATION 2,844 2,930 2,983 53 5137 WORKERS COMP INSURANCE 10,231 10,231 10,015 (216) 513A PERF - EMPLOYEES/PD BY CITY 79,879 84,599 88,851 4,252 513R RETIREES HEALTH INSURANCE 105,000 105,000 56,000 (49,000) 5161 WAGE SETTLEMENT/SEVERANCE PAY 386 — — — 5162 ACCRUED WAGES ADJ 26,537 — — — Total 5100 $ 4,176,362 $ 2,110,034 $ 4,386,562 $ 4,360,672 $ (25,890) -0.59 %5214 SAFETY ITEMS/SUPPLIES 35 100 100 — 5219 OTHER OFFICE SUPPLIES 6,693 16,100 16,100 — 521C COMPUTERS & SOFTWARE <$4999 3,143 — — — 5231 GASOLINE 15,861 21,154 840 (20,314) 5299 OTHER MATERIALS & SUPPLIES 7,115 8,500 8,500 — 529C BUNKER GEAR/UNIFORMS 7,818 9,750 9,750 — Total 5200 $ 40,664 $ 17,709 $ 55,604 $ 35,290 $ (20,314) -36.53 %5311 LEGAL SERVICES 21,262 — — — 5314 CONSULTANT SERVICES 156,415 190,690 176,000 (14,690) 531K SEMINAR FEES 450 7,500 7,500 — 531S SOFTWARE TRAINING — 1,500 1,500 — 531Z DOCUMENT RECORDING FEES 411 — — — 5322 POSTAGE 32,626 42,000 42,000 — 5324 TRAVEL EXPENSES 441 6,500 6,500 — 5326 MILEAGE 68 1,050 1,050 — 532C CELL PHONE 654 2,120 2,120 — 532V VERIZON AIR CARDS 5,448 7,000 7,000 — 5331 PRINTING OTHER THAN OFFC SUPPL 1,564 10,200 10,200 — 5332 PUBLIC OF LEGAL NOTICES/ADVTER 34 200 200 — 5342 LIABILITY INSURANCE 84,580 84,580 84,549 (31) 5363 CONTRACTED OTHER EQUIPMT REPAI 8,023 12,500 12,500 — 5369 CONTRACTED SERVICE 583,840 480,000 480,000 — 536T FLEET SERVICES 33,589 37,986 4,420 (33,566) 5374 OTHER EQUIPMENT RENTAL 11,865 12,100 12,100 — 5391 SUBSCRIPTIONS AND DUES 11,336 12,800 12,800 — 5392 LICENSES 1,660 1,000 1,000 — 5399 OTHER SERVICES AND CHARGES 1,269 1,120 1,120 — 539A OPERATING TRANSFER OUT 15,000 15,000 15,000 — 539B MASTER LEASE 27,236 36,685 2,353 (34,332) Total 5300 $ 997,771 $ 355,835 $ 962,531 $ 879,912 $ (82,619) -8.58 %Total 5400 $ — $ — $ — $ — $ —
Total $ 5,214,798 $ 2,483,578 $ 5,404,697 $ 5,275,874 $ (128,823) -2.38 %
COMMUNITY DEVELOPMENT Dept # 00082022 BUDGET COMPARISON
73

[This page intentionally left blank]
74

CUMULATIVE CAPITAL FUNDS
CUMULATIVE CAPITAL IMPROVEMENT FUND
This capital projects type fund is used to account for receipts and disbursements of state cigarette tax distributions. The fund is established by IC 6-7-1-31.1.
The City may only use money in its cumulative capital improvement fund to:
1. Purchase land, easements, or rights-of-way2. Purchase buildings3. Construct or improve city owned property4. Retire general obligation bonds5. To purchase, lease, upgrade, maintain or repair one of the following:
• Computer hardware or computer software• Wiring and computer networks• Communication access systems used to connect with computer networks or electronic gateways• To pay for the services of full-time or part-time computer maintenance employees.• To conduct nonrecurring inservice technology training of unit employees
The City of Fort Wayne has passed a local ordinance, which allows the monies received in the Cumulative Capital Improvement fund to be transferred to the City's General fund.
CUMULATIVE CAPITAL DEVELOPMENT FUND
IC 36-9-15.2 allows municipalities to establish a cumulative capital development fund. The City of Fort Wayne established such fund with Special Ordinance S-53-13 with passage on June 25, 2013.
The revenue is generated by levying a property tax and may be used for any purpose for which property taxes may be imposed.
The maximum property tax rate that may be imposed:
0 years $ 0.01671 year $ 0.03332 or more years $ 0.0500
In 2022, the City of Fort Wayne is using the majority of the revenue generated for this fund for Public Works infrastructure. There is also $1,500,000 for rebuilding an existing fire station in a new location.
75

2020 ACTUAL
2021ACTUAL
THRU30-Jun-2021
2021REVISED
BUDGET THRU 30-Jun-2021
2022SUBMITTED
$ INCREASE (DECREASE)
FROM REVISED TO 2022
% CHANGE FROM REV
TO 2022521C COMPUTERS & SOFTWARE <$4999 206 — — — 5245 LANDSCAPE & GRNHOUSE SUPPLIES 21,249 50,000 50,000 — 5264 SIGN DIVISION/MATERIAL 89,707 100,000 100,000 — 5265 SIGNAL DIVISION/MATERIAL 27,573 150,000 150,000 — 526L STREET LIGHT MATERIALS 73,561 25,000 25,000 — 5277 CEMENT CONCRETE 56,455 — — — 5299 OTHER MATERIALS & SUPPLIES 6,459 — — — 52AA IN HOUS STOCK 2,076 — — Total 5200 $ 277,287 $ 106,155 $ 325,000 $ 325,000 $ — 0.00 %5311 LEGAL SERVICES 2,940 — — — 5314 CONSULTANT SERVICES 829,515 — — — 5315 APPRAISALS SERVICES 8,890 — — — 5332 PUBLIC OF LEGAL NOTICES/ADVTER 3,053 — — — 5369 CONTRACTED SERVICE 190,992 725,000 725,000 — 5374 OTHER EQUIPMENT RENTAL 400 — — — 5393 TAXES 1,185 — — — 5399 OTHER SERVICES AND CHARGES 200 — — — Total 5300 $ 1,037,175 $ 421,121 $ 725,000 $ 725,000 $ — 0.00 %5411 PURCHASE OF LAND — — — — 5412 LAND ACQUISITION - PERM ROW 4,344 — — — 5431 CONSTRUCTION FEES - GROUND & S 2,089,461 2,250,000 3,750,000 1,500,000 Total 5400 $ 2,093,806 $ 1,310,982 $ 2,250,000 $ 3,750,000 $ 1,500,000 66.67 %
Total $ 3,408,268 $ 1,838,258 $ 3,300,000 $ 4,800,000 $ 1,500,000 45.45 %
CUMULATIVE CAPITAL DEVELOPMENT2022 BUDGET COMPARISON
76

2020 ACTUAL
2021ACTUAL
THRU30-Jun-2021
2021REVISED
BUDGET THRU 30-Jun-2021
2022SUBMITTED
$ INCREASE (DECREASE)
FROM REVISED TO 2022
% CHANGE FROM REV
TO 20225213 COMPUTER SUPPLIES 49,221 75,000 35,000 (40,000) 5219 OTHER OFFICE SUPPLIES 2,259 — — — 521C COMPUTERS & SOFTWARE <$4999 157,475 480,000 475,000 (5,000) Total 5200 $ 208,954 $ 55,025 $ 555,000 $ 510,000 $ (45,000) -8.11 %5314 CONSULTANT SERVICES — 4,450 — (4,450) 5367 MAINT. AGREEMENT - SOFTWARE — — — — 5399 OTHER SERVICES AND CHARGES — — — — Total 5300 $ — $ (1,159) $ 4,450 $ — $ (4,450) -100.00 %5444 PURCHASE OF OTHER EQUIPMENT 85,613 — — — 5445 PURCHASE OF COMPUTER EQUIP — 125,000 25,000 (100,000) Total 5400 $ 85,613 $ — $ 125,000 $ 25,000 $ (100,000) -80.00 %
Total $ 294,567 $ 53,867 $ 684,450 $ 535,000 $ (149,450) -21.84 %
CUMULATIVE CAPITAL IMPROVEMENT2022 BUDGET COMPARISON
77

[This page intentionally left blank]
78

2020 ACTUAL
2021ACTUAL
THRU30-Jun-2021
2021REVISED
BUDGET THRU 30-Jun-2021
2022SUBMITTED
$ INCREASE (DECREASE)
FROM REVISED TO 2022
% CHANGE FROM REV
TO 2022Total 5100 $ — $ — $ — $ — $ — Total 5200 $ — $ — $ — $ — $ — 531N PUBLIC EDUCATION SERVICES — 6,500 6,500 — 5322 POSTAGE — 150 150 — 5331 PRINTING OTHER THAN OFFC SUPPL 516 500 500 — 5399 OTHER SERVICES AND CHARGES 6,784 — — — Total 5300 $ 7,300 $ — $ 7,150 $ 7,150 $ — 0.00 %
Total $ 7,300 $ — $ 7,150 $ 7,150 $ — 0.00 %
DOMESTIC VIOLENCEDept # 00142022 BUDGET COMPARISON
79

[This page intentionally left blank]
80

FINANCE & ADMINISTRATION DIVISIONController’s Office/Information Systems/Payroll/Property Management/Purchasing
Mission Statement
The mission of the Finance & Administration Division is to ensure the proper fiscal management of the revenues received and expenses incurred by the City of Fort Wayne and serve as a resource to all City Divisions as they execute their responsibilities for the citizens of Fort Wayne.
Goals and Objectives
• To safeguard the assets of the City of Fort Wayne through strong internal controls• To ensure expense management through strong fiscal control• To ensure adequate resources are available for delivery of excellent services to citizens• Provide goods & services at the lowest price with the highest quality to ensure the best use of taxpayer
money• To ensure quality, reliable, available, recoverable and cost effective information systems and services to
the City of Fort Wayne• To ensure the highest quality of support to all City Divisions• To serve as resource to all City Divisions as they serve the taxpayers of Fort Wayne
81

5111 WAGES 1,786,041 1,814,164 2,029,252 215,088 5125 OVERTIME PREMIUM 1,658 1,000 1,000 — 5130 PARENTAL LEAVE — 5,000 5,000 — 5131 PERF - EMPLOYERS SHARE 198,580 201,747 225,440 23,693 5132 FICA 132,050 138,794 155,245 16,451 5134 LIFE MEDICAL & HEALTH INSURAN 405,000 390,000 378,000 (12,000) 5136 UNEMPLOYMENT COMPENSATION 1,778 1,819 2,030 211 5137 WORKERS COMP INSURANCE 2,594 2,594 1,847 (747) 513A PERF - EMPLOYEES/PD BY CITY 53,192 54,043 60,381 6,338 513R RETIREES HEALTH INSURANCE 45,000 15,000 — (15,000) 5161 WAGE SETTLEMENT/SEVERANCE PAY 3,616 33,000 33,000 — 5162 ACCRUED WAGES ADJ 3,789 — — — Total 5100 $ 2,633,297 $ 1,305,640 $ 2,657,161 $ 2,891,195 $ 234,034 9.49 %5212 STATIONERY & PRINTED FORMS 3,462 26,180 24,680 (1,500) 5213 COMPUTER SUPPLIES 3,448 2,500 2,000 (500) 5219 OTHER OFFICE SUPPLIES 10,831 23,034 22,034 (1,000) 521C COMPUTERS & SOFTWARE <$4999 — 2,500 3,000 500 5231 GASOLINE 941 1,405 1,540 135 5263 OTHER EQUIPMENT REPAIR PARTS 200 300 300 — 5299 OTHER MATERIALS & SUPPLIES 114,316 149,260 174,260 25,000 Total 5200 $ 133,198 $ 66,864 $ 205,179 $ 227,814 $ 22,635 11.03 %5310 JOINT TASK FORCE 59,540 138,000 138,000 — 5314 CONSULTANT SERVICES 2,351,308 2,614,000 2,904,000 290,000 5315 APPRAISALS SERVICES 2,500 8,000 8,000 — 531C AUDIT FEES 62,923 75,000 75,000 — 531H BANK SERVICE CHARGES 11,760 30,000 30,000 — 531K SEMINAR FEES 698 15,608 15,608 — 531M SECURITY SERVICES 136,938 210,238 200,000 (10,238) 5322 POSTAGE 12,558 14,410 14,410 — 5323 TELEPHONE & INTERNET 339,739 502,000 502,000 — 5324 TRAVEL EXPENSES 903 9,550 9,550 — 5326 MILEAGE — 2,050 2,050 — 532C CELL PHONE 12,689 10,640 10,640 — 532L LONG DISTANCE CHARGES 1,671 1,000 1,000 — 5331 PRINTING OTHER THAN OFFC SUPPL 1,314 3,500 3,500 — 5332 PUBLIC OF LEGAL NOTICES/ADVTER 1,471 3,400 3,400 — 5342 LIABILITY INSURANCE 230,515 38,874 41,589 2,715 5351 ELECTRICITY 278,897 240,800 502,515 261,715 5352 NATURAL GAS 39,810 46,263 84,583 38,320 5353 WATER 31,938 32,700 53,796 21,096 5354 SEWAGE 2,704 3,480 3,480 — 535N STORAGE COSTS — 500 500 — 5363 CONTRACTED OTHER EQUIPMT REPAI 29,901 15,500 15,500 — 5364 CONTRACTED GROUND & SURFC RPR 18,124 42,867 38,763 (4,104) 5365 JANITORIAL & LAUNDRY SERVICE 186,464 270,661 355,000 84,339 5367 MAINT. AGREEMENT - SOFTWARE 1,379,272 2,321,974 2,208,644 (113,330) 5369 CONTRACTED SERVICE 907,471 1,887,815 2,088,820 201,005 536A MAINT. AGREEMENT - HARDWARE 27,504 92,500 90,000 (2,500) 536P HVAC SERVICES 132,700 220,909 206,815 (14,094) 536T FLEET SERVICES 4,462 2,223 5,966 3,743 5373 COMPUTER EQUIPMENT RENTAL 59,994 212,000 93,000 (119,000) 5374 OTHER EQUIPMENT RENTAL 3,923 10,360 10,360 — 5375 OTHER RENT 20,944 125 125 — 5391 SUBSCRIPTIONS AND DUES 29,699 79,050 79,050 — 5393 TAXES 394 1,000 1,000 — 5395 GRANTS SUBSIDIES & LOANS 78,445 44,000 — (44,000)
2020 ACTUAL
2021ACTUAL
THRU30-Jun-2021
2021REVISED
BUDGET THRU 30-Jun-2021
2022SUBMITTED
$ INCREASE (DECREASE)
FROM REVISED TO 2022
% CHANGE FROM REV
TO 2022
FINANCE ADMINDept # 00022022 BUDGET COMPARISON
82

5399 OTHER SERVICES AND CHARGES 979,300 30,500 40,500 10,000 539A OPERATING TRANSFER OUT 2,070,985 56,288 159,250 102,962 539B MASTER LEASE 5,259 11,216 13,420 2,204 539D DRAINAGE ASSESSMENTS 2,117 1,440 1,440 — Total 5300 $ 9,516,835 $ 3,340,012 $ 9,300,441 $ 10,011,274 $ 710,833 7.64 %5444 PURCHASE OF OTHER EQUIPMENT — 259,000 325,000 66,000 5454 BETTERMENTS & ADDITIONS — — 100,000 100,000 Total 5400 $ — $ 144,000 $ 259,000 $ 425,000 $ 166,000 64.09 %
Total $ 12,283,329 $ 4,856,516 $ 12,421,781 $ 13,555,283 $ 1,133,502 9.13 %
2020 ACTUAL
2021ACTUAL
THRU30-Jun-2021
2021REVISED
BUDGET THRU 30-Jun-2021
2022SUBMITTED
$ INCREASE (DECREASE)
FROM REVISED TO 2022
% CHANGE FROM REV
TO 2022
FINANCE ADMINDept # 00022022 BUDGET COMPARISON
83

[This page intentionally left blank]
84
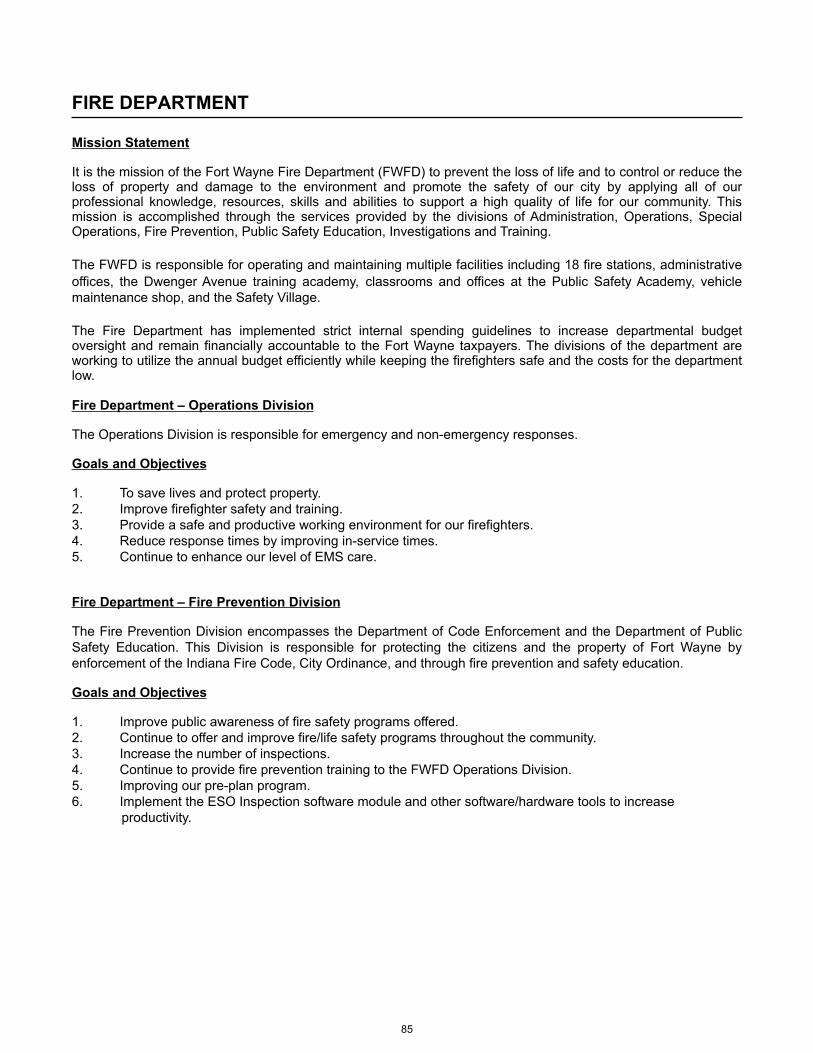
FIRE DEPARTMENT
Mission Statement
It is the mission of the Fort Wayne Fire Department (FWFD) to prevent the loss of life and to control or reduce the loss of property and damage to the environment and promote the safety of our city by applying all of our professional knowledge, resources, skills and abilities to support a high quality of life for our community. This mission is accomplished through the services provided by the divisions of Administration, Operations, Special Operations, Fire Prevention, Public Safety Education, Investigations and Training.
The FWFD is responsible for operating and maintaining multiple facilities including 18 fire stations, administrative offices, the Dwenger Avenue training academy, classrooms and offices at the Public Safety Academy, vehicle maintenance shop, and the Safety Village.
The Fire Department has implemented strict internal spending guidelines to increase departmental budget oversight and remain financially accountable to the Fort Wayne taxpayers. The divisions of the department are working to utilize the annual budget efficiently while keeping the firefighters safe and the costs for the department low.
Fire Department – Operations Division
The Operations Division is responsible for emergency and non-emergency responses.
Goals and Objectives
1. To save lives and protect property.2. Improve firefighter safety and training.3. Provide a safe and productive working environment for our firefighters.4. Reduce response times by improving in-service times.5. Continue to enhance our level of EMS care.
Fire Department – Fire Prevention Division
The Fire Prevention Division encompasses the Department of Code Enforcement and the Department of Public Safety Education. This Division is responsible for protecting the citizens and the property of Fort Wayne by enforcement of the Indiana Fire Code, City Ordinance, and through fire prevention and safety education.
Goals and Objectives
1. Improve public awareness of fire safety programs offered.2. Continue to offer and improve fire/life safety programs throughout the community.3. Increase the number of inspections.4. Continue to provide fire prevention training to the FWFD Operations Division.5. Improving our pre-plan program.6. Implement the ESO Inspection software module and other software/hardware tools to increase
productivity.
85

Fire Department – Investigations Division
Utilizing standard techniques, the Fire Investigation Division of the FWFD is responsible for determining the origin, cause, and circumstances of fires that occur within the City of Fort Wayne. The members of the FWFD Investigations Division are Indiana State certified firefighters as well as Indiana State certified law enforcement officers. The investigators are specialty trained in the discovery, preservation, and presentation of evidence and have the authority to affect probable cause arrests.
Goals and Objectives
1. Reduce the fire incident frequency, property and monetary loss, as well as injuries and deaths by completing thorough investigations and accurately determining fire cause.
2. Arrest and prosecute offenders of fire related incidents.3. Provide accurate fire data and identify trends for Fire Prevention.4. Provide training in origin and cause determination to the Operations Division.5. Provide support to the Fort Wayne Police Department’s Air Support Unit.
Fire Department – Training and Development Division
The FWFD Division of Training provides training support to the Operations, Special Operations and EMS Divisions of the FWFD. Members of the FWFD Training Division are also responsible for training new recruits on the basic techniques of fire suppression and emergency medical care.
Goals and Objectives – Fire Division
1. To provide training in the areas of fire suppression, emergency medical technician training, hazardous material handling, and basic rescue protocol to recruits.
2. Develop critical instructor driven contact drills and scenarios to achieve / maintain a specific capability for the Operations Division.
3. Prepare periodic station training schedules that designate specific subjects that are to be covered by station officers in conducting their station training.
4. Establish and implement promotional processes for the ranks of Lieutenant, Captain and Battalion Chief.5. Establish career paths and mentoring programs for company officer and battalion chief positions.6. Provide certification classes for those firefighters that want to further their education in job related
competencies.7. Maintain, oversee, and operate the FWFD nationally certified CPAT certification process.8. Retain training data to support and verify Fire Suppression Rating Schedule.
Goals and Objectives – EMS Division
The EMS Division of the Fort Wayne Fire Department provides appropriate and quality emergency medical care for the citizens of Fort Wayne. The Fort Wayne Fire Department has increased that level of care to the Advanced Life Support level through a cooperative agreement with the Three Rivers Ambulance Authority. To provide quality care, the EMS Division of the Fort Wayne Fire Department will continue to:
1. Provide pre-hospital emergency care at the first responder level.2. Provide inter-departmental training between Police, Fire and EMS.3. Increase the level of service provided to the citizens of Fort Wayne by increasing the number of Advanced
EMTs and Paramedics on the Fort Wayne Fire Department.
Fire Statistics2012 2013 2014 2015 2016 2017 2018 2019 2020
EMS Runs 7,025 6,751 7,277 8,021 8,875 9,673 9,948 10,684 10,594 Fire Rescue Runs 13,285 10,930 11,833 11,906 12,232 13,305 13,879 14,710 14,669 Total 20,310 20,310 17,681 19,110 19,927 21,107 22,978 23,827 25,394
86

5111 WAGES 23,695,840 27,150,788 28,844,211 1,693,423 5125 OVERTIME PREMIUM 2,974,358 2,257,660 2,485,747 228,087 5131 PERF - EMPLOYERS SHARE 56,597 62,409 64,906 2,497 5132 FICA 393,903 446,956 475,249 28,293 5133 SAFETY OFFICERS PENSION 4,976,300 4,451,672 4,617,035 165,363 5134 LIFE MEDICAL & HEALTH INSURAN 5,678,519 5,775,000 5,390,000 (385,000) 5135 EMPLOYEE MEDICAL EXPENSES 151,395 311,013 309,713 (1,300) 5136 UNEMPLOYMENT COMPENSATION 22,639 24,859 26,428 1,569 5137 WORKERS COMP INSURANCE 198 198 1,185 987 5138 CLOTHING ALLOWANCE 109,550 93,750 93,750 — 513A PERF - EMPLOYEES/PD BY CITY 15,160 16,717 17,385 668 513H HURT ON DUTY 605,057 375,000 375,000 — 513R RETIREES HEALTH INSURANCE 1,395,000 1,470,000 1,512,000 42,000 5142 HSA DEPOSITS (176) — — — 5162 ACCRUED WAGES ADJ 277,490 — — — Total 5100 $ 40,351,829 $ 20,459,987 $ 42,436,022 $ 44,212,609 $ 1,776,587 4.19 %5212 STATIONERY & PRINTED FORMS 3,773 1,150 1,150 — 5213 COMPUTER SUPPLIES 3,090 5,900 5,950 50 5219 OTHER OFFICE SUPPLIES 11,168 9,275 9,275 — 521C COMPUTERS & SOFTWARE <$4999 10,938 83,114 84,519 1,405 5231 GASOLINE 63,105 80,000 80,000 — 5232 DIESEL FUEL / FUEL OIL 107,431 143,974 143,974 — 5239 OTHER GARAGE & MOTOR SUPPLIES 7,867 9,395 9,395 — 5241 MEDICAL & SURGICAL SUPPLIES 20,709 40,000 40,000 — 5245 LANDSCAPE & GRNHOUSE SUPPLIES 27,916 3,000 3,000 — 5246 HOUSEHOLD & CLEANING SUPPLIES 70,187 85,540 59,700 (25,840) 5247 INSTRUCTIONAL SUPPLIES 17,140 25,015 32,372 7,357 5261 BLDG REPAIR & MAINT MATERIALS 37,907 48,702 48,700 (2) 5263 OTHER EQUIPMENT REPAIR PARTS 47,220 47,677 42,500 (5,177) 5299 OTHER MATERIALS & SUPPLIES 373,579 635,712 581,085 (54,627) 529C BUNKER GEAR/UNIFORMS 181,555 1,409,113 421,467 (987,646) 52MB SUPPLIES/MERIT BOARD — 250 250 — Total 5200 $ 983,582 $ 1,393,938 $ 2,627,816 $ 1,563,337 $ (1,064,479) -40.51 %5314 CONSULTANT SERVICES 1,050 — — — 5315 APPRAISALS SERVICES 18,340 42,109 37,450 (4,659) 5317 INSTRUCTIONAL SERVICES 5,877 51,843 73,061 21,218 531K SEMINAR FEES 7,612 33,975 67,937 33,962 5322 POSTAGE 1,341 1,800 1,800 — 5324 TRAVEL EXPENSES 1,979 17,722 22,826 5,104 5326 MILEAGE — 1,000 1,000 — 532C CELL PHONE 11,359 13,000 13,000 — 532V VERIZON AIR CARDS 36,042 35,038 33,319 (1,719) 5331 PRINTING OTHER THAN OFFC SUPPL 37 2,506 2,506 — 5342 LIABILITY INSURANCE 272,537 272,537 324,976 52,439 5351 ELECTRICITY 231,757 225,000 225,000 — 5352 NATURAL GAS 61,069 84,000 84,000 — 5353 WATER 103,769 95,000 95,000 — 5361 CONTRACTED BLDG & STRUCT REPAI 24,267 133,970 165,900 31,930 5363 CONTRACTED OTHER EQUIPMT REPAI 13,493 23,060 23,060 — 5365 JANITORIAL & LAUNDRY SERVICE 7,835 50,679 44,964 (5,715) 5367 MAINT. AGREEMENT - SOFTWARE 66,395 69,513 77,066 7,553 5369 CONTRACTED SERVICE 337,419 839,640 1,324,940 485,300 536T FLEET SERVICES 841,230 992,205 1,023,880 31,675 5371 BUILDING RENTAL 144,963 144,963 — (144,963) 5375 OTHER RENT 443 2,896 2,896 —
2020 ACTUAL
2021ACTUAL
THRU30-Jun-2021
2021REVISED
BUDGET THRU 30-Jun-2021
2022SUBMITTED
$ INCREASE (DECREASE)
FROM REVISED TO 2022
% CHANGE FROM REV
TO 2022
FIREDept # 00152022 BUDGET COMPARISON
87

5377 CC BUILDING PARKING 19,754 23,000 23,000 — 5391 SUBSCRIPTIONS AND DUES 4,081 7,765 9,807 2,042 5399 OTHER SERVICES AND CHARGES 87,951 11,450 7,850 (3,600) 539B MASTER LEASE 1,469,620 1,691,542 1,866,083 174,541 53MB SERVICES/MERIT BOARD 2,699 — — — Total 5300 $ 3,772,919 $ 2,247,154 $ 4,866,214 $ 5,551,321 $ 685,107 14.08 %5444 PURCHASE OF OTHER EQUIPMENT 46,414 119,230 185,000 65,770 Total 5400 $ 46,414 $ — $ 119,230 $ 185,000 $ 65,770 55.16 %
Total $ 45,154,744 $ 24,101,080 $ 50,049,282 $ 51,512,267 $ 1,462,985 2.92 %
2020 ACTUAL
2021ACTUAL
THRU30-Jun-2021
2021REVISED
BUDGET THRU 30-Jun-2021
2022SUBMITTED
$ INCREASE (DECREASE)
FROM REVISED TO 2022
% CHANGE FROM REV
TO 2022
FIREDept # 00152022 BUDGET COMPARISON
88

FLEET MANAGEMENT
The Fleet Management Operations Division
The City of Fort Wayne’s Fleet Management Operations Division is committed to providing service for all City departments. The Fleet Department maintains responsibility for exercising a non-biased bid process and implementing cost saving for purchases large and small.
Additionally, we are tasked with ensuring that we not only maintain compliance with environmental regulations, but also proactively address how we can make a difference environmentally in our City as well as set as example for others to follow.
Purpose
It is the purpose of the Fleet Department to deliver premium level services at a good value to the City. To provide vehicles and equipment that is safe, reliable and appropriate to those who serve our communities. This in turn helps to ensure that the City has the means to assist in providing the highest quality of life possible for all who live and/or work in the area.
Mission Statement
Our mission is to provide City of Fort Wayne employees with appropriate transportation in the most economic, environmentally friendly and effective manner possible. This is done by following procedures developed to match each department’s specific job function and utilization to the appropriate equipment specifications.
Values
Our Commitments:
• Best Quality – do it right the first time.• Respect – Honor the opinions of all co-workers and customers.• Trust – always do what we say we will.• Innovation – continuously searches for new and better ways to do things.• Availability – Ensure equipment is available to users when needed.• A Sense of Urgency – we value our customer’s time and spend it wisely, realizing that every minute a
piece of equipment is not available, our customer’s productivity is lost.• A Commitment to Serve – our customers, our co-workers and the citizens of Fort Wayne.• Excellence – Always learning new things and training to stay current on today’s ever changing technical,
safety, environmental needs and practices.
Goals and Objectives
1. Maintain facilities according to OSHA and environmental standards2. Create specifications for new equipment & trucks as well as participate in bid processes to ensure best price3. To evaluate the cost of products and obtain quotes4. Implement preventative maintenance programs for vehicles and equipment5. Maintain information on FASTER program for labor, repair costs, part replacement for life cycle cost as well as
utilization for vehicles and equipment6. Establish a concrete plan for equipment and maintenance facilities7. Educate and train our staff to stay current on today’s ever changing technology. Provide training for all team
members in technical, safety and environmental practices.
Previous year Stats (2020) reporting for 2022
▪ Fleet size 2,152▪ On road equipment 1,223
89

▪ Total fleet miles 9,463,846▪ Average usage 8,160 miles▪ Gallons of gas used 741,589▪ Gallons of diesel fuel 322,402▪ Total work orders 7,028 (work orders opened in 2020)▪ VE count 9,032
Fleet Awards
▪ Fleet Director – APWA Certification Board▪ Fleet Director – Past Ford Police Advisory Board▪ Fleet Director – Greater Indiana Clean Cities Board Vice President▪ Fleet Director – Inducted into Government Public Fleet Hall of Fame▪ Government Leading Fleets 2020 sponsored by APWA & Government Fleet▪ Listed as one of the 100 best fleets
90

2020 ACTUAL
2021ACTUAL
THRU30-Jun-2021
2021REVISED
BUDGET THRU 30-Jun-2021
2022SUBMITTED
$ INCREASE (DECREASE)
FROM REVISED TO 2022
% CHANGE FROM REV
TO 20225111 WAGES 1,423,641 1,532,372 1,807,853 275,481 5125 OVERTIME PREMIUM 45,671 62,424 62,424 — 5131 PERF - EMPLOYERS SHARE 166,602 178,617 206,462 27,845 5132 FICA 110,232 122,002 141,021 19,019 5134 LIFE MEDICAL & HEALTH INSURAN 435,000 435,000 406,000 (29,000) 5136 UNEMPLOYMENT COMPENSATION 1,551 1,595 1,843 248 5137 WORKERS COMP INSURANCE 14,671 14,671 14,072 (599) 513A PERF - EMPLOYEES/PD BY CITY 44,626 47,844 55,302 7,458 5140 MERIT INCENTIVE POOL 12,100 — — — 05162 ACCRUED WAGES ADJ 11,008 — — — 5180 TOOL ALLOWANCE 18,000 28,500 27,000 (1,500) Total 5100 $ 2,283,102 $ 1,189,618 $ 2,423,025 $ 2,721,977 $ 298,952 12.34 %5213 COMPUTER SUPPLIES 2,513 5,870 2,000 (3,870) 5214 SAFETY ITEMS/SUPPLIES 5,155 8,000 6,000 (2,000) 5219 OTHER OFFICE SUPPLIES 5,565 5,000 3,000 (2,000) 521C COMPUTERS & SOFTWARE <$4999 — — 5,500 5,500 5231 GASOLINE 1,501,961 1,478,544 1,423,100 (55,444) 5232 DIESEL FUEL / FUEL OIL 743,575 816,284 891,200 74,916 5236 DEF FLUID 4,152 10,000 10,000 — 5239 OTHER GARAGE & MOTOR SUPPLIES 43,152 45,000 45,000 — 5246 HOUSEHOLD & CLEANING SUPPLIES 1,040 4,000 3,000 (1,000) 5262 VEHICLE REPAIR PARTS 1,114,797 1,114,526 1,214,526 100,000 5291 SMALL TOOLS 24,803 14,449 10,000 (4,449) 5299 OTHER MATERIALS & SUPPLIES 3,059 5,000 3,500 (1,500) Total 5200 $ 3,449,771 $ 1,684,575 $ 3,506,673 $ 3,616,826 $ 110,153 3.14 %5314 CONSULTANT SERVICES 5,431 65,000 15,000 (50,000) 5317 INSTRUCTIONAL SERVICES 3,398 6,000 6,000 — 531K SEMINAR FEES — 5,000 5,000 — 5322 POSTAGE 216 400 400 — 5324 TRAVEL EXPENSES 3,451 6,000 6,000 — 532C CELL PHONE 741 1,080 1,080 — 5332 PUBLIC OF LEGAL NOTICES/ADVTER — 150 150 — 5342 LIABILITY INSURANCE 11,949 13,205 15,498 2,293 5351 ELECTRICITY 10,725 17,719 17,719 — 5352 NATURAL GAS 9,341 13,354 13,354 — 5353 WATER 6,002 5,000 5,000 — 5358 HAZARDOUS WASTE DISPOSAL 4,692 4,500 4,500 — 5359 STORM WATER SEWER — 1,000 1,000 — 5361 CONTRACTED BLDG & STRUCT REPAI 16,381 12,995 10,000 (2,995) 5362 CONTRACTED VEHICLE REPAIR 516,635 775,680 775,680 — 5363 CONTRACTED OTHER EQUIPMT REPAI 11,260 15,000 10,000 (5,000) 5365 JANITORIAL & LAUNDRY SERVICE 19,525 16,000 23,000 7,000 5367 MAINT. AGREEMENT - SOFTWARE 8,474 12,250 12,250 — 536T FLEET SERVICES 33,059 41,036 37,294 (3,742) 536U TOWING SERVICES 18,965 24,000 21,000 (3,000) 5374 OTHER EQUIPMENT RENTAL 2,777 3,000 3,000 — 5391 SUBSCRIPTIONS AND DUES 14,522 13,000 13,000 — 5392 LICENSES 2,534 4,000 4,000 — 5399 OTHER SERVICES AND CHARGES 7,710 4,500 4,800 300 539B MASTER LEASE 11,987 25,759 38,447 12,688 Total 5300 $ 719,776 $ 526,615 $ 1,085,628 $ 1,043,172 $ (42,456) -3.91 %5444 PURCHASE OF OTHER EQUIPMENT — 90,000 30,000 (60,000) 5446 PURCHASE OF SOFTWARE — — 8,245 8,245 0Total 5400 $ — $ (12,245) $ 90,000 $ 38,245 $ (51,755) -57.51 %
Total $ 6,452,649 $ 3,388,563 $ 7,105,326 $ 7,420,220 $ 314,894 4.43 %
FLEET MANAGEMENTDept # 08032022 BUDGET COMPARISON
91

[This page intentionally left blank]
92
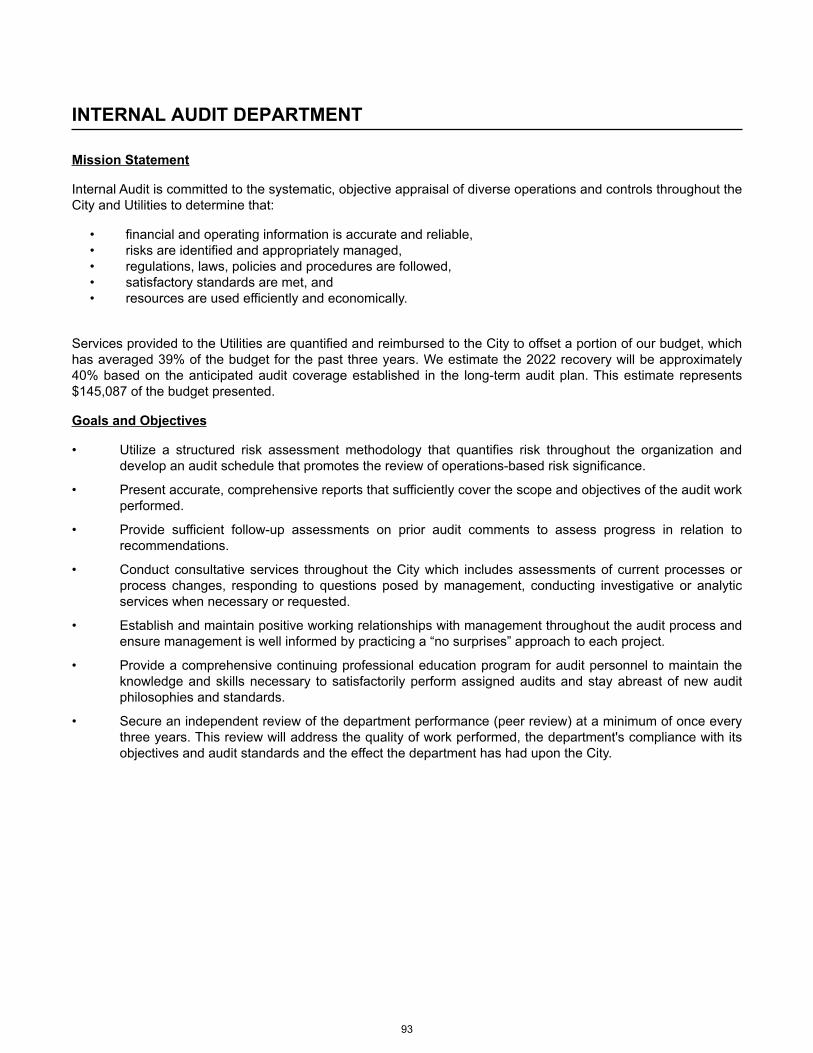
INTERNAL AUDIT DEPARTMENT
Mission Statement
Internal Audit is committed to the systematic, objective appraisal of diverse operations and controls throughout the City and Utilities to determine that:
• financial and operating information is accurate and reliable,• risks are identified and appropriately managed,• regulations, laws, policies and procedures are followed,• satisfactory standards are met, and• resources are used efficiently and economically.
Services provided to the Utilities are quantified and reimbursed to the City to offset a portion of our budget, which has averaged 39% of the budget for the past three years. We estimate the 2022 recovery will be approximately 40% based on the anticipated audit coverage established in the long-term audit plan. This estimate represents $145,087 of the budget presented.
Goals and Objectives
• Utilize a structured risk assessment methodology that quantifies risk throughout the organization and develop an audit schedule that promotes the review of operations-based risk significance.
• Present accurate, comprehensive reports that sufficiently cover the scope and objectives of the audit work performed.
• Provide sufficient follow-up assessments on prior audit comments to assess progress in relation to recommendations.
• Conduct consultative services throughout the City which includes assessments of current processes or process changes, responding to questions posed by management, conducting investigative or analytic services when necessary or requested.
• Establish and maintain positive working relationships with management throughout the audit process and ensure management is well informed by practicing a “no surprises” approach to each project.
• Provide a comprehensive continuing professional education program for audit personnel to maintain the knowledge and skills necessary to satisfactorily perform assigned audits and stay abreast of new audit philosophies and standards.
• Secure an independent review of the department performance (peer review) at a minimum of once every three years. This review will address the quality of work performed, the department's compliance with its objectives and audit standards and the effect the department has had upon the City.
93

2020 ACTUAL
2021ACTUAL
THRU30-Jun-2021
2021REVISED
BUDGET THRU 30-Jun-2021
2022SUBMITTED
$ INCREASE (DECREASE)
FROM REVISED TO 2022
% CHANGE FROM REV
TO 20225111 WAGES 157,646 236,590 245,576 8,986 5131 PERF - EMPLOYERS SHARE 17,656 26,498 27,505 1,007 5132 FICA 11,537 18,099 18,787 688 5134 LIFE MEDICAL & HEALTH INSURAN 45,000 45,000 42,000 (3,000) 5136 UNEMPLOYMENT COMPENSATION 230 237 246 9 5137 WORKERS COMP INSURANCE 233 233 170 (63) 513A PERF - EMPLOYEES/PD BY CITY 4,729 7,098 7,367 269 5162 ACCRUED WAGES ADJ 1,273 — — — Total 5100 $ 238,304 $ 123,651 $ 333,755 $ 341,651 $ 7,896 2.37 %5219 OTHER OFFICE SUPPLIES 149 450 450 — Total 5200 $ 149 $ — $ 450 $ 450 $ — 0.00 %5314 CONSULTANT SERVICES 34,000 5,120 5,120 — 531K SEMINAR FEES 1,230 12,205 3,300 (8,905) 5324 TRAVEL EXPENSES 825 2,700 2,700 — 5326 MILEAGE — 500 500 — 5342 LIABILITY INSURANCE 1,393 1,393 1,270 (123) 5374 OTHER EQUIPMENT RENTAL 1,170 2,000 2,000 — 5391 SUBSCRIPTIONS AND DUES 997 1,300 1,300 — Total 5300 $ 39,615 $ 3,866 $ 25,218 $ 16,190 $ (9,028) -35.80 %Total 5400 $ — $ — $ — $ — $ —
Total $ 278,067 $ 127,518 $ 359,423 $ 358,291 $ (1,132) -0.31 %
INTERNAL AUDITDept # 00122022 BUDGET COMPARISON
94

LAW DEPARTMENT
Mission Statement
The purpose of the Law Department is to manage the legal affairs of the City by providing legal advice/assistance to the officers, departments, boards, commissions, and other agencies of the City to comply with all City, state and federal regulations. The Law Department drafts ordinances and other legal documents for the City and its various departments. This department prosecutes violators of City ordinances and supervises and directs all litigation in which the City has an interest. Additionally, the Law Department provides labor relations services in connection with collective bargaining matters related to Public Safety.
Goals and Objectives
To provide efficient, cost effective and timely legal services through an appropriate mix of full-time attorneys and outside counsel. The department will be active in early decision making situations to limit or reduce the potential for avoidable or unnecessary litigation. The law department will apply a business-like risk analysis to pending or threatened litigation.
95

2020 ACTUAL
2021ACTUAL
THRU30-Jun-2021
2021REVISED
BUDGET THRU 30-Jun-2021
2022SUBMITTED
$ INCREASE (DECREASE)
FROM REVISED TO 2022
% CHANGE FROM REV
TO 20225111 WAGES 448,104 450,260 468,270 18,010 5131 PERF - EMPLOYERS SHARE 44,404 50,429 52,446 2,017 5132 FICA 32,753 34,445 35,823 1,378 5134 LIFE MEDICAL & HEALTH INSURAN 75,000 75,000 70,000 (5,000) 5136 UNEMPLOYMENT COMPENSATION 429 450 468 18 5137 WORKERS COMP INSURANCE 336 357 350 (7) 513A PERF - EMPLOYEES/PD BY CITY 13,443 13,508 14,048 540 5162 ACCRUED WAGES ADJ 12,676 — — — Total 5100 $ 627,145 $ 337,692 $ 624,449 $ 641,405 $ 16,956 2.72 %5212 STATIONERY & PRINTED FORMS — 250 250 — 5213 COMPUTER SUPPLIES — 150 150 — 5219 OTHER OFFICE SUPPLIES 651 850 850 — 5263 OTHER EQUIPMENT REPAIR PARTS — 300 300 — 5299 OTHER MATERIALS & SUPPLIES — 200 200 — Total 5200 $ 651 $ 321 $ 1,750 $ 1,750 $ — 0.00 %5311 LEGAL SERVICES 44,000 42,000 48,000 6,000 531K SEMINAR FEES 1,853 1,800 1,800 — 5322 POSTAGE 822 2,250 2,250 — 5324 TRAVEL EXPENSES 2,384 1,800 1,800 — 5326 MILEAGE 140 750 750 — 532C CELL PHONE 1,510 — — — 5342 LIABILITY INSURANCE 2,250 2,250 2,117 (133) 5363 CONTRACTED OTHER EQUIPMT REPAI — 100 100 — 5369 CONTRACTED SERVICE — 1,400 1,400 — 5374 OTHER EQUIPMENT RENTAL 2,469 1,500 1,500 — 5391 SUBSCRIPTIONS AND DUES 9,699 7,600 7,600 — 5399 OTHER SERVICES AND CHARGES — 100 100 — Total 5300 $ 65,128 $ 35,008 $ 61,550 $ 67,417 $ 5,867 9.53 %Total 5400 $ — $ — $ — $ — $ —
Total $ 692,924 $ 373,021 $ 687,749 $ 710,572 $ 22,823 3.32 %
LAWDept # 00092022 BUDGET COMPARISON
96

City of Fort Wayne, Indiana2022 Local Income Tax - Economic Development Allocation Plan
2022 2023 2024 2025 2026Budget Budget Budget Budget Budget
Cash Balance at January 1 $ 14,126,421 $ 12,225,676 $ 12,888,820 $ 14,619,802 $ 15,796,581 Receipts
Tax Revenue 30,868,965 31,177,655 31,489,431 31,804,326 32,122,369 Land Sales 500,000 — — — —
Estimated Interest 72,000 72,000 72,000 72,000 72,000 Total Receipts 31,440,965 31,249,655 31,561,431 31,876,326 32,194,369
TOTAL AVAILABLE CASH 45,567,386 43,475,331 44,450,251 46,496,128 47,990,950 Debt Service and Appropriations
Debt Service/CommitmentsMaturity
DateOriginal
Debt2020 CSQ Refunding Bond 2029 8,660,000 572,000 1,081,000 1,082,000 1,077,000 1,083,000
2014 CEDIT Bond 2022 30,000,000 2,372,000 — — — — 2017 Park Bond 2026 5,150,000 814,404 812,337 809,863 807,096 808,922
2019 CEDIT Refunding Bond 2034 20,715,000 1,743,077 1,741,945 1,739,357 1,740,222 1,744,449 Debt Service Total 5,501,481 3,635,282 3,631,220 3,624,318 3,636,371
Harrison Square 20,000,000 1,495,229 1,497,229 1,495,229 1,496,229 1,497,229 Provenance Hotel 2024 750,000 125,000 125,000 125,000 — —
Science Central 2026 3,000,000 600,000 600,000 600,000 600,000 600,000 Riverfront at Promenade Park 1,000,000 — — — —
Lofts at Headwaters Park Streetscapes — 750,000 — — — Public Safety Academy – Southtown 6,500,000 1,100,000 — — — —
Project Commitments Total 4,320,229 2,972,229 2,220,229 2,096,229 2,097,229
Economic DevelopmentIncentive Fund 1,490,000 1,290,000 1,290,000 1,290,000 1,290,000
Infrastructure Fund 800,000 800,000 800,000 800,000 800,000 Marketing Fund 762,000 762,000 762,000 762,000 762,000
Strategic Objective Fund 977,000 977,000 977,000 977,000 977,000 Economic Development Total 4,029,000 3,829,000 3,829,000 3,829,000 3,829,000
TransportationStreets & Roads Infrastructure 11,800,000 13,000,000 13,000,000 15,500,000 16,000,000
MVH Streets & Roads Infrastructure 4,900,000 4,900,000 4,900,000 4,900,000 4,900,000 Trails 1,500,000 1,500,000 1,500,000 — —
Southest Plan Implementation 1,075,000 — — — — Front Door/Bike/Walk Fort Wayne 216,000 750,000 750,000 750,000 750,000
Transportation Total 19,491,000 20,150,000 20,150,000 21,150,000 21,650,000
Total Debt Service and Appropriations 33,341,710 30,586,511 29,830,449 30,699,547 31,212,600
Cash Balance at December 31 $ 12,225,676 $ 12,888,820 $ 14,619,802 $ 15,796,581 $ 16,778,350
97

City of Fort Wayne, Indiana2022 Local Income Tax - Economic Development Non
Reverting Fund Allocation Plan Riverfront - Sidewalks - Alleys
2022 2023 2024 2025 2026Budget Budget Budget Budget Budget
Cash Balance at January 1 $ 10,999,110 $ 9,304,209 $ 10,615,451 $ 11,070,102 $ 10,514,362 Receipts
Tax Revenue 10,032,413 10,132,738 10,234,065 10,336,406 10,439,770 CIB Contibution to Lease 112,500 — — — —
Estimated Interest 75,000 75,000 75,000 75,000 75,000 Total Receipts 10,219,913 10,207,738 10,309,065 10,411,406 10,514,770
TOTAL AVAILABLE CASH 21,219,023 19,511,947 20,924,516 21,481,508 21,029,132
Debt Service and Appropriations
Debt Service/CommitmentsMaturity
DateOriginal
DebtPhase II Riverfront 2039 30,000,000 — — 1,886,000 1,884,000 1,881,000 Phase III Riverfront 2042 51,500,000 — — — 3,852,000 3,855,000
Lofts at Headwaters Park 2046 — 1,161,480 1,391,622 752,673 535,077 Riverfront at Promenade Park 2045 1,114,814 1,235,016 576,792 478,473 517,234
Debt Service Total 1,114,814 2,396,496 3,854,414 6,967,146 6,788,311
RiverfrontProperty Acquisition 3,000,000 — — — —
Engineering 1,000,000 500,000 — — — Stabilization 300,000 500,000 500,000 500,000 — Urban Trails 250,000 250,000 250,000 250,000 250,000
Annual Maintenance 250,000 250,000 250,000 250,000 250,000 Riverfront Total 4,800,000 1,500,000 1,000,000 1,000,000 500,000
Sidewalks and AlleysSidewalks and Alleys Total 6,000,000 5,000,000 5,000,000 3,000,000 3,000,000
Total Debt Service and Appropriations 11,914,814 8,896,496 9,854,414 10,967,146 10,288,311
Cash Balance at December 31 $ 9,304,209 $ 10,615,451 $ 11,070,102 $ 10,514,362 $ 10,740,821
98

OFFICE OF THE MAYOR
Mission Statement
It is the mission of the Office of the Mayor to assist the Mayor in serving the public by gathering information on important issues, assisting in analyzing those issues and developing policies to guide the course of the City for the future. At the direction of the Mayor, the office implements policy by coordinating and guiding the actions of the various divisions of the City government, and working cooperatively with other units of government, business, and other organizations to accomplish the goals of the City.
The Mayor’s Office consists of: Executive Office, 311 Citizen Services Department, Public Information Office, Intergovernmental Affairs, and Human Resources.
Goals and Objectives
The goals of the Office of the Mayor include:
• Job growth and retention• Maintain and enhance the City's capital assets• Addressing capital needs in the public safety division• Responsible stewardship of public assets and infrastructure• Open disclosure of City finances
Executive Office
The Executive Office carries out the direct duties and serves a support role for the Mayor of the City of Fort Wayne. It also oversees the strategic direction of the administration. The Mayor directs appointments to specified boards and commissions as well as some non-profit organizations.
311 Citizen Services Department
The 311 Citizen Services Department is designed to provide the constituents of Fort Wayne with easy access to City services and information through courteous, accurate, and responsive customer service. The 311 Center also provides performance measurement and improvement services to governmental and non-governmental agencies in their goal to improve customer service and facilitates citizen engagement. In times of emergency, the 311 Center serves as a standby emergency operating center (EOC), ready to take non-emergency calls in a matter of minutes. 311's experienced operators relieve EOC staff by taking the high volume of residents’ calls in disasters so EOC staff can concentrate on working with field employees.
Public Information Office
The Public Information Office provides accurate information about City administrative policies, services, programs, events and matters of public interest to a variety of audiences, including media, taxpayers, City Council, community partners, other units of government, neighborhood leaders, City employees and state/national groups. The Office distributes content electronically to local, statewide and niche/specialty newspapers and publications, radio stations, television news outlets and social media to provide the public with pertinent information, especially in times of emergencies.
Public Information supports City divisions and departments to help effectively communicate information about City government to media through news releases and press conferences and the public. They are tasked with taking complex and specialized subject matter and synthesizing it into easily understandable content.
99
Intergovernmental Affairs
The office of intergovernmental affairs works closely with the Mayor, Mayor’s staff, and local/state/federal legislative entities and elected officials on legislative, administrative, and community initiatives and programs to enhance the City of Fort Wayne. The office also monitors legislative and regulatory actions at the local, state, and federal levels that may impact the City of Fort Wayne. Intergovernmental affairs supports City divisions and departments to communication information about City government to elected officials, legislative bodies, and the business community to ensure Fort Wayne prospers and meets the needs of residents, neighborhoods, and businesses.
Human Resources
The goal of the Human Resources Department is to provide efficient, cost-effective services to employees and management while maintaining the ability to interact professionally with easy access for applicants and the public. The services include the facilitation of positive employee relations, internal communications, benefits administration, training and coaching; employee recordkeeping; classification of employee positions; policy and procedure development, interpretation, and enforcement; recruiting and testing of applicants.
100

2020 ACTUAL
2021ACTUAL
THRU30-Jun-2021
2021REVISED
BUDGET THRU 30-Jun-2021
2022SUBMITTED
$ INCREASE (DECREASE)
FROM REVISED TO 2022
% CHANGE FROM REV
TO 20225111 WAGES 1,539,987 1,661,486 1,731,598 70,112 5125 OVERTIME PREMIUM 47 — — — 5131 PERF - EMPLOYERS SHARE 151,586 177,385 184,941 7,556 5132 FICA 112,647 129,626 135,090 5,464 5134 LIFE MEDICAL & HEALTH INSURAN 390,000 390,000 364,000 (26,000) 5136 UNEMPLOYMENT COMPENSATION 1,658 1,694 1,766 72 5137 WORKERS COMP INSURANCE 1,472 1,472 1,625 153 513A PERF - EMPLOYEES/PD BY CITY 44,578 47,513 49,538 2,025 5161 WAGE SETTLEMENT/SEVERANCE PAY 229 — — — 5162 ACCRUED WAGES ADJ 11,429 — — — Total 5100 $ 2,253,634 $ 1,147,901 $ 2,409,176 $ 2,468,558 $ 59,382 2.46 %5213 COMPUTER SUPPLIES 371 3,600 3,600 — 5219 OTHER OFFICE SUPPLIES 9,667 8,000 8,000 — 5231 GASOLINE 937 1,785 1,785 — 5299 OTHER MATERIALS & SUPPLIES 521 900 900 — Total 5200 $ 11,496 $ 3,286 $ 14,285 $ 14,285 $ — 0.00 %5314 CONSULTANT SERVICES 11,969 9,725 9,725 — 5317 INSTRUCTIONAL SERVICES 13,911 13,000 13,000 — 531K SEMINAR FEES 529 5,200 5,200 — 5322 POSTAGE 2,073 2,550 2,550 — 5324 TRAVEL EXPENSES 1,156 6,200 6,200 — 5326 MILEAGE 231 3,180 3,180 — 532C CELL PHONE 1,990 2,500 2,500 — 5331 PRINTING OTHER THAN OFFC SUPPL 1,049 3,000 3,000 — 5332 PUBLIC OF LEGAL NOTICES/ADVTER 99 2,500 2,500 — 5334 PUBLIC RELATIONS 22,066 12,500 12,500 — 5342 LIABILITY INSURANCE 12,989 12,989 11,071 (1,918) 5363 CONTRACTED OTHER EQUIPMT REPAI 1,119 1,788 1,788 — 5369 CONTRACTED SERVICE 66,171 48,250 48,250 — 536T FLEET SERVICES 1,428 1,065 1,217 152 5374 OTHER EQUIPMENT RENTAL 911 1,000 4,768 3,768 5391 SUBSCRIPTIONS AND DUES 6,664 1,500 1,500 — 5399 OTHER SERVICES AND CHARGES 2,280 2,000 2,000 — Total 5300 $ 146,636 $ 76,059 $ 128,947 $ 130,949 $ 2,002 1.55 %5444 PURCHASE OF OTHER EQUIPMENT — — 8,000 8,000 Total 5400 $ — $ — $ — $ 8,000 $ 8,000 0.00 %
Total $ 2,411,766 $ 1,227,246 $ 2,552,408 $ 2,621,792 $ 69,384 2.72 %
MAYORDept # 00012022 BUDGET COMPARISON
101

[This page intentionally left blank]
102

METROPOLITAN HUMAN RELATIONS COMMISSION
COMMISSION CHAIRLana Keesling
COMMISSION VICE CHAIRAisha Arrington
COMMISSIONERSLarry WardlawTony Burrus
Dorian Maples Dr. David Lombard
Tabitha Ervin
STAFFNikki Quintana – Executive Director
Jenny Gosheff – Legal Counsel Dennis Sorg – Senior Investigator
Lakisha Woods – Senior Investigator Ronda Holifield – Investigator
Amber Nancarrow – Investigator Leslie Hernandez – Investigator
Renee Kelsaw – Investigator Juan Guayamo – Investigator
Vacant – Investigator Abigail Reyes – Administrative Assistant IV
Vacant – Administrative Assistant III
METROPOLITAN HUMAN RELATIONS
The Metropolitan Human Relations Commission (“Metro”) was established in 1952 by the Common Council of Fort Wayne to “administer and enforce” anti-discrimination legislation within the territorial boundaries of the City of Fort Wayne. As primary basis for establishing Metro, the Mayor and Common Council decreed the following:
“Discrimination in social, cultural and economic life in Fort Wayne against any person or persons because of race, sex, color, religion, handicap, ancestry, national origin, or place of birth, is contrary to American principles and is harmful to the social, cultural, and economic life of the city. Discrimination, particularly in employment opportunities, public accommodations and housing, increases the burden and cost of government; and, such discrimination contributes to increased crime, vice, juvenile delinquency, fires and other evils thereby affecting the public safety, public health, and general welfare of the community. It is therefore deemed to be in the best interests of the city to create a metropolitan Commission to administer and enforce anti-discrimination legislation and ordinances, all as authorized by the Indiana Civil Rights Act.”
The Commission continues to maintain a high level of productivity in case resolutions, reducing case age in the office, and implementing stringent case processing protocols to ensure timely resolution of cases. Metro has set measurable goals to increase quality of compliance with the regulations of its federal partners, the United States Equal Employment Opportunity Commission (“EEOC”), and the United States Housing and Urban Development (“HUD”).
MISSION STATEMENTTo enforce civil rights laws and empower the citizens of Fort Wayne through education on diversity and discrimination issues. Metro seeks to partner with people and organizations who promote Metro’s vision.
VISION STATEMENTTo make Fort Wayne a more diverse and inclusive City where every member of the community has equal opportunity to thrive and flourish and is empowered to assist in the eradication of discrimination.
103

GOALS
I. To continue to expeditiously and effectively investigate administrative complaints filed within the City of Fort Wayne on the basis enumerated in Ordinance G-21-78.
II. To continue to successfully meet federal contracts and standards established by EEOC and HUD.
III. To assist in making Fort Wayne a welcoming community for all, regardless of race, national origin, gender, religion, disability, color, sexual orientation, familial status, or age.
IV. To expand outreach activities, especially in housing and employment, to citizens within the territorial boundaries of the City of Fort Wayne.
V. To expand outreach to local businesses and smaller employers, to aid them in training on civil rights issues and encourage policies which promote and foster fair housing, fair employment, and equal opportunity for Fort Wayne citizens.
VI. To partner with various racial, religious, immigrant, and/or ethnic groups and human services organizations to support Metro’s mission and vision of empowering Fort Wayne citizens and eradicating discrimination.
VII. To develop Commission employees into first-rate fair, impartial, and thorough civil rights workers.
VIII. To continue to seek federal and local grants that will provide resources that will enable Metro to continue to educate and empower Fort Wayne citizens and also assist in partnering with local organizations that provide human relations type services to residents of the City in the areas of housing, employment, education, and public accommodation.
IX. To continue to successfully operate the Commission’s alternative dispute resolution processes through mediations and conciliations.
X. To actively work with local partners and departments of local government to utilize whatever existing programs, equipment, or personnel they may have and can share to help avoid duplicity/redundancy/ and cost in operations.
XI. To coordinate regionally and state-wide with other similarly situated local civil rights enforcement agencies to gain expertise, foster relationships, gain efficiencies of scale and promote sharing of best practices and resources to further aid in supporting the mission of Metro to the local community.
XII. To ensure that the Commission secures the necessary tools needed to enable it to provide services that are packaged in professionalism but not at the expense of cost effectiveness.
104

2020 ACTUAL
2021ACTUAL
THRU30-Jun-2021
2021REVISED
BUDGET THRU 30-Jun-2021
2022SUBMITTED
$ INCREASE (DECREASE)
FROM REVISED TO 2022
% CHANGE FROM REV
TO 20225111 WAGES 421,143 448,340 466,273 17,933 5131 PERF - EMPLOYERS SHARE 75,064 77,252 84,514 7,262 5132 FICA 49,082 52,766 57,726 4,960 5134 LIFE MEDICAL & HEALTH INSURAN 180,000 180,000 168,000 (12,000) 5136 UNEMPLOYMENT COMPENSATION 670 690 755 65 5137 WORKERS COMP INSURANCE 623 623 622 (1) 513A PERF - EMPLOYEES/PD BY CITY 20,107 20,693 22,638 1,945 5162 ACCRUED WAGES ADJ 3,977 — — — Total 5100 $ 750,665 $ 380,845 $ 780,364 $ 800,528 $ 20,164 2.58 %
5212 STATIONERY & PRINTED FORMS 357 600 600 — 5213 COMPUTER SUPPLIES — 180 180 — 5219 OTHER OFFICE SUPPLIES 1,360 1,500 1,500 — 5247 INSTRUCTIONAL SUPPLIES — 180 180 — Total 5200 $ 1,717 $ 605 $ 2,460 $ 2,460 $ — 0.00 %
5311 LEGAL SERVICES 718 1,980 1,000 (980) 5317 INSTRUCTIONAL SERVICES — 240 240 — 531K SEMINAR FEES 15 720 500 (220) 5322 POSTAGE 1,175 1,800 1,500 (300) 5324 TRAVEL EXPENSES 7 1,800 1,800 — 5325 COUNCIL AND/OR BOARD TRAVEL — 500 500 — 532C CELL PHONE 390 500 500 — 5331 PRINTING OTHER THAN OFFC SUPPL 96 300 300 — 5342 LIABILITY INSURANCE 5,691 5,691 5,081 (610) 5369 CONTRACTED SERVICE 837 1,320 1,320 — 5391 SUBSCRIPTIONS AND DUES 445 500 500 — Total 5300 $ 9,373 $ 7,716 $ 15,351 $ 13,241 $ (2,110) -13.75 %Total 5400 $ — $ — $ — $ — $ —
Total $ 761,755 $ 389,166 $ 798,175 $ 816,229 $ 18,054 2.26 %
METRO HUMAN RELATIONSDept # 00052022 BUDGET COMPARISON
105

[This page intentionally left blank]
106

PARKING ADMINISTRATION DEPARTMENT
Mission Statement
Under the control of the Fort Wayne City Clerk, we are committed to the efficient operations of all aspects of Parking Control. We are working to improve parking access, availability, traffic safety, management, and maintenance while encouraging the efficient movement of traffic throughout the City of Fort Wayne.
We pledge to serve our citizens by enforcing the law, promoting neighborhood harmony, and responding to residents’ needs to protect and improve the health, safety and welfare of the citizens and visitors to the City of Fort Wayne. We pledge to continually strive for excellence in the performance of our duties.
We pledge to be customer focused in all interactions with citizens, and we believe that our greatest obligation to all citizens lies in performing our duty impartially and with integrity. We pledge to support the laws of the State of Indiana, as well as the ordinance of the City of Fort Wayne.
Vision Statement
We will protect public safety, mitigate traffic congestion and promote parking turnover and access throughout the City by enforcing parking regulations. We are committed to ensuring that Parking Control Officers have a safe and secure working environment while performing their duties. We will continue to address the parking concerns of the City, citizens, and business leaders of Fort Wayne, while striving to meet the parking demand for reasonably priced parking for residents, commuters, and visitors in the downtown area and the surrounding neighborhoods.
Guiding Principles
We will work to provide parking services quickly and efficiently, applying common sense, consistent enforcement, accountability, effective communication, and evaluation all while we seek knowledge, advice and counsel on the development of downtown parking needs.
We recognize that consistent Parking Enforcement discourages illegal parking and promotes the free flow of traffic throughout the City. Enforcement of illegal parking maintains pedestrian safety; keeps fire lanes clear for emergencies, increases turnover of short term parking spaces, and keeps loading zones clear for delivery.
We realize the importance of technology and will make every effort to utilize technology where appropriate. We believe that capital investment in technology will bring long term gains in the areas of customer service, revenue enhancements, and maintenance.
We strive to improve communications at every level, especially between our residents and the Parking Control staff. We will encourage regular input from citizens on service improvements and changes, while providing an effective response mechanism for complaints and inquiries. We will significantly enhance our ability to educate the public about our policies and ordinances.
Parking Control will accomplish its goals by ensuring that appropriate enforcement is carried out vigorously, yet fairly, efficiently, and uniformly. Parking regulation enforcement includes general enforcement of meters and time zoned areas, disabled access restrictions, commercial and other restricted zones, as well as the removal of abandoned vehicles.
Services Provided
• Install, maintain, and collect revenue from parking meters;• Enforce and issue citations to vehicles parked in violation of city statutes;• Enforce city policies relating to residential parking and abandoned vehicle code infractions;• Respond to citizen complaints concerning abandoned vehicles and issue ticket(s) and /or warnings when
necessary;• Report illegal vehicles and other illegal activities to appropriate department;• Post “No Parking” signs and bag meters for merchants in downtown area when needed;
107

• Post “No Parking” signs for construction on streets in city and maintain the “No Parking” on these streets by either ticketing or towing of vehicles when milling or repaving.
108

2020 ACTUAL
2021ACTUAL
THRU30-Jun-2021
2021REVISED
BUDGET THRU 30-Jun-2021
2022SUBMITTED
$ INCREASE (DECREASE)
FROM REVISED TO 2022
% CHANGE FROM REV
TO 20225111 WAGES 295,068 331,949 345,226 13,277 5131 PERF - EMPLOYERS SHARE 33,047 37,178 38,665 1,487 5132 FICA 22,062 25,394 26,410 1,016 5134 LIFE MEDICAL & HEALTH INSURAN 105,000 105,000 98,000 (7,000) 5136 UNEMPLOYMENT COMPENSATION 322 332 345 13 5137 WORKERS COMP INSURANCE 4,140 4,140 3,701 (439) 5138 CLOTHING ALLOWANCE 5,342 4,500 4,500 — 513A PERF - EMPLOYEES/PD BY CITY 8,852 9,958 10,357 399 5162 ACCRUED WAGES ADJ 3,450 — — — Total 5100 $ 477,284 $ 251,507 $ 518,451 $ 527,204 $ 8,753 1.69 %5219 OTHER OFFICE SUPPLIES 1,736 2,000 2,000 — 5231 GASOLINE 7,266 10,000 10,000 — 5291 SMALL TOOLS 333 — — — 5299 OTHER MATERIALS & SUPPLIES 4,800 3,500 3,500 — Total 5200 $ 14,135 $ 6,198 $ 15,500 $ 15,500 $ — 0.00 %531H BANK SERVICE CHARGES 17,252 90,000 90,000 — 532C CELL PHONE 4,502 4,600 4,600 — 5331 PRINTING OTHER THAN OFFC SUPPL 4,536 2,000 2,000 — 5342 LIABILITY INSURANCE 4,551 4,551 3,917 (634) 5363 CONTRACTED OTHER EQUIPMT REPAI 2,522 90,000 90,000 — 5369 CONTRACTED SERVICE 202,171 168,636 168,636 — 536T FLEET SERVICES 10,615 12,792 12,792 — 5374 OTHER EQUIPMENT RENTAL 1,410 — — — 5399 OTHER SERVICES AND CHARGES — 2,000 2,000 — 539B MASTER LEASE 20,837 23,065 27,289 4,224 Total 5300 $ 268,396 $ 164,893 $ 397,644 $ 401,234 $ 3,590 0.90 %Total 5400 $ — $ — $ — $ — $ —
Total $ 759,815 $ 422,599 $ 931,595 $ 943,938 $ 12,343 1.32 %
PARKING ADMINISTRATIONDept # 01322022 BUDGET COMPARISON
109

[This page intentionally left blank]
110

PARKS & RECREATION
Steve McDaniel, Director
Fort Wayne Board of Park Commissioners
Richard Samek, President Pamela Kelly, M.D., Vice-President
William Zielke, Commissioner Justin Shurley, Commissioner
111

Fort Wayne Parks and Recreation Department
The Parks and Recreation Department maintains over 2,800 acres of public park land and provides numerous recreation facilities, programs and services for the Fort Wayne community. The Fort Wayne Parks and Recreation Department was created in 1905 when the Indiana General Assembly adopted the Cities and Towns Law. The Parks and Recreation Department is administered by a four member bipartisan Board of Park Commissioners. Each commissioner is appointed by the Mayor and serves a four-year term. The Park Board reviews and approves the annual budget, approves expenditures, holds regular public meetings as required by law and approves the awarding of all contracts.
Finance and Support Services Division
The Finance and Support Services Division is responsible for the financial accounting, program registration, facility reservation, budgeting, purchasing, payroll and administrative functions of the department.
Marketing Division
The Marketing Division is responsible for the public relations, publications, promotions, grant writing, service quality, strategic planning, market research, corporate sponsorship and other marketing/planning functions.
Parks Division
The Parks Division is responsible for operation and maintenance of the park land and facilities, vehicle and machinery operation and upkeep, building repairs and maintenance, construction and engineering.
Parks Planning and Development Division
The Parks Planning and Development Division is responsible for short and long term planning, park and street trees, public gardens and flower beds, park landscaping, operation of the greenhouse, special projects, and riparian.
Recreation Services Division
The Recreation Services Division is responsible for most of the recreational programs and facilities operated by the department. Facilities include: three public golf courses, two driving ranges, disc golf courses, tennis centers, tennis courts, pickleball courts, multipurpose athletic fields, basketball courts, ball diamonds, soccer fields, three aquatic centers, splash pads, boat launches, day camps, campground, dog parks, Community Center, Riverfront Park, Skate Park, Lifetime Sports Academy, Salomon Farm, Lindenwood Nature Preserve, and the Hurshtown Reservoir. The Division hosts a number of citywide and cultural events, offers competitive and instructional programs in athletics and outdoor recreation, and art programs, runs a travel program for seniors, families and adventure travelers and offer classes covering a variety of special interests for pre-school through older adult.
Botanical Conservatory\Foellinger Theatre\Community Outreach Division
The Community Outreach Division is responsible for the operations and programming of the Foellinger Theatre and the Foellinger-Freimann Botanical Conservatory. The division also manages the McMillen Community Center, three youth centers, and the summer playground program. The Division hosts a number of cultural events.
Zoo Division
The Fort Wayne Children’s Zoo Division is operated under an operating agreement between the Fort Wayne Parks and Recreation Department and the Fort Wayne Zoological Society.
112

5111 WAGES 7,295,658 8,339,236 8,651,211 311,975 5125 OVERTIME PREMIUM 97,971 69,193 98,000 28,807 5131 PERF - EMPLOYERS SHARE 715,264 752,854 784,969 32,115 5132 FICA 485,539 572,353 595,078 22,725 5134 LIFE MEDICAL & HEALTH INSURAN 1,965,000 1,890,000 1,764,000 (126,000) 5136 UNEMPLOYMENT COMPENSATION 8,185 8,380 8,750 370 5137 WORKERS COMP INSURANCE 61,097 61,097 61,691 594 513A PERF - EMPLOYEES/PD BY CITY 191,594 201,659 210,258 8,599 513R RETIREES HEALTH INSURANCE 165,000 135,000 112,000 (23,000) 5162 ACCRUED WAGES ADJ 53,443 — — — Total 5100 $ 11,038,750 $ 5,513,976 $ 12,029,772 $ 12,285,957 $ 256,185 2.13 %5213 COMPUTER SUPPLIES 21,053 22,000 20,900 (1,100) 5219 OTHER OFFICE SUPPLIES 23,187 20,000 21,750 1,750 5231 GASOLINE 87,310 112,000 112,000 — 5232 DIESEL FUEL / FUEL OIL 73,071 122,000 138,800 16,800 5233 OIL 15,398 9,000 10,500 1,500 5234 TIRES & TUBES 26,759 21,000 22,000 1,000 5239 OTHER GARAGE & MOTOR SUPPLIES 18,555 21,000 25,100 4,100 5241 MEDICAL & SURGICAL SUPPLIES 19,816 27,800 27,800 — 5243 RECREATION SUPPLIES 68,932 208,675 216,175 7,500 5245 LANDSCAPE & GRNHOUSE SUPPLIES 91,419 220,000 226,000 6,000 5246 HOUSEHOLD & CLEANING SUPPLIES 61,068 81,232 91,850 10,618 5247 INSTRUCTIONAL SUPPLIES 389 2,000 2,350 350 5261 BLDG REPAIR & MAINT MATERIALS 420,579 127,000 148,250 21,250 5262 VEHICLE REPAIR PARTS 68,045 63,000 72,000 9,000 5263 OTHER EQUIPMENT REPAIR PARTS 233,473 185,000 206,000 21,000 5271 GRAVEL 6,959 11,000 12,000 1,000 5272 BITUMINOUS MATERIALS 130 500 500 — 5273 SAND — 500 500 — 5274 SALT 11,648 28,000 31,000 3,000 5291 SMALL TOOLS 21,687 24,000 24,000 — 5293 PAINT 13,861 15,000 13,350 (1,650) 5299 OTHER MATERIALS & SUPPLIES 83,251 124,552 131,952 7,400 Total 5200 $ 1,366,590 $ 756,254 $ 1,445,259 $ 1,554,777 $ 109,518 7.58 %5312 MEDICAL SERVICES 807 4,500 4,500 — 5314 CONSULTANT SERVICES 2,631 — 2,500 2,500 5315 APPRAISALS SERVICES 350 850 850 — 5316 RECREATIONAL SERVICES 60,120 214,050 219,050 5,000 531H BANK SERVICE CHARGES 26,964 23,500 23,500 — 531K SEMINAR FEES 9,783 17,800 17,800 — 5321 FREIGHT EXPRESS & DRAYAGE 296 — — — 5322 POSTAGE 45,667 49,475 49,475 — 5324 TRAVEL EXPENSES 2,699 26,600 26,600 — 5326 MILEAGE 2,119 2,000 2,000 — 532C CELL PHONE 2,670 2,400 2,400 — 5331 PRINTING OTHER THAN OFFC SUPPL 38,632 64,000 64,000 — 5332 PUBLIC OF LEGAL NOTICES/ADVTER 3,073 12,450 12,450 — 5333 PHOTOGRAPHY & BLUEPRINTING 135 500 500 — 5342 LIABILITY INSURANCE 158,481 160,081 165,708 5,627 5351 ELECTRICITY 577,703 593,428 623,100 29,672 5352 NATURAL GAS 162,491 231,883 234,016 2,133 5353 WATER 518,250 546,504 607,027 60,523
2020 ACTUAL
2021ACTUAL
THRU30-Jun-2021
2021REVISED
BUDGET THRU 30-Jun-2021
2022SUBMITTED
$ INCREASE (DECREASE)
FROM REVISED TO 2022
% CHANGE FROM REV
TO 2022
PARKSDept # 01212022 BUDGET COMPARISON
113

5356 SOLID WASTE DISPOSAL 38,403 46,000 46,000 — 5361 CONTRACTED BLDG & STRUCT REPAI 101,863 201,400 200,000 (1,400) 5362 CONTRACTED VEHICLE REPAIR 14,991 22,000 25,000 3,000 5363 CONTRACTED OTHER EQUIPMT REPAI 114,847 132,059 118,850 (13,209) 5365 JANITORIAL & LAUNDRY SERVICE 34,511 32,450 32,450 — 5369 CONTRACTED SERVICE 608,750 613,384 632,183 18,799 536H HEADWATERS PARK MAINTENANCE 90,000 90,000 90,000 — 5371 BUILDING RENTAL — 1,000 1,000 — 5374 OTHER EQUIPMENT RENTAL 22,087 25,400 25,400 — 5391 SUBSCRIPTIONS AND DUES 22,580 18,055 19,385 1,330 5393 TAXES 3,490 2,500 2,500 — 5399 OTHER SERVICES AND CHARGES 116,706 110,028 95,100 (14,928) 539A OPERATING TRANSFER OUT 2,488,528 2,382,855 2,268,849 (114,006) 539B MASTER LEASE 503,068 617,145 731,151 114,006 Total 5300 $ 5,772,695 $ 1,544,662 $ 6,244,297 $ 6,343,344 $ 99,047 1.59 %Total 5400 $ — $ — $ — $ — $ —
Total $ 18,178,035 $ 7,814,891 $ 19,719,328 $ 20,184,078 $ 464,750 2.36 %
2020 ACTUAL
2021ACTUAL
THRU30-Jun-2021
2021REVISED
BUDGET THRU 30-Jun-2021
2022SUBMITTED
$ INCREASE (DECREASE)
FROM REVISED TO 2022
% CHANGE FROM REV
TO 2022
PARKSDept # 01212022 BUDGET COMPARISON
114
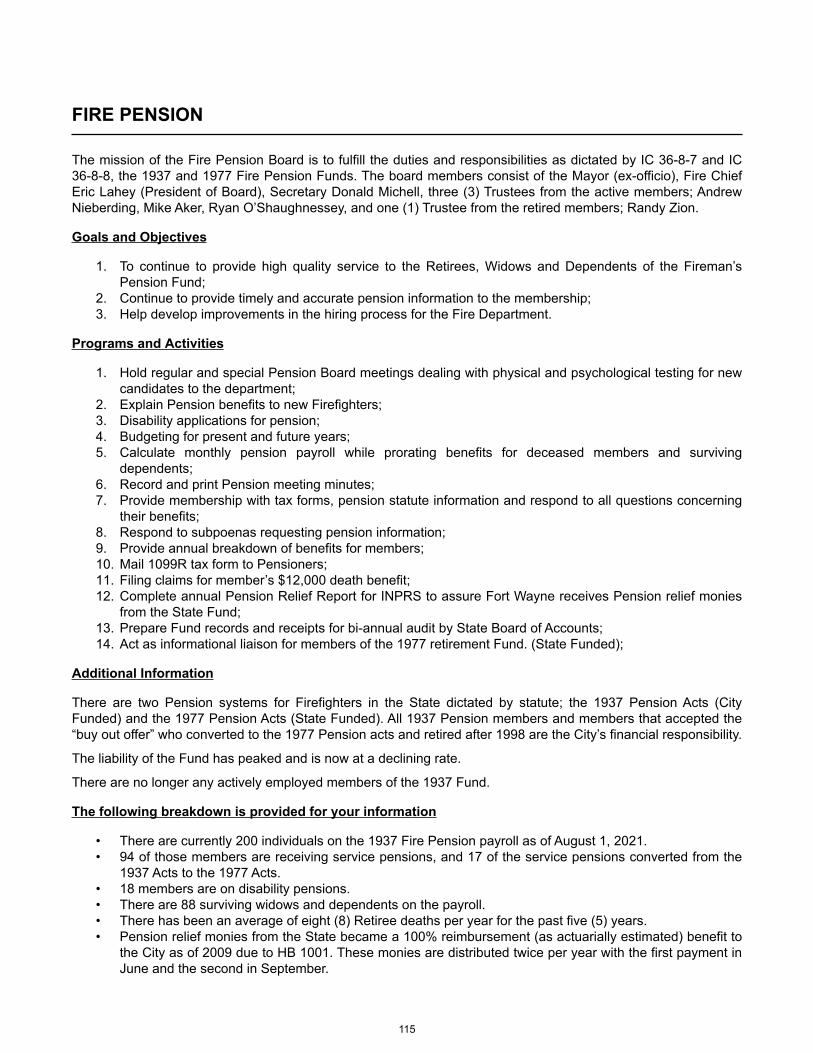
FIRE PENSION
The mission of the Fire Pension Board is to fulfill the duties and responsibilities as dictated by IC 36-8-7 and IC 36-8-8, the 1937 and 1977 Fire Pension Funds. The board members consist of the Mayor (ex-officio), Fire Chief Eric Lahey (President of Board), Secretary Donald Michell, three (3) Trustees from the active members; Andrew Nieberding, Mike Aker, Ryan O’Shaughnessey, and one (1) Trustee from the retired members; Randy Zion.
Goals and Objectives
1. To continue to provide high quality service to the Retirees, Widows and Dependents of the Fireman’s Pension Fund;
2. Continue to provide timely and accurate pension information to the membership;3. Help develop improvements in the hiring process for the Fire Department.
Programs and Activities
1. Hold regular and special Pension Board meetings dealing with physical and psychological testing for new candidates to the department;
2. Explain Pension benefits to new Firefighters;3. Disability applications for pension;4. Budgeting for present and future years;5. Calculate monthly pension payroll while prorating benefits for deceased members and surviving
dependents;6. Record and print Pension meeting minutes;7. Provide membership with tax forms, pension statute information and respond to all questions concerning
their benefits;8. Respond to subpoenas requesting pension information;9. Provide annual breakdown of benefits for members;10. Mail 1099R tax form to Pensioners;11. Filing claims for member’s $12,000 death benefit;12. Complete annual Pension Relief Report for INPRS to assure Fort Wayne receives Pension relief monies
from the State Fund;13. Prepare Fund records and receipts for bi-annual audit by State Board of Accounts;14. Act as informational liaison for members of the 1977 retirement Fund. (State Funded);
Additional Information
There are two Pension systems for Firefighters in the State dictated by statute; the 1937 Pension Acts (City Funded) and the 1977 Pension Acts (State Funded). All 1937 Pension members and members that accepted the “buy out offer” who converted to the 1977 Pension acts and retired after 1998 are the City’s financial responsibility.
The liability of the Fund has peaked and is now at a declining rate.
There are no longer any actively employed members of the 1937 Fund.
The following breakdown is provided for your information
• There are currently 200 individuals on the 1937 Fire Pension payroll as of August 1, 2021.• 94 of those members are receiving service pensions, and 17 of the service pensions converted from the
1937 Acts to the 1977 Acts.• 18 members are on disability pensions.• There are 88 surviving widows and dependents on the payroll.• There has been an average of eight (8) Retiree deaths per year for the past five (5) years.• Pension relief monies from the State became a 100% reimbursement (as actuarially estimated) benefit to
the City as of 2009 due to HB 1001. These monies are distributed twice per year with the first payment in June and the second in September.
115
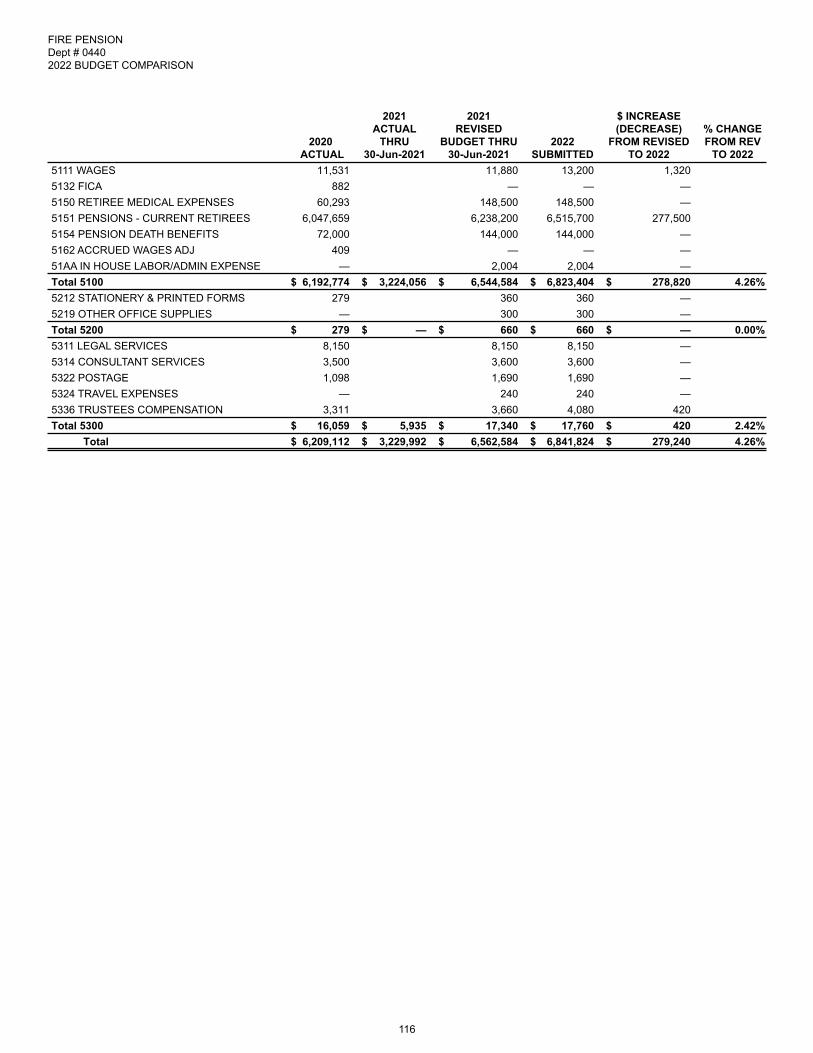
2020 ACTUAL
2021ACTUAL
THRU30-Jun-2021
2021REVISED
BUDGET THRU 30-Jun-2021
2022SUBMITTED
$ INCREASE (DECREASE)
FROM REVISED TO 2022
% CHANGE FROM REV
TO 20225111 WAGES 11,531 11,880 13,200 1,320 5132 FICA 882 — — — 5150 RETIREE MEDICAL EXPENSES 60,293 148,500 148,500 — 5151 PENSIONS - CURRENT RETIREES 6,047,659 6,238,200 6,515,700 277,500 5154 PENSION DEATH BENEFITS 72,000 144,000 144,000 — 5162 ACCRUED WAGES ADJ 409 — — — 51AA IN HOUSE LABOR/ADMIN EXPENSE — 2,004 2,004 — Total 5100 $ 6,192,774 $ 3,224,056 $ 6,544,584 $ 6,823,404 $ 278,820 4.26 %5212 STATIONERY & PRINTED FORMS 279 360 360 — 5219 OTHER OFFICE SUPPLIES — 300 300 — Total 5200 $ 279 $ — $ 660 $ 660 $ — 0.00 %5311 LEGAL SERVICES 8,150 8,150 8,150 — 5314 CONSULTANT SERVICES 3,500 3,600 3,600 — 5322 POSTAGE 1,098 1,690 1,690 — 5324 TRAVEL EXPENSES — 240 240 — 5336 TRUSTEES COMPENSATION 3,311 3,660 4,080 420 Total 5300 $ 16,059 $ 5,935 $ 17,340 $ 17,760 $ 420 2.42 %
Total $ 6,209,112 $ 3,229,992 $ 6,562,584 $ 6,841,824 $ 279,240 4.26 %
FIRE PENSIONDept # 04402022 BUDGET COMPARISON
116

POLICE PENSION
The mission of the Board of Pension Trustees is outlined in Indiana Statutes found in: IC 36-8-6 for the 1925 fund, IC 36-8-8 for the 1977 fund, and IC 38-8-8.5 for the Deferred Option Retirement Programs (DROP) and Partial Lump Sum Distribution found in 36.8.8.24.8.
The trustees are charged with the fiduciary responsibility of overseeing payments of 1925 Act pension funds, the operation of the office of the pension secretary and the evaluation of potential officers for membership in the 1977 Act fund. The local board also evaluates applications for disability from the 1977 Act and makes recommendations to the Indiana Public Retirement System (Public Employees Retirement Fund) regarding such applications.
Members
Mayor Thomas C. Henry Scott Caudill Ronald L. Buskirk (Ret.)Controller Garry Morr Casey Furge Justin RossChief Steve Reed Tracy Cannon Robert Elmer
There are nine members of the Board of Trustees. Three are members by virtue of office, the Mayor, Controller and Police Chief. Of the remaining six members, five are elected representatives of the active membership of police department and one additional member, a retired officer, is elected. The Trustees have staggered three year terms. The Board of Police Pension Trustees meets monthly on the second Tuesday of each month taking action as required. Special sessions are called for hearings and hiring reviews.
A member of the board is selected annually to serve as the secretary and is responsible for all payments, collections, and communications with the benefit recipients. In addition, the secretary is the keeper of the records of the Fort Wayne Police Pension Fund and as such, is required to communicate with all other entities, which may choose to correspond with the board.
The laws regarding police officers’ pensions are provided by statute and changes do occur from time to time. It is necessary for the trustees to be aware of these mandated changes. It is the responsibility of the secretary to keep all trustees informed of such changes.
It is the responsibility of the board to adopt an annual budget for submission for adoption within the civil city budget. Since the submitted budget of the pension fund cannot, by Indiana Statute, be reduced, it is essential that the trustees be extremely cautious when forecasting the funding necessary to meet the needs of the board to carry out the directions of the laws.
117

2020 ACTUAL
2021ACTUAL
THRU30-Jun-2021
2021REVISED
BUDGET THRU 30-Jun-2021
2022SUBMITTED
$ INCREASE (DECREASE)
FROM REVISED TO 2022
% CHANGE FROM REV
TO 20225111 WAGES 11,124 11,124 11,124 — 5132 FICA 851 — — — 5151 PENSIONS - CURRENT RETIREES 7,412,412 8,400,000 8,528,286 128,286 5162 ACCRUED WAGES ADJ 395 — — — 5154 PENSION DEATH BENEFITS 72,000 144,000 144,000 — Total 5100 $ 7,496,782 $ 3,931,985 $ 8,555,124 $ 8,683,410 $ 128,286 1.50 %5212 STATIONERY & PRINTED FORMS 668 700 700 — 5219 OTHER OFFICE SUPPLIES — 810 810 — Total 5200 $ 668 $ — $ 1,510 $ 1,510 $ — 0.00 %5311 LEGAL SERVICES 7,750 7,750 7,750 — 5314 CONSULTANT SERVICES 3,500 5,200 5,200 — 5322 POSTAGE 1,324 5,500 5,500 — 5324 TRAVEL EXPENSES — 2,840 2,840 — 5331 PRINTING OTHER THAN OFFC SUPPL — 1,150 1,150 — Total 5300 $ 12,574 $ 11,878 $ 22,440 $ 22,440 $ — 0.00 %
Total $ 7,510,024 $ 3,943,862 $ 8,579,074 $ 8,707,360 $ 128,286 1.50 %
POLICE PENSIONDept # 04412022 BUDGET COMPARISON
118

2020 ACTUAL
2021ACTUAL
THRU30-Jun-2021
2021REVISED
BUDGET THRU 30-Jun-2021
2022SUBMITTED
$ INCREASE (DECREASE)
FROM REVISED TO 2022
% CHANGE FROM REV
TO 20225151 PENSIONS - CURRENT RETIREES 474,881 473,640 527,172 53,532 5154 PENSION DEATH BENEFITS 12,000 36,000 24,000 (12,000) Total 5100 $ 486,881 $ 251,034 $ 509,640 $ 551,172 $ 41,532 8.15 %Total 5200 $ — $ — $ — $ — $ — 5322 POSTAGE 92 200 200 — Total 5300 $ 92 $ 44 $ 200 $ 200 $ — 0.00 %
Total $ 486,973 $ 251,078 $ 509,840 $ 551,372 $ 41,532 8.15 %
SANITARY OFFICERS PENSIONDept # 04422022 BUDGET COMPARISON
119

[This page intentionally left blank]
120

Fort Wayne Police Department
MISSION STATEMENT
The Fort Wayne Police Department, in partnership with our community, will strive to protect the life, property, and personal liberties of all individuals. We believe that the overall quality of life for all residents will improve through the deterrence of criminal activity and an understanding of the diversity of cultures within this community. Furthermore, we recognize the need for fair and impartial enforcement of the law with attention given the highest possible quality of service delivery to the community.
CURRENTLY
At this time, the Fort Wayne Police Department’s main headquarters is located at One East Main Street in the Edwin Rousseau Building. In addition to our main headquarters, the Department continues to utilize four “outposts” to provide our Uniform personnel with a satellite office within their assigned patrol quadrants. The Northwest outpost is located at Lima Road and Northland inside Fire Station-15; the Northeast outpost is situated in a building provided by Parkview Hospital, at the corner of East State and Beacon Street; and the Southwest outpost is housed in Fire Station-17, on Getz Road. The satellite office for the Southeast Division is housed in the Patrolman’s Benevolent Association Hall located on South Calhoun. The Department also occupies offices and training facilities at the Public Safety Academy and a portion of the Special Operations Division occupies the former St. Joe Township Fire House.
The Fort Wayne Police Department is commanded by Chief of Police Stephen Reed.
As of this report, the Fort Wayne Police Department has 460 sworn officers with a budgeted strength of 480. The Fort Wayne Police Department’s sworn and civilian personnel are distributed into to eight different divisions/groups. The following paragraphs provide a brief description of the responsibilities that are unique to each group. Although each division has individual characteristics and concerns, they all share the common goal of improving the quality of life for the residents and visitors of Fort Wayne. The Fort Wayne Police Department also oversees the Radio Shop and Police Records.
INVESTIGATIVE SUPPORT DIVISION
The Investigative Support Division (ISD) is the Division responsible for delivering investigative services to the Police Department. The ISD provides support to the Fort Wayne Police Department by conducting in-depth investigations into felony criminal incidents within the City. The ISD is staffed with Command, Supervisors, Detectives, Digital Forensic Investigators, Crime Scene Technicians, and civilian personnel that support the many facets involved in the investigation of felony incidents. The largest contingent of the Investigative Support Division is the Detective Bureau whose members are responsible for investigating felony crimes that occur within our jurisdiction. These crimes include; Homicides, Missing Persons, Robbery, Sexual Assaults, Felony Battery and Assaults, Child Molesting and Abuse, Domestic Violence, Burglary, Theft and Financial-related crimes. Other areas that fall within the Investigative Support Division are the Juvenile Aid Section, which is responsible for investigating all crimes committed by juveniles, runaway situations and custody concerns. The Evidence and Property Section, which is responsible for managing, identifying and storing the significant amount of evidence collected in criminal incidents, as well as found-property concerns. The Crime Analysis Unit is responsible for analyzing crime and producing reports for the study of criminal trends within the City. They are also responsible for the distribution of those reports within our agency, as well as other law enforcement and criminal justice agencies. The Police Laboratory Section provides expert fingerprint examination of submitted evidentiary items, management of the AFIS print system and expert court testimony. The Crime Scene Management Unit is tasked with evidence identification, collection and documentation in the field at crime scenes. The Victims’ Assistance Office provides trained advocates to victims of criminal incidents with information, direction and support for victims of crime in all of Allen County.
121

NORTHWEST UNIFORM DIVISIONS
Northwest Division Officers provide police service to approximately 66,000 citizens living in a geographical area covering 33.36 square miles. This includes 294 centerline miles of roadway and 7 miles of the I-69 corridor, which generates significant calls for service, including accidents, road rage disturbances, stranded motorists, and traffic enforcement. The Northwest Division is home to many restaurants, movie theatres, shopping centers, and visitor attractions such as the Fort Wayne Children’s Zoo, Science Central, and the War Memorial Coliseum. This division has a very high ratio of calls for service per officer. The officers in this division serve a very diverse group of citizens representing a wide range of races, cultures, and socioeconomic backgrounds.
SOUTHWEST UNIFORM DIVISIONS
Southwest Division Officers serve a population of approximately 70,000 people within its 35.05 square miles. The Southwest Division serves citizens residing in the Historic West-Central Neighborhood, south to the Fort Wayne International Airport and from the Calhoun corridor, west to Amber Rd. Located within the Southwest Division is the St. Joseph Medical Center, Lutheran Hospital, and Jefferson Pointe Mall, which, collectively, bring many non-residents into our city.
NORTHEAST UNIFORM DIVISION
Northeast Division Officers patrol an area of approximately 25.46 square miles bordered by the Maumee River to the south, the St. Joseph River to the west and north and east to the city boundaries. Being largely residential, the Northeast Division often reports the lowest amount of criminal activity of the cities quadrants. However, Officers in the Northeast Division are usually very busy patrolling and providing services to the largest number of residents in the City, approximately 75,600 residents with well over 100 organized neighborhood associations and numerous apartment developments. Additionally, officers provide police services to many areas of significant growth in retail and business development in areas along Maysville Rd., St. Joe Center Road and the Georgetown Business District. Officers work in conjunction with other agencies in the quadrant such as the Fort Wayne Purdue Campus Police and Parkview Hospital Police at their locations within the Northeast quadrant. The Northeast Division also oversees the Crime Stoppers Office.
SOUTHEAST UNIFORM DIVISION
Southeast Division Officers provide service to a diverse community of approximately 49,500 residents within its 16.95 square miles. The Southeast Division encompasses all areas of the city that lie south of the Maumee River and east of Calhoun Street. In 2009, some of the Downtown entertainment venues were moved from the Southwest quadrant to the Southeast. This was done to provide increased continuity of information, service and patrol strategies. The Southeast Division also oversees our Community Relations Section, our School Resource Officers, and Safety Village.
With respect to all of Fort Wayne’s citizens, regardless of the quadrant they call home, the Police Department is committed to providing them a safe and secure community in which to live and raise their families. We promise to protect our citizens’ quality of life for the families who have called this great city “home” for decades.
SPECIAL OPERATIONS DIVISION
The Special Operations Units report directly to the Special Operations Deputy Chief. These units include:
- Emergency Services Team (EST) or SWAT Team- Explosive Ordinance / Hazardous Devices Unit (EOD/HDU)- Traffic Unit (Hit/Run)- Fatal Accident Crash Team (FACT)- Crisis Response Team (CRT) or Hostage Negotiation Team- Crisis Intervention Team (CIT)- Public Safety Response Team (PSRT)- Air Support Unit (ASU)- The Downtown Patrol and Bicycle Patrol Program
122

The Deputy Chief over this Division is also responsible for coordinating and staffing all Special Events in the City and maintains the Police vehicle fleet.
VICE AND NARCOTICS DIVISION
The Narcotics and Violent Crimes Division is staffed with Command, Supervisors, Detectives, and Civilian personnel that investigate drug-related and violent crime. The Division is separated into the Vice and Narcotics Section and the Gang/Violent Crimes Section. The Vice and Narcotics Section investigates illegal narcotics distribution and use, fraudulent prescriptions for controlled substances, prostitution and human/sexual trafficking. The Gang and Violent Crimes' Section is responsible for targeted investigations and arrests of gang-related criminals and high-risk, wanted felons. The Division has provided FWPD Detectives to work as Task Force Officers for the Drug Enforcement Administration, Federal Bureau of Investigation, and United States Marshals’ Service.
CHIEF’S STAFF
The Chief’s administrative staff consists of both sworn and civilian personnel. The Chief’s Staff handles human resources and operational issues inherent to an organization that employs over five hundred people.
The various sections that make up the Chief’s administrative staff include the Training Academy, the School Child Safety Program, Fiscal Affairs, Grants and Research, Internal Affairs, the Information Systems and Technology Unit. In addition, the Chief of Police is a member of the Consolidated Fort Wayne/Allen County Communication Board.
2022 GOALS
In 2021, the Police Department hired 5 new lateral police officers. We also initiated the process for the 22st Lateral Officer Class that will start the Academy in October of 2021. The 66th Basic Recruit Class that will start in early 2022.The goal is to increase the Department’s strength to 485 officers, with 5 of those Officers being paid for through a COPS grant. A new Recruitment Team has been established and will assist with the hiring process. The majority of these newly-hired officers will be assigned to our four Quadrant Operations Divisions, giving our Quadrant Commanders more resources to combat crime and to proactively serve the residents of Fort Wayne. In 2022, one primary focus will be the continued effort to combat violent crime in our City with our Local and Federal Law Enforcement Partners.
In 2022 we look to expand some of our Community Relations programs. We will be assisting citizens in reestablishing connections with their neighborhoods and their Neighborhood Liaison Officers. We look to accomplish this with the full implementation of the Quadrant System. In 2021, the Police Department will have 100 Officers equipped with body cameras. We expect full implementation of the body camera program in 2022, with all Uniform personnel issued a body camera. In 2022 we look to highlight our new Podcast titled the “Blue and You”. We plan to expand our Air Support Unit and our Downtown Bicycle Patrol.
The Department will diligently pursue training opportunities for our officers and provide equipment necessary to protect the public and ensure officer safety. The Department has dedicated resources so that we may have a more expansive focus on large-scale events preparedness and continue targeted enforcement efforts against illegal gun possession and drug-related crime.
As always, the Department will carefully monitor and respond to the ever-changing public safety and quality-of-life issues that present themselves throughout the city. Public educational activities dedicated to crime prevention in our neighborhoods will help reduce our residents’ chances of being victimized.
123
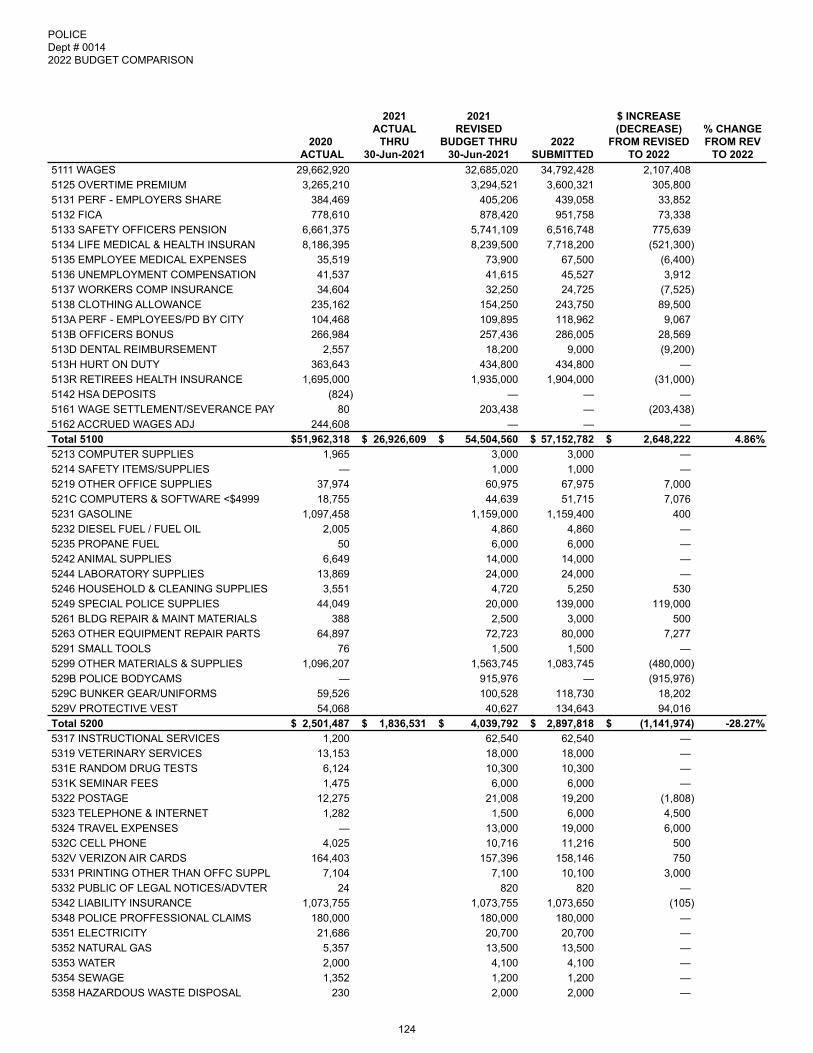
5111 WAGES 29,662,920 32,685,020 34,792,428 2,107,408 5125 OVERTIME PREMIUM 3,265,210 3,294,521 3,600,321 305,800 5131 PERF - EMPLOYERS SHARE 384,469 405,206 439,058 33,852 5132 FICA 778,610 878,420 951,758 73,338 5133 SAFETY OFFICERS PENSION 6,661,375 5,741,109 6,516,748 775,639 5134 LIFE MEDICAL & HEALTH INSURAN 8,186,395 8,239,500 7,718,200 (521,300) 5135 EMPLOYEE MEDICAL EXPENSES 35,519 73,900 67,500 (6,400) 5136 UNEMPLOYMENT COMPENSATION 41,537 41,615 45,527 3,912 5137 WORKERS COMP INSURANCE 34,604 32,250 24,725 (7,525) 5138 CLOTHING ALLOWANCE 235,162 154,250 243,750 89,500 513A PERF - EMPLOYEES/PD BY CITY 104,468 109,895 118,962 9,067 513B OFFICERS BONUS 266,984 257,436 286,005 28,569 513D DENTAL REIMBURSEMENT 2,557 18,200 9,000 (9,200) 513H HURT ON DUTY 363,643 434,800 434,800 — 513R RETIREES HEALTH INSURANCE 1,695,000 1,935,000 1,904,000 (31,000) 5142 HSA DEPOSITS (824) — — — 5161 WAGE SETTLEMENT/SEVERANCE PAY 80 203,438 — (203,438) 5162 ACCRUED WAGES ADJ 244,608 — — — Total 5100 $ 51,962,318 $ 26,926,609 $ 54,504,560 $ 57,152,782 $ 2,648,222 4.86 %5213 COMPUTER SUPPLIES 1,965 3,000 3,000 — 5214 SAFETY ITEMS/SUPPLIES — 1,000 1,000 — 5219 OTHER OFFICE SUPPLIES 37,974 60,975 67,975 7,000 521C COMPUTERS & SOFTWARE <$4999 18,755 44,639 51,715 7,076 5231 GASOLINE 1,097,458 1,159,000 1,159,400 400 5232 DIESEL FUEL / FUEL OIL 2,005 4,860 4,860 — 5235 PROPANE FUEL 50 6,000 6,000 — 5242 ANIMAL SUPPLIES 6,649 14,000 14,000 — 5244 LABORATORY SUPPLIES 13,869 24,000 24,000 — 5246 HOUSEHOLD & CLEANING SUPPLIES 3,551 4,720 5,250 530 5249 SPECIAL POLICE SUPPLIES 44,049 20,000 139,000 119,000 5261 BLDG REPAIR & MAINT MATERIALS 388 2,500 3,000 500 5263 OTHER EQUIPMENT REPAIR PARTS 64,897 72,723 80,000 7,277 5291 SMALL TOOLS 76 1,500 1,500 — 5299 OTHER MATERIALS & SUPPLIES 1,096,207 1,563,745 1,083,745 (480,000) 529B POLICE BODYCAMS — 915,976 — (915,976) 529C BUNKER GEAR/UNIFORMS 59,526 100,528 118,730 18,202 529V PROTECTIVE VEST 54,068 40,627 134,643 94,016 Total 5200 $ 2,501,487 $ 1,836,531 $ 4,039,792 $ 2,897,818 $ (1,141,974) -28.27 %5317 INSTRUCTIONAL SERVICES 1,200 62,540 62,540 — 5319 VETERINARY SERVICES 13,153 18,000 18,000 — 531E RANDOM DRUG TESTS 6,124 10,300 10,300 — 531K SEMINAR FEES 1,475 6,000 6,000 — 5322 POSTAGE 12,275 21,008 19,200 (1,808) 5323 TELEPHONE & INTERNET 1,282 1,500 6,000 4,500 5324 TRAVEL EXPENSES — 13,000 19,000 6,000 532C CELL PHONE 4,025 10,716 11,216 500 532V VERIZON AIR CARDS 164,403 157,396 158,146 750 5331 PRINTING OTHER THAN OFFC SUPPL 7,104 7,100 10,100 3,000 5332 PUBLIC OF LEGAL NOTICES/ADVTER 24 820 820 — 5342 LIABILITY INSURANCE 1,073,755 1,073,755 1,073,650 (105) 5348 POLICE PROFFESSIONAL CLAIMS 180,000 180,000 180,000 — 5351 ELECTRICITY 21,686 20,700 20,700 — 5352 NATURAL GAS 5,357 13,500 13,500 — 5353 WATER 2,000 4,100 4,100 — 5354 SEWAGE 1,352 1,200 1,200 — 5358 HAZARDOUS WASTE DISPOSAL 230 2,000 2,000 —
2020 ACTUAL
2021ACTUAL
THRU30-Jun-2021
2021REVISED
BUDGET THRU 30-Jun-2021
2022SUBMITTED
$ INCREASE (DECREASE)
FROM REVISED TO 2022
% CHANGE FROM REV
TO 2022
POLICEDept # 00142022 BUDGET COMPARISON
124

5361 CONTRACTED BLDG & STRUCT REPAI 750 8,000 8,000 — 5363 CONTRACTED OTHER EQUIPMT REPAI 28,742 36,500 57,750 21,250 5365 JANITORIAL & LAUNDRY SERVICE 16,910 19,635 18,100 (1,535) 5367 MAINT. AGREEMENT - SOFTWARE 225,839 305,842 366,396 60,554 5369 CONTRACTED SERVICE 313,378 352,680 333,680 (19,000) 536A MAINT. AGREEMENT - HARDWARE 18,627 37,219 37,219 — 536T FLEET SERVICES 1,354,790 1,443,296 1,448,758 5,462 5371 BUILDING RENTAL 361,566 363,332 73,400 (289,932) 5374 OTHER EQUIPMENT RENTAL 1,410 6,698 14,632 7,934 5377 CC BUILDING PARKING 142,953 146,120 146,120 — 5391 SUBSCRIPTIONS AND DUES 13,182 19,495 16,401 (3,094) 5396 INVESTIGATIONS 40,690 83,000 83,000 — 5399 OTHER SERVICES AND CHARGES 9,041 12,500 12,500 — 539B MASTER LEASE 3,477,215 4,564,423 5,158,913 594,490 Total 5300 $ 7,500,537 $ 4,829,851 $ 9,002,375 $ 9,391,341 $ 388,966 4.32 %5441 PURCHASE OF VEHICLES — 60,000 — (60,000) 5444 PURCHASE OF OTHER EQUIPMENT 27,600 7,000 7,500 500 Total 5400 $ 27,600 $ 3,500 $ 67,000 $ 7,500 $ (59,500) -88.81 %
Total $ 61,991,942 $ 33,596,491 $ 67,613,727 $ 69,449,441 $ 1,835,714 2.72 %
2020 ACTUAL
2021ACTUAL
THRU30-Jun-2021
2021REVISED
BUDGET THRU 30-Jun-2021
2022SUBMITTED
$ INCREASE (DECREASE)
FROM REVISED TO 2022
% CHANGE FROM REV
TO 2022
POLICEDept # 00142022 BUDGET COMPARISON
125

2020 ACTUAL
2021ACTUAL
THRU30-Jun-2021
2021REVISED
BUDGET THRU 30-Jun-2021
2022SUBMITTED
$ INCREASE (DECREASE)
FROM REVISED TO 2022
% CHANGE FROM REV
TO 20225111 WAGES 6,255,218 6,718,429 6,615,826 (102,603) Total 5100 $ 6,255,218 $ 3,359,214 $ 6,718,429 $ 6,615,826 $ (102,603) -1.53 %5395 GRANTS SUBSIDIES & LOANS 21,555 100,000 — (100,000) Total 5300 $ 21,555 $ 56,126 $ 100,000 $ — $ (100,000) -100.00 %Total 5400 $ — $ — $ — $ — $ —
Total $ 6,276,773 $ 3,415,340 $ 6,818,429 $ 6,615,826 $ (202,603) -2.97 %
POLICE - LOCAL INCOME TAX PUBLIC SAFETY FUNDDept # 00142022 BUDGET COMPARISON
126

2020 ACTUAL
2021ACTUAL
THRU30-Jun-2021
2021REVISED
BUDGET THRU 30-Jun-2021
2022SUBMITTED
$ INCREASE (DECREASE)
FROM REVISED TO 2022
% CHANGE FROM REV
TO 20225111 WAGES 2,770 4,900 2,500 (2,400) Total 5100 $ 2,770 $ 2,570 $ 4,900 $ 2,500 $ (2,400) -48.98 %5219 OTHER OFFICE SUPPLIES — 2,050 60 (1,990) Total 5200 $ — $ — $ 2,050 $ 60 $ (1,990) -97.07 %5331 PRINTING OTHER THAN OFFC SUPPL — 1,000 — (1,000) 5399 OTHER SERVICES AND CHARGES — 7,000 — (7,000) Total 5300 $ — $ 890 $ 8,000 $ — $ (8,000) -100.00 %
Total $ 2,770 $ 3,460 $ 14,950 $ 2,560 $ (12,390) -82.88 %
POLICE MERIT COMMISSIONDept # 00132022 BUDGET COMPARISON
127

2020 ACTUAL
2021ACTUAL
THRU30-Jun-2021
2021REVISED
BUDGET THRU 30-Jun-2021
2022SUBMITTED
$ INCREASE (DECREASE)
FROM REVISED TO 2022
% CHANGE FROM REV
TO 2022531K SEMINAR FEES 54,895 96,000 100,000 4,000 5324 TRAVEL EXPENSES 49,287 132,000 150,000 18,000 5326 MILEAGE 59 — — — 5399 OTHER SERVICES AND CHARGES 15,550 16,000 18,000 2,000 Total 5300 $ 119,790 $ 53,608 $ 244,000 $ 268,000 $ 24,000 9.84 %Total 5400 $ — $ — $ — $ — $ —
Total $ 119,790 $ 53,608 $ 244,000 $ 268,000 $ 24,000 9.84 %
LAW ENFORCEMENT TRAININGDept # 00142022 BUDGET COMPARISON
128

DIVISION OF PUBLIC WORKSShan Gunawardena, Director
BOARD OF WORKS ADMINISTRATIONMichelle Nelson, Manager
FINANCEAngela Erpelding, Manager
RIGHT-OF-WAYNick Jarrell, Manager
STREET LIGHT OPERATIONSBrent Spindler, Director
FLOOD CONTROLPatrick Zaharako, Manager
129
PUBLIC WORKS DIVISION
The City of Fort Wayne, Indiana Division of Public Works provides essential services that are an important part of our citizens’ daily lives along with providing vital support to neighborhoods, businesses, and economic development projects.
The Public Works departments maintain and improve the city’s systems for transportation engineering and operations involving streets alleys and sidewalk; traffic signals, lighting, markings and signs; pothole patching, crack sealing. chip sealing, leaf collection, street sweeping, snow and ice control; flood fighting and control, levee and floodwall maintenance; city bridges; greenway trails, solid waste and recycling; and the city’s fleet.
The division encompasses the
• Office of the Director• Finance & Administration Support• Board of Public Works Administration• Right-of-Way• City Engineering and Flood Control• Traffic Engineering• Transportation Engineering Services• Street Department• Traffic Operations• Greenways• Solid Waste & Recycling• Fleet Management
Together, we strive to provide exceptional services, advocate, develop, and maintain a strong transportation infrastructure and solid waste recycling/disposal system for our community. Funding for these departments and their projects comes from a variety of sources, including the General Fund, state gasoline taxes, and Local Income Tax-Economic Development (LIT-ED).
Goals and Objectives
1. Annual adoption of priorities for street, curb, sidewalk, traffic, street lighting and related infrastructure improvement projects.
2. Increase opportunities for citizen input into project selection and prioritization.3. Increase the efficiency and effectiveness of all departments by streamlining processes and techniques.4. Provide convenient and effective solid waste removal services. Promote recycling and composting efforts to
preserve land fill space in Allen County.5. Enhance the use of Innovative Technology in developing Public Works services.6. Enhance opportunities for employee development and training.7. Provide a positive and rewarding workplace experience for public works employees.
130

BOARD OF WORKS DEPARTMENT
Mission Statement
Our mission is to provide excellent customer service to our internal and external stakeholders. We strive to offer open, equitable, and efficient services. The Board of Public Works is accountable and committed to its customers and community, embracing change and continuous improvement.
It is the responsibility of the Board Members and Board of Public Works staff to ensure that all statute requirements are met in the contract bid process and that awarded contracts are fulfilled effectively and equitably. The Board of Public Works staff provides the necessary support in monitoring of all capital and emergency construction contracts, professional services agreements, purchase agreements and all other related documentation requiring Board approval for the City of Fort Wayne. In 2018 the Board of Public Works partnered with QuestCDN (Construction Data Network) .This is a web-based initiative that allows online bidding and project document information at a fraction of the cost.
Goals and Objectives
• To respond to the citizens’ need for reliable infrastructure and public services in a cost efficient and quality conscious manner.
• To assist our internal and external stakeholders in the processing and approval of various documentation by the Board of Public Works.
• To provide public information services to the general public as needed.• To maintain all public records pertaining to various Public Works and Utilities projects.• To distribute bid specifications for various Public Works and Utilities projects.• To provide assistance to various contractors and consultants as they bid on and obtain Public Works and
Utilities projects.• To provide administrative support to the Board of Public Works and the Board of Stormwater
Management.• To assist in the selection and prioritization of Neighborhood Improvement projects.• To provide property assessment records for various title companies and the general public.• To provide notary public services for internal and external customers as needed.
FLOOD CONTROL DEPARTMENT
Mission Statement
The mission of the Flood Control Department is to ensure that property damage due to flooding is minimal by the continual monitoring of the early flood warning system and ensuring that it is operational; upgrading our flood fighting strategies; maintaining our 12 plus miles of flood protection structures; and buying properties in the floodplain thereby mitigating flood damages and creating storage for flood waters.
Goals and Objectives
• Fort Wayne/Allen County Flood Control Project
As our flood control structures age; withstand significant flooding; and comply with the Army Corps of Engineers more rigid standards, keeping maintenance costs at a minimum will continue to be a challenge in the coming years. Our department has and will continue to use smaller experienced contractors and use in-house personnel to repair/rehabilitate the flood control structures. This will allow us to effectively preserve and maintain our structures for the protection of Fort Wayne residents and keep maintenance costs at a minimum.
• Federal Grants
Flood Control continues to oversee the administration of approved federal grants to acquire and demolish residential and commercial properties and remove them from the floodplain/floodway. Flood Control
131

continues to acquiring properties in the Junk Ditch and St. Mary’s River area. We are always looking for local and federal funding opportunities to continue these buyouts.
• Upgraded Early Flood Warning System
The Flood Control Department has an early flood warning system consisting of 30+ sites. The data from this system is critical to the National Weather Service for flood watches, warnings and crest predictions during a flood. This system was designed to be used by other City Departments, outside agencies and smaller communities in this area. Flood Control has budgeted to maintain and eventually upgrade the sites to continue communicating as designed and for additional sensors to be added to the system for its expanded use.
STREET LIGHT OPERATIONS DEPARTMENT
Mission Statement
Street Light Operations is responsible for providing sufficient illumination to aid in safe and efficient movement of pedestrian and motorized traffic during the evening and night time hours, using the latest technology in design, installation and maintenance.
Goals and Objectives
• To design, construct and maintain the existing street lighting facilities for the citizens of Fort Wayne.• Audit and document the entire street lighting system within the city limits.• Convert old technology street lighting to LED street lighting systems.• Deploy the Collector Application into the maintenance vehicles to enhance our maintenance capabilities.• Identify and replace end of life underground circuits.• Expand our retrofit initiative to the cobra head style fixtures.• Continue to find ways to decrease energy consumption by use of new technology. LED lighting is on the
forefront as we attempt to reach this goal.
Indicators 2017 Actual 2018 Actual 2019 Actual 2020 ActualStreet Light Bulb Replacement 2,370 2,960 3,367 3,044 Street Light Fixture Replacement 975 1,569 1,346 951 New Street Lights 120 137 246 359 Total Street Lights 34,450 33,776 33,837 34,090 Accident Repairs 224 254 238 180 Identification Tags Installed 225 235 250 237 Light Orders, Board Orders 30 30 30 32 Utility Locates 10,277 13,412 9,465 9,653 Emergency Utility Locates 1,300 1,304 333 202
RIGHT-OF-WAY DEPARTMENT
Mission Statement
The Right-of-Way Department is the face of Public Works; as such the mission is to serve the public with answers to their questions about projects, specifications and permits. Since this department handles any work in the public right-of-way (performed by the City, outside utilities or private individuals) through permitting, inspections or maintenance activities, they would be the ones most knowledgeable of what is happening in the Right-of-Way better than any other department. The Right-of-Way is the first line for all public inquiries that needed first so they can be directed to the appropriate contact person or answer.
132

Goals and Objectives
• ROW continues to serve the public with answers to questions/inquiries they may have about different situations they may see happening in the Right-of-Way
• Working with neighborhood presidents, partnership groups, property management groups on the individual needs that may need or want to plan for in the future.
• To estimate, design, construct, oversee various projects in the Right-of-Way that serve the community and keep them safe with projects that update existing infrastructure such as:
◦ 50/50 Neighborhood Cost share Program◦ ADA Curb Ramp Package◦ Miscellaneous Concrete Package◦ Trip Hazard Elimination Package◦ Sidewalk Leveling Package◦ Tree Removal Package◦ Guardrail and Attenuator Replacement Package
• Overseeing of the Street Department sidewalk replacement in neighborhoods to keep costs to a minimum for areas that may see hardship
• To maintain the City of Fort Wayne’s corridors, medians, round-a-bouts, and entrance markers for enhanced aesthetics as coming and going from Fort Wayne through our Landscape Division
• The ROW Landscape Division has approximately 23 acres of total green maintenance in 2019 and is expected to grow to 44 acres in 2020
• To ensure proper inspection is being met for the contractors and home owners constructing private projects and following specifications inside the City of Fort Wayne’s’ Right-of-Way
• The Department has increased permit revenue over the last five years. This was accomplished by stricter enforcement of permits and standardizing field work
Indicators
• 2020 - $672,710 • 2019 - $841,000• 2018 - $500,708• 2017 - $402,947• 2016 - $400,422• 2015 - $384,158
133

TRANSPORTATION ADMINISTRATION & SUPPORT DEPARTMENT
The functions of this group are varied, and generally fall within three department subsets: a surveying-drafting- inspection group; a permit and plan review group; and a finance-administrative group.
Department staff provides surveying, drafting, and inspection services necessary for the successful completion of street, curb, trail and new installation of sidewalk projects. Employees in this group also assess and report on pavement condition in order to maintain and update our pavement management system.
Other employees in this department are responsible for fielding a variety of other customer service requests, responses, and interactions. These responsibilities include permit functions; plan review of developer projects; investigation and reporting functions; data base maintenance activities; right of way acquisition functions; and general customer service activities. Department personnel also provide financial management, budgeting, purchasing, payroll, and clerical support services needed within the Transportation division.
Another function of Transportation Administration is to oversee the Barrett Law program. Barrett Law is a City- administrated loan program available to residents needing funding to pay for capital improvements over a long- term basis. We strive to provide the leadership and support necessary for the successful completion of capital improvements and the ongoing operation and maintenance of much of the City’s infrastructure.
Objectives:
• Provide surveying, drafting, and inspection services to ensure adherence to specifications and contract compliance, and to facilitate completion of neighborhood capital projects.
• Maintain and update the PASER Rating System in compliance with GASB 34 reporting requirements.• Respond to all citizens’ requests falling within our jurisdiction. Department personnel respond to citizen
requests such as removing vegetation obstructions, policing construction sites, enforcing sign restrictions, requiring snow removal, investigating reported hazards and infrastructure failures, assisting with locating property lines, determining project feasibility, and a variety of other requests.
• Ensure that all excavations in the rights-of-way are properly restored. Staff closely monitors the permit restoration process to confirm that cuts are quickly and permanently restored.
• Verify that all non-City funded construction occurring in the rights-of-way adheres to City engineering standards and specifications. The department issues drive approach permits, sidewalk permits, and parking lot permits, to ensure that City standards are followed. Multiple Inspections are performed during the permit review process, during construction, and upon completion.
• Ensure that temporary restrictions and/or street closures are properly barricaded with appropriate warning signs and traffic control devices. These permits are used to certify that proper and safe signing occurs whenever an obstruction is present within the traveled way.
• Facilitate project planning by providing meaningful, appropriate and accurate financial data to public works decision makers and ensure that the project bidding process, requisition process, and project close-out process follows established procedures and guidelines. Major funds, budgets, and programs tracked include the MVH fund, LR&S fund, LIT fund, Cumulative Capital Development fund, neighborhood capital improvement funds, and federal highway grant funds. Department staff provides clerical and administrative support for a host of activities relating to transportation capital improvements.
• Perform necessary right of way acquisitions in advance of planned construction so as to not delay anticipated construction commencement dates.
• Process all construction project payables and receivables in a timely manner. Department staff strives to have vendors paid within 30 days of the vendor’s invoice date, including mailing time.
134

5111 WAGES 3,676,911 4,003,537 4,139,235 135,698 5125 OVERTIME PREMIUM 2,687 30,000 30,000 — 5131 PERF - EMPLOYERS SHARE 350,719 386,642 401,840 15,198 5132 FICA 229,892 267,178 277,707 10,529 5134 LIFE MEDICAL & HEALTH INSURAN 795,000 825,000 770,000 (55,000) 5136 UNEMPLOYMENT COMPENSATION 3,299 3,493 3,630 137 5137 WORKERS COMP INSURANCE 32,862 32,862 36,098 3,236 513A PERF - EMPLOYEES/PD BY CITY 93,943 103,565 107,636 4,071 513R RETIREES HEALTH INSURANCE 75,000 45,000 28,000 (17,000) 5162 ACCRUED WAGES ADJ 31,056 — — — Total 5100 $ 5,291,370 $ 2,965,402 $ 5,697,277 $ 5,794,146 $ 96,869 1.70 %5212 STATIONERY & PRINTED FORMS — 775 775 — 5213 COMPUTER SUPPLIES 244 3,100 3,100 — 5214 SAFETY ITEMS/SUPPLIES 10,597 13,000 13,000 — 5219 OTHER OFFICE SUPPLIES 4,704 17,500 17,500 — 521C COMPUTERS & SOFTWARE <$4999 6,511 10,000 10,000 — 5231 GASOLINE 37,680 33,015 33,015 — 5232 DIESEL FUEL / FUEL OIL 8,723 18,886 25,817 6,931 5246 HOUSEHOLD & CLEANING SUPPLIES 1,061 4,221 4,221 — 5250 MISC STREETSCAPE INFRA SUPPLY — — 40,000 40,000 5261 BLDG REPAIR & MAINT MATERIALS — 400 400 — 5263 OTHER EQUIPMENT REPAIR PARTS — 1,000 1,000 — 5291 SMALL TOOLS 192 2,000 2,000 — 5299 OTHER MATERIALS & SUPPLIES 79,419 112,600 133,600 21,000 52AA IN HOUS STOCK 592,384 554,619 645,000 90,382 Total 5200 $ 741,517 $ 393,487 $ 771,116 $ 929,428 $ 158,313 20.53 %5314 CONSULTANT SERVICES 1 — — — 5317 INSTRUCTIONAL SERVICES — 7,000 7,000 — 531E RANDOM DRUG TESTS 170 300 300 — 531H BANK SERVICE CHARGES — 150 150 — 531K SEMINAR FEES 3,737 3,300 3,300 — 531M SECURITY SERVICES 310 300 300 — 5321 FREIGHT EXPRESS & DRAYAGE — 200 200 — 5322 POSTAGE 3,872 12,820 12,820 — 5324 TRAVEL EXPENSES 622 8,126 13,126 5,000 532C CELL PHONE 21,196 27,808 30,688 2,880 5331 PRINTING OTHER THAN OFFC SUPPL 2,479 4,300 4,300 — 5332 PUBLIC OF LEGAL NOTICES/ADVTER — 520 520 — 5333 PHOTOGRAPHY & BLUEPRINTING — 100 100 — 5342 LIABILITY INSURANCE 27,767 27,767 28,038 271 5350 MISC STREETSCAPE INFRA MAINT — — 20,000 20,000 5351 ELECTRICITY 18,511 13,470 18,470 5,000 5352 NATURAL GAS 3,061 4,997 4,997 — 5353 WATER 2,066 1,460 1,460 — 5354 SEWAGE 2,283 1,570 1,570 — 5355 PUBLIC LIGHTING ELECTRICITY 807,667 1,100,000 850,000 (250,000) 5356 SOLID WASTE DISPOSAL 3,455 3,400 3,400 — 5359 STORM WATER SEWER 342 300 300 — 535N STORAGE COSTS 780 1,800 1,800 — 5361 CONTRACTED BLDG & STRUCT REPAI 770 2,500 2,500 — 5363 CONTRACTED OTHER EQUIPMT REPAI 22,959 7,935 27,935 20,000 5365 JANITORIAL & LAUNDRY SERVICE 4,398 5,166 5,166 —
2020 ACTUAL
2021ACTUAL
THRU30-Jun-2021
2021REVISED
BUDGET THRU 30-Jun-2021
2022SUBMITTED
$ INCREASE (DECREASE)
FROM REVISED TO 2022
% CHANGE FROM REV
TO 2022
PUBLIC WORKSDept # 00062022 BUDGET COMPARISON
135

5369 CONTRACTED SERVICE 251,269 336,065 339,860 3,795 536B CONTRACTED STREET LIGHT REPAIR 108,665 35,000 135,000 100,000 536F CONTRACTED FLOOD CONTROL 52,020 52,020 52,020 — 536T FLEET SERVICES 53,913 61,203 67,807 6,604 5374 OTHER EQUIPMENT RENTAL 6,004 16,756 16,756 — 5391 SUBSCRIPTIONS AND DUES 15,271 8,820 8,820 — 5392 LICENSES 10,156 11,000 11,000 — 5399 OTHER SERVICES AND CHARGES 2,714 4,600 4,600 — 539B MASTER LEASE 168,342 198,892 239,423 40,531 Total 5300 $ 1,594,799 $ 719,368 $ 1,959,645 $ 1,913,726 $ (45,919) -2.34 %5411 PURCHASE OF LAND 7,100 — — — 5431 CONSTRUCTION FEES - GROUND & S 1,063,420 2,936,580 2,000,000 (936,580) 5441 PURCHASE OF VEHICLES — 6,000 — (6,000) 5443 PURCHASE OF OFFICE EQUIPMENT 10,972 — — — 5444 PURCHASE OF OTHER EQUIPMENT 7,586 47,000 78,000 31,000 5445 PURCHASE OF COMPUTER EQUIP — 50,000 50,000 — Total 5400 $ 1,089,078 $ 259,853 $ 3,039,580 $ 2,128,000 $ (911,580) -29.99 %
Total $ 8,716,763 $ 4,338,111 $ 11,467,617 $ 10,765,300 $ (702,317) -6.12 %
2020 ACTUAL
2021ACTUAL
THRU30-Jun-2021
2021REVISED
BUDGET THRU 30-Jun-2021
2022SUBMITTED
$ INCREASE (DECREASE)
FROM REVISED TO 2022
% CHANGE FROM REV
TO 2022
PUBLIC WORKSDept # 00062022 BUDGET COMPARISON
136

2020 ACTUAL
2021ACTUAL
THRU30-Jun-2021
2021REVISED
BUDGET THRU 30-Jun-2021
2022SUBMITTED
$ INCREASE (DECREASE)
FROM REVISED TO 2022
% CHANGE FROM REV
TO 2022539A OPERATING TRANSFER OUT 988,889 — — — Total 5300 $ 988,889 $ — $ — $ — $ — 0.00 %5431 CONSTRUCTION FEES - GROUND & S 3,332,602 5,442,266 4,522,337 (919,929) Total 5400 $ 3,332,602 $ 512,390 $ 5,442,266 $ 4,522,337 $ (919,929) -16.90 %
Total $ 4,321,491 $ 512,390 $ 5,442,266 $ 4,522,337 $ (919,929) -16.90 %
PUBLIC WORKS - MUNICIPAL SURTAX FUNDDept # 00062022 BUDGET COMPARISON
137

2020 ACTUAL
2021ACTUAL
THRU30-Jun-2021
2021REVISED
BUDGET THRU 30-Jun-2021
2022SUBMITTED
$ INCREASE (DECREASE)
FROM REVISED TO 2022
% CHANGE FROM REV
TO 20225431 CONSTRUCTION FEES - GROUND & S 624,114 577,663 577,663 — Total 5400 $ 624,114 $ — $ 577,663 $ 577,663 $ — 0.00 %
Total $ 624,114 $ — $ 577,663 $ 577,663 $ — 0.00 %
PUBLIC WORKS - MUNICIPAL WHEEL TAX FUNDDept # 00062022 BUDGET COMPARISON
138

REDEVELOPMENT
Vision Statement
To foster a vibrant, prosperous and growing Fort Wayne through extraordinary community development.
Mission Statement
To develop and implement creative community-based strategies to enhance economic opportunity, build strong neighborhoods, and ensure a dynamic framework for quality growth and development.
Executive Director’s Office
The Executive Director of Redevelopment works in conjunction with the Redevelopment Commission to promote and implement opportunity projects, acting as a catalyst to redevelop/develop areas that have shown a cessation of growth and lack of development. This is done through techniques including real estate acquisition, site preparation and/or providing public infrastructure to the site. Financing resources generally used are Tax Incremental Financing (TIF) and Redevelopment General Obligation Bonds.
139

2020 ACTUAL
2021ACTUAL
THRU30-Jun-2021
2021REVISED
BUDGET THRU 30-Jun-2021
2022SUBMITTED
$ INCREASE (DECREASE)
FROM REVISED TO 2022
% CHANGE FROM REV
TO 20225111 WAGES 419,457 455,018 473,012 17,994 5131 PERF - EMPLOYERS SHARE 45,250 50,961 52,975 2,014 5132 FICA 31,018 34,801 36,179 1,378 5134 LIFE MEDICAL & HEALTH INSURAN 120,000 120,000 112,000 (8,000) 5136 UNEMPLOYMENT COMPENSATION 436 460 474 14 5137 WORKERS COMP INSURANCE 535 535 535 — 513A PERF - EMPLOYEES/PD BY CITY 12,120 13,648 14,194 546 513R RETIREES HEALTH INSURANCE 15,000 15,000 14,000 (1,000) 5161 WAGE SETTLEMENT/SEVERANCE PAY 144 — — — 5162 ACCRUED WAGES ADJ 2,188 — — — Total 5100 $ 646,149 $ 305,601 $ 690,423 $ 703,369 $ 12,946 1.88 %5219 OTHER OFFICE SUPPLIES 2,098 2,000 2,000 — 5299 OTHER MATERIALS & SUPPLIES 92 — — — 521C COMPUTERS & SOFTWARE <$4999 200 500 500 — Total 5200 $ 2,390 $ 2,553 $ 2,500 $ 2,500 $ — 0.00 %531K SEMINAR FEES — 2,000 2,000 — 531Z DOCUMENT RECORDING FEES 103 — — — 5322 POSTAGE 184 150 150 — 5324 TRAVEL EXPENSES — 2,000 2,000 — 5326 MILEAGE — 580 580 — 532C CELL PHONE 872 1,350 1,350 — 5331 PRINTING OTHER THAN OFFC SUPPL 34 150 150 — 5332 PUBLIC OF LEGAL NOTICES/ADVTER — 100 100 — 5342 LIABILITY INSURANCE 48,907 48,907 52,867 3,960 5391 SUBSCRIPTIONS AND DUES 2,883 3,000 3,000 — 5399 OTHER SERVICES AND CHARGES 112 — — — Total 5300 $ 53,096 $ 49,542 $ 58,237 $ 62,197 $ 3,960 6.80 %
Total $ 701,634 $ 357,696 $ 751,160 $ 768,066 $ 16,906 2.25 %
REDEVELOPMENT COMMISSIONDept # 01232022 BUDGET COMPARISON
140

RISK MANAGEMENT DEPARTMENT
Risk Management identifies, assesses, and prioritizes the various risks within the operation of the City with the clear goal of preventing loss. This includes legal liabilities that come in the form of tort claims against the City, Workers Compensation and Hurt on Duty claims by injured workers and assuring adequate insurance coverage for all City assets and general liability and police professional claims. We utilize internal and external resources available to us to minimize, monitor, control, and ideally prevent loss.
The City of Fort Wayne has been self-insured for General, Auto, and Police Professional Liabilities since an ordinance was passed in 1989 establishing the self-insurance fund. Then in 1991, an additional ordinance was passed establishing the Workers Compensation Fund. All costs for the operating budget of Risk Management, actuarial costs to maintain proper funding for the General Fund, third party expenses for Workers Compensation claims processing and loss control are from the fund.
The five-person team includes two Safety Claims investigators who attend motor vehicle accidents involving City employees, perform inspections and investigations to assure OSHA compliance, process tort claims filed against the City, maintain the City's drug screening process, oversee safety training of City employees, and manage employee training records. We have two Risk Management Specialists who handle Workers Comp and Hurt on Duty injuries, process employee physicals (CDL, Confined Space, Post Offer and Workability exams), track employee immunizations, assist the Director of Risk Management with administration of a property damage database and payment collections, maintain employee files, draft certificates of insurance, and maintain records of the City's commercial insurance policies and bonds. The Risk Management Department is responsible for coordinating employee COVID cases. When we are notified that an employee has tested positive for COVID or been exposed to a COVID positive individual, we ensure that the proper forms are completed by the employee, notify the employee’s department of any isolation and/or quarantine requirements for the department’s employee(s), advise of a return to work date for each affected employee, and notify the Allen County Department of Health of the exposure. We also participate in interdepartmental groups such as insurance committees and ADA Coordinator duties. This continual monitoring and management for these functions in all City departments provides excellent stewardship of taxpayers' money.
141

2020 ACTUAL
2021ACTUAL
THRU30-Jun-2021
2021REVISED
BUDGET THRU 30-Jun-2021
2022SUBMITTED
$ INCREASE (DECREASE)
FROM REVISED TO 2022
% CHANGE FROM REV
TO 20225111 WAGES 325,475 335,019 346,517 11,498 5131 PERF - EMPLOYERS SHARE 35,323 37,522 38,810 1,288 5132 FICA 23,222 25,629 26,509 880 5134 LIFE MEDICAL & HEALTH INSURAN 75,000 75,000 70,000 (5,000) 5136 UNEMPLOYMENT COMPENSATION 326 335 347 12 5137 WORKERS COMP INSURANCE 1,470 1,470 1,531 61 513A PERF - EMPLOYEES/PD BY CITY 9,462 10,051 10,396 345 5146 SELF INSURANCE CLAIMS (351) — — — 5162 ACCRUED WAGES ADJ 2,975 — — — Total 5100 $ 472,902 $ 241,789 $ 485,026 $ 494,110 $ 9,084 1.87 %5212 STATIONERY & PRINTED FORMS — 540 540 — 5213 COMPUTER SUPPLIES 929 1,000 1,000 — 5214 SAFETY ITEMS/SUPPLIES 9,914 16,000 16,000 — 5219 OTHER OFFICE SUPPLIES 2,491 3,600 3,600 — 5231 GASOLINE 710 295 295 — Total 5200 $ 14,045 $ 5,312 $ 21,435 $ 21,435 $ — 0.00 %5311 LEGAL SERVICES 1,879,299 1,000,000 1,000,000 — 5312 MEDICAL SERVICES 50,262 46,153 46,153 — 5314 CONSULTANT SERVICES 71,229 164,336 164,336 — 531H BANK SERVICE CHARGES 546 — — — 531K SEMINAR FEES — 2,016 2,016 — 531S SOFTWARE TRAINING — 720 720 — 5322 POSTAGE 1,049 1,044 1,044 — 5324 TRAVEL EXPENSES 6 2,500 2,500 — 5326 MILEAGE 179 960 960 — 532C CELL PHONE 2,188 1,153 1,153 — 5342 LIABILITY INSURANCE (11,738) 2,500 2,297 (203) 5367 MAINT. AGREEMENT - SOFTWARE 3,149 1,815 1,815 — 5369 CONTRACTED SERVICE 553 417 417 — 536T FLEET SERVICES 1,303 2,133 1,703 (430) 5374 OTHER EQUIPMENT RENTAL 1,657 — — — 5391 SUBSCRIPTIONS AND DUES 1,377 1,200 1,200 — Total 5300 $ 2,001,059 $ 790,942 $ 1,226,947 $ 1,226,314 $ (633) -0.05 %Total 5400 $ — $ — $ — $ — $ —
Total $ 2,486,807 $ 1,038,043 $ 1,733,408 $ 1,741,859 $ 8,451 0.49 %
RISK MANAGEMENTDept # 0408 - SELF2022 BUDGET COMPARISON
142

STREET DEPARTMENT
Mission Statement
The primary mission of the Street Department is to provide the citizens of Fort Wayne with a well- maintained and safe transportation infrastructure. We strive to render cost effective, competent service including snow removal, street resurfacing, leaf pick-up, street sweeping and overall street maintenance.
Goals and Objectives
Pothole response time remains a top priority for the department, maintaining an average response time of less than two hours. We now also incorporate four heated asphalt trailers that we use throughout the city. These allow us to keep our asphalt hot throughout the day, regardless of the temperature outside, giving us much higher efficiency with respect to the “shelf life” of the material, as well as our response time. They are also excellent for “cold mix” in the winter months, making the material much more pliable in extreme temperatures for better applications, increasing patch durability.
Our seven-week leaf program is working well and we are again prepared to collect more than 3,700 truckloads or, roughly 12,500 tons of leaves this year. During leaf season, we will also collect all bagged leaves reported to the 311 call center within 2 business days.
Throughout the winter season, we maintain and clear the city streets of snow and ice to ensure safe travel for motorists.
Also, we maintain the majority of the Fort Wayne Trails system. We provide for the cutback of vegetation and trees, garbage removal, grass cutting, carpentry work on bridges and decks, repaving, and trail rebuilding as required by floods whenever necessary. Our goal is to ensure the safety and enjoyment of all who utilize the trails whether they walk, run, or ride their bicycles.
Miles of Maintenance
2012 2013 2014 2015 2016 2017 2018 2019 2020
Paving 15 12 12 13 12 12 12.3 9.5 10Chip and Seal 11 10 10 10 10 10 10.2 10.4 6Crack Sealing 75 75 75 75 75 75 52.3 7.3 55
143

5111 WAGES 4,771,808 5,169,860 5,470,230 300,370 5125 OVERTIME PREMIUM 300,880 350,000 350,000 — 5131 PERF - EMPLOYERS SHARE 567,746 614,864 637,304 22,440 5132 FICA 373,948 429,764 445,093 15,329 5134 LIFE MEDICAL & HEALTH INSURAN 1,500,000 1,500,000 1,400,000 (100,000) 5136 UNEMPLOYMENT COMPENSATION 5,472 5,618 5,816 198 5137 WORKERS COMP INSURANCE 118,006 118,006 127,579 9,573 513A PERF - EMPLOYEES/PD BY CITY 152,076 164,698 170,710 6,012 513C PRODUCTIVITY BONUS — 98,000 98,000 — 513R RETIREES HEALTH INSURANCE 120,000 105,000 140,000 35,000 5140 MERIT INCENTIVE POOL 93,679 — — — 5161 WAGE SETTLEMENT/SEVERANCE PAY 1,927 — — — 5162 ACCRUED WAGES ADJ 51,561 — — — Total 5100 $ 8,057,103 $ 4,234,920 $ 8,555,810 $ 8,844,732 $ 288,922 3.38 %5212 STATIONERY & PRINTED FORMS 159 600 600 — 5214 SAFETY ITEMS/SUPPLIES 31,602 24,702 24,500 (202) 5219 OTHER OFFICE SUPPLIES 2,571 3,000 3,000 — 5231 GASOLINE 44,830 39,800 37,800 (2,000) 5232 DIESEL FUEL / FUEL OIL 370,133 451,340 616,982 165,642 5233 OIL — 3,000 3,000 — 5235 PROPANE FUEL 2,253 2,000 2,000 — 5245 LANDSCAPE & GRNHOUSE SUPPLIES 5,980 12,500 12,500 — 5246 HOUSEHOLD & CLEANING SUPPLIES 11,400 1,800 1,800 — 5262 VEHICLE REPAIR PARTS — 2,000 2,000 — 5263 OTHER EQUIPMENT REPAIR PARTS — 2,000 2,000 — 5271 GRAVEL 350,188 300,000 300,000 — 5272 BITUMINOUS MATERIALS 1,113,536 1,296,460 1,450,000 153,540 5273 SAND 96,459 90,000 90,000 — 5274 SALT 714,952 1,277,476 1,037,500 (239,976) 5291 SMALL TOOLS 5,139 12,000 12,000 — 5292 HARDWARE 6,319 1,200 1,200 — 5293 PAINT 564 1,800 1,800 — 5299 OTHER MATERIALS & SUPPLIES 75,279 18,750 18,750 — Total 5200 $ 2,831,364 $ 1,780,416 $ 3,540,427 $ 3,617,432 $ 77,005 2.18 %5314 CONSULTANT SERVICES 5,556 3,400 3,400 — 531E RANDOM DRUG TESTS 3,110 3,000 3,000 — 531K SEMINAR FEES (1,685) 3,500 3,500 — 531Q RADIO SHOP SERVICES 5,835 4,000 4,000 — 5322 POSTAGE 27 60 60 — 5324 TRAVEL EXPENSES 2,637 1,000 1,000 — 532C CELL PHONE 7,308 6,750 6,750 — 5331 PRINTING OTHER THAN OFFC SUPPL — 100 100 — 5332 PUBLIC OF LEGAL NOTICES/ADVTER — 200 200 — 5342 LIABILITY INSURANCE 162,323 162,323 160,118 (2,205) 5351 ELECTRICITY 53,002 55,000 55,000 — 5352 NATURAL GAS 51,524 50,000 50,000 — 5353 WATER 5,775 5,500 5,500 — 5354 SEWAGE 4,196 3,600 3,600 — 5356 SOLID WASTE DISPOSAL 129,890 220,000 170,000 (50,000) 5359 STORM WATER SEWER 5,814 4,500 4,500 — 5361 CONTRACTED BLDG & STRUCT REPAI — 12,000 12,000 — 5365 JANITORIAL & LAUNDRY SERVICE 27,401 27,000 27,000 —
2020 ACTUAL
2021ACTUAL
THRU30-Jun-2021
2021REVISED
BUDGET THRU 30-Jun-2021
2022SUBMITTED
$ INCREASE (DECREASE)
FROM REVISED TO 2022
% CHANGE FROM REV
TO 2022
STREET DEPARTMENTDept # 01282022 BUDGET COMPARISON
144

5369 CONTRACTED SERVICE 49,683 15,779 50,000 34,221 536T FLEET SERVICES 1,284,437 1,226,409 1,260,277 33,868 5370 BRIDGE REPAIR & MANTENANCE 1,732,555 3,189,193 1,254,798 (1,934,395) 5374 OTHER EQUIPMENT RENTAL 79,927 69,000 69,000 — 5391 SUBSCRIPTIONS AND DUES 200 3,500 3,500 — 539A OPERATING TRANSFER OUT 596,695 — — — 5399 OTHER SERVICES AND CHARGES 47,827 24,000 40,000 16,000 539B MASTER LEASE 1,587,211 1,855,037 2,258,922 403,885 Total 5300 $ 5,841,247 $ 4,148,398 $ 6,944,851 $ 5,446,225 $ (1,498,626) -21.58 %5431 CONSTRUCTION FEES - GROUND & S 4,111,106 5,511,890 4,900,000 (611,890) Total 5400 $ 4,111,106 $ 1,125,237 $ 5,511,890 $ 4,900,000 $ (611,890) -11.10 %
Total $ 20,840,820 $ 11,288,971 $ 24,552,978 $ 22,808,389 $ (1,744,589) -7.11 %
2020 ACTUAL
2021ACTUAL
THRU30-Jun-2021
2021REVISED
BUDGET THRU 30-Jun-2021
2022SUBMITTED
$ INCREASE (DECREASE)
FROM REVISED TO 2022
% CHANGE FROM REV
TO 2022
STREET DEPARTMENTDept # 01282022 BUDGET COMPARISON
145

[This page intentionally left blank]
146

TRANSPORTATION ENGINEERING SERVICESStreet Project Management Department
Mission Statement
Street Project Management is a department within the Division of Public Works, Transportation Engineering section. The mission of the Street Project Management Department is to plan, design and implement the construction and repair of a safe and efficient transportation system within the City of Fort Wayne.
The City Engineer directs the Street Project Management section of Transportation Engineering. The duty of the City Engineer is to oversee the preparation of plans and specifications for the competitive bidding of Capital Improvement Programs, Public Works Maintenance projects requiring engineering expertise and all other improvement projects necessary for the safe, efficient and economical operation of the Public Works Division of the City of Fort Wayne government.
Goals and Objectives
• Plan, design, and construct neighborhood projects in the year they are planned for construction.
It’s important to fulfill commitments for street, curb and walk improvements in the year those commitments were made. This will be accomplished by beginning the design process earlier once projects have been selected. This goal will strengthen our customer’s confidence in our services. Our customers are the citizens of Fort Wayne and their designated government representatives.
• Maintain and update the PASER System.
Keeping this database up to date will ensure we are concentrating on the infrastructure that needs the most attention. The PASER System will also help determine from year to year how well we are accomplishing our goals and whether those goals should be re-evaluated. We have exceeded our goal of reassessing at least 1/3 of our total miles each year and are on track to complete all of our more than 1167 miles in 2021.
Our customers; the engineers, planners, government representatives, and the citizens of Fort Wayne, are important to us and together we depend on this information to make sound decisions about Transportation projects. Street Project Management will
• Assist the Street Maintenance Department in our calculated goal of asphalt resurfacing of 52 miles of asphalt roads and streets through contracted services annually.
• Repair or reconstruct in our calculated goal of 10 miles of concrete streets through contracted services annually.
It’s imperative to keep up with the pace of deterioration our infrastructure experiences each year. We have determined these are miles of pavement that must be improved upon to keep the overall system condition in the “Good” condition level. To meet our established goals, appropriate funding must be dedicated towards transportation related infrastructure.
If we can provide a well-maintained transportation system, businesses will be attracted to Fort Wayne and ultimately create new jobs. A well maintained system will also reduce our liability from accidents stemming from poor pavement condition. Our customers are the citizens of Fort Wayne who expect a safe and reliable transportation system.
Services Provided:
• Design road improvements.• Construction management of all new construction and repairs for streets, alleys, trails, sidewalks and
curbs.• Provide estimates for and recommend new street, curb, sidewalk projects stemming from:
a) Citizen Concerns
147
b) City Councilc) Neighborhood Capital Improvement Surveysd) Petitionse) Risk Management Claims
• Communication with general public• Review projects in routing• Assist various City Departments
◦ Provide engineering expertise and review◦ Provide engineering/construction management
• Assist in long-range transportation planning.• Design and manage ADA projects.
148

2020 ACTUAL
2021ACTUAL
THRU30-Jun-2021
2021REVISED
BUDGET THRU 30-Jun-2021
2022SUBMITTED
$ INCREASE (DECREASE)
FROM REVISED TO 2022
% CHANGE FROM REV
TO 20225111 WAGES 739,353 903,385 950,134 46,749 5125 OVERTIME PREMIUM 95 — — — 5131 PERF - EMPLOYERS SHARE 82,597 99,500 104,738 5,238 5132 FICA 56,069 67,963 71,539 3,576 5134 LIFE MEDICAL & HEALTH INSURAN 180,000 180,000 168,000 (12,000) 5136 UNEMPLOYMENT COMPENSATION 895 888 935 47 5137 WORKERS COMP INSURANCE 8,437 8,437 3,867 (4,570) 513A PERF - EMPLOYEES/PD BY CITY 22,124 26,648 28,052 1,404 513R RETIREES HEALTH INSURANCE 75,000 90,000 56,000 (34,000) 5161 WAGE SETTLEMENT/SEVERANCE PAY 25,520 — — — 5162 ACCRUED WAGES ADJ 4,360 — — — Total 5100 $ 1,194,451 $ 667,491 $ 1,376,821 $ 1,383,265 $ 6,444 0.47 %5214 SAFETY ITEMS/SUPPLIES 1,447 3,000 3,000 — 5219 OTHER OFFICE SUPPLIES 1,848 780 780 — 521C COMPUTERS & SOFTWARE <$4999 80 400 400 — 5231 GASOLINE 4,061 6,200 6,200 — 5241 MEDICAL & SURGICAL SUPPLIES — 50 50 — 5291 SMALL TOOLS — 1,250 1,250 — 5299 OTHER MATERIALS & SUPPLIES 994 250 250 — Total 5200 $ 8,430 $ 2,917 $ 11,930 $ 11,930 $ — 0.00 %5317 INSTRUCTIONAL SERVICES 1,500 6,300 6,300 — 531K SEMINAR FEES 745 — — — 5324 TRAVEL EXPENSES 1,535 500 500 — 532C CELL PHONE 5,173 6,092 6,092 — 5331 PRINTING OTHER THAN OFFC SUPPL — 66 66 — 5342 LIABILITY INSURANCE 6,583 6,583 6,464 (119) 536T FLEET SERVICES 13,506 14,188 14,224 36 5391 SUBSCRIPTIONS AND DUES 106 3,533 3,533 — 539B MASTER LEASE 26,725 21,992 25,938 3,946 Total 5300 $ 55,873 $ 30,980 $ 59,254 $ 63,117 $ 3,863 6.52 %Total 5400 $ — $ — $ — $ — $ —
Total $ 1,258,754 $ 701,388 $ 1,448,005 $ 1,458,312 $ 10,307 0.71 %
STREET PROJECT MANAGEMENTDept # 00102022 BUDGET COMPARISON
149

[This page intentionally left blank]
150

TRAFFIC ENGINEERING DEPARTMENT
Mission Statement
The mission of the Traffic Engineering Department is responsibility for all aspects of roadway traffic engineering and operations/maintenance including implementation of programs related thereto. General areas of responsibility include: traffic signals, installation and maintenance of fiber optics, WiFi, electrical maintenance, traffic signs, pavement markings, street signs, bus route signs, truck route signs, impact attenuators, traffic design/review, transportation planning, accident analysis, traffic level-of-service analysis and liaison with other agencies.
Goals and Objectives
The Traffic Engineering Department endeavors to provide safe and efficient movement of vehicles, people and goods through the community as advocated by the established regulations and the elected administration. Goals and objectives can be categorized into the following areas:
1. The department strives to produce and make available the maximum level of service for traffic with the limited resources available for capital improvements and operation.
2. The department attempts to develop new engineering techniques for moving persons and goods safely and efficiently.
3. The department continues to create and maintain a communication channel between the administration and the public. This is to align department services in accordance with administrative policy making, as well as provide the timely interchange of incoming and outgoing information with the public.
Indicators2017
Actual2018
Actual2019
Actual2020
ActualEngineering/Administration Staff:Accident Records & Analysis 9,600 11,072 10,702 8,654 Fatal Accident Investigation 15 15 21 30 Development & Building Plans Processed 150 141 153 154 Board of Safety Reports 90 165 401 412 Traffic Counts Conducted 260 50 60 62 Traffic Investigations (complaints) 450 400 400 300
Signal Division:
New Signals Installed 2 2 — 1 Total Signals In Service 397 399 399 400 Total Flashing Beacons In Service 56 55 55 57 Total Pedestrian Signal Locations In Service 271 272 272 272 Signals Modernized 10 11 18 15 Signal Accident Repairs 40 83 132 57 Signal LED’S Replaced (Emergency) 10 — 7 2 Signal Trouble Calls 1,950 2,919 2,027 1,916 Controller Maintenance 397 399 399 400 Detector Loop Repairs 130 61 40 39 Signal Work Orders 470 469 196 318
151
2017Actual
2018Actual
2019Actual
2020Actual
Sign & Marking Division
Signs Installed 819 1,401 1,373 1,387 Signs Relocated 1,483 1,219 1,598 1,433 Signs Replaced 3,458 3,022 1,598 2,693 Signs Removed 1,193 1,283 1,598 1,441 Signs Manufactured 2,048 4,018 4,145 4,082 Street Lanes Marked-Painted Miles 784 698 774 752 Curb Parking Marked (Yellow Curb) 13,820 ft. 9,350 ft. 7,343 ft. 10,171 ft.Crosswalks Marked 742 602 594 646 Lane Arrows Marked 2,171 1,571 1,685 1,809 Parking Stalls Marked 427 403 329 715 Banner/Wreaths — — — 427 Vehicle Decals — — — 45
152

5111 WAGES 1,335,231 1,470,737 1,546,794 76,057 5125 OVERTIME PREMIUM 39,425 48,000 48,000 — 5131 PERF - EMPLOYERS SHARE 204,968 220,800 229,327 8,527 5132 FICA 136,087 157,424 163,242 5,818 5134 LIFE MEDICAL & HEALTH INSURAN 465,000 465,000 434,000 (31,000) 5136 UNEMPLOYMENT COMPENSATION 2,003 2,058 2,134 76 5137 WORKERS COMP INSURANCE 41,964 41,964 45,495 3,531 513A PERF - EMPLOYEES/PD BY CITY 54,903 59,143 61,427 2,284 513R RETIREES HEALTH INSURANCE 75,000 60,000 42,000 (18,000) 5162 ACCRUED WAGES ADJ 20,736 — — — Total 5100 $ 2,375,317 $ 969,387 $ 2,525,126 $ 2,572,419 $ 47,293 1.87 %5212 STATIONERY & PRINTED FORMS 47 500 500 — 5214 SAFETY ITEMS/SUPPLIES 11,715 11,000 11,000 — 5219 OTHER OFFICE SUPPLIES 3,144 5,610 5,610 — 521C COMPUTERS & SOFTWARE <$4999 1,055 4,080 4,080 — 5231 GASOLINE 32,999 32,101 32,101 — 5232 DIESEL FUEL / FUEL OIL 18,792 20,574 28,125 7,551 5246 HOUSEHOLD & CLEANING SUPPLIES 4,334 3,500 3,500 — 5261 BLDG REPAIR & MAINT MATERIALS — 1,275 1,275 — 5264 SIGN DIVISION/MATERIAL 81,589 87,214 83,640 (3,574) 5265 SIGNAL DIVISION/MATERIAL 213,114 231,369 226,000 (5,369) 5275 PAVEMENT MARKING MATERIALS 141,433 143,187 142,800 (387) 5299 OTHER MATERIALS & SUPPLIES — 300 300 — Total 5200 $ 508,221 $ 355,359 $ 540,710 $ 538,931 $ (1,779) -0.33 %5317 INSTRUCTIONAL SERVICES 1,375 3,000 3,000 — 531E RANDOM DRUG TESTS 320 700 700 — 531K SEMINAR FEES — 3,000 3,000 — 531M SECURITY SERVICES 408 300 300 — 531Q RADIO SHOP SERVICES 1,683 1,130 1,130 — 5322 POSTAGE 367 400 400 — 5324 TRAVEL EXPENSES 1,103 2,750 2,750 — 5326 MILEAGE — 400 400 — 532C CELL PHONE 17,757 30,180 30,180 — 5331 PRINTING OTHER THAN OFFC SUPPL 420 150 150 — 5332 PUBLIC OF LEGAL NOTICES/ADVTER — 200 200 — 5333 PHOTOGRAPHY & BLUEPRINTING — 300 300 — 5342 LIABILITY INSURANCE 61,679 61,679 62,940 1,261 5351 ELECTRICITY 151,909 145,000 145,000 — 5352 NATURAL GAS 6,969 9,766 9,766 — 5353 WATER 5,179 3,600 3,600 — 5356 SOLID WASTE DISPOSAL 272 1,100 1,100 — 5358 HAZARDOUS WASTE DISPOSAL — 800 800 — 5361 CONTRACTED BLDG & STRUCT REPAI 1,632 950 950 — 5363 CONTRACTED OTHER EQUIPMT REPAI 104 10,000 10,000 — 5365 JANITORIAL & LAUNDRY SERVICE 8,223 8,290 8,290 — 5369 CONTRACTED SERVICE 15,553 20,204 19,000 (1,204) 536T FLEET SERVICES 76,970 81,589 77,787 (3,802) 5374 OTHER EQUIPMENT RENTAL — 1,500 1,500 — 5391 SUBSCRIPTIONS AND DUES 902 1,300 1,300 — 5392 LICENSES 684 4,700 4,700 — 5399 OTHER SERVICES AND CHARGES 546 15,000 15,000 — 539B MASTER LEASE 104,337 151,066 200,313 49,247
2020 ACTUAL
2021ACTUAL
THRU30-Jun-2021
2021REVISED
BUDGET THRU 30-Jun-2021
2022SUBMITTED
$ INCREASE (DECREASE)
FROM REVISED TO 2022
% CHANGE FROM REV
TO 2022
TRAFFIC ENGINEERINGDept # 00112022 BUDGET COMPARISON
153

Total 5300 $ 458,393 $ 269,196 $ 559,054 $ 604,556 $ 45,502 8.14 %5431 CONSTRUCTION FEES - GROUND & S 1,752,822 4,488,869 2,000,000 (2,488,869) 5443 PURCHASE OF OFFICE EQUIPMENT 12,150 — — — 5444 PURCHASE OF OTHER EQUIPMENT 19,831 25,000 48,000 23,000 Total 5400 $ 1,784,803 $ 1,266,352 $ 4,513,869 $ 2,048,000 $ (2,465,869) -54.63 %
Total $ 5,126,733 $ 2,860,294 $ 8,138,759 $ 5,763,906 $ (2,374,853) -29.18 %
2020 ACTUAL
2021ACTUAL
THRU30-Jun-2021
2021REVISED
BUDGET THRU 30-Jun-2021
2022SUBMITTED
$ INCREASE (DECREASE)
FROM REVISED TO 2022
% CHANGE FROM REV
TO 2022
TRAFFIC ENGINEERINGDept # 00112022 BUDGET COMPARISON
154

UNSAFE BUILDING
Vision Statement
To foster a vibrant, prosperous and growing Fort Wayne through extraordinary community development and safe housing.
Mission Statement
To develop and implement creative community-based strategies to enhance economic opportunity, build strong neighborhoods, and ensure a dynamic framework for quality growth and development.
General Information:
The Unsafe Building operating budget is a non-reverting fund as regulated by Indiana Code 36-7-9-14. All expenses incurred must be from carrying out the Unsafe Building Law 36-7-9 which applies to the repair or demolition of those buildings which are dilapidated, substandard, or unfit for human habitation and which constitute a hazard to the health, safety and welfare of the citizens of the City and those tracts of real property not containing a building or structure which are a fire hazard, a hazard to public health, a public nuisance, or dangerous to a person or property because of a violation of a statute or an ordinance.
155

2020 ACTUAL
2021ACTUAL
THRU30-Jun-2021
2021REVISED
BUDGET THRU 30-Jun-2021
2022SUBMITTED
$ INCREASE (DECREASE)
FROM REVISED TO 2022
% CHANGE FROM REV
TO 20225111 WAGES — — 80,640 80,640 5132 FICA — — 6,168 6,168 5136 UNEMPLOYMENT COMPENSATION — — 83 83 Total 5100 $ — $ — $ — $ 86,891 $ 86,891 0.00 %5231 GASOLINE — — 24,512 24,512 5299 OTHER MATERIALS & SUPPLIES — — 37,500 37,500 529C BUNKER GEAR/UNIFORMS — — 300 300 Total 5200 $ — $ — $ — $ 62,312 $ 62,312 0.00 %5311 LEGAL SERVICES — — 95,000 95,000 5314 CONSULTANT SERVICES — — 99,000 99,000 531Z DOCUMENT RECORDING FEES — — 180,000 180,000 5322 POSTAGE — — 5,000 5,000 5324 TRAVEL EXPENSES — — 20,000 20,000 532C CELL PHONE — — 6,000 6,000 532V VERIZON AIR CARDS — — 3,000 3,000 5331 PRINTING OTHER THAN OFFC SUPPL — — 5,190 5,190 5332 PUBLIC OF LEGAL NOTICES/ADVTER — — 700 700 5361 CONTRACTED BLDG & STRUCT REPAI — — 105,000 105,000 5363 CONTRACTED OTHER EQUIPMT REPAI — — 2,000 2,000 5364 CONTRACTED GROUND & SURFC RPR — — 190,000 190,000 5369 CONTRACTED SERVICE — — 1,063,500 1,063,500 536T FLEET SERVICES — — 34,520 34,520 5399 OTHER SERVICES AND CHARGES — — 2,000 2,000 539B MASTER LEASE — — 31,392 31,392 539U MISC COLLECTION FEES — — — — Total 5300 $ — $ — $ — $ 1,842,302 $ 1,842,302 0.00 %5441 PURCHASE OF VEHICLES — — 30,000 30,000 Total 5400 $ — $ — $ — $ 30,000 $ — $ 30,000 0.00 %
Total $ — $ — $ — $ 2,021,505 $ — $ 2,021,505 0.00 %
UNSAFE BUILDINGDept # 00072022 BUDGET COMPARISON
156