2019 Annual Report - Purdue University Fort Wayne
226
1 2019 Annual Report March 15, 2020
-
Upload
khangminh22 -
Category
Documents
-
view
0 -
download
0
Transcript of 2019 Annual Report - Purdue University Fort Wayne

1
2019 Annual Report March 15, 2020

2
Contents Viability Section............................................................................................................................................. 3
College Enrollment Management Plan ..................................................................................................... 3
College Level Enrollment and Retention Plan ....................................................................................... 3
College Support for Department Enrollment Management ................................................................. 3
Overview of Departmental Performance ................................................................................................. 4
College Level Planning based on Departmental Results - Programs Not Meeting Metrics, Programs Marginally Meeting Metrics, Programs Meeting or Exceeding Metrics ................................................... 6
College Plan ........................................................................................................................................... 7
Core Mission Section..................................................................................................................................... 7
Overview of College Goals ........................................................................................................................ 7
Telling our story .................................................................................................................................... 8
Reciprocal engagement ........................................................................................................................ 8
Increasing enrollment ........................................................................................................................... 8
Building a college community ............................................................................................................... 9
Overview of Scholarly Contributions of Department to the College ........................................................ 9
Teaching, Learning, Curriculum Highlights ........................................................................................... 9
Scholarship .......................................................................................................................................... 10
University and Community ................................................................................................................. 10
Analysis of Departmental Performance in teaching, learning, scholarship ........................................ 10
Discussion of Department Funding ......................................................................................................... 11
Analysis of Prior Year Departmental Use of Funds ............................................................................. 11
Overview of Departmental Requests .................................................................................................. 11
Prioritization of Departmental Requests ............................................................................................ 12

3
Viability Section College Enrollment Management Plan College Level Enrollment and Retention Plan In the summer of 2019, the dean, director of the Student Success Center, and the Director of Assessment and Analytics attended a training conference on the role of enrollment management in the academic unit. Following this training, in consultation with department chairs, a simplified enrollment funnel and student lifecycle was created for the college consisting of four phases:
• Owning our brand (intentional messaging to stakeholders and prospects) • Persuading admits to enroll (messaging to, and activities with, admitted students) • Enhancing student progress (retention activities through academics and advising) • Engaging alumni (involving alumni, especially in the above three lifecycle stages)
During fall duty week, a college-wide workshop was held to engage faculty in planning and ownership of their role in enrollment management. Prior to the workshop, faculty in each unit received an extensive data report that included enrollment data, workforce projections, and a competitor analysis. From this workshop, project management spreadsheets were created for each unit and collectively maintained in a shared O-drive. In addition to individual unit activities, three common retention activities were established for the first six weeks of the semester: take student attendance, have at least one early-semester (first six weeks) graded assignment, and faculty use of a Qualtrics form to alert the college’s Student Success Center of any student concerns. A second six weeks initiative focused on spring registration through faculty, Student Success Center, and social media messaging. Like the rest of campus, we saw steep increases in Monday registration for each registration week. Despite significant efforts across the college, spring freshmen retention was down. While the SOE remained above the campus norm, other units in the college did not. Continued efforts in enrollment management are needed. College Support for Department Enrollment Management There are multiple, centralized systems to improve and support enrollment management:
1. In addition to the college-wide enrollment management project, the director of the Student Success Center was given the charge of leading college-wide enrollment management. This included working with department chairs and faculty to develop unit-level plans, coordinating work between the Student Success Center and the academic units, monitoring freshmen success courses, and monitoring and promoting continued progress of the established plans.
2. Professional advisors continue to monitor individual student registration and contact students
(via email, call, and text) who did not register. For students who do not respond, faculty are requested to intervene. This is a labor intensive process, both in contacting students as well as maintaining a spreadsheet system to track enrollment and students’ reasons for not returning.

4
3. We continue to target both recruitment and retention of underrepresented students. This past year, Isabel Nunez and Alice Jordan-Miles, in cooperation with Latinos Count, brought more than 400 Latino high school students to campus. Our productive, cooperative programming continues with community organizations such as City Life and Fort Wayne UNITED. Kerrie Fineran, as a Leadership Academy project, is starting a student group to provide programming and support to underrepresented students in the college.
4. We continue to use a single-point administrative assistant for web and social media, who is also pushing out a newsletter to admitted students. This approach has increased the quality of digital media and consistency of output.
5. In addition to his other duties, our director of Assessment and Planning provides weekly enrollment data to department chairs during registration as well as regular reports on yield, retention, admissions, and other student data points.
6. Branded clothing and other items were purchased and distributed through the Student Success Center and at college- and unit-level activities to build a sense of belonging.
Overview of Departmental Performance
Analysis of Performance of Departments relative to Viability Metrics Major Demand
2019 Watch 20 Min 10
Majors 2019 Watch 30 Min 20
Graduates 2018 Watch 10 Min 5
Efficiency 2018 Flag <12.5%
Attrition 2018 Flag >25%
Growth Trend 2018 Flag <0.9
BSPA-CJ 74 144 28 19.72 28.17 1.014 BSPA-HA 5 14 15 46.88 18.75 0.609 BSED-EC 45 81 5 7.46 23.88 1.71 BSED-Elem
156 376 90 21.76 17.85 .0771
BSED-Mid 26 51 13 22.45 16.33 1.045 BSED-Sec*
100 121 1 0.0 30.95 2.0
BS-HS 27 90 43 35.54 9.92 1.5 BS-HTM 23 62 17 20.99 27.16 0.786
Not included in chart: multiple discontinued degrees, Earth/Space Science Ed, Education Policy, English Ed, Social Studies Ed., and the graduate programs (which did not receive pre-populated reports from IR). *Data inaccurately describe secondary education students due to changes to dual degree program and associated code changes. This code was previously used for non-degree students. School of Education
• Analysis of Departmental Viability The SOE and each of its programs are viable. The growth in early childhood education appears to counter the reduction in elementary education, which may be related to a shared population of

5
students. Further, Elementary education saw a one-time spike of about 90 students in 2016 and has since returned to previously consistent levels. Middle school education continues to slowly grow, and as the only public university middle school education program in the state, is a small distinction for the SOE. The secondary education dual-degree changeover continues, yet wreaks havoc on the metrics as the code switches from non-degree to degree-granting. From other data, as a whole, the secondary education program is growing. While not on the chart, growth in the graduate programs is promising.
• Analysis of Department Plans The SOE has a good number of activities for each of the four student lifecycle stages defined by the college’s strategic enrollment management plan. However, especially in the Enhancing Student Progression area, the activities are globally worded, and it is unclear when specific actions will be conducted. Overall, the plan is a good start, but it is unclear how it will move forward, especially without additional funding, as some of the suggested activities are rather ambitious.
• Discussion of Departmental Efforts The SOE was an early adopter of SEM planning in the college, and the faculty seem to accept a role in the four student lifecycle stages. However, it is unclear how successful the fall-semester activities have been. Although freshmen retention numbers for the fall are slightly down from the previous year, retention is higher than the campus average.
Department of Human Services
• Analysis of Departmental Viability Human Services saw a dramatic decrease in newly admitted students (about 50% of recent-years’ average), while other metrics remain positive. The department remains viable.
• Analysis of Department Plans
Human Services has a good start to an enrollment management plan and has a strong tradition of engagement with students. However, it is unclear how the plan is being enacted, and more emphasis may be required to define the field of human services for prospective students, especially in the face of Indiana University’s new Social Work degree that will likely compete for many of the same students.
• Discussion of Departmental Efforts Human Services has added new efforts to their SEM plan, but at the moment it appears that the majority of the plan rests on the department chair. I appreciate the high level of community engagement throughout the plan. It is important that the department create a culture of accountability for the tasks in their plan.
Department of Hospitality and Tourism Management
• Analysis of Departmental Viability Hospitality and Tourism Management saw a drop in admissions numbers and an increase in attrition, resulting in a concerning reduction in total majors. Without a change in this trajectory, viability is questionable. On the positive side, both the dean and interim-chair have had

6
enthusiastic support from the industry and low-hanging enrollment fruit remains, such as improving the TSAP pipeline and linking the department to vocational programs in high schools.
• Analysis of Department Plans HTM’s SEM plan contains a number of items in each of the student lifecycle stages. However, there is concern that the majority of the plan rests on the department chair, who already has a number of departmental issues that need addressing.
• Discussion of Departmental Efforts While progress is being made on a number of tasks, more information is needed about goal completion, and it is imperative that the department create a culture of accountability for the tasks in their plan.
Department of Public Policy • Analysis of Departmental Viability
In Public Policy, criminal justice has maintained enrollment for the third year, while health systems administration continues to experience very low admissions numbers resulting in catastrophic enrollment declines, strongly questioning its viability. The MPA is holding steady.
• Analysis of Department Plans Public Policy’s SEM plan contains a few items in each of the student lifecycle stages. However, the majority of the plan rests with the department chair, which continues to be a position in flux.
• Discussion of Departmental Efforts With changes in departmental leadership, the ability to move forward in enrollment management has been greatly hampered. It is imperative that the department pick a few, high-impact items that can be shared by faculty and execute them well.
College Level Planning based on Departmental Results - Programs Not Meeting Metrics, Programs Marginally Meeting Metrics, Programs Meeting or Exceeding Metrics
Programs Not Meeting Metrics • Health Services Administration: demand, majors, growth • HTM: attrition, growth
Programs Marginally Meeting Metrics
• CJ: attrition (28%) • Elementary Education: growth • Human Services: concern for significant drop in demand
Programs Meeting or Exceeding Metrics
• ECE: The program is actually doing well, but metrics are still cycling through the switch from a 2+2 to a four-year program.
• Middle School: Continues to show small growth.

7
• Secondary Education: Program is actually growing, but the metrics are off due to switching this degree code from non-degree to degree-granting in the new dual-degree arrangement.
College Plan From departmental data, two issues need to be addressed throughout the college: new students and retention. Enrolling new students is a particular issue for degree programs in elementary education, health services administration, HTM, and human services. To address this, emphasis needs to be placed on action plans for owning our brand and converting admits to enrolled students. The number of admitted students has generally increased over the past few years for these programs, but conversion to enrolled students has not kept pace with admissions. Regarding retention, while the SOE is strong in this area and Human Services is with upperclassmen, freshmen retention is an issue for all other programs. Some of the retention differences may be population specific, such as future teachers coming to campus with a clear commitment to their future career, which students in other majors may not exhibit. However, the SOE also has a several-year head start in best-practices in retention, such as targeting specific courses for freshmen, scaffolding of coursework, cohort-like progression of students, and strategic use of field experiences throughout the curriculum. Other departments are being encouraged to adopt similar practices. We will continue to revise freshmen success courses and engagement activities. The data for these demonstrates a bifurcated population, where those that participate are retained, and those who do not, disappear, often without any contact or feedback. To address this, we need to improve the communication pipeline with SST’s freshmen advising services at a granular level. A third area that potentially needs to be addressed as part of a college plan is increasing diversity. Multiple accrediting agencies have noted this as an area of weakness within the last 2 years. Department SEM plans mention diversity in various ways, but relatively few activities specifically address this topic and the activities are isolated across and even within departments. Much emphasis is placed on a proposed diversity plan to be developed by counseling education faculty in SOE. However, this plan must first and foremost address accreditation requirements for the graduate-level counseling education program; only after that can it potentially expand to undergraduate SOE programs and then to other departments. Also, this plan has faced numerous setbacks, including postponement of a diversity planning conference due to COVID-19.
Core Mission Section Overview of College Goals
When the college began in 2018, a two-year action plan was created consisting of four priorities: telling our story, reciprocal engagement, increasing enrollment, and, as a brand new college, building a college community. With the creation of both a college SEM plan and a new campus strategic plan, the decision of the units in the college was to align with these two plans, rather than go through a college-specific strategic planning process. It is clear that the four student lifecycle stages in the college’s SEM plan—owning our brand, persuading admits to enroll, enhancing student progression, and engaging alumni—along with the four priorities of

8
the campus strategic plan—student success, community engagement, diversity, equity, and inclusion, and quality of place—have significant overlap with the work already occurring in the college. Telling our story Telling our story cuts across the four stages of the student life cycle and across the campus strategic plan, but it is especially relevant to recruiting future potential students to campus. To this end, during the fall faculty workshop, each department spent time clarifying their brand identity. Some departments got further than others, but the discussions helped lay a foundation for producing promotional material, such as posters, other signage, and websites. We also continue to promote our work through social media and our biweekly newsletter. We are still receiving more news items than we can publish in a single newsletter, which indicates the amount of relevant, impactful work by faculty and staff remains high. Work remains in progress to turn this newsletter into a product for external constituents. A formal communications director within the college would help with this cause. As one measure of the impact of telling our story over the past year, we can look at student admissions. For fall 2019, CPS admitted 870 students for an increase of almost 3% over fall 2018 and a 50% increase over fall 2017. The number of newly enrolled from these admits remained constant at 338 students. We will continue to explore avenues for getting the word out about our work. Reciprocal engagement Reciprocal engagement is a hallmark of the college. Much or our work is community-focused. As some tangential benefits, this also helps us tell our story to more of the region and fosters a more engaging, practical curriculum for our students. We estimate that our students spent over 187,000 hours in the community through field placements, internships, and volunteerism, an increase of 20,000 hours over last year. This is in addition to a concerted effort to bring more guest speakers on campus for courses and workshops. Not all departments require such engagement equally, especially in the form of internships or field placements. In particular, Public Policy students and curricula could benefit from additional community experiences. Increasing enrollment Increasing enrollment remains the end goal of most college initiatives, whether that is through making our programs more widely known and attractive to new students or by improving the on-campus experience (academic and otherwise) to help retain students. The outcomes have been decidedly mixed. Some departments and programs, in particular in SOE, remain very strong or are even growing. Others, such as HTM, continue to decline rapidly. Human Services and Public Policy face new threats from programs at Indiana University Fort Wayne (in social work and health administration). While total enrollment did decline in fall 2019 (1219 students, down approx. 7%), some of this is due to administrative changes in the secondary education programs that have students formally listed as College of Arts & Sciences students. Meanwhile, graduate programs continued to grow. Retention campus-wide was a challenge last year, and while CPS exceeded the campus retention rates, more needs to be done to help our students succeed and reach graduation. We have implemented several

9
programs this year, in particular the work of the Student Success Center in partnership with faculty to help identify at-risk students. The outcomes for that work are still to be determined. Building a college community Building college community most closely aligns with the campus strategic priority of improving quality of place. In the first year of the college, college leadership provided guidance and support structures to promote a sense of community (e.g., a focus on opioid use in Fort Wayne and Allen County). This year, faculty began to take a more organic lead in developing the sense of community. Many natural collaborations are taking shape in the college now. One such collaboration is the urban garden sponsored by the SOE. This garden helps students explore connections among urban education, science education, and food insecurity. This fall, faculty and students from HTM began participating in the project, expanding the conversations to include ‘farm to fork’ and ‘farm to school’ system distribution topics. This collaboration is helping build community within the college while also enhancing the curricula that students in multiple programs and departments experience. Another avenue of collaboration is among members of the faculty governance committee, with representatives from each department. The committee has been more active this year than previously. They have begun tackling issues of significance across the college, such as career paths for clinical faculty (an important conversation because so many of our faculty are not tenure track), continuous improvement and assessment, and program development/review. Even students are beginning to work together and share space more often. This year, the HTM students were introduced to the Education Café in Neff Hall as a recreation space, though they have not used it as much as anticipated. The honors societies also continue to engage in joint projects.
Overview of Scholarly Contributions of Department to the College
Teaching, Learning, Curriculum Highlights Highlights from the individual departments include: School of Education: The School of Education has many accomplishments in several programs this year. One notable achievement is the successful 7-year accreditation from the Council for Accreditation of Counseling and Related Educational Programs (CACREP) for the Counselor Education Master’s Program. The accreditation team was particularly impressed by the rigorous system by which students are assessed. The other graduate programs have also made noteworthy gains. Educational Leadership and Special Education both moved to hybrid programs, and this year marked the first cohort of students in the revived Elementary and Secondary Education master’s programs. For undergraduates, meetings with Fort Wayne Community Schools and changes in the district’s personnel policies may permit our students to work as paraprofessionals in the district while still enrolled, benefiting both organizations. HTM: Faculty and staff in the HTM department have been active in teaching and learning. The Professional Development III curriculum has moved to an online option. The administrative assistant now compiles and sends weekly “Pro Tips” emails to students with information about professional behavior and expectations. Other departments are adopting this practice. Faculty also continue to participate in CELT programming.

10
Human Services: Faculty made presentations about teaching in the human services field at multiple regional and national conferences. The department also revised curriculum for several courses and continued its annual capstone presentation conference involving student work. In addition, one faculty member was invited to serve as a CELT Fellow. Public Policy: Faculty have begun analyzing the curriculum for all undergrad programs to identify areas to improve or redesign. Scholarship In the past year, CPS published at least 30 articles, 3 book chapters, and 1 book, while also making at least 50 conference presentations. See department reports for more detail.
University and Community Faculty and staff of the CPS are highly engaged in service, serving on numerous campus, community, and professional committees. Notable highlights from this past year include:
• Matthew Perkins Coppola (SOE) continued his direction of the Northeast Indiana Regional Science and Engineering Fair. Perkins Coppola and Jeff Nowak (SOE) also received a grant to provide Project Lead the Way training to area schools.
• Julia Smith (SOE) has developed an urban garden to help raise awareness and fight local food insecurity. HTM faculty began collaborating on this student project this year.
• Linda Lolkus (HTM) organized multiple events with Chef Alessia Uccellini from Italy for campus and community stakeholders.
• Community Research Institute (Public Policy) continued its extensive service both through contracted work and Rachel Blakeman’s frequent appearances in the media.
• Human Services students provided 18,640 hours at community agencies as well as 748 hours of volunteerism.
• The Behavioral Health and Family Studies Institute (HSRV) secured a Department of Mental Health and Addictions (DMHA) grant for $130,000 to use for statewide initiatives in support of Suicide Prevention Month.
• Despite their small number, Human Services faculty are heavily involved with service. They served on eleven community committees, 17 university committees, and five college committees.
Analysis of Departmental Performance in teaching, learning, scholarship A distinguishing factor of CPS is the applied nature of its degrees; therefore, the curriculum needs to match this focus. The SOE and HSRV have extensive field experiences embedded as requirements in their programs, HTM offers three options for students to engage in field experiences, and PPOL has an optional internship. I encourage both HTM and PPOL to examine how additional, practical, field experiences or project-based learning might assist with student learning as well as retention. Further, faculty in the college, across all departments, increased efforts to practice reciprocal engagement with the community. More courses are using guest speakers from the area to share practical knowledge as part of the instruction, and faculty/staff are serving on more advisory boards and hosting more on-campus events to share expertise. There are also additional collaborative projects with community partners where Purdue Fort Wayne and the community are near-equal partners.

11
Because of the strong focus on community engagement and the high use of clinical faculty and LTLs in our programs, scholarship is less of a priority than in other colleges. Nevertheless, multiple faculty published peer-reviewed papers and several were awarded tenure this year. Going forward, it may benefit faculty to consider scholarship opportunities related to community engagement or to teaching practices within their fields. Faculty should also consider the role of time spent in engagement as part of P & T and merit policies. In addition, faculty should seek out more external funding that could support such partnerships and the research/scholarship that accompanies the partnerships. Discussion of Department Funding Analysis of Prior Year Departmental Use of Funds The SOE hired a Field Experience Coordinator in 2019/20. This staff member is responsible for coordinating field placements for SOE students. These placements occur each semester from approximately a student’s fourth semester through student teaching, resulting in nearly 500 students per semester needing placement. The role also coordinates verification of Professional Growth Points (an Indiana Department of Education requirement) for K-12 teachers who supervise student teachers. The role will take on additional responsibilities over time, including communicating with K-12 teachers on behalf of faculty about curricular expectations and assessment. In HTM, the budget plan was not followed due to having an interim-chair and not running the student restaurant. Given that a new department chair will be starting July 1, it is recommended to continue with the present budget plan and allow the new chair time to understand expenses particular to the HTM department. Overview of Departmental Requests
• SOE o Faculty line—although not in the department report, with increasing enrollment in the
Early Childhood program, there is a need for additional faculty. As a fully-online program, it is difficult to find LTLs willing to invest in learning online pedagogy.
o School of Education is requesting funding for several initiatives related to enrollment management. $20,000 – Summer Bridge Program. Coordination with Student Affairs for a
bridge/transition to college program for underrepresented students. $8000 – Professional development speakers. Honoraria/travel for professional
development speakers (5) for our students and local teachers. $1000 – As part of recruiting and retention (SEM), host a family day at an
athletic event. Funding necessary for tickets and memorabilia. • HTM
o Faculty line—Replace retired faculty member (Dec 2019). The department currently has 3 full-time faculty, with only 2 located on campus. This raises concerns among faculty and students about the ability to offer necessary courses with the appropriate depth of content knowledge. I believe these concerns partially contribute to the cycle of declining enrollment. An additional faculty member would help improve SEM results.
• HSRV o Faculty line—Conversion of visiting faculty to clinical. The program has historically been
supported by LTLs and visiting faculty; I believe a permanent clinical line is more appropriate to aid in curricular consistency.
• PPOL
12
o Chair line—Public policy is currently without a chair. A national search is actively ongoing. A full-time chair is necessary to provide stability and direction to the department.
o Criminal justice faculty line—Additional clinical faculty line. The department has had a long-standing need for a clinical faculty member in CJ, both to cover a significant course load as well as to provide professional grounding and connection with law enforcement personnel in the region.
Prioritization of Departmental Requests The following lines are critical for basic coverage of courses and to better support operations. Ranking the lines is quite difficult, as all of the lines are necessary for our programs to thrive. Please note, these are only the most critical positions.
• Faculty o CJ: Clinical o CJ: Tenure track o HSRV: Clinical o HTM: Clinical or TT o Early Childhood: TT o Educational Leadership: Clinical or TT
• Staff
o Community Engagement project manager This position would be similar to the one in DBS occupied by Meg Underwood. The college in need of assistance coordinating the numerous engagement activities across the college. Because the nature of CPS’s work is so community-facing, and several departments currently have few faculty, additional staff support would help our interactions with public stakeholders.
o Communications director (staff line in Communications and Marketing, working in college) To provide basic communications and marketing materials, the college has tasked one of our administrative assistants to dedicate part of her time to developing social media and newsletters. College communications would be further enhanced by a professional communications director who can prioritize and coordinate communication strategies across the college and departments.
o Development director (staff line in Development, working in college) As engaging in development activities is a priority for the university, the college must have a development director that has the time to work closely with me to create an intentional approach to development that includes specific activities to engage stakeholders. On paper, the CPS has one-sixth of Eve Colchin’s time, which is insufficient for developing an active development program.

1
School of Education Table of Contents Section 1: Unit Goals/Progress/Accomplishments ........................................................................ 2
Section 2: Evaluation and Planning Program Viability .................................................................... 5
Early Childhood Education BSED ................................................................................................. 5
Early Childhood Education DS ..................................................................................................... 9
Earth Space Science Education BSED ........................................................................................ 12
Elem Ed Education Policy BSED ................................................................................................. 16
Elementary Education BSED ...................................................................................................... 20
Elementary Education DS .......................................................................................................... 23
English Education BSED ............................................................................................................. 26
Middle School Education BSED ................................................................................................. 29
Sec Ed Education Policy BSED ................................................................................................... 33
Secondary Education BSED ....................................................................................................... 37
Secondary Education DS ............................................................................................................ 41
Social Studies Education BSED .................................................................................................. 44
Spanish Education BSED ............................................................................................................ 47
Undecided ND ........................................................................................................................... 50
Section 3: Department Undergraduate Non-Dual Credit Hour Production ................................. 53
Section 4: Faculty/Staff/Student Accomplishments ..................................................................... 54
Section 5: Alumni Information ...................................................................................................... 55
Section 6: Resource Allocation Request ....................................................................................... 56
Supporting Documents ................................................................................................................. 57
Annual Program Review Data Definitions .................................................................................... 58

2
School of Education Annual Report Department Annual Report (outline)
I. Unit Goals/Progress/Accomplishments: focus on department/program accomplishments.
II. Program Viability and Enrollment Management: includes viability metrics, departmental enrollment management plan and departmental performance toward meeting enrollment management goals (supported by enrollment management report provided by Institutional Research).
III. Faculty, Student, and Staff Accomplishments: focus on individual accomplishments that provide evidence of advancing or enhancing program quality
IV. Alumni Accomplishments V. Resource allocation recommendations
Department Annual Report (template) Section 1: Unit Goals/Progress/Accomplishments1 In Table 1 list Unit Goals from the Five Year Plan and additional goals established for the current year, describe actions implemented to help achieve goals, and provide evidence of how the actions taken contribute to goal achievement. Table 1: Progress in Accomplishing 5 Year Goals
Unit Goal2
Action Items
Evidence of Progress to Goal
(performance relative to action item)
Owning our brand
Social media and web content that promotes what our current students and graduates are doing in their classrooms. New Project Lead the Way training and partnership opportunities. Networking events on campus for educators. Targeted recruiting of 21st Century Scholars already admitted to PFW. Create a plan for targeted recruiting of diverse potential students. Host Latinos Count college visit days.
Actions come from the SEM plan developed by the SOE this fall. This and other items are in the planning stage. Dr. Perkins Coppola secured a $4,500 grant to support PTLW training and materials. Chancellor’s Education Party scheduled for Dec. 12. This item is in the planning stage. This item is in the planning stage. Hosted 400 Latinx high school students on two days.
1 This section does not include enrollment goals. Enrollment goals are reported in Section 2. 2 In transition prior to development of 5 year strategic plan, use USAP Yr. 1 and 2 Reports

3
Persuading admits to enroll
Mail personalized postcards to new admits over the summer (i.e., from SOE faculty/staff) that welcome students to PFW and the SOE. Utilize social media (e.g., Twitter, Snapchat) to network with new admits using a hashtag like #NextGenTeacher. Photos and information of current SOE events could be posted that help new admits visualize their own, future SOE experience. Create one minute video blogs profiling the success of current 3rd and 4th year SOE students that new admits can view. Add a touch point for admitted students from underrepresented populations.
This item is in the planning stage. Social media posts as well as emailed newsletters go out regularly to admitted students. This item is in the planning stage. This item is in the planning stage.
Enhancing student progression
Mentoring students into the profession by engaging them in research, service. Leveraging our freshman success class by building cohorts connected to 4-year faculty coaching. Cultivating pedagogic relationships with open communication, positive feedback, mastery learning, positive classroom environments, learning students' names. Faculty taking primary responsibility for struggling students, collaborative Professional Improvement Plans, etc. Taking attendance in every class. Including a gradable assignment in the first month of class. Facilitating student community building through shared spaces, activities, etc.
This is an important part of the SOE with honors projects, Weitzman scholars, and student orgs doing research and conference travel. This fall, faculty coaches were assigned cohorts in the same freshman success class. This is part of the SOE culture that we hope to deepen and cultivate. PIPs are now overseen by both initiating faculty and a next-semester professor. This is SOE practice. This is SOE practice.

4
We are improving the student lounge with materials and snacks.
Engaging alumni
Create an alumni newsletter with volunteer and career opportunities. Provide faculty with SOE-branded items to give to alumni in the community. Provide professional development to the local education community. Obtain or develop a reliable database of alumni with current contact information. Alumni Ambassador program for graduate program recruiting.
This item is in the planning stage. We have SOE T-shirts, but need to select more items. This fall, we created and deployed a professional learning needs survey that received 540 responses from NE Indiana educators. This item is in the planning stage. This item is running, but needs better resourcing

5
Section 2: Evaluation and Planning Program Viability Early Childhood Education BSED Using Tables 2a through 2d, and additional data provided by Institutional Research, describe efforts the department is taking to improve enrollment, retention, and graduation. Table 2a – Fall Program Demand
Fall Semester Demand (New to Major)
Majors (New plus
Continuing)
Graduates
2019 45 81 2018 53 67 5 2017 18 35 9 2016 14 25 2 2015 5 18 3 2014 14 21 0
Averages 21 33 4 Table 2b: Fall Viability Metric Ratios
Fall Semester Graduation Efficiency
Student Attrition Growth Trend
2018 07.46% 23.88% 1.710 2017 25.71% 28.57% 0.857 2016 08.00% 20.00% 1.750 2015 16.67% 16.67% 0.714 2014 00.00% 28.57% 1.750
Ratios 11.45% 24.10% 1.387

6
Early Childhood Education BSED (continued) Table 2c: Fall Retention Totals
Fall
Semester
New
Majors
Total
Majors
Retained in Major
Retained in
Different Major
Graduated Stopped Out In
Major Out of Major
2019 45 81 2018 53 67 36 10 5 0 16 2017 18 35 14 2 9 0 10 2016 14 25 17 1 2 0 5 2015 5 18 11 1 3 0 3 2014 14 21 13 2 0 0 6
Summary 104 166 91 16 19 0 40 Table 2d: Enrollment Management Plan Performance (Departmentally Set Goals and Action Items. Institutional Research will provide information for Enrollment Management Performance column) Enrollment
Management Goal
Action Items Enrollment Management Performance (Fall Semester)
2014 2015 2016 2017 2018 2019 New Majors
53 Marketing using social media, Purdue Online Portal, faculty meeting with visiting students, targeted recruiting of 21st century scholars admitted to PFW
14 5 14 18 53 45
Retained in Major
54 Faculty coaches, use of audio/video feedback for assignments for personal connection, faculty responsibility for struggling students using collaborative PIPs, freshman success cohorts, mastery learning, social media
13 11 17 14 36
Retained at IPFW
63 Assist students to find another major within PFW that better meets their goals
15 12 18 16 46

7
Total majors
107 Encourage involvement in student orgs to increase commitment, intentional advising to keep students on track
21 18 25 35 67 81
Graduated in Major
3 Provide professional development to local education community, alumni networking, ask alumni for committee service, ask alumni to speak in classes
0 3 2 9 5
Stopped Out
15 Collaborate with other units to identify and support the specific needs of diverse student populations
6 3 5 10 16

8
Early Childhood Education BSED (continued) Table 2e: Discussion - Use the data from Tables 2a-2c to synthesize and analyze your program's enrollment and retention performance relative to the established goals. Discuss future plans to improve program viability. Finally, describe any changes in your action plan you are making to improve performance.
The BSEd in Early Childhood Education sharply increased in Fall of 2019, with 81 total majors, an increase of 21% over Fall of 2018 with 67 total majors. We believe this is the result of more active retention efforts. Faculty have used PIPs, invited struggling students to meet one-on-one to determine barriers, and have added more online supports such as tutorial videos and examples of high-quality work. There were 8 fewer new majors in 2019 over 2018 enrollments. At this time, we are unsure as to this cause. However, we can speculate that because we had one less education advisor over the summer, some calls and emails were not returned within a prospective student’s timeframe and they may have chosen another option. We understand that there is a great need to market for the early childhood educators. We are attempting to work with agencies and other universities in order to raise the status of the profession which in turn we anticipate will allow us to recruit more students. We were very excited to have launched our degree completion Early Childhood Program with continuing studies in an online format. This past August, Purdue Online inaugurated an online portal where students searching for a program were connected with Purdue Fort Wayne and our program. Since then, we have received inquiry reports from across the country and the world. Staff in Continuing Studies has a targeted marketing campaign developed where they connect with these prospective students on a regular basis. Because of these efforts, we hope to see an increase in enrollment in our degree completion programs. We recognize that students who “stop out” have diverse reasons. For some, it is financial, others have personal situations that create barriers, and for others it may be academics. Our advisors have put into place a bi-weekly communication with faculty with links so that we can send names and situations of students to our advisors in order for them to communicate with the struggling student. Additionally, our faculty are being proactive, meeting with struggling students and developing a “game-plan” with that student in order for them to be successful. We look forward to seeing the results from these strategies.

9
Early Childhood Education DS Using Tables 2a through 2d, and additional data provided by Institutional Research, describe efforts the department is taking to improve enrollment, retention, and graduation. Table 2a – Fall Program Demand
Fall Semester Demand (New to Major)
Majors (New plus
Continuing)
Graduates
2019 3 4 2018 4 4 0 2017 2 2 0 2016 1 2 0 2015 0 1 0 2014 1 1 0
Averages 2 2 0 Table 2b: Fall Viability Metric Ratios
Fall Semester Graduation Efficiency
Student Attrition Growth Trend
2018 00.00% 75.00% 1.333 2017 00.00% 100.00% 1.000 2016 00.00% 50.00% 0.500 2015 00.00% 00.00% 0.000 2014 00.00% 00.00% 1.000
Ratios 00.00% 60.00% 1.143

10
Early Childhood Education DS (continued) Table 2c: Fall Retention Totals
Fall
Semester
New
Majors
Total
Majors
Retained in Major
Retained in
Different Major
Graduated Stopped Out In
Major Out of Major
2019 3 4 2018 4 4 1 0 0 0 3 2017 2 2 0 0 0 0 2 2016 1 2 0 1 0 0 1 2015 0 1 1 0 0 0 0 2014 1 1 1 0 0 0 0
Summary 8 10 3 1 0 0 6 Table 2d: Enrollment Management Plan Performance (Departmentally Set Goals and Action Items. Institutional Research will provide information for Enrollment Management Performance column) Enrollment
Management Goal
Action Items Enrollment Management Performance (Fall Semester)
2014 2015 2016 2017 2018 2019 New Majors
0 Our goal is to have new students admitted directly to the EC BSEd
1 0 1 2 4 3
Retained in Major
0 Our goal is to move all DS students into the major.
1 1 0 0 1
Retained at IPFW
4 1 1 1 0 1
Total majors
0 1 1 2 2 4 4
Graduated in Major
0 0 0 0 0 0
Stopped Out
0 0 0 1 2 3

11
Early Childhood Education DS (continued) Table 2e: Discussion - Use the data from Tables 2a-2c to synthesize and analyze your program's enrollment and retention performance relative to the established goals. Discuss future plans to improve program viability. Finally, describe any changes in your action plan you are making to improve performance.
Our goal is to recruit high-performing students who can be admitted directly into the program, and to transfer any pre-majors into their programs as quickly as possible.

12
Earth Space Science Education BSED Using Tables 2a through 2d, and additional data provided by Institutional Research, describe efforts the department is taking to improve enrollment, retention, and graduation. Table 2a – Fall Program Demand
Fall Semester Demand (New to Major)
Majors (New plus
Continuing)
Graduates
2019 1 3 2018 6 8 1 2017 3 7 2 2016 2 9 3 2015 5 10 1 2014 7 9 0
Averages 5 9 1 Table 2b: Fall Viability Metric Ratios
Fall Semester Graduation Efficiency
Student Attrition Growth Trend
2018 00.00% 50.00% 1.200 2017 28.57% 14.29% 0.600 2016 33.33% 22.22% 0.400 2015 10.00% 10.00% 1.667 2014 00.00% 44.44% 1.750
Ratios 13.95% 27.91% 1.045

13
Earth Space Science Education BSED (continued) Table 2c: Fall Retention Totals
Fall
Semester
New
Majors
Total
Majors
Retained in Major
Retained in
Different Major
Graduated Stopped Out In
Major Out of Major
2019 1 3 2018 6 8 2 1 0 1 4 2017 3 7 2 2 2 0 1 2016 2 9 4 0 3 0 2 2015 5 10 7 1 1 0 1 2014 7 9 5 0 0 0 4
Summary 23 43 20 4 6 1 12 Table 2d: Enrollment Management Plan Performance (Departmentally Set Goals and Action Items. Institutional Research will provide information for Enrollment Management Performance column) Enrollment
Management Goal
Action Items Enrollment Management Performance (Fall Semester)
2014 2015 2016 2017 2018 2019 New Majors
4 Publicize that we offer the license, directly to local high schools and through alumni
7 5 2 3 6 1
Retained in Major
1 PFW faculty engage with and support student on a weekly basis
5 7 4 2 2
Retained at IPFW
2 Assist transition to other programs, ideally still in secondary education
5 8 4 4 3
Total majors
6 Invite current high school ESS teachers to “sponsor” a PFW major
9 10 9 7 8 3
Graduated in Major
1 Assist graduates in finding the best professional position
0 1 3 2 0
Stopped Out
0 Offer intensive advising and additional support to future teachers in high-need areas
4 1 2 1 4

14

15
Earth Space Science Education BSED (continued) Table 2e: Discussion - Use the data from Tables 2a-2c to synthesize and analyze your program's enrollment and retention performance relative to the established goals. Discuss future plans to improve program viability. Finally, describe any changes in your action plan you are making to improve performance.
According to the Indiana Department of Education Annual Licensure Report for 2018-2019 (https://www.doe.in.gov/sites/default/files/licensing/licensing-report-18-19.pdf), only 9 teachers earned initial licensure in Earth/Space Science (ESS) at in-state institutions. The demand for Earth and Space Science teachers well exceeds the supply, as in the same year the State of Indiana issued 24 original emergency permits to teach ESS. These numbers do not consider the number of teachers without licensure in ESS who are licensed in other areas and being asked to teach the course out of field. Graduating a single licensed ESS teacher means we have produced 10% of the state output in this desperate area of need. Out of this context, the numbers at Purdue University Fort Wayne are seemingly damning toward the continuation of the program; of the two accepted applicants for Fall 2019, only one matriculated. Of the six new majors reported for Fall 2018, four appear to have stopped out. As the statewide numbers reported above would indicate, this problem is not unique to our campus. All Indiana universities are struggling to identify and prepare Earth and Space Science teachers. Ours, unfortunately, is saddled with the additional burden of no longer having a geosciences department and all of the negative publicity that accompanied the transition. Recruiting students to our campus will require an exceptional touch and a bit of cleverness. This said, the maintenance of this degree program requires little expenditure of additional resources. The remaining redistributed geosciences faculty, while struggling to reach the numbers necessary to offer sections of upper level EAPS courses, are working to provide cross-referenced course numbers within their departments to support our current majors. The promise of connecting the degree program with the newly expanded Environmental Resources Center on campus, along with the strength of local environmental organizations such as Little River Wetlands, Eagle Marsh, Fort Wayne Astronomical Society, and so on, means that there are opportunities to rebuild and rethink the attractiveness of this degree program.

16
Elem Ed Education Policy BSED Using Tables 2a through 2d, and additional data provided by Institutional Research, describe efforts the department is taking to improve enrollment, retention, and graduation. Table 2a – Fall Program Demand
Fall Semester Demand (New to Major)
Majors (New plus
Continuing)
Graduates
2019 8 14 2018 11 17 8 2017 11 14 4 2016 5 7 1 2015 4 4 1 2014
Averages 8 11 4 Table 2b: Fall Viability Metric Ratios
Fall Semester Graduation Efficiency
Student Attrition Growth Trend
2018 47.06% 11.76% 1.000 2017 28.57% 21.43% 1.375 2016 14.29% 14.29% 1.250 2015 25.00% 25.00% 2.000 2014
Ratios 33.33% 16.67% 1.240

17
Elem Ed Education Policy BSED (continued) Table 2c: Fall Retention Totals
Fall
Semester
New
Majors
Total
Majors
Retained in Major
Retained in
Different Major
Graduated Stopped Out In
Major Out of Major
2019 8 14 2018 11 17 6 1 8 0 2 2017 11 14 6 1 4 0 3 2016 5 7 3 2 1 0 1 2015 4 4 2 0 1 0 1 2014
Summary 31 42 17 4 14 0 7 Table 2d: Enrollment Management Plan Performance (Departmentally Set Goals and Action Items. Institutional Research will provide information for Enrollment Management Performance column) Enrollment
Management Goal
Action Items Enrollment Management Performance (Fall Semester)
2014 2015 2016 2017 2018 2019 New Majors
8 Provide academic advisors with program information for students considering dropping out of the SOE or the university.
4 5 11 11 8
Retained in Major
6 Program coordinator meets with all students in this major once a semester to develop a relationship and to help keep students focused on their goal of graduation.
2 3 6 6
Retained at IPFW
8 Program coordinator will work closely with SOE academic advisors and students to explore other majors better for their revised professional goals.
2 5 7 7

18
Total majors
14 Program coordinator will revise program to reduce unexpected prerequisite course requirements.
4 7 14 17 14
Graduated in Major
5 Program coordinator will complete exit interviews with students graduating from the program to seek information for program improvement.
1 1 4 8
Stopped Out
1 Program coordinator will work to interview students who stop out to research how to support students as they progress through the program.
1 1 3 2

19
Elem Ed Education Policy BSED (continued) Table 2e: Discussion - Use the data from Tables 2a-2c to synthesize and analyze your program's enrollment and retention performance relative to the established goals. Discuss future plans to improve program viability. Finally, describe any changes in your action plan you are making to improve performance.
There has been a slow increase in the number of students who enroll at PFW interested in pursuing an Education Policy degree and a career in informal education contexts. We continue to recruit and market to these students, who are passionate about education but may have been dissuaded from K-12 teaching by the current climate of negative public opinion and restrictive, punitive approaches to teacher accountability. In addition, the Elementary Education Policy program continues to serve its primary purpose of providing an alternate pathway to former education majors, retaining students who otherwise might drop out of a university program. The elementary education policy program provides a pathway to help students who have a passion for children to still graduate within four years. In spring of 2019, the State of Indiana changed a rule for teacher preparation programs. In the past, any student wanting to complete a teacher preparation program would need to pass a basic test of reading, math and writing to qualify to take the last two years of the professional education courses. This rule was dropped in May of 2019 and was effective immediately. Many of the students in the past who completed the elementary education policy program were unable to successfully pass this test. Now that students do not have to pass this test to complete a teacher preparation program, it is unclear how that will impact the number of students who will enroll in the elementary education policy program. Since the impact of this rule change is an unknown factor, the decision was made to not predict a growth in this program, but to keep the numbers flat. For the 2020-2021 academic year, these are the following initiatives that have been started to help make this program better serve its purpose of providing an alternative pathway for students who realize being a licensed teacher is no longer a goal: 1. Realign coursework required to complete the program. When the program went through the transition from an Indiana University mission program to a Purdue University mission program, some of the required courses didn’t translate well. The program coordinator has undertaken a review of the course work and is in the process of proposing some new courses that will take into account prerequisites that were not considered when the program was revised in the transition. 2. Another area that the program coordinator has undertaken to strengthen this program is to work closely with the School of Education advisors to promote this program as an option to students who are considering dropping out of the School of Education or the university.

20
Elementary Education BSED Using Tables 2a through 2d, and additional data provided by Institutional Research, describe efforts the department is taking to improve enrollment, retention, and graduation. Table 2a – Fall Program Demand
Fall Semester Demand (New to Major)
Majors (New plus
Continuing)
Graduates
2019 156 376 2018 145 409 90 2017 155 441 68 2016 227 475 70 2015 150 389 48 2014 177 414 66
Averages 171 426 68 Table 2b: Fall Viability Metric Ratios
Fall Semester Graduation Efficiency
Student Attrition Growth Trend
2018 21.76% 17.85% 0.771 2017 15.42% 15.19% 0.876 2016 14.32% 18.11% 1.214 2015 12.08% 15.17% 1.071 2014 15.46% 15.70% 1.023
Ratios 15.79% 16.45% 0.987

21
Elementary Education BSED (continued) Table 2c: Fall Retention Totals
Fall
Semester
New
Majors
Total
Majors
Retained in Major
Retained in
Different Major
Graduated Stopped Out In
Major Out of Major
2019 156 376 2018 145 409 220 26 89 1 73 2017 155 441 264 42 68 0 67 2016 227 475 286 33 68 2 86 2015 150 389 248 34 47 1 59 2014 177 414 239 44 64 2 65
Summary 854 2128 1257 179 336 6 350 Table 2d: Enrollment Management Plan Performance (Departmentally Set Goals and Action Items. Institutional Research will provide information for Enrollment Management Performance column) Enrollment
Management Goal
Action Items Enrollment Management Performance (Fall Semester)
2014 2015 2016 2017 2018 2019 New Majors
160 Continued outreach to high schools and in the community promoting the profession
177 150 227 155 145 156
Retained in Major
210 Community building among students and with faculty
239 248 286 264 220
Retained at IPFW
235 Guidance to students in discovering their true vocations
283 282 319 306 246
Total majors
370 Faculty as first line of support for students who are struggling
414 389 475 441 409 376
Graduated in Major
75 Stay connected with graduates for support in critical early years
64 47 68 68 89
Stopped Out
66 Give needed support when possible, keep door open for return
65 59 86 67 73

22
Elementary Education BSED (continued) Table 2e: Discussion - Use the data from Tables 2a-2c to synthesize and analyze your program's enrollment and retention performance relative to the established goals. Discuss future plans to improve program viability. Finally, describe any changes in your action plan you are making to improve performance.
The Elementary Education BSEd is the largest major in the School of Education and one of the largest majors on the Purdue University Fort Wayne campus. At a time of significant nationwide drops in teacher education program enrollments, leading to devastating teacher shortages, PFW’s elementary program is holding steady. While total majors are down in 2019, this is partly the result of a very large class of 89 students graduating in major—and new majors are up by 11 this year. The Elementary and Early Childhood programs appear to continue sharing the same pool of about 200 newly admitted students, with new majors in each showing a dip or rise of about the same number of majors in the past couple of years. We continue to work with area dual-credit and cadet-teaching programs to encourage young people to consider the profession while still in high school. We continue to partner with community organizations to recruit underrepresented students to our campus and our program. This fall, 400 Latinx student from 11 area high schools spent the day on campus talking to mentors; hearing from colleges, college students, and employers; and learning about the various post-high school pathways they can choose from. We have an exciting new partnership with Fort Wayne Community Schools through which our students can work as paraprofessionals in FWCS classrooms with flexible scheduling adjusted for their coursework and field hours—lessening the need for so many of them to wait tables or tend bar until late at night. We are also exploring a Grow Your Own program to support FWCS students completing PFW education programs, and returning to that district as teachers. To promote retention, we are focusing on community-building in the program, creating cohorts of freshmen with the same faculty mentor taking the same sections of the freshman success course. Several assignments in that course require attendance at campus events or utilization of campus services. We hope to nurture the supportive friendships and connections to the university that research has shown to support retention.

23
Elementary Education DS Using Tables 2a through 2d, and additional data provided by Institutional Research, describe efforts the department is taking to improve enrollment, retention, and graduation. Table 2a – Fall Program Demand
Fall Semester Demand (New to Major)
Majors (New plus
Continuing)
Graduates
2019 5 7 2018 3 6 0 2017 2 4 0 2016 2 4 0 2015 4 6 0 2014 3 5 0
Averages 3 5 0 Table 2b: Fall Viability Metric Ratios
Fall Semester Graduation Efficiency
Student Attrition Growth Trend
2018 00.00% 66.67% 0.750 2017 00.00% 25.00% 2.000 2016 00.00% 50.00% 1.000 2015 00.00% 66.67% 1.000 2014 00.00% 60.00% 1.000
Ratios 00.00% 56.00% 1.000

24
Elementary Education DS (continued) Table 2c: Fall Retention Totals
Fall
Semester
New
Majors
Total
Majors
Retained in Major
Retained in
Different Major
Graduated Stopped Out In
Major Out of Major
2019 5 7 2018 3 6 2 0 0 0 4 2017 2 4 3 0 0 0 1 2016 2 4 2 0 0 0 2 2015 4 6 2 0 0 0 4 2014 3 5 2 0 0 0 3
Summary 14 25 11 0 0 0 14 Table 2d: Enrollment Management Plan Performance (Departmentally Set Goals and Action Items. Institutional Research will provide information for Enrollment Management Performance column) Enrollment
Management Goal
Action Items Enrollment Management Performance (Fall Semester)
2014 2015 2016 2017 2018 2019 New Majors
0 Our goal is new students admitted directly to the BSEd
3 4 2 2 3 5
Retained in Major
0 Our goal is to move all DS students into the major.
2 2 2 3 2
Retained at IPFW
7 2 2 2 3 2
Total majors
0 5 6 4 4 6 7
Graduated in Major
0 0 0 0 0 0
Stopped Out
0 3 4 2 1 4

25
Elementary Education DS (continued) Table 2e: Discussion - Use the data from Tables 2a-2c to synthesize and analyze your program's enrollment and retention performance relative to the established goals. Discuss future plans to improve program viability. Finally, describe any changes in your action plan you are making to improve performance.
Our goal is to recruit high-performing students who can be admitted directly into the program, and to transfer any pre-majors into their programs as quickly as possible.

26
English Education BSED Using Tables 2a through 2d, and additional data provided by Institutional Research, describe efforts the department is taking to improve enrollment, retention, and graduation. Table 2a – Fall Program Demand
Fall Semester Demand (New to Major)
Majors (New plus
Continuing)
Graduates
2019 1 18 2018 7 31 9 2017 25 47 8 2016 21 49 9 2015 30 53 6 2014 27 45 7
Averages 22 45 8 Table 2b: Fall Viability Metric Ratios
Fall Semester Graduation Efficiency
Student Attrition Growth Trend
2018 25.81% 09.68% 0.538 2017 14.89% 19.15% 1.087 2016 16.33% 30.61% 0.808 2015 11.32% 20.75% 1.200 2014 11.11% 22.22% 1.286
Ratios 15.11% 21.33% 1.019

27
English Education BSED (continued) Table 2c: Fall Retention Totals
Fall
Semester
New
Majors
Total
Majors
Retained in Major
Retained in
Different Major
Graduated Stopped Out In
Major Out of Major
2019 1 18 2018 7 31 17 2 8 1 3 2017 25 47 23 7 7 1 9 2016 21 49 22 3 8 1 15 2015 30 53 28 8 6 0 11 2014 27 45 22 6 5 2 10
Summary 110 225 112 26 34 5 48 Table 2d: Enrollment Management Plan Performance (Departmentally Set Goals and Action Items. Institutional Research will provide information for Enrollment Management Performance column) Enrollment
Management Goal
Action Items Enrollment Management Performance (Fall Semester)
2014 2015 2016 2017 2018 2019 New Majors
0 Admit to the English BA and BSEd dual degree in Secondary Education
27 30 21 25 7 1
Retained in Major
4 Continue to support students desiring this program to graduation
22 28 22 23 17
Retained at IPFW
5 Transfer as many students as possible to the dual degree
28 36 25 30 19
Total majors
4 Work to grow the Secondary Education BSEd program
45 53 49 47 31 18
Graduated in Major
11 Help students secure teaching positions whenever possible
5 6 8 7 8
Stopped Out
2 Encourage return and completion when possible.
10 11 15 9 3

28
English Education BSED (continued) Table 2e: Discussion - Use the data from Tables 2a-2c to synthesize and analyze your program's enrollment and retention performance relative to the established goals. Discuss future plans to improve program viability. Finally, describe any changes in your action plan you are making to improve performance.
This program will no longer be marketed. Students who wish to teach at the high school level in any subject area (except Earth/Space science) will now earn dual degrees in their subject-area discipline and in Secondary Education.

29
Middle School Education BSED Using Tables 2a through 2d, and additional data provided by Institutional Research, describe efforts the department is taking to improve enrollment, retention, and graduation. Table 2a – Fall Program Demand
Fall Semester Demand (New to Major)
Majors (New plus
Continuing)
Graduates
2019 26 51 2018 23 49 13 2017 26 42 2 2016 18 30 7 2015 5 23 9 2014 13 33 9
Averages 17 35 8 Table 2b: Fall Viability Metric Ratios
Fall Semester Graduation Efficiency
Student Attrition Growth Trend
2018 22.45% 16.33% 1.045 2017 02.38% 21.43% 1.733 2016 20.00% 10.00% 1.385 2015 39.13% 04.35% 0.455 2014 27.27% 03.03% 0.867
Ratios 20.34% 12.43% 1.118

30
Middle School Education BSED (continued) Table 2c: Fall Retention Totals
Fall
Semester
New
Majors
Total
Majors
Retained in Major
Retained in
Different Major
Graduated Stopped Out In
Major Out of Major
2019 26 51 2018 23 49 25 3 11 2 8 2017 26 42 26 5 1 1 9 2016 18 30 16 4 6 1 3 2015 5 23 12 1 9 0 1 2014 13 33 18 5 9 0 1
Summary 85 177 97 18 36 4 22 Table 2d: Enrollment Management Plan Performance (Departmentally Set Goals and Action Items. Institutional Research will provide information for Enrollment Management Performance column) Enrollment
Management Goal
Action Items Enrollment Management Performance (Fall Semester)
2014 2015 2016 2017 2018 2019 New Majors
27 Personalized postcards to new admits, social media to document happenings in the SOE to help new admits see themselves here.
13 5 18 26 23 26
Retained in Major
25 Mentoring students by engaging them in research & service, building freshman cohorts, open communication & positive classroom experience, working with CPS Student Success Center to catch at-risk students.
18 12 16 26 25
Retained at IPFW
34 Counseling students out of the major and into others as appropriate.
23 13 20 31 28

31
Total majors
52 All action items noted above.
33 23 30 42 49 51
Graduated in Major
7 Develop a reliable database of contact for alumni, Alumni Ambassador program for recruitment.
9 9 6 1 11
Stopped Out
10 Support for at-risk students.
1 1 3 9 8

32
Middle School Education BSED (continued) Table 2e: Discussion - Use the data from Tables 2a-2c to synthesize and analyze your program's enrollment and retention performance relative to the established goals. Discuss future plans to improve program viability. Finally, describe any changes in your action plan you are making to improve performance.
Middle School Education BSED saw a slight rise in demand, as the number of students new to the major rose from 23 in 2018 to 26 in 2019. A growth trend of 1.045 is positive, yet it’s down from 2017’s 1.733. We will continue efforts to boost enrollment, support retention, and move students toward successful program completion. We are working to improve the viability of the program and strengthen our recruitment and retention efforts. To recruit new majors, our new Strategic Enrollment Management plan includes mailing personalized postcards to new admits, welcoming them to the SOE. Staff have continued using social media to document happenings in the SOE to help new admits see themselves here in our program. Retention efforts are also ongoing. Implementation of a freshman success course stands to support our retention efforts by helping students get acclimated to the program and build connections with faculty during the early stages of their time on campus. Faculty are communicating with the CPS Student Success Center to support at-risk students. Faculty continue cultivating relationships with students by opening communication and fostering a positive classroom experience. Retention and program completion are also helped by faculty efforts to mentor students into the profession by engaging them in research and service. For example, a student studying middle school education with a focus on English education is currently preparing to participate in the “Future is Now” session at the 2020 Indiana Council of Teachers of English (ICTE) State Conference, which will be held at the University of Notre Dame in March 2020. We believe that immersing teacher candidates in the professional community will help them build a sense of belonging and further support our efforts to ensure retention and program completion.

33
Sec Ed Education Policy BSED Using Tables 2a through 2d, and additional data provided by Institutional Research, describe efforts the department is taking to improve enrollment, retention, and graduation. Table 2a – Fall Program Demand
Fall Semester Demand (New to Major)
Majors (New plus
Continuing)
Graduates
2019 2 4 2018 5 6 2 2017 2 2 0 2016 2015 1 1 1 2014
Averages 3 3 1 Table 2b: Fall Viability Metric Ratios
Fall Semester Graduation Efficiency
Student Attrition Growth Trend
2018 33.33% 16.67% 1.250 2017 00.00% 00.00% 2.000 2016 2015 100.00% 00.00% 1.000 2014
Ratios 33.33% 11.11% 1.333

34
Sec Ed Education Policy BSED (continued) Table 2c: Fall Retention Totals
Fall
Semester
New
Majors
Total
Majors
Retained in Major
Retained in
Different Major
Graduated Stopped Out In
Major Out of Major
2019 2 4 2018 5 6 2 1 2 0 1 2017 2 2 1 1 0 0 0 2016 2015 1 1 0 0 1 0 0 2014
Summary 8 9 3 2 3 0 1 Table 2d: Enrollment Management Plan Performance (Departmentally Set Goals and Action Items. Institutional Research will provide information for Enrollment Management Performance column) Enrollment
Management Goal
Action Items Enrollment Management Performance (Fall Semester)
2014 2015 2016 2017 2018 2019 New Majors
2 Provide academic advisors with program information for students considering dropping out of the SOE or the university.
1 2 5 2
Retained in Major
2 Program coordinator meets with all students in this major once a semester to develop a relationship and to help keep students focused on their goal of graduation.
0 1 2
Retained at IPFW
3 Program coordinator will work closely with SOE academic advisors and students to explore other majors better for their revised professional goals.
0 2 3

35
Total majors
4 Program coordinator will revise program to reduce unexpected prerequisite course requirements.
1 2 6 4
Graduated in Major
1 Program coordinator will complete exit interviews with students graduating from the program to seek information for program improvement.
1 0 2
Stopped Out
0 Program coordinator will work to interview students who stop out to research how to support students as they progress through the program.
0 0 1

36
Sec Ed Education Policy BSED (continued) Table 2e: Discussion - Use the data from Tables 2a-2c to synthesize and analyze your program's enrollment and retention performance relative to the established goals. Discuss future plans to improve program viability. Finally, describe any changes in your action plan you are making to improve performance.
There has been a slow increase in the number of students who enroll at PFW interested in pursuing an Education Policy degree and a career in informal education contexts. We continue to recruit and market to these students, who are passionate about education but may have been dissuaded from K-12 teaching by the current climate of negative public opinion and restrictive, punitive approaches to teacher accountability. In addition, the Secondary Education Policy program continues to serve its primary purpose of providing an alternate pathway to former education majors, retaining students who otherwise might drop out of a university program. The secondary education policy program provides a pathway to help students who have a passion for young people to still graduate within four years. In spring of 2019, the State of Indiana changed a rule for teacher preparation programs. In the past, any student wanting to complete a teacher preparation program would need to pass a basic test of reading, math and writing to qualify to take the last two years of the professional education courses. This rule was dropped in May of 2019 and was effective immediately. Many of the students in the past who completed the elementary education policy program were unable to successfully pass this test. Now that students do not have to pass this test to complete a teacher preparation program, it is unclear how that will impact the number of students who will enroll in the elementary education policy program. Since the impact of this rule change is an unknown factor, the decision was made to not predict a growth in this program, but to keep the numbers flat. For the 2020-2021 academic year, these are the following initiatives that have been started to help make this program better serve its purpose of providing an alternative pathway for students who realize being a licensed teacher is no longer a goal: 1. Realign coursework required to complete the program. When the program went through the transition from an Indiana University mission program to a Purdue University mission program, some of the required courses didn’t translate well. The program coordinator has undertaken a review of the course work and is in the process of proposing some new courses that will take into account prerequisites that were not considered when the program was revised in the transition. 2. Another area that the program coordinator has undertaken to strengthen this program is to work closely with the School of Education advisors to promote this program as an option to students who are considering dropping out of the School of Education or the university.

37
Secondary Education BSED Using Tables 2a through 2d, and additional data provided by Institutional Research, describe efforts the department is taking to improve enrollment, retention, and graduation. Table 2a – Fall Program Demand
Fall Semester Demand (New to Major)
Majors (New plus
Continuing)
Graduates
2019 100 121 2018 40 42 1 2017 10 11 0 2016 7 8 0 2015 6 6 0 2014 6 7 0
Averages 14 15 0 Table 2b: Fall Viability Metric Ratios
Fall Semester Graduation Efficiency
Student Attrition Growth Trend
2018 00.00% 30.95% 2.000 2017 00.00% 18.18% 1.111 2016 00.00% 37.50% 1.000 2015 00.00% 50.00% 1.200 2014 00.00% 85.71% 0.857
Ratios 00.00% 36.49% 1.438
38
Secondary Education BSED (continued) Table 2c: Fall Retention Totals
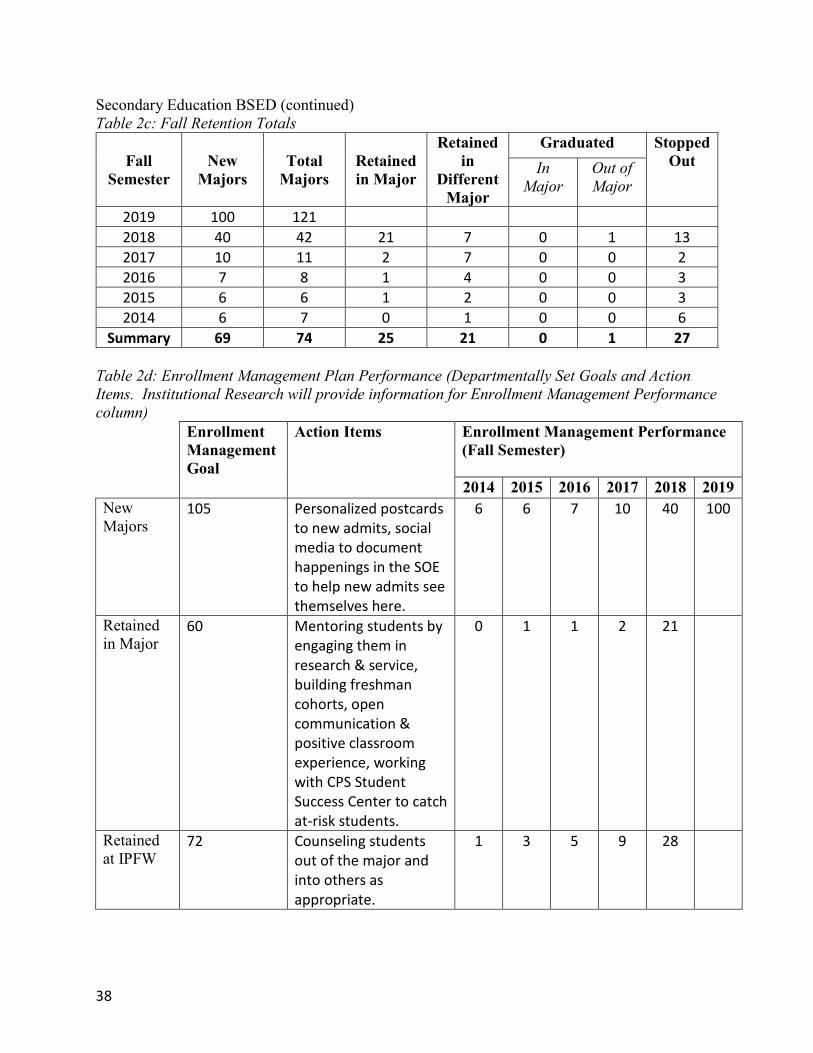
Fall
Semester
New
Majors
Total
Majors
Retained in Major
Retained in
Different Major
Graduated Stopped Out In
Major Out of Major
2019 100 121 2018 40 42 21 7 0 1 13 2017 10 11 2 7 0 0 2 2016 7 8 1 4 0 0 3 2015 6 6 1 2 0 0 3 2014 6 7 0 1 0 0 6
Summary 69 74 25 21 0 1 27 Table 2d: Enrollment Management Plan Performance (Departmentally Set Goals and Action Items. Institutional Research will provide information for Enrollment Management Performance column) Enrollment
Management Goal
Action Items Enrollment Management Performance (Fall Semester)
2014 2015 2016 2017 2018 2019 New Majors
105 Personalized postcards to new admits, social media to document happenings in the SOE to help new admits see themselves here.
6 6 7 10 40 100
Retained in Major
60 Mentoring students by engaging them in research & service, building freshman cohorts, open communication & positive classroom experience, working with CPS Student Success Center to catch at-risk students.
0 1 1 2 21
Retained at IPFW
72 Counseling students out of the major and into others as appropriate.
1 3 5 9 28

39
Total majors
165 All action items noted above.
7 6 8 11 42 121
Graduated in Major
18 Develop a reliable database of contact for alumni, Alumni Ambassador program for recruitment.
0 0 0 0 0
Stopped Out
31 Support for at-risk students.
6 3 3 2 13

40
Secondary Education BSED (continued) Table 2e: Discussion - Use the data from Tables 2a-2c to synthesize and analyze your program's enrollment and retention performance relative to the established goals. Discuss future plans to improve program viability. Finally, describe any changes in your action plan you are making to improve performance.
The Secondary Education BSED saw a considerable rise in demand, as the number of students new to the major rose from 40 in 2018 to 100 in 2019. A growth trend of 2.000 builds considerably on the trend of 1.111 we saw in 2017. A large portion of that increase is most likely rooted in the partnerships forged with COAS programs and the dual-degree approach we developed, which positions students to graduate from PFW with a degree in their content area of choice and a degree in secondary education. Though we are pleased with the growth trend, we continue striving to improve program viability and enhance our recruitment and retention efforts as detailed in our Strategic Enrollment Management plan and summarized in Section 1 of this report. Retention and program completion are particularly helped by faculty efforts to mentor students into the profession by engaging them in research and service. For example, in Spring 2019, four teacher candidates studying English education in the School of Education at Purdue University Fort Wayne—three of whom would go on to graduate that same semester—presented at the 2019 Indiana Council of Teachers of English (ICTE) State Conference in Indianapolis. All four PFW teacher candidates—Audrey Brace, Nathaniel Hess, Laura Laudeman, and Randy Swim—presented instructional methods they have been exploring in their program of study during the state-level “Future is Now” roundtable session, which, like its namesake on the national level, is designed to give undergraduate and master’s level students a platform for sharing their ideas and experiences with conference attendees. Several English education students are now preparing to participate in the “Future is Now” session at the 2020 Indiana Council of Teachers of English (ICTE) State Conference, which will be held at the University of Notre Dame in March 2020. Further, two English education students are currently preparing to present in a roundtable session at the National Council of Teachers of English (NCTE) Annual Convention in Baltimore from November 20-24. We believe that immersing teacher candidates in the professional community will help them build a sense of belonging and further support our efforts to ensure retention and program completion.

41
Secondary Education DS Using Tables 2a through 2d, and additional data provided by Institutional Research, describe efforts the department is taking to improve enrollment, retention, and graduation. Table 2a – Fall Program Demand
Fall Semester Demand (New to Major)
Majors (New plus
Continuing)
Graduates
2019 13 15 2018 10 16 0 2017 13 15 0 2016 2 7 0 2015 15 15 0 2014 6 9 0
Averages 9 12 0 Table 2b: Fall Viability Metric Ratios
Fall Semester Graduation Efficiency
Student Attrition Growth Trend
2018 00.00% 68.75% 0.714 2017 00.00% 60.00% 1.444 2016 00.00% 71.43% 0.400 2015 00.00% 60.00% 1.500 2014 00.00% 100.00% 0.667
Ratios 00.00% 69.35% 0.979

42
Secondary Education DS (continued) Table 2c: Fall Retention Totals
Fall
Semester
New
Majors
Total
Majors
Retained in Major
Retained in
Different Major
Graduated Stopped Out In
Major Out of Major
2019 13 15 2018 10 16 2 3 0 0 11 2017 13 15 6 0 0 0 9 2016 2 7 2 0 0 0 5 2015 15 15 5 1 0 0 9 2014 6 9 0 0 0 0 9
Summary 46 62 15 4 0 0 43 Table 2d: Enrollment Management Plan Performance (Departmentally Set Goals and Action Items. Institutional Research will provide information for Enrollment Management Performance column) Enrollment
Management Goal
Action Items Enrollment Management Performance (Fall Semester)
2014 2015 2016 2017 2018 2019 New Majors
0 Our goal is new students admitted directly to the BSEd
6 15 2 13 10 13
Retained in Major
0 Our goal is to move all DS students into the appropriate major.
0 5 2 6 2
Retained at IPFW
12 0 6 2 6 5
Total majors
0 9 15 7 15 16 15
Graduated in Major
0 0 0 0 0 0
Stopped Out
3 9 9 5 9 11
43
Secondary Education DS (continued) Table 2e: Discussion - Use the data from Tables 2a-2c to synthesize and analyze your program's enrollment and retention performance relative to the established goals. Discuss future plans to improve program viability. Finally, describe any changes in your action plan you are making to improve performance.
Our goal is to recruit high-performing students who can be admitted directly into the program, and to transfer any pre-majors into their programs as quickly as possible.

44
Social Studies Education BSED Using Tables 2a through 2d, and additional data provided by Institutional Research, describe efforts the department is taking to improve enrollment, retention, and graduation. Table 2a – Fall Program Demand
Fall Semester Demand (New to Major)
Majors (New plus
Continuing)
Graduates
2019 1 28 2018 12 49 11 2017 28 66 9 2016 27 63 9 2015 27 60 8 2014 34 65 9
Averages 26 61 9 Table 2b: Fall Viability Metric Ratios
Fall Semester Graduation Efficiency
Student Attrition Growth Trend
2018 20.41% 18.37% 0.571 2017 13.64% 16.67% 0.966 2016 11.11% 14.29% 1.125 2015 13.33% 20.00% 1.125 2014 13.85% 20.00% 1.063
Ratios 14.19% 17.82% 0.985

45
Social Studies Education BSED (continued) Table 2c: Fall Retention Totals
Fall
Semester
New
Majors
Total
Majors
Retained in Major
Retained in
Different Major
Graduated Stopped Out In
Major Out of Major
2019 1 28 2018 12 49 27 2 10 1 9 2017 28 66 37 9 9 0 11 2016 27 63 37 8 7 2 9 2015 27 60 36 4 8 0 12 2014 34 65 33 10 9 0 13
Summary 128 303 170 33 43 3 54 Table 2d: Enrollment Management Plan Performance (Departmentally Set Goals and Action Items. Institutional Research will provide information for Enrollment Management Performance column) Enrollment
Management Goal
Action Items Enrollment Management Performance (Fall Semester)
2014 2015 2016 2017 2018 2019 New Majors
0 Admit to History BA and BSEd dual degree in Secondary Education
34 27 27 28 12 1
Retained in Major
15 Continue to support students desiring this program to graduation
33 36 37 37 27
Retained at IPFW
17 Transfer as many students as possible to the dual degree
43 40 45 46 29
Total majors
15 Work to grow the Secondary Education BSEd program
65 60 63 66 49 28
Graduated in Major
9 Help students secure teaching positions whenever possible
9 8 7 9 10
Stopped Out
2 Encourage return and completion when possible.
13 12 9 11 9

46
Social Studies Education BSED (continued) Table 2e: Discussion - Use the data from Tables 2a-2c to synthesize and analyze your program's enrollment and retention performance relative to the established goals. Discuss future plans to improve program viability. Finally, describe any changes in your action plan you are making to improve performance.
This program will no longer be marketed. Students who wish to teach at the high school level in any subject area (except Earth/Space science) will now earn dual degrees in their subject-area discipline and in Secondary Education.

47
Spanish Education BSED Using Tables 2a through 2d, and additional data provided by Institutional Research, describe efforts the department is taking to improve enrollment, retention, and graduation. Table 2a – Fall Program Demand
Fall Semester Demand (New to Major)
Majors (New plus
Continuing)
Graduates
2019 2018 0 2 2 2017 3 4 0 2016 3 3 1 2015 0 1 1 2014 1 4 0
Averages 1 3 1 Table 2b: Fall Viability Metric Ratios
Fall Semester Graduation Efficiency
Student Attrition Growth Trend
2018 100.00% 00.00% 0.000 2017 00.00% 00.00% 1.500 2016 33.33% 33.33% 1.500 2015 100.00% 00.00% 0.000 2014 00.00% 25.00% 0.333
Ratios 28.57% 14.29% 0.700

48
Spanish Education BSED (continued) Table 2c: Fall Retention Totals
Fall
Semester
New
Majors
Total
Majors
Retained in Major
Retained in
Different Major
Graduated Stopped Out In
Major Out of Major
2019 2018 0 2 0 0 2 0 0 2017 3 4 2 2 0 0 0 2016 3 3 1 0 1 0 1 2015 0 1 0 0 1 0 0 2014 1 4 1 2 0 0 1
Summary 7 14 4 4 4 0 2 Table 2d: Enrollment Management Plan Performance (Departmentally Set Goals and Action Items. Institutional Research will provide information for Enrollment Management Performance column) Enrollment
Management Goal
Action Items Enrollment Management Performance (Fall Semester)
2014 2015 2016 2017 2018 2019 New Majors
0 All students will be admitted to the Secondary Ed BSEd
1 0 3 3 0
Retained in Major
0 1 0 1 2 0
Retained at IPFW
0 3 0 1 4 0
Total majors
0 4 1 3 4 2
Graduated in Major
0 0 1 1 0 2
Stopped Out
0 1 0 1 0 0

49
Spanish Education BSED (continued) Table 2e: Discussion - Use the data from Tables 2a-2c to synthesize and analyze your program's enrollment and retention performance relative to the established goals. Discuss future plans to improve program viability. Finally, describe any changes in your action plan you are making to improve performance.
This program will no longer be marketed. Students who wish to teach at the high school level in any subject area (except Earth/Space science) will now earn dual degrees in their subject-area discipline and in Secondary Education.

50
Undecided ND Using Tables 2a through 2d, and additional data provided by Institutional Research, describe efforts the department is taking to improve enrollment, retention, and graduation. Table 2a – Fall Program Demand
Fall Semester Demand (New to Major)
Majors (New plus
Continuing)
Graduates
2019 2018 2017 0 1 0 2016 1 1 0 2015 2014
Averages 1 1 0 Table 2b: Fall Viability Metric Ratios
Fall Semester Graduation Efficiency
Student Attrition Growth Trend
2018 2017 00.00% 100.00% 0.000 2016 00.00% 00.00% 1.000 2015 2014
Ratios 00.00% 50.00% 1.000

51
Undecided ND (continued) Table 2c: Fall Retention Totals
Fall
Semester
New
Majors
Total
Majors
Retained in Major
Retained in
Different Major
Graduated Stopped Out In
Major Out of Major
2019 2018 2017 0 1 0 0 0 0 1 2016 1 1 1 0 0 0 0 2015 2014
Summary 1 2 1 0 0 0 1 Table 2d: Enrollment Management Plan Performance (Departmentally Set Goals and Action Items. Institutional Research will provide information for Enrollment Management Performance column) Enrollment
Management Goal
Action Items Enrollment Management Performance (Fall Semester)
2014 2015 2016 2017 2018 2019 New Majors
0 Our goal is new students admitted directly to the BSEd
1 0
Retained in Major
0 Our goal is to move all DS students into the appropriate major.
1 0
Retained at IPFW
0 1 0
Total majors
0 1 1
Graduated in Major
0 0 0
Stopped Out
0 0 1

52
Undecided ND (continued) Table 2e: Discussion - Use the data from Tables 2a-2c to synthesize and analyze your program's enrollment and retention performance relative to the established goals. Discuss future plans to improve program viability. Finally, describe any changes in your action plan you are making to improve performance.
Our goal is to recruit high-performing students who can be admitted directly into the program, and to transfer any pre-majors into their programs as quickly as possible.

53
Section 3: Department Undergraduate Non-Dual Credit Hour Production Discussion: Describe changes in total non-dual credit hour production for your program and the relationship of non-dual credit hour production to overall program viability. You may include a discussion of the contribution of service hours to program viability.
Fall In-Major Service Total Credit Hours Fall 2019 4073 380 4453 Fall 2018 4233 471 4704 Fall 2017 3695 495 4190 Fall 2016 3509 437 3946 Fall 2015 3249 413 3662 Fall 2014 3161 415 3576

54
Section 4: Faculty/Staff/Student Accomplishments 1. Scholarship and Creative Endeavor 2. Teaching and Learning 3. Service
The School of Education has many accomplishments to be proud of this year. One notable achievement is the successful site visit by a team from the Council for Accreditation of Counseling and Related Educational Programs (CACREP) and the resulting initial accreditation of the Counselor Education Master’s Program. The team was highly complimentary of our program and our faculty, and was particularly impressed by the rigorous and thorough system by which students are assessed on the numerous CACREP standards. The program has been assured of at least two years’ accreditation by the team’s recommendation, and may earn an additional five based on their response to that report. The final decision by the council will be communicated to us after their meeting in January. The other graduate programs in the School of Education have also made noteworthy gains. Educational Leadership and Special Education both moved to hybrid programs, and Ed Leadership has further adopted eight-week half-term course scheduling. These changes were celebrated in a Journal Gazette article on how PFW is making our graduate programs accessible to busy teachers, and have led to growth in both programs. This year marked the matriculation of the first cohort of students in the revived Elementary and Secondary Education programs, which also uses an eight-week hybrid delivery model. The program is starting small, with five students currently taking classes, but three more will join the cohort in the spring. Undergraduate students in teacher education programs continue to serve area schools with hundreds of hours each spent doing classroom-based field experiences during their coursework. Our School of Education preservice teachers spent 155,000 hours in clinical placements last year, providing pK-12 students in Northeast Indiana with another caring adult and another pedagogic presence during their school days. We are tremendously excited about our improved relations and growing partnership with Fort Wayne Community Schools. Several meetings in which Dean Burg and I talked with senior district administrators have led to some radical policy shifts in FWCS Human Resources that will benefit the district by helping to fill unstaffed paraprofessional positions while providing our students with the opportunity to work in their professional field, rather than tending bar or waiting tables. Even more exciting is the work we are doing to develop of Grow-Your-Own Teachers program. This would establish a pipeline through which FWCS students, many of whom are students of color, would be supported in a cohort-based program to earn their bachelor’s degree and licensure at PFW, so they can return to the district as teachers.

55
Section 5: Alumni Information In this section discuss how your program is contributing to the ongoing success of its graduates. Include information such as survey information (e.g. First Destinations Survey), alumni career accomplishments, employment information, and professional and graduate school enrollment The First Destination Survey provides data and comments about graduates’ satisfaction with School of Education programs. In 2018, satisfaction among undergraduates was 87.8%, up from 82% in 2017. The percentage of undergraduates in the School of Education who would choose Purdue University Fort Wayne again was 79.3%, also an increase from the year prior. Another source of data on our graduates is the Indiana Department of Education (IDOE) program completer survey. IDOE completer surveys ask program graduates how well their pre-service programs prepared them for various aspects of their work as teachers. The data from this survey tells us that our candidates are quite confident in their learning about ethics and ethical practice, with three indicators related to these constructs rated at 100% and one at 98%. Student assessment and data use are areas of consistent relative challenge for our students, with three indicators at 84% and one at 88%. Classroom management is also lower rated than other areas at 91% and 86%. All of these, however, still show a vast majority of students agreeing and strongly agreeing that they are well prepared. A new area of struggle is working with parents and guardians, which dropped from 93% to 87% as compared to last year’s survey. Our graduates overwhelmingly find employment as teachers, most of them in Northeast Indiana. Our graduate programs, discussed in the previous section on accomplishments, offer our alumni the opportunity for further professional development and connection to the university. We also seek to support our alumni with opportunities to earn Professional Growth Points needed to renew licensure. We have now collected the results of the 2019 Professional Learning Needs Survey, a project spearheaded by Dr. Brad Oliver. During the month of October, Dr. Wylie Sirk was able to work with the Upper Wabash Valley Superintendent’s Council and, subsequently, we had 540 educators from Northeast Indiana respond to the survey. The survey provides important information on educator interest regarding their current professional learning needs. Of interest to the original purpose of the study, more than half of the respondents will be looking for ways to satisfy the new 15-point career exploration requirement in the next five years. The survey also asked the respondents for feedback on how the School of Education could best support their professional learning in the future.

56
Section 6: Resource Allocation Request Please use the section below to discuss resources needed to help meet departmental and enrollment management goals. Describe the specific projected uses of those funds and your plan for evaluating the effectiveness of the requested resources in helping reach departmental and enrollment management goals.
There are several action items in our new Strategic Enrollment Management Plan that would require significant additional resources to implement. In fact, I did not included these items among the action items we are committing to in this report because they are not possible without dedicated new funding. One of these ideas is for collaborating with Student Services to explore a summer bridge program that welcomes SOE admits from under-represented populations and helps them make the transition from high school to college. Such a program is envisioned to include academic success workshops, advising, and learning communities. This would require tens of thousand dollars in funding. A less resource-intensive project would be partnering with CELT to bring “big names” in education to campus for PD open to faculty, students, and local teachers. The major expense here would be honoraria, and hospitality and travel expenses for the speakers and could be likely be achieved with a few thousand dollars per event. A relative bargain would be hosting a family day at university athletic events with college swag and free tickets for families. This could be done for less than a thousand dollars. Any level of support for the activities in our new Strategic Enrollment Management Plan would be greatly appreciated.

57
Supporting Documents 1. 5 Year Strategic Plan for Unit (produced at last program review). For programs
transitioning to the new Program Review Process, the two USAP reports (or, a unit strategic plan developed for the period) should be included.
2. Enrollment Management Plan: The enrollment management plan should include targets for: a. total students enrolled in program, b. new students in the program defined as an annual cohort (i.e. defines cohort as
students accepted into program in current academic year), c. retention within cohort, d. aggregate retention for majors, e. progress toward degree, and
3. First Destinations Survey (Career Services) 4. Alumni Survey (5 Year) – recommended as future requirement for all programs

58
Annual Program Review Data Definitions The Annual Program Review document uses two data sources. The New Majors, Total Majors, Retained In and Out of Major, Stop-out, and Student Attrition measures are derived from the Office of Institutional Research Census data files. The Graduated measure is derived from Banner’s degree awarded tables. The viability metric ratios, Graduation Efficiency and Growth Trend, use a combination of the two data sources. Table 2a – Fall Program Demand Program demand data is defined by the number of new students to a major or concentration, the total number of majors or concentrations, and number of graduates per academic year.
1. Demand a. The number of students who are new to the major in a given fall semester either
as first year students or as returning students who have changed their major. The number of students where identified by their first or second declared major.
2. Majors a. The total number of students who declared a major in a given fall semester. This
is the sum of new and continuing students. The number of students where identified by their first or second declared major.
3. Graduates a. The number of students who graduate in a given major or concentration in a
given academic year. The number of students where identified by the first or second major on their degree.
Table 2b: Fall Viability Metric Ratios 1. Graduation Efficiency
a. The number of students who graduated in major divided by the number of majors. Since graduation efficiency measure is calculated using values in Table 2a and Table 2c, the graduation efficiency measure accounts for students first and/or second major.
2. Student Attrition a. The number of students who stop out (are not retained at PFW) divided by the
number of majors or concentration. 3. Growth Trend
a. The sum of the number of students entering major or concentration divided by the number of students graduating, changing a new major, or stopping-out. In the situation where the denominator is zero, the simply the number of majors is reported.
Table 2c: Fall Retention Totals
1. New Majors a. The number of students who are new to the major in a given fall semester either
as first year students or as returning students who changed their major.
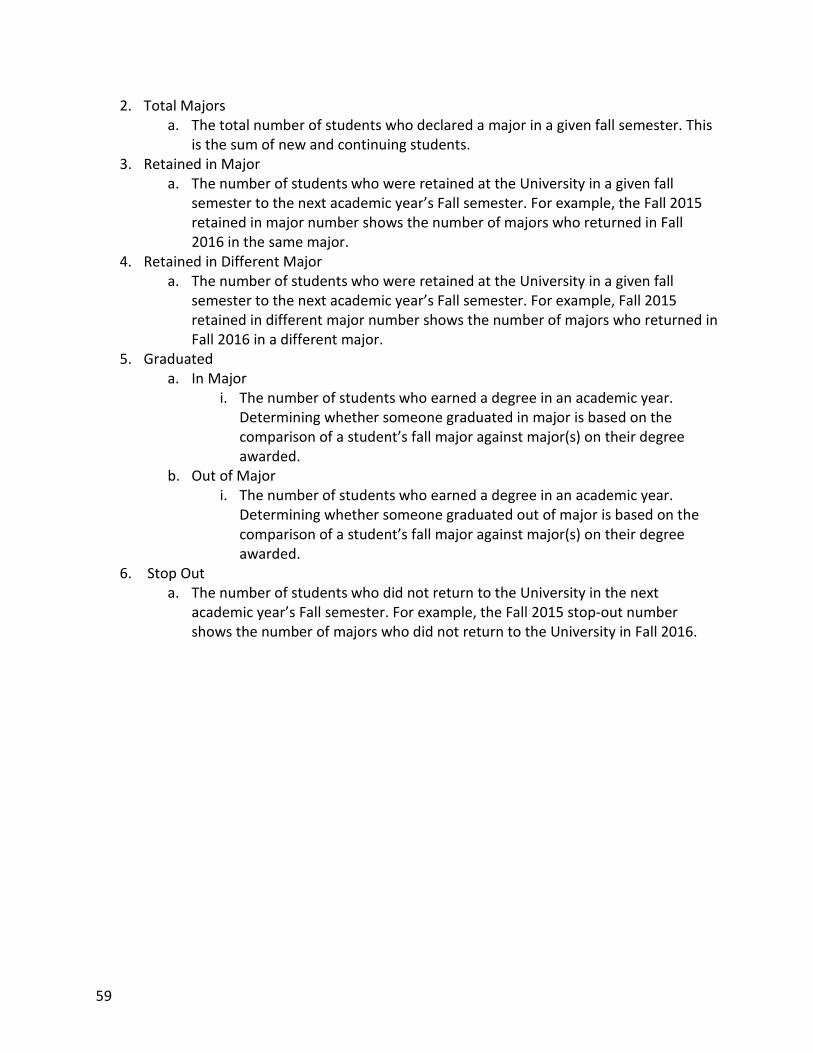
59
2. Total Majors a. The total number of students who declared a major in a given fall semester. This
is the sum of new and continuing students. 3. Retained in Major
a. The number of students who were retained at the University in a given fall semester to the next academic year’s Fall semester. For example, the Fall 2015 retained in major number shows the number of majors who returned in Fall 2016 in the same major.
4. Retained in Different Major a. The number of students who were retained at the University in a given fall
semester to the next academic year’s Fall semester. For example, Fall 2015 retained in different major number shows the number of majors who returned in Fall 2016 in a different major.
5. Graduated a. In Major
i. The number of students who earned a degree in an academic year. Determining whether someone graduated in major is based on the comparison of a student’s fall major against major(s) on their degree awarded.
b. Out of Major i. The number of students who earned a degree in an academic year.
Determining whether someone graduated out of major is based on the comparison of a student’s fall major against major(s) on their degree awarded.
6. Stop Out a. The number of students who did not return to the University in the next
academic year’s Fall semester. For example, the Fall 2015 stop-out number shows the number of majors who did not return to the University in Fall 2016.

1
Hospitality and Tourism Management Annual Report
Fall 2019
Table of Contents
Section 1: Unit Goals/Progress/Accomplishments ...................................................................................... 2
Section 2: Evaluation and Planning Program Viability .................................................................................. 4
Hospitality Management BS ..................................................................................................................... 4
Section 3: Department Undergraduate Non-Dual Credit Hour Production ................................................. 7
Section 4: Faculty/Staff/Accomplishments ................................................................................................... 8
Section 5: Alumni Information .................................................................................................................... 11
Section 6: Resource Allocation Request ..................................................................................................... 12
Supporting Documents ............................................................................................................................... 13
Annual Program Review Data Definitions ................................................................................................... 14

2
Section 1: Unit Goals/Progress/Accomplishments1
Table 1A: Progress in Accomplishing 5 Year Goals New or Updated Goals 2019 HTM Report
Unit Goal2
Action Items
Evidence of Progress to Goal (performance relative to action item)
Further detail assessment HTM concentrations and course outcomes
• Complete a comprehensive curriculum map for each of the 3 HTM concentrations utilizing current HSD outcomes
• Review HSD outcomes related to HTM program concentrations
• Identify mid-program and capstone courses for program assessment for each of the three concentrations
• Identify methodology for outcome assessment
• Completion May 2020 • Completion May 2020 • Completion May 2020 • Completion May 2020
Assess the value of membership in HSD
• Conduct a cost benefit analysis of membership in HSD
• In process – completion Fall 2020
Increase local community engagement
• Identify local industry stakeholders for membership new HTM Advisory Board
• With new Advisory Board, identify mission and goals
• Identify venues for increased local community engagement for students i.e. internships, employment, volunteer activities, special events, coursework
• Develop event for students and industry professionals showcasing local industry including engagement opportunities
• In process expected completion February 2020
• Expected completion May
2020 • Ongoing with preliminary list
May 2020 • Fall 2020
Develop a registry of HTM Alumni • Identify methods for tracking and compiling alumni names, places of employment and contact information
• Compile registry
• In process – procedure formalized by May 2020
• First draft registry May 2020
Measure long-term effectiveness of HTM Program
• Develop an assessment tool to identify impact of HTM degree on alumni
• Implement assess tool
• Draft of tool May 2020 • Pilot test tool May 2020 • Implement tool Dec.2020
Enhance teaching effectiveness supporting use of high-impact educational practices (HIP) in HTM courses for both face-to-face and online teaching venues
• Faculty workshop over HIP • Identify faculty use of CELT
resources • Review of online courses using
CELT resources
• By May 2020 • Documentation faculty use of
CELT by Dec. 2020 • Goal of 2 online courses
reviewed Dec. 2020
1 This section does not include enrollment goals. Enrollment goals are reported in Section 2. 2 In transition prior to development of 5 year strategic plan, use USAP Yr. 1 and 2 Reports

3
Table 1B: Progress in Accomplishing 5 Year Goals – Carryover Goals from 2018 HTM Report
Unit Goal3
Action Items
Evidence of Progress to Goal (performance relative to action item)
Club Management Education In collaboration with the CMAA (Club Managers Association America) we want to discuss creating a student chapter and developing a program in this field that has employment potential in and out of state.
Discussion is beginning in 2019 This has been put on hold as personnel and resources are no longer available
Tallinn Hotel School in Estonia collaboration for PFW/HTM opportunity to provide 33 online 3 cr hour courses to projected 300 students at the Tallinn Hotel School
• Development of curriculum
• Obtain activity agreement with universities involved
• Obtain approval by Estonian
Government • Initiate first student cohort
from Tallinn taking PFW/HTM courses online
• Curriculum development (ongoing)
• Activity Agreement has been completed and executed by all parties (Nov 2018).
• Submission to Estonian Government (Nov 2018)
• First cohort of students expected in Spring 2020
This collaboration has been cancelled by PFW upper administration
Offer a new four-year undergraduate degree in Integrated Health Promotion and Management. This degree will have an interdisciplinary focus. Graduates of the program will be prepared for careers in developing, managing, marketing and implementing health promotion policies and activities. Human resources, leadership and management and policies of health promotion and management will be an important component
• Final proposal in process • On hold at present
• Approved CHHS Curriculum Committee and Dean of CHHS
• Submitted to IPFW Associate Vice Chancellor Academic Affairs
• Revisions resubmitted Dec. 2018 and Spring 2019
This degree proposal is on hold due to: • Department Chair leaving
PFW leading to redirection of lead faculty to duties as Interim Department Chair
• In direct conflict with proposed IUFW Public Health Degree program
3 In transition prior to development of 5 year strategic plan, use USAP Yr. 1 and 2 Reports

4
Section 2: Evaluation and Planning Program Viability Hospitality Management BS Using Tables 2a through 2d, and additional data provided by Institutional Research, describe efforts the department is taking to improve enrollment, retention, and graduation.
Table 2a – Fall Program Demand
Fall Semester Demand (New to Major)
Majors (New plus
Continuing)
Graduates
2019 23 62 2018 33 81 17 2017 32 77 18 2016 33 85 14 2015 34 98 26 2014 37 105 17
Averages 34 89 18
Table 2b: Fall Viability Metric Ratios
Fall Semester Graduation Efficiency Student Attrition Growth Trend 2018 20.99% 27.16% 0.786 2017 22.08% 14.29% 1.143 2016 16.47% 21.18% 0.825 2015 26.53% 15.31% 0.739 2014 14.29% 18.10% 0.949
Ratios 19.96% 19.06% 0.867
Table 2c: Fall Retention Totals
Fall
Semester
New
Majors
Total
Majors
Retained in Major
Retained in
Different Major
Graduated Stopped Out In
Major Out of Major
2019 23 62 2018 33 81 39 3 17 0 22 2017 32 77 48 0 17 1 11 2016 33 85 45 8 14 0 18 2015 34 98 52 5 26 0 15 2014 37 105 64 5 15 2 19
Summary 169 446 248 21 89 3 85
Table 2d: Enrollment Management Plan Performance (Departmentally Set Goals and Action Items. Institutional Research will provide information for Enrollment Management Performance column)

5
Enrollment Management Goal
Action Items Enrollment Management Performance (Fall Semester)
2014 2015 2016 2017 2018 2019 New Majors
Increase by 5 by fall 20
See HTM Strategic Enrollment Management Plan in Appendix A
37 34 33 32 33 23
Retained in Major
Increase by 5 by fall 20
See above 64 52 45 48 39
Retained at IPFW
Increase In addition to the above, work with CPS Student Success Center supporting their initiatives
69 57 53 48 42
Total majors
Increase by 10 by fall 20
See above 105 98 85 77 81 62
Graduated in Major
Remain steady See above 15 26 14 17 17
Stopped Out
Decrease See above 19 15 18 11 22

6
Hospitality Management BS (continued)
Table 2e: Discussion - Use the data from Tables 2a-2c to synthesize and analyze your program's enrollment and retention performance relative to the established goals. Discuss future plans to improve program viability. Finally, describe any changes in your action plan you are making to improve performance.
Total number of HTM majors has declined since 2014. From 2016 to 2018 the numbers remained relatively stable with a drop again in 2019. New majors remained relatively stable until the drop in 2019, while the number of students retained in the program has had a steady decline.
Some of the decline in number of majors may correspond to the health of the industry which is recording the highest room rates and revenue per available room in history for this period. This situation creates a huge demand for employees, and our students and/or potential students may opt for employment over education. Also, the many changes our program has experienced and morale may have impacted enrollment. Rumors over the summer of 2019 of the department chair leaving the program may have caused concern about the future of the program. Needs identified to increase enrollment and retention include:
• Clear identification of the focus and outcomes of the program overall and its brand • Increase engagement with the local industry and community • Updated promotional materials to market the program • Actions to improve communication and the morale amongst students, faculty and
staff • Enhance teaching effectiveness
The department has developed a detailed strategic enrollment management plan which may be found in Appendix A.

7
Section 3: Department Undergraduate Non-Dual Credit Hour Production
Discussion: Describe changes in total non-dual credit hour production for your program and the relationship of non-dual credit hour production to overall program viability. You may include a discussion of the contribution of service hours to program viability.
Fall In-Major Service Total Credit Hours Fall 2019 643 846 1489 Fall 2018 860 1078 1938 Fall 2017 747 895 1642 Fall 2016 890 924 1814 Fall 2015 986 942 1928 Fall 2014 848 1014 1862

8
Section 4: Faculty/Staff/Accomplishments
Margaret Childers Administrative Assistant
• Service o Developed and implemented “Pro Tip Tuesdays”
Quick tips sent to HTM students once a week on Tuesdays Tips on professional behavior (correspondence, dress, etc.) Has been adopted by other departments within the college
Susan Clark, Continuing Lecturer Director of Florida Program at Gasparilla Inn
• Scholarship and Creative Endeavor o Continuing transition of HTM Florida program to the Gasparilla Inn Boca Grande,
overall achieving an improved quality of experience for our students. 16 students completed the semester successfully. One of our students secured one of only 3 places as graduate management trainees at the Gasparilla Inn
o Continuing research into impact of tourism in protected areas in USA and Indonesia. o Spoke at conference “Managing Visitor Numbers in Protected Areas”
• Teaching and Learning o Transferred Professional Development III to the Online Platform o Organized a number of field trips to hospitality and tourism organizations in South West
Florida • Service
o Board member and chair of Public Engagement for the Catskill Center for Conservation and Development
o Advisory Board member to Catskill Watershed Agricultural Council on marketing and branding of locally produced foods.
o Replaced Dr Niser as Director of Hotel Schools of Distinction representing PFW. Attended meeting at Fairleigh Dickenson University, New Jersey.
Linda Johnston Lolkus, Associate Professor Interim Department Chair and Director of Nutrition
• Scholarship and Creative Endeavor o Responsible for ongoing study abroad program, Culinary Traditions of Italy - includes
students and community members Survey assessing impact of this study abroad - qualitative analysis in process Preliminary results reported at international tourism conference in Sardinia in
past • Teaching and Learning
o Extensive curriculum and course development with ongoing review, reflection and revision of courses
o Speaker at CELT workshops, past member of CELT board, past member of CASTLE through CELT
o Founding member of the Alliance for Teaching Enrichment with ongoing involvement with student committee and workshops

9
o Past teaching awards including Friends of the University Outstanding Teacher Award, FACET, and College of Health and Human Services Innovative Teaching Award
o Mentor to 4 nutrition LTLs teaching approximately 50% of the credit hours for the department
o Participated in Honors Program offering H-Options and presentation at Honors Freshman Seminar
• Service o Professors in Partnerships
Paired with a teacher at Homestead High School Taught 2 lessons on the science of taste
o Student, campus and community engagement as coordinator of events for visiting Italian Chef Alessia Uccellini Chef’s Table at the Holiday Inn Fort Wayne sponsored by the Chancellor -
11/12/19 Renaissance Dinner for 65 at the Holiday Inn Fort Wayne – 11/14/19 Food History and Culture Course Plus, miscellaneous meetings, visits and engagements with students and
community members o Numerous campus and college committees including
Faculty Senate Representative Office of International Education - Educational Travel Committee General Studies Faculty Advisory Board Search Committee Director General Studies CPS Promotion and Tenure
Haeik Park, Assistant Professor Tenure Track
• Scholarship and Creative Endeavor o Research Publication in 2019
Park, H., Kline, S., Kim, J., Almanza, B., Ma, J. (2019). Does Hotel Cleanliness Correlate with Surfaces Guests Contact? International Journal of Contemporary Hospitality Management, 31(7), 2933-2950.
o Publications (Under Review) in 2019 Park, H. & Almanza, B. What Do Airplane Travelers Think about the
Cleanliness of Airplanes and How Do They Try to Prevent Themselves from Getting Sick? Journal of Quality Assurance in Hospitality & Tourism (Under Second Revision)
Lee, K. & Park H. Linking high-quality interpersonal relationships and employees’ creative work involvement in airline firms. Asia Pacific Journal of Management (Under Review)
o Research in Progress Park, H. & Niser, J. Factors that influence consumption behavior with food
allergy in restaurants. • A survey questionnaire developed • Data collection method was determined. Budget for data collection was
quoted though Qualtrics. • Internal grant (Grant in Aid of Research or Creative Activity) applied for
to collect data
10
Park, H., Almanza, B., Miao, L., & Sydnor, S. Consumer perception and emotional response about cleanliness in hotels.
• In the process of finalizing for submitting to a journal. Kim, J., Park, H., Ma, J., & Almanza, B. Consumer perception vs actual
cleanliness in restaurants. • We collected data and are writing a draft
Lee, K. & Park. A Study of Consumers’ Perceived Food Attributes: Chinese food vs. Japanese food
• Developing a questionnaire for data collection o Conference Presentations
Park, H. & Niser, J. (2019) Food allergic customers’ perceived risk, trust, and purchase intention for dining out in the U.S. 5th World Research Summit for Hospitality and Tourism Conference, Orlando, Florida.
Kim, J., Almanza, B., Ma, J., Park, H., & Kline, S. (2019) The Cleanliness of Restaurants: ATP tests vs. Consumers’ Perception. 2019 Annual ICHRIE Conference, New Orleans, Louisiana.
o Grant Award 2020 Summer Faculty Grant ($8,000) from Purdue Research Foundation.
Research Project: Hotel Cleanliness Standards o Grant Proposal
Grant in Aid of Research or Creative Activity ($2,000) at PFW • Applied
o Ad Hoc Journal Article Review Journal of Foodservice Business Research (8 manuscripts) International Journal of Contemporary Hospitality Management (4 manuscripts)
o Conference Article Review 25th Graduate Education & Graduate Student Research Conference in Hospitality
and Tourism (1 manuscript) • Teaching and Learning
o Teaching HTM 100 (Introduction to Hospitality and Tourism Management) Registered as a Freshmen Success Course
o Teaching HTM 141 (Financial Accounting in Service Industry) o Teaching new courses, HTM 301 (Practicum), HTM 302 (Internship)
• Service o CPS Faculty Governance Committee o CPS Assessment Committee o HTM Faculty Advisor Student Hospitality Management Association o PFW Top 50 Selection Committee

11
Section 5: Alumni Information In this section discuss how your program is contributing to the ongoing success of its graduates. Include information such as survey information (e.g. First Destinations Survey), alumni career accomplishments, employment information, and professional and graduate school enrollment
A summary of results from the First Destination Survey for 2018 with 78% of our HTM graduates responding follows:
• 92.9% of respondents are employed related to their HTM major • 100% are employed related to their career goals • 92.9% are employed in Indiana and 78.6% are employed in NE Indiana • 100% are earning salaries greater than $40,000 with 33.3% earning salaries greater than $50,000 • 100% are satisfied with their time at PFW and 100% would choose PFW again
The survey results document our recent graduates are pleased with the program and that it has prepared them for meaningful employment in the profession. This information will be useful in promoting our program. Complete survey results in Appendix B.
We have limited information regarding the location of our graduates. One of our goals set forth is to establish a procedure for collecting such information and putting together a registry of our graduates with their contact information. We have this as a program goal, and have also included this as part of our strategic enrollment management plan (Appendix A).
We have multiple reasons for gathering compiling this registry. They include:
• Conducting an alumni survey - assessing long-term impact of our program via alumni feedback • Alumni career accomplishments, including graduate and professional education • Connecting alumni with our students – community engagement and networking • Engaging alumni in HTM programs, events and courses – community engagement and
networking • Inclusion of alumni on HTM advisory board • Considering HTM sponsored continuing education for alumni
On a trial basis, we collected limited information about HTM alumni fall 2019. A sampling of where our graduates have been, or are currently employed in hospitality management positions include:
• Hospitality organizations i.e. Blue Flame Hospitality, Groupon • Lodging…i.e. White Lodging, Westin Hotels and Resorts, Gasparilla Inn and Club, Palm Island
Resort • Food and beverage operations… i.e. Tucanos Brazilian Grill, Panera Bread, Three Rivers
Distillery, The Beauty and The Bull Bar and Grill (owner), Proximo, Hoppy Gnome, Food Trucks, DeBrand’s Fine Chocolates
• Local establishments i.e. Fort Wayne Children’s Zoo, Allen County Memorial Coliseum, YMCA, Erin’s House for Grieving Children, Parkview Regional Medical Center, Fort Wayne TinCaps, Brightpoint, Purdue University
• Transportation… i.e. Delta Airlines, Westin International Airport, Community Transportation Network
• Event Planning… i.e. Unbridled (Denver Colorado), The Wedding Studio, Creative Dining Service (Michigan)

12
Section 6: Resource Allocation Request Please use the section below to discuss resources needed to help meet departmental and enrollment management goals. Describe the specific projected uses of those funds and your plan for evaluating the effectiveness of the requested resources in helping reach departmental and enrollment management goals.
The biggest need we have to meet departmental and enrollment management goals is additional full-time faculty.
With the departure of the former chair, we currently have four full-time faculty. However, another of our tenured faculty is leaving PFW at the end of fall 2019 semester.
Therefore, we have just three full-time faculty going forth. Two are located on campus, with the third teaching remote. The majority of our courses are taught by Limited Term Lecturers. While our LTLs offer rich experiences for the students, the continuity and impact of our program is negatively affected. An HTM student survey completed fall 2019 tells us that students are concerned about the loss of full-time faculty and how this loss may negatively impact their courses and path to graduation. While the department is diligent in keeping students on track, this is a concerned shared also by remaining faculty and staff.
A search for a new department chair is in progress with intent to hire for employment beginning summer 2020.
To increase the depth and breadth of our program, and support enrollment and retention, it is critical that we also replace the tenured faculty who is leaving at the end of fall 2019 semester.

13
Supporting Documents
Appendix A
HTM Strategic Enrollment Management (SEM) Plan Fall 2019
Appendix B
First Destinations Survey 2018

14
Annual Program Review Data Definitions The Annual Program Review document uses two data sources. The New Majors, Total Majors, Retained In and Out of Major, Stop-out, and Student Attrition measures are derived from the Office of Institutional Research Census data files. The Graduated measure is derived from Banner’s degree awarded tables. The viability metric ratios, Graduation Efficiency and Growth Trend, use a combination of the two data sources.
Table 2a – Fall Program Demand
Program demand data is defined by the number of new students to a major or concentration, the total number of majors or concentrations, and number of graduates per academic year.
1. Demand a. The number of students who are new to the major in a given fall semester either as first
year students or as returning students who have changed their major. The number of students where identified by their first or second declared major.
2. Majors a. The total number of students who declared a major in a given fall semester. This is the
sum of new and continuing students. The number of students where identified by their first or second declared major.
3. Graduates a. The number of students who graduate in a given major or concentration in a given
academic year. The number of students where identified by the first or second major on their degree.
Table 2b: Fall Viability Metric Ratios
1. Graduation Efficiency a. The number of students who graduated in major divided by the number of majors. Since
graduation efficiency measure is calculated using values in Table 2a and Table 2c, the graduation efficiency measure accounts for students first and/or second major.
2. Student Attrition a. The number of students who stop out (are not retained at PFW) divided by the number of
majors or concentration. 3. Growth Trend
a. The sum of the number of students entering major or concentration divided by the number of students graduating, changing a new major, or stopping-out. In the situation where the denominator is zero, the simply the number of majors is reported.
Table 2c: Fall Retention Totals
1. New Majors

15
a. The number of students who are new to the major in a given fall semester either as first year students or as returning students who changed their major.
2. Total Majors a. The total number of students who declared a major in a given fall semester. This is the
sum of new and continuing students. 3. Retained in Major
a. The number of students who were retained at the University in a given fall semester to the next academic year’s Fall semester. For example, the Fall 2015 retained in major number shows the number of majors who returned in Fall 2016 in the same major.
4. Retained in Different Major a. The number of students who were retained at the University in a given fall semester to
the next academic year’s Fall semester. For example, Fall 2015 retained in different major number shows the number of majors who returned in Fall 2016 in a different major.
5. Graduated a. In Major
i. The number of students who earned a degree in an academic year. Determining whether someone graduated in major is based on the comparison of a student’s fall major against major(s) on their degree awarded.
b. Out of Major i. The number of students who earned a degree in an academic year. Determining
whether someone graduated out of major is based on the comparison of a student’s fall major against major(s) on their degree awarded.
6. Stop Out a. The number of students who did not return to the University in the next academic year’s
Fall semester. For example, the Fall 2015 stop-out number shows the number of majors who did not return to the University in Fall 2016.
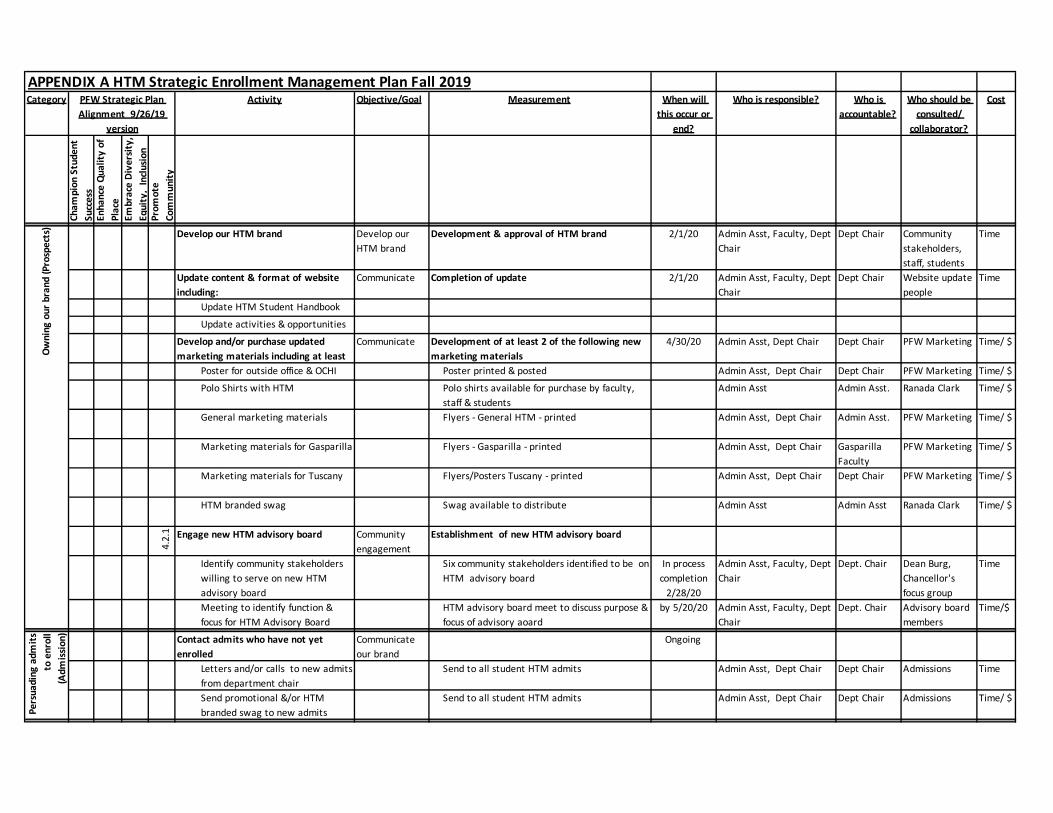
APPENDIX A HTM Strategic Enrollment Management Plan Fall 2019Category Activity Objective/Goal Measurement When will
this occur or end?
Who is responsible? Who is accountable?
Who should be consulted/
collaborator?
Cost
Cham
pion
Stu
dent
Su
cces
sEn
hanc
e Qu
ality
of
Plac
eEm
brac
e Di
vers
ity,
Equi
ty,
Inclu
sion
Prom
ote
Com
mun
ity
Develop our HTM brand Develop our HTM brand
Development & approval of HTM brand 2/1/20 Admin Asst, Faculty, Dept Chair
Dept Chair Community stakeholders, staff, students
Time
Update content & format of website including:
Communicate Completion of update 2/1/20 Admin Asst, Faculty, Dept Chair
Dept Chair Website update people
Time
Update HTM Student Handbook
Update activities & opportunities
Develop and/or purchase updated marketing materials including at least
Communicate Development of at least 2 of the following new marketing materials
4/30/20 Admin Asst, Dept Chair Dept Chair PFW Marketing Time/ $
Poster for outside office & OCHI Kitchen
Poster printed & posted Admin Asst, Dept Chair Dept Chair PFW Marketing Time/ $
Polo Shirts with HTM Polo shirts available for purchase by faculty, staff & students
Admin Asst Admin Asst. Ranada Clark Time/ $
General marketing materials Flyers - General HTM - printed Admin Asst, Dept Chair Admin Asst. PFW Marketing Time/ $
Marketing materials for Gasparilla Flyers - Gasparilla - printed Admin Asst, Dept Chair Gasparilla Faculty
PFW Marketing Time/ $
Marketing materials for Tuscany Flyers/Posters Tuscany - printed Admin Asst, Dept Chair Dept Chair PFW Marketing Time/ $
HTM branded swag Swag available to distribute Admin Asst Admin Asst Ranada Clark Time/ $
4.2.
1 Engage new HTM advisory board Community engagement
Establishment of new HTM advisory board
Identify community stakeholders willing to serve on new HTM advisory board
Six community stakeholders identified to be on HTM advisory board
In process completion
2/28/20
Admin Asst, Faculty, Dept Chair
Dept. Chair Dean Burg, Chancellor's focus group
Time
Meeting to identify function & focus for HTM Advisory Board
HTM advisory board meet to discuss purpose & focus of advisory aoard
by 5/20/20 Admin Asst, Faculty, Dept Chair
Dept. Chair Advisory board members
Time/$
Contact admits who have not yet enrolled
Communicate our brand
Ongoing
Letters and/or calls to new admits from department chair
Send to all student HTM admits Admin Asst, Dept Chair Dept Chair Admissions Time
Send promotional &/or HTM branded swag to new admits
Send to all student HTM admits Admin Asst, Dept Chair Dept Chair Admissions Time/ $
PFW Strategic Plan Alignment 9/26/19
version
Owni
ng o
ur b
rand
(Pro
spec
ts)
Pers
uadi
ng a
dmits
to
enr
oll
(Adm
issio
n)

2.3.
2 Communicate items of interest to students and others by completing at least one of the following:
Communicate & morale
Send items of interest about HTM to the Deans letter
2 or more postings sent to Dean's letter 4/30/20 Admin Asst, Faculty, Dept Chair
Dept Chair Time
Identify prefered social media formats for communicating with students
Identify social media platform as preferred method of use by students
4/30/20 Admin Asst, Faculty, Dept Chair
Admin Asst Students Time
Success stories to Dean's Newsletter
At least 1 success story to Dean's Newsletter 4/30/20 Admin Asst, Faculty, Dept Chair
Admin Asst Time
Success stories on TV outside Dean's office
At least 1 success story to TV outside Dean's office
4/30/20 Admin Asst, Faculty, Dept Chair
Admin Asst Time
Provide professional tips via Pro Tip Tuesday emails
Communicate & morale
At least 2 per month Ongoing Admin Asst Admin Asst Time
1.1.
1 Provide space in the building for student meetings and activities.
Retention, morale, student engagement
Identify space in Neff Hall for HTM student use 2/28/20 Admin Asst, Dept Chair Admin Asst Dean's Office Time/ $
1.1.
1
2.3.
1, 2
.3.2
3.2.
1
4.2.
1, 4
.2.3 Support student, faculty, staff,
community engagement activities by completing at least 2 of the following:
Community involvement & engagement
Completion of at least 3 of the following each year
1.1.
1 Ongoing internships at Gasparilla Inn
goal of 8 students each spring semester Every spring sem
Faculty Faculty Gasparilla Inn Time/ $
1.1.
1
3.1,
3.2
,
2.1 Activities with visiting Chef
Alessia Uccellini Annual visit with at least one community engagement activity per visit
Fall sem Dept Chair Dept Chair Dean's office, Marketing, Office of Development
Time/ $
1.1.
1
2.3.
1, 2
.3.2
3.2.
1
4.2.
1, 4
.2.3 Via inclusion of students & non-
students in Culinary Traditions of Italy Study Abroad
Goal of combination of 10 students and communtity travelers per trip to Italy.
Every other odd year
Dept Chair Dept Chair DCS, Dean's Office, OIE
Time
1.1.
1 Expand HTM student involvement with SOE Farm to School project
Goal of 4 students per year involvement with SOE Farm to Fork project
Every year Dept Chair, Faculty Dept Chair SOE Time
1.1.
1 With local internships &/or collaborations
Goal of 4 students per year local internships and/or collaborations
Every year Dept Chair, Faculty Faculty Community Stakeholders, HTM Advisory Board
Time
1.1.
1
2.3.
1, 2
.3.2
4.2.
1 Expand student Hospitality Management Association volunteer activities in the community
Continue volunteer activities in Erin's House for Grieving Children and St. Vincent's Village and increase by one activity per year
Every year HMA & HMA Advisor HMA Student Government, Community Stakeholders
Time
Enha
ncin
g st
uden
t pro
gres
sion
(Ret
entio
n)

1.1.
1 Presentations by local professionals in & out of the classroom
At least 4 interactions per semester Every sem Faculty Faculty Community Stakeholders
Time/ $1.
1.1 Local professional
collaborations/internshipOne new collaboration Per year Admin Asst, Faculty, Dept
ChairFaculty Community
StakeholdersTime
1.1.
1
3.2.
1
4.2.
1 Support student involvement in professional organizations, conferences & meetings
Student engagement in profession
Completion of at least 2 of the following
Engage students in professional conferences & meetingsby supporting students attendance at National HEDNA Conference
One student per year attend this conference Yearly Admin Asst, Faculty, Dept Chair, Students
Dept Chair HEDNA, Student Government
Time/ $
by supporting student attendance at International Young Hoteliers Summit
One to 2 students per year attend this conference
Yearly Admin Asst, Faculty, Dept Chair, Students
Dept Chair YHS, Student Government
Time/ $
Increase student membership in HMA
Increase student membership by 10 9/30/20 Admin Asst, Faculty, HMA, Dept Chair
HMA Student Government
Time, $
2.4.
1 Identify at risk students Student Retention
Admin Asst, Faculty, HMA, Dept Chair
Dept Chair SSC Time
2.4.
1 Notify SSC of at risk students Completion of SSC survey for at risk students by at least 5 of the faculty each semester
Ongoing Admin Asst, Faculty, Dept Chair
Dept Chair SSC Time
2.4.
1 Follow SSC recommendation Notification of SSC to all faculty of recommendtions
Ongoing Admin Asst, Faculty, Dept Chair
Dept Chair SSC Time
1.1.
1 Increase utilization of HIP practices in classrooms by achieving at least 2 of the following:
Student engagement , learning, retention & success
1.1.
1 Increase faculty knowledge of HIP Presentation on HIP at Faculty Staff meeting by 4/30/20 Admin Asst, Faculty, Dept Chair
Dept Chair CELT Time
1.1.
1 Increase numbers of faculty using HIP in HTM classrooms
At least one faculty adding at least one HIP in classroom
by 4/30/20 Faculty Faculty CELT Time
2.3.
1
4.2.
1, 4
.23 Increase involvement of HTM alumni
by at least 2 of the following:Community engagement
Alumni presence on advisory board
At least one alumni as member of new HTM advisory board
4/30/20 Admin Asst, Faculty, Dept Chair
Dept Chair Alumni Time
Develop a registry of alumni Collection of contact information for at least 50 alumni
4/30/20 Admin Asst, Faculty, Dept Chair
Admin Asst Alumni Time
Engage alumni in ongoing program activities
Invite alumni to participate in at least 2 HTM activities per year
Ongoing Admin Asst, Faculty, Dept Chair
Admin Asst, Faculty, Dept Chair
Alumni Time
Enga
ging
alu
mni
(P
ost-g
radu
atio
n)En
hanc
ing
stud
ent p
rogr
essio
n (R
eten
tion)

Appendix B HTM 1st Destinations Survey
Hospitality Management FDS 2018 Bachelor Summary
Total complete responses for Hospitality Graduates: 77.8% Responses to FDA: 77.8% Continuing Ed: 0.0% Full-time: 92.9% Part-time: 7.1% Military: 0.0% Not Seeking Employment: 0.0% Seeking: 0.0% Self-Employed: 0.0% Volunteer Service: 0.0%
Employed Related to Major: 92.9% Employed Related to Career Goals: 100.0%
Satisfied with FDA: 92.9%
Employed in Indiana: 92.9% Employed in NE Indiana: 78.6%
Wage >$14: 45.5% Wage >$19: 9.1% Wage >$24: 0.0% Salary >$30,000: 100.0% Salary >$40,000: 100.0% Salary >$50,000: 33.3% Salary >$60,000: 0.0%
Accounting: 0.0% Agriculture & Natural Resources: 0.0% Architecture/Design/Urban Planning: 0.0% Arts, Media, & Entertainment: 0.0% Automotive: 0.0% Community Organizations & Non-Profit: 0.0%

Computer Science/Technology: 0.0% Consulting: 0.0% Education: 0.0% Energy/Utilities 0.0% Engineering 0.0% Environment 0.0% Finance and Insurance 0.0% Financial Services 7.1% Government & Military Services 0.0% Healthcare 0.0% Hospitality, Tourism, & Recreation 85.7% IT & Telecommunications 0.0% Law/Legal Services 0.0% Manufacturing 0.0% Marketing/Sales 0.0% Medical/Pharmaceutical/Biotechnology 7.1% Public Affairs 0.0% Real Estate 0.0% Research (Scientific/Health/Education, Etc.) 0.0% Retail 0.0% Transportation & Logistics 0.0%
On-campus Research: 0.0% Experiential Learning: 100.0%
Worked while attending: 100.0% Full-time: 57.1% Part-time: 42.9%
Employment Opportunities: 35.7% Impact on Society: 0.0% Income Potential: 35.7% Job Satisfaction: 14.3% Other: 0.0% Personal Enrichment: 7.1% Professional Prestige: 7.1% Satisfaction w/ time at PFW: 100.0% Choose PFW again: 100.0%

1
Human Services Table of Contents
Section 1: Unit Goals/Progress/Accomplishments...............................................................................22
Section 2: Evaluation and Planning Program Viability .................................................................................. 3
Human Services BS .................................................................................................................................... 3
Human Services DS ................................................................................................................................... 9
Section 3: Department Undergraduate Non-Dual Credit Hour Production ............................................... 14
Section 4: Faculty/Staff/Student Accomplishments ................................................................................... 15
Section 5: Alumni Information .................................................................................................................... 17
Section 6: Resource Allocation Request ..................................................................................................... 19
Supporting Documents .................................................................................. Error! Bookmark not defined.
Annual Program Review Data Definitions ...................................................... Error! Bookmark not defined.

2
Human Services Annual Report Department Annual Report (outline)
I. Unit Goals/Progress/Accomplishments: focus on department/program accomplishments.
II. Program Viability and Enrollment Management: includes viability metrics, departmental enrollment management plan and departmental performance toward meeting enrollment management goals (supported by enrollment management report provided by Institutional Research).
III. Faculty, Student, and Staff Accomplishments: focus on individual accomplishments that provide evidence of advancing or enhancing program quality
IV. Alumni Accomplishments V. Resource allocation recommendations
Department Annual Report (template)
Section 1: Unit Goals/Progress/Accomplishments1
In Table 1 are Unit Goals from the initial Five-Year Plan (set in 2016), and additional goals established for the current year. In addition, there are action items and provide evidence of progress.
Table 1: Progress in Accomplishing 5 Year Goals
Unit Goal2
Action Items
Evidence of Progress to Goal (performance relative
to action item)
Initial accreditation of the Human Services Department.
2018- This goal is put on hold for a year due to the transition of the department to a new college and due to the chair preparing her P&T case. In the fall of 2019, it will be addressed again.
For 2019 the CPS Dean has requested that the chair create a proposal detailing the benefits of accreditation. This proposal will then need to be approved by the VCAA.
2017- To add 22 additional internship site placements for the academic year. 2019-This goal has transitioned to maintain our current # of programs (70). This goal will be accessed each year. At this point it is an
2017- Request for another FTE faculty member with 1.00 teaching and site supervision at partnering agencies. 2017- Denied 2018- Denied 2019- Denied
2017-The department currently has 70 partnering programs (an increase of 13 programs). The national accrediting standards now state that partnering agencies must be visited at least twice a year. Our department is
1 This section does not include enrollment goals. Enrollment goals are reported in Section 2. 2 In transition prior to development of 5 year strategic plan, use USAP Yr. 1 and 2 Reports

3
efficient amount for our students yet still manageable for clinical faculty to supervise.
struggling to comply with this standard due to the amount of time it requires to visit the agencies. An additional visiting line has been requested to assist with this.
2017-To improve the pass rate for the Human Services Board Certified Practitioner Exam (HS-BCP).
2018- This is on hold due to the low pass rate. Members of our national organization are considering whether to revise the exam or eliminate it. A new national exam has been proposed. Our department will address this issue after it has been piloted or after the current exam has been revised.
2019 – This exam is still in transition at the national level and is not currently being offered through our department.
Section 2: Evaluation and Planning Program Viability Human Services BS Using Tables 2a through 2d, and additional data provided by Institutional Research, describe efforts the department is taking to improve enrollment, retention, and graduation.
Enrollment – see “Enrollment Management Goals” and “Action Items” in Table 2d for “New Majors”.
Retention – see “Enrollment Management Goals” and “Action Items” in Table 2d for goals for “Retained in Major” and “Retained at PFW”.
Graduation – see “Enrollment Management Goals” and “Action Items” in Table 2d for “Graduated in Major”.
*It should be noted that the Department of Human Services has two sets of data in this report. The first set is called Human Service D.S. This designation refers to students who have declared human services as their major, but they have not yet been accepted into the clinical program. The second set of data is titled Human Service B.S. This group of students have been accepted into the program and have begun their clinicals.

4
*Our 2019 BS numbers have decreased by 31 students. This is a direct reflection of a lower number of degree seeking students in 2018 who applied for the program. In 2018 there were 33 less students applying to the program than the previous year. Our enrollment plan addresses the actions needed to continue to improve our degree seeking students.
Table 2a – Fall Program Demand
Fall Semester Demand (New to Major)
Majors (New plus
Continuing)
Graduates
2019 27 90 2018 87 121 43 2017 3 92 51 2016 63 147 48 2015 68 132 33 2014 86 118 39
Averages 61 122 43
Table 2b: Fall Viability Metric Ratios
Fall Semester Graduation Efficiency
Student Attrition Growth Trend
2018 35.54% 09.92% * 1.500 2017 55.43% 08.70% 0.051 2016 32.65% 05.44% 1.086 2015 25.00% 12.12% 1.388 2014 33.05% 06.78% 1.593
Ratios 35.08% 08.52% 1.104

5
Our student attrition statistics for our BS students continued to be quite low.
Human Services BS (continued)
Table 2c: Fall Retention Totals
Fall
Semester
New
Majors
Total
Majors
Retained in Major
Retained in
Different Major
Graduated Stopped Out In
Major Out of Major
2019 27 90 2018 87 121 63 3 43 0 12 2017 3 92 33 0 51 0 8 2016 63 147 89 2 48 0 8 2015 68 132 83 0 33 0 16 2014 86 118 64 7 39 0 8
Summary 307 610 332 12 214 0 52
Table 2d: Enrollment Management Plan Performance (Departmentally Set Goals and Action Items. Institutional Research will provide information for Enrollment Management Performance column)
Enrollment Management Goal
Action Items Enrollment Management Performance (Fall Semester)
2014 2015 2016 2017 2018 2019 New Majors
2018-Market to area high schools and to church youth groups -Involve our student body in marketing -Sustain current marketing activities
2018-Send marketing materials in the Fall and Spring to local high schools and church youth groups -Students will be offered to be on a Human Services Marketing Committee; they will bring in a new student to meet with an advisor and learn about our program to receive co-curricular credit -To be involved with all enrollment fairs on campus and continue to speak at college fairs/high schools
86 68 63 3 87 27
Have a presence in the social
Utilize Facebook* to keep students, parents and community informed of what’s

6
media community.
going on within the department. *Our department created a Facebook page in June of 2019.
Strengthen relationships with High School Human Service Pathways that may lead into our program.
Strengthen relationships with High School Human Service Pathways instructors by offering a list of discipline expert speakers for their courses (include faculty and community partners)
Retained in Major
-Continue our high rate of retention
-Continue our supportive systemic advising practices 2019 This action item continues to be one of the top priorities of our department.
64 83 89 33 63
Continue to promote community engagement which is a factor in retention.
Continue co-curricular program within our curriculum. Provide more opportunities for student engagement with departmental faculty and staff Continue our clinical and internship program with 70 community programs in 10 counties. Continue to promote service-learning programs with our courses.
Promote reciprocal engagement
Continue to host guest speakers and community consultants in our classes. Continue having community partners conduct an ethics panel each summer with newly accepted clinical students.

7
-Continue to support and implement our Professional Mentor Program -Community Partners conduct mock interviews each summer with newly accepted clinical students.
Retained at PFW
-If a student transfers out of our program we will work with them to find another program at PFW
-We do “What Ifs” analyses and help students set up meetings with advisors in other departments 2019- We continue to follow this action.
71 83 91 33 66
Total majors
2016-Stay at 145 students or above for our total majors
-Continue supportive meetings with students and faculty in advising. 2019- We continue with this practice.
118 132 147 92 121 90
Graduated in Major
2016-Assure students are meeting the requirements for graduation
-To have all “Plan-of Studies” up to date on myBLUEprint and to discuss these with students at each advising meeting 2019- This activity is still a priority in our department.
39 33 48 51 43
Stopped Out
2016-Making sure students’ needs are met
All faculty and staff will be educated on campus and community resources 2019-This summer our department added a snack items and microwavable lunches for our students. (The lunches are donated by faculty each week). We go through 12 –15 lunches per week. -Faculty make referrals to Student Success for at –risk students as needed.
8 16 8 8 12

8
Human Services BS (continued)
Table 2e: Discussion - Use the data from Tables 2a-2c to synthesize and analyze your program's enrollment and retention performance relative to the established goals. Discuss future plans to improve program viability. Finally, describe any changes in your action plan you are making to improve performance.
A. Analysis of performance on enrollment and retention goals and retention goals relative to established goals.
o 2017- Our Department has actively worked on enrollment and retention for the last five years. According to Irah Modry-Caron, our numbers are very strong in these areas.
2019- Our department has created additional enrollment and retention goals and action items. In the early Spring of this year our peer and professional mentor again began visiting area high schools and we sent mass mailings to high schools and church youth group leaders.

9
Human Services DS Using Tables 2a through 2d, and additional data provided by Institutional Research, describe efforts the department is taking to improve enrollment, retention, and graduation.
Table 2a – Fall Program Demand
Fall Semester Demand (New to Major)
Majors (New plus
Continuing)
Graduates
2019 64 111 2018 86 102 0 2017 85 135 0 2016 72 86 1 2015 55 79 0 2014 71 100 0
Averages 74 100 0 Table 2b: Fall Viability Metric Ratios
Fall Semester Graduation Efficiency
Student Attrition Growth Trend
2018 00.00% 31.37% * 1.564 2017 00.00% 23.70% 0.714 2016 00.00% 26.74% 2.057 2015 00.00% 27.85% 0.846 2014 00.00% 27.00% 0.934
Ratios 00.00% 27.09% 1.054

10
Our student attrition for our DS freshman is much too high. We have made a concentrated effort to retain this group of students (please see goals below).
Human Services DS (continued)
Table 2c: Fall Retention Totals
Fall
Semester
New
Majors
Total
Majors
Retained in Major
Retained in
Different Major
Graduated Stopped Out In
Major Out of Major
2019 64 111 2018 86 102 47 23 0 0 32 2017 85 135 16 87 0 0 32 2016 72 86 50 12 0 1 23 2015 55 79 14 43 0 0 22 2014 71 100 24 49 0 0 27
Summary 369 502 151 214 0 1 136
Table 2d: Enrollment Management Plan Performance (Departmentally Set Goals and Action Items. Institutional Research will provide information for Enrollment Management Performance column)
Enrollment Management Goal
Action Items Enrollment Management Performance (Fall Semester)
2014 2015 2016 2017 2018 2019 New Majors
- 2018-Market to area high schools and to church youth groups -Involve our student body in marketing -Sustain current marketing activities
- 2018-Send marketing materials in the Fall and Spring to local high schools and church youth groups -Students will be offered to be on a Human Services Marketing Committee; they will bring in a new student to meet with an advisor and learn about our program to receive co-curricular credit -To be involved with all enrollment fairs on campus and continue to speak at college fairs/high schools
71 55 72 85 86 64

11
- Have a presence in the social media community.
- Utilize Facebook* to keep students, parents and community informed of what’s going on within the department. *Our department created a Facebook page in June of 2019.
Retained in Major
-Continue our high rate of retention -Work closely with Pre’s for them meet the requirements to apply to the clinical program
-Continue our supportive systemic advising practices -Meet with all students individually and as a group in February for orientation -All day orientation in July for new students 2019- We continue each of these actions.
24 14 50 16 47
Continue to promote community engagement which is a factor in retention.
-Continue co-curricular program within our curriculum. Provide more opportunities for student engagement with departmental faculty and staff Continue our clinical and internship program with 70 community programs in 10 counties. Continue to promote service learning programs with our courses.
Promote reciprocal engagement
- Continue to host guest speakers and community consultants in our classes. Continue having community partners conduct an ethics panel each summer with newly accepted clinical students. -Continue to support and implement our

12
Professional Mentor Program -Community Partners conduct mock interviews each summer with newly accepted clinical students
Retained at IPFW
-If a student transfers out of our program we will work with them to find another program at IPFW
-We do “What Ifs” analyses and help students set up meetings with advisors in other departments 2019- We continue with this practice
73 57 62 103 70
Total majors
-Stay at 80 students or above for our total majors
-Continue supportive meetings with students and faculty in advising. 2019- We continue this practice.
100 79 86 135 102 111
Graduated in Major
-N/A because these are Pre’s -Assure students are meeting the requirements for graduation
0 0 0 0 0
Stopped Out
-Making sure students’ needs are met
-All faculty and staff will be educated on campus and community resources 2019-This summer our department added a snack items and microwavable lunches for our students. (The lunches are donated by faculty each week). We go through 12 –15 lunches per week. Faculty make referrals to Student Success for at –risk students as needed.
27 22 23 32 32

13
Human Services DS (continued)
A. Analysis of performance on enrollment and retention goals and retention goals relative to established goals.
o Our Department has actively worked on enrollment and retention for the last five years. According to Irah Modry-Caron, our numbers are very strong in these areas. This is the first time we have operationalized and reported our goals. Next year’s assessment will include an analysis on the goals that we set this year.
Table 2e: Discussion - Use the data from Tables 2a-2c to synthesize and analyze your program's enrollment and retention performance relative to the established goals. Discuss future plans to improve program viability. Finally, describe any changes in your action plan you are making to improve performance.

14
Section 3: Department Undergraduate Non-Dual Credit Hour Production Discussion: Describe changes in total non-dual credit hour production for your program and the relationship of non-dual credit hour production to overall program viability. You may include a discussion of the contribution of service hours to program viability.
Fall In-Major Service Total Credit Hours Fall 2019 1133 491 1624 Fall 2018 1350 492 1842 Fall 2017 1247 532 1779 Fall 2016 1204 564 1768 Fall 2015 1063 718 1781 Fall 2014 1039 726 1765
15
Section 4: Faculty/Staff/Student Accomplishments 1. Scholarship and Creative Endeavor 2. Teaching and Learning 3. Service
A. Scholarship and Creative Endeavor
o The Human Services Department has 4.5 fulltime faculty and one visiting faculty member. Only two are required to do scholarship and creative endeavor. The majority of scholarship is included under teaching and service for our department. With that in mind, we had four published articles, three national presentations with students and one additional faculty presentation at a national conference. One faculty member mentored a student for PFW’s Student Research and Creative Endeavor Symposium.
A. Teaching and Learning
o Community Engagment – 105 agency site visits were conducted.
o
o CELT: Human Services faculty strongly engaged with CELT for assessment purposes. This past year faculty members received the following individual services from CELT: classroom observations, syllabus review, an online course design review, small group instructional diagnostics review, assistance with creating videos for online courses, and assistance in concept mapping. A faculty member earned three certificates from CELT, In addition, numerous CELT workshops were attended. One faculty member was invited to, and currently serves as a CELT Fellow and on the CELT Advisory Board.
o Scholarship of Teaching: One faculty member conducted one national presentation focused on teaching. Another faculty member presented on teaching at the regional FALCONE conference. The Department of Human Services hosted their annual capstone poster conference where seniors presented their capstone projects that they conducted at their agency placements. 121 individuals attended this conference. Three courses were revised, and all seniors were individually mentored for their senior capstone project. A half-day orientation was conducted for 51 agencies (70 programs) for community internship partners. An all-day orientation was conducted for 51 newly accepted clinical students. Four individual trainings were offered on site at agencies.
o Community Engagement: Approximately 52 community representatives assisted as guest speakers for our classes and mock interviews for our internship students. Each of these individuals partnered with our department in the education of the community’s future human service professionals. One faculty member developed a professional mentoring
16
program through the Leadership Academy. She also developed an advisory council and held monthly meetings with mentors and students.
o Training: One faculty member completed a 30 hour advanced training and residency in William Glasser’s Choice Theory.
o Advising: Faculty members advise our student organizations: Human Services Organization and Tau Upsilon Alpha. Last year faculty spent approximately 544 hours advising our students. Faculty members oversee the Department’s peer advisor and professional advisor. The Human Services Department uses an integrated systemic advising model. This model has taken several years to develop and has assisted in the department’s low attrition statistics. When a student comes in for advising they may be scheduled with a faculty advisor, peer advisor, or professional advisor. If a student needs to wait a few minutes for their appointment, staff and faculty engage them in conversation. We also start appointments for each other or bring the student into our offices and ask how their classes and internships are going. During appointments, it is common for us to pull in other faculty for assistance or to brain storm with each other on problems a student may be having. Advising evaluations frequently report that students feel supported by our department and that it feels like a big family when they come in for help. Faculty members continue to advise two student organizations, the Human Services Student Organization and the Tau Upsilon Alpha Honor Society chapter. Both of these student organizations were very active with monthly initiatives. Faculty continue to academically advise all senior. One faculty member also advises incoming freshman.
B. Service
o Human Services faculty are heavily involved with service. We serve on eleven community committees through-out Northeastern Indiana. In addition, faculty serve on 17 university committees, five college committees, and seven departmental committees. Our faculty are actively involved in fundraising, board development, assessment, organization of conferences, and educating within our services areas.
o Through their internship, our student body clocked 18,640 hours at community agencies. In addition, our students documented 748 hours in volunteer hours that were included on their co-curricular transcripts. According to Independent Sector (https://www.independentsector.org/resource/the-value-of-volunteer-time/), one cost of volunteerism is worth $24.17 per hour in the state of Indiana. Human Services students gave back $469,768. in volunteer hours to Northeastern Indiana. Several of our community partners use these figures when they write grants and submit assessment reports.
(These hours do not include faculty’s volunteer hours).

17
Section 5: Alumni Information In this section discuss how your program is contributing to the ongoing success of its graduates. Include information such as survey information (e.g. First Destinations Survey), alumni career accomplishments, employment information, and professional and graduate school enrollment
A. First Destinations Survey (2018)
o At the time of graduation 55% of our students had fulltime employment; 33% had part-time employment
29% were highly satisfied with our department and 69% were satisfied.
o o 95% of the graduates would choose PFW again
B. Employment Information
According to research completed for the Alliance of Human Services in Allen County, non-profit human service agencies are the second leading employer in Allen County with one out of every 20 workers in Allen County working in some capacity in the human service field.
o Approximately 21% of our students go to graduate school immediately following their undergraduate studies.
o We have 219 members on our Facebook Alumni Association group
Approximately 121 open positions were shared on this Facebook page this past year
o Our graduates fulfill numerous positions in our community agencies. Presently, we have graduates who work at the following agencies:
Park Center, Adams Memorial Hospital, Wellspring, Scan, Center for Nonviolence, Mustard Seed, Women’s Bureau, IPFW (four different departments), Aging and In-Home Services, Department of Child Services, Boys and Girls Club, Saving Lives and Changing the World House, Bowen Center, Brightpoint, Cornerstone Youth Center, Children First Center, Whittington Home, Caring About People, Children’s Autism Center, United Way, Lutheran Social Services, Northeastern Center, Lifeline Youth and Family Services, Youth Services Bureau, Hope House, YWCA, Blue Jacket, Oaklawn Psychiatric Center, Benchmark, Center for Neurobehavioral Services, Guardianship Services, Rogers Memorial Hospital Psychiatric Unit, Crime Victim Care, Crossroad Child and Family Services, Saint Anne’s, AMANI, ResCare Youth Center, Beaman Home, Parkview Behavioral Health, VA Hospital, Adams Community Schools, Erin’s House, Substance Abuse Counseling, MLK Montessori, Allen County Probation, Catholic Charities, Easterseals Arc, Englewood Health and Rehabilitation Center, Urban League, Heartland

18
Hospice, Heritage of Fort Wayne, Turnstone, and Victim Assistance /Fort Wayne Police Department

19
Section 6: Resource Allocation Request Please use the section below to discuss resources needed to help meet departmental and enrollment management goals. Describe the specific projected uses of those funds and your plan for evaluating the effectiveness of the requested resources in helping reach departmental and enrollment management goals.
Resources: Our peer advisor is funded through monies from the Chancellor, Work Study and DCS monies. will be funded through Work Study and our S & E allocation. We are not requesting additional monies at this time. We are also requesting that our visiting faculty line be changed to a clinical faculty line. This request has been submitted through the Dean’s office.

1
Public Policy Table of Contents Section 1: Unit Goals/Progress/Accomplishments ...................................................................................... 2
Section 2: Evaluation and Planning Program Viability .................................................................................. 3
Environmental Policy BSPA ....................................................................................................................... 3
Health Services Admin BSPA ..................................................................................................................... 6
Public Affairs BSPA .................................................................................................................................... 9
Public Affairs - Criminal Justice BSPA ...................................................................................................... 12
Public Affairs - Healthcare Management BSPA ....................................................................................... 15
Public Affairs - Law & Public Policy BSPA ................................................................................................ 18
Public Management BSPA ....................................................................................................................... 21
Pre Public Affairs Bachelor ND ................................................................................................................ 24
Section 3: Department Undergraduate Non-Dual Credit Hour Production ............................................... 27
Section 4: Faculty/Staff/Student Accomplishments ................................................................................... 28
Section 5: Alumni Information .................................................................................................................... 29
Section 6: Resource Allocation Request ..................................................................................................... 30
Supporting Documents ............................................................................................................................... 31
Annual Program Review Data Definitions ................................................................................................... 32

2
Public Policy Annual Report Department Annual Report (outline)
I. Unit Goals/Progress/Accomplishments: focus on department/program accomplishments.
II. Program Viability and Enrollment Management: includes viability metrics, departmental enrollment management plan and departmental performance toward meeting enrollment management goals (supported by enrollment management report provided by Institutional Research).
III. Faculty, Student, and Staff Accomplishments: focus on individual accomplishments that provide evidence of advancing or enhancing program quality
IV. Alumni Accomplishments V. Resource allocation recommendations
Department Annual Report (template)
Section 1: Unit Goals/Progress/Accomplishments1
In Table 1 list Unit Goals from the Five Year Plan and additional goals established for the current year, describe actions implemented to help achieve goals, and provide evidence of how the actions taken contribute to goal achievement.
Table 1: Progress in Accomplishing 5 Year Goals
Unit Goal2
Action Items
Evidence of Progress to Goal
(performance relative to action item)
Strengthen Community Advisory Board
• Revise CAB schedule • Identify roles and goals for
CAB
• 1:1 meetings held with numerous stakeholders
• Monthly CAB meetings held — May have been too frequent
Review undergraduate curricula
• Health Care and Criminal Justice curricula to be revised by middle of Spring 2020
• National standards reviewed
• Community/market needs identified
Strengthen internship programs
• Hired internship
coordinator as LTL position
Review graduate program • Meetings with DCS 1 This section does not include enrollment goals. Enrollment goals are reported in Section 2. 2 In transition prior to development of 5 year strategic plan, use USAP Yr. 1 and 2 Reports

3
• Discussion among faculty • Input from students and
CAB Review degree, program, major, concentration alignment.
• Determine appropriate classification for Criminal Justice, Healthcare Management, and Law & Public Policy.
Section 2: Evaluation and Planning Program Viability Environmental Policy BSPA Using Tables 2a through 2d, and additional data provided by Institutional Research, describe efforts the department is taking to improve enrollment, retention, and graduation.
Table 2a – Fall Program Demand
Fall Semester Demand (New to Major)
Majors (New plus
Continuing)
Graduates
2019 2018 0 1 1 2017 0 9 7 2016 12 24 12 2015 9 22 5 2014 8 23 6
Averages 6 16 6
Table 2b: Fall Viability Metric Ratios
Fall Semester Graduation Efficiency
Student Attrition Growth Trend
2018 100.00% 00.00% 0.000 2017 77.78% 11.11% 0.000 2016 50.00% 12.50% 0.800 2015 22.73% 18.18% 0.900 2014 21.74% 13.04% 0.889
Ratios 37.97% 13.92% 0.674

4
Environmental Policy BSPA (continued)
Table 2c: Fall Retention Totals
Fall
Semester
New
Majors
Total
Majors
Retained in Major
Retained in
Different Major
Graduated Stopped Out In
Major Out of Major
2019 2018 0 1 0 0 1 0 0 2017 0 9 1 0 7 0 1 2016 12 24 9 0 12 0 3 2015 9 22 12 1 5 0 4 2014 8 23 13 1 5 1 3
Summary 29 79 35 2 30 1 11
Table 2d: Enrollment Management Plan Performance (Departmentally Set Goals and Action Items. Institutional Research will provide information for Enrollment Management Performance column)
Enrollment Management Goal
Action Items Enrollment Management Performance (Fall Semester)
2014 2015 2016 2017 2018 2019 New Majors
0 None. This concentration has been closed.
8 9 12 0 0
Retained in Major
0 13 12 9 1 0
Retained at IPFW
0 14 13 9 1 0
Total majors
0 23 22 24 9 1
Graduated in Major
0 5 5 12 7 1
Stopped Out
0 3 4 3 1 0

5
Environmental Policy BSPA (continued)
Table 2e: Discussion - Use the data from Tables 2a-2c to synthesize and analyze your program's enrollment and retention performance relative to the established goals. Discuss future plans to improve program viability. Finally, describe any changes in your action plan you are making to improve performance.
This concentration has been closed and is not accepting new students.

6
Health Services Admin BSPA Using Tables 2a through 2d, and additional data provided by Institutional Research, describe efforts the department is taking to improve enrollment, retention, and graduation.
Table 2a – Fall Program Demand
Fall Semester Demand (New to Major)
Majors (New plus
Continuing)
Graduates
2019 5 14 2018 14 32 15 2017 18 47 21 2016 32 73 32 2015 37 75 21 2014 25 75 28
Averages 25 60 23
Table 2b: Fall Viability Metric Ratios
Fall Semester Graduation Efficiency
Student Attrition Growth Trend
2018 46.88% 18.75% 0.609 2017 44.68% 08.51% 0.621 2016 43.84% 16.44% 0.727 2015 28.00% 14.67% 1.088 2014 37.33% 08.00% 0.676
Ratios 38.74% 12.91% 0.754

7
Health Services Admin BSPA (continued)
Table 2c: Fall Retention Totals
Fall
Semester
New
Majors
Total
Majors
Retained in Major
Retained in
Different Major
Graduated Stopped Out In
Major Out of Major
2019 5 14 2018 14 32 9 2 15 0 6 2017 18 47 18 4 21 0 4 2016 32 73 29 0 32 0 12 2015 37 75 41 2 21 0 11 2014 25 75 38 3 28 0 6
Summary 126 302 135 11 117 0 39
Table 2d: Enrollment Management Plan Performance (Departmentally Set Goals and Action Items. Institutional Research will provide information for Enrollment Management Performance column)
Enrollment Management Goal
Action Items Enrollment Management Performance (Fall Semester)
2014 2015 2016 2017 2018 2019 New Majors
0 This concentration has been replaced by Healthcare Management BSPA. See below.
25 37 32 18 14 5
Retained in Major
4 38 41 29 18 9
Retained at IPFW
5 41 43 29 22 11
Total majors
5 75 75 73 47 32 14
Graduated in Major
10 28 21 32 21 15
Stopped Out
0 6 11 12 4 6

8
Health Services Admin BSPA (continued)
Table 2e: Discussion - Use the data from Tables 2a-2c to synthesize and analyze your program's enrollment and retention performance relative to the established goals. Discuss future plans to improve program viability. Finally, describe any changes in your action plan you are making to improve performance.
This concentration has been reconfigured as the “Public Affairs - Healthcare Management BSPA.” It is unclear why there are new majors listed for 2019. Numbers will continue to drop as students graduate or change to the newer option. See “Public Affairs - Healthcare Management BSPA”below for details.

9
Public Affairs BSPA Using Tables 2a through 2d, and additional data provided by Institutional Research, describe efforts the department is taking to improve enrollment, retention, and graduation.
Table 2a – Fall Program Demand
Fall Semester Demand (New to Major)
Majors (New plus
Continuing)
Graduates
2019 5 5 2018 6 6 0 2017 2016 2015 2014
Averages 6 6 0
Table 2b: Fall Viability Metric Ratios
Fall Semester Graduation Efficiency
Student Attrition Growth Trend
2018 00.00% 66.67% 1.500 2017 2016 2015 2014
Ratios 00.00% 66.67% 1.500

10
Public Affairs BSPA (continued)
Table 2c: Fall Retention Totals
Fall
Semester
New
Majors
Total
Majors
Retained in Major
Retained in
Different Major
Graduated Stopped Out In
Major Out of Major
2019 5 5 2018 6 6 2 0 0 0 4 2017 2016 2015 2014
Summary 6 6 2 0 0 0 4
Table 2d: Enrollment Management Plan Performance (Departmentally Set Goals and Action Items. Institutional Research will provide information for Enrollment Management Performance column)
Enrollment Management Goal
Action Items Enrollment Management Performance (Fall Semester)
2014 2015 2016 2017 2018 2019 New Majors
5 6 5
Retained in Major
0 2
Retained at IPFW
5 2
Total majors
5 6 5
Graduated in Major
0 0
Stopped Out
2 4

11
Public Affairs BSPA (continued)
Table 2e: Discussion - Use the data from Tables 2a-2c to synthesize and analyze your program's enrollment and retention performance relative to the established goals. Discuss future plans to improve program viability. Finally, describe any changes in your action plan you are making to improve performance.
This code is used for students who have chosen Public Affairs BSPA as their degree program but who have not yet chosen a concentration (among Criminal Justice, Healthcare Management, and Law and Public Policy). We will continue to register students for this program when they first enroll in the Department, but will then advise them into specific concentrations.
Regular department and college practices are in place to help retain these new students, either within the department or at least at Purdue Fort Wayne. These practices include faculty collaborating with advisors, monitoring student attendance, and an introduction to public policy course.

12
Public Affairs - Criminal Justice BSPA Using Tables 2a through 2d, and additional data provided by Institutional Research, describe efforts the department is taking to improve enrollment, retention, and graduation.
Table 2a – Fall Program Demand
Fall Semester Demand (New to Major)
Majors (New plus
Continuing)
Graduates
2019 74 144 2018 74 142 28 2017 68 137 35 2016 78 162 40 2015 63 165 39 2014 74 194 43
Averages 71 160 37
Table 2b: Fall Viability Metric Ratios
Fall Semester Graduation Efficiency
Student Attrition Growth Trend
2018 19.72% 28.17% 1.014 2017 25.55% 20.44% 0.986 2016 24.07% 27.78% 0.839 2015 23.64% 21.21% 0.768 2014 22.16% 20.10% 0.804
Ratios 23.00% 23.38% 0.873

13
Public Affairs - Criminal Justice BSPA (continued)
Table 2c: Fall Retention Totals
Fall
Semester
New
Majors
Total
Majors
Retained in Major
Retained in
Different Major
Graduated Stopped Out In
Major Out of Major
2019 74 144 2018 74 142 69 5 28 0 40 2017 68 137 68 6 35 0 28 2016 78 162 68 9 39 1 45 2015 63 165 83 8 39 0 35 2014 74 194 102 10 43 0 39
Summary 357 800 390 38 184 1 187
Table 2d: Enrollment Management Plan Performance (Departmentally Set Goals and Action Items. Institutional Research will provide information for Enrollment Management Performance column)
Enrollment Management Goal
Action Items Enrollment Management Performance (Fall Semester)
2014 2015 2016 2017 2018 2019 New Majors
75 Revise website to be more engaging.
74 63 78 68 74 74
Retained in Major
75 Increase internship opportunities. Faculty and advisors collaborate to identify struggling students.
102 83 68 68 69
Retained at IPFW
85 112 91 77 74 74
Total majors
149 194 165 162 137 142 144
Graduated in Major
28 43 39 39 35 28
Stopped Out
30 39 35 45 28 40

14
Public Affairs - Criminal Justice BSPA (continued)
Table 2e: Discussion - Use the data from Tables 2a-2c to synthesize and analyze your program's enrollment and retention performance relative to the established goals. Discuss future plans to improve program viability. Finally, describe any changes in your action plan you are making to improve performance.
The number of students enrolled in Public Affairs – Criminal Justice has declined steadily for several years. The goal for Fall 2020 is to stop this decline by maintaining the number of admitted students while increasing the number of retained students.
The program will undergo a curriculum redesign in Spring 2020 to better attract new students and retain current students. We changed the sequence of courses, in particular a statistics-based course that had proven to be challenging for underclassmen. We have also reached out to local criminal justice employers to build community familiarity with the program.
In addition, the Department has made a goal to attract students from across campus to its Criminal Justice courses. The department has renamed courses to make them more appealing and emphasize the practical nature of the courses, and it has decided to offer several special interest courses. The result is that the number of students taking Public Policy courses, especially Criminal Justice courses, has increased year-to-year for Spring 2020 even though the number of students majoring in the program has not increased (and maybe has even declined).

15
Public Affairs - Healthcare Management BSPA Using Tables 2a through 2d, and additional data provided by Institutional Research, describe efforts the department is taking to improve enrollment, retention, and graduation.
Table 2a – Fall Program Demand
Fall Semester Demand (New to Major)
Majors (New plus
Continuing)
Graduates
2019 9 15 2018 11 12 0 2017 2016 2015 2014
Averages 11 12 0
Table 2b: Fall Viability Metric Ratios
Fall Semester Graduation Efficiency
Student Attrition Growth Trend
2018 00.00% 25.00% 1.571 2017 2016 2015 2014
Ratios 00.00% 25.00% 1.571

16
Public Affairs - Healthcare Management BSPA (continued)
Table 2c: Fall Retention Totals
Fall
Semester
New
Majors
Total
Majors
Retained in Major
Retained in
Different Major
Graduated Stopped Out In
Major Out of Major
2019 9 15 2018 11 12 5 4 0 0 3 2017 2016 2015 2014
Summary 11 12 5 4 0 0 3
Table 2d: Enrollment Management Plan Performance (Departmentally Set Goals and Action Items. Institutional Research will provide information for Enrollment Management Performance column)
Enrollment Management Goal
Action Items Enrollment Management Performance (Fall Semester)
2014 2015 2016 2017 2018 2019 New Majors
10 Send cards to each accepted applicant.
11 9
Retained in Major
10 5
Retained at IPFW
13 9
Total majors
20 12 15
Graduated in Major
0 0
Stopped Out
2 3
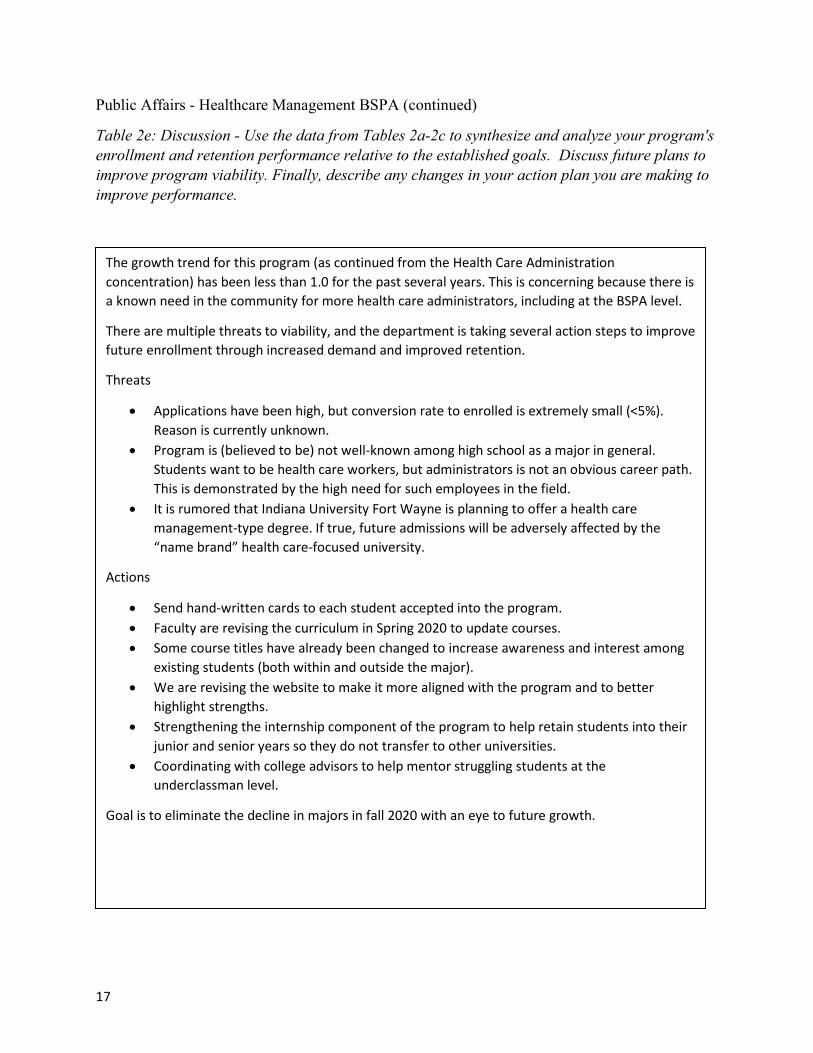
17
Public Affairs - Healthcare Management BSPA (continued)
Table 2e: Discussion - Use the data from Tables 2a-2c to synthesize and analyze your program's enrollment and retention performance relative to the established goals. Discuss future plans to improve program viability. Finally, describe any changes in your action plan you are making to improve performance.
The growth trend for this program (as continued from the Health Care Administration concentration) has been less than 1.0 for the past several years. This is concerning because there is a known need in the community for more health care administrators, including at the BSPA level.
There are multiple threats to viability, and the department is taking several action steps to improve future enrollment through increased demand and improved retention.
Threats
• Applications have been high, but conversion rate to enrolled is extremely small (<5%). Reason is currently unknown.
• Program is (believed to be) not well-known among high school as a major in general. Students want to be health care workers, but administrators is not an obvious career path. This is demonstrated by the high need for such employees in the field.
• It is rumored that Indiana University Fort Wayne is planning to offer a health care management-type degree. If true, future admissions will be adversely affected by the “name brand” health care-focused university.
Actions
• Send hand-written cards to each student accepted into the program. • Faculty are revising the curriculum in Spring 2020 to update courses. • Some course titles have already been changed to increase awareness and interest among
existing students (both within and outside the major). • We are revising the website to make it more aligned with the program and to better
highlight strengths. • Strengthening the internship component of the program to help retain students into their
junior and senior years so they do not transfer to other universities. • Coordinating with college advisors to help mentor struggling students at the
underclassman level.
Goal is to eliminate the decline in majors in fall 2020 with an eye to future growth.

18
Public Affairs - Law & Public Policy BSPA Using Tables 2a through 2d, and additional data provided by Institutional Research, describe efforts the department is taking to improve enrollment, retention, and graduation.
Table 2a – Fall Program Demand
Fall Semester Demand (New to Major)
Majors (New plus
Continuing)
Graduates
2019 9 16 2018 10 16 5 2017 1 13 7 2016 11 24 5 2015 10 24 5 2014 14 25 3
Averages 9 20 5
Table 2b: Fall Viability Metric Ratios
Fall Semester Graduation Efficiency
Student Attrition Growth Trend
2018 31.25% 25.00% 1.111 2017 46.15% 00.00% 0.167 2016 20.83% 16.67% 1.000 2015 20.83% 08.33% 0.909 2014 12.00% 28.00% 1.167
Ratios 23.53% 16.67% 0.939

19
Public Affairs - Law & Public Policy BSPA (continued)
Table 2c: Fall Retention Totals
Fall
Semester
New
Majors
Total
Majors
Retained in Major
Retained in
Different Major
Graduated Stopped Out In
Major Out of Major
2019 9 16 2018 10 16 7 0 5 0 4 2017 1 13 6 0 6 1 0 2016 11 24 13 2 5 0 4 2015 10 24 13 4 5 0 2 2014 14 25 13 2 3 0 7
Summary 46 102 52 8 24 1 17
Table 2d: Enrollment Management Plan Performance (Departmentally Set Goals and Action Items. Institutional Research will provide information for Enrollment Management Performance column)
Enrollment Management Goal
Action Items Enrollment Management Performance (Fall Semester)
2014 2015 2016 2017 2018 2019 New Majors
10 14 10 11 1 10 9
Retained in Major
7 13 13 13 6 7
Retained at IPFW
8 15 17 15 6 7
Total majors
17 25 24 24 13 16 16
Graduated in Major
5 3 5 5 6 5
Stopped Out
3 7 2 4 0 4

20
Public Affairs - Law & Public Policy BSPA (continued)
Table 2e: Discussion - Use the data from Tables 2a-2c to synthesize and analyze your program's enrollment and retention performance relative to the established goals. Discuss future plans to improve program viability. Finally, describe any changes in your action plan you are making to improve performance.
Last year, faculty voted to suspend advertising this program, but it has not been discontinued. We are redesigning the curriculum and the changing how we present the program to students. That will be reviewed in Spring 2020 to launch the new program in Fall 2020.

21
Public Management BSPA Using Tables 2a through 2d, and additional data provided by Institutional Research, describe efforts the department is taking to improve enrollment, retention, and graduation.
Table 2a – Fall Program Demand
Fall Semester Demand (New to Major)
Majors (New plus
Continuing)
Graduates
2019 2018 0 2 2 2017 0 5 2 2016 6 11 4 2015 7 12 5 2014 5 19 8
Averages 4 10 4
Table 2b: Fall Viability Metric Ratios
Fall Semester Graduation Efficiency
Student Attrition Growth Trend
2018 100.00% 00.00% 0.000 2017 40.00% 20.00% 0.000 2016 36.36% 09.09% 1.000 2015 41.67% 08.33% 1.000 2014 36.84% 21.05% 0.385
Ratios 40.82% 14.29% 0.581

22
Public Management BSPA (continued)
Table 2c: Fall Retention Totals
Fall
Semester
New
Majors
Total
Majors
Retained in Major
Retained in
Different Major
Graduated Stopped Out In
Major Out of Major
2019 2018 0 2 0 0 2 0 0 2017 0 5 2 0 2 0 1 2016 6 11 5 1 4 0 1 2015 7 12 5 1 5 0 1 2014 5 19 5 2 7 1 4
Summary 18 49 17 4 20 1 7
Table 2d: Enrollment Management Plan Performance (Departmentally Set Goals and Action Items. Institutional Research will provide information for Enrollment Management Performance column)
Enrollment Management Goal
Action Items Enrollment Management Performance (Fall Semester)
2014 2015 2016 2017 2018 2019 New Majors
This program has been eliminated.
5 7 6 0 0
Retained in Major
5 5 5 2 0
Retained at IPFW
7 6 6 2 0
Total majors
19 12 11 5 2
Graduated in Major
7 5 4 2 2
Stopped Out
4 1 1 1 0

23
Public Management BSPA (continued)
Table 2e: Discussion - Use the data from Tables 2a-2c to synthesize and analyze your program's enrollment and retention performance relative to the established goals. Discuss future plans to improve program viability. Finally, describe any changes in your action plan you are making to improve performance.
This program has been eliminated.

24
Pre Public Affairs Bachelor ND Using Tables 2a through 2d, and additional data provided by Institutional Research, describe efforts the department is taking to improve enrollment, retention, and graduation.
Table 2a – Fall Program Demand
Fall Semester Demand (New to Major)
Majors (New plus
Continuing)
Graduates
2019 0 1 2018 2 3 0 2017 9 11 0 2016 11 11 0 2015 8 12 0 2014 25 28 0
Averages 11 13 0
Table 2b: Fall Viability Metric Ratios
Fall Semester Graduation Efficiency
Student Attrition Growth Trend
2018 00.00% 00.00% 1.000 2017 00.00% 54.55% 0.900 2016 00.00% 27.27% 1.222 2015 00.00% 50.00% 0.667 2014 00.00% 35.71% 1.042
Ratios 00.00% 38.46% 0.965

25
Pre Public Affairs Bachelor ND (continued)
Table 2c: Fall Retention Totals
Fall
Semester
New
Majors
Total
Majors
Retained in Major
Retained in
Different Major
Graduated Stopped Out In
Major Out of Major
2019 0 1 2018 2 3 1 2 0 0 0 2017 9 11 1 4 0 0 6 2016 11 11 2 6 0 0 3 2015 8 12 0 6 0 0 6 2014 25 28 4 14 0 0 10
Summary 55 65 8 32 0 0 25
Table 2d: Enrollment Management Plan Performance (Departmentally Set Goals and Action Items. Institutional Research will provide information for Enrollment Management Performance column)
Enrollment Management Goal
Action Items Enrollment Management Performance (Fall Semester)
2014 2015 2016 2017 2018 2019 New Majors
This program has been eliminated.
25 8 11 9 2 0
Retained in Major
4 0 2 1 1
Retained at IPFW
18 6 8 5 3
Total majors
28 12 11 11 3 1
Graduated in Major
0 0 0 0 0
Stopped Out
10 6 3 6 0

26
Pre Public Affairs Bachelor ND (continued)
Table 2e: Discussion - Use the data from Tables 2a-2c to synthesize and analyze your program's enrollment and retention performance relative to the established goals. Discuss future plans to improve program viability. Finally, describe any changes in your action plan you are making to improve performance.
This program has been eliminated.

27
Section 3: Department Undergraduate Non-Dual Credit Hour Production Discussion: Describe changes in total non-dual credit hour production for your program and the relationship of non-dual credit hour production to overall program viability. You may include a discussion of the contribution of service hours to program viability.
Fall In-Major Service Total Credit Hours Fall 2019 1173 387 1560 Fall 2018 1167 450 1617 Fall 2017 1389 408 1797 Fall 2016 1976 450 2426 Fall 2015 1896 582 2478 Fall 2014 2094 624 2718
As enrollment by majors has declined (student headcount), so has the number of credit hours delivered. However, in spring 2020, we project a sharp increase in credit hours delivered by at least 10%. This is due to an increase in service hours provided to students across campus. We have re-titled several courses and are offering special interest topics such as courses in Cybersecurity and Crime Scene Investigation. These changes have already demonstrated a short-term impact on participation in courses within the department. We believe that if the changes are incorporated in external recruiting to potential applicants that they will have a similar impact on attracting new students to the major at Purdue Fort Wayne.

28
Section 4: Faculty/Staff/Student Accomplishments 1. Scholarship and Creative Endeavor 2. Teaching and Learning 3. Service
29
Section 5: Alumni Information In this section discuss how your program is contributing to the ongoing success of its graduates. Include information such as survey information (e.g. First Destinations Survey), alumni career accomplishments, employment information, and professional and graduate school enrollment

30
Section 6: Resource Allocation Request Please use the section below to discuss resources needed to help meet departmental and enrollment management goals. Describe the specific projected uses of those funds and your plan for evaluating the effectiveness of the requested resources in helping reach departmental and enrollment management goals.

31
Supporting Documents 1. 5 Year Strategic Plan for Unit (produced at last program review). For programs
transitioning to the new Program Review Process, the two USAP reports (or, a unit strategic plan developed for the period) should be included.
2. Enrollment Management Plan: The enrollment management plan should include targets for: a. total students enrolled in program, b. new students in the program defined as an annual cohort (i.e. defines cohort as
students accepted into program in current academic year), c. retention within cohort, d. aggregate retention for majors, e. progress toward degree, and
3. First Destinations Survey (Career Services) 4. Alumni Survey (5 Year) – recommended as future requirement for all programs

32
Annual Program Review Data Definitions The Annual Program Review document uses two data sources. The New Majors, Total Majors, Retained In and Out of Major, Stop-out, and Student Attrition measures are derived from the Office of Institutional Research Census data files. The Graduated measure is derived from Banner’s degree awarded tables. The viability metric ratios, Graduation Efficiency and Growth Trend, use a combination of the two data sources.
Table 2a – Fall Program Demand
Program demand data is defined by the number of new students to a major or concentration, the total number of majors or concentrations, and number of graduates per academic year.
1. Demand a. The number of students who are new to the major in a given fall semester either as first
year students or as returning students who have changed their major. The number of students where identified by their first or second declared major.
2. Majors a. The total number of students who declared a major in a given fall semester. This is the
sum of new and continuing students. The number of students where identified by their first or second declared major.
3. Graduates a. The number of students who graduate in a given major or concentration in a given
academic year. The number of students where identified by the first or second major on their degree.
Table 2b: Fall Viability Metric Ratios
1. Graduation Efficiency a. The number of students who graduated in major divided by the number of majors. Since
graduation efficiency measure is calculated using values in Table 2a and Table 2c, the graduation efficiency measure accounts for students first and/or second major.
2. Student Attrition a. The number of students who stop out (are not retained at PFW) divided by the number
of majors or concentration. 3. Growth Trend
a. The sum of the number of students entering major or concentration divided by the number of students graduating, changing a new major, or stopping-out. In the situation where the denominator is zero, the simply the number of majors is reported.

33
Table 2c: Fall Retention Totals
1. New Majors a. The number of students who are new to the major in a given fall semester either as first
year students or as returning students who changed their major. 2. Total Majors
a. The total number of students who declared a major in a given fall semester. This is the sum of new and continuing students.
3. Retained in Major a. The number of students who were retained at the University in a given fall semester to
the next academic year’s Fall semester. For example, the Fall 2015 retained in major number shows the number of majors who returned in Fall 2016 in the same major.
4. Retained in Different Major a. The number of students who were retained at the University in a given fall semester to
the next academic year’s Fall semester. For example, Fall 2015 retained in different major number shows the number of majors who returned in Fall 2016 in a different major.
5. Graduated a. In Major
i. The number of students who earned a degree in an academic year. Determining whether someone graduated in major is based on the comparison of a student’s fall major against major(s) on their degree awarded.
b. Out of Major i. The number of students who earned a degree in an academic year. Determining
whether someone graduated out of major is based on the comparison of a student’s fall major against major(s) on their degree awarded.
6. Stop Out a. The number of students who did not return to the University in the next academic year’s
Fall semester. For example, the Fall 2015 stop-out number shows the number of majors who did not return to the University in Fall 2016.

1
College of Arts and Sciences
2019 Annual College Report
28 February 2020 Prepared by Ronald S. Friedman, Interim Dean
I. Enrollment, Programs, Centers of Excellence
ENROLLMENT: As in past years, one of the primary concerns of the College of Arts and
Sciences is enrollment, both in the numbers of majors and in total credit hour production. Appendix
1 compares the numbers of majors in the Fall 2019 and Fall 2018 semesters for both undergraduate
and graduate programs in the units of the College. Although the numbers of majors decreased by
147 (5.8%), it is noteworthy that if the General Studies decrease of 181 majors is removed from
the picture, then the number of COAS majors increased by 34. In particular, significant increases
(>10%) in new majors include:
• Anthropology & Sociology by 10.7%
• Communication Sciences & Disorders by 14.1%
• Mathematics by 32.5%
• Political Sciences by 17.3%
Graduate programs see an increase of 11 students (10.8%) with English & Linguistics (27.3%),
Communication (13.6%), and Mathematics (12.5%) responsible for the increases.
A comparison of credit hour production from Fall 2019 and Fall 2018 appears in Appendix 2. The
departmental credit hours from IUFW students are not included. We see that the College decreased
by 1148 credit hours, a 2.34% decrease. However, noticeable increases (>10%) occurred in
Communication Sciences & Disorders (21.9%) and Political Science (17.9%).
PROGRAMS: New concentrations, minors or other program developments were initiated in
2019. These include:
• BIO: ongoing creation of an agriculture certificate
• CHM: new option to obtain AS degree using CHM 333 (biochem lecture) + 335
(biochem lab)
• COM:
➢ Graduate Certificate in Health Communication approved
➢ drafting a new Communication Consulting Certificate
• CSD: graduate program in speech-language pathology in approval pipeline
• ENG:
➢ new digital literacy concentration
➢ TENL certificate will become embedded as concentrations within B.A. program
and in the B.S. Ed degree
• GEN STUDIES:

2
➢ Beginning Fall 2020, two new concentrations will be added to the BAS degree:
Information Systems and in Information Technology.
➢ Articulation agreements signed with Macomb Community College (MI),
Schoolcraft College (MI), Washtenaw Community College (MI), and Northwest
State Community College (OH).
• HIST: initiation of a World History series
• ILCS:
➢ proposal for restructuring degrees at the Faculty Senate level: Part of new degree
plan includes a track created in partnership with the Business School
➢ Agreement made with the IU Fort Wayne Nursing program to be one of only
three approved minors for nurses. Course approval is running through Curriculog
and course will be offered Summer 2020.
➢ Creation of summer program in Granada (Spain). Proposal approved, intense
promotion campaign done in Fall 2019 and January 2020 and the first group of
students will go in summer 2020 led by ILCS faculty.
• MATH: Actuarial Minor launched in Fall 19
• PHYS: Astronomy and Astrophysics concentration
• PSY: Certificate in Behavior Analysis & Techniques was approved and launched in Fall
2019. Approval for new Certificate in Death Education is in progress.
• SOC/ANTHRO:
➢ The Anthropology Program developed a partnership with RESCOM
Environmental Corporation in conjunction with the development of a Certificate
in Cultural Resource Management.
➢ The Sociology Program began its online BA in Sociology.
Several departments completed their program reviews in 2019 (ILCS, MATH, PHYS) and several
are nearing completion with administrative feedback needed to complete the processes (BIO,
ENG, HIST). Wes still await a late departmental draft from POLS.
CENTERS OF EXCELLENCE: Detailed activities from the Centers of Excellence can be found
in Appendix 3.
• The Environmental Resources Center (ERC) promotes the understanding and
conservation of natural resources through research, education and outreach. The ERC had
an active year in terms of research, educational opportunities and community engagement.
A variety of basic and applied research projects are underway, principally with Biology
faculty and students. The Center is now headquartered in the Printing/Warehouse Building.
The former occupants vacated in January, with renovations in February and events started
happening in the largely empty building in March. Over the rest of the year the conditioned,
west end of the building was furnished by purchasing or acquiring new and used furniture,
supported largely by donations from private individuals and foundation match.
Negotiations were begun to bring in US Geological Survey as an anchor tenant.
• The Institute for Holocaust and Genocide Studies promotes public awareness of the
Holocaust and other genocides worldwide; encourages and supports scholarship, research,

3
and teaching at Purdue University Fort Wayne (PFW) about the Holocaust and genocide;
and promotes public participation in efforts both to confront contemporary genocide as it
occurs, and to engage in global genocide prevention efforts. They enjoyed another
successful year, partnering with academic units, community partners, and national
organizations to promote local initiatives and bring well-attended programs to the campus
and community.
• The Mike Downs Center for Indiana Politics is a nonpartisan organization that helps
people understand the role of politics and government in their daily lives. It does this by
informing people and giving them the tools they need to participate, improving life for all.
The Mike Downs Center for Indiana Politics continued to contribute to PFW’s engagement
with our region and beyond in 2019.
• The Center for Social Research conducts social, demographic and applied research at the
local, regional and state level. The Center provided presentations at four public events and
two presentations to an NSF peer learning group and is organizing a number of
conferences. The Center Director completed a countywide community household mailed
needs assessment for Peabody Public Library and is currently completing the report for the
project.
• The Center for Applied Mathematics and Statistics promotes, conducts, and
disseminates research in applied mathematics and statistics and strengthens the educational
mission of the Department of Mathematical Sciences by providing guidance and research
opportunities for undergraduate and graduate students. The Center was engaged in a
number of projects in 2019 and some are continuing into 2020. The national
exposure enhances CAMS reputation and contributes to its mission to serve as an
intellectual quantitative hub in the Fort Wayne metropolitan area that bridges the expertise
of the faculty with the local industry needs.
• The Center for Collaborative Media at PFW is a home for the development for creative
projects and research. Media have become a central part of the modern human experience.
They hope to educate students and colleagues about the skills of crafting media content
while also bringing them the opportunity to put those skills to use. This is a center for
potential and pragmatism where critical thinking, creative crafting, and practical skills will
be blended in harmony with one another. The Center was engaged in a number or projects
recently, including the re-establishment of College Television on our campus and the
$150,000 of annual grant funds it brings in.
• Research from the Center for Marine Conservation & Biology produced 11 reviewed
quality papers in top journals 2018-2020 which had 2 PFW faculty and 9 PFW MS biology
students as coauthors. In the area of service, the Center Director continues to serve on the
board of directors of a major international society (ISTS) and also serves as president of
the NGO The Leatherback Trust which supports organizations and projects around the
world to save and conserve marine life. In this capacity, he was awarded a Disney
Conservation Fellow grant and status. Numerous grants were obtained. They also have
developed a new Concentration in Biology: Marine Biology.

4
II. Budgetary Matters: Positions and Resource Requests
Positions: New faculty joined COAS in the capacities of
• Assistant Professors (An, Bergeson, Legg, Palu, Perkins, Selvitella, Sturm Wilkerson)
• Clinical Assistant Professor (Mankey)
• Clinical Associate Professor (Francis)
• Continuing Lecturer (Shannon)
• Visiting Assistant Professors (Hampton-Farmer, Olejniczak, Waly)
• Visiting Instructor (Sutherland)
Multiple new COAS staff also joined the College (Adams, Gregory, Heath, Horrell, Knott, Merritt,
Powell, Randall, Stewart, Theisen, Thomas).
Four faculty served as interim/acting chairpersons of COAS departments (Bischoff, Anderson,
Kracher, Toole).
Approved searches currently being undertaken include two tenure-track (CSD), one visiting
clinical (CSD), four visiting assistant professors (BIO, CHM, PSY, PHYS) and one lecturer (BIO).
Seven currently visiting assistant professors were renewed and will be returning for the next
academic year.
Resource Requests: Details for recurring and nonrecurring items will be supplied as part of the
budgeting process (including infrastructure and lab equipment as well as faculty lines). Some
items that are College priorities include:
• Tenure track faculty lines: Numerous COAS faculty lines have been recently lost as
detailed in the 2017 and 2018 College reports. It will be critical for the success of the
College (and therefore the University) that upcoming requests for faculty lines be given
serious consideration for approval. Two that were of high COAS priority last year were
positions in PHYS and MATH that are currently filled with visiting assistant professors
and which should be given serious consideration for conversion to TT lines.
• Marketing: With the recent loss of Molly Papier and David Fenker and the COAS
Marketing Team, it will be imperative for the success of College marketing efforts that a
mechanism be developed for campus prioritization of College marketing needs and
requests. The College is fortunate to have an excellent student-worker for social media;
however, a dedicated full-time marketing position will be invaluable to produce assets
promoting majors within the College.
• Cross-referencing: With the removal of Banner 8, the ability to cross-reference courses will
be lost. Cross-referencing is essential to recruitment and enrollment efforts in
interdisciplinary programs and, as such, a mechanism needs to be found that can serve the
function of cross-referencing.
• Space: Multiple units have indicated a significant need for additional office and/or research
space. For example, once its graduate program is established, CSD will need more research

5
space. The College is watching closely what happens with movement into Park 3000 of
some units on campus and cascading availability of space for COAS units.
• Advisory Boards and Alumni: A limited number of COAS departments have a Community
Advisory Board (CAB). Financial assistance from the College or campus should be
provided to encourage the creation and active involvement of a CAB in the ‘life’ of the
department. Furthermore, departments will also be encouraged to undertake frequent
alumni surveys which can have multiple possible repercussions such as yielding alumni
success stories to help in recruitment efforts. Resources might need to be provided for such
an activity.
• Undergraduate Research Support: Participation of undergraduate students in faculty
research efforts is strong in the College but support must be increased to sustain the level
of participation; the support can be in the form of travel supports or departmental
infrastructure.
III. College Initiatives
COAS Restructuring: Clearly, the largest issue looming over the College will be its possible
restructuring. Proposals have been solicited from College faculty and will be discussed at
upcoming COAS Council meetings.
START: This program was developed by Dean Link’s office in the summer of 2017, was launched
in September 2017, and had its first awardees conducting projects in 2018; a second cohort
undertook projects in 2019. START funds opportunities that support research, development, and
community-building projects in which our faculty and students work directly with our community.
The projects were
• “Fort Wayne Daisies: A Public History Project” led by Drs. Weiner, Livschiz and Wooley;
• “Improving Parent-Child Interactions in Families with Court-Ordered Visitations” led by
Dr. Lundy;
• “A Synergistic Approach to Addressing Environmental Waste” led by Dr. Tippmann;
• “The Punch/CCM Non-Profit Advocacy Project” led by Dr. Herbig;
• “Introducing Fort Wayne to its Local Bat Community” led by Dr. Bergeson;
• “Social, Cultural and Psychological Factors Associated with Resilience and Recovery
from Traumatic Injuries in the Elderly” led by Dr. Odden.
Learning2: This program was also developed by Dean Link’s office in the summer of 2017 and is
designed to create innovative, interdisciplinary courses within the college. The first of these was
offered last spring by Dr. Gurevich (CSD) and Dr. Bugel (ILCS). The cross-listed courses in the
catalog, with 18 total students enrolled, were
• CSD 41900-01 Language accents and perceptions
• SPAN 49500-02 Language accents and perceptions

6
Strategic Planning: The College Strategic Planning process began in the fall of 2018. The
leadership team for the COAS Strategic Plan (Laurie Corbin, Charlene Elsby, Ron Friedman, Julie
Hook, Curt Hosier, Bruce Kingsbury, Carol Lawton, Mark Masters, and Richard Weiner)
identified four critical themes that have arisen from various focus group discussions. These themes
included (i) promoting the value of a liberal arts education while marketing the College and
increasing the sense of cohesiveness within the College; (ii) facilitating innovation in College
curricula and programming including interdisciplinary learning and globalization; (iii) celebrating
and rewarding the success of students, faculty and staff within the College including making
positive strides in recruitment and retention efforts; and (iv) enhancing community engagement
such as experiential learning activities in the community. A survey was undertaken concerning
the importance of these themes to COAS faculty and results appear in Appendix 4.
Due to discussions of restructuring of COAS and the possibility of it being divided into two
College units, the COAS strategic planning process has been placed on hold.
Board Development: The College of Arts and Sciences Community Advisory Board, currently
composed of 10 board members, has been active with two meetings a year since its inception.
Donations are being cultivated and lively discussions concerning such issues as foreign language
requirements and an addictions counseling certificate have occurred. The Board has also been
informed of the possible COAS restructuring. Minutes from COAS Advisory Board meetings are
available upon request.
Degree+: The recently approved Degree+ proposal (to take effect Fall 2020) removes the College-
level requirements (Speech class, Technical Writing, Foreign language) from those students
pursuing a BS degree in one of the College’s departments at the same time as a BS degree in many
of the other College units on campus. The jury is still out as to how this will affect recruitment and
retention.
Recruitment & Retention Grants: In 2019, the following COS grants were awarded:
• General Studies “Keep Going” Initiative - $500 – Nov 2019
• ILCS “Summer Study in Granada Program: Recruiting Spanish Majors/Minors through
Study Abroad” - $300 – Oct 2019
• Biology “Biology Success Lunch Workshop” - $500 – Feb 2019
• Biology “Be a Biology Major for a Day” - $400 – Feb 2019
IV. Faculty/departmental Accomplishments
Research productivity: College faculty had another productive year with totals of 11 books, 9
book chapters, 112 articles, 245+ presentations and 70+ poems. The breakdown by individual
departments is shown in Appendix 5.
External grants: Acquisition of external funds was also robust. In 2019 a total of 16 new grants
were accepted for a total of $632,606.29; particularly noteworthy were the grants awarded to Drs.

7
Jordan Marshall, Steven Stevenson, and Jeannie DiClementi. Appendix 6 shows in detail the
COAS External Support.
Promotion and Tenure Recipients:
• Troy Bassett (English & Linguistics) – Professor of English
• Mieko Yamada (Anthropology & Sociology) – Professor of Sociology
• Jaiyanth Daniel (Biology) – Associate Professor of Biology
• Michelle Kearl (Communication) – Associate Professor of Communication
Departmental annual reports detail individual faculty accomplishments, as well as that of students
and alumni. A few departmental accomplishments to highlight include:
• BIO: formed a Community Advisory Board
• COM: obtained approval from City Council and Mayor for return of CATV to PFW
• CSD:
➢ began using electronic health records system in Fall 2019
➢ Dr. Betz was awarded the College Advising Award
• ENG:
➢ organized and participated in Fall 2019 UNESCO Indigenous Year of Languages
Conference
➢ Ongoing efforts with Mawlamyine University in Myanmar (Burma) and Bangkok
will promote faculty/student exchanges and opportunities for authentic Practicum
venues.
➢ In partnership with the Three Rivers Language Center, the TENL Program is
working on an MOU with Mawlamyine University in Myanmar. Also working with
Sister Cities on the project.
• HIST:
➢ Annual Undergraduate History Conference: History majors presented their
research at the department’s 11th Annual Undergraduate History Conference,
which took place on Saturday 11 February 2019 and consisted of three panels and
eleven papers.
➢ Deanna Wooley was awarded the Regional Engagement Award.
• MATH:
➢ Actuarial program received 4-exam classification by Society of Actuaries
➢ Hosted following conferences at PFW:
❖ Midwest Workshop on Asymptotic Analysis, October 4-6, 2019
❖ Data Science Week, December 4-6, 2019
• PHYS: Dr. Masters was awarded Featured Faculty for Teaching in Spring 2019.
• POLS:

8
➢ Students attended 2019 American National Model United Nations conference
➢ Dr. Janet Badia (WOST), Distinguished Lecturer, College of Arts and Sciences,
Spring 2019
• PSY: large number of students assisting in faculty labs and included as co-authors of
presentations at Midwestern Psychological Association meeting.
V. Student Advising and Success
Appendix 7 provides a complete report from the COAS Student Success Center (SSC). The
highlights are provided below.
During the course of the year, we changed the advising structure to adjust to changing demands
for advising. We transitioned our Lead Advisor to Assistant Director and the Psychology Advisor
to Social Sciences Advisor.
Our advising team participated in a variety of professional development activities. The highlights
included a BIOL Advisor presenting at the national NACADA annual conference and the Assistant
Director, BIOL Advisor, and PSY Advisor completing the HR Supervise for Success.
A variety of student advising services were offered and we participated in a range of recruitment
and retention events. The COAS SSC leadership holds monthly lead advisor meetings for Faculty
Lead advisors and Primary Role advisors. They also provide myBluePrint and NSO trainings for
faculty and staff.
Appendix 7 gives a detailed list of events in which members of the COAS SSC were engaged. It
is clear that the hard work and initiatives of the COAS SSC are crucial to the recruitment, retention
and advising efforts and successes of the College.
SSC continues coordinating and supporting the following student advising services: Admission
Don Days, Probation Intervention Program, End of Semester Processes, New Student Orientation,
entry advising for transfer, re-entry, and re-admit students, and College Enrollment Management.
Graduation clearance is also coordinated through the main college office.
New this year was the addition of the Pre-professional Studies coordination. The SSC Assistant
Director has been developing and coordinating pre-professional advising, promotion, and
development for the whole campus.
Managing the USAP teach out continues as we are entering the last phase of the process. Details
can be found in Appendix 7.
Departmental annual reports detail recruitment and retention efforts of the individual units. We
have increased the number of COAS departments that offer a freshman
resource/success/orientation course (BIO, CHM, CSD, ENGL, PHYS, PSY, and POLS). Plans are
underway for the remaining departments to offer these classes.

9
VI. College Marketing
Appendix 8 provides an account of the successes of the COAS “Marketing Team”. As indicated
above, the one student worker does an excellent job but there is a real need for a dedicated
marketing professional for the College.
Some highlights from last year are the following.
On April 24, 2019, Juliana Russell was hired by the college as a marketing intern and has been
working to improve the social media presence of the college. After getting on-boarded and up to
speed on all of the marketing standards as well as trained in the website maintenance software,
Juliana has created a marketing calendar, soliciting information from all of the departments to
advertise not only their department-level and student events, but also to celebrate the
accomplishments of faculty and staff as well as other university-wide programs.
See the appendix please for details.
VII. COAS Goals
In the 2019 College annual report the following goals were listed. Comments in red reflect
assessment of the goal.
• Keeping momentum going forward on advising, recruiting and student success efforts.
Individual departments in their annual reports reflect on advising, recruitment and retention
initiatives, as well as student and alumni accomplishments. Section V and Appendix 7
provide details on the efforts of the COAS Student Success Center which leads advising
efforts in the College.
• Sustaining and improving the visibility of the COAS through active marketing and public
relations activities.
The COAS social media intern has done a very good job marketing and advertising COAS
programs though a dedicated person within COAS would make this much more effective.
The intern’s report is contained in Section VI and Appendix 8.
• Developing and offering new degree programs and new packagings (such as Degree+
which will necessitate a resolution of the ‘college requirements’ issue)
Program developments are specified in Section I. Degree+ has now been approved to start
Fall 2020; we eagerly await word of how this will affect recruitment.
• Sustaining, increasing and promoting faculty productivity
Faculty productivity is highlighted in Section IV. Departmental annual reports provide
accomplishments of individual faculty members.
• Keeping momentum going with the COAS Community Advisory Board

10
As lifted from Section III. The College of Arts and Sciences Community Advisory Board,
currently composed of 10 board members, has been active with two meetings a year since
its inception. Donations are being cultivated and lively discussions concerning such issues
as foreign language requirements and an addictions counseling certificate have occurred.
The Board has also been informed of the possible COAS restructuring. Minutes from
COAS Advisory Board meetings are available upon request.
The narrative in Sections I to VI above details some of the current and future initiatives of the
College and its units. We can broadly classify the 2020 COAS goals, which include the same goals
as 2019 plus several more, as:
• Reaching a solution/resolution/decision on COAS restructuring and whether it will split
into two college units; this will play as a major factor in how the following occurs:
➢ Search for permanent Dean(s)
• Keeping momentum going forward on advising, recruiting and student success efforts.
• Sustaining and improving the visibility of the COAS through active marketing and public
relations activities.
• Developing and offering new degree programs and new packagings (such as Degree+
which will necessitate a resolution of the ‘college requirements’ issue)
• Sustaining, increasing and promoting faculty productivity
• Keeping momentum going with the COAS Community Advisory Board
• Continuing the charge of creation of articulation agreements with in- and out- of state two-
year colleges, with an emphasis on the BSAS and BGS degrees

APPENDIX 1 – MAJORS
Program (Undergraduate) Fall 2018 Fall 2019 Change
Anthro & Soc 75 83 +8
Biology 443 431 −12
Chemistry 108 98 −10
Communication 184 164 −20
CSD 99 113 +14
English/Linguistics 169 177 +8
General Studies 721 540 −181
History 105 110 +5
IDIS 17 13 −4
ILCS 46 30 −16
Math 80 106 +26
Physics 66 63 −3
Political Science 104 122 +18
Psychology 312 332 +20
TOTALS 2529 2382 −147
Program (Graduate) Fall 2018 Fall 2019 Change
Biology 34 33 −1
Communication 22 25 +3
English/Linguistics 22 28 +6
Math 24 27 +3
TOTALS 102 113 +11

APPENDIX 2 – CREDIT HOURS BY DEPARTMENT
(Note: The following numbers do not include IU students taking PFW courses.)
Fall 18 Fall 19 Change
Anthropology and Sociology 3240 2631 −609
Biology 4247.5 3829 −418
Chemistry 2578 2460 −118
Communication 4611 4663 +52
CSD 1125 1371 +246
English and Linguistics 9856 9195 −661
History 2442 2421 −21
Interdisciplinary Studies 514 518 +4
Intl Language and Cul Studies 2502 2416 −86
Mathematical Sciences 9310 9369 +59
Physics 2882 2843 −39
Political Science 1566 1847 +281
Psychology 4224 4387 +163
TOTAL 49,075.5 47,950 −1,148

APPENDIX 3 – CENTERS OF EXCELLENCE
The mission of the Environmental Resources Center (ERC) is to promote the understanding and conservation of natural resources through research, education and outreach. The ERC had another
active year of activities supporting its mission. Basic and applied research projects are underway,
principally with Biology faculty and students. The second annual Conservation Conversation
occurred in April and the attendance and participants doubled to about 200. Of major importance
in 2019 was moving the ERC into the old Printing/Warehouse Building. The former occupants
vacated in January, renovations in February and events started happening in the largely empty
building in March. Over the rest of the year the conditioned, west end of the building was furnished
by purchasing or acquiring new and used furniture, supported largely by donations from private
individuals and foundation match. Negotiations were begun to bring in US Geological Survey as
an anchor tenant. Samantha Theisen was hired in July to be the Sustainability Coordinator for the
campus.
The Institute for Holocaust and Genocide Studies (pfw.edu/ihgs) promotes public awareness of
the Holocaust and other genocides worldwide; encourages and supports scholarship, research, and
teaching at Purdue University Fort Wayne (PFW) about the Holocaust and genocide; and promotes
public participation in efforts both to confront contemporary genocide as it occurs, and to engage
in global genocide prevention efforts. We have enjoyed another successful year, partnering with
academic units, community partners, and national organizations to promote local initiatives and
bring well-attended programs to the campus and community. These included the following:
In February, the Institute helped broker the donation of a series of original high-resolution
photographs and negatives taken by the U.S. Signal Corps to the U.S. Holocaust Memorial
Museum. The Institute helped scan some of these images in collaboration with Helmke Library.
We also partnered with a grassroots community group, Hands Across Fort Wayne, to bring
together local and national scholars for a day-long series of events on Nazi Germany and Jim Crow
segregation. The event was underwritten by the U.S. Holocaust Memorial Museum’s national
campus outreach program, and featured two scholars from the Museum. Other panel participants
include Wendy Soltz, Director of the Indiana Jewish Historical Society; and Richard Pierce,
Associate Professor of History and author of _Polite Protest: The Political Economy of Race in
Indianapolis (Indiana U P, 2005).
In April, the Indiana University Center for the Study of the Middle East invited the Institute to join
an inaugural working group devoted to initiating a curriculum development project on Genocide
in the Middle East. We also organized a panel at the Honors Center on hate crimes legislation in
Indiana, right after the Indiana General Assembly stripped SB 12 of language that would have
addressed violence and other acts targeting individuals based on who they are, rather than
politicizing protections based on ideological beliefs. The panel featured House minority leader
Phil GiaQuinta, Tim Harmon of the Journal Gazette, and Dr. Christine Erickson. Finally, at the
end of April, I worked with Dr. Soltz to deliver an invited lecture on the Holocaust in popular
culture at the CANDLES Museum in Kokomo.
In May, the Institute partnered with the community organizations to help with holding an annual
Yom Hashoah commemoration at the Temple. Later that month, we partnered with Echoes and

Reflections, a three-way partnership between the Anti-Defamation League, the University of
Southern California, and Yad Vashem to deliver a teacher training symposium that brought the
ADL’s Deputy Project Director Melissa Mott to Fort Wayne.
In September, the Institute was instrumental in bringing an annual Diversity Awards ceremony to
the Purdue Fort Wayne campus. This event brings together various social service and local
government organizations to celebrate the accomplishments of immigrants and refugees, as well
as their contributions to the local community.
Finally, in December and on behalf of the Institute, I attended the second USHMM Leadership
Summit at the U of Nebraska Omaha in December. The first Summit, held at the U.S. Holocaust
Memorial Museum in DC, served as the genesis for the Midwest Consortium on Citizenship and
Human Rights. I now serve as Secretary for the national organization, and PFW hosts its mailing
list. At the meeting, I also convened interested academic centers to begin discussing the formation
of the Midwest Consortium.
The Institute continues to encounter significant turnover in our staff. Our education outreach
coordinator Cody Fuelling graduated and our Visiting Assistant Director, Benjamin Kearl, stepped
down from his position. However, University Research and Innovation generously agreed to fund
a graduate research assistantship, housed in Communication, that supports the Institute. We hired
Theresa Green, a graduate student in Public Policy. She will graduate in May, although we have
tentative assurance that URI will renew this position for next year.
We continue to study the results of the survey conducted last year of area Holocaust educators and
their teaching needs. We are using the results to tailor our resources and offer targeted
programming to interested educators.
We initiated a new student group on campus that is an affiliate of the national student-led
movement STAND, United to End Genocide (endgenocide.org). Unfortunately, once Cody
graduated, the group became inactive. However, restarting that group on our campus is a priority
for 2020.
For the coming year, other events besides the Summit that we are planning include the following:
We will convene a newly formed academic advisory board for the Institute.
In January, we will host a panel on the crisis in Hong Kong that discusses international human
rights violations occurring there.
We currently are communicating with both the U.S. Holocaust Memorial Museum Mandel Center
for Advanced Holocaust Study and the Simon-Skjodt Center for the Prevention of Genocide
regarding Holocaust education in Burma. This occurred as a result of Shannon Bischoff’s efforts
to involve the Institute in developing various agreements with Burmese universities.

In April, the Indiana University Center for the Study of the Middle East once again has involved
the Institute continue working on a curriculum development project on Genocide in the Middle
East.
We have scheduled a teacher training workshop on 15 June, once again in partnership with Echoes
and Reflections. We also have partnered with Congregation Achduth Vesholom to offer a series
of concurrent workshops featuring local expertise on the Holocaust.
As a result of the $5000 START grant we received from COAS, we have begun planning to involve
students this summer in the development of an Indiana-focused website on Holocaust education
that will target area teachers. This project already has received generous funding from the Salon
Foundation.
Finally, as a result of the $24,000 grant the Institute received from Islamic Relief USA in 2018,
we have made steady progress toward building the regional Midwest Consortium on Citizenship
and Human Rights. The academic centers involved with this initiative continue to meet, and we
have set our next meeting for September 2020. The Institute has partnered with the University of
Minnesota to hold this meeting in Minneapolis.
The Mike Downs Center for Indiana Politics revised its mission statement in 2019.
Mission Statement: The Mike Downs Center for Indiana Politics is a nonpartisan organization that
helps people understand the role of politics and government in their daily lives. It does this by
informing people and giving them the tools they need to participate, improving life for all.
The Mike Downs Center for Indiana Politics continued to contribute to PFW’s engagement with
our region and beyond in 2019. Specifically, the Mike Downs Center:
• Participated in, or moderated, eight panel discussions. Three of them aired on WBOI.
• Was invited to give 13 public talks on a variety of topics.
• Was interviewed more than 145 times. Approximately 53% of the interviews were with
media outlets outside of northeast Indiana including:
• CBSN (2 times)
• Governing
• Indy Star (20+ times)
• Politifact
• Reuters
• Roll Call
• Stateline (Pew Charitable Trusts
• Vox
• Washington Post
• Worked with Fort Wayne Community Schools and Riverfront Fort Wayne on public
opinion research projects
• Is working with the Community Research Institute and the Greater Fort Wayne Community
Foundation on public opinion research project
• Is working with the Downtown Improvement District on stakeholder input strategy
• Consulted several candidates for public office. It has become more challenging to keep
track of how many and success rates because the MDCfIP is being asked to take part in
group consultation activities.
• Co-sponsored the Mayoral Forum on Quality of Life with Arts United, PBS39, and the
Community Foundation of Greater Fort Wayne
The principle mission of the Center for Social Research is to conduct and advance social,
demographic and applied research at the local, regional and state level. The Center is organizing
an International Conference on US and China Social and Economic Progress. International
scholars from five Chinese Provinces are expected to attend, as well as scholars from the US. PFW
Students and PFW faculty are anticipated conference attendees. The Center for Social Research is
currently organizing the Indiana SAS Users Group (INSUG) Meeting with Ely Lilly employees
from the Indianapolis area. The INSUG conference will host a nationally renowned keynote
presentation from SAS, Inc. The Center Director provided presentations at 4 public events and two
presentations to the NSF peer learning group with Dr. Josué Libii’s working group. The Center
Director provided a detailed project report and a series of presentations to Dr. Josué Libii and his
research team on his NSF funded project. The Center Director completed a countywide community
household mailed needs assessment for Peabody Public Library and is currently completing the
report for the project. A new evidence-based program evaluation is underway and will continue
through Fall 2020. Several new student employees will be hired to assist with the project. The
Center director will host 3 data analytic training events in Spring 2020.
The Center for Applied Mathematics and Statistics strives to promote, conduct,
and disseminate research in applied mathematics and statistics and to strengthen the
educational mission of the Department of Mathematical Sciences by providing guidance and
research opportunities for undergraduate and graduate students. In 2019 the Center for Applied
Mathematics and Statistics (CAMS) completed a multi-year project work with a local tech
company VisionMenu Inc., featured in an Automotive News press release:
https://www.autonews.com/fi-press-release/vision-dealer-solutions-visionmenu-inc-and-purdue-
university-fort-wayne-announce In December 2019 the two partners have initiated a new project to
utilize data science techniques for optimization of product positioning. CAMS graduate research
assistants, Xiao Yuan and Bryan Melchert, presented their research at the 2019 Women in
Statistics and Data Science conference in Seattle, WA and the 2019 International Conference on
Statistical Distributions and Applications in Grand Rapids, MI respectively. The national
exposure enhances CAMS reputation and contributes to its mission to serve as an intellectual
quantitative hub in the Fort Wayne metropolitan area that bridges the expertise of the faculty with
the local industry needs.
The Center for Collaborative Media at PFW is a home for the development for creative projects
and research. Media have become a central part of the modern human experience. We hope to
educate students and colleagues about the skills of crafting media content while also bringing them
the opportunity to put those skills to use. This is a center for potential and pragmatism where
critical thinking, creative crafting, and practical skills will be blended in harmony with one another.

Over the Past Year We Have:
• Began re-establishing College Television on our campus including the $150,000 of annual
grant funds it brings
• Established a College Consortium partnership with Ivy Tech
• Worked on the first ever hybrid video/text Special Section of the Annenberg Foundation
sponsored International Journal of Communication
• Built a public partnership with Cinema Center and hosted three public discussions of the
impact of film in our local community
• Oversaw a wildly successful Hobnobben Film Festival and helped pull Cinema Center back
from crippling debt
• Built a Partnership with the Central States Communication Association to create the
Inclusive Spaces Project
• Won the National Communication Association Advancing the Discipline Grant
• Facilitated a course in the Communication Department that allowed students to work with
Punch Films, the City of Fort Wayne, One Lucky Guitar, and Fort Wayne Parks &
Recreation Department in order to better understand marketing campaigns and working
with clients.
• Did an interview on Cinema Center partnership on WBOI
Center for Marine Conservation & Biology
ANNUAL/ACTIVITY REPORT
FOR THE PERIOD FROM November 15, 2018 to January. 31, 2020
Submitted by Frank V. Paladino Ph. D. Center for Excellence Director
SUMMARY
Research from the center produced 11 reviewed quality papers in top journals 2018-2020 which
had 2 PFW faculty and 9 PFW MS biology students as coauthors. The Center graduated one Ph.D.
Student and former PFW MS student, Chelsea Clyde Brockway from Purdue University West
Lafayette program in Wildlife Biology. Chelsea is currently a Visiting Assistant Professor at
Whittier College in California. The Center also graduated 6 PFW MS students, Ian Silver-Gorges,
Adam Yaney-Keller, Jenell Black, Emily Mettler, Callie Veelenturf, and Quinton Bergman:
Ian – in a Ph.D. program at Florida State University
Adam – Field Manager Costa Rican Sea Turtle in Costa Rica
Jenell – Lab Coordinator at Drexel University
Emily – Field Assistant Purdue University, soon to be Ph D. Student University of Hawaii

Callie – National Geographic Society Research Fellow working in Panama
Quinton – Marine Turtle Biologist Florida Department of Natural Resources
All are doing well and successful right out of our MS program. An MS graduate Lindsay McKenna,
who graduated in 2018, was featured in a BBC Nature Special discussing her PFW research on
communication in hatchling sea turtles which has aired on the Animal Channel and Animal Planet.
The Center obtained 7 grants funded through PFW totaling $159,000. In the area of service,
Paladino continues to serve on the board of directors of a major international society (ISTS) and
also serves as president of the NGO The Leatherback Trust which supports organizations and
projects around the world to save and conserve marine life. In this capacity, Paladino was awarded
a Disney Conservation Fellow grant and status. There are 4 currently active graduate students
listed below from PFW and one doctoral student from The University of Costa Rica. A new
concentration in Marine Biology has been approved by the Biology Department and is now being
processed through the COAS and University approval system.
1. Research
Publications:
Santidrián Tomillo, P., L. G. Fonseca, M. Ward, N. Tankersley, N. J. Robinson, C. M.
Orrego, F. V. Paladino, V. S. Saba. 2020. The impacts of extreme El Niño events on sea
turtle nesting populations. Climatic Change https://doi.org/10.1007/s10584-020-02658-w
Clyde-Brockway, C., Robinson, N.J., Blanco, G.S., Morreale, S.J., Spotila, J.R.,
Santidrián Tomillo, P. and Paladino, F.V. 2019. Local variation in the internesting
behavior of green turtles in the Gulf of Papagayo, Costa Rica. Chelonian Conservation
Biology 18 (2)217-230.
L. N. McKenna, Frank V. Paladino, P. Santidrian Tomillo, and N. J. Robinson. 2019.
Do Sea Turtles Vocalize to Synchronize Hatching or Nest Emergence? Copeia 107, No. 1,
2019, 120–123
Robinson, N.J., D Anders, S Bachoo, L. Harris, G.R. Hughes, D. Kotze, S. Maduray, S.
MCCue, M. Meyer, H. Oosthuizen, F. V. Paladino, P. Luschi. 2019. SATELLITE
TRACKING OF LEATHERBACK AND LOGGERHEAD SEA TURTLES ON THE
SOUTHEAST AFRICAN COASTLINE. Indian Ocean Turtle Newsletter No. 28: 3-7
Adam Yaney-Keller & F. V. Paladino 2019. Using Unmanned Aerial Systems (UAS) to
assay mangrove estuaries on the Pacific coast of Costa Rica. PlosOne June 5, 2019
https://doi.org/10.1371/journal.pone.0217310
Emily Mettler, C. Clyde-Brockway, S. Honarvar &, F. V. Paladino. 2019. Newly
Discovered migratory corridor and foraging ground for Atlantic green turtles, Chelonia

mydas, nesting on Bioko Island, Equatorial Guinea. PlosOne 14(6):e0213231
https://doi.org/10.1371/journal.pone.0213231
Price, J., B. Drye, R. Domangue, & F. V. Paladino. 2018. Exploring the role of artificial
lighting on Loggerhead turtle (Caretta Caretta) nest-site selection & hatchling
disorientation. Herptol.Conser. & Biol. 13(2)415-422.
Swiggs, J., F.V. Paladino, J.R. Spotila, P. Santidrian-Tomillo. 2018. Depth of the drying
front and temperature affect emergence of leatherback turtle hatchlings from the nest.
Marine Biology (2018)165:91 https://doi.org/10.1007/s00227-018-3350-y
Cruz, L. M., G. Shillinger, N. Robinson, P. Santidrian-Tomillo, & F.V. Paladino. 2018.
Effect of light intensity and wavelength on the in-water orientation of Olive ridley turtle
hatchlings. J. Exp. Mar. Biol. Ecol. 505:(2018)52-56
Rees, A.F., L. Avens, K Balloran, E. Bevan, A.C. Broderick, R. Carthy, M. Christianen,
M. Heithaus, D. Johnson, J. Mangel, F. Paladino, K. Pendoley, R. Reina, N. Robinson,
R. Ryan, S. Sykora-Bodie, D. Tilley, M. Varela, E. Whitman, P. Whittlock, T. Wibbels, B.
Godley. 2018. The potential of unmanned aerial systems for sea turtle research and
conservation: a review and future directions. Endangered Species Research 35:81-
100(2018) DOI: https://doi.org/10.3354/esr0087
Farlow,J.O., N. J. Robinson, C. J. Kumigai, F. V. Paladino, P. Falkingham, R. Elsey,
& A. Martin. 2018: Trackways of the American Crocodile (Crocodylus acutus) in
Northwestern Costa Rica: Implications for Crocodylian Ichnology. Ichnos: DOI:
1080/10420940.2017.1350856
Grants:
1. Paladino, F.V. 2020 The demographics of juvenile sea turtles in Magdalena bay, Costa
Rica Fort Wayne Children’s Zoo Conservation grant $10,500
2. Mary Margaret Stucky Foundation $3,000 Sea Turtle Research
3. Paladino, F.V. 2019. Sonoma County Community Foundation Grant. Sea turtle
community conservation program in El Jobo, Costa Rica $25,000
4. Paladino, F. V. 2019. Population ecology of Leatherbacks and other sea turtles in
Costa Rica. $55,000 Awarded to The Leatherback Trust
5. Earthwatch Center for Field Studies Grant. 2019-2020 $53,000
6. Paladino. F.V. 2018-19. Pippert Research Scholar Award. $5,000
7. Paladino, F.V. 2018-9. US Embassy in Equatorial Guinea USAID Conservation
Education Grant $7500.
Current Graduate Students:
Laura St Andrews (RA) PFW-Toxic Metals in Bahamian and USA Coastal Marine turtle species,

Alison Meeth (TA): PFW- Migrations of Bioko Leatherback Turtles
Carly Cornhill (TA) PFW- Movements of juvenile sea turtles using sonic telemetry in Bajia
Magdalina, Santa Rosa Park Costa Rica
Natalia Libreros Marin (TA) Thesis topic to be determined
Maike Heidemeyer: Ph. D. Student through the University of Costa Rica where F. Paladino holds
an Adjunct appointment. Thesis: Migrations & Behaviors of adult & Juvenile Green and
Hawksbill turtles in El Jobo Bay Costa Rica
2. TEACHING
A. Developed and submitted for COAS approval a new Concentration in Biology : Marine
Biology Documentation and approval in Biology minutes
B. Created and had approved a new Center of Academic Excellence in Marine
Conservation & Biology. Center has an RA attached to the approval along with one
course load reduction per semester.
C. Spring 2019 Intro to Marine Biology BIOL 14000 (3 CR) and Marine Community
Ecology BIOL 43400 (3 CR)
3. Service and Outreach
A. Served as Past President and Board Member to the International Sea Turtle Society
B. Served as President of NGO The Leatherback Trust a not for profit that works around
the world to conserve and study sea turtles
C. Board member Equipo Tora Carey, a Costa Rican NGO helping artisanal fishermen
develop conservation practices and sustainable fisheries
D. Disney Conservation Felowship and Grant
E. Popular Articles published in Fort Wayne Magazine and Journal Gazette are attached
4. Short Term Planning: goals, needs and challenges
The Center has plans to continue collaborations with Ben Dattilo to finalize the Marine Biology
Concentration and Program. The center will continue to seek out and solicit grants to support
the research of undergraduate and graduate students.

APPENDIX 4 – COLLEGE STRATEGIC PLANNING
Summary of Results of Survey on COAS Strategic Planning
Data collected April 2019; number of respondents = 48
Themes for COAS Strategic Planning
The tables below show issues for strategic planning that were rated as “Important” or “Very
Important” by at least two-thirds of respondents.
COAS Identity & Function Important Very
Important
How to promote the value of a liberal arts (all
three areas) education
8.33% 77.08%
How to market the College
33.33% 54.17%
How to grow leadership within the College and
ensure that leadership is effective
31.25% 45.83%
How to increase a sense of community and
cohesion within COAS
14.58% 66.67%
How to increase diversity and inclusiveness of the
College as a whole
29.17% 43.75%
Programmatic Innovation Important Very
Important
How to facilitate interdisciplinary learning (cross-
discipline courses and majors)
37.50% 35.42%
How to promote globalization in COAS
programming
31.25% 37.50%
How to increase diversity and inclusiveness of
COAS programming
38.30% 31.91%
Celebrating & Rewarding Success Important Very
Important
How to increase new admits; possibility of
expanding adult/returning student population 25.00% 52.08%
How to increase diversity of COAS students
37.50% 29.17%
How to help struggling students
27.08% 56.25%
How to establish a metric to better reflect
accomplishments of COAS grads 39.58% 37.50%

How to increase respect for all faculty (not just
tenured/tenure-track)
31.25% 47.92%
Enhancing Community Engagement Important Very
Important
How to increase outreach to the community
31.25% 37.50%
In response to whether there are additional issues important to consider: Promoting research was
mentioned several times.
Mission and Goals Statements from Other Colleges of Arts & Sciences
The two mission statements that appeared to resonate most with respondents were:
"The mission of the College of Arts and Sciences is to foster knowledge and curiosity for lifelong
learning, strategies to flourish in the face of challenges, and skills to contribute positively to the
community. The College promotes an integrated education in the arts, humanities, social and
natural sciences. The College provides a foundation for creative, critical thinking with a dynamic
curriculum in order to prepare students to thrive in an ever-changing world. The College facilitates
faculty engagement in creative and scholarly activities in collaboration with students. Faculty and
students serve and enrich regional, national and international communities through vibrant artistic
and research programs, as well as civic and educational partnerships." (Eastern Michigan
University)
"The College of Arts and Sciences provides students a broad liberal education that is both rich in
tradition and responsive to an ever-changing world. Reflecting a core principle of liberal education,
students within the college have the opportunity to participate in the acquisition, development, and
synthesis of knowledge within and across diverse academic disciplines. Through these processes,
students develop habits of inquiry and reflection beneficial to all stages of life and career. These
characteristics form the foundation of productive and responsible citizenship in a diverse and
increasingly complex and globalized world. Students deepen this foundation, honing their abilities
to think critically, communicate effectively, apply quantitative and qualitative reasoning,
appreciate diversity, understand the natural and human world, and develop creative and informed
solutions to current and future challenges. Students have the opportunity within and outside the
classroom to enrich and expand their liberal educations through unique curricular experiences that
advance intellectual growth. Students are challenged to integrate knowledge across disciplines,
expand their experiences as local and global citizens, and engage in the production of scholarship
and creative activity." (COAS Requirements Working Group, December 2015.)
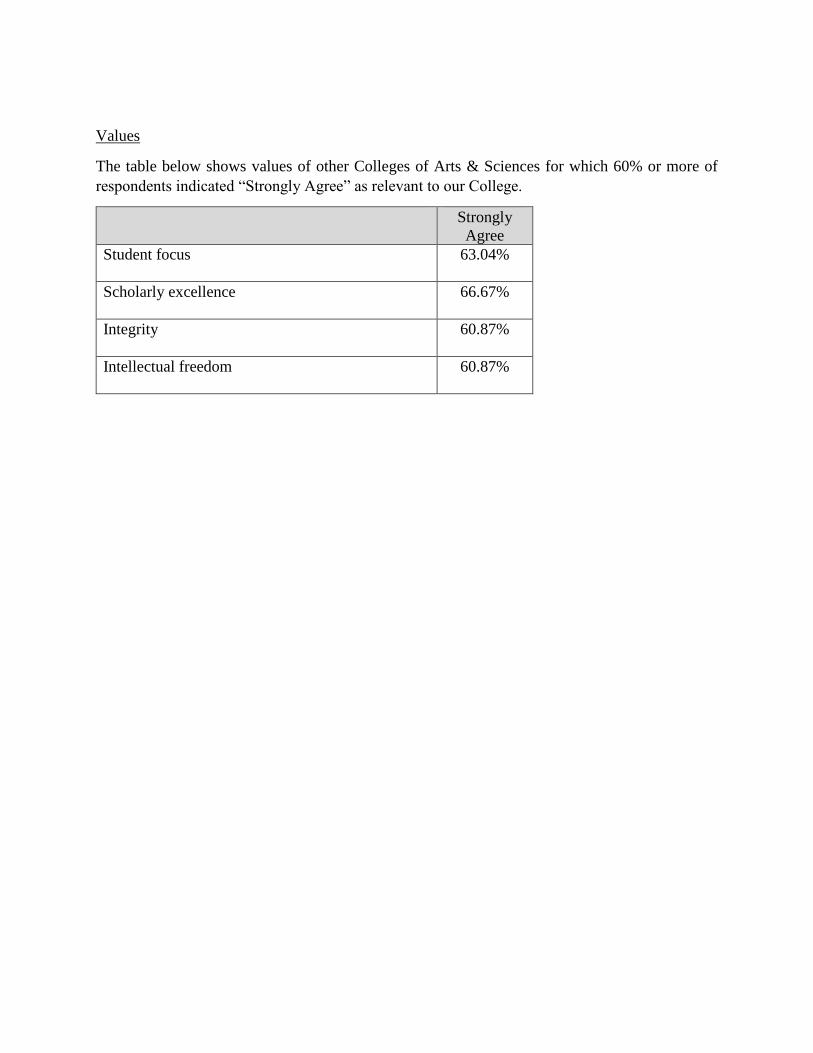
Values
The table below shows values of other Colleges of Arts & Sciences for which 60% or more of
respondents indicated “Strongly Agree” as relevant to our College.
Strongly
Agree
Student focus
63.04%
Scholarly excellence
66.67%
Integrity
60.87%
Intellectual freedom
60.87%
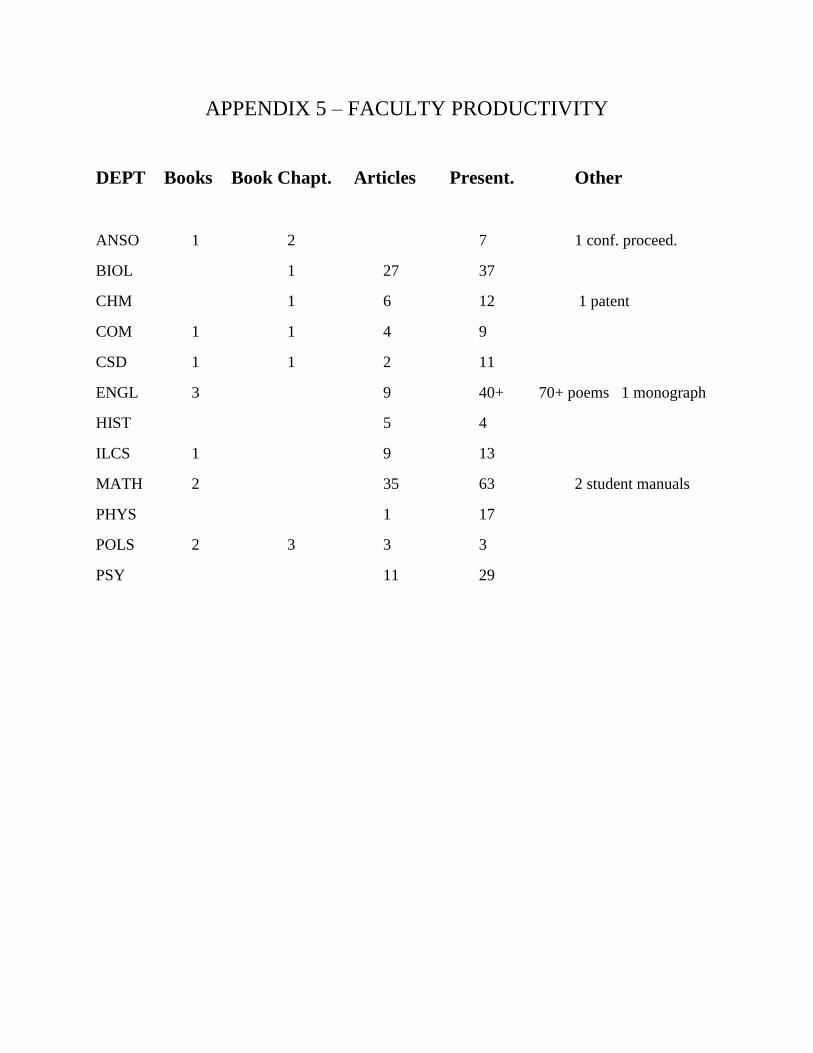
APPENDIX 5 – FACULTY PRODUCTIVITY
DEPT Books Book Chapt. Articles Present. Other
ANSO 1 2 7 1 conf. proceed.
BIOL 1 27 37
CHM 1 6 12 1 patent
COM 1 1 4 9
CSD 1 1 2 11
ENGL 3 9 40+ 70+ poems 1 monograph
HIST 5 4
ILCS 1 9 13
MATH 2 35 63 2 student manuals
PHYS 1 17
POLS 2 3 3 3
PSY 11 29

APPENDIX 7 – STUDENT SUCCESS CENTER
Year 2019 was challenging and very busy for the College of Arts and Sciences Student Success
Center (referred to as SSC throughout the report). We continue struggling with retaining trained
personnel, changed the advising structure to adjust to changing demands for advising, invested in
professional development for the college advisors & staff, coordinated and participated in a variety
of college and campus recruitment & retention events, engaged in transition activities, introduced
and developed Pre-professional Studies coordination, and provided a variety of student advising
services. This report will briefly present each point.
SSC Advising Staff
Late Spring 2019, our Lead Advisor transitioned to a different role on campus. We took the
opportunity to restructure and hired an Assistant Director of Advising and Student Success Center.
The position carries a leadership role and acts as the office leader when the Director is absent. This
position also introduced and developed Pre-professional Studies for the whole campus. More
details are included below.
In mid-fall semester, our Psychology advisor transitioned to a different role on campus. We took
the opportunity to restructure and hired a Social Sciences Primary Role Advisor (SS Advisor). The
advising departments for SS Advisor include: Psychology, Anthropology & Sociology,
Communication Sciences and Disorders, and Political Science. Primary duties for the SS Advisor
include assuring the 4-year plans are up to date, providing advice to Freshmen and Sophomores,
and teaching Freshmen Success courses.
SSC continues to struggle with the challenge of retaining talented advisors due to low
compensation and high position demands. On average, an advisor stays with SSC for about a year
before moving on to a better paid position.
As of late Fall 2019, SSC was fully staffed with four professional members: BIOL Advisor, SS
Advisor, College Assistant Director, and Director of Advising and Student Success Center. All
individuals are a huge asset to the advising operations of the College.
Professional Development for Advisors
Throughout the year, SSC conducted a number of professional development activities for the
College advisors and secretarial staff. From myBLUEprint trainings to monthly Lead Advisors
meetings and A&R trainings, SSC stresses quality of advising and aims to ensure our college
advising professionals are well trained.
SSC professional development goes beyond the lessons we learn on campus. All of our Primary
Role Advisors are active NACADA members. Fall 2019, our BIOL Advisor, Psychology Advisor,
and Assistant Director attended NACADA’s National Conference. Lessons learned through
NACADA serve as a foundation for our excellence in advising. Our BIOL Advisor presented on
International Advising at NACADA’s National Annual Conference, and she has been asked to
present at the regional conference in spring. The presentation was titled, “Bridging the Gap in
International Advising.” The Director of Advising attended a leadership conference.

Our Primary Role Advisors and Assistant Director completed a semester long training. The
program, Supervise for Success, was offered through Purdue Fort Wayne HR.
Variety of Events
SSC professionals engaged in a variety of college and campus recruitment, retention, and
recognition events. From organizing events (for example: “Not too Late to Register” or College
Orientation) to coordinating events (for example: “Transfer Summit,” or “Campus Visit Day”),
the SSC staff spent hundreds of hours engaged in serving the students. SSC professionals continue
serving as the point contact for all student events. They coordinate the events for the whole college,
they assist departments with events, and they hold their own recruitment and retention events.
2019 events are listed below:
Spring New Student Orientation
Celebrating Advising
Winter Reception
Summit Scholars Competition
Ivy Tech Transfer Event
Regional College Fair
Spring Bus Trip - Indianapolis/Gary
Health Fair
Campus Visit Day
50 students from the Detroit area for a day on campus
Summit Scholars Showcase
Admissions Overnight guests for 4/8
Honors Banquet
Dual Credit Reception
Evening Advising
Transfer Orientation
Chancellor Signing Day
Commencement
Orientation
Don Days
Finals Week Event
Student Advising Services
SSC continues coordinating and supporting college student advising services. Partnering with
departments across the campus, SSC coordinates the following services for the college: Admission
Don Days, Probation Intervention Program, End of Semester Processes, New Student Orientation.
In addition, SSC manages advising for transfer, re-entry, and re-admission students. These students
meet with the Assistant Director or Director prior to working with their department advisor. Main
goals are to transition the students to the college, clean up BLUEprint records, and work on
graduation plan.

SSC leads enrollment and retention efforts for the college. Each semester, SSC oversees the
enrollment for each department via reports. Data is collected on not-enrolled students. SSC and
the college office manage the communication outreach to students. Assistant Director and Director
both serve backup advisors for all college departments.
New this past year was the addition of the Pre-Professional Studies (PPS) program. With the
support of faculty, the Assistant Director now serves as the pre-professional advisor for all students
on campus looking to enter a professional program upon leaving PFW. She has worked with
marketing to develop a PPS website and has written the webpage content for each of the nine
primary pre-professional areas studied on campus. OSA granted her request for a $1,000 budget
for promotional materials, and she is currently working with marketing to create unique signage
and brochures. She is also establishing a Facebook page for the PFW PPS program. In addition,
she delivered a presentation on the PPS program at each spring NSO, represented PPS at Fall
Campus Visit Day, plans to attend the IUPUI Health Profession Fair on March 4th, 2020, and
continues to respond daily to all program inquires submitted through the PPS website.
USAP Reports
SSC continues to track the academic progress for USAP teach-out students. Tables below present
data on where we stand with USAP Teach-out after last year and an overview throughout the year.
Another evaluation will be conducted after Spring 2020 graduation. Spring 2020 is the last
semester during which USAP teach-out students can take major classes.
USAP Teach-out Majors after Spring 2019
Program TOTAL #
of Students
Fall 2019 Enrolled Fall 2019 Not Enrolled but Active
BIOL Pre-
Dent
1 0 1
BIOL
Teaching
1 0 1
CHM Pre-
Med
1 1 0
GEOS 5 4 1 (Summer 2019 graduation pending)
FREN BA 3 2 1
GERM BA 5 2 3:
1 - not taking GERM classes
2 - potential summer graduation
MA COM 1 0 1 (Summer 2019 graduation pending)
PHIL 8 1 7:
1- potential summer graduation
2 - registered for summer 2019
4 - not registered
WOST IU 5 3 2:
1 - potential summer graduation
TOTALS 30 13 17

USAP Teach-out Majors after Fall 2019
Program TOTAL #
of Students
Spring 2020
Enrolled
Comments
CHM Pre-
Med
1 1 Scheduled to graduate in Spring 2020
GEOS 3 3 1. Waiver allowed by Dr. Drummond for student to
complete G429 Summer 2020 for degree. Should
graduate Summer 2020.
2. Should complete GEOL courses Spring 2020.
Missing BIOL minor courses.
3. Should complete GEOL courses Spring 2020.
Taking NON-GEOL classes Summer 2020. Should
graduate Summer 2020.
FREN BA 2 2 1. Done with the major, but taking 2 more
FRENCH classes in Spring. Should graduate
Spring 2020.
2. Done with French courses. Should graduate
Spring 2020.
GERM BA 2 1 1. Missing plenty GERM classes. Will not be able
to finish.
2. Last in classes Spring 2020. Will be inactive
after Spring 2020.
PHIL 5 4 1. Last in classes Summer 2019.
2. Taking Last PHIL class Spring 2020.
3. Taking Last PHIL class Spring 2020. will have
other requirements to finish.
4. Taking Last PHIL class Spring 2020. will have
other requirements to finish.
5. Approved by Dr. Drummond to be added to the
PHIL list. Taking Last PHIL class Spring 2020.
will have other requirements to finish.
WOST IU 4 3 1. Missing 5 WOST classes. Per USAP, will not be
able to get IU degree.
2. Should graduate Spring 2020.
3. Missing 3 graduation credits.
4. Incomplete for COM 114.
TOTALS 17 14
Graduation Clearance
Changes in the graduation processes through the registrar’s office assisted in streamlining the
graduation audit process at the college level. The college Students Records Coordinator reviews

the graduation audits for every eligible undergraduate major and maintains regular communication
with the graduating seniors, cleaning their records, transferring classes in, and assisting advisors.
Data on all graduates are listed below.
2019 COAS Degrees: 518
Spring 2019 COAS Degrees: 323
Undergraduate: 306
• AS: 8
• BA: 120
• BAS: 1
• BGS: 55
• BS: 91
• BSAS: 1
• BSC: 3
• CERT: 27
Graduate: 17
• CERT: 1
• CGRAD: 2
• MA: 4
• MS: 10
Summer 2019 COAS Degrees: 68
Undergraduate: 61
• BA: 31
• BAS: 3
• BGS: 23
• BS: 3
• BSG: 1
Graduate: 7
• MS: 7
Fall 2019 COAS Degrees: 127
Undergraduate: 120
• AS: 2
• BA: 51
• BAS: 2
• BGS: 33
• BS: 14
• BSAS: 3
• BSDSAS: 3
• BSG: 1
• CERT: 11
Graduate: 7
• CGRAD: 1
• MA 1
• MAT 2
• MS 3

Curriculum Service
Students Records Coordinator and Director of Advising serve on the college curriculum
committee. They provide advice on system, technical, implementation of new courses, programs,
etc. Students Records Coordinator manages all catalog entry for the whole college. Director of
Advising and Assistant Director manage myBLUEprint and degree plans for the college. All three
members represent the college on DAAC team. myBLUEprint exceptions are coordinated through
the SSC office.
Search Committee Service
Last year, Director of Advising led three searches, two internal to the college and one for General
Studies. Other SSC professionals served as well as search committee members.

APPENDIX 8 – COAS MARKETING
On April 24, 2019, Juliana Russell was hired by the college as a marketing intern and has been
working to improve the social media presence of the college. After getting on-boarded and up to
speed on all of the marketing standards as well as trained in the website maintenance software,
Juliana has created a marketing calendar, soliciting information from all of the departments to
advertise not only their department-level and student events, but also to celebrate the
accomplishments of faculty and staff as well as other university-wide programs.
On Facebook, COAS has seen a steady increase of followers since April, 2019. Overall, from
April to December 2019, there has been an increase of nearly 17% of followers. A daily Monday
through Friday post of campus events, as well as the promotion of departmental events has created
a following that interacts on a daily basis, creating nearly 3.7K engagements, an increase of 304%.
Overall, there were 338 posts made to this platform. These efforts will continue and new ideas
will be implemented.
With regards to Twitter, while the number of followers increased only slightly (4.3%) over the
range of April to December 2019, engagements increased by more than 1400%. Clicks also saw
a dramatic increase of 4500% during the same time period. This platform had 182 posts, mostly
of campus events. It should be noted that from January to April 23, 2019, there were no posts
made on this platform.
Instagram has also seen a flurry of engagements. During the period of April 24 to December 31,
2.5K engagements were reported, up from zero for January 1 to April 23. During the year, 6
followers were lost (a 1% decrease); however, efforts are being made to promote that platform and
improve our statistics. During the first part of the year, zero posts were made, while Juliana has
made 163 posts to the platform during her time in COAS.
In addition to social media upkeep, Juliana has been updating the COAS website by changing out
old information, promoting internal events, and celebrating accomplishments. She has attended
several events, such as a research outing with Dr. Scott Bergeson, to take photographs for both the
website and social media. She continues to explore ideas for new content and to drive more people
to the website for information. Juliana has also helped the Department of Psychology to update
their website on the University’s platform, helping them keep information relevant and up-to-date.
Events that have been promoted include, but are not limited to, the external distinguished lecturer
program, Perspectives Conference (International Year of Indigenous Languages 2019), Biology
Seminar Series, Welcoming Fort Wayne Diversity Awards, Urban Turtle Festival, Holocaust
Education Teacher Workshop, Come & Chat series (Psychology), fundraising for various campus
organizations, National Conference of College Women Student Leaders, Friday Night at the
Observatory, and several panel discussions over various topics.
While Juliana’s primary role has been updating social media, she also helped update the AxisTV
programming in the common area of the Liberal Arts building, create flyers and graphics for
upcoming class offerings, and assist the COAS departments as needed. She stays on top of new

social media trends through online seminars as well as through the materials provided by the
Communications and Marketing Department.

PI Grant TitleJordan Marshall Phloem Transport Of Amino Acids: A Novel Target To Disrupt Bacterial Symbiosis In Soybean AphidsScott Bergeson Black Pine Animal Sanctuary Service-Learning ProjectScott Bergeson Black Pine Animal Sanctuary Service-Learning ProjectScott Bergeson Proposal to Track Indiana Bats on Sparta Training AreaFrank Paladino Wildlife conservation through education, outreach and capacity building on Bioko Island, Equatorial GuineaSarah LeBlanc FY19-20 PRF Summer Faculty GrantsDeborah Bauer FY19-20 PRF Summer Faculty GrantsNaomi Gurevich FY19-20 PRF Summer Faculty GrantsSteven Stevenson RUI: Selective Synthesis, Chemical Purification, and Characterization of a New Family of Nanotubular FullerenesPeter Dragnev Midwestern Workshop in Asymptotic AnalysisPeter Dragnev Midwestern Workshop in Asymptotic AnalysisSandra Berry Getting Girls into STEMSandra Berry Getting Girls into STEMMark Jordan Conservation Status of Blanding's Turtle in the Lake Erie WatershedMark Jordan Conservation Status of Blanding's Turtle in the Lake Erie WatershedJeannie DiClementi Purdue Aware: Helping Our Students Through Faculty and Staff TrainingTOTAL

Program Description Grant # Sponsor AmountColorado State University 17000494 National Inst of Food & Arg 108,926.00$ Black Pine Animal Sanctuary 40002545 Indiana Campus Compact 1,182.00$ Cost Share Black Pine Animal Sanctuary 40002545 Indiana Campus Compact 750.00$ Tracking Indiana Bats 40002759 Ball State University 10,781.00$ Wildlife Conservation 19200241 US Embassy Malabo, Equatorial Guinea 2,880.00$ FY19-20 PRF Summer Faculty Grants 60000024 PRF 8,000.00$ FY19-20 PRF Summer Faculty Grants 60000024 PRF 9,413.14$ FY19-20 PRF Summer Faculty Grants 60000024 PRF 9,413.15$ Stevenson - 47% 10001531 National Science Foundation 295,622.00$ Dragnev 47% 10001575 National Science Foundation 8,150.00$ Dragnev-participant Support 10001575 National Science Foundation 11,850.00$ Cost Share Getting Girls into STEM 40002538 Indiana Campus Compact 250.00$ Getting Girls into STEM 40002538 Indiana Campus Compact 1,000.00$ Toledo Zoo - Turtle - 10% 15200076 Toledo Zoo and Aquarium 37,692.00$ C/S - Toledo Zoo 15200076 Toledo Zoo and Aquarium 4,249.00$ DICLEMENTI - 8% (ELII) YR2 11000765 Substance Abuse,Mental Health Serv Admin 122,448.00$
632,606.29$

1
College of Visual and Performing Arts
Annual Report 2018
Section 1: Unit Goals/Progress/Accomplishments
College:
Successful transition to the School of Music.
This Fall we have successfully transitioned to the School of Music with
fairly wide recognition as a new school, both internally and externally.
The Sweetwater campus opened on time and has also had a great deal of
community recognition. The embedded Sweetwater employee is a great
asset to this program and our students.
Student enrollment in the new popular music programs is already proving
to be successful with strong initial enrollment numbers, including transfer
students into the Music Industry program from other PFW degree
programs.
An additional faculty member and increased FTE for the CL in Music
Therapy continue to add to the success of that degree program, most
notably, the hire of Dr. Garwood is proving to be an excellent decision.
The decision to search for a choral director who has significant music
education background will prove to be a real benefit to Dr. Egger and the
entire music education curriculum. Hiring the right person will be an asset
for both areas.
We had a hugely successful tour of Central Europe with 55 students who
performed in the great halls from Vienna to Gera, Germany.
With the anticipated growth in enrollment, office and rehearsal space will
quickly become an issue and our relationship with our companies-in-
residence is going to become an issue. It is my hope that as space on
campus opens up with the acquisition of Brown-M building, we might be
able to: 1) find additional space for school needs, or 2) relocate
companies-in-residence to space outside Rhinehart.
Successful merger of VCD and FINA to Department of Art and Design;
Undergoing a search for chair with 3 potential strong finalists.
Completing searches in Graphic Design and Interior Design.
As of July 1st a new curriculum better suited to 21st cent art students who
arrive at Purdue Fort Wayne with a wider array of art interest than in the
past.
The creation of the new Web and Interactive Media concentration will
meet the needs/interests of many new incoming students.

2
There remain ‘kinks’ to work out, most notably, how the BFA Senior
Exhibition format for the class as well as the exhibition can best merge the
previous formats and expectations from INTR, VCD and FINA into a
unified experience for all A&D BFA students.
The new College Advising Coordinator is a wonderful addition to our college in
creating the new College Student Success Center located in the Visual Arts Building.
Since August she has had 128 in person scheduled visits and fielded many more E Mails
and walk-in sessions.
The theatre department had an accreditation review. I find the Visitor’s Report to be
quite harsh with some inaccuracies and significant points of concern. It is my expectation
that the department will either be put on probation by the Commission or lose their
accreditation status. While we intend a response to the report, apparently the department
faculty feel much of it is accurate which, quite frankly, puzzles me.
Fund-raising efforts for 2017-18 were more successful than expected with an increase
in the annual campaign giving by 14.8%, with a total raised in the campaign of $33,918.
Total gifts for the year, including scholarship distribution and special projects was
$396,367. Concern: We have evidence already this year that we will not match this
giving for the annual campaign. NFPs agencies across the country are experiencing the
same, most think, due to the new tax laws and the lack of tax incentives for small to
average sized gifts.
A goal for this year was to create a stronger “College Identity” to match the kind of
identities we are seeing in competitive programs in the region and beyond. To that end
we have created a very nice college marketing document for our departments and the
university admissions office to use at all recruiting events/visits.
This Fall I undertook a goal of enhancing learning equipment and environments
throughout the college. To that end we are working on improved lighting options for two
drawing studios and enhancing software in design studios. Instructors were asked to
make proposals for improvement during the course of this academic year.
Department of Theatre:
The focus of much of the department’s efforts in the past year were related to the NAST
self-study and visit. As mentioned above, I am surprised and dismayed by the Visitor’s
Report and the lack of ‘alarm’ I find within the faculty regarding the report.
I applaud the adding of the under-graduate workshop production as a means to get new
students involved early and to hopefully assist with retention of these students. In
particular this Fall’s workshop production “The Secret in the Wings” was an excellent
vehicle to allow for a large cast which required mainly ensemble work.
The department annual report talks about other FYE activities that the department hopes
will assist with student retention. Concern: There is a lack of data from the department in

3
the “Evidence of Progress to Goal” to signify whether any of these FYE efforts are
having any lasting effect. In fact, the activities are not really tied to any numerical goals
allowing for hard data to be collected.
While I like the thinking around the possible impending retirement of associate professor
Craig Humphrey, it is not my understanding that his intentions are in line with the
timeline on the report. I do agree with the argument however, that a rethinking of his
faculty line is in order when the time comes. Of course a department should always
undergo a rethinking of any faculty line once a faculty member leaves.
Department of Art & Design:
It appears that new recruiting efforts and increased awareness of the portfolio scholarship
days are having a positive effect on enrollment. As we’ve seen across the college, Purdue
Fort Wayne is having a positive effect on many of our areas including Art & Design. As I
requested, the department is providing more face-to-face high school recruiting
opportunities on campus as well as in visits to area high schools which in turn is elevating
the department profile. I would say most of the enrollment gains continue to be in the
commercial arts and not the fine arts, an issue that the new chair will need to address
when it comes to resource allocation.
I expect that when the new concentration, Web and Interactive Media, is in full swing
enrollments in that area will increase significantly. Concern: a few faculty members
oppose this new program because of their own feelings about past curriculum changes
and because it is being developed and administered by a Continuing Lecturer.
For the foreseeable future, the summer study abroad to Italy has stopped due to my
intervention regarding behaviors of some supervisors on this trip. While I think there are
possible avenues to reinstate this program, I await the vision of the new chair to construct
such a plan.
All areas of Art & Design will have large graduating classes this spring so I will look to
see what strategies these areas will put into place to continue the trend towards successful
retention.
Lastly, the switch in curriculum that now allows for all students in studio and design
areas to begin as BA students and portfolio into the BFA should have an impact on the
number and quality of the graduating BFA students. The Concern will be retaining the
BA students who are not successful in their quest to portfolio into the BFA program.
School of Music:
The new School of Music has exceeded its enrollment goals for this past fall and has set a
realistic goal of 7% increase for next fall. Certainly the new degree programs will drive

4
that enrollment, but I also expect continued healthy growth in music education and music
therapy. However, as defined in the school report, space issues continue to be a problem
and with the expected growth, this issue will only get worse. Concern: Space for
companies-in-residence must be addressed and perhaps vacated space on campus from
the Brown-Mackie purchase to open up possibilities.
The development of new advanced degree programs in music education and music
therapy continue on track within the school. However the movement towards an
international certificate are stalling due to the lack of personnel time available to
undertake the paperwork and effort for this task. Concern: The only person seeming
capable of undertaking this task is Dr. Jones and he simply does not have the time in his
already over-burdened work life to get this done. There does not seem to be available to
him an Assistant Director on the current faculty roster who could assist with other tasks
to move this initiative forward. I think serious consideration should be given to an outside
search for an Assistant Director of the new School of Music.
Internal discussions regarding CORE music curriculum is a welcomed goal in the five
year plan. Certainly as we attempted to process the new popular music degrees it became
clear that the entire curriculum could use some updating and revamping to address the
needs of contemporary music students.
Overall, the School of Music is meeting many of its goals and has accomplished a great
deal in its first year as a school. As I said in earlier comments, the Sweetwater site
continues to have some programming/scheduling issues to work out. One of my main
concerns continues to be that we will grow enrollment faster than we can handle in
personnel and space.
Lastly, it is imperative that I find a solution to the workload of Dr. Jones as he will not be
successful in accomplishing the goals set forth without some help from existing or
additional faculty.
Section 2: Evaluation and Planning Program Viability
Theatre:
I am pleased to see the largest enrollment numbers in several years. I believe this is a
reflection of the increased recruiting activity by all faculty members of the department
and the increased reputation of Purdue Fort Wayne. I continue to be concerned about the
stop out rate of advanced students. Anecdotally, I am told these are students not being
successful in general education courses and leaving these courses till the later part of their
academic career. Concern: I think across VPA we should be more aggressive in our
insistence upon early general education completion in the 4-year plan.

5
I agree with Dr. Redman’s assessment with regard to current strategies and also with her
plan to bring in a consultant for a feasibility study regarding a future BFA degree in
Musical Theatre.
Art & Design:
The areas that have had strong enrollments historically for the past several years, such as,
ceramics, graphic design, photography and art education continue to do so and are
identified as such in the department report narrative for reach area of concentration.
However, I am not in support of the lower benchmarks put forth in this year’s report by
the chair in areas such as metalsmithing, painting, sculpture and printmaking. In fact, I
am concerned that printmaking is not more successful given the popularity of the
medium and the professor. I think the department should undertake a more focused
recruiting effort for printmaking. Unfortunately, to be frank, the lack of interest in
painting and sculpture are partly due to the reputation of the senior faculty in those areas.
I continue to be concerned about the downward turn in new enrollment and retention of
graphic design students. It is my hope that the new tenure-track professor in his area can
assist us in reversing this trend.
Interior Design enrollment is growing quite quickly and will soon need a full-time tenure
track faculty member if enrollment continues to grow. Concern we have no LTL talent in
Fort Wayne to teach in this area so we will need to get full-time faculty member from a
national pool.
Music:
This section of the School’s annual report is quite thorough and on target with regard to
the analysis of the data. As stated, for the most part, the School met or exceeded most
target numbers set forth in the last report. The only area they did not succeed was in the
retention of BSM students in an Outside Field. This does not concern me since most of
the future students in this area will be seeking degrees in the new degree programs.
I was surprised to read that the School is struggling with positioning the new popular
degree programs both in marketing and the overall structure of their current music
program. This does not seem to be the case for the Business Industry degree, but does
appear to be the case the popular music degrees, specifically in performance. I agree with
the strategies outlined in the report to combat this struggle.
Concern: There continues to be some issues with our IR department and the School of
Music in coding beginning students in the music program more accurately and more
timely based on the department’s requirements and timelines for entry into a specific
degree program.
Concern: Purdue School of Music and the Sweetwater Music Center. I continue to have
concerns regarding the full-time faculty member we have in this program and hope that
this year his teaching evaluations will be stronger than in the past. The embedded

6
Sweetwater employee in the program has been a huge asset to the program and I hope we
can continue to refine his involvement to assist in what has already been successful
immersion of our students in the Sweetwater system.
I would encourage Dr. Drummond to review the Music Appendix which contains a
detailed response to his concerns from the 2017 report.
Section 3: Department Undergraduate Non-Dual Credit Hour Production
There has been no significant movement in CVPA in this area in the last year. The
college continues to have a decrease in non-dual credit hour generation due to the current
general education model.
Concern: Purdue Fort Wayne must address our General Education program as it has
become so large that it has resulted in departments and colleges cannibalizing their own
programs in order to stay in the ‘gen ed game’ in order to generate credit hours. Degree
programs are mandating gen ed courses as part of their prescribed degree programs which
seems counter to the philosophy of general education which in turn results in departments
and colleges practicing protectionism in order to secure credit hours in their programs.
Case in point, my college has created a terrific communications course as an answer to
the loss of these credit hours, NOT as an answer to a need for a better communications
course.
Section 4: Faculty/Staff/Student Accomplishments
Theatre:
The department faculty continue to engage in creative endeavor activities within the
programming of the department season. I would perhaps wish that more of them engaged
in professional activity beyond the scope of Fort Wayne and our university but that has
been an on-going reality for some time.
Jeffrey Casazza:
1. Contributed a chapter and served as one of three editors on a publication
(Routledge) Physical Dramaturgy: Prospectives from the Field.
2. Presented at ATHE and also participated in 30 hours of workshops.
3. Continues to train in Alexander Technique.
Beverly Redman:
1. Invited Speaker at National Association of Schools of Theatre annual meeting
(NAST)
2. Presenting a paper at the International Academic Conference on the Social
Sciences December 20, 2018 in Sydney, Australia and serving as panel

7
moderator. Paper is titled: “Building Frustration tolerance Back into the
Learning Process.”
Art & Design:
Most of the faculty in Art & Design are engaged in their creative work and all show at
exhibitions that bring tremendous recognition to Purdue Fort Wayne. I am grateful that I
have funds available to assist many of them in their creative endeavor in ways that range
from travel money to assisting with the costs of shipping art work.
The individual list of research and creative endeavor is provided in the chair’s annual
report.
Music:
I have to appreciate the chair’s list in this section as the potential for pages of recognition
in this section for this particular department could have been extensive. Suffice it to say,
the Music faculty continue to build their reputations at regional, national and
international venues. The untenured faculty all seem to be engaged at very appropriate
levels for their pre-tenure process. The list of teaching and service is also significant and
within my expectation of this department.
Section 5: Alumni Information:
The departments continue to keep an impressive list of alumni successes and activities
that is fodder for our college electronic newsletter, Expressions. Most notable are the
number recent graduates attending reputable programs around the country. Specifics can
be found in each department report.
I look forward to developing a better network of alumni and to enhancing are outreach
with the hiring of a new Director of Alumni Relations.

8
Section 6: Resource Allocation Request
The departments have listed several items in their report, but I summarize here the most vital.
Theatre:
Building Equipment Replacement and Upgrading:
Lighting in both Williams Theatre and Kettler Studio Theatre need replacement of
failing/failed instruments and technological upgrading of lighting inventory. Namely, we
need to purchase LED fixtures, in order to remain on par with peer institutions. While
these new technologies are being employed to some degree in our theatre, the existing
infrastructure is limited, labor intensive and is at or near maximum capacity.
Sound: speakers and dedicated laptop. In the area of sound, the current speakers in the
Williams Theatre are not optimally placed and a full, qualified investigation into such
should be undertaken to determine what needs to be upgraded and how improve the
audience experience. The current speakers are approximately ten years old and are
showing their age from constant use. A dedicated computer or laptop should be
purchased for sound playback; the current departmental laptops are outdated.
Ideally, the theatre would have an installed motorized AV screen, high-output
projector and dedicated in-wall cabling/hookups for a moveable networked
instructor station so that the theatre can be configured for presentations and meetings.
The dance rehearsal hall, WT113, would also benefit from this technology upgrade for
classes, presentations and meetings.
Needed Upgrades in the Studio Theatre: There is a need for new seating, preferably
flexible seating modules that would allow us to configure the space as a true black box in
many different ways. There is also need to install sprung flooring that would allow for
use of the space as a movement, dance or voice studio (currently the degrading concrete
flooring is inadequate for these usages).
Finally, there is a need for upgrading of the Costume Shop to include a dye vat system,
which would allow us to offer the level of education in costume design on par with peer
institutions
Art & Design:
Full-time faculty in Interior Design
Lighting upgrades in drawing studios (underway)
Facilities upgrades in painting and printmaking studios

9
Music;
The School of Music has a detailed list of resources needed, including some faculty
positions currently in the final stages of the search process. I agree that an Assistant
Director of the School must be sought, I agree that consideration be made for space
issues as the School grows.

Departmental Annual Report Summary By Melissa L. Gruys, Dean
February 28, 2020

DSB Departmental Annual Report Summary – Page 2
Overview
A theme that runs across all Doermer School of Business departments, majors, and certificates, in both the data and narratives, is one of successful programs who hold plans and promise to become even better. This is very satisfying and exciting.
DSB's overall enrollment is growing and now enrolls and serves ongoing almost 1,000 students - over 14% of undergraduates and over 21% of graduate student headcount for the university (based on spring 2020 enrollment figures). Our thriving MBA program has 70% more students now than five years ago. The fifteen largest majors on campus house approximately 42% percent of degree-seeking undergraduate students at Purdue Fort Wayne student and DSB holds four of those most highly enrolled majors (Management with 272 majors, Marketing with 192, and Accounting with 142, and Finance with 120).
Last year, DSB completed the transfer of our Finance faculty to the Economics department to form the Department of Economics and Finance. The move of the Finance faculty to join Economics was a restructuring that had been recommended in the USAP process and well as by the Vice Chancellor for Academic Affairs. This process took a good portion of time, as it required working through the department, school, and university levels, and then on to the Academic Organization Committee at Purdue West Lafayette, but the reorganization has been a smooth and productive one. Accounting now functions as a stand-alone department. Given the first-time CPA pass rates national ranking of top 6% among all universities and the top pass rate among all state universities in Indiana – and the accounting faculty’s strong ties to accounting firms in the region, the department is fully capable to stand alone. There is a clear synergy between Economics and Finance that will enhance the educational experience of the students as well as the development of faculty with respect to leadership, research, and sustainability within the two programs. In the short time that has elapsed since the move, positive outcomes such as collaborative publications between finance and economics faculty have already been realized. The department has also introduced a new Money and Banking major that highlights and utilizes content from each area without adding any additional faculty or new courses. This is a nice addition to the major offerings and may allow for greater student enrollment in the department.
There currently exist two majors focusing on economics - a Bachelor of Science in Business (BSB) in Economics and a Bachelor of Arts (BA) in Economics. USAP recommendations outlined that “Maintaining both degree pathways might be both necessary and desirable.”, and stated that the Economics Department and the Political Science department (where the BA in Economics was previously housed) should hold discussions and make a decision regarding the future of the programs. When the leaders of the two departments met, it was decided that the Economics faculty will now serve as academic advisors for students in the BA Economics program. This was the first full year that this was carried out and, by all accounts, things have gone well.
We will not reiterate the specific accomplishments of each of the DSB programs here, the successes are many (and are outlined in the individual departmental reports). Overall, all DSB majors and certificate programs are experiencing strong viability statistics. The Management and Marketing majors have now surpassed Accounting as the largest DSB majors, comprising 29% and 20% of undergraduate DSB students, respectively.

DSB Departmental Annual Report Summary – Page 3
DSB majors, including the pre-business majors (now indicated as DS – e.g., a pre-accounting student is designated as Accounting DS), have average growth rates of 1.03 this year, and a five-year average growth rate of 1.13. This year, Finance and Management had the highest growth rates in DSB at 1.22 and 1.13, respectively. The Accounting, Econ BSB, and Marketing majors experienced slightly lower growth rates this year (all but Econ are still above 1.0), but they maintain high graduation efficiency and acceptable levels of attrition. Two of the DSB certificate programs have healthy growth rates - Bank Management (1.2) and Professional Sales (3.0). Two other certificate programs experienced a lower growth rate - Small Business Management (0.8) and Accounting (0.5). Though this is disappointing, it can be noted that the five-year growth rate for the Small Business Management certificate is 1.481. The Accounting Certificate is a post-baccalaureate program aimed specifically at sitting for the CPA exam, so it can be expected that the enrollments would not be high. Additionally, when the economy is flourishing, fewer individuals pursue higher education, in general, and such a program, in particular. It is also not surprising that the growth rates for the certificate programs are not extremely high (except for the 3.0 growth rate for the Professional Sales certificate), since the existence of these certificates are not widely in the community. With proper marketing of these certificate programs, both on- and off- campus, all of the DSB certificate programs have strong potential for continued growth. DSB is currently working with Purdue Fort Wayne Marketing and Communications on materials that will support the marketing of all DSB programs.
In most DSB majors (all but Finance and Economics), there are currently more than twice as many DS students in each major than the number of new majors this year [Finance and Economics also have more DS majors than new majors, but not twice as many.]. It is very positive that the average growth rate across the DSB pre-majors is 1.04. This speaks well for the likelihood that all of these majors will grow in the future, since students will typically be DS for the first two years at Purdue Fort Wayne. The Accounting DS growth rate of 1.1 indicates that the number of accounting pre- majors is growing, which will help alleviate the lower enrollment the Accounting major has seen over the past few years.
While the Economics BSB and BA majors are each fairly small, we accommodate both majors without offering any additional courses (they differ in the college/school requirements). There are a total of 55 students in the two programs combined, including the Economics DS pre- majors. Thus, there was a 34% increase in the number of students pursuing the economics degrees (BSB and BA) within the past year. The data indicate that it has been a successful transition to having the Economics department faculty advising the Economics BA students. The department faculty have made strong connections to the BA students and are working hard to serve them well. Thus, taking the Econ BSB and BA together, this is a viable program which meets the minimum metrics and is improving on important metrics.
Overall, DSB is also doing a great job retaining students in our programs, as demonstrated by our five-year average student attrition rate across all five DSB majors of 6.12%. While this attrition figure is exceptional, this year, three of our majors have lower 5 year averages than that (Management, Finance, and Marketing, with a five year averages of 5.58, 5.08, and 3.13%, respectively). The marketing major had an astonishingly low attrition rate of 2.3% this year. These rates are very impressive since the standard for the attrition metric that was set by USAP that each major should have an attrition rate of less than 25%. In looking across the university, it is rare for a major to have attrition even as low as 10-15%, (while it does occur in some smaller enrollment majors like languages and fine arts which are likely characterized by a greater level of

DSB Departmental Annual Report Summary – Page 4
individual student attention). In this context, DSB’s attrition rates are to be celebrated. This year was the second year since we also added the Econ BA major into our report, and for the second year running, the attrition rate for that major was cut in half for that major, with this year’s rate being reduced to 11.76% (the rates for the past three years were: 52.94%, 23.08%, and 11.76%).
Admittedly, these attrition rates for DSB majors do not include the pre-business (DS) majors, which does inflate the figures somewhat. DSB’s attrition rates in the DS majors was 30.96%. Though this seems somewhat high, DSB’s DS attrition rates are lower than other pre- majors across campus, and only 5% higher than the standard set for attrition from the university. We will be working to reduce this attrition rate in the coming years as we more fully develop the role of our new Director for Professional Development and Outreach and engage and involve our lower division business students even more.
Another way to view it is that other majors that don’t have pre-major designators have students at all levels of their academic program who come and go in the major. Of course, lower division students will be more likely to change their majors than upper-division students. Thus, our DS categories will, by definition, have higher attrition rates than our majors (which contain upper division students), and will also likely have higher attrition levels than most majors across campus (as majors that have students at all stages of their academic career will see a smoothing or averaging effect of the higher attrition of lower division students and the lower attrition rate of upper division students who will likely stay in their major). DSB worked with Irah to conduct an additional analysis which combined the DS pre-major students and the upper division students for each of the five DSB majors. See the following page for the results.

DSB Departmental Annual Report Summary – Page 5
Department
Major
TERMS
Demand
Majors
Graduated
Graduation Efficiency
Student Attrition
Growth Trend
Accounting Accounting 201510 53 126 50 37.30 % 7.14 % 0.803 201610 56 113 47 35.40 % 7.08 % 0.966 201710 41 94 36 36.17 % 5.32 % 0.932 201810 145 193 37 17.10 % 16.06 % 1.133 201910 117 178 24 12.36 % 25.28 % 1.083 Accounting
Total
412
704
194
27.67 %
12.18 %
0.983 Economics and Finance
Bus Econ Public Policy
201510 15 24 13 41.67 % 8.33 % 1.071
201610 10 17 8 41.18 % 0.00 % 1.250 201710 19 28 9 28.57 % 7.14 % 1.462 201810 24 38 14 28.95 % 13.16 % 1.091 201910 11 17 7 41.18 % 11.76 % 1.100 Bus Econ
Public Policy Total
79
124
51
31.11 %
8.08 %
1.359
Economics and Finance
Finance 201510 23 37 19 43.24 % 5.41 % 1.150
201610 30 45 19 40.00 % 6.67 % 1.034 201710 45 61 22 31.15 % 6.56 % 1.406
201810 105 131 31 20.61 % 12.98 % 1.193 201910 79 118 17 12.71 % 18.64 % 1.113 Finance
Total 282 392 108 24.23 % 12.24 % 1.175 Mgt and Marketing
Management 201510 69 110 59 51.82 % 8.18 % 1.000
201610 58 98 53 52.04 % 5.10 % 1.018 201710 73 113 66 53.10 % 4.42 % 1.090 201810 262 302 50 13.91 % 21.52 % 1.409 201910 193 301 62 18.27% 20.27 % 1.049
Mgt Total 655 924 290 28.68 % 15.69 % 1.163
Marketing 201510 36 48 25 47.92 % 2.08 % 1.500
201610 25 47 32 65.96 % 8.51 % 0.694 201710 51 62 33 29.03 % 4.84 % 2.040 201810 164 186 35 11.83 % 20.43 % 1.378 201910 138 192 52 21.88 % 19.27 % 1.169 Marketing
Total 414 535 176 25.23 % 15.51 % 1.286

DSB Departmental Annual Report Summary – Page 6
So, even when including the DS pre-major students in the data for each major, the five DSB majors meet all of the viability metric standards for the current year, for virtually every data point within the running five year period, and for the five-year averages. In fact, the viability statistics for our five majors, even when including the DS students, compare very favorably to even the most successful of majors across the campus. We do see, however, some trends in the data that we will be working toward improving. For example, the Marketing saw 2.3% attrition within the major (among upper division students), but saw 33.33% attrition in the pre-majors. Very full core marketing classes that make it difficult for students to enroll (due to lack of marketing faculty to offer additional sections) may contribute to this attrition among pre- majors, because if they end up enrolling in different core business courses prior to marketing, that could sway their decision on what major to pursue. We have also received student complaints about how few marketing electives are offered (again due to faculty constraints), and pre-marketing students could be aware of this lack of elective course options, causing them to consider an alternate major. We started a student Marketing Club this year, among other things, which should help engage students in the major and discipline earlier in their academic program. We can always improve upon our current status and we look forward to doing so across DSB.
DSB continues to also have excellent graduation efficiency rates, with a five-year average rate of 37.6% across DSB majors (and no major being below a graduation efficiency of 25% for the five year average). In the context of a USAP standard graduation efficiency metric minimum of 12.5%, DSB majors have graduation efficiency of double – and for some majors, three to nearly four times the standard. In looking at majors across the university that graduated more than five students this year with the highest graduation efficiency for this year, DSB holds the SIX of the top 9 highest annual graduation efficiency rates:
Major Grad. Efficiency Marketing 48.28 Elem Ed – Ed Policy
47.06 Public Policy – Health Serv Admin
46.88
Econ BSB 43.75 Management 40.44 Economics BA 41.18 Women’s Studies 31.25 Finance 28.85 Accounting 27.85 Other smaller majors with high grad efficiency rates (graduating 5 or fewer in 2019)
Public Policy – Pub Admin (2 graduates)
100.00
Public Policy – Envir Policy (1 graduate)
100.00
Spanish Educ. (2 graduates) 100.00 Media and Public Comm (2 graduates)
66.67

DSB Departmental Annual Report Summary – Page 7
Geology (3 graduates) 50.00 Philosphy (5 graduates) 40.00 Sec Ed – Ed Policy (2 graduates) 33.33
As noted in the table, there are some very small majors on campus that have higher graduation efficiency rates than the majors in DSB, but these are all small majors (graduating 5 or fewer students in 2019). These rates can be misleading (either to the positive or negative) since a program may have only had one student in the program, and if that student graduates, then they have a graduation efficiency rate of 100%. The trend of the graduation efficiency rates for the five year averages are the same as for this year’s averages. The graduation efficacy averages rates for DSB majors are some of the highest in the entire university. The six DSB majors are in the top 13 highest graduation efficiency five-year average rates university wide, among majors of any size. DSB has recently begun offering the Management and Marketing majors in a completely online format, and we have also developed a three-year pathway in which each of these majors can be earned. While there are only three students enrolled in the fully online programs to date, this is without advertising or promoting the programs formally. If the online program and the three-year pathway programs are promoted, there can be a large expansion in enrollment in these two majors. We are working with Marketing and Communication to create materials for our programs of which we can be proud. So, overall, DSB programs are strong – and there are plans for making continuous improvement in all aspects.
Gaps
The gaps in resources mentioned by the DSB departmental reports mainly surround staffing. The three department reports each highlight a very severe need to hire additional faculty. While we were able to meet AACSB Faculty Qualification ratios for the school overall and for each broad department for our accreditation visit the year before last, if the Peer Review Team had asked for the analysis at the level of the individual discipline and/or had asked us to provide data for a previous year within the five-year review period (which the team is well within their capacity and authority to do), we would not have met the required ratios. Indeed, we are only able to meet the required ratios for the current year because the data included FIVE Visiting Professors that we have on staff. AACSB accreditation will not extend accreditation with such a large number of visiting professors covering critical curriculum courses.
There are imminent faculty needs in all three DSB departments. The faculty staffing shortages are most desperate in the Management and Marketing Department in the areas of Marketing, where we have only two professors for a program which has nearly 200 majors (including the Pre-marketing majors). The two marketing faculty provide 12 sections of teaching capacity and we currently offer 10 sections of the core introductory marketing class per year, between undergraduate and graduate sections. All other marketing classes for the major (at least 10 courses) must be offered in addition to that. The only way this program is being successfully offered is through the use of faculty overloads and through the use of Limited Term Lecturers instructing courses. The program will not continue to be successful without additional faculty.
Economics saw the loss of a faculty member due to dual career issues last year, and they will be
DSB Departmental Annual Report Summary – Page 8
losing another to retirement next year. Another real threat terms of staffing is that there are at least three accounting faculty who will be retiring soon (two will be retiring in spring of 2020, with one more likely retiring in 2021 or 2022). Luckily, we were able to successfully hire a tenure track accounting professor this year who will began this fall, but the market for accounting professors is very tight and the salaries are high. When we asked the AASCB Peer Review Team for advice on how we might handle this situation, they advised that we start saving financial resources for these faculty replacements. We have had a Visiting Professor in Accounting this year, and next year we will have two Visiting Professors, but we need to have permanent faculty replacements now, We are lucky to currently have five visiting faculty members this year – one each in Accounting, Economics, Marketing, Management, and Operations. But we need to hire permanent faculty rather than continue with so many visiting professors. We currently have 34 full-time, including our visiting professors. But 3.25 FTE of our faculty is utilized in administrative roles (1.0 FTE for the Dean, .5 each for three chairs, and .75 for the MBA Director/ Accreditation Director) and one faculty member is on a VEPR appointment of 0.5 FTE. Thus, our five visiting professors this year make up 16.8% of our faculty (5.0 of 29.75 total DSB faculty FTE). The end of this academic year will bring two retirements in accounting and two faculty losses in Management – a retirement and the loss of a tenure track faculty member. While we have been allowed to conduct three faculty searches this spring (one TT, one CL, and one visiting), even if every search is successful, we will still come back in the fall with fewer faculty [losing 3.5 FTE and hiring 3.0 FTE] – and 6 will be visiting professors. We will then have our visiting professors constituting over one fifth of our faculty (20.5% - or 6.0 FTE of 29.25). If we are not successful in hiring for all three searches, the situation will be even more dire. The severity of the situation is underscored by the fact that next year’s hiring cycle (hiring in 2020-2021 for fall of 2021) will be the last one before our AACSB data year (academic year 2021-2022). Since our next re-accreditation visit for AACSB will take place in 2022-2023, the self study report will be based on the data, including faculty numbers and faculty qualifications data, from academic year 2021-2022. As we find ourselves continuing to grow undergraduate and MBA enrollments, this incredibly tight staffing scenario we face in almost all disciplines is most worrisome. Given the AACSB accreditation requirements, we cannot simply go out and hire more Long Term Lecturers (LTLs) if we require additional sections of courses to accommodate growing enrollments. MBA enrollments have grown immensely, with the current enrollment at 115 (over 70% more than 5 years ago)…and for that program alone, we have added 10 additional sections across the program (classes in many disciplines) to accommodate the large number of additional students in the program. Adding sections for the MBA program is particularly difficult, as current faculty who hold a Ph.D. will be required to be more heavily deployed into MBA courses in order to comply with HLC and AACSB accreditation requirements. This leaves fewer faculty to teach critical sections of our core business classes (classes which function highly to attract students to DSB majors) and to teach all the courses within the DSB majors. Overall, in order to continue to grow our programs, we will need additional faculty. For the next fiscal year, we also hope to hire additional professional staff. We have lost 3.0 FTE in staff positions due mainly to the universities early retirement program in 2016 – and are still 1.0 FTE behind the 2016 staffing level. DSB currently has only 5.3 total FTE

DSB Departmental Annual Report Summary – Page 9
university funded administrative support positions: 2.8 department secretaries for 3 departments (one departmental secretary is 0.8 time); one Assistant to the Dean, one administrative assistant for the Student Success Center; and a 0.5 secretary for the MBA program. We serve our students and stakeholders exceptionally and do so on an incredibly lean staff – and DSB funds temporary help to complete additional staff tasks. We currently have three professional Academic Advisors, who each have a caseload of over 330 undergraduate students. In order to continue to serve our students adequately, we hope to hire an additional Academic Advisor. We also hope to hire an additional administrative support staff person to help cover tasks our temporary employee currently carries out (which DSB currently funds) – and also to enhance our ability to create professional development opportunities for our students and to enhance our community outreach and connections. DSB is working hard to serve our students and also in many ways to serve the students across the entire PFW campus (e.g., the Start Smart pay negotiations seminars we have begun to offer regularly, and the First Annual Women’s Professional Development Day for all students on campus), but we can only do so with adequate staffing resources.
Opportunities for Synergies and Collaboration
Promising opportunities for synergies and collaboration have started between DSB and the College of Engineering, Technology, and Computer Science (ETCS). DSB continues to work on international collaborations with multiple universities in Morocco. These three institutions also have a strong focus on engineering and business, so ETCS and DSB are good partners in the programs and partnerships that are developing with these universities. We are also working with the English Highway, an English language program in Morocco which serves over 2,000 students in elementary to high school; as well as doing international student recruiting in Moroccan high schools. There is very strong potential for the opportunity to attract enrollment at both the undergraduate and graduate levels from these Moroccan universities, the language program, and the high schools, with the first students joining Purdue Fort Wayne in Fall of 2020.
DSB has continued to work this year with ETCS to help make efficient use of university resources. DSB recently worked with Organizational Leadership (OL) to provide seats to our students in OL's classes that will fulfill elective management-related courses. We worked with the Chair of OL to see how many seats could be provided to us for our students in OL classes that were already going to be offered. Then, in order to comply with the strict standards and Faculty Qualification criteria, small additional sections were established in DSB for currently listed OL classes and those sections were cross-listed with the current OL sections. Thus, what at first glance appears to be two very small, inefficient, sections are, instead, a more efficient use of university resources. This is only a start to how DSB can collaborate with OL, particularly in the area of human resources.
An additional collaboration involves the DSB Masters of Business Administration (MBA) program examining course offerings across campus to see if courses in other departments might serve as electives for the MBA program. The first example is a Systems Engineering course addressing Evaluating and Sustaining Lean serving as an MBA elective. Offering these electives serves our students well and may also facilitate the development of additional concentrations for the MBA or even cross-disciplinary programs.

DSB Departmental Annual Report Summary – Page 10
This year, the Doermer School of Business continued our Living Learning Community (LLC) in collaboration with Purdue Fort Wayne Student Housing. The program has been very successful. For example, the Resident Advisor for the LLC reports that they have had 15-20 students attend each of the events that have been held (e.g., guest speakers and seminars on career related topics).
Another positive DSB initiative is our ongoing interaction with Junior Achievement and more recently, DECA. These efforts will reach many high school students who may not have previously thought about attending Purdue Fort Wayne. We are currently sending volunteers to help with their programs and we plan to have increased involvement with them. We have also offered to host either the District and/or the State DECA competition in an upcoming year. We will be able to do much more along these lines with the addition of the DSB Director for Professional Development and Outreach.
The last positive change in DSB that we will mention is the re-design of the Student Success Center that is continuing. The newly created Director of Professional Development and Outreach, the Director of Student Success, and the MBA Director are working together to create a center and resources that serves both undergraduate and graduate students. We will more fully develop the Passport to Success career development program for our students and do much more outreach, involvement, and engagement with community businesses. We are also planning to develop closer ties and more collaboration between faculty and the Student Success Center Staff. The new Director of Professional Development and Outreach also serves as DSB’s Liaison to Career Services in the newly designed university hub and spoke model. These activities will all greatly benefit our students.
Summary
Faculty and staff are working hard to support student success in DSB...and we believe that DSB stands poised for continued positive outcomes and achievements. The coming year will no doubt allow us to achieve even greater things. We are excited to move ahead!

2019 Annual Report 1/30
ANNUAL REPORT
2019
V1.0-2.24.2020

2019 Annual Report 2/30
Overview I am delighted to present our 2019 annual report. An annual report is not compilation of facts and figures. It is a tangible demonstration of the impact our people have made on the communities in northeast Indiana, the State, and beyond. Purdue Fort Wayne’s Education with Purpose™ is transforming the lives of our students who come from diverse background. The great majority of ETCS graduates are employed locally and state-wide, who contribute significantly to the regional economic development. A summary of initiatives that were launched in 2019 is discussed below, following a brief background of the strategic planning implementation progress to provide context. The ETCS strategic plan, launched in fall 2017, was developed with several key steps in mind. The plan was developed with extensive input from all stakeholders. The National Academy of Engineering’s Grand Challenges Scholars Program (GCSP) was adopted as the framework of the plan. A dedicated web site was designed to enable the posting of up to date progress of the implementation plan and to provide feedback opportunities for the stakeholders. The plan has played a pivotal role in the college’s transformational journey, grounded in continuous improvement. Furthermore, design-thinking methodology has been used in the implementation process. Design-thinking is a toolbox of resources and methods that the teams can utilize to intentionally, collaboratively, empathically, visually, and iteratively solve problems. It is extremely useful in brainstorming many ideas to re-define a problem by understanding the human needs via empathizing approach, and prototyping and testing before finally implementing a practical solution. The core principle or mindset of design-thinking is bias toward action. The first step in the process is human needs. We empathize with our stakeholders. The second step in the process is prototyping. We dive into the action by actually doing what needs to be done at a small scale, learn from it in the process, tweak/revise it as needed, and then execute it. We test it and if it is a sound concept, we implement it. Once it is implemented, we allocate the resources needed to create a flywheel effect. We will elaborate on several such examples in the ensuing paragraphs. The ETCS community has been working collaboratively with select groups of industry/community partners, K-12, and Ivy Tech Community College to execute various initiatives of the strategic plan. We have made excellent progress in certain focus areas while other focus areas are in initial stages of execution. Originally, these were launched at the college level using the design-thinking approach as described above. In 2019, we worked closely with each academic department and the school of polytechnic to assist them in developing their respective strategic plans consistent with the ETCS’ and university’s strategic plans. In accordance with Kane, et. Al (2019), “…when the essential components of an ‘organization’: its culture, people, structure, and tasks are tightly aligned can the ‘organization’ achieve powerful results.” Furthermore, the authors contend: “… push decision-making to lower levels of the organization. This organizational structure helps the organization respond to changes more quickly.” Accordingly, we facilitated SWOT analysis for each department/school and started integrating the OKR (Objectives, Key Results) concept to expedite the implementation process. OKR, initially introduced at Intel by Andy Grove and later

2019 Annual Report 3/30
adopted by Microsoft, Google, and Apple, is a framework for identifying and tracking objectives (typically 3 to 5) and their outcomes (no more than 2 to 3 per each objective). An important aspect of OKR is that the progress is evaluated frequently, typically each quarter. One of the major accomplishments of ETCS in 2019 was in relation to the Focus Area 2.0 of our strategic plan: “Create research opportunities and innovation.” We launched several unique initiatives in collaboration with the industry including the innovation projects, industry/corporate faculty fellows program, northeast Indiana Innovation Day, and Industry 4.0 (aka IIoT). Prior to lunching these major initiatives, however, Sean Ryan and I visited PWL’s office of Corporate and Global Partnerships and discussed the IP protocols with the director and a couple of attorneys. Subsequently, Sean worked closely with the attorneys to draft an agreement that was vetted by a couple of corporate partners. The first corporate/industry innovation project was initiated with General Motors company. The proposed project was entitled: “Automated truck transportation system at the of end of assembly line.” A total of eight faculty members from the following programs: computer science, computer engineering, electrical engineering, mechanical engineering, and organizational leadership worked as a team to prepare a white paper. The PFW team collaborated with engineers at GM and also visited the plant a couple of times. After preparing the white paper, the faculty presented their findings and preliminary proposal to the local GM plant manager and several GM engineers. Although the proposal was not funded, our faculty received excellent feedback. It was a great opportunity for the faculty from different disciplines in ETCS to collaborate. As a result, the relationship between ETCS and GM has strengthened and GM is identifying other innovation projects for future collaboration and possible funding. The second industry/corporate project was developed in collaboration with OmniSource. This is another elaborate research and development (R&D) project that has to do with metal sorting. It is a multidisciplinary effort requiring expertise from computer science and several engineering programs including system, computer, electrical, and mechanical, computer science, and material science. Several other companies have expressed interest to initiate similar partnerships. The corporate faculty fellows program is the faculty placement in partner companies primarily during the summer. The faculty will provide high-level expertise in solving industry problems in collaboration with engineers while s/he gains valuable practical experience to take back to the classroom. Many of our faculty members join PFW fresh out of college (upon getting their Ph.D. degrees) without any industry experience. Additional benefits of this program is the organic relationship that is developed with the industry, ideas for capstone design projects, summer income for the faculty, and retention of faculty members, specifically female faculty. The Industry 4.0 collaboration is a large scale three-way partnership between PFW, Ivy Tech, and Whitley County EDC. The new industrial revolution, Industry 4.0 (aka smart manufacturing, Industrial Internet of Things or IIoT), refers to interconnectivity, automation, machine learning,

2019 Annual Report 4/30
and real-time data. It is not, however, merely the digitization of manufacturing industry but revolutionizing the way the entire enterprise operates and grows. Several members of our faculty and Systems Engineering staff and myself have been working diligently for the past year in collaboration with our counterparts at Ivy Tech (the dean of technology and a faculty member), Whitley County EDC, and Purdue West Lafayette (IN-MaC’s director of business development and facility) to develop plans for upgrading the conventional manufacturing industry in northeast Indiana to smart manufacturing. We have prepared and submitted a grant proposal to three different local foundations. Considering that advanced manufacturing has been identified as one of ETCS’s signature areas, the Industry 4.0 initiative aligns with our strategic priorities through which the college and Purdue Fort Wayne will make a significant impact on the economic development of northeast Indiana. The college of ETCS has also established a close partnership with the regional healthcare systems. The systems engineering center and the information analytics and visualization center have been working closely with Parkview and Lutheran hospitals and Mirro center for research and innovation. Our farm-to-fork system approach project has received much attention. During 2019, the college initiated a partnership with Indiana Institute for Prosthetics located in Zionsville, IN. The collaboration is being developed in the areas of research, certification and/or a minor program, and sponsored senior capstone projects. In 2019, ETCS launched its inaugural Northeast Indiana Innovation Day to celebrate the national engineers week and the rich heritage of innovation in northeast Indiana. A dozen companies displayed their innovative products at IDEASpace throughout the day while an overview presentation by one of the companies highlighted the impact of innovation and entrepreneurship in our region. GM parked one of their high end trucks in front of the IDEASpace to showcase their state-of-the-art technology. The event was well attended by the campus community and industry. Regarding other focus areas of the ETCS strategic plan, we continue to make progress executing various priorities. In the case of Focus Area 1.0: “Improve student success,” we grew partnership with local K-12 and Ivy Tech community college. The college hosted another lunch-and-learn session for high school guidance counselors. School of Polytechnic and IvyTech take turn to host the fall and spring collaboration summits, whereby groups of faculty from both institutions convene to discuss ways of improving collaboration and articulation. Another exciting program that we launched in relation to our highly successful “student life-cycle flow model” was the partnership with the Girl Scouts of Northeast Indiana and Michiana. A number of our female faculty and ETCS female students teamed with several female professionals to develop and implement a four-day summer camp. A total of 22 2nd and 3rd graders (Brownies) participated in the camp. They were engaged in multiple hands-on STEM related and fun activities. The camp, known as the Future Girls in STEM, received ample media coverage. The OAA provided the initial seed fund to cover the cost and to provide stipends for the faculty and PFW student helpers. We submitted a follow up proposal to the GM Foundation to ensure sustainability of the similar future

2019 Annual Report 5/30
camps. Our female faculty members have remained engaged with the Girl Scouts to foster numerous “touchpoints” to keep the girls motivated about STEM fields. They have planned an expanded version of last summer’s camp for summer 2020 involving 4th graders in the mix as well. We began late last year to look into modeling our STEM initiative with other underrepresented minority groups. As a result, we have partnered with South Side schools in creating a STEAM camp for a group of approx. 20 to 25 diverse students. We have been working on the details of the program to launch it in summer 2020. We have also approached (through the Development Office) NIPSCO for another grant, who has expressed interest in possibly matching the GM Foundation’s grant. We envision that both STEM/STEAM programs will eventually serve as pipelines to ETCS and other related majors at Purdue Fort Wayne. These are also consistent with ETCS’ diversity and inclusive excellence strategic planning priorities. The productivity of individual academic departments and school of polytechnic, outreach division, student success center, and the three Centers of Research Excellence will be discussed next. The strategic plan has served as a vehicle to advance the mission of ETCS and to help us realize the vision of becoming the college of choice (in the affiliated majors) in northeast Indiana and beyond. The thread to weave strategic communication throughout the developmental stage and execution of the plan has been Stephen Covey’s 8th habit: “Find your voice and inspire others to find theirs.” Accordingly, we have cultivated an open communication with all ETCS constituents to build a shared vision, which is one of the five learning disciplines identified by Peter Senge in his book entitled: The Fifth Discipline. Senge asserts that the systems thinking methodology will enable us to transform our institution, “where people are continually learning how to learn together.” VIABILITY SECTION STRATEGIC ENROLLMENT MANAGEMENT PLAN We believe that enrollment management, one of ETCS’s strategic priorities, is a combination of recruiting and enrolling students, providing ample curricular and co-curricular support to foster academic success, and facilitating career planning. As a result, we have taken an integrated approach to enrollment management by establishing a three-way partnerships with k-12 and industry through our student life-cycle flow model to ensure pre-college preparedness and post-college career readiness. The new Purdue brand has had a positive impact on recruiting efforts of all ETCS programs. Not only there is a greater interest in the expanded service areas of outreach in the neighboring states, we have also extended outreach internationally to schools in Morocco. In conjunction with the Doermer School of Business, we hosted a dozen prominent Moroccan high school principals/teachers over the summer who toured the ETCS labs and interacted with our faculty. We anticipate a large influx of Moroccan students to pursue engineering and technology degrees at Purdue Fort Wayne in the coming years.

2019 Annual Report 6/30
In light of the preceding integrated enrollment approach, the college continued its central advising model by the SSC professional advisors for the first year students in 2019. Each of the three professional advisors serves as the primary advisor for one department/school and as a secondary advisor to another department/school. The combination of first year advising and the living and learning community has been impactful toward student success and retention goals. Furthermore, ETCS continued expanding its LEAD peer mentor program, industry mentor program, and the enrichment program that were launched in the prior year. As a priority of the strategic plan, the college reconfigured the combined SE Center and Wireless Center space/suite into SSC suite. The SSC professional advisor offices are now clustered together with an open space and a conference table to accommodate student visitors. OVERVIEW OF DEPARTMENTS/SCHOOL PERFORMANCE DEPARTMENT OF CIVIL & MECHANICAL ENGINEERING The civil and mechanical engineering department launched its first ever comprehensive strategic plan in spring 2019. The plan engaged the internal and external constituents. It is aligned with the ETCS’ strategic plan as well as the new university’s plan. Subsequently, the department identified their top OKRs. Furthermore, CME has made a concerted effort in creating a robust assessment process for both CE and ME programs. Dr. Dong Chen is the CE’s assessment coordinator and Dr. Bongsu Kang is the ME’s assessment coordinator. Under their leadership and faculty’s contributions, the CME department is making a very good progress toward the next ABET visit. Accordingly, both programs have realigned their previous student learning outcomes (SLOs) a through k with the new ABET’s Criterion 2: student learning outcomes 1 through 7. There is also a great emphasis on continuous improvement and closing the loop process. They have incorporated the constituents’ feedback to improve their programs and have made several key changes in the curriculum and laboratories. The new format of central advising by Ashley Blauvelt of ETCS’ SSC in first year engineering (FYE) has been effective. The U.S. News & World Report raking of engineering at Purdue Fort Wayne jumped from 45 of the previous year to 38, which is amazing considering that there are a total of 400 engineering colleges/schools in this category (up to master’s degrees, no PhDs). A large number of multi-disciplinary senior design capstone projects were sponsored by the industry. Table 2a of CE program’s demand reveals that there were 42 new majors, down from 57 in fall 2018 but up from the previous two years. Overall, the total number of majors (new plus continuing) has remained steady in recent years with an average number of 13 graduates. These numbers are within the current capacity of the program based on the limited number of full time faculty and space limitation. Table 2b for CE program reveals that both graduation efficiency and student attritions being higher in 2018 than previous years. There is definitely room for improvement concerning student retention and graduation rates in CE program. One new initiative that will have a positive long-term impact on the program is the offering of CE-484, undergraduate research

2019 Annual Report 7/30
projects. It is well known that research experience at undergraduate (REU) level helps with the student retention. I highly recommend that the ME program also considers offering a similar opportunity for their students. Also, the faculty may want to apply for NSF’s REU division for funding. These types of funding are geared toward undergraduate-focused institutions and are not as competitive as other NSF grants. ME program’s total number of majors (new plus continuing) remained the same as last year, but the number of graduates dropped in the past couple of years. There is a large number of stopped out students. Graduation efficiency decreased whereas student attrition increased in comparison to the previous years. ME’s undergraduate enrollment has been the highest among all engineering programs. There needs to be a more concerted effort by the faculty to enhance student success, retention, and graduation for both the CE and ME programs. According to the chair’s comments, calculus and physics courses are part of the reason for students stop out. Historically, this has been a universal problem in many engineering schools. As a result, there is a trend to have the courses taught by the engineering faculty to shift emphasis to more practical and hands-on problem solving approach. I have been an advocate for offering summer bridge programs to better prepare the freshmen as they transition into college and provide refresher workshops to sophomores and transfers to enhance their performances. Table 2e of both CE and ME programs have outlined other measures to improve student success. Evidently, these are also part of CME’s OKRs. There is an urgent need to replace one of the very old testing equipment, which is effecting student learning attainment and could jeopardize the next ABET accreditation. The equipment is the Tinius Olsen machine and it is used in several experiments at the undergraduate level as well as for research projects. Another longstanding challenge of our engineering programs that is impacting student learning attainment and may be a cause for concern in relation to the next ABET accreditation is the space limitation of the first-year engineering (FYE) classes and studios. I suggest we consider reconfiguring the existing geoscience’s space to accommodate the FYE needs temporarily until the CSD’s modular units become available. DEPARTMENT OF ELECTRICAL & COMPUTER ENGINEERING Similar to the CME department, ECE is also enjoying the higher U.S. News & World Report’s ranking. Unlike CME, however, the strategic plan that was developed by the ECE faculty is not as comprehensive involving an execution plan. I highly recommend that the ECE department to revisit their strategic planning process and create long-term goals with measurable outcomes. They have identified several short-term objectives and are pursuing the key results as part of the OKR process. The assessment efforts of the ECE department is also robust. The assessment coordinators, in collaboration with the faculty, have already realigned their a through k student learning outcomes with the new ABET 1 through 7 SLOs. Furthermore, they have been compiling

2019 Annual Report 8/30
course assessments data, senior exit interviews and other indirect assessments data while ensuring the continuous improvement and closing the loop process. An outcome of the continuous improvement process was the development and offering one new required course and one technical elective course last year. I am confident ECE will be well-prepared for the next ABET visit. Tables 2a and 2b of computer engineering program reveal that both the demand and total number of majors have remained flat for the last three years. The percentage of student attrition and the number of stopped out have been quite high recently. There are at present some efforts to address the outreach and recruitment, student success and retention. We have discussed these concerns with the interim chair and have asked him to work with the ECE faculty to develop OKRs that will address the issues. Tables 2a through 2d of the electrical engineering program highlight pertinent data in relation to demand, number of majors, student attrition, and stopped out, etc. It is evident from these tables that the demand is relatively low whereas the total number of majors is a bit higher than previous years. Student attrition rates are not as high as the computer engineering program. The stopped out are not to that extent but can be improved. Similar to Table 2e for the computer engineering program, Table 2e of electrical engineering program describes several protocols for improving outreach and student success. One of the computer programming courses, Intro to C/C++, was taught by a LTL in CS department in the past, which was perceived to be a roadblock for ECE students. The new ECE full time faculty has developed and offered a more applicable course for ECE students which may alleviate their concern. DEPARTMENT OF COMPUTER SCIENCE The chair of CS department was on sabbatical leave during summer and fall 2019. Due to temporary nature of the position, the interim chair did not commit to developing a long-term strategic plan for the department. The first order of business is then to have the CS department chair to engage in this endeavor, which would be the first ever for the department, to prepare a strategic plan in collaboration with internal and external constituents. We also need to establish the department OKRs as an integral part of the aforementioned plan. We have offered Dr. Kim that we (Ms. Jennifer Hunter and I) will be willing, like we have done so for other ETCS’ academic departments, to assist his department in facilitating a SWOT analysis as a background to the strategic planning process. In 2019, the CS department continued collecting assessments data in preparation for the next ABET visit. There has been some difficulty staying on track with this important task for the department. Following a deliberation with the department chair, our consensus was to form an assessment team in lieu of a single assessment coordinator. This approach has significantly improved the direct and indirect assessment data collection, analysis, continuous improvement,

2019 Annual Report 9/30
and closing the loop processes. The data are more reliable and complete, which will also be helpful toward drafting the self-study report in a timely manner. Table 1 of the CS department’s annual report provides the progress in accomplishing the 5-year goals. The information in the table indicates that the CS department enjoys the support from its professional advisory board (PAB). PAB is engaged in curriculum revision, annual feedback to the department, approval of program educational objectives, and sponsorship of numerous senior capstone design projects. The table also highlights a boost in international student graduate program enrollment. It does not, however, appear that there is any concerted effort regarding undergraduate outreach and recruitment nor retention and graduation improvement. Tables 2a through 2d for the BA degree of the computer science reveal that both the demand and majors dropped considerably in 2019. The graduation efficiency has steadily improved over the years and student attrition was noticeably lower than previous three years. I highly recommend the CS department establishes a closer partnership with Ivy Tech community college for a more seamless articulation and transfer to the BA degree program because of the less stringent math and science requirements. Another great opportunity would be to recruit veterans who want to return to college to complete their four-year degrees. The CS department’s BA degree is conducive to these needs. Tables 2a through 2d of the BS degree in CS reveal that the student enrollment has been steadily growing for the past several years both in demand and majors. Unfortunately, the graduation efficiency has remained relatively low while the student attrition has increased indicating large number of stopped outs. It is important that the CS department incorporates a more proactive approach to student success, retention, and graduation. The ETCS’ student success initiatives have been impactful in the last three years and could provide best practices for the CS department to consider. Furthermore, the certificate programs don’t seem to be as popular evidenced by very low or no enrollment. We should look into a better marketing and publicizing opportunities. The two-year AS degree in IS is also suffering from low enrollment both in demand and majors. This is supposed to be a feeder program to the four-year IS and CS majors. Then again, there is an opportunity to creatively market this degree to high schools to grow enrollment. The BS in IS degree, on the other hand, has remained flat in enrollment both in relation to demand and majors. The graduation efficiency is relatively high, so is the student attrition. There is room for improvement to extend outreach and recruitment, retention, and graduation. DEPARTMENT OF ORGANIZATIONAL LEADERSHIP OL department made strides in forming an active industry advisory board and working collaboratively with all stakeholders to develop a strategic plan. The department scheduled a retreat in 2019 to conduct a SWOT analysis and used the results in identifying short-term and long-range goals. Subsequently, the faculty and staff created OKRs to advance the mission of the

2019 Annual Report 10/30
department. The existing department subcommittees assumed ownership of each objective and developed timeline to achieve the key results. These are all outlined in Table 1 of OL’s annual report. One of the goals stated in Table 1 is to improve the implementation of the OL assessment plan processes. As OL department continues to hone this process, it is also important to look for an appropriate accreditation body. We have discussed various options in the past, but never settled on one that would align with OL’s mission. Tables 2a through 2d of OL’s annual report for the A.S. degree reveal that both the demand and majors have fluctuated over the years, but it was the lowest ever in 2019. The graduation efficiency was 20.83% (a substantial drop from the prior year). The student attrition was also very high. The department chair states that the A.S. degree has served as the entry point to higher education for certain group of students and a pipeline to the four-year B.S. degree. In view of the recent enrollment numbers, it behooves to reconsider the viability of this degree program. There may be a niche for such workforce in the industry for the graduates of the program. We may want to market it more widely as well. Tables 2a through 2d of OL’s annual report in relation to the B.S. degree reveal that both demand and majors were the lowest in 2019. The graduation efficiency and student attrition remained more or less flat for the last several years. It is evident that stopped out numbers continue to be relatively high. Table 2d lists action items to improve the situation. I concur that better articulation with Ivy Tech community college and perhaps reaching out to veterans in northeast Indiana may help improving the enrollment. The online delivery of courses will make the program more appealing to working adults. The pertinent tables for certificate in supervisory leadership show insignificant enrollment. Herein lies an opportunity to better publicize the certificate campus-wide and perhaps make it appealing to the professionals. Other ETCS majors will benefit immensely by adding a leadership certificate to their qualifications, considering that a great majority of engineering/technology/computer science professionals typically assume leadership roles after several years into their careers. SCHOOL OF POLYTECHNIC School of Polytechnic developed its strategic plan more than a year ago in collaboration with internal and external constituents. The goals listed in Table 1 of Poly’s annual report were partially developed as part of the strategic planning process. The top priority of the School is to maintain its ETAC-ABET accreditation for the listed programs and to achieve the initial CAC-ABET accreditation for the IT program. Unlike the engineering programs, however, technology programs have not established a robust assessment protocol. They recently submitted a new plan. I highly recommend that the director of the school make this the number one priority and form a subcommittee/team to ensure high quality direct and indirect assessments data collection, analysis of data, evaluation, continuous improvement and close the loop. The process needs to begin immediately since there needs to be at least a couple of cycles of data compilation and evaluation to provide evidence of closing the loop.

2019 Annual Report 11/30
Tables 2a through 2d for advanced manufacturing management certificate are filled with zeros and ones, indicating that the certificate is not attracting any students. The certificate was originally intended for returning professionals. There needs to be a concerted effort in publicizing and marketing the added values for the certificate. Considering that the advanced manufacturing is a signature area for the college and the renewed focus on Industry 4.0 (smart manufacturing), in collaboration with Ivy Tech and Whitley County EDC, there is an enormous potential to deliver the certificate to a large number of manufacturing industry in northeast Indiana. This is also true regarding the other certificate programs in Poly, tabulated in the annual report. Computer Engineering Technology, B.S. Degree - Tables 2a through 2d show that this program is relatively small with low graduation efficiency and high student attrition. There has been some improvement compared to the previous year. There are overlaps with the EET program, thus the small size is not as critical since there are numerous courses which are common between the two programs. Poly has established a long list of initiatives school-wide to improve enrollment and student success. In particular, the proposed summer bridge program will help incoming freshmen to better transition to college and get a jumpstart with their classes. Construction Engineering Technology, B.S. Degree - Tables 2a through 2d provide the highlight of the current B.S. degree in construction engineering technology. The program is, however, in transition into the more hybrid construction management degree. We anticipate a significant enrollment growth under the new name and enhanced career opportunities for the graduates. Presently, the high number of stopped out students is a cause for concern. The proposed school-wide initiatives will help improve this in the future. In the interim, I highly recommend that the program reaches out to these students to find out the reason for leaving the program. The partnership with Ivy Tech will enrich the learn-by-doing aspect of the program. Ivey Tech has capability for students to construct a prototype residential building. Electrical Engineering Technology, A.S. Degree - This is an entry two-year program toward the four-year EET B.S. degree program. Both the demand and majors have fluctuated during the last several years. Student attrition was the highest in the last four years. The viability of the program needs to be investigated in light of low student enrollment and high attrition. Electrical Engineering Technology, B.S. Degree - The EET and CPET have potential to grow in demand should Poly expand its outreach with local high schools and articulation with Ivy Tech. Similar to other programs of Poly, EET is also experiencing stopped out challenges. The number of stopped outs has been the highest, more than twice the previous years. Then again, ETCS’ resources and initiatives will help these programs substantially should poly take advantage of them. Industrial Engineering Technology, A.S. & B.S. Degrees - These two programs are by far the smallest ones in ETCS. Considering the demand and majors of the A.S. degree, I suggest that we

2019 Annual Report 12/30
discontinue the program immediately. There are a couple of options in relation to the four-year degree program. The program can become an integral part of another existing Poly program such as concentration of MET. Another option would be to offer a B.A. degree to attract the Ivy Tech’s returning adults/professionals who do not have the aptitude to take calculus courses. We need to develop a complementary B.A. degree to their A.S. degree with additional 60 units for graduation. Unlike the B.S. degree, the B.A. degree will not be accredited by ABET. This degree will also be very attractive to the veterans in northeast Indiana. Information Technology, B.S. Degree - This program has a tremendous potential for growth should we consider the following ideas: (a) Partnering more intimately with key local industry; (b) Identify a niche; (c) Expand the fully online version; and (d) Obtain the CAC-ABET accreditation. The demand and majors have remained relatively flat over the years, with low graduation efficiency and high student attrition. Then again, Poly has not taken full advantage of the ETCS’ initiatives regarding student success and retention. Our LEAD peer mentor program, Help Corner Tutoring, living-learning community (LLC), and most of all the enrichment program have had positive impact college wide. Mechanical Engineering Technology, A.S. & B.S. Degrees - There doesn’t seem to be a compelling reason to continue the A.S. degree. The B.S. degree, on the other hand, has been a thriving program in Poly and ETCS. The demand and majors have steadily increased over the years. The graduation efficiency has been relatively high, but unfortunately the student attrition spiked to nearly twice as much as the prior year. It is evidenced that the number of stopped out was quite large. The school is investigating the cause of this sudden jump. In view of the high attrition rates in nearly all programs, I highly recommend that Poly forms a subcommittee to explore the various perceived causes and investigate ways of improving them. CENTER OF EXCELLENCE IN INFORMATION ANALYTICS AND VISUALIZATION (IAV) The mission of the IAV Center is to promote and conduct research in the areas of information analytics and visualization, to provide state-of-the-art resources, and actively seek partnerships with regional industry, businesses, and government enterprises. In 2019, the Center received four TAP projects (total of $10,975), IRSC-sponsored grant ($15,000), and Indiana Computers (part of a consortium with $25,384 PFW share). The Center also submitted a joint proposal to NSF, which was not funded ($290,657). There were three refereed papers published in conference proceedings, a refereed abstract, four conference presentations, and other service activities to the profession. A total of eight students have been engaged in projects related to the IAV Center. IAV’s annual report is included in the appendix. As the IAV prepares the required SWOT analysis, it is important to seek input from all stakeholders including the industry and corporations. There is a tremendous potential for greater partnerships and growth of the center to become nationally recognized and solicit large grants. I suggest that the center director revises its original mission and articulates an ambitious vision to position the center for higher levels of distinction and productivity.
2019 Annual Report 13/30
CENTER OF EXCELLENCE IN SYSTEMS ENGINEERING (SE) The SE center’s annual report is included in the appendix. The center director’s workload consists of 50% dedicated to running the center, 25% research, and 25% teaching. Center employs a full-time associate director and a part-time professional. The center has identified four functional requirements (FR1 through FR4) plus the FR0, which is in relation to developing talent and sustainable design of systems capacity. The combination of FR and PS (physical solution) is further elaborated in different sections of the report. Regarding FR1, the long-term stability of the SE center, three different revenue stream models have been identified including on-line course offerings, working with small to medium enterprise companies, and other for-profit and not-for-profit companies. Two book chapters, a refereed conference paper and several technical reports have been published. The thrust of FR3 is academics. Several graduate students are engaged with SE center who are at different stages of their graduate studies. They also contribute to the ongoing funded projects as research assistants. SE center has been working collaboratively with PWL’s MSET online master’s program and delivered four sections of courses in 2019. Industry engagement constitutes the primary focus of FR4. SE center has been engaged in NE Indiana Lean Network, two IN-MaC projects, and contributed to a whitepaper for development of smart manufacturing initiative (aka Industry 4.0). In light of preceding brief overview, it is evident that the SE center is intimately involved in academics both via online and on campus options. It is also engaged with the local industry at different levels. SE center generates its revenue through online courses and a limited amount in working with local industry. All centers at Purdue Fort Wayne are conducting individual SWOT analysis this spring. This is an opportunity for the SE center to revisit its original mission and revise accordingly, articulate a vision of research excellence (as its title claims), and develop a plan to realize that vision. The center has a tremendous potential for becoming a nationally recognized center of research excellence because of its strategic location –since northeast Indiana is known to be the manufacturing capital of the nation and the nearby town of Warsaw is the orthopedic capital of the world. I highly recommend that SE Center uses the SWOT analysis to reimagine a more impactful future for the center itself, the college, and Purdue Fort Wayne. It will be important that the Center engages other faculty members in the college and across campus to collaboratively pursue large federal grants. CNETER OF EXCELLENCE IN WIRELESS COMMUNICATION (WC) Director of the WC center never responded to our inquiry regarding the annual report. As a result, there is no information to include in this section.

2019 Annual Report 14/30
STUDENT SUCCESS CENTER (SSC) The SSC’s annual report is included in the appendix. 2019 was a pivotal year for SSC. All three academic advisors left and it took a while to recruit replacements. The new academic advisors are very capable and have done an excellent job in a few months they have joined our team. As mentioned in previous sections of this report, SSC moved to the space where the SE Center and Wireless Communication Center used to be housed. This action has been transformational for SSC and has made their reach and impact much more efficient and effective. As noted in the SSC’s annual report, all our initiatives (LLC, LEAD peer mentor, industry mentor, enrichment, Help Corner peer tutoring, and first year advising) that were launched in prior years have been quite impactful (please refer to attachment for actual data) in relation to student success, retention, and graduation. In sum, it is evident that the student success center is a viable and highly effective part of the college in enhancing the student learning and quality of education at Purdue Fort Wayne. OUTREACH DIVISION The summery of outreach activities is captured in the attached narrative and the table entitled: 2019 ETCS Outreach Statistical Impact Data. It is evidenced that our outreach division is a viable and highly effective part of the college. It offers many impactful after school programs that exposes ETCS and Purdue Fort Wayne majors and career opportunities to young minds. As notes in the table, nearly 1,800 people combination of volunteers, judges, students, and their parents were engaged in these activities. The leadership, management, and operation of all these programs and activities are made possible by dedicated efforts of one full-time director and two part-time staff. Core Mission Section OVERVIEW OF DEPARTMENTS’/SCHOOL’S PERFORMANCE Following remarks are based on the series of graphs and bar charts included in the appendix, provided by the staff of the Office of Institutional Research and Analysis, and information gathered from other ETCS/PFW sources: 1. The most important resource of ETCS is the dedicated faculty and staff who care about their
students’ learning and engagement. 2. Several faculty members have been recognized for excellence in teaching, research/scholarly
activities, and service/engagement. 3. U.S. News & World Report’s ranking of engineering programs 38 out of 400. 4. We need to encourage more students to take the FE exam in their senior years. Perhaps, we
should provide incentives such as pay ½ of the fee prior to taking it and the balance should they pass the test.

2019 Annual Report 15/30
5. Encourage students to become more engaged with student clubs and organizations. 6. Foster a better faculty mentoring program from ETCS as well as across campus. 7. More assertive recruitment of female and other underrepresented minatory faculty. 8. The new career services arrangement will enhance the co-op and internship opportunities for
students and enticing companies to recruit from our campus. 9. Greater effort toward high-impact practices. ETCS’s experiential learning opportunities are
aligned with the HIP. We need to promote more undergraduate research activities. 10. Grand challenges scholars program (GCSP) serves as the framework of our strategic plan.
Several elements of the GSCP are embedded in many of our programs. We need to take this to the next level of more structured and coherent implementation.
11. The overall ETCS’ undergraduate enrollment has remained the same as last year at 1620. As far as individual departments is concerned: (a) CME - has remained essentially flat; (b) CS - has been marginally growing; (c) ECE - also marginally growing; (d) OL - has been declining for the past four years; and (e) Poly - increased compared to last year.
12. The total number of graduate students increased last year. Departments’ status: (a) CME - only 16 students, which needs to increase efforts in light of their accelerated degree program; (b) CS - nearly doubled compared to last year, need resources, space, and additional faculty as a result; (c) ECE - doing better than CME but there is still room for growth; (d) OL - has had a relatively healthy grad program although there was a drop in last year’s enrollment, need to identify the cause and think of new recruitment strategies; (e) Poly - improved a bit last year, but has been struggling over the years. We are looking a hybrid program with OL to improve the joint enrollment.
13. The female student population in the college has remained historically flat. The 18% median is fueled by the OL’s female enrollment. Should the OL population be disaggregated from the mix, other ETCS programs will be in low single digits. We launched the inaugural Future Girls of STEM summer camp, with numerous follow up touch points, to create a pipeline in the long run. This program was highly successful and has become an annual event, expanding every year to encompass additional grades. We have also planned for another group of underreported students in relation to STEAM, modeled after the STEM program.
14. According to the retention chart, the fall-to-fall retention of undergraduate students has been continually dropping in the past five years at ETCS as well as the University as a whole.
15. The overall six-year graduation rate is at 47.3% in ETCS. According to the National Center for Education Statistics (NCES), approx. 60% of students who began seeking a B.S. degree completed their degrees in six years. There are several variables that may affect the percentages including the demographics, majors, traditional vs non-traditional students, etc.
OVERVIEW OF SCHOLARLY CONTRIBUTIONS 1. Multiple faculty members continued executing TAP and IN-MaC projects. 2. Several faculty members received the IRSC’ summer research grants. 3. Several faculty members submitted research proposals for external funding.

2019 Annual Report 16/30
4. We formed multidisciplinary teams of faculty who worked collaboratively with industry
partners and submitted whitepapers. 5. We formed a team of ETCS faculty and the dean, Ivy Tech faculty and the dean, Whitley
County EDC and developed a grant proposal to local foundations to promote Industry 4.0 initiative.
6. As evidenced in each department and school of polytechnic’s annual report, a number of faculty members published peer-reviewed journal articles and in conference proceedings.
DISCUSSION OF DEPARTMENT FUNDING During the past several year, the combination of deep state funding cuts along with enrollment challenges have created a quandary for institutions of higher learning. We have had our share of upheavals at Purdue Fort Wayne. The college of ETCS has remained frugal and the faculty and staff have made every attempt to optimize resources. With entrepreneurial mindset and full transparency, we have looked for other revenue streams including online course/program delivery, fund-raising and philanthropy, partnerships with industry and corporations. Despite our persistent efforts, there are still shortfalls in meeting the demands of the college. The demand that has been neglected for several years and has become critical and urgent in the following cases: ¨ Tenure faculty and/or continuing lecturer needs in nearly all programs. A number of the
vacancies have occurred due to retirement or departure of faculty members because of no protocol for spousal hires. In several cases, the lack of faculty expertise may have a negative consequences in relation to accreditation.
¨ Equipment and machinery are quite old and inoperable. In some cases, there is safety concern and in others the data collected are erroneous. There needs to be a dedicated budget to continually maintain and upgrade the equipment.
¨ Space limitations have become a major concern in some of the programs to the extent that it is impacting the student learning attainment. This could also jeopardize our accreditation in the next cycle of ABET visitation.

2019 Annual Report 17/30
APPENDIX

2019 Annual Report 18/30
SSC REPORT: 2019 was a pivotal year of the ETCS Student Success Center. All three academic advisors left for other jobs so some positions were open for several months and some continuity in terms of initiative reports was lacking. However, the center now has three very capable advisors who advise first year students, 2+3 students, and coordinate a variety of ETCS student success initiatives. Highlights of 2019:
• We are now in our 2nd year in which SSC staff advise all first year students. In total, the staff advises close to 500 students; each advisor is assigned certain disciplines (Ashley Blauvelt: engineering, Ranesha Smith: Polytechnic and 2+3 students, Karen Lenfestey: CS and OL students). Advising is mandatory for all first year students. Retention of ETCS first year students has improved.
• The SSC moved into the ET 229 suite in the fall. This is a great improvement having all of the advisors in one central location.
• The turnover in SSC has provided the opportunity for the advisors to determine (to some extent) their roles and responsibilities based on their interests, knowledge and experiences. A list of their roles and responsibilities has been distributed to the chairs within the college.
• The SSC was awarded $3800 from SGA in the spring to use for various initiatives (primarily LLC and LEAD events). Ranesha and Karen have submitted a proposal for funding for the 2020-2021 academic year.
Regarding ETCS initiatives, highlights include: • Projects Day was very successful this year. Efforts were made to market the event widely
and the dean’s advisory board met prior to the event and then attended Projects Day. Stats on the event are:
o 182 total people attended, o 19 community members, o 118 students, o 36 faculty/staff members. o 57 projects presented. 11 for CS, 7 for CME, 22 for ECET, 17 for MCET.
• ETCS Living Learning Community now occupies three floors within Building H. This fall 66 ETCS students lived in the LLC. In terms of events coordinated by the ETCS advisor (Karolyn Smith in the spring, Karen Lenfestey in the late fall) attendance was:
o Game Night-spring 2019: 16 students attended o Co-Op Info-spring 2019: 4 students attended o Movie Night-spring 2019: 7 students attended

2019 Annual Report 19/30
o De-stress/mindfulness: fall 2019: 15 students attended o *The Resident Assistants coordinate additional events for the LLC to ensure that
all of these topics are addressed: social, career, and academic needs, community involvement, emotional wellness, cultural/spiritual wellness and current events.
• ETCS LEAD (peer mentoring) served over 100 students in spring 2019 and over 250 in the fall of 2019. The program continues to grow and this year’s data suggests the program is improving. This table provides some data collected regarding LEAD:
Spring 2019 Fall 2019 Participants 19 mentees
5 mentors 8 industrial mentors
30 mentees 7 mentors 12 industrial mentors
Student GPAs 3.04 mentees 3.16 mentors
3.09 mentees 3.36 mentors
Student retention 84% mentees 100% mentors
100%, both mentees & mentors
Events De-stress event LEAD mentor recognition event (There may have been more not reported)
Welcome Back BBQ Industry-Mentor mixer Workshop & Bowling
• Help Corner (peer tutoring): In 2019 the ETCS Help Corner, located in ET 120 and 151,
began using TutorTrac to track the number of students using the tutoring system. However, the reports we have received do not appear to accurately reflect the number of students and the number of visits for 2019. Ashley Blauvelt, the coordinator of this initiative, is working to determine how we can better track student usage of this service. In the fall, all ETCS peer tutors went through a university-wide tutor training program. Currently we employ 5 peer tutors within the Help Corner. Ashley oversees these students and ensures new tutors receive training before they begin. This spring Ranesha has initiated a night study group; a peer tutor from the college will be available to help students during these scheduled study times.

2019 Annual Report 20/30
College of Engineering, Technology, and Computer Science Outreach Summary
Outreach Impact Outreach affects the university and pre-college youth in multiple ways. The number of participants and adults regionally served this past year by the programs, 2430, is important for the land grant institution mission of engagement. The degree to which the program provides increased exposure to Purdue Fort Wayne by the students and parents attending events is also an important factor for the college visibility and campus familiarity; both are key steps in the marketing/recruitment process. This year an estimated 1767 visited campus for events and many more watched FIRST LEGO League through the live stream. The table attached provides detailed data with a list of programs that ETCS Outreach coordinated, collaborated with other organizations, or represented ETCS at educational events. Another measure of impact is how consistently schools return and how well youth succeed with skills and knowledge related to ETCS majors. Competitions have maintained a consistent level of involvement for the past decade. The success of teams in competing at regional and national events is evident for the two regional competitions. Last spring, the team winning the Indiana FIRST LEGO League Northern Championship held at Purdue Fort Wayne took second place at the World Festival in Detroit. This is an international competition with over 100 teams from around the world. Four other Indiana FIRST LEGO League teams received invitations to national competitions. This past year, the Indiana Regional Future City team, Yemoga from Norwell Middle School won the national championship. Purdue Fort Wayne affects these team achievements by providing the program leadership needed to host regional competitions. Outreach Network of Engaged Partners, Sponsors, and Volunteers This past year, ETCS Outreach worked with multiple organizational partners to serve Indiana youth. The FIRST ®LEGO® League program engaged 13 partners around the state including six universities, three school systems, one STEM non-profit, and two FIRST robotics teams. Future City partners include the City of Fort Wayne, Fort Wayne Community Schools, and the NE Indiana Discover E Committee. The High School Bridge Contest partnership was a collaboration of ETCS Outreach, Engineering Resources and the Discover E Committee. Partner organizations who provided volunteers for the Sci-TEC Academy program included Engineering Resources, Raytheon, and Vera Bradley. Partners not only give volunteer time but also often provide support materials for programs. ETCS outreach engaged more than 143 PFW faculty and community professionals as program volunteers and 83 College of ETCS student volunteers. Outreach Budget: Sponsorships, Grants, Registrations and Expenses ETCS Outreach receives cash sponsorships and grants as well as in-kind support for various programs. The total estimated cost of outreach programs for 2019-2020 will be around $43,200. Sponsorships and grants received for programs totaled $42,791, which includes a one-time Lincoln

2019 Annual Report 21/30
Foundation grant for $11,000. Sponsorship contributions come from businesses, city offices, professional organizations, and non-profit organizations. The estimated value for in-kind support from businesses is $6,300, which included free use of equipment. Outreach also took in $7085 in registration fees for events and camps. Team registration fees are “fixed” based on national or state guidelines and scholarships offered to students in need are another demand on funding. We are restricted from charging for public viewing of regional competitions. Overall, this past year, we have been able to cover all event expenses and use additional funds to upgrade camp robotic kits, 2 new lap top computers needed for events and training, and offer some team support for schools or students in financial need so they can continue to engage in our programs.

2019 Annual Report 22/30

2019 Annual Report 23/30

2019 Annual Report 24/30
ETCS ADVISORY BOARD MEETING
1826
903
1559
1335
890
581
2225
948
15321412
977
598
1973
867
1553
1369
903
543
2309
901
1624
509
1171
587
2174
923
1620
199
1058
631
0
500
1000
1500
2000
2500
AS BN ETCS HS PS VPA
Total Number of Undergraduate Students in Fall 2015 – Fall 2019 by CollegeFall 2015 Fall 2016 Fall 2017 Fall 2018 Fall 2019

2019 Annual Report 25/30
ETCS ADVISORY BOARD MEETING
303 313
171
251
521
268
329
149
276
510
293327
155
260
518
302
350
167
246
559
295
356
172
222
575
0
100
200
300
400
500
600
700
CME CS ECE OL POLY
Total Number of Undergraduate ETCS Students in Fall 2015 – Fall 2019Fall 2015 Fall 2016 Fall 2017 Fall 2018 Fall 2019

2019 Annual Report 26/30
ETCS ADVISORY BOARD MEETING
102
82
122
85
168
9992
122
102
142
91
64
111
58
133
100
69
137
31
138
111
87
152
0
161
0
20
40
60
80
100
120
140
160
180
AS BN ETCS HS PS
Total Number of Graduate Students in Fall 2015 – Fall 2019 by CollegeFall 2015 Fall 2016 Fall 2017 Fall 2018 Fall 2019
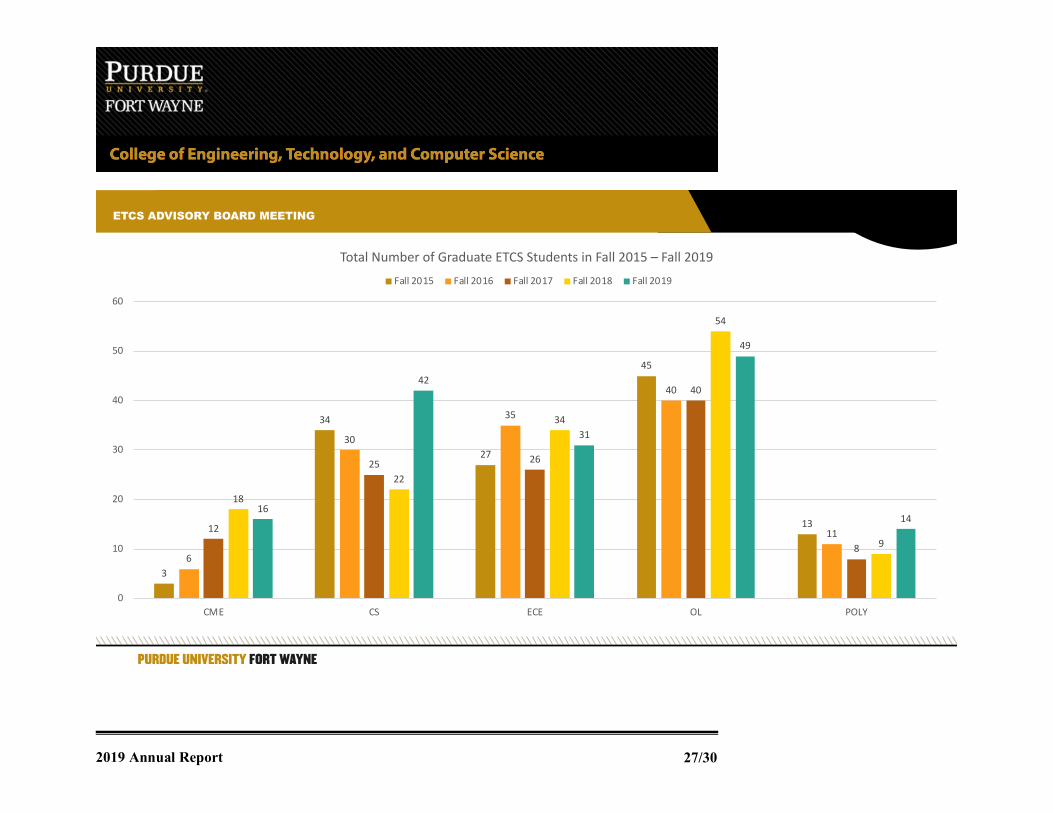
2019 Annual Report 27/30
ETCS ADVISORY BOARD MEETING
3
34
27
45
13
6
30
35
40
1112
25 26
40
8
18
22
34
54
9
16
42
31
49
14
0
10
20
30
40
50
60
CME CS ECE OL POLY
Total Number of Graduate ETCS Students in Fall 2015 – Fall 2019Fall 2015 Fall 2016 Fall 2017 Fall 2018 Fall 2019

2019 Annual Report 28/30
ETCS ADVISORY BOARD MEETING
Fall 2007 Fall 2008 Fall 2009 Fall 2010 Fall 2011 Fall 2012 Fall 2013 Fall 2014 Fall 2015 Fall 2016 Fall 2017 Fall 2018 Fall 2019University-wide 56.3% 55.8% 54.9% 54.3% 54.5% 54.4% 53.8% 54.1% 53.7% 54.0% 55.7% 52.3% 53.6%ETCS 18.4% 19.0% 17.6% 15.9% 16.1% 17.0% 16.8% 17.4% 15.8% 16.0% 17.7% 16.9% 18.1%
56.3% 55.8% 54.9% 54.3% 54.5% 54.4% 53.8% 54.1% 53.7% 54.0%55.7%
52.3% 53.6%
18.4% 19.0% 17.6%15.9% 16.1% 17.0% 16.8% 17.4%
15.8% 16.0%17.7% 16.9% 18.1%
0%
10%
20%
30%
40%
50%
60%
The Proportion of the Undergraduate Population who are Women from Fall 2007 to Fall 2019Disaggregated by ETCS and University-Wide Percentages

2019 Annual Report 29/30
ETCS ADVISORY BOARD MEETING
F06-F07 F07-F8 F08-F09 F09-F10 F10-F11 F11-F12 F12-F13 F13-F14 F14-F15 F15-F16 F16-F17 F17-F18 F18-F19ETCS Overall 68.5% 63.4% 67.0% 69.5% 64.8% 63.6% 69.3% 74.3% 71.9% 65.2% 67.3% 62.1% 60.2%University Overall 57.9% 61.5% 61.0% 61.8% 60.0% 59.8% 66.0% 67.4% 63.7% 61.6% 59.0% 56.9% 56.0%
68.5%63.4%
67.0%69.5%
64.8% 63.6%
69.3%74.3%
71.9%
65.2% 67.3%62.1% 60.2%
57.9%61.5% 61.0% 61.8% 60.0% 59.8%
66.0% 67.4%63.7% 61.6%
59.0% 56.9% 56.0%
0%
10%
20%
30%
40%
50%
60%
70%
80%
Fall to Fall Retention Rates of New Undergraduate Students Who Started at PFW in a Fall Semester Between Fall 2007 and Fall 2018
Disaggregated by ETCS and University-wide Retention Rates

2019 Annual Report 30/30
ETCS ADVISORY BOARD MEETING
Within 4 years Within 5 years Within 6 yearsUniversity Wide 22.6% 34.1% 38.4%ETCS 22.4% 49.7% 47.3%
22.6%
34.1%
38.4%
22.4%
49.7%47.3%
0%
10%
20%
30%
40%
50%
60%
Graduation Rates of Undergraduate Students Who Started at PFW in a Fall Semester Between Fall 2013 and Fall 2015Disaggregated by ETCS and University-Wide Graduation Rates


![Untitled - Physics Purdue [Edu]](https://static.fdokumen.com/doc/165x107/6329787bbfbc0e632409212c/untitled-physics-purdue-edu.jpg)