OPERATING BUDGET - City of Fort Collins
277
CITY OF FORT COLLINS MAY 2008 OPERATING BUDGET 08-09
-
Upload
khangminh22 -
Category
Documents
-
view
0 -
download
0
Transcript of OPERATING BUDGET - City of Fort Collins

CITY OF FORT COLLINS
MAY 2008
OPERATING BUDGET08-09

1 - OPERATING BUDGET
MAYOR AND CITY COUNCILDOUG HUTCHINSON, MAYORKELLY OHLSON, MAYOR PRO TEM DIGGS BROWNBEN MANVEL WADE TROXELLLISA POPPAW DAVID ROY CITY MANAGER DEPUTY CITY MANAGERDARIN ATTEBERRY DIANE JONES
CHIEF FINANCIAL OFFICER MIKE FREEMAN
ACCOUNTING & FINANCIAL REPORTING MANAGER JOHN VOSS
FINANCE DIRECTORCHARLES M. SEEST
ADOPTED
BIENNIAL BUDGET2008 and 2009

2 - OPERATING BUDGET
INQUIRIES REGARDING THE ADOPTED 2008-2009 BIENNIAL BUDGET FOR THE CITY OF FORT COLLINS, OR REQUESTS FOR MAILING, SHOULD BE DIRECTED TO:
City of Fort CollinsBudget & Research Office
P.O. Box 580Fort Collins, Colorado 80522
(970) 221-6530
This document is also available for review on the internet at www.fcgov.com/budget.

3 - OPERATING BUDGET
Special recognition is given to the following individuals for their assistance and energy in the preparation of the Adopted 2008-2009 Biennial Budget document:
SENIOR BUDGET & RESEARCH ANALYSTS Dee Toplyn Steve Engemoen BUDGET & RESEARCH ANALYST Carolyn Grulke
POLICY & PROJECT MANAGER Ann Turnquist
COMMUNICATIONS & PUBLIC INVOLVEMENT MANAGER Kelly DiMartino
GRAPHIC SPECIALIST Ryan Burke
SERVICE AREA DIRECTORS:
Diane Jones, Deputy City Manager/Community ServicesWendy Williams, Assistant City Manager/Internal ServicesDennis Harrison, Police ServicesMike Freeman, Financial ServicesBrian Janonis, Utility Services
Special acknowledgement is given to Michelle McDonough, Rich Haworth, Dave Larson, Jamie Heckman, Eric Bergersen and Janet Larsen for their efforts in supporting the Budget Development Tool (“BDT”), used during the Budget for Out-comes process.
Thanks to Amy Sharkey and Brenda Ehleiter for their work on the compensation components of the 2008-2009 budget.
Thanks to those who participated on Results Teams and to the many department and division heads, and the budget liai-sons. Their efforts were appreciated in the development of the Adopted 2008-2009 Biennial Budget.

4 - OPERATING BUDGET
TABLE OF CONTENTS
INTRODUCTION 7Introduces the reader to the City of Fort Collins including the history of the City; the current population and vital statistics; the process and basis used by the City in the development of the budget; and the organizational structure and chart.
A. CITY MANAGER’S BUDGET OVERVIEW AND BUDGET OVERVIEW 15Provides an overview of the budget, highlighting the financial condition of the City, and how we have responded to the City Council’s priorities. Also included are the appropriation ordinance adopting the 2008 and 2009 Budget and appropriating funds for 2008, and the proposed appropriations for 2009.
B. KEY OUTCOMES AND ALLOCATIONS 43Provides a summary of the 2008 and 2009 budget by outcome. Included in this section are the drilling platforms, a summary of each offer, and indicators for each outcome.
B-1 ECONOMIC HEALTH 49 B-2 ENVIRONMENTAL HEALTH 63 B-3 NEIGHBORHOOD LIVABILITY 81 B-4 SAFE COMMUNITY 93 B-5 CULTURAL AND RECREATIONAL OPPORTUNITIES 119 B-6 TRANSPORTATION 141 B-7 HIGH-PERFORMING GOVERNMENT 163
C. FUND STATEMENTS 195Describes the types of City funds, the budgeting principles used, and an analysis of changes in fund balances as well as financial statements for all of the City funds.
GENERAL FUND 201 Fund used to account for all financial resources except those required to be accounted for in another
fund. This fund provides a majority of city services to the residents of Fort Collins.
ENTERPRISE FUNDS 209 Includes Golf, Light & Power, Storm Drainage, Wastewater, and Water funds. These funds are established to
account for operations that are financed and operated in a similar manner to private business enterprises.
INTERNAL SERVICE FUNDS 220 Includes Benefits, Communications, Equipment, Self Insurance, and the Utility Customer Service and
Administration funds. These funds are used to account for the financing of services provided by one department to other departments of the City.
SPECIAL REVENUE AND DEBT SERVICE FUNDS 231 Includes Capital Leasing Corporation Fund, Capital Improvement Expansion Fund, Cemetery, Cultural
Services & Facilities, Debt Service, General Employees Retirement, Natural Areas, Perpetual Care, Recreation, Sales & Use Tax, Special Assessment Debt Service, Street Oversizing, Transit Services, and Transportation Services Funds. These funds are used to account for the proceeds of specific revenue sources that are legally restricted to expenditure for specified purposes.

5 - OPERATING BUDGET
TABLE OF CONTENTS
Other Governmental Units 250 Includes Downtown Development Authority, General Improvement District #1, and Poudre Fire Author-
ity. These are entities which, although not a part of the City government, assist the City in providing services to the residents.
D. DEBT POSTION 257The City’s Debt Financing Policy and long term debt structure.
E. APPENDIX 269Background information for property and sales & use taxes. Also descriptions of terminology used throughout the document.

6 - OPERATING BUDGET
THIS PAGE LEFT INTENTIONALLY BLANK

7 - OPERATING BUDGET
FORT COLLINS FACTS
OVERVIEW• FortCollinswasfoundedasamilitaryfortin1864andincorporatedasatownin1873.
•FortCollinsisahomerulecitywithaCouncil/Managerformofgovernment.
• TheCouncilismadeupofsixdistrictcouncilmemberswhoareelectedforafour-yeartermandaMayorwho is elected at-large for a two-year term.
• Thisrapidlyurbanizingcommunityoperatesunderasophisticatedandcomprehensivedevelopmentplanand is a full-service city.
• FortCollinsishometoColoradoStateUniversityandanoutstandingpublicschoolsystem,PoudreSchoolDistrict.
• FortCollinscontinuestoreinvestincommunityimprovements.Voter-approvedcapitalimprovementinitia-tives have enabled the City to build a second sheet of ice for Edora Pool and Ice Center, construct a Commu-nity Horticulture Center, make numerous road improvements, acquire land for future facilities, construct the new Spring Canyon Community Park, and construct a new Northside Community Center.
• Votershaveapprovedfundingtoaddseveralmorecommunityassetsoverthenext10years,includingroadimprovements, a joint museum facility between the City and the Discovery Science Center, and improve-ments to the Lincoln Center and Senior Center.
LOCATION AND CLIMATE• FortCollinsisnestledagainstthefoothillsoftheRockyMountains,alongthebanksoftheCacheLaPoudreRiver.
• TheCityliesapproximately5,000feetabovesealevel.
• Residentsenjoyamoderate,four-seasonclimatewithanaverageof300daysofsunshineand14.5inchesofprecipitation a year.
• FortCollinsencompasses52.8squaremiles.
GENERAL POPULATION• FortCollinshasapopulationof131,000residents(Est.August2007,includesCSUstudents)
• Theaverageannualpopulationgrowthsince1995hasbeen3.1percent.
• Thereare56,441housingunitsinthecity(December2007)
• Medianageis29.4yearsold(includingCSUstudents).
• Medianfamilyincomeis$68,200(familyoffour)
• Approximately48.2percentofthepopulationhavecompletedfourormoreyearsofcollege.
• ColoradoStateUniversityenrollmentis24,900students(Fall2007).

8 - OPERATING BUDGET
ECONOMY• TheLarimerCountyunemploymentrateis4.3percent(February2008).
• TheCity/Statehasacombinedsalestaxrateof6.7percent.
• TheCitysalestaxrateof3.0percentisamongthelowestinColorado.
• Theresidentialpropertytaxrateis7.96percent.
• Thebusinesspropertytaxrateis20percent.
• TheCity’sadoptedbiennialbudgettotals$571.7millionfor2008and$540.4for2009.
PARKS, RECREATION AND NATURAL AREAS• TheCitymaintainsmorethan800acresofparks,33,000acresofnaturalareas,and60milesofoff-street
hiking/biking trails.
• Therearethreegolfcourses,aracquetcenter,fourswimmingpools,twoicerinks,ahorticulturecenterandtwo community centers.
• TheFortCollinsSeniorCenterincludesapool,spa,gymnasium,track,billiards,craftsandacommunitymedia center/library.
• TheNorthsideAztlanCommunityCenterincludesatriplegymnasiumcomplex,elevatedrunningtrack,fit-ness area, spinning studio, locker rooms, meeting space, and kitchen.
LIBRARY, MUSEUM, PERFORMING ARTS• TheFortCollinsMuseumdisplaysthehistoryofFortCollinsandLarimerCountyfromprehistorictimesto
present day. The Museum also features several specialized and revolving exhibits throughout the year.
• TheMuseumisintheprocessofpartneringwiththeDiscoveryScienceCentertocreateanew,jointfacility.
• TheLincolnCenterhostsmorethan300performancesannually,includingprofessionaltheater,danceandmusic performances, as well as visual arts displays and children’s programs.
• HundredsofeventsareofferedannuallybyCSU,morethan20localtheaterandperformingartscompanies,and more than 20 fine arts galleries.
UTILITIES AND TRANSPORTATION• FortCollinsprovideselectric,water,wastewaterandstormwaterutilitiestoresidents.
• Ithasthesecond-largestmunicipalelectricsysteminColorado,withelectricratesrankingthefifth-lowestinthe state and among the lowest in the nation.
• FortCollinsUtilitieswasfirstinColoradoandamongthefirstinthecountytoofferwindenergytoitscustom-ers.
• FortCollinscontinuallymeetsorsurpassesallstateandfederalwaterqualitystandards.
• TheCitymaintainsatotalof487streetmiles.
• FortCollinssupportsmultipletransportationoptionsincluding18busroutesand200milesofon-streetandoff-street trails for pedestrians and bicycles.
9 - OPERATING BUDGET
• TheFortCollins/LovelandMunicipalAirportisjointlyownedbythecitiesofFortCollinsandLoveland.Withmore than 1,100 acres and roughly 200 aircraft, the Airport serves the private, corporate and commercial aviation needs of the Northern Front Range, as well as charter flights.
HONORS AND AWARDS• Oneof8EnrichingTownsforArtandMusicLovers–WheretoRetiremagazine,2008
• 3rdBestPlaceforBusinessandCareer–Forbesmagazine,2008
• 39thBestPlacetoLiveandLaunchaBusiness–CNN/Money,2008
• Top10DigitalCities–CenterforDigitalGovernment,2007
• Oneof30FastCities–FastCompanymagazine,2007
• Top10CollegeTownsforGrown-Ups–Kiplinger’smagazine,2007
• OneofAmerica’sMostWalkableSmallCities–msn.com,2007
• 4thamongCollegeTownsWithGreatGolf–GolfDigest,2006
• 1stBestPlacetoLiveintheNation–MoneyMagazine,2006
• 2ndSafestDrivers–AllstateInsurance,2006
• 6thmostAffordableCommunities/BestPlacestoRaiseYourFamily–Frommer’s,2006
• Oneofthe100BestCommunitiesforYoungPeople–America’sPromise,2005
• BicycleFriendlyCommunity–LeagueofAmericanBicyclists,2005
• AmericanDreamTown–Outsidemagazine,2005
• 4thBestPlacetoLiveintheUnitedStates–Men’sJournal,2005
• ATopRetirementSpot–WheretoRetiremagazine,2005
10 - OPERATING BUDGET
BUDGETING FOR OUTCOMES AND ORGANIZATIONAL STRUCTURE
The City’s 2008-2009 biennial budget was prepared using a process called Budgeting for Outcomes (“BFO”).
WHAT IS IT?• Abudgetprocessdesignedtocreateagovernmentthatworksbetterandcostsless.
• It’sbasedonthepremisethepercentageofpersonalincomethepubliciswillingtopayfortheirgovernmentthrough taxes, fees, and charges is fixed.
• Whilethe“priceofgovernment”isfixed,thecostofprovidingservicesisincreasing.
• BudgetingforOutcomesfocusesonresultsandpriorities,notoncost.Thebudgetprocessshiftsfrompay-ing for costs to buying results.
• Itputscitizensandtheirprioritiesfirst.
• Itemphasizesaccountability,innovationandpartnerships.
WHY ARE WE DOING IT?•TheFortCollinseconomyhaschanged-thetimesofrapid,double-digitrevenuegrowthareover.
• Usingasystemofbasebudgetsandtargetincreaseswasnolongereffective–pastpractices,includingspending down reserves, freezing employee wages and not refilling vacant positions are no longer viable; continuing down that road will only lead to mediocrity.
• BudgetingforOutcomesbetteralignstheservicesdeliveredbyCityofFortCollinswiththethingsthataremost important to our community.
HOW DOES IT WORK?• Thebudgetconsistsofacollectionofpurchasingdecisions.Teamsplayacriticalroleinguidingthepro-
cess, ranking and recommending purchasing proposals.
• CityCouncil,onbehalfofthecitizens,setsthepricethatcommunitymembersarewillingtopayforlocalgovernment services.
• CityCouncil,usingcitizeninput,determinesthedesiredoutcomes.
• AstaffLeadershipTeamdeterminestheprioritiesformeetingthoseoutcomesandallocatesdollars.
• StaffResultsTeamsdeveloppurchasingplansandRequestsforResults(RFR’s)foreachpriority.Thisinvolves creating a results map of the factors that lead to or impact the result.
• Serviceproviders,orsellers,(whichcouldbeacrosssectionofdepartments,workteams,partnerships,etc…) make offers.
• ResultsTeamsrankoffers;buyingprocessstartsattopofrankedproposalsandmovesdownthelist,buyingaccording to priority until available funds are spent. A line is drawn at this point, with all proposals above the line in, and the rest out.
• Proposalsthatrankwithinavailableresourcesareusedtopreparethebudget.
• Finaloutputisabudgetthatreflectscitizenprioritiesanddeliversserviceefficiently.

11 - OPERATING BUDGET
Impact on existing organizational structure?• TheCityisorganizedintofive(5)serviceareas:CommunityServices,FinancialServices,InternalServices,
Police Services, Utility Services.
• WhileBudgetingforOutcomesfocusesonresultsthatmattertothepublicversusdepartmentspecificpriori-ties, the Budgeting for Outcomes process did not change the City’s organizational structure.
• TheBFOprocesshasledtogreaterinnovationsandefficienciesinservicedeliveryandpromotedcollabora-tive offers for service delivery.
• TheBFOprocessrequiresbroaderrepresentationofstafffromwithintheorganizationthatwillbebeneficialto and improve the understanding of the budget and its relationship to service delivery.
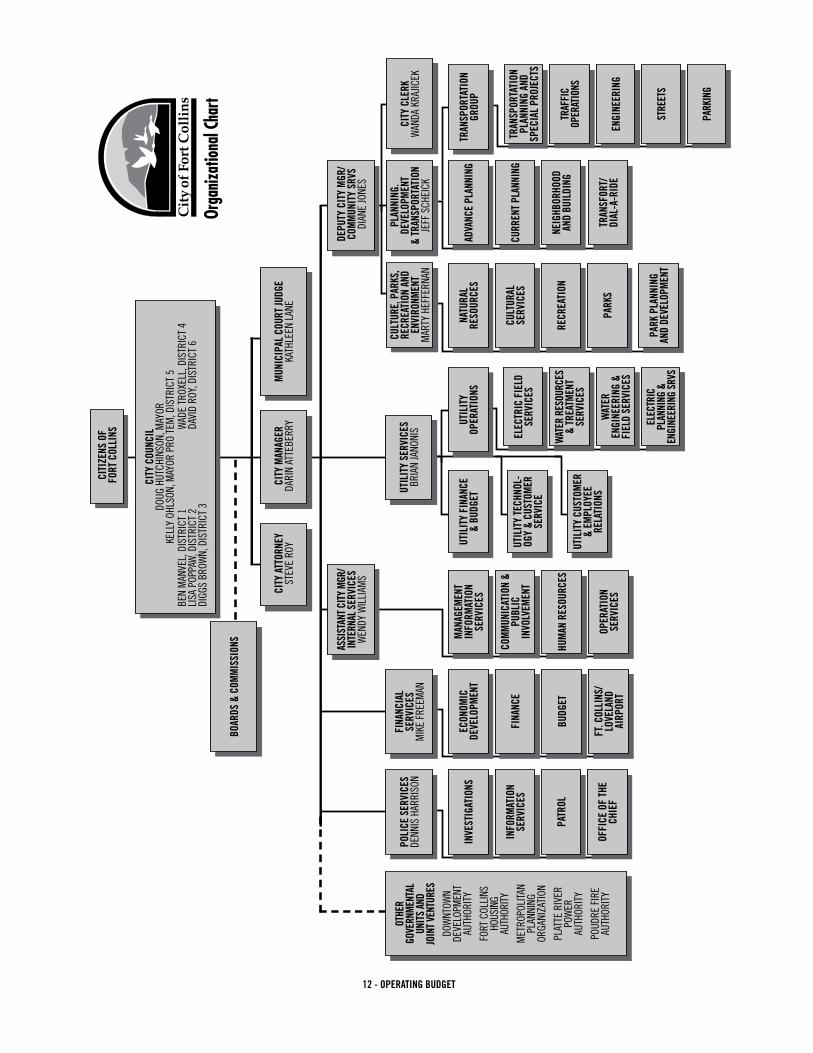
12 - OPERATING BUDGET
Orga
nizat
ional
Char
t
CITY
COU
NCIL
DOUG
HUT
CHIN
SON,
MAY
ORKE
LLY
OHLS
ON, M
AYOR
PRO
TEM
, DIS
TRIC
T 5
BEN
MAN
VEL,
DIS
TRIC
T 1
WAD
E TR
OXEL
L, D
ISTR
ICT
4LI
SA P
OPPA
W, D
ISTR
ICT
2 DA
VID
ROY,
DIS
TRIC
T 6
DIGG
S BR
OWN,
DIS
TRIC
T 3
CITY
MAN
AGER
DARI
N AT
TEBE
RRY
CITY
ATT
ORNE
YST
EVE
ROY
MUN
ICIP
AL C
OURT
JUDG
EKA
THLE
EN L
ANE
BOAR
DS &
COM
MIS
SION
S
DEPU
TY C
ITY
MGR
/CO
MM
UNIT
Y SR
VSDI
ANE
JONE
S
UTIL
ITY
SERV
ICES
BRIA
N JA
NONI
SPO
LICE
SER
VICE
SDE
NNIS
HAR
RISO
N
INVE
STIG
ATIO
NS
INFO
RMAT
ION
SERV
ICES
PATR
OL
OFFI
CE O
F TH
E CH
IEF
FINA
NCIA
L SE
RVIC
ESM
IKE
FREE
MAN
ECON
OMIC
DE
VELO
PMEN
T
FINA
NCE
BUDG
ET
ASSI
STAN
T CIT
Y MG
R/IN
TERN
AL S
ERVI
CES
WEN
DY W
ILLI
AMS
MAN
AGEM
ENT
INFO
RMAT
ION
SERV
ICES
COM
MUN
ICAT
ION
&PU
BLIC
IN
VOLV
EMEN
T
HUM
AN R
ESOU
RCES
OPER
ATIO
N SE
RVIC
ES
UTIL
ITY
FINA
NCE
& BU
DGET
UTIL
ITY
OPER
ATIO
NSTR
ANSP
ORTA
TION
GR
OUP
ELEC
TRIC
FIE
LD
SERV
ICES
TRAN
SPOR
TATI
ON
PLAN
NING
AND
SP
ECIA
L PR
OJEC
TS
WAT
ER R
ESOU
RCES
&
TREA
TMEN
T SE
RVIC
ESTR
AFFI
C
OPER
ATIO
NS
WAT
ER
ENGI
NEER
ING
& FI
ELD
SERV
ICES
ENGI
NEER
ING
ELEC
TRIC
PL
ANNI
NG &
EN
GINE
ERIN
G SR
VSST
REET
S
PARK
ING
UTIL
ITY
TECH
NOL-
OGY
& CU
STOM
ER
SERV
ICE
CULT
URE,
PAR
KS,
RECR
EATI
ON A
ND
ENVI
RONM
ENT
MAR
TY H
EFFE
RNAN
PLAN
NING
. DE
VELO
PMEN
T
& TR
ANSP
ORTA
TION
JEFF
SCH
EICK
CITI
ZENS
OF
FORT
COL
LINS
FT. C
OLLI
NS/
LOVE
LAND
AIRP
ORT
OTHE
R GO
VERN
MENT
AL
UNIT
S AN
D
JOIN
T VEN
TURE
SDO
WNT
OWN
DE
VELO
PMEN
T AU
THOR
ITY
FORT
COL
LINS
HO
USIN
G
AUTH
ORITY
MET
ROPO
LITA
N PL
ANNI
NG
ORGA
NIZA
TION
PLAT
TE R
IVER
PO
WER
AU
THOR
ITY
POUD
RE F
IRE
AU
THOR
ITY
UTIL
ITY
CUST
OMER
&
EMPL
OYEE
RE
LATI
ONS
NATU
RAL
RESO
URCE
S
CULT
URAL
SE
RVIC
ES
RECR
EATI
ON
PARK
S
PARK
PLA
NNIN
GAN
D DE
VELO
PMEN
T
ADVA
NCE
PLAN
NING
CURR
ENT
PLAN
NING
NEIG
HBOR
HOOD
AN
D BU
ILDI
NG
TRAN
SFOR
T/DI
AL-A
-RID
E
CITY
CLE
RKW
ANDA
KRA
JICEK
13 - OPERATING BUDGET
BUDGET PROCESS AND BASIS
THE CITY BUDGETThe City provides a wide variety of services to over 131,000 residents. Municipal services are financed through a variety of taxes, fees, charges for service, and intergovernmental assistance. In order to plan for the delivery of effective services and efficiently manage the revenues which support those services, the City adopts a budget or financial plan.
Direction for the budget comes from many distinct sources. The State Constitution and the City Charter provide the basic legal requirements and time lines for the process. Council goals and public input provide the policy direction to respond to the needs of the community.
The fiscal year of the City is the calendar year. By Charter, the City may adopt budgets for a budget term of one or more fiscal year(s). Council has approved a two year budget term and has adopted this biennial budget for the years 2008 and 2009. Even though the budget is adopted for a two-year term, the State and City Charter require that prior to each fiscal year; an appropriation ordinance must be adopted to authorize budgeted expenditures for the coming fiscal year.
BUDGET PROCESSThe intent of the process is more than just budget preparation and financial presentation of revenue and ex-penditures. The most important piece is the generation of a sound operational plan to serve the residents of the community.
The City of Fort Collins Charter establishes the time limits pertaining to the adoption of the budget. The budget process and schedule of development is designed to fit within the Charter mandate and to allow for active and early participation by the City Council and the service areas, with emphasis on public input.
The City’s Financial and Management Policies guide preparation and long-range planning. The City Manager, Chief Financial Officer, Deputy City Manager, and designated Service Area Directors develop the guidelines, consistent with the Policies, to be used for budget preparation. The aforementioned individuals are collectively referred to as the Budget Leadership Team. During the development of the budget, various department and divi-sion representatives may be called on to provide their expertise. In addition, the City Council, and the Strategic Issues Team provide guidance during preparation. The City’s budget is developed over a nine month period, beginning in March and ending in November.
THE CITY’S 2008-2009 BIENNIAL BUDGET WAS PREPARED USING A PROCESS CALLED BUDGETING FOR OUTCOMES.
In March, departments develop multi-year revenue projections and submit them to the Budget Office. These revenue projections effectively “set the price of government”; the amount available for purchasing outcomes/results. City Council adopts the outcomes/results that form the foundation of the budget (May). The revenues are then allocated, by the Leadership Team, across the Outcomes. During May, Results Teams, organized by outcome/result, prepare “Requests for Results” (“RFR’s”) that include strategy maps, two to three high level indicators to measure results, and purchasing strategies. During May and June, Sellers (department/divisions) prepare “offers” in response to the RFR’s. The Seller’s offers are reviewed by the Results Teams, ranked, and recommended for inclusion or omission from the City Manager’s recommended budget, based upon the offer’s merits and the resources available, given the result.

14 - OPERATING BUDGET
The City Manager’s budget recommendation is submitted to City Council before the first Monday in September. The recommended budget is made available for public inspection at this time. In September, a recommended budget-in-brief is published in the local newspaper for public information. In addition, two public hearings and Council work sessions are held in September and October. The budget for the ensuing budget term and the annual appropriation ordinance is adopted no later than November 30.
A budget exception process is conducted during the first fiscal year of the adopted budget term. Revenue and expenditure projections for the budget term are reviewed in July and if need be, adjusted. The City Manager may present any budget adjustment recommendations to the City Council in Study Sessions held in late September and early October. In November, Council may amend the budget and, as required by the State and City Charter, appropriates or authorizes expenditures for the coming fiscal year.
There generally are two opportunities during the fiscal year for supplemental additions to the annual appropria-tion approved by Council. The first is usually adopted in February to re-appropriate funds from the previous years’ ending balance for projects or obligations that were approved but not completed during the year. The second opportunity, usually in October, is used to fine-tune (clean up) the current fiscal year for previously un-foreseen events. In addition, if revenue is received during the fiscal year from a source that was not anticipated at the time of budget adoption or appropriation for the fiscal year such as grants or implementation of a new fee, Council may appropriate that unanticipated revenue for expenditure when received anytime during the year.
Outcomes determined by Council
RFR's Developed & Offers Prepared
Offer Review by Results Teams
Leadership Team Review
Feb March April May June July Aug Sept Oct Nov Dec Jan
Prepare & Publish Adopted Budget
Council Budget Approval
BUDGET PROCESS
2008-2009 Budget Preparation Schedule
BFO Planning and Organization Orientation
Develop Revenue Projections
Council Study Sessions & Public Hearings
Prepare & Print Recommended
Budget
15 - OPERATING BUDGET
January 1, 2008
TO MAYOR HUTCHINSON AND MEMBERS OF CITY COUNCIL
I am pleased to present to you the 2008-2009 City Manager’s Biennial Budget for 2008 and 2009. This repre-sents the work of many dedicated employees who have come together for the second time, using the Budgeting for Outcomes (BFO) approach. Nearly 100 employees were involved in creating a budget which builds on the ideas of transparency in the budget process, clear choices for how to allocate limited revenues and organi-zational accountability. These principles are the hallmark of the BFO process, and I am proud to deliver the 2008-2009 Final Budget.
The 2008-2009 Final Budget is organized around seven Council approved Result Areas or Outcomes that citizens want and need:
ECONOMIC HEALTHFort Collins has a healthy economy reflecting the values of our unique com-munity in a changing world.
ENVIRONMENTAL HEALTHFort Collins creates, maintains and promotes a healthy and s u s t a i n a b l e environment with an adequate, high quality water supply.
SAFE COMMUNITY Fort Collins is a safe place to live, work, learn and play.
NEIGHBORHOOD LIVABILITYFort Collins improves the livability, choices, and affordability of our neigh-borhoods.
CULTURAL AND RECREATIONALOPPORTUNITIES
Fort Collins provides diverse cultural and recreational Opportunities oppor-tunities that foster physical and mental well-being for community mem-bers.
TRANSPORTATIONFort Collins improves the safety and ease of traveling to, from, and through-out the city.
HIGH-PERFORMINGGOVERNMENT
Fort Collins is a model for an entrepreneurial, high quality Government city government.
In developing the Final Budget, staff has continued to use the BFO process because it helps the City achieve a numberofgoals:
CITY MANAGER’S OFFICE
16 - OPERATING BUDGET
•Createclarityinthebudgetprocessforthecommunity
•Allocaterevenuestohighestprioritiesandtheoutcomescitizenswantandneed
•Understandthetrade-offbetweenservicesfundedandunfunded
•Emphasizeaccountability,efficiency,innovationandpartnerships
BUDGET HIGHLIGHTSThe 2008-09 City Manager’s Final Budget is a financial and service plan linked to the seven key outcomes and resultsthatmattermosttoourcitizens.SomekeyhighlightsoftheCityBudgetInclude:
1.ThetotalbudgetforallCityfundsfor2008is$571.7millionandfor2009is$540.4million.(Thetotalbudgetis lower in 2009 because of a major one-time expense in 2008 for the Mason Corridor Project)
2. The budget includes no tax increase.
3. The tax revenue projections for 2008-09 are based on formulas developed and reviewed with City Council in May 2006. Sales and use tax is projected to increase by 2.03% in 2008 and 2.63% in 2009.
4.Minorinflationorientedfeeadjustmentsareincludedforseveralprograms.Forexample,theRecreationDivi-sion will make its typical market oriented inflationary adjustments to its user fees to reflect increased costs for hourly employees and supplies.
5. Wastewater rates will increase 12% in 2008 and 11% in 2009. Electric rates are projected to increase 2.3% to 2.7% in response to increases from Platte River Power Authority and ongoing operation increases within Light and Power.
6. The final budget includes no reductions in staff. Several vacant positions were eliminated as departments worked to develop offers which were lean, efficient and targeted at the services citizens want and need.
In the Budget Overview section, you will find more detailed information about the budget assumptions which we used in developing this final budget as well as more detailed information about revenues which will support this budget plan. Also, the summary tables and schedules in this section include more detailed information about total revenues and expenditures in all funds.
In closing, I want to express my appreciation to city staff for the hard work, commitment and innovation that characterized this extraordinary process to prepare the 2008-2009 Biennial Budget. I am grateful to the Mayor and City Council for the leadership, commitment and partnership exhibited throughout the process. This budget is truly reflective of the Budgeting for Outcomes process. It gives us the services and facilities we need to con-tinue Fort Collins’ vision of being a vibrant, world-class community and delivering a responsive budget indicative of a high-performing government.
Respectfully submitted,
Darin A. AtteberryCity Manager

17 - OPERATING BUDGET
2008-2009 BUDGET OVERVIEW
Preparation of the 2008-2009 biennial budget represents the City’s second time using the budget process known as Budgeting for Outcomes. The organization first used the BFO process during adoption of the 2006-2007 BiennialBudget.ByutilizingtheBudgetingforOutcomestheorganizationaddressesthefundamentalquestion:How can citizens get the most value for the taxes and fees they pay?
PRICE OF GOVERNMENT
While reviewing the budget, it is helpful to keep in mind the concept of Price of Government. This key concept in Budgeting for Outcomes involves examining how much residents pay for all City Services compared to the income in the community. This analysis provides the opportunity to compare what Fort Collins residents pay for services to the cost of government services in other communities.
For the past 50 years, Americans have spent approximately 35 cents of every dollar of annual personal income to buy services from their local, state and federal governments. Of this 35 cents, 20 cents has been historically been allocated to Federal government services, 8 cents to State government services, and 7 cents to Local gov-ernment services.
This “price of government” is what Americans have continued to put toward government services in the face of competition for their income for food, housing, health care, clothing, transportation, services and savings. The price of government can be viewed over long periods as a barometer for the amount American taxpayers are willing to pay.
In Fort Collins, citizens have spent between 6.1 and 6.8 cents of their dollar of annual personal income on City services from 1997 to 2007.
PRICE OF OF GOVERNMENT FOR THE CITY OF FORT COLLINS
B-1
2008-2009 BUDGET OVERVIEW
Preparation of the 2008-2009 biennial budget represents the City’s second time using the budget process known as Budgeting for Outcomes. The organization first used the BFO process during adoption of the 2006-2007 Biennial Budget. By utilizing the Budgeting for Outcomes the organization addresses the fundamental question: How can citizens get the most value for the taxes and fees they pay?
THE PRICE OF GOVERNMENT
While reviewing the budget, it is helpful to keep in mind the concept of Price of Government.This key concept in Budgeting for Outcomes involves examining how much residents pay for all City Services compared to the income in the community. This analysis provides the opportunity to compare what Fort Collins residents pay for services to the cost of government services in other communities.
For the past 50 years, Americans have spent approximately 35 cents of every dollar of annual personal income to buy services from their local, state and federal governments. Of this 35 cents, 20 cents has been historically been allocated to Federal government services, 8 cents to State government services, and 7 cents to Local government services.
This “price of government” is what Americans have continued to put toward government services in the face of competition for their income for food, housing, health care, clothing, transportation, services and savings. The price of government can be viewed over long periods as a barometer for the amount American taxpayers are willing to pay.
In Fort Collins, citizens have spent between 6.1 and 6.8 cents of their dollar of annual personal income on City services from 1997 to 2007.
Price of Government for the City of Fort Collins(cents of every dollar earned going to pay for City services, including utilities and golf)
-
1
2
3
4
5
6
7
8
1997 1998 1999 2000 2001 2002 2003 2004 2005 2006 2007 2008 2009 2010 2011
cen
ts
Assumes a 4% growth in Aggregate Personnel Income 2007-2011 2002-2006 actual2007-2011 estimated

18 - OPERATING BUDGET
City services and facilities are supported by taxes and fees. While the types of taxes (sales and use taxes; prop-erty taxes) and fees (impact fees such as Parkland Development fees and user fees such as fees for a round of golf) may vary, total Fort Collins taxes and fees compares favorably with other Colorado communities.
SALES TAX RATE COMPARISON
RESIDENTIAL ELECTRIC COST COMPARISON - 700kWh PER MONTH Source:CAMU,January2008,Utilitieswithmorethan7500residentialmeters.
B-2
City services and facilities are supported by taxes and fees. While the types of taxes (sales and use taxes; property taxes) and fees (impact fees such as Parkland Development fees and user fees such as fees for a round of golf) may vary, total Fort Collins taxes and fees compares favorably with other Colorado communities.
Sales Tax Rate Comparison
Broomfield 4.15 Northglenn 4.00 Aurora 3.75 Denver 3.62 Castle Rock 3.60 Cherry Hills Village 3.50 Englewood 3.50 Arvada 3.46 Boulder 3.41 Windsor 3.20 Littleton 3.00 Loveland 3.00 Fort Collins 3.00Colorado Springs 2.50
Residential Electric Rate Comparison – 700kWh per Month Source: CAMU, January 2008, Utilities with more than 7500 residential meters.
$0
$20
$40
$60
$80
$100
$120
SAN
LU
IS V
LYR
EA
SE C
OLO
PA
SAN
MIG
UEL
PA
EMPI
RE
EA
GU
NN
ISO
N C
OEA
MTN
PAR
KS E
I
MTN
VIE
W E
A
GR
AND
VLY
RPL
DEL
TA-
MO
NTR
OSE
EA
UN
ITED
PO
WER
AQU
ILA
POU
DR
E VA
LLEY
REA
HO
LY C
RO
SS E
A
FOU
NTA
ININ
TER
MO
UN
TAIN
REA
ESTE
S PA
RK
XCEL
EN
ERG
Y
YAM
PA V
LY E
A
CO
LO S
PRIN
GS
FOR
T C
OLL
INS
LOVE
LAN
D
LON
GM
ON
T
Municpal REA Investor Owned Fort Collins

19 - OPERATING BUDGET
The 2008-2009 Biennial Budget has been prepared with no increase in taxes (the rate for sales and use taxes earmarked for general operations remains at 2.25% and the property tax rate remains unchanged since 1992 at 9.797 mills). The budget does include proposed fee increases for a variety of user fees (see the section “User Charges and Impact Fees“).
TOTAL BUDGET SUMMARY
The2008and2009NetCityBudget(excludesinternaltransfersbetweenfunds)totals$468.2millionfor2008and$436.3millionfor2009.
The Net Operating Budget (the money necessary for operating day-to-day services, excluding internal transfers betweenfunds,debtservice,andcapitalprojects)for2008isproposedtoincrease4.9%overthe2007operat-ingbudgetandfor2009toincreaseby4.6%overthe2008operatingbudget.
The following table compares the 2007 budget with the 2008 and 2009 adopted budgets, including the net operating budgets, capital improvement budgets and debt service.
ECONOMIC OUTLOOK
At the national level, forecasters expect the U.S. economy will dramatically slowdown in 2008 and possibly con-tract, which may lead to a recession. The weak housing market and a dramatic drop in consumer confidence point to a soft economy. Consumer spending accounts for over 60% of the economic output as measured by the GrossDomesticProduct(GDP).GDPfelltoa0.6%increaseinthe4thQuarterof2007ascomparedtoa4.9%increaseforthe3rdQuarterof2007.Shouldarecessionoccur,itisexpectedtoberelativelyshortwithgrowthresuming by 2009. Unemployment is expected to increase to above 5.0 percent. Inflation, driven in large part by world demand for commodities, is also weakening the economy. The forecasters see the Consumer Price Indexforallitemsincreasingtoapproximately4.5percent,driveninlargepartbyincreasesinthecostofenergyand food.
Forecasters are seeing signs the Colorado economy is showing resilient growth. However, the slowdown at the national level will dampen the economic outlook for the State. State unemployment is expected to increase to 4.6%in2008,whichislowerthanthenationalunemploymentrate.Aneconomywithmodestgrowthshouldkeep the local inflation rate within a range of 2.7% to 2.9% over the next two years.
The Fort Collins’ economy has avoided the economic slowdown occurring at the national level. Several of the City’s major employers have added jobs and commercial construction activity has stabilized the economy while residential construction has slowed significantly. According to recent statistics from the State, the northern Colo-rado regional economy is doing better than the rest of the state in terms of employment growth. Our unemploy-
B-3
The 2008-2009 Biennial Budget has been prepared with no increase in taxes (the rate for sales and use taxes earmarked for general operations remains at 2.25% and the property tax rate remains unchanged since 1992 at 9.797 mills). The budget does include proposed fee increases for a variety of user fees (see the section “User Charges and Impact Fees“).
TOTAL BUDGET SUMMARY
The 2008 and 2009 Net City Budget (excludes internal transfers between funds) totals $468.2 million for 2008 and $436.3 million for 2009.
The Net Operating Budget (the money necessary for operating day-to-day services, excluding internal transfers between funds, debt service, and capital projects) for 2008 is proposed to increase 4.9% over the 2007 operating budget and for 2009 to increase by 4.6% over the 2008 operating budget.
The following table compares the 2007 budget with the 2008 and 2009 adopted budgets, including the net operating budgets, capital improvement budgets and debt service.
In Millions 2007 2008 % Change 2009 % Change Net Operating $320.1 $336.0 4.9% $351.3 4.6% Debt $ 24.3 $ 23.9 -1.4% $ 26.2 9.7% Capital $ 33.0 $108.3 228.5% $ 58.8 -45.7%
Total Net City $377.4 $468.2 24.1% $436.3 -6.8% Internal Transfers $ 95.1 $103.5 8.9% $104.1 0.5%
Total City Budget $472.5 $571.7 21.0% $540.4 -5.5%
ECONOMIC OUTLOOK
At the national level, forecasters expect the U.S. economy will dramatically slowdown in 2008 and possibly contract, which may lead to a recession. The weak housing market and a dramatic drop in consumer confidence point to a soft economy. Consumer spending accounts for over 60% of the economic output as measured by the Gross Domestic Product (GDP). GDP fell to a 0.6% increase in the 4th Quarter of 2007 as compared to a 4.9% increase for the 3rd Quarter of 2007. Should a recession occur, it is expected to be relatively short with growth resuming by 2009. Unemployment is expected to increase to above 5.0 percent.Inflation, driven in large part by world demand for commodities, is also weakening the economy. The forecasters see the Consumer Price Index for all items increasing to approximately 4.5 percent, driven in large part by increases in the cost of energy and food.
20 - OPERATING BUDGET
mentrateis4.3%vs.4.4%fortheStateofColorado.Thearearemainsaveryattractivelocationforqualityoflife offerings and is expected to remain competitive.
A key indicator for the City is sales and use tax collections, in particular the 2.25% that is used for general opera-tions. At year end, the 2.25% sales and use tax collections are 3.9% ahead of the collections in 2006 due in large part to strong use tax receipts. Total sales and use tax collections for 2007 are ahead of budget projections byapproximately$4,155,000.
2008-2009 REVENUE OUTLOOK
Sales and use tax revenue amounts to 60% of total General Fund revenue. Consequently, it’s important to ac-curately forecast these revenues. In 2006, the City developed a revenue model that allows regression analysis and forecasting using that analysis.
For2008,salesandusetaxcollectionsareprojectedtoincreaseover2007byapproximately1.4%andfor2009approximately4.1%over2008.Ourrevenueisprojectedtogrowoverthenexttwoyears,butataverymodestrate. Neighboring communities are increasing and maturing their retail and service bases which will negatively impact retail sales in Fort Collins.
PROPERTY TAXES
The City’s property tax mill levy of 9.797 mills, unchanged since 1992, is proposed to remain the same for 2008 and 2009. Property tax revenue is collected by the County and then paid to the City. Property tax revenue makes up approximately 15% of total General Fund revenues. For 2008, revenue collected from property tax is expected to increase approximately 6% over 2007 actual collections and 2009 property tax revenue is expected to increase approximately 1% over estimated 2008 collections.
USER CHARGES AND IMPACT FEES
Userfeesarechargedspecificservices.Alargepercentage(almost74%)ofouruserfeerevenuescomefromutility user fees (water, wastewater, stormwater and electric rates). Other user fees include recreation fees, room rental fees at the Lincoln Center, and development review fees.
Golffeesarerecommendedtoincreaseby2.2%in2008(foratotalof$55,800overthe2007operatingrev-enues)and2.4%in2009(foranincreaseof$64,000overprojected2008operatingrevenues.
ChangesinUtilityuserfees(rates)areanticipatedtochangeasfollows:
•Water—noincreasein2008or2009 •Wastewater—12%in2008and11%in2009 •Stormwater—noincreasein2008or2009 •Electric—2.3%in2008and2.7%in2009(Electricrateincreaseswillvarybyrateclass.)
Another user fee, Development Review Fees, covers a wide range of services related to land development and building in the community. Staff recently evaluated changes to the process for charging development fees as recommended in the Zucker report. Staff also examined the present level of cost recovery for these fees. In 2006, the City will increase development review fees to keep pace with costs, in conformance with the City Coun-cil policy of 80% cost recovery. A new Transportation Development Review fee is proposed to cover the costs
21 - OPERATING BUDGET
of staff work. We will also incorporate minor changes, if any, resulting from the infill and redevelopment project that will be completed in 2005.
Impact fees are one-time charges to cover the growth related impacts to public facilities. Some examples are; Plant Investment Fees (PIFs) for water, wastewater, stormwater, electric; Street Oversizing Fee; Neighborhood Parkland Fee; Capital Expansion Fees (library, community parkland; police; fire; general government facilities). Revenues from impact fees support the design and construction of new capital facilities identified in various City master plans.
Based on a recent study and discussion with City Council, an impact fee increase will be formally considered for Water, Wastewater, Stormwater and Electric facilities.
ALLOCATIONS AND AVAILABLE RESOURCES
Once City Council established the key results or outcomes, the “price” was set as an indicator for how much to pay for each outcome. We refer to this as the allocation. The total allocation for the result areas was based on the estimated resources available to the City in each of the two fiscal years. There is no “right” allocation or price for each result, just as there is no “right” price for a basket of groceries. An allocation was established for each result to guide the evaluation and determination as to which offers could and should be recommended for funding in 2008 and 2009.
What makes this rather complex is that the allocation is a mixture of unrestricted and restricted resources. For example, General Fund resources can usually be spent for any type of City service. Other resources, such as fees collected from utility ratepayers, can only be used for utility services and facilities. Some user fees are specifically earmarked for specific services such as golf fees, adult sport fees, and Lincoln Center performances. So,whileanallocationwasmadeforaparticularresult—e.g.,anallocationof$5.5million,in2008,to“ImproveEconomicHealth”—wehadtosortoutwhichresourceswerediscretionaryandwhichwererestrictedinsomeway and match offers with the appropriate allocations. The details are outlined in the section “Key Results.”
BUDGET HIGHLIGHTS
Getting Started
For the second time, the City has foregone the traditional approach of starting with a “base” budget, i.e., propos-ing to spend what was spent last year, replacing this with a process better suited to the structural budget prob-lems Fort Collins is experiencing. Budgeting for Outcomes has no concept of base. It shifts the process from building on or realigning the base to focusing on services and programs that will produce the desired results. The starting point is the agreed upon price that translates into the total allocation. The objective is to buy the best “offers” (services and programs) that are most likely to achieve the results.
The budget preparation process began with City Council identifying the results that the public values. Council identifiedsevenkeyresults:
• Improve Economic Health Fort Collins has a healthy economy reflecting the values of our unique community in a changing world.
•Improve Environmental Health Fort Collins creates, maintains and promotes a healthy and sustainable environment with an adequate, high quality water supply.
• Improve Neighborhood Quality Fort Collins improves the livability, choices, and affordability of neighborhoods.
•Safer Community Fort Collins is a safe place to live, work, learn and play.
22 - OPERATING BUDGET
• Improve Cultural, Recreational, and Educational Opportunities Fort Collins provides diverse cultural and recreational opportunities that foster physical and mental well-being for community members.
•Improve Transportation Fort Collins improves the safety and ease of traveling to, from and throughout the City.
•A High-Performing Government Fort Collins is a model for an entrepreneurial, high quality city government.
Based on these seven key results, result maps, indicators to measure progress and purchasing strategies were developed. These elements made up a request for proposals or a “request for results” (RFRs). Staff responded with competitive offers which were reviewed and prioritized, first by Results team, and then by the City Manager and the BFO Leadership Team.
WHAT TO BUY TO PRODUCE THE RESULTS
The 2008-2009 Biennial Budget takes into account available resources or allocations (primarily taxes and fees). Offers were reviewed and ranked in terms of the results delivered for the money available. This ranking is called a “Drilling Platform”--offers that are recommended for funding are above the platform/allocation line and offers not recommended for funding fell below the platform line. Specific information about the recommended offers and those not recommended for funding is detailed in the next section, “Key Results.”
Highlights of the 2008-2009 City Budget are as follows:
•ThetotalbudgetforallCityfundsfor2008is$571.7millionand$540.4millionfor2009.(Thetotalbudgetis lower in 2009 because of a major one-time expense in 2008 for the Mason Corridor Project.)
•Thebudgetincludesnotaxincrease.
•Thetaxrevenueprojectionsfor2008-09arebasedonformulasdevelopedandreviewedwithCityCouncilinMay 2006. Sales and use tax is projected to increase by 2.03% in 2008 and 2.63% in 2009.
•Minorinflationorientedfeeadjustmentsareincludedforseveralprograms.Forexample,theRecreationDi-vision will make its typical market oriented inflationary adjustments to its user fees to reflect increased costs for hourly employees and supplies.
•Wastewaterrateswillincrease12%in2008and11%in2009.Electricratesareprojectedtoincrease2.3%to 2.7% in response to increases from Platte River Power Authority.
•Theadoptedbudgetincludesnoreductionsinforce.Severalvacantpositionswereeliminatedasdepartmentsworked to develop offers which were lean, efficient and targeted at the services citizens want and need.
REvAMPED AND ENHANCED SERvICES
a. Improved downtown maintenance, flower displays, holiday lighting and landscaping in the downtown
b. Enhanced Economic Marketing programming
c. Additional resources added to enhance the City’s Climate Wise Program, a dynamic program geared towards strengthening the local economy, protecting the City’s air quality, and reinforcing the community’s commit-ment to maintaining a high quality of life
d. Additional resources for environmental compliance programming in order to both meet and exceed environ-mental standards
e. Police staffing for the Southwest Annexation area
f. Additional Natural Areas Ranger added in 2009
g. Graffiti Abatement position added
h. Library Park/Old Town security cooperative project with the Downtown Development Authority
i. Electric Utility project manager added
23 - OPERATING BUDGET
j. Utility Service Center facility expansion
k. Parks Maintenance program restorations including seasonal staffing, trail mowing, and weed control
l. Additional staffing for the recently opened new Northside Aztlan Community Center (Recreation Facility)
m.Matchingfundsfor$52.6millionFederalTransitAdministrationgrantfortheproposedMasonCorridorProject
n. State awarded grants for various City signal and intersection projects
o. Grant funding for Bicycle Library program and enhanced bike programming
p. Additional resources to operate and maintain new facilities including the new Police Building, Northside Azt-lan Community Center, and Spring Canyon Community Park facilities (utilities, maintenance, and custodial)
q. Additional staff in Human Resources (Investigations, Compensation Analyst) and Accounting to address ad-ditional workload
The choices have been difficult about how to select the most important services in the most efficient ways with-out “thinning the soup.” Staff worked hard to maximize service delivery by rethinking how we do business.
PERSONNEL IMPACTS
One of the City’s core values is that City employees are our most important and valuable asset. Our employees deliver the diverse services our community relies on, and are deeply committed to providing quality at an afford-able price.
For 2008-2009 a basic assumption was made that employee salary adjustments would be funded. As a basic cost of doing business, it is essential to ensure these cost increases are funded before making decisions about additional services or enhancements.
CAPITAL IMPROVEMENT PROGRAM
Several capital improvement projects are scheduled for 2008-2009. These projects are supported by resources in a variety of funds. Capital improvements are funded, primarily, by dedicated sales and use taxes for capital improvement plans, transfers from various governmental funds (i.e. General Fund, Capital Expansion Fund, Street Oversizing Fund, etc.), and fees and charges.
One of the key City projects included in the 2008-2009 Budget is the Mason Corridor capital project. The Mason Corridor project includes the development of the “MAX” Bus Rapid Transit (BRT) system improvements, con-verting Mason and Howes streets in the downtown area back to two-way operation, developing the South Transit Center site improvements, building the Mason trail extension north from the Spring Creek trail to the Colorado State University (CSU) main campus, and two grade-separated trail crossing projects over/under the Burlington Northern Santa Fe railroad tracks.
OTHER CAPITAL PROjECTS INCLUDE:
•Improvementstotheelectricdistributionsystemrequiredforthecontinuedsafe,reliableandefficientdeliv-ery of electric services
•StormdrainageimprovementstotheCanalImportationBasininwest-centralFortCollins
•ConstructionoftheDryCreekConnectionChannelbetweenVineDriveandTimberlineRoad
•Plan,designandconstructionoftwonewelectricdistributionsubstations
•DesignandconstructionofimprovementsattheMulberryWastewaterTreatmentfacility
•Renovation,renewalorreplacementofexistingassetsassociatedwiththeMulberryandDrakeWaterRecla-mation Facilities, the Meadow Springs Ranch, and the Pollution Control Lab

24 - OPERATING BUDGET
•Replacementofapproximately10,000feetof12-inchwastewatertrunkmainbetweenTaftHillRoadandOverland Trail
•ContinueworkonexpandingwaterstorageatHalliganReservoir
•Fundingforinspection,upgradeandmaintenanceoftheCity’s147bridgestructures
•Variousintersectionandtrafficsignalizationprojects
•PedestrianimprovementprojectsandprogrammaticactivitiestofurtherimplementthePedestrianPlan
•FundingtocontinueandexpandthedevelopmentandimplementationofthevariousfacetsoftheNorthCol-lege Avenue/US 287 corridor improvement project
•ConstructionofimprovementsprovidingaccesstotheSoapstoneNaturalArea
25 - OPERATING BUDGET
26 - OPERATING BUDGET

27 - OPERATING BUDGET
28 - OPERATING BUDGET

29 - OPERATING BUDGET

30 - OPERATING BUDGET

31 - OPERATING BUDGET
2009 PROPOSED APPROPRIATIONS
GENERAL FUND $107,760,121
ENTERPRISE FUNDSGolf 2,787,942
Light & Power 94,045,354Capital:
Service Center Additions 254,093Southwest Enclave Annexation 800,000Substation Improvements 220,000Wi Fi 100,000
Light & Power Capital Total 1,374,093Total Light & Power 95,419,447
Storm Drainage Operating 9,671,360Capital:
Basin Master Planning 95,000Canal Importation Basin 5,000,000Cooper Slough-Boxelder 1,000,000Developer Repays 85,000Drainage System Replacement 365,000Dry Creek Basin 300,000Service Center Improvements 52,294
Storm Drainage Capital Total 6,897,294Total Storm Drainage 16,568,654
Wastewater Operating 21,701,113Capital:
Collection System Replacement 1,150,000Service Center Improvements 58,548Treatment Plant Improvements 200,000Sludge Disposal Improvements 150,000Collection System Study 50,000Mulberry WRF Improvements 25,650,000Northwest Trunk Sewer Expansion 0Water Reclamation Replacement Progrm 1,497,000
Wastewater Capital Total 28,755,548Total Wastewater 50,456,661
Water Operating 27,239,531Capital:
Distribution System Replacement 795,000Service Center Improvements 139,065Meter Conversion Program 920,000Water Supply Development 100,000Cathodic Protection 50,000Halligan Reservoir Expansion 8,965,000Treatment Facility Improvements 500,000Water Production Replacement Program 1,175,000
Water Capital Total 12,644,065Total Water 39,883,596
TOTAL ENTERPRISE FUNDS $205,116,300
2009 APPROPRIATIONS

32 - OPERATING BUDGET
2009 PROPOSED APPROPRIATIONS
INTERNAL SERVICE FUNDSBenefits $23,256,640Communications 7,376,788Equipment 11,003,508Self Insurance 3,375,062Utility Customer Service & Administration 14,460,668
TOTAL INTERNAL SERVICE FUNDS $59,472,666
SPECIAL REVENUE FUNDSCapital Improvement Expansion Fund $461,141Capital Leasing Corporation Fund 5,717,380Cemeteries 651,519Cultural Services & Facilities 5,112,641Debt Service 1,352,478General Employees' Retirement 2,764,973Natural Areas Fund 9,428,171Perpetual Care 70,452Recreation 8,111,108Sales and Use Tax 78,583,777Special Assessment Debt Service 830,000Street Oversizing 5,310,478Transit Services 10,874,885Transportation Services 28,405,220
TOTAL SPECIAL REVENUE & DEBT SERVICE FUNDS $157,674,223
CAPITAL IMPROVEMENT FUNDS
General City CapitalCity Bridge Program $300,000Railroad Crossing Replacement 100,000Police Facility 665,682
Total General City Capital $1,065,682
Building on BasicsAdministrative Charge $60,656Library Technology 744,000Lincoln Center Renovation/Cultural
Facilities Plan 2,217,436Park Upgrades and Enhancements 304,897North College Ave. Improvements 250,000Intersection Improvements and Traffic Signals 2,443,155Bicycle Program Plan Implementation 125,000Pedestrian Plan and ADA Improvements 300,000
Total Building on Basics $6,445,144
1/4 Cent Streets and TransportationMason Street Transportation Corridor 0
Total 1/4 Cent Street and Transportation $0
2009 APPROPRIATIONS

33 - OPERATING BUDGET
2009 PROPOSED APPROPRIATIONS
Conservation Trust FundAdministration $251,739Fossil Creek Trail 50,000Open Space Acquisition 10,000Trail Acquisition, Development & Repair 350,000Transfer to General Fund-Parks Maintenance 725,146Tri-City Trails 30,000
Total Conservation Trust Fund $1,416,885
Neighborhood Parkland FundAdministration $438,052Huidekoper Park 50,000New Park Site Acquisition 150,000New Park Site Development 150,000Park Site Equipment 15,000Registry Ridge Park 300,000Richards Lake Park 200,000Staley Park 175,000
Total Neighborhood Parkland Fund $1,478,052
TOTAL CITY 2009 PROPOSED APPROPRIATIONS $540,429,073
2009 APPROPRIATIONS

34 - OPERATING BUDGET
CITY BUDGET SUMMARY City Budget Summary
Actual Budget Adopted Adopted2006 2007 2008 2009
CITY RESOURCESFees & Charges $222,478,808 $233,276,275 $241,666,407 $251,704,175Taxes 93,765,379 92,929,636 94,754,630 96,757,552Intergovernmental 21,565,282 16,238,460 76,732,030 16,107,034Earnings on Investments 20,312,742 6,625,981 9,691,624 9,444,866Bonds & Other Debt 458,269 0 0 30,000,000Miscellaneous 21,182,677 11,356,879 11,743,734 11,808,335Net Change in Fair Value
of Assets 1,344,040 0 0 0Transfers from Other Funds 113,667,613 95,112,759 103,556,702 104,073,356 Total Revenue 494,774,810 455,539,990 538,145,127 519,895,318
Reserves Used/(Excess) 992,280 16,937,666 33,575,028 20,533,755 Total Available Resources $495,767,090 $472,477,656 $571,720,155 $540,429,073
CITY EXPENDITURESCity Clerk $655,782 $773,620 $650,244 $859,289Culture, Parks, Recreation &
Environment 35,619,623 34,394,678 34,280,627 34,964,310Executive, Legislative &
Judicial 3,626,563 3,637,817 4,243,214 4,447,668Financial Services 4,514,118 6,519,235 7,306,714 7,518,591Internal Services 34,976,659 47,841,781 50,513,153 52,928,980Planning, Development &
Transportation 50,950,489 46,231,015 50,957,995 50,811,222Police Services 27,339,145 28,121,472 30,026,077 31,108,111Utility Services 118,050,292 132,207,446 142,072,675 148,216,379Non-Departmental 122,205,243 114,062,424 118,462,228 123,114,906 Operating Expenditures 397,937,914 413,789,488 438,512,927 453,969,456
Debt Service 24,304,613 24,269,655 23,920,155 26,232,854Capital Improvements 73,524,563 34,418,513 109,287,073 60,226,763 Total City Expenditures 495,767,090 472,477,656 571,720,155 540,429,073
Transfers to Other Funds (113,667,613) (95,112,759) (103,556,702) (104,073,356) Net City Expenditures $382,099,477 $377,364,897 $468,163,453 $436,355,717
Note: Prior years have been changed to reflect the current organizational structure.
Listed below are the resources and expenditures for all City funds. City Resources shows allrevenue by category plus the net change in reserves. City Expenditures lists the operating usesby Service Area. The Operating Budget represents expenses necessary to run the Citygovernment on a daily basis. These costs increase with inflation and as new services are addedor enhanced. Debt Service represents the annual payment of principle and interest on long-termdebt. Capital Improvements are often the purchase of land, the construction of a building, majorstreet construction or reconstruction, or major utility system improvements. Transfers to OtherFunds represent transfers of appropriations from one City fund to another City fund for services.With a transfer, revenue and expenditures are recorded in both funds. Therefore, these transfersare deducted from the Total City Expenditures, eliminating the double counting of expenditures, todetermine the Net City Expenditures.

35 - OPERATING BUDGET
Where the money will come from…
How the money will be spent…
The City Budget
City Resources by Category 2009 - $519,895,318
Fees & Charges48%
Miscellaneous2%
Transfers from Other Funds
20%
Intergovernmental3%
Investment Earnings2%
Bonds and Other Debt6%
Taxes19%
City Expenditures by Category 2009 - $540,429,073
Debt Service5%
Capital11%
Transfers to Other Funds
19%
Net Operating Budget
65%
CITY BUDGET GRAPHS
WHERE THE MONEY WILL COME FROM...
CITY RESOURCES BY CATEGORY
2008 - $538,145,127 2009 - $571,720,155
HOW THE MONEY WILL BE SPENT
CITY EXPENDITURES BY CATEGORY
2008 - $519,895,318 2009 - $540,429,073
Where the money will come from…
How the money will be spent…
The City Budget
City Resources by Category 2008 - $538,145,127
Fees & Charges45%
Miscellaneous2%
Transfers from Other Funds
19%
Intergovernmental14%
Taxes18%
Investment Earnings2%
City Expenditures by Category 2008 - $571,720,155
Debt Service4%
Capital19%
Transfers to Other Funds
18%
Net Operating Budget
59%
Where the money will come from…
How the money will be spent…
The City Budget
City Resources by Category 2009 - $519,895,318
Fees & Charges48%
Miscellaneous2%
Transfers from Other Funds
20%
Intergovernmental3%
Investment Earnings2%
Bonds and Other Debt6%
Taxes19%
City Expenditures by Category 2009 - $540,429,073
Debt Service5%
Capital11%
Transfers to Other Funds
19%
Net Operating Budget
65%
Where the money will come from…
How the money will be spent…
The City Budget
City Resources by Category 2008 - $538,145,127
Fees & Charges45%
Miscellaneous2%
Transfers from Other Funds
19%
Intergovernmental14%
Taxes18%
Investment Earnings2%
City Expenditures by Category 2008 - $571,720,155
Debt Service4%
Capital19%
Transfers to Other Funds
18%
Net Operating Budget
59%

36 - OPERATING BUDGET
CITY REVENUE COMPARISON
The following graph shows actual revenue received through 2006 and projected revenue for 2007, 2008 and 2009. Supporting information for 2006 through 2009 can be found on the City Revenue Detail sched-ule, which follows.
Fees & Charges represent revenue that is received in return for specific services. This revenue makes up about half of the total City revenue. Approximately 60% of the City’s fees and charges are generated by the Util-ity Funds, which are classified as Enterprise Funds on the City Revenue Detail schedule. Utility funds include Light & Power, Storm Drainage, Water, and Wastewater. No rate increases are planned for Stormwater or Wa-ter utilities. Wastewater rates are projected to increase by 12% in 2008 and 11% in 2009. Electric rates will increase by 2.3% in 2008 and 2.7% in 2009. The actual increase will vary by rate class.
Taxes represent about 20% of the City rev-enue. This category includes property, sales and use, auto specific ownership, lodging and other miscellaneous taxes. The primary source of tax revenue (80%) is the sales & use tax. Tax rates will remain constant.
Transfers In represents revenue that is transferred from one city fund to another city fund. As an example Sales and Use Taxes are received in the Sales & Use Tax Fund and recorded in that fund as tax revenue. Most of the taxes are then transferred to the General Fund for expenditure. In the General Fund the revenue is recorded as a Transfer In from the Sale and Use Tax Fund.
Miscellaneous revenue includes all other City revenue of which the primary sources are earnings on investments andbondproceeds.Thegreateramountofmiscellaneousrevenuein2004and2009areduetobondproceedsin those years. The increase in 2006 is due to the City’s large earnings on investments.
Intergovernmental revenue includes federal, state and local grants, entitlements, and shared revenue. The major sources in this category include state lottery proceeds, transportation grants, and the distribution from Larimer County of a countywide sales and use tax to be used for open space and natural areas. The unusual increase in 2008 represents federal grants that are expected to fund the Mason Corridor Project
City Revenue
Trend 2000 to 2009
0
100
200
300
400
500
600
2000 2001 2002 2003 2004 2005 2006 2007 2008 2009
Do
llars
in
Millio
ns
Fees & Charges Taxes Transfers InMiscellaneous Intergovernmental
City Revenue Comparison
The following graph shows actual revenue received through 2006 and projected revenue for
2007, 2008 and 2009. Supporting information for 2006 through 2009 can be found on the City
Revenue Detail schedule, which follows.
Fees & Charges represent revenue that is received in return for specific services. This revenue
makes up about half of the total City revenue. Approximately 60% of the City’s fees and
charges are generated by the Utility Funds, which are classified as Enterprise Funds on the CityRevenue Detail schedule. Utility funds include Light & Power, Storm Drainage, Water, and
Wastewater. No rate increases are planned for Stormwater or Water utilities. Wastewater rates
are projected to increase by 12% in 2008 and 11% in 2009. Electric rates will increase by 2.3%
in 2008 and 2.7% in 2009. The actualincrease will vary by rate class.
Taxes represent about 20% of the Cityrevenue. This category includes
property, sales and use, auto specific
ownership, lodging and othermiscellaneous taxes. The primary
source of tax revenue (80%) is the
sales & use tax. Tax rates will remain
constant.
Transfers In represents revenue that
is transferred from one city fund toanother city fund. As an example
Sales and Use Taxes are received in
the Sales & Use Tax Fund andrecorded in that fund as tax revenue.
Most of the taxes are then transferred
to the General Fund for expenditure.
In the General Fund the revenue is recorded as a Transfer In from the Sale and Use Tax Fund.
Miscellaneous revenue includes all other City revenue of which the primary sources are
earnings on investments and bond proceeds. The greater amount of miscellaneous revenue in2004 and 2009 are due to bond proceeds in those years. The increase in 2006 is due to the
City’s large earnings on investments.
Intergovernmental revenue includes federal, state and local grants, entitlements, and shared
revenue. The major sources in this category include state lottery proceeds, transportation
grants, and the distribution from Larimer County of a countywide sales and use tax to be usedfor open space and natural areas. The unusual increase in 2008 represents federal grants that
are expected to fund the Mason Corridor Project

37 - OPERATING BUDGET
% Change % ChangeFUND TYPE ACTUAL ADOPTED ADOPTED From ADOPTED From Revenue Category 2006 2007 2008 2007 2009 2008
GENERAL FUND Fees and Charges for Services $18,379,551 $18,284,277 $22,215,548 21.5% $20,815,315 -6.3% Taxes 16,744,700 16,563,358 17,831,275 7.7% 18,065,596 1.3% Intergovernmental 948,243 732,095 817,672 11.7% 864,825 5.8% Earnings on Investments 2,015,179 1,200,000 2,113,865 76.2% 2,006,294 -5.1% Bonds and Other Debt 396,976 0 0 0.0% 0 0.0% Net Change in Fair Value of Assets 56,780 0 0 0.0% 0 0.0% Miscellaneous 3,443,668 659,891 928,393 40.7% 861,530 -7.2% Transfers from Other Funds 59,120,454 56,885,910 59,519,928 4.6% 61,589,166 3.5%TOTAL GENERAL FUND $101,105,551 $94,325,531 $103,426,681 9.6% $104,202,726 0.8%
ENTERPRISE FUNDS Fees and Charges for Services $150,552,989 $147,188,611 $153,111,081 4.0% $159,302,284 4.0% Intergovernmental 839,308 0 0 0.0% 0 0.0% Earnings on Investments 6,280,775 2,730,000 3,165,000 15.9% 3,167,000 0.1% Bonds and Other Debt 0 0 0 0.0% 30,000,000 100.0% Net Change in Fair Value of Assets 728,980 0 0 0.0% 0 0.0% Miscellaneous 4,924,783 2,131,497 1,936,604 -9.1% 1,821,264 -6.0% Transfers from Other Funds 25,000 25,000 0 -100.0% 0 0.0%TOTAL ENTERPRISE $163,351,834 $152,075,108 $158,212,685 4.0% $194,290,548 22.8%
INTERNAL SERVICE FUNDS Fees and Charges for Services $36,271,014 $47,040,450 $47,441,706 0.9% $52,694,301 11.1% Intergovernmental 0 0 0 0.0% 0 0.0% Earnings on Investments 870,172 439,679 611,442 39.1% 613,285 0.3% Bonds and Other Debt 0 0 0 0.0% 0 0.0% Net Change in Fair Value of Assets 110,917 0 0 0.0% 0 0.0% Miscellaneous 151,895 53,214 51,700 -2.8% 52,200 1.0% Transfers from Other Funds 30,530 0 85,771 100.0% 3,212,108 3645.0%TOTAL INTERNAL SERVICE $37,434,527 $47,533,343 $48,190,619 1.4% $56,571,894 17.4%
SPECIAL REVENUE FUNDS Fees and Charges for Services $16,384,153 $19,075,437 $18,098,072 -5.1% $18,092,275 0.0% Taxes 77,020,679 76,366,278 76,923,355 0.7% 78,691,956 2.3% Intergovernmental 17,819,185 13,526,365 14,689,818 8.6% 13,199,054 -10.1% Earnings on Investments 8,376,207 2,073,773 3,507,677 69.1% 3,351,947 -4.4% Bonds and Other Debt 61,293 0 0 0.0% 0 0.0% Net Change in Fair Value of Assets 284,981 0 0 0.0% 0 0.0% Miscellaneous 10,105,619 8,512,277 8,827,037 3.7% 9,073,341 2.8% Transfers from Other Funds 30,881,322 32,094,328 34,693,787 8.1% 33,968,992 -2.1%TOTAL SPECIAL REVENUE $160,933,438 $151,648,458 $156,739,746 3.4% $156,377,565 -0.2%
CAPITAL IMPROVEMENTS Fees and Charges for Services $891,102 $1,687,500 $800,000 -52.6% $800,000 0.0% Intergovernmental 1,958,546 1,980,000 61,224,540 2992.1% 2,043,155 -96.7% Earnings on Investments 2,770,409 182,529 293,640 60.9% 306,340 4.3% Bonds and Other Debt 0 0 0 0.0% 0 0.0% Net Change in Fair Value of Assets 162,382 0 0 0.0% 0 0.0% Miscellaneous 2,556,712 0 0 0.0% 0 0.0% Transfers from Other Funds 23,610,307 6,107,521 9,257,216 51.6% 5,303,090 -42.7%TOTAL CAPITAL IMPROVEMENTS $31,949,458 $9,957,550 $71,575,396 618.8% $8,452,585 -88.2%
TOTAL CITY REVENUE $494,774,809 $455,539,990 $538,145,127 18.1% $519,895,318 -3.4%
CITY REVENUE DETAIL
If the revenue is lower than expenditures, it signifies that reserves are used. Conversely, if revenue is higher than expenditures, additional monies are added to reserves.
CITY REVENUE DETAIL

38 - OPERATING BUDGET
CITY REVENUE DETAIL (CONTINUED)
CITY SUMMARY% Change % Change
FUND TYPE ACTUAL Adopted ADOPTED From ADOPTED From Revenue Category 2006 2007 2008 2007 2009 2008
Fees and Charges for Services $222,478,808 $233,276,275 $241,666,407 3.6% $251,704,175 4.2% Taxes 93,765,379 92,929,636 94,754,630 2.0% 96,757,552 2.1% Intergovernmental 21,565,282 16,238,460 76,732,030 372.5% 16,107,034 -79.0% Earnings on Investments 20,312,742 6,625,981 9,691,624 46.3% 9,444,866 -2.5% Bonds and Other Debt 458,269 0 0 0.0% 30,000,000 100.0% Net Change in Fair Value of Assets 1,344,040 0 0 0.0% 0 0.0% Miscellaneous 21,182,677 11,356,879 11,743,734 3.4% 11,808,335 0.6%
NET CITY REVENUE $381,107,196 $360,427,231 $434,588,425 20.6% $415,821,962 -4.3% Transfers from Other Funds 113,667,613 95,112,759 103,556,702 8.9% 104,073,356 0.5%TOTAL CITY REVENUE $494,774,809 $455,539,990 $538,145,127 18.1% $519,895,318 -3.4%
CITY REVENUE DETAIL (continued)
If the revenue is lower than expenditures, it signifies that reserves are used. Conversely, if revenue is higher than expenditures, additional monies are added to reserves.
39 - OPERATING BUDGET
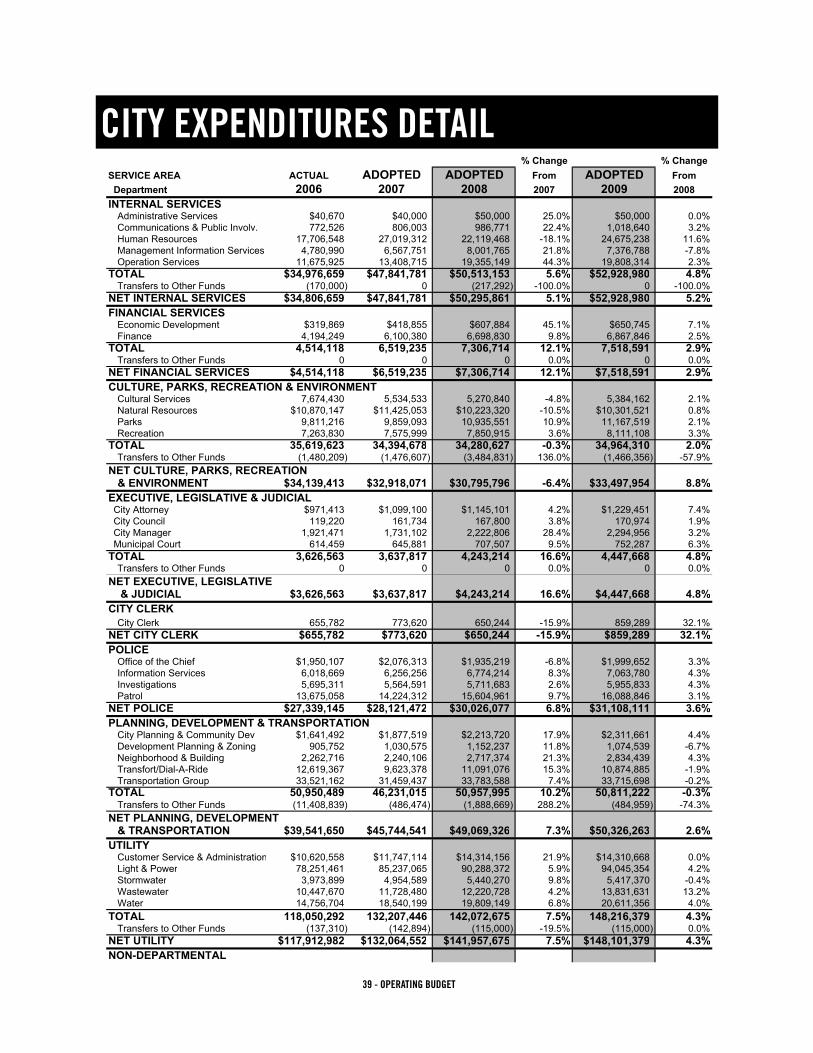
CITY EXPENDITURES DETAIL% Change % Change
SERVICE AREA ACTUAL ADOPTED ADOPTED From ADOPTED From Department 2006 2007 2008 2007 2009 2008INTERNAL SERVICES
Administrative Services $40,670 $40,000 $50,000 25.0% $50,000 0.0%Communications & Public Involv. 772,526 806,003 986,771 22.4% 1,018,640 3.2%Human Resources 17,706,548 27,019,312 22,119,468 -18.1% 24,675,238 11.6%Management Information Services 4,780,990 6,567,751 8,001,765 21.8% 7,376,788 -7.8%Operation Services 11,675,925 13,408,715 19,355,149 44.3% 19,808,314 2.3%
TOTAL $34,976,659 $47,841,781 $50,513,153 5.6% $52,928,980 4.8%Transfers to Other Funds (170,000) 0 (217,292) -100.0% 0 -100.0%
NET INTERNAL SERVICES $34,806,659 $47,841,781 $50,295,861 5.1% $52,928,980 5.2%FINANCIAL SERVICES
Economic Development $319,869 $418,855 $607,884 45.1% $650,745 7.1%Finance 4,194,249 6,100,380 6,698,830 9.8% 6,867,846 2.5%
TOTAL 4,514,118 6,519,235 7,306,714 12.1% 7,518,591 2.9%Transfers to Other Funds 0 0 0 0.0% 0 0.0%
NET FINANCIAL SERVICES $4,514,118 $6,519,235 $7,306,714 12.1% $7,518,591 2.9%CULTURE, PARKS, RECREATION & ENVIRONMENT
Cultural Services 7,674,430 5,534,533 5,270,840 -4.8% 5,384,162 2.1%Natural Resources $10,870,147 $11,425,053 $10,223,320 -10.5% $10,301,521 0.8%Parks 9,811,216 9,859,093 10,935,551 10.9% 11,167,519 2.1%Recreation 7,263,830 7,575,999 7,850,915 3.6% 8,111,108 3.3%
TOTAL 35,619,623 34,394,678 34,280,627 -0.3% 34,964,310 2.0%Transfers to Other Funds (1,480,209) (1,476,607) (3,484,831) 136.0% (1,466,356) -57.9%
NET CULTURE, PARKS, RECREATION& ENVIRONMENT $34,139,413 $32,918,071 $30,795,796 -6.4% $33,497,954 8.8%
EXECUTIVE, LEGISLATIVE & JUDICIAL City Attorney $971,413 $1,099,100 $1,145,101 4.2% $1,229,451 7.4% City Council 119,220 161,734 167,800 3.8% 170,974 1.9% City Manager 1,921,471 1,731,102 2,222,806 28.4% 2,294,956 3.2% Municipal Court 614,459 645,881 707,507 9.5% 752,287 6.3%TOTAL 3,626,563 3,637,817 4,243,214 16.6% 4,447,668 4.8%
Transfers to Other Funds 0 0 0 0.0% 0 0.0%NET EXECUTIVE, LEGISLATIVE & JUDICIAL $3,626,563 $3,637,817 $4,243,214 16.6% $4,447,668 4.8%CITY CLERK
City Clerk 655,782 773,620 650,244 -15.9% 859,289 32.1%NET CITY CLERK $655,782 $773,620 $650,244 -15.9% $859,289 32.1%POLICE
Office of the Chief $1,950,107 $2,076,313 $1,935,219 -6.8% $1,999,652 3.3%Information Services 6,018,669 6,256,256 6,774,214 8.3% 7,063,780 4.3%Investigations 5,695,311 5,564,591 5,711,683 2.6% 5,955,833 4.3%Patrol 13,675,058 14,224,312 15,604,961 9.7% 16,088,846 3.1%
NET POLICE $27,339,145 $28,121,472 $30,026,077 6.8% $31,108,111 3.6%PLANNING, DEVELOPMENT & TRANSPORTATION
City Planning & Community Dev $1,641,492 $1,877,519 $2,213,720 17.9% $2,311,661 4.4%Development Planning & Zoning 905,752 1,030,575 1,152,237 11.8% 1,074,539 -6.7%Neighborhood & Building 2,262,716 2,240,106 2,717,374 21.3% 2,834,439 4.3%Transfort/Dial-A-Ride 12,619,367 9,623,378 11,091,076 15.3% 10,874,885 -1.9%Transportation Group 33,521,162 31,459,437 33,783,588 7.4% 33,715,698 -0.2%
TOTAL 50,950,489 46,231,015 50,957,995 10.2% 50,811,222 -0.3%Transfers to Other Funds (11,408,839) (486,474) (1,888,669) 288.2% (484,959) -74.3%
NET PLANNING, DEVELOPMENT& TRANSPORTATION $39,541,650 $45,744,541 $49,069,326 7.3% $50,326,263 2.6%
UTILITYCustomer Service & Administration $10,620,558 $11,747,114 $14,314,156 21.9% $14,310,668 0.0%Light & Power 78,251,461 85,237,065 90,288,372 5.9% 94,045,354 4.2%Stormwater 3,973,899 4,954,589 5,440,270 9.8% 5,417,370 -0.4%Wastewater 10,447,670 11,728,480 12,220,728 4.2% 13,831,631 13.2%Water 14,756,704 18,540,199 19,809,149 6.8% 20,611,356 4.0%
TOTAL 118,050,292 132,207,446 142,072,675 7.5% 148,216,379 4.3%Transfers to Other Funds (137,310) (142,894) (115,000) -19.5% (115,000) 0.0%
NET UTILITY $117,912,982 $132,064,552 $141,957,675 7.5% $148,101,379 4.3%NON-DEPARTMENTAL
CITY EXPENDITURES DETAIL

40 - OPERATING BUDGET
CITY EXPENDITURES DETAIL% Change % Change
SERVICE AREA ACTUAL ADOPTED ADOPTED From ADOPTED From Department 2006 2007 2008 2007 2009 2008
CITY EXPENDITURES DETAIL
Capital Expansion Fund $8,088,258 $490,507 $459,981 -6.2% $461,141 0.3%General Fund - Other 18,666,060 18,634,066 20,797,353 11.6% 23,251,219 11.8%General Fund - Poudre Fire 15,269,412 16,440,379 16,383,100 -0.3% 17,223,796 5.1%General Employees' Retire. Fund 1,822,230 2,602,110 2,684,342 3.2% 2,764,973 3.0%Sales & Use Tax Fund 78,359,284 75,895,362 78,137,453 3.0% 78,583,777 0.6%Special Assessment Debt Service 0 0 0 0.0% 830,000 100.0%
TOTAL 122,205,244 114,062,424 118,462,229 3.9% 123,114,906 3.9%Transfers to Other Funds (99,586,126) (91,545,834) (96,829,559) 5.8% (100,557,039) 3.8%
NET NON-DEPARTMENTAL $22,619,118 $22,516,590 $21,632,670 -3.9% $22,557,867 4.3%OPERATING BUDGET 397,937,914 413,789,488 438,512,928 6.0% 453,969,456 3.5% Transfers to Other Funds (112,782,484) (93,651,809) (102,535,351) 9.5% (102,623,354) 0.1%NET OPERATING BUDGET $285,155,430 $320,137,679 $335,977,577 4.9% $351,346,102 4.6%DEBT SERVICE
Capital Leasing Corporation $4,721,041 $5,730,934 $5,726,331 -0.1% $5,717,380 -0.2%Debt Service 2,791,955 1,348,081 1,352,038 0.3% 1,352,478 0.0%Golf (Parks) 409,021 422,633 412,093 -2.5% 411,349 -0.2%Stormwater 4,493,087 4,469,968 4,418,840 -1.1% 4,253,990 -3.7%Wastewater 5,395,374 5,662,304 5,387,040 -4.9% 7,869,482 46.1%Water 6,494,135 6,635,735 6,623,813 -0.2% 6,628,175 0.1%
TOTAL 24,304,613 24,269,655 23,920,155 -1.4% 26,232,854 9.7%Transfers to Other Funds 0 0 0 0.0% 0 0.0%
NET DEBT SERVICE $24,304,613 $24,269,655 $23,920,155 -1.4% $26,232,854 9.7%CAPITAL IMPROVEMENTS
1/4 Cent Natural Areas 34,534 608,171 0 -100.0% 0 0.0%1/4 Cent Building on Basics 6,487,110 5,794,250 4,797,431 -17.2% 6,445,144 34.3%1/4 Cent Community Enhance. 6,586,702 0 0 0.0% 0 0.0%1/4 Cent Natural Areas and Parks 535,043 198,094 0 -100.0% 0 0.0%1/4 Cent Streets & Transportation 3,113,481 1,000,000 61,508,488 6050.8% 0 -100.0%Conservation Trust 1,939,114 1,267,397 1,369,885 8.1% 1,416,885 3.4%General City 37,340,119 329,070 3,074,429 834.3% 1,065,682 -65.3%Neighborhood Parkland 1,775,405 1,185,031 1,959,963 65.4% 1,478,052 -24.6%Light & Power 1,735,299 281,000 10,555,525 3656.4% 1,374,093 -87.0%Stormwater 6,836,400 5,515,000 7,611,775 38.0% 6,897,294 -9.4%Utility Customer Service & Admin. 0 0 150,000 0.0% 150,000 0.0%Wastewater 3,588,643 1,893,000 14,073,571 643.5% 28,755,548 104.3%Water 3,552,713 16,347,500 4,186,006 -74.4% 12,644,065 202.1%
TOTAL 73,524,563 34,418,513 109,287,073 217.5% 60,226,763 -44.9%Transfers to Other Funds (885,129) (1,460,950) (1,021,351) -30.1% (1,450,002) 42.0%
NET CAPITAL IMPROVEMENTS $72,639,434 $32,957,563 $108,265,722 228.5% $58,776,761 -45.7%NET CITY BUDGET $382,099,477 $377,364,897 $468,163,453 24.1% $436,355,717 -6.8%
Transfers to Other Funds 113,667,613 95,112,759 103,556,702 8.9% 104,073,356 0.5%TOTAL CITY BUDGET $495,767,090 $472,477,656 $571,720,155 21.0% $540,429,073 -5.5%

41 - OPERATING BUDGET
WHAT DOES A PROPERTY OWNER PAY?
2007 PROPERT TAX BASED ON 2006 ASSESMENTWHAT DOES A CITY PROPERTY OWNER PAY?
2007 Property Tax Based on 2006 Assessment
MILL LEVY
CITY COUNTY SCHOOL DISTRICT OTHER TOTAL
9.797 22.414 51.723 3.309 87.243
11.2% 25.7% 59.3% 3.8%
To illustrate the City property tax portion payable in 2007 by an individual owning a home valued
at $200,000 and a business owning property valued at $600,000:
Based on current Colorado statutes, residential property is assessed at 7.96%
of its actual value and commercial and industrial property is assessed at 29%.
ACTUAL VALUE ASSESSED VALUE
$ 200,000 X .0796 = $ 15,920$ 600,000 X .2900 = $ 174,000
The 2007 City mill levy is 9.797 mills based on the 2006 assessed value of
property (a mill equals one dollar for every thousand dollars of assessed
valuation).
ASSESSED VALUE MILL LEVY CITY PROPERTY TAX
$ 15,920 X .009797 = $ 155.97$ 174,000 X .009797 = $1,704.68

42 - OPERATING BUDGET
CITY EMPLOYEES BY SERVICE AREA/DEPT.
SERVICE AREA ADOPTED ADOPTED ADOPTED ADOPTEDDepartment 2006 2007 2008 2009INTERNAL SERVICES 111.30 110.65 113.45 113.45
Communications & Public Involv. 8.50 8.25 8.00 8.00Human Resources 16.80 16.80 18.00 18.00Management Information Services 27.10 26.70 27.55 27.55Operation Services 58.90 58.90 59.90 59.90
FINANCIAL SERVICES 40.00 40.00 42.80 42.80Economic Development 1.00 1.00 2.50 2.50Finance 39.00 39.00 40.30 40.30
CULTURE, PARKS, RECREATION & ENVIRONMENT 161.63 160.57 169.55 169.55Cultural Services 17.55 17.55 18.05 18.05Natural Resources 31.31 31.25 36.50 37.50Parks 63.45 63.45 63.50 63.50Parks Planning & Dev 10.02 10.02 10.00 10.00Recreation 39.30 38.30 41.50 40.50
EXECUTIVE, LEGISLATIVE & JUDICIAL 32.40 33.40 34.30 34.30 City Attorney 10.40 10.40 11.00 11.00 City Council 7.00 7.00 7.00 7.00 City Manager 9.00 10.00 10.50 10.50 Municipal Court 6.00 6.00 5.80 5.80CITY CLERK 5.75 5.75 5.75 5.75
City Clerk 5.75 5.75 5.75 5.75POLICE 251.25 252.75 257.75 257.75
Office of the Chief 15.50 15.50 13.75 13.75Information Services 66.00 66.00 66.00 66.00Investigations 55.25 55.25 52.00 52.00Patrol 114.50 116.00 126.00 126.00
PLANNING, DEVELOPMENT & TRANSPORTATION 212.13 208.87 215.70 215.70Planning 19.51 18.55 20.45 20.45Neighborhood & Building 23.45 23.45 28.50 28.50Transfort/Dial-A-Ride 60.50 58.50 60.00 60.00Transportation Group 108.67 108.37 106.75 106.75
UTILITY 346.80 346.80 351.80 351.80Customer Service & Administration 104.25 104.25 102.75 102.75Light & Power 90.75 90.75 90.25 90.25Stormwater 24.30 24.30 24.01 24.01Wastewater 61.00 61.00 64.89 64.89Water 66.50 66.50 69.90 69.90
TOTAL CITY 1,161.26 1,158.79 1,191.10 1,191.10
CITY EMPLOYEES BY SERVICE AREA / DEPARTMENT
NOTE: The total reflects classified and unclassified positions. This does not include contractual, hourly or seasonal employees.

43 - OPERATING BUDGET
KEY OUTCOMES AND ALLOCATIONS TABLE OF CONTENTS
B. KEY OUTCOMES AND ALLOCATIONS 45
B-1. ECONOMIC HEALTH 49 •KEYPURCHASES •DRILLINGPLATFORMS •OFFERSUMMARIES •INDICATORS/PURCHASINGSTRATEGIES/RESULTSMAPS
B-2. ENVIRONMENTAL HEALTH 63 •KEYPURCHASES •DRILLINGPLATFORMS •OFFERSUMMARIES •INDICATORS/PURCHASINGSTRATEGIES/RESULTSMAPS
B-3. NEIGHBORHOOD LIVABILITY 81 •KEYPURCHASES •DRILLINGPLATFORMS •OFFERSUMMARIES •INDICATORS/PURCHASINGSTRATEGIES/RESULTSMAPS
B-4. SAFER COMMUNITY 93 •KEYPURCHASES •DRILLINGPLATFORMS •OFFERSUMMARIES •INDICATORS/PURCHASINGSTRATEGIES/RESULTSMAPS
B-5. CULTURAL, RECREATIONAL, AND EDUCATIONAL OPPORTUNITIES 119 •KEYPURCHASES •DRILLINGPLATFORMS •OFFERSUMMARIES •INDICATORS/PURCHASINGSTRATEGIES/RESULTSMAPS
B-6. TRANSPORTATION 141 •KEYPURCHASES •DRILLINGPLATFORMS •OFFERSUMMARIES •INDICATORS/PURCHASINGSTRATEGIES/RESULTSMAPS
B-7. HIGH-PERFORMING GOVERNMENT 163 •KEYPURCHASES •DRILLINGPLATFORMS •OFFERSUMMARIES •INDICATORS/PURCHASINGSTRATEGIES/RESULTSMAPS
44 - OPERATING BUDGET
2008-2009 BUDGET RESULTS
B-1. ECONOMIC HEALTH Fort Collins has a healthy economy reflecting the values of our unique community in a changing world.
B-2. ENVIRONMENTAL HEALTH Fort Collins creates, maintains and promotes a healthy and sustainable environment with an adequate,
high quality water supply.
B-3. NEIGHBORHOOD LIVABILITY Fort Collins improves the livability, choices, and affordability of our neighborhoods.
B-4. SAFER COMMUNITY Fort Collins is a safe place to live, work, learn and play.
B-5. CULTURAL, RECREATIONAL, AND EDUCATIONAL OPPORTUNITIES Fort Collins provides diverse cultural and recreational opportunities that foster physical and mental well-
being for community members.
B-6. TRANSPORTATION Fort Collins improves the safety and ease of traveling to, from, and throughout the city.
B-7. HIGH-PERFORMING GOVERNMENT Fort Collins is a model for an entrepreneurial, high quality city government.
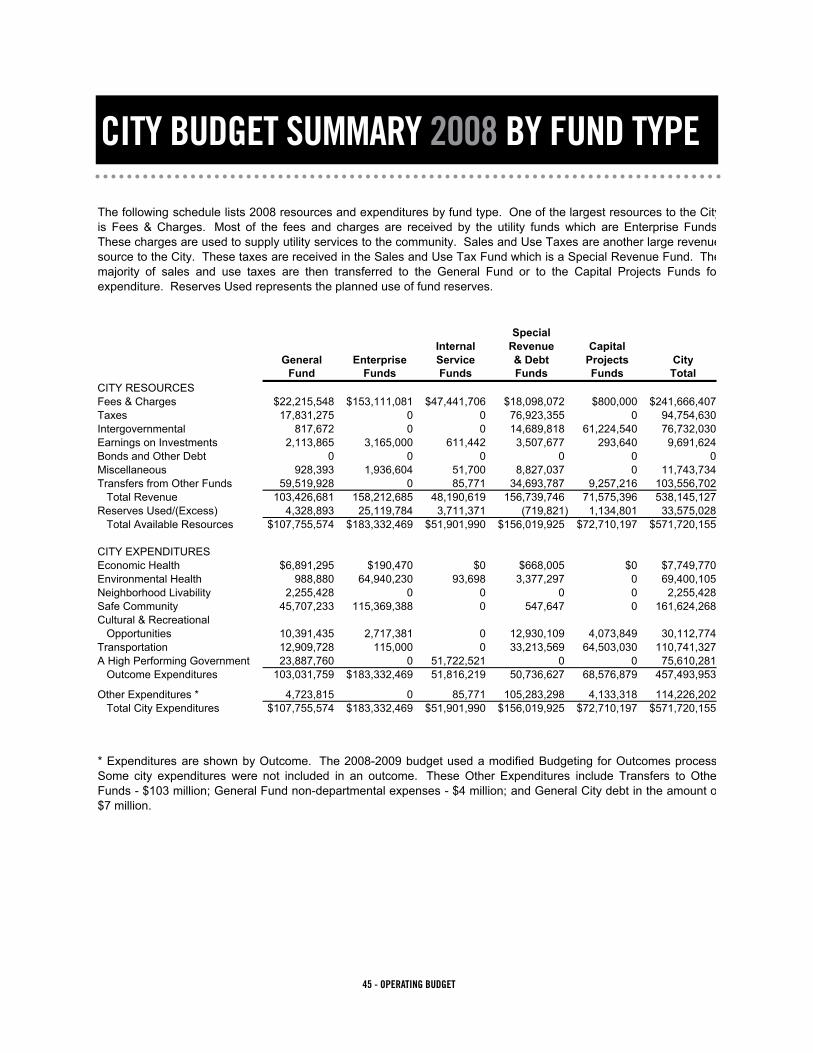
45 - OPERATING BUDGET
SpecialInternal Revenue Capital
General Enterprise Service & Debt Projects CityFund Funds Funds Funds Funds Total
CITY RESOURCESFees & Charges $22,215,548 $153,111,081 $47,441,706 $18,098,072 $800,000 $241,666,407Taxes 17,831,275 0 0 76,923,355 0 94,754,630Intergovernmental 817,672 0 0 14,689,818 61,224,540 76,732,030Earnings on Investments 2,113,865 3,165,000 611,442 3,507,677 293,640 9,691,624Bonds and Other Debt 0 0 0 0 0 0Miscellaneous 928,393 1,936,604 51,700 8,827,037 0 11,743,734Transfers from Other Funds 59,519,928 0 85,771 34,693,787 9,257,216 103,556,702 Total Revenue 103,426,681 158,212,685 48,190,619 156,739,746 71,575,396 538,145,127Reserves Used/(Excess) 4,328,893 25,119,784 3,711,371 (719,821) 1,134,801 33,575,028 Total Available Resources $107,755,574 $183,332,469 $51,901,990 $156,019,925 $72,710,197 $571,720,155
CITY EXPENDITURESEconomic Health $6,891,295 $190,470 $0 $668,005 $0 $7,749,770Environmental Health 988,880 64,940,230 93,698 3,377,297 0 69,400,105Neighborhood Livability 2,255,428 0 0 0 0 2,255,428Safe Community 45,707,233 115,369,388 0 547,647 0 161,624,268Cultural & Recreational
Opportunities 10,391,435 2,717,381 0 12,930,109 4,073,849 30,112,774Transportation 12,909,728 115,000 0 33,213,569 64,503,030 110,741,327A High Performing Government 23,887,760 0 51,722,521 0 0 75,610,281 Outcome Expenditures 103,031,759 $183,332,469 51,816,219 50,736,627 68,576,879 457,493,953
Other Expenditures * 4,723,815 0 85,771 105,283,298 4,133,318 114,226,202 Total City Expenditures $107,755,574 $183,332,469 $51,901,990 $156,019,925 $72,710,197 $571,720,155
The following schedule lists 2008 resources and expenditures by fund type. One of the largest resources to the Cityis Fees & Charges. Most of the fees and charges are received by the utility funds which are Enterprise Funds.These charges are used to supply utility services to the community. Sales and Use Taxes are another large revenuesource to the City. These taxes are received in the Sales and Use Tax Fund which is a Special Revenue Fund. Themajority of sales and use taxes are then transferred to the General Fund or to the Capital Projects Funds forexpenditure. Reserves Used represents the planned use of fund reserves.
City Budget Summary for 2008By Fund Type
* Expenditures are shown by Outcome. The 2008-2009 budget used a modified Budgeting for Outcomes process.Some city expenditures were not included in an outcome. These Other Expenditures include Transfers to OtherFunds - $103 million; General Fund non-departmental expenses - $4 million; and General City debt in the amount of$7 million.
CITY BUDGET SUMMARY 2008 BY FUND TYPE

46 - OPERATING BUDGET
CITY BUDGET SUMMARY 2009 BY FUND TYPE
SpecialInternal Revenue Capital
General Enterprise Service & Debt Projects CityFund Funds Funds Funds Funds Total
CITY RESOURCESFees & Charges $20,815,315 $159,302,284 $52,694,301 $18,092,275 $800,000 $251,704,175Taxes 18,065,596 0 0 78,691,956 0 96,757,552Intergovernmental 864,825 0 0 13,199,054 2,043,155 16,107,034Earnings on Investments 2,006,294 3,167,000 613,285 3,351,947 306,340 9,444,866Bonds and Other Debt 0 30,000,000 0 0 0 30,000,000Miscellaneous 861,530 1,821,264 52,200 9,073,341 0 11,808,335Transfers from Other Funds 61,589,166 0 3,212,108 33,968,992 5,303,090 104,073,356 Total Revenue 104,202,726 194,290,548 56,571,894 156,377,565 8,452,585 519,895,318Reserves Used/(Excess) 3,557,395 10,825,750 2,900,771 1,296,660 1,953,179 20,533,755 Total Available Resources $107,760,121 $205,116,298 $59,472,665 $157,674,225 $10,405,764 $540,429,073
CITY EXPENDITURESEconomic Health $7,123,959 $198,498 $0 $661,248 $0 $7,983,705Environmental Health 972,613 93,205,981 97,804 4,918,968 0 99,195,366Neighborhood Livability 2,212,225 0 0 0 0 2,212,225Safe Community 47,064,229 108,808,877 0 631,316 0 156,504,422Cultural & Recreational
Opportunities 10,737,928 2,787,942 0 11,699,768 6,161,271 31,386,909Transportation 12,028,262 115,000 0 32,849,641 3,718,155 48,711,058A High Performing Government 19,282,385 0 59,288,670 0 0 78,571,055 Outcome Expenditures 99,421,601 205,116,298 59,386,474 50,760,941 9,879,426 424,564,740
Other Expenditures * 8,338,520 0 86,191 106,913,284 526,338 115,864,333 Total City Expenditures $107,760,121 $205,116,298 $59,472,665 $157,674,225 $10,405,764 $540,429,073
Note: A High Performing Government has been adjusted to show the transfer of Management Information Services budget from the General Fund to the Data & Communications Internal Service Fund.
The following schedule lists 2009 resources and expenditures by fund type. One of the largest resources to the Cityis Fees & Charges. Most of the fees and charges are received by the utility funds which are Enterprise Funds.These charges are used to supply utility services to the community. Sales and Use Taxes are another large revenuesource to the City. These taxes are received in the Sales and Use Tax Fund which is a Special Revenue Fund. Themajority of sales and use taxes are then transferred to the General Fund or to the Capital Projects Funds forexpenditure. Reserves used represents the planned use of fund reserves.
City Budget Summary for 2009By Fund Type
* Expenditures are shown by Outcome. The 2008-2009 budget used a modified Budgeting for Outcomes process.Some city expenditures were not included in an outcome. These Other Expenditures include Transfers to OtherFunds - $104 million; General Fund non-departmental expenses - $5 million; and General City debt in the amount of$7 million.

47 - OPERATING BUDGET
2008-2009 BUDGET RESULTS
ECONOMIC HEALTH
ENVIRONMENTAL HEALTH
NEIGHBORHOOD QUALITY
SAFE COMMUNITY
CULT, REC & EDU
TRANSPORTATION
HIGH PERFORMING GOV
0 50 100 150 200
GF 6.9MOther .8MTotal 7.7M
GF 7.1MOther .9MTotal 7.7M
GF 1.0MOther 98.2MTotal 99.2M
GF 2.2MOther 0Total 2.2M
GF 47.1MOther 109.4MTotal 156.5M
GF 10.7MOther 20.7MTotal 31.4M
GF 12MOther 36.7MTotal 48.7M
GF 25MOther 53.7MTotal 78.7M
GF 1.0MOther 68.4MTotal 69.4M
GF 2.3MOther 0Total 2.3M
GF 45.7MOther 115.9MTotal 161.6M
GF 10.4MOther 19.7MTotal 30.1M
GF 12.9MOther 97.8MTotal 110.7M
GF 23.9MOther 51.7MTotal 75.6M
GENERAL FUNDOTHER FUNDS
MILLIONS
ECONOMIC HEALTH
ENVIRONMENTAL HEALTH
NEIGHBORHOOD QUALITY
SAFE COMMUNITY
CULT, REC & EDU
TRANSPORTATION
HIGH PERFORMING GOV
0 50 100 150 200
GENERAL FUNDOTHER FUNDS
MILLIONS“Other” expenses are included in the Total City budget, but not in specific Result Areas. These include Transfers, Debt and accounting for the Sales and Use Tax fund which is transferred into other Result Areas. “Other” items not included in offers total $114.2 Million in 2008 and $112.7 Million in 2009.
TOTAL ALLOCATION BY RESULT ($536M)GENERAL FUND & OTHER FUNDS – 2009
TOTAL ALLOCATION BY RESULT ($572M)GENERAL FUND & OTHER FUNDS – 2008

48 - OPERATING BUDGET
THIS PAGE LEFT INTENTIONALLY BLANK
49 - OPERATING BUDGET
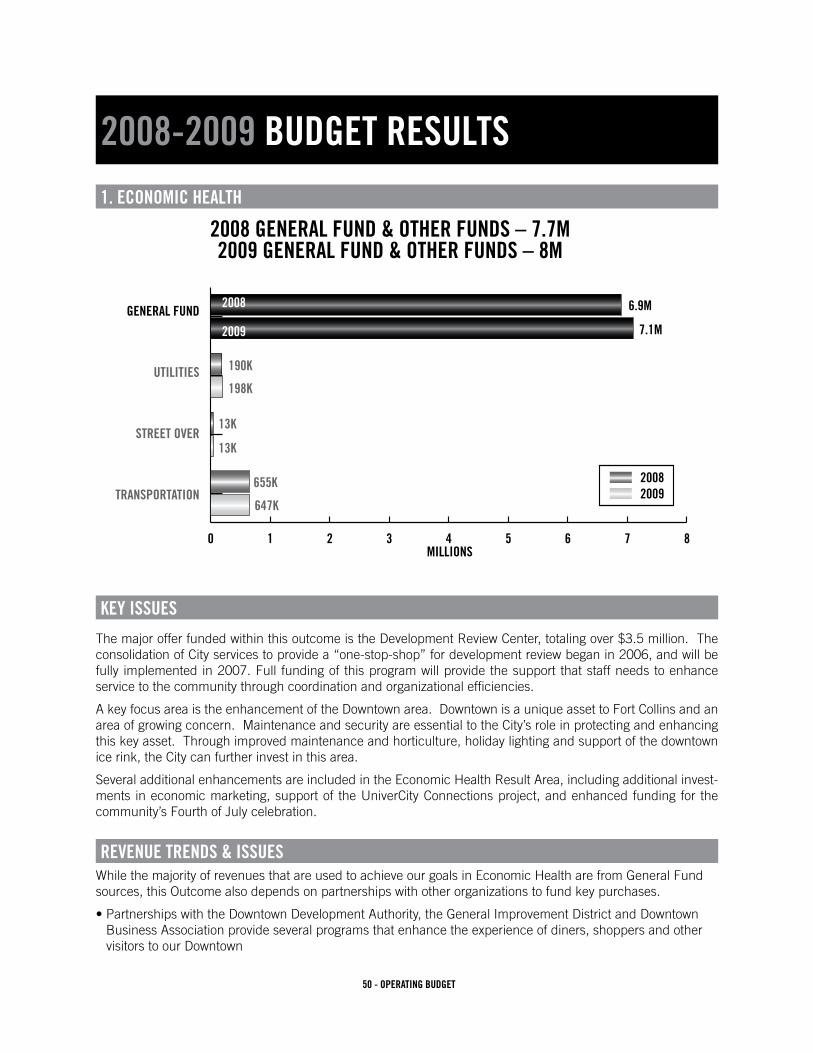
50 - OPERATING BUDGET
2008-2009 BUDGET RESULTS
1. ECONOMIC HEALTH
KEY ISSUES
ThemajorofferfundedwithinthisoutcomeistheDevelopmentReviewCenter,totalingover$3.5million.Theconsolidation of City services to provide a “one-stop-shop” for development review began in 2006, and will be fully implemented in 2007. Full funding of this program will provide the support that staff needs to enhance service to the community through coordination and organizational efficiencies.
A key focus area is the enhancement of the Downtown area. Downtown is a unique asset to Fort Collins and an area of growing concern. Maintenance and security are essential to the City’s role in protecting and enhancing this key asset. Through improved maintenance and horticulture, holiday lighting and support of the downtown ice rink, the City can further invest in this area.
Several additional enhancements are included in the Economic Health Result Area, including additional invest-ments in economic marketing, support of the UniverCity Connections project, and enhanced funding for the community’s Fourth of July celebration.
REVENUE TRENDS & ISSUESWhile the majority of revenues that are used to achieve our goals in Economic Health are from General Fund sources, this Outcome also depends on partnerships with other organizations to fund key purchases.
•PartnershipswiththeDowntownDevelopmentAuthority,theGeneralImprovementDistrictandDowntownBusiness Association provide several programs that enhance the experience of diners, shoppers and other visitors to our Downtown
0 1 2 3 4 5 6 7 8
2008 GENERAL FUND & OTHER FUNDS – 7.7M2009 GENERAL FUND & OTHER FUNDS – 8M
GENERAL FUND
UTILITIES
STREET OVER
TRANSPORTATION
190K
198K
13K
13K
MILLIONS
655K
647K
6.9M
7.1M
2008
2009
20082009

51 - OPERATING BUDGET
•LodgingTaxes,whicharegeneratedfromvisitorstoFortCollinswhostayinlocalhotelsandmotels,provideessentialfundingforConventionandVisitorServicesandtheFortFundgrantprogram
•VendorFeerevenuecontinuestoprovideresourcesfortheEconomicHealthProgram
KEY PURCHASES
•EconomicHealthProgramstaffandprogramstopromoteFortCollinsandimproveitseconomichealth
•DevelopmentReviewCenterconsolidatedapproachtoprovidingdevelopmentreview
•DistrictOnePolicesubstation
•SupportofTechnologyIncubatorandIndustryClusters
•FortCollins/LovelandAirport
ENHANCEMENTS PURCHASED
•DowntownEnhancement:Includesimproveddowntownmaintenance,flowerdisplays,holidaylightingandlandscaping
•4thofJulycelebrationenhancement
•EconomicMarketingprogramenhancement
•ContributiontoNorthernColoradoEconomicDevelopmentCorporation
EXAMPLES OF SERVICES NOT PURCHASED
•CityPlanUpdate:Originallyplannedtobegininlate2009,thestartdateofthismajorupdatetotheCity’scomprehensive plan and Transportation Master Plan was deferred until early 2010 and will be funded in the next budget cycle
•DowntownParkingCooperative
•AdditionalresourcesforDistrictOneincludingaddedofficers
•ImplementationofanewCitylogoandbranding

52 - OPERATING BUDGET
ECON
OMIC
HEA
LTH
DRIL
LING
PLA
TFOR
M 2
008
One
-tim
eO
ngoi
ng
Line
Offe
r O
ffer
Fund
ing
Offe
rG
ener
al F
und
Res
trict
edG
ener
al F
und
Oth
er R
estri
cted
##
Offe
r Des
crip
tion
Am
ount
O
ne-ti
me
Sou
rce
Am
ount
R
estri
cted
Des
crip
tion
Ong
oing
Fund
s O
ngoi
ng
111
4.1
City
Pla
nnin
g54
9,44
660
,000
Gen
eral
Fun
d48
9,44
648
9,44
62
194.
1E
cono
mic
Hea
lth P
rogr
am L
eade
rshi
p23
6,02
298
,914
Gen
eral
Fun
d13
7,10
813
7,10
8V
endo
r Fee
03
116.
1C
ity P
lann
ing
& C
omm
unity
Dev
elop
men
t Adm
in32
6,43
432
6,43
432
6,43
44
187.
1D
istri
ct O
ne a
nd C
rime
Pre
vent
ion
705,
817
705,
817
705,
817
512
9.1
Dow
ntow
n M
aint
enan
ce96
5,21
696
5,21
613
6,00
0P
arks
Rev
829,
216
619
4.2
Eco
nom
ic M
arke
ting
96,8
6296
,862
96,8
62V
endo
r Fee
07
176.
1D
evel
opm
ent R
evie
w C
ente
r3,
579,
952
3,57
9,95
22,
721,
477
858,
475
819
4.5
Sup
port
the
Fort
Col
lins
Tech
nolo
gy In
cuba
tor
60,0
0060
,000
60,0
009
193.
1C
onve
ntio
n an
d V
isito
rs S
ervi
ces
512,
120
512,
120
512,
120
Lodg
ing
Taxe
s0
1019
3.3
Wel
com
e C
ente
r Sta
te P
ass
Thro
ugh
Gra
nt75
,726
75,7
2675
,726
Gra
nt0
1119
4.3
Sup
port
Indu
stry
Clu
ster
100,
000
100,
000
60,3
80V
endo
r Fee
39,6
2012
114.
2U
nive
rCity
Con
nect
ions
Pha
se II
20,0
0020
,000
Gen
eral
Fun
d0
013
194.
7Fo
rt C
ollin
s/Lo
vela
nd A
irpor
t Con
tribu
tion
85,0
0085
,000
85,0
0014
129.
2D
ownt
own
Enh
ance
men
t23
5,17
540
,000
GF-
DD
A
1512
9.2
Dow
ntow
n E
nhan
cem
ent
78,5
25G
F-G
ID #
111
6,65
011
6,65
016
129.
3Ic
e R
ink
40,0
0040
,000
40,0
00D
DA
Pay
men
t0
1712
9.4
4th
of J
uly
57,0
0057
,000
25,0
00C
ontri
butio
n32
,000
1812
9.5
Hol
iday
Lig
htin
g
75,0
0075
,000
30,0
00D
DA
Pay
men
t19
129.
5H
olid
ay L
ight
ing
15
,000
DB
A P
aym
ent
30,0
0020
194.
9N
CE
DC
Con
tribu
tion
30,0
0030
,000
30,0
0021 22
Fund
ed O
ffers
7,74
9,77
029
7,43
97,
452,
331
1,12
8,19
65,
465,
660
858,
475
23A
lloca
tion
297,
439
1,12
8,19
65,
465,
660
858,
475
24D
iffer
ence
00
00
25 2617
6.3
Dev
elop
men
t Rev
iew
Cen
ter R
ecor
d A
rchi
ve13
,500
13,5
00G
ener
al F
und
00
2718
8.1
Dow
ntow
n P
arki
ng &
Infil
l Dev
elop
men
t10
0,00
010
0,00
0G
ener
al F
und
00
2818
7.2
Dis
trict
One
Offi
cer E
nhan
cem
ent
470,
396
470,
396
470,
396
2919
4.8
New
City
Log
o an
d B
rand
Impl
emen
tatio
n23
6,77
523
6,77
5G
ener
al F
und
00
3019
4.6
SB
DC
Dow
ntow
n B
usin
ess
and
the
Arts
Pro
gram
35,0
0035
,000
35,0
0031
226.
1D
ownt
own
Par
king
Coo
pera
tive
200,
000
200,
000
200,
000
32 33U
nfun
ded
Offe
rs1,
055,
671
350,
275
705,
396
070
5,39
60
34
35
Tota
l Offe
rs8,
805,
441
647,
714
8,15
7,72
71,
128,
196
6,17
1,05
685
8,47
536
ECO
NO
MIC
HEA
LTH
DR
ILLI
NG
PLA
TFO
RM
- 20
08

53 - OPERATING BUDGET
ECON
OMIC
HEA
LTH
DRIL
LING
PLA
TFOR
M 2
009
One
-tim
eO
ngoi
ng
Line
Offe
r O
ffer
Fund
ing
Offe
rG
ener
al F
und
Res
trict
edG
ener
al F
und
Oth
er R
estri
cted
##
Offe
r Des
crip
tion
Am
ount
O
ne-ti
me
Sou
rce
Am
ount
R
estri
cted
Des
crip
tion
Ong
oing
Fund
s O
ngoi
ng
111
4.1
City
Pla
nnin
g66
5,66
716
0,00
0G
ener
al F
und
505,
667
505,
667
219
4.1
Eco
nom
ic H
ealth
Pro
gram
Lea
ders
hip
245,
108
98,9
14G
ener
al F
und
146,
194
146,
194
Ven
dor F
ee0
311
6.1
City
Pla
nnin
g &
Com
mun
ity D
evel
opm
ent A
dmin
336,
401
336,
401
336,
401
418
7.1
Dis
trict
One
and
Crim
e P
reve
ntio
n73
3,68
373
3,68
373
3,68
35
129.
1D
ownt
own
Mai
nten
ance
990,
876
990,
876
136,
000
Par
ks R
ev85
4,87
66
194.
2E
cono
mic
Mar
ketin
g10
0,63
710
0,63
710
0,63
7V
endo
r Fee
07
176.
1D
evel
opm
ent R
evie
w C
ente
r3,
717,
789
3,71
7,78
92,
858,
043
859,
746
819
4.5
Sup
port
the
Fort
Col
lins
Tech
nolo
gy In
cuba
tor
60,0
0060
,000
1,49
458
,506
919
3.1
Con
vent
ion
and
Vis
itors
Ser
vice
s52
2,36
852
2,36
852
2,36
8Lo
dgin
g Ta
xes
010
193.
3W
elco
me
Cen
ter S
tate
Pas
s Th
roug
h G
rant
75,7
2675
,726
75,7
26G
rant
011
194.
3S
uppo
rt In
dust
ry C
lust
er10
0,00
010
0,00
050
,439
Ven
dor F
ee49
,561
1219
4.7
Fort
Col
lins/
Love
land
Airp
ort C
ontri
butio
n85
,000
85,0
0085
,000
1319
4.4
Indu
stry
Clu
ster
Dat
e U
pdat
e30
,000
30,0
00G
ener
al F
und
00
1412
9.2
Dow
ntow
n E
nhan
cem
ent
118,
450
118,
450
118,
450
1512
9.3
Ice
Rin
k40
,000
40,0
0040
,000
DD
A P
aym
ent
016
129.
44t
h of
Jul
y57
,000
57,0
0025
,000
Con
tribu
tion
32,0
0017
129.
5H
olid
ay L
ight
ing
75
,000
75,0
0030
,000
DD
A P
aym
ent
1815
,000
DB
A P
aym
ent
30,0
0019
194.
9N
CE
DC
Con
tribu
tion
30,0
0030
,000
30,0
0020 21
Fund
ed O
ffers
7,98
3,70
528
8,91
47,
694,
791
1,14
2,85
85,
692,
187
859,
746
22A
lloca
tion
288,
914
1,14
2,85
85,
692,
187
859,
746
23D
iffer
ence
00
00
24 2518
7.2
Dis
trict
One
Offi
cer E
nhan
cem
ent
427,
405
427,
405
427,
405
2619
4.6
SB
DC
Dow
ntow
n B
usin
ess
and
the
Arts
Pro
gram
35,0
0035
,000
35,0
0027
226.
1D
ownt
own
Par
king
Coo
pera
tive
100,
000
100,
000
100,
000
28 29U
nfun
ded
Offe
rs56
2,40
50
562,
405
056
2,40
50
30
31
Tota
l Offe
rs8,
546,
110
288,
914
8,25
7,19
61,
142,
858
6,25
4,59
285
9,74
6
ECO
NO
MIC
HEA
LTH
DR
ILLI
NG
PLA
TFO
RM
- 20
09

54 - OPERATING BUDGET
ECONOMIC HEALTH
114.1 City Planning - Funded 2008 - $549,446 2009 - $665,667This offer builds on projects initiated in 2006-’07, continuing high quality community planning as the foundation for strategic efforts to sustain our local economy. City Plan and related plans and policies will be updated and implemented; business data and research services will be provided to support the competitiveness of existing and new businesses; and services will support targeted industry clusters, support targeted redevelopment, and foster community attributes unique to Fort Collins such as historic Downtown, CSU, and the Poudre River. Coordinated efforts to deal with critical changes happening in the City and region will be managed through interdepartmental and intergovernmental relationships such as the UniverCity Con-nections initiative, Mason Corridor, and I-25 interchanges.
114.2 UniverCity Connections Phase II - Funded 2008 - $20,000 2009 - $0Thisofferrequests$20,000in2008asaCitymatchtoCommunityFoundationfundinginordertosustainUniverCityConnec-tions during Phase II. In 2006-07, Phase I of UniverCity Connections brought together diverse interests to develop exciting new ideas involving the Downtown, University and River. This process resulted in a report detailing initiatives that involve the City, Colorado State University, Community Foundation, Downtown Development Authority and other organizations and individuals. Phase II involves implementation of the initiatives. The goal of Phase II is to continue to raise the profile of the study area defined in Phase I, to foster communication among all stakeholders and to provide the framework, staffing and resources to move specific initiatives forward.
116.1 City Planning & Community Development Administration - Funded 2008 - $326,434 2009 - $336,401This offer provides for the City Planning and Community Development Director, Administrative Support Supervisor, and Ad-ministrative Secretary I. Functions range from executive leadership of City planning efforts, to managing department finan-cial obligations and personnel, to customer service, to logistical support for all projects, programs and activities contained in the department’s other offers. All functions are based on identifying community wants and needs; engaging the community with proactive and responsive outreach; leading City efforts with effective and progressive management; and making the most of personnel resources to accomplish these results.
129.1 Downtown Landscape and Maintenance - Funded 2008 - $965,216 2009 - $990,876This offer addresses the operation and maintenance of the public spaces in the core downtown area through financial support from General Fund, the Downtown Development Authority and Progressive Old Town Square Company. This core area is considered an essential economic asset of the City and needs to be maintained adequately to retain and attract new business, cultural and residential activities to the area. The core downtown area for this offer is defined as the area between Cherry Street and Mulberry Street, and three blocks east and west of College Avenue. Maintenance for these areas includes turf care and maintenance including irrigation systems, shrub and flower planting and maintenance, cleaning, and litter control and snow removal.
129.2 Downtown Maintenance Enhancement - Funded 2008 - $235,175 2009 - $118,450This offer is an enhancement proposal to expand the maintenance and management of the downtown core area. The Parks Division currently maintains City properties on College Avenue at the corners and public buildings in the core downtown. This offer expands the area to all sidewalks between the corners on College Avenue from Olive Street to LaPorte Avenue, one block east and west on Olive Street, Oak Street, Mountain Avenue and LaPorte Avenue. This offer includes daily litter control, monthly power washing (six times), and horticultural expansion by adding more planters at the corners and mid block on College Avenue. In addition, eight light poles will have hanging baskets added. This does not include snow removal in the proposed expanded area.

55 - OPERATING BUDGET
ECONOMIC HEALTH
129.3 Ice Rink - Funded 2008 - $40,000 2009 - $40,000This offer is for the installation and removal of the ice rink in Old Town Square for the holiday season. The ice rink brings people downtown and contributes to the economic health of the area. Funding for this project is provided by the Downtown Development Authority.
129.4 4th of July - Funded 2008 - $57,000 2009 - $57,000This offer is for the Parks Division share of coordinating and hosting the annual Fourth of July Celebration in City Park. This event includes evening entertainment and the fireworks display. This offer is based on a public/private partnership that includes full sponsorship for the cost of the fireworks.
129.5 Downtown Holiday Lighting - Funded 2008 - $75,000 2009 - $75,000This is an offer to improve the quality and quantity of holiday lighting in the downtown core area. In 2007, an upgrade in lightingisbeinginvestigatedtochangefromincandescentlightstoLEDlights.Aonetimeinvestmentof$100,000.00willbefunded by the DDA to purchase energy saving LED lights. Funding to install and remove the lights and to cover other costs willcomefromapartnershipbetweentheCity,DDA,andDBA.TheDBAwillcontribute$15,000andtheCityandtheDDAwilleachcontribute$30,000annually.
176.1 Development Review Center - Funded 2008 - $3,579,952 2009 - $3,717,789The Development Review Center (DRC) functions as a central location for most development and construction related ac-tivities and manages the development review process which ensures consistency with City codes, standards and policies. Co-located staff collaborate to provide services that include the review and evaluation of all development and construction proposals from the conceptual design stage through certificate of occupancy. All customer and admin services related to these,aswellascomplianceactivities,areincludedinthisoffer.Otherservicesinclude:buildingandrentalinspection,an-nexations and related activities, zoning use inquiries, variance and rezoning requests, and providing other code, policy or general information related to property use and development. Training sessions related to the development review process and workshops will continue to be provided. Efforts to implement new technologies that will consolidate systems, automate manual systems, and increase functionality will continue.
176.3 Development Review Center Records Archive - Not Funded 2008 - $13,500 2009 - $0This is a request for one-time money to fund an hourly employee for 6 months to complete a records archive project that will bring up to date all electronic records related to building services and activities.
187.1 District One and Crime Prevention - Funded 2008 - $705,817 2009 - $733,683This offer consists of basic police services provided to our community by officers assigned to the District One Substation. The substation, created in 1996, serves the northeast section of Fort Collins and is located in the heart of Fort Collins’ historic district. District One establishes a visible law enforcement presence in the Old Town area that encourages economic vitality for the premier entertainment and shopping district in Northern Colorado. The District One officers focus their attentions on a plethora of issues ranging from loitering, DUI, liquor enforcement, transients, traffic and loud and obnoxious noise emanating from car stereos and alternated exhaust systems. They also address problems throughout the district by taking a problem solving approach. Sworn staffing for the substation consists of one sergeant, one alcohol enforcement officer, four community-policing officers, and one-crime prevention officer.
56 - OPERATING BUDGET
ECONOMIC HEALTH
187.2 District One Officer Enhancement - Not Funded 2008 - $470,396 2009 - $427,405This is an enhancement offer to add four additional officers to the current staffing of District One. District One is the unit primarily responsible for working with businesses and business associations in Old Town. The officers have various tasks through District One. A primary responsibility is to work with bar owners and liquor establishment. They also respond to most bar disturbances on weekend nights. Fort Collins downtown is a vibrant and economically viable locale. When people feel safe in Old Town, day or night, the economic health of the city is vastly affected. This enhancement will increase the percep-tion of personal safety downtown and result in economic enhancement and vitality to the city.
188.1 Downtown Parking & Infill Development Study - Not Funded 2008 - $100,000 2009 - $0This offer is for a planning study that will assess the relative merits and feasibility of implementing one or more strategies that will serve as solutions to the special parking demands of the Downtown area. The City of Fort Collins Downtown Strategic Plan(2004)identifiedseveralissuesrelatedtoparkingandtheparkingsupplyintheDowntownareaofFortCollins.Amongthese issues was the recognition that, as the Downtown area further develops with an influx of residential development, there will result a “parking deficit”. This may inhibit overall economic vitality of the area and also exacerbate current parking issues related to the supply of public parking. The main product of this study will be a document that will provide policy makers with the solid information and guidance they need to adequately address this problem and therefore to facilitate infill development and redevelopment in the core of our City. The result will be an enhanced level of service for downtown residents and those in the development community who do business downtown.
193.1 Convention and Visitors Services - Funded 2008 - $512,120 2009 - $522,368ThisofferfundstheCity’scontractwiththeFortCollinsConventionandVisitorsBureau(FCCVB),theofficialconvention,tour-ismandmarketingsalesandservicesagencyoftheCity.Fundingcomesfromlodgingtaxrevenues.TheFCCVBmarketsFort Collins as a convention and tourism destination, with special emphasis on Fort Collins as a cultural destination. The FCCVBpublicrelationsprogramgeneratescoverageinnationaltravelpublicationsandothermedia.TheFCCVBoperatestwo visitor information centers and serves as the primary source of information and services for the visitor and convention delegate,aswellasmanylocalresidents.TheFCCVBworksincooperationwithlocalorganizations(Chamber,DBA,DDA,CSU, and Cultural Resources Board) as well as the Colorado Tourism Office.
193.3 Welcome Center State Pass Through Grant - Funded 2008 - $75,726 2009 - $75,726ThisofferprovidesfortheCity’scontractwiththeConventionandVisitorsBureauforconventionandvisitorservices.TheState of Colorado has awarded grants annually to be used for the operation of the Fort Collins Welcome Center. There are no City general funds or Lodging Tax revenue included in this program.
194.1 Economic Health Program Leadership - Funded 2008 - $236,022 2009 - $245,108This offer provides resources to fund an Economic Advisor who will serve as the coordinator of the various City activities, services and plans directly related to the economic health of the community including developing and implementing the City Council’s economic policies, the economic action plan, and providing staff support for the Economic Advisory Commission. The offer also includes developing and implementing strategies to address retention and expansion of existing businesses and attract new business to Fort Collins, partnerships with community and business leaders, encouragement of and sup-port for entrepreneurial activity, and the establishment of ongoing measures of success as it relates to economic health and sustainability in our community.

57 - OPERATING BUDGET
ECONOMIC HEALTH
194.2 Economic Marketing - Funded 2008 - $ 96,862 2009 - $100,637This offer provides resources to implement the Communications Plan element of the Economic Action Plan as well as com-munication components of the target industry study. A FTE position will be responsible for developing relationships with local businesses, developing targeted business communication campaigns, expanding economic media relations, managing economic web page updates, and working closely with the City’s graphic designer in developing and distributing high qual-ity City of Fort Collins economic marketing materials. In addition, this position will manage the implementation of the new community-wide brand developed in 2007.
194.3 Support Industry Clusters - Funded 2008 - $100,000 2009 - $100,000This offer includes funding for the support of existing and emerging clusters within Fort Collins. The funds recommended in this offer are to provide support to outside agencies for their organization and management of the cluster activities.
194.4 Industry Cluster Data Update - Funded 2008 - $0 2009 - $30,000The City of Fort Collins has adopted an industry clusters approach to retaining, growing, and selectively attracting employ-ers. In 2006, the City conducted a target industry study that identified Chip Design & Research and Development; Software; Biotechnology; Clean Energy; and Uniquely Fort Collins (Arts, Entertainment, Recreation, Unique Retail) as the key industries today in our community. This offer provides ongoing funding for updating the primary data related to selected clusters as well as scanning the local business sector to identify emerging or other clusters that the City may want to focus on.
194.5 Support the Fort Collins Technology Incubator - Funded 2008 - $60,000 2009 - $60,000This offer includes funding for the ongoing support of the Technology Incubator. Investing in the Technology incubator sup-ports the City industry clusters approach to business formation and development as well as providing one of the best tools for promoting business growth from within Fort Collins.
194.6 SBDC Downtown Business and the Arts Program - Not Funded 2008 - $35,000 2009 - $35,000This offer is to assist the Small Business Development Center in designing and implementing a new program “Downtown Business and the Arts Program” to benefit the Fort Collins Downtown Business Community.
194.7 Fort Collins/Loveland Airport Contribution - Funded 2008 - $85,000 2009 - $85,000The City of Fort Collins has an agreement with the City of Loveland to jointly own and operate the regional airport. This offer reflects the City’s contribution toward those operating costs. The vast majority of funds for operating the airport come from federal grants through the Federal Aviation Administration.
194.8 New City Logo and Brand Implementation - Not Funded 2008 - $236,775 2009 - $0In 2007, the City of Fort Collins partnered with numerous community organizations to conduct a community brand initiative. One of the recommended outcomes from that process is to replace the existing City of Fort Collins logo. This offer provides one-timefundstoreplaceseveralkeyitemsthatcarrytheCity’slogo:stationery,businesscards,signageonCitybuildings,vehicle decals, and employee uniforms.

58 - OPERATING BUDGET
ECONOMIC HEALTH
194.9 NCEDC Contribution - Funded 2008 - $30,000 2009 - $30,000This offer provides funding to support NCEDC programs and services that assist the City in implementing the Economic ActionPlan,includingthefollowing:Businessretentionandexpansion,CleanEnergyClustersupport,TechnologyIncuba-tor support, Regional Economist support, and ongoing support for managing site selection inquiries and Sate of Colorado incentives.
226.1 Downtown Parking Cooperative - Not Funded 2008 - $200,000 2009 - $100,000This offer provides seed money for the Downtown Parking Cooperative, a public/private partnership between the City of Fort Collins Parking Services and the downtown business community. Existing private parking lots will be improved and permits will be sold in those lots to downtown employees. The parking needs of the lot owner will also be met. This is the fastest, least expensive method to provide new parking availability in the downtown area.

59 - OPERATING BUDGET
ECONOMIC HEALTH
Fort Collins has a healthy economy reflecting the values of our unique community in a changing world.
TEAM MEMBERS TerriBryant–TeamLeadLynnSanchez–FacilitatorDelynnColdiron–BudgetPattyBigner–CommunicationsCraig DoddJoe FrankJohn PhelanJeremy ReeseJudiVos
INTRODUCTION/SUMMARY OF RESULTS MAP
1. Strategic Economic Leadership provides the foundation for the City’s role in helping to create and maintain a healthy economy. Leadership sets the vision, develops and directs implementation of action plans and related policies for supporting economic development. Through Strong and Effective Partnerships, the City leverages and supports diverse community initiatives and fosters collaboration. Creation of Jobs and Busi-nesses primarily focuses on retaining and growing existing businesses. Dynamic Business Centers are the core retail, cultural, and employment destinations that reflect the values of our unique community.
INDICATORS
1. REGULARLY MEASURE JOB GROWTH IN TARGETED INDUSTRY CLUSTERS Measure: Quantitative measure of growth of jobs and net new business starts in six targeted industry
clusters, compared to state and Larimer/Weld region. This indicator will be a good measure of success of City efforts to develop the City’s targeted industry clusters. This measure will need to be measured over several years.
2. TIME THAT IT TAKES A PROJECT TO GO THROUGH THE DEVELOPMENT REVIEW PROCESS. Measure: Processing time for selected development applications. This is one indicator of the success
of continual improvement in the development review process. Overall Development Plan, Preliminary Development Plan and Minor Amendments will be measured.
3. TIME THAT IT TAKES FOR A BUILDING PERMIT APPLICATION TO BE PROCESSED. Measure: Processing time for building permit applications. This is one indicator of the success of
continual improvement in the building permit application process. Permits for single family detached and attached, multi-family, new commercial, and commercial tenant finish will be measured.
4. CUSTOMER SATISFACTION WITH CITY ECONOMIC HEALTH SERVICES AND PROGRAMS. Measure: Surveys of customer satisfaction with City services. Surveying customer satisfaction with
selected City economic health services and programs will help measure performance and guide needed changes to these programs. This could be done City wide; however, it will be critical for individual pro-

60 - OPERATING BUDGET
grams to have their own customer surveys.
5. SALES TAX GROWTH Measure: Percentage share of regional retail (clothing, cars, household furnishings) sales tax growth. A measure of the City’s economic health is growth in retail sales, in particular, growth in “regional” retail. Sales tax generation is a significant source of revenue to provide needed public facilities and services.
6. HOUSEHOLD INCOME COMPARED TO COST OF LIVING Measure: Index household income to the cost of living.The growth of household income is an excellent indicator of the general level of welfare of citizens in Fort Collins. By indexing household income to the cost of living, this indicator illustrates whether the community is prospering or whether costs of consumer goods and services are rising more rapidly than wages.
7. ECONOMIC HEALTH OF OUR DYNAMIC BUSINESS CENTERS. Measure: Retail sales, job growth and net new business starts in Downtown, Foothills Mall, South Col-lege, North College, Campus West and Harmony Corridor. Retail sales, job growth and net new business starts are important indicators of the economic health of our business centers. This information can be used to identify trends, weaknesses and strengths as a foundation for appropriate City actions and strate-gies.
8. CREATION OF NEW BUSINESSES Measure: New sales tax licenses by industry classification New business starts are an excellent measure of entrepreneurial activity.
PURCHASING STRATEGIES
1. Purchasing Strategy #1–Wearelookingforoffersthatdevelopandcommunicatealongtermvisionandplan for economic health. •PleasereferencetheStrategicEconomicLeadershipcausalfactor
2. Purchasing Strategy #2–Wearelookingforoffersthatcreatejobsandbusinessesthroughretentionandexpansion, and strategic attraction.
•PleasereferencetheStrongandEffectivePartnershipsandCreationofJobsandBusinessescausalfactors.
3. Purchasing Strategy # 3–Wearelookingforoffersthatcreate,implement,andsupportCityplansandpoli-cies related to economic health. •PleasereferencetheStrategicEconomicLeadershipandDynamicBusinessCenterscausalfactor.
4. Purchasing Strategy #4 –WearelookingforoffersthatmarketFortCollinslocally,state-wide,andnationallyas an attractive, business-friendly community and as a cultural, tourism, and retail destination.
•PleasereferencetheStrategicEconomicLeadership,CreationofJobsandBusinessesandDynamicBusi-ness Centers causal factors.
5. Purchasing Strategy # 5–Wearelookingforoffersthatsupportandcreatestronglocalandregionalpart-nerships.
•PleasereferencetheStrongandEffectivePartnershipscausalfactor.
6. Purchasing Strategy #6–Wearelookingforoffersthatfosterabusiness-friendlyattitudethroughefficient,flexible, and accessible City staff and processes.
•PleasereferencetheCreationofJobsandBusinessescausalfactor.
7. Purchasing Strategy # 7–Wearelookingforoffersthatdevelopandcommunicatebusinessdatatoprovidecoordinated and readily available access to information that new and existing businesses can utilize to be
61 - OPERATING BUDGET
competitive and thrive. •PleasereferencetheCreationofJobsandBusinessescausalfactor.
8. Purchasing Strategy #8–Wearelookingforoffersthatfacilitateintra-departmentalcollaboration,coordina-tion, and communication.
•PleasereferencetheCreationofJobsandBusinessesandStrategicEconomicLeadershipcausalfactors.
9. Purchasing Strategy #9–Wearelookingforoffersthatidentifyandimplementappropriateincentivesfordevelopment and redevelopment.
•PleasereferencetheDynamicBusinessCentersandCreationofJobsandBusinessescausalfactors.
10. Purchasing Strategy #10 - We are looking for offers that strengthen our community’s dynamic business centers.
•PleasereferencetheDynamicBusinessCenterscausalfactor.
NOTES/PRACTICES/SUPPORTING EVIDENCE
Experts •DavidMayandAnnHutchinson(ChamberofCommerce)•JeremyReese,(SalesTaxoffice)•JoeFrank(AdvancePlanning)•ChipSteiner(DowntownDevelopAuthority)•CameronGloss(CurrentPlanning)•TimothyWilder(AdvancePlanning)•MikeFreeman(EconomicAdvisor)
Documentation •TheCityCounciladoptedEconomicVisionandValuestatement•EconomicActionPlan•CityPlan•DowntownStrategicPlan•ZuckerReport•StrategicEmploymentOpportunities:SelectIndustryClustersinFortCollins(2006)•RefillFortCollinsFinalReport(2006)•CleanEnergyCluster(Website)•UniverCityConnections(Website)•FortCollinsWebSite
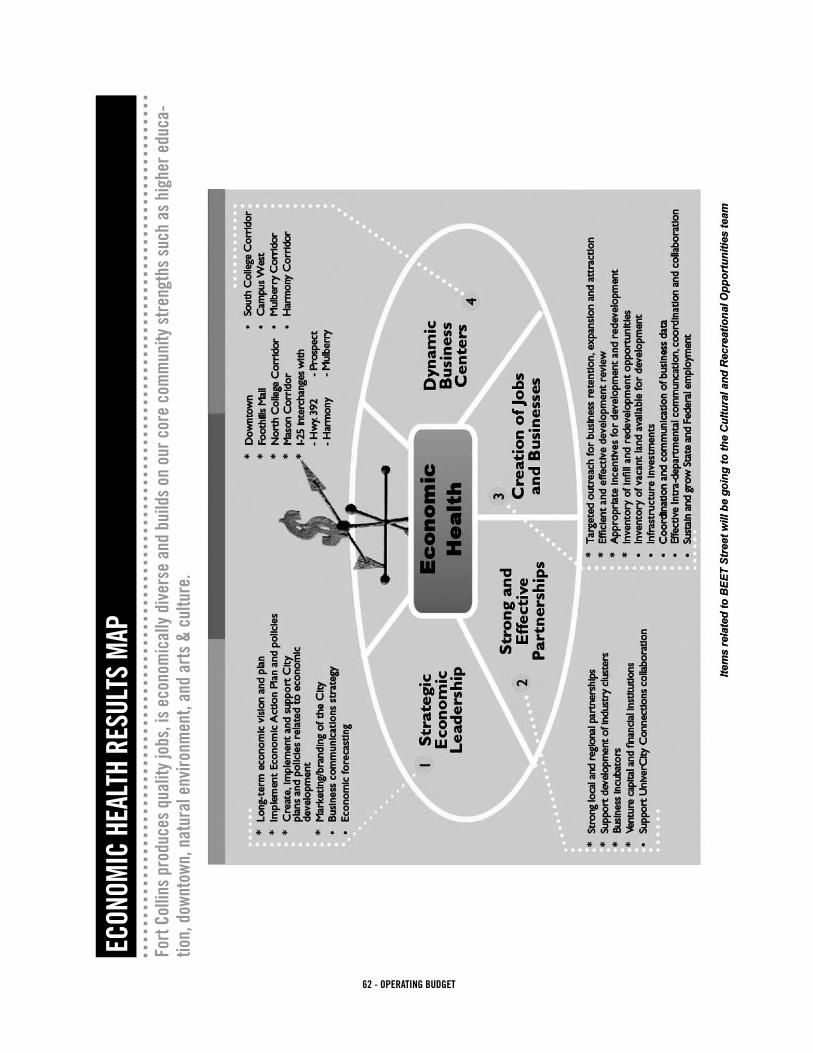
62 - OPERATING BUDGET
Fort
Col
lins
prod
uces
qua
lity
jobs
, is
econ
omic
ally
div
erse
and
bui
lds
on o
ur c
ore
com
mun
ity s
tren
gths
suc
h as
hig
her e
duca
-tio
n, d
ownt
own,
nat
ural
env
ironm
ent,
and
arts
& c
ultu
re.
ECON
OMIC
HEA
LTH
RESU
LTS
MAP
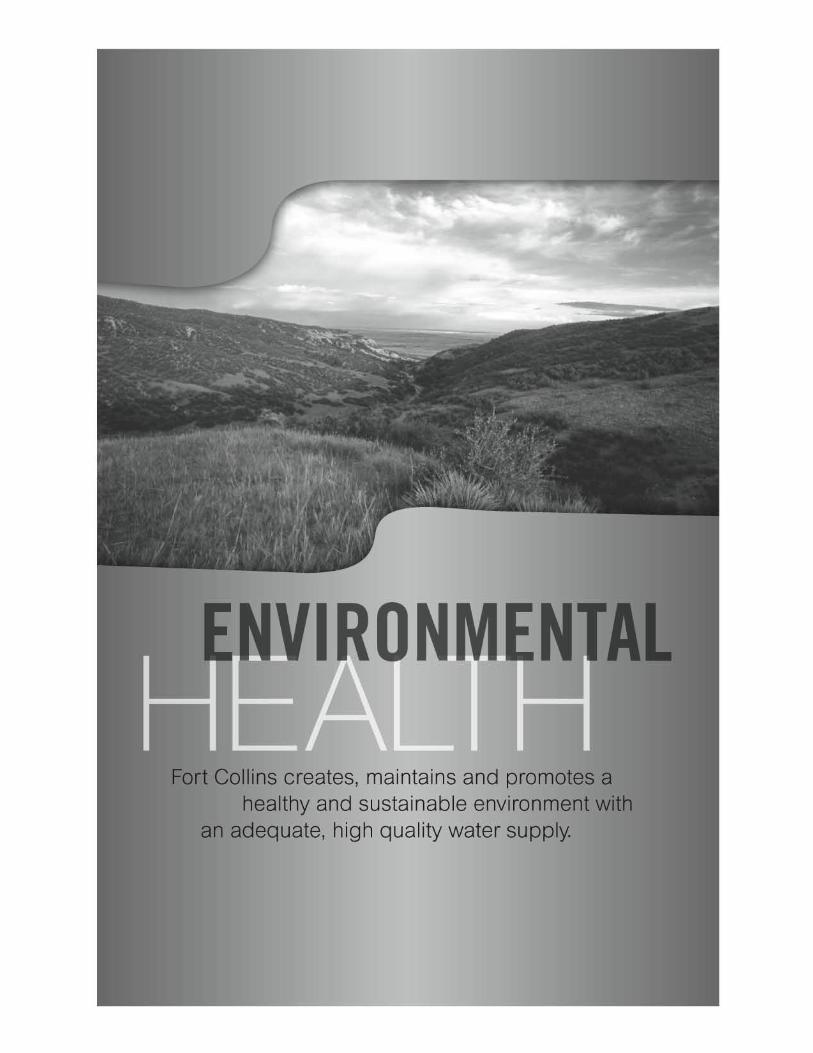
63 - OPERATING BUDGET
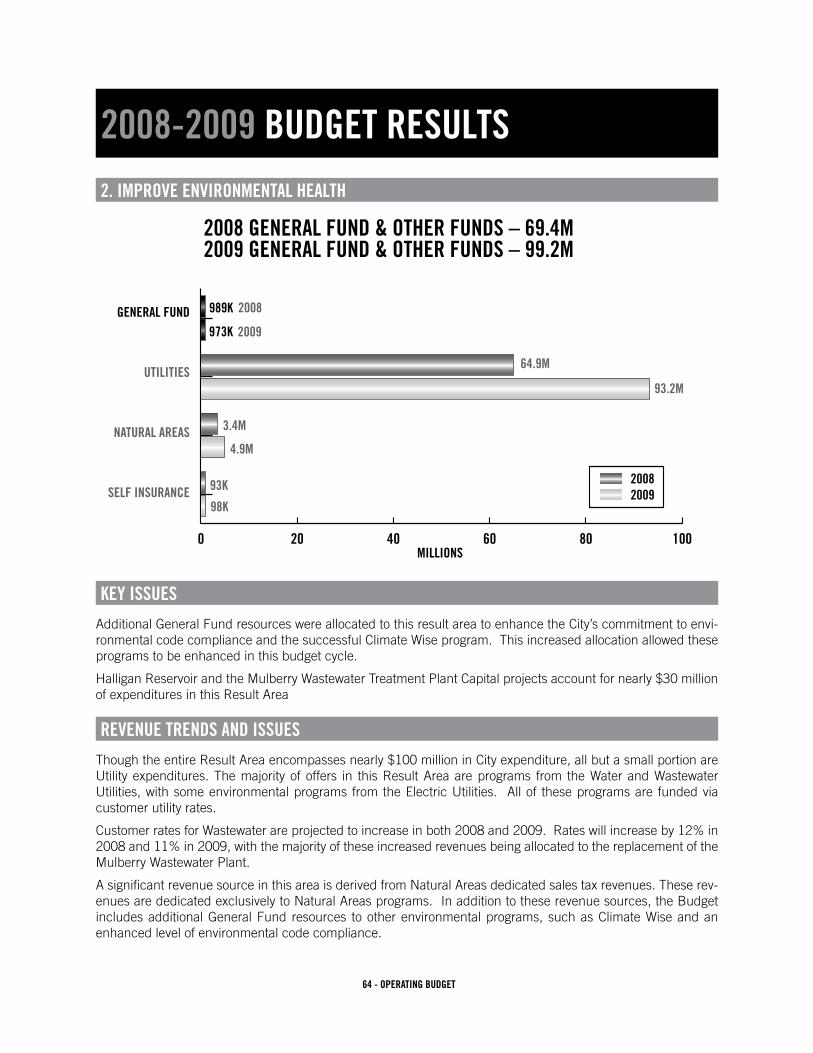
64 - OPERATING BUDGET
2008-2009 BUDGET RESULTS
2. IMPROVE ENVIRONMENTAL HEALTH
KEY ISSUES
Additional General Fund resources were allocated to this result area to enhance the City’s commitment to envi-ronmental code compliance and the successful Climate Wise program. This increased allocation allowed these programs to be enhanced in this budget cycle.
HalliganReservoirandtheMulberryWastewaterTreatmentPlantCapitalprojectsaccountfornearly$30millionof expenditures in this Result Area
REVENUE TRENDS AND ISSUES
ThoughtheentireResultAreaencompassesnearly$100millioninCityexpenditure,allbutasmallportionareUtility expenditures. The majority of offers in this Result Area are programs from the Water and Wastewater Utilities, with some environmental programs from the Electric Utilities. All of these programs are funded via customer utility rates.
Customer rates for Wastewater are projected to increase in both 2008 and 2009. Rates will increase by 12% in 2008 and 11% in 2009, with the majority of these increased revenues being allocated to the replacement of the Mulberry Wastewater Plant.
A significant revenue source in this area is derived from Natural Areas dedicated sales tax revenues. These rev-enues are dedicated exclusively to Natural Areas programs. In addition to these revenue sources, the Budget includes additional General Fund resources to other environmental programs, such as Climate Wise and an enhanced level of environmental code compliance.
0 20 40 60 80 100
2008 GENERAL FUND & OTHER FUNDS – 69.4M2009 GENERAL FUND & OTHER FUNDS – 99.2M
GENERAL FUND
UTILITIES
NATURAL AREAS
SELF INSURANCE
64.9M
93.2M
4.9M
3.4M
MILLIONS
93K
98K
989K
973K
2008
2009
20082009
65 - OPERATING BUDGET
KEY PURCHASES
•WaterandWastewaterUtilities
•RenewableEnergyprogramwithagrowingcommitmenttorenewableenergysources
•WaterQualityprogramstocontinuecommitmentstoexceedingstandardsforinstreamwaterquality,bothup-stream and downstream with no impact on aquatic life
•NaturalAreasProgramsincludingacquisition,maintenanceandtraildevelopment
ENHANCEMENTS PURCHASED
•ClimateWiseProgramwithadditionalresourcestoenhancethisprogram
•ContinuingtheEnvironmentComplianceprogramandenhancingitwithadditionalresourcestobothmeetandexceed environmental standards
•AdditionalAirQualityMonitoring
•HazardousWasteStudyfunding
EXAMPLES OF SERVICES NOT PURCHASED
•DevelopmentReviewCenterGreenBuildinginitiative
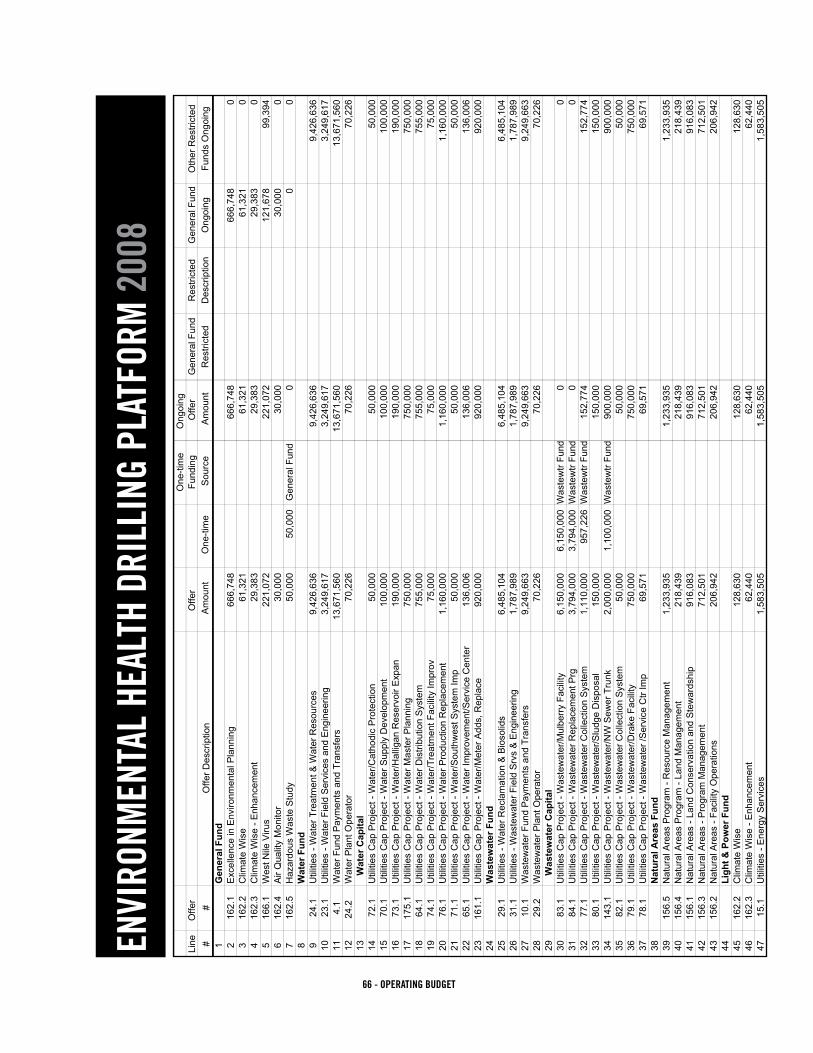
66 - OPERATING BUDGET
ENVI
RONM
ENTA
L HE
ALTH
DRI
LLIN
G PL
ATFO
RM 2
008
ENVI
RO
NM
ENTA
L H
EALT
H D
RIL
LIN
G P
LATF
OR
M -
2008
One
-tim
eO
ngoi
ng
Line
Offe
r O
ffer
Fund
ing
Offe
rG
ener
al F
und
Res
trict
edG
ener
al F
und
Oth
er R
estri
cted
##
Offe
r Des
crip
tion
Am
ount
O
ne-ti
me
Sou
rce
Am
ount
R
estri
cted
Des
crip
tion
Ong
oing
Fund
s O
ngoi
ng
1G
ener
al F
und
216
2.1
Exc
elle
nce
in E
nviro
nmen
tal P
lann
ing
666,
748
666,
748
666,
748
03
162.
2C
limat
e W
ise
61,3
2161
,321
61,3
210
416
2.3
Clim
ate
Wis
e - E
nhan
cem
ent
29,3
8329
,383
29,3
830
516
6.1
Wes
t Nile
Viru
s22
1,07
222
1,07
212
1,67
899
,394
616
2.4
Air
Qua
lity
Mon
itor
30,0
0030
,000
30,0
000
716
2.5
Haz
ardo
us W
aste
Stu
dy50
,000
50,0
00G
ener
al F
und
00
08
Wat
er F
und
924
.1U
tiliti
es -
Wat
er T
reat
men
t & W
ater
Res
ourc
es9,
426,
636
9,42
6,63
69,
426,
636
1023
.1U
tiliti
es -
Wat
er F
ield
Ser
vice
s an
d E
ngin
eerin
g3,
249,
617
3,24
9,61
73,
249,
617
114.
1W
ater
Fun
d P
aym
ents
and
Tra
nsfe
rs13
,671
,560
13,6
71,5
6013
,671
,560
1224
.2W
ater
Pla
nt O
pera
tor
70,2
2670
,226
70,2
2613
Wat
er C
apita
l14
72.1
Util
ities
Cap
Pro
ject
- W
ater
/Cat
hodi
c P
rote
ctio
n50
,000
50,0
0050
,000
1570
.1U
tiliti
es C
ap P
roje
ct -
Wat
er S
uppl
y D
evel
opm
ent
100,
000
100,
000
100,
000
1673
.1U
tiliti
es C
ap P
roje
ct -
Wat
er/H
allig
an R
eser
voir
Exp
an19
0,00
019
0,00
019
0,00
017
175.
1U
tiliti
es C
ap P
roje
ct -
Wat
er M
aste
r Pla
nnin
g75
0,00
075
0,00
075
0,00
018
64.1
Util
ities
Cap
Pro
ject
- W
ater
Dis
tribu
tion
Sys
tem
755,
000
755,
000
755,
000
1974
.1U
tiliti
es C
ap P
roje
ct -
Wat
er/T
reat
men
t Fac
ility
Impr
ov75
,000
75,0
0075
,000
2076
.1U
tiliti
es C
ap P
roje
ct -
Wat
er P
rodu
ctio
n R
epla
cem
ent
1,16
0,00
01,
160,
000
1,16
0,00
021
71.1
Util
ities
Cap
Pro
ject
- W
ater
/Sou
thw
est S
yste
m Im
p50
,000
50,0
0050
,000
2265
.1U
tiliti
es C
ap P
roje
ct -
Wat
er Im
prov
emen
t/Ser
vice
Cen
ter
136,
006
136,
006
136,
006
2316
1.1
Util
ities
Cap
Pro
ject
- W
ater
/Met
er A
dds,
Rep
lace
920,
000
920,
000
920,
000
24W
aste
wat
er F
und
2529
.1U
tiliti
es -
Wat
er R
ecla
mat
ion
& B
ioso
lids
6,48
5,10
46,
485,
104
6,48
5,10
426
31.1
Util
ities
- W
aste
wat
er F
ield
Srv
s &
Eng
inee
ring
1,78
7,98
91,
787,
989
1,78
7,98
927
10.1
Was
tew
ater
Fun
d P
aym
ents
and
Tra
nsfe
rs9,
249,
663
9,24
9,66
39,
249,
663
2829
.2W
aste
wat
er P
lant
Ope
rato
r70
,226
70,2
2670
,226
29W
aste
wat
er C
apita
l30
83.1
Util
ities
Cap
Pro
ject
- W
aste
wat
er/M
ulbe
rry
Faci
lity
6,15
0,00
06,
150,
000
Was
tew
tr Fu
nd0
031
84.1
Util
ities
Cap
Pro
ject
- W
aste
wat
er R
epla
cem
ent P
rg3,
794,
000
3,79
4,00
0W
aste
wtr
Fund
00
3277
.1U
tiliti
es C
ap P
roje
ct -
Was
tew
ater
Col
lect
ion
Sys
tem
1,11
0,00
095
7,22
6W
aste
wtr
Fund
152,
774
152,
774
3380
.1U
tiliti
es C
ap P
roje
ct -
Was
tew
ater
/Slu
dge
Dis
posa
l15
0,00
015
0,00
015
0,00
034
143.
1U
tiliti
es C
ap P
roje
ct -
Was
tew
ater
/NW
Sew
er T
runk
2,00
0,00
01,
100,
000
Was
tew
tr Fu
nd90
0,00
090
0,00
035
82.1
Util
ities
Cap
Pro
ject
- W
aste
wat
er C
olle
ctio
n S
yste
m50
,000
50,0
0050
,000
3679
.1U
tiliti
es C
ap P
roje
ct -
Was
tew
ater
/Dra
ke F
acili
ty75
0,00
075
0,00
075
0,00
037
78.1
Util
ities
Cap
Pro
ject
- W
aste
wat
er /S
ervi
ce C
tr Im
p69
,571
69,5
7169
,571
38N
atur
al A
reas
Fun
d39
156.
5N
atur
al A
reas
Pro
gram
- R
esou
rce
Man
agem
ent
1,23
3,93
51,
233,
935
1,23
3,93
540
156.
4N
atur
al A
reas
Pro
gram
- La
nd M
anag
emen
t21
8,43
921
8,43
921
8,43
941
156.
1N
atur
al A
reas
- La
nd C
onse
rvat
ion
and
Ste
war
dshi
p91
6,08
391
6,08
391
6,08
342
156.
3N
atur
al A
reas
- P
rogr
am M
anag
emen
t71
2,50
171
2,50
171
2,50
143
156.
2N
atur
al A
reas
- Fa
cilit
y O
pera
tions
206,
942
206,
942
206,
942
44Li
ght &
Pow
er F
und
4516
2.2
Clim
ate
Wis
e12
8,63
012
8,63
012
8,63
046
162.
3C
limat
e W
ise
- Enh
ance
men
t62
,440
62,4
4062
,440
4715
.1U
tiliti
es -
Ene
rgy
Ser
vice
s1,
583,
505
1,58
3,50
51,
583,
505
1 of
3
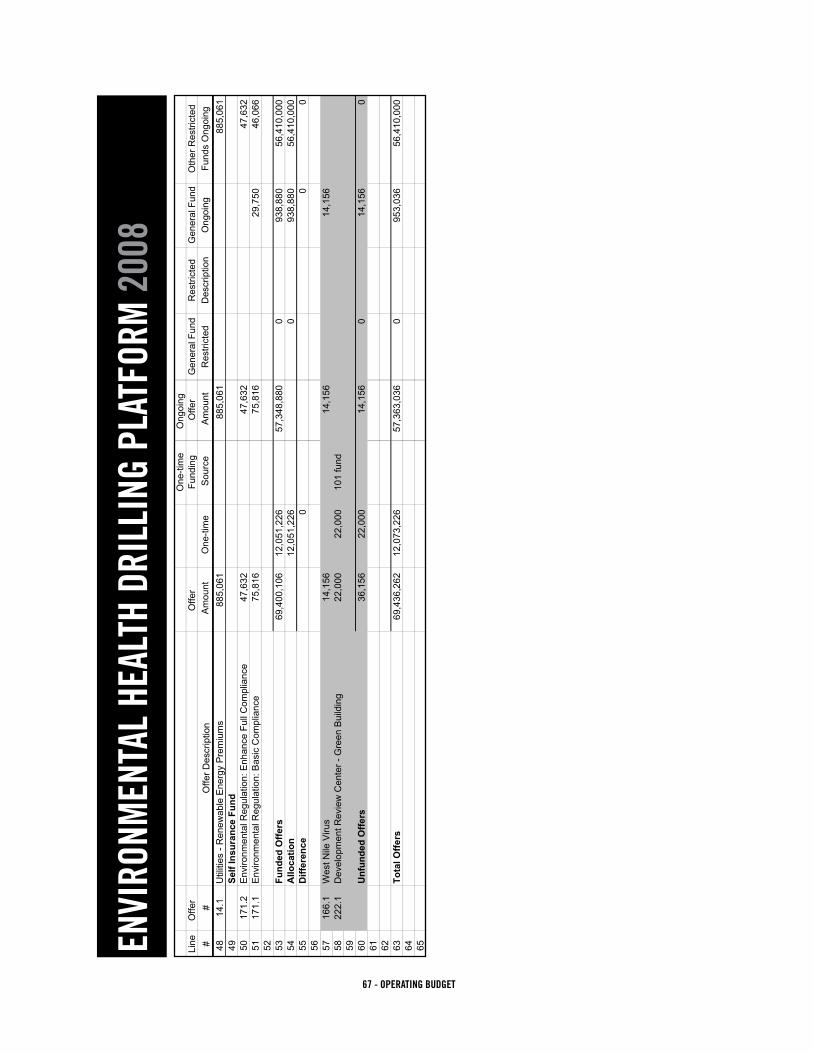
67 - OPERATING BUDGET
ENVI
RONM
ENTA
L HE
ALTH
DRI
LLIN
G PL
ATFO
RM 2
008
ENVI
RO
NM
ENTA
L H
EALT
H D
RIL
LIN
G P
LATF
OR
M -
2008
One
-tim
eO
ngoi
ng
Line
Offe
r O
ffer
Fund
ing
Offe
rG
ener
al F
und
Res
trict
edG
ener
al F
und
Oth
er R
estri
cted
##
Offe
r Des
crip
tion
Am
ount
O
ne-ti
me
Sou
rce
Am
ount
R
estri
cted
Des
crip
tion
Ong
oing
Fund
s O
ngoi
ng
4814
.1U
tiliti
es -
Ren
ewab
le E
nerg
y P
rem
ium
s88
5,06
188
5,06
188
5,06
1
2 of
3
ENVI
RO
NM
ENTA
L H
EALT
H D
RIL
LIN
G P
LATF
OR
M -
2008
One
-tim
eO
ngoi
ng
Line
Offe
r O
ffer
Fund
ing
Offe
rG
ener
al F
und
Res
trict
edG
ener
al F
und
Oth
er R
estri
cted
##
Offe
r Des
crip
tion
Am
ount
O
ne-ti
me
Sou
rce
Am
ount
R
estri
cted
Des
crip
tion
Ong
oing
Fund
s O
ngoi
ng
49Se
lf In
sura
nce
Fund
5017
1.2
Env
ironm
enta
l Reg
ulat
ion:
Enh
ance
Ful
l Com
plia
nce
47,6
3247
,632
47,6
3251
171.
1E
nviro
nmen
tal R
egul
atio
n: B
asic
Com
plia
nce
75,8
1675
,816
29,7
5046
,066
52 53Fu
nded
Offe
rs69
,400
,106
12,0
51,2
2657
,348
,880
093
8,88
056
,410
,000
54A
lloca
tion
12,0
51,2
260
938,
880
56,4
10,0
0055
Diff
eren
ce0
00
56 5716
6.1
Wes
t Nile
Viru
s14
,156
14,1
5614
,156
5822
2.1
Dev
elop
men
t Rev
iew
Cen
ter -
Gre
en B
uild
ing
22,0
0022
,000
101
fund
59 60U
nfun
ded
Offe
rs36
,156
22,0
0014
,156
014
,156
061
62 63To
tal O
ffers
69,4
36,2
6212
,073
,226
57,3
63,0
360
953,
036
56,4
10,0
0064 65
3 of
3

68 - OPERATING BUDGET
ENVI
RONM
ENTA
L HE
ALTH
DRI
LLIN
G PL
ATFO
RM 2
009
ENVI
RO
NM
ENTA
L H
EALT
H D
RIL
LIN
G P
LATF
OR
M -
2009
One
-tim
eO
ngoi
ng
Line
O
ffer
Offe
r Fu
ndin
gO
ffer
Gen
eral
Fun
dR
estri
cted
Gen
eral
Fun
dO
ther
Res
trict
ed#
#O
ffer D
escr
iptio
n A
mou
nt
One
-tim
e S
ourc
e A
mou
nt
Res
trict
edD
escr
iptio
nO
ngoi
ngFu
nds
Ong
oing
1
Gen
eral
Fun
d2
162.
1E
xcel
lenc
e in
Env
ironm
enta
l Pla
nnin
g68
4,74
668
4,74
668
4,74
60
316
2.2
Clim
ate
Wis
e62
,889
62,8
8962
,889
04
162.
3C
limat
e W
ise
- Enh
ance
men
t36
,667
36,6
6736
,667
05
166.
1W
est N
ile V
irus
239,
932
239,
932
138,
561
101,
371
616
2.4
Air
Qua
lity
Mon
itor
20,0
0020
,000
20,0
007
162.
5H
azar
dous
Was
te S
tudy
8W
ater
Fun
d9
24.1
Util
ities
- W
ater
Tre
atm
ent &
Wat
er R
esou
rces
9,97
7,96
79,
977,
967
9,97
7,96
710
23.1
Util
ities
- W
ater
Fie
ld S
ervi
ces
and
Eng
inee
ring
3,36
0,91
33,
360,
913
3,36
0,91
311
4.1
Wat
er F
und
Pay
men
ts a
nd T
rans
fers
13,8
07,4
2213
,807
,422
13,8
07,4
2212
24.2
Wat
er P
lant
Ope
rato
r77
,683
77,6
8377
,683
13W
ater
Fun
d C
apita
l14
72.1
Util
ities
Cap
Pro
ject
- W
ater
/Cat
hodi
c P
rote
ctio
n50
,000
50,0
0050
,000
1570
.1U
tiliti
es C
ap P
roje
ct -
Wat
er S
uppl
y D
evel
opm
ent
100,
000
100,
000
100,
000
1673
.1U
tiliti
es C
ap P
roje
ct -
Wat
er/H
allig
an R
eser
voir
Exp
an8,
965,
000
7,16
3,80
0W
ater
Fun
d1,
801,
200
1,80
1,20
017
175.
1U
tiliti
es C
ap P
roje
ct -
Wat
er M
aste
r Pla
nnin
g0
018
64.1
Util
ities
Cap
Pro
ject
- W
ater
Dis
tribu
tion
Sys
tem
795,
000
795,
000
795,
000
1974
.1U
tiliti
es C
ap P
roje
ct -
Wat
er/T
reat
men
t Fac
ility
Impr
ov50
0,00
050
0,00
050
0,00
020
76.1
Util
ities
Cap
Pro
ject
- W
ater
Pro
duct
ion
Rep
lace
men
t1,
175,
000
1,17
5,00
01,
175,
000
2171
.1U
tiliti
es C
ap P
roje
ct -
Wat
er/S
outh
wes
t Sys
tem
Imp
022
65.1
Util
ities
Cap
Pro
ject
- W
ater
Impr
ovem
ent/S
ervi
ce C
ente
r13
9,06
513
9,06
513
9,06
523
161.
1U
tiliti
es C
ap P
roje
ct -
Wat
er/M
eter
Add
s, R
epla
ce92
0,00
092
0,00
092
0,00
024
Was
tew
ater
Fun
d
2529
.1U
tiliti
es -
Wat
er R
ecla
mat
ion
& B
ioso
lids
6,71
6,09
46,
716,
094
6,71
6,09
426
31.1
Util
ities
- W
aste
wat
er F
ield
Srv
s &
Eng
inee
ring
1,87
7,02
81,
877,
028
1,87
7,02
827
10.1
Was
tew
ater
Fun
d P
aym
ents
and
Tra
nsfe
rs13
,014
,903
13,0
14,9
0313
,014
,903
2829
.2W
aste
wat
er P
lant
Ope
rato
r77
,683
77,6
8377
,683
29W
aste
wat
er C
apita
l30
83.1
Util
ities
Cap
Pro
ject
- W
aste
wat
er/M
ulbe
rry
Faci
lity
25,6
50,0
0025
,650
,000
25,6
50,0
0031
84.1
Util
ities
Cap
Pro
ject
- W
aste
wat
er R
epla
cem
ent P
rg1,
497,
000
1,49
7,00
01,
497,
000
3277
.1U
tiliti
es C
ap P
roje
ct -
Was
tew
ater
Col
lect
ion
Sys
ten
1,15
0,00
064
7,68
7W
/Wat
er F
und
502,
313
502,
313
3380
.1U
tiliti
es C
ap P
roje
ct -
Was
tew
ater
/Slu
dge
Dis
posa
l15
0,00
015
0,00
015
0,00
034
143.
1U
tiliti
es C
ap P
roje
ct -
Was
tew
ater
/NW
Sew
er T
runk
00
3582
.1U
tiliti
es C
ap P
roje
ct -
Was
tew
ater
Col
lect
ion
Sys
tem
50,0
0050
,000
50,0
0036
79.1
Util
ities
Cap
Pro
ject
- W
aste
wat
er/D
rake
Fac
ility
200,
000
200,
000
200,
000
3778
.1U
tiliti
es C
ap P
roje
ct -
Was
tew
ater
/Ser
vice
Ctr
Imp
58,5
4858
,548
58,5
4838
Nat
ural
Are
as F
und
3915
6.5
Nat
ural
Are
as P
rogr
am -
Res
ourc
e M
anag
emen
t1,
308,
354
1,30
8,35
41,
308,
354
4015
6.4
Nat
ural
Are
as P
rogr
am -
Land
Man
agem
ent
223,
869
223,
869
223,
869
4115
6.1
Nat
ural
Are
as -
Land
Con
serv
atio
n an
d S
tew
ards
hip
2,34
9,75
42,
349,
754
2,34
9,75
442
156.
3N
atur
al A
reas
- P
rogr
am M
anag
emen
t73
2,10
573
2,10
573
2,10
543
156.
2N
atur
al A
reas
- Fa
cilit
y O
pera
tions
213,
712
213,
712
213,
712
1 of
2

69 - OPERATING BUDGET
ENVI
RONM
ENTA
L HE
ALTH
DRI
LLIN
G PL
ATFO
RM 2
009
ENVI
RO
NM
ENTA
L H
EALT
H D
RIL
LIN
G P
LATF
OR
M -
2009
One
-tim
eO
ngoi
ng
Line
O
ffer
Offe
r Fu
ndin
gO
ffer
Gen
eral
Fun
dR
estri
cted
Gen
eral
Fun
dO
ther
Res
trict
ed#
#O
ffer D
escr
iptio
n A
mou
nt
One
-tim
e S
ourc
e A
mou
nt
Res
trict
edD
escr
iptio
nO
ngoi
ngFu
nds
Ong
oing
44
Ligh
t & P
ower
Fun
d45
162.
2C
limat
e W
ise
132,
334
132,
334
132,
334
4616
2.3
Clim
ate
Wis
e - E
nhan
cem
ent
77,9
1477
,914
77,9
1447
15.1
Util
ities
- E
nerg
y S
ervi
ces
1,60
3,53
71,
603,
537
1,60
3,53
748
14.1
Util
ities
- R
enew
able
Ene
rgy
Pre
miu
ms
1,07
2,69
31,
072,
693
1,07
2,69
349
Self
Insu
ranc
e Fu
nd50
171.
2E
nviro
nmen
tal R
egul
atio
n: E
nhan
ce F
ull C
ompl
ianc
e49
,716
49,7
1649
,716
5117
1.1
Env
ironm
enta
l Reg
ulat
ion:
Bas
ic C
ompl
ianc
e77
,838
77,8
3829
,750
48,0
8852 53
Fund
ed O
ffers
99,1
95,3
667,
811,
487
91,3
83,8
790
972,
613
90,4
11,2
6654
Allo
catio
n7,
811,
487
097
2,61
390
,411
,266
55D
iffer
ence
00
056 57
222.
1D
evel
opm
ent R
evie
w C
ente
r - G
reen
Bui
ldin
g12
,000
12,0
00G
ener
al F
und
58 59U
nfun
ded
Offe
rs12
,000
12,0
000
00
060
Tota
l Offe
rs99
,207
,366
7,82
3,48
791
,383
,879
097
2,61
390
,411
,266
2 of
2

70 - OPERATING BUDGET
ENVIRONMENTAL HEALTH4.1 Water Fund Payments and Transfers - Funded 2008 - $13,671,560 2009 - $13,807,422ThisofferisforpaymentsandtransfersfromtheWaterFundincluding:PaymentinLieuoftaxestotheGeneralFund,pay-ment for General Fund services, Risk Management expenses, debt service, the Water Funds share of Utilities Customer Service and Administration fund, and payments to other city funds for miscellaneous services.
10.1 Wastewater Fund Payments and Transfers - Funded 2008 - $ 9,249,663 2009 - $13,014,903ThisofferisforpaymentsandtransfersfromtheWastewaterFundincluding:PaymentinLieuoftaxestotheGeneralFund,payment for General Fund services, Risk Management expenses, debt service, the Wastewater Fund’s share of Utilities’ Customer Service and Administration fund, and payments to other City funds for miscellaneous services.
14.1 Renewable Energy Premiums - Funded 2008 - $885,061 2009 - $1,072,693This offer is for the purchase of wholesale wind/renewable energy for both the green pricing program and the rate-based renewables program.
15.1 Energy Services - Funded 2008 - $1,583,505 2009 - $1,603,537This offer funds energy efficiency programs, community education and energy conservation programs.
23.1 Water Field Services and Engineering - Funded 2008 - $3,249,617 2009 - $3,360,913This offer is for distribution of treated water, for domestic and fire fighting purposes, from the water treatment plant to our customers. It includes maintenance and repair of water mains, valves, fire hydrants, water meters, as well as leak detection for conservation purposes, backflow device inspection and testing to prevent contamination, and customer service response. This offer also includes engineering functions to support the above activities as well as purchase of vehicles and equipment. Ourcustomerscancontactthedepartment24hoursaday,7daysaweekforemergenciesandcustomerserviceresponses.Per State Law, all work on the water distribution system must be done under the supervision of a certified Responsible Opera-tor in Charge. Per Federal Law, the Utility is responsible for the quality of our drinking water all the way to the point of use on our customers’ premises.
24.1 Water Treatment & Water Resources - Funded 2008 - $9,426,636 2009 - $9,977,967This offer includes management of the Utility’s raw water supply and the provision of water treatment to provide the Utility’s customers adequate supplies of water for domestic, commercial, and fire fighting purposes. Water resources management includes managing the raw water supplies, protecting water rights, planning future water supplies and maintaining water account and use information. Water treatment includes the physical operation and security of our raw water supply system including the Michigan Ditch, Joe Wright Reservoir, the Poudre Intake, raw water pipelines and the treatment facilities along withtreatedwaterstoragefacilities24hoursaday,7daysaweek.ThisofferincludestheCity’swatershedprotectionpro-gram which works cooperatively with other agencies to monitor, assess and protect water quality in the Cache la Poudre and Colorado-Big Thompson watersheds. This offer also includes analytical laboratory services in support of water treatment, water distribution, and source watershed protection activities.

71 - OPERATING BUDGET
ENVIRONMENTAL HEALTH24.2 Water Plant Operator - Funded 2008 - $70,226 2009 - $77,683This enhancement offer will add an additional plant operator due to one staff member retiring in 2009. Due to the complexity of the City of Fort Collins Water Treatment Facility, cross training for one year is essential for a smooth transition. The operator needs to begin in January of 2008 prior to the departure of the existing operator to achieve this goal. We will have one extra operator until 2009 retirement.
29.1 Water Reclamation & Biosolids - Funded 2008 - $6,485,104 2009 - $6,716,094This offer assures that all wastewater and biosolid residuals are treated as needed to protect the health and safety of our customers, to comply with federal and state laws and to protect the environment. Included is the operation and maintenance of the Mulberry and Drake Water Reclamation Facilities, where all wastewater from our customers is treated. The treatment facilitiesoperate24hoursaday,7daysaweek.ThetreatedwaterisdischargedinaccordancewiththeStateNationalPol-lution Discharge Elimination System (NPDES) Permit. Also included in this offer is the operation and maintenance of the 26,000 acre Meadow Springs Ranch, where residual biosolids from the wastewater treatment process are recycled; and analytical laboratory services in support of wastewater treatment, wastewater collection, and urban watershed activities. This offer also includes operation and maintenance of septic tank waste handling facilities, the industrial pretreatment program and grease inspection program per Federal requirements.
29.2 Wastewater Plant Operator - Funded 2008 - $70,226 2009 - $77,683This enhancement offer will add an additional plant operator due to a staff member retiring.
31.1 Wastewater Field Services & Engineering - Funded 2008 - $1,787,989 2009 - $1,877,028This offer is for collection of untreated wastewater from utility customers and conveyance to the water reclamation facilities to protect the health and safety of our customers, to comply with federal and state laws and to protect the environment. Operation and maintenance of the wastewater collection system includes manhole inspection, sewer cleaning, root removal, television inspection, lining and rehabilitation, infiltration/inflow control, and customer service responses. This offer also includes engineering functions to support the above activities as well as purchase of vehicles and equipment. Our custom-erscancontactthedepartment24hoursaday,7daysaweekforemergenciesandcustomerserviceresponses.PerStateLaw, all work on the wastewater collection system must be done under the supervision of a certified Responsible Operator in Charge.
64.1 Utilities Cap Project - Water Distribution System - Funded 2008 - $755,000 2009 - $795,000This capital offer funds the design and construction of water line replacement projects.
65.1 Utilities Cap Project - Water/Service Center Improvements - Funded 2008 - $136,006 2009 - $139,065This offer is for the Water Funds share of energy and water conservation improvements to the Utilities Service Center. It also provides initial funding for the Water Funds portion for the purchase of a new customer service center. This is a capital project that will be funded by all four utility funds.
70.1 Utilities Cap Project - Water Supply Development - Funded 2008 - $100,000 2009 - $100,000 This offer is to develop, evaluate, and improve various water supply projects.

72 - OPERATING BUDGET
ENVIRONMENTAL HEALTH71.1 Utilities Cap Project - Water/Southwest System Improvements - Funded 2008 - $50,000 2009 - $0This offer funds the purchase of land in the Maxwell Open Space for construction and staging for construction of the 5 million gallon Southwest Tank in 2011.
72.1 Utilities Cap Project - Water/Cathodic Protection - Funded 2008 - $50,000 2009 - $50,000This project funds the capital replacement of cathodic protection systems on large diameter water transmission lines.
73.1 Utilities Cap Project - Water/Halligan Reservoir Expansion - Funded 2008 - $190,000 2009 - $8,965,000This offer represents two years of funding of a long term project that began in 1987. The funding requests will be used to expand Halligan Reservoir to capture additional water during peak runoff periods, create additional storage and regulate water rights. We have rights to water that we cannot store for dry periods; the enlargement enables us to provide storage for drought times.
74.1 Utilities Cap Project-Water Treatment Facility Improvements - Funded 2008 - $75,000 2009 - $500,000This offer funds design and construction for facility improvements, including a residual solids drying pad in 2009.
76.1 Utilities Cap Project - Water Production Replacement - Funded 2008 - $1,160,000 2009 - $1,175,000This offer is to renovate, renew or replace existing assets associated with Source of Supply, Drinking Water Treatment Facility, PumpingandStorage,andWaterQualityLab.
77.1 Utilities Cap Project - Wastewater Collection System - Funded 2008 - $1,110,000 2009 - $1,150,000 This offer funds the design and construction of wastewater line replacement projects.
78.1 Utilities Cap Project - Wastewater/Service Center Improvements - Funded 2008 - $69,571 2009 - $58,548This offer is for the Wastewater Funds share of energy and water conservation improvements to the Utilities Service Center. It also provides initial funding for the Wastewater Funds portion for the purchase of a new customer service center. This is a capital project that will be funded by all four utility funds.
79.1 Utilities Cap Project - Wastewater/Drake Facility - Funded 2008 - $750,000 2009 - $200,000This offer will update Drake Wastewater Master Plan and facilitate purchase of land around the plant for odor control buffer zone.
80.1 Utilities Cap Project - Wastewater/Sludge Disposal - Funded 2008 - $150,000 2009 - $150,000Design and construct replacement wells and new monitoring wells, conduct detailed surveys and purchase ranch land buffer areas for odor control abatement
73 - OPERATING BUDGET
ENVIRONMENTAL HEALTH82.1 Utilities Cap Project - Wastewater Collection System - Funded 2008 - $50,000 2009 - $50,000This capital project offer funds the ongoing monitoring of flows in the wastewater collection system and continued updating of the computer model used to ensure orderly capital expansion of the collection system. The model is also used to identify areas of the collection system where high amounts of groundwater are entering the system so that corrective efforts can be focused and effective.
83.1 Utilities Cap Project - Wastewater/Mulberry Facility - Funded 2008 - $6,150,000 2009 - $25,650,000Funds are provided to design and construct new secondary treatment for failing trickling filter and provide odor control for preliminary and primary treatment processes.
84.1 Utilities Cap Project - Wastewater Replacement Program - Funded 2008 - $3,794,000 2009 - $1,497,000Funds are provided to renovate, renew or replace existing assets associated with the Mulberry and Drake Water Reclamation Facilities, the Meadow Springs Ranch, and the Pollution Control Lab.
143.1 Utilities Cap Project - WW/NW Sewer Trunk Expansion - Funded 2008 - $2,000,000 2009 - $0This capital project offer funds the replacement of approximately 10,000 feet of 12-inch wastewater trunk main between Taft Hill Road and Overland Trail, serving Utility customers in the Northwest part of the service area.
156.1 Natural Areas – Land Conservation and Stewardship - Funded 2008 - $916,083 2009 - $2,349,754This offer continues the land and water conservation work of the Natural Areas Program, funded with designated natural areassalestaxrevenues(CityofFortCollins’“OpenSpace,Yes!”andLarimerCounty’s“HelpPreserveOpenSpace”).
156.2 Natural Areas -- Facility Operations - Funded 2008 - $206,942 2009 - $213,712This offer supports the provision, renovation, and maintenance of operational facilities used by Natural Areas Program staff. Representative facilities include Nix Farms Natural Areas where most Natural Areas staff are housed and which includes offices, maintenance shop, equipment storage, and parking areas; ranger housing and maintenance facilities at Gateway Natural Area in the Poudre Canyon and Bobcat Ridge Natural Area near Masonville; and, a resident caretaker and studio/classroom at Reservoir Ridge Natural Area.
156.3 Natural Areas – Program Management - Funded 2008 - $712,501 2009 - $732,105This offer continues program management (administration) of the Natural Areas Program, funded with designated natural areassalestaxrevenues(CityofFortCollins’“OpenSpace,Yes!”andLarimerCounty’s“HelpPreserveOpenSpace”).
74 - OPERATING BUDGET
ENVIRONMENTAL HEALTH156.4 Natural Areas Program – Land Management - Funded 2008 - $218,439 2009 - $223,869This offer supports two full-time staff and the resources necessary to implement land management activities on 31,825 acres of Natural Area property. Activities include management of leased land; site plan development to determine agricultural crop type, haying rotations, and grazing prescriptions; and, ecological monitoring activities to document the effects of manage-ment efforts. Other activities include managing Natural Area water rights, preparing site management plans, resolving neigh-boring property owner issues and boundary issues, managing gravel mining permits, managing right-of-way requests, and funding West Nile mosquito control. Importantly, land management staff is leading the development of the Soapstone Prairie Natural Area management plan. Projects associated with this effort include contracting or conducting natural and cultural resource inventories, establishing baseline conditions of the property, developing resource management and conservation plans, visitor use plans, overseeing ranching operations, grazing management, and property development.
156.5 Natural Areas Program – Resource Management - Funded 2008 - $1,233,935 2009 - $1,308,354This offer supports a variety of planning and on-the-ground management functions related to the stewardship and ecological restoration of vegetation, water, wildlife and other land-based resources on 32,000 acres of City-managed natural areas.
161.1 Utilities Cap Project - Water/Meter Adds, Replacement - Funded 2008 - $920,000 2009 - $920,000This capital offer funds the addition, replacement, and rehabilitation of water meters.
162.1 Combined Environmental Services - Funded 2008 - $666,748 2009 - $684,746This offer provides environmental programs and services to the community that will improve its environmental health. The skills and expertise of staff in the Natural Resources Department’s Environmental Services Division are combined to compre-hensively and efficiently address air quality, climate protection, waste reduction and recycling, and environmental education and outreach to the public, in support of existing City environmental policies. The offer also provides environmental services to support municipal operations and can respond to and provide leadership on emerging environmental issues.
162.2 Climate Wise - Funded 2008 - $189,951 2009 - $195,223This offer funds the management of the nationally award winning Climate Wise program is a dynamic program that strength-ens our local economy, protects our air quality, and reinforces our community’s commitment to maintain a high quality of life in Fort Collins. Climate Wise business partners have made significant progress toward the overall City of Fort Collins greenhouse gas reduction goal adopted by City Council in 1997, by saving more than 66,000 tons of CO2 in 2006. Climate Wisepartnersimplementednumerouscost-savingprojects,savingmorethan$2millionlastyear.Thisofferprovidessupportto the Climate Wise program at historic levels but does not accommodate current growth or anticipated growth for 2008-09.
162.3 Climate Wise Enhancement - Funded 2008 - $91,823 2009 - $114,581The nationally award winning Climate Wise program is a dynamic program that strengthens our local economy, protects our air quality, and reinforces our community’s commitment to maintain a high quality of life in Fort Collins. This enhancement offer proposes to increase staffing by one half-time and one quarter-time position (total of .75) to sustain services related to the expansion of the program. Additional resources are needed to support the increase of business partners, the increase in activity and number of projects from existing and new partners, and the resulting increase in marketing and technical support of the business partners. (Climate Wise has grown from 13 partners in 2000 to more than 70 in 2007, with projected future growth of more than 130 partners by the end of 2009.)

75 - OPERATING BUDGET
ENVIRONMENTAL HEALTH162.4 Air Quality Monitor - Funded 2008 - $30,000 2009 - $20,000This proposal will provide the installation and ongoing operation of an existing real-time particulate monitoring site in Fort Collinsandpublicationanddistributionofhourlyairqualitydata.Nearly45%ofFortCollinscitizensreportthatairpollutionaffects their health negatively by triggering allergies and / or respiratory problems. Citizens will have access to hourly air quality data, while currently do not have access except 3-6 months after the fact.
162.5 Hazardous Waste Study - Funded 2008 - $50,000 2009 - $0This offer from the Natural Resources Department will provide a one-year study of how Fort Collins can improve its ability to prevent household hazardous waste from being released into the local environment. The City will work with consultants to define the scope of the problem by establishing an estimate of household hazardous waste not appropriately recycled or disposed of and evaluating options and future actions. The consultant’s report and staff recommendations will be submitted to the City Manager.
166.1 West Nile Virus Protection - Funded 2008 - $221,072 2009 - $239,932ThisoffercontinuesfundingoftheWestNileVirusDiseaseManagementContractwhichincludestrapping,larvacontrol,testing,monitoring,andpubliceducation.Theofferisfor$221,072in2008and$239,932in2009.TheStormwaterFundwillcontribute$9,997in2008and$10,197in2009towardsthisprogram.NaturalAreaswillcontribute$89,397in2008and$91,174in2009towardsthisprogram.TheneteffecttotheGeneralFundwillbe$121,378in2008and$138,561in2009.
171.1 Environmental Regulation: Basic Compliance - Funded 2008 - $75,816 2009 - $77,838This offer provides environmental regulatory programs and services for municipal operations in non-Utility departments. The programs offered by the Regulatory and Government Affairs (RGA) Division will create, maintain and promote a healthy and sustainable environment in the community. Services provided address good water quality, land conservation and steward-ship through environmental programs that ensure compliance with environmental regulations while improving the sustain-ability of City operations. When the City operates without negatively impacting the environment we protect resources to meet future needs of the community. A strong internal compliance program will demonstrate to the community that the City is an environmental leader and contribute to the community’s self-perception of a clean, healthy, and attractive place to live. Utilities environmental compliance support is included in a Utilities Offer.
171.2 Environmental Regulation: Enhance Full Compliance - Funded 2008 - $47,632 2009 - $49,716This offer expands on the basic Environmental Regulation offer by providing an asbestos management program that will improve air quality and water quality. This offer and the implementation of an asbestos management program will promote compliance with federal and state air pollution laws. The risks associated with failure to comply with these laws are substan-tial,includingpossiblefinesofupto$50,000perdayofnoncompliance.
175.1 Utilities Water Cap Project - Water Master Planning - Funded 2008 - $750,000 2009 - $0ParticipateinthedesignandconstructionofsedimentanddebrisremovalimprovementsforthePleasantValleyPipelinetoprotect the Water Utility’s existing downstream facilities.

76 - OPERATING BUDGET
ENVIRONMENTAL HEALTH222.1 Development Review Center - Green Building - Not Funded 2008 - $22,000 2009 - $12,000This is a new offer for a Green Building Initiative which would serve as the point of access for green building services provided by the City. Currently, three departments are involved in a diffused effort, offering a variety of services recognized as green building programs. This offer would develop an understanding of the opportunities and challenges that exist in City programs for implementing green building codes and services, a web based service to direct the general public to begin research on relevant programs offered by the City, a program that would ensure City buildings use an integrated green building approach when public financing is involved, internal understanding on what green building is and relevant services available by various departments, and a single person or department that serves as the lead for coordinating the concerted efforts of various staff throughout the City.

77 - OPERATING BUDGET
ENVIRONMENTAL HEALTH
Fort Collins creates, maintains and promotes a healthy and sustainable environment with an adequate, high quality water supply.
TEAM MEMBERS Leader:BrianJanonisMembers:KraigBader,PollyBennett,BarbBrock,MikeCalhoon,LawrencePollack,JohnStokesCommunicationsTeamLiaison:JennyKiddFacilitator:LizStroh
INTRODUCTION/SUMMARY OF RESULTS MAP
The Team believes that good water resources, good air quality, and exemplary land conservation/stewardship are the fundamental building blocks of a healthy and sustainable environment. Our Result Map identified numerous contributing factors which can be grouped into three primary factors that cause the desired result. The Team believes that these primary factors are critical contributors to the outcome defined by City Council. The factors are broad, but they capture essential characteristics that contribute not only to improved environmental quality and public health, but an attractive, well-planned community. In particular, cross media interactions between factors are also important. For example, there are direct linkages between air pollution and water quality (acid rain) and land conservation, air quality, and water quality (erosion).
GOOD WATER RESOURCESGood water quality and quantity are an essential aspect of environmental health. Good water quality and quantity are important in fulfilling the role of the Utilities in providing life-essential services and infrastructure to advance the health, safety and prosperity of our community. According to the Center for Disease Control, “Environmental conditions greatly influence the relation between water and human health.” The World Health Organization states that, “Lack of safe water is a cause of serious illnesses such as diarrhoeal diseases, which kill over 2 mil-lion people every year.”
In Fort Collins, water is highly regulated by Federal government and the Colorado Department of Public Health and Environment. Evidence that water resources are important to the City was confirmed in October 2000 by CityCouncilwhenitpassedResolution2000-128“RecognizingtheNeedtoProtectWaterQuality.”CityCouncilalso approved water resources protection in the adoption of the Water Supply and Demand Management Policy (2003),DrinkingWaterQualityPolicy (1993) andResolution95-14 “Approving theWatershedApproach toStormwater Management” (1995).
Our team acknowledges the importance of the Poudre watershed to the community and the region in an effort to be good stewards of the aquatic environment. These efforts require collaboration with regional entities to be effective.
GOOD AIR QUALITYGood air quality is critical to the health of the environment, the health of our citizens, and to citizens’ quality of life. Of the 20 City programs analyzed in the 2003 citizen survey, air quality received the highest rating score for importance to quality of life. In 2003, “beauty and scenery” was the 7th highest attribute people liked most about livinginFortCollins.Airqualityrelatesstronglytothisattribute.Yet,FortCollinsviolatesthestate’sguidelinevisibility standard one out of every four days, and more citizens (70%) are negatively impacted by visibility im-pairment than any other consequence of air pollution. Fort Collins is currently only 9% below the Federal health
78 - OPERATING BUDGET
standardforozone,andexperienced49ozonealertdaysin2006.ThenewozonemonitorinwestFortCollinsrecorded the single highest 8-hour ozone reading in the Front Range in 2006. This is especially important be-cause over one-quarter of Fort Collins households (28%) have a member suffering from a chronic respiratory ailment and ozone is a respiratory irritant. In 2006, Larimer County received a “D” grade in the American Lung Association’s Annual State of the Air report for ozone levels.
City air quality programs are needed to respond to a citizen mandate to protect and improve air quality, and can complement and fill gaps left by federal, state, and county efforts.
In addition to creating better air quality, efforts to meet the objectives of the City’s Local Action Plan to Reduce Greenhouse Gas Emissions are critical to local environmental and economic health as well mitigating the City’s overall contribution to global warming gases.
EXEMPLARY LAND CONSERVATION AND STEWARDSHIPFort Collins is a leader in land conservation and stewardship. Citizens of Fort Collins supported five local tax ini-tiatives to support natural area and open space activities with the earliest passing in 1973 and the latest, “Open Space,Yes!”passingin2002.Residentsalsosupportedtwocounty-wideopenspacetaxinitiatives.Inthe2003Citizen Survey, residents of Fort Collins reported that “proximity to outdoor venues” was the number one factor related to what they liked most about living in Fort Collins (page 8). In a 2006 Natural Areas user survey, visitors reported high rates of satisfaction with their Natural Area recreation experiences.
In addition to citizen opinion, it is well recognized that land conservation and stewardship strongly contribute to environmental health. For example, open lands help retain and filter water and control stormwater run-off. Healthy vegetation also acts as a carbon sink, thus reducing the amount of carbon dioxide in the atmosphere and contributing to cleaner air. Open lands can help maintain a compact urban form, a key factor in maintaining air and water resources as well as the ecological integrity of natural resources. Well managed land also provides good wildlife habitat.
INDICATORS
1. THE DEGREE TO WHICH OUR WATER RESOURCES ARE MAINTAINED AND IMPROVED Measure: The level of compliance with established state and federal regulations
2. THE DEGREE TO WHICH OUR AIR QUALITY IS MAINTAINED AND IMPROVED Measure 1: The reduction of priority emissions in Fort Collins Measure 2: A reduction in green house gas emissions that puts the City on track to meet the 2010 City
policy objective of at least 30% below 2010 worst case projections
3. EXEMPLARY LAND CONSERVATION AND STEWARDSHIP Measure 1: An increase in the acres of land conserved Measure 2: The degree to which the number of acres of land undergoing rehabilitation or restoration is
maintained or increased 4. THE DEGREE TO WHICH SOLID WASTE IS DIVERTED FROM THE LANDFILL IS IMPROVED Measure: Improvement to the solid waste diversion rate
5. CITIZENS’ PERCEPTION OF THE QUALITY OF THE ENVIRONMENT IS MAINTAINED AND IMPROVED Measure: Improvement in the bi-annual citizen survey as compared to the 2006 results: questions to
be developed These indicators and the data points were chosen because records are readily available and because they
provide a continuous record of improvement and effort over time. The baseline will be represented by an improving long-term trend.
79 - OPERATING BUDGET
The Team also believes that it is crucial to understand the community’s awareness and knowledge of envi-ronmental issues. The Team would like to gather information about the level of the community’s interest and involvement in environmental health. The data collected would relate not just to air, water, and land quality, but also to the community’s self-perception as a clean, healthy and attractive place to live.
PURCHASING STRATEGIES
1. Purchasing Strategy #1–Ingeneral,weareseekingoffersthatenhancesustainableandinnovativeenvi-ronmental practices by the City of Fort Collins and it’s partners
2. Purchasing Strategy #2–Weareseekingoffersthatcontributetolong-termimprovementandmaintenanceof water resources quality and quantity, which may cut across departmental lines, programs and services. Offers will be favored that promote compliance with state and federal regulations and the City’s policy objec-tives through innovative programs, incentives, disincentives and service collaboration
3. Purchasing Strategy # 3–Weareseekingoffersthatimprovestormwaterqualityandambientwaterqualityin our watersheds. Offers will be favored that encourage regional cooperation
4. Purchasing Strategy #4 –Weareseekingoffersthatcontributetolong-termimprovementandmaintenanceof air quality as well as the reduction of green house gas emissions and which may cut across departmental lines, programs and services. Offers will be favored that encourage compliance with state and federal envi-ronmental standards and the City’s policy objectives through innovative programs, incentives, disincentives and service collaboration
5. Purchasing Strategy # 5–Weareseekingoffersthatpromoteuseofrenewableenergyandenergyconser-vation that are consistent with the City’s Energy Supply policy
6. Purchasing Strategy #6–Weareseekingoffersthat •Conserve,rehabilitateandrestorehabitatandpromotebiologicalhealth •Improveandmaintainopenlands •Helpconserveandlinkopenlands,trailsandcommunityseparators
7. Purchasing Strategy # 7–Weareseekingoffersthat •Reducewaste •Improverecycling,diversionandreuse •Provideoutreachthatincreasespublicknowledge,awarenessofandinvolvementinenvironmentalissues
and programs
8. Purchasing Strategy #8–Weareseekingoffersthatpromote“green”businesses,buildingsandtechnolo-gies
NOTES/PRACTICES/SUPPORTING EVIDENCE
We are seeking offers that create, maintain and promote a healthy and sustainable environment with an ad-equate, high quality water supply, as supported by empirical research, analytical data and/or proven results. Offers will be rated on their ability to improve environmental health. Special consideration will be given to offers that express a proactive rather than reactive approach and which encourage interdepartmental and/or inter-agency collaborations and that contribute to the environmental health, safety and prosperity of our community. The ability to scale projects, to increase or decrease their scope, will be important. Projects with the flexibility to scale up or down and continue to produce results may stand a better chance of being funded.

80 - OPERATING BUDGET
Fort
Col
lins
crea
tes
a cl
ean
and
sust
aina
ble
envi
ronm
ent.
ENVI
RONM
ENTA
L HE
ALTH
RES
ULTS
MAP
81 - OPERATING BUDGET
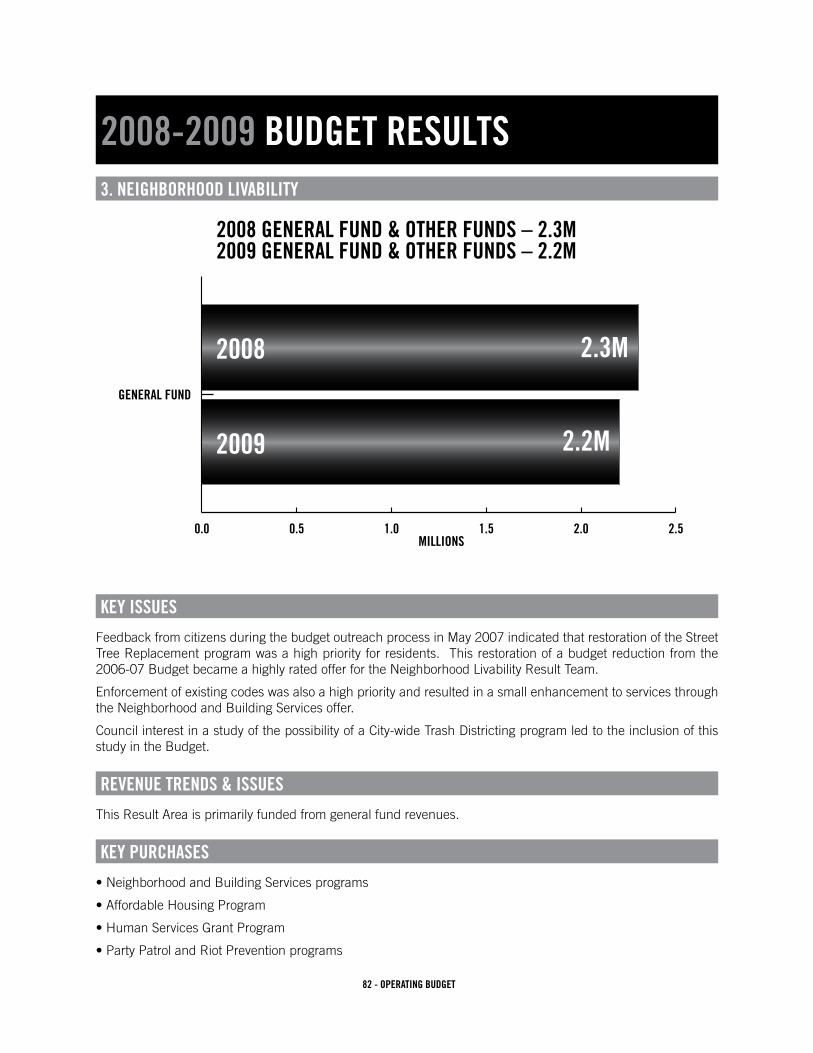
82 - OPERATING BUDGET
2008-2009 BUDGET RESULTS
3. NEIGHBORHOOD LIVABILITY
KEY ISSUES
Feedback from citizens during the budget outreach process in May 2007 indicated that restoration of the Street Tree Replacement program was a high priority for residents. This restoration of a budget reduction from the 2006-07 Budget became a highly rated offer for the Neighborhood Livability Result Team.
Enforcement of existing codes was also a high priority and resulted in a small enhancement to services through the Neighborhood and Building Services offer.
Council interest in a study of the possibility of a City-wide Trash Districting program led to the inclusion of this study in the Budget.
REVENUE TRENDS & ISSUES
This Result Area is primarily funded from general fund revenues.
KEY PURCHASES
•NeighborhoodandBuildingServicesprograms
•AffordableHousingProgram
•HumanServicesGrantProgram
•PartyPatrolandRiotPreventionprograms
0.0 0.5 1.0 1.5 2.0 2.5
2008 GENERAL FUND & OTHER FUNDS – 2.3M2009 GENERAL FUND & OTHER FUNDS – 2.2M
GENERAL FUND
MILLIONS
2008
2009
2.3M
2.2M

83 - OPERATING BUDGET
ENHANCEMENTS PURCHASED
•CityTrashUtilityStudyin2008toevaluateaTrashDistrictingprogram
•NeighborhoodStreetTreeReplacementfundingrestored
•SmallstaffingincreaseforCodeEnforcementandsmallprogramenhancement
•NeighborhoodServicesGrantEnhancement
•PartialrestorationoffundingforAffordableHousingandHumanServicesProgram
EXAMPLES OF SERVICES NOT PURCHASED
•BNSFRailroadQuietZoneStudy
•EnhancementsandfullrestorationoffundingforAffordableHousing,LandBankProgram,andHumanServices Program

84 - OPERATING BUDGET
NEIG
HBOR
HOOD
LIV
ABIL
ITY
DRIL
LING
PLA
TFOR
M 2
008
NEI
GH
BO
RH
OO
D L
IVA
BIL
ITY
DR
ILLI
NG
PLA
TFO
RM
- 20
08
One
-tim
eO
ngoi
ng
Line
Offe
r O
ffer
Fund
ing
Offe
rG
ener
al F
und
Res
trict
edG
ener
al F
und
Oth
er R
estri
cted
##
Offe
r Des
crip
tion
Am
ount
O
ne-ti
me
Sou
rce
Am
ount
R
estri
cted
Des
crip
tion
Ong
oing
Fund
s O
ngoi
ng
117
4.1
Nei
ghbo
rhoo
d S
treet
Tre
e R
epla
cem
ent
52,5
0052
,500
52,5
002
203.
1A
fford
able
Hou
sing
Fun
ds a
nd C
omm
unity
Dev
elop
men
t56
8,50
356
8,50
313
3,00
0P
UD
435,
503
321
1.1
Nei
ghbo
rhoo
d-Q
ualit
y, M
aint
., In
nova
tive
Cod
e1,
133,
537
1,13
3,53
760
,000
Spe
c A
sses
s1,
073,
537
422
3.1
His
toric
Pre
serv
atio
n N
eigh
borh
oods
87,2
5987
,259
87,2
595
234.
1C
ity T
rash
Util
ity P
roje
ct75
,000
75,0
00G
ener
al F
und
00
621
4.1
Par
ty P
atro
l and
Rio
t Pre
vent
ion
16,1
2916
,129
16,1
297
203.
3E
nhan
cem
ent o
f Hum
an S
ervi
ces
Pro
gram
100,
000
100,
000
100,
000
821
1.2
Nei
ghbo
rhoo
d S
ervi
ces
- Gra
nt E
nhan
cem
ent
5,00
05,
000
5,00
09
211.
3N
eigh
borh
ood
Ser
vice
s - C
ode
Enf
orce
men
t17
,500
17,5
0017
,500
1020
3.2
Par
tial R
esto
ratio
n of
Affo
rdab
le H
ousi
ng F
und
200,
000
200,
000
Gen
eral
Fun
d0
011 12 13
Fund
ed O
ffers
2,
255,
428
275,
000
1,98
0,42
819
3,00
01,
787,
428
014
Allo
catio
n27
5,00
019
3,00
01,
787,
428
015
Diff
eren
ce0
00
016 17 18 19 20 21 22
203.
3E
nhan
cem
ent o
f Hum
an S
ervi
ces
Pro
gram
110,
000
110,
000
110,
000
2322
1.1
Eas
tsid
e W
ests
ide
Nei
ghbo
rhoo
d P
lans
Upd
ate
171,
000
171,
000
Gen
eral
Fun
d0
024
203.
4P
artia
l Res
tora
tion
of L
and
Ban
k P
rogr
am20
0,00
020
0,00
0G
ener
al F
und
00
2520
3.2
Par
tial R
esto
ratio
n of
Affo
rdab
le H
ousi
ng F
und
50,0
0050
,000
Gen
eral
Fun
d0
026
231.
1B
NS
F R
ailw
ay Q
uiet
Zon
e S
tudy
60,0
0060
,000
00
2793
.1N
eigh
borh
ood
Par
king
Pro
gram
Pilo
t28
,735
28,7
35G
ener
al F
und
00
28 29 30U
nfun
ded
Offe
rs61
9,73
550
9,73
511
0,00
00
110,
000
0
Tota
l Offe
rs2,
875,
163
784,
735
2,09
0,42
819
3,00
01,
897,
428
0
1 of
1

85 - OPERATING BUDGET
NEIG
HBOR
HOOD
LIV
ABIL
ITY
DRIL
LING
PLA
TFOR
M 2
009
NEI
GH
BO
RH
OO
D L
IVA
BIL
ITY
DR
ILLI
NG
PLA
TFO
RM
- 20
09
One
-tim
eO
ngoi
ng
Line
Offe
r O
ffer
Fund
ing
Offe
rG
ener
al F
und
Res
trict
edG
ener
al F
und
Oth
er R
estri
cted
##
Offe
r Des
crip
tion
Am
ount
O
ne-ti
me
Sou
rce
Am
ount
R
estri
cted
Des
crip
tion
Ong
oing
Fund
s O
ngoi
ng
117
4.1
Nei
ghbo
rhoo
d S
treet
Tre
e R
epla
cem
ent
53,8
0053
,800
53,8
002
203.
1A
fford
able
Hou
sing
Fun
ds a
nd C
omm
unity
Dev
elop
men
t56
9,92
456
9,92
413
3,00
0P
UD
436,
924
321
1.1
Nei
ghbo
rhoo
d-Q
ualit
y, M
aint
., In
nova
tive
Cod
e1,
184,
252
1,18
4,25
260
,000
Spe
c A
sses
s1,
124,
252
422
3.1
His
toric
Pre
serv
atio
n N
eigh
borh
oods
64,9
7364
,973
64,9
735
214.
1P
arty
Pat
rol a
nd R
iot P
reve
ntio
n16
,776
16,7
7616
,776
620
3.3
Enh
ance
men
t of H
uman
Ser
vice
s P
rogr
am10
0,00
010
0,00
010
0,00
07
211.
2N
eigh
borh
ood
Ser
vice
s - G
rant
Enh
ance
men
t5,
000
5,00
05,
000
821
1.3
Nei
ghbo
rhoo
d S
ervi
ces
- Cod
e E
nfor
cem
ent
17,5
0017
,500
17,5
009
203.
2P
artia
l Res
tora
tion
of A
fford
able
Hou
sing
Fun
d20
0,00
020
0,00
0G
ener
al F
und
00
10 11 12 13 14 15Fu
nded
Offe
rs
2,21
2,22
520
0,00
02,
012,
225
193,
000
1,81
9,22
50
16A
lloca
tion
200,
000
193,
000
1,81
9,22
50
17D
iffer
ence
00
00
18 19 20 21 22 2320
3.3
Enh
ance
men
t of H
uman
Ser
vice
s P
rogr
am11
0,00
011
0,00
011
0,00
024
221.
1E
asts
ide
Wes
tsid
e N
eigh
borh
ood
Pla
ns U
pdat
e0
00
2520
3.4
Par
tial R
esto
ratio
n of
Lan
d B
ank
Pro
gram
200,
000
200,
000
Gen
eral
Fun
d0
026
203.
2P
artia
l Res
tora
tion
of A
fford
able
Hou
sing
Fun
d50
,000
50,0
00G
ener
al F
und
00
2723
1.1
BN
SF
Rai
lway
Qui
et Z
one
Stu
dy60
,000
60,0
00G
ener
al F
und
00
2893
.1N
eigh
borh
ood
Par
king
Pro
gram
Pilo
t21
,205
21,2
0521
,205
29 30U
nfun
ded
Offe
rs44
1,20
531
0,00
013
1,20
50
131,
205
0
Tota
l Offe
rs2,
653,
430
510,
000
2,14
3,43
019
3,00
01,
950,
430
0
1 of
1

86 - OPERATING BUDGET
NEIGHBORHOOD LIVABILITY93.1 Neighborhood Parking Program Pilot - Not Funded 2008 - $28,735 2009 - $21,205This offer is for a pilot program to introduce a residential parking management program to Fort Collins. Several neighbor-hoods have expressed the need for additional parking management. Currently, there are no programs in place to help neigh-borhoods address their parking problems, other than standard signage and striping found throughout the City. This pilot program will address problems in one or two of the neighborhoods where parking issues are most critical, by giving tools to Parking Services to manage neighborhood parking resources in partnership with the residents.
174.1 Neighborhood Street Tree Replacement - Funded 2008 - $52,500 2009 - $53,800This offer is to replace neighborhood street trees that have died or been destroyed. Residential street trees are located in parkways between the sidewalks and curb to the front and side of homes on residential streets, and on some collector and arterial streets that are adjacent to residential development.
203.1 Affordable Housing Funds and Community Development - Funded 2008 - $568,503 2009 - $569,924The City’s Affordable Housing and Community Development Program is comprised of a variety of components that assist in the production of additional affordable housing units, retaining the current inventory of units through rehabilitation efforts, offering homeownership opportunities to low income families, and providing financial support to agencies for services that helps families, for example, obtain gainful employment, provide day-care for their children, or understand the obligations of home-ownership. The Program’s efforts have to be strategic in nature because there are insufficient financial resources to deal with all of the issues, so there is a focus on the most critical needs. Having available, affordable housing is key to thriving businesses, a healthy economy, and livable neighborhoods.
203.2 Partial Restoration of Affordable Housing Fund - Partially Funded 2008 - $200,000 2009 - $200,000This is an enhancement offer to increase the amount of funding in the City’s Affordable Housing Fund. The approved in-creasewouldaddatotalof$400,000overthenexttwoyears,$200,000peryearin2008andin2009.TheFundcurrentlyprovides$133,000peryearthatisdistributedthroughtheCompetitiveProcessfortheproductionofnewaffordablehousingunitsforfamiliesbelow80%oftheAreaMedianIncome(AMI).Theofferrequested$250,000peryearin2008and2009,and$200,000peryearwasaccepted.
203.3 Enhancement of Human Services Program - Partially Funded 2008 - $100,000 2009 - $100,000This is an enhancement offer to increase the amount of funding in the Human Services Program. The approved increase wouldadd$100,000peryeartotheprogramthatcurrentlyprovides$345,934,distributedthroughtheCompetitiveProcess,to non-profit human/social service agencies that provide services to families below 80% of the Area Median Income. Ser-vices provided include such things as employment training, day-care, home-ownership education, and emergency shelters. The Competitive Process involves reviews of applications by the Community Development Block Grant Commission and a final decision on funding by the City Council. This enhancement was submitted in response to a Council request. The offer requested$210,000peryear,andwasfunded$100,000peryear.
87 - OPERATING BUDGET
NEIGHBORHOOD LIVABILITY203.4 Partial Restoration of Land Bank Program - Not Funded 2008 - $200,000 2009 - $200,000This offer seeks to reinstate funding for the City’s Land Bank Program. The program will utilize funds to acquire undeveloped properties within the City’s Growth Management Area (GMA) boundary, to be held for an extended period of time, after which the properties will be sold to a developer committed to producing affordable housing units. Proceeds from the sale of the properties will then be recycled into the program for additional land acquisitions. Over the past several years, at state confer-ences on affordable housing, the number one issue identified to be addressed by local communities was the availability of land/sites at reasonable prices for future affordable housing production. And, the most important long range strategy identi-fied to deal with the lack of land/sites in the future was a land banking program.
211.1 Neighborhood-Quality, Maintenance, Innovative Code - Funded 2008 - $1,133,537 2009 - $1,184,252ThisOffercombinesfourmainservices:neighborhoodoutreachprograms,Nuisance,Zoning,andHousing&OccupancyCompliance. Programs directly impact residents’ knowledge, education and resources available for encouraging positive neighborhood relationships. Our on-going commitment is to provide a combination of proven programs with new and evolv-ing services to meet the changing needs of our community. Codes exist to preserve the quality of our neighborhoods by reducing or eliminating nuisances that detract from their appearance, cleanliness, and overall desirability. Enforcement services also contribute to general maintenance and enhancement of neighborhoods, encourage voluntary compliance, maintain neighborhood character by ensuring compatibility of infill and new development, and help to assure an adequate supply of quality housing. We are requesting an additional Code Inspector in 2009 in order to maintain a high level of service with the potential addition of proposed exterior property maintenance codes and additional citizens to serve.
211.2 Neighborhood Services - Grant Enhancement - Funded 2008 - $5,000 2009 - $5,000This offer is an enhancement to the Neighborhood Livability, Maintenance and Innovative Code Compliance Offer in order to increase the service provided to neighborhoods wishing to utilize the Neighborhood Grant program. Grants are used for neighborhood projects including clean-up, Neighborhood Night Out social events and neighborhood signs.
211.3 Neighborhood Services - Code Enforce Enhancement - Funded 2008 - $17,500 2009 - $17,500In order to enhance our current level of service, we would need to add a seasonal, hourly inspector to help enforce the Weed Ordinance from early May to September 1st. Of the 22,000 plus inspections we performed in 2006, over a quarter of the caseswereforweedviolationsrequiringapproximately6,436inspections.Clearly,weedviolationsaretheoverwhelmingdailyservice demand faced by code enforcement staff during the summer months, limiting available resources to enforce other codes.
214.1 Party Patrol and Riot Prevention - Funded 2008 - $16,129 2009 - $16,776This offer is in response to Neighborhood Livability Indicator 2, that residents are good neighbors. Over the years the issue of loud parties and unreasonable noise has disrupted neighborhoods and caused increasing concern primarily from homeown-ers in neighborhoods in comparison to those renting properties. Police Services is requesting overtime funding for the Party Patrol/Riot Prevention in the Patrol Division so that officers can continue to effectively manage and/or reduce the number of loud parties within neighborhoods in our community.
88 - OPERATING BUDGET
NEIGHBORHOOD LIVABILITY221.1 Eastside & Westside Neighborhood Plans Update - Not Funded 2008 - $171,000 2009 - $0This offer seeks to address those concerns most frequently expressed by residents of the historic Old Town East Side and West Side Neighborhoods, including at the recent BFO Citizen Open House, regarding the critical need for updated neighbor-hood plans, standards and guidelines to regulate new construction and alterations within these residential neighborhoods. The component parts of this offer are comprehensive updates of the (1986) East Side Neighborhood Plan and the (1989) West Side Neighborhood Plan concurrent development of standards and guidelines for alterations and new construction within specific areas of the East Side and West Side Neighborhoods.
223.1 Historic Preservation Neighborhoods - Funded 2008 - $87,259 2009 - $64,973Thisofferbuildsuponhistoricneighborhoodpreservationservicesinitiatedin2006-07infourareas:Education,Regula-tory Review, Planning, and Financial Incentives. It encourages quality housing and attractive neighborhoods by promoting citizens’ appreciation of each neighborhood’s unique history and architecture, and by providing concrete financial assistance for residential rehabilitation and preservation. Neighborhood character is protected through administration of the City’s Land Use Code and demolition-alteration review processes, and future needs and neighborhood issues are identified through building surveys and plan updates. Additionally, these review processes and the financial incentives seek to address those concerns most frequently expressed by residents and at the BFO Citizen Open House, regarding scrape-offs and inappropri-ate development.
231.1 BNSF Railway Quiet Zone Study - Not Funded 2008 - $60,000 2009 - $60,000The City of Fort Collins, like many urban environments with increased population growth, has had an increase in residents adjacent to railroad tracks and crossings. As the area along the Burlington Northern Santa Fe rail corridor has transitioned from industrial to residential and recreational uses, the noise associated with the sounding of locomotive horns has become a major concern of residents and City officials. Train horns, especially during the nighttime hours, can have a significant nega-tive impact on the quality of life to the residents and economic development goals for the center of town. This offer would fundaQuietZoneStudyandimplementationprogramtoimprovethequalityoflifeforresidentsandvisitorslocatedalongthe north-south central area of Fort Collins.
234.1 Trash Districting - Funded 2008 - $75,000 2009 - $0This offer will investigate opportunities for creating a City trash utility and associated trash districting. During 2008, the City Manager’s Office, with the aid of Natural Resources Department staff, will explore and propose a structure for a City trash utility and describe the specific process and sequence of events that could lead to creating a new, City administered program. Subsequent start-up and implementation steps for a City administered trash collection would be scheduled in 2009, with the goal of beginning to administer the new system as early as possible in 2009 or 2010.

89 - OPERATING BUDGET
NEIGHBORHOOD LIVABILITY
Fort Collins improves the livability, choices, and affordability of our neighborhoods.
TEAM MEMBERS CameronGloss–Chair,Planning&ZoningPeggy Bowers - RecreationTim Buchanan - Forestry Lou Cordova - Utilities Dave Freismuth - Police Services Becca Henry, Communication, Planning Doreen Kemp, Facilitator, Human ResourcesFelix Lee, Neighborhood & Building ServicesStanWelsch–Budget,Streets
INTRODUCTION/SUMMARY OF RESULTS MAP
While creating the Results Map to support this result, the team had lengthy discussions concerning the definition of “neighborhood livability,” and shared anecdotal stories illustrating each team member’s concept of neighbor-hood livability. Based on this, the team identified six primary contributing factors based on importance from our owncitizen’sperspectiveandreferencingthe2006CitizenSurvey.You’llnoticethatourResultsMapshowsonlythree primary contributing factors. The factors: Safety, Amenities, and Transportation make a neighborhood livable, but are more appropriately deferred to other Results Teams. 1. Good neighbor relationships
2. Attractive neighborhoods
3. Adequate supply of quality housing
4.Goodamenities
5. Can move around
6. Feels safe According to the Team, the factors listed on the Results Map under each of the above causal effects work in con-junction with each other to create neighborhood quality. While the Team’s indicators and purchasing strategies cannot possibly encompass all areas, the map is meant to represent the big picture of an ideal neighborhood. The recent Council comments were also discussed, and the one which stood out was to consider bringing back the Neighborhood Tree Replacement Program.
INDICATORS
1. RESIDENTS LIKE THEIR NEIGHBORHOOD. Measure: Annual Citizen Survey Source: Communications & Public Involvement According to the 2006 Citizen Survey, regardless of where they live, respondents rated their neighbor-
hoods as “good” or better. However, there are some significant differences between levels of satisfaction among quadrants of Fort Collins.
Generally, respondents in the eastern quadrants rated their neighborhoods higher than those in the west-

90 - OPERATING BUDGET
ern quadrants. In particular, respondents residing in the southeast quadrant rated their neighborhoods muchhigherthanresidentsinthenorthwestquadrant.Nearlyone-half(48.3%)ofrespondentsfromthesoutheast quadrant rated their neighborhoods as “very good,” compared to only about 30% rating their neighborhoods “very good” in the northwest quadrant.
Overall respondents (82.3%) gave their neighborhoods a “Good” or better rating. The Neighborhood Liv-ability Results Team aims to maintain or improve this rating.
2. RESIDENTS ARE GOOD NEIGHBORS. Measure: Number of Police Service Calls and Public Nuisance Notices Source: Neighborhood & Building Services and Police Services The number of Police Service calls and Public Nuisance Notices are indicative of neighbor apathy towards
each other and their neighborhood.
•Nuisancecontacts,weeds,rubbish
•Inoperablevehicles,RVs,snowremoval,etc.
•Noise/partycontacts
•Parkingconflicts
•Over-Occupancyinvestigations
The Neighborhood Livability Results Team aims to reduce these numbers per capita and use this data to identify and improve neighbor behavior.
3. BELOW MEDIAN INCOME RESIDENTS CAN PURCHASE HOUSING. Measure: Number of units built available to buyers below 80% AMI Source: Affordable Housing Office Provide ownership opportunities for citizens below 80% AMI (Area Median Income) in order to reduce
commute times, promote diversity, encourage reinvestment, and build a “sense of community.” (HUD requires 80% or lower AMI to qualify for funding services.)
The 2006 Citizen Survey states, “Most community attributes received mean ratings of ‘good.’ Two excep-tions were the availability and diversity of job opportunities and availability of affordable housing. Respon-dents gave mean ratings of ‘average’ to both of these items.”
MandatedbyaCouncilOrdinance,theCitymustfundaminimumof$133,000peryearforaffordablehousing. Furthermore, it is supported by City Plan, “Our neighborhoods will include a variety of housing types to support a diverse population and allow people of different ages, cultures, races and incomes to live in each neighborhood. Housing that is affordable to every income will be geographically dispersed throughout the community to avoid creating over concentration in any neighborhood. Fort Collins will promote development of well-designed, compatible, high-quality multifamily developments and accessory homes throughout the community.
ItwasalsonotedthatCityrecordsdocumentrentersare4xmorelikelytoincurpublicnuisancenotices.By empowering ownership and stabilizing families, we endeavor to strengthen and improve the fundamen-talbuildingblocksofFortCollins–neighborhoods.
The Neighborhood Livability Results Team aims to increase ownership opportunities.
PURCHASING STRATEGIES
1. Purchasing Strategy #1–Wearelookingforinnovativeofferstoprovideownershipopportunitiesforcitizensbelow 80% AMI (Area Median Income).
•AdequateSupplyofQualityHousing

91 - OPERATING BUDGET
2. Purchasing Strategy #2–Wearelookingforoffersencouragingandfosteringgoodneighborrelationships.Specifically those offers improving relationships between all residents.
•GoodNeighborRelationships
3. Purchasing Strategy # 3–Wearelookingforoffersenhancingandmaintainingtheattractivenessofneigh-borhoods.
•AttractiveNeighborhood&GoodNeighborRelationships
4. Purchasing Strategy #4 –WearelookingforoffersencouragingvoluntarycompliancewithCitycodes,inaddition to innovative enforcement efforts.
•AttractiveNeighborhood&GoodNeighborRelationships
5. Purchasing Strategy # 5–WearelookingforofferscollaboratingwithColoradoStateUniversityadministra-tion and Associated Students of CSU.
•GoodNeighborRelationships
6. Purchasing Strategy #6–Wearelookingforofferstogeographically-identifyneighborhoodstocreateamapto analyze data.
•All3PrimaryFactors
7. Purchasing Strategy # 7–Wearelookingforofferstoimproveneighborhoodparkingmanagement,particu-larly those using voluntary methods in addition to enforcement.
•AttractiveNeighborhood,GoodNeighborRelationships
8. Purchasing Strategy #8–Wearelookingforoffersprovidingandmaintainingattractivepublicspaces. •AttractiveNeighborhood
9. Purchasing Strategy #9–WearelookingforoffersencouragingpartnershipsbetweentheCity,privateenti-ties and public agencies (e.g. Poudre School District, Larimer County) for housing and other programs.
•GoodNeighborRelationships&AdequateSupplyofQualityHousing
10. Purchasing Strategy #10–Wearelookingforofferstomaintainneighborhoodcharacterbyensuringcom-patibility of infill development, redevelopment, and new development as indicated in City Plan.
•AttractiveNeighborhood&AdequateSupplyofQualityHousing
NOTES/PRACTICES/SUPPORTING EVIDENCE
•2006CitizenSurvey.CityofFortCollins,2006.•CityPlan.CityofFortCollins,May4,2004.•PriorityAffordableHousingNeedsandStrategies.CityofFortCollins,July20,2004.•PoliceServicecallsandPublicNuisanceNotices,CityofFortCollins.•HUD(U.S.DeptofHousingandUrbanDevelopment)•CSU’sNeighborhoodQualityofLifeSurveys.CSU,Spring2006andAugust2006.
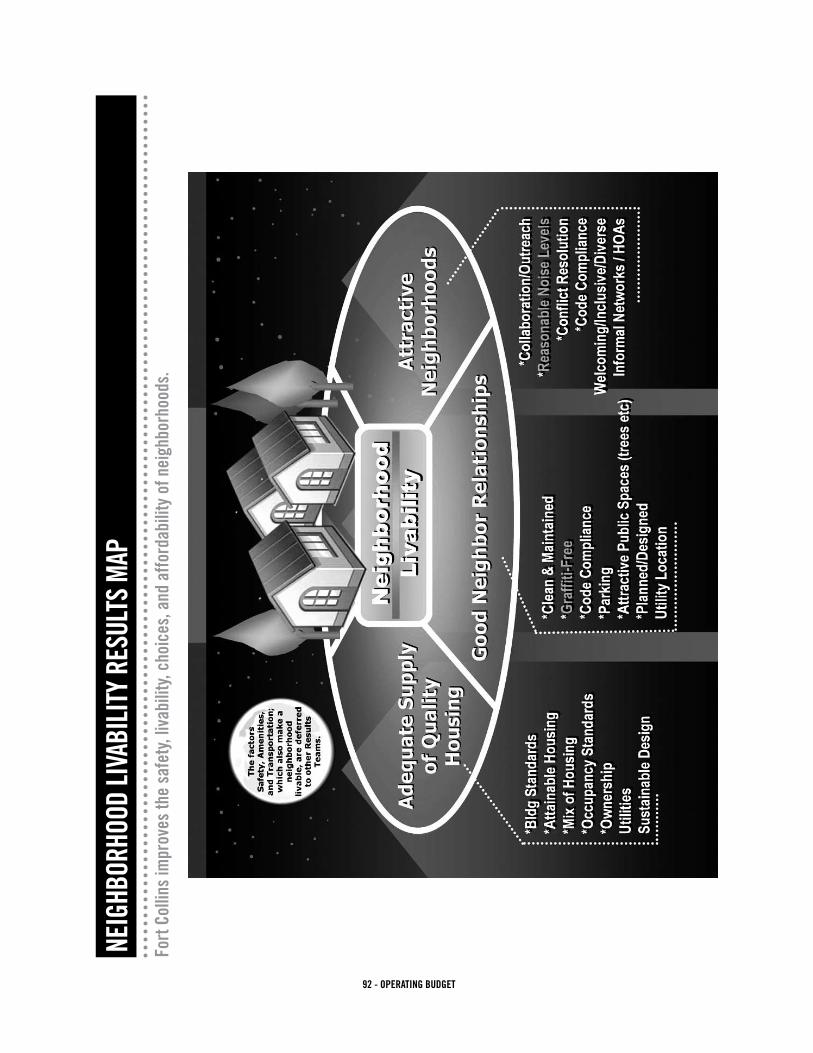
92 - OPERATING BUDGET
Fort
Col
lins
impr
oves
the
safe
ty, l
ivab
ility
, cho
ices
, and
affo
rdab
ility
of n
eigh
borh
oods
.
NEIG
HBOR
HOOD
LIVA
BILI
TY R
ESUL
TS M
AP

93 - OPERATING BUDGET

94 - OPERATING BUDGET
2008-2009 BUDGET RESULTS
4. SAFE COMMUNITY
KEY ISSUES
When resources were allocated between Result Areas at the beginning of the budget process, proportionately more resources were allocated to this result area than had been provided in 2006-07. Despite that, the major unresolved issue in this Result Area is the funds available for public safety, including Police Services and the Poudre Fire Authority. Both agencies presented offers for increased levels of service which they believe to be essential in providing safety services to the community. In light of the recent Police Staffing Study, these needs are even greater than those requested in the 2008-09 Budget process. PFA also continues to seek ways to fund its strategic plan for moving to higher minimum staffing plans, adding an additional fire station and adding a South Battalion.
REVENUE TRENDS & ISSUES
The Safe Community Outcome encompasses programs which are funded via Utility rate revenues, General Fund Revenues for Police Services, and General Fund resources provided to the Poudre Fire Authority via the existing Revenue Allocation Formula (includes City Property Taxes.)
A significant revenue change which affects this Result is the adopted Electric rate increases. Electric rates will increase 2.3% to 2.7% based on bulk power purchase agreements with Platte River Power Authority.
0 20 40 60 80 100 120
2008 GENERAL FUND & OTHER FUNDS – 161.6M2009 GENERAL FUND & OTHER FUNDS – 156.5M
GENERAL FUND
UTILITIES
NATURAL AREAS
115.4M
108.8M
547K
631K
MILLIONS
45.7M
47M
2008
2009
20082009

95 - OPERATING BUDGET
KEY PURCHASES
•PolicePatrol,Investigations,Communications,andothersupportsystems
•PoudreFireAuthoritycontract
•StormwaterUtility
•ElectricUtilityincludingsignificantElectricSystemExpansionstomaintaincurrentlevelsofservice
ENHANCEMENTS PURCHASED
•AdditionalNaturalAreasRangerin2009
•GraffitiAbatementCoordinator
•PoliceAmmunitionEnhancement
•PoliceStaffingforSouthwestAnnexationarea
•LibraryPark/OldTownSecuritycooperativeprojectwithDDA
•ElectricUtilityProjectManager
•WiFiPilotforUtilityMeterReading
•UtilityServiceCenterFacilityexpansions
EXAMPLES OF SERVICES NOT PURCHASED
•PoudreFireAuthoritySouthBattalion
•PoudreFireAuthorityNewStation4
•PoudreFireAuthorityMinimumStaffingIncrease
•EnhancedPoliceStaffingLevels
•PoliceServicesBuildingCivilianStaffforLobby
•TrafficCalmingInfrastructure

96 - OPERATING BUDGET
SAFE
COM
MUN
ITY
DRIL
LING
PLA
TFOR
M 2
008
SAFE
CO
MM
UN
ITY
DR
ILLI
NG
PLA
TFO
RM
- 20
08
One
-tim
eO
ngoi
ng
Line
Offe
rO
ffer
PFA
Dis
trict
Fund
ing
Offe
rG
ener
al F
und
Res
trict
edG
ener
al F
und
Oth
er R
estri
cted
##
Offe
r Des
crip
tion
Am
ount
&
Res
erve
s O
ne-ti
me
Sou
rce
Am
ount
R
estri
cted
Des
crip
tion
Ong
oing
Fund
s O
ngoi
ng
112
.1C
onve
ntio
nal E
nerg
y58
,075
,192
58
,075
,192
058
,075
,192
215
5.1
Bas
ic P
atro
l Ser
vice
s11
,414
,990
11
,414
,990
11,4
14,9
900
313
9.1
PFA
Em
erge
ncy
Ope
ratio
ns15
,405
,029
2,
969
15,4
02,0
6015
,402
,060
PFA
Con
trib
00
418
9.1
Inve
stig
ativ
e S
ervi
ces
Pac
kage
4,55
6,71
8 4,
556,
718
4,55
6,71
80
513
5.1
Pol
ice
Cor
e In
form
atio
n S
ervi
ces
6,54
2,70
2 35
,629
Gen
eral
Fun
d6,
507,
073
239,
156
Am
bula
nce
6,26
7,91
70
613
.1Li
ght &
Pow
er O
pera
tions
& M
aint
enan
ce5,
470,
087
5,47
0,08
70
5,47
0,08
77
5.1
Util
ities
- Li
ght &
Pow
er P
aym
ents
and
Tra
nsfe
rs11
,889
,407
11
,889
,407
011
,889
,407
823
5.1
PFA
Dis
trict
& O
ther
Rev
enue
(4,9
21,0
34)
(4,9
21,0
34)
00
010
139.
2P
FA O
pera
tions
Sup
port
231,
319
231,
319
00
011
141.
1O
ffice
of E
mer
genc
y M
anag
emen
t16
7,33
9 12
0,03
9 47
,300
47,3
00P
FA C
ontri
b0
012
139.
6P
FA F
ire P
reve
ntio
n B
urea
u1,
134,
799
1,13
4,79
9 0
00
1313
9.5
PFA
Adm
inis
tratio
n1,
772,
001
1,77
2,00
1 0
00
1414
0.1
PFA
Cap
ital P
roje
cts
1,20
8,00
0 27
4,26
0 93
3,74
093
3,74
0P
FA C
ontri
b0
015
155.
2U
nifo
rmed
Ser
vice
s C
ontra
ctua
l Ser
vice
s91
7,37
8 91
7,37
891
7,37
80
1613
9.3
PFA
Tra
inin
g59
1,52
9 59
1,52
9 0
00
1713
0.1
Pol
ice
Hiri
ng P
rom
otio
nal a
nd T
rain
ing
695,
907
695,
907
695,
907
018
105.
1P
olic
e A
dmin
istra
tion
572,
117
15,4
35G
ener
l-LC
DTF
556,
682
556,
682
019
130.
2In
tern
al A
ffairs
408,
333
408,
333
408,
333
020
139.
4P
FA O
pera
tions
Mai
nten
ance
794,
118
794,
118
00
021
28.1
Sto
rmw
ater
Eng
inee
ring
& F
ield
Ser
vice
s2,
690,
467
2,69
0,46
70
2,69
0,46
722
9.1
Util
ities
- S
torm
wat
er P
aym
ents
and
Tra
nsfe
rs6,
930,
589
6,93
0,58
9(0
)6,
930,
589
2310
5.2
Pol
ice
Logi
stic
s22
4,29
8 22
4,29
822
4,29
80
2416
.1E
lect
ric S
yste
m A
dditi
ons
12,0
58,7
81
1,69
9,32
1L
& P
fund
10,3
59,4
600
10,3
59,4
6025
128.
1U
tiliti
es C
apita
l - S
torm
wat
er M
aste
r Pla
nnin
g90
,000
90
,000
090
,000
2650
.1U
tiliti
es C
apita
l - D
rain
age
& D
eten
tion
Sys
tem
365,
000
365,
000
036
5,00
027
63.1
Util
ities
Cap
ital -
Sto
rmw
ater
Dev
elop
er R
epay
75,0
00
75,0
000
75,0
0028
59.1
Util
ities
Cap
ital -
Can
al Im
porta
tion
5,00
0,00
0 3,
571,
842
Sto
rmw
tr fu
nd1,
428,
158
01,
428,
158
2961
.1U
tiliti
es C
apita
l - C
oope
r Slo
ugh/
Box
elde
r40
0,00
0 40
0,00
00
400,
000
3060
.1U
tiliti
es C
apita
l - D
ry C
reek
Bas
in1,
600,
000
1,60
0,00
00
1,60
0,00
031
21.1
SW
Ann
ex E
lect
ric S
yste
m P
urch
ase
& T
rans
fer
800,
000
800,
000
L &
P fu
nd0
00
3218
9.2
Inve
stig
atio
ns C
ontra
ctua
l Ser
vice
s O
ffer
66,0
49
66,0
4966
,049
033
181.
1Tr
affic
Enf
orce
men
t Offe
r78
5,10
7 11
6,50
0G
ener
l-Src
hg66
8,60
727
6,29
6tra
ffic
surc
hge
392,
311
034
189.
3S
choo
l Res
ourc
e O
ffice
r Offe
r1,
069,
880
1,06
9,88
050
2,79
0P
SD
SR
O56
7,09
00
3518
9.4
Res
tora
tive
Just
ice
Offe
r14
,602
14
,602
14,6
020
3618
1.2
Cam
era
Rad
ar O
ffer
747,
708
179,
652
Gen
erl-C
amra
568,
056
568,
056
cam
era
rada
r0
037
18.1
Sub
stat
ions
Cap
ital P
roje
ct5,
222,
621
5,22
2,62
1L
& P
fund
00
038
155.
3S
WA
T O
ffer
159,
902
159,
902
159,
902
039
178.
1N
atur
al A
reas
Pro
gram
- N
atur
al A
reas
and
Tra
ils R
547,
647
547,
647
054
7,64
740
135.
3G
raffi
ti A
bate
men
t Cor
e S
ervi
ces
13,0
00
13,0
0013
,000
041
135.
11G
raffi
ti A
bate
men
t Coo
rdin
ator
- A
ssoc
. Cos
ts43
,512
43
,512
43,5
120
4213
5.2
Com
bine
d R
egio
nal I
nfo.
Sys
tem
s P
roje
ct17
5,00
0 17
5,00
017
5,00
00
4316
.2E
lect
ric P
roje
ct M
anag
er87
,565
87
,565
087
,565
4419
.1W
i Fi P
ilot
50,0
00
50,0
00L
& P
fund
00
045
144.
1U
tiliti
es C
apita
l - S
W S
ervi
ce C
ente
r Im
prov
emen
ts81
,775
81
,775
081
,775
4620
.1S
ervi
ce C
ente
r Add
ition
s Li
ght &
Pow
er4,
482,
904
4,48
2,90
4L
& P
fund
00
047
130.
9A
mm
uniti
on B
udge
t Adj
ustm
ent O
ffer
50,0
00
50,0
0050
,000
4815
5.4
SW
Ann
exat
ion
Sta
ffing
- C
ore
846,
930
134,
603
Gen
eral
Fun
d71
2,32
771
2,32
70
4915
8.1
Libr
ary
Par
k/O
ld T
own
Sec
urity
20,0
00
20,0
0020
,000
050 51
Fund
ed O
ffers
161,
624,
268
016
,308
,507
145,
315,
761
17,9
69,3
9827
,256
,016
100,
090,
347
52A
lloca
tion
16,3
08,5
0717
,969
,398
27,2
56,0
1610
0,09
0,34
753
Diff
eren
ce(0
)0
00

97 - OPERATING BUDGET
SAFE
COM
MUN
ITY
DRIL
LING
PLA
TFOR
M 2
008
SAFE
CO
MM
UN
ITY
DR
ILLI
NG
PLA
TFO
RM
- 20
08
One
-tim
eO
ngoi
ng
Line
Offe
rO
ffer
PFA
Dis
trict
Fund
ing
Offe
rG
ener
al F
und
Res
trict
edG
ener
al F
und
Oth
er R
estri
cted
##
Offe
r Des
crip
tion
Am
ount
&
Res
erve
s O
ne-ti
me
Sou
rce
Am
ount
R
estri
cted
Des
crip
tion
Ong
oing
Fund
s O
ngoi
ng
54 55 5610
5.3
SW
Ann
exat
ion
Sta
ffing
Ass
ocia
ted
Cos
ts16
,772
1,
401
Gen
eral
Fun
d15
,371
15,3
710
5713
0.3
SW
Ann
exat
ion
Sta
ffing
- A
ssoc
iate
d C
osts
62,9
12
61,1
62G
ener
al F
und
1,75
01,
750
058
181.
4C
omm
erci
al V
ehic
le In
spec
tor -
Cor
e88
,225
88
,225
88,2
250
5915
5.9
Com
mer
cial
Veh
icle
Insp
ecto
r - A
ssoc
iate
d C
osts
21,3
57
21,3
5721
,357
060
135.
13C
omm
erci
al V
ehic
le In
spec
tor -
Ass
ocia
ted
Cos
ts1,
577
1,57
71,
577
061
130.
12C
omm
erci
al V
ehic
le In
spec
tor -
Ass
ocia
ted
Cos
ts8,
516
8,51
68,
516
062
105.
11C
omm
erci
al V
ehic
le In
spec
tor -
Ass
ocia
ted
Cos
ts2,
021
2,02
12,
021
063
139.
8P
FA S
outh
Bat
talio
n66
4,61
6 18
0,00
0G
ener
al F
und
484,
616
484,
616
064
181.
3Tr
affic
Uni
t Enh
ance
men
t - C
ore
352,
900
352,
900
352,
900
065
130.
7Tr
affic
Uni
t Enh
ance
men
t - A
ssoc
. Cos
ts34
,064
34
,064
34,0
640
6613
5.9
Traf
fic U
nit E
nhan
cem
ent -
Ass
oc. C
osts
6,30
7 6,
307
6,30
70
6715
5.7
Traf
fic U
nit E
nhan
cem
ent -
Ass
oc. C
osts
85,4
28
85,4
2885
,428
068
105.
7Tr
affic
Uni
t Enh
ance
men
t8,
084
8,08
48,
084
069
135.
5In
form
atio
n S
ervi
ces
SW
Ann
exat
ion
Sta
ffing
134,
473
4,75
1G
ener
al F
und
129,
722
129,
722
070
135.
7Lo
bby
(Civ
illia
n) S
taff
New
Bui
ldin
g - C
ore
Offe
r19
6,83
8 19
6,83
819
6,83
80
7113
0.5
Lobb
y (C
ivill
ian)
Sta
ff N
ew B
uild
ing
- Ass
ocia
ted
Cos
ts4,
950
4,95
04,
950
072
105.
5Lo
bby
(Civ
illia
n) S
taff
New
Bui
ldin
g - A
ssoc
iate
d C
osts
4,87
5 4,
875
4,87
50
7315
5.6
Lobb
y O
ffice
rs, N
ew B
uild
ing
Sta
ff - A
ssoc
. Cos
ts38
5,47
9 32
,800
Gen
eral
Fun
d35
2,67
935
2,67
90
7413
5.8
Lobb
y O
ffice
rs, N
ew B
uild
ing
Sta
ff - A
ssoc
. Cos
ts6,
479
2,61
6G
ener
al F
und
3,86
33,
863
075
105.
6Lo
bby
Offi
cers
, New
Bui
ldin
g S
taffi
ng -
Ass
oc. C
osts
6,08
4 67
2G
ener
al F
und
5,41
25,
412
076
130.
6Lo
bby
Offi
cers
, New
Bui
ldin
g S
taff
- Ass
oc. C
osts
34,0
64
33,0
64G
ener
al F
und
1,00
01,
000
077
139.
7In
crea
se F
ire C
omp.
Min
. Sta
ffing
to F
our F
irefig
hter
s 1,
625,
987
1,62
5,98
71,
625,
987
078
189.
5E
cono
mic
Crim
es S
erge
ant U
pgra
de88
,316
88
,316
88,3
160
7915
5.8
Pat
rol D
ivis
ion
Mob
ile C
itatio
n U
nits
63,0
00
63,0
0063
,000
080
135.
10S
yste
ms
Ana
lyst
- C
ore
98,4
91
98,4
9198
,491
081
130.
8S
yste
ms
Ana
lyst
- A
ssoc
. Cos
ts1,
650
1,65
01,
650
082
105.
8S
yste
ms
Ana
lyst
- A
ssoc
. Cos
ts1,
336
1,33
61,
336
083
139.
9P
FA T
rain
ing
and
IT P
ositi
ons
217,
360
217,
360
217,
360
084
140.
2P
FA N
ew S
tatio
n 4
Enh
ance
men
t2,
670,
789
2,67
0,78
9G
ener
al F
und
00
085
135.
12C
ivili
an D
istri
ct O
ne S
taffi
ng P
olic
e S
ervi
ces
Mov
e-C
ore
141,
631
141,
631
141,
631
086
105.
10C
ivili
an D
istri
ct O
ne S
taff
for P
S R
eloc
atio
n - A
ssoc
. Cos
t s1,
625
1,62
51,
625
087
130.
11C
ivili
an S
taffi
ng fo
r Dis
trict
One
- A
ssoc
iate
d C
osts
1,65
0 1,
650
1,65
00
8813
0.10
Gra
ffiti
Aba
tem
ent C
oord
inat
or -
Ass
ocia
ted
Cos
ts1,
650
1,65
01,
650
089
105.
9G
raffi
ti A
bate
men
t Coo
rdin
ator
1,62
5 1,
625
1,62
50
9014
1.2
Offi
ce o
f Em
erge
ncy
Man
agem
ent E
nhan
cem
ent
467,
269
230,
000
Gen
eral
Fun
d23
7,26
923
7,26
90
9410
5.12
Pol
ice
Sta
ffing
Stu
dy Im
plem
enta
tion
(1)
4,00
0,00
0 4,
000,
000
4,00
0,00
00
9518
6.1
Traf
fic C
alm
ing
Infra
stru
ctur
e55
0,00
0 55
0,00
055
0,00
00
96 97U
nfun
ded
Offe
rs12
,058
,400
3,21
7,25
58,
841,
145
8,84
1,14
50
98 99 100
Tota
l Offe
rs17
3,68
2,66
819
,525
,762
154,
156,
906
17,9
69,3
9836
,097
,161
100,
090,
347

98 - OPERATING BUDGET
SAFE
COM
MUN
ITY
DRIL
LING
PLA
TFOR
M 2
009
SAFE
CO
MM
UN
ITY
DR
ILLI
NG
PLA
TFO
RM
- 20
09
One
-tim
eO
ngoi
ng
Line
Offe
r O
ffer
PFA
Dis
trict
Fund
ing
Offe
rG
ener
al F
und
Res
trict
edG
ener
al F
und
Oth
er R
estri
cted
##
Offe
r Des
crip
tion
Am
ount
&
Res
erve
s O
ne-ti
me
Sou
rce
Am
ount
R
estri
cted
Des
crip
tion
Ong
oing
Fund
s O
ngoi
ng
112
.1C
onve
ntio
nal E
nerg
y60
,831
,955
60
,831
,955
060
,831
,955
215
5.1
Bas
ic P
atro
l Ser
vice
s11
,915
,101
11
,915
,101
11,9
15,1
010
313
9.1
PFA
Em
erge
ncy
Ope
ratio
ns16
,174
,158
16
,174
,158
16,1
74,1
58P
FA C
ontri
b0
04
189.
1In
vest
igat
ive
Ser
vice
s P
acka
ge4,
750,
574
4,75
0,57
44,
750,
574
05
135.
1C
ore
Info
rmat
ion
Ser
vice
s6,
832,
706
35,6
29G
ener
al F
und
6,79
7,07
725
1,11
4A
mbu
lanc
e6,
545,
963
06
13.1
Ligh
t & P
ower
Ope
ratio
ns &
Mai
nten
ance
5,72
4,80
4 5,
724,
804
05,
724,
804
75.
1U
tiliti
es -
Ligh
t & P
ower
Pay
men
ts a
nd T
rans
fers
11,9
80,4
54
11,9
80,4
540
11,9
80,4
548
235.
1P
FA D
istri
ct &
Oth
er R
even
ue(4
,750
,853
)(4
,750
,853
)0
00
913
9.2
PFA
Ope
ratio
ns S
uppo
rt23
9,11
8 18
1,99
8 57
,120
57,1
20P
FA C
ontri
b0
010
141.
1O
ffice
of E
mer
genc
y M
anag
emen
t17
4,09
2 12
6,79
1 47
,301
47,3
01P
FA C
ontri
b0
011
139.
6P
FA F
ire P
reve
ntio
n B
urea
u1,
190,
052
1,19
0,05
2 0
00
1213
9.5
PFA
Adm
inis
tratio
n1,
828,
485
1,82
8,48
5 0
00
1314
0.1
PFA
Cap
ital P
roje
cts
408,
000
408,
000
408,
000
PFA
Con
trib
00
1415
5.2
Uni
form
ed S
ervi
ces
Con
tract
ual S
ervi
ces
953,
093
953,
093
953,
093
015
139.
3P
FA T
rain
ing
616,
282
616,
282
00
016
130.
1P
olic
e H
iring
Pro
mot
iona
l and
Tra
inin
g72
0,56
5 72
0,56
572
0,56
50
1710
5.1
Pol
ice
Adm
inis
tratio
n59
4,70
5 16
,111
Gen
erl-L
CD
TF57
8,59
457
8,59
40
1813
0.2
Inte
rnal
Affa
irs42
6,19
5 42
6,19
542
6,19
50
1913
9.4
PFA
Ope
ratio
ns M
aint
enan
ce80
7,24
5 80
7,24
5 0
00
2028
.1S
torm
wat
er E
ngin
eerin
g &
Fie
ld S
ervi
ces
2,62
5,61
8 2,
625,
618
02,
625,
618
219.
1U
tiliti
es -
Sto
rmw
ater
Pay
men
ts a
nd T
rans
fers
6,80
2,72
5 6,
802,
725
06,
802,
725
2210
5.2
Pol
ice
Logi
stic
s22
4,29
8 22
4,29
822
4,29
80
2316
.1E
lect
ric S
yste
m A
dditi
ons
12,4
80,6
36
2,15
2,83
0L
& P
fund
10,3
27,8
060
10,3
27,8
0624
128.
1U
tiliti
es C
apita
l - S
torm
wat
er M
aste
r Pla
nnin
g95
,000
95
,000
095
,000
2550
.1U
tiliti
es C
apita
l - D
rain
age
& D
eten
tion
Sys
tem
365,
000
365,
000
036
5,00
026
63.1
Util
ities
Cap
ital -
Sto
rmw
ater
Dev
elop
er R
epay
85,0
00
85,0
000
85,0
0027
59.1
Util
ities
Cap
ital -
Can
al Im
porta
tion
5,00
0,00
0 2,
490,
476
Sto
rmw
tr fu
nd2,
509,
524
02,
509,
524
2861
.1U
tiliti
es C
apita
l - C
oope
r Slo
ugh/
Box
elde
r1,
000,
000
1,00
0,00
00
1,00
0,00
029
60.1
Util
ities
Cap
ital -
Dry
Cre
ek B
asin
300,
000
300,
000
030
0,00
030
21.1
SW
Ann
ex E
lect
ric S
yste
m P
urch
ase
& T
rans
fer
800,
000
800,
000
L &
P fu
nd0
00
3118
9.2
Inve
stig
atio
ns C
ontra
ctua
l Ser
vice
s O
ffer
66,0
49
66,0
4966
,049
032
181.
1Tr
affic
Enf
orce
men
t Offe
r78
1,01
0 11
6,50
0G
ener
l-Src
hg66
4,51
028
4,58
5tra
ffic
surc
hge
379,
925
033
189.
3S
choo
l Res
ourc
e O
ffice
r Offe
r1,
118,
913
1,11
8,91
353
7,98
6P
SD
SR
O58
0,92
70
3418
9.4
Res
tora
tive
Just
ice
Offe
r15
,186
15
,186
15,1
860
3518
1.2
Cam
era
Rad
ar O
ffer
750,
348
750,
348
750,
348
cam
era
rada
r0
036
18.1
Sub
stat
ions
Cap
ital P
roje
ct22
0,00
0 22
0,00
0L
& P
fund
00
037
155.
3S
WA
T O
ffer
162,
902
162,
902
162,
902
038
178.
1N
atur
al A
reas
Pro
gram
- N
atur
al A
reas
and
Tra
ils R
571,
703
571,
703
057
1,70
339
178.
2A
dditi
onal
Ran
ger f
or 2
009
59,6
13
59,6
130
59,6
1340
135.
3G
raffi
ti A
bate
men
t Cor
e S
ervi
ces
13,0
00
13,0
0013
,000
041
135.
11G
raffi
ti A
bate
men
t Coo
rdin
ator
- A
ssoc
iate
d C
osts
43,0
72
43,0
7243
,072
042
135.
2C
ombi
ned
Reg
iona
l Inf
o. S
yste
ms
Pro
ject
175,
000
175,
000
175,
000
043
16.2
Ele
ctric
Pro
ject
Man
ager
91,2
98
91,2
980
91,2
9844
19.1
Wi F
i Pilo
t10
0,00
0 10
0,00
0L
& P
fund
00
045
144.
1U
tiliti
es C
apita
l - S
W S
ervi
ce C
ente
r Im
prov
emen
ts52
,294
52
,294
052
,294
4620
.1S
ervi
ce C
ente
r Add
ition
s Li
ght &
Pow
er25
4,09
3 25
4,09
3L
& P
fund
00
047
130.
9A
mm
uniti
on B
udge
t Adj
ustm
ent O
ffer
50,0
00
50,0
0050
,000
048
158.
1Li
brar
y P
ark/
Old
Tow
n S
ecur
it y20
,000
20
,000
20,0
000
4915
5.4
SW
Ann
exat
ion
Sta
ffing
- C
ore
764,
933
764,
933
764,
933
050 51 51
Fund
ed O
ffers
156,
504,
422
06,
185,
639
150,
318,
783
18,5
10,6
1228
,385
,377
103,
422,
794
52A
lloca
tion
6,18
5,63
919
,047
,829
28,3
85,3
7710
3,42
2,79
453
Diff
eren
ce0
537,
217
PFA
for c
apita
l(0
)0
1 of
2
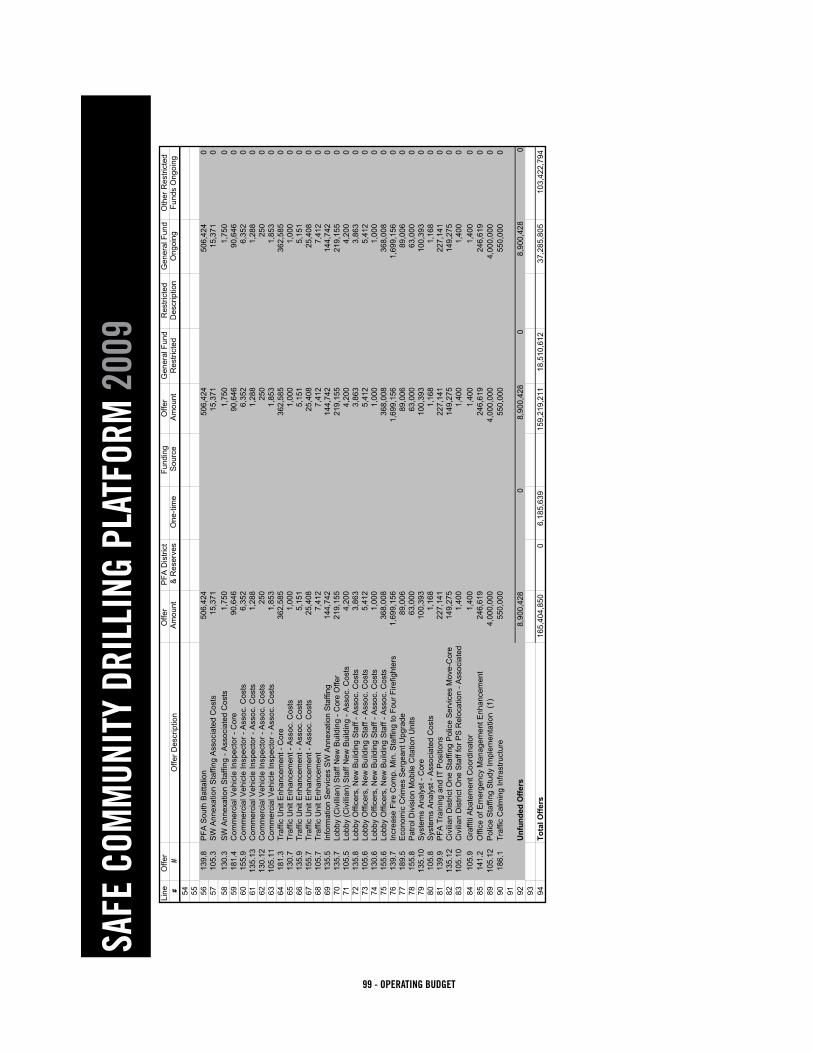
99 - OPERATING BUDGET
SAFE
COM
MUN
ITY
DRIL
LING
PLA
TFOR
M 2
009
SAFE
CO
MM
UN
ITY
DR
ILLI
NG
PLA
TFO
RM
- 20
09
One
-tim
eO
ngoi
ng
Line
Offe
r O
ffer
PFA
Dis
trict
Fund
ing
Offe
rG
ener
al F
und
Res
trict
edG
ener
al F
und
Oth
er R
estri
cted
##
Offe
r Des
crip
tion
Am
ount
&
Res
erve
s O
ne-ti
me
Sou
rce
Am
ount
R
estri
cted
Des
crip
tion
Ong
oing
Fund
s O
ngoi
ng
54 55 5613
9.8
PFA
Sou
th B
atta
lion
506,
424
506,
424
506,
424
057
105.
3S
W A
nnex
atio
n S
taffi
ng A
ssoc
iate
d C
osts
15,3
71
15,3
7115
,371
058
130.
3S
W A
nnex
atio
n S
taffi
ng -
Ass
ocia
ted
Cos
ts1,
750
1,75
01,
750
059
181.
4C
omm
erci
al V
ehic
le In
spec
tor -
Cor
e90
,646
90
,646
90,6
460
6015
5.9
Com
mer
cial
Veh
icle
Insp
ecto
r - A
ssoc
. Cos
ts6,
352
6,35
26,
352
061
135.
13C
omm
erci
al V
ehic
le In
spec
tor -
Ass
oc. C
osts
1,28
8 1,
288
1,28
80
6213
0.12
Com
mer
cial
Veh
icle
Insp
ecto
r - A
ssoc
. Cos
ts25
0 25
025
00
6310
5.11
Com
mer
cial
Veh
icle
Insp
ecto
r - A
ssoc
. Cos
ts1,
853
1,85
31,
853
064
181.
3Tr
affic
Uni
t Enh
ance
men
t - C
ore
362,
585
362,
585
362,
585
065
130.
7Tr
affic
Uni
t Enh
ance
men
t - A
ssoc
. Cos
ts1,
000
1,00
01,
000
066
135.
9Tr
affic
Uni
t Enh
ance
men
t - A
ssoc
. Cos
ts5,
151
5,15
15,
151
067
155.
7Tr
affic
Uni
t Enh
ance
men
t - A
ssoc
. Cos
ts25
,408
25
,408
25,4
080
6810
5.7
Traf
fic U
nit E
nhan
cem
ent
7,41
2 7,
412
7,41
20
6913
5.5
Info
rmat
ion
Ser
vice
s S
W A
nnex
atio
n S
taffi
ng14
4,74
2 14
4,74
214
4,74
20
7013
5.7
Lobb
y (C
ivill
ian)
Sta
ff N
ew B
uild
ing
- Cor
e O
ffer
219,
155
219,
155
219,
155
071
105.
5Lo
bby
(Civ
illia
n) S
taff
New
Bui
ldin
g - A
ssoc
. Cos
ts4,
200
4,20
04,
200
072
135.
8Lo
bby
Offi
cers
, New
Bui
ldin
g S
taff
- Ass
oc. C
osts
3,86
3 3,
863
3,86
30
7310
5.6
Lobb
y O
ffice
rs, N
ew B
uild
ing
Sta
ff - A
ssoc
. Cos
ts5,
412
5,41
25,
412
074
130.
6Lo
bby
Offi
cers
, New
Bui
ldin
g S
taff
- Ass
oc. C
osts
1,00
0 1,
000
1,00
00
7515
5.6
Lobb
y O
ffice
rs, N
ew B
uild
ing
Sta
ff - A
ssoc
. Cos
ts36
8,00
8 36
8,00
836
8,00
80
7613
9.7
Incr
ease
Fire
Com
p. M
in. S
taffi
ng to
Fou
r Fire
fight
ers
1,69
9,15
6 1,
699,
156
1,69
9,15
60
7718
9.5
Eco
nom
ic C
rimes
Ser
gean
t Upg
rade
89,0
06
89,0
0689
,006
078
155.
8P
atro
l Div
isio
n M
obile
Cita
tion
Uni
ts63
,000
63
,000
63,0
000
7913
5.10
Sys
tem
s A
naly
st -
Cor
e10
0,39
3 10
0,39
310
0,39
30
8010
5.8
Sys
tem
s A
naly
st -
Ass
ocia
ted
Cos
ts1,
168
1,16
81,
168
081
139.
9P
FA T
rain
ing
and
IT P
ositi
ons
227,
141
227,
141
227,
141
082
135.
12C
ivili
an D
istri
ct O
ne S
taffi
ng P
olic
e S
ervi
ces
Mov
e-C
ore
149,
275
149,
275
149,
275
083
105.
10C
ivili
an D
istri
ct O
ne S
taff
for P
S R
eloc
atio
n - A
ssoc
iate
d C
1,40
0 1,
400
1,40
00
8410
5.9
Gra
ffiti
Aba
tem
ent C
oord
inat
or1,
400
1,40
01,
400
085
141.
2O
ffice
of E
mer
genc
y M
anag
emen
t Enh
ance
men
t24
6,61
9 24
6,61
924
6,61
90
8910
5.12
Pol
ice
Sta
ffing
Stu
dy Im
plem
enta
tion
(1)
4,00
0,00
0 4,
000,
000
4,00
0,00
00
9018
6.1
Traf
fic C
alm
ing
Infra
stru
ctur
e55
0,00
0 55
0,00
055
0,00
00
91 92U
nfun
ded
Offe
rs8,
900,
428
08,
900,
428
08,
900,
428
093 94
Tota
l Offe
rs16
5,40
4,85
00
6,18
5,63
915
9,21
9,21
118
,510
,612
37,2
85,8
0510
3,42
2,79
4
2 of
2

100 - OPERATING BUDGET
SAFE COMMUNITY
5.1 Utilities - Light & Power Payments and Transfers - Funded 2008 - $11,889,407 2009 - $11,980,454Thisofferincludesthefollowingpaymentsandtransfers:Paymentinlieuoftaxestothegeneralfund,administrativetransferto the general fund, payment for Light and Power’s share of the Utilities customer service and administration fund, risk man-agement expenses, uncollectible accounts, and miscellaneous payments to other city funds.
9.1 Utilities - Stormwater Payments and Transfers - Funded 2008 - $6,930,589 2009 - $6,802,725ThisofferisforpaymentsandtransfersfromtheStormwaterFundincluding:PaymentinLieuoftaxestotheGeneralFund,payment for General Fund services, Risk Management expenses, debt service, the Stormwater Funds share of Utilities Cus-tomer Service and Administration fund, and payments to other city funds for miscellaneous services.
12.1 Conventional Energy - Funded 2008 - $58,075,192 2009 - $60,831,955Light and Power will purchase wholesale electric power in 2008 and 2009 from Platte River Power Authority (PRPA) to serve the needs of the citizens of Fort Collins.
13.1 Light & Power - Operations & Maintenance - Funded 2008 – $5,470,087 2009 – $5,724,804This offer provides high quality electric distribution services to meet the present and future needs of the citizens of Fort Col-lins. This includes the safe and effective operation and maintenance of the electric distribution system including distribution substation facilities and equipment.
16.1 Electric System Additions - Funded 2008 - $12,058,781 2009 – 12,480,636This offer is to provide necessary improvements to the electric distribution system required for the continued safe, reliable and efficient delivery of electric service to the citizens of Fort Collins.
16.2 Electric Project Manager - Funded 2008 - $87,565 2009 - $91,298This enhancement offer will provide electric engineering and project management services to meet the increased workload created by annexation of the Southwest Enclave, the new underground rebuild program, adequate support of the Develop-ment Review Center (DRC), and development of three new substation sites in the next six to eight years.
18.1 Substations Capital Project - Funded 2008 - $5,222,621 2009 - $220,000Plan, design and construct two new electric distribution substations over the next five years in order to meet the existing and future needs of the citizens of Fort Collins.

101 - OPERATING BUDGET
SAFE COMMUNITY
19.1 Wi Fi Pilot - Funded 2008 - $50,000 2009 - $100,000This capital project offer will construct and implement a wireless communications infrastructure utilizing WiFi radios mounted on streetlights in a trial area in Fort Collins roughly bounded by LaPorte Avenue, Shields Street, College Avenue and Prospect Road. This system will allow Utilities and other departments to explore the business models and any cost savings opportuni-ties that will offer an acceptable return on investment for the infrastructure.
20.1 Service Center Additions Light & Power - Funded 2008 - $4,482,904 2009 - $254,093This capital project offer will replace the existing Light and Power crew building, construct covered line truck parking, and build a wash-down area for service vehicles. Also included are Light and Powers portion of the funds needed for energy improvements to the existing service center and initial funds for the purchase of a customer service center.
21.1 SW Annex Electric System Purchase & Transfer - Funded 2008 - $800,000 2009 - $800,000The electric system is required to expand as the City boundaries change. As areas within the growth management area but outside the city are annexed, the Electric Utility is obligated to serve these new residents and transfer service from the incum-bent provider. Once the Southwest Enclave was annexed into the City, Utilities was required to initiate system transfer within two years of the date of annexation per City Code and state statues (for REA transfers). This project will cover the costs of purchasingsystemfromPVREAandXcelEnergy,tobuildnewcircuitconnectionsandtoconvertexistingoverheadelectricdistribution system to underground service.
28.1 Stormwater Engineering & Field Services - Funded 2008 - $2,960,467 2009 - $2,625,618This offer includes stormwater basin master planning, floodplain administration, emergency preparedness awareness and education, flood warning system operation and maintenance, storm drainage system operation and maintenance, and flood control project design and construction. Master planning identifies capital projects that are cost effective in mitigating exist-ing drainage problems. Master planning requires close collaboration with Natural Areas to plan for the preservation and enhancement of stream corridor habitat, with Transportation Services to plan for alignment of future streets, and with Com-munity Planning for future development. Floodplain administration and emergency preparedness provide analysis, advice, support, and review to other City departments proposing projects in floodplains. Emergency preparedness provides services to minimize the effects of a flood event by providing information to citizens on how they can prepare before a flood occurs, during a flooding event and after a flooding event. Warning system personnel ensures the early flood warning system is in operating order and providing real time data to field and emergency personnel. The operation and maintenance activity ensures the drainage system that carries the flood waters is functioning properly and well maintained to ensure long life. Per-sonnelareoncall24hoursaday,7daysaweekforemergenciestohelpmitigatedamageduetoflooding.Maintenanceandconstruction activities are often performed jointly with Transportation Services, Natural Areas, Parks, and other departments andoutsideagencies.Theapprovedstormwatermasterplanidentified$164millioninfloodcontrolimprovementstoreducethe risk of property damage and death in a 100-year flood. The approved financing plan will construct these improvements overthenext30years,reducingdamagesfromfloodingbyapproximately$290millionovera50-yearperiod.
50.1 Utilities Capital - Drainage & Detention System - Funded 2008 - $365,000 2009 - $365,000This capital project offer funds the design and construction of stormwater drainage system replacement projects.
59.1 Utilities Capital - Canal Importation - Funded 2008 - $5,000,000 2009 - $5,000,000This capital project offer funds the second year of the Canal Importation Ponds & Outfall (CIPO) stormwater improvement project in the Canal Importation Basin (west-central Fort Collins). The project consists of approximately 5,000 feet of large diameter stormwater pipe and enlargement of several detention ponds.

102 - OPERATING BUDGET
SAFE COMMUNITY
60.1 Utilities Capital - Dry Creek Basin - Funded 2008 - $1,600,000 2009 - $300,000ThiscapitalprojectofferfundstheconstructionoftheDryCreekConnectionChannelbetweenVineDriveandTimberlineRoad, as well as the acquisition of a regional detention pond site near Redwood and Conifer.
61.1 Utilities Capital - Cooper Slough/Boxelder - Funded 2008 - $400,000 2009 - $1,000,000This capital project offer funds collaboration with the Town of Wellington and Water Supply and Storage Company to prepare a Pre-Disaster Mitigation (PDM) grant application for submittal to the Federal Emergency Management Agency (FEMA) for construction of the Clarke Reservoir Improvements. The offer also anticipates construction of the Clarke Reservoir Improve-ments by funding the City’s share of the local match, along with other improvements in this basin.
63.1 Utilities Capital - Stormwater Developer Repay - Funded 2008 - $75,000 2009 - $85,000This capital project offer is for repayment to developers when they construct stormwater facilities not directly related to their development.
105.1 Police Administration - Funded 2008 - $572,117 2009 - $594,705This offer funds the salary and benefits and minimal associated costs for those positions housed in Police Administration. The totalFTE’sfundedbythegeneralfundinthisofferequal4.75.TheLarimerCountryDrugTaskForcepaysfor.25FTE.
105.2 Police Logistics - Funded 2008 - $224,298 2009 – 224,298This offer funds the shared department logistical expenses for Police Services.
105.3 SW Annexation Staffing Assoc. Costs - Not Funded 2008 - $16,772 2009 - $15,371ThisofferisforancillarycostspertainingtoaddingadditionalstafffortheSouthwestAnnexationarea.Pleasenote:thereareother offers in the BDT that need acceptance to fully fund this offer.
105.5 Lobby (Civilian) Staff New Building - Assoc. Costs - Not Funded 2008 - $4,875 2009 - $4,200This offer is for ancillary costs pertaining to offer 135.7, which would add 3 Police Services Technicians to staff the main lobby.Pleasenote:thereareotheroffersintheBDTthatneedacceptancetofullyfundthisoffer.
105.6 Lobby Officers, New Building Staff - Assoc. Costs - Not Funded 2008 - $6,084 2009 - $5,412Thisofferisforancillarycostspertainingtooffer155.6whichwouldadd4part-timeofficersatthemainlobbyofthenewPolicebuilding.Pleasenote:thereareotheroffersintheBDTthatneedacceptancetofullyfundthisoffer.
105.7 Traffic Unit Enhancement - Not Funded 2008 - $8,084 2009 - $7,412This offer is for ancillary costs pertaining to offers 181.3 and 155.7, which would add new officers to the Traffic Unit. Please note:thereareotheroffersintheBDTthatneedacceptancetofullyfundthisoffer.
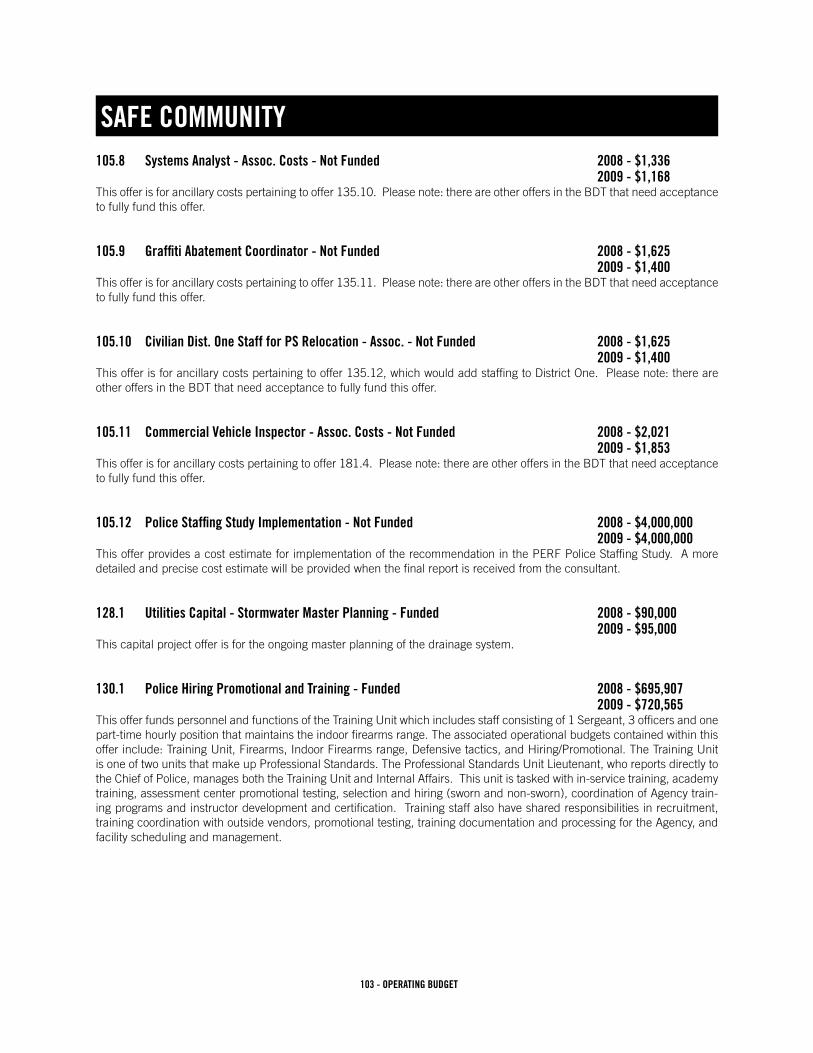
103 - OPERATING BUDGET
SAFE COMMUNITY
105.8 Systems Analyst - Assoc. Costs - Not Funded 2008 - $1,336 2009 - $1,168Thisofferisforancillarycostspertainingtooffer135.10.Pleasenote:thereareotheroffersintheBDTthatneedacceptanceto fully fund this offer.
105.9 Graffiti Abatement Coordinator - Not Funded 2008 - $1,625 2009 - $1,400Thisofferisforancillarycostspertainingtooffer135.11.Pleasenote:thereareotheroffersintheBDTthatneedacceptanceto fully fund this offer.
105.10 Civilian Dist. One Staff for PS Relocation - Assoc. - Not Funded 2008 - $1,625 2009 - $1,400Thisofferisforancillarycostspertainingtooffer135.12,whichwouldaddstaffingtoDistrictOne.Pleasenote:thereareother offers in the BDT that need acceptance to fully fund this offer.
105.11 Commercial Vehicle Inspector - Assoc. Costs - Not Funded 2008 - $2,021 2009 - $1,853Thisofferisforancillarycostspertainingtooffer181.4.Pleasenote:thereareotheroffersintheBDTthatneedacceptanceto fully fund this offer.
105.12 Police Staffing Study Implementation - Not Funded 2008 - $4,000,000 2009 - $4,000,000This offer provides a cost estimate for implementation of the recommendation in the PERF Police Staffing Study. A more detailed and precise cost estimate will be provided when the final report is received from the consultant.
128.1 Utilities Capital - Stormwater Master Planning - Funded 2008 - $90,000 2009 - $95,000This capital project offer is for the ongoing master planning of the drainage system.
130.1 Police Hiring Promotional and Training - Funded 2008 - $695,907 2009 - $720,565This offer funds personnel and functions of the Training Unit which includes staff consisting of 1 Sergeant, 3 officers and one part-time hourly position that maintains the indoor firearms range. The associated operational budgets contained within this offerinclude:TrainingUnit,Firearms,IndoorFirearmsrange,Defensivetactics,andHiring/Promotional.TheTrainingUnitis one of two units that make up Professional Standards. The Professional Standards Unit Lieutenant, who reports directly to the Chief of Police, manages both the Training Unit and Internal Affairs. This unit is tasked with in-service training, academy training, assessment center promotional testing, selection and hiring (sworn and non-sworn), coordination of Agency train-ing programs and instructor development and certification. Training staff also have shared responsibilities in recruitment, training coordination with outside vendors, promotional testing, training documentation and processing for the Agency, and facility scheduling and management.

104 - OPERATING BUDGET
SAFE COMMUNITY
130.2 Internal Affairs - Funded 2008 - $408,333 2009 - $426,195This offer funds personnel and functions of Internal Affairs which consists of one Sergeant and one Lieutenant and the as-sociated operational budget. Internal Affairs and the Training Unit are subunits of Professional Standards and are managed by an Administrative Division Lieutenant who reports directly to the Chief of Police. Internal Affairs: - Investigates citizen complaints and conducts other mandated investigations (i.e. officer involved shootings) as required
by City Code or Agency policy.
- Conducts and or coordinates administrative investigations as it pertains to 255.5 personnel (163 sworn, 92.5 non-sworn)
- Submits investigations for review to Civilian Review Board which makes findings and recommendations to the Chief of Police.
-The Professional Standards Lieutenant provides all Board liaison functions to the Citizen Review Board.
-Is the official custodian for Agency administrative investigations and all disciplinary records and documentation.
130.3 SW Annexation Staffing - Assoc. Costs - Not Funded 2008 - $62,912 2009 - $1,750Thisofferisforancillarycostspertainingtooffers155.4and135.5.Pleasenote:thereareotheroffersintheBDTthatneedacceptance to fully fund this offer.
130.5 Lobby (Civilian) Staff New Building - Assoc. Costs - Not Funded 2008 - $4,950 2009 - $0Thisofferisforancillarycostspertainingtooffer135.7.Pleasenote:thereareotheroffersintheBDTthatneedacceptanceto fully fund this offer.
130.6 Lobby Officers, New Building Staffing – Assoc. Costs - Not Funded 2008 - $34,064 2009 - $ 1,000Thisofferisforancillarycostspertainingtooffer155.6.Pleasenote:thereareotheroffersintheBDTthatneedacceptanceto fully fund this offer.
130.7 Traffic Unit Enhancement – Assoc. Costs - Not Funded 2008 - $34,064 2009 - $ 1,000Thisofferisforancillarycostspertainingtooffers181.3and155.7.Pleasenote:thereareotheroffersintheBDTthatneedacceptance to fully fund this offer.
130.8 Systems Analyst – Assoc. Costs - Not Funded 2008 - $1,650 2009 - $0Thisofferisforancillarycostspertainingtooffer135.10.Pleasenote:thereareotheroffersintheBDTthatneedacceptanceto fully fund this offer.

105 - OPERATING BUDGET
SAFE COMMUNITY
130.9 Ammunition Budget Adjustment Offer - Funded 2008 - $50,000 2009 - $50,000Thisofferrequestsanincreaseof$50,000totheFirearmsRangebudgetinordertofullyfundammunitioncoststhatarecurrentlyunderfundedby$50,000.Thisofferfundsannualrifleammunitioncostsof$30,000requiredasaresultoftheimplementation of a patrol rifle program that is currently in progress and is expected to be fully implemented by 2008. For 2007 City Council funded the purchase of a rifle as standard equipment for every police officer along with associated one time costs of ammunition and vehicle locks for the 2007 budget year. Ongoing funding for rifle ammunition is required for the 08/09budgetcycle.Additionally,thisofferfullyfundshandgunammunitioncostsintheamountofanadditional$20,000.Handgun ammunition has never been fully funded to meet existing needs.
130.10 Graffiti Abatement Coordinator - Assoc. Costs - Not Funded 2008 - $1,650 2009 - $0Thisofferisforancillarycostspertainingtooffer135.11.Pleasenote:thereareotheroffersintheBDTthatneedacceptanceto fully fund this offer.
130.11 Civilian Staffing for District One - Assoc. Cost - Not Funded 2008 - $1,650 2009 - $0Thisofferisforancillarycostspertainingtooffer135.12.Pleasenote:thereareotheroffersintheBDTthatneedacceptanceto fully fund this offer.
130.12 Commercial Vehicle Inspector - Assoc. Cost - Not Funded 2008 - $8,516 2009 - $ 250Thisofferisforancillarycostspertainingtooffer181.4.Pleasenote:thereareotheroffersintheBDTthatneedacceptanceto fully fund this offer.
135.1 Police Core Information Services - Funded 2008 - $6,542,702 2009 - $6,832,706The Information Services Division is one of four divisions within Fort Collins Police Services and is comprised of Forensic Services, Poudre Emergency Communications Center, Records, Systems and Technical Services. These services are es-sential in the performance of criminal justice activities that protect the citizens of Fort Collins. Sixty-five of the department’s eighty-seven civilian employees work in this division which provides a wide variety of services to others in the department and the community. Each of the work units is unique in its function. This offer is requesting to continue to fund the Information Services Division.
135.2 Combined Regional Information Systems Project - Funded 2008 - $175,000 2009 - $175,000As an agency member of CRISP, we have partnered with other public safety agencies to share one computerized public safety system. This system enables member Larimer County agencies to share information for more efficient use in helping to de-velop and sustain a safe community. Police Services is a leader in utilizing technology to enhance public safety and provide high-quality law enforcement services to the citizens of Fort Collins. While other agencies struggle with outdated equipment, this department embraces computerized systems and uses them as ubiquitous tools which improve every aspect of police work. From initiating contact with the department, to collecting information, to the storage and security of crucial data, tech-nology enables Police Services to perform more efficiently.

106 - OPERATING BUDGET
SAFE COMMUNITY
135.3 Graffiti Abatement Core Services - Funded 2008 - $13,000 2009 - $13,000The City of Fort Collins takes the position that the existence of graffiti is detrimental to property values, adversely affects qual-ity of life and community attractiveness, and discredits the City’s reputation for livability. When graffiti is allowed to remain, it invites yet more graffiti and may lead to an increase in vandalism and other criminal activity. Rapid removal is considered key to controlling and eradicating graffiti.
135.5 Info. Services SW Annexation Staffing - Not Funded 2008 - $134,473 2009 – $144,742This is an enhancement offer addressing the need to add police personnel due to the annexation of the South College area known as the Kelmar strip along with anticipated annexations of areas considered to be the rest of the Southwest Annexa-tion. This enhancement requests additional funding to add one sergeant, six police officers, one dispatcher, and one police records specialist. This enhancement provides the services outlined in the basic patrol package to the annexed area.
135.7 Lobby (Civilian) Staff New Building - Core Offer - Not Funded 2008 - $196,838 2009 - $219,155Police Services moved to a new facility in August of 2007 which is designed and equipped with state-of-the-art security systems. In order to benefit from the improved security systems, building access and movement within the building must be actively monitored and closely scrutinized. Additional personnel are necessary to staff the two stations at the front counter in themainlobbyofthenewbuildingfrom7:00a.m.tomidnight,MondaythroughFriday.RecordsiscurrentlyauthorizedonePolice Services Technician. This offer seeks authorization for three additional full-time Police Services Technician positions whose primary responsibilities will be to provide customer service.
135.8 Lobby Officers, New Building Staff – Assoc. Costs - Not Funded 2008 - $6,479 2009 - $3,863This offer is for ancillary costs pertaining to offer 155.6, which funds four part-time Station officers who control access to the newPolicebuildingfrom7a.m.-midnight.Pleasenote:thereareotheroffersintheBDTthatneedacceptancetofullyfundthis offer.
135.9 Traffic Unit Enhancement - Assoc. Costs - Not Funded 2008 - $6,307 2009 - $5,151This offer is for ancillary costs pertaining to offers 181.3 and 155.7, which added additional officers to the Traffic Unit. Please note:thereareotheroffersintheBDTthatneedacceptancetofullyfundthisoffer.
135.10 Systems Analyst - Core - Not Funded 2008 - $98,491 2009 - $100,393As an agency member of Combined Regional Systems Integration Project, Police Systems has partnered with other pub-lic safety agencies to share one computerized Computer Aided Dispatch (CAD)/Records Management (RMS)/Corrections Management (CMS)/Mobile Data (MDS) system. This mission-critical system enables member Larimer County agencies to access and share information which is invaluable in helping to develop and sustain a safe community. Police Systems is staffed by two systems analysts who are responsible for supporting the CRISP system as well as maintaining other public safety technologies including the local area network, wireless networks, and assisting City MIS staff as needed in supporting personal computers (laptops and desktops) and peripherals. Additional technologies in the new Police facility and the loss of key department personnel in 2006/2007 have resulted in increased workload for the systems analysts. An additional systems analyst position will be necessary to maintain current service levels.
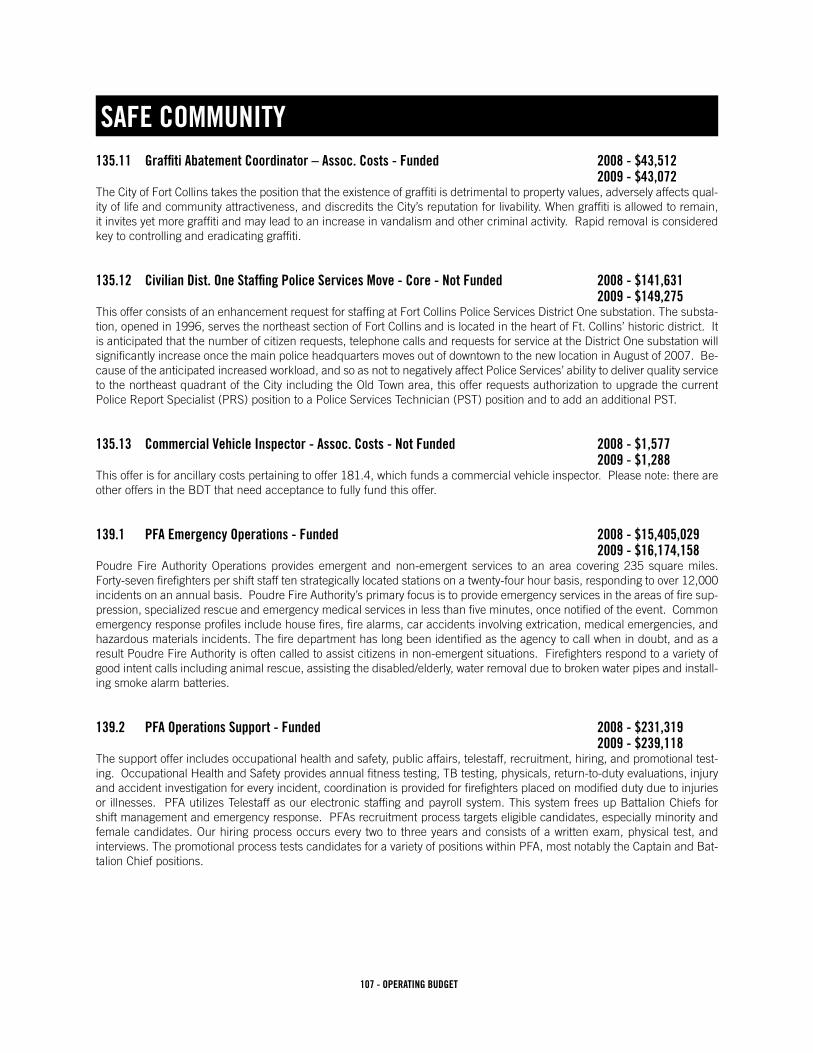
107 - OPERATING BUDGET
SAFE COMMUNITY
135.11 Graffiti Abatement Coordinator – Assoc. Costs - Funded 2008 - $43,512 2009 - $43,072The City of Fort Collins takes the position that the existence of graffiti is detrimental to property values, adversely affects qual-ity of life and community attractiveness, and discredits the City’s reputation for livability. When graffiti is allowed to remain, it invites yet more graffiti and may lead to an increase in vandalism and other criminal activity. Rapid removal is considered key to controlling and eradicating graffiti.
135.12 Civilian Dist. One Staffing Police Services Move - Core - Not Funded 2008 - $141,631 2009 - $149,275This offer consists of an enhancement request for staffing at Fort Collins Police Services District One substation. The substa-tion, opened in 1996, serves the northeast section of Fort Collins and is located in the heart of Ft. Collins’ historic district. It is anticipated that the number of citizen requests, telephone calls and requests for service at the District One substation will significantly increase once the main police headquarters moves out of downtown to the new location in August of 2007. Be-cause of the anticipated increased workload, and so as not to negatively affect Police Services’ ability to deliver quality service to the northeast quadrant of the City including the Old Town area, this offer requests authorization to upgrade the current Police Report Specialist (PRS) position to a Police Services Technician (PST) position and to add an additional PST.
135.13 Commercial Vehicle Inspector - Assoc. Costs - Not Funded 2008 - $1,577 2009 - $1,288Thisofferisforancillarycostspertainingtooffer181.4,whichfundsacommercialvehicleinspector.Pleasenote:thereareother offers in the BDT that need acceptance to fully fund this offer.
139.1 PFA Emergency Operations - Funded 2008 - $15,405,029 2009 - $16,174,158Poudre Fire Authority Operations provides emergent and non-emergent services to an area covering 235 square miles. Forty-seven firefighters per shift staff ten strategically located stations on a twenty-four hour basis, responding to over 12,000 incidents on an annual basis. Poudre Fire Authority’s primary focus is to provide emergency services in the areas of fire sup-pression, specialized rescue and emergency medical services in less than five minutes, once notified of the event. Common emergency response profiles include house fires, fire alarms, car accidents involving extrication, medical emergencies, and hazardous materials incidents. The fire department has long been identified as the agency to call when in doubt, and as a result Poudre Fire Authority is often called to assist citizens in non-emergent situations. Firefighters respond to a variety of good intent calls including animal rescue, assisting the disabled/elderly, water removal due to broken water pipes and install-ing smoke alarm batteries.
139.2 PFA Operations Support - Funded 2008 - $231,319 2009 - $239,118The support offer includes occupational health and safety, public affairs, telestaff, recruitment, hiring, and promotional test-ing. Occupational Health and Safety provides annual fitness testing, TB testing, physicals, return-to-duty evaluations, injury and accident investigation for every incident, coordination is provided for firefighters placed on modified duty due to injuries or illnesses. PFA utilizes Telestaff as our electronic staffing and payroll system. This system frees up Battalion Chiefs for shift management and emergency response. PFAs recruitment process targets eligible candidates, especially minority and female candidates. Our hiring process occurs every two to three years and consists of a written exam, physical test, and interviews. The promotional process tests candidates for a variety of positions within PFA, most notably the Captain and Bat-talion Chief positions.

108 - OPERATING BUDGET
SAFE COMMUNITY
139.3 PFA Training - Funded 2008 - $591,529 2009 - $616,282The PFA Training Division provides or coordinates basic, advanced and technical level skills, education, and practical ap-plicationtoall155operationalfirefighters,uniformed40-hourstaff,andvolunteers,aswellasthebasicrecruitfireacademy.This is accomplished by using several methods of delivery to include conference call, video teleconference, site delivery, and offerings at the Training Center. We provide conference and education/tuition reimbursement for all operations and staff per-sonnel. In addition, we develop, deliver and coordinate training curriculum for all levels of the organization to include Driver Operator, EMT, Captain, Chief Officers, and several technical response/rescue subjects. We also develop and provide testing for Driver Operator as well as firefighter certifications. The Training Center also is responsible for maintaining the training facility, all buildings, equipment, the PFA integrated calendar, and the PFA Training Division intranet site. We are currently staffed with 1-Battalion Chief, 2-Captains, and 1-Secretary.
139.4 PFA Operations Maintenance - Funded 2008 - $794,118 2009 - $807,245The maintenance offer includes firefighting equipment, facilities, self contained breathing apparatus (SCBA) maintenance, and the PFA warehouse. By providing on-site maintenance PFA is able to reduce costs, provide quicker service, and main-tain quality control. PFA provides maintenance to our emergency apparatus fleet. Regularly scheduled maintenance, repairs, annual pump, aerial testing, and emission testing make up the majority of this workload. Repair of firefighting equipment is done by either the fire mechanic or specific equipment program managers. The SCBA program provides for the mainte-nance and replacement of 172 SCBA units and 392 air bottles. Thirteen fire stations and one administration building are maintained by PFA. Money for major repairs and renovations are added to the annual budget when necessary and available. The PFA Warehouse is the central shipping and receiving location for PFA. Firefighting equipment, personal protective gear, cleaning supplies, and various other commodities are managed through the warehouse.
139.5 PFA Administration - Funded 2008 - $1,772,001 2009 - $1,828,485Administration provides overall management to the PFA. It develops the annual operating budget for approval by the PFA Board; coordinates liability, property, and workers compensation insurance; is responsible for PFAs ongoing strategic plan-ning process; provides interagency coordination with other local jurisdictions; provides financial management assistance to alldivisions;coordinatesthepersonnelsystemfor168employeesand40volunteers;monitorsrevenuesandexpendituresandpaysbillsforthedepartment;overseesthedepartmentsqualityimprovementprocess;workswithPFAandPoudreValleyFireProtectionDistrict(PVFPD)BoardsandCityCounciltodevelopfinancialandorganizationalpoliciesforPFA;providesinformation management system in cooperation with the City IT Department; provides HR functions; provides management forPVFPDwhichisaseparateentity;providesoversightandmanagementofPFAspensionprogram;coordinatesthedepart-mentsperformancebasedbenchmarkprogram,andassistsintheauditprocessforPFAandPVFPD.
139.6 PFA Fire Prevention Bureau - Funded 2008 - $1,134,799 2009 - $1,190,052This offer provides a comprehensive response to the community’s need for the prevention of fires. This is accomplished by the Office of the Fire Marshal through four areas. These are Technical Services, Inspection Services, Fixed Fire Protection Systems and Investigation Services. The Technical Services program provides construction plan reviews, inspections of all fire sprinkler systems and provides responsive comments during the conceptual review process on proposed building projects. These buildings are then passed on to the Inspection Services program to ensure that buildings remain fire code compliant through inspections of existing buildings. Along with Inspection Services, the Fixed Fire Protection Systems program ensures that all sprinkler and alarm systems remain fully functional. Finally, Investigation Services investigates all fires in the Poudre Fire Authority jurisdiction for origin and cause in an effort to further refine other prevention efforts.

109 - OPERATING BUDGET
SAFE COMMUNITY
139.7 Increase Fire Comp. Min. Staffing to Four Firefighters - Not Funded 2008 - $1,625,987 2009 - $1,699,156ThisofferisaPFA2004StrategicPlanrecommendation,whichincreasesfirecompanyminimumstaffingfromthreetofourfirefighters at outlying stations with two or more emergency response vehicles (fire engine and either a water tender or brush truck).ThiswillallowfirefightersatStations4,6,7,and12toremainintheirstationareamoreoften.Currently,callsrequiringa tender or brush truck reduces the number of firefighters from three to two, or requires the entire fire company to respond, and thus decreases the ability of the firefighters to safely perform their duties. This will result in a longer response that will negatively impact the citizen requesting help, be it for a medical condition, or a fire. This enhancement will add 16 firefighter positions to the Fire Suppression Division.
139.8 PFA South Battalion - Not Funded 2008 - $664,616 2009 - $506,424PFA has operated with one shift battalion chief (BC) since its inception in 1981. Since then, the organization has grown from a seven station system (plus two volunteer stations) responding to 3,500 calls a year, to ten stations (plus three volunteer stations) and 12,000 calls per year. Implementation criteria developed from research and review of practices of similar fire departments indicates the south area exceeds all established benchmarks and practices for adding a second shift BC. In fact, PFA is the only department of its size and response demands along the Front Range that is operating with only one bat-talion. It is recommended that a second shift BC be added.
139.9 PFA Training and IT Positions - Not Funded 2008 - $217,360 2009 - $227,141This offer funds the addition of one Training position and one IT position necessary for organizational support. A training specialist is necessary to meet increased workload created by additional stations, firefighters, and to assist in conducting multiple recruit academies annually. An IT specialist is necessary to meet increased workload created by additional stations, firefighters, computers, mobile data terminals, servers, and video conferencing.
140.1 PFA Capital Projects - Funded 2008 - $1,208,000 2009 - $408,000New stations including furnishings, Opticom, emergency equipment, and apparatus currently cost $2,944,000 (2007).These funds are necessary to provide a majority of the money for these facilities. Current projections indicate the need for two more stations and two new structures to complete the Training Facility. These structures provide a safe, controlled envi-ronment for firefighters to train and a place where the public is not inconvenienced by these exercises. These facilities are also used as our recruit training academy and Fort Collins Police Services and Poudre Emergency Communications Center use the Training Facility for investigation classes, SWAT training, dispatcher training, and programs required by the Depart-mentofHomelandSecurity.Year-to-datetheTrainingFacilityhasbeenused18timesbyoutsideagencies.
140.2 PFA New Station 4 Enhancement - Not Funded 2008 - $2,670,789 2009 - $0ThisofferfundsrelocatingStation4andbuildinganewfacility.Station4(2030Devonshire)wasplacedinservicein1981.Since few capital funds were available but service was needed for the area, this station was built simply a house on a residen-tial lot with an oversized garage. It was intended to be a cost-effective and temporary structure to house an engine company. However, PFA’s capital program has been insufficient to build our prototype urban fire station and this shortage will continue intotheforeseeablefuture.WhileanewStation4hasbeenahighpriorityfortenyears,theneedtoplacenewstationsin-serviceandtoprovideaplaceforourpersonneltotrainhastakenprecedenceoveranewStation4.Consequently,wehavebeenunabletobuildanewstation.Station4istoosmalltohousenecessaryequipment,isincapableofbeingrenovatedtomeet ADA standards, and has no room for expansion to a four-person company.
110 - OPERATING BUDGET
SAFE COMMUNITY
141.1 Office of Emergency Management - Funded 2008 - $167,339 2009 - $174,092The Office of Emergency Management is responsible for coordinating and providing internal and external services in the area of preparedness, mitigation, response and recovery as related to natural and man-made hazards and disasters within our community. The focus of these services is preservation of life safety, property conservation and environmental protection to the Fort Collins community in pre-disaster, disaster and post-disaster periods. These services include but are not limited to training, exercises, public education, establishment and maintenance of early warning systems, development of mitigation plans, emergency operational plans, disaster recovery plans, emergency operation center management and coordination of response and recovery in disasters. This involves contact and coordination with all departments/divisions of the city govern-ment, the business community, citizens and various county, state and federal agencies. Grant writing/coordination, National Incident Management System compliance, Presidential Directives and other federal and state legislative/regulatory issues are also managed within this office.
141.2 Office of Emergency Management Enhancement - Not Funded 2008 - $467,269 2009 - $246,619The Office of Emergency Management is responsible for coordinating and providing internal and external services in the area of preparedness, mitigation, response and recovery as related to natural and man-made hazards and disasters within our community. However, due to budget constraints and lack of support, these programs are coordinated and provided below benchmark and unable to either expand or achieve their full potential. This offer funds a service level increase, public edu-cation, training, technology and planning for preparedness, mitigation, response and recovery within the Office of Emergency Management. This would allow OEM to move closer to reaching its benchmark and full potential for the citizens and com-munity of Fort Collins. Mandates are being marginally reached at the current level of funding.
144.1 Utilities Capital - SW Service Center Improvements - Funded 2008 - $81,775 2009 - $52,294This offer is for the Stormwater Funds share of energy and water conservation improvements to the Utilities Service Center. It also provides initial funding for the Stormwater Funds portion for the purchase of a new customer service center. This is a capital project that will be funded by all four utility funds.
155.1 Basic Patrol Services - Funded 2008 - $11,414,990 2009 - $11,915,101This offer consists of the basic police services provided to the community by the patrol division of Fort Collins Police Services. This is a City Charter mandated function. The duties of the division are to respond to calls for service from its citizens for incidents ranging from abandoned vehicles to homicides. The patrol division provides for a safer community through efforts made in crime prevention, law enforcement, criminal investigation, traffic enforcement and investigation, active patrol, and a variety of order keeping activities. This package continues the same basic services that are currently provided.
155.2 Uniformed Services Contractual Services - Funded 2008 - $917,378 2009 - $953,093This offer addresses the contractual obligations that the Patrol Division of Fort Collins Police Services enter in for services provided to the community and it’s citizens to provide for a safer environment. For years the Patrol Division has managed contractual services provided to the community by the Larimer County Humane Society for animal control and the Island Grove Regional Treatment for detoxification from alcohol and drugs. Contracting with these two entities have greater cost effectiveness than creating City facilities and employees to address these concerns. This offer is to continue the same basic service currently provided.

111 - OPERATING BUDGET
SAFE COMMUNITY
155.3 SWAT Offer - Funded 2008 - $159,902 2009 - $162,902The Special Weapons and Tactics (SWAT) Team responds to critical, high-risk law enforcement incidents in the city and is routinely called to assist neighboring agencies. The primary mission of SWAT is to save lives. SWAT team members participate in advanced training and have specialized equipment that allows a quick response to resolve dangerous situations. Because of the additional training, experience, proper protective equipment, and increased weapon capabilities, the team is able to reduce the risk to victims, citizens, police officers and even suspects in dangerous situations. Amazingly, it only costs the citizensabout$200perdaytotrainandequipthisessentialpoliceunit.
155.4 SW Annexation Staffing - Core - Funded 2008 - $846,930 2009 - $764,933This is an enhancement offer addressing the need to add police personnel due to the annexation of the South College area known as the Kelmar strip along with anticipated annexations of areas considered to be the rest of the Southwest Annexa-tion. This enhancement requests additional funding to add one sergeant, six police officers, one dispatcher, and one police records specialist. This enhancement provides the services outlined in the basic patrol package to the annexed area.
155.6 Lobby Officers, New Building Staff – Assoc. Costs - Not Funded 2008 - $385,479 2009 - $368,008Police Services will move to a new facility in August of 2007 which is designed and equipped with state-of-the-art security systems. In order to benefit from the improved security systems, building access and movement within the building must be actively monitored and closely scrutinized. This offer provides additional personnel to staff the two stations at the front coun-terinthemainlobbyofthenewbuildingfrom7:00a.m.tomidnight,MondaythroughFriday.Recordsiscurrentlyauthorizedone Police Services Technician. This offer would create four part-time Station Officer positions whose primary responsibilities will be control access to the secure areas of the building, monitor security systems, and assist citizens.
155.7 Traffic Unit Enhancement - Assoc. Costs - Not Funded 2008 - $85,428 2009 - $25,408Thisisanenhancementrequestfortheassociatedcoststoadd4additionalofficerstotheTrafficUnit.Thecityisdividedinto seven (7) geographical patrol districts in Police Services. Currently there are four traffic unit officers that are assigned several districts apiece in order to address neighborhood traffic concerns. One of the traffic officers is also the trainer/custo-dian of the motorcycles for the unit as well as responsible for the equipment and maintenance of the CRASH team vehicle. Byadding4officerstotheteam,eachpatroldistrictinthecitywillhaveadedicatedofficertoattendtotheneighborhoodtraffic concerns.
155.8 Patrol Division Mobile Citation Units - Not Funded 2008 - $63,000 2009 - $63,000This is a joint offer with the Records Division of Fort Collins Police Services along with Municipal Court and the City Attorney’s Office. Currently officers hand write their traffic tickets, which are then turned in to the Records Division and staff then enters them into the Records Management System (RMS). The tickets are then forwarded to Municipal Court who then processes the tickets and confirms information is correct. Staff at the City Attorney’s Office then spends approximately three hours per week retrieving information so the attorneys can prepare for court. This is an enhancement offer for the Patrol Division to purchase a mobile handheld citation system. The system is comprised of software and 19 handheld citation devices which will feed directly into the Police Department’s traffic citation database eliminating the need to manually enter most citations. In addition, the system will allow the information to be transmitted directly to the courts.

112 - OPERATING BUDGET
SAFE COMMUNITY
155.9 Commercial Vehicle Inspector - Assoc. Costs - Not Funded 2008 - $21,357 2009 - $6,352This offer contains an enhancement to support the associated costs of adding an additional full-time position to the Police Services Traffic Unit dedicated to commercial vehicle enforcement. This function is closely tied to Transportation goals, and has broad impacts on Safer Community goals as well. Specific goals of this enhancement are to minimize and aggressively enforce “port running” commercial vehicles, minimize numbers of unsafe and hazardous materials commercial vehicles/drivers transiting the city, and locate/prosecute improperly loaded/ overweight vehicles contributing to roadway damage.
158.1 Library Park/Old Town Security - Funded 2008 - $20,000 2009 - $20,000The Fort Collins Museum, in partnership with the Downtown Business Association, Downtown Development Authority, Fort Collins Public Library, and Transfort, propose a security offer to significantly decrease persistent security issues in Library Park and Old Town Square. Visitors to the Museum, Library, Transfort stations, and Old Town Square businesses haverepeatedly voiced concerns and complaints regarding transient populations, disorderly conduct, harassment, alcohol and drug violations, prostitution, and other similar criminal conduct. Police Services has responded quickly and effectively, but a continued security presence in Library Park and Old Town Square is the only solution to this public safety concern. It is cost-prohibitive to have officers stationed only in this relatively small area, and this offer enables these organizations to jointly contract a security company to monitor the area and assist the organizations and Police Services in reducing citizen com-plaints and creating a safe community.
178.1 Natural Areas Program – Natural Areas & Trails Rangers - Funded 2008 - $547,647 2009 - $571,703This offer supports public safety and property protection by Natural Areas Rangers on 32,000 acres of city managed natural areas and along 56 miles of public trails throughout the City’s Parks and Natural Areas system. Funding of the Natural Areas and Trails “Ranger” function will be supported through a portion of the dedicated natural areas sales tax revenues including thecity’s“OpenSpace,Yes!”(2002’s_¢salestax)andLarimerCounty’s“HelpPreserveOpenSpace”(1996’s_¢salestax).
178.2 Additional Ranger for 2009 - Funded 2008 - $0 2009 - $59,613This offer seeks to acquire ongoing funding to provide public safety and property protection on 32,000 acres of city managed natural areas and along 56 miles of public trails throughout Fort Collins. Funding of our Natural Areas “Ranger” function would be supported through a portion of the dedicated natural areas sales tax revenues including the city’s “Open Space, Yes!”(2002’s_centsalestax)andLarimerCounty’s“HelpPreserveOpenSpace”(1996’s_centsalestax).
181.1 Traffic Enforcement Offer - Funded 2008 - $785,107 2009 - $781,010This offer consists of maintaining the Traffic Unit of the Patrol Division in Police Services. This unit focuses on the number one safety concern of the citizens in our city. Their sole duty is to enforce the traffic laws in the city. The unit consists of four traffic officers, all of whom are motorcycle certified, a DUI Enforcement officer, and the Traffic Sergeant. The Traffic Unit maintains a Traffic Hotline for citizens to call in their traffic concerns. Unit members follow up on each complaint and enlist the assistance of officers in the Patrol Division as well in these matters by conducting traffic surveys and added enforcement if collected data indicates a true problem.

113 - OPERATING BUDGET
SAFE COMMUNITY
181.2 Camera Radar Offer - Funded 2008 - $747,708 2009 - $750,348This offer consists of maintaining the existing Camera Radar speed van and Camera Red Light program in Police Services. Since its inception in 1995, statistics show nearly a 15% reduction in accidents in the city while the population has risen from99,726in1995toanestimatedpopulationof142,000in2007.Basedonthepopulationandreductionofaccidents,itis obvious that accident reduction has been exponential. The program has also yielded a 20 to 25% increase in 30 Mile Per Hour compliance which is the baseline standard used by operators.
181.3 Traffic Unit Enhancement - Core - Not Funded 2008 - $352,900 2009 - $362,585Thisisanenhancementrequesttoadd4additionalofficerstotheTrafficUnit.Thecityisdividedintoseven(7)geographicalpatroldistricts in Police Services. Currently there are four traffic unit officers that are assigned several districts apiece in order to address neighborhood traffic concerns. One of the traffic officers is also the trainer/custodian of the motorcycles for the unit as well as re-sponsiblefortheequipmentandmaintenanceoftheCRASHteamvehicle.Byadding4officerstotheteam,eachpatroldistrictinthe city will have a dedicated officer to attend to the neighborhood traffic concerns. This is an enhancement to existing services.
181.4 Commercial Vehicle Inspector - Core - Not Funded 2008 - $88,225 2009 - $90,646This offer contains an enhancement to add an additional full-time position to the Police Services Traffic Unit dedicated to commercial vehicle enforcement. This function is closely tied to Transportation goals, and has broad impacts on Safer Com-munity goals as well. Specific goals of this enhancement are to minimize and aggressively enforce “port running” commercial vehicles, minimize numbers of unsafe and hazardous materials commercial vehicles/drivers transiting the city, and locate/prosecute improperly loaded/ overweight vehicles contributing to roadway damage.
186.1 Traffic Calming Infrastructure - Not Funded 2008 - $550,000 2009 - $550,000This offer would fund neighborhood infrastructure renovations to deter speeding. The Traffic Operations Department has had a neighborhood traffic calming program in place for approximately 10 years. Staff has worked with numerous neighborhoods installing signs, pavement markings, speed humps and raised crosswalks. “After Studies” have shown that the program has had a minimal effect at reducing speeding in neighborhoods. This offer would also enhance the appearance of neighbor-hoods while encouraging compliance with the speed limits.
189.1 Investigative Services Package - Funded 2008 - $4,556,718 2009 - $4,750,574This offer includes all the Police General Investigations teams and one special department team that is funded out of the General Investigations Budget. The teams included are; Investigations Administration, Major Crimes Unit, Forensic Com-puterUnit,PropertyUnit,CriminalImpactUnit,VictimsServicesTeamandtheSpecialInvestigationsUnit.Thedepartmentteam funded by the General Investigations Budget is the Physical Fitness Team. All of these Investigations Division Teams investigate crime and work proactively to prevent crime before it occurs. The Physical Fitness Team is a group of department employees who conduct department physical fitness tests twice each year, administer fitness tests to police applicants and work with department personnel to set up personal fitness and nutritional programs.
189.2 Investigations Contractual Services Offer - Funded 2008 - $66,049 2009 - $66,049This offer is being made to maintain funding for the contractual services of the HUB Juvenile Assessment Center. The function of The HUB Juvenile Assessment Center is to coordinate a multi-agency program which contributes to the safety of youth, families, and the community through rapid, thorough assessment; early intervention; and improved access to appro-priate services. The HUB also coordinates and arranges transportation of juvenile offenders to secure detention and court through Larimer County Community Corrections.

114 - OPERATING BUDGET
SAFE COMMUNITY
189.3 School Resource Officer Offer - Funded 2008 - $1,069,880 2009 - $1,118,913TheSchoolResourceOfficersprovideservicesto thePoudreSchoolDistrict’s24,000studentsandfaculty. OneSROisprimarily assigned to each high school and junior high school in the city. In addition, each SRO is assigned to serve primary schools, special education programs, and alternative schools within the city limits as needed. The unit consists of 1 sergeant and 10 detectives.
189.4 Restorative Justice Offer - Funded 2008 - $14,602 2009 - $15,186The Restorative Justice Program consists of 2 part-time employees and 53 volunteers. The program is comprised of 2 pro-grams.TheRestorativeJusticeYouthConferencingprogramprovidesfamily/groupconferencingforyouthandyoungadultswho commit a chargeable offense. This model brings together offenders, victims, community representatives and others who were affected by the crime to decide what harm was done and collectively decide how the offender can repair the harm inflictedbyhis/heractions.Thesecasesareprimarilymisdemeanoroffensesincluding:trespass,assault,harassment,dis-orderly conduct, theft, criminal mischief, and fire offenses. The RESTORE program is family/group conferencing for youth andyoungadultswhocommitshopliftingoffenses.ItprovidesthesameserviceasRJYCinagroupsetting.TheRESTOREprogram is a unique restorative justice process designed and implemented in Fort Collins. The two programs are automatic diversions for first-time youth offenders ticketed into Fort Collins municipal Court. Other referrals come from district court, police, schools and community.
189.5 Economic Crimes Sergeant Upgrade - Not Funded 2008 - $88,316 2009 - $89,006This enhanced offer would fund the upgrade in salary and benefits of a detective position to a sergeant position. This ser-geant would be assigned to the Economics Crime Unit, which currently is part of the Property Unit, with a supervisory span of control of 10 employees. With the upgrade of this position, it is a possibility that the Economics Crime Unit could join with other Larimer County police agencies to form a Task Force that would investigate economic crimes to include, felony fraud/forgery cases and identity theft.
235.1 PFA District & Other Revenue - Funded 2008 - $(4,921,034) 2009 - $(4,750,853)PFA has participated in the BFO process and entered offers for their entire budget. Each of the PFA offers if covered by the City contribution and Fire District revenues. For the City budget, we need to show only the City’s expense and not the PFA expenses that will be covered by the Fire District revenue or PFA reserves. This offer is a negative offer to reduce PFA offers by the amounts that are not funded by the City.

115 - OPERATING BUDGET
SAFE COMMUNITY
Fort Collins is a safe place to live, work, learn and play.
TEAM MEMBERS TeamLeader:JimO’NeillFacilitator:SuzanneJarboe-SimpsonTeamMembers:TriciaDavis,TracyOchsner,DennisBode,RickBachand,JimBroderick,DeanEricksonCommunicationsTeamLiaison:BrentCarmack
INTRODUCTION/SUMMARY OF RESULTS MAP
What makes Fort Collins a Safe Community?
Immediate actions from Police and Fire are the first services that come to mind. We know that citizens who are pleased with the quality of the interactions they have with police and fire every day have an enhanced sense of security. Citizens who trust the fairness and competence of police and fire are more likely to report crime when they are victimized, more likely to cooperate during investigations, more involved in partnerships to resolve neighborhood disorder, and more likely to appear as a witness. However, we believe that the definition of a safe community is broader than simply police or fire assistance. It also includes safe and reliable electric power and storm water infrastructure, well designed, built and maintained structures, and services for those in need. The Safe Community Team discussed the elements that contribute to a safe community, and grouped them us-inganaffinityprocess.Thesefactorgroupingswerethenprioritized.Thefactorgroupings,inpriorityorder,are:
PreventionResponsivenessPlanning and PreparednessCommunity Involvement and Partnerships
INDICATORS
1. CITIZEN PERCEPTION OF SAFETY Measure: Not currently measured DataSource:CommunitySurveyonSafety The results would provide a collective picture of the attitudes, behaviors and experiences of the respon-
dents relative to safety in Fort Collins.
2. VOLUNTARY SPEED COMPLIANCE Measure: Comparison and Evaluation of Speed Compliance in residential areas in Fort Collins DataSource:TrafficOperations Safety on the roads is important to community members and visitors alike. This indicator will help show
the effectiveness of measures designed to promote responsible driving.
3. CRIME INDEX Measure: Uniform Crime Reports: Part I Crimes per 1000 Uniform Crime Reports: Part II Crimes per 1000
116 - OPERATING BUDGET
DataSource:UniformCrimeReports(UCR)ColoradoBureauofInvestigation,CrimeinColorado The UCR numbers are readily available and are tracked by many communities. This data is traditionally
used for trend and comparison analysis. Since no single performance indicator can stand alone as the measure of community safety, it is intended that this non-survey data be used to balance and cross check the survey data collected under Indicator 1.
PURCHASING STRATEGIES
1. Purchasing Strategy #1–WearelookingforoffersthatencourageandsupportPrevention,andareproac-tive,notjustresponsivetosafetyconcerns.Specificallyoffersfor/that:
a) Provide a safe environment (well-lit buildings, streets, parking lots, safe design and inspection of facilities, clean well kept non-residential areas, visible presence of safety personnel, flood control, fire prevention)
b) Provide programs/initiatives that influence driver behavior to promote responsible driving
c) Prevention programs to reduce crime
d) Provide programs for youth involvement
e) Prevention programs to reduce high risk behaviors or incidents
f) Programs that enhance people’s feeling of safety
2. Purchasing Strategy #2–WearelookingforoffersthatencourageandsupportResponsivenesstoacci-dents,crimes,fires,Emergencymedicalservices(EMS)andutilityemergencies.Specificallyoffersfor/that:
a) Provide for well-equipped, trained, caring response teams
b) Promote coordination and response by appropriate agencies
c) Provide for prompt restoration of services in emergency situations
d) Provide flexible, cost efficient, responses to developing community safety issues before they become significant problems
3. Purchasing Strategy # 3–WearelookingforoffersthatencourageandsupportPlanningandPrepared-ness,enablingustobeforwardthinkinginourplanningandpreparations.Specificallyoffersfor/that:
a) Enable appropriate staging of plans, personnel and equipment to deal with natural disasters, utility out ages and significant community events
b) Leverage the use of State and Federal Funding by regional agencies (FEMA, Homeland Security, etc.)
c) Reliable electric power and adequate flood management
d) Aid in business disaster preparedness and recovery
e) Promote strategic problem solving
4. Purchasing Strategy #4 –WearelookingforoffersthatencourageandsupportCommunityInvolvementandPartnershipsthatmakeourcommunitysaferandstronger.Specificallyoffersfor/that:
a) Maximize the resources of local and regional agencies to address safety issues
b) Provide for victim’s assistance
c) Reduce recidivism of juvenile offenders
d) Increase citizen accountability, awareness and involvement in public safety
e) Contract services which make the community safer by providing animal control, detoxification, mental health, substance abuse, and assistance to those in need
f) Encourage Public-Private partnerships to address community safety issues

117 - OPERATING BUDGET
5. Purchasing Strategy # 5–Wearelookingforofferstoprovide: a) Community Survey on the perception of safety. Some similarity to the surveys conducted in 1988, 1995 and 1997. The proposed survey would include
opportunities for respondents to provide self reporting information (i.e. victimization, driving behavior), as well as survey information concerning fear of crime, disorder, traffic safety, etc. The target audience for this survey would include residents, business owners/managers, juveniles and others.
NOTES/PRACTICES/SUPPORTING EVIDENCE
A Safe Community includes services such as:•FirePreventionandResponse•EmergencyMedicalServices•PoliceServices•AssistancetoThoseinNeed•Utilities(StormWater&ElectricPower)•BuildingInspections•DisasterPreparednessandResponse•Planning,Design,Inspection•ConstructionandMaintenanceofInfrastructure
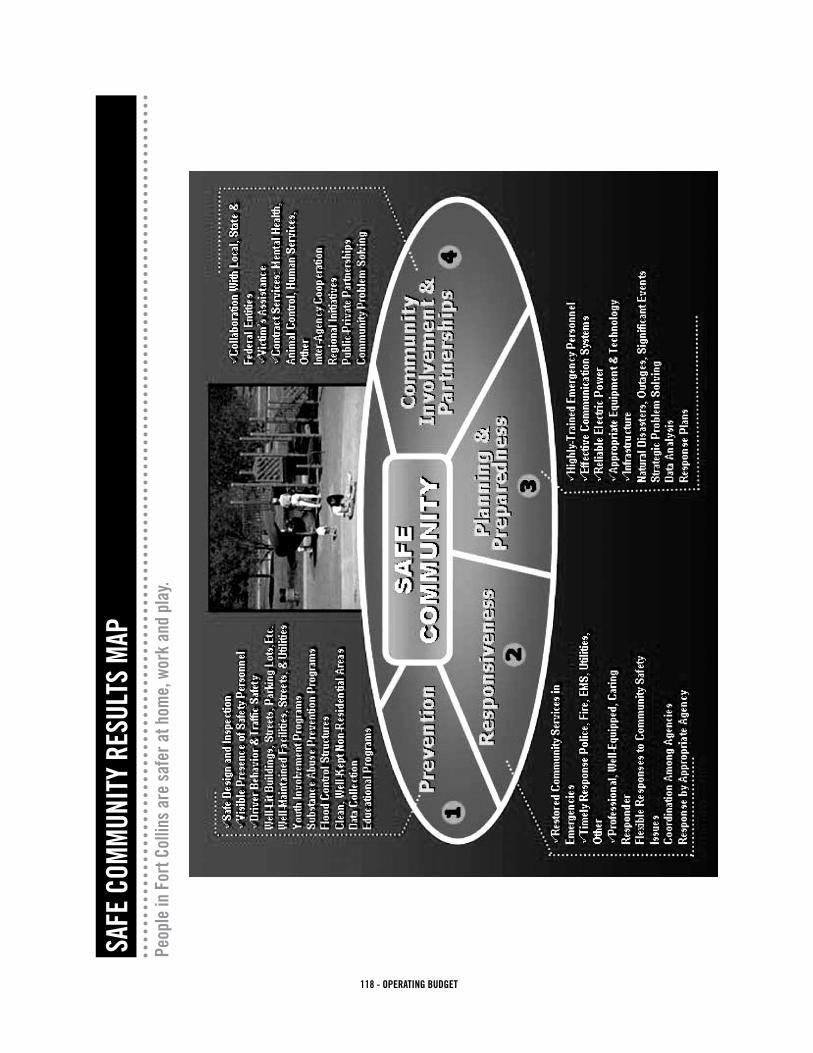
118 - OPERATING BUDGET
Peop
le in
For
t Col
lins
are
safe
r at h
ome,
wor
k an
d pl
ay.
SAFE
COM
MUN
ITY
RESU
LTS
MAP
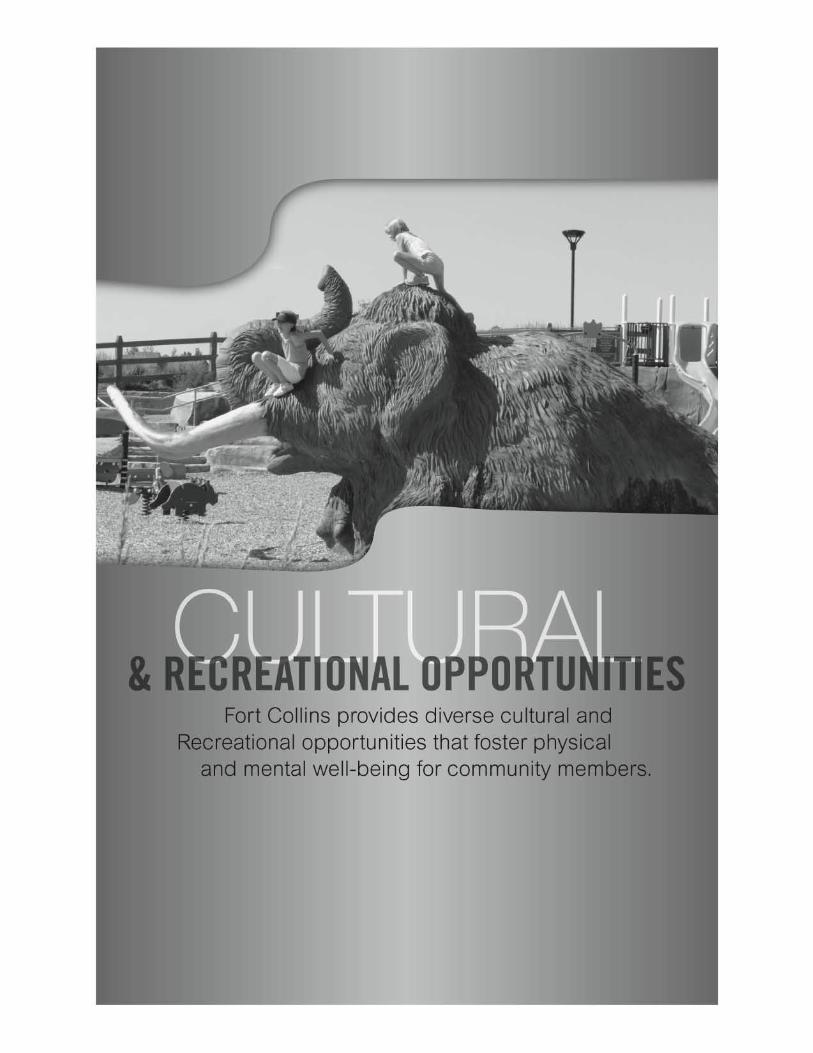
119 - OPERATING BUDGET

120 - OPERATING BUDGET
2008-2009 BUDGET RESULTS
5. CULTURAL & RECREATIONAL OPPORTUNITIES
KEY ISSUES
Fundingfortheoperationofthreenewparksisincludedinthebudget:SpringCanyonCommunityPark,Prov-incetown Neighborhood Park and Registry Ridge Neighborhood Park. These parks are being constructed with Parks capital expansion fees which are collected from new development.
High per visitor costs led the Budget Lead Team to reduce funding for the Gardens on Spring Creek offer. Staff of the program was directed to seek ways to both increase visitor attendance and increase program cost recovery.
Significant budget reductions in parks maintenance over recent years has created unacceptable levels of service in both community and neighborhood parks. Restoration of funding in several programs is included in the bud-get, including seasonal staffing, trail mowing, and weed control.
The City is currently undertaking a major review of the Parks Master Plan. This policy review may significantly impact future costs for parks by examining the standards under which both neighborhood and community parks are constructed. Though the long-term impact of any changes is not yet known, it may be a significant issue in future budget years as the City works to maintain existing infrastructure and assure that new facilities identify operation and maintenance funding sources as a part of their development.
In the 2006-07 Budget, Library Services were included in this result area. With voter approval of the Library District in 2006, Library Services are no longer included in the City budget, except as a revenue source for certain administrative support contributions from the Library to the City within the High-Performing Govern-ment result area.
0 2 4 6 8 10 12
2008 GENERAL FUND & OTHER FUNDS – 30.1M2009 GENERAL FUND & OTHER FUNDS – 31.4M
GENERAL FUND
NATURAL AREAS
RECREATION
SALES & USENEIGHBORHOOD
PARKLANDCON TRUST
CULTURE SERVICES
GOLF
CEMETERIES
PERP CARE
3.9M2.5M
5.3M5.2M
744K3.3M
MILLIONS
2M1.5M
1.4M1.4M
3.4M3.5M
2.7M2.8M
338K338K
70K70K
10.4M10.7M
20082009
20082009

121 - OPERATING BUDGET
REVENUE TRENDS & ISSUES
In addition to significant general revenues which are used to support cultural and recreational programs, a number of dedicated and restricted revenues are included in this Result Area. User fees support both recre-ation facilities and cultural facilities.
In 2008 and 2009, additional Conservation Trust revenues will be used to support new parks. These revenues were previously allocated to new trail construction.
KEY PURCHASES
•Existingrecreationfacilities(CityParkPool,CenterandRailway,EPIC,SeniorCenter,MulberryPool,PotteryStudio, Rolland Moore Racquet Complex, Skate Park Facilities, the Farm at Lee Martinez Park)
•ParkandTrailMaintenanceandPlanning
•OperationandmaintenanceoftheNewNorthsideAztlanCommunityCenter
•MuseumPrograms
•ArtinPublicPlacesProgram(programtobereviewedin2008)
•LincolnCenter
•GolfCourses
•MemorialParks
•GardensonSpringCreek
ENHANCEMENTS PURCHASED
•ParksMaintenanceprogramrestorationsincludingseasonalstaffing,trailmowing,andweedcontrol
•Useofone-timereservesforplanningandpreparingfortheexpansionoftheFortCollinsMuseumasitde-velops its joint facility with the Discovery Science Center.
•AdditionalstaffforthenewNorthsideAztlanCommunityCenter.
EXAMPLES OF SERVICES NOT PURCHASED
•One-timefundingforCitymaintenanceofthePicnicRockrecreationarea,ownedbytheStateDivisionofWildlife discontinued in 2009
•GardensonSpringCreekenhancements
•BeetStreet/CentralizedTicketingandProgramming
•EnhancementoftheRecreationScholarshipprogrambeyondthe2006-07levelofservice
•AdditionalrestorationsofoperatingresourcesforParks
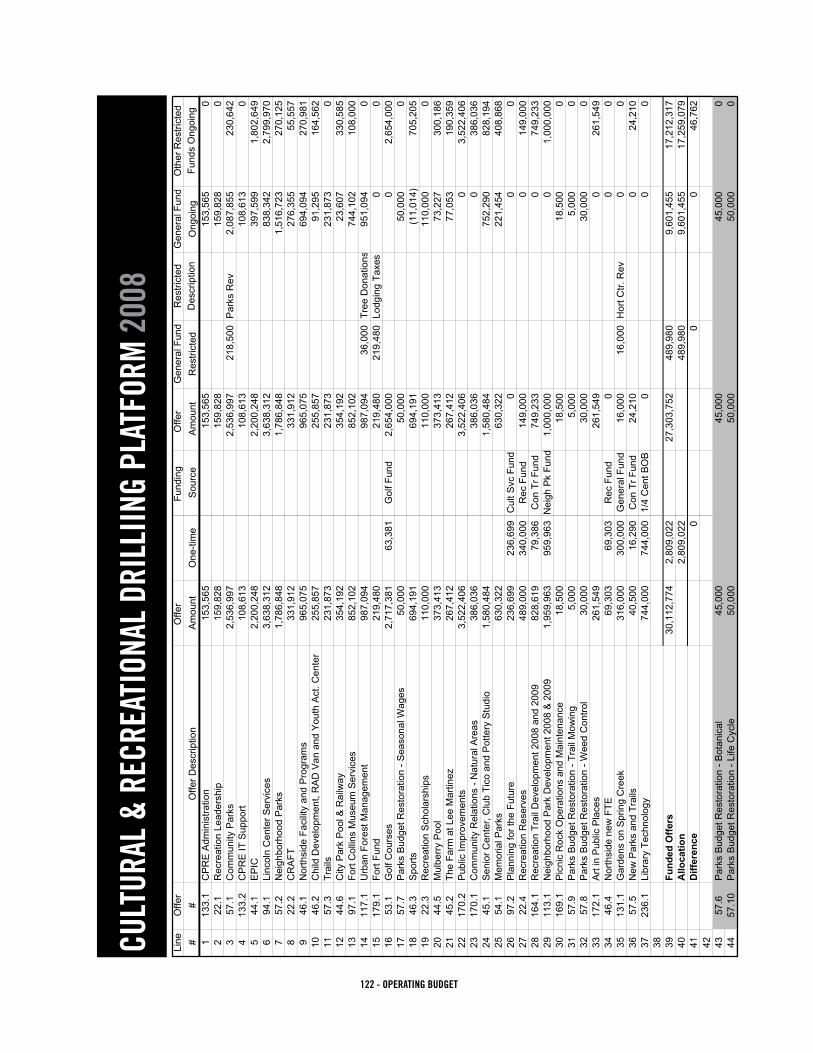
122 - OPERATING BUDGET
CULT
URAL
& R
ECRE
ATIO
NAL
DRIL
LIIN
G PL
ATFO
RM 2
008
CU
LTU
RA
L &
REC
REA
TIO
N O
PPO
RTU
NIT
IES
DR
ILLI
NG
PLA
TFO
RM
- 20
08
One
-tim
e O
ngoi
ngLi
neO
ffer
Offe
r
Fund
ing
Offe
r G
ener
al F
und
Res
trict
edG
ener
al F
und
Oth
er R
estri
cted
##
Offe
r Des
crip
tion
Am
ount
One
-tim
eS
ourc
eA
mou
ntR
estri
cted
Des
crip
tion
Ong
oing
Fund
s O
ngoi
ng
113
3.1
CP
RE
Adm
inis
tratio
n15
3,56
515
3,56
515
3,56
50
222
.1R
ecre
atio
n Le
ader
ship
159,
828
159,
828
159,
828
03
57.1
Com
mun
ity P
arks
2,53
6,99
72,
536,
997
218,
500
Par
ks R
ev2,
087,
855
230,
642
413
3.2
CP
RE
IT S
uppo
rt10
8,61
310
8,61
310
8,61
30
544
.1E
PIC
2,20
0,24
82,
200,
248
397,
599
1,80
2,64
96
94.1
Linc
oln
Cen
ter S
ervi
ces
3,63
8,31
23,
638,
312
838,
342
2,79
9,97
07
57.2
Nei
ghbo
rhoo
d P
arks
1,78
6,84
81,
786,
848
1,51
6,72
327
0,12
58
22.2
CR
AFT
331,
912
331,
912
276,
355
55,5
579
46.1
Nor
thsi
de F
acili
ty a
nd P
rogr
ams
965,
075
965,
075
694,
094
270,
981
1046
.2C
hild
Dev
elop
men
t, R
AD
Van
and
You
th A
ct. C
ente
r25
5,85
725
5,85
791
,295
164,
562
1157
.3Tr
ails
231,
873
231,
873
231,
873
012
44.6
City
Par
k P
ool &
Rai
lway
354,
192
354,
192
23,6
0733
0,58
513
97.1
Fort
Col
lins
Mus
eum
Ser
vice
s85
2,10
285
2,10
274
4,10
210
8,00
014
117.
1U
rban
For
est M
anag
emen
t98
7,09
498
7,09
436
,000
Tree
Don
atio
ns95
1,09
40
1517
9.1
Fort
Fund
219,
480
219,
480
219,
480
Lodg
ing
Taxe
s0
016
53.1
Gol
f Cou
rses
2,71
7,38
163
,381
Gol
f Fun
d2,
654,
000
02,
654,
000
1757
.7P
arks
Bud
get R
esto
ratio
n - S
easo
nal W
ages
50,0
0050
,000
50,0
000
1846
.3S
ports
694,
191
694,
191
(11,
014)
705,
205
1922
.3R
ecre
atio
n S
chol
arsh
ips
110,
000
110,
000
110,
000
020
44.5
Mul
berr
y P
ool
373,
413
373,
413
73,2
2730
0,18
621
45.2
The
Farm
at L
ee M
artin
ez26
7,41
226
7,41
277
,053
190,
359
2217
0.2
Pub
lic Im
prov
emen
ts3,
522,
406
3,52
2,40
60
3,52
2,40
623
170.
1C
omm
unity
Rel
atio
ns -
Nat
ural
Are
as38
6,03
638
6,03
60
386,
036
2445
.1S
enio
r Cen
ter,
Clu
b Ti
co a
nd P
otte
ry S
tudi
o1,
580,
484
1,58
0,48
475
2,29
082
8,19
425
54.1
Mem
oria
l Par
ks63
0,32
263
0,32
222
1,45
440
8,86
826
97.2
Pla
nnin
g fo
r the
Fut
ure
236,
699
236,
699
Cul
t Svc
Fun
d0
00
2722
.4R
ecre
atio
n R
eser
ves
489,
000
340,
000
Rec
Fun
d14
9,00
00
149,
000
2816
4.1
Rec
reat
ion
Trai
l Dev
elop
men
t 200
8 an
d 20
0982
8,61
979
,386
Con
Tr F
und
749,
233
074
9,23
329
113.
1N
eigh
borh
ood
Par
k D
evel
opm
ent 2
008
& 2
009
1,95
9,96
395
9,96
3N
eigh
Pk
Fund
1,00
0,00
00
1,00
0,00
030
169.
1P
icni
c R
ock
Ope
ratio
ns a
nd M
aint
enan
ce18
,500
18,5
0018
,500
031
57.9
Par
ks B
udge
t Res
tora
tion
- Tra
il M
owin
g5,
000
5,00
05,
000
032
57.8
Par
ks B
udge
t Res
tora
tion
- Wee
d C
ontro
l30
,000
30,0
0030
,000
033
172.
1A
rt in
Pub
lic P
lace
s26
1,54
926
1,54
90
261,
549
3446
.4N
orth
side
new
FTE
69,3
0369
,303
Rec
Fun
d0
00
3513
1.1
Gar
dens
on
Spr
ing
Cre
ek31
6,00
030
0,00
0G
ener
al F
und
16,0
0016
,000
Hor
t Ctr.
Rev
00
3657
.5N
ew P
arks
and
Tra
ils40
,500
16,2
90C
on T
r Fun
d24
,210
024
,210
3723
6.1
Libr
ary
Tech
nolo
gy74
4,00
074
4,00
01/
4 C
ent B
OB
00
038
39
Fund
ed O
ffers
30,1
12,7
742,
809,
022
27,3
03,7
5248
9,98
09,
601,
455
17,2
12,3
1740
Allo
catio
n2,
809,
022
48
9,98
09,
601,
455
17,2
59,0
7941
Diff
eren
ce0
00
46,7
6242 43
57.6
Par
ks B
udge
t Res
tora
tion
- Bot
anic
al45
,000
45,0
0045
,000
044
57.1
0P
arks
Bud
get R
esto
ratio
n - L
ife C
ycle
50,0
0050
,000
50,0
000
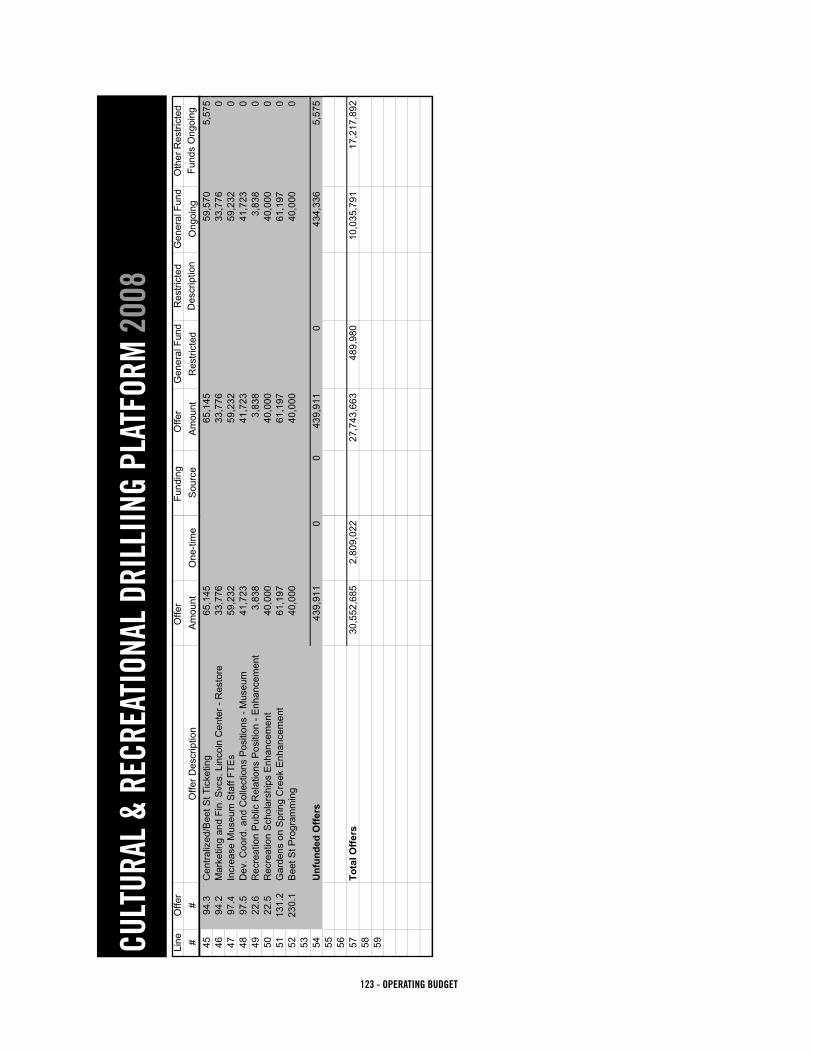
123 - OPERATING BUDGET
CULT
URAL
& R
ECRE
ATIO
NAL
DRIL
LIIN
G PL
ATFO
RM 2
008
CU
LTU
RA
L &
REC
REA
TIO
N O
PPO
RTU
NIT
IES
DR
ILLI
NG
PLA
TFO
RM
- 20
08
One
-tim
e O
ngoi
ngLi
neO
ffer
Offe
r
Fund
ing
Offe
r G
ener
al F
und
Res
trict
edG
ener
al F
und
Oth
er R
estri
cted
##
Offe
r Des
crip
tion
Am
ount
One
-tim
eS
ourc
eA
mou
ntR
estri
cted
Des
crip
tion
Ong
oing
Fund
s O
ngoi
ng
4594
.3C
entra
lized
/Bee
t St T
icke
ting
65,1
4565
,145
59,5
705,
575
4694
.2M
arke
ting
and
Fin.
Svc
s. L
inco
ln C
ente
r - R
esto
re33
,776
33,7
7633
,776
047
97.4
Incr
ease
Mus
eum
Sta
ff FT
Es
59,2
3259
,232
59,2
320
4897
.5D
ev. C
oord
. and
Col
lect
ions
Pos
ition
s - M
useu
m41
,723
41,7
2341
,723
049
22.6
Rec
reat
ion
Pub
lic R
elat
ions
Pos
ition
- E
nhan
cem
ent
3,83
83,
838
3,83
80
5022
.5R
ecre
atio
n S
chol
arsh
ips
Enh
ance
men
t40
,000
40,0
0040
,000
051
131.
2G
arde
ns o
n S
prin
g C
reek
Enh
ance
men
t61
,197
61,1
9761
,197
052
230.
1B
eet S
t Pro
gram
min
g 40
,000
40,0
0040
,000
053 54
Unf
unde
d O
ffers
439,
911
00
439,
911
043
4,33
65,
575
55
56 57
Tota
l Offe
rs30
,552
,685
2,80
9,02
2
27,7
43,6
6348
9,98
010
,035
,791
17,2
17,8
9258 59

124 - OPERATING BUDGET
CULT
URAL
& R
ECRE
ATIO
NAL
DRIL
LIIN
G PL
ATFO
RM 2
009
CU
LTU
RA
L, R
ECR
EATI
ON
AN
D E
DU
CA
TIO
N D
RIL
LIN
G P
LATF
OR
M -
2009
Line
Offe
rO
ffer
Fu
ndin
g O
ffer
Gen
eral
Fun
dR
estri
cted
Gen
eral
Fun
dO
ther
Res
trict
ed#
#O
ffer D
escr
iptio
nA
mou
ntO
ne-ti
me
Sou
rce
Am
ount
Res
trict
edD
escr
iptio
nO
ngoi
ngFu
nds
Ong
oing
1
133.
1C
PR
E A
dmin
istra
tion
158,
718
158,
718
158,
718
222
.1R
ecre
atio
n Le
ader
ship
164,
716
164,
716
164,
716
357
.1C
omm
unity
Par
ks2,
677,
934
2,67
7,93
421
8,50
0P
arks
Rev
2,16
6,25
929
3,17
54
133.
2C
PR
E IT
Sup
por t
112,
803
112,
803
112,
803
544
.1E
PIC
2,25
0,54
72,
250,
547
411,
215
1,83
9,33
26
94.1
Linc
oln
Cen
ter S
ervi
ces
3,
783,
560
3,78
3,56
087
0,02
72,
913,
533
757
.2N
eigh
borh
ood
Par
ks1,
777,
167
1,77
7,16
71,
566,
926
210,
241
822
.2C
RA
FT33
4,88
533
4,88
528
8,17
346
,712
946
.1N
orth
side
Fac
ility
and
Pro
gram
s1,
000,
640
1,00
0,64
072
7,67
527
2,96
510
46.2
Chi
ld D
evel
opm
ent,
RA
D V
an a
nd Y
outh
Act
. Cen
ter
261,
583
261,
583
92,9
1716
8,66
611
57.3
Trai
ls24
0,01
324
0,01
324
0,01
30
1244
.6C
ity P
ark
Poo
l & R
ailw
ay36
6,79
536
6,79
529
,805
336,
990
1397
.1Fo
rt C
olln
s M
useu
m S
ervi
ces
892,
677
892,
677
768,
677
124,
000
1411
7.1
Urb
an F
ores
t Man
agem
ent
1,02
1,36
51,
021,
365
37,0
00Tr
ee D
onat
ions
984,
365
015
179.
1Fo
rt Fu
nd22
3,87
222
3,87
222
3,87
2Lo
dgin
g Ta
xes
00
1653
.1G
olf C
ours
es
2,78
7,94
267
,942
Gol
f Fun
d2,
720,
000
02,
720,
000
1757
.7P
arks
Bud
get R
esto
ratio
n - S
easo
nal W
ages
50,0
0050
,000
50,0
000
1846
.3S
ports
705,
270
705,
270
(2,9
15)
708,
185
1922
.3R
ecre
atio
n S
chol
arsh
ips
110,
000
110,
000
110,
000
020
44.5
Mul
berr
y P
ool
379,
699
379,
699
73,2
6830
6,43
121
45.2
The
Farm
at L
ee M
artin
e z27
7,42
327
7,42
386
,976
190,
447
2217
0.2
Pub
lic Im
prov
emen
ts2,
102,
233
2,10
2,23
30
2,10
2,23
323
170.
1C
omm
unity
Rel
atio
ns -
Nat
ural
Are
as38
7,29
638
7,29
60
387,
296
2445
.1S
enio
r Cen
ter,
Clu
b Ti
co a
nd P
otte
ry S
tudi
o1,
648,
245
1,64
8,24
578
1,86
086
6,38
525
54.1
Mem
oria
l Par
ks65
1,97
165
1,97
124
3,08
840
8,88
326
97.2
Pla
nnin
g fo
r the
Fut
ure
215,
656
15,6
56C
ult S
vc F
und
200,
000
200,
000
027
22.4
Rec
reat
ion
Res
erve
s53
9,00
039
0,00
0R
ec F
und
149,
000
014
9,00
028
164.
1R
ecre
atio
n Tr
ail D
evel
opm
ent 2
008
and
2009
837,
970
41,3
86C
on T
r Fun
d79
6,58
40
796,
584
2911
3.1
Nei
ghbo
rhoo
d P
ark
Dev
elop
men
t 200
8 &
200
91,
478,
052
478,
052
Nei
gh P
k Fu
nd1,
000,
000
01,
000,
000
3017
2.1
Art
in P
ublic
Pla
ces
200,
748
200,
748
200,
748
031
46.4
Nor
thsi
de n
ew F
TE72
,306
72,3
06R
ec F
und
00
032
131.
1G
arde
ns o
n S
prin
g C
ree k
334,
000
315,
000
Gen
eral
Fun
d19
,000
19,0
00H
ort C
tr. R
ev0
033
57.5
New
Par
ks a
nd T
rails
75,5
0055
,195
Con
Tr F
und
20,3
050
20,3
0534
236.
1Li
brar
y Te
chno
logy
744,
000
744,
000
1/4
Cen
t BO
B0
035
237.
1Li
ncol
n C
ente
r Ren
ovat
ion
2,21
7,43
62,
217,
436
1/4
Cen
t BO
B0
036
238.
1P
ark
Upg
rade
s an
d E
nhan
cem
ent s
304,
897
304,
897
1/4
Cen
t BO
B0
037 38
Fund
ed O
ffers
31,3
86,9
194,
701,
870
26,6
85,0
4949
8,37
210
,325
,314
15,8
61,3
6339
Allo
catio
n4,
701,
870
498,
372
9,92
4,56
616
,308
,858
40D
iffer
ence
00
(400
,748
)44
7,49
541 42
169.
1P
icni
c R
ock
Ope
ratio
ns a
nd M
aint
enan
c e18
,500
18,5
0018
,500
4357
.9P
arks
Bud
get R
esto
ratio
n - T
rail
Mow
ing
5,13
55,
135
5,13
544
57.8
Par
ks B
udge
t Res
tora
tion
- Wee
d C
ontro
l30
,000
30,0
0030
,000
0
1 of
2
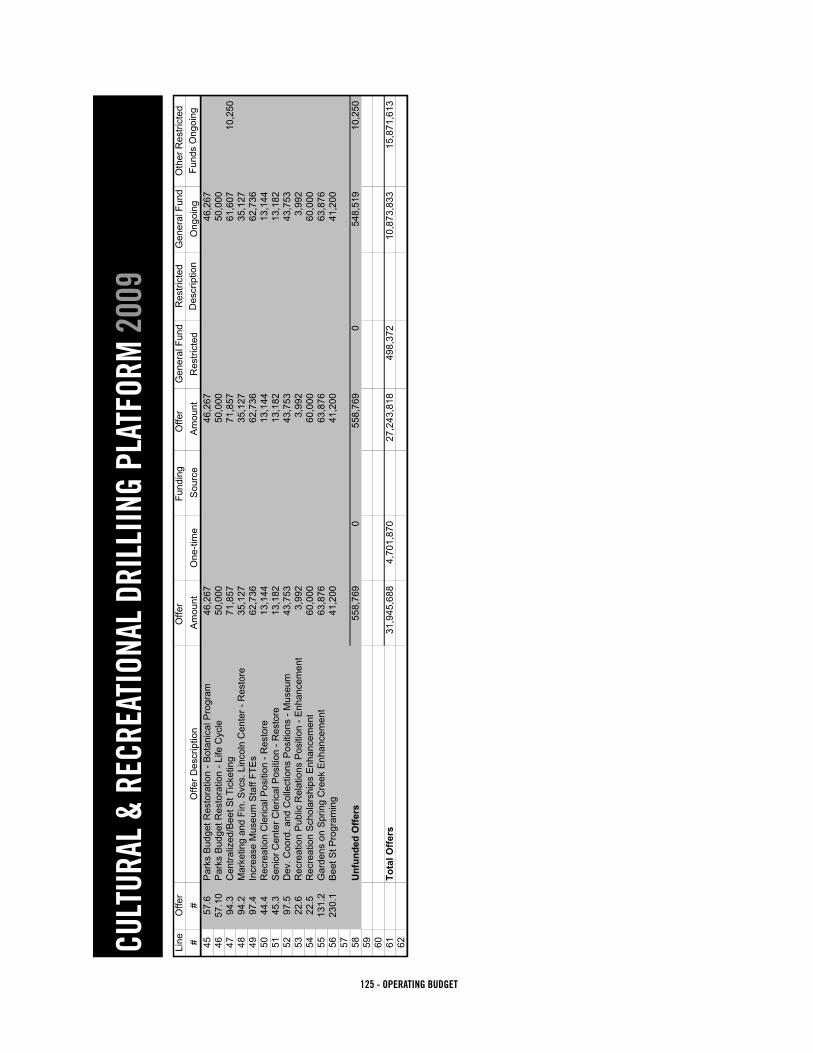
125 - OPERATING BUDGET
CULT
URAL
& R
ECRE
ATIO
NAL
DRIL
LIIN
G PL
ATFO
RM 2
009
CU
LTU
RA
L, R
ECR
EATI
ON
AN
D E
DU
CA
TIO
N D
RIL
LIN
G P
LATF
OR
M -
2009
Line
Offe
rO
ffer
Fu
ndin
g O
ffer
Gen
eral
Fun
dR
estri
cted
Gen
eral
Fun
dO
ther
Res
trict
ed#
#O
ffer D
escr
iptio
nA
mou
ntO
ne-ti
me
Sou
rce
Am
ount
Res
trict
edD
escr
iptio
nO
ngoi
ngFu
nds
Ong
oing
4557
.6P
arks
Bud
get R
esto
ratio
n - B
otan
ical
Pro
gram
46,2
6746
,267
46,2
6746
57.1
0P
arks
Bud
get R
esto
ratio
n - L
ife C
ycle
50,0
0050
,000
50,0
0047
94.3
Cen
traliz
ed/B
eet S
t Tic
ketin
g71
,857
71,8
5761
,607
10,2
5048
94.2
Mar
ketin
g an
d Fi
n. S
vcs.
Lin
coln
Cen
ter -
Res
tor e
35,1
2735
,127
35,1
2749
97.4
Incr
ease
Mus
eum
Sta
ff FT
Es
62,7
3662
,736
62,7
3650
44.4
Rec
reat
ion
Cle
rical
Pos
ition
- R
esto
re13
,144
13,1
4413
,144
5145
.3S
enio
r Cen
ter C
leric
al P
ositi
on -
Res
tore
13
,182
13,1
8213
,182
5297
.5D
ev. C
oord
. and
Col
lect
ions
Pos
ition
s - M
useu
m43
,753
43,7
5343
,753
5322
.6R
ecre
atio
n P
ublic
Rel
atio
ns P
ositi
on -
Enh
ance
men
t3,
992
3,99
23,
992
5422
.5R
ecre
atio
n S
chol
arsh
ips
Enh
ance
men
t60
,000
60,0
0060
,000
5513
1.2
Gar
dens
on
Spr
ing
Cre
ek E
nhan
cem
ent
63,8
7663
,876
63,8
7656
230.
1B
eet S
t Pro
gram
ing
41,2
0041
,200
41,2
0057 58
Unf
unde
d O
ffers
558,
769
055
8,76
90
548,
519
10,2
5059
60 61
Tota
l Offe
rs31
,945
,688
4,70
1,87
027
,243
,818
498,
372
10,8
73,8
3315
,871
,613
62
2 of
2
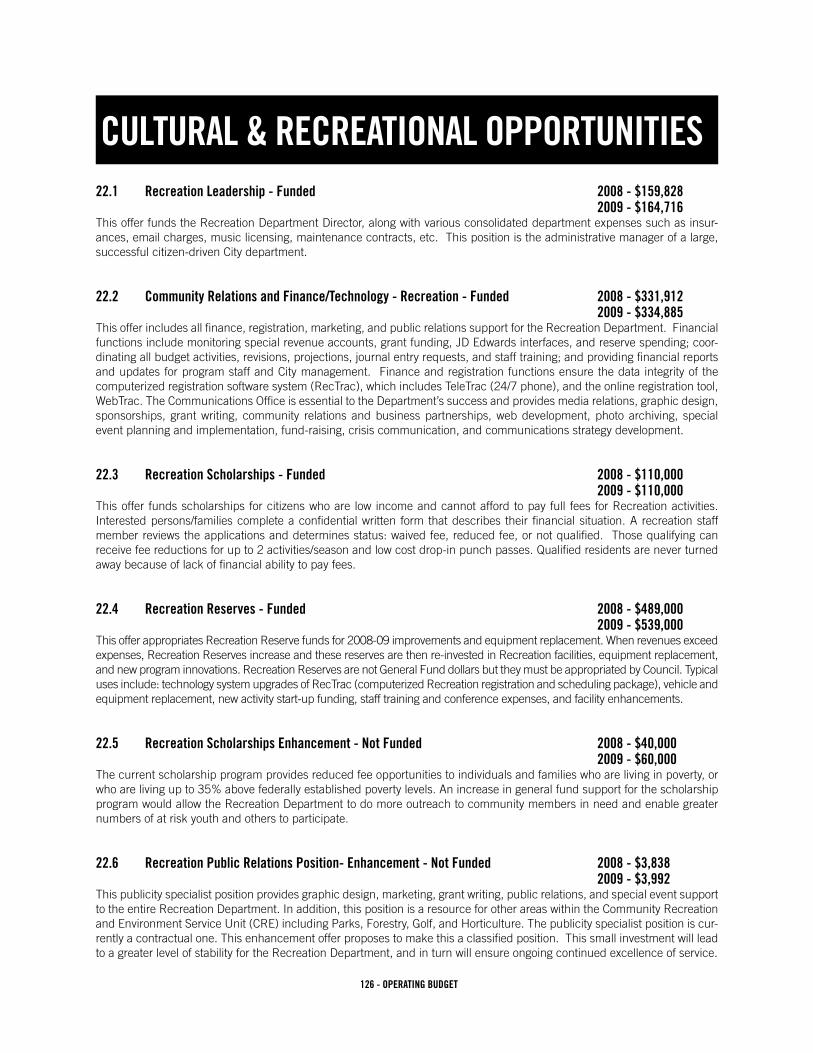
126 - OPERATING BUDGET
CULTURAL & RECREATIONAL OPPORTUNITIES
22.1 Recreation Leadership - Funded 2008 - $159,828 2009 - $164,716This offer funds the Recreation Department Director, along with various consolidated department expenses such as insur-ances, email charges, music licensing, maintenance contracts, etc. This position is the administrative manager of a large, successful citizen-driven City department.
22.2 Community Relations and Finance/Technology - Recreation - Funded 2008 - $331,912 2009 - $334,885This offer includes all finance, registration, marketing, and public relations support for the Recreation Department. Financial functions include monitoring special revenue accounts, grant funding, JD Edwards interfaces, and reserve spending; coor-dinating all budget activities, revisions, projections, journal entry requests, and staff training; and providing financial reports and updates for program staff and City management. Finance and registration functions ensure the data integrity of the computerizedregistrationsoftwaresystem(RecTrac),whichincludesTeleTrac(24/7phone),andtheonlineregistrationtool,WebTrac. The Communications Office is essential to the Department’s success and provides media relations, graphic design, sponsorships, grant writing, community relations and business partnerships, web development, photo archiving, special event planning and implementation, fund-raising, crisis communication, and communications strategy development.
22.3 Recreation Scholarships - Funded 2008 - $110,000 2009 - $110,000This offer funds scholarships for citizens who are low income and cannot afford to pay full fees for Recreation activities. Interested persons/families complete a confidential written form that describes their financial situation. A recreation staff memberreviewstheapplicationsanddeterminesstatus:waivedfee,reducedfee,ornotqualified.Thosequalifyingcanreceivefeereductionsforupto2activities/seasonandlowcostdrop-inpunchpasses.Qualifiedresidentsareneverturnedaway because of lack of financial ability to pay fees.
22.4 Recreation Reserves - Funded 2008 - $489,000 2009 - $539,000This offer appropriates Recreation Reserve funds for 2008-09 improvements and equipment replacement. When revenues exceed expenses, Recreation Reserves increase and these reserves are then re-invested in Recreation facilities, equipment replacement, and new program innovations. Recreation Reserves are not General Fund dollars but they must be appropriated by Council. Typical usesinclude:technologysystemupgradesofRecTrac(computerizedRecreationregistrationandschedulingpackage),vehicleandequipment replacement, new activity start-up funding, staff training and conference expenses, and facility enhancements.
22.5 Recreation Scholarships Enhancement - Not Funded 2008 - $40,000 2009 - $60,000The current scholarship program provides reduced fee opportunities to individuals and families who are living in poverty, or who are living up to 35% above federally established poverty levels. An increase in general fund support for the scholarship program would allow the Recreation Department to do more outreach to community members in need and enable greater numbers of at risk youth and others to participate.
22.6 Recreation Public Relations Position- Enhancement - Not Funded 2008 - $3,838 2009 - $3,992This publicity specialist position provides graphic design, marketing, grant writing, public relations, and special event support to the entire Recreation Department. In addition, this position is a resource for other areas within the Community Recreation and Environment Service Unit (CRE) including Parks, Forestry, Golf, and Horticulture. The publicity specialist position is cur-rently a contractual one. This enhancement offer proposes to make this a classified position. This small investment will lead to a greater level of stability for the Recreation Department, and in turn will ensure ongoing continued excellence of service.

127 - OPERATING BUDGET
CULTURAL & RECREATIONAL OPPORTUNITIES
44.1 EPIC - Funded 2008 - $2,200,248 2009 - $2,250,547This offer provides funds to manage Edora Pool Ice Center (EPIC), Old Town Ice Rink, and Adaptive Recreation programs, including American with Disabilities Act (ADA) support services. EPIC activities include drop-in swim and skate, instruction, specialized activities and events, competitions, and rentals. EPIC is the local venue for high school competitive swimming, diving and hockey events. The offer also provides recreational opportunities for citizens of all ages with disabilities. The trained certified therapeutic recreation staff strives to provide equal access, support, and services that allow persons with dis-abilities to participate in recreation programs and facilities to their fullest capabilities. Outdoor skating in Old Town is provided in conjunction with the Downtown Development Authority and Downtown Business Association during the holidays.
44.4 Recreation Clerical Position - Restore - Not Funded 2008 - $0 2009 - $13,144This offer proposes to restore the 0.25 FTE clerical position that was eliminated as part of the 2006-07 budget process. The recreation services representative is currently a 0.75 classified employee with many responsibilities. This position is respon-sible for overseeing the front desk area, scheduling hourly front desk employees, training new employees on the RecTrac registration system, resolving customer service issues, balancing revenue collection on a daily basis, entering background checks for all new employees and volunteers, processing purchase orders, processing and documenting all scholarship applications, compiling year end statistical information, collecting customer satisfaction survey data, working on special projects, and maintaining seamless registration and customer service to patrons during the hours of operation (100 hours, 7 days per week).
44.5 Mulberry Pool - Funded 2008 - $373,413 2009 - $379,699This offer provides and funds quality swimming programs at Mulberry Pool. Activities include drop-in swimming, leisure water play, swim instruction, specialized programs such as kayaking and birthday parties, and facility rentals. Child develop-ment classes are also held in the upstairs classroom.
44.6 City Park Pool and Railway - Funded 2008 - $354,192 2009 - $366,795This offer provides and funds quality swimming programs at City Park Pool, paddle boat rides on Sheldon Lake, and rides on the City Park Railway. Activities include drop-in swimming, leisure water play, boating, train rides, swim instruction, special-ized programs such as kayaking and birthday parties, and facility rentals. The food concession operation at City Park Pool is also included in this offer.
45.1 Senior Center, Club Tico and Potter Studio - Funded 2008 - $1,580,484 2009 - $1,648,245This offer includes funding for the operation of the Senior Center, Club Tico and the Pottery Studio. Programs include arts, crafts, pottery, aquatics, dance, lifelong learning, music and drama, health and wellness, fitness, sports, travel, outdoor ad-venture, volunteer opportunities, a variety of services, and social events. The Senior Center is a focal point for adult services, with emphasis on adults age 50 and older. The center includes a multi-use room, stage, kitchen, gymnasium, swimming pool, spa, locker rooms, library/media center, pool and snooker room, walk/jog track, class and meeting rooms, lounge and reception area, and community gardens. Club Tico is part of this offer, with dance as the predominant activity. The Pottery Studio houses a full range of pottery programs and classes.

128 - OPERATING BUDGET
CULTURAL & RECREATIONAL OPPORTUNITIES
45.2 The Farm at Lee Martinez - Funded 2008 - $267,412 2009 - $277,423This offer funds operation and programming at The Farm, a 12-acre community educational facility located in Lee Martinez Park. It is open year-round to drop in visitors and provides farm activities including pony rides and lessons, Pee Wee Farmers classes, day camps, the resident cats, birthday parties, and the old-fashioned hand pump. There are four main buildings at The Farm and numerous outbuildings and sheds. Staff at this facility educates participants about farm life, history, and farm animals through a variety of challenging and exciting programs. A portion of The Farm is dedicated to the history of farming through displays at the Rotary Club-supported Heritage Museum. Activities are designed primarily for children; however, entire families enjoy many of the events.
45.3 Senior Center Clerical Position -Restore - Not Funded 2008 - $0 2009 - $13,182This offer proposes to restore the 0.25 FTE clerical position that was eliminated as part of the 2006-07 budget process. The recreation services representative is currently a 0.75 classified employee with many responsibilities. This position is respon-sible for overseeing the front desk area, scheduling hourly front desk employees, training new employees on the RecTrac registration system, resolving customer service issues, balancing revenue collection on a daily basis, entering background checks for all new employees and volunteers, processing purchase orders, processing and documenting all scholarship applications, compiling year end statistical information, collecting customer satisfaction survey data, working on special projects, and maintaining seamless registration and customer service to patrons during the hours of operation (100 hours, 7 days per week).
46.1 Northside Facility and Programs - Funded 2008 - $ 965,075 2009 - $1,000,640This offer supports the new 50,000 square-foot Northside Aztlan Community Center (NACC) that replaces the original facil-ity constructed in 1978. Staff plans educational classes, assistance with home work, programs for low income residents, music, dancing, fitness, child development classes, community-wide cultural events, sports, and outdoor activities. Located adjacent to the Poudre River and trail just north of Old Town, this facility includes a large drop-in workout area and indoor jog/walk track, 3 gymnasiums, computer lab, lounge, classrooms, kitchen, and a large event area. This facility is well positioned as an important venue for Beet Street events, in addition to the multitude of daily activities held there.
46.2 Child Development, RAD Van, and YAC - Funded 2008 - $255,857 2009 - $261,583ThisoffersupportsChildDevelopment,theRAD(RecreationAtyourDoor)Vanprogram,andoperationofthedownsizedYouthActivityCenter(YAC).Childdevelopmentprovidesdevelopmentalactivitiesforyouthages9monthsto12years.Staffprograms learning experiences for toddlers, parents and children together, preschool, and elementary age children that encouragesocialization,independence,education,creativity,andfun.There-designedYAC,NorthsideAztlanCommunityCenter,MulberryPool,ClubTico,andEPICareutilizedasprogrammingsites.YouthinlowerincomeneighborhoodsareservedbytheRADVanprogram.Educationalandrecreationalactivitiesthatmaynototherwisebeaccessibleareprovidedas a free drop-in program. Children ages 5-12 participate in a wide variety of activities that promote self-esteem and neigh-borhoodcohesiveness.FundingisincludedtooperatethedownsizedYAC,includingthegymnasiumandtwoclassroomsat the facility’s current location.
46.3 Sports - Funded 2008 - $694,191 2009 - $705,270This offer provides funding for sports activities for youths from 5 years old to adults of all ages, through participation in sports. Youthactivitiesincludeteamandindividualsportsforelementaryandjuniorhigh-ageboysandgirls.Organizedadultsportsprograms for men and women ages 16 and older include leagues and tournaments in a supervised environment to ensure safety for spectators and participants at a fair cost to citizens. All activities are held at Americans With Disabilities (ADA)-compliant indoor and outdoor athletic facilities.
129 - OPERATING BUDGET
CULTURAL & RECREATIONAL OPPORTUNITIES
46.4 Northside new FTE - Funded 2008 - $69,303 2009 - $72,306This enhancement offer to the Northside Aztlan Community Center (NACC) offer provides an increased level of service in the facility scheduling, rental, and community coordination area by adding one classified full-time staff member to perform these services. Because of recent downsizing of staff in the Recreation Department, there is not a current staff member who can take on these responsibilities.
53.1 Golf Courses - Funded 2008 - $2,717,381 2009 - $2,787,942This offer is for the total management, operations, maintenance, and administration of City Park Nine, Collindale, and South-Ridge Golf Courses. The services provided at the three municipal golf facilities include quality grounds and infrastructure maintenance, customer services that offer for sale rounds of golf to the public in a variety of methods (i.e. green fees, 10 play punch cards, discount coupons, tournament rates, annual passes), golf cart rentals, driving ranges, practice areas, lessons, rental equipment, merchandise, and food and beverages, etc. These three full service golf courses utilize an innovative public and private sector mix of staffing in order to provide outstanding municipal golf services to the Fort Collins community at no direct cost to taxpayers. The Golf Fund is classified as an Enterprise Fund by the City and as such is 100 percent self supporting.
54.1 Memorial Parks - Funded 2008 - $630,322 2009 - $651,971Thisisanoffertooperateandmaintainthe43acresofCitymemorialparks.TheCityownstwomemorialparks,Grandviewand Roselawn. Financial support for this service is derived from a combination of fees, perpetual care interest earnings, and General Fund support. Services provided include selling various burial and cremation memorial options, preparing grounds for burials, setting foundations for headstones, maintaining the grounds and memorials, and historical recordkeeping.
57.1 Community Parks - Funded 2008 - $2,536,997 2009 - $2,677,934Community parks are developed for the benefit of the entire community. They are the most actively used parks and provide a place for families to recreate, a venue for large events, and space for unique facilities that neighborhood parks can not ac-commodate, such as the pool at City Park, skateboard parks, lighted baseball fields, lighted tennis courts, and the Inspiration Playground. This offer will manage and maintain the 6 community parks and attached recreational facility grounds owned by theCity.Communityparksare20acresorlarger.Thesesitestotal504acresandincludethefollowingamenities:15soft-ball/baseball diamonds, 15 basketball courts, 22 sports fields, 31 tennis courts, 3 skate parks, 15 restrooms, 9 playgrounds, 19 shelters, and 2 dog parks.
57.2 Neighborhood Parks - Funded 2008 - $1,786,848 2009 - $1,777,167Thisofferwillmanageandmaintainthe34neighborhoodandpocketparksownedbytheCity,excludingparkslocatedinthe downtown core area. Neighborhood parks vary in size from 3 acres to 20 acres and pocket parks are less than 3 acres. Thesesitestotal328acresandincludethefollowingamenities:252acresofturf,28softball/baseballdiamonds,19basket-ballcourts,32sportsfields,18tenniscourts,2skateparks,24restrooms,30playgrounds,and26shelters.Amenitiesareprovided on a smaller scale than community parks. Neighborhood and pocket parks are developed for the benefit of neigh-borhoods. They provide a place for families to recreate within close proximity to their homes and are essential for providing facilitiesforyouthsportsactivitiesthroughoutthecommunity.Thisofferisfor$1,786,848in2008and$1,777,167in2009.TheConservationTrustFundwillcontribute$270,125in2008and$210,241in2009.ThenetGeneralFundrequestwillbe$1,516,723in2008and$1,566,926in2009.
130 - OPERATING BUDGET
CULTURAL & RECREATIONAL OPPORTUNITIES
57.3 Trails - Funded 2008 - $231,873 2009 - $240,013This offer provides maintenance for the 25 miles of City owned hard surface trails located throughout the community. Trails include the Spring Creek Trail, Poudre Trail, Fossil Creek Trail, Power Trail, Rendezvous Trail, Redwood Trail and trail connec-tors to parks and neighborhood developments. Maintenance needs include trash and debris removal, mowing along trails, noxious weed control, infrastructure repairs, site hazard abatement, and snow removal.
57.5 New Parks and Trails - Funded 2008 - $40,500 2009 - $75,500This offer provides funding for two new neighborhood parks. Provincetown (65 acres) is scheduled to be completed in 2008, and Registry Ridge (5 acres) in 2009. These parks are part of the overall park development plan for the City. The level of service at these parks will be the same as other neighborhood parks (See Neighborhood Parks offer). In addition, the Parks Division will assume maintenance responsibilities for and additional half mile of trail per year in 2008 and 2009.
57.6 Restore Parks Botanical Program - Not Funded 2008 - $45,000 2009 - $46,267Thisofferwillrestorevariousservicereductionstakeninpreviousyears.TheParksDivisionhascut$940,000fromitsbud-getoverthelastfiveyears.Variousreductionstakeninpreviousyearshaveleftparkslookinglesscaredforandarecreat-ing infrastructure issues. The Parks Division would like to restore the botanical program within the parks system at a cost of$45,000.Thisisthethirdrestorationpriorityafterrestoringthefertilizerandweedcontrolprogram.Thesefundswouldreclassify a .75 FTE horticulture position back to full time, add seasonal help and restore flowers in the parks.
57.7 Restore Parks Seasonal Wages - Funded 2008 - $50,000 2009 - $50,000Thisofferwillrestoreseasonalwageservicereductionstakeninpreviousyears.TheParksDivisionhascut$940,000fromitsbudgetoverthelastfiveyears.Variousreductionstakeninpreviousyearshaveleftparksandtrailslookinglesscaredforand are creating infrastructure issues. Seasonal wages have been cut multiple times and were frozen for three years. This has had significant impact on the number and quality of employees the Parks Division is able to hire. This offer will enhance theParksseasonalworkforcebudgetby$50,000.Thisisthefirstrestorationpriorityafterfundingthenewparksandtrails.
57.8 Restore Weed Control - Partially Funded 2008 - $30,000 2009 - $0Thisofferwillrestorevariousservicereductionstakeninpreviousyears.TheParksDivisionhascut$940,000fromitsbud-getoverthelastfiveyears.Variousreductionstakeninpreviousyearshaveleftparksandtrailslookinglesscaredforandarecreatinginfrastructureissues.TheParksDivisionwouldliketorestorethe$30,000cutin2005forfertilizerandweedcontrol.Thisofferisthesecondpriorityafterrestoringtheseasonalbudget.Theoriginalofferincluded$30,000for2009which was not accepted.
57.9 Restore Trail Mowing - Partially Funded 2008 - $5,000 2009 - $0Thisofferwillrestorevariousservicereductionstakeninpreviousyears.Variousreductionstakeninpreviousyearshaveleftthe trails looking less cared for and are creating infrastructure issues. The Parks Division would like to restore mowing along trailstoan“asneeded”basisinsteadoftwiceayearatacostof$5,000.Thisisthefourthrestorationpriorityafterrestoringthebotanicalprogram.Theoriginalofferincluded$5,135for2009whichwasnotaccepted.

131 - OPERATING BUDGET
CULTURAL & RECREATIONAL OPPORTUNITIES
57.10 Restore Parks Lifecycle - Not Funded 2008 - $50,000 2009 - $50,000Thisofferwillrestore$50,000inthecapitalimprovements(lifecycleprogram).Thisadditionalfundingwouldbeusedtoreplace park infrastructure that is not being replaced due to lack of funding. This is the fifth restoration priority after restoring mowing on the trails.
94.1 Lincoln Center Services - Funded 2008 - $3,638,312 2009 - $3,783,560ThisofferfundsLincolnCenterservices.LincolnCenterprovideshighquality,highvalueVisualandPerformingArtspro-gramming, rental spaces, and ticketing services to Fort Collins and Northern Colorado in a community-friendly setting. The mission of Lincoln Center is to lead in cultural experience, making it an essential value to the community. Since 1978, Lincoln Center has become one of Colorado’s largest and most diverse presenters of professional theater, dance, music, visual arts, and children’s programs. Rental facilities, including two theaters, conference rooms, and outdoor gardens, provide the com-munity with small and large venues for cultural activities including performances, weddings, receptions, meetings, and more. Thefacilityboastsover350performanceseachseason,morethan1450roomrentals,andticketingservicesfordozensofperforming arts groups in the community. Lincoln Center’s success stems from strong community support through volunteer-ism, high attendance (over 275,000 annually), and partnerships with local performing arts groups and artists.
94.2 Restore Marketing and Financial Services - Lincoln - Not Funded 2008 - $33,776 2009 - $35,127This offer will restore marketing/public relations and financial services to the level they were prior to the budget cuts incurred over the last budget cycle. It will return the Lincoln Center Public Relations Coordinator to 1 FTE and the Lincoln Center Financial Coordinator to 1 FTE. Currently both are at .75 FTE. These are critical positions to the success of Lincoln Center and its ability to maintain and grow its sustainability. Lincoln Center is approximately 75% self-sustaining relying primarily on ticket sales and room rentals. Marketing is a core need to ensure consistent revenues for these activities, as well as grow these revenues through community awareness and promotion. The Financial Coordinator tracks trends, monitors on-going revenue, and helps with business planning and maintaining efficiencies, all critical in keeping Lincoln Center in the black.
94.3 Centralized/Beet Street Ticketing - Not Funded 2008 - $65,145 2009 - $71,857Lincoln Center will take the lead in developing and implementing centralized ticketing for cultural organizations, including Beet Street, to sell tickets to events. This venture is based on Lincoln Center’s 30 years of successful experience in provid-ing box office services to the community. Centralized Ticketing was identified as a goal through the UniverCity Connections process,andthisgoalwillbeachievedthroughpartnershipswithBeetStreet,FortCollinsConventionandVisitorsBureau(CVB),CSUSchooloftheArts,andlocalartsorganizations.Theservicecanalsobeextendedtonon-artsandculturalevents.CentralizedticketingwillbemadepossiblethroughLincolnCenter’sexistingBoxOfficeinfrastructure,specificallyProVenueticketing software and Tickets.com. These systems are capable of handling additional venues and increased ticket sales. This offer is requesting contractual and hourly staff support to assist in developing the partnerships, facilitate the usage of the system, and provide the actual services.
97.1 Fort Collins Museum Services - Funded 2008 - $852,102 2009 - $892,677This offer funds Fort Collins Museum Services. The Fort Collins Museum is a collections-based educational institution pro-viding opportunities to learn, reflect and have fun exploring the cultural and natural heritage of the Cache La Poudre River Region through exhibitions, programs, and collections. The Museum cares for over 35,000 three-dimensional objects repre-senting the history of the Northern Colorado region. The Museum also cares for all two-dimensional objects in the Local His-tory Archive. This offer includes bringing the Curator of Collections and Public Relations Coordinator positions to full time.

132 - OPERATING BUDGET
CULTURAL & RECREATIONAL OPPORTUNITIES
97.2 Museum Expansion Planning - Funded 2008 - $236,699 2009 - $215,656ThisofferaddscontractualemployeestotheMuseumstaff:CuratorofCulturalInterpretation,ProjectManager,andPublicRelations Coordinator. These positions will assist in development of the Fort Collins Museum/ Discovery Science Center facility. The Project Manager will oversee project development teams and future project personnel. The Curator of Cultural Interpretation will work with the Museum and Natural Areas departments to disseminate research relating to the cultural his-tory of the city’s natural areas. The Curator will serve on the Development Team working with the Project Manager to ensure the integrity of cultural elements. The Public Relations Coordinator assists in creating a marketing plan and conveys information to the public. In 2008, the offer is funded from Restricted Museum Reserves. In 2009, the offer is funded from Restricted Museum Reserves, Building On Basics, and the Natural Resources Department.
97.4 Increase Museum Staff FTEs - Not Funded 2008 - $59,232 2009 - $62,736TheMuseumservesover40,000visitorseachyearforexhibitions,educationalprograms,children’sactivitiesandmore.TheMuseum also offers opportunities to extend experiences beyond Museum walls (and increase Museums revenues) through purchases in theMuseumStore.Volunteersalsocontribute to theMuseum in theMuseumStore,Collections,Exhibits,Education, and other areas. Currently the Museum employs a Kindergarten through Twelfth Grade (K-12) Coordinator and a MuseumStore/VolunteerCoordinatorashourlyemployees.Althoughcost-effectiveinthepast,thishasledtohighturnoverand inconsistent customer service. The Museum will bring these positions from hourly to salaried in order to secure and retain the best employees and provide consistent, world-class programs and opportunities to the community.
97.5 Development Coordinator & Collections Positions - Not Funded 2008 - $41,723 2009 - $43,753This enhancement brings the Public Relations and Development Coordinator and Collections Curator positions to 1 FTE each. Currently, the Public Relations and Development Coordinator is .8 FTE, and the Collections Curator is .75 FTE. Both of these positions are critical to the success of the Museum. The focus of the Public Relations and Development Coordinator is primarily grant writing - a key component in leveraging City funds for exhibits, programs and operations. The Collections Curator is fundamental to Museum operations in collecting the community artifacts and ensuring professional standards in following the Museums collections policy, in the acquisition, care and use of the community’s artifact collections.
113.1 Neighborhood Park Development 2008 & 2009 - Funded 2008 - $1,959,963 2009 - $1,478,052Park Planning and Development will continue to develop neighborhood parks in 2008 and 2009. Staff will work with land-owners and developers for the acquisition of one to two new park sites, the master planning on two parks, the detailed design and construction drawings and specifications on two parks, construction administration on two park sites, assisting Park Maintenance and Recreation on various park improvements and interacting with other City departments on issues affecting joint sites.
117.1 Urban Forest Management - Funded 2008 - $ 987,094 2009 - $1,021,365This offer will provide for the management of trees on developed City property (urban forest) and will promote the private urban forest through indirect means. The planting, care, maintenance and perpetuation of City trees will ensure trees in parks and around recreational and cultural facilities and in parkways along streets that enhance the outdoor experience and foster physical and mental well-being for community members. A municipal urban forest will be provided that is safe, healthy, well stocked, diverse, pleasing to the senses and functional as well as one that is attractive to birds and other wildlife, which provides benefits through out the community to all citizens. Services that provide public education, development review and enforcementarealsoincludedinthisoffer.Non-generalfundrevenuein2008is$36,000andin2009is$37,000.

133 - OPERATING BUDGET
CULTURAL & RECREATIONAL OPPORTUNITIES
131.1 Gardens on Spring Creek - Funded 2008 - $316,000 2009 - $334,000The Gardens on Spring Creek (The Gardens) are a dynamic and inspiring botanic garden along with a community and environmental education center. The Gardens not only enrich the lives of people in Fort Collins, they foster environmental stewardship, sustainable horticulture, ecology, and community service. Examples of the wide variety of programs/services offeredinclude:enablingpeopletogrowherbs,flowers,andvegetables,providinghorticulturaltherapyforpeoplewithspe-cial needs, and providing applied horticulture classes that foster environmental stewardship and community partnerships. The Gardens offer residents of Fort Collins a diverse cultural and recreational opportunity that fosters physical and mental well-being for all ages, backgrounds, physical abilities, and levels of horticulture knowledge. The new Children’s Garden is a prime location for families to experience horticulture at it’s finest. The Gardens are characteristic of the level of community support which benefits our youth and encourages family participation in gardening and the environment. As part of this offer, theGardenswillbeusingincomingrevenue.Theseamountsinclude;$16,000.00in2008and$19,000in2009.
131.2 Gardens on Spring Creek Enhancement - Not Funded 2008 - $61,197 2009 - $63,876As an enhancement offer, The Gardens are requesting a fourth FTE (Horticulture Technician). This position would comple-ment the current staff of three FTEs (Horticulture Facility/Services Administrator, Horticulture Technician, and Horticulture Program Coordinator).With the recent addition of the Children’s Garden and upcoming expansions such as the Garden of Eatin’, The Gardens will need this fourth FTE to continue to maintain the current and planned gardens, to ensure the long term life of these capital improvements outlined in offer number one, and continue to meet the demand for increased educa-tion and horticulture programming. The position would be vital to the continued success, maintenance, and growth of The Gardens.SomeexamplesofworkthisFTEwoulddoinclude:plantingandmaintenanceofperennialsgardens;horticultureand education program development; installation of new Lilac beds in Lilac Park; and development and implementation of new gardens such as the Garden of Eatin’.
133.1 CPRE Administration - Funded 2008 - $153,565 2009 - $158,718This offer provides administrative leadership for Cultural, Parks, Recreation and Environment services including the ad-ministrative functions of the Director of Cultural, Parks, Recreation and Environment (CPRE). This offer is for General Fund supportof$153,565in2008and$158,718in2009.
133.2 CPRE IT Support - Funded 2008 - $108,613 2009 - $112,803The CPRE Technology Team (CPRETT) currently consists of one Senior Network Specialist/Business Analyst and Centralized PC Hardware/Software helpdesk support through the MIS department. The CPRETT program offer is to provide continued critical computer infrastructure and technology support to Natural Resources, Parks, Recreation, Forestry, Cemeteries, Golf, Horticulture Center, Park Planning, Lincoln Center and the Fort Collins Museum, which includes the online systems of ProVenueMax(Tickets.com),RecTrac,WebTrac,TeleTracandGolfTrac.ThesesystemsallowcitizenstopurchaseticketsforLincolnCentereventsandregisterforRecreationactivitiesandclasses,24hoursperday,7daysperweek,whichresultsinexcellentcustomerserviceandefficiency.ThisofferisforGeneralFundsupportof$108,613in2008and$112,803in2009.
164.1 Recreation Trail Development 2008 and 2009 - Funded 2008 - $828,619 2009 - $837,970Park Planning and Development will continue to develop trails in 2008 and 2009. Staff will work with landowners and devel-opers for the acquisition of trail right-of-way, the master planning on new trail segments, the detailed design and construction drawings and specifications on new segments including underpasses, construction and administration.

134 - OPERATING BUDGET
CULTURAL & RECREATIONAL OPPORTUNITIES
169.1 Picnic Rock Operations & Maintenance - Partially Funded 2008 - $18,500 2009 - $0Picnic Rock is a 2-acre City-owned property on the Poudre River just west of Ted’s Place. It is heavily used as a parking area and a river take out for rafters and other boaters. This package/offer will provide a modest level of general fund support for maintenance and operation of the facility while a longer-term management approach is sought by local citizens from thestate.Thesefundsarebeingrequestedfromunrestrictedgeneralfundrevenue.Theoriginalofferincluded$18,500for2009 which was not accepted.
170.1 Community Relations - Natural Areas - Funded 2008 - $386,036 2009 - $387,296This Community Relations offers supports the education, outreach, customer service evaluation, and volunteer development and coordination functions of the Natural Areas Program. Activities include robust volunteer efforts such as the nationally recognized Master Naturalist Program; customer/visitor surveys; development of interpretive materials for on-site installations as well as with the Museum-Discovery Science Center; and various other types of communication with the community including brochures, maps, videos and speaking engagements. The mission of the Natural Areas Community Relations Program is to increase citizen’s awareness of natural areas; to promote a shared understanding of natural systems; and, to foster a shared appreciation for the importance and meaning natural places add to our lives. The Community Relations Program also strives to understand the concerns and needs of our citizens through customer surveys and other outreach efforts.
170.2 Public Improvements - Natural Areas - Funded 2008 - $3,522,406 2009 - $2,102,233This offer will support the maintenance, construction, and installation of amenities for recreational use and public enjoyment of City natural areas. Specific amenities include natural surface trails, parking lots, vault toilets, benches, shelters, kiosks, signage,fences,andtrashcans.ByJanuary2008,37naturalareas(10,404totalacres)willbeopentothepublic.Thelargest natural area, Soapstone Prairie (18,728 acres), will open in 2009, increasing the amount of natural areas’ land open to the public to 29,000 acres of the 32,000 managed by the program. City natural areas have been recognized state-wide, as well as nationally, for providing fabulous outdoor opportunities that contribute to the economic vitality of Fort Collins.
172.1 Art in Public Places - Funded 2008 - $261,549 2009 - $200,748This offer supports the continuation of the existing Art in Public Places (APP) program. APP began in April 1995, with City Ordinance No. 20, and enacted in City Code Chapter 23, Article IX. APP encourages and enhances artistic expression and appreciation and adds value to the Fort Collins community through acquiring, exhibiting, and maintaining public art. APP is primarilya1%program,meaningCitycapitalprojectswithabudgetover$250,000designate1%oftheirprojectbudgetforart.ToshowacommitmenttotheAPPpurposeinallprojects,artistsareaddedtotheprojectteamforbudgetsunder$250,000.Iftheprojectisbelow$50,000,anartistmaybeaddedatthedepartment’sdiscretion.TheCityCouncil-appointedAPPBoardplays a significant role in selecting artists and artwork, and most final recommendations are approved by City Council. Art dona-tions are also handled through the APP Board, ensuring the City’s collection meets the highest standards.
179.1 Fort Fund - Funded 2008 - $219,480 2009 - $223,872This offer continues the Fort Fund program. Established in 1989, Fort Fund disburses funds from the City’s Cultural Development andProgramAccountandtheVisitorEventsAccountinaccordancewiththeprovisionsofSection25-244oftheCityCode,where25% of the revenue from the lodging tax is utilized for this program. Non-profit organizations may apply to Fort Fund for program grant support. The City’s Cultural Resources Board reviews applications for Fort Fund monies based on approved guidelines and makes recommendations to City Council, pursuant to Ordinance No. 28, 1992. Fort Fund fosters, encourages, and promotes cultural activities and tourism in the community by providing small grants to local events that may be artistic, ethnic, historic, edu-cational or recreational in nature and reflect the values and traditions of Fort Collins. Events have wide community appeal, and the resulting economic and non-economic benefit of the event promotes the general welfare of the community.

135 - OPERATING BUDGET
CULTURAL & RECREATIONAL OPPORTUNITIES
230.1 Inside Fort Collins - Bi-weekly promotion of arts - Not Funded 2008 - $40,000 2009 - $41,200Inside Fort Collins is a bi-weekly television program that will also be available as video-on-demand on the internet. It will pro-vide a comprehensive calendar of arts and cultural offerings in a unique format that allows citizens and visitors to get a taste of those offerings through video clips. This program supports the Beet Street initiative and would improve public awareness of the many arts and culture offerings in Fort Collins.
236.1 BOB - Library Technology - Funded 2008 - $744,000 2009 - $744,000The Library Technology capital project is one of the projects in the Building on Basics (BOB) capital improvement plan, ap-proved by the voters of the City of Fort Collins at a municipal election in November 2005. The BOB capital improvement program funds a variety of the City’s general capital needs and is funded by a dedicated 0.25 cent sales & use tax (excluding grocery food). The Library Technology project will provide computers, software, databases and technology maintenance for libraries in the community. Library technology will provide access to books, media, and subscription databases, to the inter-net and to personal library accounts. Library technology reduces staffing costs and enables the City to provide high quality library services to a growing community.
237.1 BOB - Lincoln Center Renovation - Funded 2008 - $0 2009 - $2,217,436The Lincoln Center Renovation capital project is one of the projects in the Building on Basics (BOB) capital improvement plan approved by the voters of the City of Fort Collins at a municipal election in November 2005. The Lincoln Center, which has been the center of Fort Collins cultural life for 27 years, is in need of improvement and renovation. This project will provide new lighting, carpeting, rest rooms, upgraded acoustics, modern conference facilities, and an elevator to the bal-cony. It will also provide funds for a cultural facilities plan to guide the development of future cultural facilities such as a new performing arts center or downtown
238.1 BOB - Park Upgrades and Enhancements - Funded 2008 - $0 2009 - $304,897The Park Upgrades and Enhancements capital project is one of the projects in the Building on Basics (BOB) capital improve-ment plan, approved by the voters of the City of Fort Collins at a municipal election in November 2005. The BOB capital improvement program funds a variety of the City’s general capital needs and is funded by a dedicated 0.25 cent sales & use tax(excludinggroceryfood).TheCityhas4oldercommunityparksandover30neighborhoodparks.Thisprojectwilladdimprovements, such as new playground equipment, picnic shelters, restrooms, landscaping and sidewalks needed to keep the City’s parks useful, enjoyable and attractive. These rebates include a property tax or rent rebate, a utility rebate, and a sales tax on food rebate. The amount of money each applicant receives varies according to the amount of income the household earns. Applications are accepted from August 1 through December 31 of each year.

136 - OPERATING BUDGET
CULTURAL AND RECREATIONAL OPPORTUNITIES
The City Council provided the Cultural and Recreational Opportunities Result Team with the following desired result and clarifying statement: Fort Collins provides diverse cultural and recreational opportunities that foster physical and mental well-being for community members.
TEAM MEMBERS Mark Radtke, Chair (CMO)Ginny Sawyer, Facilitator (Neighborhood Services)Ellen Switzer, Budget (Utilities)Susan Herlihy, Communication (Lincoln Center)Kevin Gertig (Utilities)Jim Colburn (Neighborhood Services)Dawna Gorkowski (CPRE)Linda Moore (Museum)Debbie Daugaard (Streets)
INTRODUCTION/SUMMARY OF RESULTS MAP
The Team held thoughtful discussions to develop a Request for Results (RFR) that will result in the purchase of services to fulfill the cultural and recreational budget outcome designated by City Council. The Team discussed issues with both staff and community members in designing this RFR and benefited from City Council comments and suggestions. The Results Map paints a picture of the Team’s goals for providing cultural and recreational opportunities to the citizens of Fort Collins. The Map reveals the Team’s desire for quality programming and facilities that meet community needs and standards. The Team identified three contributing primary factors and listed secondary factors related to each. Five indicators and their associated measurements are contained in the RFR along with eight purchasing strategies to guide sellers in creating their offers.
INDICATORS
1. CUSTOMER SATISFACTION WITH CULTURAL AND RECREATIONAL PROGRAMS. Measures: Maintain or improve “Good” and “Very Good” cultural and recreation programming ratings
on the Citizen Survey. The 2006 Citizen Survey has provided a benchmark to measure customer satisfaction with numerous pro-
grams. As long as future surveys include these same questions and measures customer satisfaction can be easily tracked.
2. CUSTOMER SATISFACTION WITH FACILITIES AND LANDS. Measures: •Maintainorimprove“Good”and“VeryGood”recreationfacilitiesratingsontheCitizenSurvey. •Maintainorimprove“Good”and“VeryGood”parks,trailsandopenspaceratingsontheCitizen
Survey. The 2006 Citizen Survey has provided a benchmark to measure customer satisfaction with cultural and
recreational facilities, and with open space and trails. As long as future surveys include these same ques-tions and measures customer satisfaction can be easily tracked.
137 - OPERATING BUDGET
3. CUSTOMER USAGE OF CULTURAL AND RECREATIONAL PROGRAMMING. MEASURES: •MaintainorincreaseyouthregistrationsandusageofCityrecreationandculturalprogramsand
facilities. •MaintainorincreaseadultandseniorregistrationsandusageofCityrecreationandculturalpro-
grams and facilities. •Maintainorimprove“Good”and“VeryGood”availabilityanddiversityinactivitiesratingsonthe
Citizen Survey. Recreation programming has the ability to track and report registrations by age demographics. By captur-
ing this usage data we ensure that our community needs are met as demographics change. The Citizen Survey also provides a good measure for citizen perception of the availability and diversity of cultural and recreational opportunities in Fort Collins.
4. LEVERAGING CITY AND OUTSIDE SUPPORT FOR INTERNAL BENCHMARKING MEASURE: Measure and benchmark non-general fund support (user fees, grants, volunteer hours, etc)
as a percentage of total budget. This indicator and associated measures maintain a focus on the “true cost” of providing cultural and rec-
reational opportunities. By annually measuring general fund support of programs we can track trends and compare the trend to any change in customer satisfaction or usage.
5. MAINTAIN AFFORDABLE OPTIONS IN CULTURAL AND RECREATION PROGRAMMING Measure: Track the number of cultural and recreation customers using reduced fee registrations. Reduced fee registrations are ultimately general fund support. By tracking these numbers we can maintain
a range of affordability and acceptable support levels. The Result Team would like to see a question on the Citizen Survey regarding citizen perception on the affordability of programs.
PURCHASING STRATEGIES
1. Purchasing Strategy #1–Servediversecustomerneeds(age,income,gender,ethnicity,andabilities)including providing positive alternatives for at-risk youth.
•ResponsivetoCustomers
•Convenient&AffordableAccess
•QualityFacilitiesandLands
2. Purchasing Strategy #2–Maintaincurrentculturalandrecreationalfacilitiesandpropertiestoassurethelong term life of these prior capital investments.
•QualityFacilitiesandLands
3. Purchasing Strategy # 3–LeveragetheCity’sfundsthroughtechnology,partnerships,volunteers,grants,user fee revenues, and other multipliers.
•ResponsivetoCustomers •Convenient&AffordableAccess •QualityFacilitiesandLands
4. Purchasing Strategy #4 –Demonstratecreativity,innovation,andleadership.Highrisk/highrewardoffersare welcome.
•ResponsivetoCustomers •Convenient&AffordableAccess •QualityFacilitiesandLands
5. Purchasing Strategy # 5–ProvideprogramsandfacilitiesthatcontributetoFortCollinsasadynamicanddistinctive center for arts, culture, recreation, and education.

138 - OPERATING BUDGET
•ResponsivetoCustomers •Convenient&AffordableAccess •QualityFacilitiesandLands
6. Purchasing Strategy # 6 –Continueprogramsthathaveaproventrackrecordofsuccessandcustomersatisfaction.
•ResponsivetoCustomers •Convenient&AffordableAccess •QualityFacilitiesandLands
7. Purchasing Strategy # 7–Identifyfundingstrategiesforfutureoperatingandmaintenancecostsinanynew capital development.
•QualityFacilitiesandLands
8. Purchasing Strategy # 8–IdentifyprogramsforwhichtheCityhasamandateoruniqueabilitytoprovide. •ResponsivetoCustomers •Convenient&AffordableAccess •QualityFacilitiesandLands
NOTES/PRACTICES/SUPPORTING EVIDENCE
RATIONALE OF PRIMARY AND SECONDARY FACTORS
The process for defining primary factors, casual factors and indicators involved taking a broad view of the types of programs and facilities that would meet the needs of the community. Diversity, cost effectiveness, quality, accessibility, and innovation are among the factors identified to fulfill the outcome. The Team will accept a wide variety of programming that meets the needs of all ages and abilities, and added consideration will be given to programmingthatmeetstheneedsofyouth–inparticularat-riskyouth.Theprioritizationoftheprimaryfactorscould be described as people, programming, and places. The Team is looking for quality programming to serve the needs of citizens in first class facilities.
RESPONSIVE TO CUSTOMERSCitizens expect cultural and recreational opportunities that meet their interests and are of high-quality. *Servediversecustomerneeds:tomeetneedsofdiverseusers(age,ability,income,etc.) *Provideeffectiveprogramming:tofosterphysicalandmentalwell-being •Committoinnovativeprogrammingandpractices:toremainontopoftrendsandtechnologiestobestserve
our community •Maintainqualitystaffing:toprovidethefoundationofprovidinghigh-qualityopportunities •Utilizeeffectivetechnology:toimproveefficiencyandincreasecustomerconvenience •Offerstructuredandunstructuredculturalandrecreationalopportunities:tomeetdiverseneedsandinter-
ests
CONVENIENT AND AFFORDABLE ACCESSCitizens want cultural, recreational, and educational opportunities that are accessible and affordable. *Maintainavarietyofoperatinghoursandlocales:foreaseofaccessandtomeetdiverseschedulesand
interests *Seekalternativefundingtosubsidizecosts:tomaintainaffordabilityandfinancialfeasibility •Offerfeebasedandfreeculturalandrecreationalopportunities:tomeetavarietyofneedsandinterests •Continuescholarshipprograms:toincreaseprogramreachandavailability

139 - OPERATING BUDGET
QUALITY FACILITIES AND LANDSCultural and recreational opportunities are dependent on the availability of quality facilities and lands. *Keepfacilitiesandlandswellmaintained,attractive,functional,andsafe:socitizensreceivevaluefortheir
dollar and to defray costly maintenance in the future *Demonstratefinancialsustainability:toensurefundingforfutureoperatingandmaintenancecosts *Utilizeeffectivepartnerships:toleveragetaxdollarsasefficientlyandeffectivelyaspossible •Growwiththecommunity:toensurefacilitiesandlandareplannedinawaythatwillmeetfutureneeds
* Astericks represent highest priority secondary factors

140 - OPERATING BUDGET
Fort
Col
lins
prov
ides
qua
lity
cultu
ral,
recr
eatio
nal,
open
spa
ce/n
atur
al a
reas
, and
edu
catio
nal o
ppor
tuni
ties
to e
nric
h liv
es.
CULT
URAL
& R
ECRE
ATIO
NAL
OPPO
RTUN
ITIE
S RE
SULT
S M
AP
141 - OPERATING BUDGET
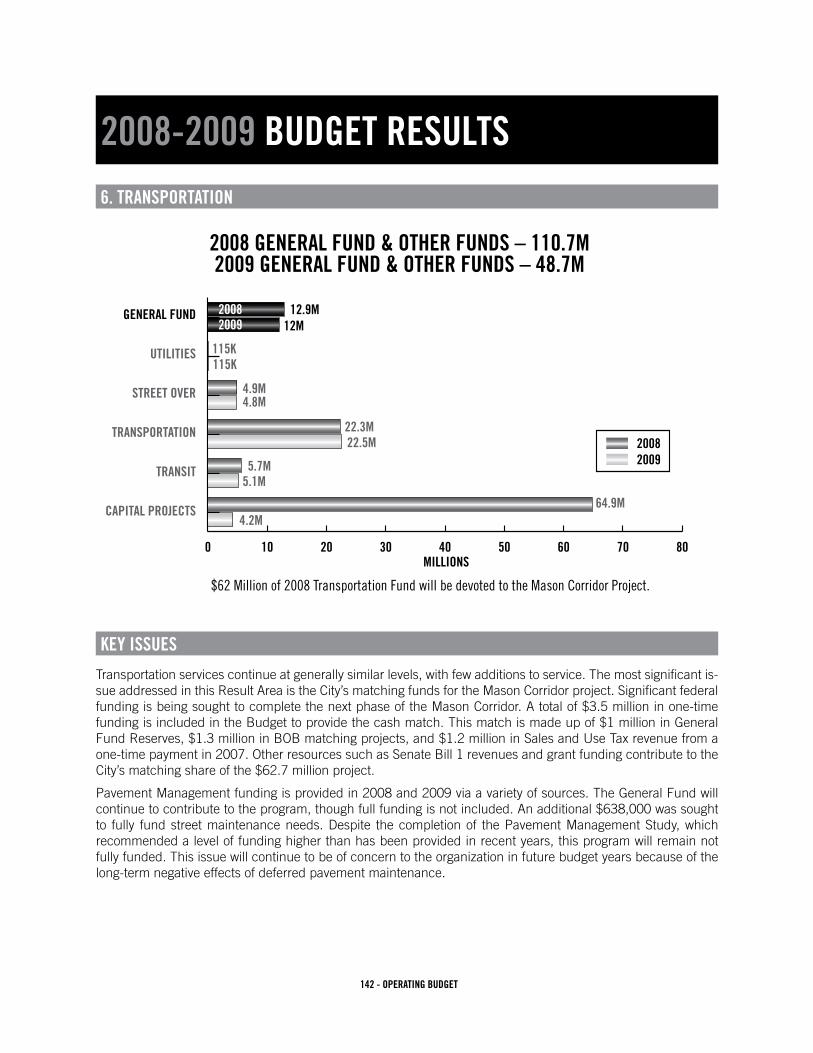
142 - OPERATING BUDGET
2008-2009 BUDGET RESULTS
6. TRANSPORTATION
KEY ISSUES
Transportation services continue at generally similar levels, with few additions to service. The most significant is-sue addressed in this Result Area is the City’s matching funds for the Mason Corridor project. Significant federal fundingisbeingsoughttocompletethenextphaseoftheMasonCorridor.Atotalof$3.5millioninone-timefundingisincludedintheBudgettoprovidethecashmatch.Thismatchismadeupof$1millioninGeneralFundReserves,$1.3millioninBOBmatchingprojects,and$1.2millioninSalesandUseTaxrevenuefromaone-time payment in 2007. Other resources such as Senate Bill 1 revenues and grant funding contribute to the City’smatchingshareofthe$62.7millionproject.
Pavement Management funding is provided in 2008 and 2009 via a variety of sources. The General Fund will continuetocontributetotheprogram,thoughfullfundingisnotincluded.Anadditional$638,000wassoughtto fully fund street maintenance needs. Despite the completion of the Pavement Management Study, which recommended a level of funding higher than has been provided in recent years, this program will remain not fully funded. This issue will continue to be of concern to the organization in future budget years because of the long-term negative effects of deferred pavement maintenance.
0 10 20 30 40 50 60 70 80
$62 Million of 2008 Transportation Fund will be devoted to the Mason Corridor Project.
2008 GENERAL FUND & OTHER FUNDS – 110.7M2009 GENERAL FUND & OTHER FUNDS – 48.7M
GENERAL FUND
UTILITIES
STREET OVER
TRANSPORTATION
TRANSIT
CAPITAL PROJECTS
115K115K
4.9M4.8M
22.3M22.5M
5.7M5.1M
MILLIONS
64.9M4.2M
12.9M12M
20082009
20082009
143 - OPERATING BUDGET
REVENUE TRENDS & ISSUES
A significant restructuring of the revenue formulas from the Federal Transit Administration (FTA) resulted in lessFederaloperationfundingforTransfort.Thisreductionrequiredanadditional$500,000inGeneralFundsupport of the Transfort system as well as budget reductions for its programs.
Slower than expected sales tax growth impacts the Pavement Management program which is primarily sup-ported through voter approved sales tax funds. Some one-time General Fund resources are provided to the program, but it continues to be under-funded compared to the needs outlined in the recent Pavement Man-agement study.
Stategrants(CMAQ)provideakeyrevenuesourceforanumberofprojectsin2008and2009.Intersectionsand signal timing projects will benefit from this revenue source.
KEY PURCHASES
•PavementManagementProgram
•Transfort/Dial-a-RideincludingcontinuedserviceforDial-a-Ridecustomersaffectedby2007serviceareachanges
•Corestreetmaintenanceandbridgerepair
•TrafficOperationsandparkingservices
•TransportationPlanninganddevelopment
•Engineeringandcapitalimprovementmanagement
•MaintenanceofCity-ownedmedians
•Snowplowingandstreetsweeping
•PartnershipwithRegionalPlanningOrganization(MPO)
•SignReplacementProgrambeginningin2009
ENHANCEMENTS PURCHASED
•MasonCorridorProjectmatchingfundsforFederalTransitAdministrationgrantof$52.6Million
•Stateawardedgrants(CMAQ)forHarmonyRoadTrafficResponsiveSignalTiming;ComprehensiveSignalTiming;NorthCollege/Highway287;JeffersonStreet/SH14ProjectStudyandDesignandotherintersectionimprovements
•BicycleLibraryprogramandenhancedbikeprogram(grantfunded)
•Railroadcrossingreplacements
•Paratransit(Dial-a-Ride)grandfatheredusersandsomefundingforNight-timeDial-a-RideService
•UpdatetotheTransfortStrategicPlan
EXAMPLES OF SERVICES NOT PURCHASED
•FullfundingofPavementManagementProgram
•ExpandedTransfortservicehours
•Alternativesnowremovalanddeicingmaterials
•Enhancedlevelsofserviceforsnowremoval,pedestrianaccess,andbridgeprogram

144 - OPERATING BUDGET
TRAN
SPOR
TATI
ON D
RILL
ING
PLAT
FORM
200
8TR
AN
SPO
RTA
TIO
N D
RIL
LIN
G P
LATF
OR
M -
2008
One
-tim
e O
ngoi
ngLi
neO
ffer
Offe
r
Fund
ing
Offe
r G
ener
al F
und
Res
trict
edG
ener
al F
und
Oth
er R
estri
cted
##
Offe
r Des
crip
tion
Am
ount
One
-tim
eS
ourc
eA
mou
ntR
estri
cted
Des
crip
tion
Ong
oing
Fund
s O
ngoi
ng
188
.4P
avem
ent M
anag
emen
t8,
698,
091
700,
000
Gen
Fun
d R
es7,
998,
091
2,44
6,28
05,
551,
811
267
.1Tr
ansf
ort/D
ial A
Rid
e10
,952
,337
186,
399
Tran
sit R
es3
65,0
00G
en F
und
Res
10,7
00,9
385,
254,
238
5,44
6,70
04
182.
1S
igna
l Mai
nten
ance
Cor
e S
ervi
ces
726,
543
726,
543
072
6,54
35
88.7
Stre
et O
vers
izin
g C
apita
l Exp
ansi
on F
ee P
rogr
am5,
266,
484
5,26
6,48
441
3,04
84,
853,
436
613
4.1
Mas
on C
orrid
or P
roje
ct
62,7
08,4
887
FTA
Fun
ds54
,622
,000
FTA
Gra
nt0
08
Loca
l Mat
ch -
CD
OT
SB
-1 F
unds
3,44
1,48
8S
B-1
Fun
ds0
09
Loca
l Mat
ch -G
ener
al F
und
Res
erve
s1,
000,
000
Gen
Fun
d R
es0
010
Loca
l Mat
ch -
CM
AQ
Fun
ds1,
145,
000
CM
AQ
Gra
nts
00
11Lo
cal M
atch
- B
OB
Inte
rsec
tion
Pro
j and
S&
U R
es2,
500,
000
S&
U T
ax F
und
00
012
88.1
4In
ters
ectio
n Im
prov
emen
ts &
Sig
nal P
roje
cts
1,30
6,05
213
BO
B -
Inte
rsec
tion
Pro
ject
s1,
125,
000
1/4
Cen
t BO
B0
014
CM
AQ
Fun
ds-V
ario
us In
ters
ectio
ns18
1,05
2C
MA
Q G
rant
s0
00
1516
8.1
CM
AQ
Pro
ject
s65
0,00
016
Har
mon
y R
oad
Traf
fic R
espo
nsiv
e S
igna
l Tim
ing
350,
000
CM
AQ
Gra
nts
00
17C
ompr
ehen
sive
Sig
nal T
imin
gs30
0,00
0C
MA
Q G
rant
s0
00
1818
3.1
Traf
fic E
ngin
eerin
g C
ore
Ser
vice
s90
2,32
490
2,32
40
902,
324
1988
.1E
ngin
eerin
g &
Bas
ic R
ight
-of-W
ay S
ervi
ces
1,14
7,54
11,
147,
541
01,
147,
541
2090
.1B
asic
Par
king
Ser
vice
s1,
735,
124
1,73
5,12
487
,386
1,64
7,73
821
160.
6S
treet
Mai
nten
ance
866,
786
866,
786
086
6,78
622
160.
1S
now
Rem
oval
-Stre
ets,
Bik
e La
nes,
and
Sid
ewal
ks1,
110,
847
1,11
0,84
70
1,11
0,84
723
86.1
Bas
ic S
ervi
ces
- Tra
nspo
rtatio
n P
lann
ing
511,
655
511,
655
051
1,65
524
160.
5W
ork
For O
ther
s - S
treet
s4,
818,
407
4,81
8,40
70
4,81
8,40
725
185.
1Tr
affic
Con
stru
ctio
n S
ervi
ces
765,
196
765,
196
076
5,19
626
134.
6N
. Col
lege
Impr
ovem
ent P
roje
ct
1,06
3,49
027
BO
B -
N. C
olle
ge Im
prov
emen
t Pro
ject
428,
490
1/4
Cen
t BO
B0
028
CM
AQ
- N
. Col
lege
/Hw
y 28
725
0,00
0C
MA
Q G
rant
s0
029
Fede
ral H
azar
d E
limin
atio
n - N
. Col
lege
385,
000
FHE
Gra
nt0
030
88.9
Eng
inee
ring
Cha
rges
to C
apita
l42
1,11
842
1,11
8C
ap P
r Fun
d0
00
3186
.4R
egio
nal P
lann
ing
Org
aniz
atio
n C
ontri
butio
n10
7,00
010
7,00
010
7,00
00
3288
.17
Har
mon
y R
oad
Mai
nten
ance
125,
444
125,
444
012
5,44
433
134.
3P
edes
trian
Pla
n/A
DA
Impr
ovem
ents
30
0,00
034
BO
B-P
edes
trian
Pla
n/A
DA
Impr
ovem
ents
300,
000
1/4
Cen
t BO
B0
00
3518
4.1
Sig
ns &
Pai
nt C
ore
Ser
vice
s91
0,06
491
0,06
40
910,
064
3613
4.4
Bic
ycle
Pla
n Im
plem
enta
tion
12
5,00
037
BO
B -
Bic
ycle
Pla
n Im
plem
enta
tion
125,
000
1/4
Cen
t BO
B0
00
3886
.2FC
Bik
es12
9,60
20
039
CM
AQ
Fun
ds87
,600
CM
AQ
Gra
nt42
,002
42,0
0240
134.
2Je
ffers
on S
treet
/SH
14
Stre
etsc
ape
& R
ound
abou
t50
0,00
041
Pro
ject
Stu
dy a
nd D
esig
n50
0,00
0C
MA
Q G
rant
s0
042
160.
2S
treet
s S
uppo
rting
Ope
ratio
ns2,
184,
047
2,18
4,04
71,
028,
632
1,15
5,41
543
160.
4S
treet
Sw
eepi
ng47
9,27
147
9,27
147
9,27
144
86.3
Sch
ool C
ross
ing
Gua
rds
94,3
5094
,350
94,3
500
4588
.10
City
Brid
ge P
rogr
am30
0,00
030
0,00
030
0,00
00
4669
.1Tr
ansp
orta
tion
Adm
inis
tratio
n42
0,47
614
0,00
0Tr
an F
nd R
es28
0,47
628
0,47
60
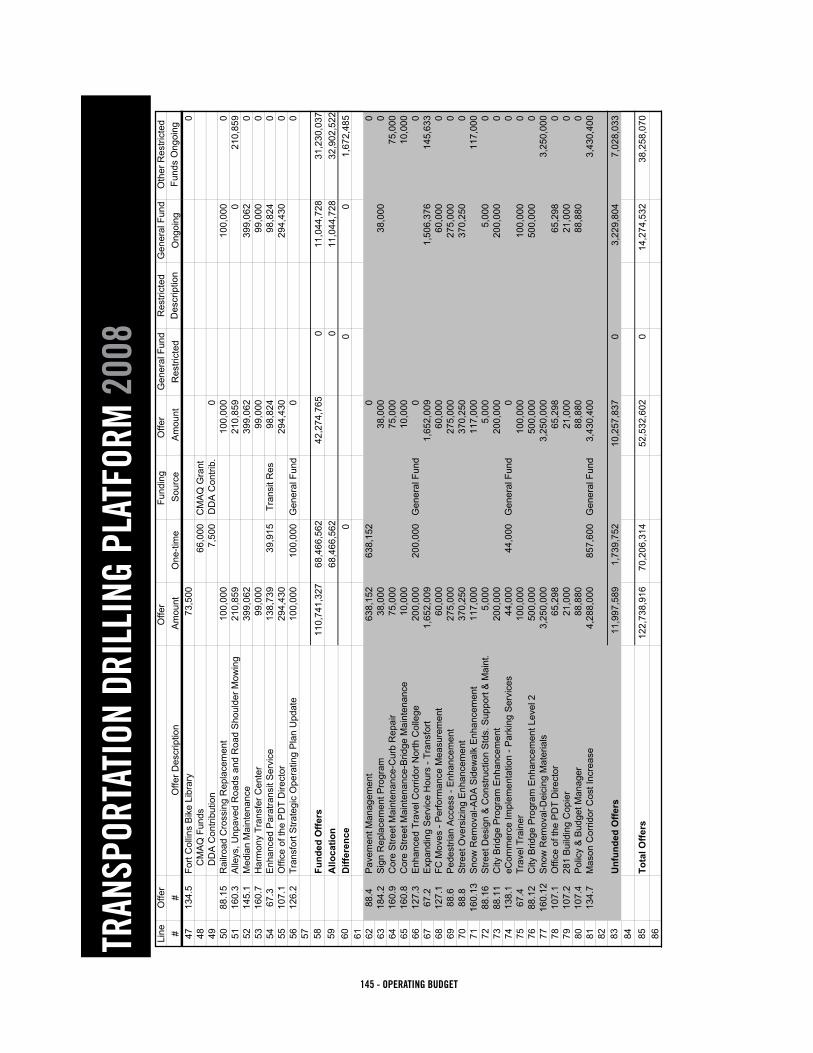
145 - OPERATING BUDGET
TRAN
SPOR
TATI
ON D
RILL
ING
PLAT
FORM
200
8TR
AN
SPO
RTA
TIO
N D
RIL
LIN
G P
LATF
OR
M -
2008
One
-tim
e O
ngoi
ngLi
neO
ffer
Offe
r
Fund
ing
Offe
r G
ener
al F
und
Res
trict
edG
ener
al F
und
Oth
er R
estri
cted
##
Offe
r Des
crip
tion
Am
ount
One
-tim
eS
ourc
eA
mou
ntR
estri
cted
Des
crip
tion
Ong
oing
Fund
s O
ngoi
ng
4713
4.5
Fort
Col
lins
Bik
e Li
brar
y
73,5
000
48C
MA
Q F
unds
66,0
00C
MA
Q G
rant
49
DD
A C
ontri
butio
n7,
500
DD
A C
ontri
b.0
5088
.15
Rai
lroad
Cro
ssin
g R
epla
cem
ent
100,
000
100,
000
100,
000
051
160.
3A
lleys
, Unp
aved
Roa
ds a
nd R
oad
Sho
ulde
r Mow
ing
210,
859
210,
859
021
0,85
952
145.
1M
edia
n M
aint
enan
ce39
9,06
239
9,06
239
9,06
20
5316
0.7
Har
mon
y Tr
ansf
er C
ente
r99
,000
99,0
0099
,000
054
67.3
Enh
ance
d P
arat
rans
it S
ervi
ce13
8,73
939
,915
Tran
sit R
es98
,824
98,8
240
5510
7.1
Offi
ce o
f the
PD
T D
irect
or29
4,43
029
4,43
029
4,43
00
5612
6.2
Tran
sfor
t Stra
tegi
c O
pera
ting
Pla
n U
pdat
e10
0,00
010
0,00
0G
ener
al F
und
00
57 58Fu
nded
Offe
rs11
0,74
1,32
768
,466
,562
42
,274
,765
011
,044
,728
31,2
30,0
3759
Allo
catio
n68
,466
,562
011
,044
,728
32,9
02,5
2260
Diff
eren
ce0
00
1,67
2,48
561 62
88.4
Pav
emen
t Man
agem
ent
638,
152
638,
152
00
6318
4.2
Sig
n R
epla
cem
ent P
rogr
am38
,000
38,0
0038
,000
064
160.
9C
ore
Stre
et M
aint
enan
ce-C
urb
Rep
air
75,0
0075
,000
75,0
0065
160.
8C
ore
Stre
et M
aint
enan
ce-B
ridge
Mai
nten
ance
10,0
0010
,000
10,0
0066
127.
3E
nhan
ced
Trav
el C
orrid
or N
orth
Col
lege
200,
000
200,
000
Gen
eral
Fun
d0
067
67.2
Exp
andi
ng S
ervi
ce H
ours
- Tr
ansf
ort
1,65
2,00
91,
652,
009
1,50
6,37
614
5,63
368
127.
1FC
Mov
es -
Per
form
ance
Mea
sure
men
t60
,000
60,0
0060
,000
069
88.6
Ped
estri
an A
cces
s - E
nhan
cem
ent
275,
000
275,
000
275,
000
070
88.8
Stre
et O
vers
izin
g E
nhan
cem
ent
370,
250
370,
250
370,
250
071
160.
13S
now
Rem
oval
-AD
A S
idew
alk
Enh
ance
men
t11
7,00
011
7,00
011
7,00
072
88.1
6S
treet
Des
ign
& C
onst
ruct
ion
Std
s. S
uppo
rt &
Mai
nt.
5,00
05,
000
5,00
00
7388
.11
City
Brid
ge P
rogr
am E
nhan
cem
ent
200,
000
200,
000
200,
000
074
138.
1eC
omm
erce
Impl
emen
tatio
n - P
arki
ng S
ervi
ces
44,0
0044
,000
Gen
eral
Fun
d0
075
67.4
Trav
el T
rain
er10
0,00
010
0,00
010
0,00
00
7688
.12
City
Brid
ge P
rogr
am E
nhan
cem
ent L
evel
250
0,00
050
0,00
050
0,00
00
7716
0.12
Sno
w R
emov
al-D
eici
ng M
ater
ials
3,25
0,00
03,
250,
000
3,25
0,00
078
107.
1O
ffice
of t
he P
DT
Dire
ctor
65,2
9865
,298
65,2
980
7910
7.2
281
Bui
ldin
g C
opie
r21
,000
21,0
0021
,000
080
107.
4P
olic
y &
Bud
get M
anag
er88
,880
88,8
8088
,880
081
134.
7M
ason
Cor
ridor
Cos
t Inc
reas
e4,
288,
000
857,
600
Gen
eral
Fun
d3,
430,
400
3,43
0,40
082 83
Unf
unde
d O
ffers
11,9
97,5
891,
739,
752
10
,257
,837
03,
229,
804
7,02
8,03
384 85
Tota
l Offe
rs12
2,73
8,91
670
,206
,314
52,5
32,6
020
14,2
74,5
3238
,258
,070
86

146 - OPERATING BUDGET
TRAN
SPOR
TATI
ON D
RILL
ING
PLAT
FORM
200
9TR
AN
SPO
RTA
TIO
N D
RIL
LIN
G P
LATF
OR
M -
2009
One
-tim
e O
ngoi
ngLi
neO
ffer
Offe
r
Fund
ing
Offe
r G
ener
al F
und
Res
trict
edG
ener
al F
und
Oth
er R
estri
cted
##
Offe
r Des
crip
tion
Am
ount
One
-tim
eS
ourc
eA
mou
ntR
estri
cted
Des
crip
tion
Ong
oing
Fund
s O
ngoi
ng
188
.4P
avem
ent M
anag
emen
t8,
846,
034
700,
000
Gen
Fun
d R
es8,
146,
034
2,48
3,24
75,
662,
787
267
.1Tr
ansf
ort/D
ial A
Rid
e10
,729
,209
193,
992
Tran
sit R
es10
,535
,217
5,71
0,28
94,
824,
928
318
2.1
Sig
nal M
aint
enan
ce C
ore
Ser
vice
s 71
0,18
371
0,18
30
710,
183
488
.7S
treet
Ove
rsiz
ing
Cap
ital E
xpan
sion
Fee
Pro
gram
5,29
6,54
289
,854
SO
Fun
d R
es5,
206,
688
413,
050
4,79
3,63
85
134.
1M
ason
Cor
ridor
Pro
ject
600,
000
6C
MA
Q -
Mas
on/T
rout
man
Und
erpa
ss60
0,00
0C
MA
Q G
rant
s0
07
88.1
4In
ters
ectio
n Im
prov
emen
ts &
Sig
nal P
roje
cts
2,44
3,15
58
BO
B -
Inte
rsec
tion
Pro
ject
s1,
900,
000
1/4
Cen
t BO
B0
9C
MA
Q F
unds
-Var
ious
Inte
rsec
tions
543,
155
CM
AQ
Gra
nts
00
1018
3.1
Traf
fic E
ngin
eerin
g C
ore
Ser
vice
s90
9,87
090
9,87
00
909,
870
1188
.1E
ngin
eerin
g &
Bas
ic R
ight
-of-W
ay S
ervi
ces
1,18
8,72
61,
188,
726
01,
188,
726
1290
.1B
asic
Par
king
Ser
vice
s1,
784,
721
1,78
4,72
187
,386
1,69
7,33
513
160.
6S
treet
Mai
nten
ance
903,
556
903,
556
090
3,55
614
160.
1S
now
Rem
oval
-Stre
ets,
Bik
e La
nes,
and
Sid
ewal
ks1,
134,
274
1,13
4,27
40
1,13
4,27
415
86.1
Bas
ic S
ervi
ces
- Tra
nspo
rtatio
n P
lann
ing
523,
851
523,
851
052
3,85
116
160.
5W
ork
For O
ther
s - S
treet
s4,
987,
852
4,98
7,85
20
4,98
7,85
217
134.
6N
. Col
lege
Impr
ovem
ent P
roje
ct25
0,00
018
CM
AQ
- N
. Col
lege
/Hw
y 28
725
0,00
0C
MA
Q G
rant
s0
019
185.
1Tr
affic
Con
stru
ctio
n S
ervi
ces
774,
061
774,
061
077
4,06
120
88.9
Eng
inee
ring
Cha
rges
to C
apita
l43
8,13
343
8,13
3C
ap P
r Fun
d0
00
2186
.4R
egio
nal P
lann
ing
Org
aniz
atio
n C
ontri
butio
n11
2,00
011
2,00
011
2,00
00
2288
.17
Har
mon
y R
oad
Mai
nten
ance
130,
000
130,
000
013
0,00
023
134.
3P
edes
trian
Pla
n/A
DA
Impr
ovem
ents
300,
000
24B
OB
-Ped
estri
an P
lan/
AD
A Im
prov
emen
ts30
0,00
01/
4 C
ent B
OB
00
2518
4.1
Sig
ns &
Pai
nt C
ore
Ser
vice
s93
6,16
993
6,16
90
936,
169
2613
4.4
Bic
ycle
Pla
n Im
plem
enta
tion
125,
000
00
27B
OB
- B
icyc
le P
lan
Impl
emen
tatio
n12
5,00
01/
4 C
ent B
OB
028
86.2
FC B
ikes
130,
224
0C
MA
Q F
unds
87,6
00C
MA
Q G
rant
42,6
2442
,624
029
134.
2D
ownt
own
Riv
er D
istri
ct P
roje
ct50
0,00
030
CM
AQ
- D
ownt
own
Riv
er D
istri
ct P
roje
ct50
0,00
0C
MA
Q G
rant
00
3116
0.2
Stre
ets
Sup
porti
ng O
pera
tions
1,97
3,35
71,
973,
357
737,
745
1,23
5,61
232
160.
4S
treet
Sw
eepi
ng50
0,54
250
0,54
250
0,54
234
86.3
Sch
ool C
ross
ing
Gua
rds
94,3
5094
,350
94,3
500
3588
.10
City
Brid
ge P
rogr
am30
0,00
030
0,00
030
0,00
00
3669
.1Tr
ansp
orta
tion
Adm
inis
tratio
n28
8,27
728
8,27
728
8,27
70
3713
4.5
Fort
Col
lins
Bik
e Li
brar
y73
,500
00
38C
MA
Q F
unds
66,0
00C
MA
Q G
rant
00
39D
DA
Con
tribu
tion
7,50
0D
DA
Con
trib.
00
040
88.1
5R
ailro
ad C
ross
ing
Rep
lace
men
t10
0,00
010
0,00
010
0,00
00

147 - OPERATING BUDGET
TRAN
SPOR
TATI
ON D
RILL
ING
PLAT
FORM
200
9TR
AN
SPO
RTA
TIO
N D
RIL
LIN
G P
LATF
OR
M -
2009
One
-tim
e O
ngoi
ngLi
neO
ffer
Offe
r
Fund
ing
Offe
r G
ener
al F
und
Res
trict
edG
ener
al F
und
Oth
er R
estri
cted
##
Offe
r Des
crip
tion
Am
ount
One
-tim
eS
ourc
eA
mou
ntR
estri
cted
Des
crip
tion
Ong
oing
Fund
s O
ngoi
ng
4118
4.2
Sig
n R
epla
cem
ent P
rogr
am38
,000
38,0
0038
,000
042
160.
3A
lleys
, Unp
aved
Roa
ds a
nd R
oad
Sho
ulde
r Mow
ing
216,
326
216,
326
021
6,32
643
160.
7H
arm
ony
Tran
sfer
Cen
ter
99,0
0099
,000
99,0
000
4414
5.1
Med
ian
Mai
nten
ance
419,
289
419,
289
419,
289
045
67.3
Enh
ance
d P
arat
rans
it S
ervi
ce14
5,67
646
,852
Tran
sit R
es98
,824
98,8
240
4610
7.1
Offi
ce o
f the
PD
T D
irect
or30
4,18
130
4,18
130
4,18
10
4716
8.1
Loca
l Mat
chin
g Fu
nds
- CM
AQ
Pro
ject
s40
5,00
0
48C
MA
Q -
Uni
nter
rupt
ed P
ower
Sup
p &
Tra
v W
eb P
g32
6,00
0C
MA
Q G
rant
s49
79,0
00Tr
an F
nd R
es0
00
50
51
Fund
ed O
ffers
48,7
11,0
586,
253,
086
42
,457
,972
011
,328
,262
31,1
29,7
1052
Allo
catio
n6,
253,
086
011
,328
,262
30,5
88,8
8253
Diff
eren
ce0
00
(540
,828
)54 55
88.5
Pav
emen
t Man
agem
ent E
nhan
ced
1,42
3,03
71,
423,
037
1,42
3,03
70
5616
0.2
Stre
ets
Sup
porti
ng O
pera
tions
226,
185
226,
185
226,
185
5712
7.4
Enh
ance
d Tr
avel
Cor
ridor
Har
mon
y R
oad
200,
000
200,
000
Gen
eral
Fun
d0
058
160.
9C
ore
Stre
et M
aint
enan
ce-C
urb
Rep
air
75,0
0075
,000
75,0
0059
126.
1Tr
ansp
orta
tion
Mas
ter P
lan
Upd
ate
300,
000
300,
000
Gen
eral
Fun
d0
060
160.
8C
ore
Stre
et M
aint
enan
ce-B
ridge
Mai
nten
ance
10,0
0010
,000
10,0
0061
67.2
Exp
andi
ng S
ervi
ce H
ours
- Tr
ansf
ort
1,73
6,11
0
1,73
6,11
01,
585,
406
150,
704
6288
.6P
edes
trian
Acc
ess
- Enh
ance
men
t32
5,00
032
5,00
032
5,00
00
6388
.8S
treet
Ove
rsiz
ing
- Enh
ance
men
t37
0,25
037
0,25
037
0,25
00
6412
7.1
FC M
oves
- P
erfo
rman
ce M
easu
rem
ent
60,0
0060
,000
60,0
000
6516
0.13
Sno
w R
emov
al-A
DA
Sid
ewal
k E
nhan
cem
ent
12,0
0012
,000
12,0
0066
88.1
6S
treet
Des
ign
& C
onst
ruct
ion
Std
s. S
uppo
rt &
Mai
nt.
5,00
05,
000
5,00
00
6712
7.2
Enh
ance
d Tr
avel
Cor
ridor
Tim
berli
ne R
oad
300,
000
300,
000
Gen
eral
Fun
d0
068
88.1
1C
ity B
ridge
Pro
gram
Enh
ance
men
t20
0,00
020
0,00
020
0,00
00
6967
.4Tr
avel
Tra
iner
100,
000
100,
000
100,
000
070
88.1
2C
ity B
ridge
Pro
gram
Enh
ance
men
t Lev
el 2
500,
000
500,
000
500,
000
071
160.
12S
now
Rem
oval
-Dei
cing
Mat
eria
ls3,
250,
000
3,25
0,00
03,
250,
000
7210
7.1
Offi
ce o
f the
PD
T D
irect
or65
,298
65,2
9865
,298
073
107.
228
1 B
uild
ing
Cop
ier
21,0
0021
,000
21,0
000
7410
7.4
Pol
icy
& B
udge
t Man
ager
92,6
6392
,663
92,6
630
75 76U
nfun
ded
Offe
rs9,
271,
543
800,
000
8,
471,
543
04,
747,
654
3,72
3,88
977 78
Tota
l Offe
rs57
,982
,601
7,05
3,08
650
,929
,515
016
,075
,916
34,8
53,5
9979

148 - OPERATING BUDGET
TRANSPORTATION
67.1 Transfort/Dial A Ride - Funded 2008 - $10,952,337 2009 - $10,729,209This offer is to provide fixed route and paratransit bus service in accordance with the City Council adopted Transit Strategic Operating Plan. All functions relate to the provision of safe, effective, and efficient public transit for the Fort Collins com-munity. This offer includes operations, planning, administration, marketing, and maintenance for fixed route transit and paratransit service, as well as capital expenditures. Fixed route service is comprised of 18 routes running Monday through Saturdayfromapproximately6:30a.m.-7p.m.Thisofferalsoincludesparatransitserviceinthesameservicearea,duringthe same hours of service, and cost no more than twice the fixed route regular fare (per the ADA). Finally, this offer includes one-time capital purchases to replace aging transit vehicles and equipment to make transit services more efficient.
67.2 Expanded Service Hours - Transfort - Not Funded 2008 - $1,652,009 2009 - $1,736,110Thisofferistoexpandthenumberofservicehoursforfixedrouteandparatransitbusservicefrom6:30a.m.-7p.m.to5:30a.m.-10 p.m.
67.3 Enhanced Paratransit Service - Funded 2008 - $138,739 2009 - $145,676This offer is to provide enhanced paratransit bus service to 58 clients who utilized paratransit in 2006 and were “grandfa-thered”into2007service,despitetheirresidingbeyond_milefromfixedrouteservice.
67.4 Travel Trainer - Not Funded 2008 - $100,000 2009 - $100,000This offer is to implement a transit travel training program, a short-term, comprehensive program to teach people how to travel safely and independently on fixed-route service.
69.1 Transportation Administration - Funded 2008 - $420,476 2009 - $288,277This offer funds Transportation Administration, which provides direction, support, planning and coordination for all of the Transportation departments (Transportation Planning, Parking Services, Traffic, Streets, and Engineering). The Administra-tion office provides policy support to City Council, the City Manager, Deputy City Manager, and Planning, Development & Transportation Director, and also acts as a liaison for State and regional agencies, local governments, and other City service areas/departments. This office supports the Transportation Board as well as various boards and commissions and responds to citizen groups and all Transportation Group-related information requests.
86.1 Transportation Planning Basic Services - Funded 2008 - $511,655 2009 - $523,851This offer funds Transportation Planning & Special Projects staff, which delivers current, strategic, and long-range transporta-tion analysis, planning, design, and project development services for the City organization, the community, and other relevant regional/state/federal agencies. These services provide the necessary baseline analysis, future projections, and conceptual designs for the development and management of current and future integrated transportation systems and infrastructure in Fort Collins. These services address all modes of travel to/from and through our community, including automobile, transit, bi-cycle, pedestrian, and movement of freight/goods. Effective transportation planning reflects an integrated analytical approach incorporating safety, mobility, land-use, economic, and environmental health perspectives as well as serves as an important component of the City’s comprehensive plan “City Plan” and Transportation Master Plan.
149 - OPERATING BUDGET
TRANSPORTATION
86.2 FC Bikes - Funded 2008 - $129,602 2009 - $130,224FC Bikes encourages the use of bicycles as a means of sensible transportation into the everyday lives of citizens, Colorado State University students, regional commuters, and visitors to Fort Collins. FC Bikes creates and maintains a bicycle friendly community atmosphere and support system by coordinating special events and programs that emulate the many facets of bicycling. This offer increases the FC Bikes Coordinator from .75 FTE to 1.0 FTE, and includes additional programmatic enhancements. Enhancement of the FC Bikes program is funded from the acquisition of new federal Congestion Mitigation andAirQuality(CMAQ)fundsfor2008-2009tocoveradditionalstaffingandprogrammaticexpenses.TheCityofFortCollinsGeneral Funds contribution will remain constant per the 2006-07 budget level and will require no additional local funding.
86.3 School Crossing Guards - Funded 2008 - $94,350 2009 - $94,350This offer continues the School Crossing Guard Program, which provides safe student crossing of major roadways located near elementary schools. Per intergovernmental agreement (in 2000), Poudre School District assumed all responsibility for the establishment, operation and administration of the School Crossing Guard Program. The City’s only continuing contribu-tiontotheprogramisanannualpaymenttotheschooldistrictintheamountof$94,350.Priortothisagreement,theentireprogram was administered and paid for by the City of Fort Collins Transportation Planning Department.
86.4 Regional Planning Organization Contribution - Funded 2008 - $107,000 2009 - $112,000This offer funds the City of Fort Collins’ membership to the North Fort Range Metropolitan Planning Organization (MPO). Membership requires an annual local match for Fort Collins’ share of the MPO’s approved projects. The match is determined by population and is divided between the voting members of the MPO. Fort Collins has a long history of collaboration and partnership with the MPO in terms of transportation and air quality planning. Fort Collins has received millions of dollars in transportation project funds from the MPO since its inception and views them as an integral partner in addressing local and regional transportation infrastructure needs. In order to receive Federal/State/ or regional funding, membership in the MPO is required.
88.1 Engineering & Basic Right-of-Way Services - Funded 2008 - $1,147,541 2009 - $1,188,726This offer includes critical Right-of-Way services provided by the Engineering Department. Engineering provides a full range of civil engineering services, with a primary focus on Transportation projects. From surveying, drafting and design to con-struction management and inspection, Engineering provides total project management capabilities for the Planning Develop-ment and Transportation Service Area, as well as for other departments and agencies.
88.4 Pavement Management - Partially Funded 2008 - $8,698,091 2009 - $8,846,034The Pavement Management Program (PMP) provides major maintenance functions for nearly 500 miles of City streets, including arterials, collectors and residential streets. This program includes repair of concrete curb, gutter, and sidewalk, construction of handicap access ramps within the project limits, repair of deteriorating asphalt, and reconstruction, overlay or sealcoat operations on existing streets. The program improves approximately 20-25 miles of streets in Fort Collins annu-ally. PMP continues to ensure quality construction by updating construction standards, monitoring excavation permits, and implementing routine maintenance strategies that reduce future maintenance costs. The PMP also maintains a computer-ized asset management system which assists staff in selecting the right maintenance treatment, at the right time, for the maximum benefit. The system includes an inventory of the entire street network as well as roadway test data for each street intheCity.Intheoriginaloffer,fundingwasreducedby$638,152in2008.

150 - OPERATING BUDGET
TRANSPORTATION
88.5 Pavement Management - Enhancement - Not Funded 2008 - $0 2009 - $1,423,037Funding of the original offer was mandated at the 2006 level. The City street system increases annually due to annexations and new developments. In addition, the Pavement Management Program (PMP) has experienced significant increases in material costs over the past two years. Asphalt material prices from the primary supplier increased by 17% in 2006, and an unprecedented 30% in 2007. This enhancement offer requests additional funding to cover these increases in 2009 in order to provide the optimum level of service. Research has shown the rate of inflation in this region has increased to 7%, up from 3.5% used in previous budget calculations. The program historically has also used 3% annual increases for growth. This offer requests 10% in additional funds above the original offer to cover these two increases and maintain the street network within an acceptable condition range.
88.6 Pedestrian Access - Enhancement - Not Funded 2008 - $275,000 2009 - $325,000This offer establishes a Pedestrian Access Program to increase and improve the safety and ease of traveling in Fort Collins, to provide a well connected, well maintained, quality sidewalk system, and to support the use of alternate modes of trans-portation. The program would provide a comprehensive, city-wide survey to identify areas with non-existent, inadequate or hazardous sidewalks. Initially the focus will be on high volume pedestrian areas including bus routes, routes to school, and the downtown and campus areas. The program will provide funding to make corrections to those areas identified by the sur-vey on a proactive basis. Improvements will include pedestrian access ramp installation, repair of hazardous sidewalks, and installation of new sidewalks in areas where none previously existed. The program will address the immediate and ongoing need to respond to complaints, fund temporary repairs for hazardous situations, and approach property owners regarding code compliance.
88.7 Street Oversizing Capital Expansion Fee Program - Funded 2008 - $5,266,484 2009 - $5,296,542This offer funds the Street Oversizing Program, a transportation impact fee program that collects revenue from new develop-ments specifically to mitigate their traffic impacts by constructing arterial and collector roadways. The program determines and collects impact fees for new development projects, provides funding for the “oversized” portion of arterial streets, and provides project oversight and management, including review, construction, and inspection. The program offers to con-struct$5.3millionintransportationimprovementsin2008and$5.5millionintransportationimprovementsin2009fundedthrough impact fees and developer contributions. The Street Oversizing Program is the implementation of the transportation element of City Plan, integrating land use and transportation. The program actively seeks to improve citizen mobility by con-structing quality transportation infrastructure to increase capacity of all modes of transportation.
88.8 Street Oversizing - Enhancement - Not Funded 2008 - $370,250 2009 - $370,250The Street Oversizing Program is a transportation impact fee program that collects revenue from new developments specifi-cally to mitigate their traffic impacts by constructing arterial and collector roadways. The program determines and collects impact fees for new development projects, provides funding for the “oversized” portion of arterial streets, and provides project oversight and management, including review, construction, and inspection. There is increased traffic attributable to regional and County growth. In the impact fee calculation, these regional trips cannot be attributed to the impact of new development. This portion of the cost of roadway improvements cannot be included in the Street Oversizing Capital Expan-sion Fee. Instead, it is paid for by an annual contribution from the City’s General Fund into the Street Oversizing Fund. This offer would be to restore the City’s General Fund contribution to fully fund this critical area of transportation funding for 2008 and 2009

151 - OPERATING BUDGET
TRANSPORTATION
88.9 Capital Projects: Engineering Charges to Capital - Funded 2008 - $421,118 2009 - $438,133This offer funds the Capital Projects Group. This group of 3.5 FTE engineering positions manages the design and construction of the City’s Transportation Capital Improvements Program and does project estimating and design. The projects consist of street improvements (curb, gutter sidewalks, pavement, drainage, landscaping, etc.), bicycle/pedestrian trails and walkways, bridges, retaining walls, other structures, railroad crossings, etc. The group charges the majority of its time to the capital projects.
88.10 City Bridge Program - Funded 2008 - $300,000 2009 - $300,000Thisprogramwasstartedin2006topayforinspection,upgradeandmaintenanceoftheCity’s147bridgestructures,thecount in 2005. The State requires that all bridge structures be inspected at a minimum frequency of every four years. De-pending upon the age and condition of the bridge, the inspection may be required more frequently. Based on inspection results, funds in the Program are spent first on “critical” needs and then on “urgent” needs. The inspection maintenance helps to reduce the possibility of a bridge failing under traffic loads.
88.11 City Bridge Program Enhancement - Not Funded 2008 - $200,000 2009 - $200,000Thisprogramwasstartedin2006topayforinspection,upgradeandmaintenanceoftheCity’s147bridgestructures,thecount in 2005. The State requires that all bridge structures be inspected at a minimum frequency of every four years. De-pending upon the age and condition of the bridge, the inspection may be required more frequently. Based on inspection results, funds in the Program are spent first on “critical” needs and then on “urgent” needs. The inspection, maintenance helps to reduce the possibility of a bridge failing under traffic loads. Through research of our records and findings in the field, we have found more bridge structures. We now count almost 250 bridges on City streets. We are finding that this program isunderfundedatthecurrentlevelof$300,000peryear.Therefore,forthisenhancementwearerequestinganadditional$200,000peryearbeaddedtotheProgram.
88.12 City Bridge Program Enhancement Level 2 - Not Funded 2008 - $500,000 2009 - $500,000Thisprogramwasstartedin2006topayforinspection,upgradeandmaintenanceoftheCity’s147bridgestructures,thecount in 2005. Almost 250 have now been identified. The State requires that all bridge structures be inspected at a mini-mum frequency of every four years. Depending upon the age and condition of the bridge, the inspection may be required more frequently. Based on inspection results, funds in the Program are spent first on “critical” needs and then on “urgent” needs. The inspection, maintenance helps to reduce the possibility of a bridge failing under traffic loads. This enhancement wouldaddanadditional$500,000peryeartotheprogramtoproactivelybeginreplacingbridgesthatshouldbereplaced.
88.14 Building on Basics - Intersection Improvements and Traffic Signal - Funded 2008 - $1,306,052 2009 - $2,443,155Thisprojectwasapprovedfor2006funding.Additionalfundingof$2,325,000and$1,500,000isprogrammedintheBOBProgram for 2008 and 2009 respectively to fund many street intersection improvements. To optimize the use of these funds for improving traffic flow for as many street intersections as possible, we apply for grants. Recently grants were offered to theCityforCongestionManagementAirQuality(CMAQ)forfourdifferentintersectionprojects.Itisproposedthattheac-ceptance of those grants be approved with this offer.
88.15 Railroad Crossing Replacement - Funded 2008 - $100,000 2009 - $100,000This offer funds the crossing material when railroad crossings need replacement. The material is generally concrete panels installed between the rails and along the outside two feet adjacent to the rails at a railroad crossing. The railroad company will install the material at their expense. The City currently has 53 track crossing locations. This offer includes the costs of crossing material, street closures and pavement patching.

152 - OPERATING BUDGET
TRANSPORTATION
88.16 Street Design & Construction Standards Support & Maintenance - Not Funded 2008 - $5,000 2009 - $5,000This offer will fund the review of new materials and methods for the purpose of updating the Larimer County Urban Area Street Standards to accommodate new and revised standards. In addition the standards often need clarifications and up-dates for new construction methods. This would be accomplished with this offer.
88.17 Harmony Road Maintenance - Funded 2008 - $125,444 2009 - $130,000This offer will allow for routine and major maintenance of the portion of Harmony Road from I-25 to College Avenue. Prior to 2006 the maintenance was performed by CDOT. The City’s Traffic Operations Department received funding from CDOT to maintain the traffic signal system and that funding will stop when the city accepts ownership of Harmony Road.
90.1 Basic Parking Services - Funded 2008 - $1,735,124 2009 - $1,784,721This offer includes basic parking services operations and maintenance in the Downtown area and in areas around the Colo-rado State University campus. These activities include permit sales, front counter operations (customer service), parking enforcement and citation writing, operation of two parking structures and several surface lots, management of the financial proceeds from parking activities, management and configuration of on-street parking spaces, and maintenance of parking facilities.
107.1 Office of the PDT Director - Partially Funded 2008 - $294,430 2009 - $304,181This offer funds the Office of the Director of Planning, Development and Transportation which consists of the director and an Executive Administrative Assistant. The Director of PDT oversees the operation of all planning functions and transportation operations, which includes streets, engineering and traffic. Also under the Director’s direction is the City’s transit system (Transfort/DAR), parking and neighborhood and building services, including licensing and code compliance. The original offeramountnotfundedis$65,298in2008and$65,298in2009.
107.2 281 Building Copier - Not Funded 2008 - $21,000 2009 - $21,000This offer funds the two existing high production non-departmental copiers located at 281 North College Avenue. Since 2001, the costs associated with the copiers were budgeted in General Fund non-departmental expenditures. Beginning in 2008, the non-departmental copiers will no longer be budgeted in General Fund non-departmental expenditures.
107.4 Budget and Policy Manager - Not Funded 2008 - $88,880 2009 - $92,663This offer will restore the Policy and Budget Manager position which provides support to the Planning, Development and Transportation Service Unit. This position was eliminated in the 2006-07 Budget process. This position will be responsible for managing policy projects and overseeing the budget and financial processes of the Service Unit.

153 - OPERATING BUDGET
TRANSPORTATION
126.1 Transportation Master Plan Update - Not Funded 2008 - $0 2009 - $300,000This offer would update the City’s Transportation Master Plan (TMP), the strategic and long-range transportation plans for Fort Collins, in conjunction with the updates to the City’s comprehensive land-use plan “City Plan”. The TMP Update will provide the necessary baseline analysis, future projections, and renewed transportation planning policies & principles for the development and management of current and future integrated transportation systems and infrastructure in Fort Col-lins. These services address all modes of travel to/from and through our community, including automobile, transit, bicycle, pedestrian, and movement of freight/goods. Keeping the TMP updated and current with the “City Plan” land-use plan is a key, necessary component of an efficient, effective, safe, and sustainable community and healthy economy.
126.2 Transfort Strategic Operating Plan Update - Funded 2008 - $100,000 2009 - $0The Transfort Strategic Operating Plan was last updated in 2002. It focused on identifying transit needs, opportunities and constraints and developing an operating plan to support the strategic plan. The plan also laid out a four-phased approach to transition the existing circuitous transit network to a grid system by 2010. Based on the City’s financial conditions, the Transfort Strategic Operating Plan implementation schedule fell behind. At present day, the City currently should be in Phase 3 of implementation as approved by City Council, but is still fixed in Phase 1 due to lack of funding sources. This offer would update the Transfort Strategic Operating Plan to reflect its existing condition and provide a strategic operational and financial plan, which will also identify potential new funding sources for full plan implementation.
127.1 FC Moves Performance Measurement - Not Funded 2008 - $60,000 2009 - $60,000FCMOVES isaproposal to furtherdevelopand implementanongoingprogram tomeasureandevaluateoverall trans-portation system performance (mobility). This program is intended for use by Fort Collins citizens and decision-makers. Information is to be presented in a manner that is easily understood and relevant to citizens’ concerns. This program began developmentin2006.TheinitialFCMOVESreportistobecompletedsummerof2007.Furtherdevelopmentandrefinementisanticipatedforthe2010/2011BudgetProcess.FCMOVESmeasuresFortCollins’transportationsystemperformanceonseveral criteria. These include safety, efficiency, reliability, access, and the provision of alternative modes of travel. Fort Collins is also compared to other similar cities and towns in northern Colorado and the United States. This affords decision makers a snapshot in time of transportation system performance, longitudinal analysis of the transportation system’s performance over time, and a benchmark comparison to other similar communities.
127.2 Enhanced Travel Corridor Timberline Road - Not Funded 2008 - $0 2009 - $300,000The City of Fort Collins City Plan, Structure Plan, Transfort Strategic Operating Plan, and Transportation Master Plan have all identified Timberline Road to be an “Enhanced Travel Corridor” (ETC) to be developed into a multi-modal travel way to bet-ter facilitate the increased travel flow within this corridor as population and employment densities increase over the coming years. Four corridors have been identified to be developed into ETC’s including the Mason Corridor, Harmony Road Corridor, Timberline Road Corridor, and the North College Avenue/Conifer Street Corridors. This offer would fund planning and pre-liminary design to develop the Timberline Road Enhanced Travel Corridor.
127.3 Enhanced Travel Corridor North College - Not Funded 2008 - $200,000 2009 - $0VariousComprehensiveCityPlanshaveallidentifiedNorthCollegeAvenueandConiferStreettobe“EnhancedTravelCorri-dors” (ETC) to be developed into high-frequency transit & multi-modal travel ways to better facilitate the increased travel flow as population and employment densities increase over the coming years. Four corridors have been identified to be developed into ETC’s including the Mason Corridor, Harmony Road Corridor, Timberline Road Corridor, and the North College Avenue/Conifer Street Corridors. This offer would fund planning and preliminary design to develop the North College Avenue/Conifer Street Enhanced Travel Corridor.

154 - OPERATING BUDGET
TRANSPORTATION
127.4 Enhanced Travel Corridor Harmony Road - Not Funded 2008 - $0 2009 - $200,000The City of Fort Collins City Plan, Structure Plan, Transfort Strategic Operating Plan, Transportation Master Plan, and Har-mony Corridor Plan have all identified Harmony Road to be an “Enhanced Travel Corridor” (ETC) to be developed into a multi-modal travel way to better facilitate the increased travel flow within this corridor as population and employment densities increase over the coming years. Four corridors have been identified to be developed into ETC’s including the Mason Corridor, Harmony Road Corridor, Timberline Road Corridor, and the North College Avenue/Conifer Street Corridors. This offer would fund planning and preliminary design to develop the Harmony Road Enhanced Travel Corridor, to address transportation improvements needed in response to the increased population and employment densities along this corridor.
134.1 Mason Corridor Project - Funded 2008 - $62,708,488 2009 - $ 600,000This offer funds the continued development and implementation of the various facets of the Mason Corridor project. The MasonCorridorcapitalproject includesthedevelopmentof thefollowingelements:MasonExpressor“MAX”BusRapidTransit (BRT) system improvements, converting Mason and Howes streets in the downtown area back to two-way operation, developing the South Transit Center site improvements, building the Mason trail extension north from the Spring Creek trail to the Colorado State University (CSU) main campus, and two grade-separated trail crossing projects over/under the Burlington Northern Santa Fe railroad tracks.
134.2 Downtown River District Project - Funded 2008 - $500,000 2009 - $500,000This offer funds continued development and implementation of the various facets of the Downtown River District project. The DowntownRiverDistrictprojectincludesconstructionofJeffersonStreet/SH14streetscapeimprovements,aroundaboutatthe intersection of Jefferson/Mountain Avenue, and initial improvements on Linden Street, north of Jefferson to the Poudre River. The Downtown River District project serves as a great example of the City’s adopted Transportation Master Plan goals for an efficient, effective, safe, and sustainable transportation system as well as the City’s and DDA’s economic development goals.
134.3 Pedestrian Plan/ADA Improvements - Funded 2008 - $300,000 2009 - $300,000The 2005 Building on Basics (BOB) ballot initiative included provisions for implementation of the Fort Collins Pedestrian Plan.Aspartofthatapprovedtaxpackage,approximately$300,000peryearhasbeenallocatedforpedestrianimprove-ment projects and programmatic activities to further implement the Pedestrian Plan in Fort Collins. This approved/existing BOB funding provides for on-going support of the annual Pedestrian Plan improvements that originally began with the former “Building Community Choices ballot initiative in 1997.
134.4 Bicycle Plan Implementation - Funded 2008 - $125,000 2009 - $125,000This offer funds the 2005 Building on Basics ballot initiative for implementation of the Fort Collins Bicycle Plan and Program. Theapprovedtaxpackageprovides$1milliondollarsoverthenext8years.Thisofferfundsconstructionandprogram-matic activities to further implement the Bicycle Plan and Program in Fort Collins. This offer will ensure that staff time and city resources are allotted to insure that the taxpayer approved funds are spent in accordance with the goals, principles, and policies as articulated in the Bicycle Plan.

155 - OPERATING BUDGET
TRANSPORTATION
134.5 Fort Collins Bike Library - Funded 2008 - $73,500 2009 - $73,500This offer funds a community bike program, also known as a “bicycle library,” that lends bicycles for little or no cost to com-munity members and visitors who might otherwise utilize an automobile. The primary goal is to reduce vehicle miles traveled, traffic congestion, and improve air quality in Fort Collins by offering a free, easy to use bicycle library program for daily trips in Fort Collins. The Fort Collins Bicycle Library funding is derived from the acquisition of new Congestion Mitigation and Air Quality(CMAQ)fundsfor2008-2009,fundingfromtheDowntownDevelopmentAuthority,and“inkind”localcontributions.No matching City General Funds are required for this project; however, the Fort Collins Bicycle Library project does request theuseofCityownedspacetohouseandmaintainthebicyclelibraryfleet.UtilityexpenseswillbecoveredbyCMAQfund-ing.
134.6 N. College Improvement Project - Funded 2008 - $1,063,490 2009 - $ 250,000The offer provides funding to continue & expand the development and implementation of the various facets of the North College Avenue/US287 corridor improvement project. The North College/US287 project includes extending the pedestrian/streetscape, bicycle, and street/intersection improvements northward from the Poudre River bridge to Hickory Street. The North College project serves as a great example of the City’s adopted Transportation Master Plan goals for an efficient, effec-tive, safe, and sustainable transportation system as well as the City’s and NFCBA’s economic development goals.
134.7 Mason Corridor Cost Increase - Not Funded 2008 - $4,288,000 2009 - $0This enhancement offer identifies the amount of the updated Mason Corridor/MAX Bus Rapid Transit (BRT) capital cost esti-mate from the original offer. This update is provided by the revised cost estimates based on the completion of the Preliminary Engineering design work which was finished in early July 2007.
138.1 eCommerce Implementation - Parking Services - Not Funded 2008 - $44,000 2009 - $0This offer will allow customers of Parking Services to pay parking citations or buy permits on-line. It also will allow existing customers to renew a parking permit on the web. This will benefit customers since they will not have to come in person to the Parking Services office. It will relieve the pressure on front-counter operations where it is becoming more and more difficult to serve the public with the limited number of staff that are available. This offer is expected to increase parking services revenue by 10-20% due to the added ease of convenient payment methods.
145.1 Median Maintenance - Funded 2008 - $399,062 2009 - $419,289This offer continues the maintenance of 300+ medians totaling 61 acres. The majority of medians are located along major thoroughfares of the City. The Parks Division outsources this maintenance to a contractor. The contractor maintains ir-rigation systems, mows, trims, weeds, cleans and renovates medians as requested. Utilities are paid separately from the maintenance contract by Parks. Parks Division staff manages the contract, has input into the design of new medians to ensure maintenance cost efficiencies with a focus on sustainability, and determines which medians should be renovated to keep them attractive and cost effect. The Parks Division has chosen to out source the daily maintenance to reduce the need for more City equipment and personnel. Outsourcing eliminates time wasted constantly training employees on the median and streetscape system. With many medians located on main thoroughfares in the City, outsourcing reduces the City’s risk from employees being injured in traffic accidents The City has an 8 month contract from March through October. Parks partners with the Forestry Division to maintain median trees. No maintenance service will be provided on medians and parkways November through February.

156 - OPERATING BUDGET
TRANSPORTATION
160.1 Snow Removal- Streets, Bike Lanes, and Sidewalks - Funded 2008 - $1,110,847 2009 - $1,134,274This offer includes snow removal operations along city streets and designated arterial sidewalks. The program includes the de-icing materials, labor, and equipment costs needed to respond to storm events.
160.2 Streets Supporting Operations - Partially Funded 2008 - $2,184,047 2009 - $1,973,357This offer includes the major components of the Streets Department supporting operations including administration, building maintenance, debt service annual payments, facility utilities and capital outlay for equipment. In the original offer, funding wasreducedby$226,185in2009.
160.3 Alleys, Unpaved Roads and Road Shoulder Mowing - Funded 2008 - $210,859 2009 - $216,326This offer includes maintenance on City alleys, unpaved roads, borrow ditches, and road shoulder mowing. The Streets Departmentbladesroadshouldersonceayeartosmoothrutsandpotholes.Theyalsomaintain240blocksofunpavedalleys.
160.4 Street Sweeping - Funded 2008 - $479,271 2009 - $500,542This offer comprises the City’s basic street sweeping program including arterial, bike lanes, collectors, residential, downtown, and accident clean-up sweeping operations. This continues the current schedule of sweeping residential streets on a quar-terly basis. Arterial streets and adjoining bike lanes are swept once every two weeks. Downtown Fort Collins is swept two times per week.
160.5 Work For Others - Streets - Funded 2008 - $4,818,407 2009 - $4,987,852This offer includes the Streets Work for Others program. In the Work for Others program, the Streets Department essentially exists as a contractor to the City and competes for bids against private contractors. The Work for Others primary services including street rehabilitation for the Pavement Management program, patching for the Utilities department, snow removal for City parking structures and lots, an in-house traffic control division and a crushing operations facility that recycles roadway materials from City and private projects.
160.6 Street Maintenance - Funded 2008 - $866,786 2009 - $903,556This offer includes the major components of the streets maintenance program including streets patching, crack-sealing, pothole-filling, and on-call emergencies. This offer funds both routine and preventative maintenance. It also supports the Pothole Hotline.
160.7 Harmony Transfer Center - Funded 2008 - $99,000 2009 - $99,000This offer provides maintenance for the Harmony Transfer Center, also known as the Harmony Park and Ride. Maintenance activities include sweeping, snow removal, parking, lot pavement maintenance, trash removal, landscaping, lighting, and general maintenance for the facility.

157 - OPERATING BUDGET
TRANSPORTATION
160.8 Bridge Maintenance - Not Funded 2008 - $10,000 2009 - $10,000This offer includes funding for a bridge guard rail maintenance program. It would create an annual program to make repairs and provide general maintenance for bridge guard rails over irrigation ditches.
160.9 Curb Repair - Not Funded 2008 - $75,000 2009 - $75,000This offer includes funds to repair broken curbs and sidewalks as a result of the 2006-2007 snow removal operations.
160.12 Snow Removal- Deicing Materials - Not Funded 2008 - $3,250,000 2009 - $3,250,000This offer proposes to uses all non-chlorides for the City’s deicing materials.
160.13 Snow Removal- ADA Sidewalk Enhancement - Not Funded 2008 - $117,000 2009 - $ 12,000This offer includes increased snow removal services on sidewalks and ramps relating to the Americans with Disabilities Act (ADA). This offer includes one-time funds to purchase a specialized sidewalk snow removal machine and annual costs for labor to equipment.
168.1 Local Matching Funds-CMAQ Projects - Funded 2008 - $650,000 2009 - $405,000The Traffic Operations Department has received notification from the North Front Range Metropolitan Planning Organization thatitwillbeawardedfourCongestionMitigationandAirQualityGrantsintheperiodof2008-2009.Theprojectsarethefollowing:ComprehensiveTrafficSignalTiming,TrafficResponsiveSignalTimingonHarmonyRoad,uninterruptedpowersupplies on fifteen cabinets and expansion of the web traveler page. The last two grants will require a local match of 20%.
182.1 Signal Maintenance Core Services - Funded 2008 - $726,543 2009 - $710,183This offer will provide for the continued construction, maintenance, repair, and upgrade to the traffic signals, communication, and associated hardware of the Advanced Traffic Management System.
183.1 Traffic Engineering Core Services - Funded 2008 - $902,324 2009 - $909,870This offer provides for the continued improvement of the City of Fort Collins’ transportation system through sound, quality traffic engineering. It will provide for the continued maintenance and operation of the Traffic Operations Department, the Advance Traffic Management System, the Neighborhood Traffic Safety Program, Work Area Traffic Control, the web traveler page (fctrip.com), development review, traffic studies, and accident statistics.
184.1 Signs & Paint Core Services - Funded 2008 - $910,064 2009 - $936,169This offer provides for the fabrication, installation, repair and maintenance of the signs and pavement markings on the public roadways in Fort Collins. Signs and pavement markings are used to inform, guide, warn and regulate traffic in a safe man-ner.

158 - OPERATING BUDGET
TRANSPORTATION
184.2 Sign Replacement Program - Partially Funded 2008 - $0 2009 - $38,000 The Manual of Uniform Traffic Control Devices (MUTCD) are the federally mandated standards for the installation and main-tenance of all traffic control devices on streets and highways. These standards are being amended to address issues and increase safety for the aging population. Some of the changes are the enlargement in letter size and the increase of traffic sign retroreflectivity. In 2006 and 2007, the Signs and Pavement Marking division replaced metro and street name signs. This offer includes the funding needed to bring the regulatory, warning and guide signs into compliance. There are approximately 10,000signsinFortCollinsthatwillnotmeetthenewstandard.TrafficOperationsisproposingtoreplace14%oftheroad-waysigns,orapproximately1,400signs,eachyearforthenextsevenyearstocomplywiththenewMUTCDrequirements.Theoriginalofferamountnotfundedis$38,000in2009.
185.1 Traffic Construction Services - Funded 2008 - $765,196 2009 - $774,064This is a self supported program that provides funding, staffing, and a separate accounting for the installation of traffic signals, signs, and pavement markings for other city departments, municipalities, and developers. This program is Traffic Operations - “work for others”. Constructing traffic signals, fabricating and installing signs and pavement markings in-house is cost-effective and allows us to maintain quality control of both the materials and the installation process.
159 - OPERATING BUDGET
TRANSPORTATION
Fort Collins improves the safety and ease of traveling to, from, and throughout the city.
TEAM MEMBERS Roger Buffington, Susie Gordon, Cory Christensen, Timothy Wilder, Mark Jackson TeamLeader:KenMannonFacilitator:LoriClements-GroteCommunications:KimNewcomerBudgetLiaison:RandyHensley
INTRODUCTION/SUMMARY OF RESULTS MAP
Qualitytransportationisintrinsictocitizens’definitionof“qualityoflife.”Aworld-classtransportationsystemcan contribute to a strong economy, healthy environment, and vibrant community. These elements are inti-mately intertwined in Fort Collins. Transportation projects, such as the Mason Corridor plan, exemplify how quality transportation can foster development and redevelopment that strengthens our local economy. Further, such plans provide a variety of alternative travel mode options that have the potential to minimize environmental impacts. Finally, these types of transportation initiatives contribute to our vibrant community by conveniently linking major activity centers throughout the community, including Downtown Fort Collins, often referred to as our “crown jewel.”
It is undeniable that quality transportation supports the economy, environment, and community. To that end, this Request for Results addresses the key result Improve Transportation: Fort Collins improves the safety and ease of traveling to, from, and throughout the city. To continually improve the safety and ease of travel in the Fort Collins area, the City must address traffic, infrastructure, planning, travel mode options, and communica-tion. Like most urban communities, traffic congestion occurs in Fort Collins and citizens cite it as an issue that needs to be improved (see 2006 Citizen Survey results). Travel outside the city, including on I-25, is increasingly dif-ficult and the State’s funding sources are limited. Along with longer trip lengths, and therefore less time for recreation and family, poor traffic flow increases citizens’ frustration and creates unsafe conditions.
Fort Collins has a well-designed surface street system that strives to provide good infrastructure for drivers, bi-cyclists, pedestrians and transit riders, which is key to improving safety and ease of travel. The winter storms of 2006 have had an adverse effect on the condition and safety of roads. This RFR recognizes the significance of maintenance as a high priority. This results map includes safety factors as they relate to infrastructure; budget offers that concentrate on driver behavior and enforcement are addressed in other result areas.
The community’s normally clement weather conditions during a substantial part of the year allow people to engage in a variety of ways to travel to work and other destinations. Along with an appreciation of healthy and outdoor activities, Fort Collins residents value clean air and the ability to choose alternative transportation modes. Recent changes to transit services have elevated the importance of providing and educating residents about travel mode options.
160 - OPERATING BUDGET
INDICATORS
1. CITIZEN SATISFACTION Measure: Community Survey There are several qualitative parameters that are implied in the desire for “ease of travel” which will be
measured through opinion polls. Statistically valid surveys have been conducted in recent years; these allow us to benchmark new survey information against perceptions citizens have expressed about the ease of mobility and other transportation concerns.
2. MOBILITY Measure: Time traveled on selected routes and delay times at key intersections. To evaluate ease of travel by automobile, the average time it takes to travel at least six of Fort Collins’ pri-
mary arterial streets during “peak” travel times will be measured. Delays at key arterial intersections will also measure automobile mobility/ease of travel.
3. TRANSIT MOBILITY Measure: Transit ridership and timeliness. To evaluate ease of travel by transit, changes in fixed route ridership per calendar year will be measured. Reliability of travel by transit will be measured by percentage of on-time transit service.
4. INDICATOR 4: ROADWAY SYSTEM MAINTENANCE Measure: Roadway conditions Roadway conditions measure efforts and effectiveness of roadway maintenance which contribute to the
safetyandeaseoftravel.Roadwayconditionswillbemeasuredby: •AveragepavementconditionsofFortCollinsroads •Numberofmaintenancerequestsandcomplaintsperyear(e.g.potholes,snowremoval,sweeping)
5. OUTSIDE FUNDING SOURCES. Measure: Amount of dollars from non-City sources. Successful acquisition of outside funding sources for improving transportation will be measured.
PURCHASING STRATEGIES
1. Purchasing Strategy #1–ContributetoSmooth,PredictableTrafficFlow. We are seeking proposals that help improve the traffic flow in Fort Collins for transporting people, goods,
and information. A variety of modes of travel contribute to smooth and predictable traffic flow. Key indica-tors of success will include the ability of a proposal to improve travel time and decrease travel delays for all modesbyaddressingthefollowingfactorsincluding,butnotlimitedto:
•Increasedcapacityforallmodes •Intersectionimprovements •Signalization(e.g.,cross-walks,trafficlighttiming,orbikecrossings) •Parking •Signsanddirections •Travelroutes •Impactsofzones(e.g.,construction,school,orloadingzones)
2. Purchasing Strategy #2–SupportQualityTravelSurfacesandInfrastructure. We are seeking proposals that will help the City meet citizens’ transportation needs by providing safe,
well-functioning, quality travel surfaces (including bikeways, sidewalks, etc.), or that improve other critical physical or communication infrastructure. Proposals should ultimately improve travel safety and overall conditionsandmayaddressthefollowing:
•Maintenance(e.g.,potholes,snowremoval,pavementmanagement)
161 - OPERATING BUDGET
•Capitalprojects •Designstandards •Ensuresystemconnectivity •Safety/efficiencyimprovements(e.g.,trafficcalming,accesscontrol) •Improvecommunicationinfrastructure(e.g.,fiberinroadright-of-way)
3. Purchasing Strategy # 3–IntegrateLandUseandTransportationPlanning. We are seeking proposals that encourage transportation-driven planning, to enhance citizens’ mobility, and
therefore help local and regional transportation networks operate at a high level of efficiency. Areas of con-siderationinclude,butarenotlimitedto:
•Planning •Newfundingsources •Demandforecasting •Partnerships(e.g.,ColoradoStateUniversity,RegionalTransportationAuthority,NorthFrontRangeMetro-
politan Planning Organization, Colorado Department of Transportation, Poudre School District, and other transportation providers)
•Citizeninput
4. Purchasing Strategy #4 –ProvideTravelModeOptions. We are seeking proposals that limit the rate of increase in traffic volume and enhance alternative travel
modes for Fort Collins citizens. By providing real travel options, citizens can choose to rely less on single-occupancyvehicles.Examplesinclude:
•Mass/paratransit •Bikeways •Pedestriansystems •Carpool •Carsharing
5. Purchasing Strategy # 5– Increase Awareness We are seeking proposals for improving outreach and education, thereby increasing citizens’ ability to travel
safelyandeasilyontheCity’stransportationsystem.Areasofconsiderationinclude,butarenotlimitedto: •Outreachandeducation •Two-waydialoguewithcitizens •Appropriateincentives
NOTES/PRACTICES/SUPPORTING EVIDENCE
•2006CityofFortCollinsCitizenSurvey•CityCouncilRetreat•FeedbackfromCityBoardsandCommissions•Requestsforroadmaintenance•Localnewsarticlesandeditorialsaddressingtransit•InterviewswithCityTransportationstaff•“TransportationandEconomicDevelopment2002,”TransportationCircular,May2003•“HealthyReturns:TheEconomicImpactofPublicInvestmentinSurfaceTransportation,”RobertJ.Shapiro
and Kevin A. Hassett, American Public Transportation Association
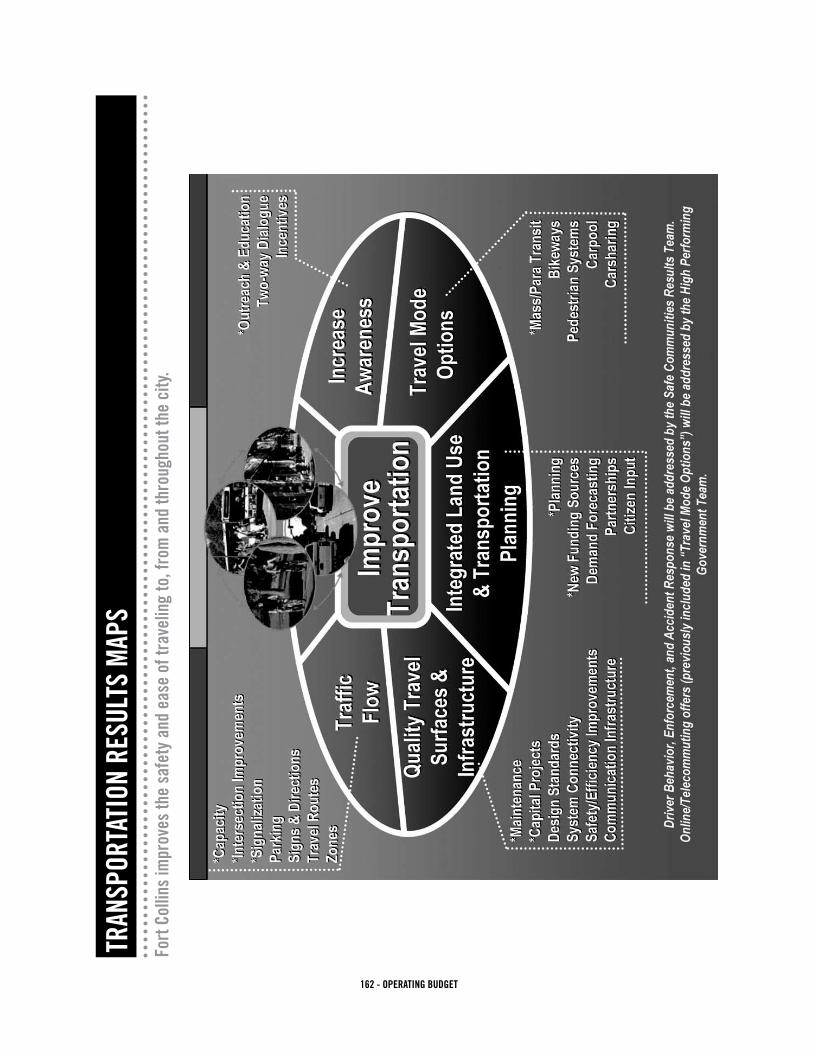
162 - OPERATING BUDGET
Fort
Col
lins
impr
oves
the
safe
ty a
nd e
ase
of tr
avel
ing
to, f
rom
and
thro
ugho
ut th
e ci
ty.
TRAN
SPOR
TATI
ON R
ESUL
TS M
APS

163 - OPERATING BUDGET

164 - OPERATING BUDGET
2008-2009 BUDGET RESULTS
7. HIGH-PERFORMING GOVERNMENT
KEY ISSUES
The majority of offers in this Result Area are for internal services which support other City operations. Most ser-vices will continue at existing levels, with some enhancements. Additional staffing in Accounting and Human Resources will provide more appropriate levels of service for City departments (includes a total of 3.0 FTE.)
New facilities which will open in 2007 require additional resources for utilities costs, custodial and maintenance needs. These increased maintenance costs are included in budgets for Operation Services and cover the new Police Building, the new Northside Aztlan Community Center and Spring Canyon Community Park.
New replacement funds will be created to better account and plan for our replacement of equipment. Computer and fleet equipment replacement funds have been established. Reserves for buildings and improvements will be consolidated for more efficiency and consistent management of these resources.
The 2009 Budget year includes plans for the implementation of a new Pay for Performance system for City employees. The commitment to this program will continue to focus the organization on efficiency and account-ability.
REVENUE TRENDS & ISSUES
This Data and Result Area is funded by a wide variety of revenue sources. Internal Service Funds such as the Communication, Benefits and Self-Insurance Funds collect revenue from all departments to provide support services. Replacement funds for facilities and equipment are also key components of this revenue stream.
A long-term revenue issue for this Result Area is the lack of ongoing funding for building repair and mainte-
2008 GENERAL FUND $18.2M
0 5 10 15 20 25
2008 GENERAL FUND & OTHER FUNDS – 75.6M2009 GENERAL FUND & OTHER FUNDS – 78.7M
GENERAL FUND
UTILITIES
BENEFITS
COMMUNICATION
EQUIPMENT
SELF INSURANCE
14.5M14.5M
20.8M23.3M
2.3M1.7M
10.9M11M
3.2M3.2M
MILLIONS
23.9M25.0M
20082009
20082009
165 - OPERATING BUDGET
nance. This Budget continues to fund these needs substantially with one-time funds. This practice places the program at risk of deferring essential maintenance and repairs in the future.
KEY PURCHASES
•CityCouncilcoreservices
•CityManager’sOffice,CityClerk’sOffice,LegalandMunicipalCourtservices
•Internal support functions: Management Information Systems, Telecommunications, Finance, Purchasing,Human Resources, and Operations Services (Fleet, Facilities and Real Estate)
•Citizenconnections:CommunicationsandPublicInvolvementOffice,Cable14servicesandE-Government
•EmployeeBenefitsfund
•Salestaxrebateprogram
•UtilityCustomerServicesandAdministration
ENHANCEMENTS PURCHASED
•AdditionalresourcestooperateandmaintainnewfacilitiesincludingthenewPoliceBuilding,NorthsideAztlanCommunity Center, and Spring Canyon Community Park facilities (utilities, maintenance, and custodial)
•TechnologyimprovementsfortheCity’sDevelopmentReviewCenter
•CompensationAnalysttoimplementPayforPerformancesystem(1.0FTE)
•SeniorAccountant(1.0FTE)
•HumanResourcesrepresentativeforInvestigations(1.0FTE)
•MISdatalabequipment
•AdministrativesupportfortheCityManager’sOffice
•ImplementationofsustainablepracticesforCitygovernment
•ImplementationofVoiceoverIPtechnologyforCityphoneservice
EXAMPLES OF SERVICES NOT PURCHASED
•EnhancedCommunicationsprogram
•On-goingfundingforFacilitiesMajorRepairandRenovations
•EnhancementsforFleetVehicleandEquipmentMaintenance,MIStechnologyneeds,CustomerRelationshipTracking (CRM) software, and other technology improvements

166 - OPERATING BUDGET
HIGH
PER
FORM
ANCE
DRI
LLIN
G PL
ATFO
RM 2
008
HIG
H P
ERFO
RM
ING
CIT
Y G
OVE
RN
MEN
T D
RIL
LIN
G P
LATF
OR
M -
2008
One
-tim
eO
ngoi
ng
Line
Offe
r O
ffer
Fund
ing
Offe
rG
ener
al F
und
Res
trict
edU
tiliti
esG
ener
al F
und
Oth
er R
estri
cte d
##
Offe
r Des
crip
tion
Am
ount
O
ne-ti
me
Sou
rce
Am
ount
R
estri
cted
Des
crip
tion
MIS
Cha
rge
Ong
oing
Fund
s O
ngoi
ng
115
7.1
Lega
l Ser
vice
s A
dmin
istra
tion
1,14
5,10
110
,498
GF
Cam
Res
v.1,
134,
603
1,13
4,60
30
2To
tal C
ity A
ttorn
ey1,
145,
101
10,4
981,
134,
603
00
1,13
4,60
30
3 46.
1C
ity C
ounc
il C
ore
Ser
vice
s16
7,80
016
7,80
016
7,80
00
5To
tal C
ity C
ounc
il16
7,80
00
167,
800
00
167,
800
06 7
112.
1C
ity C
lerk
Adm
inis
tratio
n54
2,45
554
2,45
554
2,45
50
811
2.2
Pas
spor
ts4,
710
4,71
04,
710
09
112.
3H
uman
Rel
atio
ns C
omm
issi
on S
uppo
rt6,
884
6,88
46,
884
010
112.
4W
omen
's C
omm
issi
on S
uppo
rt1,
200
1,20
01,
200
011
118.
2S
peci
al E
lect
ions
94,9
9594
,995
94,9
950
12To
tal C
ity C
lerk
650,
244
065
0,24
40
065
0,24
40
13 147.
1Le
ader
ship
and
City
Cou
ncil
Sup
port
1,04
9,66
01,
049,
660
1,04
9,66
00
157.
2P
olic
y D
evel
opm
ent a
nd A
dvan
cem
ent
306,
437
306,
437
306,
437
016
7.3
Adm
inis
trativ
e S
uppo
rt fo
r City
Man
ager
's O
ffice
59,3
8359
,383
59,3
830
17To
tal C
ity M
anag
er's
Offi
ce1,
415,
480
01,
415,
480
00
1,41
5,48
00
18 1919
1.1
Cab
le a
nd M
edia
Ser
vice
s54
3,39
954
3,39
924
8,00
0C
able
Var
ious
295,
399
020
215.
1C
omm
unic
atin
g w
ith th
e C
omm
unity
44
3,37
244
3,37
244
3,37
20
21To
tal C
omm
unic
atio
n &
Pub
lic In
volv
emen
t98
6,77
10
986,
771
248,
000
073
8,77
10
22 2310
1.1
Faci
litie
s B
uild
ing
Cus
todi
al O
pera
tions
924,
231
924,
231
272,
687
Wor
k fo
r Oth
ers
651,
544
024
151.
1Fa
cilit
ies
Bui
ldin
g U
tiliti
es &
Ene
rgy
Man
agem
ent
1,80
9,22
01,
809,
220
574,
320
Wor
k fo
r Oth
ers
1,23
4,90
00
2515
3.1
Faci
litie
s B
uild
ing
Mai
nten
ance
3,48
6,09
71,
175,
000
GF
Faci
l. R
es.
576,
944
Wor
k fo
r Oth
ers
026
153.
1Fa
cilit
ies
Bui
ldin
g M
aint
enan
ce55
0,00
0G
F C
apita
l Fa c
1,76
1,09
71,
184,
153
027
152.
1Fa
cilit
ies
Adm
inis
tratio
n41
3,06
441
3,06
441
3,06
40
2810
1.2
Faci
litie
s B
uild
ing
Cus
todi
al O
pera
tions
-Enh
ance
men
t23
7,60
423
7,60
423
7,60
40
2910
2.1
Pro
ject
Mgm
t. P
lann
ing
& D
evel
opm
ent-F
acili
ties
315,
464
315,
464
315,
464
Wor
k fo
r Oth
ers
00
3015
1.2
Faci
litie
s B
ldg.
Util
ities
& E
nerg
y M
gmt.
Enh
ance
men
t34
0,13
034
0,13
034
0,13
00
3115
3.2
Faci
litie
s B
uild
ing
Mai
nten
ance
- E
nhan
cem
ent
449,
115
449,
115
449,
115
032
Tota
l Fac
ilitie
s7,
974,
925
1,72
5,00
06,
249,
925
1,73
9,41
50
4,51
0,51
00
33 3452
.1R
isk
Man
agem
ent
3,22
9,53
760
8,72
8S
elf I
ns F
und
2,62
0,80
90
2,62
0,80
935
119.
1P
urch
asin
g40
6,67
340
6,67
340
6,67
30
3610
6.1
Bud
get O
ffice
274,
684
274,
684
274,
684
037
122.
1S
ales
Tax
501,
736
501,
736
501,
736
038
123.
1P
ayro
ll an
d A
ccou
nts
Pay
able
508,
475
508,
475
508,
475
039
227.
1R
ebat
e P
rogr
am -
Gro
cery
225,
450
225,
450
225,
450
040
125.
1Fi
nanc
e A
dmin
istra
tion
335,
346
335,
346
335,
346
041
121.
1A
ccou
ntin
g59
3,81
459
3,81
459
3,81
40
4212
4.1
Cas
h &
Inve
stm
ent M
anag
emen
t41
5,60
141
5,60
141
5,60
10
4312
1.3
Sen
ior A
ccou
ntan
t - E
nhan
cem
ent
84,0
6684
,066
84,0
660
4422
0.1
Org
aniz
atio
nal P
erfo
rman
ce M
easu
rem
ent
50,0
0050
,000
50,0
000
45To
tal F
inan
ce6,
625,
382
608,
728
6,01
6,65
40
03,
395,
845
2,62
0,80
946 47
147.
1Fl
eet F
uelin
g3,
754,
597
177,
600
Equ
ip. F
und
3,57
6,99
70
3,57
6,99
748
149.
1Fl
eet V
ehic
le R
enta
l Ser
vice
603,
309
603,
309
060
3,30
949
148.
1Fl
eet V
ehic
le &
Equ
ipm
ent M
aint
enan
ce4,
163,
017
53,1
67E
quip
. Fun
d4,
109,
850
04,
109,
850
5099
.1Fl
eet A
dmin
istra
tion
347,
987
347,
987
034
7,98
751
146.
1Fl
eet E
quip
men
t Rep
lace
men
t 1,
811,
371
1,35
0,00
0E
quip
. Fun
d46
1,37
10
461,
371
5214
8.2
Flee
t Veh
icle
& E
quip
men
t Mai
nten
ance
Enh
ance
men
t22
6,49
022
6,49
00
226,
490
53To
tal F
leet
10,9
06,7
711,
580,
767
9,32
6,00
40
00
9,32
6,00
454 55
207.
1H
uman
Res
ourc
es S
ervi
ces
925,
511
925,
511
925,
511
0
1 of
3

167 - OPERATING BUDGET
HIGH
PER
FORM
ANCE
DRI
LLIN
G PL
ATFO
RM 2
008
HIG
H P
ERFO
RM
ING
CIT
Y G
OVE
RN
MEN
T D
RIL
LIN
G P
LATF
OR
M -
2008
One
-tim
eO
ngoi
ng
Line
Offe
r O
ffer
Fund
ing
Offe
rG
ener
al F
und
Res
trict
edU
tiliti
esG
ener
al F
und
Oth
er R
estri
cte d
##
Offe
r Des
crip
tion
Am
ount
O
ne-ti
me
Sou
rce
Am
ount
R
estri
cted
Des
crip
tion
MIS
Cha
rge
Ong
oing
Fund
s O
ngoi
ng
5620
0.1
Ben
efit
Pro
gram
s an
d S
ervi
ces
20,6
31,9
0797
,969
Ben
efits
Fun
d20
,533
,938
020
,533
,938
5721
0.1
Lear
ning
and
Org
aniz
atio
nal D
evel
opm
ent
223,
653
223,
653
223,
653
058
207.
2C
ompe
nsat
ion
Ana
lyst
90,9
8690
,986
90,9
860
5921
9.1
Pol
ice
Col
lect
ive
Bar
gain
ing
5,00
05,
000
5,00
00
6020
0.2
Wel
lnes
s P
rogr
am16
1,36
916
1,36
90
161,
369
6120
7.3
Hum
an R
esou
rces
Rep
rese
ntat
ive
for I
nves
tigat
ions
81,0
4181
,041
81,0
410
62To
tal H
uman
Res
ourc
es22
,119
,467
97,9
6922
,021
,498
00
1,32
6,19
120
,695
,307
63 6427
.2V
oice
Ser
vice
s92
9,10
8
929,
108
092
9,10
865
27.3
VH
F R
adio
Mai
nten
ance
56,0
2156
,021
56,0
210
066
27.1
Em
ail S
ervi
ces
122,
959
122,
959
79,5
51E
-mai
l fee
s43
,408
067
1.1
GIS
Ser
vice
s51
8,98
351
8,98
358
,352
LETA
681.
129
,608
Chg
to T
rans
p43
1,02
30
693.
1E
nter
pris
e R
esou
rce
Pla
nnin
g S
ervi
ces
896,
104
896,
104
30,1
22
C
hg to
Lib
rary
371,
921
494,
061
070
37.1
Dev
elop
men
t Tra
ckin
g S
yste
m37
0,54
637
0,54
637
0,54
6D
TS F
ees
00
7138
.1E
-Gov
ernm
ent S
ervi
ces
352,
247
352,
247
50,6
0230
1,64
50
7235
.1A
pplic
atio
n S
ervi
ces
376,
466
376,
466
376,
466
073
39.1
Ent
erpr
ise
Doc
umen
t Man
agem
ent S
ervi
ces
311,
598
311,
598
70,0
00C
hg to
Tra
nsp
241,
598
074
32.1
Tech
nolo
gy C
usto
mer
Sup
port
756,
045
756,
045
315,
000
441,
045
075
33.1
Dat
a M
anag
emen
t Ser
vice
s48
1,97
748
1,97
72,
235
Chg
to L
ibra
ry35
0,00
012
9,74
20
7627
.5V
oice
Ser
vice
s - C
omm
unic
atio
ns F
und
Equ
ipm
ent
200,
000
200,
000
Com
m F
und
00
077
32.4
PC
's (n
ot in
clud
ed in
pre
viou
s of
fers
)47
6,78
147
6,78
1C
omm
Fun
d0
00
7830
.1N
etw
ork
Ser
vice
s76
6,91
476
6,91
423
,213
$
Chg
to L
ibra
ry36
3,66
328
6,62
293
,416
7940
.1M
gmt.
Info
rmat
ion
Ser
vice
s A
dmn.
/Fin
anci
al S
uppo
rt 50
8,27
450
8,27
414
0,00
029
3,27
475
,000
8032
.5M
icro
soft
Sof
twar
e U
pgra
des
69,0
0069
,000
Com
m F
und
00
081
30.4
Net
wor
k E
quip
men
t88
,850
48,8
76C
omm
Fun
d39
,974
39,9
740
8233
.3D
ata
Man
agem
ent E
quip
men
t17
5,00
017
5,00
0C
omm
Fun
d0
00
8333
.4E
nter
pris
e st
orag
e an
d ba
ckup
sys
tem
261,
600
261,
600
Com
m F
und
00
084
33.2
Dat
a La
b eq
uipm
ent
66,0
0066
,000
66,0
000
085
Tota
l Man
agem
ent I
nfor
mat
ion
Syst
ems
7,78
4,47
31,
231,
257
6,55
3,21
666
3,62
71,
713,
207
3,07
8,85
81,
097,
524
86 8715
9.1
Cas
e P
roce
ssin
g (n
on-C
amer
a R
adar
Red
Lig
ht)
585,
622
585,
622
168,
000
Cou
rt B
onds
417,
622
088
163.
1C
ase
Pro
cess
ing
for C
amer
a R
adar
and
Red
Lig
ht65
,823
65,8
23G
F C
am R
esv.
00
089
163.
2A
dditi
onal
Sta
ff - C
amer
a R
adar
Red
Lig
ht C
ases
27,3
8527
,385
GF
Cam
Res
v.0
00
9015
9.2
Rep
lace
men
t Sta
ff/N
on-C
amer
a R
adar
Red
Lig
ht28
,677
28,6
7728
,677
091
Tota
l Mun
icip
al C
ourt
707,
507
93,2
0861
4,29
916
8,00
00
446,
299
092 93
167.
1S
usta
inab
le C
ity G
over
nmen
t67
,151
67,1
5167
,151
094
Tota
l Nat
ural
Res
ourc
es67
,151
067
,151
00
67,1
510
95 9621
3.1
Dev
elop
men
t Rev
iew
Cen
ter -
Inno
vativ
e Te
chno
logy
121,
600
109,
000
Gen
eral
Fun
d12
,600
12,6
000
97To
tal P
lann
ing
121,
600
109,
000
12,6
000
012
,600
098 99
103.
1R
eal E
stat
e S
ervi
ces
473,
452
40,0
00G
F R
ES
Res
.43
3,45
243
3,45
2W
ork
for O
ther
s0
010
0To
tal R
eal E
stat
e Se
rvic
es47
3,45
240
,000
433,
452
433,
452
00
010
110
28.
1U
tility
Cus
tom
er S
ervi
ce6,
771,
031
6,77
1,03
10
6,77
1,03
110
311
.1U
tility
Adm
inis
tratio
n &
Gen
eral
Ope
ratio
ns7,
438,
491
30,4
92U
CS
A F
und
7,40
7,99
90
7,40
7,99
910
411
.3S
peci
al P
roje
ct M
anag
er -
Util
ities
Ass
ets
104,
634
104,
634
UC
SA
Fun
d0
00
105
17.1
Util
ities
Sys
tem
Add
ition
s an
d R
epla
cem
ents
150,
000
150,
000
UC
SA
Fun
d0
00
106
Tota
l Util
ities
14,4
64,1
5628
5,12
614
,179
,030
00
014
,179
,030
107
108
Fund
ed O
ffers
75,6
10,2
815,
781,
553
69,8
28,7
283,
252,
494
1,71
3,20
716
,944
,353
47,9
18,6
7410
9A
lloca
tion
5,78
1,55
33,
261,
948
1,71
3,20
716
,944
,353
48,0
11,1
5011
0D
iffer
ence
09,
454
00
92,4
76
2 of
3
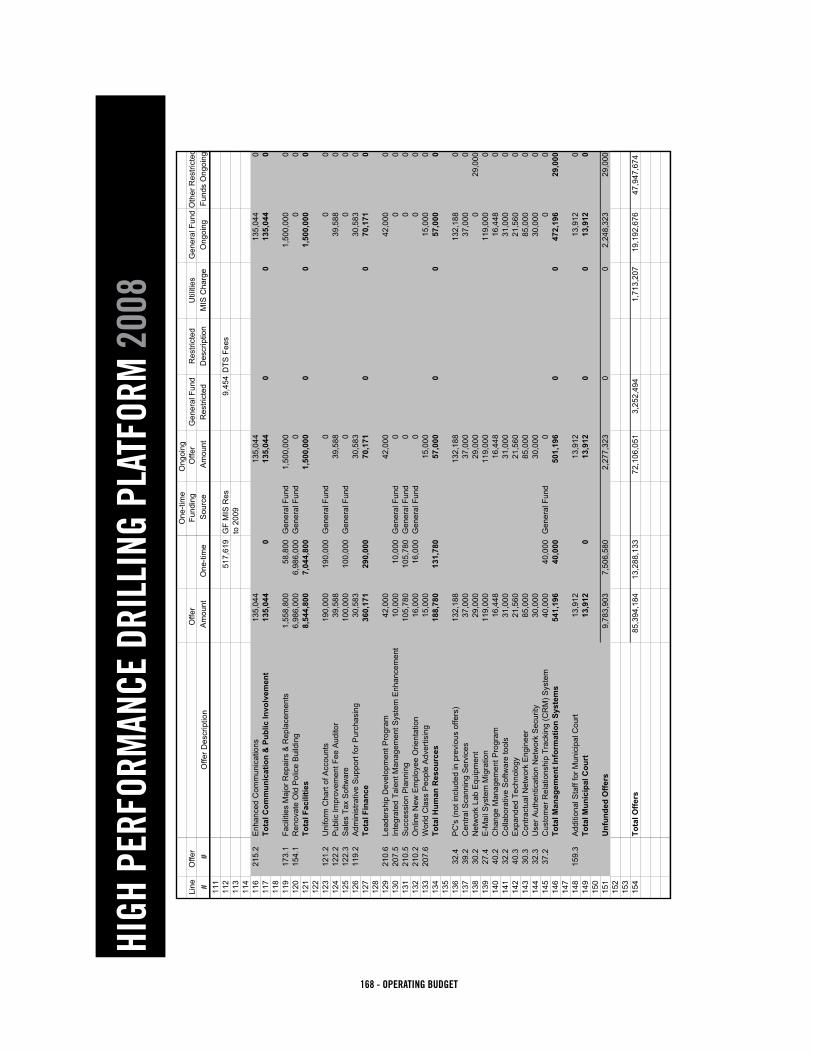
168 - OPERATING BUDGET
HIGH
PER
FORM
ANCE
DRI
LLIN
G PL
ATFO
RM 2
008
HIG
H P
ERFO
RM
ING
CIT
Y G
OVE
RN
MEN
T D
RIL
LIN
G P
LATF
OR
M -
2008
One
-tim
eO
ngoi
ng
Line
Offe
r O
ffer
Fund
ing
Offe
rG
ener
al F
und
Res
trict
edU
tiliti
esG
ener
al F
und
Oth
er R
estri
cte d
##
Offe
r Des
crip
tion
Am
ount
O
ne-ti
me
Sou
rce
Am
ount
R
estri
cted
Des
crip
tion
MIS
Cha
rge
Ong
oing
Fund
s O
ngoi
ng
111
112
517,
619
GF
MIS
Res
9,45
4D
TS F
ees
113
to 2
009
114
116
215.
2E
nhan
ced
Com
mun
icat
ions
135,
044
135,
044
135,
044
011
7To
tal C
omm
unic
atio
n &
Pub
lic In
volv
emen
t13
5,04
40
135,
044
00
135,
044
011
811
917
3.1
Faci
litie
s M
ajor
Rep
airs
& R
epla
cem
ents
1,55
8,80
058
,800
Gen
eral
Fun
d1,
500,
000
1,50
0,00
00
120
154.
1R
enov
ate
Old
Pol
ice
Bui
ldin
g6,
986,
000
6,98
6,00
0G
ener
al F
und
00
012
1To
tal F
acili
ties
8,54
4,80
07,
044,
800
1,50
0,00
00
01,
500,
000
012
212
312
1.2
Uni
form
Cha
rt of
Acc
ount
s19
0,00
019
0,00
0G
ener
al F
und
00
012
412
2.2
Pub
lic Im
prov
emen
t Fee
Aud
itor
39,5
8839
,588
39,5
880
125
122.
3S
ales
Tax
Sof
twar
e10
0,00
010
0,00
0G
ener
al F
und
00
012
611
9.2
Adm
inis
trativ
e S
uppo
rt fo
r Pur
chas
ing
30,5
8330
,583
30,5
830
127
Tota
l Fin
ance
360,
171
290,
000
70,1
710
070
,171
012
812
921
0.6
Lead
ersh
ip D
evel
opm
ent P
rogr
am
42,0
0042
,000
42,0
000
130
207.
5In
tegr
ated
Tal
ent M
anag
emen
t Sys
tem
Enh
ance
men
t10
,000
10,0
00G
ener
al F
und
00
013
121
0.5
Suc
cess
ion
Pla
nnin
g10
5,78
010
5,78
0G
ener
al F
und
00
013
221
0.2
Onl
ine
New
Em
ploy
ee O
rient
atio
n16
,000
16,0
00G
ener
al F
und
00
013
320
7.6
Wor
ld C
lass
Peo
ple
Adv
ertis
ing
15,0
0015
,000
15,0
000
134
Tota
l Hum
an R
esou
rces
188,
780
131,
780
57,0
000
057
,000
013
513
632
.4P
C's
(not
incl
uded
in p
revi
ous
offe
rs)
132,
188
132,
188
132,
188
013
739
.2C
entra
l Sca
nnin
g S
ervi
ces
37,0
0037
,000
37,0
000
138
30.2
Net
wor
k La
b E
quip
men
t29
,000
29,0
000
29,0
0013
927
.4E
-Mai
l Sys
tem
Mig
ratio
n11
9,00
011
9,00
011
9,00
00
140
40.2
Cha
nge
Man
agem
ent P
rogr
am16
,448
16,4
4816
,448
014
132
.2C
olla
bora
tive
Sof
twar
e to
ols
31,0
0031
,000
31,0
000
142
40.3
Exp
ande
d Te
chno
logy
21,5
6021
,560
21,5
600
143
30.3
Con
tract
ual N
etw
ork
Eng
inee
r85
,000
85,0
0085
,000
014
432
.3U
ser A
uthe
ntic
atio
n N
etw
ork
Sec
urity
30,0
0030
,000
30,0
000
145
37.2
Cus
tom
er R
elat
ions
hip
Trac
king
(CR
M) S
yste
m40
,000
40,0
00G
ener
al F
und
00
014
6To
tal M
anag
emen
t Inf
orm
atio
n Sy
stem
s54
1,19
640
,000
501,
196
00
472,
196
29,0
0014
714
815
9.3
Add
ition
al S
taff
for M
unic
ipal
Cou
rt13
,912
13,9
1213
,912
014
9To
tal M
unic
ipal
Cou
rt13
,912
013
,912
00
13,9
120
150
151
Unf
unde
d O
ffers
9,78
3,90
37,
506,
580
2,27
7,32
30
02,
248,
323
29,0
0015
215
315
4To
tal O
ffers
85,3
94,1
8413
,288
,133
72,1
06,0
513,
252,
494
1,71
3,20
719
,192
,676
47,9
47,6
74
3 of
3

169 - OPERATING BUDGET
HIGH
PER
FORM
ANCE
DRI
LLIN
G PL
ATFO
RM 2
009
HIG
H P
ERFO
RM
ING
CIT
Y G
OVE
RN
MEN
T D
RIL
LIN
G P
LATF
OR
M -
2009
One
-tim
eO
ngoi
ng
Line
Offe
r O
ffer
Fund
ing
Offe
rG
ener
al F
und
Res
trict
edU
tiliti
esG
ener
al F
und
Oth
er R
estri
cted
##
Offe
r Des
crip
tion
Am
ount
O
ne-ti
me
Sou
rce
Am
ount
R
estri
cted
Des
crip
tion
MIS
Cha
rge
Ong
oing
Fund
s O
ngoi
ng
115
7.1
Lega
l Ser
vice
s A
dmin
istra
tion
1,22
9,45
110
,952
GF
Cam
Res
v.1,
218,
499
1,21
8,49
90
2To
tal C
ity A
ttorn
ey1,
229,
451
10,9
521,
218,
499
00
1,21
8,49
90
3 46.
1C
ity C
ounc
il C
ore
Ser
vice
s17
0,97
417
0,97
417
0,97
40
5To
tal C
ity C
ounc
il17
0,97
40
170,
974
00
170,
974
06 7
118.
1A
pril
Reg
ular
Ele
ctio
n18
5,99
018
5,99
0G
ener
al F
und
00
08
112.
1C
ity C
lerk
Adm
inis
tratio
n56
3,52
656
3,52
656
3,52
60
911
2.2
Pas
spor
ts5,
180
5,18
05,
180
010
112.
3H
uman
Rel
atio
ns C
omm
issi
on S
uppo
rt6,
973
6,97
36,
973
011
112.
4W
omen
's C
omm
issi
on S
uppo
rt1,
200
1,20
01,
200
012
118.
2S
peci
al E
lect
ions
96,4
2096
,420
96,4
200
13To
tal C
ity C
lerk
859,
289
185,
990
673,
299
00
673,
299
014 15
7.1
Lead
ersh
ip a
nd C
ity C
ounc
il S
uppo
rt1,
091,
927
1,09
1,92
71,
091,
927
016
7.2
Pol
icy
Dev
elop
men
t and
Adv
ance
men
t31
9,07
331
9,07
331
9,07
30
177.
3A
dmin
istra
tive
Sup
port
for C
ity M
anag
er's
Offi
ce61
,989
61,9
8961
,989
018
Tota
l City
Man
ager
's O
ffice
1,47
2,98
90
1,47
2,98
90
01,
472,
989
019 20
191.
1C
able
and
Med
ia S
ervi
ces
557,
828
557,
828
248,
000
Cab
le v
ario
us30
9,82
80
2121
5.1
Com
mun
icat
ing
with
the
Com
mun
ity
460,
812
460,
812
460,
812
022
Tota
l Com
mun
icat
ion
& P
ublic
Invo
lvem
ent
1,01
8,64
00
1,01
8,64
024
8,00
00
770,
640
023 24
101.
1Fa
cilit
ies
Bui
ldin
g C
usto
dial
Ope
ratio
ns98
5,60
198
5,60
130
1,09
1W
ork
for O
ther
s68
4,51
00
2515
1.1
Faci
litie
s B
uild
ing
Util
ities
& E
nerg
y M
anag
emen
t1,
919,
350
1,91
9,35
062
6,04
0W
ork
for O
ther
s1,
293,
310
026
153.
1Fa
cilit
ies
Bui
ldin
g M
aint
enan
ce3,
586,
352
1,17
5,00
0G
F Fa
cil.
Res
.60
9,20
5W
ork
for O
ther
s27
153.
155
0,00
0G
F C
apita
l Fa c
1,86
1,35
21,
252,
147
028
152.
1Fa
cilit
ies
Adm
inis
tratio
n43
0,09
043
0,09
043
0,09
00
2910
1.2
Faci
litie
s B
uild
ing
Cus
todi
al O
pera
tions
-Enh
ance
men
t25
3,85
925
3,85
925
3,85
90
3010
2.1
Pro
ject
Mgm
t. P
lann
ing
& D
evel
opm
ent-F
acili
ties
328,
845
328,
845
328,
845
Wor
k fo
r Oth
ers
00
3115
1.2
Faci
litie
s B
ldg.
Util
ities
& E
nerg
y M
gmt.
Enh
ance
men
t35
5,06
035
5,06
035
5,06
00
3215
3.2
Faci
litie
s B
uild
ing
Mai
nten
ance
- E
nhan
cem
ent
452,
539
452,
539
452,
539
033
Tota
l Fac
ilitie
s8,
311,
696
1,72
5,00
06,
586,
696
1,86
5,18
10
4,72
1,51
50
34 3552
.1R
isk
Man
agem
ent
3,24
7,50
860
7,80
5S
elf I
ns F
und
2,63
9,70
30
2,63
9,70
336
119.
1P
urch
asin
g42
4,12
242
4,12
242
4,12
20
3710
6.1
Bud
get O
ffice
292,
105
292,
105
292,
105
038
122.
1S
ales
Tax
520,
967
520,
967
520,
967
039
123.
1P
ayro
ll an
d A
ccou
nts
Pay
able
529,
063
529,
063
529,
063
040
227.
1R
ebat
e P
rogr
am -
Gro
cery
238,
250
238,
250
238,
250
041
125.
1Fi
nanc
e A
dmin
istra
tion
354,
860
354,
860
354,
860
042
121.
1A
ccou
ntin
g61
7,92
061
7,92
061
7,92
00
4312
4.1
Cas
h &
Inve
stm
ent M
anag
emen
t43
0,22
843
0,22
843
0,22
80
4412
1.3
Sen
ior A
ccou
ntan
t - E
nhan
cem
ent
85,2
6985
,269
85,2
690
4522
0.1
Org
aniz
atio
nal P
erfo
rman
ce M
easu
rem
ent
50,0
0050
,000
50,0
000
46To
tal F
inan
ce6,
790,
292
607,
805
6,18
2,48
70
03,
542,
784
2,63
9,70
3
1 of
4
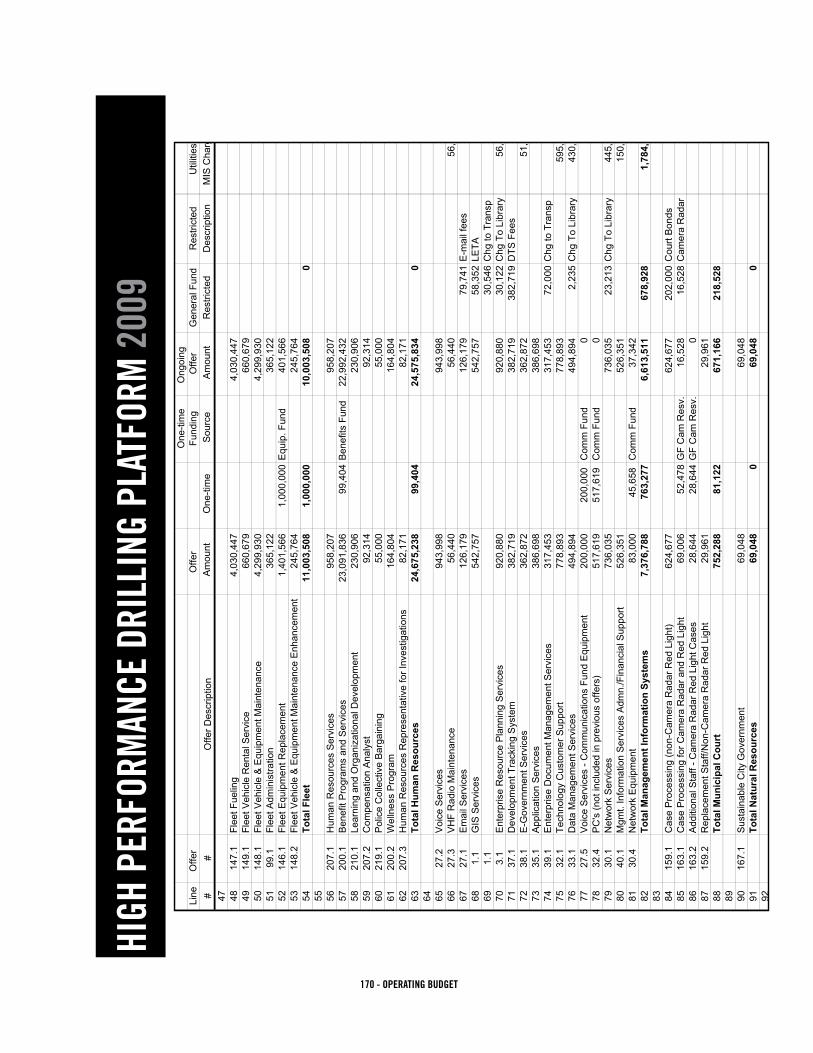
170 - OPERATING BUDGET
HIGH
PER
FORM
ANCE
DRI
LLIN
G PL
ATFO
RM 2
009
HIG
H P
ERFO
RM
ING
CIT
Y G
OVE
RN
MEN
T D
RIL
LIN
G P
LATF
OR
M -
2009
One
-tim
eO
ngoi
ng
Line
Offe
r O
ffer
Fund
ing
Offe
rG
ener
al F
und
Res
trict
edU
tiliti
esG
ener
al F
und
Oth
er R
estri
cted
##
Offe
r Des
crip
tion
Am
ount
O
ne-ti
me
Sou
rce
Am
ount
R
estri
cted
Des
crip
tion
MIS
Cha
rge
Ong
oing
Fund
s O
ngoi
ng
47 4814
7.1
Flee
t Fue
ling
4,03
0,44
74,
030,
447
04,
030,
447
4914
9.1
Flee
t Veh
icle
Ren
tal S
ervi
ce66
0,67
966
0,67
90
660,
679
5014
8.1
Flee
t Veh
icle
& E
quip
men
t Mai
nten
ance
4,29
9,93
04,
299,
930
(0)
4,29
9,93
051
99.1
Flee
t Adm
inis
tratio
n36
5,12
236
5,12
20
365,
122
5214
6.1
Flee
t Equ
ipm
ent R
epla
cem
ent
1,40
1,56
61,
000,
000
Equ
ip. F
und
401,
566
040
1,56
653
148.
2Fl
eet V
ehic
le &
Equ
ipm
ent M
aint
enan
ce E
nhan
cem
ent
245,
764
245,
764
024
5,76
454
Tota
l Fle
et11
,003
,508
1,00
0,00
010
,003
,508
00
(0)
10,0
03,5
0855 56
207.
1H
uman
Res
ourc
es S
ervi
ces
958,
207
958,
207
958,
207
057
200.
1B
enef
it P
rogr
ams
and
Ser
vice
s23
,091
,836
99,4
04B
enef
its F
und
22,9
92,4
320
22,9
92,4
3258
210.
1Le
arni
ng a
nd O
rgan
izat
iona
l Dev
elop
men
t23
0,90
623
0,90
623
0,90
60
5920
7.2
Com
pens
atio
n A
naly
st92
,314
92,3
1492
,314
060
219.
1P
olic
e C
olle
ctiv
e B
arga
inin
g55
,000
55,0
0055
,000
061
200.
2W
elln
ess
Pro
gram
164,
804
164,
804
016
4,80
462
207.
3H
uman
Res
ourc
es R
epre
sent
ativ
e fo
r Inv
estig
atio
ns82
,171
82,1
7182
,171
063
Tota
l Hum
an R
esou
rces
24,6
75,2
3899
,404
24,5
75,8
340
01,
418,
598
23,1
57,2
3664 65
27.2
Voi
ce S
ervi
ces
943,
998
943,
998
094
3,99
866
27.3
VH
F R
adio
Mai
nten
ance
56,4
4056
,440
56,4
400
067
27.1
Em
ail S
ervi
ces
126,
179
126,
179
79,7
41E
-mai
l fee
s46
,438
068
1.1
GIS
Ser
vice
s54
2,75
754
2,75
758
,352
LETA
691.
130
,546
Chg
to T
rans
p45
3,85
90
703.
1E
nter
pris
e R
esou
rce
Pla
nnin
g S
ervi
ces
920,
880
920,
880
30,1
22C
hg T
o Li
brar
y56
,440
834,
318
071
37.1
Dev
elop
men
t Tra
ckin
g S
yste
m38
2,71
938
2,71
938
2,71
9D
TS F
ees
00
7238
.1E
-Gov
ernm
ent S
ervi
ces
362,
872
362,
872
51,7
8831
1,08
40
7335
.1A
pplic
atio
n S
ervi
ces
386,
698
386,
698
386,
698
074
39.1
Ent
erpr
ise
Doc
umen
t Man
agem
ent S
ervi
ces
317,
453
317,
453
72,0
00C
hg to
Tra
nsp
245,
453
075
32.1
Tech
nolo
gy C
usto
mer
Sup
port
778,
893
778,
893
595,
000
183,
893
076
33.1
Dat
a M
anag
emen
t Ser
vice
s49
4,89
449
4,89
42,
235
Chg
To
Libr
ary
430,
000
62,6
590
7727
.5V
oice
Ser
vice
s - C
omm
unic
atio
ns F
und
Equ
ipm
ent
200,
000
200,
000
Com
m F
und
00
078
32.4
PC
's (n
ot in
clud
ed in
pre
viou
s of
fers
)51
7,61
951
7,61
9C
omm
Fun
d0
00
7930
.1N
etw
ork
Ser
vice
s73
6,03
5
736,
035
23,2
13C
hg T
o Li
brar
y44
5,12
424
4,26
223
,436
8040
.1M
gmt.
Info
rmat
ion
Ser
vice
s A
dmn.
/Fin
anci
al S
uppo
rt 52
6,35
152
6,35
115
0,00
037
6,35
10
8130
.4N
etw
ork
Equ
ipm
ent
83,0
0045
,658
Com
m F
und
37,3
4237
,342
082
Tota
l Man
agem
ent I
nfor
mat
ion
Syst
ems
7,37
6,78
876
3,27
76,
613,
511
678,
928
1,78
4,79
23,
182,
357
967,
434
83 8415
9.1
Cas
e P
roce
ssin
g (n
on-C
amer
a R
adar
Red
Lig
ht)
624,
677
624,
677
202,
000
Cou
rt B
onds
422,
677
085
163.
1C
ase
Pro
cess
ing
for C
amer
a R
adar
and
Red
Lig
ht69
,006
52,4
78G
F C
am R
esv.
16,5
2816
,528
Cam
era
Rad
ar0
086
163.
2A
dditi
onal
Sta
ff - C
amer
a R
adar
Red
Lig
ht C
ases
28,6
4428
,644
GF
Cam
Res
v.0
00
8715
9.2
Rep
lace
men
t Sta
ff/N
on-C
amer
a R
adar
Red
Lig
ht29
,961
29,9
6129
,961
088
Tota
l Mun
icip
al C
ourt
752,
288
81,1
2267
1,16
621
8,52
80
452,
638
089 90
167.
1S
usta
inab
le C
ity G
over
nmen
t69
,048
69,0
4869
,048
091
Tota
l Nat
ural
Res
ourc
es69
,048
069
,048
00
69,0
480
92
2 of
4
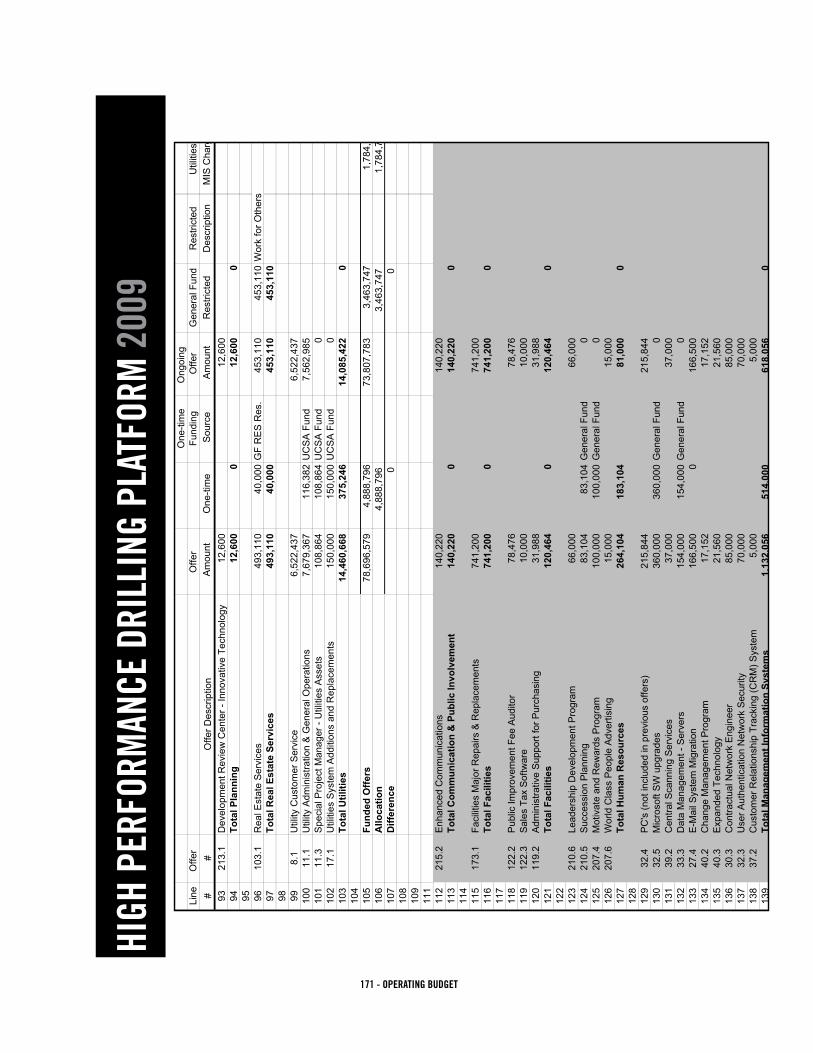
171 - OPERATING BUDGET
HIGH
PER
FORM
ANCE
DRI
LLIN
G PL
ATFO
RM 2
009
HIG
H P
ERFO
RM
ING
CIT
Y G
OVE
RN
MEN
T D
RIL
LIN
G P
LATF
OR
M -
2009
One
-tim
eO
ngoi
ng
Line
Offe
r O
ffer
Fund
ing
Offe
rG
ener
al F
und
Res
trict
edU
tiliti
esG
ener
al F
und
Oth
er R
estri
cted
##
Offe
r Des
crip
tion
Am
ount
O
ne-ti
me
Sou
rce
Am
ount
R
estri
cted
Des
crip
tion
MIS
Cha
rge
Ong
oing
Fund
s O
ngoi
ng
9321
3.1
Dev
elop
men
t Rev
iew
Cen
ter -
Inno
vativ
e Te
chno
logy
12,6
0012
,600
12,6
000
94To
tal P
lann
ing
12,6
000
12,6
000
012
,600
095 96
103.
1R
eal E
stat
e S
ervi
ces
493,
110
40,0
00G
F R
ES
Res
.45
3,11
045
3,11
0W
ork
for O
ther
s0
097
Tota
l Rea
l Est
ate
Serv
ices
493,
110
40,0
0045
3,11
045
3,11
00
00
98 998.
1U
tility
Cus
tom
er S
ervi
ce6,
522,
437
6,52
2,43
70
6,52
2,43
710
011
.1U
tility
Adm
inis
tratio
n &
Gen
eral
Ope
ratio
ns7,
679,
367
116,
382
UC
SA
Fun
d7,
562,
985
07,
562,
985
101
11.3
Spe
cial
Pro
ject
Man
ager
- U
tiliti
es A
sset
s10
8,86
410
8,86
4U
CS
A F
und
00
010
217
.1U
tiliti
es S
yste
m A
dditi
ons
and
Rep
lace
men
ts15
0,00
015
0,00
0U
CS
A F
und
00
010
3To
tal U
tiliti
es14
,460
,668
375,
246
14,0
85,4
220
00
14,0
85,4
2210
410
5Fu
nded
Offe
rs78
,696
,579
4,88
8,79
673
,807
,783
3,46
3,74
71,
784,
792
17,7
05,9
4150
,853
,303
106
Allo
catio
n4,
888,
796
3,46
3,74
71,
784,
792
17,7
05,9
4150
,798
,262
107
Diff
eren
ce0
00
0(5
5,04
1)10
810
911
111
221
5.2
Enh
ance
d C
omm
unic
atio
ns14
0,22
014
0,22
014
0,22
00
113
Tota
l Com
mun
icat
ion
& P
ublic
Invo
lvem
ent
140,
220
014
0,22
00
014
0,22
00
114
115
173.
1Fa
cilit
ies
Maj
or R
epai
rs &
Rep
lace
men
ts74
1,20
074
1,20
074
1,20
00
116
Tota
l Fac
ilitie
s74
1,20
00
741,
200
00
741,
200
011
711
812
2.2
Pub
lic Im
prov
emen
t Fee
Aud
itor
78,4
7678
,476
78,4
760
119
122.
3S
ales
Tax
Sof
twar
e10
,000
10,0
0010
,000
012
011
9.2
Adm
inis
trativ
e S
uppo
rt fo
r Pur
chas
ing
31,9
8831
,988
31,9
880
121
Tota
l Fac
ilitie
s12
0,46
40
120,
464
00
120,
464
012
212
321
0.6
Lead
ersh
ip D
evel
opm
ent P
rogr
am
66,0
0066
,000
66,0
000
124
210.
5S
ucce
ssio
n P
lann
ing
83,1
0483
,104
Gen
eral
Fun
d0
00
125
207.
4M
otiv
ate
and
Rew
ards
Pro
gram
100,
000
100,
000
Gen
eral
Fun
d0
00
126
207.
6W
orld
Cla
ss P
eopl
e A
dver
tisin
g15
,000
15,0
0015
,000
012
7To
tal H
uman
Res
ourc
es26
4,10
418
3,10
481
,000
00
81,0
000
128
129
32.4
PC
's (n
ot in
clud
ed in
pre
viou
s of
fers
)21
5,84
421
5,84
421
5,84
40
130
32.5
Mic
roso
ft S
W u
pgra
des
360,
000
360,
000
Gen
eral
Fun
d0
00
131
39.2
Cen
tral S
cann
ing
Ser
vice
s37
,000
37,0
0037
,000
013
233
.3D
ata
Man
agem
ent -
Ser
vers
154,
000
154,
000
Gen
eral
Fun
d0
00
133
27.4
E-M
ail S
yste
m M
igra
tion
166,
500
016
6,50
016
6,50
00
134
40.2
Cha
nge
Man
agem
ent P
rogr
am17
,152
17,1
5217
,152
013
540
.3E
xpan
ded
Tech
nolo
gy21
,560
21,5
6021
,560
013
630
.3C
ontra
ctua
l Net
wor
k E
ngin
eer
85,0
0085
,000
85,0
000
137
32.3
Use
r Aut
hent
icat
ion
Net
wor
k S
ecur
ity70
,000
70,0
0070
,000
013
837
.2C
usto
mer
Rel
atio
nshi
p Tr
acki
ng (C
RM
) Sys
tem
5,00
05,
000
5,00
00
139
Tota
l Man
agem
ent I
nfor
mat
ion
Syst
ems
1,13
2,05
651
4,00
061
8,05
60
061
8,05
60
3 of
4
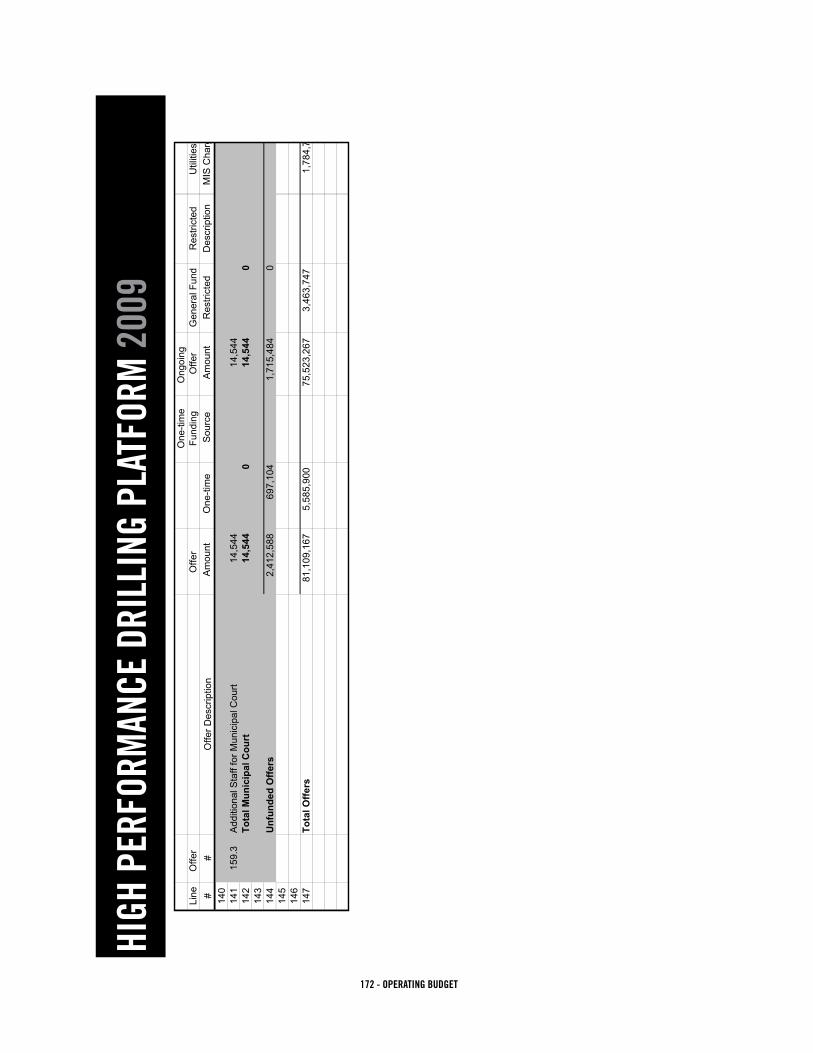
172 - OPERATING BUDGET
HIGH
PER
FORM
ANCE
DRI
LLIN
G PL
ATFO
RM 2
009
HIG
H P
ERFO
RM
ING
CIT
Y G
OVE
RN
MEN
T D
RIL
LIN
G P
LATF
OR
M -
2009
One
-tim
eO
ngoi
ng
Line
Offe
r O
ffer
Fund
ing
Offe
rG
ener
al F
und
Res
trict
edU
tiliti
esG
ener
al F
und
Oth
er R
estri
cted
##
Offe
r Des
crip
tion
Am
ount
O
ne-ti
me
Sou
rce
Am
ount
R
estri
cted
Des
crip
tion
MIS
Cha
rge
Ong
oing
Fund
s O
ngoi
ng
140
141
159.
3A
dditi
onal
Sta
ff fo
r Mun
icip
al C
ourt
14,5
4414
,544
14,5
440
142
Tota
l Mun
icip
al C
ourt
14,5
440
14,5
440
014
,544
014
314
4U
nfun
ded
Offe
rs2,
412,
588
697,
104
1,71
5,48
40
01,
715,
484
014
514
614
7To
tal O
ffers
81,1
09,1
675,
585,
900
75,5
23,2
673,
463,
747
1,78
4,79
219
,421
,425
50,8
53,3
03
4 of
4

173 - OPERATING BUDGET
HIGH-PERFORMING GOVERNMENT
1.1 GIS Services - Funded 2008 - $518,983 2009 - $542,757This offer provides for the ongoing delivery and coordination of GIS software, data, application, analysis, printing, mapping, user support/training, and printing services to the entire organization and citizens, as well. The offers contained within this package reflect the costs to continue these services as they have been historically provided without enhancement. The maincomponentsoftheservicedeliveryarelistedbelow:SharedGISsoftwarelicensingforCitystaff,datacreation,dataanalysis, shared data delivery and printing services, user support and training, map products and printing, professional GIS software licensing, support and analysis, spatial database hosting and data warehouse for city applications, such as Accela, Cityworks and E911, database and geodatabase design services, application development, departmental GIS application support, shared GPS collection unit, internet map server and Web services, address assignment and coordination, and base map services.
3.1 Enterprise Resource Planning Services - Funded 2008 - $896,104 2009 - $920,880ERP core services provide basic, mandatory technology services required by the City as well as current service levels pro-vided to City Departments. Overall project management of the Enterprise Resource Planning (ERP) system is provided as part of the basic support package. The City’s Enterprise Resource Planning system provides state and federally mandated payroll andfinancialreports.Theprimarysystemfunctionsinclude:payrollandaccountspayableprocessingandcheckwriting,accounts receivable and service billing, purchasing functions, expenditure and other budget reporting, asset tracking and management, self service enrollment and tracking of benefits, and applicant tracking for Human Resources. Interfaces with other revenue-producing or asset tracking systems are also elements of this system.
6.1 City Council Core Services - Funded 2008 - $167,800 2009 - $170,974This offer enables the City Council to provide leadership for all areas of municipal government. In the course of its work, City Council engages citizens in a variety of issues, collaborates and partners with organizations throughout the region, analyzes and enacts policies, adopts the City budget and provides for an independent audit of all City funds, authorizes issuance of bonds and other debt financing mechanisms, and provides guidance and direction for the administration of all City ser-vices.
7.1 Leadership and City Council Support - Funded 2008 - $1,049,660 2009 - $1,091,927This offer provides senior executive management of the organization through the work of the City Manager and staff. The City Manager, Deputy City Manager and Assistant City Manager facilitate the work of the City Council by developing and implementing the details of City Council’s goals and policies. The City Manager provides leadership in all areas of municipal services to the community in accordance with the City Charter and provides strategic vision and priorities for the organiza-tion, ensuring that efforts focus on the results the community wants. The City Manager’s Office staff also serve as liaisons between the City Council and City staff for carrying out service requests and supporting the myriad of activities in which the City Council and the City Manager are engaged.

174 - OPERATING BUDGET
HIGH-PERFORMING GOVERNMENT
7.2 Policy Development and Advancement - Funded 2008 - $306,437 2009 - $319,073Policy Development and Advancement (PDA) manages the development, implementation and advancement of City policies as directed by City Council and the City Manager. PDA projects span the spectrum of City government and include poli-cies that affect internal City operations as well as external policies that are developed in partnership with other government agencies, the private sector and/or the general public. PDA staff members serve in roles as conveners, facilitators, project managers and advocates. Staff members provide the expertise to “troubleshoot” difficult issues confronting City government and the community. PDA staff develop and maintain intergovernmental connections and community relations on behalf of the City Council with a focus on advocacy, relationship building and problem solving. As a result, City Council and the City organization are assured of a low-cost, centralized means of resolving issues and maintaining an effective voice with regional, state and federal elected officials and staff.
7.3 Administrative Support for City Manager Office - Funded 2008 - $59,383 2009 - $61,989This offer provides a higher level of administrative support for the City Manager than was authorized in the 2006-7 Budget. A contractual employee has provided this support in 2007. This enhancement offer would continue the service level with a classified employee.
8.1 Utility Customer Service - Funded 2008 - $6,771,031 2009 - $6,522,437The customer service offer includes the Utilities Customer Service Division comprised of the customer service management, call center, customer billing, meter reading, and credit, collections and cashiering. Also included in the offer is the portion of the Customer and Employee Relations Department which is responsible for planning and implementation of marketing communications, water conservation and education, wellness, safety, and key accounts programs.
11.1 Utility Administration & General Operations - Funded 2008 - $7,438,491 2009 - $7,679,367This offer for Utilities Administration and General Operations includes the executive director, the chief operating officer, fi-nance and budget, locating operations, support for the city wide information technology, regulatory and government affairs, IT support specific to Utilities unique applications, and other utility miscellaneous services.
11.3 Special Project Manager - Utilities Assets - Funded 2008 - $104,634 2009 - $108,864Long-term asset management for the Utilities is a crucial component of maintaining and replacing aging infrastructure. This enhancement offer funds a full time position for an asset manager. This employee will be charged with setting the groundwork for the development of an asset management process that will evolve into best practices accountability for asset replacement. It is important to start developing a long term strategic financial/operations assessment of our Utilities assets.
17.1 Utilities System Additions and Replacements - Funded 2008 - $150,000 2009 - $150,000This offer provides for uniform budgeting of the Utilities technology equipment replacements, including servers, network ap-pliances, personal computers and telecommunications tools.

175 - OPERATING BUDGET
HIGH-PERFORMING GOVERNMENT
27.1 Email Services - Funded 2008 - $122,959 2009 - $126,179This offer funds the City’s email system. 29.6 million E-mail messages were directed to City employees through the internet in2006.Weonlywantedtoreadabout4millionofthemsothejunkmailwasfiltered.Wegeneratedmorethan5millionmessages internally and stored away one trillion bytes of E-mail related data. In the last 2 years, “post offices” have been consolidated and work completed to provide E-mail in the most cost effective manner. Included in this proposal are costs for thecontinuedfundingformaintenanceandsupportofthesystem,including:vendormaintenanceandsupport,licensingcosts, a minimum amount of staff time to administer and support the system, costs associated with extending connectivity to all City buildings, and an annualized cost for hardware (server) replacement.
27.2 Voice Services - Funded 2008 - $929,108 2009 - $943,998This offer provides resources to maintain and support two integrated telephone systems and sustain the momentum of the multi-yearprojectmovingallemployeesfromtheoutdatedplatformtothenew,VoiceoverIP(VoIP).Thenewtechnologyisdatanetworkbasedratherthanhardwiredcoppercircuitdependent.WhileVoIPdeploymentdemandsahighperformancedata network, the technology avoids the higher cost of maintaining separate voice and data networks. The new technology provides a foundation for a wealth of productivity and collaboration applications. The first stage in a long series of implemen-tationsofVoIPtelephonybeganinthenewPolicefacilityinAugust2007.Networkinfrastructurewillbeupgradedaspartoftheconstructionprocess.EquipmentreplacementisrequiredinallotherfacilitiespriortoVoIPmigration.Acombinationofnew replacement funding and Telecom Fund reserves will be used to sustain the momentum of migration.
27.3 VHF Radio Maintenance - Funded 2008 - $56,021 2009 - $56,440ThisofferisexclusivetoUtilityServices.ItprovidesequipmentandotherresourcesforthemanagementandsupportofVHFradio systems, as well as a range of consulting and support services related to electric load management, remote telemetry, and video surveillance. The Federal Communications Commission (FCC) regulates the use of radio frequencies in the United States. Some spectrum is unlicensed and relatively unsupervised; other is allocated for specific purpose such as commu-nicationsrelatedtopublicsafetyandroutinefieldoperations.InthelicensedVHFbands,UtilityServicesownsaprivatenetwork of 300+ vehicle, heavy equipment, and portable radios, base stations and repeaters tied to dispatch operations. The radio network exists as the most reliable element of a layered communication strategy. Tuning the network architecture through integration of new technology and repositioning of systems within FCC frequency reallocation schemes is critical to Emergency Operations planning.
27.4 E-mail System Migration - Not Funded 2008 - $119,000 2009 - $166,500Microsoft Exchange is the predominant e-mail software program of the business community. It is the de facto platform for application development where messaging interfaces are utilized to integrate programs. It is popular among employees and supports collaboration opportunities, advanced telephone features, and enhancement of the City’s Accela application pro-gram. Two City affiliates have migrated to Exchange for the purpose of supporting outside agency communications, virtual work spaces, and third party software deployments. The existing GroupWise e-mail system is technically solid, but limited by its ability to interface with a growing number of other software programs. With the next generation of Office Software close at hand, interdependencies upon the Exchange messaging system, make it prudent to get this foundational component into place as soon as practical. This offer would fund hardware, software, licenses, training and technical resources for this migration.
27.5 Voice Services Communication Fund Equipment - Funded 2008 - $200,000 2009 - $200,000This one-time capital equipment purchase is necessary to continue the migration from the City’s current telephone system to aVoIPsystem.Thisofferdirectlysupportsoffer27.2VoiceServices.
176 - OPERATING BUDGET
HIGH-PERFORMING GOVERNMENT
30.1 Network Services - Funded 2008 - $766,914 2009 - $736,035This offer provides resources to manage and support the data network that underpins nearly every customer service deliv-ered by City departments. Behind the office wall plate with the snap-in connector labeled “data” exists a silent infrastructure of more than 200 switches and routers, hundreds of miles of copper and fiber optic cables, wireless access points, security hardware and software, all providing gateways to an infinite number of voice, video, and data resources. It is a high speed data transport system linking each PC, laptop, printer, scanner, database, server, storage system, and application program. The network hosts advanced telephone systems, call center operations, public safety dispatch, water treatment operations, fcgov.com, JDE financials, HR functions, City Council sessions, recreation registration, traffic operations, and transportation services. Critical to the performance, reliability, and cost effectiveness of such City services are continuous improvements in network architecture and expert maintenance of this intricate infrastructure.
30.2 Network Lab Equipment - Not Funded 2008 - $29,000 2009 - $0This offer supports the purchase of equipment to create a full network lab. This is needed to properly test equipment and solutions prior to implementing changes to the production network. Currently this is done using production equipment and has caused disruption in service when implementations have failed.
30.3 Contractual Network Engineer - Not Funded 2008 - $85,000 2009 - $85,000This offer is to add a contractual Network Engineer in MIS for 2008 and 2009. The current workloads and anticipated work-loads are projected to exceed current resource capacity.
30.4 Network Equipment - Funded 2008 - $88,850 2009 - $83,000This offer requests funding for equipment to upgrade the City’s fiber coax hybrid network necessary to continue the migration toVoiceOverIPaswellastoprovidebroadbandcapacitynecessarytomeettheneedsoftheorganization
32.1 Technology Customer Support - Funded 2008 - $756,045 2009 - $778,893Thisofferprovidesfundingfortheextensive“behindthescenes”workthatsupportstheServiceDeskquestion:“HowcanIhelp you?” This offer continues support for users of the City’s unified help desk, end user devices such as laptops, desktop PC’s, blackberry and other PDA devices, printers, office productivity and other pc based software.
32.2 Collaborative Software Tools - Not Funded 2008 - $31,000 2009 - $0This offer provides for the acquisition of Microsoft SharePoint and Groove for testing, evaluation, and limited deployment purposes. These are collaborative software systems that are beginning to be used by different departments within the City. There is the need for MIS to be taking a more proactive approach to these products.
32.3 User Authentication/Network Security - Not Funded 2008 - $30,000 2009 - $70,000This offer is to fund the evaluation and possible deployment of a network authentication system that places less reliance on passwords while at the same time maintaining or even improving the level of security that needs to be maintained on the City’s network.

177 - OPERATING BUDGET
HIGH-PERFORMING GOVERNMENT
32.4 PC replacement - Partially Funded 2008 - $476,781 2009 - $517,619ThisofferreflectsthecostofreplacingPC’sona4yearrotationplanasdevelopedbyMIS.ComputersforallCitydepartmentsareincludedinthereplacementschedule.Theofferamountnotfundedis$132,188in2008and$215,844in2009.
32.5 Microsoft Software Upgrades - Partially Funded 2008 - $69,000 2009 - $0
The City’s current Windows platform and Microsoft Office software is aging and support of the product will soon be discon-tinued. This offer funds the costs to upgrade the enterprise to the most recent version of Micorsoft Office and the Windows Vistaoperatingsystem.Theoriginalofferincluded$360,000for2009thatwasnotfunded.
33.1 Data Management Services - Funded 2008 - $481,977 2009 - $494,894This offer provides the resources necessary to sustain the performance and availability of nearly 150 servers and 23 indi-vidual data backup systems. Data Management Services encompass two critical components of the City computing architec-ture:serversanddata.Serversarethedataengines,anetworkedplatformprovidingcomputinghorsepowerforapplicationprograms such as PeopleSoft financials, web pages, e-mail, and spreadsheets. This data is cached in storage repositories as trillions of binary bits that must be protected from system failures and unauthorized use. Over the past nine months, Data Management staff have assessed the current structure of data systems across the City and determined that there are opportunities for building a more cost effective, yet higher performing, server and storage architecture. Consolidation and simplification are the key strategies. New technology is required to gain new efficiencies. This equipment is funded in offer 33.3 Data Management Equipment.
33.2 Data Lab Equipment - Funded 2008 - $66,000 2009 - $0This offer supports the purchase of equipment to create a full data management systems lab. This lab would be used in conjunction with the Network Lab to test new hardware, hardware and software upgrades, patches, and other changes that are proposed to the network in a closed lab environment.
33.3 Data Management Equipment - Partially Funded 2008 - $175,000 2009 - $0A recent analysis by a consulting firm showed that the City was underutilizing servers. This offer requests funding to consoli-date servers by replacing some servers with more powerful machines that will give the City a higher return on its investment. A storage and tape backup system is also requested to ensure proper backup of the City’s critical data assets. This offer funds the capital equipment costs directly supporting offer 33.1 Data Management Services. The original offer included $154,000for2009thatwasnotfunded.
33.4 Enterprise Storage and Backup System - Funded 2008 - $261,600 2009 - $0This offer provides funding for a central, integrated tape backup system to ensure the integrity and security of the City’s data assets.

178 - OPERATING BUDGET
HIGH-PERFORMING GOVERNMENT
35.1 Application Services - Funded 2008 - $376,466 2009 - $386,698The Application Services program provides a critical set of services to numerous departments and programs throughout the City. This offer requests funding for the ongoing support of a set of services related to the development, maintenance and supportofanumberofsystemsandprograms,including:CityClerk’sBallotTrackingsystem,SalesTaxsystem,theBudgetDevelopment Tool, and many others. In addition to these systems, the offer proposes to work with the City Manager’s Office in the development of a system focusing on data collection and metrics tracking in response to Purchasing strategies. The consolidation of IT services has also impacted the nature of this program from its previous offering. Enterprise database sup-port for systems within departments such as Operation Services, Purchasing, Utilities and MIS is now provided by a single database administrator (DBA) position. This DBA position’s home business unit is Application Services.
37.1 Development Tracking System - Funded 2008 - $370,546 2009 - $382,719This offer provides for the ongoing maintenance and support for what has generally been referred to as the Development Tracking System (DTS) which has been in use since 1989. The system provides for a multi-department automated land information & code enforcement application. The overall scope of the system is to coordinate and facilitate the processing of development and enforcement activities within what is commonly referred to as the Land Management Continuum. Within this continuum, the City performs numerous activities, all inter-related by their association to land, development, buildings, construction, and code enforcement. The mission of the system is to integrate as many of these related processes as pos-sible, constructing automated workflows that manage the activities. The integration of these processes provides a much more coherent information stream to staff and citizens, thus reducing inefficiencies, taking advantage of process overlaps, and filling process gaps.
37.2 Customer Relationship Tracking (CRM) System - Not Funded 2008 - $40,000 2009 - $ 5,000This offer provides the resources to allow the City to provide a higher level of service in capturing, routing and tracking the status of Citizen and Councilmember’s requests for information from the City of Fort Collins. This offer would provide the resources for the additional software licensing and consulting services necessary to implement the Customer Relationship Management (CRM) module of the City’s Accela Automation software package that supports the Development Tracking System (DTS) program.
38.1 E-Government Services - Funded 2008 - $352,247 2009 - $362,872This offer provides for the ongoing services related to eGovernment within the City of Fort Collins. The eGovernment program developsandoperatestheFCGOV.COMandCITYNETwebandintranetsites,relatedapplications,andassistswithmanyother Web-related technologies and initiatives throughout the organization. The program provides services for the support ofsystemsand/applicationssuchas,CityDocs,FCTrip,Buyspeed,MVWeb,employmentrecruiting,variousUtilitiesapplica-tions, crime reporting, general government information and much, much more. This offer also provides for the support of the eCommerce architecture, which includes online transaction processing, electronic communication tools, 311, and credit card processing. The City’s eGovernment program is an extremely useful and valuable communication and citizen transac-tion medium, serving more than two million hits per month.

179 - OPERATING BUDGET
HIGH-PERFORMING GOVERNMENT
39.1 Enterprise Document Management Services - Funded 2008 - $311,598 2009 - $317,453This offer provides for the ongoing maintenance and support for the consolidation of what has generally been referred to as the DocMan (Document Management) System and eDocs (Engineering Documents) programs. The consolidation of these systems provide for the establishment of a complex, enterprise, electronic document management program. The program provides infrastructure and services that increase the efficiencies of processes, substantially improve the delivery of informa-tion to citizenry, and secure documents and information related to critical business processes. This offer is the culmination of a significant effort within the organization to eliminate redundancies and realize the benefits of coordinating efforts. This offer also recognizes the success of an offer in the previous BFO cycle that proposed a “jump start” initiative to allow other departments to utilize the technology.
39.2 Central Scanning Services - Not Funded 2008 - $37,000 2009 - $37,000The purpose of this offer is to continue the service that was provided in 2007 by the use of reserves to fund a central scan-ning service. This service was made available to departments in order to allow them to realize the efficiencies of utilizing the City’s Document Management program. This offer would consist of a partnership with Neighborhood and Building Services, whichwillfund1/4thoftheproject.Theprogramwillprovidecentralscanningservicestodepartmentsforthepurposeofscanning larger project that they do not have the capacity for and to assist them in the initial work of establishing the use of document management.
40.1 MIS Admin and Financial Support - Funded 2008 - $508,274 2009 - $526,351The City’s executive management team has adopted the Information Technology Infrastructure Library (ITIL) as the founda-tion for implementing comprehensive best practices for the City’s IT efforts. This foundation is internationally recognized and adopted by progressive industry leaders, and promotes a quality approach to achieving business effectiveness and efficiency in the use of information technology. The MIS Administration proposal will continue the implementation of ITIL, provide administrative, financial and clerical expertise for the department, and continue process improvement and change manage-ment through the efforts of the Change Management office.
40.2 Change Management Program - Not Funded 2008 - $16,448 2009 - $17,152This enhancement offer increases the staff FTE available for MIS Change Management by .2, making it a 1.0 FTE. The MIS Change Management Program makes it possible for MIS Staff to proactively and successfully identify and address the issues and concerns that arise when people work with technology to achieve the goals of the organization.
40.3 Expanded Technology - Not Funded 2008 - $21,560 2009 - $21,560As an organization, the City is increasingly relying on electronic communication methods and tools. This offer identifies twotechnology-relatedgapsandproposestoaddressthem:Gap1:thoseemployeeswhoneedbothemailandself-serviceaccessbutdon’thaveanemailaddresswiththeCity,andGap2:thoseemployeeswhoneedadifferentlevelofaccesstotechnology/client devices (pc, laptop), in order to be part of the connected corporate community. This offer purchases com-puters, email licenses and software to give all employees electronic access. It assumes that community-wide wi-fi won’t be available until 2010.

180 - OPERATING BUDGET
HIGH-PERFORMING GOVERNMENT
52.1 Risk Management - Funded 2008 - $3,229,537 2009 - $3,247,508The Risk Management division provides Risk Management services to the City of Fort Collins, the Poudre Fire Authority andtheDowntownDevelopmentAuthority.Thegoalistoprotecttheseentities’assets–employees,propertyandmonetaryfunds. The preservation of city assets allows the organization to operate more efficiently by ensuring that employees are able to perform their jobs, city property is adequately protected from catastrophic loss, and taxpayer dollars are not wasted on unnecessary claims that could have been prevented. Good risk management also protects the city’s reputation which is important when citizens are deciding various tax or bond referendum issues. Protection of assets is accomplished by loss prevention, loss control, and loss financing.
99.1 Fleet Administration - Funded 2008 - $347,987 2009 - $365,122This offer funds administrative and management functions for the Fleet Management package. The funding comes from monthly equipment and vehicle charges from each department.
101.1 Facilities Building Custodial Operations - Funded 2008 - $924,231 2009 - $985,601This offer funds management of contracted custodial services at 31 General Fund buildings and 21 Non-General Fund build-ings, including janitorial, carpet cleaning, and window cleaning services. It also includes alarm monitoring, pest control, and snow removal at selected buildings. The general fund portion of this offer is approximately two-thirds of the total amount.
101.2 Facilities Building Custodial Operations Enhancement - Funded 2008 - $237,604 2009 - $253,859Thisofferprovidesbuildingoperations for3newGeneralFundbuildings:PoliceServices,NorthsideAztlanCenter,andSpring Canyon Maintenance Shop. These buildings represent over 153,300 square feet.
102.1 Project Management Planning & Development - Facilities - Funded 2008 - $315,464 2009 - $328,845This offer provides overall project management services for various City of Fort Collins’ building construction and major re-modelprojectsonacostreimbursementbasis.Thisofferincludes$50,000tofundthoseGeneralFundrequeststhatarenot funded through cost reimbursement.
103.1 Real Estate Services - Funded 2008 - $473,452 2009 - $493,110Real Estate Services provides accurate, timely and cost effective services to meet the land acquisition needs of other City de-partmentsandtheirprojects.Theseservicesinclude:propertyacquisition,includingacquisitionthroughEminentDomain;easement acquisitions; disposition of City property; processing easement requests from outside sources; formal Appraisals and estimated property valuations; leasing from outside sources; and property management, including rentals of City-owned properties.Thisofferincludes$50,000tofundGeneralFundrequeststhatarenotfundedthroughcostreimbursement.
106.1 Budget Office - Funded 2008 - $274,684 2009 - $292,105This offer provides staffing for the Budget Office. The Budget Office provides timely, accurate financial data for City manage-ment, City Council, departments and the citizens of Fort Collins. In doing so, the Budget Office works collaboratively with the Chief Financial Officer, Finance Director, Accounting Manager, City Manager’s Office, City departments/divisions, and various cross-functional budget teams/committees.

181 - OPERATING BUDGET
HIGH-PERFORMING GOVERNMENT
112.1 City Clerk Administration - Funded 2008 - $542,455 2009 - $563,526The City Clerk’s Office provides support to the organization and the community through the creation, maintenance, and dis-semination of legislative and historical records. Services include attesting and recording documents; preparation of the City Council agenda; liquor licensing; compliance with legal notice requirements; boards and commissions support; passport application services; and conduct of elections (see Package 118).
112.2 Passports - Funded 2008 - $4,710 2009 - $5,180The City Clerk’s Office will continue functioning as a Passport Application Acceptance Facility on behalf of the U.S. Depart-ment of State
112.3 Human Relations Commission Support - Funded 2008 - $6,884 2009 - $6,973The Human Relations Commission (HRC) is appointed by the City Council for the purpose of promoting positive interaction among all city residents and to discourage all forms of discrimination based upon the diversified values and individual dif-ferences of such residents. This offer reflects a budget that will allow the HRC to meet on a regular basis, prepare meeting minutes, and conduct an annual award ceremony.
112.4 Women’s Commission Support - Funded 2008 - $1,200 2009 - $1,200The Women’s Commission is appointed by the City Council for the purpose of enhancing the status of and opportunities for all women in the city. This offer reflects a budget that will allow the Commission to meet on a regular basis, prepare meeting minutes, and complete the activities set out in its annual work plan.
118.1 April Regular Election - Funded 2008 - $0 2009 - $185,990ThisofferprovidesforamailballotelectioninApril2009.ArticleVIII,Section2oftheCityCharterprovidesforaregularcityelection to be held in April of odd-numbered years. At the April 2009 election, voters will be electing a Mayor, and Council representatives in Districts 1, 3, and 5.
118.2 Special Elections - Funded 2008 - $94,995 2009 - $96,420This offer provides for a special election to be conducted each year in conjunction with the November Larimer County Gen-eral or Coordinated Election. Other special elections occur at other times by citizen initiative, but it is impossible to predict and budget for such occurrences.
119.1 Purchasing - Funded 2008 - $406,673 2009 - $424,122This offer funds the City’s Purchasing Department. Services include purchasing goods for City departments, managing bids and requests for proposals, and promoting the use of sustainable purchasing practices, and shall contract for all supplies, materials, and equipment required or used by all service areas and agencies of the City, including businesses and enterprises operated by the City.

182 - OPERATING BUDGET
HIGH-PERFORMING GOVERNMENT
119.2 Administrative Support for Purchasing - Not Funded 2008 - $30,583 2009 - $31,988This offer would fund a .5 FTE Administrative Support position for Purchasing to process bid, request for proposal and elec-tronic documents.
121.1 Accounting - Funded 2008 - $593,814 2009 - $617,920This offer is to provide accounting and financial reporting services for the City, including City Council, City Managers Office, department managers, citizens, granting agencies, debt holders, and employees. Services include producing monthly finan-cial reports and the year end audited financial statement, providing advice on financing and business procedures, creating, enforcing, and monitoring internal controls, monitoring transactions, reconciling bank and investment accounts, and manag-ing the accounts receivable module.
121.2 Uniform Chart of Accounts - Not Funded 2008 - $190,000 2009 - $0Over the 8 years since migrating to JD Edwards the chart of accounts has expanded to become overly complex and unman-ageable; it is the root cause of many of the issues we experience with JDE today. Implementing a uniform chart of accounts will significantly enhance reporting capabilities to further enable data driven decision making, streamline processes and reduce the amount of people time associated with current non-value-added activities related to the chart of accounts. Fund-ing will be located in the 2008 budget.
121.3 Senior Accountant Enhancement - Funded 2008 - $84,066 2009 - $85,269This offer increases 1 FTE in the accounting division by reinstating a senior accountant position eliminated in 1999. This additional position is needed to provide timely, accurate and reliable financial information to City Council, the City Manager and City departments.
122.1 Sales Tax - Funded 2008 - $501,736 2009 - $520,967Sales and use tax collections account for approximately 65% of the General Fund. Accurate and timely revenue collection is a vital function of a high-performing city government. We propose to provide sales and use tax revenue collection, compli-ance audit, licensing enforcement and taxpayer education services for the City of Fort Collins.
122.2 Public Improvement Fee Auditor - Not Funded 2008 - $39,588 2009 - $78,476TheFinancialAssistanceAgreementPertainingtotheDevelopmentoftheFrontRangeVillagerequiresthecollectionofaPublic Improvement Fee (PIF). The PIF Auditor position will provide PIF collection, compliance audit, licensing enforcement and education services.
122.3 Sales Tax Software - Not Funded 2008 - $100,000 2009 - $ 10,000Accurate and timely revenue collection is an essential function of a high-performing city government. This offer funds the purchase of sales tax software that will provide enhanced capabilities for the business community through online account access. A new system will also create revenue collection efficiencies and provide for improved reporting.

183 - OPERATING BUDGET
HIGH-PERFORMING GOVERNMENT
123.1 Payroll and Accounts Payable - Funded 2008 - $508,475 2009 - $529,063This offer funds the City of Fort Collins Payroll and Accounts Payable office, which exists as the centralized location for the biweekly payment of employees’ payroll and the centralized location for the payment of all goods and services purchased by the City of Fort Collins, Fort Collins Downtown Development Authority, the Poudre Fire Authority and the Fort Collins Regional Library District.
124.1 Cash and Investment Management - Funded 2008 - $415,601 2009 - $430,228The primary responsibility of Treasury Services is to maximize investment returns while maintaining acceptable risk and en-suringadequateliquidity.Thisincludesthemanagementofthe290milliondollaroperatingportfolioandthe43milliondollardefined benefit portfolio within the investment policy guidelines for each respective portfolio. Other responsibilities include managing the daily cash position, maintaining Investment software, and producing management reports reflecting the City’s cash and investment positions. Treasury Services also includes managing the banking relationships and verifying that the banking services provided are necessary, adequate, and priced competitively. Treasury Services will collaborate with other city departments as necessary to ensure that all transactions involving the movement, handling, and storage of cash will be handled in a timely, efficient, and safe manner.
125.1 Finance Administration - Funded 2008 - $335,346 2009 - $354,860The Finance Administration Division of the Finance Department acts as the ex-officio City Treasurer and oversees the activi-ties within the entire Finance Department.
146.1 Fleet Equipment Replacement - Partially Funded 2008 - $1,811,371 2009 - $1,401,566This offer provides a dedicated funding source for General Fund departments to replace vehicles and equipment in ac-cordance with the five-year vehicle and equipment replacement program. The funding source is primarily General Fund reserves.
147.1 Fleet Fueling - Funded 2008 - $3,754,597 2009 - $4,030,447This offer provides Fueling Services for the City of Fort Collins’ vehicles and equipment and several outside agencies. The fuel is accessible at nine internal fueling sites, several external fuel stations and one mobile truck. The fuels that are available are:biodiesel,unleaded,E85,propane,andnaturalgas.Thisofferisfundedentirelythroughfuelsalestoeachdepartmentor agency.
148.1 Fleet Vehicle & Equipment Maintenance - Funded 2008 - $4,163,017 2009 - $4,299,930This offer provides Fleet Maintenance and Repair and services for City of Fort Collins’ vehicles and equipment. The Fleet operations are housed in four maintenance shops, three parts rooms, and two mobile repair trucks.
148.2 Fleet Vehicle & Equipment Maintenance Enhancement - Funded 2008 - $226,490 2009 - $245,764This offer provides additional Fleet Maintenance, Repair and Services for City of Fort Collins’ vehicles and equipment. This offerincludes2additionalmechanicsandre-openingthe906VineStreetrepairshop.Thefundingforthisoffercomesfromdepartmental usage and direct charges.

184 - OPERATING BUDGET
HIGH-PERFORMING GOVERNMENT
149.1 Fleet Vehicle Rental Service - Funded 2008 - $603,309 2009 - $660,679ThisofferprovidesCity–ownedpoolvehiclesforallcitydepartmentstouse.Italsoprovidescoordinationbetweencityde-partments and outside rental agencies. The funding for this offer comes from individual departments who use the rental program.
151.1 Facilities Building Utilities & Energy Management - Funded 2008 - $1,809,220 2009 - $1,919,350This offer includes funding to monitor, manage and pay utility bills (Electric, Gas, Water, Sewer, & Stormwater) for 36 General Fund buildings, and 21 Non-General Fund buildings. The General Fund portion of this offer accounts for about 68% and the remainder is funded by individual departments.
151.2 Facilities Building Utilities & Energy Management Enhancement - Funded 2008 - $340,130 2009 - $355,060Monitor, manage and pay utility bills (Electric, Gas, Water, Sewer, & Stormwater) for 3 new General Fund buildings.
152.1 Facilities Administration - Funded 2008 - $413,064 2009 - $430,090This offer funds administrative and management functions for the Facilities Management package. This offer is funded entirely through the General Fund.
153.1 Facilities Building Maintenance - Funded 2008 - $3,486,097 2009 - $3,586,352Thisofferprovidesroutinebuildingmaintenanceandrepairsfor44GeneralFundbuildings,5downtownparkinglots,3City-ownednon-profit,and41Non-GeneralFundbuildings.Thesebuildingsrepresentover1.6millionsquarefeetofbuildingmaintenance(GeneralFund–715,224squarefeet).Thisofferconsistsofabout80%generalfundand20%non-generalfund (chargebacks).
153.2 Facilities Building Maintenance Enhancement - Funded 2008 - $449,115 2009 - $452,539This offer provides routine building maintenance and repairs for 3 new General Fund buildings; Police Services, Northside Aztlan Center, and Spring Canyon Maintenance Shop. These buildings represent over 153,300 maintainable square feet. This offer is funded entirely by the General Fund.
154.1 Renovate Old Police Building - Not Funded 2008 - $6,986,000 2009 - $0This offer provides for the design, renovation of, and construction of an addition to the “old” Police Services Building at 300 LaPorte Ave. in 2008. This offer is funded by General Fund monies.
157.1 Legal Services Administration - Funded 2008 - $1,145,101 2009 - $1,229,451This offer is designed to provide Charter-mandated services from the City Attorney’s Office at a level sufficient to support all Sellers in the administration and implementation of their offers.

185 - OPERATING BUDGET
HIGH-PERFORMING GOVERNMENT
159.1 Case Processing (other than Camera Radar and Red Light) - Funded 2008 - $585,622 2009 - $624,677This offer provides the funding necessary to continue to adjudicate traffic infraction and misdemeanor complaints (other than camera radar and red light (CRRL) cases, covered by a separate offer) which are filed in the Municipal Court. It does so at current staffing levels, with the only change being a partial reclassification of one of the Deputy Court Clerks. The Court will continue to handle those cases with integrity, efficiency and accuracy, treating each individual with courtesy and respect. The level of customer service that can be provided with our current staffing levels will continue to decrease, however, due to the increasing caseload. In 2006, the completed non-CR/RL caseload increased by 11% increase over 2005. In 2007, the caseload is still increasing due to increased Police Services staffing, particularly in the Traffic Unit. That increase is expected to continue in 2008 and 2009. This offer also includes the Municipal Judge’s time spent on Liquor Licensing Authority is-sues and meetings.
159.2 Replacement Staff for Non-CRRL Cases - Funded 2008 - $28,677 2009 - $29,961This offer replaces the funding for a 0.5 Deputy Court Clerk I position which was cut in 2007 as part of the budget-balancing process. At the time, the position had been vacant for a few months and we had very experienced staff so we were able to handle the caseload without refilling this position. However, with our caseload increasing and employee turnover since that time, we are no longer able to provide as high a level of customer service as we would like and as the public expects and desires.
159.3 Additional Staff for Municipal Court - Not Funded 2008 - $13,912 2009 - $14,544This offer adds an additional 0.25 FTE Deputy Court Clerk I position which is needed if the Mobile Citation Offer being sub-mitted by Police Services in the “Safer Communities” result area is not accepted. If that offer is accepted, then this offer is withdrawn. This additional partial position is needed due to the increases in Police Staffing, particularly in the Traffic Unit in 2007 and expected in 2008 and 2009. Without either the increased staffing level or the reduction in staff time spent on ticket preparation and entry which is expected with the implementation of the mobile citation system, Municipal Court will no longer be able to provide as high a level of customer service as in the past and as the public expects and desires.
163.1 Case Processing for Camera Radar and Red Light Cases - Funded 2008 - $65,823 2009 - $69,006This offer provides the funding necessary to continue to adjudicate speeding and red light cases generated by the camera radar and red light (CRRL) enforcement techniques which are filed in the Municipal Court. It does so at the current staffing level of 0.75 FTE contractual CRRL Court Clerk. The Court will continue to handle those cases with integrity, efficiency and accuracy, treating each individual with courtesy and respect. The level of customer service that can be provided with the cur-rent staffing levels will continue to decrease, however, due to the increasing caseload. The caseload is increasing in 2007 due to a second speed van being deployed and is expected to continue to increase during 2008 and 2009 due to the installation of a second red light camera system in Fort Collins in 2007. The CRRL program is funded by CRRL revenue.
163.2 Additional Staff for CRRL Cases - Funded 2008 - $27,385 2009 - $28,644This offer adds an additional 0.5 FTE contractual Camera Radar and Red Light (CRRL) Court Clerk position which is needed for 2008 and 2009 due to the increase in caseload in this area. A conservative estimate is that the CRRL caseload we handle will double in the near future due to increased use of this enforcement technique. As with the rest of our Clerks Office, without the increased staffing level we will no longer be able to provide as high a level of customer service as we have in the past and as the public expects and desires.
186 - OPERATING BUDGET
HIGH-PERFORMING GOVERNMENT
167.1 Sustainable City Government - Funded 2008 - $67,151 2009 - $69,048This offer adds a new 0.5 FTE Environmental Planner to help green the operations of City government by working with depart-ments on existing City sustainability goals such as paper reduction, solid waste reduction, promoting behaviors and polices that conserve energy, encouraging more sustainable employee commuting habits, promoting green purchasing and raising employee awareness of sustainable practices at the office and at home. In addition to work on sustainability goals, this new position will also provide needed help to coordinate assessments of City facilities and assist with implementation of Climate Wise program recommendations for the municipal government.
173.1 Facilities Major Repairs & Replacement - Not Funded 2008 - $1,558,800 2009 - $ 741,200Thisofferistofundfacilitymajorrepairsorreplacementfor49GeneralFundbuildings(863,024squarefeetofbuildingmaintenance), and 5 downtown parking lots using the dedicated maintenance fund. Facility major repairs or replacements aregenerallyplanned,areincludedinafive-yearmaintenanceplan,andexceed$20,000eachoccurrence.Thefundingforthis offer is General Fund.
191.1 Cable and Media Services - Funded 2008 - $543,399 2009 - $557,828ThisofferisforbasicservicesassociatedwithCityCable14programmingandmediaservices.Itprovidesequipmentandstaffing for live cablecasts of City Council Meetings, City Council Work Sessions, and Planning and Zoning Board delib-erations. It includes taped staff presentations for Council Work Sessions, a minimum of one studio program each month, continuation of CrossCurrents and a limited amount of other programming. This offer provides live online video streaming andvideo-on-demandforallCable14programmingsoitisaccessibletoallmembersofthecommunity.Thisofferprovidescablecasting of County Commissioner meetings, County land use hearings, and other services designated by the City’s IGA with Larimer County for Cable services. The final component is the Public, Education and Governmental Access funds which are distributed through a competitive process to the City, Poudre School District, CSU and FC-PAN.
200.1 Benefit Programs and Services - Funded 2008 - $20,631,907 2009 - $23,091,836The City’s Benefit Programs provide employees with a flexible benefit plan, through which employees have a choice of insur-anceplansthatbestfittheemployee’sandtheirfamily’sneeds.Theseplansinclude:medical,Rx,dental,life,accidentaldeath and dismemberment (AD&D), vision, long-term disability coverage, healthcare and dependent care reimbursement accounts, employee assistance program, and various/multiple retirement plans. Other coverage offered to employees is fam-ily medical leave (FMLA) and short-term disability (STD). All or portions of the above plans are offered to City, PFA, MPO, Housing Authority, DDA, and Library District employees and their families.
200.2 Wellness Program - Funded 2008 - $161,369 2009 - $164,804This offer focuses on the overall well being of City employees and their families. Components of the program include screen-ing, education, training, and program opportunities intended to reduce safety and health risk parameters, ultimately reducing healthcare utilization and workers compensation costs and improving personal and organizational health. Resources focus on the Well Day Incentive Program targeting the most prevalent health risks factors as identified through Health Risk Assess-ments and healthcare claims data.
207.1 Human Resources Services - Funded 2008 - $925,511 2009 - $958,207This offer funds existing services in the Human Resources Department. Human Resources partners with employees, man-agers and external service vendors to provide systems, resources and programs that meet strategic organization goals, com-ply with legal requirements and meet customer needs in a timely, efficient, responsive and flexible manner.

187 - OPERATING BUDGET
HIGH-PERFORMING GOVERNMENT
207.2 Compensation Analyst - Funded 2008 - $90,986 2009 - $92,314This offer adds a new 1.0 FTE Classified Compensation Analyst for the purpose of performing compensation related duties and responsibilities. This position is needed to research and consolidate market data for use in conjunction with the pay for performance system, develop/implement/maintain three pay models for the City, maintain variable pay and/or rewards and recognition program, and assist in other pay and compensation duties.
207.3 HR Representative for Investigations - Funded 2008 - $81,041 2009 - $82,171This offer provides funds to hire a 1.0 FTE Contractual Human Resources Representative for the purpose of conducting Administrative Investigations (including employee conduct, grievances and appeals) and assisting managers with investiga-tions.
207.4 Motivate and Rewards Program - Not Funded 2008 - $0 2009 - $ 100,000Thisofferprovides$100,000in2009tofundthe“MotivateandRewards”programfortheGeneralFund.Thisprogramis one of many that is recommended to be developed and implemented as part of the Total Compensation Framework as outlined in the Pay for Performance system. This amount is approximately one-quarter of one percent of the overall General Fund Personal Services (as recommended by WisdomNet, consultant for Pay for Performance).
207.5 Integrated Talent Management System - Not Funded 2008 - $10,000 2009 - $0This offer allows for the full implementation of the integrated talent management system purchased by the City as part of the pay for performance and e-learning initiatives. Additional costs are one-time dollars and are limited to process consulting to integrate the City’s recruitment and future succession planning processes into the I-TMS system. There is no additional one-time or ongoing software cost.
207.6 World Class People Advertising - Not Funded 2008 - $15,000 2009 - $15,000This offer is to improve the appeal of our recruitment ads by including City employees in the ads. The ad program would tie in with the “World Class People” program by featuring a World Class city employee. This program supports the broader goal of hiring, retaining and recognizing quality City employees.
210.1 Learning and Org Development - Funded 2008 - $223,653 2009 - $230,906This offer focuses on meeting business needs by designing and delivering training and learning opportunities that are closely aligned with strategic initiatives, demonstrating quantifiable results for the organization, and engaging for learners. Develop-ing our human capital by functioning as an integral partner in creating a learning culture is critical to organizational success. The responsibilities of this program are to consult with and support all employees in the areas of leadership development, organization assimilation, performance management, career development, professional development, personal enrichment, safety and health and wellness. In addition to building capacity in the organization and affecting culture, the Learning and Organizational Development division must continually watch the industry trends, advise the executive leaders, and create a strategy to address gaps or issues that hinder the organization’s ability to grow and succeed.

188 - OPERATING BUDGET
HIGH-PERFORMING GOVERNMENT
210.2 Online New Employee Orientation - Not Funded 2008 - $16,000 2009 - $0This offer will fund the research, redesign, and implementation of the organization’s New Employee Orientation (NEO) course. The focus will be to work with departments across the City to design the most effective method of orienting all employees and implementing various delivery methods (online, peer training, multiple “live” NEO sessions, etc.) to accomplish this task.
210.5 Succession Planning - Not Funded 2008 - $105,780 2009 - $ 83,104This offer focuses on designing and piloting a succession planning process that will help align human capital with ongoing needs of the organization. Essentially, the key to succession planning is to have the right people prepared for the right posi-tions at the right time.
210.6 Leadership Development Program - Not Funded 2008 - $42,000 2009 - $66,000This offer will fund the research, design, implementation and coordination of an organization wide leadership development program. The focus will be to develop, enhance and align the leadership competencies in the organization as they relate to the key business strategies, mission and vision, while supporting and advancing the succession planning efforts of our cur-rent and future leaders.
213.1 Development Review Center - Innovative Technology - Funded 2008 - $121,600 2009 - $ 12,600This offer is for the acquisition and implementation of technologies specifically related to development review and construc-tion plan submittal processing. This technology would enable staff to create a project-specific online information center where applicants, owners, developers, citizens, and staff would have online access to all project information, communica-tions and workflow processes. This would greatly increase project coordination and collaboration between the participants, and potentially decrease the amount of time required to process applications. Automated notification features can be utilized to alert participants of various items, alleviating the need to routinely check on status. The ability to check required changes on resubmitted documents is facilitated through document overlay or side by side comparison features that highlight the differences, thereby increasing efficiency for the staff reviewer. As well, this technology would give staff a better and more comprehensive way to track pertinent data related to these review processes.
215.1 Communicating with the Community - Funded 2008 - $443,372 2009 - $460,812This offer provides general services from the Communications and Public Involvement Office (CPIO). The CPIO manages and implements a variety of communication tools, public involvement and outreach opportunities. Primary services are in thefollowingareas:Communicationsconsultingandinformationcampaigndevelopment;Design/Production(brochures,an-nual reports, logos, events, posters, direct mail, ads, web); community relations and strategic partnerships; media relations; special events; web content; employee communication; and crisis communication.
215.2 Enhanced Communications - Not Funded 2008 – $135,044 2009 - $140,220City Council and City staff have identified a need for improved communication with community members, stakeholders, and employees. This offer includes a few key resources that are necessary to better “tell our story.” The City’s public web site (fcgov.com) and its internal site (citynet) are both becoming increasingly important, yet underutilized, communication tools. This offer includes one new FTE position to focus primarily on web design, electronic newsletters and e-learning services. The other component is this offer is additional resources for communication and marketing materials.

189 - OPERATING BUDGET
HIGH-PERFORMING GOVERNMENT
219.1 Police Collective Bargaining - Funded 2008 - $ 5,000 2009 - $55,000Beginning January 2006, the City entered into an agreement with Lodge #3 Colorado Fraternal Order of Police (FOP) to set compensation and employment conditions for a two year contract period ending December 31, 2007. At the end of the two year agreement, the FOP can request that the City enter into additional contract negotiations. Funding is required to cover the City’s legal and consulting fees associated with negotiation.
220.1 Organizational Performance Measurement - Funded 2008 - $50,000 2009 - $50,000The City of Fort Collins embarked on an organization-wide performance measurement program in 2006 by joining the ICMA Performance Measurement program. The overall performance measurement program will be organized and managed within theBudget/Financestaffteam.Thisofferincludesthreemaincomponents:asurveytoolwhichwillprovideforcentralized,online surveying and includes a one-year contract with Inquery Mobile Data Systems; the contractual costs for continued participation in ICMA’s Performance Measurement Program; and costs for software licensing for managing the City’s perfor-mance information.
227.1 Rebate Program - Grocery - Funded 2008 - $225,450 2009 - $238,250Three rebate programs are offered to low income citizens who qualify. These rebates include a property tax or rent rebate, a utility rebate, and a sales tax on food rebate. The amount of money each applicant receives varies according to the amount of income the household earns. Applications are accepted from August 1 through December 31 of each year.

190 - OPERATING BUDGET
HIGH-PERFORMING GOVERNMENT
High-Performing Government: Fort Collins is a model for an entrepreneurial, high quality city government.
TEAM MEMBERS Tess Heffernan, Team LeaderBeth Sowder, FacilitatorSandy Aragon, Budget LiaisonJohn Armstrong, CommunicationsCathy BlakemanDan ColdironHal DeanMike HerzigTom Rock
INTRODUCTION/SUMMARY OF RESULTS MAP
The High-Performing Government Results Team approached this task from the perspective of our community and its citizens. What do people want most from their municipal government? We studied the results of the 2006CitizenSurveyand–wearingourowncitizen“hats”–discussedsuchbasicsasfiscalresponsibility,trans-parency, and personal and professional service provision. These components are described under the headings “Focus on the Results the Community Wants” and “Create Active Community Connections”.
The team also looked inward by reviewing research on just what it is that makes up a healthy, high-performing organization. Sources of this research included The Gallup Organization, Baldrige Award Criteria, writings on best practices of a variety of public- and private-sector organizations, and the 2006 City Employee Survey. These findings are summarized under the headings “Promote Progressive and Effective Leadership”, “Invest in and Engage Employees”, and “Provide Exceptional Support Technology, Information and Services”.
Although each of the points within each causal area are viewed as a priority, the ones indicated with a “star” are viewed as the absolute top priorities and, in some cases, encompass the other desired results.
INDICATORS
1. CITIZEN SURVEY Conduct an annual survey enabling citizens to prioritize the services they want and provide feedback on
how well the City provides those services. This survey will result in a better understanding of citizen ex-pectations, priorities and satisfaction, and will track on-going trends in these areas.
2. PRICE OF GOVERNMENT “The quality we have depends on what we’re willing to pay for.” The price of government is calculated by comparing what citizens pay for City services against personal
income. This indicator will be tracked over time and analyzed in conjunction with the various Budgeting for Outcomes indicators. Any changes in the price of government will be compared to the organization’s performance as measured by the indicators. Citizens can use the price of government and the various indicators as they assess whether they are satisfied with both the amount they are paying for government services and the value that they receive for their investment.
191 - OPERATING BUDGET
3. EMPLOYEE ENGAGEMENT SURVEY Utilize research-based questions to gauge employee engagement. The survey will be conducted three
times each year during the same time frames in order to track ongoing trends.
4. PERFORMANCE MANAGEMENT PROGRAM By the end of 2008, establish and implement a Performance Management Program for the purposes of
aligning the City’s mission, vision, values, and goals with performance expectations and rewarding high-quality performance.
5. INTERNAL SERVICES SCORECARD By the end of 2008, establish and implement an Internal Services Scorecard for the purpose of tracking,
understanding and improving key work processes and achieving organizational success, sustainability and continuous improvement.
PURCHASING STRATEGIES
1. Purchasing Strategy #1–Dedicateresourcestoperformancemeasurementandsupportashifttoadata-driven organization.
•FocusonResultstheCommunityWants
2. Purchasing Strategy #2–Emphasizefinancialmanagementplansandstrategiesthatfocusonoutcomesand results that citizens want and are designed for long-term financial stability.
•FocusonResultstheCommunityWants
3. Purchasing Strategy # 3–Providesystems,servicesandprocessesthatincreaseaccess,efficiencyandresponsiveness in meeting the needs of our customers while eliminating unnecessary redundancies.
•FocusonResultstheCommunityWants •ProvideExceptionalSupportTechnology,InformationandServices
4. Purchasing Strategy #4 –Proactivelyinformandinvolvecitizensthroughavarietyofchannelsinordertogauge expectations, convey our services and engage people in issues that affect them.
•CreateActiveCommunityConnections
5. Purchasing Strategy # 5– Maintain and enhance community partnerships and collaborations, and empha-size the City’s role in shaping the future of our community and region
•CreateActiveCommunityConnections
6. Purchasing Strategy # 6– Outline programs and initiatives that advance progressive and effective leader-ship throughout the organization.
•PromoteProgressiveandEffectiveLeadership
7. Purchasing Strategy #7– Provide a comprehensive Performance Management program that includes in-novative strategies for rewarding high-quality performance.
•PromoteProgressiveandEffectiveLeadership •InvestinandEngageEmployees
8. Purchasing Strategy #8– Proactively inform employees through a variety of channels in order to gauge expectations, convey our internal services and involve employees in issues that affect them.
•InvestinandEngageEmployees
9. Purchasing Strategy #9– Promote and invest in safety, wellness, equipment and workspace. •InvestinandEngageEmployees

192 - OPERATING BUDGET
10. Purchasing Strategy #10– Proactively inform employees through a variety of channels in order to gauge expectations, convey our internal services and involve employees in issues that affect them.
•InvestinandEngageEmployees
11. Purchasing Strategy #11– Focus on affordable and, where possible, customized internal service func-tions that are based on a business partnership model.
•ProvideExceptionalSupportTechnology,InformationandServices
12. Purchasing Strategy #12– Enhance and better integrate financial and accounting services throughout the organization, including parameters and procedures for equipment/asset purchase and replacement.
•ProvideExceptionalSupportTechnology,InformationandServices
NOTES/PRACTICES/SUPPORTING EVIDENCE
The High-Performing Government Results team tapped a variety of sources to identify the components that will ensure Fort Collins is, as described by City Council, a model for an entrepreneurial, high quality city government. Thesesourcesinclude:•2006FortCollinsCitizenSurvey•CityofFortCollins2006EmployeeSurvey•TheGallupOrganization•2007BaldrigeAwardCriteria•“W.O.R.L.DC.L.A.S.S.asanacronym”article•RulonStacy,PoudreValleyHealthSystem,presentationtoExecutiveLeadTeam,November2006•MarcusBuckinghampresentation,April2006•TheHighPerformanceModelfromEmployeeEngagementandCommitment•WaltDisneyWorld“ChainofExcellence”•EmployeeEngagementconferenceoverview•GoodToGreatbyJimCollins
Given the many facets of a high quality city government it was quite a challenge to summarize our findings in one concise document. Fortunately, we are guided by the fact that our City vision, mission and values underscore whatisexpectedofeveryCityemployeeashe/shegoesaboutservingourcommunity:•OurVision:Wearepassionateaboutcreatingavibrant,worldclasscommunity•OurMission:Exceptionalserviceforanexceptionalcommunity•OurValues:outstandingservice,innovationandcreativity,respect,integrity,initiative,collaborationandteam-
work, stewardship
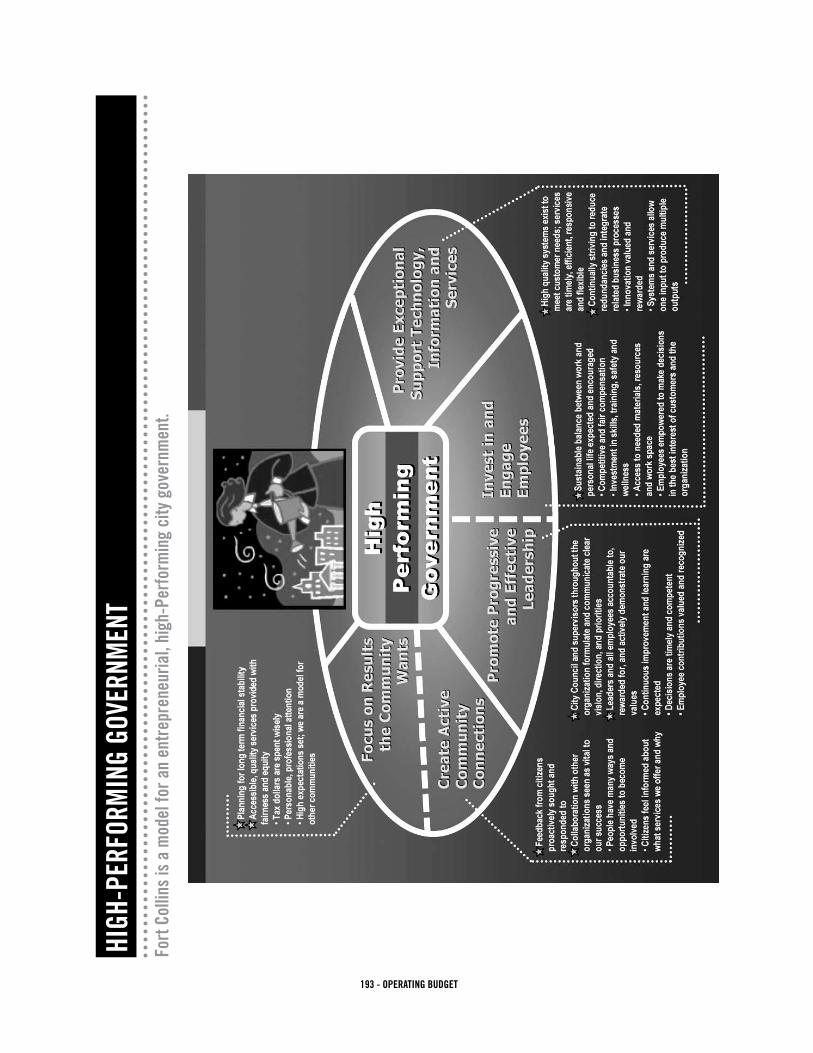
193 - OPERATING BUDGET
Fort
Col
lins
is a
mod
el fo
r an
entr
epre
neur
ial,
high
-Per
form
ing
city
gov
ernm
ent.
HIGH
-PER
FORM
ING
GOVE
RNM
ENT

194 - OPERATING BUDGET
THIS PAGE LEFT INTENTIONALLY BLANK

195 - OPERATING BUDGET
FUND STATEMENTS TABLE OF CONTENTS
FUND ACCOUNTING 197
2008 & 2009 PROJECTED CHANGES IN FUND BALANCE 199
GENERAL FUND 201
GENERAL FUND STATEMENT
WHERE THE MONEY COMES FROM?
GENERAL FUND REVENUE DETAIL
GENERAL FUND EXPENSES DETAIL
ENTERPRISE FUNDS 209
FUND DESCRIPTIONS
GOLF FUND
LIGHT & POWER FUND
STORM DRAINAGE FUND
WASTEWATER FUND
WATER FUND
INTERNAL SERVICE FUNDS 220
FUND DESCRIPTIONS
BENEFITS FUND
DATA & COMMUNICATIONS FUND
EqUIPMENT FUND
SELF INSURANCE FUND
UTILITY CUSTOMER SERVICE AND ADMINISTRATION
SPECIAL REVENUE FUNDS 231
FUND DESCRIPTIONS
CAPITAL IMPROVEMENT EXPANSION FUND
CAPITAL LEASING CORPORATION FUND
CEMETERY FUND
CULTURAL SERVICES AND FACILITIES FUND
DEBT SERVICE FUND
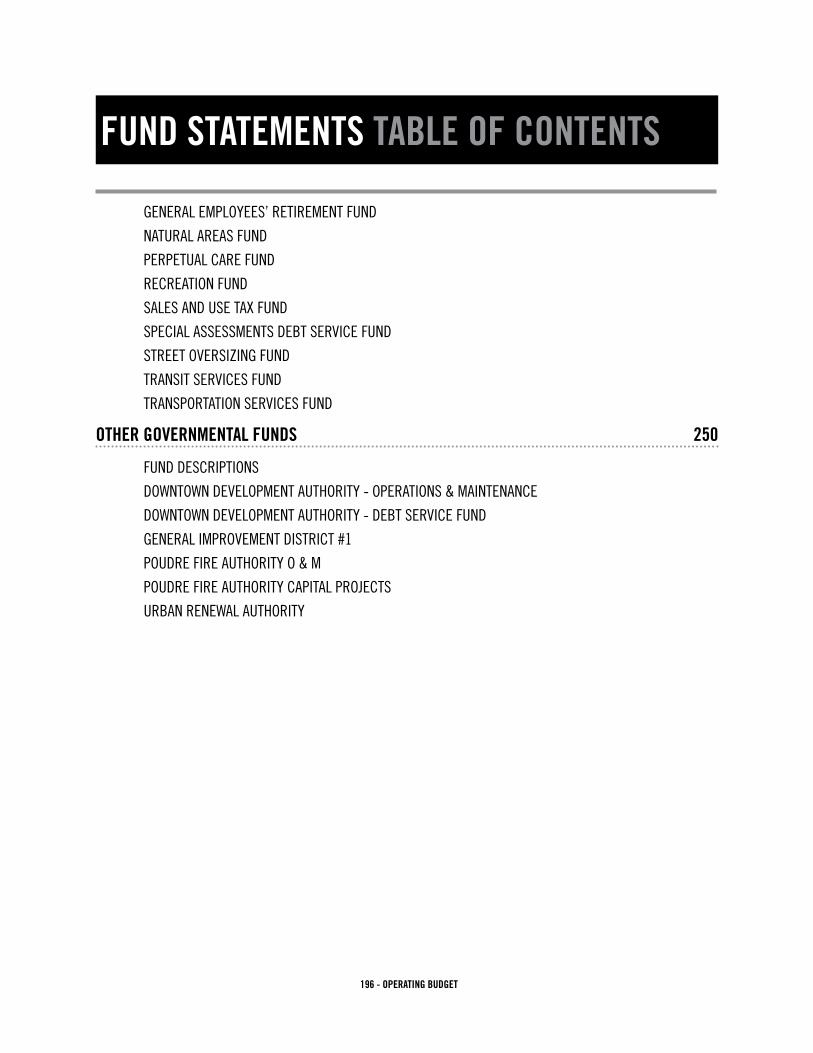
196 - OPERATING BUDGET
FUND STATEMENTS TABLE OF CONTENTS
GENERAL EMPLOYEES’ RETIREMENT FUND
NATURAL AREAS FUND
PERPETUAL CARE FUND
RECREATION FUND
SALES AND USE TAX FUND
SPECIAL ASSESSMENTS DEBT SERVICE FUND
STREET OVERSIZING FUND
TRANSIT SERVICES FUND
TRANSPORTATION SERVICES FUND
OTHER GOVERNMENTAL FUNDS 250
FUND DESCRIPTIONS
DOWNTOWN DEVELOPMENT AUTHORITY - OPERATIONS & MAINTENANCE
DOWNTOWN DEVELOPMENT AUTHORITY - DEBT SERVICE FUND
GENERAL IMPROVEMENT DISTRICT #1
POUDRE FIRE AUTHORITY O & M
POUDRE FIRE AUTHORITY CAPITAL PROJECTS
URBAN RENEWAL AUTHORITY

197 - OPERATING BUDGET
FUND ACCOUNTING
Fund accounting is used both for budgeting and accounting purposes. Each fund is established for a specific purpose and is considered a separate accounting entity.
The flow of revenues and expenditures within each fund is somewhat like a bank checking account and a savings account. Revenues are deposited into the checking account and are used to pay for operations and other ongoing activities throughout the year. Any excess of revenues over expenditures are placed in a savings account, fund balance, at year end. The savings can be restricted or designated to be spent for future capital needs or to be used for any unforeseen emergencies.
Council must approve, or appropriate any expenditure from the various funds, including expenditures from reserves. The authorization is generally done prior to the beginning of each fiscal year, but can be done by the City Council anytime during the year if funds are available. In government, appropriate or appropriation is used instead of authorize or authorization.
Total appropriations or expenditures which make up the City’s budget become somewhat complex when dealing with the issue of internal transfers, the transfer of revenues and expenditures between funds. Because each fund is a separate entity, Council must appropriate the expenditure in the entity transferring the funds and must appropriate the funds in the receiving entity. Simply put, revenues and expenditures transferred between City funds are accounted for twice and occasionally three times in arriving at total appropriations of the City. For this reason, the total appropriated or authorized amount for any fiscal year can be significantly higher than actual dollars spent or budgeted for that year. If you exclude internal transfers, you arrive at a close approximation of the actual budget of the City.
CITY FUND TYPES
TheCityofFortCollinsutilizesseveraltypesoffunds:GeneralFund,InternalServiceFunds,EnterpriseFunds,Special Revenue and Debt Service Funds, and Capital Project Funds.
The General Fund includes the majority of city services. Some of the services provided by the General Fund are:CityCouncil,CityManager’sOffice,CityAttorney,CityClerk,MunicipalCourt,Planning,BuildingInspection,Police, Parks, Library, Facilities Maintenance, Human Resources, Information & Communication Services, and Finance. Also, the General Fund contributes to the operations of the Poudre Fire Authority as well as provides subsidies to Recreational and Cultural Services, Cemeteries, Transportation and Transfort (the City’ bus system). Revenues come from sales and use taxes, property taxes, user fees, permits and licenses, internal transfers and various other miscellaneous sources.
InternalServiceFundsprovidesupporttootherCitydepartments.Includedinthiscategoryare:theBenefitsFund; the Equipment Fund which supports the city fleet and vehicle maintenance; Data & Communications Fund which supports the City telephone and computer systems; the Self Insurance Fund for city liability insur-ance, and the Utility Customer Service and Administration Fund which provides management, support services, and customer services for the four utility funds. Internal Service Funds are self-supported by charges and trans-fers from the various funds that use their services.
Special Revenue and Debt Service Funds each have a specific revenue source or sources which are restricted to specific purposes for expenditure by federal or state law, or by City ordinance or resolution. Special Revenue Funds include Cultural Services and Facilities, Cemeteries, Recreation, Transit, Transportation, and the various Pension funds. The Debt Service Funds are used for payments on the City’s long-term debt.
198 - OPERATING BUDGET
Enterprise Funds are self-supporting through user fees. Light and Power, Water, Wastewater, and Stormwater Utilities, and the Golf Fund are classified as Enterprise Funds.
The City’s Capital Improvement Program includes the Capital Projects Fund, the Conservation Trust Fund and the Neighborhood Parkland Fund. Projects are funded by various sources such as bond proceeds, grant funds, specific fees, and dedicated sales and use taxes. Operation and maintenance costs associated with each capital project are budgeted in the appropriate operating fund, and also are noted on each capital project sheet.
BUDGET BASIS
The basis or principle used for budgeting is the same as used for accounting. The different types of funds can be groupedintothreebroadcategoriesbasedontheresourcesemployedandtheoperationsrequired:governmen-tal funds, proprietary funds, and fiduciary funds. The basis of fund accounting and budgeting varies according to which category the fund resides.
Governmental Funds, which include the General Fund, Special Revenue and Debt Service Funds, and Capital Project Funds, use the modified accrual basis of budgeting. This means that revenues are recognized when they become measurable or available (cash basis), while expenditures are accounted for or recognized in the budget-ing period incurred (accrual basis).
Proprietary Funds, Enterprise Funds and Internal Service Funds, use the accrual basis of budgeting. Revenues are recognized when they are earned and expenses are recognized when incurred.
The City’s General Employees’ Retirement Fund is classified as a Special Revenue Fund for budgetary purposes. However, for accounting purposes the fund is classified as a fiduciary fund. Revenues and expenditures in this fund are budgeted by the accrual method of accounting.
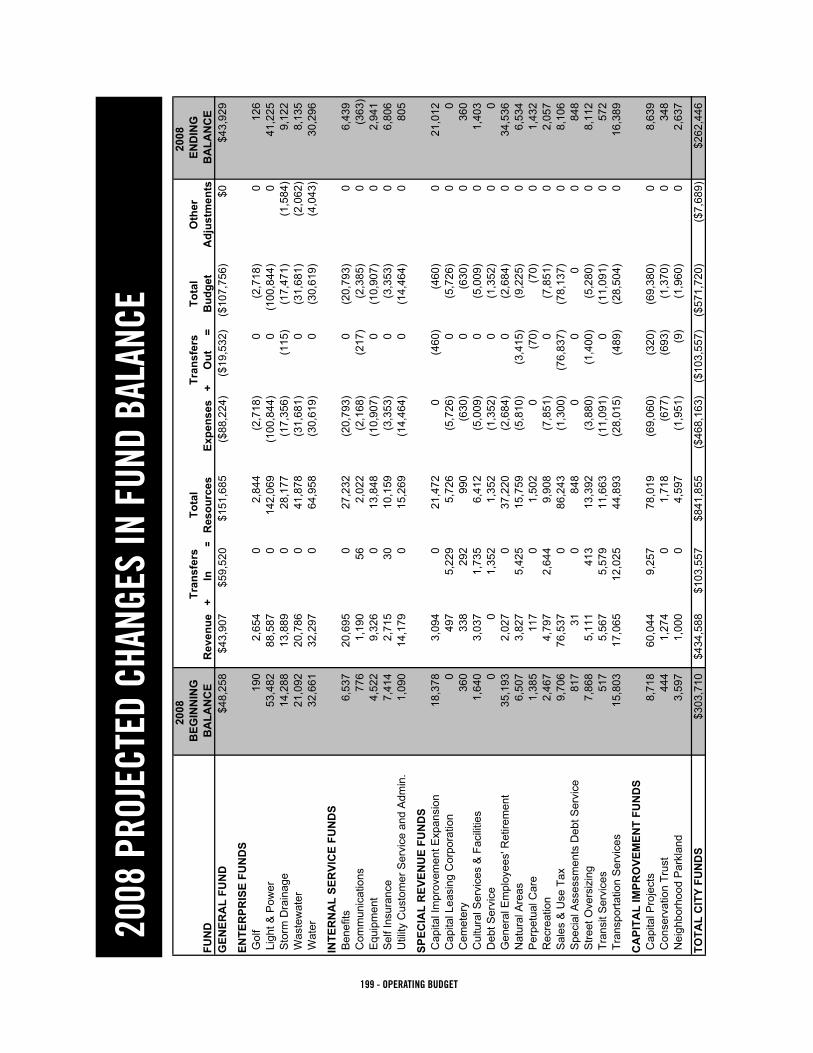
199 - OPERATING BUDGET
2008
PRO
JECT
ED C
HANG
ES IN
FUN
D BA
LANC
E20
0820
08B
EGIN
NIN
GTr
ansf
ers
Tota
lTr
ansf
ers
Tota
lO
ther
END
ING
FUN
DB
ALA
NC
ER
even
ue+
I
n
=
Res
ourc
esEx
pens
es+
O
ut
=B
udge
tA
djus
tmen
tsB
ALA
NC
EG
ENER
AL
FUN
D$4
8,25
8$4
3,90
7$5
9,52
0$1
51,6
85($
88,2
24)
($19
,532
)($
107,
756)
$0$4
3,92
9
ENTE
RPR
ISE
FUN
DS
Gol
f19
02,
654
02,
844
(2,7
18)
0(2
,718
)0
126
Lig
ht &
Pow
er
53,4
8288
,587
014
2,06
9(1
00,8
44)
0(1
00,8
44)
041
,225
Sto
rm D
rain
age
14,2
8813
,889
028
,177
(17,
356)
(115
)(1
7,47
1)(1
,584
)9,
122
Was
tew
ater
21,0
9220
,786
041
,878
(31,
681)
0(3
1,68
1)(2
,062
)8,
135
Wat
er32
,661
32,2
970
64,9
58(3
0,61
9)0
(30,
619)
(4,0
43)
30,2
96
INTE
RN
AL
SER
VIC
E FU
ND
S B
enef
its6,
537
20,6
950
27,2
32(2
0,79
3)0
(20,
793)
06,
439
Com
mun
icat
ions
776
1,19
056
2,02
2(2
,168
)(2
17)
(2,3
85)
0(3
63)
Equ
ipm
ent
4,52
29,
326
013
,848
(10,
907)
0(1
0,90
7)0
2,94
1 S
elf I
nsur
ance
7,41
42,
715
3010
,159
(3,3
53)
0(3
,353
)0
6,80
6 U
tility
Cus
tom
er S
ervi
ce a
nd A
dmin
.1,
090
14,1
790
15,2
69(1
4,46
4)0
(14,
464)
080
5
SPEC
IAL
REV
ENU
E FU
ND
S C
apita
l Im
prov
emen
t Exp
ansi
on18
,378
3,09
40
21,4
720
(460
)(4
60)
021
,012
Cap
ital L
easi
ng C
orpo
ratio
n0
497
5,22
95,
726
(5,7
26)
0(5
,726
)0
0 C
emet
ery
360
338
292
990
(630
)0
(630
)0
360
Cul
tura
l Ser
vice
s &
Fac
ilitie
s1,
640
3,03
71,
735
6,41
2(5
,009
)0
(5,0
09)
01,
403
Deb
t Ser
vice
00
1,35
21,
352
(1,3
52)
0(1
,352
)0
0 G
ener
al E
mpl
oyee
s' R
etire
men
t35
,193
2,02
70
37,2
20(2
,684
)0
(2,6
84)
034
,536
Nat
ural
Are
as6,
507
3,82
75,
425
15,7
59(5
,810
)(3
,415
)(9
,225
)0
6,53
4 P
erpe
tual
Car
e1,
385
117
01,
502
0(7
0)(7
0)0
1,43
2 R
ecre
atio
n2,
467
4,79
72,
644
9,90
8(7
,851
)0
(7,8
51)
02,
057
Sal
es &
Use
Tax
9,70
676
,537
086
,243
(1,3
00)
(76,
837)
(78,
137)
08,
106
Spe
cial
Ass
essm
ents
Deb
t Ser
vice
817
310
848
00
00
848
Stre
et O
vers
izin
g7,
868
5,11
141
313
,392
(3,8
80)
(1,4
00)
(5,2
80)
08,
112
Tra
nsit
Ser
vice
s51
75,
567
5,57
911
,663
(11,
091)
0(1
1,09
1)0
572
Tra
nspo
rtatio
n S
ervi
ces
15,8
0317
,065
12,0
2544
,893
(28,
015)
(489
)(2
8,50
4)0
16,3
89
CA
PITA
L IM
PRO
VEM
ENT
FUN
DS
Cap
ital P
roje
cts
8,71
860
,044
9,25
778
,019
(69,
060)
(320
)(6
9,38
0)0
8,63
9 C
onse
rvat
ion
Trus
t44
41,
274
01,
718
(677
)(6
93)
(1,3
70)
034
8 N
eigh
borh
ood
Par
klan
d3,
597
1,00
00
4,59
7(1
,951
)(9
)(1
,960
)0
2,63
7
TOTA
L C
ITY
FUN
DS
$303
,710
$434
,588
$103
,557
$841
,855
($46
8,16
3)($
103,
557)
($57
1,72
0)($
7,68
9)$2
62,4
46
2008 Projected Changes in Fund Balance(in Thousands of Dollars)

200 - OPERATING BUDGET
2009
PRO
JECT
ED C
HANG
ES IN
FUN
D BA
LANC
E20
0920
09B
EGIN
NIN
GTr
ansf
ers
Tota
lTr
ansf
ers
Tota
lO
ther
END
ING
FUN
DB
ALA
NC
ER
even
ue+
I
n
=
Res
ourc
esEx
pens
es+
O
ut
=B
udge
tA
djus
tmen
tsB
ALA
NC
EG
ENER
AL
FUN
D$4
0,23
3$4
2,61
4$6
1,58
9$1
44,4
36($
85,7
78)
($21
,982
)($
107,
760)
$0$3
6,67
6
ENTE
RPR
ISE
FUN
DS
Gol
f16
12,
720
02,
881
(2,7
88)
0(2
,788
)0
93 L
ight
& P
ower
43
,076
91,8
750
134,
951
(95,
419)
0(9
5,41
9)0
39,5
32 S
torm
Dra
inag
e13
,347
14,0
680
27,4
15(1
6,45
4)(1
15)
(16,
569)
(1,5
56)
9,29
0 W
aste
wat
er5,
496
52,6
530
58,1
49(5
0,45
7)0
(50,
457)
(2,0
09)
5,68
3 W
ater
60,6
6932
,974
093
,643
(39,
884)
0(3
9,88
4)(3
,984
)49
,775
INTE
RN
AL
SER
VIC
E FU
ND
S B
enef
its6,
439
23,1
570
29,5
96(2
3,25
7)0
(23,
257)
06,
339
Com
mun
icat
ions
764
3,65
43,
182
7,60
0(7
,377
)0
(7,3
77)
022
3 E
quip
men
t2,
812
9,72
60
12,5
38(1
1,00
4)0
(11,
004)
01,
534
Sel
f Ins
uran
ce6,
921
2,73
730
9,68
8(3
,375
)0
(3,3
75)
06,
313
Util
ity C
usto
mer
Ser
vice
and
Adm
in.
400
14,0
860
14,4
86(1
4,46
1)0
(14,
461)
025
SPEC
IAL
REV
ENU
E FU
ND
S C
apita
l Im
prov
emen
t Exp
ansi
on21
,012
3,02
80
24,0
400
(461
)(4
61)
023
,579
Cap
ital L
easi
ng C
orpo
ratio
n0
499
5,21
85,
717
(5,7
17)
0(5
,717
)0
0 C
emet
ery
400
339
313
1,05
2(6
51)
0(6
51)
040
1 C
ultu
ral S
ervi
ces
& F
acili
ties
1,26
03,
171
1,92
66,
357
(5,1
13)
0(5
,113
)0
1,24
4 D
ebt S
ervi
ce0
01,
352
1,35
2(1
,352
)0
(1,3
52)
00
Gen
eral
Em
ploy
ees'
Ret
irem
ent
40,6
682,
002
042
,670
(2,7
65)
0(2
,765
)0
39,9
05 N
atur
al A
reas
2,05
23,
932
5,53
311
,517
(8,0
32)
(1,3
96)
(9,4
28)
02,
089
Per
petu
al C
are
1,45
411
70
1,57
10
(70)
(70)
01,
501
Rec
reat
ion
1,85
74,
885
2,76
49,
506
(8,1
11)
0(8
,111
)0
1,39
5 S
ales
& U
se T
ax9,
245
78,2
850
87,5
30(1
,300
)(7
7,28
4)(7
8,58
4)0
8,94
6 S
peci
al A
sses
smen
ts D
ebt S
ervi
ce84
80
084
80
(830
)(8
30)
018
Stre
et O
vers
izin
g6,
252
4,80
841
311
,473
(5,3
10)
0(5
,310
)0
6,16
3 T
rans
it S
ervi
ces
330
4,67
55,
976
10,9
81(1
0,87
5)0
(10,
875)
010
6 T
rans
porta
tion
Ser
vice
s12
,246
16,6
6810
,474
39,3
88(2
7,92
0)(4
85)
(28,
405)
010
,983
CA
PITA
L IM
PRO
VEM
ENT
FUN
DS
Cap
ital P
roje
cts
10,5
5482
95,
303
16,6
86(6
,801
)(7
10)
(7,5
11)
09,
175
Con
serv
atio
n Tr
ust
757
1,32
00
2,07
7(6
86)
(731
)(1
,417
)0
660
Nei
ghbo
rhoo
d P
arkl
and
2,46
01,
000
03,
460
(1,4
69)
(9)
(1,4
78)
01,
982
TOTA
L C
ITY
FUN
DS
$291
,713
$415
,822
$104
,073
$811
,608
($43
6,35
6)($
104,
073)
($54
0,42
9)($
7,54
9)$2
63,6
30
2009 Projected Changes in Fund Balance (in Thousands of Dollars)

201 - OPERATING BUDGET
GENERAL FUND GENERAL FUND
The General Fund is the largest and most diverse of the City’s operating funds. It includes all resources not restricted legally to a specific use. The major source of revenue to the General Fund is sales and use tax. Local property and the lodging tax are also included in the General Fund as well as revenue derived from fees for services and materials, licenses, permits, and fines.
2008 BUDGET 2009 BUDGET
$107,755,574 $107,760,121
0
20
40
60
80
100
120
Do
llars
in M
illio
ns
2002 2003 2004 2005 2006 2007 2008 2009
Year
General Fund Expenses
Early in 2008, the Management Information Services budget and revenue was transferred from the General Fund to the Data & Communications Fund.

202 - OPERATING BUDGET
GENERAL FUND COMPARATIVE BUDGET STATEMENT
ACTUAL BUDGET ESTIMATED ADOPTED REVISED ADOPTED2006 2007 2007 2008 2008 2009
RevenuesTaxes 16,744,700 16,563,358 17,086,609 17,831,275 17,831,275 18,065,596Licenses & Permits 1,509,712 1,317,321 1,536,626 1,417,000 1,417,000 1,417,000Intergovernmental 948,243 732,095 1,422,259 817,672 850,822 864,825Charges for Services (see footnote) 14,603,546 14,607,030 19,733,858 18,373,196 15,986,908 * 16,594,854Fines & Forfeitures 2,266,293 2,359,926 2,824,814 2,425,352 2,425,352 2,803,461Earnings on Investments 1,947,440 1,200,000 2,267,186 2,043,865 2,043,865 1,936,294Net Increase in fair value of investments 56,780 0 390,284 0 0 0Net Security Lending Income 67,739 0 38,263 70,000 70,000 70,000Miscellaneous Revenue 3,371,892 659,891 3,375,392 849,868 869,868 861,530
Total Revenues $41,516,345 $37,439,621 $48,675,291 $43,828,228 $41,495,090 $42,613,560
Other Financing SourcesLease Purchase Proceeds $396,976 $0 $597,873 $0 $765,347 $0Transfers In 59,192,230 56,885,910 59,777,500 59,598,453 59,381,161 61,589,166
Total Other Financing Sources $59,589,206 $56,885,910 $60,375,373 $59,598,453 $60,146,508 $61,589,166
Total Revenues & Other Financing Sources $101,105,551 $94,325,531 $109,050,664 $103,426,681 $101,641,598 $104,202,726
ExpendituresCity Clerk $655,782 $773,620 $600,355 $650,244 $709,104 $859,289Cultural, Parks, Recreation & Environment 11,601,811 9,223,651 12,455,292 9,190,222 9,440,698 9,213,826Executive, Legislative & Judicial 3,626,563 3,637,817 3,979,978 4,243,214 4,043,436 4,447,668Financial 2,872,878 3,340,515 3,461,368 3,953,729 4,049,115 4,143,529Internal (see footnote) 10,656,156 12,077,202 11,480,501 16,428,304 12,287,806 * 11,292,044Planning, Development & Transportation 4,809,960 5,148,200 5,455,270 6,083,331 7,055,481 6,220,639Police 27,339,144 28,121,472 28,718,585 30,026,077 28,751,569 31,108,111Non-Departmental 3,505,291 3,128,722 1,807,564 1,265,228 2,082,182 1,269,098Contributions to Poudre Fire Authority 15,160,769 15,505,344 15,505,340 16,383,100 16,383,100 17,223,796
Total Expenditures $80,228,355 $80,956,543 $83,464,253 88,223,449 84,802,491 85,778,000
Other Financing UsesTransfers Out $15,269,412 $16,440,379 $20,332,874 19,532,125 24,863,821 * 21,982,121
Total Other Financing Sources (Uses) $15,269,412 $16,440,379 $20,332,874 19,532,125 24,863,821 21,982,121
Total Expenditures and OtherFinancing Uses $95,497,767 $97,396,922 $103,797,127 107,755,574 109,666,312 107,760,121
Net Change in Fund Balance $5,607,784 ($3,071,391) $5,253,537 (4,328,893) (8,024,714) (3,557,395)
Beginning Fund Balance $37,396,800 $22,725,484 $43,004,584 $48,258,121 $48,258,121 $40,233,407
Ending Fund Balance $43,004,584 $19,654,093 $48,258,121 $43,929,228 $40,233,407 $36,676,012The Prior Years have been changed to reflect the current organizational structure.* In early 2008, the Management Information Services budget and revenue was transferred from the General Fund to the Data &
Communications Fund. This change is reflected in Revised 2008 and Adopted 2009 under the Interal expenditure, Charges for Services, and Transfers Out categories.
General FundComparative Budget Statement
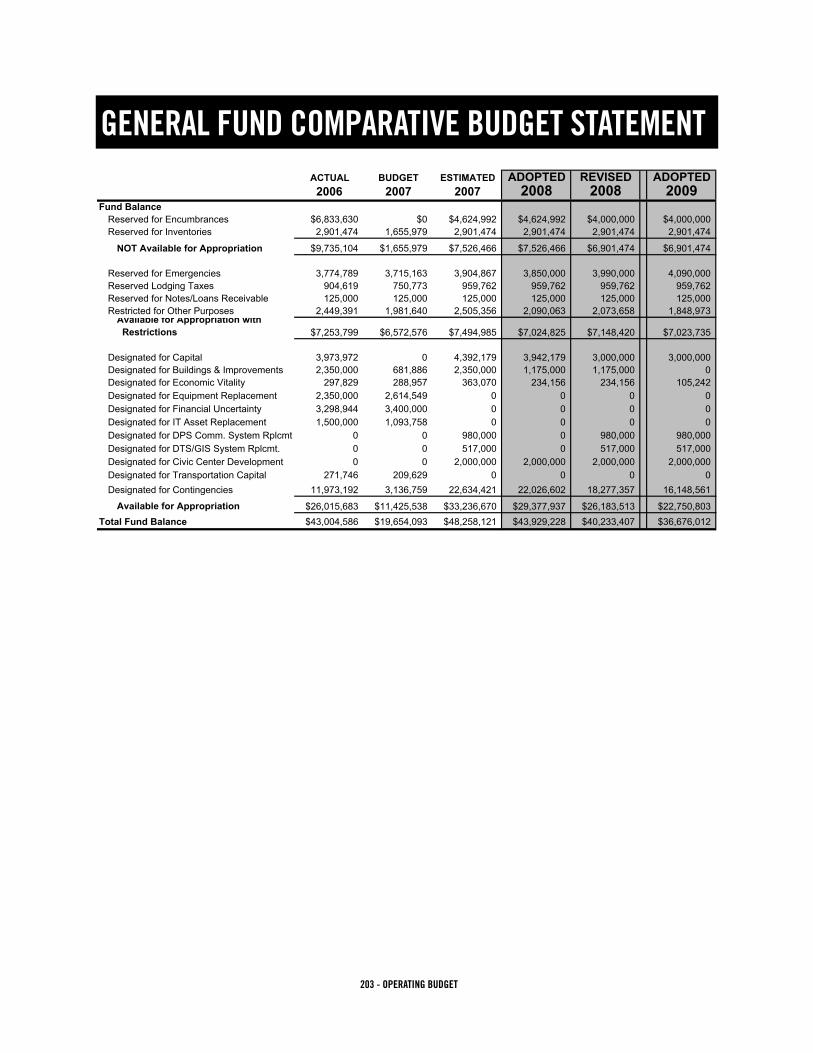
203 - OPERATING BUDGET
GENERAL FUND COMPARATIVE BUDGET STATEMENT
ACTUAL BUDGET ESTIMATED ADOPTED REVISED ADOPTED2006 2007 2007 2008 2008 2009
Fund BalanceReserved for Encumbrances $6,833,630 $0 $4,624,992 $4,624,992 $4,000,000 $4,000,000Reserved for Inventories 2,901,474 1,655,979 2,901,474 2,901,474 2,901,474 2,901,474
NOT Available for Appropriation $9,735,104 $1,655,979 $7,526,466 $7,526,466 $6,901,474 $6,901,474
Reserved for Emergencies 3,774,789 3,715,163 3,904,867 3,850,000 3,990,000 4,090,000Reserved Lodging Taxes 904,619 750,773 959,762 959,762 959,762 959,762Reserved for Notes/Loans Receivable 125,000 125,000 125,000 125,000 125,000 125,000Restricted for Other Purposes 2,449,391 1,981,640 2,505,356 2,090,063 2,073,658 1,848,973
Available for Appropriation with Restrictions $7,253,799 $6,572,576 $7,494,985 $7,024,825 $7,148,420 $7,023,735
Designated for Capital 3,973,972 0 4,392,179 3,942,179 3,000,000 3,000,000Designated for Buildings & Improvements 2,350,000 681,886 2,350,000 1,175,000 1,175,000 0Designated for Economic Vitality 297,829 288,957 363,070 234,156 234,156 105,242Designated for Equipment Replacement 2,350,000 2,614,549 0 0 0 0Designated for Financial Uncertainty 3,298,944 3,400,000 0 0 0 0Designated for IT Asset Replacement 1,500,000 1,093,758 0 0 0 0Designated for DPS Comm. System Rplcmt. 0 0 980,000 0 980,000 980,000Designated for DTS/GIS System Rplcmt. 0 0 517,000 0 517,000 517,000Designated for Civic Center Development 0 0 2,000,000 2,000,000 2,000,000 2,000,000Designated for Transportation Capital 271,746 209,629 0 0 0 0Designated for Contingencies 11,973,192 3,136,759 22,634,421 22,026,602 18,277,357 16,148,561
Available for Appropriation $26,015,683 $11,425,538 $33,236,670 $29,377,937 $26,183,513 $22,750,803Total Fund Balance $43,004,586 $19,654,093 $48,258,121 $43,929,228 $40,233,407 $36,676,012
General FundReserves

204 - OPERATING BUDGET
Where the money comes from, 2008 and 2009 detail…
General Fund Revenue 2008 - $103,426,681 2009 - $104,202,726
Other 4%
Fees & Charges21%
Intergovernmental1%
Taxes74%
Tax Revenue Detail 2008 - $76,099,615 2009 - $77,752,816
Property Tax20%
Other Taxes3%
Sales & Use Taxes77%
WHERE THE MONEY COMES FROM
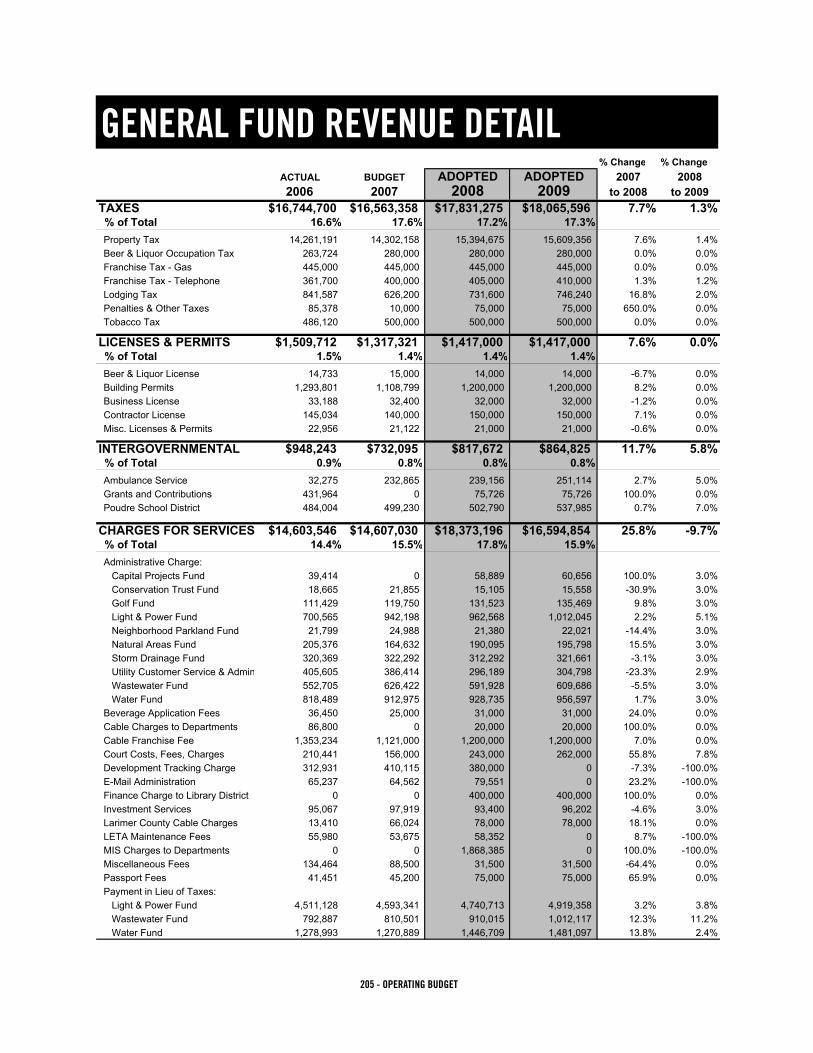
205 - OPERATING BUDGET
GENERAL FUND REVENUE DETAIL
% Change % ChangeACTUAL BUDGET ADOPTED ADOPTED 2007 20082006 2007 2008 2009 to 2008 to 2009
TAXES $16,744,700 $16,563,358 $17,831,275 $18,065,596 7.7% 1.3% % of Total 16.6% 17.6% 17.2% 17.3% Property Tax 14,261,191 14,302,158 15,394,675 15,609,356 7.6% 1.4% Beer & Liquor Occupation Tax 263,724 280,000 280,000 280,000 0.0% 0.0% Franchise Tax - Gas 445,000 445,000 445,000 445,000 0.0% 0.0% Franchise Tax - Telephone 361,700 400,000 405,000 410,000 1.3% 1.2% Lodging Tax 841,587 626,200 731,600 746,240 16.8% 2.0% Penalties & Other Taxes 85,378 10,000 75,000 75,000 650.0% 0.0% Tobacco Tax 486,120 500,000 500,000 500,000 0.0% 0.0%
LICENSES & PERMITS $1,509,712 $1,317,321 $1,417,000 $1,417,000 7.6% 0.0% % of Total 1.5% 1.4% 1.4% 1.4% Beer & Liquor License 14,733 15,000 14,000 14,000 -6.7% 0.0% Building Permits 1,293,801 1,108,799 1,200,000 1,200,000 8.2% 0.0% Business License 33,188 32,400 32,000 32,000 -1.2% 0.0% Contractor License 145,034 140,000 150,000 150,000 7.1% 0.0% Misc. Licenses & Permits 22,956 21,122 21,000 21,000 -0.6% 0.0%
INTERGOVERNMENTAL $948,243 $732,095 $817,672 $864,825 11.7% 5.8% % of Total 0.9% 0.8% 0.8% 0.8% Ambulance Service 32,275 232,865 239,156 251,114 2.7% 5.0% Grants and Contributions 431,964 0 75,726 75,726 100.0% 0.0% Poudre School District 484,004 499,230 502,790 537,985 0.7% 7.0%
CHARGES FOR SERVICES $14,603,546 $14,607,030 $18,373,196 $16,594,854 25.8% -9.7% % of Total 14.4% 15.5% 17.8% 15.9% Administrative Charge: Capital Projects Fund 39,414 0 58,889 60,656 100.0% 3.0% Conservation Trust Fund 18,665 21,855 15,105 15,558 -30.9% 3.0% Golf Fund 111,429 119,750 131,523 135,469 9.8% 3.0% Light & Power Fund 700,565 942,198 962,568 1,012,045 2.2% 5.1% Neighborhood Parkland Fund 21,799 24,988 21,380 22,021 -14.4% 3.0% Natural Areas Fund 205,376 164,632 190,095 195,798 15.5% 3.0% Storm Drainage Fund 320,369 322,292 312,292 321,661 -3.1% 3.0% Utility Customer Service & Admin 405,605 386,414 296,189 304,798 -23.3% 2.9% Wastewater Fund 552,705 626,422 591,928 609,686 -5.5% 3.0% Water Fund 818,489 912,975 928,735 956,597 1.7% 3.0% Beverage Application Fees 36,450 25,000 31,000 31,000 24.0% 0.0% Cable Charges to Departments 86,800 0 20,000 20,000 100.0% 0.0% Cable Franchise Fee 1,353,234 1,121,000 1,200,000 1,200,000 7.0% 0.0% Court Costs, Fees, Charges 210,441 156,000 243,000 262,000 55.8% 7.8% Development Tracking Charge 312,931 410,115 380,000 0 -7.3% -100.0% E-Mail Administration 65,237 64,562 79,551 0 23.2% -100.0% Finance Charge to Library District 0 0 400,000 400,000 100.0% 0.0% Investment Services 95,067 97,919 93,400 96,202 -4.6% 3.0% Larimer County Cable Charges 13,410 66,024 78,000 78,000 18.1% 0.0% LETA Maintenance Fees 55,980 53,675 58,352 0 8.7% -100.0% MIS Charges to Departments 0 0 1,868,385 0 100.0% -100.0% Miscellaneous Fees 134,464 88,500 31,500 31,500 -64.4% 0.0% Passport Fees 41,451 45,200 75,000 75,000 65.9% 0.0% Payment in Lieu of Taxes: Light & Power Fund 4,511,128 4,593,341 4,740,713 4,919,358 3.2% 3.8% Wastewater Fund 792,887 810,501 910,015 1,012,117 12.3% 11.2% Water Fund 1,278,993 1,270,889 1,446,709 1,481,097 13.8% 2.4%
General Fund Resource Detail

206 - OPERATING BUDGET
GENERAL FUND REVENUE DETAIL
% Change % ChangeACTUAL BUDGET ADOPTED ADOPTED 2007 20082006 2007 2008 2009 to 2008 to 2009
CHARGES FOR SERVICES (continued)
PEG Fee 164,000 111,000 150,000 150,000 35.1% 0.0% Plan Checking Fees 462,033 400,000 450,000 450,000 12.5% 0.0% PUD Subdivision & Zoning Fees 180,265 200,000 300,000 300,000 50.0% 0.0% Work for Other Funds 1,614,359 1,571,778 2,308,867 2,454,291 46.9% 6.3%
FINES & FORFEITURES $2,266,293 $2,359,926 $2,425,352 $2,803,461 2.8% 15.6% % of Total 2.2% 2.5% 2.3% 2.7% Camera Radar/Red Light Fines 369,418 908,485 568,056 766,876 -37.5% 35.0% Court Fines 1,144,198 1,119,000 1,413,000 1,550,000 26.3% 9.7% Municipal Court Bonds 108,988 90,000 168,000 202,000 86.7% 20.2% Other Fines 148,495 0 0 0 0.0% 0.0% Police Seizure 254,112 0 0 0 0.0% 0.0% Traffic Surcharge 241,082 242,441 276,296 284,585 14.0% 3.0%
EARNINGS ONINVESTMENTS $1,947,440 $1,200,000 $2,043,865 $1,936,294 70.3% -5.3%
% of Total 1.9% 1.3% 2.0% 1.9%
NET INCREASE IN FAIR VALUEOF INVESTMENTS $56,780 $0 $0 $0 0.0% 0.0%
% of Total 0.1% 0.0% 0.0% 0.0%
NET SECURITY LENDINGINCOME $67,739 $0 $70,000 $70,000 100.0% 0.0%
% of Total 0.1% 0.0% 0.1% 0.1%
MISCELLANEOUS $3,371,892 $659,891 $849,868 $861,530 28.8% 1.4% % of Total 3.3% 0.7% 0.8% 0.8% Donations 230,493 35,000 69,000 71,000 97.1% 2.9% Fiber Optic Loop 200,773 247,949 255,387 263,049 3.0% 3.0% Miscellaneous Revenue 474,007 157,942 301,981 302,981 91.2% 0.3% Parks Miscellaneous 85,300 189,000 223,500 224,500 18.3% 0.4% Police Miscellaneous 272,052 0 0 0 0.0% 0.0% Sale of Building 435,000 0 0 0 0.0% 0.0% Sale of Land 1,653,400 0 0 0 0.0% 0.0% ZILCH Loans Repaid 20,867 30,000 0 0 -100.0% 0.0%
LEASE PURCHASE $396,976 $0 $0 $0 0.0% 0.0% PROCEEDS % of Total 0.4% 0.0% 0.0% 0.0%TRANSFERS IN: $59,192,230 $56,885,910 $59,598,453 $61,589,166 4.8% 3.3% % of Total 58.5% 60.3% 57.6% 59.1% BOB Capital Funds 0 0 219,000 219,000 100.0% 0.0% Communications Fund 170,000 0 217,292 0 100.0% -100.0% Conservation Trust Fund 379,195 646,685 687,496 725,146 6.3% 5.5% Other Funds 224,886 154,754 206,325 127,800 33.3% -38.1% Sales & Use Tax Fund 58,418,149 56,084,471 58,268,340 59,687,220 3.9% 2.4% Surplus & Deficiency Fund 0 0 0 830,000 0.0% 100.0%
TOTAL REVENUES AND OTHERFUNDING SOURCES $101,105,551 $94,325,531 $103,426,681 $104,202,726 9.6% 0.8%
In early 2008, the Management Information Services budget and revenue was transferred from the General Fund to the Data & Communications Fund. This change is reflected in Adopted 2009 under the Charges for Services category.
General Fund Resource Detail (cont.)

207 - OPERATING BUDGET
GENERAL FUND EXPENSE DETAIL
General Fund Expenses Detail
% Change % ChangeSERVICE AREA ACTUAL BUDGET ADOPTED ADOPTED 2007 2008 Department 2006 2007 2008 2009 to 2008 to 2009
CITY CLERK $655,782 $773,620 $650,244 $859,289 -15.9% 32.1% % of Total 0.7% 0.8% 0.6% 0.8%
City Clerk 655,782 773,620 650,244 859,289 -15.9% 32.1%
CULTURE, PARKS, RECREATION & ENVIRONMENT $11,601,811 $9,223,651 $9,190,222 $9,213,826 -0.4% 0.3% % of Total 12.1% 9.5% 8.5% 8.6%
Administration 341,264 254,182 262,178 271,521 3.1% 3.6%Library 3,728,929 1,360,000 0 0 -100.0% 0.0%Natural Resources 614,319 637,820 998,103 873,350 56.5% -12.5%Parks Maintenance 6,917,299 6,971,649 7,929,941 8,068,955 13.7% 1.8%
EXECUTIVE, LEGISLATIVE & JUDICIAL $3,626,563 $3,637,817 $4,243,214 $4,447,668 16.6% 4.8% % of Total 3.8% 3.7% 3.9% 4.1%
City Attorney 971,413 1,099,100 1,145,101 1,229,451 4.2% 7.4%City Council 119,220 161,734 167,800 170,974 3.8% 1.9%City Manager 1,921,471 1,731,102 2,222,806 2,294,956 28.4% 3.2%Municipal Court 614,459 645,881 707,507 752,287 9.5% 6.3%
FINANCIAL SERVICES $2,872,878 $3,340,515 $3,953,729 $4,143,529 18.4% 4.8% % of Total 3.0% 3.4% 3.7% 3.8%
Economic Development 319,869 418,855 607,884 650,745 45.1% 7.1%Finance 2,553,009 2,921,660 3,345,845 3,492,784 14.5% 4.4%
INTERNAL SERVICES $10,656,156 $12,077,202 $16,428,304 $11,292,044 36.0% -31.3% % of Total 11.2% 12.4% 15.2% 10.5%
Administration 40,670 40,000 50,000 50,000 25.0% 0.0%Communications & Public Involv. 772,526 806,003 986,771 1,018,640 22.4% 3.2%Human Resources 920,869 1,032,139 1,326,192 1,418,598 28.5% 7.0%Management Information Services 3,423,244 3,819,769 5,616,963 0 47.0% -100.0%Operation Services 5,498,847 6,379,291 8,448,378 8,804,806 32.4% 4.2%
PLANNING, DEVELOPMENT &TRANSPORTATION $4,809,960 $5,148,200 $6,083,331 $6,220,639 18.2% 2.3%
% of Total 5.0% 5.3% 5.6% 5.8%City Planning & Community Dev. 1,641,492 1,877,519 2,213,720 2,311,661 17.9% 4.4%Development Planning & Zoning 905,752 1,030,575 1,152,237 1,074,539 11.8% -6.7%Neighborhood & Building 2,262,716 2,240,106 2,717,374 2,834,439 21.3% 4.3%
POLICE $27,339,144 $28,121,472 $30,026,077 $31,108,111 6.8% 3.6% % of Total 28.6% 28.9% 27.9% 28.9%
Office of the Chief 1,950,106 2,076,313 1,935,219 1,999,652 -6.8% 3.3%Information Services 6,018,669 6,256,256 6,774,214 7,063,780 8.3% 4.3%Investigations 5,695,311 5,564,591 5,711,683 5,955,833 2.6% 4.3%Patrol 13,675,058 14,224,312 15,604,961 16,088,846 9.7% 3.1%

208 - OPERATING BUDGET
GENERAL FUND EXPENSE DETAIL
General Fund Expenses Detail (cont.)
% Change % ChangeACTUAL BUDGET ADOPTED ADOPTED 2007 20082006 2007 2008 2009 to 2008 to 2009
NON-DEPARTMENTAL $3,505,291 $3,128,722 $1,265,228 $1,269,098 -59.6% 0.3% % of Total 3.7% 3.2% 1.2% 1.2%
Airport Maintenance 60,000 60,000 0 0 -100.0% 0.0%Banking Contract 42,038 0 0 0 0.0% 0.0%Budget One-time Savings 0 346,749 0 0 -100.0% 0.0%Camera Radar 0 85,321 0 0 -100.0% 0.0%City Dues 87,023 93,996 0 0 -100.0% 0.0%Community Opportunity Invest. 0 190,200 190,000 190,000 -0.1% 0.0%Contingencies 0 533,176 145,000 145,000 -72.8% 0.0%Copy Machines 36,481 77,031 0 0 -100.0% 0.0%Insurance 407,701 416,098 426,098 426,098 2.4% 0.0%Larimer County Admin. Fee 293,257 280,000 314,530 318,400 12.3% 1.2%Lease/Purchase Equipment 386,488 0 0 0 0.0% 0.0%Library Local History 0 160,000 0 0 0.0% 0.0%Purchase Land/Buildings 2,075,000 0 0 0 0.0% 0.0%Retirement Contribution 73,092 141,229 89,600 89,600 -36.6% 0.0%Southwest Annexantion 0 437,122 0 0 -100.0% 0.0%West Nile Virus 0 149,790 0 0 -100.0% 0.0%Other 44,212 158,010 100,000 100,000 -36.7% 0.0%
CONTRIBUTION TO POUDREPOUDRE FIRE AUTHORITY $15,160,769 $15,505,344 $16,383,100 $17,223,796 5.7% 5.1% % of Total 15.9% 15.9% 15.2% 16.0%
Contribution to Poudre Fire Authority 15,160,769 15,505,344 16,383,100 17,223,796 5.7% 5.1%
TRANSFERS TO: $15,269,412 $16,440,379 $19,532,125 $21,982,121 18.8% 12.5% % of Total 16.0% 16.9% 18.1% 20.4%
Capital Leasing Corporation Fund 2,698,407 2,701,623 2,700,028 2,701,837 -0.1% 0.1%Capital Projects Fund 795,941 420,000 1,400,000 400,000 233.3% -71.4%Cemetery Fund 191,261 180,426 221,454 243,088 22.7% 9.8%Communications Fund 0 0 56,021 3,182,358 100.0% 5580.7%Cultural Services Fund 1,291,087 1,335,838 1,602,445 1,658,704 20.0% 3.5%Equipment Fund 30,530 0 0 0 0.0% 0.0%Light and Power Fund 25,000 25,000 0 0 -100.0% 0.0%Natural Areas 0 18,500 0 0 -100.0% 0.0%Recreation Fund 2,526,672 2,405,205 2,644,334 2,763,690 9.9% 4.5%Self Insurance 0 0 29,750 29,750 100.0% 0.0%Street Oversizing Fund 413,050 413,050 413,050 413,050 0.0% 0.0%Transit Services Fund 4,048,248 4,603,759 5,418,062 5,809,113 17.7% 7.2%Transportation Services Fund 3,249,216 4,336,978 5,046,981 4,780,531 16.4% -5.3%
TOTAL GENERAL FUND EXPENSES $95,497,767 $97,396,922 $107,755,574 $107,760,121 10.6% 0.0%
In early 2008, the Management Information Services budget and revenue was transferred from the General Fund to the Data & Communications Fund. This change is reflected in Adopted 2009 under the Interal Services expenditure category.

209 - OPERATING BUDGET
ENTERPRISE FUNDS
GOLF FUND 2008-$2,717,381 2009-$2,787,942The Golf Fund provides maintenance, operations, and total management of City Park Nine, Collindale, and SouthRidge Golf Courses. This includes contractual management of the three golf professionals as well as the snack bar/restaurant concessionaires. The Golf Fund is within the Culture, Parks, Recreation, and Environment Services area (CPRE).
LIGHT & POWER FUND 2008-$100,843,897 2009-$95,419,447The Light & Power Utility is the City’s municipally owned public electric utility. Light and Power has several pro-grams designed to make effective and efficient use of available energy resources. The Utility strives to provide the lowest possible electric rates for its customers -- residents and businesses of Fort Collins. Included in the budgetamountsisLight&Powercapitalprojects;$10,555,525in2008and$1,374,093in2009(shownbyproject in the Capital Improvements section). The Light and Power Fund is in the Utility Services area.
STORM DRAINAGE FUND 2008-$17,470,885 2009-$16,568,654The Storm Drainage Utility is involved in the operation, maintenance, and construction of the City’s storm drain-age network and assesses the future needs of this network. Included in the budget amounts is Storm Drainage capitalprojects;$7,611,775in2008and$6,897,294in2009,(shownbyprojectintheCapitalImprovementssection). Storm Drainage is included in the Utility Services area.
WASTEWATER FUND 2008-$31,681,339 2009-$50,456,661The Wastewater Utility provides the City’s utility customers with all the services associated with the operation and maintenance of a wastewater treatment and pollution control system. The City’s wastewater system consists of two treatment plants, a pollution control laboratory, and a resource recovery farm for sludge disposal. Included intheBudgetamountsisWastewatercapitalprojects;$14,073,571in2008and$28,755,548in2009,(shownby project in the Capital Improvements section). The Wastewater Fund is part of the Utility Services area.
WATER FUND 2008-$30,618,968 2009-$39,883,596This Utility provides services relating to the processing and distribution of the City’s water supply, including man-agement, operation, and maintenance of water mains, valves, hydrants, and meters. The Water Utility processes water received from the Cache la Poudre River and Horsetooth Reservoir to meet federal and state drinking water standards.IncludedintheBudgetamountsisWatercapitalprojects;$4,186,006in2008and$12,644,065in2009 (shown by project in the Capital Improvements section). The Water Fund is part of the Utility Services area.

210 - OPERATING BUDGET
GOLF FUND
ACTUAL BUDGET ESTIMATED ADOPTED REVISED ADOPTED2006 2007 2007 2008 2008 2009
Revenue Charges for Service 2,540,572 2,589,300 2,577,205 2,633,000 2,633,000 2,697,000 Earnings on Investments 21,213 10,000 41,574 15,000 15,000 17,000 Miscellaneous Revenue 2,953 6,000 5,512 6,000 6,000 6,000 Net Increase (Decrease) in the fair value
of Investments (227) 0 0 0 0 0
Total Revenue 2,564,511 2,605,300 2,624,291 2,654,000 2,654,000 2,720,000
Expenditures Personal Services 1,038,985 1,187,652 1,114,661 1,176,288 1,176,286 1,223,352 Contractual Services 540,753 555,074 588,602 565,795 542,266 588,526 Commodities 201,569 155,025 256,297 197,900 207,230 205,670 Other 41,886 39,918 778 42,548 42,548 43,874 Depreciation and Amortization 308,663 297,143 243,208 300,137 300,137 304,909
Total Expenditures 2,131,857 2,234,812 2,203,546 2,282,668 2,268,467 2,366,331
Other Financing Uses Transfer to General Fund Administrative Charge 111,429 119,750 119,750 131,523 131,523 135,469 Interest Lease Purchase 15,417 4,930 19,345 19,530 19,530 13,539 Interest COPS (1999 / 2007) 97,312 96,040 88,834 90,720 63,883 85,120 Interest ALPS (2001) 115,204 110,198 110,198 104,978 104,978 99,508
Total Other Expense 339,362 330,918 338,127 346,751 319,914 333,636
Total Expenditures and OtherFinancing Uses 2,471,218 2,565,730 2,541,673 2,629,419 2,588,381 2,699,967
Change in Net Assets 93,292 39,570 82,618 24,581 65,619 20,033
Golf FundStatement of Revenues, Expenses, and Changes in Net Assets

211 - OPERATING BUDGET
GOLF FUND
ACTUAL BUDGET ESTIMATED ADOPTED REVISED ADOPTED2006 2007 2007 2008 2008 2009
Beginning Net Working Capital $99,974 $195,190 $195,190 $189,524 $234,416 $161,403
Additions Increase in Net Assets 93,292 39,570 82,618 24,581 65,619 20,033 Depreciation 304,619 292,515 240,045 295,137 295,137 299,909 Amortization 3,480 4,628 3,163 5,000 5,000 5,000 Proceeds from Lease/Purchase 187,973 0 324,740 0 0 0 Other Adjustments 7,438 0 0 0 0 0
Total Additions 596,802 336,713 650,566 324,718 365,756 324,942
Deductions Principal Reduction Lease Purchase 139,109 70,984 135,763 131,704 131,704 126,163 COP's Principal Reduction (1999/2007) 90,000 100,000 0 100,000 120,000 105,000 ALP's Principal Reduction (2001) 106,505 116,395 111,070 116,395 116,395 121,721 Reclass L-T Obligations to Current 9,001 0 0 0 0 0 Capital Purchases 0 55,000 25,140 40,000 70,670 40,000 Lease/Purchase Equipment 151,643 0 314,174 0 0 0 Other Adjustments 5,328 0 25,193 0 0 0 Total Deductions 501,586 342,379 611,340 388,099 438,769 392,884
Ending Working Capital $195,190 $189,524 $234,416 $126,143 $161,403 $93,461
Working Capital Reserves Capital $0 $0 $0 $0 $0 $0 Operations 195,190 189,524 234,416 126,143 161,403 93,461
Total Reserves $195,190 $189,524 $234,416 $126,143 $161,403 $93,461
Golf FundChanges in Working Capital

212 - OPERATING BUDGET
LIGHT & POWER FUND
ACTUAL BUDGET ESTIMATED ADOPTED REVISED ADOPTED2006 2007 2007 2008 2008 2009
Total Operating Revenue $80,234,143 $81,149,020 $81,912,180 $83,752,596 $83,752,596 $86,908,659
Operating Expenses Light & Power Operations 4,931,912 5,468,374 6,377,706 5,470,087 7,788,780 5,724,804 Purchase of Power 55,848,007 56,515,980 58,232,914 58,960,253 59,091,913 61,904,648 Payments & Transfers 5,593,887 6,415,276 5,982,470 6,123,294 6,123,294 6,331,658 Customer & Admin Services 4,184,830 4,219,105 4,324,672 5,766,113 5,766,113 5,648,796 Energy Services & Supply Policy 1,314,640 1,693,731 1,444,376 1,774,575 2,282,540 1,813,785 Depreciation 6,415,756 7,204,216 6,462,805 7,140,000 7,140,000 7,282,800
Total Operating Expenses 78,289,032 81,516,682 82,824,943 85,234,322 88,192,640 88,706,492 Operating Income 1,945,111 (367,662) (912,763) (1,481,726) (4,440,044) (1,797,833)
Other Nonoperating Revenues Investment Earnings 1,888,508 750,000 2,514,473 750,000 750,000 750,000 Net Change in Fair Value of Investments 212,267 0 577,603 0 0 0 Miscellaneous 1,340,655 1,229,272 1,391,917 1,268,642 1,268,642 1,306,458
Total Nonoperating Revenues 3,441,430 1,979,272 4,483,993 2,018,642 2,018,642 2,056,458
Income Before Other Financing Sources / Uses 5,386,541 1,611,610 3,571,230 536,916 (2,421,402) 258,625
Other Financing Sources / Uses Contribution in Aid of Construction 4,437,239 2,704,862 2,677,647 2,815,536 2,815,536 2,909,706 Transfer from General Fund 25,000 0 25,000 0 0 0
Total Other Financing Sources / Uses 4,462,239 2,704,862 2,702,647 2,815,536 2,815,536 2,909,706
Increase in Net Assets $9,848,780 $4,316,472 $6,273,877 $3,352,452 $394,134 $3,168,331
Light and Power FundStatement of Revenues, Expenses, and Changes in Net Assets

213 - OPERATING BUDGET
LIGHT & POWER FUND
ACTUAL BUDGET ESTIMATED ADOPTED REVISED ADOPTED2006 2007 2007 2008 2008 2009
Beginning Net Working Capital $48,053,503 $53,166,645 $56,342,364 $53,481,734 $59,438,123 $43,075,863
Additions Net Income 9,848,780 4,316,472 6,273,877 3,352,452 394,134 3,168,331 Depreciation 6,415,756 7,204,216 6,462,805 7,140,000 7,140,000 7,282,800 Disposal of Fixed Assets 747,137 0 0 0 0 0 Other Adjustments 0 0 162,120 0 0 0
Total Additions 17,011,673 11,520,688 12,898,802 10,492,452 7,534,134 10,451,131
Deductions Capital Projects 1,735,299 281,000 376,895 10,555,525 10,555,525 1,374,093 Prior Year Appropriations - Capital Projects 0 0 0 0 0 0 System Additions 6,378,185 10,924,599 9,426,148 12,194,050 13,340,869 12,621,662 Obtained Note Receiveable 595,586 0 0 0 0 0 Other Adjustments 13,742 0 0 0 0 0
Total Deductions 8,722,812 11,205,599 9,803,043 22,749,575 23,896,394 13,995,755
Ending Working Capital $56,342,364 $53,481,734 $59,438,123 $41,224,611 $43,075,863 $39,531,240
Working Capital Distributed to Reserve Funds:
Encumbrance Reserve 11,457,818 9,212,532 0 0 0 Purchase Power Reserve 29,711,557 38,790,481 31,633,714 23,146,453 24,997,705 21,402,538 Revenue Reserve 1,423,719 1,468,916 1,530,726 1,561,523 1,561,523 1,612,067 Art in Public Places Reserve 526,933 0 544,517 0 0 0 Capital Reserve & Encumbrances 13,222,337 13,222,337 16,516,635 16,516,635 16,516,635 16,516,635
Total Reserves $56,342,364 $53,481,734 $59,438,123 $41,224,611 $43,075,863 $39,531,240
Light and Power FundChanges in Working Capital

214 - OPERATING BUDGET
STORM DRAINAGE FUND
ACTUAL BUDGET ESTIMATED ADOPTED REVISED ADOPTED2006 2007 2007 2008 2008 2009
Operating Revenue $13,073,526 $13,165,932 $13,173,911 $13,328,099 $13,328,099 $13,500,401
Operating Expenses Customer & Administrative Services 1,246,408 1,426,721 1,311,235 1,885,766 1,885,766 1,919,509 Drainage & Detention 1,893,075 2,314,022 2,129,723 2,478,524 2,611,933 2,583,400 Water Quality 230,042 302,359 187,593 0 0 0 Payments and Transfers 409,284 512,344 397,308 402,333 418,274 412,577 Less Personal Services to Capital Projects 0 (206,938) 0 (323,955) (323,955) (336,912) Depreciation 1,613,837 2,382,575 2,205,569 1,882,235 1,882,235 2,017,022
Operating Expenses 5,392,646 6,731,083 6,231,428 6,324,903 6,474,253 6,595,596 Operating Income 7,680,880 6,434,849 6,942,483 7,003,196 6,853,846 6,904,805 Other Non-Operating Revenue (Expenses) Non-operating Revenue 139,938 12,175 (37,634) 12,540 12,540 12,917 Intergovernmental Revenue 839,308 0 1,235,602 0 0 0 Earnings on Investments 823,768 300,000 901,055 150,000 150,000 150,000 Net Change in Fair Value of Investments 54,995 0 226,428 0 0 0 Interest Expense - Bond (2,044,371) (1,974,968) (1,642,746) (1,878,840) (1,878,840) (1,771,490) Other Expense - Bond Amortization (52,103) (52,103) (32,066) (52,103) (52,103) (37,187) Total Non-Operating Revenue (Expenses) (238,465) (1,714,896) 650,639 (1,768,403) (1,768,403) (1,645,760)
Income Before Other Revenues (Expenses) 7,442,415 4,719,953 7,593,122 5,234,793 5,085,443 5,259,045
Other Revenues (Transfers) Contributed Capital 464,531 392,430 686,674 398,542 398,542 404,803 Transfers to Other Funds (112,000) (115,940) (115,940) (124,997) (115,000) (125,197) Transfers From Other Funds 0 0 0 0 0 0 Total Other Revenues (Transfers) 352,531 276,490 570,734 273,545 283,542 279,606
Increase in Net Assets $7,794,946 $4,996,443 $8,163,856 $5,508,338 $5,368,985 $5,538,651
Storm Drainage FundStatement of Revenues, Expenses, and Changes in Net Assets
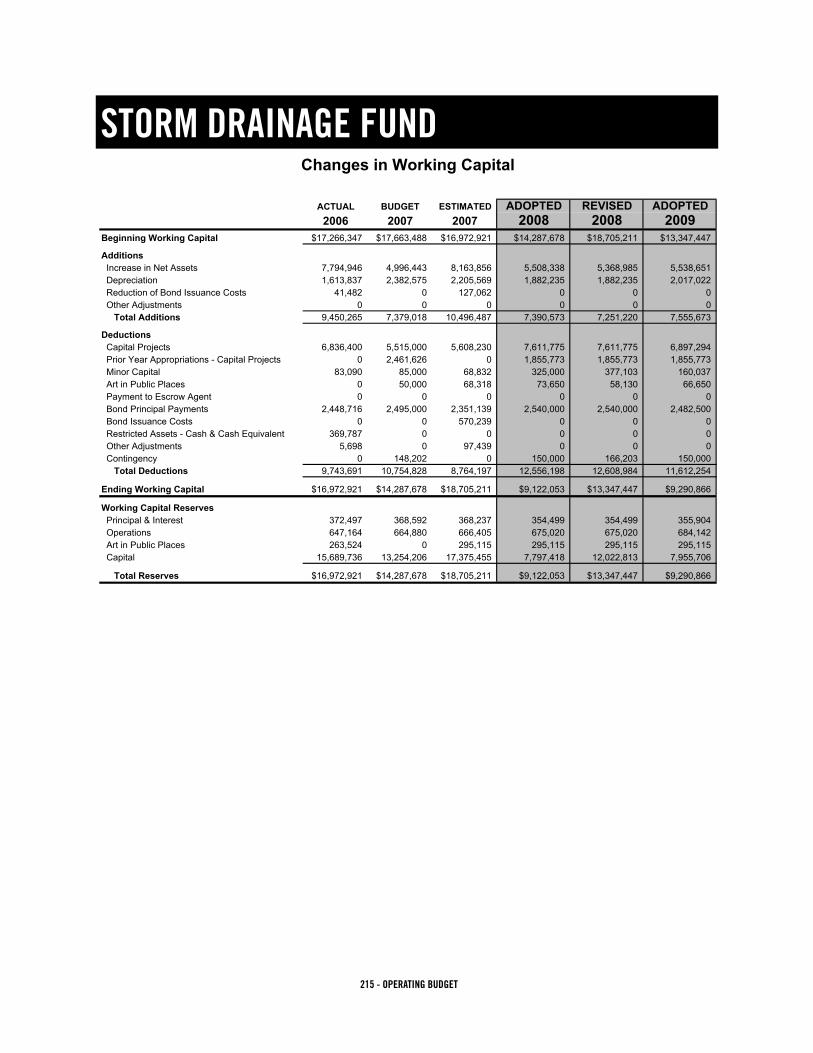
215 - OPERATING BUDGET
STORM DRAINAGE FUND
ACTUAL BUDGET ESTIMATED ADOPTED REVISED ADOPTED2006 2007 2007 2008 2008 2009
Beginning Working Capital $17,266,347 $17,663,488 $16,972,921 $14,287,678 $18,705,211 $13,347,447
Additions Increase in Net Assets 7,794,946 4,996,443 8,163,856 5,508,338 5,368,985 5,538,651 Depreciation 1,613,837 2,382,575 2,205,569 1,882,235 1,882,235 2,017,022 Reduction of Bond Issuance Costs 41,482 0 127,062 0 0 0 Other Adjustments 0 0 0 0 0 0 Total Additions 9,450,265 7,379,018 10,496,487 7,390,573 7,251,220 7,555,673
Deductions Capital Projects 6,836,400 5,515,000 5,608,230 7,611,775 7,611,775 6,897,294 Prior Year Appropriations - Capital Projects 0 2,461,626 0 1,855,773 1,855,773 1,855,773 Minor Capital 83,090 85,000 68,832 325,000 377,103 160,037 Art in Public Places 0 50,000 68,318 73,650 58,130 66,650 Payment to Escrow Agent 0 0 0 0 0 0 Bond Principal Payments 2,448,716 2,495,000 2,351,139 2,540,000 2,540,000 2,482,500 Bond Issuance Costs 0 0 570,239 0 0 0 Restricted Assets - Cash & Cash Equivalent 369,787 0 0 0 0 0 Other Adjustments 5,698 0 97,439 0 0 0 Contingency 0 148,202 0 150,000 166,203 150,000 Total Deductions 9,743,691 10,754,828 8,764,197 12,556,198 12,608,984 11,612,254
Ending Working Capital $16,972,921 $14,287,678 $18,705,211 $9,122,053 $13,347,447 $9,290,866
Working Capital Reserves Principal & Interest 372,497 368,592 368,237 354,499 354,499 355,904 Operations 647,164 664,880 666,405 675,020 675,020 684,142 Art in Public Places 263,524 0 295,115 295,115 295,115 295,115 Capital 15,689,736 13,254,206 17,375,455 7,797,418 12,022,813 7,955,706
Total Reserves $16,972,921 $14,287,678 $18,705,211 $9,122,053 $13,347,447 $9,290,866
Storm Drainage FundChanges in Working Capital

216 - OPERATING BUDGET
WASTEWATER FUND
ACTUAL BUDGET ESTIMATED ADOPTED REVISED ADOPTED2006 2007 2007 2008 2008 2009
Operating Revenue $14,032,384 $14,522,376 $14,640,171 $16,305,707 $16,305,707 $18,144,583
Operating Expenses Customer & Administration Services 1,278,792 1,388,989 1,308,645 1,429,551 1,429,551 1,486,733 Trunk and Collection 1,290,222 1,591,135 1,335,181 1,602,776 1,613,716 1,692,433 Less Personal Services to Capital Projects 0 (256,566) 0 (264,263) (264,263) (272,191) Water Reclamation 4,150,389 4,841,398 4,402,851 5,141,037 5,160,055 5,324,792 Water Quality 1,012,120 1,279,073 1,102,622 1,147,793 1,176,638 1,210,485 Payments and Transfers 1,651,758 1,744,325 1,755,086 1,844,071 1,844,071 2,002,188 Depreciation 3,064,185 3,114,771 2,817,929 3,414,526 3,414,526 4,065,124
Operating Expenses 12,447,466 13,703,125 12,722,314 14,315,491 14,374,294 15,509,564
Operating Income 1,584,918 819,251 1,917,857 1,990,216 1,931,413 2,635,019
Other Non-Operating Revenue (Expenses) Other Non-Operating Revenue 2,189,774 76,300 471,774 76,300 76,300 76,300 Master Agreement Pmts 0 491,856 0 369,531 369,531 237,038 Earnings on Investments 1,249,793 670,000 1,439,912 750,000 750,000 750,000 Net Change in Fair Value of Investments 176,072 0 302,601 0 0 0 Interest Expense (1,488,770) (1,780,746) (1,286,471) (1,320,918) (1,320,918) (2,752,567) Other Expense - Bond Amortization (44,858) (96,131) (44,858) (96,131) (96,131) (96,131)
Total Non-Operating Revenue (Expense 2,082,011 (638,721) 882,958 (221,218) (221,218) (1,785,360)
Income Before Other Revenues (Transfers) 3,666,929 180,530 2,800,815 1,768,998 1,710,195 849,659
Other Revenues (Transfers) Plant Investment Fees 993,156 1,236,065 1,604,520 793,545 793,545 819,395 Master Agreement Contributed Capital 2,717,038 2,330,000 2,715,200 2,465,000 2,465,000 2,600,000 Development Review Charges 33,220 25,958 42,091 25,958 25,958 25,958
Total Other Revenues (Transfers) 3,743,414 3,592,023 4,361,811 3,284,503 3,284,503 3,445,353
Increase in Net Assets $7,410,343 $3,772,553 $7,162,626 $5,053,501 $4,994,698 $4,295,012
Wastewater FundStatement of Revenues, Expenses, and Changes in Net Assets
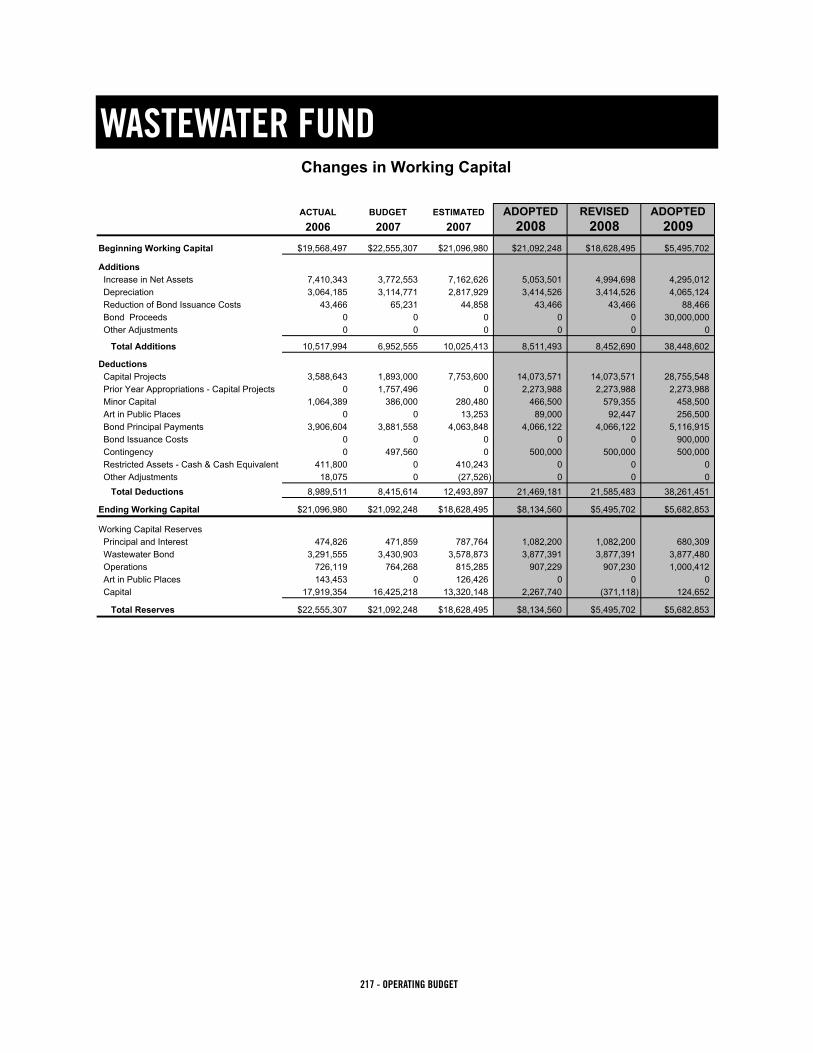
217 - OPERATING BUDGET
WASTEWATER FUND
ACTUAL BUDGET ESTIMATED ADOPTED REVISED ADOPTED2006 2007 2007 2008 2008 2009
Beginning Working Capital $19,568,497 $22,555,307 $21,096,980 $21,092,248 $18,628,495 $5,495,702
Additions Increase in Net Assets 7,410,343 3,772,553 7,162,626 5,053,501 4,994,698 4,295,012 Depreciation 3,064,185 3,114,771 2,817,929 3,414,526 3,414,526 4,065,124 Reduction of Bond Issuance Costs 43,466 65,231 44,858 43,466 43,466 88,466 Bond Proceeds 0 0 0 0 0 30,000,000 Other Adjustments 0 0 0 0 0 0
Total Additions 10,517,994 6,952,555 10,025,413 8,511,493 8,452,690 38,448,602
Deductions Capital Projects 3,588,643 1,893,000 7,753,600 14,073,571 14,073,571 28,755,548 Prior Year Appropriations - Capital Projects 0 1,757,496 0 2,273,988 2,273,988 2,273,988 Minor Capital 1,064,389 386,000 280,480 466,500 579,355 458,500 Art in Public Places 0 0 13,253 89,000 92,447 256,500 Bond Principal Payments 3,906,604 3,881,558 4,063,848 4,066,122 4,066,122 5,116,915 Bond Issuance Costs 0 0 0 0 0 900,000 Contingency 0 497,560 0 500,000 500,000 500,000 Restricted Assets - Cash & Cash Equivalent 411,800 0 410,243 0 0 0 Other Adjustments 18,075 0 (27,526) 0 0 0 Total Deductions 8,989,511 8,415,614 12,493,897 21,469,181 21,585,483 38,261,451
Ending Working Capital $21,096,980 $21,092,248 $18,628,495 $8,134,560 $5,495,702 $5,682,853
Working Capital Reserves Principal and Interest 474,826 471,859 787,764 1,082,200 1,082,200 680,309 Wastewater Bond 3,291,555 3,430,903 3,578,873 3,877,391 3,877,391 3,877,480 Operations 726,119 764,268 815,285 907,229 907,230 1,000,412 Art in Public Places 143,453 0 126,426 0 0 0 Capital 17,919,354 16,425,218 13,320,148 2,267,740 (371,118) 124,652
Total Reserves $22,555,307 $21,092,248 $18,628,495 $8,134,560 $5,495,702 $5,682,853
Wastewater FundChanges in Working Capital

218 - OPERATING BUDGET
WATER FUND
ACTUAL BUDGET ESTIMATED ADOPTED REVISED ADOPTED2006 2007 2007 2008 2008 2009
Operating Revenue $25,127,458 $23,135,846 $24,820,433 $26,789,947 $26,789,947 $27,381,054
Operating Expenses Customer Service & Administration 2,835,917 3,128,971 2,901,642 3,859,087 3,859,087 3,839,790 Water Meter Operations 451,944 607,131 466,530 615,612 615,612 647,968 Water Resources 1,376,381 1,667,515 1,389,636 1,690,898 1,690,898 1,755,429 Transmission and Distribution 2,056,289 2,336,528 2,167,858 2,372,697 2,372,697 2,475,260 Less Personal Services to Capital Projects 0 (347,568) 0 (740,020) (740,020) (769,621) Water Production 3,898,511 5,176,683 4,160,622 5,502,493 5,553,572 5,828,609 Water Quality 878,464 996,149 940,118 970,117 993,454 1,014,382 Payments and Transfers 2,429,698 2,575,366 2,549,506 2,652,810 2,652,810 2,715,908 Depreciation 5,230,243 5,787,169 5,600,347 5,528,289 5,528,289 5,733,825
Operating Expenses 19,157,447 21,927,944 20,176,259 22,451,984 22,526,399 23,241,551
Operating Income 5,970,011 1,207,902 4,644,174 4,337,963 4,263,548 4,139,503
Other Nonoperating Revenue (Expenses) Other Nonoperating Revenue 1,061,845 180,000 269,773 130,000 130,000 130,000 Master Agreement Payments 189,618 133,681 133,681 73,591 73,591 52,551 Earnings on Investments 2,297,493 1,000,000 2,964,304 1,500,000 1,500,000 1,500,000 Net Change in Fair Value of Investments 285,873 0 749,879 0 0 0 Interest Expense - Bond Principal (1,853,961) (1,839,080) (1,712,814) (1,676,904) (1,676,904) (1,518,068) Other Expense - Bond Amortization (46,751) (64,511) (46,751) (46,751) (46,751) (46,751)
Other Nonoperating Revenue (Expenses) 1,934,117 (589,910) 2,358,073 (20,064) (20,064) 117,732
Income Before Other Revenues & Transfers 7,904,128 617,992 7,002,247 4,317,899 4,243,484 4,257,235
Other Revenues (Transfers) Plant Investment Fees 2,393,580 2,476,067 2,631,513 630,572 630,572 709,489 Cash in Lieu of Water Rights 1,700,357 1,984,802 1,058,617 2,400,000 2,400,000 2,400,000 Master Agreement Contributed Capital 1,260,651 1,201,798 1,277,598 728,764 728,764 757,421 Development Review Charges 33,256 31,503 42,229 28,702 28,702 28,702 Other Contributed Capital 508,540 15,113 492,640 15,113 15,113 15,113 Water Rights Dedicated 663,338 0 2,217,540 0 0 0
Other Revenues (Transfers) 6,559,722 5,709,283 7,720,137 3,803,151 3,803,151 3,910,725
Increase in Net Assets $14,463,850 $6,327,275 $14,722,383 $8,121,050 $8,046,635 $8,167,960
Water FundStatement of Revenues, Expenses, and Changes in Net Assets

219 - OPERATING BUDGET
WATER FUND
ACTUAL BUDGET ESTIMATED ADOPTED REVISED ADOPTED2006 2007 2007 2008 2008 2009
Beginning Working Capital $44,015,985 $47,008,183 $53,718,276 $32,661,394 $63,249,795 $60,668,636
Additions Increase in Net Assets 14,463,850 6,327,275 14,722,383 8,121,050 8,046,635 8,167,960 Depreciation 5,230,243 5,787,169 5,600,347 5,528,289 5,528,289 5,733,825 Reduction of Bond Issuance Costs 35,915 46,751 35,915 46,751 46,751 76,751 Bond Amortization 46,751 0 46,751 0 0 0 Other Adjustments 545 0 0 0 0 0
Total Additions 19,777,304 12,161,195 20,405,396 13,696,090 13,621,675 13,978,536
Deductions Capital Projects 3,552,713 16,347,500 3,318,667 4,186,006 4,186,006 12,644,065 Prior Year Appropriations - Capital Projects 0 3,311,973 0 4,783,232 4,783,232 4,783,232 Minor Capital 829,500 1,404,398 617,586 1,609,585 1,738,837 1,710,459 Water Rights Dedicated 0 0 2,217,540 0 0 0 Art in Public Places 11,983 155,125 0 35,850 47,850 123,550 Bond Principal Payments 5,371,590 4,796,655 4,790,429 4,946,909 4,946,909 5,110,107 Restricted Assets - Cash & Cash Equivalent 309,227 0 706 0 0 0 Other Adjustments 0 0 (71,051) 0 0 0 Contingency 0 492,333 0 500,000 500,000 500,000
Total Deductions 10,075,013 26,507,984 10,873,877 16,061,582 16,202,834 24,871,413
Ending Working Capital 53,718,276 $32,661,394 $63,249,795 $30,295,903 $60,668,636 $49,775,759
Working Capital Reserves Art in Public Places 489,000 0 642,541 666,392 678,391 789,942 Principal & Interest 299,165 298,511 691,726 552,348 552,348 337,050 Operations 1,156,792 1,159,335 1,339,497 1,369,053 1,453,180 1,373,494 Water Rights Reserve 22,487,944 11,069,462 23,583,369 11,069,462 11,069,462 3,094,462 Capital 29,285,374 20,134,087 36,992,662 16,638,648 46,915,255 44,180,811
Total Reserves $53,718,276 $32,661,394 $63,249,795 $30,295,903 $60,668,636 $49,775,759
Water FundChanges in Working Capital

220 - OPERATING BUDGET
INTERNAL SERVICE FUNDS
BENEFITS FUND 2008-$20,793,276 2009-$23,256,640The Benefits Fund provides for the collection of benefit premiums and the payment of medical claims. Benefits include a health insurance program, life insurance, accidental death and dismemberment, vision, dental, long-term disability, and several reimbursement accounts. The Benefits Fund is part of Executive, Legislative and Judicial Services (ELJS).
DATA & COMMUNICATIONS FUND 2008-$2,167,510 2009-$7,376,788The Data and Communications Fund provides for the acquisition, operation, and maintenance of the City’s telephone system, office automation systems, and the City’s central information technology functions. In 2008, Management Information Services was transferred out of the General Fund and incorporated into the Commu-nications Fund to form the Data and Communications Fund. The Data and Communications Fund is within the Internal Services area.
EQUIPMENT FUND 2008-$10,906,771 2009-$11,003,508The Equipment Fund is used to account for the operation and maintenance, and acquisition, of certain City equipment such as vehicles, trucks, and other major equipment purchases. The Equipment Fund is part of the Utility Services (UTIL) area.
SELF INSURANCE FUND 2008-$3,352,985 2009-$3,375,062The Self Insurance Fund provides for protection against losses involving City property, equipment and personnel using a combination of risk transfer (insurance coverage) and risk retention (self insurance). The Self Insurance Fund is within the Executive, Legislative and Judicial Services (ELJS) area.
UTILITY CUSTOMER SERVICE & ADMIN. FUND 2008-$14,464,156 2009-$14,460,668The Utility Customer Service and Administration Fund provides the four Utility Funds and their customers with management, support services and customer services. The Utility Customer Service and Administration Fund is part of the Utility Services (UTIL) area.

221 - OPERATING BUDGET
BENEFITS FUND
ACTUAL BUDGET ESTIMATED ADOPTED REVISED ADOPTED2006 2007 2007 2008 2008 2009
Revenue Contributions - Medical Insurance $12,948,876 $20,013,047 $14,624,846 $15,875,969 $15,875,969 $17,781,086 - Life Insurance 466,114 654,526 474,074 710,161 710,161 795,380 - Long Term Disability 410,331 820,755 423,520 890,519 890,519 997,381 - Dental Insurance 942,944 1,449,857 967,934 1,573,095 1,573,095 1,761,866 - Denticare Dental Ins. 0 0 0 0 0 0 - Daycare Reimbursement 158,410 205,086 148,409 222,518 222,518 249,221 - Healthcare Reimbursement 529,649 514,202 569,140 557,909 557,909 624,858 - Supplemental Life Ins. 0 18,274 0 19,827 19,827 22,207 - Rocky Mountain Life Ins. 169,067 156,962 175,933 170,304 170,304 190,740 - Employee Assistance Program 5,312 0 5,849 0 0 0 - Vision 138,550 182,470 143,756 197,980 197,980 221,738 - Death & Disability - FPPA 233,608 212,254 269,911 230,296 230,296 257,931 - Accidental Death & Dismem. 7,760 9,347 7,242 10,141 10,141 11,358 - Long Term Care 14,833 37,500 15,332 40,688 40,688 45,570 Wellness Program 50,409 104,372 43,480 63,400 63,400 65,400 Interest on Investments 314,445 132,088 370,828 130,000 130,000 130,000 Net Increase (Decrease) in the fair value
of Investments 9,375 0 69,368 0 0 0 Insurance Recovery 0 0 0 0 0 Other - Miscellaneous 4,735 2,702 101 2,500 2,500 2,500 Total Revenue 16,404,418 24,513,442 18,309,723 20,695,307 20,695,307 23,157,236 Expenditures Administration Costs 485,538 691,895 576,751 682,076 713,576 757,010 HMO Administration Medical Claims 11,503,496 19,275,089 11,344,084 14,103,862 14,103,862 15,796,325 Claims Administration 574,694 802,418 602,832 870,624 870,624 944,627 Excess Risk Premiums 699,280 769,912 850,082 835,355 835,355 906,360 Transplant Insurance 151,756 235,277 137,225 150,000 150,000 200,000 Actuarial Adjustment 212,606 0 (63,357) 0 0 0 Dental Claims 810,448 1,171,295 761,784 1,000,000 1,000,000 1,200,000 Dental Premiums 59,626 74,168 63,299 80,472 80,472 87,312 Life Insurance Premiums 646,011 904,669 659,035 981,566 981,566 1,064,999 LTD Premiums 414,160 594,510 443,291 645,043 645,043 699,872 STD Premiums 0 0 18,120 30,000 30,000 30,000 Death & Disability - FPPA 249,117 193,000 271,250 260,000 260,000 280,000 Accidental Death & Dismem. 0 0 0 0 0 0 Daycare Reimbursements 155,269 257,404 140,848 200,000 200,000 225,000 Healthcare Reimbursements 516,827 514,202 547,863 557,909 557,909 605,331 Vision Insurance 106,481 182,470 130,149 150,000 150,000 200,000 Long Term Care 15,127 37,500 15,329 20,000 20,000 20,000 Wellness Program 132,941 152,075 129,255 161,369 176,369 164,804 Employee Assistance Program 37,179 83,289 34,340 45,000 45,000 50,000 Daycare Referral 15,124 48,000 0 20,000 20,000 25,000 Total Expenditures 16,785,679 25,987,173 16,662,179 20,793,276 20,839,776 23,256,640
Change in Net Assets (381,261) (1,473,731) 1,647,544 (97,969) (144,469) (99,404)
Benefits FundComparative Statement of Income

222 - OPERATING BUDGET
BENEFITS FUND
ACTUAL BUDGET ESTIMATED ADOPTED REVISED ADOPTED2006 2007 2007 2008 2008 2009
Beginning Working Capital $5,270,565 $4,814,202 $4,889,303 $6,536,847 $6,536,847 $6,438,878
Additions Change in Net Assets $0 $0 $1,647,544 $0 $0 $0
Deductions Change in Net Assets ($381,261) ($1,473,731) $0 ($97,969) ($144,469) ($99,404)
Ending Working Capital $4,889,303 $3,340,471 $6,536,847 $6,438,878 $6,392,378 $6,339,475
Benefits FundChanges in Working Capital

223 - OPERATING BUDGET
DATA & COMMUNICATIONS FUND
ACTUAL BUDGET ESTIMATED ADOPTED REVISED ADOPTED2006 2007 2007 2008 2008 2009
Operating Revenue CITEL/Telephone $1,183,440 $1,783,000 $1,292,988 $1,160,000 $1,160,000 $1,160,000 MIS Services / Infrastructure $0 $0 $0 0 2,320,813 2,463,720
Total Operating Revenue 1,183,440 1,783,000 1,292,988 1,160,000 3,480,813 3,623,720
Operating Expenses Personal Services 525,085 619,214 587,621 358,829 3,561,488 3,710,361 Contractual 483,533 735,218 729,580 563,100 3,284,892 2,396,708 Commodities 94,080 101,550 498,492 63,200 1,110,882 469,100 Capital Outlay 2,882 33,000 536 1,182,381 1,031,955 800,619
Total Operating Expenses 1,105,580 1,488,982 1,816,229 2,167,510 8,989,217 7,376,788
Operating Income (Loss) Before Depreciation 77,860 294,018 (523,241) (1,007,510) (5,508,404) (3,753,068)
Depreciation 75,701 215,583 57,569 223,128 223,128 223,128
Operating Income (Loss) After Depreciation 2,159 78,435 (580,810) (1,230,638) (5,731,532) (3,976,196)
Other Revenue (Expenses) Transfer from General Fund 0 0 1,500,000 56,021 3,996,885 3,182,358 Interest Earnings 83,647 5,000 61,851 30,000 30,000 30,000 Net Change in Fair Value of Investments 1,609 0 0 0 0 0 Other Miscellaneous 219 0 2,838 0 0 0 Transfer to General Fund (170,000) 0 0 (217,292) 0 0 Transfer to Transportation Fund 0 0 (37,861) 0 0 0
Total Other Revenue (Expenses) (84,525) 5,000 1,526,828 (131,271) 4,026,885 3,212,358
Increase in Net Assets ($82,366) $83,435 $946,018 ($1,361,909) ($1,704,647) ($763,838)
Data & Communications FundComparative Statement of Income

224 - OPERATING BUDGET
DATA & COMMUNICATIONS FUND
ACTUAL BUDGET ESTIMATED ADOPTED REVISED ADOPTED2006 2007 2007 2008 2008 2009
Beginning Working Capital $1,742,402 $1,735,641 $1,724,975 $775,659 $2,245,559 $764,040 Additions Increase in Net Assets 0 83,435 946,018 0 0 0 Other Adjustments 0 0 0 0 0 0 Depreciation/Amortization 75,701 215,583 57,569 223,128 223,128 223,128 Total Additions 75,701 299,018 1,003,587 223,128 223,128 223,128
Deductions Decrease in Net Assets 82,366 0 0 1,361,909 1,704,647 763,838 Encumbrances 0 0 286,719 0 0 0 Equipment Purchases 6,465 1,259,000 196,284 0 0 0 Other Adjustments 4,297 0 0 0 0 0 Principal Reduction Lease/Purchase 0 0 0 0 0 0 Total Deductions 93,128 1,259,000 483,003 1,361,909 1,704,647 763,838
Ending Working Capital $1,724,975 $775,659 $2,245,559 ($363,122) $764,040 $223,330
Communications FundChanges in Working Capital

225 - OPERATING BUDGET
EQUIPMENT FUND
ACTUAL BUDGET REVISED ADOPTED REVISED ADOPTED2006 2007 2007 2008 2008 2009
RevenuesCharges for Services
Fleet Support Services $3,395 $423,009 $5,837 $338,964 $338,964 $566,981Vehicle Repair & Maint. 4,407,703 4,567,924 5,038,580 4,632,995 4,632,995 4,547,032Vehicle Fueling 1,653,206 1,223,020 1,809,485 3,576,997 3,576,997 3,832,497Pool Equipment Rental 323,027 806,528 334,828 702,306 702,306 702,306
Earnings on Investments 59,777 32,591 86,908 61,442 61,442 63,285 Intergovernmental 0 0 57,993 0 0 0 Miscellaneous 31,000 14,612 66,205 13,300 13,300 13,800 Net Increase (Decrease) in the fair value
of Investments 7,015 0 35,660 0 0 0
Total Revenues 6,485,123 7,067,684 7,435,496 9,326,004 9,326,004 9,725,901
Other Financing Sources Transfer from the General Fund 30,530 0 2,350,000 0 0 0
Total Other Financing Sources 30,530 0 2,350,000 0 0 0
Total Revenues and Other FinancingSources 6,515,653 7,067,684 9,785,496 9,326,004 9,326,004 9,725,901
Expenditures Personal Services 1,996,411 2,335,912 2,179,932 2,405,521 2,405,521 2,525,098 Contractual Services 925,944 1,507,993 1,443,438 1,486,884 1,549,680 1,533,999 Commodities 3,095,835 2,981,989 3,581,789 4,884,727 4,887,387 5,196,646 Other 1,083 144,757 1,124 180,300 241,006 192,500 Depreciation and Amortization 148,383 54,967 160,262 155,383 155,383 167,383
Total Expenditures 6,167,656 7,025,618 7,366,545 9,112,815 9,238,977 9,615,626
Total Expenditures and OtherFinancing Uses 6,167,656 7,025,618 7,366,545 9,112,815 9,238,977 9,615,626
Change in Net Assets $347,997 $42,066 $2,418,951 $213,189 $87,027 $110,275
Equipment FundComparative Statement of Income

226 - OPERATING BUDGET
EQUIPMENT FUND
ACTUAL BUDGET REVISED ADOPTED REVISED ADOPTED2006 2007 2007 2008 2008 2009
Beginning Working Capital $1,669,002 1,533,516 2,017,111 4,521,772 4,521,772 2,812,135
Additions Net Income $347,997 $42,066 $2,418,951 $213,189 $87,027 $110,275 Depreciation 148,383 54,967 160,262 155,383 155,383 167,383 Other Adjustments 9,533 0 22,088 0 0 0
Total Additions $505,913 $97,033 $2,601,300 $368,572 $242,410 $277,658 Deductions Special Construction 0 0 0 0 2,708 0 Motor Vehicles 0 0 18,900 1,340,000 1,340,000 1,045,000 Lease/Purchase Equipment 0 0 0 29,500 29,500 29,300 Other Equipment Purchases 130,802 40,000 70,288 101,100 101,100 94,500 Principal Reduction Lease/Purchase 27,003 18,773 7,451 478,739 478,739 386,465
Total Deductions $157,805 $58,773 $96,639 $1,949,339 $1,952,047 $1,555,265 Ending Working Capital 2,017,111 1,571,776 4,521,772 2,941,005 2,812,135 1,534,528
Equipment FundChanges in Working Capital

227 - OPERATING BUDGET
SELF INSURANCE FUND
ACTUAL BUDGET ESTIMATED ADOPTED REVISED ADOPTED2006 2007 2007 2008 2008 2009
Operating Revenue Liability Insurance Fees 911,899 1,003,089 1,003,089 1,003,911 1,003,911 1,003,911 Property Insurance Fees 295,461 325,007 324,351 333,596 333,596 333,596 Worker's Compensation 964,649 921,426 1,073,323 1,027,000 1,027,000 1,050,000
Total Operating Revenue 2,172,009 2,249,522 2,400,763 2,364,507 2,364,507 2,387,507
Operating Expenses Administration 558,178 944,720 726,034 877,985 904,974 900,062 Employee Liability Insurance 298,814 347,000 279,210 350,000 350,000 350,000 Physical Property Insurance 274,911 347,000 364,559 300,000 300,000 300,000 Claim Settlements 1,533,508 1,450,000 1,980,557 1,700,000 1,700,000 1,700,000 Workers Compensation Ins. Charges 118,229 90,000 142,677 125,000 128,500 125,000
Total Operating Expenses 2,783,640 3,178,720 3,493,037 3,352,985 3,383,474 3,375,062
Other Revenue and (Expense) Interest 352,810 250,000 444,532 350,000 350,000 350,000 Net Change in Fair Value of Investments 93,256 0 88,269 0 0 0 Other 53,918 0 46,072 0 0 0 Transfer from General Fund 0 0 43,344 29,750 29,750 29,750 Transfer to General Fund 0 0 0 0 0 0
Total Other Revenue and (Expenses) 499,984 250,000 622,217 379,750 379,750 379,750
Actuary Adjustment (1,142,400) 0 213,073 0 0 0
Net Change in Fund Balance $1,030,753 ($679,198) ($683,131) ($608,728) ($639,217) ($607,805)
Statement of Revenues, Expenses, and Changes in Net AssetsSelf Insurance Fund

228 - OPERATING BUDGET
SELF INSURANCE FUND
ACTUAL BUDGET ESTIMATED ADOPTED REVISED ADOPTED2006 2007 2007 2008 2008 2009
Beginning Net Working Capital $8,193,288 $8,093,630 $8,244,487 $7,414,432 $7,560,246 $6,921,029
Additions Increase in Net Assets 1,030,753 0 0 0 0 0 Other Adjustments 0 0 0 0 0 0 Total Additions 1,030,753 0 0 0 0 0
Deductions Net Loss 0 679,198 683,131 608,728 639,217 607,805 Decrease in Long Term Payables 976,571 0 0 0 0 0 Other Adjustments 2,983 0 1,110 0 0 0 Total Deductions 979,554 679,198 684,241 608,728 639,217 607,805
Ending Working Capital $8,244,487 $7,414,432 $7,560,246 $6,805,704 $6,921,029 $6,313,224
Working Capital Distributed To Reserve Funds: Designated for Claims Payable $3,658,516 $6,000,000 $6,000,000 $6,000,000 $6,000,000 $5,500,000 Reserved for Note 0 0 0 0 0 0 Reserved for Counseling 0 0 0 0 0 0 Operations 4,585,971 1,414,432 1,560,246 805,704 921,029 813,224 Contributed Capital 0 0 0 0 0 0 Total Reserves 8,244,487 7,414,432 7,560,246 6,805,704 6,921,029 6,313,224
Self Insurance FundChanges in Working Capital

229 - OPERATING BUDGET
UTILITY CUSTOMER SERVICE AND ADMINISTRATION FUND
ACTUAL BUDGET ESTIMATED ADOPTED REVISED ADOPTED2006 2007 2007 2008 2008 2009
Operating Revenue Admin. Charges - General Fund $31,669 $33,252 $33,252 $0 $0 $0 Admin. Charges - Light & Power Fund 4,184,830 4,767,615 4,324,672 5,766,113 5,766,113 $5,648,796 Admin. Charges - Water Fund 2,835,917 3,128,971 2,901,642 3,859,087 3,859,087 3,839,790 Admin. Charges - Wastewater Fund 1,278,792 1,388,989 1,308,645 1,728,614 1,728,614 1,729,241 Admin. Charges - Stormwater Fund 1,246,408 1,426,721 1,311,235 1,885,766 1,885,766 1,919,509
Total Operating Revenue 9,577,616 10,745,548 9,879,446 13,239,580 13,239,580 13,137,336 Operating Expenses Customer Services 5,249,689 5,556,228 5,515,898 6,016,245 6,111,680 6,303,694 Administration & General 5,083,763 5,714,768 5,141,401 7,263,505 7,519,973 7,510,981 Depreciation 246,251 235,576 228,455 275,000 275,000 275,000 Transfer to General Fund 25,310 26,954 26,954 0 0 0
Total Operating Expenses 10,605,013 11,533,526 10,912,708 13,554,750 13,906,653 14,089,675
Operating Income (1,027,397) (787,978) (1,033,262) (315,170) (667,073) (952,339)
Other Nonoperating Revenue Investment Earnings 59,493 20,000 71,089 40,000 40,000 40,000 Net Change in Fair Value of Investments (338) 0 9,426 0 0 0 Connection Charges 496,873 539,789 484,685 505,000 505,000 510,050 Red Tag Charges 280,581 249,735 290,682 277,750 277,750 280,528 Reconnect Charges 97,300 73,723 87,440 80,800 80,800 81,608 Miscellaneous 62,023 35,900 33,331 35,900 35,900 35,900
Total Nonoperating Revenue 995,932 919,147 976,653 939,450 939,450 948,086 Net Change in Fund Balance ($31,465) $131,169 ($56,609) $624,280 $272,377 ($4,253)
Utility Customer Service and Administration FundStatement of Revenues, Expenses, and Changes in Net Assets
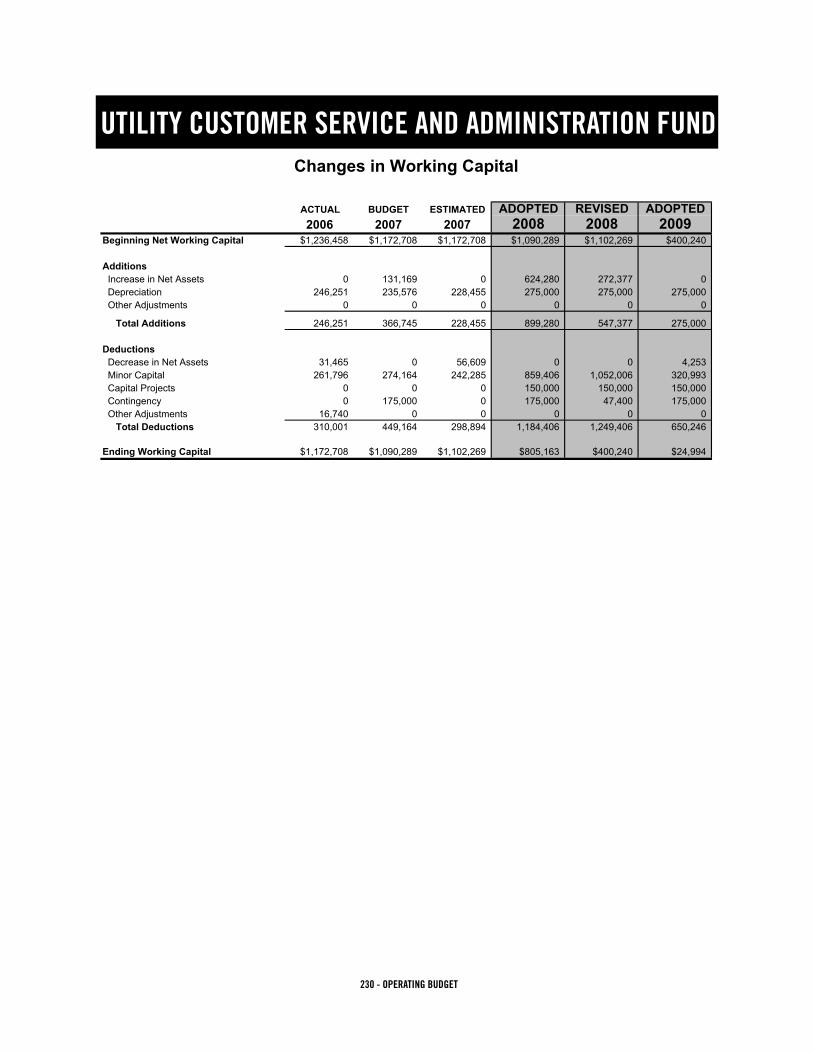
230 - OPERATING BUDGET
UTILITY CUSTOMER SERVICE AND ADMINISTRATION FUND
ACTUAL BUDGET ESTIMATED ADOPTED REVISED ADOPTED2006 2007 2007 2008 2008 2009
Beginning Net Working Capital $1,236,458 $1,172,708 $1,172,708 $1,090,289 $1,102,269 $400,240
Additions Increase in Net Assets 0 131,169 0 624,280 272,377 0 Depreciation 246,251 235,576 228,455 275,000 275,000 275,000 Other Adjustments 0 0 0 0 0 0
Total Additions 246,251 366,745 228,455 899,280 547,377 275,000
Deductions Decrease in Net Assets 31,465 0 56,609 0 0 4,253 Minor Capital 261,796 274,164 242,285 859,406 1,052,006 320,993 Capital Projects 0 0 0 150,000 150,000 150,000 Contingency 0 175,000 0 175,000 47,400 175,000 Other Adjustments 16,740 0 0 0 0 0 Total Deductions 310,001 449,164 298,894 1,184,406 1,249,406 650,246
Ending Working Capital $1,172,708 $1,090,289 $1,102,269 $805,163 $400,240 $24,994
Changes in Working CapitalUtility Customer Service and Administration Fund

231 - OPERATING BUDGET
SPECIAL REVENUE FUNDS
CAPITAL IMPROVEMENT EXPANSION FUND 2008-$459,981 2009-$461,141The Capital Expansion Fund is used to account for the impact fees collected by the City and used for Library, Community Parkland, Police Services, Fire Services, and General Governmental Facilities. Capital Expansion Fees are a form of development fee imposed on new development.
CAPITAL LEASING CORPORATION FUND 2008-$5,726,331 2009-$5,717,380The Capital Leasing Corporation Fund is used for the payment of interest and principal on long term debt for the Civic Center Parking Structure, the New Office Building, the Downtown Intersection Renovation Project, and the off-site Police Building.
CEMETERY FUND 2008-$629,884 2009-$651,519The Cemetery Fund provides coordination of all operations for the two City-owned cemeteries including inter-ments, grounds maintenance, records, memorial settings and administration. The Cemetery Fund is within the Culture, Parks, Recreation, and Environment Services (CPRE) area.
CULTURAL SERVICES AND FACILITIES 2008-$5,008,662 2009-$5,112,641The Cultural Services and Facilities Fund provides accounting for revenues received, including user fees and receiptsfromtheLincolnCenterfacility,theFortCollinsMuseum,thePerformingandVisualArtsprogram,andtransfers from the General Fund used to promote cultural activities. The Cultural Services and Facilities Fund is a part of the Culture, Parks, Recreation, and Environment Services (CPRE) area.
DEBT SERVICE FUND 2008-$1,352,038 2009-$1,352,478The Debt Service Fund is used for the payment of interest and principal on long term debt. The major source of revenue is Sales & Use Tax.
GENERAL EMPLOYEES’ RETIREMENT FUND 2008-$2,684,342 2009-$2,764,973The General Employees’ Retirement Fund is used to account for the general employees’ retirement plan.
NATURAL AREAS FUND 2008-$9,225,217 2009-$9,428,171The Natural Areas Fund is used to account for the City’s tax proceeds that are used to preserve and provide open space, natural areas, wildlife habitat, parks and trails.
232 - OPERATING BUDGET
PERPETUAL CARE FUND 2008-$70,438 2009-$70,452The Perpetual Care Fund provides accounting for perpetual care fees collected and expended in the form of transfers to the Cemetery Fund to help pay for Cemetery maintenance. The Perpetual Care Fund is within Cul-ture, Parks, Recreation, and Environment Services (CPRE) area.
RECREATION FUND 2008-$7,850,915 2009-$8,111,108The Recreation Fund provides accounting for revenues including user fees for recreational activities and operat-ing transfers from the General Fund used to provide recreational programs for citizens. The Recreation Fund is found within Culture, Parks, Recreation, and Environment Services (CPRE) area.
SALES AND USE TAX FUND 2008-$78,137,453 2009-$78,583,777The Sales and Use Tax Fund is used to account for collections of the City’s sales and use taxes which are used to provide reserves and fund payments for sales and use tax revenue debt. Tax revenue is also transferred to the General Fund and other funds of the City in accordance with the sales and use tax distribution policy.
SPECIAL ASSESSMENTS DEBT SERVICE FUND 2008-$0 2009-$0The Special Assessment Debt Service Fund consolidates all special improvement districts tax revenue and debt payments. Costs for managing the special improvement districts are also in this fund.
STREET OVERSIZING FUND 2008-$5,279,837 2009-$5,310,478The Street Oversizing Fund provides accounting for street oversizing fees collected and operating transfers from other funds to be used for construction of arterial and collector streets. The Street Oversizing Fund is part of the Transportation Service (TRAN) area.
TRANSIT SERVICES FUND 2008-$11,091,076 2009-$10,874,885The Transit Services Fund provides accounting for revenues including fees for services, advertising, contrac-tual, intergovernmental revenue, and transfers from the General Fund to be used for approved purposes in connection with public transit services. Transit Services Fund (Transfort/Paratransit and Local Transportation Demand Management) is a part of the Transportation Service (TRAN) area.
TRANSPORTATION SERVICES FUND 2008-$28,503,751 2009-$28,405,220The Transportation Services Fund provides accounting for taxes, intergovernmental revenues, and transfers from the General Fund or other City funds to be used to provide transportation services including street patch-ing, sweeping, snow removal, signs & pavement markings, traffic signal maintenance, parking enforcement, and transportation planning to name a few. The Transportation Services Fund is located in the Transportation Service (TRAN) area.

233 - OPERATING BUDGET
CAPITAL IMPROVEMENT EXPANSION FUND
ACTUAL BUDGET ESTIMATED ADOPTED REVISED ADOPTED2006 2007 2007 2008 2008 2009
Beginning Fund Balance $25,003,651 $17,183,545 $20,107,466 $18,377,922 $18,377,922 $21,011,584Revenue Capital Expansion Fees Library 275,023 550,000 330,213 264,559 264,559 272,231 Community Parkland 1,014,694 1,750,000 1,143,962 1,016,015 1,016,015 1,045,479 Police Services 162,928 205,000 242,766 120,016 120,016 123,497 Fire Services 247,208 290,000 351,371 174,354 174,354 179,410 General Government Facilities 278,607 400,000 411,536 215,899 215,899 222,160 Administrative Fee Earned 65,119 127,800 60,430 127,800 127,800 127,800 Interest Earnings 1,032,509 761,804 953,602 1,175,000 1,175,000 1,057,500 Net Increase (Decrease) in the fair value
of Investments 115,985 0 217,132 0 0 0
Total Revenue 3,192,073 4,084,604 3,711,012 3,093,643 3,093,643 3,028,077
Expenditures Library 0 0 19,248 0 0 0 Community Parkland 13,709 296 4,902 0 0 0 Police Services 0 0 1,066 0 0 0 Fire Services 1,400,176 0 1,492 0 0 0 General Government Facilities 11,953 0 1,812 0 0 0
Total Expenditures 1,425,838 296 28,520 0 0 0
Other Financing Uses Transfer to the General Fund 127,800 127,800 60,430 127,800 127,800 127,800 Transfer to the Capital Projects Fund 6,531,205 29,070 5,008,266 0 0 0 Transfer to the Capital Leasing Corp. Fund 3,415 333,341 333,341 332,181 332,181 333,341 Transfer to the Cultural Services & Fac. Fund 0 0 10,000 0 0 0
Total Other Financing Uses 6,662,420 490,211 5,412,037 459,981 459,981 461,141
Total Expenditures and OtherFinancing Uses 8,088,258 490,507 5,440,556 459,981 459,981 461,141
Net Change in Fund Balance (4,896,185) 3,594,097 (1,729,544) 2,633,662 2,633,662 2,566,936
Ending Fund Balance $20,107,466 $20,777,642 $18,377,922 $21,011,584 $21,011,584 $23,578,520
Reserves Reserved for Community Parkland 7,888,015 5,468,731 4,469,310 5,812,497 5,812,497 7,181,967 Reserved for Library 5,894,197 6,779,473 6,348,345 7,007,331 7,007,331 7,623,470 Reserved for Police Services 2,325,789 2,278,922 2,357,058 2,272,825 2,272,825 2,160,442 Reserved for Fire Services 253,569 2,073,002 637,916 860,718 860,718 1,089,267 Reserved for Government Facilities 3,788,123 4,189,531 4,428,588 4,921,508 4,921,508 5,386,670 Undesignated (42,226) (12,017) 136,705 136,705 136,705 136,705
Total Reserves 20,107,466 20,777,642 18,377,922 21,011,584 21,011,584 23,578,520
Capital Improvement Expansion FundComparative Budget Statement

234 - OPERATING BUDGET
CAPITAL LEASING CORPORATION FUND
ACTUAL BUDGET ESTIMATED ADOPTED REVISED ADOPTED2006 2007 2007 2008 2008 2009
Beginning Fund Balance $0 $0 $0 $0 $0 $0Expenditures Principal 1,713,495 2,809,930 1,899,930 2,911,605 2,911,605 3,028,280 Interest 3,005,344 2,918,804 2,893,940 2,812,526 2,812,526 2,686,900 Principal - Refunding 0 0 12,860,000 0 0 0 Other 2,150 2,200 347,178 2,200 2,200 2,200 Total Expenditures 4,720,989 5,730,934 18,001,048 5,726,331 5,726,331 5,717,380
Other Financing Sources Transfers From - General Fund for Parking Structure 281,150 281,824 117,419 282,079 282,079 281,906 for Office Building 848,617 848,959 460,712 847,109 847,109 849,091 for Police Building 1,568,640 1,568,640 1,568,640 1,568,640 1,568,640 1,568,640 for Trustee Fee 0 2,200 83,962 2,200 2,200 2,200 Downtown Development Authority Debt Service Fund 281,149 281,824 117,419 282,080 282,080 281,906 General Improvement District #1 143,280 141,840 31,605 145,120 145,120 147,840 Capital Projects Fund 6,933 676,782 676,782 674,429 674,429 665,682 Transportation Services Fund 129,656 132,831 132,831 131,044 131,044 128,844 Natural Areas Fund 1,385,231 1,393,107 1,393,106 1,391,831 1,391,831 1,388,356 Capital Expansion Fund 3,415 333,341 333,341 332,181 332,181 333,341 Proceeds - Refunding 0 0 12,880,000 0 0 0 Miscellaneous 3,193 0 135,646 0 0 0 Building Rental 69,725 69,586 69,586 69,619 69,619 69,574
Total Other Financing Sources 4,720,989 5,730,934 18,001,049 5,726,331 5,726,331 5,717,380
Excess Other Sources Over Expenditures 0 0 0 0 0 0Ending Fund Balance $0 $0 $0 $0 $0 $0
Capital Leasing Corporation FundComparative Budget Statement
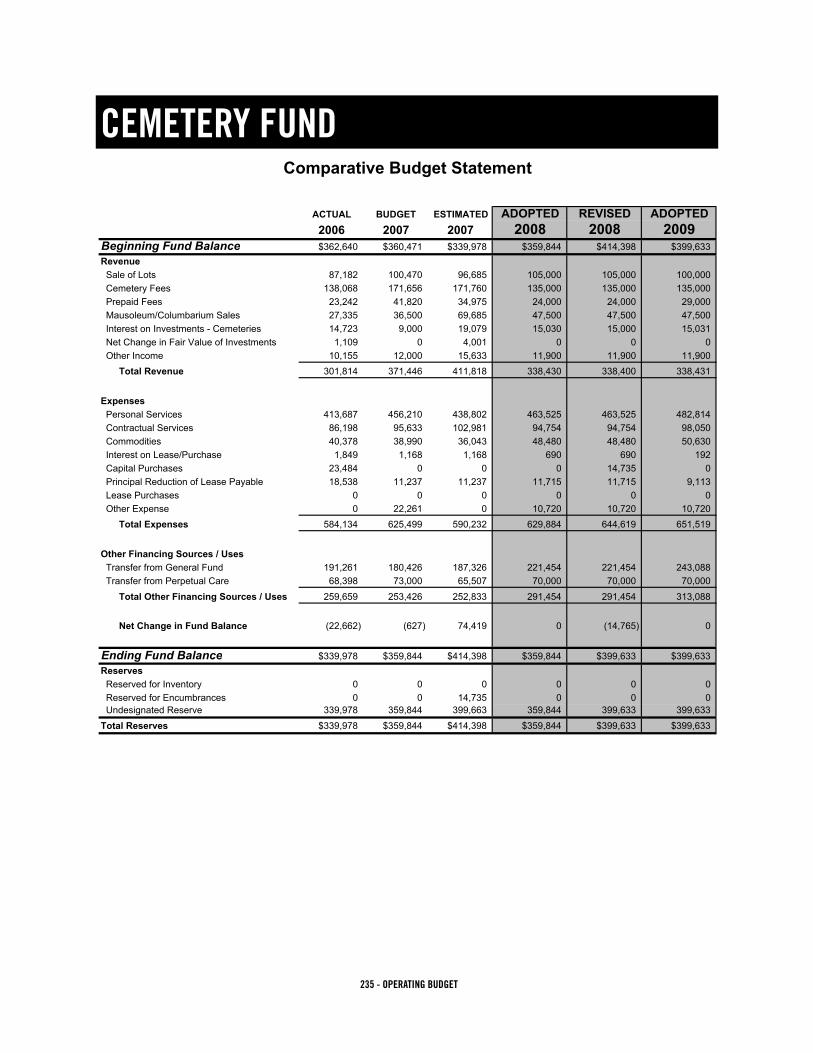
235 - OPERATING BUDGET
CEMETERY FUND
ACTUAL BUDGET ESTIMATED ADOPTED REVISED ADOPTED2006 2007 2007 2008 2008 2009
Beginning Fund Balance $362,640 $360,471 $339,978 $359,844 $414,398 $399,633Revenue Sale of Lots 87,182 100,470 96,685 105,000 105,000 100,000 Cemetery Fees 138,068 171,656 171,760 135,000 135,000 135,000 Prepaid Fees 23,242 41,820 34,975 24,000 24,000 29,000 Mausoleum/Columbarium Sales 27,335 36,500 69,685 47,500 47,500 47,500 Interest on Investments - Cemeteries 14,723 9,000 19,079 15,030 15,000 15,031 Net Change in Fair Value of Investments 1,109 0 4,001 0 0 0 Other Income 10,155 12,000 15,633 11,900 11,900 11,900
Total Revenue 301,814 371,446 411,818 338,430 338,400 338,431
Expenses Personal Services 413,687 456,210 438,802 463,525 463,525 482,814 Contractual Services 86,198 95,633 102,981 94,754 94,754 98,050 Commodities 40,378 38,990 36,043 48,480 48,480 50,630 Interest on Lease/Purchase 1,849 1,168 1,168 690 690 192 Capital Purchases 23,484 0 0 0 14,735 0 Principal Reduction of Lease Payable 18,538 11,237 11,237 11,715 11,715 9,113 Lease Purchases 0 0 0 0 0 0 Other Expense 0 22,261 0 10,720 10,720 10,720
Total Expenses 584,134 625,499 590,232 629,884 644,619 651,519
Other Financing Sources / Uses Transfer from General Fund 191,261 180,426 187,326 221,454 221,454 243,088 Transfer from Perpetual Care 68,398 73,000 65,507 70,000 70,000 70,000
Total Other Financing Sources / Uses 259,659 253,426 252,833 291,454 291,454 313,088
Net Change in Fund Balance (22,662) (627) 74,419 0 (14,765) 0
Ending Fund Balance $339,978 $359,844 $414,398 $359,844 $399,633 $399,633Reserves Reserved for Inventory 0 0 0 0 0 0 Reserved for Encumbrances 0 0 14,735 0 0 0 Undesignated Reserve 339,978 359,844 399,663 359,844 399,633 399,633Total Reserves $339,978 $359,844 $414,398 $359,844 $399,633 $399,633
Cemetery FundComparative Budget Statement

236 - OPERATING BUDGET
CULTURAL SERVICES & FACILITIES FUND
ACTUAL ADOPTED ESTIMATED ADOPTED REVISED ADOPTED2006 2007 2007 2008 2008 2009
Beginning Fund Balance $1,701,721 $621,328 $1,844,970 $1,639,737 $1,698,459 $1,259,584Revenue Lincoln Center Rentals 443,980 376,712 456,050 463,090 463,090 466,828 Ticket Sales 1,222,739 1,666,319 1,308,988 1,917,073 1,917,073 2,012,926 Other Lincoln Center Charges 27,215 50,437 18,064 19,300 19,300 19,300 Miscellaneous 3,984 115,754 13,075 131,323 131,323 135,849 User Services 264,926 246,779 263,375 289,800 289,800 304,440 Intergovernmental 21,877 0 45,476 0 0 0 Donations 65,791 26,565 77,182 83,000 83,000 99,000 Museum Sales & Charges 19,283 25,000 17,332 25,000 25,000 25,000 Interest Earnings 106,564 28,670 116,882 108,507 108,507 107,764 Net Increase (Decrease) in the fair value
of Investments 6,141 0 21,628 0 0 0
Total Revenue 2,182,499 2,536,236 2,338,052 3,037,093 3,037,093 3,171,107
Other Financing Sources Transfer from General Fund 1,291,087 1,335,838 1,342,138 1,602,445 1,602,445 1,658,704 Transfer from Sales & Use Tax Fund 150,000 0 0 0 0 200,000 Transfer from Capital Projects Fund 87,000 0 113,250 94,426 94,426 44,174 Transfer from Natural Areas Fund 24,900 10,500 10,500 23,000 23,000 8,000 Transfer from Conservation Trust Fund 8,000 8,000 8,000 6,000 6,000 6,000 Transfer from Neighborhood Parkland Fund 4,000 0 3,950 9,000 9,000 9,000
Total Other Financing Sources 1,564,987 1,354,338 1,477,838 1,734,871 1,734,871 1,925,878
Total Revenues and OtherFinancing Sources 3,747,486 3,890,574 3,815,890 4,771,964 4,771,964 5,096,985
Expenditures Personal Services 1,343,534 1,459,890 1,416,138 2,033,807 2,033,807 2,110,432 Contractual Services 1,741,913 2,107,914 1,848,403 2,336,376 2,346,408 2,452,685 Commodities 177,013 216,918 187,601 374,520 375,415 337,363 Capital 30,012 0 49,604 0 0 9,000 Other 2,083 5,016 2,162 2,410 2,410 2,413 Art in Public Places (APP) 257,210 130,613 404,771 261,549 452,798 200,748
Total Expenditures 3,551,766 3,920,351 3,908,679 5,008,662 5,210,839 5,112,641
Grant Expenditures NAGPRA Grant 11,733 0 7 0 0 0 Franz Smith Assessment 7,911 0 0 0 0 0 Preserve America Grant 32,827 0 53,716 0 0 0
Total Grant Expenditures 52,471 0 53,723 0 0 0
Total Expenditures 3,604,237 3,920,351 3,962,402 5,008,662 5,210,839 5,112,641
Net Change in Fund Balance 143,249 (29,777) (146,512) (236,698) (438,875) (15,656)
Ending Fund Balance $1,844,970 $591,551 $1,698,459 $1,403,039 $1,259,584 $1,243,929Reserves Designated for Operations 47,915 60,742 60,742 63,422 63,422 62,310 Undesignated 822,707 438,772 1,113,038 1,236,838 919,782 614,293 Reserve for Art-in-Public Places 266,715 5,674 322,501 5,674 52,632 43,453 Reserve for Museum Donations 109,151 147,105 115,036 97,105 198,036 297,184 Reserve - Building on Basics (BOB) 32,178 0 25,712 0 25,712 226,688 Reserve for Encumbrances 566,305 0 61,430 0 0 0
Total Reserves $1,844,970 $652,293 $1,698,459 $1,403,039 $1,259,584 $1,243,929
Comparative Budget StatementCultural Services & Facilities Fund

237 - OPERATING BUDGET
DEBT SERVICE FUND
ACTUAL BUDGET ESTIMATED ADOPTED REVISED ADOPTED2006 2007 2007 2008 2008 2009
Beginning Fund Balance $0 $0 $0 $0 $0 $0Expenditures Principal 2,530,000 1,149,465 1,057,866 1,091,863 1,091,863 1,265,000 Interest 261,955 198,616 290,214 260,175 260,175 87,478 Total Expenditures 2,791,955 1,348,081 1,348,080 1,352,038 1,352,038 1,352,478
Other Financing SourcesTransfers In
Sales & Use Tax Fundfor Bond Issues 994,463 994,438 994,438 994,413 994,413 996,363
for D.D.A. 1,442,574 0 0 0 0 0Transportation Fund 354,918 353,643 353,642 357,625 357,625 356,115
Total Other Financing Sources 2,791,955 1,348,081 1,348,080 1,352,038 1,352,038 1,352,478
Excess Other Sources Over Expenditures 0 0 0 0 0 0
Ending Fund Balance $0 $0 $0 $0 $0 $0
Debt Service FundComparative Budget Statement
NOTE: Debt payments are reduced beginning in 2007 because the DDA debt payments are no longer recorded in the City's Debt Service Fund. The DDA debt payments are recorded in the DDA Debt Service Fund.
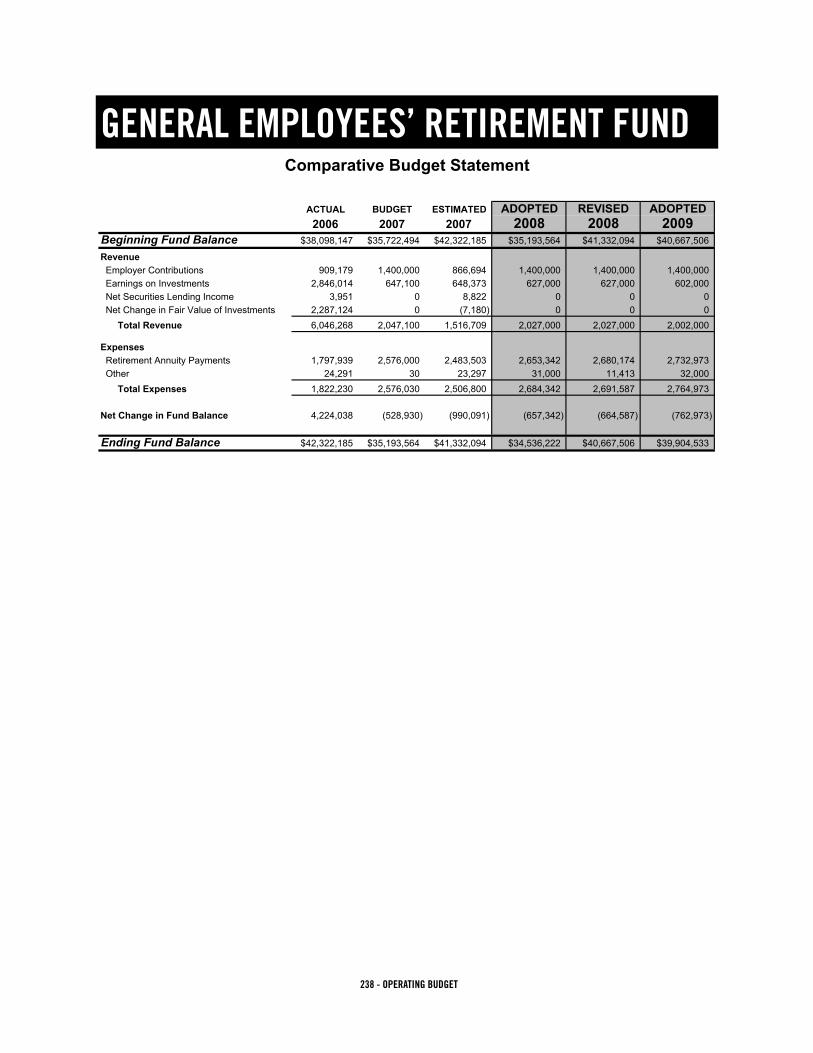
238 - OPERATING BUDGET
GENERAL EMPLOYEES’ RETIREMENT FUND
ACTUAL BUDGET ESTIMATED ADOPTED REVISED ADOPTED2006 2007 2007 2008 2008 2009
Beginning Fund Balance $38,098,147 $35,722,494 $42,322,185 $35,193,564 $41,332,094 $40,667,506
Revenue Employer Contributions 909,179 1,400,000 866,694 1,400,000 1,400,000 1,400,000 Earnings on Investments 2,846,014 647,100 648,373 627,000 627,000 602,000 Net Securities Lending Income 3,951 0 8,822 0 0 0 Net Change in Fair Value of Investments 2,287,124 0 (7,180) 0 0 0
Total Revenue 6,046,268 2,047,100 1,516,709 2,027,000 2,027,000 2,002,000
Expenses Retirement Annuity Payments 1,797,939 2,576,000 2,483,503 2,653,342 2,680,174 2,732,973 Other 24,291 30 23,297 31,000 11,413 32,000
Total Expenses 1,822,230 2,576,030 2,506,800 2,684,342 2,691,587 2,764,973
Net Change in Fund Balance 4,224,038 (528,930) (990,091) (657,342) (664,587) (762,973)
Ending Fund Balance $42,322,185 $35,193,564 $41,332,094 $34,536,222 $40,667,506 $39,904,533
General Employees' Retirement FundComparative Budget Statement

239 - OPERATING BUDGET
NATURAL AREAS FUND
ACTUAL BUDGET ESTIMATED ADOPTED REVISED ADOPTED2006 2007 2007 2008 2008 2009
Beginning Fund Balance $9,090,777 $9,019,750 $9,726,693 $6,507,536 $6,507,536 $2,051,448Revenue Proceeds from Larimer County Sales & Use Tax 3,588,084 3,400,000 3,512,210 3,502,000 3,502,000 3,607,060 Earnings on Investments 437,860 100,000 449,965 200,000 200,000 200,000 Intergovernmental 10,000 976,000 456,200 0 0 0 Fees and Charges for Services 93,669 0 27,877 0 0 0 Miscellaneous 1,165,606 100,000 411,296 125,000 125,000 125,000 Net Increase (Decrease) in the fair value
of Investments 25,579 0 93,936 0 0 0
Total Revenues 5,320,798 4,576,000 4,951,484 3,827,000 3,827,000 3,932,060
Other Financing Sources Transfer from Sales & Use Tax Fund Building Community Choices 567,028 0 0 0 0 0 Transfer from Sales & Use Tax Fund Open Space - Yes 5,003,918 5,845,445 5,767,199 5,424,900 5,424,900 5,533,398 Transfer from General Fund 0 18,500 18,500 0 0 0 Transfer from Capital Projects Fund 0 806,265 806,265 0 0 0
Total Other Financing Sources 5,570,946 6,670,210 6,591,964 5,424,900 5,424,900 5,533,398
Total Revnues and OtherFinancing Sources 10,891,744 11,246,210 11,543,448 9,251,900 9,251,900 9,465,458
Expenditures Land Conservation 3,570,308 3,861,597 6,238,686 916,083 2,866,011 2,349,754 Enforcement 376,127 551,211 517,804 547,647 576,731 631,317 Education 262,853 233,994 257,357 386,036 449,203 387,296 Program Management 688,227 1,001,846 729,725 712,501 857,411 732,105 Resource Management 1,077,220 1,327,129 1,636,446 1,233,935 2,124,971 1,308,354 Public Improvements 2,512,808 2,102,341 2,073,804 3,499,406 4,370,912 2,094,233 Facility Operations 58,954 88,214 576,516 206,942 695,565 213,712 Property Management 272,138 217,294 301,090 307,836 335,974 315,043
Total Expenditures 8,818,635 9,383,626 12,331,427 7,810,386 12,276,777 8,031,815
Grant ExpendituresArchaeological Survey 25,381 0 5,609 0 0 0Bird Survey 0 0 16,380 0 16,380 0
Total Grant Expenditures 25,381 0 21,989 0 16,380 0
Other Financing Uses Transfer to Capital Project Fund 1,680 0 1,005,583 0 0 0 Transfer to Cultural Services & Fac. Fund 24,900 10,500 10,500 23,000 23,000 8,000 Transfer to Capital Leasing Corp. Fund 1,385,231 1,393,107 1,393,106 1,391,831 1,391,831 1,388,356
Total Other Financing Uses 1,411,811 1,403,607 2,409,189 1,414,831 1,414,831 1,396,356
Total Expenditures, Grants and OtherFinancing Uses 10,255,828 10,787,233 14,762,605 9,225,217 13,707,988 9,428,171
Net Change in Fund Balance 635,916 458,977 (3,219,157) 26,683 (4,456,088) 37,287
Ending Fund Balance $9,726,693 $9,478,727 $6,507,536 $6,534,219 $2,051,448 $2,088,735
ReservesReserved for Encumbrances 938,213 0 481,271 0 0 0Reserved for Capital 50,820 0 2,011,237 0 0 0Undesignated 8,737,660 9,478,727 4,015,028 6,534,219 2,051,448 2,088,735
Total Reserves 9,726,693 9,478,727 6,507,536 6,534,219 2,051,448 2,088,735
Natural Areas FundComparative Budget Statement

240 - OPERATING BUDGET
PERPETUAL CARE FUND
ACTUAL BUDGET ESTIMATED ADOPTED REVISED ADOPTED2006 2007 2007 2008 2008 2009
Beginning Fund Balance $1,300,188 $1,337,769 $1,340,232 $1,385,318 $1,406,920 $1,453,682Revenue Perpetual Care Fees 42,957 43,816 43,672 43,000 43,000 43,000 Mausoleum Perpetual Care Fees 4,260 4,345 8,185 4,200 4,200 4,200 Earnings on Investments 15,711 73,000 68,244 70,000 70,000 70,000 Net Change in Fair Value of Investments 46,108 0 12,706 0 0 0
Total Revenue 109,036 121,161 132,807 117,200 117,200 117,200 Expenses Investment Services 594 612 612 438 438 452 Transfer to Cemeteries 68,398 73,000 65,507 70,000 70,000 70,000 Total Expenses 68,992 73,612 66,119 70,438 70,438 70,452
Net Change in Fund Balance 40,044 47,549 66,688 46,762 46,762 46,748
Ending Fund Balance $1,340,232 $1,385,318 $1,406,920 $1,432,080 $1,453,682 $1,500,430
Perpetual Care FundComparative Statement of Income
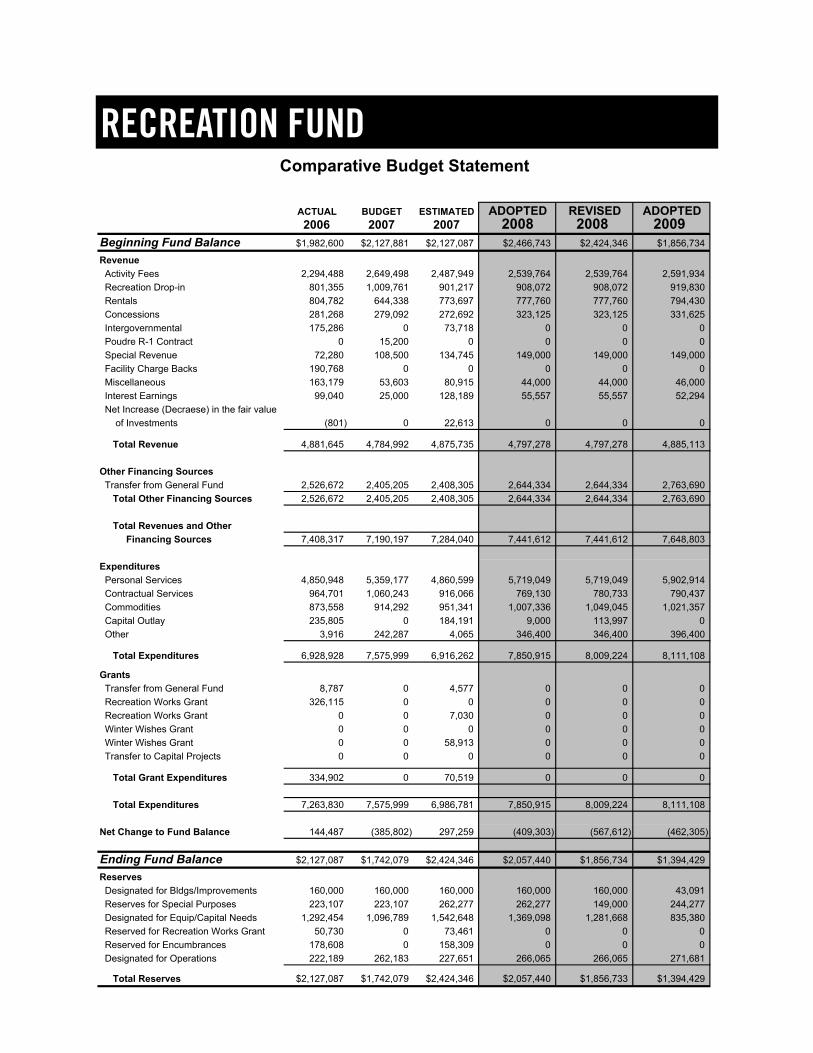
241 - OPERATING BUDGET
RECREATION FUND
ACTUAL BUDGET ESTIMATED ADOPTED REVISED ADOPTED2006 2007 2007 2008 2008 2009
Beginning Fund Balance $1,982,600 $2,127,881 $2,127,087 $2,466,743 $2,424,346 $1,856,734
Revenue Activity Fees 2,294,488 2,649,498 2,487,949 2,539,764 2,539,764 2,591,934 Recreation Drop-in 801,355 1,009,761 901,217 908,072 908,072 919,830 Rentals 804,782 644,338 773,697 777,760 777,760 794,430 Concessions 281,268 279,092 272,692 323,125 323,125 331,625 Intergovernmental 175,286 0 73,718 0 0 0 Poudre R-1 Contract 0 15,200 0 0 0 0 Special Revenue 72,280 108,500 134,745 149,000 149,000 149,000 Facility Charge Backs 190,768 0 0 0 0 0 Miscellaneous 163,179 53,603 80,915 44,000 44,000 46,000 Interest Earnings 99,040 25,000 128,189 55,557 55,557 52,294 Net Increase (Decraese) in the fair value of Investments (801) 0 22,613 0 0 0 Total Revenue 4,881,645 4,784,992 4,875,735 4,797,278 4,797,278 4,885,113
Other Financing Sources Transfer from General Fund 2,526,672 2,405,205 2,408,305 2,644,334 2,644,334 2,763,690 Total Other Financing Sources 2,526,672 2,405,205 2,408,305 2,644,334 2,644,334 2,763,690
Total Revenues and Other Financing Sources 7,408,317 7,190,197 7,284,040 7,441,612 7,441,612 7,648,803
Expenditures Personal Services 4,850,948 5,359,177 4,860,599 5,719,049 5,719,049 5,902,914 Contractual Services 964,701 1,060,243 916,066 769,130 780,733 790,437 Commodities 873,558 914,292 951,341 1,007,336 1,049,045 1,021,357 Capital Outlay 235,805 0 184,191 9,000 113,997 0 Other 3,916 242,287 4,065 346,400 346,400 396,400
Total Expenditures 6,928,928 7,575,999 6,916,262 7,850,915 8,009,224 8,111,108
Grants Transfer from General Fund 8,787 0 4,577 0 0 0 Recreation Works Grant 326,115 0 0 0 0 0 Recreation Works Grant 0 0 7,030 0 0 0 Winter Wishes Grant 0 0 0 0 0 0 Winter Wishes Grant 0 0 58,913 0 0 0 Transfer to Capital Projects 0 0 0 0 0 0
Total Grant Expenditures 334,902 0 70,519 0 0 0
Total Expenditures 7,263,830 7,575,999 6,986,781 7,850,915 8,009,224 8,111,108
Net Change to Fund Balance 144,487 (385,802) 297,259 (409,303) (567,612) (462,305)
Ending Fund Balance $2,127,087 $1,742,079 $2,424,346 $2,057,440 $1,856,734 $1,394,429
Reserves Designated for Bldgs/Improvements 160,000 160,000 160,000 160,000 160,000 43,091 Reserves for Special Purposes 223,107 223,107 262,277 262,277 149,000 244,277 Designated for Equip/Capital Needs 1,292,454 1,096,789 1,542,648 1,369,098 1,281,668 835,380 Reserved for Recreation Works Grant 50,730 0 73,461 0 0 0 Reserved for Encumbrances 178,608 0 158,309 0 0 0 Designated for Operations 222,189 262,183 227,651 266,065 266,065 271,681
Total Reserves $2,127,087 $1,742,079 $2,424,346 $2,057,440 $1,856,733 $1,394,429
Recreation FundComparative Budget Statement

242 - OPERATING BUDGET
SALES & USE TAX FUND
ACTUAL BUDGET ESTIMATED ADOPTED REVISED ADOPTED2006 2007 2007 2008 2008 2009
Beginning Fund Balance $10,142,238 $105,423 $10,078,988 $9,705,881 $11,119,461 $9,245,356Revenue
Sales Tax (2.25) 48,411,878 47,098,523 49,230,883 48,527,390 48,527,390 49,840,160Use Tax (2.25) 8,588,536 8,200,000 9,925,401 8,200,000 8,200,000 8,300,000Sales & Use Administrative Fees 702,682 1,030,118 741,844 1,000,000 1,000,000 1,000,000Sales & Use Tax-Streets & Trans. 5,570,946 5,845,445 5,767,199 5,424,900 5,424,900 5,533,398Sales & Use Tax-Community Enhance. 567,028 0 0 0 0 0Sales & Use Tax-Natural Areas & Parks 567,028 0 0 0 0 0Sales & Use Tax-Natural Areas 5,003,918 5,845,445 5,767,199 5,424,900 5,424,900 5,533,398Sales & Use Tax-Building on Basics 5,003,918 5,845,445 5,767,199 5,424,900 5,424,900 5,533,398Vendor Fee Capital 824,617 0 0 0 0 0Vendor Fee Economic 390,317 290,000 388,443 294,350 294,350 298,765Vendor Fee General Purposes 0 700,000 821,091 1,100,500 1,100,500 1,111,158Master Agreement A-B 994,463 994,438 994,438 994,413 994,413 996,363Interest 210,102 45,946 256,889 146,100 146,100 138,400Net increase in fair value of investments 17,613 0 34,074 0 0 0Miscellaneous 413 0 1,210 0 0 0Transfer from DDA Debt Service 1,442,575 0 0 0 0 0
Total Revenue 78,296,034 75,895,360 79,695,870 76,537,453 76,537,453 78,285,040
ExpendituresManufacturer's Use Tax Rebate 0 250,000 182,087 300,000 300,000 300,000Administrative Fees 702,682 1,030,118 741,844 1,000,000 1,000,000 1,000,000Other 2,308 0 2,376 0 0 0
Total Expenditures 704,990 1,280,118 926,307 1,300,000 1,300,000 1,300,000
Other Financing Sources (Uses)Transfers Out
General Fund (56,493,465) (55,794,471) (58,654,987) (57,973,990) (57,973,990) (59,388,455)General Fund-Use Tax Carryover Res. (1,534,367) 0 0 0 0 0General Fund - Economic Health (390,317) (290,000) (388,443) (294,350) (294,350) (298,765)Debt Service Fund - A-B (994,463) (994,438) (994,438) (994,413) (994,413) (996,363)Debt Service Fund - DDA (1,442,575) 0 0 0 0 0Capital Fund-General City (86,269) 0 (389,625) 0 (274,105) 0Capital Fund-Building on Basics (4,703,918) (5,658,451) (5,580,205) (5,007,216) (5,007,216) (4,903,090)Capital Fund-Community Enhancements (567,028) 0 0 (1,300,000) (1,300,000) 0Natural Areas Fund-Nat Areas & Parks (567,028) 0 0 0 0 0Natural Areas Fund (5,003,918) (5,845,445) (5,767,199) (5,424,900) (5,424,900) (5,533,398)Cultural Services Fund - BOB (150,000) 0 0 0 0 (200,000)General Fund - BOB 0 0 0 (219,000) (219,000) (219,000)Transit Services Fund - BOB (150,000) (155,250) (155,250) (160,684) (160,684) (166,308)Transportation Services Fund - BOB 0 (31,744) (31,744) (38,000) (38,000) (45,000)Transportation Services Fund-Pavement (5,570,946) (5,845,445) (5,767,199) (5,424,900) (5,424,900) (5,533,398)
Total Expenses (Transfers To) (77,654,294) (74,615,244) (77,729,090) (76,837,453) (77,111,558) (77,283,777)Total Expenditures and Other
Financing Uses (78,359,284) (75,895,362) (78,655,397) (78,137,453) (78,411,558) (78,583,777)Excess Revenue Over (Under) Expenses * (63,250) (2) 1,040,473 (1,600,000) (1,874,105) (298,737)Ending Fund Balance $10,078,988 $105,421 $11,119,461 $8,105,881 $9,245,356 $8,946,619 * Expenses in excess of revenue are due to appropriations from reserves.
Sales and Use Tax FundComparative Budget Statement

243 - OPERATING BUDGET
SALES & USE TAX FUND
ACTUAL BUDGET ESTIMATED ADOPTED REVISED ADOPTED2006 2007 2007 2008 2008 2009
Fund BalanceReserved
Principal & Interest $82,869 $82,868 $82,868 $82,868 $82,868 $82,868Unreserved
Capital Projects 663,731 0 274,105 0 0 0Mason Corridor 0 0 1,300,000 0 0 0Sales & Use Tax Accrual 7,724,276 0 7,724,276 7,724,276 7,724,276 7,724,276
UndesignatedUndesignated 1,608,112 22,553 1,438,212 298,737 1,138,212 1,139,475Manufaturer's Rebate 0 0 300,000 0 300,000 0
Total Fund Balance $10,078,988 $105,421 $11,119,461 $8,105,881 $9,245,356 $8,946,619
Sales and Use Tax FundReserves

244 - OPERATING BUDGET
SPECIAL ASSESSMENT DEBT SERVICE FUNDS
ACTUAL BUDGET REVISED ADOPTED ADOPTED2006 2007 2007 2008 2009
Beginning Fund Balance $737,308 $721,602 $773,165 $816,937 $847,937
Revenue Principal Installment 0 0 0 0 0 Interest Installment 0 0 0 0 0 Administrative Charge 0 0 0 0 0 Earnings on Investments 36,111 18,040 36,767 31,000 0 Property Sales & Other 0 0 0 0 0 Net Change in Fair Value of Investments (254) 0 7,005 0 0
Total Revenue 35,857 18,040 43,772 31,000 0Expenses Principal 0 0 0 0 0 Interest 0 0 0 0 0 Administrative Costs & Other 0 0 0 0 0 Transfer to General Fund 0 0 0 0 830,000
Total Expenses 0 0 0 0 830,000Excess of Revenue Over (Under) Expenses 35,857 18,040 43,772 31,000 (830,000)
Ending Fund Balance $773,165 $739,642 $816,937 $847,937 $17,937
Reserves Surplus and Deficiency $773,165 $739,642 $816,937 $847,937 $17,937 Total Reserves $773,165 $739,642 $816,937 $847,937 $17,937
Special Assessment Debt Service FundsConsolidated Statement

245 - OPERATING BUDGET
STREET OVERSIZING FUND
ACTUAL BUDGET ESTIMATED ADOPTED REVISED ADOPTED2006 2007 2007 2008 2008 2009
Beginning Fund Balance $7,050,080 $1,028,550 $4,203,561 $7,867,865 $7,867,865 $6,251,711Revenue Street Oversizing Fee 3,322,480 4,282,205 5,828,359 4,625,526 4,625,526 4,290,532 Interest Earnings 260,150 340,444 251,088 385,246 385,246 417,042 Contributions in Aid of Construction 359,525 100,000 672,093 100,000 616,384 100,000 Miscellaneous 4,225 0 13,310 0 0 0 Net Increase (Decrease) in the fair value
of Investments 51,649 0 98,407 0 0 0
Total Revenue 3,998,028 4,722,649 6,863,257 5,110,772 5,627,156 4,807,574
Other Financing Sources Transfer from General Fund 413,050 413,050 413,050 413,050 413,050 413,050 Transfer from Transportation Fund 0 0 1,400,000 0 0 0
Total Other Financing Sources 413,050 413,050 1,813,050 413,050 413,050 413,050
Total Revenues and Other Financing Sources 4,411,078 5,135,699 8,676,307 5,523,822 6,040,206 5,220,624
Expenditures Administrative Costs 415,516 652,730 678,388 767,135 802,812 796,555 Oversizing Costs 1,142,384 4,247,106 788,875 2,875,202 2,670,694 4,276,423 Traffic Signalization 237,000 237,500 232,321 237,500 237,500 237,500
Total Expenditures 1,794,900 5,137,336 1,699,584 3,879,837 3,711,006 5,310,478
Total Other Financing Uses Transfer to Capital Projects Fund 5,462,697 0 3,312,418 0 2,545,355 0 Transfer to Transportation Services Fund 0 0 0 1,400,000 1,400,000 0 Total Other Financing Uses 5,462,697 0 3,312,418 1,400,000 3,945,355 0
Total Expenditures and OtherFinancing Uses 7,257,598 5,137,336 5,012,002 5,279,837 7,656,361 5,310,478
Net Change to Fund Balance (2,846,519) (1,637) 3,664,305 243,985 (1,616,155) (89,854)
Ending Fund Balance $4,203,561 $1,026,913 $7,867,865 $8,111,850 $6,251,711 $6,161,857Reserves Designated for Operations 94,453 95,511 112,543 88,093 96,151 97,894 Reserved for Capital 1,653,685 0 5,633,305 0 5,633,305 5,633,305 Undesignated 2,418,295 931,402 2,086,341 8,023,757 522,255 430,658 Reserved for Encumbrances 37,128 0 35,677 0 0 0 Total Reserves $4,203,561 $1,026,913 $7,867,865 $8,111,850 $6,251,711 $6,161,857
Street Oversizing FundComparative Budget Statement

246 - OPERATING BUDGET
TRANSIT SERVICES FUND
ACTUAL BUDGET ESTIMATED ADOPTED REVISED ADOPTED2006 2007 2007 2008 2008 2009
Beginning Fund Balance $823,455 $855,298 $1,628,088 $517,706 $2,026,945 $330,294
Revenue ASCSU Contract 339,000 442,000 389,016 377,433 398,756 410,419 Fares 243,688 267,938 270,176 285,735 285,735 290,371 Passes 107,623 146,396 129,174 123,083 123,083 123,901 Medicaid 105,819 41,440 79,502 54,075 54,075 55,155 Miscellaneous 100,885 69,749 63,651 30,103 30,103 30,103 Interest Earnings 29,130 24,769 45,118 45,000 45,000 45,000 Net Change in Fair Value of Investments 17,189 0 5,492 0 0 0 Advertising 189,654 172,105 155,786 207,217 207,217 225,203 FTA 5307 2,422,659 2,026,300 1,911,932 3,797,004 2,299,836 2,444,910 FTA 5309 5,103,560 900,000 445,879 447,995 505,598 535,967 FTA 5310 0 0 77,612 0 0 0 FTA 5311 23,370 0 0 0 0 0 Job Access 191,214 319,900 163,005 119,297 119,297 125,901 CMAQ 289,375 16,173 126,150 0 1,148,000 308,000 Foxtrot (Larimer County Contribution) 28,793 25,919 25,919 40,000 40,000 40,000 Foxtrot (Loveland Contribution) 28,793 74,088 25,919 40,000 40,000 40,000 Miscellaneous Grants 5,000 0 0 0 0 0
Total Revenue 9,225,752 4,526,777 3,914,331 5,566,942 5,296,700 4,674,930
Expenses Personal Services 4,343,960 4,510,742 4,659,399 5,218,040 5,153,041 5,622,722 Contractual Services 2,318,184 2,469,766 2,388,157 2,816,628 2,835,913 2,057,321 Commodities 559,069 952,359 683,222 1,738,459 1,805,250 1,836,896 Capital Outlay 529,002 155,250 24,532 781,997 2,121,941 819,958 Other 3,167 1,445 3,287 3,284 123,284 3,284 Payment of FTA 5307 to Berthoud & Loveland 408,365 408,816 363,498 532,668 532,668 534,704 5309 Capital Purchase 0 1,125,000 334,440 0 0 0
Total Expenses 8,161,747 9,623,378 8,456,535 11,091,076 12,572,097 10,874,885
Excess of Revenue Over (Under)Expenses 1,064,005 (5,096,601) (4,542,204) (5,524,134) (7,275,397) (6,199,955)
Other Financing Sources / Uses Transfer from Sales & Use Tax - BOB 150,000 155,250 155,250 160,684 160,684 166,308 Transfer from Transportation Fund 0 0 0 0 0 0 Transfer from General Fund 4,048,248 4,603,759 4,839,775 5,418,062 5,418,062 5,809,113 Transfer to Capital Projects - DTC 0 0 0 0 0 0 Transfer to Capital Projects - CSU (4,457,620) 0 (53,964) 0 0 0
Total Other Financing Sources / Uses (259,372) 4,759,009 4,941,061 5,578,746 5,578,746 5,975,421
Net Change in Fund Balance 804,633 (337,592) 398,857 54,612 (1,696,651) (224,534)
Ending Fund Balance 1,628,088 517,706 2,026,945 572,318 330,294 105,760
Transit Services FundComparative Budget Statement
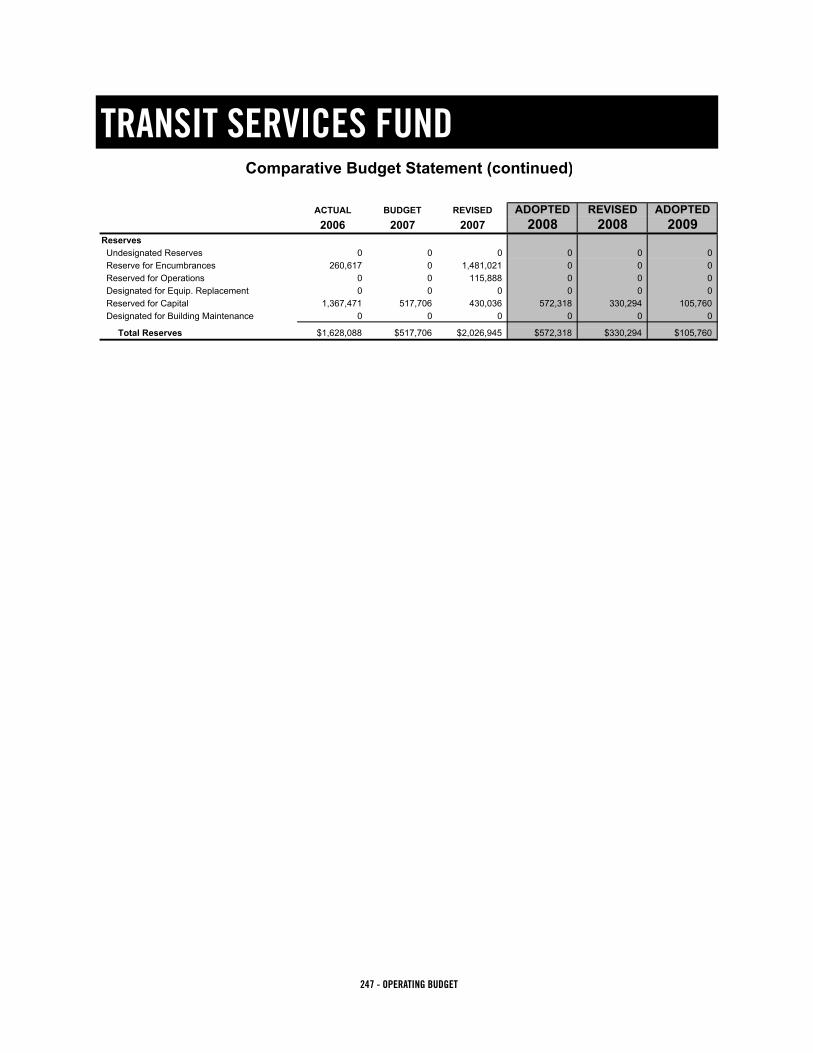
247 - OPERATING BUDGET
TRANSIT SERVICES FUND
ACTUAL BUDGET REVISED ADOPTED REVISED ADOPTED2006 2007 2007 2008 2008 2009
Reserves Undesignated Reserves 0 0 0 0 0 0 Reserve for Encumbrances 260,617 0 1,481,021 0 0 0 Reserved for Operations 0 0 115,888 0 0 0 Designated for Equip. Replacement 0 0 0 0 0 0 Reserved for Capital 1,367,471 517,706 430,036 572,318 330,294 105,760 Designated for Building Maintenance 0 0 0 0 0 0
Total Reserves $1,628,088 $517,706 $2,026,945 $572,318 $330,294 $105,760
Transit Services FundComparative Budget Statement (continued)

248 - OPERATING BUDGET
TRANSPORTATION SERVICES FUND
ACTUAL BUDGET ESTIMATED ADOPTED REVISED ADOPTED
2006 2007 2007 2008 2008 2009Beginning Fund Balance $19,310,985 $13,276,737 $18,344,549 $15,802,638 $15,802,638 $12,246,632Revenues Taxes 1,389,811 1,511,302 1,407,919 1,526,415 1,526,415 1,541,679 Licenses and Permits 146,294 138,850 119,879 101,500 101,500 103,023 Fees and Charges for Service 3,308,153 3,087,265 3,046,468 2,990,393 2,990,393 3,023,284 Intergovernmental 5,988,760 5,872,792 5,766,719 6,823,522 6,944,611 6,177,216 Interest Earnings 994,026 0 670,931 649,237 649,237 646,916 Net Increase (Decrease) in the fair value
of Investments 4,663 0 154,418 0 0 0 Miscellaneous 4,071,966 4,766,306 4,921,145 4,974,262 4,974,262 5,175,603
Total Revenues 15,903,673 15,376,515 16,087,478 17,065,329 17,186,418 16,667,721
Other Financing Sources Lease/Purchase Proceeds 61,293 0 144,972 0 0 0 Transfers in:
General Fund 3,249,217 4,336,978 4,328,746 5,046,981 5,046,981 4,780,531Sales & Use Tax Fund 5,570,946 5,877,189 5,798,943 5,462,900 5,462,900 5,578,398Communications Fund 0 0 37,861 0 0 0Capital Projects Fund 400,000 0 0 0 0 0Street Oversizing Fund 0 0 0 1,400,000 1,400,000 0Transit Services Fund 0 0 0 0 0 0Storm Drainage Fund 112,000 115,940 115,940 115,000 115,000 115,000
Total Other Financing Sources 9,393,456 10,330,107 10,426,462 12,024,881 12,024,881 10,473,929
Total Revenues and Other FinancingSources 25,297,128 25,706,622 26,513,940 29,090,210 29,211,299 27,141,650
Expenditures Personal Services 8,009,311 9,056,870 8,052,601 9,458,609 9,458,609 9,861,111 Contractual Services 11,595,806 12,247,587 11,109,670 12,293,507 15,955,709 12,321,079 Commodities 3,329,499 3,513,935 3,466,849 3,599,382 3,664,441 3,731,029 Capital Outlay 1,299,530 1,094,269 1,345,849 1,159,269 1,521,257 887,091 Other 6,833 (77,035) 6,488 151,213 176,024 11,228
Total Expenditures 24,240,980 25,835,627 23,981,457 26,661,980 30,776,040 26,811,537
Grants CMAQ Web Page 369,006 0 95,465 0 0 0 South College Bikelanes 31,144 0 90,590 0 6,169 0 Downtown River District Improvements 133,914 0 66,086 500,000 500,000 500,000 Harmony Rd. Traffic Responsive 0 0 0 350,000 350,000 0 Comprehensive Signal Timing 0 0 0 300,000 300,000 0 Uninterrupted Power Supply 0 0 0 0 0 187,500 Traveler Information Web Page 0 0 0 0 0 217,500 Downtown Trolley Enhancement 0 0 112 0 134,000 0 Safe Route to School 0 0 11,138 0 9,325 0 FC Bikes 0 0 0 129,602 129,602 130,224 Bike Library 0 0 0 73,500 73,500 73,500
Total Grant Expenditures 534,064 0 263,391 1,353,102 1,502,596 1,108,724
Other Financing Uses Transfers out:
Debt Service Fund 354,918 353,643 353,643 357,625 357,625 356,115Capital Leasing Corporation Fund 129,656 132,831 132,831 131,044 131,044 128,844Transit Services Fund 0 0 0 0 0 0Capital Projects Fund 1,003,947 0 2,924,529 0 0 0Street Oversizing Fund 0 0 1,400,000 0 0 0
Total Other Financing Uses 1,488,521 486,474 4,811,003 488,669 488,669 484,959
Total Expenditures and Other Financing Uses 26,263,564 26,322,101 29,055,851 28,503,751 32,767,305 28,405,220
Net Change to Fund Balance (966,436) (615,479) (2,541,911) 586,459 (3,556,005) (1,263,570)
Transportation FundComparative Budget Statement

249 - OPERATING BUDGET
TRANSPORTATION SERVICES FUND
ACTUAL BUDGET ESTIMATED ADOPTED REVISED ADOPTED
2006 2007 2007 2008 2008 2009Ending Fund Balance $18,344,549 $12,661,259 $15,802,638 $16,389,097 $12,246,632 $10,983,062Reserves Designated for Operations 307,530 341,307 341,307 333,354 333,354 340,022 Reserve for Civic Center Parking Maint. 825,983 917,475 843,358 858,967 708,386 799,878 Reserve for Harmony Transfer Center 140,000 160,000 159,803 179,606 199,409 219,212 Reserve for Harmony Maintenance 13,489,737 11,011,713 9,452,749 11,122,815 9,779,041 10,055,585 Reserve for Capital 350,778 0 241,862 0 241,862 241,862 Reserve for Encumbrances 2,823,139 0 3,815,805 0 0 0 Reserve for Bond Prin. & Interest 29,470 25,677 25,677 25,627 25,627 29,676 Reserve for BOB Future Maintenance 0 0 31,744 69,744 69,744 107,744 Undesignated Reserves 377,912 205,087 890,333 3,798,984 889,209 (810,916) Total Reserves $18,344,549 $12,661,259 $15,802,638 $16,389,097 $12,246,632 $10,983,062
Transportation FundComparative Budget Statement

250 - OPERATING BUDGET
OTHER GOVERNMENTAL FUNDS
DOWNTOWN DEVELOPMENT AUTHORITY (DDA) FUND 2008–$2,895,609OPERATIONS AND MAINTENANCE
The Downtown Development Authority Operations and Maintenance Fund provides a mechanism to account for all costs of general operation of the Authority in its efforts to promote the public health, safety, prosperity, security, and welfare of its inhabitants.
DOWNTOWN DEVELOPMENT AUTHORITY (DDA) FUND 2008-$3,005,439DEBT SERVICE
The Downtown Development Authority Debt Service Fund provides for the accounting of tax increment revenues received from property taxes on property within the District and used to service the debt associated with the District’s tax increment bonds.
GENERAL IMPROVEMENT DISTRICT #1 (GID #1) 2008-$300,000
The General Improvement District #1 Fund provides for the receipt of revenues, including those derived from the District’s mill levy, for the purpose of providing improvements to the District’s downtown area.
POUDRE FIRE AUTHORITY (PFA) FUND 2008-$20,193,251OPERATIONS AND MAINTENANCE
The Poudre Fire Authority Operations and Maintenance Fund is the mechanism used to account for those re-sources to be used for the general operations of the Authority in providing fire protection services.
POUDRE FIRE AUTHORITY (PFA) FUND CAPITAL 2008-$2,808,000
Poudre Fire Authority Capital Projects Fund is used to account for financial resources to be used for the capital needs of the PFA, including land acquisition, construction of additional stations, and the acquisition of fire fight-ing apparatus.

251 - OPERATING BUDGET
DOWNTOWN DEVELOPMENT AUTHORITY
ACTUAL BUDGET ESTIMATED ADOPTED REVISED2006 2007 2007 2008 2008
Beginning Fund Balance $5,465,465 $3,245,176 $3,538,595 $3,106,356 $8,168,184Revenue Property Tax 408,663 440,000 421,230 430,000 430,000 Auto Specific Ownership Tax 40,286 43,100 38,390 42,000 42,000 Interest Earnings 219,441 150,000 349,308 221,864 221,864 License and Permits 1,800 2,700 1,800 1,800 1,800 Contributions - Enterprise Zone 48,508 40,000 141,637 60,000 60,000 Colorado Historical Grant 0 0 0 0 0 Miscellaneous-POTS Plaza Improvements 4,500 0 69 0 0 Donations - Cultural Program 0 0 0 0 0 Project Management 0 120,000 217,166 150,540 150,540
Total Revenue 723,198 795,800 1,169,599 906,204 906,204
Expenses Personal Services 239,869 264,948 541,071 759,225 759,225 Contractual Services 391,791 313,920 512,287 1,714,882 1,274,302 Commodities 6,573 8,050 48,151 44,502 48,302
Total Expenses 638,233 586,918 1,101,508 2,518,609 2,081,829
Excess of Revenue Over (Under) Expenses 84,965 208,882 68,091 (1,612,405) (1,175,625)
Other Revenue (Expenses) Bond Proceeds 0 0 5,700,000 0 0 Other (Contingency) 0 (5,000) 0 (315,000) (15,000) Loan Repayment - Interest 0 0 0 0 0 Other Capital Projects (11,354) (100,000) (11,204) (62,000) (62,000) Larimer County Treasurer's Fee (8,178) (12,000) (8,433) Progressive Old Town Square Plaza Improvements (22,205) 0 (14,667) Enterprise Zone (49,872) (40,000) (138,571) Downtown Maintenance/Security (87,768) (140,702) (72,768) Transfer to Capital Projects Fund 0 0 0 0 0 Bond Issuance Costs (4,500) (50,000) (32,500) 0 0 DDA Projects - (Bonds) (1,827,958) 0 (1,732,548) 0 (6,222,102)
Total Other Revenue (Expenses) (2,011,835) (347,702) 4,561,498 (377,000) (6,299,102)
Ending Fund Balance $3,538,595 $3,106,356 $8,168,184 $1,116,951 $693,457Reserves Undesignated Reserve $3,403,131 $2,970,892 $2,566,696 $981,487 $557,993 Reserved for Encumbrances 0 0 5,466,024 0 0 Reserved for Inventory 135,464 135,464 135,464 135,464 135,464
Total Reserves $3,538,595 $3,106,356 $8,168,184 $1,116,951 $693,457
Downtown Development AuthorityOperations & Maintenance
Comparative Budget Statement

252 - OPERATING BUDGET
DOWNTOWN DEVELOPMENT AUTHORITY DEBT SERVICE FUND
ACTUAL BUDGET ESTIMATED ADOPTED2006 2007 2007 2008
Beginning Fund Balance $53,898 $1,481,255 $1,481,255 $2,501,459Revenue Tax Increment Collections 3,320,341 3,680,243 3,682,571 3,938,410 Earnings on Investments 78,170 60,000 185,592 60,000
Total Revenue 3,398,511 3,740,243 3,868,163 3,998,410
Other Revenue (Expenses) Transfer to Sales & Use Tax Fund (1,442,575) 0 0 0 Transfer to Capital Leasing Corporation Fund (1998) (281,149) (281,824) (117,419) (282,079) 2004 Bond Principal Repayment 0 (1,160,000) (1,160,000) 0 2007 Bond Principal Repayment 0 0 (1,085,000) (2,270,000) 2004 Bond Interest Repayments (247,430) (247,430) (247,430) 0 2007 Bond Interest Repayments 0 0 (238,109) (453,360) Total Other Revenue (Expenses) (1,971,154) (1,689,254) (2,847,958) (3,005,439)Ending Fund Balance $1,481,255 $3,532,244 $2,501,459 $3,494,430
Downtown Development AuthorityDebt Service Fund
Comparative Budget Statement

253 - OPERATING BUDGET
GENERAL IMPROVEMENT DISTRICT #1
ACTUAL BUDGET ESTIMATED ADOPTED2006 2007 2007 2008
Beginning Fund Balance $986,817 $717,149 $717,149 $954,372Revenue Property Tax 198,765 197,883 198,291 240,000 Auto Specific Ownership Tax 29,898 30,000 30,189 30,000 Interest Earnings 37,932 12,117 53,356 30,000 Miscellaneous Revenue 0 0 0 0
Total Revenue 266,595 240,000 281,836 300,000
Expenses Administration Rebates 193 13,000 5,273 15,500 Maintenance/Repairs 0 8,000 0 8,000 Larimer County Treasurer's Fee 6,013 7,000 6,182 12,000 Other 250 0 125 39,355 Electricity & Water Total 2,176 1,500 1,428 1,500
Projects Transfer from capital projects fund 0 0 0 0 General 0 68,660 0 0 Oak Street Plaza Park 312,575 0 0 0 Transfer to Capital Leasing Corporation 143,280 141,840 31,605 145,120 Transfer to General Fund 71,776 0 0 78,525
Total Expenses 536,262 240,000 44,613 300,000
Total Revenue Over (Under) Expenses (269,667) 0 237,223 0Ending Fund Balance $717,149 $717,149 $954,372 $954,372
General Improvement District #1Comparative Budget Statement

254 - OPERATING BUDGET
POUDRE FIRE AUTHORITY OPERATIONS & BUDGET STATEMENT
ACTUAL BUDGET ESTIMATED ADOPTED2006 2007 2007 2008
Beginning Fund Balance $2,744,914 $1,633,523 $2,149,381 $2,827,921Revenue Contribution-City of Ft. Collins 14,193,964 14,634,410 14,637,932 15,449,360 Contribution-City of Ft. Collins Utilities 40,000 47,689 47,689 49,120 Contribution-District 3,779,864 3,970,864 3,970,864 4,109,844 Permits & Sprinkler Fees 168,555 97,344 182,345 109,960 Interest Earnings 67,597 44,816 129,272 47,057 Miscellaneous 149,276 52,448 171,981 54,070 Grant Revenue 42,690 0 9,478 0 NCRN - Radio Maintenance 90,567 70,000 95,667 70,000 Emergency Management 35,527 14,000 10,100 14,000 Plan Check Fees 364,535 238,129 441,007 279,840 Wildfire 201,641 0 222,501 0 Entry Systems 7,370 10,000 8,763 10,000 Net Increase (Decrease) in the fair value
of Investments 23,122 0 29,792 0
Total Revenues 19,164,708 19,179,700 19,957,392 20,193,251
Expenditures Administration 1,670,953 1,872,315 1,694,842 1,963,704 Operations 15,438,555 16,250,826 16,503,480 17,077,128 Fire Prevention 983,057 1,060,075 1,061,081 1,152,419
Total Expenditures 18,092,565 19,183,216 19,259,404 20,193,251
Grant Expenditures DOJ Grant 0 0 0 0 FY03 Fire Ops & Firefighter Safety 0 0 0 0 CSFS Wildland Project 0 0 6,990 0 COLO Wildland Project 0 0 3,360 0 2005-06 Wildfire Plan 3,585 0 0 0 DOJ Grant - Compressor 53,131 0 0 0 Restoration - 1953 Pumper Eng 4,390 0 9,097 0
Total Grant Expenditures 61,106 0 19,447 0
Other Financing Uses Transfer to Capital Projects Fund 1,606,571 0 0 1,300,000
Total Expenditures, Grants andOther Financing Uses 19,760,242 19,183,216 19,278,851 21,493,251
Net Change in Fund Balance (595,534) (3,516) 678,541 (1,300,000)
Ending Fund Balance $2,149,381 $1,630,007 $2,827,921 $1,527,921Reserves Reserve for Operations 325,961 396,922 396,922 423,473 Undesignated Reserve 1,526,781 1,047,909 2,245,823 919,272 Reserve for NCRCN 42,880 75,958 75,958 75,958 Reserve for Encumbrances 144,541 0 0 0 Workmens Comp Reserve 109,218 109,218 109,218 109,218
Total Reserves $2,149,381 $1,630,007 $2,827,921 $1,527,921
Poudre Fire AuthorityOperations & Maintenance
Comparative Budget Statement

255 - OPERATING BUDGET
POUDRE FIRE AUTHORITY CAPITAL PROJECTS BUDGET STATEMENT
ACTUAL BUDGET ESTIMATED ADOPTED2006 2007 2007 2008
Beginning Fund Balance $2,425,781 $5,886,015 $5,947,182 $8,252,900Revenues Contribution-City of Fort Collins 973,193 867,418 867,408 933,740 Contribution-City of Fort Collins/ExFees 1,400,176 0 0 0 Contribution-District 0 0 0 0 Transfer From PFA - O&M 1,606,571 0 0 1,300,000 Interest Earnings 160,729 43,652 283,364 89,159 Radio Tower Lease 19,200 0 19,200 Project Savings 0 0 0 Bond Proceeds 0 0 3,160,000 0 Miscellaneous 1,142,517 1,250 24,548 1,250 Net Increase (Decrease) in the fair value
of Investments 10,232 58,728 0
Total Revenues 5,293,418 931,520 4,394,047 2,343,349
Expenses Apparatus Replacement 173,637 0 27,842 800,000 Burn Building 103 8,000 4,449 8,000 Station #4 1,434 0 60,317 0 Station #5 Remodel 357,693 0 0 0 Station #8 0 0 23 0 Station #9 0 0 0 0 Station #12 0 0 0 0 Station #14 0 0 0 0 Station #15 44,579 0 53 0 Training Building C 0 0 308 2,000,000 Multipurpose Building 157 0 0 0 Administration Building 179 0 1,968,055 0 Future Facilities 1,194,234 0 27,282 0
Total Expenses 1,772,017 8,000 2,088,329 2,808,000Ending Fund Balance $5,947,182 $6,809,535 $8,252,900 $7,788,249Combined O&M and Capital $8,096,562 $8,439,542 $11,080,821 $9,316,170
Capital ProjectsComparative Budget Statement
Poudre Fire Authority

256 - OPERATING BUDGET
THIS PAGE LEFT INTENTIONALLY BLANK

257 - OPERATING BUDGET
DEBT POSITION
OVERVIEW AND DEBT FINANCING PRINCIPLES
The ability to use long-term financing adds flexibility to municipalities. Like many other local governments, Fort Collins uses debt to acquire equipment or build improvements that will provide services or benefits for several years. Sustained growth challenges a local government’s ability to construct a wide range of public facilities to meet the service demands of residents. Often, there is a time lag from service demands of growth and the cor-responding growth in revenue sources, particularly tax sources.
Communitieshavethreebasicchoicestomeetthedemandforpublicfacilities:pay-as-you-gofinancing,debtfi-nancing and public-private ventures. Relying too heavily on any one of the financing options can jeopardize a lo-cal government’s fiscal health. Over-reliance on one technique may also reduce its ability to respond to changes in economic and demographic conditions. Determining the appropriate combination of financing techniques to meet Fort Collins’ needs has been a major challenge for decision-makers.
Between 1970 and 1980, the population of Fort Collins grew at an annual rate of more than four percent. While the pace of growth subsided during the 1980s, it remained at or about three percent per year. In the 1990s, the growth rate has edged lower to about 2.8 percent per year. In response to growth in demand for services, the City used all three financing techniques to finance public facilities. The chart below displays the rapid rise in the total amount of debt in the early 1980s and its later stabilization. The large increase in 1998 and 1999 is due to the debt issued for water and stormwater utility improvements and the downtown civic center projects –theparkingstructureandnewadministrativeofficebuilding.Theincreasein2004isduetothedebtissuedfor funding a new police services building, reconstruction of a transportation facility, and the acquisition of open space in the region under the City natural’s areas program.
Chart 1. Outstanding Debt at Year-end 1980-2009
City of Fort Collins Debt Position
Overview and Debt Financing Principles
The ability to use long-term financing adds flexibility to municipalities. Like many other local governments, Fort Collins uses debt to acquire equipment or build improvements that will provide services or benefits for several years. Sustained growth challenges a local government's ability to construct a wide range of public facilities to meet the service demands of residents. Often, there is a time lag from service demands of growth and the corresponding growth in revenue sources, particularly tax sources.
Communities have three basic choices to meet the demand for public facilities: pay-as-you-go financing, debt financing and public-private ventures. Relying too heavily on any one of the financing options can jeopardize a local government's fiscal health. Over-reliance on one technique may also reduce its ability to respond to changes in economic and demographic conditions. Determining the appropriate combination of financing techniques to meet Fort Collins' needs has been a major challenge for decision-makers.
Between 1970 and 1980, the population of Fort Collins grew at an annual rate of more than four percent. While the pace of growth subsided during the 1980s, it remained at or about three percent per year. In the 1990s, the growth rate has edged lower to about 2.8 percent per year. In response to growth in demand for services, the City used all three financing techniques to finance public facilities. The chart below displays the rapid rise in the total amount of debt in the early 1980s and its later stabilization. The large increase in 1998 and 1999 is due to the debt issued for water and stormwater utility improvements and the downtown civic center projects – the parking structure and new administrative office building. The increase in 2004 is due to the debt issued for funding a new police services building, reconstruction of a transportation facility, and the acquisition of open space in the region under the City natural’s areas program.
Chart 1. City of Fort Collins, ColoradoOutstanding Debt at Year-end 1980-2009
1220
36 41
80
96
139137143148
141140
168163153
144137142
178
195188187185
172
213
198
183
167
150
131
0
25
50
75
100
125
150
175
200
225
250
1980
1982
1984
1986
1988
1990
1992
1994
1996
1998
2000
2002
2004
2006
2008
Year
$ in
mill
ions
258 - OPERATING BUDGET
In addition to the use of debt financing, the City primarily uses the pay-as-you-go financing method in its capital programs. In some instances, the City has also used joint ventures with private developers to provide needed facilities and infrastructure.
Debt financing allows construction of improvements in advance of or as the need arises rather than delaying projects until enough revenue is accumulated. By using debt financing, the costs of the improvements will be more fairly distributed to the users over the expected useful life.
The goal of Fort Collins’ debt policy is to maintain the ability to provide high quality essential city services in a cost-effective manner. City officials balance service needs with maintaining the ability to borrow at the lowest possible rates. To soundly finance a project through the issuance of long-term debt, the City uses the following guidelines:
•Revenuesourcesusedtopayoffthedebtwillbebasedonconservativeprojections. •Thefinancingoftheimprovementwillnotexceeditsusefullife. •Thebenefitsoftheimprovementmustoutweighitscosts,includingtheinterestcostsoffinancing.
Through the application of these policies, the Council rigorously tests the demand for debt financing.
While other cities may use debt to cover deficits (annual expenditures greater than annual revenue) and to cover short-term cash flow difficulties, Fort Collins limits debt to essential and necessary capital projects. The two-year budget integrates debt financed projects into the City’s capital improvement plan which also includes significant pay-as-you-go projects. The budget links all capital projects to the services that the City has decided to provide to its residents and visitors.
TYPES OF CITY DEBT
The source of authority for debt financing is the City Charter. The Charter lists the following securities to evidence indebtedness:
•Short-termnotes •Generalobligationsecurities •Revenuesecurities •Refundingsecurities •TaxincrementandothersecuritiesnotincontraventionwiththeCharter.

259 - OPERATING BUDGET
Table 1. Outstanding Debt at Year-end: Actual 2007; Projected 2008 & 2009
The following table presents a synopsis of City debt. The table distinguishes between general government (tax supported) debt and debt of City-operated (fee supported) enterprises.
The City prefers to use securities supported by specific revenue sources, rather than rely on the pledge of gen-eral obligation (property tax supported) debt. In part, this is due to a state constitutional limitation on the amount of general obligation debt. Total general obligation debt may not exceed 10 percent of the assessed valuation of the property. An important exclusion from this calculation is debt issued for water rights and water treatment facilities.
The City does not have any outstanding general obligation debt subject to the state constitution debt limit. The debt for water rights and treatment facilities does not count in the City’s debt burden for purposes of the limita-tion. This means that the City has conserved its general obligation issuance capacity for future projects to be approved by the voters. The pie charts below graphically display the City’s debt structure, emphasizing the large share of enterprise operations as well as the capital program for governmental funds.
Table 1. City of Fort Collins, ColoradoDebt Outstanding at Year-end:
Actual 2007; Projected 2008 & 2009
Actual Projected Projected 2007 2008 2009
Government Debt
Sales Tax Revenue Bonds $ 1,900,000 $ 965,000 $ 0 Downtown Development Authority 5,075,000 3,880,000 1,610,000 Tax Increment Highway Users Tax Revenue 1,441,863 1,285,000 985,000
Total-Government $ 8,416,863 $ 6,130,000 $ 2,595,000
Enterprise Fund Debt
Colorado Drinking Water Loan $ 8,901,113 $ 8,142,313 $ 7,364,331 Water Revenue Bonds* 22,370,391 20,647,282 18,850,157 General Obligation Water Bonds 5,000,000 2,535,000 0 Sewer Revenue Bonds 11,105,000 8,390,000 5,560,000 Colorado Clean-Water Loan 8,960,986 7,594,864 6,188,329 Storm Drainage Revenue Bonds 32,000,000 29,925,000 27,705,000 Colorado Water Pollution Loan 7,265,000 6,830,000 6,382,500
Total-Enterprise $95,602,490 $83,964,459 $72,050,317
Total Outstanding Debt $104,019,353 $90,094,459 $74,645,317
Other Obligations
Capital Lease Obligations $ 63,116,000 $ 59,838,000 $ 56,438,000
Grand Total Debt and Other Obligations $167,135,353 $149,932,459 $131,083,317
*Includes Subordinate Water Revenue bond dated 12/01/03 issued January 2004.
The City prefers to use securities supported by specific revenue sources, rather than rely on the pledge of general obligation (property tax supported) debt. In part, this is due to a state constitutional limitation on the amount of general obligation debt. Total general obligation debt may not exceed 10 percent of the assessed valuation of the property. An important exclusion from this calculation is debt issued for water rights and water treatment facilities.
The City does not have any outstanding general obligation debt subject to the state constitution debt limit. The debt for water rights and treatment facilities does not count in the City's debt burden for purposes of the limitation. This means that the City has conserved its general obligation issuance capacity for future projects to be approved by the voters. The pie charts below graphically display the City's debt structure, emphasizing the large share of enterprise operations as well as the capital program for governmental funds.

260 - OPERATING BUDGET
Chart 2. Total City Debt By Category 2007 Debt & Capital Lease Obligations at Year-end = $167,135,353
As Chart 2 shows, the City uses specific revenue sources to support specific projects. Fees and charges to cus-tomers support water and wastewater projects. Customers within specific storm water basins that have improve-ments constructed therein pay for them through capital fee charges. The Downtown Development Authority debt is payable through the property tax that is assessed on the additional value that has been added since the base year. Sales tax revenue supports several projects that are of more general use. Specific dedicated sales tax revenues approved by the voters are also used to support community projects and the acquisition of open space under the City’s natural areas program.
The City issued a large portion of the outstanding sewer, water, and sales tax debt to support improvements for the Anheuser-Busch brewery. Through a master agreement, Anheuser-Busch pays its portion of the debt service. Anheuser-Busch received a credit for sales and use tax and property tax revenues collected during the construction period. Since the production phase began, the master agreement limits the credit to a share of the property tax paid by the project and supplemental user payments from Anheuser-Busch.
In 2008, Anheuser-Busch will pay a significant portion of debt service to the City. The total amounts to about $4.5millionof theCity’sannualdebtservice for theSalesandUseTaxBonds,SewerRevenueBonds,andGeneralObligationWaterRevenueBonds.Thesesharesoftotaldebtserviceare$1.0millionforSalesTax,$2.7millionforSewer,and$775,000forWater.
BOND RATINGS
To attain the lowest possible interest rates and to be sure it has the widest markets for its bonds, the City obtains a credit rating from the major rating services. The stronger the rating, the lower the interest rate assigned and as a result, a lower cost to taxpayers and users of City services. In some cases, the City may also purchase insur-ance when the economic analysis shows more benefit than cost. Bond insurance provides additional support for the creditworthiness of the bonds and improves (lowers) the interest costs. The two major rating services are Standard & Poor’s and Moody’s Investors Service. A comparison of their respective ratings and their meaning is presented in Table 2.
Chart 2. City of Fort Collins, ColoradoTotal City Debt By Category
2007 Debt & Capital Lease Obligations at Year-end = $167,135,353
Governmental Funds Enterprise Funds $71,532,863 - 42.8% $95,602,490 - 57.2%
Sales & Use Tax
3%
DDA7%
Highway Users
2%
Lease COPs88% Sewer
Bonds21%
Water Bonds38%
Storm Drainage
41%
As Chart 2 shows, the City uses specific revenue sources to support specific projects. Fees and charges to customers support water and wastewater projects. Customers within specific storm water basins that have improvements constructed therein pay for them through capital fee charges. The Downtown Development Authority debt is payable through the property tax that is assessed on the additional value that has been added since the base year. Sales tax revenue supports several projects that are of more general use. Specific dedicated sales tax revenues approved by the voters are also used to support community projects and the acquisition of open space under the City’s natural areas program.
The City issued a large portion of the outstanding sewer, water, and sales tax debt to support improvements for the Anheuser-Busch brewery. Through a master agreement, Anheuser-Busch pays its portion of the debt service. Anheuser-Busch received a credit for sales and use tax and property tax revenues collected during the construction period. Since the production phase began, the master agreement limits the credit to a share of the property tax paid by the project and supplemental user payments from Anheuser-Busch.
In 2008, Anheuser-Busch will pay a significant portion of debt service to the City. The total amounts to about $4.5 million of the City's annual debt service for the Sales and Use Tax Bonds, Sewer Revenue Bonds, and General Obligation Water Revenue Bonds. These shares of total debt service are $1.0 million for Sales Tax, $2.7 million for Sewer, and $775,000 for Water.
Bond Ratings
To attain the lowest possible interest rates and to be sure it has the widest markets for its bonds, the City obtains a credit rating from the major rating services. The stronger the rating, the lower the interest rate assigned and as a result, a lower cost to taxpayers and users of City

261 - OPERATING BUDGET
TABLE 2. MOODY’S AND STANDARD & POOR’S CREDIT RATINGS FOR MUNICIPAL BONDS
MOST RECENT BOND ISSUES
From1995to1998,atotalof$33millionofnewmoneybondsandloans,$25millionofrefundingbonds,and$17.2millionofleasepurchasecertificatesofparticipationwereissued.From1999to2003,atotalof$41.1millionofnewmoneybondsandloans,$31.4millionofrefundingbonds,and$7.1millionofleasepurchasecertificatesofparticipationwereissuedIn2004and2005theCity,itsutilities,andtheDowntownDevelopmentAuthorityissued$8.6millionofnewbondeddebt,$11.4millionofrefundeddebtand$48.6millionofleasepurchasecertificatesofparticipation.In2007,theCityrefunded$33.9millionindebt.
services. In some cases, the City may also purchase insurance when the economic analysis shows more benefit than cost. Bond insurance provides additional support for the creditworthiness of the bonds and improves (lowers) the interest costs. The two major rating services are Standard & Poor's and Moody's Investors Service. A comparison of their respective ratings and their meaning is presented in Table 2.
Table 2. Moody’s and Standard & Poor’sCredit Ratings for Municipal Bonds
Rating Description
Moody's Standard & Poor’s
Aaa AAA Best quality, extremely strong capacity to pay principal and interest
Aa AA High quality, very strong capacity to pay principal and interest
A A Upper medium quality, strong capacity to pay principal and interest
Baa BBB Medium grade quality, adequate capacity to pay principal and interest.
Ba and BB and Speculative quality, low capacity to lower lower pay principal and interest.
Note: Within groups, Moody's designates those bonds with the strongest attributes with a 1, for Instance A1 or Aa1 would be of slightly higher quality than A2 or Aa2. Standard & Poor's attaches “+” or a “-” to indicate slight variation within the rating groups. Examples would be AA- or A+ to indicate a credit better than an “A” but less than an “AA.”
Bonds issued by the City of Fort Collins continue to receive and maintain very favorable ratings from both rating agencies. The most recent bond ratings are:
Moody's Standard & Poor’sGeneral Obligation Water Bonds Aa1 AA Sales & Use Tax- Revenue Bonds* Aa2 No rating Sewer Revenue Bonds* A1 No rating Storm Drainage Revenue Bonds A1 AA- Water Revenue Bonds A2 AA- Highway Users Tax Revenue Bonds Aa2 No rating Lease Certificates of Participation Aa2 No rating
*Fitch has rated the City’s Sales & Use Tax Revenue Bonds “AA” and the City’s Sewer Revenue Bonds “AA-“.

262 - OPERATING BUDGET
REFUNDING ISSUES:
When interest rates decline, Fort Collins may reduce its total debt service by refunding outstanding debt. The City may also restructure debt issues if projected revenue sources are not meeting debt service demands. The City Finance Department monitors changes in interest rates and checks the debt structure of its issues. When appropriate, the City has refunded and restructured debt. Over the past few years, interest rates on municipal bonds have declined to the lowest rates in over 15 years. This situation provided the City an opportunity to lower theamountofdebtserviceitpaysonbondissues.Thefollowingbondrefundingwascompletedin2007:
2007 Fort Collins Leasing Corporation Lease Certificates of Participation. On May 3, 2007, the Fort Collins Leas-ing Corporation completed a refunding of its 1998 and 1999 Certificates of Participation. The amount of bonds refundedtotaled$14,595,000.Therefundingloweredtheinterestrateto3.86%.
2007 Stormwater Revenue Refunding Bonds.OnAugust3andSeptember4,2007,theCity’sStormwaterUtilityEnterprise completed a refunding of its 1997 Stormwater Revenue Refunding Bonds and 1999 Revenue Bonds. Theamountofbondsrefundedtotaled$21,800,000.Therefundingloweredtheinterestrateto4.086%.
OPERATING EQUIPMENT LEASE PURCHASE
In Colorado, the legal definition of debt does not include lease purchase obligations. Despite the legal distinction, the City recognizes lease purchase as a multi-year financing arrangement and includes lease purchase in debt calculations.
The reasons for using lease purchase are virtually the same as those used to justify bond financing. The City uses lease purchase to acquire equipment with a useful life of three to ten years. The City uses the equipment to provide services, but pays off the lease purchase over the life of the equipment. Total lease purchase obliga-tionsoutstandingattheendofeachofthepriorfiveyearshavebeenasfollows:
2002 5,575,006 2003 5,386,787 2004 4,883,575 2005 3,725,968 2006 3,115,284
Lease purchase activity in 2007 included the acquisition of equipment for the Police Department, and Golf operations.Thetotalamountofthe2007leaseis$1,067,585andmaximumannualleasepaymentswillbe$238,194.
For the equipment currently on lease purchase at year-end 2007, the City anticipates the following payment schedulefortheperiod2008through2012:
2008 930,763 2009 844,323 2010 652,750 2011 546,385 2012 117,221
In2008,theFinanceDepartmentanticipatesthattwoequipmentleaseswillbecompleted,approximately$1.1million of additional lease obligation principal.

263 - OPERATING BUDGET
Unless users decide equipment associated with the lease payment schedule is no longer necessary, future lease payments will be appropriated as part of the budget. Council treats lease purchase obligations like debt service obligations. To date, all City lease purchase transactions have been done with leasing firms. Credit ratings for equipment lease transactions would not provide any economic benefit because the transactions are too small. If the size of the transactions continues to increase, future lease purchasing obligations may be done with a credit rating. City Council most recently reaffirmed its lease purchase policy as part of the Financial and Management Policies for the 2008-2009 Budget.
DEBT MANAGEMENT POLICIES
In the 1991 Budget, the Council set the policy to monitor and manage its direct debt. The policy made general government annual debt service as a percent of general government operating expenses as the key debt indica-tor. The Council set a goal of 10 to 12 percent of annual operating expenses as the upper limit target for its debt policy. This level of debt service is a common measure of an issuer’s ability to pay its obligations. In 1997, the Council revised the upper limit level to 15% of operating expenses and also simplified the calculation. When the Council adopted the 2008-2009 Budget, it reaffirmed the limit of 15%.
The following chart shows the City general government debt service percentage of operating expenses over past years and the five-year budget projection period.
Chart 3. General Government Debt as a Percent of Annual Operating Expense, 1980 - 2009
The chart shows that the debt service share of annual operating expense began to diminish in 1989. The general trend is downward since then with only two major increases. The 1991 increase was due to prepayment of debt service for special districts, the General Improvement District bonds and some general obligation park bonds. The2005increaseisduetodebtserviceonthe2004LeaseCertificatesofParticipationincludingprincipalpay-ments for the first time. The chart also shows the City now has some unused debt capacity within its policy.
Debt Management Policies
In the 1991 Budget, the Council set the policy to monitor and manage its direct debt. The policy made general government annual debt service as a percent of general government operating expenses as the key debt indicator. The Council set a goal of 10 to 12 percent of annual operating expenses as the upper limit target for its debt policy. This level of debt service is a common measure of an issuer's ability to pay its obligations. In 1997, the Council revised the upper limit level to 15% of operating expenses and also simplified the calculation. When the Council adopted the 2008-2009 Budget, it reaffirmed the limit of 15%.
The following chart shows the City general government debt service percentage of operating expenses over past years and the five-year budget projection period.
Chart 3. City of Fort Collins, ColoradoGeneral Government Debt as a Percent of Annual Operating Expense, 1980 - 2009
0%
5%
10%
15%
20%
25%
30%
1980
1982
1984
1986
1988
1990
1992
1994
1996
1998
2000
2002
2004
2006
2008
Year
Per
cen
t
Actual
Target
The chart shows that the debt service share of annual operating expense began to diminish in 1989. The general trend is downward since then with only two major increases. The 1991 increase was due to prepayment of debt service for special districts, the General Improvement District bonds and some general obligation park bonds. The 2005 increase is due to debt service on the 2004 Lease Certificates of Participation including principal payments for the first time. The chart also shows the City now has some unused debt capacity within its policy.
Future Debt and Capital Lease Obligation Planning
Governmental Functions. In the five-year budget planning horizon, the City has not planned for additional bonded indebtedness for general government operations. The City will complete most major capital improvements for general government operations on a pay-as-you-go basis through the next round of capital project programming. The current program is called Building On Basics; it expires in 2016.
Enterprise Functions. The long-range capital plans of the enterprise funds contemplate significant debt financing activity at the Mulberry Water Treatment Facility.
264 - OPERATING BUDGET
FUTURE DEBT AND CAPITAL LEASE OBLIGATION PLANNING
Governmental Functions. In the five-year budget planning horizon, the City has not planned for additional bond-ed indebtedness for general government operations. The City will complete most major capital improvements for general government operations on a pay-as-you-go basis through the next round of capital project programming. The current program is called Building On Basics; it expires in 2016.
Enterprise Functions. The long-range capital plans of the enterprise funds contemplate significant debt financ-ing activity at the Mulberry Water Treatment Facility.
The wastewater fund revised its capital needs during the 2008-2009 budget process. In the upcoming five-year period,thewastewaterutilityhasidentifiedone$30milliondollar issuein2009.Theproceedswillbeusedto design and construct new secondary treatment for the failing trickling filter and provide odor control for the preliminary and primary treatment processes at the Mulberry Water Treatment Facility.
The water utility revised its capital needs in the 2008-2009 budget process. The water utility does not anticipate a bond issue with this budget cycle. Long-range capital plans based on comprehensive asset management implementation anticipate future debt obligations to replace aging infrastructure systems.
Thestormwaterutilityissued$12.3millionofbondsin2002asdirectedintheStormwaterFinancingPlantoprovide the initial capital for stormwater projects in response to the needs identified after the 1997 flood. The City used the funds to build and improve several drainage basins. Per Council direction, the stormwater utility has continued to finance capital improvements on a pay-as-you-go basis; therefore, the utility does not anticipate any new debt during the five year budget horizon.
The electric utility anticipates that its capital needs will be financed on a pay-as-you-go basis. In the five-year budget period the utility has not included any debt. Long-term capital plans may include debt for capital infra-structure replacement.
CONCLUSION
City Council and management have set policies to be sure it meets debt obligations in a timely manner and that it considers new debt issuance carefully. Staff has included those policies into the Financial and Management Policies.Brieflysummarized,thepoliciesinclude:
•Conservativerevenueprojections. •Rateincreasesbasedonrelatedcostofservicesprovidedandtheimpactofinflationonthoseservices. •Leasepurchaseequipmentandrealpropertywhensupportedbycost-benefitanalysis. •Accumulationofadequate reserves toprotect theCity fromuncontrollableexpendituresorunforeseen
reductions in revenues. •Issuedebtonlyafterrigoroustestingandifthereisanappropriatebalancebetweenservicedemandsand
the amount of debt. •Settingatargetdebtlevelforgeneralgovernmentannualdebtserviceat15percentofoperatingexpense.
The City communicates with other governmental entities to be sure that their debt issues as well as the City’s remain at conservative levels. The overall debt levels should not become an undue burden on the taxpayers of Fort Collins.
The City’s overall financial health is positive and this supports the strong credit rating that it receives from the rating agencies. Sales and use tax revenue collections and other revenue sources that back most of the City’s debt continue to meet or exceed original projections. The City Council and management through the Financial Management Policies have placed emphasis on continued effort toward maintaining and improving the City’s financial performance.

265 - OPERATING BUDGET
OUTSTANDING DEBT AND LEASE OBLIGATIONS
The following schedule summarizes the financial obligations of the City as of December 31, 2005 and projected 2008and2009year-endobligationsbasedoncurrentrepaymentschedules:
City of Fort CollinsOutstanding Debt and Lease Obligations
The following schedule summarizes the financial obligations of the City as of December 31, 2007 and projected 2008 and 2009 year-end obligations based on current repayment schedules:
Projected Projected2007 2008 2009
Bonds Serviced by Sales and Use Tax Fund,secured by sales and use tax revenue and reserves:
Sales and Use Tax Revenue RefundingIssued in 2003, maturing in 2009 $ 1,900,000 $ 965,000 $ -
Bonds Serviced by Downtown Development Authority,secured by tax increment property taxes:
Property Tax IncrementIssued in 2004, maturing 2011 5,075,000 3,880,000 1,610,000
Bonds Serviced by Streets Fund,secured by Highway Users Tax Revenues:
Highway Users Tax Revenue Refunding Bonds,Issued 1992, maturing 2012 (includes Capital 1,441,863 1,285,000 985,000 Appreciation Bond premium)
General Government Debt Total $ 8,416,863 $ 6,130,000 $ 2,595,000
Projected Projected2007 2008 2009
Bonds Serviced by the Water Fund,secured by Water Fund Revenues, general obligation water bonds are secured by the full faith and credit of the City:
General Obligation Water BondsIssued in 2002, maturing in 2009 $ 5,000,000 $2,535,000 $ -
Colorado Water Resources & PowerDevelopment AuthorityIssued in 1999, maturing in 2019 3,200,822 2,964,228 2,722,195
Water Revenue BondsIssued in 1998, maturing in 2018 20,170,000 18,525,000 16,810,000
Colorado Water Resources & PowerDevelopment AuthorityIssued in 1997, maturing in 2017 5,700,291 5,178,085 4,642,137
Subordinate Water Revenue BondIssued in 2004 (dated 12/01/03), maturing in 2030 2,200,391 2,122,282 2,040,157

266 - OPERATING BUDGET
Bonds Serviced by the Sewer Fund,secured by Sewer Fund Revenues:
Sewer Revenue BondsIssued in 2005, maturing in 2010 6,800,000 4,320,000 1,740,000
Sewer Revenue BondsIssued in 2000, maturing in 2020 4,305,000 4,070,000 3,820,000
Colorado Water Resources & PowerDevelopment Authority LoanIssued in 1992, maturing in 2014 8,960,986 7,594,864 6,188,329
Bonds Serviced by the Storm Drainage Fund,secured by Storm Drainage Fund revenues:
Storm Drainage Revenue BondsIssued in 2002, maturing in 2022 10,135,000 9,655,000 9,155,000
Storm Drainage Revenue BondsIssued in 2002, maturing in 2008 860,000 - -
Colorado Water Resources & PowerDevelopment Authority LoanIssued in 2001, maturing in 2021 7,265,000 6,830,000 6,382,000
Storm Drainage Revenue BondsIssued in 1999, maturing in 2009 1,700,000 935,000 -
Storm Drainage Revenue BondsIssued in 2007, maturing in 2019 15,945,000 15,875,000 15,505,000
Storm Drainage Revenue BondsIssued in 2007, maturing in 2017 3,360,000 3,360,000 3,045,000
Enterprise Fund Debt Total $95,602,490 $83,964,459 $72,050,317

267 - OPERATING BUDGET
Projected Projected2007 2008 2009
Other Obligations
Assignment of Lease Payments (Public Safetyand Recreational Improvements)executed and delivered in 2001, maturing in 2021 $2,936,000 $2,783,000 $2,623,000
Lease Certificates of Participation (Police Buildingand Open Space Acquisition Projects)executed and delivered in 2004, maturing in 2026 45,465,000 43,545,000 41,560,000
Lease Certificates of Participation (Golf Course and Civic Center Project)executed and delivered in 2007, maturing in 2018 14,205,000 13,120,000 11,995,000
Lease Certificates of Participation (General Improvement District)executed and delivered in 2007, maturing in 2010 390,000 270,000 140,000
Equipment Leasesexecuted various years, maximum maturity in 2012 1,256,901 1,069,539 940,805
Other Obligations Total $ 64,252,901 $ 60,787,539 $ 57,258,805
TOTAL LONG-TERM DEBT & LEASE PAYMENTS $168,272,254 $150,881,998 $131,904,122

268 - OPERATING BUDGET
REQUIRED LEASE PURCHASE AGREEMENTS DISCLOSURE
TheStateofColoradoHouseBill90-1164,approvedonApril9,1990,”declaresthattheuseofleasepurchaseagreements by local governments creates financial obligations of those governments and that the disclosure of such obligations is in the public interest and Is a matter of statewide concern.”
AccordingtotheBill,localgovernmentsarerequiredtoidentifyaspartoftheirbudgets:1)thetotalexpendituresduring the ensuing fiscal year for all lease purchase agreements involving real and personal property; 2) the total maximum payment liability under all lease purchase agreements over the entire terms of the agreements, including all optional renewal terms.
The following schedule summarizes the City of Fort Collins lease purchase agreements by fund for real and personal property.
Required Lease Purchase Agreements Disclosure
The State of Colorado House Bill 90-1164, approved on April 9, 1990, ”declares that the use of lease purchase agreements by local governments creates financial obligations of those governments and that the disclosure of such obligations is in the public interest and Is a matter of statewide concern."
According to the Bill, local governments are required to identify as part of their budgets: 1) the total expenditures during the ensuing fiscal year for all lease purchase agreements involving real and personal property; 2) the total maximum payment liability under all lease purchase agreements over the entire terms of the agreements, including all optional renewal terms.
The following schedule summarizes the City of Fort Collins lease purchase agreements by fund for real and personal property.
2008-2009 Lease Purchase Schedule
Maximum 2008 2009 Payment Payment Payment Future Liability Over Obligation Obligation Payments Term of LeasePersonal Property
General Fund $ 823,952 $ 714,147 $1,057,455 $ 3,608,027 Transportation Services Fund 76,020 72,956 104,271 322,283 Cemetery Fund 12,406 9,304 - 34,116
Golf Fund 151,211 139,935 243,647 689,476 Equipment Fund 5,950 4,463 - 18,716
Total $1,069,539 $ 940,805 $1,405,373 $4,672,618
Real Property 0 0 0 0
Grand Total $ 1,069,539 $ 940,805 $ 1,405,373 $4,672,618

269 - OPERATING BUDGET
APPENDIX TABLE OF CONTENTS
STATISTICS 270
BUDGET TERMS 273

270 - OPERATING BUDGET
MILL LEVY FROM DIRECT AND OVERLAPPING GOVERNMENTSAPPLICABLE TO MOST PROPERTIES LOCATED IN THE CITY
CITY PROPERTY TAX LEVIES AND COLLECTIONS
MILL LEVY FROM DIRECT AND OVERLAPPING GOVERNMENTS APPLICABLE TO MOST PROPERTIES LOCATED IN THE CITY
Poudre Poudre N. Colorado R1 Health Water
Levy Larimer School Services Conservancy Year (1) City County District District District Total
1997 9.797 20.889 53.712 2.167 1.000 87.565 1998 9.797 21.293 53.572 2.167 1.000 87.829 1999 9.797 21.656 48.243 1.985 1.000 82.681 2000 9.797 21.614 54.250 2.167 1.000 88.828 2001 9.797 22.461 51.723 2.167 1.000 87.148 2002 9.797 22.421 51.723 2.167 1.000 87.108 2003 9.797 22.423 52.496 2.167 1.000 87.883 2004 9.797 22.517 52.496 2.167 1.000 87.977 200520062007
9.7979.7979.797
22.54122.41022.414
50.71550.71551.723
2.1672.1672.167
1.0001.0001.000
86.22086.08987.101
CITY PROPERTY TAX LEVIES AND COLLECTIONS
Total Actual Tax Collections Levy Total Collection Versus As a Percent
Year (1) Tax Levy (2)(3) Levy (4) Of Tax Levy
1997 $7,766,667 $7,578,215 97.57% 1998 $8,485,942 $8,287,162 97.66% 1999 $8,788,552 $8,579,040 97.62% 2000 $10,325,033 $10,172,098 98.52% 2001 $10,661,031 $10,354,190 97.12% 2002 $12,004,184 $11,943,303 99.49% 2003 $12,365,206 $12,313,458 99.58% 2004 $13,064,545 $12,848,799 98.35% 200520062007
$13,327,746 $14,302,198$14,261,191
$13,290,376 $14,572,672$14,533,176
99.72% 98.14%98.13%
(1) Collection year follows the levy year. (2) Source: Larimer County Assessor's Office (3) Levy and collection is net of tax incremental for the Downtown Development Authority. (4) Collections are net of the collection fee charged by Larimer County.

271 - OPERATING BUDGET
SALES AND USE TAX COLLECTIONS
Taxable General General Restricted (1) Year Retail Sales Sales Tax Use Tax Sales & Use Tax Total
1998 $1,506,624,242 $34,426,209 $9,053,879 $13,564,011 $57,044,099
1999 $1,647,695,223 $37,723,559 $11,034,571 $15,123,354 $63,881,484
2000 $1,797,680,850 $41,067,896 $8,723,444 $15,482,421 $65,273,761
2001 $1,979,022,422 $43,473,457 $10,732,999 $16,961,629 $71,168,086
2002 $1,965,799,003 $43,303,282 $8,726,679 $16,170,582 $68,200,543
2003 $1,969,208,226 $43,108,789 $8,535,379 $16,050,134 $67,694,302
2004 $2,024,683,385 $44,329,239 $9,404,326 $16,991,296 $70,724,861
2005
2006
2007
$2,074,097,970
$2,206,064,785
$2,248,521,512
$45,442,110
$48,324,043
$49,202,266
$9,566,032
$8,598,737
$9,931,629
$17,363,484
$17,927,772
$18,511,130
$72,371,625
$74,850,552
$77,645,025
(1) These amounts represent the three voter-approved 0.25 cent taxes restricted for specific purposes. Also included in the restricted taxes is the vendor fee savings for capital projects and economic vitality.
Taxable Retail SalesPercentage Growth
10.5% 9.4% 9.1% 10.1%
-0.7%
0.2%2.8% 2.4%
6.0%
1.9%
-5%
0%
5%
10%
15%
1998 1999 2000 2001 2002 2003 2004 2005 2006 2007
SALES AND USE TAX COLLECTIONS

272 - OPERATING BUDGET
HISTORY OF SALES AND USE TAX RATES (%)HISTORY OF SALES AND USE TAX RATES
RATES (%) 1998 -2007 ADOPTED RATES (%) 2008 -2009
Total City Larimer Sales and Capital Sales and County State Total All
Year Use Tax (1) Improvements (2) Use Tax Tax Tax Taxes
1998 2.25 0.75 3.00 0.65 3.00 6.65
1999 2.25 0.75 3.00 0.75 3.00 6.75
2000 2.25 0.75 3.00 0.80 3.00 6.80
2001 2.25 0.75 3.00 0.80 2.90 6.70
2002 2.25 0.75 3.00 0.80 2.90 6.70
2003 2.25 0.75 3.00 0.80 2.90 6.70
2004 2.25 0.75 3.00 0.80 2.90 6.70
2005 2.25 0.75 3.00 0.80 2.90 6.70
2006 2.25 0.75 3.00 0.80 2.90 6.70
2007 2.25 0.75 3.00 0.80 2.90 6.70
22000088 22..2255 00..7755 33..0000 00..8800 22..9900 66..7700
2009 2.25 0.75 3.00 0.80 2.90 6.70
(1) Base tax rate (2.25%) - Ordinance No. 58, 1967, authorized the initial 1% sales and use tax. Ordinance No. 140, 1979, authorized another 1% beginning April, 1980 and another .25% was authorized beginning in January, 1982 by Ordinance No. 149, 1981.
(2) Capital improvement tax rate additions - Ordinance No. 8, 1989 authorized a .25% tax for street capital maintenance beginning July 1, 1989. Ordinance No. 9, 1989 authorized a .25% tax to finance the Choices 95 Capital Improvement Program beginning in January 1990. Ordinance No. 125, 1992 authorized a .25% tax to finance the acquisition, construction, enhancement and maintenance of trail systems, wildlife and other natural areas beginning January 1, 1993. All three taxes expired December 1997. At a municipal election in April, 1997, City residents approved the extension of the three .25% tax rates that expired in December, 1997 to finance the Building Community Choices Capital Improvement Program. The extension covered the period from January 1, 1998 through December 31, 2005.
At the November 5, 2002 election, voters approved an extension of the .25% tax to finance the acquisition, construction, enhancement and maintenance of trail systems, wildlife and other natural areas covering the period from January 1, 2006 through December 31, 2030. At the April, 2005 municipal election, voters approved an extension of the .25% tax financing for Streets and Transportation to help fund the City’s Pavement Management Program for the period January 1, 2006 through December 31, 2015. At the November 1, 2005 election, voters approved the extension of the .25% tax financing the Building Community Choices – Community Enhancements capital projects to fund projects in the Building on Basics Capital Improvement Plan. The extension went into effect on January 1, 2006, and is due to expire on December 31, 2015.

273 - OPERATING BUDGET
Accrual BasisThe basis of accounting under which revenues and ex-penses are recognized when they occur, rather than when collected or paid.
Administrative ChargesAllocates the cost of general administrative departments that are required to manage the City and provide support to all funds.
Ad valorem TaxTaxbasedontheAssessedValuationofproperty.Alsoknown as Property Taxes.
AppropriationLegal authorization granted by City Council to make expen-ditures and incur obligations up to a specific dollar amount.
Appropriation OrdinanceAn ordinance by which appropriations are made legal. It is the method by which the City Council authorizes expendi-tures for the subsequent fiscal year.
Assessed valuationBasis for determining property taxes. Assessor determines assessed valuation of real property by using a value per-centage of the property’s actual value. The percentage is determined by the State of Colorado.
AuthorityA government or public agency created to perform a single function or a restricted group of related activities. An authority may be completely independent of other govern-ments or partially dependent upon other governments for its creation, its financing, or the exercise of certain powers.
BenchmarkA comparison of the service provided with cities providing a like service, a national standard, or an accepted best prac-tice. Used as one element of performance measures.
BenchmarkingThe comparison of actual performance achieved against an accepted best practice.
BondWritten promise to pay a specified sum of money, called the face value or principal, at a specified date or dates in the future, called the maturity date(s), together with periodic interest at a specified rate.
BudgetPlan of financial operation, embodying an estimate of proposed expenditures for a given period and the proposed revenue estimates of financing them. Upon approval by Council, the budget appropriation ordinance is the legal basis for expenditures in the budget year.
Budgeting for OutcomesA system driven by goals and performance, to provide infor-mation that compares budgeting, planning and outputs/re-sults.
Capital Outlay/AssetsAssets of significant value and having a useful life of several years. Capital assets are also referred to as fixed assets.
Capital Improvement ProgramAn annual, updated plan of capital expenditures for public facilities and infrastructure (buildings, streets, etc.), with estimated costs, sources of funding and timing of work over a period of time.
Capital ProjectProjects involving the purchase or construction of capital assets. Often a capital project encompasses the purchase of land and the construction of a building or facility, or ma-jor street construction or reconstruction. Design, engineer-ing or architectural fees are often a part of a capital project.
Capital Projects FundA fund created to account for financial resources and the payment of the acquisition or construction of capital assets such as public facilities, streets, etc.
Classified EmployeeAn authorized, budgeted position which is included in the City Pay Plan. Classified employees may be either full-time (1.0FTEconsistingofa40hourworkweekorequivalent)or part-time (0.5 FTE or greater, with a work week of a mini-mum of 20 and a maximum of 39 hours). These employees are covered by the City’s Personnel Policies and Procedures Manual.
Certificates of ParticipationDebt instrument used to acquire and construct major capi-tal facilities and improvements. Through the Fort Collins Leasing Corporation, the City issues certificates of partici-pation (COP’s). The debt is secured by the constructed facilities and improvements, and debt service payments are made from the rents collected by the Leasing Corporation, based upon lease agreements between the City and the Corporation.
CommoditiesBasic or useful items necessary to conduct operations. Supplies for office operations, vehicles, copy machines, computers, or janitorial are some items in this category.
ContingencyAn appropriation of funds to cover unforeseen expenditures which may occur during the budget year.
BUDGET TERMS
274 - OPERATING BUDGET
Contractual ServicesExpenses that are usually incurred by entering into a formal agreement or contract with another party. Expenses included in this category can include utilities, insurance, repairs, professional fees, or services.
Contributions-In-Aid of New ConstructionFunds derived from assessments made on new develop-ments and redeveloped areas to defray the cost of the new or upgraded utility systems required to serve these areas. Contributions offset capital installation costs of secondary, primary, and main feeder lines, streetlighting, and supple-mental transformer capacity.
Debt ServicePayment of principal and interest related to long-term debt.
Debt Service FundA fund established to account for the accumulation of resources for, and the payment of, general long-term debt principal and interest.
DepreciationExpiration in the service life of fixed assets, attributable to wear and tear, deterioration, action of the physical ele-ments, inadequacy, and obsolescence.
Designated Fund BalanceThat portion of a fund balance that has been set aside for a specific purpose by the City Council.
Drilling PlatformA rank ordering of all offers to achieve a certain result.
EncumbrancesAppropriations committed by contract for goods or services which will not be paid for until the next fiscal year.
Enterprise FundA fund established to account for operations that are financed and operated in a manner similar to private busi-ness enterprises - where the intent of the governing body is that the costs of providing goods or services to the general public on a continuing basis be financed or recovered primarily through user charges. Example.
ExpendituresCost of goods received or services offered.
Fiscal YearA 12-month period to which the annual operating budget applies and at the end of which a government determines its financial position and the results of its operations. The City of Fort Collins’ fiscal year is January 1 through Decem-ber 31.
Full-time Equivalent (FTE) EmployeeThe hourly equivalent of a full-time employee. An FTE can be made up of either one full-time employee or two or more part-timeemployeeswhosetotalhoursequal40perweek.
FundAn accounting entity with revenues and expenditures which are segregated for the purpose of carrying on specific activities or attaining certain objectives in accordance with special regulations, restrictions or limitations.
Fund BalanceThe balance remaining in a fund after expenditures have been subtracted from revenues.
General FundThe fund used to account for all financial resources except those required to be accounted for in another fund. The General Fund provides a majority of city services to the residents of Fort Collins.
General Obligation BondBonds which the full faith and credit of the issuing govern-ment are pledged for payment.
GrantsContributions or gifts of cash or other assets from another government or agency to be used or expended for a speci-fied purpose or activity.
Home RuleStatutory and constitutional provisions which allow munici-palities to exercise powers of local self-government such as the administration and collection of local taxes. The City of Fort Collins is a home rule municipality.
Hourly EmployeeA City employee who fills a temporary or short-term posi-tion. Such employees provide contingency staffing for City operations during peak workloads, or to address temporary staffing needs. Hourly employees are paid on a per-hour basis, and receive limited benefits.
IndicatorA measure that quantifies the achievement of a result.
InfrastructureFacilities on which the continuance and growth of a com-munity depend, such as streets, waterlines, etc.
Input MeasureThe amount of resources invested, used or spent for ser-vices, products or activities.
BUDGET TERMS
275 - OPERATING BUDGET
Intergovernmental RevenueRevenue from other governments (i.e., County, State, Federal) in the form of grants, entitlements, or shared revenues.
Internal Service FundA fund used to account for the financing of services pro-vided by one department to other departments of the City. Internal Service Funds are usually operated like a business.
Lapsing AppropriationAn appropriation is made for a certain period of time, gen-erally for the budget year. At the end of the specified period, any unexpended or unencumbered balance lapses or ends, unless otherwise provided by law.
Lease-Purchase AgreementsContractual agreements which are termed “leases” but, which in substance, amount to purchase contracts, for equipment and machinery.
MaturityThe date on which the principal or stated value of invest-ments or debt obligations are due and may be reclaimed.
Mill LevyRateappliedtoAssessedValuationofpropertytodeterminepropertytaxes.Amillis1/10thofapenny,or$1.00oftaxforeach$1,000ofassessedvaluation.TheCity’smaximummill levy per City Charter, excluding debt service, is fifteen mills.
Modified Accrual BasisRevenues are recorded as the amount becomes measur-able and available. Expenditures are recorded when the liability is incurred.
Net Operating BudgetRepresents the amount of money necessary to provide for the day to day functions of city government. It does not in-clude internal transfers between funds, nor does it include expenditures for debt service and capital projects.
OfferA response to an RFR. A description of services, programs or initiatives that will produce the desired result.
OrdinanceA formal legislative enactment by the Council. If it is not in conflict with any higher form of law, such as a state statute or constitutional provision, it has the full force and effect of law within the boundaries of the city.
OutcomeA result.
Outcome MeasureThe mathematical expression of the effect on customers, clients, the environment, or infrastructure that reflect the purpose.
Output MeasureThe number of services, products, or activities produced or provided.
Performance MeasureMeasurements that reflect the service that is being provided and permit objective evaluation of the service program.
Personal ServicesSalaries, salary driven costs, and compensated benefits for classified, unclassified, hourly, and seasonal employees.
PILOT (Payment in Lieu of Taxes)An estimate of the amount of taxes that would be charge-able to a utility if owned privately.
Plant Investment FeeCharge to developers for connecting to the City’s water or sewer system to compensate the City for additional facilities needed to serve the development.
Program Performance BudgetA method of budgeting whereby the services provided to the residents are broken down in identifiable service pro-grams or performance units. A unit can be a department, a division, or a workgroup. Each program has an identifiable service or output and objectives to effectively provide the service.
ProjectedEstimation of revenues and expenditures based on past trends, current economic conditions and future financial forecasts.
Quality MeasureThe mathematical expression of how well the service, product or activity was delivered, based on characteristics important to the customers.
Request for Result (RFR)A written request to produce results following certain purchasingstrategies.AnRFRincludes:aresultstatement,three indicators, a result map and purchasing strategies.
ReserveA portion of a fund balance which has been legally segre-gated for a specific use.
ResultThe effect desired for the public, expressed as broad state-ments. Also an outcome.
BUDGET TERMS

276 - OPERATING BUDGET
Result MapA graphic description of causal factors that produce a result.
ResourcesTotal amounts available for appropriation including estimat-ed revenues, fund transfers and beginning fund balances.
Revised BudgetMost recent estimate of revenue and expenditures includ-ing additional appropriations made throughout the year and encumbrances carried over from the prior year.
Seasonal EmployeeA City employee who works for a department during a spe-cific season or for a specific work project. Such employees are typically hired for positions which fluctuate significantly with the time of year or the specific nature of the work, such as summer recreation employees, or warm-weather con-struction employees. Such employment needs are typically cyclical, with the same general needs occurring each year.
Special AssessmentA levy made against certain properties to defray part or all of the cost of a specific improvement or service deemed to primarily benefit those properties.
Special Assessment FundA fund used to account for the financing of public improve-ments or services deemed to benefit primarily the proper-ties against which special assessments are levied.
Special Revenue FundA fund used to account for the proceeds of specific revenue sources that are legally restricted to be spent for specified purposes. An example is the Recreation Fund that col-lects fees from recreational users and is legally restricted to spend those fees for recreational purposes.
StrategyAn approach to producing the desired result. Also called a purchasing Strategy.
Supplemental RequestsPrograms and services which departments would like to have added (in priority order) over their target budget, or if revenue received is greater than anticipated.
Target BudgetDesirable expenditure levels provided to departments in de-veloping the coming years’ recommended budget. Based on prior year’s adopted budget, projected revenues, and reserve requirements.
Tax Increment FinancingA financing technique that requires creation of a district whose assessed property value is “frozen”. The tax col-lected on the growth of the district’s incremental, or prop-erty value over the “frozen” value, is used to finance capital improvements in the district.
TransfersLegally authorized intra-city transfers of appropriations from one City fund to another City fund. Revenue and expendi-tures are accounted for in both funds. For example, sales and use taxes are collected in the Sales and Use Tax Fund and recorded as revenue. The taxes are then expensed in the Sales and Use Tax Fund as transfers to various other funds. In the receiving fund the transfer is accounted for as revenues and, when spent, again accounted for as an expense.
Unclassified EmployeeAn employee who is not a part of the City’s pay and clas-sification system. This includes either Unclassified Manage-ment Employees, or Hourly/Seasonal employees.
Undesignated Fund BalanceA portion of a fund balance that has not been designated or reserved for any specific use.
User FeesThe payment of a fee for direct receipt of a public service by the party benefiting from the service.
volunteerAn unpaid City worker who provides services to the City asapublicservice,orasapersonalinterest.Volunteerstypically do short-term projects or donate a small number of hours a month.
BUDGET TERMS