Dallas- Fort Worth - D Magazine
60
Dallas- Fort Worth The WalkUP Wake-Up Call: By Tracy Hadden Loh, PhD Christopher B. Leinberger January 2019
-
Upload
khangminh22 -
Category
Documents
-
view
3 -
download
0
Transcript of Dallas- Fort Worth - D Magazine

Dallas-Fort Worth
The WalkUP Wake-Up Call:
By Tracy Hadden Loh, PhDChristopher B. Leinberger
January 2019

TABLE OF CONTENTSI. EXECUTIVE SUMMARY ........................................3
II. INTRODUCTION ...................................................6
III. WALKUPS DEFINED
The Rise of the WalkUP .............................................10 Form Meets Function .................................................. 11 Methodology ..................................................................... 12 The 9 Types of WalkUPs ............................................14
IV. .WALKUPS.IN.THE.DALLAS-FORT WORTH REGION
DFW’s WalkUPs and Map .......................................24 Geographic Findings ..................................................26 Product Findings ..........................................................28
V. WALKUP TRENDS
Market Share Shifts ......................................................31 The For-Sale Housing Premium ......................... 32
VI. WALKUP RANKINGS
Economic Rankings .................................................... 35 Social Equity Rankings ...............................................41
VII. FUTURE WALKUPS
Las Colinas Urban Center ....................................... 48 WalkUPs: The Next Wave ........................................50
VIII. NEXT STEPS ..................................................... 51
IX. APPENDICES
Endnotes .............................................................................56 Photo Credits ...................................................................58 Acknowledgments.......................................................59
PHOTO CREDIT: DANIEL X. O’NEILCC BY 2.0
2

I. Executive SummaryDuring the second half of the 20th century, the dominant development model in the country in general and metropolitan Dallas-Fort Worth in particular has been the familiar “drivable sub-urban” form. This form is characterized by the segrega-tion of different real estate product types (off ice, residential, industrial, etc.) f rom each other and low building densities that mean the only viable transportation option is by car and truck. Real estate developers and investors, government reg-ulators, and f inanciers have come to understand this development form, turning it into a successful development formula and economic driver. Consumers de-veloped a taste for this Leave It to Beaver way of living. We all assumed drivable sub-urban was the only way to build the metro area.
This late 20th century form was diametrically different f rom how metro DFW was built in the 19th and early 20th century when the “walkable urban” form predom-inated; think of the many town centers like Grapevine, the two major downtowns, and streetcar suburbs like Oak Cliff.
Starting in the mid- 1990s in places like Uptown Dallas and Sundance Square in Downtown Fort Worth, the market began to move back toward demanding walk-able urban development once again. This report presents evidence of the surpris-ing re-emergence of walkable urban places in metropolitan Dallas-Fort Worth. Walkable urban development represents not only a rapidly growing market share of new development in the metro area today but, if metro DFW follows the lead of comparable metros, such as metropolitan Atlanta and Washington, DC, it will become the dominant form of new real estate development in the early and mid-21st century.
The market is speaking—and it is time for public policy to reflect this market de-mand for walkable urbanism by putting in place the necessary inf rastructure and zoning. This also includes encouraging place management entities that “supple-ment and not supplant the municipal services of the municipality” 1 to create 24/7 vital and safe walkable urban places. This research shows that these walkable urban places will be where much and possibly most future economic growth and development will be in metropolitan Dallas-Fort Worth.
3

miles) though the population of all three metros are each between four and seven million.2
This research focuses on regionally signifi-cant walkable urban places, referred to as WalkUPs, comparing WalkUP growth with growth in the balance of the metro area.
KEY FINDINGS
• There are 38 Established WalkUPs in metro DFW in 2018. Combined, these WalkUPs account for only 0.10 percent of the total land in the metro area. In addition, we have identified 17 Emerging WalkUPs totaling 0.02 of one percent of the region’s land mass. Together, these 55 Established and Emerging WalkUPs total 0.12 of one percent of the region. Finally, we have identified 22 Potential WalkUPs, though we did not determine their land mass.
• The 38 Established WalkUPs have the highest density of land use in metro DFW. The average gross floor-area ratio (FAR) for these 38 WalkUPs is 0.42 while the rest of metro DFW, excluding WalkUPs, is
only 0.02. In other words, WalkUPs are almost 25 times more dense than the rest of the metro area.
• The 38 Established WalkUPs gen-erate 12 percent of metropolitan GRP. This concentration of economic activity is due to both job density and higher productivity per job in WalkUPs. In WalkUPs, job density is 112 times greater than the rest of the metro area.
• Established WalkUPs concentrate in the cities of Dallas and Fort Worth (60%). However, the vast majority of the Emerging and Potential WalkUPs (74%) are in the suburbs of the metro area. Combining all Established, Emerging and Potential WalkUPs (total of 77), 43% are in the cities of Dallas and Fort Worth with the bal-ance (57%) in the suburbs. Like most of the largest 30 metropolitan areas in the country, the urbanization of the suburbs is a major trend.
• Rail transit stations are located in 17 Established WalkUPs (45%) and 7 Emerging WalkUPs (41%). While rail transit appears to help the develop-ment of WalkUPs, it is not essential.
BACKGROUND
In metropolitan areas, we classify land use as playing one of two economic functions: regionally significant or local-serving. Regionally significant places have con-centrations of employment, civic centers, institutions of higher education, major medical centers, and regional retail, as well as one-of-a-kind cultural, entertainment, and sports assets. Local-serving places are bedroom communities dominated by residential development that is supported by local-serving commercial (e.g., grocery stores) and civic uses, such as primary and secondary schools, police and fire stations, and so on. Land use in metropolitan areas can also be divided between the form that it takes: drivable sub-urban and walkable urban. Drivable sub-urban development is low density and relies on stand-alone real estate products and spatially segregated development patterns that are connected nearly exclusively by one form of trans-portation: highways for cars and trucks. In contrast, walkable urban places have much higher density, integrate many different real estate products in the same place, and employ multiple modes of transportation—rail and bus transit, biking, highways— but once one is there, every-thing is walkable.
Both drivable sub-urban and walkable urban forms of development have market support and appeal; it is not as if one is “better” than the other, it is only a matter of current and future supply and demand. It is important to note that each form can be found in both center cities and suburbs. Drivable sub-urban development and walkable urban places are found in both in the cities of Dallas and Fort Worth and are also in their suburbs.
This research examines metropolitan Dal-las-Fort Worth as defined by our research partner, the North Central Texas Council of Governments, using their geographic definition of the metro area. The metro DFW geographic definition is extremely large, 12,795 square miles, which is much larger geographically than the compara-ble metropolitan areas we have used in this research, metro Atlanta (2,974 square miles) and Washington, DC, (2,719 square
Executive Summary
4

ECONOMICCONCLUSIONS
• Average rent in income real es-tate.products.(office,.retail.and.multi-family rental) in Established WalkUPs is 37% higher on a vacan-cy-adjusted, rent per-square-foot basis than the regional average.
• The net absorption market share in this real estate cycle (2010-2017) of the income real estate development in Established WalkUPs is 2.36 times the 2010 basis market share. This means that the rest of the region that is drivable sub-urban is losing market share. The drivable sub-urban income real estate would have had to increase net absorption by 22% just to maintain the 2010 market share. Much of this loss of market share has been in the office product type. Drivable sub-ur-ban office net absorption would have had to increase by 82% in this real estate cycle to maintain 2010 market share; this is most negatively affecting business and office parks, which is part of a national trend.
• In.the.current.real.estate.cycle,.26.percent of new multifamily rental housing in the region was devel-oped in Established or Emerging WalkUPs.
• For-sale housing in WalkUPs has a 103% price per square foot premium over drivable sub-urban housing in metro DFW. However, this represents only a small fraction of the total for-sale housing in the metro area (0.52% of all housing).
• WalkUP Adjacent for-sale housing (1/2 mile surrounding the WalkUP) has a 71% price per square foot premium over the average house in metro DFW. These residential neighborhoods benefit from having the “best of both worlds”, living in a drivable sub-urban location but within walking distance of walkable urbanity.
SOCIAL EQUITYCONCLUSIONS
• Social.equity.in.metro.DFW.benefits.from the regional economy being among the highest GDP per capita in the US (#8 of the largest 30 met-ros and 11% higher than the average) and having relatively low housing costs. These two factors increase baseline social equity compared to nearly all of the largest 30 metros in the country, though there are still sig-nificant local geographic and afford-able housing challenges.
• The Platinum and Gold Social Equity WalkUPs are all Urban Commercial WalkUPs in formerly economically struggling,.non-favored.quarter.parts of the metropolitan area. In-creased economic growth in the most highly ranked WalkUPs must be con-sciously managed to maintain a mix of races and incomes in the future.
• There are a large percentage of WalkUPs that rank Silver on the Social.Equity.Performance.Index,.probably due to the high GDP per capita and low housing costs of the region. The best way to improve these WalkUPs in the Social Equity Perfor-mance Index is to improve transit accessibility.
• The two lowest ranked Copper So-cial Equity Performance Index Walk-UPs (Preston Center and Southlake Town Center) are also among the highest Economic Performance Index WalkUPs. These two Walk-UPs lack rental housing, have high housing costs and Southlake has no meaningful transit.
• It is possible to “do well while doing good” by achieving both highly ranked economic and social equity performance; Bishop Arts, Downtown Dallas, Downtown Fort Worth, and Oak Lawn rank highly in both indices. The goal of all WalkUPs should be both economic prosperity and social equity.
Executive Summary
• A conscious strategy for each Walk-UP is required to create and main-tain high social equity, including the provision of affordable and workforce housing and increased transit acces-sibility.
• A critical component of the solution to affordable housing is simple: build more walkable urban product. Greater walkable urban land cost is the most significant driver of higher costs for walkable urban places—hav-ing more walkable urban land will reduce land costs.
• NIMBY (Not In My Back Yard) oppo-sition to high-density development is equally responsible for the land shortage in WalkUPs. One of the proven ways of overcoming NIMBY opposition is to have multiple exam-ples in the region of great walkable urban places that increase consumer desire for this type of development near where they live. In addition, the WalkUP Adjacent for-sale housing price premium could help overcome NIMBY opposition.
• The very economic success of Walk-UPs should play a role in paying for walkable.urban.infrastructure, such as rail transit and increased social equity performance. Harnessing a portion of the increasing real estate valuations and tax-base from walk-able urban gentrification can help fund the required infrastructure and affordable and workforce housing.
5
II. IntroductionThe Walkable UrbanStructural Shift
6
The Dallas-Fort Worth metropolitan area is rediscovering a “new” way of building places that.is.finding.market.success in the current real estate cycle (2010 – 2018).
Dramatic price premiums,.low.vacancy,.and.market.share gains indicate a structural shift towards the development of walkable urban and mixed-use places.
If metropolitan DFW follows the lead of other comparable regions,.such.as.metro Atlanta and Washington,.DC,.a.majority of the future regional economy will locate.in.these.places,.even though they represent an extremely small fraction of the metro area’s overall land mass.

Known nationally as a sprawling region, metropolitan DFW is now offering both conventional low-density development and higher density, 21st-century walkable urbanism.
To today’s households and businesses, the latter feels new and fresh after a genera-tion of drivable suburbs. However, in reality walkable urbanism represents a return to how metropolitan areas were built during the vast majority of the 6,000 years since cities first emerged.
Evidence of these trends challenge policy makers, real estate developers, investors, practitioners in the new field of place management, academics, and citizens, to rethink the 35 percent of the metropolitan area’s wealth that is invested and man-aged in real estate and infrastructure—collectively, the built environment. This is an important recalibration that affects how many of us live, work, get around, and are entertained. The DFW region’s commitment to building out a rail transit system, through Dallas Area Rapid Transit (DART), Trinity Rail Express (TRE), the Den-ton County Transit Authority (DCTA), and Trinity Metro’s TEXRail, are critical invest-ments in accommodating this new form of development. However, rail transit is not the only thing that must happen to meet the pent-up market demand for walkable urban places the research described in this report demonstrates. A series of layered strategies are necessary to meet this de-mand and leverage the benefits of a more balanced approach to development, with a focus on providing more walkable urban-ism throughout the entire DFW region. To ignore this structural change would be akin to ignoring the impact roads and cars had on the built environment nearly a century ago.
For decades, real estate practitioners, ob-servers, and scholars have looked through an urban-versus-suburban geographic lens. In this framework, walkable urban form is found in the urban core of the center city, and the drivable suburbs are at the fringe. This single-center geographic model no longer applies to today’s met-ropolitan regions. Just as auto-oriented sub-urban form has colonized the historic urban core in some areas, increasingly walkable urban places are growing at nodes located “downtown” and in outer jurisdictions. Both the conventional car-based sprawl and walkable urban forms of development have market support and appeal, and each are found in both center cities and suburbs.
Walkable urban development occurs at a range of scales, from smaller main street
downtowns in the suburbs to much larger and denser districts within the urban core. In metropolitan DFW, examples of conventional sub-urban development include both the Preston Hollow neigh-borhood of city of Dallas and the Arlington Heights neighborhood of the city of Fort Worth as well as countless sub-divisions surrounding both cities. In contrast, Down-town Grapevine and Watters Creek, both outside the city limits of Dallas and Fort Worth, are examples of walkable urban development, just as Uptown and the Near Southside are examples from established major urban centers. DFW developers are engaged in both ways of building the built environment. However, the strongest pent-up demand is for walkable urbanism and should take at least a generation to satisfy.
Conventional development, which we term “drivable sub-urban” in this report,
has been the dominant approach to real estate development during the late 20th century, so much so that many people assume this is the only way to build the metro area. There was pent-up market demand for this form of development following the Second World War, and the real estate industry and governments at all levels built out the required infrastructure, particularly highways and expanded water and sewer systems, to meet that market demand. Today, the pendulum is swing-ing back to demanding walkable urban development as the drivable sub-urban demand for sub-divisions, business parks and regional malls has generally been satisfied.
The reasons for this shift back include sig-nificant demographic changes (decreased percentages of households with children and increased one and two-person house-holds), absolute increase in traffic conges-tion, proportional increase in household transportation costs for cars and trucks, and an increased appreciation for the con-venience, diversity, creativity, and health benefits associated with walkable urban lifestyles. As a result, drivable sub-urban development is now overbuilt, and this glut was one of the primary market causes of the mortgage meltdown that triggered the Great Recession.
Conversely, there is strong pent-up de-mand for walkable urban development in metro DFW, as evidenced by the price pre-miums found in this research. This trend in the Metroplex is consistent with the explosion of growth in walkable urbanism throughout the country in comparable metro areas. The special summer of 2018 issue of D magazine3, one of our partners in this project, illustrated this trend using examples throughout metro area.
The best recent economic event demon-strating the pent-up demand for walkable urbanism is the search for HQ2 by Ama-zon, the largest economic development competition in a generation. The request for proposals the company issued for its new headquarters demanded a walkable urban, rail transit-served location. Amazon ultimately selected two walkable urban HQ2s in historically suburban areas, Crystal City (metro Washington, DC) and Long
Island City (metropolitan New York City). Other recent headquarters (re)locations, such as Marriott, General Electric, NCR, Honeywell, Quicken Loans, Boeing and even McDonald’s (the retail symbol of driv-able development), have recently moved to walkable urban places from drivable sub-urban sites. The primary reasons, ac-cording to George Washington University research conducted in conjunction with Smart Growth America and the global real estate brokerage firm, Cushman and Wakefield4, is (1) to attract an educated Millennial workforce and (2) branding of the company as a 21st century knowl-edge-based firm, not a 20th century com-pany located in a stodgy business park.
Although many of the DFW metro area’s conventional shopping malls, office parks, apartments, and for-sale housing con-tinue to command moderate rents and sales prices, walkable urban development has achieved substantial premiums in rental and sales price per square foot and capitalization rates as compared to drivable sub-urban development, sug-gesting it could take a generation of new construction for this pent-up demand to be satisfied.
7
Walkable urbanism represents a return to how metropolitan areas were built during the vast
majority of the 6,000 years since cities first emerged.

This shift is extremely good news for the real estate industry and the metropolitan economy as a whole. It will provide a foun-dation for innovation and increased tax revenues, much like drivable sub-urban development benefited the economy and selected jurisdictions in the second half of the 20th century. However, there is the need to ensure these new walkable urban places are inclusive so all can live and work in or near them, if they so choose. In addition, with the need to expand existing walkable urban places and create new ones, the goal should be to locate these new economic engines of growth in over-looked places like south Dallas and east Fort Worth.
Walkable urban development calls for dramatically different approaches to urban design and planning, regulation, financ-ing, and construction. It also requires the further growth of a relatively new industry: place management. Place management organizations, such as Downtown Fort Worth, Inc. and Downtown Dallas, Inc., steward the development strategy and provide the day-to-day management for walkable urban places (abbreviated in this report as WalkUPs), creating a distinctive “could only be here” place in which capital, residents and businesses are willing to in-vest for the long term. These organizations can also be tasked with ensuring inclusive development with sufficient affordable and workforce housing. Most importantly, supporting walkable urbanism reinforc-es the need for metropolitan DFW to continue its impressive investment in rail and bus transportation, as well as biking and walking infrastructure. The recent funding of nearly a billion dollars for the Cotton Belt commuter rail is one example of DFW’s commitment to rail transit.
This new research defines—for the first time—where the Established, Emerging and Potential WalkUPs are in the metro-politan Dallas-Fort Worth region. It shows specific locations, the physical size of the places, their product mix, and ranks their economic and social equity performance. This research recognizes that these places need to aim at becoming not only mixed-use walkable places but mixed-income places as well.
Texans in general, and residents of the DFW Metroplex in particular, are known for their “can do” approach to any eco-nomic, infrastructure or social challenge, viewing it as an opportunity. The DFW WalkUP Wake Up Call shows this eco-nomic and social trend through data analysis, quantifying the 38 established and 39 emerging and potential WalkUPs
already growing and ready to be repli-cated throughout the Metroplex. There is demand for much more growth in these 77 examples and room for many more WalkUPs in the region.
8
Walkable urban development calls for radically different approaches to urban
design and planning, regulation, financing and construction. It also requires the
further growth of a relatively new industry: place management.

III. WalkUPs Defined
9

WalkUPs Defined
The Rise of the WalkUPEvidence of growing market demand for the development of regionally significant walkable urban places (WalkUPs) was first observed two decades ago in select U.S. metropolitan areas. The evidence includ-ed some downtowns and downtown-ad-jacent place redevelopments. In the DFW region, Uptown was an early example. In addition, revitalizing, inner-ring suburbs such as Addison Circle, started to become more urbanized, and New Urbanism gave birth to high profile developments such as Seaside in Florida and Southlake in metro DFW.
Today, WalkUPs promise to be a powerful driver of the economy, if the appropriate infrastructure, legal and regulatory frame-work, and financing mechanisms are put in place. Amazon’s HQ2 search is just the most high-profile recent example of com-panies locating in WalkUPs (Crystal City in metro Washington and Long Island City in metro New York). In the late 19th and early 20th centuries, Dallas and Fort Worth had walkable urban mechanisms in place when it constructed an extensive network of streetcar suburbs and encouraged walkable urban development. Though the streetcars are long gone (with few notable exceptions, such as the M-Line Trolley in Uptown), the good bones of streetcar walkable urbanism in places like Bishop Arts District has been the foundation for their revitalization.
Today the question is, what can the lead-ers of metropolitan DFW do to support both the established WalkUPs and the next generation of emerging and poten-tial WalkUPs?
In the post-WWII era, the dominant de-velopment model has been the now-fa-miliar drivable sub-urban approach. Most real estate developers and investors, government regulators, financiers and consumers have come to understand this commodity model extremely well, turning it into a successful development formula and economic driver in the late 20th century, particularly in metropolitan Dallas-Fort Worth. It not only provided a super-charge for the economy, but “fu-eled” the dominant industry of the indus-trial era—trucks and automobiles—plus the road-building, finance, insurance and oil industries, that were essential support industries.
Starting in the mid-1990s, however, the pendulum began to swing back toward building walkable urbanism. Metropoli-tan Washington, D.C. has been a national leader in walkable urban development and WalkUP management. During the real estate cycle in the first decade of this century (2001-2007) and expanding in the current cycle (starting in 2010), builders, investors, and local governments have become more experienced in developing walkable urban projects and managing WalkUPs. Metropolitan DFW is beginning to understand walkable urbanism and place management in this real estate cy-cle, attracting a substantial and growing market share of new walkable urban de-velopment and commanding impressive rent premiums over drivable sub-urban areas. The market has spoken—it’s only a matter of time before most of the region’s policymakers and real estate professionals catch up with this new reality.
As shown in the table below, the amount of walkable urban square feet absorbed in this real estate cycle in metropolitan Dallas-Fort Worth has mushroomed, start-ing with only 7% of all office and rental housing being walkable urban in 2010, but having a net absorption of 17% during the first phase of this cycle (2010-2015); which means walkable urban office and rental apartment absorption has grown 2.36 times what proportionate market share growth between walkable urban and drivable sub-urban would be expected. The DFW market share growth is slightly less than the 3.27 times walkable urban growth in metro Atlanta and the 2.79 times growth in metro Washington, DC. The last time metropolitan areas demon-strated this extreme market share growth was in the 1980s, when drivable sub-urban growth going in the opposite direction. While metro DFW is a laggard to metro Atlanta and Washington, it is certainly heading in the same direction.
DFW ATL DC
2010 WALKABLE URBANBASE MARKET SHARE
7% 15% 33%
WALKABLE URBAN 2010-2015 NET ABSORPTION MARKET SHARE
17% 49% 91%
WALKABLE URBAN 2010-2015 MARKET SHARE GAIN OVER 2010 BASE
2.36 3.27 2.79
Lagging Leading
Walkable Urban AbsorptionMetro DFW, Atlanta, and Washington5
(office and multifamily rental)
10

WalkUPs Defined
include much of the wealth-creating busi-nesses, organizations and employment, that bring new cash into the regional economy—the functions that are the pri-mary reasons the metropolitan area exists. Regionally significant locations can be either walkable urban (referred to as Walk-UPs in this research) or drivable sub-urban.
LOCAL SERVING: These are primarily bedroom communities where the vast majority of housing in a metropolitan area is located. An average of 90% of local serving locations are comprised of for-sale and rental residential development. Much of the rest is support commercial and ser-vices that are directed to local neighbor-hood needs, such as primary and second-ary education, supermarkets, local doctors and dentist offices, etc.
These two factors form the four-cell Form/Function Matrix: Metropolitan Land Use Options. For this study, we are focused only on WalkUPs (regionally significant walkable urban places) in the upper-left corner of the matrix, which uses only 0.1% of the total metropolitan DFW land mass. We found only a modest number of walkable urban neighborhoods, the upper-right hand corner of the matrix. In other metropolitan WalkUP Wake Up Call research we have found local serving, walkable urban neighborhoods to use be-tween 1.0% and 4.0% of the metropolitan land mass, but it is well under 1% in metro DFW.
Regionally significant drivable sub-urban locations were dubbed “edge cities” by Joel Garreau in his groundbreaking 1991 book. A decade later, Robert Lang ex-plored the concept of “edgeless cities,”7 boundary-less suburban office develop-ments that contain regionally significant economic functions. These edgeless cities were distinct from edge cities in that they do not agglomerate at any spatial level below the metro, such as major interstate highway interchanges or airports. In this report, we highlight the established Walk-UPs of the DFW metro area in the regional context of an edgeless city, where local serving and regionally significant drivable sub-urban geography are blended togeth-er. This means we compare the WalkUP matrix cell with all other metropolitan land use forms and functions, including walk-able urban neighborhoods, because there were very few acres of these places.
able sub-urban, four to 80 times denser, with multiple land uses in close walking proximity. Walkable urban places usually employ multiple modes of transportation, including cars/trucks, rail and bus tran-sit, bikes/scooters, and walking, that get people and goods in and around the place. Once there, nearly everything is within walking distance. Walkable urban places are defined by “walking distance,” which is about 3,000 feet or half a mile, which sub-stantially limits land mass of these places to between 100 and 500 acres.
Each of these two forms occur in both the central cities of the metro area and in the surrounding suburbs. Hence the old city-versus-suburb distinction confuses our understanding of where value and social equity occurs by blending drivable sub-urban and walkable urban place forms together, hiding the real distinctions of square footage size, product mix, eco-nomic performance and social equity.
LAND USE ECONOMIC FUNCTION
This research defines the economic func-tion of all land use in a metropolitan area, as either regionally significant or local serving:
REGIONALLY SIGNIFICANT: These are locations where there are concentrations of “export” or base employment6, civic functions, cultural assets, entertainment, regional retail, higher education, major hospitals, and one-of-a-kind facilities such as stadiums and arenas. They also tend to
LAND USE FORM
For decades, real estate practitioners, observers, and scholars studying metro-politan land use and real estate have gen-erally looked through a center city-ver-sus-suburb lens; center city (the cities of Dallas and Fort Worth, which are 32.5% of the Metroplex population) versus the sur-rounding suburbs. This research applies an analytical framework that replaces the city-versus-suburb dichotomy with a new lens by dividing metropolitan area land use form into two different categories:
DRIVABLE SUB-URBAN: This develop-ment form has the lowest density in more than 6,000 years of urban history. It was first introduced in the mid-20th century. Geometric growth of this form demon-strated substantial pent up market demand, especially in the DFW metropol-itan area. It features stand-alone real es-tate product types with office, retail, for-sale residential, rental apartments, hotel, and industrial properties separated from one another, relying upon cars and trucks as the only viable forms of efficient trans-portation. It also tends to be economically and racially segregated. This recipe of substantial land availability/consumption in a metropolitan area, dependence on motor vehicles, and separated land uses is generally referred to as sprawl.
WALKABLE URBAN: This form of de-velopment had been the default mode worldwide until the mid-20th century. It has much higher densities than driv-
Form Meets Function
REGIONALLY SIGNIFICANT LOCAL SERVING
WALKABLE URBAN
WALKUP (Walkable Urban Place) NEIGHBORHOOD
~1% Metro Area Acreage
1-3% Metro Area Acreage
DRIVABLE SUB-URBAN
EDGE CITY SUB-DIVISION
3-6% Metro Area Acreage
85-95% Metro Area Acreage
Form/Function Matrix:Metropolitan Land Use Options
11

MethodologyThe methodology used in this report has its basis in the research described in the Brookings Institu-tion Report, Walk This Way8, and used in several WalkUP Wake-Up Call reports by the GW School of Business focused on metro Washington, D.C., metro Atlanta, southeast Michigan, metro Boston, and metro New York.9 Additionally this methodology was used in Foot Traffic Ahead 2016 and Foot Traffic Ahead 2014.10 This research is the culmination of the research team’s efforts to synthesize several data sets on the built environment, and it constitutes the most comprehensive inventory of real estate in North Central Texas to date.
WalkUPs Defined
STUDY AREA
Our study area consists of sixteen coun-ties in North Central Texas, listed here in alphabetical order: Collin, Dallas, Den-ton, Ellis, Erath, Hood, Hunt, Johnson, Kaufman, Navarro, Palo Pinto, Parker, Rockwall, Somervell, Tarrant, and Wise. This North Central Texas region includes three additional counties (Erath, Navarro, and Palo Pinto) beyond the Census-de-fined Dallas-Fort Worth-Arlington CBSA, popularly known as the “Metroplex.” We selected these study area boundaries in consultation with the North Central Texas Council of Governments, in an attempt to capture the current local regional real estate market reality, rather than political or demographic lines.
With these criteria in mind, the research team assembled several data sets and conducted detailed GIS analysis for North Central Texas using a five-step process:
Identify Walkable Urbanism.We compiled Walk Score® data for 19,353 unique points in North Central Texas by creating a sampling screen of one-square-mile cells covering the study area. For any cell that overlapped a 2010 Census tract with a population density over 2,000 people/square mile, we replaced the one-square-mile cell with four half-square-mile cells. By filtering these points using the Walk Score® threshold of 70.5, we creat-ed an initial overview of walkability in the region.
Create Initial WalkUP Candidates. Using the Walk Score® grid data, the re-search team sketched initial draft bound-aries. We used publicly available defined boundaries such as Dallas and Fort Worth Public Improvement Districts and Tax In-crement Financing Districts, homeowners associations, and neighborhood associ-ations as suggestions and guides. This process yielded an initial candidate set of WalkUPs.
Refine WalkUP Candidates.The research team further refined the first cut of WalkUPs using intersection density from the US EPA Smart Location Database.11 This ensured that areas with high Walk Score® (because of dense retail amenities, such as might be found at a strip mall), but lacking in walkable infrastructure, were not falsely identified. These WalkUPs were even further refined through ground truth interviews.
Identify Regional Significance. We define regionally significant places as those with over 1.4 million square feet of office space and/or 340,000 square feet of retail space. Using data from CoStar™, the research team identified the WalkUP
candidates that were regionally signifi-cant. Candidates that did not make the cut were reclassified as Emerging Walk-UPs after passing an additional filter of ground-truthing to understand whether the place had additional realistic growth intentions/potential.
Finalize Boundaries. Having established boundaries for Es-tablished and Emerging WalkUPs, the candidate boundaries were further vetted with another set of ground truth inter-views. The results of this process were the finalized boundaries.
WHY WALK SCORE®?
Walk Score® is a measure that ranges from 0 to 100. It defines walkability as a function of how many destinations (e.g. retail amenities, schools, etc.) are near a given location. The score is a function of both density and diversity of destina-tions. Walk Score also gives some weight to residential population density and block size (distance between intersec-tions).
There is a great deal of research interest in methodologies to quantify the con-cept of “walkability.” A Google Scholar search for “walkability index” returns 2,180 results, most of which are not about Walk Score®. Walk Score® has also been criticized as being overly dependent on retail amenity locations as opposed to actual built environment features and quality.12 However, Walk Score® remains the only walkability metric with US national coverage that is easily acces-sible to the general public. While it is far from perfect, it is consistent, easy to communicate, and has been validated in multiple studies as an accurate measure of walkable amenities that is positively correlated with other measures of walk-ability and with actual walking activity.13
DEVELOPING GEOGRAPHIC BOUNDARIES
To identify the boundaries of WalkUPs, the research team engaged in a rigorous pro-cess that combined quantitative data with qualitative information from interviews with local experts (“ground truthing”). The overall process to identify the boundaries consisted of six steps. This process begins with criteria established in Walk This Way. To be considered an established WalkUP, each candidate had to meet the following criteria:
Walkability
Walk Score® >= 70.5
Intersection Density: Average intersection density >= 100 in- tersections per square mile
Office.and.Retail.Space
Office:.>=.1.4.million.square.feet.. and/or
. Retail:.>=.340,000.square.feet
12

Walk Score®
Exp
ert Grou
nd
Truth
Interview
sStep Data Input
Neighborhood Boundaries
Intersection Density
CoStarTM
ECONOMIC RANKINGS: METHODOLOGY AND SOURCES
Time-series building-level information from CoStar™ was aggregated to the defined geographies to generate the analysis of rent premiums and leasing trends. The data from CoStar™ included inventory (square feet), vacancy rates, net absorption, and average rents. CoStar™ contains asking rents. We discount these rents using the vacancy rate to estimate the market rent.
For-sale residential inventory and mar-ket valuations were provided for North Central Texas by Redfin for each WalkUP and the region as a whole. This included the median Redfin Estimate per square foot and aggregate square footage for the geography.14
Owner-user space, which consists of space owned by the same entity that occupies the space, do not otherwise appear in the CoStar™ database. This in-cludes government buildings, universities, non-profits, and buildings fully owned by the company such as a corporate head-quarters. This square footage is missing from our inventory.
This analysis represents the first use of place-based GRP in North Central Texas. The research team used two data sources to develop GRP estimates. Total employ-ment data at the 2-digit NAICS level is from the U.S. Census Longitudinal House-hold Employment Database at the Census Block level.15 Secondly, the Economic Modeling Specialists, Inc. model provides value added16 and employment data
at the county level for all 2-digit NAICS industries.
The first step was to identify the employee productivity ratios for all 16 counties in our study area, by 2-digit NAICS industry:
Secondly, those productivity rates were applied against the employment at each geography by 2-digit NAICS industry. The sum of all the industries in a geography create the place-based GRP for that ge-ography:
This measure is more precise than using an average “GRP/job” ratio because it ac-counts for the industry differences in each geography.
SOCIAL EQUITY RANKINGS: METHODOLOGY AND SOURCES
Our social equity ranking used three components: transit accessibility, hous-ing affordability, and balance of housing tenure.
We relied on the Access to Jobs and Work-ers Via Transit Tool from the EPA Smart Location Database at the Census block group level to measure transit accessibil-ity.17 Specifically, we used the population accessible by transit, which is the total population able to access the block group within a 45-minute transit and walking journey.
Housing affordability data was from the Center for Neighborhood Technology at the Census block group level.18 For this analysis we utilized the estimates for a household earning 80% of the area me-dian income. This household, on average, makes approximately $54,000 annually. The CNT dataset provides an estimate of the percentage of this household’s income that would be consumed by hous-ing for each Census block group.
Our metric of housing tenure balance begins with the US Census American Community Survey’s 2016 five-year estimates of housing tenure (number of owner households and number of renter households) at the Census block group level.19 We then posit an ideal balance of 50% owners, and 50% renters – not only in a mathematical sense, but also close to the region’s homeownership rate of 61%. After estimating a housing tenure ratio for each WalkUP using area weights to rec-oncile overlapping block groups, we use the WalkUP’s absolute deviation from 50% as the basis for its “score.” For example, a WalkUP that was 80% homeowners would enter our social equity calculation with a tenure input of 30, as would a WalkUP that was 20% homeowners.
WalkUPs Defined
13
PRODUCTIVITYC,N
Value AddedC,N
C = CountyN = 2-Digit NAICS Industry
=EmploymentC,N
EmploymentG,N N
∑ xGRPG ProductivityC,N
G = Study GeographyC = County of Study Geography, GN = 2-Digit NAICS Industry
=
Identify Walkable Urbanism
Create Initial WalkUP Candidates
Refine WalkUP Candidates
Identify Regional Significance
Finalize Boundaries

The Nine Types Of WalkUPs
There are nine possible WalkUP types that our national research has found so far. Metro DFW has eight of the nine. This section will define each of the eight and discuss the missing WalkUP type, In-novation Districts, which will be built in the near future due to market demand and economic neces-sity. Creating a new name for these places, WalkUPs (short for the regionally significant walkable ur-ban places), is borne from the reality that whether this type of place is located in the CBD of a region or on the far fringes, WalkUPs have common measurable, defining characteristics. WalkUPs share the same economic functions and land use forms. They require similar zoning, development, financ-ing, construction, and, most importantly, management of the place. The major differences between the eight WalkUPs types described below are their history and the density of development. Density is generally measured in “floor area ratio” (FAR).20 WalkUPs tend to start at a FAR of 1.0 and much of development in the future will be in the 1.0 to 4.0 FAR range in metro Dallas-Fort Worth.
WalkUPs Defined
14

1Downtown
WalkUPs Defined
Most metropolitan areas have just one Downtown21, the historic founding eco-nomic and commercial center of the region, also referred to as the “Central Business District” (CBD). The Dallas-Fort Worth Metroplex has two, similar to the few “twin cities” in the country. The Down-town WalkUPs are the founding CBDs in the region, Downtown Dallas and Down-town Fort Worth.
As is the case of some Downtowns in the country today, Downtown Dallas and Downtown Fort Worth are still dominated by office space (57% percent), its historic land use. Much of the two DFW Down-towns’ office space is owner-user, com-prised of government and corporate space owned by the occupant. The balance of office space is multi-tenant office build-ings, such as Trammel Crow Center in Dallas and the Wells Fargo Building in Fort Worth (owned by the Bass Brothers).
The typical 20th century character of the two DFW Downtowns have been “9-5” places, which “died” after 5 PM. However, that character and product mix has been
changing quickly in both of the DFW Downtown WalkUPs as other real estate product types have been built upon the historic office base and the introduction of 24/7 place management. However, the softness of the general national office market is also impacting the DFW metro area, including the two Downtowns, which had vacancy rates of 22% in Dallas, though much less(10%) in Fort Worth in 2017.
Historically downtowns had very little housing. Instead, these business districts were dominated by offices and, until their closing in the late 20th century, depart-ment stores and other regional retailing. Downtown Dallas and Fort Worth rental housing development has been impres-sive (an additional 3,153 units/71% growth since 2010 in Downtown Dallas and 1,106 units/66% growth in Downtown Fort Worth). In Metro DFW, 61.3% of metro DFW households own their own residence, close to the national average of 64.4%.22 It is unlikely the two DFW Downtown WalkUPs will ever achieve 61.3% homeownership, but it is probable the rate of Downtown homeownership will get far higher than today, where only 4% of the housing stock is for-sale residential.
Currently, only 16% percent of total square footage in the two DFW Downtown WalkUPs is residential; almost all of which is rental residential. A lesson learned from other leading Downtowns throughout the country is that for-sale housing is crucial
to future Downtown WalkUPs growth. Based on the national experience of many comparable Downtowns throughout the country which are further along the walk-able urban trend, housing in general and for-sale housing in particular will be the major growth opportunity in the decades to come in the two DFW Downtowns. Building more residential will also add to the 24/7 street level vitality and perception of safety in the two Downtown WalkUPs in the region and will drive the retail growth as well.
Retail occupies 3 percent of the square footage in the two DFW Downtown Walk-UPs due to the collapse of most Down-town retail, particularly department stores, in the late 20th century (Neiman-Marcus’ flagship store in Downtown Dallas is a notable exception). The walkable urban retail growth trends detailed in the Prod-uct Findings section will have a dramat-ic impact on unique, “could only be in downtown” retailing over the next few real estate cycles. In addition, the growth of residential will drive the local serving retail required to support that residential.
The DFW Downtown WalkUPs already have the highest concentration of hotel square footage (23%) of all WalkUP types, due to the two major regional serving convention centers and the concentration of offices supporting business traveler demand.
Downtown Dallas,Downtown Fort Worth
Captions:
A. Downtown Dallas skyline
B. Fort Worth water gardens
C. Bass Hall angel
D. Main Street Garden in Dallas
E. Thanksgiving Chapel
A.
B. E. D.
C.
15

WalkUPs Defined
2Downtown-Adjacent
Immediately connected to and surround-ing Downtown WalkUPs, Downtown Adjacent WalkUPs are a vibrant WalkUP type throughout the country. This is par-ticularly the case in the six established and emerging Downtown Adjacent WalkUPs surrounding Downtown Dallas. Downtown Adjacent WalkUPs usually have a lower density than their Downtowns, and typi-cally, each one possesses its own unique character.
Uptown Dallas is particularly noteworthy since it is an early example of this Walk-UP type. Uptown was kicked off with the opening of the 1.2 million square foot Crescent office, hotel and retail in 1986. The now-nationally imitated “Texas do-nut” rental apartment was pioneered in Uptown by developer Robert Shaw in the 1980s and 1990s and was then joined in 2001 by Blake Pogue’s and Henry Miller’s West Village, another nationally signifi-cant and successful retail and apartment development. The establishment of the place management organization, Uptown Dallas, Inc., in 1993 provided the placemak-ing needed for Uptown to be an early and unusually lively Downtown Adjacent Walk-UP. These are the major reasons Uptown is considered a national model.
Residential, particularly rental, occupies 60 percent of the square footage of the Downtown Adjacent WalkUPs in metro DFW, while office space makes up 27 per-cent. This provides a more balanced port-folio of space allocation than Downtowns. Retail occupies 6.5 percent of all space, and hotels account for three percent.
There is considerable growth potential in the six established and emerging Down-town Adjacent Dallas WalkUPs. There is also a need for new WalkUPs, such in Oak Cliff to the southwest of Downtown Dallas and Fair Park to the southeast, especially since light rail is already in place in many of these potential WalkUPs. However, the most pent up demand is in the potential Downtown Adjacent WalkUPs surround-ing Downtown Fort Worth. Only Near Southside and the Cultural District are established Downtown Adjacent Walk-UPs, both doing very well with substan-tial growth potential. However, there is a great deal of land to the east and north of Downtown Fort Worth, cut off by elevated freeways, but these have not proven to be insurmountable barriers elsewhere; think Deep Ellum in Dallas. There is no reason Downtown Fort Worth cannot be surrounded with 5-7 WalkUPs, rather than two today.
Recent research in metropolitan Washing-ton, DC, particularly the seven WalkUPs surrounding Downtown Washington, DC, has shown there are substantial rent, sale price, valuation and property tax premi-ums for Downtown Adjacent WalkUPs due to their agglomeration affect with the Downtown; “more is better”. There is a positive feedback loop or upward spiral of value creation of Downtown Adjacent WalkUPs surrounding a Downtown in every cardinal direction.
Captions:
A. Giant Connect Four in the Left Bank
B. A “Texas Donut” in Uptown
C. Fort Worth bikeshare system in the Cultural District
D. Fogo de Chao in Uptown
E. A DJ spinning in Deep Ellum
D.
C.
B.
A.
Uptown, Victory Park, Deep Ellum, Cultural District, West 7th/Left Bank, Near Southside
16
E.

3Urban Commercial
There are 12 established Urban Commer-cial WalkUPs in the metropolitan DFW, making it the most common type of WalkUP. Urban Commercial WalkUPs were historically concentrations of local-serv-ing commercial space in the center city but well outside of the Downtown. These places experienced economic decline after World War II, but maintained a pedestri-an-friendly land plan and some historic buildings. Urban Commercial WalkUPs have regained their importance as con-centrations of regional retail (Preston Center), arts (Bishop Arts District), design (Dallas Design District) and boutique retail (Knox/Henderson).
Urban Commercial WalkUPs have large concentrations of residential space (47 percent), especially rental apartments.
WalkUPs Defined
Captions:
A. Christmas in the Bishop Arts District
B. A BIG girl in the Bishop Arts District
C. Zio Carlo in the Near Southside of Fort Worth
D. Lower Greenville
E. Apartments on Magnolia Avenue
A.
B.
C.
Knox/Henderson, Bishop Arts District/Davis, Lakewood Center, Oak Lawn, Lower Greenville, Design District, Baylor U Medical Center, Camp Bowie - the Bricks, Magnolia/Fairmount, East Jefferson, Camp Bowie - Ridglea, Stockyards and North Main Street
D.
17E.

4Urban University and
the Potential for Innovation Districts
Urban University WalkUPs have become critically important for the economy of metropolitan areas, due to the growth and dominance of the knowledge economy nationwide. Not only are universities “big business” by themselves and export-cash earners but they are also where much of the future’s economic energy is being generated. Urban universities also appear to be the universities most rapidly rising in the ranks of U.S. News and World Report and other ranking services, apparently due to the demand from Millennial and Gen Z (post-Millennials) for walkable urban plac-es to attend college.
There are five established Urban University WalkUPs and one emerging in the DFW metropolitan area. Due to missing data, UNT and Texas Woman’s University are not ranked in the economic performance sec-tion of this report. TCU/West Berry is the only high-ranking Urban University Walk-UP for economic performance, indicating there is much potential for growth, given how dynamic Urban University WalkUPs have been in metropolitan Boston, At-lanta and New York City. In these regions Urban Universities are either catalysts, anchor partners, or in many cases, active real estate developers themselves. The only emerging Urban University WalkUP is Downtown Arlington/UTA. UTA is the largest university in the Metroplex (55,000 students) and has been participating in the walkable urban development of Down-town Arlington, led by the place manage-ment organization Downtown Arlington Management Corporation. The probable future is comparable to West Los Angeles (UCLA), Uptown Cincinnati (University of Cincinnati) or Ann Arbor (University of Michigan).
The presence of Urban University WalkUPs can be anchors for the development of Innovation Districts, a ninth WalkUP type that is currently not present in metropoli-tan Dallas-Fort Worth; Innovation Districts
are what happens when Urban University WalkUPs “graduate” to the next level. As defined by The Brookings Institution, In-novation Districts are “dense enclaves that merge the innovation and employment potential of research-oriented anchor institutions, high-growth firms, and tech and creative start-ups in well-designed, amenity-rich residential and commercial environments.”23 Examples include the Innovation Districts adjacent to Carnegie Mellon and University of Pittsburgh, Ken-dall Square in Cambridge adjacent to MIT and Cortex, a joint venture of Washington University and St. Louis University.
Metropolitan DFW does not now have an Innovation District but certainly will need one to compete in this century. Where it will land and whether there will be more than one are questions that are not yet answered.
SMU/Mockingbird, TCU/West Berry, Downtown Denton, UNT, Texas Woman’s University
WalkUPs Defined
Captions:
A. The Texas Christian University campus
B. UNT students
C. Downtown Denton
D. The TCU band marching
E. Mockingbird condos near SMU
A.
B.
C.
D.
E.
18

5Major Suburban Town
Center
Major Suburban Town Centers are the farm-to-market downtowns of 18th- and 19th-century cities and towns that were swept up in the sprawl of their metro-politan areas in the late 20th century sprawl. Laid out before the automobile as walkable urban places, they were initially developed independently of the eventually encroaching DFW metro area. These Walk-UPs are characterized by walkable urban grids and historic buildings that provide a unique history and character to these WalkUPs.
Following decades of decline in the late 20th century, many Major Town Centers are now finding a new economic role. In fact, a key finding of this study is that pent-up demand for walkable urbanism is the primary reason for their redevel-opment, with a majority of the square footage being retail.
Retail is the dominant product type (55 percent of square footage), which is often the result of Main Street24 revitalization and management efforts. Rental apart-ments (2 percent) and for-sale residential (5 percent) are attracted to the close prox-imity of the retail, as well as the walkable streets and historic buildings. Office occu-pies a significant 24 percent of the space. It is probable that new rental and for-sale residential will lead future development in this type of WalkUP.
WalkUPs Defined
Downtown McKinney, Downtown Carrollton, Downtown Waxahatchie
Captions:
A. Downtown McKinney
B. The DART station in Downtown Carrollton
C. Downtown Waxahatchie
D. The Texas Theater in Waxa-hatchie
E. Oktoberfest in Downtown McKinney
F. “Visit Old Downtown Carrollton” mural
A.
B.
C.D.
E.
19
F.

6Small Town
Centers
A newly discovered WalkUP type in Metro DFW, Small Town Centers, are also historic 18th and 19th century farm towns that have been absorbed into the Metroplex. However, these are smaller town centers than the Major Town Centers and do not meet our criteria for regional significance (1.4 million sq. ft. of office space or 340,000 sq. ft. of retail). However, in DFW these historic nodes still seem to play a region-ally significant role. For example, down-town Plano may only include 199K square feet of retail and a new walkable urban apartment project, but it is still drawing customers from throughout the region for its unique character, arts, and restaurant scene.
WalkUPs Defined
Grapevine Main Street, Downtown Burleson, Downtown Plano, Downtown Weatherford, Downtown Corsicana
A.
B.C.
D.
Captions:
A. Grapevine Main Street
B. The Parker County court-house
C. Downtown Plano
D. A historic mural on the side of what is now the Across the Street Diner in Corsicana
E. Dining in Grapevine
E.
20

7Redeveloped Drivable
Sub-urban
One of the country’s largest potential walkable urban assets is the Redevelop-ment of Drivable Sub-urban places. Large, generally properly zoned land, generally owned by a few property owners who are sophisticated real estate professionals, the Redeveloped Drivable Sub-urban WalkUPs has been pioneered in places like Perime-ter Center and Buckhead in metro Atlanta and White Flint (now re-branded The Pike District) and a portion of Tysons in metro Washington, DC, the largest drivable sub-urban Edge City in the country. Pres-ton Center and the Shops at Park Lane are the two examples in metro DFW, but given general retail trends mentioned above, especially many regional malls and busi-ness parks probably going dark in the next recession, there will be substantial drivable sub-urban assets that will be looking to re-invent themselves.
WalkUPs Defined
Preston Center, Shops at Park Lane
Captions:
A. The Shops at Park Lane
B. The central sculp-ture at The Plaza at Preston Center
C. Preston Center
21
A.
A.
B.
C.

8Greenfield/Brownfield
Development
Metropolitan Dallas-Fort Worth is a major center of emerging and potential Green-field and Brownfield WalkUPs. These are places that have been created de novo on land that had never been built upon (Greenfield) in the past or had some other use that had been completely scraped (Brownfield). In either case, the resulting WalkUP is newly built with no reference to history and all of the infrastructure has to be built from scratch, making these endeavors very expensive. It is as if the developer just “adds water and, poof, instant urbanity.” Metro DFW has three established Greenfield WalkUPs that are considered national models, Legacy Town Center, Addison Circle and, perhaps best known, Southlake Town Center. The prod-uct mix in this WalkUP type is extremely well balanced between office, retail, and residential.
WalkUPs Defined
Southlake Town Center, Addison Circle, Legacy Town Center
Captions:
A. Addison Circle
B. Storefronts in Southlake Town Center
C. Townhouses in Southlake Town Center
D. Legacy Town Center
A.
B.
C.
D.
22

the DFW Region
23
IV.WalkUPs in the
DFW Region

Emerging
MAP ID NAME ACRES
39 Ross Ave 66.7
40 Cedars Dallas South Side 341.5
41 CityLine 95.8
42 Preston Hollow Village 41.6
43 Downtown Garland 65
44 Frisco Square and Mainstreet 118.1
45 Old Town Lewisville 117.7
46 Cypress Waters 295.9
47 Downtown Arlington/UTA 303.3
48 Downtown Cleburne 67.4
49 Six Points Race Street 163
50 South Main Village 46
51 Clearfork 81.6
52 Downtown Greenville 81.6
53 Duncanville Main Street 37.4
54 Downtown Mansfield 96
55 Watters Creek 50.2
Dallas-Fort Worth’s WalkUPs
Established
MAP ID NAME ACRES
1 Knox/Henderson 70.4
2 SMU/Mockingbird 543.5
3 Downtown Dallas 1043
4 Uptown 599.3
5 Deep Ellum 277.5
6 Baylor U Med Center 406.9
7 Victory Park 265
8 Oak Lawn 380.2
9 Lower Greenville 100
10 Bishop Arts District/Davis 66.5
11 Downtown Fort Worth 687.1
12 Camp Bowie - The Bricks 74.7
13 Camp Bowie - Ridglea 251.5
14 Cultural District 219
15 TCU/West Berry 258
16 Grapevine Main Street 47.5
17 UNT 341.6
18 Downtown Waxahachie 177.6
19 Downtown Corsicana 72.8
20 Downtown McKinney 31.2
21 Downtown Plano 58.3
22 Downtown Weatherford 61.2
23 Southlake Town Center 75.4
24 Magnolia/Fairmount 279.6
25 Design District 250.5
26 East Jefferson 122.6
27 Preston Center 95
28 Addison Circle 234.5
29 Downtown Carrollton 56.7
30 West 7th/Left Bank 32.9
31 Lakewood Center 36.3
32 Legacy Town Center 158.7
33 Downtown Burleson 46.7
34 West 7th/Left Bank 161.6
35 Near Southside 376.7
36 Stockyards and North Main Street 122.8
37 Downtown Denton 144.7
38 Texas Woman’s University 90.7
24
MAP LEGEND
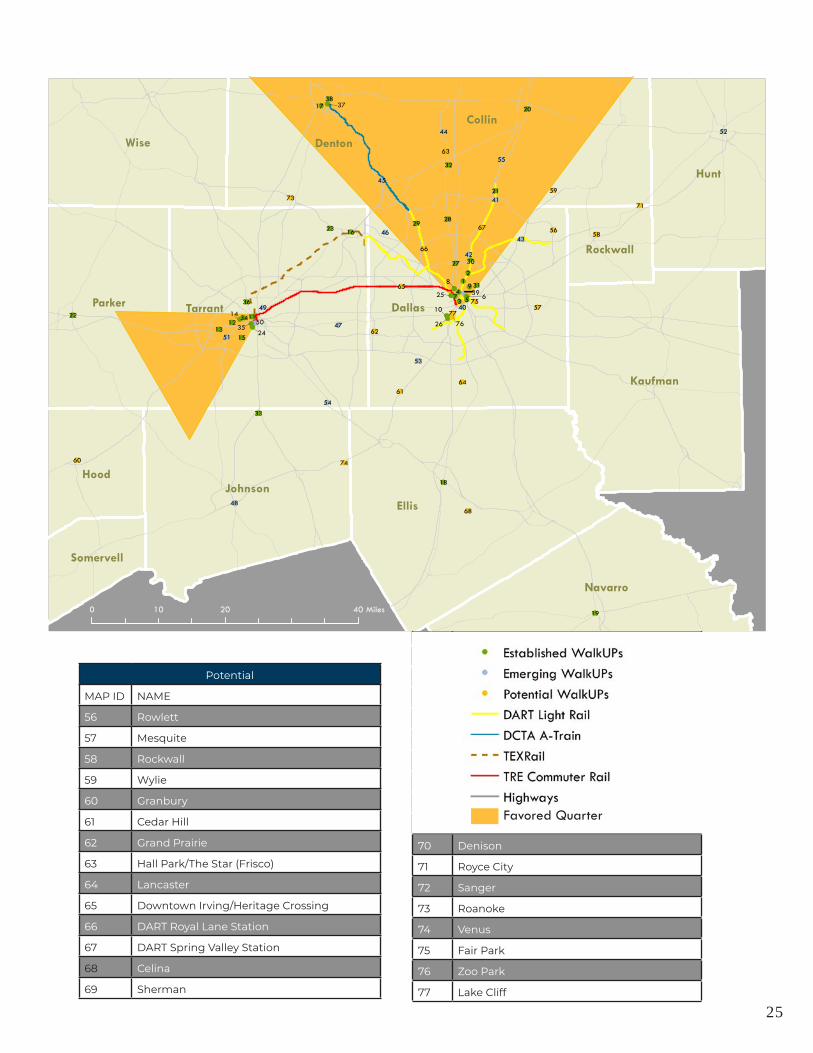
Potential
ID NAME
56 Rowlett
57 Mesquite
58 Rockwall
59 Wylie
60 Granbury
61 Cedar Hill
62 Grand Prairie
63 Hall Park/The Star (Frisco)
64 Lancaster
65 Downtown Irving/Heritage Crossing
66 DART Royal Lane Station
67 DART Spring Valley Station
68 Celina
69 Sherman
70 Denison
71 Royce City
72 Sanger
73 Roanoke
74 Venus
75 Fair Park
76 Zoo Park
77 Lake Cliff
Potential
MAP ID NAME
56 Rowlett
57 Mesquite
58 Rockwall
59 Wylie
60 Granbury
61 Cedar Hill
62 Grand Prairie
63 Hall Park/The Star (Frisco)
64 Lancaster
65 Downtown Irving/Heritage Crossing
66 DART Royal Lane Station
67 DART Spring Valley Station
68 Celina
69 Sherman
7776
75
74
7371
68
67
66
65
64
63
62
61
60
59
58
57
56
55
54
53
52
51
50
49
48
47
46
45
44
43
42
41
40
399
8
7
21
3837
36
34
33
32
31
30
29 28
27
26
25
24
23
22
21
20
19
18
17
16
15
14
13
Ellis
DallasTarrant
Wise
Hunt
Collin
Parker
Kaufman
Johnson
Denton
Navarro
Hood
Rockwall
Somervell
6543
3512
1110
0 20 4010 Miles
25
Favored Quarter

Geographic FindingsFor a region known for rapid growth in the automobile age, there are an abundance of Established, Emerging, and Potential WalkUPs in metropolitan Dallas-Fort Worth.
• There are 38 Established WalkUPs in metro DFW in 2018. Combined, these WalkUPs account for only 0.1 percent of the total land in the metro area. Their sizes range from 31 to 1,043 acres with an average of 219 acres, which is consistent with the 237-acre average size in metropolitan Washington, DC. Since WalkUPs are bound by comfort-able walking distance, it is rare that a WalkUP will exceed the area of a circle with a half-mile radius (roughly 500 acres). Examples of Established DFW WalkUPs include Downtown Fort Worth, Uptown Dallas, Grape-vine Main Street, Near Southside Fort Worth and Legacy Town Center.
• In.addition,.we.have.identified.17.Emerging WalkUPs. Some of these are regionally significant places that have long been auto-oriented, but are in the process of intentionally devel-oping into walkable urban places, such as Ross Avenue in Dallas. Others are smaller walkable neighborhoods with the foundation and capacity to grow to regional significance, such as South Main Village in Fort Worth. Emerging WalkUPs do not yet meet the walkability and/or size criteria nec-essary to be included in the list of Es-tablished WalkUPs, but it is likely that they will achieve that designation in the near future if they continue their current trajectory. Combined, these WalkUPs account for another 0.02 percent of the total land in the metro area. Their sizes range from 37 to 342 acres with an average of 120 acres. Be-cause these areas are not yet fully pe-destrian-oriented, their edges are less well defined. As a consequence, many of them may expand their boundaries in the future. In total, the Established and Emerging WalkUPs only use 0.12 percent of the region’s land mass.
• Finally,.we.have.defined.22.Poten-tial WalkUPs. These areas require significant redevelopment if they are to become truly walkable urban places. However, each of these places has a set of assets (transit access, land assembly, supportive policies, planned
development, recent/planned infra-structure investments, etc.) that make it probable that such redevelopment will eventually occur. Importantly, each of these 22 places has the inten-tion of becoming a walkable urban place, as indicated by local planning and implementation efforts and/or the presence of place management organizations.
• The densities of the 38 Estab-lished WalkUPs average 0.42 gross floor-area.ratio.(FAR),.ranging.from.0.10 to 1.18. The gross FAR for the region, excluding these 38 Established WalkUPs, is only 0.02. In other words, the regionally significant WalkUPs are almost 25 times denser than the rest of the region. The built-in capacity of WalkUPs to use much less land has many environmental, social, and economic benefits, including the far more efficient use of infrastructure, even including the capital costs of rail transit. While definitive research has not been completed on this issue, it is extremely likely that the cost per supportable square foot of walkable
urban development in most catego-ries of infrastructure is significantly less than for drivable sub-urban devel-opment.
• Of.the.38.Established.WalkUPs,.nearly 90% are in the “favored quarter” (see page 41 for discussion) of both the Dallas side of the met-ro area (the Dallas favored quarter goes in an arc to the north/northwest of Downtown Dallas) and the Fort Worth side of the metro area (favored quarter goes to the southwest from Downtown Fort Worth), as shown on the map on page 25. This is consis-tent with where Established WalkUPs have developed in metro Washington, Atlanta, Boston and Detroit.
• The Emerging and Potential Walk-UPs are more evenly distributed throughout the metropolitan area. This is primarily due to the large num-ber of Town Centers (Major and Small) laid out before the favored quarter dictated development trends. These Town Centers are taking advantage of their historic pedestrian street grid and buildings. In other metro areas further along the walkable urban development trend, there has been an expansion of the favored quarter to fringe conditions on either side of the favored quarter boundary. This is one of the most social equitable aspects of the future walkable urban trend.
• Over 10 percent of total metropoli-tan jobs are located in Established WalkUPs,.while.12%.of.the.region’s.GRP is produced in WalkUPs. This is because base (or export) and regional jobs are disproportionately concen-trated in metro DFW WalkUPs, partic-ularly knowledge economy jobs.
• Overall,.Established.WalkUPs.have.an employment density of 42.1 jobs per acre; the region as a whole, not including Established WalkUPs, has an employment density of only 0.4 jobs/acre, 112 times more employment density.
26

• Forty-five percent of Established WalkUPs in the region are in Dallas County. Another 29% are in Tarrant County, meaning these two counties contain almost three-quarters of the region’s walkable urban places. However, there are an additional 10 Established WalkUPs in suburban and exurban counties, proving it can be done. The additional Emerging and Potential WalkUPs are more evenly disbursed throughout the metro area.
• Seventeen of the 38 regionally significant.WalkUPs,.or.45.percent,.have rail transit. The remaining 21 WalkUPs have no rail service, though this will change for Grapevine with the imminent opening of TEXRail. Rail transit is highly correlated to the de-velopment of walkable urban places, as it provides increased transportation options for residents, workers, and vis-itors. In metropolitan Washington, 80
politan Washington is the model for how the country is developing the built environment, this would suggest that, in addition to increasing the den-sity and walkability of its Established WalkUPs, the DFW metro area could support at least another 25 WalkUPs. However, this formula is simply a guideline, not a proven rule. In the 1960s, when regional malls were first being developed, there was similar uncertainty about the population needed to support each mall.
percent of WalkUPs have rail transit, as do 59 percent of Atlanta WalkUPs. Good transit service also means there is less need for the building of even more costly parking within the WalkUP. However, there is no proven causal connection between rail transit and the development of walkable urban places, only correla-tion. Clearly, it is possible to foster walkable urbanism without rail.
• There is about one regionally sig-nificant.WalkUP.for.every.200,000.residents in the Dallas-Fort Worth-Arlington CBSA. As a ratio, this is 75 percent of what we found in the Atlanta metro area (where there was one WalkUP for every 150,000 residents) and 60 percent of what we found in the DC area (where there was one WalkUP for every 120,000 residents). Working under the assumption that metro-
Geographic Findings
27

Product FindingsMetropolitan Dallas-Fort Worth area office, retail, industrial, hotel, rental residential, and for-sale residential comprises 6.1 billion square feet. Like all metro areas, real estate is the largest asset class in the regional economy.
The DFW regional product mix is broken down as follows:
The 38 WalkUPs have a fundamentally different product mix than the region as a whole. The product mix of the WalkUPs is broken down into the following pie chart:
GENERAL PRODUCT TRENDS
The health of various real estate product types is dependent upon current market forces, regardless to whether the product is built in a walkable urban or a drivable sub-urban form. Current U.S. real estate market forces include:
• For-sale housing (62% of all real estate square footage) had a peak when 69% of all households owned their residences nationwide in 2004, before the Great Recession. Home-ownership dropped to 63% in 2016 as a result of the housing crash, and has crept back up to 64.4% nationally in 2018.25 This shift away from home ownership has forced substantial dis-ruption for households who have lost homes, which is still being felt today.
• As a partial result of the for-sale housing collapse mentioned above, combined with the coming of age of the Millennial generation (the largest in U.S. history), there has been a boom in rental single-family housing and multi-family rental apartment devel-opment over the past decade.
• Retail (7% of all real estate) in the DFW region has 56.7 square feet per capita,.more.than.double.the.na-tional.figure.of.23.6.square.feet.per.capita. The US national rate is higher than all other developed nations, over five times as much square footage per capita than the UK and Germany, according to the global brokerage firm Newmark Knight Frank.26 With the combination of this massive overbuilding and the rise of online shopping (9% of all retail sales now and growing approximately one per-centage point per year27), most “brick and mortar” retail categories are in decline. Many analysts estimate that a third of the 1200 regional malls will close in the next recession, due to the failure or retrenching of anchor de-partment stores such as Sears, K-Mart, Penney’s, Macy’s and others.28 Big Box stores are also in decline.
• Office.(6%.of.all.real.estate).is.expe-riencing a structural decline in the amount.of.office.space.per.employ-ee, declining from over 300 square feet per employee one cycle ago to less than 200 square feet today.29 In addition, both the “Gig Economy” and the ability for employees to work from nearly anywhere, which includes working from home, shared work-spaces (e.g., WeWork), “3rd Places” like coffee shops and even WiFi-enhanced parks, etc. have resulted in structural weakness in the office market with higher vacancies and rents than would be expected at the current height of the real estate cycle. These vacancies are particularly felt in driv-able sub-urban business parks.
• Industrial (12% of all real estate) has been a rare drivable sub-urban growth category during the current real estate cycle. This is primarily due to the need for larger and far more technologically sophisticated warehouses for companies such as Amazon and Wal-Mart (as it competes with Amazon online) and others. Also, the explosive growth in data centers for companies such as Amazon, Goo-gle, Apple, Facebook and Netflix (the big 5 tech companies) has bolstered the growth of this product category in this real estate cycle. Nearly all of this large format warehouse and data center development is truck-served, one story, drivable sub-urban form.
UNIQUE WALKABLE URBAN PRODUCT TRENDS
The market for walkable urban real estate is fundamentally different than that for drivable sub-urban real estate; as different as night is from day. The pent-up market demand for walkable urban real estate, in general, has been driven by the younger Millennials and older Baby Boomers, the two dominant generations in the country at the current time. Both are primarily comprised of one- or two-member house-holds.30 The vast majority (77%) of all future household growth over the next decade will be singles and couples31, a far cry from
28
12%

the child-based household of the mid to late-20th century. It is not a coincidence that nearly all popular television shows of the mid-20th century, such as Leave It to Beaver, Dick Van Dyck Show and The Brady Bunch, were set in child-focused single family, drivable suburbia. Nor is it a coincidence that from the 1990s through today that Seinfeld, Friends, Sex in The City, and Two Broke Girls were set in single- and couples-dominated walkable urban places.
Below are the unique and generally pos-itive impacts on walkable urban product types that layer on top of the current trends mentioned above, regardless the different types of WalkUPs that the prod-uct is located.
• Rental Residential-- There is substan-tial market demand for higher density walkable urban living throughout the country, where every day convenienc-es and even work are within walking distance. Locally, 26% of metro DFW multi-family development in this cy-cle has been in the established and emerging WalkUPs. This research indicates that an increasing share of future multi-family rental housing will be in the established and emerging WalkUPs and walkable urban neigh-borhoods.
• For-sale Residential—Only a small fraction of metro DFW walkable ur-ban housing is for-sale housing today (0.52%, far below the 62% for-sale housing footprint in the region as a whole32). Based upon comparable for-sale housing development in metro-politan Washington, DC and Atlanta, it is probable this product type will be a major source of new development in future real estate cycles in metro DFW.
• Office.Conversions—The structural overbuilding of the office market, described above, has an unexpected benefit for WalkUPs; the conver-sion of obsolete B and C Class office building to residential uses. Many older office buildings have small floor plates (under 12,000 square feet) which maximizes windows, which is a requirement for residential uses. This office conversion to residential is the ultimate “two-fer.” That is, clearing the.market.of.obsolete.office.space.while providing exactly the location and.type.of.product.(older,.charac-terful space) which the residential market is seeking and willing to pay a premium to obtain.
• Retail—Numerous walkable urban retail categories have substantial growth potential due to a combina-tion of the pent-up demand for walk-able urbanism in general and specific retail segments that generally only appear in WalkUPs. These positive walkable urban retail categories that are growing include:
» Local serving retailing (grocery stores such as the new Royal Blue Grocery in Downtown Dallas, the “new” Food Halls category, drug stores, etc.) to serve walkable urban household growth.
» Urban entertainment (restaurants, night clubs, etc.) which serve the region as a whole and the growing WalkUP resident population.
» Office-driven retailing at lunch time and after-work, generally restaurants and bars.
» “Experiential” retail that includes pop-ups, Farmer’s Markets, and new retail formats that sell experiences and consumer advisory services. The best experiential example is Apple, which provides computer consult-ing in addition to selling hardware at its retail stores. Apple stores have achieved sales per square feet (over $5,000 per square foot annually33) over twice the highest conventional retail sales category (jewelry stores) on a sales per square foot basis. One could conclude that experiential retail is not retail at all, given the huge sales volumes and fundamentally different business strategy.
• Industrial—While not seen in this metropolitan DFW research, the 2017 Metro NYC WalkUP Wake-Up Call34 showed that a staggering 59% of net absorption of industrial space in this real estate cycle in the country’s largest industrial real estate market was walkable urban. The growth in metro New York City of light man-ufacturing, artisanal food products, maker businesses and nascent urban farming seem to account for this surprising walkable urban industrial growth in metro NYC; think Brooklyn Navy Yard. An example of industrial walkable urbanism in metro DFW is the Design District in Dallas.
• Hotel—This product type is generally about one percent of all real estate square footage in a metropolitan area and tend to concentrate in WalkUPs. In.metro.DFW,.29%.of.hotel.square.footage are in the 38 WalkUPs. One
of the reasons for this is the location of the two major convention centers in Downtown Dallas and Downtown Fort Worth; conventions are one of the three major demand factors for hotel occupancy. The other two demand factors are business visitors, driven by the location of office space in particu-lar, and tourism. The over-representa-tion of office space in WalkUPs (22% of all office space in the region are in the 38 WalkUPs) is another reason for the concentration of hotels in WalkUPs. Finally, walkable urban places tend to be some of the most visited tourism locations in the world; think Paris, New York City, etc. As the WalkUPs in metro DFW continue to add cultural, athletic and event attractions, such as the art museums and the Ameri-can Airlines Center, walkable urban tourism will grow as will the demand for hotel rooms.
• Walkable Urban Valuations—One of the reasons this research employs Walk Score® in its methodology (see page 12 for description), is that it is one of the best estimators of valuation of real estate in this walkable urban era, particularly residential real estate. Once an area surpasses a Walk Score of 70.5, each additional Walk Score point gained is correlated with higher home sales prices.35 In addition, ex-perience in other metropolitan areas indicates there is a capitalization rate premium for walkable urban real es-tate of between 20-40 percent higher.
Product Findings
29

V. WalkUPTrends
30

Market Share ShiftsMarket share shifts can reveal emerging trends before they are fully established or broadly understood.
We measure this change in market share through the absolute amount of square feet of leasing activity (positive and/or negative), known as net absorption on an annual basis, and comparing it to the base year of a real estate cycle, such as 2010 which was the start of the current cycle. The rise of drivable sub-urban develop-ment was most pronounced in the 1980’s real estate cycle with the rise of edge cities. Edge cities throughout the coun-try and especially in metro DFW were gaining market share in office, retail and multi-family rental by two to four times over their baseline 1982 market share (the first year of the 1980s cycle), resulting in walkable urban places such as Downtown Dallas and Fort Worth losing market share. Generally walkable urban absorption would have had to double during the 1980s real estate cycle to just maintain its 1982 market share.
The current real estate cycle has seen walkable urban office, retail and multi-family rental all gaining substantial market share growth, two to nearly four times market share growth from the 2010 base at the beginning of the cycle. Like-wise, drivable sub-urban has been losing market share (though the absolute market size remains very large). For example, drivable sub-urban multi-family rental would have needed to increase absorption by approximately one third to maintain 2010 market share while office would have to nearly double its net absorption in this cycle just to maintain market share.During this real estate cycle, the defining real estate product has been the devel-opment of multi-family rental, booming throughout the now nine year cycle. Driv-able sub-urban net absorption cratered in the Great Recession, actually losing net
absorption, and then it mildly bounced back in the current cycle. It was about the same in absolute net absorption as the combination of emerging and established multi-family rental net absorption, even though the WalkUPs occupies only 0.2 of 1% of the metro DFW land mass. The
WalkUP Trends
31
relative market share shift toward walkable urban multi-family rental was four times greater its 2010 market share base, as the market is shifting toward more walkable urban product absorption.
Mill
ion
s of
Sq
uar
e Fe
et

For-sale housing is the largest real estate product type by square footage in nearly all U.S. metropolitan areas. It accounts for an estimated 62% of all metro DFW square footage. The true number is potentially slightly lower, as some for-sale housing units, both detached and attached, are owned by households, partnerships or corporations, but are leased to rental households.
We use Redfin Estimates for for-sale housing valuations, which one evaluation found to be the most reliable in the for-sale industry.36 We have focused on two geographic areas to determine if WalkUPs result in for-sale housing sales price valu-ation differences, when compared to the metro area median price, which is $122 per square foot:
• WalkUP Valuations—Com-paring the average price per square foot in the metro DFW region and the 38 WalkUPs and
• “WalkUP Adjacent” Valuations—The area surrounding a WalkUP, which we refer to as “WalkUP Adjacent,” is the ½ half mile radi-us around a WalkUP, chosen as a proxy for convenient walking dis-tance. WalkUP Adjacent for-sale housing values are likely influenced by walking proximity to the WalkUP itself. The WalkUP Adjacent area is where a household can live in a drivable sub-urban location but be within walking distance of walkable urbanity.
WALKUP VALUATIONS
There is a dramatic positive for-sale hous-ing price premium in the 38 WalkUPs, compared to the metro DFW regional average. The weighted average median price of for-sale housing in WalkUPs is $249 per square foot, which is a 100% price per square foot premium or two times
The For-Sale Housing PremiumWalkUPs make great neighbors.
2 x premium=+$127/ sq ft.
1/2 mile
1.7 X premium =+$87/sq.ft.
premium over the average for-sale house in the region, which is $122 per square foot. We only have for-sale price data for 36 of the 38 WalkUPs and 29 of these 36 have a positive price premium over the metropolitan median price. The highest priced housing in WalkUPs, including Victory Park, Uptown, Preston Center and Downtown in Dallas and Downtown and the Cultural District in Fort Worth, have an average median price of $308 per square foot, 151% price per square foot premium (2.5 times price premium) over the region-al median price.
For-sale housing is the largest real estate product type in
every metro-politan area in the country; metro DFW has 62% of its real estate square footage in for-sale housing. Yet the product mix of for-sale housing in the 38 WalkUPs is vanishingly low, only 0.52% of the for-sale housing in the region.
The reason for this is that over the past 20 years since walkable urban development
first began to impact real estate, nearly all development has been income product, particularly rental multi-family residential. Much of this rental housing has been oc-cupied by Millennials who have been en-tering the workforce and are predisposed to rent in their 20s and early 30s.
The role of the Baby Boomers, now gener-ally empty nesters and beginning to retire, in the for-sale walkable urban housing market is also key to its growth in this and future real estate cycles in metro DFW. The Baby Boomers buying for-sale housing in the highest priced housing WalkUPs are evidence of this demand. The challenge for Baby Boomers is that many of them need to sell their large single-family house, which is generally much lower priced on a price per square foot basis and competing
with many other Baby Boomers trying to sell their large houses, to purchase
a walkable urban residence that is much higher price per square foot.
The primary way the Baby Boom-ers make this transition from a lower-priced single-family house to a high priced walk-able urban residence is by down-sizing to less square footage. In addition, the future home buying patterns of the Millennials, a crucial question yet to be well un-derstood, will also pay a major role in the future of WalkUP housing market.
WALKUP ADJACENT VALUATIONS
WalkUP Adjacent areas, which tend to be single-family neighborhoods in
most of metro DFW, have a surprising role to play in the walkable urban trend. By living in a drivable sub-urban neighbor-hood yet within walking distance of the vitality of a WalkUP, our national research has shown positive price per square foot premiums over comparable housing not within walking distance.
On average, the for-sale housing premi-ums in WalkUP Adjacent places around the 38 WalkUPs are $210 per square foot, a 71% premium over the $122 per square foot
WalkUP Trends
32

median for metro DFW. For the highest priced WalkUPs, the weighted average median sales value per square foot is $244 per square foot, a 99% premium over the metro DFW medium for-sale housing valuation. Significantly, this latter WalkUP Adjacent price premium is even higher than the average WalkUP for-sale price premium over the metro DFW median price.
The irony of the WalkUP Adjacent price premium is that most NIMBY opposition to WalkUP development comes from the surrounding neighborhoods. These very neighborhoods that oppose walkable urban development stand to benefit both from a quality of life perspective (live in suburbia and walk to urbanity) and from an economic perspective as shown by this research.
However, the large price premiums in WalkUP Adjacent areas create market pressure for those neighborhoods to change their density and therefore their character, which is already occurring. To meet the pent-up demand for walkable urban housing and address growing social equity challenges, discussed in the Social
Equity section (pages 41 and 42), WalkUP Adjacent sections will change, assuming there is a change in the zoning to allow it. In essence, the market is ascribing much higher values to WalkUP Adjacent land, which will result in single family hous-ing being converted into higher density single-family, townhouse and stacked flat configurations.
Rezoning, specifically “up-zoning” single family neighborhoods, is controversial. The historical roots of single-family-only zoning in the mid-20th century lie in the legal transition from restrictive covenants (generally only allowing white households to own housing in a neighborhood). The outcome is that the country in general and metro DFW in particular have income- and racially-segregated neighborhoods. Up-zoning single-family neighborhoods is worth tens of billions of dollars of increased land values, reflecting market demand. While government mandates through existing zoning continue to dictate single-family neighborhoods, the market is demanding a change, particular-ly in WalkUP Adjacent neighborhoods.
The City of Minneapolis recently adopted a comprehensive plan that calls for the up-zoning of all single-family neighbor-hoods to allow for higher densities, a far-reaching move. It will increase land values tremendously and the question any municipality should ask is “who benefits from the up-zoning?” It could go 100% to existing property owners, providing a windfall profit for taking no risk. However, this financial upside could also be a split between existing land owners and the public through “value capture”, where a portion is diverted to meet social equity or infrastructure funding needs. Value capture could ensure that the redeveloped WalkUP Adjacent neighborhoods will be permanently mixed-income and mixed-race if public policy so judged these to be social priorities. This redevelopment could be a possible funding for the infrastruc-ture upgrades, transportation, water and sewer, etc., required to create additional walkable urban places. The simple change in zoning in WalkUP Adjacent areas will result in a vast increase in real estate valuations, property tax revenues and, if so determined by municipal legislative bodies, a new source of funding for social equity and infrastructure needs.
WalkUP Trends
33

VI. WalkUPRankings
34

Economic RankingsThe economics of the 38 established WalkUPs compared to the rest of the region are measured by an Economic Performance Index (EPI), comprised of:
• Asking rents per square foot, adjusted for vacancy, for office, retail and multi-family rental,
• Place-level gross regional product, a new measure never before used in metro DFW and
• Total Jobs per acre, which helps define the boundary of the WalkUP.
RENT RANKINGS
The region’s WalkUPs ranked by vacancy adjusted rental rates as of the end of calendar year 2017 are shown in the table at right. The composite rent figure we report here is an inventory-weighted aver-age of vacancy-discounted asking rents for office, retail, and multifamily. The premi-ums reprepresent a ratio of the WalkUP’s asking rent over the region’s average asking rent.
The composite rents for 33 of the 38 WalkUPs (87%) are above the composite for the region as a whole. On aver-age, WalkUPs achieve a 37% premium in vacancy adjust-ed rents for office, retail and multi-family rental over the region. The top four WalkUPs have rent averages nearly two times the regional average.
RANK NAME OFFICE PREMIUM
RETAIL PREMIUM
MULTIFAMILY PREMIUM
COMPOSITE PREMIUM
COMPOSITE RENT
1 Lakewood Center 1.26x 2.58x 1.37x 2.07x $33.03
2 Preston Center 1.53x 1.74x 1.87x 1.95x $31.17
3 Southlake Town Center 1.35x 2.07x N/A 1.94x $30.99
4 Bishop Arts District/Davis 1.57x 1.95x 0.79x 1.86x $29.76
5 Knox/Henderson 1.53x 3.60x 1.52x 1.84x $29.31
6 Grapevine Main Street 2.67x 1.44x 1.55x 1.74x $27.81
7 Victory Park 1.72x 1.85x 1.42x 1.63x $26.09
8 Oak Lawn 1.43x 1.83x 1.66x 1.62x $25.85
9 Uptown 1.50x 2.49x 1.56x 1.61x $25.70
10 Cultural District 1.25x 1.86x 1.29x 1.58x $25.25
11 Shops at Park Lane 1.22x 2.05x 1.48x 1.57x $25.10
12 Lower Greenville 0.82x 1.87x 1.14x 1.52x $24.27
13 Addison Circle 1.24x 1.26x 1.55x 1.52x $24.19
14 Magnolia/Fairmount 1.17x 1.62x 0.55x 1.49x $23.80
15 Legacy Town Center 1.61x 1.81x 1.16x 1.47x $23.50
16 Downtown Fort Worth 1.12x 1.89x 1.26x 1.44x $23.06
17 Camp Bowie-The Bricks 1.18x 1.49x 1.20x 1.44x $23.02
18 Downtown Burleson 1.33x 1.61x 0.70x 1.36x $21.67
19 SMU/Mockingbird 1.18x 1.63x 1.20x 1.34x $21.46
20 Downtown McKinney 1.06x 1.33x 1.48x 1.31x $20.93
21 Baylor U Med Center 1.01x 1.70x 1.25x 1.26x $20.17
22 Downtown Dallas 0.92x 1.23x 1.23x 1.19x $19.05
23 Near Southside 1.01x 1.02x 1.04x 1.18x $18.81
24 Texas Christian University 1.26x 1.28x 1.26x 1.17x $18.63
25 West 7th/Left Bank 1.36x 1.42x 1.12x 1.14x $18.27
26 Camp Bowie- Ridglea 0.83x 1.26x 1.08x 1.12x $17.85
27 Downtown Carrollton 0.78x 1.06x 1.40x 1.11x $17.68
28 Downtown Denton 0.94x 1.09x 1.04x 1.07x $17.14
29 Design District 1.21x 1.06x 1.21x 1.07x $17.05
30 Deep Ellum 0.73x 1.24x 1.09x 1.03x $16.38
31 East Jefferson 0.88x 1.04x 0.50x 1.02x $16.21
32 Downtown Plano 1.06x 1.08x 1.11x 1.01x $16.19
33 Downtown Waxahachie 0.91x 0.98x 1.38x 1.01x $16.18
Region 1.00x 1.00x 1.00x 1.00x $15.96
34 Downtown Weatherford 0.88x 0.96x 0.79x 0.95x $15.23
35 Stockyards and North Main Street
0.78x 0.86x 1.09x 0.87x $13.85
36 Downtown Corsicana 0.81x 0.73x 0.80x 0.72x $11.46
*UNT and Texas Woman’s University are unranked due to lack of data availability35

GROSS REGIONAL PRODUCT RANKINGS
The gross regional product (GRP) rankings for the place-based WalkUPs for 2018 is shown in the table at right. The 38 WalkUPs generate an estimated $49.7 billion in annual GRP out of $423 billion in the region, or 12% of the total GRP. This is rather impressive in particular given that these 38 WalkUPs comprise only 0.12 percent of total land mass of the region. In metro DFW and nationally, WalkUPs are very small in land mass but far larg-er in economic impact. Down-town Dallas is by far the largest contributor to the regional GRP, generating $18.7 billion of GRP or 4.4% of the regional GRP. Downtown Fort Worth is the second largest contributor to the regional GRP, generat-ing $7.1 billion in GRP or 1.7% of the regional GRP. This is the first time place-based GRP have been estimated in metro DFW.
Rank Name Jobs/Acre GRP % of Metro DFW’s GRP
1 Downtown Dallas 103.7 $ 18,718,574,240 4.4%
2 Downtown Fort Worth 61.2 $ 7,051,240,380 1.7%
3 Uptown 39.8 $ 3,789,455,092 0.9%
4 SMU/Mockingbird 28.2 $ 2,080,462,008 0.5%
5 Addison Circle 53.8 $ 1,979,227,290 0.5%
6 Victory Park 49.1 $ 1,902,565,860 0.4%
7 Oak Lawn 30.5 $ 1,707,718,635 0.4%
8 Preston Center 99.0 $ 1,654,048,547 0.4%
9 Baylor U Med Center 39.0 $ 1,496,445,398 0.4%
10 Near Southside 42.6 $ 1,390,407,486 0.3%
11 Deep Ellum 27.3 $ 1,053,838,629 0.2%
12 Magnolia/Fairmount 37.7 $ 820,159,197 0.2%
13 Legacy Town Center 28.0 $ 605,846,739 0.1%
14 East Jefferson 40.9 $ 577,114,997 0.1%
15 Design District 20.0 $ 563,993,274 0.1%
16 Camp Bowie - Ridglea 13.7 $ 352,654,179 0.1%
17 Knox Street 45.7 $ 329,066,538 0.1%
18 Shops at Park Lane 50.6 $ 302,262,917 0.1%
19 Downtown Denton 20.3 $ 300,810,223 0.1%
20 Bishop Arts District/Davis 44.9 $ 295,758,952 0.1%
21 Cultural District 16.2 $ 286,438,601 0.1%
22 Southlake Town Center 40.8 $ 277,860,466 0.1%
23 TCU/West Berry 17.0 $ 277,689,631 0.1%
24 UNT 14.8 $ 248,468,392 0.1%
25 West 7th/Left Bank 15.9 $ 227,356,250 0.1%
26 Grapevine Main Street 35.3 $ 218,543,535 0.1%
27 Downtown McKinney 73.8 $ 193,798,926 0.0%
28 Downtown Plano 36.6 $ 173,428,770 0.0%
29 Stockyards and North Main Street
13.7 $ 171,112,758 0.0%
30 Downtown Waxahachie 5.5 $ 96,771,150 0.0%
31 Lower Greenville 14.0 $ 94,641,293 0.0%
32 Downtown Weatherford 12.8 $ 93,126,377 0.0%
33 Lakewood Center 27.2 $ 89,556,690 0.0%
34 Camp Bowie - The Bricks 11.9 $ 71,128,329 0.0%
35 Downtown Carrollton 11.5 $ 58,748,559 0.0%
36 Downtown Burleson 16.6 $ 51,414,467 0.0%
37 Downtown Corsicana 7.8 $ 50,768,547 0.0%
38 Texas Woman’s University 19.7 $ 5,801,553 0.0%
All WalkUPs 42.1 $ 49,658,304,872 11.7%
Region 0.4 $ 423,983,436,792 100.0%
Economic Rankings
36

ECONOMICPERFORMANCE INDEX RANKINGS
Combining the above rankings into one composite index requires a subjective weighing of the results. We applied weights of:
• 50% for vacancy adjusted rental rate for office, retail and multi-family rental,
• 25% for WalkUP GRP and
• 25% for job density.
We present the Economic Performance Index results in four performance cate-gories named after metals, Platinum for the highest ranked, then Gold, Silver and Copper. These groupings are based upon breakpoints in performance and are rela-tive to the DFW regional competition, not comparable to rankings we have conduct-ed in other metro areas, such as metro Atlanta and Washington, DC.
The Platinum, Gold, and Silver WalkUPs have achieved substantial positive vacancy adjusted rent premiums over drivable sub-urban income real estate product types, while Copper WalkUPs are perform-ing essentially on par. Of the six Copper WalkUPs, only half actually had slightly lower rent levels than the drivable sub-ur-ban inventory in the metro DFW region.
Economic Rankings
37
S G PC

GoldGThis second highest economic performance category was achieved by 17 WalkUPs. Gold performance level also assumes the place has achieved critical mass, meaning there is no need for economic incentives to develop the next project, though it still has economic valu-ation upside that could be achieved. Gold ranked WalkUPs have a vacancy adjusted rent of $25.17 per square foot per year versus $16.68 rent for the drivable sub-urban average, or a 50% rent premium.
Preston CenterCultural District
Magnolia/FairmountDowntown Dallas
Downtown Fort WorthUptown
Victory ParkAddison Circle
Grapevine Main StreetBishop Arts District/Davis
Lakewood CenterOak Lawn
Southlake Town CenterShops at Park Lane
Knox/HendersonLegacy Town Center
Downtown McKinneySMU/Mockingbird
WalkUPs
740.57
AVERAGE KEY METRICS
Economic Rankings
38
This is the highest economic performance category which only one of the 38 WalkUPs has achieved, Preston Center in Dallas. Platinum performance level assumes the WalkUP has achieved “critical mass’, i.e., there is no need for special incentives to build new projects in the WalkUP. However, Platinum WalkUPs are best categorized as “institutional” asset places where low-risk pension funds, insurance companies and REITs predominate with less future relative economic upside. The platinum ranked WalkUP has a vacancy adjusted rent of $28.19 per square foot per year versus $16.68 rent for the regional drivable sub-urban average, or a 69% rent premium.
PlatinumP
761.09
Office $$$$$$ $32.63 $$$$$$ $29.76
Retail $$$$$ $26.26 $$$$$$ $28.76
Rental Housing
$$$$$ $25.68 $$$ $16.98
Overall Average
$$$$$ $28.19 $$$$$ $25.17
GWALKSCORE
FAR(FLOOR AREA RATIO)
P
AN
NU
AL
RE
NT
PE
R S
QU
AR
E
FOO
T ($
=5)

SilverSThis third metal level is probably not at critical mass, i.e., tax incentives, subsidies or some other write down of costs may be needed to economically build in a Silver WalkUP. However, there is the potential to achieve critical mass, resulting in substantial valuation increas-es. Silver ranked WalkUPs have an vacancy adjusted rent of $18.70 per square foot per year versus $16.68 rent for the drivable sub-urban average, or a 12% rent premium.
Deep EllumNear Southside
West 7th/Left BankDowntown Burleson
Downtown PlanoBaylor U Med Center
Camp Bowie - RidgleaCamp Bowie - The Bricks
Design DistrictEast Jefferson
Downtown DentonLower Greenville
WalkUPs
WALK SCORE71
GROSS AREA FAR(FLOOR AREA RATIO)
.25Office $$$$ $21.90
Retail $$$ $19.92
Rental Housing
$$ $14.27
Overall Average
$$$ $18.70
AVERAGE KEY METRICS
Economic Rankings
39
AN
NU
AL
RE
NT
PE
R S
QU
AR
E
FOO
T ($
=5)
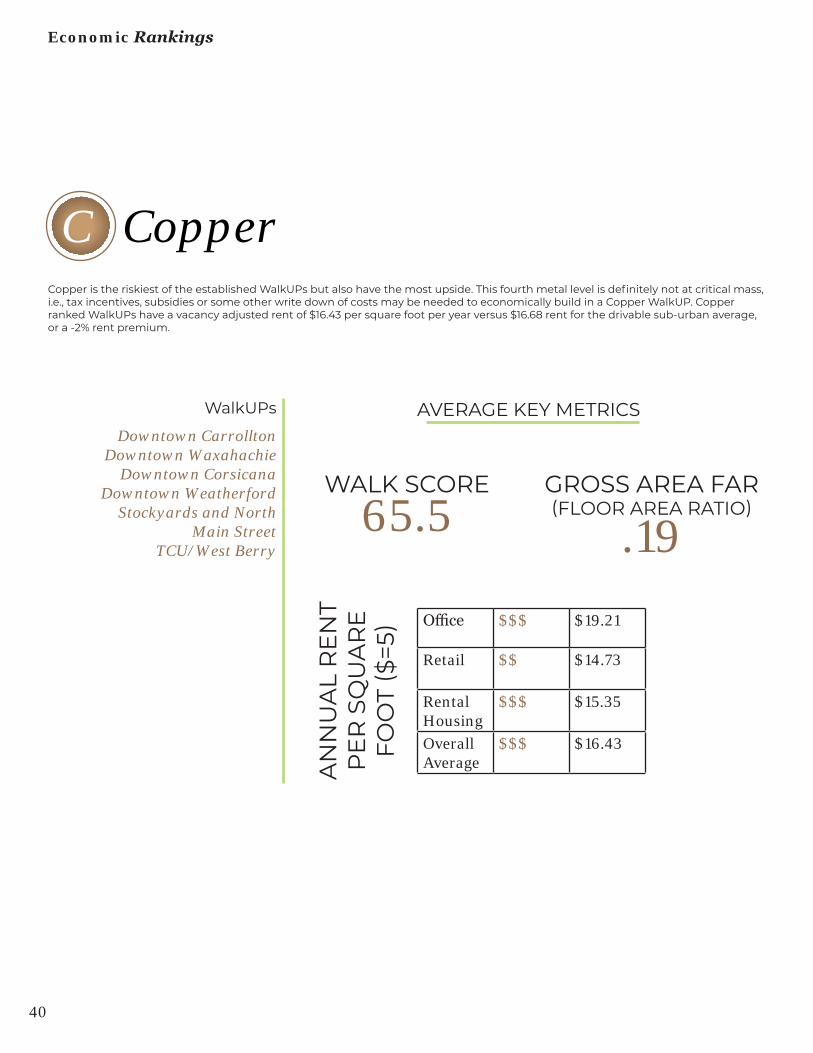
CopperCCopper is the riskiest of the established WalkUPs but also have the most upside. This fourth metal level is definitely not at critical mass, i.e., tax incentives, subsidies or some other write down of costs may be needed to economically build in a Copper WalkUP. Copper ranked WalkUPs have a vacancy adjusted rent of $16.43 per square foot per year versus $16.68 rent for the drivable sub-urban average, or a -2% rent premium.
Downtown CarrolltonDowntown Waxahachie
Downtown CorsicanaDowntown Weatherford
Stockyards and North Main Street
TCU/West Berry
WalkUPs
WALK SCORE65.5
GROSS AREA FAR(FLOOR AREA RATIO)
.19Office $$$ $19.21
Retail $$ $14.73
Rental Housing
$$$ $15.35
Overall Average
$$$ $16.43
AVERAGE KEY METRICS
Economic Rankings
40
AN
NU
AL
RE
NT
PE
R S
QU
AR
E
FOO
T ($
=5)

Social Equity RankingsNationally there is growing concern that improved economic performance in metropolitan development comes at the cost of greater social inequality. The increasing walkable urban rental and for-sale price premiums in metro DFW, outlined in the economic performance section of this report, may displacing or not allowing low-income households to locate in WalkUPs.
This research looks beyond just housing costs in determining social equity, adding transit accessibility and balance of rental/for-sale housing mix, as outlined in the methodology chapter of this report. It is important to note, however, that these measures do not capture all components of social equity. For example, they do not measure important qualities such as access to good schools, safe streets, or healthy environments.
We have developed a Social Equity Index (SEI) and used it to rank established Walk-UPs in metropolitan DFW. Our housing affordability metric is based on costs for households with income that is 80 percent of the area median income (AMI), which is generally around $51,050 in the DFW met-ro area based upon the AMI of $63,812.
The Social Equity Index we use is based on three components, equally weighed at 33%:
• Transit Accessibility—The absolute number of people who can get to the WalkUP via some form of transit (bus or rail) or by walking within a 45 min-ute trip. The more people who can get to the WalkUP by transit or walking, the higher the ranking.
• Housing Cost—The percentage of 80% AMI household income required to live in the WalkUP. The U.S. Housing and Urban Development goal is to not spend more than 30% of household income on housing. Lower housing costs for an 80% AMI household re-sults in a higher ranking.
• Rental/For-sale Housing Mix—We assume that having an even 50%/50% mix of rental and for-sale housing in the WalkUP is a positive outcome, allowing for maximum housing opportunities. Distance from this 50/50 goal in either direction, toward a majority for-sale or a majority rental housing, ranks the WalkUP lower. In other words, the closer to a balanced tenure, the higher the ranking.
Wealth and race have always been key determinants of the drivable sub-urban development era of the mid- to late 20th century. The emerging walkable urban era initially has followed the favored quarter development but has also seen the expan-sion of the favored quarter, particularly near the two Downtown WalkUPs, as this research shows.
METRO DFW SOCIAL EQUITY ASSETS
Metro DFW has two unique factors that provide major social equity assets. The first is an economy that been leading the country in growth for decades. This includes being leaders in corporate relo-cations and job growth, due to favorable state and local taxes, aggressive econom-ic development efforts, the Dallas-Fort Worth International Airport and the “can do” attitude of the region. This has resulted in metro DFW being in the top 25 regions for GDP per capita in the country, one of the major measures of economic develop-ment. The annual $64,824 GDP per capita in metro DFW compares to $54,410 for the country (19% premium) and $58,508 for the largest 30 metropolitan areas (11% premium). In addition, the metro DFW unemployment rate as of late 2018 was only 3.2%, below the national rate of 3.5%. Economic opportunity can go a long way towards easing social equity concerns.
The second factor is that metro DFW has some of the most affordable housing in the country. The estimated median for-sale housing price, $122 per square foot, is lower than the national median of $171 and among the lowest in the largest 30 metros in the country. For example, the for-sale price per square foot in metro Atlanta is $193 (58% higher than metro DFW), metro Washington DC is $207 (70%), and metro Seattle is $290 (138% higher).
Having higher incomes per capita and lower housing prices is a better starting point in achieving social equity than nearly any other of the large metropolitan area in the country.
FAVORED QUARTER
Understanding social equity in how met-ropolitan Dallas-Fort Worth has developed over the past century starts with where the “favored quarter” is located. The fa-vored quarter in any metropolitan area is a roughly 90-degree arc, starting in down-town, going in one direction. The favored quarter is where most employment has located in the mid- to late 20th century. Every metropolitan area has a favored quarter. The best way to determine where the favored quarter is in a metro area is to know three things:
• The location of upper middle and upper housing concentrations. These neighborhoods tend to cluster and to be predominantly comprised of white households;
• The location of the local minority housing concentration, which tend to be on the other side of the downtown from the upper-middle and upper housing neighborhoods; and
• The layout of the freeways, since auto and truck transportation has been the primary transportation mode of this era.
The favored quarter is located to the north in metro Atlanta, growing up the I-75, I-85 and Georgia 400 freeways. In metro Wash-ington, DC, the favored quarter is located to the northwest, growing out in between the Dulles Tollway in Virginia, I-275 in Maryland, straddling the Potomac River and connected by the Capitol Beltway. The favored quarter of Denver grows to the south, Phoenix to the northeast, Seattle to the east and Houston to the west/north-west.
Since metro DFW is a twin city, there are two favored quarters. The favored quarter of Dallas is to the north/northwest follow-ing I-75 to the north and State 114 to the northwest. In Fort Worth the favored quar-ter goes to the southwest along Chisholm Trail Parkway and I-30. See the map on page 24.
41

SOCIAL EQUITY RANKINGS
Transit Accessibility
Due to the extreme sprawling nature of metropolitan DFW, providing transit ser-vice (bus and rail) is difficult since transit only works when there is a degree of density. The ranking below is the absolute population in the metro area who can access the 38 WalkUPs within 45 minutes commuting time. The first thing that emerges is that only 28 of the 38 WalkUPs can be accessed by transit.
Of the 28 WalkUPs that have transit accessibility, most are in the Dallas side of the metropolitan area, testimony to the ex-pansion of the DART system, especially the new light rail system. Downtown Dallas and Downtown Adjacent WalkUPs in Dallas are the highest ranked in the region.
Housing Costs
We considered the percentage of house-hold income that is dedicated to housing costs for house-hold earning 80% of the area median income (AMI). U.S. HUD recommends a maximum of 30% of household income be spent on housing. Therefore the maximum annual housing spending goal for an 80% AMI household in metro DFW is $15,315 annually or $1,276 per month.
The lowest housing costs for 80% AMI households are in Urban Commercial WalkUPs (examples including East Jeffer-son, Baylor Medical Center, Bishop Arts in Dallas and Stockyards in Fort Worth), Major and Small Town Centers (Downtown Denton, Burleson and Plano) and Down-town Adjacent (Near Southside and Deep Ellum). The highest WalkUP housing costs in the metro area include Downtown Adja-
cent WalkUPs (Uptown, Victory Park, Cul-tural District), Urban Commercial (Preston Center, Design District), Urban University (SMU/Mockingbird and TCU/West Berry) and the Greenfield Southlake.
Rental/For-sale Housing Mix
The ideal in this metric is a balance be-tween renters and owners in the housing inventory of an area. The difference from a 50%/50% split is the relative measure in this metric, so 95% renter or 95% for-sale housing in the WalkUP will both result in a 45% gap from the ideal.
The 50%/50% distribution is different than the current 61% homeownership rate in metro DFW (therefore 39% renter). The reason for this is that walkable urban places, for reasons that are not yet fully un-derstood, tend to have a higher propensity to rent than drivable sub-urban locations, hence the 50%/50% split as the ideal. The important issue this metric is measuring is freedom of choice; having both an option to own or rent depending on income, household preference, lifestyle, phase of life, etc.
The highest ranked WalkUPs on this metric tend to be Urban Commercial (examples include Magnolia/Fairmont and
East Jefferson) and Major and Small Town Centers (downtown Carrollton, Corsicana). The lowest ranked are WalkUPs that have little or no rental housing, such as Green-field WalkUPs Southlake Town Center and Legacy Town Center and Urban Commer-cial Shops at Park Lane and the Design District. The low ranks of some WalkUPs on this metric may reflect the uniqueness of their recent development opportunities and rental housing may be offered in the future. However, some WalkUPs discour-age or even ban through zoning rental housing, which discriminates against a large section of households who might otherwise like to live there.
Social Equity Rankings
42
(Tens of Thousands of People) (% of 80% AMI household budget) (Percentage points away from 50)
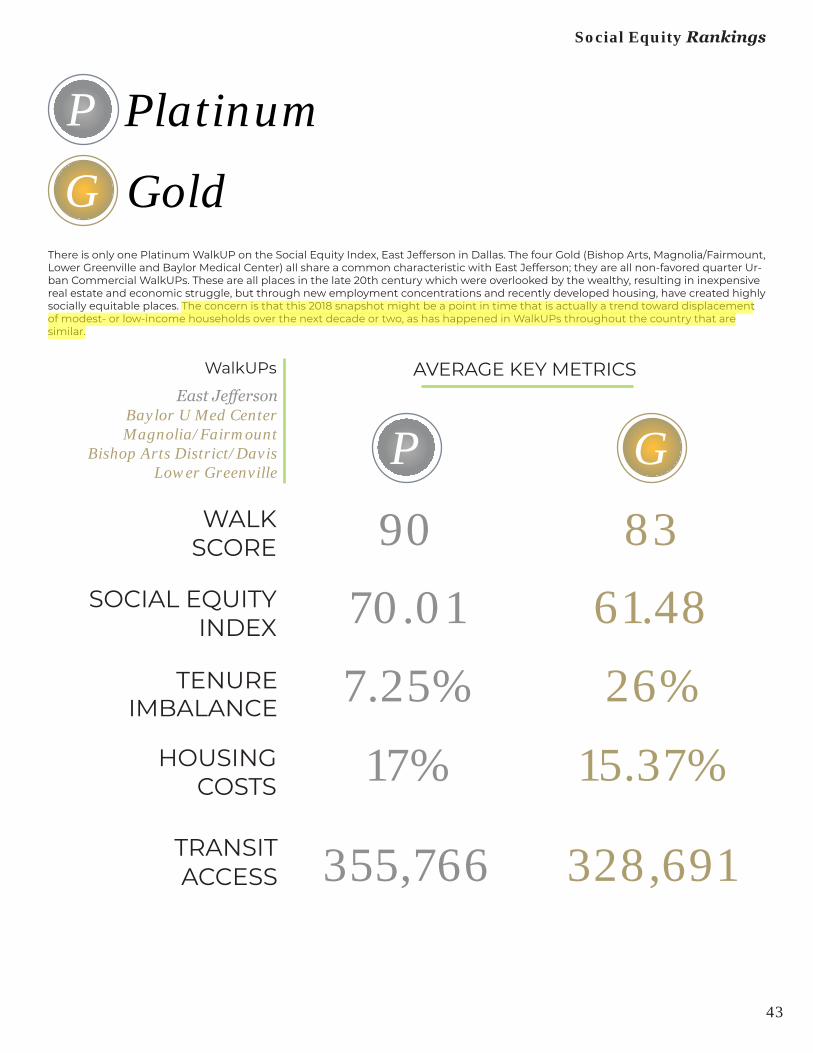
G GoldThere is only one Platinum WalkUP on the Social Equity Index, East Jefferson in Dallas. The four Gold (Bishop Arts, Magnolia/Fairmount, Lower Greenville and Baylor Medical Center) all share a common characteristic with East Jefferson; they are all non-favored quarter Ur-ban Commercial WalkUPs. These are all places in the late 20th century which were overlooked by the wealthy, resulting in inexpensive real estate and economic struggle, but through new employment concentrations and recently developed housing, have created highly socially equitable places. The concern is that this 2018 snapshot might be a point in time that is actually a trend toward displacement of modest- or low-income households over the next decade or two, as has happened in WalkUPs throughout the country that are similar.
East JeffersonBaylor U Med CenterMagnolia/Fairmount
Bishop Arts District/DavisLower Greenville
WalkUPs
70.01 61.48
AVERAGE KEY METRICS
17%
7.25%
355,766
26%
15.37%
328,691
P Platinum
Social Equity Rankings
43
SOCIAL EQUITY INDEX
HOUSING COSTS
TENURE IMBALANCE
TRANSITACCESS
GP
8390WALKSCORE
peter.simek
Highlight

S Silver
SOCIAL EQUITY INDEX
61.48HOUSING
COSTS
32%
TENURE IMBALANCE
25.06%
TRANSIT ACCESS
205,227
Metro DFW has a large number of Silver Social Equity WalkUPs. This is primarily due to the regional assets mentioned above, high GDP per capita and relatively low housing costs. The number one way to increase these rankings are to provide increased transit accessi-bility, reducing low income household spending on car-based transportation, which is now the second highest household spending category in the nation behind the cost of housing.
AVERAGE KEY METRICS
Downtown DallasDowntown Fort Worth
UptownSMU/Mockingbird
Addison CircleVictory Park
Oak LawnNear Southside
Deep EllumLegacy Town Center
Design DistrictCamp Bowie - Ridglea
Knox StreetShops at Park LaneDowntown Denton
Cultural DistrictTCU/West Berry
UNTWest 7th/Left Bank
Grapevine Main StreetDowntown McKinney
Downtown PlanoStockyards and North
Main StreetDowntown WaxahachieDowntown Weatherford
Lakewood CenterCamp Bowie - The Bricks
Downtown CarrolltonDowntown Burleson
Downtown CorsicanaTexas Woman’s University
WalkUPs
Social Equity Rankings
44
WALK SCORE70
peter.simek
Highlight

C CopperThere are two particularly low Social Equity ranked WalkUPs that are ranked Copper; Preston Center (Urban Commercial in the fa-vored quarter) and Southlake Town Center (Greenfield in the favored quarter). The low amount or complete lack of transit, high cost of housing and low amount of rental housing combine to make these two WalkUPs the lowest ranked in the metro area by a signif-icant degree. The fact that they also rank at or near the highest in the Economic Performance Index is not a coincidence; this same high economic/low social equity performance occurs in favored quarter Buckhead and Perimeter WalkUPs in metro Atlanta and the Georgetown WalkUP in metro Washington.
SOCIAL EQUITY INDEX
12.26
HOUSING COSTS87%
TENURE IMBALANCE
41.35%
AVERAGE KEY METRICSPreston Center
Southlake Town Center
WalkUPs
TRANSIT ACCESS
20,162
Social Equity Rankings
45
WALK SCORE66
peter.simek
Highlight

Downtown Dallas
Downtown Fort Worth
Victory Park
Uptown
Cultural District
Near Southside
Deep Ellum
West 7th/Left Bank
Southlake Town Center
Addison Circle
Legacy Town Center
Downtown McKinney
Downtown Carrollton
Downtown Waxahachie
Preston Center
Shops at Park Lane
Region Grapevine Main Street
Downtown Burleson
Downtown Plano
Downtown Weatherford
DowntownCorsicana Lakewood Center
Bishop Arts District/Davis
Knox Street
Oak Lawn
Magnolia/Fairmount
Baylor U Med Center
Lower Greenville
Camp Bowie - The Bricks
East Jefferson
Design District
Camp Bowie - Ridglea
Stockyards and North Main
Street
SMU/Mockingbird
Downtown Denton
TCU/West Berry
0
10
20
30
40
50
60
70
80
90
100
0 10 20 30 40 50 60 70 80 90 100
Soci
al E
quit
y In
dex
Economic Performance Index
DowntownDowntown Adjacent
Greenfield/Brownfield RedevelopmentMajor Town Center
Redeveloped Drivable Sub-Urban
Region
Small Town CenterUrban CommercialUrban University
ECONOMIC AND SOCIAL EQUITY INDEX SCATTERPLOT
Creating a scatterplot of both metrics yields both important insights and establishes a meaningful goal for WalkUPs in the metro area. The goal of a WalkUP over time should be to move into the upper right-hand corner of this scatterplot, achieving both a high eco-nomic and social equity ranking.
Our research in Foot Traffic Ahead 2016, which examined the largest 30 metro areas in the U.S., suggested that metropolitan areas with greater walkable urban development also have greater social equity, despite substantial walkable urban price premiums. The rea-son for this counter-intuitive outcome is that the higher cost of housing is offset by lower transportation costs, largely because of less reliance on expensive car transportation and increased job accessibility. In the Foot Traffic Ahead 2016 research, walkable urban metros offer lower-income households the option of commuting to more than two times as many jobs as a drivable sub-urban metro area.
Plotting our economic performance index against our social equity index demonstrates that economic prosperity and building an inclusive society are not conflicting goals that represent a tradeoff. It is possible to achieve both at the same time, and there are real world examples in the DFW region and around the country that demonstrate this. The strategy for all WalkUPs should focus on high performance on both metrics. The performance of places like Bishop Arts, Downtown Dallas, Downtown Fort Worth and Oak Lawn demonstrate that a WalkUP can “do well while doing good.”
Social Equity Rankings
46
*UN
T and
Texas Wom
an’s U
niversity are n
ot plotted
du
e to lack of data availab
ility for econom
ic perform
ance
C
C S
S
G P
G
P

VII. Past andFuture WalkUPs
47

Las Colinas Urban CenterJust east of DFW Airport airport lies a unique placemaking experiment in the short history of Amer-ican urbanism.
Las Colinas Urban Center checks many of the boxes that characterize WalkUPs. It is regionally significant, with a dense con-centration of jobs in office and hospitality high-rises. It is served by rail transit. The place is threaded with high quality public open space, including a ring of canals around Lake Carolyn. It may therefore be counter-intuitive that Las Colinas, which markets itself as “the ultimate urban center”37, is not among the DFW region’s WalkUPs.
Started by legendary developer Ben Car-penter in the 1970s, Las Colinas has been a nationally regarded development with nearly as much office square footage as downtown Dallas. The urban center’s Area Personal Transit (APT) system was one of the first people-moving systems in the country. The San Antonio-inspired canals were unique in the DFW Metroplex. The relocation of major corporate headquar-ters (ExxonMobil, Verizon, Kimberly-Horne, and many more) to Las Colinas are major achievements. The success of Las Colinas as a business location cannot be ques-tioned, but as a walkable urban place, it falls short.
Most comparable developments through-out the country that started in the 1970s have similar histories. The ‘70s were a dis-concerting time for walkable urban devel-opment. The vast majority of development in Texas and the country as a whole in that decade and the rest of the century was drivable sub-urban; segregated real estate products and unwalkable drivable devel-opment. However, there were some major greenfield and brownfield developments
that attempted a 1970’s version of walk-able urbanism. These include Century City on the former 20th Century film studio in West Los Angeles, downtown Columbia, MD, Crystal City in Arlington, VA, Reston International Center, VA, and Las Colinas.
For the most part, these major mixed-use developments had limited financial success. Most eventually went bankrupt or were restructured, and most absolutely failed as walkable urban places. Las Coli-nas and its financial partner, Southland, got in financial trouble in the 1986 Texas real estate depression. The equity investors took over Las Colinas and DART took over the APT system, both in 1989.
Looking back on this audacious, Texas-sized development, it is now possible to see what went right and wrong. Following the restructuring in the late 1980s which resulted in the write down of the asset base, Las Colinas continued to be a mag-net for corporate relocations and master planned residential development. How-ever, it was always and continues to be a drivable sub-urban location. The Las Coli-nas Urban Center’s Walk Score® is 36, far less than the 70.5 minimum Walk Score®
required to be a WalkUP. While there are thousands of units of for-sale and rental housing in the mixed-use urban center, there is no full-service grocery store. Today, the APT system is lightly used and there are few pedestrians on the sidewalks. Even walking along the canals is lonely.
Las Colinas has achieved undeniable economic success. The urban center’s weighted average rent premium across all income products is 30% above the regional average, which also exceeds the performance of Copper and Silver WalkUPs. However, Las Colinas does not represent walkable urban success, as the higher performance of Gold and Platinum WalkUPs demonstrate. All of the examples of failed 1970s walkable urbanism have a similar challenge; they attempted to be both drivable sub-urban and walkable urban and failed at the latter. Plus, the 1970’s and 1980’s had little or no market demand for walkable urbanism, and the pent-up demand was for drivable sub-ur-ban development.
All of these 1970’s developments have moved toward a walkable urban develop-ment pattern in recent years, sometimes
Past and Future WalkUPs
48
peter.simek
Highlight
peter.simek
Highlight
peter.simek
Highlight
peter.simek
Highlight
peter.simek
Highlight

redeveloping the place or trying a walkable urban development adjacent to the initial development. Reston Town Center was built across the Dulles Tollway from Reston International Center and has been the rent, sale price and absorption leader in the Dulles Corridor for decades as a walkable urban model. Century City has substantial in-fill development between the initial massive high rises. Downtown Columbia has rezoned to much higher, walkable urban densities. Crystal City has been getting a complete walk-able urban redevelopment in this real estate cycle and that is partially responsible for the Amazon HQ2 decision.
Like so much in real estate, timing is everything. The market did not want walkable urbanism in the 1970s. Today’s pent up market demand for 21st century, “Back to the Future” walkable urbanism is now resulting in great financial success for WalkUPs. Once again it shows that (as the fictional American Duct Tape Council ‘advertised’ on A Prairie Home Companion) “in the long run, all solutions are temporary.” There is always redevelopment that can deliver what the market wants.
49

Our resulting analysis found 39 places that are either emerging as regionally signifi-cant WalkUPs or have a set of assets (land, supportive policy, place management, infrastructure, etc.) that position them well to redevelop as WalkUPs at some point in the future. These places are listed on pages 24 and 25.
Of the 39 places, we classify 17 as Emerg-ing WalkUPs. These are places that either do not have sufficient commercial real estate to be considered regionally sig-nificant, or which are not (yet) walkable enough. Most have made investments in walkable infrastructure and have active place management entities that have helped them to make progress in transi-tioning from drivable sub-urban to walk-able urban development.
The remaining 22 are Potential WalkUPs. These places require significant develop-ment and/or redevelopment in order to become either Emerging or Established WalkUPs. However, each have some com-bination of the following assets critical to the rapid development of newly walkable urban places:
• Defined place by government or a government entity
• Zoning in place for mixed-use, walk-able urban development
• Transit, planned or in place, such as commuter rail or DART stations, surrounded by surface parking lots or low-density development
• Political will to become a walkable urban place, though currently without legislative or infrastructure improve-ments to make it happen.
Identifying both Emerging and Potential WalkUPs demonstrates where the new growth in the metropolitan area is going to take place, adding to the continued build out of the established WalkUPs. This
assists housing and community advocates in determining the requirements to main-tain and increase affordable housing, real estate developers in determining where the future development options might be, and the public sector in deciding where future tax revenues will come from and how to provide infrastructure and afford-able housing to anticipate this growth.
Emerging WalkUPs have great diversity of WalkUP types. The potential WalkUPs are dominated by Town Centers, though there are undoubtedly many more that have not surfaced in this research. These could include more Downtown Adjacent places in Fort Worth to surround the Downtown completely, like Downtown Dallas has done. In addition, there are many Urban Commercial places in Fort Worth and Dal-las that could be redeveloped. Finally, met-ro DFW has a large number of Greenfield/Brownfield WalkUPs which will probably lead to even more.
WalkUPs: The Next WaveIn addition to identifying the DFW region’s 38 Established WalkUPs, we also wanted to determine where its next WalkUPs are likely to emerge.
50
peter.simek
Highlight

VIII. Next Steps
51

Conclusions and RecommendationsMetropolitan Dallas-Fort Worth is witnessing the emergence of walkable urban places, starting with Uptown Dallas and Downtown Fort Worth in the 1990s, yet the region also contains nearly 10,000 square miles of drivable sub-urban development, slightly less than metropolitan NYC, which has four times the population of metro DFW.
Though walkable urban places are grow-ing rapidly with significant valuation per square foot premiums and substantial market share growth, they are confined to less than 1.0 percent of the land in the region. Low income households pay less for combined housing and transportation in walkable urban places and have access to more job opportunities, yet the “rent is too damned high” in these places due to the scarcity of affordable product.
This research has shown that the DFW metropolitan area has made initial steps toward walkable urban development. However, the region is still out of balance and there is substantial pent up demand for more walkable urbanism.
Meeting this pent-up demand will be the foundation for the economy of the DFW region over the next generation. It will boost economic output, create jobs, gen-erate additional tax revenue, and allow for more residents to enjoy the benefits of living in walkable urban places.
The shift towards walkable urbanism has major implications for policy makers and real estate investors. WalkUPs will contin-ue to have positive rental rates and sales prices premiums over drivable sub-ur-ban product, while enjoying substantial market share gains in absorption, over the next generation to catch up with the pent-up demand. This is a structural shift in how the region is building itself, driven by underlying economic fundamentals. Public policy and investment strategies must change to line up with this new mar-ket-driven reality.
The present moment is a major chal-lenge—and opportunity— for everyone connected with the built environment. This includes real estate developers, in-vestors, land use regulators, infrastructure providers, housing and community advo-cates, public sector managers, academics, and everyday residents. However, it re-quires rethinking the way we plan, invest,
and manage the built environment—as well as a conscious approach to improving social equity.
RECOMMENDATIONS 1. MAKE WALKUPs LEGAL IN ZONING The major conclusion of this research is that the DFW market is demanding more walkable urban development through the growth of established, emerging and po-tential WalkUPs, demonstrated by rental and for-sale premiums and rapid walkable urban market share gains. Walkable urban development in metro DFW is in far less than 1.0 percent of the metropolitan DFW land mass, compared to 1.5 to 5.5 percent in other metropolitan areas.
Even in free-market-friendly metropolitan DFW, there are government-imposed bar-riers to this growth. Restrictive zoning and NIMBY (not in my backyard) community opposition are the primary causes of the market not getting what it wants. There are a number of proven tactics to educate opponents about the value of rezoning their communities for more walkable urbanism:
• Crowd-Sourced Planning: Open the planning of a potential walkable urban place to all citizens through an online application that democratizes the process and encourages participa-tion. This also allows for participation without attendance at numerous meetings that may be held at incon-venient times and places.
• Emulate Regional Models: Visit and understand the benefits of region-al DFW WalkUPs, such as the easy access to restaurants, shopping, parks, community events, and work. Also understand how local jurisdictions benefit from walkable urbanism by the resulting increased tax base.
• Emulate National Models: There are now many examples in other metro-politan areas outside of metro DFW that could be visited to see examples, such as metropolitan Atlanta and Washington, DC.
• Adopt Model “Form-based Code” Zoning: There are many off-the-shelf models of zoning that will allow for mixed-use, walkable urban develop-ment that can be easily adjusted to meet the local context. Local jurisdic-tions can adopt these in a defined area—be it the redevelopment of a drivable sub-urban business park or regional mall, an urban commercial district, or a town center—in order to make walkable urbanism legal.
2. STRATEGIC PLANS FOR WALKUPs
Walkable urban places, especially region-ally significant WalkUPs, are the 4th level of governance in our society, below federal, state and local. WalkUPs are where the future economy of the metropolitan area will be emerging as the current 12% of GRP today demonstrates and the 2.6 times market share growth of income real estate products delivered by walkable urbanism in this real estate cycle.
WalkUP-based strategic plans will deter-mine where the place is going and how it plans to get there. It will include elements such as:
• Vision for the WalkUP from all “stake-holders”.
• Social values that are the foundation of the strategy.
• Economic development, including “export” business and non-profit sectors and regionally significant employment.
• Housing, including market rate, work force, affordable and transitional.
52
peter.simek
Highlight
peter.simek
Highlight
peter.simek
Highlight
peter.simek
Highlight
peter.simek
Highlight
peter.simek
Highlight
peter.simek
Highlight
peter.simek
Highlight
peter.simek
Highlight

• Retail, including export focused retail-ing, regional serving and local serving.
• Entertainment & Cultural, including arts, sports, museums, convention, and urban entertainment.
• Infrastructure, including water and sewer, transportation, security and cleanliness, parking, primary and secondary education, higher educa-tion, etc.
• Community involvement, includ-ing residents, investors, developers, tenants, corporations, major anchor institutions, local and state govern-ments, etc.
• Implementation strategies, including place management organization, catalytic developer, etc.
• Communication & marketing to resi-dents, investors, developers, tenants, corporations, major anchor institu-tions, local and state governments, etc.
The key decision is to form a place man-agement organization to actively create, help implement and manage the strate-gic plan on a 24/7 basis. The organization options include Main Street programs (generally for small places), self-manage-ment if the WalkUP is owned privately, a government department or, the most common, a business, community or public improvement district (BID, CID or PID). Texas refers to these organizations as PIDs. A PID is funded by the WalkUP property owners following state enabling legisla-tion, which will voluntarily raise property taxes (generally 5-10%) to pay for the PID capital and operating budgets. The best place management models throughout the country tend to by BIDs, CIDs or PIDs,
including Downtown DC BID, Capitol Riverfront BID (Washington, DC), Midtown Alliance (Atlanta), Buckhead Community Improvement District (Atlanta), Perimeter Community Improvement District (Atlan-ta). In metro DFW, the three largest and most active PIDs are Downtown Dallas, Inc., Downtown Fort Worth, Inc. and the Uptown Dallas management district.
3. DEVELOP CONSCIOUS SOCIAL EQUITY STRATEGIES
The research shows that, despite their price premiums, walkable urban places can be more affordable for low-income households due to more transit accessi-bility and more, generally rental, housing options. Add this to the metro DFW assets of relatively high GDP per capita income and low housing costs, and this means that most WalkUPs have a realistic oppor-tunity of achieving both high economic and social equity performance.
We argue that high economic and social equity performance in WalkUPs through-
out the DFW metro area is an achievable goal. It is important to note that there are two general tactics to meet that goal. Which tactic employed depends on the starting point of the WalkUP:
• WalkUP with Significant Economic Opportunity—High economic per-formance WalkUPs, such as Preston Village or Southlake, tend to have little in the way of affordable housing or transit service, as shown by our Social Equity Index. The best tactic to create a mixed-income place is to conscious-ly build 15-30% of all new housing as affordable (aimed at households with incomes under 80% of area median
income or AMI) or workforce housing (80-120% of AMI). In particular, this means building more rental housing, which may be illegal (in which case the zoning codes will have to change).
• WalkUP with High Social Equity—WalkUPs with the late 20th century history of lower economic develop-ment, such as Potential WalkUP Fair Park or now-established East Jeffer-son, should recognize that middle and upper-middle income housing is required to both balance the existing lower income housing but also to attract higher income households, which help drive more employment opportunities and vitality to lower income WalkUPs.
In all WalkUPs there needs to be an ag-gressive and conscious affordable housing strategy to minimize displacement and provide more affordable housing as the trend of developing more walkable urban places continues over the next generation. Specific tactics could include:
• Inclusionary zoning requires a min-imum percentage (usually 10-20%) of affordable housing in each new housing project. Ultimately, inclusion-ary housing lowers land values, since there is less residual profit due to the affordable housing in the project.
• Preserve and develop public and subsidized housing at the local juris-diction level. This is the most direct approach to growing inventory of affordable housing choices. While local taxpayers should assume some responsibility for providing it, state and federal subsidies and incen-tives to localities will also need to be increased.
• Ancillary housing should be made legal, if it is not. There are numerous unoccupied basements, garages and other ancillary spaces that could be turned into rental housing units with minor redesign modifications. How-ever in most jurisdictions, providing ancillary housing, sometimes known as granny flats, is not legal. Making legal the use of this existing and underutilized asset can assist home-owners by providing them with extra income while substantially increasing the supply of affordable housing with no public subsidy.
• Resale fees for market rate housing closing. Many jurisdictions charge a nominal fee (under one percent of the sale price) for the re-sale of a market-rate house, with the proceeds
Next Steps
53
peter.simek
Highlight
peter.simek
Highlight
peter.simek
Highlight

Next Steps
deposited in an affordable housing investment fund. While this funding goes up and down with the economic cycle, it can raise substantial sums without too much disruption of the market.
• Place management organizations, such as business improvement districts, Main Street, or other locally based nonprofits, could be empow-ered to encourage and assist in the development of affordable housing and in the stewardship of government or privately gifted land to ensure per-manently affordable housing.
4. CONTINUE TO INVEST IN TRANSPOR-TATION ALTERNATIVES, ESPECIALLY RAIL & BUS TRANSIT, WALKING, AND BICYCLING
The importance of investing in transpor-tation infrastructure, particularly existing rail and bus transit, as well as paths for biking and walking, cannot be overstated. Transportation has always been a signifi-cant determining factor shaping the built environment.
Rail transit, in particular, facilitates walk-able urbanism, as evidenced by the find-ing in this research that 86 percent of the region’s established and emerging Walk-UPs have rail transit accessibility. The large investment in rail transit by DART and Trinity Railway Express are impressive but still lag behind comparable metros. Metro DFW has the 17th highest transit ridership of the largest 50 metros, but metro DFW is the 4th largest metro in population.38 Comparably sized metros have much higher ridership, such as metro Atlanta, which has 58% more ridership (9th largest metro) and metro Washington, DC, which has five times the ridership (6th largest metro). That metro Atlanta and Washing-ton, DC have a higher percent of walkable urban development and WalkUPs than metro DFW is an indication of where met-ro DFW will probably be heading with the current transportation investment, which is toward more walkable urbanism and WalkUPs.
There will always be cars, and therefore roads, for the foreseeable future, which will continue to be a crucial element in a transportation system. However, automo-bile transportation should be considered as one of many transportation options consumers should have.
As expensive as investments in rail transit and walkable urban infrastructure may be, there are growing indications, as this research shows, that walkable urban
development generates higher economic development and property valuations, and hence property taxes, than drivable sub-urban development. Transportation infrastructure that supports walkable urban development is the best investment for the future economy and tax base of North Central Texas.
The challenge of transit infrastructure financing is developing cash flow sources to repay these loans, which tend to be 30-40-year amortization periods. There are many sources that should be considered:
• Increase Sales Tax: Dedicate exist-ing, or increase, sales or other local taxes that would be committed to servicing the loan. Metropolitan Los Angeles has recently raised sales taxes to finance over $120 billion of transit investment.
• Catalytic Development Companies: Create a catalytic development company, capitalized by deep pocket private investors, universities, and foundations, to “push the fast-forward button” on walkable urban devel-opment, especially around transit stations. Catalytic developers can as-
sume control of public, nonprofit, and donated land for the development of affordable and work- force housing.
• Value Capture: Negotiate with devel-opers and private landowners around transit stations to engage in value capture. This is capturing a portion of the anticipated upside of develop-ment that has been sparked by the rail transit. This technique is similar to how rail transit was financed 100 years ago and has been re-introduced in many international cities and in some U.S. metros, such as Washington, D.C.
54
peter.simek
Highlight
peter.simek
Highlight
peter.simek
Highlight
peter.simek
Highlight
peter.simek
Highlight
peter.simek
Highlight
peter.simek
Highlight
peter.simek
Highlight
peter.simek
Highlight

IX. Appendices
55

Endnotes1. Texas State Local Government Code,
https://statutes.capitol.texas.gov/Docs/LG/htm/LG.375.htm#375.111
2. Data Sources: https://atlantaregional.org/atlanta-region/population-forecasts-estimates/atlanta-region-population-estimates/; http://www.dfwmaps.com/RDC/PDFs/2017%20NCTCOG%20Population%20Estimates%20Publication.pdf
3. https://www.dmagazine.com/publications/d-magazine/2018/dallas-and-the-new-urbanism/
4. Smart Growth America. Core Values: Why American Companies Are Moving Downtown. Available online at: https://cpb-us-e1.wpmucdn.com/blogs.gwu.edu/dist/a/326/files/2016/12/Why-American-Companies-are-Moving-Downtown-1eu2kmg.pdf
5. Source: Leinberger, Christopher B. and Michael Rodriguez. Foot Traffic Ahead 2016. Available online at: https://cpb-us-e1.wpmucdn.com/blogs.gwu.edu/dist/a/326/files/2016/12/CREUA_Foot-Traffic-Ahead_2016.06.14-2jibzmr.pdf
6. Export or base businesses and employment ship goods and services to other parts of the United States and abroad. In Dallas-Fort Worth, these industries include defense, financial services, information technology and data processing, life sciences, semiconductors, telecommunications, etc. Export or base employment includes industries that bring customers to the metropolitan area to consume services, such as transportation (e.g., the DFW Airport), universities, tourism, etc. These businesses result in the infusion of fresh cash to the economy, which results in the employment multiplier (generally 2-3 times the number of jobs) in regionally serving and local employment. Export or base business and employment is the fundamental reason Dallas-Fort Worth metropolitan area exists and it gives the region the character it has.
7. Lang, Robert. (2003) Edgeless Cities: Exploring the Elusive Metropolis. Washington, DC: Brookings Institution Press.
8. Alfonzo, Mariela, and Christopher B. Leinberger. (2012) Walk This Way: The Economic Promise of Walkable Places in Metropolitan Washington, D.C. Available online at: https://www.brookings.edu/research/walk-this-waythe-economic-promise-of-walkable-places-in-metropolitan-washington-d-c/
9. Available at: https://creua.business.gwu.edu/research/walkups/
10. Available at: https://creua.business.gwu.edu/research/walkable-urbanism/
11. U.S. Environmental Protection Agency, Smart Location Database v2.0. Available at: https://www.epa.gov/SMARTGROWTH/SMART-LOCATION-MAPPING#Trans45. Census block groups ascribed to study geographies using area weights.
12. Goodyear, Sarah. “’Walk Score’ Is Great, But it Still Doesn’t Capture ‘Walk Appeal.’” City Lab, August 7, 2012. Available online at: https://www.citylab.com/transportation/2012/08/walk-score-great-it-still-doesnt-capture-walk-appeal/2858/
13. Duncan DT, Aldstadt J, Whalen J, Melly SJ, and Gortmaker SL. (2011) Int J Environ Res Public Health (11):4160-79; Duncan, D.T., Aldstadt, J., Whalen, J. et al. (2013) GeoJournal(78): 407; Carr LJ, Dunsiger SI, Marcus BH. (2011) Validation of Walk Score for estimating access to walkable amenities. Br J Sports Med (45):1144-1148; Scott C. Brown, Hilda Pantin, Joanna Lombard, Matthew Toro, Shi Huang, Elizabeth Plater-Zyberk, Tatiana Perrino, Gianna Perez-Gomez, Lloyd Barrera-Allen, José Szapocznik. (2013) Walk Score®: Associations with Purposive Walking in Recent Cuban Immigrants, American Journal of Preventive Medicine (45)(2): 202-206; Towne, S.D., Won, J., Lee, S. et al. (2016) J Community Health (41): 977.
14. Redfin Estimate data as of July 2018. Redfin data not available for all properties.
15. U.S. Census Longitudinal Employer-Household Dynamics, Origin-Destination Employment Statistics 7.2 (LODES 7.2). Workplace Area Characteristics, all jobs, 2015. Available
online at https://lehd.ces.census.gov/data/ Census block data was ascribed to each geography using area weights.
16. “Value added” as defined by Emsi is a measure of GRP. The idea is to quantify the difference between an industry’s or a company’s total output and the cost of its intermediate inputs.
17. U.S. Environmental Protection Agency, Smart Location Database v2.0, Access to Jobs and Workers Via Transit Tool, 2013. Available at: https://www.epa.gov/SMARTGROWTH/SMART-LOCATION-MAPPING#Trans45 Census block groups ascribed to study geographies using area weights.
18. Center for Neighborhood Technology, Location Efficiency Hub, 2017. Available online at: https://htaindex.cnt.org/. Census block groups ascribed to study geographies using area weights.
19. The ACS 2016 five-year estimates are available in geodatabase format at https://www.census.gov/geo/maps-data/data/tiger-data.html.
20. FAR is defined as a ratio of the heated building size (ignoring parking) to the size of the land the building occupies. If the building is 100,000 square feet and it sits on a 100,000 square of land (regardless of whether it is a one story or 10 story building), it has a FAR of 1.0. If the building is 400,000 square feet on the same land mass, the FAR is 4.0. Walkable urban land use tends to be start at 1.0 FAR and rising to 40.0 FAR in the most dense place in the country, Midtown and Downtown New York City, which is between 30-40 FAR. FARs used in this research are all technically “gross FAR” terms, which includes the land in a WalkUP used for right-of-way’s (streets and sidewalks which can be @40% of the total land) and parks (ignoring major parks like Central Park in New York or Hollywood Hills in Los Angeles). The use of “net FAR” metric is applied to specific property boundaries and exclude right-of-way’s and parks, resulting in a smaller denominator and lower FARs. Again, this research exclusively uses gross FAR.
56

21. Downtown as a name to describe the central business district (CBD) of a metropolitan area is a nearly exclusive American name, rarely used in other countries. The CBD is referred to as “Centro” in Spain, “City Centre” in China, United Kingdom, Ireland and Germany and “quartier d’affaires” in France.
22. Housing Vacancies and Homeownership, Third Quarter 2018. Available online at: https://www.census.gov/housing/hvs/index.html
23. https://www.brookings.edu/innovation-districts/
24. Main Street programs are programs of the Main Street Center of the National Trust for Historic Preservation and the Main Street Texas, managed by the Texas Historical Commission. Many of the metro DFW Major and Small Town Centers are Main Street participants.
25. U.S. Census Quarterly Residential Vacancies and Homeownership, Third Quarter 2018. Available online at: https://www.census.gov/housing/hvs/files/currenthvspress.pdf
26. Fedora, Dain. (2018) The Evolving Demand for Retail Space. Available online at: http://www.ngkf.com/home/research/real-insight/the-evolving-demand-for-retail-space.aspx
27. U.S. Census Bureau, Economic Indicators Division, Retail Indicator Branch. Quarterly Retail E-Commerce Sales: 3rd Quarter 2018. Available online at: https://www.census.gov/retail/mrts/www/data/pdf/ec_current.pdf
28. Danziger, Pamela N. “The Fall of the Mall and How to Make Them Rise Again.” Forbes, October 14, 2018. Available online at: https://www.forbes.com/sites/pamdanziger/2018/10/14/the-fall-of-the-mall-and-three-ways-to-make-them-rise-again/#8984c692a26c
29. Miller, Norm. (2014). Estimating Office Space per Worker Estimating Office Space per Worker. Journal of Corporate Real Estate 16(3): pp. 159-181.
30. Data source: https://www2.census.gov/programs-surveys/demo/tables/families/2016/cps-2016/tabh2-all.xls, rows 68 and 69
31. McCue, Daniel and Christopher Herbert. Updated Household Projections, 2015 - 2035: Methodology and Results. Joint Center for Housing Studies of Harvard University, December 12, 2016. Available online at: http://www.jchs.harvard.edu/research-areas/working-papers/updated-household-projections-2015-2035-methodology-and-results
32. U.S. Census Housing Vacancies and Homeownership, Quarterly Vacancy and Homeownership Rates by State and MSA. Available online at: https://www.census.gov/housing/hvs/data/rates.html
33. eMarketer. Apple Store Productivity, Average Sales per Store and Growth. Available online at: https://retail-index.emarketer.com/company/
57

58
Cover photo credits, clockwise from top left:
Robert Hensley (CC BY-NC-ND 2.0);
Hoyoung Lee courtesy of D Magazine;
Lars Plougmann (CC BY-SA 2.0);
Sharon Mollerus (CC BY 2.0);
Matthew Rutledge (CC BY 2.0);
Alan Cordova (CC BY-NC-ND 2.0);
Nicholas Henderson (CC BY 2.0)
Page. 4: Nan Palmero (CC BY 2.0)
Page 6: Jeff Stvan (CC BY-NC-ND 2.0)
Page 8: David Wilson (CC BY 2.0)
Page 9: Cynthia Smoot (CC BY-NC-ND 2.0)
Page 14: Hoyoung Lee courtesy of D Mag-azine
Page 15:
A: skys the limit2 (CC BY 2.0)B: BFS Man (CC BY-NC 2.0)C: Jeff Stvan (CC BY-NC-ND 2.0)D: Richard Wezensky (CC BY-NC-ND 2.0)E: Alicia Lee (CC BY-SA 2.0)
Page 16:
A: TheRealMstiles (CC BY-NC 2.0)B: Screenshot from Google MapsC: Jeff Stvan (CC BY-NC-ND 2.0)D: Cynthia Smoot (CC BY-NC-ND 2.0)E: Steve Floyd (CC BY-ND 2.0)F: Cynthia Smoot (CC BY-NC-ND 2.0)
Page 17:
A: Adam Simmons (CC BY-NC-ND 2.0)B: Nathan Vaughn (CC BY 2.0)C: Jeff Stvan (CC BY-NC-ND 2.0)D: David Halloran courtesy of D MagazineE: Steven Martin (CC BY-NC-ND 2.0)
Page 18:
A: Easal22 (CC BY-SA 3.0)B: University of North Texas (CC BY-NC-SA 2.0)C: CameliaTWU (CC BY-NC-ND 2.0)
Photo Credits
D: Steven Martin (CC BY-NC-ND 2.0)E: Steven Martin (CC BY-NC-ND 2.0)
Page 19:
A: Cynthia Smoot (CC BY-NC-ND 2.0)B: Adam Moss (CC BY-SA 2.0)C: Peter Boothe (CC BY-NC 2.0)D: Carol Highsmith (public domain)E: Cynthia Smoot (CC BY-NC-ND 2.0)F: Ricardo S. Nava (CC BY-NC 2.0)
Page 20:
A: GrapevineTxOnline.com (CC BY 2.0)B: D. Davis (CC BY-NC-ND 2.0)C: David Wilson (CC BY 2.0)D: Jimmy Emerson, DVM (CC BY-NC-ND 2.0)E: Hoyoung Lee courtesy of D Magazine
Page 21:
A: Jinjian Liang (CC BY-NC-ND 2.0)B: Shea ByersC: Shea Byers
Page 22:
A: Five O’Clock Dallas (CC BY-SA 2.0)B: Steven Martin (CC BY-NC-ND 2.0)C: Steven Martin (CC BY-NC-ND 2.0)D: Eric Fredericks (CC BY-SA 2.0)
Page 23: Sten-Erik Armitage (CC BY 2.0)
Page 26: Michele (CC BY-NC-ND 2.0)
Page 27: Emanuela Errico (CC BY 2.0)
Page 29: GrapevineTxOnline.com (CC BY 2.0)
Page 30: Steve Rainwater (CC BY-SA 2.0)
Page 33: Steven Martin (CC BY-NC-ND 2.0)
Page 34: Whatnot (CC BY-NC-ND 2.0)
Page 47: Steve Rainwater (CC BY-SA 2.0)
Page 48:
Top right: The Kids and Kahlie (CC BY-NC-ND 2.0)Lower left: Steve Rainwater (CC BY-SA 2.0)
Page 49: Steve Rainwater (CC BY-SA 2.0)
Page 50:
top right: Scott Polikov
bottom: Hoyoung Lee courtesy of D Mag-azine
Page 51: Giovanni Cardona (CC BY 2.0)
Page 53: Adam Simmons (CC BY-NC-ND 2.0)
Page 54: Kurt Haubrich (CC BY-ND 2.0)
Page 55: Jeff Stvan (CC BY-NC-ND 2.0)

AcknowledgmentsSpecial thanks to three individuals who have been the on-the-ground leaders of this effort over the past two years; our “DFW Posse:”
•Shea Byers, Director of Real Estate for the J Street Companies in Dallas and a GWSB MBA alum. Shea approached his alma mater about the idea of a DFW WalkUP Wake Up Call in 2015 and has expended countless hours making it happen. •Brandon Palanker, head of the Downtown Collaborative and 3BL Strategies, both based in Dallas. Brandon brought his experience of helping the Metro NYC WalkUP Wake Up Call become a reality to his new home in Dallas. •Scott Polikov, President of one of the leading land planning and economic develop-ment firms in the country, Gateway Planning, with offices in both Dallas and Fort Worth. Scott’s experience, wisdom and connections are without parallel.
We highlight the contributions of two partner institutions to this research:
• The North Central Texas Council of Governments (NCTCOG) provided valuable pro-fessional resources to this project. NCTCOG is one of the most forward-looking Met-ropolitan Planning Organizations, and deserves recognition for working to support walkable urbanism for many years.
• Wick Allison and his staff at D magazine dedicated an entire issue of the magazine in the summer of 2018 to walkable urbanism (https://www.dmagazine.com/publica-tions/d-magazine/2018/dallas-and-the-new-urbanism/) which included the prelimi-nary results of this research. In addition, D magazine provided much of the photog-raphy for this report.
Our funding, convening and local knowledge partners include many longtime Dallas and Fort Worth real estate and place management organizations and the individuals we have been working with. They include:
• Williams Family Foundation (J. McDonald Williams)• Rosewood Property (Bill Flaherty)• The Real Estate Council of Greater Fort Worth (Karen Fox)• The Real Estate Council of Dallas (Linda McMahon)• Hall Foundation (Craig Hall)• Downtown Dallas, Inc. (Kourtny Garret & Dustin Bullard)• Downtown Fort Worth, Inc. (Andy Taft)• CityPlace (Neal Sleeper)• Cienda Partners (Phil Wise)• Cooper and Company (Frank Bliss)• HNTB Corporation (Chelsie Bush)
The staff at George Washington University School of Business include:
• Matthew O’Brien, Development Director• Rob Valero, Executive Director of the Center for Real Estate and Urban Analysis• Patti Niles, Administrative Director
Special thanks to Kristen Jeffers of Kristen Jeffers Media for graphic design support. You know of her work with The Black Urbanist multimedia platform, but she has a full design studio and media company that also includes the textile design brand Kristpattern and the communications and marketing strategy training platform Plan to Speak.
Any mistakes in this report are entirely the authors’ responsibility.
On a personal note, I want to mention that one of the reasons for attempting to do this ambitious re-search is my over 30 years of work-ing in Dallas-Fort Worth and the many friends I have made in the Metroplex through that work. Many of my friends have been deeply involved with this research includ-ing providing the funding. My DFW posse, Tracy Loh and others have invested far more time and effort than we anticipated in this project. For me the reason for this over-in-vestment was as a partial payback for all the lessons I have learned in metro DFW, the friends I have in the metro area, and the respect I have for the region, especially for your Texan can-do approach that is something much of the rest of the country should emulate. So to a certain extent, this research is a thank-you to metro Dallas-Fort Worth for all you have done for me and my career.
Christopher B. Leinberger
59
Kristen Jeffers MediaThe Black Urbanist PlantoSpeakKristPattern• •