2021 Approved Budget - City of Rincon
129
City Rincon, Georgia 2021 Approved Budget
-
Upload
khangminh22 -
Category
Documents
-
view
1 -
download
0
Transcript of 2021 Approved Budget - City of Rincon

City of
Rincon, Georgia
2021 Approved Budget

02
City of Rincon, Georgia
Approved Annual Budget
Calendar Year 2021
Mayor
Ken Lee
Council Members
Levi Scott, Jr. Mayor Pro Tempore
Reese Browher
Ann Daniel
Patrick Kirkland
W. Frederick Long
City Manager
John Klimm
City Clerk
Dulcia King
City Attorney
J. Raymond Dickey

03
Table of Contents

04
City of Rincon FY 2021 Approved Annual Budget
Table of Contents
Guide to the Budget………………………...………….……………………….. 7
Introduction and Overview……………………………………………………. 9 History, Demographics and Statistics City Council’s Strategic Plan
City Manager’s Budget Message
Financial Process, Structure, and Policy………………………………………. 29 Budget Process City Financial Policies
Financial Summaries……………………………………………………………. 38 Fiscal Year Operating Budget Summery Revenue Estimates Long-Term Budget Planning Capital Budget and Deb Summary…………………………………………… 64
Capital Improvement Plan Debt Position Analysis Department Summaries General Fund………………………………………. 76 Glossary…………………………………………………………………………. 106

05
Guide to the Budget

06
GUIDE TO THE BUDGET
The FY 2021 budget document is organized into the following six sections:
1. Introduction and Overview: This section starts with the City of Rincon’s History, Demographics and Sta-tistics, followed by Property Tax Information, a definition of Rincon's Council-Manager form of govern-ment and organizational chart. In addition, the City Council’s Strategic Plan appears throughout the docu-ment as illustrated within departmental goals and objectives. Finally, it includes the City Manager’s budg-et message, which communicates the City Council’s Strategic Plan as it relates to the budget development process. The budget message highlights major changes and key initiatives in the approved budget.
2. Financial Process, Structure, and Policy: Building the Budget and City Financial Management Policies.
a. Process - Provides the reader a brief synopsis of the budget process. This includes a discussion on the relationship between the 5-Year Forecast, Capital Improvements Plan, and Operating Budget.
b. City Financial Policies- This includes the financial policies outlined in Rincon’s City Charter Section 6-1, as well as other financial policies included in the City’s Administrative Code.
3. Financial Summaries: Fiscal Year Operating Budget Summary, Revenue Estimates, and Long Term
Budget Planning.
a. Fiscal Year Operating Budget Summary- This subsection summarizes the entire fiscal year budget for the General Fund, Fire Fund and Enterprise Funds. It provides details on major changes from the previous fiscal year. Other information includes a list of Full Time Equivalent Employees (FTE), changes in fund balance, municipal operating budget changes, and a consolidated resources and ap-propriation summary.
b. Revenue Estimates- This subsection includes specific factors that influence the estimates for revenue in the fiscal year such as state and local laws and economic factors. These factors influence the City’s ability to generate resources in the fiscal year.
c. Long Term Budget Planning- There are many factors that can influence a City’s capital and operating budget. This subsection provides a brief overview of the more pertinent accounts that can influence the City’s budget into the future.
4. Capital Budget and Debt Summary: This section includes the Capital Improvements Plan for the fiscal year as well as a debt position analysis.
5. Department Summaries: This section provides an overview of the various services the town provides as categorized by departments: Police, Fire, Public Works, Administrative Services, Financial Services, Planning & Development and Golf.
6. Glossary - Provides a glossary of government or financial terms used throughout the book. This appendix will help the reader understand the technical language used in the document.

07
Introduction and Overview
Introduction &
Overview

08
Introduction and Overview
HISTORY, DEMOGRAPHICS AND STATISTICS The City of Rincon is located in the southeast area of Effingham County. Rincon is just 10
miles from the Savannah International Airport, and 20 miles from downtown
Savannah.
Just before the turn of the century, the City of Rincon sprang up around the miles and
miles of railroad tracks making their way along the eastern seaboard through the sleepy
countryside of rural Georgia. It had taken more than 150 years for residents to move be-
yond the original 1751 Salzburger New Ebenezer settlement along the Savannah River, but
once the railroad came to town, a new city and a new era had arrived.
Chief Engineer George Wadley named the newly founded city Rincon, which was Spanish
for “little spot” or “corner.” Aptly named, Rincon began as just a small area in the county
named for Lord Effingham, a former member of the House of Lords in England. Businesses
soon began popping up, managed by area natives and created to meet the needs of the rail-
road workers, followed by houses and various churches. Successful local businesses
became the order of the day.
Echoing the line-and-grid street system of Savannah, Rincon systematically marched its
way along the tracks and settled itself in an organized, orderly fashion. Serenaded by wist-
ful train whistles and lulled to sleep by the steady clackety-clack of train cars on the rails,
residents of the “little spot” of Rincon found a place they could call home.
Sawmills, cotton gins and turpentine stills dotted the landscape, providing additional
means for business opportunities. Early landowners saw potential in the railroad and
granted rights of way for its progression. Economic growth and development resulted, and
the city of Rincon was incorporated August 3, 1927.

09
Introduction and Overview
As a fledgling city in the late 1920s, Rincon elected Frank Bowers as its first mayor. The new
government disbanded in 1929 but reactivated in 1954 and reconstituted its city governmental
structure. The population was around 500. Although it later grew to be the largest municipality
in Effingham, Rincon’s hometown atmosphere revolved around locally-owned businesses,
strong community and civic organizations, and family-focused activities.
Life in Rincon continued at a slow and steady pace until the early 1980s. The city experienced a
dynamic growth spurt with the arrival of large industrial and retail companies both within and
just beyond Rincon’s city limits. Rincon had once again “arrived.”
The City of Rincon now is home to more than 10,229 people and a wide array of small local
businesses, large retail outlets, restaurants, grocery stores and gas stations. Although more
commonly used by larger cities, the council-manager form of government allows Rincon to ef-
fectively administer the vast number of services it provides.
Public services, infrastructure and great potential for quality residential and business develop-
ment abound in what began as a small stop along a turn-of-the-century railroad line. By focus-
ing on the incorporation of both hometown traditions and progressive yet balanced growth,
the City of Rincon makes its community more than just a great place to work and live. It makes
Rincon a great place to call home.

10
Introduction and Overview

11
Introduction and Overview
General Information
Established 1927
Government City Council - City Manager
Area 9.7 square miles
Density 1,050.4 per square mile
Demographics
Population estimate 10,229
Population base, April 1, 2010 8,836
Population, percent change 15.77%
Population Distribution
White alone, 74.41%; Black or African American alone, 19.72%; Asian alone, 2.24%; All others 3.63%.
Median age 31.5
Median household income $ 54,681
Unemployment rate 2.40%
Owner-occupied housing unit rate 49.00%
Median value of owner-occupied housing units $ 160,700
Source: U.S. Census
Education
Public Schools (Effingham County School District) High Schools in District 3
Middle Schools in District 3
Elementary Schools in District 8
Public School Enrollment 12,735
Public Library Live Oak Public Libraries 1
Public Recreation
Recreational Areas Freedom, Giles, Macomber, Patriots and Veterans Parks and Vernon Hinely Center
6
Municipal Golf Course Lost Planation Golf Course
Ball Fields
Tennis Courts
About the City of Rincon – Information at a Glance

12
Introduction and Overview
Regional Economy
Regional Assets:
Port of Savannah is the 4th largest and fastest growing container port in the nation.
Savannah-Hilton Head International Airport offers daily direct flights to over 20 U.S. cities.
Gulfstream
Home to Fort Stewart & Hunter Army Airfield – 20,000 soldiers.
Part of the Savannah MSA – 500,000+ area population.
Local Assets:
Award-winning Georgia QuickStart training program facilitated through Savannah Technical College.
Industry focused programming at Savannah Technical College and Effingham County College and Career Academy.
Chamber of Commerce Workforce Development Committee

13
Introduction and Overview
GOVERNMENT STRUCTURE
Council-Manager Form of Government The City of Rincon is governed by a Council-Manager form of government, in accordance with its City Charter that was adopted in November 25, 1976. Administrative authority of the City is vested in the City Manager subject to legislative decisions of a 7-member City Council. Council terms are staggered four-year terms. The City Manager supervises and directs the administration of all municipal departments.
There are nine departments as follows; City Administration, Financial Administration, Planning & Zoning, Police, Fire, Public Works, Recreation, Waste Water Treatment Plant, and Golf.

14
Org
aniz
atio
n C
har
t
Cit
izen
s of
Rin
con
C
itiz
ens
Vo
lun
teer
A
dv
iso
ry B
oar
d
P
lan
nin
g
&
Zo
nin
g
May
or
&
Cit
y C
ou
nci
l
Cit
y M
an
ager
Gen
eral
A
dm
inis
trat
ion
P
oli
ce
Fir
e
Pu
bli
c W
ork
s Pla
nn
ing
&
Zo
nin
g
Rec
reat
ion
Go
lf
Was
tew
ater
Cit
y A
tto
rney
Fin
anci
al
Ad
min
istr
atio
n

15
Introduction and Overview
Mayor &
City Council
Reese Browher Council Member
Ken Lee Mayor
Ann Daniel
Council Member
W. Frederick Long
Council Member Patrick Kirkland
Council Member
Levi Scott, Jr.
Mayor Pro Tempore Council Member

16
Introduction and Overview
Appointed Officials and
Department Directors
FY 2021 BUDGET
City Manager John Klimm
City Clerk
Dulcia King
City Attorney J. Raymond Dickey
Planning & Zoning Director
Jason Stewart
Public Works Director Tim Bowles
Police Chief John Murrell
Fire Chief
Corey Rahn
Recreation Director Mike Osborne
Wastewater Treatment Director
Tommy Kee
Golf Pro Jimmy Powell

17
Introduction and Overview
CITY COUNCIL STRATEGIC PLAN
MISSION STATEMENT
The City of Rincon government exists to serve our citizens, businesses and visitors in an open, honest, efficient and fiscally responsible manner. Public service is at our core and our mission is to provide the highest quality services possible while continuously improving the services provided. We believe in a first-rate school system for our children, safe neighborhoods, sound economic development, an impressive quality of life and a low tax burden for our residents.
Guiding Principles, We believe…
Ethics and Integrity - We believe that ethics and integrity are the foundation of public trust and con-fidence and that all meaningful relationships are built on these values.
Financial Responsibility - We believe that fiscal responsibility and prudent stewardship of public funds, both short term and long term, are essential for citizen confidence in government.
Open and Honest Communication - We believe that open and honest communication is paramount for an involved citizenry and fosters a positive working environment for employees.
Visionary Leadership and Planning - We believe that the very essence of leadership is to be visionary and innovative while planning for our future.
Excellence and Quality in the Delivery of Services - We believe that service to our residents is our reason for being and commit to delivering services in a professional, cost- effective, and effi-cient manner.
Respect for the Individual- We believe that citizens we serve are to be treated with the utmost re-spect and deserve the best treatment the city can provide.
Thoughtful Long-Range Community Planning - We believe in the development of our community through thoughtful, careful planning that is communicated in a positive manner.
Professionalism - We believe that continuous staff improvement and innovation is the mark of a professional organization, and we are committed to applying this principle to the services we offer and to the development of employees to be the best they can be.

18
Introduction and Overview
Strategic Priorities
We have identified a single goal and several strategies in six priority areas. For each, it is understood that the City Council will formulate and enact policy, the City Manager and staff will implement and manage programs to achieve the policy goals, and the City Council and City Manager will communicate frequent-ly to ensure accountability to the residents of the City of Rincon. The City Council and City Manager will meet periodically to review progress on meeting the goals laid out in this Strategic Plan and identify areas of the Strategic Plan that require more attention.
Shaped like a wheel, the strategic plan diagram shows Quality of Life at the hub, surrounded by six priori-ty areas: Public Safety, Recreation, Economic Development, Financial Accountability, Infrastructure and Good Government. These areas function like lug nuts, securing a high quality of life for Rincon residents regardless of circumstances beyond their control (or “bumps in the road”). Finance supports and protects the wheel like a tire – if it deflates, any or all areas may be compromised.

19
Introduction and Overview
Goal: Approve a viable financial plan for meeting the operational and capital needs of the City with a balanced budget that includes rigorous budget monitoring, cost savings for residents, maintaining reserves, and aggressively pursuing outside revenue (grant) dollars.
Strategies:
• Approve a Balanced Operating Budget for 2021.
• Protect Fund Balance Reserves and establish Fire Reserves.
• Approve and Fund a 5 year Capital Improvement Plan.
• Approve a Budget Document that meets GFOA Standards.
• Submit Audit documents to Auditor on schedule.
Public Safety
Goal: Promote the protection of health, safety, and welfare of our community by maintaining a high quality of life for all City residents, businesses and visitors.
Strategies:
• Approve an update of Police Policies and Procedures Manual.
• Reduce by 5% Auto Breaking in and Entering and burglary through aggressive drug enforcement.
•
• Increase on-going training opportunities for Police staff, particularly in the areas of racial sensitivity, racial profiling and use of force training.
• Develop and host a Citizens Police Academy.
• Continue to replace police vehicles on schedule and maintain all vehicles in accordance with warrantees and recom-mendations.
• Receive Fire Department Operational Audit and begin to implement recommendations.
• Begin transformation to City Fire Department in three years.
• Adjust fire fees for scheduled loss of county funding in three years and to fund new equipment requests.
Financial Accountability

20
Introduction and Overview
Goal: To provide exceptional recreational opportunities to every segment of our community in a safe and holistic way.
Strategies:
• Increase participation in programs by developing various programs including travel football and at least 3 new programs for adults.
• Develop a long-term Recreation Plan that identifies projected future needs for programs and facilities.
• Evaluate the feasibility of a long-term recreational facility to meet growing population demands.
Goal: Rincon’s future stability depends on funding and implementing a safe and sound infrastructure. Our City’s streets, sidewalks, drainage, sewerage and facilities are our public investments in our City and are a reflection of who we are and the pride we take in our community. Deferring maintenance to our infrastructure places an unfair and burdensome respon-sibility to future generations and threaten the fiscal stability of our City.
Strategies:
• Create and Approve a 5-year Capital Improvement Plan.
• Implement TSPLOST Program, if approved by voters.
• Implement LMIG Program for 2021.
• Implement 5-year Wastewater Management Plan
• Acquiring property for future municipal operations.
Goal: The City Council is committed to support and grow a vibrant economy with a diversity of businesses, organiza-tions and services.
Strategies:
• Continually improve the permitting process, including policies, rules and regulations to foster healthy economic growth.
• Coordinate the revision and update of the Rincon Zoning Ordinance and Land Use Map.
• Monitor land use and economic development trends to keep the City informed of opportunities to better position itself for the future.
Recreation
Infrastructure
Economic Development/Comprehensive Planning

21
Introduction and Overview
Good Government
Goal: To provide exceptional customer services in an open and transparent way. The City of Rincon is com-mitted to creating a culture focused on results for customers and ensuring the community receives exceptional public service.
Strategies:
• Improve Budget document to make more transparent and user friendly.
• Start a Citizens Police Academy to educate and involve our citizens with Police operations.
• Review municipal Voting practices for 2021 election to see if voting process can be improved for the con-venience of our citizens.

22
Introduction and Overview
CITY MANAGER’S 2021 BUDGET MESSAGE
November 23, 2020
Honorable Mayor Lee and Council Members:
I am pleased to present our FY 2021 Approved Annual Budget to you for your consideration. It rep-
resents an annual financial roadmap for the City of Rincon, with projected total expenditures of
$13,107,932. The Annual Budget allocates resources to a variety of City priorities and programs to
ensure the community’s physical security, enhance the community's quality of life, and maintain
and develop the City's facilities and infrastructure.
This policy document represents our continued commitment to prudent fiscal management, to effec-
tive service delivery and to supporting an affordable quality of life for our citizens. Once adopted by
the Council, the budget establishes the direction for all City government programs and services for
the coming year. It represents the consensus of Council direction and staff recommendations on
how to best accomplish Council goals and respond to the highest priorities of community needs. We
based the approved budget on the City Council’s goals, vision and priorities from this past year,
with many of the goals stretching several more years into the future. The adopted City Council’s
policies and budget principles below also guided budget preparation:
Continue to implement City Council top priorities;
Balance current revenues and current expenses and maintain acceptable reserve levels;
Minimize impacts of any fee increases on residents and ratepayers;
Make decisions in the 2021 Budget that continue to reset the City’s financial plan and
create a foundation to maintain a balanced budget in future years; and
Maintain the highest quality of services.
The COVID-19 public health emergency, and the City’s response to it, is a theme you constantly
have heard for the past year. Although our budget policy calls for maintaining the highest quality of
service, the City is learning how to do that in the “new normal” of social distancing, office renova-
tions and protections and limited social gatherings.

23
Introduction and Overview
The City Vision/Mission Statement is as follows:
The City of Rincon government exists to serve our citizens, businesses and visitors in an open, honest,
efficient and fiscally responsible manner. Public service is at our core and our mission is to provide the
highest quality services possible while continuously improving the services provided. We believe in a
first-rate school system for our children, safe neighborhoods, sound economic development, an impres-
sive quality of life and a low tax burden for our residents.
And this Mayor and this Council has told us, time and time again, that “fiscal responsibility and pru-
dent stewardship of public funds, both short term and long term, are essential for citizen confidence in
government.”
2020 Accomplishments
Our accomplishments this past year are many, thanks to the dedication and hard work of every one of
our employees. They include (in part):
Stabilized the turnover in our Police Department while increasing employee morale and
bringing a new team approach to management;
Rewrote (in part) the Police Department Policies and Procedures Manual;
Completed a successful intergovernmental Fire Agreement with Effingham County and
completed a comprehensive operational audit which will be our blueprint going forward;
Completed and approved our City’s Comprehensive Land Use Plan and hired a new man-
agement team in our Planning Department;
Completed an evaluation of the need to expand our Wastewater Treatment Plant and have a
plan to move forward with implementation;
Implemented reforms in our Finance Department for more timely bank reconciliations, and
submission of audit materials to secure a timelier audit;
Implemented more effective zoning and code enforcement;
Implemented policies and practices to address Covid-19;
Developed Roads project list and provided public education for the TSPLOST referendum;
Provided water and sewer to the OMNITRAX site;
Approved request to install lights at the Fort Howard roundabout for safety reasons;
Successfully completing the process of competitive bidding for our waste and recycling
services;
Annexed properties into Rincon; and
Progress on Public works projects such as Omitrax sewer and water, W. 7th Street sewer
and water, Lexington Ave and East 9th Street lift station upgrades.

24
Introduction and Overview
For 2021, we have drafted a set of Strategic Priorities for 2020 which include:
●FINANCIAL ACCOUNTABILITY
Goal: Approve a viable financial plan for meeting the operational and capital needs of the City with a bal-
anced budget that includes rigorous budget monitoring, cost savings for residents, maintaining reserves, and
aggressively pursuing outside revenue (grant) dollars.
Strategies:
Approve a Balanced Operating Budget for 2021.
Protect Fund Balance Reserves and establish Fire Reserves.
Approve and Fund a 5-year Capital Improvement Plan.
Approve a Budget Document that meets GFOA Standards.
Submit Audit documents to Auditor on schedule.
Direct Staff to Explore Grant opportunities and apply for funding, subject to the approval of the City
Council.
●PUBLIC SAFETY
Goal: Promote the protection of health, safety, and welfare of our community by maintaining a high quality
of life for all City residents, businesses and visitors.
Strategies:
Approve an update of Police Policies and Procedures Manual.
Reduce by 5% Auto Breaking in and Entering and burglary through aggressive drug enforcement.
Increase on-going training opportunities for Police staff, particularly in the areas of racial sensitivity,
racial profiling and use of force training.
Develop and host a Citizens Police Academy.
Continue to replace police vehicles on schedule and maintain all vehicles in accordance with warrantees
and recommendations.
Receive Fire Department Operational Audit and begin to implement recommendations.
Begin transformation to City Fire Department in three years.
Adjust fire fees for scheduled loss of county funding in three years and to fund new equipment requests.
●RECREATION
Goal: To provide exceptional recreational opportunities to every segment of our community in a safe and
holistic way.
Strategies:
Increase participation in programs by developing various programs including travel football and at least
3 new programs for adults.

25
Introduction and Overview
Develop a long-term Recreation Plan that identifies projected future needs for programs and facili-
ties.
Evaluate the feasibility of a long-term recreational facility to meet growing population demands.
●INFRASTRUCTURE
Goal: Rincon’s future stability depends on funding and implementing a safe and sound infrastructure.
Our City’s streets, sidewalks, drainage, sewerage and facilities are our public investments in our City
and are a reflection of who we are and the pride we take in our community. Deferring maintenance to
our infrastructure places an unfair and burdensome responsibility to future generations and threaten the
fiscal stability of our City.
Strategies:
Create and Approve a 5-year Capital Improvement Plan.
Implement TSPLOST Program, if approved by voters.
Implement LMIG Program for 2021.
Implement 5-year Wastewater Management Plan
Acquiring property for future municipal operations.
●ECONOMIC DEVELOPMENT/COMPREHENSIVE PLANNING
Goal: The City Council is committed to support and grow a vibrant economy with a diversity of busi-
nesses, organizations and services.
Strategies:
Continually improve the permitting process, including policies, rules and regulations to foster
healthy economic growth.
Coordinate the revision and update of the Rincon Zoning Ordinance and Land Use Map.
Monitor land use and economic development trends to keep the City informed of opportunities to
better position itself for the future.
●GOOD GOVERNMENT:
Goal: To provide exceptional customer services in an open and transparent way. The City of Rincon is
committed to creating a culture focused on results for customers and ensuring the community receives
exceptional public service.
Strategies:
Improve Budget document to make more transparent and user friendly.
Start a Citizens Police Academy to educate and involve our citizens with Police operations.
Review municipal Voting practices for 2021 election to see if voting process can be improved for the convenience of our citizens.

26
Introduction and Overview
2021 Budget Presentation
For 2021, I am recommending that we adopt a budget of $13,107,932.
I also recommend in this budget proposal that we fund a series of capital projects, we rehire two positions in our Police department that have been frozen to get more officers on the streets, and that we rehire a Planning position to start on July 1, 2021. In addition, I am requesting that we fully fund our Employee Compensation Plan and that we approve a 2% Cost of Living adjustment for our employees next year.
This budget proposal recommends a 15% increase in commercial fire fees to begin to fill the gap of the eventual loss of County funding, that we implement a $1 water and sewer increase to pay for capital projects and that we consider a new stormwater fee, that will be the subject of an upcoming workshop.
The General Fund budget proposal requests a total of $ 4,887,000 in general fund revenues and expenses of $4,738,723.
A snapshot of the recent history of the General Fund is as follows:
The 2017 approved General Fund Budget was $5.4 million;
The 2018 approved General Budget was for $5 million
The 2019 approved General Fund Budget was for $3.9 million;
The 2020 approval was $4.6 million and the
2021 request is for $4.7 million of General fund spending, still well below historic spending levels.
Other funds requests are as follows:
Fire Fund- $1,343,626
Hotel/Motel Fund- $6500.
SPLOST- $2,456,383
Water Fund- $1,200,814
Sewer Fund- $2,045,263
Golf Course- $719,073
TSPLOST- $518,750
Stormwater- $78,800
The total City budget compares to past years as follows:
2021– $13,107,932 (with TSPLOST)
2020- $11, 920,497
2019- $9,964,471
2018- $16,587, 429
2017- $15,034,835

27
Introduction and Overview
We have set an ambitious set of Goals for 2021 which include:
Approve a Balanced Operating Budget for 2021 that protects reserves and continues our work on
Infrastructure projects.
Moving forward with rewrite of the City’s Zoning Ordinance and Growth Management Plan to be
submitted to the Council in draft form by March 1, 2021.
Developing a strategy for the future of our Fire Department. For years, we have collaborated with
Effingham County providing what they have publicly declared as “excellent service”. But that
future is changing, and we need to begin implementing the recommendations of our operational
audit.
Develop strategy for City Engineering services to meet growing needs.
Hiring key permanent staff in the critical areas of Police officers and Finance.
Capital Projects Management- getting projects done.
Conclusion of Service Delivery negotiations with the County.
Continue discussions, if you so choose, about the future of City buildings, specifically City Hall,
Fire Station #1 and the Police Department.
Increase Recreational programs for our residents.
Rethink golf course as a larger recreational facility.
In closing, I want to thank you, Mayor Lee and our Council Members for your leadership and dedication over
the past year. You have led our organization and supported our employees and we are, indeed, grateful. I also
want to acknowledge and thank our Department Heads who have been asked to do more with less and have
performed admirably during the Covid-19 pandemic.
I also want to recognize several individuals that have helped in formulating this budget, Ms. Fran Harbin,
Ms. Cristina Lawson, Ms. Dulcia King and the considerable, substantive and sound legal advice from our
City Attorney, Raymond Dickey. You are well served by a team of professionals who serve the citizens of
Rincon with distinction each and every day!
Sincerely,
JKlimm
John C. Klimm
CITY MANAGER

Financial process, Structure, and Policy
28
Financial Process, Structure, and Policy

Financial process, Structure, and Policy
29
BUDGET PROCESS
The Charter of the City of Rincon specifies that a proposed Operating Budget and a Capital Budget will be provided to
Mayor and Council no later than 60 days prior to the beginning of the ensuing fiscal year. The City’s operating budget
process is generally a three month process begins in September and ends at the beginning of December. The City
Council, management, departments, and the public have opportunities to participate in the preparation of the budget at
various stages in the process. Throughout the process, the City Manager presents reports delineating particular areas of
concern to the City Council, which then provides direction. The development of the annual operating and capital budg-
ets involve a multi-faceted approach, which includes the examination of several documents and the monitoring of fed-
eral, state, and local economic factors. The interrelationship of the documents used is depicted in the diagram below.
Budget Preparation Schedule:
OVERVIEW
ACTIVITY DATE
Finance communicates the 2020 budget development procedures to
department heads and business units. September 4, 2020
Department heads and business units submit operating budget and
service enhancements requests. September 25, 2020
City Manager will hold meetings to discuss budget highlights,
unresolved issues and service improvement requests October 12 - 16, 2020
Public advertisement of 2021 proposed budget hearings October 23, 2020
Distribution of City's 2021 Proposed Budget documents to City
Manager, City Council and Public November 12, 2020
Budget Work Shop November 16,2020
City Council meeting - First Reading and Public Hearing November 23, 2020
City Council meeting - Budget Adoption December 14, 2020
Financial process, Structure, and Policy
30
Basis of Budgeting
Pursuant to Georgia Code Title 36. Local Governments § 36-81-2, the City adopts an annual operating budget for the general fund, fire fund and hotel/motel tax fund for which the level of expenditure may not legally exceed appropriations for each department or undertaking. Though not required by Georgia Code, the City also adopts an annual operating budget for the water and sewer fund and the Lost Planation golf fund.
The City’s governmental and enterprise fund budgets are prepared on a modified accrual basis of accounting. Generally accepted accounting principles require the accrual basis of accounting for enterprise funds. The major differences between the modified and accrual basis of accounting are that:
1. Depreciation is recorded as an expense under the accrual basis and is not under the modified accrual basis of accounting.
2. Cash disbursements for capital assets are recorded as an expenditure under the modified accrual basis and capitalized under the accrual basis.
3. Cash disbursements for debt service is recorded as an expenditure under the modified accrual basis and principal is applied to the note or bond payable under the accrual basis.
The approved appropriations for all departments and operation of the City are prepared under the
direction of the City Manager. The City Manager may recommend additional budget amendments as are
deemed necessary. City Council approval is required when changing the total appropriations of a
department.
Definition of a Balanced Budget
Every year the City prepares a balanced budget. A balance budget occurs under one of three scenarios:
1. Revenues exceed expenditures. 2. Revenues equal expenditures. 3. Revenues plus appropriated fund balance equal expenditures. The appropriation of fund
balance cannot exceed total fund balance.
The City’s FY 2021 operating budgets are balanced.
Implementation of the Approved Budget and Amendments to the Budget
Upon adoption of the budget, staff updates the approved operating and capital budgets, incorporating all
changes from the proposed budget. The approved budget is published in late December. The City Council
may, by ordinance, amend the budget to decrease, increase, or transfer appropriations among
departments. If at any time during the fiscal year, the City Manager determines that available revenues
will be less than total appropriations for the year, he will revise departmental work programs and
appropriations to ensure that available revenues are not exceeded, and presents the amended
appropriations to the City Council for their approval. Supplemental appropriations are provided for
emergencies if they arise. Towards the end of the fiscal year, departments have the opportunity to request
transfers in their budgets if deemed necessary.

Financial process, Structure, and Policy
31
The City’s financial records are organized within several different fund types. Funds requiring the annual appropriation
process include the General Fund, Fire Fund, Hotel/Motel Tax Fund, and all Enterprise Funds. All other funds are to ac-
count for certain receipts and their subsequent expenditure in accordance with Federal or State law, granting agency re-
quirements or donor requirements. All capital program appropriations are accounted for within the Capital Projects
Fund. The following list includes all fund types utilized by the City with a brief description for each one.
FINANCIAL FUND STRUCTURE
General Fund This is the main operating fund of the City. All resources are credited to this fund unless they are specifically
required to go elsewhere. This is where a majority of the City's services are provided from including general
Requires annual administration, financial administration, municipal court, police, public works, sanitation, recreation,
appropriation by and planning and zoning.
City Council
Fire Fund This fund is funded by a special user charge for fire protection services and an intergovernmental agreement
with Effingham County to cover areas of the County for an agreed upon contractual amount. Fire protection operating
Requires annual costs are charged to this fund.
appropriation by
City Council
Hotel/Motel Tax Fund
Requires annual
appropriation by
City Council
Captial Projects Fund This fund is funded by a special user charge for fire protection services and an intergovernmental agreement
with Effingham County to cover areas of the County for an agreed upon contractual amount. Fire protection operating
These funds are used costs are charged to this fund.
to track the annual
capital improvement
program of the City.
Water and Sewer Fund
Requires annual
appropriation by
City Council
Lost Plantation
Golf Fund
Requires annual
appropriation by
City Council

Financial process, Structure, and Policy
32
DEPARTMENT AND FUND RELATIONSHIP
Lost
Hotel/ Water and Plantation
General Fire Motel SPLOST Sewer Golf
Department Fund Fund Tax Fund Fund Fund Fund
City council X
City administration X X X X X X
Financial administration X X X X X X
Court X
Police X X
Fire X X
Public works X X X
Waste Water Treatment Plant X
Sanitation X
Recreation X X
Pro Shop X
Bistro X
Planning and zoning X X

Financial process, Structure, and Policy
33
Overview
The City’s Annual Operating Budget is a fiscal plan which presents the programs and services to be provided to the community and describes the resources needed to perform those activities. The overall goal of the budget is to establish and maintain effective management of the City’s financial resources. Revenues that sup-port municipal services are derived from four sources: current revenue charges, increases in existing revenue charges, new revenue sources and unallocated reserves carried forward from prior years. Various policies and processes are used to guide maintenance of the City’s financial resources.
Under the City’s organizational plan, policy making in response to the needs of the community is entrusted to the Mayor and Councilmember. Administrative or executive authority is vested in the City Manager to devel-op, implement and execute programs and policies established by City Council. The annual budget is prepared under the direction and guidance of the City Manager. State law and local ordinances also impacts the devel-opment of the annual budget.
Policies
The City of Rincon’s Council-Manager form of government was adopted in 1954. Under this organizational plan, the legislative responsibility for municipal government is entrusted to a City Council. The Rincon City Council consists of the Mayor and six Councilmembers. City Council levies taxes, enacts ordinances, adopts the annual budget and performs many other legislative functions. The City Council is also responsible for set-ting priorities through the City’s strategic planning process.
The City Manager is appointed by the Mayor and Council Members to manage the government through the development, implementation and execution of programs and policies established by City Council. The City Manager recommends the annual budget and work programs in addition to advising City Council on policy and legislative matters.
Various policies are used to guide the maintenance and use of the City’s financial resources. They are de-scribed as follows:
Financial Accounting Policies
In developing and evaluating the City's accounting system, consideration is given to the effective implementa-tion of financial accounting policies, specifically to the adequacy of internal controls. Internal accounting con-trols are designed to provide reasonable, but not absolute assurance regarding safeguarding assets against loss from unauthorized use or disposition, reliability of financial records for preparing financial statements and maintenance of accountability for assets. As a recipient of Federal and State assistance, the City is responsible for ensuring that an adequate internal control structure is in place to secure compliance with applicable laws and regulations related to those programs. This internal control structure is subject to periodic evaluation by manage-ment.
FINANCIAL POLICIES

Financial process, Structure, and Policy
34
Investment Policy Objectives: The primary policy objective is safety of principal. Secondary objectives in-
clude adequate liquidity to provide cash as needed and rate of return on investments.
Allowable Investments: It is the policy of the City of Rincon to limit investments to certificates of deposits;
however, Georgia law permits the City to invest in: Obligations of the State of Georgia or of any other states;
Obligations of the United States Government; Obligations fully insured or guaranteed by the United States
Government or Government agency; Obligations of any corporation of the United States Government; Prime
bankers' acceptances; State of Georgia local government investment pool (i.e., Georgia Fund I); and Repur-
chase agreements.
Risk Controls: To ensure liquidity and reduce market risks, investments have maturity dates on or prior to
the date cash is projected to be required to meet disbursement needs.
Collateralization: Collateralization is used to:
• Secure Certificates of Deposit • Secure Repurchase Agreements • Secure Demand Deposits
Pooled Cash Fund: The Pooled Cash Fund is an agency fund which is the owning fund for all City invest-
ments. Accrued interest is distributed to funds participating in the Pooled Cash Fund based on their average
equity balance for the month. The fund also contains cash accounts from which all disbursements are made
and all receipts are deposited.
Revenue Policies
The City’s revenue programs are administered by the Finance Department. These programs strictly adhere to
principles which balance the City’s need for revenue and the community’s ability to provide the necessary
financial resources. Revenue policies which guide the City are outlined below:
• In order to fulfill funding needs without any dependence on property taxes, the City will attempt to enlarge the revenue base by seeking new revenue sources. Efforts will be made to work individually as well as with statewide groups to encourage the State of Georgia to adopt legislation which will enhance local gov-ernment revenues.
• The City will implement user fees in all areas where feasible and productive, as well as set fees at levels related to the costs of providing the services. Moreover, user fees will be reviewed annually as part of the budget process and will be adjusted accordingly to maintain or move incrementally closer to full coverage.
• As deemed appropriate, the City will establish self-supporting enterprise funds where the relationship be-tween operating costs and revenues will be clearly identified.
• The City will limit the designation of General Fund revenues for specified purposes in order to maximize flexibility in budgeting and utilize revenues more efficiently.

Financial process, Structure, and Policy
35
• The City will maintain effective collection systems and implement aggressive enforcement strategies in order to maximize revenues from available sources.
• Revenues will be projected conservatively in order to ensure that actual revenues at the fund level will consistently equal or exceed budgeted revenues.
Debt Policies The City of Rincon is authorized to issue general obligation bonds equivalent to 10 percent of assessed taxa-
ble values within the City. Bonded indebtedness is well within this limit. As of December 31, 2018, the City
had outstanding general obligation bonded debt totaling $6,000,000. To maintain this favorable position and
the current AA+ bond rating designated by Standard & Poor’s, the following debt policies are in place:
• Total long-term debt and major contractual obligations will not exceed 8 percent of assessed valuation.
• Long-term borrowing will be restricted to capital improvements that are too costly to be financed from
current revenues.
• Proceeds from long-term debt will not be used for current ongoing operations.
• Bonds will be retired within a period not to exceed the expected useful life of the capital project.
• Additional major obligations should only be undertaken with new, dedicated streams of revenue to support
them.
• When feasible special assessment, revenue or other self-supporting bonds will be used instead of general
obligation bonds.
• The use of any revenue anticipation borrowing will be avoided. If such borrowing becomes necessary, the
debt will be retired in full within the same fiscal year as it is incurred.
Capital Expenditure Policies
Preparation for the City's capital budget is guided by the following policies:
• A five-year program for capital infrastructure improvements is updated annually. The program identifies
anticipated funding sources and allocates those funds to capital projects over five years. Funding alloca-
tions for each year are determined by: priorities established by City Council, available funding and the
immediate need to address critical infrastructure projects.
• Capital projects financed through the issuance of bonds will be financed for a period not to exceed the use-
ful life of the project.
• The City will coordinate the development of the capital budget with the development of the operating budget. Future operating costs associated with new capital projects will be included in operating budget forecasts.
• The City will preserve its assets at a level adequate to protect capital investment while minimizing future maintenance and replacement costs.
• The City will establish an appropriate distribution of bonded debt and cash financing in the funding of capital projects.

Financial process, Structure, and Policy
36
Operating Budget Policies
• Preparation of the City's operating budget is guided by the following policies:
• All governmental funds are required to balance. As such, total anticipated revenues must equal the sum of
budgeted expenditures for each fund in order for the budget to be considered balanced.
• All requests for allocations are considered in conjunction with measurable performance criteria and the
Strategic Priority they primarily support. Expenditures are approved or rejected on the
• basis of planned levels of performance. Therefore, it is necessary for each activity within a fund to prepare
a performance plan consisting of goals, objectives and specific benchmarks.
• Expenditure budgets for enterprise operations (i.e., Water, Sewer and Lost Plantation Golf) must be funded
either exclusively or primarily by user fee revenues. Self-sufficiency remains a long-range objective for
these funds.
• Allocations from the General Fund are based on a long-range financial plan which includes an unassigned
fund reserve. At the end of 2018, the unassigned fund reserve totaled $37.9 million. This reserve protects
the City against catastrophic revenue losses and major emergency expenditures and contributes to the
City's ability to obtain capital financing at favorable interest rates.
• Ongoing expenses are never funded by a non-recurring or one-time revenue source. Future and current
funding sources are identified for all new programs, services and expansions.

Financial Summaries
37
Financial Summaries

Financial Summaries
38
ALL FUNDS SUMMARY– OPERATING FUNDS ONLY (NOT CAPITAL)
The tables below provide a summary of 2018 actual, 2019 projected, and 2020 adopted revenues and expenses.
City operating funds adopted revenues for 2021 total $10,736,544. This is a decrease of $1.3 million or 9.3 percent under the 2020 projected amount.
Total adopted expenditures for 2021 are $9,857,799. This is a decrease of $1.7 million or 14.4 percent under the 2020 projected expenditures.
Actual Projected Adopted Change Percent
Revenue Source 2019 2020 2021 FY20-21 Change
Taxes 3,476,237$ 3,109,920$ 3,208,200$ 98,280$ 3.16%
Licenses and permits 294,996 117,403 123,800 6,397 5.45%
Intergovernmental 382,604 718,500 773,500 55,000 7.65%
User fees 5,994,471 6,082,320 5,719,300 (363,020) -5.97%
Fines, forfeits and penalities 520,085 465,365 518,000 52,635 11.31%
Interest earned 101,508 42,237 43,050 813 1.92%
Contributions 1,023,723 1,165,637 209,000 (956,637) -82.07%
Other 300,335 81,500 84,800 3,300 4.05%
Transfers in 174,833 56,894 56,894 - 0.00%
Total revenues 12,268,792$ 11,839,776$ 10,736,544$ (1,103,232)$ -9.32%
Actual Projected Adopted Change Percent
Expenditures by Type 2019 2020 2021 FY20-21 Change
Personnel services 3,983,791$ 4,525,534$ 4,722,853$ 197,319$ 4.36%
Purchased/contracted services 2,396,437 2,277,784 2,511,767 233,983 10.27%
Supplies 1,233,703 1,151,938 1,306,529 154,591 13.42%
Capital outlay 868,233 2,799,582 453,000 (2,346,582) -83.82%
Debt service 653,202 706,084 806,756 100,672 14.26%
Transfers out 174,833 56,894 56,894 - 0.00%
Total revenues 9,310,199$ 11,517,816$ 9,857,799$ (1,660,017)$ -14.41%

Financial Summaries
39
All Funds Revenues and Overview
The graph below presents a breakdown by category of total revenues for 2021. Taxes Sales, Franchise Fees, Insurance Premium and Other Taxes. User Fees are made up of the following: Recreation Service Fees, Sanitation Fees, Fees for Other Services in the General Fund, Water Services, Sewer Services, and Golf fees. Intergovernmental includes grants from other governmental agencies.
The City of Rincon is a multi-faceted municipal operation, and its revenue sources reflect the several businesses that make up City operations. City revenue totals $10,736,544 for 2021, a decrease of $1.3 million or 9.5 percent over 2020 projections. City revenue sources are divided into the following categories with major changes highlighted below:
Taxes represent a significant portion of the City’s revenue stream, consisting of 30 percent of total budgeted revenue. This funding source aids in supporting the City’s operations, maintenance, and debt service. The City does not assess a property tax. Tax revenue includes $1.4 million from sales tax, $650,000 insurance premium tax, $500,000 from franchise fees and $376,000 from taxes assessed on alcoholic beverages, and other taxes as mandated through state laws and local ordinances.
User Fees are received for specific services provided by the City and represent 53 percent of revenue. Approximately, three quarters of user fee revenue is generated by fire fees, water, sewer, and sanitation services. Rate increases are planned for water and sewer base charges in 2021 to fund much needed infrastructure improvements, yet remain reasonable for consumer affordability. The City also will begin to assess a stormwater fee in 2021 to fund cost for monitoring stormwater and infrastructure projects. A 10% increase in the commercial fire fee will be implemented in 2021. The changes in these fees account for a majority of the increase in user fees projected for 2021.
Intergovernmental Revenues are funds received from grants for various City projects. This revenue decreased significantly from 2020 due to completing projects partially funded by onetime grants in 2020.
Taxes 30%
Licenses and permits
1%
Intergovernmental 7%
User fees 53%
Fines, forfeits and penalities
5%
Interest earned 0%
Contributions 2%
Other 1%
Transfers in 1%

Financial Summaries
40
Licenses and Permits revenue is derived from such sources as alcoholic beverage licenses and building permits. Total revenue within this category is projected to increase 5.4 percent in 2021.
Fines, Forfeits, and Penalties consist primarily of Municipal Court fines. In 2021, fines revenue is forecast to increase 11.3 percent. In 2020, projections were revised downward due to the COVID 19 outbreak.
Interest Earned revenue comes from City investments. Revenue generated from this source is expected to decrease by 29.6 percent in 2021. This funding stream is extremely volatile, thus conservative budgeting practices are implemented when estimating revenues annually.
Other Revenues consist of various revenue sources. This revenue is projected to increase by 4.%. Contributions are primarily water and sewer impact fees. This revenue source decreased 82.1% in 2021.
A significant development accounted for a majority of the collections in 2020.

Financial Summaries
41
All Funds Expenditures and Overview
The graph below presents total expenditures by major category for 2021. Within the total funds budgeted, Personnel Services is the largest expenditure category. This category supports salaries and a benefits program. Funding for Supplies, Purchased/contracted services, and Capital Outlay are used to provide direct services to .
City operating funds expenditures total $9,857,799, which is 14.4 percent under 2020 projected expenditures. City expenditures are divided into six major categories, with significant changes in each highlighted below:
PERSONNEL SERVICES represent 48 percent of City expenditures and are comprised primarily of funding for salaries and wages for employees and a comprehensive benefits program for employees and their dependents. This category increased $197,319 or 4.4 percent above 2020 projected expenditures. Major changes are described as follows:
The 2021 workforce budget was increased two and half positions in the general fund for positions frozen in 2020. Also, all budgeted positions were provided a 2% cost of living increase as well as amounts budgeted for step increases in accordance with the City’s compensation plan.
The budget continues to provide medical benefits plan to employees. Health insurance is projected to increase approximately 6% in 2021. The City also contributes to a pension plan for employees.
Personnel services 48%
Purchased/contracted services
25%
Supplies 13%
Capital outlay 5%
Debt service 8%
Transfers out 1%

Financial Summaries
42
PURCHASED / CONTRACTED SERVICES are services the City receives primarily from outside companies and represents 25 percent of expenditures. Overall, funding for services in this category increased $233,983 or 10.27 percent above 2021 projected expenditures.
SUPPLIES are items which are consumed or show material change in physical condition and are generally of limited value after use. Overall, this expenditure category increased $154,591 or 13.2 percent compared to 2020 projected expenditures.
CAPITAL OUTLAY includes items costing more than $5,000 each and having a useful life of more than one year. This category decreased $2,346,582 or 83.8 percent under the 2020 projected budget due to the procurement of critical equipment needs that were funded with appropriations for 2019.
DEBT SERVICE accounts for payments of principal and interest to lenders or creditors on outstanding debt. This area increased $100,672 or 14.3 percent from 2020 projected expenditures based on debt service requirements.
INTERFUND TRANSFERS are amounts transferred from one fund to another to pay for such items as debt requirements and services performed by one department for another as well as subsidies to cover budgetary shortfalls to other funds. Expenditures in this category represent .6 percent of the total budget and remained unchanged from the 2020 projected expenditures.

43
Fin
an
cia
l Su
mm
ari
es
Ge
ne
ral
Fire
Sto
rmw
ate
rH
ote
l/M
ote
lSP
LOST
TSP
LOST
Wat
er
and
Go
lf
Fun
dFu
nd
Fun
dTa
x Fu
nd
Cap
ital
Pro
ject
sC
apit
al P
roje
cts
Sew
er
Fun
dFu
nd
Tota
l
FY 2
021
FY 2
021
FY 2
021
FY 2
021
FY 2
021
FY 2
021
FY 2
021
FY 2
021
FY 2
021
Bu
dge
tB
ud
get
Bu
dge
tB
ud
get
Bu
dge
tB
ud
get
Bu
dge
tB
ud
get
Bu
dge
t
RES
OU
RC
ES:
Taxe
s3,
201,
700
$
-$
-
$
6,
500
$
-
$
-
$
-$
3,20
8,20
0$
Lice
nse
s an
d p
erm
its
123,
800
-
-
-
-
-
-
12
3,80
0
Inte
rgo
vern
me
nta
l14
8,50
0
62
5,00
0
-
-
1,
400,
000
1,
147,
500
-
3,32
1,00
0
LMIG
130,
000
130,
000
Use
r fe
es
877,
500
703,
000
78
,800
-
-
-
3,
518,
000
54
2,00
0
5,71
9,30
0
Fin
es,
fo
rfe
its
and
pe
nal
itie
s51
8,00
0
-
-
-
-
-
-
518,
000
Inte
rest
ear
ne
d12
,700
2,00
0
-
-
13
,350
-
15,0
00
43,0
50
Oth
er
4,80
0
-
-
-
-
-
80
,000
84
,800
Co
ntr
ibu
tio
ns
-
-
-
-
-
-
209,
000
209,
000
Inte
rfu
nd
tra
nsf
ers
-
-
-
-
-
-
-
56,8
94
56
,894
Tota
l Re
sou
rce
s4,
887,
000
1,33
0,00
0
78
,800
6,
500
1,
413,
350
1,
277,
500
3,82
2,00
0
598,
894
13
,414
,044
AP
PR
OP
RIA
TIO
NS:
Cit
y C
ou
nci
l24
8,40
5
24
8,40
5
Cit
y A
dm
inis
trat
ion
240,
723
-
6,50
0
247,
223
Fin
anci
al A
dm
inis
trat
ion
141,
016
311,
076
452,
092
Co
urt
87,1
10
87
,110
Po
lice
1,78
7,92
6
1,
787,
926
Fire
-
1,
343,
626
1,34
3,62
6
Pu
bli
c W
ork
s63
5,03
6
1,
522,
268
2,
157,
304
San
itat
ion
676,
433
676,
433
Sto
rmw
ate
r -
78,8
00
78,8
00
Was
te W
ate
r Tr
eat
me
nt
Pla
nt
-
-
576,
260
576,
260
Re
cre
atio
n62
2,25
1
62
2,25
1
Go
lf-
-
-
-
-
719,
073
71
9,07
3
Pla
nn
ing
and
Zo
nin
g27
2,64
6
27
2,64
6
De
bt
Serv
ice
27,1
77
77
9,57
9
80
6,75
6
Cap
ital
Ou
tlay
s-
2,45
6,38
3
518,
750
2,97
5,13
3
Inte
rfu
nd
tra
nsf
ers
-
56
,894
56
,894
Co
nti
nge
ncy
-
-
Tota
l Ap
pro
pri
atio
ns
4,73
8,72
3
1,
343,
626
78,8
00
6,50
0
2,45
6,38
3
518,
750
3,24
6,07
7
719,
073
13
,107
,932
Exce
ss (
De
fici
en
cy)
148,
277
$
(1
3,62
6)$
-$
-$
(1
,043
,033
)$
758,
750
$
575,
923
$
(120
,179
)$
30
6,11
2$

Financial Summaries
44
0.00%
5.00%
10.00%
15.00%
20.00%
25.00%
30.00%
35.00%
40.00%
Distribution of All Appropriated Funds

Financial Summaries
45
Projected Changes in Fund Balance
FY 2020 FY 2020 FY 2021
Beginning FY 2019 Ending Projected Projected Projected
Fund Balance Excess/ Fund Balance Excess/ Fund Balance FY 2021 FY 2021 Fund Balance
Fund 1/1/2019 (Deficiency) 12/31/2019 (Deficiency) 12/31/2020 Resources Appropriations 12/31/2021
General 1,328,744$ 1,023,453$ 2,352,197$ 757,170$ 3,109,367$ 4,887,000$ 4,738,723$ 3,257,644$
Fire 311,831 345,790 657,621 159,470 817,091 1,330,000 1,343,626 803,465
Stormwater - - - - - 78,800 78,800 -
Hotel/Motel Tax - 456 456 - 456 6,500 6,500 456
SPLOST Capital Projects 4,148,724 678,952 4,827,676 (2,169,772) 2,657,904 1,413,350 2,456,383 1,614,871
TSPLOST Capital Projects - - - - - 1,277,500 581,750 695,750
Water and Sewer 23,551,726 1,690,144 25,241,870 (153,131) 25,088,739 3,822,000 3,246,077 25,664,662
Golf 2,818,447 (118,407) 2,700,040 - 2,700,040 598,894 719,073 2,579,861
Total Resources 32,159,472$ 3,620,388$ 35,779,860$ (1,406,263)$ 34,373,597$ 13,414,044$ 13,170,932$ 34,616,709$
Financial Summaries
46
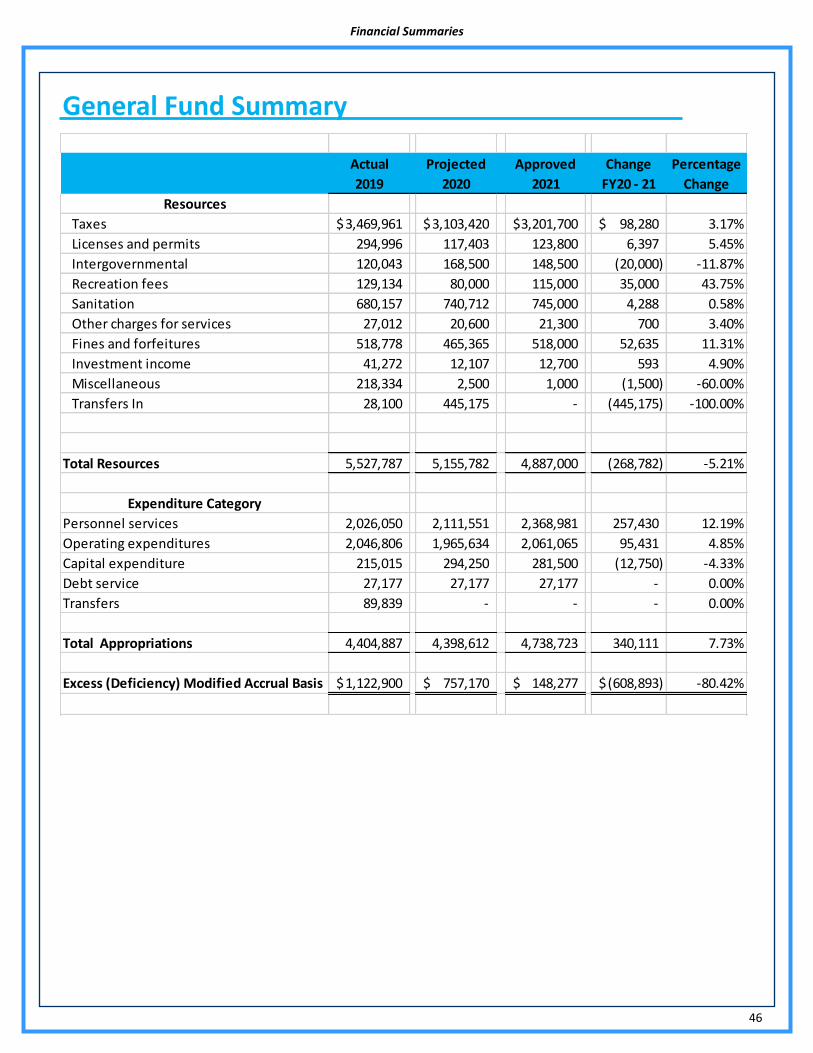
General Fund Summary
Actual Projected Approved Change Percentage
2019 2020 2021 FY20 - 21 Change
Resources
Taxes 3,469,961$ 3,103,420$ 3,201,700$ 98,280$ 3.17%
Licenses and permits 294,996 117,403 123,800 6,397 5.45%
Intergovernmental 120,043 168,500 148,500 (20,000) -11.87%
Recreation fees 129,134 80,000 115,000 35,000 43.75%
Sanitation 680,157 740,712 745,000 4,288 0.58%
Other charges for services 27,012 20,600 21,300 700 3.40%
Fines and forfeitures 518,778 465,365 518,000 52,635 11.31%
Investment income 41,272 12,107 12,700 593 4.90%
Miscellaneous 218,334 2,500 1,000 (1,500) -60.00%
Transfers In 28,100 445,175 - (445,175) -100.00%
Total Resources 5,527,787 5,155,782 4,887,000 (268,782) -5.21%
Expenditure Category
Personnel services 2,026,050 2,111,551 2,368,981 257,430 12.19%
Operating expenditures 2,046,806 1,965,634 2,061,065 95,431 4.85%
Capital expenditure 215,015 294,250 281,500 (12,750) -4.33%
Debt service 27,177 27,177 27,177 - 0.00%
Transfers 89,839 - - - 0.00%
Total Appropriations 4,404,887 4,398,612 4,738,723 340,111 7.73%
Excess (Deficiency) Modified Accrual Basis 1,122,900$ 757,170$ 148,277$ (608,893)$ -80.42%

Financial Summaries
47
WHERE DOES THE MONEY COME FROM? – The City’s General Fund revenue portfolio is diversified. However, it does not have a property tax which does create challenges when funding activities of the City. Approximately 65% of all annual rev-enues are from taxes such as the local option sales tax, franchise fees or other taxes. The remaining sources include fees and charges from residents and businesses and outside funding, like grants.
Taxes
65%
Licenses and permits3%
Intergovernmental
3%
Charges for services2%
Fines and forfeitures15%
Investment earnings0%
Miscellaneous11%
Interfund transfers1%
WHERE DOES THE MONEY GO? – The City’s General Fund revenue portfolio is diversified.
Personnel
50%
Operating expenditures
43%
Capital expenditure
6%
Debt service
1%

Financial Summaries
48
Council5%
Administration5%
Financial
administration3%
Court
2%
Police 37%
Publ ic works14%
Sanitation
14%
Recreation13%
Planning and zoning6%
Debt service1%
Transfers out0%
Contingency0%
Revenue by Sources 2019
Total Activity
2020 Original
Budget
2020 Amended
Budget
2021
Approved
% Change
2020-2021
GENERAL FUNDTAXES
INTANGIBLE TAX 13,582$ 12,544 12,544$ 12,500$
MOTOR VECHICLE- PREV YR 267,203 150,000 150,000 160,000
REAL ESTATE TRANSFER TAX 4,448 4,092 4,092 3,200
FRANCHISE FEES 575,605 500,000 500,000 550,000
SALES TAX 1,527,964 1,400,000 1,400,000 1,450,000
BEER/WINE TAXES 194,919 202,558 202,558 200,000
LIQUOR BY THE DRINK TAX 17,039 18,026 18,026 15,000
ENERGY EXCISE TAX 61,965 - 45,000 45,000
BUSINESS OCCUPATION TAX 105,273 100,000 100,000 100,000
INSURANCE OCCUPATION TAX 23,450 20,000 20,000 16,000
INSURANCE PREMIUMS 678,513 650,000 650,000 650,000
TAX PENALTIES AND INTEREST - 1,200 1,200 -
TOTAL TAXES 3,469,961 3,058,420 3,103,420 3,201,700 4.7%

Financial Summaries
49
2019
Total Activity
2020 Original
Budget
2020 Amended
Budget
2021
Approved
% Change
2020-2021
LICENSES AND PERMITS
BEER/WINE LICENSE FEES 25,052 12,469 12,469 25,000
BEER / WINE / POURING LICENSE 21,853 18,253 18,253 15,000
ZONING/PLANNING FEES 12,420 3,543 3,543 10,000
LAND DEVELOPMENT PERMITS 12,781 5,315 5,315 5,300
RECORD PLATS 195 89 89 -
SIGN PERMITS 3,541 709 709 1,500
SPECIAL EVENTS PERMITS 5,266 709 709 1,000
MISC. PERMITS 18,910 2,835 2,835 10,000
PLUMBING PERMITS 26,345 12,000 12,000 10,000
ELECTRICAL PERMITS 55,645 25,000 25,000 15,000
MECHANICAL PERMITS 17,945 8,000 8,000 5,000
BUILDING PERMITS 56,566 25,000 25,000 20,000
CAPITAL COST RECOVER FEE netted against expense - - - -
PROJECT DEVELOP/ENGINEERING 32,653 1,772 1,772 5,000
RE-INSPECTION FEES 2,525 709 709 1,000
PENALTY AND INTEREST 3,300 1,000 1,000 -
TOTAL LICENSES AND PERMITS 294,996 117,403 117,403 123,800 5.4%
INTERGOVERNMENTAL REVENUES
DOT-DEPT.OF TRANS GRANT $ LMIG 120,043 125,000 125,000 130,000
DNR - COASTAL INCENTIVE GRANT - 18,500 18,500 18,500
U.S. TREASURY - CARES ACT - - 25,000 -
TOTAL INTERGOVERNMENTAL REVENUES 120,043 143,500 168,500 148,500 3.5%
CHARGES FOR SERVICES
OPEN RECORDS 2,309 1,000 1,000 1,500
RETURNED CHECK FEE 70 100 100 -
ACCIDENT REPORTS 1,091 1,000 1,000 1,000
CRIMINAL HISTORY REPORTS 4,421 5,000 5,000 5,000
PD SPECIAL EVENTS REVENUE - 500 500 -
RECREATION FEES 28,537 91,000 50,000 40,000
CONCESSION STAND REVENUES 49,381 45,000 30,000 40,000
FAIR REVENUE 42,634 55,000 - 35,000
FREEDOM RINGS REVENUE 8,582 - - -
BILLBOARD LEASE 9,390 11,000 11,000 10,000
INSURANCE RECOVERY 616 - - -
ELECTIONS QUAL FEES 360 - - -
BUILDING RENTAL - HINELY 5,905 - 4,000 3,800
BUILDING RENTAL - LIONS CLUB 2,850 - 3,000 -
SANITATION PICK UP FEE CH 668,984 658,182 730,182 740,000
PENALTIES 11,173 10,530 10,530 5,000
TOTAL CHARGES FOR SERVICES 836,302 878,312 846,312 881,300 0.3%

Financial Summaries
50
2019
Total Activity
2020 Original
Budget
2020 Amended
Budget
2021
Approved
% Change
2020-2021
FINES AND FORFEITURES
CONTEMPT CHARGES 44,781 65,700 40,000 32,000
FINES,COSTS AND BONDS 358,590 401,500 301,500 400,000
TECHNOLOGY FEE 17,366 30,000 22,500 16,000
FINES - ADMINISTRATIVE FEES 30,257 25,000 18,750 25,000
PRE TRIAL DIVERSION 9,066 5,000 7,500 10,000
SEIZED ASSETS - - 21,000 -
CONDEMNED PROPERTY - 500 500 -
GCVA PROBATION FEES 10,071 10,021 10,021 -
PROBATION FEES 48,647 45,000 30,000 35,000
RESTITUTION - 8,594 8,594 -
TOTAL FINES AND FORFEITURES 518,778 591,315 460,365 518,000 -12.4%
INVESTMENT INCOME
INTEREST INCOME 38,868 25,000 10,000 12,000
INTEREST INCOME - RESTRICTED 478 50 50 100
INTEREST INCOME 1,927 2,057 2,057 600
TOTAL INVESTMENT INCOME 41,272 27,107 12,107 12,700 -53.1%
MISCELLANEOUS REVENUE
MISCELLANEOUS REVENUES 216,944 1,500 1,500 1,000
OVER/SHORT 359 - - -
SCRAP METAL 1,031 1,000 1,000 -
TOTAL MISCELLANEOUS REVENUE 218,334 2,500 2,500 1,000 -60.0%
OTHER FINANCING SOURCES
TRANSFER FROM GOLF FUND 28,100 28,100 - -
TOTAL OTHER FINANCING SOURCES 28,100 28,100 - - 0.0%
TOTAL REVENUES 5,527,786$ 4,846,657$ 4,710,607$ 4,887,000$ 0.8%

Financial Summaries
51
2019 Actual
2020 Original
Budget
2020 Current
Budget 2021 Approved
% Change
2020-2021
GENERAL FUND
Council
Regular employees 22,200$ 22,200 22,200$ 22,200$
Group Health insurance 26,200 31,941 31,941 29,000
Group Life Insurance 327 420 420 420
Social Security (FICA) contributions 1,137 1,698 1,698 1,699
Retirement contributions 2,672 2,730 2,730 1,086
Worker's compensation 1,739 - - 600
Salary and benefits reductions - - (5,394) -
Legal Fees 72,861 100,000 160,000 140,000
Public Officials Insurance - 28,000 6,000 6,000
Advertising Community Promotion) 6,298 6,000 6,000 6,000
Legal Ads 1,066 3,000 3,000 3,000
BUSINESS TRAVEL - 400 400 400
Dues and fees (Memberships) 16,555 18,500 18,500 15,000
Employee Recognition 2,202 6,000 6,000 6,000
Meetings and Conferences 10,595 8,664 8,664 9,500
Office Supplies 343 500 500 500
Workshops 1,409 2,500 2,500 2,500
Operating Supplies 2,629 3,000 3,000 4,500
Tablets For Council 3,041 3,500 3,500 -
Christmas Decorations 18 - -
Operating cost reductions (12,010) -
Total Council 171,292 239,053 259,649 248,405 3.91%
Administration
Regular employees 65,993 67,462 67,462 70,275
Overtime 1,805 4,200 4,200 -
Group Health insurance 7,767 9,126 9,126 8,334
Group Life Insurance 165 71 71 70
Social Security (FICA) contributions 4,679 5,110 5,110 5,375
Retirement contributions 5,610 3,776 3,776 3,369
Workers’ compensation 5,170 108,798 108,798 9,000
Salary and benefit reductions - (82,976) -
Professional Contracted Services 20,014 18,000 18,000 19,500
Legal Fees 61,074 1,500 1,500 -
Building Maintenance 7,921 6,000 6,000 6,000
Vehicle Maintenance 393 600 600 600
Property/Liability Insurance 57,268 51,110 18,410 8,300
Vehicle Insurance 16,851 16,631 631 700
Telephone 4,943 5,000 5,000 9,800
Advertising 783 1,200 1,200 1,200
Travel (Business and Milage) 1,615 - - 5,000
Dues and fees (Memberships) 3,300 1,000 1,000 2,500
Education and training 11,916 2,500 2,500 11,000
Meetings and Conferences 12 11,000 11,000 -
MERCHANT & BANK FEES 1,112 1,000 1,000 -
Office Supplies 1,178 2,000 2,000 3,000
Postage 957 2,000 2,000 2,000
Meals & Entertainment 554 600 600 700
Operating Supplies 16,743 3,500 3,500 3,500
Computer Support and IT 6,305 6,500 6,500 6,500
FUEL / OIL 400 500 500 500
Utilities 14,093 15,000 15,000 21,000
Building Improvements - 2,500 2,500 2,500
Office Equipment - 1,000 1,000 1,000
Computer Software 6,518 39,000 39,000 39,000
Operating cost reductions (28,221) -
Total Administration 325,139 386,684 226,787 240,723 -37.75%
Expenditures by Department

Financial Summaries
52
2019 Actual
2020 Original
Budget
2020 Current
Budget 2021 Approved
% Change
2020-2021
Finance
Regular employees 42,343 41,503 41,503 42,044
Overtime 201 2,000 2,000 2,000
Group Health insurance 4,698 6,084 6,084 8,000
Group Life Insurance 110 40 40 40
Social Security (FICA) contributions 3,049 3,113 3,113 3,216
Retirement contributions 1,746 2,346 2,346 2,016
Workers’ compensation 3,317 - - 1,200
Salary and benefit reductions - (1,573) -
Professional Contracted Services 40,110 20,000 67,000 15,000
Audit Fees 8,000 30,000 43,000 32,000
Office Equipment Maintenance 838 1,200 1,200 1,500
Telephone 482 - 1,600 -
Property/Liability Insurance - 400 400 1,600
Dues and fees (Memberships) 200 500 500 1,500
Education and training 12,268 9,000 9,000 9,000
Merchant and Bank Fees - 5,000 5,000 1,400
Office Supplies 3,313 3,000 3,000 5,000
Postage 761 1,000 1,000 1,000
Computer Support and IT 6,039 7,000 7,000 7,000
Office Equipment 188 3,000 3,000 7,500
Operating cost reductions (12,015) -
Total Finance 127,663 135,186 183,198 141,016 4.31%
(2,993)
Court
Regular employees 26,838 35,485 35,485 36,187
Overtime 832 1,000 1,000 500
Group Health insurance 6,937 9,126 9,126 13,000
Group Life Insurance 45 60 60 60
Social Security (FICA) contributions 1,950 2,661 2,661 2,768
Retirement contributions 1,437 1,701 1,701 1,735
Workers’ compensation 2,103 - - 1,200
Salary and benefit reductions - (7,406) -
Professional Contracted Services 12,303 13,100 13,100 14,100
Legal Fees 43,145 1,000 1,000 -
PRE TRIAL DIVERSION FEE - 1,500 1,500 1,500
Office Equipment Maintenance 681 750 750 750
Telephone 1,013 - 800 1,000
Property/Liability Insurance - 1,000 1,000 800
Education and training 893 600 600 600
MERCHANT & BANK FEES 3,445 3,000 3,000 6,110
Office Supplies 1,560 1,800 1,800 1,800
Postage 280 200 200 500
Operating Supplies, Misc. 143 250 250 500
Technology Fee/Court Expense 166 2,500 2,500 2,500
Computer Support and IT 333 300 300 1,500
Operating cost reductions (3,900) -
Total Court 104,104 76,033 65,527 87,110 14.57%

Financial Summaries
53
2019 Actual
2020 Original
Budget
2020 Current
Budget 2021 Approved
% Change
2020-2021
Police
Regular employees 862,206 1,052,066 1,052,066 1,091,976
Overtime 64,259 40,000 40,000 40,000
Group Health insurance 125,119 200,090 200,090 178,293
Group Life Insurance 917 1,260 1,260 1,260
Social Security (FICA) contributions 66,863 78,905 78,905 83,115
Retirement contributions 45,295 64,319 64,319 51,032
Workers’ compensation 69,338 - - 35,000
Salary and benefit reductions - (150,509) -
Professional Contracted Services 41,668 6,800 6,800 6,000
GCIC - TECHNICAL 6,575 10,000 10,000 8,000
Building Maintenance 13,088 10,000 10,000 8,000
Vehicle Maintenance 52,107 40,000 40,000 25,000
EQUIPMENT MAINTENANCE 1,792 1,000 1,000 1,000
SOFTWARE SUBSCIPTION FEE 40,300 40,300 40,300 40,300
Property/Liability Insurance 13,882 - 41,000 41,000
Telephone 17,183 15,000 15,000 18,500
RADIO/PAGER/RADAR MAINTENANCE 3,884 7,500 7,500 7,500
Legal Ads 342 600 600 600
Dues and fees (Memberships) 1,081 1,500 1,500 2,500
Education and training 5,636 10,000 10,000 12,000
MERCHANT & BANK FEES 2,130 2,000 2,000 2,000
Office Supplies 10,837 8,000 8,000 8,000
Postage 298 350 350 350
Operating Supplies, Misc. 6,709 6,000 6,000 5,000
Computer Support and IT 9,233 7,000 7,000 7,000
CID Operation Supplies 3,408 4,000 4,000 4,000
Property and evidence - - 3,000
Armory - - 6,000
FUEL/OIL 42,073 43,800 43,800 43,000
Utilities 12,567 12,000 12,000 15,000
UNIFORMS 14,709 17,700 17,700 15,000
Condemned Funds Expenditures 5,690 2,000 2,000 2,000
Computers 7,003 8,250 8,250 6,000
K-9 Unit 1,448 3,500 3,500 4,000
Police Equipment - 30,000 30,000 15,000
Police Dept - Firearms 555 1,500 1,500 1,500
Restitution - 500 500 -
Operating cost reductions - (37,350) -
Total Police 1,548,194 1,725,940 1,579,081 1,787,926 3.59%

Financial Summaries
54
2019 Actual
2020 Original
Budget
2020 Current
Budget 2021 Approved
% Change
2020-2021
Public WorksRegular employees 74,931 104,711 104,711 85,656
Overtime 1,230 1,000 1,000 2,500
Group Health insurance 16,455 24,336 24,336 16,000
Group Life Insurance 135 160 160 120
Social Security (FICA) contributions 5,588 7,853 7,853 6,554
Retirement contributions 6,509 4,461 4,461 4,107
Workers’ compensation 19,614 - - 5,000
Salary and benefit reductions - (36,956) -
Professional Contracted Services 64,310 80,000 80,000 65,000
Building Maintenance 689 1,000 1,000 1,000
Vehicle Maintenance 3,254 6,500 6,500 6,500
Rental of equipment 1,850 2,000 2,000 4,000
Property/Liability Insurance 8,864 - 9,700 10,000
Telephone 1,468 2,000 2,000 3,800
Legal Ads 180 200 200 200
Dues and fees (Memberships) 202 600 600 400
Education and training - 500 500 500
Office Supplies 11 200 200 200
Operating Supplies, Misc. 34,011 37,000 37,000 35,000
Inmate Small Equipment 8,785 15,000 15,000 15,000
Parts / Repairs 9,741 10,000 10,000 10,000
COMPUTER SUPPORT / IT - 500 500 500
Electricity 2,718 2,500 2,500 1,400
FUEL / OIL 8,628 7,000 7,000 7,000
UNIFORMS 2,695 3,000 3,000 1,600
Landscaping - 500 500 -
Street Improvements - LMIG 145,789 125,000 125,000 130,000
Street Light 131,285 112,000 147,000 150,000
Streets - Construct & Patch 19,985 50,000 50,000 50,000
Signs/Sign Posts 290 3,000 3,000 3,000
Streets - Sweeper Lease - 27,177 - -
Misc Equipment 27,550 25,000 25,000 20,000
Operating cost reductions (36,975) -
Total Public Works 596,768 653,198 596,790 635,036 -2.78%
SANITATION
REGULAR EMPLOYEES 18,736 25,271 25,271 26,316
OVERTIME 407 500 500 500
GROUP HEALTH INSURANCE 3,830 6,639 6,639 6,300
GROUP LIFE INSURANCE - 54 54 54
SOCIAL SECURITY (FICA) CONTRIBUTION 1,413 1,895 1,895 2,006
RETIREMENT CONTRIBUTION - 1,212 1,212 1,257
WORKERS' COMPENSATION - - - -
Professional Contracted Services - - - -
Garbage Fee Payments 558,249 560,000 632,000 640,000
Office Supplies - -
Total Sanitation 582,635 595,572 667,572 676,433 13.58%

Financial Summaries
55
2019 Actual
2020 Original
Budget
2020 Current
Budget 2021 Approved
% Change
2020-2021
RecreationRegular employees 175,424 195,692 195,692 206,614
Overtime 12,012 15,000 15,000 15,000
UMPIRE PAY 35,981 45,000 30,000 45,000
Group Health insurance 33,644 44,946 44,946 41,000
Group Life Insurance 190 240 240 240
Social Security (FICA) contributions 13,146 13,765 13,765 15,806
Retirement contributions 4,701 9,290 9,290 8,341
Workers’ compensation - - - 5,500
Salary and benefit reductions - (6,117) -
Professional Contracted Services 12,717 7,600 7,600 12,800
Building Maintenance 5,768 7,000 7,000 5,000
Vehicle Maintenance 1,351 1,000 1,000 1,000
Grounds Maintenance 11,144 15,000 15,000 16,500
Property/Liability Insurance 12,571 - 15,000 15,000
Telephone 6,453 4,700 4,700 6,500
Legal Ads 435 1,000 1,000 750
Dues and fees (Memberships) 865 800 800 1,200
Meetings and Conferences 1,950 2,000 2,000 2,000
Merchant and Bank Fees 8,032 8,000 8,000 4,500
Office Supplies 3,546 5,000 5,000 4,000
Operating Supplies 85,254 84,000 84,000 80,000
Parts / Repairs - - -
FUEL / OIL 3,372 2,500 2,500 3,500
Utilities 67,992 65,000 65,000 66,000
Seniors Program 1,453 1,000 1,000 1,000
Concessions - cost of goods 19,897 20,000 20,000 25,000
Fair expenditures 22,315 22,500 19,000
Freedom rings expenditures 21,222 21,000 21,000 21,000
Operating cost reductions - - (33,690)
Total Recreation 561,435 592,033 529,726 622,251 5.10%

Financial Summaries
56
2019 Actual
2020 Original
Budget
2020 Current
Budget 2021 Approved
% Change
2020-2021
Planning & Zoning
Regular employees 87,238 102,614 102,614 100,044
Overtime 3,866 3,000 3,000 3,000
Group Health insurance 15,183 19,773 19,773 10,491
Group Life Insurance 165 130 130 110
Social Security (FICA) contributions 6,935 7,696 7,696 7,653
Retirement contributions 6,817 5,341 5,341 4,797
Workers’ compensation 6,835 - - 3,500
Salary and benefit reductions - - (22,389) -
Professional Contracted Services 87,175 78,000 78,000 78,000
Engineering Fees 20,845 20,000 20,000 20,000
CAPITAL COST RECOVERY PAYMENT netted against revenue - - - -
Vehicle Maintenance 1,904 2,500 2,500 1,500
Office Equipment Maintenance 3,311 2,500 2,500 2,500
Planning / Zoning Comission 894 1,000 1,000 2,000
Property/Liability Insurance 1,377 - 2,600 2,500
Telephone 3,368 3,000 3,000 3,000
Legal Ads 1,601 1,450 1,450 1,450
Printing and binding 351 600 600 2,000
Dues and fees (Memberships) 147 1,200 1,200 1,200
Education and training 6,254 6,000 6,000 6,000
MERCHANT AND BANK FEES 5,156 5,000 5,000 5,000
Office Supplies 3,154 3,000 3,000 3,000
Postage 2,508 4,750 4,750 3,500
GICH - 1,000 1,000 1,000
Operating Supplies, Misc. 686 1,500 1,500 1,500
Computer Support and IT 475 2,000 2,000 2,000
Infrastructure Data Base 226 6,000 6,000 6,000
FUEL / OIL 510 750 750 750
Books and periodicals - 150 150 150
Operating cost reductions - (21,060) -
Total Planning & Zoning 266,981 278,955 238,106 272,645 -2.26%
Debt ServiceCapital Lease - Principal 25,442 - 26,537 26,837
Capital Lease - Interest and other charges 1,735 - 640 340
Total Debt Service 27,177 - 27,177 27,177 0.00%
Transfers OutGolf Fund 89,839 - - -
Capital Improvement Program - - - -
Total Transfers Out 89,839 - - - 0.00%
TOTAL GENERAL FUND APPROPRIATIONS 4,401,228 4,682,653 4,398,612 4,738,723 1.20%

Financial Summaries
57
The City’s Fire Fund is funded primarily from two revenue sources. 53% of revenue are from user charges to residents and businesses in the City borders. The Commercial rates will be increased by 15% in 2021 and residential fees will reman the same. The fee increase is necessary to address operating cost increases and to replace aging equipment. The intergovernmental revenues which represent 47% of revenues will be discontinued on June 30, 2023 since the city and Effingham
County has agreed to terminate the agreement where the City provided fire service for certain areas of the unincorporated areas of the county.
71 % of the fund’s expenditures are for personnel (salaries and benefits). This expenditure class increased by 2.9% from the prior year. The City has provided step increases and a cost of living adjustment which accounts for a majority of the increase.
Fire Fund Summary
Actual Projected Approved Change Percentage
2019 2020 2021 FY20 - 21 Change
Fire
Resources
Intergovernmental 580,384$ 625,000$ 625,000$ -$
Charges for services - Fire Fees 528,064 622,626 703,000 80,374
Investment earnings 6,668 350 2,000 1,650
Miscellaneous 10,147 7,281 - (7,281)
Total Resources 1,125,263 1,255,257 1,330,000 74,743 5.95%
Expenditure Category
Personnel services 641,173 793,995 817,326 23,331
Operating expenditures 172,077 190,792 212,300 21,508
Capital expenditure 180 111,000 314,000 203,000
Total Appropriations 813,430 1,095,787 1,343,626 247,839 22.62%
Excess (Deficiency) Modified Accrual Basis 311,833$ 159,470$ (13,626)$ (173,096)$ -108.54%
Beginning Balance 235,000 546,833 706,303
Projected Ending Balance 546,833$ 706,303$ 692,677$

Financial Summaries
58
2019
Total Activity
2020 Original
Budget
2020 Amended
Budget
2021
Approved
% Change
2020-2021
FIRE FUNDCHARGES FOR SERVICES
FIRE DEPT EFFINGHAM COUNTY 442,570$ 485,000$ 485,000$ 485,000$
FIRE DEPT STA 4 - EFF CO 137,814 140,000 140,000 140,000
PENALTIES - 3,500 3,500 -
FIRE FEES VIA UTILITY 528,064 619,126 619,126 703,000
TOTAL CHARGES FOR SERVICES 1,108,448 1,247,626 1,247,626 1,328,000 6.4%
INVESTMENT INCOME
INTEREST INCOME 6,668 350 350 2,000
TOTAL INVESTMENT INCOME 6,668 350 350 2,000 471.4%
CONTRIBUTIONS AND DONATIONS FROM PRIVATE SOURCES
DONATIONS - 7,281 7,281 -
TOTAL CONTRIBUTIONS AND DONATIONS FROM PRIVATE SOURCES - 7,281 7,281 - -100.0%
MISCELLANEOUS REVENUE
MISCELLANEOUS REVENUE 10,147 - - -
TOTAL MISCELLANEOUS REVENUE 10,147 - - - 0.0%
TOTAL REVENUES 1,125,262$ 1,255,257$ 1,255,257$ 1,330,000$ 6.0%

Financial Summaries
59
2019 Actual
2020 Original
Budget
2020 Current
Budget 2021 Approved
% Change
2020-2021
FIRE FUND
Regular employees 428,269 491,234 491,234 516,248
Volunteer Stipends 36,100 60,000 60,000 60,000
Overtime 31,948 35,000 35,000 35,000
Group Health insurance 78,236 118,799 118,799 109,900
Group Life Insurance 495 720 720 678
CANCER INSURANCE 2,466 5,600 5,600 6,500
Social Security (FICA) contributions 32,121 36,843 36,843 39,808
Retirement contributions 13,433 26,168 26,168 24,192
Workers’ compensation 15,233 19,631 19,631 25,000
Professional Contracted Services 17,613 15,000 15,000 20,000
AUDIT FEES - - - 2,000
Legal Fees 13,480 10,000 10,000 10,000
Equipment Testing 1,655 5,000 5,000 5,000
Building Maintenance 8,843 20,000 20,000 10,000
Vehicle Maintenance 16,956 20,000 20,000 20,000
EQUIPMENT MAINTENANCE 21,595 25,000 25,000 20,000
Property/Liability Insurance 8,989 5,159 5,159 25,000
Vehicle Insurance 2,708 11,133 11,133 -
Telephone 6,956 7,000 7,000 8,000
RADIO/PAGER/RADAR MAINTENANCE 1,565 6,000 6,000 6,000
Legal Ads - - -
Education and training 8,889 10,000 10,000 10,000
Bank Fees - - - 5,000
DONATIONS/CHARITY EXPENSE 5,825 - - -
Medical Supplies 4,628 6,000 6,000 6,000
Operating Supplies 11,442 12,000 12,000 23,000
Computer Support and IT - - -
FUEL / OIL 18,471 22,000 22,000 22,000
Utilities 7,984 10,000 10,000 13,800
UNIFORMS 5,359 6,500 6,500 6,500
AEDS - 3,000 3,000 3,000
Building Rescue Equip & Engine - 30,000 30,000 -
Office Equipment - 1,500 1,500 1,500
Office Furniture 180 1,500 1,500 1,500
Capital Equipment - 50,000 50,000 288,000
Misc Equipment - 25,000 25,000 20,000
Employee Salaries 2,039 - - -
Health Insurance 553 - - -
Life Insurance - - - -
Cancer Insurance 126 - - -
FICA-PAYROLL EXPENSE 154 - - -
Retirement - - - -
Equipment Testing - - - -
Building Maintenance 2,414 - - -
VEHICLE MAINTENANCE 408 - - -
EQUI PMENT MAINTENANCE 309 - - -
Telephone 612 - - -
Operating Supplies 295 - - -
Utilities 5,082 - - -
TOTAL FIRE FUND APPROPRIATIONS 813,430 1,095,787 1,095,787 1,343,626 22.62%

Financial Summaries
60
Water and Sewer Fund Summary
Actual Projected Approved Change Percentage
2019 2020 2021 FY20 - 21 Change
Resources
Water
Intergovernmental 60,040$ 300,000$ -$ (300,000)$ -100.00%
Charges for services 1,834,480 1,754,000 1,860,000 106,000 6.04%
Investment earnings 42,786 16,000 11,500 (4,500) -28.13%
Contributions 205,410 1,010,000 60,000 (950,000) -94.06%
Sewer
Intergovernmental 202,521 250,000 - (250,000) -100.00%
Charges for services 1,739,087 1,532,362 1,738,000 205,638 13.42%
Investment earnings 9,949 13,580 3,500 (10,080) -74.23%
Contributions 1,002,481 148,356 149,000 644 0.43%
Total Resources 5,096,754 5,024,298 3,822,000 (1,202,298) -23.93%
Expenditure Category
Water
Administration
Personnel services 151,161 148,779 146,775 (2,004) -1.35%
Operating expenditures 118,310 143,100 156,300 13,200 9.22%
Capital expenditure - 1,000 8,000 7,000 700.00%
Total water administration 269,471 292,879 311,075 18,196 6.21%
Water operations
Personnel services 259,693 357,496 352,074 (5,422) -1.52%
Operating expenditures 471,002 327,606 408,200 80,594 24.60%
Capital expenditure 243,949 1,588,500 2,500 (1,586,000) -99.84%
Total water operations 974,644 2,273,602 762,774 (1,510,828) -66.45%
Sewer
Sewer operations
Personnel services 388,606 507,235 505,284 (1,951) -0.38%
Operating expenditures 206,090 184,700 189,211 4,511 2.44%
Capital expenditure 229,353 745,762 65,000 (680,762) -91.28%
Total sewer operations 824,049 1,437,697 759,495 (678,202) -47.17%
Waste water treatment plant
Personnel services 158,151 216,003 211,510 (4,493) -2.08%
Operating expenditures 305,263 338,341 334,750 (3,591) -1.06%
Capital expenditure 178,221 30,000 30,000 - 0.00%
Total waste water treatment plant 641,635 584,344 576,260 (8,084) -1.38%
Debt service
Principal 553,741 506,353 621,860 115,507 22.81%
Interest 72,285 172,554 157,719 (14,835) -8.60%
Total waste water treatment plant 626,026 678,907 779,579 100,672 14.83%
Transfers 56,894 56,894 56,894 - 0.00%
Total appropriations 3,392,719 5,324,323 3,246,077 (2,078,246) -39.03%
Excess (Deficiency) Modified Accrual Basis 1,704,035$ (300,025)$ 575,923$ 875,948$ -291.96%

Financial Summaries
61
Charges for services
94%
Interest Income0%
Contributions6%
Revenues
Personnel 37%
Operating expenditures
34%
Capital expenditures
3%
Debt Service24%
Transfer out2%
Expenditures

Financial Summaries
62
2019
Total Activity
2020 Original
Budget
2020 Amended
Budget
2021
Approved
% Change
2020-2021
WATER FUND INTERGOVERNMENTAL REVENUES
DNR Coastal Incentive Grant 60,040$ - -$ -$
CDBG REVENUE - 300,000 300,000 -
TOTAL INTERGOVERNMENTAL REVENUES 60,040 300,000 300,000 - -100.0%
CHARGES FOR SERVICES
WATER SALES 1,495,777 1,500,000 1,500,000 1,700,000
PENALTIES 28,409 15,000 15,000 10,000
WATER RECONNECTS 189,510 133,000 133,000 50,000
WATER TAP FEES 104,100 30,000 30,000 20,000
CALL OUT FEES 150 - - -
MISC. WATER REVENUE (63,627) 1,500 1,500 -
METER/METER FEES - 2,500 2,500 -
WATER SALE 61 - - -
TOWER RENTAL 80,365 72,000 72,000 80,000
TOTAL CHARGES FOR SERVICES 1,834,745 1,754,000 1,754,000 1,860,000 6.0%
MISCELLANEOUS REVENUE
MISCELLANEOUS REVENUES (264) - - -
OVER/SHORT (1) - - -
TOTAL MISCELLANEOUS REVENUE (265) - - - 0.0%
INVESTMENT INCOME
INTEREST INCOME 25,594 10,000 10,000 9,000
INTEREST INCOME - WATER IMPACT 17,192 6,000 6,000 2,500
TOTAL INVESTMENT INCOME 42,786 16,000 16,000 11,500 -28.1%
OTHER FINANCING SOURCES AND CONRIBUTIONS
CONTRIBUTED CAPITAL 64,977 - - -
CONTRIBUTED CAPITAL - - 950,000 -
WATER IMPACT FEES 140,433 60,000 60,000 60,000
TOTAL OTHER FINANCING SOURCES AND CONTRIBUTIONS 205,410 60,000 1,010,000 60,000 -94.1%
TOTAL REVENUES 2,142,716$ 2,130,000$ 3,080,000$ 1,931,500$ -37.3%

Financial Summaries
63
2019 Actual
2020 Original
Budget
2020 Current
Budget 2021 Approved
% Change
2020-2021
WATER FUND
Water AdministrationRegular employees 120,953 112,232 112,232 114,939
Overtime 2,990 3,000 3,000 2,500
Group Health insurance 14,241 18,024 18,024 14,000
Group Life Insurance 140 260 260 134
Social Security (FICA) contributions 8,714 8,467 8,467 8,793
Retirement contributions 443 6,414 6,414 5,510
Workers’ compensation 3,680 382 382 900
Professional Contracted Services 13,007 18,600 18,600 24,000
AUDIT FEES - 7,500 7,500 7,500
LEGAL FEES 1,438 28,000 28,000 26,000
Telephone 655 1,000 1,000 1,000
Legal Ads - 300 300 300
Education and training 787 5,000 5,000 5,000
MERCHANT AND BANK FEES 37,443 35,000 35,000 40,000
Office Supplies 1,430 1,500 1,500 1,500
Postage 25,554 26,600 26,600 30,000
Operating Supplies 20,954 12,000 12,000 12,000
Computer Support and IT 3,232 7,400 7,400 9,000
Utilities - 200 200 -
Office Equipment - 1,000 1,000 8,000
Total Water Administration 255,661 292,879 292,879 311,076 6.21%

Financial Summaries
64
2019 Actual
2020 Original
Budget
2020 Current
Budget 2021 Approved
% Change
2020-2021
Water OperationsRegular employees 178,215 251,706 251,706 253,977
Overtime 3,433 4,000 4,000 4,000
Group Health insurance 37,926 57,799 57,799 52,333
Group Life Insurance 265 390 390 405
Social Security (FICA) contributions 12,292 18,827 18,827 19,395
Retirement contributions 6,024 12,034 12,034 11,964
Workers’ compensation 21,538 12,740 12,740 10,000
Professional Contracted Services 55,973 45,000 45,000 45,000
Engineering Fees 1,415 2,000 2,000 2,000
Repairs and maintenance 62,662 - - -
Building Maintenance - - - -
Vehicle Maintenance 3,278 6,000 6,000 6,000
Miscellaneous waterlines 32,213 - - 60,000
Pipes/fittings 10,170 - 15,000 15,000
Watershed Plan 22,277 10,000 10,000 20,000
Property/Liability Insurance 11,389 5,614 5,614 8,000
Vehicle Insurance 2,407 1,742 1,742 -
Telephone 4,395 4,000 4,000 3,500
Legal Ads 515 500 500 1,000
Dues and fees (Memberships) 1,218 1,500 1,500 500
Education and training 230 750 750 2,000
Merchant and Bank Fees 4,355 - -
Postage 3,520 4,000 4,000 4,000
Operating Supplies, Misc. 18,332 20,000 20,000 20,000
Chemicals 26,333 25,000 25,000 27,000
Parts / Repairs 4,141 3,500 3,500 3,000
Meter Supplies 3,865 5,000 5,000 5,000
Computer support and IT 7,813 - - 3,500
FUEL / OIL 8,996 7,000 7,000 6,900
Utilities 68,290 60,000 60,000 64,000
UNIFORMS 1,593 2,500 2,500 1,800
DNR - COASTAL INCENTIVE GRANT 61,234 18,500 18,500 20,000
Water Projects - 30,000 -
Water - Meters 60,045 90,000 90,000 90,000
Misc. Waterlines 60,000 60,000 -
North Tank 92,696 100,000 100,000 -
Office Equipment - 500 500 500
Capital Outlay- Right Spot - - 2,000
Total Water Operations 829,048 830,602 875,602 762,773 -12.89%
-
Water Impact7th St Improvements 1 & 2 - 158,000 158,000 -
Lower Floridian Well 145,597 200,000 200,000 -
DEBT SVC Note Principal 87,715
DEBT SVC INTEREST GEFA 2016 39,119 50,000 50,000 39,250
Total Water Impact 184,716 408,000 408,000 126,965 -68.88%
Water Capital Projects
Legal Fees - - 20,000 -
Engineering Fees - - 50,000 -
Other purchased services - - 20,250 -
Construction - - 789,750 -
Contingencies - - 70,000 -
Total Water Capital Projects - - 950,000 -
Total Water Fund 1,269,425 1,531,481 2,526,481 1,200,814 -52.47%

Financial Summaries
65
2019
Total Activity
2020 Original
Budget
2020 Amended
Budget
2021
Approved
% Change
2020-2021
SEWER FUNDINTERGOVERNMENTAL REVENUES
CDBG Revenue 202,521$ 250,000 250,000$ -$
TOTAL INTERGOVERNMENTAL REVENUES 202,521 250,000 250,000 - -100.0%
CHARGES FOR SERVICES
SEWER USE SALES 1,630,183 1,500,000 1,500,000 1,720,000
PENALTIES 25,352 24,562 24,562 10,000
SEWER TAP FEES 73,050 7,800 7,800 8,000
MISCELLANEOUS CHARGES 10,501 - - -
TOTAL CHARGES FOR SERVICES 1,739,087 1,532,362 1,532,362 1,738,000 13.4%
INVESTMENT INCOME
INTEREST INCOME - SEWER 821 8,580 8,580 1,000
INTEREST INCOME - SEWER IMPACT 9,128 5,000 5,000 2,500
TOTAL INVESTMENT INCOME 9,949 13,580 13,580 3,500 -74.2%
OTHER FINANCING SOURCES AND CONRIBUTIONS
CONTRIBUTED CAPITAL 304,139 - - -
SEWER IMPACT FEES 514,174 148,356 148,356 149,000
LOAN PROCEEDS - GEFA 184,169 - - -
TOTAL OTHER FINANCING SOURCES AND CONRIBUTIONS 1,002,482 148,356 148,356 149,000 0.4%
TOTAL REVENUES 2,954,039$ 1,944,298 1,944,298$ 1,890,500$ -2.8%

Financial Summaries
66
2019 Actual
2020 Original
Budget
2020 Current
Budget 2021 Approved
% Change
2020-2021
SEWER FUND
Sewer OperationsRegular employees 293,097 359,596 359,596 371,160
Overtime 14,736 15,000 15,000 15,000
Group Health insurance 50,194 75,085 75,085 65,633
Group Life Insurance 115 523 523 529
Social Security (FICA) contributions 21,568 27,020 27,020 26,359
Retirement contributions 3,819 17,271 17,271 17,603
Workers’ compensation 5,079 12,740 12,740 9,000
Professional Contracted Services 13,808 15,000 15,000 20,000
AUDIT FEES - 7,500 7,500 7,500
PROFESSIONAL OR LEGAL FEE - - - -
Engineering Fees 1,415 2,000 2,000 2,500
Vehicle Maintenance 5,817 7,000 7,000 7,000
Pipes/fittings 2,273 200 200 3,000
Property/Liability Insurance 20,806 16,500 16,500 9,000
Vehicle Insurance 3,412 4,200 4,200 -
Telephone 866 700 700 511
Legal Ads 86 300 300 200
Dues and fees (Memberships) 736 1,500 1,500 1,500
Education and training 375 500 500 1,000
Merchant and Bank Fees 7 - - -
Office Supplies -
Operating Supplies, Misc. 27,371 28,000 28,000 28,000
Parts / Repairs 5,533 5,000 5,000 10,000
FUEL / OIL 6,461 7,000 7,000 7,000
Utilities 27,152 25,000 25,000 28,000
UNIFORMS 1,153 2,500 2,500 2,000
7th St Improvements 1 & 2 202,521 - 483,562 -
9th Street LS Upgrade - - 212,000 -
Infrastructure Replacement 65,533 50,000 50,000 50,000
Misc Equipment - - - 15,000
Total Sewer Operations 773,933 680,135 1,375,697 697,495 -49.30%

Financial Summaries
67
2019 Actual
2020 Original
Budget
2020 Current
Budget 2021 Approved
% Change
2020-2021
Waste Water Treatment
Regular employees 112,606 143,583 143,583 151,035
Overtime 3,124 3,500 3,500 3,500
Group Health insurance 25,899 44,262 44,262 34,000
Group Life Insurance 125 180 180 180
Social Security (FICA) contributions 7,728 10,769 10,769 11,554
Retirement contributions 3,879 8,333 8,333 7,241
Workers’ compensation 4,788 5,377 5,377 4,000
Professional Contracted Services 86,782 85,000 85,000 85,000
Engineering Fees - 1,000 1,000 1,000
Building Maintenance 172 250 250 5,000
Vehicle Maintenance - 350 350 1,000
Office Equipment Maintenance - 400 400 500
Rental of equipment - 300 300 500
Property/Liability Insurance 6,693 14,191 14,191 5,000
Vehicle Insurance 2,261 1,500 1,500 -
Telephone 2,956 3,500 3,500 3,500
Legal Ads 199 250 250 250
Education and training 3,983 4,500 4,500 4,500
OFFICE SUPPLIES 279 200 200 300
Postage 497 - - 1,300
Operating Supplies 13,964 20,000 20,000 20,000
Chemicals 35,694 47,000 47,000 47,000
Parts / Repairs 51,423 50,000 50,000 50,000
FUEL / OIL 2,286 3,000 3,000 3,000
Utilities 96,748 105,000 105,000 105,000
UNIFORMS 1,326 1,900 1,900 1,900
SEWER PROJECTS 7,122 - 30,000 30,000
Cap -2.0 MGD Headworks 171,099 - - -
BOND INTEREST - - 100,554 89,065
BOND PRINCIPAL 559,322 554,907 454,353 465,842
DEBT SVC INTEREST GEFA 2016 - - - -
Total Waste Water Treatment 1,200,955 1,109,251 1,139,251 1,131,167 -0.71%
Transfer Out - Golf Fund 56,894 - - 56,894 100.00%
Sewer ImpactGrinder Pump Purch/Repair 50,118 50,000 50,000 50,000
PARTS/REPAIRS 12,000 12,000
DEBT SERVICE - GEFA PRINCIPAL 74,000 52,000 68,303
DEBT SERVICE - GEFA INTEREST 27,585 22,000 29,404
Total Sewer Impact 77,703 124,000 136,000 159,707 17.43%
SEWER FUND Total: 2,109,485 1,913,386 2,650,948 2,045,263 -22.85%

Financial Summaries
68
Lost Plantation Golf Fund Summary
Actual Projected Approved Change
2019 2020 2021 FY20 - 21
Resources
Golf
Charges for services - sales and fees 550,868$ 693,320$ 542,000$ (151,320)$
Interfund transfers 146,733 56,894 56,894 -
Total Resources 697,601 750,214 598,894 (151,320)
Expenditure Category
Pro Shop
Personnel services 117,925 169,999 151,010 (18,989)
Operating expenditures 127,620 69,845 252,261 182,416
Transfers 28,100 28,100 - (28,100)
Total Pro Shop 273,645 267,944 403,271 135,327
Maintenance
Personnel services 181,726 139,589 161,989 22,400
Operating expenditures 97,540 120,318 135,210 14,892
Capital expenditure 1,515 - - -
Total Maintenance 280,781 259,907 297,199 37,292
Fairway Bistro
Personnel services 59,306 80,888 7,903 (72,985)
Operating expenditures 94,084 111,956 10,700 (101,256)
Total Fairway Bistro 153,390 192,844 18,603 (174,241)
Excess (Deficiency) Modified Accrual Basis (10,215)$ 29,519$ (120,179)$ (149,698)$

Financial Summaries
69
2019
Total Activity
2020 Original
Budget
2020 Amended
Budget
2021
Approved
GOLF COURSE FUND
CHARGES FOR SERVICES
MEMBERSHIP FEES 131,652 180,600 180,600 177,000
GREEN FEES 125,124 130,000 130,000 143,000
CART FEES 121,087 130,000 130,000 123,000
RANGE FEES 16,332 16,000 16,000 18,000
TOURNAMENT FEES 19,651 16,720 16,720 9,000
RENTAL FEES 2,982 2,000 2,000 -
GROUP GOLFERS 2,594 1,500 1,500 4,500
GIFT CERTIFICATES 3,531 1,500 1,500 2,000
RAIN CHECKS 396 - - -
HANDICAP FEES 640 1,400 1,400 1,500
HOLE SPONSOR - 10,800 10,800 9,000
MISCELLANEOUS/STORAGE (10,756) - - -
SALES TAX COMMISSION (14,781) 20,000 20,000 -
TOURNAMENT FOOD 1,159 - - -
PROSHOP SALES 3,674 1,500 1,500 -
GOLF BALL SALES 9,149 9,600 9,600 11,000
CLOTHING SALES 6,921 8,000 8,000 8,000
GLOVE SALES 2,641 2,500 2,500 2,750
GOLF CLUB SALES 6,467 4,500 4,500 5,250
HEAD GEAR SALES 2,605 2,400 2,400 2,750
MISCELLANEOUS PROSHOP SALES 10,714 3,000 3,000 5,250
FOOD SALES - PRO SHOP - - - -
BEVERAGES - - - -
BAR SALES - - - -
Sub-Total Pro Shop 441,782 542,020 542,020 522,000
Food Sales - Bistro 54,668 178,000 178,000 20,000
Beverages - Bistro 12,261 26,000 26,000 -
Bar Sales - Bistro 36,766 40,000 40,000 -
MISCELLANEOUS GRILL SALES 1,021 200 200 -
TOURNAMENT MEALS 630 - - -
OVER/SHORT 630 - - -
Tips In 3,110 - - -
Sub-Total Bistro 109,086 244,200 244,200 20,000
TOTAL CHARGES FOR SERVICES 550,868 786,220 786,220 542,000
OTHER FINANCING SOURCES
TRANSFER IN FROM GENERAL FUND 89,839 - - -
TRANSFER IN FROM WATER FUND 56,894 56,894 56,894 56,894
TOTAL OTHER FINANCING SOURCES 146,733 56,894 56,894 56,894
TOTAL GOLF COURSE FUND 697,601 843,114 843,114 598,894

Financial Summaries
70
2019 Actual
2020 Original
Budget
2020 Current
Budget 2021 Approved
Fund: 580 - GOLF COURSE FUND
MaintenanceRegular employees 133,025 116,367 116,367 127,709
Overtime 11,135 2,000 2,000 -
Group Health insurance 20,560 9,126 9,126 16,000
Group Life Insurance 155 120 120 180
Social Security (FICA) contributions 9,909 8,803 8,803 9,770
Retirement contributions 3,064 3,173 3,173 4,900
Workers’ compensation 3,879 - - 3,430
Professional Contracted Services 2,887 950 950 -
Building Maintenance 20,246 10,000 10,000 10,000
EQUIPMENT MAINTENANCE 18,847 25,000 25,000 26,000
Other Maintenance 2,840 3,400 1,400 1,400
Equipment Lease 705 17,000 17,000 17,000
Telephone 990 - - -
Legal Ads - 600 600 -
Education and training 331 - - -
Licenses and Taxes 549 300 300 -
Merchant and Bank Fees 2,712 - - -
POLLINATOR PROJECT EXPENSE 390 250 250 250
Sand 2,966 6,000 6,000 7,000
Seed And Sod 179 - - 1,000
Small Tools - 2,000 2,000 2,000
Course Accessories 1,500 2,000 2,000 1,500
Fertilizer And Chemicals 28,945 53,588 50,588 48,000
FUEL / OIL 7,778 10,000 10,000 11,000
UNIFORMS - 100 100 -
Capital Leased Equipment 1,515 29,070 29,070 -
Miscellaneous 5,673 - - -
Insectide ( New Line Item) - 3,000 2,000
Irrigtation Computer Service Plan ( New Line Item) 6,060 6,060 6,060
Preventive Maintenance Irrigation Pump ( New Line Item) - 2,000 2,000
Operating cost reductions (46,000)
Maintenance Total: 280,780 305,907 259,907 297,199
Pro-Shop Cost of SalesCLOTHING PURCHASES 4,836 6,000 6,000 5,600
GLOVE PURCHASES - 2,000 2,000 1,925
GOLF CLUB PURCHASES 5,805 4,000 4,000 3,675
HEAD GEAR PURCHASES 1,536 1,500 1,500 1,925
MISC PROSHOP PURCHASES 3,396 2,000 2,000 3,675
HANDICAP SERVICE COST 1,515 1,500 1,500 1,250
GOLF BALLS 4,569 6,600 6,600 7,700
Operating cost reductions (7,500)
Pro-Shop Cost of Sales Total: 21,657 23,600 16,100 25,750

Financial Summaries
71
2019 Actual
2020 Original
Budget
2020 Current
Budget 2021 Approved
Pro-Shop & Cart Barn AdministrationRegular employees 98,527 142,980 142,980 127,500
Overtime 633 2,000 2,000 -
Group Health insurance 3,496 9,126 9,126 12,000
Group Life Insurance 25 60 60 60
Social Security (FICA) contributions 7,518 10,877 10,877 10,200
Retirement contributions 783 1,956 1,956 -
Workers’ compensation 6,943 3,000 3,000 1,250
Professional Contracted Services 10,490 - - 1,000
AUDIT FEES - 2,000 2,000 3,000
MAINTENANCE - OTHER (GOLFCART) 7,260 2,000 2,000 2,000
Building Maintenance 6,456 12,725 12,725 81,000
Security System 1,136 480 480 1,236
Rental of equipment 115 - - 30,000
Property/Liability Insurance 8,178 4,300 4,300 13,000
Telephone 4,266 4,500 4,500 4,800
Legal Ads 628 3,000 3,000 -
Dues and fees (Memberships) 521 500 500 -
Merchant and Bank Fees 9,924 9,000 9,000 13,200
Office Supplies 1,617 2,300 2,300 3,500
Operating Supplies 3,097 2,500 2,500 7,650
Computer Support and IT 490 1,260 1,260 1,200
Utilities 46,605 45,000 45,000 55,000
WATER UTILITIES 1,115 1,200 1,200 4,525
UNIFORMS - 280 280 400
Tournament Expense 3,006 1,600 1,600 -
Miscellaneous Expenses 1,064 500 500 5,000
Repay General Fund 28,100 28,100 28,100 -
Over / Short (6) - - -
Operating cost reductions (39,400) -
Pro-Shop & Cart Barn Admin Total: 251,987 291,244 251,844 377,521
Fairway Bistro Cost of SalesCost of Food - Grill 31,815 50,000 50,000 7,000
Cost of Beverages - Grill 5,404 6,500 6,500 -
Cost of Bar Sales - Grill 18,486 13,000 13,000 -
Miscellaneous Cost - Grill 233 2,400 2,400 -
Tournament Meal Cost - Grill 1,141 - - -
Fairway Bistro Cost of Sales: 57,079 71,900 71,900 7,000
Fairway Bistro AdministrationRegular employees - Grill 46,232 65,421 65,421 7,250
Overtime 1,387 1,000 1,000 -
HEALTH INSURANCE 4,050 9,126 9,126 -
LIFE INSURANCE 35 60 60 -
Social Security (FICA) contributions 4,087 4,501 4,501 580
Retirement contributions - - - -
Workers’ compensation 3,515 780 780 73
Professional Contracted Services 2,317 2,200 2,200 600
LEGAL FEES -- GRILLE 2,375 - - -
Repairs and maintenance buildings 23,412 - - -
Equipment Maintenance - Grill - 2,400 2,400 600
Rental of equipment 495 500 500 500
Equipment Lease 1,255 4,155 4,155 -
Licenses and Taxes (3,194) 20,000 20,000 -
Supplies - general 1,644
Grill - Other Supplies 7,926 7,800 7,800 1,500
Grill - Furniture & Fixtures - - - -
Miscellaneous Expenses 776 3,000 3,000 500
Fairway Bistro Admin Total 96,312 120,943 120,943 11,603
GOLF COURSE FUND Total: 707,815 813,595 720,695 719,073

Financial Summaries
72
Storm Water Fund
2019
Total Activity
2020 Original
Budget
2020 Amended
Budget
2021
Approved
% Change
2020-2021
STORMWATER FUNDCHARGES FOR SERVICES
STORMWATER FEES -$ -$ -$ 78,750$
TOTAL CHARGES FOR SERVICES - - - 78,750 100.0%
INVESTMENT INCOME
INTEREST INCOME - - - 50
TOTAL INVESTMENT INCOME - - - 50 100.0%
TOTAL REVENUES -$ -$ -$ 78,800$ 100.0%
2019 Actual
2020 Original
Budget
2020 Current
Budget 2021 Approved
% Change
2020-2021
Stormwater Fund
Professional Contracted Services -$ -$ 78,800$
TOTAL STORMWATER FUND APPROPRIATIONS -$ 5,240,562 -$ 78,800$ 100.00%

Financial Summaries
73
Hotel/Motel
2019
Total Activity
2020 Original
Budget
2020 Amended
Budget
2021
Approved
% Change
2020-2021
HOTEL MOTEL TAX FUNDTAXES
HOTEL/MOTEL TAX 6,276$ 6,500$ 6,500$ 6,500$ 0.0%
TOTAL TAXES 6,276$ 6,500$ 6,500$ 6,500$ 0.0%
2019 Actual
2020 Original
Budget
2020 Current
Budget 2021 Approved
% Change
2020-2021
Fund: 275 - HOTEL MOTEL FUND
Advertising 5,820 6,500 6,500 6,500
TOTAL HOTEL MOTEL FUND 5,820 6,500 6,500 6,500 0.00%

Financial Summaries
74
SPLOST
2019
Total Activity
2020 Original
Budget
2020 Amended
Budget
2021
Approved
% Change
2020-2021
SPECIAL PURPOSE LOCAL OPTION SALES TAX
INTERGOVERNMENTAL REVENUES
SPLOST - CURRENT YEAR REVENUE 1,552,908$ 1,100,000 1,100,000$ 1,400,000$ 27.3%
TOTAL INTERGOVERNMENTAL REVENUES 1,552,908 1,100,000 1,100,000 1,400,000 27.3%
INVESTMENT INCOME
SPLOST - INTEREST INCOME 47,124 22,000 22,000 13,350 -39.3%
TOTAL INVESTMENT INCOME 47,124 22,000 22,000 13,350 -39.3%
TOTAL REVENUES 1,600,032$ 1,122,000 1,122,000$ 1,413,350$ 26.0%

Financial Summaries
75
2019 Actual
2020 Original
Budget
2020 Current
Budget 2021 Approved
% Change
2020-2021
SPLOST
BUILDING MAINTENANCE 8,147 25,000 41,853 -
BUILDING MAINTENANCE (Police) 47,873 - 27,127 -
Police - Vehicle Equipment 42,730 79,215 111,485 -
Police Dept - Patrol Cars - 142,381 193,881 -
Police Dept - Radio Equipment - 20,400 32,900 -
New projects for 2021 84,898
Fire Dept - Misc. Equipment 25,250 - - 445,000
CAPITAL EQUIPMENT 19,075 - 20,175 -
Fire Dep. - 1 Vehicle - 375,000 375,000 -
Streets - Stripping - - 11,800 -
FIBER OPTICS INSTALLATION - - 25,000 -
STREETS - LMIG 2019 200,445 - - -
STREETS - LMIG 2020 200,445 250,000 260,000 -
DRAINAGE - 9TH STREET 152,111 200,000 200,000 -
DRAINAGE - HOLE 15 ON DRESSLER (977) 200,000 250,000 -
Streets - Mini Excavator (1/3) - 11,700 11,700 -
SPLOST - TRANSPORT VEHICLE 18,178 - - -
New projects for 2021 223,000
7th St Sewer 332,595 - 272,094 -
Sewer - PW Building & Parking - - -
SEWER - 9TH TO WWTP UPGRADE 2,800 - 100,000 -
Sewer - Vehicle 15,000 15,000 -
Sewer - Vehicle 14,150 - - -
Sewer - Mini Excavator (1/3) 11,700 11,700 -
Sewer - Vehicle - 13,000 13,000 -
VEHICLE #2 - 15,000 -
Sewer - Trailer Mounted Pump 23,000 23,000 -
WWTP - Reuse Backup Pump - 60,000 75,000 -
WWTP - TREATMENT POND LINER - - 200,000 -
WWTP EXPANSION - - 100,000 -
WWTP - Mower 15,000 15,000 -
Water - 7th St. Water 19,573 - 80,427 -
Water - Line Improvements 3,413 - 100,000 -
WATER LINE EXT FROM LOWER FLORIDAN - - 200,000 -
Water - vehicles - 15,000 -
Water - Mini Excavator (1/3) 11,700 11,700 -
Water - Vehicle 13,000 13,000 -
Water - Vehicle 15,000 15,000 -
Sewer - Trailer Mounted Pump 23,000 23,000 -
New projects for 2021 1,363,485
RECREATION - BUILDING MAINTENANCE 9,000 75,000 75,000 -
Recreation - Freedom Park - 70,000 89,000 -
Recreation - Mower - 40,000 60,000 -
Recreation - Veterans Park - - 1,300 -
Recreation - Landscaping 10,000 10,000 -
Recreation - Macomber shade cover 80,000 80,000 -
Recreation - Disk Golf Baskets 8,000 8,000 -
Recreation - Batting Cages 15,000 15,000 -
Recreation - Umpires Room at Macomber 20,000 20,000 -
Recreation - Macomber Park Land -
Recreation - Gator 15,000 15,000 -
Recreation - Equipment 26,720 25,000 59,630 -
New projects for 2021 340,000
TOTAL SPLOST FUND EXPENDITURES 1,121,527 1,862,096 3,291,772 2,456,383 -25.38%

Financial Summaries
76
T-SPLOST
2019
Total Activity
2020 Original
Budget
2020 Amended
Budget
2021
Approved
% Change
2020-2021
TSPLOST 2020INTERGOVERNMENTAL
TSPLOST - County -$ - -$ 1,147,500$
LMIG 130,000
TOTAL INTERGOVERNMENTAL - - - 1,277,500 100.0%
2019 Actual
2020 Original
Budget
2020 Current
Budget 2021 Approved
% Change
2020-2021
TSPLOST
LMIG 2021 - Lockner Ave. & pipe crossing at Walthour - 25,000 - 230,000
Richland Ave culvert replacement - - - 288,750
TOTAL TSPLOST FUND EXPENDITURES - 3,482,196 - 518,750

Financial Summaries
77
Financial Foundation Principles
The overall goal of financial planning by the City of Rincon is to establish and maintain effective management of the City’s financial resources. This continues to be accomplished through the use of financial policies and processes that guide decision-making.
Because the economic environment can change quickly with lasting effects, a snapshot of the City’s financial future allows City leadership to identify challenges early and provide information to the Mayor and Council to assist in policy making which is critical in addressing potential problems proactively.
Adoption of policies that will stimulate economic growth, enhance attractiveness of the City and address quality of life issues is an integral part of the financial planning process. The following data present key fiscal and economic indicators to examine trends which may affect the City’s financial health.
Particular attention is given to certain areas of the revenue and expense structure contained in the operating budgets in order to maintain a sustainable budget in the years ahead.
Local Option Sales Tax Revenues (LOST)
Additional taxes generated from LOST are estimated to increase gradually over the next few years, as the local economy has remained robust and as the area population increases. However, with any economic downturn, the sales tax is at risk to decrease as there are limited dollars to spend especially on non-essential purchases.
Transportation Special Purpose Local Option Sales Tax Revenues (TSPLOST)
TSPLOST works much like LOST above and is sensitive to economic downturns. This is a new revenue source which was approved by referendum by the citizens of Effingham County. These funds will be used to assist in the funding of transportation projects such as roads in the community. This will be a major funding source for the City’s capital improvement plan.
Special Purpose Local Option Sales Tax Revenues (SPLOST)
SPLOST works much like LOST and TSPLOST above and is sensitive to economic downturns. This is a revenue source which was approved by referendum by the citizens of Effingham County and has to be renewed every 5 to 6 years. These funds are restricted as to their use for projects approved in the referendum. In the current SPLOST referendum, projects are for water and sewer, fire, police, streets and drainage, waste water treatment plant, and general administration. These funds can be used to construct or purchase vehicles, major machinery and equipment, buildings, land, other facilities, streets, drainage systems, water systems, sewer systems and waste water treatment plant. This revenue source must be approved by the voters in 2021 in order to continue its collection. This revenue source is a major funding source for the City’s capital improvement plan.
User Fees
The user fees charged by the City are a significant revenue source. These fees range from fire fee, sanitation fee, and water and sewer fees. The fire and sanitation fees are based on a rates established by City Council. However, the water and sewer fees are impacted not only by rates set by Council but by consumption of water. Weather conditions will have a direct impact on the revenues of the water and sewer fund.
Long-Term Budget Planning

Financial Summaries
78
Salaries
Salaries are the single largest expense for the City. The City implemented a compensation plan in 2019 and is making efforts to continue with the plan in future years. Employees are moved to the next step upon a satisfactory evaluation. In order to maintain salaries in line with inflation, the City will make efforts to provide employees with a cost of living adjustment (COLA).
Health Insurance
The City offers health insurance to all full-time employees which paid by the City. The City also offers family coverage for health insurance for employee families that do not have access to other plans. The City contributes 50% of the cost of this benefit. The City is continually looking for other options to reduce the cost of health insurance; however, the City has only had modest increases of 6% in the past two years.
Capital Program
This includes land, land improvements, buildings, equipment and machinery, furniture and fixtures, vehicles, trailers, roads, sidewalks, parks, water and sewer systems, and wastewater treatment plant. This inventory of assets requires the City to invest considerable funds to replace or improve the assets over time. City departments have identified in excess of $100 million dollars of capital needs over the next 5 years. This is more than what the City can immediately provide. However, the City is building reserves to fund future capital projects. The citizens are also asked to approve certain referendums for certain taxes that will used to fund these capital projects. The City will review financing options for significant capital expenditures such as the expansion of the waste water treatment plant.

Capital Budget and Debt Summary
79
Capital Budget
&
Debt Summary

Capital Budget and Debt Summary
80
Capital Improvements Plan (CIP) Submissions
Capital Improvement Development
The City updates its five-year capital improvements plan (CIP) on an annual basis. The plan requires every de-partment to look ahead and anticipate their capital needs separate and apart from the operating budget. This includes projects that cost at least $10,000 and the asset having a useful life of two or more years. Depart-ments submit their requests and senior level management reviews the submission and ranks the projects. The costs of projects submitted exceed the City’s ability to finance them over the next five years so projects must be prioritized and opportunities for grants and other resources are constantly evaluated to assist in addressing this area of the budget. During this process, the City will also review the status of prior capital appropriations to see if there are any remaining fund available due to project savings that could be reauthorized for another purpose.
Submission Cost and Fiscal Year Summary
The capital projects identified by departments in this year’s capital improvements plan process represent a total of $2,211,483 of requests for 2021, and a combined total of $45.6 million over a five-year period. Of the $2,211,483, $2,036,483 million are SPLOST fund requests, $130,000 are LMIG grant requests and $45,000 are Fire fund requests.
Projects are distributed by fund as follows:
FY 2021 Capital Improvements Plan Budget
Several factors were taken into consideration when determining which projects to recommend for funding in fiscal year 2021. In addition to considerations by senior management of the City, funding considerations are directed towards projects that had received previous funding; and therefore, are ready for the next stage of development; projects that would contribute to the economic development of the City; projects that would preserve important infrastructure components of the City; projects that improve high usage assets; projects that have outside funding available to offset the costs or can be covered by user fees; and projects that have an important public safety component associated with them.
The recommended projects total $2,211,483. The general fund totals $846,998, the fire fund totals $45,000 and the water and sewer fund totals $1,319,485. The special purpose local option sales tax fund (SPLOST) pro-vides a majority of the funding for these projects.
2021 2022 2023 2024 2025
Fund Total Fiscal Year Fiscal Year Fiscal Year Fiscal Year Fiscal Year
Water and Sewer Fund 22,254,485$ 1,319,485$ 1,785,000$ 8,750,000$ 7,005,000$ 3,395,000$
General Fund 21,975,998 846,998 9,900,000 4,128,000 5,226,000 1,875,000
Fire 955,000 45,000 80,000 330,000 - 500,000
45,185,483$ 2,211,483$ 11,765,000$ 13,208,000$ 12,231,000$ 5,770,000$

Capital Budget and Debt Summary
81
2021 Projects and Descriptions
Department Project Description Fiscal Year
Public Works - WS Phase III W 7th St water and sewer upgrades 1,194,485$
Public Works - WS Well 3" piping replacement 60,000
Public Works - WS Keller lift and manhole repairs 50,000
Public Works - Streets and sidewalks LMIG 2021 - Lockner Ave. and pipe crossing at Walthour 348,750
Public Works - Stormwater Drainage Richland Ave culvert replacement with box culvert 300,000
Public Works - Heavy equipment and vehicles Replace 06 F-250 due to age and condition 30,000
Public Works - Heavy equipment and vehicles Replace 06 F-650 dump truck due to age and condition 90,000
WWTP Aerator Motor Backup 15,000
WWTP WWTP Expansion 240,000
Recreation Football Stadium 340,000
Police 4 Patrol cars 53,898
Police 20 Tasers 31,000
Fire Pumper 600,000
Fire Thermal imaging 15,000
Fire PPE 30,000
3,398,133$

Capital Budget and Debt Summary
82
Five
Ye
ar P
lan
Tota
l
Esti
mat
ed
2021
2022
2023
2024
2025
De
par
tme
nt
No
tes
Pro
ject
De
scri
pti
on
Exp
en
dit
ure
Fisc
al Y
ear
Fisc
al Y
ear
Fisc
al Y
ear
Fisc
al Y
ear
Fisc
al Y
ear
Pu
bli
c W
ork
s -
WS
Ph
ase
III W
7th
St
wat
er
and
se
we
r u
pgr
ade
s1,
194,
485
$
1,
194,
485
$
Pu
bli
c W
ork
s -
WS
We
ll 3
" p
ipin
g re
pla
cem
en
t60
,000
60
,000
Pu
bli
c W
ork
s -
WS
Ke
lle
r li
ft a
nd
man
ho
le r
ep
airs
50,0
00
50,0
00
Pu
bli
c W
ork
s -
WS
Re
pla
ce p
um
p a
t w
ell
4 la
st r
ep
lace
d 2
016
$40,
000
40,0
00
40,0
00
Pu
bli
c W
ork
s -
WS
Re
pla
ce 2
” ga
lvan
ize
d w
ate
r li
ne
Ric
hla
nd
Ave
wit
h 8
” m
ain
an
d
fire
hyd
ran
ts33
0,00
0
33
0,00
0
Pu
bli
c W
ork
s -
WS
Re
hab
Dre
ssle
r li
ft s
tati
on
250,
000
250,
000
Pu
bli
c W
ork
s -
WS
Re
hab
Wo
dle
y St
lift
sta
tio
n25
0,00
0
25
0,00
0
Pu
bli
c W
ork
s -
WS
Exte
nd
16”
wat
er
fro
m w
ell
5 t
o F
t. H
ow
ard
an
d c
on
ne
ct t
o
Lexi
ngt
on
Ave
. an
d E
4th
St
4,50
0,00
0
4,50
0,00
0
Pu
bli
c W
ork
s -
WS
Lisa
St
tan
k m
ain
ten
ance
300,
000
300,
000
Pu
bli
c W
ork
s -
WS
Re
hab
Re
ese
Pin
es
lift
sta
tio
n25
0,00
0
25
0,00
0
Pu
bli
c W
ork
s -
WS
Re
hab
Kat
es
Co
ve li
ft s
tati
on
300,
000
300,
000
Pu
bli
c W
ork
s -
WS
Exte
nd
ed
12”
wat
er
mai
n f
rom
Ch
imn
ey
Rd
to
Ft.
Ho
war
d2,
500,
000
2,
500,
000
Pu
bli
c W
ork
s -
WS
Re
hab
Mad
iso
n O
aks
lift
sta
tio
n80
,000
80
,000
Pu
bli
c W
ork
s -
WS
Re
hab
. Rid
gew
oo
d li
ft s
tati
on
90,0
00
90,0
00
Pu
bli
c W
ork
s -
WS
Re
pla
ce p
um
p a
t w
ell
3 la
st d
on
e 2
018
60,0
00
60,0
00
Pu
bli
c W
ork
s -
WS
Re
pla
ce a
ny
rem
ain
ing
2” w
ate
r li
ne
s th
ru o
ut
city
200,
000
200,
000
Pu
bli
c W
ork
s -
WS
Last
ph
ase
se
we
r o
n W
est
sid
e n
ort
h o
f W
7th
to
Hw
y 21
800,
000
800,
000
Pu
bli
c W
ork
s -
Stre
ets
an
d s
ide
wal
ks L
MIG
202
1 -
Lock
ne
r A
ve. a
nd
pip
e c
ross
ing
at W
alth
ou
r34
8,75
0
34
8,75
0
Pu
bli
c W
ork
s -
Stre
ets
an
d s
ide
wal
ksLM
IG 2
022
- W
9th
St
to c
ity
lim
its
400,
000
400,
000
Pu
bli
c W
ork
s -
Stre
ets
an
d s
ide
wal
ksLM
IG 2
023
- M
idd
legr
ou
nd
Rd
Hw
y 21
to
W 6
th40
0,00
0
40
0,00
0
Pu
bli
c W
ork
s -
Stre
ets
an
d s
ide
wal
ksM
isc.
pav
ing
rep
airs
/ s
ide
wal
ks w
he
re n
ee
de
d20
0,00
0
20
0,00
0
Pu
bli
c W
ork
s -
Stre
ets
an
d s
ide
wal
ks
LMIG
202
4 -
E 4th
St
fro
m H
wy
21 t
o c
ity
lim
its
and
2’ s
ho
uld
er
on
eac
h s
ide
450,
000
450,
000
Pu
bli
c W
ork
s -
Stre
ets
an
d s
ide
wal
ksM
isc.
pav
ing
rep
airs
/ s
ide
wal
ks a
s n
ee
de
d20
0,00
0
20
0,00
0
Pu
bli
c W
ork
s -
Stre
ets
an
d s
ide
wal
ksLM
IG 2
025
- Sa
van
nah
Ave
. an
d G
eo
rgia
Ave
fro
m W
9th
St
to e
nd
200,
000
200,
000
Pu
bli
c W
ork
s -
Stre
ets
an
d s
ide
wal
ksM
isc.
pav
ing
rep
airs
/ s
ide
wal
ks a
s n
ee
de
d20
0,00
0
20
0,00
0
Pu
bli
c W
ork
s -
Stre
ets
an
d s
ide
wal
ksG
eo
rgia
Ave
nu
e f
rom
W 9
th t
o e
nd
350,
000
350,
000
Pu
bli
c W
ork
s -
Stre
ets
an
d s
ide
wal
ksSa
van
nah
Ave
nu
e r
esu
rfac
e w
ith
dra
inag
e im
pro
vem
en
ts35
0,00
0
35
0,00
0
Pu
bli
c W
ork
s -
Stre
ets
an
d s
ide
wal
ksLi
sa S
tre
e r
esu
rfac
ing
and
bas
e, w
ith
dra
inag
e im
pro
vem
en
ts50
0,00
0
50
0,00
0
Pu
bli
c W
ork
s -
Stre
ets
an
d s
ide
wal
ksSc
ott
Ave
nu
e r
esu
rfac
ing
wit
h d
rain
age
imp
rove
me
nts
375,
000
375,
000
Pu
bli
c W
ork
s -
Stre
ets
an
d s
ide
wal
ksW
eis
en
bak
er
Ro
ad r
esu
rfac
ing
and
bas
e w
ith
dra
inag
e im
pro
vem
en
ts80
0,00
0
80
0,00
0

Capital Budget and Debt Summary
83
Five
Ye
ar P
lan
Tota
l
Esti
mat
ed
2021
2022
2023
2024
2025
De
par
tme
nt
No
tes
Pro
ject
De
scri
pti
on
Exp
en
dit
ure
Fisc
al Y
ear
Fisc
al Y
ear
Fisc
al Y
ear
Fisc
al Y
ear
Fisc
al Y
ear
Pu
bli
c W
ork
s -
Stre
ets
an
d s
ide
wal
ks7t
h S
tre
et
resu
rfac
ing
and
bas
e w
ith
dra
inag
e im
pro
vem
en
ts1,
000,
000
1,
000,
000
Pu
bli
c W
ork
s -
Stre
ets
an
d s
ide
wal
ksP
icke
t Fe
nce
s al
tern
ativ
e e
ntr
ance
750,
000
750,
000
Pu
bli
c W
ork
s -
Stre
ets
an
d s
ide
wal
ksSi
de
wal
ks C
ityw
ide
Pro
gram
500,
000
100,
000
10
0,00
0
10
0,00
0
20
0,00
0
Pu
bli
c W
ork
s -
Sto
rmw
ate
r D
rain
age
Ric
hla
nd
Ave
cu
lve
rt r
ep
lace
me
nt
wit
h b
ox
culv
ert
300,
000
300,
000
Pu
bli
c W
ork
s -
Sto
rmw
ate
r D
rain
age
Re
pla
ce p
ipin
g w
ith
bo
x cu
lve
rt M
idd
legr
ou
nd
Rd
at
cre
ek
300,
000
300,
000
Pu
bli
c W
ork
s -
Sto
rmw
ate
r D
rain
age
Mis
cell
ane
ou
s d
rain
age
500,
000
500,
000
Pu
bli
c W
ork
s -
He
avy
eq
uip
me
nt
and
ve
hic
les
Re
pla
ce 0
6 F-
250
du
e t
o a
ge a
nd
co
nd
itio
n30
,000
30
,000
Pu
bli
c W
ork
s -
He
avy
eq
uip
me
nt
and
ve
hic
les
Re
pla
ce 0
6 F-
650
du
mp
tru
ck d
ue
to
age
an
d c
on
dit
ion
90,0
00
90,0
00
WW
TPW
aste
wat
er
tre
ate
me
nt
pla
nt
exp
ansi
on
10,1
80,0
00
24
0,00
0
240,
000
3,
300,
000
4,
200,
000
2,
200,
000
WW
TPA
era
tor
Mo
tor
Bac
kup
15,0
00
15,0
00
WW
TPTr
acto
r b
ush
ho
g (r
ep
lace
me
nt)
75,0
00
75,0
00
WW
TPSi
de
by
sid
e25
,000
25
,000
WW
TPR
em
od
el s
ho
p (
reco
nfi
gure
fo
r m
ore
eff
icie
nt
use
of
spac
e)
75,0
00
75,0
00
WW
TPA
cce
ss r
oad
to
pla
nt
35,0
00
35,0
00
WW
TPC
on
vert
pla
nt
ligh
tin
g to
LED
100,
000
100,
000
WW
TPTr
uck
(re
pla
cem
en
t)35
,000
35
,000
WW
TPB
ackh
oe
tra
cto
r (r
ep
lace
me
nt)
100,
000
100,
000
WW
TPP
urp
le P
ipe
Pil
ot
Pro
gram
600,
000
600,
000
Re
cre
atio
n
Fen
cin
g -
Fie
ld 1
64,0
00
64,0
00
Re
cre
atio
n
Fen
cin
g -
Fie
ld 2
66,0
00
-
66,0
00
Re
cre
atio
n
Fen
cin
g -
Fie
ld 3
45,0
00
-
45,0
00
Re
cre
atio
n
Fen
cin
g -
Fie
ld 4
39,0
00
39,0
00
Re
cre
atio
n
3Fo
otb
all F
ield
340,
000
340,
000
Re
cre
atio
n
Foo
tbal
l Fie
ld L
igh
ts16
0,00
0
16
0,00
0
Re
cre
atio
n
Re
cre
atio
n F
acil
ity
4,00
0,00
0
-
2,00
0,00
0
1,00
0,00
0
1,00
0,00
0
Ad
min
istr
atio
n1
Cit
y H
all
4,00
0,00
0
4,00
0,00
0

Capital Budget and Debt Summary
84
Five
Ye
ar P
lan
Tota
l
Esti
mat
ed
2021
2022
2023
2024
2025
De
par
tme
nt
No
tes
Pro
ject
De
scri
pti
on
Exp
en
dit
ure
Fisc
al Y
ear
Fisc
al Y
ear
Fisc
al Y
ear
Fisc
al Y
ear
Fisc
al Y
ear
Po
lice
4 P
atro
l car
s53
,898
53
,898
Po
lice
Can
ine
- 1
15,0
00
15,0
00
Po
lice
20 T
ase
rs31
,000
31
,000
Po
lice
3 p
atro
l car
s (e
ach
ye
ar)
680,
000
170,
000
17
0,00
0
17
0,00
0
17
0,00
0
Po
lice
13 r
adio
s80
,000
80
,000
Po
lice
Pri
son
er
tran
spo
rt v
an65
,000
65
,000
Po
lice
K-9
Car
65,0
00
65,0
00
Po
lice
AC
Un
it w
/ ai
r h
and
ler
20,0
00
20,0
00
Po
lice
Ou
tfit
SW
AT
team
70,0
00
70,0
00
Po
lice
Re
bu
ild
ran
ge w
ith
tra
inin
g b
uil
din
g17
5,00
0
17
5,00
0
Po
lice
Live
Sca
n M
ach
ine
20,0
00
20,0
00
Po
lice
2N
ew
Po
lice
an
d C
ou
rt b
uil
din
g an
d la
nd
4,00
0,00
0
1,00
0,00
0
3,00
0,00
0
Po
lice
18 M
DTs
90,0
00
90,0
00
Fire
Ch
iefs
Tru
ck-
Fire
Lad
de
r tr
uck
-
Fire
4P
um
pe
rs
600,
000
600,
000
Fire
Bu
ild
ing
Imp
rove
me
nt
500,
000
500,
000
Fire
Rad
ios
300,
000
300,
000
Fire
The
rmal
imag
ing
15,0
00
15,0
00
Fire
Re
scu
e t
oo
ls50
,000
50
,000
Fire
PP
E90
,000
30
,000
30,0
00
30
,000
Tota
l Exp
en
dit
ure
s46
,372
,133
$
3,39
8,13
3$
11,7
65,0
00$
13,2
08,0
00$
12
,231
,000
$
5,77
0,00
0$
1Th
e e
stim
ate
d c
ost
is f
or
lan
d a
cqu
isti
on
an
d b
uil
din
g a
ne
w C
ity
Hal
l. R
en
ova
tio
n o
f th
e c
urr
en
t C
ity
Hal
l is
est
imat
ed
to
be
$1.
5 m
illi
on
.
2Th
e e
stim
ate
d c
ost
fo
r a
ne
w p
oli
ce b
uil
din
g is
fo
r la
nd
acq
uis
itio
n a
nd
co
nst
ruct
ion
co
st.
3Th
is p
roje
ct is
par
tial
ly f
un
de
d w
ith
202
0 p
roje
cts
that
hav
e b
ee
n d
ete
rmin
ed
to
be
un
feas
ible
to
acc
om
pli
sh. T
he
to
tal e
stim
ate
d c
ost
fo
r
this
pro
ject
is $
340,
000.
4Th
e a
mo
un
t fo
r 20
21 is
fo
r th
e f
inal
am
ou
nt
ow
ed
if 2
pu
mp
ers
are
pu
rch
ase
d. $
750,
000
is f
un
de
d in
202
0 fr
om
SP
LOST
an
d t
he
Fir
e F
un
d.
The
to
tal e
stim
ate
d c
ost
fo
r th
e p
um
pe
rs is
$1.
2 m
illi
on
.

Capital Budget and Debt Summary
85
Spec
ial P
urp
ose
Sal
es T
ax F
un
d (
20
11
an
d 2
01
6 R
efer
end
um
s)
Sp
ecia
l P
urp
ose
Lo
cal
Op
tio
n S
ales
Tax
(SP
LOST
) re
ven
ue
colle
ctio
n m
ust
be
app
rove
d b
y vo
ter
refe
ren
du
m,
hav
e a
spec
ific
colle
c-ti
on
per
iod
, an
d c
an o
nly
be
app
lied
to
ap
pro
ved
pro
ject
s o
r p
roje
ct c
ate
gori
es.
The
SPLO
ST F
un
d c
olle
ctio
n p
erio
d b
egan
in
201
7
and
en
ters
its
fin
al y
ear
in 2
022
.
The
SPLO
ST r
eso
luti
on
incl
ud
es p
rovi
sio
ns
for
reve
nu
e al
loca
tio
ns
to c
apit
al p
roje
cts
to t
he
vari
ou
s fu
ncti
on
s o
f th
e C
ity
ba
sed
up
on
co
llecti
on
th
resh
old
s. 2
02
0 a
lloca
tio
ns
are
bu
dge
ted
at
eigh
ty p
erce
nt
of
pro
ject
ed a
dd
itio
nal
SP
LOST
VI r
even
ue.
Tie
r 3
pro
toco
l ded
-ic
ates
$15
mill
ion
to
Are
na
Co
nst
ructi
on
. Tie
r 4
pro
toco
l allo
ts $
9.3
mill
ion
to
div
erse
pro
ject
s in
clu
din
g P
ub
lic B
uild
ing
Imp
rove
men
ts
such
as
the
Joh
n D
elaw
are
Cen
ter
Ren
ova
tio
n a
nd
th
e B
ento
n B
ou
leva
rd W
iden
ing
Traffi
c Im
pro
vem
ent
pro
ject
.
The
follo
win
g sc
hed
ule
s re
pre
sen
t th
e am
ou
nt
of
fun
ds
pro
ject
ed
to
be
rece
ived
an
d t
he
amo
un
ts s
pen
t o
r co
mm
itted
to
var
iou
s p
roje
cts
thro
ugh
20
21.
The
201
6 r
efer
end
um
will
en
d i
n 2
02
2.
If a
n a
dd
itio
nal
ref
ere
nd
um
is
no
t p
asse
d i
n 2
02
1 b
y th
e vo
ters
of
Effin
gham
Co
un
ty,
the
Cit
y w
ill h
ave
to e
xplo
re o
ther
op
tio
ns
sin
ce a
maj
ori
ty o
f ca
pit
al p
roje
cts
for
the
Cit
y h
ave
bee
n h
isto
rica
lly
fun
ded
th
rou
gh t
he
SPLO
ST c
apit
al p
roje
cts
fun
d.
20
11
Re
fere
nd
um
To
tal
Wa
ter
&
Se
we
r/W
as
te
wa
ter
Tre
atm
en
t
Pla
nt
Fir
eP
oli
ce
Str
ee
ts a
nd
Dra
ina
ge
Re
cre
ati
on
Pu
bli
c
Bu
ild
ing
s
Ad
jus
ted
ba
lan
ce
12
-31
-19
94
9,1
08
$
83
6,8
11
$
-$
-$
0
$
1
12
,29
7$
-$
20
20
Pro
jec
ted
Re
ve
nu
es
-
Re
ma
inin
g P
roje
ct
Bu
dg
et
(61
6,6
34
)
(53
7,3
54
)
(79
,28
0)
Ex
pe
nd
itu
res
(33
2,4
74
)
(29
9,4
57
)
(33
,01
7)
Ad
jus
ted
ba
lan
ce
12
-31
-20
-$
-$
-$
-$
0
$
-
$
-$
No
te:
All
fu
nd
s fr
om
th
e 2
01
1 R
efe
ren
du
m h
av
e b
ee
n c
om
mit
ted
to
va
rio
us
pro
jec
ts.

Capital Budget and Debt Summary
86
2
01
6 R
efe
ren
du
m
Tota
l W
ater
& S
ewer
/W
aste
wat
er
Trea
tmen
t P
lan
t
Fire
P
olic
e
Stre
ets
and
D
rain
age
R
ecre
atio
n
Pu
blic
Bu
ild-
ings
Dec
em
ber
31
, 20
19
3
,87
8,5
68
.33
1,6
13
,60
2.9
3
3
12
,53
0.8
7
2
00
,48
5.9
5
1
,00
3,7
19
.18
35
2,9
75
.65
3
95
,25
3.7
5
20
20
Pro
ject
ed
Rev
enu
es
SPLO
ST
1,5
60
,81
0.0
0
62
4,3
24
.00
12
6,8
15
.81
12
6,8
15
.81
3
90
,20
2.5
0
1
36
,57
0.8
8
15
6,0
81
.00
Exci
se T
ax
-
-
-
-
-
-
-
Inte
rest
1
4,5
00
.00
5
,80
0.0
0
1
,17
8.1
3
1
,17
8.1
3
3,6
25
.00
1,2
68
.75
1,4
50
.00
Co
rrec
tio
n
-
-
-
-
-
-
-
1
,57
5,3
10
.00
6
30
,12
4.0
0
1
27
,99
3.9
4
1
27
,99
3.9
4
39
3,8
27
.50
13
7,8
39
.63
1
57
,53
1.0
0
Exp
end
itu
res
- A
ctu
al
(3
12
,49
5.0
0)
(10
5,3
65
.00
)
(
2,0
80
.00
) (
13
4,2
64
.00
)
(3
1,9
44
.00
)
(2
7,4
42
.00
)
(1
1,4
00
.00
)
Encu
mb
ran
ces
- P
os
&
Co
ntr
acts
(
45
7,5
35
.10
)
-
-
-
(4
57
,53
5.1
0)
-
-
Rem
ain
ing
Pro
ject
B
ud
get
(
1,6
02
,63
4.8
5)
(35
5,7
46
.00
) (
39
3,0
94
.77
) (
23
1,1
28
.85
)
(2
99
,02
1.2
3)
(2
93
,19
1.0
0)
(30
,45
3.0
0)
(2
,37
2,6
64
.95
)
(4
61
,11
1.0
0)
(3
95
,17
4.7
7)
(3
65
,39
2.8
5)
(78
8,5
00
.33
)
(32
0,6
33
.00
)
(4
1,8
53
.00
)
20
20
Net
acti
vity
(
79
7,3
54
.95
)
1
69
,01
3.0
0
(2
67
,18
0.8
3)
(2
37
,39
8.9
1)
(39
4,6
72
.83
)
(18
2,7
93
.37
)
1
15
,67
8.0
0
Dec
em
ber
31
, 20
20
3
,08
1,2
13
.38
1,7
82
,61
5.9
3
45
,35
0.0
4
(
36
,91
2.9
6)
60
9,0
46
.35
17
0,1
82
.28
5
10
,93
1.7
5

Capital Budget and Debt Summary
87
To
tal
Wat
er
& S
ewer
/W
aste
wat
er
Trea
tmen
t P
lan
t Fi
re
Po
lice
Stre
ets
and
Dra
in-
age
R
ecre
atio
n
Pu
blic
Bu
ildin
gs
202
1 P
roje
cte
d
Rev
enu
es
SPLO
ST
1,5
36
,000
.00
6
14
,40
0.0
0
1
24
,80
0.0
0
1
24
,80
0.0
0
3
84
,00
0.0
0
1
34
,40
0.0
0
1
53
,60
0.0
0
Exci
se T
ax
-
-
-
-
-
-
-
Inte
rest
14
,500
.00
5
,80
0.0
0
1,1
78
.13
1
,17
8.1
3
3
,62
5.0
0
1,2
68
.75
1
,45
0.0
0
Co
rrec
tio
n
-
-
-
-
-
-
-
1
,55
0,5
00.0
0
62
0,2
00
.00
12
5,9
78
.13
12
5,9
78
.13
38
7,6
25
.00
13
5,6
68
.75
15
5,0
50
.00
New
pro
ject
s fo
r 2
021
(2
,036
,48
3.0
0)
(1
,31
9,4
85
.00
)
(
56
,99
8.0
0)
(
32
0,0
00
.00
) (
34
0,0
00
.00
)
(2
,036
,48
3.0
0)
(1
,31
9,4
85
.00
)
-
(
56
,99
8.0
0)
(
32
0,0
00
.00
) (
34
0,0
00
.00
)
-
20
21
Net
acti
vity
(
48
5,9
83
.00
)
(69
9,2
85
.00
)
12
5,9
78
.13
68
,98
0.1
3
67
,62
5.0
0
(2
04
,33
1.2
5)
15
5,0
50
.00
Dec
emb
er 3
1, 2
021
2
,59
5,2
30.3
8
1
,08
3,3
30
.93
17
1,3
28
.17
3
2,0
67
.17
67
6,6
71
.35
(3
4,1
48
.97
)
66
5,9
81
.75

Capital Budget and Debt Summary
88
To
tal
Wat
er
& S
ewer
/W
aste
wat
er
Trea
tmen
t P
lan
t Fi
re
Po
lice
Stre
ets
and
Dra
in-
age
R
ecre
atio
n
Pu
blic
Bu
ildin
gs
202
2 P
roje
cte
d
Rev
enu
es
SPLO
ST
7
68
,00
0.0
0
30
7,2
00
.00
6
2,4
00
.00
62
,40
0.0
0
1
92
,00
0.0
0
67
,20
0.0
0
76
,80
0.0
0
Exci
se T
ax
-
-
-
-
-
-
-
Inte
rest
7,2
50
.00
2,9
00
.00
58
9.0
6
5
89
.06
1,8
12
.50
63
4.3
8
72
5.0
0
Co
rrec
tio
n
-
-
-
-
-
-
-
77
5,2
50
.00
3
10
,10
0.0
0
62
,98
9.0
6
6
2,9
89
.06
19
3,8
12
.50
6
7,8
34
.38
7
7,5
25
.00
New
pro
ject
s fo
r 2
022
-
-
-
-
-
-
-
-
-
202
2 N
et a
ctivi
ty
7
75
,25
0.0
0
31
0,1
00
.00
6
2,9
89
.06
62
,98
9.0
6
1
93
,81
2.5
0
67
,83
4.3
8
77
,52
5.0
0
Dec
emb
er 3
1, 2
022
3
,37
0,4
80.3
8
1
,39
3,4
30
.93
23
4,3
17
.23
9
5,0
56
.23
87
0,4
83
.85
3
3,6
85
.41
74
3,5
06
.75
20
16
Re
fere
nd
um
en
ds
in 2
022
(e
xpe
ct 6
mo
nth
s o
f co
llecti
on
s).

Capital Budget and Debt Summary
89
Debt Position Analysis
Type and Purpose of Debt
The City does not have general obligation bonds (G.O.B.). The only debt paid with governmental funds is a capital lease. The City has made efforts over the years to fund projects on a pay as you go basis instead of issuing debt that will be paid with future revenues of the City. The City operates two Enter-prise Funds that include a water supply operation and a wastewater treatment facility and a golf fund. The Water and Sewer Fund accounts for both the water supply operations and wastewater treatment facility. The Water and Sewer Fund has had to finance major capital improvements that require large cash outlays. Most of this debt are loans through revolving loan funds administered by Georgia Envi-ronmental Finance Authority (GEFA). The programs offered by GEFA are at competitive rates. Due to the COVID-19 emergency, GEFA has suspended loan payments from July 1 to December 31, 2020 in order to assist local governments. Interest did not accrue on this debt during this period. The City has issued Refunding Revenue Bonds (private placement) to refinance debt that had been issued to con-struct the wastewater treatment facility. The bonds and loans are repaid from revenues generated by the fund. The golf fund has equipment financed through 3 capital leases.
Legal Debt Margins
State statutes limit the amount of general obligation bonded debt a governmental entity may issue up to 10 percent of its total assessed valuation. The 2018 debt limitation for the City was $564,092,880. The City has no outstanding general obligation bonded debt.
Bond Ratings
A bond rating is a measure of a city’s ability to repay its debt; as such it is considered a measure of the city’s overall financial strength. The city’s bond rating is the primary factor in deciding the interest rate that will be paid on debt. As of December 31, 2020, the City has not had a bond rating done by a rating agency. The City has no debt requiring a bond rating.

Capital Budget and Debt Summary
90
Debt Issues
Tables on the following pages summarize outstanding debt issues and annual debt service requirements. Included are the City’s obligations for the Water and Sewer Fund.
Annual Debt Service Requirements
The table below shows debt funding requirements for the City of Rincon 2021-2040. Shown are principal and interest based on outstanding debt issues. All debt is paid from Water and Sewer revenues.
Year Principal Interest Principal Interest Total
2021 465,842 89,065 68,303 29,404 652,614
2022 477,623 77,284 69,605 28,102 652,614
2023 489,701 65,206 70,932 26,775 652,614
2024 502,085 52,822 72,285 25,422 652,614
2025 514,782 40,125 73,663 24,044 652,614
2026 527,800 27,107 75,067 22,640 652,614
2027 541,147 13,760 78,498 21,209 654,614
2028 256,160 1,770 77,957 19,750 355,637
2029 79,443 18,264 97,707
2030 80,957 16,750 97,707
2031 82,501 15,206 97,707
2032 84,074 13,633 97,707
2033 85,676 12,030 97,706
2034 87,310 10,397 97,707
2035 88,974 8,733 97,707
2036 90,671 7,036 97,707
2037 92,399 5,308 97,707
2038 94,161 3,546 97,707
2039 95,956 1,751 97,707
2040 40,520 192 40,712
Construction Loan 2,069,769 - 2,069,769
Revenue Bonds GEFA Loans
For Revenue Bonds and GEFA Loans
2021-2040
As of December 31, 2020
Summary of Outstanding Debt Issues
Amount 2021 Debt
Original Issue Final Outstanding Service
Issue Purpose Amount Date Maturity at 12/31/2020 Requirement
Water and Sewer Refunding Refunded GEFA loans which were used
Revenue Bonds, Series 2015 to construct the wastewater treatment facility 6,150,000$ 6/26/2015 6/1/2028 3,775,141$ 554,907$
GEFA Loan CW16001
1,626,202 11/1/2019 5/1/2040 1,588,950 97,707
GEFA Loan DW201609
2,540,000 5/1/2017 2,069,769 -
(1) - This loan is still in the construction phase. The permanent loan with a repayment schedule will be finalized by April 2021.

Department Summaries
91
Department Summaries

Department Summaries
92
# of Full Time Employees by Department
Department FY 2019 FY 2020 Approved FY 2021
Administration 3 3 3
Court 1 1 1
Finance 2 2 2
Golf Course 5 4 4
Police 24 19 19
Planning & Zoning 4 3 4
Public Works 2 3 3
Recreation 3 4 4
Fire 14 11 11
Water Administration 3 3 3
Water Department 5 4 4
Sewer Department 6 5 5
WWTP 3 3 3
Total: 75 65 66

Department Summaries
93
Per
son
nel
Sch
edu
le
AD
MIN
B & Z
COU
RTFI
NAN
CE FIRE
GO
LF MA
INT
GO
LF PRO
SH
OP
BISTRO
POLIC
EPU
BLIC W
ORK
S
RECREATIO
NSA
NIT
ATIO
NSEW
ERW
ATER
WA
TER AD
MIN
WW
TP
AC
CO
UN
TIN
G C
LE
RK
33
%3
3%
33
%
AD
MIN
IST
RA
TIO
N &
FIN
AN
CE
TE
CH
33
%3
3%
33
%
BU
ILD
ING
IN
SP
EC
TO
R3
3%
33
%3
3%
CIT
Y C
LE
RK
50
%2
5%
25
%
CIT
Y M
AN
AG
ER
34
%3
3%
33
%
CO
UR
T C
LE
RK
10
0%
EQ
UIP
ME
NT
OP
ER
AT
OR
30
0%
FIN
AN
CE
DIR
EC
TO
R3
3%
33
%3
3%
FIR
E C
AP
TA
IN1
00
%
FIR
E F
IGH
TE
R1
00
%
FIR
E L
IEU
TE
NA
NT
10
0%
GO
LF
MA
INT
EN
AN
CE
10
0%
GO
LF
MA
INT
EN
AN
CE
SU
PE
RIN
TE
ND
EN
T1
00
%
GO
LF
PR
O S
HO
P S
UP
ER
VIS
OR
10
0%
GR
ILL
SU
PE
RV
ISO
R1
00
%
ME
TE
R R
EA
DE
R1
00
%
PE
RM
IT T
EC
HN
ICIA
N5
0%
25
%2
5%
PL
AN
NIN
G &
DE
VE
LO
PM
EN
T D
IRE
CT
OR
34
%3
3%
33
%
PO
LIC
E C
HIE
F1
00
%
PO
LIC
E C
LE
RK
10
0%
PO
LIC
E C
OR
PO
RA
L1
00
%
PO
LIC
E L
IEU
TE
NA
NT
10
0%
PO
LIC
E O
FF
ICE
R1
00
%
PO
LIC
E S
ER
GE
AN
T1
00
%
PR
OB
AT
ION
OF
FIC
ER
10
0%
PU
BL
IC W
OR
KS
DIR
EC
TO
R3
4%
33
%3
3%
PU
BL
IC W
OR
KS
AS
SIS
TA
NT
DIR
EC
TO
R1
00
%
PU
BL
IC W
OR
KS
LA
BO
RE
R1
00
%
RE
CR
EA
TIO
N C
OO
RD
INA
TO
R1
00
%
RE
CR
EA
TIO
N D
IRE
CT
OR
10
0%
SE
WE
R L
AB
OR
ER
10
0%
UT
ILIT
IES
CL
ER
K1
0%
30
%3
0%
30
%
WW
TP
PL
AN
T D
IRE
CT
OR
10
0%
WW
TP
OP
ER
AT
OR
10
0%
WA
TE
R L
AB
OR
ER
10
0%
WA
TE
R O
PE
RA
TO
R1
00
%
ZO
NIN
G &
DE
VE
LO
PM
EN
T T
EC
H.
10
0%

Department Summaries
94
Departments

Department Summaries
95
City Council
City Council
Department Purpose Statement
Moving ideas to projects for implementation. Good governance is essential for the success of all
City functions. The guidance of the Mayor and Councilmembers provides a road map for all
local government services.
Accomplishments:
Increased fund balance
Established TSPLOT roads list
Annex properties into the City
Goals:
Maintain fiscally sound financial practices and accountability
To support and grow a vibrant economy with a diversity of businesses, organizations and
services
Actual Projected Approved
2019 2020 2021
Revenue Source
General Fund 171,292$ 259,649$ 248,405$
Total revenue 171,292$ 259,649$ 248,405$
Expenditure by Type
Personnel services 54,275$ 53,595$ 55,005$
Operating expenditures 117,017 206,054 193,400
Total expenditures 171,292$ 259,649$ 248,405$
Authorized Positions
Mayor 1 1 1
Councilmembers 6 6 6
Total 7 7 7

Department Summaries
96
City Administrative Services
City Administrative Services
The Department of City Administration includes the City Manager, City Clerk and Human Resources.
The Department is responsible for the overall administration of the City of Rincon governmental oper-
ation. The mission of the Department is to ensure that residents receive the highest quality services
possible within the budgetary constraints of the City. The City Manager is responsible for planning,
directing, and supervising the activities of all City employees, is responsible for the proper administra-
tion of the policies and affairs of the City and is responsible for policy development and implementa-
tion. The City Manager manages and controls the functions of all City departments and performs du-
ties and functions relative to a wide range of City programs and functions and reports to the City
Council.
The Department of City Administration oversees the general administration and operations of the de-
partments of the City of Rincon; executes the policies, directives and legislative actions of the City
Council, and prepares and presents policy improvements/changes to same. The City Manager manag-
es activities of City departments by assigning priorities and objectives to department heads and pro-
fessional staff and reviews/approves management reports regarding department and administrative
activities. The City Manager monitors the financial condition of the City and advises the Council of the
same; estimates present and future financial needs; works and consults with Council Members and
department heads concerning budget preparation; reviews and analyzes the financial position and re-
lated matters of the City; submits approved budget to City Council for review, consideration, and ap-
proval and administers and monitors operating budget.
The General Administration is responsible for staff development and motivation; provides instruction
and guidance to department heads as needed; oversees and controls the planning, development, and
implementation of various City systems and functions. The Department maintains effective working
relationships with elected officials, representatives of local, state, and federal agencies, local civic or-
ganizations, the media and others involved with City government.
The City Clerk City manages and coordinates the activities and operations of the City Clerk’s Office
including preparation and recording of the activities and decisions of the City Council and mainte-
nance of official City records; administers municipal elections; coordinates assigned activities with
other divisions, departments and outside agencies; and provides highly responsible and complex ad-
ministrative support to the City Manager and City Council.
Department Purpose Statement

Department Summaries
97
City Administrative Services
Accomplishments & Goals:
Accomplishments for FY 2020
Completion of the state required Comprehensive Plan update
Renovations of numerous city Buildings including the Golf course clubhouse, City Hall and the Po-
lice Department
Completion of Golf Course and Fire Department Operational Audits and implementation of recom-
mendations.
Goals for FY 2021
Plotting a strategy for the future of our Fire Department
Completing the transformation of our Golf operation
Hiring key permanent staff in the critical areas of Police and Finance
Linkage to Strategic Priorities:
Financial accountability
Public Safety
Infrastructure
Economic development/comprehensive development
Good government
Recreation

Department Summaries
98
City Administrative Services
Actual Projected Approved
2019 2020 2021
Revenue Source
General Fund 330,961$ 233,287$ 240,723$
Total revenue 330,961$ 233,287$ 240,723$
Expenditure by Type
Personnel services 91,188$ 115,567$ 96,423$
Operating expenditures 233,255 75,220 101,800
Capital expenditure 6,518 42,500 42,500
Total expenditures 330,961$ 233,287$ 240,723$
Authorized Positions
City Manager 1 1 1
City Clerk 1 1 1
Human Resources 1 1 1
Total 3 3 3

Department Summaries
99
Financial Administration
Financial Administration
This department is headed by the Finance Director. The mission of Financial Administration is to
provide superior customer and financial services with integrity for the enhancement of the City
and the community.
Financial Administration is responsible for the accounting and financial reporting of all City oper-
ations. This department is responsible for assisting the City Manager in the preparation of the
Budget and the Capital Improvements Program. The Department is also responsible for treasury
management, payroll administration, accounts payable, revenue management, debt management
and capital assets.
Linkage to Strategic Priorities:
Financial accountability
Infrastructure
Good government
Accomplishments & Goals:
Accomplishments for FY 2020:
Submitted the 2019 financial report to the Georgia Department of Accounts and Audits by June 30, 2020
as required by state law.
Increased vendors participating in electronic funds transfer program resulting in a reduction of checks
issued.
Bank reconciliations are prepared in a timely manner.
Provided timely monthly reports to City Council, management and the public.
Department Goals for FY 2021:
Provide oversight and direction for the financial management of the City.
Create and monitor the City budget to safeguard and distribute assets as prioritized by City Council.
Prepare accurate and complete financial statements for use by City Council, management and the public.
Department Purpose Statement

Department Summaries
100
Financial Administration
Department Goals for FY 2021 continue:
Submit a Comprehensive Annual Financial Report (CAFR) to Government Finance Officers Associa-
tion (GFOA) with expectation to receive the Certificate of Achievement for Excellence in Financial Re-
porting.
Improve budget process to be more informative, transparent, and user friendly.
Submit 2021 Budget to GFOA with expectation to receive the Distinguished Budget Presentation
Award.
Implement new procedures for submitting requisitions and issuing purchase orders.
Complete the implementation of the City’s pooled cash system.

Department Summaries
101
Financial Administration
Actual Projected Approved
2019 2020 2021
Revenue Source
General Fund 130,655$ 183,198$ 141,016$
Water and Sewer Fund 255,663 292,879 311,076
Total revenue 386,318$ 476,077$ 452,092$
Expenditure by Type
Personnel services 206,626$ 203,865$ 205,292$
Operating expenditures 179,505 268,212 231,300
Capital expenditure 187 4,000 15,500
Total expenditures 386,318$ 476,077$ 452,092$
Expenditure by Division
Financial administration 130,656$ 183,198$ 141,016$
Water and sewer administration 255,662 292,879 311,076
Total expenditures 386,318$ 476,077$ 452,092$
Authorized Positions
Finance Director 1 1 1
Accounting Clerk 1 1 1
Water Administration 3 3 3
Total 5 5 5

Department Summaries
102
Planning & Development Operations
Planning & Development Operations
The Planning & Development Services for the City of Rincon is primarily responsible for all communi-
ty and economic development functions of the City as well as project management. The department is
also responsible for all planning activities involving the City, providing Code Enforcement, and issu-
ing Occupation Tax Certificates and Alcoholic Beverage Licenses.
The economic development function of the department concentrates on providing excellent customer
service for all economic development projects and land use permits issued within the City’s bounda-
ries and for those properties wishing to annex into the City’s jurisdiction. Essential tasks of the City
Planner include managing land use projects from concept to completion, providing project manage-
ment services between the customer and the citywide Development Team, and overseeing capital pro-
jects. This department is committed to working with staff, developers, citizens, and economic develop-
ment professionals to ensure that the City of Rincon is an excellent place to do business! This team also
reviews and issues permits and approvals independent of building permit projects. We work with oth-
er City departments in the review of permits and license applications, as well as providing one stop
permitting services for the customer.
The community development function of the department provides services in grant applications, man-
agement, and project delivery. Community Development also works to bring additional amenities
and quality of life attributes to economic development and planning functions of the department, par-
ticularly through ordinance and policy recommendations that achieve the vision of the economic de-
velopment and planning goals of the City of Rincon.
The planning function of the department refers to a variety of short- and long-range planning, strategic
planning activities, and associated implementation services engaged in by the department. We are
charged with ensuring that the city fulfills the requirements of all federal, state, and regional mandates
regarding long range planning and implementation.
Department Purpose Statement
Linkage to Strategic Priorities:
Infrastructure
Economic development/comprehensive development

Department Summaries
103
Planning & Development Operations
Accomplishments & Goals:
Accomplishments for FY 2020:
Obtained and Implemented $18,500 Coastal Incentive Grant to implement strom water utility fee
Annexed three properties
Processed 23.7 ERU’s and 143 permits
Departments Goals for FY 2021:
Coordinate revision and update of Rincon Zoning Ordinance and Land Use Map
Annex properties into the City of Rincon
Increase digitization of records and permitting as appropriate to improve efficiency
Work to streamline code enforcement processes and procedures to better serve the citizens in an efficient man-
ner
Seek out and apply for grant opportunities to serve the needs of the Department and City and provide assis-
tance to other departments as needed
Monitor land use and economic developments trends to keep the City informed of opportunities to better posi-
tion itself for the future and provide guidance as needed.
Department Objectives: To provide courteous, timely and accessible customer service to customers and applicants to positively represent
the City of Rincon in economic and community development opportunities, encourage needed development, and provide timely and consistent permitting processes.
To manage and/or participate in all long term and strategic planning involving or impacting the City of Rincon: including land use, economic development, infrastructure, and service provision plans and to aid in providing coordinated service delivery; growth; operations, etc.
Provide consistency in interpretation and application of development ordinances and in permitting processes. To ensure City compliance with all federal, state, and regional planning activities and mandates. To manage and/or participate in all long term and strategic planning involving or impacting the City of Rincon:
including land use, economic development, infrastructure, and service provision plans and to aid in providing coordinated service delivery; growth; operations, etc.
To manage land use development and administer the Rincon Zoning and Subdivision Ordinances. To continue to monitor current and long-term land use and economic development needs; including residential
and commercial and identify and recommend appropriate methods of meeting those needs within the City of Rincon.
To manage building permit projects & the City's "One Stop Shop" permitting activities.

Department Summaries
104
Planning & Development Operations
Actual Projected Approved
2019 2020 2021
Revenue Source
General Fund 266,980$ 238,105$ 272,645$
Total revenue 266,980$ 238,105$ 272,645$
Expenditure by Type
Personnel services 127,039$ 116,165$ 129,595$
Operating expenditures 139,941 121,940 143,050
Capital expenditure - - -
Total expenditures 266,980$ 238,105$ 272,645$
Authorized Positions
Planning and Zoning Director 1 1 1
Planning Technician 1 1 1
Inspector and Code Enforcement 1 1 1
Permit Technician 1 0 1
Total 4 3 4

Department Summaries
105
Public Works
Department Purpose Statement
Public Works provides community services enhancing the quality of life for the citizens of Rincon
while protecting the environment by ensuring safe and clean neighborhoods and public places.
The Public Works Department is to provide the most cost-effective infrastructure and services possi-
ble while ensuring residents are able to live their lives and conduct business in a safe and healthy
and environmentally sound manner in a community they can be proud of .
The services within Public Works that accounts for General fund includes streets and drainage. Solid
waste pickup and removal is contracted out to a private firm and is managed through the Public
Works Department.
Linkage to Strategic Priorities:
Infrastructure
Economic development/comprehensive development
Public Works

Department Summaries
106
Public Works
Accomplishments & Goals:
Accomplishments for FY 2020:
W. 7th Street water and sewer upgrades
Lexington Ave. LMIG and box culvert installation
Purchase new 2020 F-150 for Utilities Director
E. 9th Street lift station upgrades
E. 9th Street box culvert installation
Omni Tracks water and sewer extensions
E. Townepark lift station and Hwy 21 lift station upgrades for Omni Tracks
Hwy 21 N. tank and lower Floridian well #5 on line
Goals for FY 2021:
Maintain and inspect the City’s streets and traffic control devices by continually sweeping, repair-
ing and improving the city’s public streets and rights-or-way
Maintain the City’s storm water system by performing routine inspections and repairing the wa-
tershed system
Efficiently maintain facilities, vehicles and equipment
Operate in a professional manner and stay within the approved FY 2020 budget while promoting
safety
Ensure that City sand State Ordinances and Specifications are observed
Maintain thorough maintenance records for all City-owned equipment and vehicles to monitor ser-
vice and repair costs and assist other departments with decisions about repairs and replacements
Create and maintain preventive service schedules for the City’s infrastructure

Department Summaries
107
Public Works
Actual Projected Approved
2019 2020 2021
Revenue Source
General fund 596,768$ 596,790$ 635,037$
Water and sewer fund 2,067,206 3,711,299 1,523,569
Total revenue 2,663,974$ 4,308,089$ 2,158,606$
Expenditure by Type
Personnel services 772,758$ 970,295$ 977,295$
Operating expenditures 1,224,299 800,031 910,811
Capital expenditure 666,917 2,537,763 270,500
Total expenditures 2,663,974$ 4,308,089$ 2,158,606$
Expenditure by Division
Streets and drainage 465,483$ 449,790$ 485,037$
Street Lights 131,285 147,000 150,000
Water operations 1,242,661 2,273,602 762,774
Sewer operations 824,565 1,437,697 760,795
Total expenditures 2,663,994$ 4,308,089$ 2,158,606$
Authorized Positions
Public Works Director 1 1 1
Assistant P.W. Director 1 1 1
Public Works Laborer 2 1 1
Water Laborers 4 4 4
Sewer Laborers 5 5 5
Total 13 12 12

Department Summaries
108
Police
Department Purpose Statement
The Rincon Police Department is comprised of two divisions. The Administrative Division is re-
sponsible for records, training, Municipal Court Probation, GCIC operation, property / evidence
handling, and the police clerk. The Patrol Division is responsible for all uniformed patrol and
traffic operations, criminal investigations and K-9. The department operates twenty-four hours per
day, seven days per week to provided full service law enforcement support under a community
oriented policing philosophy.
The Rincon Police Department is a dedicated and diverse group of professionals who are
committed to the community we serve by providing a safe and desirable place to live,
work or visit. Our mission is to partner with the community to solve problems and im-
prove public safety in a manner that is fair, impartial, transparent, and consistent.
Police
Linkage to Strategic Priorities:
Public Safety
Good government

Department Summaries
109
Police
Accomplishments & Goals:
Accomplishments for FY 2020:
Stabilizing and properly staffing patrol, CID, and Canine units.
Our management team has stabilized the turnover in the department having only one employee leave over
the course of the year. The units are still not properly staffed due to complications of COVID-19 and posi-
tions being frozen.
Developing a successful fleet maintenance program and reducing cost.
Our management team has tremendously reduced expenditures for vehicle maintenance while also reduc-
ing breakdown frequency.
Reviewing, implementing, and updating policy.
Our management team has been able to focus on and successfully implement multiple policies. This is still
a work in progress.
Strengthen partnerships with the community.
Our management team has expanded Coffee With a Cop to a county wide event by incorporating locations
in Springfield and Guyton as well. We have also began working on a Citizens Police Academy.
Department Goals for FY 2021:
Implement and host a Citizens Police Academy
Replace old equipment such as Tasers, Radios, Body Cameras, and weapons.
Continue with maintaining our fleet by purchasing a minimum of four new vehicles and ro-
tating more old ones off the road.

Department Summaries
110
Police
Actual Projected Approved
2019 2020 2021
Revenue Source
General Fund 1,548,194$ 1,579,081$ 1,787,926$
Total revenue 1,548,194$ 1,579,081$ 1,787,926$
Expenditure by Type
Personnel services 1,233,998$ 1,286,131$ 1,480,676$
Operating expenditures 299,501 247,700 278,750
Capital expenditure 14,695 45,250 28,500
Total expenditures 1,548,194$ 1,579,081$ 1,787,926$
Authorized Positions
Chief of Police 1 1 1
Lieutenant 1 1 1
Sergeant 1 1 1
Detectives 3 3 3
Corporal 5 5 5
Officers 8 8 8
Total 19 19 19

Department Summaries
111
Recreation
Recreation
Department Purpose Statement
The Rincon Recreation Department oversees the operation and maintenance of all parks within
City of Rincon, including: Macomber Call Park, Veteran’s Park, Peter J. Giles Park , Patriot’s
Park, and the Vernon Hinley Center. The Recreation Department is also responsible for the man-
aging the city’s Recreation programs.
The Rincon Recreation Department wants to enhance the quality of life by providing safe well
maintained parks and public places; preserving open space and historic resources and to provide
the best quality program and activities for the community that are safe, competitive and educa-
tional. Programs that create, promote and enhance a healthy lifestyle, as well as encouraging
good sportsmanship, teamwork and fair play.
The department also oversees programs offered by the Senior Citizen Center which has its own
operation budget.
Linkage to Strategic Priorities:
Infrastructure
Good government
Recreation
Accomplishments & Goals:
Accomplishments for FY 2020:
Filled positions to operate department
Concession revenues were up by almost $10,000
Field rentals up
Goals for FY 2021:
Completion of all recreational SPLOST projects for 2021
To develop a travel foot ball program for the program growth
To introduce at least three new programs for adults: pickle ball league, cornhole league
and dart league
To Bring in a rodeo or monster truck show event that will generate additional revenues
Have each staff member to complete a certification in GRPA

Department Summaries
112
Recreation
Actual Projected Approved
2019 2020 2021
Revenue Source
General Fund 561,435$ 529,726$ 622,251$
Total revenue 561,435$ 529,726$ 622,251$
Expenditure by Type
Personnel services 275,097$ 302,816$ 337,501$
Operating expenditures 286,338 226,910 284,750
Capital expenditure - - -
Total expenditures 561,435$ 529,726$ 622,251$
Authorized Positions
Recreation Director 1 1 1
Recreation Coordinator 3 3 3
Total 4 4 4

Department Summaries
113
Fire
Fire
Department Purpose Statement
The department is made up of four stations The department offers a full range of emergency medical
response, fire suppression, vehicle and technical rescue and fire safety education. The department
operates 3 shifts with each shift working 24-hour period providing the community with 24/7-365 days
per year coverage. The Captain and Mechanic are also State certified firefighters that work 0800-1700
Monday through Friday.
Our four current station locations are equipped with two staffed pumpers and two volunteer
pumpers, 1 reserve pumper, 1 ladder, four rescues and one 3500 gallon tender. All units are dis-
patched by Effingham County 911 center which has enhanced 9-1-1 telephone system. The depart-
ment is actively involved in fire prevention. In addition the department presents fire safety programs
to hundreds of school children throughout the Rincon Fire protection District.
Linkage to Strategic Priorities:
Public Safety
Good government

Department Summaries
114
Fire
Accomplishments & Goals:
Accomplishments for FY 2020 :
Designing & Replacing one engine and equipment
New breathing air compressor
Absorbed a call volume of over 1% without further response being required
Passed audit by Standards and training for department personnel
Goals for FY 2021:
Take deliver and place in service 1 new engine
Purchasing radios to replace and upgrade
Department Objectives
Continue to stress fire prevention through annual pre-fire planning of businesses.
Continue to stress fire prevention through visits to the public schools, daycare facilities and businesses in the
city and fire protection district that we serve.
Continue to properly train firefighters to stress safety in their work.
Continue to pursue grants and develop additional funding strategies as an alternative source of funding for
needed capital items.
Develop and implement additional funding strategies to protect the department from material financial loss.
Improve the staffing levels of the fire department to provide the safest most efficient level of operations within a
growing city.
Begin implementation processes and programs in an effort to maintain ISO Class 3 Rating.
Develop a plan to reduce to a Class 2.
Provide a professional, safe, and efficient emergency response while expanding the department.
Expand/and/or fully utilizes technology to enhance the efficiency of the fire department operation.

Department Summaries
115
Fire
Actual Projected Approved
2019 2020 2021
Revenue Source
Fire fund 813,431$ 1,095,787$ 1,095,626$
Total revenue 813,431 1,095,787 1,095,626
Expenditure by Type
Personnel services 641,171 793,995 817,326
Operating expenditures 172,080 190,792 212,300
Capital expenditure 180 111,000 66,000
Total expenditures 813,431$ 1,095,787$ 1,095,626$
Authorized Positions
Captain 1 1 1
Fire Lieutenant 0 0 0
Firefighters 13 10 10
Total 14 11 11

Department Summaries
116
Waste Water Treatment
Waste Water Treatment
Department Purpose Statement
The basic function of wastewater treatment is to speed up the natural processes by which water is puri-
fied.
The Wastewater Treatment Plant Department treats household and light industrial waste biologically,
disinfects it to meet or exceed Georgia Environmental Protections and NPDES permit perimeters, and
to protect downstream users along with the aquatic environment upon which all life depends.
The mission of the Wastewater Treatment Plant Department is to protect the citizens, the interests of
Rincon, the environment, and all receiving waterways by eliminating pollutants in waste water and by
meeting or exceeding the requirements mandated by standards set by the State and Federal govern-
ment.
Linkage to Strategic Priorities:
Infrastructure
Good government

Department Summaries
117
Waste Water Treatment
Accomplishments & Goals:
Accomplishments for FY 2020 :
Internal reuse pumps and piping have been installed
We applied for and were issued a new NPDES permit
We are under budget on chemical usage
Goals for FY 2021:
100% compliance with new NPDER permit
0 accidents for the year
Operate within approved budget
Train and educate staff
Begin planning process for plant expansion
Actual Projected Approved
2019 2020 2021
Revenue Source
Water and sewer fund 1,127,376$ 584,345$ 574,960$
Total revenue 1,127,376$ 584,345$ 574,960$
Expenditure by Type
Personnel services 158,152$ 216,004$ 211,510$
Operating expenditures 969,224 338,341 333,450
Capital expenditure 30,000 30,000
Total expenditures 1,127,376$ 584,345$ 574,960$
Authorized Positions
WWTP Director 1 1 1
Lab Analyst 1 1 1
WWTP Operator 1 1 1
Total 3 3 3

Department Summaries
118
Golf
Golf
Department Purpose Statement
The basic function of the Lost Plantation Golf Course is to provided a welcoming and safe en-
vironment to our members and guest. Lost Plantation Golf Club offers many benefits to the
residents of Rincon and beyond. Players enjoy on a lush, well-manicured course, and dine at
the fully renovated Fairway Bistro restaurant. The course also displaces reclaimed water and
limits the environmental impact of the City’s waste water facility, in turn saving the course
from financing irrigation.
Lost Plantation Golf Club’s mission is to provide members with an exceptional golfing experience,
build community relationships between the City of Rincon and business, industry and education, and
host unique fundraising tournaments for charities schools and organizations. Then Club services as an
educational forum for youth who wish to expand their golf game under the direction of a PGA Pro.
Linkage to Strategic Priorities:
Recreation

Department Summaries
119
Golf
Accomplishments & Goals:
Accomplishments for FY 2020 :
LPGC hosted golf tournaments for local civic groups as well as member-specific tournaments,
increasing course play and membership value
LPGC completed a total renovation of the clubhouse including the pro shop, conference room
and newly expanded dining room for the Fairway Bistro
LPGC restructured internal procedures and trained staff to provide more streamlined service to
its members and revenue reporting to the City of Rincon
Goals for FY 2021:
LPGC plans to increase membership by 25%, from 85 current members to a minimum of 107
members.
LPGC plans to host a minimum of eight profit-rendering tournaments, including a first-ever
invitational tournament, with minimum tournament profits of $12,0000
LPGC plans to continue supporting local businesses by offering affordable sponsorship oppor-
tunities marketed to the 1,000+ players on the course each month
LPGC plans to invest in course maintenance equipment and increase fertilizer to improve the
grasses on all 18 holes and the driving range
LPGC plans to value its members by hosting members-only functions, continued discounted
play and purchases, and increased online communication of events and champions

Department Summaries
120
Golf
Actual Projected Approved
2019 2020 2021
Resources
Lost Planation golf course 622,823$ 635,700$ 560,000$
Water and sewer fund 56,894 56,894 56,894
General fund - - 102,179
Total Resources 679,717$ 692,594$ 719,073$
Expenditure by Type
Personnel services 358,959 390,476 320,902
Operating expenditures 319,243 273,048 398,171
Capital expenditure 1,515 29,070 -
Debt service - -
Total expenditures 679,717$ 692,594$ 719,073$
Expenditure by Division
Pro Shop 245,546 239,844 328,271
Maintenance 280,780 259,907 372,199
Fairway Bistro 153,391 192,843 18,603
Total expenditures 679,717$ 692,594$ 719,073$
Authorized Positions
Pro Manager 0 0 1
Maintenance Workers 4 3 3
Fairway Bistro Supervisor 0 1 0
Total 4 4 4

Glossary
121
Glossary

Glossary
122
Glossary ACCOUNT GROUP A self-balancing set of accounts which are not a fund or a fiscal entity. General Fixed Assets Account Group and General Long-Term Debt Account Group are such examples.
ACCOUNTING SYSTEM The total structure of records and procedures that identify, record, classify, summarize and report information on the financial position and results of operations of a governmental unit or any of its
funds. ACCRUAL BASIS ACCOUNTING A method of accounting in which revenues are
recorded when measurable and available, and expenses are recognized when a good or service issued. ACCRUED REVENUE
Revenue earned during the current accounting period which will not be collected until a subsequent accounting period. AGENCY FUND
A fund consisting of resources received and held by the governmental unit as an agent for others. APPROPRIATION An authorization by the City Council to incur obligations and to expend public funds for a stated
purpose. An appropriation is usually limited in amount and as to the time when it may be expended. ASSETS
Resources owned or held by a government that have monetary value. AUDIT A methodical examination of the utilization of and changes in resources. It concludes in a written
report of the findings. A financial audit is a test of the management’s financial statements and internal accounting control procedures to determine the extent to which: internal accounting controls are both available and being used, and to determine whether the financial statements fairly present the City’s financial condition and results of operations.
AVAILABLE (UNDESIGNATED) FUND BALANCE This refers to the funds remaining from the prior year which are available for appropriation and expenditure in the current year.
BALANCED BUDGET A budget in which planned revenues and resources available equal planned expenditures.

Glossary
123
BUDGET An annual financial plan embodying estimated expenditures for providing services and the approved means of financing them.
BUDGET AMENDMENT A budget amendment alters the total appropriation for a department or fund and requires approval by a resolution passed by the Rincon City Council.
BUDGET CALENDAR The schedule of key dates that a government follows in preparation and adoption of the budget. BUDGET CONTROL
The control or management of the approved Budget for the purpose of keeping expenditures within the limitations of available appropriations and available revenues. BUDGET DOCUMENT
The instrument used by the budget-making authority to present a comprehensive financial program to the appropriating body. BUDGET MESSAGE
A general discussion of the approved budget as presented in writing by the City Manager to Mayor and Council. The message contains an explanation of the principal budget items and recommendations regarding the financial policy for the coming year.
BUDGET RESOLUTION The formal statement approved by the Mayor and Council which shows budgeted revenues and expenditures for the approaching fiscal year.
CAFR (Comprehensive Annual Financial Report) This official annual report, prepared by the Finance Department, presents the status of the City’s finances in a standardized format.
CALEA (Commission on Accreditation for Law Enforcement Agencies) The primary purpose of the Commission is to improve law enforcement services by creating a national body of standards developed by law enforcement professionals. It recognizes professional achievements by establishing and administering an accreditation process through which a law
enforcement agency can demonstrate that it meets those standards. CAPITAL COST RECOVERY FEE Fees charged to a new development to offset the cost of infrastructure improvements to the water
and sewer system. Fees are based upon the developments proportionate share of demand placed upon the infrastructure. CAPITAL EXPENDITURES - Capital outlay of five thousand dollars ($5,000.00)
or more for assets that have a useful life in excess of one year.

Glossary
124
CAPITAL PROJECTS FUND
A fund used to account for financial resources used for the acquisition or construction of major
capital equipment or facilities.
CAPITAL OUTLAY
Expenditures that result in the acquisition of, or addition to fixed assets.
CONSTRUCTION IN PROGRESS
The cost of construction work that has been started but not yet completed.
CONTRACTUAL SERVICE
An agreement to perform a service or task by external organizational units. A group of accounts
which cover the above, as well as travel and training and other miscellaneous services.
CONTINGENCY FUNDS
Funds set aside to provide for unforeseen expenditures of uncertain amounts.
DEBT LIMIT
The maximum amount of gross or net debt which is legally permitted.
DEBT SERVICE
Expenditures for principal and interest payments on loans, notes, and bonds.
DEPARTMENT
Departments are the major functional sub-divisions of and correspond roughly to the functional hierarchy used by the City. Each department has been assigned to one of the functions according to
the type of activity it performs. For example, the Police Department is part of the Public Safety
function.
DEPRECIATION
(1) Expiration in the service life of capital assets attributable to wear and tear, deterioration, action of
the physical elements, inadequacy or obsolescence.
(2) The portion of the cost of a capital asset which is charged as an expense during a fiscal period.
ENCUMBRANCE
A contingent liability, contract, purchase order, payroll commitment, tax payable, or legal penalty that is chargeable to an account. It ceases to be an encumbrance when paid-out or when the actual
liability amount is determined and recorded as an expense.
ENTERPRISE FUND
A self-supporting fund designated to account for activities supported by user charges; examples
include: Water, Solid Waste and Sewer Funds.
EXCISE TAX
A levy on a specific type of transaction at a rate specific to that transaction. Also known as a selective
sales tax, these taxes are separate from general sales tax and usually are based on a separate statutory
authority. One example is hotel/motel tax.

Glossary
125
EXPENSE Outflows or other uses of assets or incurring of liabilities during a period from delivering or producing goods, rendering services or carrying out other activities that constitute the entity’s ongoing major or central operations; for example, depreciation.
FIDUCIARY FUND Any fund held by a governmental unit as an agent or trustee.
FISCAL PERIOD Any period at the end of which a governmental unit determines its financial position and the results of its operations
FISCAL YEAR A 12-month period of time of an annual budget, at the end of which a governmental unit determines its financial position and the results of its operations
FIXED ASSETS Assets of a long-term nature which are not intended to be sold for profit, but which are to be used in an organization’s normal course of business, such as land, buildings, machinery, and equipment.
FRANCHISE TAX Fees levied on a corporation in return for granting a privilege sanctioning a monopoly or permitting the use of public property, usually subject to regulation set by the governing body.
FRINGE BENEFITS Employers’ share of F.I.C.A taxes, health and dental insurance premiums, disability insurance, life insurance, worker’s compensation, unemployment taxes, and retirement contributions made on behalf of the City employees.
FULL-TIME POSITION A position which qualifies for full City benefits and requires the employee to work at least 30 hours per week.
FUND A fiscal and accounting entity with a self-balancing set of accounts recording cash and other financial resources, together with all related liabilities and residual equities, or balances and changes therein,
which are segregated for the purpose of carrying on specific activities or attaining certain objectives in accordance with special regulations, restrictions, or limitations. FUND BALANCE
Fund equity (excess of assets over liabilities) available for appropriation. FUND EQUITY The excess of assets over liabilities. A portion of the equity may be reserved or designated; the
remainder is Fund Balance GAAP Generally Accepted Accounting Principles as determined through common practice or as
promulgated by the Governmental Accounting Standards Board, Financial Accounting Standards Board, or various other accounting standards setting bodies.

Glossary
126
GEFA Georgia Environmental Facilities Authority
GENERAL FUND
A fund used to account for all transactions of a governmental unit that are not accounted for in
another fund.
GFOA
Government Finance Officers Association
GOAL
A goal is a statement of desired conditions to be maintained or achieved through the efforts of an organization. Actual total achievement may be impossible, but the goal is a standard against which to
measure progress toward ideal conditions. A goal is a definition of results toward which the work of
the organization is directed.
GOVERNMENTAL FUND
A generic classification adopted by the National Council on Governmental Accounting to refer to all funds other than proprietary and fiduciary funds. General fund, special revenue funds and capital
projects funds are all examples of governmental fund types.
GRANT
A contribution by one governmental unit to another unit. The contribution is
usually made to aid in the support of a specified function, activity or for the acquisition or construction
of fixed assets.
INFRASTRUCTUR
An underlying base or foundation; the basic facilities needed for the functioning of the City.
INTERFUND LOAN
A loan made by one fund to another to be repaid at a later date.
INTERGOVERNMENTAL REVENUE
Revenue from other governments in the form of entitlements, grants, shared revenues or payments in
lieu of taxes.
INVESTMENT
Securities held for the production of income in the form of interest and dividends.
LIABILTY
Debts or other legal obligations arising out of transactions in the past that must be liquidated,
renewed, or refunded at some future date. This term does not include encumbrances.
LINE-ITEM
A detailed classification of an expense or expenditures classified within each department.

Glossary
127
LINE-ITEM BUDGET
A budget featuring things to be purchased. By relating appropriations to commodities, a line-item
budget represents a “shopping list” approach to allocation problems. This approach is believed to express official and citizen interest in the values of economy and control. Also known as traditional
budgeting.
LONG-TERM DEBT
Debt with a maturity date of more than one year after the date of issuance.
LOST
Local Option Sales Tax
MPC
Metropolitan Planning Commission
MODIFIED ACCRUAL BASIS OF ACCOUNTING
Governmental funds use the modified accrual basis of accounting. Revenues are recognized in the period in which they become both available and measurable. Expenditures are recognized at the time a
liability is incurred.
NON-OPERATING EXPENSE
Proprietary fund income that is not derived from the basic operations of such enterprises.
OBJECT CODE
Expenditure classification according to the types of items purchased or services obtained; for example,
personnel services, materials & supplies, contractual services, and capital.
OBJECTIVE
An objective is a decision about the amount of progress to be made within a specified period of time. It states in measurable and quantitative terms the results to be achieved within a specified time and
plans the incremental steps to achieve the goal.
OPERATING BUDGET
Plans of current expenditures and the approved means of financing them. The annual operating
budget (or, in the case of some governments, the biennial operating budget) is the primary means by which most of the financing acquisition, spending, and service delivery activities of a government are
controlled. The use of annual operating budgets is usually required by law.
OPERATING COSTS
Operating costs are proprietary (Enterprise) fund expenses that directly relate to the fund’s primary
service activities. For example: salaries and wages, expendable supplies, and contractual services.
OPERATING TRANSFER
Legally authorized inter-fund transfers from a fund receiving revenue to the fund that incurs the
expenditures.

Glossary
128
ORDINANCE
A formal legislative enactment by the governing body of a municipality. It is not in conflict with any
higher form of law, such as state statute or constitutional provision; it has the full force and effect of
law within the boundaries of the municipality to which it applies.
ORGANIZATIONAL CHART
A chart representing the authority, responsibility, and relationships among departmental entities
within the City organization.
PART-TIME
Part-time employees work fewer than 30 hours per week and are not entitled to full- time employee
benefits.
PERSONNEL COSTS
All costs directly associated with employee, including salaries and fringe benefits
PROFESSIONAL SERVICES
Expenditures incurred by the City to obtain the services of recognized, licensed professionals such as
Doctors, Engineers, Certified Public Accountants, etc.
RESERVE
(1) An account used to earmark a portion of fund balance to indicate that it has been earmarked for a
particular purpose;
(2) an account used to earmark a portion of fund equity as legally segregated for a future use.
REVENUE
Income of a government from taxation, excise taxes, or other sources to fund government operations
other than from inter-fund transfers and debt issue proceeds.
SALARIES & BENEFITS
The costs of all salaries, wages, and associated fringe benefits required to provide a governmental
service.
SPLOST
Special Purpose Local Option Sales Tax
SPECIAL REVENUE FUND
A fund established to account for revenues from specific taxes or other earmarked revenue sources
that by law are designated to finance particular functions or activities of government.
UNRESERVED FUND BALANCE
The amount remaining in a fund that is not designated for some future use and which is available for
further appropriation or expenditure.
USER CHARGES
The payment of a fee for direct receipt of a public service by the party benefiting from the service.

129