Alteration of cytosolic free calcium homeostasis by SIN1: high sensitivity of L-type Ca2+ channels...
17
Alteration of cytosolic free calcium homeostasis by SIN-1: high sensitivity of L-type Ca 2+ channels to extracellular oxidative/ nitrosative stress in cerebellar granule cells Yolanda Gutie ´rrez-Martı ´n, 1 Francisco Javier Martı ´n-Romero, 1 Fernando Henao and Carlos Gutie ´rrez-Merino Departamento de Bioquı ´mica y Biologı ´a Molecular, Facultad de Ciencias and Escuela de Ingenierı ´as Agrarias, Universidad de Extremadura, Badajoz, Spain Abstract Exposure of cerebellar granule neurones in 25 mM KCl HEPES-containing Locke’s buffer (pH 7.4) to 50–100 lM SIN-1 during 2 h decreased the steady-state free cytosolic Ca 2+ concentration ([Ca 2+ ]i) from 168 ± 33 nM to 60 ± 10 nM, whereas exposure to ‡ 0.3 mM SIN-1 produced biphasic kin- etics: (i) decrease of [Ca 2+ ]i during the first 30 min, reaching a limiting value of 75 ± 10 nM (due to inactivation of L-type Ca 2+ channels) and (ii) a delayed increase of [Ca 2+ ]i at longer exposures, which correlated with SIN-1-induced necrotic cell death. Both effects of SIN-1 on [Ca 2+ ]i are blocked by superoxide dismutase plus catalase and by Mn(III)tetrakis (4-benzoic acid)porphyrin chloride. Supplementation of Locke’s buffer with catalase before addition of 0.5–1 mM SIN-1 had no effect on the decrease of [Ca 2+ ]i but further delayed and attenuated the increase of [Ca 2+ ]i observed after 60–120 min exposure to SIN-1 and also protected against SIN-1-induced necrotic cell death. a-Tocopherol, the potent NMDA receptor antagonist (+)-MK-801 and the N- and P-type Ca 2+ channels blocker x-conotoxin MVIIC had no effect on the alterations of [Ca 2+ ]i upon exposure to SIN-1. However, inhibition of the plasma membrane Ca 2+ ATPase can account for the increase of [Ca 2+ ]i observed after 60–120 min expo- sure to 0.5–1 mM SIN-1. It is concluded that L-type Ca 2+ channels are a primary target of SIN-1-induced extracellular nitrosative/oxidative stress, being inactivated by chronic exposure to fluxes of peroxynitrite of 0.5–1 lM/min, while higher concentrations of peroxynitrite and hydrogen peroxide are required for the inhibition of the plasma membrane Ca 2+ ATPase and induction of necrotic cell death, respectively. Keywords: hydrogen peroxide, cerebellar granule neurones, cytosolic calcium, L-type calcium channels, oxidative stress, peroxynitrite. J. Neurochem. (2005) 92, 973–989. During the last decade, peroxynitrite has been involved as a major causal agent in the neurodegeneration associated with ischaemia and inflammation (Iadecola 1997; van der Veen et al. 1997), excitotoxicity (Bolanos et al. 1997; Beal 2000; Atlante et al. 2001), spinal cord injury (Scott et al. 1999; Liu et al. 2000; Bao and Liu 2002) and several major brain pathologies in humans (Beal 2000, 2002). The compound 3-morpholinosydnonimine (SIN-1), which decomposes in aqueous solution and releases • NO and O 2 •– in a 1 : 1 stoichiometry (Kelm et al. 1997) and then rapidly reacts to each other to produce peroxynitrite (de Groot et al. 1993; Huie and Padmaja 1993; Beckman 1994), is currently used to mimic extracellular exposure to the peroxynitrite concentra- tions likely to be achieved during ischaemia/reperfusion, inflammation and excitotoxicity, e.g. exposure to peroxyni- trite concentrations in the submicromolar to micromolar Received June 21, 2004; revised manuscript received October 26, 2004; accepted November 1, 2004. Address correspondence and reprint requests to: Carlos Gutie ´rrez- Merino, Departamento de Bioquı ´mica y Biologı ´a Molecular, Facultad de Ciencias, Avenida de Elvas s/n, 06071-Badajoz, Spain. E-mail: [email protected] 1 These authors contributed equally to this work. Abbreviations used: Ac-DEVD-pNA, N-acetyl-Asp-Glu-Val-Asp-p- nitroanilide; Br-A23187, 4-bromo-calcimycin; [Ca 2+ ]i, cytosolic free calcium concentration; CGC, cerebellar granule cells; DIV, days in vitro; DMEM, Dulbecco’s modified Eagle’s medium; FBS, fetal bovine serum; Fura-2, AM, fura-2 acetoxymethyl ester; GSH, reduced glutathione; MnTBAP, Mn(III)tetrakis(4-benzoic acid)porphyrin; MTT, 3-(4,5-dimethyl-2-yl)-2,5-diphenyltetrazolium bromide; NMDA, N-methyl-D-aspartate; NOR-4, 3-[(+/–)-(E)-ethyl-2¢-[(E)-hydroxiimino]- 5-nitro-3-hexenocarbamoil] pyridine; PMCA, plasma membrane Ca 2+ ATPase; SFM, serum-free medium; SIN-1, 3-morpholinosydnonimine; SOD, superoxide dismutase; VOCC, voltage-operated calcium channels. Journal of Neurochemistry , 2005, 92, 973–989 doi:10.1111/j.1471-4159.2004.02964.x ȑ 2005 International Society for Neurochemistry, J. Neurochem. (2005) 92, 973–989 973
Transcript of Alteration of cytosolic free calcium homeostasis by SIN1: high sensitivity of L-type Ca2+ channels...
Alteration of cytosolic free calcium homeostasis by SIN-1: highsensitivity of L-type Ca2+ channels to extracellular oxidative/nitrosative stress in cerebellar granule cells
Yolanda Gutierrez-Martın,1 Francisco Javier Martın-Romero,1 Fernando Henao and CarlosGutierrez-Merino
Departamento de Bioquımica y Biologıa Molecular, Facultad de Ciencias and Escuela de Ingenierıas Agrarias, Universidad de
Extremadura, Badajoz, Spain
Abstract
Exposure of cerebellar granule neurones in 25 mM KCl
HEPES-containing Locke’s buffer (pH 7.4) to 50–100 lM
SIN-1 during 2 h decreased the steady-state free cytosolic
Ca2+ concentration ([Ca2+]i) from 168 ± 33 nM to 60 ± 10 nM,
whereas exposure to ‡0.3 mM SIN-1 produced biphasic kin-
etics: (i) decrease of [Ca2+]i during the first 30 min, reaching a
limiting value of 75 ± 10 nM (due to inactivation of L-type Ca2+
channels) and (ii) a delayed increase of [Ca2+]i at longer
exposures, which correlated with SIN-1-induced necrotic cell
death. Both effects of SIN-1 on [Ca2+]i are blocked by
superoxide dismutase plus catalase and by Mn(III)tetrakis
(4-benzoic acid)porphyrin chloride. Supplementation of
Locke’s buffer with catalase before addition of 0.5–1 mM
SIN-1 had no effect on the decrease of [Ca2+]i but further
delayed and attenuated the increase of [Ca2+]i observed after
60–120 min exposure to SIN-1 and also protected against
SIN-1-induced necrotic cell death. a-Tocopherol, the potent
NMDA receptor antagonist (+)-MK-801 and the N- and P-type
Ca2+ channels blocker x-conotoxin MVIIC had no effect on
the alterations of [Ca2+]i upon exposure to SIN-1. However,
inhibition of the plasma membrane Ca2+ ATPase can account
for the increase of [Ca2+]i observed after 60–120 min expo-
sure to 0.5–1 mM SIN-1. It is concluded that L-type Ca2+
channels are a primary target of SIN-1-induced extracellular
nitrosative/oxidative stress, being inactivated by chronic
exposure to fluxes of peroxynitrite of 0.5–1 lM/min, while
higher concentrations of peroxynitrite and hydrogen peroxide
are required for the inhibition of the plasma membrane Ca2+
ATPase and induction of necrotic cell death, respectively.
Keywords: hydrogen peroxide, cerebellar granule neurones,
cytosolic calcium, L-type calcium channels, oxidative stress,
peroxynitrite.
J. Neurochem. (2005) 92, 973–989.
During the last decade, peroxynitrite has been involved as amajor causal agent in the neurodegeneration associated withischaemia and inflammation (Iadecola 1997; van der Veenet al. 1997), excitotoxicity (Bolanos et al. 1997; Beal 2000;Atlante et al. 2001), spinal cord injury (Scott et al. 1999; Liuet al. 2000; Bao and Liu 2002) and several major brainpathologies in humans (Beal 2000, 2002). The compound3-morpholinosydnonimine (SIN-1), which decomposes inaqueous solution and releases •NO and O2
•– in a 1 : 1stoichiometry (Kelm et al. 1997) and then rapidly reacts toeach other to produce peroxynitrite (de Groot et al. 1993;Huie and Padmaja 1993; Beckman 1994), is currently used tomimic extracellular exposure to the peroxynitrite concentra-tions likely to be achieved during ischaemia/reperfusion,inflammation and excitotoxicity, e.g. exposure to peroxyni-trite concentrations in the submicromolar to micromolar
Received June 21, 2004; revised manuscript received October 26, 2004;accepted November 1, 2004.Address correspondence and reprint requests to: Carlos Gutierrez-
Merino, Departamento de Bioquımica y Biologıa Molecular, Facultad deCiencias, Avenida de Elvas s/n, 06071-Badajoz, Spain.E-mail: [email protected] authors contributed equally to this work.Abbreviations used: Ac-DEVD-pNA, N-acetyl-Asp-Glu-Val-Asp-p-
nitroanilide; Br-A23187, 4-bromo-calcimycin; [Ca2+]i, cytosolic freecalcium concentration; CGC, cerebellar granule cells; DIV, days in vitro;DMEM, Dulbecco’s modified Eagle’s medium; FBS, fetal bovineserum; Fura-2, AM, fura-2 acetoxymethyl ester; GSH, reducedglutathione; MnTBAP, Mn(III)tetrakis(4-benzoic acid)porphyrin; MTT,3-(4,5-dimethyl-2-yl)-2,5-diphenyltetrazolium bromide; NMDA,N-methyl-D-aspartate; NOR-4, 3-[(+/–)-(E)-ethyl-2¢-[(E)-hydroxiimino]-5-nitro-3-hexenocarbamoil] pyridine; PMCA, plasma membrane Ca2+
ATPase; SFM, serum-free medium; SIN-1, 3-morpholinosydnonimine;SOD, superoxide dismutase; VOCC, voltage-operated calcium channels.
Journal of Neurochemistry, 2005, 92, 973–989 doi:10.1111/j.1471-4159.2004.02964.x
� 2005 International Society for Neurochemistry, J. Neurochem. (2005) 92, 973–989 973
range (Malinski et al. 1993; Murphy et al. 1998; Bal-Priceet al. 2002; Bao and Liu 2002). Several studies have beenaddressed to demonstrate that the toxicity of neuronesexposed to SIN-1 is due to peroxynitrite formed during itsdecomposition in primary cultures of neurones (Lafon-Cazalet al. 1993; Trackey et al. 2001), in neuronal cell lines(Estevez et al. 1995; Ischiropoulos et al. 1995) and inneuronal tissues in vivo (de Groot et al. 1993; Bao and Liu2002). Nevertheless, it has been noted that a significantamount of hydrogen peroxide (H2O2) is formed when SIN-1decomposes in HEPES-containing buffers (Kirsch et al.1998) and that the cytotoxicity of SIN-1 to L929 cells inHEPES-containing buffers was mainly due to H2O2 and notto peroxynitrite (Lomonosova et al. 1998).
Exposure to SIN-1 produced either apoptotic or necroticcell death in neurones in culture (Bonfoco et al. 1995) or inneuronal tissue (Bao and Liu 2002, 2003) depending on theintensity of the insult (i.e. time of exposure to SIN-1 and/orconcentration of SIN-1). Therefore, it is relevant to determinethe range of peroxynitrite concentrations that producesapoptotic and necrotic cell death and also the identificationof the primary targets for peroxynitrite-induced neuronaldeath is needed. Free cytosolic Ca2+ concentration ([Ca2+]i)is one of the most relevant intracellular variables for neuronalsurvival, as it has been shown that a sustained decrease of[Ca2+]i to values of 40–60 nM can be sufficient to initiate theneuronal apoptotic programme in culture, whereas a sus-tained raise of [Ca2+]i to values ‡ 400 nM produced rapidnecrotic neuronal death (Franklin and Johnson 1992).Furthermore, peroxynitrite has been shown to stimulate thesecretion of acetylcholine (Ohkuma et al. 1995), glutamate(Leist et al. 1997), GABA (Ca2+-dependent) (Higo et al.1998) and aspartate (Moro et al. 1998). An enhancedgeneralized neurotransmitter secretion is indicative of analtered cytosolic Ca2+ homeostasis (Burgoyne and Morgan1995). Peroxynitrite has been reported to impair the activityof NMDA receptors (Manzoni et al. 1992; Gbadegesin et al.1999; Pall 2002), VOCC (Ohkuma et al. 2001), the plasmamembrane Na+/Ca2+-exchanger (Huschenbett et al. 1998;Chakraborti et al. 2004) and PMCA (Zaidi and Michaelis1999; Gutierrez-Martin et al. 2002). Therefore, the effects ofexposure of neurones to peroxynitrite on the steady-state[Ca2+]i will be dependent on the in vivo relative reactivity ofthese Ca2+ transport systems against peroxynitrite.
On these grounds, primary cultures of cerebellar granulecells (CGC), the most abundant neurones in the cerebellum,are particularly well suited as a model system to study theeffects of peroxynitrite on neuronal Ca2+ homeostasis,because they undergo a slow developing apoptotic processwith a sustained low level of [Ca2+]i induced by loweringK+ in the extracellular medium to 5 mM (Franklin andJohnson 1992). Activation of voltage-operated Ca2+ channels(VOCC) has been shown to account for most of the rise of[Ca2+]i observed in CGC upon partial depolarization by
increasing KCl concentration up to 25 mM (Franklin andJohnson 1992; Marchetti and Usai 1996; Evans and Pocock1999; Toescu 1999). Mature CGC in culture [7–8 daysin vitro (DIV)] express several types of VOCC. BesidesL-type sensitive to dihydropyridines similar to cardiac L-type,these neurones also express L-type with ‘anomalous gating’(Forti and Pietrobon 1993), N-, P-, Q-, T- and R-type(resistant to known blockers of the aforementioned VOCC,but with inactivation rate several-fold higher than T-type;Forti et al. 1994; Pearson et al. 1995; Randall and Tsien1995, 1997; Tottene et al. 1996; Schramm et al. 1999). Inspite of such VOCC diversity in CGC, several studies haveshown that in mature CGC grown in 25 mM KCl medium(7–8 DIV), L-type Ca2+ channels are predominantly respon-sible for the sustained rise of [Ca2+]i upon partial plasmamembrane depolarization in 25 mM KCl medium, whichpromotes neuronal survival (Franklin and Johnson 1992;Marchetti and Usai 1996; See et al. 2001). The relevance ofthe sustained raise in [Ca2+]i produced by 25 mM KCl-plasma membrane depolarization for CGC survival ishighlighted by the fact that within the first several hoursafter induction of apoptosis in 5 mM KCl medium, the celldeath can be largely blocked by simply increasing the KClconcentration of the extracellular medium to 25 mM (Galloet al. 1987; Martin-Romero et al. 2002), or with addition ofthe L-type Ca2+ channels activator BAY-K8644 to theextracellular medium (Franklin and Johnson 1992). More-over, blockade of L-type Ca2+ channels (nifedipine-sensitive)but not N/P/Q-type Ca2+ channels, triggered apoptosis inCGC in a 25 mM KCl medium (Gallo et al. 1987; Franklinand Johnson 1992; See et al. 2001).
Although CGC express NMDA receptor and metabotropicglutamate receptors (Balazs et al. 1988; Bessho et al. 1994;Resink et al. 1995), it is to be recalled that these receptorshave a yet immature subunit composition in CGC differen-tiated and grown in 25 mM KCl for 7–8 DIV (Vallano et al.1996). In addition, as L-type Ca2+ channels are largelyregionalized in the neuronal cell bodies of CGC (Harroldet al. 1997), the sustained rise of [Ca2+]i upon partialdepolarization by 25 mM KCl results only in a small increaseof glutamate secretion by the synaptic terminals (Abe et al.2003). Due to these reasons, the contribution of activation ofNMDA receptors to the sustained rise of [Ca2+]i upon partialdepolarization by 25 mM KCl is almost negligible, i.e. muchsmaller than that of VOCC and in particular of L-type VOCC(Toescu 1999; Pellistri et al. 2004).
The activity of plasma membrane Ca2+ pumps (PMCA) islargely responsible for resetting and maintaining the neuronal[Ca2+]i in the non-toxic range of 100–250 nM, a Ca2+
concentration range where the Na+/Ca2+ -exchanger operateswith much lower efficiency than the plasma membrane Ca2+
pump (Benham et al. 1992; Garcia-Martin and Gutierrez-Merino 1996; Werth et al. 1996; Garcia and Strehler 1999;Zenisek and Matthews 2000; Bhargava et al. 2002).
974 Y. Guiterrez-Martin et al.
� 2005 International Society for Neurochemistry, J. Neurochem. (2005) 92, 973–989
In this work we have studied the modulation of the steady-state cytosolic Ca2+ and cell viability of CGC neurones byexposure to SIN-1 concentrations which produce a peak ofperoxynitrite concentration between 1 and 20 lM. The resultsled to the conclusion that, in culture, L-type VOCC are moresensitive to inactivation by extracellular peroxynitrite thanthe PMCA and that the plasma membrane Na+/Ca2+-exchanger contribution to intracelular [Ca2+]i alterationsproduced by exposure of CGC to peroxynitrite is secondaryto those due to functional impairment of L-type VOCC andPMCA.
Materials and methods
Preparation of rat cerebellar granule cells
Cultures of cerebellar granule neurones were obtained from
dissociated cerebella of 7-day-old Wistar rats as described
previously (Martin-Romero et al. 1996b, 2000, 2002; Samhan-
Arias et al. 2004). Cells were plated in Dulbecco’s modified
Eagle’s medium (DMEM) supplemented with 10% heat-inactivated
fetal bovine serum (FBS), 0.1 mg/mL gentamicin and 25 mM KCl
on 35-mm dishes coated with poly-D-lysine, at a density of
2.5 · 106 cells/dish. Cultures were maintained at 37�C in a
humidified atmosphere of 95% air/5% CO2. Cytosine arabino-
furanoside (10 lM) was added to fresh culture medium 48 h after
plating to prevent replication of non-neuronal cells. Seven days
after plating, the culture medium was replaced with the following
serum-free medium (SFM): DMEM/F12 medium (1 : 1) supple-
mented with 30 mM glucose, 5 lg/mL insulin, 0.1 mg/mL
apo-transferrin, 20 nM progesterone, 50 U/mL penicillin, 50 lg/mL streptomycin, 0.1 mg/mL pyruvate, 2 mM L-glutamine and
containing either 5 or 25 mM KCl. All experiments were performed
using CGC at 8 DIV.
Exposure to SIN-1 has been performed in the following buffers
(pH 7.4 at 37�C): 4 mM NaHCO3, 10 mM HEPES, 5 mM glucose,
2.3 mM CaCl2, 1 mM MgCl2 and 134 mM NaCl/25 mM KCl (for
K25-Locke’s buffer) or 154 mM NaCl/5 mM KCl (for K5-Locke’s
buffer) and in a modified Locke’s buffers in which HEPES was
substituted by Tricine to minimize H2O2 production during SIN-1
decomposition, which we named K25- and K5-MLocke’s buffer.
Cell viability, caspase-3 activity, reduced glutathione content,
lipid peroxidation and energy charge
Estimation of viable cells was obtained by trypan blue exclusion and
also assessed by measuring the amount of coloured formazan by the
reduction of 3-(4,5-dimethylthiazol-2-yl)-2,5-diphenyltetrazolium
bromide (MTT) by viable cells as described previously (Martin-
Romero et al. 1996b, 2000, 2002; Samhan-Arias et al. 2004).
Caspase-3 activity was measured using Ac-DEVD-pNA as des-
cribed in Samhan-Arias et al. (2004).The measurement of reduced glutathione content of CGC was
done as described in Martin-Romero et al. (2002). Briefly, afterremoval of cell culture medium, CGC were lysed in ice-cold 10 mM
Tris, 1 mM EDTA supplemented with 10% perchloric acid and
precipitated proteins were removed by 10 min centrifugation at
12 000 g at 4�C. Thereafter, total and oxidized glutathione
measurements in the supernatant were done as indicated in Tietze
(1969), using 5,5¢-dithiobis(2-nitrobenzoic acid) and the recycling
system (glutathione reductase + NADPH).
Adenine nucleotides were determined fluorometrically as des-
cribed in Estabrook et al. (1967) after extraction with perchloric
acid and neutralization with KOH (Martin-Romero et al. 2002). Cellenergy charge was calculated according to the following equation:
(ATP + 0.5xADP)/(ATP + ADP + AMP).
Protein concentration was determined by the method of Bradford
(1976) using the Bio-Rad (Hercules, CA, USA) protein assay
reagent and bovine serum albumin as standard. Lipid peroxidation
has been measured using the thiobarbituric acid assay (Buege and
Aust 1978), as modified by Asakawa and Matsushita (1979) to
avoid lipid peroxidation during samples heating and interferences by
aldehydes.
Measurement of the cytosolic Ca2+ concentration
[Ca2+]i was measured basically as indicated in previous papers
(Guerini et al. 1999; Samhan-Arias et al. 2004). CGC were loaded
with fura-2 by incubation in DMEM-F12 for 45–60 min with 5 lMfura-2-acetoxymethyl ester (fura-2 AM) and 0.025% Pluronic-F127
at 37�C. Afterwards, CGC were washed twice with K25-Locke’s
buffer and the culture dish was placed in a thermostatic controlled
plate (Warner Instrument Co., Hamden, CT, USA) of a Nikon
Diaphot 300 inverted microscope, equipped with an epifluorescence
attachment and excitation filter wheel. To measure the intracellular
calcium concentration, ratio fluorescence images were obtained with
excitation filters of 340 and 380 nm and a dichroic mirror DM510
and absorption filter (emission side) of 510 nm. Digital images were
taken with a Hamamatsu Hisca CCD camera and Lamdba 10–2 filter
wheel controller and subsequently analysed with the Argus/Hisca
software. [Ca2+]i was calculated as indicated in (Thomas and
Delaville 1991), with the equation:
½Ca2þ�i ¼ Kd � fðR� RminÞ=ðRmax � RÞg � b ½1�
where R is the measured fluorescence ratio (340/380) and Rmax and
Rmin are the ratio values (340/380) for Ca2+-bound and Ca2+-free
fura-2 in loaded CGC. Rmax and Rmin were experimentally
determined from steady-state fluorescence ratio (340/380) measure-
ments after sequential addition to the culture medium of fura-2-
loaded CGC of (i) BrA23187 (5 lg/mL) or ionomycin (45 lg/mL)
and (ii) 10 mM EGTA, respectively. The average values obtained for
Rmax and Rmin were 2.8 ± 0.2 and 0.20 ± 0.02 (n > 500 cells),
respectively and the obtained average value for the ratio of
fluorescence values for Ca2+-free/Ca2+-bound indicator at 380 nm
(b) obtained with our instrument setup was 1.85 ± 0.15. A value of
224 nM has been used for Kd, the dissociation constant of the
complex fura-2:Ca2+ (Thomas 1991). The contribution of autoflu-
orescence, measured after fura-2 fluorescence quenching by addition
of 0.5–5 mM Mn2+ to the extracellular medium, was always lower
than 5% of the initial fluorescence signal of fura-2-loaded CGC and
the loss of fluorescence during the repetitive irradiation of fura-2-
loaded CGC in the kinetic measurements reported in this paper,
monitored with the 360 nm excitation filter, was at most 50% of the
initial fluorescence in long time readings with high SIN-1 concen-
trations, e.g. 100–110 min with 0.5 mM SIN-1. In addition, the
fluorescence of fura-2-loaded CGC was homogeneously quenched
Modulation of neuronal cytosolic calcium by SIN-1 975
� 2005 International Society for Neurochemistry, J. Neurochem. (2005) 92, 973–989

by Mn2+, indicating a diffuse distribution of fura-2 within the cells
and excluding a significant loading of fura-2 in subcellular
organelles, such as mitochondria or endoplasmic reticulum.
Measurement of peroxynitrite produced during SIN-1
decomposition
The rate of production of peroxynitrite during SIN-1 decomposition
in K25-Locke’s solution at 37�C has been calculated from the slope
at different times (with a time windows of 1 min) of the kinetics of
oxidation of NADH (Fig. 1) and the efficiency of peroxynitrite
detection by NADH, as in Martin-Romero et al. (2004). The
maximum peak for peroxynitrite production is attained at 20–
30 min after SIN-1 addition and it is 1.4 ± 0.1% of the total SIN-1
concentration. From Fig. 1(b), the time course of total peroxynitrite
production by SIN-1 can be obtained by integrating the area below
the curve up to different times and the results are shown in Fig. 1(c).
The maximum rate of peroxynitrite production, determined from the
rate of NADH oxidation, showed a linear dependence with SIN-1
concentration (Martin-Romero et al. 2004).H2O2 measurements have been done with Amplex Red/horse-
radish peroxidase assay, as indicated in the Molecular Probes
Handbook of Fluorescence Probes and Research Products (9th
edition).
Preparation of plasma membrane vesicles derived from
synaptosomes and assay of the Ca2+ ATPase activity
Synaptic plasma membrane vesicles were prepared from 3-month-
old Wistar rats brains, following the sucrose gradient method
described in Martin-Romero et al. (1996a). The plasma membrane
(Ca2+ + Mg2+) ATPase activity (PMCA) was measured at 25�Cusing the coupled pyruvate kinase/lactate dehydrogenase enzyme
system as described previously (Garcia-Martin and Gutierrez-Merino
1990; Martin-Romero et al. 1996a; Gutierrez-Martin et al. 2002)and calculated after steady-state activity was attained (Garcia-Martin
and Gutierrez-Merino 1990; Martin-Romero et al. 1996a). The
composition of the assay medium was the following: 0.1 M KCl,
2.5 mM MgCl2, 2 mM ATP, 50 lM CaCl2, 5 mM NaN3, 145 lg/mL
ouabain, 0.42 mM phosphoenolpyruvate, 0.22 mM NADH, 35 lg/mL pyruvate kinase, 30 lg/mL lactate dehydrogenase, 50 mM Tes
(pH 7.4) and 10–100 lg protein/mL of synaptic plasma membrane
vesicles. The Ca2+ ATPase was determined from the partial inhibition
of the total ATPase activity observed after addition of 5 mM EGTA.
Chemicals
3-morpholinosydnonimine (SIN-1), DMEM, DMEM:F12 (1 : 1),
heat inactivated fetal bovine serum, apo-transferrin, insulin, prog-
esterone, gentamicin, penicillin, streptomycin, pyruvate, glutamine,
cytosine arabinofuranoside, poly-D-lysine, MTT, NADH, NADPH,
NADP+, catalase, xanthine, xanthine oxidase (S)-(–)-BAY-K8644
(BAY-K8644), ionomycin, MnCl2+, 5,5¢-dithiobis(2-nitrobenzoate),
nimodipine and nifedipine were obtained from Sigma (St Louis,
MO, USA). COMPLETETM (protease inhibitor cocktail), glucose-6-
phosphate dehydrogenase, glutathione reductase, hexokinase, lactate
dehydrogenase, myokinase, proteinase K, pyruvate kinase, RNase
and SOD were purchased from Roche Molecular Biochemicals
(Indianapolis, IN, USA). (+)-MK-801 was obtained from RBI
(Natick, MA, USA) and x-conotoxin MVIIC, FPL 64176 and
KB-R7943 were purchased from Tocris Cookson (Ballwin, MO,
USA). Caspase-3 activity kit, MnTBAP and NOR-4 were purchased
from Calbiochem (San Diego, CA, USA). Fura-2 acetoxymethyl
ester (fura-2 AM), Pluronic-F127 and Br-A23187 were obtained
from Molecular Probes (Eugene, OR, USA). All other chemicals
were of the highest quality available.
To prevent SIN-1 decomposition, pre-weighed solid SIN-1 was
dissolved in Locke’s buffer (as a concentrated 0.1 or 0.2 M stock
solution), split into aliquots and rapidly frozen in liquid nitrogen and
used within 1–2 days. Frozen aliquots were thawed just before
Fig. 1 Kinetics of NADH oxidation by SIN-1: kinetics of peroxynitrite
production. Buffer: K25-Locke’s buffer (pH 7.4, 37�C). (a) Kinetics of
NADH oxidation (monitored by the decay of the absorbance at
340 nm) after addition of 30 lM SIN-1 to the buffered solution con-
taining 220 lM NADH (solid line). The dotted line (reference line)
corresponds to the air-dependent NADH oxidation upon irradiation at
340 nm in the same cuvette holder. (b) Time dependence of peroxy-
nitrite (ONOO)) production, obtained from the decrease of NADH
concentration (with 1-min intervals) derived from the kinetics of NADH
oxidation shown in (a). In the right Y-axis it is indicated the percentage
of total SIN-1 which corresponds to the data shown in the left Y-axis.
The continuous line shows that the data can be fit to a modified
Gaussian (non-linear least squares fit done with OriginTM software,
with a chi-square value of 0.00021). (c) Total [ONOO)] produced at
different times after addition of 30 lM SIN-1 to the solution, obtained
from the plots shown in (b) areas up to the time indicated in the
abscissa. Total [ONOO)] is given as the percentage of added SIN-1.
976 Y. Guiterrez-Martin et al.
� 2005 International Society for Neurochemistry, J. Neurochem. (2005) 92, 973–989
addition to the cell culture dish and in parallel routinely tested with
the NADH assay indicated above.
Results
The effect of exposure to SIN-1 on the cytosolic calcium
concentration of cerebellar granule cells is dependent
upon SIN-1 concentration
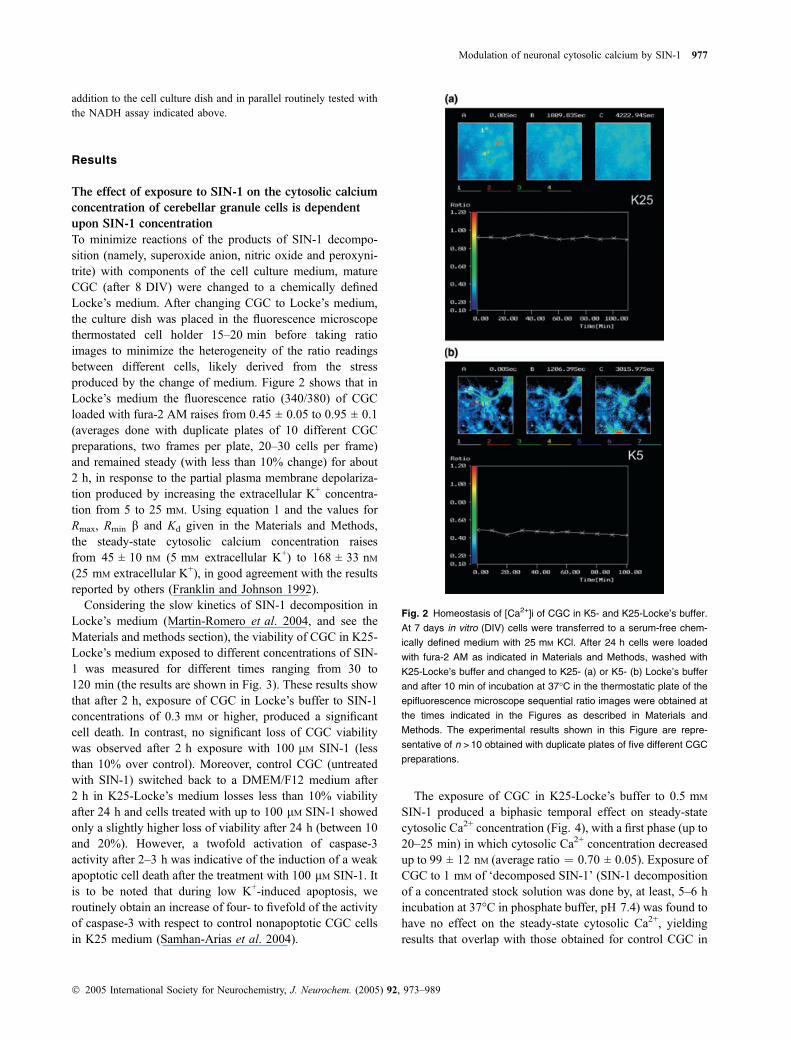
To minimize reactions of the products of SIN-1 decompo-sition (namely, superoxide anion, nitric oxide and peroxyni-trite) with components of the cell culture medium, matureCGC (after 8 DIV) were changed to a chemically definedLocke’s medium. After changing CGC to Locke’s medium,the culture dish was placed in the fluorescence microscopethermostated cell holder 15–20 min before taking ratioimages to minimize the heterogeneity of the ratio readingsbetween different cells, likely derived from the stressproduced by the change of medium. Figure 2 shows that inLocke’s medium the fluorescence ratio (340/380) of CGCloaded with fura-2 AM raises from 0.45 ± 0.05 to 0.95 ± 0.1(averages done with duplicate plates of 10 different CGCpreparations, two frames per plate, 20–30 cells per frame)and remained steady (with less than 10% change) for about2 h, in response to the partial plasma membrane depolariza-tion produced by increasing the extracellular K+ concentra-tion from 5 to 25 mM. Using equation 1 and the values forRmax, Rmin b and Kd given in the Materials and Methods,the steady-state cytosolic calcium concentration raisesfrom 45 ± 10 nM (5 mM extracellular K+) to 168 ± 33 nM(25 mM extracellular K+), in good agreement with the resultsreported by others (Franklin and Johnson 1992).
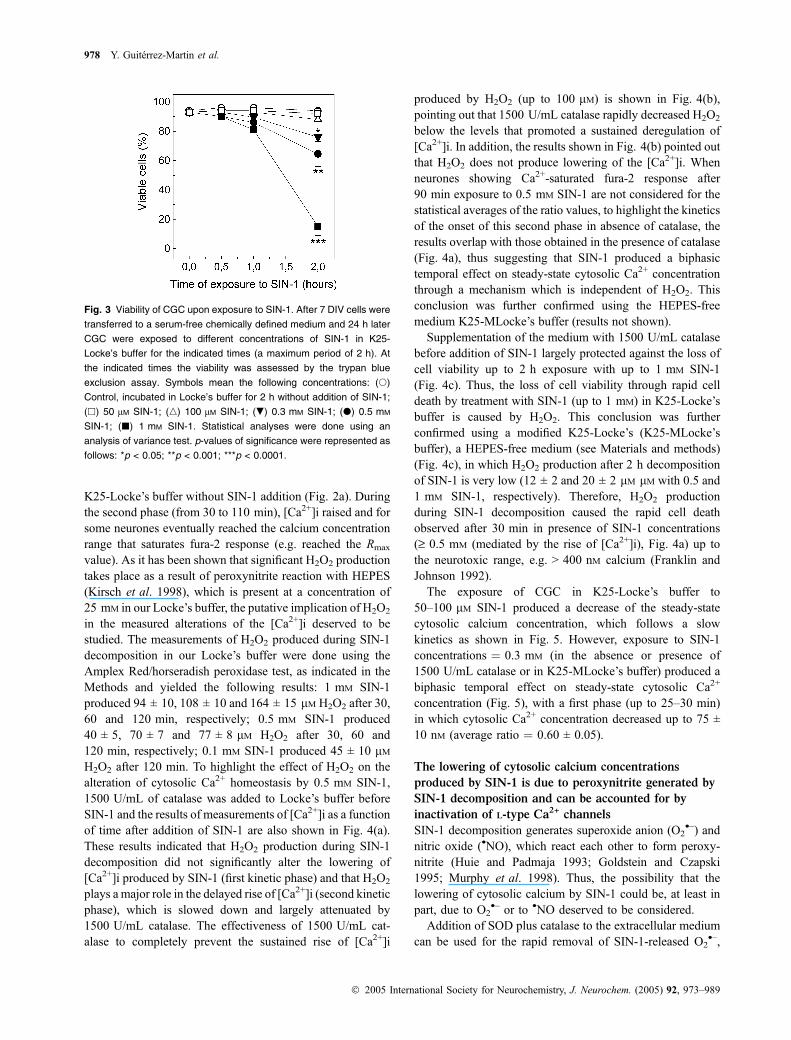
Considering the slow kinetics of SIN-1 decomposition inLocke’s medium (Martin-Romero et al. 2004, and see theMaterials and methods section), the viability of CGC in K25-Locke’s medium exposed to different concentrations of SIN-1 was measured for different times ranging from 30 to120 min (the results are shown in Fig. 3). These results showthat after 2 h, exposure of CGC in Locke’s buffer to SIN-1concentrations of 0.3 mM or higher, produced a significantcell death. In contrast, no significant loss of CGC viabilitywas observed after 2 h exposure with 100 lM SIN-1 (lessthan 10% over control). Moreover, control CGC (untreatedwith SIN-1) switched back to a DMEM/F12 medium after2 h in K25-Locke’s medium losses less than 10% viabilityafter 24 h and cells treated with up to 100 lM SIN-1 showedonly a slightly higher loss of viability after 24 h (between 10and 20%). However, a twofold activation of caspase-3activity after 2–3 h was indicative of the induction of a weakapoptotic cell death after the treatment with 100 lM SIN-1. Itis to be noted that during low K+-induced apoptosis, weroutinely obtain an increase of four- to fivefold of the activityof caspase-3 with respect to control nonapoptotic CGC cellsin K25 medium (Samhan-Arias et al. 2004).
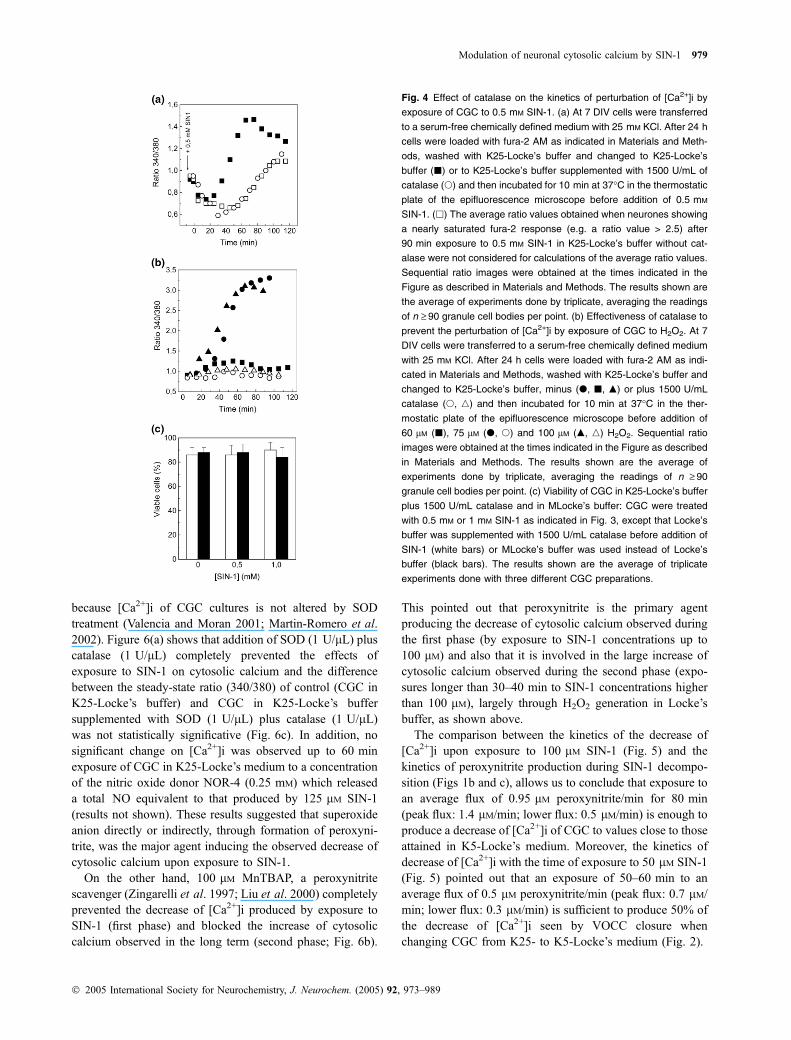
The exposure of CGC in K25-Locke’s buffer to 0.5 mM
SIN-1 produced a biphasic temporal effect on steady-statecytosolic Ca2+ concentration (Fig. 4), with a first phase (up to20–25 min) in which cytosolic Ca2+ concentration decreasedup to 99 ± 12 nM (average ratio ¼ 0.70 ± 0.05). Exposure ofCGC to 1 mM of ‘decomposed SIN-1’ (SIN-1 decompositionof a concentrated stock solution was done by, at least, 5–6 hincubation at 37�C in phosphate buffer, pH 7.4) was found tohave no effect on the steady-state cytosolic Ca2+, yieldingresults that overlap with those obtained for control CGC in
Fig. 2 Homeostasis of [Ca2+]i of CGC in K5- and K25-Locke’s buffer.
At 7 days in vitro (DIV) cells were transferred to a serum-free chem-
ically defined medium with 25 mM KCl. After 24 h cells were loaded
with fura-2 AM as indicated in Materials and Methods, washed with
K25-Locke’s buffer and changed to K25- (a) or K5- (b) Locke’s buffer
and after 10 min of incubation at 37�C in the thermostatic plate of the
epifluorescence microscope sequential ratio images were obtained at
the times indicated in the Figures as described in Materials and
Methods. The experimental results shown in this Figure are repre-
sentative of n > 10 obtained with duplicate plates of five different CGC
preparations.
Modulation of neuronal cytosolic calcium by SIN-1 977
� 2005 International Society for Neurochemistry, J. Neurochem. (2005) 92, 973–989
K25-Locke’s buffer without SIN-1 addition (Fig. 2a). Duringthe second phase (from 30 to 110 min), [Ca2+]i raised and forsome neurones eventually reached the calcium concentrationrange that saturates fura-2 response (e.g. reached the Rmax
value). As it has been shown that significant H2O2 productiontakes place as a result of peroxynitrite reaction with HEPES(Kirsch et al. 1998), which is present at a concentration of25 mM in our Locke’s buffer, the putative implication of H2O2
in the measured alterations of the [Ca2+]i deserved to bestudied. The measurements of H2O2 produced during SIN-1decomposition in our Locke’s buffer were done using theAmplex Red/horseradish peroxidase test, as indicated in theMethods and yielded the following results: 1 mM SIN-1produced 94 ± 10, 108 ± 10 and 164 ± 15 lM H2O2 after 30,60 and 120 min, respectively; 0.5 mM SIN-1 produced40 ± 5, 70 ± 7 and 77 ± 8 lM H2O2 after 30, 60 and120 min, respectively; 0.1 mM SIN-1 produced 45 ± 10 lMH2O2 after 120 min. To highlight the effect of H2O2 on thealteration of cytosolic Ca2+ homeostasis by 0.5 mM SIN-1,1500 U/mL of catalase was added to Locke’s buffer beforeSIN-1 and the results of measurements of [Ca2+]i as a functionof time after addition of SIN-1 are also shown in Fig. 4(a).These results indicated that H2O2 production during SIN-1decomposition did not significantly alter the lowering of[Ca2+]i produced by SIN-1 (first kinetic phase) and that H2O2
plays a major role in the delayed rise of [Ca2+]i (second kineticphase), which is slowed down and largely attenuated by1500 U/mL catalase. The effectiveness of 1500 U/mL cat-alase to completely prevent the sustained rise of [Ca2+]i
produced by H2O2 (up to 100 lM) is shown in Fig. 4(b),pointing out that 1500 U/mL catalase rapidly decreased H2O2
below the levels that promoted a sustained deregulation of[Ca2+]i. In addition, the results shown in Fig. 4(b) pointed outthat H2O2 does not produce lowering of the [Ca2+]i. Whenneurones showing Ca2+-saturated fura-2 response after90 min exposure to 0.5 mM SIN-1 are not considered for thestatistical averages of the ratio values, to highlight the kineticsof the onset of this second phase in absence of catalase, theresults overlap with those obtained in the presence of catalase(Fig. 4a), thus suggesting that SIN-1 produced a biphasictemporal effect on steady-state cytosolic Ca2+ concentrationthrough a mechanism which is independent of H2O2. Thisconclusion was further confirmed using the HEPES-freemedium K25-MLocke’s buffer (results not shown).
Supplementation of the medium with 1500 U/mL catalasebefore addition of SIN-1 largely protected against the loss ofcell viability up to 2 h exposure with up to 1 mM SIN-1(Fig. 4c). Thus, the loss of cell viability through rapid celldeath by treatment with SIN-1 (up to 1 mM) in K25-Locke’sbuffer is caused by H2O2. This conclusion was furtherconfirmed using a modified K25-Locke’s (K25-MLocke’sbuffer), a HEPES-free medium (see Materials and methods)(Fig. 4c), in which H2O2 production after 2 h decompositionof SIN-1 is very low (12 ± 2 and 20 ± 2 lM lM with 0.5 and1 mM SIN-1, respectively). Therefore, H2O2 productionduring SIN-1 decomposition caused the rapid cell deathobserved after 30 min in presence of SIN-1 concentrations(‡ 0.5 mM (mediated by the rise of [Ca2+]i), Fig. 4a) up tothe neurotoxic range, e.g. > 400 nM calcium (Franklin andJohnson 1992).
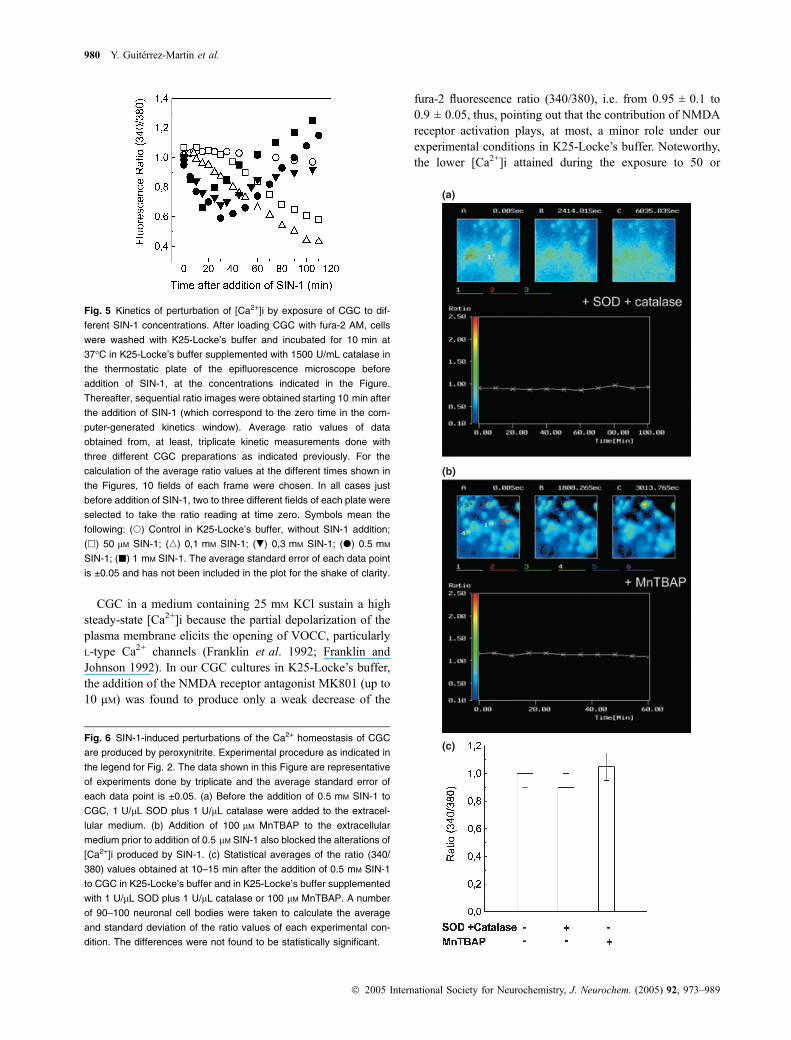
The exposure of CGC in K25-Locke’s buffer to50–100 lM SIN-1 produced a decrease of the steady-statecytosolic calcium concentration, which follows a slowkinetics as shown in Fig. 5. However, exposure to SIN-1concentrations ¼ 0.3 mM (in the absence or presence of1500 U/mL catalase or in K25-MLocke’s buffer) produced abiphasic temporal effect on steady-state cytosolic Ca2+
concentration (Fig. 5), with a first phase (up to 25–30 min)in which cytosolic Ca2+ concentration decreased up to 75 ±10 nM (average ratio ¼ 0.60 ± 0.05).
The lowering of cytosolic calcium concentrations
produced by SIN-1 is due to peroxynitrite generated by
SIN-1 decomposition and can be accounted for by
inactivation of L-type Ca2+ channels
SIN-1 decomposition generates superoxide anion (O2•–) and
nitric oxide (•NO), which react each other to form peroxy-nitrite (Huie and Padmaja 1993; Goldstein and Czapski1995; Murphy et al. 1998). Thus, the possibility that thelowering of cytosolic calcium by SIN-1 could be, at least inpart, due to O2
•– or to •NO deserved to be considered.Addition of SOD plus catalase to the extracellular medium
can be used for the rapid removal of SIN-1-released O2•–,
Fig. 3 Viability of CGC upon exposure to SIN-1. After 7 DIV cells were
transferred to a serum-free chemically defined medium and 24 h later
CGC were exposed to different concentrations of SIN-1 in K25-
Locke’s buffer for the indicated times (a maximum period of 2 h). At
the indicated times the viability was assessed by the trypan blue
exclusion assay. Symbols mean the following concentrations: (s)
Control, incubated in Locke’s buffer for 2 h without addition of SIN-1;
(h) 50 lM SIN-1; (n) 100 lM SIN-1; (.) 0.3 mM SIN-1; (d) 0.5 mM
SIN-1; (j) 1 mM SIN-1. Statistical analyses were done using an
analysis of variance test. p-values of significance were represented as
follows: *p < 0.05; **p < 0.001; ***p < 0.0001.
978 Y. Guiterrez-Martin et al.
� 2005 International Society for Neurochemistry, J. Neurochem. (2005) 92, 973–989
because [Ca2+]i of CGC cultures is not altered by SODtreatment (Valencia and Moran 2001; Martin-Romero et al.2002). Figure 6(a) shows that addition of SOD (1 U/lL) pluscatalase (1 U/lL) completely prevented the effects ofexposure to SIN-1 on cytosolic calcium and the differencebetween the steady-state ratio (340/380) of control (CGC inK25-Locke’s buffer) and CGC in K25-Locke’s buffersupplemented with SOD (1 U/lL) plus catalase (1 U/lL)was not statistically significative (Fig. 6c). In addition, nosignificant change on [Ca2+]i was observed up to 60 minexposure of CGC in K25-Locke’s medium to a concentrationof the nitric oxide donor NOR-4 (0.25 mM) which releaseda total ÆNO equivalent to that produced by 125 lM SIN-1(results not shown). These results suggested that superoxideanion directly or indirectly, through formation of peroxyni-trite, was the major agent inducing the observed decrease ofcytosolic calcium upon exposure to SIN-1.
On the other hand, 100 lM MnTBAP, a peroxynitritescavenger (Zingarelli et al. 1997; Liu et al. 2000) completelyprevented the decrease of [Ca2+]i produced by exposure toSIN-1 (first phase) and blocked the increase of cytosoliccalcium observed in the long term (second phase; Fig. 6b).
This pointed out that peroxynitrite is the primary agentproducing the decrease of cytosolic calcium observed duringthe first phase (by exposure to SIN-1 concentrations up to100 lM) and also that it is involved in the large increase ofcytosolic calcium observed during the second phase (expo-sures longer than 30–40 min to SIN-1 concentrations higherthan 100 lM), largely through H2O2 generation in Locke’sbuffer, as shown above.
The comparison between the kinetics of the decrease of[Ca2+]i upon exposure to 100 lM SIN-1 (Fig. 5) and thekinetics of peroxynitrite production during SIN-1 decompo-sition (Figs 1b and c), allows us to conclude that exposure toan average flux of 0.95 lM peroxynitrite/min for 80 min(peak flux: 1.4 lM/min; lower flux: 0.5 lM/min) is enough toproduce a decrease of [Ca2+]i of CGC to values close to thoseattained in K5-Locke’s medium. Moreover, the kinetics ofdecrease of [Ca2+]i with the time of exposure to 50 lM SIN-1(Fig. 5) pointed out that an exposure of 50–60 min to anaverage flux of 0.5 lM peroxynitrite/min (peak flux: 0.7 lM/min; lower flux: 0.3 lM/min) is sufficient to produce 50% ofthe decrease of [Ca2+]i seen by VOCC closure whenchanging CGC from K25- to K5-Locke’s medium (Fig. 2).
Fig. 4 Effect of catalase on the kinetics of perturbation of [Ca2+]i by
exposure of CGC to 0.5 mM SIN-1. (a) At 7 DIV cells were transferred
to a serum-free chemically defined medium with 25 mM KCl. After 24 h
cells were loaded with fura-2 AM as indicated in Materials and Meth-
ods, washed with K25-Locke’s buffer and changed to K25-Locke’s
buffer (j) or to K25-Locke’s buffer supplemented with 1500 U/mL of
catalase (s) and then incubated for 10 min at 37�C in the thermostatic
plate of the epifluorescence microscope before addition of 0.5 mM
SIN-1. (h) The average ratio values obtained when neurones showing
a nearly saturated fura-2 response (e.g. a ratio value > 2.5) after
90 min exposure to 0.5 mM SIN-1 in K25-Locke’s buffer without cat-
alase were not considered for calculations of the average ratio values.
Sequential ratio images were obtained at the times indicated in the
Figure as described in Materials and Methods. The results shown are
the average of experiments done by triplicate, averaging the readings
of n ‡ 90 granule cell bodies per point. (b) Effectiveness of catalase to
prevent the perturbation of [Ca2+]i by exposure of CGC to H2O2. At 7
DIV cells were transferred to a serum-free chemically defined medium
with 25 mM KCl. After 24 h cells were loaded with fura-2 AM as indi-
cated in Materials and Methods, washed with K25-Locke’s buffer and
changed to K25-Locke’s buffer, minus (d, j, m) or plus 1500 U/mL
catalase (s, n) and then incubated for 10 min at 37�C in the ther-
mostatic plate of the epifluorescence microscope before addition of
60 lM (j), 75 lM (d, s) and 100 lM (m, n) H2O2. Sequential ratio
images were obtained at the times indicated in the Figure as described
in Materials and Methods. The results shown are the average of
experiments done by triplicate, averaging the readings of n ‡ 90
granule cell bodies per point. (c) Viability of CGC in K25-Locke’s buffer
plus 1500 U/mL catalase and in MLocke’s buffer: CGC were treated
with 0.5 mM or 1 mM SIN-1 as indicated in Fig. 3, except that Locke’s
buffer was supplemented with 1500 U/mL catalase before addition of
SIN-1 (white bars) or MLocke’s buffer was used instead of Locke’s
buffer (black bars). The results shown are the average of triplicate
experiments done with three different CGC preparations.
Modulation of neuronal cytosolic calcium by SIN-1 979
� 2005 International Society for Neurochemistry, J. Neurochem. (2005) 92, 973–989
CGC in a medium containing 25 mM KCl sustain a highsteady-state [Ca2+]i because the partial depolarization of theplasma membrane elicits the opening of VOCC, particularlyL-type Ca2+ channels (Franklin et al. 1992; Franklin andJohnson 1992). In our CGC cultures in K25-Locke’s buffer,the addition of the NMDA receptor antagonist MK801 (up to10 lM) was found to produce only a weak decrease of the
fura-2 fluorescence ratio (340/380), i.e. from 0.95 ± 0.1 to0.9 ± 0.05, thus, pointing out that the contribution of NMDAreceptor activation plays, at most, a minor role under ourexperimental conditions in K25-Locke’s buffer. Noteworthy,the lower [Ca2+]i attained during the exposure to 50 or
Fig. 5 Kinetics of perturbation of [Ca2+]i by exposure of CGC to dif-
ferent SIN-1 concentrations. After loading CGC with fura-2 AM, cells
were washed with K25-Locke’s buffer and incubated for 10 min at
37�C in K25-Locke’s buffer supplemented with 1500 U/mL catalase in
the thermostatic plate of the epifluorescence microscope before
addition of SIN-1, at the concentrations indicated in the Figure.
Thereafter, sequential ratio images were obtained starting 10 min after
the addition of SIN-1 (which correspond to the zero time in the com-
puter-generated kinetics window). Average ratio values of data
obtained from, at least, triplicate kinetic measurements done with
three different CGC preparations as indicated previously. For the
calculation of the average ratio values at the different times shown in
the Figures, 10 fields of each frame were chosen. In all cases just
before addition of SIN-1, two to three different fields of each plate were
selected to take the ratio reading at time zero. Symbols mean the
following: (s) Control in K25-Locke’s buffer, without SIN-1 addition;
(h) 50 lM SIN-1; (n) 0,1 mM SIN-1; (.) 0,3 mM SIN-1; (d) 0.5 mM
SIN-1; (j) 1 mM SIN-1. The average standard error of each data point
is ±0.05 and has not been included in the plot for the shake of clarity.
(a)
(b)
(c)Fig. 6 SIN-1-induced perturbations of the Ca2+ homeostasis of CGC
are produced by peroxynitrite. Experimental procedure as indicated in
the legend for Fig. 2. The data shown in this Figure are representative
of experiments done by triplicate and the average standard error of
each data point is ±0.05. (a) Before the addition of 0.5 mM SIN-1 to
CGC, 1 U/lL SOD plus 1 U/lL catalase were added to the extracel-
lular medium. (b) Addition of 100 lM MnTBAP to the extracellular
medium prior to addition of 0.5 lM SIN-1 also blocked the alterations of
[Ca2+]i produced by SIN-1. (c) Statistical averages of the ratio (340/
380) values obtained at 10–15 min after the addition of 0.5 mM SIN-1
to CGC in K25-Locke’s buffer and in K25-Locke’s buffer supplemented
with 1 U/lL SOD plus 1 U/lL catalase or 100 lM MnTBAP. A number
of 90–100 neuronal cell bodies were taken to calculate the average
and standard deviation of the ratio values of each experimental con-
dition. The differences were not found to be statistically significant.
980 Y. Guiterrez-Martin et al.
� 2005 International Society for Neurochemistry, J. Neurochem. (2005) 92, 973–989
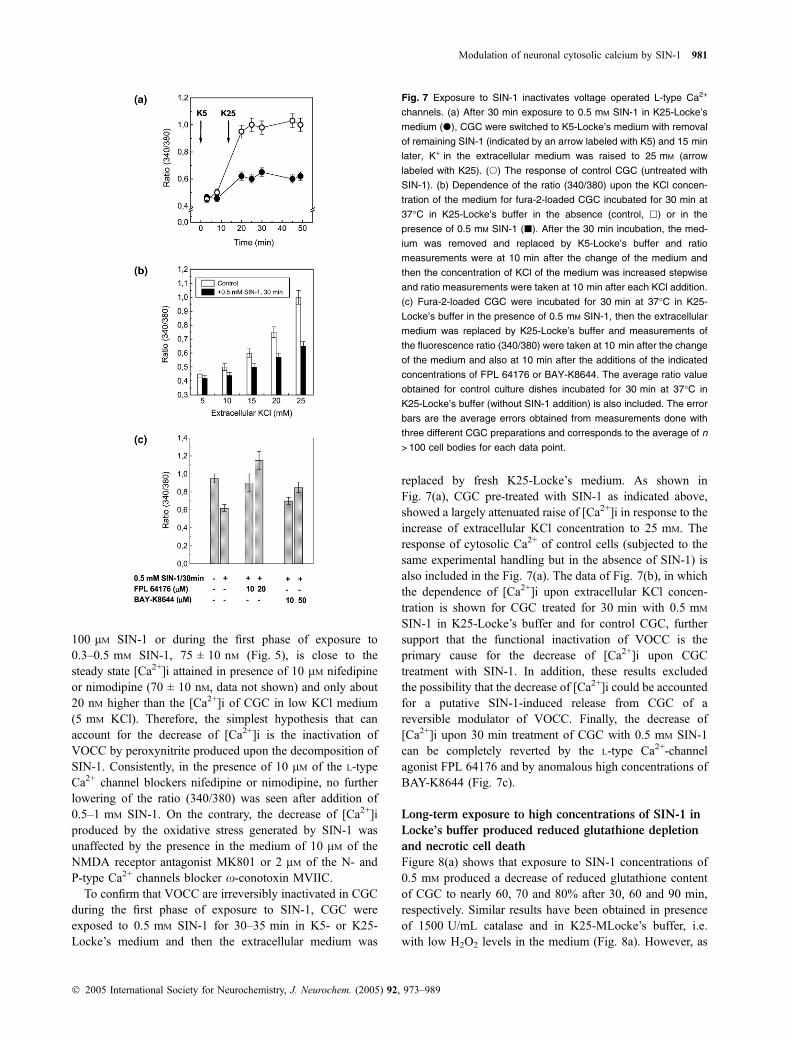
100 lM SIN-1 or during the first phase of exposure to0.3–0.5 mM SIN-1, 75 ± 10 nM (Fig. 5), is close to thesteady state [Ca2+]i attained in presence of 10 lM nifedipineor nimodipine (70 ± 10 nM, data not shown) and only about20 nM higher than the [Ca2+]i of CGC in low KCl medium(5 mM KCl). Therefore, the simplest hypothesis that canaccount for the decrease of [Ca2+]i is the inactivation ofVOCC by peroxynitrite produced upon the decomposition ofSIN-1. Consistently, in the presence of 10 lM of the L-typeCa2+ channel blockers nifedipine or nimodipine, no furtherlowering of the ratio (340/380) was seen after addition of0.5–1 mM SIN-1. On the contrary, the decrease of [Ca2+]iproduced by the oxidative stress generated by SIN-1 wasunaffected by the presence in the medium of 10 lM of theNMDA receptor antagonist MK801 or 2 lM of the N- andP-type Ca2+ channels blocker x-conotoxin MVIIC.
To confirm that VOCC are irreversibly inactivated in CGCduring the first phase of exposure to SIN-1, CGC wereexposed to 0.5 mM SIN-1 for 30–35 min in K5- or K25-Locke’s medium and then the extracellular medium was
replaced by fresh K25-Locke’s medium. As shown inFig. 7(a), CGC pre-treated with SIN-1 as indicated above,showed a largely attenuated raise of [Ca2+]i in response to theincrease of extracellular KCl concentration to 25 mM. Theresponse of cytosolic Ca2+ of control cells (subjected to thesame experimental handling but in the absence of SIN-1) isalso included in the Fig. 7(a). The data of Fig. 7(b), in whichthe dependence of [Ca2+]i upon extracellular KCl concen-tration is shown for CGC treated for 30 min with 0.5 mM
SIN-1 in K25-Locke’s buffer and for control CGC, furthersupport that the functional inactivation of VOCC is theprimary cause for the decrease of [Ca2+]i upon CGCtreatment with SIN-1. In addition, these results excludedthe possibility that the decrease of [Ca2+]i could be accountedfor a putative SIN-1-induced release from CGC of areversible modulator of VOCC. Finally, the decrease of[Ca2+]i upon 30 min treatment of CGC with 0.5 mM SIN-1can be completely reverted by the L-type Ca2+-channelagonist FPL 64176 and by anomalous high concentrations ofBAY-K8644 (Fig. 7c).
Long-term exposure to high concentrations of SIN-1 in
Locke’s buffer produced reduced glutathione depletion
and necrotic cell death
Figure 8(a) shows that exposure to SIN-1 concentrations of0.5 mM produced a decrease of reduced glutathione contentof CGC to nearly 60, 70 and 80% after 30, 60 and 90 min,respectively. Similar results have been obtained in presenceof 1500 U/mL catalase and in K25-MLocke’s buffer, i.e.with low H2O2 levels in the medium (Fig. 8a). However, as
Fig. 7 Exposure to SIN-1 inactivates voltage operated L-type Ca2+
channels. (a) After 30 min exposure to 0.5 mM SIN-1 in K25-Locke’s
medium (d), CGC were switched to K5-Locke’s medium with removal
of remaining SIN-1 (indicated by an arrow labeled with K5) and 15 min
later, K+ in the extracellular medium was raised to 25 mM (arrow
labeled with K25). (s) The response of control CGC (untreated with
SIN-1). (b) Dependence of the ratio (340/380) upon the KCl concen-
tration of the medium for fura-2-loaded CGC incubated for 30 min at
37�C in K25-Locke’s buffer in the absence (control, h) or in the
presence of 0.5 mM SIN-1 (j). After the 30 min incubation, the med-
ium was removed and replaced by K5-Locke’s buffer and ratio
measurements were at 10 min after the change of the medium and
then the concentration of KCl of the medium was increased stepwise
and ratio measurements were taken at 10 min after each KCl addition.
(c) Fura-2-loaded CGC were incubated for 30 min at 37�C in K25-
Locke’s buffer in the presence of 0.5 mM SIN-1, then the extracellular
medium was replaced by K25-Locke’s buffer and measurements of
the fluorescence ratio (340/380) were taken at 10 min after the change
of the medium and also at 10 min after the additions of the indicated
concentrations of FPL 64176 or BAY-K8644. The average ratio value
obtained for control culture dishes incubated for 30 min at 37�C in
K25-Locke’s buffer (without SIN-1 addition) is also included. The error
bars are the average errors obtained from measurements done with
three different CGC preparations and corresponds to the average of n
> 100 cell bodies for each data point.
Modulation of neuronal cytosolic calcium by SIN-1 981
� 2005 International Society for Neurochemistry, J. Neurochem. (2005) 92, 973–989
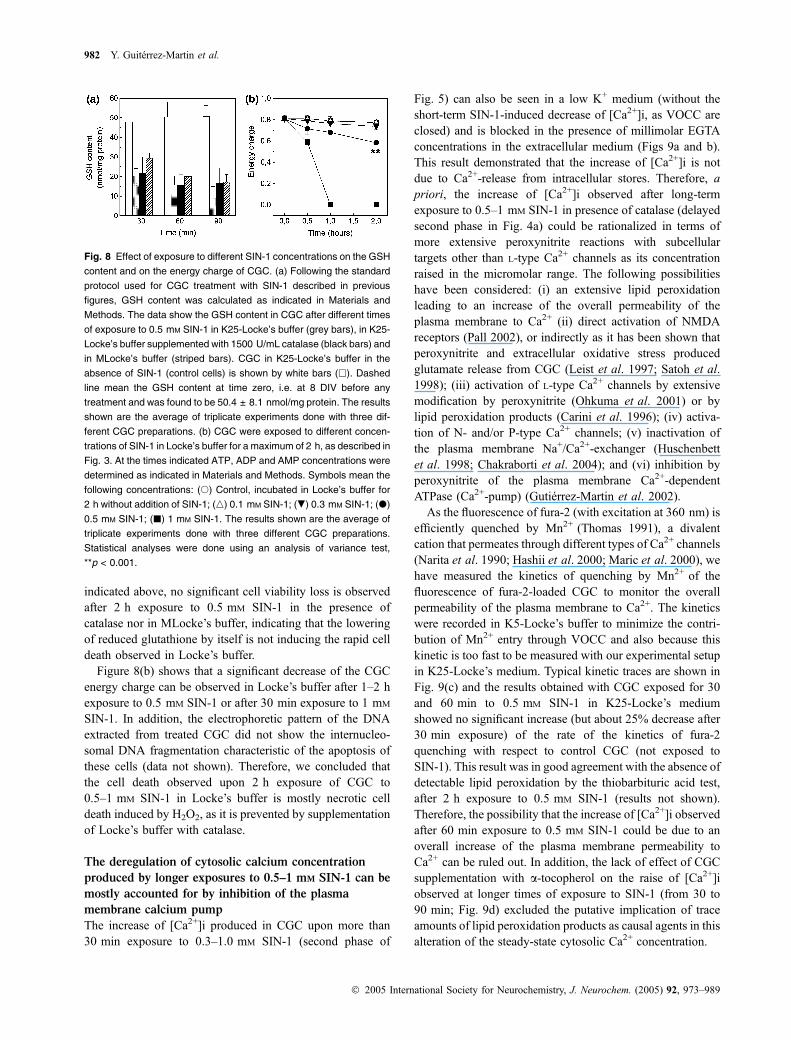
indicated above, no significant cell viability loss is observedafter 2 h exposure to 0.5 mM SIN-1 in the presence ofcatalase nor in MLocke’s buffer, indicating that the loweringof reduced glutathione by itself is not inducing the rapid celldeath observed in Locke’s buffer.
Figure 8(b) shows that a significant decrease of the CGCenergy charge can be observed in Locke’s buffer after 1–2 hexposure to 0.5 mM SIN-1 or after 30 min exposure to 1 mM
SIN-1. In addition, the electrophoretic pattern of the DNAextracted from treated CGC did not show the internucleo-somal DNA fragmentation characteristic of the apoptosis ofthese cells (data not shown). Therefore, we concluded thatthe cell death observed upon 2 h exposure of CGC to0.5–1 mM SIN-1 in Locke’s buffer is mostly necrotic celldeath induced by H2O2, as it is prevented by supplementationof Locke’s buffer with catalase.
The deregulation of cytosolic calcium concentration
produced by longer exposures to 0.5–1 mM SIN-1 can be
mostly accounted for by inhibition of the plasma
membrane calcium pump
The increase of [Ca2+]i produced in CGC upon more than30 min exposure to 0.3–1.0 mM SIN-1 (second phase of
Fig. 5) can also be seen in a low K+ medium (without theshort-term SIN-1-induced decrease of [Ca2+]i, as VOCC areclosed) and is blocked in the presence of millimolar EGTAconcentrations in the extracellular medium (Figs 9a and b).This result demonstrated that the increase of [Ca2+]i is notdue to Ca2+-release from intracellular stores. Therefore, apriori, the increase of [Ca2+]i observed after long-termexposure to 0.5–1 mM SIN-1 in presence of catalase (delayedsecond phase in Fig. 4a) could be rationalized in terms ofmore extensive peroxynitrite reactions with subcellulartargets other than L-type Ca2+ channels as its concentrationraised in the micromolar range. The following possibilitieshave been considered: (i) an extensive lipid peroxidationleading to an increase of the overall permeability of theplasma membrane to Ca2+ (ii) direct activation of NMDAreceptors (Pall 2002), or indirectly as it has been shown thatperoxynitrite and extracellular oxidative stress producedglutamate release from CGC (Leist et al. 1997; Satoh et al.1998); (iii) activation of L-type Ca2+ channels by extensivemodification by peroxynitrite (Ohkuma et al. 2001) or bylipid peroxidation products (Carini et al. 1996); (iv) activa-tion of N- and/or P-type Ca2+ channels; (v) inactivation ofthe plasma membrane Na+/Ca2+-exchanger (Huschenbettet al. 1998; Chakraborti et al. 2004); and (vi) inhibition byperoxynitrite of the plasma membrane Ca2+-dependentATPase (Ca2+-pump) (Gutierrez-Martin et al. 2002).
As the fluorescence of fura-2 (with excitation at 360 nm) isefficiently quenched by Mn2+ (Thomas 1991), a divalentcation that permeates through different types of Ca2+ channels(Narita et al. 1990; Hashii et al. 2000; Maric et al. 2000), wehave measured the kinetics of quenching by Mn2+ of thefluorescence of fura-2-loaded CGC to monitor the overallpermeability of the plasma membrane to Ca2+. The kineticswere recorded in K5-Locke’s buffer to minimize the contri-bution of Mn2+ entry through VOCC and also because thiskinetic is too fast to be measured with our experimental setupin K25-Locke’s medium. Typical kinetic traces are shown inFig. 9(c) and the results obtained with CGC exposed for 30and 60 min to 0.5 mM SIN-1 in K25-Locke’s mediumshowed no significant increase (but about 25% decrease after30 min exposure) of the rate of the kinetics of fura-2quenching with respect to control CGC (not exposed toSIN-1). This result was in good agreement with the absence ofdetectable lipid peroxidation by the thiobarbituric acid test,after 2 h exposure to 0.5 mM SIN-1 (results not shown).Therefore, the possibility that the increase of [Ca2+]i observedafter 60 min exposure to 0.5 mM SIN-1 could be due to anoverall increase of the plasma membrane permeability toCa2+ can be ruled out. In addition, the lack of effect of CGCsupplementation with a-tocopherol on the raise of [Ca2+]iobserved at longer times of exposure to SIN-1 (from 30 to90 min; Fig. 9d) excluded the putative implication of traceamounts of lipid peroxidation products as causal agents in thisalteration of the steady-state cytosolic Ca2+ concentration.
Fig. 8 Effect of exposure to different SIN-1 concentrations on the GSH
content and on the energy charge of CGC. (a) Following the standard
protocol used for CGC treatment with SIN-1 described in previous
figures, GSH content was calculated as indicated in Materials and
Methods. The data show the GSH content in CGC after different times
of exposure to 0.5 mM SIN-1 in K25-Locke’s buffer (grey bars), in K25-
Locke’s buffer supplemented with 1500 U/mL catalase (black bars) and
in MLocke’s buffer (striped bars). CGC in K25-Locke’s buffer in the
absence of SIN-1 (control cells) is shown by white bars (h). Dashed
line mean the GSH content at time zero, i.e. at 8 DIV before any
treatment and was found to be 50.4 ± 8.1 nmol/mg protein. The results
shown are the average of triplicate experiments done with three dif-
ferent CGC preparations. (b) CGC were exposed to different concen-
trations of SIN-1 in Locke’s buffer for a maximum of 2 h, as described in
Fig. 3. At the times indicated ATP, ADP and AMP concentrations were
determined as indicated in Materials and Methods. Symbols mean the
following concentrations: (s) Control, incubated in Locke’s buffer for
2 h without addition of SIN-1; (n) 0.1 mM SIN-1; (.) 0.3 mM SIN-1; (d)
0.5 mM SIN-1; (j) 1 mM SIN-1. The results shown are the average of
triplicate experiments done with three different CGC preparations.
Statistical analyses were done using an analysis of variance test,
**p < 0.001.
982 Y. Guiterrez-Martin et al.
� 2005 International Society for Neurochemistry, J. Neurochem. (2005) 92, 973–989
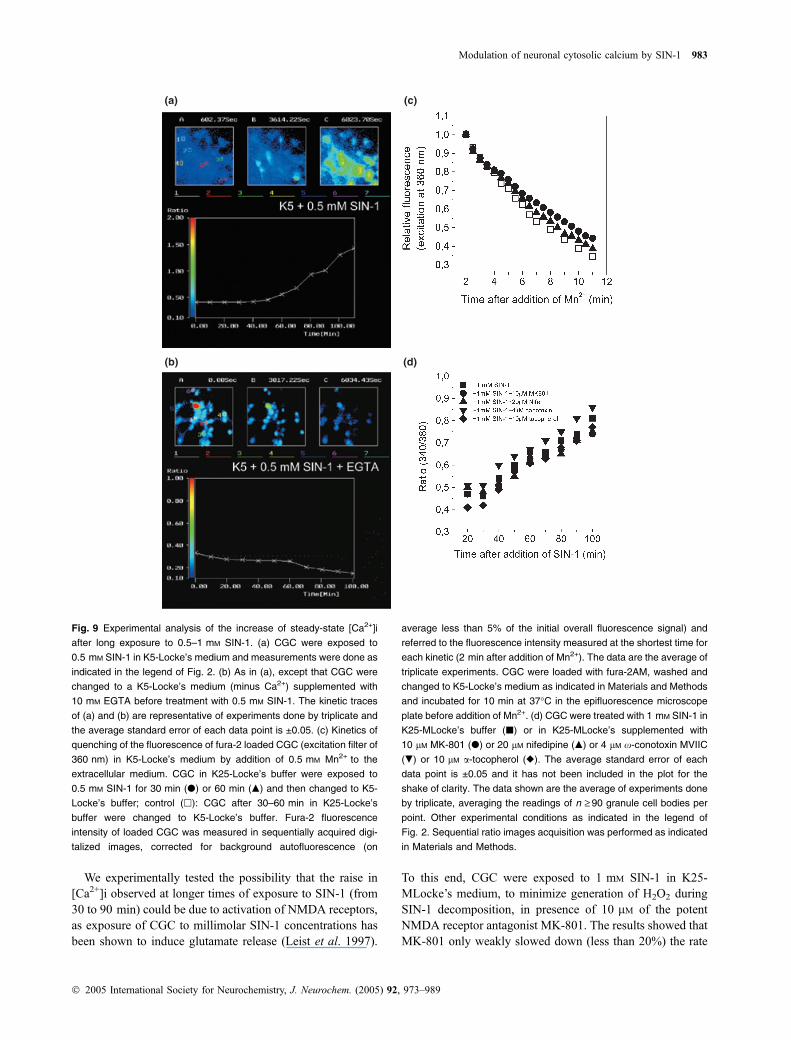
We experimentally tested the possibility that the raise in[Ca2+]i observed at longer times of exposure to SIN-1 (from30 to 90 min) could be due to activation of NMDA receptors,as exposure of CGC to millimolar SIN-1 concentrations hasbeen shown to induce glutamate release (Leist et al. 1997).
To this end, CGC were exposed to 1 mM SIN-1 in K25-MLocke’s medium, to minimize generation of H2O2 duringSIN-1 decomposition, in presence of 10 lM of the potentNMDA receptor antagonist MK-801. The results showed thatMK-801 only weakly slowed down (less than 20%) the rate
(a)
(b) (d)
(c)
Fig. 9 Experimental analysis of the increase of steady-state [Ca2+]i
after long exposure to 0.5–1 mM SIN-1. (a) CGC were exposed to
0.5 mM SIN-1 in K5-Locke’s medium and measurements were done as
indicated in the legend of Fig. 2. (b) As in (a), except that CGC were
changed to a K5-Locke’s medium (minus Ca2+) supplemented with
10 mM EGTA before treatment with 0.5 mM SIN-1. The kinetic traces
of (a) and (b) are representative of experiments done by triplicate and
the average standard error of each data point is ±0.05. (c) Kinetics of
quenching of the fluorescence of fura-2 loaded CGC (excitation filter of
360 nm) in K5-Locke’s medium by addition of 0.5 mM Mn2+ to the
extracellular medium. CGC in K25-Locke’s buffer were exposed to
0.5 mM SIN-1 for 30 min (d) or 60 min (m) and then changed to K5-
Locke’s buffer; control (h): CGC after 30–60 min in K25-Locke’s
buffer were changed to K5-Locke’s buffer. Fura-2 fluorescence
intensity of loaded CGC was measured in sequentially acquired digi-
talized images, corrected for background autofluorescence (on
average less than 5% of the initial overall fluorescence signal) and
referred to the fluorescence intensity measured at the shortest time for
each kinetic (2 min after addition of Mn2+). The data are the average of
triplicate experiments. CGC were loaded with fura-2AM, washed and
changed to K5-Locke’s medium as indicated in Materials and Methods
and incubated for 10 min at 37�C in the epifluorescence microscope
plate before addition of Mn2+. (d) CGC were treated with 1 mM SIN-1 in
K25-MLocke’s buffer (j) or in K25-MLocke’s supplemented with
10 lM MK-801 (d) or 20 lM nifedipine (m) or 4 lM x-conotoxin MVIIC
(.) or 10 lM a-tocopherol (r). The average standard error of each
data point is ±0.05 and it has not been included in the plot for the
shake of clarity. The data shown are the average of experiments done
by triplicate, averaging the readings of n ‡ 90 granule cell bodies per
point. Other experimental conditions as indicated in the legend of
Fig. 2. Sequential ratio images acquisition was performed as indicated
in Materials and Methods.
Modulation of neuronal cytosolic calcium by SIN-1 983
� 2005 International Society for Neurochemistry, J. Neurochem. (2005) 92, 973–989
of the increase of [Ca2+]i (Fig. 9d) and nearly 30% whenCGC were exposed to 0.5 mM SIN-1 in K25-Locke’s buffer,e.g. exposed to a combined (peroxynitrite + H2O2) insult(results not shown). Furthermore, the increase of [Ca2+]i wasnot prevented nor significantly attenuated by the potent L-type Ca2+ blocker nifedipine, neither by x-conotoxin MVIIC(see also Fig. 9d), thus, excluding the possibility of anincrease of [Ca2+]i due to an activation of L-type Ca2+
channels, or N-/P-type Ca2+ channels by a putative extensivemodification by peroxynitrite.
On the other hand, a rise in [Ca2+]i can be also rationalizedin terms of SIN-1 inhibition of any of the major systems ofthe plasma membrane involved in the maintenance of low[Ca2+]i, namely, the Na+/Ca2+-exchanger and the Ca2+-pump.The first of these possibilities has been tested by using KB-R7943, a specific inhibitor of the Na+/Ca2+-exchanger(Iwamoto et al. 1996; Bradford and Nadler 2004). However:(i) incubation up to 30 min with 5 lM KB-R7943 did notchange of the fluorescence ratio (340/380) of fura-2-loadedCGC in K25-Locke’s buffer (e.g. less than 0.05 units change)and (ii) we have not found any difference in the kinetics ofthe fluorescence ratio (340/380) up to 75 min after additionof 0.5 mM SIN-1 in presence of 1500 U/mL catalase and5 lM KB-R7943 with respect to the kinetic traces obtained inabsence of KB-R7943 (results not shown). Higher concen-trations of KB-R7943 have not been used to avoid unspecific
effects on other Ca2+-transport systems described previously(Matsuda et al. 2001).
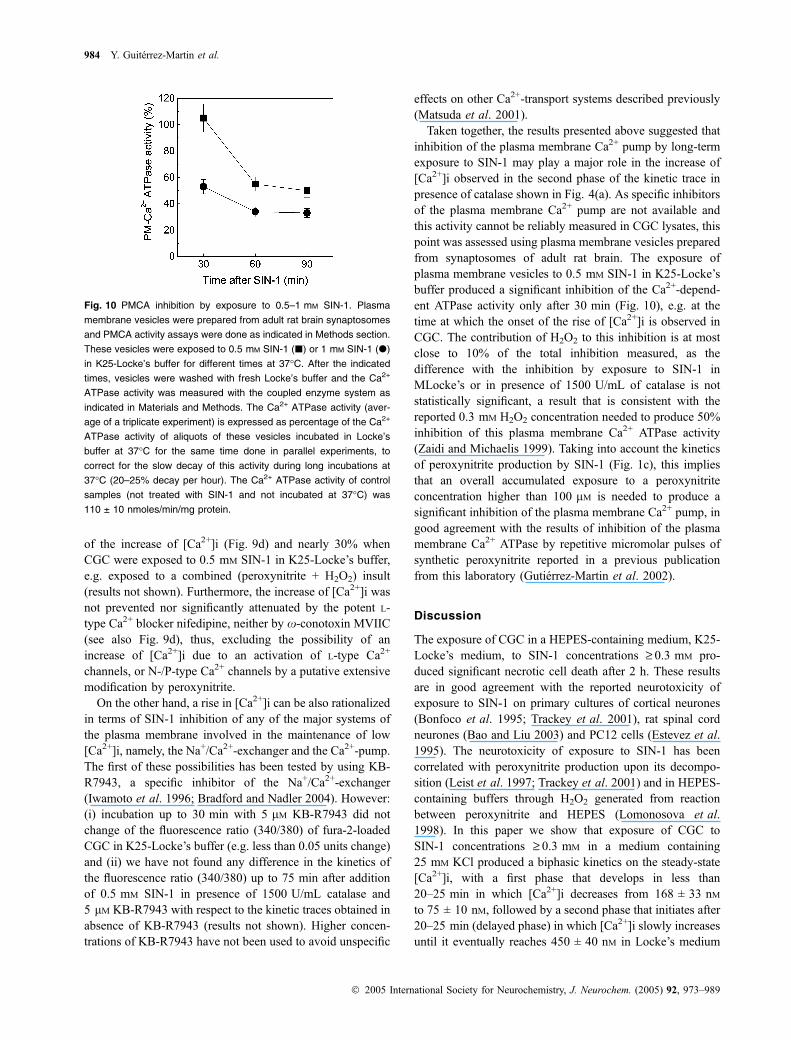
Taken together, the results presented above suggested thatinhibition of the plasma membrane Ca2+ pump by long-termexposure to SIN-1 may play a major role in the increase of[Ca2+]i observed in the second phase of the kinetic trace inpresence of catalase shown in Fig. 4(a). As specific inhibitorsof the plasma membrane Ca2+ pump are not available andthis activity cannot be reliably measured in CGC lysates, thispoint was assessed using plasma membrane vesicles preparedfrom synaptosomes of adult rat brain. The exposure ofplasma membrane vesicles to 0.5 mM SIN-1 in K25-Locke’sbuffer produced a significant inhibition of the Ca2+-depend-ent ATPase activity only after 30 min (Fig. 10), e.g. at thetime at which the onset of the rise of [Ca2+]i is observed inCGC. The contribution of H2O2 to this inhibition is at mostclose to 10% of the total inhibition measured, as thedifference with the inhibition by exposure to SIN-1 inMLocke’s or in presence of 1500 U/mL of catalase is notstatistically significant, a result that is consistent with thereported 0.3 mM H2O2 concentration needed to produce 50%inhibition of this plasma membrane Ca2+ ATPase activity(Zaidi and Michaelis 1999). Taking into account the kineticsof peroxynitrite production by SIN-1 (Fig. 1c), this impliesthat an overall accumulated exposure to a peroxynitriteconcentration higher than 100 lM is needed to produce asignificant inhibition of the plasma membrane Ca2+ pump, ingood agreement with the results of inhibition of the plasmamembrane Ca2+ ATPase by repetitive micromolar pulses ofsynthetic peroxynitrite reported in a previous publicationfrom this laboratory (Gutierrez-Martin et al. 2002).
Discussion
The exposure of CGC in a HEPES-containing medium, K25-Locke’s medium, to SIN-1 concentrations ‡ 0.3 mM pro-duced significant necrotic cell death after 2 h. These resultsare in good agreement with the reported neurotoxicity ofexposure to SIN-1 on primary cultures of cortical neurones(Bonfoco et al. 1995; Trackey et al. 2001), rat spinal cordneurones (Bao and Liu 2003) and PC12 cells (Estevez et al.1995). The neurotoxicity of exposure to SIN-1 has beencorrelated with peroxynitrite production upon its decompo-sition (Leist et al. 1997; Trackey et al. 2001) and in HEPES-containing buffers through H2O2 generated from reactionbetween peroxynitrite and HEPES (Lomonosova et al.1998). In this paper we show that exposure of CGC toSIN-1 concentrations ‡ 0.3 mM in a medium containing25 mM KCl produced a biphasic kinetics on the steady-state[Ca2+]i, with a first phase that develops in less than20–25 min in which [Ca2+]i decreases from 168 ± 33 nMto 75 ± 10 nM, followed by a second phase that initiates after20–25 min (delayed phase) in which [Ca2+]i slowly increasesuntil it eventually reaches 450 ± 40 nM in Locke’s medium
Fig. 10 PMCA inhibition by exposure to 0.5–1 mM SIN-1. Plasma
membrane vesicles were prepared from adult rat brain synaptosomes
and PMCA activity assays were done as indicated in Methods section.
These vesicles were exposed to 0.5 mM SIN-1 (j) or 1 mM SIN-1 (d)
in K25-Locke’s buffer for different times at 37�C. After the indicated
times, vesicles were washed with fresh Locke’s buffer and the Ca2+
ATPase activity was measured with the coupled enzyme system as
indicated in Materials and Methods. The Ca2+ ATPase activity (aver-
age of a triplicate experiment) is expressed as percentage of the Ca2+
ATPase activity of aliquots of these vesicles incubated in Locke’s
buffer at 37�C for the same time done in parallel experiments, to
correct for the slow decay of this activity during long incubations at
37�C (20–25% decay per hour). The Ca2+ ATPase activity of control
samples (not treated with SIN-1 and not incubated at 37�C) was
110 ± 10 nmoles/min/mg protein.
984 Y. Guiterrez-Martin et al.
� 2005 International Society for Neurochemistry, J. Neurochem. (2005) 92, 973–989
(HEPES-containing medium) or 230 ± 40 nM in MLocke’smedium (minus HEPES) or in Locke’s medium supplemen-ted with catalase. The attenuation by catalase of the delayedraise of [Ca2+]i induced by SIN-1 is fully consistent with theprotection afforded by catalase against cell viability lossupon exposure of CGC to SIN-1 in Locke’s buffer, as it hasbeen shown that [Ca2+]i ‡ 400 nM is highly neurotoxic(Franklin and Johnson 1992). These effects of SIN-1 are dueto peroxynitrite production during SIN-1 decomposition,because they are blocked by addition to the extracellularmedium of SOD plus catalase and by the peroxynitritescavenger MnTBAP. H2O2 generated from peroxynitrite inHEPES-containing Locke’s buffer strongly enhanced theamplitude of the increase of [Ca2+]i in the second (delayed)phase, as shown by the large amplitude attenuation producedby the presence of 1500 U/mL of catalase or in MLocke’smedium. In addition, our results indicated that the loweringof the steady-state [Ca2+]i (first kinetic phase) takes placewithout complete depletion of intracellular reduced glutathi-one (e.g. with less than 50% decrease of reduced glutathione)and is abolished by addition of EGTA to the extracellularmedium. Therefore, the changes of the steady-state cytosolicCa2+ concentration induced by CGC exposure to extracellu-lar peroxynitrite are due to functional impairment ofCa2+-transport systems of the plasma membrane relevantfor the maintenance of cytosolic Ca2+ concentration home-ostasis in neurones.
The biphasic temporal effect of exposure to 0.5–1.0 mM
SIN-1 on the steady-state [Ca2+]i of CGC strongly suggestedthat the different plasma membrane transport systemsinvolved in the control of cytosolic Ca2+ concentration havea differential reactivity against the extracellular combinedoxidative stress produced upon exposure to SIN-1. There-fore, it is to be expected that the effects of exposure to SIN-1on the steady-state [Ca2+]i of CGC should be related not onlywith total peroxynitrite produced but also with the peakperoxynitrite and H2O2 concentrations attained during SIN-1decomposition in HEPES-containing buffers. Peroxynitriterelease by SIN-1 in K25-Locke’s buffer has been monitoredas indicated in Martin-Romero et al. (2004), by the kineticsof decrease of the absorbance at 340 nm (Fig. 1a) after SIN-1addition to the solution containing NADH. Taking intoaccount that one mole of peroxynitrite is produced per moleof SIN-1 (Murphy et al. 1998; Schrammel et al. 1998), theefficiency of detection by NADH of the peroxynitrite pro-duced continuously in the solution upon SIN-1 decomposi-tion was found to be 80–90%, in good agreement with Kirschand de Groot (1999) and Martin-Romero et al. (2004).Moreover, taking into account the peak concentration ofperoxynitrite attained during SIN-1 decomposition (Fig. 1 ofthis paper and Martin-Romero et al. 2004) to observe a slowkinetics leading to a sustained increase of [Ca2+]i, the peakconcentration of peroxynitrite during SIN-1 decompositionmust be ‡ 5 lM. It is to be noted that this is close to the
estimated peroxynitrite concentrations that may be attained inlocal regions of the brain after a ischaemic insult (Malinskiet al. 1993) or inflammation (Bao and Liu 2002).
The exposure to lower concentrations of SIN-1 (up to100 lM) or short-term exposure (up to 30 min in Locke’sbuffer supplemented with catalase or in MLocke’s buffer) to0.5–1 mM SIN-1 produced a decrease of the CGC cytosolicCa2+ concentrations to 75 ± 10 nM, values that are closer tothose attained by CGC in 5 mM K+ medium (45 ± 10 nM)than in 25 mM K+ medium (168 ± 33 nM). As it has beenshown that blockade of L-type Ca2+ channels by dihydropy-ridines induced decrease of [Ca2+]i and apoptotic cell deathof CGC closely resembling to those produced by loweringK+ to 5 mM in the extracellular medium (Gallo et al. 1987;Franklin and Johnson 1992; See et al. 2001), the possibilitythat the decrease of [Ca2+]i induced by SIN-1 can be due toblockade of L-type Ca2+ channels seemed likely. Thispossibility was strongly supported by the fact that inpresence of the L-type Ca2+ channels blockers nifedipineand nimodipine, which lowered the cytosolic calciumconcentration to 70 ± 10 nM, exposure to SIN-1 did notfurther lower the [Ca2+]i, whereas the N- and P-type of Ca2+
channels blocker x-conotoxin MVIIC did not block orsignificantly attenuate the lowering of [Ca2+]i produced bySIN-1. The results of this paper also showed that thedecrease of [Ca2+]i produced by short-term exposure(30 min) of CGC to 0.5 mM SIN-1 is largely irreversible,as it is less than 30% reverted by changing the cells to freshK25 medium. In addition, CGC switched to a fresh mediumafter 30 min exposure to 0.5 mM SIN-1 showed a largelyattenuated increase of steady-state [Ca2+]i in response toplasma membrane partial depolarization in K25-Locke’sbuffer and also that the L-type Ca2+ channels agonists (FPL64176 and BAY-K8644) are able to completely rise [Ca2+]ito the values obtained for control CGC (e.g. 0.95 ± 0.1),albeit anomalous high concentrations of these agonists areneeded, in particular the concentration of BAY-K8644needed (50 lM) is between 10- and 50-fold higher over the1–5 lM interval normally used in studies with neuronalcultures (Shirotani et al. 2001). Thus, the results allow toreach the conclusion that exposure to an average flux of0.5 lM/min of peroxynitrite for 1 h is sufficient to reduce by50% the increase of CGC cytosolic Ca2+ concentrationproduced by raising KCl in the extracellular medium from 5to 25 mM. Functional impairment of proteins by peroxyni-trite may be due to oxidative modification, e.g. often Cysoxidation and/or nitroTyr formation (see, for example Vineret al. 1999; Gutierrez-Martin et al. 2004), by peroxynitriteitself or by one or several of the radicals derived fromperoxynitrite decomposition in aqueous buffers (Gutierrez-Martin et al. 2004). The molecular mechanism by whichperoxynitrite produced inactivation of L-type Ca2+ channelsdeserves to be studied but, owing to its amplitude, is beyondthe scope of this paper, although it is to be noted that
Modulation of neuronal cytosolic calcium by SIN-1 985
� 2005 International Society for Neurochemistry, J. Neurochem. (2005) 92, 973–989
hydroxyl radicals, one type of radical generated duringperoxynitrite decomposition (Pfeiffer et al. 1997; Corsaroet al. 2004), have been shown to inactivate L-type Ca2+
channels in cortical neurones (Shirotani et al. 2001).On the other hand, the exposure of CGC to 0.5–1.0 mM
SIN-1 in HEPES-containing Locke’s buffer for more than30 min elicits a deregulation of steady-state [Ca2+]i, whichleads to a sustained raise of [Ca2+]i, following a slowkinetics (half-time of about 1 h after addition of SIN-1).During this time period a significant depletion of reducedglutathione, significant loss of neurite extensions andnecrotic cell death are observed. As only glutathionedepletion, but not significant necrotic cell death, is observedafter 2 h exposure to 1 mM SIN-1 in MLocke’s buffer (inwhich H2O2 production during peroxynitrite decompositionis strongly lowered), we can conclude that the latter effectsare largely due to H2O2. At least 50–60 min exposure ofCGC to averages fluxes of peroxynitrite ‡ 3.5 lM or to totalperoxynitrite higher than 200 lM was found to be requiredfor the onset of a sustained and deregulated raise of [Ca2+]i.This delayed increase of steady-state [Ca2+]i upon exposureto SIN-1 is not observed in presence of millimolar EGTA inthe medium (indicating that is not due to Ca2+-release fromintracellular stores). In addition, the delayed and sustainedraise of steady-state [Ca2+]i is not due to an unspecificincrease of the passive Ca2+ permeability of the plasmamembrane, as the kinetics of quenching by Mn2+ of the fura-2 fluorescence of loaded cells is not altered by up to 60 minexposure to 0.5 mM SIN-1. This latter result is consistentwith the lack of significant lipid peroxidation after 2 hexposure of CGC to SIN-1 and also with the fact that thedelayed kinetics of increase of cytosolic calcium concentra-tion is not altered in the presence of 10 lM a-tocopherol.Furthermore, it is not blocked nor significantly attenuatedwhen the exposure to SIN-1 is done in MLocke’s buffer inthe presence of the NMDA receptor antagonist (+)-MK-801,or in the presence of the N- and P-type Ca2+ channel blockerx-conotoxin MVIIC.
Therefore, impairment of other(s) transport system(s)relevant for the control of low steady-state cytosolic Ca2+
concentration in CGC must be involved in the deregulationof steady-state [Ca2+]i. It has been previously reported thatperoxynitrite can produce functional impairment of VOCC(Ohkuma et al. 2001), Na+/Ca2+-exchanger (Huschenbettet al. 1998; Chakraborti et al. 2004) and PMCA (Zaidi andMichaelis 1999; Gutierrez-Martin et al. 2002). Activationof L-type VOCC after 30–90 min exposure of CGC to0.5–1.0 mM SIN-1 can be excluded, because the kinetics ofsustained raise of steady-state [Ca2+]i is not altered byaddition to the extracellular medium of nifedipine, a potentL-type Ca2+ channel blocker and it has been shown thatactivation of L-type Ca2+ channels account for most ofinwardly directed Ca2+ current in CGC in a 25 mM KClmedium (Franklin and Johnson 1992; Franklin et al. 1992).
This result is in contrast with the proposed activation ofL-type Ca2+ channels in cerebral cortical neurones by asingle pulse of micromolar peroxynitrite and indirectly frommeasurements of 45Ca2+ uptake by the cortical cells(Ohkuma et al. 2001). This could be accounted for by adifferent functional state of L-type Ca2+ channels in CGCand in cerebral cortical neurones, as they can be down-regulated by a different level of expression of neuronal Ca2+
sensor protein-1 (Rousset et al. 2003) and activated by otherapoptotic-inducing stimuli (see e.g. Yagami et al. 2003). Inthis regard, it is to be noted that L-type Ca2+ channelsantagonists nimodipine and nifedipine have survival-promo-ting activity in rat motoneurones (Arakawa et al. 2002),whereas in CGC they trigger apoptosis (Franklin andJohnson 1992; See et al. 2001).
The results obtained with the specific Na+/Ca2+-exchangerinhibitor KB-R7943 allowed us to exclude a significant roleof a putative impairment of this exchanger in the alterationsproduced on [Ca2+]i upon exposure of CGC to up to 0.5 mM
SIN-1 for 75 min. Therefore, its implication in SIN-1-induced alterations of [Ca2+]i reported in this paper isunlikely. On the contrary, the results obtained in this workshowed that the Ca2+ ATPase activity of plasma mem-brane vesicles is more than 50% irreversibly inhibited by60–90 min exposure to 0.5–1.0 mM SIN-1. Taking intoaccount the kinetics of peroxynitrite production during SIN-1decomposition (see Materials and methods), this result is inexcellent agreement with the inhibition of the synaptosomalplasma membrane Ca2+ pump activity by repetitive micro-molar pulses of peroxynitrite reported in a recent paper fromthis laboratory (Gutierrez-Martin et al. 2002).
In conclusion, the results of this study pointed out that: (i)L-type voltage-operated Ca2+ channels are more sensitive tothe oxidative stress induced by extracellular peroxynitritethan plasma membrane Ca2+ pumps in CGC and this leads toa decrease of the steady-state cytosolic Ca2+ concentrationupon exposure to submicromolar fluxes of peroxynitrite; (ii)at higher levels of exposure of CGC to extracellularperoxynitrite (i.e. to fluxes of peroxynitrite in the micromolarrange) the steady-state of cytosolic Ca2+ concentrationslowly raises, due to the inhibition by peroxynitrite of theplasma membrane Ca2+ pump; and (iii) in HEPES-contain-ing buffers or in tissues, peroxynitrite induced H2O2
production, leading to a further rise of [Ca2+]i until theneurotoxic range of Ca2+ concentration which ensues a rapidnecrotic cell death. As peroxynitrite levels expected to beattained during ischaemia and inflammation are equivalent toexposure to 1–5 mM SIN-1 (Bao and Liu 2002), our resultsallow to predict that depending on the extent and intensity ofinflammation, the peroxynitrite generated in brain canproduce focalized apoptotic or necrotic neuronal death.Recent results with a rat model of spinal cord injury are ingood agreement with this conclusion (Bao and Liu 2002,2003).
986 Y. Guiterrez-Martin et al.
� 2005 International Society for Neurochemistry, J. Neurochem. (2005) 92, 973–989
Acknowledgements
This work has been supported by Grant BMC2000-0547 of the
Spanish Ministerio de Educacion, Cultura y Deporte (to C.G.-M)
and Grant 2PR02A018 (to F.H) of the Junta de Extremadura.
Yolanda Gutierrez-Martın is the recipient of a predoctoral fellowship
of the Spanish Ministerio de Educacion, Cultura y Deporte.
References
Abe K., Abe Y. and Saito H. (2003) Agmatine induces glutamate releaseand cell death in cultured rat cerebellar granule neurons. Brain Res.990, 165–171.
Arakawa Y., Nishijima C., Shimizu N. and Urushidani T. (2002) Sur-vival-promoting activity of nimodipine and nifedipine in ratmotoneurons: implications of an intrinsic calcium toxicity inmotoneurons. J. Neurochem. 83, 150–156.
Asakawa T. and Matsushita S. (1979) Thiobarbituric acid test fordetecting lipid peroxides. Lipids 14, 401–406.
Atlante A., Calissano P., Bobba A., Giannattasio S., Marra E. andPassarella S. (2001) Glutamate neurotoxicity, oxidative stress andmitochondria. FEBS Lett. 497, 1–5.
Balazs R., Jorgensen O. S. and Hack N. (1988) N-methyl-D-aspartatepromotes the survival of cerebellar granule cells in culture.Neuroscience 27, 437–451.
Bal-Price A., Matthias A. and Brown G. C. (2002) Stimulation ofthe NADPH oxidase in activated rat microglia removes nitricoxide but induces peroxynitrite production. J. Neurochem. 80,73–80.
Bao F. and Liu D. (2002) Peroxynitrite generated in the rat spinal cordinduces neuron death and neurological deficits. Neuroscience 115,839–849.
Bao F. and Liu D. (2003) Peroxynitrite generated in the rat spinal cordinduces apoptotic cell death and activates caspase-3. Neuroscience116, 59–70.
Beal M. F. (2000) Energetics in the pathogenesis of neurodegenerativediseases. Trends Neurosci. 23, 298–304.
Beal M. F. (2002) Oxidatively modified proteins in aging and disease.Free Radic. Biol. Med. 32, 797–803.
Beckman J. S. (1994) Peroxynitrite versus hydroxyl radical: the role ofnitric oxide in superoxide-dependent cerebral injury. Ann. NYAcad. Sci. 738, 69–75.
Benham C. D., Evans M. L. and McBain C. J. (1992) Ca2+ effluxmechanisms following depolarization evoked calcium transients incultured rat sensory neurones. J. Physiol. 455, 567–583.
Bessho Y., Nawa H. and Nakanishi S. (1994) Selective up-regulation ofan NMDA receptor subunit mRNA in cultured cerebellar granulecells by K (+)-induced depolarization and NMDA treatment.Neuron 12, 87–95.
Bhargava A., Mathias R. S., McCormick J. A., Dallman M. F.and Pearce D. (2002) Glucocorticoids prolong Ca2+ transientsin hippocampal-derived H19–7 neurons by repressing theplasma membrane Ca2+-ATPase-1. Mol Endocrinol. 16, 1629–1637.
Bolanos J. P., Almeida A., Stewart V., Peuchen S., Land J. M., Clark J. B.and Heales S. J. (1997) Nitric oxide-mediated mitochondrial dam-age in the brain: mechanisms and implications for neurodegenera-tive diseases. J. Neurochem. 68, 2227–2240.
Bonfoco E., Krainc D., Ankarcrona M., Nicotera P. and Lipton S. A.(1995) Apoptosis and necrosis: two distinct events induced,respectively, by mild and intense insults with N-methyl-D-aspartateor nitric oxide/superoxide in cortical cell cultures. Proc. Natl Acad.Sci. USA 92, 7162–7166.
Bradford M. M. (1976) A rapid and sensitive method for the quantitationof microgram quantities of protein utilizing the principle of protein-dye binding. Anal. Biochem. 72, 248–254.
Bradford S. E. and Nadler J. V. (2004) Aspartate release from rat hip-pocampal synaptosomes. Neuroscience 128, 751–765.
Buege J. A. and Aust. S. D. (1978) Microsomal lipid peroxidation.Methods Enzymol. 52, 302–310.
Burgoyne R. D. and Morgan A. (1995) Ca2+ and secretory-vesicledynamics. Trends Neurosci. 18, 191–196.
Carini R., Bellomo G., Paradisi L., Dianzani M. U. and Albano E. (1996)4-Hydroxynonenal triggers Ca2+ influx in isolated rat hepatocytes.Biochem. Biophys. Res. Commun. 218, 772–776.
Chakraborti S., Mandal A., Das S. and Chakraborti T. (2004) Inhibitionof Na+/Ca2+ exchanger by peroxynitrite in microsomes of pul-monary smooth muscle: role of matrix metalloproteinase-2. Bio-chim. Biophys. Acta 1671, 70–78.
Corsaro M. M., Pietraforte D., Di Lorenzo A. S., Minetti M. andMarino G. (2004) Reaction of peroxynitrite with hyaluronan andrelated saccharides. Free Radic. Res. 38, 343–353.
Estabrook R. W., Williamson J. R., Frenkel R. and Maitra P. K. (1967)The fluorometric determination of mitochondrial adenine andpyridine nucleotides. Methods Enzymol. 10, 474–482.
Estevez A. G., Radi R., Barbeito L., Shin J. T., Thompson J. A. andBeckman J. S. (1995) Peroxynitrite-induced cytotoxicity inPC12 cells: evidence for an apoptotic mechanism differentiallymodulated by neurotrophic factors. J. Neurochem. 65, 1543–1550.
Evans G. J. and Pocock J. M. (1999) Modulation of neurotransmitterrelease by dihydropyridine-sensitive calcium channels involvestyrosine phosphorylation. Eur. J. Neurosci. 11, 279–292.
Forti L. and Pietrobon D. (1993) Functional diversity of 1-type calciumchannels in rat cerebellar neurons. Neuron 10, 437–450.
Forti L., Tottene A., Moretti A. and Pietrobon D. (1994) Three noveltypes of voltage-dependent calcium channels in rat cerebellarneurons. J. Neurosci. 14, 5243–5256.
Franklin J. L., Fickbohm D. J. and Willard A. L. (1992) Long-termregulation of neuronal calcium currents by prolonged changes ofmembrane potential. J. Neurosci. 12, 1726–1735.
Franklin J. L. and Johnson E. M. Jr (1992) Suppression of programmedneuronal death by sustained elevation of cytoplasmic calcium.Trends Neurosci. 15, 501–508.
Gallo V., Kingsbury A., Balazs R. and Jorgensen O. S. (1987) The roleof depolarization in the survival and differentiation of cerebellargranule cells in culture. J. Neurosci. 7, 2203–2213.
Garcia M. L. and Strehler E. E. (1999) Plasma membrane calciumATPases as critical regulators of calcium homeostasis duringneuronal cell function. Front Biosci. 4, D869–D882.
Garcia-Martin E. and Gutierrez-Merino C. (1990) Modulation of theCa2+, Mg2+-ATPase activity of synaptosomal plasma membrane bythe local anesthetics dibucaine and lidocaine. J. Neurochem. 54,1238–1246.
Garcia-Martin E. and Gutierrez-Merino C. (1996) Rate of Na+/Ca2+
exchange across the plasma membrane of synaptosomes measuredusing the fluorescence of chlorotetracycline. Implications to cal-cium homeostasis in synaptic terminals. Biochim. Biophys. Acta1280, 257–264.
GbadegesinM., Vicini S., Hewett S. J.,Wink D. A., EspeyM., Pluta R.M.and Colton C. A. (1999) Hypoxia modulates nitric oxide-inducedregulation of NMDA receptor currents and neuronal cell death. Am.J. Physiol. 277, C673–C683.
Goldstein S. and Czapski G. (1995) The reaction of, •NO with O2•–
and HO2: a pulse radiolysis study. Free Radic. Biol. Med. 19,505–510.
Modulation of neuronal cytosolic calcium by SIN-1 987
� 2005 International Society for Neurochemistry, J. Neurochem. (2005) 92, 973–989
de Groot H., Hegi U. and Sies H. (1993) Loss of a-tocopherol uponexposure to nitric oxide or the sydnonimine SIN-1. FEBS Lett. 315,139–142.
Guerini D., Garcia-Martin E., Gerber A., Volbracht C., Leist M., MerinoC. G. and Carafoli E. (1999) The expression of plasma membraneCa2+ pump isoforms in cerebellar granule neurons is modulated byCa2+. J. Biol. Chem. 274, 1667–1676.
Gutierrez-Martin Y., Martin-Romero F. J., Henao F. and Gutierrez-Merino C. (2002) Synaptosomal plasma membrane Ca(2+) pumpactivity inhibition by repetitive micromolar ONOO()) pulses. FreeRadic. Biol. Med. 32, 46–55.
Gutierrez-Martin Y., Martin-Romero F. J., Inesta-Vaquera F. A.,Gutierrez-Merino C. and Henao F. (2004) Modulation of sarco-plasmic reticulum Ca2+-ATPase by chronic and acute exposure toperoxynitrite. Eur J. Biochem. 271, 2647–2657.
Harrold J., Ritchie J., Nicholls D., Smith W., Bowman D. and Pocock J.(1997) The development of Ca2+ channel responses and theircoupling to exocytosis in cultured cerebellar granule cells. Neu-roscience 77, 683–694.
Hashii M., Minabe Y. and Higashida H. (2000) cADP-ribose potentiatescytosolic Ca2+ elevation and Ca2+ entry via 1-type voltage-acti-vated Ca2+ channels in NG108-15 neuronal cells. Biochem. J. 345Part 2, 207–215.
HigoA., KatsuraM., HibinoY., HaraA., TarumiC. andOhkuma S. (1998)Removal of hydroxyl radical facilitates Ca2+-dependent [3H]GABArelease by peroxynitrite. Brain Res. Mol. Brain Res. 62, 96–100.
Huie R. E. and Padmaja S. (1993) The reaction of NO with superoxide.Free Radic. Res. Commun. 18, 195–199.
Huschenbett J., Zaidi A. and Michaelis M. L. (1998) Sensitivity of thesynaptic membrane Na2+/Ca2+ exchanger and the expressed NCX1isoform to reactive oxygen species. Biochim. Biophys. Acta 1374,34–46.
Iadecola C. (1997) Bright and dark sides of nitric oxide in ischemic braininjury. Trends Neurosci. 20, 132–139.
Ischiropoulos H., Duran D. and Horwitz J. (1995) Peroxynitrite-medi-ated inhibition of DOPA synthesis in PC12 cells. J. Neurochem.65, 2366–2372.
Iwamoto T., Watano T. and Shigekawa M. (1996) A novel isothioureaderivative selectively inhibits the reverse mode of Na+/Ca2+
exchange in cells expressing NCX1. J. Biol. Chem. 271, 22 391–22 397.
Kelm M., Dahmann R., Wink D. and Feelisch M. (1997) The nitricoxide/superoxide assay. Insights into the biological chemistry ofthe NO/O2 interaction. J. Biol. Chem. 272, 9922–9932.
Kirsch M. and de Groot H. (1999) Reaction of peroxynitrite withreduced nicotinamide nucleotides, the formation of hydrogen per-oxide. J. Biol. Chem. 274, 24664–24670.
Kirsch M., Lomonosova E. E., Korth H. G., Sustmann R. and de GrootH. (1998) Hydrogen peroxide formation by reaction of peroxyni-trite with HEPES and related tertiary amines. Implications for ageneral mechanism. J. Biol. Chem. 273, 12 716–12 724.
Lafon-Cazal M., Culcasi M., Gaven F., Pietri S. and Bockaert J. (1993)Nitric oxide, superoxide and peroxynitrite: putative mediators ofNMDA-induced cell death in cerebellar granule cells. Neuro-pharmacology 32, 1259–1266.
Leist M., Fava E., Montecucco C. and Nicotera P. (1997) Peroxynitriteand nitric oxide donors induce neuronal apoptosis by elicitingautocrine excitotoxicity. Eur. J. Neurosci. 9, 1488–1498.
Liu D., Ling X., Wen J. and Liu J. (2000) The role of reactive nitrogenspecies in secondary spinal cord injury: formation of nitric oxide,peroxynitrite, and nitrated protein. J. Neurochem. 75, 2144–2154.
Lomonosova E. E., Kirsch M., Rauen U. and de Groot H. (1998) Thecritical role of HEPES in SIN-1 cytotoxicity, peroxynitrite versushydrogen peroxide. Free Radic. Biol. Med. 24, 522–528.
Malinski T., Bailey F., Zhang Z. G. and Chopp M. (1993) Nitric oxidemeasured by a porphyrinic microsensor in rat brain after transientmiddle cerebral artery occlusion. J. Cereb. Blood Flow Metab. 13,355–358.
Manzoni O., Prezeau L., Marin P., Deshager S., Bockaert J. and Fagni L.(1992) Nitric oxide-induced blockade of NMDA receptors. Neuron8, 653–662.
Marchetti C. and Usai C. (1996) High affinity block by nimodipine ofthe internal calcium elevation in chronically depolarized rat cere-bellar granule neurons. Neurosci. Lett. 207, 77–80.
Maric D., Maric I. and Barker J. L. (2000) Developmental changes incell calcium homeostasis during neurogenesis of the embryonic ratcerebral cortex. Cereb. Cortex 10, 561–573.
Martin-Romero F. J., Garcia-Martin E. and Gutierrez-Merino C. (1996a)Inactivation of ecto-ATPase activity of rat brain synaptosomes.Biochim. Biophys. Acta 1283, 51–59.
Martin-Romero F. J., Garcia-Martin E. and Gutierrez-Merino C. (1996b)Involvement of free radicals in signalling of low-potassiuminduced apoptosis in cultured cerebellar granule cells. Int. J. Dev.Biol. Supplement 1, 197S–198S.
Martin-Romero F. J., Santiago-Josefat B., Correa-Bordes J., Gutierrez-Merino C. and Fernandez-Salguero P. (2000) Potassium-inducedapoptosis in rat cerebellar granule cells involves cell-cycle block-ade at the G1/S transition. J. Mol. Neurosci. 15, 155–165.
Martin-Romero F. J., Garcia-Martin E. and Gutierrez-Merino C. (2002)Inhibition of oxidative stress produced by plasma membraneNADH oxidase delays low-potassium-induced apoptosis of cere-bellar granule cells. J. Neurochem. 82, 705–715.
Martin-Romero F. J., Gutierrez-Martin Y., Henao F. and Gutierrez-Merino C. (2004) Fluorescence measurements of steady-stateperoxynitrite production upon SIN-1 decomposition: NADHversus dihydrodichlorofluorescein and dihydrorhodamine 123.J. Fluorescence 14, 17–23.
Matsuda T., Arakawa N., Takuma K. et al. (2001) SEA0400, a novel andselective inhibitor of the Na+/Ca2+ exchanger, attenuates reper-fusion injury in the in vitro and in vivo cerebral ischemic models.J. Pharmacol. Exp. Ther. 298, 249–256.
Moro M. A., Leza J. C., Lorenzo P. and Lizasoain I. (1998) Peroxynitritecauses aspartate release from dissociated rat cerebellar granuleneurones. Free Radic. Res. 28, 193–204.
Murphy M. P., Packer M. A., Scarlett J. L. and Martin S. W. (1998)Peroxynitrite: a biologically significant oxidant. Gen. Pharmacol.31, 179–186.
Narita K., Kawasaki F. and Kita H. (1990) Mn and Mg influxes throughCa channels of motor nerve terminals are prevented by verapamilin frogs. Brain Res. 510, 289–295.
Ohkuma S., Katsura M., Guo J. L., Hasegawa T. and Kuriyama K.(1995) Participation of peroxynitrite in acetylcholine releaseinduced by nitric oxide generators. Neurosci. Lett. 183, 151–154.
Ohkuma S., Katsura M., Higo A., Shirotani K., Hara A., Tarumi C. andOhgi T. (2001) Peroxynitrite affects Ca2+ influx through voltage-dependent calcium channels. J. Neurochem. 76, 341–350.
Pall M. L. (2002) NMDA sensitization and stimulation by peroxynitrite,nitric oxide, and organic solvents as the mechanism of chemicalsensitivity in multiple chemical sensitivity. Faseb J. 16, 1407–1417.
Pearson H. A., Sutton K. G., Scott R. H. and Dolphin A. C. (1995)Characterization of Ca2+ channel currents in cultured rat cerebellargranule neurones. J. Physiol. 482, 493–509.
Pellistri F., Cupello A., Esposito A., Marchetti C. and Robello M. (2004)Two-photon imaging of calcium accumulation in rat cerebellargranule cells. Neuroreport 15, 83–87.
Pfeiffer S., Gorren A. C., Schmidt K., Werner E. R., Hansert B., BohleD. S. and Mayer B. (1997) Metabolic fate of peroxynitrite inaqueous solution. Reaction with nitric oxide and pH-dependent
988 Y. Guiterrez-Martin et al.
� 2005 International Society for Neurochemistry, J. Neurochem. (2005) 92, 973–989
decomposition to nitrite and oxygen in a 2:1 stoichiometry. J. Biol.Chem. 272, 3465–3470.
Randall A. and Tsien R. W. (1995) Pharmacological dissection of mul-tiple types of Ca2+ channel currents in rat cerebellar granule neu-rons. J. Neurosci. 15, 2995–3012.
Randall A. D. and Tsien R. W. (1997) Contrasting biophysical andpharmacological properties of T-type and R-type calcium channels.Neuropharmacology 36, 879–893.
Resink A., Villa M., Benke D., Mohler H. and Balazs R. (1995)Regulation of the expression of NMDA receptor subunits in ratcerebellar granule cells: effect of chronic K+-induced depolariza-tion and NMDA exposure. J. Neurochem. 64, 558–565.
Rousset M., Cens T., Gavarini S., Jeromin A. and Charnet P. (2003)Down-regulation of voltage-gated Ca2+ channels by neuronal cal-cium sensor-1 is b subunit-specific. J. Biol. Chem. 278, 7019–7026.
Samhan-Arias A. K., Martin-Romero F. J. and Gutierrez-Merino C.(2004) Kaempferol blocks oxidative stress in cerebellar granulecells and reveals a key role for reactive oxygen species productionat the plasma membrane in the commitment to apoptosis. FreeRadic. Biol. Med. 37, 48–61.
Satoh T., Numakawa T., Abiru Y., Yamagata T., Ishikawa Y., Enokido Y.and Hatanaka H. (1998) Production of reactive oxygen species andrelease of 1-glutamate during superoxide anion-induced cell deathof cerebellar granule neurons. J. Neurochem. 70, 316–324.
Schramm M., Vajna R., Pereverzev A., Tottene A., Klockner U.,Pietrobon D., Hescheler J. and Schneider T. (1999) Isoforms ofa1E voltage-gated calcium channels in rat cerebellar granule cells –detection of major calcium channel a1-transcripts by reversetranscription-polymerase chain reaction. Neuroscience 92,565–575.
Schrammel A., Pfeiffer S., Schmidt K., Koesling D. and Mayer B.(1998) Activation of soluble guanylyl cyclase by the nitrovasodi-lator 3-morpholinosydnonimine involves formation of S-nitro-soglutathione. Mol. Pharmacol. 54, 207–212.
Scott G. S., Jakeman L. B., Stokes B. T. and Szabo C. (1999) Per-oxynitrite production and activation of poly-(adenosine diphos-phate-ribose) synthetase in spinal cord injury. Ann. Neurol. 45,120–124.
See V., Boutillier A. L., Bito H. and Loeffler J. P. (2001) Calcium/calmodulin-dependent protein kinase type IV (CaMKIV) inhibitsapoptosis induced by potassium deprivation in cerebellar granuleneurons. Faseb J. 15, 134–144.
Shirotani K., Katsura M., Higo A., Takesue M., Mohri Y., Shuto K.,Tarumi C. and Ohkuma S. (2001) Suppression of Ca2+ influxthrough 1-type voltage-dependent calcium channels by hydroxylradical in mouse cerebral cortical neurons. Brain Res. Mol. BrainRes. 92, 12–18.
Thomas A. P. and Delaville F. (1991) The use of fluorescent indicatorsfor measurements of cytosolic-free calcium concentration in cellpopulation and single cells, in Cellular Calcium (McCormack J. G.and Cobbold P. H., ed.), pp. 1–54. IRL Press, Oxford, UK.
Tietze F. (1969) Enzymic method for quantitative determination of nano-gram amounts of total and oxidized glutathione: applications tomammalian blood and other tissues. Anal. Biochem. 27, 502–522.
Toescu E. C. (1999) Activity of voltage-operated calcium channels in ratcerebellar granule neurons and neuronal survival. Neuroscience 94,561–570.
Tottene A., Moretti A. and Pietrobon D. (1996) Functional diversity ofP-type and R.-type calcium channels in rat cerebellar neurons.J. Neurosci. 16, 6353–6363.
Trackey J. L., Uliasz T. F. and Hewett S. J. (2001) SIN-1-inducedcytotoxicity in mixed cortical cell culture: peroxynitrite-dependentand – independent induction of excitotoxic cell death. J. Neuro-chem. 79, 445–455.
Valencia A. and Moran J. (2001) Role of oxidative stress in the apoptoticcell death of cultured cerebellar granule neurons. J. Neurosci. Res.64, 284–297.
Vallano M. L., Lambolez B., Audinat E. and Rossier J. (1996) Neuronalactivity differentially regulates NMDA receptor subunit expressionin cerebellar granule cells. J. Neurosci. 16, 631–639.
van der Veen R. C., Hinton D. R., Incardonna F. and Hofman F. M.(1997) Extensive peroxynitrite activity during progressive stages ofcentral nervous system inflammation. J. Neuroimmunol. 77, 1–7.
Viner R. I., Williams T. D. and Schoneich C. (1999) Peroxynitritemodification of protein thiols: oxidation, nitrosylation, andS-glutathiolation of functionally important cysteine residue(s) inthe sarcoplasmic reticulum Ca-ATPase. Biochemistry 38, 12 408–12 415.
Werth J. L., Usachev Y. M. and Thayer S. A. (1996) Modulation ofcalcium efflux from cultured rat dorsal root ganglion neurons.J. Neurosci. 16, 1008–1015.
Yagami T., Ueda K., Asakura K. et al. (2003) Human group IIAsecretory phospholipase A2 potentiates Ca2+ influx through 1-typevoltage-sensitive Ca2+ channels in cultured rat cortical neurons.J. Neurochem. 85, 749–758.
Zaidi A. and Michaelis M. L. (1999) Effects of reactive oxygen specieson brain synaptic plasma membrane Ca2+-ATPase. Free Radic.Biol. Med. 27, 810–821.
Zenisek D. and Matthews G. (2000) The role of mitochondria in pre-synaptic calcium handling at a ribbon synapse. Neuron 25, 229–237.
Zingarelli B., Day B. J., Crapo J. D., Salzman A. L. and Szabo C. (1997)The potential role of peroxynitrite in the vascular contractile andcellular energetic failure in endotoxic shock. Br. J. Pharmacol.120, 259–267.
Modulation of neuronal cytosolic calcium by SIN-1 989
� 2005 International Society for Neurochemistry, J. Neurochem. (2005) 92, 973–989