AGRICULTURE AND NATURAL RESOURCES - ThaiJO
8
Agr. Nat. Resour. 54 (2020) 279–286 Article history: Received 9 February 2018 Revised 31 October 2018 Accepted 14 November 2018 Available online 30 June 2020 Keywords: Polyacrylamide gel electrophoresis (PAGE), Protease activity, Protease stability, Substrate-polyacrylamide gel electrophoresis, Tabernaemontana divaricata Research article Identification and characterization of proteases from Tabernaemontana divaricata Merrine Raju, Y. Vasudeva Rao* Department of Soil Science and Agricultural Chemistry, Palli Siksha Bhavana (Institute of Agriculture), Visva-Bharati, Sriniketan, West Bengal, 731236, India. * Corresponding author. E-mail address: [email protected] (Y. Vasudeva Rao) Abstract Article Info AGRICULTURE AND NATURAL RESOURCES During the screening of latex collected from several native plant sources, good protease activity was observed in the latex of Tabernaemontana divericata (Apocynaceae). The proteases from the latex of T. divaricata were characterized by studying the effect of temperature, pH, latex volume, substrate volume and time kinetics. The stability of the protease activity was also studied. Native polyacrylamide gel electrophoresis and substrate polyacrylamide gel electrophoresis were performed to analyze the proteases in the latex sample. From the results, the optimum protease activity was observed at pH 5.0 and 50°C temperature. Enzyme activity was lost over a period of 5 days at room temperature, whereas the enzyme activity was relatively stable at 0°C. Three types of protease molecules were found in the latex of T. divaricata, whose molecular weights were 54.95 kDa, 21.87 kDa and 20.89 kDa. Proteases are important molecules in the living organisms as they carry out crucial biological functions including immunity. Apart from their biological functions, proteases play important role in a variety of industrial applications such as- an additive in detergents, food processing, brewing and leather tanning. online 2452-316X print 2468-1458/Copyright © 2020. This is an open access article, production and hosting by Kasetsart University of Research and Development institute on behalf of Kasetsart University. https://doi.org/10.34044/j.anres.2020.54.3.07 Journal homepage: http://anres.kasetsart.org Introduction Tabernaemontana divaricata L., an indigenous plant source, commonly called pinwheel-flower and probably native to India is now cultivated throughout South East Asia and the warmer regions of continental Asia (Khan, 2011). T. divaricata is a glabrous, evergreen, dichotomously branched shrub belonging to the family Apocynaceae (Khan, 2011). T. divaricata possess a wide range of therapeutic activities including alexipharmic, emmenogogue, astringent, anticancer, hepatoprotective, aphrodisiac, digestible, purgative and antibacterial properties (Raj and Balasubramaniam, 2011). The methanolic extract of the flower of T. divaricata exhibits a remarkable gastroprotective effect (Khan, 2011). The ethanolic extract of flowers and stems showed inhibition against Bacillus subtilis, Escherichia coli and Staphylococcus aureus (Kalaimagal and Umamaheswari, 2014). The ethanolic extract of leaves showed inhibitory action against Staphylococcus aureus but no inhibition activity against E. coli and B. subtilis (Kalaimagal and Umamaheswari, 2014). The methanolic extract of leaves of T. divaricata has shown potential with antidiabetic activity and low cytotoxicity in an alloxen-induced diabetic mouse model (Rahman et al., 2012). T. divaricata plant extract has shown antioxidant activity and broad-spectrum antibacterial activity (Thombre et al., 2013). The cytotoxic activity of the T. divaricata extracts were assessed on the THP-1 leukemia cell line using MTT assay and the plant demonstrated cancer cell inhibitory activity (Thombre et al., 2013). T. divaricata has potential applications in the pharmaceutical industry and in medicines due to its phytoconstituents, antioxidants, antibacterial and anticancer activities (Thombre et al., 2013).
-
Upload
khangminh22 -
Category
Documents
-
view
5 -
download
0
Transcript of AGRICULTURE AND NATURAL RESOURCES - ThaiJO
Agr. Nat. Resour. 54 (2020) 279–286
Article history:Received 9 February 2018Revised 31 October 2018Accepted 14 November 2018Available online 30 June 2020
Keywords:Polyacrylamide gel electrophoresis (PAGE), Protease activity, Protease stability, Substrate-polyacrylamide gel electrophoresis,Tabernaemontana divaricata
Research article
Identification and characterization of proteases from Tabernaemontana divaricataMerrine Raju, Y. Vasudeva Rao*Department of Soil Science and Agricultural Chemistry, Palli Siksha Bhavana (Institute of Agriculture), Visva-Bharati, Sriniketan, West Bengal, 731236, India.
* Corresponding author. E-mail address: [email protected] (Y. Vasudeva Rao)
AbstractArticle Info
AGRICULTURE ANDNATURAL RESOURCES
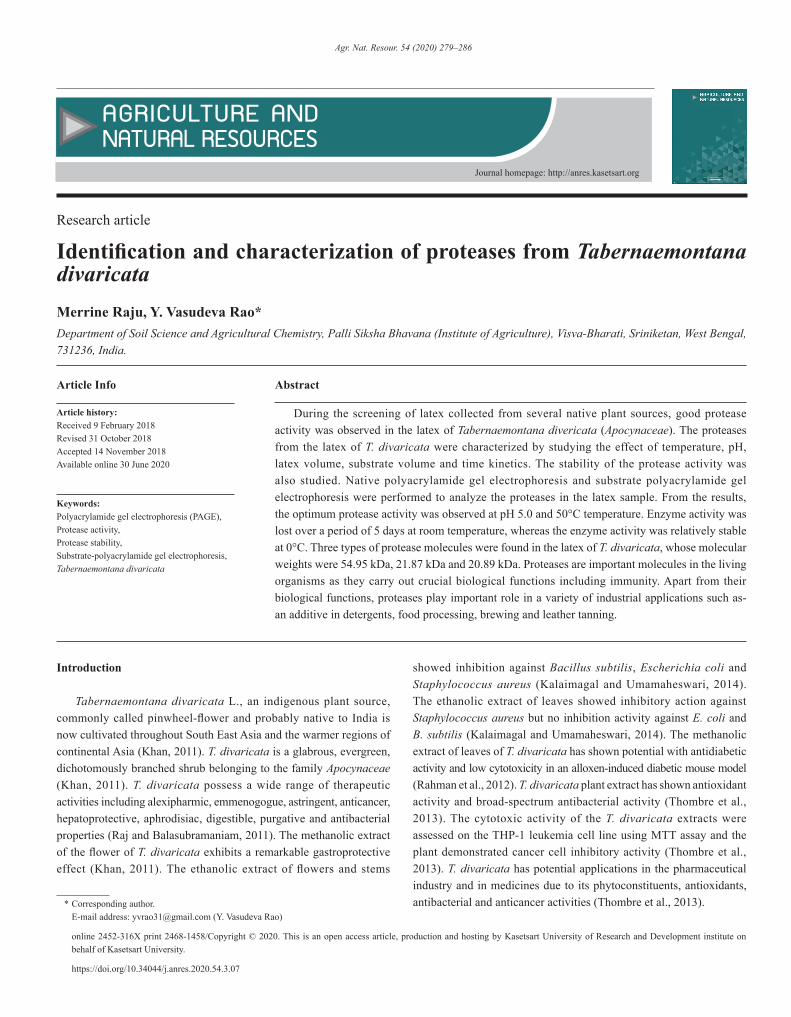
During the screening of latex collected from several native plant sources, good protease activity was observed in the latex of Tabernaemontana divericata (Apocynaceae). The proteases from the latex of T. divaricata were characterized by studying the effect of temperature, pH, latex volume, substrate volume and time kinetics. The stability of the protease activity was also studied. Native polyacrylamide gel electrophoresis and substrate polyacrylamide gel electrophoresis were performed to analyze the proteases in the latex sample. From the results, the optimum protease activity was observed at pH 5.0 and 50°C temperature. Enzyme activity was lost over a period of 5 days at room temperature, whereas the enzyme activity was relatively stable at 0°C. Three types of protease molecules were found in the latex of T. divaricata, whose molecular weights were 54.95 kDa, 21.87 kDa and 20.89 kDa. Proteases are important molecules in the living organisms as they carry out crucial biological functions including immunity. Apart from their biological functions, proteases play important role in a variety of industrial applications such as- an additive in detergents, food processing, brewing and leather tanning.
online 2452-316X print 2468-1458/Copyright © 2020. This is an open access article, production and hosting by Kasetsart University of Research and Development institute on behalf of Kasetsart University.
https://doi.org/10.34044/j.anres.2020.54.3.07
Journal homepage: http://anres.kasetsart.org
Introduction
Tabernaemontana divaricata L., an indigenous plant source, commonly called pinwheel-flower and probably native to India is now cultivated throughout South East Asia and the warmer regions of continental Asia (Khan, 2011). T. divaricata is a glabrous, evergreen, dichotomously branched shrub belonging to the family Apocynaceae (Khan, 2011). T. divaricata possess a wide range of therapeutic activities including alexipharmic, emmenogogue, astringent, anticancer, hepatoprotective, aphrodisiac, digestible, purgative and antibacterial properties (Raj and Balasubramaniam, 2011). The methanolic extract of the flower of T. divaricata exhibits a remarkable gastroprotective effect (Khan, 2011). The ethanolic extract of flowers and stems
showed inhibition against Bacillus subtilis, Escherichia coli and Staphylococcus aureus (Kalaimagal and Umamaheswari, 2014). The ethanolic extract of leaves showed inhibitory action against Staphylococcus aureus but no inhibition activity against E. coli and B. subtilis (Kalaimagal and Umamaheswari, 2014). The methanolic extract of leaves of T. divaricata has shown potential with antidiabetic activity and low cytotoxicity in an alloxen-induced diabetic mouse model (Rahman et al., 2012). T. divaricata plant extract has shown antioxidant activity and broad-spectrum antibacterial activity (Thombre et al., 2013). The cytotoxic activity of the T. divaricata extracts were assessed on the THP-1 leukemia cell line using MTT assay and the plant demonstrated cancer cell inhibitory activity (Thombre et al., 2013). T. divaricata has potential applications in the pharmaceutical industry and in medicines due to its phytoconstituents, antioxidants, antibacterial and anticancer activities (Thombre et al., 2013).
280 M. Raju, Y.V. Rao / Agr. Nat. Resour. 54 (2020) 279–286
Proteases are important constituents of all forms of existence on earth including prokaryotes, fungi, plants and animals (Priya et al., 2016). The protease enzyme is naturally present in all organisms and it corresponds to 1–5% of the total protein content (Priya et al., 2016). Sources of proteases include all forms of life, that is, plants, animals and microorganisms (Alnahdi, 2012). Proteases are enzymes that break peptide bonds between amino acids of proteins, also called proteolytic enzymes and are very important in digestion as they break down the complex proteins to simpler amino acids (Sathyavrathan and Kavitha, 2013). Protease enzymes constitute one of the most important groups of industrial enzymes being extensively used in the food, pharmaceutical, protein hydrolysis, detergent, cheese-making, brewing, photographic, baking, meat, leather industries, and in animal and human food as digestive aids (Kumar et al., 2016). It can be obtained commercially from plants, animals and microbial sources (Kumar et al., 2016). Papain, a protease enzyme present in the latex of Carica papaya, has been extensively studied for industrial use, including for application in the food industry, beer clarification, meat tenderizing, preparation of protein hydrolysates (Monti et al., 2000). Papain, was isolated and characterized from the plant source Carica papaya (Monti et al., 2000). Extraction of protease from a local ginger rhizome (Zingiber officinale var. Bentong) was carried out, and the isolated protease was characterized (Nafi et al., 2014). The proteolytic enzyme, ginger protease (GP), was extracted and characterized from ginger rhizome of Zingiber officinale Roscoe (Nafi et al., 2013). In previous studies, several native plant sources were screened for anti-oxidant, catalase and protease activities in-vitro; among them T. divaricata had the highest protease activity (Rao and Raju, 2016). Following the discovery of the protease activity in the latex of T. divaricata, the current study was carried out to characterize the protease in the latex of T. divaricata.
Materials and Methods
Sample collection
Latex was freshly collected from T. divaricata before the analysis. The twig of the plant was thoroughly cleaned using wet cotton and then tissue paper, a small scratch was made with a blade and the exuded latex was collected in a micro tube. After the collection, samples were diluted 1:3 with distilled water, and the diluted latex was centrifuged at 10,000×g for 15 min. The precipitate was discarded and the supernatant was collected and used in all the experiments. Whole, undiluted latex was used for the phytochemical screening. Laboratory experiments were carried out at the Department of Soil Science and Agricultural Chemistry, Palli Siksha Bhavana (Institute of Agriculture), Visva-Bharati, Sriniketan, India.
Phytochemical screening of the plant sample
The latex of T. divaricata was subjected to phytochemical screening for the detection of phenol, tannins, alkaloids, saponins, flavonoids, amino acids, protein, carbohydrates and reducing sugar (Kalaimagal
and Umamaheswari, 2015). The details of the tests are provided below.
Determination of phenol In a clean glass test tube, 1 mL of the sample was taken and mixed with 3 mL of sodium carbonate (3% in distilled water). After mixing the contents, 1 mL of Folin-Ciocalteu reagent (FC reagent) was added. Development of a light-to-deep blue color indicated the presence of phenols.
Determination of tannins In a clean glass test tube, 1 mL of the sample was added with 2–3 drops of FeCl3 (5% in distilled water). Development of a green or black precipitate indicated the presence of tannins.
Determination of alkaloidsIn a clean glass test tube, 1mL of the sample was taken and mixed with 1mL of Mayer’s reagent (1.36 g of mercuric chloride and 5 g of potassium iodide dissolved in about 30 mL of distilled water in separate beakers, followed by both solutions being mixed and made up to 100 mL with distilled water). White precipitate indicated the presence of alkaloids.
Determination of saponins: In a clean glass test tube, 0.5 mL of the sample was taken and then combined with 5 mL of distilled water and shaken vigorously. The presence of saponins was indicated by the formation of persistent froth.
Determination of flavonoids In a clean glass test tube, 1 mL of the sample was taken and to this were added a few drops of Wagner’s reagent (6 g of potassium iodide dissolved in 75 mL of distilled water, 2 g of iodine is added and allowed to dissolve and then the volume is made up to 100 mL with distilled water.). Formation of a reddish brown precipitate indicated the presence of flavonoids.
Determination of amino acids In a clean glass test tube, 1 mL of the sample was taken and mixed with 2 mL of ninhydrin solution (1% in ethanol) and heated in a boiling water bath for 10 minutes. Development of a purple or bluish color indicated the presence of amino acids.
Determination of protein The presence of the proteins was determined using the Bradford test. In a clean glass test tube, 1 mL of sample was taken and mixed with 1 mL of Bradford reagent. Development of blue color shows the presence of protein. The stock solution for Bradford reagent was made by dissolving 100 mg of Coomassie brilliant blue G 250 in 50 mL of 95% ethanol and then adding 100 mL of concentrated ortho-phosphoric acid followed by distilled water to a final volume of 200 ml before storing refrigerated in amber bottles. The working solution was made by mixing 1 volume of concentrated dye solution with 4 volumes of distilled water.
281M. Raju, Y.V. Rao / Agr. Nat. Resour. 54 (2020) 279–286
Determination of carbohydrates The presence of the carbohydrates was determined using Molisch’s test. In a clean glass test tube, 1 mL of the sample was added with 2–3 drops of alcoholic α-naphthol solution (1% in ethanol) and mixed. About 1 mL of concentrated H2SO4 was added carefully down the insides of the tube, without mixing or shaking the contents. The appearance of a purple-to-violet color ring at the junction of the two layers revealed the presence of carbohydrates.
Determination of reducing sugar The presence of starch was determined using Fehling’s test. Fehling’s reagent consists of: [A] 7 g of CuSO4 dissolved in distilled water and made up to 100 mL with distilled water; and [B] 24 g of KOH and 34.6 g of Na, K-tartarate dissolved separately in distilled water and after dissolution, both contents are mixed and made up to 100 mL with distilled water. Working Fehling’s reagent was prepared by mixing 1 mL of [A] + 50 mL of [B] before the experiment. In a clean glass test tube, 1 mL of the sample was mixed with 1 mL of Fehling’s reagent. After mixing, it was kept in a boiling water bath for 5 min. The development of green, yellow or brownish-red color indicated the presence of reducing sugar.
Determination of starch The presence of starch was determined using an iodine test. Iodine solution was made by adding a few iodine crystals to 100 mL of 2% KI solution until the color became deep yellow. In a clean glass test tube, 1 mL of the sample was mixed with a few drops of the iodine solution. A deep-blue color indicated the presence of the starch.
Determination of protease activity
The reaction was carried out in micro Eppendorf tubes. Proteases hydrolyze protein (such as casein) into peptide fragments and amino acids and the free aromatic amino acids yield a blue color in an alkaline medium with FC reagent, which was measured at 700 nm in an ultraviolet-visible light (UV-Vis) spectrophotometer (Rao and Raju, 2016). The proteolytic activity was calculated and expressed as micrograms of tyrosine liberated in 1 min at 37°C and pH 7 per 1 mL of enzyme.
Effect of temperature on protease activity
A sample of 10 µL of latex was placed in a series of micro vials and 40 µL of phosphate buffered saline (PBS, pH 7) was added to all tubes. Substrate casein (1%, dissolved in 0.1 M PBS) aliquots, which had been kept at different temperatures was added (750 µL/tube) to each micro vial respective to their incubation temperature and the tubes were incubated at different temperatures in the range 10–100°C. After 15 min of incubation, 750 µL of trichloroacetic acid (TCA) was added to stop the reaction and each tube was mixed thoroughly and centrifuged. Then, 0.5 mL of supernatant was placed in a fresh test tube and 5 mL of NaOH solution and 0.5 mL of FC reagent were added. The color that developed was measured at 700 nm in a UV-Vis spectrophotometer.
Effect of pH on protease activity
0.2 M buffers were prepared with pH values in the range 2–10. Citric acid and Na2HPO4 were used to prepare buffers with pH levels of 2, 3, 4, 5, 6 and 7. Glycine and NaOH were used to prepare buffers with pH levels of 8, 9 and 10. Then, 2 mL of buffer solution of pH ranging from 2 to 10 were placed in a series of test tubes that were labelled from 2 to 10. To each test tube, 75 µL of latex sample (diluted 1:4 with distilled water and centrifuged) was added and incubated for 10 min. After incubation, 1 mL of BApNA (4 mM, 43.5 mg of benzoyl-DL-arginine-paranitroanilide [BApNA] was dissolved in 0.5 mL of dimethyl sulfoxide and made up to 25 mL with distilled water) was added to each test tube and incubated for 1 hr. After incubation, 0.5 mL of 30% acetic acid was added to stop the reaction and then the solution was mixed thoroughly. In the blank, 75 µL of distilled water was used instead of the latex sample. The developed yellow color intensity was measured at 410 nm in a UV-Vis spectrophotometer (Rao and Chakrabarti, 2005).
Effect of latex concentration on protease activity
Different volumes of latex sample (diluted 1 in 10 with distilled water) in the range 10–100 µL were placed in a series of microtubes and the volume in each tube was made up to 100 µL with the addition of distilled water, where necessary. Then, 750 µL of substrate casein was added to all tubes. After 15 min incubation, the reaction was stopped by the addition of 750 µL of TCA. After centrifugation, 0.5 mL of supernatant was taken from each microtube and transferred into a series of clean test tubes; 5 mL of NaOH solution and 0.5 mL of FC reagent were added to all tubes. The color developed was read at 700 nm using a UV-Vis spectrophotometer.
Effect of substrate concentration on protease activity
Different volumes of substrate casein (1%, dissolved in PBS, pH=7.0) in the range 50–750 µL were placed in a series of microtubes and the volume in each tube was made up to 750 µL with the addition of PBS. Then, 30 µL of latex sample (diluted 1 in 10 with distilled water and centrifuged) was added to each tube. After 15 min incubation, the reaction was stopped by the addition of 750 µL of TCA. After centrifugation, 0.5 mL of supernatant was taken from each microtube and transferred into a series of clean test tubes; 5 mL of NaOH solution and 0.5 mL of FC reagent were added to each tube. The color developed was read at 700 nm in a UV-Vis spectrophotometer.
Enzyme activity at different periods
A sample of 22.5 mL substrate casein (preincubated at room temperature) was placed in a small beaker, and to this 0.3 mL of latex (diluted 1 in 10 with distilled water and centrifuged) was added; the mixture was kept in incubation at room temperature. Immediately after mixing the enzyme to the substrate, a 0.75 mL aliquot was drawn from the beaker and transferred to another tube containing 0.75 mL of 10%

282 M. Raju, Y.V. Rao / Agr. Nat. Resour. 54 (2020) 279–286
TCA to stop the reaction; this was recorded as the 0 min reading. After 1 min of incubation, another aliquot of 0.75 mL was drawn and transferred to a second tube containing 0.75 mL of TCA. Likewise, samples were collected at different periods up to 60 min and each reaction was stopped in the same manner using TCA. All the aliquot tubes, in which the reaction had been stopped at different intervals by adding TCA, were centrifuged and 0.5 mL of supernatant from each tube was transferred into a clean test tube and added with 5 mL of NaOH and 0.5 mL of FC reagent. The color developed was read at 700 nm in a UV-Vis spectrophotometer.
Determination of protease stability
The latex was collected from the plant source and left at room temperature for 1, 4 and 30 days. On the day 31, a fresh latex sample was collected and its proteolytic activity was compared with those of the samples left at room temperature for 1, 4 and 30 days. A new experiment was carried out, in which, after sample collection, the latex was aliquoted into separate vials and stored under different temperature conditions. One vial was stored at room temperature and another at 4°C in the refrigerator. Likewise, samples were collected and stored for 7 days. Later, on the day 8, a fresh sample was collected and its protease activity was compared with the samples stored at different temperatures for 7 days.
Native poly acrylamide gel electrophoresis (PAGE) and substrate-native PAGE Analysis
Native PAGE of the latex sample was performed according to the method of Walker (2002) for nondenaturing polyacrylamide gel electrophoresis of proteins which used 12% resolving gel and 5% stacking gels. After setting up the electrophoresis unit, the total gel was considered as two halves. In the wells of both halves, 10 µL as well as 20 µL of the samples were loaded, but 10 µL of pre-stained molecular weight marker (Himedia) was loaded in the well of first half only. The electrophoresis was performed at 30 mA for 4 hr. After the electrophoresis, the gel was removed from the cassette and was cut into two halves. One half of the gel in which molecular weight marker was present was directly transferred into the fixative solution, whereas the other half of the gel was transferred in the 1% substrate casein and incubated for 1 hr. After incubation was completed, this half of the gel was washed and transferred into the fixative where the first gel was already present. Now after fixation, both the gels were processed for silver staining, according to the detection of proteins in polyacrylamide gels by silver staining in Walker (2002). After the staining, both the native and substrate-treated gels were photographed.
Statistical analysis
ANOVA was performed to analyze the data using the SPSS 25 software (IBM Corp.; White Plains, NY, USA). Means were compared using Duncan’s multiple range test (DMRT).
Results and Discussion
Phytochemical screening of plant latex
It has been reported that saponins, amino acids and reducing sugars were present in the flower extract of T. divaricate (Kalaimagal and Umamaheswari, 2015). Other researchers reported that alkaloids, flavonoids, steroids, terpenoids, cardiac glycosides, carbohydrates, proteins, saponins, tannins and phenols were present in the leaf extracts of T. divaricata. Alkaloids, flavonoids, terpenoids, carbohydrates, proteins, tannins and phenols were reported to be present in the stem extracts, while the flower extracts contained flavonoids, terpenoids, cardiac glycosides, carbohydrates, proteins, saponins, tannins and phenols (Kalaimagal and Umamaheswari, 2015). In the current study, only phenols, alkaloids, flavonoids, amino acids and proteins were identified in the latex of T. divaricata; saponins and carbohydrates were not detected.
Protease activity
Antioxidant and protease activities were identified in the latex of the T. divaricate, consistent with the findings reported by Rao and Raju (2016). From the current results, it was observed that T. divaricata had good protease activity (297.47 µg/mL/min).
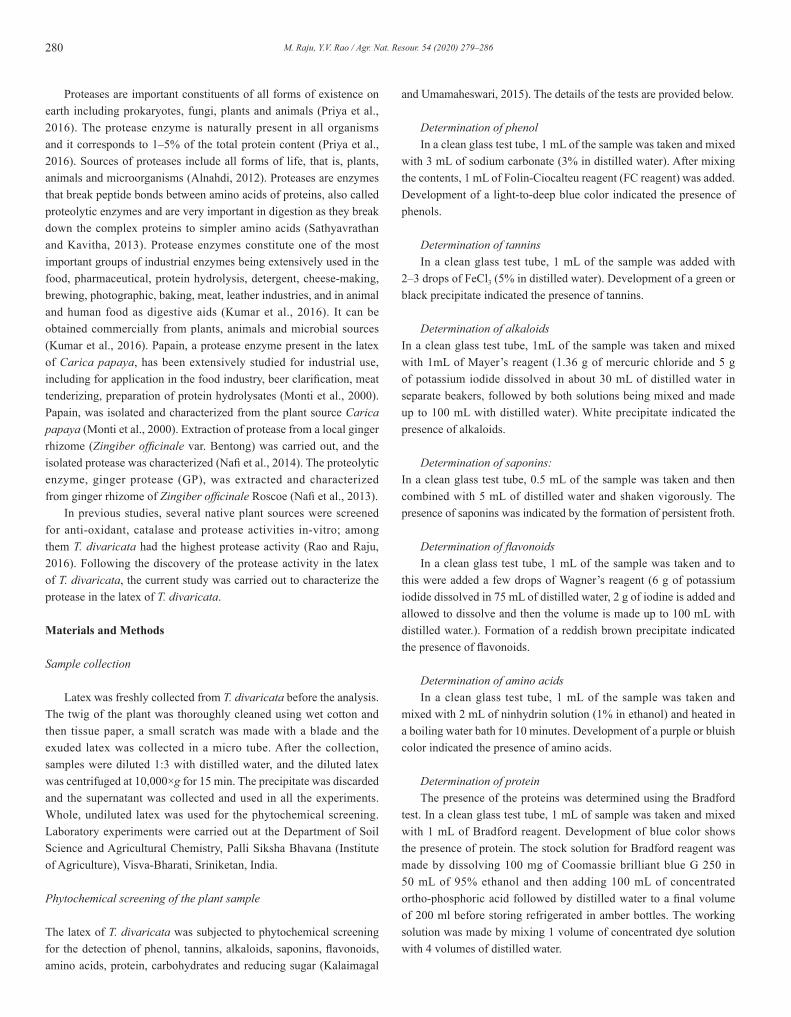
Effect of temperature on protease enzyme activity
The protease activity was analyzed at different temperatures (10–100°C) at a constant pH of 7.0 using 0.1M PBS. The protease activity was lower at the minimum temperature of 10°C and gradually increased and peaked at 50°C; then, it declined to its lowest activity at the maximum temperature of 100°C (Fig. 1). If the optimum protease activity at 50°C were considered as 100%, the protease activities were 62.25%, 71.93%, 77.35%, 86.60%, 100%, 94.63%, 79.05%, 17.43%, 16.26 and 14.56% at temperatures of 10°C, 20°C, 30°C, 40°C, 50°C, 60°C, 70°C, 80°C, 90°C and 100°C, respectively. The activity increased gradually from 62.25% at 10°C and peaked at 100% at 50°C and from there it started to decline gradually to 79.05% at 70°C. The activity substantially declined from 79.05% at 70°C to 17.43% at 80°C and then gradually reached 14.56% at 100°C. Ramya and Bharathi (2015) isolated proteolytic bacteria from red soil and produced enzyme protease using specific media. They identified the isolated bacterial species as Bacillus spp. and the protease secreted from this soil bacterial source had optimum activity at 37°C. A protease from the medicinal mushroom Pleurotus sajor-caju was reported to have optimum proteolytic activity at 60°C (Ravikumar et al., 2012) whereas the protease isolated from Bacillus latrosporus had optimum activity at 40°C (Usharani and Muthuraj, 2010). Recently, it has been reported that the optimum protease activity of latex isolated from T. divaricata was observed at 40°C (Banu et al., 2017). However, this observation was found to be contrary to the findings in the current study (optimum protease activity was found at 50°C) and even at 60°C and 70°C, the protease retained was 94.63% and 79.05% of activity, respectively.
283M. Raju, Y.V. Rao / Agr. Nat. Resour. 54 (2020) 279–286
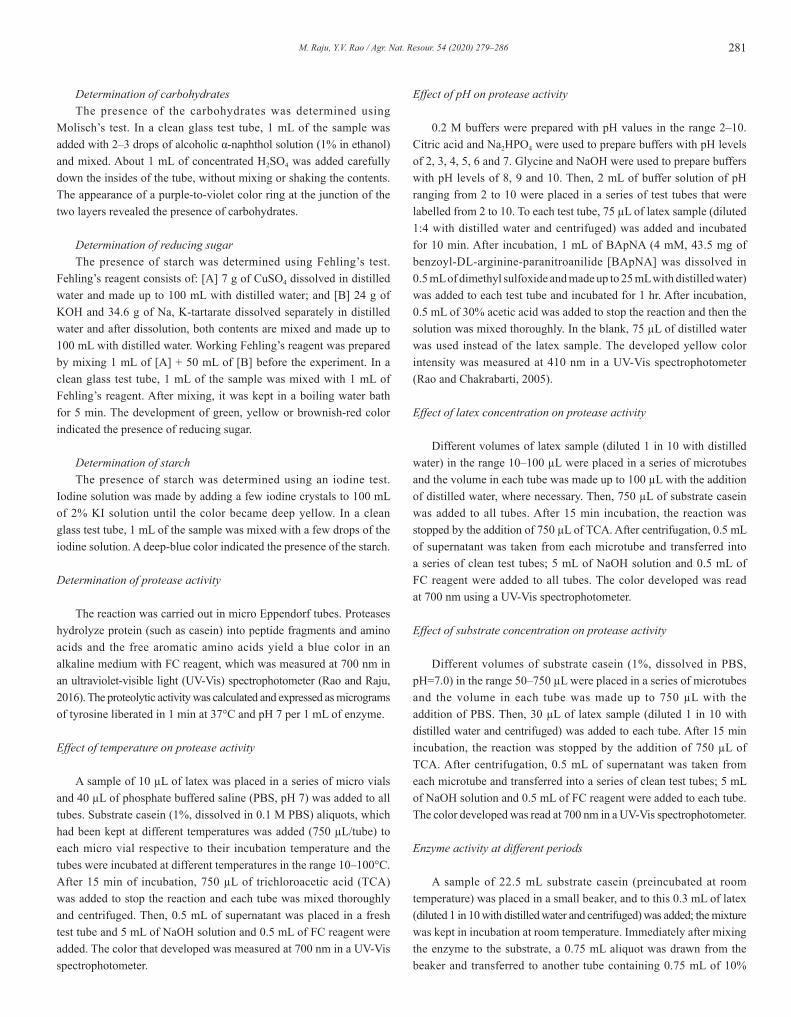
Effect of pH and determination of optimum pH of protease activity
The casein substrate was precipitated at buffers having a pH less than 5; hence, BApNA was used as substrate for this assay. The protease activity was analyzed at room temperature using different pH buffers in the range of pH 2–10. The protease activity was least at pH 2 and gradually increased and peaked at pH 5, maintaining relatively stable activity up to pH 7 and from then it gradually declined incrementally and reached a minimum at pH 10 (Fig. 2). If the optimum protease activity at pH 5 were considered as 100%, the protease activities were 8.55%, 22.81%, 68%, 100%, 96.14%, 93.79%, 38.53%, 28.07% and 12.58% at pH 2, pH 3, pH 4, pH 5, pH 6, pH 7, pH 8, pH 9 and pH 10, respectively. The activity increased gradually from 8.55% at pH 2 to 100% at pH 5, and from there declined toward pH 6 and pH 7; however, this decrement was minute and not significant (p > 0.05), that is, the decrease in activity was only 4 % and 6.76 % at pH 6 and pH 7 respectively. The activity substantially declined from 93.24% to 38.31% as the pH of the medium changed from 7 to 8, and from pH 8 onward, the activity steadily declined toward pH 10, from 38.31% to 12.52%, respectively. It was observed that the protease isolated from Bacillus latrosporus had optimal activity at pH 7 (Usharani and Muthuraj, 2010). A protease from the medicinal mushroom Pleurotus sajor-caju was reported to have optimum proteolytic activity at pH 8 (Ravikumar et al., 2012). A Bacillus species was isolated from red soil and the protease secreted from the bacterial source had optimum activity at pH 9 (Ramya and Bharathi, 2015). Banu et al. (2017) carried out an experiment using 2% casein as substrate, with buffers in the range pH 4.5–8. They reported that the optimum protease activity in T. divaricata was in alkaline range, (pH 7–11). These researchers used casein and their pH observation range was also narrow. However, their observation was contrary to the current findings, in which the optimum protease activity was in the acidic range (pH 5–7).
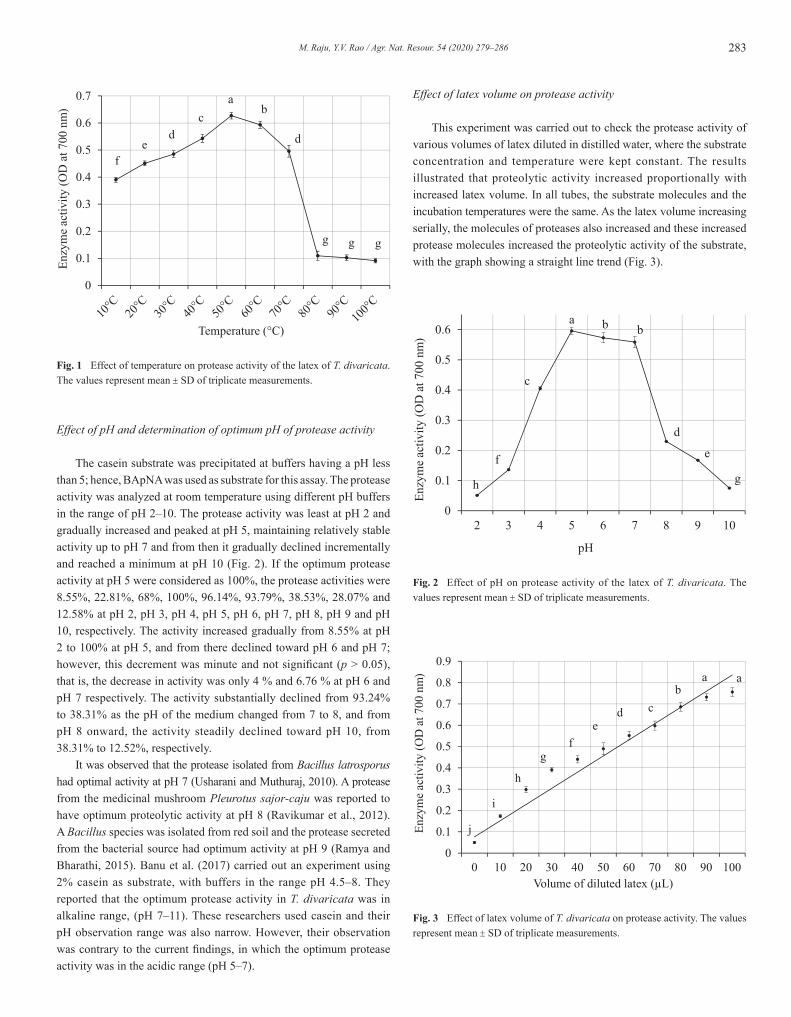
Effect of latex volume on protease activity
This experiment was carried out to check the protease activity of various volumes of latex diluted in distilled water, where the substrate concentration and temperature were kept constant. The results illustrated that proteolytic activity increased proportionally with increased latex volume. In all tubes, the substrate molecules and the incubation temperatures were the same. As the latex volume increasing serially, the molecules of proteases also increased and these increased protease molecules increased the proteolytic activity of the substrate, with the graph showing a straight line trend (Fig. 3).
0
0.1
0.2
0.3
0.4
0.5
0.6
0.7
En
zym
e ac
tiv
ity
(O
D a
t 7
00
nm
)
Temperature (°C)
ab
c
d de
f
g g g
Fig. 1 Effect of temperature on protease activity of the latex of T. divaricata. The values represent mean ± SD of triplicate measurements.
0
0.1
0.2
0.3
0.4
0.5
0.6
2 3 4 5 6 7 8 9 10
En
zym
e ac
tiv
ity
(O
D a
t 7
00
nm
)
pH
a b b
c
d
ef
gh
Fig. 2 Effect of pH on protease activity of the latex of T. divaricata. The values represent mean ± SD of triplicate measurements.
Fig. 3 Effect of latex volume of T. divaricata on protease activity. The values represent mean ± SD of triplicate measurements.
0
0.1
0.2
0.3
0.4
0.50.6
0.7
0.8
0.9
0 10 20 30 40 50 60 70 80 90 100
Enzy
me a
ctiv
ity (O
D at
700
nm
)
Volume of diluted latex (µL)
aab
cde
fg
h
i
j
284 M. Raju, Y.V. Rao / Agr. Nat. Resour. 54 (2020) 279–286
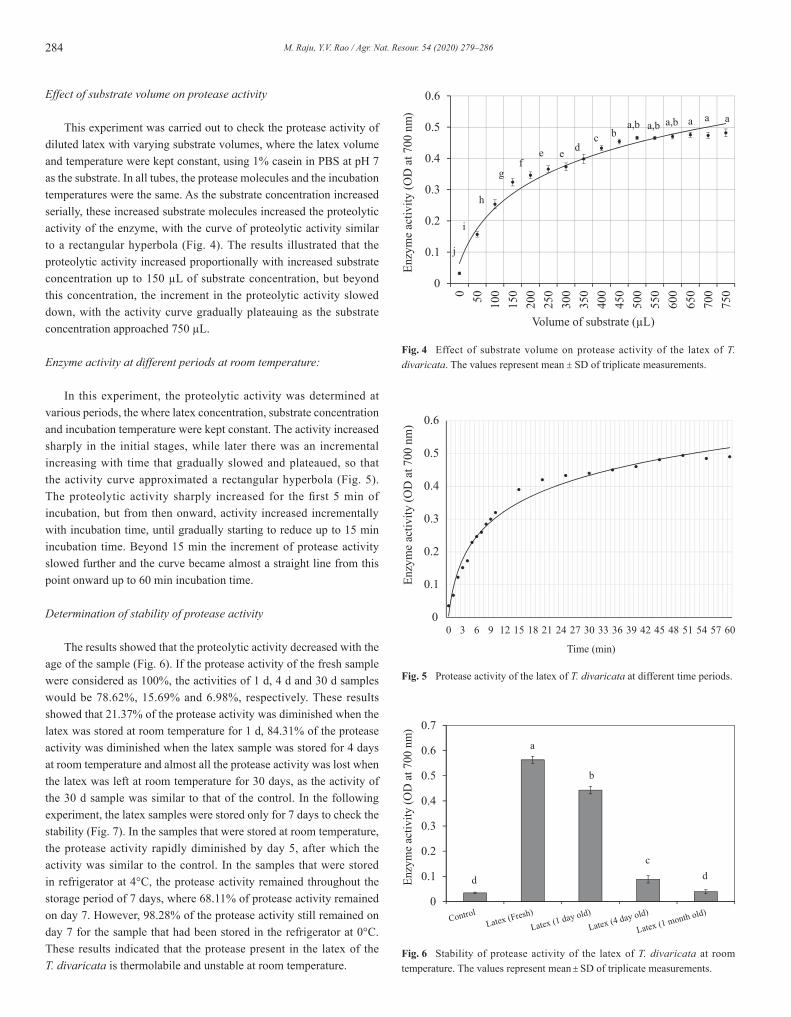
Effect of substrate volume on protease activity
This experiment was carried out to check the protease activity of diluted latex with varying substrate volumes, where the latex volume and temperature were kept constant, using 1% casein in PBS at pH 7 as the substrate. In all tubes, the protease molecules and the incubation temperatures were the same. As the substrate concentration increased serially, these increased substrate molecules increased the proteolytic activity of the enzyme, with the curve of proteolytic activity similar to a rectangular hyperbola (Fig. 4). The results illustrated that the proteolytic activity increased proportionally with increased substrate concentration up to 150 µL of substrate concentration, but beyond this concentration, the increment in the proteolytic activity slowed down, with the activity curve gradually plateauing as the substrate concentration approached 750 µL.
Enzyme activity at different periods at room temperature:
In this experiment, the proteolytic activity was determined at various periods, the where latex concentration, substrate concentration and incubation temperature were kept constant. The activity increased sharply in the initial stages, while later there was an incremental increasing with time that gradually slowed and plateaued, so that the activity curve approximated a rectangular hyperbola (Fig. 5). The proteolytic activity sharply increased for the first 5 min of incubation, but from then onward, activity increased incrementally with incubation time, until gradually starting to reduce up to 15 min incubation time. Beyond 15 min the increment of protease activity slowed further and the curve became almost a straight line from this point onward up to 60 min incubation time.
Determination of stability of protease activity
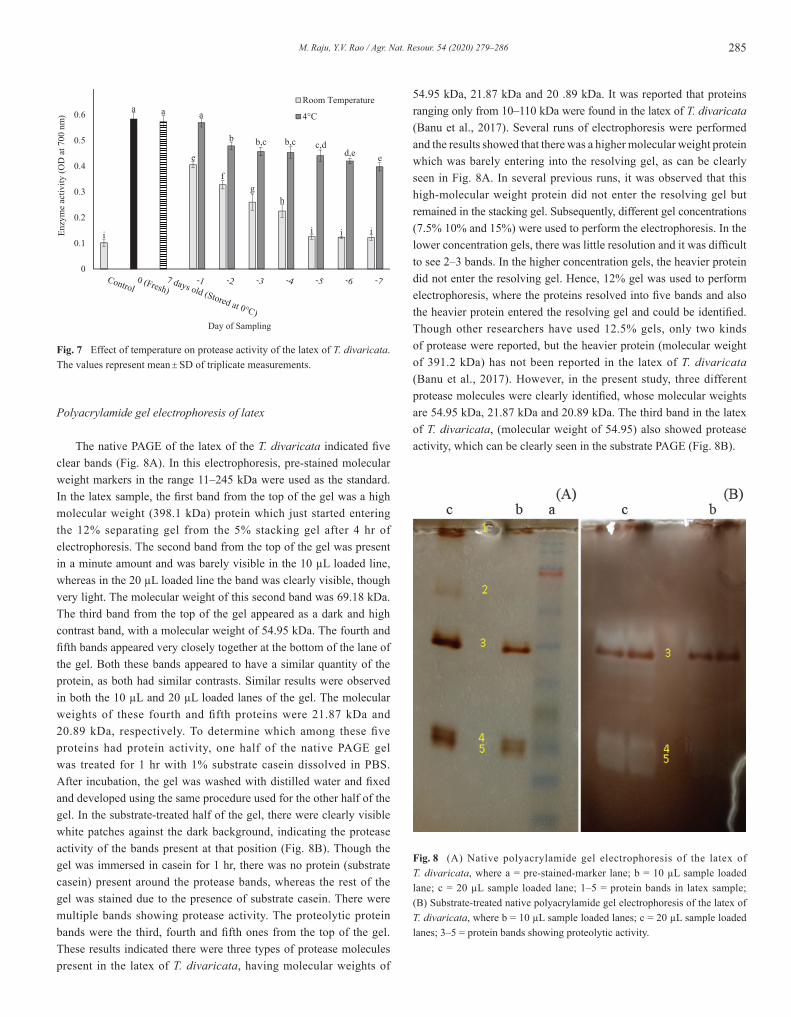
The results showed that the proteolytic activity decreased with the age of the sample (Fig. 6). If the protease activity of the fresh sample were considered as 100%, the activities of 1 d, 4 d and 30 d samples would be 78.62%, 15.69% and 6.98%, respectively. These results showed that 21.37% of the protease activity was diminished when the latex was stored at room temperature for 1 d, 84.31% of the protease activity was diminished when the latex sample was stored for 4 days at room temperature and almost all the protease activity was lost when the latex was left at room temperature for 30 days, as the activity of the 30 d sample was similar to that of the control. In the following experiment, the latex samples were stored only for 7 days to check the stability (Fig. 7). In the samples that were stored at room temperature, the protease activity rapidly diminished by day 5, after which the activity was similar to the control. In the samples that were stored in refrigerator at 4°C, the protease activity remained throughout the storage period of 7 days, where 68.11% of protease activity remained on day 7. However, 98.28% of the protease activity still remained on day 7 for the sample that had been stored in the refrigerator at 0°C. These results indicated that the protease present in the latex of the T. divaricata is thermolabile and unstable at room temperature.
0
0.1
0.2
0.3
0.4
0.5
0.6
0 50 100
150
200
250
300
350
400
450
500
550
600
650
700
750
Enzy
me a
ctiv
ity (O
D at
700
nm
)
Volume of substrate (µL)
j
i
h
gf
e e dc b
a,b a,b a,b a a a
Fig. 4 Effect of substrate volume on protease activity of the latex of T. divaricata. The values represent mean ± SD of triplicate measurements.
0
0.1
0.2
0.3
0.4
0.5
0.6
0 3 6 9 12 15 18 21 24 27 30 33 36 39 42 45 48 51 54 57 60
En
zym
e ac
tiv
ity
(O
D a
t 7
00
nm
)
Time (min)
Fig. 5 Protease activity of the latex of T. divaricata at different time periods.
0
0.1
0.2
0.3
0.4
0.5
0.6
0.7
En
zym
e ac
tiv
ity
(O
D a
t 7
00
nm
)
a
b
c
d d
Fig. 6 Stability of protease activity of the latex of T. divaricata at room temperature. The values represent mean ± SD of triplicate measurements.
285M. Raju, Y.V. Rao / Agr. Nat. Resour. 54 (2020) 279–286
Polyacrylamide gel electrophoresis of latex
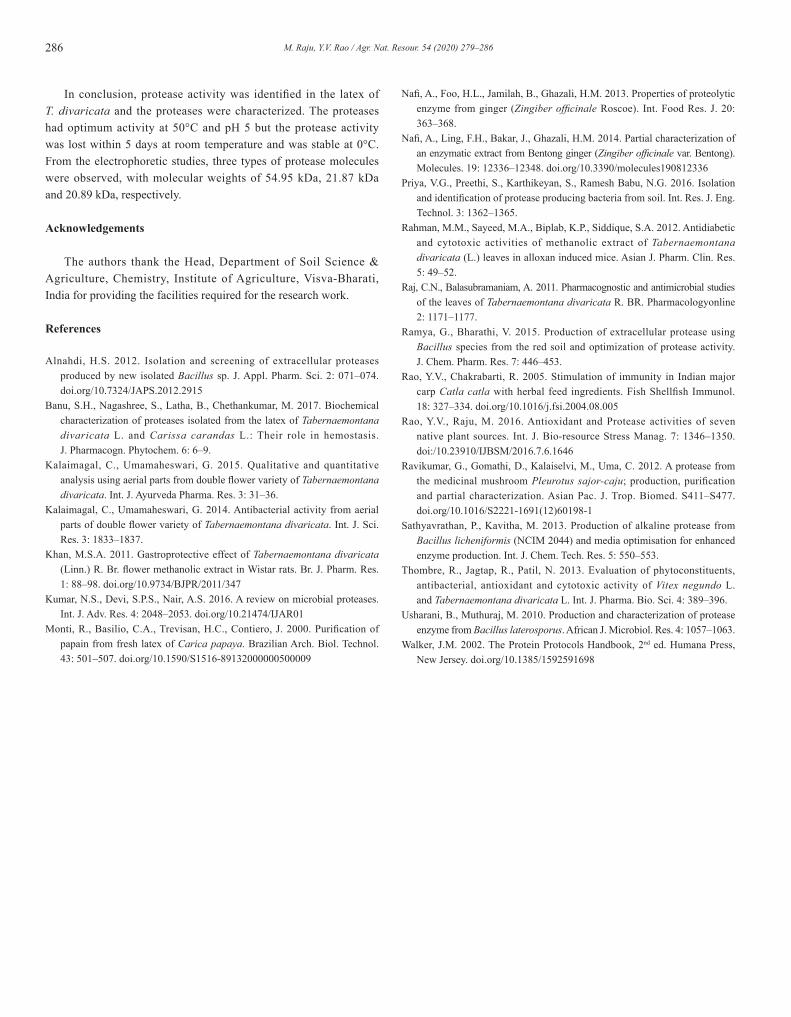
The native PAGE of the latex of the T. divaricata indicated five clear bands (Fig. 8A). In this electrophoresis, pre-stained molecular weight markers in the range 11–245 kDa were used as the standard. In the latex sample, the first band from the top of the gel was a high molecular weight (398.1 kDa) protein which just started entering the 12% separating gel from the 5% stacking gel after 4 hr of electrophoresis. The second band from the top of the gel was present in a minute amount and was barely visible in the 10 µL loaded line, whereas in the 20 µL loaded line the band was clearly visible, though very light. The molecular weight of this second band was 69.18 kDa. The third band from the top of the gel appeared as a dark and high contrast band, with a molecular weight of 54.95 kDa. The fourth and fifth bands appeared very closely together at the bottom of the lane of the gel. Both these bands appeared to have a similar quantity of the protein, as both had similar contrasts. Similar results were observed in both the 10 µL and 20 µL loaded lanes of the gel. The molecular weights of these fourth and fifth proteins were 21.87 kDa and 20.89 kDa, respectively. To determine which among these five proteins had protein activity, one half of the native PAGE gel was treated for 1 hr with 1% substrate casein dissolved in PBS. After incubation, the gel was washed with distilled water and fixed and developed using the same procedure used for the other half of the gel. In the substrate-treated half of the gel, there were clearly visible white patches against the dark background, indicating the protease activity of the bands present at that position (Fig. 8B). Though the gel was immersed in casein for 1 hr, there was no protein (substrate casein) present around the protease bands, whereas the rest of the gel was stained due to the presence of substrate casein. There were multiple bands showing protease activity. The proteolytic protein bands were the third, fourth and fifth ones from the top of the gel. These results indicated there were three types of protease molecules present in the latex of T. divaricata, having molecular weights of
54.95 kDa, 21.87 kDa and 20 .89 kDa. It was reported that proteins ranging only from 10–110 kDa were found in the latex of T. divaricata (Banu et al., 2017). Several runs of electrophoresis were performed and the results showed that there was a higher molecular weight protein which was barely entering into the resolving gel, as can be clearly seen in Fig. 8A. In several previous runs, it was observed that this high-molecular weight protein did not enter the resolving gel but remained in the stacking gel. Subsequently, different gel concentrations (7.5% 10% and 15%) were used to perform the electrophoresis. In the lower concentration gels, there was little resolution and it was difficult to see 2–3 bands. In the higher concentration gels, the heavier protein did not enter the resolving gel. Hence, 12% gel was used to perform electrophoresis, where the proteins resolved into five bands and also the heavier protein entered the resolving gel and could be identified. Though other researchers have used 12.5% gels, only two kinds of protease were reported, but the heavier protein (molecular weight of 391.2 kDa) has not been reported in the latex of T. divaricata (Banu et al., 2017). However, in the present study, three different protease molecules were clearly identified, whose molecular weights are 54.95 kDa, 21.87 kDa and 20.89 kDa. The third band in the latex of T. divaricata, (molecular weight of 54.95) also showed protease activity, which can be clearly seen in the substrate PAGE (Fig. 8B).
0
0.1
0.2
0.3
0.4
0.5
0.6
Enzy
me a
ctiv
ity (O
D at
700
nm
)
Day of Sampling
Room Temperature
4°Ca a a
b b,c b,c c,dd,ee e
fg
h
i i ii
Fig. 7 Effect of temperature on protease activity of the latex of T. divaricata. The values represent mean ± SD of triplicate measurements.
Fig. 8 (A) Native polyacrylamide gel electrophoresis of the latex of T. divaricata, where a = pre-stained-marker lane; b = 10 µL sample loaded lane; c = 20 µL sample loaded lane; 1–5 = protein bands in latex sample; (B) Substrate-treated native polyacrylamide gel electrophoresis of the latex of T. divaricata, where b = 10 µL sample loaded lanes; c = 20 µL sample loaded lanes; 3–5 = protein bands showing proteolytic activity.
286 M. Raju, Y.V. Rao / Agr. Nat. Resour. 54 (2020) 279–286
In conclusion, protease activity was identified in the latex of T. divaricata and the proteases were characterized. The proteases had optimum activity at 50°C and pH 5 but the protease activity was lost within 5 days at room temperature and was stable at 0°C. From the electrophoretic studies, three types of protease molecules were observed, with molecular weights of 54.95 kDa, 21.87 kDa and 20.89 kDa, respectively.
Acknowledgements
The authors thank the Head, Department of Soil Science & Agriculture, Chemistry, Institute of Agriculture, Visva-Bharati, India for providing the facilities required for the research work.
References
Alnahdi, H.S. 2012. Isolation and screening of extracellular proteases produced by new isolated Bacillus sp. J. Appl. Pharm. Sci. 2: 071–074. doi.org/10.7324/JAPS.2012.2915
Banu, S.H., Nagashree, S., Latha, B., Chethankumar, M. 2017. Biochemical characterization of proteases isolated from the latex of Tabernaemontana divaricata L. and Carissa carandas L.: Their role in hemostasis. J. Pharmacogn. Phytochem. 6: 6–9.
Kalaimagal, C., Umamaheswari, G. 2015. Qualitative and quantitative analysis using aerial parts from double flower variety of Tabernaemontana divaricata. Int. J. Ayurveda Pharma. Res. 3: 31–36.
Kalaimagal, C., Umamaheswari, G. 2014. Antibacterial activity from aerial parts of double flower variety of Tabernaemontana divaricata. Int. J. Sci. Res. 3: 1833–1837.
Khan, M.S.A. 2011. Gastroprotective effect of Tabernaemontana divaricata (Linn.) R. Br. flower methanolic extract in Wistar rats. Br. J. Pharm. Res. 1: 88–98. doi.org/10.9734/BJPR/2011/347
Kumar, N.S., Devi, S.P.S., Nair, A.S. 2016. A review on microbial proteases. Int. J. Adv. Res. 4: 2048–2053. doi.org/10.21474/IJAR01
Monti, R., Basilio, C.A., Trevisan, H.C., Contiero, J. 2000. Purification of papain from fresh latex of Carica papaya. Brazilian Arch. Biol. Technol. 43: 501–507. doi.org/10.1590/S1516-89132000000500009
Nafi, A., Foo, H.L., Jamilah, B., Ghazali, H.M. 2013. Properties of proteolytic enzyme from ginger (Zingiber officinale Roscoe). Int. Food Res. J. 20: 363–368.
Nafi, A., Ling, F.H., Bakar, J., Ghazali, H.M. 2014. Partial characterization of an enzymatic extract from Bentong ginger (Zingiber officinale var. Bentong). Molecules. 19: 12336–12348. doi.org/10.3390/molecules190812336
Priya, V.G., Preethi, S., Karthikeyan, S., Ramesh Babu, N.G. 2016. Isolation and identification of protease producing bacteria from soil. Int. Res. J. Eng. Technol. 3: 1362–1365.
Rahman, M.M., Sayeed, M.A., Biplab, K.P., Siddique, S.A. 2012. Antidiabetic and cytotoxic activities of methanolic extract of Tabernaemontana divaricata (L.) leaves in alloxan induced mice. Asian J. Pharm. Clin. Res. 5: 49–52.
Raj, C.N., Balasubramaniam, A. 2011. Pharmacognostic and antimicrobial studies of the leaves of Tabernaemontana divaricata R. BR. Pharmacologyonline 2: 1171–1177.
Ramya, G., Bharathi, V. 2015. Production of extracellular protease using Bacillus species from the red soil and optimization of protease activity. J. Chem. Pharm. Res. 7: 446–453.
Rao, Y.V., Chakrabarti, R. 2005. Stimulation of immunity in Indian major carp Catla catla with herbal feed ingredients. Fish Shellfish Immunol. 18: 327–334. doi.org/10.1016/j.fsi.2004.08.005
Rao, Y.V., Raju, M. 2016. Antioxidant and Protease activities of seven native plant sources. Int. J. Bio-resource Stress Manag. 7: 1346–1350. doi:/10.23910/IJBSM/2016.7.6.1646
Ravikumar, G., Gomathi, D., Kalaiselvi, M., Uma, C. 2012. A protease from the medicinal mushroom Pleurotus sajor-caju; production, purification and partial characterization. Asian Pac. J. Trop. Biomed. S411–S477. doi.org/10.1016/S2221-1691(12)60198-1
Sathyavrathan, P., Kavitha, M. 2013. Production of alkaline protease from Bacillus licheniformis (NCIM 2044) and media optimisation for enhanced enzyme production. Int. J. Chem. Tech. Res. 5: 550–553.
Thombre, R., Jagtap, R., Patil, N. 2013. Evaluation of phytoconstituents, antibacterial, antioxidant and cytotoxic activity of Vitex negundo L. and Tabernaemontana divaricata L. Int. J. Pharma. Bio. Sci. 4: 389–396.
Usharani, B., Muthuraj, M. 2010. Production and characterization of protease enzyme from Bacillus laterosporus. African J. Microbiol. Res. 4: 1057–1063.
Walker, J.M. 2002. The Protein Protocols Handbook, 2nd ed. Humana Press, New Jersey. doi.org/10.1385/1592591698