
A Guide to Energy Master Planning of High-Performance ...
146
Shanti Pless Ben Polly Sammy Houssainy Paul Torcellini William Livingood National Renewable Energy Laboratory Sarah Zaleski U.S. Department of Energy Matt Jungclaus Rocky Mountain Institute Tom Hootman Integral Group Mindy Craig BluePoint Planning A GUIDE TO ENERGY MASTER PLANNING OF HIGH-PERFORMANCE DISTRICTS AND COMMUNITIES
-
Upload
khangminh22 -
Category
Documents
-
view
0 -
download
0
Transcript of A Guide to Energy Master Planning of High-Performance ...
Shanti Pless Ben Polly Sammy Houssainy Paul Torcellini William Livingood National Renewable Energy Laboratory
Sarah Zaleski U.S. Department of Energy
Matt Jungclaus Rocky Mountain Institute
Tom Hootman Integral Group
Mindy Craig BluePoint Planning
A GUIDE TO ENERGY MASTER PLANNING OF HIGH-PERFORMANCE DISTRICTS AND COMMUNITIES
A GUIDE TO ENERGY MASTER PLANNING OF HIGH-PERFORMANCE DISTRICTS AND COMMUNITIES
Shanti Pless,1 Ben Polly,1 Sammy Houssainy,1 Paul Torcellini,1 William Livingood,1 Sarah Zaleski,2 Matt Jungclaus,3 Tom Hootman,4 and Mindy Craig5
1. National Renewable Energy Laboratory2. U.S. Department of Energy3. Rocky Mountain Institute4. Integral Group5. BluePoint Planning
SUGGESTED CITATION: Pless, Shanti, Ben Polly, Sammy Houssainy, Paul Torcellini, William Livingood, Sarah Zaleski, Matt Jungclaus, Tom Hootman, and Mindy Craig. 2020. A Guide to Energy Master Planning of High-Performance Districts and Communities. Golden, CO: National Renewable Energy Laboratory. NREL/TP-5500-78495. https://www.nrel.gov/docs/fy21osti/78495.pdf.
AUTHOR CONTRIBUTIONS: Sarah Zaleski led this publication’s overall organization and direction with contributions to and reviews of all sections. Ben Polly and Shanti Pless led content creation and concept development throughout the document with significant contributions from Mindy Craig, Tom Hootman, and Matt Jungclaus. Sammy Houssainy performed example analyses and Paul Torcellini and William Livingood contributed to district scale grid integra-tion content and concepts.
FRONT COVER: Boulder Commons is a 100,000 square foot mixed use zero energy development in Boulder, Colorado. Photo from Bruce Damonte for Morgan Creek Ventures
PHOTO THIS PAGE:
The LEED Platinum Norm Asbjornson Hall has transformed multidisciplinary education at Montana State University and integrates, among other strategies, thermochromic glazing; ground source heat pumps, transpired solar air collectors, heat recovery; and 225 kW of roof mounted solar photovoltaics.Photo from Adrian Sanchez-Gonzalez for Montana State University
NREL is a national laboratory of the U.S. Department of Energy Office of Energy Efficiency & Renewable Energy Operated by the Alliance for Sustainable Energy, LLC
Contract No. DE-AC36-08GO28308
Technical Report NREL/TP-5500-78495 November 2020
National Renewable Energy Laboratory 15013 Denver West Parkway Golden, CO 80401 303-275-3000 • www.nrel.gov
NOTICEThis work was authored in part by the National Renewable Energy Laboratory, operated by Alliance for Sustainable Energy, LLC, for the U.S. Department of Energy (DOE) under Contract No. DE-AC36-08GO28308. Funding provided by the U.S. Department of Energy Office of Energy Efficiency and Renewable Energy Building Technologies Office.
This report was prepared as an account of work sponsored by an agency of the United States government. Neither the United States government nor any agency thereof, nor any of their employees, makes any warranty, express or implied, or assumes any legal liability or responsibility for the accuracy, completeness, or usefulness of any information, apparatus, product, or process disclosed, or represents that its use would not infringe privately
owned rights. Reference herein to any specific commercial product, process, or service by trade name, trademark, manufac-turer, or otherwise does not necessarily constitute or imply its endorsement, recommendation, or favoring by the United States government or any agency thereof. The views and opinions of authors expressed herein do not necessarily state or reflect those of the United States government or any agency thereof.
This report is available at no cost from the National Renewable Energy Laboratory (NREL) at www.nrel.gov/publications.
U.S. Department of Energy (DOE) reports produced after 1991 and a growing number of pre-1991 documents are available free via www.OSTI.gov.
NREL prints on paper that contains recycled content.

ACKNOWLEDGMENTSThe authors acknowledge the innovation, generosity, and transparency of the Better Buildings Zero Energy Districts Accelerator participants:
Denver National Western Center: Barbara Frommell, Jocelyn Hittle, Laura Rip
Fresno Energy Performance District: Local Government Commission
Huntington Beach: Robert Flores, Antonia Graham
Saint Paul, Minnesota, Ford Site (now Highland Bridge): Mike Richardson, Menaka Mohan, Richard Graves, Nina Axleson
Spokane Catalyst District: Brad Liljequist
Sun Valley EcoDistrict: Chris Parr
Western New York Manufacturing Zero Energy District: Philip Riggs, Grant Lesswing, Lori Szewczyk
EcoDistricts: Naomi Cole, Rob Bennett
Rocky Mountain Institute: Victor Olgyay
U.S. Green Building Council: Elizabeth Beardsley, Alysson Blackwelder
Xcel Energy: Andrew Quirk, André Gouin, Daniel King, Leslie Baer
Special thanks to the individuals and organizations that helped shape the case studies and content for this publication as well as those who contributed photography and graphics:
CASE STUDIES AND CONTENT
Cornell Tech: Luke Leung, SOM
Denver Water: Mundi Wahlberg, Tony Thornton, Stantec
Erie County, New York: Philip Riggs, Erie County Industrial Development Agency
Fort Collins Civic Center: John Phelan, Fort Collins Utilities
Geos Neighborhood: Norbert Klebl, Stephanie Andelman
Hazelwood Green: Gina Johnson, Sustainable Pittsburgh; Victor Olgyay, Rocky Mountain Institute; Emily Sipes, Regional Industrial Development Corporation
Highland Bridge (Ford Site): Mike Richardson, Hannah Burchill, Luis Pereira, City of Saint Paul, Minnesota; Taylor Green, Ryan Companies
Huntington Beach: Robert Flores, Advanced Power and Energy Program, University of California, Irvine
Montana State University: Daniel Stevenson, Megan Sterl, Montana State University
National Western Center: Barbara Frommell, Denver Mayor’s Office of the National Western Center
Peña Station: Laurie Kane, Fulenwider
Port of Long Beach
Revive Fort Collins: Susan McFaddin, Revive Properties, LLC
Rocky Mountain Institute: Victor Olgyay
Stanford University: Joseph Stagner, Fahmida Bangert, Lauren Hennessy, Stanford University
Whisper Valley: Chad Blevins, EcoSmart Solution
PHOTOGRAPHY AND GRAPHICS
Boulder Commons: Melissa Morgan, Morgan Creek Ventures
City of Vancouver, British Columbia
Cornell Tech: Luke Leung, Nikki Snodgrass, SOM
Denver Water: Mundi Wahlberg, Stantec
Erie County, New York: Philip Riggs, Erie County Industrial Development Agency
Geos Neighborhood: Stephanie Andelman
Hazelwood Green: Emily Sipes, Regional Industrial Development Corporation; Kelsey Padgham, U3 Advisors
Highland Bridge (Ford Site): Taylor Green, Ryan Companies
Huntington Beach: Robert Flores, University of California, Irvine
Montana State University: Daniel Stevenson, Montana State University
Peña Station: Laurie Kane, Fulenwider
Port of Long Beach
Rocky Mountain Institute: Marijke Jongbloed
Spokane Catalyst District: Scot Keith, McKinstry
Stanford University: Lauren Hennessy, Stanford University
Whisper Valley: Chad Blevins and David Currie, EcoSmart Solution; Kelly Hanson, Anderson Hanson Blanton
The authors would also like to thank NREL colleagues Marjorie Schott, graphic designer extraordinaire, and Dennis Schroeder, award-winning photographer. Thanks as well to NREL colleagues Paul Norton and Michael Deru for their thorough and thoughtful reviews of this publication. Additional thanks to Maureen McIntyre of McIntyre Communications Inc., our editor and coordinator extraordinaire. Special thanks to the Urban Land Institute's Marta Schantz for her insightful review of an early version of this document and to Slipstream's Brett Bridgeland and Xcel Energy's André Gouin for their generous discussions and suggestions related to engaging utilities.
33 A GUIDE TO ENERGY MASTER PLANNING OF HIGH-PERFORMANCE DISTRICTS AND COMMUNITIES
TABLE OF CONTENTSAcknowledgments 3
Table of Contents 4
List of Figures 6
List of Tables 7
Acronyms 8
Glossary 8
OVERVIEW 10How To Use This Document 10
CHAPTER 1 14
INTRODUCTION 14What Is a High-Performance District? 15
What Is the Value Proposition and Business Case for a High-Performance District? 16
Benefits of High-Performance Buildings 17
Benefits of High-Performance Districts 17
Achieving High Performance at District Scale 18
Challenges of High-Performance Districts 20
CHAPTER 2 22
FOSTERING SUPPORT AND ASSEMBLING A TEAM 22
Engaging Stakeholders 23
Developing a Technical Advisory Team and/or Community Advisory Committees 26
Stakeholder Engagement Resources 26
Creating a Vision and Telling the Story 26
Setting Project Goals and Principles 28
Selecting a Developer and Navigating Land Entitlements 29
Developer Request for Proposal 29
Land Entitlements 30
Getting the First Project Right 30
CHAPTER 3 32
DEVELOPING FINANCIAL AND BUSINESS MODELS 32
Elements of a Robust Financial Analysis 34
Cost Analysis: Balancing Up-Front with Long-Term Operations Costs 34
Scenario Analysis 34
An Iterative and Holistic Approach to Considering Costs 34
Key Considerations for High-Performance District Scenarios 35
Value Analysis and Key Metrics 35
Additional Benefits 37
Energy Development Models 37
Key Business Model Considerations 38
Choosing an Energy Developer 39
Financing Approaches 40
Procurement at Scale To Reduce First Costs 40
Phasing District Development 41
CHAPTER 4 44
ENGAGING UTILITIES 44Contact Relevant Utilities and Compare Goals 45
Understand Utility Rate and Metering Options 46
Explore District Master Metering Options 47
Consider Utility Rate Changes 47
Determine Utility Involvement in the District Thermal System 47
Identify Renewable Energy and Interconnection Procedures 47
Identify Utility Programs 48
Engage Utility Engineers 49
Peña Station URBANopt and Distribution Modeling Analysis 49
Explore New Technologies, Programs, and Business Models 50
National Western Center and Xcel Energy Partner in Energy Program 50
CHAPTER 5 52
DEVELOPING AN ENERGY MASTER PLAN 52
Energy Master Planning Process 53
Detailed Energy Master Plan 54
Energy Systems Financial Planning 54
Resilience Planning 55
What is Resilience? 55
High-Performance Districts and Resilience 55
Incorporating Resilience into a High-Performance District 55
Implementation Success Factors 56
Operations Planning 57
CHAPTER 6 58
PLANNING FOR ENERGY DEMAND AND EFFICIENCY 58
Analysis and Approaches 59
Goal Setting Decision Analysis 59
Feasibility and Energy Budget Analysis 61
Table of Contents
44A GUIDE TO ENERGY MASTER PLANNING OF HIGH-PERFORMANCE DISTRICTS AND COMMUNITIES
Balancing Energy Consumption and Production 61
Modeling 63
Example Analysis: Energy Use Intensities 64
Considerations 65
Bioclimatic Design and Energy System Frameworks 65
Integration 67
Including Energy Use Intensities in Design Guidelines and Master Plans 67
CHAPTER 7 68
DISTRICT THERMAL ENERGY PLANNING 68
Analysis and Approaches 70
Load Diversity and Energy Sharing 70
Heating and Cooling Load Analysis 70
Example Analysis: Heating and Cooling 74
Considerations 76
Phasing 76
Architectural Benefits 76
Business Model Approaches 76
Integration 77
Successful Implementation Examples 77
CHAPTER 8 80
RENEWABLE ENERGY ANALYSIS AND PLANNING 80
Analysis and Approaches 81
Renewable Energy Analysis 81
Determining Photovoltaic Output Requirements 82
Example Analysis: Highland Bridge Ford
Redevelopment Site Solar Photovoltaics 83
Considerations 85
Photovoltaics and Solar Access Planning 85
Locating Photovoltaics 85
On-Site Solar Photovoltaics 87
Off-Site and Community Solar 87
Integration 89
Including Photovoltaics in Concept Renderings and Master Plans 89
Optimizing Building Solar Access and Minimizing Shading 89
Including Solar Specifications in Design Guidelines and Master Plans 92
CHAPTER 9 96
PLANNING FOR GRID INTEGRATION, ENERGY STORAGE, AND ELECTRIC VEHICLES 96
Overview 97
Grid-Interactive Energy-Efficient Buildings 97
Electric Vehicle Charging Infrastructure 97
Analysis and Approaches 98
Potential Energy Cost Savings 98
Electric Load Diversity 98
Peak Demand Savings and Load Shifting 98
Basic District-Scale Grid-Interactive Approaches 100
Example Analysis: Building and District Scale Grid Interactivity 102
Example Analysis: Electric Vehicle Infrastructure Planning and Charge Load Modeling 105
Considerations 108
Stationary Batteries 108
Coordinated Controls 108
Available Electric Vehicle Charging Infrastructure 108
Integration 110
Aligning Electric Vehicle Charging with Distributed Renewables 110
Aligning with Local Proposed New Construction Codes by Building Type 111
Including Charging Infrastructure in Energy Plans and Design Guidelines 112
CHAPTER 10 114
HIGH-PERFORMANCE DISTRICT CASE STUDIES 114
Cornell Tech, New York, New York 116
Denver Water, Colorado 118
Erie County, New York 120
Fort Collins Colorado Civic Center 122
Geos Neighborhood, Arvada, Colorado 124
Hazelwood Green, Pittsburgh, Pennsylvania 126
Highland Bridge (Ford Site), Saint Paul, Minnesota 128
Huntington Beach, California 130
Montana State University, Bozeman, Montana 132
National Western Center, Denver, Colorado 134
Peña Station NEXT, Denver, Colorado 136
Port of Long Beach, California 138
Revive Fort Collins, Colorado 140
Stanford University, California 142
Whisper Valley, Austin, Texas 144
55 A GUIDE TO ENERGY MASTER PLANNING OF HIGH-PERFORMANCE DISTRICTS AND COMMUNITIES

LIST OF FIGURESFIGURE 1. Zero energy district definition framework based
on Architecture 2030’s ZERO Code standard 16
FIGURE 2. High-performance district development process 19
FIGURE 3. Stakeholder roles and relationships 24
FIGURE 4. Makeup of the project team for a high-performance district 25
FIGURE 5. Outreach materials accessible to both English and Spanish speakers developed for an Advanced Energy Community demonstration project in Oak View, a low-income community in Huntington Beach, California. 27
FIGURE 6. A zero energy light industrial manufacturing and commercial facility designed to achieve zero or better in several sustainability categories: energy, carbon, water, waste, materials, and value on an Erie County (New York) brownfield site 31
FIGURE 7. Financially attractive investment opportunities 33
FIGURE 8. When considering the costs of a building, the ongoing costs of ownership far outweigh the up-front cost of construction 35
FIGURE 9. The integrated technical and business plan ensures that high performance is profitable for an integrated energy services provider and attractive to vertical developers and tenants 37
FIGURE 10. The integrated energy services provider model can benefit developers, building owners, and tenants through long-term financing 41
FIGURE 11. Installed price (2018$/Wdc) versus system size range (kWdc) for sample of nonresidential systems installed in 2018 41
FIGURE 12. Denver Water campus central utility plant as engineered for implementation 54
FIGURE 13. Early design decisions versus project cost projections 59
FIGURE 14. Flow map showing the transformation of an existing campus into a high-performance campus 62
FIGURE 15. Example of energy model results informing energy use intensity targets for two building types 64
FIGURE 16. Example building energy simulation analysis to identify achievable energy use intensity values in different building types relative to business as usual 64
FIGURE 17. Example building energy simulation analysis to identify achievable energy use intensity values in different hypothetical district types relative to business as usual 65
FIGURE 18. Simple sketches can convey key bioclimatic site design concepts 65
FIGURE 19. Simple sketches can convey key energy system frameworks 66
FIGURE 20. High-performance framework plan for the Fort Collins Civic Center 66
FIGURE 21. Design guidelines example from Peña Station NEXT design standards requiring energy modeling and minimum energy savings for all vertical development 67
FIGURE 22. District energy system evolution, from first generation to fifth generation 69
FIGURE 23. Example of load profile analysis of the Swarthmore College campus 71
FIGURE 24. Denver Water campus thermal system option 1: ambient loop with geothermal loop fields 72
FIGURE 25. Denver Water campus thermal system option 2: Stand-alone systems with geothermal for administration building 72
FIGURE 26. Denver Water campus thermal system option 3: Central utility plant with water main heat exchanger 72
FIGURE 27. Example of a study for a potential geothermal loop field footprint sized for a district and overlaid on the master site plan at Buckley Annex in Denver, Colorado 73
FIGURE 28. EXAMPLE ANALYSIS: Plots of estimated heating and cooling loads of hypothetical live-work-play district in Atlanta, Georgia 75
FIGURE 29. EXAMPLE ANALYSIS: Estimating hourly heating and cooling loads of hypothetical live-work-play district in Atlanta, Georgia 75
FIGURE 30. EXAMPLE ANALYSIS: Estimating overlapping hourly heating/cooling loads 75
FIGURE 31. Campus energy loop at the National Western Center in Denver, Colorado 78
FIGURE 32. Whisper Valley shared ground source district system layout 79
FIGURE 33. PV Watts®, a user-friendly solar photovoltaics calculator available to homeowners and others for estimating solar performance for a given location 82
FIGURE 34. Avoid shading roofs by carefully planning the locations and heights of adjacent buildings based on solar access requirements for roofs 85
FIGURE 35. Strategies to maximize solar photovoltaic system size for rooftop and building connected systems 85
FIGURE 36. Solar photovoltaic location options 86
FIGURE 37. Boston Solar Access low-to-moderate income community solar program structure 88
FIGURE 38. Catalyst Spokane District concept graphic with more than 50% rooftop solar photovoltaics coverage 89
FIGURE 39. ModernWest, a 16-acre mixed use light industrial/office/multifamily district in Longmont, Colorado 90
List of Figures
66A GUIDE TO ENERGY MASTER PLANNING OF HIGH-PERFORMANCE DISTRICTS AND COMMUNITIES

FIGURE 40. The Geos Neighborhood master plan ensures solar access for all buildings with a checkerboard pattern of homes and landscaping 91
FIGURE 41. Denver Water campus energy master plan with building energy use intensity targets at 50% savings and on-site solar photovoltaic systems located on buildings and sized to reach high-performance goals 93
FIGURE 42. Guidance on using roof forms and parapets to optimize the available roof areas available for solar photovoltaics from the Peña Station NEXT design standards 94
FIGURE 43. Peña Station NEXT design guidelines example for parking lot solar photovoltaic canopy integrated with parking design guidelines 95
FIGURE 44. Characteristics of grid-interactive energy-efficient buildings 97
FIGURE 45. A typical day of total grid demand, net grid demand (total grid demand minus renewable generation), and highest net demand hours 100
FIGURE 46. EXAMPLE ANALYSIS: Average daily summer electric load profiles for simulated higher efficiency buildings in Atlanta, Georgia 102
FIGURE 47. EXAMPLE ANALYSIS: Average daily summer electric load profiles for simulated higher efficiency hypothetical districts in Atlanta, Georgia 102
FIGURE 48. EXAMPLE ANALYSIS: Average daily summer electric load profiles for simulated baseline and higher efficiency “live-work-play” hypothetical district in Atlanta, Georgia 103
FIGURE 49. Example summer day load shifting analysis 103
FIGURE 50. EXAMPLE ANALYSIS: Average daily summer electric net load profiles (building demand minus solar photovoltaic generation) for simulated higher efficiency mixed fuel buildings with solar photovoltaic systems sized to achieve zero energy in Atlanta, Georgia (IECC climate zone 3A) 104
FIGURE 51. Plots demonstrating how control and behavior scenarios affect the distribution and timing of electric vehicle charging and the magnitude and timing of peak power draw for charging 107
FIGURE 52. Zero energy definition energy use boundary with electric vehicles 109
FIGURE 53. Electric vehicle charging loads provide an opportunity to maximize the benefits of demand flexibility 110
FIGURE 54. New construction codes across the United States include electric vehicle requirements 111
LIST OF TABLESTABLE 1. Nonenergy and Other Benefits of a
High-Performance District 36
TABLE 2. Risks and Benefits of Energy Ownership Structures 39
TABLE 3. Hypothetical District Square Footage Breakdowns Example 65
TABLE 4. Selected Highlights of Solar Photovoltaic System Analysis Approaches 83
TABLE 5. Build-Out by Space Type for Each Site Development Scenario at Highland Bridge Ford Site Redevelopment 83
TABLE 6. Estimates of Solar Photovoltaics Needed for Zero Electricity and Rooftop Space Available at Highland Bridge Ford Site Redevelopment 84
TABLE 7. High-Performance Building Energy Supply Option Hierarchy 87
TABLE 8. Summary of Zero Code Renewable Energy Allocation for On-Site and Off-Site Renewable Options 88
TABLE 9. Example Strategies Relevant to Shifting Space Cooling, Space Heating, and Service/Domestic Water Heating 99
TABLE 10. Example Strategies Relevant to Schedulable Loads 99
TABLE 11. Multifamily Electric Vehicle Infrastructure Denver Code Requirements (proposed in 2019) 112
TABLE 12. Commercial and Parking Garage Electric Vehicle Charging Infrastructure Denver Code Proposed Requirements 112
List of Tables
77 A GUIDE TO ENERGY MASTER PLANNING OF HIGH-PERFORMANCE DISTRICTS AND COMMUNITIES
ACRONYMSDOE U.S. Department of Energy
EUI energy use intensity
EV electric vehicle
EVSE electric vehicle supply equipment
FEMA Federal Emergency Management Agency
HP high performance
HPD high-performance district
HVAC heating, ventilating, and air conditioning
IESP integrated energy services provider
NREL National Renewable Energy Laboratory
POLB Port of Long Beach
PV solar photovoltaics
TOU time-of-use
ZE zero energy
GLOSSARYambient loop
Two-stage heating and cooling network that distributes low- or ambient-temperature heat between buildings or floors of buildings to provide heating and cooling, supplemented by individual heat pumps that ensure occupant comfort.1
behind the meterPositioned on-site, on the customer (energy user) side of the meter.
business improvement districtArea within which businesses and property owners pay an additional tax or levy to fund projects and services beyond government offerings.2
charrette (or design charrette) Meeting in which all stakeholders in a project gather to resolve conflicts and map solutions collaboratively.
combined heat and powerSimultaneous production of electricity and heat from a single fuel source in a way that captures and uses some of “waste” heat typically lost in the conversion process.3
community solarDistributed solar energy deployment model that allows customers to buy or lease part of a larger, off-site shared solar photovoltaic system.
construction phasingBuilding out a district or development in several scheduled construction phases rather than all at once.
1 www.energistuk.co.uk/gla-are-ambient-loop-heating-systems-the-future/2 www.pps.org/article/bid-23 www.eesi.org/topics/combined-heat-and-power/description4 www.eia.gov/electricity/data/eia861/dsm/5 hmcarchitects.com/news/what-is-a-greenfield-project-advantages-brownfield-project-2019-04-03/
demand-side management Electric utility planning, implementing, and monitoring activities designed to encourage consumers to modify their level and pattern of electricity usage.4
development programDescription of the building area, densities, range of building types, and construction phasing plans for the overall devel-opment.
electric vehicleVehicles that operate on electricity.
energy balancingUsing the diversity of energy loads and load profiles, building types, renewable energy sources, and other considerations to cost-effectively optimize district energy use by balancing energy consumption and production.
energy positiveBuilding or district that produces more energy from renew-able sources than it consumes.
energy use intensityMeasure of energy consumption per square foot per year (in the United States), expressed as kBtu/ft2·yr, and typically referred to as EUI.
greenfieldA vacant site with a minimum of constraints, in contrast with, for example, a brownfield site contaminated from industrial or other uses.5
88A GUIDE TO ENERGY MASTER PLANNING OF HIGH-PERFORMANCE DISTRICTS AND COMMUNITIES
horizontal developerEntity responsible for roads, bridges, water and wastewater pipes, railways, landfills, water and wastewater treatment plants, power transmission lines, sidewalks, public spaces, etc.
integrated energy services providerAn entity charged with managing district energy-related operations; acts as a multipurpose developer, financier, operator, and administrator for district energy systems.6
integrated energy solution Energy plan that integrates energy efficiency to reduce energy consumption, energy production from renewable sources to meet on-site energy loads, and sometimes energy storage to provide energy services during power outages.
interconnectionSystems synchronized to the utility grid at the point of coupling to allow seamless interaction.
internal rate of returnInterest rate at which the net present value of all the cash flows (both positive and negative) from a project or invest-ment equal zero.
IslandingAct of physically disconnecting a defined group of electric circuits from a utility system and operating them independently; islanding capabilities are fundamental to the function of a microgrid.
land entitlementsPart of the legal process a developer must go through to get approval; entitlements dictate permissible uses and thus define what a developer can or cannot do at a site.
6 www.naiop.org/Research-and-Publications/Magazine/2016/Winter-2016-2017/Development-Ownership/Net-Zero-Districts-Finding-the-Quadruple-Bottom-Line7 emp.lbl.gov/publications/peak-demand-impacts-electricity8 www.epa.gov/greenpower/renewable-energy-certificates-recs
microgridSmall energy system capable of balancing supply and demand resources to maintain stable service within a defined boundary. Most are grid-connected but capable of disconnecting and operating autonomously (islanding).
net present valueIndicator of the value an investment or project adds; compares the value of a dollar today to the value of that same dollar in the future, taking inflation and returns into account (a positive net present value indicates a profitable project).
off-grid microgridMicrogrid not interconnected with a local utility network.
payback periodLength of time required for an investment to recover its initial outlay in terms of profits or savings.
peak demandThe maximum load during a specified period of time.7
performance-based Focus on measurable performance outcomes rather than prescriptive solutions to design problems; for example, describing how a building will perform by establishing a maximum annual energy use intensity rather than what it will be (an energy-efficient or high-performance building).
ramp rateRate of grid net load changes; for example, when the sun sets, solar photovoltaic production decreases but in cases where building loads remain constant or increase due to air-conditioning loads, the grid net load can increase sharply.
renewable energy certificateA market-based instrument that represents the property rights to the environmental, social, and other non-power attributes of renewable electricity generation.8
resilienceAbility of a system, community, business, etc., to mitigate damage, respond effectively to power and other disrup-tions, and rebound quickly after a crisis or disaster.
smart gridAn energy system characterized by two-way communications and distributed sensors, automation, and supervisory control systems.
solar readyDesign that includes shade-free roof areas and building structures to support solar photovoltaic loads so that solar can be added cost-effectively in the future.
summer peakingHighest summer electricity demand when warmer weather increases use of energy-intensive air conditioning.
value engineeringPractice intended to ensure optimum value for the owner in commercial design and construction that can have the unintended consequence of stripping energy efficiency measures that are deemed to be too costly up front.
vertical developer Entity responsible for the design and construction of buildings.
zero energyBuilding or district that produces as much energy from renewable sources as it consumes over the course of a full year.
99 A GUIDE TO ENERGY MASTER PLANNING OF HIGH-PERFORMANCE DISTRICTS AND COMMUNITIES
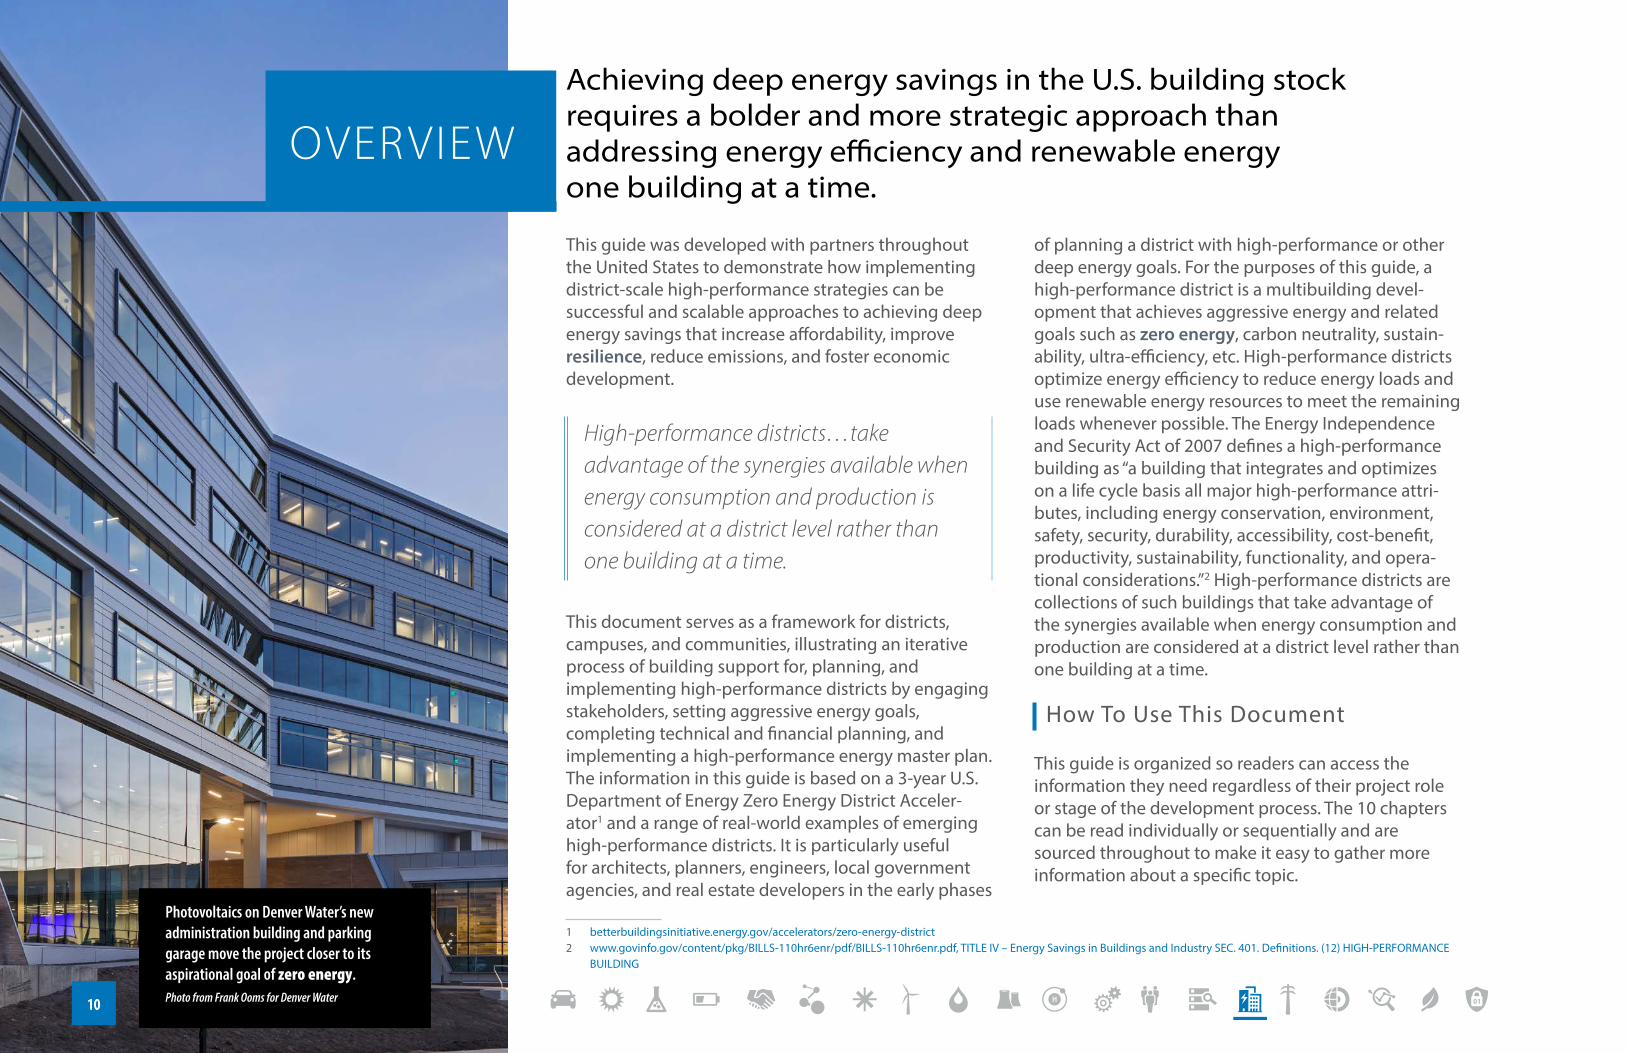
Photovoltaics on Denver Water’s new administration building and parking garage move the project closer to its aspirational goal of zero energy.Photo from Frank Ooms for Denver Water
Achieving deep energy savings in the U.S. building stock requires a bolder and more strategic approach than addressing energy efficiency and renewable energy one building at a time.
1 betterbuildingsinitiative.energy.gov/accelerators/zero-energy-district 2 www.govinfo.gov/content/pkg/BILLS-110hr6enr/pdf/BILLS-110hr6enr.pdf, TITLE IV – Energy Savings in Buildings and Industry SEC. 401. Definitions. (12) HIGH-PERFORMANCE
BUILDING
This guide was developed with partners throughout the United States to demonstrate how implementing district-scale high-performance strategies can be successful and scalable approaches to achieving deep energy savings that increase affordability, improve resilience, reduce emissions, and foster economic development.
High-performance districts…take advantage of the synergies available when energy consumption and production is considered at a district level rather than one building at a time.
This document serves as a framework for districts, campuses, and communities, illustrating an iterative process of building support for, planning, and implementing high-performance districts by engaging stakeholders, setting aggressive energy goals, completing technical and financial planning, and implementing a high-performance energy master plan. The information in this guide is based on a 3-year U.S. Department of Energy Zero Energy District Acceler-ator1 and a range of real-world examples of emerging high-performance districts. It is particularly useful for architects, planners, engineers, local government agencies, and real estate developers in the early phases
of planning a district with high-performance or other deep energy goals. For the purposes of this guide, a high-performance district is a multibuilding devel-opment that achieves aggressive energy and related goals such as zero energy, carbon neutrality, sustain-ability, ultra-efficiency, etc. High-performance districts optimize energy efficiency to reduce energy loads and use renewable energy resources to meet the remaining loads whenever possible. The Energy Independence and Security Act of 2007 defines a high-performance building as “a building that integrates and optimizes on a life cycle basis all major high-performance attri-butes, including energy conservation, environment, safety, security, durability, accessibility, cost-benefit, productivity, sustainability, functionality, and opera-tional considerations.”2 High-performance districts are collections of such buildings that take advantage of the synergies available when energy consumption and production are considered at a district level rather than one building at a time.
How To Use This Document
This guide is organized so readers can access the information they need regardless of their project role or stage of the development process. The 10 chapters can be read individually or sequentially and are sourced throughout to make it easy to gather more information about a specific topic.
OVERVIEW
1010
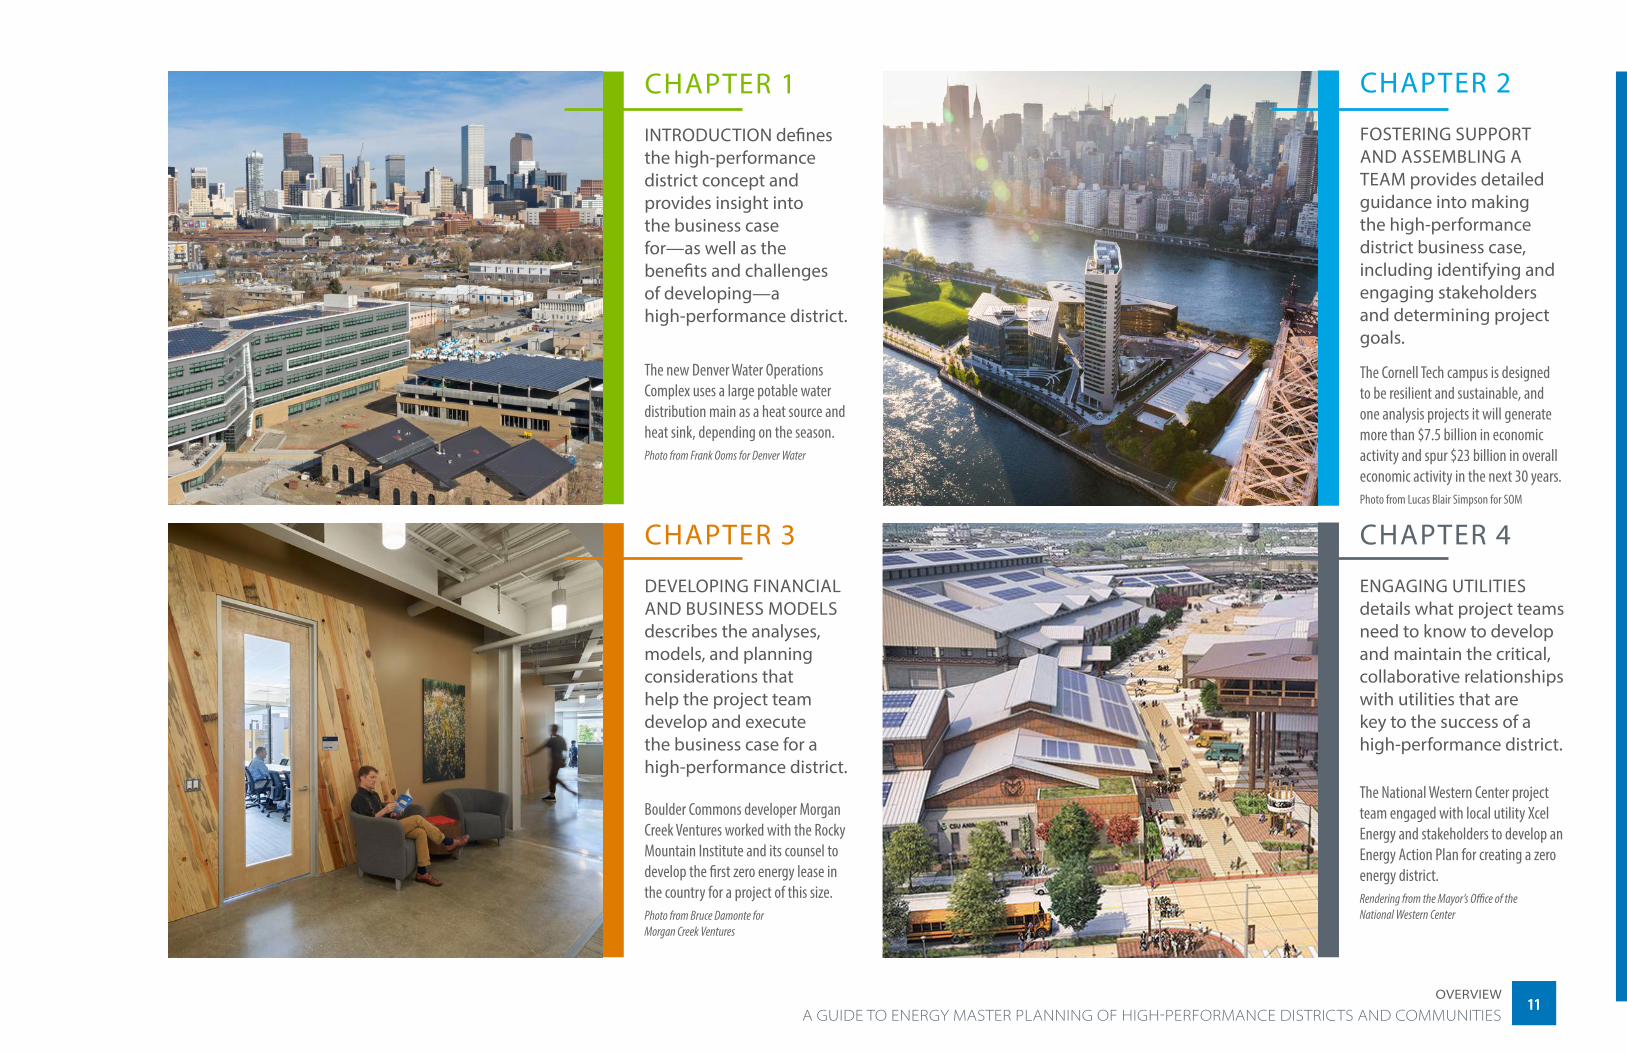
CHAPTER 2
FOSTERING SUPPORT AND ASSEMBLING A TEAM provides detailed guidance into making the high-performance district business case, including identifying and engaging stakeholders and determining project goals.
The Cornell Tech campus is designed to be resilient and sustainable, and one analysis projects it will generate more than $7.5 billion in economic activity and spur $23 billion in overall economic activity in the next 30 years.Photo from Lucas Blair Simpson for SOM
CHAPTER 3
DEVELOPING FINANCIAL AND BUSINESS MODELS describes the analyses, models, and planning considerations that help the project team develop and execute the business case for a high-performance district.
Boulder Commons developer Morgan Creek Ventures worked with the Rocky Mountain Institute and its counsel to develop the first zero energy lease in the country for a project of this size. Photo from Bruce Damonte for Morgan Creek Ventures
CHAPTER 4
ENGAGING UTILITIES details what project teams need to know to develop and maintain the critical, collaborative relationships with utilities that are key to the success of a high-performance district.
The National Western Center project team engaged with local utility Xcel Energy and stakeholders to develop an Energy Action Plan for creating a zero energy district.Rendering from the Mayor’s Office of the National Western Center
3
Stockyards & RTD Pedestrian BridgeLooking Southeast During Stock Show
Livestock Arena and Barn Looking North During Stock Show
CHAPTER 1
INTRODUCTION defines the high-performance district concept and provides insight into the business case for—as well as the benefits and challenges of developing—a high-performance district.
The new Denver Water Operations Complex uses a large potable water distribution main as a heat source and heat sink, depending on the season. Photo from Frank Ooms for Denver Water
A GUIDE TO ENERGY MASTER PLANNING OF HIGH-PERFORMANCE DISTRICTS AND COMMUNITIES1111
Overview

CHAPTER 5
DEVELOPING AN ENERGY MASTER PLAN establishes the importance of an energy master plan and offers guidance on developing such a plan.
ModernWest will be a 16-acre mixed use development In Longmont, Colorado.Graphic from ModernWest Ventures Inc.
CHAPTERS 6–9provide a deep dive into the analysis and planning of a high performance district.
Chapters 6–9 are organized as follows:
A brief overview of why the section is important, how it impacts the high-performance district project, and how it relates to other project elements
Analysis and Approaches. What analyses to run, when and how to run them, example analyses, and available tools; each of chapters 6–9 includes at least one example analysis
Considerations. Factors that impact analysis inputs and outputs and tips to expedite the process
Integration. How to integrate the analysis results to optimize cost-effectiveness.
CHAPTER 6
PLANNING FOR ENERGY DEMAND AND EFFICIENCY discusses the analysis and planning required to reduce energy loads cost-effectively and set appropriate energy targets.
All the structures in the Whisper Valley development in Austin, Texas, will be equipped with solar photovoltaics and a ground source heat pump system. Photo from Rob Aldridge for Whisper Valley
CHAPTER 7
DISTRICT THERMAL ENERGY PLANNING describes the sophisticated district heating and cooling systems that improve the economics of large thermal systems through technology, analysis, and planning.Montana State University’s reduce, reclaim, renewable strategy optimiz-es building energy efficiency through ground source heat pumps, solar photovoltaics, and infrastructure and energy sharing.Photo from Adrian Sanchez-Gonzalez for Mon-tana State University
1212A GUIDE TO ENERGY MASTER PLANNING OF HIGH-PERFORMANCE DISTRICTS AND COMMUNITIESOverview
CHAPTER 8
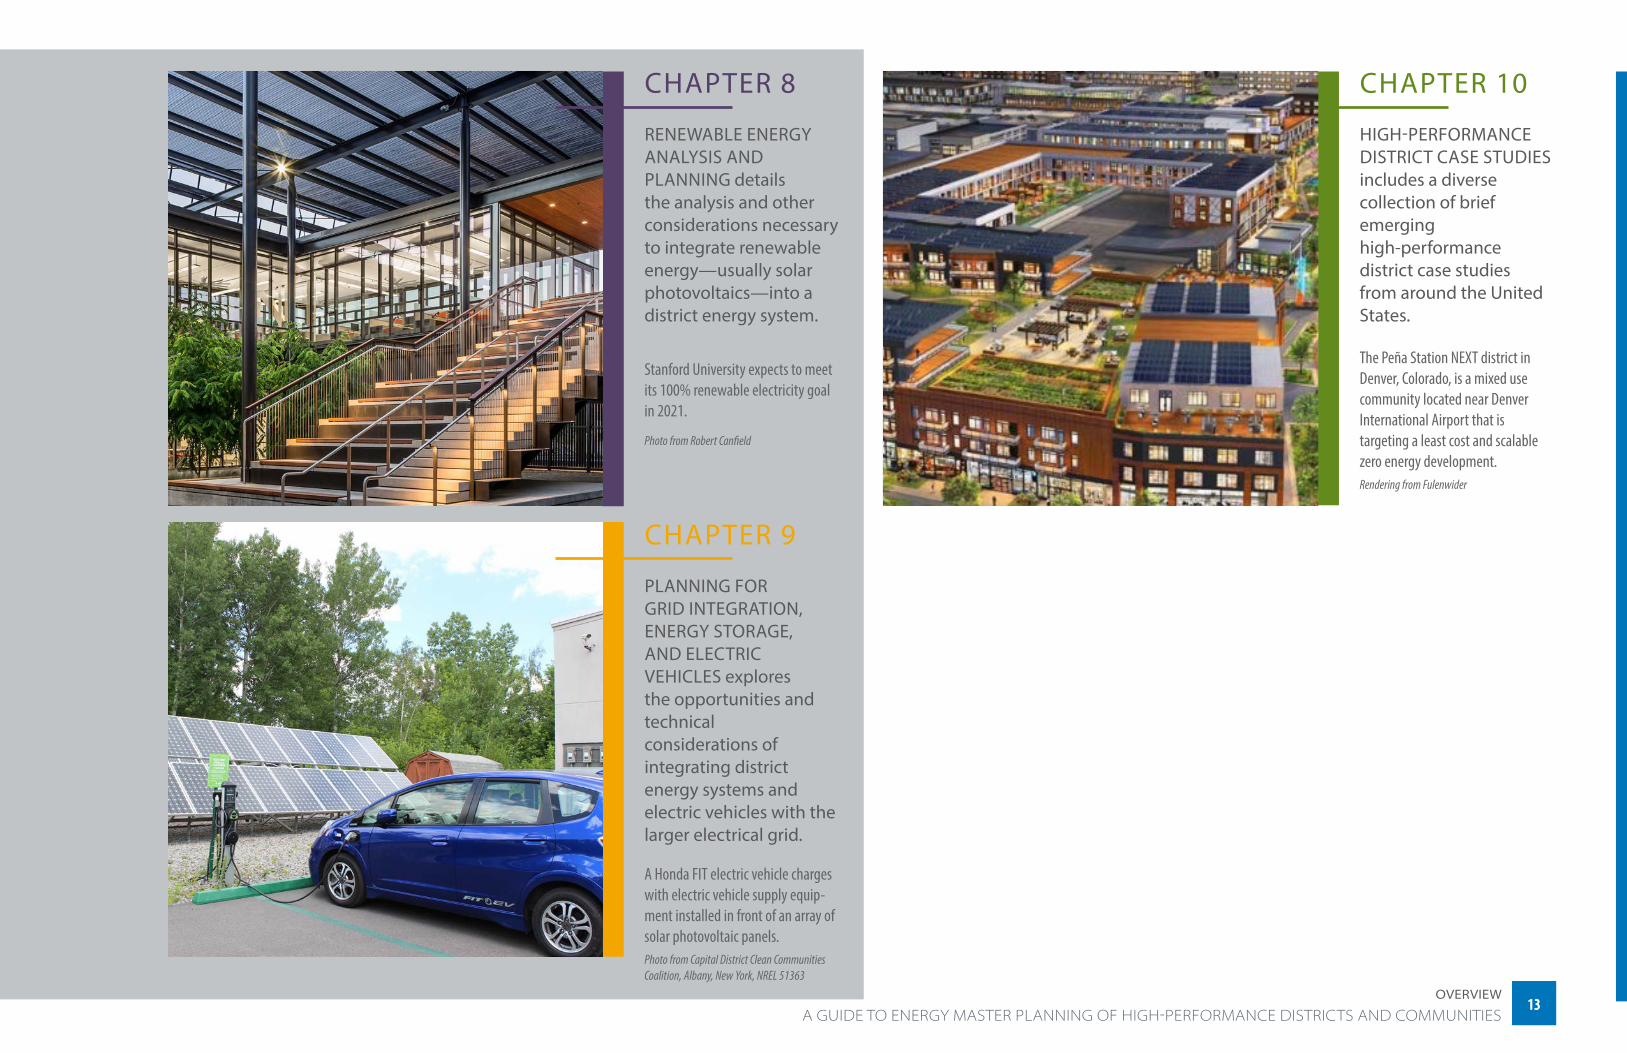
RENEWABLE ENERGY ANALYSIS AND PLANNING details the analysis and other considerations necessary to integrate renewable energy—usually solar photovoltaics—into a district energy system.
Stanford University expects to meet its 100% renewable electricity goal in 2021.
Photo from Robert Canfield
CHAPTER 9
PLANNING FOR GRID INTEGRATION, ENERGY STORAGE, AND ELECTRIC VEHICLES explores the opportunities and technical considerations of integrating district energy systems and electric vehicles with the larger electrical grid.
A Honda FIT electric vehicle charges with electric vehicle supply equip-ment installed in front of an array of solar photovoltaic panels.Photo from Capital District Clean Communities Coalition, Albany, New York, NREL 51363
CHAPTER 10
HIGH-PERFORMANCE DISTRICT CASE STUDIES includes a diverse collection of brief emerging high-performance district case studies from around the United States.
The Peña Station NEXT district in Denver, Colorado, is a mixed use community located near Denver International Airport that is targeting a least cost and scalable zero energy development.Rendering from Fulenwider
1313 A GUIDE TO ENERGY MASTER PLANNING OF HIGH-PERFORMANCE DISTRICTS AND COMMUNITIES
Overview
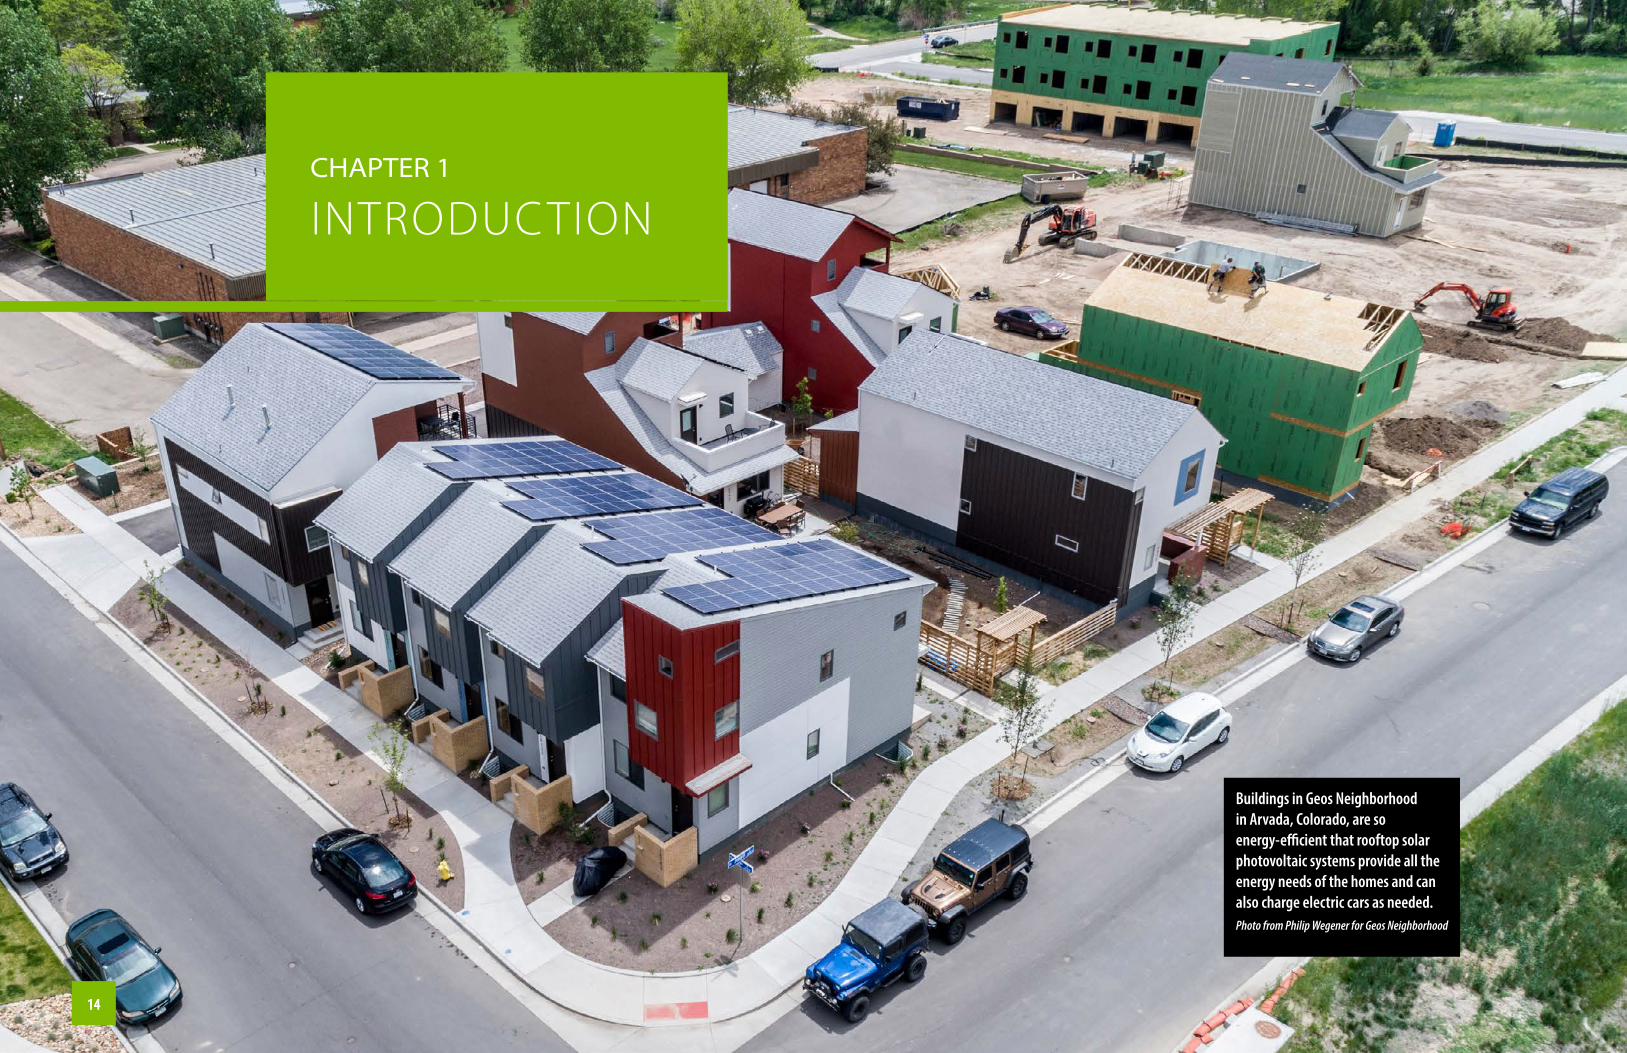
Buildings in Geos Neighborhood in Arvada, Colorado, are so energy-efficient that rooftop solar photovoltaic systems provide all the energy needs of the homes and can also charge electric cars as needed.Photo from Philip Wegener for Geos Neighborhood
CHAPTer 1
INTRODUCTION
1414
High-performance districts (HPDs) are an emerging strategy for fulfilling local, national, and international commitments to energy security, resilience, environmental sustainability, and reduced emissions.
1 www.govinfo.gov/content/pkg/BILLS-110hr6enr/pdf/BILLS-110hr6enr.pdf, TITLE IV – Energy Savings in Buildings and Industry SEC. 401. Definitions. (12) HIGH-PERFORMANCE BUILDING2 architecture2030.org/zero-code/ 3 www.energy.gov/sites/prod/files/2015/09/f26/bto_common_definition_zero_energy_buildings_093015.pdf 4 zeroenergy.org/project-types/districts-communities/ 5 zeroenergy.org6 emp.lbl.gov/news/energy-efficiency-continues-be-cheaper
HPDs comprise diverse types of energy-efficient build-ings and use a variety of district-scale approaches to optimize energy use. Typically, HPDs use cost-effective energy efficiency in buildings to reduce overall energy consumption and renewable energy sources, usually solar photovoltaics (PV), to meet the remaining loads. Approaches include setting district-scale energy and sustainability requirements for individual buildings as well as using next-generation district heating and cooling systems, microgrid technologies, district-scale renew-able energy generation sources, energy storage, and other strategies to aggregate loads, leverage economies of scale, and share infrastructure. HPDs can be mixed use developments, corporate and university campuses, and other geographically contiguous groups of buildings that share infrastructure and optimize energy use.
Each high-performance district establishes specific energy and other goals early in the development process.
Ideally, each district has a commonality that allows for ease of governance, organization, and financing. That commonality can range from ownership of the land and buildings to a business improvement district, special tax district, or redevelopment planning area. An HPD can balance energy loads between new and existing buildings to achieve a combined high-performance
(HP) profile and provide opportunities for dramati-cally reduced energy consumption, grid-coordinated design and demand management, water conservation, integrated stormwater management, zero waste, and alternative transportation systems. Engaging stake-holders, especially local utilities, is important and should start at the beginning of the planning process (see Engaging Stakeholders on page 23 and Engaging Utilities on page 44.
HPDs are gaining traction in the market (see CHAPTER 10 on page 114 for examples of emerging HPDs). Currently, however, HPDs represent a small fraction of commercial and residential building developments and working definitions of what makes a district “high perfor-mance” vary. Given the complexities of designing and developing an HPD; variations in local building code, zoning, and other regulations; disparities in the quality and availability of renewable resources; and differences in the HPD goals of a specific district, developing an HPD definition for a project can be challenging.
What Is a High-Performance District?
For the purposes of this guide, an HPD is a multibuilding project in which the buildings as well as the district as a whole integrate and optimize, on a life cycle basis, “all major high-performance attributes, including energy conservation, environment, safety, security, durability, accessibility, cost-benefit, productivity, sustainability,
functionality, and operational considerations.”1 In addition, HPDs often incorporate resilience (see Resil-ience Planning on page 55).
Each HPD establishes specific energy and other goals early in the development process. These goals can range from a percent improvement beyond business as usual to a zero energy (ZE), carbon neutral, or even energy positive district. A ZE district generates as much energy as it uses on an annual basis from renewable energy sources. A carbon neutral2 district’s operations result in no net CO2 emissions on an annual basis. An energy positive district generates more energy than it uses and either stores the excess for use during outages or peak demand periods or sends it back to the electric grid. The U.S. Department of Energy (DOE) and the National Renewable Energy Laboratory (NREL) have developed definitions for ZE buildings as well as campuses, portfo-lios, and communities.3 In each case, the level of energy efficiency is such that “on a source energy basis, the actual annual delivered energy is less than or equal to the on-site renewable exported energy.”4 In addition, the Districts & Communities section of NREL’s Zero Energy Buildings Resource Hub5 offers suggestions and resources for HPDs.
Energy efficiency, a proven and cost-effective strategy,6 is optimized in an HPD to reduce energy loads as much as economically feasible. The project team then identi-fies opportunities to further reduce energy loads and/or satisfy thermal loads by using, for example, waste heat from neighboring data centers, buildings, or sewer lines. Renewable energy resources within the district bound-aries can then meet some or all of the remaining loads. Off-site renewable energy is often used as well. Each project team will choose the renewable energy resource approach most appropriate for its goals.
A GUIDE TO ENERGY MASTER PLANNING OF HIGH-PERFORMANCE DISTRICTS AND COMMUNITIES1515
1: inTrODUCTiOn
Energy efficiency, a proven and cost-effective strategy, is optimized in a high-performance district to reduce energy loads as much as economically feasible.
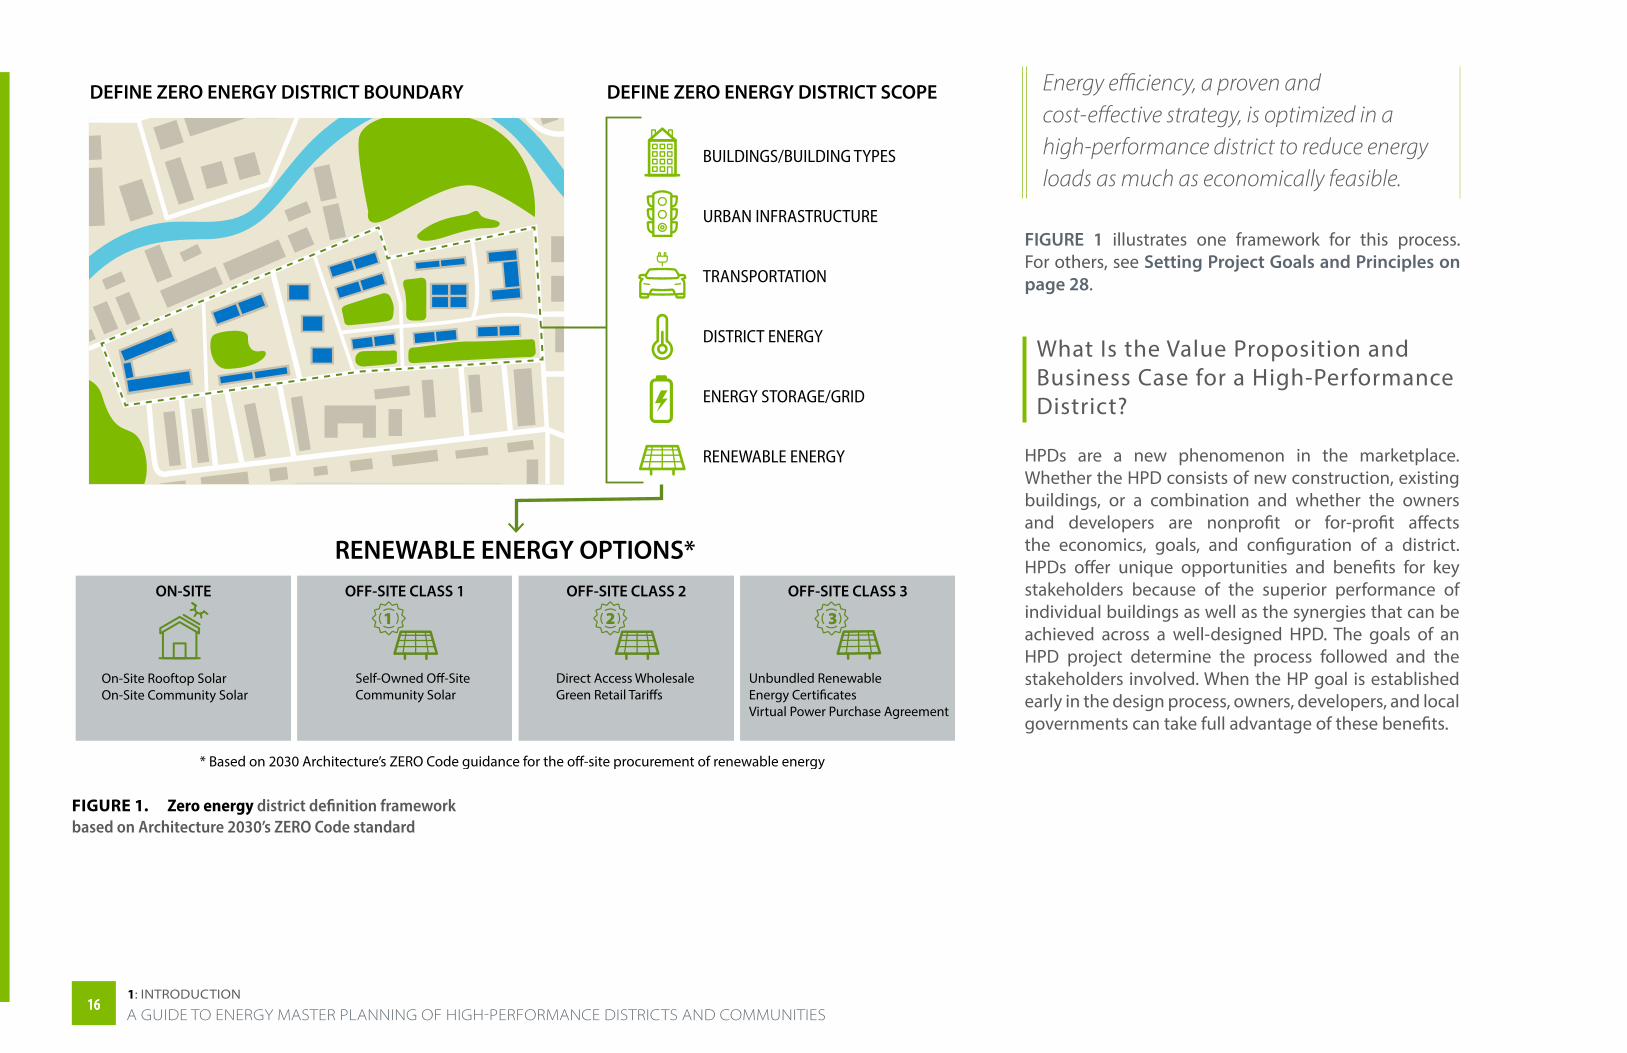
FIGURE 1 illustrates one framework for this process. For others, see Setting Project Goals and Principles on page 28.
What Is the Value Proposition and Business Case for a High-Performance District?
HPDs are a new phenomenon in the marketplace. Whether the HPD consists of new construction, existing buildings, or a combination and whether the owners and developers are nonprofit or for-profit affects the economics, goals, and configuration of a district. HPDs offer unique opportunities and benefits for key stakeholders because of the superior performance of individual buildings as well as the synergies that can be achieved across a well-designed HPD. The goals of an HPD project determine the process followed and the stakeholders involved. When the HP goal is established early in the design process, owners, developers, and local governments can take full advantage of these benefits.
FIGURE 1. Zero energy district definition framework based on Architecture 2030’s ZERO Code standard
1616A GUIDE TO ENERGY MASTER PLANNING OF HIGH-PERFORMANCE DISTRICTS AND COMMUNITIES1: inTrODUCTiOn
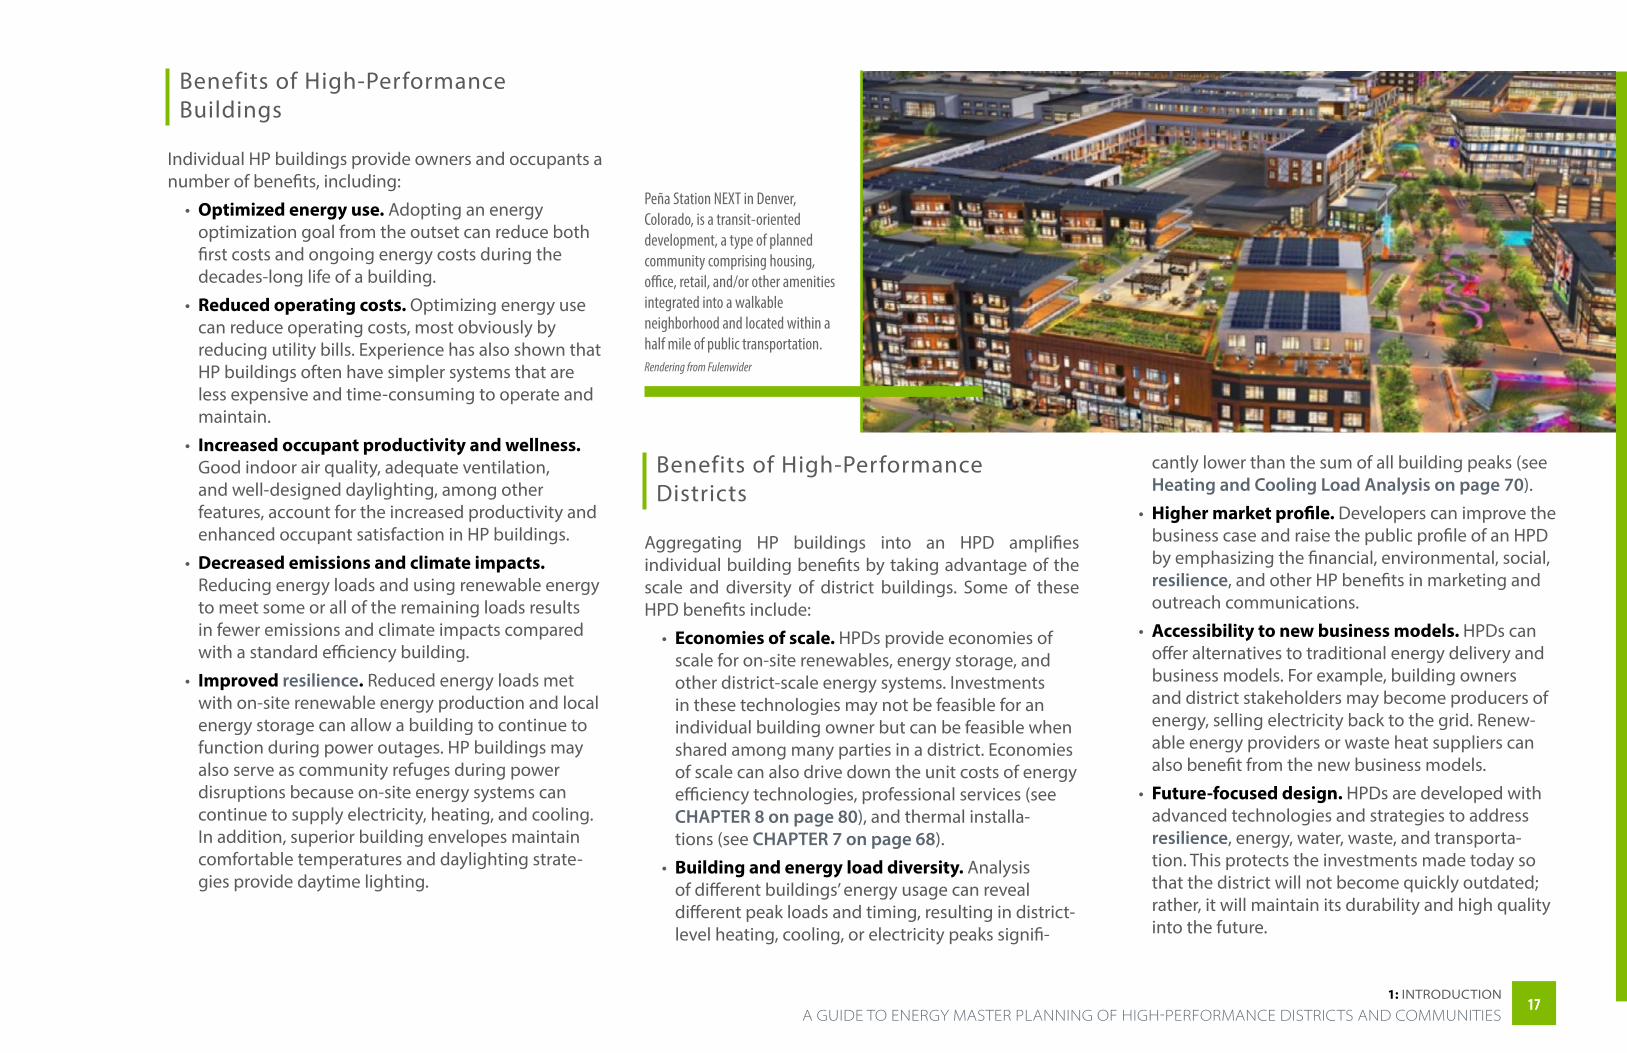
Peña Station NEXT in Denver, Colorado, is a transit-oriented development, a type of planned community comprising housing, office, retail, and/or other amenities integrated into a walkable neighborhood and located within a half mile of public transportation.Rendering from Fulenwider
Benefits of High-Performance Buildings
Individual HP buildings provide owners and occupants a number of benefits, including:
• Optimized energy use. Adopting an energy optimization goal from the outset can reduce both first costs and ongoing energy costs during the decades-long life of a building.
• Reduced operating costs. Optimizing energy use can reduce operating costs, most obviously by reducing utility bills. Experience has also shown that HP buildings often have simpler systems that are less expensive and time-consuming to operate and maintain.
• Increased occupant productivity and wellness. Good indoor air quality, adequate ventilation, and well-designed daylighting, among other features, account for the increased productivity and enhanced occupant satisfaction in HP buildings.
• Decreased emissions and climate impacts. Reducing energy loads and using renewable energy to meet some or all of the remaining loads results in fewer emissions and climate impacts compared with a standard efficiency building.
• Improved resilience. Reduced energy loads met with on-site renewable energy production and local energy storage can allow a building to continue to function during power outages. HP buildings may also serve as community refuges during power disruptions because on-site energy systems can continue to supply electricity, heating, and cooling. In addition, superior building envelopes maintain comfortable temperatures and daylighting strate-gies provide daytime lighting.
Benefits of High-Performance Districts
Aggregating HP buildings into an HPD amplifies individual building benefits by taking advantage of the scale and diversity of district buildings. Some of these HPD benefits include:
• Economies of scale. HPDs provide economies of scale for on-site renewables, energy storage, and other district-scale energy systems. Investments in these technologies may not be feasible for an individual building owner but can be feasible when shared among many parties in a district. Economies of scale can also drive down the unit costs of energy efficiency technologies, professional services (see CHAPTER 8 on page 80), and thermal installa-tions (see CHAPTER 7 on page 68).
• Building and energy load diversity. Analysis of different buildings’ energy usage can reveal different peak loads and timing, resulting in district-level heating, cooling, or electricity peaks signifi-
cantly lower than the sum of all building peaks (see Heating and Cooling Load Analysis on page 70).
• Higher market profile. Developers can improve the business case and raise the public profile of an HPD by emphasizing the financial, environmental, social, resilience, and other HP benefits in marketing and outreach communications.
• Accessibility to new business models. HPDs can offer alternatives to traditional energy delivery and business models. For example, building owners and district stakeholders may become producers of energy, selling electricity back to the grid. Renew-able energy providers or waste heat suppliers can also benefit from the new business models.
• Future-focused design. HPDs are developed with advanced technologies and strategies to address resilience, energy, water, waste, and transporta-tion. This protects the investments made today so that the district will not become quickly outdated; rather, it will maintain its durability and high quality into the future.
1717 A GUIDE TO ENERGY MASTER PLANNING OF HIGH-PERFORMANCE DISTRICTS AND COMMUNITIES
1: inTrODUCTiOn
• Grid interactivity. Given their scale, HPDs can provide grid services while adjusting their loads in response to grid needs to help utilities and grid operators better assess and manage distribution networks.
• Resilience. The reduced downtime and increased business continuity possible when HP buildings are aggregated into an HPD—especially if energy storage and islandable microgrids provide uninter-rupted power during power outages—are attri-butes that can attract businesses and residents to the district.
7 https://www.irena.org/-/media/Files/IRENA/Agency/Publication/2016/IRENA_Measuring-the-Economics_2016.pdf8 www.epa.gov/statelocalenergy/public-health-benefits-kwh-energy-efficiency-and-renewable-energy-united-states
Achieving High Performance at District Scale
The benefits of building energy efficiency are well under-stood and have been integrated into many local and inter-national building codes. In addition, renewable energy installations are becoming commonplace and evidence of their economic, health, environmental, resilience, and other benefits7, 8 is readily available. Optimizing energy efficiency and renewable energy generation across a large development, however, is a paradigm shift for most real estate developers, owners, and professionals.
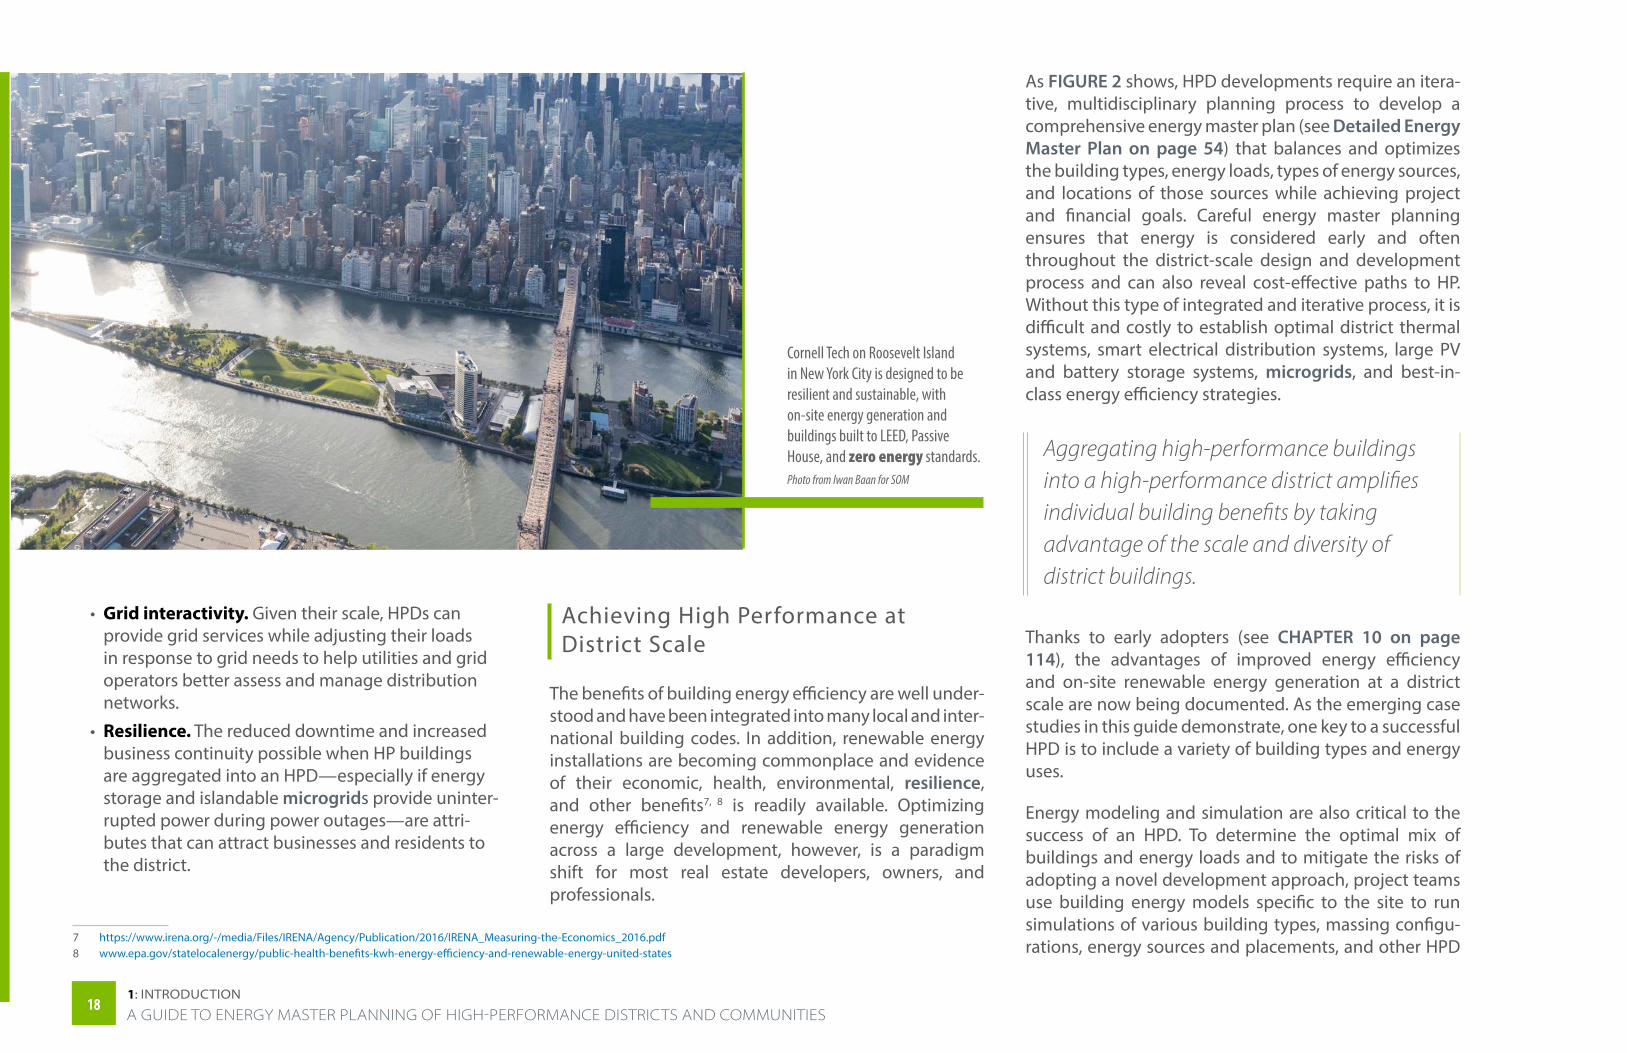
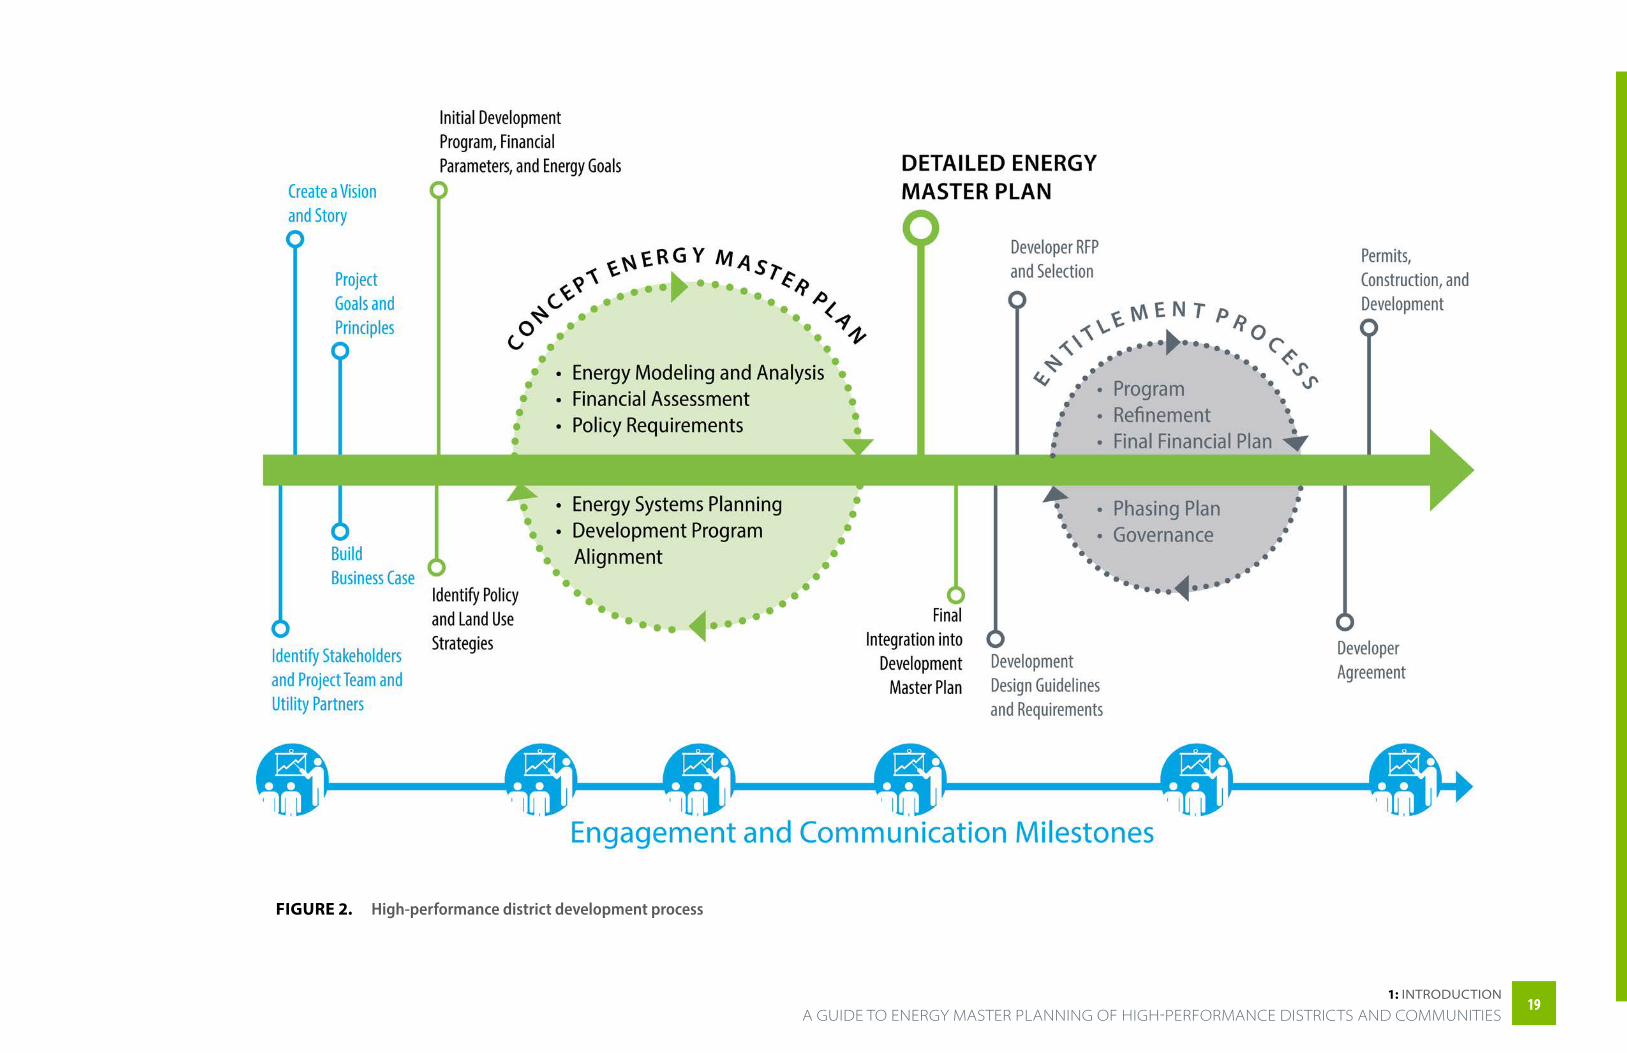
As FIGURE 2 shows, HPD developments require an itera-tive, multidisciplinary planning process to develop a comprehensive energy master plan (see Detailed Energy Master Plan on page 54) that balances and optimizes the building types, energy loads, types of energy sources, and locations of those sources while achieving project and financial goals. Careful energy master planning ensures that energy is considered early and often throughout the district-scale design and development process and can also reveal cost-effective paths to HP. Without this type of integrated and iterative process, it is difficult and costly to establish optimal district thermal systems, smart electrical distribution systems, large PV and battery storage systems, microgrids, and best-in-class energy efficiency strategies.
Aggregating high-performance buildings into a high-performance district amplifies individual building benefits by taking advantage of the scale and diversity of district buildings.
Thanks to early adopters (see CHAPTER 10 on page 114), the advantages of improved energy efficiency and on-site renewable energy generation at a district scale are now being documented. As the emerging case studies in this guide demonstrate, one key to a successful HPD is to include a variety of building types and energy uses.
Energy modeling and simulation are also critical to the success of an HPD. To determine the optimal mix of buildings and energy loads and to mitigate the risks of adopting a novel development approach, project teams use building energy models specific to the site to run simulations of various building types, massing configu-rations, energy sources and placements, and other HPD
Cornell Tech on Roosevelt Island in New York City is designed to be resilient and sustainable, with on-site energy generation and buildings built to LEED, Passive House, and zero energy standards.Photo from Iwan Baan for SOM
1818A GUIDE TO ENERGY MASTER PLANNING OF HIGH-PERFORMANCE DISTRICTS AND COMMUNITIES1: inTrODUCTiOn
As FIGURE 2 shows, HPD developments require an itera-tive, multidisciplinary planning process to develop a comprehensive energy master plan (see Detailed Energy Master Plan on page 54) that balances and optimizes the building types, energy loads, types of energy sources, and locations of those sources while achieving project and financial goals. Careful energy master planning ensures that energy is considered early and often throughout the district-scale design and development process and can also reveal cost-effective paths to HP. Without this type of integrated and iterative process, it is difficult and costly to establish optimal district thermal systems, smart electrical distribution systems, large PV and battery storage systems, microgrids, and best-in-class energy efficiency strategies.
Aggregating high-performance buildings into a high-performance district amplifies individual building benefits by taking advantage of the scale and diversity of district buildings.
Thanks to early adopters (see CHAPTER 10 on page 114), the advantages of improved energy efficiency and on-site renewable energy generation at a district scale are now being documented. As the emerging case studies in this guide demonstrate, one key to a successful HPD is to include a variety of building types and energy uses.
Energy modeling and simulation are also critical to the success of an HPD. To determine the optimal mix of buildings and energy loads and to mitigate the risks of adopting a novel development approach, project teams use building energy models specific to the site to run simulations of various building types, massing configu-rations, energy sources and placements, and other HPD
Cornell Tech on Roosevelt Island in New York City is designed to be resilient and sustainable, with on-site energy generation and buildings built to LEED, Passive House, and zero energy standards.Photo from Iwan Baan for SOM
FIGURE 2. High-performance district development process
1919 A GUIDE TO ENERGY MASTER PLANNING OF HIGH-PERFORMANCE DISTRICTS AND COMMUNITIES
1: inTrODUCTiOn

elements. Ideally, this testing and refinement process starts at the beginning of the design process (see Planning for Energy Demand and Efficiency on page 58). Careful attention to the process of balancing energy use and renewable energy production (see Balancing Energy Consumption and Production on page 61) enables some developments to reach the aspirational goal of a ZE or even an energy positive district.
All-electric construction also provides benefits at a district level. Notably, it can cost less to build, improves indoor air quality, increases public safety, and—in most locations—reduces utility bills.9 Adding PV and storage enhances district resilience and reduces exposure to future energy price increases.
Challenges of High-Performance Districts
Although HPDs offer communities and developers many benefits, there are critical barriers to consider and address as the project team develops a master plan. The following are some of the most important, but there may be others unique to a location:
• Complexity. Creating an HPD is more involved than a standard development and requires consider-ation of financing, planning, design, and operations early in the process as well as constant balancing of objectives to avoid unintended consequences and keep costs down (see CHAPTER 5 on page 52)
• Utility engagement. A utility can be a powerful and important ally and partner in the development of an HPD or it can derail the project. Soliciting utility support from the outset is essential (see CHAPTER 4 on page 44).
9 fossilfreebuildings.org/ElectricMFGuide.pdf
• Novelty. HPDs are a new concept, with few examples for developers or local governments to use as models. Risk aversion among real estate developers and some local governments can be a serious obstacle to sustaining the long-term momentum required to meet aggressive energy goals.
• Business models. Many developers and energy providers use established business models and may resist a longer HPD path to return on investment (e.g., 20–30 years, rather than 5–10 years).
• Governance. Financing and managing an HPD’s novel energy systems can be challenging for the parties involved in the district. Although new energy controls, metering technology, owner-ship models, and payment tools will mitigate this challenge over time, these issues should be consid-ered from early in the project.
• Up-front costs. HPDs typically cost more initially than conventional developments, and the project team must identify the additional up-front costs (district-scale system and infrastructure invest-ments, phasing costs, etc.) and balance them with the long-term benefits (lower operating costs, reduced emissions, higher rents/property values, etc.).
• Inadequate energy master planning. In the absence of a strategic and informed master plan, aggressive energy goals can be more costly and difficult to achieve. Energy master planning should be integrated into the overall land use develop-ment master plan, providing sufficient detail to cost, phase, and understand energy system options related to the building program, other infrastructure improvements, and landscaping.
2020A GUIDE TO ENERGY MASTER PLANNING OF HIGH-PERFORMANCE DISTRICTS AND COMMUNITIES1: inTrODUCTiOn
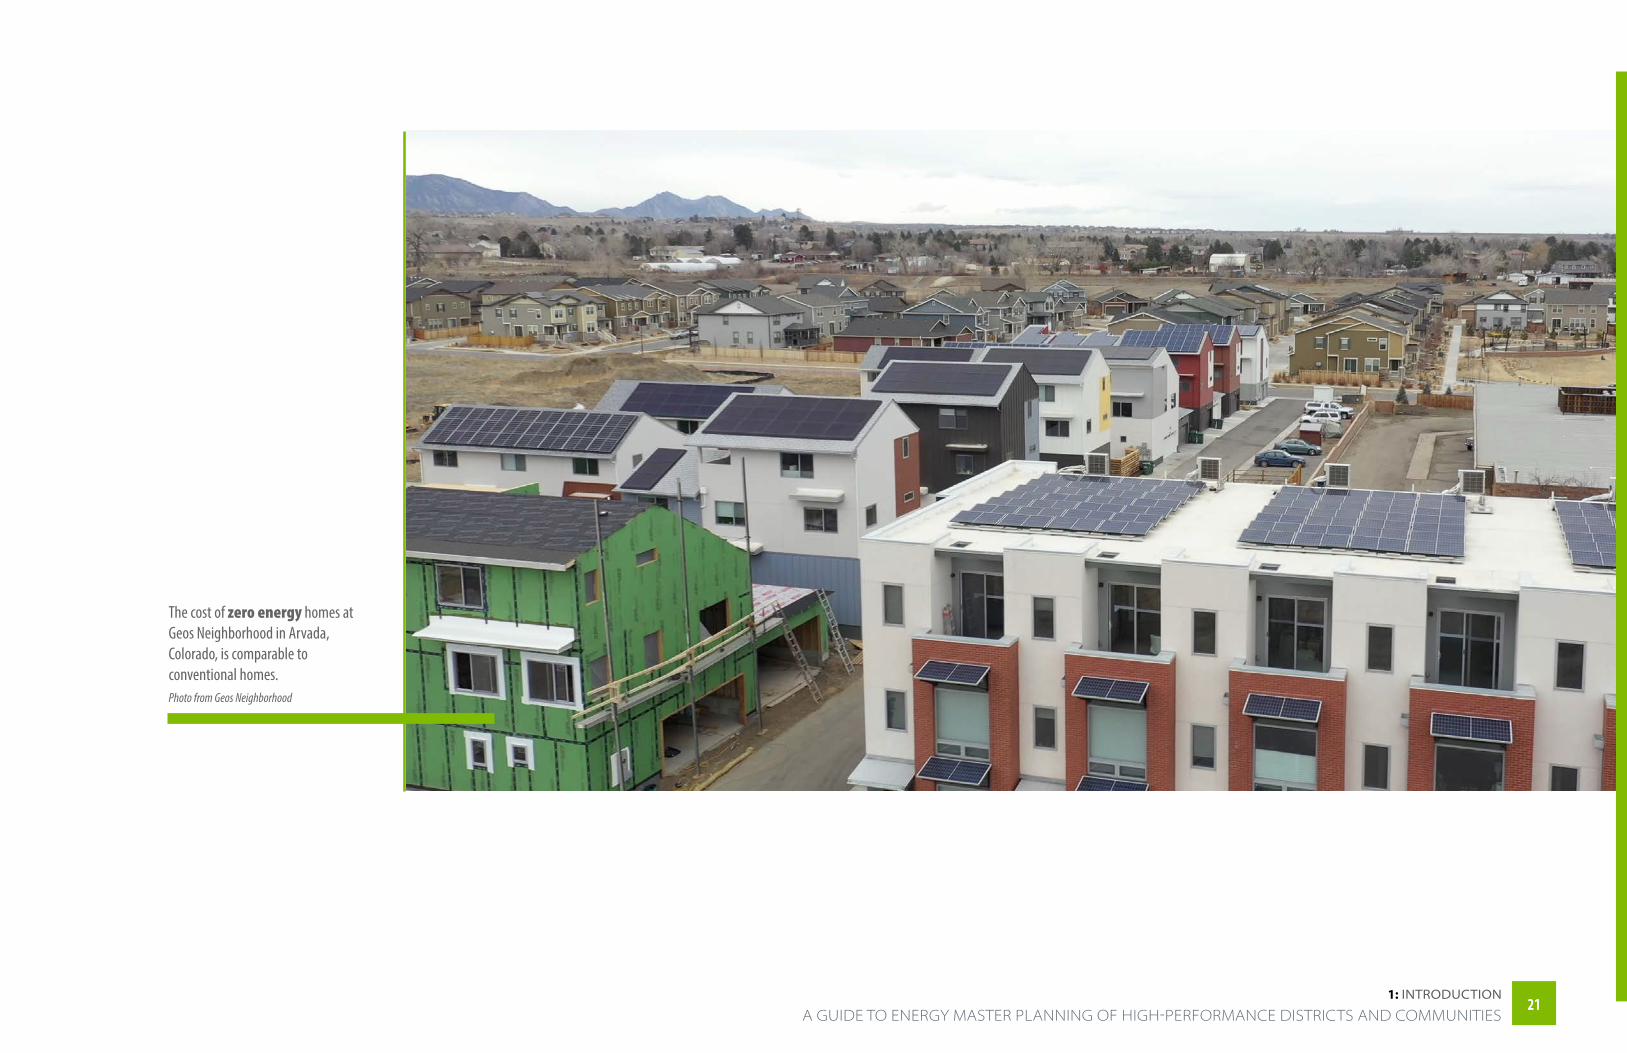
The cost of zero energy homes at Geos Neighborhood in Arvada, Colorado, is comparable to conventional homes.Photo from Geos Neighborhood
2121 A GUIDE TO ENERGY MASTER PLANNING OF HIGH-PERFORMANCE DISTRICTS AND COMMUNITIES
1: inTrODUCTiOn

CHAPTer 2
FOSTERING SUPPORT AND ASSEMBLING A TEAM
Oak View, a low-income community in Huntington Beach, California, is exploring the use of energy efficiency, renewable energy, and microgrid technologies to improve the environmental performance and resiliency of the local electric infrastructure.Photo from Dr. Laura Novoa, University of California, Irvine
2222
HPDs are a new, complex, cutting-edge approach to achieving energy goals in large developments or on campuses. This added complexity compared to a standard project requires strong communication and engagement strategies from the inception of the project through occupancy and operation.
Communication is critical for developing understanding and building support with decision makers within devel-opment companies and local government agencies; creating clarity and buy-in from financial/grant partners; establishing and maintaining good relations with the utility; ensuring the planning, design, and construc-tion team delivers the vision; and establishing trust and working relationships with external stakeholders, including community groups, environmental groups, state and regional agencies, and others. An effective communications and outreach effort builds local support for the project, which in turn can help strengthen the project’s business case.
Engaging Stakeholders
The complexity and novelty of an HPD project can make it a more challenging concept for stakeholders to under-stand than other large development projects. Focusing on this complexity and the benefits of the energy system are common mistakes when trying to involve decision makers and laypeople in the project. All stakeholders do not need to know all the details of the proposed energy system; the key to a successful project is a compelling, accessible story focused on the benefits that will accrue to different community groups if the project is successful. This primary tenet should be central to all stakeholder engagement efforts—project team members must connect the dots between stakeholders’ interests and values and the relevant HPD characteristics and benefits.
Although community and stakeholder involvement has long been a mainstay in development projects, there is evidence that many local government jurisdictions and developers are concerned about the engagement process and potential barriers such as the extended timelines for engaging the community, opportunities for misunderstanding and derailment by a vocal few, and overall uncertainty about how the community process will inform and shape the final product. This concern is compounded by the reality that often the same small group of engaged citizens shows up over and over. Further, the need to involve disadvantaged and histor-ically underserved communities provides additional challenges that can make effective and authentic community and stakeholder involvement elusive.
Project team members must connect the dots between stakeholders’ interests and values and the relevant high-performance district characteristics and benefits.
Initially, the idea of pursuing an HPD might be the brain-child of an individual or small group of people, but a successful project will require buy-in from all levels of the owner’s team, project team, and a range of stakeholders. The first cost of an HPD can be higher than a standard development and a persuasive case must be made from the outset that the return on investment justifies the
increased cost. The HPD will require steadfast support to ensure that early choices support the HP goal and that the owners, stakeholders, and project team members understand the vision in terms of money, time, risk, and effort from the beginning.
For the ownership team, this may mean developing an economic model that illustrates the incremental costs, the cost savings over time, the benefits of market differ-entiation, and the attractive long-term return on invest-ment. For a government entity, it means linking existing local plans, goals, and initiatives to the project, including economic development, sustainability, resilience, and emission reductions, among other community benefits.
For specific stakeholders, the vision needs to be commu-nicated and discussed within the framework of each group’s agenda. For the local utility—a key stakeholder in every HPD—sharing the details of the project and devel-oping a close, collaborative relationship from the outset will help all parties identify opportunities and avoid roadblocks (see CHAPTER 4 on page 44). For the larger community, that could mean communicating benefits in a simple and transparent way that resonates with local needs. Interactive workshops, visioning exercises, and focus groups are all effective ways to engage stake-holders in the discussion and build support. Communica-tion tools such as well designed and produced websites, print materials, and videos are also useful. These initial relationships and support structures need to be fostered and maintained throughout the effort.
A GUIDE TO ENERGY MASTER PLANNING OF HIGH-PERFORMANCE DISTRICTS AND COMMUNITIES2323
2: FOSTering SUPPOrT AnD ASSembling A TeAm
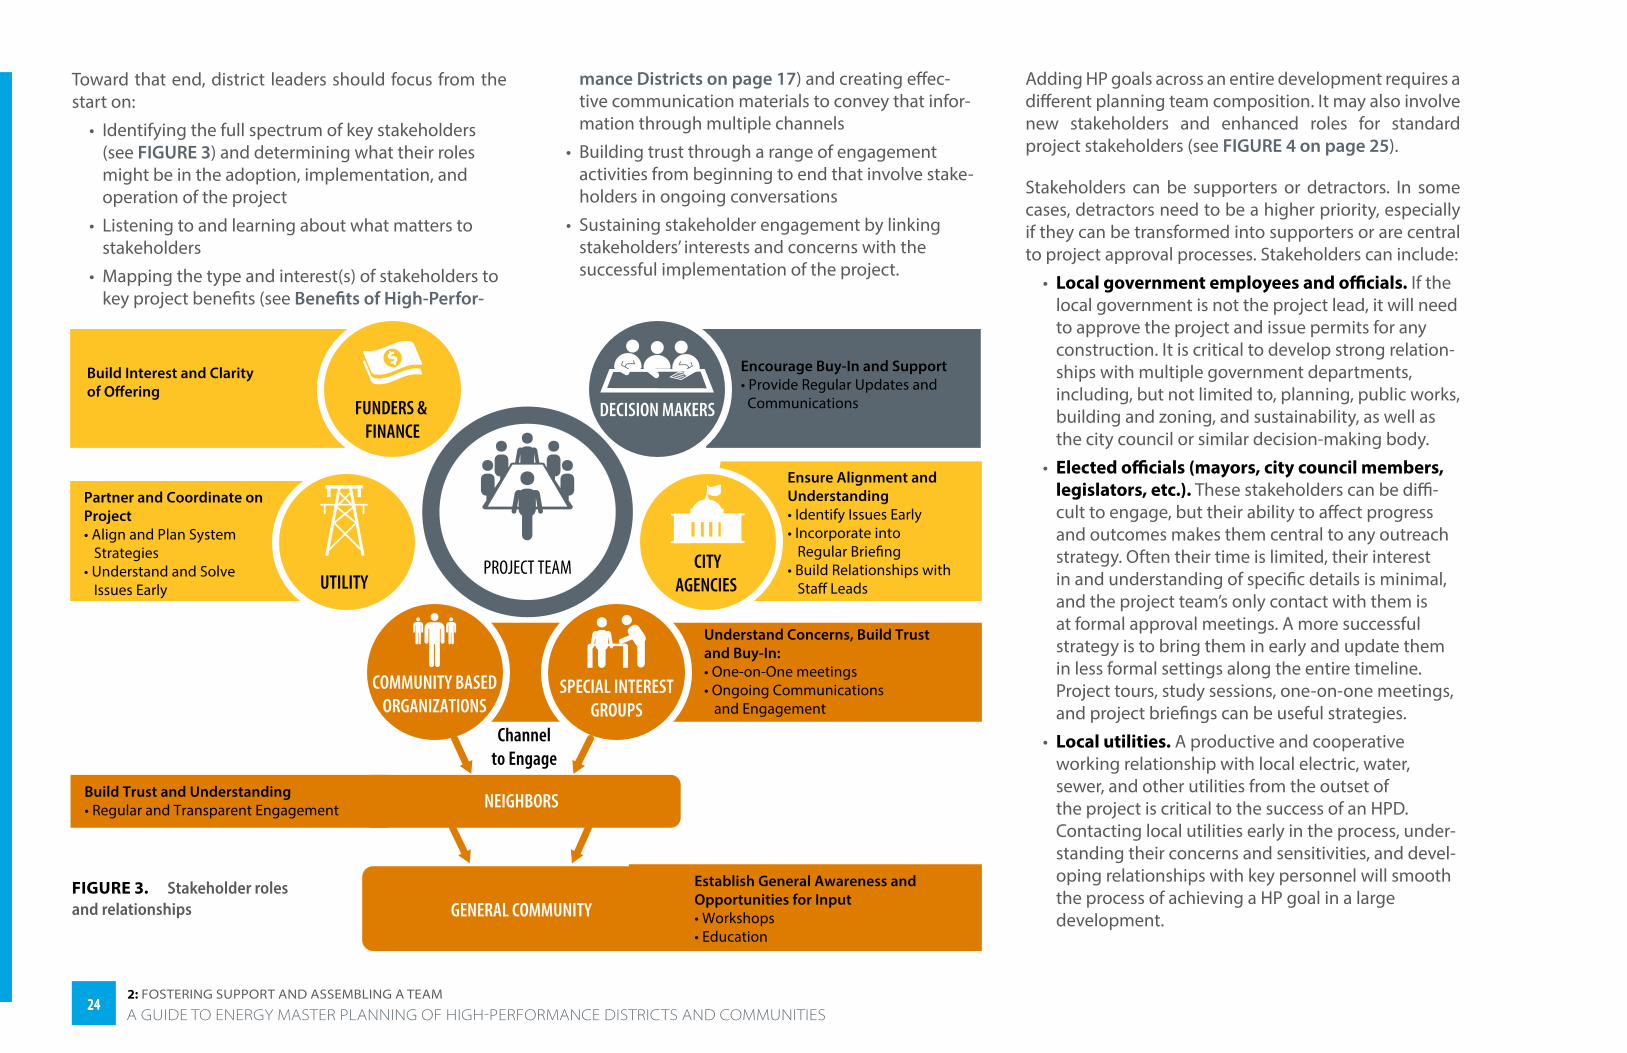
Toward that end, district leaders should focus from the start on:
• Identifying the full spectrum of key stakeholders (see FIGURE 3) and determining what their roles might be in the adoption, implementation, and operation of the project
• Listening to and learning about what matters to stakeholders
• Mapping the type and interest(s) of stakeholders to key project benefits (see Benefits of High-Perfor-
mance Districts on page 17) and creating effec-tive communication materials to convey that infor-mation through multiple channels
• Building trust through a range of engagement activities from beginning to end that involve stake-holders in ongoing conversations
• Sustaining stakeholder engagement by linking stakeholders’ interests and concerns with the successful implementation of the project.
UTILITY
FUNDERS & FINANCE
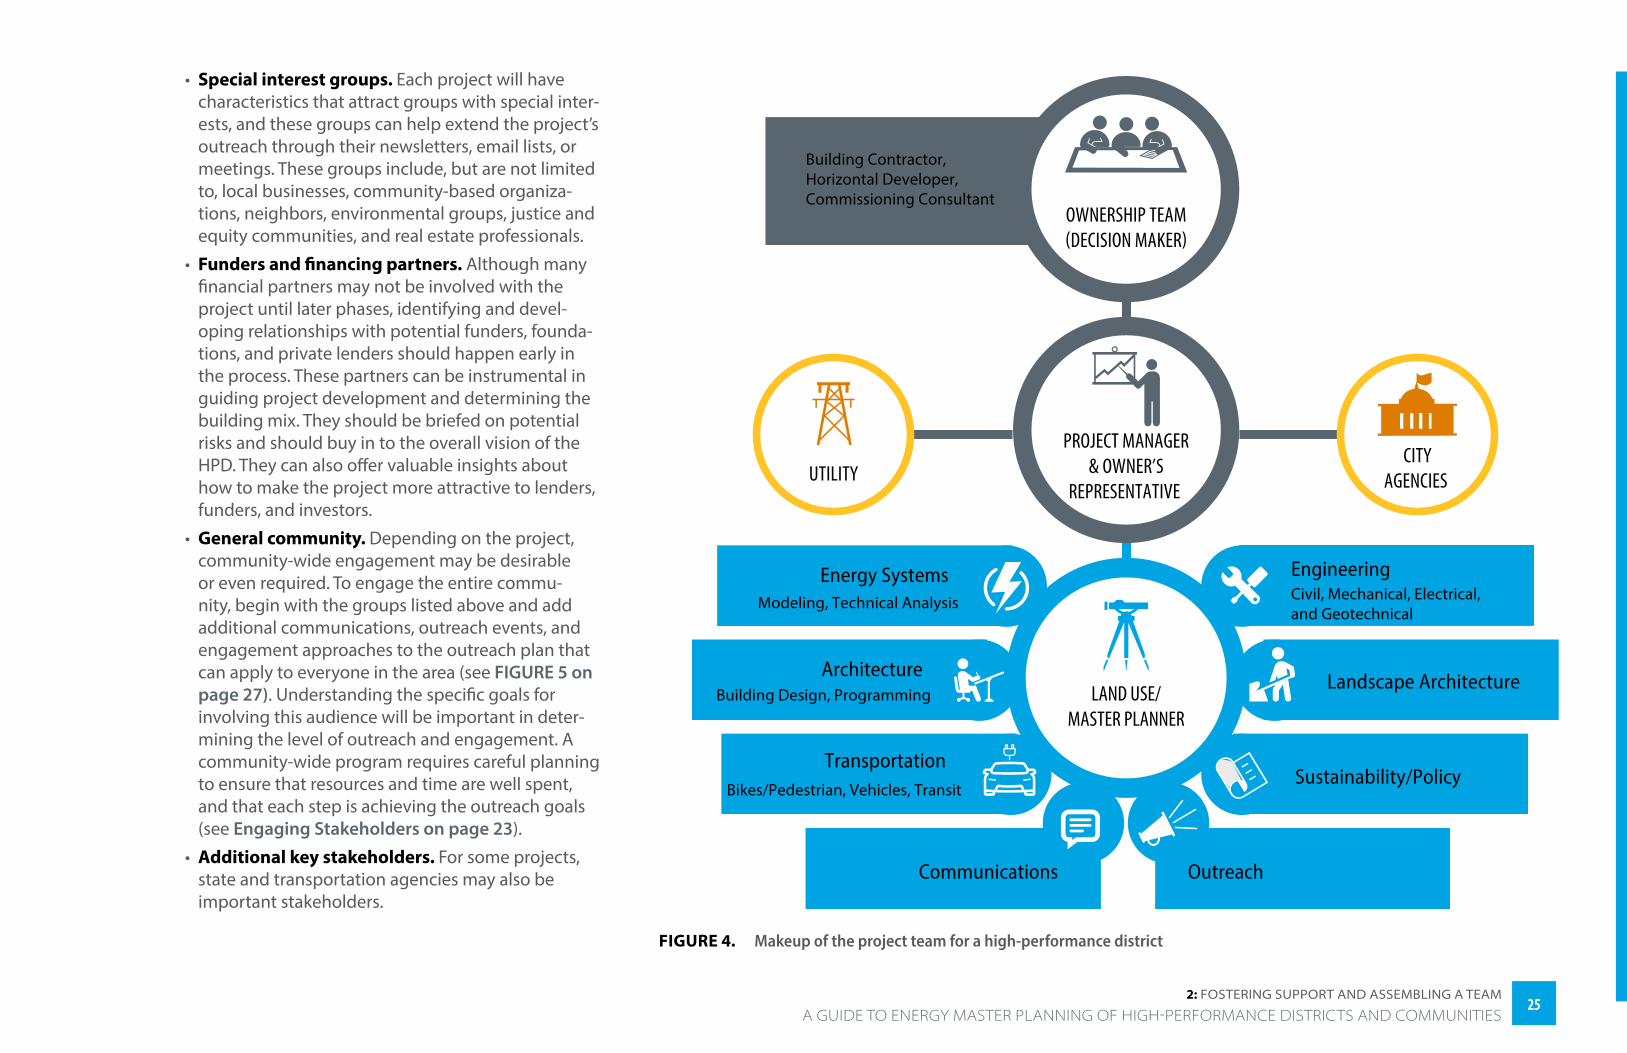
Adding HP goals across an entire development requires a different planning team composition. It may also involve new stakeholders and enhanced roles for standard project stakeholders (see FIGURE 4 on page 25).
Stakeholders can be supporters or detractors. In some cases, detractors need to be a higher priority, especially if they can be transformed into supporters or are central to project approval processes. Stakeholders can include:
• Local government employees and officials. If the local government is not the project lead, it will need to approve the project and issue permits for any construction. It is critical to develop strong relation-ships with multiple government departments, including, but not limited to, planning, public works, building and zoning, and sustainability, as well as the city council or similar decision-making body.
• Elected officials (mayors, city council members, legislators, etc.). These stakeholders can be diffi-cult to engage, but their ability to affect progress and outcomes makes them central to any outreach strategy. Often their time is limited, their interest in and understanding of specific details is minimal, and the project team’s only contact with them is at formal approval meetings. A more successful strategy is to bring them in early and update them in less formal settings along the entire timeline. Project tours, study sessions, one-on-one meetings, and project briefings can be useful strategies.
• Local utilities. A productive and cooperative working relationship with local electric, water, sewer, and other utilities from the outset of the project is critical to the success of an HPD. Contacting local utilities early in the process, under-standing their concerns and sensitivities, and devel-oping relationships with key personnel will smooth the process of achieving a HP goal in a large development.
FIGURE 3. Stakeholder roles and relationships
2424A GUIDE TO ENERGY MASTER PLANNING OF HIGH-PERFORMANCE DISTRICTS AND COMMUNITIES2: FOSTering SUPPOrT AnD ASSembling A TeAm
• Special interest groups. Each project will have characteristics that attract groups with special inter-ests, and these groups can help extend the project’s outreach through their newsletters, email lists, or meetings. These groups include, but are not limited to, local businesses, community-based organiza-tions, neighbors, environmental groups, justice and equity communities, and real estate professionals.
• Funders and financing partners. Although many financial partners may not be involved with the project until later phases, identifying and devel-oping relationships with potential funders, founda-tions, and private lenders should happen early in the process. These partners can be instrumental in guiding project development and determining the building mix. They should be briefed on potential risks and should buy in to the overall vision of the HPD. They can also offer valuable insights about how to make the project more attractive to lenders, funders, and investors.
• General community. Depending on the project, community-wide engagement may be desirable or even required. To engage the entire commu-nity, begin with the groups listed above and add additional communications, outreach events, and engagement approaches to the outreach plan that can apply to everyone in the area (see FIGURE 5 on page 27). Understanding the specific goals for involving this audience will be important in deter-mining the level of outreach and engagement. A community-wide program requires careful planning to ensure that resources and time are well spent, and that each step is achieving the outreach goals (see Engaging Stakeholders on page 23).
• Additional key stakeholders. For some projects, state and transportation agencies may also be important stakeholders.
FIGURE 4. Makeup of the project team for a high-performance district
2525 A GUIDE TO ENERGY MASTER PLANNING OF HIGH-PERFORMANCE DISTRICTS AND COMMUNITIES
2: FOSTering SUPPOrT AnD ASSembling A TeAm
Developing clear outreach goals (separate from project goals) and creating an outreach plan for the stakeholder process is essential to ensuring the project effectively engages the groups mentioned above. Stakeholder engagement goals can help focus messaging, choose venues, shape communication materials, and indicate specific engagement activities. Different communities can have vastly different characteristics that need to be considered in order to develop an appropriate and effec-tive engagement process.
Developing a Technical Advisory Team and/or Community Advisory Committees
One of the greatest challenges in large projects is the extended timeline and the complex issues that are diffi-cult to explore in a typical meeting. An approach that has proven successful is to establish dedicated commit-tees with carefully chosen members willing to commit to these longer time frames and complexities.
Two types of committees can be useful to get stake-holders involved. The first is a technical committee comprising individuals with detailed technical knowl-edge related to the project, including, but not limited to, energy, sustainability, urban planning, environmental regulations, finance, and real estate. Members of this committee must be able and willing to deeply explore and advise on technical aspects of the project. The committee may meet most frequently during the early planning phases but will likely be used throughout the project; participation requires a serious commitment.
The second is a community advisory committee made up of laypeople from various community groups. These committee members are able to devote time and atten-tion to learning about and providing input on the project
1 www.iap2.org/page/resources2 healthyplacesindex.org/wp-content/uploads/2018/01/ccaej_transforming_toxic_hot_spots_thriving_communities.pdf3 www.epa.gov/smartgrowth/regional-resilience-toolkit
at key milestones. They are also able to network and serve as project advocates during broader community meetings as well as discussions with decision makers. Members of the community advisory group should commit to the process and agree to attend at least three or more meetings before joining the committee.
Stakeholder Engagement Resources
International Association of Public Participation A wide range of resources and tools for effective community and stakeholder outreach.1
Center for Community Action and Environmental Justice
The Center for Community Action and Environ-mental Justice is a progressive, base-building, nonprofit organization that convenes people on cooperative community processes to improve social and environmental planning. See Transforming Toxic Hot Spots into Thriving Communities.2
Regional Resilience Toolkit: 5 Steps to Build Large-Scale Resilience to Natural Disasters3
From 2013 to 2018, the Federal Emergency Manage-ment Agency (FEMA) and U.S. Environmental Protec-tion Agency (EPA) helped three California regions take large-scale action to improve disaster resilience.
Based on these technical assistance projects, FEMA and EPA partnered with the Metropolitan Transpor-tation Commission/Association of Bay Area Govern-ments (MTC/ABAG) to create a toolkit that helps regions plan for disasters by working across multiple jurisdictions and with nongovernmental partners.
Creating a Vision and Telling the Story
People gravitate to good stories—especially ones with a new and innovative vision—and crafting and telling a district’s HP story are important to its success. The story will develop and evolve as the project moves through planning, implementation, and operation, but telling the HP story early can attract influential stakeholders to the project. During the planning process, the story can help build public support and turn community members into advocates. This can ease the regulatory process and even make the project more marketable. The HP story can also be part of an effective marketing campaign to attract building owners and tenants to the district. During operation, the story can help ensure ongoing engage-ment with and education of district building occupants so that the importance of the HP goal is communicated to current and new occupants. The story can also be a tool to familiarize real estate brokers with the value of HPD features as they sell and lease space to prospective buyers and tenants.
People gravitate to good stories—especially ones with a new and innovative vision—and crafting and telling a district’s high-performance story are important to its success.
At the same time, the story must resonate with a broad range of project stakeholders. To be effective, it should be multifaceted and illustrate how an HPD can promote economic development, reduce costs, increase resilience, and enhance community wellness, among other key elements specific to the development.
2626A GUIDE TO ENERGY MASTER PLANNING OF HIGH-PERFORMANCE DISTRICTS AND COMMUNITIES2: FOSTering SUPPOrT AnD ASSembling A TeAm
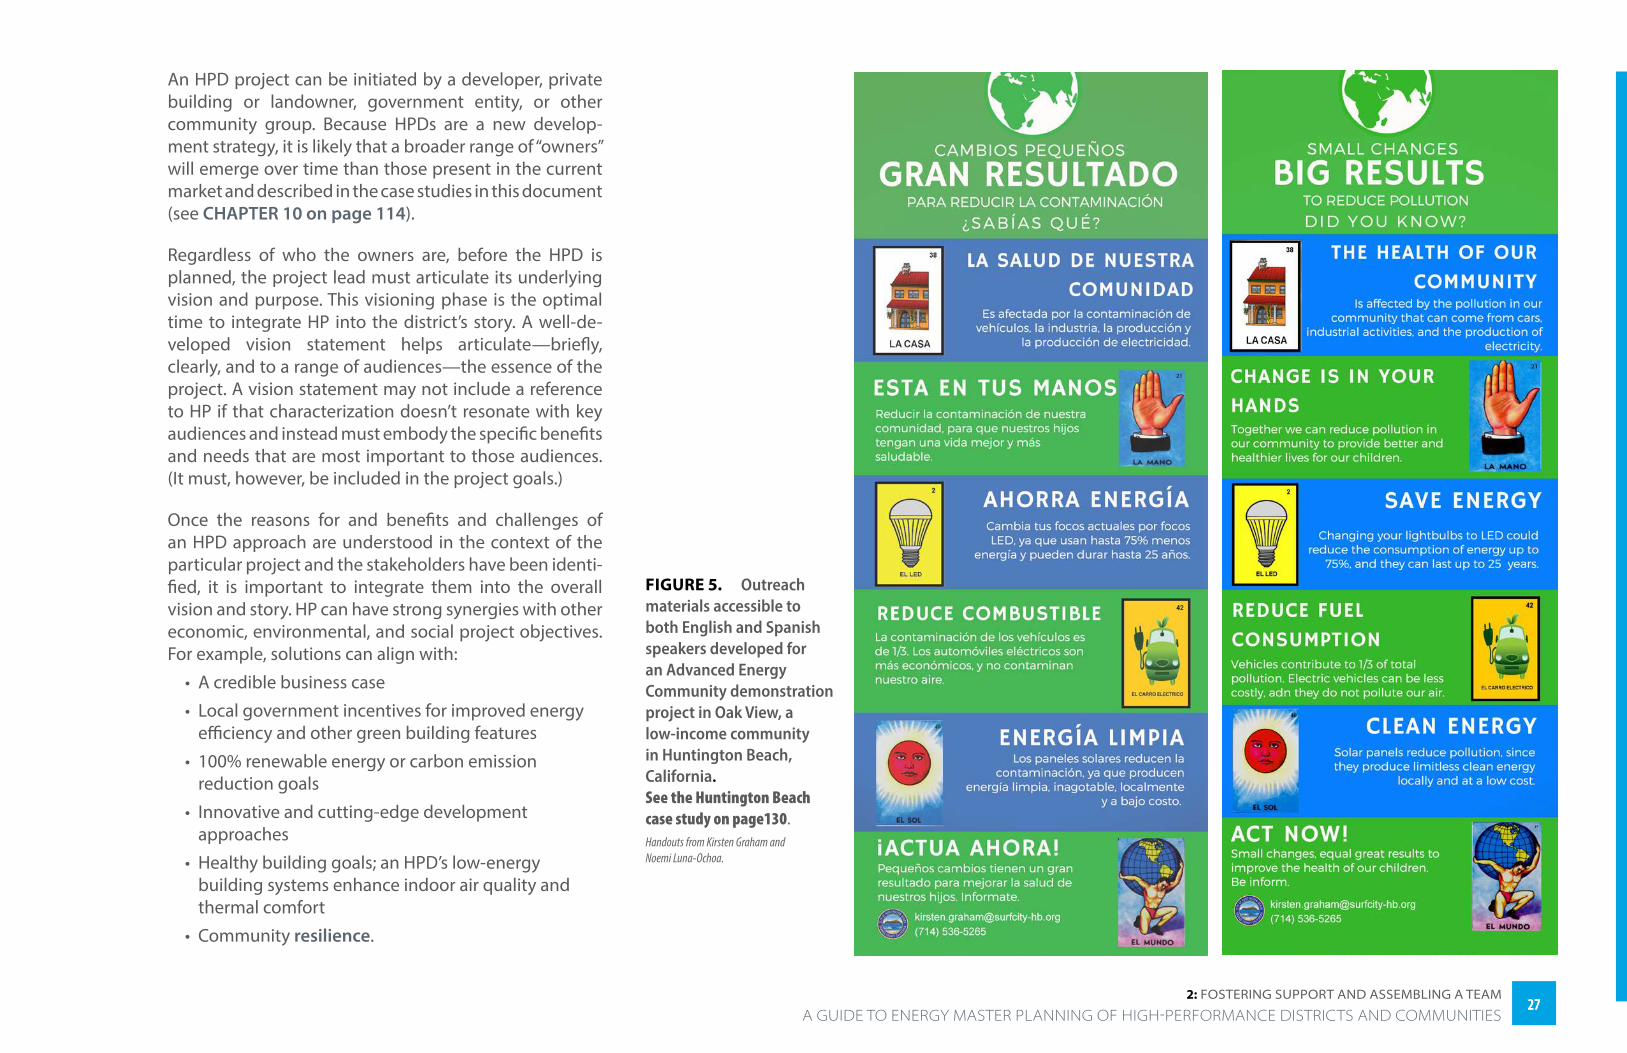
FIGURE 5. Outreach materials accessible to both English and Spanish speakers developed for an Advanced Energy Community demonstration project in Oak View, a low-income community in Huntington Beach, California.
See the Huntington Beach case study on page130.Handouts from Kirsten Graham and Noemi Luna-Ochoa.
An HPD project can be initiated by a developer, private building or landowner, government entity, or other community group. Because HPDs are a new develop-ment strategy, it is likely that a broader range of “owners” will emerge over time than those present in the current market and described in the case studies in this document (see CHAPTER 10 on page 114).
Regardless of who the owners are, before the HPD is planned, the project lead must articulate its underlying vision and purpose. This visioning phase is the optimal time to integrate HP into the district’s story. A well-de-veloped vision statement helps articulate—briefly, clearly, and to a range of audiences—the essence of the project. A vision statement may not include a reference to HP if that characterization doesn’t resonate with key audiences and instead must embody the specific benefits and needs that are most important to those audiences. (It must, however, be included in the project goals.)
Once the reasons for and benefits and challenges of an HPD approach are understood in the context of the particular project and the stakeholders have been identi-fied, it is important to integrate them into the overall vision and story. HP can have strong synergies with other economic, environmental, and social project objectives. For example, solutions can align with:
• A credible business case
• Local government incentives for improved energy efficiency and other green building features
• 100% renewable energy or carbon emission reduction goals
• Innovative and cutting-edge development approaches
• Healthy building goals; an HPD’s low-energy building systems enhance indoor air quality and thermal comfort
• Community resilience.
2727 A GUIDE TO ENERGY MASTER PLANNING OF HIGH-PERFORMANCE DISTRICTS AND COMMUNITIES
2: FOSTering SUPPOrT AnD ASSembling A TeAm
HP is also a key aspect of many comprehensive third-party green rating systems for projects comprising multiple buildings. One of the most exciting aspects of an HPD is its leadership potential to define a new and better way of building. HPDs are creating the next gener-ation of built environment and therefore defining the future. Enthusiasm for an HPD can raise the profile of a community, campus, or district and attract the attention of top-tier developers, builders, designers, businesses, tenants, employees, and customers. It can also help build public and regulatory support, because all communities have a keen interest in building for a better future.
Investment in quality messaging material and highly visual graphic content that clarifies and illuminates a district’s HP vision is important from the beginning and should include a website, social media presence, and coverage in appropriate media outlets to help dissemi-nate the story.
Setting Project Goals and Principles
The vision should capture the imagination and generate excitement, while the goals should articulate the vision and provide measurable steps to realize it. Project goals should be clear, simple, and meaningful and express the vision in ways that can be easily translated into policies. This may include goals for resilience, sustainability, affordability, equity, economic development, energy performance, carbon emission reduction, and the like. Goals can range from broad policy statements to specific objectives to key principles. Goals from community plans, especially from the land use/general plan or plans specific to the HPD, should be reviewed and aligned with the HPD goals. A large development project such as an HPD can build on existing plan goals, tailoring them or adding only goals that relate to the project. Once drafted,
4 newbuildings.org/resource/gridoptimal/5 www.stpaul.gov/sites/default/files/Media%20Root/Planning%20%26%20Economic%20Development/Ford%20Site%20Zoning%20and%20Public%20Realm%20Master%20Plan%20FINAL.pdf 6 www.b3mn.org/2030energystandard/ 7 architecture2030.org/zero-code/
project goals along with the vision should help guide the project team’s conversations and direct decisions.
The vision should capture the imagination and generate excitement, while the goals should articulate the vision and provide measurable steps to realize it.
Project goals are refined from the master developer’s original vision. The goal setting process involves the planning team and other key players and can also involve community and special interest groups. HPD needs are integrated into clear, measurable, and achievable goals.
In an HPD, the project team must define the energy goal for the district, determine how it will be measured (often a specific energy use intensity [EUI] expressed as kBtu/ft2·yr), and establish district boundaries. The energy goal will include energy use targets for each building as well as renewable energy generation targets, often based on the building roofs, parking canopies, and other areas available for PV installations (see What Is a High-Perfor-mance District? on page 15, and Photovoltaics and Solar Access Planning on page 85).
Energy-related goals and principles should be embedded in the master plan and carried forward into the imple-mentation process. This is particularly important if devel-opers other than the master developer will be respon-sible for the vertical development (buildings). One way to accomplish this is to include energy goals in the design guidelines, development covenants, and requests for proposal for building developers. The energy goals could also address potential challenges and opportuni-
ties related to the grid interconnection with the local utility and could include a set of grid optimized energy management metrics.4 In addition, third-party certifica-tion might be a project goal. This could include certifica-tion for individual buildings and/or certification for the district as a whole. Certification goals should be identi-fied early because those choices will determine the metrics measured for compliance.
The project team develops design and planning princi-ples in response to the project’s vision, goals, program, and other specific drivers. These principles serve as design and decision-making guides throughout the process and should include energy-related principles specific to the vision of and approach to the HPD. Examples include requiring all-electric buildings, emphasizing energy efficiency, mandating passive design strategies, and optimizing roofs for PV (see Locating Photovoltaics on page 85).
While developing goals, it may become clear that the team will need to understand the existing policy barriers or opportunities that will enable the project to move forward with the HP vision intact. For the Highland Bridge Ford site in Saint Paul, Minnesota, two policies were critical enablers—the city’s Sustainable Building Policy5 and Minnesota’s SB20306 law based on Archi-tecture 2030’s limits for buildings.7 Saint Paul has been able to use these policies to ensure the developer will achieve high levels of energy efficiency and will use solar to balance costs and meet sustainability goals. One of the lessons learned from that effort is that had team members realized the importance of the city’s policy in developer negotiations, they would have amended their proposal to apply more clearly to large developments or to a district.
2828A GUIDE TO ENERGY MASTER PLANNING OF HIGH-PERFORMANCE DISTRICTS AND COMMUNITIES2: FOSTering SUPPOrT AnD ASSembling A TeAm
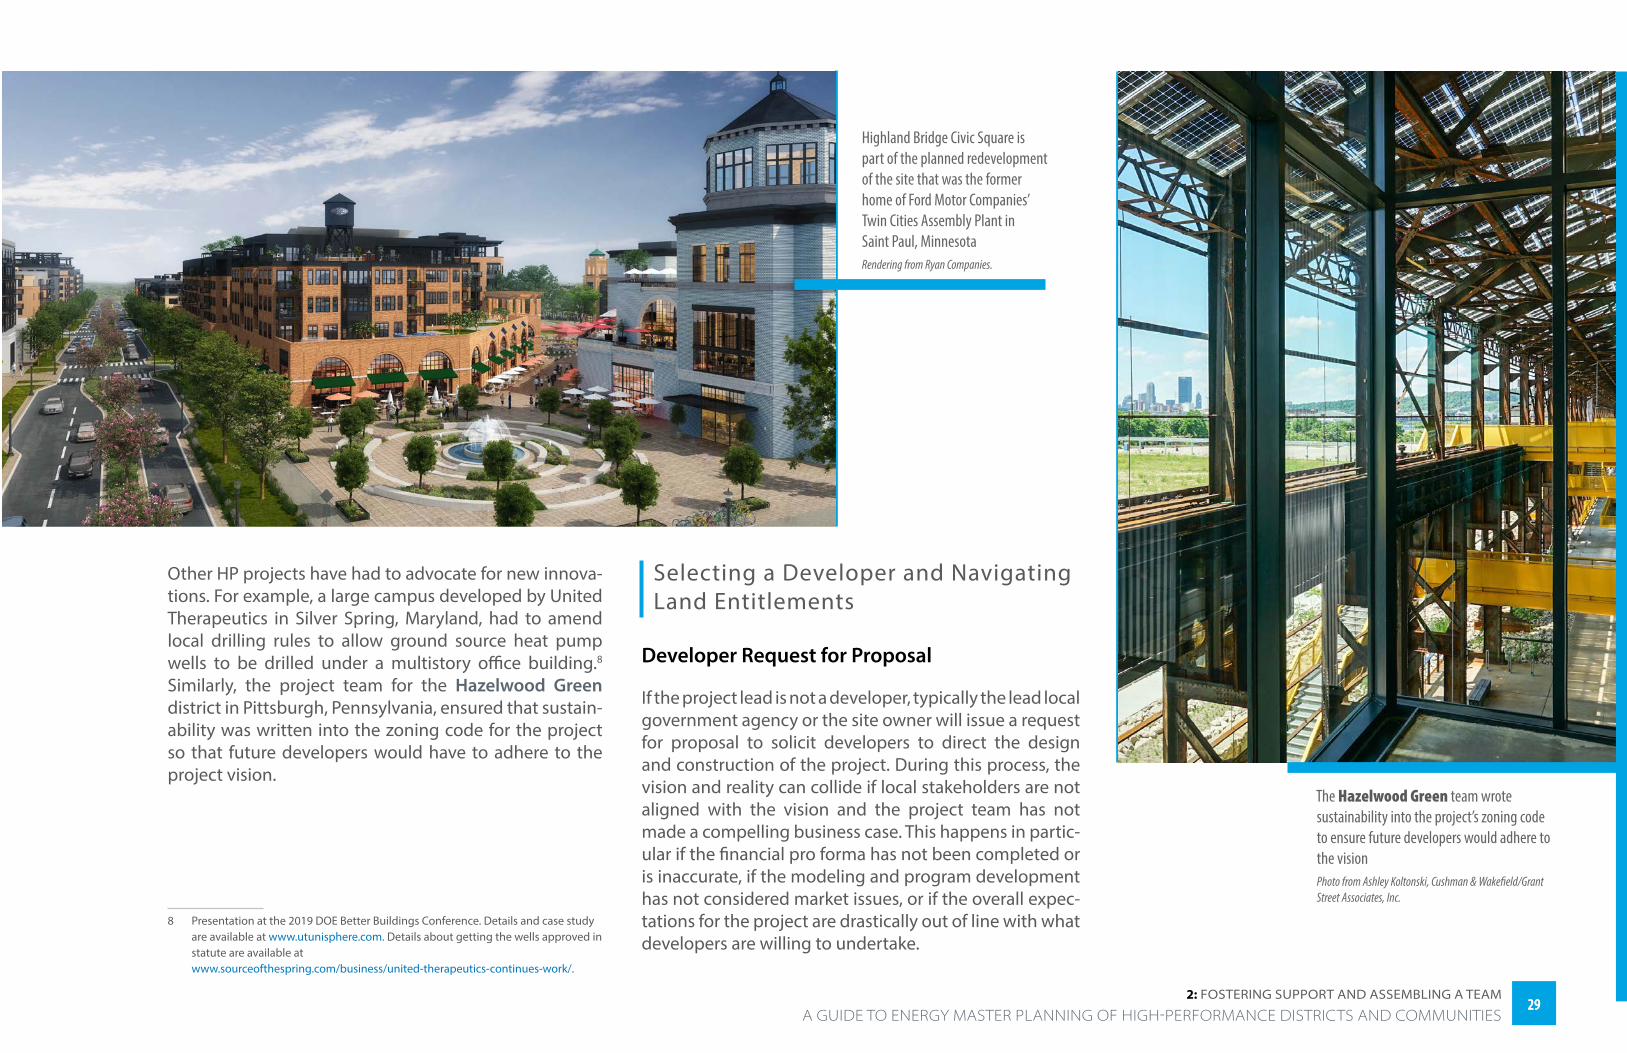
Highland Bridge Civic Square is part of the planned redevelopment of the site that was the former home of Ford Motor Companies’ Twin Cities Assembly Plant in Saint Paul, MinnesotaRendering from Ryan Companies.
Other HP projects have had to advocate for new innova-tions. For example, a large campus developed by United Therapeutics in Silver Spring, Maryland, had to amend local drilling rules to allow ground source heat pump wells to be drilled under a multistory office building.8
Similarly, the project team for the Hazelwood Green district in Pittsburgh, Pennsylvania, ensured that sustain-ability was written into the zoning code for the project so that future developers would have to adhere to the project vision.
8 Presentation at the 2019 DOE Better Buildings Conference. Details and case study are available at www.utunisphere.com. Details about getting the wells approved in statute are available at www.sourceofthespring.com/business/united-therapeutics-continues-work/.
The Hazelwood Green team wrote sustainability into the project’s zoning code to ensure future developers would adhere to the visionPhoto from Ashley Koltonski, Cushman & Wakefield/Grant Street Associates, Inc.
Selecting a Developer and Navigating Land Entitlements
Developer Request for Proposal
If the project lead is not a developer, typically the lead local government agency or the site owner will issue a request for proposal to solicit developers to direct the design and construction of the project. During this process, the vision and reality can collide if local stakeholders are not aligned with the vision and the project team has not made a compelling business case. This happens in partic-ular if the financial pro forma has not been completed or is inaccurate, if the modeling and program development has not considered market issues, or if the overall expec-tations for the project are drastically out of line with what developers are willing to undertake.
2929 A GUIDE TO ENERGY MASTER PLANNING OF HIGH-PERFORMANCE DISTRICTS AND COMMUNITIES
2: FOSTering SUPPOrT AnD ASSembling A TeAm
The latter scenario occurred early in the development of a ZE district in Erie County, New York—the develop-ment market was not ready to embrace the vision the owners developed. The market has evolved, however, and in 2019 the project began moving forward (see FIGURE 6 on page 31).
The request for proposal is an important tool for conveying the specifics about what the lead agency/owner expects and clarifying for the developer what is required and what is negotiable. Coordinating and communicating the expected outcomes, goals, and unique elements of the project with the owner’s purchasing department and selection committee is important at this point. Ideally, they have been engaged much earlier and are well aware of the project and its intent. At a minimum, the request for proposal should include:
• Project description
• Project vision, goals, and principles (including energy and sustainability performance goals):
�Tiered goals9
- Must have/mission critical goals
- Highly desirable/important
- If possible, wish list.
�Clear definition of project outcomes—the more precise the goals and definition, the more likely the vision will be realized
�Achievable and reasonable mission critical goals.
• Description of relevant ordinances, guiding policies, and required certifications
• Planned building and program mix as well as stipu-lations related to affordability or use limitations
• City, state, or other regulatory requirements
• Links to existing studies and models if available
9 www1.eere.energy.gov/buildings/publications/pdfs/rsf/performance_based_how_to_guide.pdf, pages 31–3210 rmi.org/news/boulder-commons-sets-new-standard-net-zero-leases/
• Initial concept and site plans
• Expected land entitlement process including stake-holder engagement, approval process, and timeline
• Phasing plans if available.
Land Entitlements
Land entitlements are part of the legal process a devel-oper must go through to get approvals for a develop-ment. Entitlements dictate what uses are allowed on the property and define what a developer can or cannot do. The process can be complex, time-consuming, and costly.
The entitlement phase is an important juncture to recon-nect to stakeholders, remind decision makers of the vision, and update individuals new to the project about what the development is intended to achieve. Bringing the key parties up to date and back into the conversation can help ensure the project will proceed as envisioned. This phase is also an opportunity to update and refresh communication tools, reengage with the press, and reach out again to the community.
For major land developments that require entitlements, the local jurisdiction has the opportunity and need to embed the master plan vision into land entitlement requirements. Quantifiable performance goals estab-lished during the master planning process will be updated and refined to ensure that the developer meets the requirements and understands the vision of the project.
Typical land entitlement processes require community engagement. This is an opportunity to leverage project advocates and community members who have been involved from the beginning to continue to advocate
and ensure the project vision is captured in the entitle-ment. Entitlements can cover, among other things:
• Zoning updates or variances
• Use permits
• Utility approvals
• Transportation and parking approvals
• Landscaping, open space, and park requirements
• Sustainability and performance requirements.
Getting the First Project Right
A critical step in realizing district HP goals is ensuring that the first building project in the district reflects the energy efficiency, renewable energy, and design expectations for the rest of the development. This project sets the design standard and provides inspiration and guidance for future development. It also serves as a model, proving to local stakeholders and industry professionals that it can be done and directly addressing concerns about meeting energy and sustainability requirements in the master plan and design guidelines.
In addition, ownership and lease models can be tested in this showcase project. For example, the managers of the Boulder Commons office building in Boulder, Colorado, piloted an innovative design and operations model with their tenants and developed a ZE lease structure model.10
The first district project is an opportunity to define the “starter thermal network” for a phased district thermal energy system, setting the stage for future buildings to connect to the district energy system. Often this project has a heating, ventilating, and air-conditioning (HVAC) system designed in parallel with the district system infra-structure that can easily connect into the district energy system once it becomes available.
FIGURE 6. A zero energy light industrial manufacturing and commercial facility designed to achieve zero or better in several sustainability categories: energy, carbon, water, waste, materials, and value on an Erie County (New York) brownfield siteGraphic from HGA, ELEMENTA, and C&S Compa
WIND TURBINE
GEOTHERMAL WELLFIELD
GROUND MOUNTED PV ARRAYROOF MOUNTED PV ARRAY
ON-SITE STORMWATER DETENTION POND
3030A GUIDE TO ENERGY MASTER PLANNING OF HIGH-PERFORMANCE DISTRICTS AND COMMUNITIES2: FOSTering SUPPOrT AnD ASSembling A TeAm
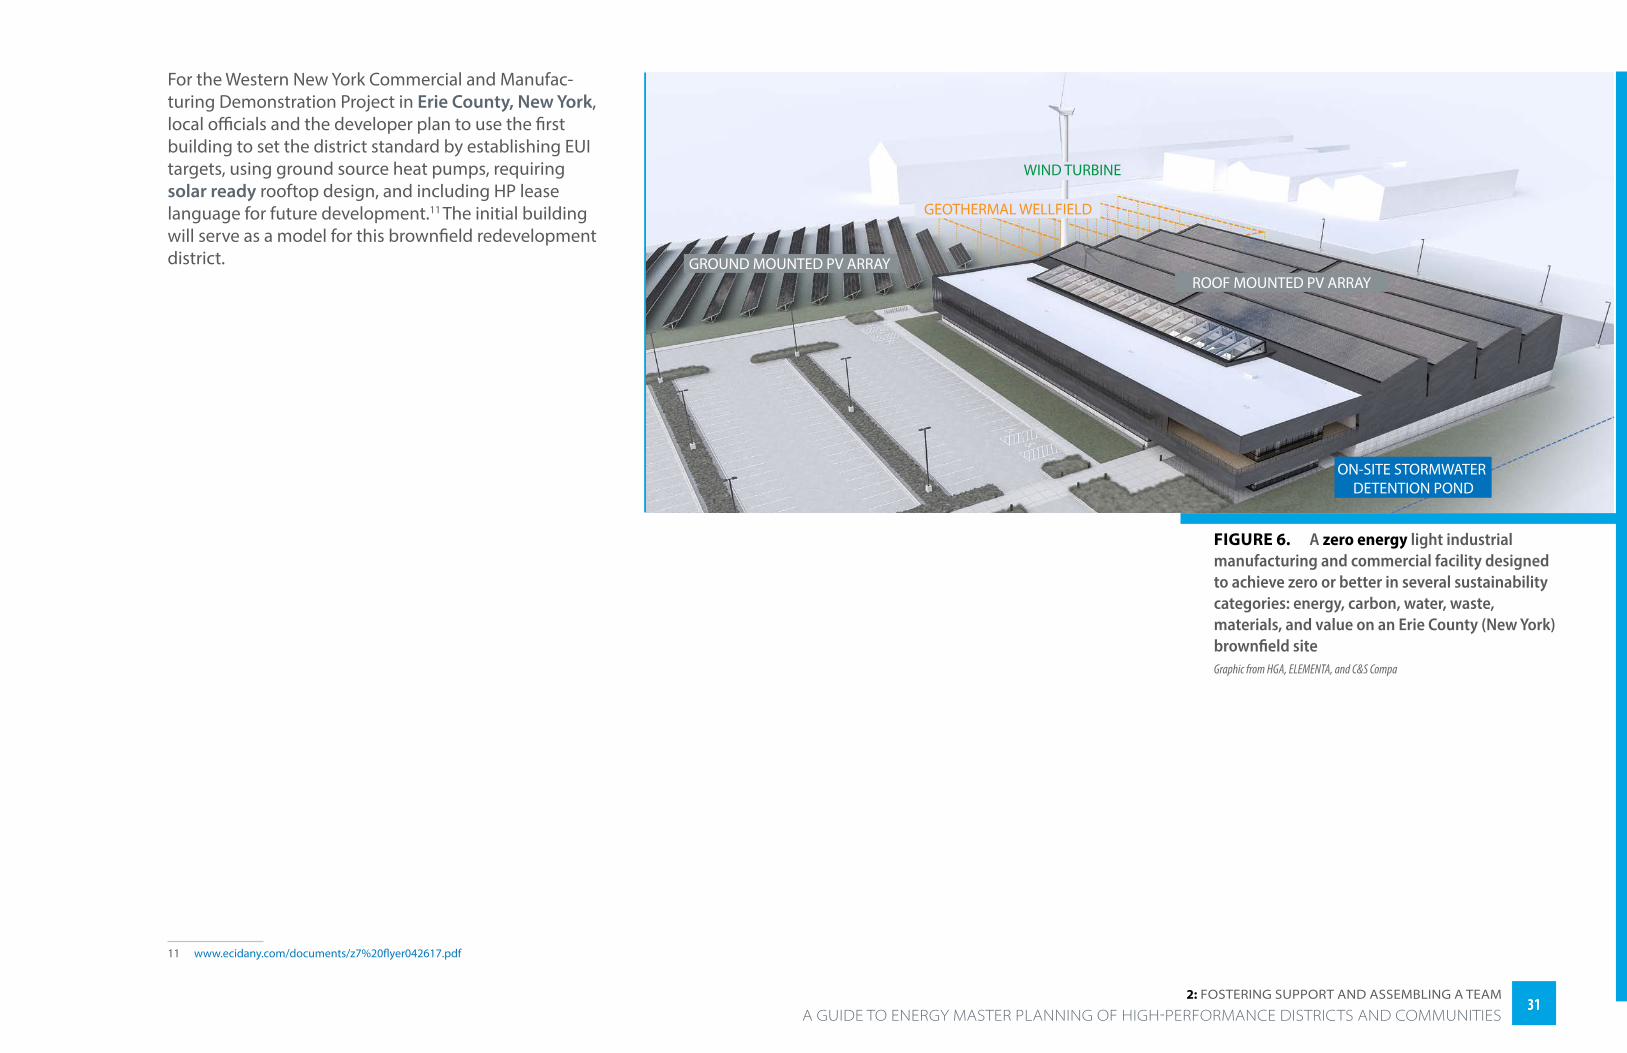
The latter scenario occurred early in the development of a ZE district in Erie County, New York—the develop-ment market was not ready to embrace the vision the owners developed. The market has evolved, however, and in 2019 the project began moving forward (see FIGURE 6 on page 31).
The request for proposal is an important tool for conveying the specifics about what the lead agency/owner expects and clarifying for the developer what is required and what is negotiable. Coordinating and communicating the expected outcomes, goals, and unique elements of the project with the owner’s purchasing department and selection committee is important at this point. Ideally, they have been engaged much earlier and are well aware of the project and its intent. At a minimum, the request for proposal should include:
• Project description
• Project vision, goals, and principles (including energy and sustainability performance goals):
�Tiered goals9
- Must have/mission critical goals
- Highly desirable/important
- If possible, wish list.
�Clear definition of project outcomes—the more precise the goals and definition, the more likely the vision will be realized
�Achievable and reasonable mission critical goals.
• Description of relevant ordinances, guiding policies, and required certifications
• Planned building and program mix as well as stipu-lations related to affordability or use limitations
• City, state, or other regulatory requirements
• Links to existing studies and models if available
9 www1.eere.energy.gov/buildings/publications/pdfs/rsf/performance_based_how_to_guide.pdf, pages 31–3210 rmi.org/news/boulder-commons-sets-new-standard-net-zero-leases/
FIGURE 6. A zero energy light industrial manufacturing and commercial facility designed to achieve zero or better in several sustainability categories: energy, carbon, water, waste, materials, and value on an Erie County (New York) brownfield siteGraphic from HGA, ELEMENTA, and C&S Compa
WIND TURBINE
GEOTHERMAL WELLFIELD
GROUND MOUNTED PV ARRAYROOF MOUNTED PV ARRAY
ON-SITE STORMWATER DETENTION POND
For the Western New York Commercial and Manufac-turing Demonstration Project in Erie County, New York, local officials and the developer plan to use the first building to set the district standard by establishing EUI targets, using ground source heat pumps, requiring solar ready rooftop design, and including HP lease language for future development.11 The initial building will serve as a model for this brownfield redevelopment district.
11 www.ecidany.com/documents/z7%20flyer042617.pdf
3131 A GUIDE TO ENERGY MASTER PLANNING OF HIGH-PERFORMANCE DISTRICTS AND COMMUNITIES
2: FOSTering SUPPOrT AnD ASSembling A TeAm
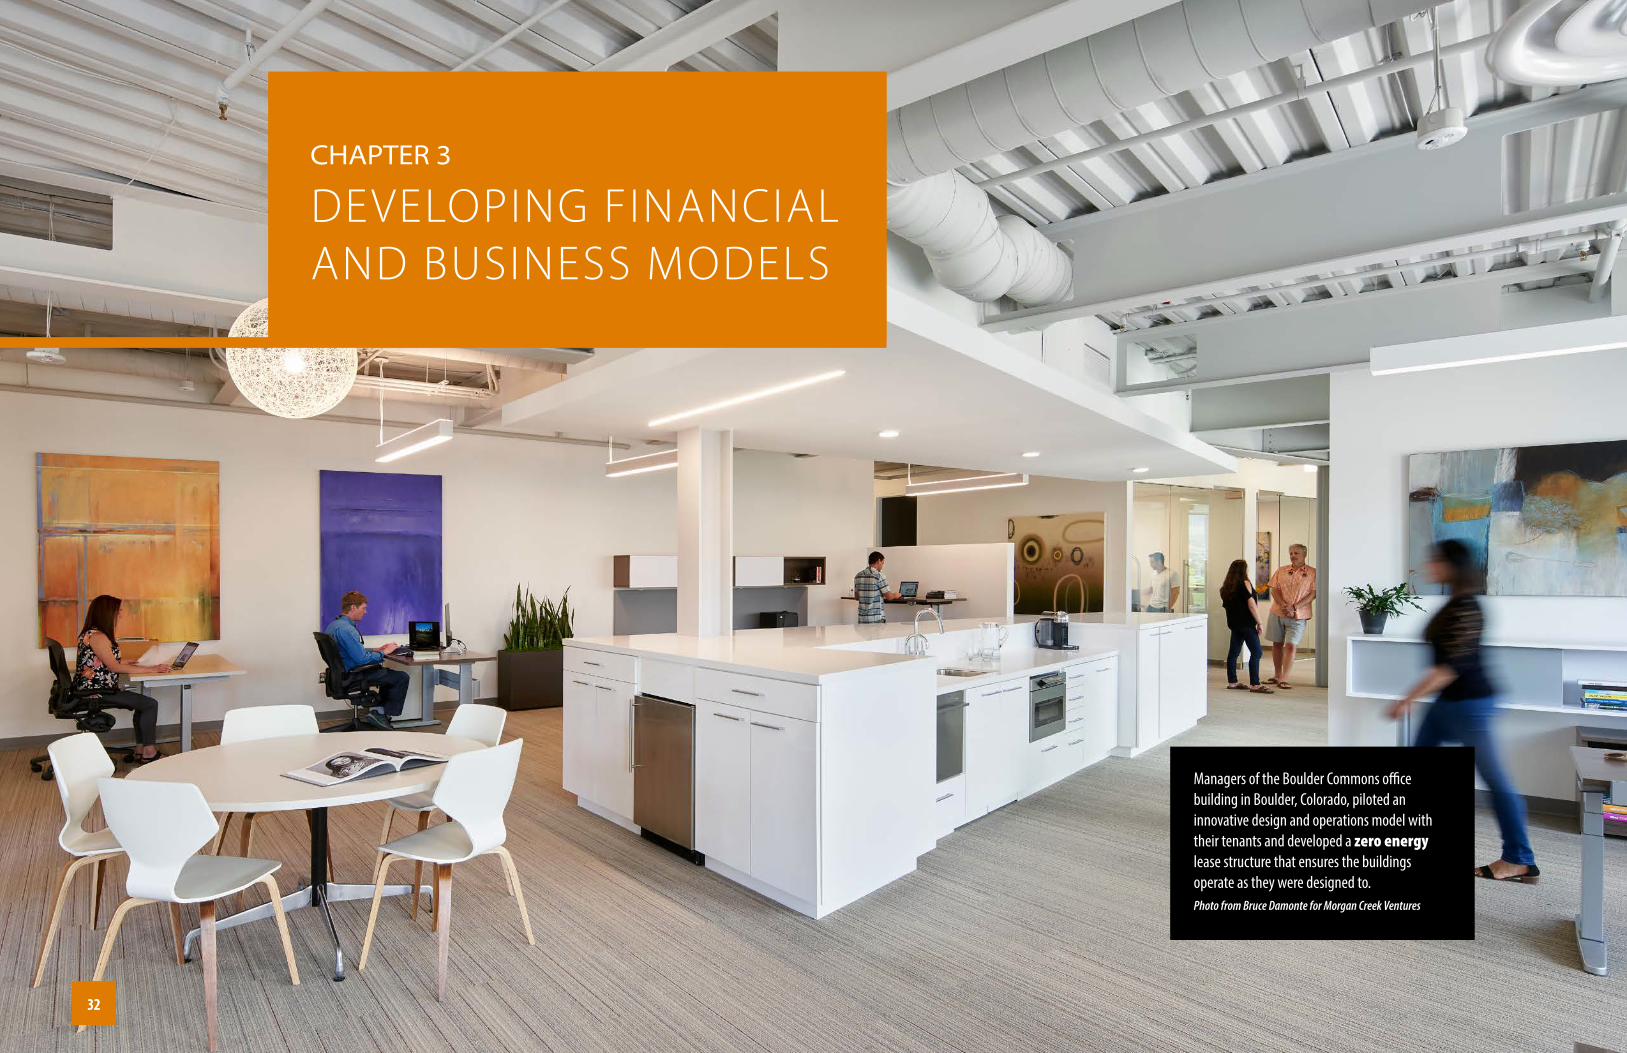
Managers of the Boulder Commons office building in Boulder, Colorado, piloted an innovative design and operations model with their tenants and developed a zero energy lease structure that ensures the buildings operate as they were designed to.Photo from Bruce Damonte for Morgan Creek Ventures
CHAPTer 3
DEVELOPING FINANCIAL AND BUSINESS MODELS
3232
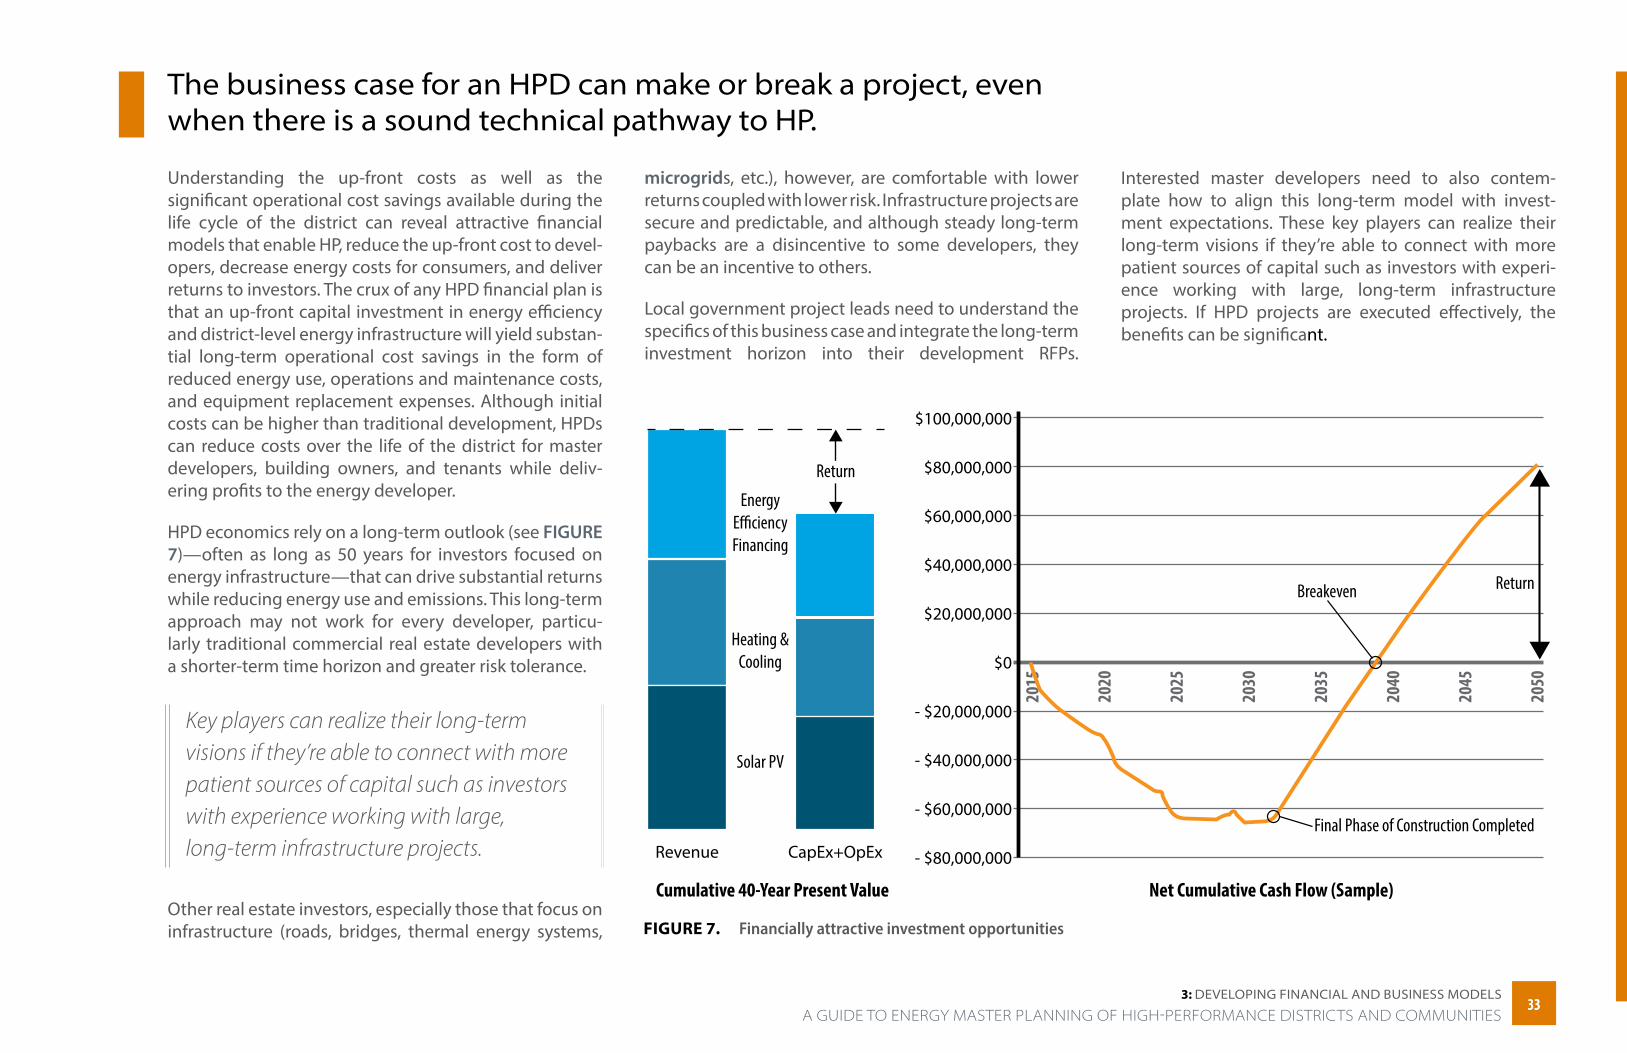
The business case for an HPD can make or break a project, even when there is a sound technical pathway to HP.
Understanding the up-front costs as well as the significant operational cost savings available during the life cycle of the district can reveal attractive financial models that enable HP, reduce the up-front cost to devel-opers, decrease energy costs for consumers, and deliver returns to investors. The crux of any HPD financial plan is that an up-front capital investment in energy efficiency and district-level energy infrastructure will yield substan-tial long-term operational cost savings in the form of reduced energy use, operations and maintenance costs, and equipment replacement expenses. Although initial costs can be higher than traditional development, HPDs can reduce costs over the life of the district for master developers, building owners, and tenants while deliv-ering profits to the energy developer.
HPD economics rely on a long-term outlook (see FIGURE 7)—often as long as 50 years for investors focused on energy infrastructure—that can drive substantial returns while reducing energy use and emissions. This long-term approach may not work for every developer, particu-larly traditional commercial real estate developers with a shorter-term time horizon and greater risk tolerance.
Key players can realize their long-term visions if they’re able to connect with more patient sources of capital such as investors with experience working with large, long-term infrastructure projects.
Other real estate investors, especially those that focus on infrastructure (roads, bridges, thermal energy systems,
microgrids, etc.), however, are comfortable with lower returns coupled with lower risk. Infrastructure projects are secure and predictable, and although steady long-term paybacks are a disincentive to some developers, they can be an incentive to others.
Local government project leads need to understand the specifics of this business case and integrate the long-term investment horizon into their development RFPs.
Interested master developers need to also contem-plate how to align this long-term model with invest-ment expectations. These key players can realize their long-term visions if they’re able to connect with more patient sources of capital such as investors with experi-ence working with large, long-term infrastructure projects. If HPD projects are executed effectively, the benefits can be significant.
FIGURE 7. Financially attractive investment opportunities
Revenue CapEx+OpEx
Cumulative 40-Year Present Value
EnergyEfficiencyFinancing
Heating &Cooling
Return
Solar PV
$100,000,000
$80,000,000
$60,000,000
$40,000,000
$20,000,000
$0
- $20,000,000
- $40,000,000
- $60,000,000
- $80,000,000
2015
2020
2025
2030
2035
2040
2045
2050
Net Cumulative Cash Flow (Sample)
ReturnBreakeven
Final Phase of Construction Completed
A GUIDE TO ENERGY MASTER PLANNING OF HIGH-PERFORMANCE DISTRICTS AND COMMUNITIES3333
3: DevelOPing FinAnCiAl AnD bUSineSS mODelS
Elements of a Robust Financial Analysis
This section outlines critical concepts to consider when formulating a district business plan, which should be developed as early as possible in the process. A robust financial analysis focuses on a balance of up-front capital costs, long-term energy and operating costs, and other key values that the development team might consider. Financial analysis should be closely coordinated with the thought process and considerations of the design team, so the energy and financial plans can be improved itera-tively and based on a comparison of findings.
Cost Analysis: Balancing Up-Front with Long-Term Operations Costs
The first step in performing a financial analysis is under-standing the up-front capital costs and the poten-tial long-term cost savings of the technical scenarios considered by the design team. In a typical district-level development, the site owner or developer is working to procure a commodity (buildings that match urban planning requirements) rather than outcomes (a district that produces more energy through renewable resources than it consumes). Costing for a commod-ity-based approach typically leads to rules of thumb around the construction cost per unit area (typically $/ft2) that conform to an expected market rate based on the anticipated finish quality of the space. Costing based on outcomes typically leads the design team not only to consider that higher up-front costs might be warranted for higher levels of performance, but also that a value analysis should incorporate life cycle energy, operations, maintenance, and equipment replacement costs.
1 rmi.org/wp-content/uploads/2017/03/Insight-brief_Net-zero-energy8_2.pdf 2 www.solar-estimate.org/solar-panels-101/what-is-net-present-value 3 labs21.lbl.gov/DPM/Assets/procurement_aesvcs.pdf, page 30
Many of these developments will exist 50, 75, or 100+ years down the road, so project owners, developers, and building owners should consider scenarios that provide the greatest long-term value. For projects initiated by a local government entity, it is important to align financial goals and the final business plan with the overall vision and project goals to ensure ongoing support by stake-holders and decision makers.
Many of these developments will exist 50, 75, or 100+ years down the road, so project owners, developers, and building owners should consider scenarios that provide the greatest long-term value.
Scenario Analysis
An HPD analysis typically includes multiple scenarios, which allow the design team to understand the trade-offs in up-front cost, long-term costs, and other values among the various options. Even if up-front costs are higher for HPDs, the long-term value is typically much higher than that of a conventional development. In other words, over a longer time horizon, the HPD will deliver greater financial returns while anticipating future code changes.1
After analyzing each of these scenarios, they can be compared based on energy performance, net present value2 (an indicator of how much value an investment or project adds) of any investment beyond business as usual, and alignment with project goals, including energy and sustainability goals. A focus on net present value or other long-term economic variables is crucial,
because many investments with the lowest up-front costs deliver less value over time and could result in substantially higher energy costs, operating costs, and emissions. FIGURE 8 shows that the long-term energy, operations, maintenance, and other costs far outweigh the up-front capital costs of a building. It is therefore important to leverage variables that include both short- and long-term costs to make the best investments and to develop a business plan that can leverage these long-term savings.
An Iterative and Holistic Approach to Considering Costs
A successful financial analysis is developed with the design team rather than after the design team has completed its work. In a traditional arrangement, the design team might leverage established rules of thumb to develop a building that is code-compliant, invests minimally in energy efficiency measures, and only seeks premium features when considering the desired finish quality of the development.
There might be a round of value engineering—a practice intended to ensure optimum value for the owner. Unfortunately, value engineering can have the unintended consequence of stripping energy efficiency measures that are deemed to be too costly up front. The value engineer may be unaware that these measures are good investments, saving energy and money over the life of the building or development.3
In an HP planning process, the project team recalcu-lates costs, energy performance, and ongoing operating costs for each of the scenarios outlined above. The HPD scenario is then fine-tuned, and multiple iterations might be considered to weigh the benefits and drawbacks of
3434A GUIDE TO ENERGY MASTER PLANNING OF HIGH-PERFORMANCE DISTRICTS AND COMMUNITIES3: DevelOPing FinAnCiAl AnD bUSineSS mODelS
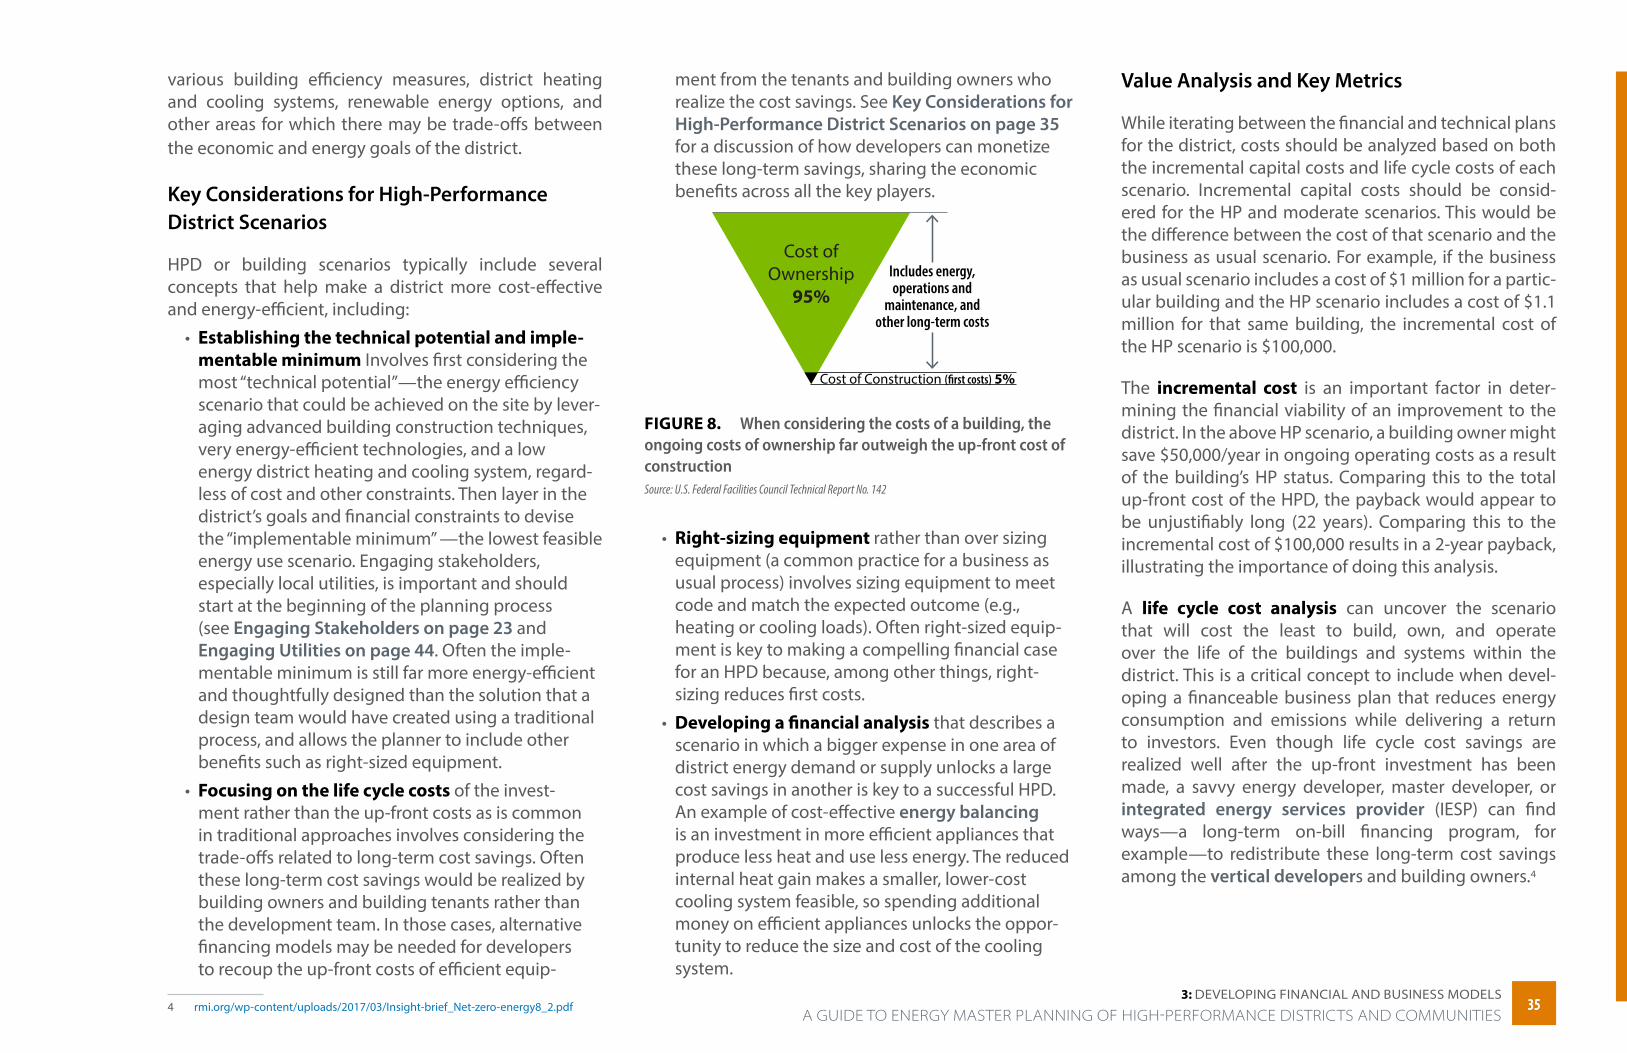
various building efficiency measures, district heating and cooling systems, renewable energy options, and other areas for which there may be trade-offs between the economic and energy goals of the district.
Key Considerations for High-Performance District Scenarios
HPD or building scenarios typically include several concepts that help make a district more cost-effective and energy-efficient, including:
• Establishing the technical potential and imple-mentable minimum Involves first considering the most “technical potential”—the energy efficiency scenario that could be achieved on the site by lever-aging advanced building construction techniques, very energy-efficient technologies, and a low energy district heating and cooling system, regard-less of cost and other constraints. Then layer in the district’s goals and financial constraints to devise the “implementable minimum” —the lowest feasible energy use scenario. Engaging stakeholders, especially local utilities, is important and should start at the beginning of the planning process (see Engaging Stakeholders on page 23 and Engaging Utilities on page 44. Often the imple-mentable minimum is still far more energy-efficient and thoughtfully designed than the solution that a design team would have created using a traditional process, and allows the planner to include other benefits such as right-sized equipment.
• Focusing on the life cycle costs of the invest-ment rather than the up-front costs as is common in traditional approaches involves considering the trade-offs related to long-term cost savings. Often these long-term cost savings would be realized by building owners and building tenants rather than the development team. In those cases, alternative financing models may be needed for developers to recoup the up-front costs of efficient equip-
4 rmi.org/wp-content/uploads/2017/03/Insight-brief_Net-zero-energy8_2.pdf
ment from the tenants and building owners who realize the cost savings. See Key Considerations for High-Performance District Scenarios on page 35 for a discussion of how developers can monetize these long-term savings, sharing the economic benefits across all the key players.
FIGURE 8. When considering the costs of a building, the ongoing costs of ownership far outweigh the up-front cost of construction Source: U.S. Federal Facilities Council Technical Report No. 142
• Right-sizing equipment rather than over sizing equipment (a common practice for a business as usual process) involves sizing equipment to meet code and match the expected outcome (e.g., heating or cooling loads). Often right-sized equip-ment is key to making a compelling financial case for an HPD because, among other things, right-sizing reduces first costs.
• Developing a financial analysis that describes a scenario in which a bigger expense in one area of district energy demand or supply unlocks a large cost savings in another is key to a successful HPD. An example of cost-effective energy balancing is an investment in more efficient appliances that produce less heat and use less energy. The reduced internal heat gain makes a smaller, lower-cost cooling system feasible, so spending additional money on efficient appliances unlocks the oppor-tunity to reduce the size and cost of the cooling system.
Value Analysis and Key Metrics
While iterating between the financial and technical plans for the district, costs should be analyzed based on both the incremental capital costs and life cycle costs of each scenario. Incremental capital costs should be consid-ered for the HP and moderate scenarios. This would be the difference between the cost of that scenario and the business as usual scenario. For example, if the business as usual scenario includes a cost of $1 million for a partic-ular building and the HP scenario includes a cost of $1.1 million for that same building, the incremental cost of the HP scenario is $100,000.
The incremental cost is an important factor in deter-mining the financial viability of an improvement to the district. In the above HP scenario, a building owner might save $50,000/year in ongoing operating costs as a result of the building’s HP status. Comparing this to the total up-front cost of the HPD, the payback would appear to be unjustifiably long (22 years). Comparing this to the incremental cost of $100,000 results in a 2-year payback, illustrating the importance of doing this analysis.
A life cycle cost analysis can uncover the scenario that will cost the least to build, own, and operate over the life of the buildings and systems within the district. This is a critical concept to include when devel-oping a financeable business plan that reduces energy consumption and emissions while delivering a return to investors. Even though life cycle cost savings are realized well after the up-front investment has been made, a savvy energy developer, master developer, or integrated energy services provider (IESP) can find ways—a long-term on-bill financing program, for example—to redistribute these long-term cost savings among the vertical developers and building owners.4
Cost ofOwnership
95%Includes energy,operations and
maintenance, andother long-term costs
3535 A GUIDE TO ENERGY MASTER PLANNING OF HIGH-PERFORMANCE DISTRICTS AND COMMUNITIES
3: DevelOPing FinAnCiAl AnD bUSineSS mODelS
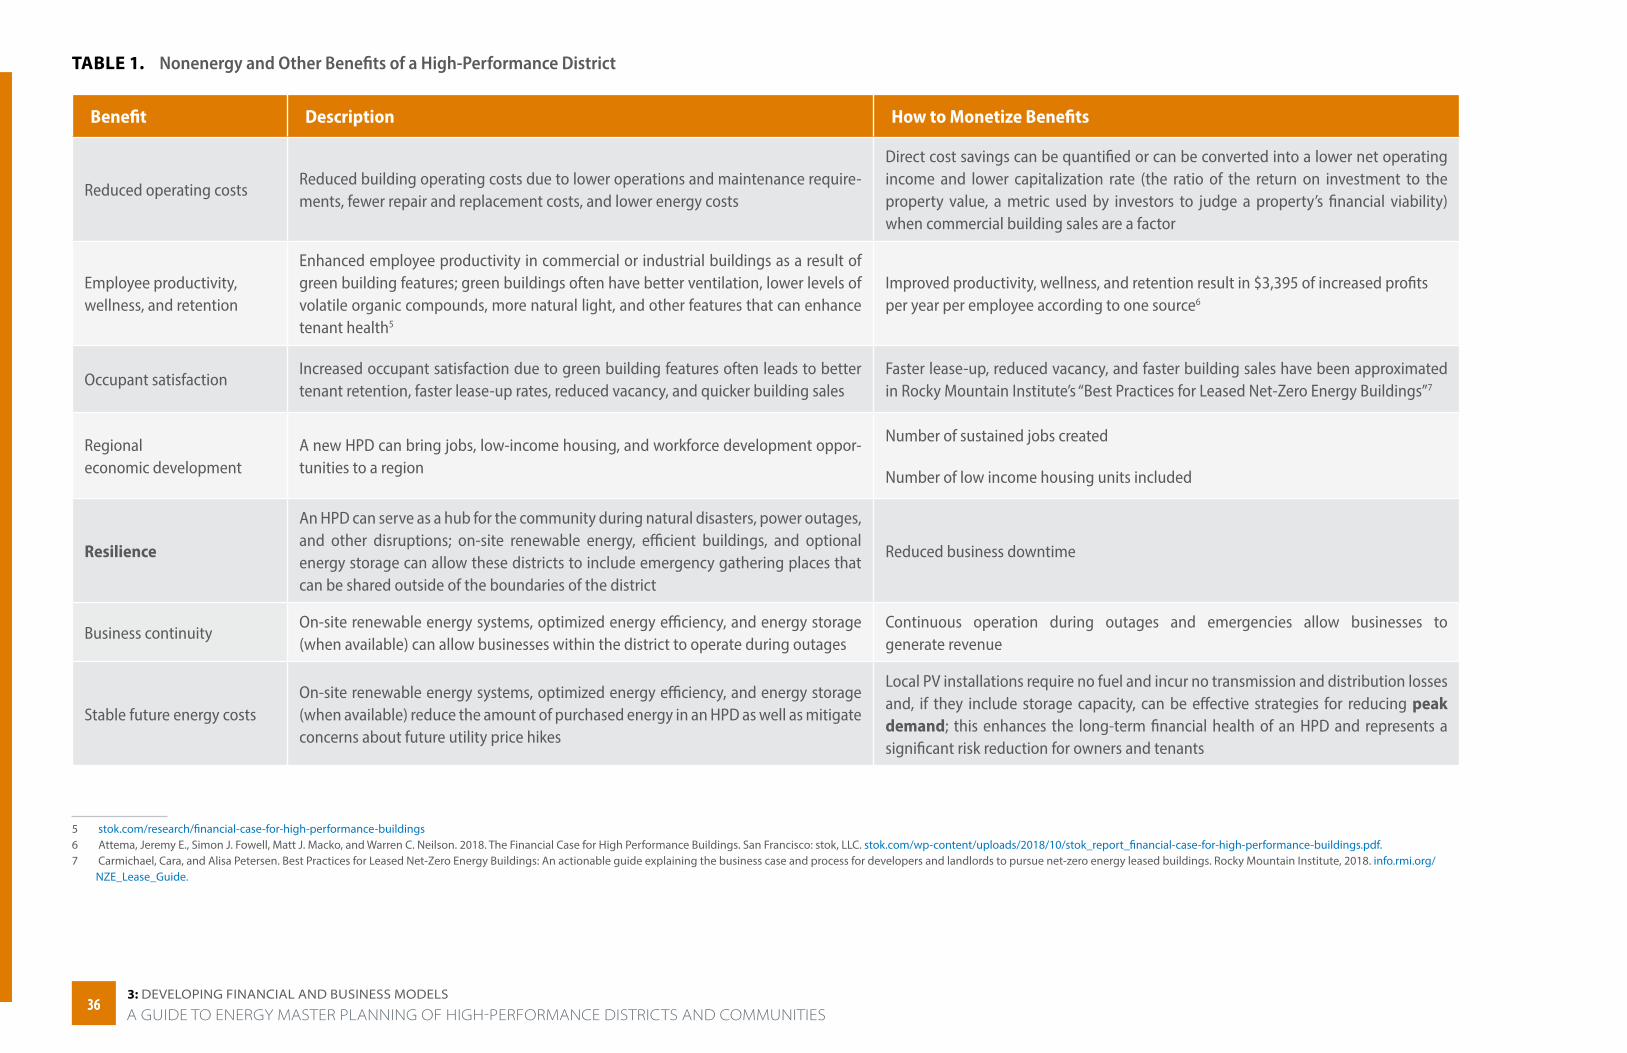
TABLE 1. Nonenergy and Other Benefits of a High-Performance District
Benefit Description How to Monetize Benefits
Reduced operating costsReduced building operating costs due to lower operations and maintenance require-ments, fewer repair and replacement costs, and lower energy costs
Direct cost savings can be quantified or can be converted into a lower net operating income and lower capitalization rate (the ratio of the return on investment to the property value, a metric used by investors to judge a property’s financial viability) when commercial building sales are a factor
Employee productivity, wellness, and retention
Enhanced employee productivity in commercial or industrial buildings as a result of green building features; green buildings often have better ventilation, lower levels of volatile organic compounds, more natural light, and other features that can enhance tenant health5
Improved productivity, wellness, and retention result in $3,395 of increased profits per year per employee according to one source6
Occupant satisfactionIncreased occupant satisfaction due to green building features often leads to better tenant retention, faster lease-up rates, reduced vacancy, and quicker building sales
Faster lease-up, reduced vacancy, and faster building sales have been approximated in Rocky Mountain Institute’s “Best Practices for Leased Net-Zero Energy Buildings”7
Regional economic development
A new HPD can bring jobs, low-income housing, and workforce development oppor-tunities to a region
Number of sustained jobs created
Number of low income housing units included
Resilience
An HPD can serve as a hub for the community during natural disasters, power outages, and other disruptions; on-site renewable energy, efficient buildings, and optional energy storage can allow these districts to include emergency gathering places that can be shared outside of the boundaries of the district
Reduced business downtime
Business continuity On-site renewable energy systems, optimized energy efficiency, and energy storage (when available) can allow businesses within the district to operate during outages
Continuous operation during outages and emergencies allow businesses to generate revenue
Stable future energy costsOn-site renewable energy systems, optimized energy efficiency, and energy storage (when available) reduce the amount of purchased energy in an HPD as well as mitigate concerns about future utility price hikes
Local PV installations require no fuel and incur no transmission and distribution losses and, if they include storage capacity, can be effective strategies for reducing peak demand; this enhances the long-term financial health of an HPD and represents a significant risk reduction for owners and tenants
5 stok.com/research/financial-case-for-high-performance-buildings6 Attema, Jeremy E., Simon J. Fowell, Matt J. Macko, and Warren C. Neilson. 2018. The Financial Case for High Performance Buildings. San Francisco: stok, LLC. stok.com/wp-content/uploads/2018/10/stok_report_financial-case-for-high-performance-buildings.pdf. 7 Carmichael, Cara, and Alisa Petersen. Best Practices for Leased Net-Zero Energy Buildings: An actionable guide explaining the business case and process for developers and landlords to pursue net-zero energy leased buildings. Rocky Mountain Institute, 2018. info.rmi.org/
NZE_Lease_Guide.
3636A GUIDE TO ENERGY MASTER PLANNING OF HIGH-PERFORMANCE DISTRICTS AND COMMUNITIES3: DevelOPing FinAnCiAl AnD bUSineSS mODelS
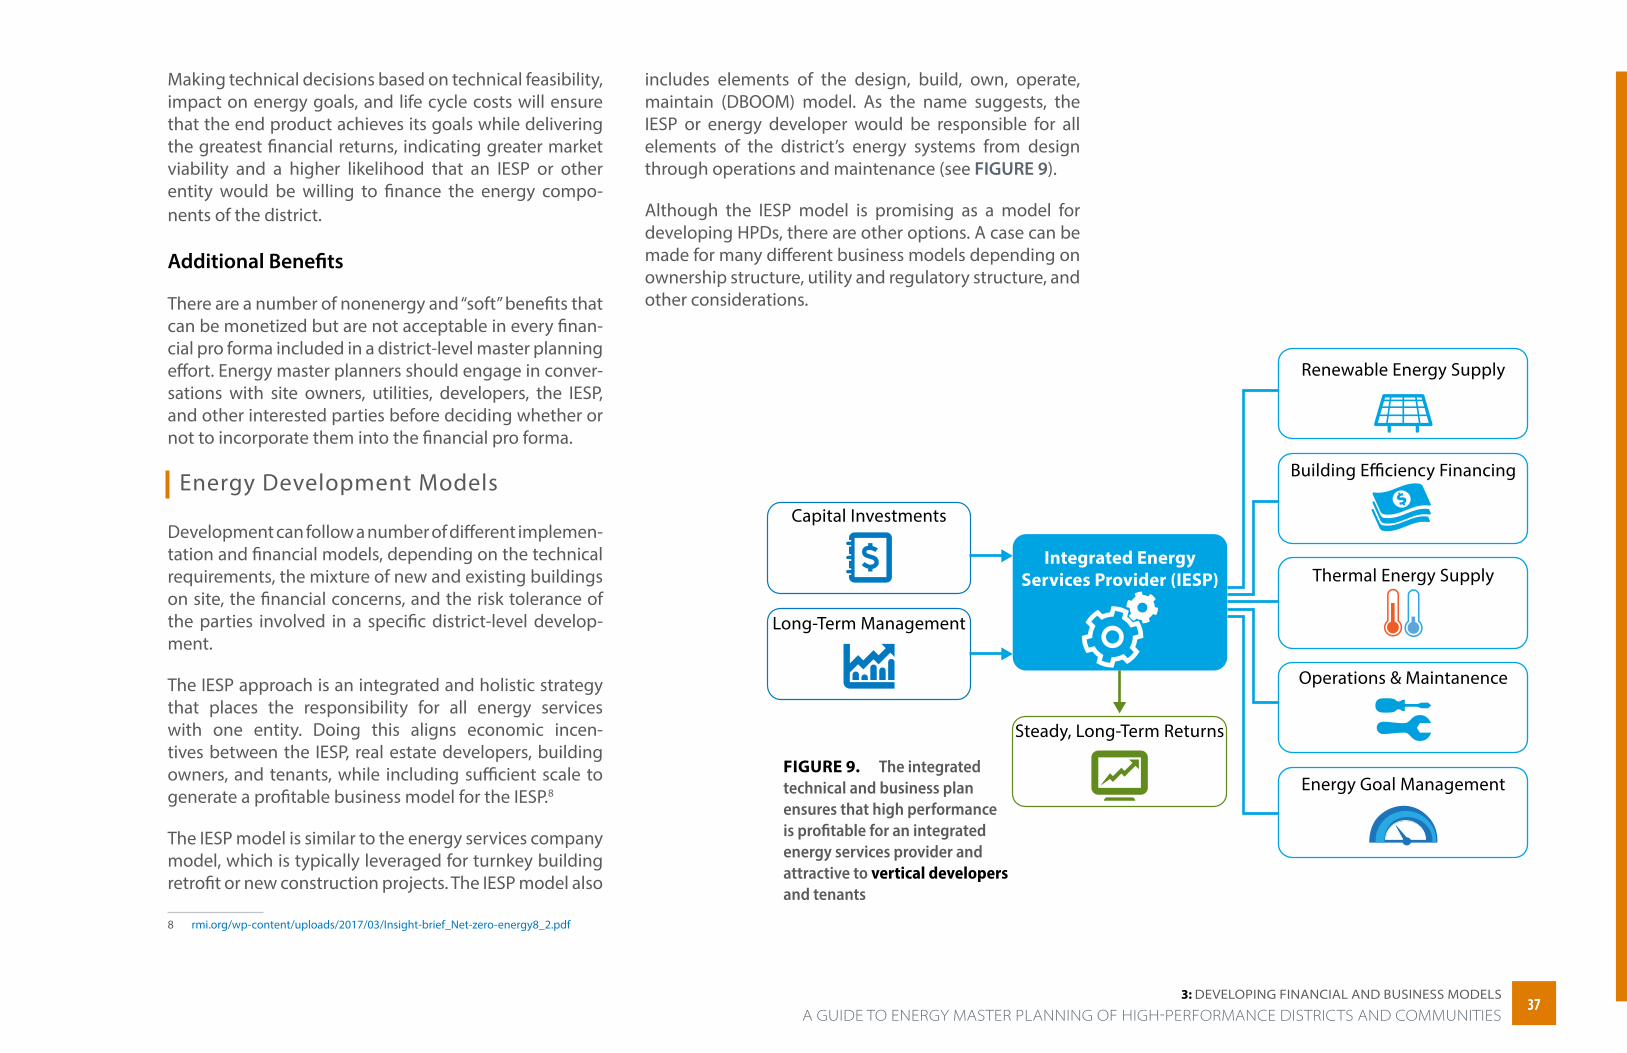
Making technical decisions based on technical feasibility, impact on energy goals, and life cycle costs will ensure that the end product achieves its goals while delivering the greatest financial returns, indicating greater market viability and a higher likelihood that an IESP or other entity would be willing to finance the energy compo-nents of the district.
Additional Benefits
There are a number of nonenergy and “soft” benefits that can be monetized but are not acceptable in every finan-cial pro forma included in a district-level master planning effort. Energy master planners should engage in conver-sations with site owners, utilities, developers, the IESP, and other interested parties before deciding whether or not to incorporate them into the financial pro forma.
Energy Development Models
Development can follow a number of different implemen-tation and financial models, depending on the technical requirements, the mixture of new and existing buildings on site, the financial concerns, and the risk tolerance of the parties involved in a specific district-level develop-ment.
The IESP approach is an integrated and holistic strategy that places the responsibility for all energy services with one entity. Doing this aligns economic incen-tives between the IESP, real estate developers, building owners, and tenants, while including sufficient scale to generate a profitable business model for the IESP.8
The IESP model is similar to the energy services company model, which is typically leveraged for turnkey building retrofit or new construction projects. The IESP model also
8 rmi.org/wp-content/uploads/2017/03/Insight-brief_Net-zero-energy8_2.pdf
includes elements of the design, build, own, operate, maintain (DBOOM) model. As the name suggests, the IESP or energy developer would be responsible for all elements of the district’s energy systems from design through operations and maintenance (see FIGURE 9).
Although the IESP model is promising as a model for developing HPDs, there are other options. A case can be made for many different business models depending on ownership structure, utility and regulatory structure, and other considerations.
FIGURE 9. The integrated technical and business plan ensures that high performance is profitable for an integrated energy services provider and attractive to vertical developers and tenants
3737 A GUIDE TO ENERGY MASTER PLANNING OF HIGH-PERFORMANCE DISTRICTS AND COMMUNITIES
3: DevelOPing FinAnCiAl AnD bUSineSS mODelS
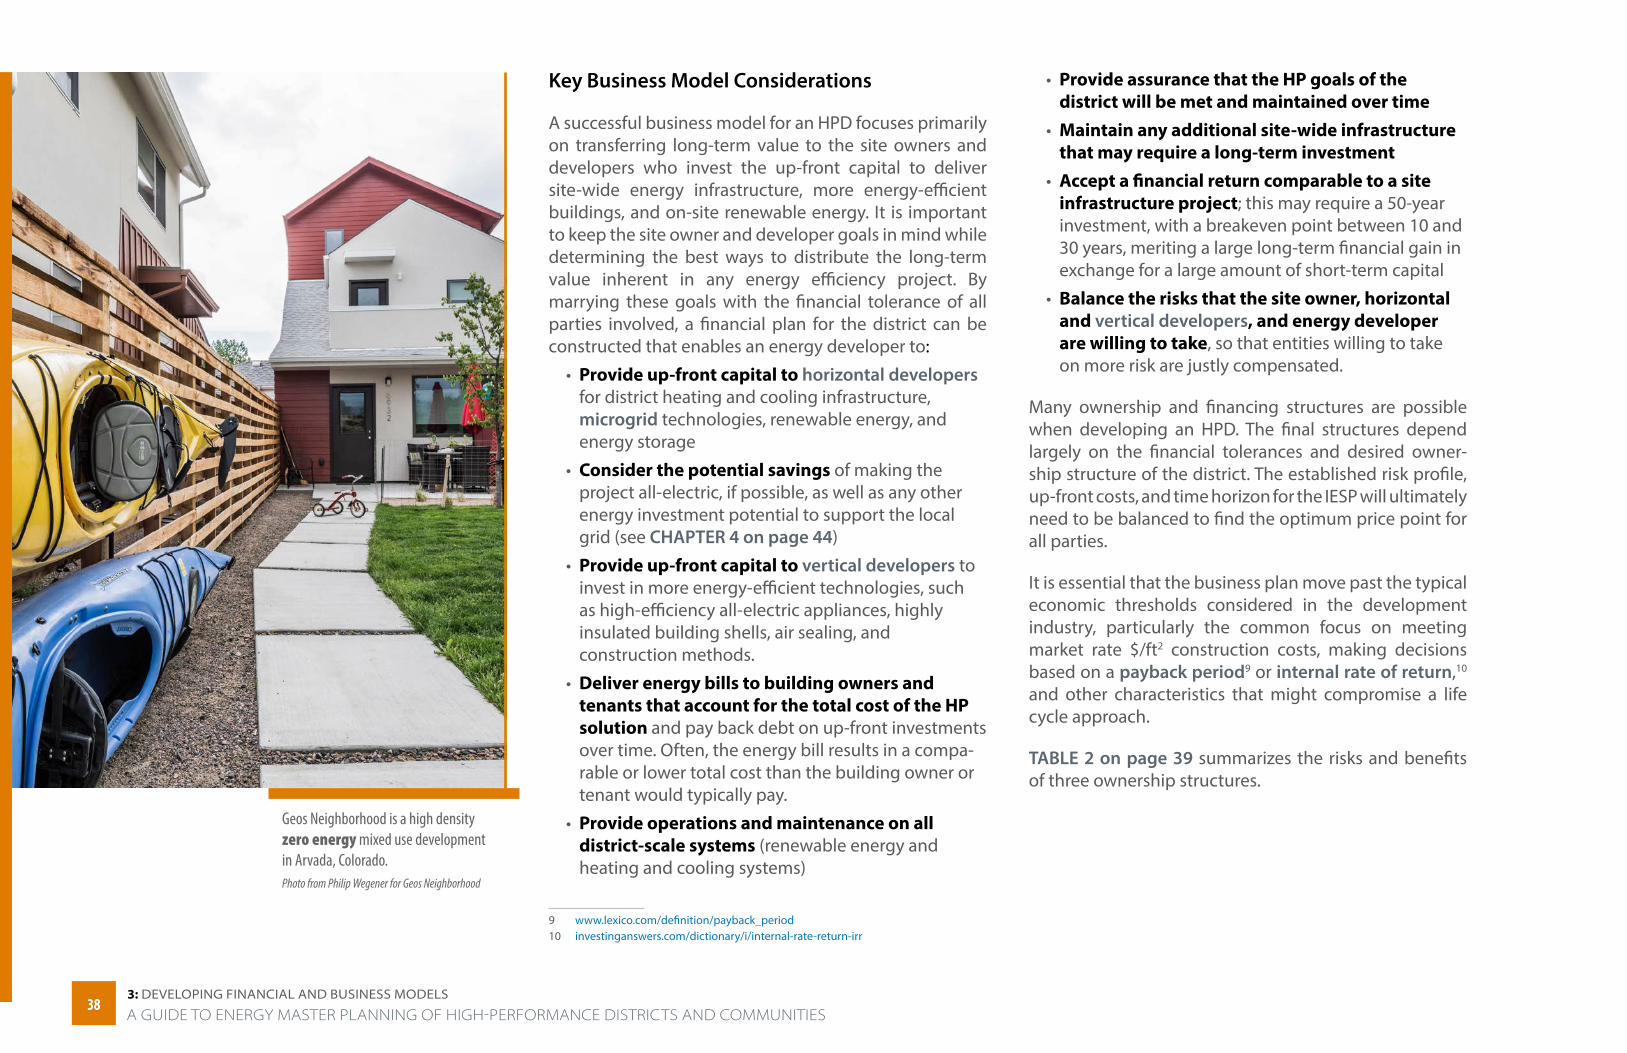
Key Business Model Considerations
A successful business model for an HPD focuses primarily on transferring long-term value to the site owners and developers who invest the up-front capital to deliver site-wide energy infrastructure, more energy-efficient buildings, and on-site renewable energy. It is important to keep the site owner and developer goals in mind while determining the best ways to distribute the long-term value inherent in any energy efficiency project. By marrying these goals with the financial tolerance of all parties involved, a financial plan for the district can be constructed that enables an energy developer to:
• Provide up-front capital to horizontal developers for district heating and cooling infrastructure, microgrid technologies, renewable energy, and energy storage
• Consider the potential savings of making the project all-electric, if possible, as well as any other energy investment potential to support the local grid (see CHAPTER 4 on page 44)
• Provide up-front capital to vertical developers to invest in more energy-efficient technologies, such as high-efficiency all-electric appliances, highly insulated building shells, air sealing, and construction methods.
• Deliver energy bills to building owners and tenants that account for the total cost of the HP solution and pay back debt on up-front investments over time. Often, the energy bill results in a compa-rable or lower total cost than the building owner or tenant would typically pay.
• Provide operations and maintenance on all district-scale systems (renewable energy and heating and cooling systems)
9 www.lexico.com/definition/payback_period 10 investinganswers.com/dictionary/i/internal-rate-return-irr
• Provide assurance that the HP goals of the district will be met and maintained over time
• Maintain any additional site-wide infrastructure that may require a long-term investment
• Accept a financial return comparable to a site infrastructure project; this may require a 50-year investment, with a breakeven point between 10 and 30 years, meriting a large long-term financial gain in exchange for a large amount of short-term capital
• Balance the risks that the site owner, horizontal and vertical developers, and energy developer are willing to take, so that entities willing to take on more risk are justly compensated.
Many ownership and financing structures are possible when developing an HPD. The final structures depend largely on the financial tolerances and desired owner-ship structure of the district. The established risk profile, up-front costs, and time horizon for the IESP will ultimately need to be balanced to find the optimum price point for all parties.
It is essential that the business plan move past the typical economic thresholds considered in the development industry, particularly the common focus on meeting market rate $/ft2 construction costs, making decisions based on a payback period9 or internal rate of return,10 and other characteristics that might compromise a life cycle approach.
TABLE 2 on page 39 summarizes the risks and benefits of three ownership structures.
Geos Neighborhood is a high density zero energy mixed use development in Arvada, Colorado.Photo from Philip Wegener for Geos Neighborhood
3838A GUIDE TO ENERGY MASTER PLANNING OF HIGH-PERFORMANCE DISTRICTS AND COMMUNITIES3: DevelOPing FinAnCiAl AnD bUSineSS mODelS
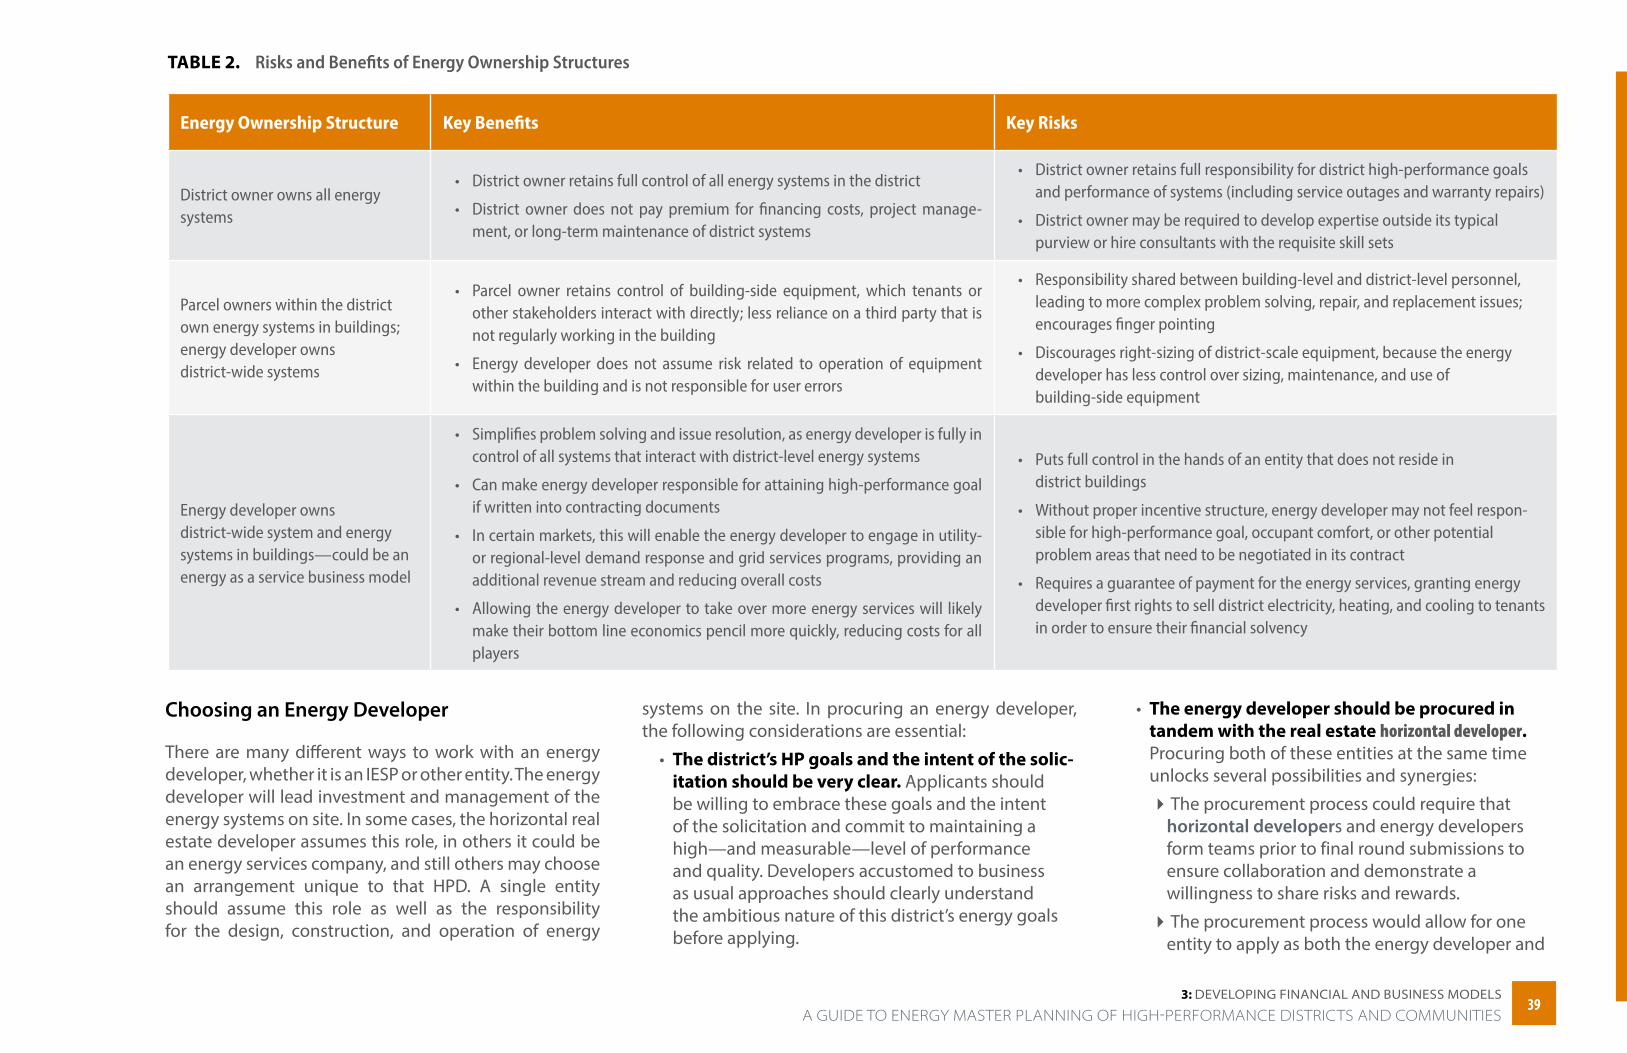
TABLE 2. Risks and Benefits of Energy Ownership Structures
Energy Ownership Structure Key Benefits Key Risks
District owner owns all energy systems
• District owner retains full control of all energy systems in the district
• District owner does not pay premium for financing costs, project manage-ment, or long-term maintenance of district systems
• District owner retains full responsibility for district high-performance goals and performance of systems (including service outages and warranty repairs)
• District owner may be required to develop expertise outside its typical purview or hire consultants with the requisite skill sets
Parcel owners within the district own energy systems in buildings; energy developer owns district-wide systems
• Parcel owner retains control of building-side equipment, which tenants or other stakeholders interact with directly; less reliance on a third party that is not regularly working in the building
• Energy developer does not assume risk related to operation of equipment within the building and is not responsible for user errors
• Responsibility shared between building-level and district-level personnel, leading to more complex problem solving, repair, and replacement issues; encourages finger pointing
• Discourages right-sizing of district-scale equipment, because the energy developer has less control over sizing, maintenance, and use of building-side equipment
Energy developer owns district-wide system and energy systems in buildings—could be an energy as a service business model
• Simplifies problem solving and issue resolution, as energy developer is fully in control of all systems that interact with district-level energy systems
• Can make energy developer responsible for attaining high-performance goal if written into contracting documents
• In certain markets, this will enable the energy developer to engage in utility- or regional-level demand response and grid services programs, providing an additional revenue stream and reducing overall costs
• Allowing the energy developer to take over more energy services will likely make their bottom line economics pencil more quickly, reducing costs for all players
• Puts full control in the hands of an entity that does not reside in district buildings
• Without proper incentive structure, energy developer may not feel respon-sible for high-performance goal, occupant comfort, or other potential problem areas that need to be negotiated in its contract
• Requires a guarantee of payment for the energy services, granting energy developer first rights to sell district electricity, heating, and cooling to tenants in order to ensure their financial solvency
Choosing an Energy Developer
There are many different ways to work with an energy developer, whether it is an IESP or other entity. The energy developer will lead investment and management of the energy systems on site. In some cases, the horizontal real estate developer assumes this role, in others it could be an energy services company, and still others may choose an arrangement unique to that HPD. A single entity should assume this role as well as the responsibility for the design, construction, and operation of energy
systems on the site. In procuring an energy developer, the following considerations are essential:
• The district’s HP goals and the intent of the solic-itation should be very clear. Applicants should be willing to embrace these goals and the intent of the solicitation and commit to maintaining a high—and measurable—level of performance and quality. Developers accustomed to business as usual approaches should clearly understand the ambitious nature of this district’s energy goals before applying.
• The energy developer should be procured in tandem with the real estate horizontal developer. Procuring both of these entities at the same time unlocks several possibilities and synergies:
�The procurement process could require that horizontal developers and energy developers form teams prior to final round submissions to ensure collaboration and demonstrate a willingness to share risks and rewards.
�The procurement process would allow for one entity to apply as both the energy developer and
3939 A GUIDE TO ENERGY MASTER PLANNING OF HIGH-PERFORMANCE DISTRICTS AND COMMUNITIES
3: DevelOPing FinAnCiAl AnD bUSineSS mODelS
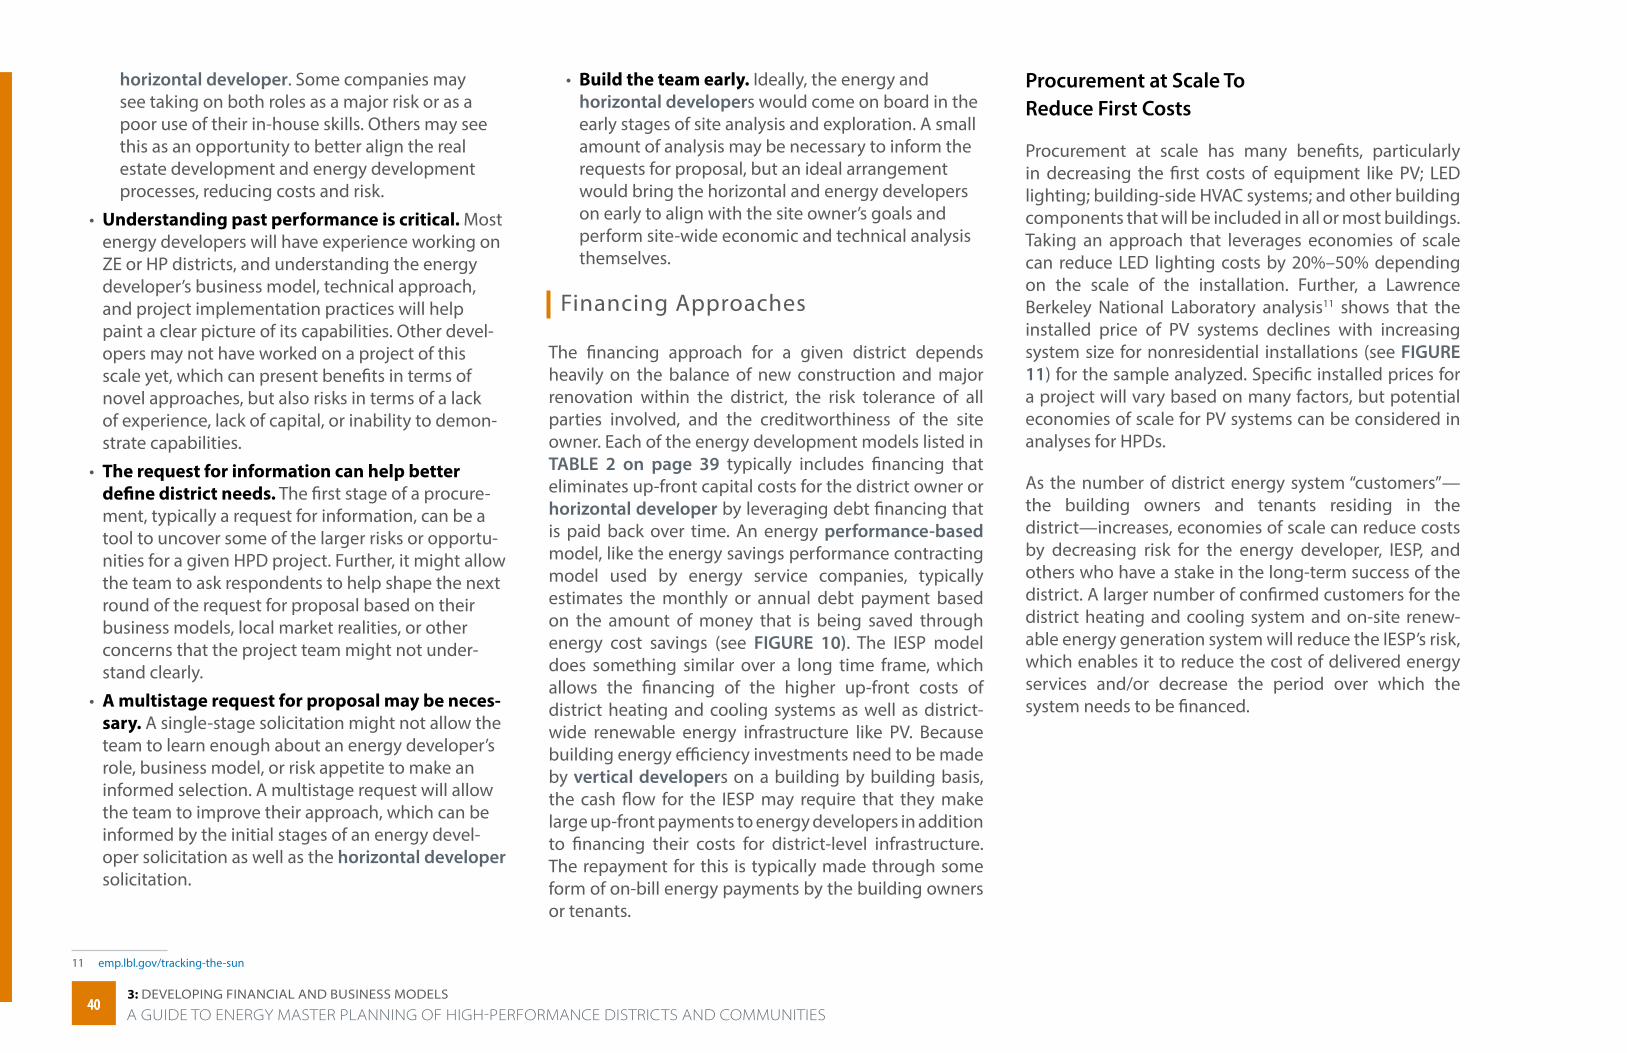
horizontal developer. Some companies may see taking on both roles as a major risk or as a poor use of their in-house skills. Others may see this as an opportunity to better align the real estate development and energy development processes, reducing costs and risk.
• Understanding past performance is critical. Most energy developers will have experience working on ZE or HP districts, and understanding the energy developer’s business model, technical approach, and project implementation practices will help paint a clear picture of its capabilities. Other devel-opers may not have worked on a project of this scale yet, which can present benefits in terms of novel approaches, but also risks in terms of a lack of experience, lack of capital, or inability to demon-strate capabilities.
• The request for information can help better define district needs. The first stage of a procure-ment, typically a request for information, can be a tool to uncover some of the larger risks or opportu-nities for a given HPD project. Further, it might allow the team to ask respondents to help shape the next round of the request for proposal based on their business models, local market realities, or other concerns that the project team might not under-stand clearly.
• A multistage request for proposal may be neces-sary. A single-stage solicitation might not allow the team to learn enough about an energy developer’s role, business model, or risk appetite to make an informed selection. A multistage request will allow the team to improve their approach, which can be informed by the initial stages of an energy devel-oper solicitation as well as the horizontal developer solicitation.
11 emp.lbl.gov/tracking-the-sun
• Build the team early. Ideally, the energy and horizontal developers would come on board in the early stages of site analysis and exploration. A small amount of analysis may be necessary to inform the requests for proposal, but an ideal arrangement would bring the horizontal and energy developers on early to align with the site owner’s goals and perform site-wide economic and technical analysis themselves.
Financing Approaches
The financing approach for a given district depends heavily on the balance of new construction and major renovation within the district, the risk tolerance of all parties involved, and the creditworthiness of the site owner. Each of the energy development models listed in TABLE 2 on page 39 typically includes financing that eliminates up-front capital costs for the district owner or horizontal developer by leveraging debt financing that is paid back over time. An energy performance-based model, like the energy savings performance contracting model used by energy service companies, typically estimates the monthly or annual debt payment based on the amount of money that is being saved through energy cost savings (see FIGURE 10). The IESP model does something similar over a long time frame, which allows the financing of the higher up-front costs of district heating and cooling systems as well as district-wide renewable energy infrastructure like PV. Because building energy efficiency investments need to be made by vertical developers on a building by building basis, the cash flow for the IESP may require that they make large up-front payments to energy developers in addition to financing their costs for district-level infrastructure. The repayment for this is typically made through some form of on-bill energy payments by the building owners or tenants.
Procurement at Scale To Reduce First Costs
Procurement at scale has many benefits, particularly in decreasing the first costs of equipment like PV; LED lighting; building-side HVAC systems; and other building components that will be included in all or most buildings. Taking an approach that leverages economies of scale can reduce LED lighting costs by 20%–50% depending on the scale of the installation. Further, a Lawrence Berkeley National Laboratory analysis11 shows that the installed price of PV systems declines with increasing system size for nonresidential installations (see FIGURE 11) for the sample analyzed. Specific installed prices for a project will vary based on many factors, but potential economies of scale for PV systems can be considered in analyses for HPDs.
As the number of district energy system “customers”—the building owners and tenants residing in the district—increases, economies of scale can reduce costs by decreasing risk for the energy developer, IESP, and others who have a stake in the long-term success of the district. A larger number of confirmed customers for the district heating and cooling system and on-site renew-able energy generation system will reduce the IESP’s risk, which enables it to reduce the cost of delivered energy services and/or decrease the period over which the system needs to be financed.
4040A GUIDE TO ENERGY MASTER PLANNING OF HIGH-PERFORMANCE DISTRICTS AND COMMUNITIES3: DevelOPing FinAnCiAl AnD bUSineSS mODelS
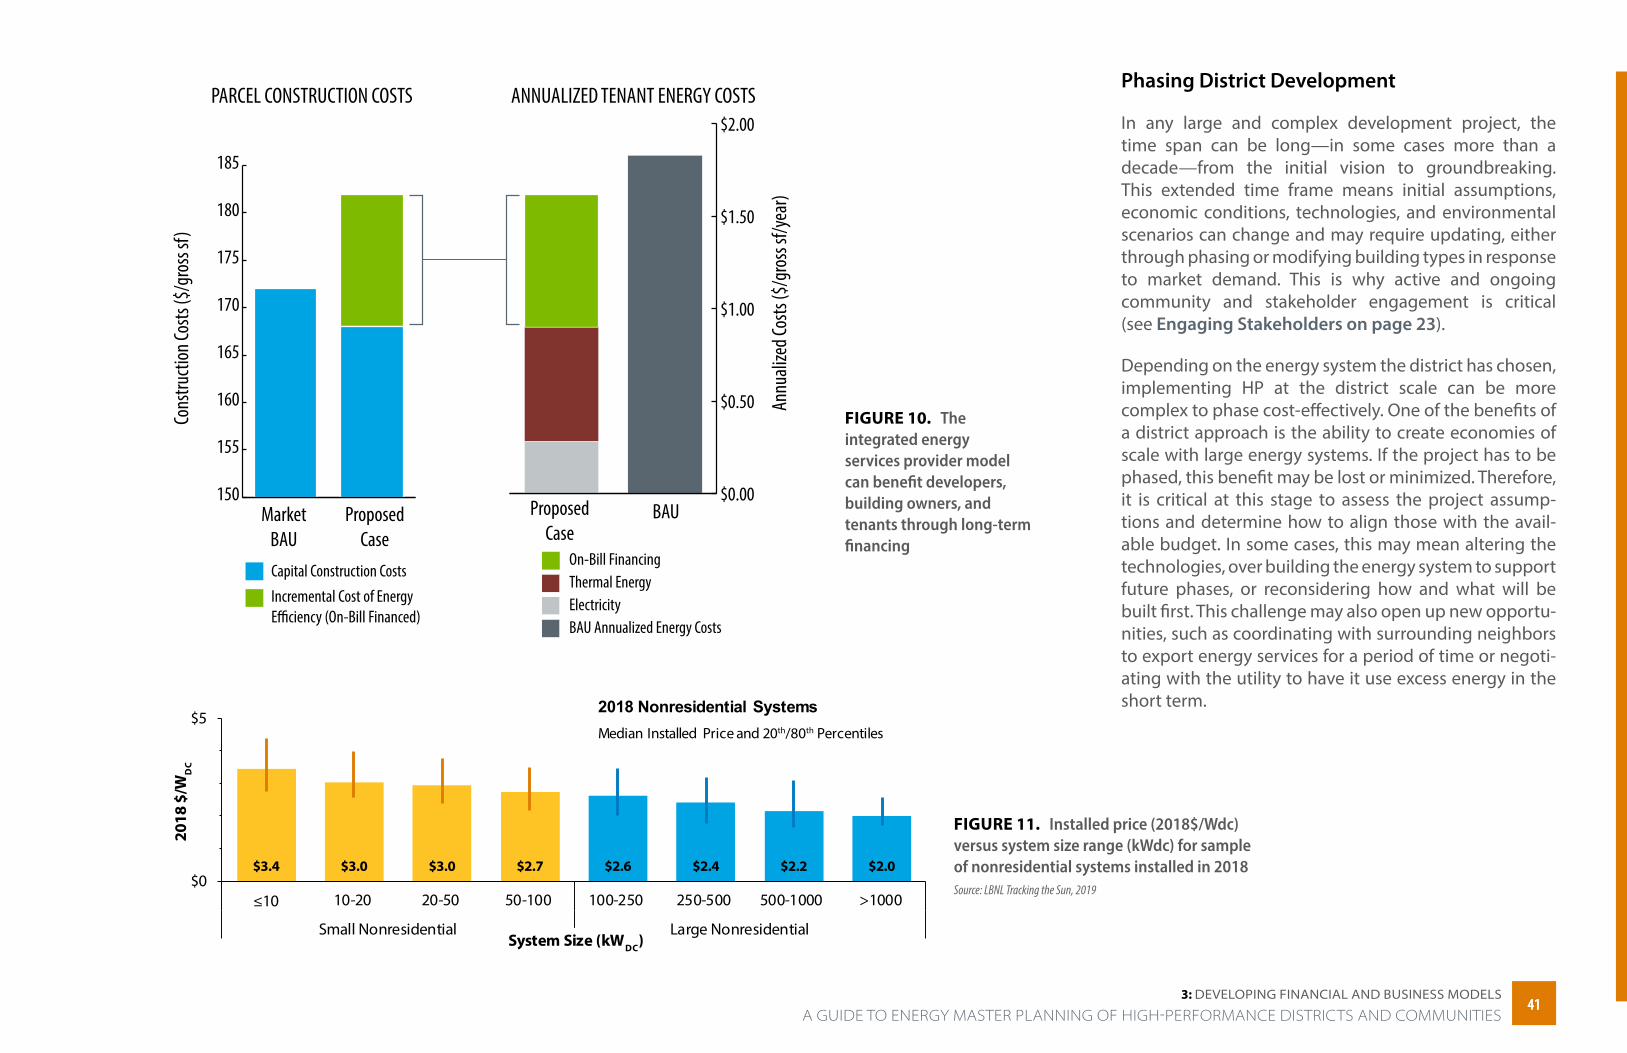
FIGURE 10. The integrated energy services provider model can benefit developers, building owners, and tenants through long-term financing
150
155
160
165
170
175
180
185
MarketBAU
ProposedCase
Cons
tructi
on Co
sts ($
/gro
ss sf)
Capital Construction CostsIncremental Cost of EnergyEfficiency (On-Bill Financed)
PARCEL CONSTRUCTION COSTS
$0.00
$0.50
$1.00
$1.50
$2.00
BAUProposedCase
ANNUALIZED TENANT ENERGY COSTS
Annu
alize
d Cos
ts ($
/gro
ss sf/
year
)
Electricity
On-Bill FinancingThermal Energy
BAU Annualized Energy Costs
Phasing District Development
In any large and complex development project, the time span can be long—in some cases more than a decade—from the initial vision to groundbreaking. This extended time frame means initial assumptions, economic conditions, technologies, and environmental scenarios can change and may require updating, either through phasing or modifying building types in response to market demand. This is why active and ongoing community and stakeholder engagement is critical (see Engaging Stakeholders on page 23).
Depending on the energy system the district has chosen, implementing HP at the district scale can be more complex to phase cost-effectively. One of the benefits of a district approach is the ability to create economies of scale with large energy systems. If the project has to be phased, this benefit may be lost or minimized. Therefore, it is critical at this stage to assess the project assump-tions and determine how to align those with the avail-able budget. In some cases, this may mean altering the technologies, over building the energy system to support future phases, or reconsidering how and what will be built first. This challenge may also open up new opportu-nities, such as coordinating with surrounding neighbors to export energy services for a period of time or negoti-ating with the utility to have it use excess energy in the short term.
FIGURE 11. Installed price (2018$/Wdc) versus system size range (kWdc) for sample of nonresidential systems installed in 2018 Source: LBNL Tracking the Sun, 2019
$3.4 $3.0 $3.0 $2.7 $2.6 $2.4 $2.2 $2.0$0
$5
10-20 20-50 50-100 100-250 250-500 500-1000
Small Nonresidential Large NonresidentialSystem Size (kWDC)
2018 Nonresidential SystemsMedian Installed Price and 20th/80th Percentiles
2018
$/W
DC
4141 A GUIDE TO ENERGY MASTER PLANNING OF HIGH-PERFORMANCE DISTRICTS AND COMMUNITIES
3: DevelOPing FinAnCiAl AnD bUSineSS mODelS

Some key considerations that should be evaluated when determining whether and how the project will be phased include:
• Technology innovations. Recognize that new technologies and equipment will continue to come to market and enable different savings and oppor-tunities. Use a plug and play approach as much as possible by designing the buildings with standard connections and limiting unique and specialized elements that could restrict future options.
• New projects and development. District energy must be designed to add to a backbone and phase investments in expensive infrastructure in line with buildings. Major up-front costs to build large systems can upend a project. At the same time, the inherent benefits of an HPD are to create a single synergistic energy system that serves many build-ings and shares costs among them. Questions to address include:
�What can/should be added at the beginning of a project and what should be added later?
�Can the up-front investment of energy systems be leveraged before all the buildings are completed? For example, can a large solar array or ground source heat pump system serve the surrounding neighborhood? Will the utility purchase excess power?
�Will the lack of investment early likely result in no investment and a return to business as usual?
• Existing projects.12 Leverage trigger points to transition existing buildings to HP by developing protocols for buildings undergoing major renova-tions or sale. In addition, oversize renewable energy and storage systems on adjacent new buildings and on the site to help offset energy use in older
12 rmi.org/insight/zero-over-time-for-building-portfolios 13 A Guide to Zero Energy and Zero Energy Ready K–12 Schools, www.nrel.gov/docs/fy19osti/72847.pdf
buildings, particularly those that are historic or difficult and expensive to retrofit.
• Energy modeling. Maintain/develop a usable energy model, ideally available to help run scenarios over time to assess new technology options, account for future technical improvements, and address new demands.
• Build in flexibility. Build flexibility into the planning and financing model to enable adaptation and evolution of the energy system and assumptions over time.
• Develop performance goals. Ensure that there are specific energy and sustainability performance goals that allow a future developer to be innova-tive and achieve goals in different ways depending on market, technologies, and current needs. These performance goals may be different from vision and project goals that are more aspirational in nature.
It is important to note that private real estate owners and developers often do not own the property for its entire life cycle, so reducing life cycle costs may not be a motivator for them. Rather, they expect to see finan-cial returns within their ownership period; operating and energy costs over the life of the district don’t figure into the calculus.
There are exceptions to this rule, however, notably government- or other nonprofit-led projects. For example, reduced life cycle costs can be very attrac-tive to cash-strapped school districts. A district’s energy costs are usually its largest expense after salaries, and the money saved by reducing energy use can be used to support educational programs.13 Brownfield devel-opments such as Hazelwood Green in Pittsburgh, Pennsylvania, provide other examples.
4242A GUIDE TO ENERGY MASTER PLANNING OF HIGH-PERFORMANCE DISTRICTS AND COMMUNITIES3: DevelOPing FinAnCiAl AnD bUSineSS mODelS
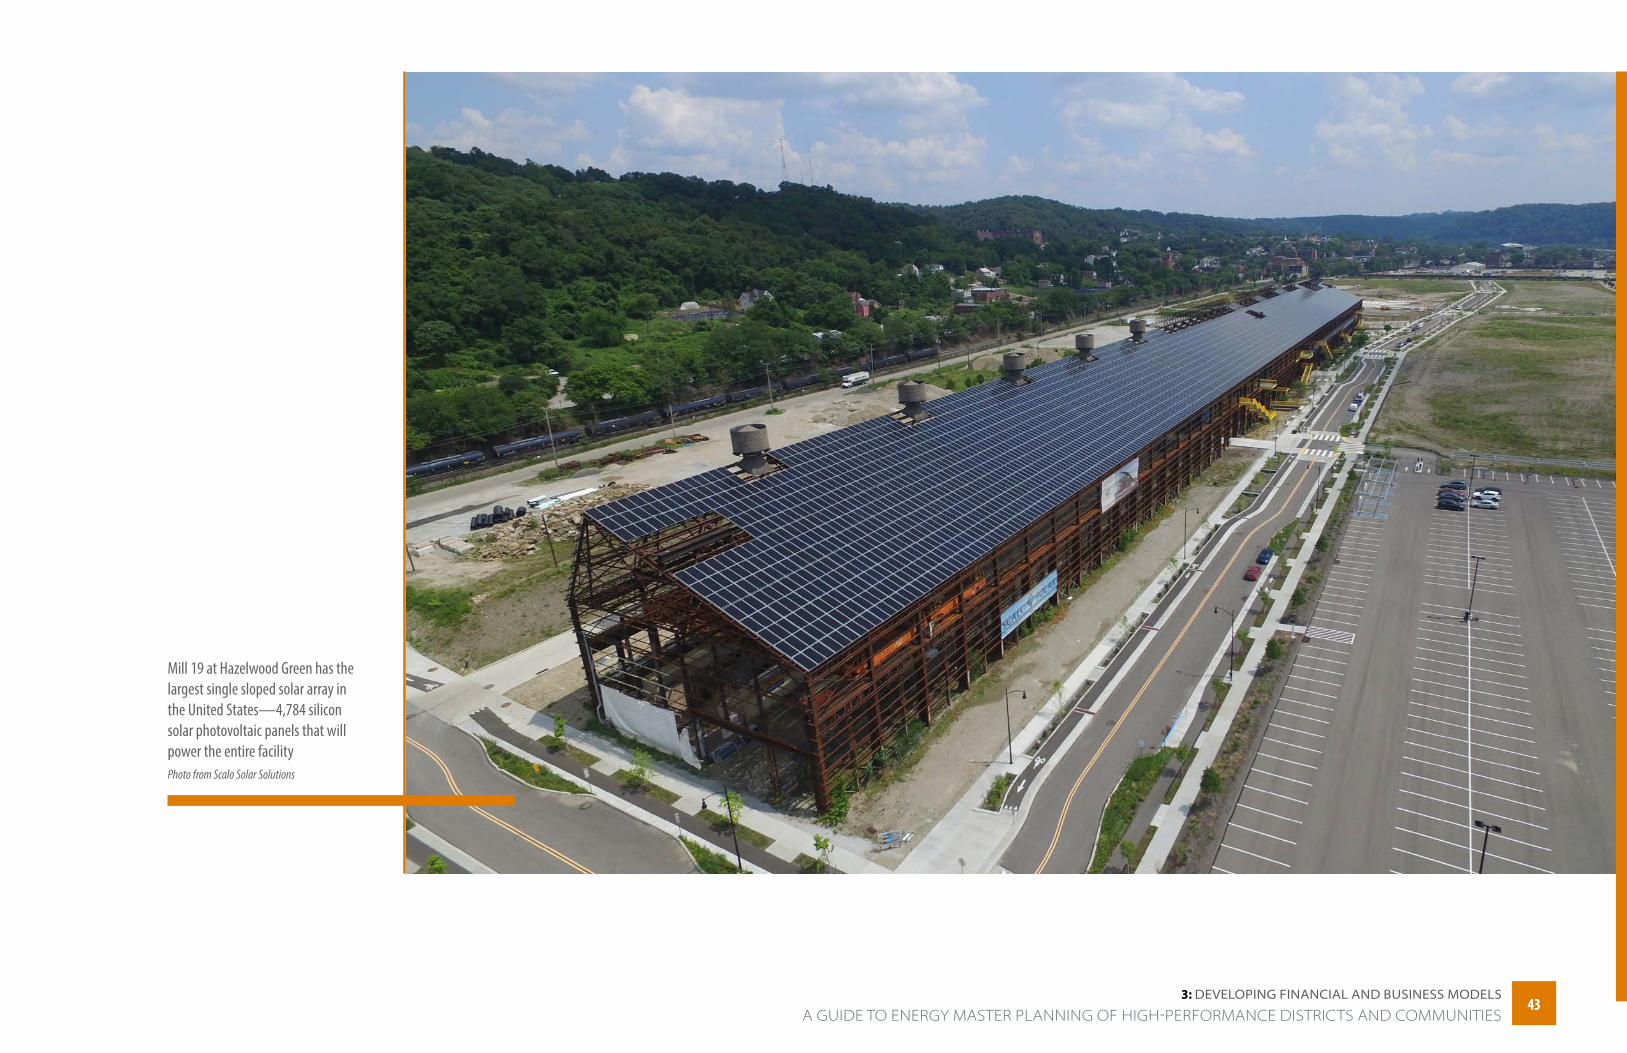
Mill 19 at Hazelwood Green has the largest single sloped solar array in the United States—4,784 silicon solar photovoltaic panels that will power the entire facilityPhoto from Scalo Solar Solutions
4343 A GUIDE TO ENERGY MASTER PLANNING OF HIGH-PERFORMANCE DISTRICTS AND COMMUNITIES
3: DevelOPing FinAnCiAl AnD bUSineSS mODelS
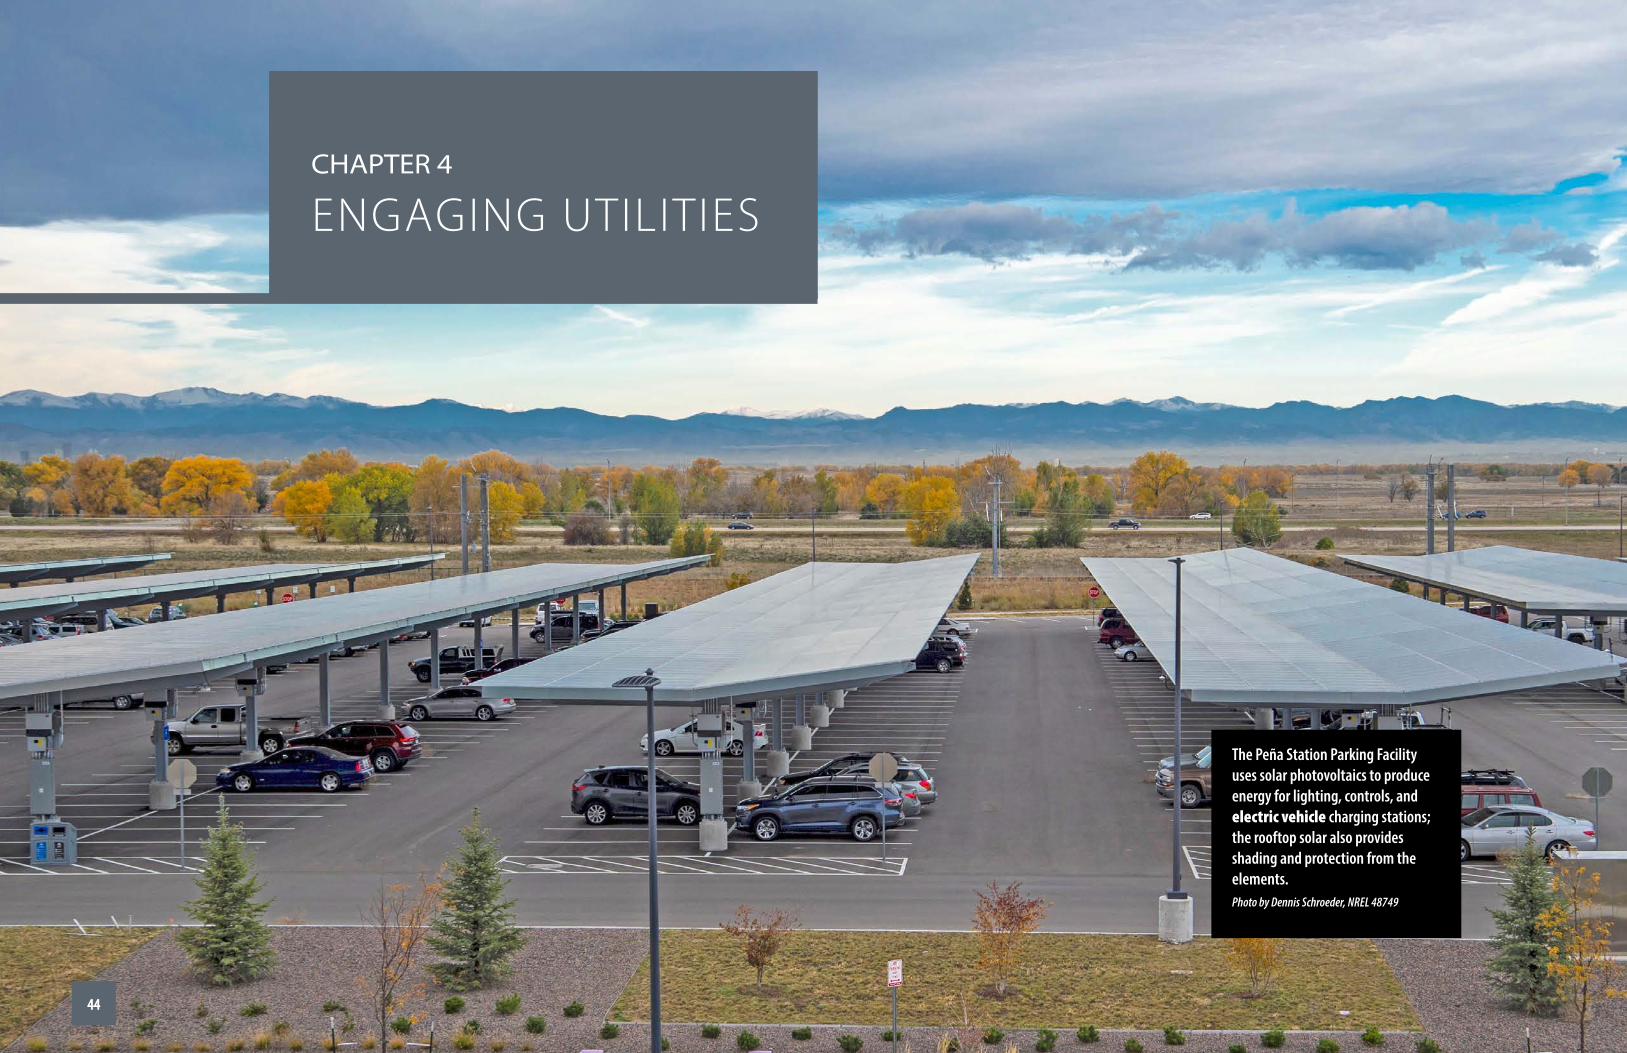
CHAPTer 4
ENGAGING UTILITIES
The Peña Station Parking Facility uses solar photovoltaics to produce energy for lighting, controls, and electric vehicle charging stations; the rooftop solar also provides shading and protection from the elements. Photo by Dennis Schroeder, NREL 48749
4444
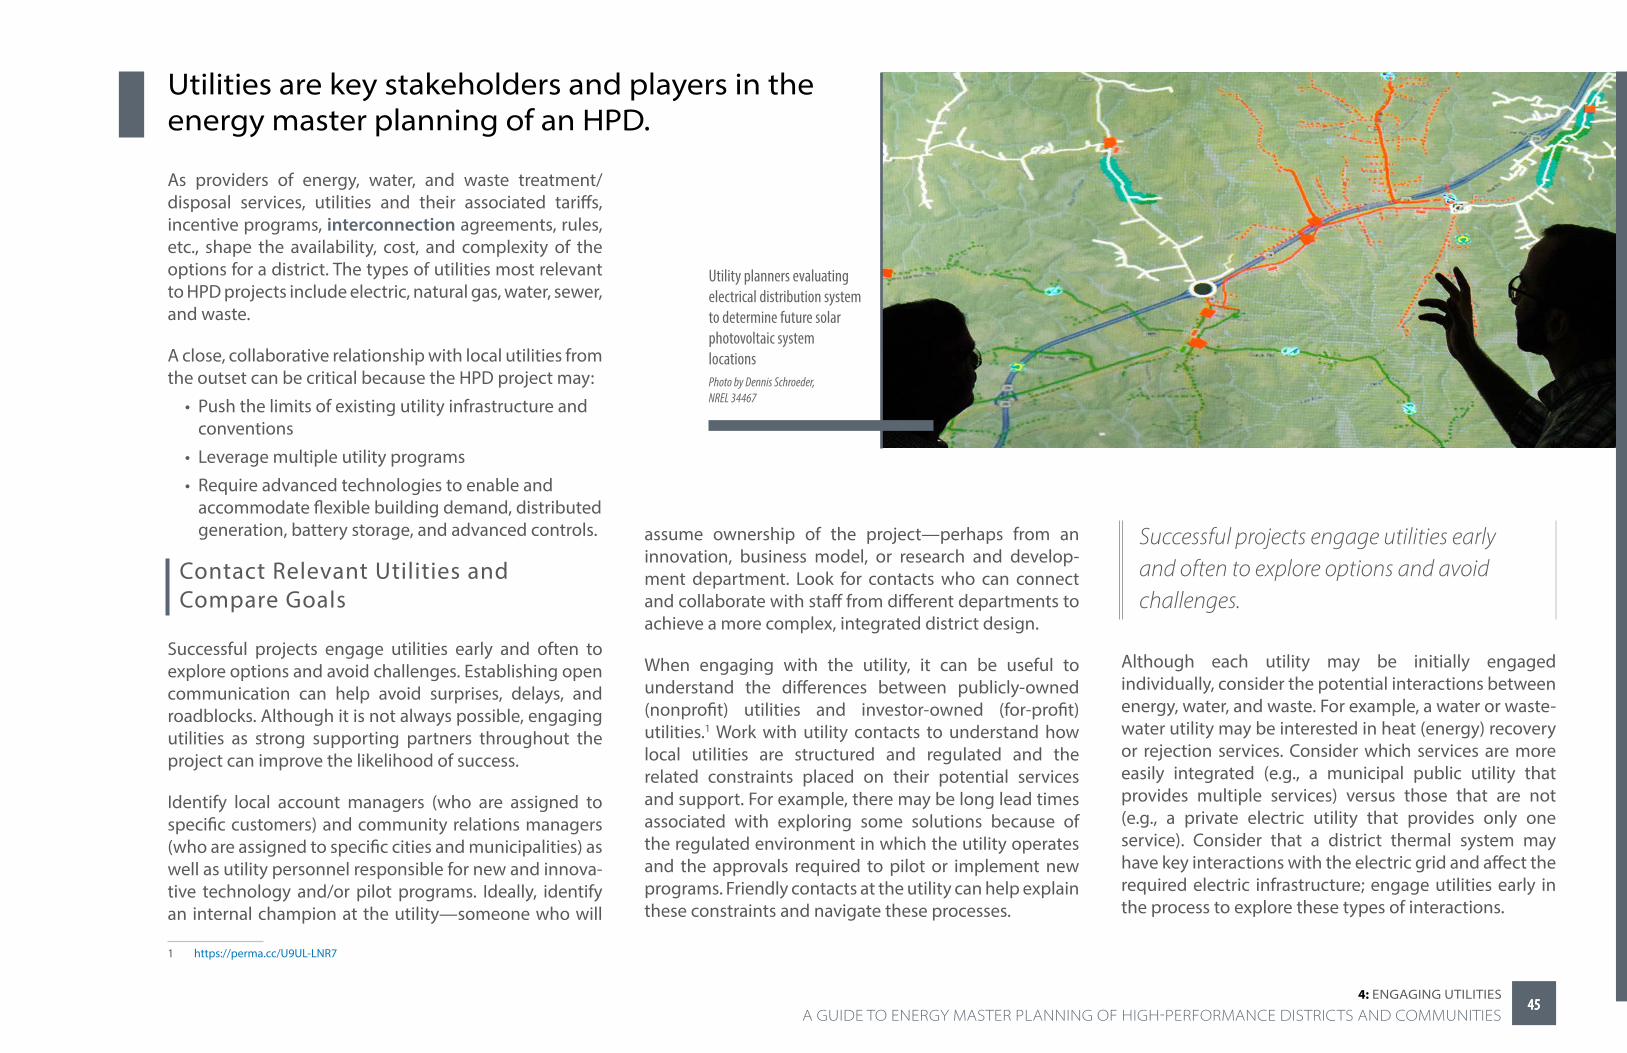
Utilities are key stakeholders and players in the energy master planning of an HPD.
As providers of energy, water, and waste treatment/disposal services, utilities and their associated tariffs, incentive programs, interconnection agreements, rules, etc., shape the availability, cost, and complexity of the options for a district. The types of utilities most relevant to HPD projects include electric, natural gas, water, sewer, and waste.
A close, collaborative relationship with local utilities from the outset can be critical because the HPD project may:
• Push the limits of existing utility infrastructure and conventions
• Leverage multiple utility programs
• Require advanced technologies to enable and accommodate flexible building demand, distributed generation, battery storage, and advanced controls.
Utility planners evaluating electrical distribution system to determine future solar photovoltaic system locations Photo by Dennis Schroeder, NREL 34467
Contact Relevant Utilities and Compare Goals
Successful projects engage utilities early and often to explore options and avoid challenges. Establishing open communication can help avoid surprises, delays, and roadblocks. Although it is not always possible, engaging utilities as strong supporting partners throughout the project can improve the likelihood of success.
Identify local account managers (who are assigned to specific customers) and community relations managers (who are assigned to specific cities and municipalities) as well as utility personnel responsible for new and innova-tive technology and/or pilot programs. Ideally, identify an internal champion at the utility—someone who will
1 https://perma.cc/U9UL-LNR7
assume ownership of the project—perhaps from an innovation, business model, or research and develop-ment department. Look for contacts who can connect and collaborate with staff from different departments to achieve a more complex, integrated district design.
When engaging with the utility, it can be useful to understand the differences between publicly-owned (nonprofit) utilities and investor-owned (for-profit) utilities.1 Work with utility contacts to understand how local utilities are structured and regulated and the related constraints placed on their potential services and support. For example, there may be long lead times associated with exploring some solutions because of the regulated environment in which the utility operates and the approvals required to pilot or implement new programs. Friendly contacts at the utility can help explain these constraints and navigate these processes.
Successful projects engage utilities early and often to explore options and avoid challenges.
Although each utility may be initially engaged individually, consider the potential interactions between energy, water, and waste. For example, a water or waste-water utility may be interested in heat (energy) recovery or rejection services. Consider which services are more easily integrated (e.g., a municipal public utility that provides multiple services) versus those that are not (e.g., a private electric utility that provides only one service). Consider that a district thermal system may have key interactions with the electric grid and affect the required electric infrastructure; engage utilities early in the process to explore these types of interactions.
4545 A GUIDE TO ENERGY MASTER PLANNING OF HIGH-PERFORMANCE DISTRICTS AND COMMUNITIES
4: engAging UTiliTieS

Consider working with other district-scale projects in your region to engage utilities on topics of shared interest.
Consider working with other district-scale projects in your region to engage utilities on topics of shared interest. One development project is likely small compared to the overall customer base of the utility, but when multiple projects request similar services, the utility can more easily justify devoting resources to engaging with the districts. For private developers, it may be possible to enlist local governments to help engage with utilities.
During the engagement process, it is important to assess how the HPD’s goals might align or conflict with utility goals, objectives, and business models. Key questions include:
• Does the utility have energy efficiency, renewable energy, and/or emissions goals/targets (e.g., those mandated by a renewable portfolio standard)?
• Does the utility have other initiatives and priorities that may align with the project, such as:
�Grid modernization and advanced metering infrastructure
�Equity and community integration
�Energy storage
�Electrification
�Wastewater heat recovery
�Peak load shaving.
• Does the utility have challenges that may be exacer-bated by the proposed project without proper
2 www.energy.gov/eere/articles/confronting-duck-curve-how-address-over-generation-solar-energy Ramp rate in this case refers to how quickly the grid net load changes. For example, when PV production decreases as the sun sets but building loads remain relatively constant or even increase due to late afternoon/early evening air-conditioning loads, this can result a relatively steep increase in the grid net load.
3 www.smartgrid.gov/recovery_act/time_based_rate_programs.html. Rates often also include fixed charges, which do not vary based on the volume or time of energy consumption.
considerations and design, such as:
�Ramp rate and peak period grid challenges2
�Local supply/capacity distribution constraints.
• Can the district project team work with the utility to lessen the impact of these challenges? Can they quantify the level of investment needed to alleviate these issues?
Understand Utility Rate and Metering Options
A key step to understanding potential energy costs is to gather information about applicable utility rates. Different utility rates may be applicable to different building types. For example, commercial buildings in a district may be subject to demand charges while residen-tial buildings may not. Are there “opt-in” or “pilot” rates that are not required but may be relevant and provide cost savings for efficient, low-peaking districts?
The total costs associated with the electrical energy consumption of buildings and other devices connected “behind the meter” within the district will depend on the rate structures of the local electric utility. In many cases, mass market customers such as residential and smaller commercial buildings are billed based on the total amount or volume of electricity they consume (e.g., kWh) during a monthly billing period.3 This is sometimes referred to as a “flat rate” or “flat volumetric rate.”
Most commercial buildings, however, are billed based on both the total amount of electricity they consume and the magnitude and/or timing of their peak power consumption events, often referred to as “peak demand.” Whereas total energy consumption is often expressed
Power lines in Denver, Colorado. Photo by Dennis Schroeder, NREL 18975
4646A GUIDE TO ENERGY MASTER PLANNING OF HIGH-PERFORMANCE DISTRICTS AND COMMUNITIES4: engAging UTiliTieS
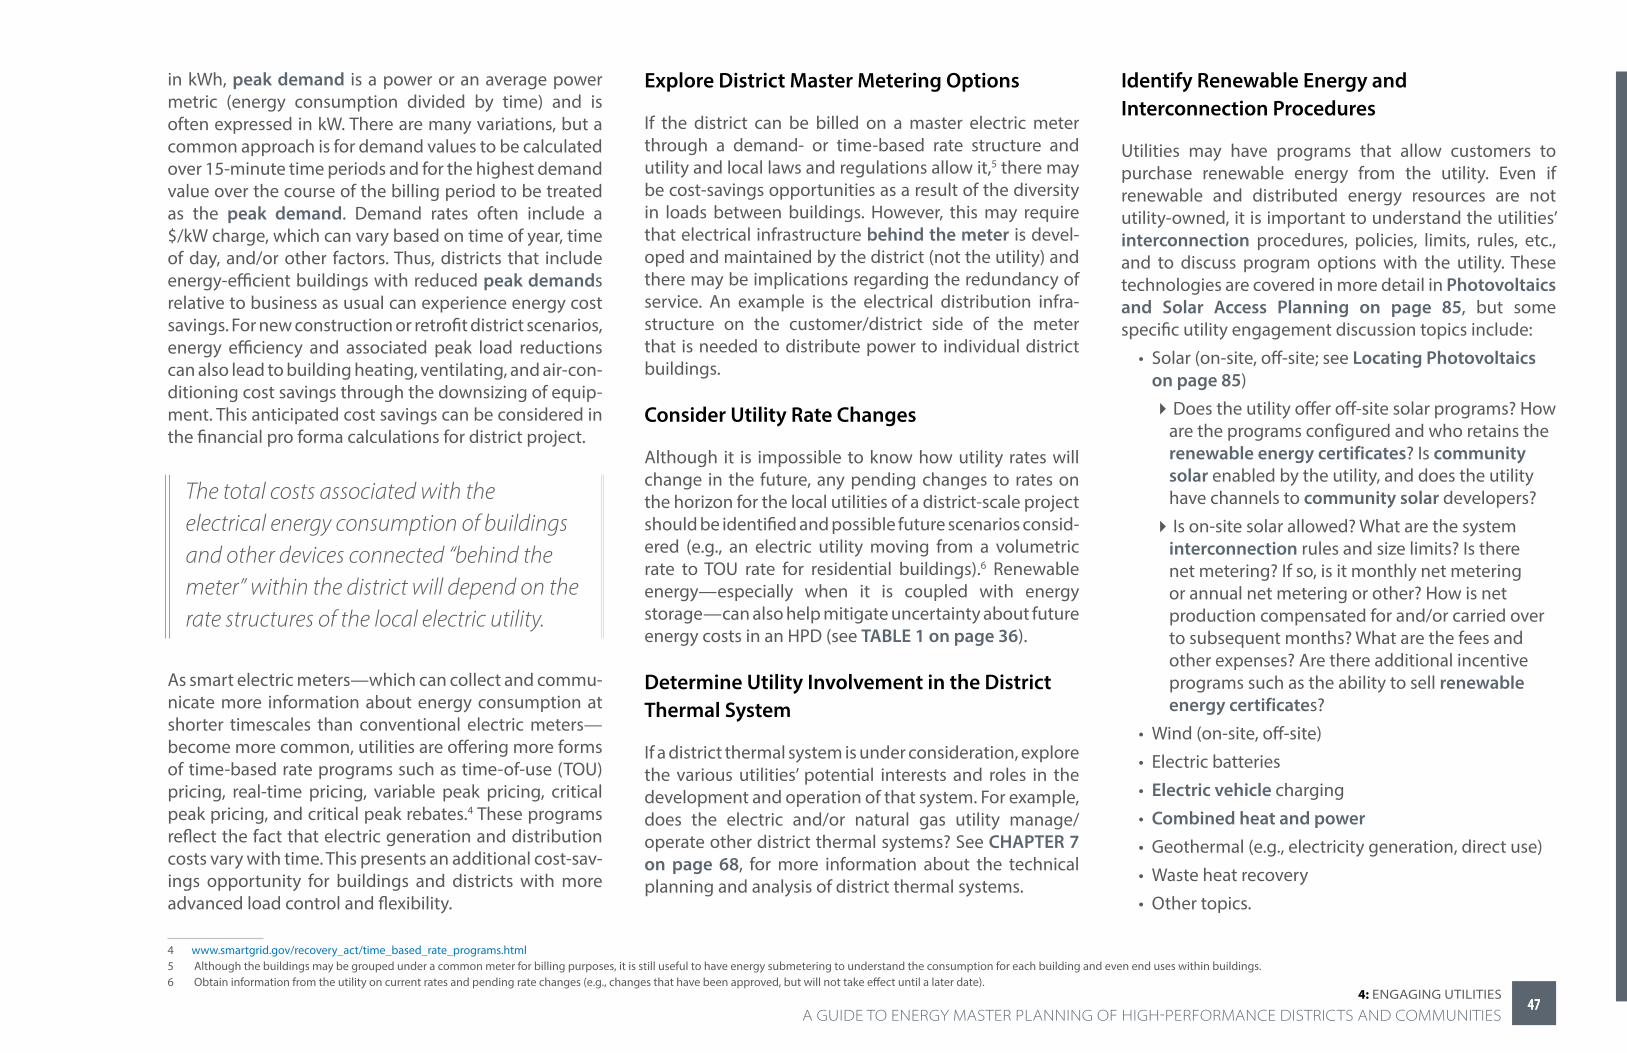
in kWh, peak demand is a power or an average power metric (energy consumption divided by time) and is often expressed in kW. There are many variations, but a common approach is for demand values to be calculated over 15-minute time periods and for the highest demand value over the course of the billing period to be treated as the peak demand. Demand rates often include a $/kW charge, which can vary based on time of year, time of day, and/or other factors. Thus, districts that include energy-efficient buildings with reduced peak demands relative to business as usual can experience energy cost savings. For new construction or retrofit district scenarios, energy efficiency and associated peak load reductions can also lead to building heating, ventilating, and air-con-ditioning cost savings through the downsizing of equip-ment. This anticipated cost savings can be considered in the financial pro forma calculations for district project.
The total costs associated with the electrical energy consumption of buildings and other devices connected “behind the meter” within the district will depend on the rate structures of the local electric utility.
As smart electric meters—which can collect and commu-nicate more information about energy consumption at shorter timescales than conventional electric meters—become more common, utilities are offering more forms of time-based rate programs such as time-of-use (TOU) pricing, real-time pricing, variable peak pricing, critical peak pricing, and critical peak rebates.4 These programs reflect the fact that electric generation and distribution costs vary with time. This presents an additional cost-sav-ings opportunity for buildings and districts with more advanced load control and flexibility.
4 www.smartgrid.gov/recovery_act/time_based_rate_programs.html 5 Although the buildings may be grouped under a common meter for billing purposes, it is still useful to have energy submetering to understand the consumption for each building and even end uses within buildings.6 Obtain information from the utility on current rates and pending rate changes (e.g., changes that have been approved, but will not take effect until a later date).
Explore District Master Metering Options
If the district can be billed on a master electric meter through a demand- or time-based rate structure and utility and local laws and regulations allow it,5 there may be cost-savings opportunities as a result of the diversity in loads between buildings. However, this may require that electrical infrastructure behind the meter is devel-oped and maintained by the district (not the utility) and there may be implications regarding the redundancy of service. An example is the electrical distribution infra-structure on the customer/district side of the meter that is needed to distribute power to individual district buildings.
Consider Utility Rate Changes
Although it is impossible to know how utility rates will change in the future, any pending changes to rates on the horizon for the local utilities of a district-scale project should be identified and possible future scenarios consid-ered (e.g., an electric utility moving from a volumetric rate to TOU rate for residential buildings).6 Renewable energy—especially when it is coupled with energy storage—can also help mitigate uncertainty about future energy costs in an HPD (see TABLE 1 on page 36).
Determine Utility Involvement in the District Thermal System
If a district thermal system is under consideration, explore the various utilities’ potential interests and roles in the development and operation of that system. For example, does the electric and/or natural gas utility manage/operate other district thermal systems? See CHAPTER 7 on page 68, for more information about the technical planning and analysis of district thermal systems.
Identify Renewable Energy and Interconnection Procedures
Utilities may have programs that allow customers to purchase renewable energy from the utility. Even if renewable and distributed energy resources are not utility-owned, it is important to understand the utilities’ interconnection procedures, policies, limits, rules, etc., and to discuss program options with the utility. These technologies are covered in more detail in Photovoltaics and Solar Access Planning on page 85, but some specific utility engagement discussion topics include:
• Solar (on-site, off-site; see Locating Photovoltaics on page 85)
�Does the utility offer off-site solar programs? How are the programs configured and who retains the renewable energy certificates? Is community solar enabled by the utility, and does the utility have channels to community solar developers?
�Is on-site solar allowed? What are the system interconnection rules and size limits? Is there net metering? If so, is it monthly net metering or annual net metering or other? How is net production compensated for and/or carried over to subsequent months? What are the fees and other expenses? Are there additional incentive programs such as the ability to sell renewable energy certificates?
• Wind (on-site, off-site)
• Electric batteries
• Electric vehicle charging
• Combined heat and power• Geothermal (e.g., electricity generation, direct use)
• Waste heat recovery
• Other topics.
4747 A GUIDE TO ENERGY MASTER PLANNING OF HIGH-PERFORMANCE DISTRICTS AND COMMUNITIES
4: engAging UTiliTieS

It may be advisable to have a renewable energy procure-ment specialist on the owner/developer team. Utilities may be limited as to what renewable energy options they can present and discuss.
Identify Utility Programs
In 2017, electric and natural gas utilities in the United States and Canada spent close to $9 billion on demand-side management, which includes energy efficiency and demand response programs.7 Identify the demand-side management programs offered by the local utilities, regional transmission organizations, and/or indepen-dent system operators of your district project to ensure all cost savings incentives and rebates are considered. These programs can cover the following sectors8:
7 library.cee1.org/system/files/library/13981/CEE_2018_AnnualIndustryReport.pdf 8 A detailed list of program types is in the appendices of library.cee1.org/system/files/library/13981/CEE_2018_AnnualIndustryReport.pdf
• Commercial
• Residential
• Low-income
• Industrial
• Cross-sector
• Others.
For example, some utilities offer new construction programs that incentivize buildings more energy-ef-ficient than current code or that meet a certification program’s criteria (see Goal Setting Decision Analysis on page 59 for examples of certifications). Some offer demand response programs to incentivize reduc-tions in load during peak periods (e.g., using technol-ogies such as ice storage for cooling—see Example
Analysis: Building and District Scale Grid Interactivity on page 102). With all types of utility demand-side management programs, work with utility contacts to understand the timing of the district build-out relative to the utility’s planning horizon. For example, utility planning is often on 1- to 4-year cycles, while the development project may be on a much longer timeline.
Utility-scale wind turbines at the Cedar Creek Wind Farm in Grover, Colorado Photo by Dennis Schroeder, NREL 31194
4848A GUIDE TO ENERGY MASTER PLANNING OF HIGH-PERFORMANCE DISTRICTS AND COMMUNITIES4: engAging UTiliTieS
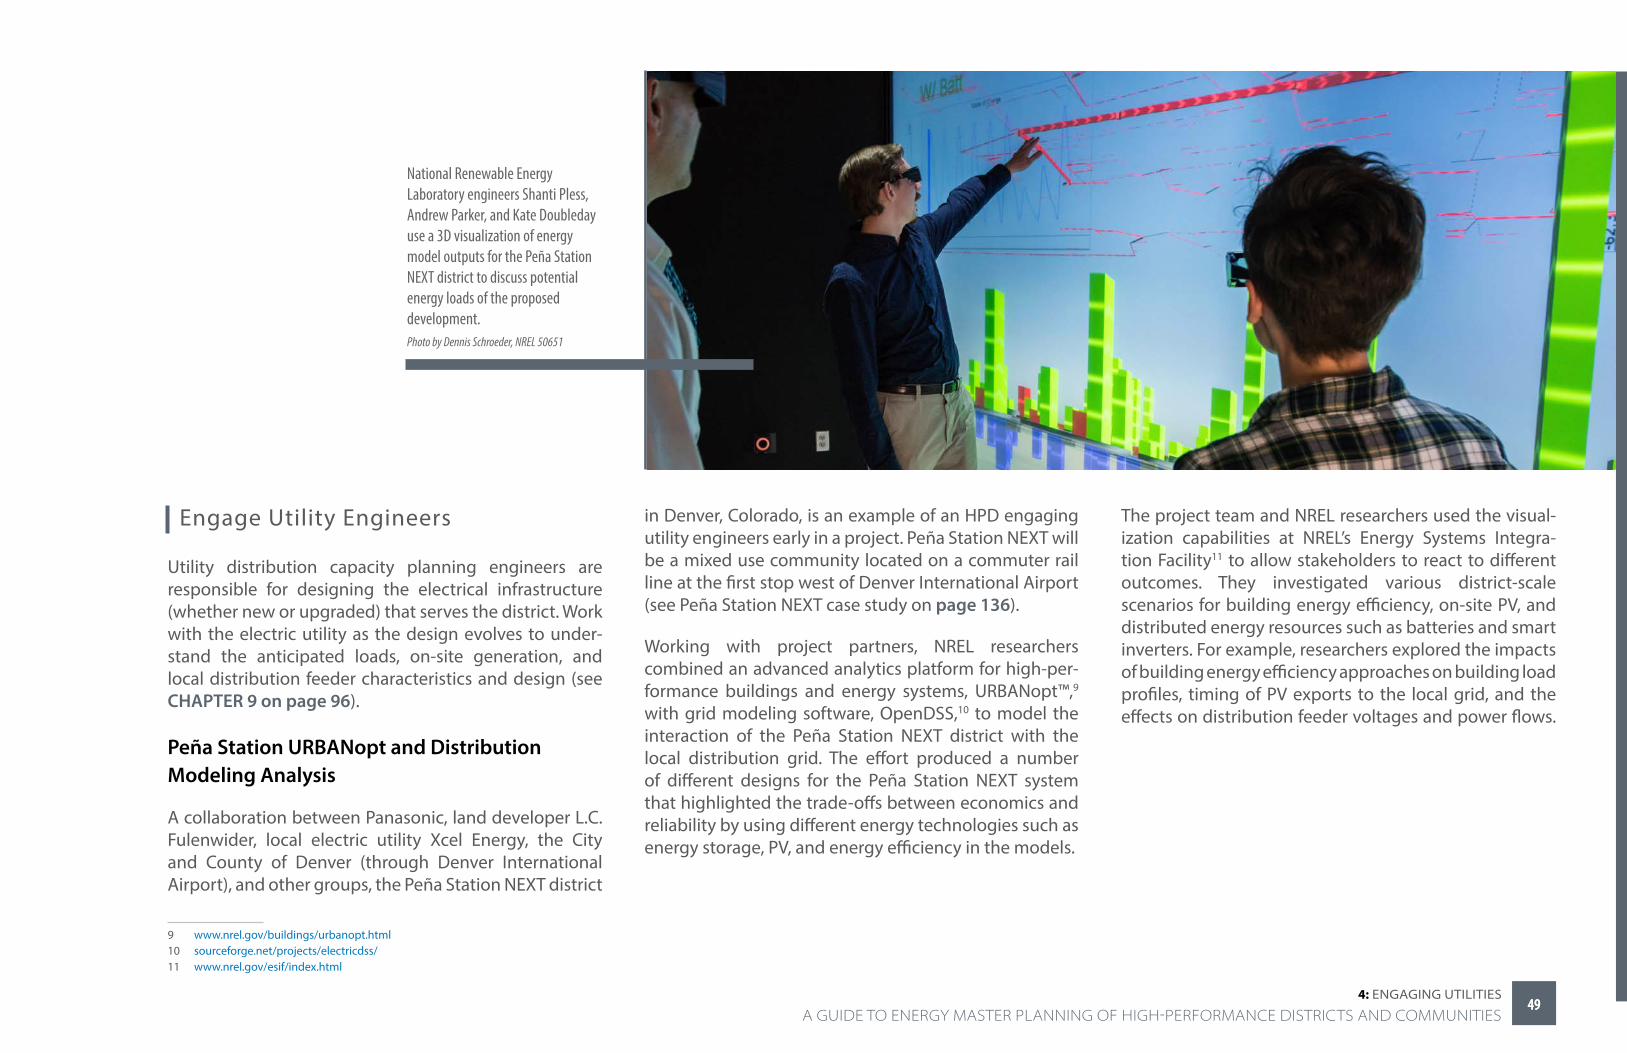
Engage Utility Engineers
Utility distribution capacity planning engineers are responsible for designing the electrical infrastructure (whether new or upgraded) that serves the district. Work with the electric utility as the design evolves to under-stand the anticipated loads, on-site generation, and local distribution feeder characteristics and design (see CHAPTER 9 on page 96).
Peña Station URBANopt and Distribution Modeling Analysis
A collaboration between Panasonic, land developer L.C. Fulenwider, local electric utility Xcel Energy, the City and County of Denver (through Denver International Airport), and other groups, the Peña Station NEXT district
9 www.nrel.gov/buildings/urbanopt.html 10 sourceforge.net/projects/electricdss/ 11 www.nrel.gov/esif/index.html
in Denver, Colorado, is an example of an HPD engaging utility engineers early in a project. Peña Station NEXT will be a mixed use community located on a commuter rail line at the first stop west of Denver International Airport (see Peña Station NEXT case study on page 136).
Working with project partners, NREL researchers combined an advanced analytics platform for high-per-formance buildings and energy systems, URBANopt™,9 with grid modeling software, OpenDSS,10 to model the interaction of the Peña Station NEXT district with the local distribution grid. The effort produced a number of different designs for the Peña Station NEXT system that highlighted the trade-offs between economics and reliability by using different energy technologies such as energy storage, PV, and energy efficiency in the models.
The project team and NREL researchers used the visual-ization capabilities at NREL’s Energy Systems Integra-tion Facility11 to allow stakeholders to react to different outcomes. They investigated various district-scale scenarios for building energy efficiency, on-site PV, and distributed energy resources such as batteries and smart inverters. For example, researchers explored the impacts of building energy efficiency approaches on building load profiles, timing of PV exports to the local grid, and the effects on distribution feeder voltages and power flows.
National Renewable Energy Laboratory engineers Shanti Pless, Andrew Parker, and Kate Doubleday use a 3D visualization of energy model outputs for the Peña Station NEXT district to discuss potential energy loads of the proposed development. Photo by Dennis Schroeder, NREL 50651
4949 A GUIDE TO ENERGY MASTER PLANNING OF HIGH-PERFORMANCE DISTRICTS AND COMMUNITIES
4: engAging UTiliTieS
Explore New Technologies, Programs, and Business Models
HPDs often push the limits of utility technologies, demand-side management programs, and business models. With a strong utility partnership, this challenge can become an opportunity to participate in utility pilot programs. Key questions include:
• What partnership opportunities are there?
• How can the partnership deliver value to the district and the utility?
• What is the utility interested in piloting?
• Are there opportunities for the utility to explore new business models?
• How much lead time is required to get a pilot in place, given the constraints and regulatory environ-ment in which the utility operates?
National Western Center and Xcel Energy Partner in Energy Program
The National Western Center project in Denver, Colorado, (see case study on page 134) is another example of successful utility engagement strategies. The National Western Center project team engaged contacts from Xcel Energy—the local gas and electric utility—early on in the planning process, including the local account manager, the community relations manager for the City and County of Denver, and innovation and product development staff.
One key point of engagement was through Xcel’s Partners in Energy program.12 This was initiated and formalized when Xcel Energy and the City and County of Denver
12 www.xcelenergy.com/working_with_us/municipalities/partners_in_energy 13 nationalwesterncenter.com/wp-content/uploads/2017/11/NWC-Energy-Action-Plan.pdf14 nationalwesterncenter.com/wp-content/uploads/2018/04/Xcel-National-Western-Center-letter-04232018.pdf15 nationalwesterncenter.com/denver-city-council-approves-agreement-to-improve-environmental-conditions-provide-odor-control-at-national-western-center/
signed a memorandum of understanding that defined each entity’s role and the deliverables of the agreement. Partners in Energy is a facilitated planning process that occurs over 6 months and results in an Energy Action Plan Technical Advisory Report13 and then follow-on implementation support from the utility.
The development of the Energy Action Plan for the National Western Center involved several planning workshops, data collection, and modeling and analysis. A diverse group, comprising project staff and stakeholders, were involved in the process, which also included local energy advisors such as Metro Wastewater Reclamation District, Colorado State University, and NREL. The plan analyzed the projected energy, carbon, and economic differences for three different scenarios:
• A baseline LEED Gold v4 scenario
• A ZE but not carbon neutral scenario
• A ZE and carbon neutral scenario.
One of the key findings was that sewer heat recovery from sewer lines running through the National Western Center district could support more than half of campus energy needs based on information at the time, and that sewer heat recovery was a crucial strategy for pursuing a cost-effective ZE district. Partners in Energy also helped identify relevant Xcel incentive programs and factor those incentives into the cost analysis of different scenarios. Xcel Energy further defined and committed to their support in a letter14 to the National Western Center.
Following the Partners in Energy study, the National Western Center has worked closely with the Metro Waste-water Reclamation District to assess the feasibility of sewer heat recovery. The City and County of Denver and
Metro Wastewater Reclamation District formalized their commitments through an intergovernmental agree-ment15 to relocate and bury the lines, improving public access to the nearby South Platte River; make the waste-water accessible to a heat recovery system; and mitigate odors from the sewer line through a new biofilter.
5050A GUIDE TO ENERGY MASTER PLANNING OF HIGH-PERFORMANCE DISTRICTS AND COMMUNITIES4: engAging UTiliTieS
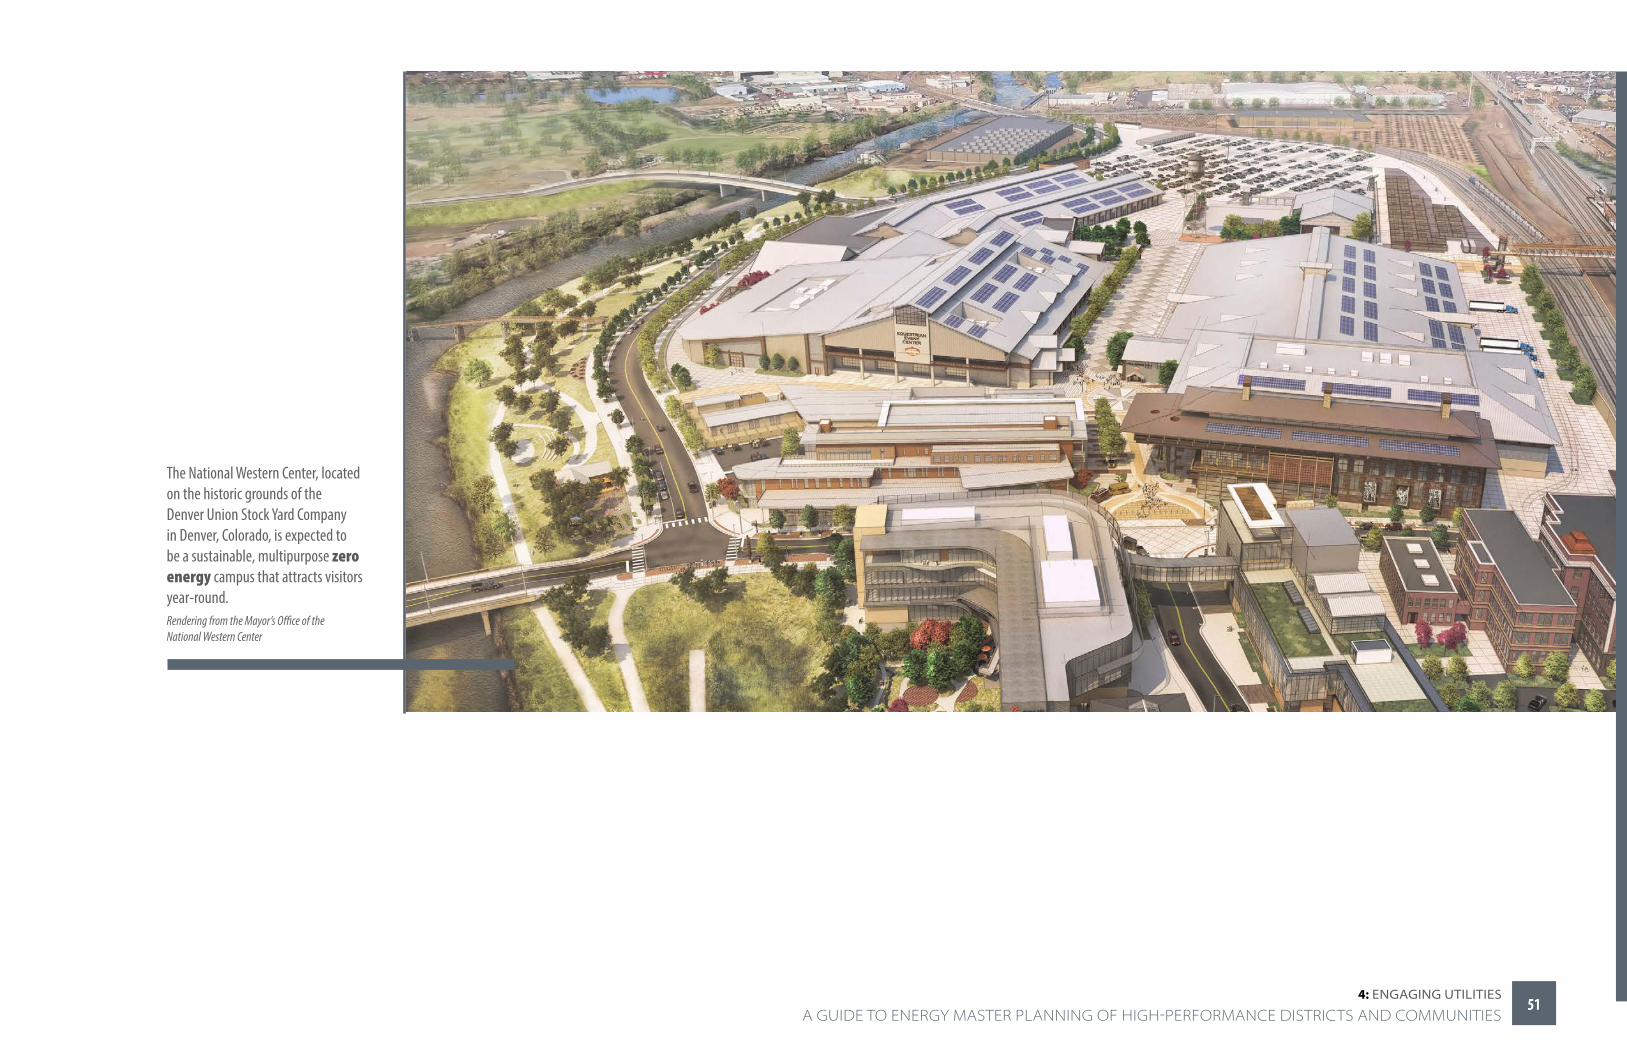
The National Western Center, located on the historic grounds of the Denver Union Stock Yard Company in Denver, Colorado, is expected to be a sustainable, multipurpose zero energy campus that attracts visitors year-round. Rendering from the Mayor’s Office of the National Western Center
5151 A GUIDE TO ENERGY MASTER PLANNING OF HIGH-PERFORMANCE DISTRICTS AND COMMUNITIES
4: engAging UTiliTieS

CHAPTer 5
DEVELOPING AN ENERGY MASTER PLAN
The control room at Stanford University’s Central Energy Facility.Photo from Linda Cicero
5252
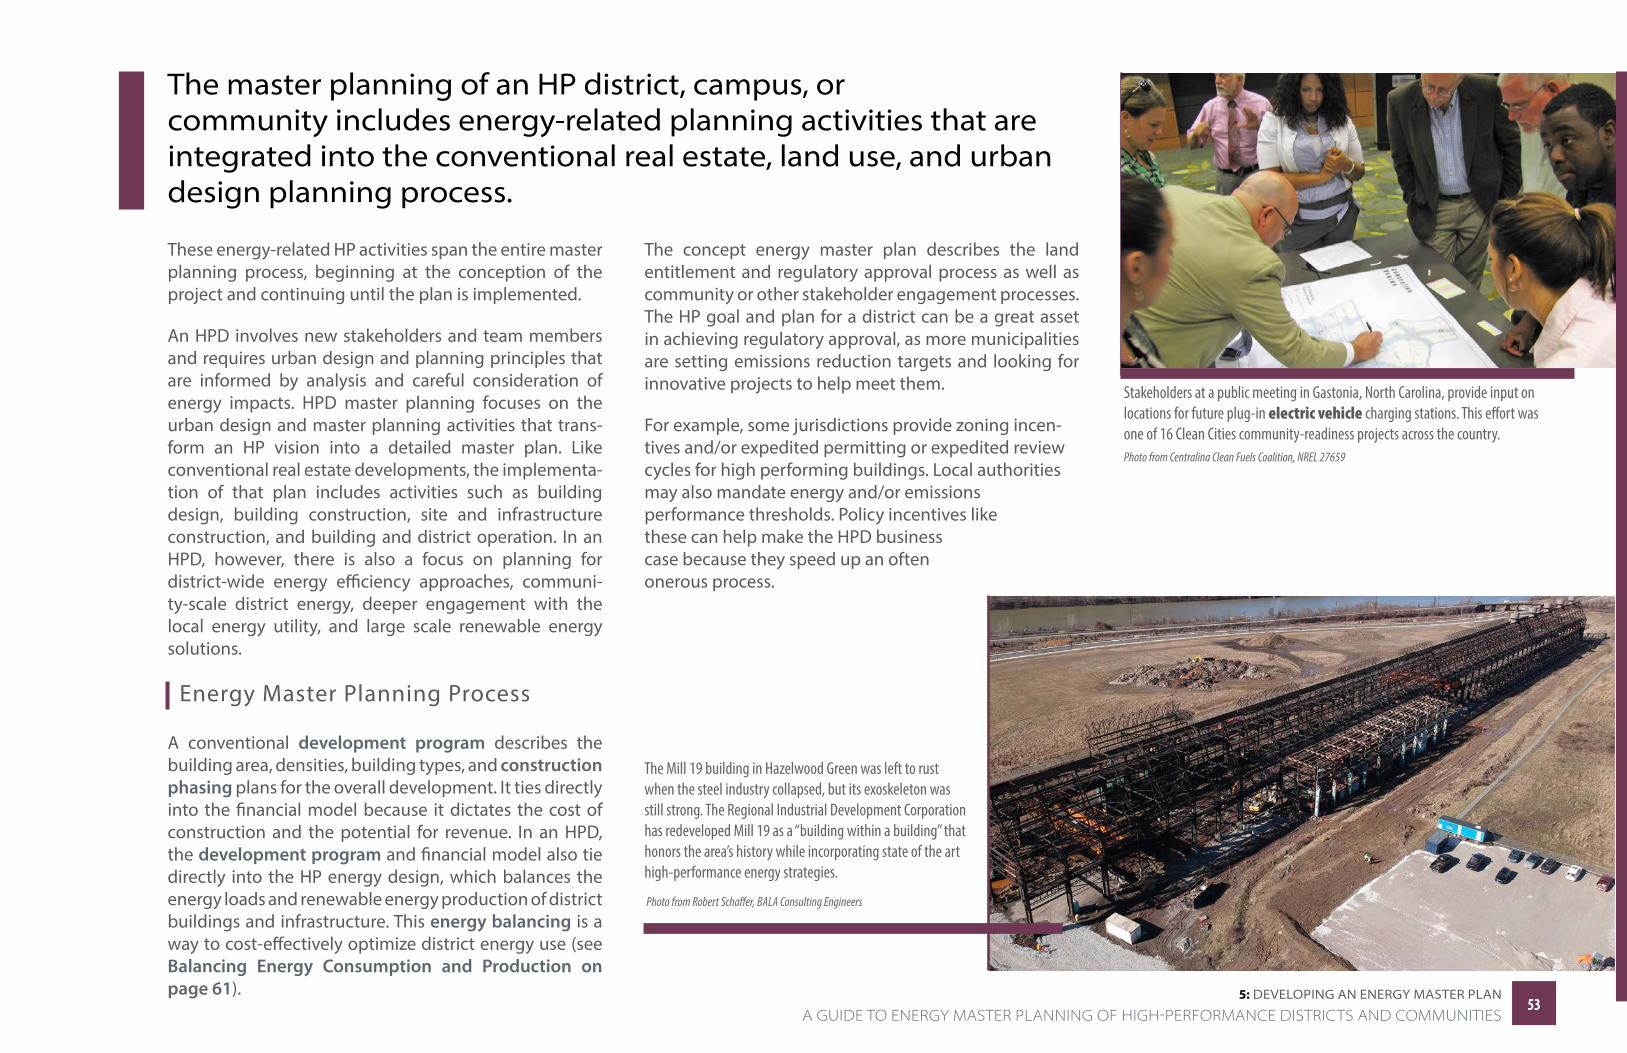
5: DevelOPing An energy mASTer PlAn
The master planning of an HP district, campus, or community includes energy-related planning activities that are integrated into the conventional real estate, land use, and urban design planning process.
These energy-related HP activities span the entire master planning process, beginning at the conception of the project and continuing until the plan is implemented.
An HPD involves new stakeholders and team members and requires urban design and planning principles that are informed by analysis and careful consideration of energy impacts. HPD master planning focuses on the urban design and master planning activities that trans-form an HP vision into a detailed master plan. Like conventional real estate developments, the implementa-tion of that plan includes activities such as building design, building construction, site and infrastructure construction, and building and district operation. In an HPD, however, there is also a focus on planning for district-wide energy efficiency approaches, communi-ty-scale district energy, deeper engagement with the local energy utility, and large scale renewable energy solutions.
Energy Master Planning Process
A conventional development program describes the building area, densities, building types, and construction phasing plans for the overall development. It ties directly into the financial model because it dictates the cost of construction and the potential for revenue. In an HPD, the development program and financial model also tie directly into the HP energy design, which balances the energy loads and renewable energy production of district buildings and infrastructure. This energy balancing is a way to cost-effectively optimize district energy use (see Balancing Energy Consumption and Production on page 61).
The concept energy master plan describes the land entitlement and regulatory approval process as well as community or other stakeholder engagement processes. The HP goal and plan for a district can be a great asset in achieving regulatory approval, as more municipalities are setting emissions reduction targets and looking for innovative projects to help meet them.
For example, some jurisdictions provide zoning incen-tives and/or expedited permitting or expedited review cycles for high performing buildings. Local authorities may also mandate energy and/or emissions performance thresholds. Policy incentives like these can help make the HPD business case because they speed up an often onerous process.
The Mill 19 building in Hazelwood Green was left to rust when the steel industry collapsed, but its exoskeleton was still strong. The Regional Industrial Development Corporation has redeveloped Mill 19 as a “building within a building” that honors the area’s history while incorporating state of the art high-performance energy strategies.
Photo from Robert Schaffer, BALA Consulting Engineers
Stakeholders at a public meeting in Gastonia, North Carolina, provide input on locations for future plug-in electric vehicle charging stations. This effort was one of 16 Clean Cities community-readiness projects across the country. Photo from Centralina Clean Fuels Coalition, NREL 27659
A GUIDE TO ENERGY MASTER PLANNING OF HIGH-PERFORMANCE DISTRICTS AND COMMUNITIES5353
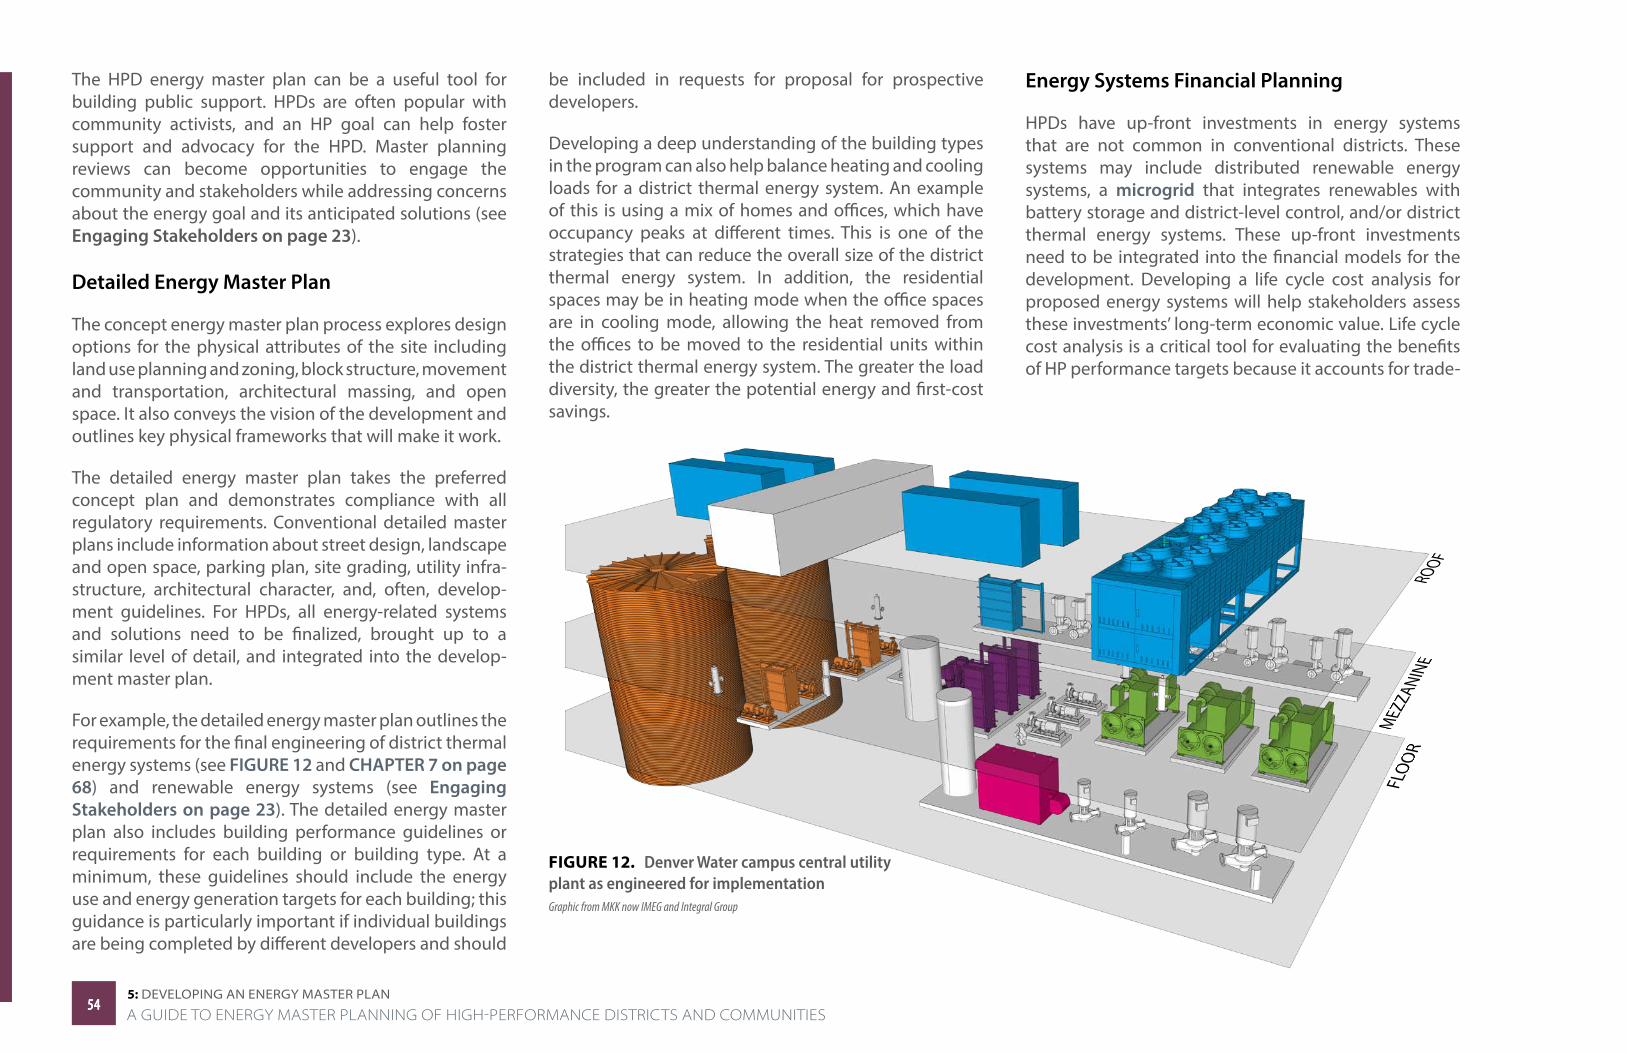
5: DevelOPing An energy mASTer PlAn
The HPD energy master plan can be a useful tool for building public support. HPDs are often popular with community activists, and an HP goal can help foster support and advocacy for the HPD. Master planning reviews can become opportunities to engage the community and stakeholders while addressing concerns about the energy goal and its anticipated solutions (see Engaging Stakeholders on page 23).
Detailed Energy Master Plan
The concept energy master plan process explores design options for the physical attributes of the site including land use planning and zoning, block structure, movement and transportation, architectural massing, and open space. It also conveys the vision of the development and outlines key physical frameworks that will make it work.
The detailed energy master plan takes the preferred concept plan and demonstrates compliance with all regulatory requirements. Conventional detailed master plans include information about street design, landscape and open space, parking plan, site grading, utility infra-structure, architectural character, and, often, develop-ment guidelines. For HPDs, all energy-related systems and solutions need to be finalized, brought up to a similar level of detail, and integrated into the develop-ment master plan.
For example, the detailed energy master plan outlines the requirements for the final engineering of district thermal energy systems (see FIGURE 12 and CHAPTER 7 on page 68) and renewable energy systems (see Engaging Stakeholders on page 23). The detailed energy master plan also includes building performance guidelines or requirements for each building or building type. At a minimum, these guidelines should include the energy use and energy generation targets for each building; this guidance is particularly important if individual buildings are being completed by different developers and should
be included in requests for proposal for prospective developers.
Developing a deep understanding of the building types in the program can also help balance heating and cooling loads for a district thermal energy system. An example of this is using a mix of homes and offices, which have occupancy peaks at different times. This is one of the strategies that can reduce the overall size of the district thermal energy system. In addition, the residential spaces may be in heating mode when the office spaces are in cooling mode, allowing the heat removed from the offices to be moved to the residential units within the district thermal energy system. The greater the load diversity, the greater the potential energy and first-cost savings.
FIGURE 12. Denver Water campus central utility plant as engineered for implementation Graphic from MKK now IMEG and Integral Group
Energy Systems Financial Planning
HPDs have up-front investments in energy systems that are not common in conventional districts. These systems may include distributed renewable energy systems, a microgrid that integrates renewables with battery storage and district-level control, and/or district thermal energy systems. These up-front investments need to be integrated into the financial models for the development. Developing a life cycle cost analysis for proposed energy systems will help stakeholders assess these investments’ long-term economic value. Life cycle cost analysis is a critical tool for evaluating the benefits of HP performance targets because it accounts for trade-
5454A GUIDE TO ENERGY MASTER PLANNING OF HIGH-PERFORMANCE DISTRICTS AND COMMUNITIES
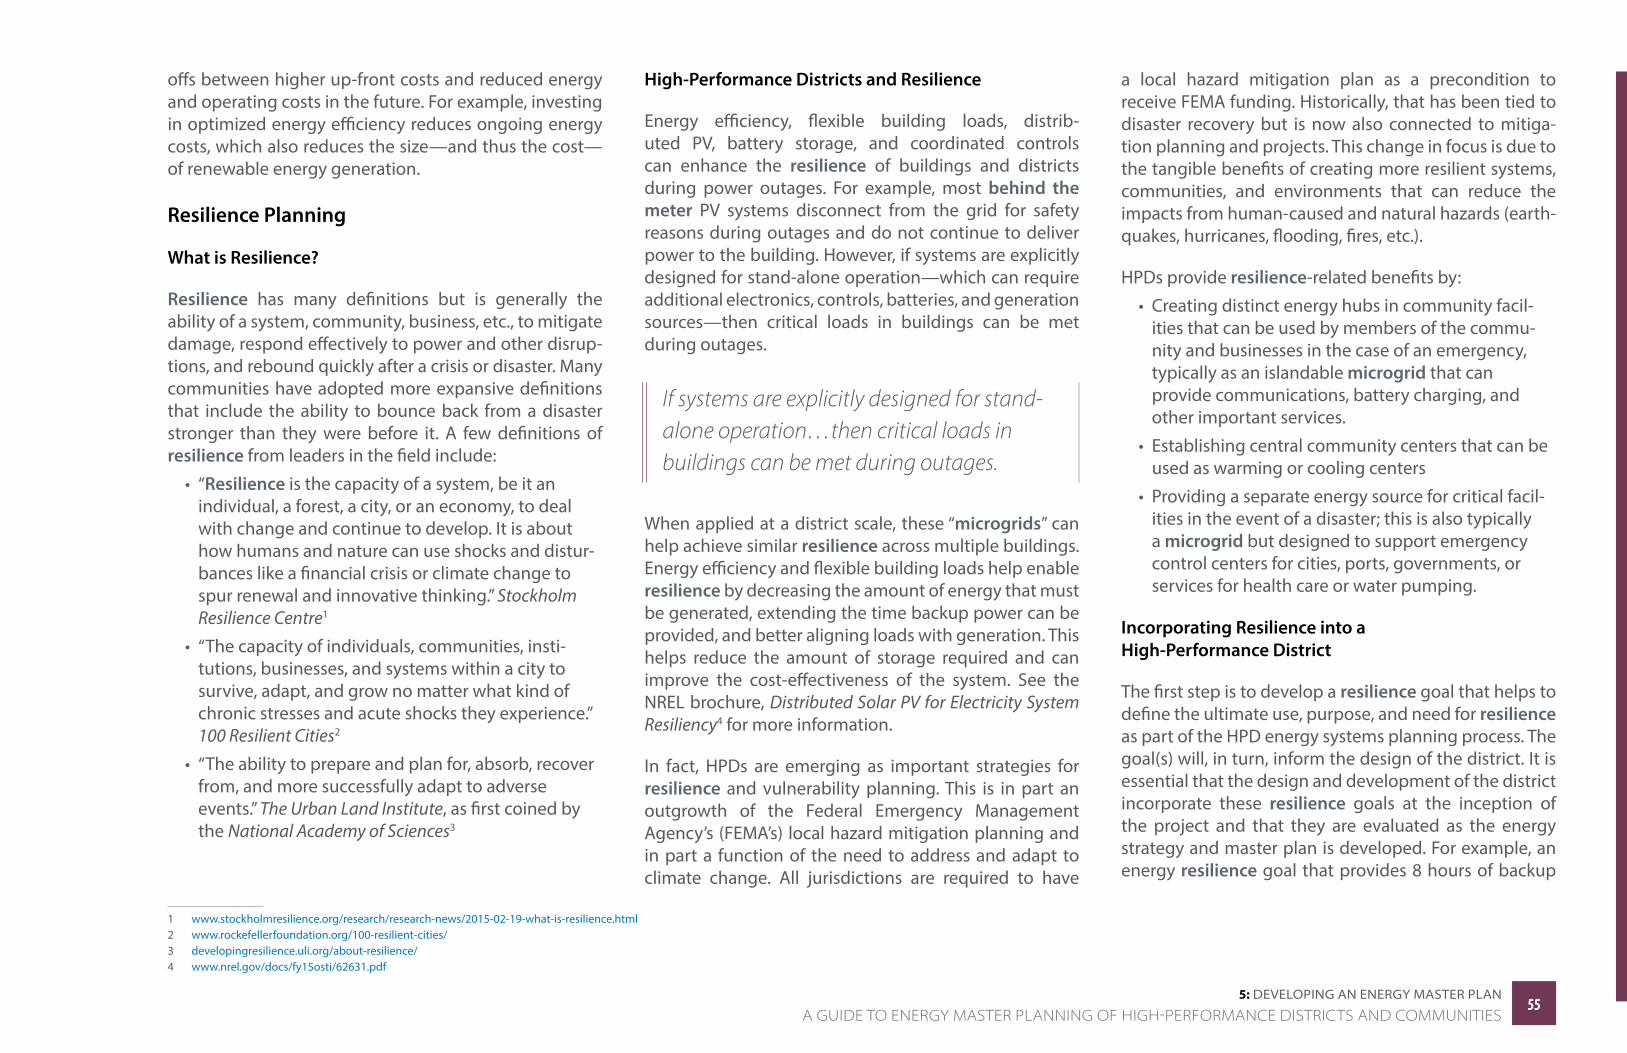
5: DevelOPing An energy mASTer PlAn
offs between higher up-front costs and reduced energy and operating costs in the future. For example, investing in optimized energy efficiency reduces ongoing energy costs, which also reduces the size—and thus the cost—of renewable energy generation.
Resilience Planning
What is Resilience?
Resilience has many definitions but is generally the ability of a system, community, business, etc., to mitigate damage, respond effectively to power and other disrup-tions, and rebound quickly after a crisis or disaster. Many communities have adopted more expansive definitions that include the ability to bounce back from a disaster stronger than they were before it. A few definitions of resilience from leaders in the field include:
• “Resilience is the capacity of a system, be it an individual, a forest, a city, or an economy, to deal with change and continue to develop. It is about how humans and nature can use shocks and distur-bances like a financial crisis or climate change to spur renewal and innovative thinking.” Stockholm Resilience Centre1
• “The capacity of individuals, communities, insti-tutions, businesses, and systems within a city to survive, adapt, and grow no matter what kind of chronic stresses and acute shocks they experience.” 100 Resilient Cities2
• “The ability to prepare and plan for, absorb, recover from, and more successfully adapt to adverse events.” The Urban Land Institute, as first coined by the National Academy of Sciences3
1 www.stockholmresilience.org/research/research-news/2015-02-19-what-is-resilience.html 2 www.rockefellerfoundation.org/100-resilient-cities/3 developingresilience.uli.org/about-resilience/4 www.nrel.gov/docs/fy15osti/62631.pdf
High-Performance Districts and Resilience
Energy efficiency, flexible building loads, distrib-uted PV, battery storage, and coordinated controls can enhance the resilience of buildings and districts during power outages. For example, most behind the meter PV systems disconnect from the grid for safety reasons during outages and do not continue to deliver power to the building. However, if systems are explicitly designed for stand-alone operation—which can require additional electronics, controls, batteries, and generation sources—then critical loads in buildings can be met during outages.
If systems are explicitly designed for stand-alone operation…then critical loads in buildings can be met during outages.
When applied at a district scale, these “microgrids” can help achieve similar resilience across multiple buildings. Energy efficiency and flexible building loads help enable resilience by decreasing the amount of energy that must be generated, extending the time backup power can be provided, and better aligning loads with generation. This helps reduce the amount of storage required and can improve the cost-effectiveness of the system. See the NREL brochure, Distributed Solar PV for Electricity System Resiliency4 for more information.
In fact, HPDs are emerging as important strategies for resilience and vulnerability planning. This is in part an outgrowth of the Federal Emergency Management Agency’s (FEMA’s) local hazard mitigation planning and in part a function of the need to address and adapt to climate change. All jurisdictions are required to have
a local hazard mitigation plan as a precondition to receive FEMA funding. Historically, that has been tied to disaster recovery but is now also connected to mitiga-tion planning and projects. This change in focus is due to the tangible benefits of creating more resilient systems, communities, and environments that can reduce the impacts from human-caused and natural hazards (earth-quakes, hurricanes, flooding, fires, etc.).
HPDs provide resilience-related benefits by:
• Creating distinct energy hubs in community facil-ities that can be used by members of the commu-nity and businesses in the case of an emergency, typically as an islandable microgrid that can provide communications, battery charging, and other important services.
• Establishing central community centers that can be used as warming or cooling centers
• Providing a separate energy source for critical facil-ities in the event of a disaster; this is also typically a microgrid but designed to support emergency control centers for cities, ports, governments, or services for health care or water pumping.
Incorporating Resilience into a High-Performance District
The first step is to develop a resilience goal that helps to define the ultimate use, purpose, and need for resilience as part of the HPD energy systems planning process. The goal(s) will, in turn, inform the design of the district. It is essential that the design and development of the district incorporate these resilience goals at the inception of the project and that they are evaluated as the energy strategy and master plan is developed. For example, an energy resilience goal that provides 8 hours of backup
5555 A GUIDE TO ENERGY MASTER PLANNING OF HIGH-PERFORMANCE DISTRICTS AND COMMUNITIES
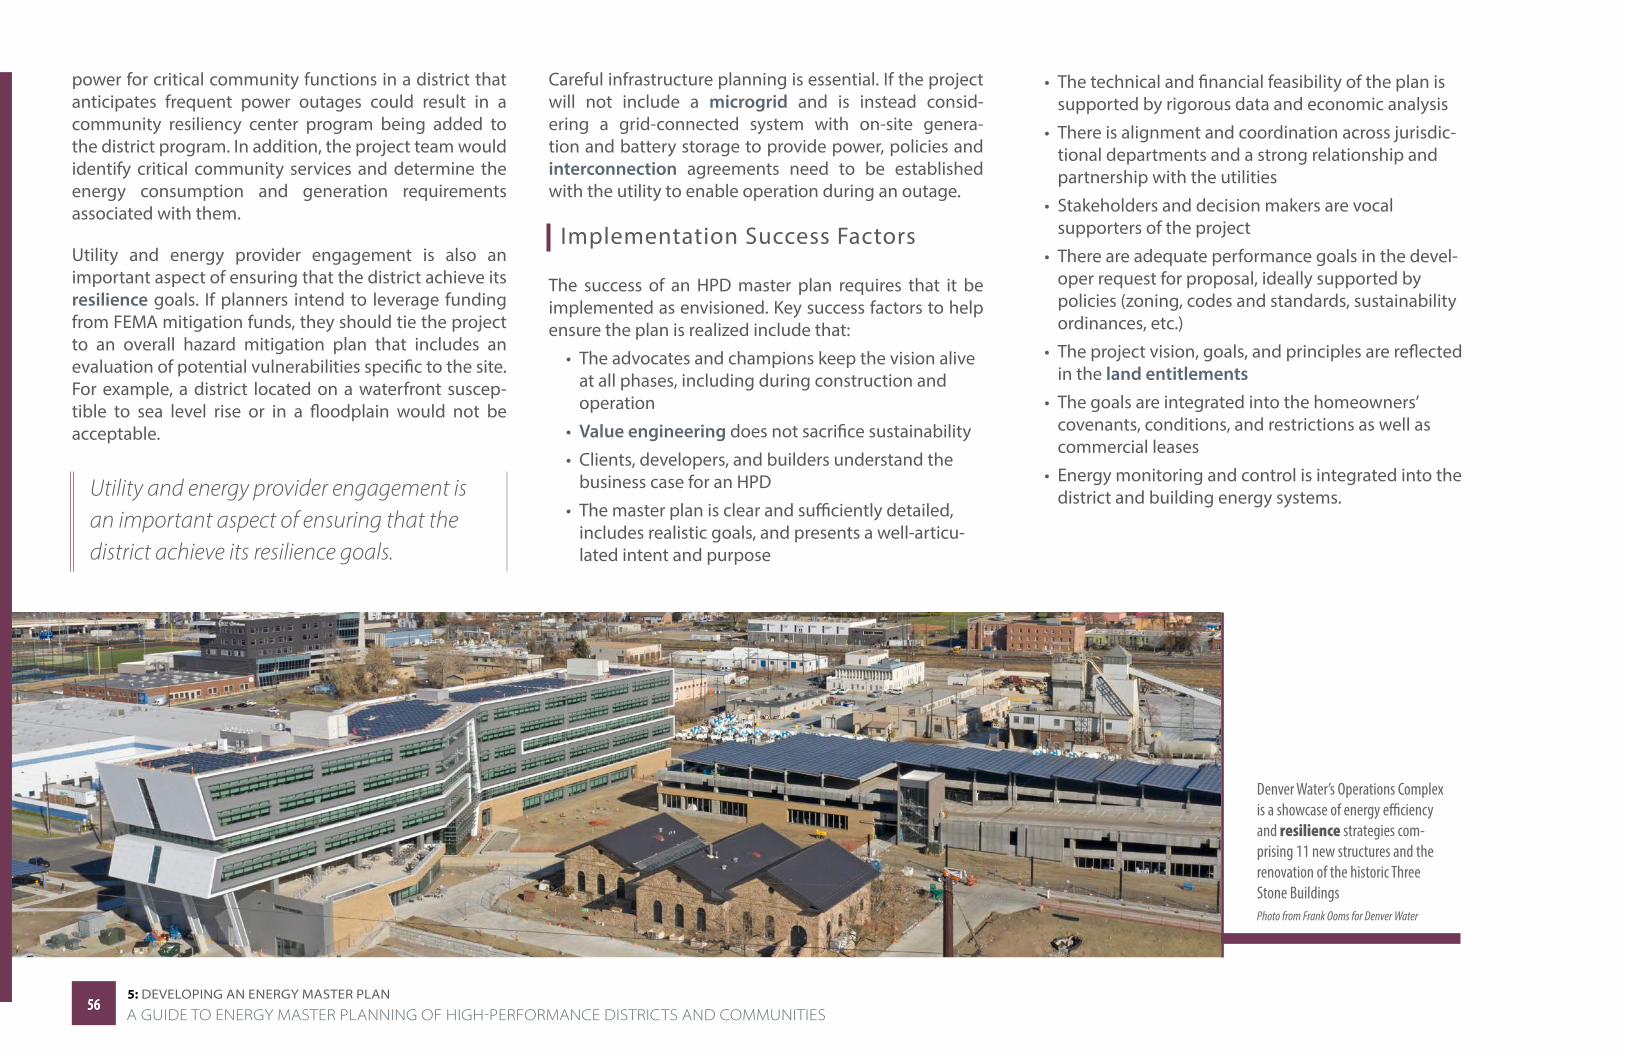
5: DevelOPing An energy mASTer PlAn
power for critical community functions in a district that anticipates frequent power outages could result in a community resiliency center program being added to the district program. In addition, the project team would identify critical community services and determine the energy consumption and generation requirements associated with them.
Utility and energy provider engagement is also an important aspect of ensuring that the district achieve its resilience goals. If planners intend to leverage funding from FEMA mitigation funds, they should tie the project to an overall hazard mitigation plan that includes an evaluation of potential vulnerabilities specific to the site. For example, a district located on a waterfront suscep-tible to sea level rise or in a floodplain would not be acceptable.
Utility and energy provider engagement is an important aspect of ensuring that the district achieve its resilience goals.
Careful infrastructure planning is essential. If the project will not include a microgrid and is instead consid-ering a grid-connected system with on-site genera-tion and battery storage to provide power, policies and interconnection agreements need to be established with the utility to enable operation during an outage.
Implementation Success Factors
The success of an HPD master plan requires that it be implemented as envisioned. Key success factors to help ensure the plan is realized include that:
• The advocates and champions keep the vision alive at all phases, including during construction and operation
• Value engineering does not sacrifice sustainability
• Clients, developers, and builders understand the business case for an HPD
• The master plan is clear and sufficiently detailed, includes realistic goals, and presents a well-articu-lated intent and purpose
Denver Water’s Operations Complex is a showcase of energy efficiency and resilience strategies com-prising 11 new structures and the renovation of the historic Three Stone BuildingsPhoto from Frank Ooms for Denver Water
• The technical and financial feasibility of the plan is supported by rigorous data and economic analysis
• There is alignment and coordination across jurisdic-tional departments and a strong relationship and partnership with the utilities
• Stakeholders and decision makers are vocal supporters of the project
• There are adequate performance goals in the devel-oper request for proposal, ideally supported by policies (zoning, codes and standards, sustainability ordinances, etc.)
• The project vision, goals, and principles are reflected in the land entitlements
• The goals are integrated into the homeowners’ covenants, conditions, and restrictions as well as commercial leases
• Energy monitoring and control is integrated into the district and building energy systems.
5656A GUIDE TO ENERGY MASTER PLANNING OF HIGH-PERFORMANCE DISTRICTS AND COMMUNITIES
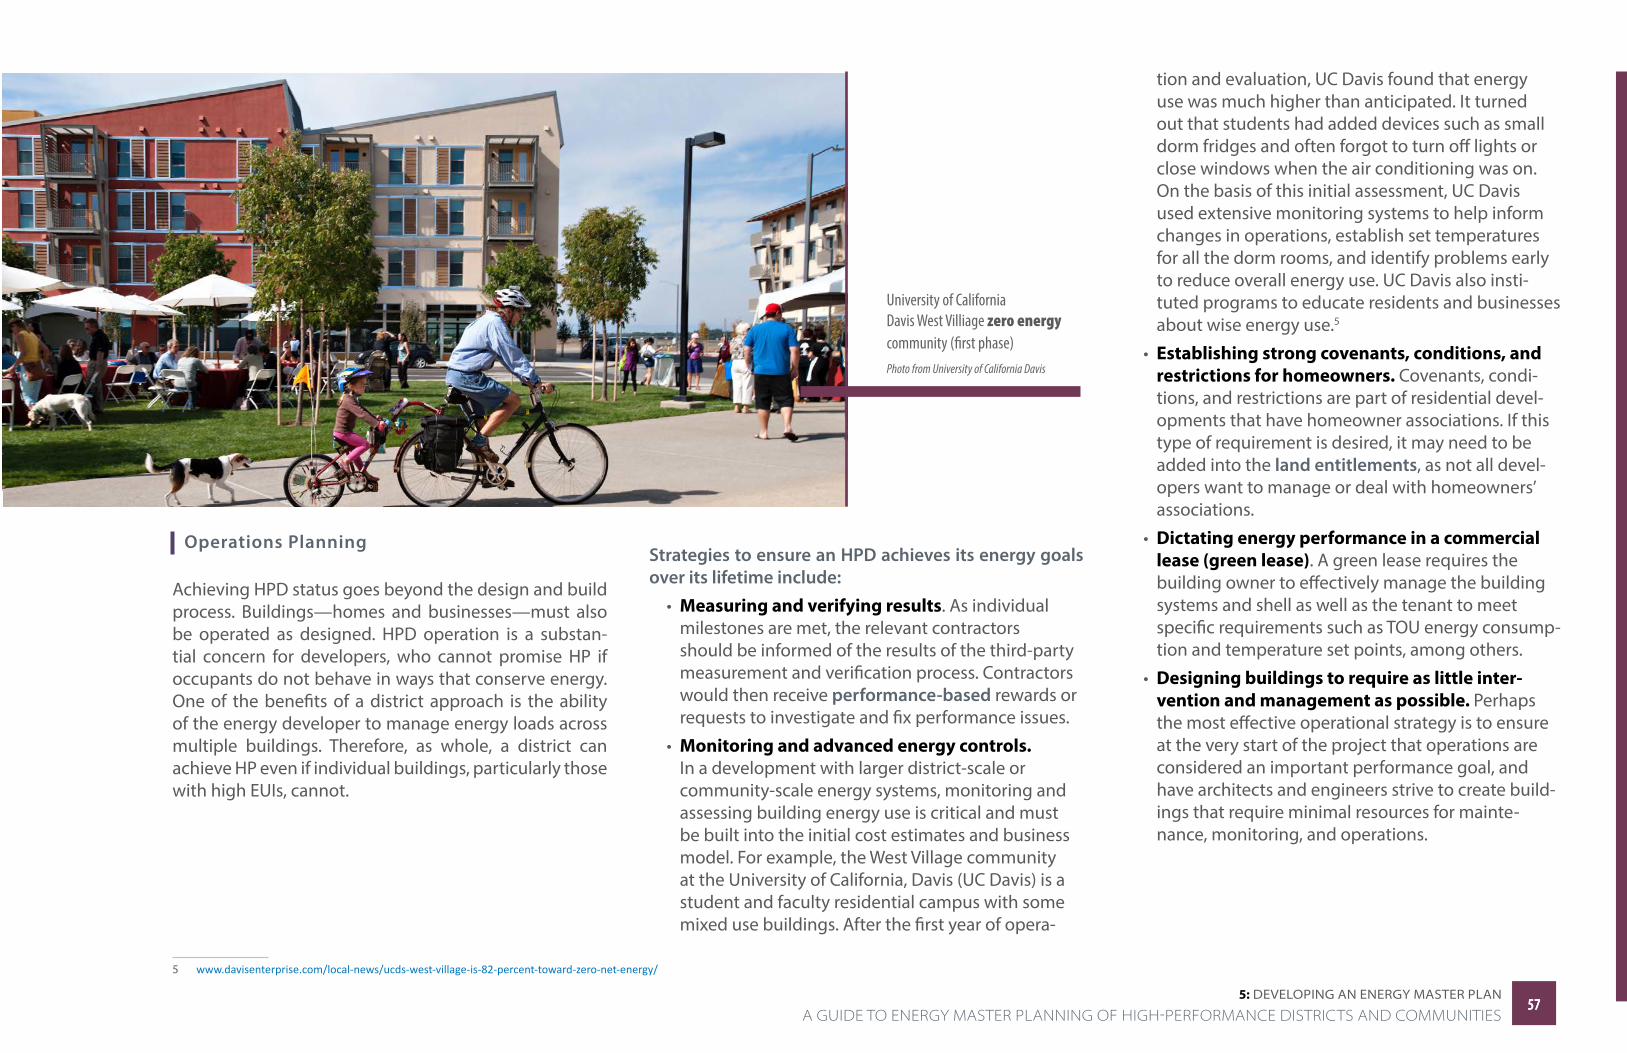
5: DevelOPing An energy mASTer PlAn
Operations Planning
Achieving HPD status goes beyond the design and build process. Buildings—homes and businesses—must also be operated as designed. HPD operation is a substan-tial concern for developers, who cannot promise HP if occupants do not behave in ways that conserve energy. One of the benefits of a district approach is the ability of the energy developer to manage energy loads across multiple buildings. Therefore, as whole, a district can achieve HP even if individual buildings, particularly those with high EUIs, cannot.
5 www.davisenterprise.com/local-news/ucds-west-village-is-82-percent-toward-zero-net-energy/
University of California Davis West Villiage zero energy community (first phase) Photo from University of California Davis
Strategies to ensure an HPD achieves its energy goals over its lifetime include:
• Measuring and verifying results. As individual milestones are met, the relevant contractors should be informed of the results of the third-party measurement and verification process. Contractors would then receive performance-based rewards or requests to investigate and fix performance issues.
• Monitoring and advanced energy controls. In a development with larger district-scale or community-scale energy systems, monitoring and assessing building energy use is critical and must be built into the initial cost estimates and business model. For example, the West Village community at the University of California, Davis (UC Davis) is a student and faculty residential campus with some mixed use buildings. After the first year of opera-
tion and evaluation, UC Davis found that energy use was much higher than anticipated. It turned out that students had added devices such as small dorm fridges and often forgot to turn off lights or close windows when the air conditioning was on. On the basis of this initial assessment, UC Davis used extensive monitoring systems to help inform changes in operations, establish set temperatures for all the dorm rooms, and identify problems early to reduce overall energy use. UC Davis also insti-tuted programs to educate residents and businesses about wise energy use.5
• Establishing strong covenants, conditions, and restrictions for homeowners. Covenants, condi-tions, and restrictions are part of residential devel-opments that have homeowner associations. If this type of requirement is desired, it may need to be added into the land entitlements, as not all devel-opers want to manage or deal with homeowners’ associations.
• Dictating energy performance in a commercial lease (green lease). A green lease requires the building owner to effectively manage the building systems and shell as well as the tenant to meet specific requirements such as TOU energy consump-tion and temperature set points, among others.
• Designing buildings to require as little inter-vention and management as possible. Perhaps the most effective operational strategy is to ensure at the very start of the project that operations are considered an important performance goal, and have architects and engineers strive to create build-ings that require minimal resources for mainte-nance, monitoring, and operations.
5757 A GUIDE TO ENERGY MASTER PLANNING OF HIGH-PERFORMANCE DISTRICTS AND COMMUNITIES
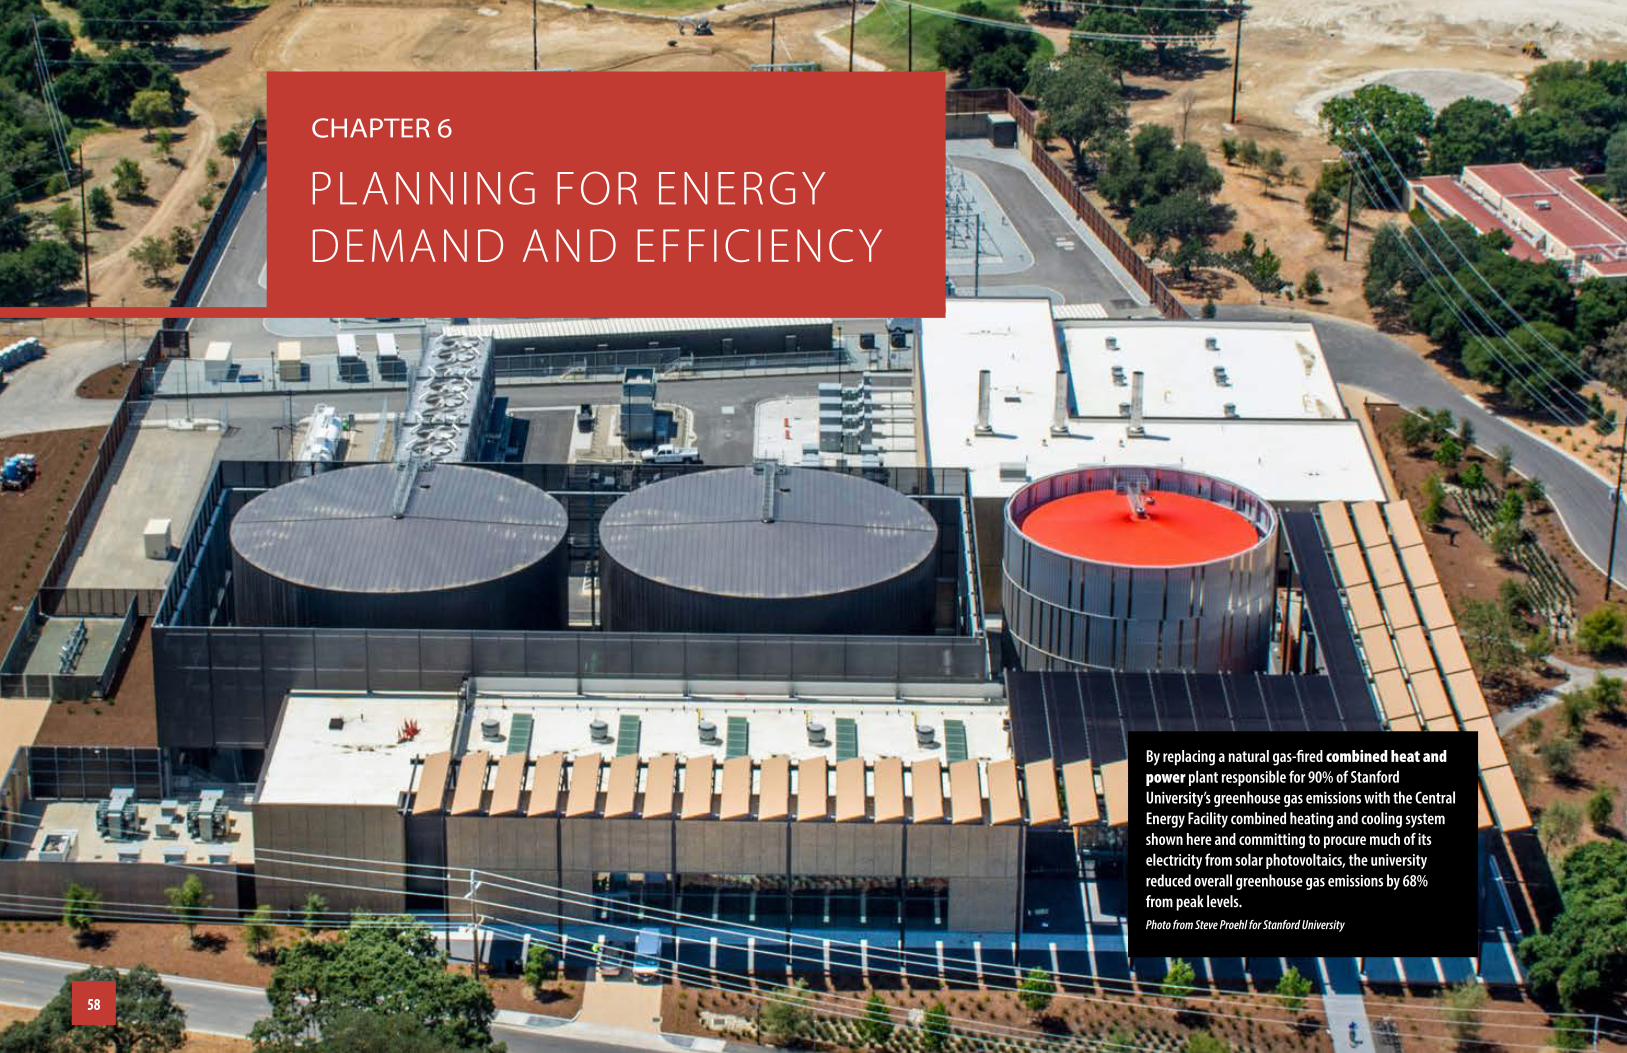
PLANNING FOR ENERGY DEMAND AND EFFICIENCY
CHAPTer 6
By replacing a natural gas-fired combined heat and power plant responsible for 90% of Stanford University’s greenhouse gas emissions with the Central Energy Facility combined heating and cooling system shown here and committing to procure much of its electricity from solar photovoltaics, the university reduced overall greenhouse gas emissions by 68% from peak levels.Photo from Steve Proehl for Stanford University
5858
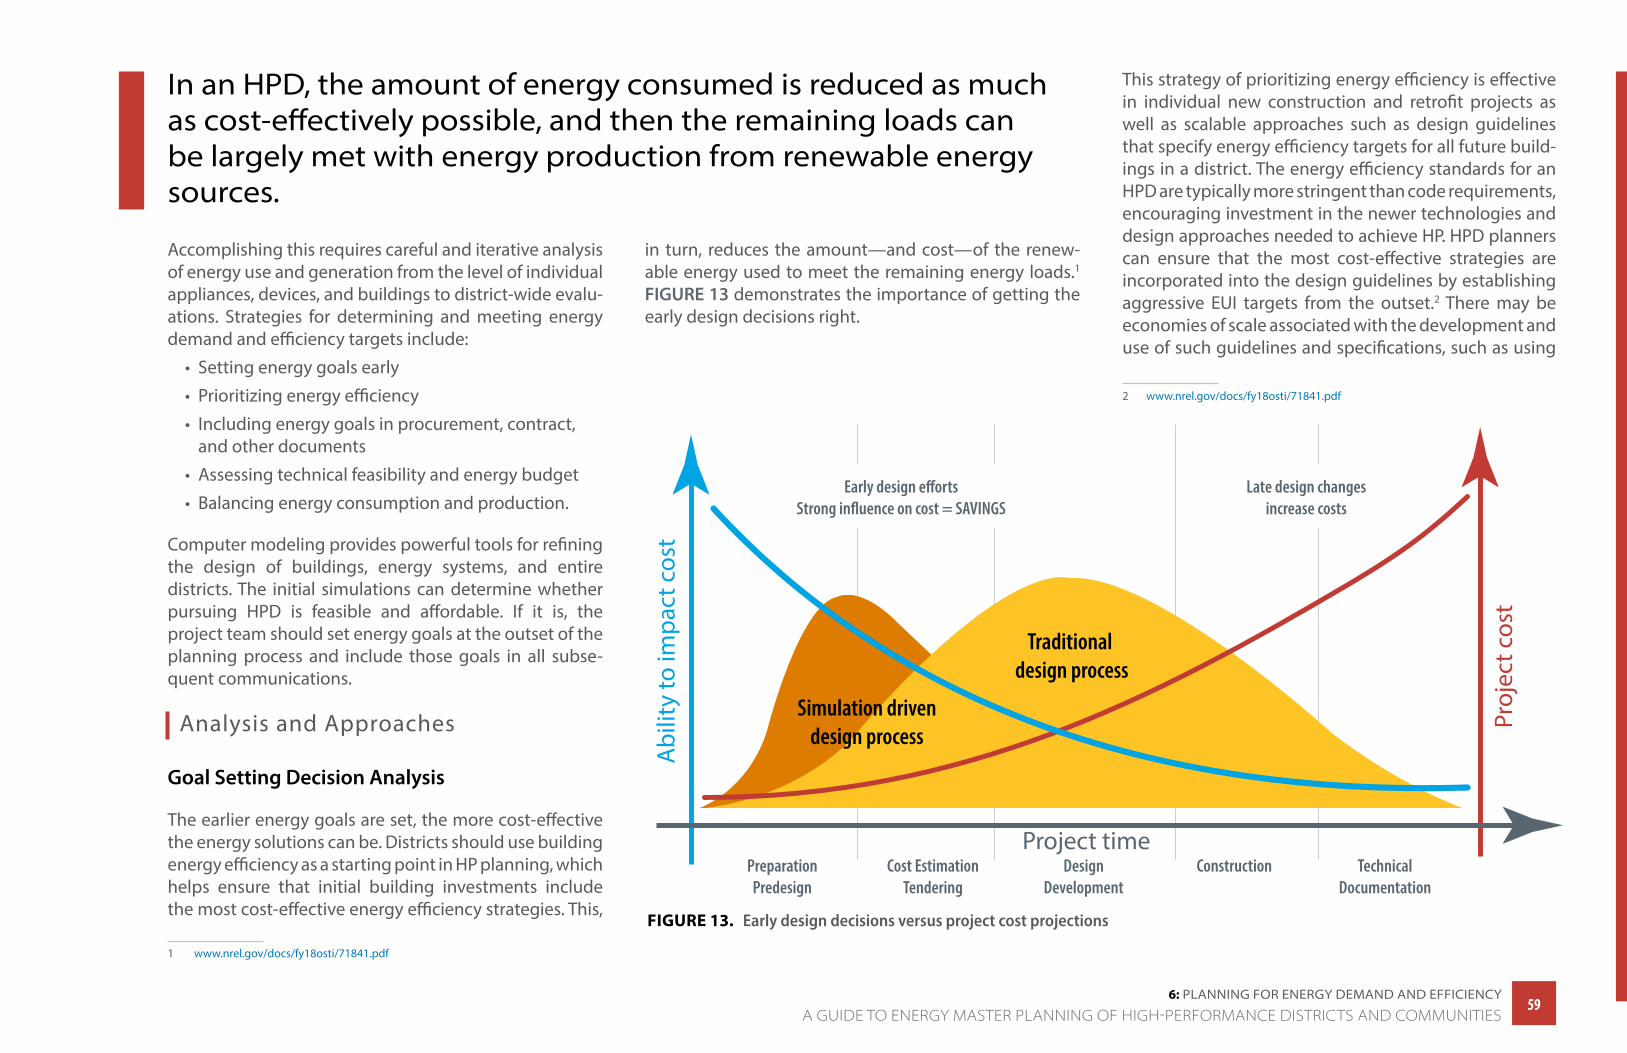
6: PlAnning FOr energy DemAnD AnD eFFiCienCy
in an HPD, the amount of energy consumed is reduced as much as cost-effectively possible, and then the remaining loads can be largely met with energy production from renewable energy sources.
1 www.nrel.gov/docs/fy18osti/71841.pdf
Accomplishing this requires careful and iterative analysis of energy use and generation from the level of individual appliances, devices, and buildings to district-wide evalu-ations. Strategies for determining and meeting energy demand and efficiency targets include:
• Setting energy goals early
• Prioritizing energy efficiency
• Including energy goals in procurement, contract, and other documents
• Assessing technical feasibility and energy budget
• Balancing energy consumption and production.
Computer modeling provides powerful tools for refining the design of buildings, energy systems, and entire districts. The initial simulations can determine whether pursuing HPD is feasible and affordable. If it is, the project team should set energy goals at the outset of the planning process and include those goals in all subse-quent communications.
Analysis and Approaches
Goal Setting Decision Analysis
The earlier energy goals are set, the more cost-effective the energy solutions can be. Districts should use building energy efficiency as a starting point in HP planning, which helps ensure that initial building investments include the most cost-effective energy efficiency strategies. This,
in turn, reduces the amount—and cost—of the renew-able energy used to meet the remaining energy loads.1 FIGURE 13 demonstrates the importance of getting the early design decisions right.
Abi
lity
to im
pact
cos
t
Proj
ect c
ost
Simulation drivendesign process
Traditional design process
Project timePreparationPredesign
Cost EstimationTendering
DesignDevelopment
Construction TechnicalDocumentation
Late design changesincrease costs
FIGURE 13. Early design decisions versus project cost projections
This strategy of prioritizing energy efficiency is effective in individual new construction and retrofit projects as well as scalable approaches such as design guidelines that specify energy efficiency targets for all future build-ings in a district. The energy efficiency standards for an HPD are typically more stringent than code requirements, encouraging investment in the newer technologies and design approaches needed to achieve HP. HPD planners can ensure that the most cost-effective strategies are incorporated into the design guidelines by establishing aggressive EUI targets from the outset.2 There may be economies of scale associated with the development and use of such guidelines and specifications, such as using
2 www.nrel.gov/docs/fy18osti/71841.pdf
A GUIDE TO ENERGY MASTER PLANNING OF HIGH-PERFORMANCE DISTRICTS AND COMMUNITIES5959
6: PlAnning FOr energy DemAnD AnD eFFiCienCy
replicable technical design solutions across buildings in a district. Examples of related questions that district planners should consider in the early stages of planning include:
• What are the EUIs in the project climate zone for different building types and mixes of building types for “business as usual” efficiency levels (e.g., standard efficiency) to high-efficiency levels (e.g., approaching ZE)?
• What are the savings that can be expected by requiring optimized energy efficiency in district design guidelines?
• How do the EUIs compare to what has been achieved in local projects and/or projects in similar climates?
Following the promising practices below can help ensure that the energy goals are aggressive, easy to interpret, measurable, and tied directly to performance.
Define goals at the project’s outset to align stake-holders around common objectives. For example:
• All relevant stakeholders should be aware of and support all goals before design and planning begin. This can be accomplished through a goal-setting and visioning charrette.
• The site owner should ensure that these goals are made clear to the energy developer, master real estate developer, and any design and construction personnel involved with the project.
• Goals should be documented, and, where possible, included in contracts, covenants, and other legal
3 www1.eere.energy.gov/buildings/publications/pdfs/rsf/performance_based_how_to_guide.pdf 4 rmi.org/insight/zero-over-time-for-building-portfolios 5 ecodistricts.org/wp-content/uploads/2013/03/EcoDistricts_Protocol_Executive_Summary_ISSUE_6.242.pdf 6 ecodistricts.org/wp-content/uploads/2016/06/ed-protocol-guide-v1.3-FINAL.pdf 7 living-future.org/zero-energy/certification/ 8 www.usgbc.org/resources/leed-zero-program-guide 9 new.usgbc.org/leed-for-cities
documents that legitimize the goals and the team’s commitment to meeting these goals throughout the project.
• Stakeholders whose efforts will be measured against these goals should be involved in the goal-setting process and supportive of the final outcome.
Incorporate goals into the procurement process and contracting documents for all design and construc-tion team members. Strategies for accomplishing this can include energy performance-based procurement mechanisms3 as well as predefined measurement and verification protocols that specify success criteria.
By balancing the energy use intensity targets for each building type with on-site (and, if necessary, off-site) renewable energy production targets, the project team can achieve aggressive high-performance goals and even aspirational goals like zero energy.
Make goals specific and clear by identifying perfor-mance targets for building energy consumption based on building type. The EUI is a familiar and useful metric for building designers, engineers, and parcel developers. Similarly, there should be energy production targets for renewable energy generation based on the size of each rooftop, plot of land, or other surface available for
installing renewables. By balancing the EUI targets for each building type with on-site (and, if necessary, off-site) renewable energy production targets, the project team can achieve aggressive HP goals and even aspirational goals like ZE.
A number of organizations have developed guidance to inform this process that can include certification or other documentary evidence that a project has met its goals:
• In Guide: Best Practices for Achieving Zero over Time for Building Portfolios from the Rocky Mountain Institute and the Urban Land Institute,4 the authors suggest a hierarchy of renewable energy options from exclusively on-site resources to local community solar to other local off-site renew-able energy sources to sources such as renewable energy certificates.
• The EcoDistricts Protocol5 requires zero emissions and its energy goal is to “achieve net zero energy usage annually.”6
• International Living Future Institute’s Zero Energy Building Certification™ requires that “100% of a building’s energy needs on a net annual basis…be supplied by on-site renewable energy, and no combustion is allowed.”7 Some exceptions are acceptable, however.
• LEED Zero8 recognizes zero emissions, water, and waste achievements in addition to ZE.
• LEED for Cities and Communities9 recognizes—among other things—resilience and energy strate-gies designed to create cities powered by clean and reliable energy.
6060A GUIDE TO ENERGY MASTER PLANNING OF HIGH-PERFORMANCE DISTRICTS AND COMMUNITIES
6: PlAnning FOr energy DemAnD AnD eFFiCienCy
• Architecture 2030 publishes a ZERO Code standard for new building construction that integrates cost-effective energy efficiency measures with on-site and/or off-site renewable energy to get to zero emission buildings.10
Develop metrics to emphasize the market compet-itiveness of an HPD such as the expected first cost and life cycle cost for both conventional and HP build-ings and districts (see Chapter 3: Developing Financial and Business Models on page 32). Include the life cycle energy costs as well as energy-related operating costs. This analysis can make it possible to use financing mechanisms and other tools that demonstrate how larger up-front investments in energy infrastruc-ture can be paid off over time. As always, specificity is preferable. For example, consider wording such as “The commercial buildings in this district will achieve an EUI of 20 kBtu/ft2·yr, not including the district heating and cooling system.” Lower EUIs indicate reduced energy use, which saves owners and tenants money in operating costs. Further statements could cover energy efficiency requirements and the configuration of district-level PV and heating and cooling systems.
Feasibility and Energy Budget Analysis
The energy balance calculation can be completed as soon a preliminary development program is drafted. This first pass energy balance allows the technical feasibility of HP to be assessed very early. An experienced energy consultant can make assumptions about building EUIs and renewable energy system parameters to provide a credible assessment.
Key risks can be identified during the feasibility assess-ment:
• Do the buildings need very low or potentially
10 architecture2030.org/zero-code/
unachievably low EUIs for the energy balance to be achieved?
• Is there enough potential roof or open space area for the PV needed to achieve the energy balance?
• Is it advisable to explore other locations for PV?
One of the greatest barriers to achieving the full vision of an HPD is unrealistic or inadequate budgeting in the early project planning stages. It is important to develop a complete budget comprising the details required to achieve an HPD and get buy-in from key decision makers about the value and benefit of those additional costs. As the project team assesses energy system options, the development program, and other infrastructure needs, initial costing for those systems and technologies must be included in the budget. These costs, along with other trade-offs, can be discussed early and choices made to alleviate costs now or in the future. If this is not done, it can derail the project or reduce the probability of reaching the HP goal.
One of the greatest barriers to achieving the full vision of an HPD is unrealistic or inadequate budgeting in the early project planning stages.
Balancing Energy Consumption and Production
Although the development program is primarily a response to a project vision, the owner’s financial model, market dynamics, and zoning regulations, considering the balance of energy consumption and renewable energy production can enable synergies at the district level. One key to balancing consumption and production is to Include diverse building types.
For example, residential and commercial buildings are often used at different times of the day, and thus can have complementary heating and cooling load profiles. Low-rise, low EUI buildings with large roofs like warehouses can balance higher EUI buildings like those that house restaurants. Taller buildings with small roof areas relative to their floor areas will also require more PV than will fit on their roofs to balance out their energy consumption.
In addition, the presence of nonbuilding features in a district’s development program provides balancing opportunities, notably when parking lots and parking garages are used to site PV for renewable energy gener-ation. In addition, parks and open spaces can serve as sites for ground source heat pump bore fields as part of a district thermal energy system and bodies of water such as lakes can be used for a water source in lieu of bore fields.
For districts with existing buildings that can be renovated or replaced, it can be useful to map out scenarios comparing existing performance to new code and HP levels. A sample scenario map comparing existing energy use by building type and the energy use target pathways from code to HP, net zero electric, and ZE is shown in FIGURE 14 on page 62.
6161 A GUIDE TO ENERGY MASTER PLANNING OF HIGH-PERFORMANCE DISTRICTS AND COMMUNITIES
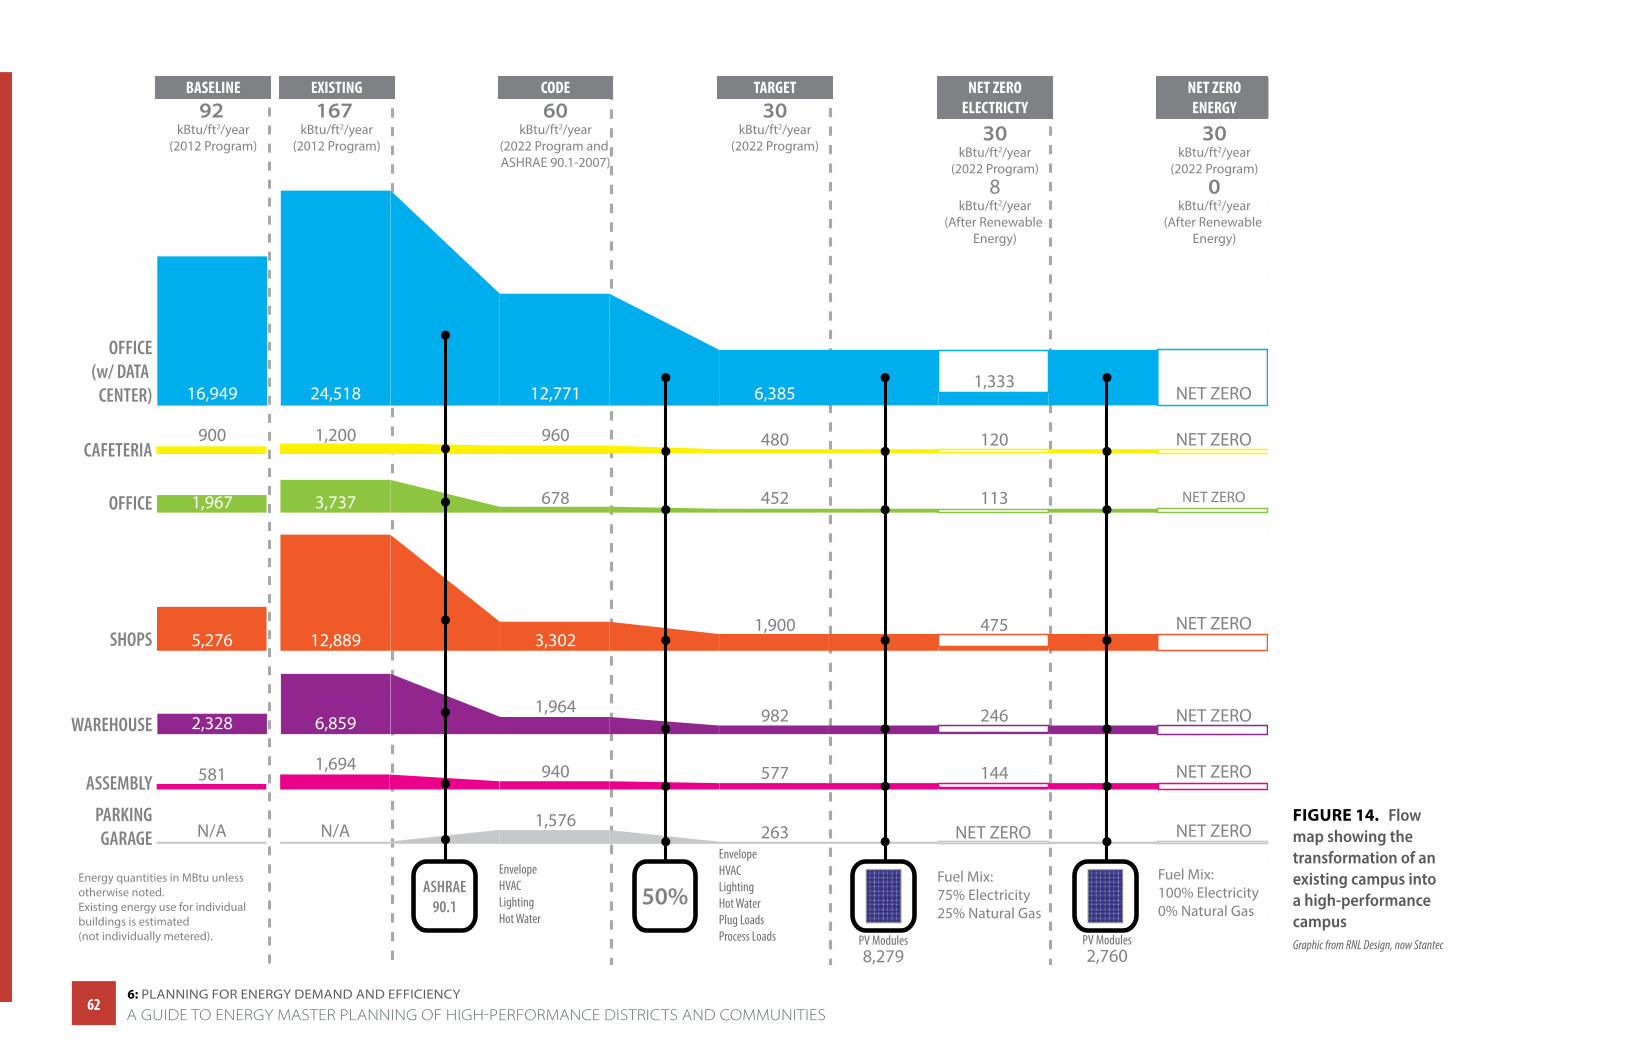
6: PlAnning FOr energy DemAnD AnD eFFiCienCy
FIGURE 14. Flow map showing the transformation of an existing campus into a high-performance campus Graphic from RNL Design, now Stantec
92 kBtu/ft2/year
(2012 Program)
167 kBtu/ft2/year
(2012 Program)
BASELINE EXISTING60
kBtu/ft2/year(2022 Program and ASHRAE 90.1-2007)
CODE30
kBtu/ft2/year(2022 Program)
TARGET
30kBtu/ft2/year
(2022 Program)
NET ZEROELECTRICTY
24,518
3,737
1,200
12,889
6,859
16,949
1,967
900
581
5,276
2,328
12,771
960
678
940
1,576
3,302
1,964
6,385
480
452
577
263N/AN/A
1,900
982
1,333
120
113
144
475
246
30kBtu/ft2/year
(2022 Program)0
kBtu/ft2/year(After Renewable
Energy)
8kBtu/ft2/year
(After Renewable Energy)
NET ZEROENERGY
NET ZERO
NET ZERO
NET ZERO
NET ZERO
NET ZERO
NET ZERO
NET ZERONET ZERO
1,694
OFFICE(w/ DATA
CENTER)
OFFICE
SHOPS
WAREHOUSE
ASSEMBLY
PARKINGGARAGE
ASHRAE90.1
EnvelopeHVACLightingHot Water
50%
EnvelopeHVACLightingHot WaterPlug LoadsProcess Loads PV Modules
8,279PV Modules2,760
Fuel Mix: 75% Electricity 25% Natural Gas
Fuel Mix: 100% Electricity 0% Natural Gas
Energy quantities in MBtu unless otherwise noted.Existing energy use for individual buildings is estimated (not individually metered).
CAFETERIA
6262A GUIDE TO ENERGY MASTER PLANNING OF HIGH-PERFORMANCE DISTRICTS AND COMMUNITIES
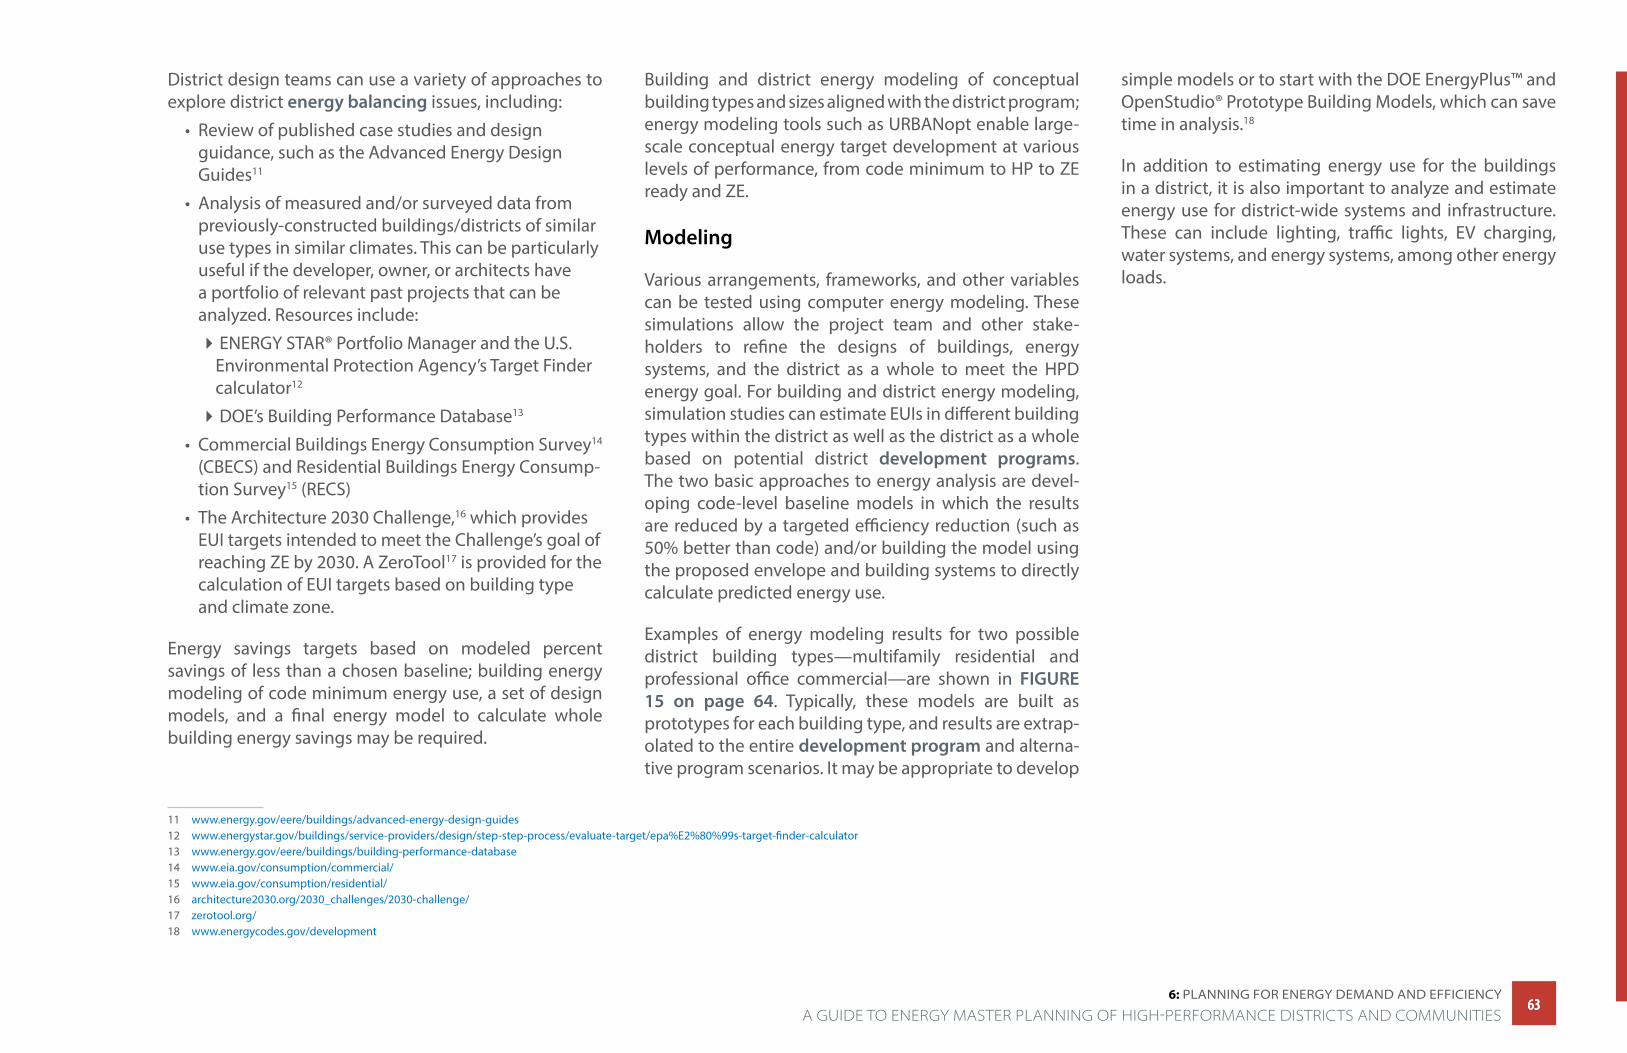
6: PlAnning FOr energy DemAnD AnD eFFiCienCy
District design teams can use a variety of approaches to explore district energy balancing issues, including:
• Review of published case studies and design guidance, such as the Advanced Energy Design Guides11
• Analysis of measured and/or surveyed data from previously-constructed buildings/districts of similar use types in similar climates. This can be particularly useful if the developer, owner, or architects have a portfolio of relevant past projects that can be analyzed. Resources include:
�ENERGY STAR® Portfolio Manager and the U.S. Environmental Protection Agency’s Target Finder calculator12
�DOE’s Building Performance Database13
• Commercial Buildings Energy Consumption Survey14 (CBECS) and Residential Buildings Energy Consump-tion Survey15 (RECS)
• The Architecture 2030 Challenge,16 which provides EUI targets intended to meet the Challenge’s goal of reaching ZE by 2030. A ZeroTool17 is provided for the calculation of EUI targets based on building type and climate zone.
Energy savings targets based on modeled percent savings of less than a chosen baseline; building energy modeling of code minimum energy use, a set of design models, and a final energy model to calculate whole building energy savings may be required.
11 www.energy.gov/eere/buildings/advanced-energy-design-guides 12 www.energystar.gov/buildings/service-providers/design/step-step-process/evaluate-target/epa%E2%80%99s-target-finder-calculator 13 www.energy.gov/eere/buildings/building-performance-database 14 www.eia.gov/consumption/commercial/ 15 www.eia.gov/consumption/residential/ 16 architecture2030.org/2030_challenges/2030-challenge/ 17 zerotool.org/ 18 www.energycodes.gov/development
Building and district energy modeling of conceptual building types and sizes aligned with the district program; energy modeling tools such as URBANopt enable large-scale conceptual energy target development at various levels of performance, from code minimum to HP to ZE ready and ZE.
Modeling
Various arrangements, frameworks, and other variables can be tested using computer energy modeling. These simulations allow the project team and other stake-holders to refine the designs of buildings, energy systems, and the district as a whole to meet the HPD energy goal. For building and district energy modeling, simulation studies can estimate EUIs in different building types within the district as well as the district as a whole based on potential district development programs. The two basic approaches to energy analysis are devel-oping code-level baseline models in which the results are reduced by a targeted efficiency reduction (such as 50% better than code) and/or building the model using the proposed envelope and building systems to directly calculate predicted energy use.
Examples of energy modeling results for two possible district building types—multifamily residential and professional office commercial—are shown in FIGURE 15 on page 64. Typically, these models are built as prototypes for each building type, and results are extrap-olated to the entire development program and alterna-tive program scenarios. It may be appropriate to develop
simple models or to start with the DOE EnergyPlus™ and OpenStudio® Prototype Building Models, which can save time in analysis.18
In addition to estimating energy use for the buildings in a district, it is also important to analyze and estimate energy use for district-wide systems and infrastructure. These can include lighting, traffic lights, EV charging, water systems, and energy systems, among other energy loads.
6363 A GUIDE TO ENERGY MASTER PLANNING OF HIGH-PERFORMANCE DISTRICTS AND COMMUNITIES
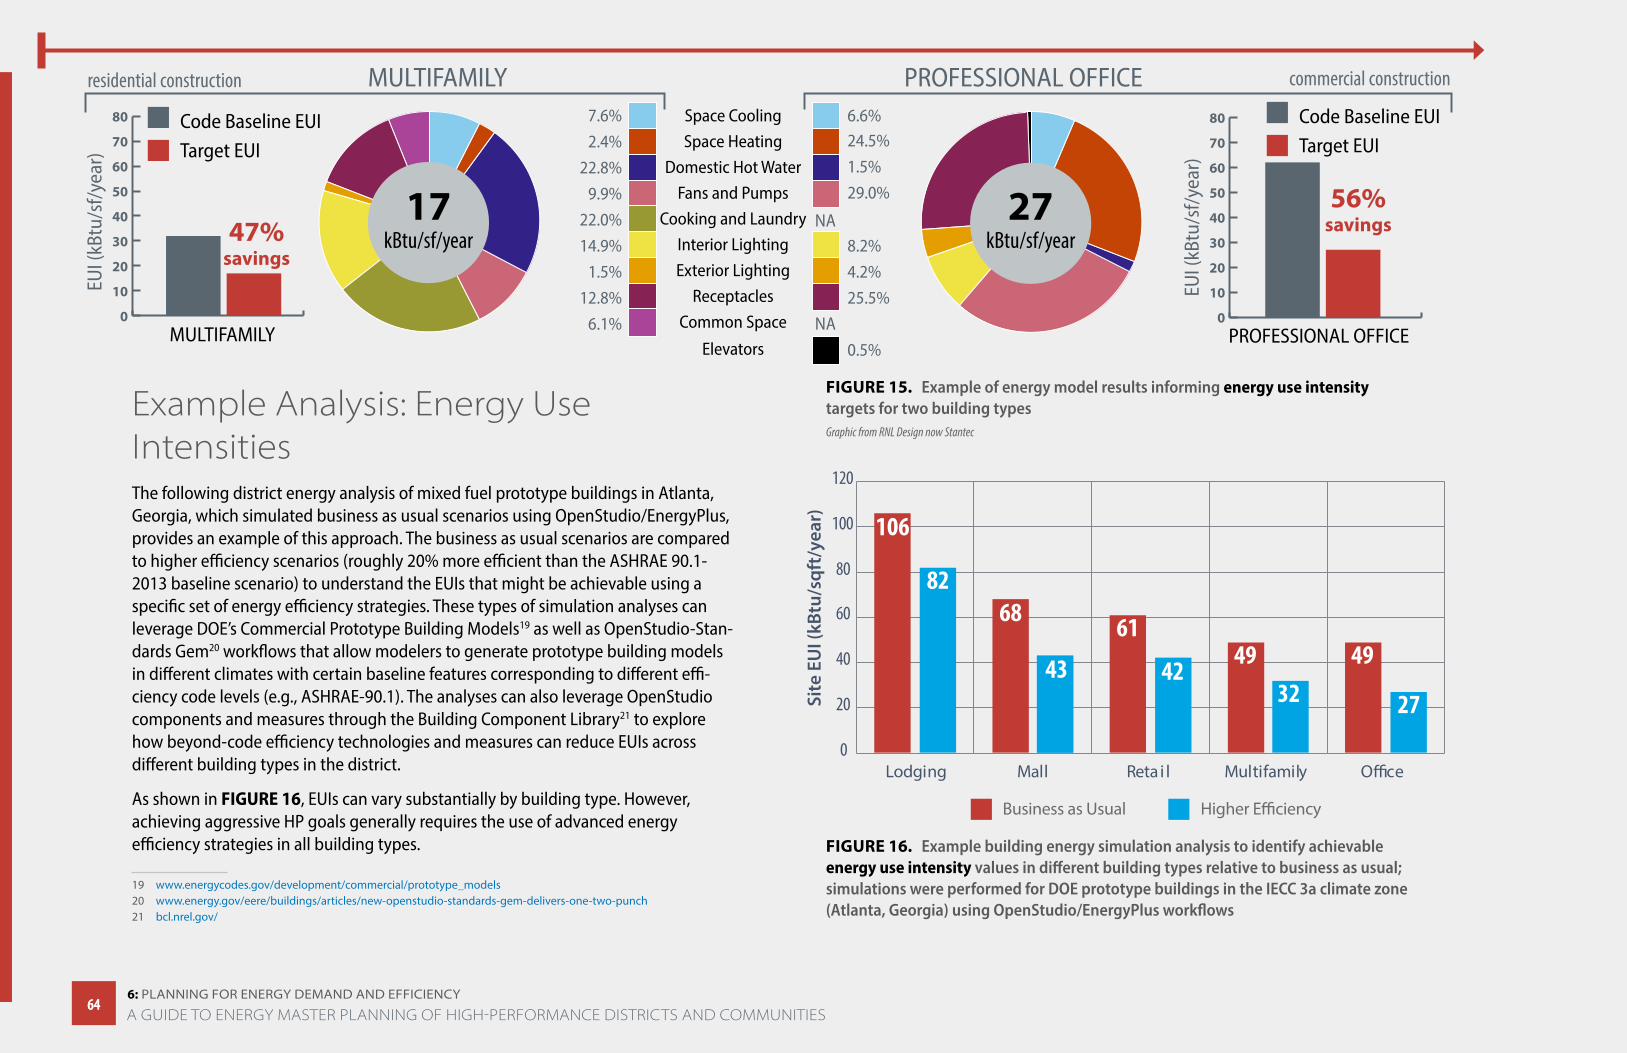
6: PlAnning FOr energy DemAnD AnD eFFiCienCy
Example Analysis: Energy Use IntensitiesThe following district energy analysis of mixed fuel prototype buildings in Atlanta, Georgia, which simulated business as usual scenarios using OpenStudio/EnergyPlus, provides an example of this approach. The business as usual scenarios are compared to higher efficiency scenarios (roughly 20% more efficient than the ASHRAE 90.1-2013 baseline scenario) to understand the EUIs that might be achievable using a specific set of energy efficiency strategies. These types of simulation analyses can leverage DOE’s Commercial Prototype Building Models19 as well as OpenStudio-Stan-dards Gem20 workflows that allow modelers to generate prototype building models in different climates with certain baseline features corresponding to different effi-ciency code levels (e.g., ASHRAE-90.1). The analyses can also leverage OpenStudio components and measures through the Building Component Library21 to explore how beyond-code efficiency technologies and measures can reduce EUIs across different building types in the district.
As shown in FIGURE 16, EUIs can vary substantially by building type. However, achieving aggressive HP goals generally requires the use of advanced energy efficiency strategies in all building types.
19 www.energycodes.gov/development/commercial/prototype_models 20 www.energy.gov/eere/buildings/articles/new-openstudio-standards-gem-delivers-one-two-punch 21 bcl.nrel.gov/
FIGURE 15. Example of energy model results informing energy use intensity targets for two building types Graphic from RNL Design now Stantec
Domestic Hot Water
Cooking and LaundryInterior LightingExterior Lighting
7.6%
Receptacles
Fans and Pumps
Space Cooling
Common Space
Space Heating
Elevators
PROFESSIONAL OFFICEMULTIFAMILY
17kBtu/sf/year
27kBtu/sf/year47%
savings
0
10
20
30
40
50
60
70
80
MULTIFAMILY
EUI (
kBtu
/sf/y
ear)
Code Baseline EUITarget EUI
NA
NA
Energy Use Intensity Target
residential construction commercial construction
2.4%22.8%
9.9%22.0%14.9%
1.5%12.8%
6.1%
6.6%24.5%1.5%29.0%
8.2%4.2%25.5%
0.5%
0
10
20
30
40
50
60
70
80
PROFESSIONAL OFFICE
56%savings
EUI (
kBtu
/sf/y
ear)
Code Baseline EUITarget EUI
FIGURE 16. Example building energy simulation analysis to identify achievable energy use intensity values in different building types relative to business as usual; simulations were performed for DOE prototype buildings in the IECC 3a climate zone (Atlanta, Georgia) using OpenStudio/EnergyPlus workflows
106
68 6149 49
82
43 4232 27
0
20
40
60
80
100
120
Site
EU
I (kB
tu/s
qft/
year
)
90
50
8066
33
59
0102030405060708090
100
Site
EU
I (kB
tu/s
qft/
year
)
6464A GUIDE TO ENERGY MASTER PLANNING OF HIGH-PERFORMANCE DISTRICTS AND COMMUNITIES
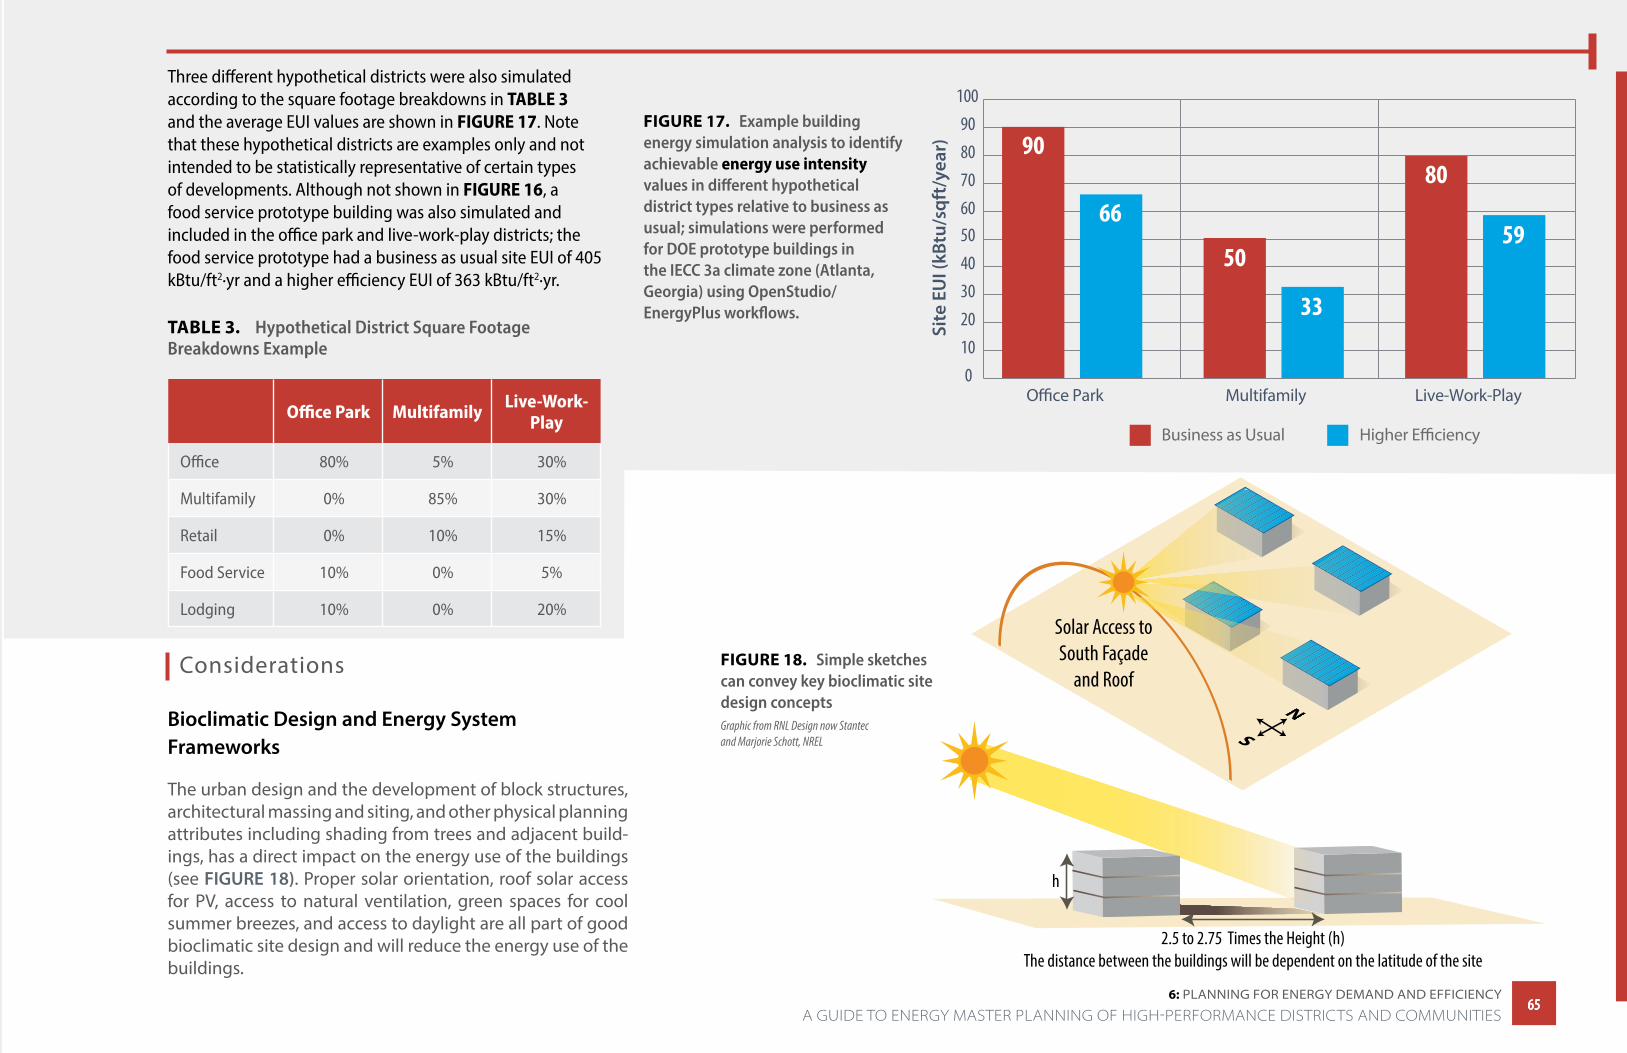
6: PlAnning FOr energy DemAnD AnD eFFiCienCy
Three different hypothetical districts were also simulated according to the square footage breakdowns in TABLE 3 and the average EUI values are shown in FIGURE 17. Note that these hypothetical districts are examples only and not intended to be statistically representative of certain types of developments. Although not shown in FIGURE 16, a food service prototype building was also simulated and included in the office park and live-work-play districts; the food service prototype had a business as usual site EUI of 405 kBtu/ft2·yr and a higher efficiency EUI of 363 kBtu/ft2·yr.
TABLE 3. Hypothetical District Square Footage Breakdowns Example
Office Park Multifamily Live-Work-Play
Office 80% 5% 30%
Multifamily 0% 85% 30%
Retail 0% 10% 15%
Food Service 10% 0% 5%
Lodging 10% 0% 20%
FIGURE 17. Example building energy simulation analysis to identify achievable energy use intensity values in different hypothetical district types relative to business as usual; simulations were performed for DOE prototype buildings in the IECC 3a climate zone (Atlanta, Georgia) using OpenStudio/EnergyPlus workflows.
106
68 6149 49
82
43 4232 27
0
20
40
60
80
100
120
Site
EU
I (kB
tu/s
qft/
year
)
90
50
8066
33
59
0102030405060708090
100
Site
EU
I (kB
tu/s
qft/
year
)
Considerations
Bioclimatic Design and Energy System Frameworks
The urban design and the development of block structures, architectural massing and siting, and other physical planning attributes including shading from trees and adjacent build-ings, has a direct impact on the energy use of the buildings (see FIGURE 18). Proper solar orientation, roof solar access for PV, access to natural ventilation, green spaces for cool summer breezes, and access to daylight are all part of good bioclimatic site design and will reduce the energy use of the buildings.
FIGURE 18. Simple sketches can convey key bioclimatic site design concepts Graphic from RNL Design now Stantec and Marjorie Schott, NREL
Solar Access toSouth Façade
and Roof
2.5 to 2.75 Times the Height (h)The distance between the buildings will be dependent on the latitude of the site
h
6565 A GUIDE TO ENERGY MASTER PLANNING OF HIGH-PERFORMANCE DISTRICTS AND COMMUNITIES
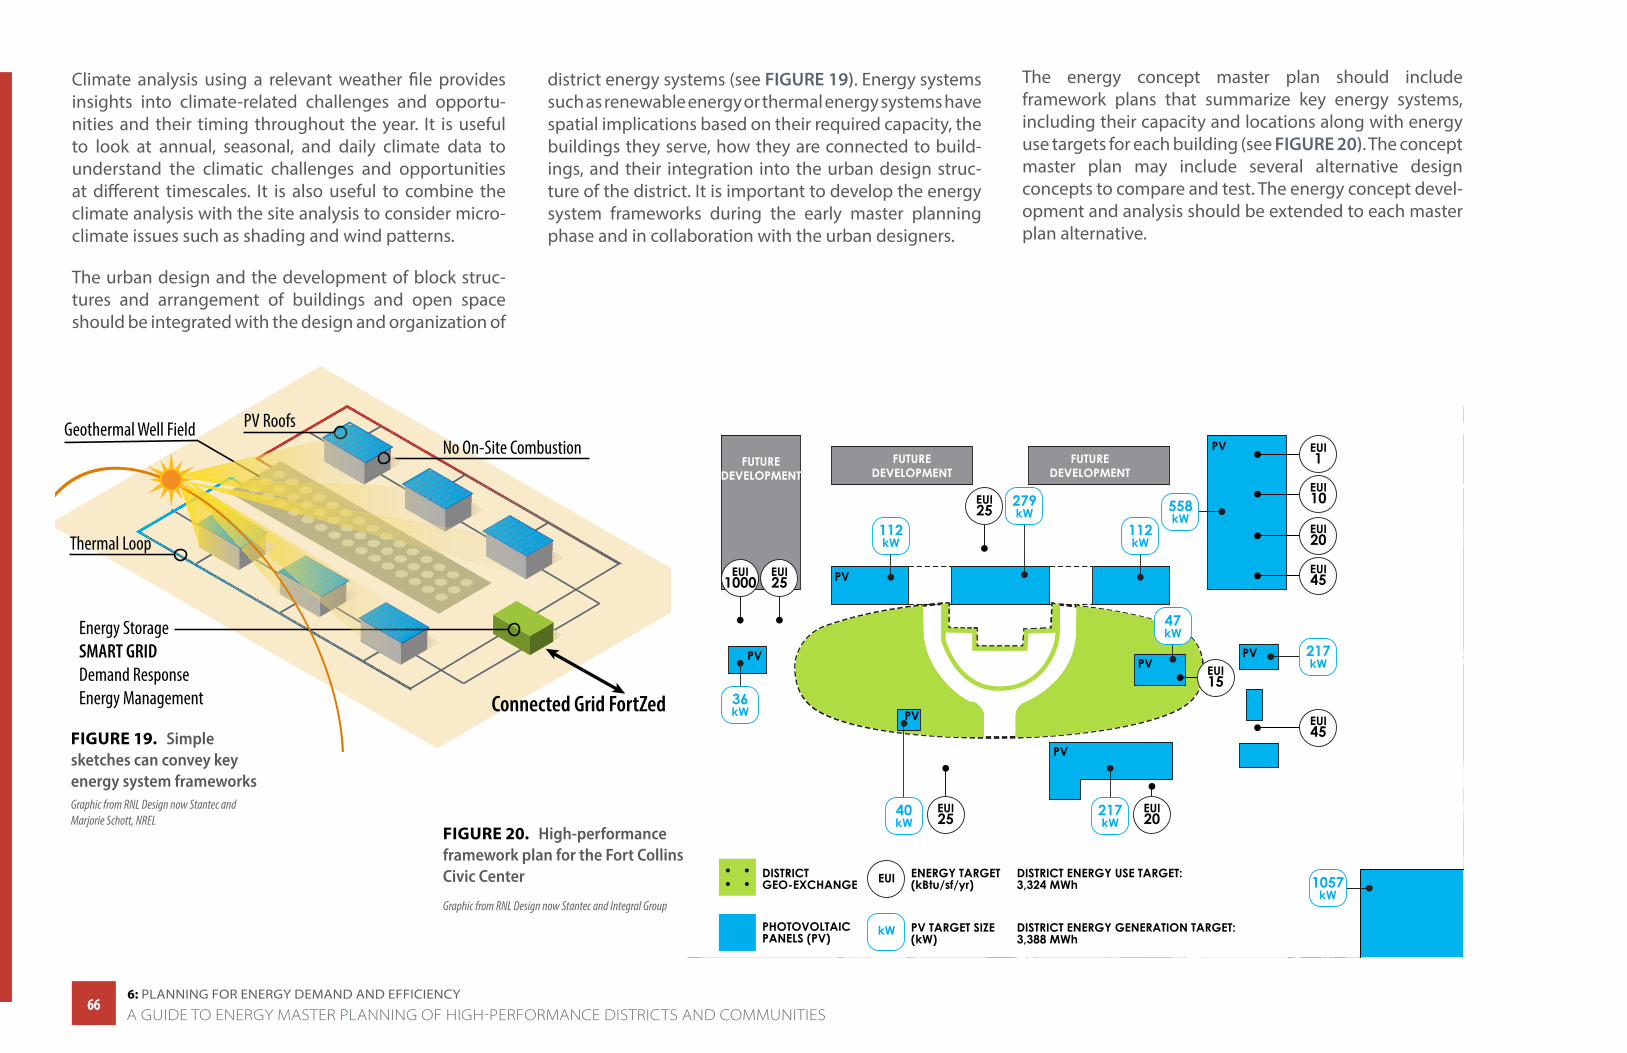
6: PlAnning FOr energy DemAnD AnD eFFiCienCy
Climate analysis using a relevant weather file provides insights into climate-related challenges and opportu-nities and their timing throughout the year. It is useful to look at annual, seasonal, and daily climate data to understand the climatic challenges and opportunities at different timescales. It is also useful to combine the climate analysis with the site analysis to consider micro-climate issues such as shading and wind patterns.
The urban design and the development of block struc-tures and arrangement of buildings and open space should be integrated with the design and organization of
district energy systems (see FIGURE 19). Energy systems such as renewable energy or thermal energy systems have spatial implications based on their required capacity, the buildings they serve, how they are connected to build-ings, and their integration into the urban design struc-ture of the district. It is important to develop the energy system frameworks during the early master planning phase and in collaboration with the urban designers.
Connected Grid FortZed
Energy StorageSMART GRIDDemand ResponseEnergy Management
Geothermal Well Field
Thermal Loop
PV RoofsNo On-Site Combustion
FIGURE 19. Simple sketches can convey key energy system frameworks Graphic from RNL Design now Stantec and Marjorie Schott, NREL
The energy concept master plan should include framework plans that summarize key energy systems, including their capacity and locations along with energy use targets for each building (see FIGURE 20). The concept master plan may include several alternative design concepts to compare and test. The energy concept devel-opment and analysis should be extended to each master plan alternative.
FUTUREDEVELOPMENT
FUTUREDEVELOPMENT
FUTUREDEVELOPMENT
EUI1000
36kW
EUI25
EUI25
112kW
112kW
279kW
EUI2540
kWEUI20
EUI15
217kW
PV
PV
PV
PVPV
PV
PV EUI45
EUI45
EUI20
EUI10
EUI1
217kW
558kW
47kW
EUI
kW
DISTRICTGEO-EXCHANGE
PHOTOVOLTAICPANELS (PV)
PV TARGET SIZE(kW)
ENERGY TARGET(kBtu/sf/yr) 1057
kW
DISTRICT ENERGY USE TARGET: 3,324 MWh
DISTRICT ENERGY GENERATION TARGET: 3,388 MWh
FIGURE 20. High-performance framework plan for the Fort Collins Civic Center
Graphic from RNL Design now Stantec and Integral Group
6666A GUIDE TO ENERGY MASTER PLANNING OF HIGH-PERFORMANCE DISTRICTS AND COMMUNITIES
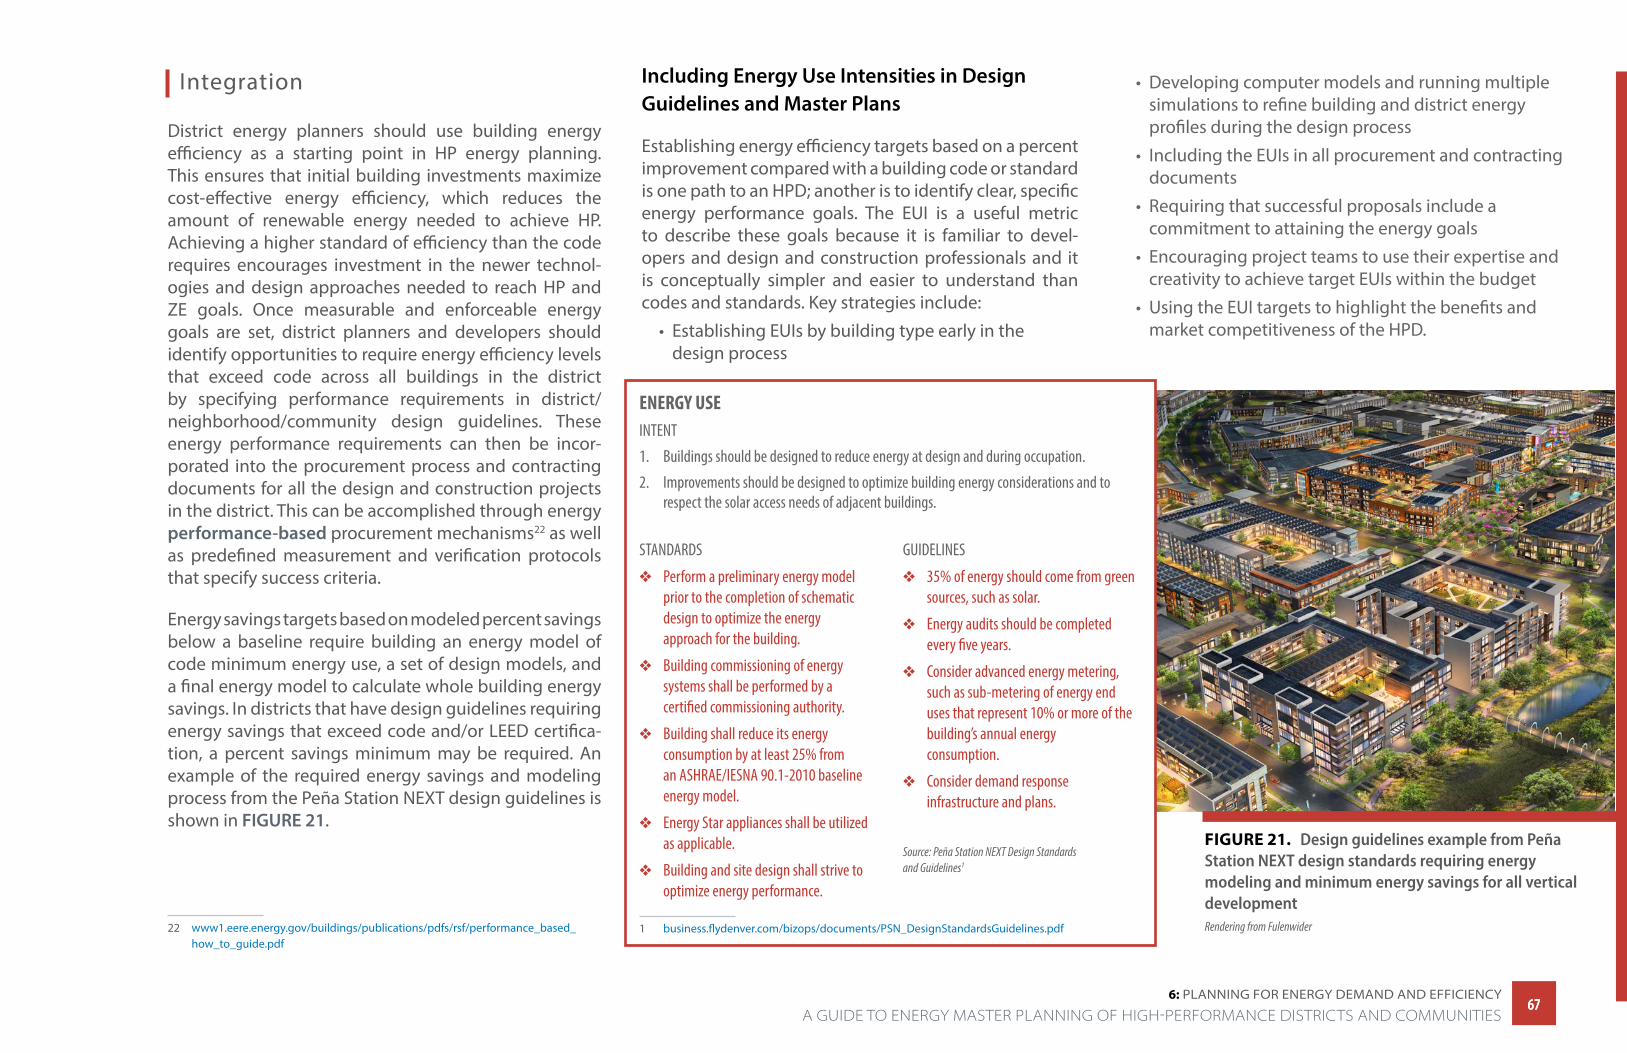
6: PlAnning FOr energy DemAnD AnD eFFiCienCy
Integration
District energy planners should use building energy efficiency as a starting point in HP energy planning. This ensures that initial building investments maximize cost-effective energy efficiency, which reduces the amount of renewable energy needed to achieve HP. Achieving a higher standard of efficiency than the code requires encourages investment in the newer technol-ogies and design approaches needed to reach HP and ZE goals. Once measurable and enforceable energy goals are set, district planners and developers should identify opportunities to require energy efficiency levels that exceed code across all buildings in the district by specifying performance requirements in district/neighborhood/community design guidelines. These energy performance requirements can then be incor-porated into the procurement process and contracting documents for all the design and construction projects in the district. This can be accomplished through energy performance-based procurement mechanisms22 as well as predefined measurement and verification protocols that specify success criteria.
Energy savings targets based on modeled percent savings below a baseline require building an energy model of code minimum energy use, a set of design models, and a final energy model to calculate whole building energy savings. In districts that have design guidelines requiring energy savings that exceed code and/or LEED certifica-tion, a percent savings minimum may be required. An example of the required energy savings and modeling process from the Peña Station NEXT design guidelines is shown in FIGURE 21.
22 www1.eere.energy.gov/buildings/publications/pdfs/rsf/performance_based_how_to_guide.pdf
FIGURE 21. Design guidelines example from Peña Station NEXT design standards requiring energy modeling and minimum energy savings for all vertical developmentRendering from Fulenwider
ENERGY USE
1 business.flydenver.com/bizops/documents/PSN_DesignStandardsGuidelines.pdf
INTENT
1. Buildings should be designed to reduce energy at design and during occupation.
2. Improvements should be designed to optimize building energy considerations and to respect the solar access needs of adjacent buildings.
STANDARDS
v Perform a preliminary energy model prior to the completion of schematic design to optimize the energy approach for the building.
v Building commissioning of energy systems shall be performed by a certified commissioning authority.
v Building shall reduce its energy consumption by at least 25% from an ASHRAE/IESNA 90.1-2010 baseline energy model.
v Energy Star appliances shall be utilized as applicable.
v Building and site design shall strive to optimize energy performance.
GUIDELINES
v 35% of energy should come from green sources, such as solar.
v Energy audits should be completed every five years.
v Consider advanced energy metering, such as sub-metering of energy end uses that represent 10% or more of the building’s annual energy consumption.
v Consider demand response infrastructure and plans.
Source: Peña Station NEXT Design Standards and Guidelines1
Including Energy Use Intensities in Design Guidelines and Master Plans
Establishing energy efficiency targets based on a percent improvement compared with a building code or standard is one path to an HPD; another is to identify clear, specific energy performance goals. The EUI is a useful metric to describe these goals because it is familiar to devel-opers and design and construction professionals and it is conceptually simpler and easier to understand than codes and standards. Key strategies include:
• Establishing EUIs by building type early in the design process
• Developing computer models and running multiple simulations to refine building and district energy profiles during the design process
• Including the EUIs in all procurement and contracting documents
• Requiring that successful proposals include a commitment to attaining the energy goals
• Encouraging project teams to use their expertise and creativity to achieve target EUIs within the budget
• Using the EUI targets to highlight the benefits and market competitiveness of the HPD.
6767 A GUIDE TO ENERGY MASTER PLANNING OF HIGH-PERFORMANCE DISTRICTS AND COMMUNITIES

CHAPTer 7
DISTRICT THERMAL ENERGY PLANNING
The False Creek Neighbourhood Energy Utility in Vancouver, British Columbia, uses waste thermal energy captured from sewage to provide space heating and hot water to buildings in several neighborhoods.Photo from City of Vancouver, British Columbia
6868
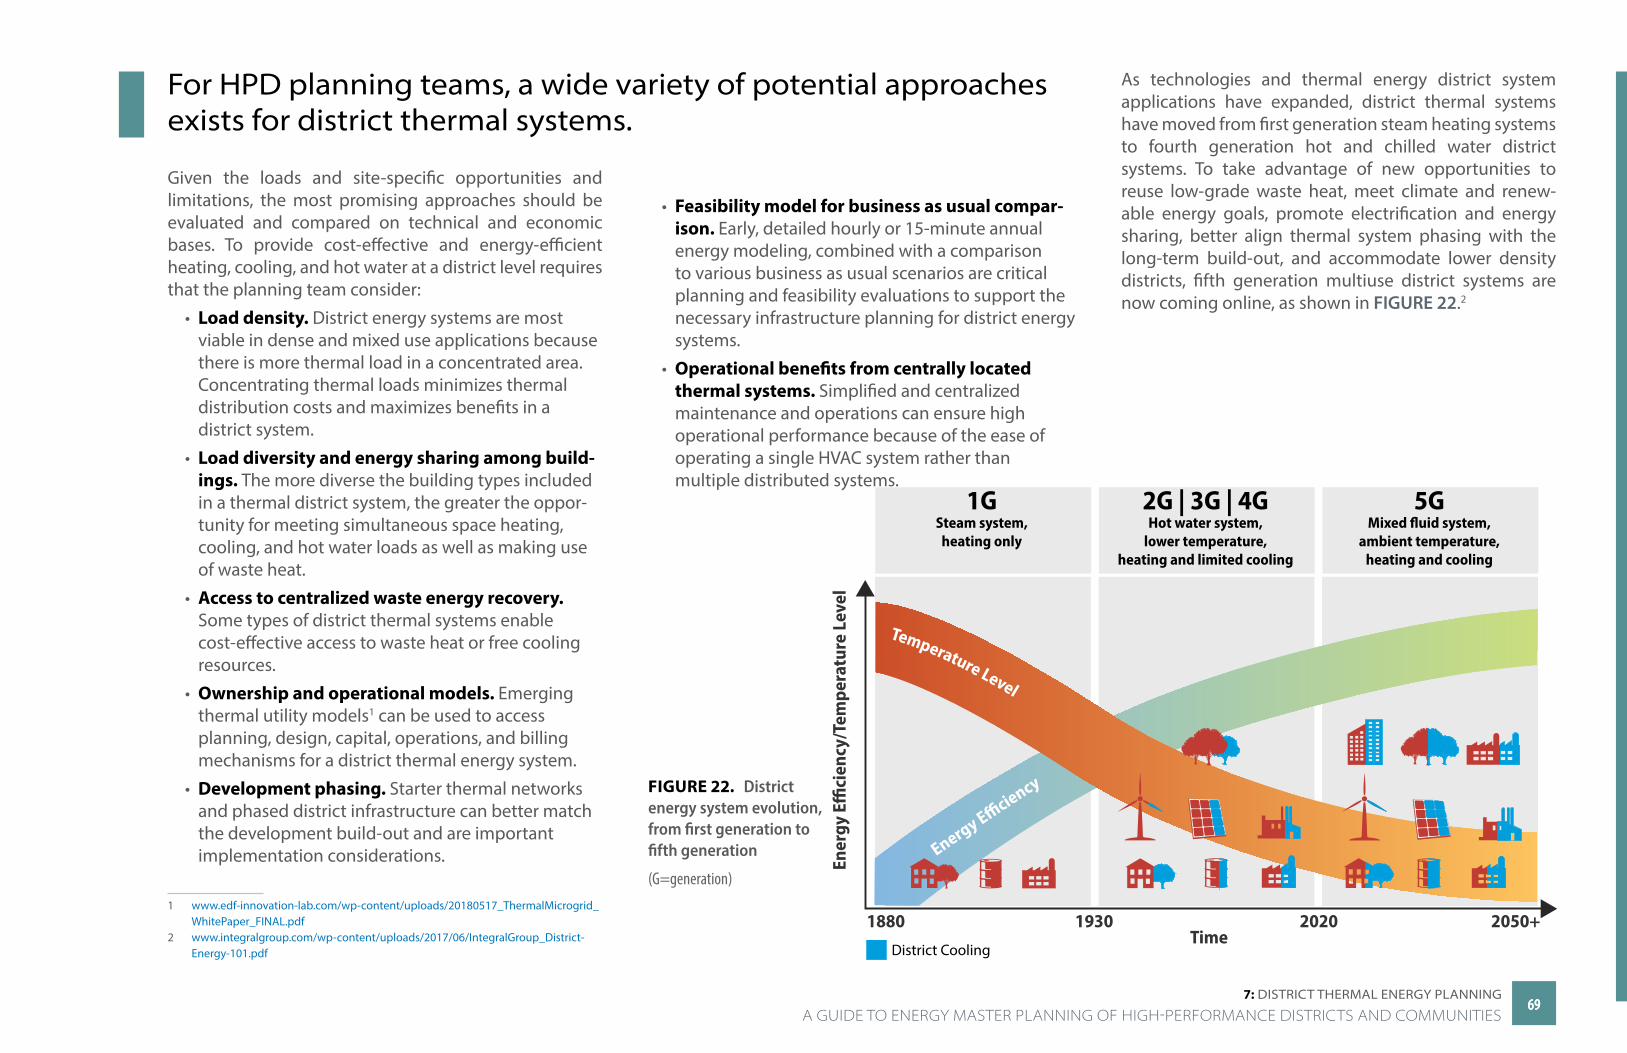
7: DiSTriCT THermAl energy PlAnning
For HPD planning teams, a wide variety of potential approaches exists for district thermal systems.
1 www.edf-innovation-lab.com/wp-content/uploads/20180517_ThermalMicrogrid_WhitePaper_FINAL.pdf
2 www.integralgroup.com/wp-content/uploads/2017/06/IntegralGroup_District-Energy-101.pdf
Given the loads and site-specific opportunities and limitations, the most promising approaches should be evaluated and compared on technical and economic bases. To provide cost-effective and energy-efficient heating, cooling, and hot water at a district level requires that the planning team consider:
• Load density. District energy systems are most viable in dense and mixed use applications because there is more thermal load in a concentrated area. Concentrating thermal loads minimizes thermal distribution costs and maximizes benefits in a district system.
• Load diversity and energy sharing among build-ings. The more diverse the building types included in a thermal district system, the greater the oppor-tunity for meeting simultaneous space heating, cooling, and hot water loads as well as making use of waste heat.
• Access to centralized waste energy recovery. Some types of district thermal systems enable cost-effective access to waste heat or free cooling resources.
• Ownership and operational models. Emerging thermal utility models1 can be used to access planning, design, capital, operations, and billing mechanisms for a district thermal energy system.
• Development phasing. Starter thermal networks and phased district infrastructure can better match the development build-out and are important implementation considerations.
• Feasibility model for business as usual compar-ison. Early, detailed hourly or 15-minute annual energy modeling, combined with a comparison to various business as usual scenarios are critical planning and feasibility evaluations to support the necessary infrastructure planning for district energy systems.
• Operational benefits from centrally located thermal systems. Simplified and centralized maintenance and operations can ensure high operational performance because of the ease of operating a single HVAC system rather than multiple distributed systems.
As technologies and thermal energy district system applications have expanded, district thermal systems have moved from first generation steam heating systems to fourth generation hot and chilled water district systems. To take advantage of new opportunities to reuse low-grade waste heat, meet climate and renew-able energy goals, promote electrification and energy sharing, better align thermal system phasing with the long-term build-out, and accommodate lower density districts, fifth generation multiuse district systems are now coming online, as shown in FIGURE 22.2
1880 1930 2020 2050+Time
Temperature Level
District Cooling
FIGURE 22. District energy system evolution, from first generation to fifth generation
(G=generation)
A GUIDE TO ENERGY MASTER PLANNING OF HIGH-PERFORMANCE DISTRICTS AND COMMUNITIES6969
https://www.edf-innovation-lab.com/wp-content/uploads/20180517_ThermalMicrogrid_WhitePaper_FINAL.pdf
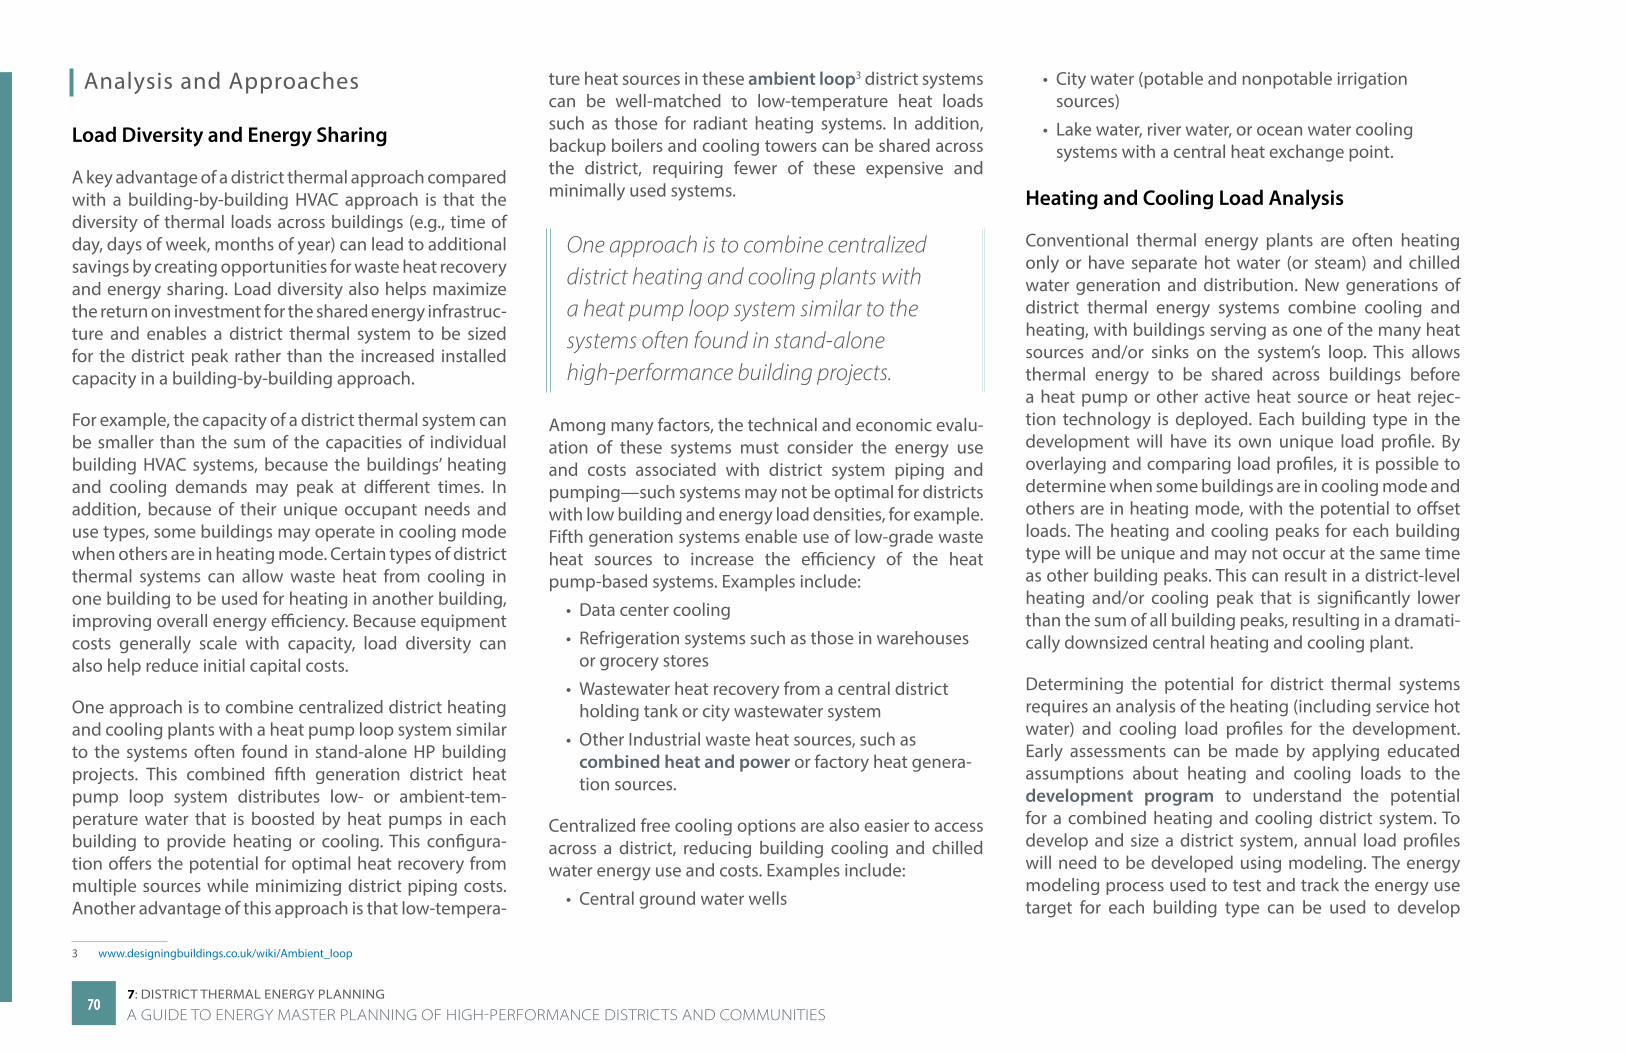
7: DiSTriCT THermAl energy PlAnning
Analysis and Approaches
Load Diversity and Energy Sharing
A key advantage of a district thermal approach compared with a building-by-building HVAC approach is that the diversity of thermal loads across buildings (e.g., time of day, days of week, months of year) can lead to additional savings by creating opportunities for waste heat recovery and energy sharing. Load diversity also helps maximize the return on investment for the shared energy infrastruc-ture and enables a district thermal system to be sized for the district peak rather than the increased installed capacity in a building-by-building approach.
For example, the capacity of a district thermal system can be smaller than the sum of the capacities of individual building HVAC systems, because the buildings’ heating and cooling demands may peak at different times. In addition, because of their unique occupant needs and use types, some buildings may operate in cooling mode when others are in heating mode. Certain types of district thermal systems can allow waste heat from cooling in one building to be used for heating in another building, improving overall energy efficiency. Because equipment costs generally scale with capacity, load diversity can also help reduce initial capital costs.
One approach is to combine centralized district heating and cooling plants with a heat pump loop system similar to the systems often found in stand-alone HP building projects. This combined fifth generation district heat pump loop system distributes low- or ambient-tem-perature water that is boosted by heat pumps in each building to provide heating or cooling. This configura-tion offers the potential for optimal heat recovery from multiple sources while minimizing district piping costs. Another advantage of this approach is that low-tempera-
3 www.designingbuildings.co.uk/wiki/Ambient_loop
ture heat sources in these ambient loop3 district systems can be well-matched to low-temperature heat loads such as those for radiant heating systems. In addition, backup boilers and cooling towers can be shared across the district, requiring fewer of these expensive and minimally used systems.
One approach is to combine centralized district heating and cooling plants with a heat pump loop system similar to the systems often found in stand-alone high-performance building projects.
Among many factors, the technical and economic evalu-ation of these systems must consider the energy use and costs associated with district system piping and pumping—such systems may not be optimal for districts with low building and energy load densities, for example. Fifth generation systems enable use of low-grade waste heat sources to increase the efficiency of the heat pump-based systems. Examples include:
• Data center cooling
• Refrigeration systems such as those in warehouses or grocery stores
• Wastewater heat recovery from a central district holding tank or city wastewater system
• Other Industrial waste heat sources, such as combined heat and power or factory heat genera-tion sources.
Centralized free cooling options are also easier to access across a district, reducing building cooling and chilled water energy use and costs. Examples include:
• Central ground water wells
• City water (potable and nonpotable irrigation sources)
• Lake water, river water, or ocean water cooling systems with a central heat exchange point.
Heating and Cooling Load Analysis
Conventional thermal energy plants are often heating only or have separate hot water (or steam) and chilled water generation and distribution. New generations of district thermal energy systems combine cooling and heating, with buildings serving as one of the many heat sources and/or sinks on the system’s loop. This allows thermal energy to be shared across buildings before a heat pump or other active heat source or heat rejec-tion technology is deployed. Each building type in the development will have its own unique load profile. By overlaying and comparing load profiles, it is possible to determine when some buildings are in cooling mode and others are in heating mode, with the potential to offset loads. The heating and cooling peaks for each building type will be unique and may not occur at the same time as other building peaks. This can result in a district-level heating and/or cooling peak that is significantly lower than the sum of all building peaks, resulting in a dramati-cally downsized central heating and cooling plant.
Determining the potential for district thermal systems requires an analysis of the heating (including service hot water) and cooling load profiles for the development. Early assessments can be made by applying educated assumptions about heating and cooling loads to the development program to understand the potential for a combined heating and cooling district system. To develop and size a district system, annual load profiles will need to be developed using modeling. The energy modeling process used to test and track the energy use target for each building type can be used to develop
7070A GUIDE TO ENERGY MASTER PLANNING OF HIGH-PERFORMANCE DISTRICTS AND COMMUNITIES
7: DiSTriCT THermAl energy PlAnning
more accurate and detailed load profiles (see FIGURE 23). The energy modeling process should also be used to test different district thermal system designs. FIGURE 24 through FIGURE 26 illustrate the range of thermal district systems that were considered and evaluated for the Denver Water campus (see the Denver Water case study on page 118).
-
50
100
150
200
250
300
350
400
450
500
550
600
Daily
ther
mal
ener
gy de
man
d, Bt
u x 10
6 /day
January February March April May June July August September October November December
Chilled hot water load, boiler gas+oil, distributed gas, data processed to daily average demand, Btu x 106/day
Projected for new construction and additional cooling at existing buildings
FIGURE 23. Example of load profile analysis of the Swarthmore College campus Graphic from Integral Group
7171 A GUIDE TO ENERGY MASTER PLANNING OF HIGH-PERFORMANCE DISTRICTS AND COMMUNITIES
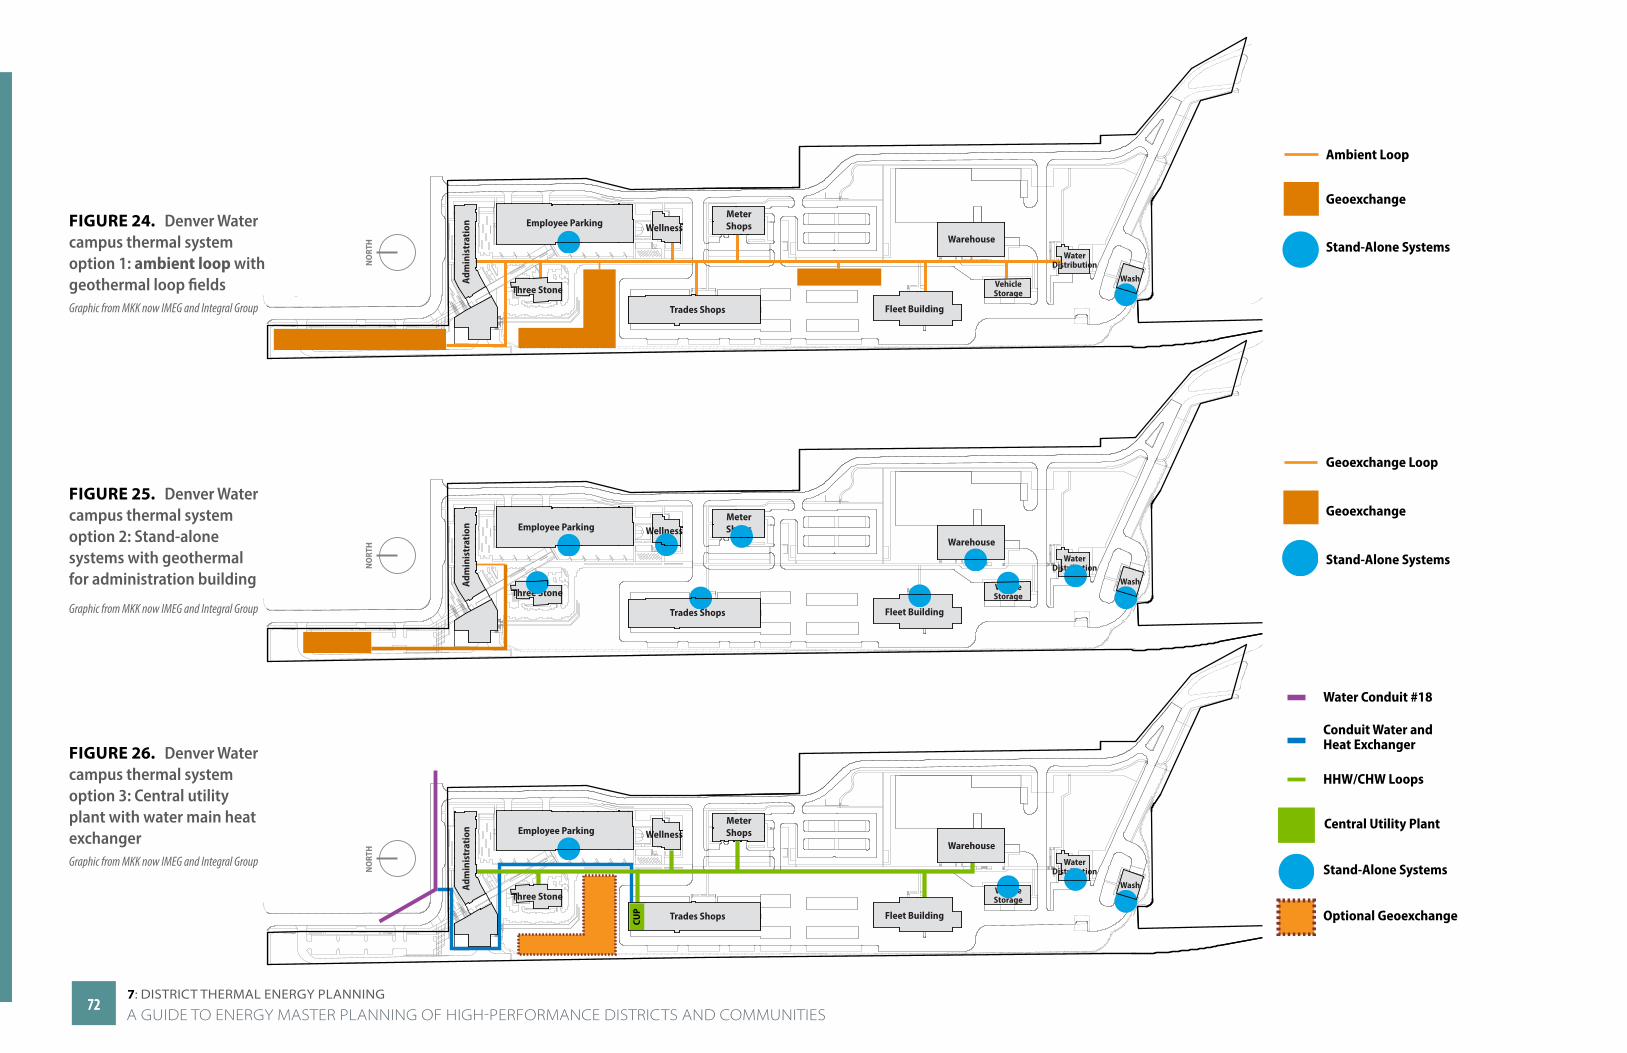
7: DiSTriCT THermAl energy PlAnning
FIGURE 24. Denver Water campus thermal system option 1: ambient loop with geothermal loop fields Graphic from MKK now IMEG and Integral Group
FIGURE 25. Denver Water campus thermal system option 2: Stand-alone systems with geothermal for administration building
Graphic from MKK now IMEG and Integral Group
FIGURE 26. Denver Water campus thermal system option 3: Central utility plant with water main heat exchanger Graphic from MKK now IMEG and Integral Group
Employee Parking
Adm
inis
trat
ion Wellness
MeterShops
Trades Shops
Three Stone
Fleet Building
Warehouse
VehicleStorage
WaterDistribution
Wash
NO
RTH
Employee Parking
Adm
inis
trat
ion Wellness
MeterShops
Trades Shops
Three Stone
Fleet Building
Warehouse
VehicleStorage
WaterDistribution
Wash
CUP
NO
RTH
NO
RTH
Employee Parking
Adm
inis
trat
ion Wellness
MeterShops
Trades Shops
Three Stone
Fleet Building
Warehouse
VehicleStorage
WaterDistribution
Wash
Ambient Loop
Geoexchange
Stand-Alone Systems
Geoexchange Loop
Geoexchange
Stand-Alone Systems
Conduit Water and Heat Exchanger
HHW/CHW Loops
Water Conduit #18
Central Utility Plant
Optional Geoexchange
Stand-Alone Systems
7272A GUIDE TO ENERGY MASTER PLANNING OF HIGH-PERFORMANCE DISTRICTS AND COMMUNITIES
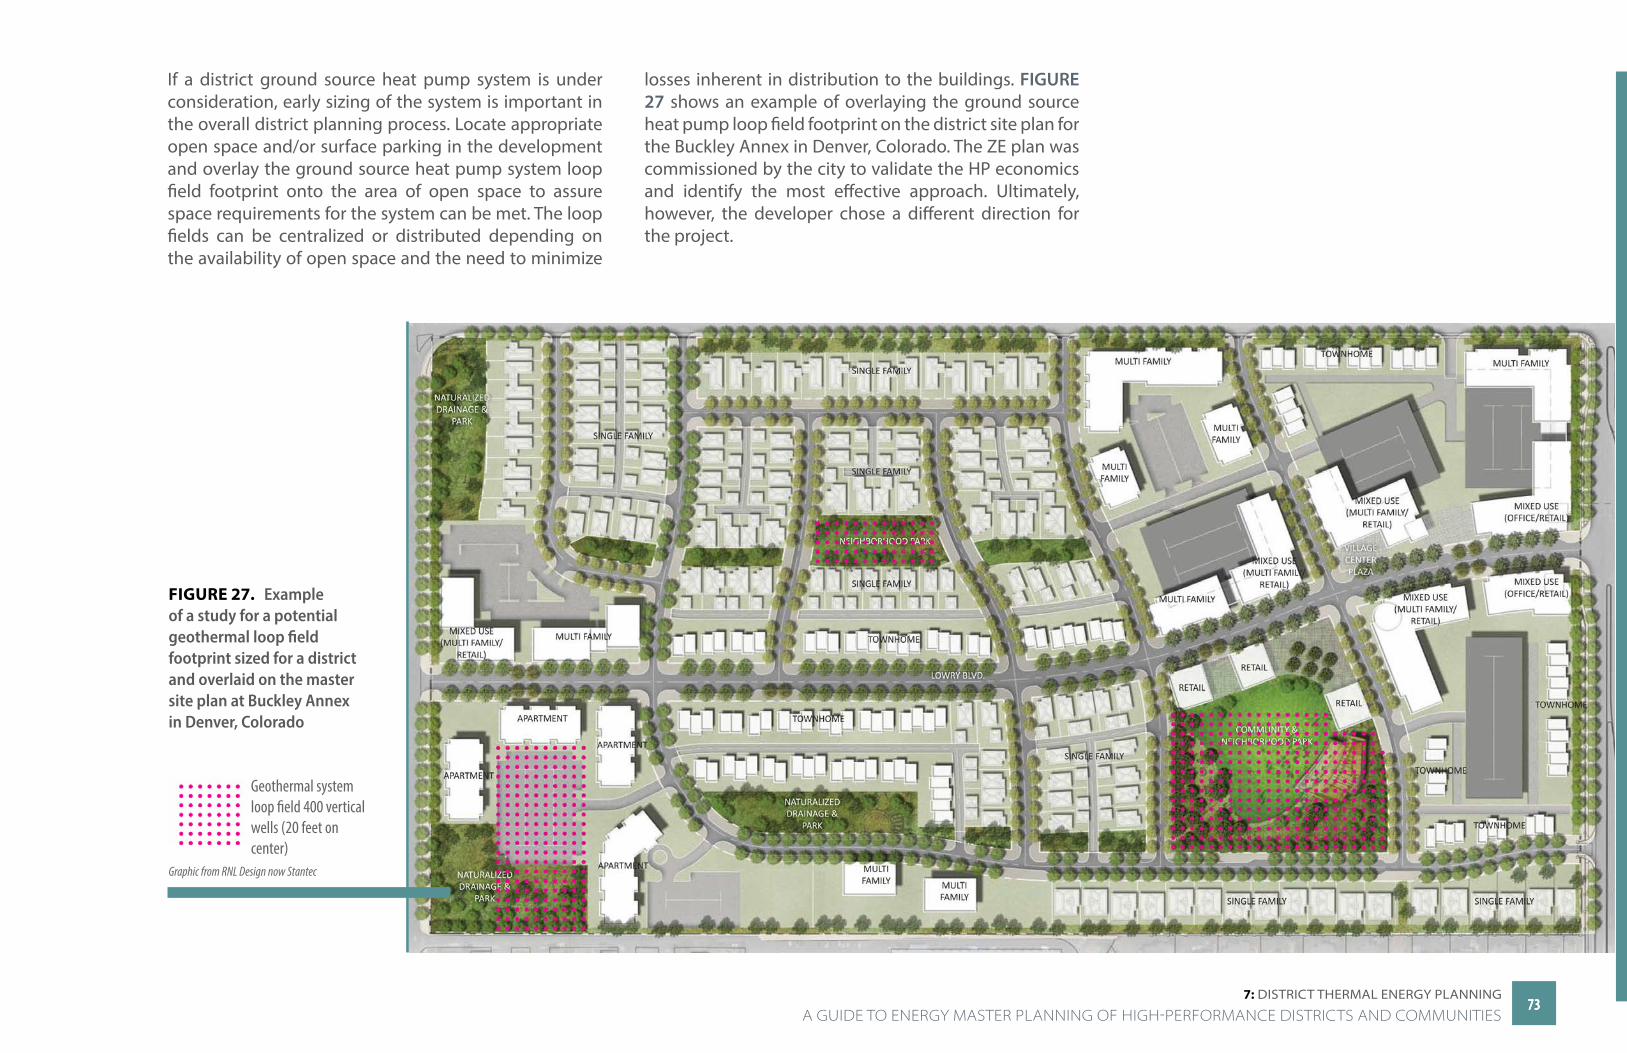
7: DiSTriCT THermAl energy PlAnning
If a district ground source heat pump system is under consideration, early sizing of the system is important in the overall district planning process. Locate appropriate open space and/or surface parking in the development and overlay the ground source heat pump system loop field footprint onto the area of open space to assure space requirements for the system can be met. The loop fields can be centralized or distributed depending on the availability of open space and the need to minimize
losses inherent in distribution to the buildings. FIGURE 27 shows an example of overlaying the ground source heat pump loop field footprint on the district site plan for the Buckley Annex in Denver, Colorado. The ZE plan was commissioned by the city to validate the HP economics and identify the most effective approach. Ultimately, however, the developer chose a different direction for the project.
FIGURE 27. Example of a study for a potential geothermal loop field footprint sized for a district and overlaid on the master site plan at Buckley Annex in Denver, Colorado
Geothermal system loop field 400 vertical wells (20 feet on center)
Graphic from RNL Design now Stantec
7373 A GUIDE TO ENERGY MASTER PLANNING OF HIGH-PERFORMANCE DISTRICTS AND COMMUNITIES

7: DiSTriCT THermAl energy PlAnning
Example Analysis: Heating and CoolingPlanners should consider energy and cost questions in the early district planning stages, including:
• Based on the mix of building types and sizes for the district in question, are there enough periods of simul-taneous heating and cooling in the district to convince designers that a district thermal system with heat recovery is feasible?
• Is there sufficient annual balance between heating and cooling loads for a district ground source heat pump system? Are soil properties suitable for a ground source heat pump system?
• Are the district energy benefits sufficient to justify distribution and piping costs for the district distribution system?
• Are the centralized waste heating and cooling resources sufficient to justify a district scale thermal distribution system?
District planners can use building energy modeling and/or utility and submeter data analysis to investigate the expected occurrences of simultaneous heating and cooling in the district. Modeling is likely required for new construc-tion districts or retrofit districts in which deep building energy efficiency improvements are being considered along with the addition or upgrade of a district thermal system. For new construction districts, the analysis builds directly on the district building energy efficiency analysis reviewed in Planning for Energy Demand and Efficiency on page 58. Using prototype building models gener-ated for the different building types in the district, the
4 The types of visualizations shown in Figures 28 and 29 were inspired by prior analysis performed by Stanford University for the Stanford campus district energy system (see Stanford case study on page 142).
analyst’s objective is to estimate the hourly or subhourly heating and cooling loads over the course of a year and then quantify the degree to which those loads overlap in timing and magnitude.
An example of this type of analysis is shown in FIGURE 28–FIGURE 30 for a live-work-play hypothetical district in the IECC 3a climate zone (Atlanta, Georgia). The example district is 1 million total square feet comprising 30% office, 30% multifamily, 15% retail, 5% food service, and 20% lodging. The building prototypes were simulated at approaching ZE efficiency levels. The district-wide total aggregate hourly heating and cooling loads were estimated based on the simulation end use output data (power consumption for heating and cooling converted to estimates of heating and cooling loads based on system efficiencies). It is important that heating and cooling loads are calculated and compared in the same energy units (e.g., millions of British thermal units or MBtu).
FIGURE 28 visually shows how heating and cooling loads can be compared on a daily basis for example days in the fall/spring, summer, and winter. The yellow area represents the amount of overlapping heating and cooling loads for those days. FIGURE 29 shows the overlap in heating and cooling loads over the course of the entire year. For this type of visualization, cooling loads are plotted in the positive y-axis direction and heating loads in the negative direction. The magnitude of the overlapping heating and cooling loads is plotted in black in both the positive and negative directions. For this hypothetical live-work-play district in Atlanta, Georgia, FIGURE 28 and FIGURE 294 make it apparent that there are substantial overlapping heating and cooling loads. The largest opportunities occur during the summer when there is abundant waste heat
from cooling that could be used to meet almost all of the heating requirements in the district (e.g., service water heating for multifamily buildings) if a shared district thermal system was in place.
Thermal overlap can also be quantified by performing calculations based on the hourly or subhourly heating and cooling load data. One calculation approach is:
min (HLhour,CLhour)OL = ∑ hour =1hour =8760
where OL is the total annual overlapping load, HL is the hourly heating load, CL is the hourly cooling load, and “min” indicates that for a particular hour of the year, the hourly overlapping load is the minimum of the heating and cooling loads, whichever is lesser. The overlapping load can also be expressed as a percentage of either the cooling or heating load in the district:
Percent heating overlapped by cooling = OL/HL
Percent cooling overlapped by heating = OL/CL
For example, these values were calculated for several hypothetical district types in IECC 5B climate region (Denver, Colorado). As FIGURE 30 shows, the amount of overlap varies by district type, but each district has some opportunity for energy savings through energy recovery. In addition to varying based on the mix of building types and sizes, overlap varies depending on the climate so it is important to consider the local climate of the district in these types of analyses.
7474A GUIDE TO ENERGY MASTER PLANNING OF HIGH-PERFORMANCE DISTRICTS AND COMMUNITIES
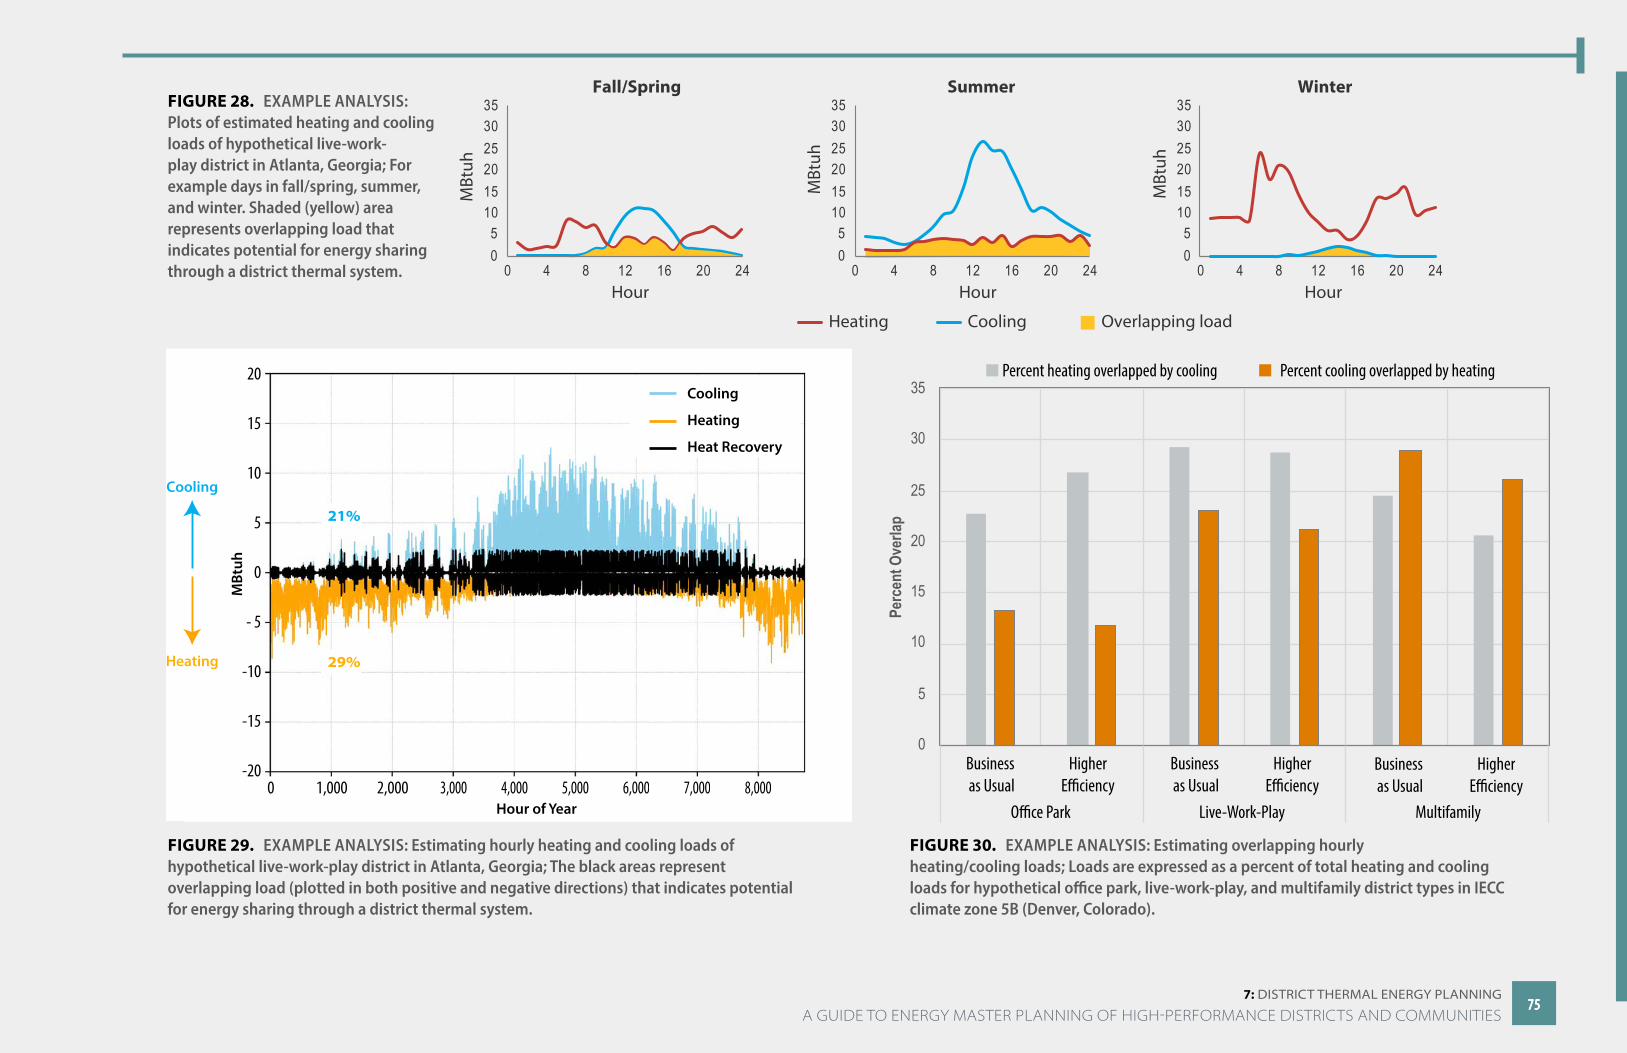
7: DiSTriCT THermAl energy PlAnning
FIGURE 28. EXAMPLE ANALYSIS: Plots of estimated heating and cooling loads of hypothetical live-work-play district in Atlanta, Georgia; For example days in fall/spring, summer, and winter. Shaded (yellow) area represents overlapping load that indicates potential for energy sharing through a district thermal system.
05
101520253035
0 4 8 12 16 20 24
MBt
uh
Hour
Summer
05
101520253035
0 4 8 12 16 20 24
MBt
uh
Hour
Winter
05
101520253035
0 4 8 12 16 20 24
MBt
uh
Hour
Fall/Spring
Heating Cooling Overlapping load
FIGURE 29. EXAMPLE ANALYSIS: Estimating hourly heating and cooling loads of hypothetical live-work-play district in Atlanta, Georgia; The black areas represent overlapping load (plotted in both positive and negative directions) that indicates potential for energy sharing through a district thermal system.
'
Cooling
Heating 29%
21%
Cooling
Heating
Heat Recovery
Hour of Year0 1,000 2,000 3,000 4,000 5,000 6,000 7,000 8,000
-20
-15
-10
- 5
0
20
15
10
5
MBt
uh
FIGURE 30. EXAMPLE ANALYSIS: Estimating overlapping hourly heating/cooling loads; Loads are expressed as a percent of total heating and cooling loads for hypothetical office park, live-work-play, and multifamily district types in IECC climate zone 5B (Denver, Colorado).
0
5
10
15
20
25
30
35
Office Park Live-Work-Play Multifamily
Perc
ent O
verla
p
Simultaneous Heating & Cooling – CZ 5B
Business as Usual
HigherEfficiency
Business as Usual
HigherEfficiency
Business as Usual
HigherEfficiency
Percent heating overlapped by cooling Percent cooling overlapped by heating
7575 A GUIDE TO ENERGY MASTER PLANNING OF HIGH-PERFORMANCE DISTRICTS AND COMMUNITIES
7: DiSTriCT THermAl energy PlAnning
Considerations
Despite the promise of district energy systems, a number of challenges inhibit their wide use in the United States. The infrastructure needed to distribute energy, typically underground pipes, can be expensive and is not typically included in the cost calculations of traditional develop-ments. One study found that 77% of the cost of installing heat distribution networks consists of excavation (37%), installing pipes (17%), and installing the equipment that connects the district system to buildings (23%).5 When excavation work is aligned with excavation for other projects, such as transportation, water/wastewater, or data infrastructure, the additional excavation cost of installing a district system can be eliminated or reduced significantly. Infrastructure costs can be particularly high in retrofit scenarios in which distribution system rights of way have not yet been secured and individual buildings have to be built without clarity on the district energy system design and interconnection. In Europe, district thermal systems have been shown to be 13%–26% less expensive in greenfield developments than in existing development retrofits.6
Phasing
A district energy system has to be built before it can begin to collect revenue and that construction can take a long time. This investment/revenue time lag can be a challenge for attracting private sector capital to these projects. Securing commitments from anchor customers can help spur the construction of the first “starter network,” which can then be expanded as the devel-opment phasing progresses. It is important to get this first district project or phase right so that it serves as a
5 d2umxnkyjne36n.cloudfront.net/teaserImages/Reducing-the-capital-cost-of-district-heat-network-infrastructure.pdf?mtime=20171103092304 6 www.witpress.com/Secure/elibrary/papers/ESUS13/ESUS13009FU1.pdf 7 higherlogicdownload.s3.amazonaws.com/DISTRICTENERGY/UploadedImages/06ccd955-5616-4383-af4d-ee333155fa32/EXEC-2018-003761_AMO_District_Energy_Report.pdf8 www.districtenergyinitiative.org/sites/default/files/report_pdf/03%20District%20Energy%20Chapter%203_print.pdf
compelling example of the efficacy of district thermal energy systems.
Architectural Benefits
There are many nonenergy benefits of district systems (see TABLE 1 on page 36), such as minimizing the need for rooftop HVAC equipment, which makes larger rooftop PV systems possible. District systems also free up building floor area for more valuable uses than an HVAC mechanical room.
Business Model Approaches
When district systems are owned and used by one entity, such as a university campus or hospital system, business and governance models are typically straightforward. However, when the district system connects many different building owners, multiuser agreements can be very complex and successful models are still not widely shared.7 This holds true for smaller thermal energy sharing agreements between residential homeowners and land developers or homeowners’ associations. Business models for district energy systems can be categorized as public, hybrid public/private (see Chapter 3: Developing Financial and Business Models on page 32), and private. The vast majority of district systems have some sort of public involvement as an owner, lender, operator, consumer, or demand aggregator.
Most of the existing district systems worldwide are wholly publicly owned. One advantage of publicly-owned systems is that they can be a means for aligning public goals such as reducing carbon emissions, improving resilience, or providing affordable heat to residents. Another advantage of publicly-owned systems is access
to lower cost financing through the bond market than is possible in the private sector.
District systems that are wholly public often create a “special purpose vehicle” or other subsidiary, governed by a separate board, to reduce the financial liability of the city or other entity, ease the administrative burden, expedite the development process, and make selling the system down the road easier. Once the system is built out and collecting stable revenue, it will have a more established value and the public owners may be able to recoup their investment by selling it off in whole or part.
Hybrid public/private systems share the risk of the system development and operation between governments—typically local authorities—and a private entity—typically an energy services company. These systems usually have higher rates of return than wholly-public systems, which makes them attractive to private inves-tors. Each entity brings forth its competitive advantages, skill sets, and resources to create a mutually beneficial partnership. As risk, decisions, and authority are often shared, clear agreements between the parties are key to long-term success.
Three common types of the hybrid model are the joint venture, the concession contract, and the community owned nonprofit.8 In the joint venture, ownership of the special purpose vehicle created for the project is split between the public and private entities, which may use a pooled asset model to create a combined single company to which each brings its expertise and skills. In other cases, the two entities independently carry out their agreed upon functions using a split asset model.
7676A GUIDE TO ENERGY MASTER PLANNING OF HIGH-PERFORMANCE DISTRICTS AND COMMUNITIES
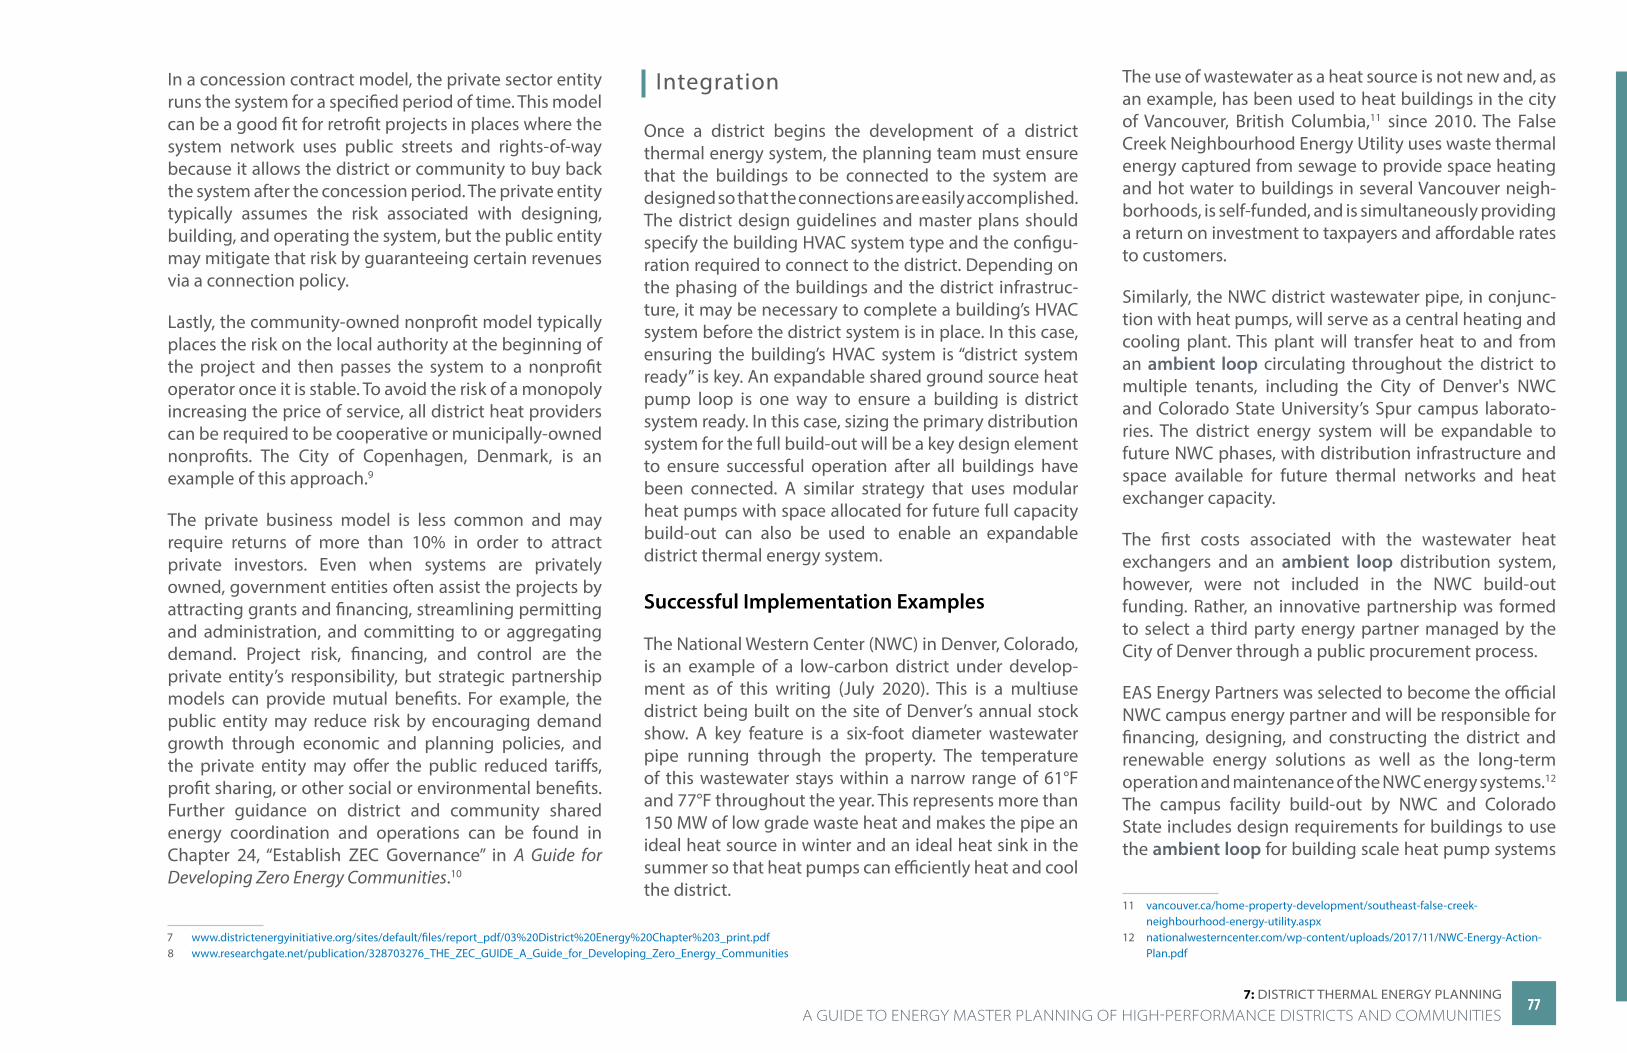
7: DiSTriCT THermAl energy PlAnning
In a concession contract model, the private sector entity runs the system for a specified period of time. This model can be a good fit for retrofit projects in places where the system network uses public streets and rights-of-way because it allows the district or community to buy back the system after the concession period. The private entity typically assumes the risk associated with designing, building, and operating the system, but the public entity may mitigate that risk by guaranteeing certain revenues via a connection policy.
Lastly, the community-owned nonprofit model typically places the risk on the local authority at the beginning of the project and then passes the system to a nonprofit operator once it is stable. To avoid the risk of a monopoly increasing the price of service, all district heat providers can be required to be cooperative or municipally-owned nonprofits. The City of Copenhagen, Denmark, is an example of this approach.9
The private business model is less common and may require returns of more than 10% in order to attract private investors. Even when systems are privately owned, government entities often assist the projects by attracting grants and financing, streamlining permitting and administration, and committing to or aggregating demand. Project risk, financing, and control are the private entity’s responsibility, but strategic partnership models can provide mutual benefits. For example, the public entity may reduce risk by encouraging demand growth through economic and planning policies, and the private entity may offer the public reduced tariffs, profit sharing, or other social or environmental benefits. Further guidance on district and community shared energy coordination and operations can be found in Chapter 24, “Establish ZEC Governance” in A Guide for Developing Zero Energy Communities.10
7 www.districtenergyinitiative.org/sites/default/files/report_pdf/03%20District%20Energy%20Chapter%203_print.pdf 8 www.researchgate.net/publication/328703276_THE_ZEC_GUIDE_A_Guide_for_Developing_Zero_Energy_Communities
Integration
Once a district begins the development of a district thermal energy system, the planning team must ensure that the buildings to be connected to the system are designed so that the connections are easily accomplished. The district design guidelines and master plans should specify the building HVAC system type and the configu-ration required to connect to the district. Depending on the phasing of the buildings and the district infrastruc-ture, it may be necessary to complete a building’s HVAC system before the district system is in place. In this case, ensuring the building’s HVAC system is “district system ready” is key. An expandable shared ground source heat pump loop is one way to ensure a building is district system ready. In this case, sizing the primary distribution system for the full build-out will be a key design element to ensure successful operation after all buildings have been connected. A similar strategy that uses modular heat pumps with space allocated for future full capacity build-out can also be used to enable an expandable district thermal energy system.
Successful Implementation Examples
The National Western Center (NWC) in Denver, Colorado, is an example of a low-carbon district under develop-ment as of this writing (July 2020). This is a multiuse district being built on the site of Denver’s annual stock show. A key feature is a six-foot diameter wastewater pipe running through the property. The temperature of this wastewater stays within a narrow range of 61°F and 77°F throughout the year. This represents more than 150 MW of low grade waste heat and makes the pipe an ideal heat source in winter and an ideal heat sink in the summer so that heat pumps can efficiently heat and cool the district.
The use of wastewater as a heat source is not new and, as an example, has been used to heat buildings in the city of Vancouver, British Columbia,11 since 2010. The False Creek Neighbourhood Energy Utility uses waste thermal energy captured from sewage to provide space heating and hot water to buildings in several Vancouver neigh-borhoods, is self-funded, and is simultaneously providing a return on investment to taxpayers and affordable rates to customers.
Similarly, the NWC district wastewater pipe, in conjunc-tion with heat pumps, will serve as a central heating and cooling plant. This plant will transfer heat to and from an ambient loop circulating throughout the district to multiple tenants, including the City of Denver's NWC and Colorado State University’s Spur campus laborato-ries. The district energy system will be expandable to future NWC phases, with distribution infrastructure and space available for future thermal networks and heat exchanger capacity.
The first costs associated with the wastewater heat exchangers and an ambient loop distribution system, however, were not included in the NWC build-out funding. Rather, an innovative partnership was formed to select a third party energy partner managed by the City of Denver through a public procurement process.
EAS Energy Partners was selected to become the official NWC campus energy partner and will be responsible for financing, designing, and constructing the district and renewable energy solutions as well as the long-term operation and maintenance of the NWC energy systems.12 The campus facility build-out by NWC and Colorado State includes design requirements for buildings to use the ambient loop for building scale heat pump systems
11 vancouver.ca/home-property-development/southeast-false-creek-neighbourhood-energy-utility.aspx
12 nationalwesterncenter.com/wp-content/uploads/2017/11/NWC-Energy-Action-Plan.pdf
7777 A GUIDE TO ENERGY MASTER PLANNING OF HIGH-PERFORMANCE DISTRICTS AND COMMUNITIES
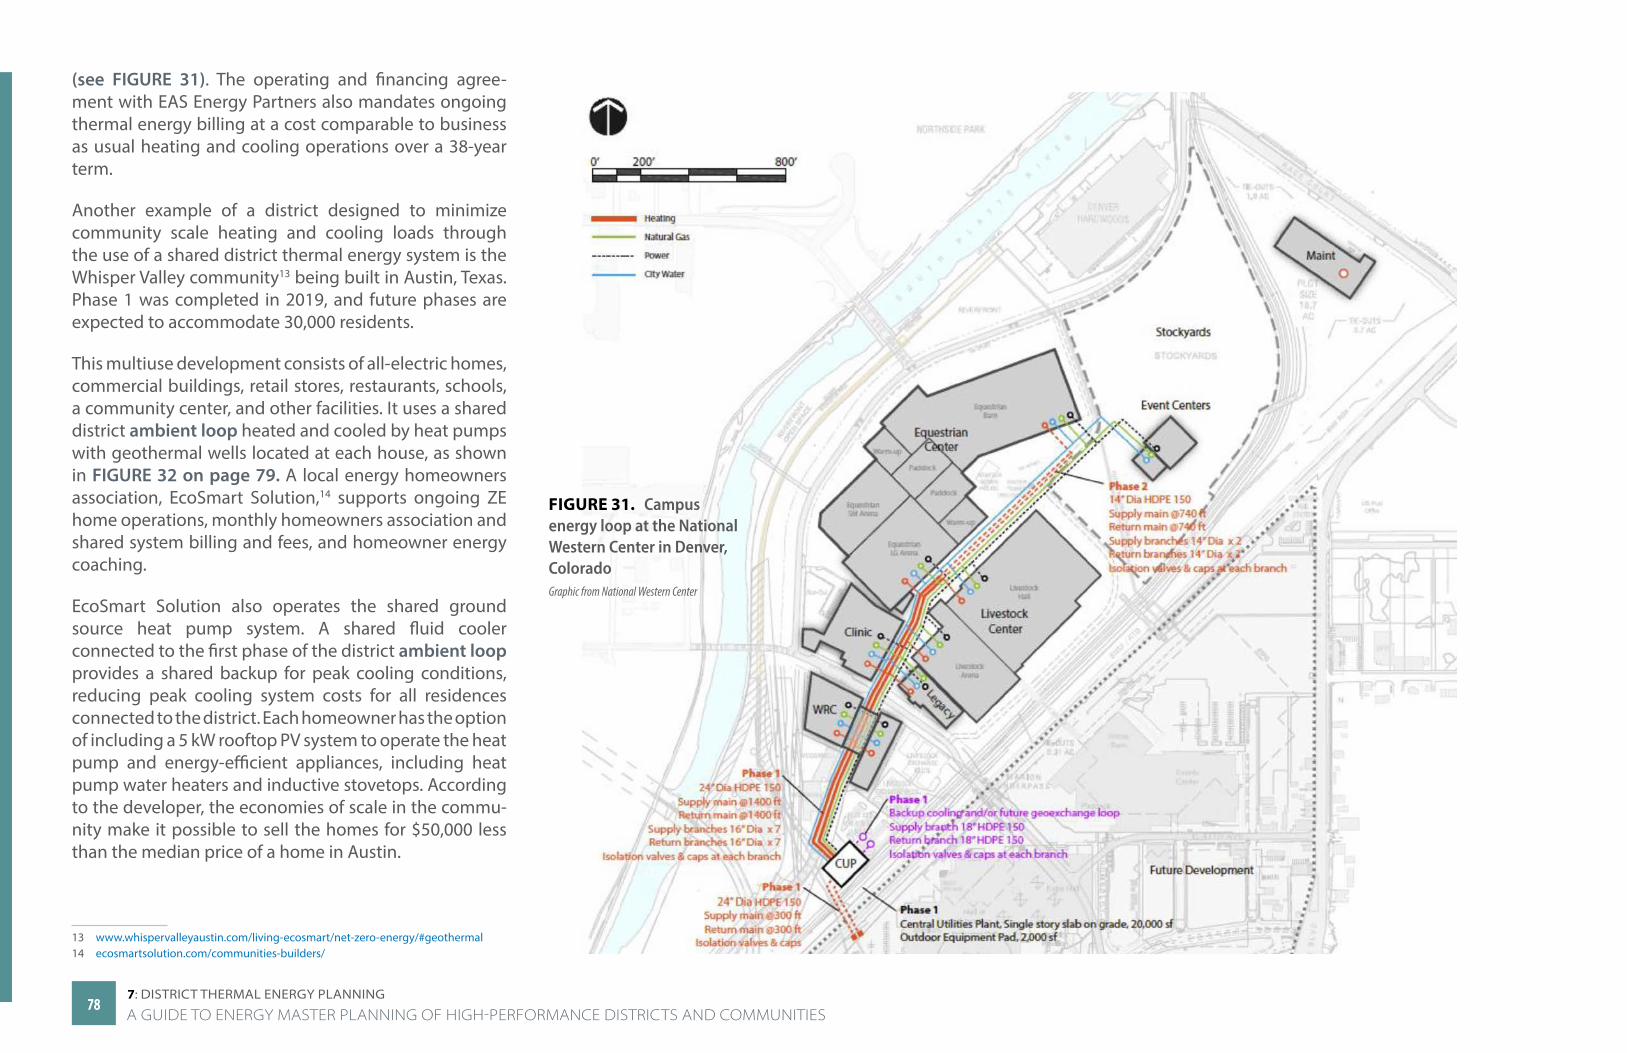
7: DiSTriCT THermAl energy PlAnning
FIGURE 31. Campus energy loop at the National Western Center in Denver, ColoradoGraphic from National Western Center
(see FIGURE 31). The operating and financing agree-ment with EAS Energy Partners also mandates ongoing thermal energy billing at a cost comparable to business as usual heating and cooling operations over a 38-year term.
Another example of a district designed to minimize community scale heating and cooling loads through the use of a shared district thermal energy system is the Whisper Valley community13 being built in Austin, Texas. Phase 1 was completed in 2019, and future phases are expected to accommodate 30,000 residents.
This multiuse development consists of all-electric homes, commercial buildings, retail stores, restaurants, schools, a community center, and other facilities. It uses a shared district ambient loop heated and cooled by heat pumps with geothermal wells located at each house, as shown in FIGURE 32 on page 79. A local energy homeowners association, EcoSmart Solution,14 supports ongoing ZE home operations, monthly homeowners association and shared system billing and fees, and homeowner energy coaching.
EcoSmart Solution also operates the shared ground source heat pump system. A shared fluid cooler connected to the first phase of the district ambient loop provides a shared backup for peak cooling conditions, reducing peak cooling system costs for all residences connected to the district. Each homeowner has the option of including a 5 kW rooftop PV system to operate the heat pump and energy-efficient appliances, including heat pump water heaters and inductive stovetops. According to the developer, the economies of scale in the commu-nity make it possible to sell the homes for $50,000 less than the median price of a home in Austin.
13 www.whispervalleyaustin.com/living-ecosmart/net-zero-energy/#geothermal 14 ecosmartsolution.com/communities-builders/
7878A GUIDE TO ENERGY MASTER PLANNING OF HIGH-PERFORMANCE DISTRICTS AND COMMUNITIES
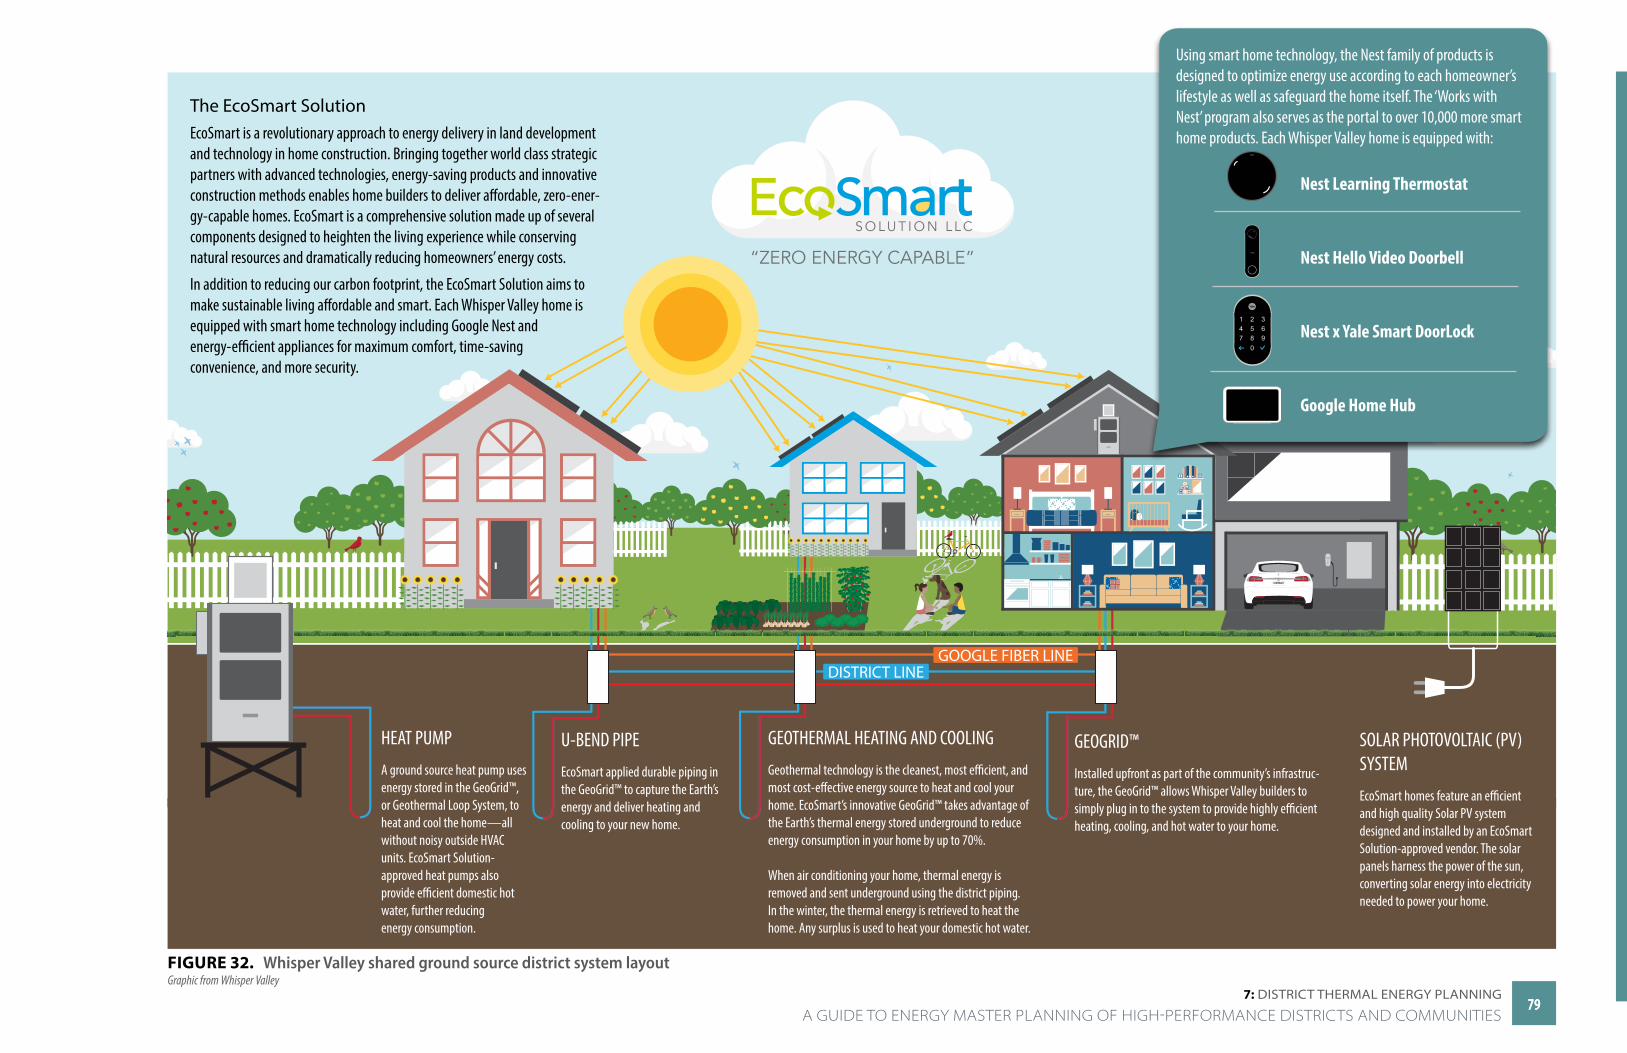
ECOSMARTTEXAS
1
GOOGLE FIBER LINEDISTRICT LINE
Using smart home technology, the Nest family of products is designed to optimize energy use according to each homeowner’s lifestyle as well as safeguard the home itself. The ‘Works with Nest’ program also serves as the portal to over 10,000 more smart home products. Each Whisper Valley home is equipped with:
369
1
74
2580
Nest Learning Thermostat Nest Hello Video Doorbell
Nest x Yale Smart DoorLock
Google Home Hub
7: DiSTriCT THermAl energy PlAnning
HEAT PUMP
A ground source heat pump uses energy stored in the GeoGrid™, or Geothermal Loop System, to heat and cool the home—all without noisy outside HVAC units. EcoSmart Solution- approved heat pumps also provide efficient domestic hot water, further reducing energy consumption.
U-BEND PIPE
EcoSmart applied durable piping in the GeoGrid™ to capture the Earth’s energy and deliver heating and cooling to your new home.
The EcoSmart SolutionEcoSmart is a revolutionary approach to energy delivery in land development and technology in home construction. Bringing together world class strategic partners with advanced technologies, energy-saving products and innovative construction methods enables home builders to deliver affordable, zero-ener-gy-capable homes. EcoSmart is a comprehensive solution made up of several components designed to heighten the living experience while conserving natural resources and dramatically reducing homeowners’ energy costs.
In addition to reducing our carbon footprint, the EcoSmart Solution aims to make sustainable living affordable and smart. Each Whisper Valley home is equipped with smart home technology including Google Nest and energy-efficient appliances for maximum comfort, time-saving convenience, and more security.
GEOTHERMAL HEATING AND COOLING
Geothermal technology is the cleanest, most efficient, and most cost-effective energy source to heat and cool your home. EcoSmart’s innovative GeoGrid™ takes advantage of the Earth’s thermal energy stored underground to reduce energy consumption in your home by up to 70%.
When air conditioning your home, thermal energy is removed and sent underground using the district piping. In the winter, the thermal energy is retrieved to heat the home. Any surplus is used to heat your domestic hot water.
SOLAR PHOTOVOLTAIC (PV) SYSTEM
EcoSmart homes feature an efficient and high quality Solar PV system designed and installed by an EcoSmart Solution-approved vendor. The solar panels harness the power of the sun, converting solar energy into electricity needed to power your home.
GEOGRID™
Installed upfront as part of the community’s infrastruc-ture, the GeoGrid™ allows Whisper Valley builders to simply plug in to the system to provide highly efficient heating, cooling, and hot water to your home.
FIGURE 32. Whisper Valley shared ground source district system layoutGraphic from Whisper Valley
7979 A GUIDE TO ENERGY MASTER PLANNING OF HIGH-PERFORMANCE DISTRICTS AND COMMUNITIES
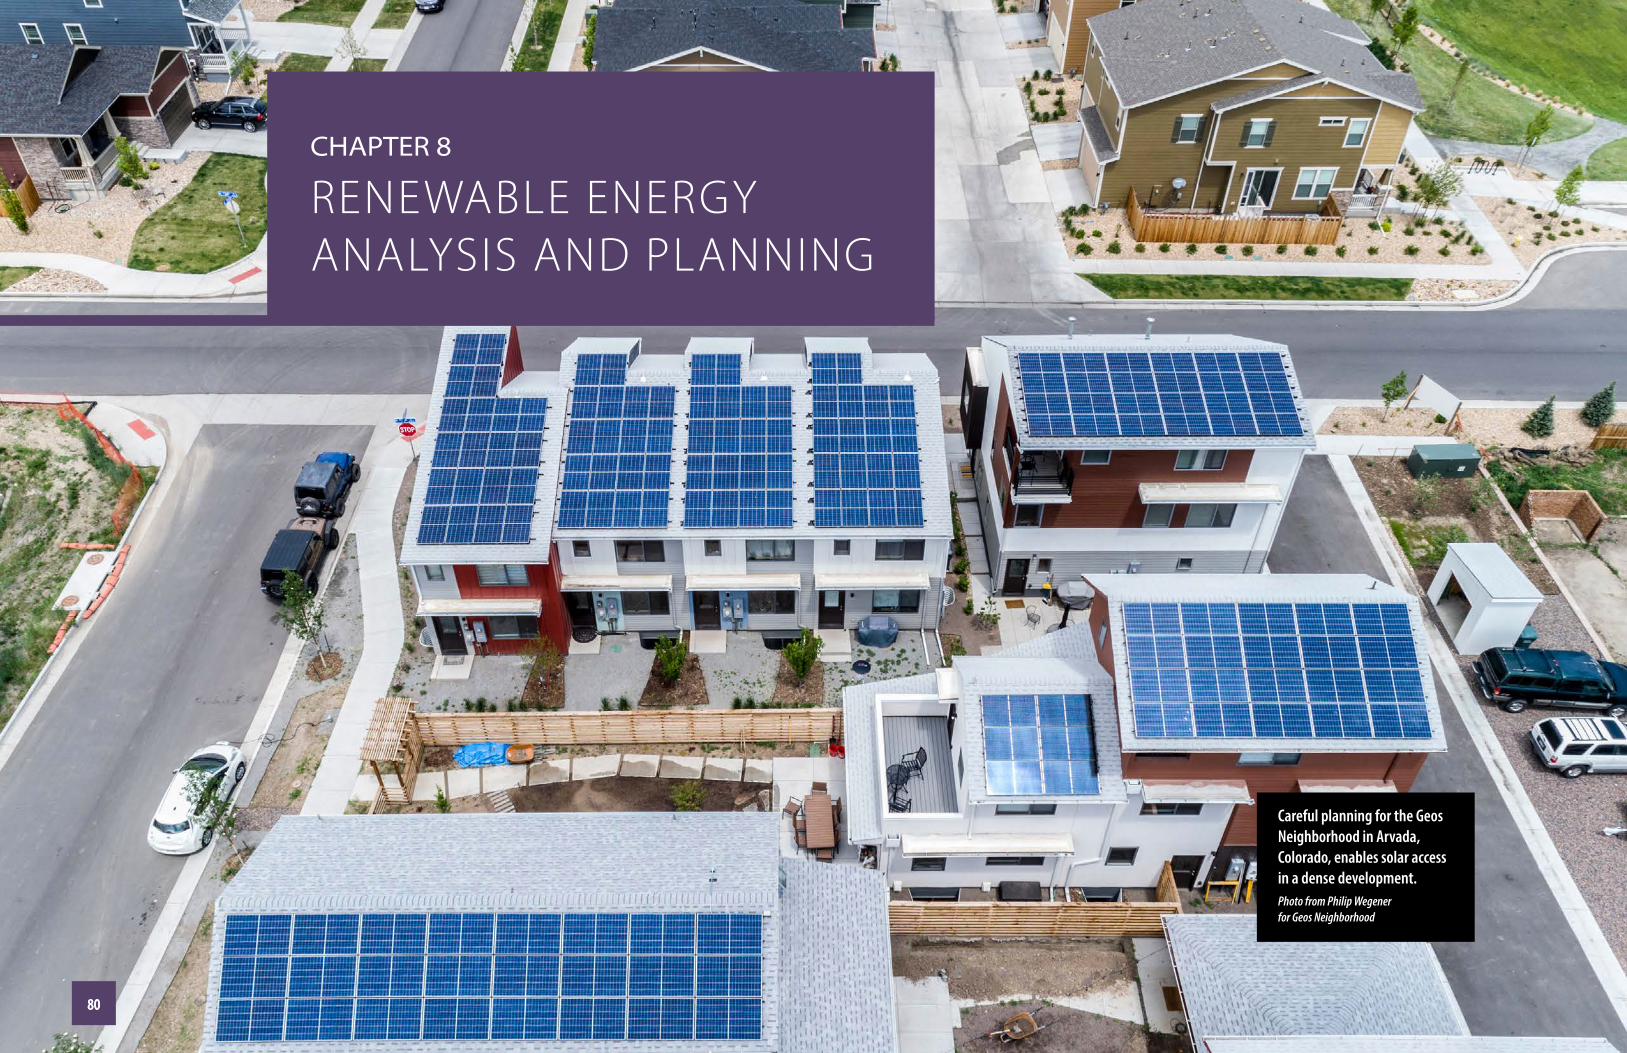
CHAPTer 8
RENEWABLE ENERGY ANALYSIS AND PLANNING
Careful planning for the Geos Neighborhood in Arvada, Colorado, enables solar access in a dense development.Photo from Philip Wegener for Geos Neighborhood
8080
8: renewAble energy AnAlySiS AnD PlAnning
HPDs use energy efficiency strategies to reduce energy loads (see Planning for Energy Demand and Efficiency on page 58) and renewable energy resources to meet those reduced loads, most commonly Pv systems.
1 www.nrel.gov/news/program/2019/pvwatts-at-20.html
To ensure the most cost-effective applications for PV within the district, consider the following promising planning strategies:
• Determine and plan the PV output required to meet energy goals, and include system sizes and designs in district master plans and design guidelines
• Consider the suite of locations for PV systems, from building scale to district scale to regional scale systems that balance performance, costs, local production, and resiliency goals
• Ensure the early concept renderings and master plans include the planned PV integration in the district and on buildings
• Use energy-driven planning to enable all individual buildings to optimize a building’s solar access and minimize solar shading
• Leverage architectural design guidelines and master plans to ensure solar ready building design.
Analysis and Approaches
Renewable Energy Analysis
During the energy master planning of an HPD, the energy planner should estimate the energy generation potential of proposed renewable energy systems as well as their size and location within the district. These renewable energy system planning parameters are tightly linked. The locations available for siting a renewable energy
system will impact the size of the system and the size and location of the system will determine its generation potential. As outlined in Balancing Energy Consumption and Production on page 61, to achieve the HP and ZE goals, the renewable energy generation of the district is balanced with its annual energy use. The relationship between energy consumption and production forms the basis of the integrated energy solution for every HPD.
The relationship between energy consumption and production forms the basis of the integrated energy solution for every HPD.
Using the development program and/or site plan, it is possible to estimate the area available for PV systems—the most common renewable energy generation source in HPDs—by taking an inventory of shade-free roofs, areas appropriate for site-mounted arrays, and parking canopy locations. In some instances, it may also be feasible to locate PV systems on building façades. The sum of all potential PV locations determines the total footprint of the renewable energy system in square feet (ft2). The PV module efficiency (in terms of watts/ft2) then determines the total size of the system in kW. With this information, the PV system size and orientation(s) can be modeled to calculate the total renewable energy generation in kWh per year using the appropriate weather file and modeling
tool (such as PVWatts®, System Advisor Model, or Energy-Plus). FIGURE 33 on page 82 provides examples of PV Watts outputs.1
If the renewable energy analysis includes multiple district PV scenarios, it can be useful to calculate the solar gener-ation ratio for each PV module orientation used in the district. The solar generation ratio is the annual kWh of energy generated for every 1 kW of PV module capacity installed. Each orientation of PV modules will result in a different energy production per kW of PV, so it is neces-sary to have a different solar generation ratio for each orientation. These solar generation ratios can then be applied to kW PV sizes in a number of scenarios to calcu-late renewable energy generation potential. This total generation potential determines the maximum energy use that can be targeted to achieve the HP or aspira-tional ZE goal. Note that it is often financially beneficial to identify the best combination of energy efficiency measures and renewable energy generation, as the economics of these systems vary based on market and local utility incentives, interconnection rules, and billing considerations.
A GUIDE TO ENERGY MASTER PLANNING OF HIGH-PERFORMANCE DISTRICTS AND COMMUNITIES8181

8: renewAble energy AnAlySiS AnD PlAnning
FIGURE 33. PV Watts®, a user-friendly solar photovoltaics calculator available to homeowners and others for estimating solar performance for a given location
Each development program scenario may result in a different renewable energy generation potential based on its allocation of appropriate locations for PV systems (see Photovoltaics and Solar Access Planning on page 85). In addition, some project teams may have the interest and resources to integrate other types of renewable energy generation systems such as hydro-power, biomass, geothermal, landfill gas, and wind.
The PV system(s) should be sized to offset the energy use within the district based on the energy use or efficiency targets set by building type.
Determining Photovoltaic Output Requirements
The PV system(s) should be sized to offset the energy use within the district based on the energy use or efficiency targets set by building type. PV system production and size should also be balanced with other district renew-able energy sources as appropriate. As a starting point to analyze PV output, district energy planners can use NREL’s PVWatts® tool2 to estimate the electricity produc-tion of a grid-connected, roof- or ground-mounted PV system based on several simple inputs.
More detailed solar analysis is possible using NREL’s System Advisor Model,3 which can make performance predictions and cost-of-energy estimates for grid-con-nected renewable energy projects based on specified system design parameters. To further optimize renew-able energy options, economic decision support models such as REopt Lite4 can evaluate energy systems for buildings, campuses, communities, and microgrids. REopt recommends an optimal mix of renewable energy, conventional generation, and energy storage technolo-
8282A GUIDE TO ENERGY MASTER PLANNING OF HIGH-PERFORMANCE DISTRICTS AND COMMUNITIES
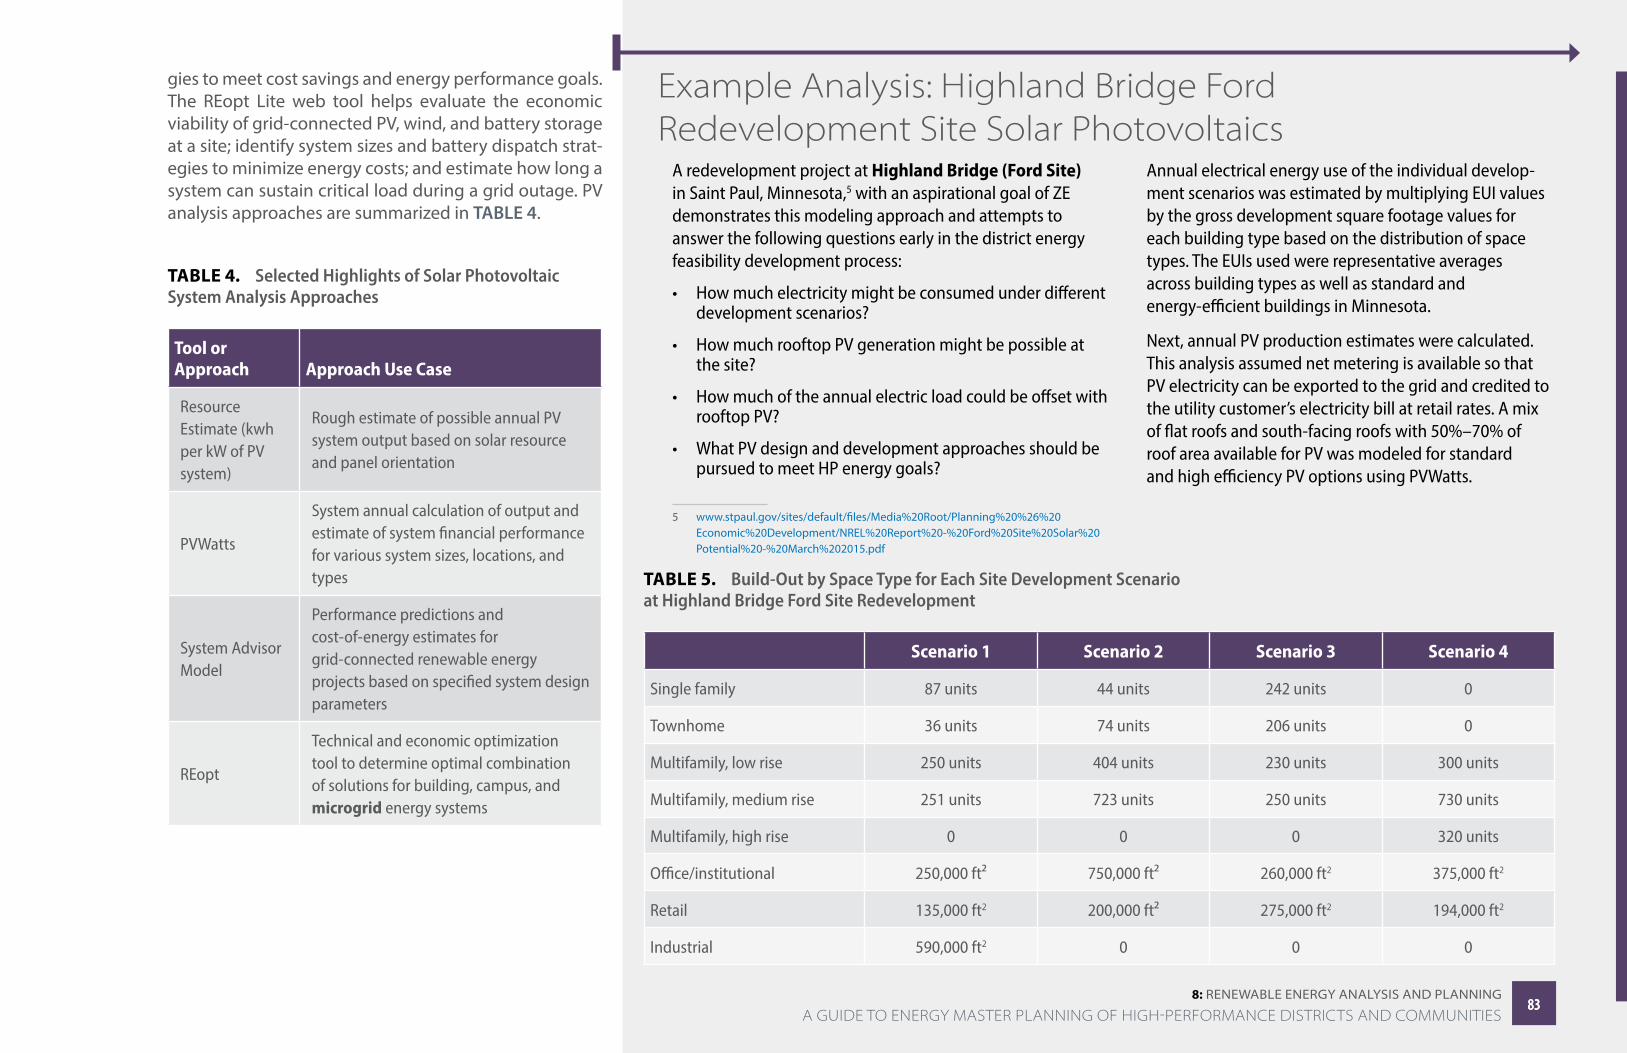
8: renewAble energy AnAlySiS AnD PlAnning
gies to meet cost savings and energy performance goals. The REopt Lite web tool helps evaluate the economic viability of grid-connected PV, wind, and battery storage at a site; identify system sizes and battery dispatch strat-egies to minimize energy costs; and estimate how long a system can sustain critical load during a grid outage. PV analysis approaches are summarized in TABLE 4.
TABLE 4. Selected Highlights of Solar Photovoltaic System Analysis Approaches
Tool or Approach Approach Use Case
Resource Estimate (kwh per kW of PV system)
Rough estimate of possible annual PV system output based on solar resource and panel orientation
PVWatts
System annual calculation of output and estimate of system financial performance for various system sizes, locations, and types
System Advisor Model
Performance predictions and cost-of-energy estimates for grid-connected renewable energy projects based on specified system design parameters
REopt
Technical and economic optimization tool to determine optimal combination of solutions for building, campus, and microgrid energy systems
Example Analysis: Highland Bridge Ford Redevelopment Site Solar Photovoltaics
A redevelopment project at Highland Bridge (Ford Site) in Saint Paul, Minnesota,5 with an aspirational goal of ZE demonstrates this modeling approach and attempts to answer the following questions early in the district energy feasibility development process:
• How much electricity might be consumed under different development scenarios?
• How much rooftop PV generation might be possible at the site?
• How much of the annual electric load could be offset with rooftop PV?
• What PV design and development approaches should be pursued to meet HP energy goals?
5 www.stpaul.gov/sites/default/files/Media%20Root/Planning%20%26%20Economic%20Development/NREL%20Report%20-%20Ford%20Site%20Solar%20Potential%20-%20March%202015.pdf
Annual electrical energy use of the individual develop-ment scenarios was estimated by multiplying EUI values by the gross development square footage values for each building type based on the distribution of space types. The EUIs used were representative averages across building types as well as standard and energy-efficient buildings in Minnesota.
Next, annual PV production estimates were calculated. This analysis assumed net metering is available so that PV electricity can be exported to the grid and credited to the utility customer’s electricity bill at retail rates. A mix of flat roofs and south-facing roofs with 50%–70% of roof area available for PV was modeled for standard and high efficiency PV options using PVWatts.
TABLE 5. Build-Out by Space Type for Each Site Development Scenario at Highland Bridge Ford Site Redevelopment
Scenario 1 Scenario 2 Scenario 3 Scenario 4
Single family 87 units 44 units 242 units 0
Townhome 36 units 74 units 206 units 0
Multifamily, low rise 250 units 404 units 230 units 300 units
Multifamily, medium rise 251 units 723 units 250 units 730 units
Multifamily, high rise 0 0 0 320 units
Office/institutional 250,000 ft2 750,000 ft2 260,000 ft2 375,000 ft2
Retail 135,000 ft2 200,000 ft2 275,000 ft2 194,000 ft2
Industrial 590,000 ft2 0 0 0
8383 A GUIDE TO ENERGY MASTER PLANNING OF HIGH-PERFORMANCE DISTRICTS AND COMMUNITIES
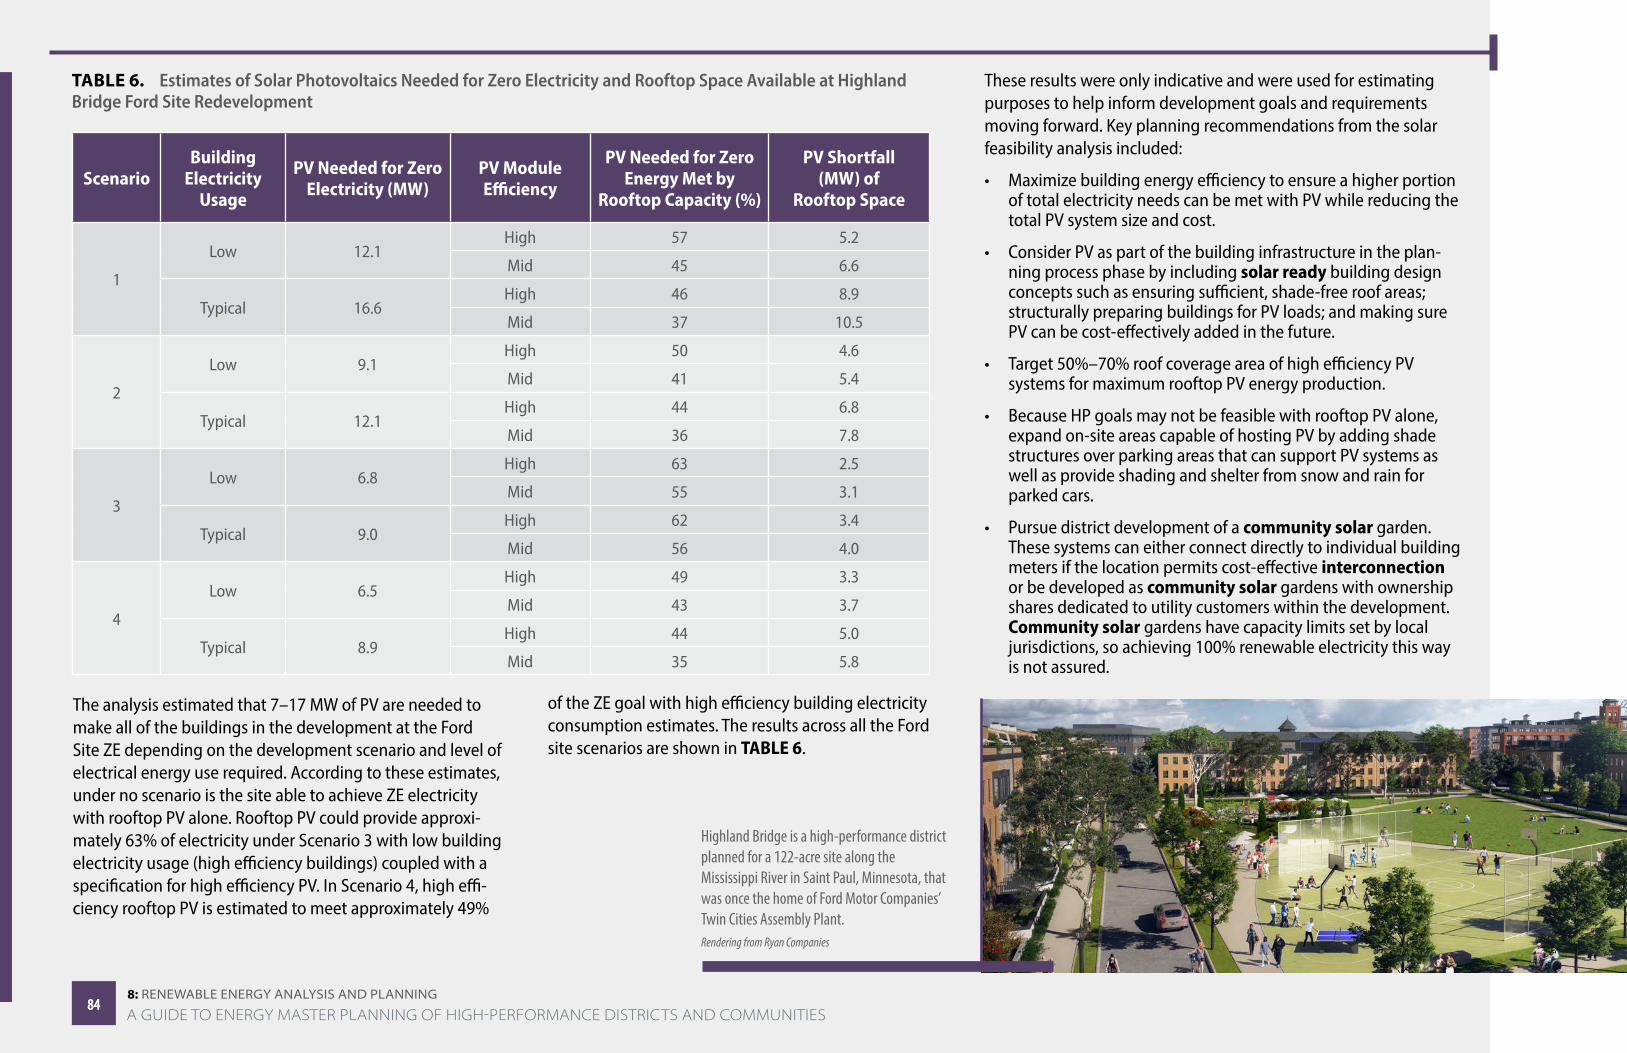
8: renewAble energy AnAlySiS AnD PlAnning
The analysis estimated that 7–17 MW of PV are needed to make all of the buildings in the development at the Ford Site ZE depending on the development scenario and level of electrical energy use required. According to these estimates, under no scenario is the site able to achieve ZE electricity with rooftop PV alone. Rooftop PV could provide approxi-mately 63% of electricity under Scenario 3 with low building electricity usage (high efficiency buildings) coupled with a specification for high efficiency PV. In Scenario 4, high effi-ciency rooftop PV is estimated to meet approximately 49%
TABLE 6. Estimates of Solar Photovoltaics Needed for Zero Electricity and Rooftop Space Available at Highland Bridge Ford Site Redevelopment
ScenarioBuilding
Electricity Usage
PV Needed for Zero Electricity (MW)
PV Module Efficiency
PV Needed for Zero Energy Met by
Rooftop Capacity (%)
PV Shortfall (MW) of
Rooftop Space
1
Low 12.1High 57 5.2
Mid 45 6.6
Typical 16.6High 46 8.9
Mid 37 10.5
2
Low 9.1High 50 4.6
Mid 41 5.4
Typical 12.1High 44 6.8
Mid 36 7.8
3
Low 6.8High 63 2.5
Mid 55 3.1
Typical 9.0High 62 3.4
Mid 56 4.0
4
Low 6.5High 49 3.3
Mid 43 3.7
Typical 8.9High 44 5.0
Mid 35 5.8
These results were only indicative and were used for estimating purposes to help inform development goals and requirements moving forward. Key planning recommendations from the solar feasibility analysis included:
• Maximize building energy efficiency to ensure a higher portion of total electricity needs can be met with PV while reducing the total PV system size and cost.
• Consider PV as part of the building infrastructure in the plan-ning process phase by including solar ready building design concepts such as ensuring sufficient, shade-free roof areas; structurally preparing buildings for PV loads; and making sure PV can be cost-effectively added in the future.
• Target 50%–70% roof coverage area of high efficiency PV systems for maximum rooftop PV energy production.
• Because HP goals may not be feasible with rooftop PV alone, expand on-site areas capable of hosting PV by adding shade structures over parking areas that can support PV systems as well as provide shading and shelter from snow and rain for parked cars.
• Pursue district development of a community solar garden. These systems can either connect directly to individual building meters if the location permits cost-effective interconnection or be developed as community solar gardens with ownership shares dedicated to utility customers within the development. Community solar gardens have capacity limits set by local jurisdictions, so achieving 100% renewable electricity this way is not assured.
Highland Bridge is a high-performance district planned for a 122-acre site along the Mississippi River in Saint Paul, Minnesota, that was once the home of Ford Motor Companies’ Twin Cities Assembly Plant.Rendering from Ryan Companies
of the ZE goal with high efficiency building electricity consumption estimates. The results across all the Ford site scenarios are shown in TABLE 6.
8484A GUIDE TO ENERGY MASTER PLANNING OF HIGH-PERFORMANCE DISTRICTS AND COMMUNITIES
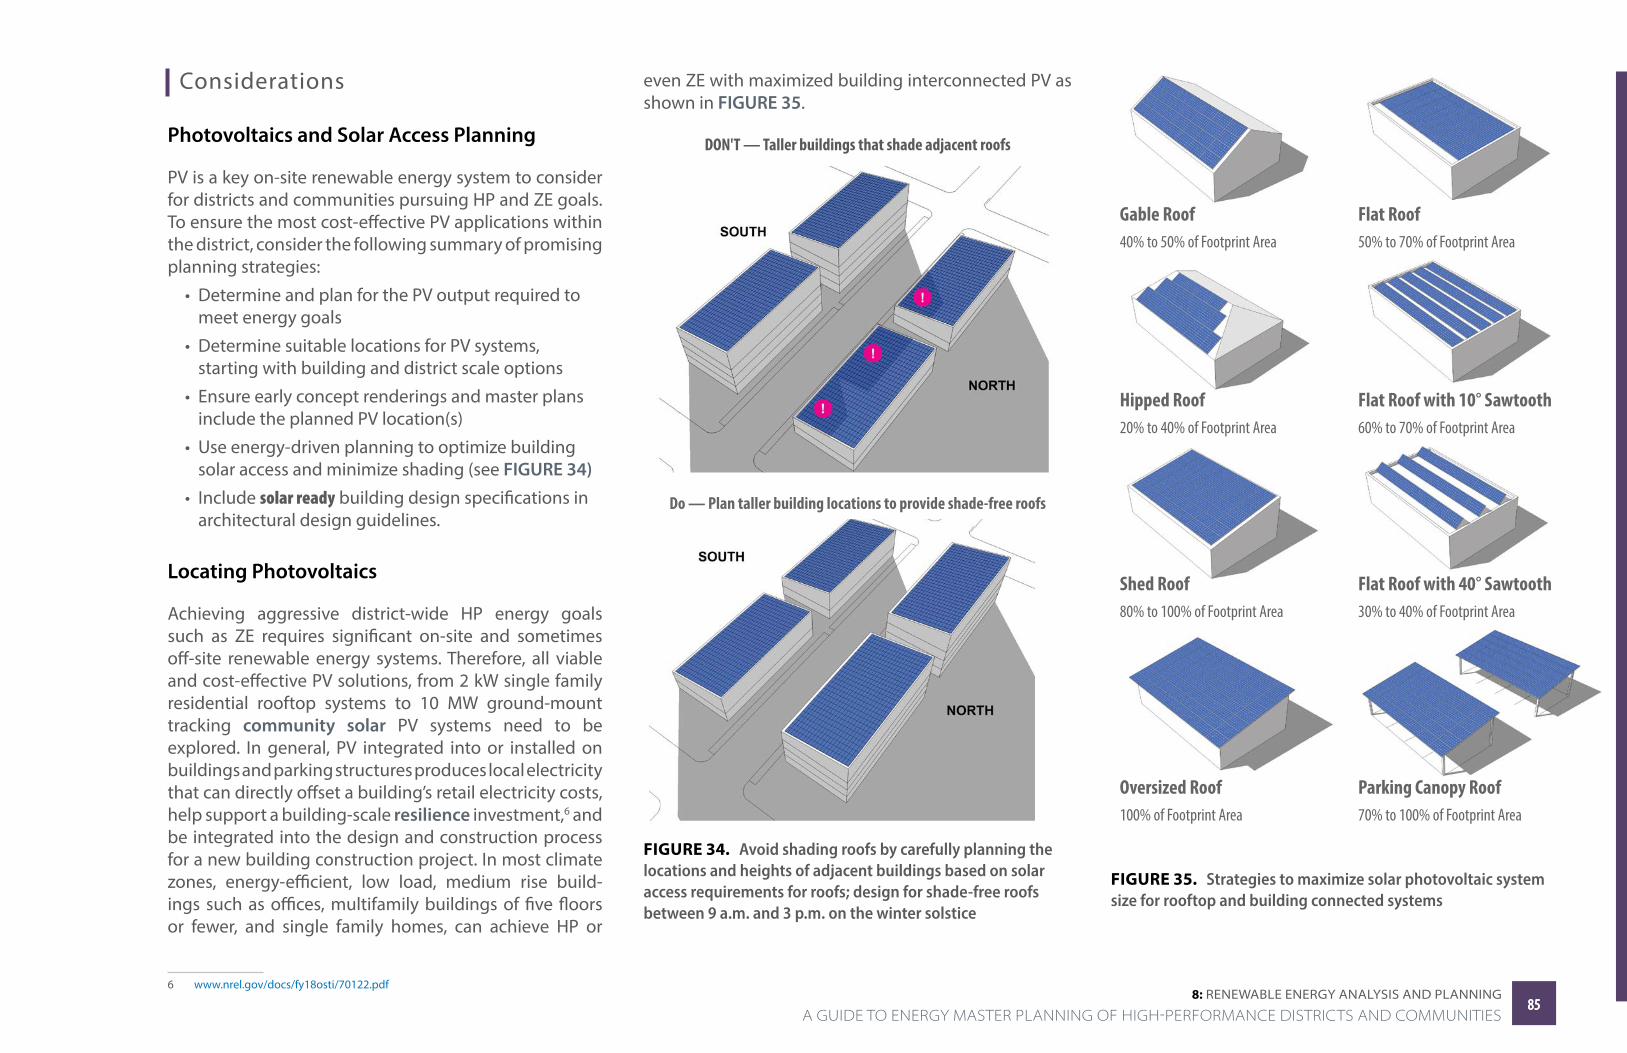
8: renewAble energy AnAlySiS AnD PlAnning
Considerations
Photovoltaics and Solar Access Planning
PV is a key on-site renewable energy system to consider for districts and communities pursuing HP and ZE goals. To ensure the most cost-effective PV applications within the district, consider the following summary of promising planning strategies:
• Determine and plan for the PV output required to meet energy goals
• Determine suitable locations for PV systems, starting with building and district scale options
• Ensure early concept renderings and master plans include the planned PV location(s)
• Use energy-driven planning to optimize building solar access and minimize shading (see FIGURE 34)
• Include solar ready building design specifications in architectural design guidelines.
even ZE with maximized building interconnected PV as shown in FIGURE 35.
DON'T — Taller buildings that shade adjacent roofs
Do — Plan taller building locations to provide shade-free roofs
FIGURE 34. Avoid shading roofs by carefully planning the locations and heights of adjacent buildings based on solar access requirements for roofs; design for shade-free roofs between 9 a.m. and 3 p.m. on the winter solstice
Gable Roof40% to 50% of Footprint Area
Flat Roof50% to 70% of Footprint Area
Hipped Roof20% to 40% of Footprint Area
Flat Roof with 10° Sawtooth60% to 70% of Footprint Area
Shed Roof80% to 100% of Footprint Area
Flat Roof with 40° Sawtooth30% to 40% of Footprint Area
Oversized Roof100% of Footprint Area
Parking Canopy Roof70% to 100% of Footprint Area
Locating Photovoltaics
Achieving aggressive district-wide HP energy goals such as ZE requires significant on-site and sometimes off-site renewable energy systems. Therefore, all viable and cost-effective PV solutions, from 2 kW single family residential rooftop systems to 10 MW ground-mount tracking community solar PV systems need to be explored. In general, PV integrated into or installed on buildings and parking structures produces local electricity that can directly offset a building’s retail electricity costs, help support a building-scale resilience investment,6 and be integrated into the design and construction process for a new building construction project. In most climate zones, energy-efficient, low load, medium rise build-ings such as offices, multifamily buildings of five floors or fewer, and single family homes, can achieve HP or
6 www.nrel.gov/docs/fy18osti/70122.pdf
FIGURE 35. Strategies to maximize solar photovoltaic system size for rooftop and building connected systems
8585 A GUIDE TO ENERGY MASTER PLANNING OF HIGH-PERFORMANCE DISTRICTS AND COMMUNITIES
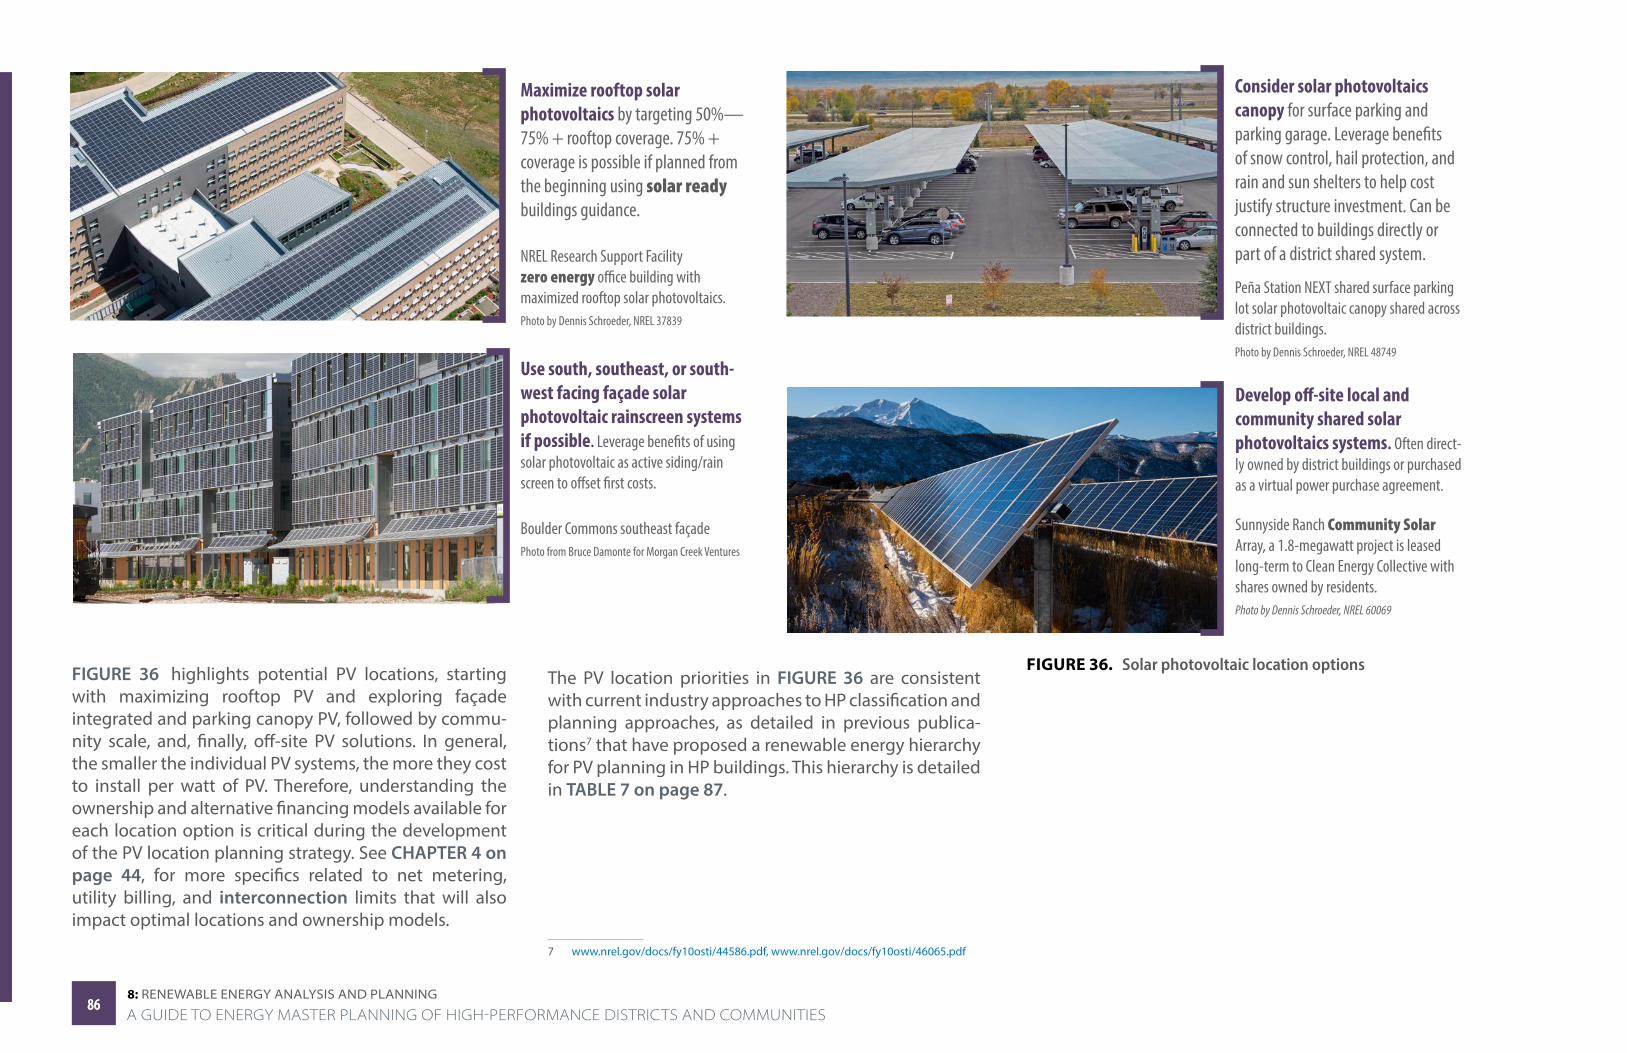
8: renewAble energy AnAlySiS AnD PlAnning
FIGURE 36 highlights potential PV locations, starting with maximizing rooftop PV and exploring façade integrated and parking canopy PV, followed by commu-nity scale, and, finally, off-site PV solutions. In general, the smaller the individual PV systems, the more they cost to install per watt of PV. Therefore, understanding the ownership and alternative financing models available for each location option is critical during the development of the PV location planning strategy. See CHAPTER 4 on page 44, for more specifics related to net metering, utility billing, and interconnection limits that will also impact optimal locations and ownership models.
Maximize rooftop solar photovoltaics by targeting 50%—75% + rooftop coverage. 75% + coverage is possible if planned from the beginning using solar ready buildings guidance.
NREL Research Support Facility zero energy office building with maximized rooftop solar photovoltaics.Photo by Dennis Schroeder, NREL 37839
Consider solar photovoltaics canopy for surface parking and parking garage. Leverage benefits of snow control, hail protection, and rain and sun shelters to help cost justify structure investment. Can be connected to buildings directly or part of a district shared system.
Peña Station NEXT shared surface parking lot solar photovoltaic canopy shared across district buildings.Photo by Dennis Schroeder, NREL 48749
Use south, southeast, or south-west facing façade solar photovoltaic rainscreen systems if possible. Leverage benefits of using solar photovoltaic as active siding/rain screen to offset first costs.
Boulder Commons southeast façadePhoto from Bruce Damonte for Morgan Creek Ventures
Develop off-site local and community shared solar photovoltaics systems. Often direct-ly owned by district buildings or purchased as a virtual power purchase agreement.
Sunnyside Ranch Community Solar Array, a 1.8-megawatt project is leased long-term to Clean Energy Collective with shares owned by residents.Photo by Dennis Schroeder, NREL 60069
FIGURE 36. Solar photovoltaic location optionsThe PV location priorities in FIGURE 36 are consistent with current industry approaches to HP classification and planning approaches, as detailed in previous publica-tions7 that have proposed a renewable energy hierarchy for PV planning in HP buildings. This hierarchy is detailed in TABLE 7 on page 87.
7 www.nrel.gov/docs/fy10osti/44586.pdf, www.nrel.gov/docs/fy10osti/46065.pdf
8686A GUIDE TO ENERGY MASTER PLANNING OF HIGH-PERFORMANCE DISTRICTS AND COMMUNITIES
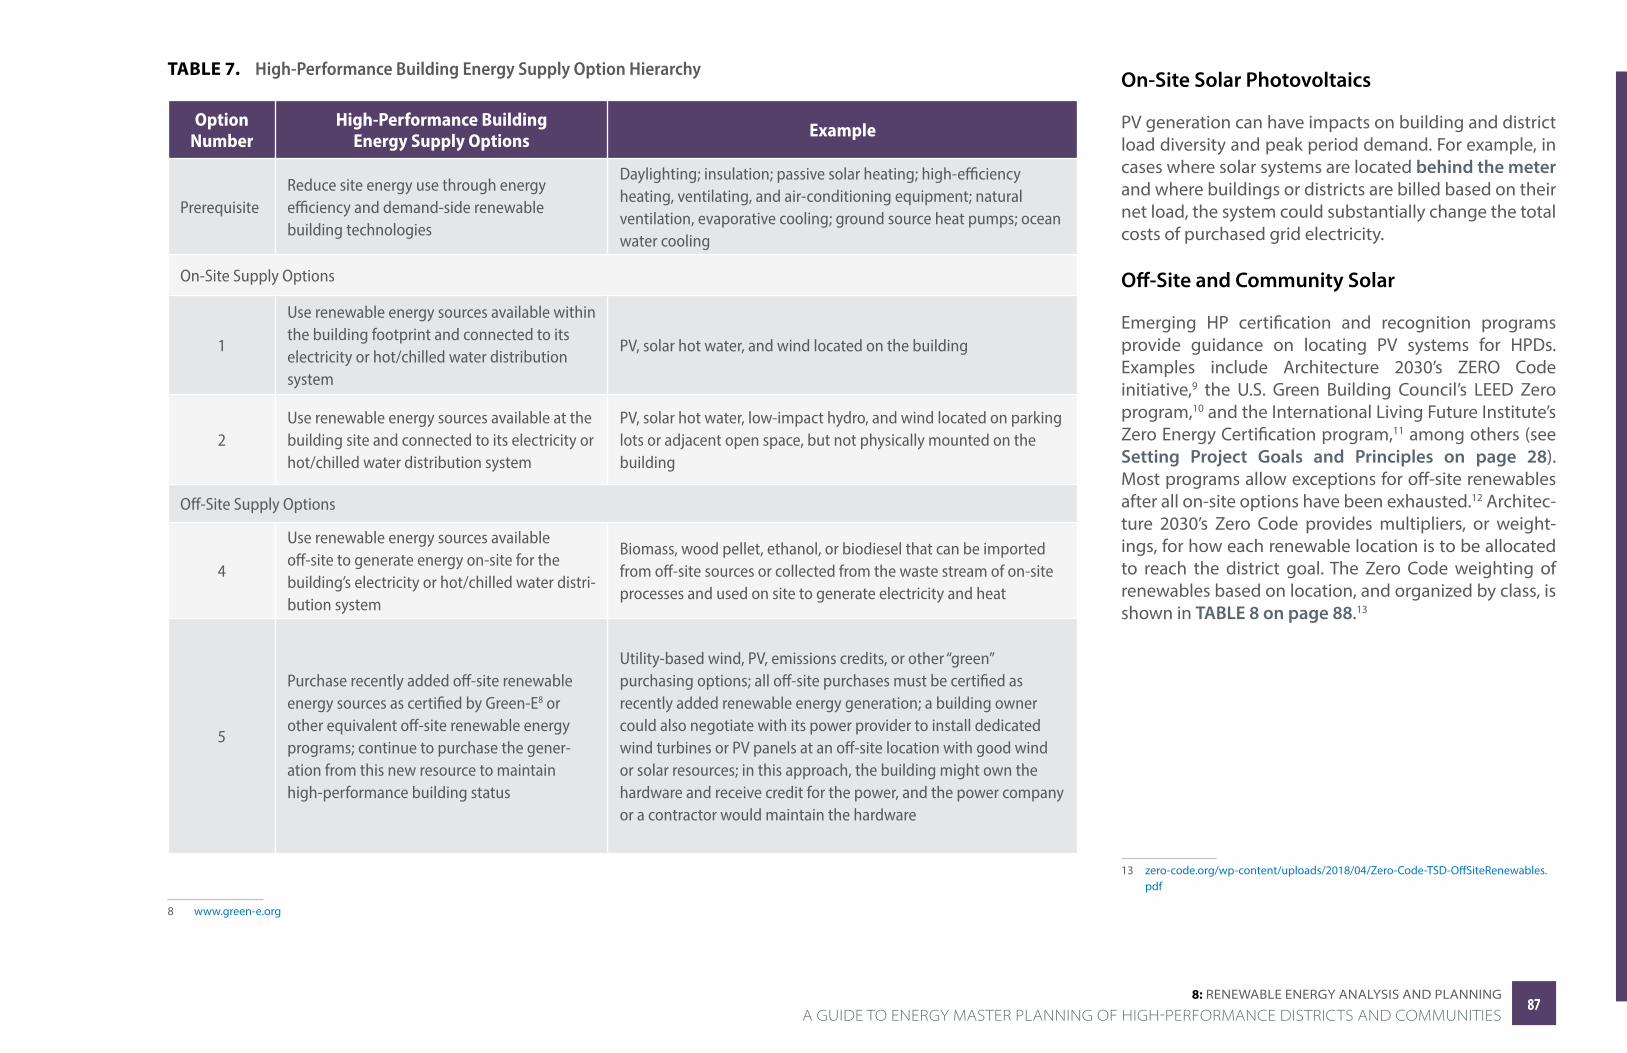
8: renewAble energy AnAlySiS AnD PlAnning
TABLE 7. High-Performance Building Energy Supply Option Hierarchy
Option Number
High-Performance Building Energy Supply Options Example
PrerequisiteReduce site energy use through energy efficiency and demand-side renewable building technologies
Daylighting; insulation; passive solar heating; high-efficiency heating, ventilating, and air-conditioning equipment; natural ventilation, evaporative cooling; ground source heat pumps; ocean water cooling
On-Site Supply Options
1
Use renewable energy sources available within the building footprint and connected to its electricity or hot/chilled water distribution system
PV, solar hot water, and wind located on the building
2Use renewable energy sources available at the building site and connected to its electricity or hot/chilled water distribution system
PV, solar hot water, low-impact hydro, and wind located on parking lots or adjacent open space, but not physically mounted on the building
Off-Site Supply Options
4
Use renewable energy sources available off-site to generate energy on-site for the building’s electricity or hot/chilled water distri-bution system
Biomass, wood pellet, ethanol, or biodiesel that can be imported from off-site sources or collected from the waste stream of on-site processes and used on site to generate electricity and heat
5
Purchase recently added off-site renewable energy sources as certified by Green-E8 or other equivalent off-site renewable energy programs; continue to purchase the gener-ation from this new resource to maintain high-performance building status
Utility-based wind, PV, emissions credits, or other “green” purchasing options; all off-site purchases must be certified as recently added renewable energy generation; a building owner could also negotiate with its power provider to install dedicated wind turbines or PV panels at an off-site location with good wind or solar resources; in this approach, the building might own the hardware and receive credit for the power, and the power company or a contractor would maintain the hardware
8 www.green-e.org
On-Site Solar Photovoltaics
PV generation can have impacts on building and district load diversity and peak period demand. For example, in cases where solar systems are located behind the meter and where buildings or districts are billed based on their net load, the system could substantially change the total costs of purchased grid electricity.
Off-Site and Community Solar
Emerging HP certification and recognition programs provide guidance on locating PV systems for HPDs. Examples include Architecture 2030’s ZERO Code initiative,9 the U.S. Green Building Council’s LEED Zero program,10 and the International Living Future Institute’s Zero Energy Certification program,11 among others (see Setting Project Goals and Principles on page 28). Most programs allow exceptions for off-site renewables after all on-site options have been exhausted.12 Architec-ture 2030’s Zero Code provides multipliers, or weight-ings, for how each renewable location is to be allocated to reach the district goal. The Zero Code weighting of renewables based on location, and organized by class, is shown in TABLE 8 on page 88.13
13 zero-code.org/wp-content/uploads/2018/04/Zero-Code-TSD-OffSiteRenewables.pdf
8787 A GUIDE TO ENERGY MASTER PLANNING OF HIGH-PERFORMANCE DISTRICTS AND COMMUNITIES
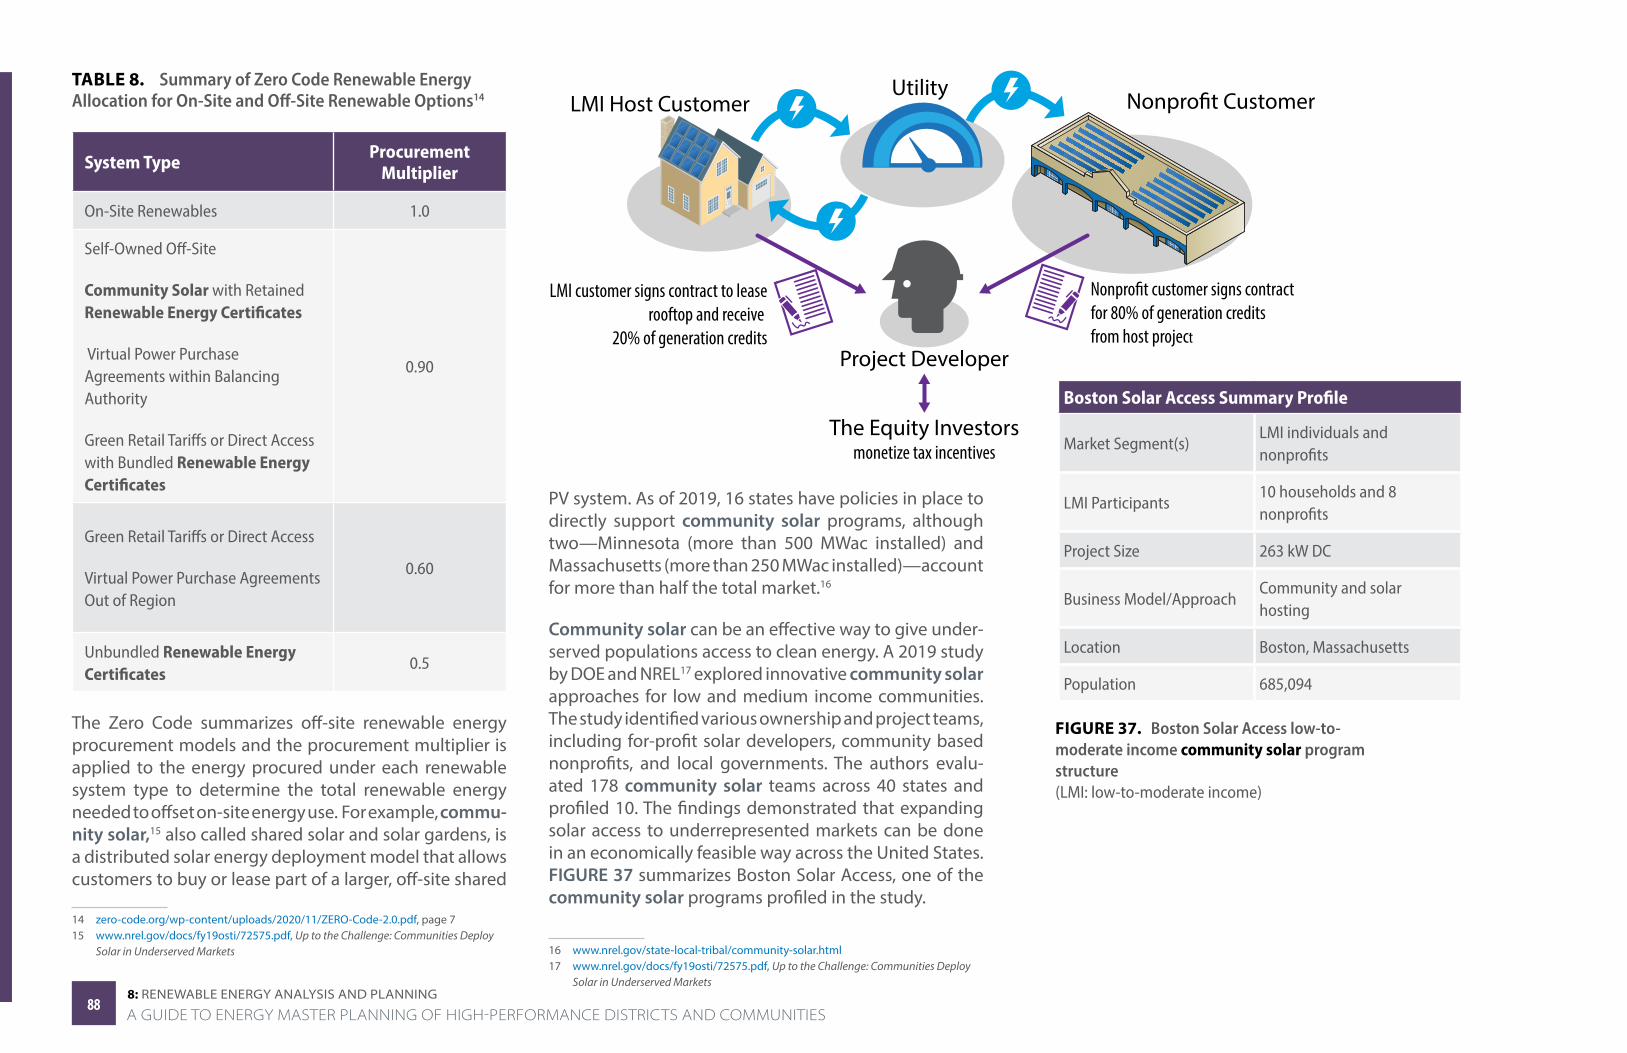
8: renewAble energy AnAlySiS AnD PlAnning
TABLE 8. Summary of Zero Code Renewable Energy Allocation for On-Site and Off-Site Renewable Options14
System Type Procurement Multiplier
On-Site Renewables 1.0
Self-Owned Off-Site
Community Solar with Retained Renewable Energy Certificates
Virtual Power Purchase Agreements within Balancing Authority
Green Retail Tariffs or Direct Access with Bundled Renewable Energy Certificates
0.90
Green Retail Tariffs or Direct Access
Virtual Power Purchase Agreements Out of Region
0.60
Unbundled Renewable Energy Certificates
0.5
The Zero Code summarizes off-site renewable energy procurement models and the procurement multiplier is applied to the energy procured under each renewable system type to determine the total renewable energy needed to offset on-site energy use. For example, commu-nity solar,15 also called shared solar and solar gardens, is a distributed solar energy deployment model that allows customers to buy or lease part of a larger, off-site shared
14 zero-code.org/wp-content/uploads/2020/11/ZERO-Code-2.0.pdf, page 715 www.nrel.gov/docs/fy19osti/72575.pdf, Up to the Challenge: Communities Deploy
Solar in Underserved Markets
PV system. As of 2019, 16 states have policies in place to directly support community solar programs, although two—Minnesota (more than 500 MWac installed) and Massachusetts (more than 250 MWac installed)—account for more than half the total market.16
Community solar can be an effective way to give under-served populations access to clean energy. A 2019 study by DOE and NREL17 explored innovative community solar approaches for low and medium income communities. The study identified various ownership and project teams, including for-profit solar developers, community based nonprofits, and local governments. The authors evalu-ated 178 community solar teams across 40 states and profiled 10. The findings demonstrated that expanding solar access to underrepresented markets can be done in an economically feasible way across the United States. FIGURE 37 summarizes Boston Solar Access, one of the community solar programs profiled in the study.
16 www.nrel.gov/state-local-tribal/community-solar.html17 www.nrel.gov/docs/fy19osti/72575.pdf, Up to the Challenge: Communities Deploy
Solar in Underserved Markets
FIGURE 37. Boston Solar Access low-to-moderate income community solar program structure(LMI: low-to-moderate income)
LMI Host CustomerUtility
Project Developer
LMI customer signs contract to leaserooftop and receive
20% of generation credits
The Equity Investorsmonetize tax incentives
Boston Solar Access Summary Profile
Market Segment(s)LMI individuals and nonprofits
LMI Participants10 households and 8 nonprofits
Project Size 263 kW DC
Business Model/ApproachCommunity and solar hosting
Location Boston, Massachusetts
Population 685,094
8888A GUIDE TO ENERGY MASTER PLANNING OF HIGH-PERFORMANCE DISTRICTS AND COMMUNITIES
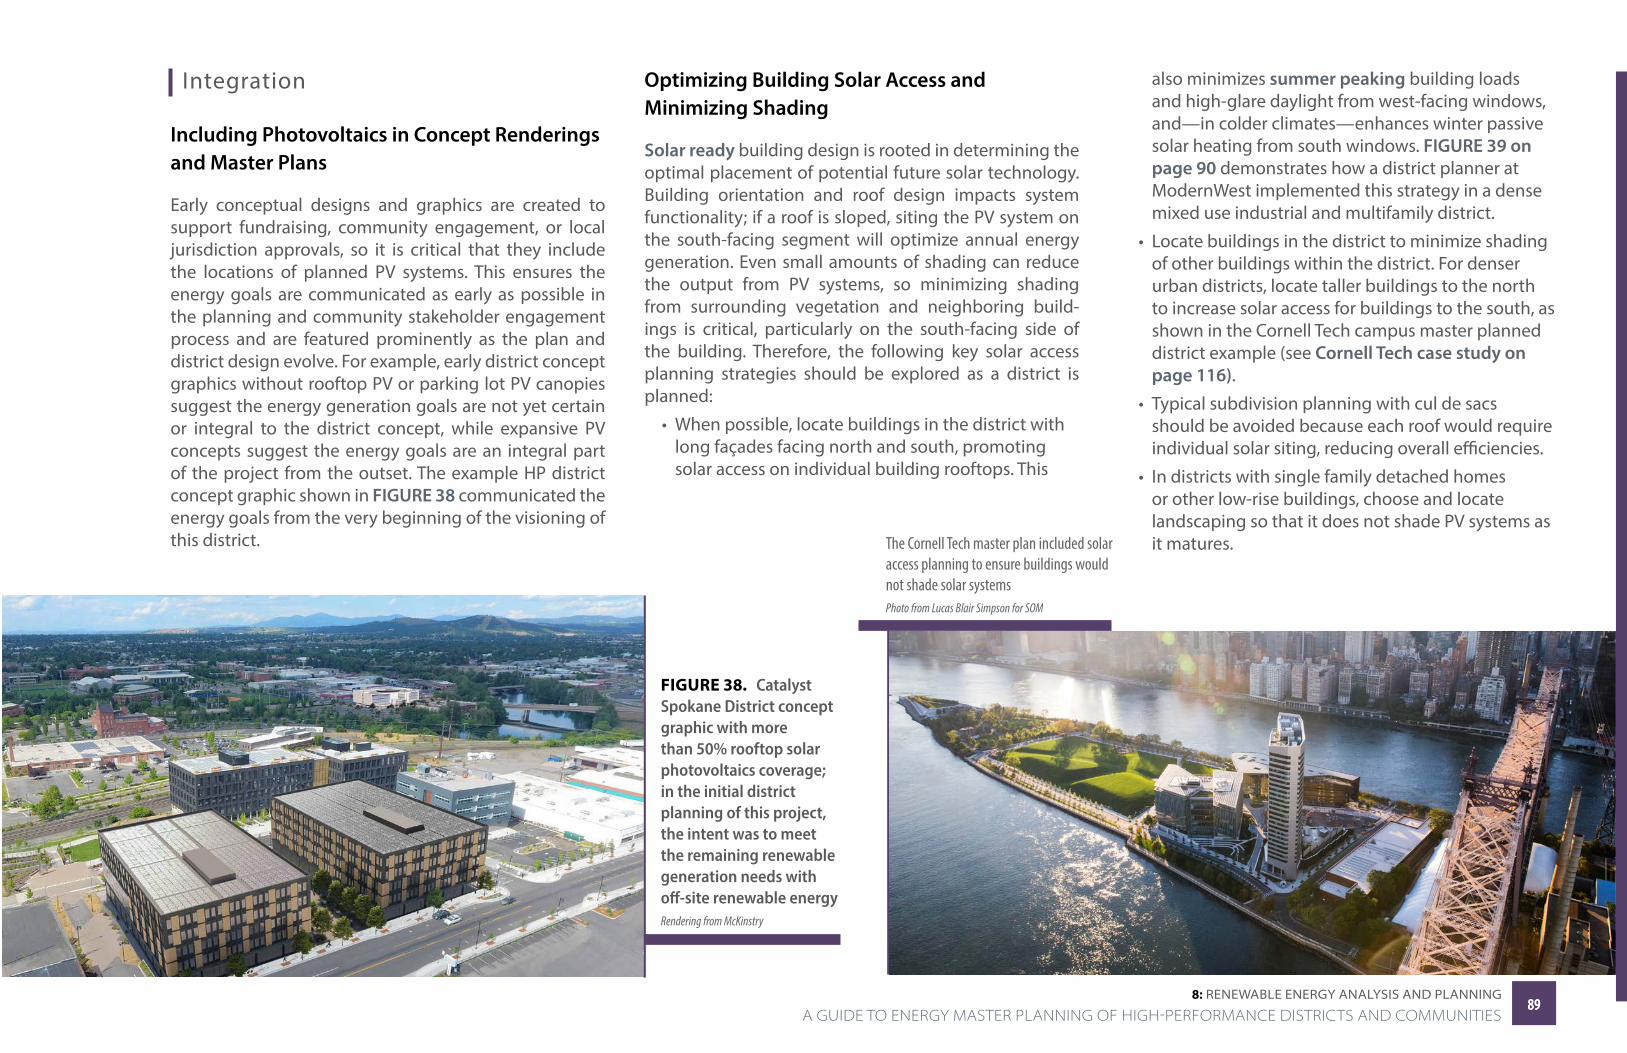
8: renewAble energy AnAlySiS AnD PlAnning
Integration
Including Photovoltaics in Concept Renderings and Master Plans
Early conceptual designs and graphics are created to support fundraising, community engagement, or local jurisdiction approvals, so it is critical that they include the locations of planned PV systems. This ensures the energy goals are communicated as early as possible in the planning and community stakeholder engagement process and are featured prominently as the plan and district design evolve. For example, early district concept graphics without rooftop PV or parking lot PV canopies suggest the energy generation goals are not yet certain or integral to the district concept, while expansive PV concepts suggest the energy goals are an integral part of the project from the outset. The example HP district concept graphic shown in FIGURE 38 communicated the energy goals from the very beginning of the visioning of this district.
FIGURE 38. Catalyst Spokane District concept graphic with more than 50% rooftop solar photovoltaics coverage; in the initial district planning of this project, the intent was to meet the remaining renewable generation needs with off-site renewable energyRendering from McKinstry
Optimizing Building Solar Access and Minimizing Shading
Solar ready building design is rooted in determining the optimal placement of potential future solar technology. Building orientation and roof design impacts system functionality; if a roof is sloped, siting the PV system on the south-facing segment will optimize annual energy generation. Even small amounts of shading can reduce the output from PV systems, so minimizing shading from surrounding vegetation and neighboring build-ings is critical, particularly on the south-facing side of the building. Therefore, the following key solar access planning strategies should be explored as a district is planned:
• When possible, locate buildings in the district with long façades facing north and south, promoting solar access on individual building rooftops. This
also minimizes summer peaking building loads and high-glare daylight from west-facing windows, and—in colder climates—enhances winter passive solar heating from south windows. FIGURE 39 on page 90 demonstrates how a district planner at ModernWest implemented this strategy in a dense mixed use industrial and multifamily district.
• Locate buildings in the district to minimize shading of other buildings within the district. For denser urban districts, locate taller buildings to the north to increase solar access for buildings to the south, as shown in the Cornell Tech campus master planned district example (see Cornell Tech case study on page 116).
• Typical subdivision planning with cul de sacs should be avoided because each roof would require individual solar siting, reducing overall efficiencies.
• In districts with single family detached homes or other low-rise buildings, choose and locate landscaping so that it does not shade PV systems as it matures.The Cornell Tech master plan included solar
access planning to ensure buildings would not shade solar systemsPhoto from Lucas Blair Simpson for SOM
8989 A GUIDE TO ENERGY MASTER PLANNING OF HIGH-PERFORMANCE DISTRICTS AND COMMUNITIES
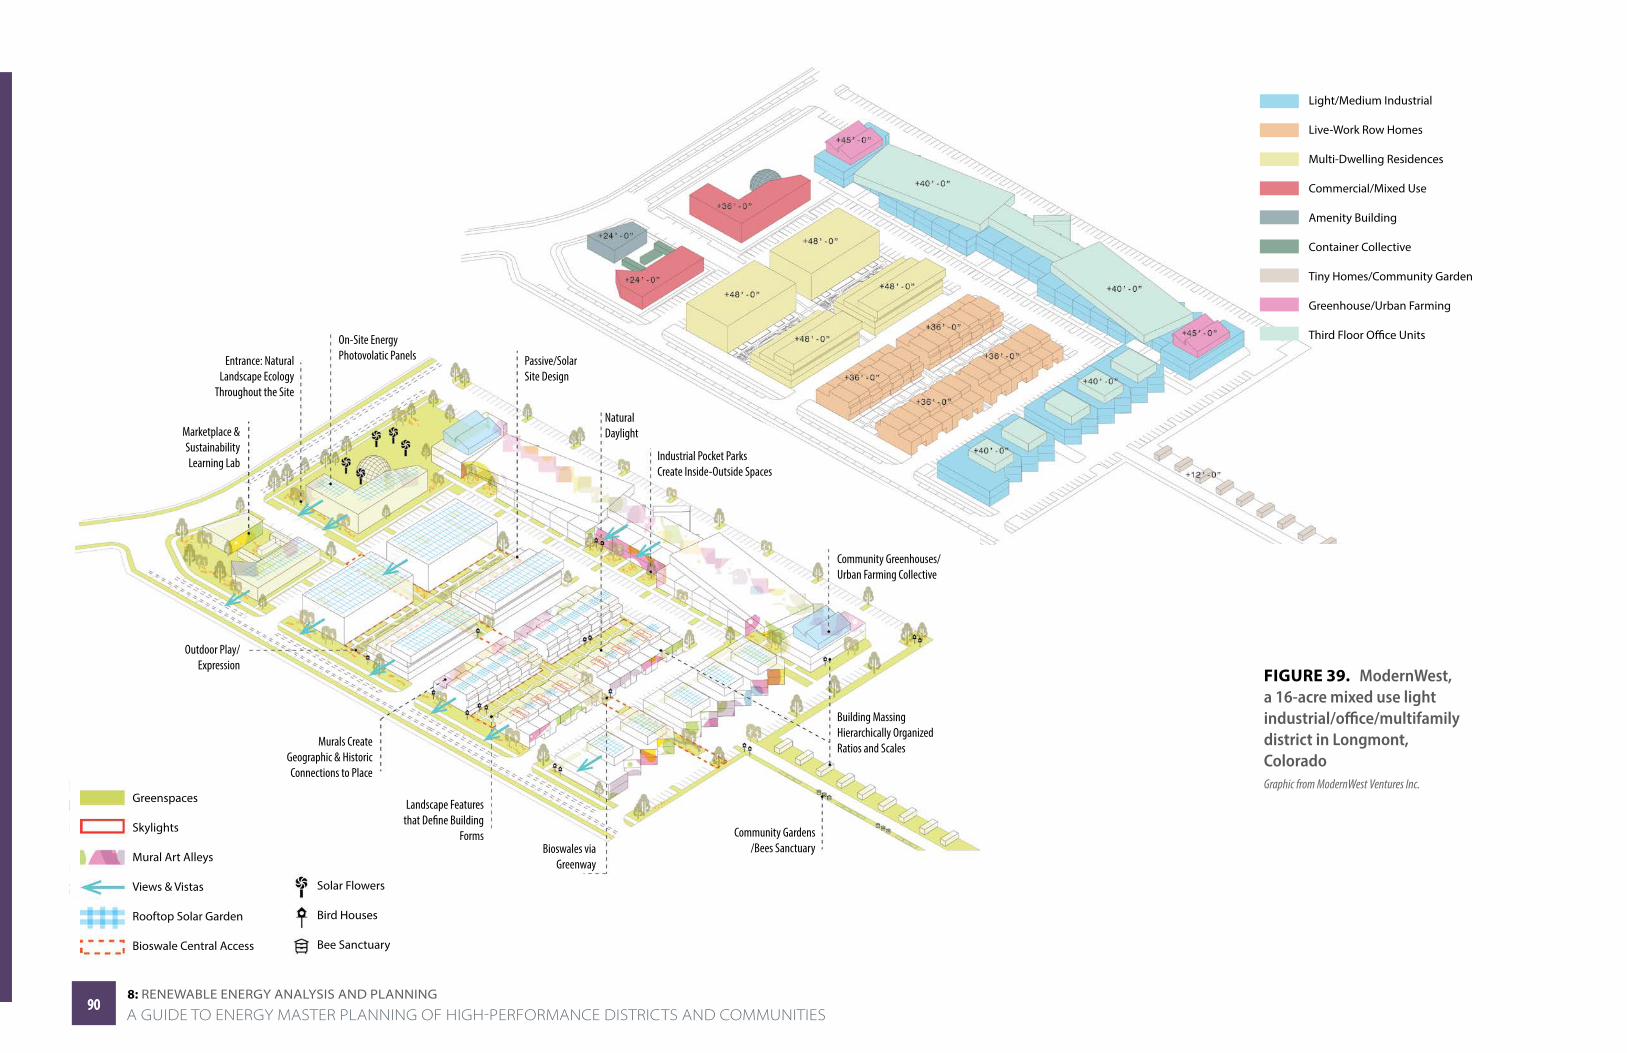
8: renewAble energy AnAlySiS AnD PlAnning
FIGURE 39. ModernWest, a 16-acre mixed use light industrial/office/multifamily district in Longmont, ColoradoGraphic from ModernWest Ventures Inc.
Greenspaces
Skylights
Mural Art Alleys
Views & Vistas
Rooftop Solar Garden
Bioswale Central Access
Solar Flowers
Bird Houses
Bee Sanctuary
Marketplace &SustainabilityLearning Lab
Entrance: NaturalLandscape Ecology
Throughout the Site
On-Site EnergyPhotovolatic Panels Passive/Solar
Site Design
Natural Daylight
Industrial Pocket ParksCreate Inside-Outside Spaces
Community Greenhouses/Urban Farming Collective
Building MassingHierarchically OrganizedRatios and Scales
Community Gardens/Bees SanctuaryBioswales via
Greenway
Murals CreateGeographic & HistoricConnections to Place
Outdoor Play/Expression
9090A GUIDE TO ENERGY MASTER PLANNING OF HIGH-PERFORMANCE DISTRICTS AND COMMUNITIES
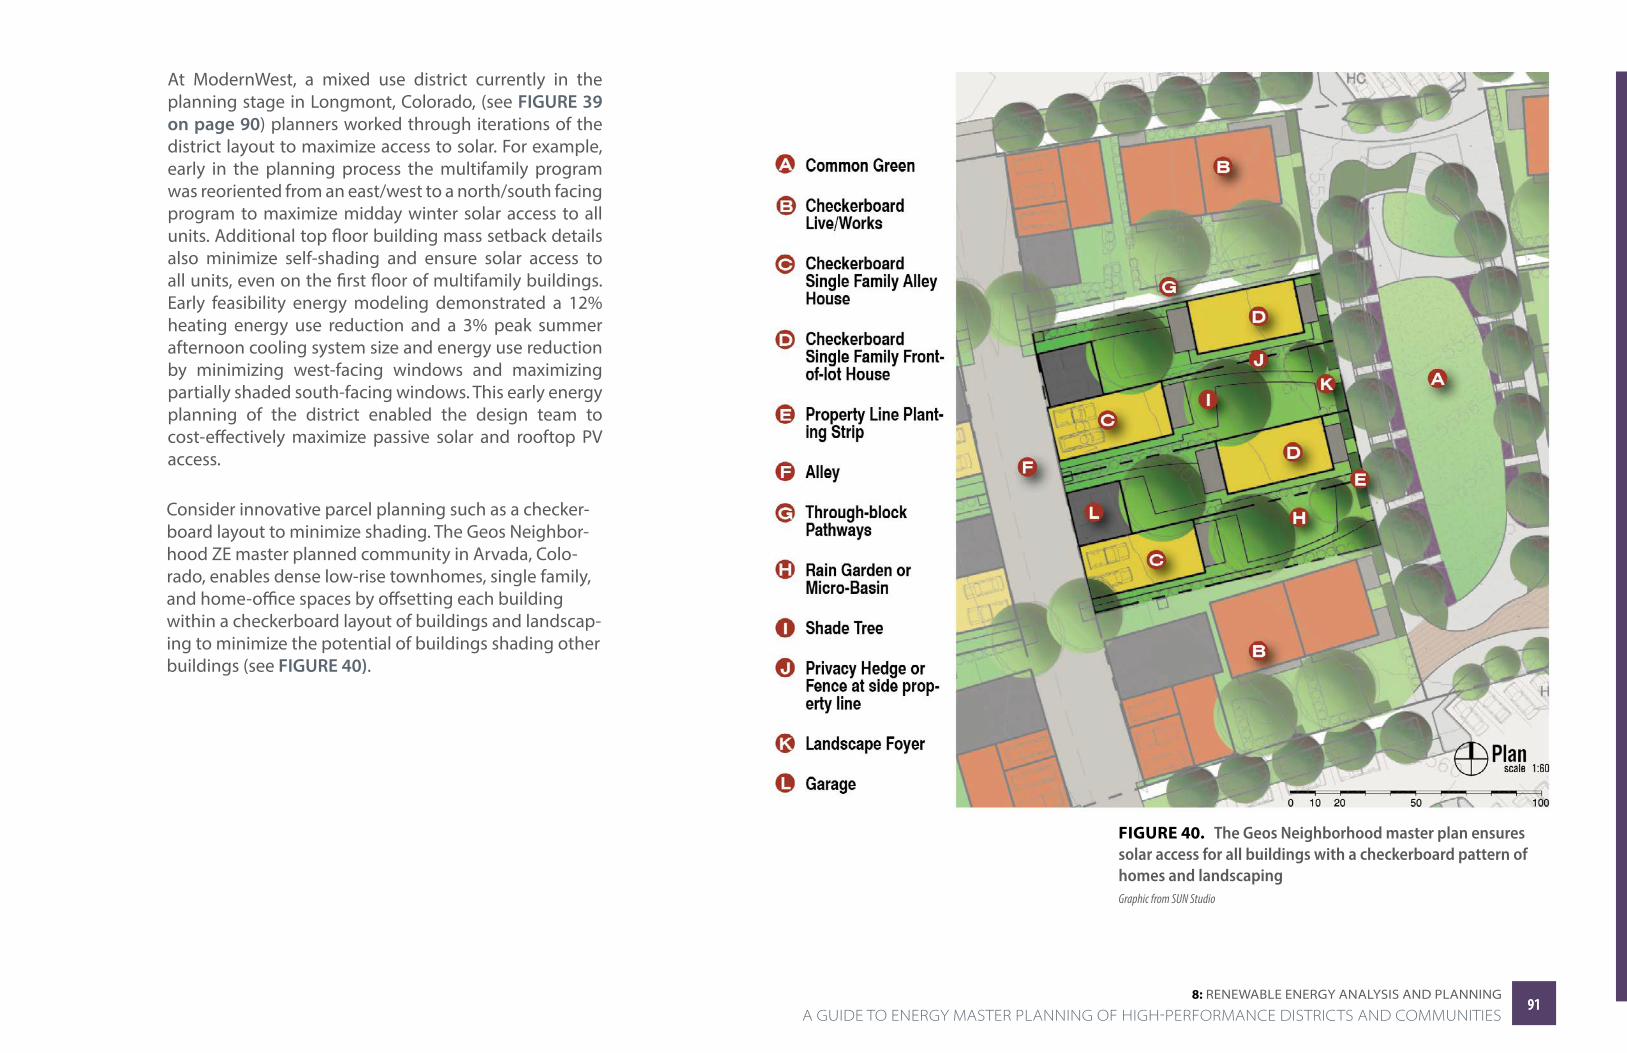
8: renewAble energy AnAlySiS AnD PlAnning
At ModernWest, a mixed use district currently in the planning stage in Longmont, Colorado, (see FIGURE 39 on page 90) planners worked through iterations of the district layout to maximize access to solar. For example, early in the planning process the multifamily program was reoriented from an east/west to a north/south facing program to maximize midday winter solar access to all units. Additional top floor building mass setback details also minimize self-shading and ensure solar access to all units, even on the first floor of multifamily buildings. Early feasibility energy modeling demonstrated a 12% heating energy use reduction and a 3% peak summer afternoon cooling system size and energy use reduction by minimizing west-facing windows and maximizing partially shaded south-facing windows. This early energy planning of the district enabled the design team to cost-effectively maximize passive solar and rooftop PV access.
FIGURE 40. The Geos Neighborhood master plan ensures solar access for all buildings with a checkerboard pattern of homes and landscapingGraphic from SUN Studio
Consider innovative parcel planning such as a checker-board layout to minimize shading. The Geos Neighbor-hood ZE master planned community in Arvada, Colo-rado, enables dense low-rise townhomes, single family, and home-office spaces by offsetting each building within a checkerboard layout of buildings and landscap-ing to minimize the potential of buildings shading other buildings (see FIGURE 40).
9191 A GUIDE TO ENERGY MASTER PLANNING OF HIGH-PERFORMANCE DISTRICTS AND COMMUNITIES

8: renewAble energy AnAlySiS AnD PlAnning
The Geos Neighborhood master plan demonstrates dense development while still enabling unshaded rooftop photovoltaicsPhoto from Philip Wegener for Geos Neighborhood
Including Solar Specifications in Design Guidelines and Master Plans
Solar ready building design involves designing and constructing a building in a way that facilitates and optimizes the installation of a future rooftop PV system. Installing a PV system on a solar ready building is more cost-effective because solar technical feasibility is already established and the infrastructure is in place. Even if there are no immediate plans to install a PV system, under-standing special energy load considerations (e.g., whether the building will require an uninterrupted power supply and whether electricity storage will be necessary) before a building is constructed allows designers and building contractors to anticipate those potential scenarios. In addition, assessing the future PV system size and energy production informs the building design and results in optimized system sizing when the system is eventually installed (see FIGURE 41). Integrating guidelines18 into architectural design standards and district master plans ensures that district buildings are designed to optimize PV systems. Key strategies include:
• Maximizing contiguous, south-facing, expansive, and unshaded roof areas for PV system placement
• Requiring the roof design to be compatible with the mounting and support of future PV systems
18 www.nrel.gov/docs/fy10osti/46078.pdf
• Considering in advance where and how PV panels will be mounted, including preinstalling mounting hardware
• Ensuring required electrical conduits are routed from the solar PV system to the building’s electrical panel
• Anticipating the mature size of trees and choosing tree species and locations that will not shade poten-tial PV locations
• Allocating sufficient space for PV electrical equip-ment, including the inverter, other balance of system components, and safety equipment
• Accounting for shading from adjacent buildings; place single family dwellings separately from two-story homes to optimize solar access.
9292A GUIDE TO ENERGY MASTER PLANNING OF HIGH-PERFORMANCE DISTRICTS AND COMMUNITIES
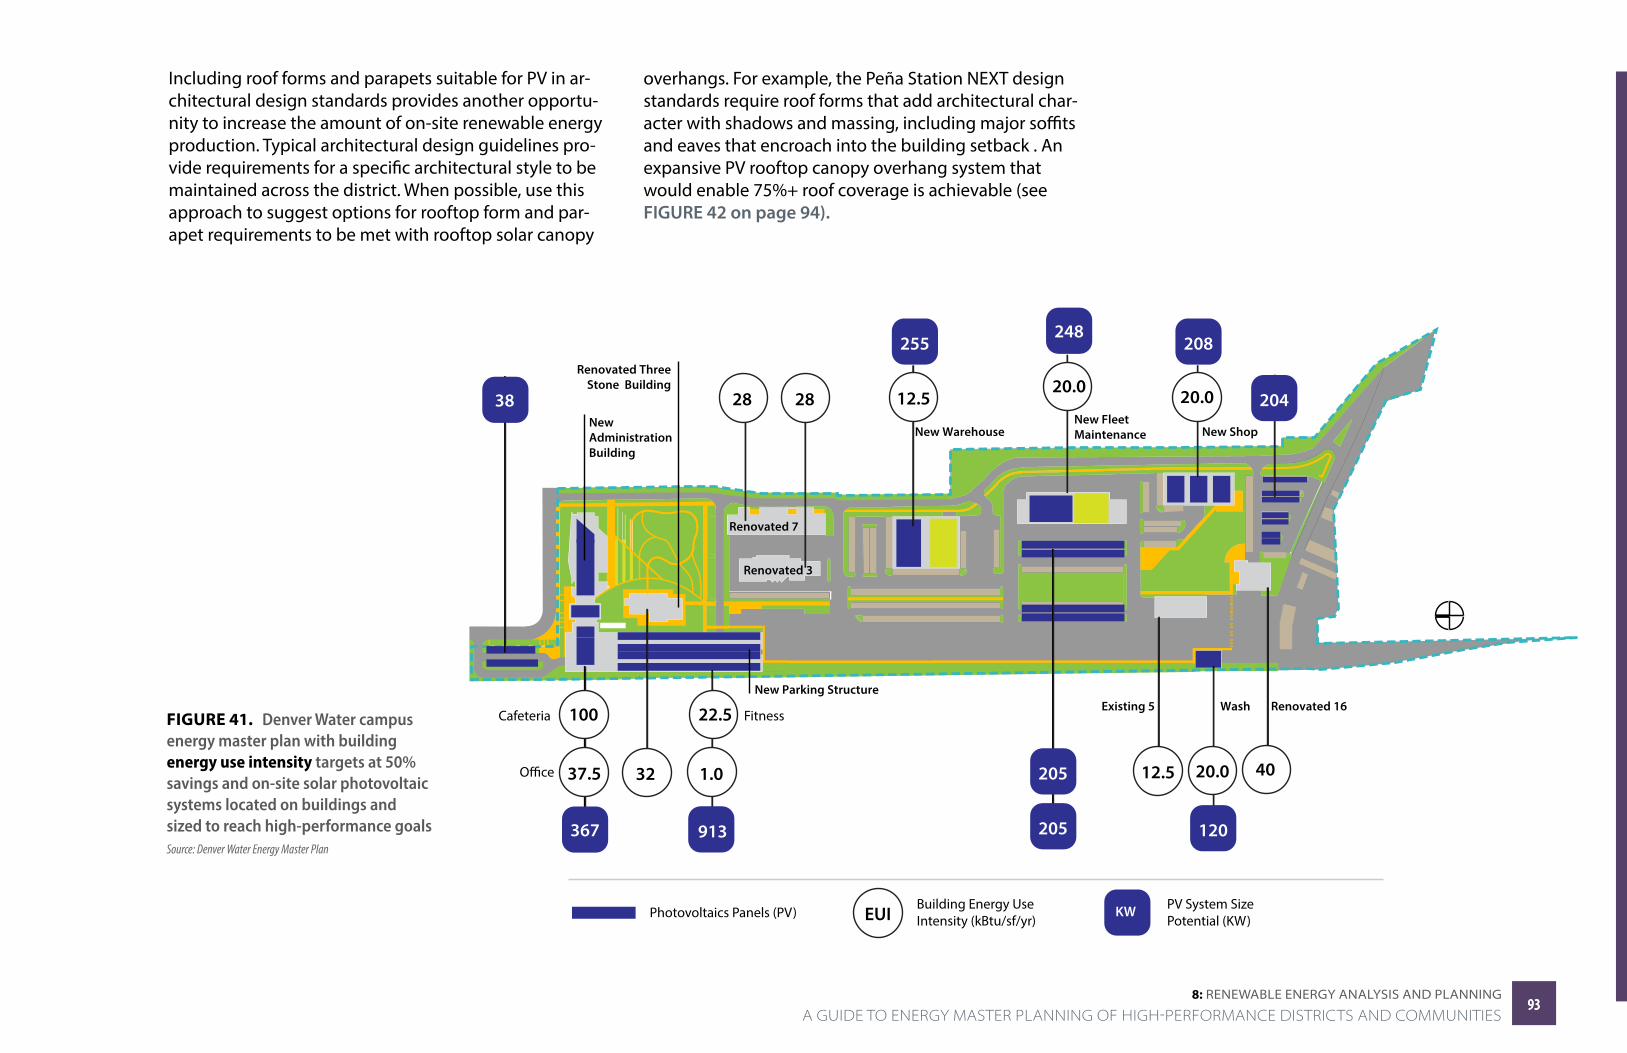
8: renewAble energy AnAlySiS AnD PlAnning
FIGURE 41. Denver Water campus energy master plan with building energy use intensity targets at 50% savings and on-site solar photovoltaic systems located on buildings and sized to reach high-performance goalsSource: Denver Water Energy Master Plan
Including roof forms and parapets suitable for PV in ar-chitectural design standards provides another opportu-nity to increase the amount of on-site renewable energy production. Typical architectural design guidelines pro-vide requirements for a specific architectural style to be maintained across the district. When possible, use this approach to suggest options for rooftop form and par-apet requirements to be met with rooftop solar canopy
overhangs. For example, the Peña Station NEXT design standards require roof forms that add architectural char-acter with shadows and massing, including major soffits and eaves that encroach into the building setback . An expansive PV rooftop canopy overhang system that would enable 75%+ roof coverage is achievable (see FIGURE 42 on page 94).
New Warehouse New FleetMaintenance New Shop
Existing 5 Renovated 16Wash
Renovated 7
Renovated 3
Renovated ThreeStone Building
New Parking Structure
New AdministrationBuilding
1.0
913
Photovoltaics Panels (PV)Building Energy Use Intensity (kBtu/sf/yr)
PV System Size Potential (KW)EUI KW
37.5
100Cafeteria
367
32
2828
20.0
120
205
205
12.5
255
20.0
248
20.0
208
22.5 Fitness
4012.5
38 204
9393 A GUIDE TO ENERGY MASTER PLANNING OF HIGH-PERFORMANCE DISTRICTS AND COMMUNITIES
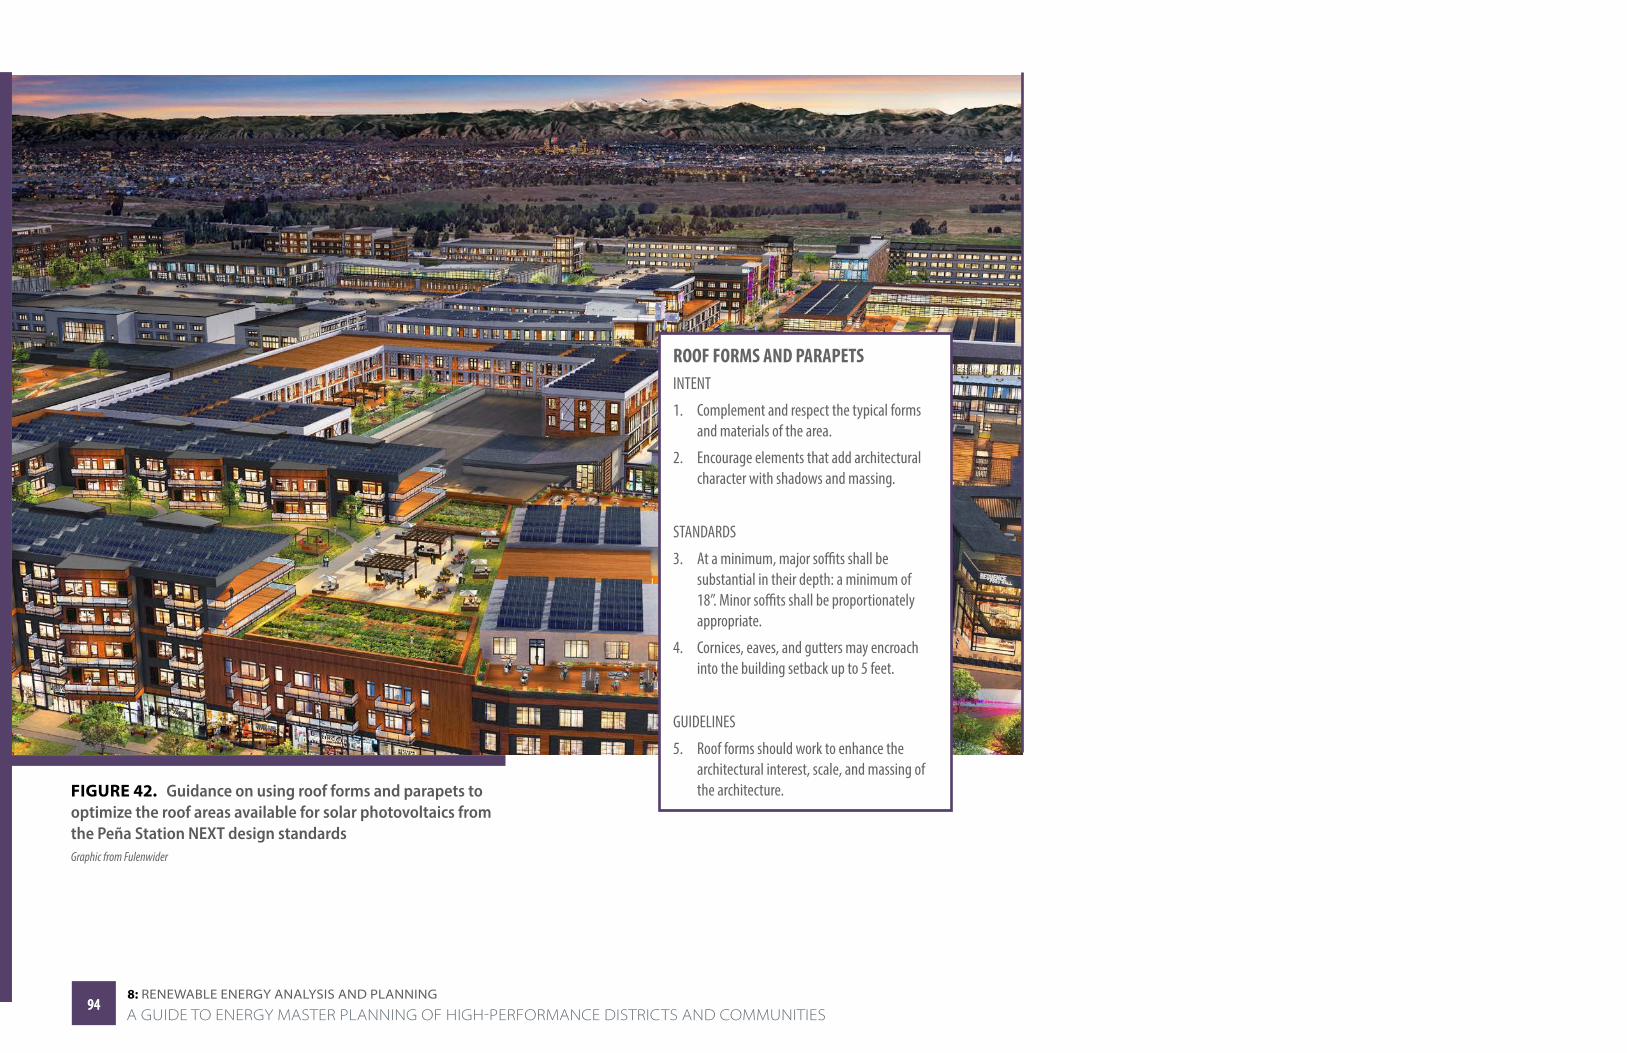
8: renewAble energy AnAlySiS AnD PlAnning
FIGURE 42. Guidance on using roof forms and parapets to optimize the roof areas available for solar photovoltaics from the Peña Station NEXT design standards Graphic from Fulenwider
ROOF FORMS AND PARAPETSINTENT
1. Complement and respect the typical forms and materials of the area.
2. Encourage elements that add architectural character with shadows and massing.
STANDARDS
3. At a minimum, major soffits shall be substantial in their depth: a minimum of 18”. Minor soffits shall be proportionately appropriate.
4. Cornices, eaves, and gutters may encroach into the building setback up to 5 feet.
GUIDELINES
5. Roof forms should work to enhance the architectural interest, scale, and massing of the architecture.
9494A GUIDE TO ENERGY MASTER PLANNING OF HIGH-PERFORMANCE DISTRICTS AND COMMUNITIES
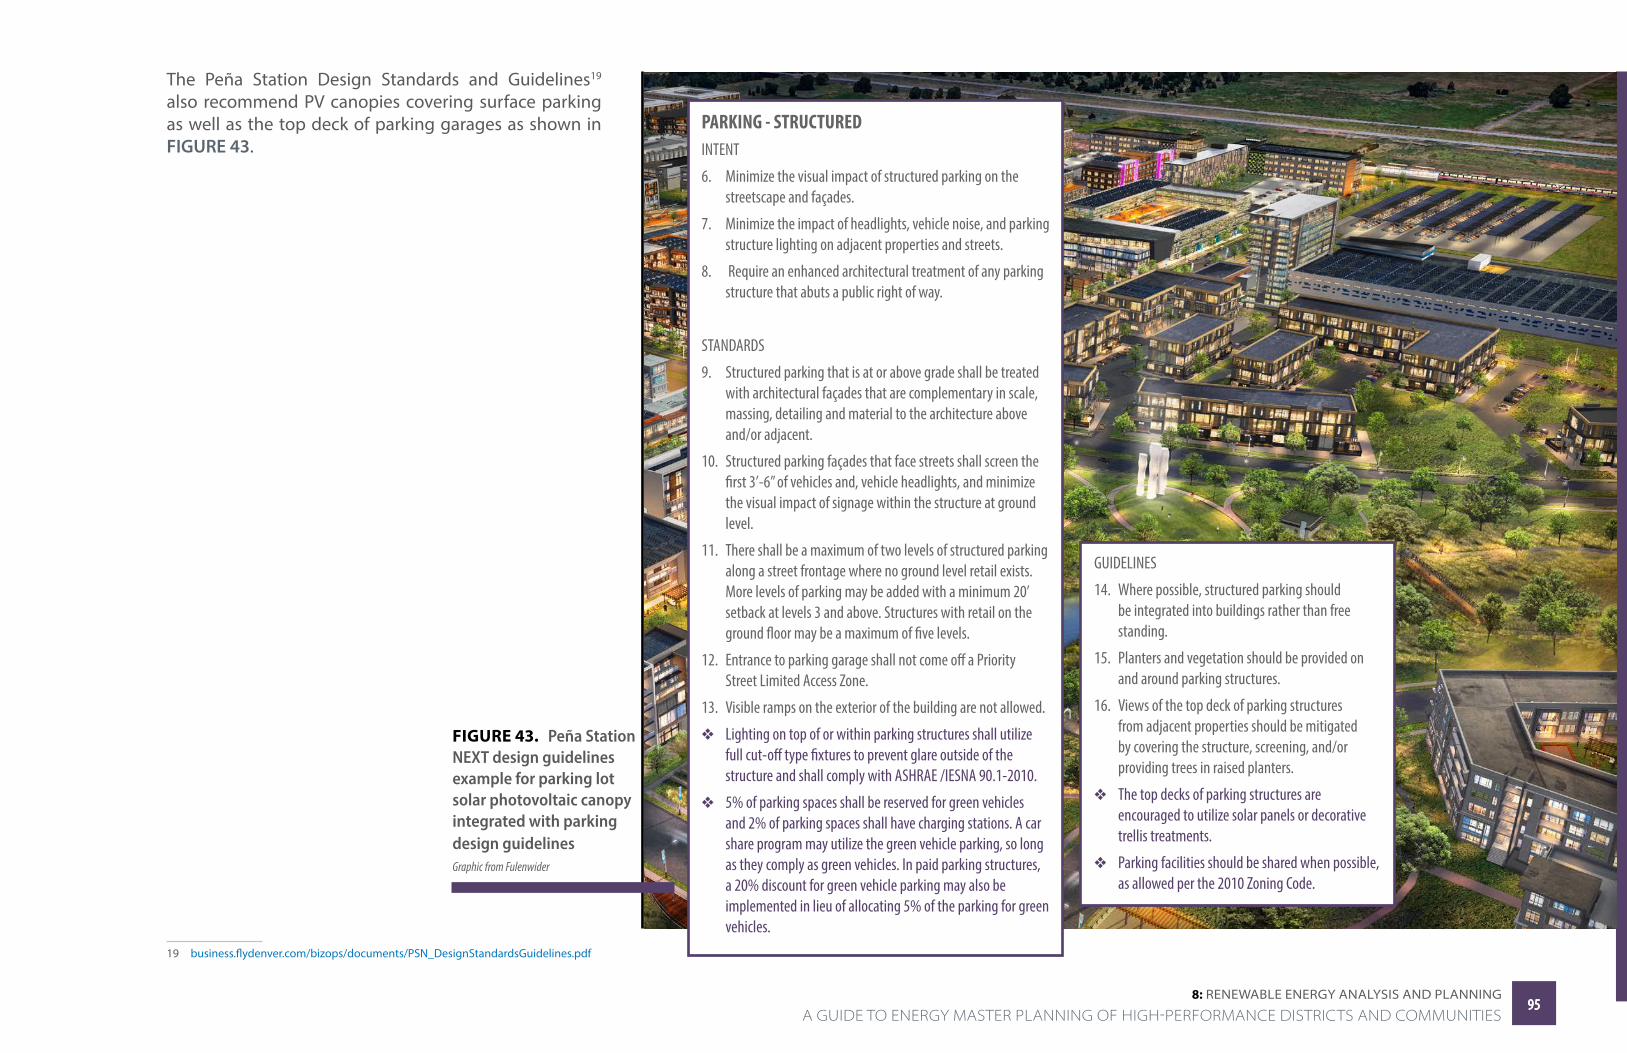
8: renewAble energy AnAlySiS AnD PlAnning
The Peña Station Design Standards and Guidelines19 also recommend PV canopies covering surface parking as well as the top deck of parking garages as shown in FIGURE 43.
19 business.flydenver.com/bizops/documents/PSN_DesignStandardsGuidelines.pdf
PARKING - STRUCTUREDINTENT
6. Minimize the visual impact of structured parking on the streetscape and façades.
7. Minimize the impact of headlights, vehicle noise, and parking structure lighting on adjacent properties and streets.
8. Require an enhanced architectural treatment of any parking structure that abuts a public right of way.
STANDARDS
9. Structured parking that is at or above grade shall be treated with architectural façades that are complementary in scale, massing, detailing and material to the architecture above and/or adjacent.
10. Structured parking façades that face streets shall screen the first 3’-6” of vehicles and, vehicle headlights, and minimize the visual impact of signage within the structure at ground level.
11. There shall be a maximum of two levels of structured parking along a street frontage where no ground level retail exists. More levels of parking may be added with a minimum 20’ setback at levels 3 and above. Structures with retail on the ground floor may be a maximum of five levels.
12. Entrance to parking garage shall not come off a Priority Street Limited Access Zone.
13. Visible ramps on the exterior of the building are not allowed.
v Lighting on top of or within parking structures shall utilize full cut-off type fixtures to prevent glare outside of the structure and shall comply with ASHRAE /IESNA 90.1-2010.
v 5% of parking spaces shall be reserved for green vehicles and 2% of parking spaces shall have charging stations. A car share program may utilize the green vehicle parking, so long as they comply as green vehicles. In paid parking structures, a 20% discount for green vehicle parking may also be implemented in lieu of allocating 5% of the parking for green vehicles.
GUIDELINES
14. Where possible, structured parking should be integrated into buildings rather than free standing.
15. Planters and vegetation should be provided on and around parking structures.
16. Views of the top deck of parking structures from adjacent properties should be mitigated by covering the structure, screening, and/or providing trees in raised planters.
v The top decks of parking structures are encouraged to utilize solar panels or decorative trellis treatments.
v Parking facilities should be shared when possible, as allowed per the 2010 Zoning Code.
FIGURE 43. Peña Station NEXT design guidelines example for parking lot solar photovoltaic canopy integrated with parking design guidelines Graphic from Fulenwider
9595 A GUIDE TO ENERGY MASTER PLANNING OF HIGH-PERFORMANCE DISTRICTS AND COMMUNITIES
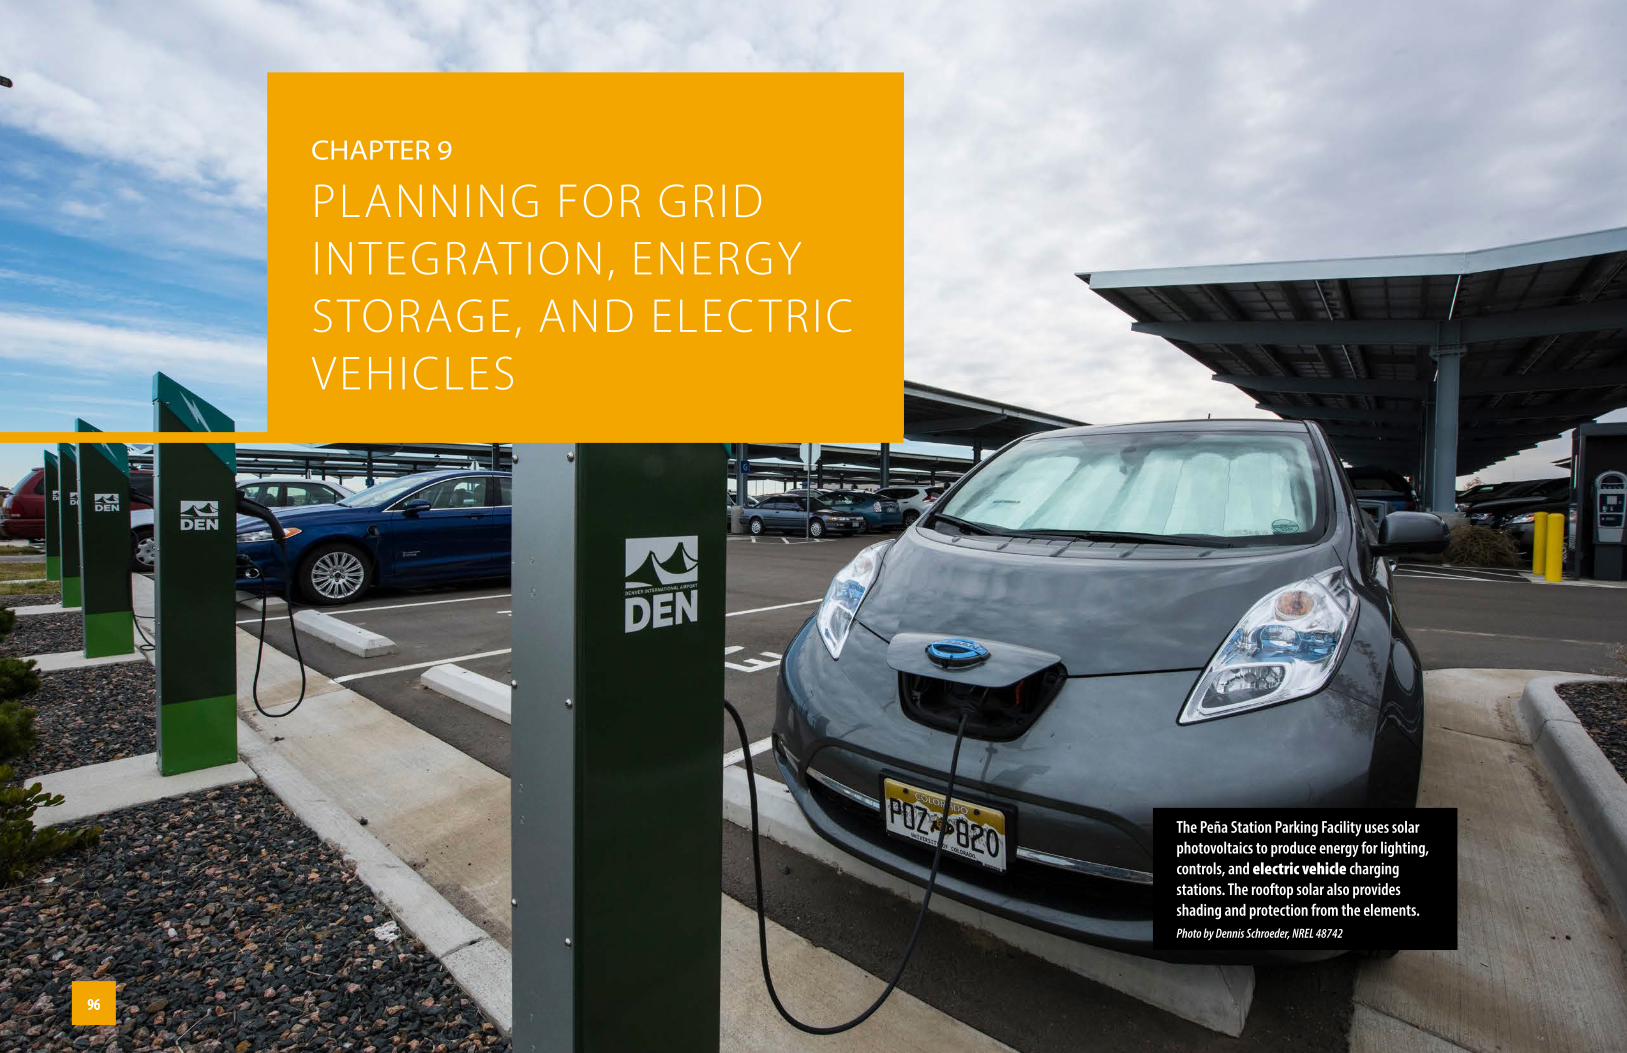
CHAPTer 9
PLANNING FOR GRID INTEGRATION, ENERGY STORAGE, AND ELECTRIC VEHICLES
The Peña Station Parking Facility uses solar photovoltaics to produce energy for lighting, controls, and electric vehicle charging stations. The rooftop solar also provides shading and protection from the elements. Photo by Dennis Schroeder, NREL 48742
9696
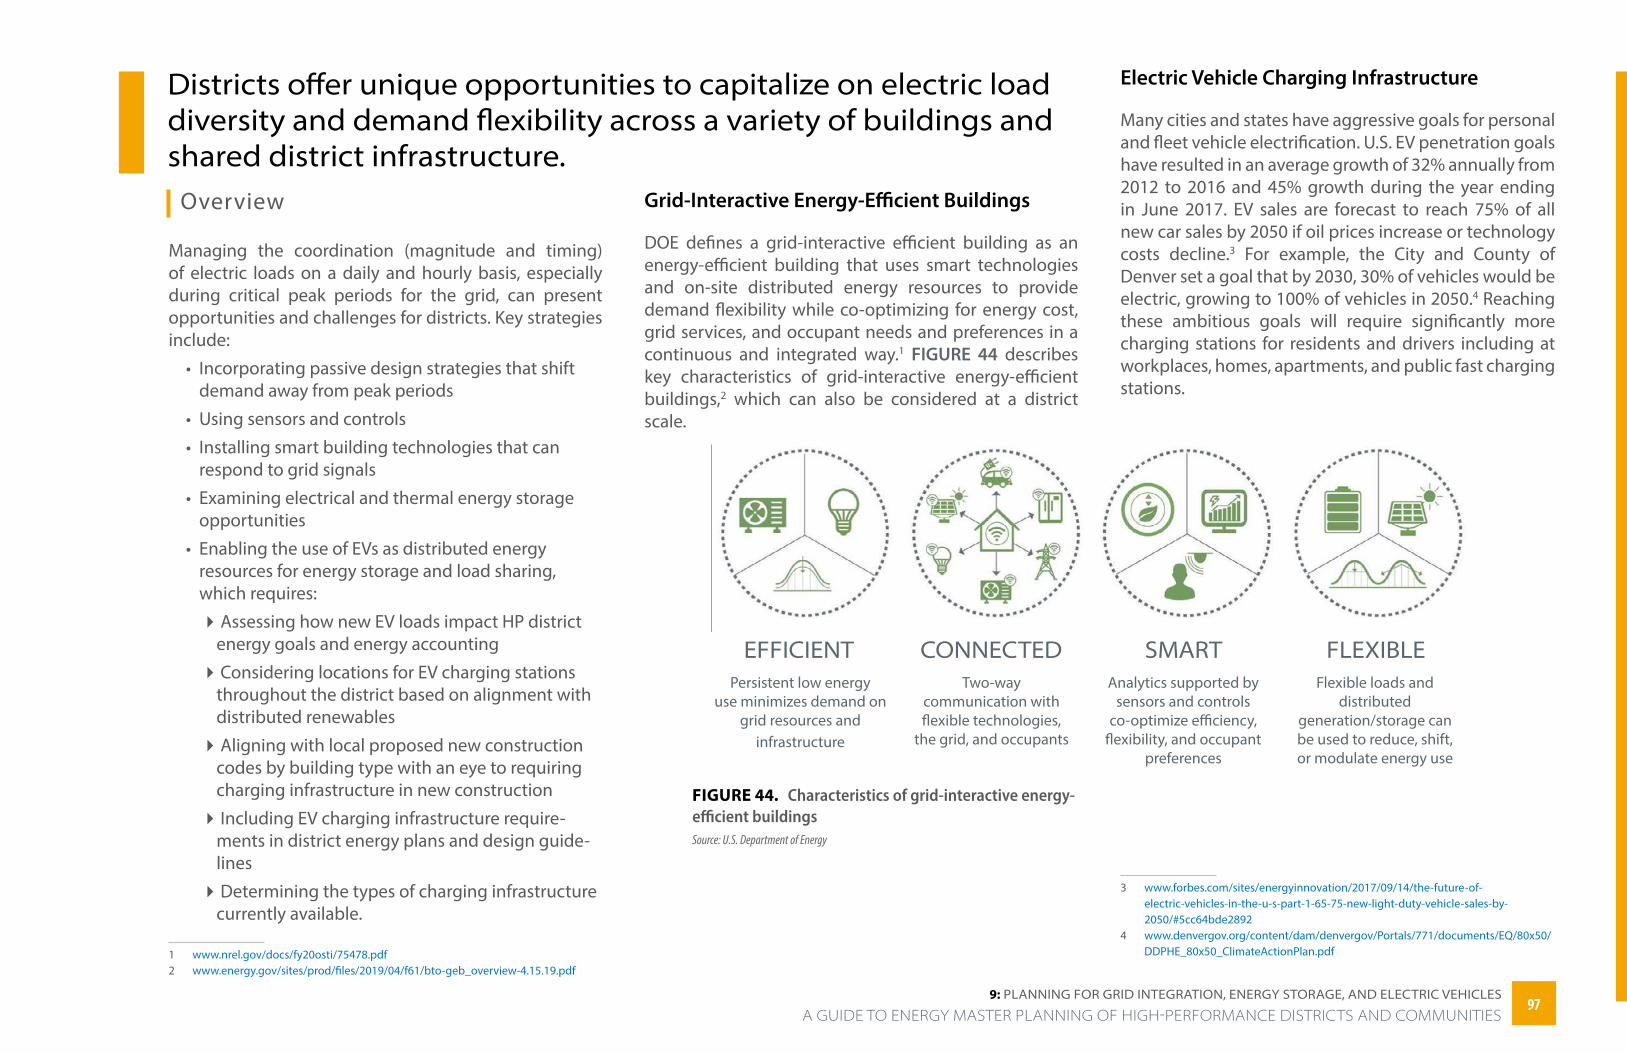
9: PlAnning FOr griD inTegrATiOn, energy STOrAge, AnD eleCTriC veHiCleS
Districts offer unique opportunities to capitalize on electric load diversity and demand flexibility across a variety of buildings and shared district infrastructure.
Overview
Managing the coordination (magnitude and timing) of electric loads on a daily and hourly basis, especially during critical peak periods for the grid, can present opportunities and challenges for districts. Key strategies include:
• Incorporating passive design strategies that shift demand away from peak periods
• Using sensors and controls
• Installing smart building technologies that can respond to grid signals
• Examining electrical and thermal energy storage opportunities
• Enabling the use of EVs as distributed energy resources for energy storage and load sharing, which requires:
�Assessing how new EV loads impact HP district energy goals and energy accounting
�Considering locations for EV charging stations throughout the district based on alignment with distributed renewables
�Aligning with local proposed new construction codes by building type with an eye to requiring charging infrastructure in new construction
�Including EV charging infrastructure require-ments in district energy plans and design guide-lines
�Determining the types of charging infrastructure currently available.
1 www.nrel.gov/docs/fy20osti/75478.pdf 2 www.energy.gov/sites/prod/files/2019/04/f61/bto-geb_overview-4.15.19.pdf
Grid-Interactive Energy-Efficient Buildings
DOE defines a grid-interactive efficient building as an energy-efficient building that uses smart technologies and on-site distributed energy resources to provide demand flexibility while co-optimizing for energy cost, grid services, and occupant needs and preferences in a continuous and integrated way.1 FIGURE 44 describes key characteristics of grid-interactive energy-efficient buildings,2 which can also be considered at a district scale.
FIGURE 44. Characteristics of grid-interactive energy-efficient buildingsSource: U.S. Department of Energy
GEB Key Characteristics
EFFICIENT CONNECTED SMART FLEXIBLE
Electric Vehicle Charging Infrastructure
Many cities and states have aggressive goals for personal and fleet vehicle electrification. U.S. EV penetration goals have resulted in an average growth of 32% annually from 2012 to 2016 and 45% growth during the year ending in June 2017. EV sales are forecast to reach 75% of all new car sales by 2050 if oil prices increase or technology costs decline.3 For example, the City and County of Denver set a goal that by 2030, 30% of vehicles would be electric, growing to 100% of vehicles in 2050.4 Reaching these ambitious goals will require significantly more charging stations for residents and drivers including at workplaces, homes, apartments, and public fast charging stations.
3 www.forbes.com/sites/energyinnovation/2017/09/14/the-future-of-electric-vehicles-in-the-u-s-part-1-65-75-new-light-duty-vehicle-sales-by-2050/#5cc64bde2892
4 www.denvergov.org/content/dam/denvergov/Portals/771/documents/EQ/80x50/DDPHE_80x50_ClimateActionPlan.pdf
A GUIDE TO ENERGY MASTER PLANNING OF HIGH-PERFORMANCE DISTRICTS AND COMMUNITIES9797
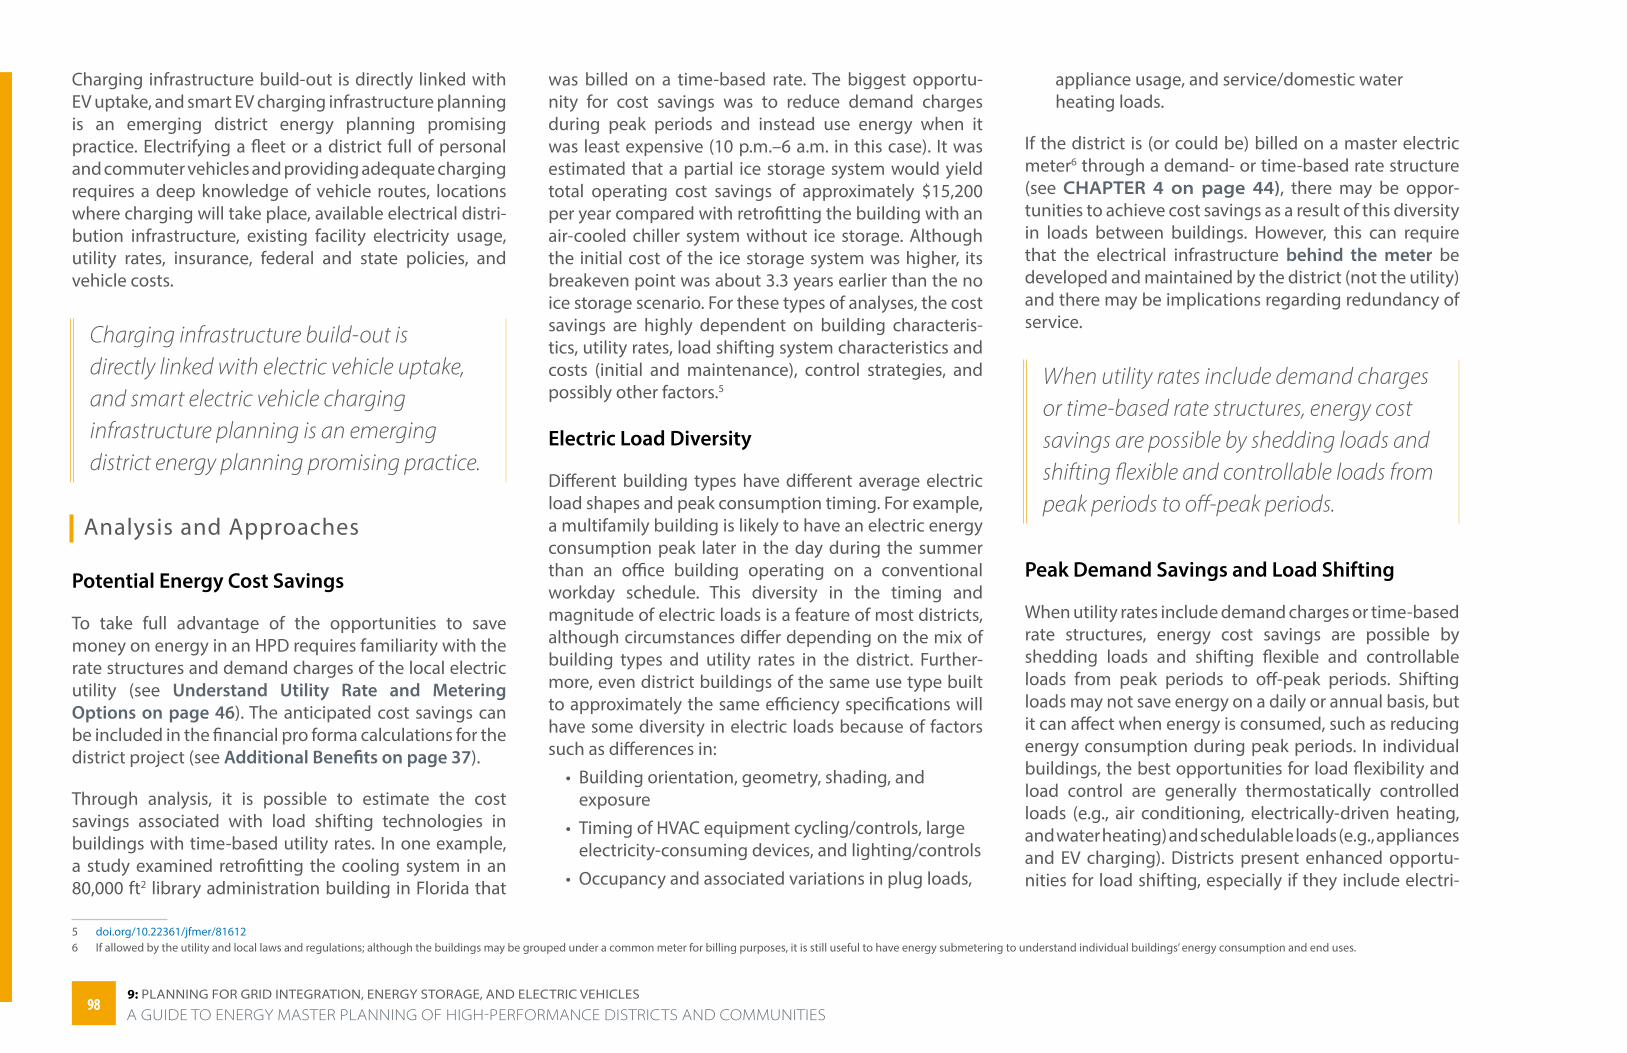
9: PlAnning FOr griD inTegrATiOn, energy STOrAge, AnD eleCTriC veHiCleS
Charging infrastructure build-out is directly linked with EV uptake, and smart EV charging infrastructure planning is an emerging district energy planning promising practice. Electrifying a fleet or a district full of personal and commuter vehicles and providing adequate charging requires a deep knowledge of vehicle routes, locations where charging will take place, available electrical distri-bution infrastructure, existing facility electricity usage, utility rates, insurance, federal and state policies, and vehicle costs.
Charging infrastructure build-out is directly linked with electric vehicle uptake, and smart electric vehicle charging infrastructure planning is an emerging district energy planning promising practice.
Analysis and Approaches
Potential Energy Cost Savings
To take full advantage of the opportunities to save money on energy in an HPD requires familiarity with the rate structures and demand charges of the local electric utility (see Understand Utility Rate and Metering Options on page 46). The anticipated cost savings can be included in the financial pro forma calculations for the district project (see Additional Benefits on page 37).
Through analysis, it is possible to estimate the cost savings associated with load shifting technologies in buildings with time-based utility rates. In one example, a study examined retrofitting the cooling system in an 80,000 ft2 library administration building in Florida that
5 doi.org/10.22361/jfmer/816126 If allowed by the utility and local laws and regulations; although the buildings may be grouped under a common meter for billing purposes, it is still useful to have energy submetering to understand individual buildings’ energy consumption and end uses.
was billed on a time-based rate. The biggest opportu-nity for cost savings was to reduce demand charges during peak periods and instead use energy when it was least expensive (10 p.m.–6 a.m. in this case). It was estimated that a partial ice storage system would yield total operating cost savings of approximately $15,200 per year compared with retrofitting the building with an air-cooled chiller system without ice storage. Although the initial cost of the ice storage system was higher, its breakeven point was about 3.3 years earlier than the no ice storage scenario. For these types of analyses, the cost savings are highly dependent on building characteris-tics, utility rates, load shifting system characteristics and costs (initial and maintenance), control strategies, and possibly other factors.5
Electric Load Diversity
Different building types have different average electric load shapes and peak consumption timing. For example, a multifamily building is likely to have an electric energy consumption peak later in the day during the summer than an office building operating on a conventional workday schedule. This diversity in the timing and magnitude of electric loads is a feature of most districts, although circumstances differ depending on the mix of building types and utility rates in the district. Further-more, even district buildings of the same use type built to approximately the same efficiency specifications will have some diversity in electric loads because of factors such as differences in:
• Building orientation, geometry, shading, and exposure
• Timing of HVAC equipment cycling/controls, large electricity-consuming devices, and lighting/controls
• Occupancy and associated variations in plug loads,
appliance usage, and service/domestic water heating loads.
If the district is (or could be) billed on a master electric meter6 through a demand- or time-based rate structure (see CHAPTER 4 on page 44), there may be oppor-tunities to achieve cost savings as a result of this diversity in loads between buildings. However, this can require that the electrical infrastructure behind the meter be developed and maintained by the district (not the utility) and there may be implications regarding redundancy of service.
When utility rates include demand charges or time-based rate structures, energy cost savings are possible by shedding loads and shifting flexible and controllable loads from peak periods to off-peak periods.
Peak Demand Savings and Load Shifting
When utility rates include demand charges or time-based rate structures, energy cost savings are possible by shedding loads and shifting flexible and controllable loads from peak periods to off-peak periods. Shifting loads may not save energy on a daily or annual basis, but it can affect when energy is consumed, such as reducing energy consumption during peak periods. In individual buildings, the best opportunities for load flexibility and load control are generally thermostatically controlled loads (e.g., air conditioning, electrically-driven heating, and water heating) and schedulable loads (e.g., appliances and EV charging). Districts present enhanced opportu-nities for load shifting, especially if they include electri-
9898A GUIDE TO ENERGY MASTER PLANNING OF HIGH-PERFORMANCE DISTRICTS AND COMMUNITIES
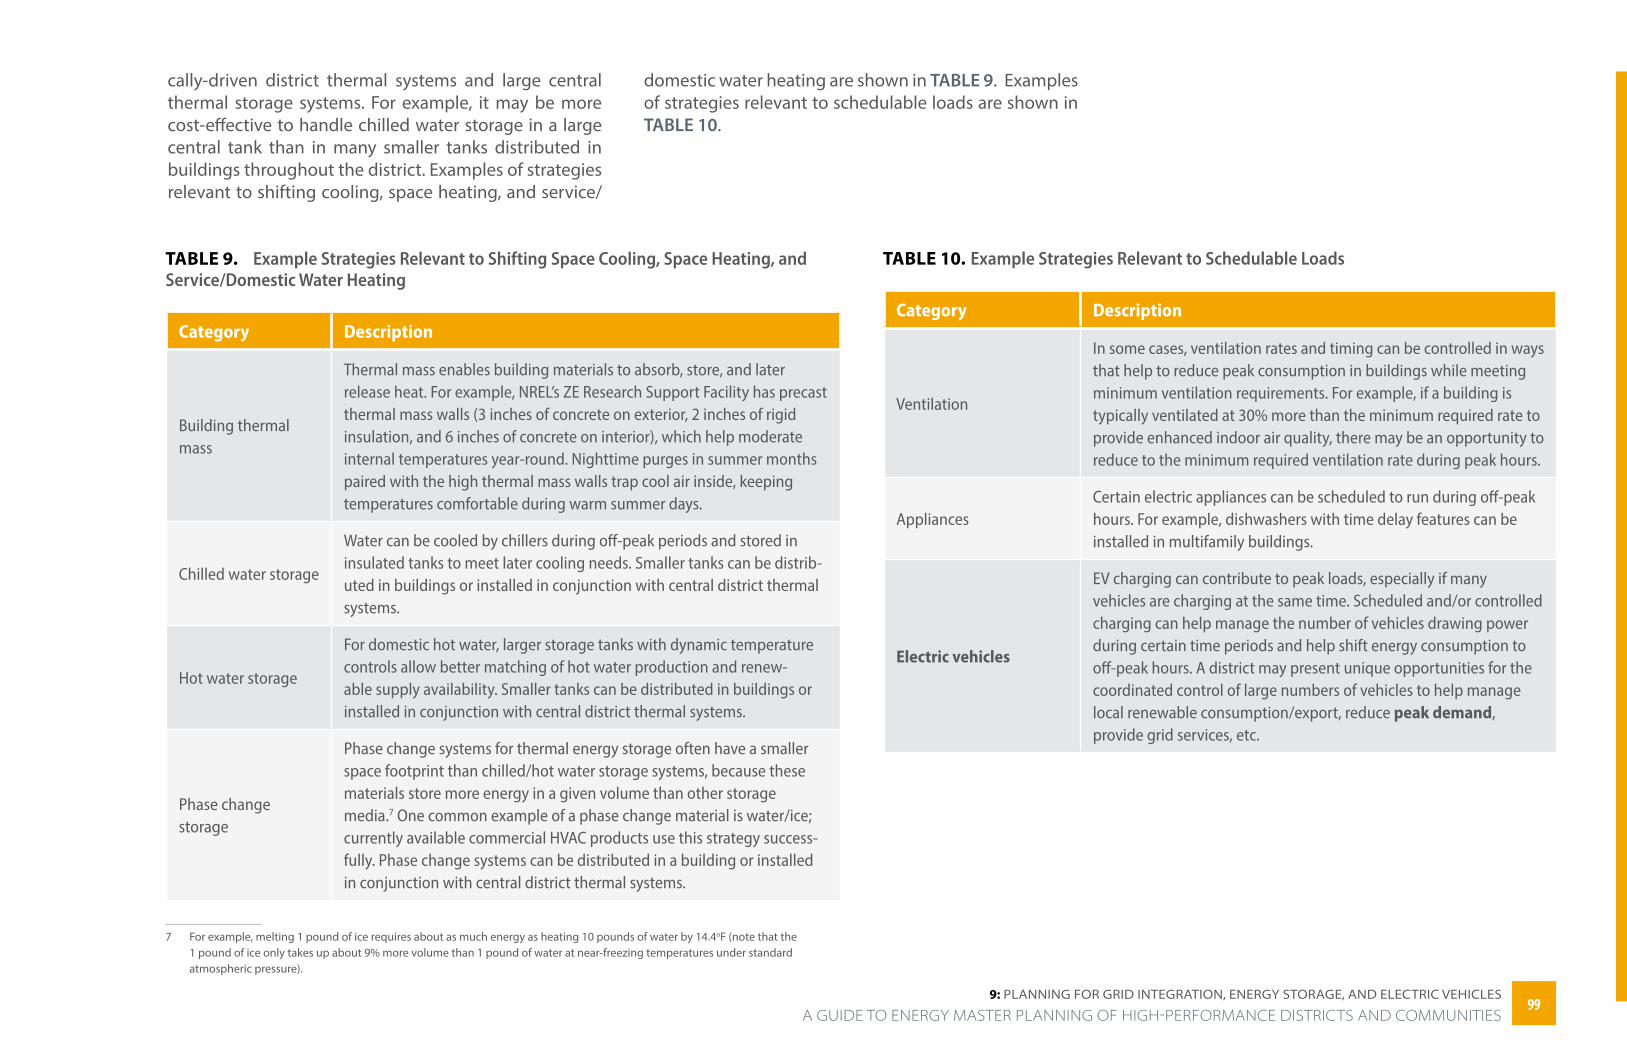
9: PlAnning FOr griD inTegrATiOn, energy STOrAge, AnD eleCTriC veHiCleS
cally-driven district thermal systems and large central thermal storage systems. For example, it may be more cost-effective to handle chilled water storage in a large central tank than in many smaller tanks distributed in buildings throughout the district. Examples of strategies relevant to shifting cooling, space heating, and service/
domestic water heating are shown in TABLE 9. Examples of strategies relevant to schedulable loads are shown in TABLE 10.
TABLE 10. Example Strategies Relevant to Schedulable Loads
Category Description
Ventilation
In some cases, ventilation rates and timing can be controlled in ways that help to reduce peak consumption in buildings while meeting minimum ventilation requirements. For example, if a building is typically ventilated at 30% more than the minimum required rate to provide enhanced indoor air quality, there may be an opportunity to reduce to the minimum required ventilation rate during peak hours.
AppliancesCertain electric appliances can be scheduled to run during off-peak hours. For example, dishwashers with time delay features can be installed in multifamily buildings.
Electric vehicles
EV charging can contribute to peak loads, especially if many vehicles are charging at the same time. Scheduled and/or controlled charging can help manage the number of vehicles drawing power during certain time periods and help shift energy consumption to off-peak hours. A district may present unique opportunities for the coordinated control of large numbers of vehicles to help manage local renewable consumption/export, reduce peak demand, provide grid services, etc.
TABLE 9. Example Strategies Relevant to Shifting Space Cooling, Space Heating, and Service/Domestic Water Heating
Category Description
Building thermal mass
Thermal mass enables building materials to absorb, store, and later release heat. For example, NREL’s ZE Research Support Facility has precast thermal mass walls (3 inches of concrete on exterior, 2 inches of rigid insulation, and 6 inches of concrete on interior), which help moderate internal temperatures year-round. Nighttime purges in summer months paired with the high thermal mass walls trap cool air inside, keeping temperatures comfortable during warm summer days.
Chilled water storage
Water can be cooled by chillers during off-peak periods and stored in insulated tanks to meet later cooling needs. Smaller tanks can be distrib-uted in buildings or installed in conjunction with central district thermal systems.
Hot water storage
For domestic hot water, larger storage tanks with dynamic temperature controls allow better matching of hot water production and renew-able supply availability. Smaller tanks can be distributed in buildings or installed in conjunction with central district thermal systems.
Phase change storage
Phase change systems for thermal energy storage often have a smaller space footprint than chilled/hot water storage systems, because these materials store more energy in a given volume than other storage media.7 One common example of a phase change material is water/ice; currently available commercial HVAC products use this strategy success-fully. Phase change systems can be distributed in a building or installed in conjunction with central district thermal systems.
7 For example, melting 1 pound of ice requires about as much energy as heating 10 pounds of water by 14.4oF (note that the 1 pound of ice only takes up about 9% more volume than 1 pound of water at near-freezing temperatures under standard atmospheric pressure).
9999 A GUIDE TO ENERGY MASTER PLANNING OF HIGH-PERFORMANCE DISTRICTS AND COMMUNITIES
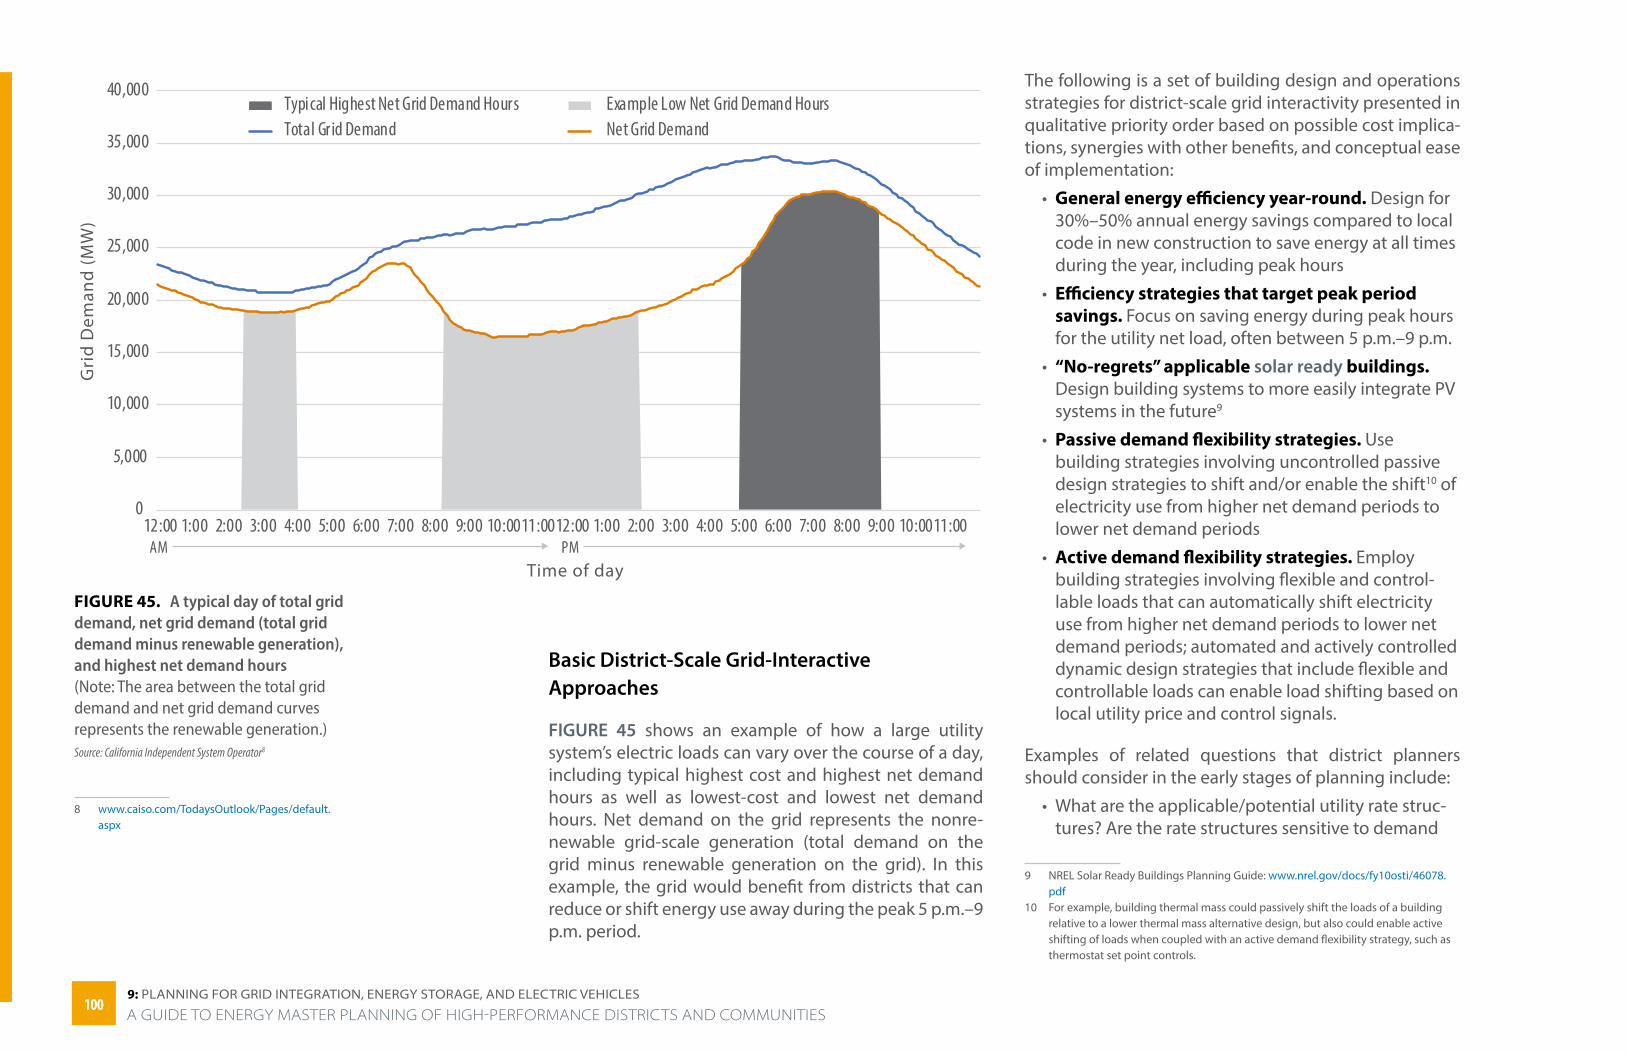
9: PlAnning FOr griD inTegrATiOn, energy STOrAge, AnD eleCTriC veHiCleS
Basic District-Scale Grid-Interactive Approaches
FIGURE 45 shows an example of how a large utility system’s electric loads can vary over the course of a day, including typical highest cost and highest net demand hours as well as lowest-cost and lowest net demand hours. Net demand on the grid represents the nonre-newable grid-scale generation (total demand on the grid minus renewable generation on the grid). In this example, the grid would benefit from districts that can reduce or shift energy use away during the peak 5 p.m.–9 p.m. period.
FIGURE 45. A typical day of total grid demand, net grid demand (total grid demand minus renewable generation), and highest net demand hours (Note: The area between the total grid demand and net grid demand curves represents the renewable generation.)Source: California Independent System Operator8
8 www.caiso.com/TodaysOutlook/Pages/default.aspx
0
5,000
10,000
15,000
20,000
25,000
30,000
35,000
40,000
12:00 1:00 2:00 3:00 4:00AM
5:00 6:00 7:00 8:00 9:00 10:0011:0012:00PM
1:00 2:00 3:00 4:00 5:00 6:00 7:00 8:00 9:00 10:0011:00
Gri
d D
eman
d (M
W)
Time of day
Typical Highest Net Grid Demand Hours Example Low Net Grid Demand HoursTotal Grid Demand Net Grid Demand
The following is a set of building design and operations strategies for district-scale grid interactivity presented in qualitative priority order based on possible cost implica-tions, synergies with other benefits, and conceptual ease of implementation:
• General energy efficiency year-round. Design for 30%–50% annual energy savings compared to local code in new construction to save energy at all times during the year, including peak hours
• Efficiency strategies that target peak period savings. Focus on saving energy during peak hours for the utility net load, often between 5 p.m.–9 p.m.
• “No-regrets” applicable solar ready buildings. Design building systems to more easily integrate PV systems in the future9
• Passive demand flexibility strategies. Use building strategies involving uncontrolled passive design strategies to shift and/or enable the shift10 of electricity use from higher net demand periods to lower net demand periods
• Active demand flexibility strategies. Employ building strategies involving flexible and control-lable loads that can automatically shift electricity use from higher net demand periods to lower net demand periods; automated and actively controlled dynamic design strategies that include flexible and controllable loads can enable load shifting based on local utility price and control signals.
Examples of related questions that district planners should consider in the early stages of planning include:
• What are the applicable/potential utility rate struc-tures? Are the rate structures sensitive to demand
9 NREL Solar Ready Buildings Planning Guide: www.nrel.gov/docs/fy10osti/46078.pdf
10 For example, building thermal mass could passively shift the loads of a building relative to a lower thermal mass alternative design, but also could enable active shifting of loads when coupled with an active demand flexibility strategy, such as thermostat set point controls.
100100A GUIDE TO ENERGY MASTER PLANNING OF HIGH-PERFORMANCE DISTRICTS AND COMMUNITIES
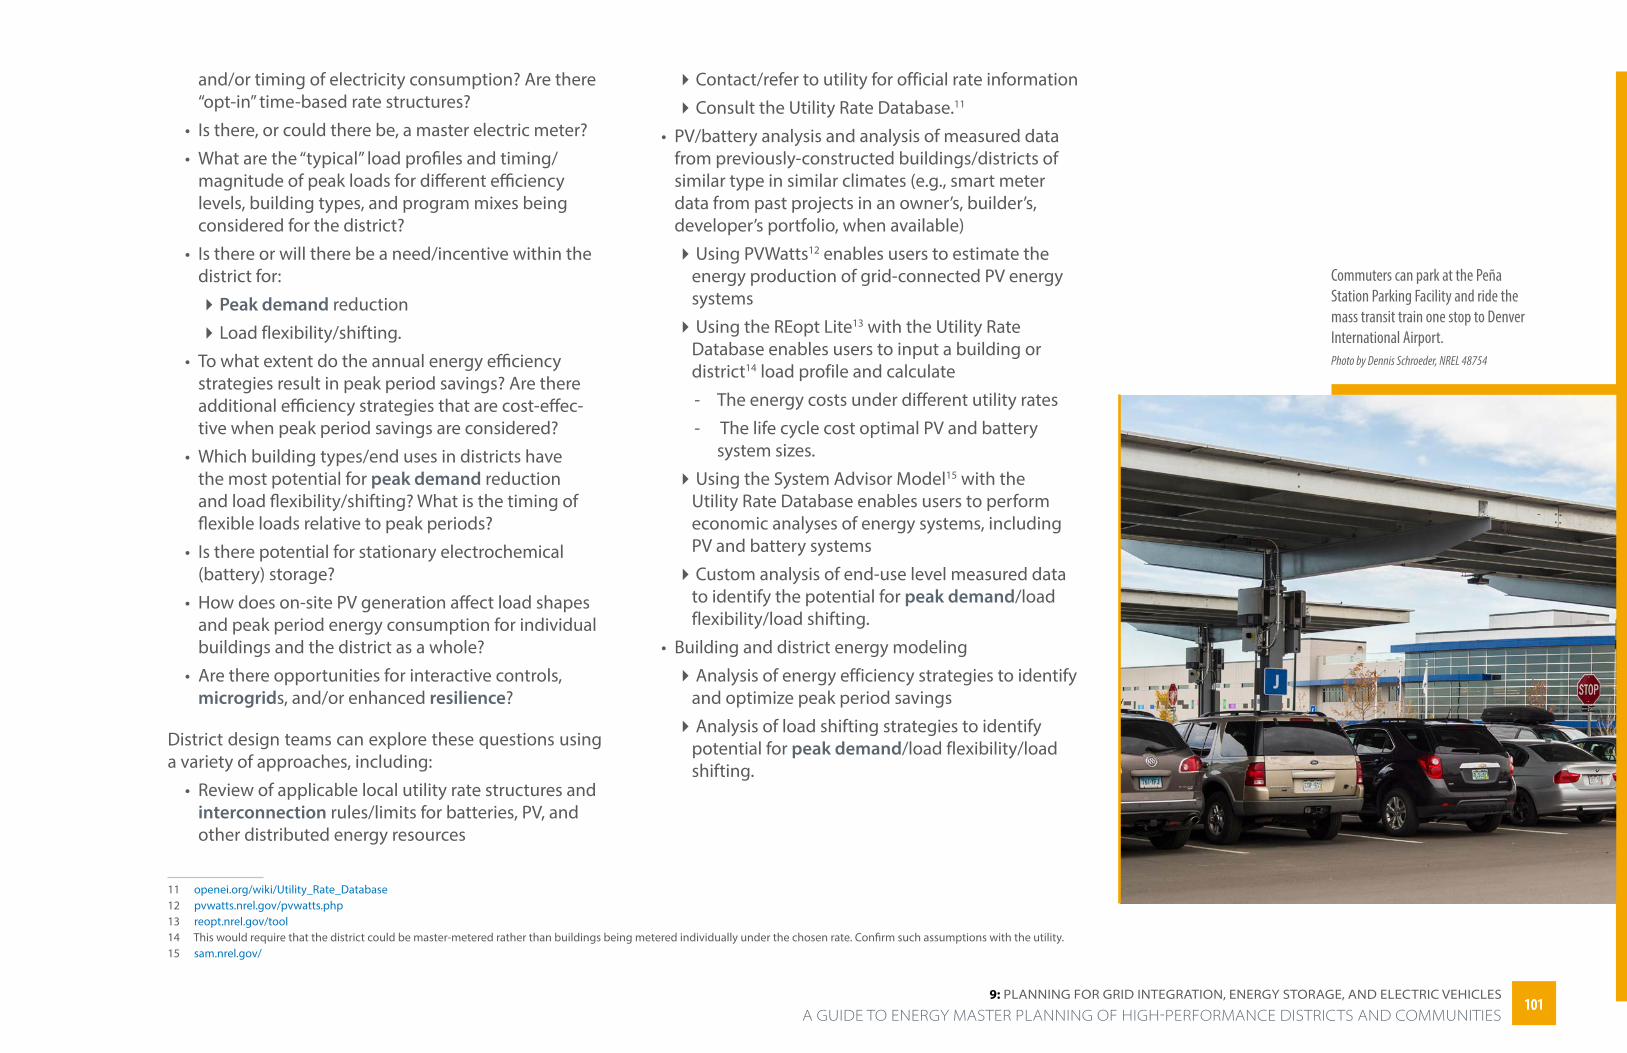
9: PlAnning FOr griD inTegrATiOn, energy STOrAge, AnD eleCTriC veHiCleS
and/or timing of electricity consumption? Are there “opt-in” time-based rate structures?
• Is there, or could there be, a master electric meter?
• What are the “typical” load profiles and timing/magnitude of peak loads for different efficiency levels, building types, and program mixes being considered for the district?
• Is there or will there be a need/incentive within the district for:
�Peak demand reduction
�Load flexibility/shifting.
• To what extent do the annual energy efficiency strategies result in peak period savings? Are there additional efficiency strategies that are cost-effec-tive when peak period savings are considered?
• Which building types/end uses in districts have the most potential for peak demand reduction and load flexibility/shifting? What is the timing of flexible loads relative to peak periods?
• Is there potential for stationary electrochemical (battery) storage?
• How does on-site PV generation affect load shapes and peak period energy consumption for individual buildings and the district as a whole?
• Are there opportunities for interactive controls, microgrids, and/or enhanced resilience?
District design teams can explore these questions using a variety of approaches, including:
• Review of applicable local utility rate structures and interconnection rules/limits for batteries, PV, and other distributed energy resources
11 openei.org/wiki/Utility_Rate_Database 12 pvwatts.nrel.gov/pvwatts.php 13 reopt.nrel.gov/tool 14 This would require that the district could be master-metered rather than buildings being metered individually under the chosen rate. Confirm such assumptions with the utility. 15 sam.nrel.gov/
�Contact/refer to utility for official rate information
�Consult the Utility Rate Database.11
• PV/battery analysis and analysis of measured data from previously-constructed buildings/districts of similar type in similar climates (e.g., smart meter data from past projects in an owner’s, builder’s, developer’s portfolio, when available)
�Using PVWatts12 enables users to estimate the energy production of grid-connected PV energy systems
�Using the REopt Lite13 with the Utility Rate Database enables users to input a building or district14 load profile and calculate
- The energy costs under different utility rates
- The life cycle cost optimal PV and battery system sizes.
�Using the System Advisor Model15 with the Utility Rate Database enables users to perform economic analyses of energy systems, including PV and battery systems
�Custom analysis of end-use level measured data to identify the potential for peak demand/load flexibility/load shifting.
• Building and district energy modeling
�Analysis of energy efficiency strategies to identify and optimize peak period savings
�Analysis of load shifting strategies to identify potential for peak demand/load flexibility/load shifting.
Commuters can park at the Peña Station Parking Facility and ride the mass transit train one stop to Denver International Airport.Photo by Dennis Schroeder, NREL 48754
101101 A GUIDE TO ENERGY MASTER PLANNING OF HIGH-PERFORMANCE DISTRICTS AND COMMUNITIES
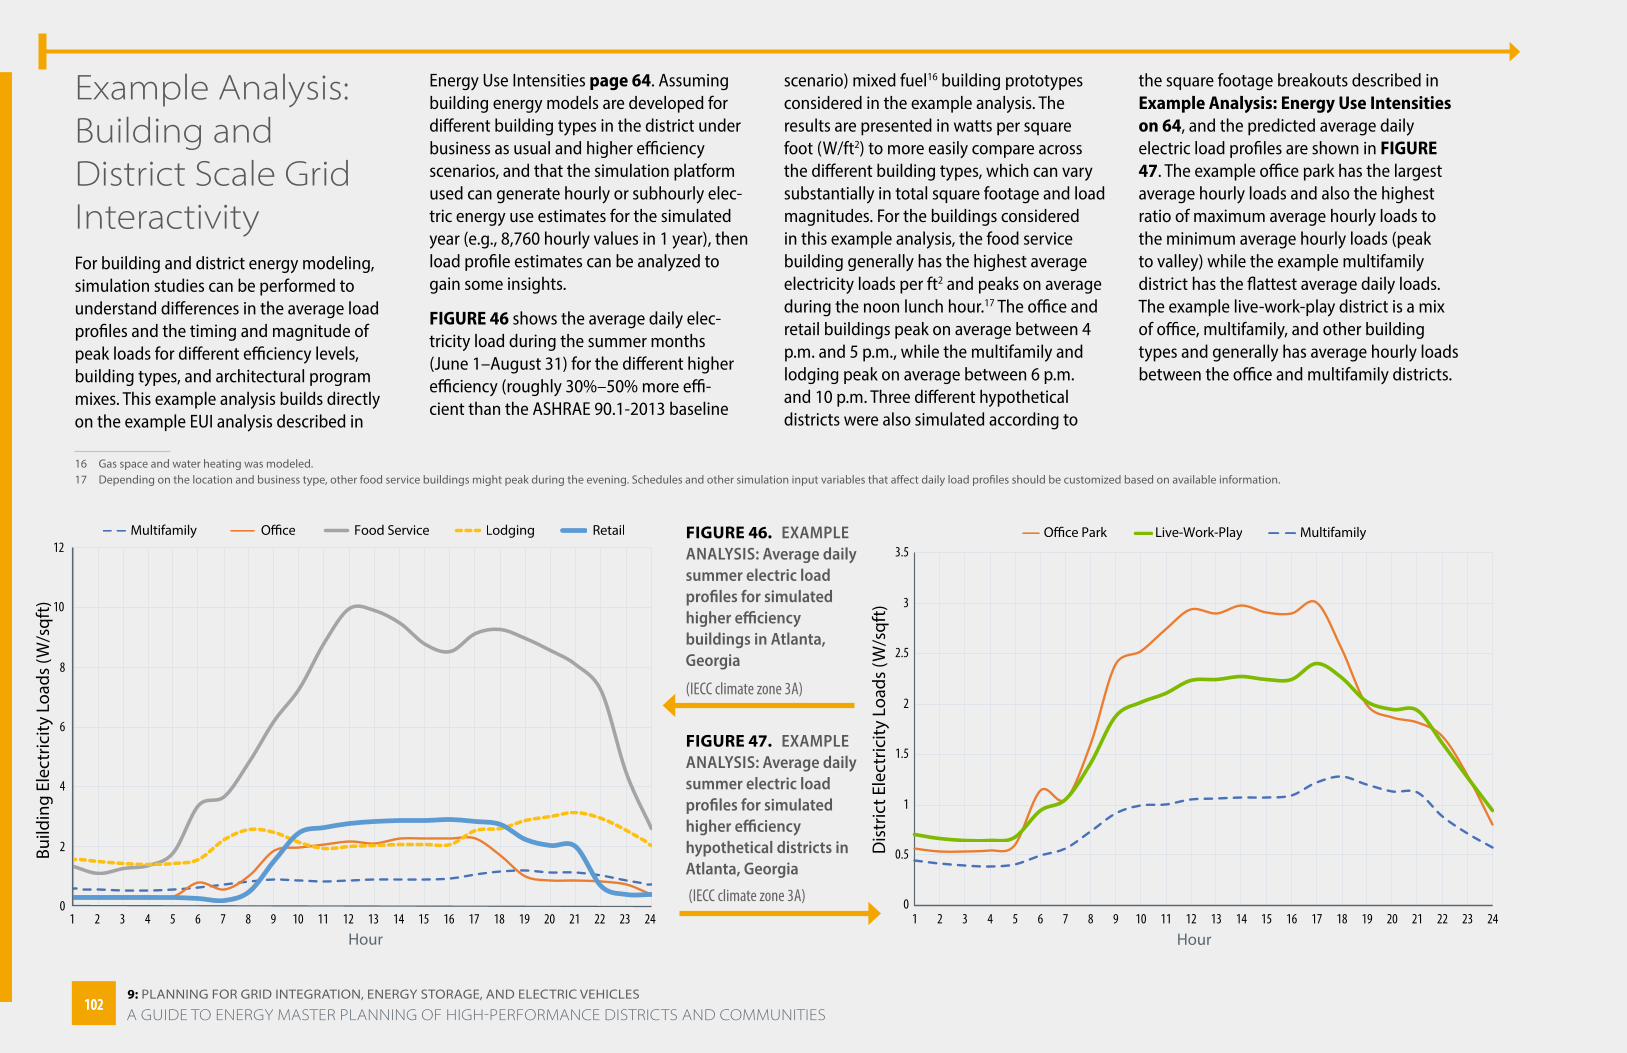
9: PlAnning FOr griD inTegrATiOn, energy STOrAge, AnD eleCTriC veHiCleS
Example Analysis: Building and District Scale Grid InteractivityFor building and district energy modeling, simulation studies can be performed to understand differences in the average load profiles and the timing and magnitude of peak loads for different efficiency levels, building types, and architectural program mixes. This example analysis builds directly on the example EUI analysis described in
16 Gas space and water heating was modeled.17 Depending on the location and business type, other food service buildings might peak during the evening. Schedules and other simulation input variables that affect daily load profiles should be customized based on available information.
Energy Use Intensities page 64. Assuming building energy models are developed for different building types in the district under business as usual and higher efficiency scenarios, and that the simulation platform used can generate hourly or subhourly elec-tric energy use estimates for the simulated year (e.g., 8,760 hourly values in 1 year), then load profile estimates can be analyzed to gain some insights.
FIGURE 46 shows the average daily elec-tricity load during the summer months (June 1–August 31) for the different higher efficiency (roughly 30%–50% more effi-cient than the ASHRAE 90.1-2013 baseline
scenario) mixed fuel16 building prototypes considered in the example analysis. The results are presented in watts per square foot (W/ft2) to more easily compare across the different building types, which can vary substantially in total square footage and load magnitudes. For the buildings considered in this example analysis, the food service building generally has the highest average electricity loads per ft2 and peaks on average during the noon lunch hour.17 The office and retail buildings peak on average between 4 p.m. and 5 p.m., while the multifamily and lodging peak on average between 6 p.m. and 10 p.m. Three different hypothetical districts were also simulated according to
the square footage breakouts described in Example Analysis: Energy Use Intensities on 64, and the predicted average daily electric load profiles are shown in FIGURE 47. The example office park has the largest average hourly loads and also the highest ratio of maximum average hourly loads to the minimum average hourly loads (peak to valley) while the example multifamily district has the flattest average daily loads. The example live-work-play district is a mix of office, multifamily, and other building types and generally has average hourly loads between the office and multifamily districts.
Build
ing
Elec
tric
ity L
oads
(W/s
qft)
Peak Hours
Dis
tric
t Ele
ctric
ity L
oads
(W/s
qft)
Dis
tric
t Ele
ctric
ity L
oads
(W/s
qft)
Dis
tric
t Ele
ctric
ity L
oads
(W/s
qft)
Dis
tric
t Ele
ctric
ity L
oads
(W/s
qft)
FIGURE 46. EXAMPLE ANALYSIS: Average daily summer electric load profiles for simulated higher efficiency buildings in Atlanta, Georgia
(IECC climate zone 3A)
FIGURE 47. EXAMPLE ANALYSIS: Average daily summer electric load profiles for simulated higher efficiency hypothetical districts in Atlanta, Georgia
(IECC climate zone 3A)
Build
ing
Elec
tric
ity L
oads
(W/s
qft)
Peak Hours
Dis
tric
t Ele
ctric
ity L
oads
(W/s
qft)
Dis
tric
t Ele
ctric
ity L
oads
(W/s
qft)
Dis
tric
t Ele
ctric
ity L
oads
(W/s
qft)
Dis
tric
t Ele
ctric
ity L
oads
(W/s
qft)
102102A GUIDE TO ENERGY MASTER PLANNING OF HIGH-PERFORMANCE DISTRICTS AND COMMUNITIES
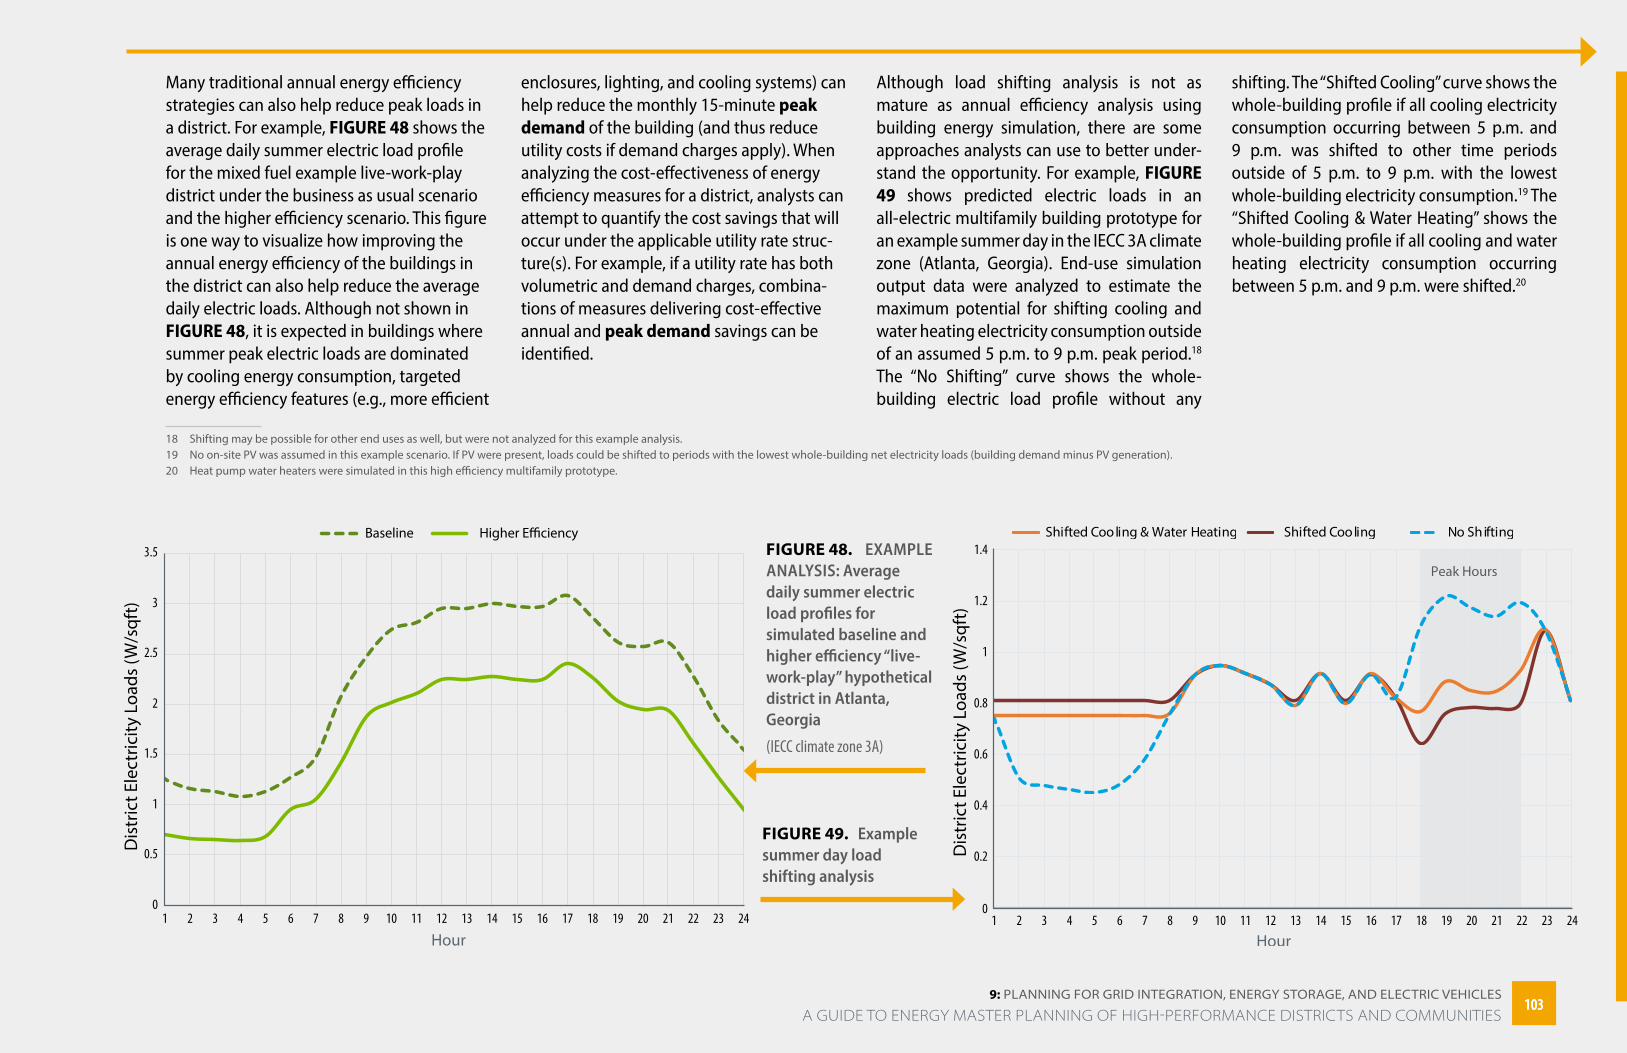
9: PlAnning FOr griD inTegrATiOn, energy STOrAge, AnD eleCTriC veHiCleS
Many traditional annual energy efficiency strategies can also help reduce peak loads in a district. For example, FIGURE 48 shows the average daily summer electric load profile for the mixed fuel example live-work-play district under the business as usual scenario and the higher efficiency scenario. This figure is one way to visualize how improving the annual energy efficiency of the buildings in the district can also help reduce the average daily electric loads. Although not shown in FIGURE 48, it is expected in buildings where summer peak electric loads are dominated by cooling energy consumption, targeted energy efficiency features (e.g., more efficient
18 Shifting may be possible for other end uses as well, but were not analyzed for this example analysis. 19 No on-site PV was assumed in this example scenario. If PV were present, loads could be shifted to periods with the lowest whole-building net electricity loads (building demand minus PV generation).20 Heat pump water heaters were simulated in this high efficiency multifamily prototype.
enclosures, lighting, and cooling systems) can help reduce the monthly 15-minute peak demand of the building (and thus reduce utility costs if demand charges apply). When analyzing the cost-effectiveness of energy efficiency measures for a district, analysts can attempt to quantify the cost savings that will occur under the applicable utility rate struc-ture(s). For example, if a utility rate has both volumetric and demand charges, combina-tions of measures delivering cost-effective annual and peak demand savings can be identified.
Although load shifting analysis is not as mature as annual efficiency analysis using building energy simulation, there are some approaches analysts can use to better under-stand the opportunity. For example, FIGURE 49 shows predicted electric loads in an all-electric multifamily building prototype for an example summer day in the IECC 3A climate zone (Atlanta, Georgia). End-use simulation output data were analyzed to estimate the maximum potential for shifting cooling and water heating electricity consumption outside of an assumed 5 p.m. to 9 p.m. peak period.18 The “No Shifting” curve shows the whole-building electric load profile without any
shifting. The “Shifted Cooling” curve shows the whole-building profile if all cooling electricity consumption occurring between 5 p.m. and 9 p.m. was shifted to other time periods outside of 5 p.m. to 9 p.m. with the lowest whole-building electricity consumption.19 The “Shifted Cooling & Water Heating” shows the whole-building profile if all cooling and water heating electricity consumption occurring between 5 p.m. and 9 p.m. were shifted.20
Build
ing
Elec
tric
ity L
oads
(W/s
qft)
Peak Hours
Dis
tric
t Ele
ctric
ity L
oads
(W/s
qft)
Dis
tric
t Ele
ctric
ity L
oads
(W/s
qft)
Dis
tric
t Ele
ctric
ity L
oads
(W/s
qft)
Dis
tric
t Ele
ctric
ity L
oads
(W/s
qft)
FIGURE 48. EXAMPLE ANALYSIS: Average daily summer electric load profiles for simulated baseline and higher efficiency “live-work-play” hypothetical district in Atlanta, Georgia
(IECC climate zone 3A)
Build
ing
Elec
tric
ity L
oads
(W/s
qft)
Peak Hours
Dis
tric
t Ele
ctric
ity L
oads
(W/s
qft)
Dis
tric
t Ele
ctric
ity L
oads
(W/s
qft)
Dis
tric
t Ele
ctric
ity L
oads
(W/s
qft)
Dis
tric
t Ele
ctric
ity L
oads
(W/s
qft)
FIGURE 49. Example summer day load shifting analysis
103103 A GUIDE TO ENERGY MASTER PLANNING OF HIGH-PERFORMANCE DISTRICTS AND COMMUNITIES
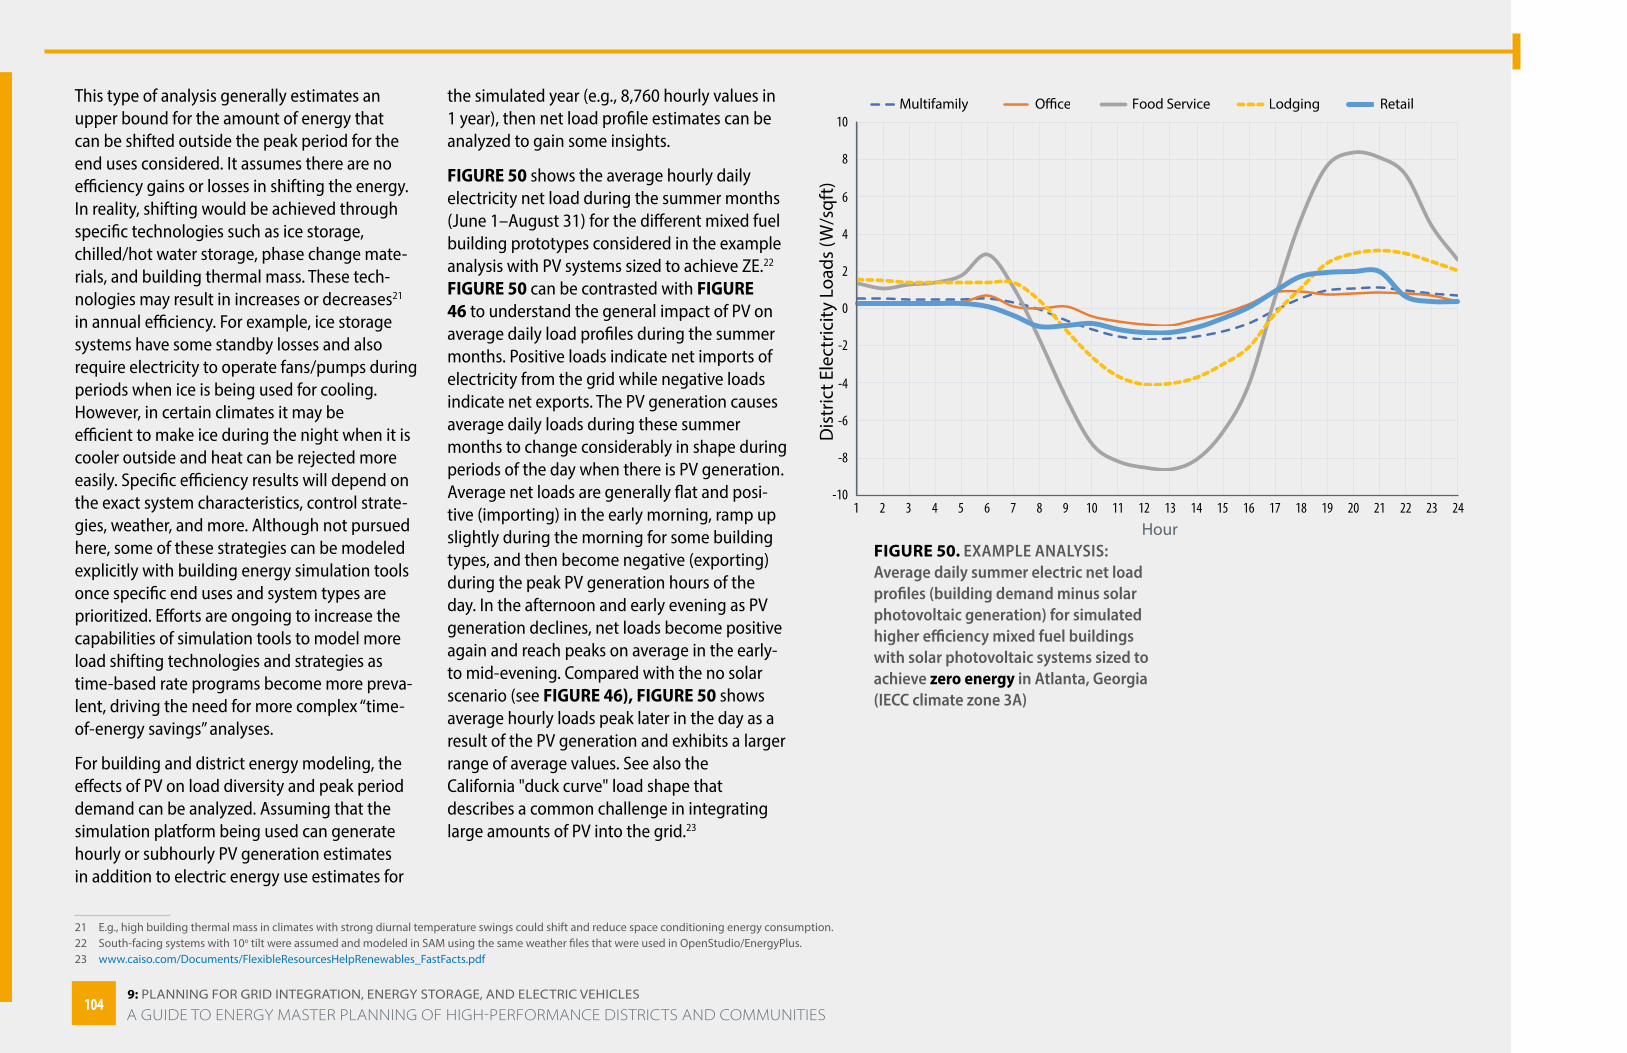
9: PlAnning FOr griD inTegrATiOn, energy STOrAge, AnD eleCTriC veHiCleS
This type of analysis generally estimates an upper bound for the amount of energy that can be shifted outside the peak period for the end uses considered. It assumes there are no efficiency gains or losses in shifting the energy. In reality, shifting would be achieved through specific technologies such as ice storage, chilled/hot water storage, phase change mate-rials, and building thermal mass. These tech-nologies may result in increases or decreases21 in annual efficiency. For example, ice storage systems have some standby losses and also require electricity to operate fans/pumps during periods when ice is being used for cooling. However, in certain climates it may be efficient to make ice during the night when it is cooler outside and heat can be rejected more easily. Specific efficiency results will depend on the exact system characteristics, control strate-gies, weather, and more. Although not pursued here, some of these strategies can be modeled explicitly with building energy simulation tools once specific end uses and system types are prioritized. Efforts are ongoing to increase the capabilities of simulation tools to model more load shifting technologies and strategies as time-based rate programs become more preva-lent, driving the need for more complex “time-of-energy savings” analyses.
For building and district energy modeling, the effects of PV on load diversity and peak period demand can be analyzed. Assuming that the simulation platform being used can generate hourly or subhourly PV generation estimates in addition to electric energy use estimates for
21 E.g., high building thermal mass in climates with strong diurnal temperature swings could shift and reduce space conditioning energy consumption.22 South-facing systems with 10o tilt were assumed and modeled in SAM using the same weather files that were used in OpenStudio/EnergyPlus.23 www.caiso.com/Documents/FlexibleResourcesHelpRenewables_FastFacts.pdf
the simulated year (e.g., 8,760 hourly values in 1 year), then net load profile estimates can be analyzed to gain some insights.
FIGURE 50 shows the average hourly daily electricity net load during the summer months (June 1–August 31) for the different mixed fuel building prototypes considered in the example analysis with PV systems sized to achieve ZE.22 FIGURE 50 can be contrasted with FIGURE 46 to understand the general impact of PV on average daily load profiles during the summer months. Positive loads indicate net imports of electricity from the grid while negative loads indicate net exports. The PV generation causes average daily loads during these summer months to change considerably in shape during periods of the day when there is PV generation. Average net loads are generally flat and posi-tive (importing) in the early morning, ramp up slightly during the morning for some building types, and then become negative (exporting) during the peak PV generation hours of the day. In the afternoon and early evening as PV generation declines, net loads become positive again and reach peaks on average in the early- to mid-evening. Compared with the no solar scenario (see FIGURE 46), FIGURE 50 shows average hourly loads peak later in the day as a result of the PV generation and exhibits a larger range of average values. See also the California "duck curve" load shape that describes a common challenge in integrating large amounts of PV into the grid.23
FIGURE 50. EXAMPLE ANALYSIS: Average daily summer electric net load profiles (building demand minus solar photovoltaic generation) for simulated higher efficiency mixed fuel buildings with solar photovoltaic systems sized to achieve zero energy in Atlanta, Georgia (IECC climate zone 3A)
Build
ing
Elec
tric
ity L
oads
(W/s
qft)
Peak Hours
Dis
tric
t Ele
ctric
ity L
oads
(W/s
qft)
Dis
tric
t Ele
ctric
ity L
oads
(W/s
qft)
Dis
tric
t Ele
ctric
ity L
oads
(W/s
qft)
Dis
tric
t Ele
ctric
ity L
oads
(W/s
qft)
104104A GUIDE TO ENERGY MASTER PLANNING OF HIGH-PERFORMANCE DISTRICTS AND COMMUNITIES
9: PlAnning FOr griD inTegrATiOn, energy STOrAge, AnD eleCTriC veHiCleS
Example Analysis: Electric Vehicle Infrastructure Planning and Charge Load Modeling The following provides an example analysis linking the City and County of Denver’s goals for EVs and charging infrastruc-ture to a district’s energy planning goals and approach. The example analysis demonstrates how a district could consider the energy impacts and planning goals for EV supply equip-ment (EVSE) within a district to answer specific planning questions such as:
• How much future electrical load could be expected for various EVSE infrastructure scenarios?
• What EVSE charging infrastructure location options and control strategies allow for a better alignment with local renewable energy generation?
In the Denver mayor’s Climate Action Plan, Denver set the goal of reducing greenhouse gas emissions 80% by 2050.24 The transportation sector is the second largest source of GHG emissions in Denver and the Climate Action Plan identifies EVs as one of the key strategies for reducing GHG emissions from vehicles. To achieve these objectives, Denver set a goal that by 2030, 30% of vehicles would be electric, growing to 100% of vehicles in 2050.25 Specific guidance from Denver includes26:
To reach these ambitious goals, there will need to be significantly more charging stations available to Denver residents and drivers. The EVI-Pro tool developed by the Department of Energy,27 estimates that Denver would need to have nearly 10,000 publicly available stations in 2030 and 25,000 charging stations in 2050 to support
24 www.denvergov.org/content/dam/denvergov/Portals/771/documents/EQ/80x50/DDPHE_80x50_ClimateActionPlan.pdf 25 www.denvergov.org/content/dam/denvergov/Portals/771/documents/EQ/80x50/DDPHE_80x50_ClimateActionPlan.pdf26 www.denvergov.org/content/dam/denvergov/Portals/696/documents/Denver_Building_Code/2019-code-update/iecc/(p129)_447_IECC-Chapter2_Final%20EV%20Ready.pdf 27 Projection Tool (EVI-Pro) Lite. afdc.energy.gov/evi-pro-lite 28 Alternative Fuels Data Center. 2019. Alternative Fueling Station Locator. afdc.energy.gov/stations/#/find/nearest
the vehicle electrification goals. Currently in Denver there are approximately 350 publicly available charging stations so there is a significant need for additional charging stations.28 In 2018, electric vehicles made up 2.6% of vehicles sales in Colorado and in December of 2018, electric vehicles sales made up 5.36% of vehicles sales in the state. In Colorado, electric vehicle (EV) sales increased by 70 percent from 2017 to 2018. To serve all these new people and their associated jobs, the City’s stock of residential and commercial buildings will need to increase significantly. Making sure all these new buildings are equipped to charge electric vehicles will help increase EV adoption and save consumers and businesses a lot of money. Because charging is most convenient where one is parked for long periods of time, it is important to make charging as easy as possible at residences. In partic-ular, there are significant logistical barriers for residents of multi-family dwellings to upgrade existing electrical infrastructure and install new EV charging stations. Installing charging stations at multi-family properties has proven challenging. With just under half (44%) of its population living in multi-family properties, this is an especially important area for Denver to concentrate on. While updating the building code will not directly address existing multi-family properties, it should encourage the overall market to move in the right direction as existing properties compete with new properties for customers. …Due to their lower fueling and maintenance costs, electric vehicles can provide a substantial economic benefit to lower income populations, if they have access to charging stations. Lower income households spend twice as much of their income on transportation compared to higher income households and would benefit the most from access to charging. Without these requirements it will be even more unlikely that property owners and landlords will support the installation of charging stations at lower income properties.
For a possible district energy planning effort in the city of Denver, the following example analysis demonstrates an approach to answer the EVSE questions for the district.
The future district will occupy a 300-acre site comprising more than 100 buildings. The development is anchored by a large corporate office park, with additional planned devel-opment that includes attached residential buildings, three-story multifamily apartment buildings, hotels, small offices, and retail buildings. The stretch goal of the development is to be ZE and include electrical infrastructure for future EVSE build-out goals. To assess the impact of the possible EV charging loads on the district’s overall electrical load profile and the local distribution grid, an hourly end-use modeling analysis of the EV charging loads was performed using URBANopt and OpenStudio. URBANopt is an urban modeling platform originally created by NREL and now collabora-tively developed by multiple national labs, universities, and industry partners. According to its developers, “the URBANopt platform uses the OpenStudio platform to perform detailed energy modeling at the individual building level using EnergyPlus.” OpenStudio is a “cross-platform collection of software tools to support whole building energy modeling using EnergyPlus,” and is developed collaboratively by five national laboratories (NREL, Argonne National Laboratory, Lawrence Berkeley National Labora-tory, Oak Ridge National Laboratory, and Pacific Northwest National Laboratory). NREL constructed building energy models of the 100 planned buildings based on the district program using URBANopt. Then an OpenStudio measure was developed to add an EV charging load to a building energy model for various assumptions of EVSE users. Additionally, an EnergyPlus measure was developed for demand manage-ment control of the EV charging load in a building energy model.
105105 A GUIDE TO ENERGY MASTER PLANNING OF HIGH-PERFORMANCE DISTRICTS AND COMMUNITIES
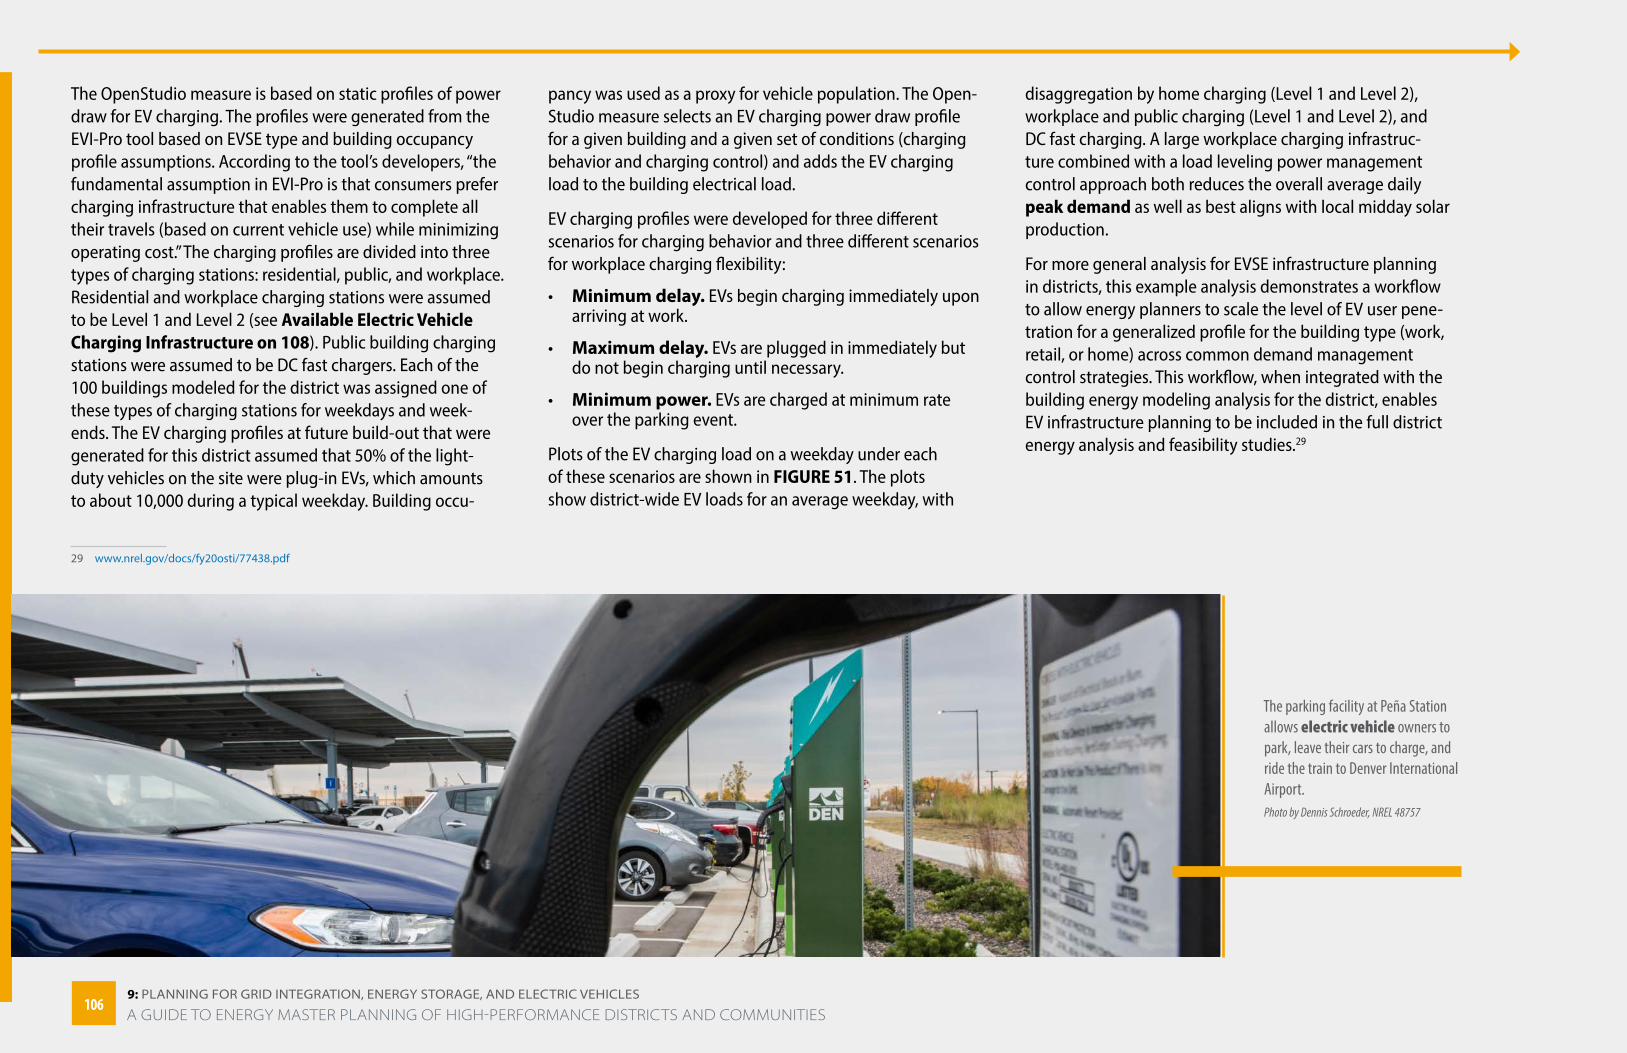
9: PlAnning FOr griD inTegrATiOn, energy STOrAge, AnD eleCTriC veHiCleS
The OpenStudio measure is based on static profiles of power draw for EV charging. The profiles were generated from the EVI-Pro tool based on EVSE type and building occupancy profile assumptions. According to the tool’s developers, “the fundamental assumption in EVI-Pro is that consumers prefer charging infrastructure that enables them to complete all their travels (based on current vehicle use) while minimizing operating cost.” The charging profiles are divided into three types of charging stations: residential, public, and workplace. Residential and workplace charging stations were assumed to be Level 1 and Level 2 (see Available Electric Vehicle Charging Infrastructure on 108). Public building charging stations were assumed to be DC fast chargers. Each of the 100 buildings modeled for the district was assigned one of these types of charging stations for weekdays and week-ends. The EV charging profiles at future build-out that were generated for this district assumed that 50% of the light-duty vehicles on the site were plug-in EVs, which amounts to about 10,000 during a typical weekday. Building occu-
29 www.nrel.gov/docs/fy20osti/77438.pdf
pancy was used as a proxy for vehicle population. The Open-Studio measure selects an EV charging power draw profile for a given building and a given set of conditions (charging behavior and charging control) and adds the EV charging load to the building electrical load.
EV charging profiles were developed for three different scenarios for charging behavior and three different scenarios for workplace charging flexibility:
• Minimum delay. EVs begin charging immediately upon arriving at work.
• Maximum delay. EVs are plugged in immediately but do not begin charging until necessary.
• Minimum power. EVs are charged at minimum rate over the parking event.
Plots of the EV charging load on a weekday under each of these scenarios are shown in FIGURE 51. The plots show district-wide EV loads for an average weekday, with
disaggregation by home charging (Level 1 and Level 2), workplace and public charging (Level 1 and Level 2), and DC fast charging. A large workplace charging infrastruc-ture combined with a load leveling power management control approach both reduces the overall average daily peak demand as well as best aligns with local midday solar production.
For more general analysis for EVSE infrastructure planning in districts, this example analysis demonstrates a workflow to allow energy planners to scale the level of EV user pene-tration for a generalized profile for the building type (work, retail, or home) across common demand management control strategies. This workflow, when integrated with the building energy modeling analysis for the district, enables EV infrastructure planning to be included in the full district energy analysis and feasibility studies.29
The parking facility at Peña Station allows electric vehicle owners to park, leave their cars to charge, and ride the train to Denver International Airport.Photo by Dennis Schroeder, NREL 48757
106106A GUIDE TO ENERGY MASTER PLANNING OF HIGH-PERFORMANCE DISTRICTS AND COMMUNITIES
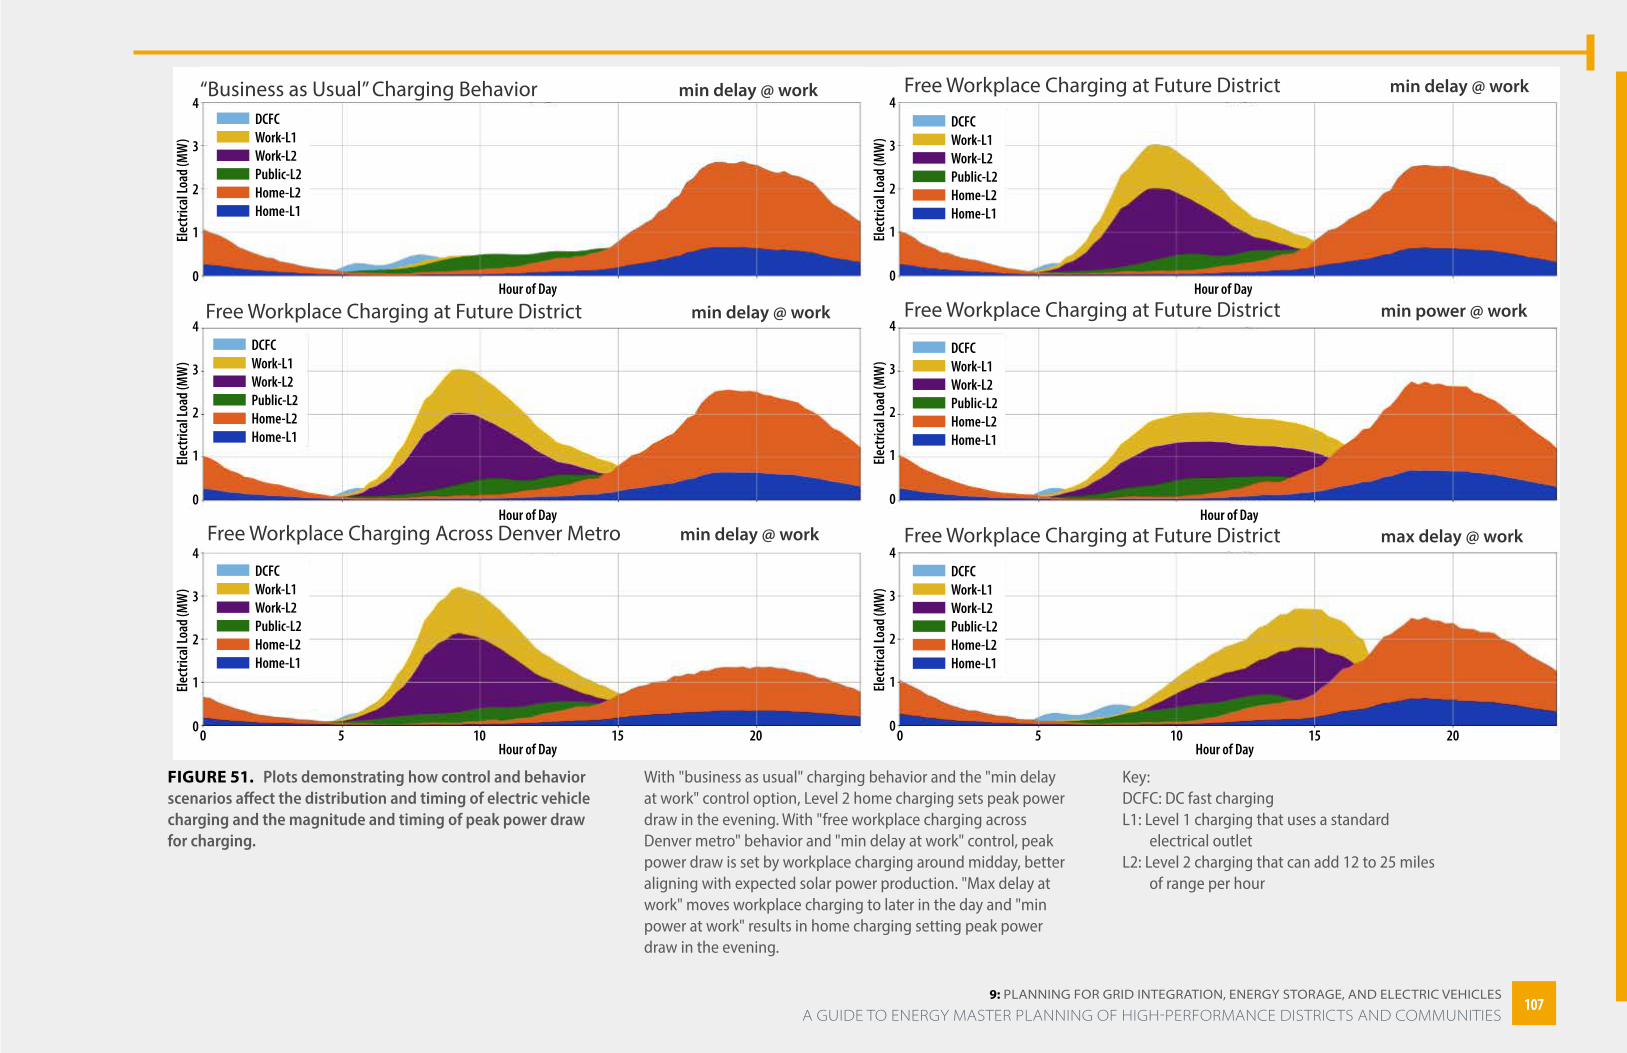
9: PlAnning FOr griD inTegrATiOn, energy STOrAge, AnD eleCTriC veHiCleS
FIGURE 51. Plots demonstrating how control and behavior scenarios affect the distribution and timing of electric vehicle charging and the magnitude and timing of peak power draw for charging.
“Business as Usual” Charging Behavior min delay @ work
Hour of Day
Hour of Day
Hour of Day
Elect
rical
Load
(MW
)
4
3
2
1
0
Free Workplace Charging at Future District min delay @ work
DCFCWork-L1Work-L2Public-L2Home-L2Home-L1
Elect
rical
Load
(MW
)
4
3
2
1
0
Elect
rical
Load
(MW
)
4
3
2
1
0
Free Workplace Charging Across Denver Metro min delay @ work
50 10 15 20Hour of Day
Elect
rical
Load
(MW
)
4
3
2
1
050 10 15 20
Free Workplace Charging at Future District max delay @ work
DCFCWork-L1Work-L2Public-L2Home-L2Home-L1
DCFCWork-L1Work-L2Public-L2Home-L2Home-L1
DCFCWork-L1Work-L2Public-L2Home-L2Home-L1
DCFCWork-L1Work-L2Public-L2Home-L2Home-L1
DCFCWork-L1Work-L2Public-L2Home-L2Home-L1
Elect
rical
Load
(MW
)
4
3
2
1
0
Elect
rical
Load
(MW
)
4
3
2
1
0
Elect
rical
Load
(MW
)
4
3
2
1
0
Free Workplace Charging at Future District min delay @ work
Free Workplace Charging at Future District min power @ workHour of Day
Hour of Day
With "business as usual" charging behavior and the "min delay at work" control option, Level 2 home charging sets peak power draw in the evening. With "free workplace charging across Denver metro" behavior and "min delay at work" control, peak power draw is set by workplace charging around midday, better aligning with expected solar power production. "Max delay at work" moves workplace charging to later in the day and "min power at work" results in home charging setting peak power draw in the evening.
Key: DCFC: DC fast chargingL1: Level 1 charging that uses a standard electrical outletL2: Level 2 charging that can add 12 to 25 miles of range per hour
107107 A GUIDE TO ENERGY MASTER PLANNING OF HIGH-PERFORMANCE DISTRICTS AND COMMUNITIES
9: PlAnning FOr griD inTegrATiOn, energy STOrAge, AnD eleCTriC veHiCleS
Considerations
Stationary Batteries
Electrochemical (or battery) storage is another potential technology for load shifting and peak demand manage-ment in HPDs, whether batteries are located behind the meter in individual buildings or larger community-scale batteries are installed within the district (e.g., by the electric utility or an energy services company). Whereas energy generation technologies are often characterized by their power capacity (e.g., kW or MW), batteries are typically characterized by both their power capacity (maximum discharge rate, typically in kW or MW) and their energy capacity, the length of time the battery can sustain power output at its maximum discharge rate (typically hours).30
Various resources are available to help understand the economics of batteries. For example, the Rocky Mountain Institute published a report on “The Economics of Battery Energy Storage: How Multi-Use, Customer-Site Batteries Deliver the Most Services and Value to Customers and the Grid”31 and NREL previously reported key basics of battery economics and potential energy storage value streams.32
Coordinated Controls
An emerging potential advantage of a district-scale approach is the coordinated control of connected devices in buildings as well as distributed energy resources such as stationary batteries, EV charging stations, and PV systems within a district. Traditional utility demand
30 www.eia.gov/analysis/studies/electricity/batterystorage/pdf/battery_storage.pdf 31 rmi.org/wp-content/uploads/2017/03/RMI-TheEconomicsOfBatteryEnergyStorage-FullReport-FINAL.pdf 32 www.nrel.gov/docs/fy16osti/66967.pdf. Specific potential value streams for a project will vary.33 These advances are also enabling the creation and use of “digital twins,” where digital replicas of physical systems are created and explored to improve operations and efficiency.
www.forbes.com/sites/bernardmarr/2019/04/23/7-amazing-examples-of-digital-twin-technology-in-practice/#32c1991e6443
response programs have often relied on participating customers to take actions to reduce their loads during demand response events. Utilities have used direct load control approaches to turn off or modulate power to certain devices during these events per an agreement with the customer that can include financial incentives for participation. With the increasing number of inter-net-connected devices in buildings, the installation of advanced metering infrastructure, and other advances in data communication, processing, and analytics, there is a growing opportunity to coordinate the control of individual devices within buildings to achieve whole-building objectives.33 For example, a building energy management system may centrally coordinate multiple flexible load technologies in a commercial building or home to shift loads and manage peak demands in a way that delivers energy cost savings to the building owner while satisfying other preferences such as occupant thermal comfort.
For a district, additional opportunities may exist for expanding coordinated control beyond individual build-ings to the collection of buildings within the district. In addition, shared energy infrastructure such as district thermal systems, community-scale energy generation and thermal or electric storage, and the electric distri-bution system offer control opportunities. Control strat-egies at these scales could take a variety of forms, such as a hierarchical control structure in which individual connected devices or building energy management systems are in two-way communication with a central aggregator or more distributed control structures such as transactive energy markets in which devices or individual building energy management systems are communi-cating and interacting with each other.
Approaches and technologies for coordinated control at building and larger scales are emerging and are the subject of ongoing research. However, district planners can explore the feasibility and potential benefits of advanced controls for their districts now and may consider partnering with researchers, technology companies, utili-ties, etc. to pilot advanced technologies and approaches. Important considerations include, but are not limited to, identifying potential financial mechanisms, incen-tives, and markets for such controls and understanding potential barriers related to data privacy and security.34 A more detailed discussion of many of these concepts and potential benefits can be found in Connected Communi-ties: A Multi-Building Energy Management Approach.35
Available Electric Vehicle Charging Infrastructure
An energy district development process takes time, so it is important to ensure adaptability in planning. This is particularly important in determining EV charging infra-structure needs, which are evolving rapidly. A district may deploy multiple kinds of EV charging systems based on the building type and connection to the energy system. The plan should first determine where single car chargers, multiple car chargers, fast chargers, etc. are best deployed. Understanding the existing definitions of EVs and charging infrastructure is the first step in this process. The Southwest Energy Efficiency Project defini-tions include36:
• EV. A motorized vehicle registered for on-road use, powered by an electric motor that draws current from rechargeable storage that is charged by being plugged into an electrical source
34 www.nature.com/articles/s41560-018-0257-2.pdf 35 www.nrel.gov/docs/fy20osti/75528.pdf36 www.swenergy.org/transportation/electric-vehicles
108108A GUIDE TO ENERGY MASTER PLANNING OF HIGH-PERFORMANCE DISTRICTS AND COMMUNITIES
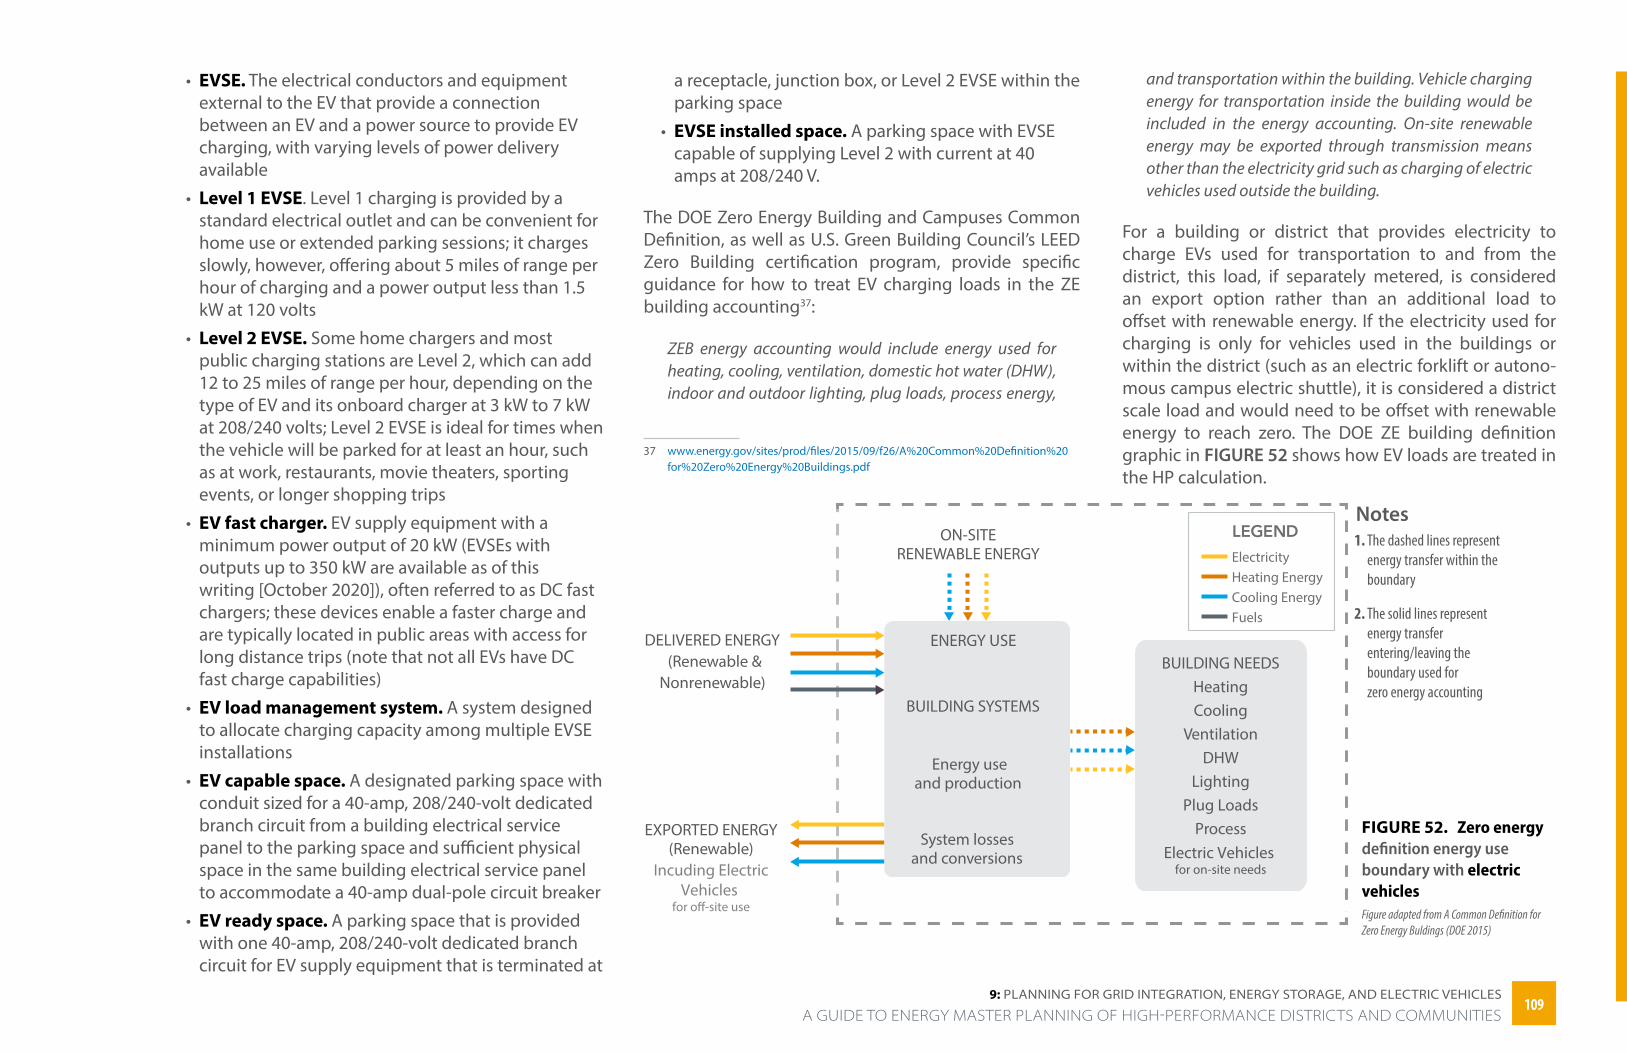
9: PlAnning FOr griD inTegrATiOn, energy STOrAge, AnD eleCTriC veHiCleS
• EVSE. The electrical conductors and equipment external to the EV that provide a connection between an EV and a power source to provide EV charging, with varying levels of power delivery available
• Level 1 EVSE. Level 1 charging is provided by a standard electrical outlet and can be convenient for home use or extended parking sessions; it charges slowly, however, offering about 5 miles of range per hour of charging and a power output less than 1.5 kW at 120 volts
• Level 2 EVSE. Some home chargers and most public charging stations are Level 2, which can add 12 to 25 miles of range per hour, depending on the type of EV and its onboard charger at 3 kW to 7 kW at 208/240 volts; Level 2 EVSE is ideal for times when the vehicle will be parked for at least an hour, such as at work, restaurants, movie theaters, sporting events, or longer shopping trips
• EV fast charger. EV supply equipment with a minimum power output of 20 kW (EVSEs with outputs up to 350 kW are available as of this writing [October 2020]), often referred to as DC fast chargers; these devices enable a faster charge and are typically located in public areas with access for long distance trips (note that not all EVs have DC fast charge capabilities)
• EV load management system. A system designed to allocate charging capacity among multiple EVSE installations
• EV capable space. A designated parking space with conduit sized for a 40-amp, 208/240-volt dedicated branch circuit from a building electrical service panel to the parking space and sufficient physical space in the same building electrical service panel to accommodate a 40-amp dual-pole circuit breaker
• EV ready space. A parking space that is provided with one 40-amp, 208/240-volt dedicated branch circuit for EV supply equipment that is terminated at
a receptacle, junction box, or Level 2 EVSE within the parking space
• EVSE installed space. A parking space with EVSE capable of supplying Level 2 with current at 40 amps at 208/240 V.
The DOE Zero Energy Building and Campuses Common Definition, as well as U.S. Green Building Council’s LEED Zero Building certification program, provide specific guidance for how to treat EV charging loads in the ZE building accounting37:
ZEB energy accounting would include energy used for heating, cooling, ventilation, domestic hot water (DHW), indoor and outdoor lighting, plug loads, process energy,
37 www.energy.gov/sites/prod/files/2015/09/f26/A%20Common%20Definition%20for%20Zero%20Energy%20Buildings.pdf
FIGURE 52. Zero energy definition energy use boundary with electric vehiclesFigure adapted from A Common Definition for Zero Energy Buldings (DOE 2015)
DELIVERED ENERGY(Renewable &
Nonrenewable)
ON-SITERENEWABLE ENERGY
EXPORTED ENERGY(Renewable)
ENERGY USEBUILDING NEEDS
HeatingCooling
VentilationDHW
LightingPlug Loads
Process
BUILDING SYSTEMS
Energy useand production
System lossesand conversions Electric Vehicles
for on-site needs
ElectricityHeating EnergyCooling EnergyFuels
1. The dashed lines represent energy transfer within the boundary
2. The solid lines represent energy transfer entering/leaving the boundary used for zero energy accounting
Notes
and transportation within the building. Vehicle charging energy for transportation inside the building would be included in the energy accounting. On-site renewable energy may be exported through transmission means other than the electricity grid such as charging of electric vehicles used outside the building.
For a building or district that provides electricity to charge EVs used for transportation to and from the district, this load, if separately metered, is considered an export option rather than an additional load to offset with renewable energy. If the electricity used for charging is only for vehicles used in the buildings or within the district (such as an electric forklift or autono-mous campus electric shuttle), it is considered a district scale load and would need to be offset with renewable energy to reach zero. The DOE ZE building definition graphic in FIGURE 52 shows how EV loads are treated in the HP calculation.
109109 A GUIDE TO ENERGY MASTER PLANNING OF HIGH-PERFORMANCE DISTRICTS AND COMMUNITIES
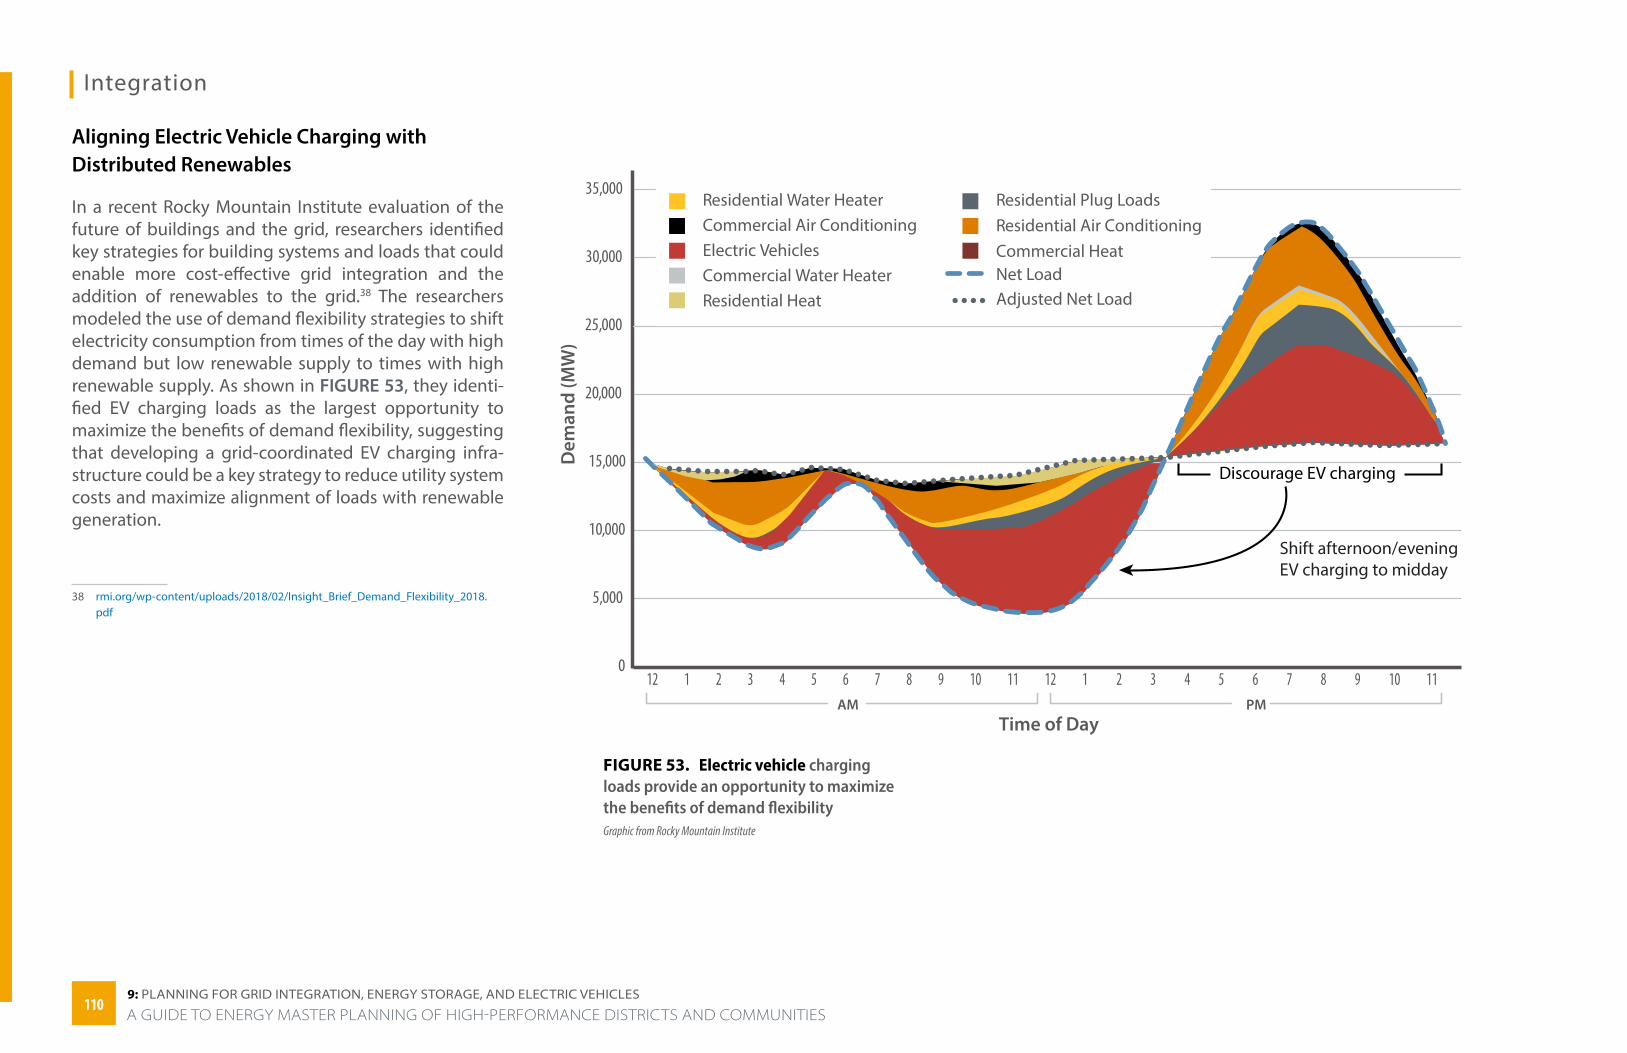
9: PlAnning FOr griD inTegrATiOn, energy STOrAge, AnD eleCTriC veHiCleS
Integration
Aligning Electric Vehicle Charging with Distributed Renewables
In a recent Rocky Mountain Institute evaluation of the future of buildings and the grid, researchers identified key strategies for building systems and loads that could enable more cost-effective grid integration and the addition of renewables to the grid.38 The researchers modeled the use of demand flexibility strategies to shift electricity consumption from times of the day with high demand but low renewable supply to times with high renewable supply. As shown in FIGURE 53, they identi-fied EV charging loads as the largest opportunity to maximize the benefits of demand flexibility, suggesting that developing a grid-coordinated EV charging infra-structure could be a key strategy to reduce utility system costs and maximize alignment of loads with renewable generation.
38 rmi.org/wp-content/uploads/2018/02/Insight_Brief_Demand_Flexibility_2018.pdf
FIGURE 53. Electric vehicle charging loads provide an opportunity to maximize the benefits of demand flexibilityGraphic from Rocky Mountain Institute
35,000
30,000
25,000
20,000
15,000
10,000
5,000
0
Dem
and
(MW
)
Time of Day
12 1 2 3 4 5 6 7 8 9 10 11 12 1 2 3 4 5 6 7 8 9 10 11
Discourage EV charging
AM PM
Residential Water HeaterCommercial Air ConditioningElectric VehiclesCommercial Water HeaterResidential Heat
Residential Plug LoadsResidential Air ConditioningCommercial HeatNet LoadAdjusted Net Load
Shift afternoon/evening EV charging to midday
110110A GUIDE TO ENERGY MASTER PLANNING OF HIGH-PERFORMANCE DISTRICTS AND COMMUNITIES
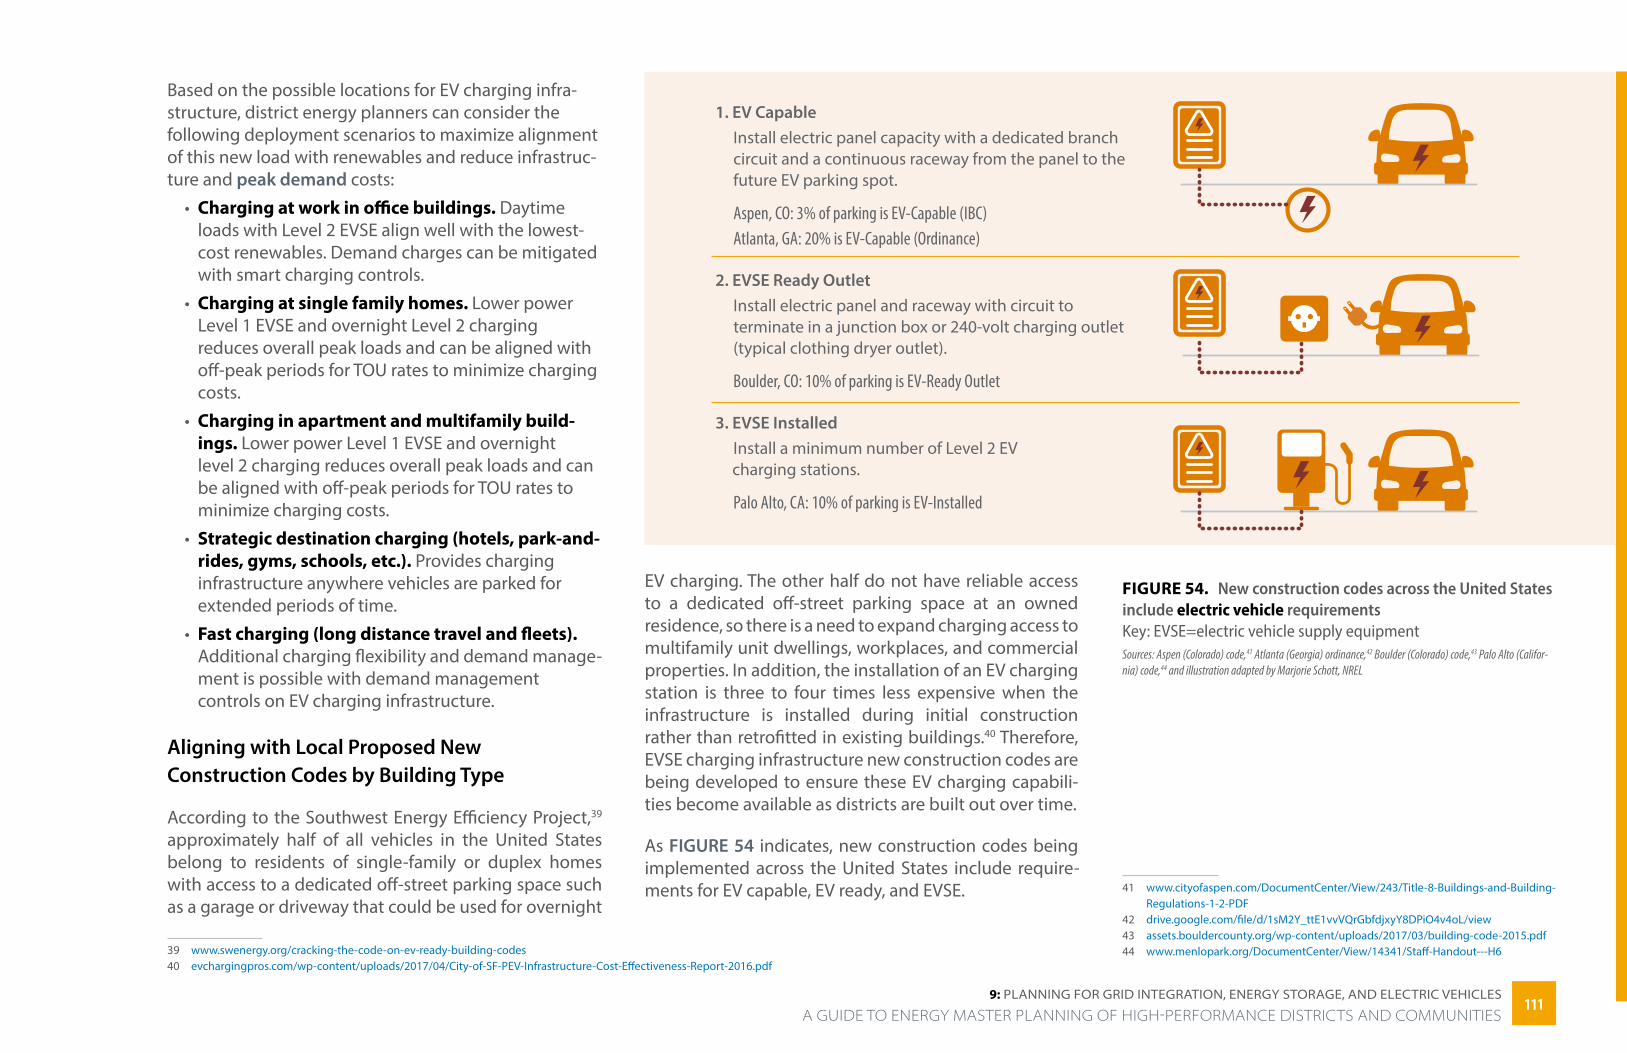
9: PlAnning FOr griD inTegrATiOn, energy STOrAge, AnD eleCTriC veHiCleS
Based on the possible locations for EV charging infra-structure, district energy planners can consider the following deployment scenarios to maximize alignment of this new load with renewables and reduce infrastruc-ture and peak demand costs:
• Charging at work in office buildings. Daytime loads with Level 2 EVSE align well with the lowest-cost renewables. Demand charges can be mitigated with smart charging controls.
• Charging at single family homes. Lower power Level 1 EVSE and overnight Level 2 charging reduces overall peak loads and can be aligned with off-peak periods for TOU rates to minimize charging costs.
• Charging in apartment and multifamily build-ings. Lower power Level 1 EVSE and overnight level 2 charging reduces overall peak loads and can be aligned with off-peak periods for TOU rates to minimize charging costs.
• Strategic destination charging (hotels, park-and-rides, gyms, schools, etc.). Provides charging infrastructure anywhere vehicles are parked for extended periods of time.
• Fast charging (long distance travel and fleets). Additional charging flexibility and demand manage-ment is possible with demand management controls on EV charging infrastructure.
Aligning with Local Proposed New Construction Codes by Building Type
According to the Southwest Energy Efficiency Project,39 approximately half of all vehicles in the United States belong to residents of single-family or duplex homes with access to a dedicated off-street parking space such as a garage or driveway that could be used for overnight
39 www.swenergy.org/cracking-the-code-on-ev-ready-building-codes40 evchargingpros.com/wp-content/uploads/2017/04/City-of-SF-PEV-Infrastructure-Cost-Effectiveness-Report-2016.pdf
EV charging. The other half do not have reliable access to a dedicated off-street parking space at an owned residence, so there is a need to expand charging access to multifamily unit dwellings, workplaces, and commercial properties. In addition, the installation of an EV charging station is three to four times less expensive when the infrastructure is installed during initial construction rather than retrofitted in existing buildings.40 Therefore, EVSE charging infrastructure new construction codes are being developed to ensure these EV charging capabili-ties become available as districts are built out over time.
As FIGURE 54 indicates, new construction codes being implemented across the United States include require-ments for EV capable, EV ready, and EVSE.
FIGURE 54. New construction codes across the United States include electric vehicle requirementsKey: EVSE=electric vehicle supply equipmentSources: Aspen (Colorado) code,41 Atlanta (Georgia) ordinance,42 Boulder (Colorado) code,43 Palo Alto (Califor-nia) code,44 and illustration adapted by Marjorie Schott, NREL
41 www.cityofaspen.com/DocumentCenter/View/243/Title-8-Buildings-and-Building-Regulations-1-2-PDF
42 drive.google.com/file/d/1sM2Y_ttE1vvVQrGbfdjxyY8DPiO4v4oL/view 43 assets.bouldercounty.org/wp-content/uploads/2017/03/building-code-2015.pdf 44 www.menlopark.org/DocumentCenter/View/14341/Staff-Handout---H6
1. EV CapableInstall electric panel capacity with a dedicated branch circuit and a continuous raceway from the panel to the future EV parking spot.
Aspen, CO: 3% of parking is EV-Capable (IBC)Atlanta, GA: 20% is EV-Capable (Ordinance)
2. EVSE Ready OutletInstall electric panel and raceway with circuit to terminate in a junction box or 240-volt charging outlet (typical clothing dryer outlet).
Boulder, CO: 10% of parking is EV-Ready Outlet
3. EVSE InstalledInstall a minimum number of Level 2 EV
charging stations.
Palo Alto, CA: 10% of parking is EV-Installed
111111 A GUIDE TO ENERGY MASTER PLANNING OF HIGH-PERFORMANCE DISTRICTS AND COMMUNITIES
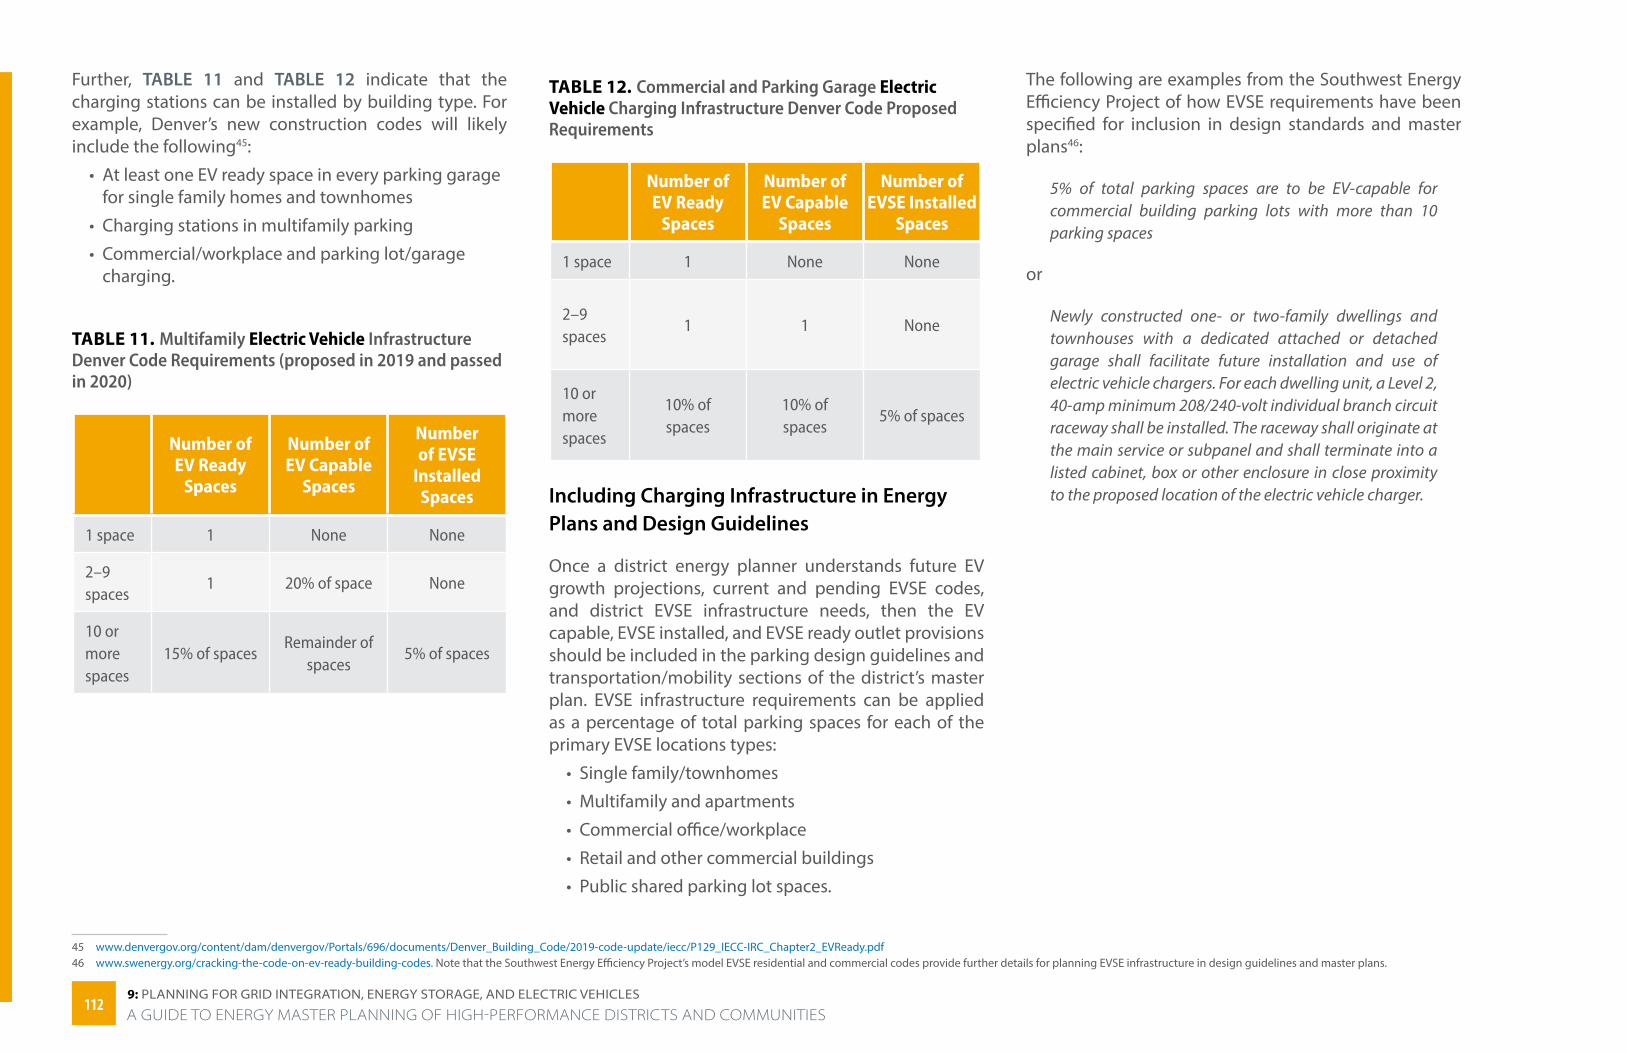
9: PlAnning FOr griD inTegrATiOn, energy STOrAge, AnD eleCTriC veHiCleS
Further, TABLE 11 and TABLE 12 indicate that the charging stations can be installed by building type. For example, Denver’s new construction codes will likely include the following45:
• At least one EV ready space in every parking garage for single family homes and townhomes
• Charging stations in multifamily parking
• Commercial/workplace and parking lot/garage charging.
TABLE 11. Multifamily Electric Vehicle Infrastructure Denver Code Requirements (proposed in 2019 and passed in 2020)
Number of EV Ready
Spaces
Number of EV Capable
Spaces
Number of EVSE
Installed Spaces
1 space 1 None None
2–9 spaces
1 20% of space None
10 or more spaces
15% of spacesRemainder of
spaces5% of spaces
45 www.denvergov.org/content/dam/denvergov/Portals/696/documents/Denver_Building_Code/2019-code-update/iecc/P129_IECC-IRC_Chapter2_EVReady.pdf46 www.swenergy.org/cracking-the-code-on-ev-ready-building-codes. Note that the Southwest Energy Efficiency Project’s model EVSE residential and commercial codes provide further details for planning EVSE infrastructure in design guidelines and master plans.
TABLE 12. Commercial and Parking Garage Electric Vehicle Charging Infrastructure Denver Code Proposed Requirements
Number of EV Ready
Spaces
Number of EV Capable
Spaces
Number of EVSE Installed
Spaces
1 space 1 None None
2–9 spaces
1 1 None
10 or more spaces
10% of spaces
10% of spaces
5% of spaces
Including Charging Infrastructure in Energy Plans and Design Guidelines
Once a district energy planner understands future EV growth projections, current and pending EVSE codes, and district EVSE infrastructure needs, then the EV capable, EVSE installed, and EVSE ready outlet provisions should be included in the parking design guidelines and transportation/mobility sections of the district’s master plan. EVSE infrastructure requirements can be applied as a percentage of total parking spaces for each of the primary EVSE locations types:
• Single family/townhomes
• Multifamily and apartments
• Commercial office/workplace
• Retail and other commercial buildings
• Public shared parking lot spaces.
The following are examples from the Southwest Energy Efficiency Project of how EVSE requirements have been specified for inclusion in design standards and master plans46:
5% of total parking spaces are to be EV-capable for commercial building parking lots with more than 10 parking spaces
or
Newly constructed one- or two-family dwellings and townhouses with a dedicated attached or detached garage shall facilitate future installation and use of electric vehicle chargers. For each dwelling unit, a Level 2, 40-amp minimum 208/240-volt individual branch circuit raceway shall be installed. The raceway shall originate at the main service or subpanel and shall terminate into a listed cabinet, box or other enclosure in close proximity to the proposed location of the electric vehicle charger.
112112A GUIDE TO ENERGY MASTER PLANNING OF HIGH-PERFORMANCE DISTRICTS AND COMMUNITIES
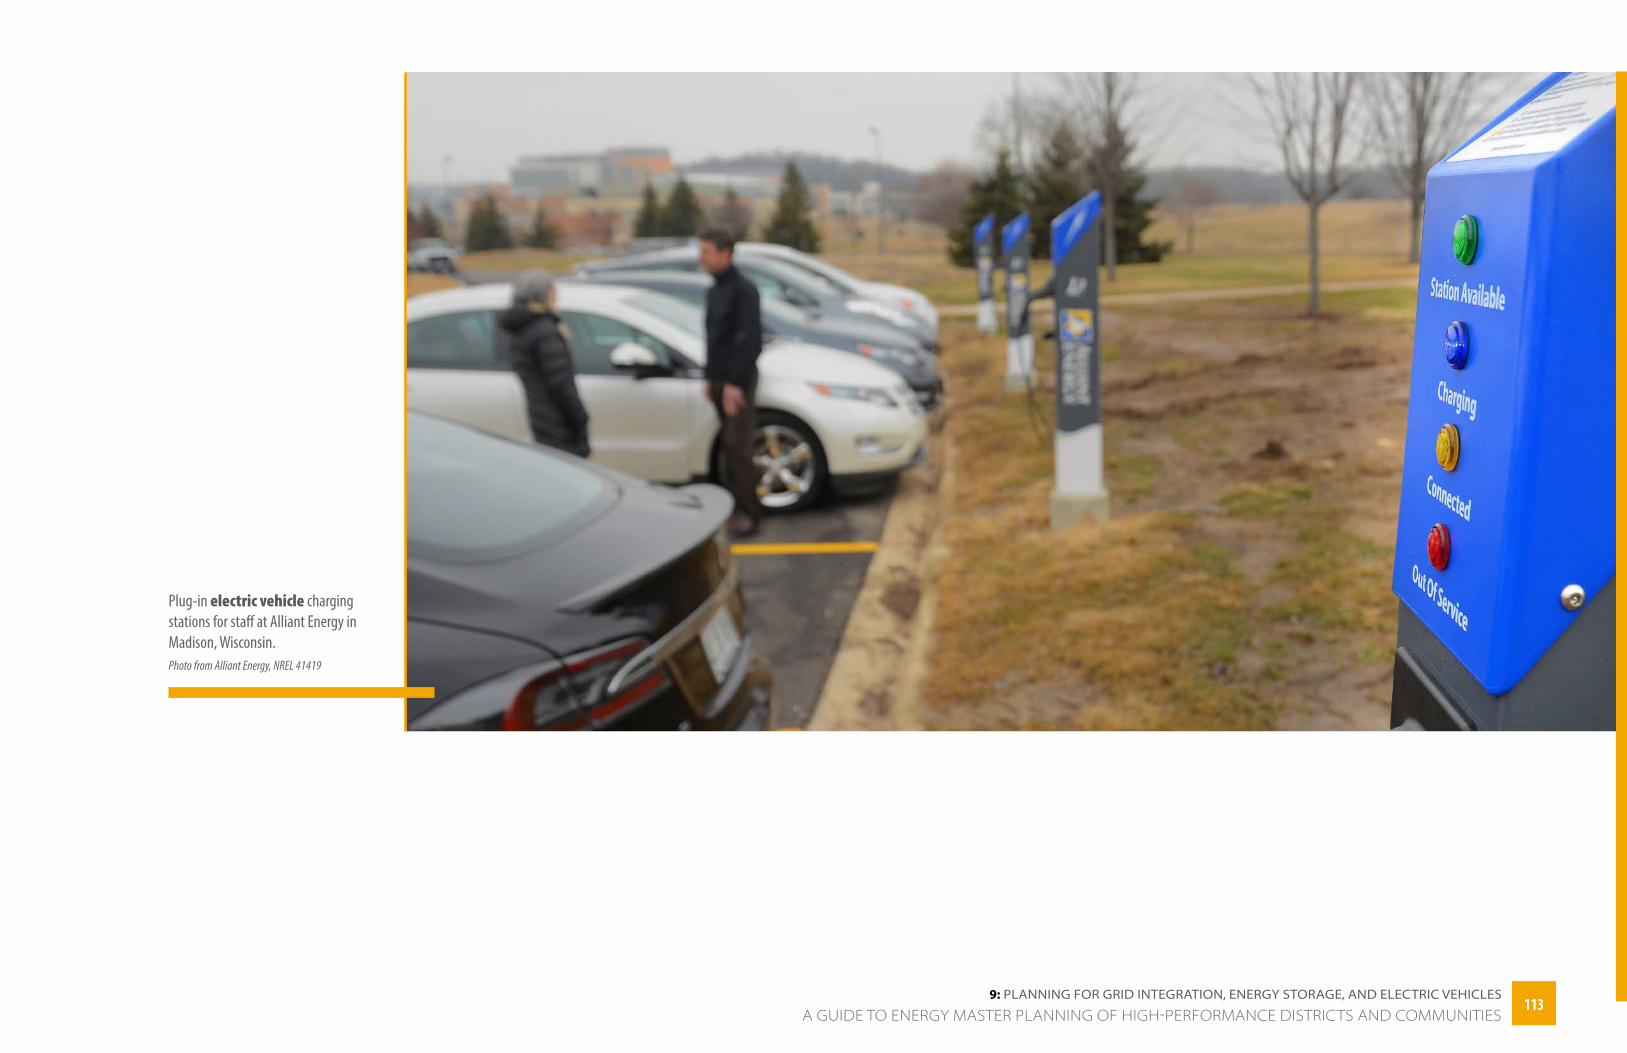
9: PlAnning FOr griD inTegrATiOn, energy STOrAge, AnD eleCTriC veHiCleS
Plug-in electric vehicle charging stations for staff at Alliant Energy in Madison, Wisconsin. Photo from Alliant Energy, NREL 41419
113113 A GUIDE TO ENERGY MASTER PLANNING OF HIGH-PERFORMANCE DISTRICTS AND COMMUNITIES

CHAPTer 10
HIGH-PERFORMANCE DISTRICT CASE STUDIES
The rooftop solar photovoltaic system on the Mill 19 building at Hazelwood Green provides occupants with filtered daylight as well as power.Photo from Ashley Koltonski, Cushman & Wakefield/Grant Street Associates, Inc.
114114
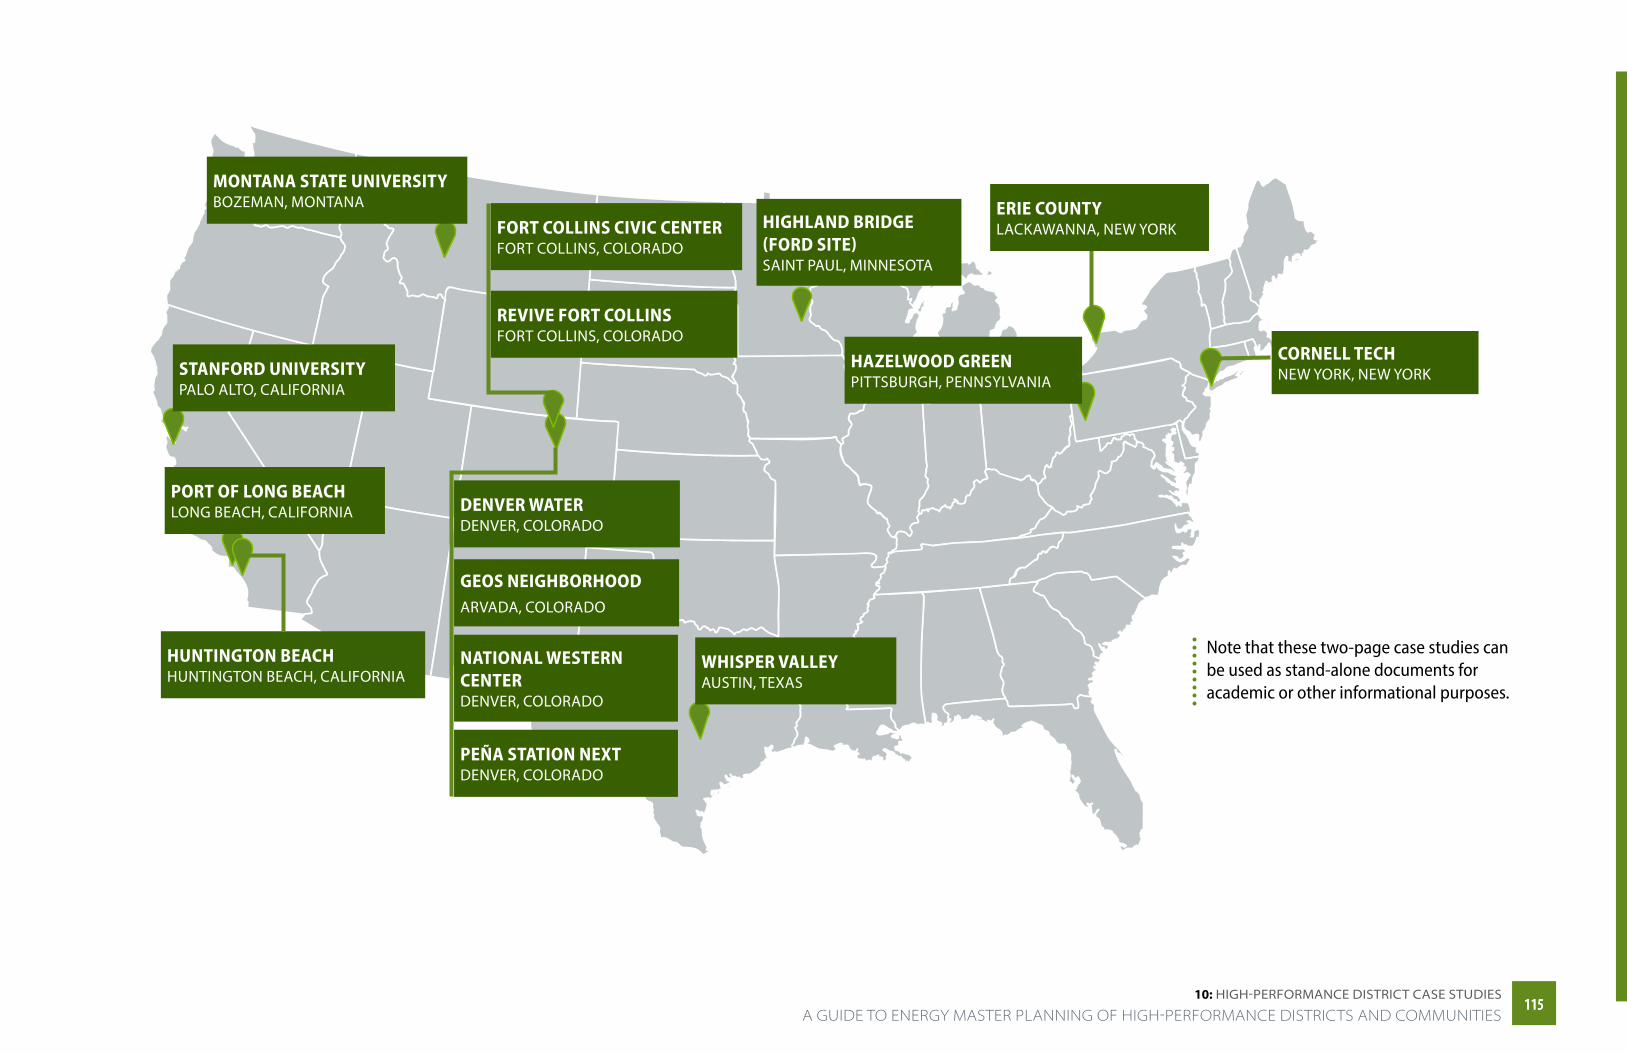
MONTANA STATE UNIVERSITYBOZEMAN, MONTANA
HIGHLAND BRIDGE (FORD SITE) SAINT PAUL, MINNESOTA
HUNTINGTON BEACH HUNTINGTON BEACH, CALIFORNIA
WHISPER VALLEYAUSTIN, TEXAS
CORNELL TECH NEW YORK, NEW YORK
DENVER WATER DENVER, COLORADO
FORT COLLINS CIVIC CENTERFORT COLLINS, COLORADO
HAZELWOOD GREENPITTSBURGH, PENNSYLVANIA
NATIONAL WESTERN CENTER DENVER, COLORADO
PEÑA STATION NEXTDENVER, COLORADO
PORT OF LONG BEACHLONG BEACH, CALIFORNIA
REVIVE FORT COLLINSFORT COLLINS, COLORADO
STANFORD UNIVERSITYPALO ALTO, CALIFORNIA
ERIE COUNTY LACKAWANNA, NEW YORK
GEOS NEIGHBORHOODARVADA, COLORADO
Note that these two-page case studies can be used as stand-alone documents for academic or other informational purposes.
A GUIDE TO ENERGY MASTER PLANNING OF HIGH-PERFORMANCE DISTRICTS AND COMMUNITIES115115
10: HigH-PerFOrmAnCe DiSTriCT CASe STUDieS

Photo from Lucas Blair Simpson for SOM
Cornell Tech New York, New York
CASE STUDY
1 americas.uli.org/awards/cornell-tech-campus-framework-plan-and-phase-i-site-development-2019-global-awards-for-excellence-finalist/2 Master architect through civil and transportation engineering: www.aia.org/showcases/6246330-cornell-tech-campus-framework-plan3 www.architectmagazine.com/project-gallery/cornell-tech-campus-framework-plan_o
Location: Roosevelt Island, New York, New York
Size: 12.4 acres1
Building/space types: Educational (classrooms, instructional labs, lecture hall, huddle rooms, collaboration areas, conference rooms, cafe, open work areas, and shared spaces)
Building area: 2 million square feet
Master plan: Skidmore, Owings & Merrill
Master architect: Skidmore, Owings & Merrill
Urban design and site planning: James Corner Field Operations
Master developer: Forest City Ratner Corporation
Housing developer: Hudson and the Related Companies
Development strategy: U3 Advisors
Mechanical, electrical, and plumbing engineering: AKF
Structural engineering planning: Robert Silman
Civil and transportation engineering: Philip Habib & Associates2
Certifications, awards, standards:
Buildings built to LEED, Passive House, and zero energy standards
Urban Land Institute, Finalist in Awards for Excellence in Development, 2019
Society of American Registered Architects National Design Awards, 2019
American Institute of Architects Regional & Urban Design Award,3 2020
Description
The Cornell Tech campus is pioneering a new model for higher education in the United States. Located on Roosevelt Island in New York City, the campus is designed to encourage interactions between industry and academia rather than consign them to their respec-tive silos. In addition to academic buildings, the devel-opment includes corporate colocation, offices, a hotel, a residential tower, and conferencing and assembly areas, with space remaining to accommodate future program requirements.
The campus is designed to be resilient and sustainable, with on-site energy generation and buildings built to LEED, Passive House, and zero energy standards. A New York City Economic Development Corporation analysis projected that the campus will generate more than $7.5 billion in economic activity and spur $23 billion in overall economic activity in the next 30 years. When fully built out, the campus will include 2 million square
CORNELL TECH | NEW YORK, NEW YORK11611610: HIGH-PERFORMANCE DISTRICT CASE STUDIESA GUIDE TO ENERGY MASTER PLANNING OF HIGH-PERFORMANCE DISTRICTS AND COMMUNITIES
feet of state-of-the-art buildings and more than two acres of open space. It will also accommodate more than 2,000 graduate students and hundreds of faculty and staff.
At least one building, the 160,000 square foot Bloomberg Center, which opened in September 2017, is expected to achieve zero energy status, and the adjacent Bridge building will host additional solar photovoltaics to help The Bloomberg Center meet that goal. In addition, the first residential building on campus is also the world’s first high-rise Passive House building. The Passive House designation requires that the building operate at a site energy use intensity of no more than 38.1 kBtu/ft2·yr.
Cornell Tech is a partnership between the Technion-Is-rael Institute of Technology and Cornell University. The partnership secured the site by winning a New York City competition for the development of a campus on Roosevelt Island.
Project status (as of October 2020)
Three buildings—Tata Innovation Center, the House, and the Bloomberg Center—opened in September 2017 and the Verizon Executive Education Center and Graduate Hotel could be finished as soon as late 2020.4 Campus build-out is projected to be complete by 2037.5
4 newyorkyimby.com/2020/08/exterior-work-finishes-on-verizon-executive-education-center-and-graduate-hotel-on-roosevelt-island.html5 en.wikipedia.org/wiki/Cornell_Tech#Phase_16 www.arup.com/perspectives/publications/the-arup-journal/section/the-arup-journal-2018-issue-1, page 44; 31.9 according to NBI newbuildings.org/wp-content/uploads/2019/02/2019_SchoolsWatchlist.pdf, p. 127 tech.cornell.edu/news/cornell-tech-on-path-to-reach-net-zero-at-the-bloomberg-center/8 www.arup.com/perspectives/publications/the-arup-journal/section/the-arup-journal-2018-issue-1, page 43
Key energy opportunities
The Bloomberg Center (energy use intensity of 29.3 kBtu/ft2·yr6), the first academic building on the Cornell Tech campus and its main academic hub, is expected to be a zero energy building. Features include7:
All-electric building: No fossil fuel is used in the building.
Ground source heat pump system wells: 80 closed-loop ground source heat pump system wells, each 400 feet deep, were drilled below the main campus public open space. The electrically powered ground source heat pumps are used to heat and cool the building in conjunction with an active chilled-beam system
Solar power: An acre-sized solar photovoltaic array on the roofs of The Bloomberg Center and the neigh-boring Bridge building generates solar power. Instead of locating solar systems off-site, The Bloomberg Center and The Bridge incorporate the panels as an integral design feature. The array on The Bloomberg Center provides shading while harvesting solar power.
Highly insulated façade: A unitized, continuously insulated rainscreen wall system covered by an iconic metal panel façade designed by Morphosis architects balances exterior views and daylight while maximizing façade insulation.
Smart building technology: Smart building features, designed by Morphosis and engineering firm Arup, links lighting control, occupancy sensors, security, and other building controls to provide on-demand power, respond to user needs and occupancy, and reduce energy use.
Green roof: A low-maintenance green roof incorpo-rates native plant species along the southeast edge of the building to help cool the lower roof surface.
Innovative strategies
Cornell Tech began as an initiative of former New York City Mayor Michael Bloomberg’s administration to make New York a tech innovation hub.8 From the beginning of the process, the focus was on a zero energy devel-opment, with on-site renewable energy production to offset campus energy use. The early zero energy focus informed project participants’ decision making as the development progressed. The district master plan included ensuring optimal solar access and locating the tallest buildings on the north side of the site so they do not shade other buildings within the district.
CORNELL TECH | NEW YORK, NEW YORK 11711710: HIGH-PERFORMANCE DISTRICT CASE STUDIES
A gUiDe TO energy mASTer PlAnning OF HigH-PerFOrmAnCe DiSTriCTS AnD COmmUniTieS
https://newyorkyimby.com/2020/08/exterior-work-finishes-on-verizon-executive-education-center-and-gr

Denver Water Colorado
CASE STUDY
1 www.denverwater.org/project-updates/denver-waters-operation-complex-redevelopment-project2 www.denverwater.org/project-updates/denver-waters-operation-complex-redevelopment-project3 www.stantec.com/en/projects/united-states-projects/d/denver-water-operations-complex-redevelopment4 www.mortenson.com/denver/projects/denver-water-operations-complex-redevelopment 5 www.mortenson.com/denver/projects/denver-water-operations-complex-redevelopment6 www.denverwater.org/project-updates/denver-waters-operation-complex-redevelopment-project
Location: Denver, Colorado
Size: 34.6 acres1
Building/space types2: Administration building, equipment shops, fleet maintenance, warehouses, trade buildings, parking garage, and wellness building
Building area: 345,000 square feet3
General contractor: Mortenson4
Delivery method: Construction manager at risk5
Architect: Stantec
Owner: Denver Water
Owner representative: Trammell Crow6
Master planner: Stantec and Integral Group Certifications, awards, standards: Zero energy, LEED Platinum, One Water standards
Photo from Frank Ooms for Denver Water
Description
Denver’s water utility operations have been located on the same site since 1881 and an update was overdue. That update began in 2016 and was largely completed in 2019; the remaining work is expected to be complete by fall 2020.
The new Denver Water Operations Complex is a showcase of energy efficiency and resilience strategies. The redevelopment includes eight new structures (seven buildings and a parking garage) as well as the renovation of the existing water distribution building and the historic Three Stone Buildings.7 Eight of those buildings will be LEED-certified at levels ranging from Silver to Platinum. The administration building as well as the four new operations-based buildings—the warehouse, fleet services, trade shops, and meter shop—use radiant tubing in the floors for cooling and heating to reduce energy use and increase thermal comfort. An innovative central utility plant for the complex uses a large potable water distribution main as a heat source and heat sink, depending on the season.8
7 www.mortenson.com/denver/projects/denver-water-operations-complex-redevelopment8 denverwatertap.org/2019/04/15/building-for-the-future-on-a-sustainable-foundation/
DENVER WATER | DENVER, COLORADO11811810: HIGH-PERFORMANCE DISTRICT CASE STUDIESA GUIDE TO ENERGY MASTER PLANNING OF HIGH-PERFORMANCE DISTRICTS AND COMMUNITIES

Furthermore, the administration building is targeting zero energy and One Water, a first of its kind holistic low water use strategy; rainwater capture; and an on-site water recycling initiative that expands local water law for more aggressive conservation strategies. The redeveloped campus will be more accessible to the public, with increased public outreach and water and energy educational resources.
Project status (as of October 2020)9
The first phase of construction began in 2016 with a focus on the operational facilities. The second phase, which was substantially completed in October of 2019 and finalized in October of 2020, focuses on the zero energy administration building, the parking garage, and the Three Stone Buildings.
Key energy opportunities• Administration building designed to operate at an
energy use intensity of 26 kBtu/ft2·yr and pursuing zero energy and LEED Platinum certification
• Campus as a whole designed to have an energy use intensity of 25 kBtu/ft2·yr, a step toward achieving the campus stretch goal of zero energy
• District hot water and chilled water district system linked to a central heat pump system connected to city potable water supply provides a free cooling resource
9 www.denverwater.org/project-updates/denver-waters-operation-complex-redevelopment-project
10 denverwatertap.org/2019/04/15/building-for-the-future-on-a-sustainable-foundation/11 www.wellcertified.com12 ensia.com/features/one-water/13 drive.google.com/open?id=1H5pBZDdcz3W7Ye9lroYJ8aAdm_gy-Q1l
• More than 85% of the workspaces will have natural light during the day, and lighting controls adjust based on the amount of daylight coming through the windows and turn lights off when they are not needed10
• Rooftop solar photovoltaic systems on the admin-istration building (290 kW) and the parking garage (690 kW).
Innovative strategies• Design using health and wellness strategies included
in WELL Building standards 11
• Commit to One Water principles, which are strategies to manage water more holistically by shifting from the separate management of drinking water, waste-water, stormwater, and water for the environment to water management that provides multiple benefits12
• Analysis of energy-water nexus for the administra-tion building to quantify energy savings from water system and water savings from energy systems
• Water used for distribution of thermal energy (radiant slabs and central utility plant), but no water evaporated for cooling.
Links to additional materialsMaster plan • Energy Master Plan13
Denver Water’s new six-story, 186,000-square-foot administration building is targeting LEED-NC Platinum certification and zero energy status.Photo from Frank Ooms for Denver Water
DENVER WATER | DENVER, COLORADO 11911910: HIGH-PERFORMANCE DISTRICT CASE STUDIES
A gUiDe TO energy mASTer PlAnning OF HigH-PerFOrmAnCe DiSTriCTS AnD COmmUniTieS
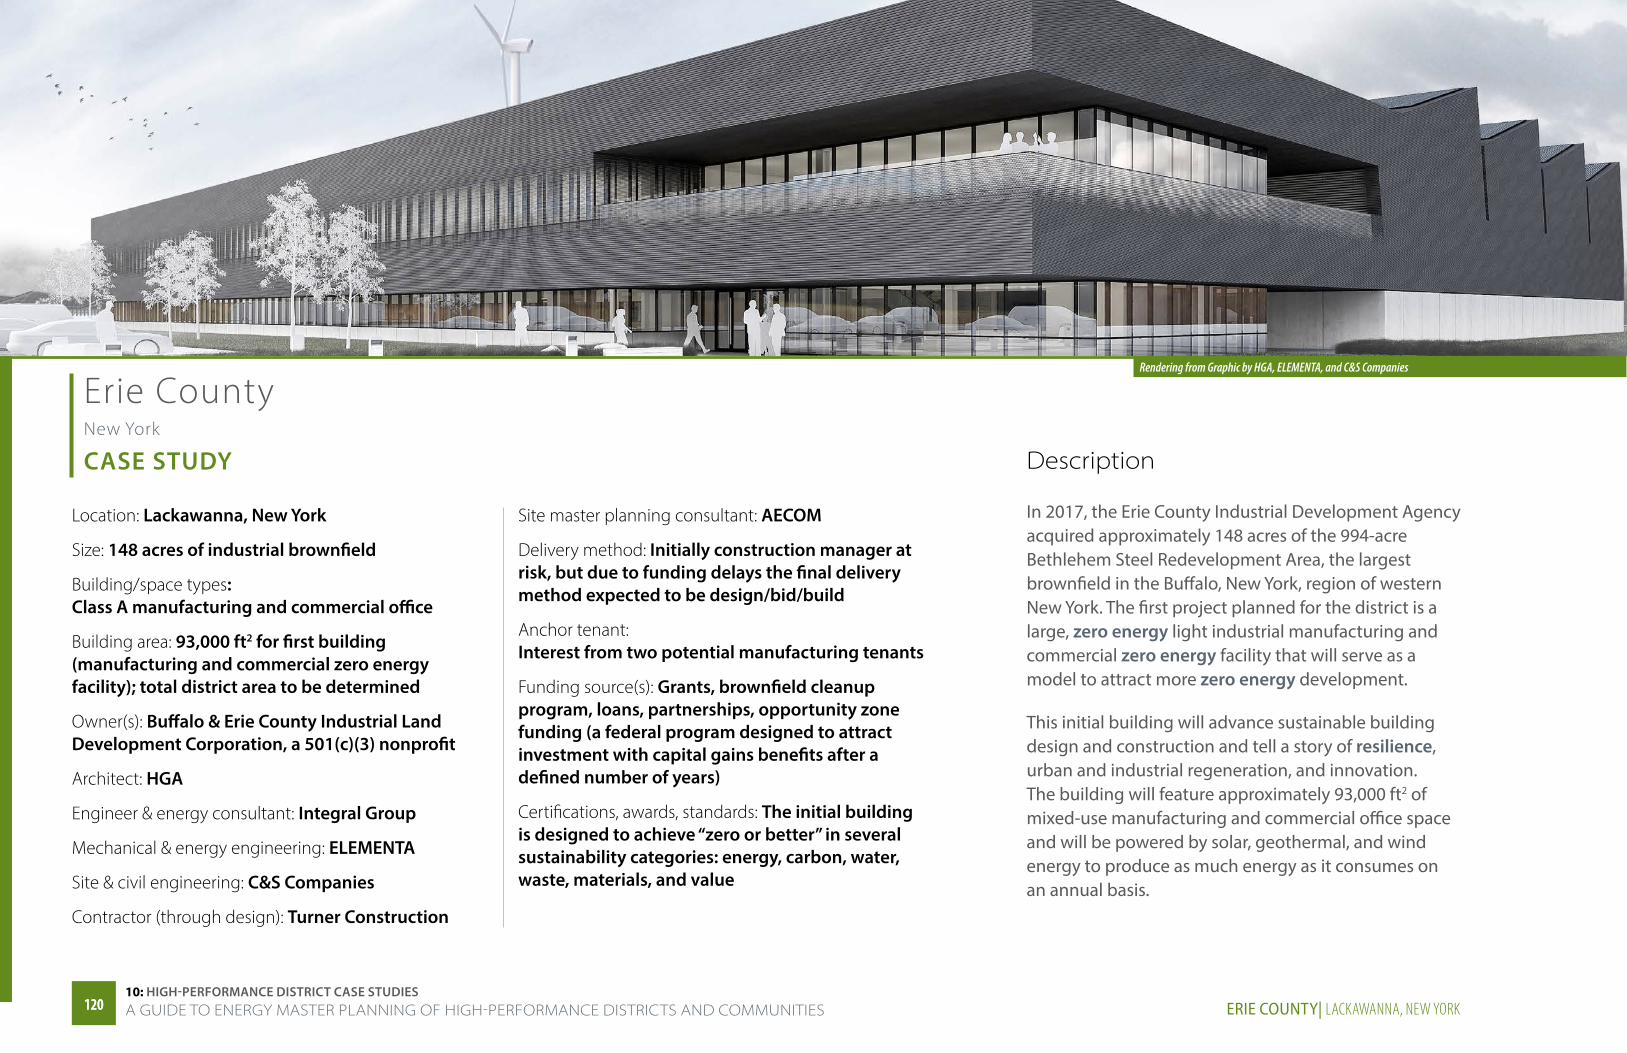
Rendering from Graphic by HGA, ELEMENTA, and C&S Companies
Erie County New York
CASE STUDY
Location: Lackawanna, New York
Size: 148 acres of industrial brownfield
Building/space types: Class A manufacturing and commercial office
Building area: 93,000 ft2 for first building (manufacturing and commercial zero energy facility); total district area to be determined
Owner(s): Buffalo & Erie County Industrial Land Development Corporation, a 501(c)(3) nonprofit
Architect: HGA
Engineer & energy consultant: Integral Group
Mechanical & energy engineering: ELEMENTA
Site & civil engineering: C&S Companies
Contractor (through design): Turner Construction
Site master planning consultant: AECOM
Delivery method: Initially construction manager at risk, but due to funding delays the final delivery method expected to be design/bid/build
Anchor tenant: Interest from two potential manufacturing tenants
Funding source(s): Grants, brownfield cleanup program, loans, partnerships, opportunity zone funding (a federal program designed to attract investment with capital gains benefits after a defined number of years)
Certifications, awards, standards: The initial building is designed to achieve “zero or better” in several sustainability categories: energy, carbon, water, waste, materials, and value
Description
In 2017, the Erie County Industrial Development Agency acquired approximately 148 acres of the 994-acre Bethlehem Steel Redevelopment Area, the largest brownfield in the Buffalo, New York, region of western New York. The first project planned for the district is a large, zero energy light industrial manufacturing and commercial zero energy facility that will serve as a model to attract more zero energy development.
This initial building will advance sustainable building design and construction and tell a story of resilience, urban and industrial regeneration, and innovation. The building will feature approximately 93,000 ft2 of mixed-use manufacturing and commercial office space and will be powered by solar, geothermal, and wind energy to produce as much energy as it consumes on an annual basis.
ERIE COUNTY| LACKAWANNA, NEW YORK12012010: HIGH-PERFORMANCE DISTRICT CASE STUDIESA GUIDE TO ENERGY MASTER PLANNING OF HIGH-PERFORMANCE DISTRICTS AND COMMUNITIES
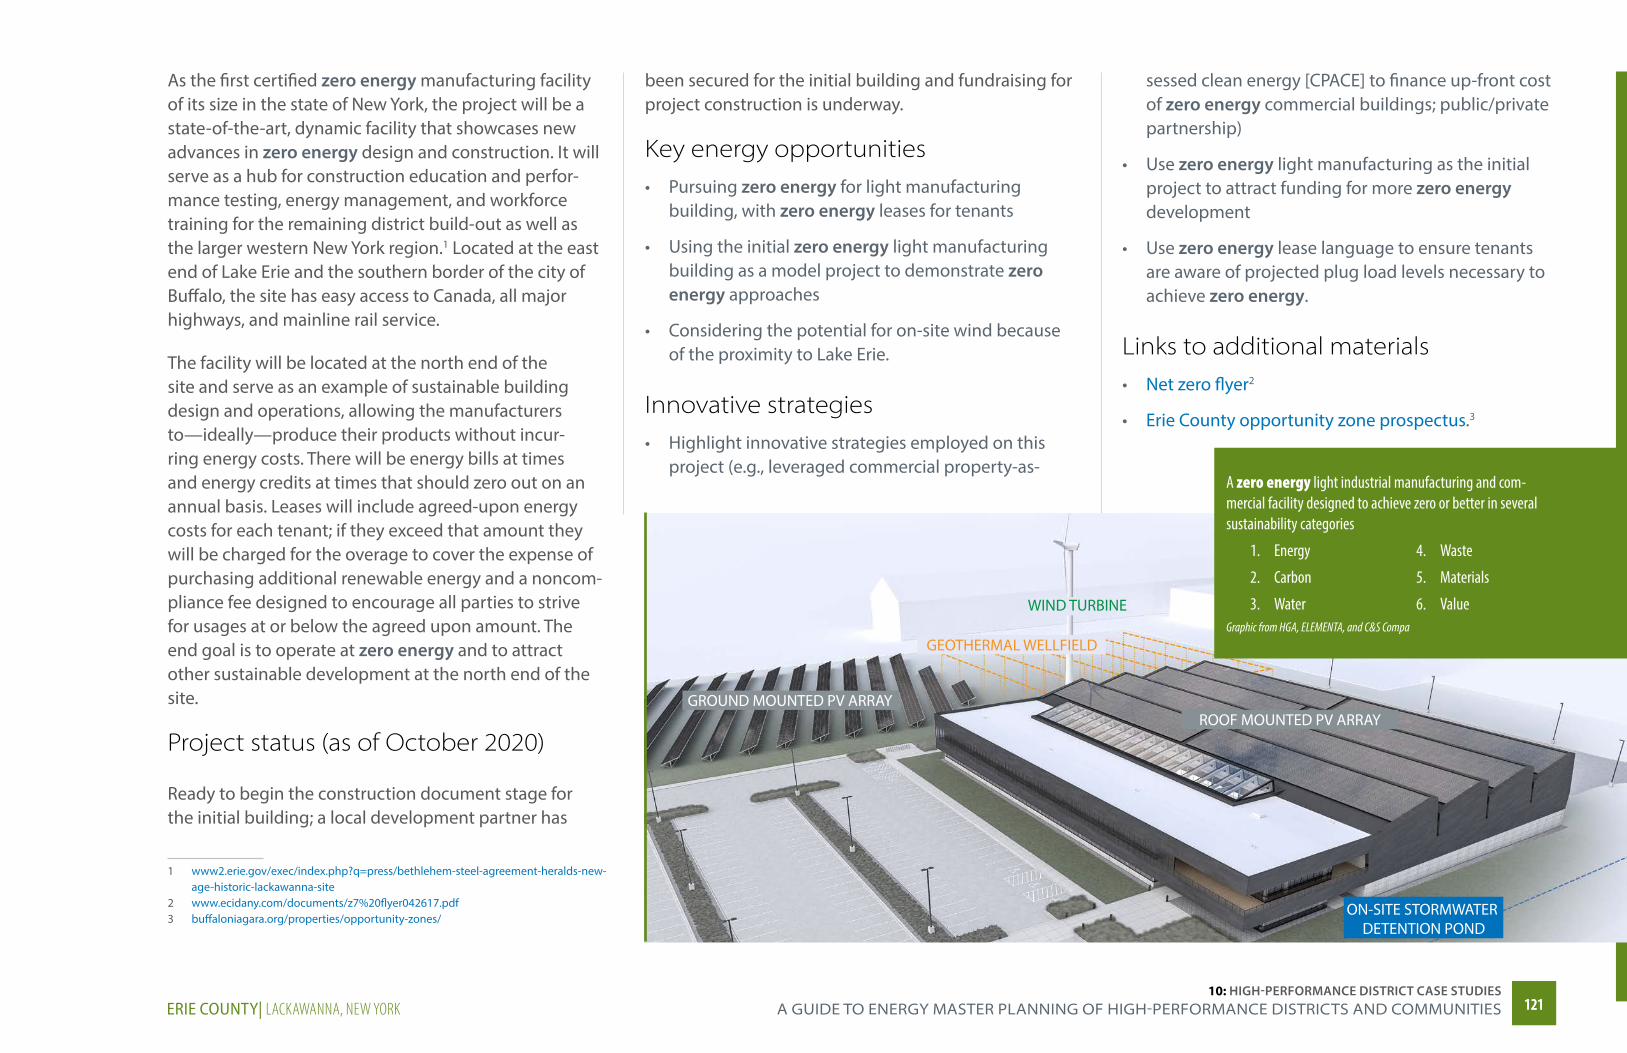
As the first certified zero energy manufacturing facility of its size in the state of New York, the project will be a state-of-the-art, dynamic facility that showcases new advances in zero energy design and construction. It will serve as a hub for construction education and perfor-mance testing, energy management, and workforce training for the remaining district build-out as well as the larger western New York region.1 Located at the east end of Lake Erie and the southern border of the city of Buffalo, the site has easy access to Canada, all major highways, and mainline rail service.
The facility will be located at the north end of the site and serve as an example of sustainable building design and operations, allowing the manufacturers to—ideally—produce their products without incur-ring energy costs. There will be energy bills at times and energy credits at times that should zero out on an annual basis. Leases will include agreed-upon energy costs for each tenant; if they exceed that amount they will be charged for the overage to cover the expense of purchasing additional renewable energy and a noncom-pliance fee designed to encourage all parties to strive for usages at or below the agreed upon amount. The end goal is to operate at zero energy and to attract other sustainable development at the north end of the site.
Project status (as of October 2020)
Ready to begin the construction document stage for the initial building; a local development partner has
1 www2.erie.gov/exec/index.php?q=press/bethlehem-steel-agreement-heralds-new-age-historic-lackawanna-site
2 www.ecidany.com/documents/z7%20flyer042617.pdf3 buffaloniagara.org/properties/opportunity-zones/
been secured for the initial building and fundraising for project construction is underway.
Key energy opportunities• Pursuing zero energy for light manufacturing
building, with zero energy leases for tenants
• Using the initial zero energy light manufacturing building as a model project to demonstrate zero energy approaches
• Considering the potential for on-site wind because of the proximity to Lake Erie.
Innovative strategies• Highlight innovative strategies employed on this
project (e.g., leveraged commercial property-as-
sessed clean energy [CPACE] to finance up-front cost of zero energy commercial buildings; public/private partnership)
• Use zero energy light manufacturing as the initial project to attract funding for more zero energy development
• Use zero energy lease language to ensure tenants are aware of projected plug load levels necessary to achieve zero energy.
Links to additional materials• Net zero flyer2
• Erie County opportunity zone prospectus.3
WIND TURBINE
GEOTHERMAL WELLFIELD
GROUND MOUNTED PV ARRAYROOF MOUNTED PV ARRAY
ON-SITE STORMWATER DETENTION POND
A zero energy light industrial manufacturing and com-mercial facility designed to achieve zero or better in several sustainability categories
1. Energy
2. Carbon
3. Water
4. Waste
5. Materials
6. Value Graphic from HGA, ELEMENTA, and C&S Compa
ERIE COUNTY| LACKAWANNA, NEW YORK 12112110: HIGH-PERFORMANCE DISTRICT CASE STUDIES
A gUiDe TO energy mASTer PlAnning OF HigH-PerFOrmAnCe DiSTriCTS AnD COmmUniTieS
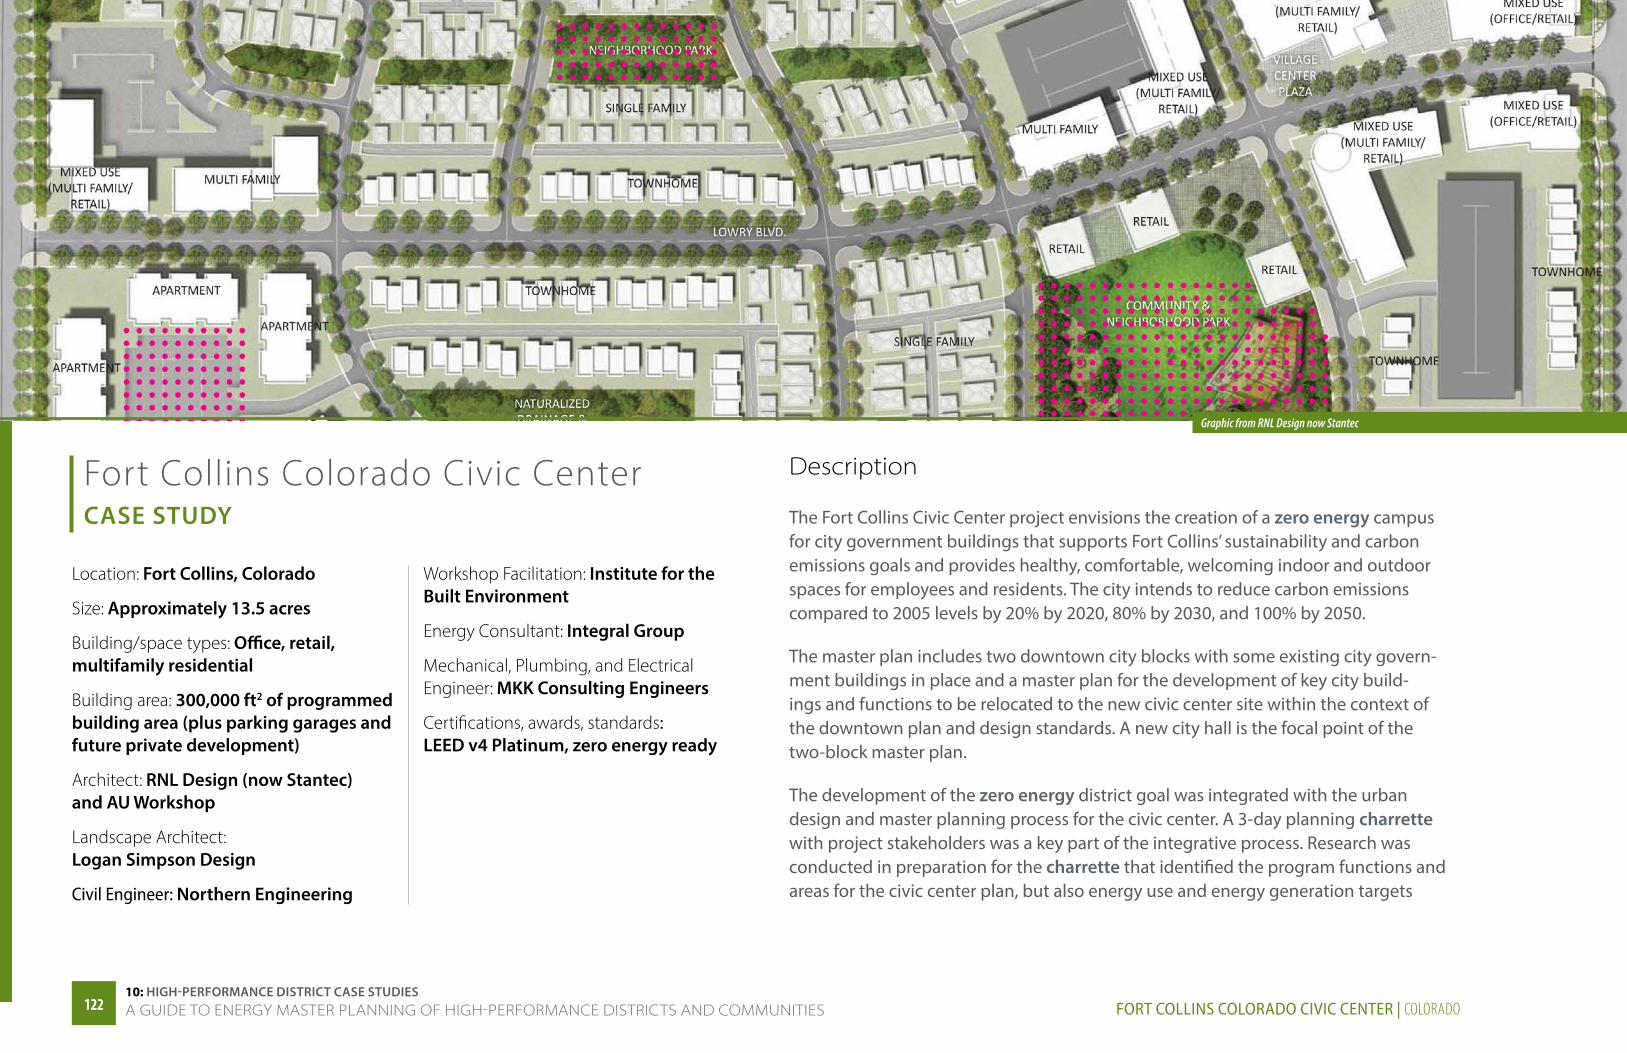
Fort Collins Colorado Civic CenterCASE STUDY
Location: Fort Collins, Colorado
Size: Approximately 13.5 acres
Building/space types: Office, retail, multifamily residential
Building area: 300,000 ft2 of programmed building area (plus parking garages and future private development)
Architect: RNL Design (now Stantec) and AU Workshop
Landscape Architect: Logan Simpson Design
Civil Engineer: Northern Engineering
Workshop Facilitation: Institute for the Built Environment
Energy Consultant: Integral Group
Mechanical, Plumbing, and Electrical Engineer: MKK Consulting Engineers
Certifications, awards, standards: LEED v4 Platinum, zero energy ready
Description
The Fort Collins Civic Center project envisions the creation of a zero energy campus for city government buildings that supports Fort Collins’ sustainability and carbon emissions goals and provides healthy, comfortable, welcoming indoor and outdoor spaces for employees and residents. The city intends to reduce carbon emissions compared to 2005 levels by 20% by 2020, 80% by 2030, and 100% by 2050.
The master plan includes two downtown city blocks with some existing city govern-ment buildings in place and a master plan for the development of key city build-ings and functions to be relocated to the new civic center site within the context of the downtown plan and design standards. A new city hall is the focal point of the two-block master plan.
The development of the zero energy district goal was integrated with the urban design and master planning process for the civic center. A 3-day planning charrette with project stakeholders was a key part of the integrative process. Research was conducted in preparation for the charrette that identified the program functions and areas for the civic center plan, but also energy use and energy generation targets
Graphic from RNL Design now Stantec
FORT COLLINS COLORADO CIVIC CENTER | COLORADO12212210: HIGH-PERFORMANCE DISTRICT CASE STUDIESA GUIDE TO ENERGY MASTER PLANNING OF HIGH-PERFORMANCE DISTRICTS AND COMMUNITIES
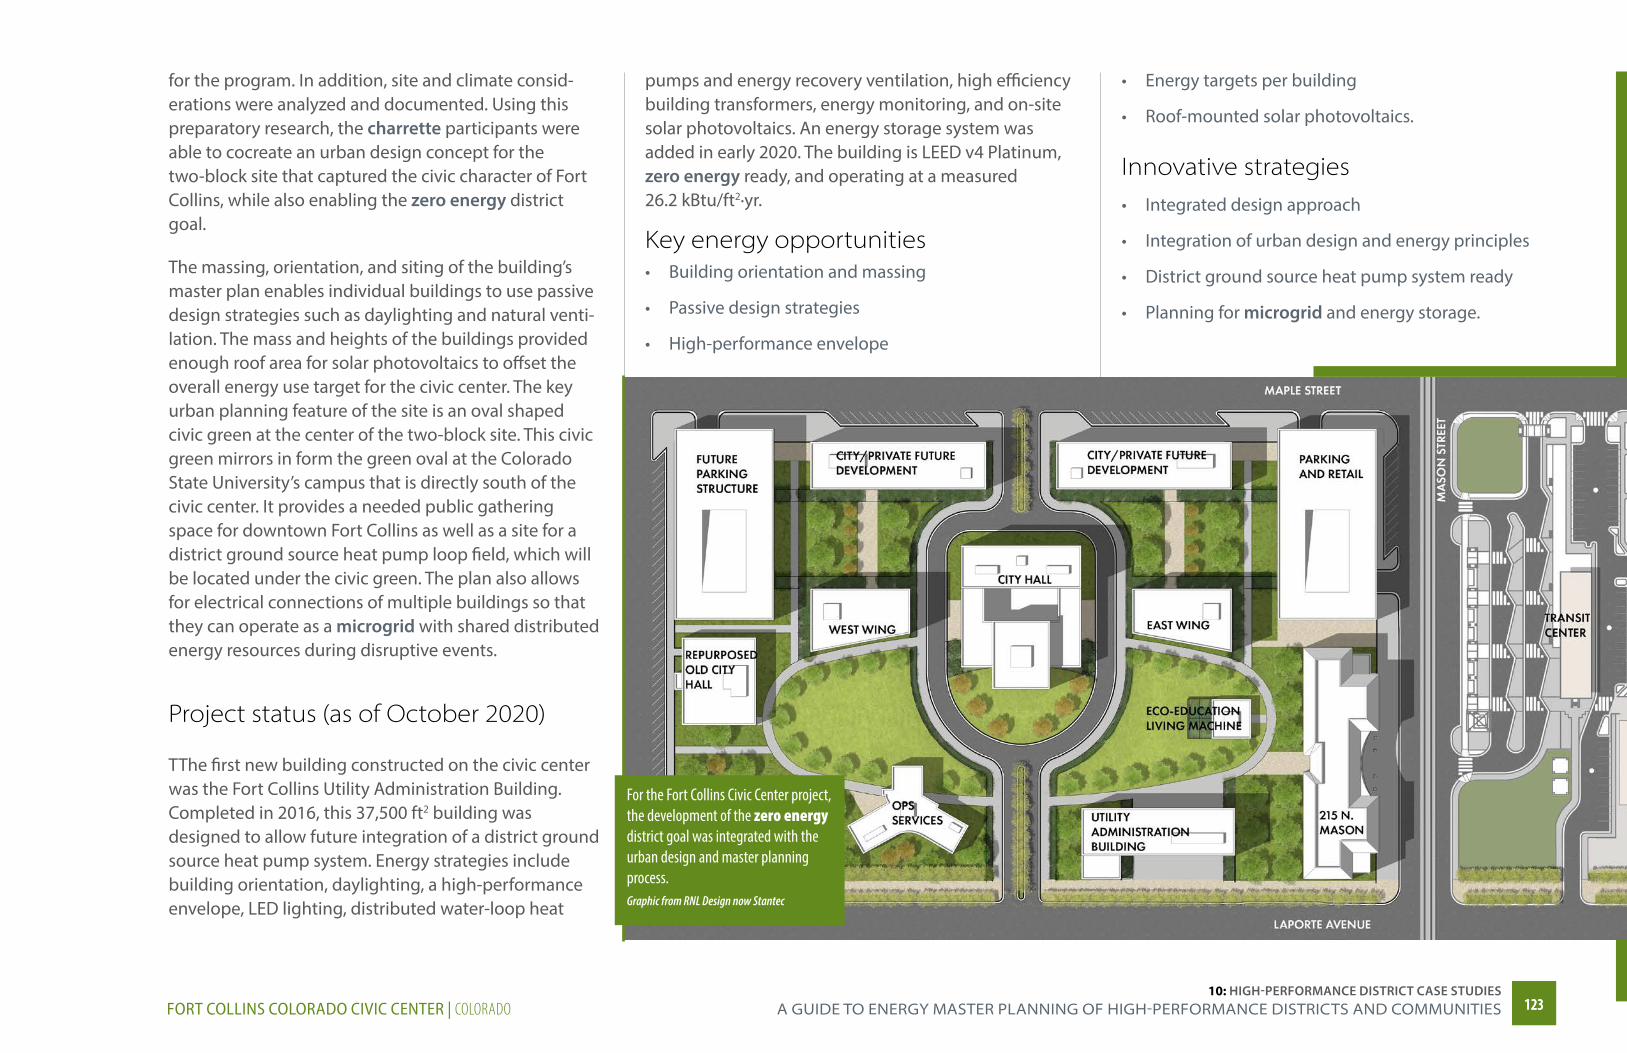
for the program. In addition, site and climate consid-erations were analyzed and documented. Using this preparatory research, the charrette participants were able to cocreate an urban design concept for the two-block site that captured the civic character of Fort Collins, while also enabling the zero energy district goal.
The massing, orientation, and siting of the building’s master plan enables individual buildings to use passive design strategies such as daylighting and natural venti-lation. The mass and heights of the buildings provided enough roof area for solar photovoltaics to offset the overall energy use target for the civic center. The key urban planning feature of the site is an oval shaped civic green at the center of the two-block site. This civic green mirrors in form the green oval at the Colorado State University’s campus that is directly south of the civic center. It provides a needed public gathering space for downtown Fort Collins as well as a site for a district ground source heat pump loop field, which will be located under the civic green. The plan also allows for electrical connections of multiple buildings so that they can operate as a microgrid with shared distributed energy resources during disruptive events.
Project status (as of October 2020)
TThe first new building constructed on the civic center was the Fort Collins Utility Administration Building. Completed in 2016, this 37,500 ft2 building was designed to allow future integration of a district ground source heat pump system. Energy strategies include building orientation, daylighting, a high-performance envelope, LED lighting, distributed water-loop heat
pumps and energy recovery ventilation, high efficiency building transformers, energy monitoring, and on-site solar photovoltaics. An energy storage system was added in early 2020. The building is LEED v4 Platinum, zero energy ready, and operating at a measured 26.2 kBtu/ft2·yr.
Key energy opportunities• Building orientation and massing
• Passive design strategies
• High-performance envelope
• Energy targets per building
• Roof-mounted solar photovoltaics.
Innovative strategies• Integrated design approach
• Integration of urban design and energy principles
• District ground source heat pump system ready
• Planning for microgrid and energy storage.
For the Fort Collins Civic Center project, the development of the zero energy district goal was integrated with the urban design and master planning process.Graphic from RNL Design now Stantec
FORT COLLINS COLORADO CIVIC CENTER | COLORADO 12312310: HIGH-PERFORMANCE DISTRICT CASE STUDIES
A gUiDe TO energy mASTer PlAnning OF HigH-PerFOrmAnCe DiSTriCTS AnD COmmUniTieS
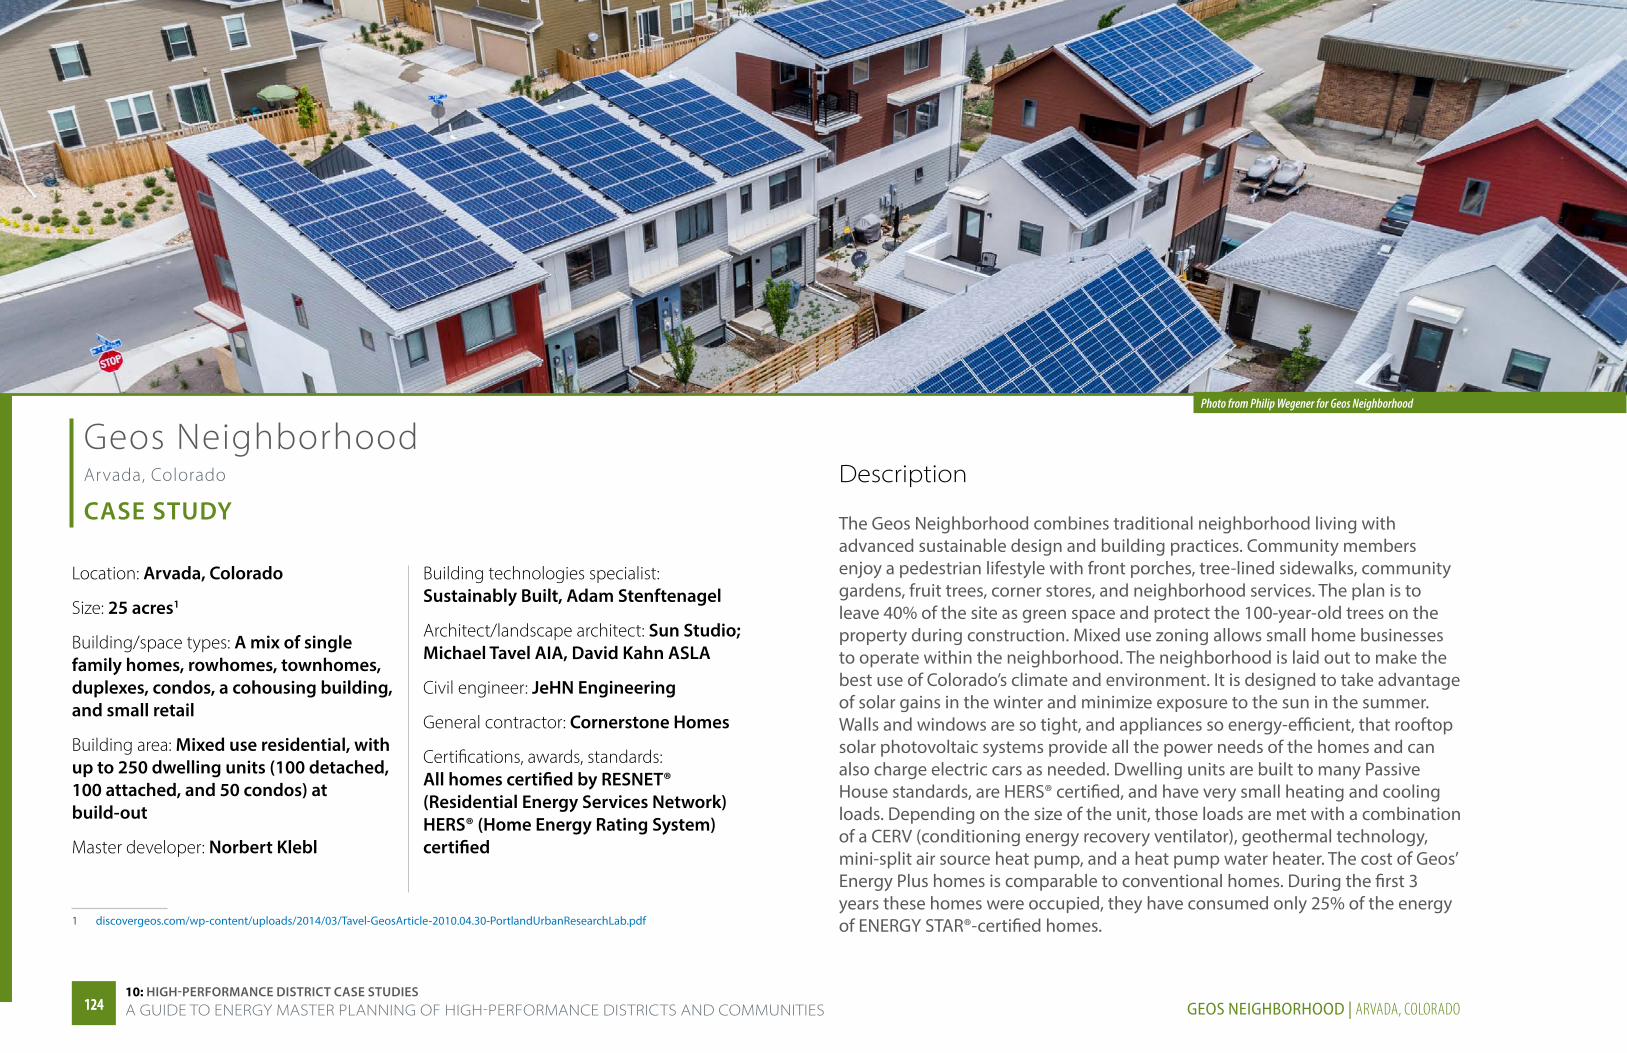
Geos Neighborhood Arvada, Colorado
CASE STUDY
1 discovergeos.com/wp-content/uploads/2014/03/Tavel-GeosArticle-2010.04.30-PortlandUrbanResearchLab.pdf
Location: Arvada, Colorado
Size: 25 acres1
Building/space types: A mix of single family homes, rowhomes, townhomes, duplexes, condos, a cohousing building, and small retail
Building area: Mixed use residential, with up to 250 dwelling units (100 detached, 100 attached, and 50 condos) at build-out
Master developer: Norbert Klebl
Building technologies specialist: Sustainably Built, Adam Stenftenagel
Architect/landscape architect: Sun Studio; Michael Tavel AIA, David Kahn ASLA
Civil engineer: JeHN Engineering
General contractor: Cornerstone Homes
Certifications, awards, standards: All homes certified by RESNET® (Residential Energy Services Network) HERS® (Home Energy Rating System) certified
Description
The Geos Neighborhood combines traditional neighborhood living with advanced sustainable design and building practices. Community members enjoy a pedestrian lifestyle with front porches, tree-lined sidewalks, community gardens, fruit trees, corner stores, and neighborhood services. The plan is to leave 40% of the site as green space and protect the 100-year-old trees on the property during construction. Mixed use zoning allows small home businesses to operate within the neighborhood. The neighborhood is laid out to make the best use of Colorado’s climate and environment. It is designed to take advantage of solar gains in the winter and minimize exposure to the sun in the summer. Walls and windows are so tight, and appliances so energy-efficient, that rooftop solar photovoltaic systems provide all the power needs of the homes and can also charge electric cars as needed. Dwelling units are built to many Passive House standards, are HERS® certified, and have very small heating and cooling loads. Depending on the size of the unit, those loads are met with a combination of a CERV (conditioning energy recovery ventilator), geothermal technology, mini-split air source heat pump, and a heat pump water heater. The cost of Geos’ Energy Plus homes is comparable to conventional homes. During the first 3 years these homes were occupied, they have consumed only 25% of the energy of ENERGY STAR®-certified homes.
Photo from Philip Wegener for Geos Neighborhood
GEOS NEIGHBORHOOD | ARVADA, COLORADO12412410: HIGH-PERFORMANCE DISTRICT CASE STUDIESA GUIDE TO ENERGY MASTER PLANNING OF HIGH-PERFORMANCE DISTRICTS AND COMMUNITIES
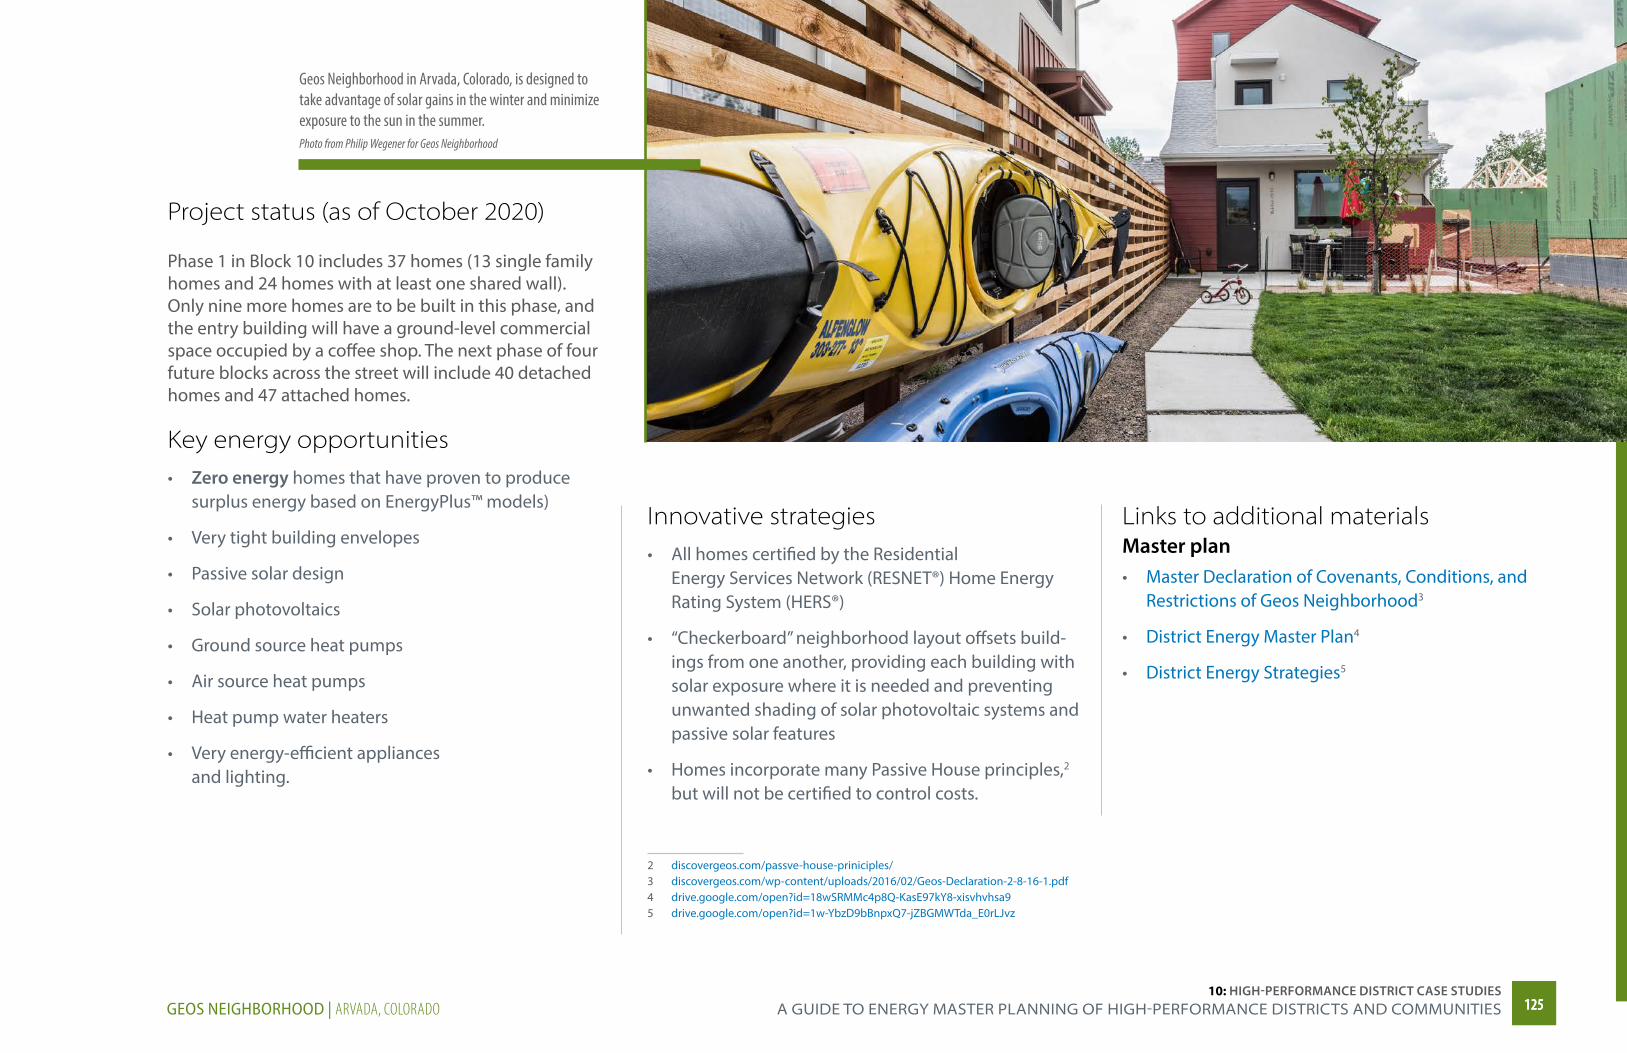
Geos Neighborhood in Arvada, Colorado, is designed to take advantage of solar gains in the winter and minimize exposure to the sun in the summer. Photo from Philip Wegener for Geos Neighborhood
Project status (as of October 2020)
Phase 1 in Block 10 includes 37 homes (13 single family homes and 24 homes with at least one shared wall). Only nine more homes are to be built in this phase, and the entry building will have a ground-level commercial space occupied by a coffee shop. The next phase of four future blocks across the street will include 40 detached homes and 47 attached homes.
Key energy opportunities• Zero energy homes that have proven to produce
surplus energy based on EnergyPlus™ models)
• Very tight building envelopes
• Passive solar design
• Solar photovoltaics
• Ground source heat pumps
• Air source heat pumps
• Heat pump water heaters
• Very energy-efficient appliances and lighting.
Innovative strategies• All homes certified by the Residential
Energy Services Network (RESNET®) Home Energy Rating System (HERS®)
• “Checkerboard” neighborhood layout offsets build-ings from one another, providing each building with solar exposure where it is needed and preventing unwanted shading of solar photovoltaic systems and passive solar features
• Homes incorporate many Passive House principles,2 but will not be certified to control costs.
2 discovergeos.com/passve-house-priniciples/3 discovergeos.com/wp-content/uploads/2016/02/Geos-Declaration-2-8-16-1.pdf4 drive.google.com/open?id=18wSRMMc4p8Q-KasE97kY8-xisvhvhsa95 drive.google.com/open?id=1w-YbzD9bBnpxQ7-jZBGMWTda_E0rLJvz
Links to additional materialsMaster plan• Master Declaration of Covenants, Conditions, and
Restrictions of Geos Neighborhood3
• District Energy Master Plan4
• District Energy Strategies5
GEOS NEIGHBORHOOD | ARVADA, COLORADO 12512510: HIGH-PERFORMANCE DISTRICT CASE STUDIES
A gUiDe TO energy mASTer PlAnning OF HigH-PerFOrmAnCe DiSTriCTS AnD COmmUniTieS

Hazelwood Green Pittsburgh, Pennsylvania
CASE STUDY
RIDC’s Mill 19 at Hazelwood Green comprises three buildings within the superstructure of a former steel rolling mill.Photo from Ashley Koltonski, Cushman & Wakefield/Grant Street Associates, Inc.
Mill 19Developer and landowner (13 acres): Regional Industrial Development Corporation (RIDC)
Master architect (core and shell, all phases): MSR Design, Minneapolis, Minnesota
Building A interiors: Renaissance 3 Architects, Pittsburgh, Pennsylvania
Building B Interiors: Desmone Architects, Pittsburgh, Pennsylvania
Engineering (core and shell, all phases): BALA and BALA Structures
General contractor (site work and core/shell Building A): Turner Construction Company
General contractor (core/shell Building B): Jendoco Construction Corporation
Solar contractor: Scalo Solar Solutions
Plaza designer: Gustafson Guthrie Nichol
Roundhouse designer: GBBN
Location: Pittsburgh, Pennsylvania
Size: 178 acres1
Building/space types: Light industrial, office, residential, retail
Building area at build-out: 6–10.7 million square feet
Primary landowner (165 acres): Almono LP 2
Site manager: Almono LLC3
Project director and site manager authorized agent: U3 Advisors4
1 drive.google.com/file/d/1G7_0TCE9ZsvmlSasZt_UYeKQcm_2eTGz/view
2 www.hazelwoodgreen.com/owners3 www.hazelwoodgreen.com/owners4 www.hazelwoodgreen.com/owners
Certifications, awards, standards: Hazelwood Green is being built to LEED-ND, Living Community Challenge, WELL Community, and Pittsburgh’s p4 Performance Measures standards.
Mill 19, the first phase of the Hazel-wood Green development, is expected to achieve LEED Gold certification. Awards for Mill 19 (as of September 2020) include:
• Best Office/Retail/Mixed Use Project, Engineering News Record Mid Atlantic, 2020
• Placemaking Award for Visionary Excel-lence, Urban Land Institute Pittsburgh, 2019
• National Association of Industrial and Office Partners Pittsburgh, Green Building Award, 2019
• March of Dimes Pittsburgh, Building Project of the Year, 2020.
The Roundhouse is pursuing LEED Gold certification.
Description
The mixed use development of Hazelwood Green, a riverfront property along the Monongahela River in Pittsburgh, Pennsylvania, is based on four principles—advancing human well-being, regen-erating the local ecology, inspiring innovation, and creating resilient spaces. The site was originally named Almono after the first syllables of Pitts-burgh’s rivers—the Allegheny, Monongahela, and Ohio.
As part of the effort to regenerate this brown-field site and create a resilient neighborhood, the owner, Almono LP, aspires to energy positive building performance site-wide. In support of the energy positive goal as well as the principle of creating resilient spaces, Hazelwood Green features on-site renewable energy systems.
Mill 19, the first phase of the development, comprises three buildings (A, B, and C) built within the skeleton of a former Jones and Laughlin steel mill. The building includes a rooftop solar photovoltaic array that, as of summer 2020, was the largest single-sloped solar array in the
12612610: HIGH-PERFORMANCE DISTRICT CASE STUDIESA GUIDE TO ENERGY MASTER PLANNING OF HIGH-PERFORMANCE DISTRICTS AND COMMUNITIES HAZELWOOD GREEN | PITTSBURGH, PENNSYLVANIA
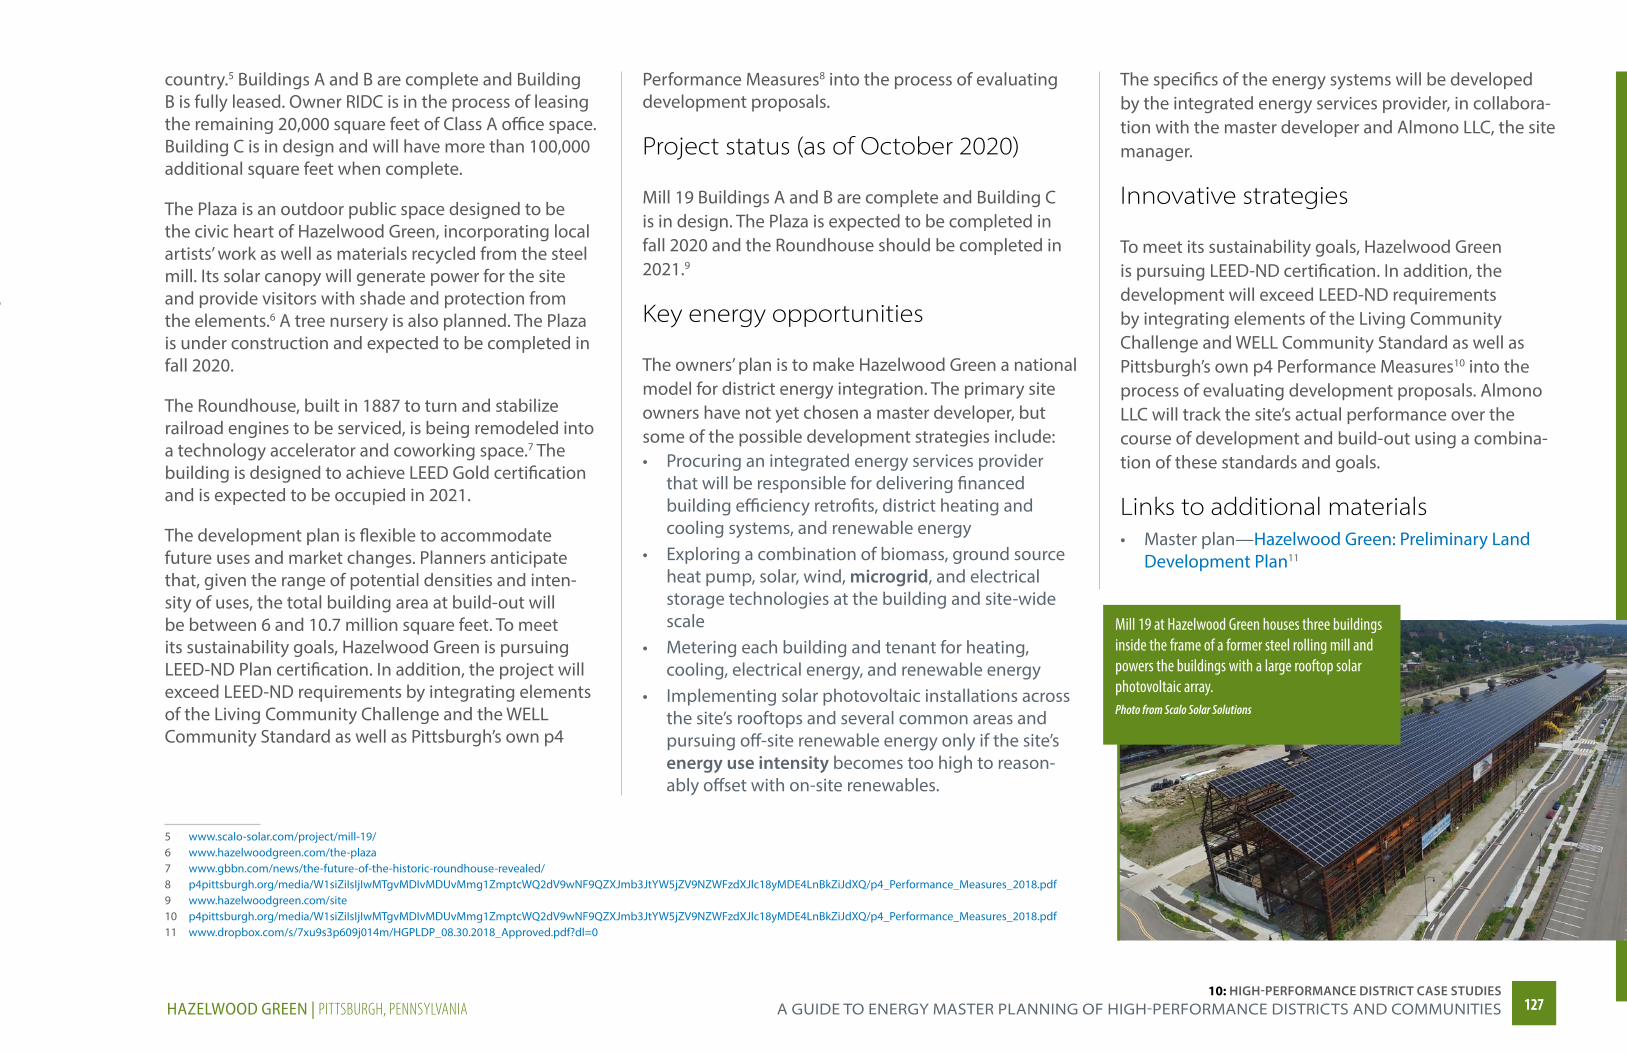
country.5 Buildings A and B are complete and Building B is fully leased. Owner RIDC is in the process of leasing the remaining 20,000 square feet of Class A office space. Building C is in design and will have more than 100,000 additional square feet when complete.
The Plaza is an outdoor public space designed to be the civic heart of Hazelwood Green, incorporating local artists’ work as well as materials recycled from the steel mill. Its solar canopy will generate power for the site and provide visitors with shade and protection from the elements.6 A tree nursery is also planned. The Plaza is under construction and expected to be completed in fall 2020.
The Roundhouse, built in 1887 to turn and stabilize railroad engines to be serviced, is being remodeled into a technology accelerator and coworking space.7 The building is designed to achieve LEED Gold certification and is expected to be occupied in 2021.
The development plan is flexible to accommodate future uses and market changes. Planners anticipate that, given the range of potential densities and inten-sity of uses, the total building area at build-out will be between 6 and 10.7 million square feet. To meet its sustainability goals, Hazelwood Green is pursuing LEED-ND Plan certification. In addition, the project will exceed LEED-ND requirements by integrating elements of the Living Community Challenge and the WELL Community Standard as well as Pittsburgh’s own p4
5 www.scalo-solar.com/project/mill-19/6 www.hazelwoodgreen.com/the-plaza7 www.gbbn.com/news/the-future-of-the-historic-roundhouse-revealed/8 p4pittsburgh.org/media/W1siZiIsIjIwMTgvMDIvMDUvMmg1ZmptcWQ2dV9wNF9QZXJmb3JtYW5jZV9NZWFzdXJlc18yMDE4LnBkZiJdXQ/p4_Performance_Measures_2018.pdf9 www.hazelwoodgreen.com/site10 p4pittsburgh.org/media/W1siZiIsIjIwMTgvMDIvMDUvMmg1ZmptcWQ2dV9wNF9QZXJmb3JtYW5jZV9NZWFzdXJlc18yMDE4LnBkZiJdXQ/p4_Performance_Measures_2018.pdf11 www.dropbox.com/s/7xu9s3p609j014m/HGPLDP_08.30.2018_Approved.pdf?dl=0
Performance Measures8 into the process of evaluating development proposals.
Project status (as of October 2020)
Mill 19 Buildings A and B are complete and Building C is in design. The Plaza is expected to be completed in fall 2020 and the Roundhouse should be completed in 2021.9
Key energy opportunities
The owners’ plan is to make Hazelwood Green a national model for district energy integration. The primary site owners have not yet chosen a master developer, but some of the possible development strategies include:• Procuring an integrated energy services provider
that will be responsible for delivering financed building efficiency retrofits, district heating and cooling systems, and renewable energy
• Exploring a combination of biomass, ground source heat pump, solar, wind, microgrid, and electrical storage technologies at the building and site-wide scale
• Metering each building and tenant for heating, cooling, electrical energy, and renewable energy
• Implementing solar photovoltaic installations across the site’s rooftops and several common areas and pursuing off-site renewable energy only if the site’s energy use intensity becomes too high to reason-ably offset with on-site renewables.
The specifics of the energy systems will be developed by the integrated energy services provider, in collabora-tion with the master developer and Almono LLC, the site manager.
Innovative strategies
To meet its sustainability goals, Hazelwood Green is pursuing LEED-ND certification. In addition, the development will exceed LEED-ND requirements by integrating elements of the Living Community Challenge and WELL Community Standard as well as Pittsburgh’s own p4 Performance Measures10 into the process of evaluating development proposals. Almono LLC will track the site’s actual performance over the course of development and build-out using a combina-tion of these standards and goals.
Links to additional materials• Master plan—Hazelwood Green: Preliminary Land
Development Plan11
Mill 19 at Hazelwood Green houses three buildings inside the frame of a former steel rolling mill and powers the buildings with a large rooftop solar photovoltaic array.Photo from Scalo Solar Solutions
12712710: HIGH-PERFORMANCE DISTRICT CASE STUDIES
A gUiDe TO energy mASTer PlAnning OF HigH-PerFOrmAnCe DiSTriCTS AnD COmmUniTieSHAZELWOOD GREEN | PITTSBURGH, PENNSYLVANIA
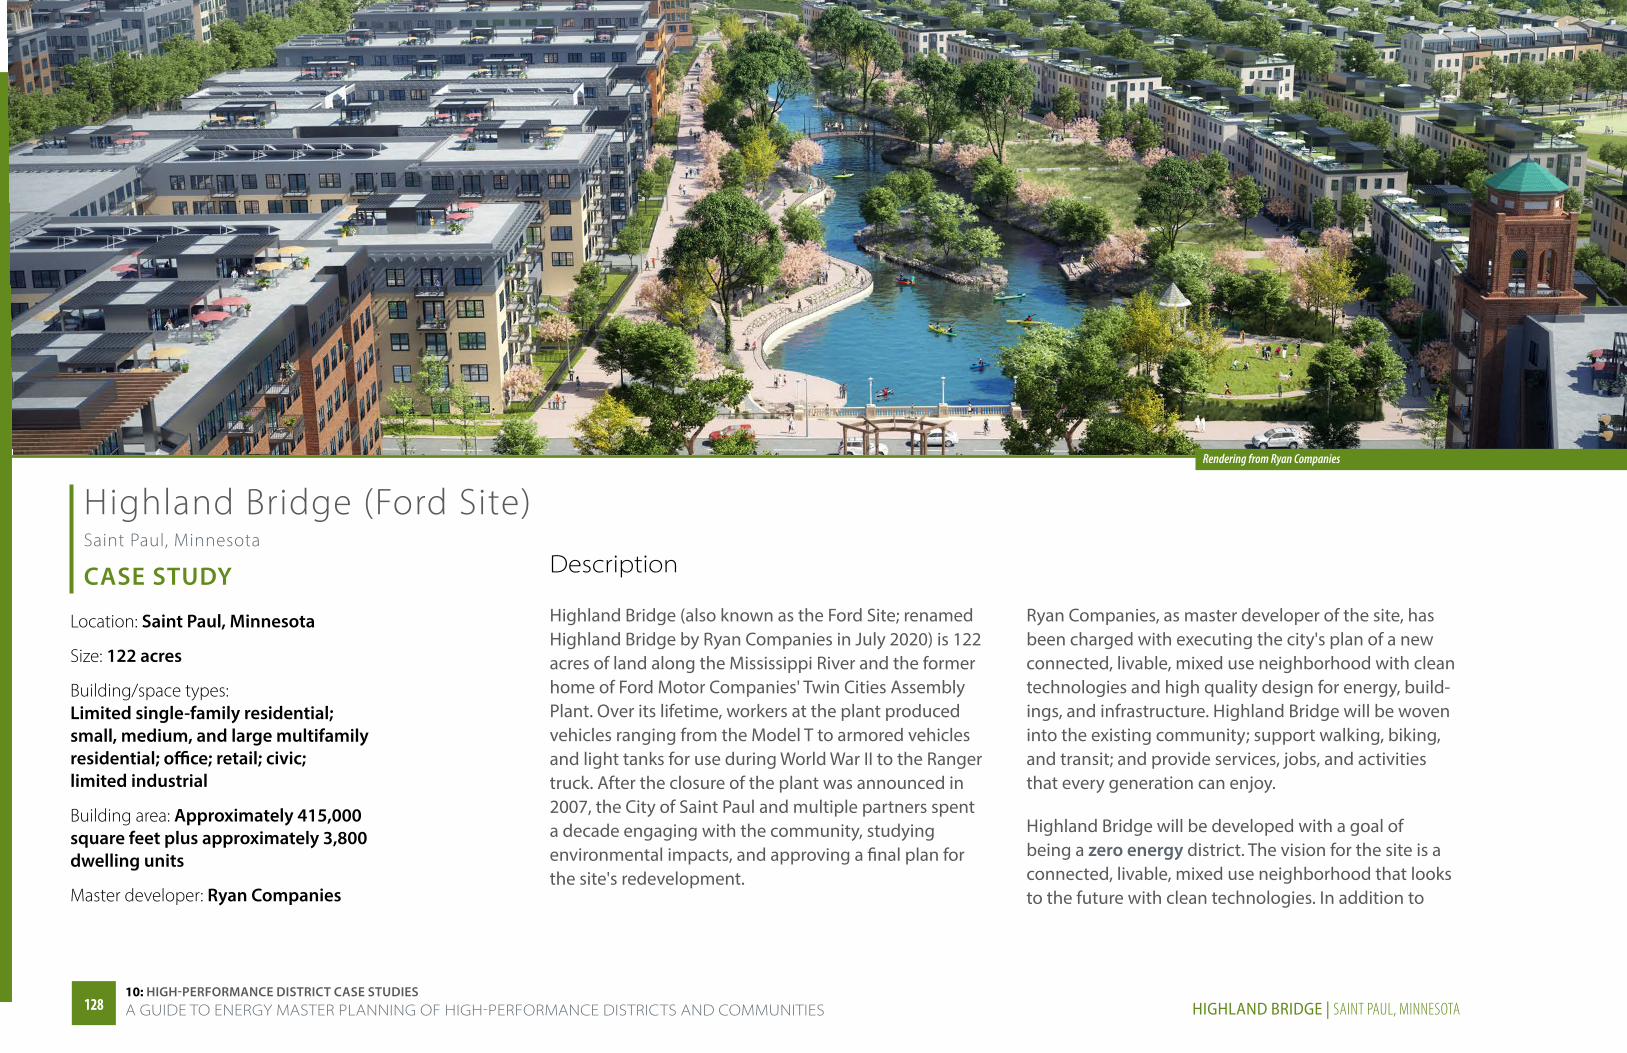
Highland Bridge (Ford Site) Saint Paul, Minnesota
CASE STUDY
Location: Saint Paul, Minnesota
Size: 122 acres
Building/space types: Limited single-family residential; small, medium, and large multifamily residential; office; retail; civic; limited industrial
Building area: Approximately 415,000 square feet plus approximately 3,800 dwelling units
Master developer: Ryan Companies
Description
Highland Bridge (also known as the Ford Site; renamed Highland Bridge by Ryan Companies in July 2020) is 122 acres of land along the Mississippi River and the former home of Ford Motor Companies' Twin Cities Assembly Plant. Over its lifetime, workers at the plant produced vehicles ranging from the Model T to armored vehicles and light tanks for use during World War II to the Ranger truck. After the closure of the plant was announced in 2007, the City of Saint Paul and multiple partners spent a decade engaging with the community, studying environmental impacts, and approving a final plan for the site's redevelopment.
Ryan Companies, as master developer of the site, has been charged with executing the city's plan of a new connected, livable, mixed use neighborhood with clean technologies and high quality design for energy, build-ings, and infrastructure. Highland Bridge will be woven into the existing community; support walking, biking, and transit; and provide services, jobs, and activities that every generation can enjoy.
Highland Bridge will be developed with a goal of being a zero energy district. The vision for the site is a connected, livable, mixed use neighborhood that looks to the future with clean technologies. In addition to
Rendering from Ryan Companies
12812810: HIGH-PERFORMANCE DISTRICT CASE STUDIESA GUIDE TO ENERGY MASTER PLANNING OF HIGH-PERFORMANCE DISTRICTS AND COMMUNITIES HIGHLAND BRIDGE | SAINT PAUL, MINNESOTA
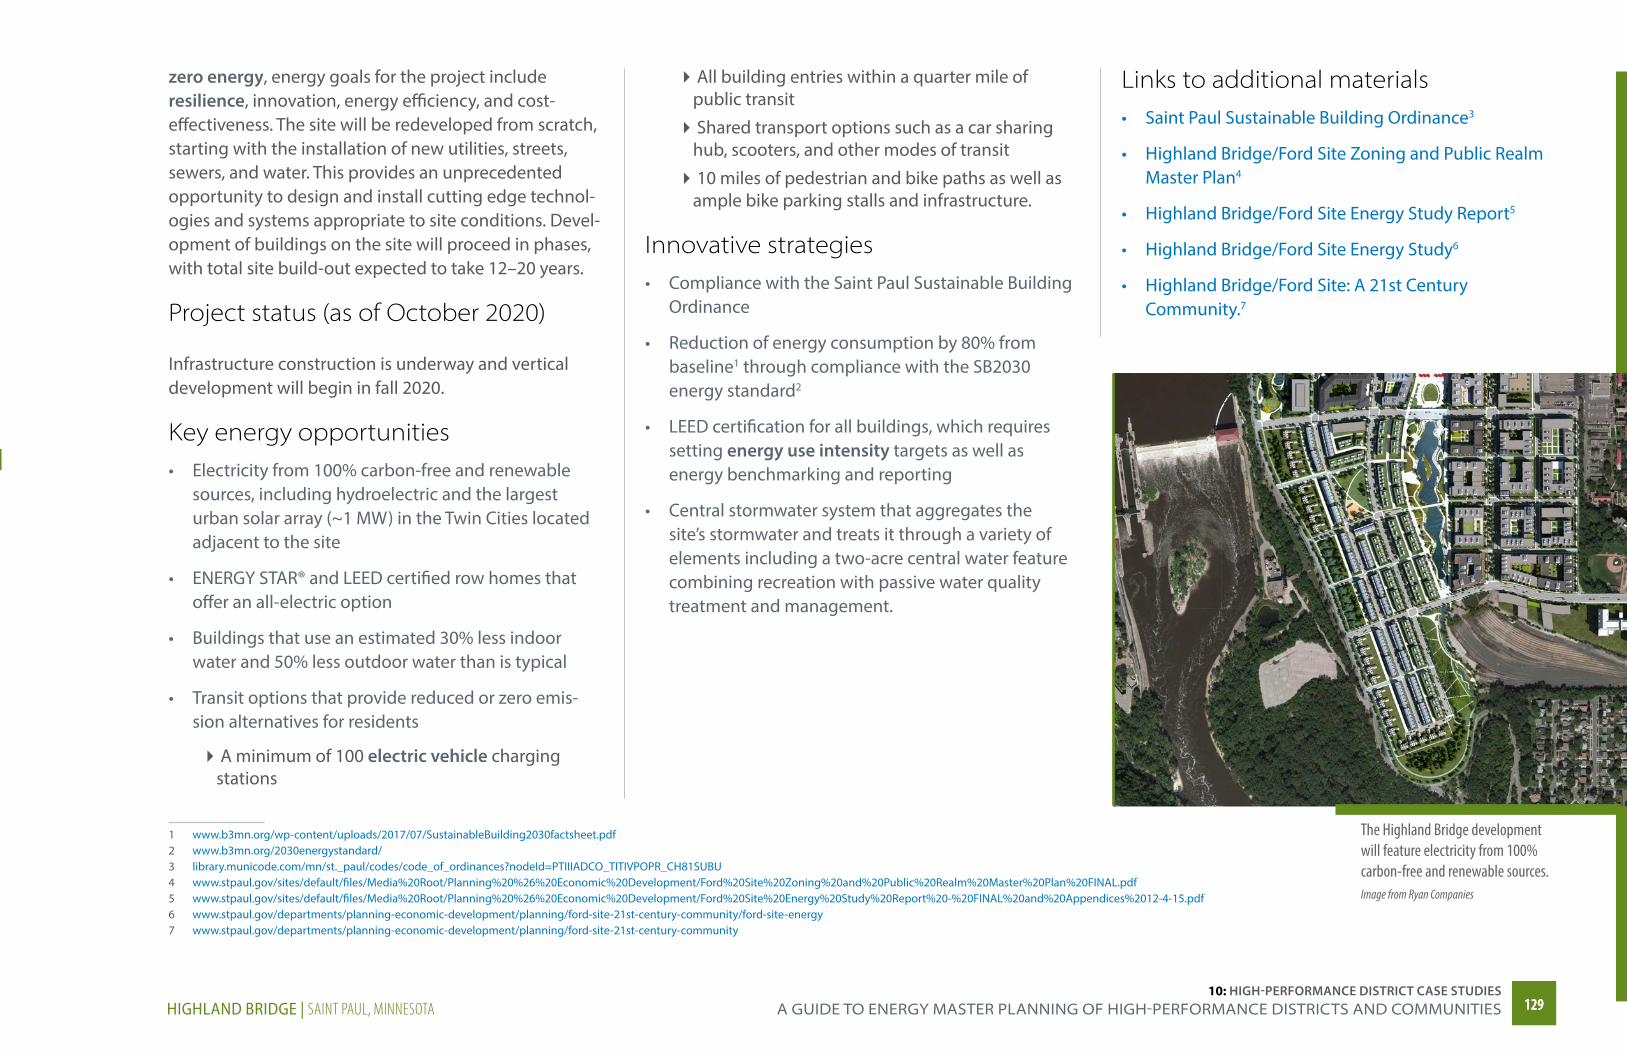
zero energy, energy goals for the project include resilience, innovation, energy efficiency, and cost- effectiveness. The site will be redeveloped from scratch, starting with the installation of new utilities, streets, sewers, and water. This provides an unprecedented opportunity to design and install cutting edge technol-ogies and systems appropriate to site conditions. Devel-opment of buildings on the site will proceed in phases, with total site build-out expected to take 12–20 years.
Project status (as of October 2020)
Infrastructure construction is underway and vertical development will begin in fall 2020.
Key energy opportunities• Electricity from 100% carbon-free and renewable
sources, including hydroelectric and the largest urban solar array (~1 MW) in the Twin Cities located adjacent to the site
• ENERGY STAR® and LEED certified row homes that offer an all-electric option
• Buildings that use an estimated 30% less indoor water and 50% less outdoor water than is typical
• Transit options that provide reduced or zero emis-sion alternatives for residents
�A minimum of 100 electric vehicle charging stations
1 www.b3mn.org/wp-content/uploads/2017/07/SustainableBuilding2030factsheet.pdf2 www.b3mn.org/2030energystandard/3 library.municode.com/mn/st._paul/codes/code_of_ordinances?nodeId=PTIIIADCO_TITIVPOPR_CH81SUBU4 www.stpaul.gov/sites/default/files/Media%20Root/Planning%20%26%20Economic%20Development/Ford%20Site%20Zoning%20and%20Public%20Realm%20Master%20Plan%20FINAL.pdf5 www.stpaul.gov/sites/default/files/Media%20Root/Planning%20%26%20Economic%20Development/Ford%20Site%20Energy%20Study%20Report%20-%20FINAL%20and%20Appendices%2012-4-15.pdf 6 www.stpaul.gov/departments/planning-economic-development/planning/ford-site-21st-century-community/ford-site-energy7 www.stpaul.gov/departments/planning-economic-development/planning/ford-site-21st-century-community
�All building entries within a quarter mile of public transit
�Shared transport options such as a car sharing hub, scooters, and other modes of transit
�10 miles of pedestrian and bike paths as well as ample bike parking stalls and infrastructure.
Innovative strategies• Compliance with the Saint Paul Sustainable Building
Ordinance
• Reduction of energy consumption by 80% from baseline1 through compliance with the SB2030 energy standard2
• LEED certification for all buildings, which requires setting energy use intensity targets as well as energy benchmarking and reporting
• Central stormwater system that aggregates the site’s stormwater and treats it through a variety of elements including a two-acre central water feature combining recreation with passive water quality treatment and management.
Links to additional materials• Saint Paul Sustainable Building Ordinance3
• Highland Bridge/Ford Site Zoning and Public Realm Master Plan4
• Highland Bridge/Ford Site Energy Study Report5
• Highland Bridge/Ford Site Energy Study6
• Highland Bridge/Ford Site: A 21st Century Community.7
The Highland Bridge development will feature electricity from 100% carbon-free and renewable sources.Image from Ryan Companies
12912910: HIGH-PERFORMANCE DISTRICT CASE STUDIES
A gUiDe TO energy mASTer PlAnning OF HigH-PerFOrmAnCe DiSTriCTS AnD COmmUniTieSHIGHLAND BRIDGE | SAINT PAUL, MINNESOTA
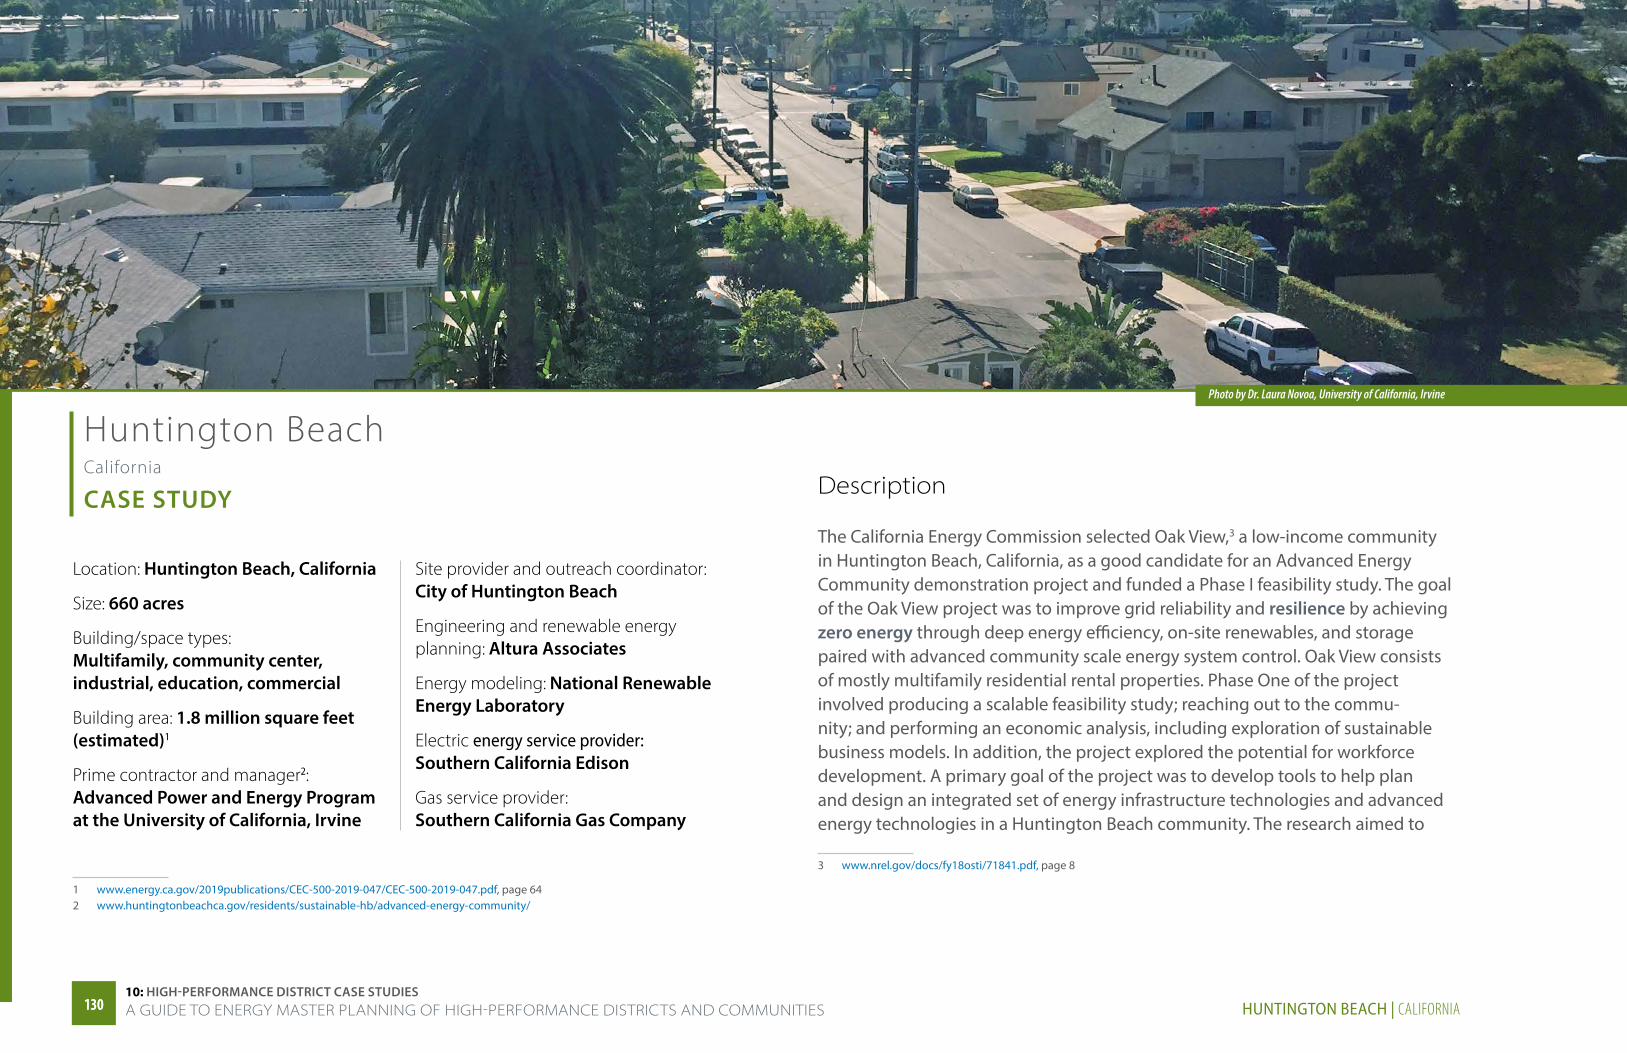
Huntington Beach California
CASE STUDY Description
The California Energy Commission selected Oak View,3 a low-income community in Huntington Beach, California, as a good candidate for an Advanced Energy Community demonstration project and funded a Phase I feasibility study. The goal of the Oak View project was to improve grid reliability and resilience by achieving zero energy through deep energy efficiency, on-site renewables, and storage paired with advanced community scale energy system control. Oak View consists of mostly multifamily residential rental properties. Phase One of the project involved producing a scalable feasibility study; reaching out to the commu-nity; and performing an economic analysis, including exploration of sustainable business models. In addition, the project explored the potential for workforce development. A primary goal of the project was to develop tools to help plan and design an integrated set of energy infrastructure technologies and advanced energy technologies in a Huntington Beach community. The research aimed to
3 www.nrel.gov/docs/fy18osti/71841.pdf, page 8
Location: Huntington Beach, California
Size: 660 acres
Building/space types: Multifamily, community center, industrial, education, commercial
Building area: 1.8 million square feet (estimated)1
Prime contractor and manager2: Advanced Power and Energy Program at the University of California, Irvine
1 www.energy.ca.gov/2019publications/CEC-500-2019-047/CEC-500-2019-047.pdf, page 642 www.huntingtonbeachca.gov/residents/sustainable-hb/advanced-energy-community/
Site provider and outreach coordinator: City of Huntington Beach
Engineering and renewable energy planning: Altura Associates
Energy modeling: National Renewable Energy Laboratory
Electric energy service provider: Southern California Edison
Gas service provider: Southern California Gas Company
Photo by Dr. Laura Novoa, University of California, Irvine
13013010: HIGH-PERFORMANCE DISTRICT CASE STUDIESA GUIDE TO ENERGY MASTER PLANNING OF HIGH-PERFORMANCE DISTRICTS AND COMMUNITIES HUNTINGTON BEACH | CALIFORNIA
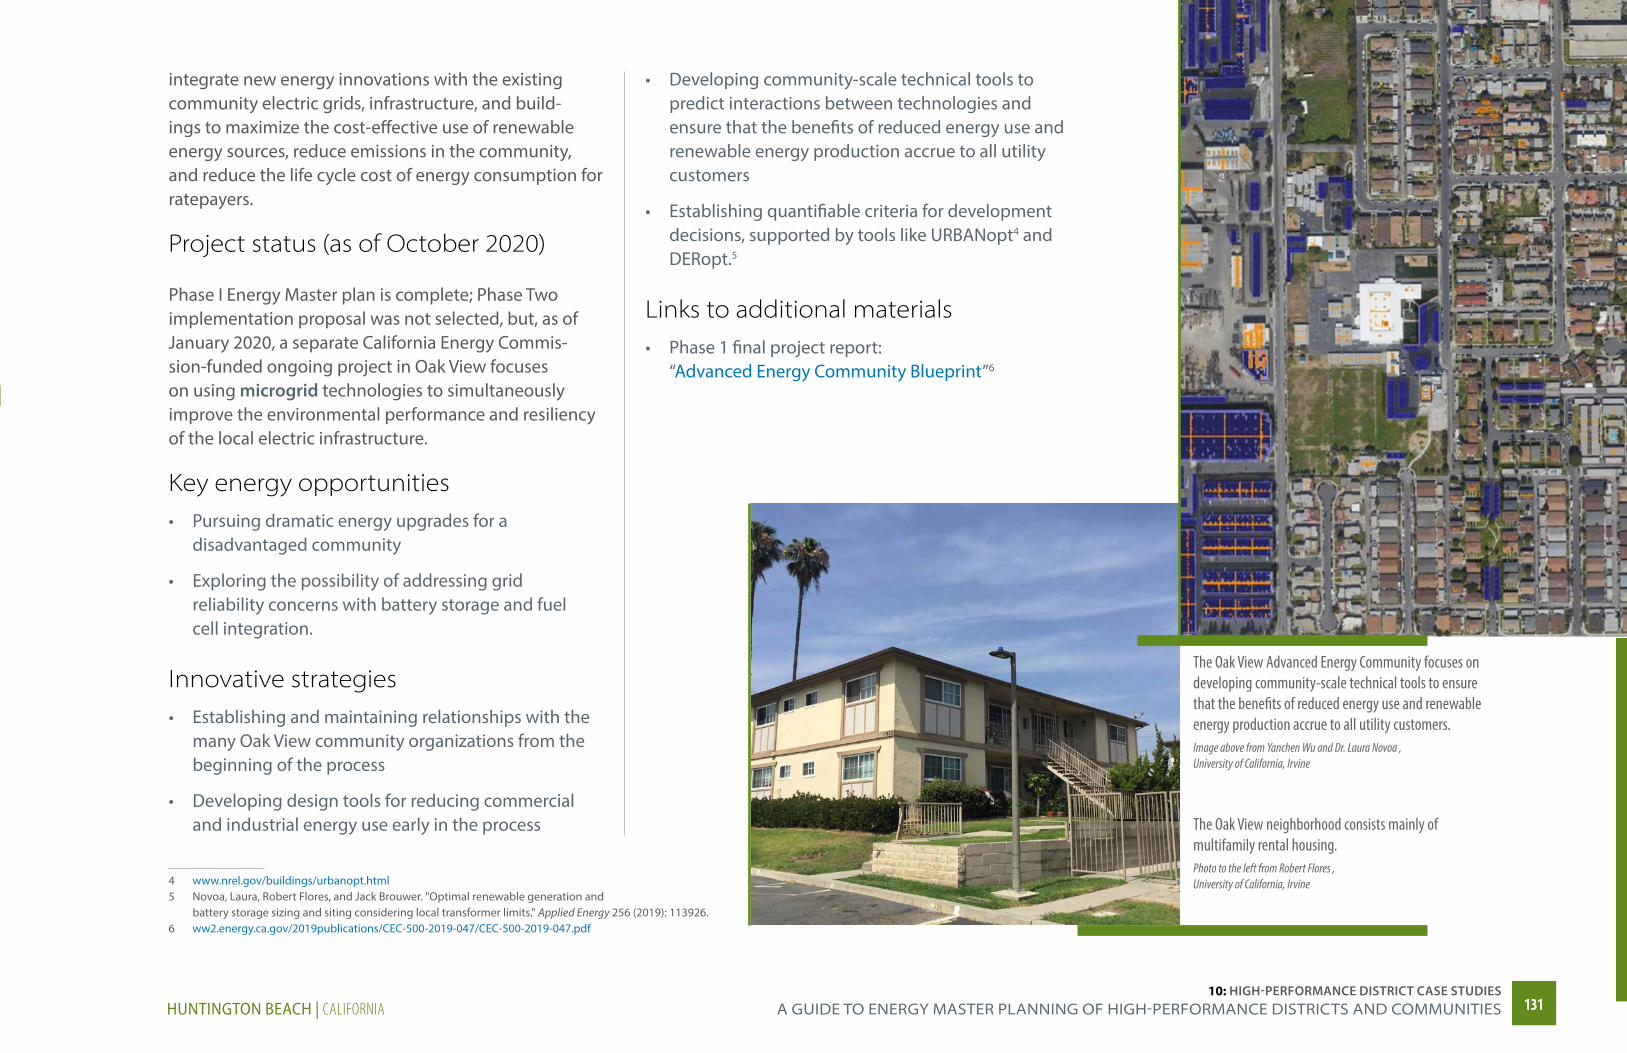
integrate new energy innovations with the existing community electric grids, infrastructure, and build-ings to maximize the cost-effective use of renewable energy sources, reduce emissions in the community, and reduce the life cycle cost of energy consumption for ratepayers.
Project status (as of October 2020)
Phase I Energy Master plan is complete; Phase Two implementation proposal was not selected, but, as of January 2020, a separate California Energy Commis-sion-funded ongoing project in Oak View focuses on using microgrid technologies to simultaneously improve the environmental performance and resiliency of the local electric infrastructure.
Key energy opportunities• Pursuing dramatic energy upgrades for a
disadvantaged community
• Exploring the possibility of addressing grid reliability concerns with battery storage and fuel cell integration.
Innovative strategies• Establishing and maintaining relationships with the
many Oak View community organizations from the beginning of the process
• Developing design tools for reducing commercial and industrial energy use early in the process
4 www.nrel.gov/buildings/urbanopt.html5 Novoa, Laura, Robert Flores, and Jack Brouwer. "Optimal renewable generation and
battery storage sizing and siting considering local transformer limits." Applied Energy 256 (2019): 113926.6 ww2.energy.ca.gov/2019publications/CEC-500-2019-047/CEC-500-2019-047.pdf
• Developing community-scale technical tools to predict interactions between technologies and ensure that the benefits of reduced energy use and renewable energy production accrue to all utility customers
• Establishing quantifiable criteria for development decisions, supported by tools like URBANopt4 and DERopt.5
Links to additional materials• Phase 1 final project report:
“Advanced Energy Community Blueprint”6
The Oak View Advanced Energy Community focuses on developing community-scale technical tools to ensure that the benefits of reduced energy use and renewable energy production accrue to all utility customers.Image above from Yanchen Wu and Dr. Laura Novoa , University of California, Irvine
The Oak View neighborhood consists mainly of multifamily rental housing.Photo to the left from Robert Flores , University of California, Irvine
13113110: HIGH-PERFORMANCE DISTRICT CASE STUDIES
A gUiDe TO energy mASTer PlAnning OF HigH-PerFOrmAnCe DiSTriCTS AnD COmmUniTieSHUNTINGTON BEACH | CALIFORNIA
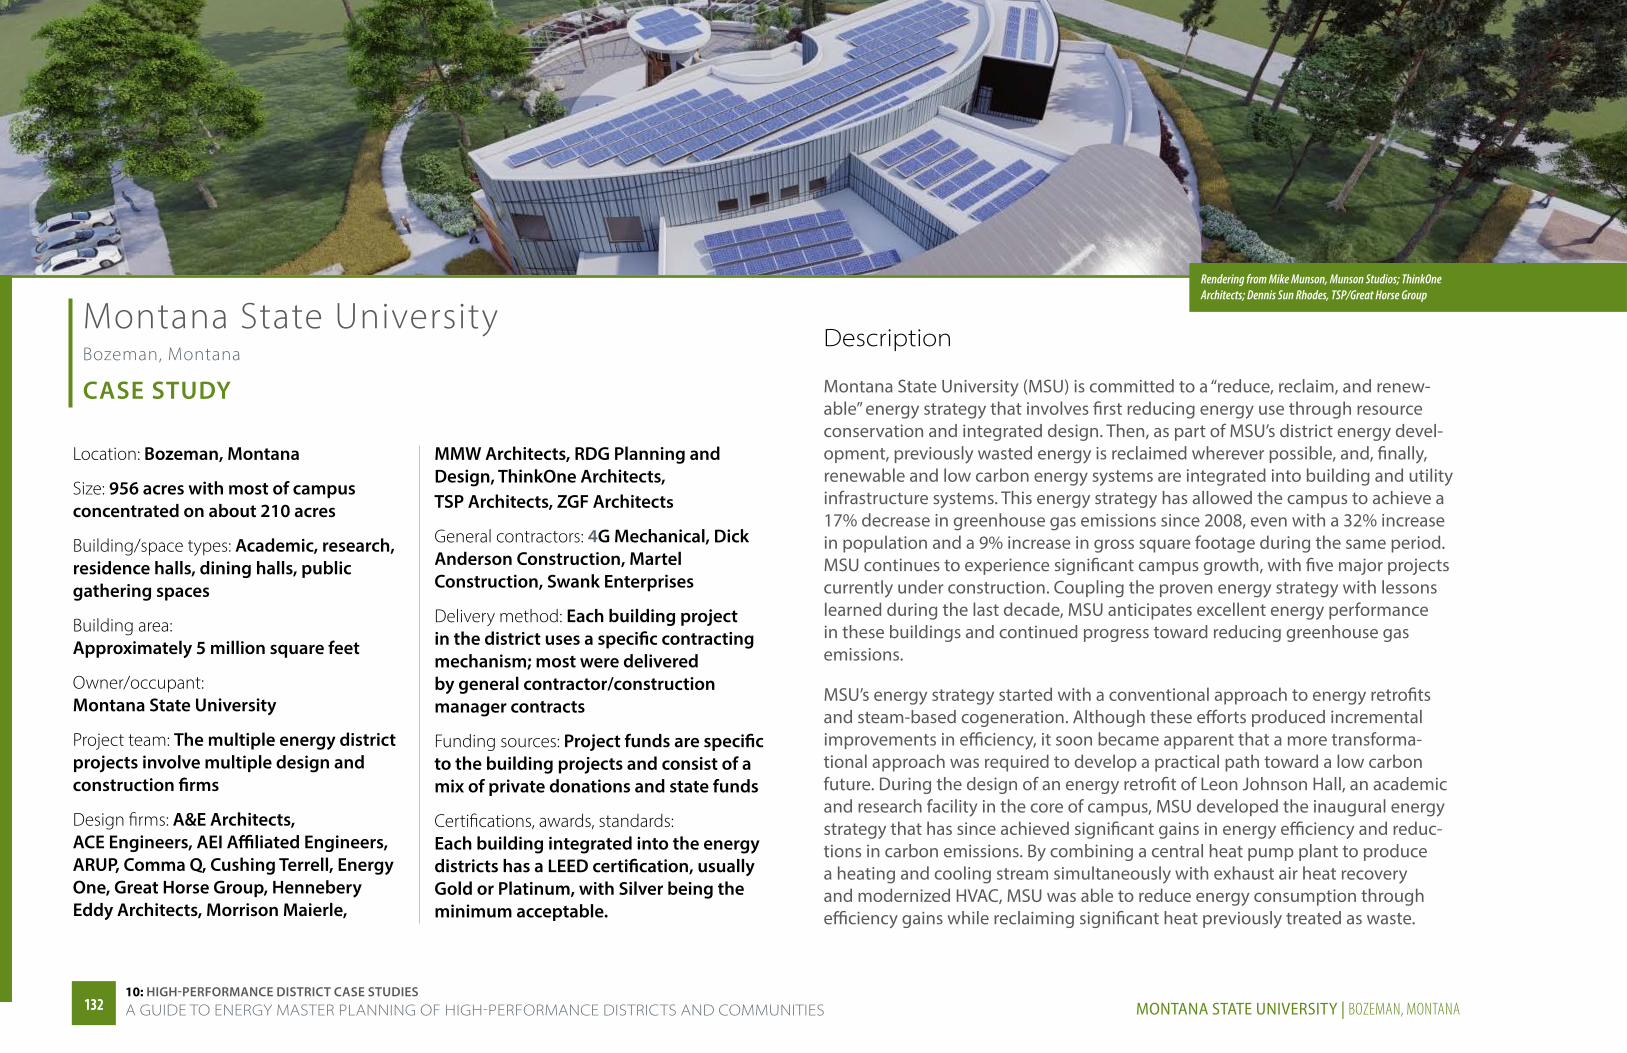
Montana State University Bozeman, Montana
CASE STUDY
Location: Bozeman, Montana
Size: 956 acres with most of campus concentrated on about 210 acres
Building/space types: Academic, research, residence halls, dining halls, public gathering spaces
Building area: Approximately 5 million square feet
Owner/occupant: Montana State University
Project team: The multiple energy district projects involve multiple design and construction firms
Design firms: A&E Architects, ACE Engineers, AEI Affiliated Engineers, ARUP, Comma Q, Cushing Terrell, Energy One, Great Horse Group, Hennebery Eddy Architects, Morrison Maierle,
MMW Architects, RDG Planning and Design, ThinkOne Architects, TSP Architects, ZGF Architects
General contractors: 4G Mechanical, Dick Anderson Construction, Martel Construction, Swank Enterprises
Delivery method: Each building project in the district uses a specific contracting mechanism; most were delivered by general contractor/construction manager contracts
Funding sources: Project funds are specific to the building projects and consist of a mix of private donations and state funds
Certifications, awards, standards: Each building integrated into the energy districts has a LEED certification, usually Gold or Platinum, with Silver being the minimum acceptable.
Description
Montana State University (MSU) is committed to a “reduce, reclaim, and renew-able” energy strategy that involves first reducing energy use through resource conservation and integrated design. Then, as part of MSU’s district energy devel-opment, previously wasted energy is reclaimed wherever possible, and, finally, renewable and low carbon energy systems are integrated into building and utility infrastructure systems. This energy strategy has allowed the campus to achieve a 17% decrease in greenhouse gas emissions since 2008, even with a 32% increase in population and a 9% increase in gross square footage during the same period. MSU continues to experience significant campus growth, with five major projects currently under construction. Coupling the proven energy strategy with lessons learned during the last decade, MSU anticipates excellent energy performance in these buildings and continued progress toward reducing greenhouse gas emissions.
MSU’s energy strategy started with a conventional approach to energy retrofits and steam-based cogeneration. Although these efforts produced incremental improvements in efficiency, it soon became apparent that a more transforma-tional approach was required to develop a practical path toward a low carbon future. During the design of an energy retrofit of Leon Johnson Hall, an academic and research facility in the core of campus, MSU developed the inaugural energy strategy that has since achieved significant gains in energy efficiency and reduc-tions in carbon emissions. By combining a central heat pump plant to produce a heating and cooling stream simultaneously with exhaust air heat recovery and modernized HVAC, MSU was able to reduce energy consumption through efficiency gains while reclaiming significant heat previously treated as waste.
Rendering from Mike Munson, Munson Studios; ThinkOne Architects; Dennis Sun Rhodes, TSP/Great Horse Group
13213210: HIGH-PERFORMANCE DISTRICT CASE STUDIESA GUIDE TO ENERGY MASTER PLANNING OF HIGH-PERFORMANCE DISTRICTS AND COMMUNITIES MONTANA STATE UNIVERSITY | BOZEMAN, MONTANA
Finally, geothermal assets were added to the plant in a later phase.
MSU’s commitment to reducing energy use and carbon emissions got a boost in 2011 when Jake Jabs, an MSU alumni, made a substantial donation to finance a new building, Jabs Hall. The donation opened the possibility of expanding the heating and cooling system of Leon Johnson Hall as part of its retrofit.
By making the Leon Johnson central heat pump plant big enough to serve multiple buildings, MSU could taking advantage of the benefits of sharing one system rather than having separate HVAC equipment in each building. In addition to itself, the Leon Johnson plant now supplies three other buildings with a combina-tion of heating and/or chilled water for use by various heating and cooling systems. From 2007 to 2017, there was a 40% drop in the measured energy use intensity in these buildings, resulting in annual savings of roughly $130,000.
Since Jabs Hall was completed in 2015, the use of low temperature water systems in combination with heat pump technology has become a cornerstone of MSU’s mission to achieve very low energy and carbon inten-sity. Among other projects, the new Norm Asbjornson Hall and American Indian Hall as well as the renovated Romney Hall all incorporate heat pump technology integrated with geothermal resources as well as active and passive solar strategies.
The basic principles of Norm Asbjornson Hall’s heating and cooling system are similar to those pioneered in the Leon Johnson energy district, with the addition of unglazed transpired solar collectors that cover much of the south face of the building and cutting edge envelope technology including thermochromic glazing
1 www.montana.edu/news/mountainsandminds/18845/reinventing-energy2 www.montana.edu/news/19588/3 www.hpbmagazine.org/montana-state-university/
on the southern exposures. This building also includes a 216 kW rooftop solar photovoltaic array and a distrib-uted heat pump system with 70 smaller units, each serving a room or hallway. These design concepts have already informed MSU’s next buildings—the renovation of Romney Hall and the construction of American Indian Hall.
The new Norm Asbjornson Hall, the renovation of Romney Hall, and the reconstruction—after part of the roof collapsed during a historic snowstorm—of the Marga Hosaeus Fitness Center are included in the initial plan for a second energy district at MSU. This South Campus energy district concept was developed using lessons learned from the Leon Johnson energy plant. Unlike the Leon Johnson energy plant, this future energy district will more closely follow a distributed heat pump model; buildings will be connected for energy sharing using a low temperature heat pump loop.
Project status (as of October 2020)
The South Campus energy district continues to make progress with the addition of eighty-eight 700 foot deep geothermal bores in fall 2020, for a total of nearly 200 bores and more than 40 miles of installed vertical heat exchanger. American Indian Hall and Romney Hall are under construction with completion anticipated in 2021 and 2022 respectively.
Key energy opportunities• Minimization or elimination of the direct use of
fossil fuels• Integrated design to achieve building energy goals• Innovative site and building integrated
photovoltaics
• Low energy ventilation strategies using unglazed transpired solar air collectors
• The use of modestly-sized geothermal assets for district level use.
Innovative strategies• Buildings as energy producers and shared energy
resources• Campus-level low carbon energy district planning
and development• Retirement of high levels of deferred maintenance
while achieving very high energy performance• Reduce, reclaim, renewable strategy that couples the
conventional with the transformational• A road map to carbon neutrality for northern climate
campuses• Unique application of unglazed transpired solar
collectors • Use of thermochromic glazing to optimize solar gain.
Links to additional materials
Case studies• Mountains and Minds, “Reinventing energy”1 • MSU News, “New geothermal system for Romney
Hall to be one of MSU's biggest energy conservation projects”2
• High Performing Buildings, “Montana State University (MSU) Campus, Bozeman, Montana”3
13313310: HIGH-PERFORMANCE DISTRICT CASE STUDIES
A gUiDe TO energy mASTer PlAnning OF HigH-PerFOrmAnCe DiSTriCTS AnD COmmUniTieSMONTANA STATE UNIVERSITY | BOZEMAN, MONTANA

National Western Center Denver, Colorado
CASE STUDY
Rendering from Mayor’s Office of the National Western Center
Location: Denver, Colorado
Size: 250 acres
Building/space types: Event centers, arenas, office, education
Building area: 2.8 million square feet
Energy project team: EAS Energy Partners, led by Enwave, a global district energy leader, and including AECOM Technical Services and Saunders Construction
Description
1 milehighcre.com/national-western-center-to-source-recycled-thermal-energy-to-meet-clean-energy-goals/
The National Western Center (NWC) is located on the historic grounds of the Denver Union Stock Yard Company, which currently hosts the annual National Western Stock Show. The redevelopment project is a partnership between the City and County of Denver, the National Western Center Authority, the Western Stock Show Association, and Colorado State University, and will transform the area, doubling its footprint, with the goal of creating a sustain-able, multipurpose campus that attracts visitors year-round. The project is aiming for a zero energy campus to include energy-efficient buildings and the development of on-site renewable resources by 5 years after full build-out.
In August 2020, the NWC entered into an agree-ment with EAS Energy Partners, led by Enwave and including AECOM Technical Services and Saunders Construction, to develop an innovative, technically and financially feasible campus-wide energy system. An underground sewer pipeline will provide recycled thermal energy, and, when complete, the 3.8 MW system will be the largest sewer heat recovery system in North America. The system is expected to meet nearly 90% of campus heating and cooling loads.1
13413410: HIGH-PERFORMANCE DISTRICT CASE STUDIESA GUIDE TO ENERGY MASTER PLANNING OF HIGH-PERFORMANCE DISTRICTS AND COMMUNITIES NATIONAL WESTERN CENTER | DENVER, COLORADO
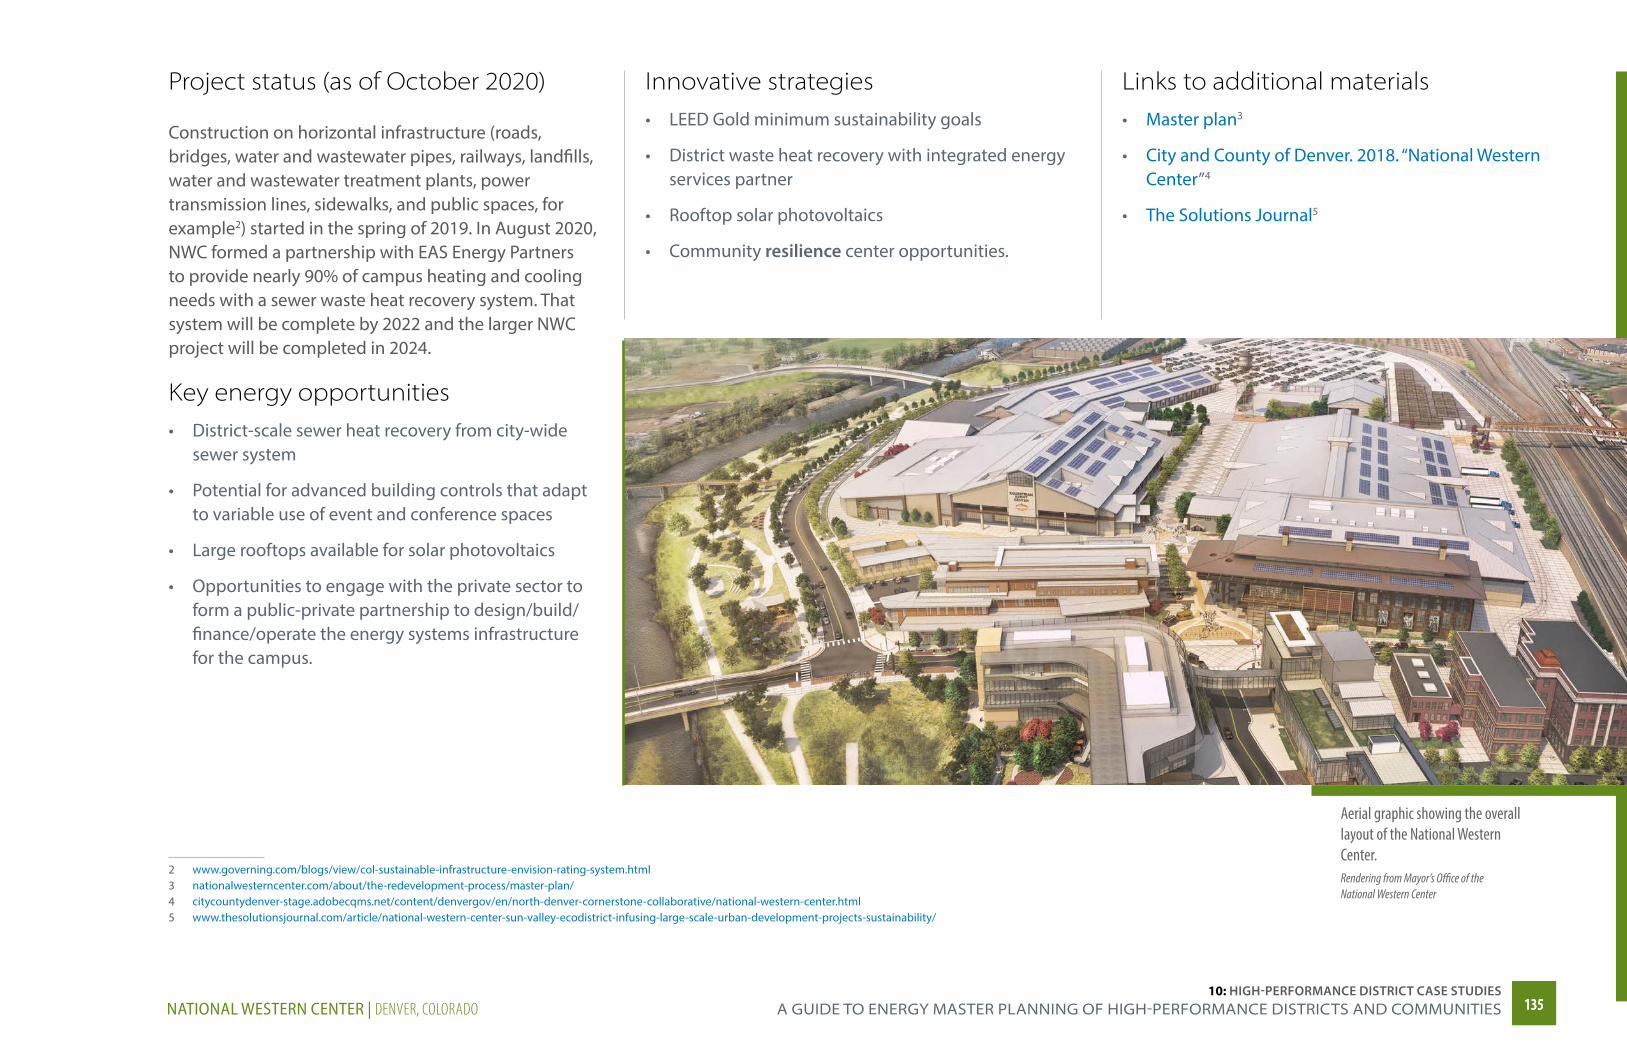
Rendering from Mayor’s Office of the National Western Center
Project status (as of October 2020)
Construction on horizontal infrastructure (roads, bridges, water and wastewater pipes, railways, landfills, water and wastewater treatment plants, power transmission lines, sidewalks, and public spaces, for example2) started in the spring of 2019. In August 2020, NWC formed a partnership with EAS Energy Partners to provide nearly 90% of campus heating and cooling needs with a sewer waste heat recovery system. That system will be complete by 2022 and the larger NWC project will be completed in 2024.
Key energy opportunities• District-scale sewer heat recovery from city-wide
sewer system
• Potential for advanced building controls that adapt to variable use of event and conference spaces
• Large rooftops available for solar photovoltaics
• Opportunities to engage with the private sector to form a public-private partnership to design/build/finance/operate the energy systems infrastructure for the campus.
2 www.governing.com/blogs/view/col-sustainable-infrastructure-envision-rating-system.html3 nationalwesterncenter.com/about/the-redevelopment-process/master-plan/4 citycountydenver-stage.adobecqms.net/content/denvergov/en/north-denver-cornerstone-collaborative/national-western-center.html 5 www.thesolutionsjournal.com/article/national-western-center-sun-valley-ecodistrict-infusing-large-scale-urban-development-projects-sustainability/
Innovative strategies• LEED Gold minimum sustainability goals
• District waste heat recovery with integrated energy services partner
• Rooftop solar photovoltaics
• Community resilience center opportunities.
Links to additional materials• Master plan3
• City and County of Denver. 2018. “National Western Center”4
• The Solutions Journal5
Aerial graphic showing the overall layout of the National Western Center.Rendering from Mayor’s Office of the National Western Center
13513510: HIGH-PERFORMANCE DISTRICT CASE STUDIES
A gUiDe TO energy mASTer PlAnning OF HigH-PerFOrmAnCe DiSTriCTS AnD COmmUniTieSNATIONAL WESTERN CENTER | DENVER, COLORADO
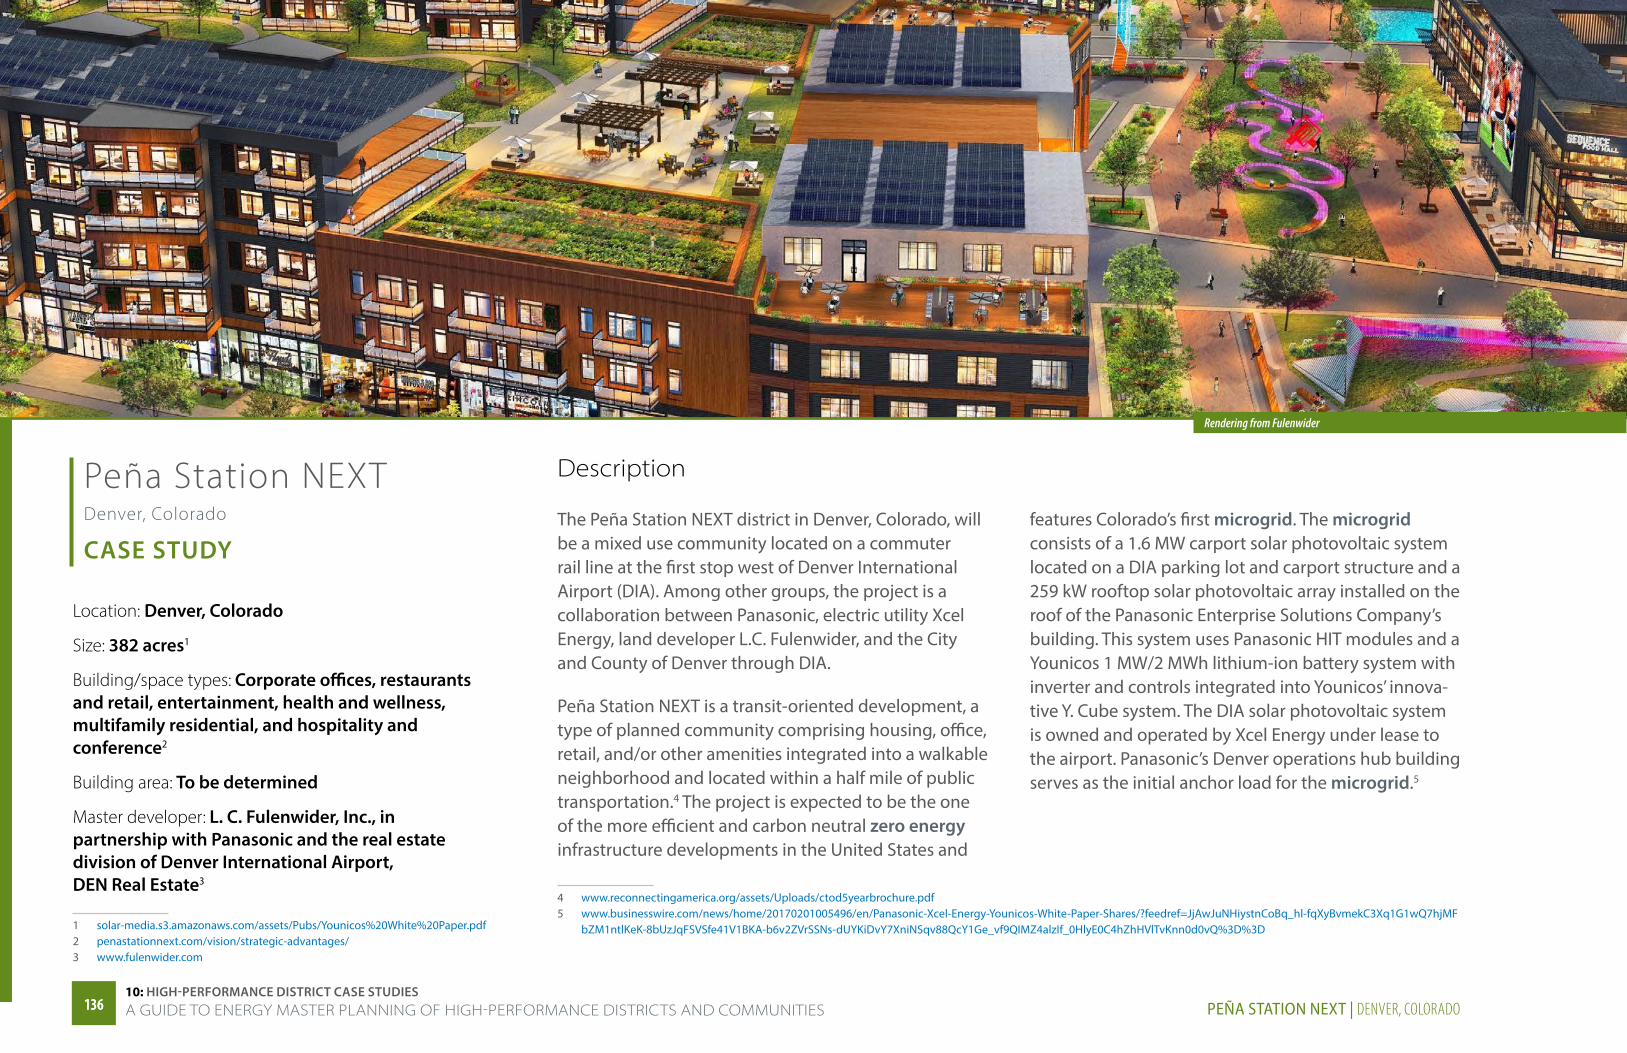
Peña Station NEXT Denver, Colorado
CASE STUDY
Rendering from Fulenwider
1 solar-media.s3.amazonaws.com/assets/Pubs/Younicos%20White%20Paper.pdf2 penastationnext.com/vision/strategic-advantages/3 www.fulenwider.com
Location: Denver, Colorado
Size: 382 acres1
Building/space types: Corporate offices, restaurants and retail, entertainment, health and wellness, multifamily residential, and hospitality and conference2
Building area: To be determined
Master developer: L. C. Fulenwider, Inc., in partnership with Panasonic and the real estate division of Denver International Airport, DEN Real Estate3
Description
4 www.reconnectingamerica.org/assets/Uploads/ctod5yearbrochure.pdf5 www.businesswire.com/news/home/20170201005496/en/Panasonic-Xcel-Energy-Younicos-White-Paper-Shares/?feedref=JjAwJuNHiystnCoBq_hl-fqXyBvmekC3Xq1G1wQ7hjMF
bZM1ntlKeK-8bUzJqFSVSfe41V1BKA-b6v2ZVrSSNs-dUYKiDvY7XniNSqv88QcY1Ge_vf9QIMZ4alzIf_0HlyE0C4hZhHVlTvKnn0d0vQ%3D%3D
The Peña Station NEXT district in Denver, Colorado, will be a mixed use community located on a commuter rail line at the first stop west of Denver International Airport (DIA). Among other groups, the project is a collaboration between Panasonic, electric utility Xcel Energy, land developer L.C. Fulenwider, and the City and County of Denver through DIA.
Peña Station NEXT is a transit-oriented development, a type of planned community comprising housing, office, retail, and/or other amenities integrated into a walkable neighborhood and located within a half mile of public transportation.4 The project is expected to be the one of the more efficient and carbon neutral zero energy infrastructure developments in the United States and
features Colorado’s first microgrid. The microgrid consists of a 1.6 MW carport solar photovoltaic system located on a DIA parking lot and carport structure and a 259 kW rooftop solar photovoltaic array installed on the roof of the Panasonic Enterprise Solutions Company’s building. This system uses Panasonic HIT modules and a Younicos 1 MW/2 MWh lithium-ion battery system with inverter and controls integrated into Younicos’ innova-tive Y. Cube system. The DIA solar photovoltaic system is owned and operated by Xcel Energy under lease to the airport. Panasonic’s Denver operations hub building serves as the initial anchor load for the microgrid.5
13613610: HIGH-PERFORMANCE DISTRICT CASE STUDIESA GUIDE TO ENERGY MASTER PLANNING OF HIGH-PERFORMANCE DISTRICTS AND COMMUNITIES PEÑA STATION NEXT | DENVER, COLORADO

Project status (as of October 2020)
The 112,500-square-foot Panasonic Enterprise Solutions Company facility is the first vertical construction project at Peña Station NEXT. Among other functions, this facility serves as a 24/7 network operations center that monitors a nationwide network of large-scale solar photo-voltaic installations. The site also currently includes a DIA parking lot with shaded parking, a solar photovoltaic installation, and a battery energy storage system.6 The resulting installation can be operated as a microgrid and can provide backup power in emergencies. In August 2020, KDC, which develops corporate build-to-suit campus projects, teamed up with Fulenwider to add 1 million square feet of build-to-suit office.
Key energy opportunities
The microgrid can feed power into the utility grid as well as provide backup power in emergencies.
Innovative strategies• Researchers from NREL are providing technical assistance by
modeling building energy consumption and the dynamic flow of distributed energy resources within the entire district.
� Specifically, NREL researchers are modeling energy consumption in corporate offices, retail spaces, multifamily dwellings, a hotel, parking, and street lighting.
� The data will be integrated into Xcel Energy’s grid distribution modeling tools to help the utility analyze rate and payment structures.7
6 www.xcelenergy.com/staticfiles/xe-responsive/Energy%20Portfolio/CO-Panasonic-Pictorial-Sheet.pdf7 microgridknowledge.com/pena-station-next/8 microgridknowledge.com/pena-station-next/ 9 solar-media.s3.amazonaws.com/assets/Pubs/Younicos%20White%20Paper.pdf10 business.flydenver.com/bizops/documents/PSN_DesignStandardsGuidelines.pdf11 microgridknowledge.com/pena-station-next/12 aip.scitation.org/doi/full/10.1063/1.509391713 www.nrel.gov/docs/fy17osti/68998.pdf
• Participants are exploring the possibility of having the entire community be a large, islandable microgrid.8
Links to additional materials• Case study Microgrid9
• Master plan10
• Energy planning analysis
� Denver’s Peña Station NEXT: This Way to Energy Utopia?11
� Journal of Renewable and Sustain-able Energy, “Toward a subhourly net zero energy district design through integrated building and distribution system modeling.”12
� NREL + PANASONIC: Developing a Zero Energy, Transit-Oriented Campus in Denver, Colorado.13
The Peña Station development will be a walkable community.Rendering from Fulenwider
13713710: HIGH-PERFORMANCE DISTRICT CASE STUDIES
A gUiDe TO energy mASTer PlAnning OF HigH-PerFOrmAnCe DiSTriCTS AnD COmmUniTieSPEÑA STATION NEXT | DENVER, COLORADO
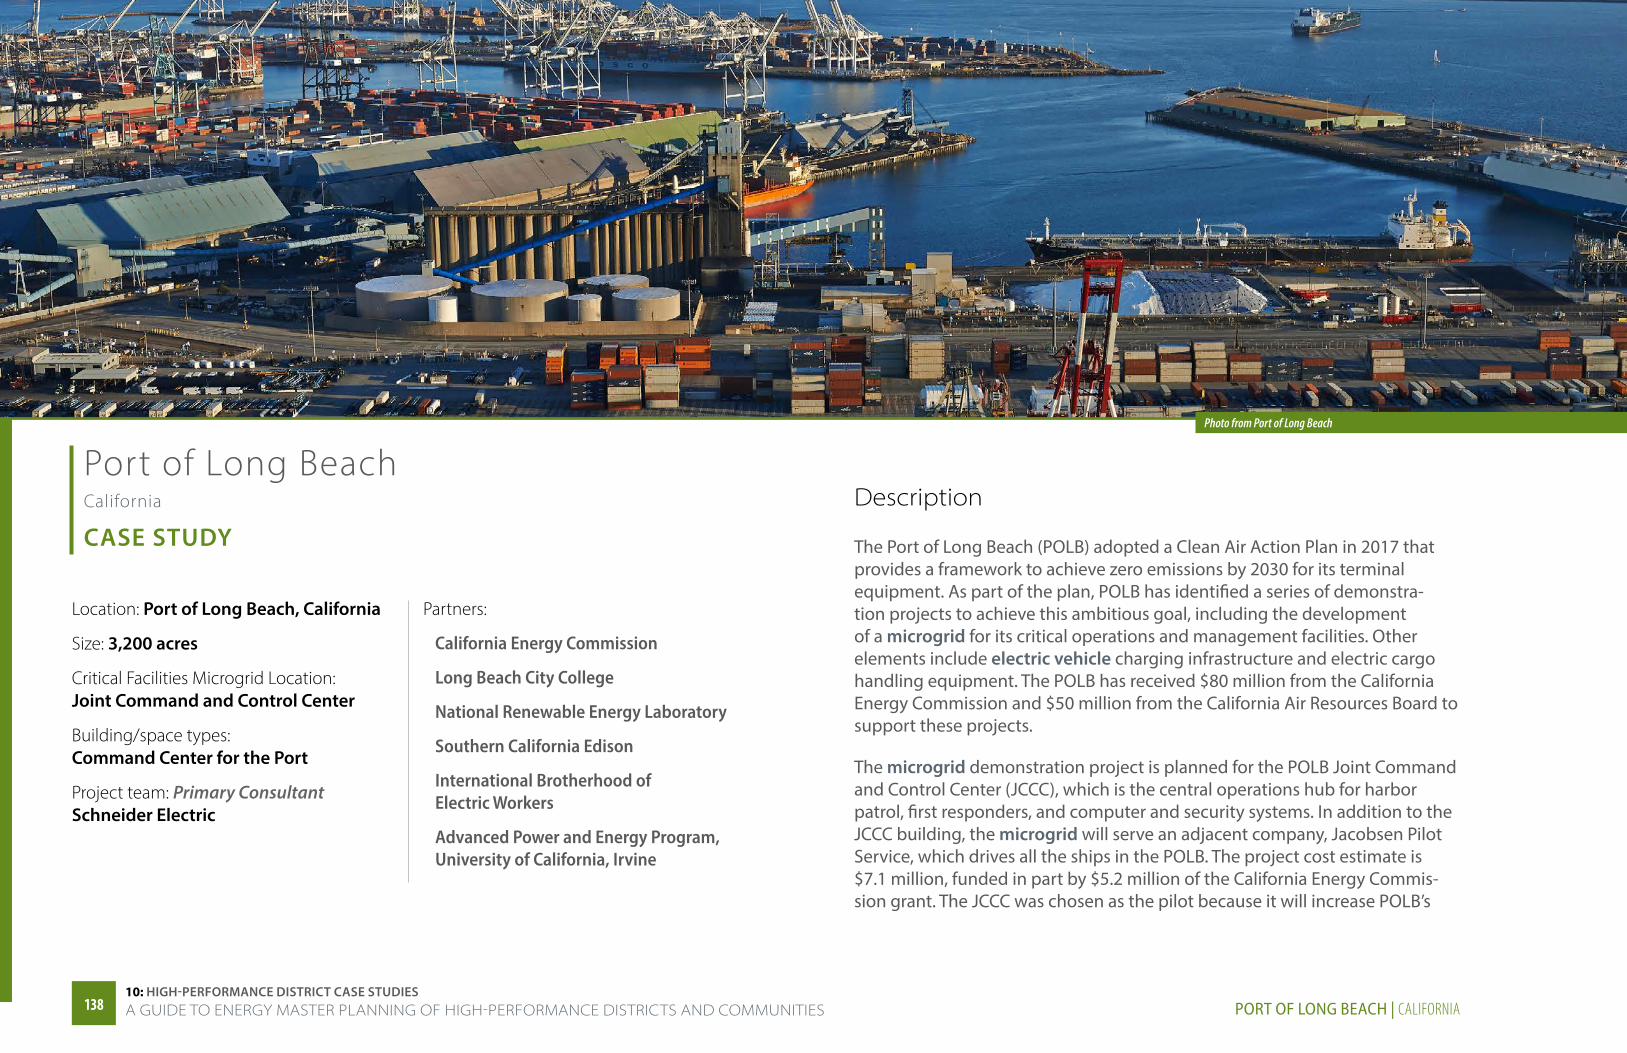
Port of Long Beach California
CASE STUDY
Location: Port of Long Beach, California
Size: 3,200 acres
Critical Facilities Microgrid Location: Joint Command and Control Center
Building/space types: Command Center for the Port
Project team: Primary Consultant Schneider Electric
Partners:
California Energy Commission
Long Beach City College
National Renewable Energy Laboratory
Southern California Edison
International Brotherhood of Electric Workers
Advanced Power and Energy Program, University of California, Irvine
Description
The Port of Long Beach (POLB) adopted a Clean Air Action Plan in 2017 that provides a framework to achieve zero emissions by 2030 for its terminal equipment. As part of the plan, POLB has identified a series of demonstra-tion projects to achieve this ambitious goal, including the development of a microgrid for its critical operations and management facilities. Other elements include electric vehicle charging infrastructure and electric cargo handling equipment. The POLB has received $80 million from the California Energy Commission and $50 million from the California Air Resources Board to support these projects.
The microgrid demonstration project is planned for the POLB Joint Command and Control Center (JCCC), which is the central operations hub for harbor patrol, first responders, and computer and security systems. In addition to the JCCC building, the microgrid will serve an adjacent company, Jacobsen Pilot Service, which drives all the ships in the POLB. The project cost estimate is $7.1 million, funded in part by $5.2 million of the California Energy Commis-sion grant. The JCCC was chosen as the pilot because it will increase POLB’s
Photo from Port of Long Beach
13813810: HIGH-PERFORMANCE DISTRICT CASE STUDIESA GUIDE TO ENERGY MASTER PLANNING OF HIGH-PERFORMANCE DISTRICTS AND COMMUNITIES PORT OF LONG BEACH | CALIFORNIA
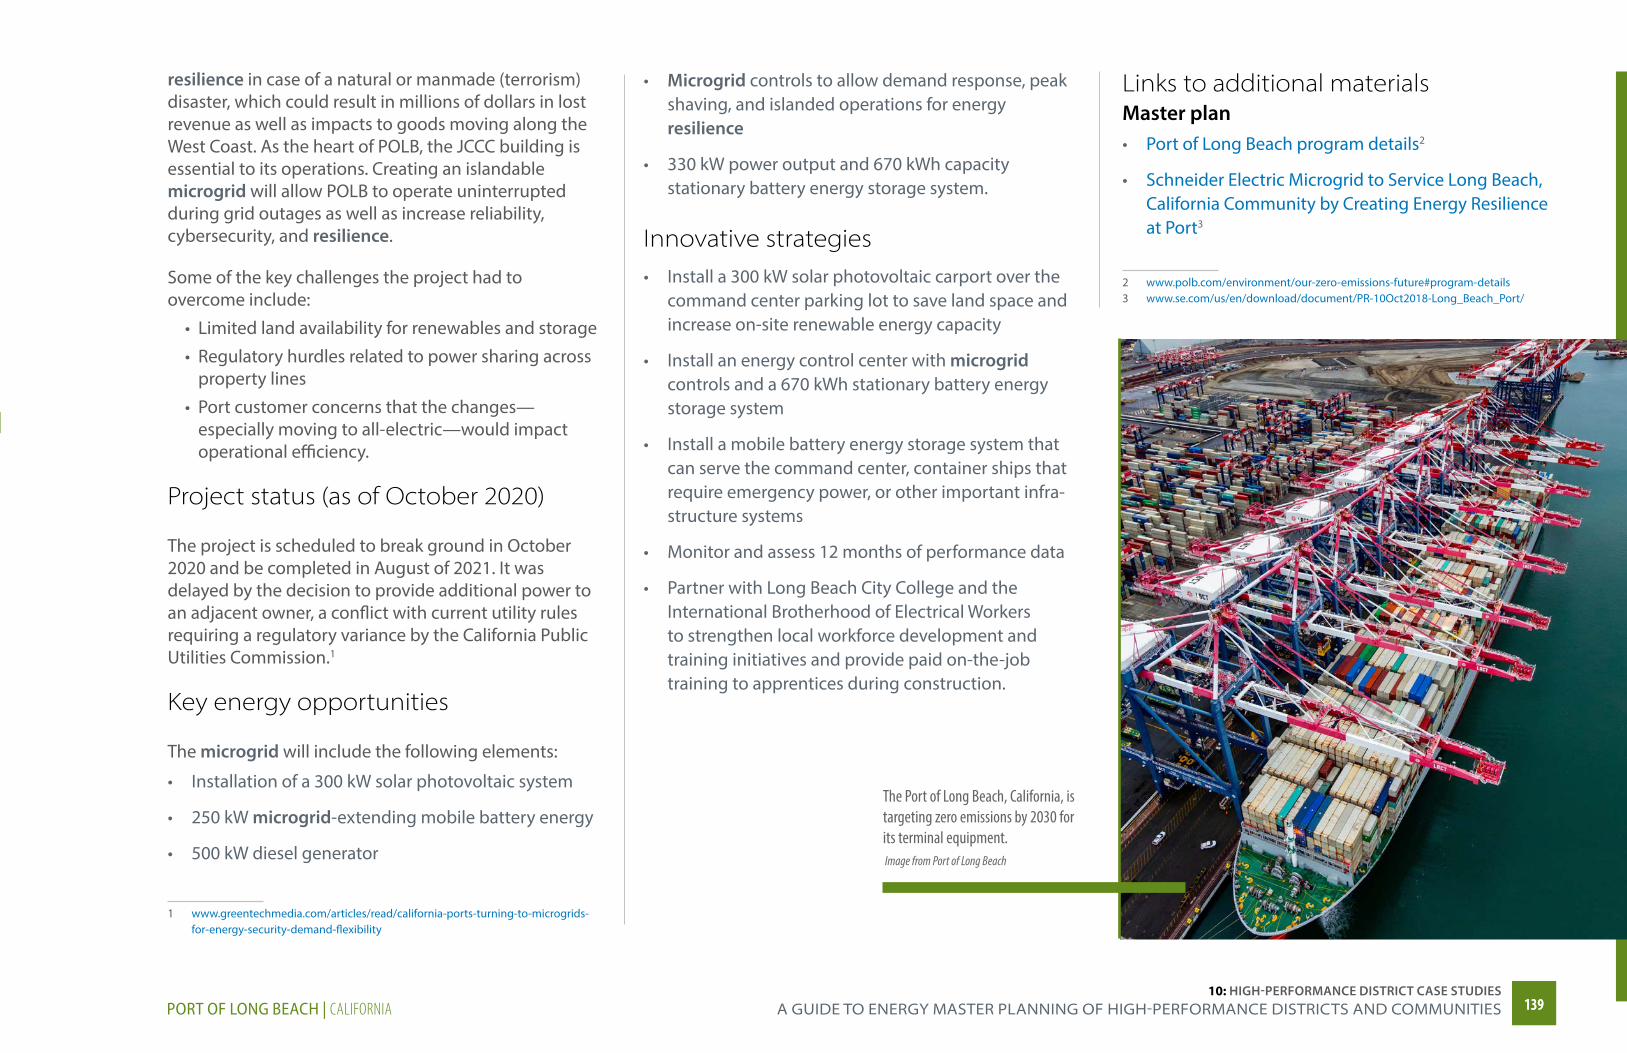
resilience in case of a natural or manmade (terrorism) disaster, which could result in millions of dollars in lost revenue as well as impacts to goods moving along the West Coast. As the heart of POLB, the JCCC building is essential to its operations. Creating an islandable microgrid will allow POLB to operate uninterrupted during grid outages as well as increase reliability, cybersecurity, and resilience.
Some of the key challenges the project had to overcome include:
• Limited land availability for renewables and storage
• Regulatory hurdles related to power sharing across property lines
• Port customer concerns that the changes—especially moving to all-electric—would impact operational efficiency.
Project status (as of October 2020)
The project is scheduled to break ground in October 2020 and be completed in August of 2021. It was delayed by the decision to provide additional power to an adjacent owner, a conflict with current utility rules requiring a regulatory variance by the California Public Utilities Commission.1
Key energy opportunities
The microgrid will include the following elements:
• Installation of a 300 kW solar photovoltaic system
• 250 kW microgrid-extending mobile battery energy
• 500 kW diesel generator
1 www.greentechmedia.com/articles/read/california-ports-turning-to-microgrids-for-energy-security-demand-flexibility
The Port of Long Beach, California, is targeting zero emissions by 2030 for its terminal equipment. Image from Port of Long Beach
• Microgrid controls to allow demand response, peak shaving, and islanded operations for energy resilience
• 330 kW power output and 670 kWh capacity stationary battery energy storage system.
Innovative strategies• Install a 300 kW solar photovoltaic carport over the
command center parking lot to save land space and increase on-site renewable energy capacity
• Install an energy control center with microgrid controls and a 670 kWh stationary battery energy storage system
• Install a mobile battery energy storage system that can serve the command center, container ships that require emergency power, or other important infra-structure systems
• Monitor and assess 12 months of performance data
• Partner with Long Beach City College and the International Brotherhood of Electrical Workers to strengthen local workforce development and training initiatives and provide paid on-the-job training to apprentices during construction.
Links to additional materialsMaster plan• Port of Long Beach program details2
• Schneider Electric Microgrid to Service Long Beach, California Community by Creating Energy Resilience at Port3
2 www.polb.com/environment/our-zero-emissions-future#program-details3 www.se.com/us/en/download/document/PR-10Oct2018-Long_Beach_Port/
13913910: HIGH-PERFORMANCE DISTRICT CASE STUDIES
A gUiDe TO energy mASTer PlAnning OF HigH-PerFOrmAnCe DiSTriCTS AnD COmmUniTieSPORT OF LONG BEACH | CALIFORNIA
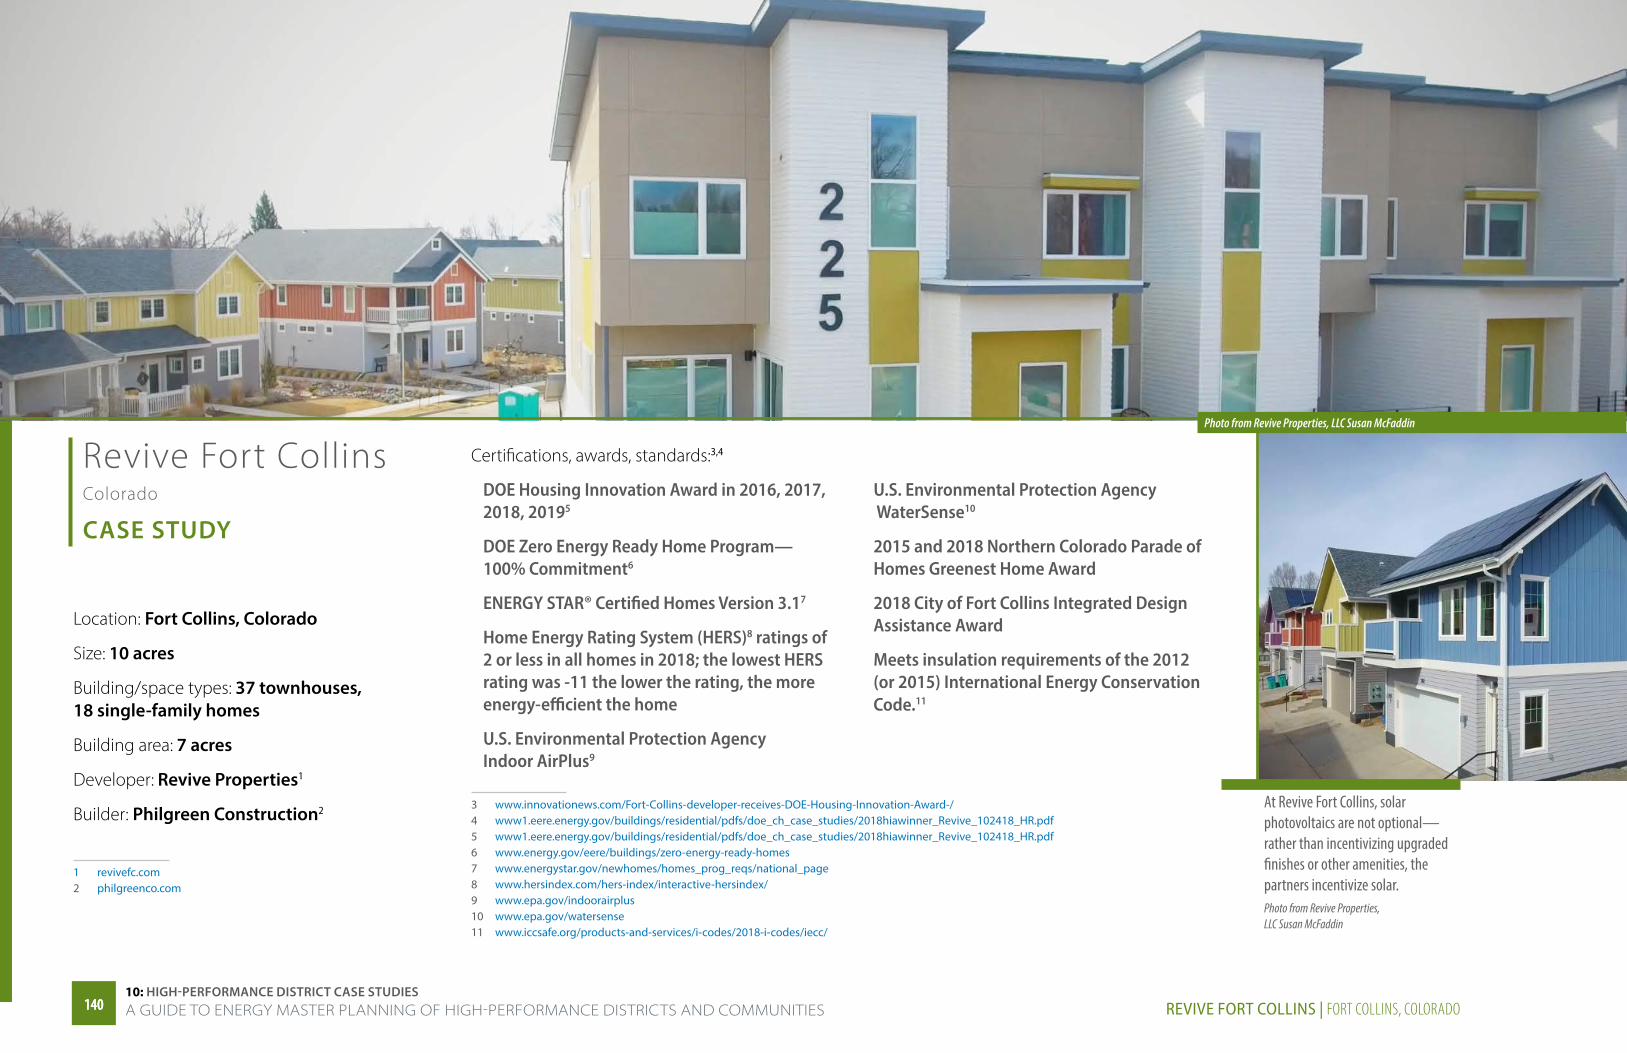
Revive Fort Collins Colorado
CASE STUDY
Location: Fort Collins, Colorado
Size: 10 acres
Building/space types: 37 townhouses, 18 single-family homes
Building area: 7 acres
Developer: Revive Properties1
Builder: Philgreen Construction2
1 revivefc.com2 philgreenco.com
Certifications, awards, standards:3,4
3 www.innovationews.com/Fort-Collins-developer-receives-DOE-Housing-Innovation-Award-/4 www1.eere.energy.gov/buildings/residential/pdfs/doe_ch_case_studies/2018hiawinner_Revive_102418_HR.pdf5 www1.eere.energy.gov/buildings/residential/pdfs/doe_ch_case_studies/2018hiawinner_Revive_102418_HR.pdf6 www.energy.gov/eere/buildings/zero-energy-ready-homes7 www.energystar.gov/newhomes/homes_prog_reqs/national_page8 www.hersindex.com/hers-index/interactive-hersindex/9 www.epa.gov/indoorairplus10 www.epa.gov/watersense 11 www.iccsafe.org/products-and-services/i-codes/2018-i-codes/iecc/
DOE Housing Innovation Award in 2016, 2017, 2018, 20195
DOE Zero Energy Ready Home Program— 100% Commitment6
ENERGY STAR® Certified Homes Version 3.17
Home Energy Rating System (HERS)8 ratings of 2 or less in all homes in 2018; the lowest HERS rating was -11 the lower the rating, the more energy-efficient the home
U.S. Environmental Protection Agency Indoor AirPlus9
U.S. Environmental Protection Agency WaterSense10
2015 and 2018 Northern Colorado Parade of Homes Greenest Home Award
2018 City of Fort Collins Integrated Design Assistance Award
Meets insulation requirements of the 2012 (or 2015) International Energy Conservation Code.11
At Revive Fort Collins, solar photovoltaics are not optional—rather than incentivizing upgraded finishes or other amenities, the partners incentivize solar.Photo from Revive Properties, LLC Susan McFaddin
Photo from Revive Properties, LLC Susan McFaddin
14014010: HIGH-PERFORMANCE DISTRICT CASE STUDIESA GUIDE TO ENERGY MASTER PLANNING OF HIGH-PERFORMANCE DISTRICTS AND COMMUNITIES REVIVE FORT COLLINS | FORT COLLINS, COLORADO
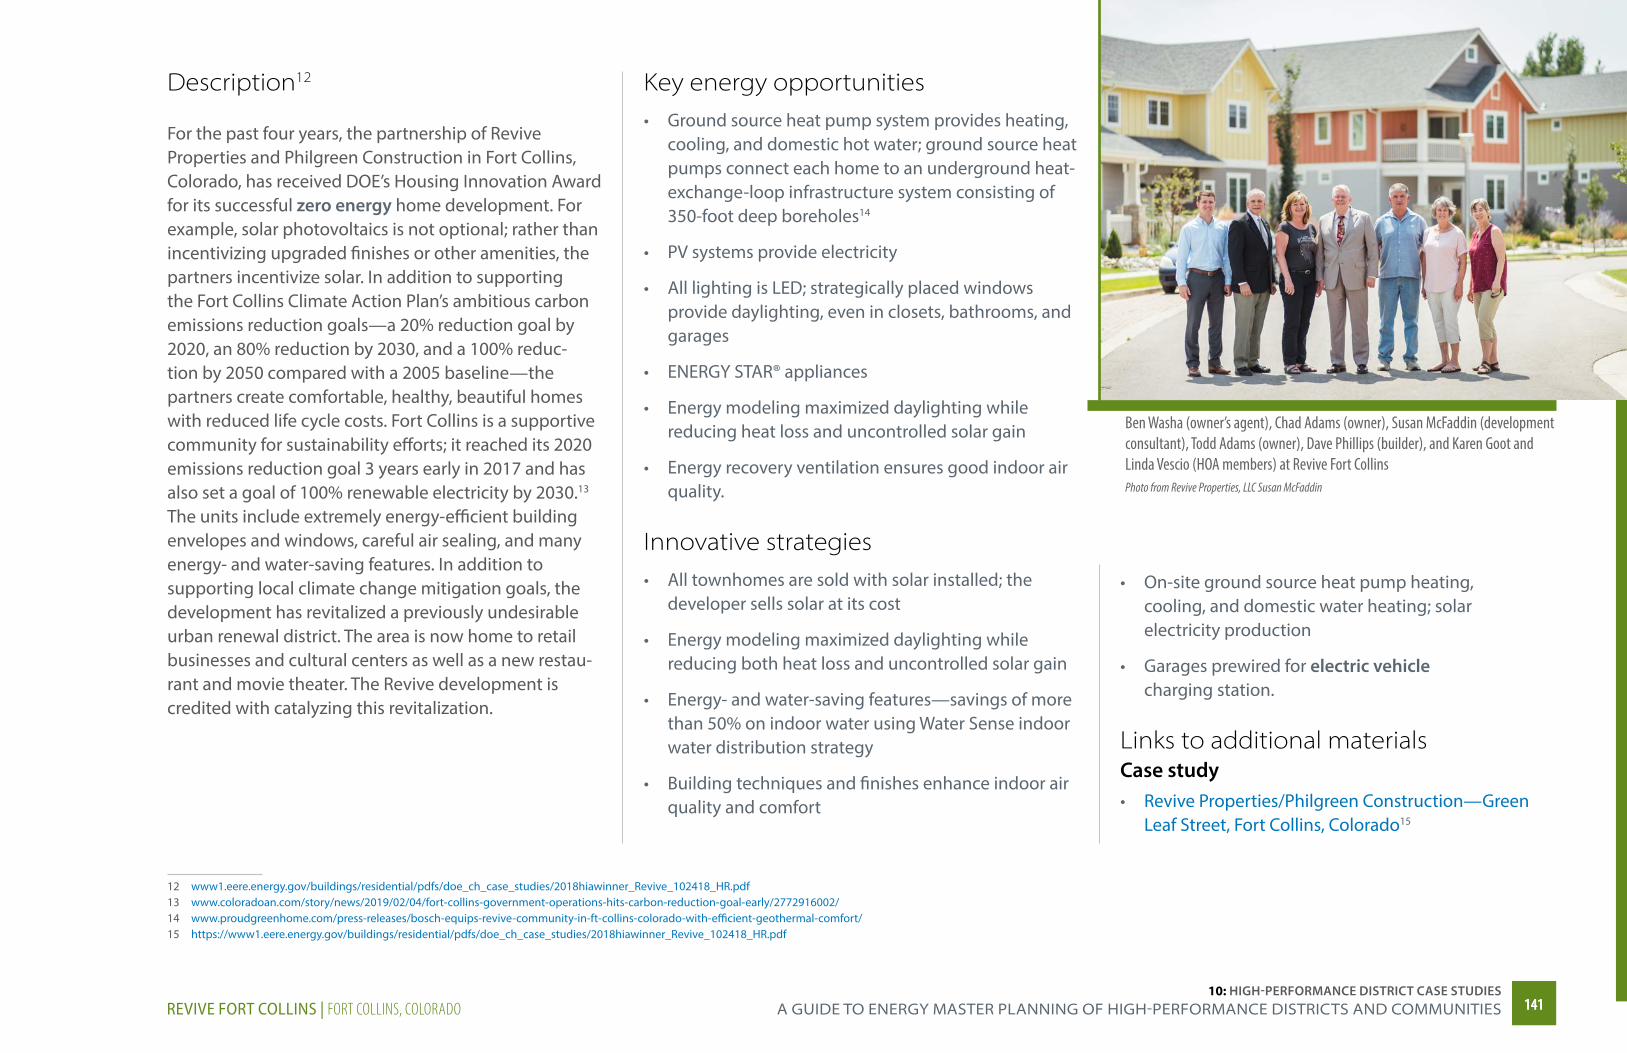
Description12
For the past four years, the partnership of Revive Properties and Philgreen Construction in Fort Collins, Colorado, has received DOE’s Housing Innovation Award for its successful zero energy home development. For example, solar photovoltaics is not optional; rather than incentivizing upgraded finishes or other amenities, the partners incentivize solar. In addition to supporting the Fort Collins Climate Action Plan’s ambitious carbon emissions reduction goals—a 20% reduction goal by 2020, an 80% reduction by 2030, and a 100% reduc-tion by 2050 compared with a 2005 baseline—the partners create comfortable, healthy, beautiful homes with reduced life cycle costs. Fort Collins is a supportive community for sustainability efforts; it reached its 2020 emissions reduction goal 3 years early in 2017 and has also set a goal of 100% renewable electricity by 2030.13 The units include extremely energy-efficient building envelopes and windows, careful air sealing, and many energy- and water-saving features. In addition to supporting local climate change mitigation goals, the development has revitalized a previously undesirable urban renewal district. The area is now home to retail businesses and cultural centers as well as a new restau-rant and movie theater. The Revive development is credited with catalyzing this revitalization.
12 www1.eere.energy.gov/buildings/residential/pdfs/doe_ch_case_studies/2018hiawinner_Revive_102418_HR.pdf13 www.coloradoan.com/story/news/2019/02/04/fort-collins-government-operations-hits-carbon-reduction-goal-early/2772916002/14 www.proudgreenhome.com/press-releases/bosch-equips-revive-community-in-ft-collins-colorado-with-efficient-geothermal-comfort/15 https://www1.eere.energy.gov/buildings/residential/pdfs/doe_ch_case_studies/2018hiawinner_Revive_102418_HR.pdf
Key energy opportunities• Ground source heat pump system provides heating,
cooling, and domestic hot water; ground source heat pumps connect each home to an underground heat-exchange-loop infrastructure system consisting of 350-foot deep boreholes14
• PV systems provide electricity
• All lighting is LED; strategically placed windows provide daylighting, even in closets, bathrooms, and garages
• ENERGY STAR® appliances
• Energy modeling maximized daylighting while reducing heat loss and uncontrolled solar gain
• Energy recovery ventilation ensures good indoor air quality.
Innovative strategies• All townhomes are sold with solar installed; the
developer sells solar at its cost
• Energy modeling maximized daylighting while reducing both heat loss and uncontrolled solar gain
• Energy- and water-saving features—savings of more than 50% on indoor water using Water Sense indoor water distribution strategy
• Building techniques and finishes enhance indoor air quality and comfort
• On-site ground source heat pump heating, cooling, and domestic water heating; solar electricity production
• Garages prewired for electric vehicle charging station.
Links to additional materialsCase study• Revive Properties/Philgreen Construction—Green
Leaf Street, Fort Collins, Colorado15
Ben Washa (owner’s agent), Chad Adams (owner), Susan McFaddin (development consultant), Todd Adams (owner), Dave Phillips (builder), and Karen Goot and Linda Vescio (HOA members) at Revive Fort CollinsPhoto from Revive Properties, LLC Susan McFaddin
14114110: HIGH-PERFORMANCE DISTRICT CASE STUDIES
A gUiDe TO energy mASTer PlAnning OF HigH-PerFOrmAnCe DiSTriCTS AnD COmmUniTieSREVIVE FORT COLLINS | FORT COLLINS, COLORADO
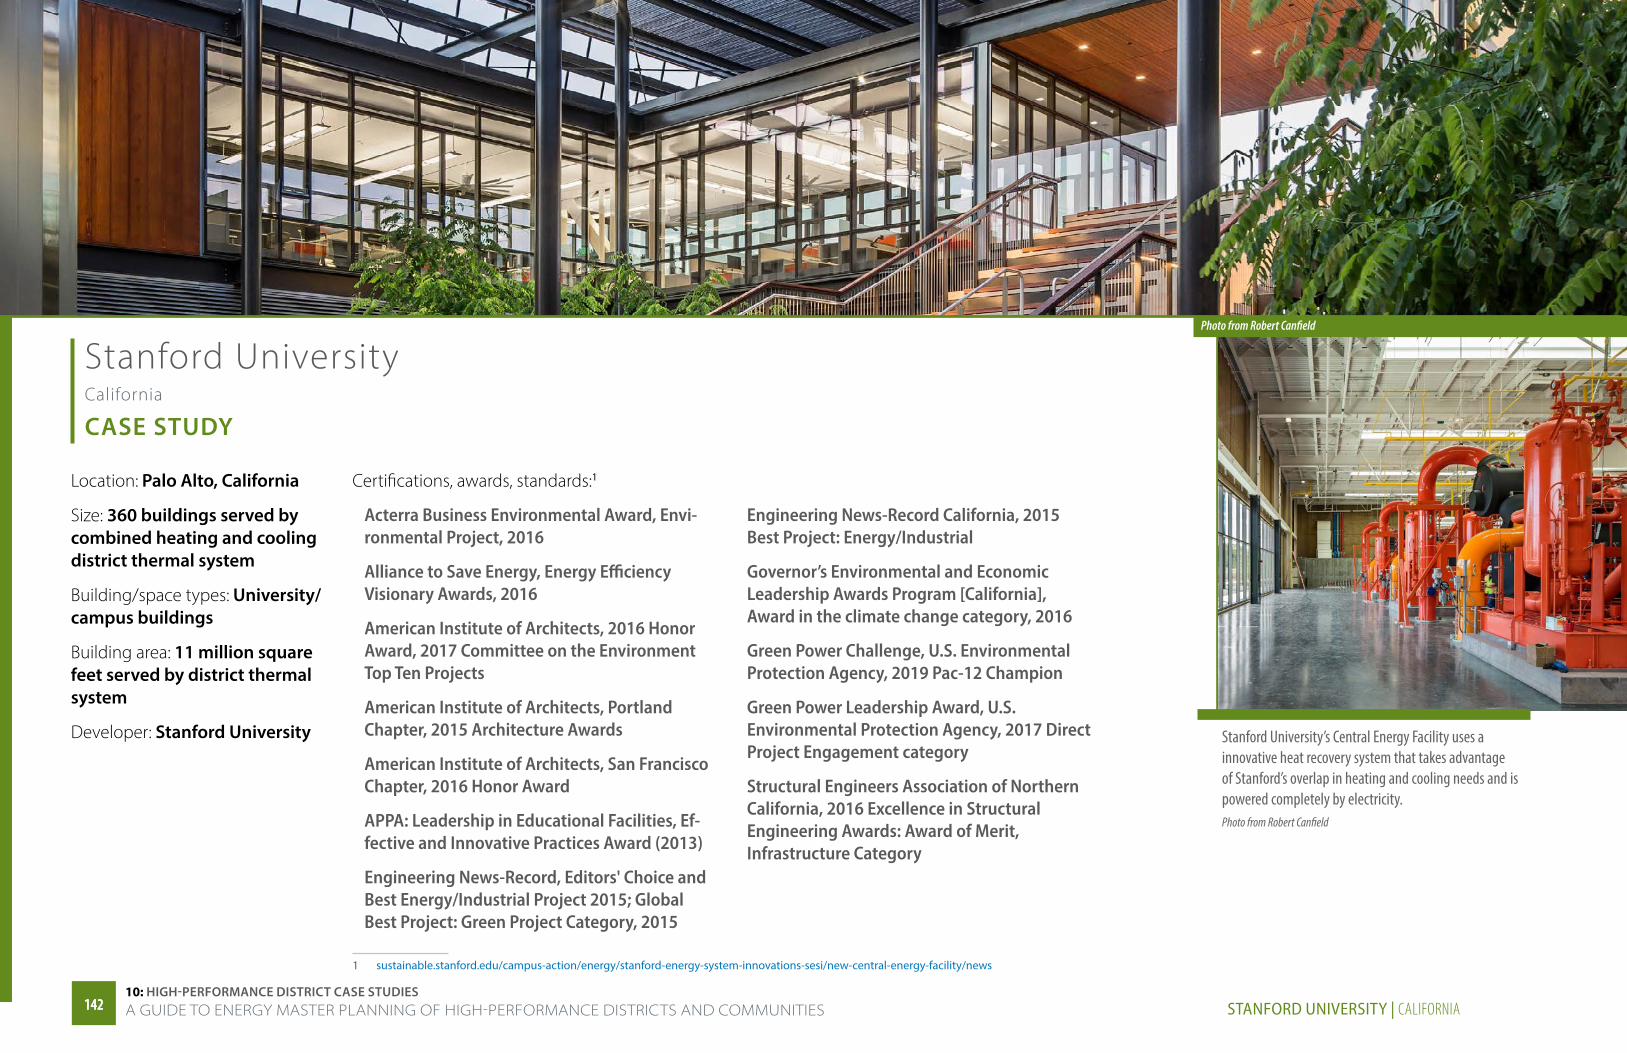
Photo from Robert Canfield
Stanford University California
CASE STUDY
Location: Palo Alto, California
Size: 360 buildings served by combined heating and cooling district thermal system
Building/space types: University/campus buildings
Building area: 11 million square feet served by district thermal system
Developer: Stanford University
Certifications, awards, standards:1
1 sustainable.stanford.edu/campus-action/energy/stanford-energy-system-innovations-sesi/new-central-energy-facility/news
Acterra Business Environmental Award, Envi-ronmental Project, 2016
Alliance to Save Energy, Energy Efficiency Visionary Awards, 2016
American Institute of Architects, 2016 Honor Award, 2017 Committee on the Environment Top Ten Projects
American Institute of Architects, Portland Chapter, 2015 Architecture Awards
American Institute of Architects, San Francisco Chapter, 2016 Honor Award
APPA: Leadership in Educational Facilities, Ef-fective and Innovative Practices Award (2013)
Engineering News-Record, Editors' Choice and Best Energy/Industrial Project 2015; Global Best Project: Green Project Category, 2015
Engineering News-Record California, 2015 Best Project: Energy/Industrial
Governor’s Environmental and Economic Leadership Awards Program [California], Award in the climate change category, 2016
Green Power Challenge, U.S. Environmental Protection Agency, 2019 Pac-12 Champion
Green Power Leadership Award, U.S. Environmental Protection Agency, 2017 Direct Project Engagement category
Structural Engineers Association of Northern California, 2016 Excellence in Structural Engineering Awards: Award of Merit, Infrastructure Category
Stanford University’s Central Energy Facility uses a innovative heat recovery system that takes advantage of Stanford’s overlap in heating and cooling needs and is powered completely by electricity.Photo from Robert Canfield
14214210: HIGH-PERFORMANCE DISTRICT CASE STUDIESA GUIDE TO ENERGY MASTER PLANNING OF HIGH-PERFORMANCE DISTRICTS AND COMMUNITIES STANFORD UNIVERSITY | CALIFORNIA
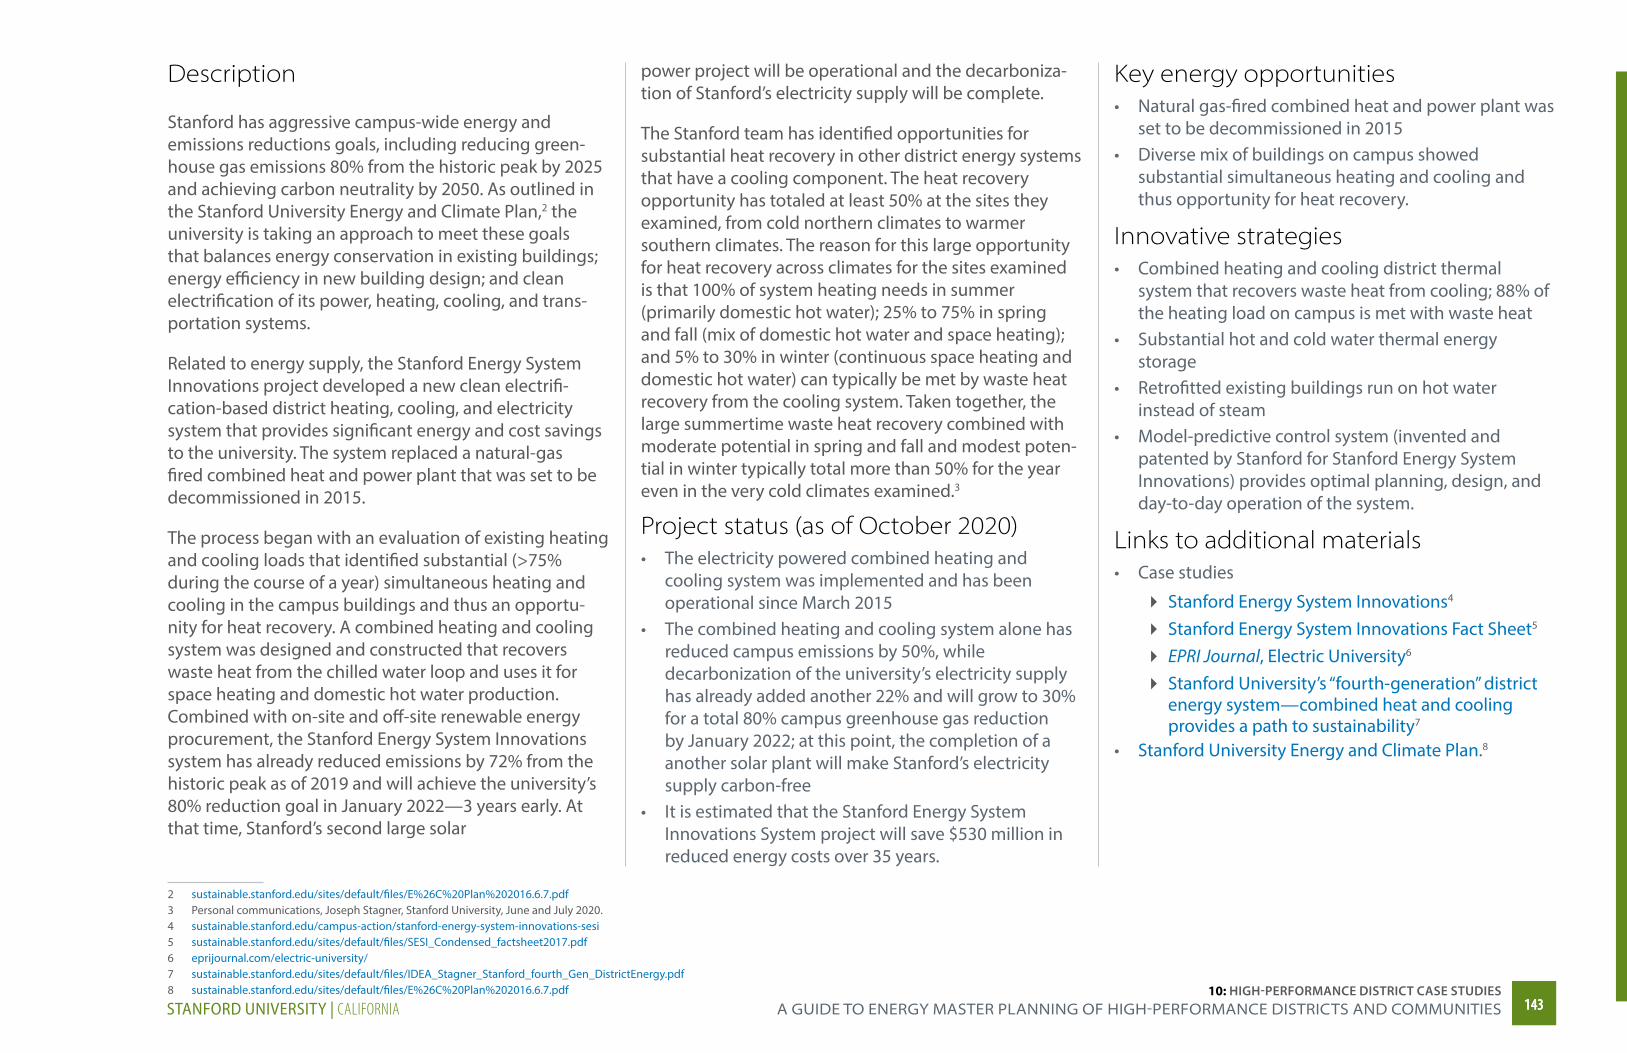
Description
Stanford has aggressive campus-wide energy and emissions reductions goals, including reducing green-house gas emissions 80% from the historic peak by 2025 and achieving carbon neutrality by 2050. As outlined in the Stanford University Energy and Climate Plan,2 the university is taking an approach to meet these goals that balances energy conservation in existing buildings; energy efficiency in new building design; and clean electrification of its power, heating, cooling, and trans-portation systems.
Related to energy supply, the Stanford Energy System Innovations project developed a new clean electrifi-cation-based district heating, cooling, and electricity system that provides significant energy and cost savings to the university. The system replaced a natural-gas fired combined heat and power plant that was set to be decommissioned in 2015.
The process began with an evaluation of existing heating and cooling loads that identified substantial (>75% during the course of a year) simultaneous heating and cooling in the campus buildings and thus an opportu-nity for heat recovery. A combined heating and cooling system was designed and constructed that recovers waste heat from the chilled water loop and uses it for space heating and domestic hot water production. Combined with on-site and off-site renewable energy procurement, the Stanford Energy System Innovations system has already reduced emissions by 72% from the historic peak as of 2019 and will achieve the university’s 80% reduction goal in January 2022—3 years early. At that time, Stanford’s second large solar
2 sustainable.stanford.edu/sites/default/files/E%26C%20Plan%202016.6.7.pdf 3 Personal communications, Joseph Stagner, Stanford University, June and July 2020.4 sustainable.stanford.edu/campus-action/stanford-energy-system-innovations-sesi 5 sustainable.stanford.edu/sites/default/files/SESI_Condensed_factsheet2017.pdf6 eprijournal.com/electric-university/7 sustainable.stanford.edu/sites/default/files/IDEA_Stagner_Stanford_fourth_Gen_DistrictEnergy.pdf 8 sustainable.stanford.edu/sites/default/files/E%26C%20Plan%202016.6.7.pdf
power project will be operational and the decarboniza-tion of Stanford’s electricity supply will be complete.
The Stanford team has identified opportunities for substantial heat recovery in other district energy systems that have a cooling component. The heat recovery opportunity has totaled at least 50% at the sites they examined, from cold northern climates to warmer southern climates. The reason for this large opportunity for heat recovery across climates for the sites examined is that 100% of system heating needs in summer (primarily domestic hot water); 25% to 75% in spring and fall (mix of domestic hot water and space heating); and 5% to 30% in winter (continuous space heating and domestic hot water) can typically be met by waste heat recovery from the cooling system. Taken together, the large summertime waste heat recovery combined with moderate potential in spring and fall and modest poten-tial in winter typically total more than 50% for the year even in the very cold climates examined.3
Project status (as of October 2020)• The electricity powered combined heating and
cooling system was implemented and has been operational since March 2015
• The combined heating and cooling system alone has reduced campus emissions by 50%, while decarbonization of the university’s electricity supply has already added another 22% and will grow to 30% for a total 80% campus greenhouse gas reduction by January 2022; at this point, the completion of a another solar plant will make Stanford’s electricity supply carbon-free
• It is estimated that the Stanford Energy System Innovations System project will save $530 million in reduced energy costs over 35 years.
Key energy opportunities• Natural gas-fired combined heat and power plant was
set to be decommissioned in 2015• Diverse mix of buildings on campus showed
substantial simultaneous heating and cooling and thus opportunity for heat recovery.
Innovative strategies• Combined heating and cooling district thermal
system that recovers waste heat from cooling; 88% of the heating load on campus is met with waste heat
• Substantial hot and cold water thermal energy storage
• Retrofitted existing buildings run on hot water instead of steam
• Model-predictive control system (invented and patented by Stanford for Stanford Energy System Innovations) provides optimal planning, design, and day-to-day operation of the system.
Links to additional materials• Case studies
� Stanford Energy System Innovations4
� Stanford Energy System Innovations Fact Sheet5 � EPRI Journal, Electric University6 � Stanford University’s “fourth-generation” district energy system—combined heat and cooling provides a path to sustainability7
• Stanford University Energy and Climate Plan.8
14314310: HIGH-PERFORMANCE DISTRICT CASE STUDIES
A gUiDe TO energy mASTer PlAnning OF HigH-PerFOrmAnCe DiSTriCTS AnD COmmUniTieSSTANFORD UNIVERSITY | CALIFORNIA
https://sustainable.stanford.edu/sites/default/files/IDEA_Stagner_Stanford_fourth_Gen_DistrictEnergy
https://sustainable.stanford.edu/sites/default/files/IDEA_Stagner_Stanford_fourth_Gen_DistrictEnergy
https://sustainable.stanford.edu/sites/default/files/IDEA_Stagner_Stanford_fourth_Gen_DistrictEnergy
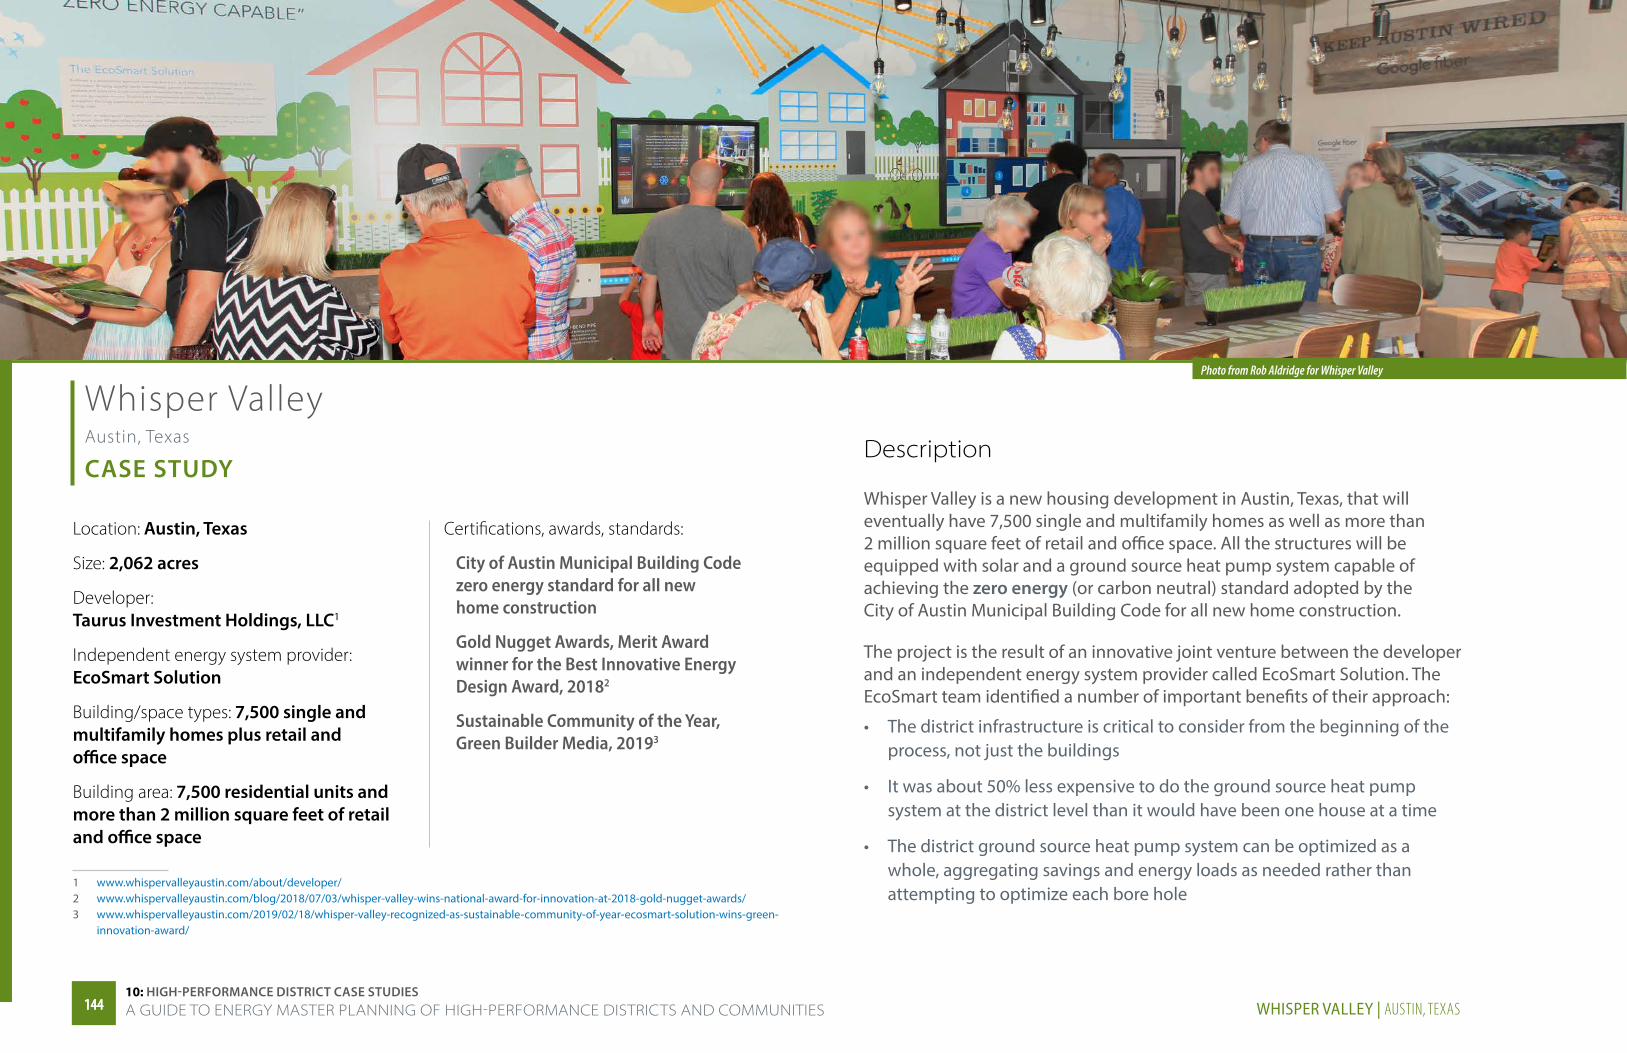
Photo from Rob Aldridge for Whisper Valley
Whisper Valley Austin, Texas
CASE STUDY
Location: Austin, Texas
Size: 2,062 acres
Developer: Taurus Investment Holdings, LLC1
Independent energy system provider: EcoSmart Solution
Building/space types: 7,500 single and multifamily homes plus retail and office space
Building area: 7,500 residential units and more than 2 million square feet of retail and office space
1 www.whispervalleyaustin.com/about/developer/2 www.whispervalleyaustin.com/blog/2018/07/03/whisper-valley-wins-national-award-for-innovation-at-2018-gold-nugget-awards/3 www.whispervalleyaustin.com/2019/02/18/whisper-valley-recognized-as-sustainable-community-of-year-ecosmart-solution-wins-green-
innovation-award/
Certifications, awards, standards:
City of Austin Municipal Building Code zero energy standard for all new home construction
Gold Nugget Awards, Merit Award winner for the Best Innovative Energy Design Award, 20182
Sustainable Community of the Year, Green Builder Media, 20193
Description
Whisper Valley is a new housing development in Austin, Texas, that will eventually have 7,500 single and multifamily homes as well as more than 2 million square feet of retail and office space. All the structures will be equipped with solar and a ground source heat pump system capable of achieving the zero energy (or carbon neutral) standard adopted by the City of Austin Municipal Building Code for all new home construction.
The project is the result of an innovative joint venture between the developer and an independent energy system provider called EcoSmart Solution. The EcoSmart team identified a number of important benefits of their approach:
• The district infrastructure is critical to consider from the beginning of the process, not just the buildings
• It was about 50% less expensive to do the ground source heat pump system at the district level than it would have been one house at a time
• The district ground source heat pump system can be optimized as a whole, aggregating savings and energy loads as needed rather than attempting to optimize each bore hole
14414410: HIGH-PERFORMANCE DISTRICT CASE STUDIESA GUIDE TO ENERGY MASTER PLANNING OF HIGH-PERFORMANCE DISTRICTS AND COMMUNITIES WHISPER VALLEY | AUSTIN, TEXAS
https://www.whispervalleyaustin.com/blog/2018/07/03/whisper-valley-wins-national-award-for-innovatio
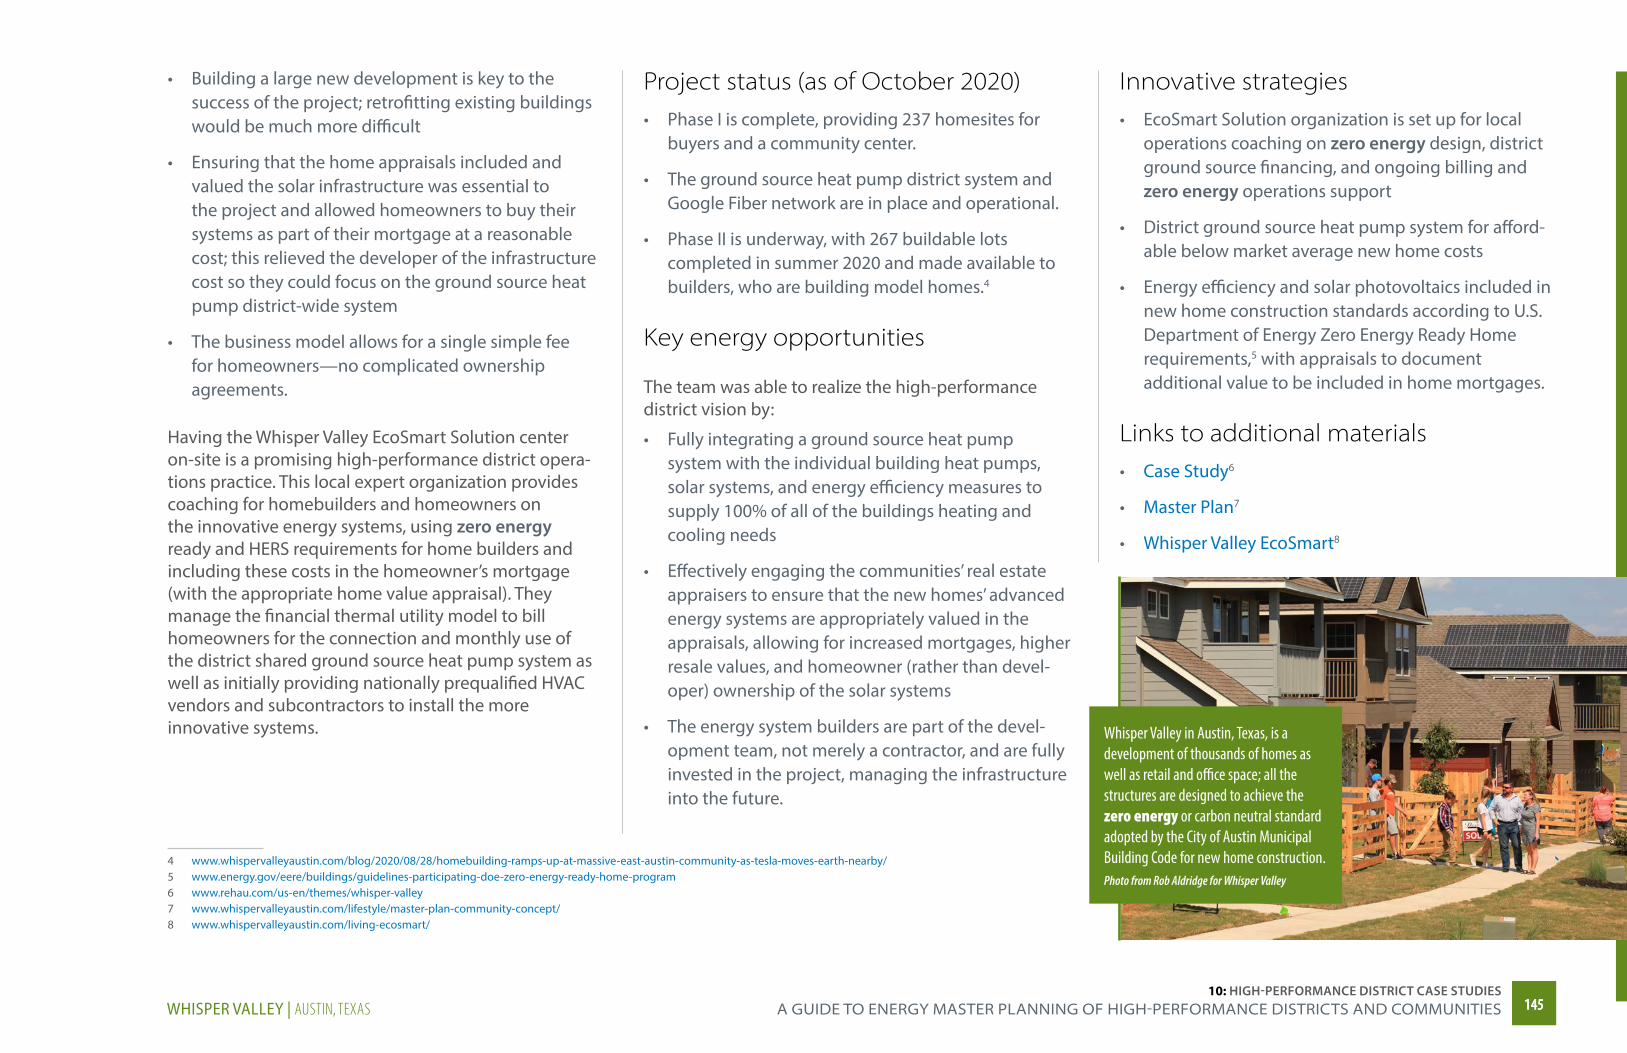
• Building a large new development is key to the success of the project; retrofitting existing buildings would be much more difficult
• Ensuring that the home appraisals included and valued the solar infrastructure was essential to the project and allowed homeowners to buy their systems as part of their mortgage at a reasonable cost; this relieved the developer of the infrastructure cost so they could focus on the ground source heat pump district-wide system
• The business model allows for a single simple fee for homeowners—no complicated ownership agreements.
Having the Whisper Valley EcoSmart Solution center on-site is a promising high-performance district opera-tions practice. This local expert organization provides coaching for homebuilders and homeowners on the innovative energy systems, using zero energy ready and HERS requirements for home builders and including these costs in the homeowner’s mortgage (with the appropriate home value appraisal). They manage the financial thermal utility model to bill homeowners for the connection and monthly use of the district shared ground source heat pump system as well as initially providing nationally prequalified HVAC vendors and subcontractors to install the more innovative systems.
4 www.whispervalleyaustin.com/blog/2020/08/28/homebuilding-ramps-up-at-massive-east-austin-community-as-tesla-moves-earth-nearby/5 www.energy.gov/eere/buildings/guidelines-participating-doe-zero-energy-ready-home-program6 www.rehau.com/us-en/themes/whisper-valley7 www.whispervalleyaustin.com/lifestyle/master-plan-community-concept/8 www.whispervalleyaustin.com/living-ecosmart/
Project status (as of October 2020)• Phase I is complete, providing 237 homesites for
buyers and a community center.
• The ground source heat pump district system and Google Fiber network are in place and operational.
• Phase II is underway, with 267 buildable lots completed in summer 2020 and made available to builders, who are building model homes.4
Key energy opportunities
The team was able to realize the high-performance district vision by:
• Fully integrating a ground source heat pump system with the individual building heat pumps, solar systems, and energy efficiency measures to supply 100% of all of the buildings heating and cooling needs
• Effectively engaging the communities’ real estate appraisers to ensure that the new homes’ advanced energy systems are appropriately valued in the appraisals, allowing for increased mortgages, higher resale values, and homeowner (rather than devel-oper) ownership of the solar systems
• The energy system builders are part of the devel-opment team, not merely a contractor, and are fully invested in the project, managing the infrastructure into the future.
Innovative strategies• EcoSmart Solution organization is set up for local
operations coaching on zero energy design, district ground source financing, and ongoing billing and zero energy operations support
• District ground source heat pump system for afford-able below market average new home costs
• Energy efficiency and solar photovoltaics included in new home construction standards according to U.S. Department of Energy Zero Energy Ready Home requirements,5 with appraisals to document additional value to be included in home mortgages.
Links to additional materials• Case Study6
• Master Plan7
• Whisper Valley EcoSmart8
Whisper Valley in Austin, Texas, is a development of thousands of homes as well as retail and office space; all the structures are designed to achieve the zero energy or carbon neutral standard adopted by the City of Austin Municipal Building Code for new home construction.Photo from Rob Aldridge for Whisper Valley
14514510: HIGH-PERFORMANCE DISTRICT CASE STUDIES
A gUiDe TO energy mASTer PlAnning OF HigH-PerFOrmAnCe DiSTriCTS AnD COmmUniTieSWHISPER VALLEY | AUSTIN, TEXAS
National Renewable Energy Laboratory 15013 Denver West Parkway Golden, CO 80401303-275-3000 • www.nrel.gov
NREL is a national laboratory of the U.S. Department of Energy, Office of Energy Efficiency and Renewable Energy, operated by the Alliance for Sustainable Energy, LLC.
NREL/TP-5500-78495 • November 2020
Mill 19 is the first phase of the Hazelwood Green high-performance development in Pittsburgh, Pennsylvania.Photo from Turner Construction