Guideline for solar energy (strategic) planning - Effect4buildings
49
1 Guideline for solar energy (strategic) planning EFFECT4buildings Toolbox: Prosumerism; Annex 1
-
Upload
khangminh22 -
Category
Documents
-
view
1 -
download
0
Transcript of Guideline for solar energy (strategic) planning - Effect4buildings
1
Guideline for solar energy
(strategic) planning
EFFECT4buildings Toolbox:
Prosumerism; Annex 1

2
EFFECT4buildings project is implemented with the support from the EU funding Programme Interreg Baltic Sea
Region (European Regional Development Fund) and Norwegian national funding. The aim of the project is to
improve the capacity of public building managers in the Baltic Sea Region by providing them a comprehensive
decision-making support toolbox with a set of financial instruments to unlock the investments and lower the risks
of implementing energy efficiency measures in buildings owned by public stakeholders. More information:
http://www.effect4buildings.se/
Partners
The project “Effective Financing Tools for implementing Energy Efficiency in Buildings” (EFFECT4buildings)
develops in collaboration with public building managers a comprehensive decision-making support toolbox
with a set of financial instruments: Financial calculation tools; Bundling; Funding; Convincing decision
makers; Energy Performance Contract; Multi Service Contract; Green Lease Contract; Prosumerism. The
tools and instruments chosen by the project has the biggest potential to help building managers to
overcome financial barriers, based on nearly 40 interviews with the target group. The project improves
these tools through different real cases.
To make sure building managers invest in the best available solutions, more knowledge on different
possibilities is needed as well as confirmation from colleagues that the solutions performs well.
EFFECT4buildings mapped technological solutions for energy efficiency in buildings with the aim to share
knowledge and experiences of energy efficiency solutions among building managers in the Baltic Sea Region.
This document is made to be a handbook for solar energy (strategic) planning. It gives insight in EU and each
participating countries legislation framework regarding prosumerism including support schemes, tools and
guidelines. Next it tackles PV market trends and costs, including global and each countries installed capacity
trends, price trends for modules and installation and PV technology and its efficiency trends. Further it
informs about future development and existing case studies and lessons learned from them.

3
Table of Contents
1. Legislation framework ........................................................................................................ 4
1.1. EU policy and prosumerism ......................................................................................... 4
1.2. Country specific legislation .......................................................................................... 8
1.3. Country specific information on support schemes ................................................... 10
1.4. Support tools and guidelines ..................................................................................... 17
1.4.1. Maps/atlases .................................................................................................. 18
1.4.2. Online/browser-based simulations ................................................................ 20
1.4.3. Online/browser based simulations with premium downloadable software .. 21
1.4.4. Installable simulation software ...................................................................... 23
1.4.5. Guidelines and best practice examples .......................................................... 25
2. PV market trends and costs ............................................................................................. 29
2.1. Global installed capacity trends ................................................................................ 30
2.2. PV energy share and installed capacity ..................................................................... 32
2.3. Module prices and installed cost ............................................................................... 35
2.4. PV technology and efficiency .................................................................................... 37
2.4.1. Types of solar panels ...................................................................................... 38
2.4.2. General solar PV set up .................................................................................. 41
2.4.3. PV module rating ............................................................................................ 41
2.5. PV module efficiency ................................................................................................. 41
2.5.1. Solar irradiation and orientation .................................................................... 42
2.5.2. Reflection ....................................................................................................... 43
2.5.3. Shade .............................................................................................................. 43
2.5.4. Temperature .................................................................................................. 43
2.6. Solar energy accumulation ........................................................................................ 43
2.7. Development/Future ................................................................................................. 44
2.8. Case studies around Baltic Sea region ....................................................................... 45
4
1. Legislation framework Access to energy and its production has proven to be a key aspect of modern life. Until recently,
most of the energy in the world was produced by means of combustion, the only exception
being hydroelectric power. However, recent technological developments have made it
possible to obtain energy in cleaner forms without having to burn anything, like sun and wind
energy. These sources are free and inexhaustible and their costs arise only from installation of
the equipment needed for producing it. The use of these resources has not only changed the
way we produce energy, but has also caused social and economic changes, which have led to
the development of the prosumers and these changes need to be addressed.
When setting its new renewable energy targets in 2015 the European Commission set out a
vision that, the energy in future would be partially delivered by self-consumers and citizens
would become active participants in the market and benefit from new technologies. In this
case, citizens would become one of the driving forces in transitioning to renewable energy
resources as well as help reducing bills and costs of energy.
On the other hand, this brings some more challenges. For example, the International Energy
Agency (IEA) considers that solar photovoltaics (PV) could turn into a disruptive technology
drastically affecting and changing the electricity market.1 Therefore, it is necessary to have a
clear policy regarding prosumerism in order to avoid major consequences.
1.1. EU policy and prosumerism
Currently there are no strict EU-wide regulations regarding prosumers. The revised renewable
energy directive 2018/2001/EU is the main legal act, which determines the set course of the
EU towards renewable energy use and, among many other subjects, describes the EU policy
towards prosumers, or renewables self-consumers, terms sometimes used interchangeably. It
entered into force In December 2018 as part of the Clean energy for all Europeans package
and it means that is up to each individual Member State to devise their own legal acts on how
to reach these goals. 2
Article 21 of this directive states that that consumers in all of the Member States are entitled
to become renewables self-consumers. This includes:
• installing and operating renewable electricity generation and storage systems for self-
consumption;
• generating renewable energy for their own consumption as well as storing and selling the
excess production of renewable electricity;
1 RESIDENTIAL PROSUMERS - DRIVERS AND POLICY OPTIONS (RE-PROSUMERS). Available: http://iea-retd.org/wp-
content/uploads/2014/06/RE-PROSUMERS_IEA-RETD_2014.pdf 2 Directive (EU) 2018/2001 of the European Parliament and of the Council of 11 December 2018 on the promotion of the use of energy from renewable sources. Available: https://eur-lex.europa.eu/legal-content/EN/TXT/?uri=uriserv:OJ.L_.2018.328.01.0082.01.ENG&toc=OJ:L:2018:328:TOC

5
• receiving remuneration for the electricity the feed into the grid;
• maintaining their rights and obligations as final consumers. 2
The directive also states, that they also are entitled to enter various energy purchase
agreements with electricity suppliers or peers, without being subject to discriminatory or
disproportionate procedures and charges that are not cost-reflective. The remuneration for
the self-generated renewable electricity that they feed into the grid must reflect the market
value and consider its long-term value to the grid, the environment and society. 2
However, Member States may apply non-discriminatory and proportionate charges and fees
to self-consumers for the self-generated renewable electricity, even if it remains within their
premises in one or more of these cases:
• if the generation of the electricity is supported via support schemes, but only to the extent
which does not undermine the economic viability of it;
• starting from 1 December 2026, if in a Member State the overall share of self-consumption
installations exceeds 8 % of the total installed electricity capacity, and if a cost-benefit
analysis performed by the national regulatory authority of that Member State proves that
the self-consumption creates a significant disproportionate burden on the long-term
financial sustainability of the electric system, or exceeds the objective of cost-effective
deployment of renewable energy, and cannot be minimised taking other reasonable
actions;
• if the total installed electrical capacity of the installations, where this electricity is produced
is more than 30 kW. 3
Self-consumers are also entitled to engage in joint energy generation for self-consumption and
are permitted to arrange sharing of the energy produced on their sites between themselves,
without any network or other relevant charges, fees, levies and taxes, which could be applied
to each self-consumer. The Member States can differentiate individual self-consumers and
jointly acting self-consumers, however such differentiation must be proportionate and duly
justified. 3
The directive also addresses management of the energy generation installations owned by
third party. They may be owned or managed by it, which includes installation, operation,
metering and maintenance. However, the third party itself shall not be considered a
renewables self-consumer and is a subject to the renewables self-consumer's instructions. 3
In addition, the directive implies that the development of self-consumption must be
encouraged by the Member States, which must put in place an enabling framework and
remove any existing barriers. This framework should:
• make self-consumption accessible to all customers, including low-income or vulnerable
households;

6
• remove financial and market barriers;
• remove regulatory barriers;
• support incentives of building owners for self-consumption;
• grant non-discriminatory access to existing support schemes as well as to all electricity
market segments to self-consumers for feeding electricity into the grid;
• ensure balanced and adequate way of contribution to the overall cost sharing of the system
when electricity is fed into the grid by the self-consumers. 3
The Article 22 of this directive regards Renewable energy communities. It addresses the
possibility of self-consumers to form renewable energy communities and specifies their rights
as individual self-consumers. In addition, public authorities shall provide regulatory and
capacity-building support in enabling and setting up these communities. Member States
should choose any form of appropriate entity for renewable energy communities to provide
them an equal footing with large-scale players in their respective country as well as act in its
own name, exercise rights and be subject to obligations. They should be able to share the
energy produced by their community-owned installations between themselves. However, if
any relevant costs, charges, levies and taxes arise for final consumers not in the community or
producers in a similar situation and if the public grid infrastructure is used for energy transfers,
their members should not be exempt from these costs. 2
Both Articles also establish that all of the Member States are required to include a summary of
the implemented policies and measures, as well as an assessment of their implementation in
their respective national energy and climate plans. 4
In addition to this directive, Energy Community Secretariat has released extensive policy
guidelines on the Grid Integration of Prosumers. These guidelines provide recommendation
sets on various fields related to prosumers, including legal and regulatory framework.3 4
Concerning legislation, these recommendations are as following:
• self-consumption schemes, both with or without decentralized storage, should be
permitted or even enforced by renewable energy law or any other means of applicable
legislation;
• it is advised to amend any primary and/or secondary legislation regarding consumers with
installed distributed generation units, specifically connection and metering rules for these
users;
• allow additional customer classes and to establish billing and reporting systems;
3 Source: Energy Community Secretariat. Policy guidelines on the Grid Integration of Prosumers. Available: https://www.energy-community.org/dam/jcr:5e6fd995-f753-4fe2-b180-95df8a1bf19d/PG_01_2018_ECS_RE_grid.pdf 4 Source: Distributed generation for self-consumption key aspects and recommendations of good practice. Available: https://www.energy-community.org/dam/jcr:b73594c1-0e30-48bc-aac1-e8b7ce1478d7/WSEL052017_Muratovi%C4%87_recommendations.pdf

7
• tariffs should be designed to be as flexible as possible and so that they could be timely
adjusted;
• the regulatory framework also has to be market-oriented and it is necessary to minimalize
the market distortion while at the same time respecting the main principles of cost
reflectivity, cost recovery as well as to avoid cross subsidization of network users and not
shifting the costs of grid services to consumers who cannot become prosumers;
• it is necessary to establish precise definitions of consumer categories and their eligibility
for self-consumption schemes in the regulatory framework, households and small
commercial consumers should be treated separately from large commercial and industrial
consumers;
• any legislative changes should also not have any retroactive impact on existing self-
consumption installations or other grid users, but should ensure legal certainty for
investors as well as protect the stability of their investments (unit price changes of excess
energy, grid tariffs or any other taxes and levies are excluded);
• it is crucial to make changes regarding VAT legislation, which should allow implementing
self-consumption schemes and in particular netting schemes recommended by the Policy
Guidelines of Energy Community Secretariat;
• if VAT legislation is too restrictive, it should be amended in favour of self-consumption;
• any support provided for energy generated from renewable resources should take into the
account retail or market wholesale price in order to avoid any hidden subsidies, like
exemption from grid costs, and cross-subsidization across among network users;
• a commercial arrangement between suppliers, grid operator and prosumers has to be
established in order to support chosen netting schemes;
• grid operators also have to provide all the relevant meter data in order to facilitate clear
commercial conditions;
• it is necessary to establish a reporting system as well as key statistical indicators of the
energy statistics and the share of self-consumption at the power system level. 3,4
In recent study on residential prosumers in the European Energy union, it is stated that the
European Commission has identified and set following priorities for policy and regulatory
action regarding prosumers:
• provide consumers standardized clearer electricity bills, where suppliers prominently
display basic information, energy costs, network charges, taxes and levies;
• make switching conditions easier by prohibiting all related charges except early
termination fees on fixed term contracts, contracts should also provide consumers
information on tangible advantages;
• spread the use of smart metering;
8
• empower consumers and communities to actively participate in electricity market,
including generating, consuming and selling electricity back to the grid as well as take
into the account costs and benefits of this participation to electricity market as a whole;
• promote smart energy demand management with new technologies like smart homes,
smart appliances and smart meters in combination with dynamic price contracts;
• promote the engagement of consumers with an aggregator through regulatory
framework;
• promote electricity storing technologies by making the pricing more appropriate.5
Recent study conducted by International Energy Agency (IEA) defined prosumer installations
belonging to residential category as being below 10 kW. Several EU member states have also
adopted this cap. However, at present moment prosumer installations across Europe rarely
exceed it without being strictly defined. 1
The main strategy of the existing EU energy policy is to place consumers at the core and
encourage them to take ownership of the energy transition. They are expected to actively
participate in the market while at the same time fundamentally transforming the energy
system of Europe. The aim of this policy is to reduce greenhouse gas emissions and energy
bills, transition to sustainable and secure energy system as well as provide industrial
development and growth of employment.6
1.2. Country specific legislation
Currently there are many different distinctions regarding prosumers in regulatory framework
of each Member State. Currently none of Member States have a specific piece of legislation,
which fully regulates prosumers. Instead, most countries have adjusted existing regulations
and legislation, regulating Electricity Sector, use of RES or both, to include and define
prosumers, as well as regulate aspects regarding them. 5
There are also differences regarding the term “prosumer”. Many countries do not use the term
at all, but instead use equivalent concepts in their legislations such as auto-consumption, self-
consumption, self-supplier etc. However, in most of the countries these definitions are legally
binding. 5
By analysing legal basis, on which the concept of the prosumer is built, it is clear that it is based
upon following indicators:
• generation and consumption;
5Source: Study on “Residential Prosumers in the European Energy Union”. Prepared by: GfK Belgium consortium JUST/2015/CONS/FW/C006/0127, Framework Contract EAHC/2013/CP/04, 2 May 2017. Available: https://ec.europa.eu/commission/sites/beta-political/files/study-residential-prosumers-energy-union_en.pdf
6 Source: Commission staff working document: Best practices on Renewable Energy Self-consumption. Available: https://ec.europa.eu/energy/sites/ener/files/documents/1_EN_autre_document_travail_service_part1_v6.pdf
9
• capacity of power generation and installation size.
Different Member States put different weight on each of these indicators on their own
legislation. For example, some countries refer to self-consumption or auto-consumption, while
others manly refer to the production of energy and feeding it into the grid. 5
Several Member States also include limitations to the size or power capacity of the prosumer
installations, mainly by stating that it has to be small, sometimes referring to a single household
and in other times small-scale electric power plants. Therefore, in many countries also use the
term microgeneration. However, these variations and caps vary significantly across Member
States and this cap is used to distinguish prosumers from registered producers.
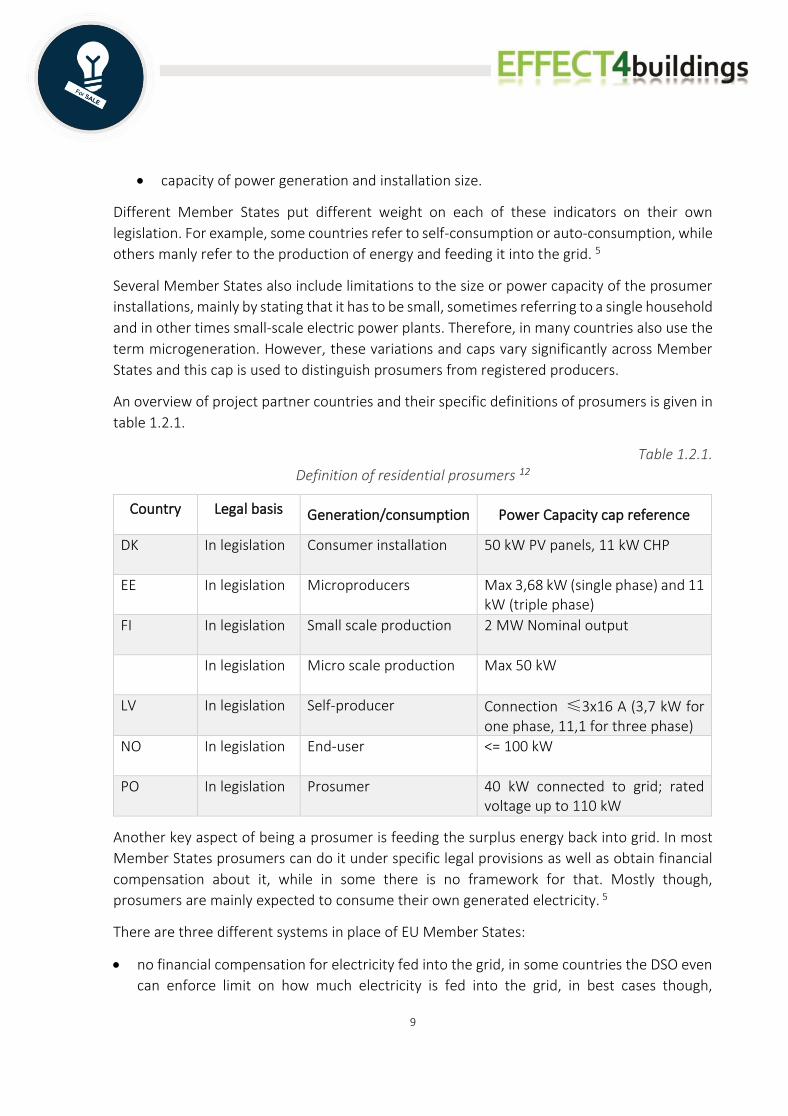
An overview of project partner countries and their specific definitions of prosumers is given in
table 1.2.1.
Table 1.2.1.
Definition of residential prosumers 12
Country Legal basis Generation/consumption Power Capacity cap reference
DK In legislation Consumer installation 50 kW PV panels, 11 kW CHP
EE In legislation Microproducers Max 3,68 kW (single phase) and 11 kW (triple phase)
FI In legislation Small scale production 2 MW Nominal output
In legislation Micro scale production Max 50 kW
LV In legislation Self-producer Connection ≤3x16 A (3,7 kW for one phase, 11,1 for three phase)
NO In legislation End-user <= 100 kW
PO In legislation Prosumer 40 kW connected to grid; rated voltage up to 110 kW
Another key aspect of being a prosumer is feeding the surplus energy back into grid. In most
Member States prosumers can do it under specific legal provisions as well as obtain financial
compensation about it, while in some there is no framework for that. Mostly though,
prosumers are mainly expected to consume their own generated electricity. 5
There are three different systems in place of EU Member States:
• no financial compensation for electricity fed into the grid, in some countries the DSO even
can enforce limit on how much electricity is fed into the grid, in best cases though,

10
prosumers can enter into contractual relationship with the DSO, which will purchase the
electricity from prosumer, but only to cover distribution losses or to resell it at the market
prices;
• other countries do not provide any direct remuneration to prosumers, but there is a
compensation scheme in place between the excess electricity generated and fed into the
grid and periods when prosumer purchases electricity from the grid and the needs for
electricity are greater than generation based on a set billing period (from an hour to a year);
• countries with legal framework which enables prosumers to sell excess energy back into
the grid and receive financial compensation for it. 5
Some EU Member States do not require any building permit costs for small installations such
as installations on rooftops, while in some any type of installation requires one. However, most
countries require to at least obtain a prior notification to a competent authority to start the
installation. The bureaucratic process may vary from, a single application form and registration
of the installation to obtaining a construction permit and a one-off fee for either the
construction itself or establishing a connection to the grid. In some countries the installation
itself must be carried out by a specialist and validated by a competent authority. This also
includes obtaining other documents such as installation certificates, exploitation certificates,
registering installations, carrying out commissioning tests, etc. and applicable costs. In most
countries, prosumers must still pay for the use of grid and can be fixed, variable or a
combination of both. 5
There are also differences among Member States in terms of the ownership of the installation,
which generates the electricity. For example, in France it is a key aspect of being a prosumer.
Also, collective PV generation is treated differently in each country. In several Member States,
prosumer can be either physical or legal person, while others have also defined specific terms
such as energy communities or industrial prosumers. 5
There are also various support schemes to incentivise prosumers which are described in detail
in the next chapter.
1.3. Country specific information on support schemes
There are currently several methods, how governments support, incentivise as well as
remunerate generation of electricity from various renewable resources. This includes support
for PV installations as well as encouragement of self-consumption.
11
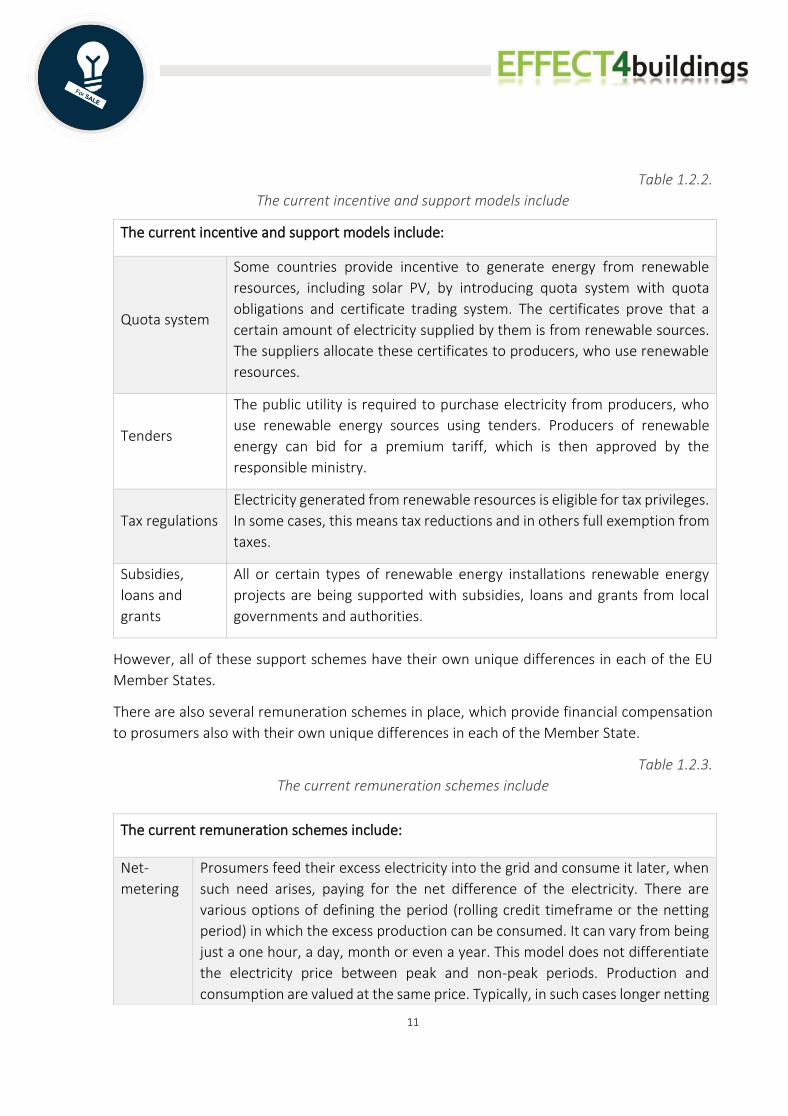
Table 1.2.2.
The current incentive and support models include
The current incentive and support models include:
Quota system
Some countries provide incentive to generate energy from renewable
resources, including solar PV, by introducing quota system with quota
obligations and certificate trading system. The certificates prove that a
certain amount of electricity supplied by them is from renewable sources.
The suppliers allocate these certificates to producers, who use renewable
resources.
Tenders
The public utility is required to purchase electricity from producers, who
use renewable energy sources using tenders. Producers of renewable
energy can bid for a premium tariff, which is then approved by the
responsible ministry.
Tax regulations
Electricity generated from renewable resources is eligible for tax privileges.
In some cases, this means tax reductions and in others full exemption from
taxes.
Subsidies,
loans and
grants
All or certain types of renewable energy installations renewable energy
projects are being supported with subsidies, loans and grants from local
governments and authorities.
However, all of these support schemes have their own unique differences in each of the EU
Member States.
There are also several remuneration schemes in place, which provide financial compensation
to prosumers also with their own unique differences in each of the Member State.
Table 1.2.3.
The current remuneration schemes include
The current remuneration schemes include:
Net-
metering
Prosumers feed their excess electricity into the grid and consume it later, when
such need arises, paying for the net difference of the electricity. There are
various options of defining the period (rolling credit timeframe or the netting
period) in which the excess production can be consumed. It can vary from being
just a one hour, a day, month or even a year. This model does not differentiate
the electricity price between peak and non-peak periods. Production and
consumption are valued at the same price. Typically, in such cases longer netting

12
The overall information about support mechanisms in each of the project partner countries is
compiled in table 1.2.2. Information was mainly gathered with help of the each of the project
partner countries as well as from RES LEGAL Europe website7, which contains information
about regulations on renewable energy generation and a 2017 Study on “Residential
Prosumers in the European Energy Union”. 5
For more information on support schemes in the European countries, visit the RES Legal
website: http://www.res-legal.eu/home/.
7 RES Legal. LEGAL SOURCES ON RENEWABLE ENERGY. http://www.res-legal.eu/home/
periods mean lower consumer energy bills and allows prosumers to use the grid
as an energy storage. This type of remuneration does not encourage prosumers
to consume their own energy while also causing larger cross subsidies and
lowering DSO incomes.
Feed-in
tariffs
Prosumers must pay the retail price of electricity they consume from the grid.
Large energy providers usually offer prosumers long-term contracts (10 – 25
years) at an above-the-market price and are determined according to
technology. Feed-in-tariffs are attractive to investors as they offer security and
predictability. However, they may lead to extra profit for prosumers and cross
subsidies, which can raise the price of electricity for everyone, as these models
are being funded by levies added to the price of kilowatt-hour of electricity.
Feed-in
premiums
The remuneration model preferred by IEA and European Commission. Uses long-
term contracts determined by technology but introduce a bonus added to the
current market price. This premium can be fixed or sliding but, in both cases, it
encourages prosumers to produce electricity at times, when it is needed the
most.

13
Table 1.2.2.
Overview of prosumer support schemes in each of the project partner countries 7, 5
Country Support
scheme Eligibility Further information
DK
Loan
Local associations of wind and solar plant owners as well as other local initiative groups with at least 10 members, majority of them must be members of the respective municipality or live 4,5 kilometres of the plant site
The maximum amount of such guarantee is 500 000 DKK (approx. EUR 67 260) per project
Net-
metering
(hourly)
Solar installations ≤50 kW, connected to private supply system and located at place of consumption or solar installations >50 kW, connected to private supply system
Installations ≤50 kW are exempt from paying whole PSO tariff if installation is owned by the property owner, solar energy installations > 50 kW are exempt from the surcharge for the support of renewable energy
Premium tariff
Non-commercial RES systems <6 kW Bonus on top of market price, sum of both should not exceed statutory maximum
Tender Solar PV installations Tenders are supported through state budget
EE
Feed-in tariff
Renewable installations <125 MW, only electricity supplied to network is eligible
Prosumer pays one-time charge for connecting to the grid, for residential prosumers usually just the cost of meter and its installation, fixed bonus of 0,0537 EUR/kWh, support is provided for 12 years from the date of commission
Tender Electrical capacity ≤50 kW ≥1 MW, installations with
electrical capacity ≤1 MW will be supported from 2020 Support is provided for 12 years from the date of commission
FI Subsidy Projects promoting the use or production of renewable energies; advance energy efficiency and energy saving or
Support up to 30% for energy production facilities and up to 40% for research, 25% of total costs must be subsidised by entity receiving the subsidy
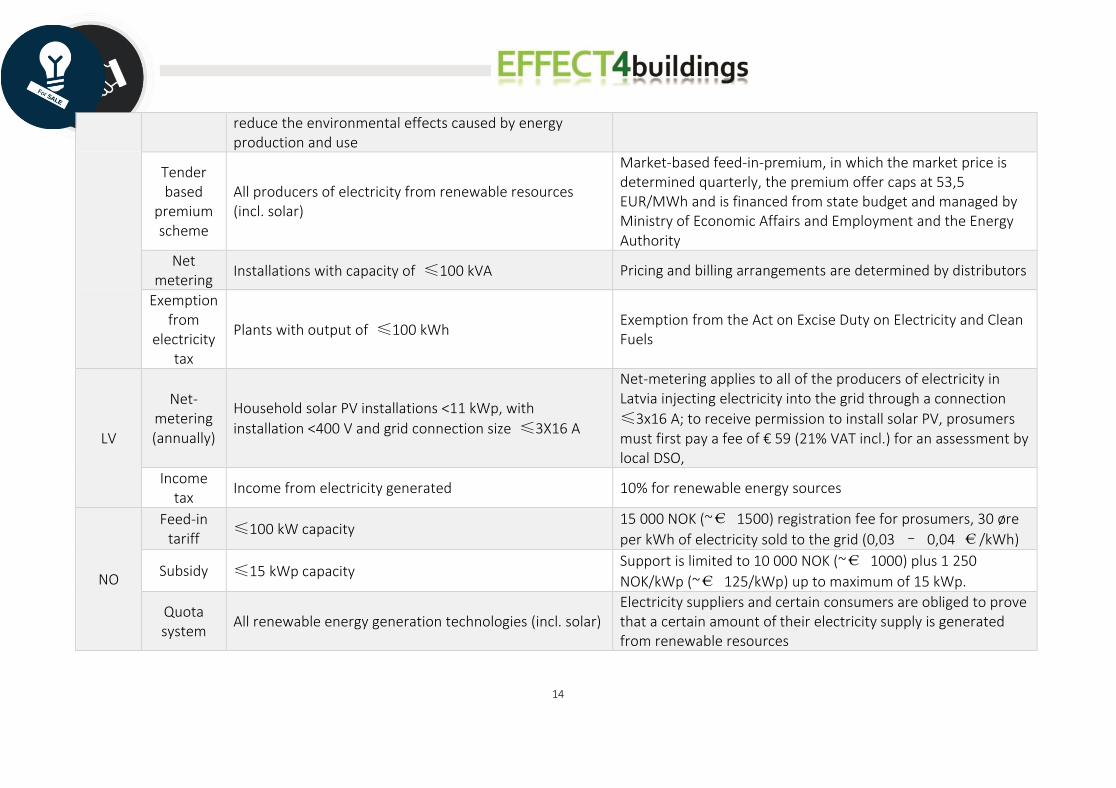
14
reduce the environmental effects caused by energy production and use
Tender based
premium scheme
All producers of electricity from renewable resources (incl. solar)
Market-based feed-in-premium, in which the market price is determined quarterly, the premium offer caps at 53,5 EUR/MWh and is financed from state budget and managed by Ministry of Economic Affairs and Employment and the Energy Authority
Net metering
Installations with capacity of ≤100 kVA Pricing and billing arrangements are determined by distributors
Exemption from
electricity tax
Plants with output of ≤100 kWh Exemption from the Act on Excise Duty on Electricity and Clean Fuels
LV
Net-metering (annually)
Household solar PV installations <11 kWp, with
installation <400 V and grid connection size ≤3X16 A
Net-metering applies to all of the producers of electricity in Latvia injecting electricity into the grid through a connection
≤3x16 A; to receive permission to install solar PV, prosumers must first pay a fee of € 59 (21% VAT incl.) for an assessment by local DSO,
Income tax
Income from electricity generated 10% for renewable energy sources
NO
Feed-in tariff
≤100 kW capacity 15 000 NOK (~€ 1500) registration fee for prosumers, 30 øre
per kWh of electricity sold to the grid (0,03 – 0,04 €/kWh)
Subsidy ≤15 kWp capacity Support is limited to 10 000 NOK (~€ 1000) plus 1 250
NOK/kWp (~€ 125/kWp) up to maximum of 15 kWp.
Quota system
All renewable energy generation technologies (incl. solar) Electricity suppliers and certain consumers are obliged to prove that a certain amount of their electricity supply is generated from renewable resources
15
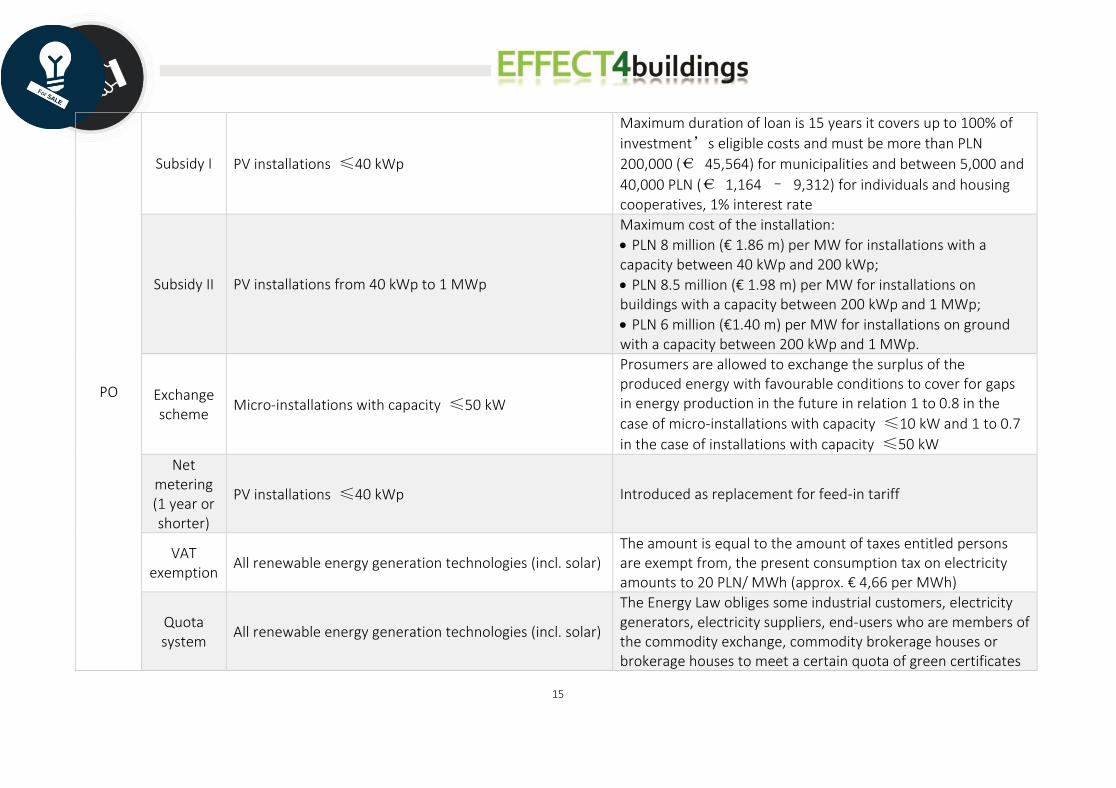
PO
Subsidy I PV installations ≤40 kWp
Maximum duration of loan is 15 years it covers up to 100% of
investment’s eligible costs and must be more than PLN
200,000 (€ 45,564) for municipalities and between 5,000 and
40,000 PLN (€ 1,164 – 9,312) for individuals and housing cooperatives, 1% interest rate
Subsidy II PV installations from 40 kWp to 1 MWp
Maximum cost of the installation:
• PLN 8 million (€ 1.86 m) per MW for installations with a capacity between 40 kWp and 200 kWp;
• PLN 8.5 million (€ 1.98 m) per MW for installations on buildings with a capacity between 200 kWp and 1 MWp;
• PLN 6 million (€1.40 m) per MW for installations on ground with a capacity between 200 kWp and 1 MWp.
Exchange scheme
Micro-installations with capacity ≤50 kW
Prosumers are allowed to exchange the surplus of the produced energy with favourable conditions to cover for gaps in energy production in the future in relation 1 to 0.8 in the
case of micro-installations with capacity ≤10 kW and 1 to 0.7
in the case of installations with capacity ≤50 kW
Net metering (1 year or shorter)
PV installations ≤40 kWp Introduced as replacement for feed-in tariff
VAT exemption
All renewable energy generation technologies (incl. solar) The amount is equal to the amount of taxes entitled persons are exempt from, the present consumption tax on electricity amounts to 20 PLN/ MWh (approx. € 4,66 per MWh)
Quota system
All renewable energy generation technologies (incl. solar)
The Energy Law obliges some industrial customers, electricity generators, electricity suppliers, end-users who are members of the commodity exchange, commodity brokerage houses or brokerage houses to meet a certain quota of green certificates

16
SW
Subsidy PV installations only (either internal or external grid) State support for PV installations for municipalities and private individuals with a budget of € 41 million annually, covers 20% of eligible costs
Tax reduction
Excess electricity fed into the grid from solar, wind, wave, tidal, hydro, geothermal and biomass micro-producers
The reduction amounts to 60 öre (€ct. 6.3) per kWh, it may not exceed 30 000 kWh or the amount of electricity withdrawn from grid access point per person/legal entity/connection point, PV owner must not own fuse >100 amperes and must notify grid owner about electricity produced.
Tax exemption
Electricity produced from solar with capacity ≤255 kW State bears all the costs arising from tax exemption.
Quota system
Electricity self-consumers, consuming more than 60 MWh of self-produced electricity per year, which is produced in a plant with an installed capacity of more than 50 kW;
The quota obligation is applied to:

17
1.4. Support tools and guidelines
There are already many tools and guidelines available and many being developed for anyone
interested in becoming a prosumer or at least estimating their PV potential. They vary
significantly in both, the amount and quality of data they can provide as well as require various
amounts of expertise level in order to use and comprehend them.
Previous reviews and summaries of the tools available mainly focus on tools used by experts
and architects, as they previously were the main persons being responsible for integrating
these technologies into buildings. However, in recent years with the PV technology becoming
much more affordable and widespread as well as the development of the concept of
prosumersim, the available tools have also adapted and become more available and
democratic.8, 9
The tools described in previous reviews were mainly divided into three groups:
• CAAD tools – primarily used as a modelling tool to refine building geometry by
architects and designers, sometimes includes plugins to support PV or ST design;
• visualization tools – used to simulate daylighting in a specific object, which could be
used to model and study light and shading on building facades;
• simulation tools – used for PV system sizing and simulation with limited 3D support. 8,
9
Most of these tools were focused on industry professionals. However, as mentioned before,
recently there has been a significant change in the PV market and energy industry as well. With
development of prosumerism, virtually anyone can become an energy producer. That is also
reflected in the tools, which have become more available and user friendly, so that most
interested people with basic knowledge about solar PV would be able to use them in their own
projects.
For example, one type of these kind of tools is solar maps and atlases. These maps often
provide basic information necessary for PV projects, like various types of solar irradiation or
potential maximum PV energy yield per square meter. Some European cities like Stockholm
and Copenhagen and even some countries like Switzerland have already developed roof maps
to provide people information about the potential solar energy yield. These types of tools do
not provide detailed simulation of PV installation, but instead provide general overview of PV
8 Horvat, Miljana, Dubois Marie-Claude. Tools and methods for solar design - An overview of IEA SHC Task 41, Subtask B. 2012. Available: https://www.researchgate.net/publication/271580933_Tools_and_methods_for_solar_design_-_An_overview_of_IEA_SHC_Task_41_Subtask_B 9 Horvat, Miljana, Dubois Marie-Claude. (editors), Report T.41.B.1 State-of-the-art of digital tools used by architects for solar design, IEA-SHC Programme Task 41: Solar Energy and Architecture. 2010. Available: http://task41.iea-shc.org/Data/Sites/1/publications/IEA-T41_STB-DB1_SOA-DigitalTools.pdf

18
potential of a selected location or, in cases of city solar maps, even selected building rooftops
or facades. These maps and atlases are usually free of charge. 8, 9
Second type of tools are web/online-based simulation tools. These tools also include map
support but also add basic or in some cases also a more advanced PV simulation. Usually these
types of tools allow for designing and sizing PV systems on maps and some even include 3D
support. Additionally, they allow defining parameters of solar panels or selecting components
from a database and may even include pre-set load profiles to estimate more precise energy
yield. Some of these tools are available free of charge, some are available as a free sample of
a more advanced premium software and some are available only for a charge. 8, 9
The third type of tools is downloadable simulation software. This software often provides the
most precise estimation of solar energy yield. Usually it includes map or GIS support for
location selection as well as solar irradiation and meteorological data for the chosen location,
PV sizing, component database, load profile database and 3D support, which can vary from the
complexity of the software. Usually this type of software is available only for a charge and a
certain level of expertise and knowledge about solar technology is required in order to use it. 8,9
To sum up, currently there are a lot of tools and guidelines available for prosumers. This paper
will try to summarize most of the currently available tools and guidelines to offer an overview
and provide information to potential prosumers. However, it does not aim to produce a
complete list of them, as it is virtually impossible to consider every tool and guideline available.
Any prosumer is strongly encouraged to do their own research to find the necessary tools,
which suite their own unique needs and financial possibilities.
1.4.1. Maps/atlases
Maps and atlases are the type of tools, which provide the most basic information needed for
a solar PV project. Apart from global maps and atlases, there are also several cities, for
example, Vienna, Stockholm and Copenhagen, which have developed their own solar rooftop
maps. As these might be interesting only for limited amount of people, only global maps will
be included in this paper.
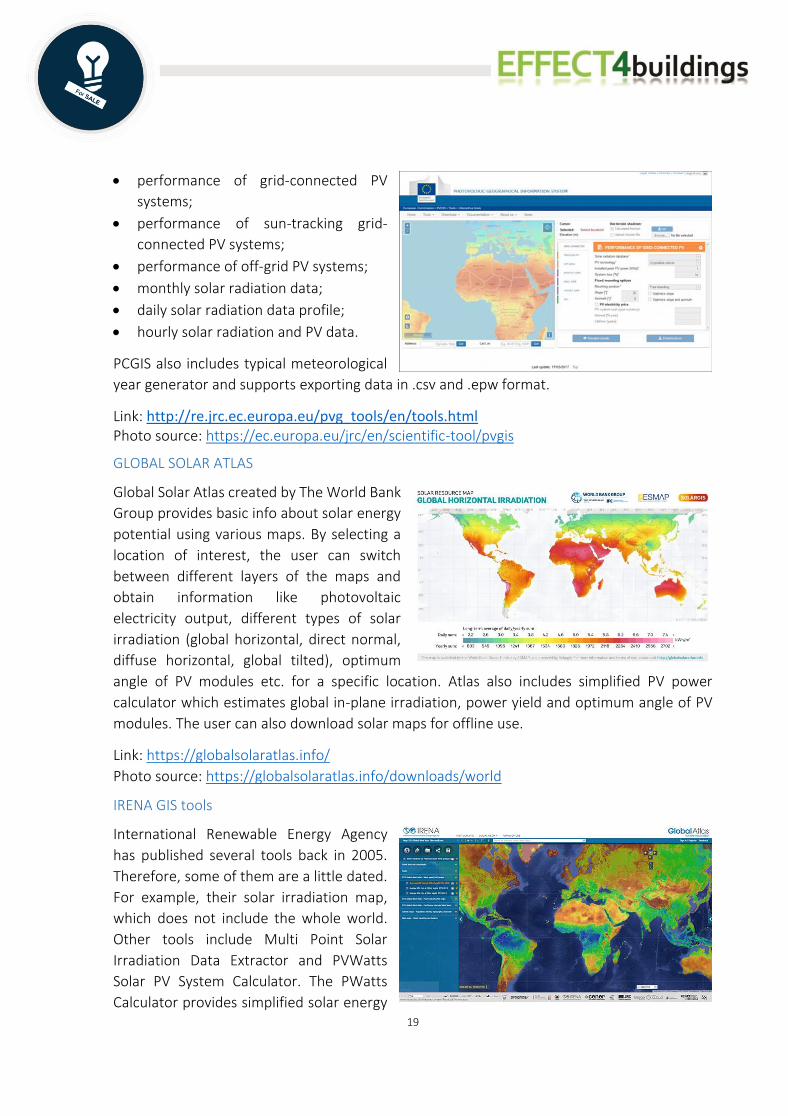
Photovoltaic Geographical Information System (PVGIS)
PVGIS is a GIS based tool, which allows user according to its geographical location to estimate:
19
• performance of grid-connected PV
systems;
• performance of sun-tracking grid-
connected PV systems;
• performance of off-grid PV systems;
• monthly solar radiation data;
• daily solar radiation data profile;
• hourly solar radiation and PV data.
PCGIS also includes typical meteorological
year generator and supports exporting data in .csv and .epw format.
Link: http://re.jrc.ec.europa.eu/pvg_tools/en/tools.html Photo source: https://ec.europa.eu/jrc/en/scientific-tool/pvgis
GLOBAL SOLAR ATLAS
Global Solar Atlas created by The World Bank
Group provides basic info about solar energy
potential using various maps. By selecting a
location of interest, the user can switch
between different layers of the maps and
obtain information like photovoltaic
electricity output, different types of solar
irradiation (global horizontal, direct normal,
diffuse horizontal, global tilted), optimum
angle of PV modules etc. for a specific location. Atlas also includes simplified PV power
calculator which estimates global in-plane irradiation, power yield and optimum angle of PV
modules. The user can also download solar maps for offline use.
Link: https://globalsolaratlas.info/
Photo source: https://globalsolaratlas.info/downloads/world
IRENA GIS tools
International Renewable Energy Agency
has published several tools back in 2005.
Therefore, some of them are a little dated.
For example, their solar irradiation map,
which does not include the whole world.
Other tools include Multi Point Solar
Irradiation Data Extractor and PVWatts
Solar PV System Calculator. The PWatts
Calculator provides simplified solar energy
20
yield estimations, but does include only USA. IRENA Solar Data Viewer is similar to Global Solar
Atlas and provides information about potential solar energy yield for a selected location.
Link: https://irena.masdar.ac.ae/gallery/#gallery
Photo source: https://irena.org/newsroom/pressreleases/2015/Oct/IRENA-and-DTU-Launch-
Worlds-Most-Detailed-Wind-Resource-Data
1.4.2. Online or browser-based simulations
These tools do not require the user to download any software, but instead provide simulations
and calculations online using a web browser, and detailed information and calculations than a
solar map.
SISIFO
SISIFO is free open-source design and modelling simulation open-source design and modelling
simulation tool for grid-connected PV systems, such as large plants and building-integrated PV
(BIPV) and it was the internal tool for simulation of the Solar Energy Institute of the Universidad
Politecnica de Madrid but is now available as a web-service. It allows any user or company
carry out accurate simulations of PV systems. The tool assists PV designers and owners to
optimise PV designs and estimate revenue returns. It provides the energy yield, analysis and
breakdown of energy losses, as well as estimations of financial returns. SISIFO is completely
free.
Link: https://www.sisifo.info/en/default
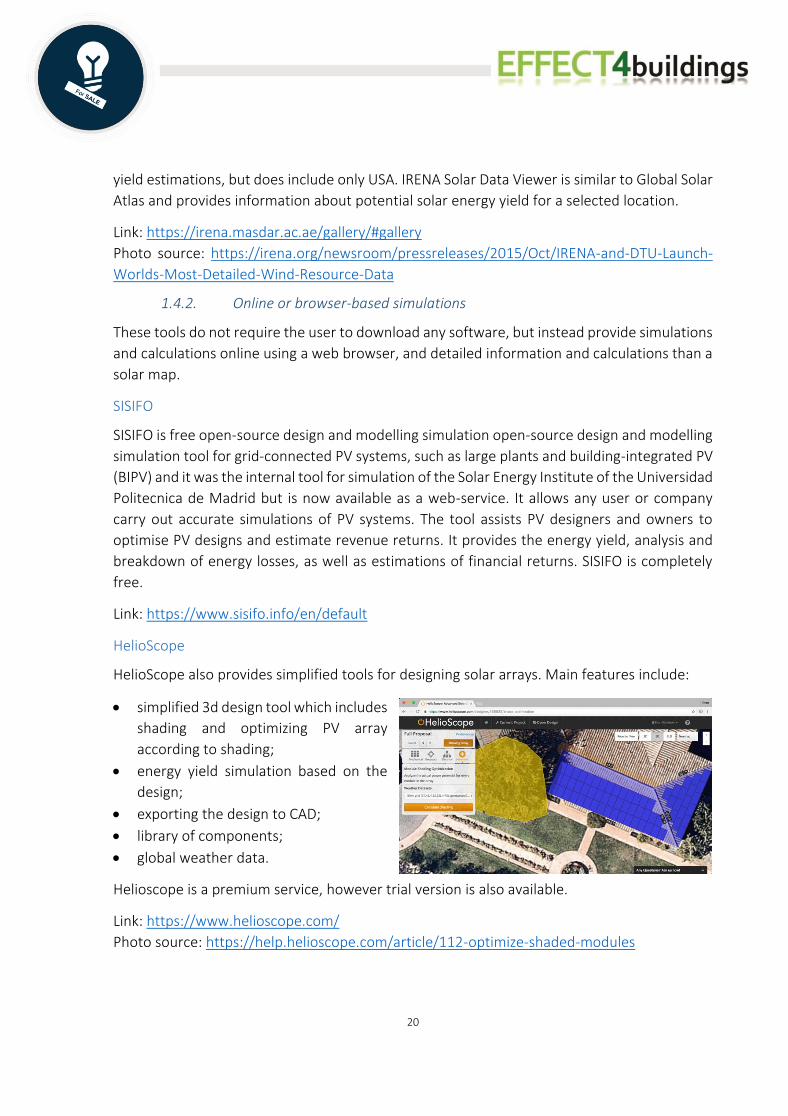
HelioScope
HelioScope also provides simplified tools for designing solar arrays. Main features include:
• simplified 3d design tool which includes
shading and optimizing PV array
according to shading;
• energy yield simulation based on the
design;
• exporting the design to CAD;
• library of components;
• global weather data.
Helioscope is a premium service, however trial version is also available.
Link: https://www.helioscope.com/
Photo source: https://help.helioscope.com/article/112-optimize-shaded-modules

21
SOLARGIS
SOLARGIS provides various services related
to solar PV. One of those is SOLARGIS
premium solar PV modelling online
platform. It is a map based simulation tool
for planning and optimisation of PV
systems by using climate and geographic
data. Additional tools and databases are
also available on the website of the
company such as PV performance
assessment tool, interactive solar maps,
solar and meteorological database as well as various APIs for automation of data flows and
evaluation of solar and PV performance in real time. SOLARGIS is a premium service, but a free
trial is also available.
Link: https://solargis.com/products/
Photo source: https://www.researchgate.net/figure/Global-irradiance-distribution-source-
wwwsolargiscom_fig2_322690355
PVP calculator
PV-Prosumers4Grid (PVP4Grid) is an EU-funded project, which involves 12 partners from
various European countries. They do not offer typical solar PV software, but provide additional
calculation tool for prosumers in order to determine, if solar PV is profitable for them at all.
This tool helps prosumers to get an economic assessment of their PV projects comparing the
cost of PV electricity per kilowatt-hour (kWh) with the current grid electricity and heat
generation costs, in order to estimate the financial viability of installing a PV system.
Unfortunately, the tool is only available only for partner countries. However, the project also
aims to develop detailed guidelines for Prosumers and Distributed System Operators (DSO´s),
as well as policy recommendations for national and European policy makers, specifically on
how to achieve suitable regulatory framework for prosumption.
Link: https://www.pvp4grid.eu/cmt/
1.4.3. Online or browser based simulations with premium downloadable software
These tools also provide similar functions as ones mentioned previously, but are available as
simplified versions of similar premium tools.
22
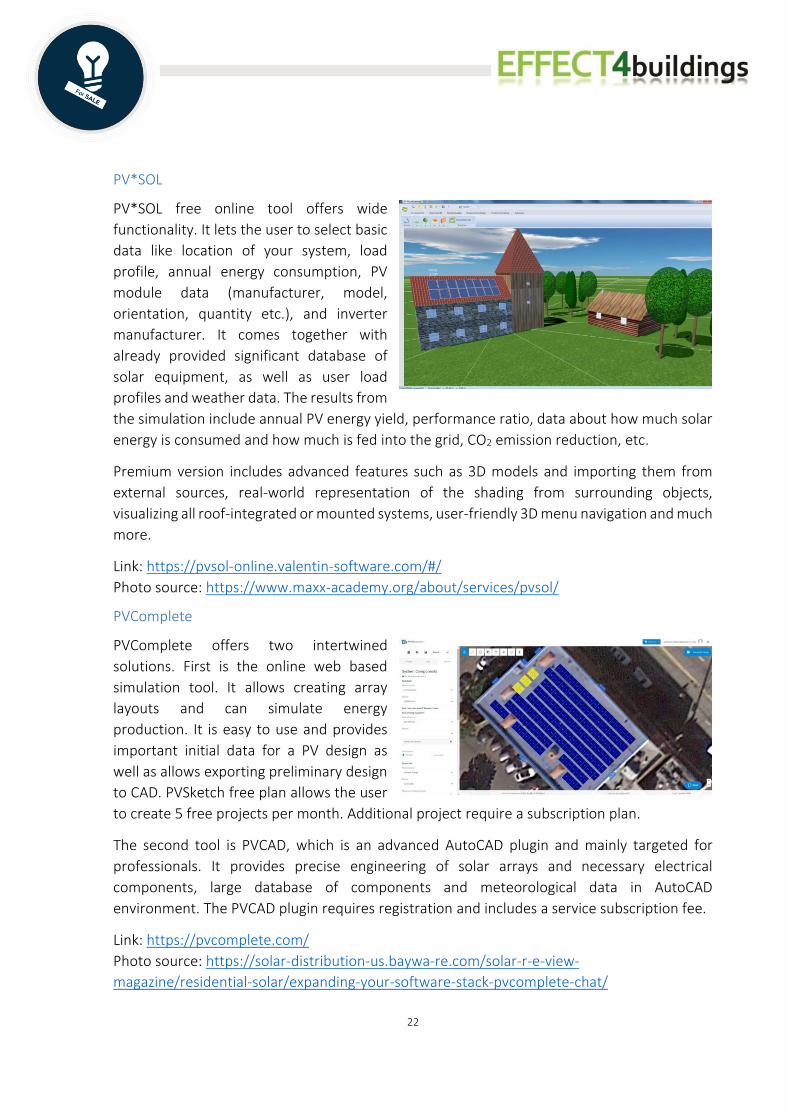
PV*SOL
PV*SOL free online tool offers wide
functionality. It lets the user to select basic
data like location of your system, load
profile, annual energy consumption, PV
module data (manufacturer, model,
orientation, quantity etc.), and inverter
manufacturer. It comes together with
already provided significant database of
solar equipment, as well as user load
profiles and weather data. The results from
the simulation include annual PV energy yield, performance ratio, data about how much solar
energy is consumed and how much is fed into the grid, CO2 emission reduction, etc.
Premium version includes advanced features such as 3D models and importing them from
external sources, real-world representation of the shading from surrounding objects,
visualizing all roof-integrated or mounted systems, user-friendly 3D menu navigation and much
more.
Link: https://pvsol-online.valentin-software.com/#/
Photo source: https://www.maxx-academy.org/about/services/pvsol/
PVComplete
PVComplete offers two intertwined
solutions. First is the online web based
simulation tool. It allows creating array
layouts and can simulate energy
production. It is easy to use and provides
important initial data for a PV design as
well as allows exporting preliminary design
to CAD. PVSketch free plan allows the user
to create 5 free projects per month. Additional project require a subscription plan.
The second tool is PVCAD, which is an advanced AutoCAD plugin and mainly targeted for
professionals. It provides precise engineering of solar arrays and necessary electrical
components, large database of components and meteorological data in AutoCAD
environment. The PVCAD plugin requires registration and includes a service subscription fee.
Link: https://pvcomplete.com/
Photo source: https://solar-distribution-us.baywa-re.com/solar-r-e-view-
magazine/residential-solar/expanding-your-software-stack-pvcomplete-chat/

23
1.4.4. Installable simulation software
Last type of calculation and simulation tools, which also provide the most detailed results, are
simulation tools. Most of this software requires purchasing a license.
iDistributedPV
iDistributedPV is an international project funded by the European Union under the H2020
programme and is specifically focused on helping prosumers. It is still in progress, but
guidelines and a simulation tool is already available for downloading without any additional
cost and is not constrained only to the project partner countries.
The Prosumer Tool allows user to perform solar PV simulation based on input data. Solar
radiation profile can be imported for the selected location from PVGIS database. The tool also
provides few demand profiles, which can be used for the simulation, for example household
or office building. Other user specified data include electricity tariff, electricity market
framework, panels and inverters, storage system and simulation parameters. However, in this
case, no database of components is provided and the data must be added manually. The tool
provides two types of simulation outputs. First, informative graphs such as estimated energy
production profile, battery usage as well as energy sold and bought from the grid based on
demand profiles. Other data include economic outputs, technical outputs, environmental
outputs and many other indicators.
Link: http://www.idistributedpv.eu/prosumer-tool/
PVsyst
PVsyst offers similar simulation capabilities
as previously mentioned software the main
difference is that it can perform two types
of simulations – simplified preliminary
design simulation for grid connected,
stand-alone and pumping PV systems and
detailed project design simulation starting
from system design and sizing. It also
includes storage simulation, database of
components and meteorological data as
well as ageing simulation. The user can also input custom metrological and PV panel data
according to a given set of parameters. Software also includes 3D shading scene, which allows
basic shading simulation.
Link: https://www.pvsyst.com/
Photo source: https://www.civilax.com/pvsyst-v6-6-8/pvsyst-v6-6/

24
BlueSol
BlueSol is also a very powerful PV
simulation software. The entire process of
designing a PV system, starting from the
preliminary assessment of productivity to
the realization of the project
documentation can be carried out in this
software. BlueSol uses a standard
Microsoft interface and manages every
detail of the PV system. The preliminary
design and pre-dimensioning of the also
the electrical components can be carried
out over map in 3D view. It also includes expandable database of components, includes
weather and solar irradiation map support, provides energy as well as economic evaluation
and supports exporting of the design to DWG and editing using CAD tools.
Link: http://www.bluesolpv.com/dnnsite/Home.aspx
Photo source: http://www.bluesolpv.com/dnnsite/Products/BlueSolDesign.aspx
POLYSUN
Polysun provides variety of premium simulation software for solar PV energy as well as for
solar thermal energy. The solar PV package provides complete PV simulation:
• PV rooftop planner;
• energy yield forecasts;
• large database of components;
• inverter lay-out and system comparison;
• calculate self-consumption from load profiles,
battery and e-mobility;
• explore optimization possibilities.
Polysun is the most advanced software package allows user to design holistic energy systems
as well as simulate various external control algorithms and manually set the time steps. There
are also more than 1000 energy concept templates available, which also include large-scale
installations.
Link: https://www.velasolaris.com/?lang=en
Photo source: https://www.downloadcollection.com/polysun.htm

25
Solar Pro
Solar Pro offers its users robust PV design and energy simulation, with an integrated 3D-CAD
shading scene, which allows visualizing shading on a minute-by-minute basis. It is one of the
most precise solar PV simulation tools currently available. Full list of features includes:
• precise 3D and shading analysis;
• site selection and system sizing;
• accurate energy yield calculations;
• design optimization;
• database of components;
• support for all popular weather data formats;
• detailed and customized report generation.
Solar Pro is a premium software and requires purchasing a license.
Link: https://www.lapsys.co.jp/english/products/where_to_buy/index.html
1.4.5. Guidelines and best practice examples
PERFORMANCE PLUS
Performance Plus is project funded by the European Union’s Seventh Framework Programme
and its main aims are to develop tools for PV system monitoring, controlling and testing, all of
which can be useful for prosumers once they have become prosumers. There even have been
tools developed for on-site PV testing and monitoring. However, what might be of more
interest to an upcoming prosumer, are the extensive guidelines on best practices for optimal
PV performance starting from PV plant design as well as plant operation, performance
optimization and control.
Link: http://www.perfplus.eu/
PVTRIN (Training of Photovoltaic Installers)
The PVTRIN (Training of Photovoltaic Installers) is an EU project with the main goal to develop
a training and certification scheme for small-scale PV system technicians. However, there are
also several materials available for everyone on the website like checklists and practical tips on
PV installation and maintenance, catalogue of common failures and improper practices on PV
installations as well as the full handbook for trainees.
Link:
http://pvtrin.eu/en/publications_1/index.html#Installing%20Photovoltaics%20%E2%80%93%
20Practical%20aspects%20for%20installers

26
Solar Bankability
Solar Bankability project has been funded with the help of European Union's Horizon 2020
research and innovation programme and has produced various reports of interest for
prosumers. For example, report on Financial Modelling of Technical Risks in PV Projects as well
as Best Practice guidelines for PV cost calculation, etc. One of the main objectives of the project
is to establish a common practice for professional risk assessment, which is rooted in strong
technical and commercial diligence. It is focused is on photovoltaic (PV) installations projects,
with emphasis on rooftop installations as well as on prosumers, which generate and consume
their own electricity, and to help them find financing solutions with help from professional
investors. Project also provides detailed best practice checklist and matrix as well as levelled
cost of energy sensitivity tool for selected countries.
Link: http://www.solarbankability.org/home.html
IEA Solar Heating & Cooling Technology Collaboration Programme
This programme of International Energy Agency has produced variety of materials of interest
for solar energy utilisation. These include various reports and materials. One that might be
useful for prosumers is the website of innovative solar products for building integration. This
website can provide useful information about innovative products and possibilities about PV
product integrated in buildings.
Link: https://www.solarintegrationsolutions.org/index.php?page=photovoltaics
PV database
PV database is an online collection of building integrated and urban photovoltaic solar energy
projects and products. The website displays urban PV projects, best practice examples, PV
communities.
Link: http://www.pvdatabase.org/index.php
27
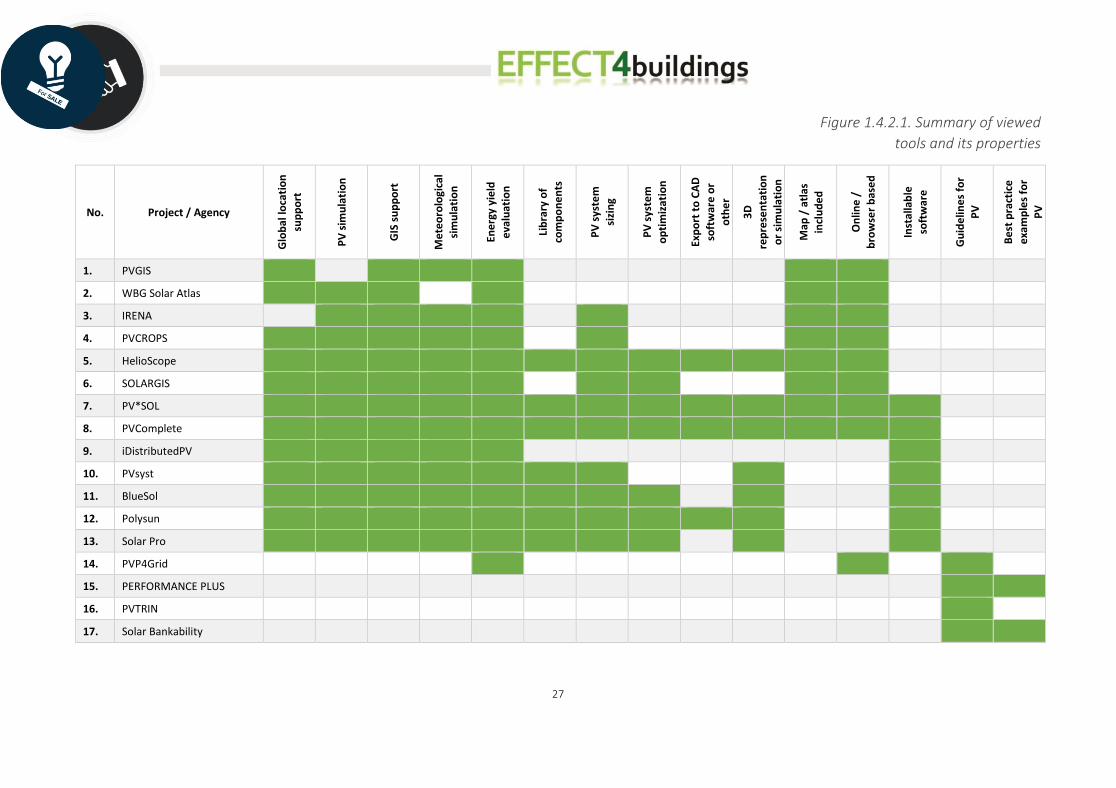
Figure 1.4.2.1. Summary of viewed
tools and its properties
No. Project / Agency
Glo
bal
loca
tio
n
sup
po
rt
PV
sim
ula
tio
n
GIS
su
pp
ort
Me
teo
rolo
gica
l
sim
ula
tio
n
Ene
rgy
yie
ld
eva
luat
ion
Lib
rary
of
com
po
ne
nts
PV
sys
tem
sizi
ng
PV
sys
tem
op
tim
izat
ion
Exp
ort
to
CA
D
soft
war
e o
r
oth
er
3D
rep
rese
nta
tio
n
or
sim
ula
tio
n
Map
/ a
tlas
incl
ud
ed
On
line
/
bro
wse
r b
ase
d
Inst
alla
ble
soft
war
e
Gu
ide
line
s fo
r
PV
Be
st p
ract
ice
exa
mp
les
for
PV
1. PVGIS
2. WBG Solar Atlas
3. IRENA
4. PVCROPS
5. HelioScope
6. SOLARGIS
7. PV*SOL
8. PVComplete
9. iDistributedPV
10. PVsyst
11. BlueSol
12. Polysun
13. Solar Pro
14. PVP4Grid
15. PERFORMANCE PLUS
16. PVTRIN
17. Solar Bankability
28
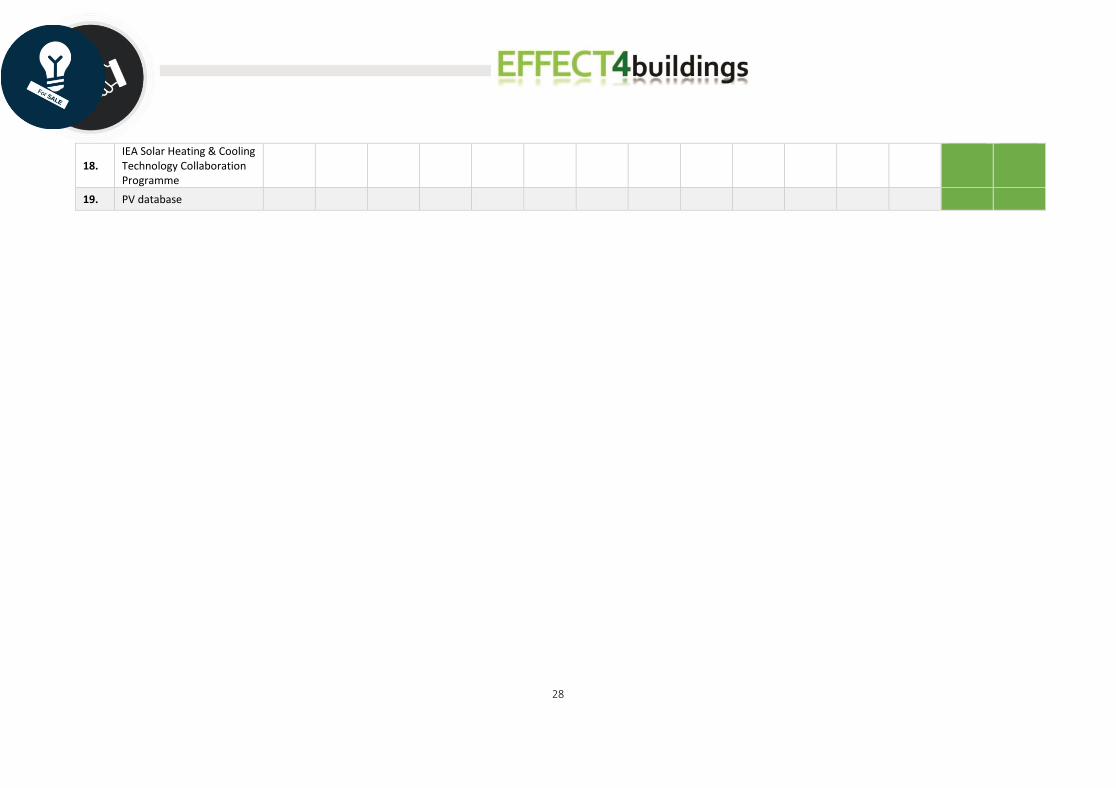
18. IEA Solar Heating & Cooling Technology Collaboration Programme
19. PV database
29
2. PV market trends and costs Sunlight has by far the highest theoretical potential of the earth’s renewable energy sources.
Solar energy systems/power plants do not produce air pollution, water pollution, or
greenhouse gases providing cleaner renewable energy and have a cooling effect on the land
where they are installed. Improve independency from fossil fuels. Solar panels, by shading of
the roof, slightly increase the need for domestic heating (3%). However, in summer the solar
panels reduce the energy needed for air-conditioning (by 12%), thanks to the shading of the
roof.10, 11
Solar technology has existed since the 19th century and from then it has come a long way.
Efficiency of solar cells have increased from less than 1% to between 15% and 18%, costs have
decreased from $300 per watt to as low as $0.50 per watt. 12,13, 14
Table 2.1.
History of PV technology
10 https://www.ucsusa.org/clean_energy/our-energy-choices/renewable-energy/environmental-impacts-solar-power.html 11 https://www.frontiersin.org/articles/10.3389/fenvs.2014.00014/full 12 https://www.aps.org/publications/apsnews/200904/physicshistory.cfm 13 https://www.instituteforenergyresearch.org/renewable/solar/history-of-solar-power/ 14 https://www.vivintsolar.com/blog/history-of-solar-energy
1839 Photovoltaic effect, a physical and chemical phenomenon when a small electric
current is produced in a material when exposed to light, is discovered.
1873 Photoconductivity of selenium, meaning that it can function as a
photoconductor, is discovered.
1876 Photovoltaic principle is applied to selenium.
1883 The first solar cells from selenium are made. They are less than one percent efficient at converting sunlight to electricity and cost around $300 per watt.
1954 A more practical solar cell is created using silicon with around 4 percent efficiency. After many improvements to the design, efficiency is raised to 11 percent. Several solar cells are linked together to create a solar battery with about 6 percent efficiency.
1959 10 percent efficiency for solar batteries is achieved.
30
2.1. Global installed capacity trends
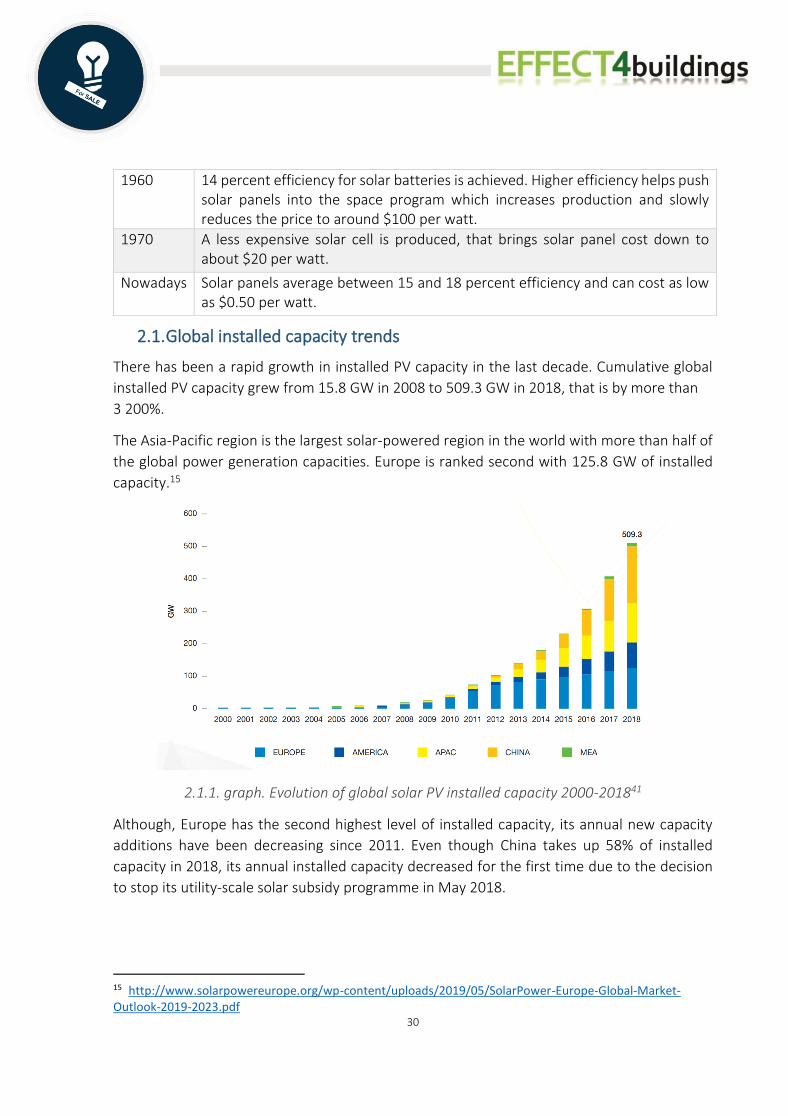
There has been a rapid growth in installed PV capacity in the last decade. Cumulative global
installed PV capacity grew from 15.8 GW in 2008 to 509.3 GW in 2018, that is by more than
3 200%.
The Asia-Pacific region is the largest solar-powered region in the world with more than half of
the global power generation capacities. Europe is ranked second with 125.8 GW of installed
capacity.15
2.1.1. graph. Evolution of global solar PV installed capacity 2000-201841
Although, Europe has the second highest level of installed capacity, its annual new capacity
additions have been decreasing since 2011. Even though China takes up 58% of installed
capacity in 2018, its annual installed capacity decreased for the first time due to the decision
to stop its utility-scale solar subsidy programme in May 2018.
15 http://www.solarpowereurope.org/wp-content/uploads/2019/05/SolarPower-Europe-Global-Market-Outlook-2019-2023.pdf
1960 14 percent efficiency for solar batteries is achieved. Higher efficiency helps push solar panels into the space program which increases production and slowly reduces the price to around $100 per watt.
1970 A less expensive solar cell is produced, that brings solar panel cost down to about $20 per watt.
Nowadays Solar panels average between 15 and 18 percent efficiency and can cost as low as $0.50 per watt.

31
2.1.2. graph. Evolution of global annual solar PV installed capacity 2000-201841
Europe’s total installed solar PV capacity reached 125.8 GW in 2018. Germany is the largest
solar power plant operator in Europe with 45.9 GW of total installed capacity that takes up
36.5%, followed by Italy with 19.9 GW (15.8%).
2.1.3. graph. European total solar PV installed capacity 2000-201841
32
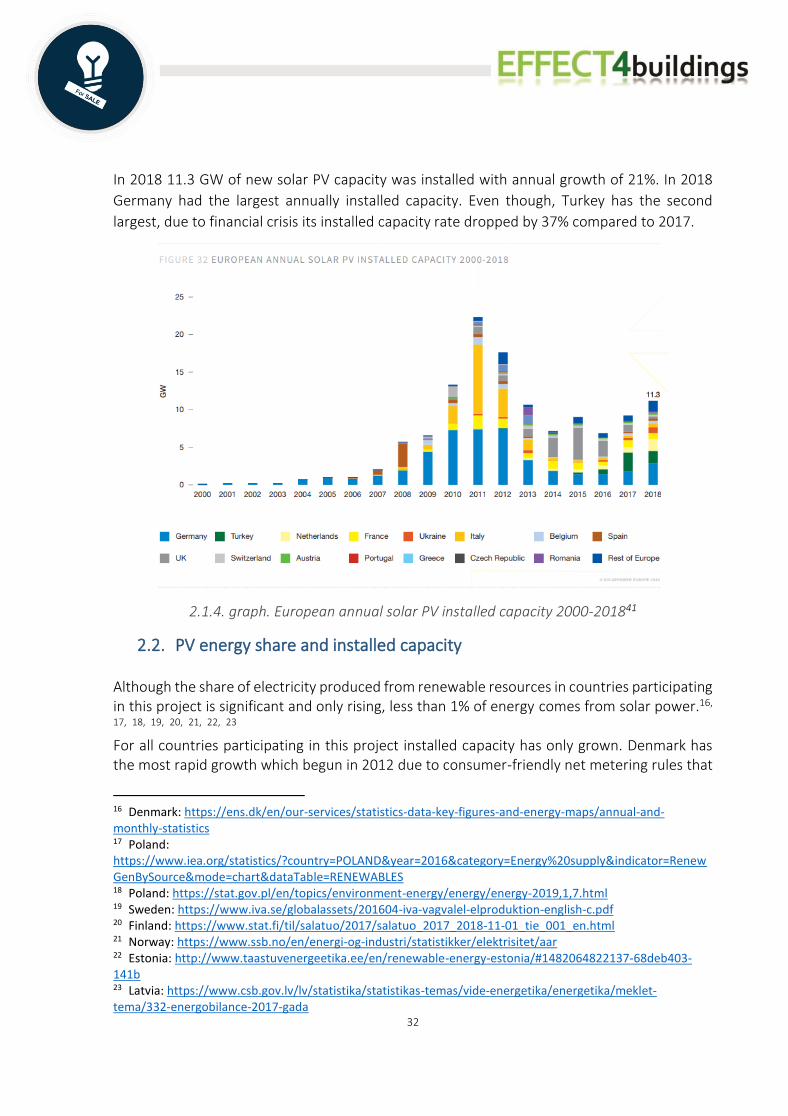
In 2018 11.3 GW of new solar PV capacity was installed with annual growth of 21%. In 2018
Germany had the largest annually installed capacity. Even though, Turkey has the second
largest, due to financial crisis its installed capacity rate dropped by 37% compared to 2017.
2.1.4. graph. European annual solar PV installed capacity 2000-201841
2.2. PV energy share and installed capacity
Although the share of electricity produced from renewable resources in countries participating in this project is significant and only rising, less than 1% of energy comes from solar power.16,
17, 18, 19, 20, 21, 22, 23
For all countries participating in this project installed capacity has only grown. Denmark has the most rapid growth which begun in 2012 due to consumer-friendly net metering rules that
16 Denmark: https://ens.dk/en/our-services/statistics-data-key-figures-and-energy-maps/annual-and-monthly-statistics 17 Poland: https://www.iea.org/statistics/?country=POLAND&year=2016&category=Energy%20supply&indicator=RenewGenBySource&mode=chart&dataTable=RENEWABLES 18 Poland: https://stat.gov.pl/en/topics/environment-energy/energy/energy-2019,1,7.html 19 Sweden: https://www.iva.se/globalassets/201604-iva-vagvalel-elproduktion-english-c.pdf 20 Finland: https://www.stat.fi/til/salatuo/2017/salatuo_2017_2018-11-01_tie_001_en.html 21 Norway: https://www.ssb.no/en/energi-og-industri/statistikker/elektrisitet/aar 22 Estonia: http://www.taastuvenergeetika.ee/en/renewable-energy-estonia/#1482064822137-68deb403-141b 23 Latvia: https://www.csb.gov.lv/lv/statistika/statistikas-temas/vide-energetika/energetika/meklet-tema/332-energobilance-2017-gada

33
were implemented in 2010 and offered a generous return from electricity sold to the grid. 2012 was the Danish PV boom year, comparing to the previous year it had a 2 342% growth. And since then it has been a declining market. Main reasons for this declining market trend are a series of abrupt political initiatives since 2013 to hinder the PV market development. In 2018 the cumulative installed PV capacity was 998 MW.24, 25
Poland’s, Sweden’s and Finland’s growths are exponential. In 2018 Poland had a 70% rise in installed solar PV capacity compared to 2017, the cumulative installed PV capacity reached 486.5 MW. For Sweden the rise was a bit smoother, in 2018 cumulative installed PV capacity has reached around 421 MW. Finland’s installed capacity is significantly less and was steady for a long time. It is because the PV marked in Finland consisted almost only of small off-grid systems. In 2010 the number of grid-connected systems started to increase, but the growth is slow for there is no economic potential for utility-scale PV systems for grid electricity generation. The cumulative installed PV capacity for Finland in 2018 reached 124.7 MW.26, 27,
28, 29
Because of low prices for retail electricity and the weak and fragmented support-schemes for PV, growth in installed PV power in Norway is very low and slow. The main driver for growth is the high environmental goals set by property developers who want to achieve energy efficient buildings or operations to reduce the amount of energy needed from the grid. The cumulative installed PV capacity for Norway in 2018 was 68.4 MW30
Estonia and Latvia have the least growth. Cumulative installed capacity in 2018 for Estonia was 11,04 MW and for Latvia 1,19 MW.31
The biggest reasons for installed capacity growth are the significant drop in module prices,
installation costs and the increase in energy prices. Growth is amplified using government
policies, subsidies and other support systems. The opposite, meaning lack of governmental
support and other factors, discourage consumers to implement PV systems.
More precise numbers for cumulative installed solar PV capacity can be found in graph and
table 2.2.1.
24 National Survey Reports of Photovoltaic Applications in Denmark 2017, 2016 25 https://www.forbes.com/sites/justingerdes/2012/11/30/denmark-moves-to-cool-its-red-hot-solar-energy-market/#dee26592cbeb 26 https://www.pv-magazine.com/2018/10/18/solar-not-coal-can-stop-hike-in-electricity-prices-in-poland/ 27 http://renewablemarketwatch.com/news-analysis/273-poland-solar-photovoltaic-pv-market-development-perspective-and-opportunities-in-2019 28 National Survey Report of PV Power Applications in Sweden 2016 29 National Survey Report of Photovoltaic Applications in Finland 2017 30 https://teknologiradet.no/en/the-solar-revolution-and-what-it-can-mean-for-norway/ 31 http://www.ast.lv/en/electricity-market-review?year=2018&month=13

34
2.2.1. graph. Cumulative installed capacity (MW) 52. – 57.
Table 2.2.1. Cumulative installed solar PV capacity from 2010 till 2011 for specific countries
0
100
200
300
400
500
600
700
800
900
1000
1100
2010 2011 2012 2013 2014 2015 2016 2017 2018
MW
Norway Finland Estonia Latvia Denmark Poland Sweden
Year 2010 2011 2012 2013 2014 2015 2016 2017
Country Solar PV capacity MW
Norway 9,1 9,5 10 10,6 12,8 15,3 26,7 44,9
Finland 7 7 8 9 11 20 37 80
35
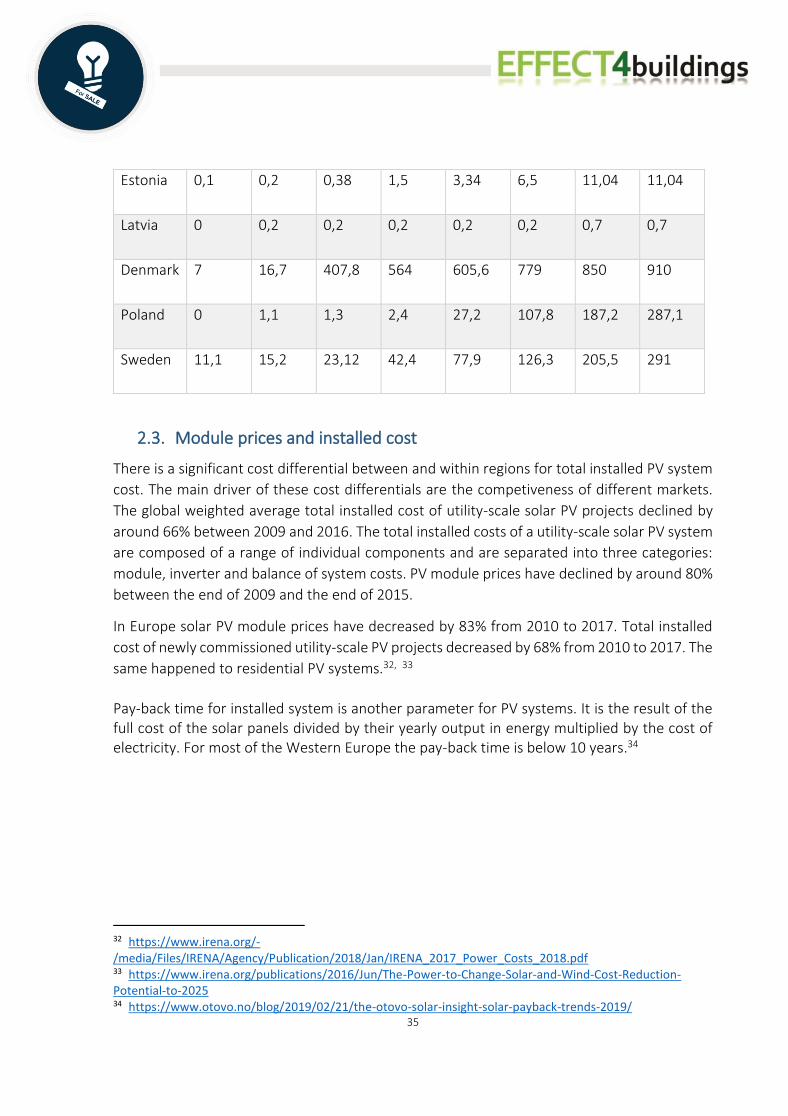
2.3. Module prices and installed cost
There is a significant cost differential between and within regions for total installed PV system
cost. The main driver of these cost differentials are the competiveness of different markets.
The global weighted average total installed cost of utility-scale solar PV projects declined by
around 66% between 2009 and 2016. The total installed costs of a utility-scale solar PV system
are composed of a range of individual components and are separated into three categories:
module, inverter and balance of system costs. PV module prices have declined by around 80%
between the end of 2009 and the end of 2015.
In Europe solar PV module prices have decreased by 83% from 2010 to 2017. Total installed
cost of newly commissioned utility-scale PV projects decreased by 68% from 2010 to 2017. The
same happened to residential PV systems.32, 33
Pay-back time for installed system is another parameter for PV systems. It is the result of the full cost of the solar panels divided by their yearly output in energy multiplied by the cost of electricity. For most of the Western Europe the pay-back time is below 10 years.34
32 https://www.irena.org/-/media/Files/IRENA/Agency/Publication/2018/Jan/IRENA_2017_Power_Costs_2018.pdf 33 https://www.irena.org/publications/2016/Jun/The-Power-to-Change-Solar-and-Wind-Cost-Reduction-Potential-to-2025 34 https://www.otovo.no/blog/2019/02/21/the-otovo-solar-insight-solar-payback-trends-2019/
Estonia 0,1 0,2 0,38 1,5 3,34 6,5 11,04 11,04
Latvia 0 0,2 0,2 0,2 0,2 0,2 0,7 0,7
Denmark 7 16,7 407,8 564 605,6 779 850 910
Poland 0 1,1 1,3 2,4 27,2 107,8 187,2 287,1
Sweden 11,1 15,2 23,12 42,4 77,9 126,3 205,5 291

36
2.3.1 graph. Global weighted average utility-scale solar PV total installed costs, 2009-202559
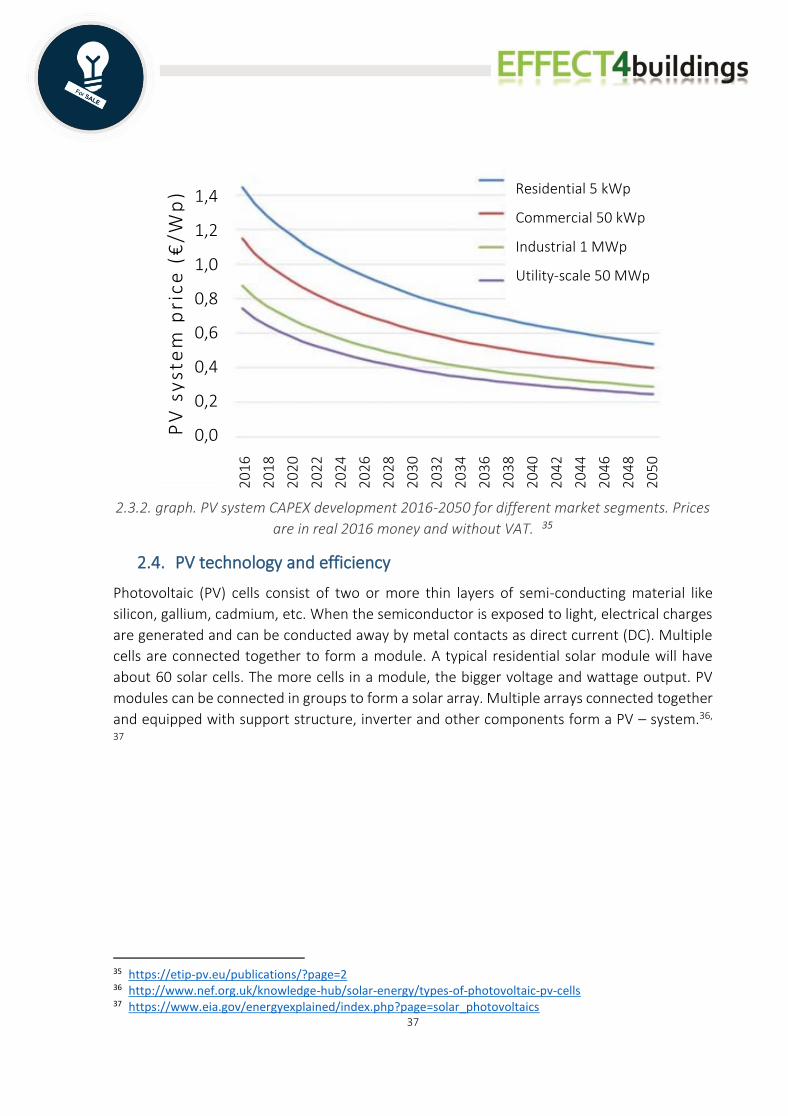
Report “The true competitiveness of solar PV: A European case study” by European Technology
& Innovation Platform for Photovoltaics (ETIP PV), mentions average capital expenditure
(CAPEX) for 4 kinds of PV systems: Residential (5 kWp), Commercial (50 kWp), Industrial 1 MWp)
and Utility-scale (50 MWp). The capital investment of a PV system consists of two components:
the PV modules and the Balance of System (BoS), which includes e.g. mounting structures,
cabling, inverters, transformers and other electrical components, grid connection,
infrastructure, installation work, planning, documentation and other work. Results can be seen
in Figure 2.3.2.
37
2.3.2. graph. PV system CAPEX development 2016-2050 for different market segments. Prices
are in real 2016 money and without VAT. 35
2.4. PV technology and efficiency
Photovoltaic (PV) cells consist of two or more thin layers of semi-conducting material like
silicon, gallium, cadmium, etc. When the semiconductor is exposed to light, electrical charges
are generated and can be conducted away by metal contacts as direct current (DC). Multiple
cells are connected together to form a module. A typical residential solar module will have
about 60 solar cells. The more cells in a module, the bigger voltage and wattage output. PV
modules can be connected in groups to form a solar array. Multiple arrays connected together
and equipped with support structure, inverter and other components form a PV – system.36,
37
35 https://etip-pv.eu/publications/?page=2 36 http://www.nef.org.uk/knowledge-hub/solar-energy/types-of-photovoltaic-pv-cells 37 https://www.eia.gov/energyexplained/index.php?page=solar_photovoltaics
Residential 5 kWp
Commercial 50 kWp
Industrial 1 MWp
Utility-scale 50 MWp
PV
sy
ste
m p
ric
e (
€/W
p)
20
16
20
18
20
20
20
22
20
24
20
26
20
28
20
30
20
32
20
34
20
36
20
38
20
40
20
42
20
44
20
46
20
48
20
50
1,4
1,2
1,0
0,8
0,6
0,4
0,2
0,0

38
2.4.1. graph. PV - system
2.4.1. Types of solar panels
There exists a wide sort of solar cells in the market from crystalline silicon cells to thin layer
cells. Available in different sizes, appearance, colour and efficiencies. 38, 39. 40
38 http://www.nef.org.uk/knowledge-hub/solar-energy/types-of-photovoltaic-pv-cells
39 https://freedomsolarpower.com/blog/types-of-solar-panels
40 http://www.alternative-energy-tutorials.com/solar-power/photovoltaic-types.html
Solar cell
Solar module
Electricity meter
AC Isolator
Fusebox
Inverter
Battery
Charger controller
Generation meter
DC isolator
Cabling
Mounting
Tracking system
PV - system
Solar array

39
Crystalline silicon cells
Polycrystalline
Monocrystalline
Thin film cells
Thin film silicon
Cadmium-teluride cells
Copper-indium diselenide cells
Amorphous
Microcrystalline
Hybrid cells
3.1.1. graph. PV technologies41, 42. 43
1. Monocrystalline silicon PV panels Made using cells sliced from a single cylindrical crystal of silicon. Considered the most efficient photovoltaic technology, with average efficiency range: 15%-24%. Ideal for smaller rooftops and has a proven track record of durability. Manufacturing process required to produce monocrystalline silicon is complicated, so cost is slightly higher than for other technologies. Production generates more waste in the manufacturing process.
41 http://www.nef.org.uk/knowledge-hub/solar-energy/types-of-photovoltaic-pv-cells
42 https://freedomsolarpower.com/blog/types-of-solar-panels
43 http://www.alternative-energy-tutorials.com/solar-power/photovoltaic-types.html

40
2. Polycrystalline silicon PV panels Made from cells cut from an ingot of melted and recrystallised silicon. The ingots are then saw-cut into very thin wafers and assembled into complete cells. Average efficiency range: 12%-16%, but generally cheaper to produce and has less silicon waste in the manufacturing process.
3. Thin film silicon PV panels Produced by printing or spraying a thin semiconductor layer of PV material onto a glass, metal or plastic foil substrate. By applying these materials in thin layers, the overall thickness of each photovoltaic cell is substantially smaller than an equivalent cut crystalline cell. Average efficiency range: 7%-13%. Low cost, easy to produce, flexible, portable, and lightweight, which makes it ideal for curved surfaces or bonding directly onto roofing materials. They are expected to be less durable and to have a shorter lifespan. Semiconductor materials used for the thin film types of photovoltaic cell include: Cadmium Telluride, Amorphous Silicon and Copper Indium diSelenide or CIS.
4. Cadmium Telluride, (CdTe) is a poly-crystalline semiconductor material made from cadmium and tellurium. Has a high light absorption level so the amount required can be quite minimal with less than 1.0 microns of semiconductor material needed to effectively absorb sunlight for the solar device to perform. Although it is cheap to apply, the main material, cadmium is a toxic heavy metal that can pollute the environment if the cell is damaged or broken. Panels have low conversion efficiency - less than 10%. 5. Copper Indium diselenide, (CIS) is a type of poly-crystalline semiconductor material composed of copper, Indium and Selenium, (CuInSe2). A cell can produce conversion efficiencies of nearly 10%, but without suffering from the same outdoor degradation problems due to their thicker film. Although CIS cells are efficient, the complexity of the formulation of the semiconductor compound makes them difficult to manufacture and expensive. 6. Amorphous Silicon, (a-Si) is a non-crystalline form of silicon that has the highest light absorption of over 40 times higher than crystalline silicon. Meaning a much thinner layer of amorphous silicon material is required, reducing manufacturing costs and price. It is widely

41
used in calculators, consumer electronics and solar garden products that require a small current at a low voltage. Has a very low conversion efficiency ranging from between 7 to 9%.
2.4.2. General solar PV set up
Photovoltaics (PV) systems can be grouped in stand-alone and grid-connect systems. Their
application ranges from small systems used for the electrification of rural area (few kW) to
utility scale applications.
3.2.1. graph. Stand-alone and grid connected systems
2.4.3. PV module rating
PV modules are rated at standard test conditions – STC. Different modules can be compared
using gathered ratings. Standard test conditions include irradiance of 1000W/m2, temperature
of 25C and air mass coefficient AM 1.5. Gathered ratings include maximum power (Pmax),
maximum voltage (Vpmax), maximum current (Ipmax), open circuit voltage (Voc) and short
circuit current (Isc).
2.5. PV module efficiency
Conversion efficiency can also be used to rate a module. It is the percentage of the solar energy
shining on a PV device that is converted into usable electricity. There are many factors that
contributing to efficiency. Panels themselves introduce factors that affect the conversion
efficiency. Also, the position and the surrounding environment has an effect.

42
2.5.1. Solar irradiation and orientation
Efficiency of a module is affected by its
location’s irradiation. Solar irradiance is the
power of solar radiation per unit surface
area, for example irradiation of 1000
kWh/m² means that sun shines on a 1m2
area with 1000kWh power over a one-year
period. Solar radiation is affected by
modules location and orientation.
Orientation includes its tilt angle and
orientation with respect to the horizontal
plane. PV modules generate the maximum
amount of power when they are directly
facing the sun. Solar trackers were
invented in order to adjust the orientation
of solar panels to follow the sun`s
trajectory throughout the day. 44, 45
2.4.5.1. graph. Solar radiation map for northern Europe
44 ReaserchGate / Effect of Tilt Angle Orientation on Photovoltaic Module Performance 45 https://energyinformative.org/solar-panel-efficiency/

43
2.5.2. Reflection
A certain fraction of incident light bounces off the surface of the cell without encountering an
electron. The less light is reflected away from the cell’s surface the higher the cell’s efficiency.
For example, untreated silicon reflects more than 30% of incident light. Anti-reflection coatings
and textured surfaces help decreases reflection. A high-efficiency cell appears dark blue or
black. 46, 47
2.5.3. Shade
Shading can have a huge impact on the performance of solar photovoltaic panels. Solar photovoltaic panels consist of a number of solar photovoltaic cells that are wired together into a series circuit. Meaning when the power output of a single cell is significantly reduced, the power output for the whole system in series is reduced to the level of current passing through the weakest cell. Therefore, a small amount of shading can significantly reduce the performance of entire solar photovoltaic panels system. Micro-inverters and professional solar panel installers that take in consideration thorough analysis of shading in your specific situation can offer a possible solution to shading issues. 48, 49
2.5.4. Temperature
Solar cell performance decreases with increasing temperature. Both the electrical efficiency
and the power output of a photovoltaic (PV) module depend linearly on the operating
temperature. Higher temperatures cause the semiconductor properties to shift, resulting in a
slight increase in current, but a much larger decrease in voltage. PV modules with less
sensitivity to temperature are preferable for the high temperature regions and those more
responsive to temperature for low temperature regions. Also, professional installers can make
sure that the solar panels are positioned to receive sufficient amounts of airflow to induce
natural cooling and helps keeping the efficiency rates up. 50,
2.6. Solar energy accumulation
Usually residential solar energy systems are connected to the electricity grid, without
accumulation the extra electricity that is produced but is not needed is fed back into the power
grid. Solar batteries are made to store extra solar power for later use. There are a few different
types of storage systems like Hybrid inverter, AC Coupled and DC Coupled solutions.
46 https://sciencing.com/effect-wavelength-photovoltaic-cells-6957.html 47 https://www.energy.gov/eere/solar/articles/solar-performance-and-efficiency 48 IOSR Journal of Electrical and Electronics Engineering / Effect of Shading on Photovoltaic Cell 49 https://energyinformative.org/solar-panel-efficiency/ 50 Science Direct / Temperature Dependent Photovoltaic (PV) Efficiency and Its Effect on PV Production in the World – A Review

44
DC Coupled Storage involves inserting a system between the inverter and the solar panel.
System senses when excess power is being produced and redirects it to the batteries. If you
are consuming more power than you're producing, this power is released into your inverter.
Power is stored in the batteries before it is converted into AC, saving on unnecessary
conversions later on. The system cannot draw power from the grid and store it for later use
and can't be configured to provide power in a grid outage.
AC Coupled Storage is the most common type of storage. It requires two inverters: a common
grid-tied solar inverter and a battery-based inverter. Even though AC Coupled storage is not as
efficient or as cost effective as DC coupled storage, it has significant advantages like: it can
draw power from the grid, meaning home owners can purchase power at cheaper rates. AC
coupled systems can also be configured for battery backup and can store excess solar energy,
they can work independently of solar power systems, so they're completely retrofittable and
also allow you to draw on other energy sources.
Hybrid Inverters are technically DC and AC coupled solutions, you can store power in the
battery before it is converted to AC, saving on unnecessary future conversions and you can still
incorporate features like battery backup and storing power during cheaper times.51, 52
2.7. Development/Future
All PV technologies can be divided in three generations:
2.7.1. table
Future PV technologies
51 https://www.solargain.com.au/how-battery-storage-works 52 https://storagefact.com/how-does-solar-battery-storage-work/
Description Improvements
Firs
t ge
ner
atio
n
Source: http://www.solarintegral.com/
• Fully commercial
• Wafer-based devices, like crystalline silicon
• Typically have a higher efficiency than second generation technologies, but with substantially higher cost per m2
• Improving material quality
• For example, by replacing the multi-crystalline silicon with high-performance multi crystalline silicon or monocrystalline silicon

45
2.8. Case studies around Baltic Sea region
All of the information given below is from files sent in by member states.
Sweden
The energy efficiency measures for an apartment building started in 2003. The starting point
specific energy consumption was 189 kWh/m2. Solutions:
1. 2003: heat recovery system was installed;
2. 2004: central monitoring and control system was installed;
3. 2005: new water pipes were installed;
Seco
nd
gen
erat
ion
Source: https://mercomindia.com/nbfc-crisis-financing-challenges-utility-scale-solar/
• “Conventional” thin films, like as cadmium-telluride (CdTe)
• Low material and manufacturing costs, but has lower efficiencies compared to first-generation technologies
• Improving the quality of surfaces and interfaces by using thin films for advanced surface passivation
Thir
d g
ener
atio
n
Source: https://janaloka.com/peman faatan-teknologi-sel-surya/opv/
• Advanced thin films
• Not commercialised
• With potential efficiency above the Shockley-Queisser SQ limit
• Unclear costs
• Minimise the effect of the intrinsic material quality - use as little material as possible, while still ensuring (almost) full absorption of all photons
• Focus on specific properties like ultra-light weight and flexibility, freedom of shape and size, excellent aesthetics or even partial transparency

46
4. 2009: new windows were installed;
5. 2012: 229 m2 of solar collectors and heat pumps;
6. 2016: 400 m2 of solar panels for energy generation.
The end result for 2018 specific energy consumption was 66 kWh/m2, that’s 8688 MWh in
yearly savings. Investments for solutions between 2003 and 2012 was 360 000 euro, but 400
m2 of solar panels cost 120 000 euro, calculated payback time for solar panels are 15 years.
Estonia
Solar panels for state school building operation started in 2016. First nearly-zero energy school
building in Estonia was built. Solutions:
1. 144 solar panels for electricity production with 37,4 kW nominal capacity;
2. Building managements system (BMS) for the building;
3. Rainwater is reused in toilets;
4. Low SPF and high heat recovery ventilation systems;
5. LAD-lightening system.
Total investments for the project were 5 780 235 euro, with EU Fund contribution of 4 913 200
euro. Electricity produced from solar panels are 31 080 kWh/year.
A pilot project with plans to install of up to 100 PV- solar plants with total investments
approximately 3 million euro during the years of 2019-2020.

47
6. 2018 solar panels with total power of 30 kW are installed for an office building.
PV system covers 18% of total buildings electricity consumption, produced electricity: 26 176
kWh/year.
Norway
Energy efficiency project for a university student campus of 61 000 m2 with 17 buildings.
• For one of the buildings 276 roof PV modules were installed with power 70,380 kWp;
• The oil-based energy centre was replaced with 300 kW pallets (biomass) boiler;
• Old buildings were replaced or renovated.
PV modules produced approximately 60 000 kWh/year and the biomass boiler covers 80% of
the heat demand. Total installed cost for the project were 100 000 euro.
Poland
Energy efficiency project for an indoor swimming pool started in 2016. Solutions:
1. Solar panels, power 167 kWp, area 1020 m2;
2. 3 heat pumps, power 204 kW, vertical collector (19 boreholes, 160 m depth).
Total project cost was PLN 989 092,2 (approx. 225454.74 euro), 64,51 % Co-financing by the
Swiss Contribution. Average savings from PV installation are 81,38 PLN/day (approx. 18.55
euro/day) or 179 71,57 PLN/year (approx. 4096.46 euro/year).
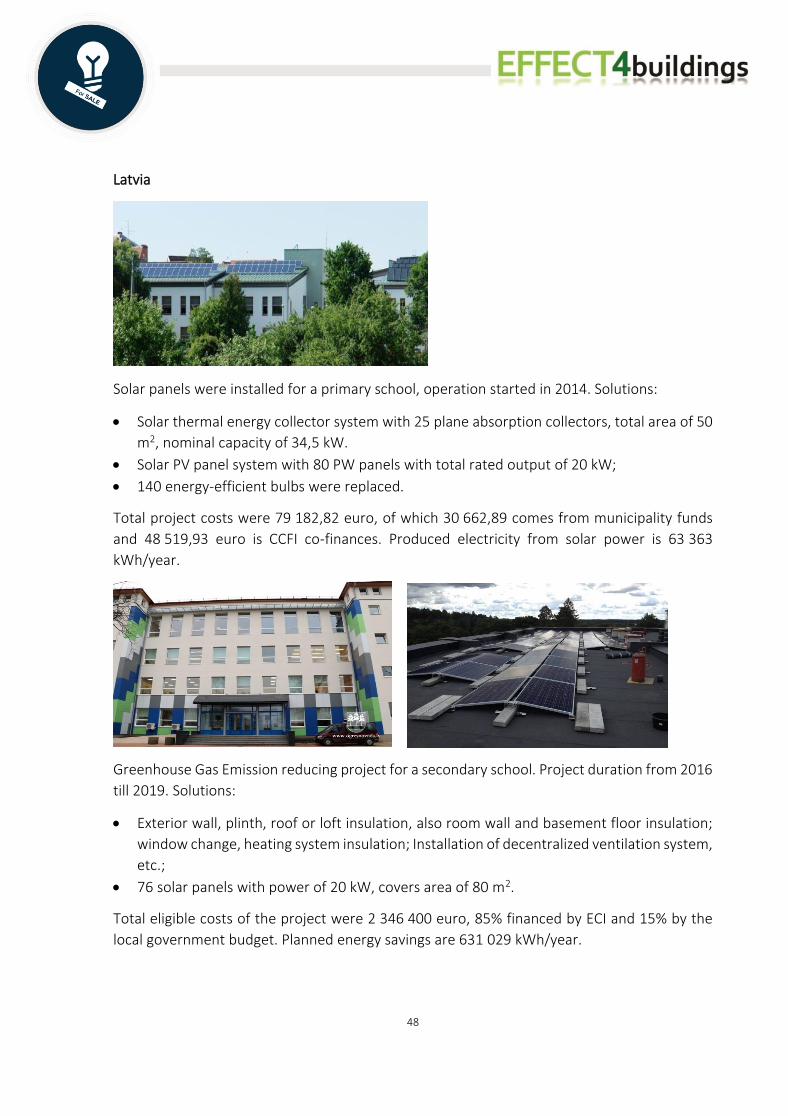
48
Latvia
Solar panels were installed for a primary school, operation started in 2014. Solutions:
• Solar thermal energy collector system with 25 plane absorption collectors, total area of 50
m2, nominal capacity of 34,5 kW.
• Solar PV panel system with 80 PW panels with total rated output of 20 kW;
• 140 energy-efficient bulbs were replaced.
Total project costs were 79 182,82 euro, of which 30 662,89 comes from municipality funds
and 48 519,93 euro is CCFI co-finances. Produced electricity from solar power is 63 363
kWh/year.
Greenhouse Gas Emission reducing project for a secondary school. Project duration from 2016
till 2019. Solutions:
• Exterior wall, plinth, roof or loft insulation, also room wall and basement floor insulation;
window change, heating system insulation; Installation of decentralized ventilation system,
etc.;
• 76 solar panels with power of 20 kW, covers area of 80 m2.
Total eligible costs of the project were 2 346 400 euro, 85% financed by ECI and 15% by the
local government budget. Planned energy savings are 631 029 kWh/year.

49
49