Urban energy planning in Tartu
63
university of copenhagen Urban energy planning in Tartu [PLEEC Report D4.2 / Tartu] Große, Juliane; Groth, Niels Boje; Fertner, Christian; Tamm, Jaanus; Alev, Kaspar Publication date: 2015 Document version Publisher's PDF, also known as Version of record Citation for published version (APA): Große, J., Groth, N. B., Fertner, C., Tamm, J., & Alev, K. (2015). Urban energy planning in Tartu: [PLEEC Report D4.2 / Tartu]. EU-FP7 project PLEEC. http://pleecproject.eu/results/documents/viewdownload/131-work- package-4/579-d4-2-urban-energy-planning-in-tartu.html Download date: 10. Jan. 2022
-
Upload
khangminh22 -
Category
Documents
-
view
0 -
download
0
Transcript of Urban energy planning in Tartu

u n i ve r s i t y o f co pe n h ag e n
Urban energy planning in Tartu
[PLEEC Report D4.2 / Tartu]
Große, Juliane; Groth, Niels Boje; Fertner, Christian; Tamm, Jaanus; Alev, Kaspar
Publication date:2015
Document versionPublisher's PDF, also known as Version of record
Citation for published version (APA):Große, J., Groth, N. B., Fertner, C., Tamm, J., & Alev, K. (2015). Urban energy planning in Tartu: [PLEECReport D4.2 / Tartu]. EU-FP7 project PLEEC. http://pleecproject.eu/results/documents/viewdownload/131-work-package-4/579-d4-2-urban-energy-planning-in-tartu.html
Download date: 10. Jan. 2022

Deliverable 4.2 / Tartu
Urban energy planning in Tartu
20 January 2015
Juliane Große (UCPH)
Niels Boje Groth (UCPH)
Christian Fertner (UCPH)
Jaanus Tamm (City of Tartu)
Kaspar Alev (City of Tartu)

page2
Abstract
MainaimofreportThepurposeofDeliverable4.2istogiveanoverviewofurbanen‐ergyplanninginthe6PLEECpartnercities.The6reportsil‐lustratehowcitiesdealwithdif‐ferentchallengesoftheurbanenergytransformationfromastructuralperspectiveincludingissuesofurbangovernanceandspatialplanning.The6reportswillprovideinputforthefollow‐ingcross‐thematicreport(D4.3).TargetgroupThemainaddresseeistheWP4‐team(universitiesandcities)whowillworkonthecross‐thematicreport(D4.3).Thereportswillalsosupportalearningprocessbetweenthecities.Further,theyarerelevantforawidergroupofPLEECpartnerstodiscusstherelationshipbetweenthethreepillars(technology,structure,behaviour)ineachofthecities.Mainfindings/conclusionsTheEstonianplanningsystemallotsthemainresponsibilitiesforplanningactivitiestothelocallevel,whereastheregionallevel(county)isratherweak.Thatimpliesagapofcoop‐erationontheregionallevel,leadingtodispersedurbandevelopmentinsuburbanmunici‐palitiesandongoingurbansprawlinthevicinityofTartu.Thisdevelopmentappearscon‐trarytotheconceptof“low‐densityurbanisedspace”asformulatedintheNationalSpatialPlan“Estonia2030+”(NSP)asthecentralspatialdevelopmentconceptforEstoniaandalsotoacompactandintensivecitydevelopmentasformulatedintheMasterPlanofTartu.SinceTartuhasnorelevantbigindustries,themainemployersarethemunicipalityandtheuniversity,energyrelatedchallengesoccurfromtransportandresidential(district)heat‐ing.ThemodalsplitshowsbigdifferencesbetweenjourneyswithinTartuandjourneysbetweenTartuanditsvicinity.Whilethefirstshowsahighshareofpublictransportandwalking,thelatterincludesahighshareofcaruse,especiallyinworkrelatedtravelling.Thisiscloselyrelatedtotheissueofongoingurbansprawlandincreasingcarownership.AlthoughtheTartuCityTransportDevelopmentPlan2012‐2020pointsveryclearlyattheweaknessesinthetransportsystemofTartu,theplanisnotaddressingcross‐borderis‐sues,likee.g.regionalcommuting.Thehighestshareofemissionsisallottedtoenergyproduction.IntermsofenergysourcesEstoniaisverymuchdependentonimportslikeoilandgasandtheEstonianelectricityproductionistomorethan90%basedonEstonianoilshale.Thus,effortstowardshigherenergyefficiency–atleastonthenationallevel–areratherdrivenbyambitionstode‐creasefueldependencythanmerelyefficiencyobjectives.ThatillustratestheneedforatransitionoftheenergysupplyandgenerationsysteminEstoniafromtwoforces:decreas‐ingfueldependencyandashifttoanincreasinguseofrenewableresources.
WP4 location in PLEEC project

page3
ActivitiescarriedoutincludingmethodologyusedAll6reportsarebasedonworkshops(Stoke‐on‐Trent,Turku),fieldwork(interviewswithstakeholders)inthecities,theanalysisoflocalreportsaswellasclosecontactwithourcitypartners.Thisismoredescribedinthemethodologychapter.ThePLEECprojectEnergyefficiencyishighontheEuropeanagenda.OneofthegoalsoftheEuropeanUnion's20‐20‐20planistoimproveenergyefficiencyby20%in2020.However,holisticknowledgeaboutenergyefficiencypotentialsincitiesisfarfromcomplete.Currently,avarietyofindividualstrategiesandapproachesbydifferentstakeholderstacklingseparatekeyaspectshindersstrategicenergyefficiencyplanning.Forthisreason,thePLEECproject–"PlanningforEnergyEfficientCities"–fundedbytheEUSeventhFrameworkProgrammeusesanintegrativeapproachtoachievethesustaina‐ble,energy–efficient,smartcity.Bycoordinatingstrategiesandcombiningbestpractices,PLEECwilldevelopageneralmodelforenergyefficiencyandsustainablecityplanning.Byconnectingscientificexcellenceandinnovativeenterprisesintheenergysectorwithambi‐tiousandwell‐organizedcities,theprojectaimstoreduceenergyuseinEuropeinthenearfutureandwillthereforebeanimportanttoolcontributingtotheEU's20‐20‐20targets.

page4
TableofContent1 Introduction......................................................................................................................................................................5
2 Methods..............................................................................................................................................................................5
3 OverviewofTartu...........................................................................................................................................................6
4 Historicalurbandevelopment................................................................................................................................11
5 Evolutionofnationalandlocalenergyplanning............................................................................................15
5.1 OverviewoftheEstonianplanningsystem............................................................................................15
5.2 Nationalenergypolicy.....................................................................................................................................16
5.3 Municipalenergypolicy..................................................................................................................................20
6 Managementofurbanplanningandenergytoday........................................................................................22
6.1 MainplanningdocumentsofTartu............................................................................................................22
6.1.1 PreviousMasterPlanofTartu2012(1999).................................................................................22
6.1.2 CurrentMasterPlanofTartu(2006)...............................................................................................24
6.1.3 TartuCityTransportDevelopmentPlan2012‐2020(2011).................................................26
6.2 Transportplanning...........................................................................................................................................29
6.3 Energyplanning.................................................................................................................................................33
6.4 Urbansprawl.......................................................................................................................................................39
7 Pilotprojects..................................................................................................................................................................42
7.1 Pedestrianandbicyclebridgeacrosstherailway................................................................................42
7.2 Districtcoolingstation....................................................................................................................................43
7.3 LEDpubliclighting............................................................................................................................................46
8 SummaryofurbanenergyplanninginTartu...................................................................................................49
9 Perspectivesforthematicreport(D4.3)............................................................................................................51
10 Figuresandtables.......................................................................................................................................................53
11 References......................................................................................................................................................................55
Annex1.TranslationoftextonhistoricaldevelopmentofTartu.....................................................................57

page5
1 Introduction
Thisisoneofsixcase‐studiesinthePLEECproject,thegoalofwhichistodescribehowcitiesdealwithclimateplanningandstrategies.Infocusarerelationsbetween‘theurban’andenergyandkeyclimatemeasures.By‘urban’,wemeanthestructureofthecity,itsdensityandthecohesionbetweenthebuiltenvironmentandtheinfrastructure.Alongwiththis,weexaminerelationsbetweenthecityandothercities,i.e.theurbansysteminare‐gionalcontext.Finally,wediscussurbanissuesconcernedwithmanagingacity’sinfra‐structure,itsenergysystemsandservices.
2 Methods
Thecasestudywaselaboratedinthreetiers.First,atemplateoncontentwasdiscussedbetweentheresearchersatthebackdropofthefirstdatacollectedaboutthesixcities(Fertneretal.,2014).Second,afieldtriptoTartuwasplanned,beginningwithdiscussionsatthejointmeetinginTurku25th–28thMarch2014betweenresearchersandrepresenta‐tivesofthecities.Followingthat,thefieldtriptoTartuwasorganized,combiningstudytourandinterviewswithkeystakeholders(seeTable1).TheinterviewguidecanbefoundinDeliverableReport4.1(ibid.).
Table1: FieldstudyagendainTartu,5‐6thJune2014
Thursday,5thJune2014 Hosts/interviewee10:00 12:00 Studytourinthecity JaanusTamm,KasparAlev (CityofTartu) Lunch13:00 16:30 Urban,Transport
andEnergyPlanningDepartmentofUrbanPlanning,LandSurveyandUse,CityofTartu:MatiRaamat,IndrekRanniku,JaanusTamm,KasparAlev
Friday,6thJune201409:00 10:30 Energysupply FortumTartu: RihoKõks,MargusRaud
ThemaindocumentswhichwereusedassourcestodrawapictureoftheenergyandtransportpolicyinEstoniaonthenationallevelare:
NationalSpatialPlan“Estonia2030+”(NSP)(MinistryoftheInterior,2013) NationalRenewableEnergyActionPlan(NREAP)2020(MinistryofEconomicAffairs
andCommunicationsandMinistryoftheEnvironment,2010) EstonianEnvironmentalStrategy2030(MinistryoftheEnvironment,2007)OntheregionalleveltheTartuCountyDevelopmentStrategy2014‐2020(TartuMaava‐litsusKonsultatsiooni‐jakoolituskeskusGeomedia,2012)isonlymarginallyincluded.Cur‐rentlyTartuispreparingaSustainableEnergyActionPlan(SEAP)withintheEU’s“Cove‐nantofMayors”movementwhichissupposedtobeapprovedbymidof2015.Onthelocallevelthemaindocumentswhichwereexaminedintermsofurbanplanningandenergyandtransportpolicyare:
DevelopmentStrategy“Tartu2030”(TartuCityGovernment,2006) MasterPlanofTartu(2006)(CityofTartu,2006) TartuCityTransportDevelopmentPlan2012‐2020(TartuCityGovernment,2011)Duetothecomplexityofurbanaffairsandthewidediversityofthesixcities,theresearchwasorientedmoretowardsaphenomenologicalunderstandingthanpositivecomparisononfixedparameters.AtoneoftheSkypemeetingsbetweentheDelftandCopenhagen

page6
team,itwasdecidedtodelaythecomparativestudyuntilthesixcase‐studyreportshaveshownwhatispossibleandreasonabletocompare.
3 Overview of Tartu
TartuislocatedinthecentreofSoutheasternEstonia,about185kmsoutheastofthecapi‐talTallinn.TartuliesontheEmajõgi(“Motherriver”),whichisnowplannedtobeusedforadistrictcoolingplant.Withabout100,000inhabitantsTartuisthesecondlargestcityinEstonia.Themunicipali‐ty’sareaisroughly40km².TheUniversityofTartuistheoldestuniversityofEstonia,itwasfoundedin1632.Thus,TartuisconsideredastheintellectualcentreofEstoniawhichisalsoreflectedbythe20,000studentsenrolledineithertheUniversityofTartuortheEs‐tonianUniversityofLifeSciences1,bothlocatedinTartu.
Figure1: LocationofTartuinEstonia(googlemaps)
AsTartuissituatedbetweenLatviaandRussiaitispartoftheso‐calledTallinn–Riga(Lat‐via)–Pskov(Russia)triangle(MinistryoftheInterior,2013).Tartuisseenas“secondcity”behindTallinninEstonia.2Themainemployersaretheuni‐versitiesandthemunicipality(incl.hospital);furthermoreTartuservesasregionalcentrewithpublicservicesandascommercialcentre.
1 seewww.studyinestonia.ee(July2014)2 InterviewwithDepartmentofUrbanPlanning,LandSurveyandUse,CityofTartu,05.06.2014

page7
Table2:Tartukeynumbers(Giffingeretal.,2014)
Key parameter Count Year
Inhabitants 97,847 2014
Households 42,082 2014
Household size 2.33 2014
Number of dwellings 35,602 2014
Inhabitants per dwelling 2.75 2014
Number of residential buildings 8,617 2014
Number of dwellings per residential building 4.13 2014
Administrative area in km² 38.8 2013
Settled area in km² 28.81 2013
GDP per capita in Euro 17,000 (national) 2011
Average annual household net income in Euro 12,000 2012
Estoniaisdividedinto15counties,eachcountyconsistsofurbanmunicipalities(‘linnad’)andruralmunicipalities(‘valdade’).TartuispartofTartuCounty(‘Tartumaakond’or‘Tar‐tumaa’).
Figure2: TartuinTartuCounty(TartuMaavalitsusKonsultatsiooni‐jakoolituskeskusGeomedia,2012,p.28)
municipal borders
municipal centre
larger settlements

page8
Population
Theaveragepopulationdensityofthecityisabout2,500inhabitants/km².ThefollowingmapsillustratethatdensesettlementareasareratherconcentratedwithinthemunicipalboundaryofTartu,butalsothatlessdensesettlementscontinuebeyondthecity’smunici‐palarea.
Figure3: LanduseinTartuarea2006
ThedistrictAnnelinn(Figure4,#16)hasbyfarthehighestpopulationofalldistrictsofTartuwithmorethanonequarterofthecity’spopulationlivingthereandapopulationdensityabouttwiceashighastheaverageofTartu.
Figure4: Tartucitydistricts(TartuCityGovernment,2011)

page9
Figure5: PopulationdevelopmentinTartuanditsregion1875‐2014
DuringtheSovietperiodTartuwasaninstantlygrowingcity,thepopulationalmostdou‐bleduptoabout114,000inhabitantsin1990,duetoimmigrationfromotherSovietrepub‐licsandnaturalpopulationgrowth.AftertheindependencyofEstoniain1991thepopula‐tiondecreased,eventhoughthenaturalgrowthispositive,downtoabout101,000inhabit‐antsin2000andabout98,000inhabitantsin2014.TartuCounty,whichconsistsofTartuand21othermunicipalitiesinitssurroundings,gainedhoweveralittleinpopulationinrecentyears.SeeninaregionalperspectivethismeansafurtherconcentrationofpopulationinandaroundTartuwhiletherestofSouth‐ernEstonialostonaverage25%inpopulationsince1991.
Economy
Tartuisanadministrativeandservicecentre,alsoincludingtradeandtourism,inSouthernEstonia.Withinthemunicipality,theservicesectorhasbyfarthemostemployees,andmanyofthoseworkinpublicadministration.ComparedtoEstoniaingeneralTartuhasonlyrelativelyfewemploymentinindustry,however,theconstructionsectorisstrongerrepresented.

page10
Figure6: EmploymentpersectorinEstoniaandTartu,2011
Tartuisalsoanemploymentcentreintheregion,offeringmorejobsthanthereareeco‐nomicallyactivepersonslivinginthecity.Withabout3,500employees,theUniversityofTartuisoneofthelargestemployers.

page11
4 Historical urban development
Today’sappearanceandlayoutofthecitystartedtodevelopafterthegreatfirein1775,afterwhichthetown’sborderswereshiftedin1787.Tartubasicallylostitsfortressandmorethantwothirdsofthewoodenhousesweredestroyedbythefire.Thereconstructionplanintendedawell‐plannedconstructionofthetown,includingthestraighteningofthemedievalstreetgrid.BesidestheNewTownHallandtheStoneBridge,whichbecamethearchitecturaldominantsofthemarketsquare,thenewUniversitybuildingbecameanothercompositionallandmarknexttotheTownHall.
Figure7: TartuTownHallSquare,1925(viaWikimediaCommons,http://commons.wikimedia.org/wiki/Tartu)
Furthermoretheoutskirtsofthetownstarteddeveloping,mainlyalongthedescendingroadsheadingoutsidethecity,alongtheoldvalleyofEmajõgi.Aboutonecenturylater,inthe1870s,thenumberofbusinessenterprisesandindustriesincreasedremarkableinTartu,comingalongwiththepermanentabolitionofthemedievalguildsystemandtheimplementationofthenewRussiantownlawin1877.Inthesecondhalfofthe19thcenturyTartu’spopulationincreasedfrom12,600to40,600duetoimmigration,ofmainlyEstonianruralworkers,fromthehinterlandsofthetown.In1876therailwaylinebetweenTartuandTapainNorthernEstoniawascompletedandbytheendofthe19thcenturyTartuwasalsoconnectedtoRiga(Latvia)viarailway.Thiswasanimportantmilestoneinthecity’sdevelopment:Ontheonehanditfacilitatedfurtherandfastertradeconnections,ontheotherhanditaffectedthedevelopmentofVaksalidis‐trict(Figure4,#6),whereTartu’smaintrainstationislocated,remarkable.TheopeningoftherailwayconnectionbetweenTartuandPskov(Russia)in1931increasedtheim‐portanceofTartuinrailwaytrafficsignificantly.

page12
Inthe1920sthecityterritoryexpandedagainnotablyduetotheincorporationofthesur‐roundingmanorsandtheirland(seeFigure9).(CityofTartu,1999,pp.4–7)3EstoniabecameindependentafterWorldWarI.PriortothatTartuwaspartoftheRussianEmpire.Butagainin1940EstoniawasannexedintotheUnionofSovietSocialistRepublics(USSR).DuringWorldWarIIlargepartsofTartuweredestroyed,includingthecentreonbothsidesofEmajõgi.Manyofthegreenspacesinthecityremainfromformerstonebuildings,whichweredestroyedinthewar,theirruinswereremoved,butnotrebuildorreplacedbynewbuildings.AfterthewaramajorSovietbomberbasewasconstructedonRaadiAirfieldnortheastofTartu.ForthisreasonTartubecamea‘closedcity’forforeignersforseveraldecades.Theairbasewasclosedinthe1990s.In1956,duringtheperiodofNikitaKhrushchev,insteadof“architecturalexcesses”,liketheneo‐Classicist“Illusioon”(“Komsomol”)cinemaanddwellingsinthecitycentreandonRiiaHill,only“box‐shapedbuildingswiththemostessentialstandarddetails”wereal‐lowedtobebuilt.Thesestandardscameup“inordertomorerapidlysatisfytheneedfornewflats”.Bythismeansabout25,000m²ofnewlivingspacewasbuilteveryyearandabout70%oftheresidentsofTartumovedintotheseapartmentsbetween1960and1990.(Salupere,2013,p.44)Residentialbuildingconstructionwasconcentratedontheedgesofthetown.Thebiggestnewresidentialareawasthe“city’sbedroom”inAnnelinndistrict(Figure8,#16).Thecon‐structionofprefabricatedSoviet‐styleblocksbeganinthelate1970s.
Figure8: Annelinndistrict(fieldwork,June2014)
TheresidentialbuildingconstructioncamealongwithestablishingofthedistrictheatingsysteminTartuinthe1970s.AcrosstheriverfromAnnelinnanewindustrialdistrictwasbuiltinthesoutheastcornerofthetown.Furthermore,duetotheneedsofspeedandsavingmoneymanyofthestonehousesinthecitycentrewereelevatedbyonestorey,whichwassimplyaddedbyliftingtheroof.(Jauhiainen,2003a,p.39;Salupere,2013,p.45)TheincorporationofareasofSoinasteVillage,theTuberculosisSanatorium,theuniversityandsurroundingcollectivefarmsin1962markedthefirstpost‐warexpansionofthecityborder.Figure9illustratesthatinthe1960sand1970sthecityexpandedespeciallyacross
3 BasedonatranslationofMartinKukk,studentattheUniversityofCopenhagen;seeAnnex1forfullver‐
sionofthetranslatedchapter.

page13
therivertowardssoutheast(AnnelinnandIhastedistrict)aswellastowardsnorthwest(Tähtvere,VeerikuandÜlejõedistrict).TheconstructionaldevelopmentofthetownduringtheSovietperiodsince1976wasmainlyguidedbyTartu’sgeneralplan;theplandeterminedthetown’sborderhowtheyareuntiltoday.(CityofTartu,1999,pp.4–7)4
Figure9: UrbanandterritorialdevelopmentofTartuuntil1977(CityofTartu,2003)
ThelasttwentyyearsoftheSovietperiod,between1970and1990,werecharacterisedbya‘buildingboom’ofresidentialbuildings,healthandeducationalinstitutions,morethanintheprevious200yearstogether,aswellasproductionspaceandrelatedadministrativebuildingsandleisurefacilities.(Jauhiainen,2003a,p.36)DuringtheSovietperiodanumberof‘experimental’industrialenterprisescameupinTar‐tu,leadingproducerswiththerighttocreatenewproducts.Thisgenerated“moregener‐
4 BasedonatranslationofMartinKukk,studentattheUniversityofCopenhagen;seeAnnex1forfullver‐
sionofthetranslatedchapter.

page14
ousfinancing,higherwages,theconstructionofshowybuildings,andalsoexporttoforeigncountries”.(Salupere,2013,p.45)TowardstheendoftheSovietperiodTartugainedanoteworthyshareofabout10%oftheEstonianSSR’sindustrialproduction,especiallyduetomachineandequipmentbuilding,andlightindustry.Estonia’sindependencyin1991wasfollowedupbytheclosureofmanyindustriesandhencethelossofalargenumberofjobs.ThehistoricalurbandevelopmentofTartuishence,amongothers,stronglyrelatedtoitssocialistbackgroundandtheformerinfluenceoftheSovietUnion.Urbanplanningwaspar‐ticularrelevantastownsplayedanimportantroleintheorganisationoftheeconomicde‐velopmentduringthesocialistperiod.Thus,urbanplanningwaspartoftheorganisationofthesocietyandsubjectofhierarchicalplanningpracticesentailingparticularland‐usepat‐terns(e.g.suburbanneighbourhoods,industrialareasintheoutskirts).(Jauhiainen,2003a,p.36)Nowadays’urbanstructureofTartureflectsatownfollowing“thesocialistpatternofatownbuiltpartiallybeforethesocialistperiod,reorganisedduringsocialism,andredevel‐opedaftersocialism”.(Jauhiainen,2003a,p.40)

page15
5 Evolution of national and local energy planning
5.1 Overview of the Estonian planning system
ThelegalbasisfortheEstonianplanningsystemisthePlanningActof[2003].TheEstonianplanningsystemisbasicallyor‐ganisedinfourplanninglevels:
nationallevel, regionallevel(15counties), locallevel(215municipalities)
generalplan(masterplan)and detailedplan.
Themainplanningdocumentonthena‐tionallevelistheNationalSpatialPlan“Es‐tonia2030+”(2013).
Figure10: The22municipalitiesofTartuCountywith
Tartumunicipalityinthecentre
OntheregionallevelEstoniaisdividedinto15countieswithacountyplanforeach.ThecurrentplanforTartuCountyismorethan10yearsoldandthereforedoesnotincludemanyup‐to‐dateissues.In2013thedraftingprocessforanewcountyplanstarted,imply‐ingtheaimtoestablishmoreconnectionsbetweennational,countyandlocalplans.Thecountylevelwiththecountyplanhasactuallytheweakestcompetencesasitoperatesin‐betweenthecompetencesofnationalministriesandlocalgovernments.Regardingtheallocationofplanningcompetencesthemainresponsibilitiesforplanningactivitiesareholdonthelocallevelatthe215municipalities.MunicipalareasinEstoniaarequitenarrowconfined,andthus,thelocalplanningcompetenceshaveaverylimitedscopeofaction,tiedtothemunicipality’scoreterritory.Themainplanninginstrumentisthemasterplan(former‘generalplan’)forthecity.Ithastobeapprovedbythecountyandwiththeneighbouringmunicipalities.InTartutherearefourdifferentplansresp.planninglayersoutliningthecity’splanningobjectivesandprin‐ciples:
conditionsforbuildings(Tartulinnaarengukava2013‐2020), functionalzoningforlanduse(ArengustrateegiaTartu2030;Tartulinnaarengukava
2013‐2020), transport(Tartulinnatranspordiarengukava2012‐2020;Tartulinnaliiklusohutuspro‐
grammirakendusplaan2011‐2015)and openspace(ArengustrateegiaTartu2030;Tartulinnaarengukava2013‐2020;Tartu
linnavälisõhuslevivakeskkonnamüravähendamisetegevuskava),TheoutlinedEstonianplanningsystem,withaweakcountyplanningandastronglocalplanningbutincombinationwiththelimitedterritorialscopeoflocalplanning,impliesasignificantgapofcooperationontheregionallevel,potentiallyleadingtowardsdisperseddevelopmentsinneighbouringmunicipalities.Thus,underthecurrentconditions,withoutguidelinesfromthenationalorcountylevelthemunicipalityhasnocontroloverdevelopmentofsettlementsaroundthecity.
page16
5.2 National energy policy
OnthenationallevelEstoniahasthreedocumentsformingthenationalenergystrategy:
NationalDevelopmentPlanoftheEnergySectoruntil2020(2009) NationalRenewableEnergyActionPlan(NREAP)2020(2010) DevelopmentPlanoftheEstonianElectricitySectoruntil2018(2009)Thebasisforthesesector‐specificdevelopmentplanswithinthesphereoftheenvironmentistheEstonianEnvironmentalStrategy2030.FurthermoretheNationalSpatialPlan(NSP)“Estonia2030+”directstheintegrateddevelopmentofsettlementstructureonnationalandregionallevelaswellasinfrastructures(e.g.transportandenergy)inEstonia,whileconsideringregionalspecifications.
Figure11: Nationalpoliciesonenergyandspatialplanning
NationalSpatialPlan“Estonia2030+”(2013)
ThecentralconceptoftheNSPistheconceptof“low‐densityurbanisedspace”,whichissupposedtointegratecompactcities,suburbsandtraditionalvillagesequallyandtherebymeetingtherequirementofcompacturbanspaceaswellaspreservingthevaluesoflow‐densitysettlementcharacteristicsofEstonia.Low‐densityurbanisedspaceisintendedtocombinetheadvantagesoflivinginthecountrysidewiththeavailabilityofhigh‐qualityservicesofcitiesandanurbanlifestyleinpeople’sdailyactivityspace,inordertofightur‐bansprawl.Theregionalcentresarenamedbythenationalplan.Abasicrequirementisgoodmobilityfacilities.(MinistryoftheInterior,2013,p.13f)ButtheNSPdoesnotincludespecificprinciplese.g.forthedevelopmentofnewhousingorlanduserelatedtotransportinfrastructureinordertoachievetheproclaimedspatialcon‐cept.
EstonianEnvironmentalStrategy2030
principlesoftheNationalStrategyon
SustainableDevelopment
“SustainableEstonia21”
EstonianEnvironmentalAction
Plan2007‐2013
NationalEnergyStrategy
NationalDevelopmentPlanoftheEnergySectoruntil2020
NationalRenewableEnergyActionPlan(NREAP)2020
DevelopmentPlanfortheEstonianElectricity
Sectoruntil2018
NationalSpatialPlan"Estonia
2030+"
shapingsettlement(low‐densityurbanised
space)
entrepreneurship
decisionmakingconcerningtransport

page17
Thus,inrealitytheconceptisnotworkingverywell,sincestrongurbansprawlisanongo‐ingchallenge.Onereasonistheveryexpensiveland;ownerskeepthelandbutdon’tbuild;whichmakesdensificationverydifficult.5RegardingenergypolicytheNSPpointsoutthefollowingrelevantaspectsinordertoin‐fluenceenergyconsumption:
shapingsettlement, entrepreneurshipand decisionmakingconcerningtransport.TheEstonianenergypolicyemphasisestheimportanceofreducingdependencyonim‐portedresourcesaswellastoensuresecurityofenergysupply.Amoredecentralisedregionalenergyproductionshallimprovetheoverallenergysecurityaswellasthebet‐terexploitationoflocalenergyresources(wind,solar,biomass,earthheat).Furthermoreintegratedenergy‐productionsolutions,e.g.combinedheat‐power‐production,shallbeintroducedmore.CurrentlyEstoniaisabletosupplyitsfulldemandofelectricalenergy(seealsoRudi,2010).Butthepresentelectricityproduction(seeFigure12),mainlybasedonoilshale,isnotsupposedtobecompetitiveenoughinthelongterm(e.g.duetoenvironmentalcharg‐es).Thus,theshareofother(renewable)energysourcesshallbeincreasedandinordertotradeenergymoreextensivelywithotherEUcountriestheinfrastructureistobedevel‐oped.MentionableisthateventheconstructionofanuclearpowerplantonthenorthcoastofEstoniaisconsidered.
Figure12: Electricityproductionbyenergysource2007(MinistryofEconomicAffairsandCommunications,2009,p.13)
Heatenergyiscurrentlyproducedfromlocalfuels(wood,peat,otherbiomass)orimport‐edfuels(gas,liquidfuels,coal).Theshareoflocalfuelsinheatenergyissupposedtobeincreased.FurthermoretheNSPemphasisestherelevanceofsettlementstructure,compactnessofurbanregionsandmulti‐functionalityasimportantpreconditionsforefficientsupplyanduseofheatenergy.RegardingenginefuelsEstoniaisdependingonimports.Bothtoreducefueldependencyandtoensureenergysafety,theuseofmoreenergyefficientmodesoftransport(publictransport,cycling,walking)andproducingfuelsfromoilshaleareseenasimportantmeasures.(MinistryoftheInterior,2013,p.43ff)
5 InterviewwithDepartmentofUrbanPlanning,LandSurveyandUse,CityofTartu,05.06.2014

page18
Inordertoachievethat,“fast,affordable,high‐quality,convenientandsafeconnections”,includingvariousandsustainablemodesoftransportsneedtobeprovidedwithinthedailyactivityspaces(seeFigure32,p.40)andbetweenthedifferentcentresinthesettlementsystem.Awell‐functioningticketingsystem,improvingthelinkagebetweendifferentmodesoftransport(e.g.Park&Ride)aswellasjoiningthepedestrianandbicyclepathsintoregionalnetworksshallcontributetothat.(MinistryoftheInterior,2013,pp.31–34)
ThemaingoalsinenergypolicysummarisedintheNSPare
increaseenergyefficiencyofbuildings:thisareaholdshighpotentialsforthecutofheatenergyrequirementby30‐60%andtodecreasethedemandforelectricalenergybyupto20%(tougherrequirementsforthermalresistanceofbuildingsneeded);
energysavingsinmanufacturingsector; cohesiveanduser‐friendlypublictransport(decreasefueldependency).
EstonianEnergyStrategy
TheNationalRenewableEnergyActionPlan(NREAP)2020ispartofthe“roofstrategy”oftheenergysector,theNationalDevelopmentPlanoftheEnergySectoruntil2020.TheNREAPgivesanoverviewoftheexpectedgrossfinalenergyconsumptionofEstoniainheatingandcooling,electricityandtransportupto2020(seeTable2).
Table2: ExpectedgrossfinalenergyconsumptionofEstoniainheatingandcooling,electricityandtransportupto2020takingintoaccounttheeffectsofenergyefficiencyandenergysavingmeasures2010‐2020(MinistryofEconomicAffairsandCommunicationsandMinistryoftheEnvironment,2010,p.5f)
2005 2010 2015 2020
Baseyear Referencescenario
Additionalenergyeffi‐ciency
Referencescenario
Additionalenergyefficiency
Referencescenario
Additionalenergyefficiency
Heating and
cooling 1,615 1,592 1,572 1,637 1,577 1,698 1,579
Electricity 738 829 829 896 884 951 938
Transport 746 789 789 886 868 954 934
Gross final
energy con‐
sumption
3,098 3,210 3,190 3,419 3,329 3,602 3,451
Basedonthat,theexpectedchangesby2020–takingintoaccounttheeffectsofadditionalenergyefficiencyandenergysavingmeasures–aresummarisedasfollowsintheNREAP:
finalenergyconsumptionwillincreaseby8.4%comparedtotheaveragefinalener‐gyconsumptionfrom2005to2008;
electricityconsumptionwillincreaseby28%comparedtotheaverageof2005to2008(notincludingtheenergysector);
heatconsumptionwilldecreaseby15%comparedtotheaverageof2005to2008(notincludingtheenergysector);
fuelconsumptionwillincreaseby12.4%comparedtotheaverageof2005to2008(notincludingtheenergysector),
motorfuelconsumptionofwillincreaseby16%;

page19
industrialsectorenergyconsumptionwillincreaseby24%,inagricultureby17%,inthetransportsectorby13%,andinthebusinessandpublicservicesec‐torsby2.5%comparedtotheaveragefrom2005to2008;
householdenergyconsumptionwilldecreaseby1.7%comparedtotheaverageof2005to2008;
energyconsumptionintheenergysectorwilldecreaseby3%.ReferringtotheRenewableEnergyDirective2009/28/ECthenationaloveralltargetforEstoniaistoincreasetheshareofrenewableresourcesfrom18%in2005upto25%in2020.TheNREAPsplitstheoverall25%targetfor2020asfollows:
17.6%renewableelectricity(RES‐E) 38.4%renewableheatingandcooling(RES‐H&C) 9.9%renewabletransport(RES‐T)Thesegoalswillfulfiltheoverallbindingtargetfor2020buttheyareremarkablebelowtheactualpotentialsinEstonia.(EuropeanRenewableEnergyCouncil,2011,p.43)
TheEstonianEnvironmentalStrategy2030(MinistryoftheEnvironment,2007,p.20f)identifiesthemajorproblemsinnationalenergyproductioninconnectionwithprioritis‐ing,onthenationallevel,ofpowerengineeringbasedonoilshaleandconcentratedinonegeographicalarea(Narva):
concentrationofpollution; largelossesinthetransmissionofelectricenergy; considerablevulnerabilityofthesysteminemergencysituations; inhibitionofthedevelopmentofrenewableenergysources.Regardingenergyconsumptionthemajorproblemsarerelatedtothecontinuoususeofinefficient(outofdate)machineryandtechnologies:
largeenergyconsumptionofbuildings; lossesintransmissionanddistributionofenergy; considerableenergy‐intensityofeconomy; increaseddemandforenergy.Intermsoftransport,urbansprawl,insufficientdevelopmentofpublictransportandal‐ternativeenergysourcesaswellasthefunctioningofEstoniaasacheaptransitcorridorhasentailed
increasingnumberofcarsand,accordingly,increasinguseofland; increasingpollutionofambientair; increasingamountandchancesofrealisationofenvironmentalrisks; unsatisfactoryuseofenvironmentallysustainableenergysourcesandfuels.ReferringtotheabovenamedmajorproblemsintheareasofenergyandtransporttheEs‐tonianEnvironmentalStrategy2030(MinistryoftheEnvironment,2007,p.30ff)namesthefollowingobjectivesandindicatorstomeetthesechallenges:
productionofenergyinanamountthatmeetstheconsumptionneedsinEstonia,basedondifferentenergysources,enableelectricityproductionforexport;
by2015therelativeshareofoilshaleintheproductionofelectricityamountstolessthan90%;
by2015therelativeshareofelectricityproducedonthebasisofrenewableenergysourcesandconsumedinEstoniawillincreasetoatleast8%;

page20
by2020therelativeshareofelectricityproducedincombinedheat‐power‐plants(CHP)andconsumedinEstoniawillincreasetoatleast20%;
keepingthenetworklossesinthedistributionnetworkatthelevelof8%atleastuntil2015;
keepingthenetworklossesinthetransmissionnetworkatleastatthelevelof3%until2015;
reducingtheEstonianpowerstations’ownconsumptionatleasttothelevelof9%by2015.
InEstoniaexistfourtypesofenvironmentaltaxes:pollutiontaxes,energytaxers,transporttaxesandresourcetaxes.Resourcetaxesincludemineralresourcesextractioncharge,wa‐terabstractioncharge,fishingcharge,foreststandcuttingchargeandhuntingcharge.(Eu‐ropeanEnvironmentAgency(EEA),2011,p.12)TheEUIndustryRoadmap(EuropeanRenewableEnergyCouncil,2011,p.43ff)criticisesthecurrentdraftlawinEstoniaregardingchangesinthesupportschemefortheFiT(feed‐intariff)intheelectricitysector.ThedraftaimstosettheFiTinaccordancetothemarketprice:thehigherthemarketprice,thelowertheFiT.Furthermorethecurrentsupportschemedoesnotdistinguishbetweendifferenttechnologies,thus,theuseofrenewableenergysourcesisnoteconomical.Alsothecomplicatedlicensingprocessforheatingandcoolingsystemsisremarked.ThespecialroleoilshalehasalsoasastrategicenergyresourceintheEstonianenergypol‐icy,makesitevenmoredifficulttoshifttotheuseofrenewables.Inordertoexploitthefullpotentialforincreasingenergyefficiencyinbuildings,tougherrequirementsforthermalresistanceofbuildingsareneeded.(MinistryoftheInterior,2013,p.50)ThemaindriverforEstonianenergyefficiencypolicies,especiallyregardingthechangetotheuseofrenewables(woodchips),oilshaleorpeataslocalresources,isapparentlytoreducedependencyonimportedresources(e.g.Russiangas)aswellassecurityofenergysupply,alsoinordertoincreaseeconomiccompetitiveness.SinceEstoniaisplanningtojointhe“CentralEuropeansynchronousarea”thenetworkconnectionswithRussiaaretobemadecontrollableandespeciallythenetworkswiththeBalticSeaRegionshallbestrengthened.(EuropeanEnvironmentAgency(EEA),2011,p.6;MinistryoftheInterior,2013,p.43ff)
5.3 Municipal energy policy
TheDevelopmentStrategy“Tartu2030”asabasicstrategicdocumentforthelong‐termdevelopmentofthecityaddressesfuturechallengesforthecity’sdevelopmentinvariousfieldsofactions.Amongothers,thestrategyfocussesonnecessarychangesrelatedtourbanstructure:Anidentifiedobstacletowardsmoresustainabletransportflowsistozonetheurbanspaceincombinationwithautomobile‐orientedtransportrespectivelyseparationoftransportmodes.Instead,urbanspaceshouldbeorganisedratherdistrict‐centredandbythesemeansattractingtheuseofpublictransportaswellasanintegrateduseoftransportmodes.Thus,ontheonehandhigh‐riseanddenseconstructioninthecitycentreshallbeavoided,butontheotherhand,intermsofintensifyinglanduse,industrialareasaretoberestruc‐tured.Furthermoreresidential,industrialandrecreationalareasintheenvironsofTartushallbeconnectedwithTartu.(TartuCityGovernment,2006,pp.27,37)

page21
Regardingpublictransportthedevelopmentstrategyformulatesveryconcretegoals:“Thecapacityofpublictransportwillbeincreased–fromonethirdofthewholetransporttodaytothehalfofthewholetransport.Intheyear2030halfofthepublictransportvehiclesareenvi‐ronmentfriendly.Fromonefifthtoonequarterofalltheridesaremadebybicycle.”(TartuCityGovernment,2006,p.39)Furthermorethedevelopmentstrategyincludesvariousgoalsregardingenergyplanning,e.g.thebetterintegrationofwasteasresourceinenergycyclesandthecompletionofthedistrictheatingsystem.
Figure13:ModelofthedevelopmentofTartu2030(TartuCityGovernment,2006,p.29)
BeyondtheobjectivesandstrategicdirectionsformulatedintheDevelopmentStrategy“Tartu2030”thedocumentalsoemphasisestheimportanceofhowplanningcompetenciesandresponsibilitiesareadministeredandinwhichwaythedifferentactorsareinvolved.Thus,theDevelopmentStrategy“Tartu2030”interlacestheformulatedobjectivesforthecity’sdevelopmentswiththerequiredplanningmodelandimplementationprocess.
Figure14: Localpoliciesonenergyandspatialplanning
DevelopmentStrategy“Tartu2030”
MasterPlanofTartu(2006)
TartuCityTransportDevelopmentPlan
2012‐2020

page22
ConsideringtheEstonianplanningsystemthemainresponsibilitiesarestronglytiedtothelocalself‐government,butatthesametimestrategicquestionsabouttheregionalposition‐ingofTartucomeup.NotonlytheCityCouncil,theCitygovernmentanditsadministrationareinchargeoftheimplementationofthecity’sstrategy;italsodemandsthecontributionofthestateandstateagencies,publicinstitutions,privatecompanies,non‐profitorganisa‐tionsandthepublic.Theimplementationofthemunicipalpolicy,draftedbytheDevelopmentStrategy“Tartu2030”iscarriedoutbymeansofgeneralplanning(MasterPlanofTartu),budgetstrategy,developmentplans(TartuCityTransportDevelopmentPlan),sectorialdevelopmentplansandtheplansofactivitiesofcityadministeredinstitutions(seechapter6.1,p.22).Thesedocumentsaresupposedtoformanintegralsystemasabasisforthecross‐sectoralandintegratedregulationofurbandevelopmentinTartu.
6 Management of urban planning and energy today
6.1 Main planning documents of Tartu
InthissectionthemaincontentofthepreviousandthecurrentMasterPlanofTartuandofthecurrentTransportDevelopmentPlanissummarised.ThemainregulatoryprinciplesforthedevelopmentofthecityaresettledintheMasterPlan.TheMasterPlanisalsotheonlyinstrumenttosetregulations.Untilthe1990sthedevelopmentofthecitywassolelyguidedbynationalministriesandtherewerenopossi‐bilitiestodirecturbanplanningonthelocallevel.6
6.1.1 Previous Master Plan of Tartu 2012 (1999)
ThepreviousMasterPlanfortheCityofTartuuntiltheyear2012(”Tartulinnaüldplaneer‐ingaastani2012”)wasapprovedandadoptedbytheMunicipalCouncilofTartuin1999.Changesintheadministrativeterritory,wardamagesandsocio‐economicchangesinducedtheneedforageneralplanwithnewdevelopmentprinciples.Furthermoretheconditionsofpossessingandmanagingresidentialspace,thedemographicandeconomicsituationaswellastherequirementsforthetransportationsystemhadchanged(CityofTartu,1999).Notleastthechangesinthelegalsystemenforcedthedesignofanewmasterplan(Jauhi‐ainen,2003a,p.42).TheMasterPlanwassupposedtodirecttheterritorialaswellasthesocialandeconomicdevelopmentofthecity.InthissensetheMasterPlan’sobjectivewasthedeterminationof“thetrendsofpurposefulandbalanceddevelopment[of]thefourmainfunctionsofthecity–working,living,movingandresting–basedonrealisticeconomicpossibilities”.ThereforetheMasterPlanwasalsosupposedtoprovidetheframeworkforthelong‐termspatial‐economicdevelopmentofthecityaswellasabasisforinvestments.(CityofTartu,1999)ThemainprincipleoftheMasterPlanwassustainabledevelopment;prioritywasgiventothesocialneedsoftheinhabitants,followedbythesupportofeconomicdevelopment.In‐tensificationoflandusewasseenasmajorpreconditionintermsofsustainabilityandeco‐nomicconstraints.(Jauhiainen,2003a,p.42)
6 InterviewwithDepartmentofUrbanPlanning,LandSurveyandUse,CityofTartu,05.06.2014

page23
Figure15: Extensivedevelopment–developmentalbuildingtoemptyareas(CityofTartu,1999)
TheMasterPlanexaminedtwoalternativesfortheterritorialdevelopmentofTartu,anextensivedevelopment,directingthecity’sdevelopmentmainlyonunderdevelopedareas,andanintensivedevelopment,directingthecity’sdevelopmentmainlyonbuilt‐upareas.Bothalternativeswherebasedonpartsofthecitywherethepopulationissupposedtode‐crease,themaindecreaseisprojectedforAnnelinndistrict.Theprincipleoftheextensivealternativeistoexpandtheimmediaterangeofthecity,whereastheprincipleofthelatterisasustainableuseoftheexistinglandresources,buildingsandthestructureofurbande‐velopment.TheMunicipalCouncilapprovedthepolicyoftheintensivedevelopment.(CityofTartu,1999)

page24
Figure16: Intensivedevelopment–raiseofthepresentqualityofthecityenvironment(CityofTartu,1999)
6.1.2 Current Master Plan of Tartu (2006)
ThecurrentMasterPlanfortheCityofTartu(“Tartulinnaüldplaneering”)wasapprovedin2006,whichwasrathersoonafterthepreviousMasterPlanfrom1999.7TheMasterPlanincludesspatialdevelopmentprinciplesforTartu,illustratedbydiversemapsaddressingvariousfieldsofthedevelopmentofthecitylikehousing,distributionofthepopulation,citycentres,energy,heatandwatersupply,transportroutes,culturalherit‐age,greenspacesetc.Also,thecurrentMasterPlanincludesazoningforlandusecoveringthewholecityarea(Figure17),butinmoredetailthanthepreviousMasterPlan.Beyondfunctionalzoningitincludesdetailedinformationaboutbuildingregulationsindifferentlandusezonesonablocklevel(CityofTartu,2006).
7 Themunicipalitynamesthreereasonsforthat:
1.Thelandreformwasnotcompletedatthetimeofthepreviousmasterplan.2.Meanwhilelegislationhassignificantlychangedandthepreviousplandidnolongermeetthenewre‐quirements.3.TheenergycompanyFortumgotmonopolyonheatproductioninTartuand–referringtothenewrealestatedevelopments–Itwasnecessarytomodifytheexistingplanningconditions.

page25
Figure17: Tartu,zoningforlanduse(CityofTartu,2006,http://www.tartu.ee/kaart/)
Contrarytotheprincipleofcompactandintensivedevelopment,whichwassetupbytheprevious(seechapter6.1.1)andalsothecurrentMasterPlan8,underthecurrentMasterPlannewresidentialareasaremainlyplannedintheoutskirtsofthecity,especiallyinÜlejõedistrict(Figure4,#14),intheUjula‐KvissentalisettlementandalsoinJaamamõisa(#15),Ihaste(#17)andRänilinn(#5)district(CityofTartu,2006,p.22f;TartuCityGov‐ernment,2011,p.15).Bythesemeansalsotheconceptoflow‐densityurbanisedspaceassetupintheNationalSpatialPlanisthwarted.TheworkonanewMasterPlanforTartuistobestartedinautumn2014.ThecityplannersemphasizetheneedtodeveloptheMasterPlanincooperationwiththecounty.9
8 InterviewwithDepartmentofUrbanPlanning,LandSurveyandUse,CityofTartu,05.06.20149 Ibid.
page26
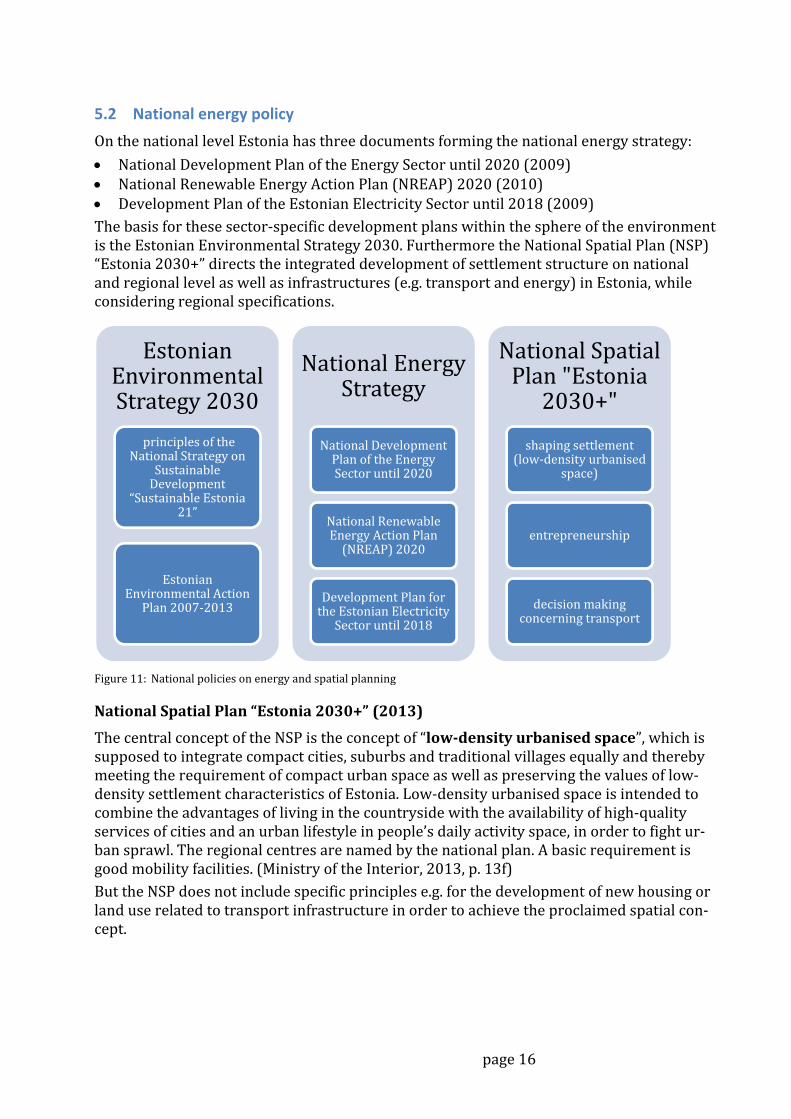
Figure18: Single‐family‐housinginIhastedistrict(fieldwork,June2014)
6.1.3 Tartu City Transport Development Plan 2012‐2020 (2011)
InNovember2011theTartuCityTransportDevelopmentPlan2012–2020wasapprovedbythecitycouncil.TheTransportDevelopmentPlanwasinitiatedbythecitycouncil’sde‐cisionno.73,20.05.2010,andwassetuptospecifythegoalsofthecity’ssectorialdevel‐opmentdocumentsaswellastocreateabasisforthedevelopmentandfinancingofthetransportsystem.Theplanisprimarilysupposedtobeapracticaltooltoenablelong‐termtransportplanningandtodevelopsustainabletransportpolicy.
GoalsoftheTransportPlan
TheTransportDevelopmentPlanaddressesproblemsofmotorisationaswellasthetrans‐portationsystemofTartu:“Carusagehasconsistentlygrownwhileatthesametimetheuseofpublictransporthasdecreased.”TheplanwasdraftedaccordingtothemottooftheBalticBiogasBusproject(“Workingtogetheronclimate‐neutralpublictransport”),wherethemainobjectivesweretointroduceabiogasbusinthepublictransportsystemofTartuandtoincreasetheuseofpublictransportation.(TartuCityGovernment,2011,p.4)Furthermore,theTransportDevelopmentPlanemphasisesthestronginterrelationsbe‐tweentransportandothersectorsandthusthenecessitytoimplementthegoalscross‐sectorialbyhandlingtransportplanningasintegralpartofcityplanning.Asthetransportplanisguidedbythegoaltocreateacompactcityandmultifunctionalspacetoreducepeople’sneedsformovement,it’sdirectlyreferringtotherelevanceofurbanstructuretotransport.“Theneedsandhabitsofmovementthusdependonthespa‐tialstructureofthecityandtheconnectionsbetweenthelocationsofinterest.Asignificantinfluenceonthehabitsofmovementisexertedbythetransportationsystem,whichcreateslinksbetweendifferentpointsandshapespossibletypesofconnectionsandhabits.”(TartuCityGovernment,2011,p.17)Furthermore,inordertoreduceprivatecarusethetransportplanaimsfornewtransportandtaxationpoliciesontheonehandandonraisingattractivenessofalternativemodesoftransportontheotherhand.Thefollowingthreemainprinciples–pointingaturbanstructure–arementionedinthetransportplan:
Tofacilitatenewdevelopmentsinthevicinityofexistingcentrallocations(accessibilityofbasiceverydayservices,socialinfrastructure,leisurepossibilities);
Tofacilitatedevelopmentsinthevicinityofexistingtransportgridstoensureaccessi‐bilityofexistingpublictransport(“transitorienteddevelopment”);
Toensureeducationfacilitiesforchildrenneartheirresidence.

page27
ModesoftransportinTartu
Asmaincausesforincreasingneedsformovementarementionedtheongoingestablish‐mentofworkplaces(industrialparks)separatedfromresidentialareasandthedevelop‐mentofshoppingcentresintheoutskirtsofthecity.(TartuCityGovernment,2011,p.11ff)Figure19showsthedistributionoftypesofmovementtotalandforworkersinTartu.Thecombinedshareofwalkingandcyclingisalreadyquitehigh(45%resp.37%).Inthetotaldistributionwalkinghasthehighestsharecomparedtoallothermodesoftransportinthecity,whichshows,thatthecitybasicallyhasacompactstructureandprovidesshortdis‐tancesforeverydayrequirements.
Figure19:ModalsplitinTartu200910(TartuCityGovernment,2011,pp.17,21)
Butacloserlookattheworkers’distributionshowsaremarkablehighershareofcarusethaninthetotaldistribution.Onereasonmightbeadeficitinconvenientaccessibilityofworkplacesbypublictransportorfoot/cycle.ThetransportplanfurthermorementionsasoneimportantlimitingfactorofcarusethatonlyapproximatelyhalfofthepopulationofTartuabove18hasadrivinglicence.FurthermorecarownershipinTartu(comparablewithTallinn)isstillabout20%belowtheEstonianaverage,withabout27,000registeredprivatecarsinTartuin2011(popula‐tion97,600)(eurostat,2014;StatisticsEstonia,2011).Though,Figure20showsthecon‐stantlyincreasingnumberofregisteredcarsinTartusince2008.Thatcouldbeeitheranindicatorthatcarownershipanddrivinglicenceisyetnotaffordableformanypeopleorthatit’snotnecessaryforeverydaylifeinTartu.
10 SurveyofMovementsoftheInhabitantsoftheCityofTartyandtheNeighbouringLocalGovernments
(“Tartulinnajalähiomavalitsusteelanikeliikumisuuring”)2009(includingTartuandthenearestruralmunicipalities)
28,2%38,2%
26,6%
25,0%4,7%
3,1%
40,4%33,8%
0%
10%
20%
30%
40%
50%
60%
70%
80%
90%
100%
total ofworkers
ModalsplitinTartu2009
byfoot
cycle
publictransport
car

page28
Figure20: DevelopmentofcarownershipinTartu2004‐2011(eurostat,2014)
Fromanenergypointofviewthehighshareofwalking,cyclingandpublictransportinTartuisanassetofthecity.AcomparisonbetweenEskilstunaandTartu11revealsthatEskilstunaismoreambitiousinrelativeterms(increaseofpublictransportfrom8%in2006to16%in2020),butstartsatamuchlowerlevelastheshareofpublictransportinTartu12isalreadyaboutonequarter(Grothetal.,2014;TartuCityGovernment,2011).ThesituationinSwedishEskilstunaandEstonianTartuseemsverydifferent.InEstoniatheongoingcatchupwithEuropeanstandardsofcarownershipisastrongdriver,makingitdifficulttokeeporevenincreasethehighshareofpublictransportfurther.InSwedenin‐creasingtheuseofpublictransportfromthelowlevelseemsnotinconflictwithcarown‐ershipperse,sincepublictransportmaybeincreasednotasanalternativetoownbuttouseyourcar.
Transportplanningacrossborders
AmajordeficitoftheTransportDevelopmentPlanisitslimitationtothecityarea.Transportrelationsinaregionalorevennationalcontextareonlymarginallymentioned.Thisisprobablycausedbythelimitedscopeofactionofthelocalgovernment,butanywayitmanifestsaremarkablelackofcoordinationofcross‐borderplanningdemandsliketransport.ButkeepinginmindthatthemaininitiativeforthetransportplanwasonlytointroduceabiogasbusinTartuandtoincreasetheuseofpublictransport,thefinaldocumenthasagainedamuchfar‐rangingperspectiveinordertoaddressthewholetransportsystemasintegralpartofurbanplanning.InordertoachievethesetupgoalsforthetransportsystemtheTransportDevelopmentPlanhighlightsthenecessitytoimprovethecooperationbetweenthedifferentnationalandlocalorganisationsaswellastheinvolvementofstakeholdersinthedecisionmaking
11 ThefiguresforEskilstunaandTartuaretakenfromdifferentsourcesandcanthereforeonlybetakenas
indicativeintermsofthedimension.12 ThefiguresformodalsplitinTartuoriginatefromdifferentsourceswhicharedifficulttocompareasthe
referenceyearsandreferenceareasdiffersresp.arenotalwaysclearlydefined.Especiallyregardingthemodalsplitinlongdistancecommutingonlyfewrelevantstatisticaldataisavail‐ableforTartu.
240
250
260
270
280
290
300
310
320
2004 2005 2006 2007 2008 2009 2011
registeredcars
per1.000inhabitants
DevelopmentofcarownershipinTartu

page29
processes.Highlyessentialisthecooperationwiththeneighbouringlocalgovernments.(TartuCityGovernment,2011,p.61ff)Infactthesecooperationsarenotverywelldevel‐oped,there’snoestablishedprocesstocoordinateplanningbetweenthemunicipalitiesandthecountyplanistooweaktoassumecoordination.13
6.2 Transport planning
Asillustratedaboveamajorchallengeliesintheworkrelatedtransport(commuting)bothwithinthecityareaandinthefunctionalurbanarea.
Cycling
TheformerMasterPlan(1999)impliednorelevantchangesintransportplanning.Forex‐amplecyclingisquiteanewtopic.Firstin2001amasterplanonbicyclepathsaskeymeasuretoestablishcyclingasanissueofcitypolicieswasimplemented,notleastbecauseofveryactivebicycleorganisationsinTartu.Theplanhowever,didnotcreateprojectsmainlyduetolackingknowledge.14In2006areportaboutbicycletraffic,whichwasalsoatoolfordesignersofstreets,con‐cludedthatthere’saneedtoaccountbetterfortheneedsandhabitsofcyclistsregardingroutesandbicyclestands.Thecurrentcitygovernmentpolicyaimstoinstall100kmofbikingpathswithinfouryears.15
Commutingandworkplacelocations
TheworkplacesinTartuaremainlyconcentratedinthecitycentre(ca.29%)andinanimportantindustrialareainRopkadistrict(Figure4,#10)withabout10%ofthework‐places.OntheotherhandinAnnelinndistrictareonlyabout10%oftheworkplaces,butmorethan25%ofthepopulationlivesthere.(TartuCityGovernment,2011,p.20ff)Theseproportionscauseremarkableneedsformovementstowork.Thetypeoftransportpeoplechosetogotoworkhighlydependsonthedistanceandtheaccessibilityofdifferentmodesoftransport;thesevaryalotacrossthedistricts.ThehighestshareofcarusetoworkisinIhastedistrict(Figure4,#17)whichhasalsothelongestaveragedistancebetweenhomeandwork(seeFigure21).ButbesidesthelongdistancethereisparticularlyapooraccessibilityofpublictransportinIhaste,asFigure22shows.Furthermorethere’remostlysingle‐family‐housesinIhaste,whichindicatesara‐theraffluentpopulationwithaprobablyhigherrateofcarownership.ConnectingFigure21andFigure22witheachotherattestsobviouslyaninterrelationbe‐tweentheaccessibilityofefficientpublictransportandtheshareofcaruseforthetraveltowork.Furthermorethefiguresandthecomparisonbetweenthedistrictsrevealthatprimarilynotonlythedistributionproportionbetweenworkplacesandresidentsorthedistancesaredetermining,butrathertheaccessibilityofpublictransportandprobablyalsothelevelofincome(carownership)oftheinhabitants.
13 InterviewwithDepartmentofUrbanPlanning,LandSurveyandUse,CityofTartu,05.06.201414 Ibid.15 Ibid.

page30
Figure21: DistancebetweenhomeandworkandmodelsplitinTartubycitydistrict
Figure22: Publictransportaccessibilitywithin300m
Figure23drawsadifferentpictureregardingalljourneystowork,notonlywithinTartuanditsvicinity(seeFigure19).Theseshowaremarkablehighershareofcarusageandaremarkablelowershareofpublictransport,comparedtothejourneysinTartu.Further‐

page31
moretheshareofjourneystoworkbycarincreasedbetween2008and2011from45to55%,whiletheshareofpublictransportdecreasedfrom25to13%.Thisindicatesthatpublictransportishardlycompetitivecomparedtocaruse,atleastnotforjourneysout‐sideTartu.Consideringthere’re6,500workerscommutingoutofTartuandabout16,300workerscommutingintothecityin2011thesecausearemarkablevolumeofcartraffic.(eurostat,2014)
Figure23: Journeystowork,Tartu2011(eurostat,2014)
Thus,notonlyhome‐work‐relationswithinTartuanditsvicinity,butalsoregionalcom‐mutingdemandsacriticalviewintermsofthecity’senergyefficiency.Nevertheless,eventhefiguresfrom2009(Figure19)and2011(Figure23)arehardlycomparableastheylookatdifferentreferenceareas.Atendencytowardsadecreasingshareofpublictransportcanberecognised.
Theroleofrailways
TherailwayroutesinEstoniaarealreadyquitewelldeveloped,about80%ofthepopula‐tionlivesinthevicinityofrailwayroutes.Butduetotheratherpoorqualityoftherailwayconnections,especiallyregardingspeed,accessibilityandconvenience,toofewpeopleusetherailwayforregionalorlongdistancetravelorpreferthebusconnections.Thus,cur‐rentlytherailwayisnotcompetitivetoothermodesoflongdistancetransport(MinistryoftheInterior,2013,p.35).
55%
14%
5%
26%
JourneystoworkTartu2011
bycar
bypublictransport(rail,metro,bus,tram)
bymotorcycle/bicycle
byfoot

page32
Figure24: BasicstructureofthetransportnetworkinEstoniain2023(MinistryoftheInterior,2013,p.32)

page33
6.3 Energy planning
ThemajorcompanyforenergysupplyinEstoniaisFortumEestiAS.Fortumislocatedinthreecities:theadministrativecentreinTallinnandtwoproductionplants(CHP)inPärnuandTartu.HeatsupplyinTartuissincethe1970smainlycarriedoutbydistrictheating(CHP).Fur‐thermorein2012geothermalenergywasintroduced(heatpumps).Figure25showsbusinessandresidentialenergyconsumptioninTartu.Almosthalfoftheenergyinbusinessconsumptionisallottedtoelectricity,about40%todistrictheatingandtheresttofossilfuels.Inresidentialconsumptionbyfarthehighestshare(about55%)isallottedtodistrictheating,whileelectricity’sandfossilfuels’shareislessthanaquartereach.Fossilfuelsincludemainlygasandoil,whichisalsousedforheating,especiallyinsingle‐family‐houses,orcooking.
Figure25: Businessandresidentialenergyconsumption(PresentationCityofTartu,05.06.2014)
ThetotaldistributionofenergyusebysectorsinTartu(seeFigure26)showsthatbyfarthehighestshare(50%)isallottedtoheatingandcooling.Transportandelectricitybothhaveashareofabout25%.
Figure26: Energyusebysector2010(PresentationCityofTartu,05.06.2014)
174
284
197
113
56
117
0
100
200
300
400
500
business residential
GWh
Businessandresidentialenergyconsumption
fossilfuels
electricity
districtheating
24%
26%
50%
Energyusebysector2010
transport
electricity
heatingandcooling

page34
Inaccordancetothispicturethehighestshareofemissions(morethan70%)isallottedtoenergyproduction,onlyabout12%totransportandtherest,withlessthan10%each,toagriculture,wasteandindustry(seeFigure27).Thatrevealsaprobablyhighpotentialtoreduceemissionscausedbyheatingandcoolingaswellaselectricityproduction,asthesearethebiggestenergyconsumingsectors.About75%ofthehousingstockinEstoniaismultiple‐unitbuildings.AtthesametimeEs‐toniausestwotothreetimesmoreenergyinbuildingsthantheNordiccountries.Thatre‐vealsthelowqualityofthebuildingstockintermsofenergyefficiency.(Lewisetal.,2013,p.29)Thus,buildingrefurbishmentisoneofthemosturgentissuesinordertodecreaseenergyuseinhouseholds.16
Figure27: Distributionofemissionsbysectors(PresentationCityofTartu,05.06.2014)
TheresidentialenergyconsumptionoftheSupilinndistrict(Figure4,#13)shouldbemen‐tionedparticularly.TheoldwoodenhouseresidentialdistrictinthehistoricalcentreofTartuischaracterisedbydetached,mostlytwo‐storeywoodenbuildingswithgardensandyards,mainlybuiltinthelate19thandearly20thcentury.Withregardtothephysicalcondi‐tionandtechnicalfacilitiesofthehouses,SupilinnisamongtheworstneighbourhoodsinTartu(Jauhiainen,2003b,p.48).About80%oftheapartmentshavenohotwater.Also,althoughthesurroundingdistrictsareconnectedtodistrictheating,Supilinnisn’tandtherearenoplansaboutchangingthatinthecurrentMasterPlan(seeFigure31).About80%havenocentral,gasorelectricheating.Heatingismostlywoodbased.Fromanener‐gyperspectiveespeciallytheconditionsintermsofheatinsulationofthebuildingsarequitecriticalregardingresidentialenergyconsumption.Furthermore,thepropertysitua‐tionofthesehousescausesdifficultiestoimprovethephysicalstructureofthedistrict.
16 Inordertoimplementenergyefficiencymeasuresinmultiple‐unitresidentialbuildingsbuiltbefore1993
theKredExmodelasanalternativetothestate‐fundedgrantschemewassetup.KredExaimstoimprovethefinancingpossibilitiesforinvestmentsinenergyefficiency;itcombinesaloanoftheCouncilofEuropeDevelopmentBank(CEB)andagrantoftheEuropeanRegionalDevelopmentFund(ERDF).(Lewisetal.,2013,p.29)
3%
73%
5%
12%
7%
Distributionofemissionsbysectors
waste
energy
industry
transport
agriculture

page35
ContrarytootherpartsofTartutheresidentsdomainlyrent,butnotowntheapartments,hencethere’rehardlyambitionstorenovatethebuildings.17(Jauhiainen,2003b,p.46f)
Figure28:WoodenhouseresidentialdistrictSupilinn(fieldwork,June2014)
Districtheating
Until2013thecitywasdividedintotworegionsfordistrictheating,runbytwocompanies.TodaythesoleresponsibilityfordistrictheatingsupplyinTartuiscarriedoutbyFortumTartu.Thefirstdistrictheatingpowerplantclosetothecentrewasinauguratedinthe1970s.IthasjustrecentlybeenreplacedbyanewCHPplantnortheastoutsidethecityborders(seeFigure29).TheCHPplantismostlyfuelledbywoodchips(since1994)andpeat;gasisonlyaddedinthepeaksofthecoldseason.Thus,theFortumdistrictheatingplantisquitecom‐petitivemeasuredbythepriceperdeliveredenergy.FurthermoreFortumrunssomeheatplants.Thelargestoneissituatedinthesouthernpartofthecity.18
17 AtthesametimeithastobeconsideredthatthecurrenthousingconditionsmakelivinginSupilinnaf‐
fordableforlesswell‐offpeople.Renovatingthebuildingswouldprobablyleadtohigherrentsandcouldcauseagentrificationprocess.
18 InterviewwithFortumTartu,06.06.2014

page36
Figure29: CHPplantandpeatproductionofFortumTartu(PresentationFortumTartu,06.06.2014)
Figure30: Newcombinedheat‐power‐plant(CHP),Tartu(fieldwork,June2014)
Inthe1970severyhouseinthecitycentrehaditsownoilboiler.Atthesametimethedis‐trictheatingsysteminTartuwasestablishedinthe1970s.Inthe1990sindividualgasstationswerethefavouredenergysupplyofprivatehouse‐holds;butasthedistrictheatingnetworkwasalreadydeveloped,thecityintervenedonbehalfoftherunningenergycompanybecauseitwouldhavebecometooexpensivetokeepthenetwork.

page37
Currentlyabout90%oftheapartmenthousesareconnectedtodistrictheating;butlessthan5%ofthesingle‐family‐houses19areconnected.Ifavailable,residentshavetheoptionofchoosinggasratherthandistrictheating,sincegasisavailableinmostareasasenergysourceforcooking.However,inseveralsinglefamilyhousingareas,neithergasnordistrictheatingisavailable;intheseareaselectricityisusedforcookingandair‐to‐airheatpumpsandwoodfurnacesforheating.Inappointeddistrictheatingzonesit’scompulsorytoconnect,unlesstheenergydemandofahouseislessthan40kW/m²/yrorissuppliedinanenvironmentallycleanerwayofheat‐ing(e.g.groundheating,solarpanels).Though,connectinghousestodistrictheatingisal‐waysnegotiated.TheformerMasterPlan(1999)includedanenergydevelopmentplanforTartucity(dis‐trictheating,electricity)andassigneddistrictheatingareas.Thiswaspriortotheimple‐mentationofthenationalDistrictHeatingActin2003whichenablesmunicipalitiestoes‐tablishdistrictheatingzoneswhichmakeconnectiontodistrictheatingcompulsory.ThecurrentMasterPlan(2006)includesfurtherareasinthedistrictheatingsystem(seeFigure31).Inordertoincludethesenewareasthecityhadtoestablishstricterregulationsindis‐trictheatingzones,sincetheenergycompaniesrefusedtoexpandthenetworkduetoitshighcosts(longdistancepipes).ThedistrictheatingnetworkisbasedondraftplansbyFortum,buttheassignmentofthezonesiscarriedoutbythemunicipality.ThenewMasterPlanofTartu(worktobestartedinautumn2014)shallagainincludetheextensionofthedistrictheatingarea,incl.newlanduseschemes.20
19 Theshareofthesingle‐family‐houses(ca.7.000)isabout20%ofthetotalhousingstockinTartu(Cityof
Tartu).20 InterviewwithDepartmentofUrbanPlanning,LandSurveyandUse,CityofTartu,05.06.2014

page38
Figure31: Areassuppliedbydistrictheating(CityofTartu,2006)
TheefficiencyoftheTartudistrictheatingsystemhasbeenincreasedduetomonitoringofthewatertemperatureandrefurbishmentofthetubesinthestreets.Energylossescouldbecontainedtoabout20%between2000and2013.AdditionaltothedistrictheatingsystemadistrictcoolingsystemistobeintroducedinTartu.AtthepremisesoftheoldCHPplant,plansarebeingpreparedforacoolingsystemusingwaterfromtheriver.Coolingwillbeofferedwarehousesandotherlargepublicbuildings,consumingenergybycoolingmachines.21
21 InterviewwithFortumTartu,06.06.2014

page39
Electricity
ElectricityinTartuisnotdirectlysuppliedbyFortum.TheFortumCHPisdrivenbytheheatdemand;theelectricityisaresidualandsoldtothenationalgridsystem(twonationalelectricitycompanies,oneonhighvoltagemaingridandoneondistributiongrid).ThenationalgridsystemisconnectedwithRussia,Finland,Lithuania,LatviaandSweden.EstonianpowerisproducedonoilshaleinNarva.Theonlycriteriaforselling,buyinganddistributingpoweristheprice,notCO2emissions.AdditionallytotheelectricityproductioninFortum’sCHPplantstheuseofsunpowerandwindenergywasintroducedin2013inTartu.22
Renewables
94%oftheFortumfuelisbio‐fuel,ofwhichabout70%iswoodchipsand30%peat.Bio‐fuelshavebeenusedsince1994.Fortumownsthreepeatsitesfromwhichpeatisextract‐ed.Inwintertimeabout40lorriestransportthepeattotheplants,ofwhichabout25lor‐riesareforthenewplant.23However,peatisnotconsideredasrenewablefuel,neitherbytheEUnorbyEstonianlaw.Furthermorecurrentlythere’snoprogramrunningtoreplacetheharvestedpeatorwood.
6.4 Urban sprawl
FollowingthecurrentMasterPlanforTartunewresidentialareasaremainlyplannedintheoutskirtsofthecity.Thiscanbeseencriticalasincreasingpopulationintheoutskirtscausesahigherneedformovements,e.g.toreachworkplacesinthecitycentre;further‐moretheactualdevelopmentofthepopulationisarguable,whichmakeslong‐termplan‐ningoftherequiredtransportationsystemverydifficult.Moreover,TartuhastofacethechallengesofurbansprawlsinceformerfarminglandinthevicinityofTartuisprogressivelytransformedintohousing,businessandindustrialareas,basicallyonlyaccessiblebycar(TartuCityGovernment,2011,p.15f).Thesefactorsin‐creasecarusageevenmoreaslongasnocompetitivepublictransportsystemexists.Thelatestphaseofsuburbandevelopmenthasbeenongoingsincethelate1990s.Thiswasalsocausedbybiggapsbetweenissuedmasterplans,whichfaroverestimateddemands,andactualestablishmentofsuburbansettlements(GaukandRoose,2011).Thestudy(GaukandRoose,2011)addresseschangesinlandandenergyuseinTartu’ssuburbanar‐ea.Itshowsthatsincethesecondhalfofthe2000smorecompacthousingtypesbecamepopularinthesuburbanzone,butstillabout60%ofnewresidentialconstructionsweresingle‐family‐housesin2008.Figure32showsthatthemainhubsforcommutingareafewcountycentres.Furthermoreitshowsthatthedailycommutingdistancesarequitefar,upto30%oftheworkerscom‐mutefromoutsidetheurbanregion.Between2000and2010thenumberofdailycommut‐ersinEstoniaincreasedbymorethan30%(MinistryoftheInterior,2013,p.23).Thisunderlinestheprocessesofeconomicrestructuringandurbandispersion(urbansprawl),alsoTartuhastoface.Themappedcommutingpatternsarequitedifficulttoservewithpublictransportsincethey’reratherscattered,thusitrequiresaflexiblepublictransportsystem,e.g.alsocombiningdifferentmodesoftransport,inordertoreducecaruse.
22 Ibid.23 Ibid.

page40
Figure32: DailyactivityspacesinEstonia,2010(MinistryoftheInterior,2013,p.24)
Tomakemattersworse,thecompetencesforplanningactivitiesareholdbythelocalgov‐ernmentsandtiedtothecorecityterritoryasmunicipalareasarequitenarrowconfined(seeFigure33).Thecityhasnocontrolaboutplanningactivitiesinneighbouringruralmu‐nicipalities(seechapter5.1).

page41
Figure33:Municipalborders(grey)vs.actualsettlementareaofTartu(Metspalu,2007)
Thecurrentplanninglegislationandallocationofplanningcompetencesunderminesplan‐ningeffortsaddressingissueswithrelevantandfar‐rangingimpactsontransport.Howev‐er,aninevitablepreconditiontocontrolurbansprawlistoovercomethelackincoordina‐tionofplanningactivitiesbetweenneighbouringmunicipalitiesbystrengtheningregionalcooperation,eitherbystrengtheningthecounties’planningcompetenciesorbyextendingthemunicipalities’scopeofaction.(TartuCityGovernment,2011,p.16f)Urbandensityandspatialorganisationareseenasthedeterminingfactorsinordertoin‐fluenceenergyconsumption.“[T]oshiftthepolicyfocusesoflocalmasterplansandtobettercopewiththeissuesrelatedtosuburbanization,apolicyresponseonavariablegeographicalscaleisrequired,integratinglocaldevelopmentinitiativesandcooperationbetweendifferentlevelsofadministration.”(GaukandRoose,2011)
Tartu

page42
7 Pilot projects
7.1 Pedestrian and bicycle bridge across the railway
TheCityofTartuisdividedintothreepartsbytheriverandtherailwayrunningthroughthecity.Crossingtheriverisratherwellorganisedwith5bridgesinthecitycentreandasixthbridgeinconstructioninthesouth‐eastpartofthecity.Therailwaycrossingsontheotherhandareonlyafewandwideapartfromeachother.ThelargestproblemtocrosstherailwayisbetweenthecentraldistrictandVeerikudistrictintheeasternpartofthecity.Thesetwodistrictsaredividedbytherailwaystationwithmanysparerailwaylanes.Thebarriercreatedbytherailwayisupto320mwidewithasmanyas25parallelrailwaylines.
Figure34: Locationoftherailwaycrossing
TartuUniversityiscurrentlyconstructingitsnewcampusandadditionalbuildingstoitshospitalintheVeerikuandMaarjamõisadistrictinthesouth‐eastpartofTartu.ThenewcampusincludesBiomedicum,Chemicum,PhysicumandTechnologyInstitute.Theactivi‐tiesthatusedtotakeplaceinthecentreofthecityinuniversity’shistoricalbuildingshavebeenmovedtothenewbuildings,whichcreatesextrademandforbetterpedestrianandcyclinglanestocrosstherailway.Thecitygovernmentiscurrentlypreparingaprojectfortheconstructionofapedestrianandcyclingbridgeoratunneltocrosstherailway.Itisplannedtobuildthebridgebe‐tweenLembitustreetontheVeerikusideandeitherVanemuiseand/orTiigistreetonthecentresideoftherailway.

page43
Figure35: Alternatives1‐6forpositionthepedestrian/bicyclebride(CityofTartu)
Currentlythecityhasdrafted6differentpositions(seeFigure35)forabridgeoratunneltocrosstherailway.These6positionswillbeputonpublicdisplayandapublicdiscussiontoenablecitizenstobringintheiropinions.Whenoneofthesolutionsisselectedaninitialdraftdesignoftheconstructionwillbepro‐duced.ThebridgeoratunnelhastobeincompliancewithEstonianstandardsandthecrossingitselfwithallroadsandlanesleadingtoithavetobeatleast6mwide.Thedraftsketchwillbefollowedbyafeasibilitystudytoassessthefinancialfeasibilityandevaluatetheeffectsontrafficandenvironment.Untilnownostricttimelineforconstruct‐ingthecrossingisset.Thedraftsketchwillalsogivethecitygovernmentabetterpictureabouthowstreetsleadingtothecrossingwillhavetobereconstructed.Thiswilldeterminethefinalcostsoftheprojectandprovideatimelineforthenecessaryinvestments.
7.2 District cooling station
DistrictheatinginTartuisorganisedbyFortumTartuAS,apartoftheFinnishFortumGroup.ThegrouphasexperiencedsuccesswithdistrictcoolinginanumberofnorthernEuropeancitiesandisplanningtooffertheserviceinTartu.Theirpreliminaryresearchhasshownthatanumberofrequirementsarefulfilledforabetterthanaverageorganisationofdistrictcooling:

page44
Thecitycentreisdenselyconstructed; thecitycentrewillbecomeevenmoredenseintime; theconstructiondensitywillprovideforhighpowerdensityofca7kW/m(average:
1,8‐5,5kW/M); Fortumisanownerofgroundplotrightnexttotheriver; theriverwatercanbeusedforcoolingduringtheautumn‐winter‐springmonthsand
thewatercanbeusedforcoolingtheturbocompressorsprovidingcoolingduringthesummermonths.
Figure36: Technicalconceptionofthedistrictcoolingstation(CityofTartu/FortumTartuAS)
Thebenefitsofdistrictcoolingwillfirstofallbeenergyefficiency.Thecitycentreincludesmostlypublicbuildingsincludingawatersportscentre,atheatre,threeshoppingcentreswithafourthinconstruction,ayouthsportscentreasciencecentreandanumberofofficebuildings(seeFigure37).Currentlyallthebuildingshavetheirownlocalcoolingdevices.Thedifferentbuildingshavedifferentuseintensityandpeaksthatprovideapossibilityforhighoptimisationofthedistrictcoolingsystem.Theefficiencyfordistrictcoolingsystemcanbe3timeshigherthanthebestlocalcoolingdevicescanprovide.
Legend:
1–intakepipe
4–turbocompressors
6–outflowpipe

page45
Figure37: Potentialclientsfordistrictcooling(CityofTartu/FortumTartuAS)
Theresultsofenvironmentalimpactresearchshowalowimpactontheriverandsur‐roundingareas.AsEmajõgiisahomeforcarptherearestrictrestrictionsonaffectingtheriver:
Thewatertemperaturemustnotincreasemorethan3degreesintheoutflowarea. Thewatertemperaturemustnotexceed28degreesintheoutflowarea Thewatertemperaturemustnotbehigherthan10degreesduringreplicationperiod.Resultsoftheresearchshowthat:
Thewaterdirectedbacktotheriverisonaverage4.4degreeswarmerthanintakewa‐ter.
Thedistrictcoolingsystemwilluseaboutca0.18%(436m3/h)ofthewater. Worstcasescenarioisthatthewatertemperaturewillincreaseby0.09degreeinthe
outflowarea. Fordecreasingtheeffectsontemperaturetheoutflowpipeshouldbesituatedinthe
morerapidflowareainthecentreoftheriver.
Table3: Environmentaleffectsofthedistrictcoolingstation(CityofTartu/FortumTartuAS)
Unit Localcooling Districtcooling
Savings Savings
Energyusage GWh/y 6,0 1,8 4,2 70%
Primaryenergy GWh/y 24 7 17,2 71%
CO2emissions T/y 8500 2500 6000 71%

page46
Table3showstheexpectedsavingsinenergyusage,primaryenergyconsumptionandCO2emissionsinducedbytheshiftfromlocalcoolingtoadistrictcoolingsystem.Thesavingsareestimatedwithabout70%.
7.3 LED public lighting
Themaingoaloftheprojectistoreduceenergyconsumptioninpubliclightingandtoim‐provetheroadsafetyinthecity.TheprojectwasinitiatedbytheDepartmentofCommunalServicesoftheCityofTartu.Theprimarydrivertoinitiatetheprojectwastheever‐risingelectricitypricesandtheneedtoensuresafenight‐timelightinginanurbanenvironment.Theinitialplanistoupgradelightingfirstinthestreetswithmostintensivetrafficandaf‐tertestingthenewlightingsystemtoreplacegraduallyallthecity'sconventionalpubliclighting.Theresultsofthefirstphase(energyconsumption,dimmingchances)showthatLEDlight‐ingmeetstheintendedgoals;itisthereforeplannedtomoveforwardwiththisprojectinthenearfuture.StreetlightingofTartuinfigures: 321kmlightenedroads 227kmaircablesand126kmundergroundcables ca11,500luminaires 151switchboards
Figure38: Typesofluminaires
Figure39showsthatthemainexpendituresofthecityforpubliclightingareinducedbytheelectricityconsumption,thus,hereliesahighpotentialforoptimisation.
HPSluminairesbypower LEDluminairesbypower

page47
Figure39: Expendituresonelectricity
TheobjectiveoftheprojectistodecreasetheenvironmentalimpactofpubliclightinginTartuandthedevelopmentofanintelligentstreetlightingnetwork.AcquiringnewenergyefficientLEDstreetlightsenablestoreduceenergyconsumptionandGHGemissions,whileimprovingtrafficsafetyandsecurityofcitizensinthecity;lowenergyconsumptionofLEDluminairesenablestohavemorelightingforthesamecostsandenergyconsumption.LEDlightingenablesbetteruniformityofpavement,theestablishmentofalampbasedcontrolsystemenablestoreduceoperational(dimming)andmaintenancecosts.Inthefirstphase470pre‐dimmedluminairesplus20radio‐controlledluminaireswereinstalled.Thesecondphaseiscurrentlyinimplementation,450radio‐controlledlumi‐nairesshallbeinstalled.
Figure40: Comparisonofdifferentlightingsystems

page48
Figure41: LEDandHPSluminairesinRiiastreet
Figure42: Uniformityofthepavementluminance,VabaduseAlley,newLED(107,6W,PhilipsSelenium,luminousflux
9348(lm,efficacy88lm/W,colourrenderingindex4000K)
Figure43: Uniformityofthepavementluminance,VabaduseAlley,HPS(250W)

page49
Figure44: DimminginVabaduseAlley,107WLED100%(left)vs.107WLED20%(right)
ThetestingoftheLEDlightingshowsthatthestreetenvironmentisstillsecureaswellascolourandrenderingofthelightingisgood.Furthermoreit’spossibletosavemorethan70%ofenergy.AstheuniformityofthepavementisbetterinthecaseofLEDlights,itispossibletoincreasethedistancebetweenthepolesanddecreasethepowerconsumptionofluminaires.LEDlightingmakesitpossibletoimprovethesecurityofthecityanddoesnotshedlightonareaswithlowtrafficdensity.
8 Summary of urban energy planning in Tartu
Themaingoalsregardingnationaltransportandenergypoliciesareformulatedin
theNationalSpatialPlan“Estonia2030+”(NSP) theNationalRenewableEnergyActionPlan(NREAP)2020and theEstonianEnvironmentalStrategy2030.Thesedocumentsshowaclearvisionoftheobjectiveswhicharepursuedonthenationallevel,butatthesametimethedocumentslacktoformulateconcretemeasuresthatputthespecifieddevelopmentprinciplesintoaction.“Low‐densityurbanisedspace”isthecentralspatialdevelopmentconcept,describedintheNSP.Itaimstocombinetheconceptofcompacturbanspacewithlow‐densitysettle‐mentcharacteristicsinEstonia.FurthermoretheNSPfocusesonreducingenergydepend‐encyonimportedresourcesaswellasensuringsecurityofenergysupply,whichshallbeachievedbyregionalenergyproductionandincreasingtheshareofrenewableandlocalfuels.Thus,effortstowardshigherenergyefficiency–atleastonthenationallevel–areratherdrivenbystrivingtodecreasefueldependencythanmerelyefficiencyobjectives.Themainstrategicandplanningdocumentsonthelocallevelare
theDevelopmentStrategy“Tartu2030” theMasterPlanofTartu(2006) theTartuCityTransportDevelopmentPlan2012‐2020TheDevelopmentStrategy“Tartu2030”setsupastrategicvisionforthecity’sdevelop‐mentupto2030,includinggoalsanddirectionsofactivities.BythesemeanstheDevelop‐mentStrategy“Tartu2030”interlacestheformulatedobjectivesforthecity’sdevelop‐mentswiththerequiredplanningmodelandimplementationprocess.

page50
TheMasterPlanofTartuandtheTartuCityTransportDevelopmentPlanformulateacon‐creteconceptwithgoals,measuresandplansforthecity’sdevelopment.Thedocumentspointthenecessitytoinvolve“allrelevantstakeholders”out,butdonotmentionconcretealliancegroups.Hence,besidesthecurrentmainactorsshapingtheurbandevelopmentofTartu,whicharethemunicipalityanditsadministrationandthemainenergysupplierFor‐tumTartu,purposefulalliancesshouldbefiguredout.Contrarytotheconceptofacompactandintensivecitydevelopment,asformulatedintheNSPandtheMasterPlan,theconcretedevelopmenttendenciesoftheMasterPlanoperatenotinaccordancetothat,bye.g.planningnewresidentialareasintheoutskirtsofthecity.Thus,theactualdevelopmentofTartuischaracterizedbyongoingurbansprawl.Asonereasonisnamedhighlandvalueswhichcauselandimmobility.RegardingquestionsofenergyefficiencyandtransportespeciallytheTransportDevelop‐mentPlanhighlightscurrentweaknessesinthetransportsystemanddrawsaclearpictureofthegoalsforthedevelopmentofthetransportsysteminTartu.Though,theTransportDevelopmentPlanpointstheweaknessesinthecity’stransportsys‐temandpartlyacrossthecityborderout,butthemeasuresaddressonlythecityscaleandnotaspectsofe.g.regionalcommuting,whichisactuallythebiggerproblem.
Theoutlinedmissinglinksarise,amongothers,fromthefollowingaspectscontradictingintegratedeffortstowardsincreasingenergyefficiency:OneobstacleiscausedbytheEstonianplanningsystemincombinationwiththemunicipalstructure:Themainresponsibilitiesforplanningactivitiesareheldonthelocallevel,whereastheregionallevel(county)isratherweak.Estoniahas215municipalities24andtheterritoryofthemunicipalitiesisquitenarrowconfined,thus,thelocalplanningcompe‐tenceshaveaverylimitedscopeofaction,tiedtothecorecityterritory.Thisconstellationimpliesaproblematicgapofcooperationontheregionallevel,leadingtodispersedurbandevelopmentinsuburbanmunicipalities.Furthermore,duetotherathersmallmunicipalitiestheirinterestsexcessreasonablyitsmunicipalborders;thatcausescontradictinginterestsanddevelopmentsbetweenneighbouringmunicipalities,butmissesacoordinationlevelatthesametime.Similarlydemandsofregionalpositioningandintegratedplanningwithinthefunctionalurbanarea(ase.g.mentionedintheDevelopmentStrategy“Tartu2030”)canbehardlyaddressedneitherfulfilled.Anotheraspectistheextensiveprivatisation,whichtookplaceespeciallyinthehousingmarket,inEstonia.Mostofthehousesandapartmentsareprivatelyownedandthereisalackofhousingorganisationstakingresponsibilityofcommonissues,suchasdecisionsabouttheheatingsystem.Itisforexamplenotmandatorytoconnecttothedistrictheatingnetwork,whichimpliesuncertaintiesfortheenergysuppliersindecisionsabouttheexten‐sionofthedistrictheatingnetwork.Thus,theaspectofprivatisationisconsideredasoneofthemainlimitationstopolicyimplementation.Decisionsaretakentooclosetoeachprop‐ertyand,hence,lackthebroaderplanningperspectivecoveringafunctionalentity.OnemajorprobleminTartuisregionalcommuting,whichincludesshortdistancecommut‐ingduetoongoingurbansprawlandfar‐distancecommuting,e.g.toTallinn.ThisisalsocausedbythenationalconcentrationonTallinnasthecapital,providingdiverseemploy‐mentpossibilities,whilethemainemployersinTartuarethemunicipalityandtheuniver‐
24 Currentlyareformtojoinlocalgovernments(municipalities)uptoaminimumamountofinhabitants(e.g.
5,000)isinprocess.

page51
sity.Atthesametimetransportplanningwithinthecityregionbecomesexceedinglyprob‐lematicduetotheoutlinedplanningframework.Alackofavailabledataonregionalcom‐mutingisjustanotherhintforaplanninggapontheregionallevel.
9 Perspectives for thematic report (D4.3)
TherearetwocentralaspectsregardingthecaseofTartu,whichareinterestingandrele‐vanttoexaminefurtherregardingthequestionofenergyefficienturbanplanning:
1. Theconceptof“low‐densityurbanizedspace”2. Thelimitedinfluenceofthemunicipality/planningonhouseholddecisions
Thefirstaspectistheconceptof“low‐densityurbanizedspace”,whichisoutlinedintheNationalSpatialPlan“Estonia2030+”(NSP)and–asaprincipleforurbandevelopment–alsotransferredintothepreviousandcurrentMasterPlanofTartu.Thisconceptaimstocombinetheprincipleofcompacturbanspacewiththelow‐densitysettlementcharacteris‐ticsinEstonia.Bythesemeanstherequirementsofasustainable(compact)urbanformshallbemetandatthesametimethehistoricallyevolvedEstoniansettlementstructuresareconsidered.Contrarytothisconcepttheactualdevelopmenttendenciesshowhoweveranongoingurbansprawl25inthevicinityofTartu.Responsiblecausesseemthefollowing:
Theplanningsystemincombinationwiththespatialconfinesofthemunicipalitiescauses
agapofcooperationontheregionallevel,leadingtodispersedurbandevelopmentinsuburbanmunicipalities;
contradictinginterestsanddevelopmentsbetweenneighbouringmunicipalities;
Highlandvalues,whichcauselandimmobility.Asecondrelevantaspectforfurtherexaminationisthelimitedinfluenceofthemunici‐palityonhouseholddecisionsduetoahighprivateownership.Thatmakese.g.refur‐bishmentorconnectiontothedistrictheatingnetworkasubjectofnegotiation.Thus,pri‐vatisationisconsideredasoneofthemainlimitationstopolicyimplementation.Thefirstmentionedaspectillustratesverywellthatquestionsofenergyefficienturbanplanningarenottiedtothecorecitylevel,butrequireawiderperspectivetakingintoac‐counttheregionalurbansystem(‘functionalurbanarea’).Bothdraftedaspectsshow,thattheactualpossibilitiesofthemunicipalitytoincludeener‐gyissuesinurbanplanningortocontrolurbandevelopmentatallareverymuchrelatedtotheframeworkoftheplanningsystemandthelocalpowerrelations.Thesedeterminethescopeofactionintermsoftheterritorialscope(municipalarea)aswellastheplanningcompetence(vs.e.g.privatepropertyrights).Althoughthere’salreadyafirstapproachofexplanationsfortheoutlinedgapsinenergyefficienturbanplanninginTartu,thequestion–ifthere’remightbefurtherobstacles–needstobecloserexamined.AninterestingaspectinEstonianenergypolicyisthefactthatthedrivingforceisnotener‐gyefficiencybutfuelindependency,whichstandsforaneconomicorsocial(secureenergysupply)objectiveandprobablycausespolicyrelatedgoalconflicts.Thisisalsoreflectedin
25 Thisraisesanadditionalquestion:Atwhatpointdoweconsiderurbanformassprawled?Canweapplya
generalpatternordowehavetoincludehistoricalandregionalspecificities(e.g.acultureofremotesin‐gle‐family‐housesinFinlandorEstoniavs.atraditionofcompactcitystructuresintheUK)?

page52
thefactthatnationalenergyrelateddocumentslacktoformulateconcreteenergyefficien‐cymeasuresaffectingurbanenergypolicy.Also,urbanplanninginTartuhastodealwithadifferentcommitmenttoenergyefficiencyorsustainabilitythanforexampleinEskilstuna.Hence,theframeworkwithinwhichurbanplanninginTartuhastoactisnotfavouringeffi‐ciencyrelatedeffortsinurbanplanning.Urbanplanningis‘locked‐in’theframeworkoftheplanningsystemandthelocalpowerrelations.Thereforeit’snecessarytoexploreap‐propriatepossibilitiesthatenableintegratedenergyefficiencymeasureswithinthegivenframeworkandtocontrolurbandevelopment.Potentialstoinvestigateliee.g.intheinvolvementofstakeholdersandthefacilitationofalliance‐buildingaswellasinthetargeteduseofincentives(e.g.toconnecttodistrictheat‐ing…).

page53
10 Figures and tables
Figure1: LocationofTartuinEstonia(googlemaps)...........................................................................6Figure2: TartuinTartuCounty(TartuMaavalitsusKonsultatsiooni‐jakoolituskeskus
Geomedia,2012,p.28)....................................................................................................................7Figure3: LanduseinTartuarea2006.........................................................................................................8Figure4: Tartucitydistricts(TartuCityGovernment,2011)............................................................8Figure5: PopulationdevelopmentinTartuanditsregion1875‐2014.........................................9Figure6: EmploymentpersectorinEstoniaandTartu,2011.......................................................10Figure7: TartuTownHallSquare,1925(viaWikimediaCommons,
http://commons.wikimedia.org/wiki/Tartu)...................................................................11Figure8: Annelinndistrict(fieldwork,June2014)............................................................................12Figure9: UrbanandterritorialdevelopmentofTartuuntil1977(CityofTartu,2003)....13Figure10: The22municipalitiesofTartuCountywithTartumunicipalityinthecentre....15Figure11: Nationalpoliciesonenergyandspatialplanning.............................................................16Figure12: Electricityproductionbyenergysource2007(MinistryofEconomicAffairsand
Communications,2009,p.13)..................................................................................................17Figure13: ModelofthedevelopmentofTartu2030(TartuCityGovernment,2006,p.29)21Figure14: Localpoliciesonenergyandspatialplanning...................................................................21Figure15: Extensivedevelopment–developmentalbuildingtoemptyareas(CityofTartu,
1999)....................................................................................................................................................23Figure16: Intensivedevelopment–raiseofthepresentqualityofthecityenvironment
(CityofTartu,1999)......................................................................................................................24Figure17: Tartu,zoningforlanduse(CityofTartu,2006,http://www.tartu.ee/kaart/)..25Figure18: Single‐family‐housinginIhastedistrict(fieldwork,June2014)...............................26Figure19: ModalsplitinTartu2009(TartuCityGovernment,2011,pp.17,21)....................27Figure20: DevelopmentofcarownershipinTartu2004‐2011(eurostat,2014)....................28Figure21: DistancebetweenhomeandworkandmodelsplitinTartubycitydistrict........30Figure22: Publictransportaccessibilitywithin300m.......................................................................30Figure23: Journeystowork,Tartu2011(eurostat,2014)................................................................31Figure24: BasicstructureofthetransportnetworkinEstoniain2023(Ministryofthe
Interior,2013,p.32).....................................................................................................................32Figure25: Businessandresidentialenergyconsumption(PresentationCityofTartu,
05.06.2014).......................................................................................................................................33Figure26: Energyusebysector2010(PresentationCityofTartu,05.06.2014).....................33Figure27: Distributionofemissionsbysectors(PresentationCityofTartu,05.06.2014)..34Figure28:WoodenhouseresidentialdistrictSupilinn(fieldwork,June2014)......................35Figure29: CHPplantandpeatproductionofFortumTartu(PresentationFortumTartu,
06.06.2014).......................................................................................................................................36Figure30: Newcombinedheat‐power‐plant(CHP),Tartu(fieldwork,June2014)...............36Figure31: Areassuppliedbydistrictheating(CityofTartu,2006)...............................................38Figure32: DailyactivityspacesinEstonia,2010(MinistryoftheInterior,2013,p.24)......40

page54
Figure33: Municipalborders(grey)vs.actualsettlementareaofTartu(Metspalu,2007)41Figure34: Locationoftherailwaycrossing..............................................................................................42Figure35: Alternatives1‐6forpositionthepedestrian/bicyclebride(CityofTartu)...........43Figure36: Technicalconceptionofthedistrictcoolingstation(CityofTartu/FortumTartu
AS).........................................................................................................................................................44Figure37: Potentialclientsfordistrictcooling(CityofTartu/FortumTartuAS).................45Figure38: Typesofluminaires.......................................................................................................................46Figure39: Expendituresonelectricity........................................................................................................47Figure40: Comparisonofdifferentlightingsystems............................................................................47Figure41: LEDandHPSluminairesinRiiastreet..................................................................................48Figure42: Uniformityofthepavementluminance,VabaduseAlley,newLED(107,6W,
PhilipsSelenium,luminousflux9348(lm,efficacy88lm/W,colourrenderingindex4000K)....................................................................................................................................48
Figure43: Uniformityofthepavementluminance,VabaduseAlley,HPS(250W)..................48Figure44: DimminginVabaduseAlley,107WLED100%(left)vs.107WLED20%(right)49Table1: FieldstudyagendainTartu,5‐6thJune2014........................................................................5Table2: ExpectedgrossfinalenergyconsumptionofEstoniainheatingandcooling,
electricityandtransportupto2020takingintoaccounttheeffectsofenergyefficiencyandenergysavingmeasures2010‐2020(MinistryofEconomicAffairsandCommunicationsandMinistryoftheEnvironment,2010,p.5f)......................18
Table3: Environmentaleffectsofthedistrictcoolingstation(CityofTartu/FortumTartuAS).............................................................................................................................................45

page55
11 References
CityofTartu,1999.MasterplanofTartu2012(Tartulinnaüldplaneeringaastani2012).
CityofTartu,2006.MasterplanofTartu(Tartulinnaüldplaneering).
EuropeanEnvironmentAgency(EEA),2011.2011SurveyofresourceefficiencypoliciesinEEAmemberandcooperatingcountries.CountryProfile:Estonia.Countryinfor‐mationonresourceefficiencypolicies,instruments,objectives,targetsandindica‐tors,institutionalsetupandinformationneeds.
EuropeanRenewableEnergyCouncil,2011.MappingRenewableEnergyPathwaystowards2020.EURoadmap.
eurostat,2014.Citystatistics‐UrbanAudit[WWWDocument].URLhttp://epp.eurostat.ec.europa.eu/portal/page/portal/region_cities/city_urban(ac‐cessed7.30.14).
Fertner,C.,Groth,N.B.,Große,J.,Read,S.,Rocco,R.,Meijers,E.,FernandezMaldonado,A.M.,Mashayekhi,A.,2014.Frameworkforreportsonurbanenergyplanningin6casecities:PLEECReportD4.1.EU‐FP7projectPLEEC.
Gauk,M.,Roose,A.,2011.UrbanenergyconsumptionpatternsinEstonia‐amandateofmasterplans.
Giffinger,R.,Hemis,H.,Weninger,K.,Haindlmaier,G.,2014.EnergyEfficiencyIndicatorsWP2.Partofdeliverable2.3“EnergySmartCityProfiles”anddeliverable2.4“Meth‐odologyforMonitoring.”Wien.
Groth,N.B.,Große,J.,Fertner,C.,2014.Deliverable4.2/EskilstunaUrbanenergyplanninginEskilstuna.EU‐FP7projectPLEEC.
Jauhiainen,J.,2003a.Urbanplanningandland‐useinpost‐socialistEstonia.ThecaseofTartu.,in:CaseStudiesVolumeII:BuildingandRe‐BuildingSustainableCommuni‐ties,ReportsfromtheSuperbsProject.BalticUniversityPress,Uppsala.
Jauhiainen,J.,2003b.Developmentofanoldwoodenhouseresidentialdistrict.SupilinnincentralTartu.,in:CaseStudiesVolumeII:BuildingandRe‐BuildingSustainableCommunities,ReportsfromtheSuperbsProject.BalticUniversityPress,Uppsala.
Lewis,J.O.,Hógáin,S.N.,Borghi,A.,2013.BuildingenergyefficiencyinEuropeancities,Cit‐iesofTomorrow–ActionToday.URBACTIICapitalisation.
Metspalu,P.,2007.IndicationsofurbansprawlinHarjuandTartuCounty.
MinistryofEconomicAffairsandCommunications,2009.DevelopmentPlanoftheEstonianElectricitySectoruntil2018.
MinistryofEconomicAffairsandCommunications,MinistryoftheEnvironment,2010.Es‐tonianNationalRenewableEnergyActionPlan(NREAP)2020.
MinistryoftheEnvironment,2007.EstonianEnvironmentalStrategy2030.
MinistryoftheInterior,2013.NationalSpatialPlanEstonia2030+.
Rudi,U.,2010.ThefutureofpowergenerationinEstonia.Int.J.Glob.EnergyIssues34,68–77.doi:10.1504/IJGEI.2010.037393
Salupere,M.,2013.MillenaryTartu:thecityofyouthandgoodideas.M.Sallupere,Tartu.

page56
StatisticsEstonia,2011.PopulationandHousingCensus2011[WWWDocument].URLhttp://www.stat.ee/en(accessed7.30.14).
TartuCityGovernment,2006.DevelopmentStrategyTartu2030.
TartuCityGovernment,2011.TartuCityTransportDevelopmentPlan2012‐2020.
TartuMaavalitsusKonsultatsiooni‐jakoolituskeskusGeomedia,2012.TartuCountyDe‐velopmentStrategy2014‐2020(Tartumaakonnaarengustrateegia2014–2020).
Weblinks:Maps:http://www.tartu.ee/index.php?page_id=656&lang_id=1&www.ubcwheel.eu/index.php/gpdp:gpdb?action=pa%3Aarticle&aid=3519www.covenantofmayors.eu

page57
Annex 1. Translation of text on historical development of Tartu
Thefollowingtextisatranslationofchapter1.3oftheMasterPlanofTartu2012(Tartulinnaüldplaneeringaastani2012,CityofTartu,1999),describingthetown’shistoricalde‐velopment.TranslationwasconductedbyMartinKukk,studentattheUniversityofCopenhagen.
1.3Thetown’sterritorialdevelopmentWithinthecurrentareaofTartulaidacomplexsystemofvalleysandgorgesinpre‐quaternaryperiod.ThelargestofthesewereRaadi‐JaamagorgeandRaadi‐Maarjamõisagorge,whichalsobordertheoldtownofTartu.TheoldvalleyofEmajõgiisthoughttobeemergedduringthemuraavino26era,bywhichtimetheabove‐mentionedgorgeswereal‐readyfilledwithglacialsediments.Duetotheeffectofthemeltingwaterfromtheglacialaterrainofgulches,floodvalleysandsandhillswascompiledduringthelateiceageintheareaofoldtown.TheoldestarchaeologicalfindingsfromtheareasofTartuoriginatealreadyfromtheMeso‐lithiceraandwerefoundin1997fromIhaste,fromtheareaoftheHipodroomStreet.Youngerstone‐ageandbronze‐agestoneaxesarefoundfrommanysitesfromtheoldriverbankintheareaofthetown.Alatestone‐ageburialgroundwasdiscoveredin1911inKar‐lovaPark.NaturalconditionswerethedecisivefactorwhendecidingonthelocationofTartu.Namely,thehigherboulderclayridgespermittedapassageacrossthebogsofPärnuCounty,themarshybasinofVõrtsjärveandthelowlandsofPeipsionlyintheareasofTartuandViljan‐di.Furthermore,theeasternmostofthethreeancienttraderoutesranalongtheboulderclayridgesofnorthernpartofTartuCountyandcrossedtheriverEmajõgifromtheplaceoftoday’sTartu.Thesettlementwasestablishedonthenarrowestpartoftheoldriverval‐ley,whereexcellentconditionsforbuildingafortressonahillandforestablishingaportplaceoccurredandamplequantitiesofspringwaterforeverydayneedscouldbefound.Basedonarchaeologicalfindings,itisestimatedthattheancientEstoniansestablishedawoodenfortontheSouth‐EastplateauofToomeneemikuduringthe5‐6thcentury.Amorepermanenttypeofsettlementwasestablishedontheplateaus’EasternandNorthernsidebytheendofthefirstmillenniumlatest.Waterbarrierssurroundedthefortress.FindingswithrelationtotheearliestsettlementareobtainednearbytheintersectionofJakobiandMungaStreet,itseemstoreachthelineofKitsaStreetfromtheSouthside.BythesideofEmajõe,theViking‐timesettlementreachesthecentreofthequartersinplacesbetweenRüütli,KüüniandÜlikooliStreets.Duringtheperiodinquestion,smithieswerelocatedunderthefortresses’Northernslope.Inthecourseofthearchaeologicalexcavationsduringthesecondhalfofthe1980stwouniqueNorelund‐typeScandinavianbronzependantsmadehereduringthesecondhalfofthe10thcenturywerefoundfromtheculturallayerofthesesmithies.ThesefindingsrefertoculturalbondswithScandinaviancountries.Inthebeginningofthesecondmillennium,theareaofancientTartuincreasednotably.Thear‐chaeologicalfindingsfromtheoldtownsuggestthatthereasonforitlaysintheevolve‐mentofthesettlement,whichwasabletomediatetradebetweenthetownsofOld‐RussiaandthelandsbytheBalticSeabasin.Consideringtheabove,thewarexpeditionoftheRus‐sianprinceJaroslavSmartintheyearof1030,withthehelpofwhichTartuwentdownin
26 Muraavino – It was not possible to translate this term since no other sources referring to it could be found.

page58
writtenhistoryasJurjev,becomesmoreunderstandable.ItseemsthatinthisperiodtheentireplateauofToomemägiwasalreadytakenintouse.ThesettlementcouldhavebeenborderedbyLaiStreetfromtheNorthsideandbythecontemporaryVanemuiseStreetfromtheSouthside.FromtheEastside,theculturallayercontainingwheel‐thrownpotterytypicalforthisperiodreachesinplacesthecentresofthequartersbetweenthestreetsofRüütliandKompanii.TracesofthesettlementfromthesecondhalfoftheyoungerIronAgearealsofoundfromtheareaofthemainbuildingofRaadimanor’s,fromthesouthsideofFr.R.KreutzwaldStreet54inTähtvereandalsofromthemiddlepartsofthequarterbe‐tweenthestreetsofVanemuise,Pepleri,TiigiandAkadeemia.Itispresumedthataroadnetworkconnectingthehinterlandwiththecenteremergedbytheendoftheperiodinquestion.TartuandOtepääwerethemajorcentersoftheancientUgandicounty.Tartu(Tarbatu)wasconqueredbystrongholdcrusadersin1224.Abishop’scastlemadeofstonewasbuiltinsteadofthewoodenfortressoftheancientEstoniansduringthe13thcen‐tury.ThelargestcathedraloftheBalticlandsdedicatedtoPeterandPaulwasbuiltnearbythecastle.Tartuwasthecentreofthedioceseandthefuturehanseaticcity.ThetownwasnownamedGerman‐likeDorpat.EvenaftertheGermanconquest,Tartuwasstillawoodentownwithfewstonehousesandchurches,whichbordersdidnotcompletelycoincidewiththeareaborderedbytheprotectionwallin14thcentury.Anampleamountoffacilitiesre‐latedtohandicraftswerefoundduringthearchaeologicalexcavationsfromtheculturallayerofthetown’scentrebelongingtotheperiodunderquestion.Blacksmithing,tanneryandboneworkingweredealtwithatthefootofthecastle.TheproductionwasliquidatedatthemarketinTownHallSquare,wherespecialrowstoreswithworkshopslocated.Thesocialorganisationandthestatuteofthetownwereprobablysignificantlydifferentinthebeginningofthemiddleagesfromthatofsubsequenttimes.ArchaeologicalstudiesshowthatthewoodenroadpavementsofLossi,RüütliandLaiStreetswerealreadyestablishedbeforetheGermanconquest.ThestreetsparalleltoEmajõgiandthestreetsinintersectionwiththeseoccurredinthecourseoftheplannedestablishmentofthemedievaltownbas‐ingtheprocessontheexamplesofGermantownsandonthemaindirectionsoftraffic.TheroadnetworksurroundingthetownwasformedofoldPihkvaroad,whichhaditsstartingpointatKarjagateandofRiga,Viljandi,Otepää,NarvaandTallinn,Alevaküla,KastreandTähtvereroads.Theroadsjoinedbeforeenteringtown’sgate,formingfieldsandsquareswherealreadyinthe16thcenturypostalstationsmayhavelocated(onRigaHillandinJüriValley,forexample).ThelengthofTartu’stownwallwas2.1kilometresanditsurroundedanareaof27.6hainsize,wherecitizens’houses,churches,monasteriesandotherim‐portantpublicbuildingswerelocated.StJohn’sChurchcompletedinthebeginningofthe14thcenturyisalsolocatedinthetown’scentre.Duringthearchaeologicalexcavationsinthe1980s,relicsofPre‐Christening‐eraChristiansanctuarywerefoundfromtheculturallayerofSt.John’sChurch.Itisthoughtthatalready5,000‐6,000peoplelivedinTartudur‐ingthefirsthalfofthe15thcentury.TheprosperityofTartuduringtheMiddleAgeswasbasedonsuccessfullymediatingthetradebetweenGermancommercialcentresandmainlytownsofPskovandNovgorod.MaintraderoutespassingthroughthetownweretheroadsofNarva‐RigaandTallinn‐PskovandriverrootswithPskovandperhapswithPärnu.ItislikelythatthebargeswerealreadyusedinTartuduringthehanseaticperiodandalsothatannualfairswereheld.Westilldonotknowmuchaboutthesuburbsi.e.slumsofTartuduringthemedievalandmodernperiod.MetropolitanIsidoros,whotravelledthroughTartuinthefirsthalfofthe15thcentury,praisedthetown’ssize,itsfancystonehousesandplentifulgardensinhistravelogues.Butthecitizens’gardenplotswerelocatedinthesuburbs.Itisalsopresumed,thataRussianfreightyardwaslocatedonHolm(anislandbetweentheriversofKoolujõe

page59
andEmajõgi).Stonewarefindingsdatedfrom14‐16thcentury,neartheNorthwestcornerofpresent‐daynightclub“Atlantis”fromtheculturallayerabovesilt‐layer,confirmtheex‐istenceofamedievalsettlementinthisarea.OneofthemedievalsuburbswasprobablyalsolocatedabitfartheratÜlejõeBorough.Weknowfromtheoldestplans,thatastreetnetworkoppositetoKoolujõeriver,similartomodernnetworkwasalreadyestablishedbythe17thcentury.IntheareaofTuuleStreet,theSt.George’sleprosyhospitalandanexecu‐tionsite(socalledKaagimägi)werelocated.Themostcomprehensivearchaeologicalstud‐iesoftheculturallayerofsuburbsareconductedintheareaslocatedsouthofthetownwall.FromtheculturallayerexposedduringtheaggravationworksfortheconstructionofcontemporaryMarketHall(Kaubahall)andPostOffice(Postimaja),dataaboutthemedie‐valroadnetwork,largeyardssurroundedwithuprightpiles,thewayofbuildinghousesandaboutwatermanagementsystemsfrommedievaltimeswasobtained.Itislikely,thatthemedievalsettlementcontinuedevenfartheralongsidetheformerAlevakülaRoad(KaleviStreet).FromthequarterbetweenthestreetsofVallikraavi,ÜlikooliandKitsas,tracesofabrick‐nave,madeofDevon‐eraclay,werefoundduringthe1997‐1998archaeo‐logicalexcavations.TheculturallayerofTartu’smediaevalandmodernperiodsuburbswithrelevantfindingsisalsoidentifiedclosebytoNarvaStreet,intheareaofformerVet‐erinaryInstitute,infrontofNarva89,atKiviStreet,atthewesternsideofPõikStreet,ontheshoresofKooluriver,intheareabetweenTuruStreetandEmajõgiandalsointheareaofPepleriandVeskiStreets.ThehistoricaldataaboutTähtvere,RaadiandRopkamanorsalsoalreadydatesbacktothe16thcentury.TartuwasheldbyRussiaduringtheLivonianwarin1558‐1582.TheKingdomofPolandgotpossessionofthetownupto1625withthetreatyofJamZapolsky(exceptfortheshortSwedishreinintheyearsof1600‐1603).BothRussianandPolishauthoritiesdealtinsomeextentwithrenovatingandrepairingthetown’sfortification.Accordingtoabuildingrevi‐sioncompiledbyPolishauthoritiesin1590,71buildingplotsoftown’s276wereemptyand16wereeitherdestroyedorthebuildingsontheplotsweredestroyed.DuringtheSwedishreinmanyadministrationandchurchinstitutionswereestablishedandin1632auniversity–AcademiaGustaviana–wasfounded.TheSwedesstartedtorenovateTartu’sfortificationbeltduringthesecondhalfofthe17thcenturybymodifyingToomemäe’sbeltofbastions.Still,thetownwasconqueredalreadyin1704byPetertheFirst’stroopsduringtheGreatNorthernWar.TartuwasseverelydamagedduringtheGreatNorthernWar.Russiansstarteddestroyingthetownsystematicallyin1708.Thedefencewallswereblownup,churchesandhouseswerearsonandcitizensweredeportedtoRussia.Theopportunitytoreturntohomedidnotcomeuntil1714,bywhichtimemanydecidednottoseizeit.Arduousworkofrecon‐structingthetownbegan.Stillin1735only69houseswereinthetownandonly8madeofstone.Themunicipalityrulewasre‐establishedin1719.Theborderofcitizens’commonpropertyreachedthegroundsofmedievalleprosyhospital‐approximatelythelineofcur‐rentJäneseStreet‐innortheastbytheyear1729.InSouth,theborderreachedthelaterLinaStreetandintheWestthegroundsweremoreorlessborderedbythetownfortifica‐tions.InnorthwestthegroundsofcommonpropertyalsocoveredtheareaofSupilinnSub‐urb,reachingthelineofcurrentMeloniStreet.ThetraditionofoldnamescontinuedalsoaftertheGreatNorthWar.Forexample,writtenresourcesrefertoKiviStreetatÜlejõeBorough,toHolm,Narva,Jaama,LuunjaandKastreRoadsandtootherformernames.Thereasonforshiftingthetown’sborderin1787wasthegreatfirein1775,afterwhichTartuwasconclusivelyremovedfromthelistoffortresstowns.Thefiredestroyedovertwothirdsofthetown’swoodenhouses.Thereconstructionplanenvisagedthestraighten‐ingofthemedievalstreetnetworkandwell‐plannedconstructionofthetown.NewTown

page60
HallandStoneBridgebecamethearchitecturaldominantoftheMarketSquare,providingthesquarewithcompleteandclear‐cutspatialeffect.TsarPaultheFirstdonatedtheareaofformerentrenchmentsinToomemäetotheUniversityofTartuin1799,itsre‐openingin1802createdfavourableconditionsforfurtherdevelopmentofthetown.Themainbuild‐ingoftheuniversitybecamethesecondcompositionalnodeofthetownnexttothetownhallbuilding.ThecomplexoftheuniversitybuildingsinToomemäeaugmentedthisfur‐ther.Thecentreofthetowngottheclassicisticappearancestillobservabletoday.NewstonebuildingswerealsobuiltbyNarvaandRiiaStreets.Greenspacearoundthetown’scentrewasdevelopedandseveralnewsquareswerecreated(TheSquareofBarclaydeTolly,thesurroundingsoftheStoneBridge,AurikuStreetandothers).Theoutskirtsofthetownwerealsodeveloping.Thesuburbsmainlyemergedbytheroadsdescendingalongthesideoftheoldvalley.Incontrast,thestreetsweredesignedunnaturallyacrosstheoldvalleyandtheyoftenheadedstraightuptheslopeofthevalley.Inhigherpositionsaroundtheoutskirtsofthetown,intheareasofVeski,TiigiandPuiesteeStreetsandelsewherewerewindmills.Insouth,Lower‐KarlovauptoRebaseStreetbelongedtothetown.ThebuildingsatÜlejõeBoroughreachedJaamaStreetandJuudaoja.Inwest,thetownwasbor‐deredbyVeskiStreetandinnortheastbyPiiriStreet.ItisinterestingtocomparethebanksofcurrentEmajõetotheoldriverbanks.Theriverwasmorewindingandpartitioned,withmanypitsdeeplypenetratingtheriverbank.Manybondswereconnectedwiththeriverbynowlonggonecreeks.OneoftheformercreeksthathaditsstartfromthespringsofToomemäewaslocatedwhenarcheologicallystudyingthebuildingpitofthecontemporaryMarketHallinthesecondhalfofthe1980s.Newnumbersweregiventoplotsoftheentirecityin1785,theywerevaliduntil1941(firstmentionedonthecityplanofreviserO.GDreyerin1787).Numberswerealsogiventotheboroughs:I‐thetown’scentre,II‐thesouthernsuburbandIII‐ÜlejõeBorough.Duringthe1870stheproportionofindustryandthenumberofbusinessenterprisesin‐creasednotably.Themachineerahadbegun.Theguild‐systemoriginatingfromthemiddleageswaspermanentlyabolishedin1877andnewRussiantown‐lawcameintoforceinBal‐ticprovinces.Thetransitionfromlabour‐tocapital‐rentandmorefrequentincidentsofbuyingfarmsteadinperpetuitybroughtalongtheemergenceoftheruralworkersclassmovingtothetowns.MajorityoftheimmigrantswereEstoniansmovingfromthehinter‐landstotown.In1851,12,627peoplelivedinTartu,accordingtothepopulationcensusof1897thisnumberhadbeenincreasedto40,664.KastaniStreetuptoVõruStreetbecamethetown’swesternborderinthe1870s.ThecompletionofTapa‐Tarturailwayin1876andconnectingthetownwithRigaviarailwaybytheendofthecentury,affectedparticularlyToometaguse‐VaksaliBoroughandtheareabetweenthestreetsofFilosoofiandKastani.WoodensuburbsarosemainlyaroundTäheStreetandKarlovamanor,butalsoatÜlejõeintheareaofyeastfactoryandNarvaStreetandintheareaofPuiesteeandJäneseStreets.MarketsquareswereestablishedbetweenPeetriandMaarjaStreets.StreetsinÜlejõeBor‐oughdevelopedinthedirectionofcemeteriesthatwereestablishedonthelandsofRaadimanorafterthecountrywideorderin1773tostopburyingthedeceasedintownchurchesandincemeteriessurroundingthem.TradinghadgatheredaroundHenningSquare,wheretheroadstohinterlandshadtheirstart.Timber,meat,food,hay,fishandJewishmarketslocatedonbothsidesoftheriverinthetowncenterneartheport.Intheendofthe19thcenturySupilinnBoroughwithstructuralplanninganddwellingsbythesideoftheplotdevelopedbelowTähtvere.ThewoodenhousesonLepikuStreet,genuinelypreservedtothisday,werebuiltbeforetheIWorldWar(designedbyarchitectFr.Kangro).AlandareaborderingRigaStreet,therailwayandapproximatelytoday’sJ.TõnissoniStreetwasincor‐poratedwiththetownintheendofthecentury.Alittlepieceofmarshygrasslandonthe
page61
leftbankoftheriver,oppositetoKuuStreetwasalsoincorporated.TartuhadbecomeanEstoniantown,althoughthemunicipalitywasheldbyGermanstilltheendoftheTsaristera.Tartubecamethecentreofnationalmovementin1860s.DuringtheyearsofRussification,in1893‐1918,theofficialnameofthetownwasJurjev.TheterritorialexpansionofTartucontinuedalsointhebeginningofthe20thcentury.ThegroundsoftheslaughterhouseandnewboroughsintheareaofKastaniandVeskiwereaddedin1901.KarlovaSuburbandanewboroughformedfromthelandsofTähtveremanorandPurdefarmsteadbetweenthestreetsofSavi,Tööstuse,NäituseandKastaniwereaddedtothetownin1916.AtthattimethearchitecturalfocusshiftedfromthelowfloodplainsbytherivertotheareaofRiga,AiaandPepleriStreets,wheremanypresenta‐blebuildingswerebuilt(the“Vanemuise”clubhouse,theGermanTheatre,anuniversitybuilding,theEstonianStudentsSocietybuildingandothers).ThetrialsofdesigningthenationalformwereparticularlypronouncedintheworksofthearchitectsK.Burman,A.PernaandG.Hellatatthattime.VeerikuBoroughwasaddedtothetownintheearlyyearsoftheRepublicofEstoniaandwiththenationalisationofthenearbymanorsandtheirlandsin1923,theterritoryofthetownincreasedmorethantwo‐fold,amountingto2149hectares.Theterritoryofthetownwasdividedintotown’s,have‐not’s,church’s,state’s,university’sandprivateproperties.ThearchitectsA.SoansandA.Eichhorndesignedaboroughoffactoriesandprivatehousesin1923tothelandsofRopkaandBishop’smanor.Thepossibilityforitoccurredbecauseoftheexistenceofvacantland,whichwasalsousedforbuildingarailwaybranch.Inthesameyear,architectE.KuusikdesignedTammegarden‐town,whichwasdevelopedtobe‐comearesidentialareawithdeepplotsandstreetswithrichgreenery.BasedontheplansofthearchitectA.MatteusanewboroughwithmodernarchitectureemergedonthelandsofTähtveremanorin1930s.TaaraAvenuewithitspeacefulsurroundingswasconstructedin1932.Duringthepre‐warperiodthebanksofEmajõgiwerealsoinsuredandnewgrovesandgreenspaceswereestablishedthere.Duringthe1930smostofthemarketplaceslocat‐edontheriverbankwereabolished.TheimportanceofTartuinrailwaytrafficincreasedsignificantlyaftertheopeningoftheTartu‐Pskovrailwayin1931.60300peoplelivedinTartuin1938.ThegeometricalcentreofTartu’scommercialterritoryshiftedtowardssouthby130metersbetweentheyearsof1913‐1935.Itisworthnoting,thatsimilarlythebordersofTartu’sancientsettlementreachedfurtherfromthesouthernsidethansubse‐quenttowncentresurroundedbythemedievalprotectivewall.TartulostoverhalfofitsbuildingsduringtheIIWorldWar.Thetown’scentreonbothsidesofEmajõgiwasdestroyed,alsothebuildingsbyRiiaandAiaStreetsandespeciallyextensivelybyTiigiStreet.ToreplacethedestroyedsouthsideoftheTownHallsquareaseriesofbuildingswithclassicistfacadeswereconstructedinthe1950s,whichstillengagewiththegeneralconceptofthepreservedbuildings(authorsI.JaagusandA.Matteus).TheTownHallsquarewaswidenedabitfromthewesternside.Greenareasweredesignedonbothsidesoftherivertoreplacethedestroyedquarters.RigaStreetbecamethemainar‐terypassingthroughthetown.VõiduBridgewascompletedin1957.ReconstructionofTiigiStreetstartedintheendofthe1950s.Freelayoutofthestandardbuildingsdifferedentirelyfromthehistoricaltown’sstructure.Residentialquarterswithsimilarbuildingswerecompletedinthe1960sintheareasofTuru,Soola,RaatuseandPärnaStreets.PrivatehomeswerebuiltonvacantsitesinTähtvere,Tammelinn,aroundthehighwaytoRäpina,intheareasofKruusamäeandVõruStreetsandelsewhere.Thefirstpost‐warexpansionoftownbordersoccurredonthe28thofDecember1962onthebasisoffixedlegislation.Are‐asofSoinasteVillage’s,theTuberculosisSanatorium’s,theuniversity’sandsurroundingcollectivefarms’weremergedwiththecity.Duringthesecondhalfofthe1960stheground

page62
layoutofIhasteHorticulturalCooperativewascompleted.Inthe1970sthegeneralplanofAnnelinnwaspreparedbythedesignorganisation“EstonianProject.”ThebasematerialfortheprivatehomedistrictNew‐Ihastewaspreparedinthe1980s.Themaindocumentthatguidedtheconstructionaldevelopmentofsoviet‐eraTartusince1976wasTartu’sgeneralplan,whichdeterminedthetown’sbordervalidtothepresentday.ThehistoricaldevelopmentofTartu’sterritoryisintroducedbythescheme“TheformationoftownTartuanditsterritorialdevelopment”.(seeFigure9,p.13)