Spatial mapping for improved intra-urban education planning ...
60
By Filiberto Viteri Chavez 2016 Spatial mapping for improved intra-urban education planning This paper was commissioned by the Global Education Monitoring Report as background information to assist in drafting the 2016 report. It has not been edited by the team. The views and opinions expressed in this paper are those of the author(s) and should not be attributed to the Global Education Monitoring Report or to UNESCO. The papers can be cited with the following reference: “Paper commissioned for the Global Education Monitoring Report 2016, Education for All 2000-2015: achievements and challenges” For further information, please contact [email protected]. Background paper prepared for the 2016 Global Education Monitoring Report Education for people and planet: Creating sustainable futures for all
-
Upload
khangminh22 -
Category
Documents
-
view
1 -
download
0
Transcript of Spatial mapping for improved intra-urban education planning ...

�
B y F i l i b e r t o V i t e r i C h a v e z 2 0 1 6
Spatial mapping for improved intra-urban education planning
This paper was commissioned by the Global Education Monitoring Report as background information to assist in drafting the 2016 report. It has not been edited by the team. The views and opinions expressed in this paper are those of the author(s) and should not be attributed to the Global Education Monitoring Report or to UNESCO. The papers can be cited with the following reference: “Paper commissioned for the Global Education Monitoring Report 2016, Education for All 2000-2015: achievements and challenges” For further information, please contact [email protected].
��������������� ���
Background paper prepared for the 2016 Global Education Monitoring Report
Education for people and planet: Creating sustainable futures for all
2
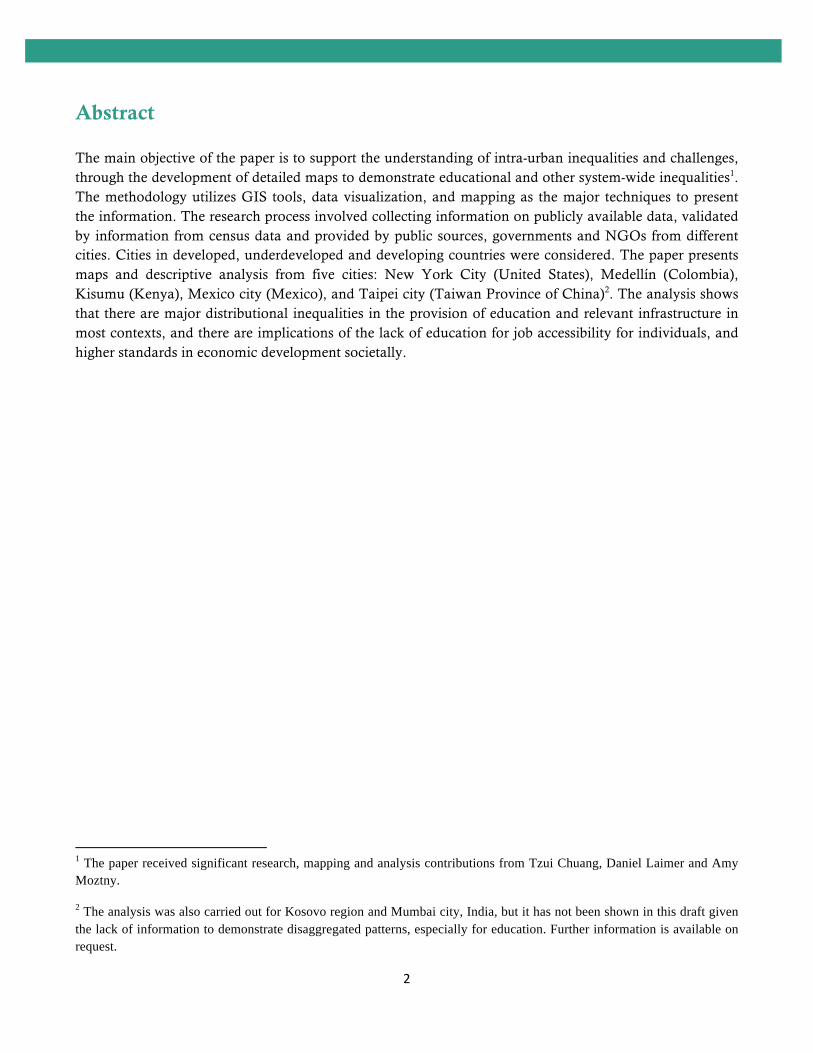
Abstract The main objective of the paper is to support the understanding of intra-urban inequalities and challenges, through the development of detailed maps to demonstrate educational and other system-wide inequalities1. The methodology utilizes GIS tools, data visualization, and mapping as the major techniques to present the information. The research process involved collecting information on publicly available data, validated by information from census data and provided by public sources, governments and NGOs from different cities. Cities in developed, underdeveloped and developing countries were considered. The paper presents maps and descriptive analysis from five cities: New York City (United States), Medellín (Colombia), Kisumu (Kenya), Mexico city (Mexico), and Taipei city (Taiwan Province of China)2. The analysis shows that there are major distributional inequalities in the provision of education and relevant infrastructure in most contexts, and there are implications of the lack of education for job accessibility for individuals, and higher standards in economic development societally.
1 The paper received significant research, mapping and analysis contributions from Tzui Chuang, Daniel Laimer and Amy Moztny.
2 The analysis was also carried out for Kosovo region and Mumbai city, India, but it has not been shown in this draft given the lack of information to demonstrate disaggregated patterns, especially for education. Further information is available on request.
3
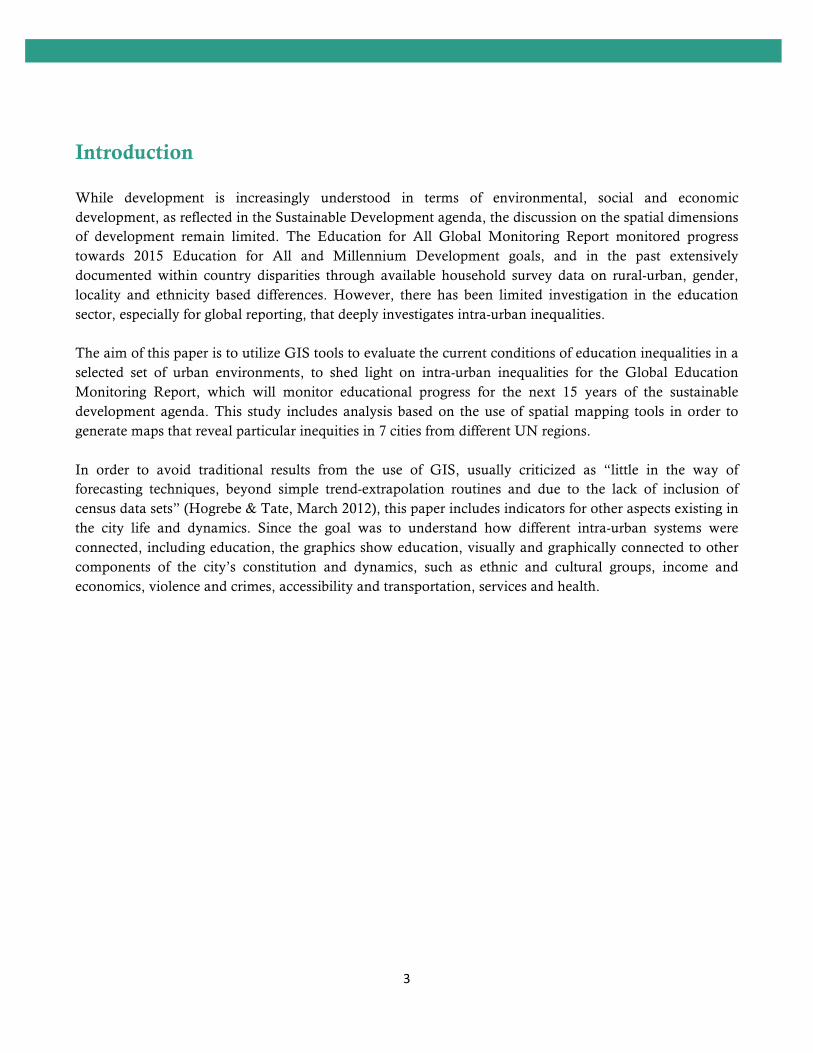
Introduction While development is increasingly understood in terms of environmental, social and economic development, as reflected in the Sustainable Development agenda, the discussion on the spatial dimensions of development remain limited. The Education for All Global Monitoring Report monitored progress towards 2015 Education for All and Millennium Development goals, and in the past extensively documented within country disparities through available household survey data on rural-urban, gender, locality and ethnicity based differences. However, there has been limited investigation in the education sector, especially for global reporting, that deeply investigates intra-urban inequalities. The aim of this paper is to utilize GIS tools to evaluate the current conditions of education inequalities in a selected set of urban environments, to shed light on intra-urban inequalities for the Global Education Monitoring Report, which will monitor educational progress for the next 15 years of the sustainable development agenda. This study includes analysis based on the use of spatial mapping tools in order to generate maps that reveal particular inequities in 7 cities from different UN regions. In order to avoid traditional results from the use of GIS, usually criticized as “little in the way of forecasting techniques, beyond simple trend-extrapolation routines and due to the lack of inclusion of census data sets” (Hogrebe & Tate, March 2012), this paper includes indicators for other aspects existing in the city life and dynamics. Since the goal was to understand how different intra-urban systems were connected, including education, the graphics show education, visually and graphically connected to other components of the city’s constitution and dynamics, such as ethnic and cultural groups, income and economics, violence and crimes, accessibility and transportation, services and health.

4
Review of Literature The main objective of this research was to explore different scenarios in order to unveil potential inequalities in education and expose them in a graphic form. As a consequence, the reference search focused on two main aspects: (1) The importance and use of GIS tools for reading patterns in a intra urban contexts, and (2) the use of GIS tools3 in the field of education. Furthermore, the studies were selected in order to capture a diversity of locations. There were three key themes in the reviewed information, of which two are focused on education sector based spatial inequalities: (1) GIS use in studies and policymaking; (2) market availability and competition in the education sector; and (3) the geographical distribution of education services.
1. GIS: In the reviewed studies, GIS is mainly used to study infrastructure distribution. There are several papers that look at how GIS works to identify patterns in the distribution of education infrastructure (Eray, 2012) (Aliyu, Shahidah, & Aliyu, May, 2013) and as a potential tool to empower communities by visualizing the results (Hogrebe & Tate, March 2012). However, most studies do not further explore the potential of GIS to identify connections with other pieces of urban infrastructure beyond patterns in the distribution of facilities in the territory. It is worth noticing how some governments seem to have manipulated school census tracks in order to show a better distribution of resources (Richards, December 2014), legitimizing education as instrument for segregation.
2. Market availability and competition in education: In many of the studied school systems, there was
a shift in schooling from public to private schooling – with systems moving from school allocations based on the proximity of schools to households making a choice in a market-like system. Many of
3 Some key urban planning terminology included throughout this draft are defined below: GIS. GIS or Geographic Information System is a tool that helps planners, researchers and the general public, to link data to a geographical location in order to visualize and understand the relationships between both and identify patterns, connections and presence of specific. “GIS uses specialized software that integrates spatial data (e.g., geo-referenced coordinates such as latitude and longitude) and nonspatial data to produce geographic maps variables in the territory” (Hogrebe & Tate, March 2012). Data Visualization. Data visualization is the result of putting census data in a graphic form. In the case of this paper, the term Data Visualization will be used to describe the maps. Mapping. The technique in which several type of information layers are superimposed correlated within the same graphic. Usually a map contains geographic information, data and visual elements that, once assembled together, reveal or clarify hidden connections between components from different fields or origins and show them in a visual format in order to compel or support an argument. Geospatial. A term used “to refer to geographic space that includes location, distance, and the relative position of things on the earth’s surface” (Hogrebe & Tate, March 2012).
5
the reviewed research focus on how several institutions –mostly public- started to decay in the last years or decades, due to their lack of resources and their incapacity to remain appealing alternatives for parents. As the curriculum is fixed and defined equally for all the schools by the government, this market setting forces schools to promote other characteristics, not necessarily related to education, to stand out from the rest. For example in the UK, after the 1988 Education Reform, the schools started to compete for kids, producing “winner” institutions in the predictable settings: students coming from richer neighborhoods, demonstrating better student attendance and achievement (Clarke & Langley, 1996). Such studies measure how public funding, completion rates, exam performance and accessibility have played a major role in disadvantaging some schools in deprived areas, while advantaging schools located in certain suburbs or localities with better accessibility to other types of infrastructure. These studies also attempt to explain how policymakers have tried to reverse this disadvantage and tried to define a more equitable distribution of education facilities (Lubiensky, Gulosino, & Weitzel, 2009). But, even though some of the papers discuss the struggle of these forces, they are analyzed from the perspective of the market and not as a system that takes into consideration social components, such as culture, behavior and ethnicity.
3. Geographical distribution: Geographical distribution focused studies incorporate elements of
studies that use GIS as a tool, and those focused on education. In the papers related to distribution of education (Aliyu, Shahidah, & Aliyu, May, 2013) (Njuguna, 2013), the authors mention clustering, spatial concentration, availability for specific income areas (Lotfi & Koohsari, 2009), distance, area of influence and land coverage of education institutions, with some of them distinguishing between public and private, religious and secular. From the planning perspective and, as noticed in most of the examples studied, the process of analyzing distribution of one resource in a piece of land must incorporate more variables than those related to geography. The main reason is that relative geographical distance or distribution does not necessarily mean better accessibility since other factors such as topography, land value, neighborhood limits, and cost of service also matter. Consequently, the maps resulting from the GIS modeling should be analyzed from a tridimensional point of view - incorporating contour lines and the influence of the built environment- and by imagining how city dynamics may affect the map at different times thought the day or season- even when those layers are not part of the visual results for the purpose of showing the most important variables to map in a clear manner. Along these lines, Lofti and Hoohsari also include social variables like quality of life to demonstrate correlations between geographical location and segregation. They recognize the existence of virtual services and compare average distance within a neighborhood with people of similar characteristics or background to neighborhoods with people from different characteristics or coming from different places and countries (Lotfi & Koohsari, 2009).
Finally, some valuable arguments were also noted to identify other types of inequalities, such as the location of hazards, like gas stations, with respect of a school (Eray, 2012), the potential differences in the results when comparing different levels of education (De la Fuente, Rojas, Salado, Carrasco, & Neutens, 2013) and, as Hogrebe mentions when citing Kulhavy et al, the importance of maps as a visual tool to understand your own environment in the context of political literacy and cognitive science: “from childhood through adulthood, images, illustrations, and graphic representations support learning as well as reading” (Hogrebe & Tate, March 2012). The following chart summarizes the projects reviewed and their content.

6

7
Methodology Obtaining Data Sets For obtaining the data sets we aimed available data from public certified sources. For serving this purpose, we did a preliminary evaluation on the availability of sets utilizing the “Local Open Data Index”, provided by "Open Knowledge" (http://census.okfn.org/); this NGO shows available census information worldwide and rate their transparency. After identifying the places with open-data collections, we categorized these cities into developed, underdeveloped, and developing countries’ cities, following the International Monetary Fund's definitions (World Economic Outlook. Uneven Growth: Short- and Long-Term Factors, April 2015). Then, we downloaded specific spatial datasets from municipal and central government’s online reports/databases, targeting social/economic demographics and educational information. Most of the information downloaded corresponded to census data and city’s household surveys in defined boundaries. The targeted datasets include infrastructure GIS data, education institution GIS data, household census, official education census, and the others that relate to education inequality. In order to complete certain type of data, the team has also traced and digitalized older maps or quantitative information provided in not editable sources. s Due to the availability of information, for most of the cities, the team created their own attribute tables by combining compatible information from different sources. As stated before, further pieces of information could have been gathered by contacting the sources and initiate a request protocol; nevertheless, due to time contains, the team choose to work with open information only. Furthermore, the team had also conducted the following tasks in order to complete the information needed:
• translated certain data from governments located in countries that use languages other than English,
• trace the census tracks from files which formats are not compatible with GIS software,
• assign a geospatial component to some of the attributes Selection of Cities After a first survey on available information, we selected a list of potential cities to get datasets. We proposed the list to the GMR team and, in order to achieve greater diversity, they suggested to further investigate availability of an increased number of locations. Below, we present the final list of cities4.
4 As mentioned earlier, the analysis was also carried out for Kosovo region and Mumbai city, India, but lacked adequate data.

8
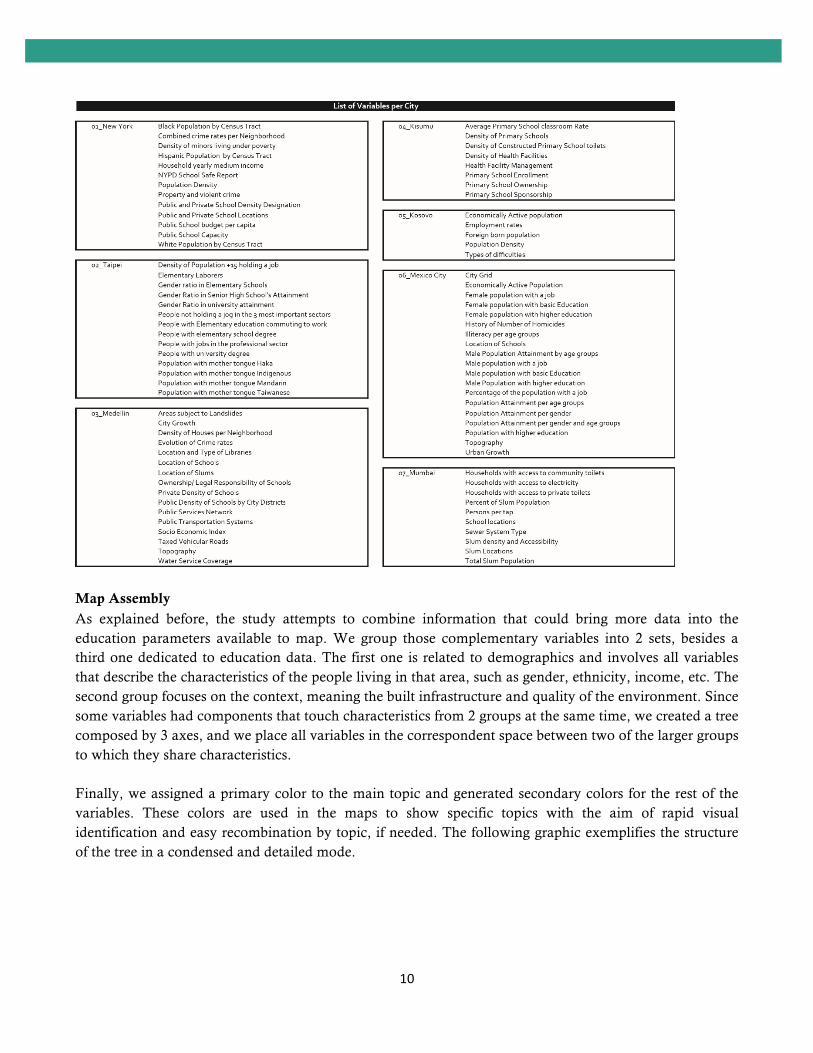
Defining variables In order to define the validity and relevancy of the variables in the field of education, we decided to take into consideration 4 criteria. While three of these are constructed out of the literature search, the 4th aspect filters the others based on the availability of open information for each one of the selected cities/countries’ data sets. At first, we selected variables that were commonly cited in the bibliography. Despite the fact that our sources did not use them since these parameters were already explored in several prior studies, we decided to include them due to a potential new mechanism – mapping - to portray results. A second set of parameters took into consideration variables utilized in the projects presented in the revised list of papers. They were extracted from the maps and data visualization results since they already portrayed education inequalities. The reasoning for its addition was the potential generation of maps for the same variable or indicator, but in locations other than those in the original source. A third component involved information potentially compatible with mapping strategies throughout the different cities, mentioned or suggested in papers and reports as further possibilities to research. At the end the entire pool of variables and parameters the team targeted do gather is summarized in the following table. s

9
Finally, we filtered those components by using 2 mapping techniques: common information available on the data sets with potential comparability, and graphic precedents displaying overlapping variables in one map. Validation of parameters After the parameters and variables were compiled, we contrasted the information from the datasets of the different cities and constructed a matrix in which we evaluated the availability of such information for each city. In other words, how many of those variables could be found in the data sets. Out of that list, the GEMR team chose the more relevant for their interest. The following charts present the information that was found for each of the cities.
10
Map Assembly As explained before, the study attempts to combine information that could bring more data into the education parameters available to map. We group those complementary variables into 2 sets, besides a third one dedicated to education data. The first one is related to demographics and involves all variables that describe the characteristics of the people living in that area, such as gender, ethnicity, income, etc. The second group focuses on the context, meaning the built infrastructure and quality of the environment. Since some variables had components that touch characteristics from 2 groups at the same time, we created a tree composed by 3 axes, and we place all variables in the correspondent space between two of the larger groups to which they share characteristics. Finally, we assigned a primary color to the main topic and generated secondary colors for the rest of the variables. These colors are used in the maps to show specific topics with the aim of rapid visual identification and easy recombination by topic, if needed. The following graphic exemplifies the structure of the tree in a condensed and detailed mode.

11
12
Results
In this section, we display maps for the seven cities of the study, along with some descriptions of what is visible in the graphical representation.
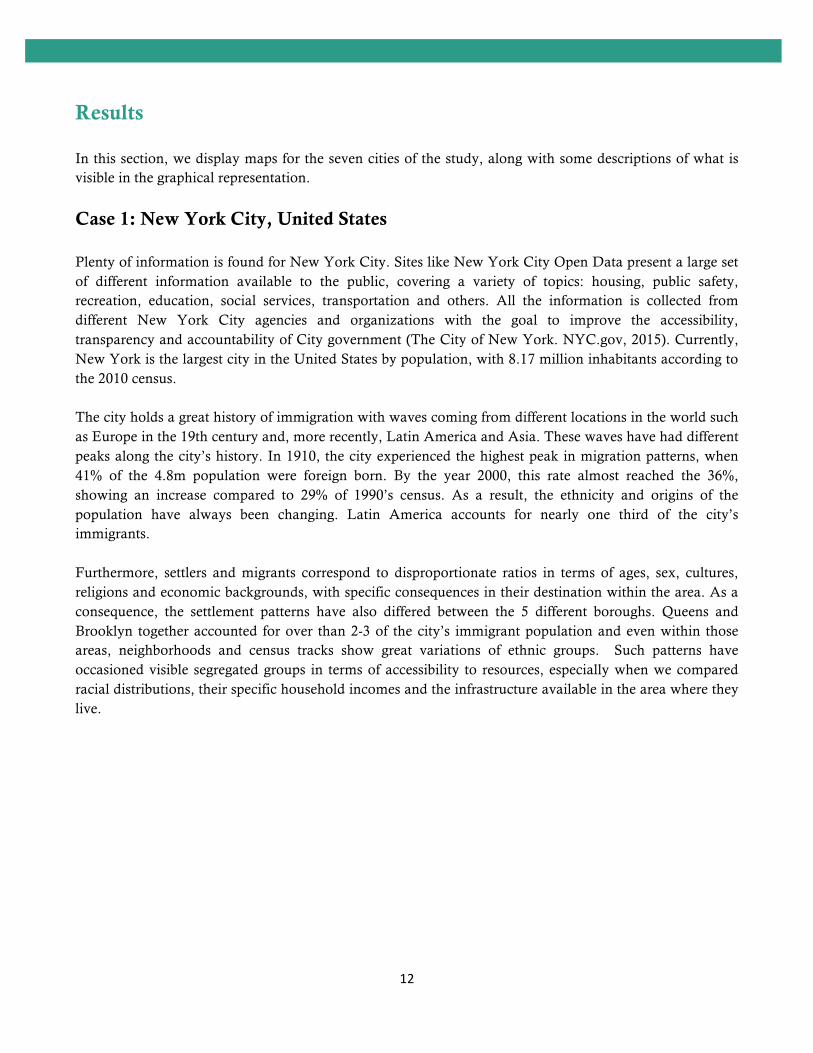
Case 1: New York City, United States Plenty of information is found for New York City. Sites like New York City Open Data present a large set of different information available to the public, covering a variety of topics: housing, public safety, recreation, education, social services, transportation and others. All the information is collected from different New York City agencies and organizations with the goal to improve the accessibility, transparency and accountability of City government (The City of New York. NYC.gov, 2015). Currently, New York is the largest city in the United States by population, with 8.17 million inhabitants according to the 2010 census. The city holds a great history of immigration with waves coming from different locations in the world such as Europe in the 19th century and, more recently, Latin America and Asia. These waves have had different peaks along the city’s history. In 1910, the city experienced the highest peak in migration patterns, when 41% of the 4.8m population were foreign born. By the year 2000, this rate almost reached the 36%, showing an increase compared to 29% of 1990’s census. As a result, the ethnicity and origins of the population have always been changing. Latin America accounts for nearly one third of the city’s immigrants. Furthermore, settlers and migrants correspond to disproportionate ratios in terms of ages, sex, cultures, religions and economic backgrounds, with specific consequences in their destination within the area. As a consequence, the settlement patterns have also differed between the 5 different boroughs. Queens and Brooklyn together accounted for over than 2-3 of the city’s immigrant population and even within those areas, neighborhoods and census tracks show great variations of ethnic groups. Such patterns have occasioned visible segregated groups in terms of accessibility to resources, especially when we compared racial distributions, their specific household incomes and the infrastructure available in the area where they live.

13
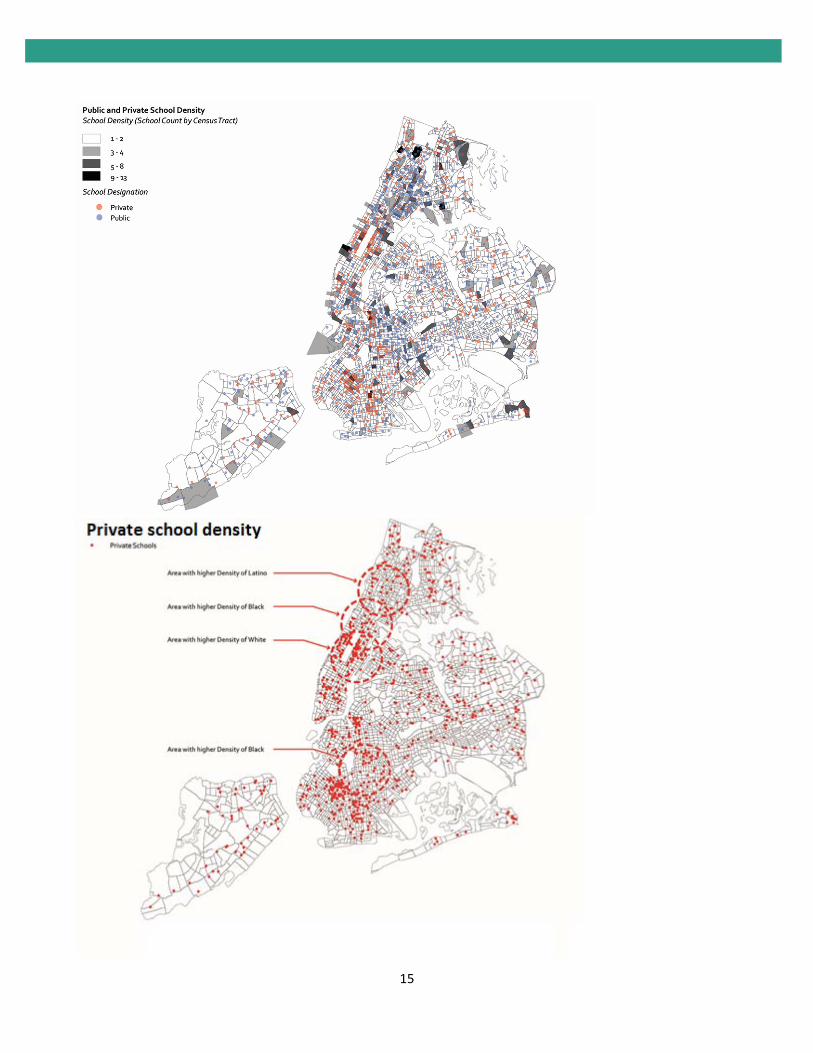
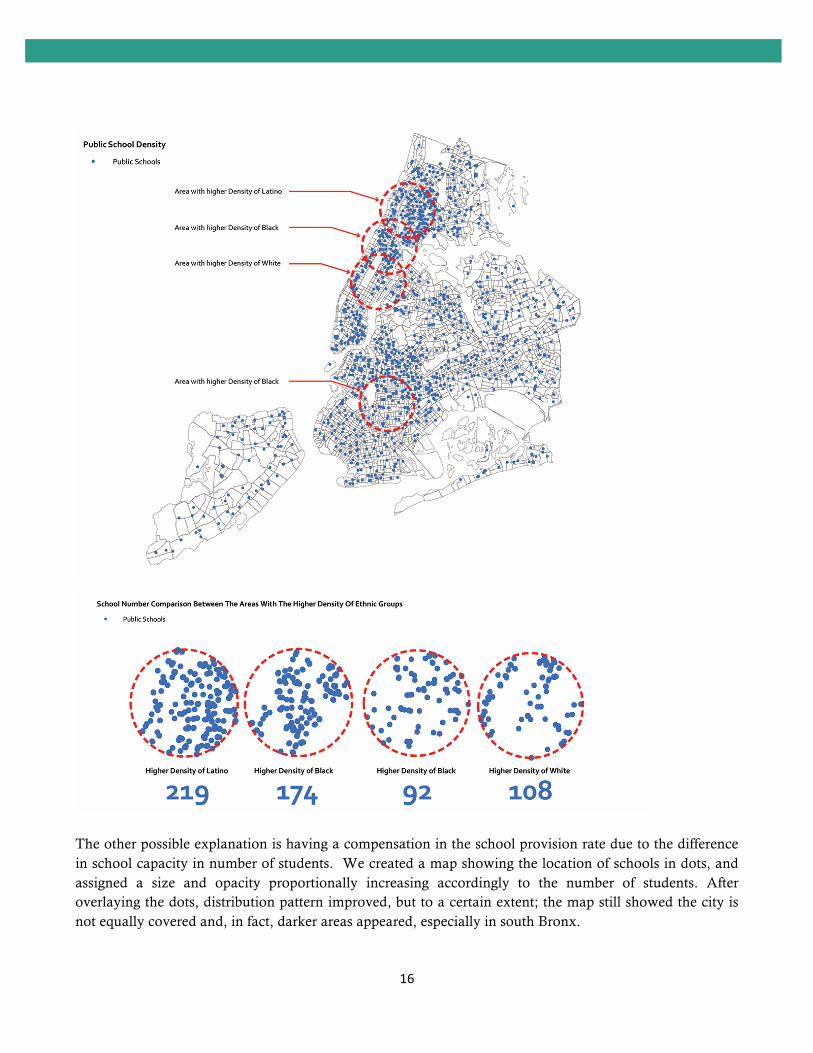
Distribution by race For the first set of maps, we compared the distribution by census track of the 3 main racial categories in the city (white, black, and Hispanic) highlighting in different tones their higher densities. The first 3 maps show each group population distribution, featuring in darker colors those areas where the population is higher. At first, these 3 maps show a clear correlation between higher income household zones and the distribution on white population, whereas the Hispanic/Latino appeared to be located in areas economically deprived. We then generated a map that shows the density of schools and how they are distributed in the areas where each racial group presented higher densities. We do not decide to show private schools in order to only compare public provision of education infrastructure. The maps reveal how the 5 different boroughs show larger differences in school density. For example, downtown and uptown Manhattan as well as The Bronx show higher density of schools, especially when compared to Queens, which appears with a more scattered pattern. A possible explanation could be the variation in population rates, consequently generating a disproportionate demand. Nevertheless, although this explanation may be applicable for Staten Island, it does not seem to justify the variations between Manhattan and equally dense areas in Queens and Brooklyn.

14
15
16
The other possible explanation is having a compensation in the school provision rate due to the difference in school capacity in number of students. We created a map showing the location of schools in dots, and assigned a size and opacity proportionally increasing accordingly to the number of students. After overlaying the dots, distribution pattern improved, but to a certain extent; the map still showed the city is not equally covered and, in fact, darker areas appeared, especially in south Bronx.

17
18
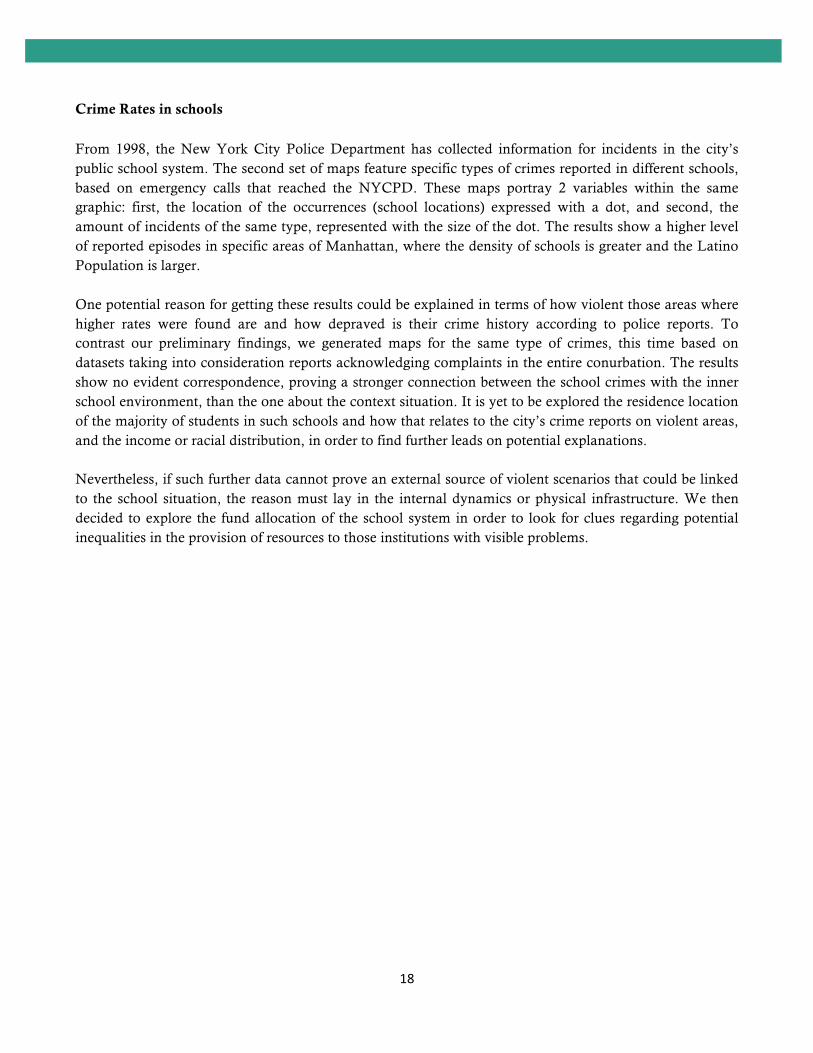
Crime Rates in schools From 1998, the New York City Police Department has collected information for incidents in the city’s public school system. The second set of maps feature specific types of crimes reported in different schools, based on emergency calls that reached the NYCPD. These maps portray 2 variables within the same graphic: first, the location of the occurrences (school locations) expressed with a dot, and second, the amount of incidents of the same type, represented with the size of the dot. The results show a higher level of reported episodes in specific areas of Manhattan, where the density of schools is greater and the Latino Population is larger. One potential reason for getting these results could be explained in terms of how violent those areas where higher rates were found are and how depraved is their crime history according to police reports. To contrast our preliminary findings, we generated maps for the same type of crimes, this time based on datasets taking into consideration reports acknowledging complaints in the entire conurbation. The results show no evident correspondence, proving a stronger connection between the school crimes with the inner school environment, than the one about the context situation. It is yet to be explored the residence location of the majority of students in such schools and how that relates to the city’s crime reports on violent areas, and the income or racial distribution, in order to find further leads on potential explanations. Nevertheless, if such further data cannot prove an external source of violent scenarios that could be linked to the school situation, the reason must lay in the internal dynamics or physical infrastructure. We then decided to explore the fund allocation of the school system in order to look for clues regarding potential inequalities in the provision of resources to those institutions with visible problems.

19

20
School Funding
The final aspect we analyzed is fund allocation. We obtained the revised base budget (DOE) assigned per school in the fiscal year of 2015 and normalized it by the school’s capacity in number of students, in order to obtain the allocation per capita. The findings show an equally distributed funding for those schools with small number of students. On the contrary, larger schools seem to be clustered in 3 specific areas: Lower Manhattan, upper Manhattan-south Bronx, and downtown Brooklyn. The first corresponds with a higher income area, and the other two seem to present a correlation with areas of higher density of Hispanic and Black populations.

21
After creating maps to show yearly household income and location of minors living in families with a combined salary under the poverty line, we could not find any correlation with the fund allocation, making those living there less likely to access quality education.

22
Case 2: Medellín, Colombia
Located in a valley in the Andes mountain range, at 1500 meters above sea level, Medellín is the second largest city in Colombia. The city is surrounded by irregular topographic variations, with altitudes ranging from 1300 to 2800 meters high. According to official information, the population will reach 2.5 m in 2018 but the metropolitan area is already above 3.5 m inhabitants (Departamento Administrativo Nacional de Estadística de Colombia, 2015). As other Latin-American cities the population grew extensively in the second half of the 20th century. Due to geographic conditions, the city expanded to the north and south, along both sides of the Medellín River, but some slums areas appeared in the sloped hills toward the east and west. Part of its economic and industrial development was truncated by trafficking, narcoterrorism and corruption in the 1980s. As stated in The Guardian, by 1991 6.349 killings were reported, a murder rate of 380 per 100k people, which is comparatively 2.25 times greater than the 2012 homicide rate in the world’s most deadly city outside a war zone, San Pedro Sula in Honduras (Henley, 2013). In New York City that would mean 32,000 murders a year. One of the main reasons: Medellín was the official headquarters of the eponymous drug cartel, a situation that lasted until the death of its leader, Pablo Escobar, in 1993. From that moment, the city left behind a background associated with guerrillas and paramilitaries, and went through a progressive transformation. Currently, several sources mention it as one of the most innovative and equity-oriented cities in the world, leading international rankings in health and public investment (Bomberg, 2014). In 2013, the city was awarded by the Citi Bank, the Marketing Services Department of WSJ Magazine and the Urban Land Institute (ULI) as the Most Innovative City in the World, outrunning New York and Tel Aviv with more than 70% of the favor of online voters (Citigroup Inc, 2015). Among the characteristics highlighted in the award statement, the Urban Land Institute’s cited a decrease in the homicide rate in 80% from 1991 to 2010, a renovated public transportation system that includes cable cars and escalators for the perimeter neighborhoods located in the hills, public private partnerships to fund infrastructure, negotiations for pro bono projects from local design firms, participatory budgeting and an increase in the provision of public infrastructure. This happened over a period of 20 years. As recognition, it was selected to host the 2014 World Urban Forum for Urban Equity in Development. In terms of education, the original master plan was developed by former major Sergio Fajardo, under the slogan “Medellín: the Most Educated”; the investment included the design and construction of library parks that will be connected in the future to a larger network throughout the entire Antioquia department. The plan of Fajardo’s administration included campaigns to increase trust, dignity and opportunities. As an example, the municipality organized the “Knowledge Olympics” to encourage residents to test their knowledge playing for scholarship prizes (McClure & Berkeley, 2014). The Spain Library, located in the Santo Domingo Savio neighborhood in the eastern hillsides has become a city landmark and due to its strategic location on top of the hill, it conveyed a message of public domain and presence in a place that used to belong to crime gangs. Part of the funds for such investment came from the E.P.M., the Empresas Públicas de Medellín. Besides supplying water, gas, sanitation, telecommunications and electricity, the institutions redirected their annual $450 million profits to the building of new schools, public plazas, parks and the metro (Kimmelman, 2012). According to Federico Restrepo, the former manager of EPM, the number of students in the Medellín public school system exceeding the national average reached 80% in 2009, a rate that was only 20% in 2002 (Kimmelman, 2012).
23
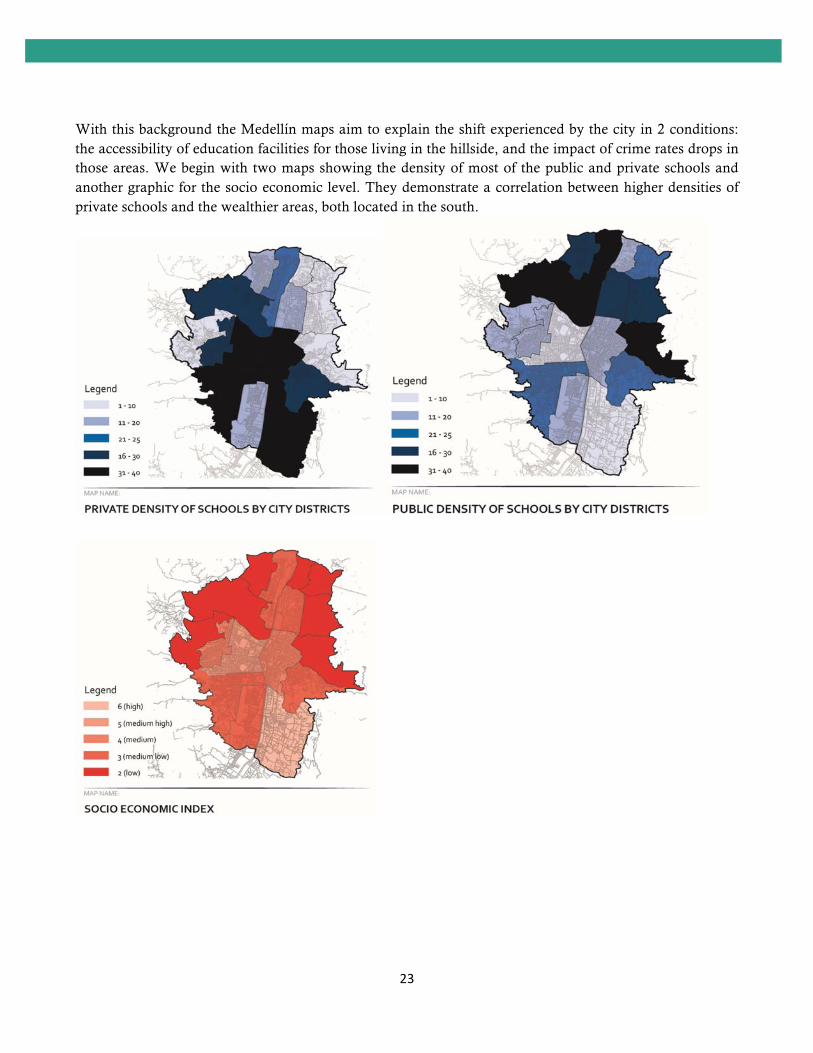
With this background the Medellín maps aim to explain the shift experienced by the city in 2 conditions: the accessibility of education facilities for those living in the hillside, and the impact of crime rates drops in those areas. We begin with two maps showing the density of most of the public and private schools and another graphic for the socio economic level. They demonstrate a correlation between higher densities of private schools and the wealthier areas, both located in the south.

24
Accessibility The first set of maps shows difficulties in providing distributed education facilities to all areas in the city, due to the topography and growing pattern along the river, in the valley. As a consequence, new transportation mechanisms such as metro cable, had to be implemented in order to provide accessibility to the higher areas. At the same time, some of the main lines of complementary infrastructure still cannot reach to the elevated neighborhoods where we also find zones vulnerable to natural disasters. When we look at the maps for public services such as electricity and water, the entire city has an equally distributed built network, even serving the slums and the areas at high risk of landslides in the hillsides. At the same time, the taxed zones for private transportation are located in the center, excluding the areas where income is lower, and incentivizing the use of public transportation. The final maps for this set explains the progressive addition of mass transportation lines, including different types of systems and the points where they meet in order to connect the city center along the river from north to south, and branching out towards the sides and up toward the hills and informal areas.

25

26
Evolution of the environment – Crime The second set of maps show the density of schools in the city districts and how that is related to income and the process of improvement in security, consequently developing a higher livability value in areas where crime used to reach higher numbers. The initial maps show a progressive diminishing homicide rates, with a peak in 1995 of 1255 homicides that year in the city center. The same area showed almost 50% decrease 5 years after (666) and, during the past 15 years, the number barely went over 200 in the 5-year lapse analysis. Currently, despite being still the most dangerous area in terms of number of homicides, with a rate of 136 situations per year, the city center presents very different averages compared to the rest of the city; the second ranked number is 3 times lower. Finally, it is worth to mention that the periphery has always shown smaller homicide rates compared to the downtown area. Even during the year of 1995, the highest rate in the periphery represented only a 15% the rate of downtown.

27
28
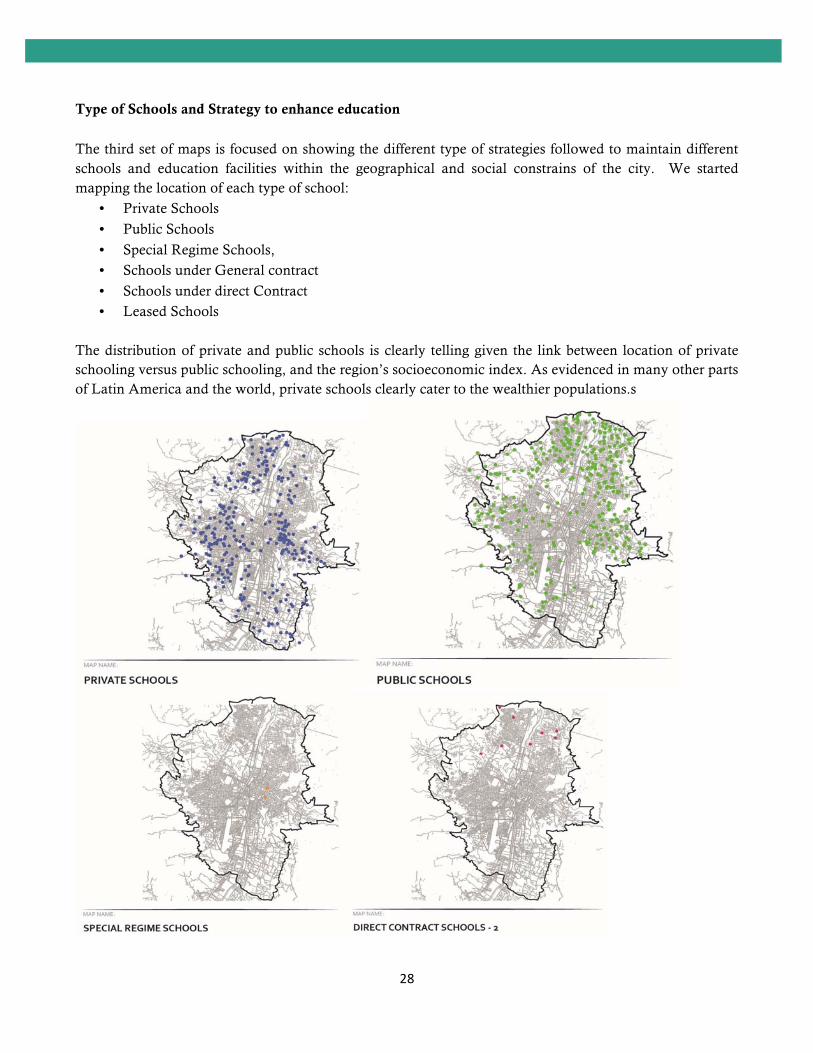
Type of Schools and Strategy to enhance education The third set of maps is focused on showing the different type of strategies followed to maintain different schools and education facilities within the geographical and social constrains of the city. We started mapping the location of each type of school:
• Private Schools
• Public Schools
• Special Regime Schools,
• Schools under General contract
• Schools under direct Contract
• Leased Schools The distribution of private and public schools is clearly telling given the link between location of private schooling versus public schooling, and the region’s socioeconomic index. As evidenced in many other parts of Latin America and the world, private schools clearly cater to the wealthier populations.s

29

30
Networks of libraries Then, we moved to larger pieces of infrastructure, deploying a larger reach in a network of libraries and public facilities. Each library has been place next to nodes for public transportation at a city level as well as local. The only area where no library could be found is the wealthiest area at the south east, where the socio economic index is the best in Medellín and the density of households is one of the lowest.
31
Case 3: Kisumu, Kenya Kisumu is the third largest city in Kenya, with an estimated 2009 census population of 410000. The city is the capital of the Nyanza Province, and it is placed next to Lake Victoria. As a consequence, it’s a predominant port, and a local trade hub with regional transportation reach. Present-day Kisumu consists of 25 sub-locations that can be grouped into 10 main locations (Maoulidi, 2008). The education system is managed by the sMinistry of Education of Kenya, which provides the service at all levels. Locally, they partner with the local Municipality to manage the primary schools and the District Education Office deals with the institutions for secondary level (Maoulidi, 2008). The funding comes, in part, from the World Bank, the United Kingdom’s Department for International Development and other agencies, always through the Ministry of Education, Science and Technology. The formal public education system follows an 8-4-4 model introduced in 1985, where eight years of primary education, four years of secondary education and four years at a university are the rule. Some private institutions, on the contrary, utilize the six years of secondary schooling in order to mimic international standards (Maoulidi, 2008). In 2006, there were 159 primary schools and 36 secondary schools, 21 officially recognized non-formal education schools/centers and several institutions of higher learning (Maoulidi, 2008). Kisumu’s literacy rate borders 50% of the population. Currently, the educational system presents adversities related to 4 topics: policies, poverty/health, infrastructure, and socio-cultural restrictions. Since 2003, when the government granted free public education, the infrastructure felt short for the suddenly higher demand. Such policy, although the apparently correct approach, ended up worsening the already low student/teacher ratio, limiting the accessibility to textbooks and facilities such as toilets, and augmenting the number of students per classroom. (Maoulidi, 2008). On the other hand, in January 2006, Kisumu was designated the world’s first Millennium City. The designation was followed by an immediate urban development plan that addressed existing assets and challenges with the aim of achieving the Millennium Development Goals (Maoulidi, 2008). But, since the local authority cannot rely in their own resources at all times, processes and paperwork are rarely completed, “allowing quite a number of primary school heads to enter into scrupulous deals with perceived contractors/ suppliers” (Kisumu County Education Network, 2014) Kisumu faces also severe burdens due to poverty, consecutively diminishing the health and quality of life conditions. It is estimated that in 2006, about half of the city inhabitants were poor, 15 percent were HIV-positive and over 60 percent lived in peri-urban informal settlements (UN-HABITAT, 2006). HIV/AIDS numbers in Kisumu Municipality doubled the national average of 6.1% in 2006. Furthermore, due to the quality of households and drinkable water, the population is subject to be victim of maladies such as malaria, cholera, typhoid and diarrhea. In terms of infrastructure, potable water and sewage coverage are very limited. Poor households spend almost 2 hours per day fetching water in normal conditions, and around 3 hours during the dry periods (Plunz, Opiyo-Omolo, Blaustein, & al, 2015). Inside schools, the classrooms and the surrounding physical environment (outdoor space) does not meet the national standards, failing to provide safety and support to the learning process due to their poorly maintained conditions. Most of the centers are squeezed (less than

32
8 x 6 meters) and are dilapidated. (Kisumu County Education Network, 2014). Lack of adequate sanitary facilities (toilets and water) is also a problem. Common disposal methods include pit latrines, open defecation and flying toilets (Plunz, Opiyo-Omolo, Blaustein, & al, 2015). In the best scenarios for public institutions, children usually share community toilets, located some distance away from the classroom (Kisumu County Education Network, 2014). Finally, the social and cultural characteristics of the population act against women and certain minorities making them more vulnerable by restricting their future possibilities for development. In one hand, sources cite an increasing number of students in primary schools, but the same data reveal many girls do not complete the primary school cycle, “suggesting that addressing gender-specific needs is critical to achieving gender parity” (Maoulidi, 2008). According to Maoulidi, parents prevent female children to attend further levels of education. Common reasons are the lack of need to invest in them because of a potential marriage, a higher risk of getting pregnant, the need for household labor, and the likely future job market discrimination and wage differentials between men and women (Narayan, 1997) (Maoulidi, 2008). After this introduction, the team aimed for maps grouped into 2 sets. The first set demonstrate how, despite having the education facilities fairly distributed in the area, with a certain correlation with the population density, the enrollment rates peak for students attending schools located in the city center. The first two following maps show the distinction between education facilities and enrollment very clearly.
In the third map, we evaluated the size of primary schools because their capacity in number of students could have an influence in the attainment rates. Despite this fact is indeed true, -due to the density of schools in the city center- the size of the schools is fairly even for all districts, even much higher in specific cases in the periphery. This data show that clearly more people live in the city center and, therefore a larger amount of schools is located there. The schools downtown feature key facilities in the Kisumu context such as toilets. Furthermore, the city center possesses a larger number of public facilities and complementary infrastructure.

33
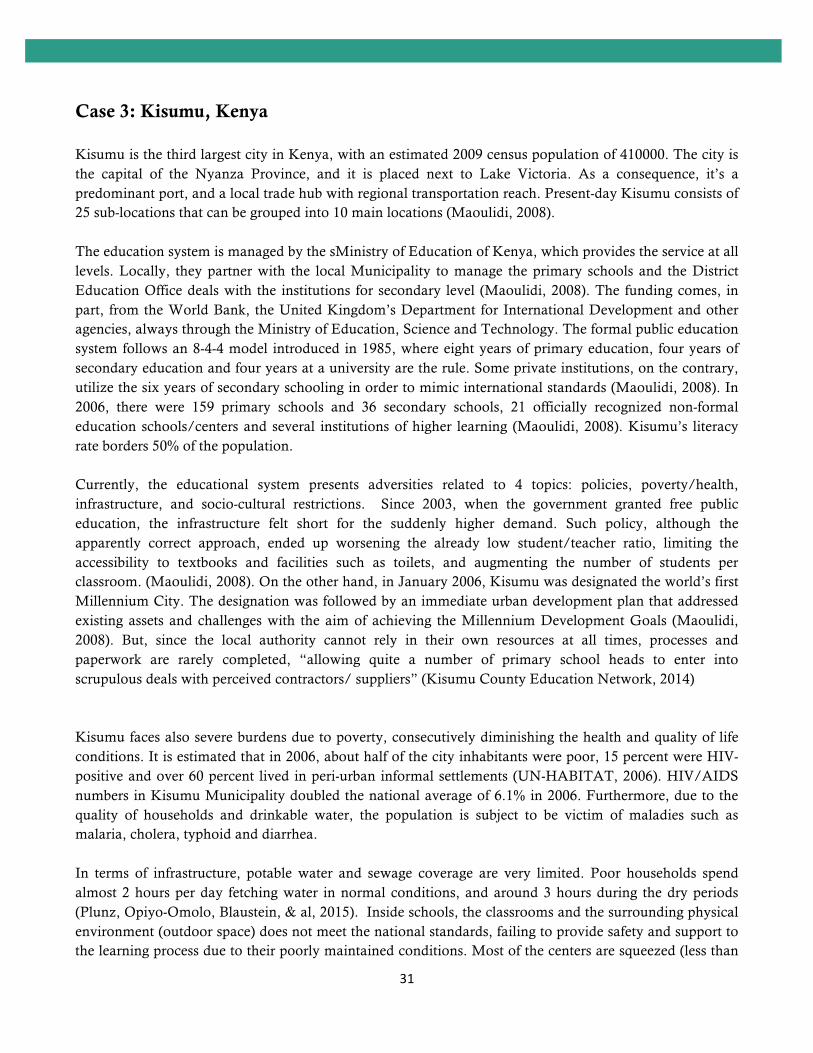
The second set of maps exposes further situations that aggravate the difference; for example, school ownership. According to our data there are 182 primary schools, from which almost 70% are public. Nonetheless, all public school are distributed in the territory, while the 30% of private schools are mostly concentrated in the center part of the city.

34
Also, the available resources are inequitably distributed. There are several sources of sponsorship, ranging from the central government to local authorities, or aid from international organizations. The maps show that private sources as well as local CBOs and international NGOs focus their sponsorship on schools located primarily at the center while public and religious funding are more evenly distributed geographically.
35
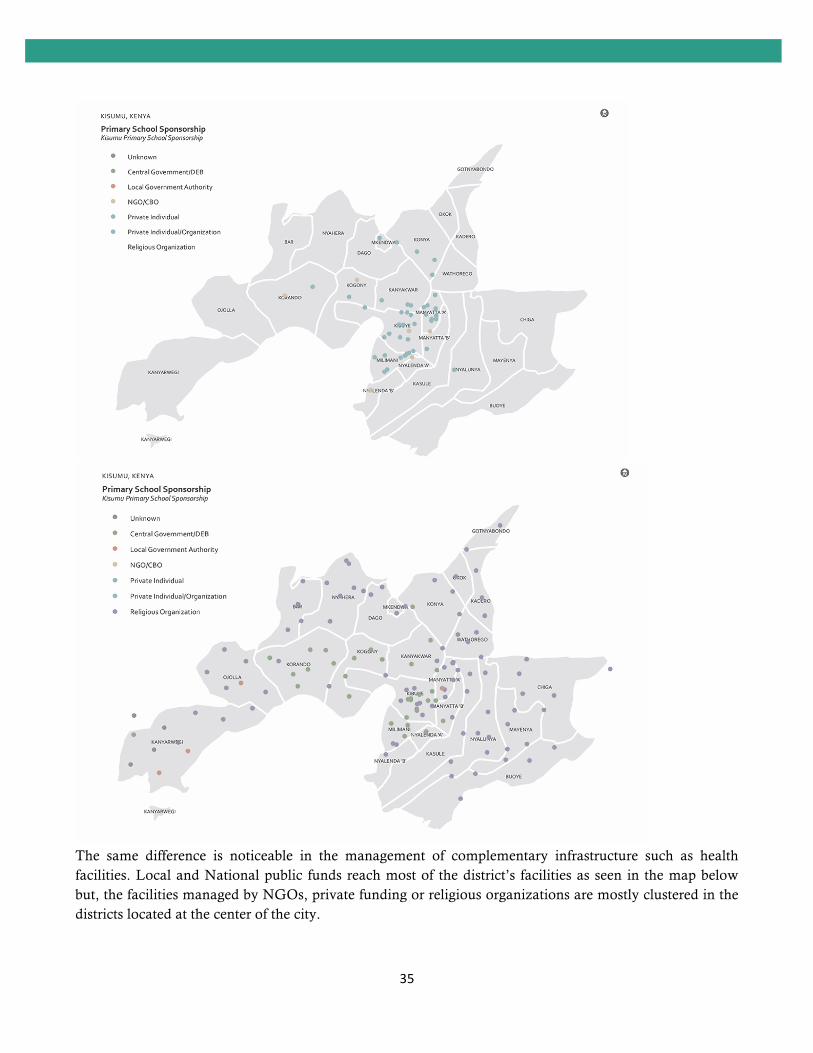
The same difference is noticeable in the management of complementary infrastructure such as health facilities. Local and National public funds reach most of the district’s facilities as seen in the map below but, the facilities managed by NGOs, private funding or religious organizations are mostly clustered in the districts located at the center of the city.

36
37
Case 4: Mexico City, Mexico Mexico City is the largest, most important city and the capital of Mexico. As a Federal District, it has autonomy from the states of the union, and its territory does not belong to any of them, but it is a Federal jurisdiction. Recently renamed the Valley of Mexico metropolitan area, it is the largest conurbation in America, with a territory of 2000km2 and a population of 21.4 million according to the 2010 census (Cox, 2011). In terms of education, Mexico City tops in literacy rates in the country, with more than 90 percent of the population (City-Data, 2008). Nevertheless, reported insufficient enrollments and high dropout rates beyond the primary level, remain as issues (Santibañez, Vernez, & Razquin, 2005). Mexico grew largely in the last century. By 1950, “the core delegations” that constituted Mexico City had 2.23 million people out of the urban area's 2.88 million” (Cox, 2011). This core area accounted for 78 % of the urban area population and, even though the area still serves as the geographical hart of the territory, by 2010 it only represents 9% of the entire urban area (Cox, 2011). Among the reasons for this drop, is the increasing rate for people abandoning the city center for the suburbs, lower birth rates in the central neighborhoods and a decentralization of the city dynamics after the late 1970s. As a consequence of sprawl, traffic congestion, insecurity, and social disparities raised. On top of that, the country has been the victim of an increasing drug traffic and drug dealing activities, accompanied by corruption in the public sectors, affecting directly the central government located in the city. Violence against women and children remains as one of the most important social issues despite passing several laws in the recent years, and becoming more responsible for gender disparities. The city has partnered with national and international NGOs and the local authority has signed agreements to fulfill goals set by entities such as UNO, and participated in campaigns such as Beijing20 and HeforShe (ONU Mujeres, 2014). Nevertheless, according to the National Survey for the Dynamics in household Relationships, in 2011 five out of ten women older than 15 years old have been victims of gender violence. On top of that, it was reported than only 1 out of 10 actually reported it to the authorities (Pérez Courtade, 2014). Nine out of 10 crimes still go unreported and public-opinion cite security as a predominant preoccupation. (Jimenez, 2011) On the other hand, the largely deployed strategies to ameliorate crimes seem to have paid off, considering other cities in the country that have become very violent due to the above-mentioned drug issues. The strategy started in 2000, when Mayor Andres Manuel Lopez Obrador lowered the total of crimes to 478 per day on average, almost half of 1990’s (Reuters, 2004). Then, in 2004, the city hired former New York Mayor Rudolph Giuliani as a consultant and, by following tactics previously tested in NYC, crime rates fell by 8.8 percent that year according to police reports (Jimenez, 2011). Furthermore, Mexico augmented the number of police patrols, increased the amount of officers until they reached one for every 100 citizens, placed police on foot, motorcycles, and horseback in designated areas and, as an initiative of Mayor Marcelo Ebrard later, installed 11,000 closed-circuit security cameras. Ebrard cited a 16.4 decrease in the number of assaults during the first four months of 2004 (Reuters, 2004), and by 2010, according to the public security secretariat’s annual report, armed robbery had decreased by 5.8 % (Jimenez, 2011). In this context, basic education enrollments have also shown an increasing trend in the last years. Between 1970 and 2000, the number of students went from 9.7 million to 21.6 demanding a forced double shifting of

38
schools and teachers and the provision of distance learning models in lower secondary schools (Santibañez, Vernez, & Razquin, 2005). Currently, students are required to attend six years of primary school and three years of secondary school, while another mandatory 3-year period is required if the students want to pursue college education (City-Data, 2008). Therefore, the Mexican education system is organized into four levels: preschool, basic (grades 1-9), upper secondary (grades 10-12) and higher education (Santibañez, Vernez, & Razquin, 2005). Public funding is managed by a central agency (Secretaria de Educación SEP) and it is designated to supply the needs of all 4 levels. The Secretary also sets the curriculum, selects textbooks and designates the personnel and their salary (Santibañez, Vernez, & Razquin, 2005). Mexico’s educational budget is provided by government lending agencies in most cases. Recently, private institutions -both national and international- as well as business organizations have started to take part in the funding process. Together with parent groups, they are growing in popularity, but still play a very limited role (Santibañez, Vernez, & Razquin, 2005).
The first set of maps focused on the direct correlation between education level and the job quality, and how different areas of the city show better standards compared to others. People with complete higher education levels ranges from around 15 to 65% of the population depending on the district. These variations mean, for instance, that the city center -with around 62% of high educated people-, is proportionally 4.5 times better educated that the south west area -with only 14.1%-. This fact correlates with the percentage of the

39
population with a job: while at the center, around half of the population holds a job, the same area in the south west shows a 10% proportional negative difference. Actually, the two maps that explain the correlation between job and education show also a concentric pattern in the increase of rates, with higher numbers in the center and lower ratios in the periphery.
On the other hand, there seems to be a correlation with the third map too, which shows the people defined as of age capable for economic activities. The economically active age starts at 12 in Mexico and, throughout the city, it ranges around 50 to 65 % of the population for each district; the highest ratio is found downtown, while the lowest is located at the same south east area; both locations differ with almost 10 percent between them, with 62.67% at the center, and 53.9 in the south.
Due to this correlation, we wanted to monitor the current rates for school attainment throughout the city at different ages -therefore different school levels-. At ages 3-5, corresponding to the first levels of primary education, the indicators show a clear correspondence with the previous maps. In the center, only 15-20% of the population between 3 and 5 do not attend school while in the south and north poles of the city, the percentage doubles, reaching 36% in the northernmost district, and 40% in the south east. For ages 6-11, the map differs a bit; in this condition, the center shows the highest rates -around 2.5% of the population with those ages).

40
For the later years of primary education and secondary education levels, the illiteracy maps are very clear. Although low, the areas far from the center show higher illiteracy rates in both for children 8-14, as well as for older than 15 years old. In both locations, the rates are twice or 4 times higher than those in the center.

41
In a second set, we further explored the same problem differentiating gender in order to study dissimilarities between male and female collectives for education levels and job opportunities. Starting with the male population, the rates show more individuals attending school in the center, lowering to almost a 60% in the north and east, where 43% do not go to elementary schools. For primary education, the numbers are smaller, with only 2.4% of the population not attending school in the worst condition; in this case, higher numbers for male not attending to school are equally located in the center as well as in some areas in the periphery. Finally, for the secondary students, the rates average between 2 and 7 % of males not going to school, with the worst circumstance happening in the south east area (7.33%). If we incorporate all data for male individuals older than 25 living in Mexico City, the ranges for those with higher education vary drastically. After comparing the 2 areas discussed in earlier paragraphs, the center and the lower right district, the first one shows almost 70% of males with higher education, which proportionally means 4.5 times more than the 14% found in the south east district. As a consequence, some correlation could be found in the percentage of males having a job, where the center presents the highest with around 55%.

42
Female children between 3 - 5 are 3 times more likely to attend school if they live in the center districts, where only 15-25% individuals neglect school. For the rest of the primary education, the attainment increases similarly to the male population’s, displaying also a random pattern for those areas in better conditions than others. The maximum higher education levels in male residents over 25 years old are still 30% higher compare to what was found in women’s. On the other hand, “…while women and men spend similar amounts of time in education (an average of 5.0 years and 5.2 years, respectively), based on current patterns, 15-29 year-old women are expected to spend [5-7 years] without being enrolled…” in any education facility, or involved with any employment or training procedure (OECD.org, 2013). This condition, known as NEET, reveals large gender inequalities if we consider that men are expected to be NEET for 1.7 years only. In fact, the proportion NEET for women is reported to be 3 times larger than the one for men in 2011, and it seems to grow as the population ages (OECD.org, 2013). Further data from the Encuesta Nacional de la Juventud in 2010, suggested a cultural explanation to the gap between men and women, that includes pressures given by early marriages and pregnancies. “Being neither employed nor in education or training has serious adverse repercussions on employability later on, self-sufficiency and gender equality” (OECD.org, 2013). According to our maps, job rates for women fall to almost half of the number for males: men average 55% of employment in the best rated area, and women only reached 30 to 35%. Finally, in the last group of maps for Mexico, areas in the north and east show higher homicide rates in the past years, but the maps do not suggest a clear correlation to the education attainment or completion. Although not conclusive, there seems to be a correlation between the most dangerous areas and those districts with lower amounts of employment. Homicide rates peaked 2000 in 2015 in certain areas, which is much higher than Medellín in the 90s but, if we normalize the numbers by population, the results are different. In 2010, Mexico reported 1100 homicides, equivalent to 125 crimes per million residents, whereas Medellín reported 1611 homicides the same year for the period 2009-2010, which means 732 crimes per million residents, almost 6 times more.

43

44
45
Case 5: Taipei city, Taiwan Province of China Taipei City is the capital, largest conurbation and special municipality of Taiwan Province of China. During the second half of the 20th century, the country experienced rapid economic growth and an increase of population rates. As a consequence, 3 main sectors have become prominent, and they are currently used to group the population according to their type of jobs. The 3 sectors are:
• Sector 1: Agriculture, forestry, fishing and animal husbandry.
• Sector 2: Industry (included Manufacturing and Construction).
• Sector 3: Services (included Wholesale and retail trade, Transportation and storage, Accommodation and food service activities, Financial and insurance activities, Public administration and defense, compulsory social security, Education, Human health
The total population in the country reached 23.46m as of September 2015, and a density of 648 people per sq.km (Republic of China (Taiwan), 2015). Out of the total population, Taipei has the lowest gender ratio in Taiwan. As published in The China Post, one of the two English-language newspapers in Taiwan, the Ministry of the Interior stated on July 2015 that Taipei had only 92 men for every 100 women (CNA, 2015). Another fact to take into consideration is language. As in the rest of Taiwan, the residents of Taipei use the state’s official Standard Chinese (Standard Mandarin) as the common language, especially for taking part of the economic activities, usually concentrated in metropolitan Taipei where more than 7m people live. Nevertheless, it is noticeable how some inhabitants still maintain certain cultural traits such as aboriginal dialects inherited from groups that have inhabited the island for centuries. Many elderly in Taipei also speak Japanese since the territory was subjected to Japanese education until 1945, when they were occupied by the Empire of Japan. Based on these facts, we focused the mapping explorations in 3 premises. The first one is related to gender: If Taipei holds a greater female majority, in circumstances of equality, the amount of educated women should be, at least, the same as of men’s. Second, we aimed for the cultural inequalities. In order to visually demonstrate how cultural groups present clear differences in the settlement distribution patterns within the metropolitan area, we analyzed the territorial distribution of groups with diverse cultural backgrounds -expressed by their mother languages-. We were able to find disadvantages of specific groups in terms of their accessibility to economic resources and job opportunities; as a consequence, their territorial distribution plays a negative role for those who do not speak Mandarin as their mother tongue, and the residents with aborigines’ ancestry are those most geographically disadvantaged. Finally, we further explored the distribution patterns of jobs, especially those that required specific levels of education, and how their geographic location correlated to the proximity toward the city center, where most of the economic activities take place. Gender inequalities Since the industrialization of the economy and due to globalization, women have experienced increased standards for freedom and social status recognition, especially in areas like Taipei, more prompted to global influences. In 2002, women were granted equal custody privileges and the right to manage their

46
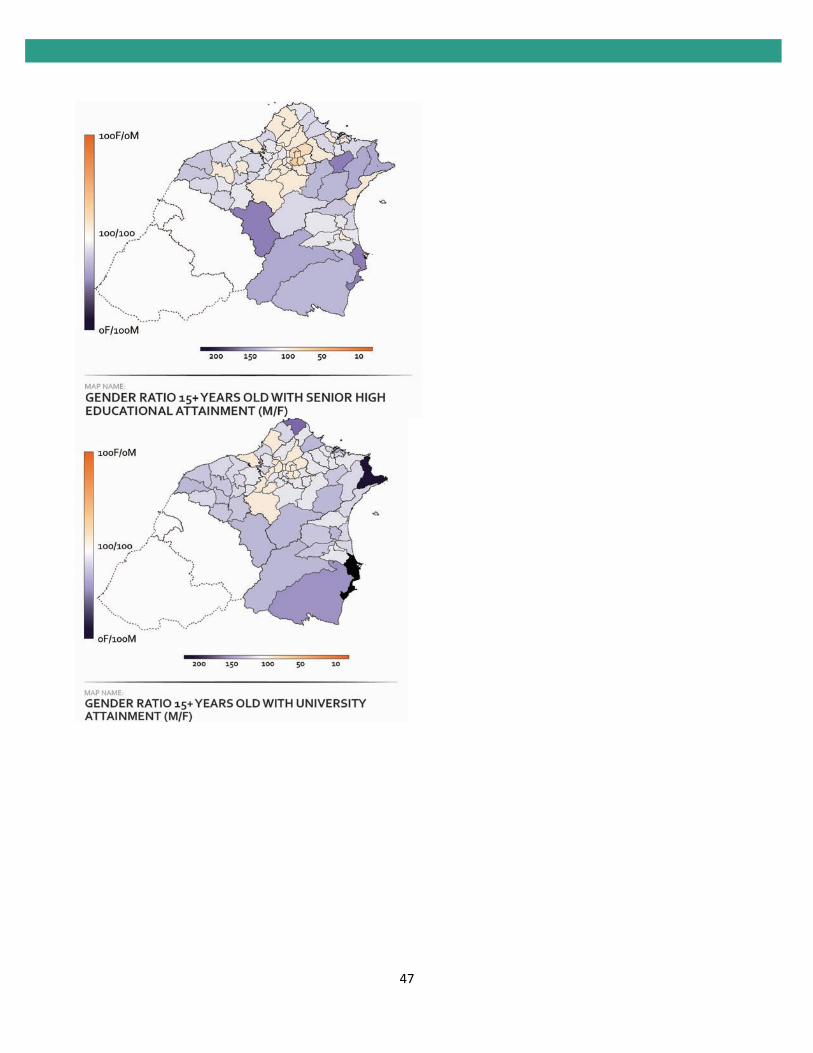
matrimonial poverty (The Organisation for Economic Co-operation and Development, 2010). Nevertheless, regardless of the adoption of Western civil legal systems and despite the initiatives and efforts toward the awareness of women’s rights issues, according to the Atlas of Gender and Development, Taiwan’s civil Code still retains strong paternal characteristics and women are still defined largely by their roles as mothers, wives and homemakers. The first set of maps shows the gender ratio at 3 different levels of education. First, in Elementary Schools, the great majority of census tracks, both in the city center and in the periphery of the metropolitan area, show a majority of women attendance. In the center, census tracks show a rough average of 60% more girls, while in the periphery, this ratio decreases to 30%. This fact seems to correspond to the city demographics stated by the Ministry of Interior. Nonetheless, by High school levels, the ratio is fairly neutral suggesting a greater dropping rate in women, especially in the periphery where the men supersede the female numbers. Finally, at the University level, the big majority of census tracks show a majority of male students, especially in the periphery where a rough 50% more men seem to reach 4th level education. The location of lower female students at university levels correlate with areas where the majority work on trade and crafts or do not hold a job in the major sectors of the economy. Here, the male students are more than 100% the number of females.
47
48
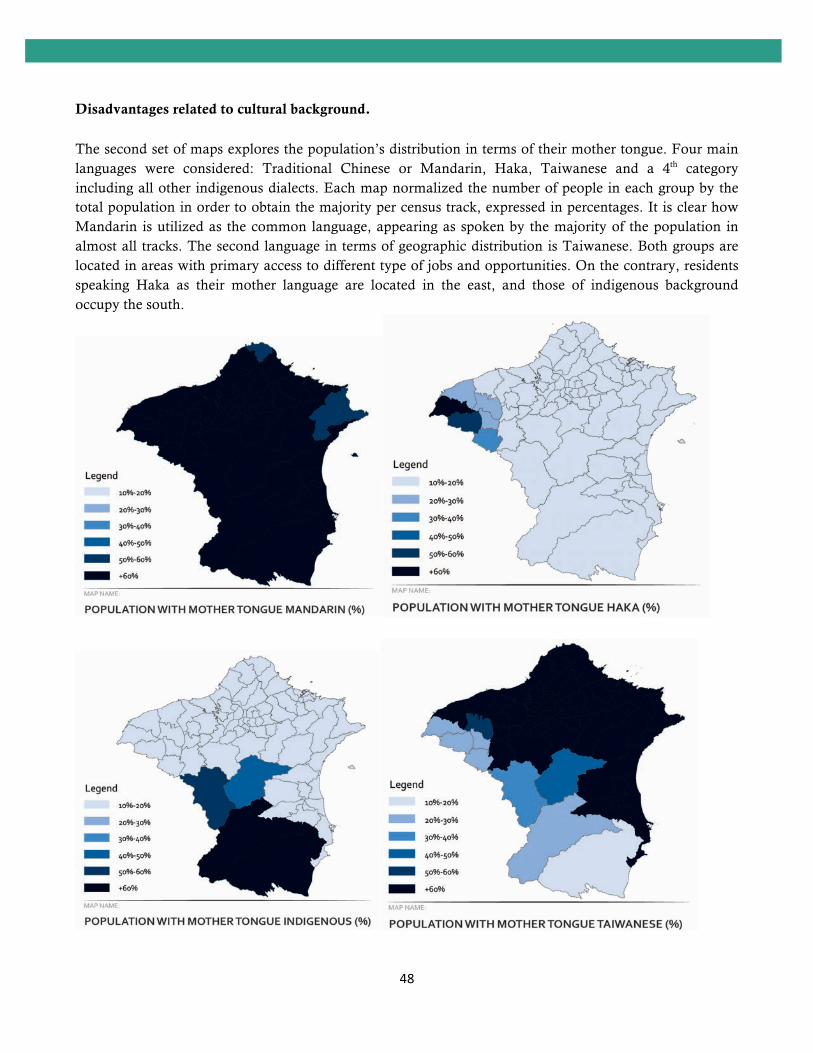
Disadvantages related to cultural background. The second set of maps explores the population’s distribution in terms of their mother tongue. Four main languages were considered: Traditional Chinese or Mandarin, Haka, Taiwanese and a 4th category including all other indigenous dialects. Each map normalized the number of people in each group by the total population in order to obtain the majority per census track, expressed in percentages. It is clear how Mandarin is utilized as the common language, appearing as spoken by the majority of the population in almost all tracks. The second language in terms of geographic distribution is Taiwanese. Both groups are located in areas with primary access to different type of jobs and opportunities. On the contrary, residents speaking Haka as their mother language are located in the east, and those of indigenous background occupy the south.

49
Economic opportunities
We also investigated the type of jobs existing in those areas and their correspondent educational background requirements in order to find a potential correlation between cultural background of a group and their territorial accessibility to jobs. The results showed that areas with 60% or more inhabitants coming from indigenous background were those concentrating the majority of lower educated jobs. These jobs are called elementary, and even though they are still conducted by people with elementary, junior or senior education, the requirements and core responsibilities don't encompass any special training, and since mostly any person can carry them out, salaries are much lower. At the same time, the only census tracks in which the Taiwanese speaking people were majority compared to those speaking Mandarin were the same areas where it is less likely to be employed in the important sectors of the economy.
These forms of jobs are distributed along the territory according to resources found in the country and distribution networks originated in the industrialization years. Based on the premise that, to the extent possible, people will show a tendency to live nearby their sources of employment and supplies, we wanted to investigate how education levels could determine potential areas for settle as residents in terms of the type of jobs they could access in the proximity.

50
Education and Job opportunities The third set of maps reconnoitered census tracks in terms of density of people holding a job in the most important sectors of the economy. As expected, according to our results, the majority of these quality jobs are located in the downtown area. In the corresponding census tracks, we were able to find also greater densities of people holding a job in the most important sectors of the economy, larger numbers of residents holding professional jobs and increased levels of university educated residents. All these values were ratios resulting from comparing each category to the total population in those tracks.
On the contrary, people with elementary education seem to live in the outskirts of the metropolitan area, with less than 5% representation in the census tracks located in the core. As a consequence, besides the

51
education level, distance and commuting time represent serious disadvantages in their accessibility to a larger market and better economic conditions.

52
Discussion The mapping-based distributional sanalysis carried out for this study has been exploratory in nature. The cases varied substantially in the availability of data and analysis possibilities, which limited the extent to which one could provide a comprehensive picture of the educational distribution and inequalities in the system. However, despite these limitations, a few key patterns are clear from the overall analysis, all of which point to one central narrative. There is clear differentiation in society by space, which is visible in the distribution of educational outcomes, the types of education that are available to people of different socioeconomic backgrounds, and the kinds of services and economic opportunities these people have access to in geographic proximity. At the same time, examples like the Medellín reduction in crime and violence and strategic location of public libraries indicate that cities can evolve over time, and improve education and other outcomes simultaneously through policy interventions. While more causal analysis is not feasible with the data available, this analysis points to the clear need for future research and attention to intra-urban inequalities, which recognize the need to view education systems as one of the many interlinked systems in urban settings (health, social servicess, infrastructure, water and electricity provision), and pay careful attention to the distribution and accessibility of such services.

53
Bibliography
Acemoglu, D., & Autor, D. (2011). Skills, tasks, and technologies: Implications for employment and earnings. In O. Ashenfelter, & D. Card, Handbook of Labor Economics (pp. 1043-1171). Amsterdam: Elsevier.
Acemoglu, D., & Autor, D. (2012). What does human capital do? A review of Goldin and Katz's The Race Between Education and Technology. Journal of Economic Literature , 50(2): 426-463.
Aedo, C., Hentschel, J., Luque, J., & Moreno, M. (2013). From occupations to embedded skills: A cross-country comparison. World Bank Policy Research Working Paper .
Aliyu, A., Shahidah, M., & Aliyu, R. (May, 2013). Mapping and Spatial Distribution of Post Primary Schools in Yola North Local Government Area of Adamawa State, Nigeria. International Journal of Science and Technology Volume 2 No. 5, , 405-422.
Altonji, J., & Mansfield, R. (2011). The role of family, school and community characteristics in inequality in education and labor market outcomes. In G. Duncan, & R. Murnane, Whither opportunity? Rising inequality and the uncertain life chances of low-income children. Russel Sage Foundation.
Autor, D. (2013). The task approach to labor markets: An overview. Journal of Labor Market Research , 46(3): 185-199.
Autor, D., & Dorn, D. (2013). The growth of low-skill service jobs and the polarization of the US labor market. American Economic Review , 96(2): 189-194.
Baert, S., Cockx, B., & Verhaest, D. (2013). Overeducation at the start of the career: Stepping stone or trap? Labour Economics , 25: 123-140.
Barro, R., & Lee, J. (2013). A new data set of educational attainment in the world, 1950-2010. Journal of Development Economics , 104: 184-198.
Battu, H., Sloane, E., Building, D., Street, D., & Park, S. (2002). Overeducation and ethnic minorities in Britain. Machester School , 72(4): 535-559.
Baud, I., Pfeffer, K., Sridharan, N., & Nainan, N. (2009). Matching deprivation mapping to urban governance in three Indian mega-cities. Habitat International xxx , 1-13.
Benjamin, N. B. (2014). Informal Economy and the World Bank. World Bank Policy Research Working Paper 6888 .
Bertrand, M., & Mullainathan, S. (2004). Are Emily and Greg more employable than Lakisha and Jamal? A field experiment on labor market discrimination. American Economic Review , 94(4): 991-1013.
Bils, M., & Klenow, P. (2000). Does schooling cause growth? American Economic Review , 90: 1160-1183.
Blinder, A. (1973). Wage discrimination: Reduced form and structural estimates. Journal of Human Resources , 8(4): 436-455.

54
Bomberg, N. (2014, Arpil 4). Medellín, Colombia: A City Transformed? From Cities Speak - National League of Cities: http://citiesspeak.org/2014/04/04/Medellín-colombia-a-city-transformed/
Carneiro, P., Meghir, C., & Parey, M. (2012). Maternal education, home environments, and the development of children and adolescents. Journal of the European Economic Association , 123-160.
Chua, K., & Chun, N. (2015). In search of a better match: Qualification mismatches in developing Asia. Unpublished .
Citigroup Inc. (2015, 10 20). City of the Year. From WSJ Magazine: http://online.wsj.com/ad/cityoftheyear
City-Data. (2008). Mexico City. Education. From City Data: http://www.city-data.com/world-cities/Mexico-City-Education.html
Clark, B., Joubert, C., & Maurel, A. (2014). The career prospects of overeducated Americans. National Bureau of Economic Research Working Paper No. 20167 .
Clarke, G. P., & Langley, R. (1996). A review of the potential of GIS and spatial modelling for planning in the new education market. Environment and Planning C: Government and Policy , Volume 14, 301-323.
CNA. (2015, July 19). Taipei has lowest gender ratio in Taiwan. The China Post .
Cox, W. (2011, March 02). THE EVOLVING URBAN FORM: THE VALLEY OF MEXICO. From New Geography: http://www.newgeography.com/content/002088-the-evolving-urban-form-the-valley-mexico
Cunha, F., & Heckman, J. (2007). The technology of skill formation. American Economic Review , 97(2): 31-47.
Cunha, F., James, L., & Heckman, J. (2006). Interpreting the evidence on life cycle skill formation. In Handbook of the Economics of Education. Amsterdam: Elsevier.
Currie, J. (2009). Healthy, wealthy, and wise: Socioeconomic status, poor health in childhood, and human capital development. Journal of Economic Literature , 47(1): 87-122.
Dahl, G., & Lochner, L. (2012). The impact of family income on child achievement: Evidence from the earned income tax credit. American Economic Review , 102(5): 1927-1956.
De la Fuente, H., Rojas, C., Salado, M. J., Carrasco, J. A., & Neutens, T. (2013). Socio-Spatial Inequality in Education Facilities in the Concepción Metropolitan Area (Chile). SciRes Current Urban Studies , 117-129.
Departamento Administrativo Nacional de Estadística de Colombia. (2015, June 30). Population Estimates 1985-2005 and Projections 2005-2020. From Dane.GOV: http://www.dane.gov.co/files/investigaciones/poblacion/proyepobla06_20/Municipal_area_1985-2020.xls
Department of Economic and Social Affairs of the United Nations. (2015). The Millennium Development Goals Report. New York: UN.

55
Dinkelman, T., & Martinez, C. (2014). Investing in schooling in Chile: The role of information about financial aid for higher education. The Review of Economics and Statistics , 96(2): 224-257.
Duflo, E. (2012). Women empowerment and economic development. Journal of Economic Literature , 50(4): 1051-1079.
Durlak, J., Weissberg, R., Dyminicki, A., Taylor, R., & Schellinger, K. (2011). The impact of enhancing students' social and emotional learning: A meta-analysis of school-based universal interventions. Child Development , 82(1): 405-432.
Education in Kosovo. (2015). From Be In Kosovo: http://www.beinkosovo.com/en/education-in-kosovo
Eray, O. (2012). Application of Geographic Information System (GIS) in Education. Journal of Technical Science and Technologies , 53-58.
Felipe, J., Mehta, A., & Rhee, C. (2014). Manufacturing matters... But it's the jobs that count. ADB Economics Working Paper Series .
Fields, G. (1975). Rural-urban migration, urban unemployment and underemployment, and job search activity in LDCs. Journal of Development Economics , 2(2): 165-187.
Fields, G. (1975). Rural-urban migration, urban unemployment and underemployment, and job search activity in LDSCs. Journal of Development Economics , 2(2): 165-187.
Frank, R. (1978). Why women earn less: Theory and estimation of differential overqualification. American Economic Review , 68(3): 360-373.
Frey, C., & Osborne, M. (2013). The future of employment: How susceptible are jobs to computerization? Oxford Martin School Publications .
Garcia, E. (2014). The need to address non-cognitive skills in the education policy agenda. Economic Policy Institute Briefing Paper .
Ghosh, & Aditya. (2006, February 27). Mumbai’s slums are India’s most literate. DNA .
Goldin, C., & Katz, L. (2007). The race between education and technology: The evolution of U.S. educational wage differentials, 1890 to 2005. National Bureau of Economic Research Working Paper No. 12984 .
Goos, M. (2007). Lousy and lovely jobs: The rising polarization of work in Britain. The Review of Economics and Statistics , 89(1): 118-133.
Goos, M., & Salomons, A. (2014). Explaining job polarization: Routine-biased technological change and offshoring. American Economic Review , 104(8): 2509-2526.
Gorg, H. (2011). Globalization, offshoring and jobs. In M. Bachetta, & M. Jansen, Making Globalization Socially Sustainable. Geneva: WTO Publications.
Gunther, I., & Launov, A. (2012). Informal employment in developing countries: Opportunity or last resort? Journal of Development Economics , 97: 88-98.
56
Haider, S., & Solon, G. (2006). Life-cycle variation in the association between current and lifetime earnings. American Economic Review , 96(4): 1308-1320.
Hanushek, E., & Woessmann, L. (2012). Do better schools lead to more growth? Cognitive skills, economic outcomes, and causation. Journal of Economic Growth , 17(4): 267-321.
Hanushek, E., & Woessmann, L. (2011). The economics of international differences in educational achievement. In E. Hanushek, S. Machin, & L. Woessmann, Handbook of the Economics of Education . Amsterdam: Elsevier.
Hanushek, E., & Woessmann, L. (2008). The role of cognitive skills in economic development. Journal of Economic Literature , 46(3): 607-668.
Hanushek, E., Schwerdt, G., Wiederhold, S., & Woessmann, L. (2015). Returns to skills around the world: Evidence from PIAAC. European Economic Review , 73: 103-130.
Hastings, J., & Weinstein, J. (2008). Information, school choice, and academic achievement: Evidence from two experiments. Quarterly Journal of Economics , 123(4): 1373-1414.
Heckman, J., & Kautz, T. (2012). Hard evidence on soft skills. Labour Economics , 19(4): 451-464.
Heckman, J., Stixrud, J., & Urzua, S. (2006). The effects of cognitive and non-cognitive abilities on labor market outcomes and social behavior. Journal of Labor Economics , 24(3): 411-482.
Henley, J. (2013, July 31). Medellín: the fast track from the slums. The Guardian .
Hogrebe, M. C., & Tate, W. (March 2012). Geospatial Perspective: Toward a Visual Political Literacy Project in Education, Health, and Human Services. Review of Research in Education, Vol. 36 , 67-94.
Hsieh, C., Hurst, E., Jones, C., & Klenow, P. (2013). The allocation of talent and U.S. economic growth. National Bureau of Economic Research Working Paper No. 18693 .
ILO. (2014). Skills mismatch in Europe. Geneva: International Labour Organization.
Index Mundi. (2014, July). Kosovo Demographics Profile 2014. From http://www.indexmundi.com/: http://www.indexmundi.com/kosovo/demographics_profile.html
Jann, B. (2008). The Blinder-Oaxaca decomposition for linear regression models. The Stata Journal , 8(4): 453-479.
Jensen, R. (2010). The (perceived) returns to education and the demand for schooling. Quarterly Journal of Economics , 125(2): 515-548.
Jimenez, M. (2011, July 1). Security central in Mexico City's makeover. The Globe and Mail .
Kampelmann, S., & Rycx, F. (2012). The impact of educational mismatch on firm productivity: Evidence from linked panel data. Economics of Education Review , 31(6): 918-931.
57
Kautz, T., Heckman, J., Diris, R., ter Weel, B., & Borghans, L. (2015). Fostering and measuring skills: Improving cognitive and non-cognitive skills to promote lifetime success. Paris: OECD Publishing.
Khor, N., Pang, L., Liu, C., Chang, F., Mo, D., Loyalka, P., et al. (2015). China's looming human capital crisis: Upper secondary educational attainment rates and the middle income trap. Stanford REAP Working Paper Series .
Kimmelman, M. (2012, May 18). A City Rises, Along With Its Hopes. The New York Times .
Kisumu County Education Network. (2014). The Status of Basic Education in Kisumu County. Kisumu: Copyright © Kisumu County Education Network (K-CEN).
Kolesnikova, N. (2010). The return to education isn't calculated easily. The Regional Economist .
Korpi, T., & Tahlin, M. (2009). Educational mismatch, wages, and wage growth: Overeducation in Sweden, 1974-2000. Labour Economics , 16(2): 183-193.
La Porta, R., & Shleifer, A. (2014). Informality and development. Journal of Economic Perspectives , 28(3): 109-126.
Lanz, R., Miroudot, S., & Nordas, H. (2011). Trade in tasks. OECD Trade Policy Working Papers .
Leuven, E., & Oosterbeek, H. (2011). Overeducation and mismatch in the labor market. In E. Hanushek, S. Machin, & L. Woessmann, Handbook of Economics of Education. Amsterdam: Elsevier.
Levine, L. (2012). Offshoring (or Offshore Outsourcing) and Job Loss Among U.S. Workers. Congressional Research Service.
Lochner, L., & Monge-Naranjo, A. (2012). Credit constraints in education. Annual Review of Economics , 4: 225-256.
Lochner, L., & Moretti, E. (2004). The effect of education on criminal activity: Evidence from prison inmates, arrests and self-reports. American Economic Review , 94(1).
Lotfi, S., & Koohsari, M. J. (2009). Measuring objective accessibility to neighborhood facilities in the city (A case study: Zone 6 in Tehran, Iran). Elsevier , 134-140.
Lubiensky, C., Gulosino, C., & Weitzel, P. (2009). School Choice and Competitive Incentives: Mapping the Distribution of Educational Opportunities across Local Education Markets. American Journal of Education 115 , 601-647.
Mankiw, N., Romer, D., & Weil, D. (1992). A contribution to the empirics of economic growth. Quarterly Journal of Economics , 107(2): 407-437.
Maoulidi, M. (2008). EDUCATION NEEDS ASSESSMENT FOR KISUMU CITY, KENYA. New York: MCI SOCIAL SECTOR WORKING PAPER SERIES.

58
McClure, S., & Berkeley, U. o. (2014, Spring). Center for Latin American Studies. From Berkeley Review of Latin American Studies. COLOMBIA: Building on Education: http://clas.berkeley.edu/research/colombia-building-education
McMillan, M., & Rodrik, D. (2011). Globalization, structural change and productivity growth. In M. Bachetta, & M. Jansen, Making Globalization Socially Sustainable. Geneva: WTO Publications.
MID DAY. (2006, September 24). City has 43 one-teacher schools. MiD Day .
MigrationDialogue.edu. (1999, May). Kosovar Refugees. Migration News , pp. Volume 6, Number 5.
Milligan, K., Moretti, E., & Oreopoulos, P. (2004). Does education improve citizenship? Evidence from the U.S. and U.K. Journal of Public Economics , 88(9-10).
MMRDA. (2013). Extended Mumbai Urban Infrastructure Project. From Mumbai Metropolitan Region Development Authority: https://mmrda.maharashtra.gov.in/extende-mumbai-urban-infrastructure-project
Moretti, E. (2004). Estimating the social return to higher education: Evidence from longitudinal and repeated cross-sectional data. Journal of Econometrics , 121.
Mumbai Railway Vikas Corporation LTD. (2010). Indian Railways. From Overview of the Existing Mumbai Suburban Railway: http://www.mrvc.indianrailways.gov.in/view_section.jsp?lang=0&id=0,294,302
Municipal Corporation of Greater Mumbai. (2006, January 31). Education. From Municipal Corporation of Greater Mumbai: http://www.mcgm.gov.in/irj/go/km/docs/documents/MCGM%20Department%20List/City%20Engineer/Deputy%20City%20Engineer%20(Planning%20and%20Design)/City%20Development%20Plan/Education.pdf
Neisser, U., Boodoo, G., Bouchard, T., Boykin, W., Brody, N., Ceci, S., et al. (1996). Intelligence: Knowns and unknowns. American Psychologist , 51: 77-101.
Njuguna, N. (2013). Distribution and State Of Primary Schools in Kenya. From ESRI Wastern Africa: http://www.esriea.co.ke/EdUC-2013/Paper%20Session%20pdf's/Distribution%20and%20State%20of%20Primary%20Schools%20in%20Kenya.pdf
Oaxaca, R. (1973). Male-female wage differentials in urban labor markets. International Economic Review , 14(3): 693-709.
OECD. (2009). OECD Employment Outlook 2009: Tackling the jobs crisis. OECD Publishing.
OECD. (2013). OECD Skills Outlook 2013: First results from the Survey of Adult Skills. OECD Publishing.
OECD.org. (2013). Mexico. From Education at a Glance 2013: http://www.oecd.org/edu/Mexico_EAG2013%20Country%20Note.pdf
59
ONU Mujeres. (2014, December 8). México reitera su compromiso con la igualdad de género durante la visita de Phumzile Nlambo-Ngcuka. From UN Women: http://www.unwomen.org/es/news/stories/2014/12/mexico-reitera-su-compromiso-con-igualdad-de-genero
Patiño, A. (2015, April 9). Descubre a Medellín a través de 15 increíbles mapas. From MDE Ciudad Inteligente: http://descubre.mdeinteligente.co/descubre-Medellín-15-mapas-y-mas/
Pérez Courtade, L. (2014, November 17). En la Ciudad de México cinco de cada 10 mujeres sufren violencia. Excelsior .
Perry, A. W.-P. (2014). How can skill mismatch be measured? New approaches with PIAAC. Methods, Data, Analyses , 8(2): 137-174.
Perry, A. W.-P. (2014). How can skill mismatch be measured? New approaches with PIAAC. Methods, Data, Analyses , 8(2): 137-174.
Pierre, G., Sanchez Puerta, M., Valerio, A., & Rajadel, T. (2014). STEP skills measurement surveys: Innovative tools for assessing skills. World Bank Social Protection and Labor Discussion Paper No. 1421 .
Plunz, R., Opiyo-Omolo, B., Blaustein, S., & al, e. (2015). Manyatta. A guide to do-it-yourself Infrastructure. New York: The Urban Design Lab at Columbia University.
Pritchett, L. (2001). Where has all the education gone? . World Development , 15(3): 367-391.
Republic of China (Taiwan). (2015, October 25). National Statistics. From Latest Indicators: http://eng.stat.gov.tw/point.asp?index=9
Republika e Kosoves. (2011). KOSOVO EDUCATION STRATEGIC PLAN 2011-2016. Ministry of Education Science and Technology .
Reuters. (2004, May 12). Police say Giuliani helps cut Mexico City crime. From The San Diego Union Tribute: http://legacy.utsandiego.com/news/mexico/20040512-1639-crime-mexico.html
Richards, M. P. (December 2014). The Gerrymandering of School Attendance Zones and the Segregation of Public Schools: A Geospatial Analysis. American Educational Research Journal , Vol. 51, No. 6, pp. 1119–1157.
Roberts, B. W. (2009). Back to the future: Personality and assessment and personality development. Journal of Research in Personality , 43(2): 137-145.
Rodrik, D. (2015). Premature industrialization. National Bureau of Economic Research Working Paper No. 20935 .
Santibañez, L., Vernez, G., & Razquin, P. (2005). Education in Mexico. Challenges and Opportunities. From Rand Education: http://www.rand.org/content/dam/rand/pubs/documented_briefings/2005/RAND_DB480.sum.pdf

60
Shah, T. I., Bell, S., & Elahi, M. (2011). School mapping in education micro-planning: a case study of Union Council Chak 84/15L, District Khanewal, Pakistan. Prairie Perspectives: Geographical Essays , 1-9.
Spence, M. (1973). Job market signaling. Quarterly Journal of Economics , 87: 355-374.
Temple, J. (1999). A positive effect of human capital on growth. Economics Letters , 65(1): 131-34.
The City of New York. NYC.gov. (2015). New York City Open Data. From About New York City Open Data: https://nycopendata.socrata.com/
The Economist: Finance and Economics. (2012, June 9). Property in Mumbai. The minimum city. The Economist .
The Organisation for Economic Co-operation and Development. (2010). Atlas of Gender and Development: How Social Norms Affect Gender Equality in Non-OECD Countries. Paris: OECD Publishing.
Tinbergen, J. (1975). Income Difference: Recent Research. Amsterdam: North-Holland Publishing Company.
United Nations. (2014). Open working group proposal for Sustainable Development Goals. New York: United Nations.
United Nations. (2015). The Millenium Development Goals Report 2015. New York: United Nations.
Wenderoth, A., & Sang, B. M. (2004). Situational Anaylis of Education in Kosovo. Kosovo: UNICEF.
(April 2015). World Economic Outlook. Uneven Growth: Short- and Long-Term Factors. Washington, DC: International Monetary Fund.
Yahoo! Finance India. (2012, September 20). India’s top 15 cities with the highest GDP. From Yahoo! Finance : https://in.finance.yahoo.com/photos/the-top-15-indian-cities-by-gdp-1348807591-slideshow/
Zhang, L., Yi, H., Luo, R., Liu, C., & Rozelle, S. (2013). The human capital roots of the middle income trap: The case of China. Agricultural Economics , 44(1): 151-162.