
Integrated Energy Master Plan - Sustain IU - Indiana University
207
Integrated Energy Master Plan Indiana University - Bloomington november 14, 2012 622 Emerson Road, Suite 220 St. Louis, MO 63141 (314) 727-8760
-
Upload
khangminh22 -
Category
Documents
-
view
1 -
download
0
Transcript of Integrated Energy Master Plan - Sustain IU - Indiana University
Integrated Energy Master PlanIndiana University - Bloomington
november 14, 2012
622 Emerson Road, Suite 220St. Louis, MO 63141(314) 727-8760

8760 Engineering
Integrated Energy Master Plan IU 20096161 Page 1
Table of Contents
1 EXECUTIVE SUMMARY 1.1 Overview 1.2 Findings 1.3 Conclusions and Recommendations
2 DEFINITIONS AND ASSUMPTIONS 2.1 Introduction 2.2 Review of Previous Reports 2.3 Detailed Data Sample Buildings 2.4 Energy Data Considered 2.5 Greenhouse Gas Emissions Considered
3 FUEL AND ENERGY SOURCES 3.1 Fuel Characteristics, Cost, Consumption, and CO2 Emissions 3.2 Electricity Source, Cost, Consumption, and Emissions 3.3 Comparison of Study Emissions to 2010 IUB Carbon Inventory
4 CAMPUS DISTRIBUTED HEATING AND COOLING SERVICES 4.1 High and Medium Pressure Steam 4.2 The Cost of Steam Provided to Campus 4.3 Chilled Water Systems 4.4 Cost of Chilled Water Provided by the CCWP
5 ENERGY CONSUMPTION AND COST 5.1 Overview 5.2 Average Daily Use of Fuel 5.3 Average Daily Use of Chilled Water 5.4 Average Daily Use of Electricity 5.5 Average Utility Costs Utilized in Energy Calculations

Integrated Energy Master Plan IU 20096161 Page 2
6 DEMAND SIDE ANALYSIS 6.1 Techniques of Analysis, Overview 6.2 Building Model Results, Energy and Demand 6.3 Campus Central Plant – Model for Demand Side 6.4 Building Utility Audit 6.5 Building Retro‐Commissioning Opportunities
7 PRIORITIZE BUILDING ENERGY CONSERVATION MEASURES
7.1 Energy Economics 7.2 Building Energy Conservations Measures (ECM’s) 7.3 Methodology for Selecting Applicable ECM’s and Parametric Analysis 7.4 Building Energy Run Results
8 BUILDING INITIATIVES 8.1 Building Retro‐Commissioning 8.2 Building Energy Savings Opportunities 8.3 Building HVAC Capital Renewal
9 CENTRAL PLANT INITIATIVES 9.1 Central Steam Heating Plant 9.2 Steam and Condensate Distribution Systems 9.3 Campus Chilled Water System 9.4 Central Electrical Distribution System
10 INCORPORATION OF RENEWABLE ENERGY RESOURCES 10.1 Utilization of Renewable Energy at Indiana University Bloomington 10.2 Solar Energy 10.3 Renewable Energy from Wind Power
11 THE INTEGRATED ENERGY MASTER PLAN 11.1 Overview 11.2 Recommendations
APPENDIX A APPENDIX B

8760 Engineering
Integrated Energy Master Plan IU 20096161 Page 3
Executive Summary
1 EXECUTIVE SUMMARY
1.1 Overview
1.1.1 In March 2010, Indiana University Issued the “Campus Master Plan”. This document focuses on improving
the campus grounds, facilities, infrastructure and planning for growth guided by sustainable planning principles. Among these principles is the concept of moving toward a carbon‐neutral campus. This report provided broad recommendations for achieving this goal but further investigation was required to identify the specific steps necessary to accomplish this target.
1.1.2 In August of 2010, 8760 Engineering was commissioned to prepare an Integrated Energy Master Plan for the Indiana University Bloomington (IUB) campus. The purpose of the Integrated Energy Master Plan is to define and prioritize categories of projects to achieve the most transformative effect on the energy consumption of the IUB campus at the minimum cost and with the highest measure of greenhouse gas emission reduction. This report is to identify a plan for the reduction of energy to best support the ultimate achievement of the goal to move toward a carbon‐neutral campus. The Findings, Conclusions and Recommendations of the study that was conducted are summarized in the following paragraphs.
1.2 Findings
1.2.1 Campus Energy Picture and Carbon Footprint
For fiscal year 2010/2011, the total cost of energy consumed on the Indiana University Bloomington campus was $25.6M according to the annual report. This cost includes Electricity, Coal, Natural Gas and Fuel Oil. Carbon emissions released in the generation or combustion of this energy totals 489,895 tons of CO2.

Integrated Energy Master Plan IU 20096161 Page 4
Table 1.2.1.1: Campus Energy Cost and Carbon Footprint
Energy Source Energy Cost Carbon Emissions
(tons CO2)
Electricity $18,677,297 73.1% 304,959 62.2% Coal $4,263,004 16.7% 165,009 33.7%
Natural Gas $2,542,489 9.9% 19,623 4.0%
Fuel Oil $75,282 0.3% 303 0.1%
Total $25,558,072 100% 489,895 100.0%
Through energy simulation and review of building energy metering data, an audit was conducted of a large portion of the Indiana University Bloomington campus. This audit identified that energy is consumed in vastly different ways depending on the building type, age and sources of energy. In general, Table 1.2.1.2 displays the overall splits of energy consumption (by cost and carbon emissions) on campus.
Table 1.2.1.2: Campus Energy Audit by Energy Cost and Carbon Emissions
Energy Load Cost Carbon
Emissions Building Lighting 23% 19%
Building Equipment 17% 14%
Building Fans 16% 13%
Heating 17% 26%
Cooling 18% 13%
Heating Losses 7% 10%
Building Losses 4% 5%
While Table 1.2.1.2 suggests that the single largest energy consumer on campus is lighting, other consumers including cooling, heating, fans and building equipment (plug loads, elevators, computers, etc.) are equal players in campus energy consumption. There is no single simple approach to addressing all of these energy demands. Furthermore, overall reduction of energy will require the participation of students and staff to turn lights off and unplug equipment, maintenance personnel to address operation issues and administration to fund projects to bring buildings up to current standards.
1.2.2 Benchmarking of Buildings
When comparing energy metering data and building energy simulation data to the Department of Energy’s Commercial Building Energy Consumption Survey (CBECS), it is apparent that buildings on Indiana University Bloomington campus generally utilize more energy on average when compared to similar buildings around the country. These results are not entirely unexpected. While a substantial amount of new construction has been performed in recent years, many of the buildings on campus were constructed in the 1960’s and the energy systems serving these buildings are not high performance systems. Furthermore, as part of the survey conducted on this project, 22 buildings were identified that will require capital improvement for building heating and air conditioning systems in the near future.

Integrated Energy Master Plan IU 20096161 Page 5
Figure 1.2.2.1: Campus Benchmarking
1.2.3 Utility Distribution
With the exception of the campus steam system, the electric and chilled water distribution systems on campus are in good condition and expected to provide a long service life. However, the campus steam and condensate distribution systems are failing. Review of this system found 4.2 miles of buried piping that is currently in need of replacement. It is estimated that leaks and heat loss associated with these pipes are responsible for $1.8M of energy consumption annually. In order to retain reliable steam service, these piping systems need to be replaced.
1.2.4 Central Plant Age and Condition
The Central Heating Plant is in reasonably good condition considering its age. Substantial investment has been made in the Central Heating Plant in the last few years for the purpose of enabling the plant to operate on either natural gas or coal and to address EPA regulations related to burning coal. During Fiscal Year 2010/2011, coal comprised 92% of fuel burned to generate steam. However, three of the existing boilers (representing more than 50% of the coal boiler capacity) are 50 years old and are nearing the end of their useful life. In February of 2011, the EPA released the Boiler MACT requirements which further restrict allowable emissions from solid fuel fired boilers. Although the timeline of implementation of this regulation is in question, the ultimate cost of complying with these regulations for Indiana University will be in excess of $90 million. Moving forward, we believe the plant will change to a natural gas plant due to both equipment age and the difficulties encountered in replacing coal boilers in compliance with the EPA’s rules that exist today. In general, the majority of the Central Cooling Plant is also in excellent condition. However, there are a number of satellite chillers located around campus that have exceeded their useful life. Although the condition of the central plant chillers is generally excellent, the capacity of the plant has been insufficient to serve the campus peak cooling demand. To address this, additional chillers are being installed such that there will be sufficient cooling capacity during the summer of 2012.
0%10%20%30%40%50%60%70%80%90%
100%
Academ
ic
Office
Student Life
Science
Residen
tial
CBEC
S Score
Note: EUI Score >50% indicates above average energy consumptionCBECS Energy UsageIndex (EUI) Score.

Integrated Energy Master Plan IU 20096161 Page 6
1.3 Conclusions and Recommendations Based on our observations, calculations, and discussions with IU staff, the following recommendations represent the essence of the Integrated Energy Master Plan identified for the Indiana University Bloomington campus:
1) PREPARE TO STOP BURNING COAL:
a. It is our belief that the Central Heating Plant, either through federal regulatory pressures to limit carbon emissions or tightened EPA requirements on other emissions, will change within the next ten years from a predominately coal fired plant to a plant firing a high percentage or 100% natural gas.
b. It is desirable for the University to retain the multiple fuel sources that they have today to maintain as much operating cost stability as possible. Until a switch has been made at the Central Heating Plant to burn 100% natural gas on a year‐round basis, analyze gas and coal costs on a monthly basis to determine which fuel to utilize.
c. When natural gas becomes the prime heating source on campus, the advantages of the large central boiler plant generating steam with coal will largely be eliminated. The campus should plan for replacing the steam system over time with a low temperature heating water system utilizing distributed thermal plants. Such distributed thermal plants should be installed as new buildings are added at the perimeter of the campus, ultimately working inward to sequentially retire buildings from the central steam system. Heat for these thermal plants will be produced utilizing natural gas boilers and technologies including heat and electric cogeneration, geothermal, heat recovery chillers, and solar heating.
d. In lieu of replacing failing steam and condensate distribution piping between the Central Heating Plant and Research Park, implement a phased plan to build a natural gas fired thermal heating plant at Research Park and install building boilers at the Campus View Apartments, Recreational Sports, and the Nelson Halls Residence Administration Building. The design intent of the Research Park plant would be to ultimately convert its operation to both heating and cooling with heat pump chillers to recover the data center heat rejection for providing the heating needs of the other buildings planned for the Research Park Campus as well as the Tulip Tree Apartments.
e. With the exception of the most recently installed gas fired boiler, boiler fuel efficiency at the
central plant is less than 70%. When the switch is made to burn 100% natural gas, at least one of the existing boilers will need to be replaced with a more efficient gas fired boiler. The size of this replacement boiler is difficult to predict. As heating load is reduced through energy conservation projects and the construction of satellite heating plants, the appropriate size of this boiler should be determined based on heating needs at that future time.
2) IMPLEMENT ENERGY CONSERVATION PROJECTS a. Establish a process going forward to make retro‐commissioning of the HVAC systems of the major
existing buildings on campus a continuous process. Begin the work with the prioritized buildings identified by the report.
b. Aggressively implement energy conservation measures (ECM’s) on campus. Utilizing the ECM’s described in this report as a guide and target, continue implementing projects through the Qualified Energy Savings Program (QESP) and/or through traditional study/design/bid/build
Integrated Energy Master Plan IU 20096161 Page 7
methods. Energy reduction of the existing building stock is essential to making substantial carbon emissions reductions and managing the peak demand on campus infrastructure systems.
c. Even after the implementation of the energy retrofits recommended, a significant electrical base
load will exist on the Indiana University Bloomington campus. To offset a portion of this base load, a 7,500 kW gas turbine cogeneration plant with heat recovery boiler should be installed in or near the current Central Heating Plant generating electricity and recovering waste heat from the process to make steam for campus use.
3) REPAIR CAMPUS INFRASTRUCTURE
a. Continue the current effort to selectively replace segments of the existing steam and condensate distribution piping systems due to age and failure potential with new engineered, pre‐insulated piping system components. Many of these piping runs are 50 and more years old and should be replaced to reduce distribution heat losses and to improve the reliability of the building systems they serve. Such replacements are necessary because the thermal plants proposed in item 1d above will occur over a period of 15 years or more (with implementation of the Campus Master Plan).
b. Institute a program to survey all steam traps within the buildings on campus. Experience on similar campuses and on the trap surveys conducted on the CHP and the steam distribution systems would indicate that between 10 and 20% of the traps will be malfunctioning and that the cost of the survey and trap replacement will be paid back in less than two years through the energy saved.
c. Continue the current practice of providing metering for the electrical, steam, chilled water,
domestic cold water, and natural gas use at each of the major campus buildings. Assemble this data in an energy use database providing rolling annual profiles for benchmarking building consumption against similar buildings and for flagging significant excursions from previous consumption experience.
4) DESIGN MORE EFFICIENTLY
a. Continue requiring LEED certification for all new buildings constructed at the site and for all major renovations (22 buildings were identified as being in need of substantial HVAC capital improvement). Require the building design team to review the first year of actual building energy performance to verify the accuracy of the computer modeling used to achieve the above referenced credits and to identify the source of any significant divergence from predicted consumption.
b. Supplement the current Indiana University Bloomington Design Standards with energy systems requirements for all new buildings and major additions to existing buildings.
c. Although renewable energy implementation opportunities through solar and wind projects are
possible, current economics do not support these projects unless other incentives become available. Under best case scenarios, without government incentives, paybacks for photovoltaic are greater than 40 years, paybacks for solar water heating are greater than 20 years and paybacks for large scale wind projects are greater than 12 years. Because the economics of these opportunities are expected to improve, perform an annual analysis of new opportunities for renewable energy implementation for review by the IEMP steering committee with representatives of administration, faculty, staff and students.

Integrated Energy Master Plan IU 20096161 Page 8
d. Continue to monitor the economics of renewable energy technologies in the future and continue to
investigate the application of renewable energy technology in new and existing buildings. Consider the inclusion of a renewable energy component into the design of all new projects.
5) ENERGY CONSERVATION THROUGH INVOLVEMENT OF CAMPUS COMMUNITY
a. As indicated in Table 1.2.1.2, the building occupants play a very significant role in energy consumption on campus. Roughly 40% or $10M per year of campus energy consumption can be directly related to the activities and behaviors of the campus community. While eliminating this energy consumption is not possible while continuing the mission of the University, it is certainly possible to reduce this consumption by as much as $3M per year. The University should continue to encourage the behavior changes necessary for the campus community to maximize their role in reducing energy use. Furthermore, the University should support research activities that evaluate the methods of achieving lasting behavioral change for energy conservation.
b. Continue to promote individual and group behaviors in the students, faculty, and staff that reduce energy consumption and promote a sustainable ethic that will permeate the campus community and beyond. Programs such as the Energy Challenge, the Sustainability Internship Program, and the Green Teams have been key elements in these efforts. Continue and expand these functions to include guidelines for sustainable laboratory practices, guidelines for sustainable office practices, and regular re‐evaluation of campus IT practices to use the latest technology to minimize energy and paper use.
c. In order to keep energy conservation in the minds of the campus community, prepare an
awareness campaign to inform the community. This campaign should include installation of video dashboards at the main entrance of each building on campus to report instant energy usage data as well as display tracking data for the past comparable periods. These dashboards would also educate and inform the community of campus energy initiatives.
6) ACCOUNTABILITY
a. Even with the most aggressive implementation program, achieving the goals identified in this document will require more than 10 years to implement. Tracking the progress to achieving these goals in a systematic way will be necessary to ensure that progress is made over the long term. As part of this plan, an annual report should be issued to the campus community that tracks the progress toward achieving the goals of this plan. This report should summarize the utility consumption (electricity and fuel) on a building by building basis, should track annual carbon emissions, identify renewable energy sources on campus and quantify the energy output of these systems, identify new renewable energy opportunities and economics, and would summarize the activities that are being performed to achieve energy reduction.
Of the recommendations listed above that involve substantial capital investment, Table 1.3.1 summarizes these major Integrated Energy Master Plan initiatives. When completely implemented, these initiatives will cost an estimated $82.6M to implement, reduce annual energy costs by $9.7M per year, and will reduce carbon emissions due to energy use by 52%.

Integrated Energy Master Plan IU 20096161 Page 9
Table 1.3.1: Recommended Integrated Energy Master Plan Initiatives
Project Description Project Type
Annual Energy, Consumables
and Maintenance
Cost1
Implementation Cost
Annual CO2 Savings (tons)
Existing Campus NA $ 26,080,000 NA 496,000
1 Retro‐Commissioning Energy $ (910,000) $ 3,270,000 ‐27,000
2 Building Energy Conservation
Measures Energy $ (5,740,000) $ 44,920,000 ‐105,000
4A
Selective Retrofit for Central Steam and Condensate Distribution Systems (not
including East Main)
Capital Improvement and Energy
$ (950,000) $ 10,600,000 ‐28,000
4C
Abandon 10" East 150 psig Steam Main; Replace with Hot Water Boilers and Heating Water
Distribution System from the Main Split to Research Park
Capital Improvement and Energy
$ (480,000) $ 5,310,0002 ‐22,000
9A Install Natural Gas Cogeneration
System at the CHP
Energy $ (1,790,000) $ 18,480,000 ‐58,000
M&R $ 310,000
5B Revised Central Steam Plant Firing Strategy; 100% Natural Gas with
Staff Reductions
Energy $ 190,000 ‐20,000
M&R $ (360,000)
Project Subtotals $ (9,730,000) $ 82,580,000 ‐260,000
Existing Campus $ 26,080,000 496,000
Campus After Implementation of IEMP $ 16,350,000 236,000
(37% Reduction) (52%
Reduction)
Notes: 1 Savings based on FY 10/11 estimated average utility costs and carbon emission rates. Annual Cost
Reduction includes Energy Cost, Maintenance and Repair Cost and consumables related to the use of coal. 2 Installing distribution piping in shallow tunnels increases cost by $2,290,000.
8760 Engineering
Integrated Energy Master Plan IU 20096161 Page 10
Definitions and Assumptions
2 DEFINITIONS AND ASSUMPTIONS
2.1 Introduction
2.1.1 With the adoption of the 2010 Indiana University Bloomington Master Plan, President McRobbie and the IU Board of Trustees have made energy conservation one of the highest priorities of the University. In response, the University is pursuing efforts to conserve energy through four main approaches, related in outcome but dissimilar in the cost and complexity of implementation. These approaches to saving energy in order of increasing cost and complexity are:
Energy conservation at the individual personal level. This may range from an individual turning off lights when not in use, to groups of individuals participating in the Energy Challenges, to campus wide policies for reducing the energy consumption of computers, printers, and peripherals when not in use. These initiatives save energy quickly and are low in overall cost to implement, but the persistence of their savings is determined by their degree of acceptance into the University culture.
Energy conservation from the retro‐commissioning of the heating, ventilating and air conditioning (HVAC) systems in campus buildings. This is the arduous process of systematically checking the major energy consuming systems in existing IUB buildings to assure that these systems are functioning as designed and intended. These activities may involve correcting inoperative valves and actuators or altering temperature control sequences that have malfunctioned over time. The energy savings from these changes can be substantial as they often correct the simultaneous use of cooling and heating that may be “silently” wasting energy without the occupant’s knowledge. This process is more expensive than energy conservation at the personal level. Retro‐commissioning is time consuming and requires individuals to perform these services that are skilled in the technology of building HVAC systems.
Energy conservation through Qualified Energy Savings Projects. These are projects that involve basic modifications to the HVAC and electrical systems in existing buildings to reduce energy consumption. Often called Energy Conservation Measures (or ECM’s), these measures may take the form of replacing existing lighting with more efficient lighting, the addition of heat recovery systems to reclaim heat normally lost in the space conditioning process, and basic changes in the arrangement and control of the existing HVAC systems. These changes are significantly more expensive than the previous options and may require up to 10 years of reduced operating costs to offset the initial capital investment.

Integrated Energy Master Plan IU 20096161 Page 11
Energy conservation through longer term, higher capital cost projects that are more transformative to campus energy consumption. These projects may take the form of utilization of solar energy or biomass fuels for generating heating, solar energy or wind energy for the generation of electricity, or the use of cogeneration facilities on campus to generate electricity, heating, and cooling at lower cost with a more benign impact on the environment.
2.1.2 The purpose of the Integrated Energy Master Plan that is embodied in these pages is to define and
prioritize these four categories of projects to achieve the most transformative effect on the energy consumption of the IUB campus at the minimum cost and with the highest measure of greenhouse gas emission reduction. The goals of the Campus Sustainability Report are clear; the purpose of this report is to identify a plan for the reduction of energy to best support the ultimate achievement of these goals.
2.2 Review of Previous Reports
2.2.1 In an effort to understand the characteristics of the existing energy utility systems on campus, the
magnitude of use and the conditions and cost of service of the various utilities that serve the campus, the sustainability goals that have been addressed, and the plans for University growth that are envisioned in the future, the following reports were obtained and reviewed. These documents are the basis of our understanding of the existing energy systems, the current cost of operation of these systems, and the greenhouse gas (GHG) emissions impact resulting from energy systems operations.
Indiana University Bloomington Campus Master Plan, March 2010, prepared by SmithGroup JJR
The Indiana University Physical Plant Bloomington Annual Reports from 2007‐2008, 2008‐2009, 2009‐2010, and 2010‐2011.
The Indiana University Utility Master Plan, Final Report, February 2003 prepared by Sebesta Blomberg & Associates, Inc.
The Initial Campus GHG Inventory, Towards Carbon Neutrality at Indiana University, 2008, prepared by Jonathan Brooks Bell
The updated Campus Greenhouse Gas Inventory, August 2010, prepared by Melissa Greulich
2.2.2 In addition, numerous documents were obtained from the Department of Physical Plant and the Utility Information Group documenting the costs and operating conditions of many of the energy systems serving the campus. This data was invaluable to our understanding of the site and for the preparation of this report.
2.3 Detailed Data Sample Buildings 2.3.1 The Bloomington campus of Indiana University consists of over 500 buildings on almost 2,000 acres. The
vast majority of these buildings are conditioned year‐round, with either central heating and cooling systems or individual systems housed within the building or building group. The energy consumption of these individual buildings is the key driver of the total campus energy needs and therefore is a significant target of the current study. Yet many of the facilities included on the building list are quite small, with HVAC and electrical systems that are residential in nature.
2.3.2 In an effort to reduce the data from this extensive building portfolio into a more manageable size while still capturing the bulk of the campus energy consumption, the following technique was employed. To capture over 80% of the campus energy use while considering the fewest number of buildings, a small

Integrated Energy Master Plan IU 20096161 Page 12
group of buildings was designated as the Detailed Data Sample (DDS) buildings. Such buildings were arbitrarily defined as having the following characteristics:
Buildings and parking garages of all ages that are served by any of the central plant systems (steam, chilled water, and electricity) having an area greater than 20,000 ft2
Buildings and parking garages of all ages over 50,000 ft2 whether or not they are they are served by any of the central plant systems
Not scheduled for demolition in the Campus Master Plan
Does not include the Cyclotron
2.3.3 Review of the campus building list revealed that 104 buildings would be included in this data set based on the characteristics described above. As indicated in Table 2.3.1 below, the DDS Buildings account for just over 82% of the gross campus building area and capture all of the energy intensive buildings on campus except for the Cyclotron. Table 2.3.2 lists the DDS Buildings that were considered.
Table 2.3.1: IUB Building Statistics for the Detailed Data Sample
Indiana University Bloomington ‐ Facts
Indiana University Fact Book 2010‐2011
8760 Engineering Building Database
8760 Engineering Detailed Data Sample Buildings
Acreage 1,937 ‐ ‐
No. of Buildings 551 554 104
Gross Area (ft2) 16,249,500 16,870,586 13,840,908
Assignable Area (ft2) 10,158,205 10,582,250 ‐
2.3.4 These 104 buildings were studied for current metered energy use as well as modeled to determine an
approximate audit of the current energy consumption of these facilities. Using this model, classes of energy conservation measures were simulated to determine the effect on the campus energy needs with the best system arrangement put forward to serve these needs.
Table 2.3.2: Detailed Data Sample Buildings
Building Code
Building Description
Gross Area (ft2)
Building Code
Building Description
Gross Area (ft2)
Building Code
Building Description
Gross Area (ft2)
BL209 Wells Library
557,163 BL009 Poplars Parking
136,402 BL276A Hickory Hall 63,414
BL601 Memorial Stadium
472,398 BL172
Lee Norvelle Theatre Drama/
Neal&Mars
135,627 BL276D Linden Hall 63,414
BL053 IN Memorial
Union 439,018 BL423
Multi Science 2
131,074 BL276G Pine Hall 63,414
BL603 Assembly
Hall 381,106 BL615
IU Warehouse
130,746 BL316 408 N Union St 60,229

Integrated Energy Master Plan IU 20096161 Page 13
Building Code
Building Description
Gross Area (ft2)
Building Code
Building Description
Gross Area (ft2)
Building Code
Building Description
Gross Area (ft2)
BL227 Read Hall 359,658 BL441 McNutt South
129,665 BL059 Lindley Hall 59,910
BL313 Eigenmann
Hall 349,442 BL452 SPEA 128,619 BL141 Memorial Hall 58,578
BL107 Jordan Hall 324,279 BL417 Geological Sciences
126,422 BL147 Merrill Hall 58,322
BL111 Ballantine
Hall 305,420 BL148
Music Addition
122,165 BL602 Tennis Center 57,708
BL243 Teter Quad 300,873 BL297 Willkie B 120,091 BL614 ALF‐Ruth Lilly
Auxiliary Library55,824
BL237 Wright Quad
295,887 BL301 Willkie A 119,951 BL139 Morrison Hall 53,989
BL257 Forest Quad 289,014 BL153 Art
Museum119,314 BL155 Lilly Library 52,516
BL433 Briscoe Quad
279,424 BL157 Fine Arts 115,554 BL418 Geological Survey
52,361
BL529 Campus View
Apartments 267,723 BL453 Harper Hall 109,147 BL005 Bryan Hall 51,436
BL177 Musical Arts
Center 267,130 BL072
Chemistry Addition
106,551 BL454 Gresham Dining
Hall 50,888
BL555 Tulip Tree
Apts 263,003 BL604
Gladstein Fieldhouse
103,427 BL276B Birch Hall 42,460
BL475 Recreational
Sports 253,302 BL150
Music Studio
101,348 BL276E Cypress Hall 42,460
BL171 Auditorium 238,364 BL595 Mellencamp Pavilion
100,282 BL067 Rawles Hall 42,017
BL451 Business School
238,158 BL158 Radio‐TV 99,373 BL455 Shea Hall 42,003
BL181 Simon Msc Lbr Rec
231,539 BL065 Optometry School
94,228 BL463 Nelson RPS Admin.
40,453
BL448 Fee Lane Pkg Garage
223,279 BL276C Cedar Hall 92,198 BL563 Innovation Center
39,871
BL063 Henderson Parking Garage
205,012 BL299 Willkie C 85,302 BL075 Ernie Pyle Hall 38,292
BL199 Jordan Ave Parking
194,648 BL445 Central Heating
84,020 BL109 Goodbody Hall 37,522
BL069 Atwater Parking
193,084 BL672 Food
Storage81,273 BL461 Magee Hall 37,064
BL450 Godfrey
Grad&Exec Ed Ctr
191,743 BL579 Data Center 81,186 BL456 Martin Hall 37,063

Integrated Energy Master Plan IU 20096161 Page 14
Building Code
Building Description
Gross Area (ft2)
Building Code
Building Description
Gross Area (ft2)
Building Code
Building Description
Gross Area (ft2)
BL245 Wendell W. Wright
191,111 BL630 Service Bldg 78,452 BL462 Jenkinson Hall 36,896
BL119 HPER
Building 189,776 BL439
McNutt Central
78,264 BL058 Kirkwood Hall 36,450
BL071 Chemistry 183,387 BL101 Myers Hall 76,521 BL061 Swain East 35,609
BL001 Law 170,098 BL149 Sycamore
Hall74,602 BL045 Cravens Hall 35,040
BL419 Psychology 155,246 BL133 Woodburn
Hall73,257 BL057 Wylie Hall 33,513
BL027 Swain West 154,602 BL664 IU Research
Park71,120 BL407
DeVault Alumni Center
32,563
BL437 McNutt North
153,143 BL017 Student Building
69,737 BL033 Maxwell Hall 31,091
BL008 Poplars 150,420 BL607 Cook Hall 69,441 BL304 Mason Hall 24,717
BL091 Wildermuth
Center 141,341 BL043
Edmondson Hall
68,588 BL047 Smith Hall 22,621
BL070 Simon Hall (Science)
141,094 BL467 Health Center
64,656 BL055 Owen Hall 20,148
BL007 Franklin Hall 138,149 BL276F Beech Hall 63,415 Total Area = 13,840,908
2.4 Energy Data Considered 2.4.1 Four years of detailed energy consumption data were obtained for the IUB buildings with one year defined
as the University fiscal year of July 1st through June 30th of the following year. The years considered were: FY 07‐08 July 1, 2007 through June 30, 2008 FY 08‐09 July 1, 2008 through June 30, 2009 FY 09‐10 July 1, 2009 through June 30, 2010 FY 10‐11 July 1, 2010 through June 30, 2011
2.4.2 The four years of data obtained were to determine unusual variations that may have occurred in individual buildings throughout this period. The weather in Bloomington for these four years is indicated in Table 2.4.1. Degree Days for both the heating and cooling seasons are relative to a 65° F outdoor air temperature.

Integrated Energy Master Plan IU 20096161 Page 15
Table 2.4.1: Fiscal Year 2007 through 2011 Weather Comparison Bloomington, Indiana Weather
ASHRAE Average FY 07‐08 FY 08‐09 FY 09‐10 FY 10‐11
Heating Degree Days 5,322 5,297 5,592 5,553 5,531
Cooling Degree Days 1,055 1,183 1,175 1,107 1,469
2.4.3 Heating degree days for the four years of energy consumption data obtained are relatively constant with
the maximum deviation from historical average at + 5.1% in FY 08‐09. Cooling degree days varied considerably more with a maximum deviation from historical average of + 39.2% in FY 10‐11. Of the four years of detailed energy consumption data obtained, FY 09‐10 was closest to the historical average (+ 4.9%).
2.4.4 Coal and natural gas compositions for the actual fuel delivered were obtained during FY 09‐10 and these specific characteristics were used in the calculations to determine the rate of greenhouse gas emissions.
2.5 Greenhouse Gas Emissions Considered
2.5.1 Greenhouse gas (GHG) inventories were identified earlier for the Indiana University Bloomington campus
in 2008 and again in 2010. These inventories were based on a set of accounting standards jointly established by the World Business Council for Sustainable Development and the World Resource Institute, and embodied in the Cool Air‐Cool Planet Campus Carbon Calculator software. These standards divide GHG emissions into the three broad categories enumerated below:
Scope 1 Direct Emissions – Direct emissions from sources that are owned and/or controlled by the University. a) On‐Campus Stationary Sources – Emissions from on‐campus combustion in boilers, furnaces, and
other fossil‐fueled combustion processes but not including vehicle fuels b) Direct Transportation Sources – Emissions from fuel combustion in vehicles owned by the
University c) Refrigeration and other Chemical Sources – Emissions from fugitive refrigerant leaks or other
chemicals expelled into the atmosphere at the site d) Agriculture Sources – Emissions from fertilizer use and methane released from animals housed on
site
Scope 2 Indirect Emissions – Emissions from sources that are neither owned nor operated by the University but that produce a commodity that is linked to on‐campus energy use. a) Purchased Electricity – Emissions created in combustion processes by power companies off‐site to
generate electricity for campus use. b) Purchased Steam – Emissions created from the production of steam that is purchased from an off
campus source (not applicable for IUB since all steam is generated on‐campus and appears as a Scope 1 Direct Emission.)
c) Purchased Chilled Water ‐ Emissions created from the production of chilled water that is purchased from an off campus source (not applicable for IUB since all chilled water is generated on‐campus and appears as a Scope 2 Indirect Emission of purchased electricity.)

Integrated Energy Master Plan IU 20096161 Page 16
Scope 3 Indirect Emissions ‐ Emissions from sources that are neither owned nor operated by the University but that are either financed or otherwise linked to the University. a) Solid Waste – Emissions resulting from managing waste produced by the University such as
incineration or land filling. b) Directly Financed Transportation – Emissions from travel by staff or students financed by the
University but not occurring in University owned vehicles such as airline travel and reimbursed travel in personal vehicles.
c) Commuting – Emissions resulting from regular commuting by faculty, staff, and students to and from campus
d) Study Abroad Air Travel – Emissions resulting from student travel to study abroad at University designated locations
e) Transportation and Distribution Losses from Purchased Energy – Emissions associated with losses resulting from the transportation of electricity, steam, or chilled water to the campus (Only losses from purchased electricity apply for IUB.)
f) Upstream Emissions from Directly Financed Purchases – Emissions associated with paper production, food production, or fuel extraction losses.
2.5.2 The purpose of the Integrated Energy Master Plan was never to duplicate or update the campus GHG
inventories developed earlier. Rather, the purpose of the IEMP is to set forth a plan to reduce energy use and cost while simultaneously reducing the carbon impact of campus energy use. With the aggressive carbon reduction goals set forth by the IUB Campus Master Plan, such reductions will represent a critical contributor to the success of these endeavors. For the purposes of this study, our focus was limited to Scope 1a and Scope 2a emissions for the campus. Based on the 2010 GHG Inventory for the campus, these two components represented about 77% of the current campus GHG emissions.
2.5.3 As an engineering study, the approach to GHG emissions in this report is based on the most fundamental engineering concepts and relies to the minimal extent possible on generally accepted emission factors. Emission factors presented here are generally limited to those derived from the most fundamental of scientific principles and calculations. This approach will differ from accepted techniques of GHG measurements in several ways.
2.5.3.1 The study focuses only on carbon dioxide (CO2) as the greenhouse gas of significance. Often,
emissions quoted in the literature are based on equivalent carbon dioxide (eCO2) from the six greenhouse gases mentioned in the Kyoto Protocol. Such emission values are obtained by multiplying the quantity of the GHG emitted from the particular process multiplied times its global warming potential (GWP) relative to carbon dioxide. For the combustion processes involved in the Scope 1a and 2a emissions considered in this study, the greenhouse gases of concern are limited to carbon dioxide, methane (CH4) and nitrous oxide (N2O). The generation of methane and nitrous oxide from combustion occur due to complex factors related to the specifics of the combustion process and cannot generally be calculated from basic principles and fundamental combustion calculations. Table 2.5.1 indicates that the error caused by calculating emissions in terms of CO2 instead of eCO2 is less than 1%. Therefore in this study, our measure of GHG emissions will be in units of pounds of CO2 emitted.
2.5.3.2 Acceptance of item 2.5.3.1 above allows customized combustion calculations based on the fundamental chemical equations of combustion to determine the emissions for the specific composition of the coal and natural gas utilized at the IUB campus (rather than using regional average values). The factors described in this report are therefore specific to the IUB campus.

Integrated Energy Master Plan IU 20096161 Page 17
Scope 2a emissions are likewise calculated from the specific emission factors for Duke Energy Indiana (rather than using regional average values).
2.5.3.3 Emissions are generally presented in units customarily seen in US engineering calculations, e.g., lbs CO2/MMBtu or lbs CO2/kWh (where an MMBtu = 106 Btu of fuel consumed and a kWh = kilowatt‐hours of electricity generated). If tons are referred to, they are in the units of US short tons equal to 2,000 lbs (not MT or metric tonnes of 2,204.6 lbs) unless otherwise noted. Savings will always be stated in customary energy units so that differing units or emission factors may be utilized based on the purpose of future calculations.
Table 2.5.1: Comparison of CO2 and eCO2 Emissions Factors
Emission Source
CO2 Emission Factors eCO2 Emission Factors eCO2 Emission Factors ‐
Consistent Units Error
Electricity 0.697543 kg CO2/kWh 0.000702 MT eCO2/kWh 0.7020 kg CO2/kWh ‐0.63%
Coal 1912.357 kg CO2/ton 1.927269 MT eCO2/ton 1927.2690 kg CO2/ton ‐0.77%
Natural Gas
52.75574 kg
CO2/MMBtu 0.052919
MT eCO2/MMBtu
52.9190 kg
CO2/MMBtu ‐0.31%
No. 1 Fuel Oil
9.987005 kg
CO2/gallon 0.010049
MT eCO2/gallon
10.0490 kg CO2/gallon ‐0.62%
Source: Clean Air ‐ Cool Planet, Campus Carbon Calculator, Version 6.6

8760 Engineering
Integrated Energy Master Plan IU 20096161 Page 18
Fuel and Energy Sources
3 FUEL AND ENERGY SOURCES 3.1 Fuel Characteristics, Cost, Consumption, and CO2 Emissions
In this section, each of the major fuels utilized on site will be reviewed including their composition, base year cost, current year cost, and projected future costs, as well as the carbon dioxide emissions resulting from their combustion. In addition, the consumption and annual cost for the base year of FY 09‐10 will be established. (It should be noted that IUB uses propane in very small quantities at locations off the main campus. Due to its limited use, propane consumption was not considered in our analysis.) 3.1.1 Coal
3.1.1.1 Coal has been used as a primary heating source for the Indiana University Bloomington campus
for many years. When the first portion of the Central Heating Plant Building was constructed in 1954, two 64,000 lb/hr coal fired boilers were installed. Though the Central Heating Plant (to be discussed in greater detail in a subsequent section) currently has the capacity to serve the site solely with natural gas, coal has continued to predominate in recent years as the primary source of heat energy for the campus.
3.1.1.2 Coal for the Central Heating Plant is obtained under contract from the Black Beauty Coal
Company, a subsidiary of Peabody Energy. The coal that is obtained is a bituminous coal brought in by truck from the Bear Run Mine in Sullivan County, southwest Indiana in an area known as the Illinois Basin. The composition of this coal for the base year of FY 09‐10 is indicated in Table A3.1.1.1 in Appendix A. (The software that accompanies this report includes the spreadsheet calculations indicated in this table for future calculations of emissions when coal composition is known). The coal burned is relatively high in sulfur content but the negative aspects of sulfur dioxide (SO2) in the effluent gases are reduced through the flue gas treatment system installed recently. A summary of the coal data derived from Table A3.1.1.1 for FY 09‐10 is summarized below.
Average Heat Content (HHV) = 11,897 Btu/lb (As‐Received)
Carbon Content = 72.15% (Moisture Free Basis)
Sulfur Content = 2.44% (Moisture Free Basis)
Integrated Energy Master Plan IU 20096161 Page 19
Carbon Dioxide Emissions from Combustion = 202.5 lb CO2/MMBtu Fuel Consumed
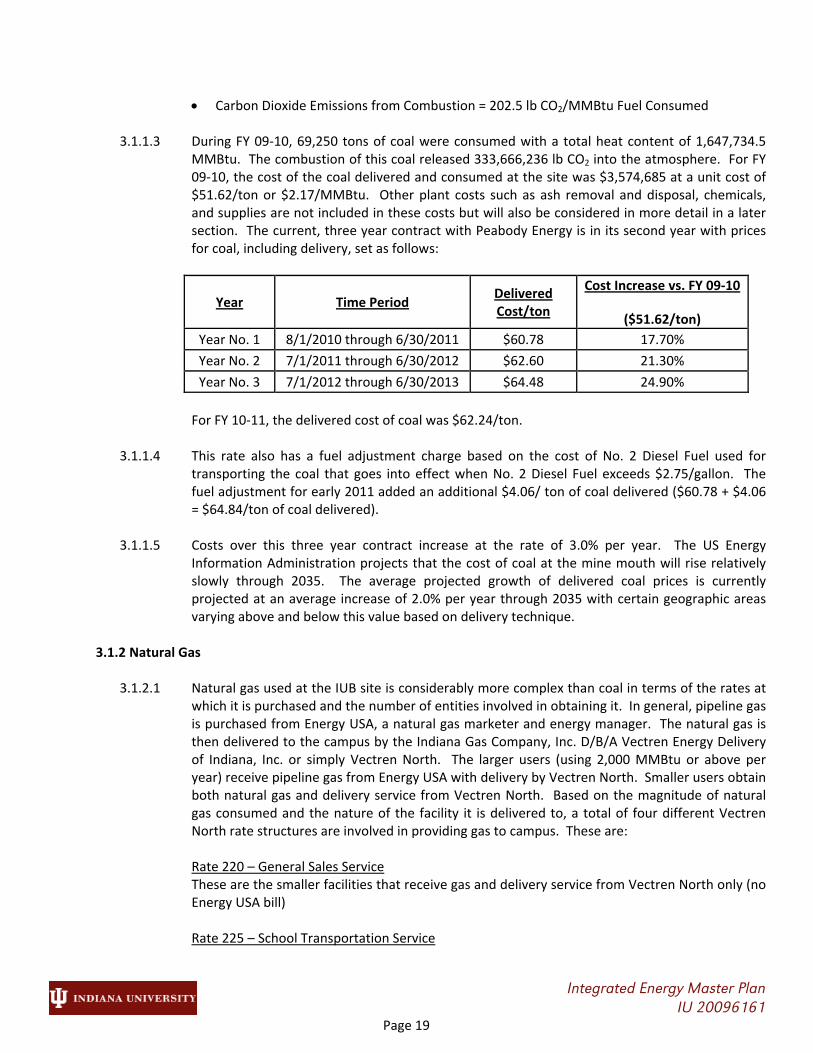
3.1.1.3 During FY 09‐10, 69,250 tons of coal were consumed with a total heat content of 1,647,734.5 MMBtu. The combustion of this coal released 333,666,236 lb CO2 into the atmosphere. For FY 09‐10, the cost of the coal delivered and consumed at the site was $3,574,685 at a unit cost of $51.62/ton or $2.17/MMBtu. Other plant costs such as ash removal and disposal, chemicals, and supplies are not included in these costs but will also be considered in more detail in a later section. The current, three year contract with Peabody Energy is in its second year with prices for coal, including delivery, set as follows:
Year Time Period Delivered Cost/ton
Cost Increase vs. FY 09‐10
($51.62/ton)
Year No. 1 8/1/2010 through 6/30/2011 $60.78 17.70%
Year No. 2 7/1/2011 through 6/30/2012 $62.60 21.30%
Year No. 3 7/1/2012 through 6/30/2013 $64.48 24.90%
For FY 10‐11, the delivered cost of coal was $62.24/ton.
3.1.1.4 This rate also has a fuel adjustment charge based on the cost of No. 2 Diesel Fuel used for transporting the coal that goes into effect when No. 2 Diesel Fuel exceeds $2.75/gallon. The fuel adjustment for early 2011 added an additional $4.06/ ton of coal delivered ($60.78 + $4.06 = $64.84/ton of coal delivered).
3.1.1.5 Costs over this three year contract increase at the rate of 3.0% per year. The US Energy
Information Administration projects that the cost of coal at the mine mouth will rise relatively slowly through 2035. The average projected growth of delivered coal prices is currently projected at an average increase of 2.0% per year through 2035 with certain geographic areas varying above and below this value based on delivery technique.
3.1.2 Natural Gas
3.1.2.1 Natural gas used at the IUB site is considerably more complex than coal in terms of the rates at
which it is purchased and the number of entities involved in obtaining it. In general, pipeline gas is purchased from Energy USA, a natural gas marketer and energy manager. The natural gas is then delivered to the campus by the Indiana Gas Company, Inc. D/B/A Vectren Energy Delivery of Indiana, Inc. or simply Vectren North. The larger users (using 2,000 MMBtu or above per year) receive pipeline gas from Energy USA with delivery by Vectren North. Smaller users obtain both natural gas and delivery service from Vectren North. Based on the magnitude of natural gas consumed and the nature of the facility it is delivered to, a total of four different Vectren North rate structures are involved in providing gas to campus. These are:
Rate 220 – General Sales Service These are the smaller facilities that receive gas and delivery service from Vectren North only (no Energy USA bill)
Rate 225 – School Transportation Service

Integrated Energy Master Plan IU 20096161 Page 20
This is a school pooling rate with transportation services provided by Vectren North and pipeline gas provided by Energy USA. This is a slightly higher gas rate with most of the gas purchased on the cash market.
Rate 245 – Large General Transportation Service Rate for larger buildings with an annual usage of 50,000 to 500,000 therms and a maximum daily use of 15,000 therms or less; gas for this rate is purchased on the hedge market from Energy USA but still delivered to the site by Vectren North.
Rate 260 – Large Volume Transportation Service Rate applicable for only the Central Heating Plant; requires an annual usage of greater than 500,000 therms or a demand of greater than 15,000 therms per day. Gas for this rate is purchased on the hedge market from Energy USA but still delivered to the site by Vectren North. The service is interruptible but IUB pays Vectren North approximately $190,000 annually for a 60,000 MMBtu storage reserve in case of interruption.
3.1.2.2 The cost per MMBtu of these rates vary considerably. For FY 10‐11, the campus used 333,161.1
MMBtu of natural gas for a total cost of $2,542,489 and an average cost of $7.63/MMBtu. However, comparing the Central Heating Plant natural gas costs to the remainder of campus for this period show significantly different costs as indicated below:
Portion of Campus Total Natural Gas Use Total Cost Average Cost
Central Heating Plant 140,767.0 MMBtu (42%) $913,437 $6.49/MMBtu
Remainder of Campus 192,394.1 MMBtu (58%) $1,629,052
$8.47/MMBtu
Campus Total 333,161.1 MMBtu (100%) $2, 542,489 $7.63/MMBtu
3.1.2.3 The average cost of natural gas for the Central Heating Plant will be used in the calculation of
the marginal cost of steam for FY 10‐11 in the energy reduction calculations that follow. For campus buildings not served by campus steam, natural gas costs will be based on the average cost for the remainder of campus.
3.1.2.4 Based on data provided from Vectren North, the natural gas arriving at the IUB campus comes
from two main sources:
Panhandle Eastern Pipeline (Mainline Tuscola East Station)
Texas Gas Transmission Pipeline (Lebanon Station)
3.1.2.5 For the purpose of the emissions calculations, it was assumed that each of these sources represented 50% of the gas delivered to campus. Thus, the composition of the natural gas for FY 09‐10 is indicated in Table A3.1.2.1 in Appendix A reflecting the composition of gas delivered from the two pipeline sources indicated above. (The software that accompanies this report includes the spreadsheet calculations indicated in this table for future calculations of emissions when natural gas composition is known). These calculations indicate that the average carbon dioxide emission factor for the natural gas burned during FY 09‐10 was 117.8 lb CO2/MMBtu.
3.1.2.6 The US Energy Information Administration projects that the cost of natural gas as measured by
the Henry Hub Spot Price will increase at an annual average of 4.06% through 2035. The

Integrated Energy Master Plan IU 20096161 Page 21
average projected growth of delivered natural gas prices is currently projected at an average increase of 3.13% per year through 2035.
3.1.3 Fuel Oil
3.1.3.1 Fuel oil is used in very limited quantities at the IUB campus and is purchased from the White
River Cooperative. It is used as a back‐up fuel source for several of the boilers at the Central Heating Plant. The fuel is produced at the County Mark Mount Vernon Refinery with a heat content of approximately 138,000 Btu/gal. For FY 10‐11, total campus use was as indicated below:
Location of Use Quantity Used
Heat Content (MMBtu) Cost Average Cost
Central Heating Plant
9,100 gal 1,255.8 MMBtu
$20,930
$16.67/MMBtu
Remainder of Campus
18,440 gal 2,544.7 MMBtu
$54,352
$21.36/MMBtu
Total for Campus
27,540 gal 3,800.5 MMBtu
$75,282
$19.81/MMBtu
3.1.3.2 The average cost of fuel oil for the Central Heating Plant will be used in the calculation of the
marginal cost of steam for FY 10‐11 in the energy reduction calculations that follow. For campus buildings not served by campus steam, fuel oil costs will be based on the average cost for the remainder of campus.
3.1.3.3 Emissions for the combustion of fuel oil were assumed to be a nominal value of 159.6 lb
CO2/MMBtu.
3.2 Electricity Source, Cost, Consumption, and CO2 Emissions 3.2.1 For FY 10‐11, electrical energy consumption for the IUB main campus is described in the following
summary:
Portion of Service Demand Energy Use Cost Average Cost
Master Meters 42,049 kW 241,000,615 kWh (82%) $15,026,455 $0.0624/kWh
Isolated Meters ‐ 51,245,933 kWh (18%) $3,650,842 $0.0712/kWh
Total Main Campus
42,049 kW 292,246,548 kWh (100%) $18,677,297
$0.0639/kWh
3.2.2 Electrical demand for the Master Meters in FY 10‐11 varied from a monthly maximum peak of 42,049 kW
in September 2010 to a monthly minimum peak of 27,223 kW in January of 2011. However, the true minimum demand was measured between 12/24/2010 and 12/26/2010 at 18,857 kW on 12/25/2010.
3.2.3 All electricity for the IUB main campus is obtained from Duke Energy Indiana, Inc. except for:
A maximum of 250 kW of electrical power obtained through electrical generation at the Central Heating Plant. Electricity is generated here through the use of a steam micro‐turbine receiving 150

Integrated Energy Master Plan IU 20096161 Page 22
psig boiler steam and operating at 40 psig back‐pressure in parallel with the steam pressure reducing station providing 40 psig steam to a large portion of the campus,
Approximately 46 kW of electrical power obtained from photo‐voltaic collectors on campus at the Tulip Tree Apartments and at Briscoe.
(Several remote buildings are served by Duke Energy Indiana and other utility providers but these are not included in the data presented here.) A large portion of the main campus is served from five high voltage (12.47 kV) Duke Energy master meters with power purchased under a real time pricing tariff designated as Rate HPNO. The letters of the rate indicate it is applicable for High Load Factor, Primary Service Voltage, No Meter Adjustments, and Normal Service. In addition to the master meters, a number of buildings are also served from Duke Energy Indiana but with separate connections and meters that are not a portion of the master meters and their real time summing of demands. These isolated metered buildings fall under several rate classifications depending on their size and the voltage at which they are served, but their costs and consumption were considered part of the main campus.
3.2.4 Electrical costs from Duke Energy Indiana for FY 10‐11 were expected to rise by 8% over FY 09‐10 but ultimately, the average cost only increased by about 1.6. Similarly, Duke is suggesting a 7% to 12% rate increase for HLF customers like IUB for 2012 relative to 2010. In sharp contrast, the US Energy Information Administration projects that the end use, delivered costs of electric service measured in 2009 dollars will remain flat or even fall by several tenths of a percent through 2035. However, the current Duke Energy Indiana rates are below the national average and thus may be subject to increases beyond those expected for the US average.
3.2.5 Several sources were accessed to determine the emissions that result from the generation of a kWh of electricity delivered to the IUB campus. Based on any of these sources, Scope 2 emissions from the generation of electricity used on site represents the largest single source of carbon emissions for Indiana University Bloomington. Thus the establishment of a proper emission factor for electrical generation will be an important parameter in gauging the success of the campus sustainability effort. This emission factor can be viewed from several perspectives with each yielding a slightly different result. Table 3.2.1 indicates a summary of the resources consulted in pursuit of the proper emission factor to describe electricity for the IUB campus.
3.2.6 Clearly, the simplest approach would be to adhere to the Clean Air – Cool Planet database that was utilized
in the preparation of the Campus Carbon Inventories for 2008 and 2010 described earlier with a custom fuel mix selected for electrical generation. However, as can be seen from Table 3.2.1, in 2006 there was a change in the region to which Indiana was assigned by the North American Electrical Reliability Corporation (NERC) essentially reducing the emission factor for electrical generation by over 24%! Since both of the carbon inventories for the IUB campus were completed post 2006, this would appear to be the correct factor to use (1.538 lb CO2/kWh). However it is clear from every resource consulted that the State of Indiana and Duke Energy Indiana rely very heavily on coal for electric generation. If the State were furnished with electricity generated 100% by coal, the proper theoretical emission factor for electrical generation would be approximately 2.19 lb CO2/kWh, much closer to the pre 2006 Clean Air – Cool Planet value. After considerable discussion, we recommend for this study that the most current value available from Duke Energy Indiana, 2.087 lb CO2/kWh be utilized to represent current emissions due to electrical generation. If renewable energy becomes a more prevalent portion of the Duke Energy Indiana source portfolio, then the University should take that reduction into account along with reductions made on campus.

Integrated Energy Master Plan IU 20096161 Page 23
Table 3.2.1: Carbon Dioxide Emissions from Electrical Generation
Date Source lbs
CO2/kWhWebsite Software Comments
2006 and
Before
Clean Air ‐ Cool Planet
Database 2.028 www.coolair‐coolplanet.org v6.6
Data Based on NERC Zone ECAR
Ohio Valley
Post‐2006
Clean Air ‐ Cool Planet
Database 1.538 www.coolair‐coolplanet.org v6.6
Data Based on NERC Zone RFCW
2009 Energy
Information Administration
2.100 www.eia.gov ‐ State of Indiana Electricity Profile
2007 Carbon
Monitoring for Action
1.965 www.carma.org ‐ State of Indiana Electricity Profile
2007 Carbon
Monitoring for Action
1.856 www.carma.org ‐ Duke Energy Indiana Inc.
2010 Jeff Honaker, Duke Energy Indiana Inc.
1.990 ‐ ‐ Duke Energy Indiana Inc.
2011 Duke Energy
Carbon Calculator
2.087 www.duke‐
energy.com/indiana
‐ Duke Energy Indiana Inc.
3.3 Comparison of Study Emissions to 2010 IUB Carbon Inventory 3.3.1 The following Tables 3.3.1, 3.3.2, and 3.3.3 compare the emissions calculated for the current study to the
results of the 2010 campus carbon inventory. For clarity in these comparisons only, CO2 emissions are stated in metric tonnes (MT) as opposed to US short tons. The obvious differences are:
The Scope 1 emissions in the current calculations are based on the actual fuel composition for the coal and natural gas burned on campus and,
Scope 2 emissions are considerably higher in the current study because of what we believe to be the most accurate emission factor for the generation of electricity used on the IUB campus.

Integrated Energy Master Plan IU 20096161 Page 24
Table 3.3.1: FY 10‐11 Emissions Due to Energy Systems Operation
Campus Emissions Sources
Total Consumption Total CO2 Emissions CO2 Emissions in
MT
Scope 1 Coal 1,629,722.4 MMBtu 330,018,786 lbs CO2 149,695.5
Natural Gas 333,161.1 MMBtu 39,246,378 lbs CO2 17,802.0
Fuel Oil 3,800.5 MMBtu 606,560 lbs CO2 275.1
Scope 2 Electricity 292,246,548 kWh 609,918,546 lbs CO2 276,657.2
979,790,270 lbs CO2 444,429.8
Table 3.3.2: Emission Factors Used for this Study
Coal 202.5 lbs CO2/MMBtu Calculated from FY' 09‐10 Coal Analysis
Natural Gas 117.8 lbs CO2/MMBtu Calculated from FY' 09‐10 Natural Gas
Sources
Fuel Oil 159.6 lbs CO2/MMBtu Cool Air‐Cool Planet, Campus Carbon
Calculator V6.6
Electricity 2.087 lbs CO2/kWh Duke Energy Carbon Calculator
Table No. 3.3.3: Comparison of Study with IU 2010 Carbon Inventory
Emissions Source
Integrated Energy Master Plan Study
IU 2010 Carbon Inventory
Scope 1 169,359.70 MT CO2 179,101 MT eCO2
Scope 2 267,904.20 MT CO2 190,367 MT eCO2
Scope 3 Not Included In Study 109,009 MT eCO2
Offsets Not Included In Study (3,747) MT eCO2
Total 437,263.90 MT CO2 474,730 MT eCO2

8760 Engineering
Integrated Energy Master Plan IU 20096161 Page 25
Campus Distributed Heating and Cooling Services
4 CAMPUS DISTRIBUTED HEATING AND COOLING SERVICES
4.1 High and Medium Pressure Steam
4.1.1 Located on East 11th Street between North Fee and North Walnut Grove is the Central Heating Plant (CHP)
– Building BL455, a facility housing the central high pressure steam boiler plant. Built in phases between 1955 and 1971, the building currently houses five boilers generating 150 psig steam for the IUB campus. Steam is distributed from the plant at both 150 psig and at 40 psig through four mains, designated as follows:
150 psig North Campus Main
40 psig West Campus Main
40 psig South Campus Main No. 1
40 psig South Campus Main No. 2
4.1.2 Pumped condensate mains return approximately 70% of the steam produced back to the plant. 40 psig steam is obtained through a 150 psig to 40 psig pressure reducing station or through a micro‐turbine operating between these two pressures and providing electricity for the plant. Peak steam flow from the plant is approximately 340,000 lbs/hr in the winter and the minimum summer flow is about 70,000 lbs/hr. The plant provides steam for heating and process use to 11,890,974 ft2 or about 71% of the total campus. The remaining 29% of the campus is served by other local boilers, heaters, or furnaces, generally serving the building in which they are housed and generally fueled with natural gas.
4.1.3 The boilers in the CHP are described in Table 4.1.1 that follows. The boilers vary in the fuels on which they can fire depending on the specific boiler. The CHP boilers were modified significantly in 2007‐2008 to reduce pollutants in its effluent gases in order to bring the plant in compliance with the Federal Clean Air Act Rules for Maximum Achievable Control Technology (MACT). The modification included:
The removal of two aging 1950’s coal boilers (Boiler No. 1 and No. 2),
The addition of a new, high efficiency natural gas boiler (Boiler No. 7),
The addition of bag houses to remove particulates from the flue gas of the three remaining coal boilers,

Integrated Energy Master Plan IU 20096161 Page 26
The installation of lime injection equipment for coal boilers No. 3, 4 and 6 to reduce sulfur dioxide and chlorine in the effluent gases, and
The installation of activated carbon injection equipment for coal boilers No. 3, 4, and 6 to reduce mercury emissions from the stack gases.
4.1.4 Review of Table 4.1.1 indicates that the firm capacity of the plant (the capacity remaining after the loss of
the largest increment of capacity) differs depending on the fuel source considered. If all fuels are considered (any boiler firing on any available fuel), the firm capacity of 460,000 lbs/hr is 35% or 120,000 lbs/hr in excess of the peak flow requirement. Operating on a single fuel only, coal firing does not have the capacity to meet the current peak load requirement either in terms of full capacity or in terms of firm capacity. At times of winter peak loads, coal must be supplemented with another fuel to meet the current campus peak steam needs.
Table 4.1.1: Existing CHP Boilers – Total and Firm Capacity
Output Capacity
Boiler Number
Manufacturer Installed Coal
(lbs/hr)
Natural Gas
(lbs/hr)
No. 2 Fuel Oil
(lbs/hr)
Maximum Capacity (lbs/hr)
3 Erie City Iron Works 1959 80,000 50,000 50,000 80,000
4 Erie City Iron Works 1959 80,000 60,000 60,000 80,000
5 Union Iron Works 1964 ‐ 150,000 150,000 150,000
6 Riley Stoker Corp. 1970 150,000 130,000 130,000 150,000
7 Nebraska Boiler 2007 ‐ 180,000 180,000 180,000
Total 640,000
Total Output Capacity
(lbs/hr) Firm Capacity (lbs/hr)
All Fuels 640,000 460,000
Coal 310,000 160,000
Natural Gas
570,000 390,000
Fuel Oil 570,000 390,000
Integrated Energy Master Plan IU 20096161 Page 27
4.1.5 Though the plant is quite flexible in terms of fuel to be utilized, economic pressures remain strong to fire on coal whenever possible. For FY 10‐11, the mix of fuels used to generate steam at the CHP was as follows:
Fuel Source
MMBtu of Fuel Consumed
Cost / MMBtu
Total Cost Percentage of Total
Coal
1,629,722.40
$2.62 $4,263,004
92.0%
Natural Gas
140,767.00
$6.49 $913,437
7.9%
Fuel Oil
1,255.80
$19.80
$20,930
0.1%
Total
1,771,745.20
$2.93 $5,197,371 100.00%
4.1.6 Based on the same time period, the average calculated combustion efficiency of the plant was
approximately 70% (actual calculations based on metered flows and enthalpies gives a likely range of efficiencies between 69.8% and 70.8%). Generally, the coal fired boilers are operating at lower than this efficiency while the new natural gas boiler no. 7 is firing at a considerably higher efficiency but on a more expensive fuel.
4.1.7 A more detailed look at the CHP, the steam distribution system, and the condensate return system with a focus on overall losses will be discussed in a later section.
4.2 The Cost of Steam Provided to Campus
4.2.1 The annual report for FY 10‐11, and previous years devotes a page to the cost of operation of the Central
Heating Plant and to the cost per pound of steam generated. A copy of that analysis for FY 10‐11 is included in the Appendix as Table A4.2.1. The conclusion of Table A4.2.1 is that the cost of operation of the Central Heating Plant in FY 10‐11 could be expressed as $7.59/thousand pounds of steam produced. As correct as this value is from an accounting standpoint, it overstates value in analyzing energy conservation measures on campus. For example, if an energy conservation measure in Wells Library saves a significant amount of steam in that building, the savings will be less than $7.59/thousand pounds of steam saved. The reason is that in any plant operation, there are fixed costs that are not dependent directly on how many pounds of steam are produced. For instance, Table A4.2.1 indicates that employee costs represent about 17% of the cost of the steam produced. But an energy conservation measure will not affect the employee cost. Therefore, the only valid approach should be to calculate the marginal cost of steam, the portion of the cost that is affected by the consumption of steam. Table 4.2.1 is an example of a calculation of the marginal cost of steam for the IUB campus during FY 10‐11. This table format is actually derived from a format used by Charles Matson of the IUB Engineering Services Department with a few slightly altered values.
4.2.2 The table (4.2.1) describes the value of the metered steam produced at the boilers. By this definition, the cost shown represents the marginal cost to produce steam based on only the variable cost parameters related to the generation of the steam. This definition still does not describe the fixed costs (losses) that exist in the system outside the boilers. Such losses would include supply and return piping distribution system losses, losses associated with unreturned condensate, as well as system “losses” in the form of

Integrated Energy Master Plan IU 20096161 Page 28
blowdown, radiation, deaerator venting, and feedwater heating. These losses are considered separately in sections that follow.

Integrated Energy Master Plan IU 20096161 Page 29
Table 4.2.1: Steam – Marginal Cost Analysis
Annual Cost Item Cost FY 10‐11
Marginal Marginal Cost (FY 10‐11)Cost (%)
Employee Compensation $ 1,629,804 0 $ ‐
Coal $ 4,263,004 100 $ 4,263,004
Electricity $ 334,764 100 $ 334,764
Water $ 112,136 100 $ 112,136
Sewer $ 140,517 100 $ 140,517
Natural Gas ‐ Local Distribution $ 261,264 97 $ 253,426
Natural Gas ‐ Gas & Transportation $ 652,174 97 $ 632,609
Fuel Oil $ 20,930 100 $ 20,930
Supplies, Chemicals, Other $ 500,786 49 $ 245,385
Ash Handling $ 141,655 100 $ 141,655
Maintenance & Repairs $ 1,597,596 6 $ 95,856
Coal Samples $ 6,613 100 $ 6,613
Totals $ 9,661,243 $ 6,246,895
Steam Produced (1,000 lb) 1,273,133 1,273,133
Steam Produced (MMBtu) 1,243,978 1,243,978
Unit Cost (per 1,000 lb) $ 7.59 $ 4.91
Unit Cost (per MMBtu) $ 7.77 $ 5.022
Notes: 1. Costs from FY 10‐11 Annual Report of the Physical Plant
2. Marginal Cost Estimate Assumptions a. Natural Gas reduced to 97% due to hot standby firing practice.
b. Consumables related to coal firing 49% of total
c. Bag replacements for coal firing 6% of total 3. Enthalpy150 psig steam ‐ Enthalpyfeedwater = 1,196.0 ‐ 218.9 = 977.1 Btu/lb steam

Integrated Energy Master Plan IU 20096161 Page 30
4.3 Chilled Water Systems 4.3.1 Located on East 13th Street between North Woodlawn Avenue and North Forrest Avenue is the central
chilled water plant (CCWP) – Building BL411. Built in 1970, the plant houses eight electric centrifugal chillers with a total capacity of 14,596 tons and serves approximately 7,761,451 ft2 or 46% of the campus including most major campus buildings. Tables A4.3.1 and A4.3.2 in the Appendix indicate the chiller sizes, ages, and refrigerant utilized along with the capacity of support equipment including all associated cooling towers, chilled water pumps, and condenser water pumps. The CCWP Chilled Water System would be generally classified as a primary/secondary/tertiary pumped variable flow chilled water system with the tertiary pumping scheme having been modified from the original and usual design approach. A second variable flow chiller plant at the Forest Quad includes two additional 500 ton chillers and support equipment with room for a third machine of similar size. This system is hydraulically interconnected with the CCWP to function as a base load plant serving the Forest Quad with the ability to also provide chilled water capacity to the campus system. In addition, a 275 ton chiller at Swain West, a 150 ton chiller at Lily Library, and a 100 ton heat pump chiller at the Lee Norvel Theater and Drama Center are connected to the CCWP chilled water loop but can only serve cooling for the building in which they are located. Their use during peak summertime periods does serve to unload the CCWP. The CCWP has the following overall performance and plant efficiency.
Central Cooling Plant Equipment
Full Load Power (kW)Full Load kW/ton
Electric Chillers 9,368 0.64 Cooling Auxiliary's
Chilled Water Pumps 1,056 0.07 Condenser Pumps 1,008 0.07 Cooling Tower Fans 626 0.04
Total Cooling Auxiliaries 2,690 0.18
Totals for Plant 12,058 0.83
4.3.2 The central chiller plant, the Forest chiller plant, and the Briscoe chiller plant currently act as the three nodes of the existing CCWP. Additional detail on the campus chilled water systems and the correct modifications in design are described in Section 9.3.
4.3.3 From the standpoint of overall campus chilled water system design, the chilled water production (chiller) plants are rated and pumped on the basis of a 55°F return chilled water temperature from the buildings and a 40°F supply chilled water temperature delivered to the buildings, resulting in a 15°F Δt between supply and return. The campus cooling coils have been designed over the years for a variety of different supply and return water temperatures with the median temperatures of the major buildings being 43°F supply water and 55°F return water. The lower chilled water supply temperature from the plants should improve the overall log mean temperature difference (LMTD) between the chilled water system and the campus air systems, likely promoting higher return water temperature and improved variable flow performance.
4.3.4 The CCWP and the associated distributed chiller plants currently have insufficient installed capacity to provide firm cooling capacity for the IUB campus buildings it serves. This assertion was realized during 24 days during the summer of 2010 that campus chilled water curtailment was necessary for all or part of the

Integrated Energy Master Plan IU 20096161 Page 31
operating day. A similar experience occurred during the summer of 2011 when a curtailment was required during 12 days. Modifications currently in design to increase campus chilled water capacity are discussed in Section 9.3.
4.4 Cost of Chilled Water Provided by the CCWP 4.4.1 The Physical Plant operating staff prepares an annual summary of the cost of operation of the central
chilled water plant (CCWP) and the other chiller plants serving as sources for the loop (Forest Plant and Briscoe Plant). A copy of that analysis for FY 10‐11 is included in the Appendix as Table A4.4.1. The conclusion of this table is that the cost of chilled water (cooling energy) generated by the CCWP for FY 10‐11 was $0.0568/ton‐hour delivered. Unlike the similar data described earlier for the Central Heating Plant, these values should yield a true marginal cost for chilled water that would directly apply for energy conservation measures. Thus for the CCWP for FY 10‐11:
Total Cooling Produced 54,773,346 ton‐hours Total Cost of Cooling Provided $ 3,109,808 Average Cost of Cooling Produced $ 0.0568/ton‐hour
4.4.2 However, as the performance of the central chilled water plant (CCWP) and the Forest plant were reviewed and compared to other similar plants, another issue became evident. By dividing the electrical consumption utilized in kilowatt‐hours by the metered ton hours produced by the plants, the result is the average kW/ton for the plant during the period documented. The results of this calculation for the central plant and the Forest plant for FY 09‐10 are: Central Chilled Water Plant 0.69 kW/ton Forest Chilled Water Plant 0.66 kW/ton
4.4.3 Typically we would expect these kW/ton figures to be higher. The operation shown here would be
extremely efficient but difficult to achieve with the equipment installed. For the central chilled water plant, the chillers alone at full load require an average of 0.64 kW/ton. The chiller pumps, system chilled water pumps, condenser water pumps, and cooling tower fans together represent an additional 0.19 kW/ton at full load for a total plant performance at full load of 0.83 kW/ton. Chiller kW per ton does drop off somewhat at intermediate loads and many of the auxiliaries are equipped with variable speed drives that also unload at reduced loads. Our first inclination is that the chilled water metering performed at the cooling plant is erroneous, however, analysis of building metered data and the results of the campus energy analysis suggest that the metering is valid. This result, although not expected, may occur because the plant is too small to serve the attached load, which forces the facility chillers to operate for more hours at a high efficiency load point.

8760 Engineering
Integrated Energy Master Plan IU 20096161 Page 32
Character of Site Energy Consumption and Cost
5 CHARACTER OF SITE ENERGY CONSUMPTION AND COST
5.1 Overview
5.1.1 In an effort to understand the energy use patterns for a campus like IUB, it is often useful to normalize the
metered energy consumption for such a complex facility into uniform graphic representations that can be deconstructed to identify the various components of the total energy use. If such graphs are uniformly presented, the character of use of the energy consumed often yields clues to energy conservation opportunities that should be explored. Our tool for this analysis is to graph the average daily use of each energy form on a monthly basis. For each month, the metered energy consumption is divided by the days in the billing period to arrive at the average daily use of energy for the facility. This variable is graphed on the ordinate of the graph with the month indicated on the abscissa. Several distinct subdivisions of energy use are described and analyzed in the paragraphs that follow. (Note that the use and cost of propane as an energy source has not been included as explained earlier.)
5.1.2 It is also helpful to characterize the total cost of energy for the IUB campus so the contribution of each can be understood in with respect to other energy types. For the fiscal of FY 10‐11, energy costs for the portion of campus included in this study were as follows:
Electricity $18,677,297 73.1%
Coal $4,263,004 16.7%
Natural Gas $2,542,489 9.9%
Fuel Oil $75,282 0.3%
Total $25,558,072 100%

Integrated Energy Master Plan IU 20096161 Page 33
5.1.3 In addition, the average cost of each energy source per unit of consumption for FY 10‐11 (for large quantity purchases) was as follows:
Electricity $ 0.0639/kWh (or $18.72/MMBtu for heating use) Coal $2.62/MMBtu
Natural Gas $6.49/MMBtu (Based on current ratio of gas to coal burning)
Fuel Oil $19.81/MMBtu
5.2 Average Daily Use of Fuel 5.2.1 As described in earlier sections, the campus fuel use consists principally of coal, natural gas, and fuel oil.
Of the total use of fuel on the campus, approximately 90% of that fuel is consumed at the Central Heating Plant to produce steam for use in approximately 71% of the total campus building area (with coal representing 83% of the total campus fuel consumption). Figure 5.2.1 indicates the average fuel use by month in FY 09‐10 for the Central Heating Plant alone.
Figure 5.2.1: Central Heating Plant Average Fuel Use
5.2.2 The average daily use graph for fuel in FY 09‐10 shows the characteristic shape for a fuel‐fired heating system with increased consumption during both “wings” of the winter heating season. The most salient feature of this graph however, is the base use that occurs irrespective of the weather. That base of approximately 3,000 MMBtu/day of fuel, or 60% of the energy annually used to produce steam, has nothing to do with the outside temperature. In terms of cost, about $2.7M or 11% of the overall facilities energy budget occurs due to this base fuel consumption (as compared to the $1.8M of fuel that is truly associated with space heating). This should be a clear target of fuel energy reduction efforts on campus over the coming years. This report will focus in later sections on methods of reducing this base use component.

Integrated Energy Master Plan IU 20096161 Page 34
5.2.3 Figure No. 5.2.2 indicates the same central plant fuel consumption for the identical period but also
includes the natural gas and fuel oil used in buildings that are not connected to the campus steam distribution system emanating from the Central Heating Plant. Notice that, although this additional fuel consumption serves about 29% of the campus area, the fuel use per square foot of building area is lower and the summertime base use is significantly smaller for these areas. These observations relate to the type of buildings served in this group and also to the lack of energy distribution losses in this portion of campus (principally served by natural gas fired equipment on a building‐by‐building or small building group basis). Figure 5.2.3 graphs the non‐CHP fuel use separately indicating the much lower base consumption of 34% versus 60% for the CHP fuel use.
Figure 5.2.2: Campus Average Fuel Use

Integrated Energy Master Plan IU 20096161 Page 35
Figure 5.2.3: Non‐CHP Fuel Use
5.3 Average Daily Use of Chilled Water 5.3.1 Chilled water use as discussed in this section will be limited to that occurring at the Central Chilled Water
Plant. As discussed earlier, this plant and the associated chiller plant at Forest provide chilled water to approximately 47% of the total campus building areas. (The remainder of the campus is cooled by chilled water produced by numerous remote chillers, direct expansion cooling systems, or remains unconditioned during the summer.) This data does not include the Briscoe Chiller Plant that came on line during the summer of 2011. Figure No. 5.3.1 indicates the average daily use of chilled water from the central chilled water system for fiscal year FY 09‐10.
0
200
400
600
800
1,000
1,200
Jan Feb Mar Apr May Jun Jul Aug Sep Oct Nov Dec
Average Daily Non‐CHP Fuel Use (MMBtu/day)
Average Daily Non‐CHP FuelUse (MMBtu/day)
Base Use = 34% of Total

Integrated Energy Master Plan IU 20096161 Page 36
Figure 5.3.1: Average Daily Chilled Water Use
5.3.2 The average daily use curve shows the expected increase in use during the summer months. Since cooling in the system is produced entirely by electrical driven chillers, average daily electrical energy use for this system would have a curve very similar in shape to the average daily ton‐hour use.
5.3.3 Of interest again on this graphic is the base use; those ton‐hours that are independent of outside weather conditions. In this case, the base load represents approximately 27% of the overall annual consumption of electricity for the central plant. Again, this base load should be the target of energy conservation efforts to identify these base load uses and eliminate them if possible. Examples of such use are chilled water use for condensing water for coolers or lab equipment, chilled water use for interior area fan coil systems, or chilled water use for economizer fan systems whose economizer control systems are not functioning.
5.4 Average Daily Use of Electricity
5.4.1 Electricity as discussed in this section relates to campus electricity provided from the master meters on the
high voltage sub‐stations. As described in an earlier section, this represents the consumption for over 87% of the IUB campus. The average daily consumption of electricity for FY 09‐10 for the master campus high‐voltage meters is shown in Figure No. 5.4.1.

Integrated Energy Master Plan IU 20096161 Page 37
Figure 5.4.1: Average Daily Electric Use
5.4.2 The graph again divides the total consumption into the base and variable components. Obviously, the increase in electrical use during the summertime is the characteristic shape for facilities with electric driven cooling systems. However, looking back at Figure 5.3.1 would indicate that some cooling energy is also in the base electrical load because of the base cooling load needs. Not surprisingly, 81% of the facility electrical energy use is in the base while only 19% is in the variable or weather related portion of the total. Electrical base usage includes energy activities that occur on a regular basis such as lighting, air handling, plug loads, etc. Savings in these areas often target conversion of lighting systems to lower energy luminaires, reducing hours of operation of lights and fan systems, or converting constant volume air moving and pumping systems to variable flow, reducing electrical energy required at part load times. Each of these types of modifications also affect the amount of cooling or heating energy required in the spaces and thus their effects are much more complex than say an increase in the efficiency of a chiller. Often in the case of lighting retrofits, reducing the lighting load and therefore the heat contributed to the space, the summer cooling load for the space may decrease while the winter heating required may actually increase.
5.4.3 Subsequent calculations will further define the character of the energy use and determine the interrelated effects of these energy reduction modifications on the campus overall energy use.
5.5 Average Utility Costs Utilized in Energy Calculations
5.5.1 In an effort to utilize the most current energy costs available for evaluation of the energy conservation
measures (ECM’s) and energy reduction initiatives that follow in this report, annual utility costs for FY 10/11 were obtained. Based on the parameters set forth earlier in the report, and unless stated

Integrated Energy Master Plan IU 20096161 Page 38
otherwise, the following average costs of fuel, energy, and water have been used in the ECM calculations that follow.
Electricity $0.0639/kWh Natural Gas (CHP Only) $6.49/MMBtu Campus Natural Gas $8.47/MMBtu Coal (CHP Only) $2.62/MMBtu Fuel Oil $19.80/MMBtu Water $0.00178/gal Sewer $0.00419/gal Chilled Water (CCWP Only) $0.0568/ton‐hour (marginal cost) Steam (CHP Only) $5.022/MMBtu (marginal cost)
5.5.2 Table A5.5.1 in Appendix A describes the FY 10/11 costs that were used to establish these average costs. Natural gas costs considered for fuel switching and cogeneration options were calculated based on the current Vectren and Energy USA rates.

8760 Engineering
Integrated Energy Master Plan IU 20096161 Page 39
Demand Side Analysis
ANALYSIS OF BUILDING AND SITE ENERGY USE 6 DEMAND SIDE ANALYSIS
6.1 Techniques of Analysis, Overview 6.1.1 Central to analyzing the Bloomington campus was developing a fundamental understanding of the campus
buildings and how they work. As noted earlier in this report, a total of 104 buildings comprising 82% of the campus gross square footage were included in this analysis. To best understand how the buildings work, a simplified energy model was constructed that enabled simulating building performance utilizing fundamental building data. The building simulation was constructed from survey data, rather than a detailed field investigation or drawing review that is typical of an investment grade energy study. The goals and scope of the Integrated Energy Master Plan dictated a high level approach to the energy modeling effort rather than a detailed study.
6.1.2 This simulation included a number of variables including building skin construction, occupancy, lighting and equipment usage patterns, heating, ventilating and air conditioning system types and source of heating and cooling energy. All of this data was collected in a database and utilized as an input to the energy simulation program. This program constructs an hourly prediction of energy consumption for a typical weather year for each building that is analyzed. From this data, we are able to determine peak heating and cooling demand as well as predict energy usage. Furthermore, utilizing metered utility data for each building (when available), the energy model is validated.
6.1.3 Building Survey for Energy Model: The building energy model accounts for a number of building variables
including:
General building data such a floor area, building type and occupancy
Building exterior skin construction
Lighting
Heating Ventilation and Air Conditioning Systems Collecting this data involved verbal surveys with key Indiana University staff, field inspections and some review of original building construction drawings. A description of this data collection is included below.

Integrated Energy Master Plan IU 20096161 Page 40
6.1.3.1 General Building Data
Building Gross Square Footage: In general, building floor areas were provided by the Indiana University Space Information Department. In the instance of Memorial Stadium, the building square footage was split between the North End Zone, West Stands and East Stands.
Conditioned Gross Square Footage: For buildings that included floor area that was lighted, but not heated or cooled (such as parking garages), a manual calculation was performed to determine the actual amount of floor area that is heated or cooled. This value is used to calculate HVAC heating and cooling loads.
Building Type: Based on the known usage, each building was split into one of the following use categories: Parking, Single Family, Academic, Laboratory, Theatre/Assembly, Library, Student Life, Office, Museum, Sports / Recreation, Facilities / Service, Dormitory, Data Center, Warehouse, etc. The selection of building type is used to set equipment load densities, equipment load schedules, occupancy schedules, lighting schedules and domestic hot water consumption. For instance, the estimated average peak equipment load density for an academic building is 0.5 Watts / SF versus 2.75 Watt / SF for a laboratory building.
Building Occupancy: Building occupancy is estimated utilizing historical data and data from the Indiana University Residential Programs and Services Department.
6.1.3.2 Building Exterior Skin
Wall, Roof and Window Areas: Estimating the area of building surfaces is necessary for modeling the energy performance of a building. For this study, eight buildings on the IUB campus were analyzed to determine wall, roof and window surface areas. This building data was analyzed to determine ratios for interior floor area versus overall floor area, exterior wall area versus overall floor area, roof area versus overall floor area and window area versus exterior wall area. With this data, the eight buildings were split into three categories of exterior exposure; low, average and high exposure. The ratios displayed in Table 6.1.1.2: Building Skin Model display the values used in analyzing the campus buildings. Using these ratios, wall, roof and window areas are calculated for the energy model. Furthermore, these surface areas are utilized as the basis for the cost estimate for associated energy conservation measures.
Table 6.1.3.2: Building Skin Model
Exterior Exposure Category
Percent Interior SF /
GSF Wall SF / GSF Roof SF / GSF
Window SF / Wall SF
Low 73% 33% 33% 17.9% Average 57% 40% 28% 17.9% High 33% 49% 21% 17.9%
Wall Insulation: Many of the campus buildings were built before the existence of modern energy codes and do not include any significant insulation system. For the energy simulation,

Integrated Energy Master Plan IU 20096161 Page 41
walls are considered to be “insulated” or “non‐insulated”. By surveying the architectural drawings of the buildings in the study, a database was developed to place the buildings in the study into one of the two categories for insulation. Of the 104 Buildings, 67 buildings do not include insulation in the exterior skin of the building. Table A6.1.1 in Appendix A includes a list of buildings that do not have insulation in the exterior skin of the building.
Window Type: Similar to Wall Insulation, many of the older buildings on campus have single pane windows. Buildings constructed today in general have double pane and in some cases, triple pane windows. Furthermore, these windows commonly include a coating or tinting to reduce solar heat gain into the building. For the energy simulation, windows are considered to be “single pane” or “double pane” where single pane windows are clear glass, and double pane windows comply with ASHRAE Standard 90.1. Through a survey conducted in conversation with IUB Facilities Department, a database was assembled to place each building in one of the two categories. At the time of that survey, 47 of the 104 buildings had “single pane” windows. Table A6.1.2 in Appendix A includes a list of buildings that have “single pane” windows.
6.1.3.3 Lighting: As part of the Integrated Energy Master Plan, student interns were employed to
perform a lighting survey of the 104 buildings included in the detailed study. As part of this survey, the students surveyed 5 to 10 rooms per floor of each building. In each room, the following data was collected:
room floor area
number and type of lamps
tested if fluorescent ballasts were electronic or magnetic
observed if lighting controls were utilized Following the survey, this data was compiled and an average building power density (Watts / SF) was calculated and entered into the building database.
6.1.3.4 Heating, Ventilating and Air Conditioning (HVAC) System Data: Through a survey and review of
building automation graphics with Indiana University Facilities Department, an HVAC survey was conducted for the 104 buildings. This survey focused on determining the following characteristics of the systems serving the buildings:
HVAC system types
Are air‐side economizers utilized?
Estimated ventilation air quantity
Heating, Cooling and Humidification Energy Sources (electric, natural gas, chilled water, steam, etc)
Building cooling plant description and capacities
Building heating plant description and capacities
Fan modulation types (variable speed drives)
Estimated building supply airflow (per GSF)
HVAC operating schedule
Humidification setpoints
Type of building automation
While some buildings utilized consistent system types throughout, there were a number of buildings that have HVAC systems that exhibit significantly different behaviors (constant volume

Integrated Energy Master Plan IU 20096161 Page 42
systems versus variable volume systems for instance). To simulate these buildings, parameters are set to approximate the average building performance.
6.1.4 Building Metering Data: As part of the Integrated Energy Master Plan process, utility data for electricity,
natural gas, chilled water, steam and coal was collected. This data was entered into the building database to enable retrieving data on a building by building and month by month basis. Where metered data was obviously incorrect or erroneous, the data was removed from the database. Metered data was collected from variety of different sources including the following:
6.1.4.1 Electric Metering: Electric metering data is collected from two sources: Duke Energy bills and Indiana University metering data (for buildings on the IU central electric distribution system). In general, this data appears to be valid. However, our comparisons with the energy model did show abnormalities in the electrical metering of a few buildings. These abnormalities appeared to be the scaling factors were incorrectly applied to the meter output or that meters were not installed on all branches downstream of the main service entrance.
6.1.4.2 Gas Metering: Gas metering data was entirely collected from monthly bills from Vectren (the local natural gas distributor).
6.1.4.3 Steam Metering: Part of the campus metering initiative includes placing positive displacement
water meters on the building condensate return piping. These meters are located in various configurations in the buildings, sometimes upstream of condensate return pumps and at times downstream of these pumps. The meters are read on a monthly basis. In general, this system appears to produce reliable results. However, there were a few abnormalities noted during the comparison with the energy model including:
There are instances when condensate is dumped to the building drain rather than pumped back to the central plant. This occurs when the pump has failed, the condensate return system downstream of the building has failed or the meter has locked up. In general, monthly readings of 0.0 condensate flow were not considered for the validation of the energy model.
There are instances where metered data appears to include more than one building. These instances are being investigated by IU.
6.1.4.4 Chilled Water Metering: Metering of chilled water is accomplished via the flow meters and
temperatures sensors that are wired into the building automation system (Siemens and Johnson Controls). Building chilled water flow meters are high quality ultrasonic flow meters. The building automation systems record chilled water flow, chilled water supply temperature and chilled water return temperature. Simple math is used to calculate chilled water load from these values. There were several abnormalities related to this data:
There are periods of time during which no data is collected. The data collection for this system is less evolved than the other metering systems.
There are a number of buildings for which the data collected is obviously erroneous.
Demand data is collected. Ton‐Hour data is not collected or stored and must be manually calculated using the demand data.
Although demand data is collected, it is virtually impossible to use this data to verify building peak chilled water demand. From review of the data, it appears that peak demands are generally set when a building is taken off of the summertime chilled water curtailment.

Integrated Energy Master Plan IU 20096161 Page 43
6.1.5 Utility Costs: The unit costs for electricity, steam, chilled water, natural gas, coal and domestic water are
based on marginal costs of these utilities during the IU fiscal year that started in July 2010 and ended in June 2011. This data is discussed in detail in paragraph 5 of this report.
6.1.6 Building Energy Model: Following collection of the building data, a computerized energy simulation was performed. For these models, the building floor area is split into an interior zone and exterior zone. All the data collected above in the building database is input into the energy model. Next, a simulation is performed for the interior and exterior zone for every hour of a typical meteorological weather year (8760 hours). Energy demands and usages in terms of electricity, natural gas, steam, chilled water, heating water, domestic cold water and sewer are calculated and stored for totalizing of building, campus and central plant energy demands and usages. Additionally, a degree day fit is performed for the simulation data. This data is plotted on the same graph as actual metered data. This process is used to validate the energy model. If the degree day fit from the energy simulation is similar to the degree day fit of the actual metered data, the energy model is assumed to be valid. Attached below (Figure 6.1.4: Wells Library Chilled Water Simulation Results) is a copy of a graph from the simulation program. In this example, the blue dots represent measured chilled water usage in 2010 and 2011. The red dashed line represents a heating and cooling degree day fit of the data. The green (non‐dashed) line represents energy consumption predicted by the energy simulation when corrected for the weather experienced during 2010 and 2011. In this instance, the energy model is slightly under‐predicting chilled water consumption, but overall exhibits excellent correlation between the energy model and the actual consumption.
Figure 6.1.4: Wells Library Chilled Water Simulation Results
In the instance where the metered data and model do not exhibit correlation, the energy model parameters are adjusted in an attempt to obtain correlation. In the instances when there is valid energy metering data, the final energy model predicted consumptions are adjusted (up or down) such that annual energy consumption predicted by the model equals the metered data. This adjustment is also applied to the energy conservation measure items described later in this report.
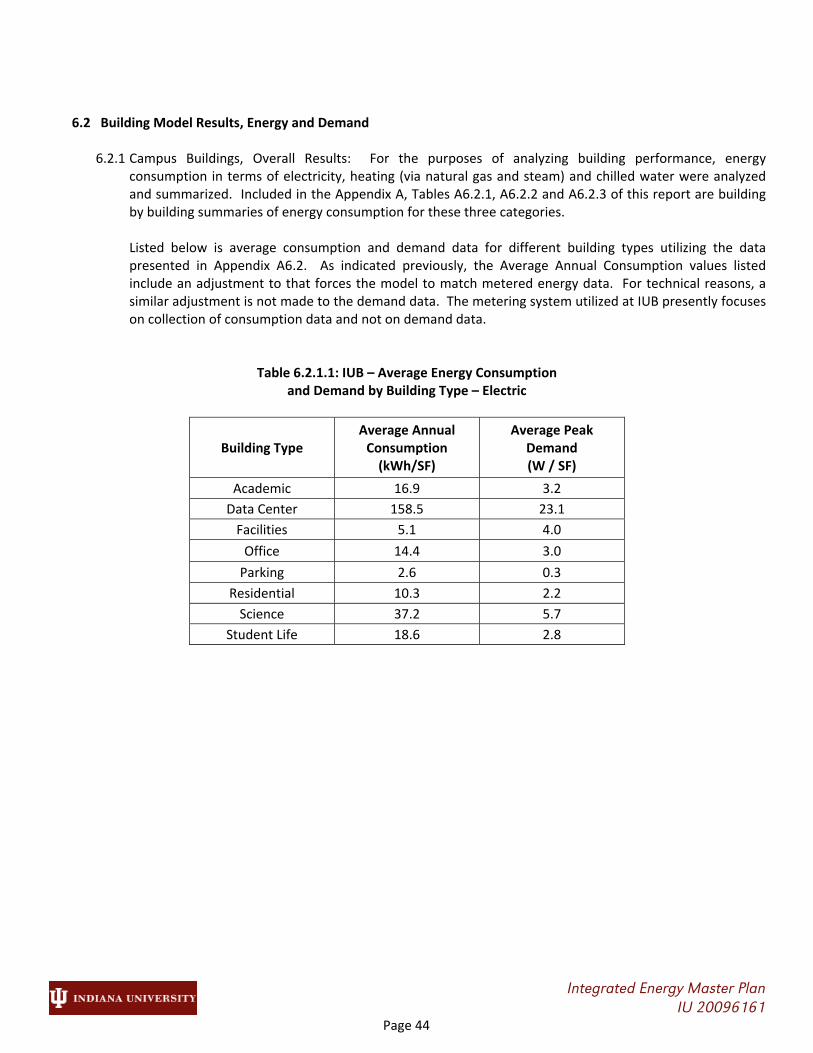
Integrated Energy Master Plan IU 20096161 Page 44
6.2 Building Model Results, Energy and Demand
6.2.1 Campus Buildings, Overall Results: For the purposes of analyzing building performance, energy
consumption in terms of electricity, heating (via natural gas and steam) and chilled water were analyzed and summarized. Included in the Appendix A, Tables A6.2.1, A6.2.2 and A6.2.3 of this report are building by building summaries of energy consumption for these three categories.
Listed below is average consumption and demand data for different building types utilizing the data presented in Appendix A6.2. As indicated previously, the Average Annual Consumption values listed include an adjustment to that forces the model to match metered energy data. For technical reasons, a similar adjustment is not made to the demand data. The metering system utilized at IUB presently focuses on collection of consumption data and not on demand data.
Table 6.2.1.1: IUB – Average Energy Consumption and Demand by Building Type – Electric
Building Type Average Annual Consumption (kWh/SF)
Average Peak Demand (W / SF)
Academic 16.9 3.2
Data Center 158.5 23.1
Facilities 5.1 4.0
Office 14.4 3.0
Parking 2.6 0.3
Residential 10.3 2.2
Science 37.2 5.7
Student Life 18.6 2.8

Integrated Energy Master Plan IU 20096161 Page 45
Table 6.2.1.2: IUB – Average Energy Consumption and Demand by Building Type – Gas and Steam
Building Type Average Annual Consumption (MMBtu/SF)
Average Peak Demand (Btuh/SF)
Academic 81 27
Data Center 47 17
Facilities 20 8
Office 69 23
Residential 58 24
Science 111 49
Student Life 89 23
Table 6.2.1.3: IUB – Average Energy Consumption and Demand by Building Type – Chilled Water
Building Type Average Annual Consumption (Ton‐Hours/SF)
Average Peak Demand (SF / Ton)
Academic 4.9 447
Office 4.1 454
Residential 2.3 609
Science 12.6 155
Student Life 2.8 417
Note: Averages only includes buildings on central cooling plant
6.2.1.1 Observations from Tables in 6.2.1: Listed below are a few general observations from this data:
The Data Center exhibits significantly electrical energy consumption (per unit floor area) than all other types of buildings. This result is certainly related to the electrical energy consumption of the computer equipment at the facility.
Science Buildings exhibit twice the energy consumption and demand (per unit floor area) of other buildings. This result is related to the significantly higher requirements for ventilation, greater intensity of equipment electrical usage and reliance on HVAC systems that utilize reheat energy to control space temperature. Furthermore, the HVAC systems and equipment serving Science Buildings generally cannot be scheduled off during unoccupied hours.
Residential Buildings exhibit reduced chilled water consumption when compared to other building types. For IUB, this result is not surprising in that a number of the larger residence halls are not fully air conditioned.
Integrated Energy Master Plan IU 20096161 Page 46
6.2.2 Building Benchmarking: One goal of the Integrated Energy Master Plan is to benchmark the performance of the buildings. The source of benchmark data for IUB is data collected by US Energy Information Administration Commercial Buildings Energy Consumption Survey (CBECS). This survey is performed on a regular basis (usually every four years), but was last released in 2003. This data is also used as the basis for benchmarking in the Energy Star program that is administered by the US Department of Energy and US Environmental Protection Agency.
Included in the CBECS database is energy consumption data for a range of building types including many of the types of buildings on the IUB campus including: Education (college or university), Lodging (dormitory, fraternity, or sorority), Office, Laboratory, etc. The CBECS data provides three ways to evaluate building performance against a national average. These methods are described below:
6.2.2.1 Energy Intensity Index (EUI): The first method involves calculating site energy use intensity (EUI).
The EUI is calculated by summing all energy consumption utilizing a common unit of kBtu/year/GSF. For electricity, kWh energy is converted to kBtu/year by multiplying kWh by 3.413 kBtu/kWh. For chilled water, the corresponding electrical usage must be calculated by converting ton‐hours of cooling to electrical energy (kWh) using the average conversion efficiency (for IUB, we used an average kW/Ton of 0.89). For each building type, a percentile score is assigned based on EUI. A score of 50% indicates that the building is average. A score above 50% indicates that the building uses more energy (has a higher EUI) than the average building.
6.2.2.2 Electricity Use Index: The second method of benchmarking involves calculating site electricity use index. The electricity use index is calculated similarly to the EUI except that fuel sources are not included and units of kWh/year/GSF are utilized. For the IUB, steam and natural gas consumption are not included in the calculation of this index. For each building type, a percentile score is assigned based on electricity use index. A score of 50% indicates that the building is average. A score above 50% indicates that the building uses more electricity (has a higher index) than the average building.
6.2.2.3 Cost Index: The third method of benchmarking involves calculating energy cost per GSF.
Because the energy rates present in Indiana are significantly different than the national average, this index was not used in benchmarking IUB.
6.2.2.4 CBECS Benchmarking Graphs: Included below are graphs detailing both EUI and Electricity Use
Index for IUB buildings by building type.

Integrated Energy Master Plan IU 20096161 Page 47
FIGURE 6.2.2.1: CBECS Benchmarking – Academic Buildings
FIGURE 6.2.2.2: CBECS Benchmarking – Office Buildings
0%
10%
20%
30%
40%
50%
60%
70%
80%
90%
100%
Ernie Pyle Hall
Lindley Hall
Music Addition
Art M
useum
SPEA
ALF‐Ruth Lilly…
Lee Norvelle…
Swain W
est
Wen
dell W
. Wright
Psychology
Merrill Hall
Business School
Wells Library
Geo
logical Sciences
Optometry School
Studen
t Building
Musical A
rts Cen
ter
Fine Arts
Goodbody Hall
Law
Wylie Hall
Radio‐TV
Simon M
sc Lbr Rec
Auditorium
Godfrey…
Ballantine Hall
Sycamore Hall
IU Cinem
a
CBEC
S Score
Academic Buildings
CBECS Energy Utilization Index Score
CBECS Electrical Index Score
0%
10%
20%
30%
40%
50%
60%
70%
80%
90%
100%
Bryan
Hall
Woodburn Hall
DeV
ault Alumni
Cen
ter
Raw
les Hall
Innovation Cen
ter
Morrison Hall
Franklin Hall
Lilly Library
Swain East
Nelson RPS Admin.
Kirkw
ood Hall
Maxwell H
all
Owen
Hall
Poplars
Memorial Hall
Service Bldg
CBEC
S Score
Office Buildings
CBECS Energy Utilization Index Score
CBECS Electrical Index Score

Integrated Energy Master Plan IU 20096161 Page 48
FIGURE 6.2.2.3: CBECS Benchmarking – Science Buildings
FIGURE 6.2.2.4: CBECS Benchmarking – Residential Buildings
0%
10%
20%
30%
40%
50%
60%
70%
80%
90%
100%
Simon Hall
(Scien
ce)
Myers Hall
Chemistry
Jordan
Hall
Chemistry Addition
Multi Science 2
CBEC
S Score
Science Buildings
CBECS Electrical Index Score
CBECS Energy Utilization Index Score
0%
10%
20%
30%
40%
50%
60%
70%
80%
90%
100%
Willkie B
Forest Quad
Hickory Hall
Jenkinson Hall
Eigenmann Hall
Briscoe Quad
Wright Quad
Teter Quad
Cam
pus View…
Martin Hall
Mason Hall
Edmondson Hall
McN
utt North
Magee
Hall
Shea Hall
Read
Hall
Smith Hall
Harper Hall
McN
utt South
Tulip
Tree Apts
Cravens Hall
CBEC
S Score
Residential BuildingsCBECS Energy Utilization Index Score
CBECS Electrical Index Score

Integrated Energy Master Plan IU 20096161 Page 49
FIGURE 6.2.2.5: CBECS Benchmarking – Student Life Buildings
6.2.2.5 Observations from Figures in 6.2.2.4: Listed below are conclusions from review of CBECS Benchmarking Figures 6.2.3.1, 6.2.3.2, 6.2.3.3, 6.2.3.4 and 6.2.3.5.
The vast majority of the campus buildings included in this study use more energy and electricity than the average building in the CBECS database.
Because the CBECS averages are based on a study conducted in 2003, it is possible that a typical 2003 residence hall did not have cooling (where as most of IU residence halls have cooling). This change in residence halls may contribute to higher CBECS scores for this category.
The CBECS Electrical Index Score is generally lower than the CBECS Energy Utilization Index Score. This trend is likely because more buildings in the CBECS survey were heated by electric than gas or coal.
6.2.2.6 Cost Per Square Foot Analysis: Using both the average CBECS Energy Utilization Index and
Electricity Use Index and Indiana University energy costs, we are able to compare the cost of building energy consumption to a CBECS average building and to other building on the IUB Campus. The graphs presented below display this cost information:
0%
10%
20%
30%
40%
50%
60%
70%
80%
90%
100%
Gladstein
Fieldhouse
Cook Hall
Health Cen
ter
McN
utt Central
Recreational Sports
IN M
emorial Union
Gresham
Dining
Hall
Tennis Cen
ter
Assem
bly Hall
HPER
Building
Mellencamp
Pavilion
Wildermuth Center
Memorial Stadium
CBEC
S Score
Student Life Buildings
CBECS Energy Utilization Index Score
CBECS Electrical Index Score

Integrated Energy Master Plan IU 20096161 Page 50
FIGURE 6.2.2.6: Cost / GSF Benchmarking – Academic Buildings
FIGURE 6.2.2.7: Cost / GSF Benchmarking – Office Buildings
$0.00
$1.00
$2.00
$3.00
$4.00
$5.00
Ernie Pyle Hall
Lindley Hall
Music Addition
Art M
useum
SPEA
ALF‐Ruth Lilly…
Lee Norvelle…
Swain W
est
Wen
dell W
. Wright
Psychology
Merrill Hall
Business School
Wells Library
Geo
logical Sciences
Optometry School
Studen
t Building
Musical A
rts Cen
ter
Fine Arts
Goodbody Hall
Law
Wylie Hall
Radio‐TV
Simon M
sc Lbr Rec
Auditorium
Godfrey…
Ballantine Hall
Sycamore Hall
IU Cinem
a
Annual Cost / SF
Academic Buildings
Est. Cost / SF
CBECS EUI Average Cost/SF
$0.00
$1.00
$2.00
$3.00
$4.00
$5.00
Bryan
Hall
Woodburn Hall
DeV
ault Alumni
Cen
ter
Raw
les Hall
Innovation Cen
ter
Morrison Hall
Franklin Hall
Lilly Library
Swain East
Nelson RPS Admin.
Kirkw
ood Hall
Maxwell H
all
Owen
Hall
Poplars
Memorial Hall
Service Bldg
Annual Cost / SF
Office Buildings
Est. Cost / SF
CBECS EUI Average Cost/SF

Integrated Energy Master Plan IU 20096161 Page 51
FIGURE 6.2.2.8: Cost / GSF Benchmarking – Science Buildings
FIGURE 6.2.2.9: Cost / GSF Benchmarking – Residential Buildings
$0.00
$1.00
$2.00
$3.00
$4.00
$5.00
Simon Hall
(Scien
ce)
Myers Hall
Chemistry
Jordan
Hall
Chemistry Addition
Multi Science 2
Annual Cost / SF
Science Buildings
Est. Cost / SF
CBECS EUI Average Cost/SF
$0.00
$1.00
$2.00
$3.00
$4.00
$5.00
Willkie B
Forest Quad
Hickory Hall
Jenkinson Hall
Eigenmann Hall
Briscoe Quad
Wright Quad
Teter Quad
Cam
pus View…
Martin Hall
Mason Hall
Edmondson Hall
McN
utt North
Magee
Hall
Shea Hall
Read
Hall
Smith Hall
Harper Hall
McN
utt South
Tulip
Tree Apts
Cravens Hall
Annual Cost / SF
Residential Buildings
Est. Cost / SF
CBECS EUI Average Cost/SF
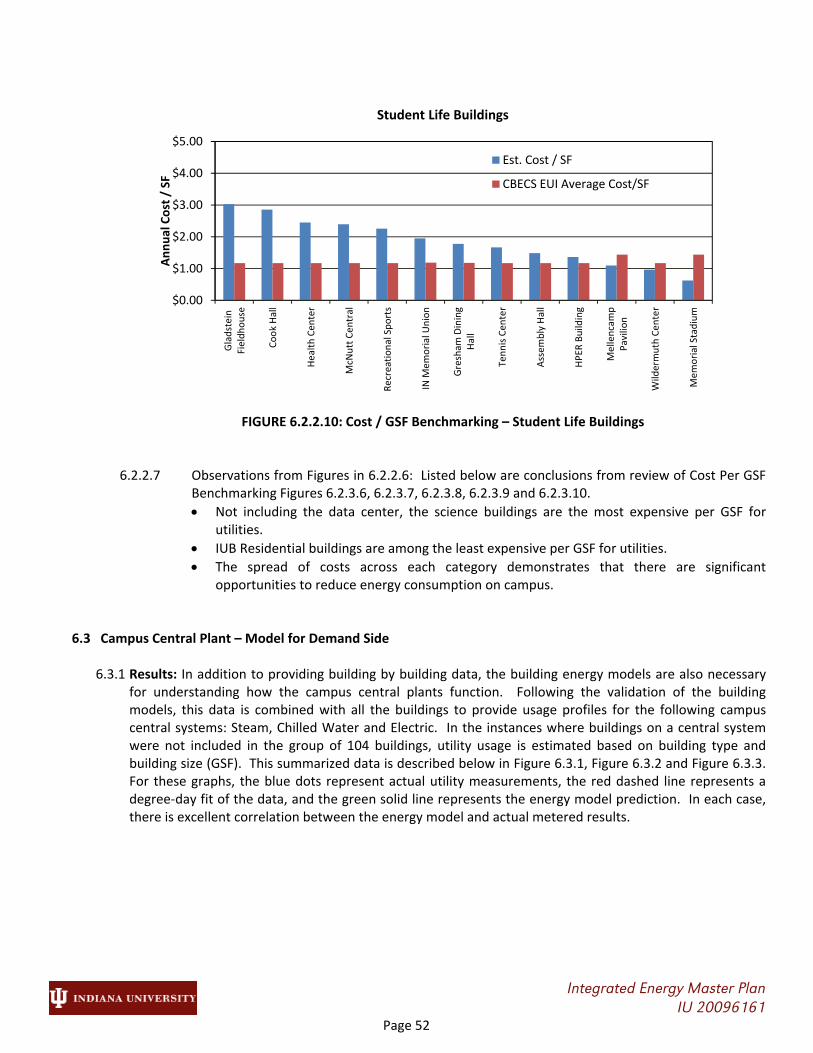
Integrated Energy Master Plan IU 20096161 Page 52
FIGURE 6.2.2.10: Cost / GSF Benchmarking – Student Life Buildings
6.2.2.7 Observations from Figures in 6.2.2.6: Listed below are conclusions from review of Cost Per GSF Benchmarking Figures 6.2.3.6, 6.2.3.7, 6.2.3.8, 6.2.3.9 and 6.2.3.10.
Not including the data center, the science buildings are the most expensive per GSF for utilities.
IUB Residential buildings are among the least expensive per GSF for utilities.
The spread of costs across each category demonstrates that there are significant opportunities to reduce energy consumption on campus.
6.3 Campus Central Plant – Model for Demand Side
6.3.1 Results: In addition to providing building by building data, the building energy models are also necessary for understanding how the campus central plants function. Following the validation of the building models, this data is combined with all the buildings to provide usage profiles for the following campus central systems: Steam, Chilled Water and Electric. In the instances where buildings on a central system were not included in the group of 104 buildings, utility usage is estimated based on building type and building size (GSF). This summarized data is described below in Figure 6.3.1, Figure 6.3.2 and Figure 6.3.3. For these graphs, the blue dots represent actual utility measurements, the red dashed line represents a degree‐day fit of the data, and the green solid line represents the energy model prediction. In each case, there is excellent correlation between the energy model and actual metered results.
$0.00
$1.00
$2.00
$3.00
$4.00
$5.00
Gladstein
Fieldhouse
Cook Hall
Health Cen
ter
McN
utt Central
Recreational Sports
IN M
emorial Union
Gresham
Dining
Hall
Tennis Cen
ter
Assem
bly Hall
HPER
Building
Mellencamp
Pavilion
Wildermuth Center
Memorial Stadium
Annual Cost / SF
Student Life Buildings
Est. Cost / SF
CBECS EUI Average Cost/SF

Integrated Energy Master Plan IU 20096161 Page 53
Figure 6.3.1: Demand Side Energy Model – Campus Steam
Figure 6.3.2: Demand Side Energy Model – Campus Chilled Water
0
1000
2000
3000
4000
5000
Jul‐09
Aug‐09
Sep‐09
Oct‐09
Nov‐09
Dec‐09
Jan‐10
Feb‐10
Mar‐10
Apr‐10
May‐10
Jun‐10
Consumption
STEAM Leaving Central Heating Plant(MMBtus / Day)
Actual
Actual DD Fit
Energy Model
0
50000
100000
150000
200000
250000
300000
350000
Jan‐10
Feb‐10
Mar‐10
Apr‐10
May‐10
Jun‐10
Jul‐10
Aug‐10
Sep‐10
Oct‐10
Nov‐10
Dec‐10
Jan‐11
Feb‐11
Mar‐11
Apr‐11
May‐11
Jun‐11
Consumption
CHILLED WATER (Ton‐Hours / Day)
Actual
Actual DD Fit
Energy Model

Integrated Energy Master Plan IU 20096161 Page 54
Figure 6.3.3: Demand Side Energy Model – Campus Electric
6.4 Building Utility Audit
6.4.1 Results: In addition to determining the overall energy consumption for each building on campus, the
energy model data also provides a glimpse of where energy is consumed within the buildings.
6.4.1.1 Energy Audit Graphs: Figure 6.4.1.1 displays an accounting of energy consumption by cost for the various types of buildings at IUB. Energy consumption is grouped in categories including domestic cold water, domestic hot water (including heat energy), fans, lighting, equipment and plug loads, preheat (heating for ventilation air up to 55°F), reheat (heat used to control space temperature), humidification and cooling. It is important to note that this figure does not portray losses within the building resulting from poorly functioning equipment or leaks, but rather the idealized results of the energy model. The difference between the energy model and actual building performance can be attributed to a number of variables which include items that are discussed in the Retro‐Commissioning Opportunities section of this report.
0100000200000300000400000500000600000700000800000900000
May‐09
Jun‐09
Jul‐09
Aug‐09
Sep‐09
Oct‐09
Nov‐09
Dec‐09
Jan‐10
Feb‐10
Mar‐10
Apr‐10
May‐10
Jun‐10
Jul‐10
Consumption
ELECTRIC (kWh / Day)
Actual
Actual DD Fit
Energy Model
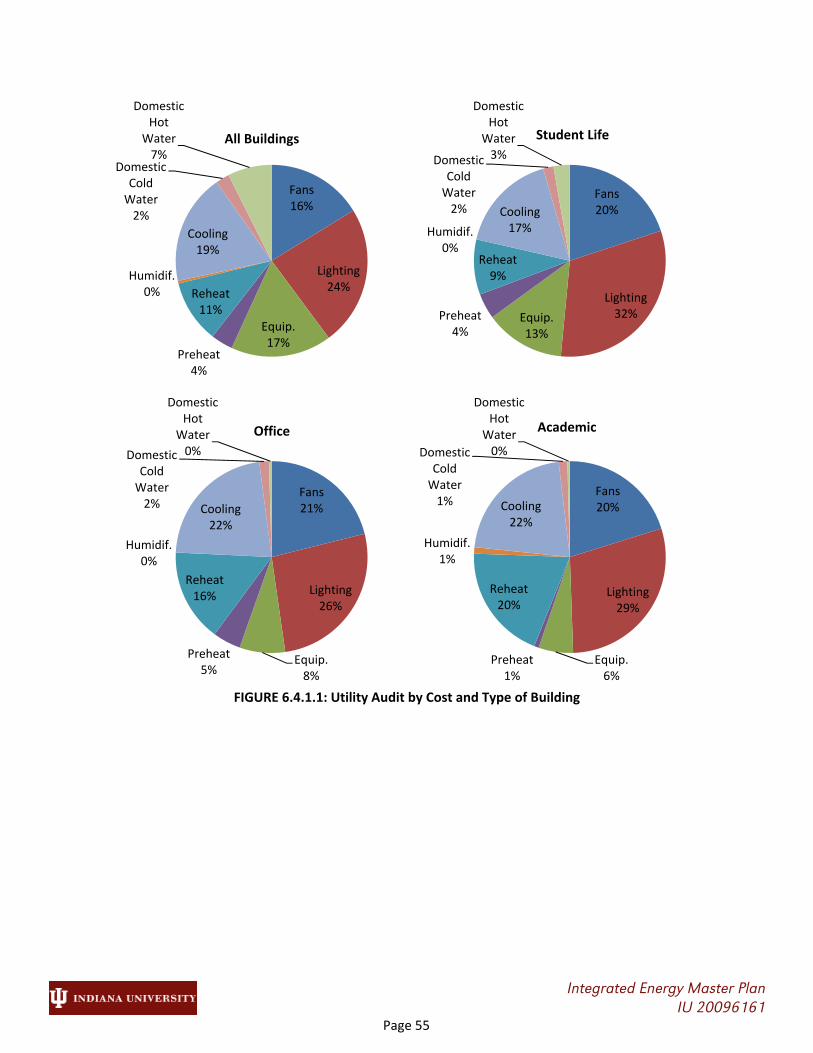
Integrated Energy Master Plan IU 20096161 Page 55
FIGURE 6.4.1.1: Utility Audit by Cost and Type of Building
Fans16%
Lighting24%
Equip.17%
Preheat4%
Reheat11%
Humidif.0%
Cooling19%
Domestic Cold Water2%
Domestic Hot
Water7%
All Buildings
Fans20%
Lighting32%Equip.
13%
Preheat4%
Reheat9%
Humidif.0%
Cooling17%
Domestic Cold Water2%
Domestic Hot
Water3%
Student Life
Fans21%
Lighting26%
Equip.8%
Preheat5%
Reheat16%
Humidif.0%
Cooling22%
Domestic Cold Water2%
Domestic Hot
Water0%
Office
Fans20%
Lighting29%
Equip.6%
Preheat1%
Reheat20%
Humidif.1%
Cooling22%
Domestic Cold Water1%
Domestic Hot
Water0%
Academic

Integrated Energy Master Plan IU 20096161 Page 56
FIGURE 6.4.1.1: Utility Audit by Cost and Type of Building (continued)
6.4.1.2 Observations from Figure in 6.4.1.1: Listed below are conclusions from review of Utility Audit
Figure 6.4.1.1.
Lighting dominates energy consumption cost on the campus. The energy model estimates that 24% of utility consumption on campus is for lighting.
Cooling is the second most significant energy cost on the campus. Electricity and domestic cold water usage (for the cooling tower) drive the cost of cooling to 19% of the campus utility consumption.
Heating energy generally doesn’t represent a large portion of the overall utility cost. For IUB, the marginal cost of producing heat with the Central Heating Plant is significantly less expensive than for facilities that are heated directly by natural gas or electricity. This comparison could be construed as being erroneous because we know that fixed losses (on
Fans15%
Lighting1%
Equip.60%
Preheat0%
Reheat2%
Humidif.0%
Cooling22%
Domestic Cold Water0%
Domestic Hot
Water0%
Data Center
Fans6%
Lighting18%
Equip.16%
Preheat9%
Reheat2%
Humidif.0%
Cooling15%
Domestic Cold Water6%
Domestic Hot
Water28%
Residential
Fans19%
Lighting14%
Equip.34%
Preheat2%
Reheat9%
Humidif.1%
Cooling20%
Domestic Cold Water1%
Domestic Hot
Water0%
Science
Lighting50%
Equip.50%
Parking

Integrated Energy Master Plan IU 20096161 Page 57
the heating system) that exist outside the buildings drive up the actual cost of heating buildings at IUB.
Nearly half of the cost of utilities purchased for campus is ultimately used for heating, cooling and ventilating the buildings.
Utility cost associated with domestic hot water usage is a significant for residence halls.
6.5 Building Retro‐Commissioning Opportunities 6.5.1 Definition of Retro‐Commissioning: In the facilities engineering and management communities, there are a
number of conflicting definitions of retro‐commissioning. The scope of this service can include everything from simple tweaks to equipment, energy studies and even major equipment replacement. For the purpose of this study, retro‐commissioning has the following definition:
Retro‐Commissioning: The service of adjusting, tweaking and repairing mechanical and electrical systems so that performance is returned to the as designed level.
A typical Retro‐Commissioning project would identify and repair items such as:
Control dampers / actuators failed
Control valves / actuators failed (valves leaking thru)
Control setpoints are set inappropriately
Steam traps failed open
Steam condensate pumps failed
Insulation is missing
6.5.2 Evaluating Opportunity for Retro‐Commissioning at IUB: For a traditional energy study, a basic assumption that is made is that the systems being modeled are fully functional. These studies rely a great deal on review of building drawings and review of building automation shop drawings and schedules of operation. For retro‐commissioning, an extensive field investigation phase must be conducted to find how systems have actually broken down. For this reason, it is difficult (with a high level of certainty) to identify the actual economic benefits of retro‐commissioning on a particular building without first conducting a detailed survey.
Because the Integrated Energy Master Plan scope of work did not include the exploratory services of retro‐commissioning, a more simplistic approach to evaluating the potential for savings was performed.
As noted in paragraph 6.1.4 Building Energy Model, the validation of the energy model included a step of applying an adjustment to the energy model result based on energy metering data. Based solely on our level of understanding of the buildings and confidence in the metering data, we believe that adjustments that increase the amount of energy consumed over the energy model prediction account for retro‐commissioning opportunities in the buildings. It is important to note that this method of analysis cannot be as accurate as a formal retro‐commissioning study. However, this analysis does provide a glimpse of the scale of savings that are attainable and does identify likely candidates for retro‐commissioning.
6.5.2.1 Retro‐Commissioning Evaluation Sample: In the analysis for retro‐commissioning, the
Recreational Sports building appears to be a candidate for retro‐commissioning. In this case, there appears to be an excessive consumption of steam. Figure 6.5.2.1 below is a copy of the

Integrated Energy Master Plan IU 20096161 Page 58
graph from the energy model. The solid green line represents predicted steam consumption by the energy model and the red dashed line represents a degree day fit of the steam metering data. When this was first observed, we contacted IUB Facilities and discussed the deviation. They had just recently identified that the building heat recovery chiller system was not functioning properly. This improper operation results in direct passage of steam heat through the building heating water system to the building cooling tower. The net result of this failure is that the building uses significantly more heat than a conventional building that does not have heat recovery chillers. For this building, the Integrated Energy Master Plan will claim $116,000 of annual energy savings by retro‐commissioning this building.
Figure 6.5.2.1: Recreational Sports Steam Consumption

8760 Engineering
Integrated Energy Master Plan IU 20096161 Page 59
Prioritize Building Energy Conservation Measures
7 PRIORITIZE BUILDING ENERGY CONSERVATION MEASURES (ECM’S)
7.1 Energy Economics
7.1.1 Overview: As part of energy conservation measure planning, a business case that weighs the value of
energy saved against the cost of implementing the ECM must be performed. For this study, a Payback Period is calculated to provide an indication of the number of years required to pay back the initial investment in the energy conservation measure. Rather than relying on a simple payback analysis, the analysis utilized on this project includes the time value of money. Additionally, for the parametric analysis in which combinations of ECM’s must be compared, a Marginal Payback Period must be calculated. This term provides economic comparison similar to Payback Period, but also allow for determining the relative benefit of each ECM in the recommended group of projects.
7.1.2 Payback Period: A typical measure of energy performance that has been used over time is simple payback period. This equation is a described below:
The simple payback period provides the number of years required to recoup the investment without taking into account the time value of money. This analysis is valid for short payback projects (less than 3 years), but can be inaccurate with longer payback periods because of inflation associated with the cost of energy as well as the internal rate of return of the institution performing the work. To correct for these variables, a present worth escalation factor is applied to the annual cost of energy. This factor is described below:

Integrated Energy Master Plan IU 20096161 Page 60
Given:
The present worth escalation factor (PWEF) is calculated below:
11 1
111
Using the PWEF defined above for each utility, Payback Period can be calculated by solving for “n” in the following equation:
Project Cost = Base Year Electric Cost * PWEFelec + Base Year Natural Gas Cost * PWEFgas + Base Year Steam Cost * PWEFsteam
+ Base Year Chilled Water Cost * PWEFchw + Base Year Coal Cost * PWEFcoal + Base Year Domestic Water Cost * PWEFwtr + Base Year Sewer Cost * PWEFsewer
‐ Annual Electric Cost After Project * PWEFelec ‐ Annual Natural Gas Cost After Project * PWEFgas ‐ Annual Steam Cost After Project * PWEFsteam
‐ Annual Chilled Water Cost After Project * PWEFchw ‐ Annual Coal Cost After Project * PWEFcoal ‐ Annual Domestic Water Cost After Project * PWEFwtr ‐ Annual Sewer Cost After Project * PWEFsewer
For the Integrated Energy Master Plan, the economic parameters utilized match those that are being used for Indiana University Qualified Energy Savings Projects. These values are listed below:
4.75%
5.5%
5.5%
6%
4.5%
5.5%
9.8%

Integrated Energy Master Plan IU 20096161 Page 61
10%
7.1.3 Marginal Payback Period: When multiple ECM’s are combined into a single project, the economic analysis used in this report lists a marginal payback period (years). The marginal payback calculation is identical to the Payback Period calculation except that the Project and Energy Costs are compared to another project on the same building. Similar to Payback Period, the PWEF is calculated in exactly the same manner. The equations for calculating the Marginal Payback Period are described below: Given:
. 1 $
. 1 . 2 $
. 1 $
. 1 . 2 $
. 2 . 1
Marginal Payback Period1‐2 is calculated by solving the equation below for “n” where “n” equals the Marginal Payback Period.
I1+2 ‐ I1 = Annual Electric Cost After Project1+2 * PWEFelec + Annual Natural Gas Cost After Project1+2 * PWEFgas + Annual Steam Cost After Project1+2 * PWEFsteam
+ Annual Chilled Water Cost After Project1+2 * PWEFchw + Annual Coal Cost After Project1+2 * PWEFcoal + Annual Domestic Water Cost After Project1+2 * PWEFwtr + Annual Sewer Cost After Project1+2 * PWEFsewer ‐ Annual Electric Cost After Project1 * PWEFelec ‐ Annual Natural Gas Cost After Project1 * PWEFgas ‐ Annual Steam Cost After Project1 * PWEFsteam
‐ Annual Chilled Water Cost After Project1 * PWEFchw ‐ Annual Coal Cost After Project1 * PWEFcoal ‐ Annual Domestic Water Cost After Project1 * PWEFwtr ‐ Annual Sewer Cost After Project1 * PWEFsewer
7.1.4 Value of Carbon Reduction: The value of any future tax on the cost of carbon dioxide emissions (or any
other emission for that matter) is not included in the analysis of the ECM economics. Options for using carbon offsets or renewable energy to meet sustainability goals are discussed later in this report.

Integrated Energy Master Plan IU 20096161 Page 62
7.2 Building Energy Conservation Measures (ECM’s) 7.2.1 Overview: Included in the following paragraphs are lists of energy conservation measures that were
considered for building energy reduction at IUB. This list was developed specifically in response to the general opportunities that were apparent on campus. These ECM’s are simulated as though the work applies to the entire building. In actual practice, this is rarely the case. For this reason, project scope and budget must be validated on a building by building basis prior to final budgeting and implementation.
7.2.2 Budgeting: Note that the cost figures listed below are project cost estimates which include a 20% markup
for soft costs. In general, cost figures are based on performing the ECM on a building of approximately 127,000 GSF (which corresponds to the average size building in our study). Costs are based on 2011 construction market conditions.
7.2.3 Energy Conservation Measures (ECM’s) Summary: A listing of the energy conservation measures that
were considered for IUB is described in the paragraphs that follow. These descriptions include a brief scope of work and an explanation of how implementation costs were assigned to the projects.
7.2.3.1 ECM: Add Building Insulation
General Description: Many buildings on the IUB campus do not utilize insulation in the exterior wall cavity. This ECM saves energy by increasing the R‐Value of exterior walls by an R‐Value of 10.0 (°F * ft2 / Btuh).
Exceptions:
Assumes scope of work is performed as part of a larger building renovation that includes dismantling finishes inside the building along the perimeter of the building.
In buildings where humidification is used, considerations must be made to prevent condensation in the new insulation system.
Scope of Work:
Remove and reinstall ceilings in the vicinity of the exterior wall.
Remove and reinstall all accessories and fixtures from the exterior wall.
For stud walls: Remove existing interior drywall partitions from floor to bottom of structure. Install 6 inches of fiberglass insulation between existing studs. Reinstall drywall.
For masonry walls: Install 3.5” thermally broken studs against the exterior wall (from floor to structural deck). Install 3.5” of fiberglass insulation between the studs. Extend existing power / data outlets to the new wall surface. Reinstall drywall.
Project Cost Allowance: $8.94 / SF of wall area (including windows)
7.2.3.2 ECM: Upgrade Windows
General Description: Change windows to two layers of ¼” glass with low emissivity coating on the exterior that comply with ASHRAE Standard 90.1 (U Value = 0.5 and SHGC = 0.4).
Exceptions:

Integrated Energy Master Plan IU 20096161 Page 63
1. Assumes work is performed as part of a larger building renovation and that work can be performed during normal working hours.
Scope of Work: 1. Remove existing windows and frames. 2. Install new windows. 3. Patch interior walls window/wall interface. 4. Caulk joints between walls and windows on the exterior of the building.
Project Cost Allowance: $43.97 / SF of window area
7.2.3.3 ECM: Lighting Retrofit
General Description: Convert existing fluorescent fixtures to accept T‐8 lamps and electronic ballasts.
Scope of Work: 1. Remove existing lamps and ballasts. 2. Install T‐8 lamps and electronic ballasts.
Project Cost Allowance: $0.18 / GSF of building floor area + $1.44 / W reduction
7.2.3.4 ECM: Lighting Controls General Description: Install occupancy sensors to automatically switch lights on and off.
Scope of Work: 1. Replace existing light switches with combination occupancy / light switches. 2. In larger open spaces, install ceiling mounted occupancy sensors. 3. Wiring lighting control relays into existing lighting circuits to control lighting.
Project Cost Allowance: $0.94 / GSF of building floor area
7.2.3.5 ECM: Change HVAC Type
General Description: Change HVAC system type to a more efficient system
Exceptions: 1. These cost estimates assume work would be performed in conjunction with other projects
that affect space finishes (ceiling work for instance). 2. Installation of DDC controls on spaces is included under a separate budget. 3. Work would be performed during normal working hours.
Project Cost Allowance: Refer to Table A.

Integrated Energy Master Plan IU 20096161 Page 64
Table A: Change HVAC Type, Cost Model
Proposed HVAC System Type Conversion
Estimated Project Cost / GSF of building floor
area
VAV to Fan Coil Units w/ Makeup Air Unit $ 33.28
CAV to VAV $ 5.88
CAV to FCU w/ Makeup Air Unit $ 33.28
Dual Duct VAV to Fan Coil Units w/ Makeup Air Unit $ 33.16
Dual Duct CAV to Dual Duct VAV $ 4.84
Dual Duct CAV to Fan Coil Units w/ Makeup Air Unit $ 33.16
FCU wo/MAU to Fan Coil Units w/ Makeup Air Unit $ 12.29
Single Zone AHU to Fan Coil Units w/ Makeup Air Unit $ 22.46
Multi‐Zone AHU to VAV $ 7.10
Multi‐Zone AHU to Fan Coil Units w/ Makeup Air Unit $ 27.14
7.2.3.6 ECM: Install Fan VFD’s General Description: Install variable frequency drives on air handling system that do not currently utilize volume control.
Exceptions: 1. Does not include cost associated with adding VAV boxes or other volume regulating devices. 2. Estimate based on installing VFD’s on supply and return fans of 5 AHUs in an average sized
building on campus (127,000 gsf)
Scope of Work: 1. Remove existing volume control system (inlet guide vanes, outlet dampers, etc) that exist. 2. Disable existing motor starter. 3. Install variable frequency drive. 4. Install controls to variable frequency drive. Modify programming as required.
Project Cost Allowance: $1.50 / GSF of building floor area
7.2.3.7 ECM: Reduce Max Airflow General Description: Reduce design airflow quantities in the building. For constant volume systems and 100% outside air systems, there are substantial energy savings available in terms of fan energy and reheat energy (in some cases) by reducing the quantity of air moved in the building.
Exceptions: 1. Does not include cost associated with adding VAV boxes or other volume regulating devices. 2. Estimates assume supply fans would be re‐sheaved to revised airflow quantities (VFD’s
would not be installed as part of this work). 3. Does not include cost associated with adding DDC controls to VAV Boxes.

Integrated Energy Master Plan IU 20096161 Page 65
Scope of Work: 1. Perform additional engineering to determine the proper amount of airflow required. 2. Perform testing and balancing to reduce airflows to new settings.
Project Cost Allowance: $1.14 / GSF of building floor area
7.2.3.8 ECM: Optimize VAV Operation General Description: Reduce VAV Box minimum airflow setpoints to allow heating to start at lower airflow quantities. This change reduces reheat energy consumption and reduces cooling energy during summer operation.
Exceptions: 1. Does not include cost associated with adding VAV boxes or other volume regulating devices. 2. Cost estimates do not include installation of a variable frequency drive or other volume
control device. 3. Does not include cost associated with adding DDC controls to VAV Boxes.
Scope of Work: 1. Perform additional engineering to determine the proper amount of airflow required. 2. Perform testing and balancing to reduce airflows to new settings.
Project Cost Allowance: $1.14 / GSF of building floor area
7.2.3.9 ECM: Reduce Outside Air Quantity
General Description: Reduce minimum outside air quantities to the building air handling system (via scheduling or as a blanket modification).
Exceptions: 1. Does not include cost of occupancy controls.
Scope of Work: 1. Perform testing and balancing to modify outside airflow. 2. Implement any control logic required to reduce outside airflow based on schedule.
Project Cost Allowance: $0.17 / GSF of building floor area
7.2.3.10 ECM: Change AHU Operating Schedule General Description: Reduce HVAC energy by shutting equipment off during unoccupied hours.
Exceptions: 1. Does not include cost associated with addressing individual rooms that may require year‐
round cooling 2. Does not include cost of installing full DDC controls on AHU’s that do not have DDC controls.
Scope of Work:
Integrated Energy Master Plan IU 20096161 Page 66
1. Implement any control logic required to change building operating schedule.
Project Cost Allowance: $0.036 / GSF of building floor area
7.2.3.11 ECM: Modify Space Temperature Setpoints General Description: Revise space temperature setpoints such that the cooling setpoint is 78°F and heating setpoint is 68°F for every hour of the year. Note that this implementation is different than the current system in which building thermostats are manually changed in the spring and fall rather than utilizing a wide deadband.
Exceptions: 1. Does not include cost associated with adding DDC controls to VAV Boxes.
Scope of Work: 1. For buildings with pneumatic thermostats, replace thermostats with deadband thermostats. 2. For buildings with DDC thermostats, modify temperature setpoints to achieve the specified
temperature range.
Project Cost Allowance: $0.31 / GSF of building floor area
7.2.3.12 ECM: Implement Air‐Side Heat Recovery General Description: Install air – to – air heat recovery between HVAC supply air and HVAC exhaust.
Exceptions: 1. Pricing assumes that exhaust and outside air ductwork is in close proximity and that existing
supply and exhaust systems can handle the additional pressure drop associated with these systems.
Scope of Work: 1. Install heat recovery coils downstream of filterbanks in the air handling unit and exhaust
ductwork. 2. Install heat recovery pumps and piping between the heat recovery coils. 3. Install building automation for heat recovery system.
Project Cost Allowance: $15.26 / CFM of outside air
7.2.3.13 ECM: Reduce Humidification Setpoint
General Description: Eliminate humidification in the building.
Scope of Work: 1. Revise controls as required to disable operation of the humidifier.
Project Cost Allowance: $0.036 / GSF of building floor area
Integrated Energy Master Plan IU 20096161 Page 67
7.2.3.14 ECM: Install Zone DDC Controls General Description: Replace existing pneumatic zone controls with DDC controls. This ECM is automatically included when zone DDC controls are not present and when one of the following ECM’s is selected: Change HVAC System Type, Reduce Maximum Airflows, Optimize VAV Operation and Modify Space Temperature Setpoints.
Exceptions: 1. Pricing assumes an average of 1 zone per 800 GSF.
Scope of Work: 1. Demolish existing pneumatic controls. 2. Demolish existing pneumatic reheat control valves. 3. Install electric zone control valves. 4. Install DDC controls on all zone controls. 5. Test and balance to reset VAV Box maximum and minimum airflows.
Project Cost Allowance: $4.58 / GSF of building floor area.
7.2.3.15 Install Pump VFD (Heating Water or Chilled Water) General Description: Replace existing motor starter with variable frequency drive.
Exceptions: 1. Modifications to AHU and zone control valves (conversion from three‐way to two‐way
valves).
Scope of Work: 1. Demolish existing motor starter. 2. Install variable speed drive. 3. Install DDC controls to modulate speed and monitor.
Project Cost Allowance: For 7.5 HP Motors: $1090/HP, For 75 HP Motors: $382/HP
7.2.3.16 Install Water Side Economizer
General Description: Install plate frame heat exchanger system configured to cool chilled water with condenser water during winter months.
Exceptions: 1. Assumes there is space to install this equipment.
Scope of Work: 1. Install plate frame heat exchanger. 2. Install chilled water and condenser water pump station for system. 3. Install DDC controls to control and monitor.
Project Cost Allowance: For 1200 Tons Cooling: $683 / Ton, For 100 Tons Cooling: $3359/ton
7.2.3.17 Install Heat Recovery Chiller

Integrated Energy Master Plan IU 20096161 Page 68
General Description: Install a building chiller capable of simultaneously producing chilled water and heating water.
Exceptions: 1. Modifications to zone terminal equipment to enable operation with low temperature
heating water. 2. Requires installation of water cooled chiller of equal size. 3. Assumes there is space to install this equipment.
Project Cost Allowance: Machine Size – 1200 Tons Cooling: $1057/Ton, 100 Tons Cooling: $1531/Ton
7.3 Methodology For Selecting Applicable ECM’s and Parametric Analysis
7.3.1 Overview: The following section describes how the various energy conservation measures noted above are
selected and analyzed on the building in the study. This analysis balances the economic viability of ECM’s, the practicality of implementation and the overall suitability of the ECM’s. When analyzing energy savings projects, it is of particular importance to determine how different ECM’s interact with each other. For example; there is significant interaction between the Lighting Controls ECM and the Lighting Retrofit ECM. If these two ECM’s are analyzed separately, the energy savings of implementing both together will be less than the sum of the ECM savings when considered alone. If more efficient lighting is installed, there is less energy to be saved when utilizing lighting controls (compared to the case in which efficient lighting is not installed). Because this interaction between ECM’s is rarely predictable, the analysis of the ECM’s must be performed to evaluate the relative performance associated with different combinations of ECM’s. This process is referred to as a parametric analysis in this report and is described in more detail below.
7.3.2 Selecting Applicable ECM’s: Following the validation of the energy model, energy conservation measures (ECM’s) that apply to the given building are selected as options for analysis. For this study, the selection of ECM’s that were analyzed was performed manually utilizing the survey information collected for lighting and HVAC system types as well as a dedicated review meeting with IUB was conducted specifically to review these selections. In most cases, these ECM’s are selected to minimize energy consumption while continuing to maintain occupant comfort. Other guidelines that were followed in selecting applicable ECM’s are as follows:
Air Conditioning is added to buildings that aren’t cooled with Change HVAC Type ECM.
An ECM that would reduce humidification levels is not considered in buildings with art work or musical instruments.
Laboratory building minimum airflow is not reduced below 4 to 6 air changes per hour.
Occupancy schedules are not implemented in science buildings.
Each of the following ECM types are combined into a single ECM’s for the parametric analysis: o Lighting retrofit ECM and lighting control ECM o Change HVAC Type ECM, Reduce Maximum Airflow ECM, Optimize VAV Operation ECM, Install
Fan VFD ECM and Modify Space Temperature Setpoints ECM
7.3.3 Parametric Analysis: Following the selection of applicable ECM’s, a parametric analysis is conducted to determine the order in which the ECM’s should be implemented. This process is performed in the following fashion:

Integrated Energy Master Plan IU 20096161 Page 69
An ECM energy run is calculated that only includes one ECM. If the Payback Period of the ECM energy run is greater than 50 years, it is not considered for further analysis.
The ECM energy run that provides the shortest Payback Period is selected as the new base case. Each ECM is added to the base energy run (one at a time) and the Payback Period and Marginal Payback Periods are calculated. The energy run that has the shortest Marginal Payback Period is then selected as the new base case and this process is repeated until all ECM’s are included in the energy run.
7.3.3.1 Parametric Analysis Example: Included below is an example of the Parametric Analysis for
Maxwell Hall. The first table (Table 7.3.3.1) shows the single elimination test. In this instance, the window replacement has a payback period greater than 50 years and automatically eliminated from further consideration. The second table shows the results of the parametric analysis for Maxwell Hall. This analysis begins with the ECM that had the best simple payback in the Elimination Test. Next, the other two remaining ECM’s are added in the order that results in best Marginal Payback.
Table 7.3.3.1: ECM Elimination Test ‐ EXAMPLE
Maxwell Hall Elimination Test
Energy Run
Included Energy Conservation Measures
Estimated Annual Energy Cost Reduction
Estimated Implementation
Cost
Payback Period
1 Optimize VAV Operation and Space Temp. Setback
$12,747 $45,144 3.5 years
2 Lighting Retrofit and Lighting Controls
$5,944 $43,652 7.2 years
3 Add VFD's to Heating Water $132 $1,389 7.9 years
4 Replace Windows
$375 $119,900 163 years
In this example, Replace Windows would be removed from further consideration because simple payback is greater than 50 years.

Integrated Energy Master Plan IU 20096161 Page 70
Table 7.3.3.2: ECM Parametric Analysis ‐ EXAMPLE
Parametric Run
Energy Run
Included Energy Conservation Measures
Estimated Annual Energy Cost Reduction
Estimated Implementation
Cost
Payback Period
Marginal Payback
2 Optimize VAV Operation and Space Temp. Setback
$12,748 $45,144 3.5 years
NA
5
Optimize VAV Operation and Space Temp. Setback + Lighting Retrofit and Lighting Controls
$19,746 $88,796 4.5 years
6.1 years
7
Optimize VAV Operation and Space Temp. Setback + Lighting Retrofit and Lighting Controls + Add VFD's to Heating Water
$20,438 $90,185 4.6 years
25.8 years
7.4 Building Energy Run Results
7.4.1 Results: The results of the parametric analysis are included in Appendix A, Table A8.2.1. Review and
totalization of this data suggests that by implementing all the projects described by the ECM’s, a grand total of $6,890,000 per year can be saved through energy conservation. However, the implementation cost to obtain the savings would be $126,476,000 (simple payback period of 18.4 years) and reduce carbon emissions by 129,800 Tons CO2 per year.
In this example, the determination of whether or not to implement the ECM should be based on Marginal Payback rather than Simple Payback.

8760 Engineering
Integrated Energy Master Plan IU 20096161 Page 71
Building Initiatives
POTENTIAL COMPONENTS OF THE ENERGY MASTER PLAN 8 BUILDING INITIATIVES
8.1 Building Retro‐Commissioning
8.1.1 Opportunities for Retro‐Commissioning: Included below are two tables summarizing the opportunities for
retro‐commissioning at IUB. Our evaluation resulted in two lists of buildings; Strong Candidates and Questionable Candidates. Table 8.1.1.1 summarizes the “Strong Candidates” list. For buildings on this list, there is strong confidence in the metered readings and in our understanding of the building for modeling. Table 8.1.1.2 summarizes the “Questionable Candidates”. For buildings on this list, there is some question as to the accuracy of the metering data and/or our understanding of the building for modeling. For both tables, implementation cost is based on a $0.50 / GSF cost for a retro‐commissioning study and an average project simple payback of 1.25 years (based on recent experience).

Integrated Energy Master Plan IU 20096161
Page 72
Table 8.1.1.1: Retro‐Commissioning Summary for Strong Candidates
Building
"Strong Candidates" Opportunity for Retro‐
Commissioning (Potential Annual Savings)
Estimated Implementation Cost
BL604 Gladstein Fieldhouse $131,361 $215,915
BL475 Recreational Sports $115,888 $271,511
BL603 Assembly Hall $114,414 $333,570
BL107 Jordan Hall $107,771 $296,853
BL237 Wright Quad $59,946 $222,876
BL209 Wells Library $60,339 $354,005
BL452 SPEA $49,297 $125,931
BL451 Business School $42,942 $172,757
BL243 Teter Quad $42,038 $202,984
BL111 Ballantine Hall $40,795 $203,703
BL433 Briscoe Quad $35,950 $184,649
BL071 Chemistry $25,363 $123,398
BL027 Swain West $22,550 $105,489
BL450 Godfrey Grad&Exec Ed Ctr
$10,179
$108,596
BL008 Poplars $16,776 $96,180
BL462 Jenkinson Hall $12,298 $33,820
BL155 Lilly Library $11,355 $40,452
BL017 Student Building $7,699 $44,492
BL463 Nelson RPS Admin. $7,242 $29,279
BL059 Lindley Hall $7,107 $38,839
BL047 Smith Hall $6,546 $19,493
BL109 Goodbody Hall $4,601 $24,512
BL033 Maxwell Hall $4,069 $20,631
Total $936,526 $3,269,935

Integrated Energy Master Plan IU 20096161
Page 73
Table 8.1.1.2: Retro‐Commissioning Summary for Questionable Candidates
Building
"Questionable Candidates" Opportunity for Retro‐
Commissioning (Potential Annual Savings)
Estimated Implementation Cost
BL072 Chemistry Addition $128,686 $53,276
BL119 HPER Building $62,866 $94,888
BL139 Morrison Hall $53,558 $26,995
BL157 Fine Arts $54,713 $57,777
BL453 Harper Hall $42,207 $54,574
BL257 Forest Quad $41,422 $144,507
BL602 Tennis Center $27,050 $28,854
BL461 Magee Hall $25,089 $18,532
BL149 Sycamore Hall $21,799 $37,301
BL007 Franklin Hall $19,167 $69,075
BL454 Gresham Dining Hall $11,730 $25,444
BL153 Art Museum $3,453 $59,657
Total $491,739 $670,878
8.1.2 Remarks Concerning Table 8.1.1.1 and Table 8.1.1.2: As indicated in Paragraph 6.5, the economics
presented for retro‐commissioning are based on comparisons between building metered usage and the simplified energy model utilized to simulate the building performance. A detailed retro‐commissioning study will be required to validate and identify the specific issues that exist at these and other buildings.
8.2 Building Energy Savings Opportunities
8.2.1 Results: The results of the parametric analysis are included in Appendix A, Table A8.2.1 and Table A8.2.2 . Review and totalization of this data indicates that by implementing all the ECM’s included, a grand total of $6.89M per year can be saved through energy conservation with an implementation cost of $126M. These results are based on marginal utility rates for FY2010‐2011 assuming that the existing fuel mix does not change.
8.2.2 Analysis of Building Energy Conservation Measure Opportunities: Specific recommendations for how to proceed with the building energy conservation measures are discussed in the recommendations section of this report. Included below is an analysis of the various energy conservation measures that were analyzed and information about the projects that will ultimately reduce energy consumption most effectively.
8.2.2.1 Change HVAC Schedule and Reduce Humidification: The work associated with implementing this
ECM’s is very little. Even with conservative cost estimates, the average Marginal Payback associated with implementing these projects is 0.2 years. Overall, the Building ECM analysis shows a range of marginal paybacks in the range of 0 to 2 years.

Integrated Energy Master Plan IU 20096161
Page 74
8.2.2.2 Lighting Retrofit and Lighting Controls: Given rising electrical rates, it is not surprising to see that
performing lighting retrofits and installing lighting occupancy controls provide reasonable marginal paybacks. For the list of ECM’s presented, ECM’s for Lighting represent an average marginal payback of 7.6 years with a range of paybacks between 4.3 and 16 years.
8.2.2.3 Air Handling System Modifications: This broad category includes energy conservation measures
that change the operation of the air handling systems beyond simple schedule modifications. These modifications include: Install Fan VFD’s, Reduce Maximum Airflow, Optimize VAV Operation, Space Temperature Deadbands and complete system change‐outs. Because the scopes of work vary widely and are dependent on a large number a parameters, the average marginal payback is 13.3 years with paybacks between 1 year and 47 years.
8.2.2.4 Air‐Side Energy Recovery: For the ECM’s investigated, the marginal payback associated with
installing air to air energy recovery is between 23 and 39 years. This ECM produces poor paybacks because: 1) In a retrofit application, the cost of installing an air to air energy recovery system is very high. Implementing this when first installing a system is substantially less expensive. 2) The marginal cost of steam heat at IUB is low. Because of this, there is less energy cost to save.
8.2.2.5 Replace Windows and Insulate Buildings: For both window replacement and building insulation,
the payback periods exceeded 50 years in our model. This result is not unexpected. This result is partly driven by the relatively low marginal cost for heating on campus. This result is also driven by the large cost of implementation. For these types of projects, the business case for performing the project must contain factors in addition to energy savings (such as windows that fail to stop rain intrusion). Similar to Air‐Side Energy Recovery, the right time to address these issues (in terms of energy) is when the building is first built.
8.3 Building HVAC Capital Renewal
8.3.1 Candidates for HVAC Capital Renewal: As part of the survey that was performed on the buildings, the
condition of the HVAC systems was recorded. After reviewing this information, it is apparent that there are many buildings on campus that utilize HVAC systems that have served beyond their expected useful life. For these types of buildings, consideration must be made as to whether it is more prudent to spend capital to improve the overall building rather than improve performance in the short term by placing band‐aids on a worn out components. Listed below are buildings which we believe belong in the “Needs Capital Renewal” category:

Integrated Energy Master Plan IU 20096161
Page 75
Table 8.3.1: Buildings Candidates for HVAC Capital Renewal
Building ID
Building Name Building
ID Building Name
BL008 Poplars BL148 Music Addition
BL027 Swain West BL149 Sycamore Hall
BL043 Edmondson Hall BL177 Musical Arts Center
BL045 Cravens Hall BL227 Read Hall
BL047 Smith Hall BL237 Wright Quad
BL055 Owen Hall BL304 Mason Hall
BL058 Kirkwood Hall BL417 Geological Sciences
BL091 Wildermuth Center BL418 Geological Survey
BL109 Goodbody Hall BL467 Health Center
BL111 Ballantine Hall BL602 Tennis Center
BL141 Memorial Hall BL604 Gladstein Fieldhouse The typical scope of a HVAC capital renewal would include replacing all or parts of the HVAC system including central station air handling units and terminal units as well as ductwork and piping as applicable. Similar to the decision to replace windows, the justification for HVAC Capital Renewal needs to extend beyond energy savings. Other justification may include: 1) parts are no longer available, 2) the system is unable to maintain occupant comfort, 3) maintenance costs are too high and 4) cooling is not provided. Energy savings and project costs are included in the results outlined in Tables A8.2.1 and A8.2.2.

8760 Engineering
Integrated Energy Master Plan IU 20096161 Page 76
Central Plant Initiatives
9 CENTRAL PLANT INITIATIVES
9.1 Central Steam Heating Plant
9.1.1 Development of Thermal Model
9.1.1.1 An earlier section of the report briefly described the components and capacity of the CHP and
the fuels utilized to distribute heating energy in the form of steam to the IUB campus. Figure A9.1.1.1 in the Appendix illustrates the schematic flow diagram of the major components of the steam plant and steam distribution system to and returning from the campus buildings. To analyze fuel use for optional plant operating scenarios such as fuel switching or marginal energy reductions due to reduced campus loads through the initiation of building ECM’s and retro‐commissioning, a thermal model of the CHP and the distribution system it serves was developed. To develop the model, FY 09‐10 plant production data was obtained for all of the major elements of the operation of the CHP including available metered steam, condensate, and make‐up water flows, fuel use by service, and electricity generated and purchased to support the steam plant operation. A schematic of the CHP thermal model is indicated on Figure A9.1.1.2 in the Appendix. Operating points and corresponding annual mass flows for FY 09‐10 are indicated on Table A9.1.1.3, also in the Appendix. The development of the thermal model of the distribution system and the identification of the thermal requirements of the buildings connected to the steam system are discussed in other sections.
9.1.1.2 The salient features of the thermal model for the CHP and its distribution system based on FY 09/10 data are:
Overall boiler combustion efficiency of 70.1%
ASME PTC‐4 overall boiler efficiency of 68.6% (considering total heat available for steam production)
Annual steam distributed to the campus consists of 79% at 40 psig and 21% at 150 psig
Annual condensate returned to the plant represents 69% of the steam produced with the remaining 31% (plus blowdown) provided by softened and treated make‐up water.

Integrated Energy Master Plan IU 20096161
Page 77
Of the total annual fuel consumed by the plant, 49.4% of the energy is ultimately delivered to the buildings for heating purposes.
New gas fired boiler No.7 fires at much higher efficiency than the remaining boilers, approaching 88% based on metered fuel use and steam produced.
9.1.1.3 The thermal model was utilized as the basis for all of the CHP calculations that follow.
9.1.2 Energy Conservation/Emissions Reduction Measures
9.1.2.1 Addition of Second Micro‐Turbine Generator Set In 2010, IUB installed a Carrier Micro‐Turbine Power System at the CHP. The device is fundamentally a steam turbine generator set installed in parallel with one of the existing plant pressure reducing stations, reducing 150 psig boiler steam generation pressure to 40 psig for distribution to a large portion of the campus. The steam turbine extracts some of the heat content of the entering steam, converting it into shaft energy. This shaft energy spins an electrical generator to provide 480 volt 3 phase electrical energy for the CHP. The energy in the steam extracted by the micro‐turbine is by no means free but the value of the electricity produced exceeds the value of the steam used to produce it. Therefore, the micro‐turbine generator represents an ECM that saves energy cost. It does not however reduce total energy use or net carbon emissions in that the electricity produced by the micro‐turbine is generated mainly by burning coal in coal fired boilers, the same operation that is occurring at the Duke Energy electric power plant generating electricity to serve the IUB campus.
This ECM considers the addition of a second nominal 250 kW micro‐turbine generator set in parallel with the first unit. Operating in tandem with the first unit, the system would have the capability of offsetting over 70% of the electricity required by the CHP. Based on our calculations, the installation of a second 250 kW steam micro‐turbine generator at the CHP would present the following economic pro forma:
Description of ECM Annual Cost
Savings1
Implementation Cost
Payback Period (yrs)
Annual CO2
Savings (tons)
Percentage of Total CO2
Emissions from Energy Use2
Retrofit of CHP with Additional Micro‐Turbine Generator
$88,2023,4 $881,910 10.0 0 tons 0.0%
Note 1: Savings based on FY 10‐11 estimated average utility costs Note 2: Based on FY 10‐11 energy related emissions of 489,895 tons CO2 total Note 3: Based on an annual electrical savings of 1,971,000 kWh based on (250 kW) x (8760 hours/year) x 0.90 Utilization Factor Note 4: Cost savings are variable based on fuel cost
Though total annual energy use would not be reduced, the operation of the second micro‐turbine generator would reduce total energy cost and serve to unload the campus electrical distribution system by a total of 500 kW. If natural gas were being used as the source of steam in the CHP, the annual energy cost savings would be reduced but total carbon emissions would also be reduced (substituting natural gas for coal for that portion of electrical generation).

Integrated Energy Master Plan IU 20096161
Page 78
However, better options are available with similar paybacks that serve both energy cost and carbon emissions. Therefore, we do not recommend this option be implemented.
9.1.2.2 Fuel Source Modifications: Conversion to Full or Partial Natural Gas Use
The emissions benefits of firing on natural gas in lieu of coal are well understood. Combustion of natural gas releases about 58% of the carbon dioxide that is released in the combustion of coal for an equivalent Btu content of fuel burned. Considering the typical efficiency of modern watertube natural gas boilers versus the efficiency of moving grate stoker coal boilers, the actual reduction in carbon dioxide emissions with natural gas is to about 48% looking at the steam produced by each fuel source. From the standpoint of carbon dioxide emissions only, the decision to burn natural gas is simple.
However, the cost per MMBtu for coal has been very stable and inexpensive; with plentiful reserves located close enough to campus that trucking has been a very cost efficient means of delivery for IUB. Coal pricing including delivery is relatively simple with multiple year contracts at relatively fixed prices. Natural gas on the other hand has seen major excursions in cost in the past 5 years and in the current deregulated environment, its purchase is complex, with multiple vendors involved in the purchase and delivery of natural gas with multiple tiers of cost based on the amount of natural gas purchased.
It is our belief that ultimately legislation or operating restrictions imposed by the EPA will limit or prevent the firing of coal at the CHP. But until this becomes the case, we believe it is desirable for the University to retain the multiple fuel sources that they have today to maintain as much operating cost stability as possible. Thus the fuel mix decision must be based on the economics of operation on the comparative fuels available and the stated desire of the University to reduce greenhouse gas emissions. Since there are no present economic drivers in the form of a “carbon tax” on carbon dioxide emissions, it is up to the University to weigh the value of reduced carbon emissions versus the lower cost of operations burning coal at the CHP.
However in the course of our study, it became apparent that the cost of natural gas has been dropping consistently and shows signs of dropping even further. It therefore seemed to make sense to provide the University with an accurate tool to assess the true differential cost between current operations on 90% coal and 10% natural gas and operation on 100% natural gas. Our goal in this effort was threefold.
To determine the current annual projected operating cost difference between coal and natural gas at the CHP,
To determine on a month‐by‐month basis the estimated difference in cost between current operations on 90% coal/10% natural gas and operation on 100% natural gas, and
To determine the annual cost of base loading the new natural gas boiler no. 7 with the remaining heating needs provided by burning coal.
Given this data, the University can make an informed decision that is based on a combination of the lowest operating cost and the additional cost that would be borne in an operating scenario that defines the resolve of the University to reduce carbon emissions.
To accomplish these tasks, the spreadsheets indicated as Tables A9.1.2.1 thru A9.1.2.5 in the appendix were created. The upper part of the spreadsheet calculates the cost of natural gas for

Integrated Energy Master Plan IU 20096161
Page 79
each specific scenario. Each sheet begins with a projected steam load and applies Vectren local delivery charges (Tariff for Gas Service I.U.R.C No. G‐19 – effective 2/14/08) and the Energy USA Citygate Gas prices (combining the NYMEX settlement price for past months or NYMEX Futures prices for future months plus the Basis Costs for Vectren North). For the purpose of these comparisons, FY 2010/2011 steam loads were assumed with boiler efficiencies for boiler no. 7, boiler no. 7 and boiler no. 5, or boiler no. 7 and a new higher efficiency boiler no. 8 (replacing boiler no. 5) depending on the scenario considered. The bottom part of the spreadsheet calculates the operating cost of the running on 90% coal and 10% natural gas as is the current technique used at the CHP. Employee costs and differential costs of operating on coal versus natural gas are captured here, with the magnitudes depending on the options considered.
Tables A9.1.2.1 and A9.1.2.5 indicate four options that were considered for the plant and the assumptions that were used, all based on projected operation for FY 11/12. The results of these calculations are indicated below.
1) If operations were switched to 100% natural gas for FY 11/12 and the staff was reduced to
accommodate only natural gas, the additional annual cost to operate on natural gas would be $586,314 (Option A).
2) If Boiler No. 5 were replaced with a modern water‐tube natural gas boiler of similar size (designated as Boiler No. 8) and efficiency as Boiler No. 7 and with staff reductions as in 1) above, the additional annual cost to operate on natural gas would be reduced to $210,633 (Option B).
3) Without the addition of a new high efficiency Boiler No. 8 but by base loading Boiler No. 7 on natural gas, without any staff reductions, and using coal for the remainder of the steam required, the additional annual cost to operate on in this mode would be $455,622 (Option C). This option would burn approximately 80% natural gas annually.
4) If Boiler No. 7 were base loaded but plant operations were arranged to burn approximately 50% natural gas and 50% coal, the additional annual cost to operate in this mode would be $271,840 (Option E).
Based on these calculations, we would offer several recommendations. These recommendations are based on our assertion that IUB is moving toward firing higher quantities of natural gas in the CHP based on environmental and/or legislative restrictions on the firing of coal, though the timing of these events is yet unknown.
Using the spreadsheets indicated above, compare the cost of coal versus the cost of natural gas on a month‐by‐month basis for the CHP to determine the lowest cost fuel choice. If the natural gas cost is higher, determine the monthly premium cost the University is willing to spend for the reduced carbon emissions that will result from this change. (For January of 2012, base loading on natural gas in Boiler No. 7 has yielded favorable results.)
Assuming favorable natural gas rates continue, revise operations to option (3) indicated above. This would indicate operation on Boiler No. 7 for the months of May through September, with coal and natural gas fired in the remaining months. Such a change would reduce carbon dioxide emissions from the CHP by 71,423 tons of CO2 per year or a reduction of 40% of present emissions from the CHP.
Existing Boiler No. 5, capable of firing natural gas or fuel oil but not coal, was installed in 1964 and is currently firing at very low efficiency (63.1% based on FY 09/10 plant production report, even lower in FY 10/11). If increased firing on natural gas is contemplated, we

Integrated Energy Master Plan IU 20096161
Page 80
recommend Boiler No. 5 be replaced with a new high efficiency Boiler No. 8 of the size and efficiency of Boiler No. 7. Such a modification would improve the stability and redundancy of natural gas firing in the plant. If a conversion to 100% natural gas firing occurred, the new boiler would save approximately $376,000 annually (vs. Option A above).
9.1.2.3 Fuel Source Modifications: Conversion to Firing on Biomass
Biomass is an attractive option as a substitute for coal on campuses such as Indiana University Bloomington that are equipped with coal fired boilers but who wish to reduce their carbon emissions. This is possible since at the moment, burning biomass like wood is considered a “Carbon Neutral” process. (Since carbon emitted from the combustion of wood and other biomass materials is recaptured by the growth of replacement wood and crops, it is generally recognized as long term carbon neutral.) The biomass options indicated below were each reviewed for their applicability for IUB. Unfortunately, it is our conclusion that this technology cannot currently compete with natural gas for IUB because of significantly increased biomass fuel costs relative to converting to natural gas. In addition, each of these technologies is proprietary in nature and in the development phase, making true comparisons difficult at this time. This conclusion may change in the future as the technology becomes better developed but for now, it is our recommendation to adopt a “wait and see” posture with respect to the incorporation of biomass in the campus fuel mix. Specifics of our findings are indicated below.
Nu Materials Coal/Biomass Briquettes (www.numaterials.com).
Nu Materials, a company from Ooltic, Indiana, is marketing a biomass material that is currently composed of 60% coal, 40% biomass, and a binder that holds the product in a briquette form. This mixture has roughly the emissions characteristics of natural gas. This technology and the applicable patents associated with it have just become available for commercial use. Assuming Nu Materials coal biomass briquettes were now available at a cost of $90/ton (their current estimate) and having a heat content of approximately 10,000 Btu/lb (60%coal/40%Biomass designated I‐Fuel 60), replacing coal with this fuel based on FY 10‐11 stem use would increase the annual operating cost by $3,120,627. Utilizing this technology when it becomes available has the potential to reduce plant emissions by 67,331 tons of CO2 annually. Initially, the product will be a combination of Peabody coal, wood chips, and a binder. Future materials for binding to coal are paper and various corn or bean products. Nu Materials is working on combining coal with torrefied wood as a biomass option and believes it can be done less expensively than New Biomass but it is still in an experimental stage for them.
New Biomass Torrefied Wood (www.newbiomass.com)
Torrefaction is the roasting of wood or other biomass to create a product that (1) has increased energy density, (2) have characteristics that make it easy to handle and transport, and (3) is practical to coal fire in existing boilers. The idea would be that the torrefied wood product would be burned in a mix with coal to mimic the emissions characteristics of burning natural gas. This technology is currently available but not in the quantities required by IUB. Based on FY 10‐11 fuel costs, burning torrefied wood under a proposed agreement with New Biomass in quantities of approximately 42% torrefied wood/58% coal would displace 70,077 tons of CO2

Integrated Energy Master Plan IU 20096161
Page 81
emissions annually. The estimated cost of the torrefied wood is $8.00/MMBtu for an estimated additional plant operating cost of $3,723,600 a year.
Nexterra Biomass Gasification Systems (www.nexterra.ca) The Nexterra process utilizes wood chips in a fixed bed, updraft gasifier, creating in a proprietary process a synthetic, combustible gas that can be burned in specially designed boilers (but cannot be burned in the existing boilers at the CHP). Such a design would require a significant up‐front cost of approaching $7,000,000 for a 40,000 lb/hr boiler plant producing 150 psig steam, significantly smaller than the needs at the CHP except for a partial source. In addition, this would be a turnkey plant addition where Nexterra would design the plant but it would be the responsibility of IUB to procure the biomass materials and set up delivery arrangements for transporting the materials from their point of origin to the CHP. Data that was offered to Nexterra to develop an economic pro forma for the IUB campus CHP have not been responded to as of this date. However our research has led us to believe that the technology is currently not competitive with the option of natural gas combustion.
9.2 Steam and Condensate Distribution Systems
9.2.1 Development of Thermal Model
9.2.1.1 The previous section described the establishment of a thermal model for the CHP and the
buildings connected to it. Included in the state points of that model were losses associated with the steam and condensate distribution systems as well as the losses associated with the condensate that does not return to the CHP (being lost from the distribution system). Further, previous sections have indicated that base load steam use (significantly evident in the summertime) should be an important element in reducing energy consumption in the campus thermal systems. By all outward indications, various segments of the steam and condensate distribution piping systems are quite old and, based on repairs undertaken in recent years, have likely lost most of the insulation materials that accompanied their original installation.
9.2.1.2 In an effort to define the losses from the steam and condensate distribution systems at Indiana University Bloomington, a thermal model of the distribution model of the distribution system was developed. The model includes losses for buried piping and piping in tunnels based on algorithms found in the 2008 ASHRAE Handbook – HVAC Systems and Equipment, Chapter 11, “District Heating and Cooling”. For existing components of the distribution systems that are more than 15 years old, buried piping was considered uninsulated and piping in tunnels was considered minimally insulated with fiberglass insulation with all service jacket. Sections of the piping that have been recently replaced or that were considered for replacement under this study were considered insulated as per ASHRAE Standard 90.1‐2007 requirements. New buried piping was assumed to be in a Multi‐Therm 500 Piping System as manufactured by Perma Pipe, Inc. with the insulated steam or condensate pipe centered in an air space surrounded by an insulated steel conduit with fiberglass outer jacket. Soil conditions were varied from dry to very moist with the following values used for soil conductivity ks:
Soil Type Soil Conductivity (Btu/hr‐ft‐°F) Dry 0.5

Integrated Energy Master Plan IU 20096161
Page 82
Average 1
Moist 1.25
Very Moist 1.7
9.2.1.3 Based on these parameters, Tables A9.2.1.1 through A9.2.1.3 indicate per unit length heat
losses expected based on piping insulation system and soil type. Tables A9.2.1.4 through A9.2.1.7 indicate the results achieved from the thermal model of the IUB distribution system. Based on the results of these calculations, the following steady heat losses from the distribution system would be predicted by the model based on the degree of dryness of the soil.
Soil Conditions Pipe Heat Loss (MMBtu/hr)
Very Moist Soil 48.1
Moist Soil 36.3
Average Soil 29.8
Dry Soil 16.8
9.2.1.4 Obviously based on the season and rainfall, the soil conductivity probably varies considerably
over the year. Based on the nearly continuous limestone substrate below the campus, moistness is probably often apparent. The model predicts that between dry soil and very moist soil losses would increase by 31,324 MBh or about 32,058 lbs/hr of steam flow. This value roughly matches the experience of the CHP that during a period of heavy rain, the steam load increases by about 35,000 lbs/hr.
9.2.1.5 The thermal model therefore seems accurate at least at its limits. Though the specific variability of weather cannot be definitively determined, what is sure is that losses from the distribution system vary by soil conditions but probably account for at least 50% of the summertime steam load experienced by the CHP. Thus the steam and condensate distribution system is an obvious candidate for any energy conservation measures available.
9.2.2 Energy Conservation/Emissions Reduction Measures
9.2.2.1 Reduction of Plant Steam Generation Pressure to 40 psig
From a theoretical standpoint based on normal boiler design, a 40°F reduction in flue gas temperature for a natural gas fired boiler results in approximately a 1% increase in boiler thermal efficiency. For the same boiler design firing at lower steam pressure, the flue gas temperature reduces in approximately a direct proportion to the temperature reduction of the steam produced by the boiler. For a change in steam pressure from 150 psig saturated to 40 psig saturated, there is a steam temperature drop from 367°F to 287°F. This 80°F drop in temperature will result in a 2.0% increase in boiler efficiency. Based on the FY 10/11 CHP plant production and fuel mix, this change would result in a fuel reduction of about 49,478 MMBtu and a cost reduction of approximately $206,800 annually. In addition, heat losses in the form of radiation and convection from steam piping and vessels that would see this change in pressure would reduce by about 28%.

Integrated Energy Master Plan IU 20096161
Page 83
However, several design issues relative to the existing CHP boilers will make this option difficult to achieve.
The plant is currently equipped with industrial watertube type boilers that are designed for operation on high pressure steam. Firing these boilers at 40 psig will present several operational issues because of the higher nozzle velocity at the lower pressure steam. Water carryover will almost certainly occur with firing at 40 psig unless the boiler steaming capacities are significantly reduced from their current design capacities.
The current flue gas economizers on the boilers are effectively reducing the flue gas temperature to attain a large portion of the efficiency benefits that would be achieved by firing the boilers at 40 psig.
Though the existing micro‐turbine does not save energy in the strictest sense, it does reduce plant energy cost, thus reducing again the payback of a reduction in boiler operating pressure since this feature would be lost.
Because of these concerns, we do not recommend the implementation of this option. We believe that a reduction in the operation of the steam main pressure leaving the boiler plant to 40 psig on all of the campus steam mains provides a more viable option to reduce energy as described later.
9.2.2.2 Distribution Steam Pressure Reduction
Energy can be saved through steam pressure reductions in the distribution system serving the campus. The savings can be achieved through related techniques:
Reduce steam pressure in the 150 psig mains to 40 psig
Retain the 40 psig steam pressure in all of the mains throughout the year (with no increase in the winter months to serve Jordan Hall)
Our calculations on the heating loads in the various buildings and the sizes of the 150 psig mains lead us to the conclusion that the 150 psig system is oversized for the loads currently connected. Reduction in steam pressure in these mains to 40 psig would save approximately 2,650 lbs/hr of steam flow for an annual savings estimated at the CHP estimated at $102,104 per year (for the existing buried pipe that is in poor condition). These savings would be significantly reduced by simply replacing the existing failed piping. However, additional savings would accrue due to the reduced life of steam traps on the 150 psig system, currently causing frequent replacements. Operation at 40 psig would significantly reduce maintenance and repairs on this part of the piping system.
This work would involve some detailed engineering to verify the extent of the changes required. Though pressure reductions at the boilers may be possible, the simplest approach here would be to utilize a new pressure reducing station in the existing 150 psig main (or possibly reusing one of the existing 150 to 40 psig pressure reducing stations if capacity is available). In addition, the pressure reducing stations in each of the buildings served by the 150 psig mains would require new regulators operating from 40 psig down to the building utilization pressure. The retrofit details vary in each building based on the specific arrangement of the steam system there. However based on the number of buildings connected, we estimate that the costs of this retrofit versus the savings will payback in well less than 10 years.

Integrated Energy Master Plan IU 20096161
Page 84
During the winter months, the steam pressure leaving the plant is raised to 55 to 60 psig to serve the autoclaves located in Jordan Hall. Typically, about 25 psig steam is required to provide the 121°C temperature needed for sterilizing equipment. Analysis of the piping system between the CHP and Jordan hall indicate some pressure loss but significantly less than 15 psig. We believe the issue has to do with the steam distribution and pressure regulation system within Jordan Hall. Our calculations indicate that maintaining 40 psig steam distribution pressure year‐round would save approximately $62,500 per year.
To obtain these savings, we recommend a study of Jordan hall be undertaken to identify the true source of the problem. This will require a detailed engineering review of the steam system in Jordan Hall focusing on the actual pressure needs of the autoclaves there, the piping arrangement and size, and the pressure reducing station serving the autoclaves. The fix may involve some piping modifications and retrofit of the pressure regulating valves at the building to operate through an entering pressure of 40 psig maximum to 30 psig minimum. The modification will also permit more electricity to be generated by the CHP micro‐turbine generators (since currently output of the micro‐turbine generator drops as the exit steam pressure increases during the wintertime to satisfy Jordan Hall).
9.2.2.3 Prioritized Replacement of High Loss Distribution System Piping
The high summer steam demand and the thermal losses that are evident around campus are indications of the large amount of loss occurring in the steam and condensate distribution systems. The thermal model of this system described earlier in this section reinforces and quantifies those losses. In concert with IUB staff, a total of 40 sections of the existing distribution system were identified as areas where high losses were apparent. A distribution system drawing was prepared and is included in the Appendix B as Drawing B9.2.2.1. A spreadsheet was developed and keyed to the above drawing indicating the length and size of the piping from these 40 identified sections. This table appears in Appendix A as Table A9.2.2.1. Next, a second table, Table A9.2.2.2 was developed with the savings prioritized based on the apparent payback for replacing these various segments of the distribution system.
Also in concert with members of the IUB staff and as described later in this report, several sections of the distribution system are not recommended for repair. These segments are:
Section No. 4 – Steam and Condensate Piping to the Tennis Center The nearly $400,000 cost of this project is not justified for the connected loads. It is a long section of piping at the northern edge of the distribution system that experiences significant losses for the amount of heat required. This facility should be converted to natural gas heat and taken off the central steam distribution system.
Section Nos. 9, 10, 11, 12, 13, 14, 15, 16, 17, and 18 – Steam and Condensate Piping between Central Heating Plant and Research Park This deletion is described later in this section.
Section Nos. 22, 30, and 31 –Steam and Condensate Piping in Tunnels or Routed Within Buildings Though these are aging sections of the piping system, their current heat losses do not justify their replacement based on energy economics. Section Nos. 30 and 31 are very old cast iron

Integrated Energy Master Plan IU 20096161
Page 85
threaded piping that probably should be replaced but the replacement would be done more as a capital investment to reduce maintenance costs and prevent future system failures. Table A9.2.2.3 therefore indicates the recommended segments of the piping system that should be replaced after the deletions indicated above.
9.2.2.4 Initiation of Steam Trap Maintenance Program
Steam traps can be a significant source of energy loss on a campus distribution system such as at Indiana University Bloomington. Traps that are cycling too rapidly or that have failed open admit steam into the condensate return/pump discharge piping, increasing fuel consumption through vented steam loss, interfering with proper condensate return to the boiler plant, and potentially increasing water consumption and chemical treatment. A trap that is cycling too slowly or is failed closed can result in wet steam, water hammer in the steam system with possible resulting damage, increased maintenance, and increased start‐up times for morning pickup. To counteract these effects, many campuses have initiated steam trap surveys and then on‐going steam trap maintenance programs. To highlight the potential of such a program, the Washington University Medical School in St. Louis presents a good example. A comparison of this steam system with the system at IUB is described below.
Facility Area Served
(ft2) Steam Distribution Pressures (psig)
Washington University Medical
School4,070,000 100, 50, 10
Indiana University Bloomington CHP
11,890,974 150, 40
The portion of the IUB campus served by the CHP is roughly three times larger than the Washington University Medical School. In 2003, the Medical School contracted with Spirax Sarco to perform a steam trap survey of the campus. In the course of the work, the survey team visited well over 1,000 steam traps. Traps were tagged with location, service, size, type, manufacturer, and status of operation. Spirax Sarco used an ultrasonic testing, recording, and evaluation instrument to perform the survey. The results of the survey were that 181 failed traps were located. Calculations indicated that the faulty traps were wasting a total of 4,800 lbs/hour of steam annually. Replacement and repair of the subject traps resulted in an annual energy cost savings of almost $325,000. The cost of the initial survey and the replacement cost of the traps resulted in a payback of less than 2 years. The traps are now reviewed annually by in‐house personnel using test instruments very similar to those employed in the original survey. IUB initiated such a steam trap maintenance program in 2009 for the steam straps in the central plant and in the distribution system but not within the buildings. Approximately 125 traps were set up in a database with failures located and repaired of 18% of the traps reviewed in 2009. Subsequent years have seen fewer failures but the failure rate is still over 10%.
We recommend that IUB institute a similar steam trap survey to identify failed traps and initiate repairs on the steam systems within the campus buildings. Since these represent continuous

Integrated Energy Master Plan IU 20096161
Page 86
losses over the year, payback on investments should be similar to those experienced by the Washington University Medical School.
9.2.2.5 Development of Current and Future Distributed Thermal Plants We believe that looking into the future, IUB will likely discontinue central steam production, at least on the scale that it is currently employed. There are several reasons for this assertion. 1) Delivering heat to the campus at 366°F (150 psig saturated steam) or 316°F (superheated 40
psig steam) is significantly above the temperature required for heating the buildings. Process steam devices that may require these temperatures represent a tiny fraction of the boiler loads and should be handled separately on a case‐by‐case basis. Heating water at 130 to 150°F could perform all of the building heating functions required on campus at significantly lower levels of heat loss and therefore lower energy use.
2) The high temperatures indicated in 1) above create significantly higher thermal expansion in the piping system, contributing to failures in the thermal insulation systems, ultimately leading to failure of the piping systems. These effects will continue as long as the higher temperature steam is used.
3) Because of its basic design, a steam system is an “open” system (vented to the atmosphere at various points) where steam can be lost due to vented steam or from steam traps that have failed open. Leaks in the condensate system are often ignored and blow down from the boilers must occur during operation. Because this represents a loss of mass from the system, make‐up water must be continually added to the system, increasing heating requirements and requiring significantly more chemical treatment.
4) The coal boilers at the CHP are between 41 and 52 years old and maintenance requirements due to the age of the equipment will continue to increase as time passes. With the permitting and emissions requirements in place for new coal boilers, replacing these boilers will likely be prohibitively expensive. In earlier discussions, it was our thought that at some point, the burning of coal will be phased out at IUB by clean air legislation or the institution of a federally mandated carbon tax. When natural gas becomes the primary campus fuel, the reason for a central boiler facility delivering steam to the campus becomes less important and the high heating system efficiency available with natural gas becomes the key imperative.
We see the conversion to low temperature heating water systems with condensing boilers, possibly combined with geothermal technology, as the system of the future for the IUB campus. With natural gas as the heating source, we see these as distributed thermal plants as indicated on Drawing B9.2.2.2 in the Appendix. Lower temperature heating water systems provide the opportunity of utilizing condensing type natural gas boilers with combustion efficiencies in excess of 90%. In addition, the lower heating water temperature makes heat recovery from cooling system compressors much simpler and less expensive than higher temperature options.
We see this change in heating source occurring from the perimeter of the campus inward, gradually reducing the steam loads on the current CHP over time. A concept for the location of these plants has been indicated on drawing B9.2.2.2 described above. This concept should be considered each time major new buildings or building renovations are considered on the perimeter of the campus. Likewise, heating system renovations of existing buildings anywhere on campus should be arranged for low temperature heating water, making the future conversion of the building to this system arrangement simpler.

Integrated Energy Master Plan IU 20096161
Page 87
The best candidate to initiate this process of conversion to distributed, low temperature thermal plants is the Research Park (or U School), designated as the Research Park Thermal Plant on Drawing B9.2.2.2. At present, most of the direct buried 150 psig high pressure steam and condensate mains extending from the Central Plant to the Tulip Tree Apartments and the Research Park are in very bad condition. Much of the condensate from this section of the campus is not returned to the CHP. Referring to Appendix Table A9.2.2.1 described in an earlier section, these sections of the steam piping system are labeled as Nos. 9, 10, 11, 12, 13, 14, 15, 16, 17, and 18.
Instead of replacing this piping segment, we recommend installing a boiler plant adjacent to the Data Center to serve the Research Park area and the Tulip Tree Apartments and separate boiler plants at Campus View, Recreation Sports and Nelson RPS. These would become the first steps toward initiating the remote distributed thermal plant concept for the campus. This would initially include low temperature condensing boilers and a distribution network to distribute heating water to the Research Park Area and the Tulip Tree Apartments with the provision for expansion as the Research Park development grows. Then in phases over time, similar boiler plants would be installed at Campus View, Recreation Sports, and Nelson RPS. At the completion of these phases, the entire 150 psig east steam main would be retired. At time of the initial phase of the work, Eigenmann would be disconnected from the 150 psig service and connected to the 40 psig service at E. 10th Street. The new system at Research Park and Tulip Tree should be designed to ultimately also serve as the cooling source for Research Park since heat recovery from the cooling required for the IT areas will benefit all of the buildings. Distribution should be arranged in shallow tunnels installed beneath sidewalks or direct buried. Obviously, more engineering work would be necessary to pinpoint the costs and benefits of this option but we believe this work can definitely be done for less than the cost of the replacement of the present underground steam distribution system.
9.3 Campus Chilled Water System 9.3.1 Capacity Limitations and Energy Source Economics
9.3.1.1 A deficiency in peak chilled water capacity has long been a concern to the University. As
evidenced by the chilled water curtailments that have been required in recent years, the need for solutions to this issue are both compelling and urgent. Obviously, our current study is focusing on the campus energy needs for cooling as they exist today and as they extend into the future. As part of the overall study, we have focused on means of reducing the energy consumed by this system while providing the additional load necessary to meet a growing campus chilled water demand.
9.3.1.2 One component of this effort has been to quantify the load reductions that are possible at both peak and part load conditions due to modifications in the plant and more importantly, arising from modifications in the buildings that reduce cooling loads. Such load reductions will occur due to the implementation of energy conservation measures, elimination of simultaneous heating and cooling through retro‐commissioning, looking toward geothermal systems to replace the aging cooling infrastructure in certain buildings and employing heat recovery chillers at buildings where summer heat is necessary (both thus unloading the CCWP).

Integrated Energy Master Plan IU 20096161
Page 88
9.3.1.3 The following paragraphs summarize our observations and conclusions on the central chilled
water system serving the campus.
1) Of the buildings we considered as part of the IU/Bloomington Campus totaling 16,870,586 ft2, some 7,761,451 ft2 of these buildings are served by the Central Chilled Water Plant (CCWP). This represents about 46% of the total campus area and includes almost all of the major campus buildings.
2) We would classify the system as a primary/secondary/tertiary pumped variable flow chilled water system with the tertiary pumping scheme having been modified from the original and usual design approach.
3) From the standpoint of overall campus chilled water system design, the chilled water
production (chiller) plants are rated and pumped on the basis of a 55°F return chilled water temperature from the buildings and a 40°F supply chilled water temperature delivered to the buildings, resulting in a 15°F Δt between supply and return. The campus cooling coils have been designed over the years for a variety of different supply and return water temperatures with the median temperatures of the major buildings being 43°F supply water and 55°F return water. The lower chilled water supply temperature from the plants promotes higher return water temperature and improved variable flow performance of the system.
4) The CCWP plant (without any contributions from the Forest, Swain West, or Lilly Library
chillers) produced 55,087,644 ton‐hours of cooling energy during FY2009‐2010. Of these ton‐hours, about 27% represented a base load that seems to be totally independent of outdoor weather conditions. These ton‐hours of cooling energy use would represent a constant load of approximately 1,700 tons. This base load likely represents a large amount of simultaneous cooling and heating that must be a principal target of retro‐commissioning efforts as well as process cooling needs such as providing a condensing source for cold rooms and freezers.
5) As of FY 10‐11, the CCWP consisted of 10 chillers located at the central plant (14,596 tons)
and the Forest plant (1,000 tons), with additional chillers at Swain West (275 tons) and Lilly Library (150 tons) that are operated at times of high campus cooling loads and a heat recovery chiller (100 tons) at the Lee Norvel Theater and Drama Center that is operated as a function of the building reheat load. These additional chillers partially serve the buildings in which they are located, effectively unloading the remainder of the central chilled water system.
6) During FY 10‐11, the central chiller plant and the Forest chiller plant acted as the two nodes
of the existing CCWP. A third node at the Briscoe chiller plant has recently been completed. The Briscoe plant includes two chillers with a total additional capacity of 1,500 tons including space for the addition of a future 750 ton chiller. The CCWP and associated chillers described above at the conclusion of FY 10‐11 had a total current capacity of 17,521 tons. Our computer simulation of the campus cooling loads connected to the plant at that time indicated a peak cooling load of 19,058 tons. A summary of this data is indicated in the table below.

Integrated Energy Master Plan IU 20096161
Page 89
Table 9.3.1: Central Cooling Capacity Summary – FY 10‐11
Location of Chiller(s)
Total Capacity (tons)
Function
Chiller Condition ‐ Installation Date
Refrigerant
CCWP 14,596 Central Plant
Good, 1984 – 2004
HCFC‐123, HFC‐134A
Forest 1,000 Central Plant
Good, 2007 HCFC‐123
Briscoe 1,500 Central Plant
Good, 2010 HCFC‐123
Lilly Library 150 Building Plant
Fair, 1999 HCFC‐22
Swain West 275 Building Plant
Poor, 1976 CFC‐11
Total Capacity 17,521
Calculated Load (2011)
19,058
Current Shortfall
1,537
Current Shortfall w/o Bldg. Chillers
1,962
7) Obviously, the CCWP appears to have insufficient installed tonnage to provide firm cooling
capacity for the IU campus. This assertion has been borne out by the 24 days during the summer of 2010 that campus chilled water curtailment was necessary for all or part of the operating day. A similar set of events transpired during the summer of 2011. Further, the aging chillers at Swain West and the Lily Library cannot be considered as firm capacity for the chilled water system moving forward.
8) To address this shortfall, plans are in place to add a third 750 ton chiller and associated equipment at the Forest chiller plant. In addition, a 2,500 ton chiller is planned for installation at the MAC chiller plant including the connection of this plant to the campus chilled water loop as a fourth node. (The chilled water piping infrastructure will be modified to make this capacity more available to serve other campus loads by providing new 16” connections to the existing 24” chilled water mains southwest of the Musical Arts building.) The situation at the conclusion of this work is described in the table below including cooling load increases anticipated by the summer of 2012.

Integrated Energy Master Plan IU 20096161
Page 90
Table 9.3.2: Central Cooling Capacity Summary – With Planned Capacity Increases – Summer 2012
Location of Chiller(s)
Total Capacity (tons)
Function
Chiller Condition ‐ Installation Date
Refrigerant
CCWP 14,596 Central Plant
Good, 1984 ‐ 2004
HCFC‐123, HFC‐134A
Forest 1,750 Central Plant
Good, 2007‐2012
HCFC‐123
Briscoe 1,500 Central Plant
Good, 2010 HCFC‐123
M100/MAC 2,500 Central Plant
Planned 2012 ‐
Total Capacity 20,346 Calculated Load (2012)
19,546
Excess Capacity
800
9) If the Energy Conservation Measures described earlier in the report are implemented, the
cooling load will drop to a calculated 16,339 tons. Such a change would provide 4,007 tons of excess cooling capacity for the chilled water plant, resulting in a situation of providing firm capacity to the campus (adequate cooling capacity such that if the largest chiller were unavailable, the 4,000 ton chiller at the CCWP, the plant would still have adequate capacity to meet the design loads).
10) As discussed earlier, we have reviewed the performance of the central chilled water plant
and the Forest plant to determine their current operating efficiency. By dividing the electrical consumption utilized in kilowatt‐hours by the metered ton‐hours of cooling produced by the plants, the result is the average kW/ton for the plant. The results of this calculation for the CCWP and the Forest plant for FY 09‐10 were 0.69 kW/ton for the CCWP and 0.66 kW/ton for the Forest plant for an average of 0.68 kW/ton for the two plants. For FY 10‐11, the combined operating efficiency of the two plants was 0.75 kW/ton. All of these values indicate a very efficiently operated central chilled water facility. Our computer simulations of the cooling required reinforce the ton‐hour measurements at the plant, clearly again indicating the very efficient operation of these plants. It is apparent to us that further reductions in energy consumption of these plants will only be obtained by reducing the loads of the buildings connected to the system.
11) Our calculations indicate that with the current prevailing costs for electricity, coal, and natural gas, a high efficiency electric centrifugal chiller is the best current stand‐alone option for producing or augmenting the campus cooling needs. At the energy costs experienced for FY 2009‐2010, costs of various optional cooling choices available (considering energy costs only) for the production of one ton‐hour of cooling were:

Integrated Energy Master Plan IU 20096161
Page 91
Table 9.3.3: Cost Comparison of Chiller Options
High Efficiency Electric Centrifugal Chiller (0.57 kW/ton) $0.034 / ton‐hour
Low Pressure Steam Absorption Chiller (Current Fuel Mix) $0.064 / ton‐hour
High Pressure Steam Absorption Chiller (Current Fuel Mix) $0.036 / ton‐hour
Low Pressure Steam Absorption Chiller (Natural Gas Fuel Only) $0.137 / ton‐hour
High Pressure Steam Absorption Chiller (Natural Gas Fuel Only) $0.074 / ton‐hour
Direct Fired Natural Gas Double Effect Absorption Chiller $0.076 / ton‐hour
Natural Gas Engine Driven High Efficiency Centrifugal Chiller (Without Heat Recovery)
$0.049 / ton‐hour
Natural Gas Engine Driven High Efficiency Centrifugal Chiller (With Heat Recovery)
$0.036 / ton‐hour
As we look at the cogeneration options in the following section, the economics become more complex when electricity is also a by‐product. But as a stand‐alone technology, the high efficiency electric chiller is still the least expensive means to obtain ton‐hours of cooling.
12) Based on 11) above, the University should purchase all new electric centrifugal chillers
based on a life cycle cost bidding approach minimizing energy use for both the direct energy use for the chiller as well as the energy burden that the chiller represents for chilled water and condenser water pumping. The return on investment for reduced energy cost should be based on a minimum of 10 years so that the Owning Cost Index (OCI) for a proposed chiller would be evaluated based on OCI = [First Cost of the Chiller + the Present Worth of Ten Years of Chiller Operating Cost]. The proposed chiller with the lowest OCI would be then be selected.
13) The age of many of the campus chillers is of concern. The latest approach taken by ASHRAE
to determine the median life for a centrifugal chiller is to consider the median life a point where 50% of chillers of that age are still in service. Based on this data set, the median life of a centrifugal chiller is 31 years. At 35 years, only slightly more than 25% of centrifugal chillers are still in service. A 31 year old chiller on the IU‐Bloomington campus would have been installed in around 1980. Though the chillers at the CCWP, Forest, and Briscoe are in good condition from an age and operational standpoint, the satellite plants around the campus do contain candidates for replacement. Five satellite chillers at a total capacity of 815 tons would meet this parameter. Further, eleven satellite chillers having a total capacity of 3,085 tons are still operating with refrigerant CFC‐11. It should be assumed that this capacity must be replaced within the next five to ten years.
14) Additional chiller capacity would also become available through the installation of heat
recovery chillers at selected buildings. Such chillers would likely be smaller, incremental chillers installed at buildings that have a summer heating load for reheat, with such chillers being sized based on the anticipated summer heating load. These additional heat recovery chillers would partially serve the buildings in which they are located, effectively unloading the remainder of the central chilled water system while providing a cost effective heating source for summer needs.

Integrated Energy Master Plan IU 20096161
Page 92
15) Another approach to providing additional chiller capacity for the campus would be to
consider the construction of a cogeneration plant in the vicinity of the central boiler plant. This option is discussed in greater detail in the next section.
16) Yet another approach to providing additional chiller capacity would be through the
utilization of thermal energy storage. The typical scenario would involve generating sub‐cooled chilled water at night in a storage tank for subsequent use the next day to offset peak loads. The technique is often considered when the local electric rates reward off‐peak nighttime use with a lower demand charge, thus making less expensive ton‐hours of cooling during off‐peak times. However, the Duke Energy electric rate provided to the master meters offers no time of day demand cost reduction. Thus the nominal of 1,000,000 gallon storage tank required to provide for a 1,000 ton daytime peak would simply compare the cost of the vessel and the system re‐piping to the cost of a new chiller and tower. Our experience would indicate the chiller addition to be much simpler and more cost‐effective for adding this cooling capacity.
9.3.2 Addressing Campus Cooling Shortfall and Providing for Future Growth
9.3.2.1 Plans already in place for adding cooling capacity at the Forest plant and at the MAC chiller plant (M100) will provide for adequate capacity for the summer of 2012 but without any significant redundant chiller capacity. To provide long term solutions for campus cooling growth, there are several steps that should be taken. Our approach to addressing the long term cooling needs of the campus as loads continue to grow is described in the following summary. 1) Reduce the cooling loads through energy conservation measures and retro‐commissioning
to reduce simultaneous heating and cooling to a minimum. This step has the potential to remove over 3,200 tons of peak cooling required, providing over 4,000 tons of excess capacity.
2) Add the final 750 tons of chiller capacity to the existing Briscoe chiller plant, increasing the total central chilled water system capacity to 20,846 tons
3) If a cogeneration system is installed at or near the CHP, absorption water chillers may provide additional chilled water capacity to the loop but only if the base steam load is reduced to below the capacity of the cogeneration system heat recovery boiler.
4) As satellite chillers in the buildings are retired, this capacity should be obtained by connecting to the Central Plant or through the implementation of one of the distributed cooling/heating plants described earlier.
9.3.2.2 At this point, two main options remain for the further augmentation of plant capacity
1) Additional chiller capacity could logically be located near the existing CCWP because of proximity of access to the 36” chilled water mains leaving the plant. It is our understanding that such a new chiller plant concept had been set forth for funding consideration to the State of Indiana but with no results as yet. This is a viable option but because of the main sizes leaving the CCWP, adding more than about 5,000 tons at this location will be problematic.
2) Unload the chiller plant by installing new distributed cooling and heating plants around campus as suggested on Drawing B9.2.2.2 in Appendix B. These distributed heating and cooling plants could utilize geothermal well fields to improve cooling efficiency while

Integrated Energy Master Plan IU 20096161
Page 93
significantly reducing distribution losses from the current steam system. We believe this is the better long term investment for the University.
9.3.2.3 The result of these efforts should be to work toward a situation in which firm chiller capacity is
available at peak loads for the campus central chilled water system as well as the distributed plants that are developed in the future. Such chiller capacity would be based on current needs, reduced by the implementation of energy reduction measures and retro‐commissioning, but augmented by a plan for the additional capacity necessary for future buildings in the master plan and the retirement of aging campus chillers utilizing CFC refrigerants.
9.4 Central Electrical Distribution System
9.4.1 Electrical System Evaluation and Plans for Future Growth
9.4.1.1 Except for isolated buildings that are separately metered by Duke Energy, the bulk of the electric
service to the campus is fed by Duke Energy through two distribution points, the University Switching Center located near the CHP and the University Distribution Center located near the Indiana Memorial Union Building. From these points, the University distributes power at 12.47 kV and 4.16 kV to the various campus loads. To date, the capacity of these systems has been adequate to support campus growth. However, new proposed construction on the campus will require the addition of just over 2,000 kW at the University Switching Center, with the attendant needs for new switchgear and bus ducts to carry the additional power needs.
9.4.1.2 It is our position that the current capacity of the electrical distribution need not grow if the energy conservation measures described here are implemented. We estimate that if these ECM’s are implemented, the campus load will shrink by an estimated 8600 kW. Further increases in campus demand should be addressed with cogeneration as described in the following paragraphs.
9.4.2 Cogeneration System Option
9.4.2.1 Another more fundamental approach to providing additional electrical capacity for the campus
would be to consider the construction of a cogeneration plant in the vicinity of the central boiler plant. The campus base electrical loads, established by meter readings taken during the Christmas week of 2010, indicate that the minimum load is approximately 18,900 kW. Assuming energy conservation efforts could reduce this number by at least 15%, the remaining campus base load might still be in the range of 16,000 kW. As an initial step toward cogenerating the campus base load, a natural gas fired gas turbine generator set with an auxiliary duct burner for co‐firing and a heat recovery boiler could be installed with an electrical generating capacity in the range of 8,000 kW. Based on a Solar Turbine Taurus 70 unit with duct co‐firing and a heat recovery boiler producing either 150 psig or 40 psig saturated steam, the following performance would be achieved:

Integrated Energy Master Plan IU 20096161
Page 94
Electrical Generation 7,604 kW
Net Electrical Output (less Plant Parasitic Loads)
7,413 kW
150 Psig Steam Generation (with Duct Burner Co‐Firing)
75,000 lbs/hr
150 Psig Steam Generation (without operation of Duct Burner Co‐Firing)
35,000 lbs/hr
Natural Gas Input at Full Load 131.3 MMBtu/hr
9.4.2.2 Such a plant would reduce energy costs significantly, provide for the option of future additional
chilled water capacity needed for the campus, and significantly reduce CO2 emissions by trading natural gas for coal for some of the campus steam required and trading natural gas electric generation for a large portion of the existing use of coal for electric generation by Duke Energy at the regional level. The general arrangement for such a plant is shown below in Figure No. 9.4.2.1. Duct co‐firing of the products of combustion off the gas turbine provides additional heating capacity at a very high fuel‐to‐steam efficiency.
Figure No. 9.4.2.1: Proposed Cogeneration System

Integrated Energy Master Plan IU 20096161
Page 95
9.4.2.3 The analysis of the economics is quite complex and require the insertion of a number of assumptions regarding the operation of the system and, most importantly, on how energy costs, labor costs, and materials costs will increase over the period of the analysis. For this exercise, a software tool from the Department of Energy – Energy Efficiency and Renewable Energy Program of the Federal Energy Management Program (FEMP) was utilized. The Energy Rate Escalation Calculator (EERC 2.0‐10) computes an average annual escalation rate for a specified time period (in this case 15 years) specifically for the State of Indiana. This calculator is basically used as a guide for contract payments on Federal Energy Savings Performance Contracts. The annual energy escalation factors from EERC 2.0‐10 that were utilized in this analysis are indicated below. The rates identified include inflation.
9.4.2.4 Inflation Rate 3.40%
Escalation Rate for Electricity 4.84%
Escalation Rate for Natural Gas 5.57%
Escalation Rate for Coal 3.40%
(Rates for Electricity, Natural Gas, and Coal all include inflation)
9.4.2.5 These factors were used to set up a 15 year Net Present Value (NPV) matrix for several central
plant options including cogeneration. For the cogeneration option, estimated construction costs were prepared for a stand‐alone building just north of the existing CHP and utilizing some CHP support services such as softened feedwater and deaeration systems. The cost for such a plant is estimated at $18,480,000. Costs could be reduced somewhat if the equipment could be housed in the CHP but would require the demolition of one of the aging existing boilers. Tables A9.4.2.1 through A9.4.2.6 in the Appendix describe the net present value calculations. The results of these calculations are indicated below in Table 9.4.2.1.
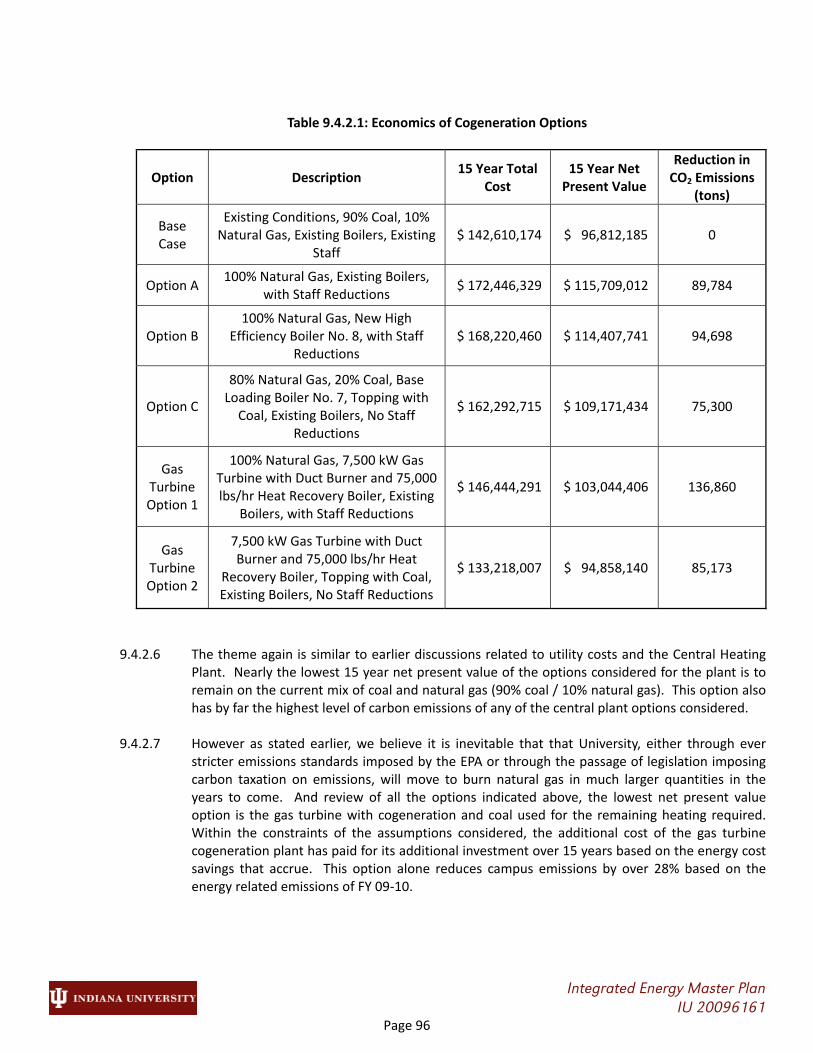
Integrated Energy Master Plan IU 20096161
Page 96
Table 9.4.2.1: Economics of Cogeneration Options
Option Description 15 Year Total
Cost 15 Year Net Present Value
Reduction in CO2 Emissions
(tons)
Base Case
Existing Conditions, 90% Coal, 10% Natural Gas, Existing Boilers, Existing
Staff $ 142,610,174 $ 96,812,185 0
Option A 100% Natural Gas, Existing Boilers,
with Staff Reductions $ 172,446,329 $ 115,709,012 89,784
Option B 100% Natural Gas, New High
Efficiency Boiler No. 8, with Staff Reductions
$ 168,220,460 $ 114,407,741 94,698
Option C
80% Natural Gas, 20% Coal, Base Loading Boiler No. 7, Topping with Coal, Existing Boilers, No Staff
Reductions
$ 162,292,715 $ 109,171,434 75,300
Gas Turbine Option 1
100% Natural Gas, 7,500 kW Gas Turbine with Duct Burner and 75,000 lbs/hr Heat Recovery Boiler, Existing
Boilers, with Staff Reductions
$ 146,444,291 $ 103,044,406 136,860
Gas Turbine Option 2
7,500 kW Gas Turbine with Duct Burner and 75,000 lbs/hr Heat
Recovery Boiler, Topping with Coal, Existing Boilers, No Staff Reductions
$ 133,218,007 $ 94,858,140 85,173
9.4.2.6 The theme again is similar to earlier discussions related to utility costs and the Central Heating Plant. Nearly the lowest 15 year net present value of the options considered for the plant is to remain on the current mix of coal and natural gas (90% coal / 10% natural gas). This option also has by far the highest level of carbon emissions of any of the central plant options considered.
9.4.2.7 However as stated earlier, we believe it is inevitable that that University, either through ever stricter emissions standards imposed by the EPA or through the passage of legislation imposing carbon taxation on emissions, will move to burn natural gas in much larger quantities in the years to come. And review of all the options indicated above, the lowest net present value option is the gas turbine with cogeneration and coal used for the remaining heating required. Within the constraints of the assumptions considered, the additional cost of the gas turbine cogeneration plant has paid for its additional investment over 15 years based on the energy cost savings that accrue. This option alone reduces campus emissions by over 28% based on the energy related emissions of FY 09‐10.

8760 Engineering
Integrated Energy Master Plan IU 20096161 Page 97
Incorporation of Renewable Energy Resources
10 INCORPORATION OF RENEWABLE ENERGY RESOURCES
10.1 Utilization of Renewable Energy at Indiana University Bloomington
10.1.1 No portion of the energy source equation is receiving more focus than the renewable energy sources –
those sources of energy that do not deplete natural resources as they are consumed – sources like hydropower, wind, geothermal systems, biomass, landfill gas, and solar energy. In this section, we will look at renewable energy for IUB in the form of the most practical options currently available – solar energy and wind energy. Our review will include the possible role of legislation and other outside economic drivers on the implementation and economics of renewable energy for the campus. The accomplishment of the reduction milestones for greenhouse gas emissions set forth in the “Campus Master Plan” described earlier will require the deployment of every tool available to the University, both through energy retrofits and behavioral changes on campus as well as through impetus from outside sources of legislation and potential funding.
10.1.2 For renewable energy to play a role in moving the campus toward sustainability, the first element in the puzzle is to reduce the energy needs of campus to the minimum possible level. In existing buildings, this will often require retrofit and periodic retro‐commissioning. In new buildings, it will involve not only attaining LEED certification but challenging the designers to creatively achieve minimum energy levels without depending on the acquisition of Renewable Energy Credits (RECs) or Verified Emission Reductions (VERs, sometimes referred to as carbon offsets) to achieve these goals. The basis of this assertion is simple – renewable energy sources are “weak” sources of energy compared to fossil fuel fired power plants generating electricity or massive fossil fuel fired boilers producing steam for heating. Renewable energy by its very nature is generally collected in far lower available energy density than that achieved by large quantities of fossil fuels transported to a point of conversion for the energy required. Thus for renewable energy to play any significant role in the needs of campus, the energy needs of the buildings must be reduced to the absolute minimum. Without such a concerted effort at energy reduction in our buildings, renewable energy will always be relegated to an auxiliary source of building energy rather than a key player in building energy service.

Integrated Energy Master Plan IU 20096161
Page 98
10.2 Solar Energy 10.2.1 Solar Photovoltaic Collectors
10.2.1.1 The installed cost of solar photovoltaic collectors to generate electricity has dropped
dramatically in recent years. As recently as 2008, installed costs for photovoltaic systems were in the range of $8.00 to $10.00/watt of installed capacity. Based on late 2011 data, similar costs have dropped into the range of $4.25/watt with prices likely to fall even further. Technology has also continued to increase the energy density that can be recovered from sunlight, now in the range of 14 watts per ft2 of collector surface. But at IUB, with purchased electricity available in the range of $0.06 to $0.07/kWh and annual sunlight hours of 1,500 or less, current paybacks for such photovoltaic collectors without other funding sources than energy savings exceed 40 years.
10.2.1.2 At IUB, we identified all roof surfaces of the major buildings that would be available to install solar collectors while still providing roof access for any maintenance needed. This total of 493,000 ft2 were considered covered with solar collectors producing a net output of approximately 6,850 kW of electrical power integrated over the year to produce slightly over 10,000,000 kWh of electricity. The payback on such a project would exceed 40 years without any additional incentives beyond energy cost savings.
10.2.1.3 Obviously, deployment of solar photovoltaic power on any scale will require incentives in terms
of utility company rebates, tax incentives, grants, and any other funding mechanisms available to improve the economics to achieve reasonable paybacks. The University must seek out such opportunities as they appear to incorporate innovative financing on solar photovoltaic projects in the future. Without outside incentives, such projects will be difficult to justify. Websites such as www.dsireusa.org should be periodically reviewed for future incentives that may become available for State or Federal sources.
10.2.1.4 As a leader among Midwest Universities in sustainability awareness and education, IUB should
be forward leading in its application of renewable energy. However, IUB must maintain a fiscally responsible focus as alternative renewable energy forms are considered. Evaluation should continue going forward to capture changes in cost or technology that may alter the current paybacks available.
10.2.2 Solar Collectors for Space Heating or Domestic Hot Water Heating
10.2.2.1 Here again the installed cost of the systems is the major deterrent to implementation, coupled
with the relatively small amount of solar energy available in Bloomington and the high levels of building heat needed during the winter. To establish a test case, a domestic hot water heating system utilizing solar collectors was considered for a location in a dormitory in central Indiana. Assuming that under the base case, such heat was provided by steam from the Central Heating Plant with a marginal cost of $5.022/MMBtu, operation of the solar collection system with 100% coincidence in solar heat available versus heat needed, the system would have a straight line payback period of 20 years. No real system has total coincidence of heat required versus heat available, making the payback always greater than 20 years.
10.2.2.2 Obviously, deployment of solar space heating or domestic hot water heating will require incentives in terms of utility company rebates, tax incentives, grants, and any other funding
Integrated Energy Master Plan IU 20096161
Page 99
mechanisms available to improve the economics to achieve reasonable paybacks. The University must seek out such opportunities as they appear to incorporate innovative financing on solar photovoltaic projects in the future. Without outside incentives, such projects will be difficult to justify.
10.2.2.3 In terms of both areas of utilization of recovered renewable solar energy, at best these energy
forms are available only while the sun is shining. For example, even if the capacity were available through solar photovoltaic collectors to meet the demand load of the IUB campus, such collectors would occupy over 72 acres of land and could serve only about 17% of the energy consumption of the campus. Thus solar renewable energy, without some effective means of storage, will never offset more than 15 to 20% of the overall electrical needs of the facility it serves no matter what incentives are available.
10.3 Renewable Energy from Wind Power
10.3.1 To assess the economics of renewable energy from wind power, we met with Performance Services, Inc.
of Indianapolis who has been involved in the development of several community wind farms in the State of Indiana. All of the facilities that Performance Services have participated in have received a cash grant through the Treasury Grant 1603, found in the American Recovery and Reinvestment Act of 2009 providing nearly 20% of the upfront financing of such a renewable energy project. Unfortunately, only taxable entities are eligible to receive this grant, disqualifying IUB based on its status as a non‐profit institution. Table A10.3.1 in the Appendix indicates the financial pro forma for a proposed 12,000 kW wind farm that could be constructed in South Bend, Indiana on land that is owned by the University. (This site was selected due to the more favorable wind conditions that exist there in comparison to Bloomington.) Six – two MW turbines were projected for this project at a total installed cost of $26,191,210 (or $2,180/kW). Based on the economics presented, the average annual cost savings over the 25 year course of the investment is $746,000 with actual cash flow becoming positive after the ninth year of the investment. The project would also provide IUB with 35,740,800 kWh per year of Renewable Energy Credits that could be sold or retained to fund LEED project certification on future projects. Unfortunately, the current value of these credits is only about $0.82/mWh or about $29,308 per year.
10.3.2 Again as in the case of the solar renewable energy options, deployment of wind power will require
incentives in terms of Federal or State grants to receive a reasonable return on investment based on other comparative means of reducing energy on campus.

8760 Engineering
Integrated Energy Master Plan IU 20096161
Page 100
The Integrated Energy Master Plan
11 THE INTEGRATED ENERGY MASTER PLAN 11.1 Overview
As stated earlier, the University is pursuing efforts to conserve energy through four main approaches, related in outcome but dissimilar in the cost and complexity of their implementation. Simply stated, these four approaches in order of increasing cost and complexity are:
Energy conservation at the individual personal level involving behavioral redirection of the campus community,
Energy conservation through the retro‐commissioning of the heating, ventilating, and air conditioning (HVAC) systems of the campus buildings to achieve efficient operation consistent with the original design intent,
Energy conservation measures that involve basic modifications to the building HVAC and electrical systems to reduce energy use (as embodied in Qualified Energy Savings Projects), and
Energy conservation through longer term, even higher capital cost projects that reduce campus energy consumption through modifications to the energy sources and energy distribution models that are currently in place.
Listed below in Table 11.1.1 is a summary of the options presented throughout this report that target one or more of the approaches described above. From a quick review of this list, it is obvious that not all of these projects ultimately make good fiscal sense. The purpose of the Integrated Energy Master Plan as stated in Section 2.0 of this report was to define and prioritize the four approaches above to achieve the most transformative effect on reducing energy consumption on the IUB campus at the minimum cost but with the highest measure of greenhouse gas emission reduction. It was the intent that the results of this report would become the framework for a long range energy master plan to move toward the achievement of the goals set forth by the 2010 Campus Master Plan.

Integrated Energy Master Plan IU 20096161
Page 101
Table 11.1.1: Possible Components of an Integrated Energy Master Plan
Number Description of ECM Annual
Energy Cost Savings1
Implementation Cost
Payback Period (yrs)
Annual CO2 Savings (tons)
CO2 Emissions Reduction
3
1 Retro‐Commissioning $936,526 $3,269,935 3.5 30,415 6.2%
2 Building Energy Conservation Measures (Marginal
Payback < 15 yr) $5,444,090 $44,916,598 8.3 99,080 20.2%
3A Retrofit of Central Steam Plant with Additional
Micro‐Turbine $88,202
4,6 $881,910 10.0 0 0.0%
3B Steam Pressure Reduction in Distribution System
from 150 psig to 40 psig $102,104 $700,000 6.9 1,845 0.4%
4A Selective Retrofit for Central Steam and
Condensate Distribution Systems (not including East Main)
$999,189 $10,510,080 10.5 13,912 2.8%
4B Retrofit for East Main of Central Steam and
Condensate Distribution Systems $696,000 $6,720,945 9.7 21,282 4.3%
4C
Abandon 10" East 150 psig Steam Main; Replace with Hot Water Boilers and Heating Water Distribution System from the Main Split to
Research Park
$480,000 $5,310,000 11.6 25,017 5.1%
5A Revised Central Steam Plant Firing Strategy; 100%
Natural Gas with Staff Reductions and with Existing Boilers
($586,318) $0 No Payback 84,881 17.3%
5B Revised Central Steam Plant Firing Strategy; 100% Natural Gas with Staff Reductions and with New
High Efficiency Boiler No. 8 ($210,633) $4,650,000
No Payback (12.4 years compared to
5A)
89,795 18.3%
5C Revised Central Steam Plant Firing Strategy; Base
Load Natural Gas, Topping with Coal ($455,262)2 $0 No Payback 71,423 14.6%
6 Firing with 40% Torrified Wood at the CHP ($3,723,600) $0 No Payback 70,077 14.3%
7 Firing Biomass at CHP ‐ Nu Materials I Fuel 60 ($3,120,627) $0 No Payback 67,331 13.7%
8 12,000 kW Wind Farm installed at South Bend
Campus $746,0008,9 $26,191,000 35.1 37,296 7.6%
9A Install Natural Gas Cogeneration System at the CHP; 100% Natural Gas Fired for Remaining
Heating
$2,017,0007
(compared to option 5A)
$18,480,000 6.85 47,0767
(compared to option 5A)
9.6%
9B Install Natural Gas Cogeneration System at the
CHP; Remaining Heat Furnished by Coal $2,042,000 $18,480,000 9.1
5 85,173 17.4%
10 Install PV Collectors on all Campus Buildings $611,793 $29,104,000 47.6 10,516 2.1%
Note 1: Savings based on FY 10‐11 estimated average utility costs Note 2: Economics based on no staff reductions Note 3: Based on FY 10‐11 energy related emissions of 489,895 tons CO2 total Note 4: Based on an annual electrical savings of 1,971,000 kWh based on (250 kW) x (8760 hours/year) x 0.90 Utilization Factor
Note 5: Payback period is based on a net present value calculation that credits the Project Installation Cost by $3,000,000 for cost avoidance associated with adding an additional 75,000 lb/hr boiler at the plant
Note 6: Cost savings reduces dramatically if plant if firing solely on natural gas
Note 7: This option assumes that the CHP has been converted to 100% natural gas in the base case.
Note 8: Annual cost savings based on average savings over the 25 year life; actual cash flow becomes positive at the ninth year of the investment
Note 9: Would provide IUB with 35,740,800 kWh of renewable energy credits annually but the current value of such credits are only $29,308 ($0.82/MWh)
11.2 Recommendations

Integrated Energy Master Plan IU 20096161
Page 102
Based on our observations, calculations, and discussions with IU staff, the following recommendations represent the essence of the Integrated Energy Master Plan identified for the Indiana University Bloomington campus:
1) Continue to promote individual and group behaviors in the students, faculty, and staff that reduce
energy consumption and promote a sustainable ethic that will permeate the campus community and beyond. Programs such as the Energy Challenge, the Sustainability Internship Program, and the Green Teams have been key elements in these efforts. Continue and expand these functions to include guidelines for sustainable laboratory practices, guidelines for sustainable office practices, and regular re‐evaluation of campus IT practices to use the latest technology to minimize energy and paper use.
2) Continue requiring LEED certification for all new buildings constructed at the site and for all major renovations (22 buildings were identified as being in need of substantial HVAC capital improvement). Such certification process should include as a minimum, attainment of LEED Silver Certification, commissioning and enhanced commissioning providing an independent peer review engineer during the design process, and a minimum of 15 points achieved under Energy and Atmosphere, Credit 1 – Optimize Energy Performance. In addition, the designer should be required to review the first year of actual building energy performance to verify the accuracy of the computer modeling used to achieve the above referenced credits.
3) Supplement the current Indiana University Bloomington Design Standards with energy systems requirements for all new buildings and major additions to existing buildings.
4) Establish a process going forward to make retro‐commissioning of the HVAC systems of the major existing buildings on campus a continuous process. Begin the work with the prioritized buildings identified by the report. This process is best accomplished by internal retro‐commissioning teams whose main duty is retro‐commissioning, supplemented by outside technical support or training on an as‐needed basis. This additional operational cost of this effort will be significantly outweighed by the energy cost savings that will accrue through its implementation.
5) Continue the current practice of providing metering for the electrical, steam, chilled water, domestic cold water, and natural gas use at each of the major campus buildings. Assemble this data in an energy use database providing rolling annual profiles for benchmarking building consumption against similar buildings and for flagging significant excursions from previous consumption experience. Such data should be used to inform the internal retro‐commissioning teams of prioritized buildings to be addressed.
6) Implement energy conservation measures in the major campus buildings with a marginal payback of 10 years or less. These measures are defined in detail in the body of the report. This is the most important recommendation of the study in that it has the most lasting, transformative effect on the reduction of campus energy use. Since building energy needs determine the “customer” requirements that the energy distribution and source systems must serve, reductions in building energy needs will cascade through the systems, providing for reduced demands on the distribution and source systems as well. Whether these retrofits are undertaken by in‐house personnel, through a QESP program, or by means of a traditional design/bid/build approach, the importance of implementing these changes is paramount to the success of the energy conservation program at IUB.

Integrated Energy Master Plan IU 20096161
Page 103
7) Continue the current effort to selectively replace segments of the existing steam and condensate distribution piping systems due to age and failure potential with new engineered, pre‐insulated piping system components. Failures and earlier replacements indicate that the aging insulation systems on these lines have repeatedly failed, creating high levels of heat loss from the distribution system. Many of these piping runs are 50 and more years old and should be replaced to reduce these distribution heat losses and to improve the reliability of the building systems they serve.
8) Institute a program to survey all steam traps within the campus and assemble a database indicating location, service, size, type, and manufacturer of each trap. During this survey, observe and record, through visual and ultrasonic testing, the operating status of each trap and systematically repair or replace the faulty traps. (Such a process has already been established for the CHP and the distribution piping.) Experience on similar campuses and on the IUB distribution system would indicate that between 10 and 20% of the traps will be malfunctioning and that the cost of the survey and trap replacement will be paid back in less than two years through the energy saved.
9) Retain the capability to fire coal at the Central Heating Plant but make the operational modifications and capital improvements necessary to convert the Central Heating Plant into a high‐efficiency, natural gas fired plant with the infrastructure to reliably fire up to 100% natural gas to meet the campus loads. It is our belief that the Central Heating Plant, either through legislative pressures to limit carbon emissions or tightened EPA requirements on other emissions, will change within the next ten years from a predominately coal fired plant to a plant firing a high percentage or 100% natural gas. To address this upcoming change in plant operations, the aging and inefficient natural gas/oil fired Boiler No. 5 should be replaced with a new high‐efficiency Boiler No. 8.
10) Until a switch has been made at the Central Heating Plant to burn 100% natural gas on a year‐round basis, utilize and improve the operational gas spreadsheets developed in this report to compare coal costs versus natural gas costs on a monthly or seasonal basis to determine the appropriate fuel choice for the University based on the true operating cost on each fuel. If the natural gas cost is higher, determine the monthly premium cost the University is willing to spend for the reduced carbon emissions that will result from this change. (For January of 2012, base loading on natural gas in Boiler No. 7 has yielded favorable results.)
11) When natural gas becomes the prime heating source on campus, the advantages of the large central boiler plant generating steam with coal will largely be eliminated. Therefore, the long range direction for heating energy conversion and distribution to campus should be modified from the current paradigm of a large Central Heating Plant distributing 300+°F steam to the campus to a model of distributed thermal plants delivering relatively low temperature heating water (160°F or less) for heating smaller clusters of buildings or individual buildings. Such a paradigm switch would significantly limit distribution losses through shorter, lower temperature distribution mains and would permit the application of even higher efficiency natural gas condensing boiler technology with the potential for geothermal energy storage to be utilized. Such distributed thermal plants should be installed as new buildings are added at the perimeter of the campus, ultimately working inward to sequentially retire buildings from the central steam system.
12) The first of the natural gas fired distributed thermal heating plants should be installed at the Research Park/Tulip Tree Apartments with additional incremental gas boilers installed at the Campus View Apartments, Recreational Sports, and the Nelson Halls Residence Administration Building. Due to the poor condition of the 150 psig high pressure steam and condensate piping system serving this part of

Integrated Energy Master Plan IU 20096161
Page 104
the campus and the significant distances involved from the Central Heating Plant, this development makes sense based on the high cost of the replacement of this element of the steam and condensate piping network and the significant losses currently occurring due to its use. The design intent of this plant would be to ultimately convert its operation to both heating and cooling with heat pump chillers to recover the data center heat rejection for providing the heating needs of the other buildings on the Research Park Campus.
13) At present, the economics of firing biomass in the form of torrefied wood or Nu‐Materials I Fuel 60 in the IUB coal boilers cannot compete with the economics of firing on natural gas, even when burning the limited quantities of such biomass with coal in quantities to simulate the carbon emission properties of natural gas. In addition, the concept that the burning of biomass such as wood represents a truly carbon neutral process has been challenged in certain areas of the country. Nevertheless, IUB should stay current on this technology including test burns on competing products and identifying any lowering of the price point of these materials if their production mechanisms see more widespread use.
14) Renewable Energy in the form of wind power to generate electricity for the IUB campus cannot currently compete with the cost of purchased electricity from Duke Energy without the assistance of external drivers such as tax incentives, grants, and a firm and consistent market for the renewable energy credits such a wind project could generate. Again IUB should remain cognizant of Federal or State of Indiana grants that may become available for funding wind power projects for public, non‐profit entities. However without such incentives, an investment in such a project at this time is not recommended.
15) Even after the implementation of the energy retrofits recommended, a significant electrical base load will exist on the Indiana University Bloomington campus. To offset a portion of this base load, a 7,500 kW gas turbine cogeneration plant with heat recovery boiler should be installed in or near the current Central Heating Plant generating electricity and recovering waste heat from the process to make steam for campus use. The 75,000 lb/hr heat recovery boiler would further cement the reliability of the CHP as a natural gas fired facility and has the capability of utilizing 77% of the entering natural gas fuel to provide useful electrical and heat energy to the campus while significantly reducing carbon emissions.
16) Solar renewable energy in the form of solar photovoltaic collectors has seen dramatic reductions in cost in recent years, with installed costs in 2011 less than 50% of the same costs in 2008. The expectation is that these costs will continue to drop in coming years as technology and greater production allows prices to continue to plummet. However, at current installed costs of approximately $4.25/watt for a photovoltaic system, compared to campus master meter charges (Duke Energy Rate HPNO), with the typical annual incidence of sunlight hours in Bloomington, and without additional grants or incentives, the payback period in terms of cost/savings will exceed 40 years. However, as a leader among Midwest universities in sustainability awareness and education, IUB should be forward leading in the application of solar photovoltaic technology. The University should continue to search for grants, gifts, tax incentives, and other innovative financing techniques that may serve to make the application of these systems more cost effective.
Of the recommendations listed above that involve substantial investment, Table 11.2.1 summarizes these major Integrated Energy Master Plan initiatives. When completely implemented, these initiatives will cost an estimated $82.6M to implement, reduce annual energy costs by $9.7M per year, and will reduce carbon emissions due to energy use by 52%.

Integrated Energy Master Plan IU 20096161
Page 105
Table 11.2.1: Recommended Integrated Energy Master Plan Initiatives
Project Description Project Type
Annual Energy, Consumables
and Maintenance
Cost1
Implementation Cost
Annual CO2 Savings (tons)
Existing Campus NA $ 26,080,000 NA 496,000
1 Retro‐Commissioning Energy $ (910,000) $ 3,270,000 ‐27,000
2 Building Energy Conservation
Measures Energy $ (5,740,000) $ 44,920,000 ‐105,000
4A
Selective Retrofit for Central Steam and Condensate Distribution Systems (not
including East Main)
Capital Improvement and Energy
$ (950,000) $ 10,600,000 ‐28,000
4C
Abandon 10" East 150 psig Steam Main; Replace with Hot Water Boilers and Heating Water
Distribution System from the Main Split to Research Park
Capital Improvement and Energy
$ (480,000) $ 5,310,0002 ‐22,000
9A Install Natural Gas Cogeneration
System at the CHP
Energy $ (1,790,000) $ 18,480,000 ‐58,000
M&R $ 310,000
5B Revised Central Steam Plant Firing Strategy; 100% Natural Gas with
Staff Reductions
Energy $ 190,000 ‐20,000
M&R $ (360,000)
Project Subtotals $ (9,730,000) $ 82,580,000 ‐260,000
Existing Campus $ 26,080,000 496,000
Campus After Implementation of IEMP $ 16,350,000 236,000
(37% Reduction) (52%
Reduction)
Notes: 1 Savings based on FY 10/11 estimated average utility costs and carbon emission rates. Annual Cost Reduction includes Energy Cost, Maintenance and Repair Cost and consumables related to the use of coal. 2 Installing distribution piping in shallow tunnels increases cost by $2,290,000.

8760 Engineering
Integrated Energy Master Plan IU 20096161
Page 106
Appendix A Supporting Tables and Figures

Table A3.1.1.1: Coal Chemical Composition Analysis FY 09/10 Delivered Coal
Integrated Energy Master Plan IU 20096161 Page 107
AR (As‐Received) MF (Dry Basis) MAF MF (Dry Basis)
Component (Dry Basis)
% by Weight lbs/lb coal Reaction Multiplier lbs Oxygen Required
Sample ID Moisture
(%) Ash (%) Sulfur (%) Btu/lb Ash (%) Sulfur (%) Btu/lb Btu/lb
Carbon (%)
Hydrogen (%)
Nitrogen (%)
Oxygen (%)
Chlorine (%)
Carbon 72.15 0.7215 C + O2 = CO2 2.664 1.922
July‐09 7.79 7.96 2.66 12,184 8.63 2.89 13,213 14,461 73.33 5.18 1.42 8.55 0.01 Hydrogen 5.09 0.0509 H2 + 0.5O2 = H2O 7.937 0.404
August‐09 8.08 8.13 2.46 12,188 8.84 2.68 13,259 14,545 73.76 5.13 1.40 8.19 0.01 Sulfur 2.68 0.0268 S + O2 = SO2 0.998 0.027
September‐09 9.13 8.84 2.34 11,954 9.73 2.58 13,155 14,573 72.54 5.03 1.47 8.65 0.01 Oxygen 8.18 0.0818 Used for Combustion ‐1.000 ‐0.082
October‐09 7.50 9.95 2.37 11,934 10.76 2.56 12,902 14,458 71.31 5.08 1.49 8.80 <0.01 Nitrogen 1.48 0.0148 ‐ ‐ ‐
November‐09 8.15 9.07 2.38 12,179 9.88 2.59 13,260 14,714 72.66 5.17 1.40 8.30 0.01 Ash 10.42 0.1042 ‐ ‐ ‐
December‐09 4.48 7.94 2.81 12,940 8.31 2.94 13,547 14,775 73.81 5.24 1.48 8.22 0.01 Total = 2.271
January‐10 11.76 9.35 2.27 11,418 10.60 2.57 12,940 14,474 74.04 5.41 1.54 5.84 <0.01 Therefore, 2.271 lbs oxygen required to burn one lb of coal; air is 23.1% oxygen
February‐10 9.96 10.53 2.34 11,553 11.70 2.60 12,831 14,531 70.19 4.85 1.53 9.13 0.01 Therefore, 9.83 lbs of air required to burn 1 lb of coal
March‐10 9.85 10.39 2.46 11,778 11.52 2.73 13,065 14,766 70.96 4.92 1.53 8.34 0.01 Carbon Dioxide produced in combustion = 0.7215 + 1.922 = 2.644 lbs CO2 /lb coal
April‐10 8.82 10.31 2.43 11,706 11.31 2.66 12,838 14,475 71.71 4.99 1.51 7.82 0.01 Sulfur Dioxide produced in combustion = 0.0268 + 0.027 = 0.054 lbs SO2 / lb coal
May‐10 8.55 10.71 2.38 11,705 11.71 2.60 12,799 14,497 70.68 5.07 1.48 8.46 0.01 Composition
(Dry) Carbon 72.15%
June‐10 12.36 10.57 2.37 11,228 12.06 2.70 12,812 14,569 70.80 5.04 1.50 7.90 0.01 Hydrogen 5.09%
FY 2010 Average 8.87 9.48 2.44 11,897 10.42 2.68 13,052 14,570 72.15 5.09 1.48 8.18 0.01 Sulfur 2.68%
Total Use = 69,250 short tons @ $51.62/ton = $3,574,685 (Source: Annual Report) Oxygen 8.18%
($51.62 / 2,000 lb coal) x (1 lb coal / 11,897 Btu) x (1,000,000 Btu / MMBtu) = $ 2.17 / MMBtu (Source: Annual Report) Nitrogen 1.48%
Ash 10.42%
Accounting for moisture Total 100.00%
Both HHV and LHV can be expressed in terms of AR (all moisture counted), MF and MAF (only water from combustion of hydrogen). AR, MF, and MAF are commonly used for indicating the heating values of coal:
AR (As Received) indicates that the fuel heating value has been measured with all moisture and ash forming minerals present.
MF (Moisture Free) or Dry indicates that the fuel heating value has been measured after the fuel has been dried of all inherent moisture but still retaining its ash forming minerals.
MAF (Moisture and Ash Free) or DAF (Dry and Ash Free) indicates that the fuel heating value has been measured in the absence of inherent moisture and ash forming minerals.
(2.644 lbs CO2/lb coal) x (2,000 lbs/short ton)/(2.2046 Kg/lb) = 2,398.621 Kg CO2/short ton coal (Dry Basis)
(2,398.621 Kg CO2/ short ton coal) x (1.000 ‐ 0.0887) = 2,185.863 Kg CO2/short ton coal (As Received Basis)
(2,398.621 Kg CO2/2,000 lb coal) x (2.2046 lb CO2/Kg CO2) x (1 lb coal/11,897 Btu) x (84.05/84.05) = 202.53 lb CO2/MMBtu coal (As Received Basis)
Carbon Dioxide Emissions = 202.53 lb CO2/MMBtu Coal (As Received Basis)
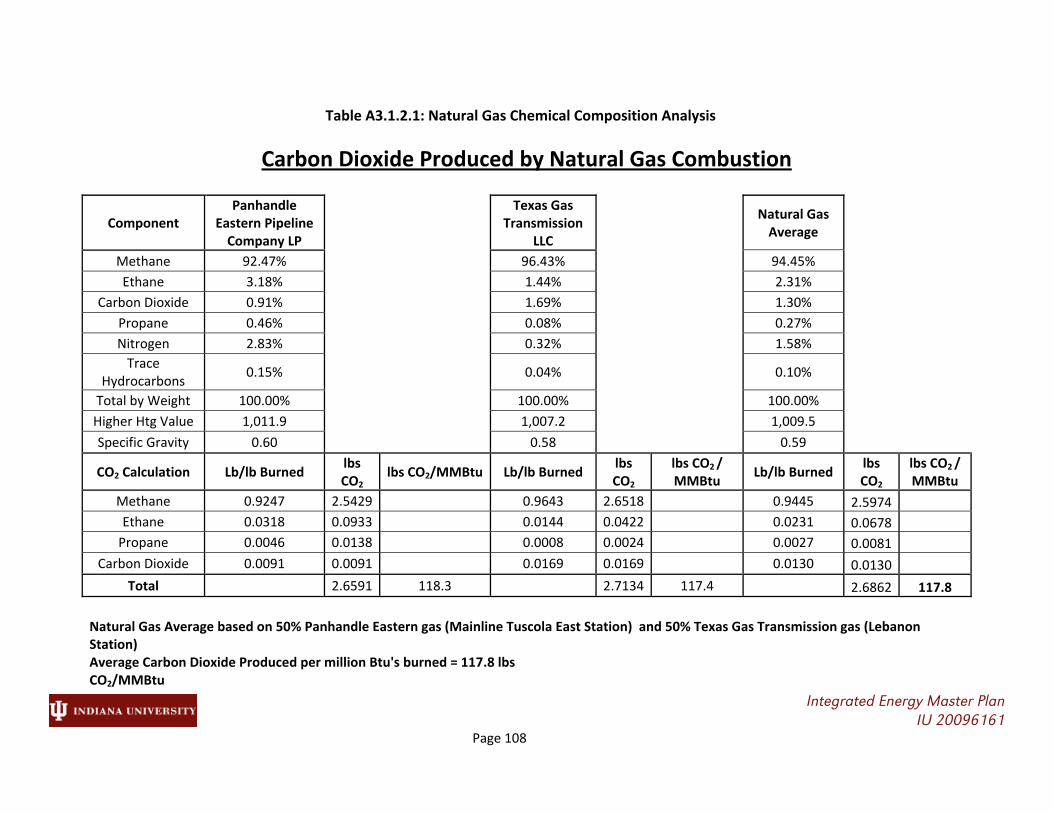
Table A3.1.2.1: Natural Gas Chemical Composition Analysis
Integrated Energy Master Plan IU 20096161 Page 108
Carbon Dioxide Produced by Natural Gas Combustion
Component Panhandle
Eastern Pipeline Company LP
Texas Gas
Transmission LLC
Natural Gas Average
Methane 92.47% 96.43% 94.45%
Ethane 3.18% 1.44% 2.31%
Carbon Dioxide 0.91% 1.69% 1.30%
Propane 0.46% 0.08% 0.27%
Nitrogen 2.83% 0.32% 1.58%
Trace Hydrocarbons
0.15% 0.04%
0.10%
Total by Weight 100.00% 100.00% 100.00%
Higher Htg Value 1,011.9 1,007.2 1,009.5
Specific Gravity 0.60 0.58 0.59
CO2 Calculation Lb/lb Burned lbs CO2
lbs CO2/MMBtu Lb/lb Burned lbs CO2
lbs CO2 / MMBtu
Lb/lb Burned lbs CO2
lbs CO2 / MMBtu
Methane 0.9247 2.5429 0.9643 2.6518 0.9445 2.5974
Ethane 0.0318 0.0933 0.0144 0.0422 0.0231 0.0678
Propane 0.0046 0.0138 0.0008 0.0024 0.0027 0.0081
Carbon Dioxide 0.0091 0.0091 0.0169 0.0169 0.0130 0.0130
Total 2.6591 118.3 2.7134 117.4 2.6862 117.8
Natural Gas Average based on 50% Panhandle Eastern gas (Mainline Tuscola East Station) and 50% Texas Gas Transmission gas (Lebanon Station) Average Carbon Dioxide Produced per million Btu's burned = 117.8 lbs CO2/MMBtu

Table A4.2.1: Steam Unit Cost from Annual Report
Integrated Energy Master Plan IU 20096161 Page 109

Table A4.3.1: Chilled Water Pumps and Cooling Towers – Central Chilled Water Plant
Integrated Energy Master Plan IU 20096161 Page 110

Table A4.3.2: Chilled Water Pumps and Condenser Water Pumps – Central Chilled Water Plant
Integrated Energy Master Plan IU 20096161 Page 111

Table A4.4.1: Chilled Water Unit Cost from Annual Report
Integrated Energy Master Plan IU 20096161 Page 112

Table A5.5.1: Marginal Utility Cost for FY 2010 / 2011
Integrated Energy Master Plan IU 20096161 Page 113
FY 10‐11 Fuel, Energy, and Water Estimates
Actual FY 10/11 Costs
Utility
Electricity Natural Gas Coal
Usage Units Cost Average Cost
Units Service Usage Units Cost Average Cost
Units Usage Units Cost Average Cost
Units
Data 292,246,548 kWh $18,677,297 $0.0639 $/kWh Total
Campus 3,331,611.0 therms $2,542,489.17 $0.763 $/therm 68,493.00 tons $4,263,004.00 $62.24 $/ton
CHP only 1,407,670.0 therms $913,437.00 $0.649 $/therm 16,297,224.4 therm $4,263,004.00 $0.262 $/therm
Campus Only
1,923,941.0 therms $1,629,052.17 $0.847 $/therm
Utility
Fuel Oil Water Sewer
Usage Units Cost Average Cost
Units Usage Units Cost Average Cost
Units Usage Units Cost Average Cost
Units
CHP 9,100 gallons $20,930.00 $2.30 $/gallon 623,435 Kgallons $1,112,303.46 $1.78 $/Kgallons 501,972 Kgallons $2,102,113.39 $4.19 $/Kgallons
Campus 18,440 gallons $54,351.74 $2.95 $/gallon 623,435,000 gallons $1,112,303.46 $0.00178 $/gallon 501,972,000 gallons $2,102,113.39 $0.00419 $/gallon
Total 38,005 therms $75,281.74 $1.98 $/therm
Utility Chilled Water
Units Steam Units
FY 09‐10 Rate
$0.0518 $/ton‐hour
$0.4489 $/therm
Factor 1.0965 ‐ 1.1187 ‐ FY 10‐11 Rate
$0.0568 $/ton‐hour
$0.5022 $/therm
Report Data
Emissions Total Emissions
kWh MMBtu Cost % lb CO2/kWh lb CO2/MMBtutons CO2
%
Electricity 292,246,548 ‐ $18,677,297 73.1% 2.087 ‐ 304,959 62.2%
Coal ‐ 1,629,722 $4,263,004 16.7% ‐ 202.5 165,009 33.7%
Natural Gas ‐ 333,161 $2,542,489 9.9% ‐ 117.8 19,623 4.0%
Fuel Oil ‐ 3,801 $75,282 0.3% ‐ 159.6 303 0.1%
Total Cost ‐ 1,966,684 $25,558,072 100.0% Total
Emissions = 489,895 100.0%

Table A6.1.1: Building Skin Survey, Buildings without Exterior Insulation
Integrated Energy Master Plan IU 20096161 Page 114

Table A6.1.2: Building Skin Survey, Buildings with Single Pane Windows
Integrated Energy Master Plan IU 20096161 Page 115
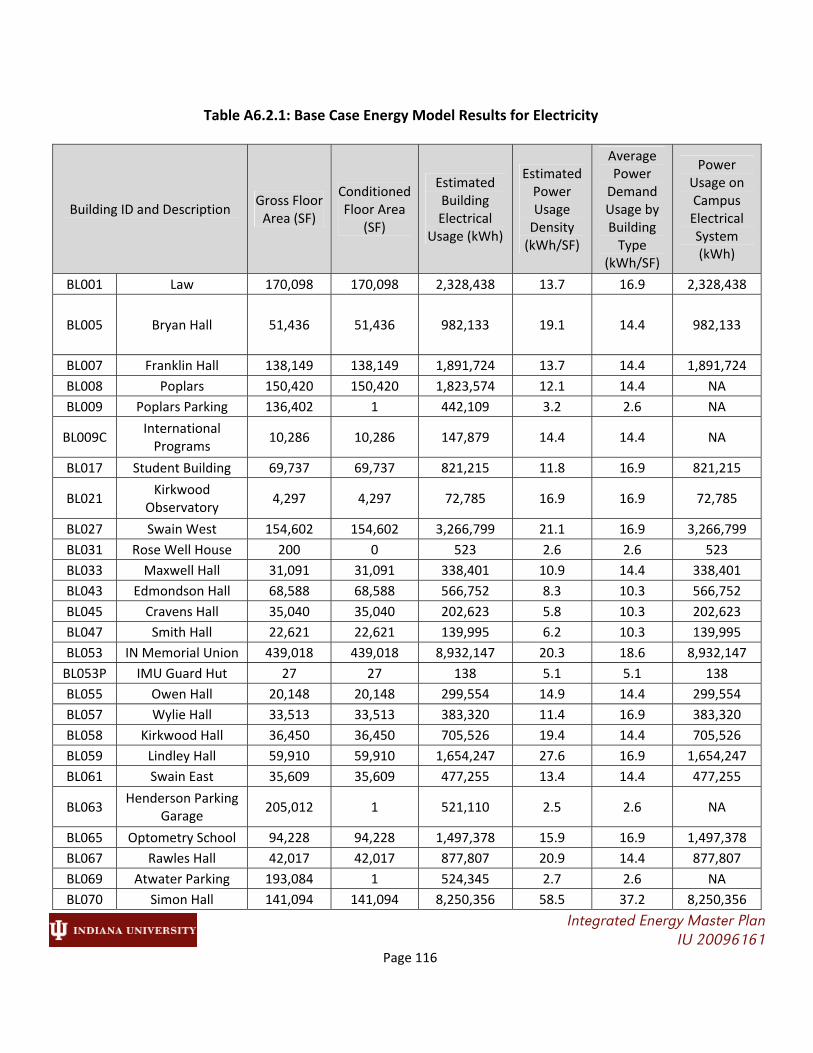
Table A6.2.1: Base Case Energy Model Results for Electricity
Integrated Energy Master Plan IU 20096161 Page 116
Building ID and Description Gross Floor Area (SF)
Conditioned Floor Area
(SF)
Estimated Building Electrical
Usage (kWh)
Estimated Power Usage Density (kWh/SF)
Average Power Demand Usage by Building Type
(kWh/SF)
Power Usage on Campus Electrical System (kWh)
BL001 Law 170,098 170,098 2,328,438 13.7 16.9 2,328,438
BL005 Bryan Hall 51,436 51,436 982,133 19.1 14.4 982,133
BL007 Franklin Hall 138,149 138,149 1,891,724 13.7 14.4 1,891,724
BL008 Poplars 150,420 150,420 1,823,574 12.1 14.4 NA
BL009 Poplars Parking 136,402 1 442,109 3.2 2.6 NA
BL009C International Programs
10,286 10,286 147,879 14.4 14.4 NA
BL017 Student Building 69,737 69,737 821,215 11.8 16.9 821,215
BL021 Kirkwood
Observatory 4,297 4,297 72,785 16.9 16.9 72,785
BL027 Swain West 154,602 154,602 3,266,799 21.1 16.9 3,266,799
BL031 Rose Well House 200 0 523 2.6 2.6 523
BL033 Maxwell Hall 31,091 31,091 338,401 10.9 14.4 338,401
BL043 Edmondson Hall 68,588 68,588 566,752 8.3 10.3 566,752
BL045 Cravens Hall 35,040 35,040 202,623 5.8 10.3 202,623
BL047 Smith Hall 22,621 22,621 139,995 6.2 10.3 139,995
BL053 IN Memorial Union 439,018 439,018 8,932,147 20.3 18.6 8,932,147
BL053P IMU Guard Hut 27 27 138 5.1 5.1 138
BL055 Owen Hall 20,148 20,148 299,554 14.9 14.4 299,554
BL057 Wylie Hall 33,513 33,513 383,320 11.4 16.9 383,320
BL058 Kirkwood Hall 36,450 36,450 705,526 19.4 14.4 705,526
BL059 Lindley Hall 59,910 59,910 1,654,247 27.6 16.9 1,654,247
BL061 Swain East 35,609 35,609 477,255 13.4 14.4 477,255
BL063 Henderson Parking
Garage 205,012 1 521,110 2.5 2.6 NA
BL065 Optometry School 94,228 94,228 1,497,378 15.9 16.9 1,497,378
BL067 Rawles Hall 42,017 42,017 877,807 20.9 14.4 877,807
BL069 Atwater Parking 193,084 1 524,345 2.7 2.6 NA
BL070 Simon Hall 141,094 141,094 8,250,356 58.5 37.2 8,250,356

Table A6.2.1: Base Case Energy Model Results for Electricity (continued)
Integrated Energy Master Plan IU 20096161 Page 117
Building ID and Description Gross Floor Area (SF)
Conditioned Floor Area
(SF)
Estimated Building Electrical
Usage (kWh)
Estimated Power Usage Density (kWh/SF)
Average Power Demand Usage by Building Type
(kWh/SF)
Power Usage on Campus Electrical System (kWh)
(Science)
BL071 Chemistry 183,387 183,387 7,455,436 40.7 37.2 7,455,436
BL072 Chemistry Addition 106,551 106,551 3,925,624 36.8 37.2 3,925,624
BL074A 8th St Hut (Hper) 20 20 102 5.1 5.1 102
BL075 Ernie Pyle Hall 38,292 38,292 1,319,630 34.5 16.9 1,319,630
BL091 Wildermuth Center 141,341 141,341 1,848,911 13.1 18.6 1,848,911
BL095 Beck Chapel 2,046 2,046 38,156 18.6 18.6 38,156
BL101 Myers Hall 76,521 76,521 3,122,753 40.8 37.2 3,122,753
BL107 Jordan Hall 324,279 324,279 9,592,417 29.6 37.2 9,592,417
BL109 Goodbody Hall 37,522 37,522 721,435 19.2 16.9 721,435
BL111 Ballantine Hall 305,420 305,420 3,951,453 12.9 16.9 3,951,453
BL119 HPER Building 189,776 189,776 3,222,523 17.0 18.6 3,222,523
BL130A 7th St Hut 16 16 82 5.1 5.1 82
BL133 Woodburn Hall 73,257 73,257 1,285,792 17.6 14.4 1,285,792
BL135 Bryan House 8,188 8,188 117,716 14.4 14.4 117,716
BL139 Morrison Hall 53,989 53,989 764,644 14.2 14.4 764,644
BL141 Memorial Hall 58,578 58,578 534,218 9.1 14.4 534,218
BL143 Music Practice 18,635 18,635 315,650 16.9 16.9 315,650
BL147 Merrill Hall 58,322 58,322 732,587 12.6 16.9 732,587
BL148 Music Addition 122,165 122,165 2,606,871 21.3 16.9 2,606,871
BL149 Sycamore Hall 74,602 74,602 789,078 10.6 16.9 789,078
BL153 Art Museum 119,314 119,314 4,205,194 35.2 16.9 4,205,194
BL155 Lilly Library 52,516 52,516 774,531 14.7 14.4 774,531
BL157 Fine Arts 115,554 115,554 1,735,591 15.0 16.9 1,735,591
BL158 Radio‐TV 99,373 99,373 1,122,834 11.3 16.9 1,122,834
BL171 Auditorium 238,364 238,364 2,234,290 9.4 16.9 2,234,290
BL172 Lee Norvelle
Theatre Drama/ Neal&Mars
135,627 135,627 3,121,242 23.0 16.9 3,121,242
BL173 IU Cinema 13,506 13,506 116,407 8.6 16.9 116,407
BL177 Musical Arts Center 267,130 267,130 5,690,209 21.3 16.9 5,690,209
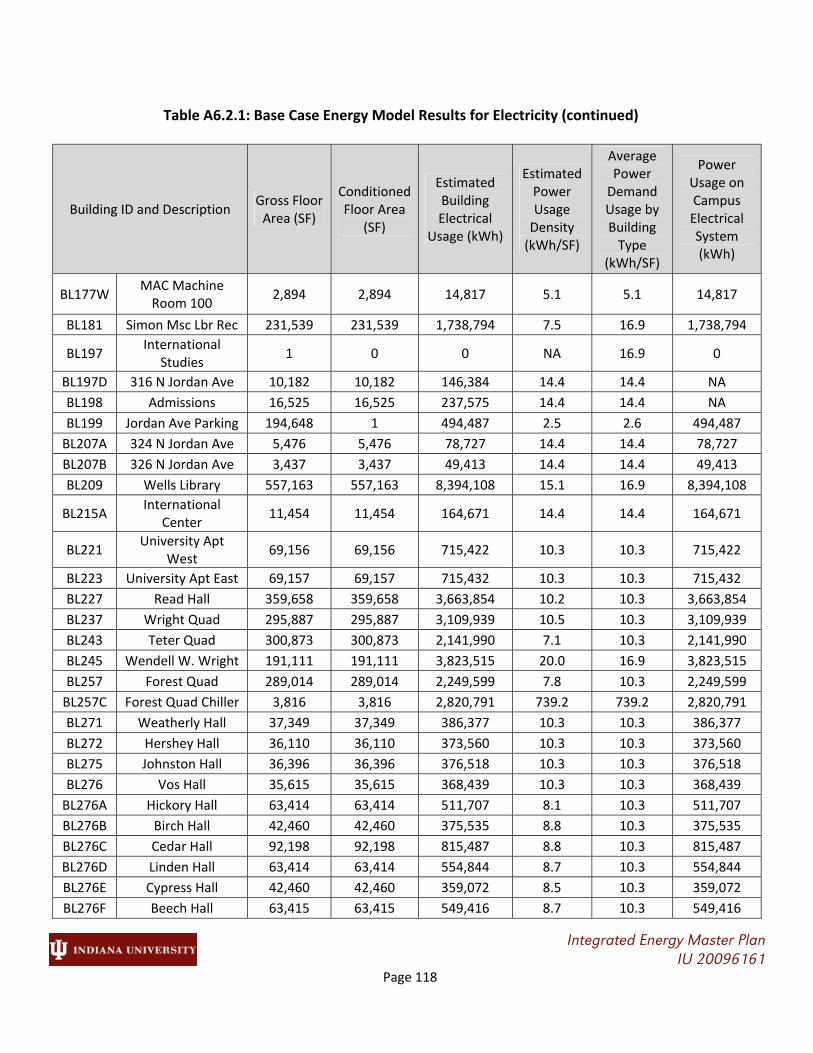
Table A6.2.1: Base Case Energy Model Results for Electricity (continued)
Integrated Energy Master Plan IU 20096161 Page 118
Building ID and Description Gross Floor Area (SF)
Conditioned Floor Area
(SF)
Estimated Building Electrical
Usage (kWh)
Estimated Power Usage Density (kWh/SF)
Average Power Demand Usage by Building Type
(kWh/SF)
Power Usage on Campus Electrical System (kWh)
BL177W MAC Machine Room 100
2,894 2,894 14,817 5.1 5.1 14,817
BL181 Simon Msc Lbr Rec 231,539 231,539 1,738,794 7.5 16.9 1,738,794
BL197 International
Studies 1 0 0 NA 16.9 0
BL197D 316 N Jordan Ave 10,182 10,182 146,384 14.4 14.4 NA
BL198 Admissions 16,525 16,525 237,575 14.4 14.4 NA
BL199 Jordan Ave Parking 194,648 1 494,487 2.5 2.6 494,487
BL207A 324 N Jordan Ave 5,476 5,476 78,727 14.4 14.4 78,727
BL207B 326 N Jordan Ave 3,437 3,437 49,413 14.4 14.4 49,413
BL209 Wells Library 557,163 557,163 8,394,108 15.1 16.9 8,394,108
BL215A International
Center 11,454 11,454 164,671 14.4 14.4 164,671
BL221 University Apt
West 69,156 69,156 715,422 10.3 10.3 715,422
BL223 University Apt East 69,157 69,157 715,432 10.3 10.3 715,432
BL227 Read Hall 359,658 359,658 3,663,854 10.2 10.3 3,663,854
BL237 Wright Quad 295,887 295,887 3,109,939 10.5 10.3 3,109,939
BL243 Teter Quad 300,873 300,873 2,141,990 7.1 10.3 2,141,990
BL245 Wendell W. Wright 191,111 191,111 3,823,515 20.0 16.9 3,823,515
BL257 Forest Quad 289,014 289,014 2,249,599 7.8 10.3 2,249,599
BL257C Forest Quad Chiller 3,816 3,816 2,820,791 739.2 739.2 2,820,791
BL271 Weatherly Hall 37,349 37,349 386,377 10.3 10.3 386,377
BL272 Hershey Hall 36,110 36,110 373,560 10.3 10.3 373,560
BL275 Johnston Hall 36,396 36,396 376,518 10.3 10.3 376,518
BL276 Vos Hall 35,615 35,615 368,439 10.3 10.3 368,439
BL276A Hickory Hall 63,414 63,414 511,707 8.1 10.3 511,707
BL276B Birch Hall 42,460 42,460 375,535 8.8 10.3 375,535
BL276C Cedar Hall 92,198 92,198 815,487 8.8 10.3 815,487
BL276D Linden Hall 63,414 63,414 554,844 8.7 10.3 554,844
BL276E Cypress Hall 42,460 42,460 359,072 8.5 10.3 359,072
BL276F Beech Hall 63,415 63,415 549,416 8.7 10.3 549,416

Table A6.2.1: Base Case Energy Model Results for Electricity (continued)
Integrated Energy Master Plan IU 20096161 Page 119
Building ID and Description Gross Floor Area (SF)
Conditioned Floor Area
(SF)
Estimated Building Electrical
Usage (kWh)
Estimated Power Usage Density (kWh/SF)
Average Power Demand Usage by Building Type
(kWh/SF)
Power Usage on Campus Electrical System (kWh)
BL276G Pine Hall 63,414 63,414 535,619 8.4 10.3 535,619
BL276L Union St Chiller 4,371 4,371 2,194,694 502.1 5.1 2,194,694
BL277 Moffatt Hall 25,769 25,769 266,582 10.3 10.3 266,582
BL278 Griggs Lounge 4,759 4,759 88,752 18.6 18.6 88,752
BL279 Dreiser Hall 2,701 2,701 50,372 18.6 18.6 50,372
BL280 Stempel Hall 40,378 40,378 417,712 10.3 10.3 417,712
BL282 Barnes Lounge 3,892 3,892 72,583 18.6 18.6 72,583
BL297 Willkie B 120,091 120,091 1,341,544 11.2 10.3 1,341,544
BL299 Willkie C 85,302 85,302 2,805,903 32.9 10.3 2,805,903
BL301 Willkie A 119,951 119,951 950,764 7.9 10.3 950,764
BL304 Mason Hall 24,717 24,717 171,405 6.9 10.3 171,405
BL313 Eigenmann Hall 349,442 349,442 6,000,050 17.2 10.3 6,000,050
BL316 408 N Union St 60,229 60,229 NA NA 14.4 NA
BL404A Brown Hall 14,653 14,653 151,586 10.3 10.3 151,586
BL404B Greene Hall 17,294 17,294 178,907 10.3 10.3 178,907
BL404C Monroe Hall 3,394 3,394 57,490 16.9 16.9 57,490
BL404D Morgan Hall 19,434 19,434 201,046 10.3 10.3 201,046
BL405 Research Svc. Bldg. 4,126 4,126 21,124 5.1 5.1 21,124
BL407 DeVault Alumni
Center 32,563 32,563 536,371 16.5 14.4 536,371
BL411 Chilled Water Plant 38,817 38,817 35,348,099 910.6 739.2 35,348,099
BL411N N Forrest Ave
Chiller 0 0 0 NA 5.1 0
BL413 Arts Annex 25,411 25,411 430,426 16.9 16.9 430,426
BL413A Graduate
Printmaking 6,713 6,713 34,369 5.1 5.1 34,369
BL417 Geological Sciences 126,422 126,422 2,521,325 19.9 16.9 2,521,325
BL418 Geological Survey 52,361 52,361 1,044,516 19.9 16.9 1,044,516
BL419 Psychology 155,246 155,246 2,991,502 19.3 16.9 2,991,502
BL423 Multi Science 2 131,074 131,074 3,439,320 26.2 37.2 3,439,320
BL425C 880 N Walnut
Grove 4,189 4,189 43,335 10.3 10.3 43,335

Table A6.2.1: Base Case Energy Model Results for Electricity (continued)
Integrated Energy Master Plan IU 20096161 Page 120
Building ID and Description Gross Floor Area (SF)
Conditioned Floor Area
(SF)
Estimated Building Electrical
Usage (kWh)
Estimated Power Usage Density (kWh/SF)
Average Power Demand Usage by Building Type
(kWh/SF)
Power Usage on Campus Electrical System (kWh)
BL433 Briscoe Quad 279,424 279,424 2,545,804 9.1 10.3 2,545,804
BL437 McNutt North 153,143 153,143 1,299,989 8.5 10.3 1,299,989
BL439 McNutt Central 78,264 78,264 1,591,464 20.3 18.6 1,591,464
BL441 McNutt South 129,665 129,665 1,051,898 8.1 10.3 1,051,898
BL445 Central Heating 84,020 3,000 1,240,084 413.4 5.1 1,240,084
BL448 Fee Lane Pkg
Garage 223,279 1 508,539 2.3 2.6 508,539
BL450 Godfrey
Grad&Exec Ed Ctr 191,743 191,743 1,698,131 8.9 16.9 1,698,131
BL451 Business School 238,158 238,158 4,232,737 17.8 16.9 4,232,737
BL452 SPEA 128,619 128,619 3,135,440 24.4 16.9 3,135,440
BL453 Harper Hall 109,147 109,147 894,214 8.2 10.3 894,214
BL454 Gresham Dining
Hall 50,888 50,888 526,076 10.3 18.6 526,076
BL455 Shea Hall 42,003 42,003 300,455 7.2 10.3 300,455
BL456 Martin Hall 37,063 37,063 270,964 7.3 10.3 270,964
BL461 Magee Hall 37,064 37,064 299,401 8.1 10.3 299,401
BL462 Jenkinson Hall 36,896 36,896 284,596 7.7 10.3 284,596
BL463 Nelson RPS Admin. 40,453 40,453 529,993 13.1 14.4 529,993
BL465C Wells House 6,678 6,678 96,008 14.4 14.4 96,008
BL467 Health Center 64,656 64,656 1,966,587 30.4 18.6 1,966,587
BL475 Recreational Sports 253,302 253,302 5,818,687 23.0 18.6 5,818,687
BL489 Rogers HL Elev
Pump 388 0 0 NA 149.9 0
BL490 Physical Plt Storage 15,047 0 0 NA 5.1 0
BL493 Hepburn
Apartments 26,033 26,033 269,313 10.3 10.3 269,313
BL513 Nutt Apartments 24,520 24,520 253,661 10.3 10.3 253,661
BL519 Bicknell Hall 25,212 25,212 260,819 10.3 10.3 260,819
BL523 Hoosier Courts D/C 6,481 6,481 120,866 18.6 18.6 120,866
BL529 Campus View Apartments
267,723 267,723 3,500,433 13.1 10.3 3,500,433

Table A6.2.1: Base Case Energy Model Results for Electricity (continued)
Integrated Energy Master Plan IU 20096161 Page 121
Building ID and Description Gross Floor Area (SF)
Conditioned Floor Area
(SF)
Estimated Building Electrical
Usage (kWh)
Estimated Power Usage Density (kWh/SF)
Average Power Demand Usage by Building Type
(kWh/SF)
Power Usage on Campus Electrical System (kWh)
BL539 Banta Apartments 35,904 35,904 371,429 10.3 10.3 371,429
BL543 Evermann Apartments
218,273 218,273 2,258,045 10.3 10.3 2,258,045
BL545 Carillon 943 943 2,466 2.6 2.6 2,466
BL547 Redbud 2 North 49,030 49,030 507,218 10.3 10.3 507,218
BL548 Redbud 1 East 49,029 49,029 507,207 10.3 10.3 507,207
BL549 Botany
Greenhouse 3,225 3,225 8,433 2.6 2.6 8,433
BL549A Junior Gardening 908 908 2,374 2.6 2.6 2,374
BL549B Pole Barn A 718 0 1,878 2.6 2.6 1,878
BL549C Pole Barn B 598 0 1,564 2.6 2.6 1,564
BL549G Botany Field Greenhouse
20,559 20,559 105,257 5.1 5.1 105,257
BL550 Research Lab 693 693 25,755 37.2 37.2 25,755
BL551 Hilltop Garden
Center 3,397 3,397 63,351 18.6 18.6 63,351
BL552 Fly Magnetic
Center 740 740 3,789 5.1 5.1 3,789
BL555 Tulip Tree Apts 263,003 263,003 2,407,930 9.2 10.3 2,407,930
BL563 Innovation Center 39,871 39,871 686,426 17.2 14.4 NA
BL565 U School E‐1 10,151 10,151 145,938 14.4 14.4 145,938
BL566 UITS E‐2 15,033 15,033 216,125 14.4 14.4 216,125
BL567 U School E‐3 6,512 6,512 93,621 14.4 14.4 93,621
BL568 UITS E‐4 8,323 8,323 119,657 14.4 14.4 119,657
BL569 Wrubel Computing
Ct 47,248 47,248 679,270 14.4 14.4 679,270
BL570 UITS E‐5 12,714 12,714 182,785 14.4 14.4 182,785
BL571 Communication
Svcs. 20,028 20,028 287,937 14.4 14.4 287,937
BL572 Intercol. Athl. Gym 35,669 35,669 665,200 18.6 18.6 665,200
BL573 Smith Research
Center 56,312 56,312 809,581 14.4 14.4 809,581
BL576 Childrens Center 11,836 11,836 220,732 18.6 18.6 220,732

Table A6.2.1: Base Case Energy Model Results for Electricity (continued)
Integrated Energy Master Plan IU 20096161 Page 122
Building ID and Description Gross Floor Area (SF)
Conditioned Floor Area
(SF)
Estimated Building Electrical
Usage (kWh)
Estimated Power Usage Density (kWh/SF)
Average Power Demand Usage by Building Type
(kWh/SF)
Power Usage on Campus Electrical System (kWh)
BL577 ROTC Supply
Center 10,421 10,421 53,353 5.1 5.1 53,353
BL578 Cyberinfrastructure
Bldg (CIB) 131,140 131,140 20,789,342 158.5 158.5 20,789,342
BL579 Data Center 81,186 81,186 12,870,242 158.5 158.5 NA
BL580 Disability & Community
39,419 39,419 566,715 14.4 14.4 566,715
BL595 Mellencamp Pavilion
100,282 100,282 1,034,749 10.3 18.6 NA
BL601 Memorial Stadium 253,872 16,749 473,507 28.3 18.6 473,507
BL601a Memorial Stadium
East Stands 46,384 46,384 699,227 15.1 18.6 699,227
BL601b Memorial Stadium
West Stands 56,223 56,223 1,492,087 26.5 18.6 1,492,087
BL601c Memorial Stadium North Endzone
115,919 70,000 1,514,833 21.6 18.6 NA
BL602 Tennis Center 57,708 57,708 991,403 17.2 18.6 991,403
BL603 Assembly Hall 381,106 381,106 4,743,415 12.4 18.6 4,743,415
BL604 Gladstein Fieldhouse
103,427 103,427 2,266,366 21.9 18.6 2,266,366
BL605 Outdoor Pool 4,550 4,550 84,854 18.6 18.6 84,854
BL606 Sembwr
Concession 1,405 1,405 7,193 5.1 5.1 7,193
BL606A Sembwr DO 3rd
Base 362 0 0 NA 149.9 0
BL606B Sembwr DO 1st
Base 362 0 0 NA 149.9 0
BL606C Softball DO 3rd
Base 242 0 0 NA 149.9 0
BL606D Softball DO 1st
Base 242 0 0 NA 149.9 0
BL606E Softball Press Box 589 0 0 NA 5.1 0
BL606F Sembwr Press Box 653 653 3,343 5.1 5.1 3,343

Table A6.2.1: Base Case Energy Model Results for Electricity (continued)
Integrated Energy Master Plan IU 20096161 Page 123
Building ID and Description Gross Floor Area (SF)
Conditioned Floor Area
(SF)
Estimated Building Electrical
Usage (kWh)
Estimated Power Usage Density (kWh/SF)
Average Power Demand Usage by Building Type
(kWh/SF)
Power Usage on Campus Electrical System (kWh)
BL607 Cook Hall 69,441 69,441 2,387,653 34.4 18.6 2,387,653
BL612 N. Fee Rec. Storage 1,309 1,309 3,423 2.6 2.6 3,423
BL614 ALF‐Ruth Lilly Auxilary Library
55,824 55,824 2,170,598 38.9 16.9 NA
BL615 IU Warehouse 130,746 130,746 669,387 5.1 5.1 NA
BL630 Service Bldg 78,452 78,452 934,249 11.9 14.4 NA
BL664 IU Research Park 71,120 71,120 NA NA 14.4 NA
BL672 Food Storage 81,273 81,273 NA NA 5.1 NA
BL899 Showalter Fountain 1,500 0 0 NA 149.9 0
BL614 ALF‐Ruth Lilly Auxilary Library
55,824 55,824 2,170,598 38.9 16.9 NA
BL615 IU Warehouse 130,746 130,746 669,387 5.1 5.1 NA
BL630 Service Bldg 78,452 78,452 934,249 11.9 14.4 NA
BL664 IU Research Park 71,120 71,120 NA NA 14.4 NA
BL672 Food Storage 81,273 81,273 NA NA 5.1 NA
BL990P Informatics East 39,922 39,922 676,222 16.9 16.9 NA
Total 15,711,983 14,375,252 296,895,893 5,362 5,193 268,721,979

Table A6.2.2: Base Case Energy Model Results for Heating
Integrated Energy Master Plan IU 20096161 Page 124
Building ID and Description Gross Floor Area (SF)
Conditioned Floor Area
(SF)
Estimated Building Annual
Steam and Gas Usage (MMBtu)
Estimated Annual
Steam and Gas
(MBtu/SF)
Average Steam and Gas Density by Building
Type (Mbtu/SF)
Estimated Central
Steam Plant Usage
(MMBtu)
Basis for Energy Usage
BL001 Law 170,098 170,098 11,859 70 81 11,859 Model Data
BL005 Bryan Hall 51,436 51,436 5,562 108 69 5,249 Meter Data
BL007 Franklin Hall 138,149 138,149 12,611 91 69 12,611 Meter Data
BL008 Poplars 150,420 150,420 6,189 41 69 0 Model Data
BL009 Poplars Parking 136,402 1 0 0 1 0 Model Data
BL017 Student Building 69,737 69,737 7,773 111 81 7,773 Meter Data
BL021 Kirkwood
Observatory 4,297 4,297 348 81 81 340 SF Estimate
BL027 Swain West 154,602 154,602 16,332 106 81 16,332 Meter Data
BL033 Maxwell Hall 31,091 31,091 2,483 80 69 2,483 Meter Data
BL043 Edmondson Hall 68,588 68,588 6,293 92 58 6,293 Meter Data
BL045 Cravens Hall 35,040 35,040 2,297 66 58 2,297 Meter Data
BL047 Smith Hall 22,621 22,621 2,525 112 58 2,525 Meter Data
BL053 IN Memorial Union 439,018 439,018 29,025 66 84 26,797 Model Data
BL055 Owen Hall 20,148 20,148 706 35 69 706 Model Data
BL057 Wylie Hall 33,513 33,513 2,758 82 81 2,758 Meter Data
BL058 Kirkwood Hall 36,450 36,450 1,417 39 69 1,417 Model Data
BL059 Lindley Hall 59,910 59,910 5,513 92 81 5,513 Meter Data
BL061 Swain East 35,609 35,609 2,988 84 69 2,988 Model Data

Table A6.2.2: Base Case Energy Model Results for Heating (continued)
Integrated Energy Master Plan IU 20096161 Page 125
Building ID and Description Gross Floor Area (SF)
Conditioned Floor Area
(SF)
Estimated Building Annual
Steam and Gas Usage (MMBtu)
Estimated Annual
Steam and Gas
(MBtu/SF)
Average Steam and Gas Density by Building
Type (Mbtu/SF)
Estimated Central
Steam Plant Usage
(MMBtu)
Basis for Energy Usage
BL063 Henderson Parking
Garage 205,012 1 664 3 1 0 Model Data
BL065 Optometry School 94,228 94,228 8,022 85 81 0 Model Data
BL067 Rawles Hall 42,017 42,017 2,146 51 69 2,146 Meter Data
BL069 Atwater Parking 193,084 1 481 2 1 0 Model Data
BL070 Simon Hall (Science) 141,094 141,094 8,272 59 111 8,112 Meter Data
BL071 Chemistry 183,387 183,387 14,244 78 111 13,807 Meter Data
BL072 Chemistry Addition 106,551 106,551 6,648 62 111 6,648 Model Data
BL075 Ernie Pyle Hall 38,292 38,292 7,500 196 81 7,500 Meter Data
BL091 Wildermuth Center 141,341 141,341 3,681 26 84 3,681 Model Data
BL095 Beck Chapel 2,046 2,046 172 84 84 163 SF Estimate
BL101 Myers Hall 76,521 76,521 14,619 191 111 14,619 Meter Data
BL107 Jordan Hall 324,279 324,279 57,515 177 111 57,150 Meter Data
BL109 Goodbody Hall 37,522 37,522 2,233 60 81 2,233 Meter Data
BL111 Ballantine Hall 305,420 305,420 14,735 48 81 14,735 Meter Data
BL119 HPER Building 189,776 189,776 5,575 29 84 5,575 Model Data
BL133 Woodburn Hall 73,257 73,257 5,556 76 69 5,556 Meter Data
BL139 Morrison Hall 53,989 53,989 3,664 68 69 3,664 Model Data
BL141 Memorial Hall 58,578 58,578 4,174 71 69 4,174 Meter Data
BL147 Merrill Hall 58,322 58,322 6,311 108 81 6,311 Meter Data

Table A6.2.2: Base Case Energy Model Results for Heating (continued)
Integrated Energy Master Plan IU 20096161 Page 126
Building ID and Description Gross Floor Area (SF)
Conditioned Floor Area
(SF)
Estimated Building Annual
Steam and Gas Usage (MMBtu)
Estimated Annual
Steam and Gas
(MBtu/SF)
Average Steam and Gas Density by Building
Type (Mbtu/SF)
Estimated Central
Steam Plant Usage
(MMBtu)
Basis for Energy Usage
BL148 Music Addition 122,165 122,165 13,480 110 81 13,480 Model Data
BL149 Sycamore Hall 74,602 74,602 2,239 30 81 2,239 Model Data
BL153 Art Museum 119,314 119,314 8,009 67 81 8,009 Model Data
BL155 Lilly Library 52,516 52,516 5,034 96 69 5,034 Meter Data
BL157 Fine Arts 115,554 115,554 8,064 70 81 7,644 Model Data
BL158 Radio‐TV 99,373 99,373 7,643 77 81 7,643 Meter Data
BL171 Auditorium 238,364 238,364 10,666 45 81 10,666 Meter Data
BL172 Lee Norvelle Theatre Drama/ Neal&Mars
135,627 135,627 11,122 82 81 11,122 Meter Data
BL173 IU Cinema 13,506 13,506 7 0 81 0 Model Data
BL177 Musical Arts Center 267,130 267,130 14,943 56 81 14,943 Meter Data
BL177W MAC Machine Room
100 2,894 2,894 57 20 20 0 SF Estimate
BL181 Simon Msc Lbr Rec 231,539 231,539 20,144 87 81 20,144 Meter Data
BL199 Jordan Ave Parking 194,648 1 0 0 1 0 Model Data
BL209 Wells Library 557,163 557,163 55,317 99 81 55,317 Meter Data
BL215A International Center 11,454 11,454 792 69 69 652 SF Estimate
BL221 University Apt West 69,156 69,156 4,028 58 58 3,593 SF Estimate
BL223 University Apt East 69,157 69,157 4,029 58 58 3,593 SF Estimate
BL227 Read Hall 359,658 359,658 13,976 39 58 13,976 Meter Data
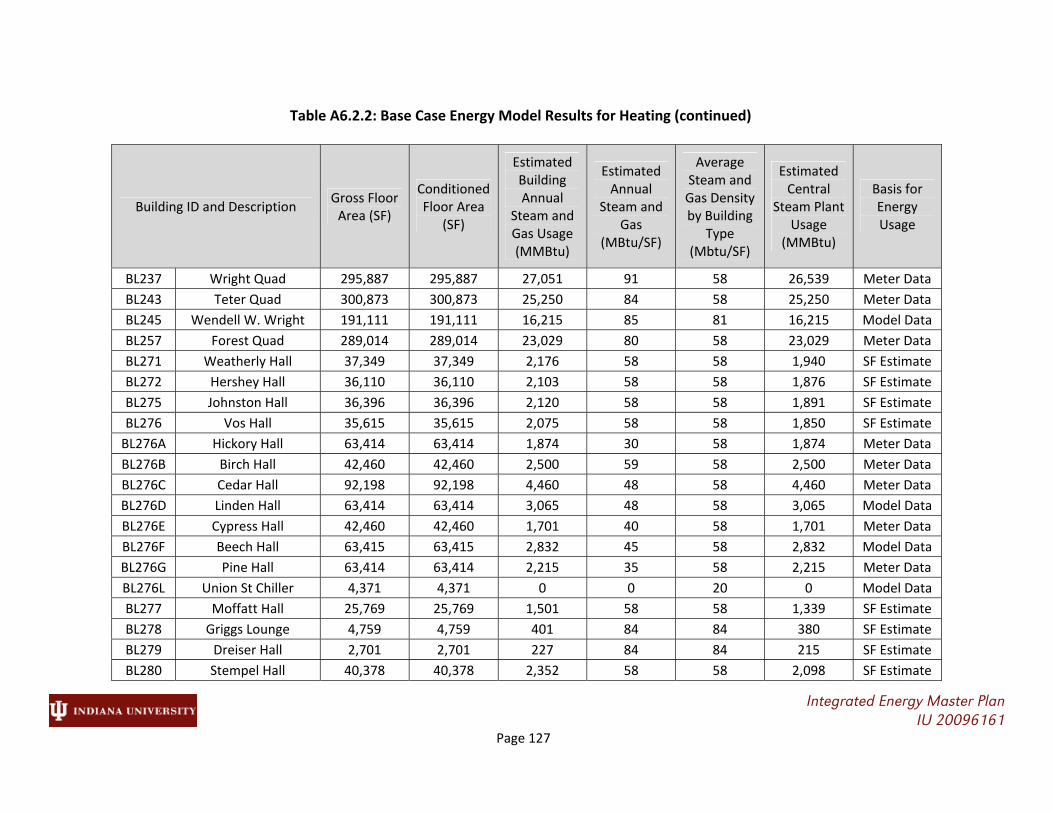
Table A6.2.2: Base Case Energy Model Results for Heating (continued)
Integrated Energy Master Plan IU 20096161 Page 127
Building ID and Description Gross Floor Area (SF)
Conditioned Floor Area
(SF)
Estimated Building Annual
Steam and Gas Usage (MMBtu)
Estimated Annual
Steam and Gas
(MBtu/SF)
Average Steam and Gas Density by Building
Type (Mbtu/SF)
Estimated Central
Steam Plant Usage
(MMBtu)
Basis for Energy Usage
BL237 Wright Quad 295,887 295,887 27,051 91 58 26,539 Meter Data
BL243 Teter Quad 300,873 300,873 25,250 84 58 25,250 Meter Data
BL245 Wendell W. Wright 191,111 191,111 16,215 85 81 16,215 Model Data
BL257 Forest Quad 289,014 289,014 23,029 80 58 23,029 Meter Data
BL271 Weatherly Hall 37,349 37,349 2,176 58 58 1,940 SF Estimate
BL272 Hershey Hall 36,110 36,110 2,103 58 58 1,876 SF Estimate
BL275 Johnston Hall 36,396 36,396 2,120 58 58 1,891 SF Estimate
BL276 Vos Hall 35,615 35,615 2,075 58 58 1,850 SF Estimate
BL276A Hickory Hall 63,414 63,414 1,874 30 58 1,874 Meter Data
BL276B Birch Hall 42,460 42,460 2,500 59 58 2,500 Meter Data
BL276C Cedar Hall 92,198 92,198 4,460 48 58 4,460 Meter Data
BL276D Linden Hall 63,414 63,414 3,065 48 58 3,065 Model Data
BL276E Cypress Hall 42,460 42,460 1,701 40 58 1,701 Meter Data
BL276F Beech Hall 63,415 63,415 2,832 45 58 2,832 Model Data
BL276G Pine Hall 63,414 63,414 2,215 35 58 2,215 Meter Data
BL276L Union St Chiller 4,371 4,371 0 0 20 0 Model Data
BL277 Moffatt Hall 25,769 25,769 1,501 58 58 1,339 SF Estimate
BL278 Griggs Lounge 4,759 4,759 401 84 84 380 SF Estimate
BL279 Dreiser Hall 2,701 2,701 227 84 84 215 SF Estimate
BL280 Stempel Hall 40,378 40,378 2,352 58 58 2,098 SF Estimate

Table A6.2.2: Base Case Energy Model Results for Heating (continued)
Integrated Energy Master Plan IU 20096161 Page 128
Building ID and Description Gross Floor Area (SF)
Conditioned Floor Area
(SF)
Estimated Building Annual
Steam and Gas Usage (MMBtu)
Estimated Annual
Steam and Gas
(MBtu/SF)
Average Steam and Gas Density by Building
Type (Mbtu/SF)
Estimated Central
Steam Plant Usage
(MMBtu)
Basis for Energy Usage
BL282 Barnes Lounge 3,892 3,892 328 84 84 311 SF Estimate
BL297 Willkie B 120,091 120,091 0 0 58 0 Model Data
BL299 Willkie C 85,302 85,302 22,114 259 58 0 Model Data
BL301 Willkie A 119,951 119,951 0 0 58 0 Model Data
BL304 Mason Hall 24,717 24,717 1,662 67 58 0 Model Data
BL313 Eigenmann Hall 349,442 349,442 11,883 34 58 11,883 Model Data
BL316 408 N Union St 60,229 60,229 4,166 69 69 0 SF Estimate
BL404A Brown Hall 14,653 14,653 854 58 58 761 SF Estimate
BL404B Greene Hall 17,294 17,294 1,007 58 58 899 SF Estimate
BL404C Monroe Hall 3,394 3,394 275 81 81 268 SF Estimate
BL404D Morgan Hall 19,434 19,434 1,132 58 58 1,010 SF Estimate
BL405 Research Svc. Bldg. 4,126 4,126 82 20 20 0 SF Estimate
BL407 DeVault Alumni
Center 32,563 32,563 3,527 108 69 3,340 Meter Data
BL411 Chilled Water Plant 38,817 38,817 475 12 0 0 Model Data
BL413 Arts Annex 25,411 25,411 2,060 81 81 2,009 SF Estimate
BL417 Geological Sciences 126,422 126,422 9,474 75 81 9,474 Meter Data
BL418 Geological Survey 52,361 52,361 4,239 81 81 4,239 Model Data
BL419 Psychology 155,246 155,246 15,589 100 81 15,589 Meter Data
BL423 Multi Science 2 131,074 131,074 5,503 42 111 5,503 Model Data
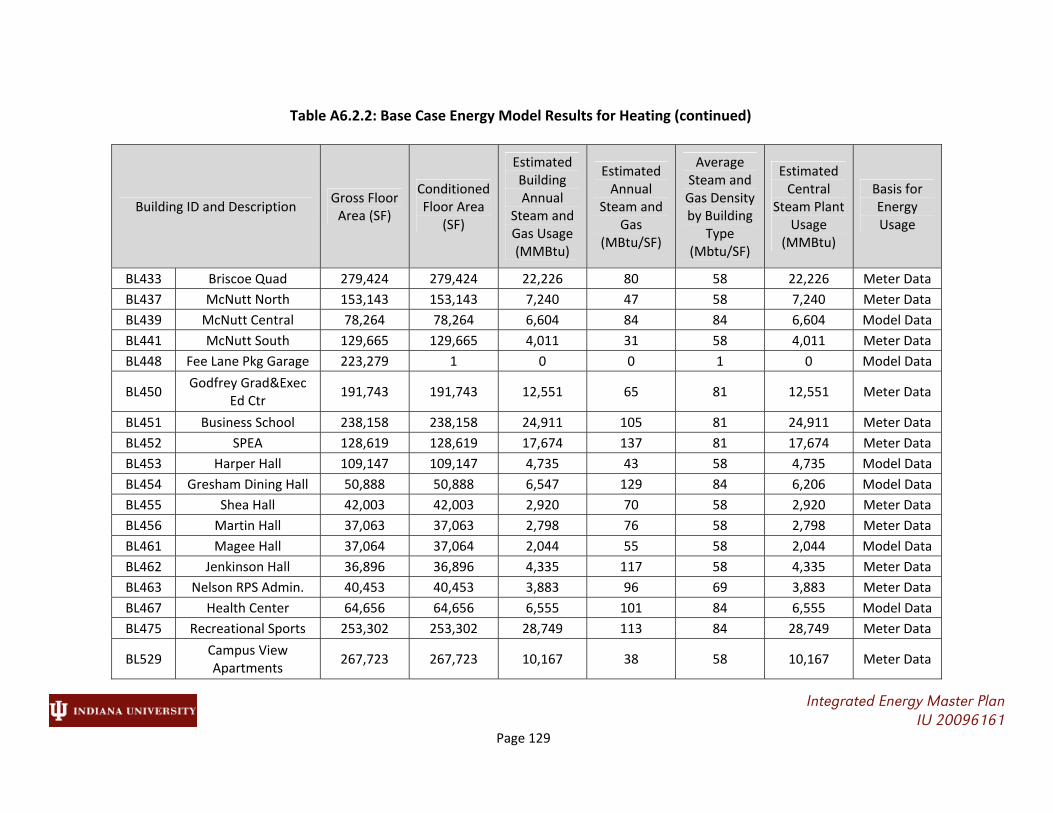
Table A6.2.2: Base Case Energy Model Results for Heating (continued)
Integrated Energy Master Plan IU 20096161 Page 129
Building ID and Description Gross Floor Area (SF)
Conditioned Floor Area
(SF)
Estimated Building Annual
Steam and Gas Usage (MMBtu)
Estimated Annual
Steam and Gas
(MBtu/SF)
Average Steam and Gas Density by Building
Type (Mbtu/SF)
Estimated Central
Steam Plant Usage
(MMBtu)
Basis for Energy Usage
BL433 Briscoe Quad 279,424 279,424 22,226 80 58 22,226 Meter Data
BL437 McNutt North 153,143 153,143 7,240 47 58 7,240 Meter Data
BL439 McNutt Central 78,264 78,264 6,604 84 84 6,604 Model Data
BL441 McNutt South 129,665 129,665 4,011 31 58 4,011 Meter Data
BL448 Fee Lane Pkg Garage 223,279 1 0 0 1 0 Model Data
BL450 Godfrey Grad&Exec
Ed Ctr 191,743 191,743 12,551 65 81 12,551 Meter Data
BL451 Business School 238,158 238,158 24,911 105 81 24,911 Meter Data
BL452 SPEA 128,619 128,619 17,674 137 81 17,674 Meter Data
BL453 Harper Hall 109,147 109,147 4,735 43 58 4,735 Model Data
BL454 Gresham Dining Hall 50,888 50,888 6,547 129 84 6,206 Model Data
BL455 Shea Hall 42,003 42,003 2,920 70 58 2,920 Meter Data
BL456 Martin Hall 37,063 37,063 2,798 76 58 2,798 Meter Data
BL461 Magee Hall 37,064 37,064 2,044 55 58 2,044 Model Data
BL462 Jenkinson Hall 36,896 36,896 4,335 117 58 4,335 Meter Data
BL463 Nelson RPS Admin. 40,453 40,453 3,883 96 69 3,883 Meter Data
BL467 Health Center 64,656 64,656 6,555 101 84 6,555 Model Data
BL475 Recreational Sports 253,302 253,302 28,749 113 84 28,749 Meter Data
BL529 Campus View Apartments
267,723 267,723 10,167 38 58 10,167 Meter Data

Table A6.2.2: Base Case Energy Model Results for Heating (continued)
Integrated Energy Master Plan IU 20096161 Page 130
Building ID and Description Gross Floor Area (SF)
Conditioned Floor Area
(SF)
Estimated Building Annual
Steam and Gas Usage (MMBtu)
Estimated Annual
Steam and Gas
(MBtu/SF)
Average Steam and Gas Density by Building
Type (Mbtu/SF)
Estimated Central
Steam Plant Usage
(MMBtu)
Basis for Energy Usage
BL555 Tulip Tree Apts 263,003 263,003 9,479 36 58 9,479 Meter Data
BL563 Innovation Center 39,871 39,871 3,158 79 69 0 Model Data
BL565 U School E‐1 10,151 10,151 702 69 69 578 SF Estimate
BL566 UITS E‐2 15,033 15,033 1,040 69 69 856 SF Estimate
BL567 U School E‐3 6,512 6,512 450 69 69 371 SF Estimate
BL568 UITS E‐4 8,323 8,323 576 69 69 474 SF Estimate
BL569 Wrubel Computing Ct 47,248 47,248 3,268 69 69 2,691 SF Estimate
BL570 UITS E‐5 12,714 12,714 879 69 69 724 SF Estimate
BL571 Communication Svcs. 20,028 20,028 1,385 69 69 1,141 SF Estimate
BL572 Intercol. Athl. Gym 35,669 35,669 3,002 84 84 2,846 SF Estimate
BL573 Smith Research
Center 56,312 56,312 3,895 69 69 3,207 SF Estimate
BL576 Childrens Center 11,836 11,836 996 84 84 944 SF Estimate
BL577 ROTC Supply Center 10,421 10,421 206 20 20 0 SF Estimate
BL578 Cyberinfrastructure
Bldg (CIB) 131,140 131,140 6,137 47 47 6,137 SF Estimate
BL579 Data Center 81,186 81,186 3,799 47 47 3,799 Meter Data
BL580 Disability & Community
39,419 39,419 2,726 69 69 2,245 SF Estimate
BL595 Mellencamp Pavilion 100,282 100,282 5,162 51 84 0 Model Data

Table A6.2.2: Base Case Energy Model Results for Heating (continued)
Integrated Energy Master Plan IU 20096161 Page 131
Building ID and Description Gross Floor Area (SF)
Conditioned Floor Area
(SF)
Estimated Building Annual
Steam and Gas Usage (MMBtu)
Estimated Annual
Steam and Gas
(MBtu/SF)
Average Steam and Gas Density by Building
Type (Mbtu/SF)
Estimated Central
Steam Plant Usage
(MMBtu)
Basis for Energy Usage
BL601 Memorial Stadium 253,872 16,749 0 0 84 0 Model Data
BL601a Memorial Stadium
East Stands 46,384 46,384 0 0 84 0 Model Data
BL601b Memorial Stadium
West Stands 56,223 56,223 0 0 84 0 Model Data
BL601c Memorial Stadium North Endzone
115,919 70,000 1,552 13 84 0 Model Data
BL602 Tennis Center 57,708 57,708 6,560 114 84 6,560 Meter Data
BL603 Assembly Hall 381,106 381,106 35,606 93 84 35,606 Meter Data
BL604 Gladstein Fieldhouse 103,427 103,427 33,578 325 84 33,578 Meter Data
BL605 Outdoor Pool 4,550 4,550 383 84 84 363 SF Estimate
BL607 Cook Hall 69,441 69,441 9,107 131 84 9,107 Meter Data
BL614 ALF‐Ruth Lilly Auxilary Library
55,824 55,824 0 0 81 0 Model Data
BL615 IU Warehouse 130,746 130,746 2,589 20 20 0 SF Estimate
BL630 Service Bldg 78,452 78,452 1,569 20 69 0 Model Data
BL664 IU Research Park 71,120 71,120 4,919 69 69 0 SF Estimate
BL672 Food Storage 81,273 81,273 1,609 20 20 0 SF Estimate
Total 14,587,875 13,352,413 982,243 906,947

Table A6.2.3: Base Case Energy Model Results for Chilled Water
Integrated Energy Master Plan IU 20096161 Page 132
Building ID and Description Gross Floor Area (SF)
Conditioned Floor Area
(SF)
Estimated Central Cooling
Plant Usage (Ton‐Hours)
Estimated CHW Use Density (Ton‐
Hour/SF)
Average CHW Use Density by Building
Type (Ton‐Hour/SF)
BL001 Law 170,098 170,098 872,739 5.1 4.9
BL005 Bryan Hall 51,436 51,436 658,233 12.8 4.1
BL007 Franklin Hall 138,149 138,149 905,514 6.6 4.1
BL017 Student Building 69,737 69,737 454,379 6.5 4.9
BL021 Kirkwood Observatory
4,297 4,297 20,853 4.9 4.9
BL027 Swain West 154,602 154,602 662,048 4.3 4.9
BL033 Maxwell Hall 31,091 31,091 77,069 2.5 4.1
BL043 Edmondson Hall 68,588 68,588 8,478 0.1 2.3
BL053 IN Memorial Union 439,018 439,018 2,331,360 5.3 2.8
BL057 Wylie Hall 33,513 33,513 183,326 5.5 4.9
BL059 Lindley Hall 59,910 59,910 834,539 13.9 4.9
BL061 Swain East 35,609 35,609 231,192 6.5 4.1
BL067 Rawles Hall 42,017 42,017 209,657 5.0 4.1
BL070 Simon Hall (Science) 141,094 141,094 2,116,972 15.0 12.6
BL071 Chemistry 183,387 183,387 2,144,628 11.7 12.6
BL072 Chemistry Addition 106,551 106,551 1,277,097 12.0 12.6
BL095 Beck Chapel 2,046 2,046 5,641 2.8 2.8
BL101 Myers Hall 76,521 76,521 1,181,127 15.4 12.6
BL107 Jordan Hall 324,279 324,279 4,135,913 12.8 12.6
BL111 Ballantine Hall 305,420 305,420 202,720 0.7 4.9
BL119 HPER Building 189,776 189,776 440,920 2.3 2.8
BL133 Woodburn Hall 73,257 73,257 707,489 9.7 4.1
BL139 Morrison Hall 53,989 53,989 490,925 9.1 4.1
BL147 Merrill Hall 58,322 58,322 676,852 11.6 4.9
BL148 Music Addition 122,165 122,165 1,489,434 12.2 4.9
BL149 Sycamore Hall 74,602 74,602 226,663 3.0 4.9
BL155 Lilly Library 52,516 52,516 223,145 4.2 4.1
BL157 Fine Arts 115,554 115,554 598,960 5.2 4.9
BL158 Radio‐TV 99,373 99,373 573,611 5.8 4.9
BL171 Auditorium 238,364 238,364 1,707,487 7.2 4.9
BL172 Lee Norvelle Theatre Drama/ Neal&Mars
135,627 135,627 953,217 7.0 4.9
BL173 IU Cinema 13,506 13,506 42,003 3.1 4.9

Table A6.2.3: Base Case Energy Model Results for Chilled Water (continued)
Integrated Energy Master Plan IU 20096161 Page 133
Building ID and Description Gross Floor Area (SF)
Conditioned Floor Area
(SF)
Estimated Central Cooling
Plant Usage (Ton‐Hours)
Estimated CHW Use Density (Ton‐
Hour/SF)
Average CHW Use Density by Building
Type (Ton‐Hour/SF)
BL181 Simon Msc Lbr Rec 231,539 231,539 1,986,887 8.6 4.9
BL209 Wells Library 557,163 557,163 3,415,935 6.1 4.9
BL215A International Center 11,454 11,454 47,076 4.1 4.1
BL227 Read Hall 359,658 359,658 755,942 2.1 2.3
BL237 Wright Quad 295,887 295,887 119,912 0.4 2.3
BL243 Teter Quad 300,873 300,873 1,041,154 3.5 2.3
BL245 Wendell W. Wright 191,111 191,111 1,388,687 7.3 4.9
BL257 Forest Quad 289,014 289,014 883,242 3.1 2.3
BL407 DeVault Alumni Center
32,563 32,563 192,683 5.9 4.1
BL413 Arts Annex 25,411 25,411 123,315 4.9 4.9
BL414 Informatics West 28,184 28,184 136,772 4.9 4.9
BL419 Psychology 155,246 155,246 942,692 6.1 4.9
BL423 Multi Science 2 131,074 131,074 1,315,498 10.0 12.6
BL433 Briscoe Quad 279,424 279,424 1,032,086 3.7 2.3
BL437 McNutt North 153,143 153,143 525,560 3.4 2.3
BL439 McNutt Central 78,264 78,264 927,681 11.9 2.8
BL441 McNutt South 129,665 129,665 455,138 3.5 2.3
BL450 Godfrey Grad&Exec Ed Ctr
191,743 191,743 837,278 4.4 4.9
BL451 Business School 238,158 238,158 1,151,762 4.8 4.9
BL452 SPEA 128,619 128,619 558,349 4.3 4.9
BL453 Harper Hall 109,147 109,147 349,861 3.2 2.3
BL454 Gresham Dining Hall 50,888 50,888 402,026 7.9 2.8
BL455 Shea Hall 42,003 42,003 120,958 2.9 2.3
BL456 Martin Hall 37,063 37,063 111,295 3.0 2.3
BL461 Magee Hall 37,064 37,064 116,531 3.1 2.3
BL462 Jenkinson Hall 36,896 36,896 121,400 3.3 2.3
BL463 Nelson RPS Admin. 40,453 40,453 146,974 3.6 4.1
BL601a Memorial Stadium East Stands
46,384 46,384 254,989 5.5 2.8
BL603 Assembly Hall 381,106 381,106 1,483,692 3.9 2.8
BL990P Informatics East 39,922 39,922 193,734 4.9 4.9
Totals 8,293,533 8,293,533 47,783,302 5.8

Table A8.2.1: Building Energy Conservation Measures, Ordered by Marginal Payback
Integrated Energy Master Plan IU 20096161 Page 134
Building Name Estimated
Annual Energy Cost Reduction
Estimated Implementation
Cost
Marginal Payback (Years)
Accumulated Annual Energy Cost Savings
Accumulated Implementation
Cost
Overall Cumulative Simple Payback
Included Energy Conservation Measures
Ernie Pyle Hall $31,276 $1,379 0.0 $31,276 $1,379 0.0 Change HVAC Schedule
Cook Hall $38,011 $2,500 0.1 $69,287 $3,878 0.1 Change HVAC Schedule
Bryan Hall $28,180 $1,852 0.1 $97,467 $5,730 0.1 Change HVAC Schedule
Merrill Hall $27,689 $2,100 0.1 $125,157 $7,830 0.1 Change HVAC Schedule
Gresham Dining Hall
$18,884 $1,832 0.1 $144,040 $9,662 0.1 Change HVAC Schedule
SPEA $41,018 $4,630 0.1 $185,058 $14,292 0.1 Change HVAC Schedule
Memorial Stadium North Endzone
$14,806 $2,520 0.2 $199,865 $16,812 0.1 Change HVAC Schedule
Law $31,345 $6,124 0.2 $231,209 $22,935 0.1 Change HVAC Schedule
Simon Msc Lbr Rec
$40,083 $8,335 0.2 $271,292 $31,271 0.1 Change HVAC Schedule
Myers Hall $10,910 $2,755 0.3 $282,203 $34,026 0.1 Reduce Humidification
Memorial Stadium East Stands
$5,111 $1,670 0.3 $287,314 $35,695 0.1 Change HVAC Schedule
Radio‐TV $9,992 $3,577 0.4 $297,306 $39,273 0.1 Reduce Humidification
Multi Science 2 $10,105 $4,719 0.5 $307,410 $43,992 0.1 Reduce Humidification
Godfrey Grad&Exec Ed Ctr
$8,860 $6,903 0.8 $316,270 $50,894 0.2 Reduce Humidification
Cook Hall $12,594 $11,666 0.9 $328,864 $62,560 0.2 Reduce Outside Air
Lee Norvelle Theatre Drama/ Neal&Mars
$115,150 $154,615 1.3 $444,014 $217,175 0.5 Optimize VAV Operation

Table A8.2.1: Building Energy Conservation Measures, Ordered by Marginal Payback (continued)
Integrated Energy Master Plan IU 20096161 Page 135
Building Name Estimated
Annual Energy Cost Reduction
Estimated Implementation
Cost
Marginal Payback (Years)
Accumulated Annual Energy Cost Savings
Accumulated Implementation
Cost
Overall Cumulative Simple Payback
Included Energy Conservation Measures
Myers Hall $68,108 $111,109 1.6 $512,121 $328,284 0.6 Optimize VAV Operation, Space Temp. Setback
Wendell W. Wright
$3,182 $6,880 2.1 $515,304 $335,164 0.7 Reduce Humidification
Eigenmann Hall $7,871 $17,441 2.2 $523,175 $352,605 0.7 Add Variable Flow CHW Pumping
Cook Hall $43,591 $100,828 2.3 $566,766 $453,433 0.8 Optimize VAV Operation, Space Temp. Setback
Willkie A $15,314 $37,425 2.4 $582,080 $490,858 0.8 Space Temp. Setback
Simon Hall (Science)
$78,061 $204,869 2.6 $660,141 $695,727 1.1 Optimize VAV Operation, Space Temp. Setback
Assembly Hall $21,225 $64,026 2.9 $681,366 $759,752 1.1 Reduce Outside Air
Chilled Water Plant
$11,274 $36,333 3.2 $692,640 $796,085 1.1 Lighting Controls
Tulip Tree Apts $24,938 $82,057 3.2 $717,578 $878,142 1.2 Space Temp. Setback
Maxwell Hall $12,748 $45,144 3.5 $730,325 $923,286 1.3 Optimize VAV Operation, Space Temp. Setback
Ballantine Hall $71,310 $285,873 3.9 $801,635 $1,209,159 1.5 Lighting Controls

Table A8.2.1: Building Energy Conservation Measures, Ordered by Marginal Payback (continued)
Integrated Energy Master Plan IU 20096161 Page 136
Building Name Estimated
Annual Energy Cost Reduction
Estimated Implementation
Cost
Marginal Payback (Years)
Accumulated Annual Energy Cost Savings
Accumulated Implementation
Cost
Overall Cumulative Simple Payback
Included Energy Conservation Measures
Gresham Dining Hall
$2,045 $8,549 4.2 $803,680 $1,217,708 1.5 Reduce Outside Air
Myers Hall $16,586 $71,624 4.3 $820,267 $1,289,332 1.6 Lighting Controls
Central Heating $18,112 $78,643 4.3 $838,379 $1,367,975 1.6 Lighting Controls
Simon Hall (Science)
$71,702 $326,096 4.5 $910,081 $1,694,071 1.9 Lighting Retrofit, Lighting Controls
Owen Hall $4,055 $18,859 4.6 $914,135 $1,712,930 1.9 Lighting Controls
Kirkwood Hall $15,506 $72,171 4.6 $929,641 $1,785,101 1.9 Lighting Retrofit, Lighting Controls
Godfrey Grad&Exec Ed Ctr
$6,987 $32,213 4.6 $936,629 $1,817,314 1.9 Reduce Outside Air
Service Bldg $14,807 $73,431 4.9 $951,436 $1,890,745 2.0 Lighting Controls
Forest Quad $18,149 $90,172 4.9 $969,585 $1,980,917 2.0 Space Temp. Setback
Goodbody Hall $15,777 $79,697 5.0 $985,362 $2,060,614 2.1 Lighting Retrofit, Lighting Controls
Sycamore Hall $13,724 $69,827 5.0 $999,085 $2,130,441 2.1 Lighting Controls
Poplars $26,851 $140,793 5.1 $1,025,937 $2,271,234 2.2 Lighting Controls
Poplars Parking $9,164 $48,123 5.1 $1,035,101 $2,319,357 2.2 Lighting Retrofit
Wendell W. Wright
$1,416 $7,474 5.2 $1,036,517 $2,326,831 2.2 Convert to Variable Volume Heating Water
Optometry School $687 $3,786 5.4 $1,037,204 $2,330,617 2.2 Convert to Variable Volume Chilled Water
HPER Building $65,534 $359,360 5.4 $1,102,738 $2,689,977 2.4 Lighting Retrofit, Lighting Controls

Table A8.2.1: Building Energy Conservation Measures, Ordered by Marginal Payback (continued)
Integrated Energy Master Plan IU 20096161 Page 137
Building Name Estimated
Annual Energy Cost Reduction
Estimated Implementation
Cost
Marginal Payback (Years)
Accumulated Annual Energy Cost Savings
Accumulated Implementation
Cost
Overall Cumulative Simple Payback
Included Energy Conservation Measures
Chemistry $41,888 $241,631 5.7 $1,144,626 $2,931,608 2.6 Lighting Retrofit, Lighting Controls
Gladstein Fieldhouse
$53,706 $310,529 5.7 $1,198,332 $3,242,137 2.7 Lighting Retrofit, Lighting Controls
Art Museum $61,436 $356,510 5.7 $1,259,768 $3,598,647 2.9 Lighting Retrofit, Lighting Controls
Memorial Stadium East Stands
$7,415 $43,415 5.7 $1,267,182 $3,642,063 2.9 Lighting Controls
SPEA $42,622 $254,666 5.9 $1,309,805 $3,896,728 3.0 Lighting Retrofit, Lighting Controls
Lee Norvelle Theatre Drama/ Neal&Mars
$73,907 $444,314 5.9 $1,383,712 $4,341,042 3.1 Lighting Retrofit, Lighting Controls
Lindley Hall $77,712 $469,023 5.9 $1,461,424 $4,810,066 3.3
Lighting Retrofit, Lighting Controls, Optimize VAV Operation, Install DDC Zone Controls, Space Temp. Setback
Mellencamp Pavilion
$2,774 $16,847 5.9 $1,464,197 $4,826,913 3.3 Reduce Outside Air
IN Memorial Union
$127,918 $774,428 5.9 $1,592,115 $5,601,341 3.5 Lighting Retrofit, Lighting Controls
Multi Science 2 $20,073 $122,685 6.0 $1,612,188 $5,724,026 3.6 Lighting Controls
Assembly Hall $57,427 $356,715 6.1 $1,669,614 $6,080,741 3.6 Lighting Controls

Table A8.2.1: Building Energy Conservation Measures, Ordered by Marginal Payback (continued)
Integrated Energy Master Plan IU 20096161 Page 138
Building Name Estimated
Annual Energy Cost Reduction
Estimated Implementation
Cost
Marginal Payback (Years)
Accumulated Annual Energy Cost Savings
Accumulated Implementation
Cost
Overall Cumulative Simple Payback
Included Energy Conservation Measures
Music Addition $44,627 $277,070 6.1 $1,714,241 $6,357,812 3.7 Lighting Retrofit, Lighting Controls
Maxwell Hall $6,998 $43,652 6.1 $1,721,240 $6,401,463 3.7 Lighting Retrofit, Lighting Controls
Geological Survey $18,030 $113,477 6.2 $1,739,270 $6,514,940 3.7 Lighting Retrofit, Lighting Controls
Cook Hall $10,193 $64,997 6.2 $1,749,463 $6,579,937 3.8 Lighting Controls
Woodburn Hall $25,846 $166,147 6.3 $1,775,309 $6,746,084 3.8 Lighting Retrofit, Lighting Controls
Recreational Sports
$148,907 $984,838 6.4 $1,924,216 $7,730,922 4.0
Lighting Controls, Install Fan VFD's, Optimize VAV Operation, Space Temp. Setback
Law $47,399 $314,749 6.5 $1,971,615 $8,045,672 4.1 Lighting Retrofit, Lighting Controls
Bryan Hall $46,481 $310,468 6.5 $2,018,096 $8,356,139 4.1 Optimize VAV Operation, Install DDC Zone Controls, Space Temp. Setback
Eigenmann Hall $81,281 $550,710 6.6 $2,099,377 $8,906,849 4.2 Lighting Retrofit, Lighting Controls
McNutt Central $10,911 $73,255 6.6 $2,110,288 $8,980,104 4.3 Lighting Controls
DeVault Alumni Center
$4,486 $30,479 6.7 $2,114,774 $9,010,583 4.3 Lighting Controls
Morrison Hall $15,463 $105,343 6.7 $2,130,237 $9,115,926 4.3 Lighting Retrofit, Lighting Controls

Table A8.2.1: Building Energy Conservation Measures, Ordered by Marginal Payback (continued)
Integrated Energy Master Plan IU 20096161 Page 139
Building Name Estimated
Annual Energy Cost Reduction
Estimated Implementation
Cost
Marginal Payback (Years)
Accumulated Annual Energy Cost Savings
Accumulated Implementation
Cost
Overall Cumulative Simple Payback
Included Energy Conservation Measures
Nelson RPS Admin.
$9,640 $66,116 6.7 $2,139,878 $9,182,042 4.3 Lighting Retrofit, Lighting Controls
Bryan Hall $12,703 $87,030 6.7 $2,152,581 $9,269,072 4.3 Lighting Retrofit, Lighting Controls
Art Museum $123,468 $861,925 6.7 $2,276,048 $10,130,997 4.5 Install Fan VFD's, Optimize VAV Operation, Install DDC Zone Controls
Chemistry Addition
$20,426 $140,392 6.7 $2,296,474 $10,271,389 4.5 Lighting Retrofit, Lighting Controls
Tennis Center $7,731 $54,015 6.8 $2,304,205 $10,325,403 4.5 Lighting Controls
Swain West $43,584 $306,112 6.9 $2,347,788 $10,631,515 4.5 Lighting Retrofit, Lighting Controls
Swain East $7,497 $54,097 7.1 $2,355,285 $10,685,612 4.5 Lighting Retrofit, Lighting Controls
Radio‐TV $12,739 $93,013 7.1 $2,368,024 $10,778,626 4.6 Lighting Controls
Woodburn Hall $60,482 $442,179 7.1 $2,428,506 $11,220,805 4.6 Optimize VAV Operation, Install DDC Zone Controls, Space Temp. Setback
Jordan Hall $63,544 $464,627 7.1 $2,492,050 $11,685,432 4.7 Lighting Retrofit, Lighting Controls
Business School $30,490 $222,916 7.2 $2,522,540 $11,908,348 4.7 Lighting Controls
Briscoe Quad $35,593 $261,541 7.2 $2,558,133 $12,169,889 4.8 Lighting Controls
Rawles Hall $9,897 $72,908 7.2 $2,568,030 $12,242,796 4.8 Lighting Retrofit, Lighting Controls
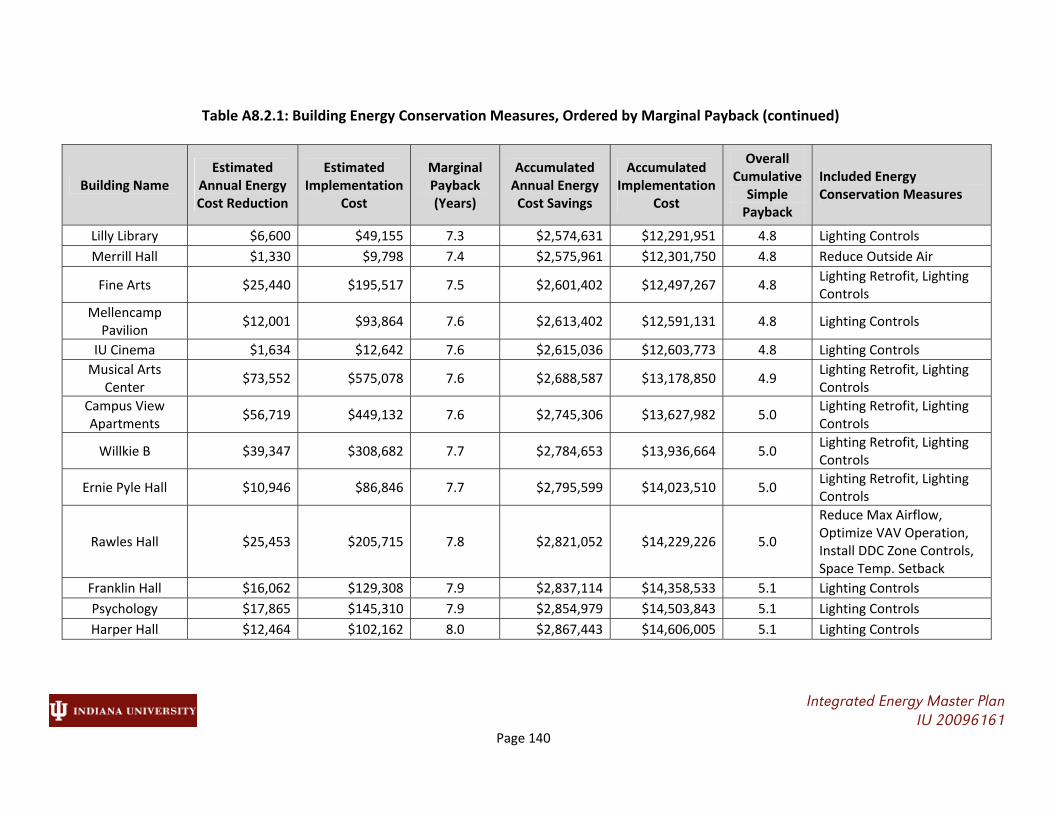
Table A8.2.1: Building Energy Conservation Measures, Ordered by Marginal Payback (continued)
Integrated Energy Master Plan IU 20096161 Page 140
Building Name Estimated
Annual Energy Cost Reduction
Estimated Implementation
Cost
Marginal Payback (Years)
Accumulated Annual Energy Cost Savings
Accumulated Implementation
Cost
Overall Cumulative Simple Payback
Included Energy Conservation Measures
Lilly Library $6,600 $49,155 7.3 $2,574,631 $12,291,951 4.8 Lighting Controls
Merrill Hall $1,330 $9,798 7.4 $2,575,961 $12,301,750 4.8 Reduce Outside Air
Fine Arts $25,440 $195,517 7.5 $2,601,402 $12,497,267 4.8 Lighting Retrofit, Lighting Controls
Mellencamp Pavilion
$12,001 $93,864 7.6 $2,613,402 $12,591,131 4.8 Lighting Controls
IU Cinema $1,634 $12,642 7.6 $2,615,036 $12,603,773 4.8 Lighting Controls
Musical Arts Center
$73,552 $575,078 7.6 $2,688,587 $13,178,850 4.9 Lighting Retrofit, Lighting Controls
Campus View Apartments
$56,719 $449,132 7.6 $2,745,306 $13,627,982 5.0 Lighting Retrofit, Lighting Controls
Willkie B $39,347 $308,682 7.7 $2,784,653 $13,936,664 5.0 Lighting Retrofit, Lighting Controls
Ernie Pyle Hall $10,946 $86,846 7.7 $2,795,599 $14,023,510 5.0 Lighting Retrofit, Lighting Controls
Rawles Hall $25,453 $205,715 7.8 $2,821,052 $14,229,226 5.0
Reduce Max Airflow, Optimize VAV Operation, Install DDC Zone Controls, Space Temp. Setback
Franklin Hall $16,062 $129,308 7.9 $2,837,114 $14,358,533 5.1 Lighting Controls
Psychology $17,865 $145,310 7.9 $2,854,979 $14,503,843 5.1 Lighting Controls
Harper Hall $12,464 $102,162 8.0 $2,867,443 $14,606,005 5.1 Lighting Controls
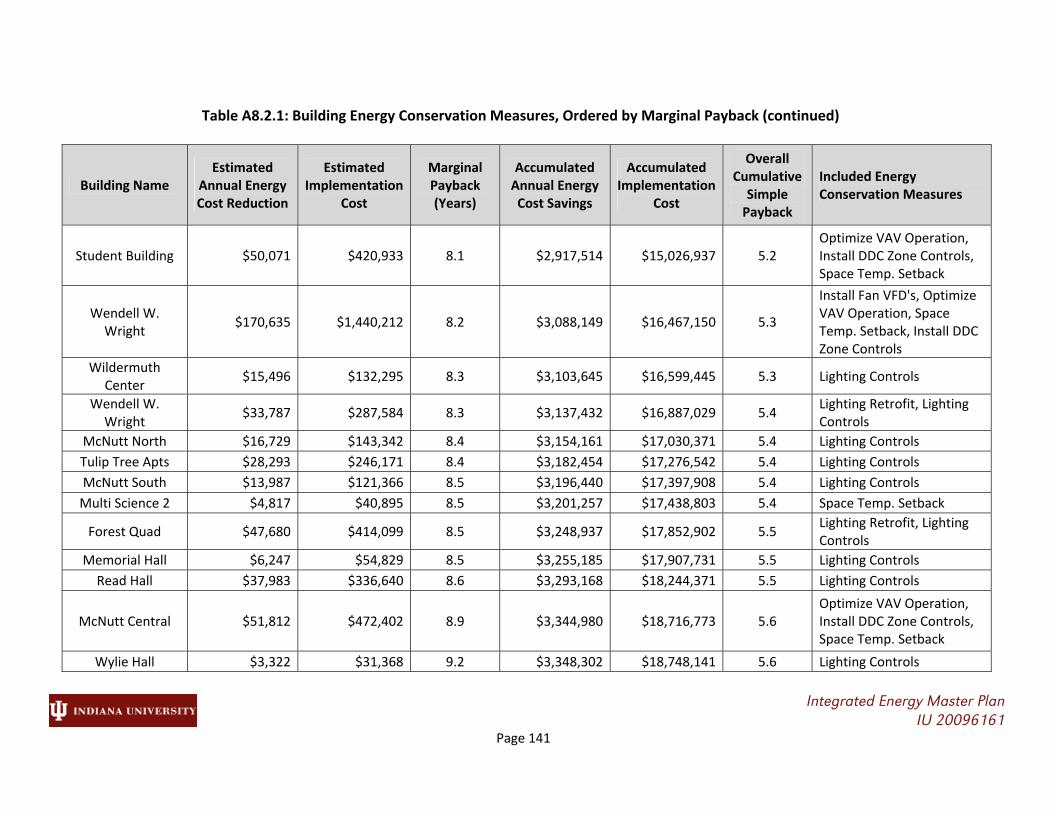
Table A8.2.1: Building Energy Conservation Measures, Ordered by Marginal Payback (continued)
Integrated Energy Master Plan IU 20096161 Page 141
Building Name Estimated
Annual Energy Cost Reduction
Estimated Implementation
Cost
Marginal Payback (Years)
Accumulated Annual Energy Cost Savings
Accumulated Implementation
Cost
Overall Cumulative Simple Payback
Included Energy Conservation Measures
Student Building $50,071 $420,933 8.1 $2,917,514 $15,026,937 5.2 Optimize VAV Operation, Install DDC Zone Controls, Space Temp. Setback
Wendell W. Wright
$170,635 $1,440,212 8.2 $3,088,149 $16,467,150 5.3
Install Fan VFD's, Optimize VAV Operation, Space Temp. Setback, Install DDC Zone Controls
Wildermuth Center
$15,496 $132,295 8.3 $3,103,645 $16,599,445 5.3 Lighting Controls
Wendell W. Wright
$33,787 $287,584 8.3 $3,137,432 $16,887,029 5.4 Lighting Retrofit, Lighting Controls
McNutt North $16,729 $143,342 8.4 $3,154,161 $17,030,371 5.4 Lighting Controls
Tulip Tree Apts $28,293 $246,171 8.4 $3,182,454 $17,276,542 5.4 Lighting Controls
McNutt South $13,987 $121,366 8.5 $3,196,440 $17,397,908 5.4 Lighting Controls
Multi Science 2 $4,817 $40,895 8.5 $3,201,257 $17,438,803 5.4 Space Temp. Setback
Forest Quad $47,680 $414,099 8.5 $3,248,937 $17,852,902 5.5 Lighting Retrofit, Lighting Controls
Memorial Hall $6,247 $54,829 8.5 $3,255,185 $17,907,731 5.5 Lighting Controls
Read Hall $37,983 $336,640 8.6 $3,293,168 $18,244,371 5.5 Lighting Controls
McNutt Central $51,812 $472,402 8.9 $3,344,980 $18,716,773 5.6 Optimize VAV Operation, Install DDC Zone Controls, Space Temp. Setback
Wylie Hall $3,322 $31,368 9.2 $3,348,302 $18,748,141 5.6 Lighting Controls

Table A8.2.1: Building Energy Conservation Measures, Ordered by Marginal Payback (continued)
Integrated Energy Master Plan IU 20096161 Page 142
Building Name Estimated
Annual Energy Cost Reduction
Estimated Implementation
Cost
Marginal Payback (Years)
Accumulated Annual Energy Cost Savings
Accumulated Implementation
Cost
Overall Cumulative Simple Payback
Included Energy Conservation Measures
Health Center $6,474 $60,518 9.2 $3,354,775 $18,808,659 5.6 Lighting Controls
Lee Norvelle Theatre Drama/ Neal&Mars
$2,436 $22,785 9.3 $3,357,211 $18,831,444 5.6 Reduce Outside Air
Law $969 $9,471 9.5 $3,358,181 $18,840,916 5.6 Convert to Variable Volume Heating Water
Auditorium $146,647 $1,438,765 9.5 $3,504,828 $20,279,681 5.8 Optimize VAV Operation, Install DDC Zone Controls, Space Temp. Setback
Student Building $6,649 $65,274 9.6 $3,511,477 $20,344,955 5.8 Lighting Controls
Willkie A $11,295 $112,274 9.7 $3,522,772 $20,457,229 5.8 Lighting Controls
DeVault Alumni Center
$19,128 $196,550 9.9 $3,541,899 $20,653,779 5.8 Optimize VAV Operation, Install DDC Zone Controls, Space Temp. Setback
Wylie Hall $19,732 $202,285 9.9 $3,561,632 $20,856,064 5.9 Optimize VAV Operation, Install DDC Zone Controls, Space Temp. Setback
Innovation Center $3,635 $37,319 9.9 $3,565,267 $20,893,383 5.9 Lighting Controls
Godfrey Grad&Exec Ed Ctr
$17,560 $179,471 9.9 $3,582,827 $21,072,854 5.9 Lighting Controls
Magee Hall $3,394 $34,692 10.0 $3,586,221 $21,107,546 5.9 Lighting Controls
Jenkinson Hall $3,375 $34,535 10.0 $3,589,596 $21,142,081 5.9 Lighting Controls
Martin Hall $3,369 $34,691 10.0 $3,592,964 $21,176,772 5.9 Lighting Controls

Table A8.2.1: Building Energy Conservation Measures, Ordered by Marginal Payback (continued)
Integrated Energy Master Plan IU 20096161 Page 143
Building Name Estimated
Annual Energy Cost Reduction
Estimated Implementation
Cost
Marginal Payback (Years)
Accumulated Annual Energy Cost Savings
Accumulated Implementation
Cost
Overall Cumulative Simple Payback
Included Energy Conservation Measures
Memorial Stadium North Endzone
$10,388 $108,500 10.0 $3,603,352 $21,285,272 5.9 Lighting Controls
Wells Library $50,623 $521,505 10.0 $3,653,975 $21,806,777 6.0 Lighting Controls
Merrill Hall $5,282 $54,589 10.1 $3,659,258 $21,861,366 6.0 Lighting Controls
Hickory Hall $5,714 $59,356 10.1 $3,664,972 $21,920,722 6.0 Lighting Controls
Teter Quad $38,243 $396,430 10.1 $3,703,215 $22,317,152 6.0 Lighting Retrofit, Lighting Controls
Shea Hall $3,773 $39,315 10.1 $3,706,988 $22,356,467 6.0 Lighting Controls
Swain East $20,149 $214,936 10.2 $3,727,137 $22,571,403 6.1 Optimize VAV Operation, Space Temp. Setback, Install DDC Zone Controls
Simon Msc Lbr Rec
$20,311 $216,721 10.4 $3,747,448 $22,788,123 6.1 Lighting Controls
Optometry School $118,198 $1,295,824 10.5 $3,865,646 $24,083,947 6.2
Lighting Retrofit, Lighting Controls, Change HVAC Type, Install DDC Zone Controls, Optimize VAV Operation, Space Temp. Setback
Wells Library $303,896 $3,363,037 10.6 $4,169,541 $27,446,983 6.6 Optimize VAV Operation, Install DDC Zone Controls, Space Temp. Setback
IU Warehouse $10,669 $117,671 10.6 $4,180,210 $27,564,655 6.6 Lighting Retrofit, Lighting Controls

Table A8.2.1: Building Energy Conservation Measures, Ordered by Marginal Payback (continued)
Integrated Energy Master Plan IU 20096161 Page 144
Building Name Estimated
Annual Energy Cost Reduction
Estimated Implementation
Cost
Marginal Payback (Years)
Accumulated Annual Energy Cost Savings
Accumulated Implementation
Cost
Overall Cumulative Simple Payback
Included Energy Conservation Measures
Business School $160,432 $1,794,759 10.7 $4,340,643 $29,359,414 6.8
Install Fan VFD's, Optimize VAV Operation, Install DDC Zone Controls, Space Temp. Setback
Wright Quad $41,130 $458,033 10.7 $4,381,773 $29,817,447 6.8 Lighting Retrofit, Lighting Controls
Fine Arts $77,361 $870,815 10.8 $4,459,135 $30,688,261 6.9
Install Fan VFD's, Optimize VAV Operation, Install DDC Zone Controls, Space Temp. Setback
Ernie Pyle Hall $44,673 $513,726 10.8 $4,503,808 $31,201,987 6.9
Change HVAC Type, Install DDC Zone Controls, Install Fan VFD's, Optimize VAV Operation, Space Temp. Setback
Gresham Dining Hall
$4,124 $47,631 11.2 $4,507,932 $31,249,618 6.9 Lighting Controls
Cypress Hall $3,273 $39,743 11.7 $4,511,206 $31,289,361 6.9 Lighting Controls
Auditorium $25,978 $314,069 11.7 $4,537,183 $31,603,430 7.0 Lighting Retrofit, Lighting Controls
Willkie C $35,414 $417,639 11.8 $4,572,598 $32,021,068 7.0 Space Temp. Setback, Install DDC Zone Controls
Willkie C $6,361 $79,843 11.9 $4,578,959 $32,100,911 7.0 Lighting Controls
Radio‐TV $1,382 $16,695 12.2 $4,580,341 $32,117,606 7.0 Reduce Outside Air

Table A8.2.1: Building Energy Conservation Measures, Ordered by Marginal Payback (continued)
Integrated Energy Master Plan IU 20096161 Page 145
Building Name Estimated
Annual Energy Cost Reduction
Estimated Implementation
Cost
Marginal Payback (Years)
Accumulated Annual Energy Cost Savings
Accumulated Implementation
Cost
Overall Cumulative Simple Payback
Included Energy Conservation Measures
Gresham Dining Hall
$29,485 $383,492 12.4 $4,609,827 $32,501,098 7.1
Install Fan VFD's, Optimize VAV Operation, Install DDC Zone Controls, Space Temp. Setback
Beech Hall $4,573 $59,356 12.5 $4,614,399 $32,560,454 7.1 Lighting Controls
Geological Survey $39,562 $531,344 12.8 $4,653,962 $33,091,798 7.1
Replace Windows, Install Fan VFD's, Optimize VAV Operation, Install DDC Zone Controls, Space Temp. Setback
SPEA $57,099 $776,344 13.0 $4,711,061 $33,868,142 7.2
Install Fan VFD's, Optimize VAV Operation, Space Temp. Setback, Install DDC Zone Controls
Chemistry $80,332 $1,106,924 13.1 $4,791,393 $34,975,066 7.3
Install Fan VFD's, Optimize VAV Operation, Install DDC Zone Controls, Space Temp. Setback
Pine Hall $4,298 $59,356 13.3 $4,795,690 $35,034,422 7.3 Lighting Controls
Linden Hall $4,265 $59,356 13.4 $4,799,956 $35,093,777 7.3 Lighting Controls
Birch Hall $2,796 $39,743 13.7 $4,802,752 $35,133,520 7.3 Lighting Controls
Memorial Stadium West Stands
$28,709 $423,697 13.8 $4,831,461 $35,557,216 7.4
Install Fan VFD's, Optimize VAV Operation, Install DDC Zone Controls, Space Temp. Setback

Table A8.2.1: Building Energy Conservation Measures, Ordered by Marginal Payback (continued)
Integrated Energy Master Plan IU 20096161 Page 146
Building Name Estimated
Annual Energy Cost Reduction
Estimated Implementation
Cost
Marginal Payback (Years)
Accumulated Annual Energy Cost Savings
Accumulated Implementation
Cost
Overall Cumulative Simple Payback
Included Energy Conservation Measures
Merrill Hall $47,951 $694,965 13.9 $4,879,412 $36,252,181 7.4
Change HVAC Type, Install DDC Zone Controls, Remove Air Economizer, Optimize VAV Operation, Space Temp. Setback
IN Memorial Union
$223,596 $3,308,440 14.1 $5,103,008 $39,560,621 7.8
Install Fan VFD's, Optimize VAV Operation, Install DDC Zone Controls, Space Temp. Setback
Radio‐TV $39,769 $599,816 14.2 $5,142,777 $40,160,437 7.8 Reduce Max Airflow, Install DDC Zone Controls, Space Temp. Setback
Morrison Hall $17,517 $264,330 14.3 $5,160,294 $40,424,767 7.8 Space Temp. Setback, Install DDC Zone Controls
Smith Hall $1,406 $21,173 14.4 $5,161,700 $40,445,940 7.8 Lighting Controls
Cravens Hall $2,176 $32,797 14.4 $5,163,876 $40,478,738 7.8 Lighting Controls
Edmondson Hall $4,217 $64,198 14.6 $5,168,093 $40,542,936 7.8 Lighting Controls
Mason Hall $1,478 $23,135 14.8 $5,169,572 $40,566,071 7.8 Lighting Controls
Jordan Hall $274,518 $4,350,527 15.0 $5,444,090 $44,916,598 8.3
Change HVAC Type, Install DDC Zone Controls, Install Fan VFD's, Optimize VAV Operation, Space Temp. Setback
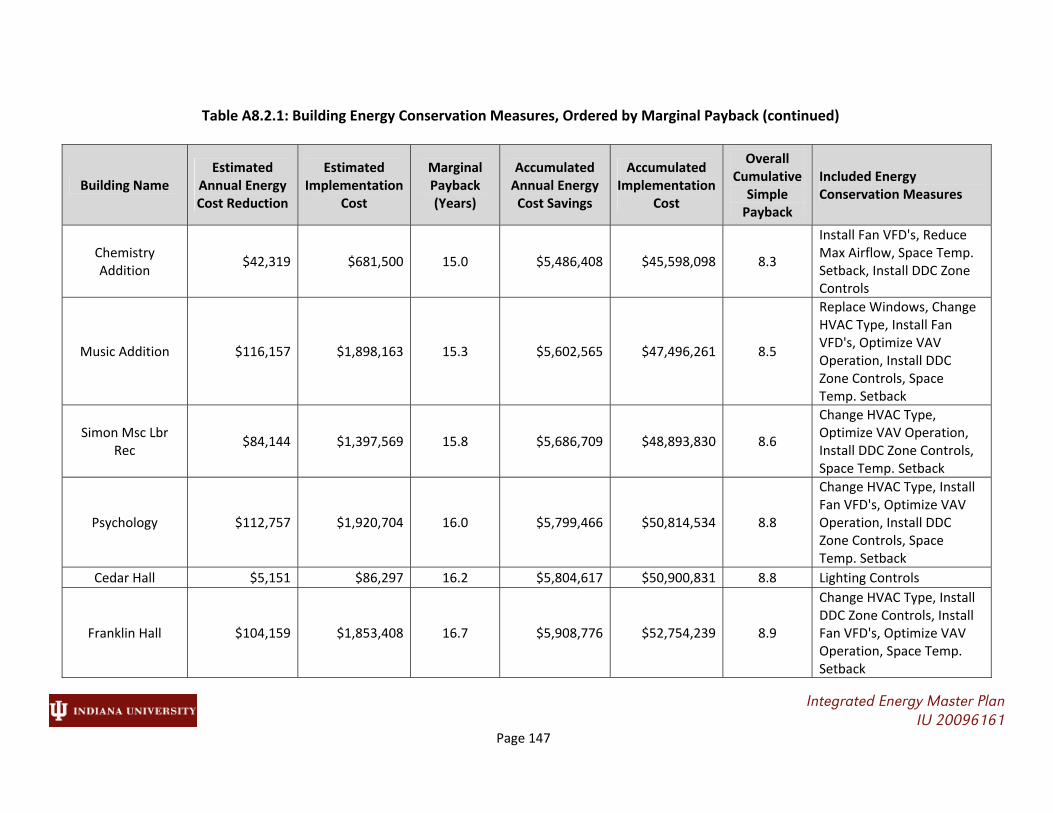
Table A8.2.1: Building Energy Conservation Measures, Ordered by Marginal Payback (continued)
Integrated Energy Master Plan IU 20096161 Page 147
Building Name Estimated
Annual Energy Cost Reduction
Estimated Implementation
Cost
Marginal Payback (Years)
Accumulated Annual Energy Cost Savings
Accumulated Implementation
Cost
Overall Cumulative Simple Payback
Included Energy Conservation Measures
Chemistry Addition
$42,319 $681,500 15.0 $5,486,408 $45,598,098 8.3
Install Fan VFD's, Reduce Max Airflow, Space Temp. Setback, Install DDC Zone Controls
Music Addition $116,157 $1,898,163 15.3 $5,602,565 $47,496,261 8.5
Replace Windows, Change HVAC Type, Install Fan VFD's, Optimize VAV Operation, Install DDC Zone Controls, Space Temp. Setback
Simon Msc Lbr Rec
$84,144 $1,397,569 15.8 $5,686,709 $48,893,830 8.6
Change HVAC Type, Optimize VAV Operation, Install DDC Zone Controls, Space Temp. Setback
Psychology $112,757 $1,920,704 16.0 $5,799,466 $50,814,534 8.8
Change HVAC Type, Install Fan VFD's, Optimize VAV Operation, Install DDC Zone Controls, Space Temp. Setback
Cedar Hall $5,151 $86,297 16.2 $5,804,617 $50,900,831 8.8 Lighting Controls
Franklin Hall $104,159 $1,853,408 16.7 $5,908,776 $52,754,239 8.9
Change HVAC Type, Install DDC Zone Controls, Install Fan VFD's, Optimize VAV Operation, Space Temp. Setback

Table A8.2.1: Building Energy Conservation Measures, Ordered by Marginal Payback (continued)
Integrated Energy Master Plan IU 20096161 Page 148
Building Name Estimated
Annual Energy Cost Reduction
Estimated Implementation
Cost
Marginal Payback (Years)
Accumulated Annual Energy Cost Savings
Accumulated Implementation
Cost
Overall Cumulative Simple Payback
Included Energy Conservation Measures
Law $47,807 $1,022,521 19.7 $5,956,584 $53,776,759 9.0 Optimize VAV Operation, Install DDC Zone Controls, Space Temp. Setback
Musical Arts Center
$189,666 $4,304,691 20.3 $6,146,250 $58,081,450 9.4
Replace Windows, Change HVAC Type, Install DDC Zone Controls, Install Fan VFD's, Optimize VAV Operation, Change HVAC Schedule, Space Temp. Setback, Install CHW Pump Variable Speed Drives
Memorial Stadium East Stands
$2,484 $52,878 20.5 $6,148,734 $58,134,328 9.5 Optimize VAV Operation
Memorial Stadium North Endzone
$4,478 $101,640 21.0 $6,153,212 $58,235,968 9.5 Optimize VAV Operation, Space Temp. Setback
Birch Hall $9,142 $207,884 21.3 $6,162,354 $58,443,852 9.5 Space Temp. Setback, Install DDC Zone Controls
Willkie B $3,400 $87,987 22.5 $6,165,754 $58,531,839 9.5 Air‐Side Heat Recovery
Linden Hall $12,864 $310,475 22.6 $6,178,618 $58,842,314 9.5 Space Temp. Setback, Install DDC Zone Controls
Beech Hall $11,662 $310,480 24.8 $6,190,280 $59,152,794 9.6 Space Temp. Setback, Install DDC Zone Controls

Table A8.2.1: Building Energy Conservation Measures, Ordered by Marginal Payback (continued)
Integrated Energy Master Plan IU 20096161 Page 149
Building Name Estimated
Annual Energy Cost Reduction
Estimated Implementation
Cost
Marginal Payback (Years)
Accumulated Annual Energy Cost Savings
Accumulated Implementation
Cost
Overall Cumulative Simple Payback
Included Energy Conservation Measures
Maxwell Hall $50 $1,389 25.8 $6,190,330 $59,154,183 9.6 Convert to Variable Volume Heating Water
Health Center $89,380 $2,790,205 26.7 $6,279,709 $61,944,388 9.9
Change HVAC Type, Install DDC Zone Controls, Space Temp. Setback, Air‐Side Heat Recovery, Add Variable Volume CHW Pumping
Nelson RPS Admin.
$18,988 $592,232 27.6 $6,298,697 $62,536,620 9.9
Change HVAC Type, Install DDC Zone Controls, Install Fan VFD's, Optimize VAV Operation, Space Temp. Setback
Art Museum $3,927 $360,000 28.5 $6,302,625 $62,896,620 10.0 Connect to Campus CWP ‐ Variable Flow Pumping
Cedar Hall $14,057 $451,401 28.5 $6,316,682 $63,348,022 10.0 Space Temp. Setback, Install DDC Zone Controls
Swain West $40,725 $1,353,144 28.6 $6,357,407 $64,701,166 10.2
Replace Windows, Reduce Max Airflow, Space Temp. Setback, Install DDC Zone Controls
Pine Hall $9,540 $310,475 30.0 $6,366,947 $65,011,641 10.2 Space Temp. Setback, Install DDC Zone Controls

Table A8.2.1: Building Energy Conservation Measures, Ordered by Marginal Payback (continued)
Integrated Energy Master Plan IU 20096161 Page 150
Building Name Estimated
Annual Energy Cost Reduction
Estimated Implementation
Cost
Marginal Payback (Years)
Accumulated Annual Energy Cost Savings
Accumulated Implementation
Cost
Overall Cumulative Simple Payback
Included Energy Conservation Measures
Tennis Center $15,240 $576,203 32.3 $6,382,187 $65,587,844 10.3
Install Fan VFD's, Optimize VAV Operation, Install DDC Zone Controls, Change HVAC Schedule, Space Temp. Setback, Condensing Water Boiler
Cypress Hall $5,617 $207,884 34.1 $6,387,804 $65,795,728 10.3 Space Temp. Setback, Install DDC Zone Controls
Willkie B $14,028 $587,966 36.0 $6,401,832 $66,383,694 10.4 Space Temp. Setback, Install DDC Zone Controls
McNutt South $1,187 $53,439 36.6 $6,403,019 $66,437,132 10.4 Air‐Side Heat Recovery
Jenkinson Hall $546 $25,343 37.5 $6,403,565 $66,462,475 10.4 Air‐Side Heat Recovery
Shea Hall $619 $28,851 37.6 $6,404,184 $66,491,326 10.4 Air‐Side Heat Recovery
McNutt North $3,351 $157,786 37.9 $6,407,535 $66,649,113 10.4 Air‐Side Heat Recovery
Harper Hall $1,539 $74,971 38.8 $6,409,073 $66,724,083 10.4 Air‐Side Heat Recovery
Magee Hall $519 $25,459 39.0 $6,409,593 $66,749,542 10.4 Air‐Side Heat Recovery
Martin Hall $519 $25,458 39.0 $6,410,111 $66,775,000 10.4 Air‐Side Heat Recovery
Teter Quad $5,788 $286,574 39.4 $6,415,900 $67,061,573 10.5 Air‐Side Heat Recovery
Briscoe Quad $30,323 $1,368,060 40.2 $6,446,223 $68,429,633 10.6 Space Temp. Setback, Install DDC Zone Controls
McNutt North $16,286 $749,788 40.7 $6,462,509 $69,179,421 10.7 Space Temp. Setback, Install DDC Zone Controls

Table A8.2.1: Building Energy Conservation Measures, Ordered by Marginal Payback (continued)
Integrated Energy Master Plan IU 20096161 Page 151
Building Name Estimated
Annual Energy Cost Reduction
Estimated Implementation
Cost
Marginal Payback (Years)
Accumulated Annual Energy Cost Savings
Accumulated Implementation
Cost
Overall Cumulative Simple Payback
Included Energy Conservation Measures
Eigenmann Hall $31,222 $1,706,127 41.1 $6,493,730 $70,885,548 10.9 Space Temp. Setback, Install DDC Zone Controls
Teter Quad $31,186 $1,473,074 41.7 $6,524,917 $72,358,623 11.1 Space Temp. Setback, Install DDC Zone Controls
Jenkinson Hall $3,567 $180,643 44.3 $6,528,483 $72,539,265 11.1 Space Temp. Setback, Install DDC Zone Controls
Harper Hall $10,459 $534,384 44.6 $6,538,942 $73,073,649 11.2 Space Temp. Setback, Install DDC Zone Controls
Campus View Apartments
$21,140 $1,310,772 45.3 $6,560,082 $74,384,421 11.3 Space Temp. Setback, Install DDC Zone Controls
Ernie Pyle Hall $2,962 $363,163 46.3 $6,563,045 $74,747,584 11.4 Connect to Campus CWP ‐ Variable Flow
Lilly Library $12,745 $752,449 47.1 $6,575,789 $75,500,033 11.5
Change HVAC Type, Install DDC Zone Controls, Install Fan VFD's, Optimize VAV Operation

Table A8.2.1: Building Energy Conservation Measures, Ordered by Marginal Payback (continued)
Integrated Energy Master Plan IU 20096161 Page 152
Building Name Estimated
Annual Energy Cost Reduction
Estimated Implementation
Cost
Marginal Payback (Years)
Accumulated Annual Energy Cost Savings
Accumulated Implementation
Cost
Overall Cumulative Simple Payback
Included Energy Conservation Measures
Goodbody Hall $14,358 $1,068,862 54.8 $6,590,147 $76,568,895 11.6
Replace Windows, Change HVAC Type, Install DDC Zone Controls, Install Fan VFD's, Remove Air Economizer, Reduce Outside Air, Change HVAC Schedule, Space Temp. Setback, Air‐Side Heat Recovery, Connect to Campus CWP ‐ Variable Flow
Myers Hall $14,152 $1,121,296 56.9 $6,604,299 $77,690,192 11.8 Air‐Side Heat Recovery
Assembly Hall $37,788 $2,872,015 58.5 $6,642,088 $80,562,207 12.1
Install Fan VFD's, Optimize VAV Operation, Install DDC Zone Controls, Space Temp. Setback
Poplars $41,669 $3,153,004 60.3 $6,683,756 $83,715,211 12.5
Replace Windows, Change HVAC Type, Install DDC Zone Controls, Reduce Outside Air, Change HVAC Schedule, Space Temp. Setback, Air‐Side Heat Recovery
Hickory Hall $3,926 $310,475 63.9 $6,687,683 $84,025,685 12.6 Space Temp. Setback, Install DDC Zone Controls

Table A8.2.1: Building Energy Conservation Measures, Ordered by Marginal Payback (continued)
Integrated Energy Master Plan IU 20096161 Page 153
Building Name Estimated
Annual Energy Cost Reduction
Estimated Implementation
Cost
Marginal Payback (Years)
Accumulated Annual Energy Cost Savings
Accumulated Implementation
Cost
Overall Cumulative Simple Payback
Included Energy Conservation Measures
Jordan Hall $45,651 $4,727,036 69.9 $6,733,334 $88,752,721 13.2 Replace Windows, Air‐Side Heat Recovery
Optometry School $2,811 $382,606 77.6 $6,736,145 $89,135,327 13.2 Replace Windows, Reduce Outside Air, Reduce Humidification
Kirkwood Hall $9,773 $1,802,130 95.1 $6,745,918 $90,937,457 13.5
Replace Windows, Change HVAC Type, Install DDC Zone Controls, Install Fan VFD's, Remove Air Economizer, Optimize VAV Operation, Reduce Outside Air, Change HVAC Schedule, Space Temp. Setback, Connect to Campus CWP ‐ Variable Flow Pumping
Forest Quad $8,662 $1,114,563 96.1 $6,754,580 $92,052,021 13.6 Replace Windows
Teter Quad $8,946 $1,160,297 96.7 $6,763,526 $93,212,318 13.8 Replace Windows
Briscoe Quad $8,364 $1,077,580 96.9 $6,771,890 $94,289,898 13.9 Replace Windows

Table A8.2.1: Building Energy Conservation Measures, Ordered by Marginal Payback (continued)
Integrated Energy Master Plan IU 20096161 Page 154
Building Name Estimated
Annual Energy Cost Reduction
Estimated Implementation
Cost
Marginal Payback (Years)
Accumulated Annual Energy Cost Savings
Accumulated Implementation
Cost
Overall Cumulative Simple Payback
Included Energy Conservation Measures
Read Hall $32,847 $6,566,475 104.4 $6,804,738 $100,856,373 14.8
Change HVAC Type, Install DDC Zone Controls, Reduce Max Airflow, Reduce Outside Air, Space Temp. Setback, Increase size of CHW Pumping
Franklin Hall $3,002 $437,337 105.9 $6,807,740 $101,293,710 14.9 Replace Windows
Owen Hall $4,142 $928,087 106.0 $6,811,882 $102,221,797 15.0
Replace Windows, Change HVAC Type, Install DDC Zone Controls, Install Fan VFD's, Remove Air Economizer, Optimize VAV Operation, Reduce Outside Air, Change HVAC Schedule, Space Temp. Setback, Connect to Campus CWP ‐ Variable Flow
Chemistry $3,988 $611,356 106.0 $6,815,870 $102,833,153 15.1 Replace Windows, Reduce Outside Air

Table A8.2.1: Building Energy Conservation Measures, Ordered by Marginal Payback (continued)
Integrated Energy Master Plan IU 20096161 Page 155
Building Name Estimated
Annual Energy Cost Reduction
Estimated Implementation
Cost
Marginal Payback (Years)
Accumulated Annual Energy Cost Savings
Accumulated Implementation
Cost
Overall Cumulative Simple Payback
Included Energy Conservation Measures
Memorial Hall $4,359 $2,684,801 117.6 $6,820,229 $105,517,954 15.5
Replace Windows, Change HVAC Type, Install DDC Zone Controls, Install Fan VFD's, Optimize VAV Operation, Reduce Outside Air, Change HVAC Schedule, Space Temp. Setback, Connect to Campus CWP ‐ Variable Flow Pumping
Gladstein Fieldhouse
$12,708 $3,581,725 123.4 $6,832,936 $109,099,679 16.0
Replace Windows, Optimize VAV Operation, Install DDC Zone Controls, Space Temp. Setback, Change FCU Cool Source, Air‐Side Heat Recovery, Connect to Campus CWP, Variable Flow
Wright Quad $12,606 $5,711,646 124.7 $6,845,543 $114,811,325 16.8
Replace Windows, Change HVAC Type, Space Temp. Setback, Install DDC Zone Controls, Air‐Side Heat Recovery, Convert to Variable Volume Heating Water

Table A8.2.1: Building Energy Conservation Measures, Ordered by Marginal Payback (continued)
Integrated Energy Master Plan IU 20096161 Page 156
Building Name Estimated
Annual Energy Cost Reduction
Estimated Implementation
Cost
Marginal Payback (Years)
Accumulated Annual Energy Cost Savings
Accumulated Implementation
Cost
Overall Cumulative Simple Payback
Included Energy Conservation Measures
Chemistry Addition
$1,597 $337,308 126.4 $6,847,140 $115,148,633 16.8 Replace Windows
Maxwell Hall $642 $119,900 127.2 $6,847,782 $115,268,533 16.8 Replace Windows
Nelson RPS Admin.
$801 $156,004 134.2 $6,848,583 $115,424,538 16.9 Replace Windows
Mellencamp Pavilion
$6,770 $1,539,080 134.8 $6,855,353 $116,963,617 17.1 Change HVAC Type, Space Temp. Setback, Air‐Side Heat Recovery
Magee Hall $1,627 $356,085 150.1 $6,856,980 $117,319,703 17.1
Replace Windows, Reduce Outside Air, Space Temp. Setback, Install DDC Zone Controls
Martin Hall $1,568 $356,076 151.5 $6,858,548 $117,675,779 17.2
Replace Windows, Reduce Outside Air, Space Temp. Setback, Install DDC Zone Controls
Gresham Dining Hall
$668 $161,096 162.8 $6,859,216 $117,836,875 17.2 Replace Windows
Business School $3,133 $753,936 165.4 $6,862,349 $118,590,811 17.3 Replace Windows
Psychology $2,086 $491,462 165.4 $6,864,435 $119,082,273 17.3 Replace Windows
McNutt Central $907 $247,760 168.8 $6,865,342 $119,330,033 17.4 Replace Windows
Wells Library $5,495 $1,455,142 176.6 $6,870,837 $120,785,175 17.6 Replace Windows
Fine Arts $1,408 $365,809 179.3 $6,872,245 $121,150,984 17.6 Replace Windows

Table A8.2.1: Building Energy Conservation Measures, Ordered by Marginal Payback (continued)
Integrated Energy Master Plan IU 20096161 Page 157
Building Name Estimated
Annual Energy Cost Reduction
Estimated Implementation
Cost
Marginal Payback (Years)
Accumulated Annual Energy Cost Savings
Accumulated Implementation
Cost
Overall Cumulative Simple Payback
Included Energy Conservation Measures
Assembly Hall $3,134 $995,335 181.3 $6,875,379 $122,146,319 17.8 Replace Windows, Convert to Variable Volume Heating Water
Shea Hall $1,347 $405,048 195.3 $6,876,727 $122,551,367 17.8
Replace Windows, Reduce Outside Air, Change HVAC Schedule, Space Temp. Setback, Install DDC Zone Controls
Merrill Hall $620 $184,630 208.5 $6,877,347 $122,735,997 17.8 Replace Windows
Wildermuth Center
$8,271 $2,959,073 305.3 $6,885,617 $125,695,069 18.3
Replace Windows, Change HVAC Type, Install DDC Zone Controls, Optimize VAV Operation, Space Temp. Setback
McNutt South $4,383 $781,314 489.3 $6,890,001 $126,476,383 18.4 Install Water Side Economizer

Table A8.2.2: Building Energy Conservation Measures, Ordered by Building
Integrated Energy Master Plan IU 20096161 Page 158
Building Name Estimated Annual Energy
Cost ReductionEstimated
Implementation CostMarginal Payback
(Years)Included Energy Conservation
Measures
Law $31,345 $6,124 0.2 Change HVAC Schedule
Law $47,399 $314,749 6.5 Lighting Retrofit, Lighting Controls
Law $969 $9,471 9.5 Convert to Variable Volume Heating
Water
Law $47,807 $1,022,521 19.7 Optimize VAV Operation, Install DDC Zone Controls, Space Temp. Setback
Bryan Hall $28,180 $1,852 0.1 Change HVAC Schedule
Bryan Hall $46,481 $310,468 6.5 Optimize VAV Operation, Install DDC Zone Controls, Space Temp. Setback
Bryan Hall $12,703 $87,030 6.7 Lighting Retrofit, Lighting Controls
Franklin Hall $16,062 $129,308 7.9 Lighting Controls
Franklin Hall $104,159 $1,853,408 16.7 Change HVAC Type, Install DDC Zone Controls, Install Fan VFD's, Optimize VAV Operation, Space Temp. Setback
Franklin Hall $3,002 $437,337 105.9 Replace Windows
Poplars $26,851 $140,793 5.1 Lighting Controls
Poplars $41,669 $3,153,004 60.3
Replace Windows, Change HVAC Type, Install DDC Zone Controls, Reduce Outside Air, Change HVAC Schedule, Space Temp. Setback, Air‐
Side Heat Recovery
Poplars Parking $9,164 $48,123 5.1 Lighting Retrofit
Student Building $50,071 $420,933 8.1 Optimize VAV Operation, Install DDC Zone Controls, Space Temp. Setback
Student Building $6,649 $65,274 9.6 Lighting Controls

Table A8.2.2: Building Energy Conservation Measures, Ordered by Building (continued)
Integrated Energy Master Plan IU 20096161 Page 159
Building Name Estimated Annual Energy
Cost ReductionEstimated
Implementation CostMarginal Payback
(Years)Included Energy Conservation
Measures
Swain West $43,584 $306,112 6.9 Lighting Retrofit, Lighting Controls
Swain West $40,725 $1,353,144 28.6 Replace Windows, Reduce Max
Airflow, Space Temp. Setback, Install DDC Zone Controls
Maxwell Hall $12,748 $45,144 3.5 Optimize VAV Operation, Space
Temp. Setback
Maxwell Hall $6,998 $43,652 6.1 Lighting Retrofit, Lighting Controls
Maxwell Hall $50 $1,389 25.8 Convert to Variable Volume Heating
Water
Maxwell Hall $642 $119,900 127.2 Replace Windows
Edmondson Hall $4,217 $64,198 14.6 Lighting Controls
Cravens Hall $2,176 $32,797 14.4 Lighting Controls
Smith Hall $1,406 $21,173 14.4 Lighting Controls
IN Memorial Union $127,918 $774,428 5.9 Lighting Retrofit, Lighting Controls
IN Memorial Union $223,596 $3,308,440 14.1 Install Fan VFD's, Optimize VAV
Operation, Install DDC Zone Controls, Space Temp. Setback
Owen Hall $4,055 $18,859 4.6 Lighting Controls
Owen Hall $4,142 $928,087 106.0
Replace Windows, Change HVAC Type, Install DDC Zone Controls, Install Fan VFD's, Remove Air
Economizer, Optimize VAV Operation, Reduce Outside Air, Change HVAC Schedule, Space Temp. Setback,
Connect to Campus CWP ‐ Variable Flow

Table A8.2.2: Building Energy Conservation Measures, Ordered by Building (continued)
Integrated Energy Master Plan IU 20096161 Page 160
Building Name Estimated Annual Energy
Cost ReductionEstimated
Implementation CostMarginal Payback
(Years)Included Energy Conservation
Measures
Wylie Hall $3,322 $31,368 9.2 Lighting Controls
Wylie Hall $19,732 $202,285 9.9 Optimize VAV Operation, Install DDC Zone Controls, Space Temp. Setback
Kirkwood Hall $15,506 $72,171 4.6 Lighting Retrofit, Lighting Controls
Kirkwood Hall $9,773 $1,802,130 95.1
Replace Windows, Change HVAC Type, Install DDC Zone Controls, Install Fan VFD's, Remove Air
Economizer, Optimize VAV Operation, Reduce Outside Air, Change HVAC Schedule, Space Temp. Setback,
Connect to Campus CWP ‐ Variable Flow Pumping
Lindley Hall $77,712 $469,023 5.9 Lighting Retrofit, Lighting Controls, Optimize VAV Operation, Install DDC Zone Controls, Space Temp. Setback
Swain East $7,497 $54,097 7.1 Lighting Retrofit, Lighting Controls
Swain East $20,149 $214,936 10.2 Optimize VAV Operation, Space Temp. Setback, Install DDC Zone
Controls
Optometry School $687 $3,786 5.4 Convert to Variable Volume Chilled
Water
Optometry School $118,198 $1,295,824 10.5
Lighting Retrofit, Lighting Controls, Change HVAC Type, Install DDC Zone Controls, Optimize VAV Operation,
Space Temp. Setback
Optometry School $2,811 $382,606 77.6 Replace Windows, Reduce Outside
Air, Reduce Humidification

Table A8.2.2: Building Energy Conservation Measures, Ordered by Building (continued)
Integrated Energy Master Plan IU 20096161 Page 161
Building Name Estimated Annual Energy
Cost ReductionEstimated
Implementation CostMarginal Payback
(Years)Included Energy Conservation
Measures
Rawles Hall $9,897 $72,908 7.2 Lighting Retrofit, Lighting Controls
Rawles Hall $25,453 $205,715 7.8 Reduce Max Airflow, Optimize VAV Operation, Install DDC Zone Controls,
Space Temp. Setback
Simon Hall (Science) $78,061 $204,869 2.6 Optimize VAV Operation, Space
Temp. Setback
Simon Hall (Science) $71,702 $326,096 4.5 Lighting Retrofit, Lighting Controls
Chemistry $41,888 $241,631 5.7 Lighting Retrofit, Lighting Controls
Chemistry $80,332 $1,106,924 13.1 Install Fan VFD's, Optimize VAV
Operation, Install DDC Zone Controls, Space Temp. Setback
Chemistry $3,988 $611,356 106.0 Replace Windows, Reduce Outside Air
Chemistry Addition $20,426 $140,392 6.7 Lighting Retrofit, Lighting Controls
Chemistry Addition $42,319 $681,500 15.0 Install Fan VFD's, Reduce Max Airflow, Space Temp. Setback, Install DDC
Zone Controls
Chemistry Addition $1,597 $337,308 126.4 Replace Windows
Ernie Pyle Hall $31,276 $1,379 0.0 Change HVAC Schedule
Ernie Pyle Hall $10,946 $86,846 7.7 Lighting Retrofit, Lighting Controls
Ernie Pyle Hall $44,673 $513,726 10.8 Change HVAC Type, Install DDC Zone Controls, Install Fan VFD's, Optimize VAV Operation, Space Temp. Setback
Ernie Pyle Hall $2,962 $363,163 46.3 Connect to Campus CWP ‐ Variable
Flow
Ernie Pyle Hall $52 $127,654 1000.0 #N/A
Wildermuth Center $15,496 $132,295 8.3 Lighting Controls

Table A8.2.2: Building Energy Conservation Measures, Ordered by Building (continued)
Integrated Energy Master Plan IU 20096161 Page 162
Building Name Estimated Annual Energy
Cost ReductionEstimated
Implementation CostMarginal Payback
(Years)Included Energy Conservation
Measures
Wildermuth Center $8,271 $2,959,073 305.3
Replace Windows, Change HVAC Type, Install DDC Zone Controls, Optimize VAV Operation, Space
Temp. Setback
Myers Hall $10,910 $2,755 0.3 Reduce Humidification
Myers Hall $68,108 $111,109 1.6 Optimize VAV Operation, Space
Temp. Setback
Myers Hall $16,586 $71,624 4.3 Lighting Controls
Myers Hall $14,152 $1,121,296 56.9 Air‐Side Heat Recovery
Jordan Hall $63,544 $464,627 7.1 Lighting Retrofit, Lighting Controls
Jordan Hall $274,518 $4,350,527 15.0 Change HVAC Type, Install DDC Zone Controls, Install Fan VFD's, Optimize VAV Operation, Space Temp. Setback
Jordan Hall $45,651 $4,727,036 69.9 Replace Windows, Air‐Side Heat
Recovery
Goodbody Hall $15,777 $79,697 5.0 Lighting Retrofit, Lighting Controls
Goodbody Hall $14,358 $1,068,862 54.8
Replace Windows, Change HVAC Type, Install DDC Zone Controls, Install Fan VFD's, Remove Air
Economizer, Reduce Outside Air, Change HVAC Schedule, Space Temp. Setback, Air‐Side Heat Recovery,
Connect to Campus CWP ‐ Variable Flow
Ballantine Hall $71,310 $285,873 3.9 Lighting Controls
HPER Building $65,534 $359,360 5.4 Lighting Retrofit, Lighting Controls
Woodburn Hall $25,846 $166,147 6.3 Lighting Retrofit, Lighting Controls

Table A8.2.2: Building Energy Conservation Measures, Ordered by Building (continued)
Integrated Energy Master Plan IU 20096161 Page 163
Building Name Estimated Annual Energy
Cost ReductionEstimated
Implementation CostMarginal Payback
(Years)Included Energy Conservation
Measures
Woodburn Hall $60,482 $442,179 7.1 Optimize VAV Operation, Install DDC Zone Controls, Space Temp. Setback
Morrison Hall $15,463 $105,343 6.7 Lighting Retrofit, Lighting Controls
Morrison Hall $17,517 $264,330 14.3 Space Temp. Setback, Install DDC
Zone Controls
Memorial Hall $6,247 $54,829 8.5 Lighting Controls
Memorial Hall $4,359 $2,684,801 117.6
Replace Windows, Change HVAC Type, Install DDC Zone Controls, Install Fan VFD's, Optimize VAV Operation, Reduce Outside Air,
Change HVAC Schedule, Space Temp. Setback, Connect to Campus CWP ‐
Variable Flow Pumping
Merrill Hall $27,689 $2,100 0.1 Change HVAC Schedule
Merrill Hall $1,330 $9,798 7.4 Reduce Outside Air
Merrill Hall $5,282 $54,589 10.1 Lighting Controls
Merrill Hall $47,951 $694,965 13.9
Change HVAC Type, Install DDC Zone Controls, Remove Air Economizer, Optimize VAV Operation, Space
Temp. Setback
Merrill Hall $620 $184,630 208.5 Replace Windows
Music Addition $44,627 $277,070 6.1 Lighting Retrofit, Lighting Controls
Music Addition $116,157 $1,898,163 15.3
Replace Windows, Change HVAC Type, Install Fan VFD's, Optimize VAV Operation, Install DDC Zone Controls,
Space Temp. Setback
Sycamore Hall $13,724 $69,827 5.0 Lighting Controls

Table A8.2.2: Building Energy Conservation Measures, Ordered by Building (continued)
Integrated Energy Master Plan IU 20096161 Page 164
Building Name Estimated Annual Energy
Cost ReductionEstimated
Implementation CostMarginal Payback
(Years)Included Energy Conservation
Measures
Art Museum $61,436 $356,510 5.7 Lighting Retrofit, Lighting Controls
Art Museum $123,468 $861,925 6.7 Install Fan VFD's, Optimize VAV
Operation, Install DDC Zone Controls
Art Museum $3,927 $360,000 28.5 Connect to Campus CWP ‐ Variable
Flow Pumping
Lilly Library $6,600 $49,155 7.3 Lighting Controls
Lilly Library $12,745 $752,449 47.1 Change HVAC Type, Install DDC Zone Controls, Install Fan VFD's, Optimize
VAV Operation
Fine Arts $25,440 $195,517 7.5 Lighting Retrofit, Lighting Controls
Fine Arts $77,361 $870,815 10.8 Install Fan VFD's, Optimize VAV
Operation, Install DDC Zone Controls, Space Temp. Setback
Fine Arts $1,408 $365,809 179.3 Replace Windows
Radio‐TV $9,992 $3,577 0.4 Reduce Humidification
Radio‐TV $12,739 $93,013 7.1 Lighting Controls
Radio‐TV $1,382 $16,695 12.2 Reduce Outside Air
Radio‐TV $39,769 $599,816 14.2 Reduce Max Airflow, Install DDC Zone
Controls, Space Temp. Setback
Auditorium $146,647 $1,438,765 9.5 Optimize VAV Operation, Install DDC Zone Controls, Space Temp. Setback
Auditorium $25,978 $314,069 11.7 Lighting Retrofit, Lighting Controls
Lee Norvelle Theatre Drama/ Neal&Mars
$115,150 $154,615 1.3 Optimize VAV Operation
Lee Norvelle Theatre Drama/ Neal&Mars
$73,907 $444,314 5.9 Lighting Retrofit, Lighting Controls

Table A8.2.2: Building Energy Conservation Measures, Ordered by Building (continued)
Integrated Energy Master Plan IU 20096161 Page 165
Building Name Estimated Annual Energy
Cost ReductionEstimated
Implementation CostMarginal Payback
(Years)Included Energy Conservation
Measures
Lee Norvelle Theatre Drama/ Neal&Mars
$2,436 $22,785 9.3 Reduce Outside Air
IU Cinema $1,634 $12,642 7.6 Lighting Controls
Musical Arts Center $73,552 $575,078 7.6 Lighting Retrofit, Lighting Controls
Musical Arts Center $189,666 $4,304,691 20.3
Replace Windows, Change HVAC Type, Install DDC Zone Controls, Install Fan VFD's, Optimize VAV
Operation, Change HVAC Schedule, Space Temp. Setback, Install CHW
Pump Variable Speed Drives
Simon Msc Lbr Rec $40,083 $8,335 0.2 Change HVAC Schedule
Simon Msc Lbr Rec $20,311 $216,721 10.4 Lighting Controls
Simon Msc Lbr Rec $84,144 $1,397,569 15.8 Change HVAC Type, Optimize VAV
Operation, Install DDC Zone Controls, Space Temp. Setback
Wells Library $50,623 $521,505 10.0 Lighting Controls
Wells Library $303,896 $3,363,037 10.6 Optimize VAV Operation, Install DDC Zone Controls, Space Temp. Setback
Wells Library $5,495 $1,455,142 176.6 Replace Windows
Read Hall $37,983 $336,640 8.6 Lighting Controls
Read Hall $32,847 $6,566,475 104.4
Change HVAC Type, Install DDC Zone Controls, Reduce Max Airflow,
Reduce Outside Air, Space Temp. Setback, Increase size of CHW
Pumping
Wright Quad $41,130 $458,033 10.7 Lighting Retrofit, Lighting Controls

Table A8.2.2: Building Energy Conservation Measures, Ordered by Building (continued)
Integrated Energy Master Plan IU 20096161 Page 166
Building Name Estimated Annual Energy
Cost ReductionEstimated
Implementation CostMarginal Payback
(Years)Included Energy Conservation
Measures
Wright Quad $12,606 $5,711,646 124.7
Replace Windows, Change HVAC Type, Space Temp. Setback, Install DDC Zone Controls, Air‐Side Heat
Recovery, Convert to Variable Volume Heating Water
Teter Quad $38,243 $396,430 10.1 Lighting Retrofit, Lighting Controls
Teter Quad $5,788 $286,574 39.4 Air‐Side Heat Recovery
Teter Quad $31,186 $1,473,074 41.7 Space Temp. Setback, Install DDC
Zone Controls
Teter Quad $8,946 $1,160,297 96.7 Replace Windows
Wendell W. Wright $3,182 $6,880 2.1 Reduce Humidification
Wendell W. Wright $1,416 $7,474 5.2 Convert to Variable Volume Heating
Water
Wendell W. Wright $170,635 $1,440,212 8.2 Install Fan VFD's, Optimize VAV Operation, Space Temp. Setback,
Install DDC Zone Controls
Wendell W. Wright $33,787 $287,584 8.3 Lighting Retrofit, Lighting Controls
Forest Quad $18,149 $90,172 4.9 Space Temp. Setback
Forest Quad $47,680 $414,099 8.5 Lighting Retrofit, Lighting Controls
Forest Quad $8,662 $1,114,563 96.1 Replace Windows
Hickory Hall $5,714 $59,356 10.1 Lighting Controls
Hickory Hall $3,926 $310,475 63.9 Space Temp. Setback, Install DDC
Zone Controls
Birch Hall $2,796 $39,743 13.7 Lighting Controls
Birch Hall $9,142 $207,884 21.3 Space Temp. Setback, Install DDC
Zone Controls

Table A8.2.2: Building Energy Conservation Measures, Ordered by Building (continued)
Integrated Energy Master Plan IU 20096161 Page 167
Building Name Estimated Annual Energy
Cost ReductionEstimated
Implementation CostMarginal Payback
(Years)Included Energy Conservation
Measures
Cedar Hall $5,151 $86,297 16.2 Lighting Controls
Cedar Hall $14,057 $451,401 28.5 Space Temp. Setback, Install DDC
Zone Controls
Linden Hall $4,265 $59,356 13.4 Lighting Controls
Linden Hall $12,864 $310,475 22.6 Space Temp. Setback, Install DDC
Zone Controls
Cypress Hall $3,273 $39,743 11.7 Lighting Controls
Cypress Hall $5,617 $207,884 34.1 Space Temp. Setback, Install DDC
Zone Controls
Beech Hall $4,573 $59,356 12.5 Lighting Controls
Beech Hall $11,662 $310,480 24.8 Space Temp. Setback, Install DDC
Zone Controls
Pine Hall $4,298 $59,356 13.3 Lighting Controls
Pine Hall $9,540 $310,475 30.0 Space Temp. Setback, Install DDC
Zone Controls
Willkie B $39,347 $308,682 7.7 Lighting Retrofit, Lighting Controls
Willkie B $3,400 $87,987 22.5 Air‐Side Heat Recovery
Willkie B $14,028 $587,966 36.0 Space Temp. Setback, Install DDC
Zone Controls
Willkie C $35,414 $417,639 11.8 Space Temp. Setback, Install DDC
Zone Controls
Willkie C $6,361 $79,843 11.9 Lighting Controls
Willkie A $15,314 $37,425 2.4 Space Temp. Setback
Willkie A $11,295 $112,274 9.7 Lighting Controls
Mason Hall $1,478 $23,135 14.8 Lighting Controls
Eigenmann Hall $7,871 $17,441 2.2 Add Variable Flow CHW Pumping

Table A8.2.2: Building Energy Conservation Measures, Ordered by Building (continued)
Integrated Energy Master Plan IU 20096161 Page 168
Building Name Estimated Annual Energy
Cost ReductionEstimated
Implementation CostMarginal Payback
(Years)Included Energy Conservation
Measures
Eigenmann Hall $81,281 $550,710 6.6 Lighting Retrofit, Lighting Controls
Eigenmann Hall $31,222 $1,706,127 41.1 Space Temp. Setback, Install DDC
Zone Controls
DeVault Alumni Center $4,486 $30,479 6.7 Lighting Controls
DeVault Alumni Center $19,128 $196,550 9.9 Optimize VAV Operation, Install DDC Zone Controls, Space Temp. Setback
Chilled Water Plant $11,274 $36,333 3.2 Lighting Controls
Chilled Water Plant $7,027 $2,269,766,656 1000.0 #N/A
Geological Survey $18,030 $113,477 6.2 Lighting Retrofit, Lighting Controls
Geological Survey $39,562 $531,344 12.8 Replace Windows, Install Fan VFD's, Optimize VAV Operation, Install DDC Zone Controls, Space Temp. Setback
Psychology $17,865 $145,310 7.9 Lighting Controls
Psychology $112,757 $1,920,704 16.0 Change HVAC Type, Install Fan VFD's, Optimize VAV Operation, Install DDC Zone Controls, Space Temp. Setback
Psychology $2,086 $491,462 165.4 Replace Windows
Multi Science 2 $10,105 $4,719 0.5 Reduce Humidification
Multi Science 2 $20,073 $122,685 6.0 Lighting Controls
Multi Science 2 $4,817 $40,895 8.5 Space Temp. Setback
Briscoe Quad $35,593 $261,541 7.2 Lighting Controls
Briscoe Quad $30,323 $1,368,060 40.2 Space Temp. Setback, Install DDC
Zone Controls
Briscoe Quad $8,364 $1,077,580 96.9 Replace Windows
McNutt North $16,729 $143,342 8.4 Lighting Controls
McNutt North $3,351 $157,786 37.9 Air‐Side Heat Recovery

Table A8.2.2: Building Energy Conservation Measures, Ordered by Building (continued)
Integrated Energy Master Plan IU 20096161 Page 169
Building Name Estimated Annual Energy
Cost ReductionEstimated
Implementation CostMarginal Payback
(Years)Included Energy Conservation
Measures
McNutt North $16,286 $749,788 40.7 Space Temp. Setback, Install DDC
Zone Controls
McNutt North $433 $668,910 1000.0 #N/A
McNutt Central $10,911 $73,255 6.6 Lighting Controls
McNutt Central $51,812 $472,402 8.9 Optimize VAV Operation, Install DDC Zone Controls, Space Temp. Setback
McNutt Central $907 $247,760 168.8 Replace Windows
McNutt South $13,987 $121,366 8.5 Lighting Controls
McNutt South $1,187 $53,439 36.6 Air‐Side Heat Recovery
McNutt South $4,383 $781,314 489.3 Install Water Side Economizer
Central Heating $18,112 $78,643 4.3 Lighting Controls
Godfrey Grad&Exec Ed Ctr
$8,860 $6,903 0.8 Reduce Humidification
Godfrey Grad&Exec Ed Ctr
$6,987 $32,213 4.6 Reduce Outside Air
Godfrey Grad&Exec Ed Ctr
$17,560 $179,471 9.9 Lighting Controls
Business School $30,490 $222,916 7.2 Lighting Controls
Business School $160,432 $1,794,759 10.7 Install Fan VFD's, Optimize VAV
Operation, Install DDC Zone Controls, Space Temp. Setback
Business School $3,133 $753,936 165.4 Replace Windows
SPEA $41,018 $4,630 0.1 Change HVAC Schedule
SPEA $42,622 $254,666 5.9 Lighting Retrofit, Lighting Controls
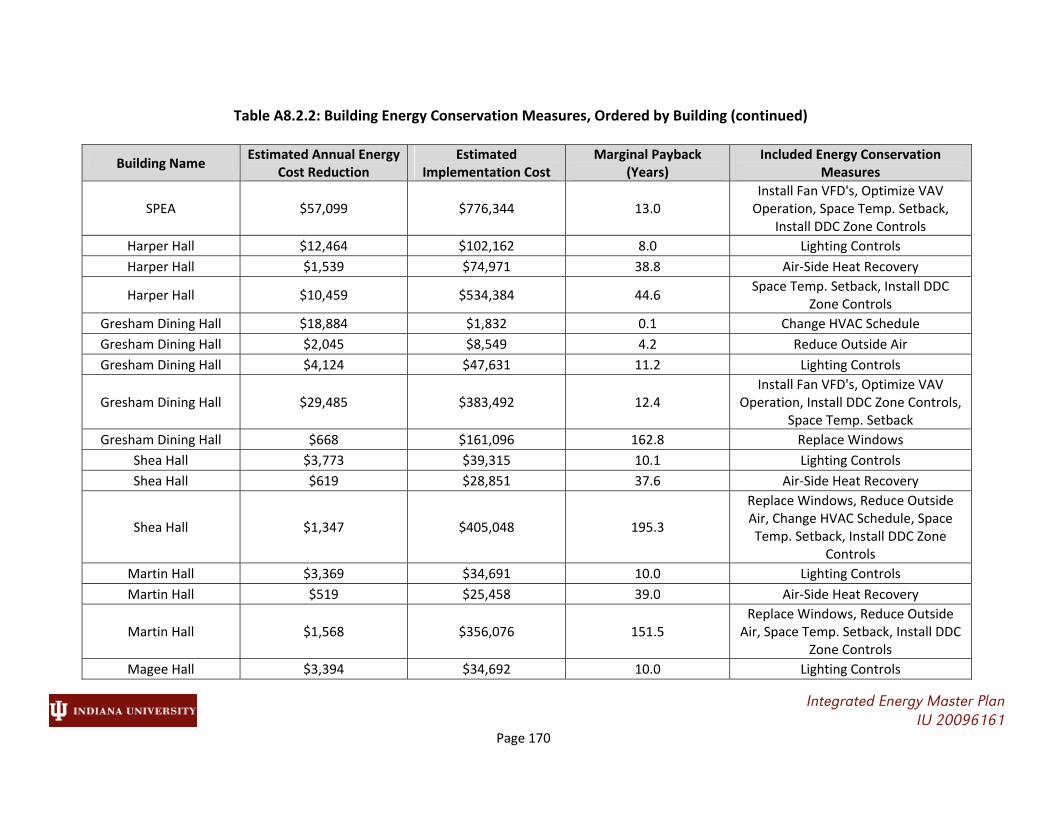
Table A8.2.2: Building Energy Conservation Measures, Ordered by Building (continued)
Integrated Energy Master Plan IU 20096161 Page 170
Building Name Estimated Annual Energy
Cost ReductionEstimated
Implementation CostMarginal Payback
(Years)Included Energy Conservation
Measures
SPEA $57,099 $776,344 13.0 Install Fan VFD's, Optimize VAV Operation, Space Temp. Setback,
Install DDC Zone Controls
Harper Hall $12,464 $102,162 8.0 Lighting Controls
Harper Hall $1,539 $74,971 38.8 Air‐Side Heat Recovery
Harper Hall $10,459 $534,384 44.6 Space Temp. Setback, Install DDC
Zone Controls
Gresham Dining Hall $18,884 $1,832 0.1 Change HVAC Schedule
Gresham Dining Hall $2,045 $8,549 4.2 Reduce Outside Air
Gresham Dining Hall $4,124 $47,631 11.2 Lighting Controls
Gresham Dining Hall $29,485 $383,492 12.4 Install Fan VFD's, Optimize VAV
Operation, Install DDC Zone Controls, Space Temp. Setback
Gresham Dining Hall $668 $161,096 162.8 Replace Windows
Shea Hall $3,773 $39,315 10.1 Lighting Controls
Shea Hall $619 $28,851 37.6 Air‐Side Heat Recovery
Shea Hall $1,347 $405,048 195.3
Replace Windows, Reduce Outside Air, Change HVAC Schedule, Space Temp. Setback, Install DDC Zone
Controls
Martin Hall $3,369 $34,691 10.0 Lighting Controls
Martin Hall $519 $25,458 39.0 Air‐Side Heat Recovery
Martin Hall $1,568 $356,076 151.5 Replace Windows, Reduce Outside Air, Space Temp. Setback, Install DDC
Zone Controls
Magee Hall $3,394 $34,692 10.0 Lighting Controls

Table A8.2.2: Building Energy Conservation Measures, Ordered by Building (continued)
Integrated Energy Master Plan IU 20096161 Page 171
Building Name Estimated Annual Energy
Cost ReductionEstimated
Implementation CostMarginal Payback
(Years)Included Energy Conservation
Measures
Magee Hall $519 $25,459 39.0 Air‐Side Heat Recovery
Magee Hall $1,627 $356,085 150.1 Replace Windows, Reduce Outside Air, Space Temp. Setback, Install DDC
Zone Controls
Jenkinson Hall $3,375 $34,535 10.0 Lighting Controls
Jenkinson Hall $546 $25,343 37.5 Air‐Side Heat Recovery
Jenkinson Hall $3,567 $180,643 44.3 Space Temp. Setback, Install DDC
Zone Controls
Nelson RPS Admin. $9,640 $66,116 6.7 Lighting Retrofit, Lighting Controls
Nelson RPS Admin. $18,988 $592,232 27.6 Change HVAC Type, Install DDC Zone Controls, Install Fan VFD's, Optimize VAV Operation, Space Temp. Setback
Nelson RPS Admin. $801 $156,004 134.2 Replace Windows
Health Center $6,474 $60,518 9.2 Lighting Controls
Health Center $89,380 $2,790,205 26.7
Change HVAC Type, Install DDC Zone Controls, Space Temp. Setback, Air‐Side Heat Recovery, Add Variable
Volume CHW Pumping
Recreational Sports $148,907 $984,838 6.4 Lighting Controls, Install Fan VFD's, Optimize VAV Operation, Space
Temp. Setback
Campus View Apartments
$56,719 $449,132 7.6 Lighting Retrofit, Lighting Controls
Campus View Apartments
$21,140 $1,310,772 45.3 Space Temp. Setback, Install DDC
Zone Controls
Tulip Tree Apts $24,938 $82,057 3.2 Space Temp. Setback
Tulip Tree Apts $28,293 $246,171 8.4 Lighting Controls

Table A8.2.2: Building Energy Conservation Measures, Ordered by Building (continued)
Integrated Energy Master Plan IU 20096161 Page 172
Building Name Estimated Annual Energy
Cost ReductionEstimated
Implementation CostMarginal Payback
(Years)Included Energy Conservation
Measures
Innovation Center $3,635 $37,319 9.9 Lighting Controls
Mellencamp Pavilion $2,774 $16,847 5.9 Reduce Outside Air
Mellencamp Pavilion $12,001 $93,864 7.6 Lighting Controls
Mellencamp Pavilion $6,770 $1,539,080 134.8 Change HVAC Type, Space Temp. Setback, Air‐Side Heat Recovery
Memorial Stadium East Stands
$5,111 $1,670 0.3 Change HVAC Schedule
Memorial Stadium East Stands
$7,415 $43,415 5.7 Lighting Controls
Memorial Stadium East Stands
$2,484 $52,878 20.5 Optimize VAV Operation
Memorial Stadium West Stands
$28,709 $423,697 13.8 Install Fan VFD's, Optimize VAV
Operation, Install DDC Zone Controls, Space Temp. Setback
Memorial Stadium North Endzone
$14,806 $2,520 0.2 Change HVAC Schedule
Memorial Stadium North Endzone
$10,388 $108,500 10.0 Lighting Controls
Memorial Stadium North Endzone
$4,478 $101,640 21.0 Optimize VAV Operation, Space
Temp. Setback
Tennis Center $7,731 $54,015 6.8 Lighting Controls
Tennis Center $15,240 $576,203 32.3
Install Fan VFD's, Optimize VAV Operation, Install DDC Zone Controls, Change HVAC Schedule, Space Temp. Setback, Condensing Water Boiler
Assembly Hall $21,225 $64,026 2.9 Reduce Outside Air
Assembly Hall $57,427 $356,715 6.1 Lighting Controls

Table A8.2.2: Building Energy Conservation Measures, Ordered by Building (continued)
Integrated Energy Master Plan IU 20096161 Page 173
Building Name Estimated Annual Energy
Cost ReductionEstimated
Implementation CostMarginal Payback
(Years)Included Energy Conservation
Measures
Assembly Hall $37,788 $2,872,015 58.5 Install Fan VFD's, Optimize VAV
Operation, Install DDC Zone Controls, Space Temp. Setback
Assembly Hall $3,134 $995,335 181.3 Replace Windows, Convert to Variable Volume Heating Water
Gladstein Fieldhouse $53,706 $310,529 5.7 Lighting Retrofit, Lighting Controls
Gladstein Fieldhouse $12,708 $3,581,725 123.4
Replace Windows, Optimize VAV Operation, Install DDC Zone Controls, Space Temp. Setback, Change FCU Cool Source, Air‐Side Heat Recovery, Connect to Campus CWP, Variable
Flow
Cook Hall $38,011 $2,500 0.1 Change HVAC Schedule
Cook Hall $12,594 $11,666 0.9 Reduce Outside Air
Cook Hall $43,591 $100,828 2.3 Optimize VAV Operation, Space
Temp. Setback

Figure A9.1.1.1: Central Heating Plant Flow Schematic
Integrated Energy Master Plan IU 20096161 Page 174

Figure A9.1.1.2: Central Heating Plant Thermal Model
Integrated Energy Master Plan IU 20096161 Page 175
Flue Gas Losses
6
Deaerator
Condensate
Venting
Steam Boilers
Campus Heating Needs
Micro‐Turbine
PRV Station
Blowdown
Distribution Losses
Condensate Losses City Water Make‐Up Fuel Input
1
2
3 54
8
79
10
11
12
1 Distribution Losses
150 psig Steam
40 psig Steam
Low Pressure Condensate
Plant Boundary
Plant Heating Needs
1
Distribution Losses
1
Distribution Losses

Table A9.1.1.3: FY 09‐10 Central Heating Plant Annual Energy Flow
Integrated Energy Master Plan IU 20096161 Page 176
IUB CHP Steam System Flows and State Points
Boiler Inputs Plant Inputs
State Point
Description of State Point Steam Pressure
(psig) Steam Condition
Temperature (°F)
Enthalpy (Btu/lb)
Annual Flow (10
3lbs/year)
Fuel 1,783,503 MMBtu/yr Fuel 1,783,503 MMBtu/yr
1 Boiler Discharge 150 Saturated Vapor 366 1,196.0 1,266,133 Feedwater 291,651 MMBtu/yr City Water 12,957 MMBtu/yr
2 Micro‐Turbine Discharge 40 95.5% Quality 287 1,134.4 47,838 Total 2,075,154 MMBtu/yr Condensate Return 103,571 MMBtu/yr
3 PRV Station Discharge 40 Superheated Vapor 324 1,196.0 995,399 Total 1,900,031 MMBtu/yr
4 40 psig Steam to Plant 40 Superheated Vapor 319 1,193.2 1,043,237 Boiler Outputs
5 Steam to Deaerator 40 Superheated Vapor 319 1,193.2 131,924 Steam 1,514,295 MMBtu/yr Plant Outputs MMBtu/yr
6 40 psig Steam to Campus 40 Superheated Vapor 319 1,193.2 853,515 Blowdown 22,413 MMBtu/yr Flue Gas Losses 533,986 MMBtu/yr
7 Condensate Returned from Campus and from
Plant 0 Subcooled Liquid 171 139.3 743,509 Radiation 4,459 MMBtu/yr Blowdown 22,413 MMBtu/yr
8 Softened Make‐Up Water 0 Subcooled Liquid 60 28.1 461,112 Flue Gas Losses 533,986 MMBtu/yr 150 Psig Steam 266,584 MMBtu/yr
9 Feedwater to Deaerator 15 Subcooled Liquid 129 96.7 1,204,621 Total 2,075,154 MMBtu/yr 40 Psig Steam 1,018,414 MMBtu/yr
10 Feedwater to Boiler 165 Subcooled Liquid 250 218.9 1,332,347 Combustion Efficiency 70.1% Radiation 4,459 MMBtu/yr
11 Boiler Blowdown 150 Saturated Liquid 366 338.5 66,214 Efficiency based on Boiler lbs
Produced 68.6% DA Venting 4,829 MMBtu/yr
12 Unreturned Condensate 0 Saturated Liquid 212 180.2 390,700 Efficiency based on Steam
Leaving Plant 66.2%
Other Plant Needs for Heat
58,549 MMBtu/yr
13 150 psig Steam to Campus 150 Saturated Vapor 366 1,196.0 222,896 Electricity 3,015 MMBtu/yr
14 Other Plant Steam Needs 40 Superheated Vapor 319 1,193.2 57,798 Total 1,912,250 MMBtu/yr
15 Condensate Returned from Campus 0 Subcooled Liquid 168 135.9 685,711
Accuracy of Heat Balance
‐0.64%
Total Heat Resulting in Steam Production = Qout ‐ Qin = (mh)1 ‐ (mh)10 = 1,222,644 MMBtu/year
Total Fuel Input = 1,783,503 MMBtu/year
Implied ASME PTC‐4 Boiler Efficiency = 68.6%
Boiler Combustion Efficiency = 70.1%
Average Enthalpy of Steam Leaving Plant = (m6h6 + m13h13)/(m6 + m13) = 1,193.8 (havg) Btu/lb For Average Soil Conditions, 49.4% of Heat Input is Used for Heat in the Buildings
Enthalpy of Condensate at 212°F, 14.7 psia = 180.2 (hcond) Btu/lb
Heat Available from One LB Steam to Loads and Distribution Losses = 1,013.6 (Δh) Btu/lb
Average Return Losses = (m6 + m13) hcond ‐ (mh)7 = 100,781 MMBtu/year (Including Heat Loss and Unreturned Condensate)
Return Losses as % of Total Output = 8.2%
Enthalpy of 5 psig Saturated Steam = 1,155.9 (hsupply) Btu/lb
Losses from Supply Distribution Analysis as % of Total Output = 209,110 MMBtu/year (Average Soil Conditions)
Distribution Losses as Percentage of Total Output = 17.1%
Losses from Supply Distribution Analysis as % of Total Output = 117,410 MMBtu/year (Dry Soil Conditions)
Distribution Losses as Percentage of Total Output = 9.6%
Total Distribution Losses as % of Total Output= 25.3% MMBtu/year (Average Soil Conditions)
Total Distribution Losses as % of Total Output= 17.8% MMBtu/year (Dry Soil Conditions)
Implied Plant Efficiency = 49.4% (Average Soil Conditions)
Implied Plant Efficiency = 54.6% (Dry Soil Conditions)
Heat Consumed in the Buildings =
(m6h6 + m13h13) ‐ Supply Losses ‐ (m6 + m13)hcond = 881,918 MMBtu/year (Average Soil Conditions)
Percentage Condensate Return from the System = 63.7% Apparent % Counting Returns from the Plant = 69.1%

Table A9.1.2.1: 100% Natural Gas, Existing Boilers, Reduce Staff with Elimination of Coal Operation
Integrated Energy Master Plan IU 20096161 Page 177
Option A: 100% Natural Gas, Existing Boilers, Staff Reductions
Cost Premium for Operation on 100% Natural Gas in FY 2011/2012
Total Costs for 100% Natural Gas Operation FY 11/12 = $7,579,797
Total Costs for 90% Coal/10% Natural Gas Operation FY 11/12 = $6,993,478
Total Additional Cost for FY 11/12 to Burn 100% Natural Gas = $586,318
FY 2011/2012 Natural Gas Costs
Differential Cost of Operation for 100% Natural Gas Plant Use (with Efficiency of Existing Gas Boilers Considered)
Vectren Charges (LDC) Energy USA Charges
Month FY 11/12
Natural Gas Use (therms)
Throughput Charges
Customer Facilities Charge (CFC)
Capacity Reservation
Charge (CRC)
Delivery Reservation
Charge (DRC)
Pipeline Safety
Adjustment Charge (PSAC)
Universal Service Fund Charge (USFC)
Gas Cost Adjustment
(GCA)
Total Vectren Charges
Vectren Line Loss (0.2% of therms used)
Energy USA Therms
Energy USA Citygate
Price/MMBtu
Total Commodity
Cost
Mgmt. Fees
Indiana Utilities Receipts
Tax
Total Energy USA
Charges
Total Natural Gas Cost
Total Natural Gas Cost/MMBtu
Jul 595,973 $22,472 $1,100 $3,750 $0 $715 $179 $179 $28,395 1,192 597,165 $4.5520 $271,829 $699 $3,806 $276,334 $304,728 $5.113
Aug 663,998 $24,465 $1,100 $3,750 $0 $797 $199 $199 $30,510 1,328 665,326 $4.5800 $304,719 $733 $4,266 $309,718 $340,228 $5.124
Sep 839,451 $29,606 $1,100 $3,750 $0 $1,007 $200 $252 $35,915 1,679 841,130 $4.0870 $343,770 $821 $4,813 $349,403 $385,318 $4.590
Oct 1,117,812 $37,762 $1,100 $3,750 $0 $1,341 $200 $335 $44,489 2,236 1,120,047 $4.0090 $449,027 $960 $6,286 $456,273 $500,762 $4.480
Nov 1,521,713 $49,596 $1,100 $3,750 $26,740 $1,826 $200 $457 $83,669 3,043 1,524,757 $3.7940 $578,493 $1,162 $8,099 $587,754 $671,423 $4.412
Dec 2,361,073 $74,189 $1,100 $3,750 $26,740 $2,833 $200 $708 $109,521 4,722 2,365,795 $4.0815 $965,599 $1,583 $13,518 $980,701 $1,090,222 $4.617
Jan 2,546,209 $79,614 $1,100 $3,750 $26,740 $3,055 $200 $764 $115,223 5,092 2,551,302 $4.1780 $1,065,934 $1,676 $14,923 $1,082,533 $1,197,756 $4.704
Feb 2,165,858 $68,470 $1,100 $3,750 $26,740 $2,599 $200 $650 $103,508 4,332 2,170,190 $4.2010 $911,697 $1,485 $12,764 $925,946 $1,029,454 $4.753
Mar 1,277,512 $42,441 $1,100 $3,750 $26,740 $1,533 $200 $383 $76,147 2,555 1,280,067 $4.1700 $533,788 $1,040 $7,473 $542,301 $618,448 $4.841
Apr 1,171,792 $39,344 $1,100 $3,750 $0 $1,406 $200 $352 $46,151 2,344 1,174,135 $4.1670 $489,262 $987 $6,850 $497,099 $543,250 $4.636
May 1,110,729 $37,554 $1,100 $3,750 $0 $1,333 $200 $333 $44,270 2,221 1,112,950 $4.1875 $466,048 $956 $6,525 $473,529 $517,799 $4.662
Jun 810,024 $28,744 $1,100 $3,750 $0 $972 $200 $243 $35,009 1,620 811,644 $4.1870 $339,835 $806 $4,758 $345,399 $380,408 $4.696
16,182,143 $534,257 $13,200 $45,000 $133,700 $19,419 $2,378 $4,855 $752,808 32,364 16,214,507 $6,720,001 $12,907 $94,080 $6,826,989 $7,579,797
Per
MMBtu = $0.330 $0.008 $0.028 $0.083 $0.012 $0.001 $0.003 $0.465
$4.153 $0.008 $0.001 $4.219 $4.684
Energy USA Citygate Price = NYMEX Monthly Settlement Price + Vectren North NEC Basis (Historical Summary through November 2011, Futures for Remainder of FY 11/12)
Displays Natural Gas Charges for Heat Necessary to Produce all the Steam that was Generated with the Existing Natural Gas Boilers
Rates Applicable for Energy USA Costs FY 11/12 Only

Table A9.1.2.1: 100% Natural Gas, Existing Boilers, Reduce Staff with Elimination of Coal Operation (Continued)
Integrated Energy Master Plan IU 20096161 Page 178
Costs of Operation for FY 2011/2012 Operating on 90% Coal and 10% Natural Gas
Vectren Charges (LDC) Energy USA Charges Coal and Differential Costs
Month FY 11/12
Total Steam Consumption (MMBtu)
Natural Gas Use (therms)
Throughput Charges
Customer Facilities Charge (CFC)
Capacity Reservation
Charge (CRC)
Delivery Reservation
Charge (DRC)
Pipeline Safety
Adjustment Charge (PSAC)
Universal Service Fund Charge (USFC)
Gas Cost Adjustment
(GCA)
Total Vectren Charges
Vectren Line Loss (0.2% of therms used)
Energy USA
Therms
Energy USA Citygate
Price/MMBtu
Total Commodity
Cost
Mgmt. Fees
Indiana Utilities Receipts
Tax
Total Energy USA
Charges
Total Natural Gas Cost
MMBtu Coal
Required
Differential Costs per MMBtu
Note
1
Coal Costs per
MMBtu
Total Coal +
Differential Cost per MMBtu
Coal and Differential
Costs
Total Cost of Coal and Natural Gas Required
Jul 50,062 59,597 $3,222 $1,100 $3,750 $0 $72 $18 $18 $8,180 119 59,716 $4.5520 $27,183 $269 $381 $27,832 $36,012 66,552 $0.900 $2.694 $3.594 $239,188 $275,200
Aug 55,776 66,400 $3,522 $1,100 $3,750 $0 $80 $20 $20 $8,491 133 66,533 $4.5800 $30,472 $299 $427 $31,198 $39,689 74,148 $0.900 $2.694 $3.594 $266,489 $306,178
Sep 70,453 83,872 $4,290 $1,100 $3,750 $0 $101 $25 $25 $9,291 168 84,040 $4.0870 $34,347 $378 $481 $35,206 $44,498 93,660 $0.900 $2.694 $3.594 $336,614 $381,111
Oct 92,334 109,921 $5,437 $1,100 $3,750 $0 $132 $33 $33 $10,484 220 110,141 $4.0090 $44,156 $455 $618 $45,229 $55,713 122,748 $0.900 $2.694 $3.594 $441,159 $496,872
Nov 122,916 146,329 $7,038 $1,100 $3,750 $26,740 $176 $44 $44 $38,892 293 146,622 $3.7940 $55,628 $473 $779 $56,880 $95,772 163,404 $0.900 $2.694 $3.594 $587,276 $683,048
Dec 174,715 207,994 $9,752 $1,100 $3,750 $26,740 $250 $62 $62 $41,716 416 208,410 $4.0815 $85,063 $504 $1,191 $86,758 $128,474 232,265 $0.900 $2.694 $3.594 $834,765 $963,238
Jan 190,145 226,363 $10,560 $1,100 $3,750 $26,740 $272 $68 $68 $42,557 453 226,815 $4.1780 $94,763 $513 $1,327 $96,604 $139,161 252,777 $0.900 $2.694 $3.594 $908,484 $1,047,645
Feb 163,146 194,222 $9,146 $1,100 $3,750 $26,740 $233 $58 $58 $41,085 388 194,610 $4.2010 $81,756 $497 $1,145 $83,398 $124,483 216,886 $0.900 $2.694 $3.594 $779,490 $903,973
Mar 101,930 121,345 $5,939 $1,100 $3,750 $26,740 $146 $36 $36 $37,748 243 121,588 $4.1700 $50,702 $461 $710 $51,873 $89,620 135,505 $0.900 $2.694 $3.594 $487,007 $576,628
Apr 97,184 115,696 $5,691 $1,100 $3,750 $0 $139 $35 $35 $10,749 231 115,927 $4.1670 $48,307 $458 $676 $49,441 $60,190 129,196 $0.900 $2.694 $3.594 $464,333 $524,523
May 93,298 111,070 $5,487 $1,100 $3,750 $0 $133 $33 $33 $10,537 222 111,292 $4.1875 $46,603 $456 $652 $47,711 $58,248 124,030 $0.900 $2.694 $3.594 $445,766 $504,015
Jun 60,082 81,002 $4,164 $1,100 $3,750 $0 $97 $24 $24 $9,160 162 81,164 $4.1870 $33,984 $365 $476 $34,825 $43,984 79,873 $0.900 $2.694 $3.594 $287,063 $331,047
Totals 1,272,042 1,523,812 $74,248 $13,200 $45,000 $133,700 $1,829 $457 $457 $268,891 3,048 1,526,859 $632,964 $5,129 $8,861 $646,955 $915,845 1,691,045 $6,077,633 $6,993,478
Cost Per MMBtu = $0.046 $0.008 $0.028 $0.083 $0.001 $0.000 $0.000 $1.765 $4.154 $0.034 $0.001 $4.246 $6.010
Note 1: Differential Costs Based on $1,418,306/1,575,877 MMBtu = $0.900/MMBtu
(Differential Costs Based on Burning 1,575,877 MMBtu of coal in FY 2010/2011)

Table A9.1.2.2: 100% Natural Gas, High Efficiency Boilers, Reduce Staff with Elimination of Coal Operation
Integrated Energy Master Plan IU 20096161 Page 179
Option B: 100% Natural Gas, High Efficiency Boilers Boilers, Staff Reductions
Cost Premium for Operation on 100% Natural Gas in FY 2011/2012
Total Costs for 100% Natural Gas Operation FY 11/12 = $7,204,111
Total Costs for 90% Coal/10% Natural Gas Operation FY 11/12 = $6,993,478
Total Additional Cost for FY 11/12 to Burn 100% Natural Gas = $210,633
FY 2011/2012 Natural Gas Costs
Differential Cost of Operation for 100% Natural Gas Plant Use (with New High Efficiency Boiler Replacing Boiler No. 5)
Vectren Charges (LDC) Energy USA Charges
Month FY 11/12
Natural Gas Use (therms)
Throughput Charges
Customer Facilities Charge (CFC)
Capacity Reservation
Charge (CRC)
Delivery Reservation
Charge (DRC)
Pipeline Safety
Adjustment Charge (PSAC)
Universal Service Fund Charge (USFC)
Gas Cost Adjustment
(GCA)
Total Vectren Charges
VectrenLine Loss (0.2% of therms used)
Energy USA Therms
Energy USA Citygate
Price/MMBtu
Total Commodity
Cost
Mgmt. Fees
Indiana Utilities Receipts
Tax
Total Energy USA
Charges
Total Natural Gas Cost
Total Natural Gas Cost/MMBtu
Jul 595,973 $22,472 $1,100 $3,750 $0 $715 $179 $179 $28,395 1,192 597,165 $4.5520 $271,829 $699 $3,806 $276,334 $304,728 $5.113
Aug 663,998 $24,465 $1,100 $3,750 $0 $797 $199 $199 $30,510 1,328 665,326 $4.5800 $304,719 $733 $4,266 $309,718 $340,228 $5.124
Sep 838,724 $29,585 $1,100 $3,750 $0 $1,006 $200 $252 $35,893 1,677 840,401 $4.0870 $343,472 $820 $4,809 $349,101 $384,994 $4.590
Oct 1,099,214 $37,217 $1,100 $3,750 $0 $1,319 $200 $330 $43,916 2,198 1,101,413 $4.0090 $441,556 $951 $6,182 $448,689 $492,605 $4.481
Nov 1,463,392 $47,887 $1,100 $3,750 $26,740 $1,756 $200 $439 $81,872 2,927 1,466,318 $3.7940 $556,321 $1,133 $7,788 $565,243 $647,115 $4.422
Dec 2,120,157 $67,131 $1,100 $3,750 $26,740 $2,544 $200 $636 $102,101 4,240 2,124,397 $4.0815 $867,073 $1,462 $12,139 $880,674 $982,775 $4.635
Jan 2,294,555 $72,240 $1,100 $3,750 $26,740 $2,753 $200 $688 $107,472 4,589 2,299,144 $4.1780 $960,582 $1,550 $13,448 $975,580 $1,083,052 $4.720
Feb 1,980,311 $63,033 $1,100 $3,750 $26,740 $2,376 $200 $594 $97,794 3,961 1,984,271 $4.2010 $833,592 $1,392 $11,670 $846,655 $944,448 $4.769
Mar 1,213,819 $40,575 $1,100 $3,750 $26,740 $1,457 $200 $364 $74,186 2,428 1,216,247 $4.1700 $507,175 $1,008 $7,100 $515,284 $589,469 $4.856
Apr 1,156,956 $38,909 $1,100 $3,750 $0 $1,388 $200 $347 $45,694 2,314 1,159,270 $4.1670 $483,068 $980 $6,763 $490,810 $536,505 $4.637
May 1,110,695 $37,553 $1,100 $3,750 $0 $1,333 $200 $333 $44,269 2,221 1,112,917 $4.1875 $466,034 $956 $6,524 $473,515 $517,784 $4.662
Jun 810,024 $28,744 $1,100 $3,750 $0 $972 $200 $243 $35,009 1,620 811,644 $4.1870 $339,835 $806 $4,758 $345,399 $380,408 $4.696
15,347,817 $509,811 $13,200 $45,000 $133,700 $18,417 $2,378 $4,604 $727,111 30,696 15,378,513 $6,375,258 $12,489 $89,254 $6,477,000 $7,204,111
Per
MMBtu = $0.332 $0.009 $0.029 $0.087 $0.012 $0.002 $0.003 $0.474
$4.154 $0.008 $0.001 $4.220 $4.694
Energy USA Citygate Price = NYMEX Monthly Settlement Price + Vectren North NEC Basis (Historical Summary through November 2011, Futures for Remainder of FY 11/12)
Displays Natural Gas Charges for Heat Necessary to Produce all the Steam that was Generated with the Existing Natural Gas Boilers
Rates Applicable for Energy USA Costs FY 11/12 Only

Table A9.1.2.2: 100% Natural Gas, High Efficiency Boilers, Reduce Staff with Elimination of Coal Operation (Continued)
Integrated Energy Master Plan IU 20096161 Page 180
Costs of Operation for FY 2011/2012 Operating on 90% Coal and 10% Natural Gas (but with New High Efficiency Gas Boiler)
Vectren Charges (LDC) Energy USA Charges Coal and Differential Costs
Month FY 11/12
Total Steam Consumption (MMBtu)
Natural Gas Use (therms)
Throughput Charges
Customer Facilities Charge (CFC)
Capacity Reservation
Charge (CRC)
Delivery Reservation
Charge (DRC)
Pipeline Safety
Adjustment Charge (PSAC)
Universal Service Fund Charge (USFC)
Gas Cost Adjustment
(GCA)
Total Vectren Charges
Vectren Line Loss (0.2% of therms used)
Energy USA
Therms
Energy USA Citygate
Price/MMBtu
Total Commodity
Cost
Mgmt. Fees
Indiana Utilities Receipts
Tax
Total Energy USA
Charges
Total Natural Gas Cost
MMBtu Coal
Required
Differential Costs per MMBtu
Note
1
Coal Costs per
MMBtu
Total Coal +
Differential Cost per MMBtu
Coal and Differential
Costs
Total Cost of Coal and Natural Gas
Required
Jul 50,062 59,597 $3,222 $1,100 $3,750 $0 $72 $18 $18 $8,180 119 59,716 $4.5520 $27,183 $269 $381 $27,832 $36,012 66,552 $0.900 $2.694 $3.594 $239,188 $275,200
Aug 55,776 66,400 $3,522 $1,100 $3,750 $0 $80 $20 $20 $8,491 133 66,533 $4.5800 $30,472 $299 $427 $31,198 $39,689 74,148 $0.900 $2.694 $3.594 $266,489 $306,178
Sep 70,453 83,872 $4,290 $1,100 $3,750 $0 $101 $25 $25 $9,291 168 84,040 $4.0870 $34,347 $378 $481 $35,206 $44,498 93,660 $0.900 $2.694 $3.594 $336,614 $381,111
Oct 92,334 109,921 $5,437 $1,100 $3,750 $0 $132 $33 $33 $10,484 220 110,141 $4.0090 $44,156 $455 $618 $45,229 $55,713 122,748 $0.900 $2.694 $3.594 $441,159 $496,872
Nov 122,916 146,329 $7,038 $1,100 $3,750 $26,740 $176 $44 $44 $38,892 293 146,622 $3.7940 $55,628 $473 $779 $56,880 $95,772 163,404 $0.900 $2.694 $3.594 $587,276 $683,048
Dec 174,715 207,994 $9,752 $1,100 $3,750 $26,740 $250 $62 $62 $41,716 416 208,410 $4.0815 $85,063 $504 $1,191 $86,758 $128,474 232,265 $0.900 $2.694 $3.594 $834,765 $963,238
Jan 190,145 226,363 $10,560 $1,100 $3,750 $26,740 $272 $68 $68 $42,557 453 226,815 $4.1780 $94,763 $513 $1,327 $96,604 $139,161 252,777 $0.900 $2.694 $3.594 $908,484 $1,047,645
Feb 163,146 194,222 $9,146 $1,100 $3,750 $26,740 $233 $58 $58 $41,085 388 194,610 $4.2010 $81,756 $497 $1,145 $83,398 $124,483 216,886 $0.900 $2.694 $3.594 $779,490 $903,973
Mar 101,930 121,345 $5,939 $1,100 $3,750 $26,740 $146 $36 $36 $37,748 243 121,588 $4.1700 $50,702 $461 $710 $51,873 $89,620 135,505 $0.900 $2.694 $3.594 $487,007 $576,628
Apr 97,184 115,696 $5,691 $1,100 $3,750 $0 $139 $35 $35 $10,749 231 115,927 $4.1670 $48,307 $458 $676 $49,441 $60,190 129,196 $0.900 $2.694 $3.594 $464,333 $524,523
May 93,298 111,070 $5,487 $1,100 $3,750 $0 $133 $33 $33 $10,537 222 111,292 $4.1875 $46,603 $456 $652 $47,711 $58,248 124,030 $0.900 $2.694 $3.594 $445,766 $504,015
Jun 60,082 81,002 $4,164 $1,100 $3,750 $0 $97 $24 $24 $9,160 162 81,164 $4.1870 $33,984 $365 $476 $34,825 $43,984 79,873 $0.900 $2.694 $3.594 $287,063 $331,047
Totals 1,272,042 1,523,812 $74,248 $13,200 $45,000 $133,700 $1,829 $457 $457 $268,891 3,048 1,526,859 $632,964 $5,129 $8,861 $646,955 $915,845 1,691,045 $6,077,633 $6,993,478
Cost Per MMBtu = $0.487 $0.087 $0.295 $0.877 $0.012 $0.003 $0.003 $1.765 $4.154 $0.034 $0.058 $4.246 $6.010
Note 1: Differential Costs Based on $1,418,306/1,575,877 MMBtu = $0.900/MMBtu
(Differential Costs Based on Burning 1,575,877 MMBtu of coal in FY 2010/2011)

Table A9.1.2.3: Baseload Boiler No. 7, Remaining Load Coal Fired, No Staff Reductions
Integrated Energy Master Plan IU 20096161 Page 181
Option C: Baseload Boiler No. 7, Remaining Load Coal Fired, No Staff Reductions
Cost Premium for Baseload of Boiler No. 7 in FY 2011/2012
Total Costs for 100% Natural Gas Operation FY 11/12 = $7,059,782
Total Costs for 90% Coal/10% Natural Gas Operation FY 11/12 = $6,604,520
Total Additional Cost for FY 11/12 to Burn 100% Natural Gas = $455,262
FY 2011/2012 Natural Gas Costs for Intermittent Gas Operation
Costs of Operation for FY 2011/2012 Operating Base Loaded on Natural Gas, Supplemented with Coal for Topping and with No Staff Changes
Vectren Charges (LDC) Energy USA Charges Coal and Differential Costs
Month FY 11/12
Total Steam Consumption (MMBtu)
Natural Gas Use (therms)
Throughput Charges
Customer
Facilities Charge (CFC)
Capacity Reservation Charge (CRC)
Delivery Reservation Charge (DRC)
Pipeline Safety
Adjustment Charge (PSAC)
Universal Service Fund Charge (USFC)
Gas Cost Adjustment (GCA)
Total Vectren Charges
Vectren Line Loss (0.2% of therms used)
Energy USA Therms
Energy USA Citygate
Price/MMBtu
Total Commodity Cost
Mgmt. Fees
Indiana Utilities Receipts
Tax
Total Energy USA Charges
Total Natural Gas Cost
MMBtu Coal
Required
Differential Costs per MMBtu
Note
1
Coal Costs per
MMBtu
Total Coal +
Differential Cost per MMBtu
Coal and Differential
Costs
Total Cost of Coal and Natural Gas
Required
Jul 50,062 595,973 $22,472 $1,100 $3,750 $0 $715 $179 $179 $28,395 1,192 597,165 $4.5520 $271,829 $699 $3,806 $276,334 $304,728 0 $0.670 $2.694 $3.364 $0 $304,728
Aug 55,776 663,998 $24,465 $1,100 $3,750 $0 $797 $199 $199 $30,510 1,328 665,326 $4.5800 $304,719 $733 $4,266 $309,718 $340,228 0 $0.670 $2.694 $3.364 $0 $340,228
Sep 70,453 836,528 $29,520 $1,100 $3,750 $0 $1,004 $200 $251 $35,825 1,673 838,202 $4.0870 $342,573 $819 $4,796 $348,188 $384,013 272 $0.670 $2.694 $3.364 $916 $384,930
Oct 92,334 1,043,066 $35,572 $1,100 $3,750 $0 $1,252 $200 $313 $42,186 2,086 1,045,152 $4.0090 $419,001 $923 $5,866 $425,790 $467,977 6,967 $0.670 $2.694 $3.364 $23,436 $491,412
Nov 122,916 1,286,897 $42,716 $1,100 $3,750 $26,740 $1,544 $200 $386 $76,436 2,574 1,289,471 $3.7940 $489,225 $1,045 $6,849 $497,119 $573,556 21,886 $0.670 $2.694 $3.364 $73,625 $647,180
Dec 174,715 1,231,175 $41,083 $1,100 $3,750 $26,740 $1,477 $200 $369 $74,720 2,462 1,233,637 $4.0815 $503,509 $1,017 $7,049 $511,575 $586,295 105,312 $0.670 $2.694 $3.364 $354,271 $940,566
Jan 190,145 1,410,470 $46,337 $1,100 $3,750 $26,740 $1,693 $200 $423 $80,242 2,821 1,413,291 $4.1780 $590,473 $1,107 $8,267 $599,846 $680,089 105,857 $0.670 $2.694 $3.364 $356,103 $1,036,192
Feb 163,146 1,267,020 $42,134 $1,100 $3,750 $26,740 $1,520 $200 $380 $75,824 2,534 1,269,554 $4.2010 $533,340 $1,035 $7,467 $541,841 $617,665 83,777 $0.670 $2.694 $3.364 $281,824 $899,490
Mar 101,930 1,020,053 $34,898 $1,100 $3,750 $26,740 $1,224 $200 $306 $68,218 2,040 1,022,093 $4.1700 $426,213 $911 $5,967 $433,091 $501,308 23,997 $0.670 $2.694 $3.364 $80,724 $582,033
Apr 97,184 1,112,165 $37,596 $1,100 $3,750 $0 $1,335 $200 $334 $44,315 2,224 1,114,389 $4.1670 $464,366 $957 $6,501 $471,824 $516,139 5,558 $0.670 $2.694 $3.364 $18,696 $534,835
May 93,298 1,110,594 $37,550 $1,100 $3,750 $0 $1,333 $200 $333 $44,266 2,221 1,112,815 $4.1875 $465,991 $956 $6,524 $473,472 $517,738 13 $0.670 $2.694 $3.364 $42 $517,780
Jun 60,082 810,024 $28,744 $1,100 $3,750 $0 $972 $200 $243 $35,009 1,620 811,644 $4.1870 $339,835 $806 $4,758 $345,399 $380,408 0 $0.670 $2.694 $3.364 $0 $380,408
Totals 1,272,042
12,387,964
$423,087 $13,200 $45,000 $133,700 $14,866 $2,378 $3,716
$635,947 24,776 12,412,740 $5,151,076 $11,006 $72,115
$5,234,197 $5,870,145 353,638
$1,189,637 $7,059,782
Cost Per MMBtu = $0.333 $0.010 $0.035 $0.105 $0.012 $0.002 $0.003 $0.500 $4.158 $0.009 $0.001 $4.225 $4.739
Note 1: Differential Costs Based on $1,055,413/1,575,877 MMBtu = $0.670/MMBtu
(Differential Costs Based on Burning 1,575,877 MMBtu of coal in FY 2010/2011)

Table A9.1.2.3: Baseload Boiler No. 7, Remaining Load Coal Fired, No Staff Reductions (Continued)
Integrated Energy Master Plan IU 20096161 Page 182
Costs of Operation for FY 2011/2012 Operating on 90% Coal and 10% Natural Gas
Vectren Charges (LDC) Energy USA Charges Coal and Differential Costs
Month FY 11/12
Total Steam Consumption (MMBtu)
Natural Gas Use (therms)
Throughput Charges
Customer Facilities Charge (CFC)
Capacity Reservation
Charge (CRC)
Delivery Reservation
Charge (DRC)
Pipeline Safety
Adjustment Charge (PSAC)
Universal Service Fund Charge (USFC)
Gas Cost Adjustment
(GCA)
Total Vectren Charges
Vectren Line Loss (0.2% of therms used)
Energy USA
Therms
Energy USA Citygate
Price/MMBtu
Total Commodity
Cost
Mgmt. Fees
Indiana Utilities Receipts
Tax
Total Energy USA
Charges
Total Natural Gas Cost
MMBtu Coal
Required
Differential Costs per MMBtu
Note
1
Coal Costs per
MMBtu
Total Coal +
Differential Cost per MMBtu
Coal and Differential
Costs
Total Cost of Coal and Natural Gas Required
Jul 50,062 59,597 $3,222 $1,100 $3,750 $0 $72 $18 $18 $8,180 119 59,716 $4.5520 $27,183 $269 $381 $27,832 $36,012 66,552 $0.670 $2.694 $3.364 $223,880 $259,892
Aug 55,776 66,400 $3,522 $1,100 $3,750 $0 $80 $20 $20 $8,491 133 66,533 $4.5800 $30,472 $299 $427 $31,198 $39,689 74,148 $0.670 $2.694 $3.364 $249,434 $289,123
Sep 70,453 83,872 $4,290 $1,100 $3,750 $0 $101 $25 $25 $9,291 168 84,040 $4.0870 $34,347 $378 $481 $35,206 $44,498 93,660 $0.670 $2.694 $3.364 $315,071 $359,568
Oct 92,334 109,921 $5,437 $1,100 $3,750 $0 $132 $33 $33 $10,484 220 110,141 $4.0090 $44,156 $455 $618 $45,229 $55,713 122,748 $0.670 $2.694 $3.364 $412,925 $468,639
Nov 122,916 146,329 $7,038 $1,100 $3,750 $26,740 $176 $44 $44 $38,892 293 146,622 $3.7940 $55,628 $473 $779 $56,880 $95,772 163,404 $0.670 $2.694 $3.364 $549,692 $645,464
Dec 174,715 207,994 $9,752 $1,100 $3,750 $26,740 $250 $62 $62 $41,716 416 208,410 $4.0815 $85,063 $504 $1,191 $86,758 $128,474 232,265 $0.670 $2.694 $3.364 $781,341 $909,815
Jan 190,145 226,363 $10,560 $1,100 $3,750 $26,740 $272 $68 $68 $42,557 453 226,815 $4.1780 $94,763 $513 $1,327 $96,604 $139,161 252,777 $0.670 $2.694 $3.364 $850,343 $989,504
Feb 163,146 194,222 $9,146 $1,100 $3,750 $26,740 $233 $58 $58 $41,085 388 194,610 $4.2010 $81,756 $497 $1,145 $83,398 $124,483 216,886 $0.670 $2.694 $3.364 $729,604 $854,087
Mar 101,930 121,345 $5,939 $1,100 $3,750 $26,740 $146 $36 $36 $37,748 243 121,588 $4.1700 $50,702 $461 $710 $51,873 $89,620 135,505 $0.670 $2.694 $3.364 $455,840 $545,460
Apr 97,184 115,696 $5,691 $1,100 $3,750 $0 $139 $35 $35 $10,749 231 115,927 $4.1670 $48,307 $458 $676 $49,441 $60,190 129,196 $0.670 $2.694 $3.364 $434,616 $494,806
May 93,298 111,070 $5,487 $1,100 $3,750 $0 $133 $33 $33 $10,537 222 111,292 $4.1875 $46,603 $456 $652 $47,711 $58,248 124,030 $0.670 $2.694 $3.364 $417,238 $475,487
Jun 60,082 81,002 $4,164 $1,100 $3,750 $0 $97 $24 $24 $9,160 162 81,164 $4.1870 $33,984 $365 $476 $34,825 $43,984 79,873 $0.670 $2.694 $3.364 $268,691 $312,676
Totals 1,272,042 1,523,812 $74,248 $13,200 $45,000 $133,700 $1,829 $457 $457 $268,891 3,048 1,526,859 $632,964 $5,129 $8,861 $646,955 $915,845 1,691,045 $5,688,675 $6,604,520
Cost Per MMBtu = $0.584 $0.104 $0.354 $1.051 $0.014 $0.004 $0.004 $1.765 $4.154 $0.034 $0.001 $4.246 $6.010
Note 1: Differential Costs Based on $1,055,413/1,575,877 MMBtu = $0.670/MMBtu
(Differential Costs Based on Burning 1,575,877 MMBtu of coal in FY 2010/2011)

Table A9.1.2.4: 50% Of Annual Load on Boiler 7, Remaining Load on Coal Boilers, No Staff Reductions
Integrated Energy Master Plan IU 20096161 Page 183
Option E: 50% Load on Boiler No. 7, Remaining 50% Load on Coal, No Staff Reductions
Cost Premium for 50% Natural Gas qand 50% Coal Firing in FY 2011/2012
Total Costs for 50% Natural Gas / 50% Coal Operation FY 11/12 =
$6,876,360
Total Costs for 90% Coal/10% Natural Gas Operation FY 11/12 =
$6,604,520
Total Additional Cost for FY 11/12 to Burn 100% Natural Gas = $271,840
Energy USA Citygate Price = NYMEX Monthly Settlement Price + Vectren North NEC Basis (Historical Summary through November, Futures for Remainder of FY 11/12)
Displays Natural Gas Charges for Heat Necessary to Produce all the Steam that was Generated with the Existing Natural Gas Boilers
Rates Applicable for Energy USA Costs FY 11/12 Only
Costs of Operation for FY 2011/2012 Operating on 50% Natural Gas and 50% Coal with Existing Boilers and No Staff Changes
Vectren Charges (LDC) Energy USA Charges Coal and Differential Costs
Month FY 11/12
Total Steam Consumption (MMBtu)
Natural Gas Use (therms)
Throughput Charges
Customer Facilities Charge (CFC)
Capacity Reservation Charge (CRC)
Delivery Reservation Charge (DRC)
Pipeline Safety
Adjustment Charge (PSAC)
Universal Service Fund Charge (USFC)
Gas Cost Adjustment (GCA)
Total Vectren Charges
Vectren Line Loss (0.2% of therms used)
Energy USA
Therms
Energy USA Citygate Price
/MMBtu
Total Commodity Cost
Mgmt. Fees
Indiana Utilities Receipts
Tax
Total Energy USA Charges
Total Natural Gas Cost
MMBtu Coal
Required
Differential Costs
per MMBtu
N
ote 1
Coal Costs per MMBtu
Total Coal +
Differential Cost per MMBtu
Coal and Differential Costs
Total Cost of Coal and Natural Gas
Required
Jul 50,062 560,343 $21,428 $1,100 $3,750 $0 $672 $168 $168 $27,287 1,121 561,463 $4.5520 $255,578 $681 $3,578 $259,837 $287,124 4,421 $0.670 $2.694 $3.364 $14,872 $301,995
Aug 55,776 623,864 $23,289 $1,100 $3,750 $0 $749 $187 $187 $29,262 1,248 625,112 $4.5800 $286,301 $713 $4,008 $291,022 $320,284 4,980 $0.670 $2.694 $3.364 $16,752 $337,036
Sep 70,453 660,070 $24,350 $1,100 $3,750 $0 $792 $198 $198 $30,388 1,320 661,391 $4.0870 $270,310 $731 $3,784 $274,825 $305,214 22,167 $0.670 $2.694 $3.364 $74,569 $379,783
Oct 92,334 610,624 $22,901 $1,100 $3,750 $0 $733 $183 $183 $28,850 1,221 611,845 $4.0090 $245,289 $706 $3,434 $249,429 $278,279 60,623 $0.670 $2.694 $3.364 $203,935 $482,214
Nov 122,916 665,491 $24,509 $1,100 $3,750 $26,740 $799 $200 $200 $57,297 1,331 666,822 $3.7940 $252,992 $733 $3,542 $257,268 $314,564 98,988 $0.670 $2.694 $3.364 $332,996 $647,561
Dec 174,715 582,601 $22,080 $1,100 $3,750 $26,740 $699 $175 $175 $54,719 1,165 583,766 $4.0815 $238,264 $692 $3,336 $242,292 $297,011 185,785 $0.670 $2.694 $3.364 $624,982 $921,993
Jan 190,145 673,284 $24,737 $1,100 $3,750 $26,740 $808 $200 $202 $57,537 1,347 674,631 $4.1780 $281,861 $737 $3,946 $286,544 $344,081 197,325 $0.670 $2.694 $3.364 $663,800 $1,007,881
Feb 163,146 614,842 $23,025 $1,100 $3,750 $26,740 $738 $184 $184 $55,722 1,230 616,072 $4.2010 $258,812 $708 $3,623 $263,143 $318,865 164,697 $0.670 $2.694 $3.364 $554,040 $872,904
Mar 101,930 531,636 $20,587 $1,100 $3,750 $26,740 $638 $159 $159 $53,134 1,063 532,699 $4.1700 $222,135 $666 $3,110 $225,912 $279,046 84,598 $0.670 $2.694 $3.364 $284,587 $563,633
Apr 97,184 724,953 $26,251 $1,100 $3,750 $0 $870 $200 $217 $32,389 1,450 726,403 $4.1670 $302,692 $763 $4,238 $307,693 $340,081 53,602 $0.670 $2.694 $3.364 $180,316 $520,397
May 93,298 864,749 $30,347 $1,100 $3,750 $0 $1,038 $200 $259 $36,694 1,729 866,479 $4.1875 $362,838 $833 $5,080 $368,751 $405,445 30,516 $0.670 $2.694 $3.364 $102,656 $508,102
Jun 60,082 607,218 $22,801 $1,100 $3,750 $0 $729 $182 $182 $28,744 1,214 608,432 $4.1870 $254,751 $704 $3,567 $259,021 $287,766 13,406 $0.670 $2.694 $3.364 $45,096 $332,862
Totals 1,272,042 7,719,674 $286,306 $13,200 $45,000 $133,700 $9,264 $2,237 $2,316 $492,023 15,439 7,735,114 $3,231,823 $8,668 $45,246 $3,285,736 $3,777,759 921,106 $3,098,601 $6,876,360
Cost Per MMBtu = $0.225 $0.010 $0.035 $0.105 $0.007 $0.002 $0.002 $0.387 $4.186 $0.011 $0.001 $4.256 $4.894
Note 1: Differential Costs Based on $1,055,413/1,575,877 MMBtu = $0.670/MMBtu
(Differential Costs Based on Burning 1,575,877 MMBtu of coal in FY 2010/2011)
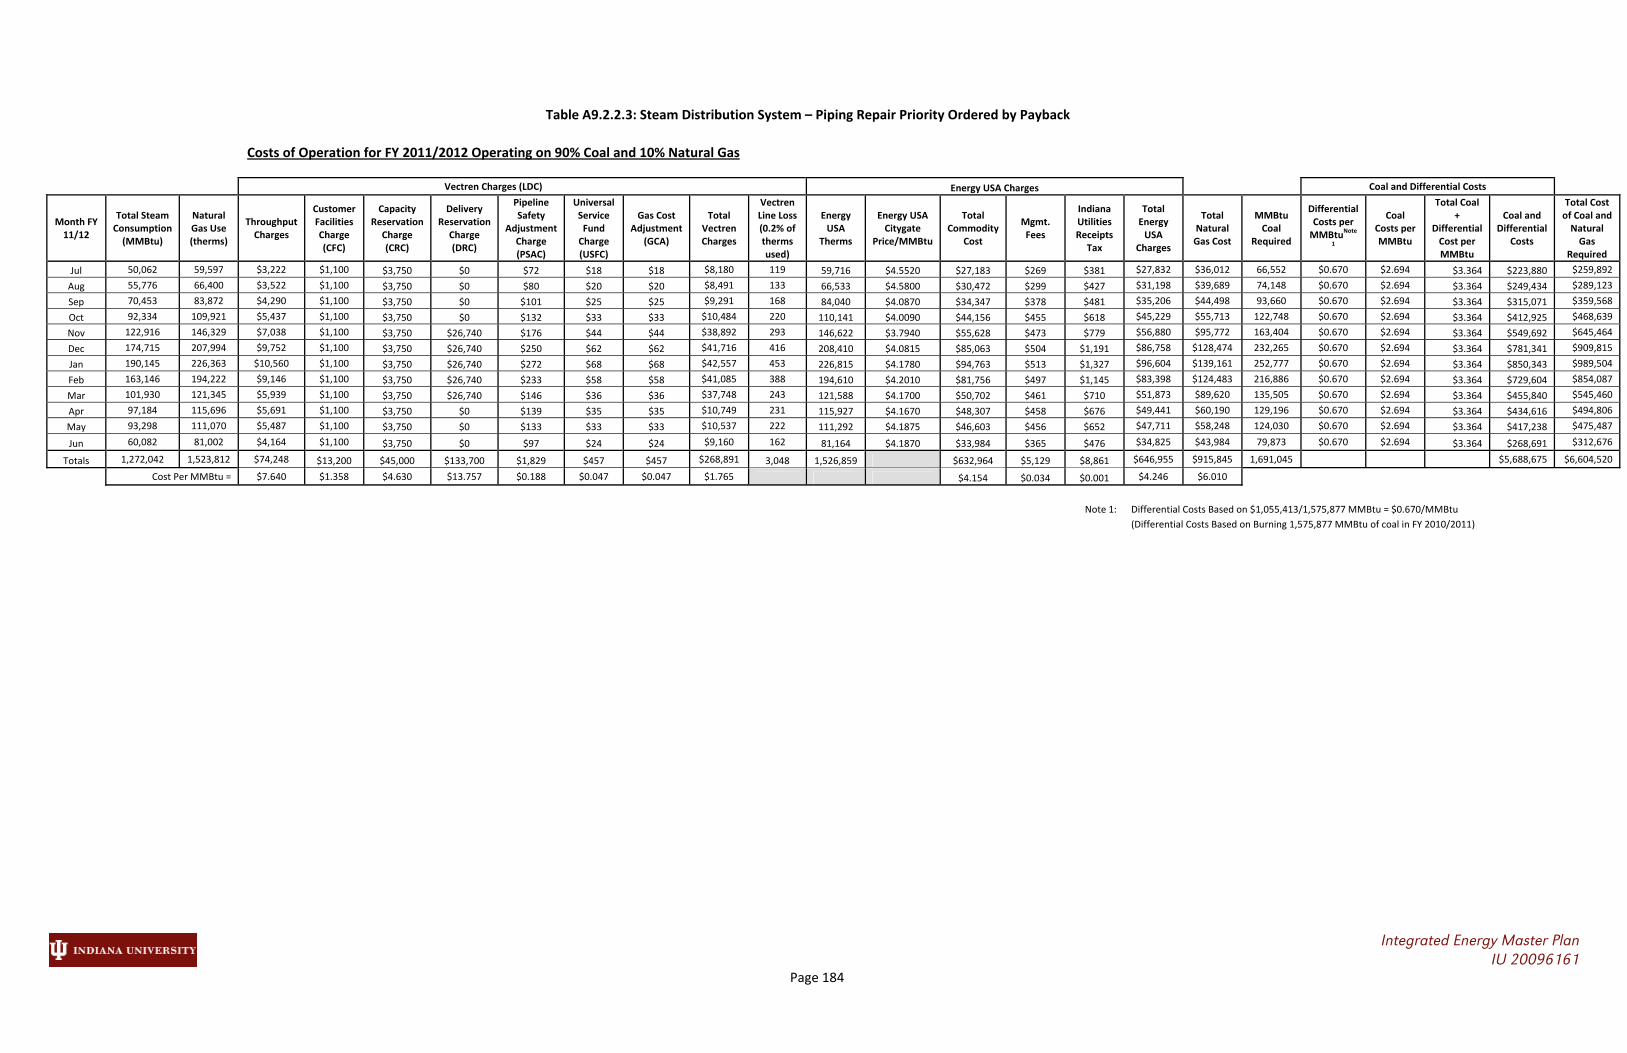
Table A9.2.2.3: Steam Distribution System – Piping Repair Priority Ordered by Payback
Integrated Energy Master Plan IU 20096161 Page 184
Costs of Operation for FY 2011/2012 Operating on 90% Coal and 10% Natural Gas
Vectren Charges (LDC) Energy USA Charges Coal and Differential Costs
Month FY 11/12
Total Steam Consumption (MMBtu)
Natural Gas Use (therms)
Throughput Charges
Customer Facilities Charge (CFC)
Capacity Reservation
Charge (CRC)
Delivery Reservation
Charge (DRC)
Pipeline Safety
Adjustment Charge (PSAC)
Universal Service Fund Charge (USFC)
Gas Cost Adjustment
(GCA)
Total Vectren Charges
VectrenLine Loss (0.2% of therms used)
Energy USA
Therms
Energy USA Citygate
Price/MMBtu
Total Commodity
Cost
Mgmt. Fees
Indiana Utilities Receipts
Tax
Total Energy USA
Charges
Total Natural Gas Cost
MMBtu Coal
Required
Differential Costs per MMBtu
Note
1
Coal Costs per MMBtu
Total Coal +
Differential Cost per MMBtu
Coal and Differential
Costs
Total Cost of Coal and Natural Gas
Required
Jul 50,062 59,597 $3,222 $1,100 $3,750 $0 $72 $18 $18 $8,180 119 59,716 $4.5520 $27,183 $269 $381 $27,832 $36,012 66,552 $0.670 $2.694 $3.364 $223,880 $259,892
Aug 55,776 66,400 $3,522 $1,100 $3,750 $0 $80 $20 $20 $8,491 133 66,533 $4.5800 $30,472 $299 $427 $31,198 $39,689 74,148 $0.670 $2.694 $3.364 $249,434 $289,123
Sep 70,453 83,872 $4,290 $1,100 $3,750 $0 $101 $25 $25 $9,291 168 84,040 $4.0870 $34,347 $378 $481 $35,206 $44,498 93,660 $0.670 $2.694 $3.364 $315,071 $359,568
Oct 92,334 109,921 $5,437 $1,100 $3,750 $0 $132 $33 $33 $10,484 220 110,141 $4.0090 $44,156 $455 $618 $45,229 $55,713 122,748 $0.670 $2.694 $3.364 $412,925 $468,639
Nov 122,916 146,329 $7,038 $1,100 $3,750 $26,740 $176 $44 $44 $38,892 293 146,622 $3.7940 $55,628 $473 $779 $56,880 $95,772 163,404 $0.670 $2.694 $3.364 $549,692 $645,464
Dec 174,715 207,994 $9,752 $1,100 $3,750 $26,740 $250 $62 $62 $41,716 416 208,410 $4.0815 $85,063 $504 $1,191 $86,758 $128,474 232,265 $0.670 $2.694 $3.364 $781,341 $909,815
Jan 190,145 226,363 $10,560 $1,100 $3,750 $26,740 $272 $68 $68 $42,557 453 226,815 $4.1780 $94,763 $513 $1,327 $96,604 $139,161 252,777 $0.670 $2.694 $3.364 $850,343 $989,504
Feb 163,146 194,222 $9,146 $1,100 $3,750 $26,740 $233 $58 $58 $41,085 388 194,610 $4.2010 $81,756 $497 $1,145 $83,398 $124,483 216,886 $0.670 $2.694 $3.364 $729,604 $854,087
Mar 101,930 121,345 $5,939 $1,100 $3,750 $26,740 $146 $36 $36 $37,748 243 121,588 $4.1700 $50,702 $461 $710 $51,873 $89,620 135,505 $0.670 $2.694 $3.364 $455,840 $545,460
Apr 97,184 115,696 $5,691 $1,100 $3,750 $0 $139 $35 $35 $10,749 231 115,927 $4.1670 $48,307 $458 $676 $49,441 $60,190 129,196 $0.670 $2.694 $3.364 $434,616 $494,806
May 93,298 111,070 $5,487 $1,100 $3,750 $0 $133 $33 $33 $10,537 222 111,292 $4.1875 $46,603 $456 $652 $47,711 $58,248 124,030 $0.670 $2.694 $3.364 $417,238 $475,487
Jun 60,082 81,002 $4,164 $1,100 $3,750 $0 $97 $24 $24 $9,160 162 81,164 $4.1870 $33,984 $365 $476 $34,825 $43,984 79,873 $0.670 $2.694 $3.364 $268,691 $312,676
Totals 1,272,042 1,523,812 $74,248 $13,200 $45,000 $133,700 $1,829 $457 $457 $268,891 3,048 1,526,859 $632,964 $5,129 $8,861 $646,955 $915,845 1,691,045 $5,688,675 $6,604,520
Cost Per MMBtu = $7.640 $1.358 $4.630 $13.757 $0.188 $0.047 $0.047 $1.765 $4.154 $0.034 $0.001 $4.246 $6.010
Note 1: Differential Costs Based on $1,055,413/1,575,877 MMBtu = $0.670/MMBtu
(Differential Costs Based on Burning 1,575,877 MMBtu of coal in FY 2010/2011)

Table A9.1.2.5: Assumptions for CHP Fuel Selection Calculation
Integrated Energy Master Plan IU 20096161 Page 185
Assumptions Description of Assumption
1 Baseline Assumptions Fuel Use Based on Metered Steam Loads for FY 2010/2011 FY 2011/12 budget costs based on 90% Coal and 10% Natural Gas Other Natural Gas Boilers = 63.1% (Based on FY 09/10 Boiler No. 5)
2 Boiler Efficiencies Coal Boilers = 67.7% Natural Gas Boiler No. 7 = 84.0% Other Natural Gas Boilers = 63.1% (Based on FY 09/10 Boiler No. 5)
3 Estimated Yearly Plant Operational Savings Using 100% Natural Gas Wages and Fringes = $255,271 Maintenance and Repair = $350,000 Electrical Savings = $305,409 (4,779,484 kWh) Ash Disposal = $141,655 Coal Sampling = $7,622 Lime = $153,349 Carbon = $105,000 Stack Testing = $10,000 IDEM Emissions Fee=$90,000 Total Savings = $1,418,306
4 Estimated Yearly Plant Operational Savings Using Some Natural Gas Maintenance and Repair = $350,000 Electrical Savings = $305,409 Ash Disposal = $141,655 Lime = $153,349 Carbon = $105,000 Total Savings = $1,055,413 (prorated based on 80% Gas / 20% coal )
5 Natural Gas Costs Historical and future gas prices based on November 1, 2011 settlements
FY 2011/12 Natural Gas Commodity Prices from Energy USA as City Gate Prices
City Gate prices include NYMEX Commodity Charge and the Energy USA Basis
Local Distribution Cost = Vectren Rate 260 Large Volume Transportation Service
6 Coal Costs 100% Coal Option analyzed at 90% coal and 10% natural gas For FY 09/10 = $62.24/ton, $2.616/MMBtu For FY 10/11 = $64.10/ton, $2.694/MMBtu

Table A9.1.2.5: Assumptions for CHP Fuel Selection Calculation (Continued)
Integrated Energy Master Plan IU 20096161 Page 186
Assumptions Description of Assumption
7 Boiler No. 7 Assumptions
Boiler peak capacity for continuous operation set a 150,000 lbs/hr vs. peak capacity rating of 180,000 lbs/hr; Two week boiler operation shut down for maintenance is assumed.
8 New High Efficiency Boiler No. 8 Assumptions
Boiler peak capacity for continuous operation set a 120,000 lbs/hr vs. assumed capacity rating of 150,000 lbs/hr; Two week boiler operation shut down for maintenance is assumed. Installation requires demolition of existing boiler.
9 New Gas Turbine and Heat Recovery Boiler Assumptions 7.5 MW electric generation; 75,000 lbs/hr steam generation Could be located at CHP or remotely and connected to distribution systems

Table A9.2.1.1: Steam System Distribution Thermal Losses Per Unit Length – Very Moist Soil Conditions
Integrated Energy Master Plan IU 20096161 Page 187
40 psig System Losses
Existing Piping Losses Perma‐Pipe Losses
Steam Pipe Size (in)
Condensate Pipe Size
(in)
Steam Pipe Heat Loss (Btu/hr‐ft)
Condensate Pipe Heat
Loss (Btu/hr‐ft)
Total Pipe Heat Loss (Btu/hr‐ft)
Steam Pipe Heat Loss (Btu/hr‐ft)
Condensate Pipe Heat
Loss (Btu/hr‐ft)
Total Pipe Heat Loss (Btu/hr‐ft)
Total Heat Loss Savings (Btu/hr‐ft)
Percentage of Original
Loss
14 6 1,073 428 1,501 93 30 123 1,378 8.2%
12 5 1,036 407 1,443 88 29 116 1,327 8.1%
10 4 975 384 1,359 78 25 103 1,256 7.6%
8 3 905 360 1,265 73 21 94 1,171 7.5%
6 2.5 834 343 1,177 59 21 80 1,097 6.8%
5 2 793 328 1,121 56 19 74 1,047 6.6%
4 2 748 328 1,076 49 19 68 1,008 6.4%
3 1.5 701 312 1,013 42 18 60 954 5.9%
150 psig System Losses
Existing Piping Losses Perma‐Pipe Losses
Steam Pipe Size (in)
Condensate Pipe Size
(in)
Steam Pipe Heat Loss (Btu/hr‐ft)
Condensate Pipe Heat
Loss (Btu/hr‐ft)
Total Pipe Heat Loss (Btu/hr‐ft)
Steam Pipe Heat Loss (Btu/hr‐ft)
Condensate Pipe Heat
Loss (Btu/hr‐ft)
Total Pipe Heat Loss (Btu/hr‐ft)
Total Heat Loss Savings (Btu/hr‐ft)
Percentage of Original
Loss
14 6 1,265 428 1,693 109 30 139 1,554 8.2%
12 5 1,221 407 1,628 103 29 132 1,496 8.1%
10 4 1,149 384 1,533 92 25 117 1,416 7.7%
8 3 1,067 360 1,427 86 21 107 1,320 7.5%
6 2.5 984 343 1,327 70 21 91 1,236 6.8%
5 2 935 328 1,263 65 19 84 1,179 6.6%
4 2 882 328 1,210 58 19 77 1,133 6.4%
3 1.5 827 312 1,139 49 18 67 1,072 5.9%

Table A9.2.1.2: Steam System Distribution Thermal Losses Per Unit Length – Moist Soil Conditions
Integrated Energy Master Plan IU 20096161 Page 188
40 psig System Losses
Existing Piping Losses Perma‐Pipe Losses
Steam Pipe Size (in)
Condensate Pipe Size
(in)
Steam Pipe Heat Loss (Btu/hr‐ft)
Condensate Pipe Heat
Loss (Btu/hr‐ft)
Total Pipe Heat Loss (Btu/hr‐ft)
Steam Pipe Heat Loss (Btu/hr‐ft)
Condensate Pipe Heat
Loss (Btu/hr‐ft)
Total Pipe Heat Loss (Btu/hr‐ft)
Total Heat Loss Savings (Btu/hr‐ft)
Percentage of Original
Loss
14 6 789 315 1,104 89 30 119 985 10.8%
12 5 762 299 1,061 86 28 114 947 10.7%
10 4 717 282 999 76 25 101 898 10.1%
8 3 666 265 931 71 21 92 838 9.9%
6 2.5 614 252 866 58 20 79 787 9.1%
5 2 583 241 824 55 18 73 751 8.8%
4 2 550 241 791 49 18 66 725 8.4%
3 1.5 516 230 746 41 18 59 687 7.9%
150 psig System Losses
Existing Piping Losses Perma‐Pipe Losses
Steam Pipe Size (in)
Condensate Pipe Size
(in)
Steam Pipe Heat Loss (Btu/hr‐ft)
Condensate Pipe Heat
Loss (Btu/hr‐ft)
Total Pipe Heat Loss (Btu/hr‐ft)
Steam Pipe Heat Loss (Btu/hr‐ft)
Condensate Pipe Heat
Loss (Btu/hr‐ft)
Total Pipe Heat Loss (Btu/hr‐ft)
Total Heat Loss Savings (Btu/hr‐ft)
Percentage of Original
Loss
14 6 930 315 1,245 105 30 135 1,110 10.9%
12 5 898 299 1,197 101 28 129 1,068 10.8%
10 4 845 282 1,127 90 25 115 1,012 10.2%
8 3 785 265 1,050 84 21 105 945 10.0%
6 2.5 723 252 975 68 20 89 886 9.1%
5 2 688 241 929 64 18 83 846 8.9%
4 2 649 241 890 57 18 75 815 8.4%
3 1.5 608 230 838 48 18 66 772 7.9%

Table A9.2.1.3: Steam System Distribution Thermal Losses Per Unit Length – Average Soil Conditions
Integrated Energy Master Plan IU 20096161 Page 189
40 psig System Losses
Existing Piping Losses Perma‐Pipe Losses
Steam Pipe Size (in)
Condensate Pipe Size
(in)
Steam Pipe Heat Loss (Btu/hr‐ft)
Condensate Pipe Heat
Loss (Btu/hr‐ft)
Total Pipe Heat Loss (Btu/hr‐ft)
Steam Pipe Heat Loss (Btu/hr‐ft)
Condensate Pipe Heat
Loss (Btu/hr‐ft)
Total Pipe Heat Loss (Btu/hr‐ft)
Total Heat Loss Savings (Btu/hr‐ft)
Percentage of Original
Loss
14 6 631 252 883 87 29 116 767 13.1%
12 5 609 240 849 84 28 111 738 13.1%
10 4 573 226 799 74 25 99 700 12.4%
8 3 533 212 745 70 21 91 654 12.2%
6 2.5 491 202 693 57 20 77 616 11.1%
5 2 467 193 660 54 18 72 588 10.9%
4 2 440 193 633 48 18 66 567 10.4%
3 1.5 413 184 597 40 17 57 539 9.6%
150 psig System Losses
Existing Piping Losses Perma‐Pipe Losses
Steam Pipe Size (in)
Condensate Pipe Size
(in)
Steam Pipe Heat Loss (Btu/hr‐ft)
Condensate Pipe Heat
Loss (Btu/hr‐ft)
Total Pipe Heat Loss (Btu/hr‐ft)
Steam Pipe Heat Loss (Btu/hr‐ft)
Condensate Pipe Heat
Loss (Btu/hr‐ft)
Total Pipe Heat Loss (Btu/hr‐ft)
Total Heat Loss Savings (Btu/hr‐ft)
Percentage of Original
Loss
14 6 744 252 996 102 29 131 865 13.2%
12 5 718 240 958 99 28 126 832 13.2%
10 4 676 226 902 88 25 112 790 12.5%
8 3 628 212 840 83 21 103 737 12.3%
6 2.5 579 202 781 67 20 87 694 11.2%
5 2 550 193 743 63 18 81 662 11.0%
4 2 519 193 712 56 18 74 638 10.5%
3 1.5 486 184 670 48 17 65 605 9.6%

Table A9.2.1.4: Steam System Distribution Thermal Losses – Dry Soil Conditions
Integrated Energy Master Plan IU 20096161
Page 190
Buried 150 Psig Steam (HPS)
Buried Condensate from HPS
150 Psig Steam in New Perma‐Pipe System Condensate from HPS in New Perma‐
Pipe System
Pipe Size (in)
Length (ft)
Heat Loss
(Btu/hr‐ft)
Total Heat Loss (MBh)
Pipe Size (in)
Length (ft)
Heat Loss (Btu/hr‐ft)
Total Heat Loss (MBh)
Pipe Size (in)
Length (ft) Heat Loss (Btu/hr‐ft)
Total Heat Loss (MBh)
Pipe Size (in)
Length (ft)
Heat Loss
(Btu/hr‐ft)
Total Heat Loss (MBh)
2 481 222 107 1 317 85 27 8 2,263 77 174 3 2,263 23 52
3 529 243 129 1.5 349 92 32 4 185 56 10 2 185 19 4
4 1,886 259 489 2 1,245 97 120 2,448 185 2,448 56
5 600 275 165 2 396 97 38
6 1,317 289 381 2.5 869 101 88 40 Psig Steam in Tunnels Condensate from MPS in Tunnels
8 5,103 314 1,602 3 3,368 106 357 2 0 66 0 1 0 25 0
10 3,818 338 1,290 4 2,520 113 285 3 0 93 0 1.5 0 25 0
12 2,012 359 723 5 1,328 120 159 4 0 108 0 2 0 25 0
14 604 372 225 6 399 126 50 5 0 132 0 2 0 25 0
16,350 5,109 10,791 1,156 6 45 156 7 2.5 45 31 1
8 65 137 9 3 65 36 2
Buried 40 Psig Steam MPWS) Buried Condensate from MPS 10 5,038 159 801 4 5,038 41 207
2 451 188 85 1 298 85 25 12 2,618 186 487 5 2,618 48 126
3 441 206 91 1.5 291 92 27 14 1,535 216 332 6 1,535 64 98
4 2,204 220 485 2 1,455 97 140 16 4,410 246 1,085 6 4,410 64 282
5 2,739 233 639 2 1,808 97 175 20 0 298 0 8 0 72 0
6 3,029 245 743 2.5 1,999 101 202 24 88 357 31 10 88 90 8
8 5,451 266 1,452 3 3,598 106 381 13,799 2,752 13,799 724
10 4,426 287 1,269 4 2,921 113 330
12 878 305 267 5 579 120 69
14 14 316 4 6 9 116 1
16 0 333 0 6 0 126 0
20 881 365 322 8 581 137 79
24 0 400 0 10 0 147 0
20,514 5,357 13,539 1,430
Total HPS/Condensate Piping Length = 32,037 ft 34% Total MPS/Condensate Piping Length = 61,651 ft 66%
Total HPS/Condensate Piping Heat
Loss = 6,506 MBh
Total MPS/Condensate Piping Heat Loss =
10,263 MBh
Total HPS/Condensate Piping Heat
Loss = 6,404 lbs/hr steam (@ 1,015.8 Btu/lb)
Total MPS/Condensate Piping Heat Loss =
10,132 lbs/hr steam (@ 1,013.0 Btu/lb)
Total Piping Length = 93,688 ft
Total Piping Heat Loss = 16,769 MBh

Table A9.2.1.5: Steam System Distribution Thermal Losses – Average Soil Conditions
Integrated Energy Master Plan IU 20096161
Page 191
Buried 150 Psig Steam (HPS)
Buried Condensate from HPS
150 Psig Steam in New Perma‐Pipe System
Condensate from HPS in New Perma‐Pipe System
Pipe Size (in)
Length (ft)
Heat Loss
(Btu/hr‐ft)
Total Heat Loss (MBh)
Pipe Size (in)
Length (ft)
Heat Loss (Btu/hr‐ft)
Total Heat Loss (MBh)
Pipe Size (in)
Length (ft) Heat Loss (Btu/hr‐ft)
Total Heat Loss (MBh)
Pipe Size (in)
Length (ft)
Heat Loss
(Btu/hr‐ft)
Total Heat Loss (MBh)
2 481 443 213 1 317 170 54 8 2,263 77 174 3 2,263 23 52
3 529 486 257 1.5 349 184 64 4 185 56 10 2 185 19 4
4 1,886 519 979 2 1,245 193 240 2,448 185 2,448 56
5 600 550 330 2 396 193 76
6 1,317 579 762 2.5 869 202 175 40 Psig Steam in Tunnels Condensate from MPS in Tunnels
8 5,103 628 3,203 3 3,368 212 713 2 0 66 0 1 0 25 0
10 3,818 676 2,580 4 2,520 226 569 3 0 93 0 1.5 0 25 0
12 2,012 718 1,445 5 1,328 240 318 4 0 108 0 2 0 25 0
14 604 744 449 6 399 252 100 5 0 132 0 2 0 25 0
16,350 10,219 10,791 2,312 6 45 156 7 2.5 45 31 1
8 65 137 9 3 65 36 2
Buried 40 Psig Steam MPWS) Buried Condensate from MPS 10 5,038 159 801 4 5,038 41 207
2 451 376 170 1 298 170 51 12 2,618 186 487 5 2,618 48 126
3 441 413 182 1.5 291 184 53 14 1,535 216 332 6 1,535 64 98
4 2,204 440 970 2 1,455 193 281 16 4,410 246 1,085 6 4,410 64 282
5 2,739 467 1,278 2 1,808 193 349 20 0 298 0 8 0 72 0
6 3,029 491 1,487 2.5 1,999 202 404 24 88 357 31 10 88 90 8
8 5,451 533 2,903 3 3,598 212 762 13,799 2,752 13,799 724
10 4,426 573 2,537 4 2,921 226 660
12 878 609 535 5 579 240 139
14 14 631 9 6 9 116 1
16 0 665 0 6 0 252 0
20 881 731 644 8 581 273 159
24 0 801 0 10 0 294 0
20,514 10,715 13,539 2,859
Total HPS/Condensate Piping Length = 32,037 ft 34% Total MPS/Condensate Piping Length = 61,651 ft 66%
Total HPS/Condensate Piping Heat
Loss = 12,771 MBh
Total MPS/Condensate Piping Heat Loss =
17,049 MBh
Total HPS/Condensate Piping Heat
Loss = 12,572 lbs/hr steam (@ 1,015.8 Btu/lb)
Total MPS/Condensate Piping Heat Loss =
16,831 lbs/hr steam (@ 1,013.0 Btu/lb)
Total Piping Length = 93,688 ft
Total Piping Heat Loss = 29,820 MBh

Table A9.2.1.6: Steam System Distribution Thermal Losses – Moist Soil Conditions
Integrated Energy Master Plan IU 20096161
Page 192
Buried 150 Psig Steam (HPS)
Buried Condensate from HPS
150 Psig Steam in New Perma‐Pipe System
Condensate from HPS in New Perma‐Pipe System
Pipe Size (in)
Length (ft)
Heat Loss
(Btu/hr‐ft)
Total Heat Loss (MBh)
Pipe Size (in)
Length (ft)
Heat Loss (Btu/hr‐ft)
Total Heat Loss (MBh)
Pipe Size (in)
Length (ft) Heat Loss (Btu/hr‐ft)
Total Heat Loss (MBh)
Pipe Size (in)
Length (ft)
Heat Loss
(Btu/hr‐ft)
Total Heat Loss (MBh)
2 481 554 267 1 317 213 68 8 2,263 77 174 3 2,263 23 52
3 529 608 322 1.5 349 230 80 4 185 56 10 2 185 19 4
4 1,886 649 1,223 2 1,245 241 300 2,448 185 2,448 56
5 600 688 413 2 396 241 96
6 1,317 723 952 2.5 869 252 219 40 Psig Steam in Tunnels Condensate from MPS in Tunnels
8 5,103 785 4,004 3 3,368 265 892 2 0 66 0 1 0 25 0
10 3,818 845 3,225 4 2,520 282 712 3 0 93 0 1.5 0 25 0
12 2,012 898 1,806 5 1,328 299 398 4 0 108 0 2 0 25 0
14 604 930 562 6 399 315 126 5 0 132 0 2 0 25 0
16,350 12,774 10,791 2,890 6 45 156 7 2.5 45 31 1
8 65 137 9 3 65 36 2
Buried 40 Psig Steam MPWS) Buried Condensate from MPS 10 5,038 159 801 4 5,038 41 207
2 451 470 212 1 298 213 63 12 2,618 186 487 5 2,618 48 126
3 441 516 227 1.5 291 230 67 14 1,535 216 332 6 1,535 64 98
4 2,204 550 1,213 2 1,455 241 351 16 4,410 246 1,085 6 4,410 64 282
5 2,739 583 1,598 2 1,808 241 436 20 0 298 0 8 0 72 0
6 3,029 614 1,858 2.5 1,999 252 505 24 88 357 31 10 88 90 8
8 5,451 666 3,629 3 3,598 265 953 13,799 2,752 13,799 724
10 4,426 717 3,172 4 2,921 282 825
12 878 762 669 5 579 299 173
14 14 789 11 6 9 116 1
16 0 831 0 6 0 315 0
20 881 913 805 8 581 342 199
24 0 1,001 0 10 0 368 0
20,514 13,393 13,539 3,573
Total HPS/Condensate Piping Length = 32,037 ft 34% Total MPS/Condensate Piping Length = 61,651 ft 66%
Total HPS/Condensate Piping Heat
Loss = 15,904 MBh
Total MPS/Condensate Piping Heat Loss =
20,443 MBh
Total HPS/Condensate Piping Heat
Loss = 15,656 lbs/hr steam (@ 1,015.8 Btu/lb)
Total MPS/Condensate Piping Heat Loss =
20,180 lbs/hr steam (@ 1,013.0 Btu/lb)
Total Piping Length = 93,688 ft
Total Piping Heat Loss = 36,346 MBh

Table A9.2.2.1: Steam Distribution System – Piping Repair Energy Economics
Integrated Energy Master Plan IU 20096161
Page 193
Buried 150 Psig Steam (HPS)
Buried Condensate from HPS
150 Psig Steam in New Perma‐Pipe System Condensate from HPS in New Perma‐
Pipe System
Pipe Size (in)
Length (ft)
Heat Loss
(Btu/hr‐ft)
Total Heat Loss (MBh)
Pipe Size (in)
Length (ft)
Heat Loss (Btu/hr‐ft)
Total Heat Loss (MBh)
Pipe Size (in)
Length (ft) Heat Loss (Btu/hr‐ft)
Total Heat Loss (MBh)
Pipe Size (in)
Length (ft)
Heat Loss
(Btu/hr‐ft)
Total Heat Loss (MBh)
2 481 754 363 1 317 289 92 8 2,263 77 174 3 2,263 23 52
3 529 827 437 1.5 349 312 109 4 185 56 10 2 185 19 4
4 1,886 882 1,664 2 1,245 328 409 2,448 185 2,448 56
5 600 935 561 2 396 328 130
6 1,317 984 1,295 2.5 869 343 298 40 Psig Steam in Tunnels Condensate from MPS in Tunnels
8 5,103 1,067 5,446 3 3,368 360 1,213 2 0 66 0 1 0 25 0
10 3,818 1,149 4,386 4 2,520 384 968 3 0 93 0 1.5 0 25 0
12 2,012 1,221 2,457 5 1,328 407 541 4 0 108 0 2 0 25 0
14 604 1,265 764 6 399 428 171 5 0 132 0 2 0 25 0
16,350 17,372 10,791 3,930 6 45 156 7 2.5 45 31 1
8 65 137 9 3 65 36 2
Buried 40 Psig Steam MPWS) Buried Condensate from MPS 10 5,038 159 801 4 5,038 41 207
2 451 640 288 1 298 289 86 12 2,618 186 487 5 2,618 48 126
3 441 701 309 1.5 291 312 91 14 1,535 216 332 6 1,535 64 98
4 2,204 748 1,650 2 1,455 328 478 16 4,410 246 1,085 6 4,410 64 282
5 2,739 793 2,173 2 1,808 328 593 20 0 298 0 8 0 72 0
6 3,029 834 2,527 2.5 1,999 343 686 24 88 357 31 10 88 90 8
8 5,451 905 4,935 3 3,598 360 1,295 13,799 2,752 13,799 724
10 4,426 975 4,313 4 2,921 384 1,122
12 878 1,036 909 5 579 407 236
14 14 1,073 15 6 9 116 1
16 0 1,131 0 6 0 428 0
20 881 1,242 1,094 8 581 465 270
24 0 1,361 0 10 0 500 0
20,514 18,215 13,539 4,859
Total HPS/Condensate Piping Length = 32,037 ft 34% Total MPS/Condensate Piping Length = 61,651 ft 66%
Total HPS/Condensate Piping Heat
Loss = 21,542 MBh
Total MPS/Condensate Piping Heat Loss =
26,550 MBh
Total HPS/Condensate Piping Heat
Loss = 21,207 lbs/hr steam (@ 1,015.8 Btu/lb)
Total MPS/Condensate Piping Heat Loss =
26,209 lbs/hr steam (@ 1,013.0 Btu/lb)
Total Piping Length = 93,688 ft
Total Piping Heat Loss = 48,093 MBh

Table A9.2.2.1: Steam Distribution System – Piping Repair Energy Economics
Integrated Energy Master Plan IU 20096161
Page 194

Table A9.2.2.2: Steam Distribution System – Piping Repair Ordered by Payback
Integrated Energy Master Plan IU 20096161
Page 195

Table A9.2.2.3: Steam Distribution System – Piping Repair Priority Ordered by Payback – Recommended Segments Only
Integrated Energy Master Plan IU 20096161 Page 196

Table A9.4.2.1: Cogeneration Options – BASE CASE
Integrated Energy Master Plan IU 20096161
Page 197
Base Case ‐ Existing Conditions ‐ 90% Coal/10% Natural Gas
NPV of Current Power Plant Operation
Steam Production = 1,272,042 MMBtu/yr
Year
Total Annual Steam
Production (MMBtu)
Coal Use (MMBtu/yr)
Coal Unit Cost ($/MMBtu)
Coal Cost Natural Gas
Use (MMBtu/yr)
Natural Gas Unit Cost ($/MMBtu)
Natural Gas Cost
Electrical Cost
Labor Cost M&R Costs Net Annual
Cost
Initial Cost
$0.00 $0 $0
1 1,272,042 1,691,045 $2.69 $4,555,675 152,381 $6 $915,811 $305,409 $255,271 $961,278 $6,993,444
2 1,272,042 1,691,045 $2.79 $4,710,568 152,381 $6 $968,012 $320,191 $265,482 $1,021,839 $7,286,092
3 1,272,042 1,691,045 $2.88 $4,870,728 152,381 $7 $1,023,189 $335,688 $276,101 $1,086,214 $7,591,920
4 1,272,042 1,691,045 $2.98 $5,036,332 152,381 $7 $1,081,511 $351,935 $287,145 $1,154,646 $7,911,569
5 1,272,042 1,691,045 $3.08 $5,207,568 152,381 $8 $1,143,157 $368,969 $298,631 $1,227,389 $8,245,713
6 1,272,042 1,691,045 $3.18 $5,384,625 152,381 $8 $1,208,317 $386,827 $310,576 $1,304,714 $8,595,059
7 1,272,042 1,691,045 $3.29 $5,567,702 152,381 $8 $1,277,191 $405,550 $322,999 $1,386,911 $8,960,353
8 1,272,042 1,691,045 $3.40 $5,757,004 152,381 $9 $1,349,991 $425,178 $335,919 $1,474,286 $9,342,378
9 1,272,042 1,691,045 $3.52 $5,952,742 152,381 $9 $1,426,940 $445,757 $349,356 $1,567,166 $9,741,961
10 1,272,042 1,691,045 $3.64 $6,155,135 152,381 $10 $1,508,276 $467,331 $363,330 $1,665,898 $10,159,971
11 1,272,042 1,691,045 $3.76 $6,364,410 152,381 $10 $1,594,247 $489,950 $377,863 $1,770,849 $10,597,321
12 1,272,042 1,691,045 $3.89 $6,580,800 152,381 $11 $1,685,120 $513,664 $392,978 $1,882,413 $11,054,974
13 1,272,042 1,691,045 $4.02 $6,804,547 152,381 $12 $1,781,171 $538,525 $408,697 $2,001,005 $11,533,946
14 1,272,042 1,691,045 $4.16 $7,035,902 152,381 $12 $1,882,698 $564,590 $425,045 $2,127,068 $12,035,303
15 1,272,042 1,691,045 $4.30 $7,275,122 152,381 $13 $1,990,012 $591,916 $442,047 $2,261,074 $12,560,171
Coal increases in cost by 3.40% per year Total Cost = $142,610,174
Electricity Increases at 4.84% per year NPV = $96,812,185
Natural Gas increases at 5.57% per year
Carbon Dioxide Emissions =
185,097 tons
Labor increases at 4.00% per year Savings from Base = 0 tons
Materials increase at 8.60% per Year; M&R then at average of Labor and Materials ‐ 6.30% per year
University Interest Rate Target of 4.75% Electrical premium for coal firing based on 4,698,604 kWh/yr

Table A9.4.2.2: Cogeneration Options – Option A (100% Natural Gas Option with No Cogeneration)
Integrated Energy Master Plan IU 20096161
Page 198
NPV of 100% Natural Gas Option A ‐ Existing Steam Boilers ‐ With Staff Reductions
Steam Production = 1,272,042 MMBtu/yr
Year Total Annual
Steam Production (MMBtu)
Coal Use (MMBtu/yr)
Coal Unit Cost ($/MMBtu)
Coal Cost
Natural Gas Use
(MMBtu/yr)
Natural Gas Unit Cost ($/MMBtu)
Natural Gas Cost
Electrical Cost
Labor Cost M&R Costs Net Annual Cost
Initial Cost
0
1 1,272,042 0 $2.69 $0 1,618,214 $4.68 $7,579,716 $0 $0 $0 $7,579,716
2 1,272,042 0 $2.79 $0 1,618,214 $4.95 $8,011,760 $0 $0 $0 $8,011,760
3 1,272,042 0 $2.88 $0 1,618,214 $5.23 $8,468,430 $0 $0 $0 $8,468,430
4 1,272,042 0 $2.98 $0 1,618,214 $5.53 $8,951,130 $0 $0 $0 $8,951,130
5 1,272,042 0 $3.08 $0 1,618,214 $5.85 $9,461,345 $0 $0 $0 $9,461,345
6 1,272,042 0 $3.18 $0 1,618,214 $6.18 $10,000,641 $0 $0 $0 $10,000,641
7 1,272,042 0 $3.29 $0 1,618,214 $6.53 $10,570,678 $0 $0 $0 $10,570,678
8 1,272,042 0 $3.40 $0 1,618,214 $6.90 $11,173,207 $0 $0 $0 $11,173,207
9 1,272,042 0 $3.52 $0 1,618,214 $7.30 $11,810,079 $0 $0 $0 $11,810,079
10 1,272,042 0 $3.64 $0 1,618,214 $7.71 $12,483,254 $0 $0 $0 $12,483,254
11 1,272,042 0 $3.76 $0 1,618,214 $8.15 $13,194,799 $0 $0 $0 $13,194,799
12 1,272,042 0 $3.89 $0 1,618,214 $8.62 $13,946,903 $0 $0 $0 $13,946,903
13 1,272,042 0 $4.02 $0 1,618,214 $9.11 $14,741,877 $0 $0 $0 $14,741,877
14 1,272,042 0 $4.16 $0 1,618,214 $9.63 $15,582,163 $0 $0 $0 $15,582,163
15 1,272,042 0 $4.30 $0 1,618,214 $10.18 $16,470,347 $0 $0 $0 $16,470,347
Total Cost = $172,446,329
NPV = $115,709,012
Carbon Dioxide
Emissions = 95,313 tons
Savings from Base = 89,784 tons
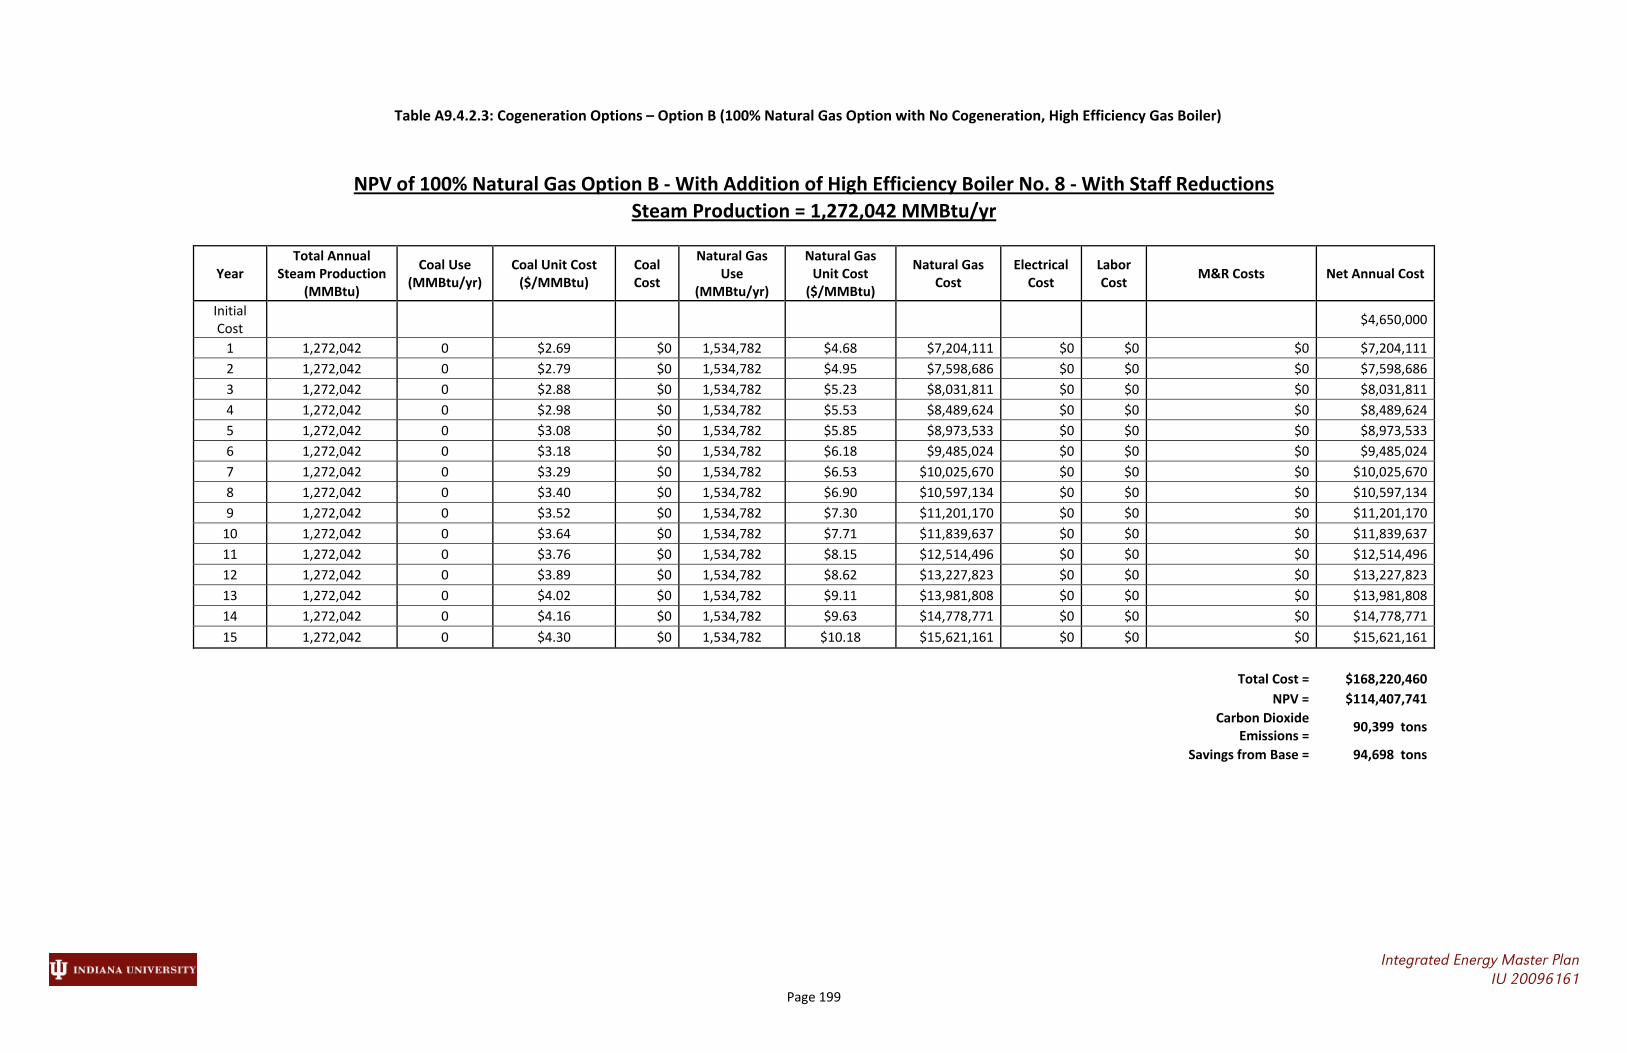
Table A9.4.2.3: Cogeneration Options – Option B (100% Natural Gas Option with No Cogeneration, High Efficiency Gas Boiler)
Integrated Energy Master Plan IU 20096161
Page 199
NPV of 100% Natural Gas Option B ‐ With Addition of High Efficiency Boiler No. 8 ‐ With Staff Reductions
Steam Production = 1,272,042 MMBtu/yr
Year Total Annual
Steam Production (MMBtu)
Coal Use (MMBtu/yr)
Coal Unit Cost ($/MMBtu)
Coal Cost
Natural Gas Use
(MMBtu/yr)
Natural Gas Unit Cost ($/MMBtu)
Natural Gas Cost
Electrical Cost
Labor Cost
M&R Costs Net Annual Cost
Initial Cost
$4,650,000
1 1,272,042 0 $2.69 $0 1,534,782 $4.68 $7,204,111 $0 $0 $0 $7,204,111
2 1,272,042 0 $2.79 $0 1,534,782 $4.95 $7,598,686 $0 $0 $0 $7,598,686
3 1,272,042 0 $2.88 $0 1,534,782 $5.23 $8,031,811 $0 $0 $0 $8,031,811
4 1,272,042 0 $2.98 $0 1,534,782 $5.53 $8,489,624 $0 $0 $0 $8,489,624
5 1,272,042 0 $3.08 $0 1,534,782 $5.85 $8,973,533 $0 $0 $0 $8,973,533
6 1,272,042 0 $3.18 $0 1,534,782 $6.18 $9,485,024 $0 $0 $0 $9,485,024
7 1,272,042 0 $3.29 $0 1,534,782 $6.53 $10,025,670 $0 $0 $0 $10,025,670
8 1,272,042 0 $3.40 $0 1,534,782 $6.90 $10,597,134 $0 $0 $0 $10,597,134
9 1,272,042 0 $3.52 $0 1,534,782 $7.30 $11,201,170 $0 $0 $0 $11,201,170
10 1,272,042 0 $3.64 $0 1,534,782 $7.71 $11,839,637 $0 $0 $0 $11,839,637
11 1,272,042 0 $3.76 $0 1,534,782 $8.15 $12,514,496 $0 $0 $0 $12,514,496
12 1,272,042 0 $3.89 $0 1,534,782 $8.62 $13,227,823 $0 $0 $0 $13,227,823
13 1,272,042 0 $4.02 $0 1,534,782 $9.11 $13,981,808 $0 $0 $0 $13,981,808
14 1,272,042 0 $4.16 $0 1,534,782 $9.63 $14,778,771 $0 $0 $0 $14,778,771
15 1,272,042 0 $4.30 $0 1,534,782 $10.18 $15,621,161 $0 $0 $0 $15,621,161
Total Cost = $168,220,460
NPV = $114,407,741
Carbon Dioxide
Emissions = 90,399 tons
Savings from Base = 94,698 tons
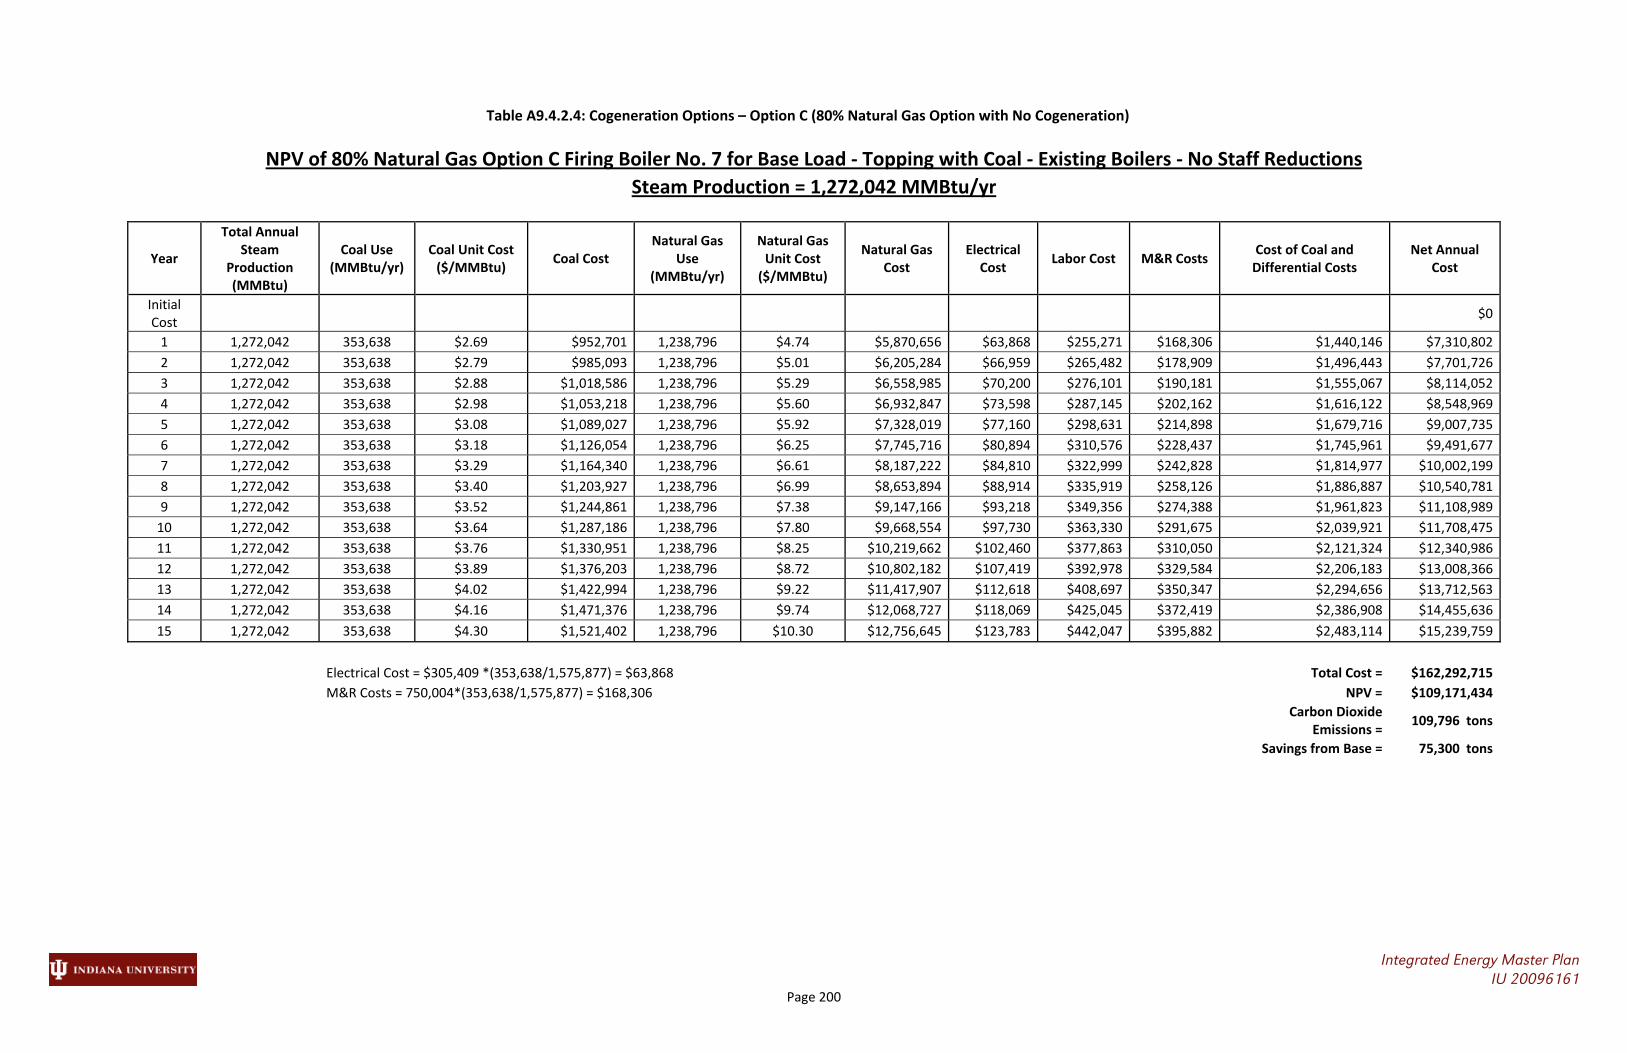
Table A9.4.2.4: Cogeneration Options – Option C (80% Natural Gas Option with No Cogeneration)
Integrated Energy Master Plan IU 20096161
Page 200
NPV of 80% Natural Gas Option C Firing Boiler No. 7 for Base Load ‐ Topping with Coal ‐ Existing Boilers ‐ No Staff Reductions
Steam Production = 1,272,042 MMBtu/yr
Year
Total Annual Steam
Production (MMBtu)
Coal Use (MMBtu/yr)
Coal Unit Cost ($/MMBtu)
Coal Cost Natural Gas
Use (MMBtu/yr)
Natural Gas Unit Cost ($/MMBtu)
Natural Gas Cost
Electrical Cost
Labor Cost M&R Costs Cost of Coal and Differential Costs
Net Annual Cost
Initial Cost
$0
1 1,272,042 353,638 $2.69 $952,701 1,238,796 $4.74 $5,870,656 $63,868 $255,271 $168,306 $1,440,146 $7,310,802
2 1,272,042 353,638 $2.79 $985,093 1,238,796 $5.01 $6,205,284 $66,959 $265,482 $178,909 $1,496,443 $7,701,726
3 1,272,042 353,638 $2.88 $1,018,586 1,238,796 $5.29 $6,558,985 $70,200 $276,101 $190,181 $1,555,067 $8,114,052
4 1,272,042 353,638 $2.98 $1,053,218 1,238,796 $5.60 $6,932,847 $73,598 $287,145 $202,162 $1,616,122 $8,548,969
5 1,272,042 353,638 $3.08 $1,089,027 1,238,796 $5.92 $7,328,019 $77,160 $298,631 $214,898 $1,679,716 $9,007,735
6 1,272,042 353,638 $3.18 $1,126,054 1,238,796 $6.25 $7,745,716 $80,894 $310,576 $228,437 $1,745,961 $9,491,677
7 1,272,042 353,638 $3.29 $1,164,340 1,238,796 $6.61 $8,187,222 $84,810 $322,999 $242,828 $1,814,977 $10,002,199
8 1,272,042 353,638 $3.40 $1,203,927 1,238,796 $6.99 $8,653,894 $88,914 $335,919 $258,126 $1,886,887 $10,540,781
9 1,272,042 353,638 $3.52 $1,244,861 1,238,796 $7.38 $9,147,166 $93,218 $349,356 $274,388 $1,961,823 $11,108,989
10 1,272,042 353,638 $3.64 $1,287,186 1,238,796 $7.80 $9,668,554 $97,730 $363,330 $291,675 $2,039,921 $11,708,475
11 1,272,042 353,638 $3.76 $1,330,951 1,238,796 $8.25 $10,219,662 $102,460 $377,863 $310,050 $2,121,324 $12,340,986
12 1,272,042 353,638 $3.89 $1,376,203 1,238,796 $8.72 $10,802,182 $107,419 $392,978 $329,584 $2,206,183 $13,008,366
13 1,272,042 353,638 $4.02 $1,422,994 1,238,796 $9.22 $11,417,907 $112,618 $408,697 $350,347 $2,294,656 $13,712,563
14 1,272,042 353,638 $4.16 $1,471,376 1,238,796 $9.74 $12,068,727 $118,069 $425,045 $372,419 $2,386,908 $14,455,636
15 1,272,042 353,638 $4.30 $1,521,402 1,238,796 $10.30 $12,756,645 $123,783 $442,047 $395,882 $2,483,114 $15,239,759
Electrical Cost = $305,409 *(353,638/1,575,877) = $63,868 Total Cost = $162,292,715
M&R Costs = 750,004*(353,638/1,575,877) = $168,306 NPV = $109,171,434
Carbon Dioxide
Emissions = 109,796 tons
Savings from Base = 75,300 tons

Table A9.4.2.5: Cogeneration Options – Gas Turbine Option 1 (Central Plant on 100% Natural Gas Option – Compare with Option A and Option B)
Integrated Energy Master Plan IU 20096161
Page 201
NPV of Turbine Option 1 with Turbine Generator and 75,000 lb/hr Heat Recovery Boiler ‐ 100% Gas ‐ With Staff Reductions
Steam Production = 1,272,042 MMBtu/yr
Year
Total Annual Steam
Production Required (MMBtu)
Electrical Savings (kWh)
Unit Cost of Electricity ($/kWh)
Value of Electricity Saved
Natural Gas Use for
Cogeneration (MMBtu/yr)
Natural Gas Use for Boilers (MMBtu/yr)
Total Natural Gas
Use (MMBtu)
Natural Gas Unit Cost ($/MMBtu)
Natural Gas Cost
Labor Cost Additional
Labor Cost for Gas Tuirbine
Net Annual Cost
Initial Cost
$15,480,000
1 1,272,042 ‐61,690,986 $0.06 ‐$3,670,614 1,080,262 831,639 1,911,901 $4.67 $8,924,754 $0 $308,455 $5,562,595
2 1,272,042 ‐61,690,986 $0.06 ‐$3,848,271 1,080,262 831,639 1,911,901 $4.93 $9,433,464 $0 $320,793 $5,905,986
3 1,272,042 ‐61,690,986 $0.07 ‐$4,034,528 1,080,262 831,639 1,911,901 $5.22 $9,971,172 $0 $333,625 $6,270,269
4 1,272,042 ‐61,690,986 $0.07 ‐$4,229,799 1,080,262 831,639 1,911,901 $5.51 $10,539,529 $0 $346,970 $6,656,700
5 1,272,042 ‐61,690,986 $0.07 ‐$4,434,521 1,080,262 831,639 1,911,901 $5.83 $11,140,282 $0 $360,849 $7,066,610
6 1,272,042 ‐61,690,986 $0.08 ‐$4,649,152 1,080,262 831,639 1,911,901 $6.16 $11,775,278 $0 $375,283 $7,501,409
7 1,272,042 ‐61,690,986 $0.08 ‐$4,874,171 1,080,262 831,639 1,911,901 $6.51 $12,446,469 $0 $390,294 $7,962,592
8 1,272,042 ‐61,690,986 $0.08 ‐$5,110,081 1,080,262 831,639 1,911,901 $6.88 $13,155,918 $0 $405,906 $8,451,743
9 1,272,042 ‐61,690,986 $0.09 ‐$5,357,409 1,080,262 831,639 1,911,901 $7.27 $13,905,805 $0 $422,142 $8,970,538
10 1,272,042 ‐61,690,986 $0.09 ‐$5,616,707 1,080,262 831,639 1,911,901 $7.69 $14,698,436 $0 $439,028 $9,520,756
11 1,272,042 ‐61,690,986 $0.10 ‐$5,888,556 1,080,262 831,639 1,911,901 $8.13 $15,536,247 $0 $456,589 $10,104,279
12 1,272,042 ‐61,690,986 $0.10 ‐$6,173,562 1,080,262 831,639 1,911,901 $8.59 $16,421,813 $0 $474,852 $10,723,103
13 1,272,042 ‐61,690,986 $0.10 ‐$6,472,362 1,080,262 831,639 1,911,901 $9.08 $17,357,856 $0 $493,846 $11,379,340
14 1,272,042 ‐61,690,986 $0.11 ‐$6,785,625 1,080,262 831,639 1,911,901 $9.60 $18,347,254 $0 $513,600 $12,075,229
15 1,272,042 ‐61,690,986 $0.12 ‐$7,114,049 1,080,262 831,639 1,911,901 $10.14 $19,393,047 $0 $534,144 $12,813,142
Total Cost = $146,444,291
(Initial Cost for installation of gas turbine, duct heater, and heat recovery boiler) ‐ (Value of 75,000 lb/hr boiler) = $18,480,000 ‐ $3,000,000 = $15,480,000
NPV = $103,044,406
Carbon Dioxide Emissions =
48,236 tons
Savings from Base = 136,860 tons

Table A9.4.2.6: Cogeneration Options – Gas Turbine Option 2 (Central Plant on Coal – Compare with Base Case)
Integrated Energy Master Plan IU 20096161
Page 202
NPV of Turbine Option 2 with Turbine Generator and 75,000 lb/hr Heat Recovery Boiler ‐ Coal for Topping ‐ Existing Boilers ‐ With No Staff Reductions
Steam Production = 1,272,042 MMBtu/yr
Year
Total Annual Steam
Production Required (MMBtu)
Electrical Savings (kWh)
Unit Cost of Electricity ($/kWh)
Value of Electricity Saved
Total Natural Gas Use for Cogeneration (MMBtu/yr)
Natural Gas Unit Cost ($/MMBtu)
Natural Gas Cost
Coal Use (MMBtu/yr)
Coal Unit Cost
($/MMBtu)Coal Cost
Electrical Cost
Labor Cost
M&R Costs
Cost of Coal and
Differential Costs
Additional Labor Cost for Gas Turbine
Net Annual Cost
Initial Cost
$15,480,000
1 1,272,042 ‐61,690,986 $0.06 ‐$3,670,614 1,080,262 $4.80 $5,187,750 994,278 $2.69 $2,678,584 $192,694 $255,271 $473,205 $3,599,754 $308,455 $5,425,345
2 1,272,042 ‐61,690,986 $0.06 ‐$3,848,271 1,080,262 $5.08 $5,483,451 994,278 $2.79 $2,769,656 $202,020 $265,482 $503,017 $3,740,175 $320,793 $5,696,149
3 1,272,042 ‐61,690,986 $0.07 ‐$4,034,528 1,080,262 $5.37 $5,796,008 994,278 $2.88 $2,863,825 $211,798 $276,101 $534,707 $3,886,431 $333,625 $5,981,536
4 1,272,042 ‐61,690,986 $0.07 ‐$4,229,799 1,080,262 $5.67 $6,126,380 994,278 $2.98 $2,961,195 $222,049 $287,145 $568,394 $4,038,782 $346,970 $6,282,334
5 1,272,042 ‐61,690,986 $0.07 ‐$4,434,521 1,080,262 $5.99 $6,475,584 994,278 $3.08 $3,061,875 $232,796 $298,631 $604,202 $4,197,505 $360,849 $6,599,417
6 1,272,042 ‐61,690,986 $0.08 ‐$4,649,152 1,080,262 $6.34 $6,844,692 994,278 $3.18 $3,165,979 $244,064 $310,576 $642,267 $4,362,886 $375,283 $6,933,709
7 1,272,042 ‐61,690,986 $0.08 ‐$4,874,171 1,080,262 $6.70 $7,234,840 994,278 $3.29 $3,273,622 $255,876 $322,999 $682,730 $4,535,228 $390,294 $7,286,191
8 1,272,042 ‐61,690,986 $0.08 ‐$5,110,081 1,080,262 $7.08 $7,647,226 994,278 $3.40 $3,384,925 $268,261 $335,919 $725,742 $4,714,847 $405,906 $7,657,898
9 1,272,042 ‐61,690,986 $0.09 ‐$5,357,409 1,080,262 $7.48 $8,083,118 994,278 $3.52 $3,500,013 $281,245 $349,356 $771,464 $4,902,077 $422,142 $8,049,928
10 1,272,042 ‐61,690,986 $0.09 ‐$5,616,707 1,080,262 $7.91 $8,543,855 994,278 $3.64 $3,619,013 $294,857 $363,330 $820,066 $5,097,266 $439,028 $8,463,442
11 1,272,042 ‐61,690,986 $0.10 ‐$5,888,556 1,080,262 $8.36 $9,030,855 994,278 $3.76 $3,742,060 $309,128 $377,863 $871,730 $5,300,781 $456,589 $8,899,669
12 1,272,042 ‐61,690,986 $0.10 ‐$6,173,562 1,080,262 $8.84 $9,545,614 994,278 $3.89 $3,869,290 $324,090 $392,978 $926,649 $5,513,006 $474,852 $9,359,911
13 1,272,042 ‐61,690,986 $0.10 ‐$6,472,362 1,080,262 $9.34 $10,089,714 994,278 $4.02 $4,000,846 $339,776 $408,697 $985,028 $5,734,346 $493,846 $9,845,544
14 1,272,042 ‐61,690,986 $0.11 ‐$6,785,625 1,080,262 $9.87 $10,664,828 994,278 $4.16 $4,136,874 $356,221 $425,045 $1,047,085 $5,965,225 $513,600 $10,358,028
15 1,272,042 ‐61,690,986 $0.12 ‐$7,114,049 1,080,262 $10.44 $11,272,723 994,278 $4.30 $4,277,528 $373,462 $442,047 $1,113,051 $6,206,088 $534,144 $10,898,906
Total Cost = $133,218,007
(Initial Cost for installation of gas turbine, duct heater, and heat recovery boiler) ‐ (Value of 75,000 lb/hr boiler) = $18,480,000 ‐ $3,000,000 = $15,480,000
NPV = $94,858,140
Carbon Dioxide
Emissions = 99,924 tons
Savings from
Base = 85,173 tons

Table 10.3.1: Wind Energy Economic Analysis
Integrated Energy Master Plan IU 20096161
Page 203
Information Provided By: Performance Services Indianapolis, IN
www.performanceservices.com

Integrated Energy Master Plan IU 20096161 Page 204
Appendix B Drawings

DN
M
M
M
M
M
RESEARCH SERVICE
COLLEGEHONORSHUTTON
WEST
EAST
IU POLICEIUPD
SIMON HALL
CHEMISTRY
CHEMISTRYADDITION
300' X 180'
FIELD HOCKEY
340' X 225'
SOCCER PRACTICE
MAC CHILLER
INFORMATICS
CIRCLE OF CHAMPIONS
HONORS COLLEGE
EDWARD L. HUTTON
INFORMATICS
CONCESSIONS
GRAD. & EXEC.EDUC. CENTER
FEE LANE
PARKING GARAGE
LAW
KIRKWOODOBSERAVTORY
THEATRE & DRAMA CENTER
PRESSBOX
WEST
PRESSBOX
EAST
UNIVERSITY APTEAST
HALL
FINEA RTS
(WILDERMUTH)
SCIENCES
MEN'S GYM
GEOLOGICAL
MONROEHALL
DUNN MEADOW
FRANKLIN HALL
STUDENTBUILDING
BRYANHALL
SWAIN WEST
KIRKWOODOBSERAVTORY
SWAIN EAST
RAWLES HALL MYERS HALL
LINDLEY HALL
KIRKWOOD HALL
JORDAN HALL
MORRISON HALL
GOODBODY HALL
MEMORIAL HALL
SYCAMORE
MUSICADDITION
B.W.MERRILL
HALL
SIMON MUSICLIB/REC
BALLANTINEHALL
BECK CHAPEL
UNIVERSITY APTWEST
FOREST QUAD
WILLKIE B
WILLKIE C
WILLKIE A
UNION BUILDING
MAXWELL HALL
OWEN HALL
WYLIEHALL
WELLHOUSE
ERNIE PYLE HALL
WOODBURN HALL
BRYAN HOUSE
LILLY LIBRARY
AUDITORIUM
RADIO-TV
ART MUSEUM
HPER
MUSICAL A RTS
CENTERINTERNATIONAL
READ HALL
ADMISSIONS
PARKING GARAGEJORDAN A VE.
WENDELL W. WRIGHTCENTER FOR EXCELLENCE
IN EDUCATION
MASON HALL
EIGENMANN
LOUNGEBARNES
WEATHERLYHALL
HALLHERSHEY
STEMPELHALL
TETER QUADWRIGHT
QUAD
WELLS
LIBRARY
ARBORETUM
HEALTH CENTER
GRIGGSLOUNGE
VOSHALL
MOFFATTHALL
JOHNSTONHALL
DREISERLIBRARY
CAMPUS VIEW
APARTMENTS
RECREATIONAL
SPORTS
HOOSIER
COURTS
DAYCARE
HEPBURN
APARTMENTS
BANTA
APARTMENTS
NUTT
APARTMENTS BICKNELL
HALL
EVERMANN
APARTMENTS
STORAGE
PHYSICAL PLANT
CARILLON
SPEA
BUSINESS
BUSINESSSCHOOL
PSYCHOLOGY
GEOLOGICAL SURVEY
CENTRALHEATING
PPT RAINING
NELSON-HALLSRESIDENCE
ADMINISTRATION
JENKINSON
HALLHARPER
HALL
GRESHAM
DINING HALL
SHEA
HALLMARTIN
HALLMAGEEHALL
SEMBOWER
CONCESSION
DUGOUT
MEN'S
MEN'S
DUGOUT
WOMEN'S
DUGOUT WOMEN'S
DUGOUT
BRISCOE QUAD
MCNUTT SOUTH
CENTRAL
MCNUTT NORTH
MCNUTT
OUTDOOR
POOL
BILLY HAYESPRESSBOX
STORAGE
BILLY HAYES
TRACK
FIELDHOUSE
ASSEMBLY HALL
HARRY GLADSTEIN
ALUMNI CENTERVIRGIL T . DEVAULT
MEMORIALSTADIUM
& RESTROOMS
REC. STORAGE
TENNIS CENTER
MELLENCAMP PAVILION
FOOTBALL STORAGE
WOOD LAWN FIELD
CHILLED WATERPLANTWAREHOUSE
UNIV. PRESS
GEOL. SURVEY
CORE LIBRARY GRADUATE
PRINTMAKING
ARTS
ANNEXGEOL. MATERIAL
TESTING
GREENE
HALL
MORGANHALL
BROWNHALL
EDMONDSONHALL
CRAVENS HALL
SMITH HALL
GLENN
BLACK
LAB
MATHERS
MUSEUM
HILLCREST
(MSB II)SCIENCE 2
MULTI
BL607
COOK HALL
HICKORYHALL
CEDARHALL
BIRCHHALL
LINDENHALL
CYPRESSHALL
BEECHHALL
BEECHHALL
PINEHALL
UNION ST CHILLER
ROTCSUPPLY CENTER
HARLOSWAREHOUSE
TULIP
TREEAPTS
INTERCOLLEGIATE
ATHLETIC GYM
COMMUNICATIONSERVICES
M.H. WRUBEL
CMP CENTER
SMITHRESEARCHCENTER
CHILDREN'SCENTER
U-SCHOOLBLDG.# 1
UNIV. INFO.TECH. SERV.
U-SCHOOLBLDG.# 3
U-SCHOOL
BLDG.# 4
UNIV. INFO.TECH. SERV.
INSTITUTE ON
DISABILITY & COMMUNITY
DATA CENTER
CONTINUATION OF CAMPUS (APPROX. 875FT EAST OF MAIN CAMPUS PLAN - A LONG E 10TH STREET)
FUTURE JACOB’S SCHOOL OF MUSIC
CI B
SIMON HALL
BASEMENTBELOW
FUTURE INTERNATIONAL
STUDY (5-10Y EARS)
HO
TE
L
A REA FOR FUTURE RESIDENT HALLS
INNOVATIONCENTER
Steam Layout
INDEX
STEAM PIPE
STEAM PIPE INBAD CONDITION
BAD CONDITION-NO CONDENSATE RETURN
MULTI-THERM
HOT WATER DIST.
50-60 YEARS OLD
WALK-THRU TUNNEL
CAST IRON THREADED
WALK-THRU TUNNEL
SHALLOW TUNNEL
SHALLOW TUNNEL
WALK-THRU TUNNEL
GAS BOILER INSTALLED MID 90s
CURRENT REPLACEMENT PROJECT (UNDER CONTRACT)
MULTI-THERM
CAP
150 psig
GAS OFF 10TH STREET
HEATING HOT WATER HEATED BY STEAM
HOT WATER
150 psig DIRECT BURIED GETTING
150 psig
150 psig
PLANNED REPLACEMENT
ADDING CONDENSATE
40 psig
40 psig,VERY OLD
HOT WATER AFTER STEAM REACHES GREENE HALL
CLASS A
SHALLOW TRENCH TUNNEL
TWIN STEAM LINE & 1 CONDENSATE RETURN IN SHALLOW TRENCH
STEAM PIPE INTUNNEL/TRENCH
STEAM PIPE INBAD CONDITION INTUNNEL/TRENCH
Integrated Energy Master Plan
050
991Z
990M
990C
316
257C
990Q
990S
990R
990U
990T
990V
990X
990Z991A
991C
991E
991D
991F
991G
991R
990Y
70
071
072
990P
BSC150
450
313D
448
001
021
172
414
095
021
005
007017
033 055
053
075
057
058
059
027 067101
133
155
111
107141
109
139
149
147
135
181
177
227
221223
257
297
299
301
304
313
243
237
209
171
157
158
153091
119
043
045
047
011
013
417419
413
409
445
451
467
454
463
453
462
493
529
523
539
519
513
543
455 456 461
441
439
437
433
605
604603
601
452
061
148
271
272
282
280
279
276275
199
245
215A
177W
171W
198
207A
207B
197D
418
411
407
602
595
610
490
475
277
278
423
276A
276B
276C
276D
276E
276F
276G
276L
569C
571
572
569
573
566
580570
568
576
567
565
577
BL579
578
555 563
1
2
3
4
6
7
8
9
10
11
12
12
13
14
15
16
17
18
19
20
21
23
24
25
26
27
28
29
30
3132
33
34
35
36
37
5
5
5
22
39
38
40
PRELIMINARY - FOR REVIEW 2012 Jan 04
eutterson
Text Box
Figure B9.2.2.1: Steam Distribution System – Piping Condition Assessment
jfoley
Rectangle

eutterson
Text Box
Figure B9.2.2.2: Proposed Distributed Thermal Plants