Master Finalv6
88
1 Examples of Some Things You Will Find in the Airline Data Project
-
Upload
independent -
Category
Documents
-
view
1 -
download
0
Transcript of Master Finalv6

1
Examples of Some Things You Will Find in the Airline Data Project

2
About the Airline Data ProjectAbout the Airline Data Project

3
About Us and the Establishment of the Airline Data Project
• The MIT Global Airline Industry Program represents a large-scale effort that provides themeans for MIT and the academic community to make contributions in studying the airlineindustry and in educating its future leaders. This effort is funded under the umbrella of theSloan Foundation’s Industry Studies Program.
• The MIT Airline Industry Consortium is an outgrowth of the MIT Global Airline IndustryProgram, sponsored by the Alfred P. Sloan Foundation. Its goal is to engage industrystakeholders in the next phase of the Program's research and to provide a forum foraddressing key issues facing the airline industry during this critical period of transformation.
• Another goal of MIT’s Global Airline Industry Program is to develop a body of knowledgefor understanding development, growth and competitive advantage in this industry, which isone of the most diverse, dynamic and perplexing of the world. To further this goal, and tosupport the goals of the Sloan Foundation Industry Studies Program and the goals setforth in establishing the MIT Airline Industry Research Consortium, the MIT GlobalAirline Industry Program is introducing the establishment of the Airline Data Project.

4
About Us and the Establishment of the Airline Data Project
• Dramatic changes have occurred in the US airline industry since 2000:
– Competition between Legacy and LCC airlines has led to fare compression andrevenue degradation
– Despite the industry’s unhealthy operating environment, new entrants continue enterthe market further threatening the revenues of incumbent airlines
– The historic relationship of airline revenue performance to GDP growth has beenbroken and has not recovered
– Despite the well documented labor cost reductions that were realized in the 2002 –2007 time frame, the reductions in those costs do not make up for the rise in the costof fuel
– Productivity has increased at the network legacy carriers, but still does not approachthe levels realized within the low cost carrier segment
– With the exception of Southwest, fragile balance sheets are the rule of the industry.Given the need for both aircraft and non-aircraft capital expenditures by nearly everycarrier, a lack of meaningful profits and expensive capital make these much neededprojects very difficult to fund.
• Each of these trends can be more closely examined by users of all interestlevels inside of the Airline Data Project

5
About Us and the Establishment of the Airline Data Project
• There are some statements being made within the industry that suggest a data portal likethe Airline Data Project will be important for academia, Wall Street, labor leadership, theindustry press, and other direct and indirect stakeholders to use in order to makeconclusions within a proper historical context.
– Douglas Parker, CEO of US Airways suggesting that the industry’s restructuring is far from completeand that consolidation in some form is one path toward finding a sustainable and profitable industry
– Labor leaders such as Captain Prater, President of the Airline Pilots Association and the Allied PilotsAssociation suggesting that labor will win back all of the concessions granted and more during therecently completed restructuring round of negotiations in the coming years
• Before jumping to conclusions about the economic health of a company or the industry, theAirline Data Project urges users to not evaluate a singular position in a vacuum, rather relyon the breadth of data and analysis provided to make decisions with proper context.

6
Revenue & RelatedRevenue & Related
7
Revenue & Related
• The new environment challenging the US commercial airline industry begins andends with the revenue line. We consider this a most important section of theAirline Data Project (ADP) and strongly encourage all analysis to take intoaccount the industry’s revenue makeup before making conclusions on cost, fleetor the balance sheet.
– Recent changes in the ability of legacy airlines to generate revenues represents astructural change and cannot be considered cyclic
– Whereas revenue per available seat mile (RASM)has become a most importantindustry benchmark, as load factors continue to increase, focus on yield, or revenueper revenue passenger mile, will be the critical metric to watch to signal a carrier’ssuccess
– In most cases, today’s fares are equal to fares charged in the mid 1990s. And thepremiums that carriers could charge in markets where they had a significant marketposition have dissipated largely as the result of increased competition.

8
System Total Operating Revenue$ Billions
1995 1996 1997 1998 1999 2000 2001 2002 2003 2004 2005 2006
American 15.61$ 15.14$ 15.86$ 16.30$ 16.09$ 18.12$ 15.64$ 15.87$ 17.40$ 18.61$ 20.66$ 22.49$ Continental 4.92$ 5.49$ 6.36$ 7.30$ 8.03$ 9.13$ 7.97$ 7.35$ 7.33$ 9.53$ 11.11$ 13.01$ Delta 12.56$ 13.32$ 14.20$ 14.63$ 14.90$ 15.32$ 13.21$ 12.41$ 14.20$ 15.15$ 16.11$ 17.34$ Northwest 8.91$ 9.75$ 9.98$ 8.71$ 9.87$ 10.96$ 9.59$ 9.15$ 9.18$ 11.27$ 12.32$ 12.55$ United 14.89$ 16.32$ 17.34$ 17.52$ 17.97$ 19.33$ 16.09$ 13.92$ 13.40$ 15.70$ 17.30$ 19.33$ US Airways 6.98$ 7.70$ 8.50$ 8.56$ 8.46$ 9.18$ 8.25$ 6.91$ 6.76$ 7.07$ 7.21$ 8.08$ America West 1.56$ 1.75$ 1.89$ 1.98$ 2.16$ 2.31$ 2.04$ 2.02$ 2.22$ 2.48$ 3.40$ 3.77$ --sub Network 65.44$ 69.46$ 74.13$ 74.99$ 77.48$ 84.35$ 72.79$ 67.64$ 70.51$ 79.81$ 88.11$ 96.58$
Southwest 2.87$ 3.41$ 3.82$ 4.16$ 4.74$ 5.65$ 5.56$ 5.52$ 5.94$ 6.53$ 7.58$ 9.09$ jetBlue -$ -$ -$ -$ -$ 0.11$ 0.32$ 0.64$ 1.00$ 1.27$ 1.70$ 2.36$ AirTran -$ -$ -$ 0.37$ 0.52$ 0.62$ 0.67$ 0.73$ 0.92$ 1.04$ 1.45$ 1.89$ Frontier 0.06$ 0.11$ 0.14$ 0.19$ 0.31$ 0.45$ 0.45$ 0.46$ 0.59$ 0.79$ 0.96$ 1.13$ ATA 0.68$ 0.72$ 0.75$ 0.88$ 1.00$ 1.18$ 1.15$ 1.15$ 1.40$ 1.41$ 1.05$ 0.75$ -- sub LCC 3.61$ 4.23$ 4.70$ 5.60$ 6.57$ 8.01$ 8.14$ 8.50$ 9.84$ 11.04$ 12.75$ 15.23$
Alaska 1.16$ 1.31$ 1.46$ 1.58$ 1.70$ 1.76$ 1.76$ 1.83$ 2.03$ 2.24$ 2.42$ 2.69$ Hawaiian 0.35$ 0.38$ 0.40$ 0.43$ 0.49$ 0.61$ 0.61$ 0.63$ 0.71$ 0.78$ 0.82$ 0.88$ Midwest 0.23$ 0.27$ 0.31$ 0.35$ 0.41$ 0.43$ 0.40$ 0.36$ 0.32$ 0.34$ 0.44$ 0.57$ -- sub Other 1.74$ 1.96$ 2.17$ 2.36$ 2.59$ 2.79$ 2.77$ 2.82$ 3.05$ 3.37$ 3.68$ 4.15$
Total All Sectors 70.79$ 75.66$ 81.00$ 82.95$ 86.64$ 95.15$ 83.70$ 78.97$ 83.40$ 94.22$ 104.53$ 115.95$

9
System Total Operating Revenue$ Billions

10
System Passenger YieldCents per Revenue Passenger Mile
1995 1996 1997 1998 1999 2000 2001 2002 2003 2004 2005 2006
American 12.97 13.03 13.35 13.48 12.94 14.04 13.24 11.84 11.83 11.51 11.98 12.80
Continental 12.16 13.00 12.84 12.52 12.02 12.93 12.18 11.49 11.38 11.16 11.62 12.19
Delta 13.37 12.75 12.81 12.75 12.60 13.11 12.16 11.26 11.49 11.01 10.94 11.79
Northwest 12.39 12.51 12.08 11.24 11.56 12.02 11.22 10.75 11.08 11.49 11.64 12.45
United 11.65 12.21 12.41 12.20 12.31 13.08 11.55 10.53 10.17 10.37 10.90 11.82
US Airways 16.45 17.30 17.04 16.96 16.48 16.10 14.30 13.04 13.04 12.47 12.57 13.56
America West 10.84 10.61 10.82 11.32 11.43 11.38 10.13 9.66 9.91 9.40 10.35 11.67
--sub Network 12.80 12.97 13.01 12.85 12.66 13.31 12.23 11.27 11.28 11.12 11.45 12.30
Southwest 11.61 12.01 12.76 12.85 12.33 12.78 11.86 11.51 11.68 11.43 11.75 12.61
jetBlue 10.20 9.47 9.02 8.38 7.77 8.06 9.54
AirTran 12.98 13.56 14.56 14.18 12.78 12.39 11.82 12.31 13.11
Frontier 15.44 13.43 12.70 14.17 14.64 16.68 15.81 14.50 12.00 10.65 11.07 11.39
ATA 3.94 4.24 4.11 5.30 6.43 7.02 6.74 6.66 7.12 7.01 7.18 6.81
-- sub LCC 9.56 10.14 10.74 11.26 11.32 11.93 11.18 10.68 10.56 10.18 10.71 11.70
Alaska 11.16 11.25 12.10 12.16 12.56 13.16 12.77 12.32 12.32 12.08 12.52 13.32
Hawaiian 8.27 8.50 7.98 8.40 8.20 8.19 7.72 10.15 10.82 11.26 11.08 11.45
Midwest 17.54 18.98 19.16 19.14 18.41 19.19 17.58 15.50 13.07 11.73 11.83 12.80
-- sub Other 10.94 11.19 11.65 11.89 12.03 12.30 11.68 12.07 12.00 11.84 12.07 12.80
Total All Sectors 12.54 12.72 12.82 12.70 12.52 13.15 12.09 11.23 11.20 11.00 11.36 12.22

11
System Passenger Yield Cents per Revenue Passenger Mile
2006
Network LCCs Other
Other: 12.80Network: 12.30TOTAL: 12.22
LCC: 11.70
¢

12
System Passenger Yield per Equivalent Seat MileSTAGE LENGTH ADJUSTED
Cents per Equivalent Passenger Mile
1995 1996 1997 1998 1999 2000 2001 2002 2003 2004 2005 2006
American 14.93 15.00 15.27 15.40 14.66 15.63 14.63 12.69 12.78 12.64 13.01 13.79
Continental 11.97 13.04 13.30 13.31 13.08 14.33 13.45 12.85 12.78 12.59 13.27 13.96
Delta 12.69 12.06 12.08 12.10 12.01 12.64 11.79 11.01 11.16 10.73 10.83 12.24
Northwest 12.40 12.41 12.01 11.15 11.38 11.85 10.99 10.45 10.57 10.84 11.09 11.82
United 12.97 13.47 13.69 13.47 13.48 14.44 12.77 11.80 11.37 11.58 12.39 13.25
US Airways 13.44 14.25 13.93 13.71 13.37 13.28 11.89 10.94 11.35 10.89 10.87 12.11
America West 9.77 9.70 10.11 10.74 10.98 11.00 9.75 9.54 9.91 9.46 10.19 11.35
--sub Network 13.11 13.27 13.32 13.19 12.99 13.71 12.63 11.64 11.68 11.56 11.95 12.93
Southwest 8.00 8.23 8.82 8.93 8.69 9.25 8.66 8.56 8.71 8.52 8.91 9.54
jetBlue - - - - - 9.60 9.56 9.80 9.44 8.83 9.13 9.96
AirTran - - - 10.08 10.16 10.99 10.58 9.66 9.55 9.19 9.68 10.16
Frontier 11.24 11.21 11.17 13.08 13.65 15.72 14.95 13.55 11.12 10.20 10.43 10.39
ATA 4.72 4.96 5.07 6.42 7.65 8.02 7.54 7.41 7.89 7.57 7.74 8.20
-- sub LCC 7.59 8.23 8.74 8.99 8.93 9.51 8.89 8.62 8.61 8.26 8.63 9.29
Alaska 10.38 10.27 10.92 11.02 11.37 12.06 11.61 11.37 11.44 11.16 11.53 12.26
Hawaiian 5.08 5.33 5.24 5.43 8.88 5.63 6.80 7.26 8.37 8.70 8.73 8.78
Midwest 15.86 17.34 17.05 17.19 16.71 17.46 15.80 13.89 11.68 10.79 10.78 11.55
-- sub Other 9.59 9.70 10.05 10.28 11.31 10.77 10.56 10.76 10.78 10.68 10.87 11.46
Base Length of Haul 844 877 894 914 935 940 966 973 1,004 1,038 1,059 1,086
Note: Stage Length Adjustment formula: ((observed length of haul/base length of haul [15 carrier average])^.5) times respective carrier unit cost.

13
System Passenger Yield per Equivalent Seat MileSTAGE LENGTH ADJUSTED
Cents per Equivalent Passenger Mile
2006
Network LCCs Other
Other11.46
Network 12.93
LCC9.29
¢

14
Domestic Fare ProfileAll Domestic Markets
AMERICAN
Year
American Pax Share
Other Network Carrier Share LCC Share
Other Carrier Share
American Revenue
Share
American Average
Fare OA Fare
American Fare
Premium
Average Passenger Trip Length Coupons
Total Market
Revenue ($Mils)
Total Market
Pax (Mils)
1995 15.8% 56.5% 18.5% 2.3% 19.0% $192.35 $153.56 25.3% 1,363 1.44 10,446$ 65.4 1996 15.3% 54.8% 19.3% 2.8% 19.2% $188.93 $143.72 31.5% 1,388 1.43 10,473$ 69.5 1997 15.9% 54.6% 19.0% 2.2% 18.7% $194.40 $159.72 21.7% 1,384 1.41 11,511$ 69.7 1998 15.0% 56.4% 20.4% 3.1% 18.2% $205.67 $162.95 26.2% 1,381 1.42 12,531$ 74.0 1999 13.6% 57.1% 20.1% 3.8% 16.5% $204.16 $162.68 25.5% 1,367 1.39 13,878$ 82.4 2000 13.7% 54.6% 23.9% 3.7% 17.2% $221.74 $169.64 30.7% 1,340 1.38 15,934$ 90.1 2001 13.3% 51.9% 25.7% 4.9% 16.0% $185.63 $150.03 23.7% 1,368 1.39 12,537$ 81.0 2002 17.9% 48.7% 28.1% 2.2% 20.2% $175.99 $151.05 16.5% 1,367 1.41 12,336$ 79.3 2003 16.6% 47.9% 28.8% 3.7% 18.6% $180.67 $157.38 14.8% 1,409 1.40 12,585$ 78.0 2004 15.9% 45.6% 30.1% 5.5% 17.9% $172.36 $148.86 15.8% 1,400 1.36 13,829$ 90.6 2005 16.1% 43.6% 31.3% 5.8% 18.2% $181.69 $157.14 15.6% 1,366 1.37 15,437$ 95.8 2006 15.9% 44.2% 31.1% 5.8% 17.4% $191.87 $172.73 11.1% 1,344 1.35 16,740$ 95.2
Source: US DOT DB1B via BTS for the third quarters of each year.

15
Domestic Fare ProfileAll Domestic Markets
CONTINENTAL
Year
Continental Pax Share
Other Network Carrier Share
LCC Share
Other Carrier Share
Continental Revenue
ShareContinental
Average Fare OA FareContinental
Fare Premium
Average Passenger Trip Length Coupons
Total Market
Revenue ($Mils)
Total Market
Pax (Mils)
1995 9.8% 64.6% 17.7% 0.9% 9.7% $159.81 $162.83 (1.9%) 1,156 1.35 9,187$ 56.5 1996 8.9% 61.8% 19.7% 2.2% 9.1% $154.98 $150.28 3.1% 1,180 1.26 9,552$ 63.4 1997 8.9% 62.0% 19.4% 2.0% 9.1% $168.87 $164.38 2.7% 1,221 1.24 10,703$ 65.0 1998 9.6% 64.3% 19.7% 1.5% 10.0% $180.17 $171.57 5.0% 1,231 1.32 12,068$ 70.0 1999 9.6% 66.1% 18.4% 1.2% 10.4% $192.00 $175.05 9.7% 1,238 1.32 13,237$ 74.9 2000 8.8% 64.6% 20.8% 1.4% 10.1% $212.16 $182.53 16.2% 1,265 1.33 15,075$ 81.4 2001 8.9% 61.0% 22.2% 3.5% 10.3% $185.32 $158.35 17.0% 1,322 1.36 12,190$ 75.8 2002 9.0% 61.7% 24.3% 1.7% 10.3% $184.02 $158.56 16.1% 1,328 1.34 11,557$ 71.8 2003 9.5% 58.9% 26.7% 2.0% 10.7% $188.20 $163.72 15.0% 1,379 1.36 12,330$ 74.3 2004 8.6% 58.0% 27.1% 3.4% 10.1% $184.37 $153.82 19.9% 1,352 1.33 13,222$ 84.5 2005 8.6% 54.4% 30.7% 3.2% 10.2% $191.89 $159.55 20.3% 1,355 1.32 14,733$ 90.8 2006 10.3% 55.6% 27.5% 3.5% 11.6% $204.23 $178.39 14.5% 1,343 1.30 15,157$ 83.7
Source: US DOT DB1B via BTS for the third quarters of each year.

16
Domestic Fare ProfilesAll Domestic Markets
American
% %
Continental

17
Domestic Fare ProfileAll Domestic Markets
US AIRWAYS
Year
US Airways
Pax Share
Other Network Carrier Share
LCC Share
Other Carrier Share
US Airways Revenue
Share
US Airways Average
Fare OA Fare
US Airways
Fare Premium
Average Passenger Trip Length Coupons
Total Market
Revenue ($Mils)
Total Market
Pax (Mils)
1995 16.7% 59.5% 15.3% 1.0% 16.5% $163.35 $165.28 (1.2%) 902 1.51 9,054$ 54.9 1996 16.4% 60.6% 13.8% 0.5% 17.1% $166.68 $158.59 5.1% 899 1.49 9,072$ 56.7 1997 16.8% 58.6% 13.8% 1.7% 17.0% $171.63 $169.32 1.4% 886 1.49 10,389$ 61.2 1998 18.2% 60.6% 15.2% 0.7% 18.0% $172.81 $174.59 (1.0%) 854 1.48 10,370$ 59.5 1999 17.4% 61.0% 15.8% 0.7% 16.5% $164.98 $175.35 (5.9%) 844 1.42 11,143$ 64.2 2000 18.2% 60.5% 15.9% 0.7% 16.7% $173.27 $192.07 (9.8%) 907 1.43 12,077$ 64.0 2001 17.2% 58.0% 19.3% 0.7% 16.6% $155.96 $163.17 (4.4%) 945 1.46 9,399$ 58.0 2002 14.8% 59.8% 21.6% 0.8% 14.7% $158.96 $159.65 (0.4%) 957 1.50 9,201$ 57.7 2003 9.9% 55.1% 28.6% 3.7% 10.6% $171.07 $158.59 7.9% 987 1.48 11,881$ 74.3 2004 9.4% 56.1% 28.4% 3.3% 9.4% $153.67 $152.68 0.6% 957 1.44 12,744$ 83.4 2005 9.2% 53.1% 31.4% 3.6% 9.1% $157.57 $158.43 (0.5%) 912 1.43 13,627$ 86.1 2006 8.7% 51.0% 33.4% 4.0% 9.2% $186.34 $173.87 7.2% 1,034 1.51 16,684$ 95.4
Source: US DOT DB1B via BTS for the third quarters of each year.

18
Domestic Fare ProfileAll Domestic Markets
SOUTHWEST
Year
Southwest Pax Share
Network Carrier Share
Other LCC
Share
Other Carrier Share
Southwest Revenue
Share
Southwest Average
Fare OA Fare
Southwest Fare
Premium
Average Passenger Trip Length Coupons
Total Market
Revenue ($Mils)
Total Market
Pax (Mils)
1995 38.8% 44.1% 7.0% 5.4% 25.0% $71.18 $135.80 (47.6%) 525 1.13 3,329$ 30.1 1996 34.8% 47.7% 6.9% 5.0% 22.6% $72.64 $132.98 (45.4%) 560 1.13 4,128$ 36.9 1997 31.9% 51.1% 7.1% 4.1% 20.0% $80.64 $151.11 (46.6%) 568 1.12 5,259$ 40.9 1998 32.6% 51.4% 6.7% 4.5% 21.3% $86.75 $154.91 (44.0%) 616 1.15 5,767$ 43.5 1999 31.6% 52.8% 7.0% 4.4% 21.3% $91.60 $156.38 (41.4%) 623 1.15 6,431$ 47.3 2000 33.2% 52.3% 7.0% 4.0% 22.1% $97.61 $171.24 (43.0%) 652 1.15 7,373$ 50.2 2001 34.7% 49.6% 7.9% 4.3% 25.2% $92.36 $145.91 (36.7%) 688 1.16 6,030$ 47.4 2002 35.6% 47.7% 9.2% 4.8% 26.4% $94.93 $146.80 (35.3%) 717 1.16 5,921$ 46.1 2003 37.9% 44.9% 9.9% 5.1% 27.5% $98.33 $158.49 (38.0%) 729 1.15 6,172$ 45.5 2004 35.1% 47.6% 11.0% 4.4% 26.9% $101.27 $149.11 (32.1%) 763 1.16 6,868$ 51.9 2005 30.2% 49.9% 13.7% 4.0% 22.1% $107.26 $163.68 (34.5%) 788 1.16 10,214$ 69.6 2006 30.9% 49.6% 12.9% 4.5% 23.1% $120.52 $179.57 (32.9%) 818 1.16 11,465$ 71.1
Source: US DOT DB1B via BTS for the third quarters of each year.

19
Domestic Fare ProfilesAll Domestic Markets
US Airways
% %
Southwest

20
Expense & RelatedExpense & Related

21
Expense & Related
• The industry’s revenue problems have forced it to focus on costs to find asustainable path to profitability. This section looks at the largest centers of costto an airline and the industry – labor, fuel and transport related. Moreover it ishas become a practice to analyze unit costs in a variety of ways to best makecomparisons to the respective competition.
– The cuts in labor expense has been well documented and you will find that for theindustry there has been a convergence of labor costs among various sectors.However, there are individual airlines that still operate at a disadvantage.
– The increase in fuel expense has far overshadowed the cuts in absolute laborexpense.
– The increase in transport related expense, which primarily takes into account the costof sub-contracting flying to regional partners, has been significant and it will becomeincreasingly important to weigh the cost of this flying against the revenue generatedgoing forward.
• Finally, this section makes an effort to measure labor versus non-labor unitcosts. While labor unit cost is a report card to the employees, non-labor unitcosts are a report card on the efficiency of management actions across theremainder of the company.

22
System Total Expense per Available Seat Mile (CASM)Cents per Available Seat Mile
1995 1996 1997 1998 1999 2000 2001 2002 2003 2004 2005 2006
American 9.44 9.04 9.36 9.37 9.40 10.48 11.88 11.14 11.41 10.94 11.93 12.46
Continental 8.62 9.26 9.23 9.40 9.50 10.20 10.24 10.15 9.60 12.04 13.07 13.46
Delta 8.85 9.53 9.06 9.03 9.10 9.42 10.03 10.21 12.75 12.91 12.93 13.80
Northwest 9.12 9.19 9.04 9.66 9.14 9.94 10.54 10.62 10.62 12.79 14.37 13.74
United 8.87 9.33 9.53 9.24 9.40 10.59 12.03 11.38 10.95 11.60 12.51 13.20
US Airways 11.50 12.79 13.53 13.30 13.94 13.85 14.13 13.89 13.93 13.74 13.90 15.67
America West 7.25 7.78 7.32 7.34 7.59 8.56 9.26 8.09 7.89 8.24 11.53 12.87
--sub Network 9.20 9.52 9.56 9.56 9.61 10.42 11.30 10.94 11.29 11.90 12.82 13.38
Southwest 6.96 7.48 7.36 7.31 7.47 7.72 7.51 7.39 7.59 7.76 7.92 8.79
jetBlue 8.70 6.69 6.44 6.06 6.08 6.91 7.86
AirTran 8.28 7.70 9.18 9.25 8.48 8.23 8.40 9.34 9.71
Frontier 8.99 9.05 8.72 8.39 7.86 9.15 9.11 9.13 8.37 9.59 10.47 10.90
ATA 5.21 5.76 5.82 5.85 6.43 7.25 7.74 7.37 6.80 9.51 11.34 9.66
-- sub LCC 6.55 7.11 7.07 7.12 7.31 7.81 7.71 7.48 7.38 7.96 8.37 8.91
Alaska 7.85 8.23 8.58 8.25 8.75 10.24 10.20 9.88 9.79 10.23 10.87 12.01
Hawaiian 7.46 7.50 7.40 7.34 8.37 8.35 7.90 10.52 8.96 9.81 10.21 10.80
Midwest 10.90 11.97 12.17 11.88 11.49 12.99 12.95 11.72 11.16 10.41 10.74 11.22
-- sub Other 8.04 8.40 8.65 8.41 8.97 10.05 9.88 10.23 9.73 10.16 10.71 11.63
Total All Sectors 8.98 9.31 9.35 9.31 9.39 10.15 10.85 10.47 10.65 11.22 12.00 12.51

23
System Total Expense per Available Seat Mile (CASM)Cents per Available Seat Miles
Network LCCs Other
Other: 11.63
Network: 13.38TOTAL: 12.51
LCC: 8.91
Other: 10.42
Network: 14.06
LCC: 7.08
Actual Cost per Available Seat Mile 2006
Stage Length Adjusted Cost per Available Seat Mile 2006
Network LCCs Other
¢ ¢

24
System Total Labor and Related Expenses$ Billions
1995 1996 1997 1998 1999 2000 2001 2002 2003 2004 2005 2006
American 5.74$ 5.16$ 5.40$ 5.77$ 6.03$ 6.72$ 6.97$ 8.29$ 7.12$ 6.48$ 6.43$ 6.47$ Continental 1.32$ 1.45$ 1.73$ 2.15$ 2.46$ 2.76$ 2.80$ 2.71$ 2.76$ 2.79$ 2.63$ 2.87$ Delta 4.23$ 4.59$ 4.64$ 4.77$ 4.98$ 5.48$ 5.80$ 5.68$ 5.77$ 5.69$ 4.47$ 3.76$ Northwest 3.03$ 3.10$ 3.15$ 3.39$ 3.55$ 3.77$ 4.09$ 3.96$ 3.96$ 3.91$ 3.85$ 2.79$ United 5.29$ 5.69$ 6.33$ 6.53$ 6.82$ 7.29$ 7.80$ 7.35$ 5.56$ 5.24$ 4.25$ 4.51$ US Airways 2.87$ 3.15$ 3.14$ 3.03$ 3.29$ 3.56$ 3.76$ 3.02$ 2.45$ 2.25$ 1.50$ 1.44$ America West 0.40$ 0.41$ 0.45$ 0.48$ 0.54$ 0.60$ 0.64$ 0.63$ 0.69$ 0.69$ 0.74$ 0.78$ --sub Network 22.89$ 23.54$ 24.83$ 26.12$ 27.67$ 30.19$ 31.86$ 31.64$ 28.32$ 27.04$ 23.87$ 22.61$
Southwest 0.93$ 1.07$ 1.21$ 1.37$ 1.55$ 1.79$ 1.98$ 2.11$ 2.33$ 2.57$ 2.84$ 3.20$ jetBlue -$ -$ -$ -$ -$ 0.04$ 0.09$ 0.18$ 0.29$ 0.37$ 0.47$ 0.61$ AirTran -$ -$ -$ 0.10$ 0.13$ 0.15$ 0.17$ 0.22$ 0.25$ 0.30$ 0.36$ 0.43$ Frontier 0.01$ 0.02$ 0.02$ 0.03$ 0.05$ 0.08$ 0.10$ 0.13$ 0.16$ 0.20$ 0.23$ 0.25$ ATA 0.16$ 0.19$ 0.20$ 0.23$ 0.27$ 0.34$ 0.36$ 0.38$ 0.43$ 0.44$ 0.31$ 0.23$ -- sub LCC 1.10$ 1.28$ 1.43$ 1.74$ 2.01$ 2.39$ 2.71$ 3.01$ 3.46$ 3.88$ 4.20$ 4.71$
Alaska 0.36$ 0.41$ 0.46$ 0.51$ 0.56$ 0.61$ 0.69$ 0.74$ 0.82$ 0.87$ 0.78$ 0.81$ Hawaiian 0.11$ 0.11$ 0.12$ 0.12$ 0.15$ 0.17$ 0.20$ 0.21$ 0.22$ 0.23$ 0.24$ 0.24$ Midwest 0.06$ 0.08$ 0.09$ 0.11$ 0.13$ 0.15$ 0.16$ 0.15$ 0.13$ 0.13$ 0.13$ 0.14$ -- sub Other 0.53$ 0.60$ 0.67$ 0.75$ 0.83$ 0.93$ 1.04$ 1.11$ 1.17$ 1.23$ 1.15$ 1.19$
Total All Sectors 24.52$ 25.42$ 26.94$ 28.60$ 30.51$ 33.51$ 35.61$ 35.76$ 32.95$ 32.16$ 29.22$ 28.51$

25
Total Labor Expense$ Billions

26
System Total Labor and Related Expense per Available Seat Mile (LCASM)Cents per Available Seat Mile
1995 1996 1997 1998 1999 2000 2001 2002 2003 2004 2005 2006
American 3.70 3.37 3.51 3.71 3.76 4.17 4.55 4.82 4.31 3.72 3.65 3.72
Continental 2.43 2.64 2.79 3.04 3.10 3.30 3.45 3.51 3.63 3.42 3.07 3.07
Delta 3.25 3.43 3.34 3.36 3.44 3.72 4.10 4.31 4.79 4.38 3.34 3.00
Northwest 3.46 3.29 3.24 3.71 3.56 3.65 4.15 4.24 4.45 4.27 4.19 3.25
United 3.34 3.49 3.74 3.75 3.86 4.16 4.73 4.94 4.07 3.60 3.03 3.15
US Airways 4.88 5.49 5.37 5.32 5.56 5.34 5.62 5.35 4.75 4.17 2.81 3.01
America West 2.06 1.90 1.89 1.98 2.07 2.21 2.42 2.34 2.47 2.30 2.43 2.64
--sub Network 3.45 3.48 3.53 3.65 3.71 3.95 4.35 4.48 4.25 3.83 3.35 3.23
Southwest 2.51 2.62 2.71 2.88 2.94 2.99 3.02 3.06 3.25 3.34 3.32 3.45
jetBlue 2.59 2.16 2.17 2.12 1.95 1.96 2.12
AirTran 2.18 2.20 2.53 2.65 2.61 2.47 2.46 2.33 2.25
Frontier 1.60 1.36 1.38 1.42 1.60 1.99 2.19 2.45 2.34 2.35 2.47 2.37
ATA 1.28 1.46 1.56 1.71 1.93 2.09 2.22 2.15 2.11 2.15 2.38 2.80
-- sub LCC 2.19 2.32 2.42 2.55 2.63 2.74 2.79 2.78 2.82 2.83 2.86 2.96
Alaska 2.59 2.73 2.99 3.05 3.21 3.53 3.82 3.85 3.94 3.89 3.50 3.47
Hawaiian 2.43 2.21 2.19 2.23 2.32 2.28 2.51 3.27 3.10 3.25 3.03 2.97
Midwest 3.33 3.79 4.11 4.40 4.15 4.55 4.90 4.62 4.22 3.58 2.94 2.76
-- sub Other 2.62 2.71 2.91 3.01 3.11 3.31 3.58 3.80 3.77 3.71 3.32 3.26
Total All Sectors 3.34 3.37 3.43 3.54 3.59 3.81 4.15 4.24 4.02 3.67 3.27 3.19

27
System Total Labor and Related Expense per Available Seat Mile (LCASM)Cents per Available Seat Mile
Network LCCs Other
Other: 3.26Network: 3.23TOTAL: 3.19
LCC: 2.96
Labor Cost per Available Seat Mile
2006
Non-Labor Cost per Available Seat Mile
2006
Network LCCs Other
Other: 5.17
Network: 4.44
TOTAL: 4.27
LCC: 3.31
excludes: labor, fuel and transport related
¢ ¢

28
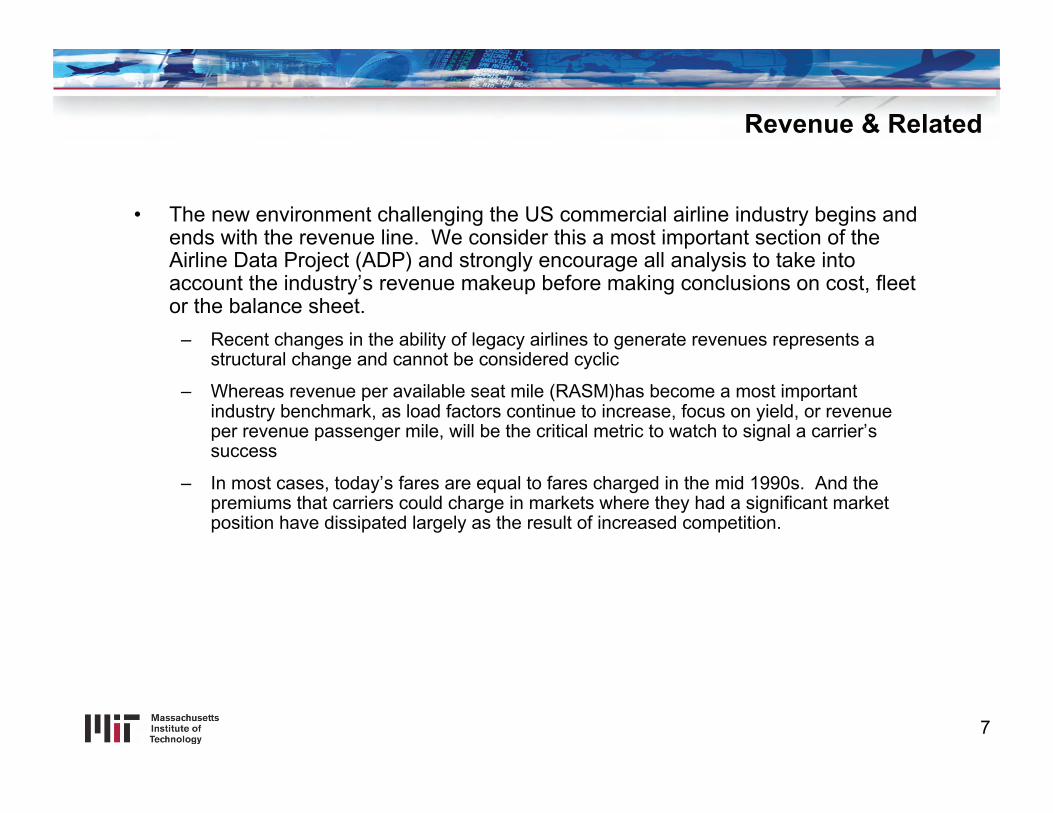
System Total Fuel Expenses$ Billions
1995 1996 1997 1998 1999 2000 2001 2002 2003 2004 2005 2006
American 1.48$ 1.73$ 1.72$ 1.42$ 1.45$ 2.20$ 2.24$ 2.24$ 2.42$ 3.47$ 4.96$ 5.59$ Continental 0.57$ 0.65$ 0.76$ 0.66$ 0.70$ 1.29$ 1.07$ 0.87$ 1.05$ 1.47$ 2.28$ 2.85$ Delta 1.36$ 1.65$ 1.67$ 1.39$ 1.38$ 1.77$ 1.70$ 1.46$ 1.60$ 2.41$ 3.65$ 4.04$ Northwest 1.03$ 1.31$ 1.29$ 1.01$ 1.09$ 1.76$ 1.61$ 1.32$ 1.42$ 2.09$ 2.95$ 3.23$ United 1.58$ 1.91$ 1.89$ 1.62$ 1.59$ 2.31$ 2.33$ 1.79$ 1.94$ 2.78$ 3.86$ 4.63$ US Airways 0.61$ 0.71$ 0.69$ 0.51$ 0.60$ 1.12$ 0.97$ 0.67$ 0.72$ 0.96$ 1.51$ 1.56$ America West 0.17$ 0.23$ 0.24$ 0.18$ 0.23$ 0.39$ 0.33$ 0.30$ 0.37$ 0.55$ 0.77$ 0.87$ --sub Network 6.79$ 8.18$ 8.27$ 6.78$ 7.05$ 10.84$ 10.25$ 8.65$ 9.52$ 13.73$ 19.97$ 22.76$
Southwest 0.37$ 0.48$ 0.49$ 0.39$ 0.49$ 0.83$ 0.85$ 0.84$ 0.92$ 1.10$ 1.47$ 2.13$ jetBlue -$ -$ -$ -$ -$ 0.02$ 0.04$ 0.08$ 0.15$ 0.26$ 0.49$ 0.75$ AirTran -$ -$ -$ 0.06$ 0.07$ 0.14$ 0.14$ 0.15$ 0.18$ 0.22$ 0.41$ 0.62$ Frontier -$ -$ -$ 0.02$ 0.03$ 0.06$ 0.05$ 0.06$ 0.09$ 0.16$ 0.25$ 0.32$ ATA 0.13$ 0.16$ 0.15$ 0.14$ 0.17$ 0.27$ 0.25$ 0.20$ 0.27$ 0.36$ 0.32$ 0.24$ -- sub LCC 0.50$ 0.65$ 0.65$ 0.60$ 0.76$ 1.31$ 1.33$ 1.34$ 1.60$ 2.09$ 2.93$ 4.06$
Alaska 0.14$ 0.18$ 0.18$ 0.14$ 0.18$ 0.28$ 0.24$ 0.23$ 0.27$ 0.43$ 0.58$ 0.72$ Hawaiian 0.05$ 0.07$ 0.07$ 0.06$ 0.07$ 0.12$ 0.10$ 0.08$ 0.09$ 0.13$ 0.19$ 0.23$ Midwest 0.03$ 0.04$ 0.04$ 0.03$ 0.04$ 0.08$ 0.07$ 0.06$ 0.06$ 0.08$ 0.14$ 0.19$ -- sub Other 0.22$ 0.28$ 0.29$ 0.23$ 0.29$ 0.47$ 0.41$ 0.37$ 0.42$ 0.64$ 0.92$ 1.14$
Total All Sectors 7.51$ 9.11$ 9.20$ 7.61$ 8.09$ 12.63$ 12.00$ 10.35$ 11.54$ 16.46$ 23.82$ 27.97$
29
Total Fuel Expense$ Billions

30
System Total Expense per Available Seat Mile (CASM ex fuel and Transport Related)Cents per Available Seat Mile
1995 1996 1997 1998 1999 2000 2001 2002 2003 2004 2005 2006
American 8.43 7.83 8.07 8.27 8.28 8.95 10.25 9.76 8.99 7.85 7.82 7.83
Continental 7.24 7.77 7.71 8.00 8.17 8.16 8.38 8.41 7.87 7.83 7.59 7.57
Delta 7.64 8.04 7.61 7.89 7.93 7.98 8.51 8.58 9.12 8.56 7.53 7.40
Northwest 7.83 7.70 7.60 8.49 7.96 8.14 8.76 9.03 8.82 8.94 9.10 8.08
United 7.59 7.82 8.08 8.04 8.16 8.68 9.86 9.37 8.36 7.78 7.35 7.52
US Airways 10.09 10.98 11.19 11.12 11.54 10.70 11.02 10.43 9.93 9.02 7.59 7.92
America West 6.29 6.65 6.25 6.54 6.63 7.07 7.95 6.96 6.53 5.89 6.63 7.37
--sub Network 7.98 8.07 8.09 8.31 8.33 8.59 9.41 9.16 8.70 8.11 7.74 7.67
Southwest 5.94 6.26 6.23 6.47 6.51 6.32 6.19 6.15 6.29 6.31 6.19 6.47
jetBlue 7.43 5.72 5.50 4.95 4.72 4.82 5.18
AirTran 7.08 6.53 6.80 7.14 6.62 6.46 6.61 6.67 6.47
Frontier 8.99 9.05 8.72 7.35 7.00 7.70 7.94 7.89 7.07 7.56 6.74 6.80
ATA 4.20 4.53 4.61 4.84 5.24 5.55 6.19 6.22 5.48 7.79 8.91 6.71
-- sub LCC 5.54 5.92 5.96 6.21 6.30 6.29 6.32 6.23 6.06 6.42 6.30 6.27
Alaska 6.70 6.97 7.38 7.34 7.64 8.54 8.80 8.67 8.43 8.17 8.16 8.83
Hawaiian 6.31 6.14 6.07 6.24 7.23 6.76 6.56 9.10 7.60 7.81 7.72 7.89
Midwest 9.35 10.15 10.42 10.60 10.15 10.62 10.86 9.90 9.18 8.15 7.52 7.43
-- sub Other 6.85 7.07 7.36 7.42 7.82 8.30 8.42 8.90 8.31 8.09 7.98 8.42
Total All Sectors 7.78 7.89 7.90 8.10 8.13 8.36 9.02 8.78 8.29 7.85 7.51 7.45

31
System Total Expense per Available Seat Mile (CASM ex fuel and Transport Related)
Cents per Available Seat Mile

32
System Total Labor and Related Expense per Equivalent Seat Mile (LCESM)STAGE LENGTH ADJUSTED
Cents per Equivalent Seat Mile
1995 1996 1997 1998 1999 2000 2001 2002 2003 2004 2005 2006
American 4.26 3.88 4.02 4.24 4.26 4.65 5.02 5.16 4.66 4.09 3.97 4.01
Continental 2.39 2.65 2.88 3.24 3.37 3.66 3.81 3.93 4.08 3.85 3.51 3.51
Delta 3.09 3.24 3.15 3.19 3.28 3.59 3.98 4.22 4.65 4.26 3.31 3.12
Northwest 3.46 3.27 3.22 3.68 3.50 3.60 4.07 4.12 4.25 4.03 3.99 3.08
United 3.72 3.86 4.13 4.14 4.23 4.59 5.23 5.54 4.55 4.02 3.45 3.53
US Airways 3.99 4.52 4.39 4.30 4.51 4.41 4.67 4.49 4.14 3.64 2.43 2.69
America West 1.86 1.74 1.77 1.88 1.98 2.14 2.33 2.31 2.47 2.32 2.40 2.57
--sub Network 3.53 3.55 3.61 3.75 3.81 4.07 4.49 4.62 4.40 3.98 3.50 3.40
Southwest 1.73 1.80 1.87 2.00 2.07 2.16 2.21 2.27 2.42 2.49 2.52 2.61
jetBlue - - - - - 2.43 2.18 2.35 2.39 2.22 2.22 2.21
AirTran - - - 1.70 1.65 1.91 1.97 1.98 1.91 1.92 1.83 1.74
Frontier 1.17 1.14 1.21 1.31 1.49 1.87 2.07 2.29 2.17 2.25 2.33 2.16
ATA 1.54 1.71 1.93 2.06 2.30 2.39 2.48 2.40 2.34 2.32 2.57 3.37
-- sub LCC 1.74 1.88 1.97 2.04 2.08 2.18 2.22 2.24 2.30 2.30 2.31 2.35
Alaska 2.41 2.49 2.69 2.77 2.91 3.23 3.48 3.55 3.66 3.59 3.22 3.19
Hawaiian 1.49 1.38 1.44 1.44 2.51 1.57 2.21 2.34 2.40 2.51 2.39 2.28
Midwest 3.02 3.46 3.65 3.95 3.76 4.14 4.40 4.14 3.77 3.29 2.68 2.50
-- sub Other 2.30 2.34 2.51 2.60 2.92 2.90 3.24 3.39 3.39 3.35 2.99 2.92
Base Length of Haul 844 877 894 914 935 940 966 973 1,004 1,038 1,059 1,086
Note: Stage Length Adjustment formula: ((observed length of haul/base length of haul [15 carrier average])^.5) times respective carrier unit cost.

33
System Total Labor and Non-Labor Expense per Equivalent Seat Mile STAGE LENGTH ADJUSTED
Cents per Equivalent Seat Mile
Network LCCs Other
Other: 2.92
Network: 3.40
LCC: 2.35
Stage Length Adjusted Labor Cost per Available Seat Mile
Stage Length Adjusted Non-Labor Cost per Available Seat Mile
Network LCCs Other
Other: 4.63Network: 4.66
LCC: 2.63
¢ ¢

34
Employees & CompensationEmployees & Compensation
35
Employees & Compensation
• Given the increased attention being paid to labor’s portion of a company’s coststructure, the ADP has made its best effort to breakdown the publicly availabledata, and make transparent, consistent calculations to enable the user tobenchmark compensation and related calculation by employee group.
– There will of course be nuances with each individual company that might impact theresulting calculations, and the ADP does not make adjustments for those nuances.
– Robust data is available to measure pilot cost and in-house maintenance costs.Lesser publicly available data is derived for flight attendants although we are confidentthat we have put forth our best effort to measure these costs. There is not sufficientdata to accurately measure the various class and crafts of ground and relatedemployees and therefore we have grouped them all together. Adjustments arenecessary at the micro level. Finally, given the increased attention on managementcompensation, we have revealed what has been filed in the public domain. Again, insome instances the data provides for a reliable time series and in other instances lessso.
• There are many who believe the US DOT Form 41 filings do not represent areliable data source. Total labor cost is calibrated with the filings made with theSecurities and Exchange Commission filings. The ADP has been careful not todisaggregate the data so that it loses its meaning.

36
Total Full-time Employee Equivalents
1995 1996 1997 1998 1999 2000 2001 2002 2003 2004 2005 2006
American 83,463 78,902 80,842 82,470 90,136 92,665 92,277 98,960 84,770 79,413 74,960 72,755
Continental 30,263 30,331 33,168 37,289 40,810 42,471 42,151 38,242 38,396 37,144 37,309 39,313
Delta 66,302 58,839 64,651 69,561 72,450 71,384 70,142 65,316 58,939 57,558 52,231 45,562
Northwest 43,491 45,756 47,337 49,294 50,689 51,551 49,910 44,718 39,733 38,204 35,985 30,729
United 75,695 79,205 73,328 88,097 92,625 95,327 93,844 75,470 62,356 60,862 56,661 55,026
US Airways 40,972 39,952 39,936 38,382 39,905 42,652 29,705 31,404 26,736 26,509 21,202 21,449
America West 10,122 10,691 11,455 12,430 13,949 12,187 11,994 12,299 12,958 13,743 12,142 13,013
--sub Network 350,308 343,676 350,717 377,523 400,564 408,237 390,023 366,409 323,888 313,433 290,490 277,847
Southwest 18,930 22,281 24,185 25,111 27,374 28,671 30,848 33,421 33,360 31,675 31,543 32,167
jetBlue - - - - - 693 2,116 2,928 4,343 5,850 7,462 9,272
AirTran - - - 2,974 3,882 4,035 4,234 4,725 5,350 5,814 6,458 7,415
Frontier 326 582 745 1,025 1,640 1,744 2,145 2,402 2,975 3,634 3,790 4,034
ATA 2,810 4,757 5,362 5,516 4,363 6,537 6,890 5,961 6,419 4,820 2,856 1,131
--sub LCC 22,066 27,620 30,292 34,626 37,259 41,680 46,233 49,437 52,447 51,793 52,109 54,019
Alaska 7,007 8,067 8,237 8,669 9,217 9,523 10,115 10,142 10,040 9,900 9,269 9,307
Hawaiian 2,014 2,207 2,247 2,343 2,812 3,281 2,878 2,878 2,878 3,128 2,855 3,243
Midwest 6,310 6,040 8,467 9,993 12,193 16,221 22,013 22,618 17,319 17,014 12,378 11,066
-- sub Other 15,331 16,313 18,951 21,005 24,222 29,025 35,006 35,638 30,237 30,042 24,502 23,616
Total All Sectors 387,705 387,609 399,960 433,154 462,045 478,942 471,262 451,484 406,572 395,268 367,101 355,482

37
Total Full-time Employee Equivalents

38
Total Pilot and Copilot Employee Equivalents
1995 1996 1997 1998 1999 2000 2001 2002 2003 2004 2005 2006
American 9,000 8,954 8,885 8,813 9,533 10,408 10,960 12,319 10,857 9,929 9,074 8,572
Continental 3,770 3,366 3,635 4,216 4,605 4,656 4,571 4,209 3,852 3,943 4,184 4,408
Delta 8,348 8,143 8,152 8,753 8,072 9,123 8,103 8,074 7,155 6,786 6,181 5,706
Northwest 4,903 5,193 5,407 5,151 5,822 5,981 6,103 5,534 5,112 4,942 4,995 4,531
United 7,613 7,862 9,083 10,014 11,754 11,404 11,262 7,992 7,688 6,374 6,133 6,277
US Airways 4,662 4,575 4,521 4,482 4,844 5,330 4,791 3,828 3,147 2,967 2,599 3,132
America West 1,107 1,260 1,364 1,494 1,890 1,641 1,650 1,675 1,727 1,851 1,850 1,803
--sub Network 39,403 39,353 41,047 42,923 46,520 48,543 47,440 43,631 39,538 36,792 35,016 34,429
Southwest 2,025 2,243 2,414 2,667 2,962 3,316 3,725 3,966 4,022 4,197 4,535 4,845
jetBlue - - - - - 203 252 371 591 809 1,059 1,451
AirTran - - - 429 495 547 642 767 860 902 1,133 1,325
Frontier 42 91 288 356 489 547 314 389 489 542 599 655
ATA - 690 765 884 937 975 898 851 1,072 1,070 747 592
-- sub LCC 2,067 3,024 3,467 4,336 4,883 5,588 5,831 6,344 7,034 7,520 8,073 8,868
Alaska 892 988 1,074 1,130 1,207 1,239 1,345 1,329 1,348 1,440 1,331 1,367
Hawaiian 258 260 268 287 346 405 398 398 398 307 280 312
Midwest 157 225 235 283 340 353 297 340 290 308 347 378
-- sub Other 1,307 1,473 1,577 1,700 1,893 1,997 2,040 2,067 2,036 2,055 1,958 2,057
Total All Sectors 42,777 43,850 46,091 48,959 53,296 56,128 55,311 52,042 48,608 46,367 45,047 45,354

39
Total Full-time Pilot and Copilot Equivalents

40
Average Annual Wages and Salaries - PILOT AND CO-PILOT PERSONNELNO ADJUSTMENTS MADE
1995 1996 1997 1998 1999 2000 2001 2002 2003 2004 2005 2006
American 112,190$ 116,470$ 131,651$ 137,971$ 130,099$ 132,477$ 123,244$ 126,335$ 130,019$ 129,947$ 137,734$ 138,290$ Continental 90,461$ 108,561$ 124,152$ 154,401$ 161,395$ 166,752$ 163,624$ 136,685$ 140,028$ 145,061$ 128,723$ 123,618$ Delta 129,313$ 133,988$ 131,249$ 121,885$ 143,880$ 150,549$ 185,980$ 173,365$ 197,380$ 209,330$ 155,532$ 127,268$ Northwest 154,586$ 131,636$ 125,514$ 142,578$ 128,100$ 134,177$ 138,427$ 148,084$ 161,931$ 169,208$ 143,618$ 117,556$ United 135,728$ 146,249$ 147,212$ 135,886$ 117,920$ 132,126$ 137,638$ 184,370$ 116,009$ 131,930$ 114,762$ 114,985$ US Airways 127,053$ 132,433$ 134,540$ 135,762$ 128,722$ 119,513$ 157,090$ 153,563$ 154,445$ 132,741$ 120,017$ 86,958$ America West 77,093$ 82,589$ 86,289$ 85,117$ 75,045$ 99,221$ 99,301$ 92,148$ 92,111$ 100,269$ 101,279$ 99,168$ --sub Network 124,334$ 128,140$ 132,353$ 134,301$ 129,881$ 136,740$ 145,806$ 150,502$ 144,874$ 150,558$ 133,374$ 120,889$
Southwest 107,109$ 106,862$ 110,905$ 107,498$ 109,958$ 110,601$ 112,259$ 117,558$ 130,069$ 144,511$ 157,420$ 165,882$ jetBlue 22,132$ 56,644$ 93,332$ 93,532$ 95,841$ 96,734$ 98,927$ AirTran 54,838$ 65,770$ 68,926$ 75,335$ 85,709$ 89,593$ 98,055$ 95,809$ 96,527$ FrontierATA -$ 54,537$ 56,924$ 60,062$ 65,909$ 72,001$ 79,674$ 107,563$ 110,444$ 121,459$ 116,100$ 105,952$ --sub LCC 104,933$ 91,707$ 89,781$ 83,791$ 86,015$ 85,746$ 94,727$ 103,741$ 110,017$ 120,007$ 125,309$ 128,311$
Alaska 104,869$ 106,838$ 114,791$ 126,181$ 127,233$ 132,140$ 141,808$ 151,734$ 163,211$ 160,974$ 145,953$ 129,620$ Hawaiian 74,565$ 75,803$ 79,762$ 76,402$ 75,224$ 79,289$ 90,924$ 111,463$ 105,289$ 121,216$ 132,782$ 125,350$ Midwest 85,197$ 72,677$ 83,059$ 76,799$ 74,548$ 94,373$ 125,002$ 104,213$ 115,512$ 107,474$ 101,895$ 93,052$ -- sub Other 96,524$ 96,142$ 104,109$ 109,557$ 108,264$ 114,746$ 129,434$ 136,163$ 145,094$ 147,016$ 136,261$ 122,252$
Total All Sectors 122,547$ 124,552$ 128,184$ 128,968$ 125,094$ 130,881$ 139,817$ 144,232$ 139,839$ 145,446$ 132,054$ 122,402$

41
Average Salary for Pilot and Copilots 2006
Network LCCs Other
Other: $122,252TOTAL: $122,402
Network: $120,889
LCC: $128,311
Trend in Average Pilot and Copilot Salaries

42
Total Pilot Compensation per Pilot Employee EquivalentNO ADJUSTMENTS MADE
1995 1996 1997 1998 1999 2000 2001 2002 2003 2004 2005 2006
American 159,770$ 163,792$ 191,910$ 204,178$ 199,112$ 205,096$ 194,907$ 198,774$ 199,589$ 202,202$ 216,246$ 222,602$ Continental 109,319$ 131,938$ 149,001$ 179,516$ 186,740$ 192,915$ 190,841$ 161,846$ 223,994$ 214,247$ 187,675$ 175,221$ Delta 179,463$ 215,968$ 182,918$ 168,139$ 187,075$ 192,545$ 233,652$ 247,072$ 307,622$ 323,126$ 255,755$ 223,893$ Northwest 201,670$ 188,690$ 181,090$ 202,144$ 190,302$ 189,508$ 198,333$ 215,606$ 247,091$ 257,916$ 245,298$ 194,385$ United 178,812$ 191,608$ 186,973$ 180,280$ 157,746$ 180,629$ 208,179$ 288,617$ 197,644$ 216,671$ 179,500$ 177,558$ US Airways 192,180$ 213,838$ 232,785$ 216,129$ 227,862$ 219,086$ 270,437$ 281,164$ 266,281$ 239,789$ 179,006$ 132,341$ American West 103,872$ 109,664$ 114,961$ 114,035$ 98,209$ 126,602$ 129,157$ 122,667$ 131,819$ 141,765$ 143,526$ 146,334$ --sub Network 170,272$ 184,792$ 185,751$ 186,697$ 183,139$ 192,783$ 210,066$ 227,048$ 229,628$ 235,777$ 210,908$ 192,619$
Southwest 139,050$ 139,860$ 145,765$ 142,302$ 146,738$ 138,749$ 141,140$ 146,620$ 179,246$ 194,450$ 208,360$ 231,664$ jetBlue 32,541$ 95,493$ 140,946$ 144,115$ 134,283$ 130,262$ 139,971$ AirTran 68,629$ 79,953$ 90,556$ 101,305$ 105,400$ 111,092$ 124,889$ 122,082$ 125,118$ Frontier -$ -$ 33,490$ 35,698$ 46,184$ 124,674$ 134,312$ 132,335$ 137,254$ 121,924$ 124,880$ ATA 88,494$ 87,517$ 91,423$ 100,394$ 104,501$ 137,026$ 176,043$ 166,661$ 171,676$ 172,858$ 186,592$ --sub LCC 159,883$ 123,931$ 120,804$ 115,706$ 119,955$ 115,137$ 133,261$ 144,497$ 162,782$ 172,271$ 176,308$ 189,846$
Alaska 134,981$ 137,469$ 149,366$ 165,288$ 166,775$ 171,160$ 181,994$ 204,454$ 233,772$ 228,860$ 217,503$ 199,023$ Hawaiian 119,586$ 113,342$ 113,946$ 106,005$ 104,167$ 106,015$ 136,570$ 164,625$ 163,075$ 215,816$ 225,490$ 202,536$ Midwest 109,808$ 94,187$ 107,709$ 99,966$ 98,284$ 124,576$ 166,108$ 138,178$ 153,517$ 145,042$ 139,995$ 131,545$ -- sub Other 128,918$ 126,599$ 137,139$ 144,406$ 143,030$ 149,714$ 170,819$ 185,883$ 208,521$ 214,349$ 204,909$ 187,156$
Total All Sectors 168,507$ 178,640$ 179,203$ 178,941$ 175,925$ 183,520$ 200,521$ 215,350$ 219,071$ 224,528$ 204,447$ 191,829$
Notes: The full effect of each Delta's and Northwest's restructuring of financials and operations are not fully reflected in 2006.Pilot Cost includes: salaries and wages, benefits and pensions, payroll taxes and personnel expenses impacted by collective bargaining terms.Data Source: US DOT Form 41.

43
Total Pilot Compensation per Pilot Employee EquivalentNO ADJUSTMENTS MADE
Network LCCs Other
Other: $187,156
Network: $192,619TOTAL: $191,829LCC: $189,846
Average Total Compensation for Pilot and Copilots Trend in Average Pilot and Copilot Total Compensation

44
Average Pension and Benefit Package PILOTS AND CO-PILOTS
1995 1996 1997 1998 1999 2000 2001 2002 2003 2004 2005 2006
American 29,951$ 29,119$ 32,749$ 35,149$ 34,113$ 36,028$ 36,115$ 42,634$ 44,167$ 45,852$ 52,998$ 60,493$ Continental 6,670$ 7,723$ 7,381$ 7,049$ 4,022$ 5,271$ 7,114$ 8,610$ 65,985$ 50,600$ 40,418$ 32,682$ Delta 26,237$ 58,222$ 22,675$ 20,720$ 15,065$ 8,304$ 9,655$ 45,077$ 83,537$ 86,195$ 77,320$ 75,500$ Northwest 21,687$ 29,489$ 24,002$ 26,785$ 31,886$ 24,229$ 29,615$ 38,694$ 53,047$ 56,276$ 72,772$ 49,411$ United 18,539$ 21,294$ 16,903$ 23,224$ 19,586$ 25,855$ 45,315$ 74,232$ 57,955$ 59,832$ 40,708$ 37,321$ US Airways 38,184$ 55,722$ 73,072$ 51,030$ 55,867$ 54,190$ 65,350$ 85,796$ 81,905$ 82,329$ 34,290$ 36,364$ America West 19,946$ 19,636$ 20,590$ 20,381$ 17,556$ 22,569$ 22,991$ 21,979$ 27,379$ 27,702$ 26,285$ 30,413$ --sub Network 24,396$ 34,586$ 27,880$ 26,805$ 25,472$ 25,563$ 32,645$ 48,086$ 59,517$ 59,652$ 53,657$ 49,966$
Southwest 13,447$ 13,588$ 14,650$ 14,652$ 16,044$ 6,797$ 5,498$ 6,508$ 25,831$ 25,142$ 30,633$ 44,300$ jetBlue 1,985$ 17,220$ 25,283$ 29,019$ 17,601$ 9,881$ 18,684$ AirTran 2,649$ 2,262$ 2,776$ 5,348$ 4,338$ 6,300$ 9,440$ 9,240$ 10,702$ FrontierATA --sub LCC 13,174$ 10,079$ 10,200$ 9,274$ 9,961$ 4,377$ 4,845$ 6,071$ 17,978$ 17,058$ 19,801$ 28,859$
Alaska 16,721$ 17,997$ 18,213$ 24,565$ 27,205$ 26,515$ 27,178$ 38,640$ 56,021$ 53,862$ 56,671$ 55,808$ Hawaiian 29,587$ 24,462$ 24,541$ 20,242$ 18,521$ 16,511$ 33,712$ 40,330$ 45,056$ 80,910$ 75,220$ 59,527$ Midwest 12,480$ 11,511$ 14,452$ 11,579$ 12,620$ 17,888$ 25,024$ 20,704$ 24,688$ 24,966$ 21,988$ 16,958$ -- sub Other 18,751$ 18,147$ 18,728$ 21,674$ 22,998$ 22,961$ 28,139$ 36,015$ 49,415$ 53,572$ 53,177$ 49,233$
Total All Sectors 23,682$ 32,343$ 26,237$ 25,074$ 23,963$ 23,361$ 29,548$ 42,485$ 53,083$ 52,475$ 47,568$ 45,806$

45
Average Pension and Benefit Package per Pilot and Copilot 2006
Network LCCs Other
Other: 49,233
TOTAL: 45,806
Network: $49,996
LCC: $28,859
Notes: The full effect of each Delta's and Northwest's restructuring of financials and operations are not fully reflected in 2006.

46
AA CO DL NW UA US HP WN B6 FL F9 TZ AS HA YX
American (AA) ($224) ($29) ($81) ($173) ($258) ($283) ($175) ($396) ($411) ($409) $325 ($158) ($37) ($378)Continental (CO) $224 $194 $143 $51 ($34) ($60) $49 ($172) ($187) ($185) $549 $66 $186 ($154)Delta (DL) $29 ($194) ($51) ($144) ($228) ($254) ($145) ($367) ($381) ($379) $355 ($128) ($8) ($349)Northwest (NW) $81 ($143) $51 ($92) ($177) ($203) ($94) ($316) ($330) ($328) $406 ($77) $43 ($297)United (UA) $173 ($51) $144 $92 ($85) ($110) ($2) ($223) ($238) ($236) $498 $15 $136 ($205)US Airways (US) $258 $34 $228 $177 $85 ($26) $83 ($138) ($153) ($151) $583 $100 $220 ($120)America West (HP) $283 $60 $254 $203 $110 $26 $109 ($113) ($127) ($125) $609 $125 $246 ($95)Southwest (WN) $175 ($49) $145 $94 $2 ($83) ($109) ($221) ($236) ($234) $500 $17 $137 ($203)jetBlue (B6) $396 $172 $367 $316 $223 $138 $113 $221 ($15) ($13) $722 $238 $359 $18AirTran (FL) $411 $187 $381 $330 $238 $153 $127 $236 $15 $2 $736 $253 $373 $33Frontier (F9) $409 $185 $379 $328 $236 $151 $125 $234 $13 ($2) $734 $251 $371 $31ATA (TZ) ($325) ($549) ($355) ($406) ($498) ($583) ($609) ($500) ($722) ($736) ($734) ($483) ($363) ($703)Alaska (AS) $158 ($66) $128 $77 ($15) ($100) ($125) ($17) ($238) ($253) ($251) $483 $120 ($220)Hawaiian (HA) $37 ($186) $8 ($43) ($136) ($220) ($246) ($137) ($359) ($373) ($371) $363 ($120) ($341)Midwest (YX) $378 $154 $349 $297 $205 $510 $95 $203 ($18) ($33) ($31) $703 $220 $341
Notes: The full effect of each Delta's and Northwest's restructuring of financials and operations are not fully reflected in 2006.Cockpit Cost includes: salaries and wages, benefits and pensions, payroll taxes and personnel expenses impacted by collective bargaining terms.Data Source: US DOT Form 41.
Competitive Advantage/(Disadvantage) in Total Cockpit Cost per Block Hour2006

47
Average Annual Wages and Salaries FLIGHT ATTENDANT PERSONNEL
1995 1996 1997 1998 1999 2000 2001 2002 2003 2004 2005 2006
American 29,036$ 30,482$ 34,908$ 37,377$ 32,572$ 34,288$ 35,071$ 42,242$ 47,851$ 45,893$ 46,191$ 47,249$ Continental 27,203$ 31,440$ 34,292$ 34,643$ 35,956$ 41,981$ 40,694$ 40,162$ 40,050$ 44,312$ 43,871$ 41,932$ Delta 29,955$ 35,752$ 34,952$ 35,087$ 38,127$ 19,519$ 40,483$ 42,158$ 45,441$ 45,333$ 40,037$ 37,039$ Northwest 30,927$ 30,094$ 29,975$ 30,714$ 32,406$ 32,098$ 34,218$ 37,331$ 42,425$ 43,184$ 42,329$ 33,747$ United 43,496$ 46,528$ 60,664$ 33,258$ 31,307$ 35,604$ 33,428$ 44,213$ 34,471$ 39,347$ 35,461$ 36,180$ US Airways 34,996$ 36,665$ 36,501$ 36,430$ 35,872$ 34,727$ 49,576$ 37,785$ 36,975$ 37,110$ 38,578$ 34,709$ America West 19,855$ 20,286$ 20,070$ 19,590$ 17,735$ 28,998$ 24,328$ 25,812$ 26,911$ 25,947$ 26,851$ 27,469$ --sub Network 32,566$ 35,208$ 38,079$ 34,238$ 33,382$ 32,192$ 36,942$ 41,066$ 41,335$ 42,399$ 40,712$ 39,053$
Southwest 27,101$ 27,024$ 27,920$ 30,007$ 27,550$ 30,745$ 30,514$ 31,447$ 36,537$ 40,720$ 42,045$ 44,564$ jetBlue 21,987$ 26,468$ 27,043$ 28,494$ 29,120$ 30,916$ AirTran 20,122$ 17,580$ 14,840$ 17,882$ 18,509$ 20,399$ 22,710$ 24,879$ 26,244$ FrontierATA -$ 23,720$ 20,343$ 21,838$ 23,633$ 90,512$ 29,688$ 22,393$ 27,386$ 30,881$ 34,197$ 35,265$ --sub LCC 19,837$ 24,886$ 25,429$ 26,728$ 25,574$ 40,247$ 27,588$ 26,793$ 30,454$ 33,164$ 34,224$ 36,120$
Alaska 29,688$ 22,959$ 29,641$ 26,394$ 26,844$ 32,153$ 29,627$ 30,603$ 30,794$ 28,671$ 30,032$ 31,884$ Hawaiian 26,998$ 27,892$ 29,712$ 30,118$ 27,826$ 27,313$ 45,074$ 47,306$ 46,761$ 38,288$ 47,495$ 37,972$ Midwest 25,032$ 25,957$ 29,436$ 28,296$ 30,956$ 27,805$ 38,454$ 34,681$ 32,311$ 28,869$ 31,871$ 33,080$ -- sub Other 28,489$ 24,257$ 29,632$ 27,492$ 27,639$ 30,111$ 34,191$ 34,788$ 34,366$ 30,904$ 33,876$ 33,523$
Total All Sectors 31,730$ 34,140$ 36,951$ 33,545$ 32,746$ 32,719$ 36,034$ 39,331$ 39,780$ 40,762$ 39,540$ 38,382$

48
Average Wage and Salary per Flight Attendant 2006
Network LCCs Other
Other: $33,523
TOTAL: $38,382Network: $39,053
LCC: $36,120

49
Average Annual Wages and Salaries INHOUSE MAINTENANCE PERSONNEL
1995 1996 1997 1998 1999 2000 2001 2002 2003 2004 2005 2006
American 35,854$ 32,218$ 52,149$ 48,235$ 45,302$ 49,078$ 49,318$ 57,112$ 57,830$ 51,869$ 54,645$ 54,435$ Continental 67,675$ 73,535$ 78,931$ 82,828$ 89,195$ 90,004$ 86,140$ 78,205$ 88,760$ 82,139$ 79,486$ 78,724$ Delta 33,052$ 40,024$ 39,669$ 38,788$ 33,287$ 62,432$ 58,800$ 57,697$ 61,400$ 65,248$ 58,523$ 57,015$ Northwest 54,171$ 52,781$ 51,582$ 49,877$ 46,090$ 52,881$ 72,133$ 72,014$ 72,788$ 74,402$ 93,471$ 71,311$ United 134,850$ 307,347$ 48,006$ 47,085$ 46,288$ 49,525$ 51,112$ 103,942$ 48,276$ 70,429$ 65,873$ 68,432$ US Airways 39,845$ 42,388$ 47,297$ 50,346$ 57,201$ 57,816$ 759,052$ 52,046$ 47,553$ 50,152$ 37,282$ 45,019$ America West 35,477$ 35,751$ 38,442$ 40,058$ 31,063$ 49,022$ 46,928$ 43,927$ 45,085$ 45,077$ 47,690$ 49,511$ --sub Network 53,441$ 59,277$ 49,928$ 48,926$ 47,416$ 54,720$ 62,747$ 66,109$ 58,992$ 60,721$ 59,888$ 58,994$
Southwest 58,000$ 53,755$ 56,940$ 60,210$ 62,578$ 64,839$ 63,839$ 68,635$ 74,754$ 78,801$ 81,465$ 86,469$ jetBlue 20,095$ 24,186$ 47,478$ 45,809$ 66,466$ 65,400$ 55,740$ AirTran 34,448$ 39,265$ 45,906$ 46,020$ 46,589$ 50,154$ 52,389$ 55,813$ 56,465$ FrontierATA --sub LCC 29,022$ 30,691$ 31,071$ 32,480$ 33,376$ 36,620$ 32,776$ 39,984$ 45,428$ 60,636$ 63,137$ 66,388$
Alaska 28,916$ 34,415$ 38,690$ 38,320$ 35,818$ 38,320$ 45,419$ 47,098$ 52,479$ 33,082$ 48,241$ 64,375$ Hawaiian 39,859$ 40,735$ 43,285$ 44,736$ 38,903$ 34,016$ 51,794$ 45,546$ 49,000$ 36,107$ 55,209$ 38,246$ Midwest 33,084$ 29,060$ 35,254$ 34,732$ 28,831$ 26,303$ 40,428$ 44,871$ 55,650$ 46,262$ 55,026$ 46,521$ -- sub Other 33,007$ 29,961$ 35,690$ 35,163$ 29,410$ 26,921$ 40,687$ 44,942$ 55,456$ 45,328$ 54,905$ 46,560$
Total All Sectors 49,994$ 54,367$ 47,532$ 46,437$ 43,997$ 48,114$ 54,866$ 58,508$ 57,374$ 56,439$ 58,936$ 56,755$

50
Average Wages and Salary for In-House Maintenance Employees 2006
Network LCCs Other
Other: $46,560
TOTAL: $56,755Network: 58,994
LCC: $66,388

51
Average Pension and Benefit Package ALL NON-COCKPIT EMPLOYEES
1995 1996 1997 1998 1999 2000 2001 2002 2003 2004 2005 2006
American 12,316$ 7,903$ 6,392$ 6,590$ 6,973$ 7,952$ 8,910$ 13,423$ 16,810$ 15,654$ 15,079$ 15,529$ Continental 4,128$ 7,139$ 7,614$ 7,368$ 423$ 1,958$ 4,181$ 13,846$ 10,342$ 11,351$ 9,721$ 14,337$ Delta 7,662$ 8,680$ 8,609$ 7,727$ 7,363$ 8,238$ 9,407$ 10,674$ 12,560$ 13,666$ 12,594$ 13,851$ Northwest 5,649$ 6,544$ 6,100$ 6,685$ 7,289$ 7,728$ 11,188$ 14,691$ 17,846$ 17,007$ 22,962$ 19,443$ United 9,884$ 9,385$ 9,341$ 9,203$ 9,520$ 9,151$ 12,201$ 17,411$ 23,031$ 18,399$ 13,903$ 15,328$ US Airways 8,489$ 11,196$ 9,899$ 9,773$ 10,026$ 10,327$ 15,008$ 15,541$ 16,154$ 14,755$ 7,419$ 2,022$ America West 2,271$ 2,358$ 2,001$ 1,833$ 2,299$ 3,408$ 5,207$ 6,675$ 7,704$ 5,136$ 8,074$ 6,926$ --sub Network 8,652$ 8,342$ 7,743$ 7,663$ 7,139$ 7,736$ 9,898$ 13,927$ 16,158$ 14,948$ 13,820$ 14,052$
Southwest 8,051$ 7,893$ 9,351$ 11,200$ 12,255$ 16,062$ 15,664$ 13,453$ 13,460$ 14,989$ 17,247$ 19,197$ jetBlue 5,436$ 6,715$ 9,584$ 11,396$ 7,568$ 5,575$ 4,200$ AirTran 1,357$ 1,345$ 2,179$ 1,875$ 3,643$ 4,094$ 4,566$ 4,664$ 4,834$ FrontierATA --sub LCC 6,805$ 6,430$ 7,589$ 8,413$ 9,381$ 11,568$ 10,992$ 10,099$ 10,042$ 10,671$ 11,953$ 12,996$
Alaska 4,875$ 5,525$ 5,694$ 7,876$ 8,536$ 7,563$ 8,495$ 10,740$ 13,718$ 14,647$ 14,771$ 16,514$ Hawaiian 7,400$ 5,153$ 5,704$ 5,966$ 5,810$ 5,785$ 9,239$ 9,287$ 12,677$ 12,176$ 13,163$ 10,100$ Midwest 3,076$ 4,166$ 3,964$ 4,158$ 7,180$ 7,992$ 10,496$ 9,265$ 10,047$ 9,785$ 9,791$ 13,256$ -- sub Other 4,402$ 4,944$ 4,876$ 5,802$ 7,515$ 7,626$ 9,869$ 9,654$ 11,410$ 11,496$ 11,930$ 14,027$
Total All Sectors 8,373$ 8,058$ 7,591$ 7,629$ 7,337$ 8,056$ 10,002$ 13,154$ 15,008$ 14,128$ 13,432$ 13,896$

52
Average Pension and Benefit Package NON-COCKPIT PERSONNEL
2006
Network LCCs Other
Other: $14,027TOTAL: $13,896
Network: $14,052
LCC: $12,996

53
Employees & ProductivityEmployees & Productivity

54
Employees & Productivity
• A company’s labor cost position cannot be fully measured by compensationalone. A measure of productivity by employee group must accompany anycompensation measure. The ADP presents both traditional calculations as wellas alternative ideas as to how to combine compensation and productivity.
– What these examples and a myriad of other calculations reveal is the productivitylevels of the industry have significantly improved.
– These core examples will highlight the fundamental structural impediment faced by thenetwork legacy carriers in closing the productivity gap – a significantly older workforces. Until the network legacy carriers again participate in organic growth or the lowcost sector finds itself in a no or very slow growth period, this gap will be hard toovercome.
• In the low cost sector, many carriers have potentially maximized theirproductivity level making any negotiations which need to balance pay forproductivity difficult.

55
Total ASMs Produced per Employee EquivalentMillions
1995 1996 1997 1998 1999 2000 2001 2002 2003 2004 2005 2006
American 1.86 1.94 1.90 1.88 1.78 1.74 1.66 1.74 1.95 2.19 2.35 2.39
Continental 1.79 1.81 1.87 1.89 1.95 1.97 1.93 2.02 1.98 2.19 2.30 2.38
Delta 1.96 2.27 2.15 2.04 2.00 2.06 2.02 2.02 2.04 2.26 2.56 2.75
Northwest 2.02 2.05 2.05 1.86 1.96 2.01 1.97 2.09 2.24 2.40 2.55 2.79
United 2.09 2.06 2.31 1.98 1.91 1.84 1.76 1.97 2.19 2.39 2.48 2.60
US Airways 1.43 1.44 1.46 1.48 1.48 1.56 2.25 1.80 1.93 2.04 2.52 2.23
America West 1.92 2.02 2.06 1.96 1.86 2.22 2.21 2.19 2.15 2.19 2.51 2.27
--sub Network 1.90 1.97 2.00 1.89 1.86 1.87 1.88 1.93 2.06 2.25 2.45 2.52
Southwest 1.95 1.84 1.85 1.90 1.93 2.09 2.12 2.07 2.16 2.43 2.71 2.88
jetBlue 1.99 2.01 2.81 3.15 3.24 3.18 3.08
AirTran 1.55 1.50 1.47 1.56 1.75 1.89 2.06 2.38 2.56
Frontier 2.20 2.25 2.43 2.12 2.06 2.32 2.18 2.16 2.27 2.37 2.43 2.60
ATA 4.56 2.76 2.36 2.48 3.26 2.46 2.32 2.94 3.17 4.30 4.61 7.17
--sub LCC 2.28 2.00 1.95 1.97 2.05 2.10 2.10 2.19 2.34 2.65 2.82 2.94
Alaska 1.98 1.85 1.87 1.94 1.88 1.82 1.77 1.91 2.07 2.25 2.41 2.50
Hawaiian 2.32 2.31 2.42 2.38 2.25 2.27 2.75 2.27 2.51 2.31 2.72 2.48
Midwest 0.29 0.33 0.26 0.25 0.25 0.20 0.15 0.14 0.18 0.22 0.36 0.46
-- sub Other 1.33 1.35 1.22 1.19 1.10 0.96 0.83 0.82 1.03 1.10 1.41 1.54
Total All Sectors 1.90 1.95 1.96 1.86 1.84 1.84 1.82 1.87 2.02 2.22 2.43 2.52

56
Total Available Seat Miles Produced per Employee EquivalentMillions

57
Total ASMs Produced per Dollar of Employee Compensation
1995 1996 1997 1998 1999 2000 2001 2002 2003 2004 2005 2006
American 27.02 29.63 28.48 26.93 26.59 23.95 21.99 20.76 23.19 26.85 27.38 26.91
Continental 41.11 37.88 35.90 32.87 32.29 30.31 29.01 28.47 27.54 29.26 32.58 32.61
Delta 30.77 29.14 29.92 29.78 29.07 26.86 24.37 23.18 20.89 22.84 29.96 33.31
Northwest 28.93 30.37 30.83 26.94 28.08 27.43 24.07 23.61 22.47 23.42 23.89 30.78
United 29.96 28.62 26.73 26.66 25.90 24.06 21.14 20.25 24.56 27.77 32.98 31.76
US Airways 20.47 18.23 18.63 18.79 17.99 18.72 17.78 18.70 21.04 24.01 35.56 33.20
America West 48.44 52.62 52.77 50.47 48.39 45.22 41.28 42.73 40.51 43.42 41.08 37.82
--sub Network 29.02 28.77 28.31 27.36 26.96 25.33 22.99 22.34 23.55 26.13 29.81 30.92
Southwest 39.79 38.16 36.91 34.70 34.05 33.47 33.07 32.71 30.81 29.95 30.08 28.99
jetBlue 38.63 46.25 46.18 47.16 51.20 51.02 47.19
AirTran 45.77 45.36 39.55 37.79 38.25 40.45 40.58 43.00 44.52
Frontier 62.42 73.36 72.68 70.50 62.59 50.34 45.76 40.76 42.73 42.57 40.44 42.24
ATA 77.83 68.35 63.99 58.64 51.76 47.89 45.04 46.41 47.32 46.59 42.02 35.74
-- sub LCC 45.71 43.18 41.26 39.19 37.96 36.51 35.87 35.96 35.48 35.35 34.95 33.77
Alaska 38.60 36.61 33.50 32.74 31.15 28.34 26.15 25.99 25.36 25.74 28.60 28.85
Hawaiian 41.15 45.31 45.59 44.79 43.10 43.89 39.91 30.60 32.21 30.79 33.00 33.70
Midwest 30.00 26.39 24.36 22.75 24.12 21.97 20.41 21.66 23.71 27.96 33.98 36.17
-- sub Other 38.16 36.95 34.40 33.27 32.21 30.19 27.89 26.30 26.49 26.94 30.12 30.69
Total All Sectors 29.96 29.69 29.15 28.24 27.83 26.26 24.11 23.61 24.91 27.27 30.56 31.38

58
Available Seat Miles Produced per Dollar of Employee Compensation2006
Network LCCs Other
Other: 30.69
TOTAL: 31.38Network: 30.92
LCC: 33.77

59
Total Pilot and CoPilot Average Block Hours per MonthNO ADJUSTMENTS MADE
1995 1996 1997 1998 1999 2000 2001 2002 2003 2004 2005 2006
American 43.4 43.6 44.6 45.2 43.0 41.6 38.1 38.5 40.5 44.0 47.0 48.3
Continental 45.7 53.0 52.7 49.7 48.4 49.4 48.7 48.8 51.3 52.5 51.7 53.6
Delta 39.0 41.0 43.0 41.2 46.0 41.3 43.5 39.7 41.6 47.5 51.9 50.5
Northwest 43.9 43.7 42.9 42.4 41.1 41.4 39.5 42.4 44.3 47.3 46.1 47.1
United 44.3 44.1 39.4 36.7 32.4 33.9 32.1 40.6 40.0 51.2 49.8 49.7
US Airways 48.0 46.1 47.9 47.3 45.4 45.7 48.1 47.1 50.6 53.9 59.4 43.2
America West 56.2 56.1 55.8 51.5 43.4 52.5 51.3 50.0 49.8 49.9 50.6 50.3
--sub Network 43.8 44.7 44.3 42.9 41.4 41.3 40.3 41.8 43.4 48.4 49.9 49.1
Southwest 70.2 69.5 70.7 66.7 65.8 65.7 62.4 61.2 62.3 63.8 64.5 65.0
jetBlue 19.1 44.4 56.9 58.8 61.2 59.6 62.7
AirTran 51.9 58.1 41.6 30.4 50.8 53.4 57.5 56.8 58.3
Frontier - - 22.7 24.5 25.2 48.7 49.4 45.8 58.3 54.9 57.9
ATA 33.1 28.2 27.0 26.9 29.1 32.0 39.6 37.8 40.0 35.8 28.4
--sub LCC 79.1 59.1 55.5 53.5 53.4 51.3 52.7 56.1 56.0 59.0 59.4 60.7
Alaska 53.9 52.1 49.4 50.8 49.1 48.3 46.5 49.4 51.1 50.4 58.2 54.3
Hawaiian 38.1 40.1 38.7 36.7 33.9 33.4 29.0 30.4 32.4 41.9 48.5 46.2
Midwest 66.6 51.2 54.7 49.7 47.9 47.7 54.5 45.5 46.6 48.2 52.2 56.2
-- sub Other 52.3 49.8 48.4 48.2 46.1 45.2 44.2 45.1 46.8 48.8 55.8 53.4
Total All Sectors 45.8 45.8 45.3 44.1 42.7 42.4 41.7 43.7 45.3 50.1 51.9 51.6

60
Average Monthly Pilot Block Hours Flown 2006
Network LCCs Other
Other: 53.4TOTAL: 51.6Network: 49.1
LCC: 60.7

61
Total Flight Attendant Average Block Hours per Month(Estimate based on Average Seat Size of System Fleet)
1995 1996 1997 1998 1999 2000 2001 2002 2003 2004 2005 2006
American 36.6 37.1 36.9 36.0 31.8 32.1 31.2 34.5 37.9 41.5 42.7 43.7
Continental 49.9 48.9 48.0 46.6 45.3 44.7 42.8 45.2 44.0 46.5 44.5 47.2
Delta 36.8 41.9 40.3 39.0 38.2 38.1 38.0 40.2 42.1 45.4 48.9 51.6
Northwest 45.2 45.4 45.3 40.9 44.1 43.6 42.8 45.6 47.4 47.5 46.3 48.6
United 47.4 47.5 61.3 32.0 29.5 30.8 28.6 32.4 34.3 39.1 37.2 39.0
US Airways 37.4 36.9 36.6 35.8 35.0 34.2 47.0 39.5 40.8 44.4 53.3 42.1
America West 47.8 50.5 50.2 47.8 41.4 68.2 51.5 49.9 50.4 50.1 52.2 47.6
--sub Network 41.1 42.5 44.0 37.3 35.4 36.2 36.0 38.2 40.2 43.5 44.3 44.9
Southwest 58.0 55.6 57.2 55.6 52.5 55.8 55.1 52.1 56.6 59.1 59.3 60.9
jetBlue 42.3 57.9 57.3 59.3 58.7 66.9
AirTran 44.1 53.2 46.4 47.3 48.9 51.6 50.5 53.6 54.2
Frontier 31.0 24.9 69.9 74.5 97.9 121.5 52.8 49.2 50.5 52.4 45.3 53.5
ATA 50.3 40.4 44.2 45.2 154.3 44.7 42.3 47.4 54.8 49.8 36.4
--sub LCC 43.2 52.8 53.5 52.5 53.2 75.4 51.7 50.3 54.4 57.2 56.7 60.4
Alaska 47.0 36.3 47.4 47.9 46.3 44.9 44.1 45.6 45.1 42.3 48.6 44.7
Hawaiian 46.2 47.9 48.5 47.9 15.0 38.5 57.8 47.7 48.0 38.1 47.5 38.0
Midwest 50.3 40.4 44.2 45.2 154.3 44.7 42.3 47.4 54.8 49.8 36.4
-- sub Other 41.4 40.1 46.8 47.4 38.0 59.4 47.3 45.6 46.0 42.7 48.5 42.1
Total All Sectors 41.2 43.1 44.8 38.6 36.6 39.8 37.7 39.7 42.1 45.2 46.2 47.0

62
Average Monthly Flight Attendant Block Hours Flown2006
Network LCCs Other
Other: 42.1
TOTAL: 47.0
Network: 44.9
LCC: 60.4
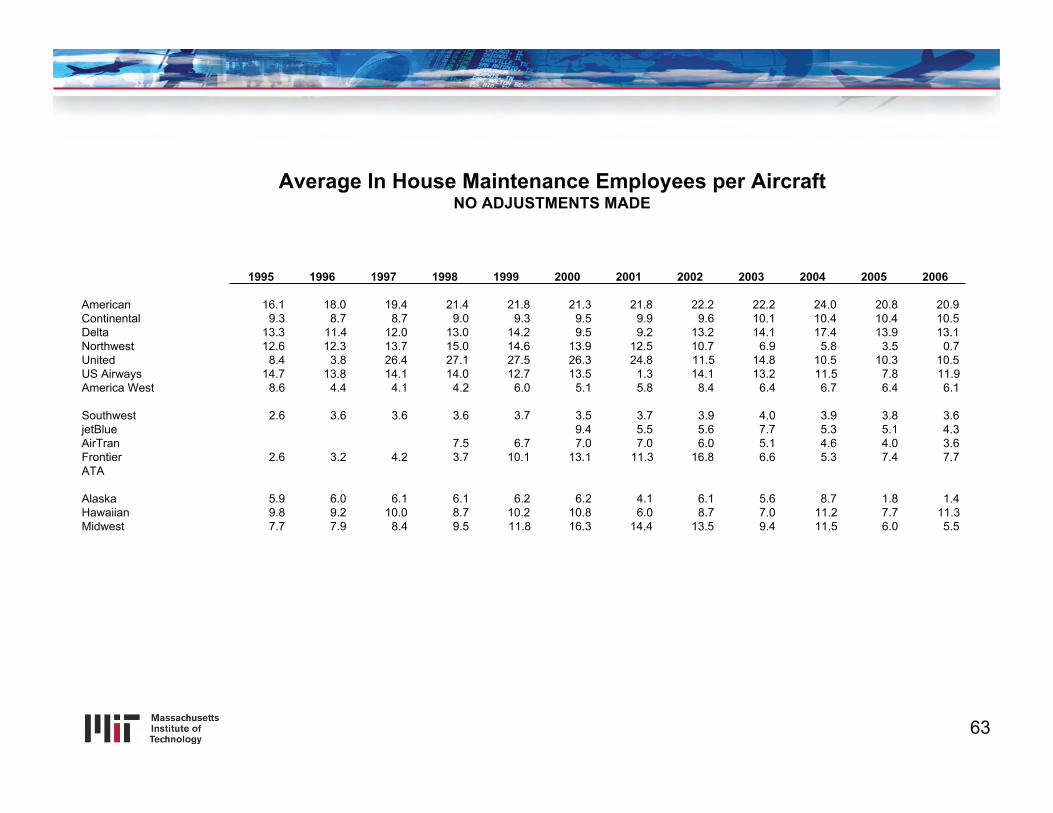
63
Average In House Maintenance Employees per AircraftNO ADJUSTMENTS MADE
1995 1996 1997 1998 1999 2000 2001 2002 2003 2004 2005 2006
American 16.1 18.0 19.4 21.4 21.8 21.3 21.8 22.2 22.2 24.0 20.8 20.9
Continental 9.3 8.7 8.7 9.0 9.3 9.5 9.9 9.6 10.1 10.4 10.4 10.5
Delta 13.3 11.4 12.0 13.0 14.2 9.5 9.2 13.2 14.1 17.4 13.9 13.1
Northwest 12.6 12.3 13.7 15.0 14.6 13.9 12.5 10.7 6.9 5.8 3.5 0.7
United 8.4 3.8 26.4 27.1 27.5 26.3 24.8 11.5 14.8 10.5 10.3 10.5
US Airways 14.7 13.8 14.1 14.0 12.7 13.5 1.3 14.1 13.2 11.5 7.8 11.9
America West 8.6 4.4 4.1 4.2 6.0 5.1 5.8 8.4 6.4 6.7 6.4 6.1
Southwest 2.6 3.6 3.6 3.6 3.7 3.5 3.7 3.9 4.0 3.9 3.8 3.6
jetBlue 9.4 5.5 5.6 7.7 5.3 5.1 4.3
AirTran 7.5 6.7 7.0 7.0 6.0 5.1 4.6 4.0 3.6
Frontier 2.6 3.2 4.2 3.7 10.1 13.1 11.3 16.8 6.6 5.3 7.4 7.7
ATA
Alaska 5.9 6.0 6.1 6.1 6.2 6.2 4.1 6.1 5.6 8.7 1.8 1.4
Hawaiian 9.8 9.2 10.0 8.7 10.2 10.8 6.0 8.7 7.0 11.2 7.7 11.3
Midwest 7.7 7.9 8.4 9.5 11.8 16.3 14.4 13.5 9.4 11.5 6.0 5.5

64
Average In House Maintenance Employees per AircraftNO ADJUSTMENTS MADE
Network LCCs Other
Average In-house Maintenance Employees per Aircraft 2006
Percent of Maintenance Expense Outsourced 2006
Network LCCs Other
%

65
Aircraft & RelatedAircraft & Related

66
Aircraft & Related
• With few exceptions, the network legacy carrier sector of the US industry hasvery few aircraft on order and faces the fact that its fleet replacementrequirements are significant. The ADP has broken down the fleets of its 15carrier industry dataset into 3 types: small narrowbody, large narrowbody andwidebody. By limiting the disaggregation of the data, meaningful results arefound.
– Among the examples included, you will see that the small narrowbody flying domainhas seen a significant shift to the low cost sector.
• That Southwest now has the second largest operating fleet among the carriers analyzed
• That the low cost carriers enjoy a significant advantage in aircraft utilization
• The ADP does not claim to be the definitive site regarding aircraft and relatedoperating characteristics. Rather, any analysis of an airline or the industrybegins with asset utilization whether it be fixed or human capital. That is thedata and analysis the ADP will provide.

67
Total Operating FleetAll Aircraft
1995 1996 1997 1998 1999 2000 2001 2002 2003 2004 2005 2006
American 649 649 643 642 674 710 711 818 755 697 708 685
Continental 300 295 313 338 355 361 357 352 339 344 336 349
Delta 537 535 552 562 581 597 599 574 533 423 427 371
Northwest 370 393 399 412 414 421 435 444 429 435 420 373
United 553 562 569 573 587 603 597 556 551 520 462 460
US Airways 379 380 381 370 382 398 307 305 276 278 262 234
America West 90 98 101 104 115 129 143 107 141 139 140 136
--sub Network 2,877 2,912 2,957 3,001 3,108 3,219 3,150 3,158 3,023 2,836 2,756 2,609
Southwest 251 230 249 261 291 326 354 365 380 405 432 462
jetBlue 5 16 27 43 60 77 106
AirTran 1 15 11 40 48 37 32 61 69 78 92 114
Frontier 5 8 12 15 17 18 21 15 36 42 45 47
ATA 48 54 50 47 44 50 49 58 64 63 41 22
-- sub LCC 305 306 322 363 401 436 472 527 592 647 687 751
Alaska 73 74 76 82 86 91 158 102 107 108 110 111
Hawaiian 20 22 21 23 25 29 26 22 28 25 25 25
Midwest 20 20 23 24 30 33 34 34 30 29 32 36
-- sub Other 113 117 120 129 142 153 218 158 165 162 166 172
Total All Sectors 3,296 3,335 3,399 3,494 3,651 3,808 3,840 3,844 3,780 3,645 3,610 3,531

68
Operating Fleet by Sector Total Operating Fleet 2006
Network LCCs Other

69
Average Seat Density of Total Operating FleetAll Aircraft 2006
1995 1996 1997 1998 1999 2000 2001 2002 2003 2004 2005 2006
American 169 167 165 164 164 159 156 155 159 166 172 175
Continental 144 140 144 148 155 157 157 159 162 166 166 167
Delta 180 181 180 179 178 178 179 182 180 180 183 187
Northwest 183 186 188 188 188 189 184 179 176 176 178 179
United 194 194 195 195 192 190 188 187 181 183 186 186
US Airways 131 134 134 134 135 138 144 153 154 155 156 161
America West 144 142 142 144 143 143 141 141 140 141 143 142
--sub Network 169 169 170 170 170 169 168 169 168 170 173 175
Southwest 132 133 133 133 134 135 135 135 135 136 136 136
jetBlue 164 164 162 161 157 157 152
AirTran 126 127 126 111 112 107 107 113 116 118 121 123
Frontier 110 118 123 126 129 132 134 131 132 126 123 123
ATA 242 236 233 228 228 232 231 217 211 204 206 193
-- sub LCC 149 150 148 143 142 144 143 142 142 140 138 135
Alaska 132 132 133 133 133 131 131 132 133 135 138 140
Hawaiian 245 249 254 256 93 254 273 252 238 237 239 237
Midwest 79 77 80 82 86 88 91 93 100 109 106 104
-- sub Other 143 144 144 145 116 146 142 141 145 146 147 146
Total All Sectors 166 167 167 166 165 165 164 164 163 164 166 166

70
Average Seat Density of Total Operating FleetAll Aircraft - 2006
Network LCCs Other
Other: 146
Network: 175
LCC: 135
TOTAL: 166

71
Average Daily Utilization of Total Operating FleetAll Aircraft
1995 1996 1997 1998 1999 2000 2001 2002 2003 2004 2005 2006
American 9.89 9.89 10.13 10.19 10.01 10.04 9.65 9.54 9.57 10.31 9.91 9.94
Continental 9.45 9.93 10.06 10.19 10.33 10.48 10.26 9.59 9.59 9.91 10.58 11.12
Delta 9.97 10.25 10.43 10.54 10.50 10.37 9.67 9.18 9.19 12.53 12.35 12.75
Northwest 9.56 9.50 9.56 8.73 9.49 9.67 9.12 8.69 8.67 8.83 9.00 9.40
United 10.04 10.13 10.32 10.55 10.68 10.53 9.95 9.58 9.18 10.31 10.86 11.15
US Airways 9.71 9.11 9.34 9.42 9.46 10.07 12.32 9.71 9.47 9.46 9.68 9.50
America West 11.43 11.89 12.38 12.10 11.77 10.99 9.73 12.84 10.04 10.91 10.95 11.00
--sub Network 9.87 9.92 10.11 10.10 10.19 10.24 9.97 9.49 9.32 10.31 10.42 10.65
Southwest 9.32 11.17 11.26 11.19 11.01 10.98 10.81 10.92 10.83 10.88 11.13 11.22
jetBlue 11.99 11.60 12.69 13.34 13.58 13.39 14.04
AirTran 6.73 5.72 8.18 9.09 9.82 10.18 9.98 171.29 10.95 10.94 11.55 11.19
Frontier 9.81 11.07 10.06 9.15 11.29 12.80 11.84 20.40 10.24 12.40 12.03 13.30
ATA 7.33 6.95 7.09 8.39 9.36 9.40 9.66 9.52 10.44 11.16 10.68 12.53
-- sub LCC 9.01 10.16 10.46 10.51 10.70 10.82 10.68 30.40 10.79 11.05 11.25 11.43
Alaska 10.80 11.36 11.49 11.52 11.27 10.76 6.52 10.60 10.55 11.02 11.63 11.00
Hawaiian 7.95 7.84 8.20 7.54 7.58 7.57 7.16 9.02 7.69 8.44 8.95 9.46
Midwest 8.67 9.36 9.22 9.46 8.98 8.46 7.75 7.44 7.43 8.55 9.32 9.76
-- sub Other 9.92 10.35 10.48 10.42 10.13 9.66 6.79 9.69 9.50 10.19 10.79 10.52
Total All Sectors 9.79 9.96 10.16 10.15 10.24 10.28 9.88 12.27 9.55 10.43 10.58 10.79

72
Average Daily Aircraft Utilization2006
Network LCCs Other
Other: 10.52Network: 10.65
LCC: 11.43
TOTAL: 10.79

73
Small Narrowbody Operating Fleet(Seat Size 150 and Less, Single Aisle, Multi Class Configuration)
1995 1996 1997 1998 1999 2000 2001 2002 2003 2004 2005 2006
American 417 417 415 413 417 421 388 433 388 343 335 311
Continental 267 263 265 274 279 249 222 193 180 163 149 147
Delta 325 327 332 334 334 316 279 240 214 193 195 124
Northwest 267 278 275 284 283 286 295 307 298 303 287 247
United 329 333 332 325 336 348 349 303 305 294 249 246
US Airways 341 335 335 324 336 349 252 226 199 200 185 160
America West 76 84 87 91 102 116 130 98 128 126 127 123
--sub Network 2,022 2,036 2,040 2,044 2,088 2,085 1,917 1,799 1,711 1,622 1,527 1,359
Southwest 251 230 249 261 291 326 354 365 380 405 432 462
jetBlue 5 16 27 43 60 77 106
AirTran 1 15 11 40 48 37 32 61 69 78 92 114
Frontier 5 8 12 15 17 18 21 15 36 42 45 47
ATA 21 25 26 25 22 22 20 4 - - - 3
-- sub LCC 278 277 298 341 379 408 443 473 528 584 646 731
Alaska 73 74 76 82 86 91 155 97 99 96 95 91
Hawaiian 13 13 12 13 14 15 8 10 13 11 11 11
Midwest 20 20 23 24 30 33 34 34 30 29 32 36
-- sub Other 106 108 111 119 130 139 197 140 141 136 138 138
Total All Sectors 2,406 2,422 2,450 2,504 2,597 2,632 2,558 2,412 2,380 2,343 2,311 2,228

74
Small Narrowbody Flying by Sector2000 v. 2006
2000 2006

75
Traffic & CapacityTraffic & Capacity

76
Traffic & Capacity
• This section of the ADP is not intended to be a robust resource giventhe number of portals where the industry’s most fundamental data ismade available. Rather we will make available all data that supportsthe calculations made in the various areas of analysis provided
– There will be less focus on origin and destination traffic analysis initially
– The ADP will make available more data analysis on the internationalaspects and provide analysis depicting the shifts in capacity from domesticoperations to international operations
– The ADP will add meaningful analysis on changes in the competitiveenvironment at each the carrier and market levels
– The ADP will eventually expand its coverage of these fundamentals toregions outside of the US

77
System Passenger Revenue Miles (RPMs)Millions
1995 1996 1997 1998 1999 2000 2001 2002 2003 2004 2005 2006
American 102,754 104,618 107,030 108,957 111,745 116,595 106,343 121,751 120,325 130,155 138,368 139,451
Continental 35,798 37,588 44,294 51,028 58,028 62,357 58,763 57,292 57,590 63,376 68,367 76,319
Delta 85,176 93,929 99,689 103,342 104,784 107,852 97,666 95,312 89,432 98,278 103,740 98,909
Northwest 62,668 68,719 72,174 66,828 74,263 79,252 73,280 72,142 68,762 73,403 75,920 72,690
United 111,812 116,698 121,427 124,610 125,466 126,934 116,636 109,429 104,394 115,232 114,271 117,471
US Airways 38,102 39,296 41,749 41,386 41,565 46,925 46,000 40,073 37,782 40,504 40,149 37,366
America West 13,313 15,321 16,204 16,374 17,709 19,113 19,080 19,871 21,284 23,334 24,261 23,553
--sub Network 449,622 476,170 502,567 512,526 533,560 559,029 517,767 515,869 499,569 544,282 565,076 565,758
Southwest 23,776 27,228 28,531 30,837 36,485 42,230 44,606 45,512 48,035 53,524 60,346 67,782
jetBlue - - - - - 1,003 3,280 6,821 11,519 15,707 20,127 23,310
AirTran - - - 2,652 3,588 4,155 4,574 5,583 7,165 8,485 11,295 13,806
Frontier 347 783 1,028 1,287 2,003 2,596 2,710 3,061 4,652 6,312 7,285 8,360
ATA 9,025 9,085 8,980 9,615 10,498 11,695 11,539 12,319 14,120 14,536 8,720 5,661
-- sub LCC 33,148 37,096 38,539 44,390 52,574 61,679 66,708 73,297 85,492 98,565 107,773 118,920
Alaska 8,584 9,831 10,386 11,283 11,786 11,987 12,249 13,183 14,557 16,234 16,918 17,826
Hawaiian 3,597 3,840 4,161 4,218 4,880 5,807 6,326 5,214 5,792 6,215 6,771 6,959
Midwest 1,170 1,260 1,423 1,629 1,968 1,982 1,974 1,971 1,991 2,380 3,148 3,843
-- sub Other 13,352 14,931 15,971 17,130 18,633 19,775 20,549 20,368 22,339 24,830 26,838 28,628
Total All Sectors 496,122 528,197 557,077 574,047 604,767 640,483 605,024 609,533 607,400 667,677 699,687 713,307

78
Revenue Passenger MilesMillions
Network LCCs Other
Revenue Passenger Miles2006
System Passenger Revenue Miles (RPMs)Millions

79
System Available Seat Miles (ASMs)Millions
1995 1996 1997 1998 1999 2000 2001 2002 2003 2004 2005 2006
American 155,177 152,796 153,923 155,302 160,438 161,035 153,227 172,196 165,214 174,002 176,102 174,016
Continental 54,310 54,998 61,941 70,636 79,434 83,771 81,202 77,193 76,086 81,506 85,675 93,614
Delta 130,219 133,715 138,831 142,144 144,797 147,221 141,425 131,681 120,455 129,907 133,847 125,418
Northwest 87,673 94,021 97,152 91,444 99,575 103,527 98,565 93,583 89,077 91,510 91,915 85,716
United 158,570 162,845 169,111 174,009 176,688 175,493 164,850 148,806 136,566 145,388 140,294 143,085
US Airways 58,679 57,349 58,499 56,882 59,248 66,631 66,773 56,404 51,565 53,991 53,431 47,767
America West 19,421 21,625 23,568 24,307 25,908 27,112 26,546 26,995 27,871 30,153 30,503 29,555
--sub Network 664,049 677,349 703,025 714,724 746,087 764,789 732,588 706,858 666,834 706,458 711,766 699,172
Southwest 36,841 40,900 44,728 47,619 52,901 59,941 65,538 69,057 71,911 77,006 85,354 92,785
jetBlue - - - - - 1,380 4,260 8,229 13,689 18,967 23,744 28,581
AirTran - - - 4,604 5,813 5,917 6,594 8,277 10,105 12,005 15,384 19,000
Frontier 717 1,309 1,810 2,174 3,387 4,039 4,681 5,177 6,750 8,596 9,195 10,493
ATA 12,816 13,124 12,640 13,659 14,234 16,049 16,015 17,516 20,368 20,724 13,168 8,106
-- sub LCC 50,374 55,332 59,178 68,057 76,334 87,326 97,088 108,255 122,822 137,298 146,844 158,965
Alaska 13,885 14,904 15,436 16,807 17,351 17,315 17,918 19,355 20,808 22,275 22,295 23,281
Hawaiian 4,677 5,101 5,440 5,575 6,324 7,442 7,923 6,534 7,210 7,223 7,759 8,053
Midwest 1,825 1,998 2,234 2,515 3,020 3,188 3,233 3,206 3,031 3,665 4,441 5,065
-- sub Other 20,388 22,003 23,110 24,896 26,694 27,945 29,074 29,095 31,049 33,164 34,495 36,399
Total All Sectors 734,811 754,685 785,313 807,677 849,115 880,059 858,750 844,208 820,705 876,920 893,106 894,536

80
System Available Seat Miles (ASMs)2000 v. 2006
2000 2006

81
System Seat Load FactorPercent
1995 1996 1997 1998 1999 2000 2001 2002 2003 2004 2005 2006
American 66.2% 68.5% 69.5% 70.2% 69.7% 72.4% 69.4% 70.7% 72.8% 74.8% 78.6% 80.1%
Continental 65.9% 68.3% 71.5% 72.2% 73.1% 74.4% 72.4% 74.2% 75.7% 77.8% 79.8% 81.5%
Delta 65.4% 70.2% 71.8% 72.7% 72.4% 73.3% 69.1% 72.4% 74.2% 75.7% 77.5% 78.9%
Northwest 71.5% 73.1% 74.3% 73.1% 74.6% 76.6% 74.3% 77.1% 77.2% 80.2% 82.6% 84.8%
United 70.5% 71.7% 71.8% 71.6% 71.0% 72.3% 70.8% 73.5% 76.4% 79.3% 81.5% 82.1%
US Airways 64.9% 68.5% 71.4% 72.8% 70.2% 70.4% 68.9% 71.0% 73.3% 75.0% 75.1% 78.2%
America West 68.5% 70.9% 68.8% 67.4% 68.4% 70.5% 71.9% 73.6% 76.4% 77.4% 79.5% 79.7%
--sub Network 67.7% 70.3% 71.5% 71.7% 71.5% 73.1% 70.7% 73.0% 74.9% 77.0% 79.4% 80.9%
Southwest 64.5% 66.6% 63.8% 64.8% 69.0% 70.5% 68.1% 65.9% 66.8% 69.5% 70.7% 73.1%
jetBlue 72.7% 77.0% 82.9% 84.2% 82.8% 84.8% 81.6%
AirTran 57.6% 61.7% 70.2% 69.4% 67.5% 70.9% 70.7% 73.4% 72.7%
Frontier 48.5% 59.8% 56.8% 59.2% 59.1% 64.3% 57.9% 59.1% 68.9% 73.4% 79.2% 79.7%
ATA 70.4% 69.2% 71.0% 70.4% 73.8% 72.9% 72.0% 70.3% 69.3% 70.1% 66.2% 69.8%
-- sub LCC 65.8% 67.0% 65.1% 65.2% 68.9% 70.6% 68.7% 67.7% 69.6% 71.8% 73.4% 74.8%
Alaska 61.8% 66.0% 67.3% 67.1% 67.9% 69.2% 68.4% 68.1% 70.0% 72.9% 75.9% 76.6%
Hawaiian 76.9% 75.3% 76.5% 75.7% 77.2% 78.0% 79.8% 79.8% 80.3% 86.0% 87.3% 86.4%
Midwest 64.1% 63.0% 63.7% 64.8% 65.2% 62.2% 61.1% 61.5% 65.7% 64.9% 70.9% 75.9%
-- sub Other 65.5% 67.9% 69.1% 68.8% 69.8% 70.8% 70.7% 70.0% 71.9% 74.9% 77.8% 78.7%
Total All Sectors 67.5% 70.0% 70.9% 71.1% 71.2% 72.8% 70.5% 72.2% 74.0% 76.1% 78.3% 79.7%

82
System Seat Load FactorPercent

83
Profitability, Cash Flow & Balance SheetProfitability, Cash Flow & Balance Sheet

84
Profitability, Cash Flow & Balance Sheet
• This area will become an increasingly important component of the ADP.Students of the industry tend to be quite savvy in its operationalaspects. What has been missing is a portal of critical information thathelps all users follow the flow of earnings to the cash flow statement,understand the uses of cash and then how cash flow and earningsimpact a company’s balance sheet. While the site will not satisfy themost sophisticated of financial practitioners in the industry, it will benefitthe majority of users looking to benchmark various carriers or look atthe industry’s improving or worsening health.

85
Total Operating Profit/Loss$Millions
1995 1996 1997 1998 1999 2000 2001 2002 2003 2004 2005 2006
American $601 $1,331 $1,447 $1,769 $1,020 $1,244 ($2,274) ($3,772) ($2,361) ($421) ($351) $815Continental $385 $525 $716 $701 $600 $729 $144 ($312) $188 ($238) ($39) $468Delta $661 $463 $1,530 $1,803 $1,318 $1,637 ($1,602) ($1,309) ($785) ($3,308) ($2,001) $58Northwest $913 $1,054 $1,157 ($191) $714 $569 ($868) ($846) ($265) ($505) ($919) $740United $829 $1,123 $1,259 $1,478 $1,391 $654 ($3,771) ($2,837) ($1,360) ($854) ($219) $447US Airways/America West $389 $437 $749 $1,188 $400 ($57) ($1,605) ($1,083) ($397) ($352) ($334) $557 --sub Network $3,779 $4,933 $6,858 $6,748 $5,443 $4,776 ($9,976) ($10,159) ($4,980) ($5,678) ($3,863) $3,085
Southwest $314 $351 $524 $684 $782 $1,021 $631 $417 $483 $554 $820 $934jetBlue ($21) $27 $105 $167 $111 $48 $127AirTran ($19) ($72) $81 $36 $31 $86 $33 $13 $42Frontier $25 $39 $81 $16 ($31) $27 ($26) ($8)ATA --sub LCC $314 $351 $524 $665 $734 $1,120 $775 $570 $706 $725 $855 $1,095
Alaska $72 $90 $134 $194 $176 ($14) ($72) ($75) ($14) ($85) ($11) ($96)Hawaiian ($2) $2 $2 $17 ($40) ($14) ($14) ($55) $60 $76 $32 $12Midwest $30 $31 $38 $53 $59 $11 ($23) ($16) ($19) ($38) ($38) $4 -- sub Other $100 $123 $174 $264 $195 ($16) ($109) ($146) $27 ($48) ($17) ($80)
Total All Sectors $4,193 $5,407 $7,556 $7,677 $6,372 $5,880 ($9,311) ($9,736) ($4,247) ($5,000) ($3,025) $4,100
Source: SEC 10K Filings. Some augmentation with Form 41. See supporting documents if in question.Note: Supporting documents attempt to calibrate SEC filings with Form 41. Minimal differences exist in the two principal data sources.

86
Total Operating Profit/Loss$Millions
Cumulative Operating Profits for 15 Carrier Industry2000-2006
$Billions
Cumulative Operating Profits for Network Carriers 1995-2006
$Billions

87
Total Operating MarginPercent of Total Revenue
1995 1996 1997 1998 1999 2000 2001 2002 2003 2004 2005 2006
American 4.1% 8.8% 9.1% 10.8% 6.2% 6.9% (13.0%) (23.6%) (13.6%) (2.3%) (1.7%) 3.6%
Continental 6.6% 8.3% 10.0% 8.8% 6.9% 7.4% 1.6% (3.7%) 2.1% (2.4%) (0.3%) 3.6%
Delta 5.4% 3.7% 11.3% 12.6% 8.9% 9.8% (11.5%) (9.8%) (5.5%) (21.7%) (12.4%) 0.3%
Northwest 10.1% 10.7% 11.3% (2.1%) 6.9% 5.1% (8.8%) (8.9%) (2.6%) (4.5%) (7.5%) 5.9%
United 5.5% 6.9% 7.2% 8.4% 7.7% 3.4% (23.4%) (19.9%) (9.1%) (5.2%) (1.3%) 2.3%
US Airways/
America West 4.6% 4.6% 7.2% 11.3% 3.8% (0.5%) (15.6%) (12.1%) (4.4%) (3.7%) (3.1%) 4.7%
--sub Network 5.8% 7.1% 9.2% 8.9% 6.9% 5.5% (13.0%) (14.4%) (6.7%) (7.0%) (4.4%) 3.2%
Southwest 10.9% 10.3% 13.7% 16.4% 16.5% 18.1% 11.4% 7.6% 8.1% 8.5% 10.8% 10.3%
jetBlue (20.3%) 8.4% 16.5% 16.7% 8.8% 2.8% 5.4%
AirTran (4.2%) (13.8%) 13.0% 5.4% 4.3% 9.4% 3.2% 0.9% 2.2%
Frontier 11.2% 11.9% 17.1% 3.7% (6.5%) 4.3% (3.2%) (0.8%)
ATA
--sub LCC 10.9% 10.3% 13.7% 14.4% 13.4% 16.7% 11.0% 7.8% 8.5% 7.7% 7.4% 7.6%
Alaska 6.3% 6.9% 9.3% 12.4% 10.5% (0.8%) (4.1%) (4.1%) (0.7%) (3.8%) (0.4%) (3.6%)
Hawaiian (0.6%) 0.5% 0.5% 4.1% (8.3%) (2.3%) (2.4%) (8.7%) 8.5% 9.7% 3.9% 1.4%
Midwest 13.1% 11.6% 12.3% 15.0% 14.5% 2.6% (5.9%) (4.5%) (5.9%) (11.2%) (8.7%) 0.7%
-- sub Other 5.8% 6.3% 8.1% 11.3% 7.6% (0.6%) (3.9%) (5.2%) 0.9% (1.4%) (0.5%) (1.9%)
Total All Sectors 6.0% 7.2% 9.4% 9.3% 7.3% 6.1% (10.8%) (12.1%) (4.9%) (5.3%) (2.9%) 3.6%
Source: SEC 10K Filings. Some augmentation with Form 41. See supporting documents if in question.
Note: Supporting documents attempt to calibrate SEC filings with Form 41. Minimal differences exist in the two principal data sources.

88
Operating Margin 2000
Network LCCs Other
Total Operating MarginPercent of Total Revenue
Operating Margin 2006
Network LCCs Other
% %