Master Thesis - Nemertes
77
Department of Electrical & Computer Engineering MSc. Biomedical Engineering Master Thesis Ultrasound propagation through trabecular structures – Influence of structure and material Anastasia K. Manta Mathematician Laboratory of Biomechanics and Biomedical Engineering, Department of Mechanical Engineering & Aeronautics Patras 2021
-
Upload
khangminh22 -
Category
Documents
-
view
1 -
download
0
Transcript of Master Thesis - Nemertes

Department of Electrical & Computer Engineering
MSc. Biomedical Engineering
Master Thesis
Ultrasound propagation through trabecular
structures – Influence of structure and material
Anastasia K. Manta
Mathematician
Laboratory of Biomechanics and Biomedical Engineering,
Department of Mechanical Engineering & Aeronautics
Patras 2021


Department of Electrical & Computer Engineering
MSc. Biomedical Engineering
Master Thesis
Ultrasound propagation through trabecular
structures – Influence of structure and material.
Anastasia K. Manta
Three-member Advisory Committee
Deligianni Despina, Professor Supervisor
Polyzos Dimosthenis, Professor Academic staff member
Mavrilas Dimosthenis, Peer Professor Academic staff member
Laboratory of Biomechanics and Biomedical Engineering,
Department of Mechanical Engineering & Aeronautics

University of Patras Department of Electrical & Computer Engineering
Anastasia K. Manta ©2021-All rights reserved

Acknowledgements
I would like to thank my supervisor professor Mrs. Deligianni Despina for
the opportunity she offered to me to conduct my master thesis in the Laboratory
of Biomechanics and Biomedical Engineering of University of Patras, as well as
for her guidance in achieving this goal.
Also, I would like to thank Dr. Apostolopoulos Konstantinos for his support
and for the knowledge and the advices he provided to me, in order to improve
myself both as a person and as a scientist.
In addition, I would like to thank professor Mr. Polyzos Dimosthenis and
peer professor Mr. Mavrilas Dimosthenis for their contribution as members of
the three-member advisory committee.
Anastasia K. Manta
Patras, 2021


i
Contents
Abstract .................................................................................................................... iii
Περίληψη ................................................................................................................... v
List of figures ......................................................................................................... vii
List of tables ........................................................................................................... ix
1. Chapter 1: Introduction .................................................................................. 1
1.1. Applications of ultrasonic waves ................................................................ 1
1.2. Object of master thesis ................................................................................ 2
1.3. Outline .......................................................................................................... 2
Bibliography ............................................................................................................ 3
2. Chapter 2: Literature review .......................................................................... 5
2.1. Review on ultrasound propagation through trabecular bone .................. 5
2.2. Bone structure-Physical properties of trabecular bone ........................... 9
2.3. Wave characteristics-Physics of ultrasound ............................................ 13
2.4. Characteristics of probes-transducers ..................................................... 16
2.5. Interaction of ultrasound with trabecular bone ..................................... 18
2.6. Modeling of differential scattering cross section of ultrasound ........... 20
2.7. 3D-printing technology ............................................................................ 24
2.8. Research on 3D-printed trabecular bone ................................................. 27
Bibliography ......................................................................................................... 28
3. Chapter 3: Materials ....................................................................................... 37
3.1. Polylactic Acid (PLA) ................................................................................ 37
3.2. Thermoplastic Polyurethane (TPU) ......................................................... 38
3.3. Polypropylene (PP) .................................................................................... 39
Bibliography ......................................................................................................... 40
4. Chapter 4: Experimental Procedure ........................................................... 41
4.1. Fabrication of bone specimens ................................................................. 41
4.1.1. 3D-printing with transparent PLA material ........................................ 42
4.1.2. 3D-printing with white TPU 95A material .......................................... 42
4.1.3. 3D-printing with transparent PP material ........................................... 43
4.2. Measurements of ultrasound acoustic properties ................................... 45

ii
Bibliography ......................................................................................................... 48
5. Chapter 5: Results ......................................................................................... 49
5.1. Relationship between speed of sound and apparent density ................ 49
5.2. Influence of material properties on ultrasound propagation ................ 51
5.3. Simulation of osteoporosis ....................................................................... 52
Bibliography ......................................................................................................... 56
6. Chapter 6: Conclusions ................................................................................. 57
Bibliography ......................................................................................................... 59
iii
Abstract
Ultrasound is used broadly in research, such as the field of biomechanics,
where osteoporosis is studied by mechanisms of interaction of ultrasound with
trabecular bone. The present study concerns the influence of trabecular bone
architecture and material on ultrasound characteristics, speed of sound and
backscatter coefficient, using 3D-printed trabecular bone models.
3D-printing is an innovative technology used for the creation of 3D objects.
Its applications concern industry, healthcare and medical industry. This
technology applied to this study, because it offers the opportunity of
constructing identical trabecular bone structures for each single sample in order
to quantify structural degradation. The main purpose was to construct trabecular
bone replicas with as much accurate structure as possible, following the same
printing methods for all the specimens in order to ensure that the results and
conclusions concern only the material influence on ultrasound properties.
First, replicas of bovine cancellous bones, with different structures and
materials, were fabricated by a 3D-printer. Polylactic acid (PLA), thermoplastic
polyurethane (TPU) and polypropylene (PP) were used for the fabrication of the
specimens. Then, ultrasound propagation experiments were conducted and the
backscattered signals were studied in order to make conclusions about the
parameters of trabecular bone replicas (material properties, structure) that
influence the ultrasound propagation.
The ultrasound measurements indicated that speed of sound has a perfect
linear relationship with apparent density and that material properties, such as
density and stiffness, influence the magnitude of the backscatter spectrum,
whereas the shape of backscatter coefficient as a function of frequency depends
on the bone structure.
These outcomes most likely cannot be associated with the original
trabecular bone; especially, in case of osteoporotic one. Nevertheless, significant
conclusions are presented related to the origins of backscatter and ultrasound
properties alteration due to structural degradation, which is a result of the ageing
process and extent research may contribute to the formulation of osteoporosis
diagnostic devices.

iv

v
Περίληψη
Ο υπέρηχος χρησιμοποιείται ευρέως στην έρευνα, όπως στο πεδίο της εμβιομηχανικής, όπου η οστεοπόρωση μελετάται μέσω μηχανισμών αλληλεπίδρασης υπερήχων με δοκιδωτό οστό. Η παρούσα μελέτη αφορά την επίδραση της αρχιτεκτονικής και του υλικού του σπογγώδους οστού στα χαρακτηριστικά των υπερήχων, ταχύτητα του ήχου και συντελεστής οπισθοσκέδασης, χρησιμοποιώντας μοντέλα σπογγώδους οστού τρισδιάστατης εκτύπωσης.
Η τρισδιάστατη εκτύπωση είναι μια καινοτόμος τεχνολογία που χρησιμοποιείται για τη δημιουργία τρισδιάστατων αντικειμένων. Οι εφαρμογές της αφορούν την βιομηχανία, την υγειονομική περίθαλψη και την ιατρική. Η τεχνολογία της τρισδιάστατης εκτύπωσης εφαρμόστηκε στην παρούσα μελέτη, επειδή προσφέρει την ευκαιρία κατασκευής πανομοιότυπων δομών σπογγώδους οστού για κάθε μεμονωμένο δείγμα προκειμένου να ποσοτικοποιηθεί η οστική αποδόμηση. Ο κύριος σκοπός ήταν η κατασκευή αντιγράφων δοκιδωτού οστού με όσο το δυνατόν ακριβέστερη δομή, ακολουθώντας τις ίδιες μεθόδους εκτύπωσης για όλα τα δοκίμια, προκειμένου να διασφαλιστεί ότι τα αποτελέσματα και τα συμπεράσματα αφορούν μόνο την επίδραση του υλικού στις ιδιότητες των υπερήχων.
Αρχικά, αντίγραφα από δοκιδωτά οστά βοοειδών, με διαφορετικές δομές και υλικά, κατασκευάστηκαν από έναν 3D-εκτυπωτή. Τα υλικά: πολυγαλακτικό οξύ (PLA), θερμοπλαστική πολυουρεθάνη (TPU) και πολυπροπυλένιο (PP) χρησιμοποιήθηκαν για την κατασκευή των δοκιμίων. Στη συνέχεια, πραγματοποιήθηκαν πειράματα διάδοσης υπερήχων και τα σήματα οπισθοσκέδασης μελετήθηκαν προκειμένου να εξαχθούν συμπεράσματα σχετικά με τις παραμέτρους των αντιγράφων των δοκιδωτών οστών (ιδιότητες υλικού, δομή) που επηρεάζουν τη διάδοση των υπερήχων.
Οι μετρήσεις υπερήχων έδειξαν ότι η ταχύτητα του ήχου έχει εξαιρετική γραμμική σχέση με την φαινόμενη πυκνότητα και ότι οι ιδιότητες του υλικού, όπως η πυκνότητα και η ακαμψία, επηρεάζουν το μέγεθος του φάσματος οπισθοσκέδασης, ενώ η μορφή του συντελεστή οπισθοσκέδασης ως συνάρτηση της συχνότητας εξαρτάται από την δομή του.
Τα παραπάνω αποτελέσματα, πιθανότατα δεν μπορούν να συσχετιστούν με το αρχικό δοκιδωτό οστό, ειδικά σε περίπτωση οστεοπορωτικού οστού. Παρ 'όλα αυτά, παρουσιάζονται σημαντικά συμπεράσματα σχετικά με την προέλευση της μεταβολής του συντελεστή οπισθοσκέδασης και των ιδιοτήτων των υπερήχων, που προκύπτουν από την οστική αποδόμηση, η οποία είναι αποτέλεσμα της διαδικασίας γήρανσης. Επομένως, η εκτενής έρευνα μπορεί να συμβάλει στη διαμόρφωση διαγνωστικών συσκευών της οστεοπόρωσης.

vi

vii
List of figures
Figure 1: Application of Ultrasound in Medicine (a) Ultrasound in a transplanted
kidney artery, (b) Display of the fetus in uterus ...................................................... 1
Figure 2: Ultrasound measurement techniques ...................................................... 1
Figure 3: Light micrographs of bones. Osteoblasts (Ob) and bone lining cells
(BLC) are on bone surface. Osteocytes (Ot) are observed entrapped in the bone
matrix. B: bony trabecula. BV: blood vessels [56]. ................................................ 10
Figure 4: Organization of osteons and lamellae in compact bone. The orientation
of collagen fibers in adjacent lamellae of an osteon. ............................................ 10
Figure 5: Compact and trabecular bone representation. ....................................... 11
Figure 6: Light micrograph of compact and trabecular bone. .............................. 11
Figure 7: Direction of oscillation and propagation of ultrasound waves. (a)
Longitudinal wave, (b) Transverse wave. ............................................................... 15
Figure 8: (a) Transducer beam characteristics, (b) Immersion transducers. ...... 17
Figure 9: (a) Prediction of differential scattering cross section in spongy bone
with 70% porosity for different sizes of scatterers, (b) Prediction of attenuation.
Dense Populate [7]. .................................................................................................. 22
Figure 10:(a) Prediction of differential scattering cross section in spongy bone
with 70% porosity for different sizes of scatterers, (b) Prediction of attenuation.
Fluid spherical distribution [7]. .............................................................................. 23
Figure 11: A 3D-printing machine. .......................................................................... 24
Figure 12: Two cardiac 3D-printed models opened at the level of the four-
chamber view, for healthcare teaching [113]. ........................................................ 26
Figure 13: (a) Ultimaker 3D-printer, (b) 3D-printing process of a bone replica. 41
Figure 14:3D-printed PLA replicas of trabecular bone. (a) BV/TV=40%, (b)
BV/TV=34%. ............................................................................................................ 42
Figure 15: 3D-printed TPU replicas of trabecular bone. (a) BV/TV=40%, (b)
BV/TV=34%. ............................................................................................................. 43
Figure 16: 3D-printed PP replicas of trabecular bone. (a) BV/TV=55%, (b)
BV/TV=40%. ............................................................................................................. 43
Figure 17: 3D-printed PP replicas of trabecular bone. (a) BV/TV=34%, (b)
BV/TV=21%. ............................................................................................................. 44
Figure 18: (a) The degassing of specimens, (b) Through-transmission ultrasound
measurements layout. .............................................................................................. 45
Figure 19: The area characterized as the interface refers to the surface between
the water and the bone specimen with a depth of about 3mm, due to the nature
of the bone. The area of 7mm delimits the volume of interest of which the
differential scattering cross section 1800 is measured and follows the interface.
The length z is measured from the beginning of the specimen to its middle
volume of which the differential scattering cross section 1800 is measured. ..... 47

viii
Figure 20:(a) Linear relationship between SOS and apparent density for three 3D-
printed trabecular bone specimens with different bone volume fractions,
constructed from PLA, in the three directions, (b) Graph data and analysis. ... 50
Figure 21: (a) Linear relationship between SOS and apparent density for three 3D-
printed trabecular bone specimens with different bone volume fractions,
constructed from PP, in the three directions, (b) Graph data and analysis. ....... 51
Figure 22: Backscatter coefficient as a function of frequency of two 3D-printed
trabecular bone specimens with the same bone volume fraction, constructed
from PLA and TPU in the (a) X direction, (b) Y direction and (c) Z direction. .. 52
Figure 23: Backscatter coefficient as a function of frequency of two 3D-printed
trabecular bone specimens with different bone volume fractions, constructed
from PLA. (a) X direction, (b) Y direction and (c) Z direction. ............................ 54
Figure 24: Backscatter coefficient as a function of frequency of 3D-printed
trabecular bone specimens with different bone volume fractions, constructed
from PP. (a) X direction, (b) Y direction and (c) Z direction. ............................. 56
ix
List of tables
Table 1: The most important quantities of ultrasound physics. ........................... 16
Table 2: Thermal properties of transparent PLA material. ................................... 37
Table 3: Mechanical properties of 3D-printing transparent PLA material. ......... 38
Table 4: Thermal properties of TPU 95A white material. ..................................... 38
Table 5: Mechanical properties of 3D-printing TPU 95A white material. ........... 39
Table 6:Thermal properties of PP material. ........................................................... 39
Table 7: Mechanical properties of 3D-printing PP material. ............................... 40
Table 8: Physical quantities of 3D-printed replicas. ............................................. 44

x

Introduction
1
1. Chapter 1:
Introduction 1.1. Applications of ultrasonic waves
Ultrasound is sound waves with a frequency above human hearing (20,000
hertz or 20 kilohertz). Ultrasonic waves have many different applications.
Ultrasonic devices are used for object detection and distance measurements. In
medicine, ultrasound is used for diagnostic or therapeutic purposes. Ultrasound
imaging or sonography is a technique applied in order to create an image of
internal body structures such as blood vessels, and internal organs, either to
determine the source of a disease or to exclude pathology [1][2], as it is shown in
figure 1. Soft tissue and bone injuries treatment, cancer therapy and focused
ultrasound surgery are some of ultrasound therapeutic applications [3-5].
(a)
(b)
Figure 1: Application of Ultrasound in Medicine (a) Ultrasound in a transplanted kidney artery, (b) Display of the fetus in uterus
In industry, it is used for cleaning and accelerating chemical processes
[6][7]. Also, ultrasonic waves are applied in food technology, contributing to the
analysis, processing and quality control of food [8-10]. Finally, ultrasound is used
broadly in research (Figure 2), such as the field of biomechanics, where
osteoporosis is studied by mechanisms of interaction of ultrasound with
trabecular bone [11].
Figure 2: Ultrasound measurement techniques

Introduction
2
Regarding the ultrasound effects and safety, there is no evidence that
ultrasound exposure could cause hearing loss. However, exposing subjects to
frequencies of 18kHz at 150dB has caused concerns to scientific community.
Also, studies have shown that symptoms of nausea, fatigue, and headaches could
be triggered from airborne ultrasound. Health Canada recommend a
conservative standard according to which, sound pressure levels should be less
than 110dB beyond 25kHz, regardless of the exposure duration [12][13].
1.2. Object of master thesis
The present master thesis concerns the influence of 3D-printed trabecular
bone models’ architecture and material on ultrasound propagation. First,
replicas of bovine cancellous bones were fabricated by a 3D-printer. 3D-printed
specimens were constructed with different structures and materials. Polylactic
acid (PLA), thermoplastic polyurethane (TPU) and polypropylene (PP) were used
for the fabrication of the specimens. Then, ultrasound propagation experiments
were conducted and the backscattered signals were studied in order to make
conclusions about the parameters of trabecular bone replicas (material
properties, structure) that influence the ultrasound propagation. The results
indicated that the material properties affect the magnitude of backscatter
coefficient and that the trabecular structure is related to the characteristic
backscatter coefficient patterns which correspond to the thickness of trabeculae.
1.3. Outline
Chapter 1: Applications of ultrasonic waves are presented and an introduction to the object of the master thesis is given.
Chapter 2: First, a review on ultrasound propagation through trabecular bone is conducted and bone structure, physics of ultrasound and characteristics of probes-transducers are presented. Then, the interaction of ultrasound with trabecular bone and the modeling of differential scattering cross section of ultrasound are described. Finally, 3D-printing technology and research on 3D-printed trabecular bone are introduced.
Chapter 3: The characteristics and properties of the materials, that were used in this study, are described. The materials were polylactic acid (PLA), thermoplastic polyurethane (TPU) and polypropylene (PP).
Chapter 4: The experimental procedure is described. In particular, the fabrication of bone specimens and the measurements of ultrasound acoustic properties are presented.
Chapter 5: The results of the current study, which are related to the influence of material properties and bone structure on ultrasound propagation, are presented and analyzed.

Introduction
3
Chapter 6: The conclusions of this study are quoted and the advantages and limitations are presented.
Bibliography
[1]. Wells, P. N. (2006). Ultrasound imaging. Physics in Medicine & Biology,
51(13), R83.
[2]. Carovac, A., Smajlovic, F., & Junuzovic, D. (2011). Application of ultrasound
in medicine. Acta Informatica Medica, 19(3), 168.
[3]. Ter Haar, G. (1999). Therapeutic ultrasound. European Journal of ultrasound, 9(1), 3-9.
[4]. Miller, D. L., Smith, N. B., Bailey, M. R., Czarnota, G. J., Hynynen, K., Makin, I. R. S., & Bioeffects Committee of the American Institute of Ultrasound in Medicine. (2012). Overview of therapeutic ultrasound applications and safety considerations. Journal of ultrasound in medicine, 31(4), 623-634.
[5]. Robertson, V. J., & Baker, K. G. (2001). A review of therapeutic ultrasound: effectiveness studies. Physical therapy, 81(7), 1339-1350.
[6]. Harvey, G., Gachagan, A., & Mutasa, T. (2014). Review of high-power ultrasound-industrial applications and measurement methods. IEEE transactions on ultrasonics, ferroelectrics, and frequency control, 61(3), 481-495.
[7]. Payne, P. A. (1985). Medical and industrial applications of high resolution ultrasound. Journal of Physics E: Scientific Instruments, 18(6), 465.
[8]. Awad, T. S., Moharram, H. A., Shaltout, O. E., Asker, D. Y. M. M., & Youssef, M. M. (2012). Applications of ultrasound in analysis, processing and quality control of food: A review. Food research international, 48(2), 410-427.
[9]. Dolatowski, Z. J., Stadnik, J., & Stasiak, D. (2007). Applications of ultrasound in food technology. Acta Scientiarum Polonorum Technologia Alimentaria, 6(3), 88-99.
[10]. Mason, T. J., Riera, E., Vercet, A., & Lopez-Buesa, P. (2005). Application of ultrasound. In Emerging technologies for food processing (pp. 323-351). Academic Press.
[11]. Wear, K. A. (2019). Mechanisms of interaction of ultrasound with cancellous bone: A review. IEEE transactions on ultrasonics, ferroelectrics, and frequency control, 67(3), 454-482.
[12]. Howard, C. Q., Hansen, C. H., & Zander, A. C. (2005). A review of current ultrasound exposure limits. The Journal of Occupational Health and Safety of Australia and New Zealand, 21(3), 253-257.
[13]. Health Protection Branch Health Canada, Environmental Health Directorate. Guidelines for the safe use of ultrasound: Part II - Industrial and commercial applications - safety code 24. Technical report, Published by authority of the Minister of National Health and Welfare, 1991. URL http://www.hc-sc.gc.ca/ hecs-sesc/ccrpb/pdf/safety code24.pdf. EHD-TR-158, Catalogue No. H46- 2/90-158E, ISBN 0-660-13741-0

Introduction
4

Literature review
5
2. Chapter 2:
Literature review 2.1. Review on ultrasound propagation through trabecular bone
Trabecular bone is a composite material with two phases, large porosity and
complex architectural structure [1]. Its inhomogeneity and anisotropy make its
characterization very difficult, both in vivo and in vitro.
Studies about ultrasound propagation in the trabecular bone has found a
great response in recent years [2][3]. Ultrasound is able to provide information
for both the bone density, as well as for the geometry of the trabeculae within
the spongy bone. By this method, both factors, that determine the mechanics
properties of bones, can be determined [4].
The main methodologies, that have been developed for the diagnosis of
osteoporosis with the use of ultrasound, concern the change of group velocity
and phase velocity, the calculation and change of fast and slow wave, that occur
during wave propagation, as well as the correlations of velocity and attenuation
with the density [5][6].
Also, the determination of bone mass may be achieved with similar
techniques that have been developed. These techniques are:
Magnetic resonance imaging (MRI), Radiographic absorptiometry (RA), Dual X-
ray absorptiometry (DXA), Peripheral Quantitative computed tomography
(pQCT), Quantitative computed tomography (QCT), Peripheral Dual X-ray
absorptiometry (pDXA), Single-photon absorptiometry (SPA), Dual-photon
absorptiometry (DPA), Single X-ray absorptiometry (SXA), and Quantitative
ultrasound (QUS) [7-9].
The advantages that ultrasound has, compared to the previous techniques
that have been developed are:
• Non-invasive diagnostic tests on the human body
One of the important applications of ultrasound is the diagnosis of diseases in
human organism. The well-known ultrasound is used in order to make diagnoses
of diseases related to the liver, pancreas, thyroid, breast, etc. Also, it could give
information on movements of internal organs of the human body such as parts
of the heart.
• Non-destructive ultrasound testing.

Literature review
6
Sound is a phenomenon that does not cause any permanent change in the
medium in which it propagates, although its presence is easily observed. This is
the reason why, the application of sound is appropriate to the non-destructive
testing, where the aim is to diagnose accurate information about the condition
of the specimen that is examined, without changing its state. For this purpose, a
method, which produces a distinct reaction with the specimen, but does not
change its state, is required. That's why, the advantage of sound to be passive,
makes it appropriate for testing materials [10].
Sound waves are mechanical waves and therefore they require a medium,
through which they will propagate. Condition of any medium, either solid, liquid
or gas, could be assessed through the interaction of sound waves with it. The
basis of ultrasonic testing is the way in which the waves are affected by their
propagation through the medium examined. During the wave propagation,
changes, that occur, could be measured. According to these changes, the state of
the material examined, could be assessed [11][12]. The evaluation of material
properties could be done indirectly, by using models and empirical relations that
connect changes in the sound signal with a specific state of the material or the
existence of discontinuities. The assessment of the quality of the material always
depends on its reliability method we use and from the proper interpretation of
the signal that we receive.
• The accuracy of osteoporosis evaluation
Osteoporosis is recognized as a silent epidemic disease with an ever-increasing
need for its diagnosis and treatment. The technique of ultrasound is widely used
to evaluate osteoporosis [13] and relies mainly on Broadband Ultrasound
Attenuation (BUA) and Speed of Sound (SOS) [14]. In general, ultrasound
provides valuable density-related information (Bone Mineral Density) that are
associated with information we get through methods like DXA, in various areas
of body such as the thigh, vertebrae, hip, etc. In some cases, ultrasound gives
more accurate information than other techniques [15-19].
Speed of sound (SOS) and attenuation of the ultrasonic signal (BUA), are
the two properties of ultrasound that have been studied mainly in trabecular
bone [20-22].
Studies that have been conducted regarding the speed of sound have led to
the following conclusions:
• There is a very good correlation (R2> 0.85) between the density of the
specimens and the speeds, as well as the speeds with modulus of elasticity
in the three dimensions of space [18][23].

Literature review
7
• There is a linear relationship between the modulus of elasticity determined
with ultrasound and the modulus of elasticity measured by mechanical
tests (R2 = 0.935) [23].
Modulus of elasticity of the trabecular bone depends on both its density
and its architectural structure. By the fact that modulus of elasticity is well
correlated with density [24], it is concluded that probably density is a factor of
primary importance for the elasticity of material. However, different values of
modulus of elasticity occur from measurements in the three directions, while the
density is constant [25].
Langton (1984) developed a technique known as Broadband Ultrasound
Attenuation (BUA). The correlation coefficient of ultrasound attenuation with
the density of spongy bone in vitro, is around 0.5 [20]. The effects of attenuation
during ultrasound propagation through the cancellous bone are due to on the
one hand the absorption, on the other hand the scattering. Absorption depends
on the density of spongy bone, the viscosity of the bone marrow, and the
frequency of ultrasonic wave. Scattering depends on the structure of the bone
[26]. The BUA parameter is directly related to the 3D architecture of spongy bone
as it is associated with ultrasound scattering effects.
The relation between attenuation and physical-mechanical properties of
trabecular bone is not easy to be determined. Research studies on bones, that
conducted in vitro, led to the following conclusions:
• The BUA parameter is not related to modulus of elasticity in the three
dimensions of space [18].
• Attenuation of ultrasonic signal (BUA) in human bones in vitro, is linearly
related to density as well as modulus of elasticity [27-29].
In most researches, an attempt is made in order to correlate the ultrasound
properties, mainly with the density and modulus of elasticity of the sponge bone,
without essentially taking into account the “architectural structure” factor.
However, the above remarks led to the conclusion that a further study on the
effect of bone architectural structure on both ultrasound propagation, and in
general to the mechanical properties of the spongy bone it is necessary [30-33].
Currently, various 3D techniques have been developed for the trabecular
bone imaging. Some of the most common imaging techniques are [34]:
• X-ray tomographic methods
• Serial sectioning
• Nuclear Magnetic Resonance (NMR)-Magnetic Resonance Imaging (MRI)

Literature review
8
Applying the above methods, images from the inside of the trabecular bone could
be stored in the computer. Then, if the images get composed with the aid of
suitable software, a digital representation of the architectural structure of bone
could occur [35].
Having represented the structure of trabecular bone, the next step is its
quantification, i.e., the application of methods that will give us information on
the density, porosity, and orientation of trabeculae. A method used is Mean
Intercept Length (MIL). Similar methods have been developed such as volume
orientation, star volume distribution, star length distribution, which are referred
to as alternative versions of MIL method [34]. Also, Quantitative Computed
Tomography (QCT) is a very well-known method, which provides information
for both density and structure [36]. Finally, in recent years the characterization
of structure with fractals is implemented [37-40] and emphasis is given to three-
dimensional analysis by the finite element method, which could be used in
combination with one of the above quantification methods of the architectural
structure of bone [41][42].
Despite the fact that a large number of measurements, that have carried
out, about ultrasound speed propagation and attenuation, the range of values
mentioned in the literature is wide. The authors’ opinions differ in the extent to
which these quantities are related to other physical and mechanical parameters
of normal spongy bone or pathological specimens [14][43][44]. In order to
systematically examine the individual contribution of density and structure to
attenuation, various researchers have proposed the introduction of new
directions in the characterization of bone with ultrasound, such as
measurements with the pulse-echo technique [45].
Finally, the need of processing new parameters that describe the structure
of bone tissue as important information for predicting fracture risk has been
recognized and an international effort in this direction is made [1][46].
In addition, except for speed and attenuation, scattering is another
property that can provide information on osteoporosis. Studies of wave
scattering from various biological tissues have been conducted [47-49], with
results of good correlation with density [50]. The size of the scatterers is
estimated according to the autocorrelation functions of Dense Populate and
Fluid Sphere distribution. From experimental calculation of a differential
scattering cross section of 180° in a representative bovine spongy specimen, using
ultrasound, peaks appear at specific frequency values corresponding to dominant
groups of trabeculae. These peaks correspond to the aforementioned
autocorrelation functions to beams of specific dimensions.

Literature review
9
The differential scattering cross section 180° that the ultrasound undergoes
during its propagation to the cancellous bone, is particularly sensitive to
microstructure changes associated with osteoporosis, as opposed to speed and
attenuation [19]. Also, there has been a strong correlation between the three
acoustic parameters of ultrasound during the propagation to trabecular bone
[14]. The remarks performed in the above parameters concern experiments on
human spongy bones, and especially osteoporotic, thus limiting the results to a
small range of densities.
2.2. Bone structure-Physical properties of trabecular bone
Bones have a remarkable and extremely complex structure [51-55]. They have two main functions:
• They form the skeleton that supports mechanically and protects the body.
• They maintain the homeostasis of minerals components in the body by
regulating the concentration of electrolytes in the blood.
Bones are neither morphologically nor mechanically homogeneous, but their
heterogeneity not only does not prevent their functional adaptation, but on the
contrary contributes to it. The adaptation to the mechanical function concerns
the shape, the axial shape, the distribution of the material along their length and
cross section, and their internal structure.
Bones could be distinguished at three levels of structural organization:
• Molecular level
• Microscopic level
• Macroscopic level
At the lower level of organization bone can be considered as a composite
material consisting of a fibrous protein, collagen (basic binding protein tissue),
and calcium phosphate. The other components are water, amorphous
polysaccharides and proteins, living cells and blood vessels. The tiny crystals
hydroxyapatite, that are formed by calcium and phosphorus, are found along the
collagen fibrils. Collagen microfibers have a diameter of 50-70 nm and their
pattern direction is not random but defined. Bone tissue consists of three types
of bone cells; osteocytes, osteoblasts and osteoclasts. Among them there is the
intercellular substance. Osteocytes occupy, completely the bone lumen during
their lifetime. From osteocytes begin numerous delicate offshoots that enter the
bone tubes where they come in contact with offshoots of neighboring osteocytes.
In the developed bone tissue, the osteocytes are osteoblasts, which are
surrounded by bone tissue they produce themselves (Figure 3). They remain
active cells that they have a role in the maintenance of bone substance and the
mobilization of calcium from bone tissue into the blood. Osteoblasts produce
the organic elements of bone substance; collagen, polysaccharides. Osteoclasts

Literature review
10
are agile giant multinucleated cells with a diameter of 20-100 μm containing 5-
50 nuclei. They are where bone tissue is absorbed and they usually are into the
scaphoid lumens of the free surface of the bone substance [51-55].
(a)
(b)
Figure 3: Light micrographs of bones. Osteoblasts (Ob) and bone lining cells (BLC) are on bone surface. Osteocytes (Ot) are observed entrapped in the bone matrix. B: bony trabecula. BV: blood
vessels [56].
At the microscopic level, in mammals, there are two types of bone [57][58].
In the laminar tissue, the collagen and the hydroxyapatite form layers called
lamellae, which have a thickness about 5μm. Collagen fibrils are located at the
level of bony lamella and tend to be oriented in one direction within that level.
Some researchers claim that all collagen fibrils have the same direction within a
lamella [59][60]. But it is more likely that fibrils with a specific orientation
occupy small areas. Within an area the orientation of the fibrils is not constant,
but varies from area to area on the same lamella. Although, all the fibrils in a
lamella do not have the same direction, it seems that going from one lamella to
the other, the direction changes. The second type of bone consists of osteons or
Haversian systems formed as the bone around a blood vessel is absorbed by
osteoclasts. In this way a lumen about 100 μm in diameter is formed (Haversian
canals). The walls of the lumen are smooth and the bone is located at the inner
surface in concentric layers. The central lumen contains one or two blood vessels.
Figure 4: Organization of osteons and lamellae in compact bone. The orientation of collagen fibers in adjacent lamellae of an osteon.

Literature review
11
At the macroscopic level of organization, there is an extremely important,
in terms of mechanics, distinction between compact and spongy bone, called
trabecular or cancellous bone (Figure 5 & 6). In compact bone the only pores,
that exist, are those occupied by osteocytes, bone canals (canaliculi), vessels and
areas of erosion. On the contrary, spongy bone has pores that occupy a large
percentage of its volume. The bone tissue from which the trabecular bone is
composed, is usually primary lamellar tissue or parts of Haversian systems.
Spongy bone is an anisotropic material. Both in terms of the tissue that makes it
up, but also its structure macroscopically. Singh (1978) [61] described in detail
the morphology of trabecular bone based on the microscopic studies of
Whitehouse and others [62][63]. The study of the cancellous bone from various
parts of human skeleton reveals a great architectural variety. Trabecular bone
architectural structure could be classified into types I, II a, II b, II c, III a, III b
and III c.
Figure 5: Compact and trabecular bone representation.
Figure 6: Light micrograph of compact and trabecular bone.
In addition, inside bones there is a soft tissue called bone marrow. Bone
marrow is rich in vessels and it is found not only between the trabeculae of the
cancellous bone, but also in their medullary lumen of long bones and in the

Literature review
12
larger tubes of the Haversian canals. Its composition varies in different bones
and it depends on age. Bone marrow occurs in two forms, pale or fatty and red
marrow.
The hue of fatty marrow occurs due to the presence of numerous fat cells,
which are its main component. The marrow consists of a thin layer of free blood
cells and vessels that fill the interstices. Adipocytes disperse individually into the
interstices of its reticular layer whose reticular cells are derived from perivascular
cells (mesenchymal cells). The wall of the capillaries of marrow allows the
passage of free cells of the tissue in the blood. Between these capillaries and
trabeculae of reticular layer exist all forms of platelets at various stages of
development; erythrocytes, granular leukocytes, lymphocytes, monocytes and
platelets [64].
Characterization of bone structure is necessary in order to study further its
properties. The structural and architectural approach of a tissue is called
histomorphometry. Histomorphometry studies and quantifies the relation
between various parameters that characterize the structure of a tissue. The most
important parameters that describe the structure of the trabecular bone are the
following [65-71]:
• BV/TV (Relative bone volume), is the relative amount of bone per unit of
volume. It is a dimensionless quantity and is measured in % or in unit
fractions.
• BS/BV (Bone surface to volume ratio), is the relative area of bone per unit
of volume, and describes the complexity of the structure. This parameter
occurs from 3D μCT, and is measured in mm-1.
• Tb.Th. (Trabecular thickness), refers to the thickness of the trabeculae.
This parameter is calculated by measurements in the plane (2D),
considering two models of trabeculae; the model of parallel plate and the
cylinder rod model.
• Tr.Sp. (Trabecular separation), refers to the average width of the pores
perpendicular to trabecula direction. It is measured in mm or μm, for both
models.
• Tr.N. (Trabecular number), refers to the average distance of the trabeculae,
from ridge to ridge, and is measured in mm for both models.
• D.A. (Degree of anisotropy). A material is characterized as anisotropic
when its properties change in different directions. Trabecular bone is
generally an anisotropic material with great complexity in its structure.
The most important techniques that determine and quantify anisotropy are
Mean Intercept Length (MIL), Star Volume Orientation (SVD) and Star Length
Distribution (SLD), whose algorithmic applications in 3D are well correlated [72].
Literature review
13
Bone physical properties are related to bone density, bone mineral density
and porosity [73]. Density is defined as a scalar quantity that expressed by
quotient of the mass of an object, to the volume of the object. In the spongy bone
the density is expressed in the same way, but complex problems occur in terms
of both mass estimation and volume estimation. Mass calculation concerns the
presence or absence of marrow. The calculation of volume that occurs from the
porosity leads to two solutions. The first calculation concerns the volume as a
whole, including pores that are filled with marrow and is called total volume. The
second calculation refers to the volume without the marrow and is called matrix
volume [74]. Therefore, the density of the trabecular bone is expressed as either
real density or as apparent density:
• Real density is defined as the quotient of wet mass-weight of the specimen
to the actual volume of the tissue.
• Apparent density is defined as the quotient of the mass of solid matrix), to
the corresponding total volume of the specimen.
Other expressions of density occur depending on the state of the mass, such as
dry mass-weight 100°C or ash mass-weight 500°C.
The porosity in porous materials, is what makes them have different and
complex physical properties, in relation to non-porous ones. The complexity of
their properties may be increased if the pores of materials include liquids, even
in a very small percentage [75]. The ratio of the volume of the interstices to the
total volume of the object is called porous and is relatively easy to be determined
and be measured. Nevertheless, it is much more difficult and complicated to have
a geometric description of the pores, because in most cases the pores have a
complex geometry. Finally, only a few specific cases can be described
quantitatively for instance, when the pores are spheres of the same diameter.
2.3. Wave characteristics-Physics of ultrasound
Wave is one of the ways in which energy travels without mass transfer with
main feature the periodicity in space and in time [76]. The process by which
energy is transmitted from one area to another is called propagation.
Useful definitions [76-79]:
• An isophasic surface is the locus of the points that have the same period
and phase.
• Plane, spherical, cylindrical wave, is the wave that has a plane, spherical
and cylindrical isophasic surface respectively.
• A stationary wave is that whose isophasic or nodal surfaces do not travel in
space.
• Node is the point with a null distance for any time t.

Literature review
14
• Wavenumber is the measure of the direction vector of the wave. Its
notation is k and is defined as k = 2π / λ (1 / m).
• Phase velocity is the one at which the phase of wave travels. It is given by
the formula: c = λ / Τ = ω / k.
• Intensity of wave is the energy of the incident wave per second and per unit
area.
• Wave front is the first surface of the wave that comes in contact with non-
disrupted space. The geometry of the wave front may be plane, spherical,
cylindrical and so on.
• Wave attenuation is the degression of the wave amplitude.
• Dispersion is the gradual change of the wave shape due to the property of
the medium to propagate the various harmonics waves that compose the
wave, with different phase velocities, depending on ω.
• Dissipation is the natural mechanism that creates the attenuation effects.
The energy loss because of distance is due to conversion of mechanical
energy or any other form of energy into heat or in the diversion of energy
from the main propagation direction.
• Scattering effect happens when the propagation path of a wave is
interrupted by any inhomogeneity of compressibility or density. Scattering
may be seen as a change of the amplitude, frequency, phase velocity or
direction of the wave propagation as a result of inhomogeneity of the
medium within which it propagates [80]. This is due to the finite size of the
scatterers, compared to the wavelength and is measured in Sr-1cm-1. Should
be noted that a sound wave is not scattered when the acoustic properties
of the medium in which the wave propagates are not differentiated
(density, compressibility).
• Backscattering: The differential scattering cross section 1800, expresses the
percentage of power of the wave scattered at 1800 to intensity of the
incident wave.
• Attenuation coefficient expresses the loss of energy to any direction.
• Attenuation due to scattering expresses the loss of ultrasound energy due
to scattering.
• Nepers (Np) is a dimensionless unit that expresses the ratio of two similar
quantities logarithmically. The number 2.71878 is the basis of the Np unit
in contrast to the dB unit that has the number 10 as a basis (1 Neper-8,686
decibels).
The physical principles governing ultrasound [81][82] are the same as those
of sound in the auditory field, with the difference that the oscillation evolves so
rapidly that it cannot be perceived by the human ear. While the limit of audibility
is at about 0.02 MHz in ultrasound experiments frequencies are used between
0.5 MHz and 20 MHz. The property of ultrasound of not being perceived has the

Literature review
15
advantage that it may be used during experiments, such a high sound volume
that if it were in the auditory field would be unbearable.
Any medium, either solid, liquid or gas is able to oscillate. If the oscillation
evolves so rapidly that it cannot be perceived by the human ear is referred to as
ultrasound. In fact, there are small particles of the medium that oscillate like
being connected in elastic way. The type of oscillation is determined by the
elastic properties of the medium and by the shape of the pulse that causes the
oscillation. The oscillation propagates in the medium at a sound velocity c. The
sound oscillation may be described as a motion of the medium particles, for
example as a displacement of the particles as a function of their position and time
δ = f (z, t), or as the change in sound pressure as a function of position and time
p = f (z, t). The sound pressure or the change in pressure because of oscillation is
very important because the electric potential created by a piezoelectric crystal
U = f (z, t) is directly proportional to the sound wave generated and vice versa.
Figure 7a shows the propagation of sound in gases, solids and liquids. The
particles of the medium oscillate in the direction of sound propagation. This type
of oscillation is called longitudinal wave. At the points where particles are close
to each other, there is little displacement but the speed and pressure of sound is
high. If shear forces may be developed the particles can also oscillate in a
direction perpendicular to the wave propagation (It mainly happens in solids).
This oscillation is called a transverse wave (Figure 7b).
(a)
(b)
Figure 7: Direction of oscillation and propagation of ultrasound waves. (a) Longitudinal wave, (b) Transverse wave.
Literature review
16
However, the above applies only in ideal cases and for infinitely long media.
If, during the experiment, there is a reflection from the outer surfaces of the
specimens that are slightly apart, entangled waveforms are developed (plate
waves). The equations that apply to purely longitudinal and transverse waves do
not apply to this type of waves. All these types of waves may coexist in the testing
of a specimen, making the interpretation of corresponding effects very difficult.
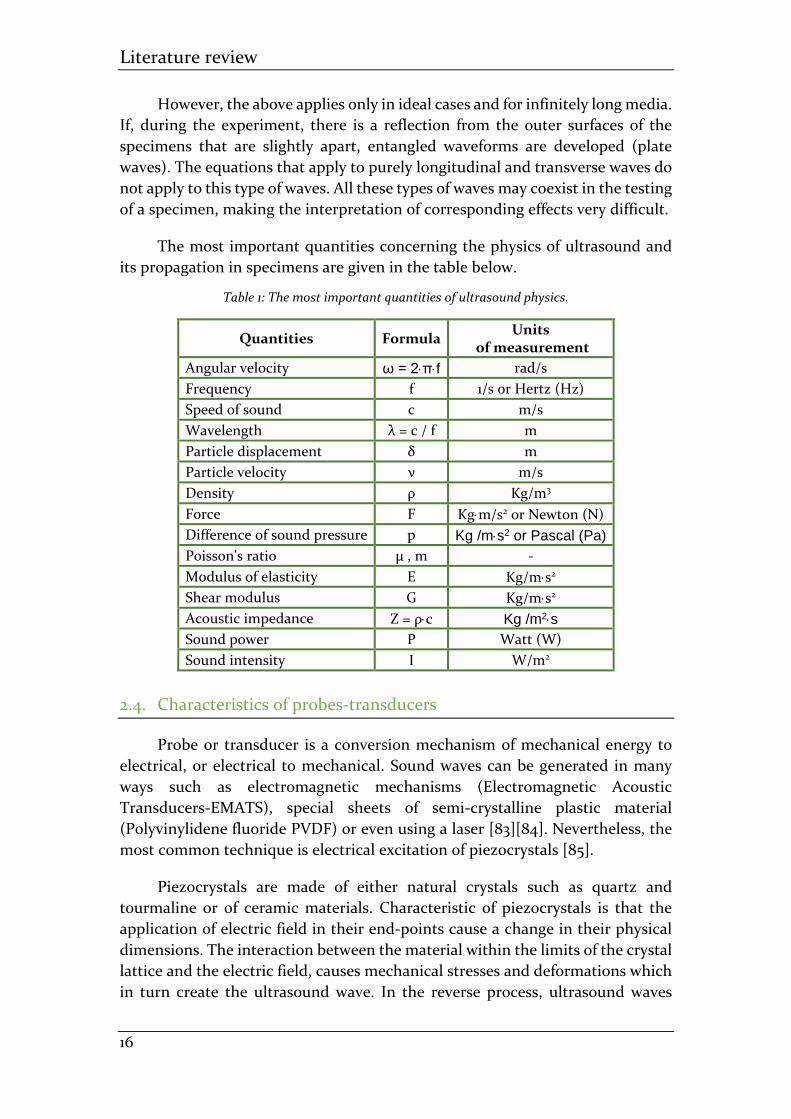
The most important quantities concerning the physics of ultrasound and
its propagation in specimens are given in the table below.
Table 1: The most important quantities of ultrasound physics.
Quantities Formula Units
of measurement
Angular velocity ω = 2πf rad/s
Frequency f 1/s or Hertz (Hz)
Speed of sound c m/s
Wavelength λ = c / f m
Particle displacement δ m
Particle velocity ν m/s
Density ρ Kg/m3
Force F Kgm/s2 or Newton (N)
Difference of sound pressure p Kg /ms2 or Pascal (Pa)
Poisson's ratio μ , m -
Modulus of elasticity E Kg/ms2
Shear modulus G Kg/ms2
Acoustic impedance Z = ρc Kg /m2s
Sound power P Watt (W)
Sound intensity I W/m2
2.4. Characteristics of probes-transducers
Probe or transducer is a conversion mechanism of mechanical energy to
electrical, or electrical to mechanical. Sound waves can be generated in many
ways such as electromagnetic mechanisms (Electromagnetic Acoustic
Transducers-EMATS), special sheets of semi-crystalline plastic material
(Polyvinylidene fluoride PVDF) or even using a laser [83][84]. Nevertheless, the
most common technique is electrical excitation of piezocrystals [85].
Piezocrystals are made of either natural crystals such as quartz and
tourmaline or of ceramic materials. Characteristic of piezocrystals is that the
application of electric field in their end-points cause a change in their physical
dimensions. The interaction between the material within the limits of the crystal
lattice and the electric field, causes mechanical stresses and deformations which
in turn create the ultrasound wave. In the reverse process, ultrasound waves
Literature review
17
cause mechanical stresses which in turn are converted to potential difference in
the end-points of the piezocrystal.
Crystal transmitters-receivers are devices that perform at the maximum
level when the piezocrystal they contain be excited near its resonance frequency.
In this case, the pressure produced is proportional to the excitation voltage.
Usually, the piezocrystals are in the form of a thin disk and they have electrodes
placed on each side of them. The resonance frequency f of the transmitter-
receiver is determined by the thickness of the disk. A common dimension is λ /
2, where λ = c / f. On its outer side is placed a protective layer of suitable
absorbent material, depending on the environment in which it operates, with a
thickness equal to λ / 4. Also, thin layers are placed on the back of the crystal in
order to absorb the reflections from the outer cover of the transmitter. In this
way, the back sheets play the role of the damper. When the damping is small the
pulse is of large duration (Narrow band). On the contrary, high damping leads
to short pulses (Broad band), which are commonly used to measure thickness
and generally for accurately definition of the duration of events.
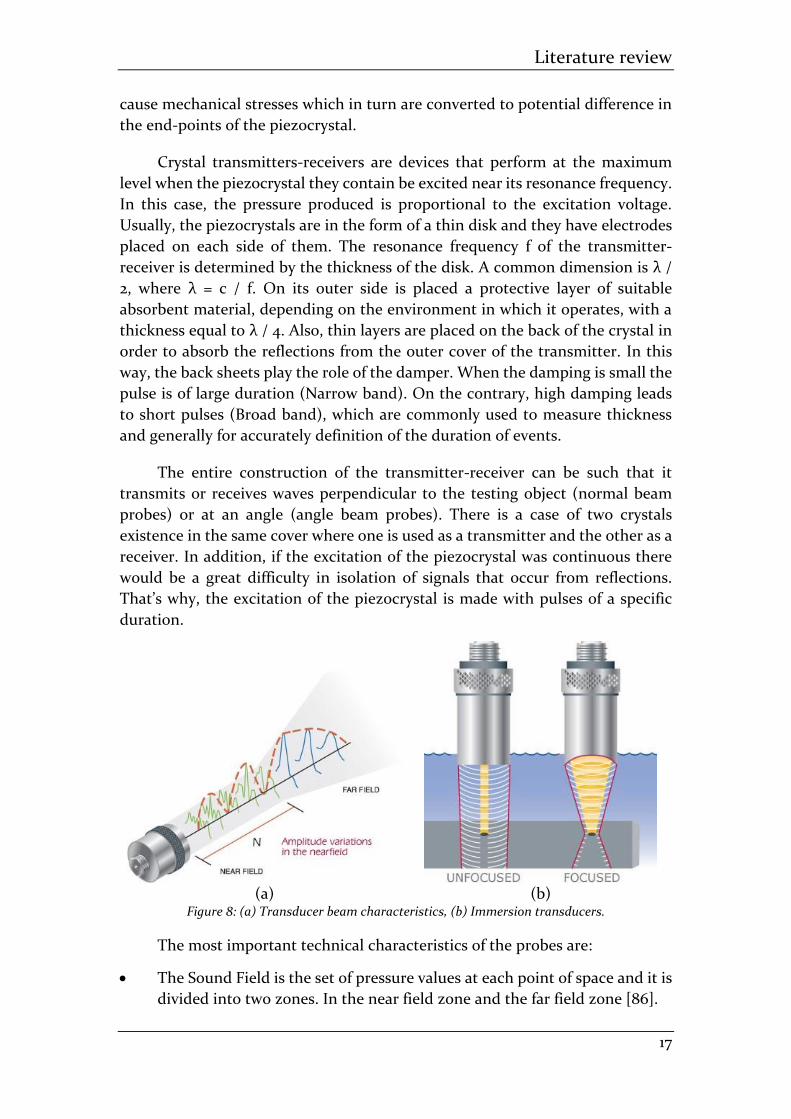
The entire construction of the transmitter-receiver can be such that it
transmits or receives waves perpendicular to the testing object (normal beam
probes) or at an angle (angle beam probes). There is a case of two crystals
existence in the same cover where one is used as a transmitter and the other as a
receiver. In addition, if the excitation of the piezocrystal was continuous there
would be a great difficulty in isolation of signals that occur from reflections.
That’s why, the excitation of the piezocrystal is made with pulses of a specific
duration.
(a) (b) Figure 8: (a) Transducer beam characteristics, (b) Immersion transducers.
The most important technical characteristics of the probes are:
• The Sound Field is the set of pressure values at each point of space and it is
divided into two zones. In the near field zone and the far field zone [86].

Literature review
18
• Near Field Length is the distance of the probe surface from the position
where the beam develops the maximum pressure value.
• Far Field is the corresponding position behind the NFL, where the pressure
distribution is zero, after first decreasing gradually, (Figure 8a).
• Beam shape is the "theoretical" shape of the sound field, that is defined by
the set of pressure values. In circular cross section probes, the beam has a
conical shape where its cross-section is being reduced to NFL and then it is
being increasing.
• Element size D or axb: The transducers have a circular or rectangular cross
section. The size of the cross section greatly affects the form of the
transmitted sound.
• Central frequency is the peak of the probe response curve.
• Focus and unfocus transducers focus the ultrasound beam on a small
(focus) or a larger part of the material (unfocus), thus giving corresponding
information about these areas, as it is shown in figure 8b.
2.5. Interaction of ultrasound with trabecular bone
As it has been mentioned, the research about the characteristics and
properties of trabecular bone, using ultrasound, is achieved by studying the
changes in ultrasound propagation and its physical properties. Below, they will
be introduced the corresponding mechanisms [87] that constitute the basis of
this study; SOS, attenuation coefficient and backscatter coefficient.
The through-transmission method is used in order to measure the Speed of
Sound (SOS) and attenuation of ultrasound (BUA). Two transducers are used in
the through-transmission process. The first transducer is applied for a
broadband pulse transmission into the trabecular bone. The second transducer
is opposite co-axially-aligned positioned and it operates as a receiver of the
attenuated signal that passed through the bone.
SOS is often computed from the following formula:
𝑆𝑂𝑆 =𝑐𝑤
1 +𝑐𝑤𝛥𝑡
𝑑
where cw is the acoustic velocity in water. Δt is the difference between the times
of transmission of the two pulses, and d is the thickness of the specimen. Unit of
measurement is m/sec [88].
Attenuation coefficient is a material property which depends on frequency
and describes loss of energy due to absorption and scattering. If f is frequency,
X(f) is the amplitude spectrum of calibration (with water) and Y(f) is the
amplitude spectrum of the signal that is propagated through the trabecular bone,

Literature review
19
the formula according to which the attenuation coefficient is calculated, is the
following:
20 log|𝑋(𝑓)|
|𝑌(𝑓)|
where the attenuation in water is neglected [89]. The slope of a linear part of
20log[X(f)/Y(f)] vs. f over the functional frequency band of the ultrasound
measurement system is known as broadband ultrasound attenuation (BUA).
Normalized BUA (nBUA) is BUA divided by the thickness d of the specimen [90].
Units of measurement for BUA and nBUA are dB/MHz and dB/cmMHz
respectively.
For in vitro experiments, the surfaces of trabecular bone specimens are
fabricated to be approximately planar. That’s why, the dependence of frequency
on transmission coefficients could be neglected over the experimental frequency
band. According to this assumption, the slope of the attenuation coefficient
occurs from nBUA.
As it has been mentioned above, the loss of energy that occurs during the
propagation of ultrasound in the biological tissues (hard and soft), is mainly
because of two factors: absorption and scattering. Absorption occurs from the
conversion of acoustic energy into thermal energy while scattering takes place
by transmitting acoustic waves, with properties different from those of the
incident wave, when they come in contact with a point of the medium that has
different acoustic properties (scatterer).
So, if a plane wave Pinc(f) is incident upon a scatterer with backscattering
amplitude Φb(f), then the scattered wave Pscat(f) that is measured in distance r
away from the scatterer could be described by the following formula [87][91][92]:
𝑃𝑠𝑐𝑎𝑡(𝑟, 𝑓) = 𝑃𝑖𝑛𝑐(𝑓)𝛷𝑏(𝑓)𝑒𝑖𝑘𝑟
𝑟
If kr >> 1, kas << 1, and as is the scatterer radius. The backscatter coefficient η(f)
occurs from the following formula [87][93]:
𝜂(𝑓) = 𝑛0|𝛷𝑏(𝑓)|2
where n0 is the number of scatterers per unit volume.
Backscatter coefficient is an intrinsic material property and it provides
useful information about the size and distribution of scatterers. Backscatter
measurements take place using pulse-echo method. In this method, one
transducer is applied that operates as a transmitter and receiver of the signal,
simultaneously. In addition, constructive and destructive interference from
waves scattered by randomly-positioned scatterers make backscatter
Literature review
20
measurements noisier than sound of speed and attenuation measurements
[3][93] and backscatter coefficient is difficult to be determined by in vivo
measurements.
2.6. Modeling of differential scattering cross section of ultrasound
The scattering that ultrasound undergoes when it propagates into spongy
bovine bone, has recently begun to be studied and has been approached with
two models. The first is proposed by Wear [94-96] who uses the detailed Faran
models, which they provide an analytical solution for the differential scattering
cross section from a spherical or a cylindrical elastic solid body. The
measurements of the differential scattering cross section are in good agreement
with theoretical predictions at low frequencies. In addition, Chaffai and his
colleagues [97] found well correlations between experimental data of Faran’s
cylindrical and spherical models. The second model [12][98] is based on one
Chernov’s proof that scattering is proportional to the fluctuation of
compressibility, and to the autocorrelation function that concerns the body. In
this model, the medium is considered as a continuous random fluid and this
modeling was successful in soft tissues. Scatterers are described as sources of
disturbance in the wave transmitted to the surrounding fluid. This approach
presupposes weak scattering.
Strelitski and Nicholson [99] presented a scattering model, using the
variation of velocity in a two-phase object and an exponential autocorrelation
function to describe statistical properties of the medium, but without being
compared with experimental results.
Jenson [100] used various autocorrelation functions (Gaussian, exponential
and dense populate) to calculate the differential scattering cross section and
found well correlations between the theoretical predictions and experimental
data. The best prediction was achieved with the Gaussian autocorrelation
function, although no large differences in results were observed comparing to
these that occurred from the use of other autocorrelation functions. Significant
correlations emerged between the predicted values for the trabeculae of spongy
bone that occurred from the models and those that calculated from the
experimental results.
All of the above models have studied scattering in human spongy bone and especially in osteoporotic calcaneus, characterized by low density and small scattering. Healthy or younger human bones, or even most animal bones, are much denser and they have larger trabeculae, resulting in a different scattering behavior. Between human and bovine spongy bone, there are differences in structure and composition. The dimensions of the trabeculae for the bovine spongy bone are from 90 up to 400 μm while for human one the range is from 50 to 230μm [101][102]. The dense and complex structure of bovine spongy bone is a

Literature review
21
limiting factor for modeling spongy bone trabeculae with cylinders. Bovine spongy bone structure does not consist of trabeculae-scatterers with little fluctuation in thickness as it happens in the osteoporotic human spongy bone, but from one set of trabeculae with large thickness variation.
As it has been mentioned, the existence of the scatterers is due to different
density or compressibility. Also, they may have a random position or a random
population into the medium, thus characterizing it inhomogeneous. This is
observed to a very large extent in biological tissues and especially in the hard
ones. In a homogeneous medium with no absorption, an acoustic wave can
propagate unchanged. Nevertheless, in biological tissues neither density nor
compressibility are constant, but both values fluctuate due to differences in
tissue structure. These fluctuations create the scattering of the acoustic wave and
consequently the possibility to be diagnosed through ultrasound.
For the modeling of a medium with random continuous inhomogeneity, as
it happens with the spongy bone, two different autocorrelation functions are
applied. The most important assumptions of the theory for the modeling of
differential scattering cross section 1800 of ultrasound as it propagates through
the cancellous bone, are the following:
• The assumption that the specimen is statistically homogeneous and
isotropic.
• There are no multiple scattering effects. This would happen in the bovine
spongy bone if only the trabeculae were of a size comparable to wavelength
[103][104].
• The assumption of weak scattering. Weak scattering is a result of small
changes in compressibility and density fluctuations, and is valid only when
the logarithm of the range of the attenuation coefficient in the direction of
the propagation of ultrasound is between 0.2-0.5 [11]. The range of the
attenuation coefficient on a heterogeneous random medium in the model
of dense populate, is given by the formula:
𝜎𝜒2 = ⟨𝛾2⟩
2
3√2𝑎𝑘2𝐿√𝜋
where: L is the distance that ultrasound travels in the specimens. The
attenuation coefficient is a function of the quantity αk2, because L and γ2
are constants. According to the above relation for the maximum variation
value of the refraction index γ2 which is 0.4, (it occurs for porosity over
65%), the range variation can be assessed as a weak one for frequencies
above 600 kHz and for scatterer size less than 300μm [7]. Thus, the
experimental data fall within the limits of weak scattering.
• An additional limitation of the propagation theory in continuous media
with random inhomogeneities, is that it takes into account only
longitudinal waves of propagation, and a possible case of conversion into

Literature review
22
shear waves at the interfaces solid and fluid is considered negligible.
Finally, although the theory of propagation in continuous media with
random inhomogeneities is suitable for soft tissues, hard tissues are
described quite well.
• The phasic speed of sound is obtained constant in the whole range of
frequencies.
Below, the two autocorrelation functions used for the description of the
dense spongy bone are presented; dense populate, fluid sphere distribution [7].
Autocorrelation function of dense populate.
In bovine spongy bone the trabeculae are densely distributed. Therefore,
the mean values of density ρ0 and compressibility κ0 do not only come from those
of the fluid that surrounds the trabeculae (marrow), but also from the
corresponding ones of trabeculae-scatterers. Thus, cancellous bone can be
considered as a densely populated medium where ρf <ρ0 and κf <κ0. With other
words cancellous bone is a medium where each of its inhomogeneities is more
uncompressed and denser than the surrounding medium. Τhe differential
scattering cross section σb and the attenuation αsc (Figure 9) have been proven
to be determined by the following formulas:
𝜎𝑏 =1
6√
2
𝜋𝛾2𝑘6𝑎5𝑒−2𝑎2𝑘2
𝑎𝑠𝑐 = √𝜋
2
𝑘2𝜇2
6𝑎𝑒−
9𝑘2𝛼2
2 (−2 − 9𝑎2𝑘2 + 𝑒4𝑎2𝑘2(2 + 𝑎2𝑘2))
where α is the size of scatterer, μ2 is the variation of speed and k= 2π /λ.
(a) (b) Figure 9: (a) Prediction of differential scattering cross section in spongy bone with 70% porosity
for different sizes of scatterers, (b) Prediction of attenuation. Dense Populate [7].

Literature review
23
Autocorrelation function of fluid sphere distribution.
Suppose a random medium in which there are spheres of the same radius
randomly distributed, of different density and compressibility from this
medium. The autocorrelation function of this medium (spherical
distribution function) has been determined by the autocorrelation of a
sphere in three dimensions [78]. The differential scattering cross section σb
and the attenuation αsc (Figure 10) have been proven to be determined by the
following formulas:
𝜎𝑏 =𝑘4𝑉𝑆
2�̅�𝛾02
16𝜋2(
3
2𝑘𝑎𝐽1(2𝑘𝑎))
where: J1 is of first degree and first type of the spherical function Bessel, Vs is the
total volume of spherical scatterers with a radius α, n is the average of scatterers
per unit volume in the medium, γ0 is the average square variation per scatterer
and k= 2π /λ.
𝑎𝑠𝑐 =𝑘2𝜇2
2[10 − 9 cos 2𝑎𝑘 − cos 6𝑎𝑘
36𝑎𝑘2+
1
𝑎3𝑘4(
41
108+
3(−2 + 4𝑎2𝑘2) cos 2𝑎𝑘
16+
+(−2 + 36𝑎2𝑘2) cos 6𝑎𝑘
432) +
3 sin 2𝑎𝑘 + sin 6𝑎𝑘
6𝑘+
1
8𝑎2𝑘3((−6 + 4𝑎2𝑘2) sin 2𝑎𝑘 +
+1
81(−6 + 36𝑎2𝑘2) sin 6𝑎𝑘)]
where μ2 is the variation of speed.
(a) (b) Figure 10:(a) Prediction of differential scattering cross section in spongy bone with 70% porosity for different sizes of scatterers, (b) Prediction of attenuation. Fluid spherical distribution [7].

Literature review
24
2.7. 3D-printing technology
Three-dimensional (3D) printing is a method used for the fabrication of
objects. A 3D-printer is a progressive machine that is able to fuse or deposit
materials in layers in order to create a 3D object. The materials applied may be
plastic, metals, ceramics, powders, liquids, or even living cells. The 3D-printing
procedure is also referred to as rapid prototyping (RP), additive manufacturing
(AM), or solid free-form technology (SFF) and it is expected to dominate
medicine and other fields.
Figure 11: A 3D-printing machine.
There are a lot of 3D-printing processes that differ from each other, they
are applied to distinct fields and their printer technologies, speeds, resolutions,
and materials vary. The 3D object could be constructed in almost any shape
imaginable as defined in a computer-aided design (CAD). The 3D-printer follows
the instructions programmed by the computer in order to build the base of the
object, moving the printhead along the x–y plane. Then, it continues moving the
printhead along the z-axis to build the object vertically layer by layer [105-109].
Last but not least, it is remarkable the fact that two-dimensional (2D)
radiographic images can be converted into digital 3D-print files, thus giving the
opportunity of complex, customized anatomical and medical structures
fabrication. Radiographic images may come from magnetic resonance imaging
(MRI), computerized tomography (CT) or x-rays scans.
In the early 1980s, Charles Hull invented 3D-printing, which he called
“stereolithography”. He was working at the company Ultra Violet Products in
California, making objects from photopolymers. Stereolithography uses an .stl
file format that contains instructions about the shape, the color, the texture and
the thickness of the 3D-printing object. This .stl file is applied for the

Literature review
25
interpretation of the data in a CAD file, allowing this to be communicated
electronically to the 3D-printer.
Later, Hull founded the company 3D Systems, which developed
“stereolithography apparatus” the first 3D-printer. In 1988, 3D Systems
introduced the 3D-printer SLA-250, which was the first commercially available,
while many other companies followed suit and developed 3D-printers for
commercial applications [108].
As it was mentioned before, there are many distinct 3D-printing processes
according to the fields that these are applied. The types of 3D-printing are
[110][111]:
• Binder jetting
• Directed energy deposition
• Materials extrusion
• Materials jetting
• Powder bed fusion
• Sheet lamination
• Vat Photopolymerization
Materials that are used for 3D-printing technology in manufacturing
industry are [105][110][111]:
• Metals
• Polymers
• Ceramics
• Composites
• Smart materials
• Special material, such as food, lunar dust and textile.
The applications of 3D-printing in manufacturing technology concern the industries of aerospace, automotive, food, architecture and building, fabric and fashion, electric and electronic and finally healthcare and medical industry [105][110]. Regarding the applications of 3D-printing in medicine there are four levels [112][113].
• Organ models are constructed in order to help in preoperative planning
and surgical treatment analysis.
3D-printed organ and medical models aid doctors in the preparation of a surgery
but they also can provide a medium of communication between doctors and
engineers, thus assisting in surgical analysis and diagnosis. Applications that
include in vitro equipment, medical models, testing standards and prosthesis
design do not require the biocompatibility of materials, because these 3D objects
will not enter the body.

Literature review
26
• Permanent non-bioactive implants.
In dentistry and orthopedics are used permanent medical implants
manufactured by non-degradable biomaterials. Permanent medical implants
provide good biocompatibility after the surgical operation and compared with
traditional fabricated implants, 3D-printing ones with any complex structure can
be personalized real-time manufactured with high dimensional accuracy.
• Fabricating bioactive and biodegradable scaffolds.
Fabrication of tissues and organs could be achieved by two possible ways. The
first method concern the tissue engineering and it is known as indirect cell
assembly, which includes the construction of a 3D scaffold and then the seeding
of cells. The biomimetic tissue-like microarchitecture structures could be created
by biocompatible materials, growth factors, and physical factors. This could be
achieved either only with these factors or combined with living cells [114]. The
second method creates both cells and materials into a composite structure and
it is known as direct cell assembly.
• Directly printing tissue and organs.
Cell and organ printing represents the origin of modern 3D bioprinting
technology. Various materials and ‘‘biological ink” containing seed cells, growth
factors, and nutritional components are printed layer by layer, thus forming
tissue structures. Then, by the process of culturing, tissues or organs with
physiological functions can be formed.
Figure 12: Two cardiac 3D-printed models opened at the level of the four-chamber view, for healthcare teaching [113].
3D-printing has become an innovative tool that has plenty of distinct
application fields, including medicine and it is a constantly developing
technology [108], as printer performance, resolution, and available materials are
increased. The medical advances that 3D-printing has offered, are significant and

Literature review
27
exciting. However, scientists continue to improve the existing medical
applications of 3D-printing technology, such as organ printing.
2.8. Research on 3D-printed trabecular bone
3D-printing technology is used for trabecular bone replicas fabrication in
order to simulate the same bone structure with distinct parameters. It is difficult
to have the same sample in different states and thus, compare the characteristics
and mechanical properties. Thus, 3D-printing technology gives the opportunity
to overcome these issues and study the bone properties with different ways that
lead to quantified results easily [115][116].
C.M. Langton (1997) used the method of stereolithography in order to
manufacture a model, thus simulating the trabecular bone of the human
calcaneus [31]. In this way, perforation and thinning of trabecular bone related
to osteoporosis was simulated and the dependence of ultrasound and mechanical
parameters on the cancellous bone structure was assessed. Also, in 2006, C.M.
Langton and C.A. Dobson applied stereolithography in order to construct models
of trabecular bone structures [117]. The 3D-printed models were mechanically
tested and the results regarding to bone stiffness were compared with that
predicted by finite element analysis. After this comparison a strong correlation
between the predicted and calculated stiffnesses of the structures occurred, thus
showing that the method of stereolithography is promising. After a few years,
Haydar Aygün (2010) applied ultrasound propagation through stereolithography
bone replicas that were 13 times larger than the original bone samples [118]. The
measurements of pulses, that were centered on 100 kHz and 1 MHz and
transmitted through the bone replicas, were compared with predictions of a
modified anisotropic Biot–Allard theory.
V. Kuhn (2014) studied the quality and difference of microCT-based
trabecular bone structures and the biomechanical properties of 3D-printed
trabecular bone specimens, having used high-end 3D-printers enabling
resolutions up to 16μm [119]. Y.J. Yoon (2015) applied the 3D-printing technology
and the compression test in order to investigate the mechanical properties of
engineered trabecular bone and honeycomb structures [120]. The structures
designed were manufactured using the fused deposition modeling (FDM) with
acrylonitrile butadiene styrene (ABS) as a material.
The following year, F. Meziere carried out ultrasound measurements of 1:1
scale 3D-printed trabecular bone specimens [121]. The ultrasound through
transmission experiments were performed through a highly anisotropic version
of the bone structure, and both the fast and slow waves were observed. In this
study the potential of stereolithography is underlined and the relevance of such

Literature review
28
bone models for the study of ultrasound propagation in bone indicates the
upcoming progress of science and research.
D. Wu (2020) assessed the possibilities of using fused deposition modeling
(FDM) regarding to the cancellous bone simulation [122]. A composite of
degradable polymer, polylactic acid (PLA), and hydroxyapatite (HA) was used for
better mimic real bone, both in terms of mechanical properties and
biodegradability. Micro-computed tomography, compression and screw pull out
tests were conducted in order to be evaluated the morphometric and mechanical
properties of the 3D-printed models. The reproduction of the trabecular bone
structures by 3D-printed PLA/HA composites occurs to be a promising strategy
for synthetic bone models, when high printed resolution can be achieved. The
same year, R.M. Carew evaluated the surface quality of 3D- printed bone models
[123]. He manufactured models of nine human bones using selective laser
sintering (SLS). The results indicated that the 3D-printed specimens were
accurate to within 2.0 mm of the original dry bone.
The most recent study published in terms of ultrasonic wave propagation
through a 3D-printed replica model of trabecular bone conducted by A.
Tsirigotis, D. Deligianni and K. Apostolopoulos (2021) [124]. First, the fact that
the 3D-printer is able to produce precisely and repeatedly “bone replica models”
of different size and density was verified by compressive tests. Then, replicas of
the original trabecular bone specimens were constructed with two different
polymers and thinned trabeculae models were used for the assessment of the
influence of material properties on ultrasound characteristics. The results
indicated that only the magnitude of the backscatter coefficient is influenced,
whereas the characteristics of ultrasonic wave propagation is associated with the
trabecular structure.
Bibliography
[1]. McKelvie, M. L., & Palmer, S. B. (1991). The interaction of ultrasound with cancellous bone. Physics in Medicine & Biology, 36(10), 1331.
[2]. Langton, C. M., Palmer, S. B., & Porter, R. W. (1984). The measurement of broadband ultrasonic attenuation in cancellous bone. Engineering in medicine, 13(2), 89-91.
[3]. Padilla, F., Jenson, F., & Laugier, P. (2006). Estimation of trabecular thickness using ultrasonic backcatter. Ultrasonic imaging, 28(1), 3-22.
[4]. Rüegsegger, P., Koller, B., & Müller, R. (1996). A microtomographic system
for the nondestructive evaluation of bone architecture. Calcified tissue
international, 58(1), 24-29.
[5]. Chen, I. I., & Saha, S. (1987). Wave propagation characteristics in long bones to diagnose osteoporosis. Journal of biomechanics, 20(5), 523-527.
[6]. Nagatani, Y., Mizuno, K., Saeki, T., Matsukawa, M., Sakaguchi, T., & Hosoi,
H. (2008). Numerical and experimental study on the wave attenuation in

Literature review
29
bone–FDTD simulation of ultrasound propagation in cancellous bone.
Ultrasonics, 48(6-7), 607-612.
[7]. Αποστολόπουλος, Κ. (2009). Διάδοση υπερήχων σε σπογγώδες οστούν in
vitro. Eπίδραση των μεταβολών της μικροδομής στην σκέδαση των υπερήχων
σ’ένα πειραματικό μοντέλο οστεοπόρωσης (Doctoral dissertation).
[8]. Blake, G., Wahner, H., & Fogelman, I. (1999). The evaluation of osteoporosis:
Dual energy X-ray absorptiometry in clinical practice (Second ed.). London:
Martin Dunitz.
[9]. Kelly, T. L., Crane, G., & Baran, D. T. (1994). Single X-ray absorptiometry of the forearm: precision, correlation, and reference data. Calcified tissue international, 54(3), 212-218.
[10]. Θ. Φιλιππίδης (2000). Μη καταστροφικός έλεγχος με υπερήχους, Πανεπιστήμιο Πατρών, Τμήμα Μηχανολόγων Μηχανικών, Εργαστήριο Τεχνικής Μηχανικής και Ταλαντώσεων.
[11]. Ishimaru, A. (1990). Wave propagation and scattering in random media. San
Diego: Acad. Pr.
[12]. Chernov, L. A., & Silverman, R. A. (1960). Wave propagation in a random
medium (p. 168). New York: McGraw-Hill.
[13]. Njeh, C. F., Boivin, C. M., & Langton, C. M. (1997). The role of ultrasound
in the assessment of osteoporosis: a review. Osteoporosis international, 7(1),
7-22.
[14]. Wear, K. A., Stuber, A. P., & Reynolds, J. C. (2000). Relationships of
ultrasonic backscatter with ultrasonic attenuation, sound speed and bone
mineral density in human calcaneus. Ultrasound in medicine & biology,
26(8), 1311-1316.
[15]. Chappard, C., Laugier, P., Fournier, B., Roux, C., & Berger, G. (1997). Assessment of the relationship between broadband ultrasound attenuation and bone mineral density at the calcaneus using BUA imaging and DXA. Osteoporosis international, 7(4), 316-322.
[16]. Baran, D. T., Faulkner, K. G., Genant, H. K., Miller, P. D., & Pacifici, R.
(1997). Diagnosis and management of osteoporosis: guidelines for the
utilization of bone densitometry. Calcified Tissue International, 61(6), 433-
440.
[17]. Han, S., Rho, J., Medige, J., & Ziv, I. (1996). Ultrasound velocity and broadband attenuation over a wide range of bone mineral density. Osteoporosis international, 6(4), 291-296.
[18]. Langton, C. M., Ali, A. V., Riggs, C. M., Evans, G. P., & Bonfield, W. (1990). A contact method for the assessment of ultrasonic velocity and broadband attenuation in cortical and cancellous bone. Clinical physics and physiological measurement, 11(3), 243.
[19]. Wear, K. A., & Garra, B. S. (1998). Assessment of bone density using ultrasonic backscatter. Ultrasound in medicine & biology, 24(5), 689-695.
[20]. Evans, J. A., & Tavakoli, M. B. (1990). Ultrasonic attenuation and velocity in bone. Physics in Medicine & Biology, 35(10), 1387.

Literature review
30
[21]. Nicholson, P. H. F., Lowet, G., Langton, C. M., Dequeker, J., & Van der Perre, G. (1996). A comparison of time-domain and frequency-domain approaches to ultrasonic velocity measurement in trabecular bone. Physics in Medicine & Biology, 41(11), 2421.
[22]. Njeh, C. F., Hodgskinson, R., Currey, J. D., & Langton, C. M. (1996). Orthogonal relationships between ultrasonic velocity and material properties of bovine cancellous bone. Medical engineering & physics, 18(5), 373-381.
[23]. Ashman, R. B., & Rho, J. Y. (1988). Elastic modulus of trabecular bone material. Journal of biomechanics, 21(3), 177-181.
[24]. Gibson, L. J. (1985). The mechanical behaviour of cancellous bone. Journal of biomechanics, 18(5), 317-328.
[25]. Nicholson, P. H. F., Haddaway, M. J., & Davie, M. W. J. (1994). The dependence of ultrasonic properties on orientation in human vertebral bone. Physics in Medicine & Biology, 39(6), 1013.
[26]. Langton, C. M. (1994). The role of ultrasound in the assessment of osteoporosis. Clinical Rheumatology, 13, 13-17.
[27]. Alves, J. M., Ryaby, J. T., Kaufman, J. J., Magee, F. P., & Siffert, R. S. (1996). Influence of marrow on ultrasonic velocity and attenuation in bovine trabecular bone. Calcified tissue international, 58(5), 362-367.
[28]. Duquette, J., Lin, J., Hoffman, A., Houde, J., Ahmadi, S., & Baran, D. (1997). Correlations among bone mineral density, broadband ultrasound attenuation, mechanical indentation testing, and bone orientation in bovine femoral neck samples. Calcified tissue international, 60(2), 181-186.
[29]. Duquette, J., Honeyman, T., Hoffman, A., Ahmadi, S., & Baran, D. (1997). Effect of bovine bone constituents on broadband ultrasound attenuation measurements. Bone, 21(3), 289-294.
[30]. Strelitzki, R., Evans, J. A., & Clarke, A. J. (1997). The influence of porosity and pore size on the ultrasonic properties of bone investigated using a phantom material. Osteoporosis international, 7(4), 370-375.
[31]. Langton, C. M., Whitehead, M. A., Langton, D. K., & Langley, G. (1997). Development of a cancellous bone structural model by stereolithography for ultrasound characterisation of the calcaneus. Medical engineering & physics, 19(7), 599-604.
[32]. Hodgskinson, R., Njeh, C. F., Currey, J. D., & Langton, C. M. (1997). The ability of ultrasound velocity to predict the stiffness of cancellous bone in vitro. Bone, 21(2), 183-190.
[33]. Dequeker, J. (1994). Assessment of quality of bone in osteoporosis--BIOMED I: fundamental study of relevant bone. Clinical rheumatology, 13, 7-12.
[34]. Geraets 1998ard, A. (1997). Three-dimensional methods for quantification of cancellous bone architecture. Bone, 20(4), 315-328.
[35]. Mehta, B. V., Rajani, S., & Sinha, G. (1997). Comparison of image processing techniques (magnetic resonance imaging, computed tomography scan and ultrasound) for 3D modeling and analysis of the human bones. Journal of digital imaging, 10(1), 203-206.

Literature review
31
[36]. Laugier, P., Droin, P., Laval-Jeantet, A. M., & Berger, G. (1997). In vitro assessment of the relationship between acoustic properties and bone mass density of the calcaneus by comparison of ultrasound parametric imaging and quantitative computed tomography. Bone, 20(2), 157-165.
[37]. Majumdar, S., Weinstein, R. S., & Prasad, R. R. (1993). Application of fractal geometry techniques to the study of trabecular bone. Medical physics, 20(6), 1611-1619.
[38]. Fazzalari, N. L., & Parkinson, I. H. (1997). Fractal properties of subchondral cancellous bone in severe osteoarthritis of the hip. Journal of Bone and Mineral Research, 12(4), 632-640.
[39]. Rho, J. Y., Tsui, T. Y., & Pharr, G. M. (1997). Elastic properties of human cortical and trabecular lamellar bone measured by nanoindentation. Biomaterials, 18(20), 1325-1330.
[40]. Langton, C. M., Whitehead, M. A., Haire, T. J., & Hodgskinson, R. (1998). Fractal dimension predicts broadband ultrasound attenuation in stereolithography models of cancellous bone. Physics in Medicine & Biology, 43(2), 467.
[41]. Müller, R., Hildebrand, T. H. H. J., Häuselmann, H. J., & Rüegsegger, P. (1996). In vivo reproducibility of three‐dimensional structural properties of noninvasive bone biopsies using 3D‐pQCT. Journal of Bone and Mineral Research, 11(11), 1745-1750.
[42]. Van Rietbergen, B., Odgaard, A., Kabel, J., & Huiskes, R. (1996). Direct mechanics assessment of elastic symmetries and properties of trabecular bone architecture. Journal of biomechanics, 29(12), 1653-1657.
[43]. Zagzebski, J. A., Rossman, P. J., Mesina, C., Mazess, R. B., & Madsen, E. L. (1991). Ultrasound transmission measurements through the os calcis. Calcified tissue international, 49(2), 107-111.
[44]. Mahrt, K. H., Barkmann, R., Niedermayer, W., & Kroebel, W. (1991, December). Extremely sensitive ultrasound scanning system for non-invasive in vivo detection of minute mineralisation changes in human heel bones. In IEEE 1991 Ultrasonics Symposium, (pp. 1119-1122). IEEE.
[45]. Laugier, P., Giat, P., & Berger, G. (1994). Bone characterization with ultrasound: state of the art and new proposal. Clinical rheumatology, 13, 22-32.
[46]. Langton, C. M., Riggs, C. M., & Evans, G. P. (1991). Pathway of ultrasound waves in the equine third metacarpal bone. Journal of biomedical engineering, 13(2), 113-118.
[47]. Campbell, J. A., & Waag, R. C. (1983). Normalization of ultrasonic scattering measurements to obtain average differential scattering cross sections for tissues. The Journal of the Acoustical Society of America, 74(2), 393-399.
[48]. Madsen, E. L., Insana, M. F., & Zagzebski, J. A. (1984). Method of data reduction for accurate determination of acoustic backscatter coefficients. The Journal of the Acoustical Society of America, 76(3), 913-923.
[49]. Lizzi, F. L., Ostromogilsky, M., Feleppa, E. J., Rorke, M. C., & Yaremko, M. M. (1987). Relationship of ultrasonic spectral parameters to features of tissue microstructure. IEEE transactions on ultrasonics, ferroelectrics, and frequency control, 34(3), 319-329.

Literature review
32
[50]. Sehgal, C. M. (1993). Quantitative relationship between tissue composition and scattering of ultrasound. The Journal of the Acoustical Society of America, 94(4), 1944-1952.
[51]. Florencio-Silva, R., Sasso, G. R. D. S., Sasso-Cerri, E., Simões, M. J., & Cerri, P. S. (2015). Biology of bone tissue: structure, function, and factors that influence bone cells. BioMed research international, 2015.
[52]. Olszta, M. J., Cheng, X., Jee, S. S., Kumar, R., Kim, Y. Y., Kaufman, M. J., ... & Gower, L. B. (2007). Bone structure and formation: A new perspective. Materials Science and Engineering: R: Reports, 58(3-5), 77-116.
[53]. Weiner, S., & Wagner, H. D. (1998). The material bone: structure-mechanical function relations. Annual review of materials science, 28(1), 271-298.
[54]. Bourne, G. H. (Ed.). (2014). The biochemistry and physiology of bone. Elsevier.
[55]. Cooper, R. R., MILGRAM, J. W., & ROBINSON, R. A. (1966). Morphology of the osteon: an electron microscopic study. JBJS, 48(7), 1239-1271.
[56]. Florencio-Silva, R., Sasso, G. R. D. S., Sasso-Cerri, E., Simões, M. J., & Cerri, P. S. (2015). Biology of bone tissue: structure, function, and factors that influence bone cells. BioMed research international, 2015.
[57]. Currey, J. (1984). Comparative mechanical properties and histology of bone. American Zoologist, 24(1), 5-12.
[58]. Currey, J. D. (1984). Effects of differences in mineralization on the mechanical properties of bone. Philosophical Transactions of the Royal Society of London. B, Biological Sciences, 304(1121), 509-518.
[59]. Ascenzi, A., Benvenuti, A., & Bonucci, E. (1982). The tensile properties of single osteonic lamellae: technical problems and preliminary results. Journal of biomechanics, 15(1), 29-37.
[60]. Barbos, M. P., Bianco, P., & Ascenzi, A. (1982). Structural and biomechanical analysis of osteonic compact bone: a new method. In Biomechanics: Principles and Applications (pp. 261-266). Springer, Dordrecht.
[61]. Singh, I. (1978). The architecture of cancellous bone. Journal of anatomy, 127(Pt 2), 305.
[62]. Whitehouse, W. J., Dyson, E. D., & Jackson, C. K. (1971). The scanning electron microscope in studies of trabecular bone from a human vertebral body. Journal of anatomy, 108(Pt 3), 481.
[63]. Whitehouse, W. J. (1974). The quantitative morphology of anisotropic trabecular bone. Journal of microscopy, 101(2), 153-168.
[64]. Gray, H. (2009). Gray's anatomy. Arcturus Publishing. [65]. Borah, B., Dufresne, T. E., Chmielewski, P. A., Gross, G. J., Prenger, M. C.,
& Phipps, R. J. (2002). Risedronate preserves trabecular architecture and increases bone strength in vertebra of ovariectomized minipigs as measured by three‐dimensional microcomputed tomography. Journal of Bone and Mineral Research, 17(7), 1139-1147.
[66]. Harrigan, T. P., & Mann, R. W. (1984). Characterization of microstructural anisotropy in orthotropic materials using a second rank tensor. Journal of Materials Science, 19(3), 761-767.
Literature review
33
[67]. Hildebrand, T. O. R., & Rüegsegger, P. (1997). Quantification of bone microarchitecture with the structure model index. Computer Methods in Biomechanics and Bio Medical Engineering, 1(1), 15-23.
[68]. Odgaard, A., & Gundersen, H. J. G. (1993). Quantification of connectivity in cancellous bone, with special emphasis on 3-D reconstructions. Bone, 14(2), 173-182.
[69]. Odgaard, A. (1997). Three-dimensional methods for quantification of cancellous bone architecture. Bone, 20(4), 315-328.
[70]. Parfitt, A. M., Drezner, M. K., Glorieux, F. H., Kanis, J. A., Malluche, H., Meunier, P. J., ... & Recker, R. R. (1987). Bone histomorphometry: standardization of nomenclature, symbols, and units: report of the ASBMR Histomorphometry Nomenclature Committee. Journal of bone and mineral research, 2(6), 595-610.
[71]. Ulrich, D., Van Rietbergen, B., Laib, A., & Ruegsegger, P. (1999). The ability of three-dimensional structural indices to reflect mechanical aspects of trabecular bone. Bone, 25(1), 55-60.
[72]. Geraets, W. G. M. (1998). Comparison of two methods for measuring orientation. Bone, 23(4), 383-388.
[73]. Galante, J., Rostoker, W., & Ray, R. D. (1970). Physical properties of trabecular bone. Calcified tissue research, 5(1), 236-246.
[74]. Bourbié, T., Coussy, O., Zinszner, B., & Junger, M. C. (1992). Acoustics of porous media.
[75]. Keller, J. B. (1958). Surface waves on water of non-uniform depth. Journal of Fluid Mechanics, 4(6), 607-614.
[76]. Crawford, F. S. (1971). Berkeley physics course: Ondas. 3 (Vol. 3). Reverté. [77]. Whitham, G. B. (2011). Linear and nonlinear waves (Vol. 42). John Wiley &
Sons. [78]. Insana, M. F., Brown, D. G., & Shung, K. K. (1993). Acoustic scattering
theory applied to soft biological tissues. Ultrasonic scattering in biological tissues, 75-124.
[79]. Lighthill, M. J., & Lighthill, J. (2001). Waves in fluids. Cambridge university press.
[80]. Chivers, R. C. (1977). The scattering of ultrasound by human tissues—Some theoretical models. Ultrasound in medicine & biology, 3(1), 1-13.
[81]. Laugier, P., & Haïat, G. (2011). Introduction to the physics of ultrasound. Bone quantitative ultrasound, 29-45.
[82]. Martin, D. J., Wells, I. T., & Goodwin, C. R. (2015). Physics of ultrasound. Anaesthesia & Intensive Care Medicine, 16(3), 132-135.
[83]. Hirao, M., & Ogi, H. (2017). Electromagnetic acoustic transducers (Vol. 20017). Tokyo, Japan:: Springer.
[84]. Platte, M. (1991). PVDF ultrasonic transducers for non-destructive testing. Ferroelectrics, 115(4), 229-246.
[85]. Arnau, A. (Ed.). (2004). Piezoelectric transducers and applications (Vol. 2004). Berlin: Springer.
[86]. Kelly, J. F. (2003). Nearfield pressure calculations for circular transducers. East Lansing: Michigan State University.
Literature review
34
[87]. Wear, K. A. (2019). Mechanisms of interaction of ultrasound with cancellous bone: A review. IEEE transactions on ultrasonics, ferroelectrics, and frequency control, 67(3), 454-482.
[88]. Droin, P., Berger, G., & Laugier, P. (1998). Velocity dispersion of acoustic waves in cancellous bone. IEEE transactions on ultrasonics, ferroelectrics, and frequency control, 45(3), 581-592.
[89]. Bauer, A. Q., Anderson, C. C., Holland, M. R., & Miller, J. G. (2009). Bone sonometry: Reducing phase aberration to improve estimates of broadband ultrasonic attenuation. The Journal of the Acoustical Society of America, 125(1), 522-529.
[90]. Langton, C. M., Njeh, C. F., Hodgskinson, R., & Currey, J. D. (1996). Prediction of mechanical properties of the human calcaneus by broadband ultrasonic attenuation. Bone, 18(6), 495-503.
[91]. Chen, X., Phillips, D., Schwarz, K. Q., Mottley, J. G., & Parker, K. J. (1997). The measurement of backscatter coefficient from a broadband pulse-echo system: A new formulation. IEEE transactions on ultrasonics, ferroelectrics, and frequency control, 44(2), 515-525.
[92]. O’Donnell, M., & Miller, J. G. (1981). Quantitative broadband ultrasonic backscatter: An approach to nondestructive evaluation in acoustically inhomogeneous materials. Journal of Applied Physics, 52(2), 1056-1065.
[93]. Wear, K. A. (2001). Fundamental precision limitations for measurements of frequency dependence of backscatter: Applications in tissue-mimicking phantoms and trabecular bone. The Journal of the Acoustical Society of America, 110(6), 3275-3282.
[94]. Wear, K. A. (1999). Frequency dependence of ultrasonic backscatter from human trabecular bone: Theory and experiment. The Journal of the Acoustical Society of America, 106(6), 3659-3664.
[95]. Wear, K. A., & Laib, A. (2003). The dependence of ultrasonic backscatter on trabecular thickness in human calcaneus: Theoretical and experimental results. IEEE transactions on ultrasonics, ferroelectrics, and frequency control, 50(8), 979-986.
[96]. Wear, K. A. (2004). Measurement of dependence of backscatter coefficient from cylinders on frequency and diameter using focused transducers—with applications in trabecular bone. The Journal of the Acoustical Society of America, 115(1), 66-72.
[97]. Chaffaı, S., Roberjot, V., Peyrin, F., Berger, G., & Laugier, P. (2000). Frequency dependence of ultrasonic backscattering in cancellous bone: Autocorrelation model and experimental results. The journal of the Acoustical Society of America, 108(5), 2403-2411.
[98]. Morse, P. M., & Ingard, K. U. (1986). Theoretical acoustics. Princeton university press.
[99]. Nicholson, P. H. F., Strelitzki, R., Cleveland, R. O., & Bouxsein, M. L. (2000). Scattering of ultrasound in cancellous bone: predictions from a theoretical model. Journal of biomechanics, 33(4), 503-506.
[100]. rédéric Jenson, F., rédéric Padilla, F., & Laugier, P. (2003). Prediction of frequency-dependent ultrasonic backscatter in cancellous bone using

Literature review
35
statistical weak scattering model. Ultrasound in medicine & biology, 29(3), 455-464.
[101]. Trebacz, H., & Natali, A. (1999). Ultrasound velocity and attenuation in cancellous bone samples from lumbar vertebra and calcaneus. Osteoporosis international, 9(2), 99-105.
[102]. Thomsen, J. S., Ebbesen, E. N., & Mosekilde, L. I. (2002). Static histomorphometry of human iliac crest and vertebral trabecular bone: a comparative study. Bone, 30(1), 267-274.
[103]. Tourin, A., Derode, A., Peyre, A., & Fink, M. (2000). Transport parameters for an ultrasonic pulsed wave propagating in a multiple scattering medium. The Journal of the Acoustical Society of America, 108(2), 503-512.
[104]. Page, J. H., Sheng, P., Schriemer, H. P., Jones, I., Jing, X., & Weitz, D. A. (1996). Group velocity in strongly scattering media. Science, 271(5249), 634-637.
[105]. Ventola, C. L. (2014). Medical applications for 3D-printing: current and projected uses. Pharmacy and Therapeutics, 39(10), 704.
[106]. Schubert, C., Van Langeveld, M. C., & Donoso, L. A. (2014). Innovations in 3D-printing: a 3D overview from optics to organs. British Journal of Ophthalmology, 98(2), 159-161.
[107]. Ursan, I. D., Chiu, L., & Pierce, A. (2013). Three-dimensional drug printing: a structured review. Journal of the American Pharmacists Association, 53(2), 136-144.
[108]. Gross, B. C., Erkal, J. L., Lockwood, S. Y., Chen, C., & Spence, D. M. (2014). Evaluation of 3D-printing and its potential impact on biotechnology and the chemical sciences.
[109]. Cui, X., Boland, T., DD'Lima, D., & K Lotz, M. (2012). Thermal inkjet printing in tissue engineering and regenerative medicine. Recent patents on drug delivery & formulation, 6(2), 149-155.
[110]. Shahrubudin, N., Lee, T. C., & Ramlan, R. (2019). An overview on 3D-printing technology: Technological, materials, and applications. Procedia Manufacturing, 35, 1286-1296.
[111]. Lee, J. Y., An, J., & Chua, C. K. (2017). Fundamentals and applications of 3D-printing for novel materials. Applied materials today, 7, 120-133.
[112]. Yan, Q., Dong, H., Su, J., Han, J., Song, B., Wei, Q., & Shi, Y. (2018). A review of 3D-printing technology for medical applications. Engineering, 4(5), 729-742.
[113]. Dodziuk, H. (2016). Applications of 3D-printing in healthcare. Kardiochirurgia i torakochirurgia polska= Polish journal of cardio-thoracic surgery, 13(3), 283.
[114]. Li, S., Qian, T., Wang, X., Liu, J., & Gu, X. (2017). Noncoding RNAs and their potential therapeutic applications in tissue engineering. Engineering, 3(1), 3-15.
[115]. Thomas, D., & Singh, D. (2017). 3D-printing for engineering the next generation of artificial trabecular bone structures. International journal of surgery (London, England), 46, 195-197.
[116]. Barak, M. M., & Black, M. A. (2018). A novel use of 3D-printing model demonstrates the effects of deteriorated trabecular bone structure on bone

Literature review
36
stiffness and strength. Journal of the mechanical behavior of biomedical materials, 78, 455-464.
[117]. Dobson, C. A., Sisias, G., Phillips, R., Fagan, M. J., & Langton, C. M. (2006). Three dimensional stereolithography models of cancellous bone structures from μCT data: testing and validation of finite element results. Proceedings of the Institution of Mechanical Engineers, Part H: Journal of Engineering in Medicine, 220(3), 481-484.
[118]. Aygün, H., Attenborough, K., Lauriks, W., & Langton, C. M. (2010). Ultrasonic wave propagation in stereo-lithographical bone replicas. The Journal of the Acoustical Society of America, 127(6), 3781-3789.
[119]. Kuhn, V., Ivanovic, N., & Recheis, W. (2014). High resolution 3D-printing of trabecular bone based on micro-CT data. Journal of Orthopaedic Translation, 4(2), 238.
[120]. Yoon, Y. J., Moon, S. K., & Hwang, J. (2014). 3D-printing as an efficient way for comparative study of biomimetic structures—trabecular bone and honeycomb. Journal of Mechanical Science and Technology, 28(11), 4635-4640.
[121]. Meziere, F., Juskova, P., Woittequand, J., Muller, M., Bossy, E., Boistel, R., ... & Derode, A. (2016). Experimental observation of ultrasound fast and slow waves through three-dimensional printed trabecular bone phantoms. The Journal of the Acoustical Society of America, 139(2), EL13-EL18.
[122]. Wu, D., Spanou, A., Diez-Escudero, A., & Persson, C. (2020). 3D-printed PLA/HA composite structures as synthetic trabecular bone: A feasibility study using fused deposition modeling. Journal of the mechanical behavior of biomedical materials, 103, 103608.
[123]. Carew, R. M., Morgan, R. M., & Rando, C. (2020). Experimental assessment of the surface quality of 3D-printed bones. Australian Journal of Forensic Sciences, 1-18.
[124]. Athanasios, T., Konstantinos, A., & Despoina, D. (2021). Three-dimensional-printed replica models of bone for experimentally decoupling trabecular bone properties contribution to ultrasound propagation parameters. The Journal of the Acoustical Society of America, 149(1), 296-306.

Materials
37
3. Chapter 3:
Materials
In the present study, they were manufactured 3D-printed replicas of bovine
trabecular bone, using three different materials in order to evaluate the influence
of material properties in ultrasound propagation through the bone structures.
First, Polylactic Acid (PLA) and Thermoplastic Polyurethane (TPU) were used
for the fabrication of trabecular bone specimens of BV/TV=40% and
BV/TV=34%. Then, Polypropylene (PP) has a density close to that of the human
bones. Thus, it was used for trabecular bone specimens of BV/TV=55%,
BV/TV=40% and for osteoporotic ones (BV/TV=34% and BV/TV=21%) in order
to simulate the real conditions and make useful conclusions in terms of
osteoporosis. In total, they were manufactured eight specimens.
3.1. Polylactic Acid (PLA)
Polylactic acid is a biodegradable and renewable aliphatic polyester that is
extensively researched and utilized. It has proven that PLA is able to replace
petrochemical-based polymers used for industrial applications and be a leading
biomaterial for various applications in medicine [1]. Some of its applications in
medicine concern:
• Wound management and stent applications
• Drug delivery system-based PLA
• Orthopedic and fixation devices
• Tissue engineering and regenerative medicine
PLA is a thermoplastic, high-strength and high-modulus polymer that can
be derived from annually renewable resources to produce distinct components
either for industrial usage or for the biocompatible/bioabsorbable medical device
construction. It can be easily processed on standard plastic for the fabrication of
fibers, film or molded parts. Also, PLA is widely used for 3D-printing, where it is
not suitable for food contact and in-vivo applications.
Below, technical data [2] of transparent PLA used for 3D-printing are
presented (Table 2&3):
Table 2: Thermal properties of transparent PLA material.
Transparent PLA
Thermal Properties Typical Value
Melt mass-flow rate (MFR) 6.09 g/10min
Glass transition ~60 ̊C
Melting temperature 145-160 C̊

Materials
38
Table 3: Mechanical properties of 3D-printing transparent PLA material.
Transparent PLA-3D-printing
Property Typical Value
Density 1.24 g/cm3
Me
cha
nic
al
Pro
pe
rtie
s Tensile modulus 2346.5 MPa
Tensile stress at yield 49.5 MPa
Tensile stress at break 45.6 MPa
Elongation at yield 3.3 %
Elongation at break 5.2 %
Flexural strength 103.0 MPa
Flexural modulus 3150.0 MPa
Izod impact strength, notched (at 23 ̊C)
5.1 kJ/m2
3.2. Thermoplastic Polyurethane (TPU)
Thermoplastic polyurethane (TPU) is synthesized via the reaction of a
polyol with a diisocyanate. TPU is extensively used because of its useful
properties. Characteristic properties of TPU are the mechanical strength,
elasticity, flexibility, good wear resistance, and transparency [3]. According to the
type of polyol used for synthesis of TPU, this material may present typical
properties of either soft elastomers or hard plastics.
TPU is widely used in healthcare, aerospace and many industries for
coatings, components and customer goods, because of its good properties and
compound versatility. Also, it is used for 3D-printing, where it is not suitable for
food contact and in-vivo applications.
Below, technical data [4] of TPU 95A White used for 3D-printing are
presented (Table 4&5):
Table 4: Thermal properties of TPU 95A white material.
TPU 95A White
Thermal Properties Typical Value
Melt mass-flow rate (MFR) 15.9 g/10min
Heat deflection (HDT) at 0.455 MPa 74 ˚C
Heat deflection (HDT) at 1.82 MPa 49 ˚C
Glass transition -24 ˚C
Coefficient of thermal expansion 100·10-6 ˚C-1
Melting temperature 220 ˚C

Materials
39
Table 5: Mechanical properties of 3D-printing TPU 95A white material.
TPU 95A White -3D-printing
Property Typical Value
Density 1.21 g/cm3
Me
cha
nic
al
Pro
pe
rtie
s Tensile modulus 26.0 MPa
Tensile stress at yield 8.6 MPa
Tensile stress at break 39.0 MPa
Elongation at yield 55.0 %
Elongation at break 580.0 %
Flexural strength 4.3 MPa
Flexural modulus 78.7 MPa
Izod impact strength, notched (at 23 ̊C)
34.4 kJ/m2
3.3. Polypropylene (PP)
Polypropylene (PP) is a thermoplastic material which has a rigid and
crystalline structure [5]. Its applications concern the construction of everyday
objects like household products, battery cases, packaging trays, and medical
devices. Also, polypropylene is one of the most important industrial
petrochemical building blocks used to produce various chemical derivatives.
Polypropylene is a leading material among polyolefins because of its
favorable properties. It is a low-density material with high melting temperature,
chemical inertness and low-cost production. Also, structural designs and
mechanical properties diversity may be achieved because of its high versatility.
Finally, the usage of fillers or reinforcing agents and blending PP with other
polymers can lead to the fabrication of distinct morphological structures of PP,
thus achieving superior characteristics.
In addition, polypropylene is extensively used as a 3D-printing material,
which is not suitable for food contact and in vivo applications. Below, technical
data [6] of PP used for 3D-printing are presented (Table 6&7):
Table 6:Thermal properties of PP material.
Polypropylene (PP)
Thermal Properties Typical Value
Melt mass-flow rate (MFR) 20 g/10min
Vicat softening temperature at 5N 115°C
Melting temperature 130 °C
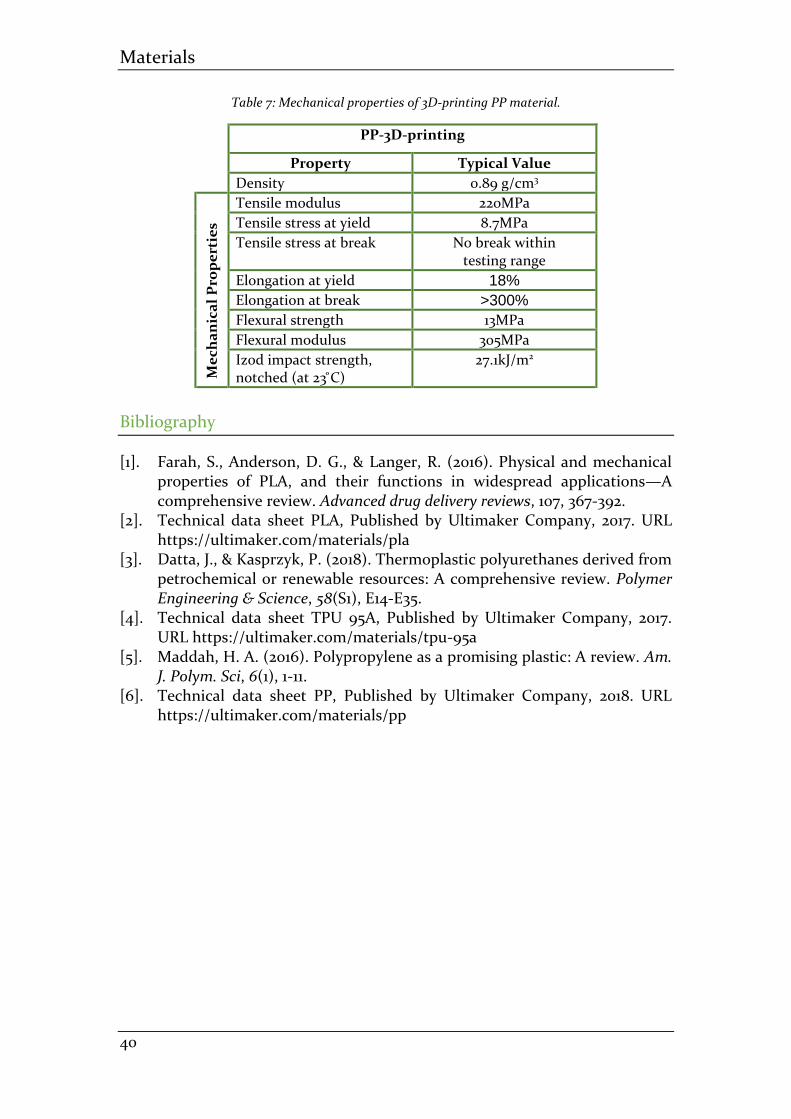
Materials
40
Table 7: Mechanical properties of 3D-printing PP material.
PP-3D-printing
Property Typical Value
Density 0.89 g/cm3
Me
cha
nic
al
Pro
pe
rtie
s Tensile modulus 220MPa
Tensile stress at yield 8.7MPa
Tensile stress at break No break within testing range
Elongation at yield 18%
Elongation at break >300%
Flexural strength 13MPa
Flexural modulus 305MPa
Izod impact strength, notched (at 23 ̊C)
27.1kJ/m2
Bibliography
[1]. Farah, S., Anderson, D. G., & Langer, R. (2016). Physical and mechanical properties of PLA, and their functions in widespread applications—A comprehensive review. Advanced drug delivery reviews, 107, 367-392.
[2]. Technical data sheet PLA, Published by Ultimaker Company, 2017. URL https://ultimaker.com/materials/pla
[3]. Datta, J., & Kasprzyk, P. (2018). Thermoplastic polyurethanes derived from petrochemical or renewable resources: A comprehensive review. Polymer Engineering & Science, 58(S1), E14-E35.
[4]. Technical data sheet TPU 95A, Published by Ultimaker Company, 2017. URL https://ultimaker.com/materials/tpu-95a
[5]. Maddah, H. A. (2016). Polypropylene as a promising plastic: A review. Am. J. Polym. Sci, 6(1), 1-11.
[6]. Technical data sheet PP, Published by Ultimaker Company, 2018. URL https://ultimaker.com/materials/pp

Experimental procedure
41
4. Chapter 4:
Experimental Procedure 4.1. Fabrication of bone specimens
In the present study, they were manufactured eight 3D-printed replicas of
trabecular bone from bovine femur. The specimens were of BV/TV=55%,
BV/TV=40%, BV/TV=34% and BV/TV=21% (Figures 14-17, Table 8).
First of all, microfocus X-ray computed tomography was performed on the
original specimens, using a X-CUBE CT Scanner [1]. The bone marrow had been
removed before this procedure. Then, the projections were reconstructed into a
3D volume into X-CUBE software and using a 3D filter back-projection
algorithm. After the image construction process [1], the differentiation of bone
from non-bone pixels followed. For this study, a cube of size 6 mm (110 x 110 x 110
voxels) was the selected volume of interest (VOI). Finally, a 3D surface model of
the trabecular bone specimen was reconstructed by the import of the stack with
the differentiated images into InVesalius 3.1.1 software [1][2] and the 3D surface
model saved as “stl” file.
The fabrication of 3D-printed trabecular bone replicas was achieved using
an Ultimaker 2+ 3D-printer. First, the “stl files” mentioned before, are imported
into a software called Ultimaker Cura in order to process the characteristics of
models and define the 3D-printer appropriate settings. Then, slicing of the
models and their conversion into g-code, follows. G-code is a readable file type
by the 3Dprinter. Ultimaker 2+ follows a procedure called Fused Filament
Fabrication (FFF), which has a great accuracy for complex engineering
structures.
(a)
(b)
Figure 13: (a) Ultimaker 3D-printer, (b) 3D-printing process of a bone replica.

Experimental procedure
42
In the present study, three different materials were used in order to
evaluate the influence of material properties in ultrasound propagation through
the bone structures. Pure polylactic acid (PLA) and thermoplastic polyurethane
(TPU 95A) were used for the fabrication of bone specimens of BV/TV=40% and
BV/TV=34% (a total of four specimens) in order to compare the ultrasound
properties. These materials were chosen because of their different mechanical
properties, except density which is similar. Also, polypropylene (PP) was used for
trabecular bone specimens of BV/TV=55%, BV/TV=40% and for osteoporotic
ones -BV/TV=34% and BV/TV=21%- because of its density which is similar to that
of the human bones. Should be noted that all the materials used for the 3D-
printing process were obtained directly from the “Ultimaker” company.
4.1.1. 3D-printing with transparent PLA material As it was mentioned before, “stl” files of the 3D models were imported into
a software called Ultimaker Cura. The dimensions of the 3D bone models of
BV/TV=40% and BV/TV=34% determined to be about 18mm with uniform
scaling and the 3D-printer settings were defined by the default standard of
“Ultimaker” company. G-code files, that was occurred after slicing, were saved at
3D-printer SD card, which then was inserted the printer.
Then, according to the instructions of “Ultimaker” company, a nozzle of
0.25mm diameter was installed, whereas the nozzle temperature and the build
plate temperature were set to be at 210 0C and 60 0C, correspondingly. After
calibrating the 3D-printer, the printing process started with a set print speed of
30 mm / s. Should be noted that each trabecular bone specimen was
manufactured separately. The 3D-printed bone replicas are shown in figure 14.
(a)
(b)
Figure 14:3D-printed PLA replicas of trabecular bone. (a) BV/TV=40%, (b) BV/TV=34%.
4.1.2. 3D-printing with white TPU 95A material “Stl” files of the 3D models were imported into Ultimaker Cura software.
The dimensions of the 3D bone models of BV/TV=40% and BV/TV=34% were
determined to be about 18mm with uniform scaling and the 3D-printer settings
were defined by the default standard of “Ultimaker” company. G-code files, that

Experimental procedure
43
was occurred after slicing, were saved at 3D-printer SD card, which then was
inserted the printer.
Then, according to the instructions of “Ultimaker” company, a nozzle of
0.25mm diameter was installed, whereas the nozzle temperature and the build
plate temperature were set to be at 235 0C and 70 0C, correspondingly. After
calibrating the 3D-printer, the printing process started with a set print speed of
40 mm / s. Should be noted that each trabecular bone specimen was
manufactured separately. The 3D-printed bone replicas are shown in figure 15.
(a)
(b)
Figure 15: 3D-printed TPU replicas of trabecular bone. (a) BV/TV=40%, (b) BV/TV=34%.
4.1.3. 3D-printing with transparent PP material “Stl” files of the 3D models were imported into Ultimaker Cura software.
The dimensions of the 3D bone models of BV/TV=55%, BV/TV=40%,
BV/TV=34%, and BV/TV=21% were determined to be about 18mm with uniform
scaling and the 3D-printer settings were defined by the default standard of
“Ultimaker” company. G-code files, that was occurred after slicing, were saved at
3D-printer SD card, which then was inserted the printer.
(a)
(b)
Figure 16: 3D-printed PP replicas of trabecular bone. (a) BV/TV=55%, (b) BV/TV=40%.
Then, according to the instructions of “Ultimaker” company, a nozzle of
0.4mm diameter was installed, whereas the nozzle temperature and the build
plate temperature were set to be at 220 0C and 100 0C, correspondingly. Because

Experimental procedure
44
of PP susceptibility to warping, an adhesion sheet was applied to the glass plate,
as it was recommended by the company. Also, due to the same reason, a provided
front enclosure was used in order to remove possible air draft and keep the
temperature inside the 3D-printer at around 45 °C. These environment
conditions provide a higher print success rate, better quality and performance of
the printed bone replicas. After calibrating the 3D-printer, the printing process
started with a set print speed of 25 mm / s. Should be noted that each trabecular
bone specimen was manufactured separately. The 3D-printed bone replicas are
shown in figures 16&17.
(a)
(b)
Figure 17: 3D-printed PP replicas of trabecular bone. (a) BV/TV=34%, (b) BV/TV=21%.
Below, are presented the physical quantities of 3D-printed bone replicas
that were measured at room temperature 25 0C, after their fabrication. Their
mass was measured using a digital scale and their volume was determined by
measuring the external dimensions of the cubes with a caliper.
Table 8: Physical quantities of 3D-printed replicas.
Material PLA TPU PP
BV/TV 40% 34% 40% 34% 55% 40% 34% 21%
Dim
ensi
on
s
(mm
)
X 18.5 18.2 18.5 18.2 18.3 18.0 18.0 18.0
Y 18.3 18.2 18.3 18.2 18.0 19.4 18.0 18.0
Z 18.3 18.5 18.3 18.5 18.1 18.0 18.1 18.2
Mass (gr)
2.894 2.611 2.851 2.552 2.421 2.139 1.863 0.999
Volume (cm3)
6.195 6.128 6.195 6.128 5.962 6.286 5.864 5.897
Density (gr/cm3)
0.467 0.426 0.460 0.416 0.406 0.340 0.318 0.169

Experimental procedure
45
4.2. Measurements of ultrasound acoustic properties
In a number of eight 3D-printed trabecular bone specimens, measurements
were conducted in three directions perpendicular to each other. In the axial (Y)
direction, the anterior-posterior (X), and lateral (Z). The ultrasonic
measurements were performed in distilled water at room temperature [3]. The
specimens were degassed in a vacuum flask to remove air bubbles. In order to
position the specimen in the ultrasound beam a custom holder was used.
(a)
(b)
Figure 18: (a) The degassing of specimens, (b) Through-transmission ultrasound measurements layout.
Unfocused immersion transducers (Panametrics, V303, d =1.27cm (0.5in),
center frequency 1MHz, and focal length F = 23mm) were used in this study
connected to an ultrasonic pulse receiver (USD 10NF, Krautkraemer, Germany).
Ultrasonic pulse receiver can operate in two ways:
• With two coaxially aligned transducers (transmitter and receiver), and the
specimen between them (through-transmission method).
• With a transducer which is both a transmitter and receiver (pulse-echo
method).
RF digital signals were received with frequency sampling 35 MHz. The
-20dB frequency bandwidth corresponds to frequency from 0.38 to 1.18 MHz for
unfocused transducers.
The through-transmission method was used to measure ultrasound speed
(SOS) and attenuation (BUA) that occurs when propagating through water or
the specimen. The attenuation coefficient has the dB as a unit and it is calculated
as the decimal logarithm of the ratio of the spectrum ranges of wave power
propagated through the specimen and water respectively. The attenuation as a
function of frequency shows a linear region in a frequency range from 200 to 900
kHz. The slope of attenuation linear area as a function of frequency determines

Experimental procedure
46
the value of broadband ultrasound attenuation (BUA). The speed of ultrasonic
wave propagation through the 3D-printed cancellous bone specimens is based
on the determination of the ultrasound pulse time of flight [4] from the
transducer-transmitter to the transducer-receiver (Section 2.5). Errors generated
during the diffraction of sound when this propagates from water into the
specimen, were calculated and eliminated [5].
The measurements of the differential scattering cross section were
conducted applying the pulse-echo method. The differential scattering cross
section 1800 as a function of frequency was calculated by the method described
by Roberjot and Chaffai [6][7]. The RF signals from 3D-printed bone specimens
were received in 1 mm steps, in a 2D scan of their cross section. The cross section
of ultrasound beam occurs by the ratio 2.44λF / d = 6.75mm [8] for a transducer
of frequency 1MHz, where λ is the wavelength, F is the focal length and d is the
diameter of the transducer. From the time series of the signal corresponding to
the entire length of the specimen a range of 7 mm was selected in which the
differential scattering cross section 1800 was calculated. This calculation includes
a correction at the edges of signal with Hamming window, and three correction
factors which are related to errors due to signal attenuation in bone specimens
[9], to the frequency dependence on the testing volume, and to the refraction [5]
that occurs in sound when it meets water-bone interface.
The power spectrum of the 7mm area of the specimen, that occurs from the
transition from the time domain to the frequency domain with the Fourier
transform, is divided by the corresponding power spectrum of a steel plate
considered as a reference. The surface of the plate is as far away from the
transducer as the distance of the transducer from the middle of the selected 7mm
area of the specimen. In this way, occurs the apparent scattering coefficient with
the following formula:
�̂�𝛣(𝑓) =⟨𝑆𝐵(𝑓)⟩
⟨𝑆0(𝑓)⟩
where <SB(f)> is the average of the power spectrum values obtained in different
positions and they correspond to the area of the specimen, that is tested, and
<S0(f)> is the average of the power spectrum values of the reference steel plate.
The use of the average rather than just one measurement for spectrum
determination is necessary, because in this way, the statistical errors of the
reflected signal, that occur due to the random phase of the fundamental reflected
waves, are removed. The apparent scattering coefficient must be corrected due
to the sufficient sources of error, including signal loss caused by reflection on the
surface of the specimen, the attenuation of the signal through the specimen, and
the frequency dependence on the volume being measured. Has been proved that
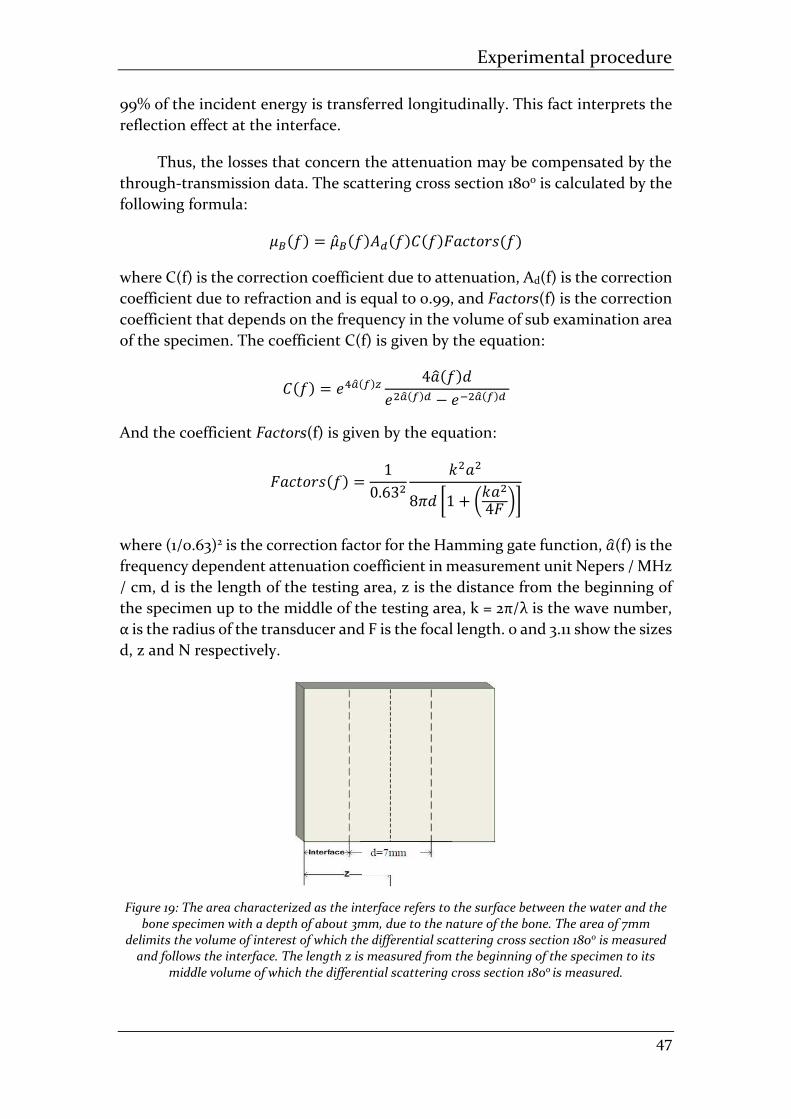
Experimental procedure
47
99% of the incident energy is transferred longitudinally. This fact interprets the
reflection effect at the interface.
Thus, the losses that concern the attenuation may be compensated by the
through-transmission data. The scattering cross section 1800 is calculated by the
following formula:
𝜇𝐵(𝑓) = �̂�𝐵(𝑓)𝐴𝑑(𝑓)𝐶(𝑓)𝐹𝑎𝑐𝑡𝑜𝑟𝑠(𝑓)
where C(f) is the correction coefficient due to attenuation, Αd(f) is the correction
coefficient due to refraction and is equal to 0.99, and Factors(f) is the correction
coefficient that depends on the frequency in the volume of sub examination area
of the specimen. The coefficient C(f) is given by the equation:
𝐶(𝑓) = 𝑒4�̂�(𝑓)𝑧4�̂�(𝑓)𝑑
𝑒2�̂�(𝑓)𝑑 − 𝑒−2�̂�(𝑓)𝑑
And the coefficient Factors(f) is given by the equation:
𝐹𝑎𝑐𝑡𝑜𝑟𝑠(𝑓) =1
0.632
𝑘2𝑎2
8𝜋𝑑 [1 + (𝑘𝑎2
4𝐹 )]
where (1/0.63)2 is the correction factor for the Hamming gate function, �̂�(f) is the
frequency dependent attenuation coefficient in measurement unit Nepers / MHz
/ cm, d is the length of the testing area, z is the distance from the beginning of
the specimen up to the middle of the testing area, k = 2π/λ is the wave number,
α is the radius of the transducer and F is the focal length. 0 and 3.11 show the sizes
d, z and N respectively.
Figure 19: The area characterized as the interface refers to the surface between the water and the bone specimen with a depth of about 3mm, due to the nature of the bone. The area of 7mm
delimits the volume of interest of which the differential scattering cross section 1800 is measured and follows the interface. The length z is measured from the beginning of the specimen to its
middle volume of which the differential scattering cross section 1800 is measured.
Experimental procedure
48
Bibliography
[1]. Athanasios, T., Konstantinos, A., & Despoina, D. (2021). Three-dimensional-printed replica models of bone for experimentally decoupling trabecular bone properties contribution to ultrasound propagation parameters. The Journal of the Acoustical Society of America, 149(1), 296-306.
[2]. Amorim, P., Moraes, T., Silva, J., & Pedrini, H. (2015, December). InVesalius: An interactive rendering framework for health care support. In International symposium on visual computing (pp. 45-54). Springer, Cham.
[3]. Deligianni, D. D., & Apostolopoulos, K. N. (2007). Characterization of dense bovine cancellous bone tissue microstructure by ultrasonic backscattering using weak scattering models. The Journal of the Acoustical Society of America, 122(2), 1180-1190.
[4]. Njeh, C. F., Boivin, C. M., & Langton, C. M. (1997). The role of ultrasound in the assessment of osteoporosis: a review. Osteoporosis international, 7(1), 7-22.
[5]. Xu, W., & Kaufman, J. J. (1993). Diffraction correction methods for insertion ultrasound attenuation estimation. IEEE transactions on Biomedical Engineering, 40(6), 563-570.
[6]. Roberjot, V., Laugier, P., Droin, P., Giat, P., & Berger, G. (1996, November). Measurement of integrated backscatter coefficient of trabecular bone. In 1996 IEEE Ultrasonics Symposium. Proceedings (Vol. 2, pp. 1123-1126). IEEE.
[7]. Chaffaı, S., Peyrin, F., Nuzzo, S., Porcher, R., Berger, G., & Laugier, P. (2002). Ultrasonic characterization of human cancellous bone using transmission and backscatter measurements: relationships to density and microstructure. Bone, 30(1), 229-237.
[8]. Wear, K. A. (2001). Fundamental precision limitations for measurements of frequency dependence of backscatter: Applications in tissue-mimicking phantoms and trabecular bone. The Journal of the Acoustical Society of America, 110(6), 3275-3282.
[9]. O’Donnell, M., & Miller, J. G. (1981). Quantitative broadband ultrasonic backscatter: An approach to nondestructive evaluation in acoustically inhomogeneous materials. Journal of Applied Physics, 52(2), 1056-1065.

Results
49
5. Chapter 5:
Results
The aim of this study was to investigate and decompose the influence of
trabecular bone architecture and material on ultrasound characteristics,
speed of sound and backscatter coefficient, using 3D-printed trabecular
bone models. It was very significant to fabricate trabecular bone replicas with as
much accurate structure as possible, following the same printing methods for all
the specimens in order to ensure that the results and conclusions concern only
the material influence on ultrasound properties and characteristics since the
bone samples are the same.
5.1. Relationship between speed of sound and apparent density
A strong linear dependence of speed of sound (SOS) with the density of 3D-
printed trabecular bone specimens occurred from ultrasound propagation
measurements. Especially, a correlation coefficient of 𝑅2 = 0.97 − 1.00 was
occurred in all three directions of the specimens, taking into consideration a PLA
bone replica with BV/TV=21% [1]. In figure 20, the correlation between the
density of the specimens and SOS is presented. The replicas were fabricated
using the same material (PLA). Thus, they have the same Young’s modulus. This
is the reason why SOS and apparent density have a strong linear relationship.
Finally, the difference in trabecular bone structure in each direction becomes
obvious by the slopes of the three lines that correspond to 𝑋, 𝑌, 𝑍 directions.
(a)

Results
50
(b)
Figure 20:(a) Linear relationship between SOS and apparent density for three 3D-printed trabecular bone specimens with different bone volume fractions, constructed from PLA, in the
three directions, (b) Graph data and analysis.
Also, a linear dependence of speed of sound (SOS) with the density of 3D-
printed trabecular bone specimens occurred from ultrasound propagation
measurements. Especially, a correlation coefficient of 𝑅2 = 0.93 − 1.00 was
occurred in all three directions of the specimens. In figure 21, the correlation
between the density of the specimens and SOS is presented. The replicas were
fabricated using the same material (PP). Thus, they have the same Young’s
modulus. This is the reason why SOS and apparent density have a strong linear
relationship. Finally, the difference in trabecular bone structure in each direction
becomes obvious by the slopes of the three lines that correspond to 𝑋, 𝑌, 𝑍
directions.
(a)

Results
51
(b) Figure 21: (a) Linear relationship between SOS and apparent density for three 3D-printed
trabecular bone specimens with different bone volume fractions, constructed from PP, in the three directions, (b) Graph data and analysis.
5.2. Influence of material properties on ultrasound propagation
The backscatter coefficient of two 3D-printed replicas of the same
trabecular bone sample fabricated using two different materials -PLA and TPU
95A- is presented in figure 22 as a function of frequency. In each direction is
observed a significant similarity between the two backscatter coefficient
patterns. It is obvious that the corresponding backscatter spectra are different.
The 3D-printed specimen fabricated from a material with higher modulus of
elasticity has a higher backscatter coefficient magnitude. Also, it is remarkable
that the partial peaks correspond to certain frequencies and they are identical in
all directions for PLA and TPU materials. An interesting conclusion is that the
magnitude of the backscatter coefficient depends on the modulus of elasticity of
the corresponding material and that its pattern is influenced by the structure of
trabecular bone.
(a)

Results
52
(b)
(c)
Figure 22: Backscatter coefficient as a function of frequency of two 3D-printed trabecular bone specimens with the same bone volume fraction, constructed from PLA and TPU in the (a) X
direction, (b) Y direction and (c) Z direction.
5.3. Simulation of osteoporosis
The backscatter coefficient of two different 3D-printed replicas -
BV/TV=40%, BV/TV=34%- constructed from PLA is shown in figure 23 as a
function of frequency. In a previous study [2], was applied a weak scattering
model for the ultrasound backscatter in dense bovine trabecular bone as a

Results
53
function of frequency. In particular, two autocorrelation functions were used for
the description of the medium and the study indicated that the maximum value
of the backscatter coefficient corresponds to a certain frequency, whereas reflects
a scatterer of a certain size. Based on this study, it was assumed that the partial
peaks of the backscatter coefficient correlate to a certain scatterer size. In this
way, the scatterers size of the trabecular bone with BV/TV=34% were estimated.
In particular, the above scattering model indicated that the thickness of
trabeculae is reduced at 15% compared to the bone specimen with BV/TV=40%
[1][2].
(a)

Results
54
(b)
(c)
Figure 23: Backscatter coefficient as a function of frequency of two 3D-printed trabecular bone specimens with different bone volume fractions, constructed from PLA. (a) X direction, (b) Y
direction and (c) Z direction.
The backscatter coefficient of 3D-printed trabecular bone replicas
constructed from PP is shown in figure 24 as a function of frequency. The integral
of the backscatter coefficient as a function of frequency tends to be proportional
to the density of the bone specimens. In particular, in most cases it has lower
values in lower density bone specimens. However, this relationship has not been
determined. Finally, as it was mentioned before, the maximum value of the
backscatter coefficient corresponds to a certain frequency, whereas reflects a
scatterer of a certain size [2].

Results
55
(a)
(b)

Results
56
(c) Figure 24: Backscatter coefficient as a function of frequency of 3D-printed trabecular bone specimens with different bone volume fractions, constructed from PP. (a) X direction, (b) Y
direction and (c) Z direction.
Bibliography
[1]. Athanasios, T., Konstantinos, A., & Despoina, D. (2021). Three-dimensional-printed replica models of bone for experimentally decoupling trabecular bone properties contribution to ultrasound propagation parameters. The Journal of the Acoustical Society of America, 149(1), 296-306.
[2]. Deligianni, D. D., & Apostolopoulos, K. N. (2007). Characterization of dense bovine cancellous bone tissue microstructure by ultrasonic backscattering using weak scattering models. The Journal of the Acoustical Society of America, 122(2), 1180-1190.

Conclusions
57
6. Chapter 6:
Conclusions
The purpose of this study was to investigate the influence of trabecular
bone structure and material on ultrasound properties and characteristics. In
total, three materials were used for the construction of trabecular bone
specimens by a 3D-printer. These were PLA, TPU that have similar density but
different mechanical properties and PP that has lower density, close to that of
the human bones. In total, eight trabecular bone specimens were constructed
with different bone volume fractions by a 3D-printer and measurements of
ultrasound propagation through the specimens were conducted.
3D-printing offers the opportunity of constructing identical trabecular
bone structures for each single sample in order to quantify structural
degradation. The main purpose was to construct trabecular bone replicas with as
much accurate structure as possible, following the same printing methods for all
the specimens in order to ensure that the results and conclusions concern only
the material influence on ultrasound properties.
It is known that the backscatter signals may be sensitive to small
displacements of the transducer because of the phase-sensitivity of the
ultrasound propagation measurements. However, a perfect conformity of the
backscatter signals pattern was achieved, concerning two identical 3D-printed
trabecular bone specimens, constructed from two different materials (Figure 22).
The ultrasound measurements indicate that material properties, such as
density and stiffness, influence the magnitude of the backscatter spectrum,
whereas the shape of backscatter coefficient as a function of frequency depends
on the bone structure (Figure 22). The fact that the material properties influence
the magnitude of the backscatter spectrum is verified by the results occurred
from bone replicas with the same material but different density (Figure 23 & 24).
Also, an interesting observation is that the integral of the backscatter coefficient
as a function of frequency seems to be proportional to the density of the bone
specimens. In particular, it has lower values in lower density bone specimens.
However, this relationship has not been determined.
In addition, based on a weak scattering model and combination of two
autocorrelation functions [1], the thinning of the trabeculae was estimated by
measuring the shift of the partial peaks of the backscatter coefficient as a
function of frequency. In particular, the thickness of bone specimen trabeculae
with BV/TV=34% is reduced at 15% compared to the bone specimen with
BV/TV=40% [2].

Conclusions
58
Also, a remarkable result occurred from this study; speed of sound has a
perfect linear relationship with apparent density. The dependence of SOS on
apparent density presents a correlation coefficient of 𝑅2 = 0.97 − 1.00 and of
𝑅2 = 0.93 − 1.00 for PLA and PP, respectively (Figure 20 & 21). This means that
SOS indicates the quantity of material present in the direction of ultrasound
propagation. Should be noted that SOS is different along the three orientation
axes because of bone specimens’ different structural modulus. However, the
values of SOS in three directions of the constructed trabecular bone replicas did
not show high anisotropy of specimens. In case of ultrasound propagation
parallel to the main orientation of trabeculae, through specimens with high
anisotropy, two waves -fast and slow- are observed. As a result, there will be
different relationships between SOS and apparent density. Finally, the
construction of trabecular bone replicas from the same material, which means
that they have the same matrix material Young’s modulus and density, led to the
observation of SOS and mechanical properties decrease in a perfectly linear way
as a function of apparent density, when the structure degrades because of bone
loss.
3D-printing technology offers the opportunity of studying the mechanical
and ultrasound properties alteration due to structural degradation for a single
sample because it is feasible the manufacture of the same sample in both intact
and degraded state. The fact that the printed trabecular bone specimens have
larger dimensions than that of the original ones and that their matrix material
have different density comparing to that of bones were the limitations of this
research.
The purpose of this study and the corresponding ones, was the
investigation of the qualitative features of ultrasound propagation through the
3D-printed specimens. The outcomes, that occurred from the research on
ultrasound propagation through the 3D-printed bone specimens, most likely
cannot be associated with the original trabecular bone; especially, in case of
osteoporotic one. Nevertheless, significant conclusions are presented related to
the origins of backscatter and ultrasound properties alteration due to structural
degradation, which is a result of the ageing process. Also, 3D-printing technology
has progressed to the point that the idea of reconstructing structural tissues
using inorganic materials is feasible. Finally, as micro-CT and manufacturing
technologies advance, specimens with morphometric characteristics and
properties close to these of diseased bones can be developed. The extent research
on these phantoms may contribute to the formulation of osteoporosis diagnostic
devices.

Conclusions
59
Bibliography
[1]. Deligianni, D. D., & Apostolopoulos, K. N. (2007). Characterization of dense bovine cancellous bone tissue microstructure by ultrasonic backscattering using weak scattering models. The Journal of the Acoustical Society of America, 122(2), 1180-1190.
[2]. Athanasios, T., Konstantinos, A., & Despoina, D. (2021). Three-dimensional-printed replica models of bone for experimentally decoupling trabecular bone properties contribution to ultrasound propagation parameters. The Journal of the Acoustical Society of America, 149(1), 296-306.