Master thesis in finance-signed
52
Department of Business & Industrial Management 2011 M Ma a s s t t e e r r ’ ’ s s t t h h e e s s i i s s w w i i t t h h i i n n F F i i n n a a n n c c e e Academic Research Report Dhaval Shah
-
Upload
dhrd-vnsgu -
Category
Documents
-
view
0 -
download
0
Transcript of Master thesis in finance-signed

Department of Business & Industrial Management
2011
MMMaaasssttteeerrr’’’sss ttthhheeesssiiisss wwwiiittthhhiiinnn FFFiiinnnaaannnccceee AAccaaddeemmiicc RReesseeaarrcchh RReeppoorrtt
DDhhaavvaall SShhaahh
A Winter Project Report
On
““CCOONNSSTTRRUUCCTTIIOONN OOFF OOPPTTIIMMAALL PPOORRTTFFOOLLIIOO
UUSSIINNGG SSHHAARRPPEE IINNDDEEXX MMOODDEELL””
FOR THE PARTIAL FULFILLMENT TO DEGREE OF MASTER OF BUSINESS ADMINISTRATION
Department of Business and Industrial Management,
Veer Narmad South Gujarat University
Surat
Submitted to: - Submitted by:-
Mr. HITESH PARMAR DHAVAL SHAH, (MENTOR & FACULTY MEMBER, MBA (FT) (FINANCE), DBIM, VNSGU) SEM IV, DBIM, VNSGU
2009-11

PREFACE
In this development and changing world, I feel proud for being a student of MBA
full time course offered by DEPARTMENT OF BUSINESS AND INDUSTRIAL
MANAGEMENT, VEER NARMAD SOUTH GUJARAT UNIVERSITY, SURAT.
This study is an attempt to construct an optimal portfolio by applying Sharpe’s
Index Model of Capital Asset Pricing. Taking BSE 30 SENSEX as market index
and considering daily indices for the Janauary’2010 to December 2010 period,
the proposed method formulates a unique cut off point (Cut off rate of return) and
selects stocks having excess of their expected return over risk-free rate of return
surpassing this cut-off point. Percentage of investment in each of the selected
stocks is then decided on the basis of respective weights assigned to each stock
depending on respective Beta)value, stock movement variance representing
unsystematic risk, return on stock and risk free return vis-a-vis the cut off rate of
return.
I have collected all the needed information for the project report at my best level
and the information provided are true and authentic.
DHAVAL A SHAH,
MBA (FT) (Finance), SEMIV,
DBIM, VNSGU
acc02
Stamp

STUDENT’S DECLARATION
““CCOONNSSTTRRUUCCTTIIOONN OOFF OOPPTTIIMMAALL PPOORRTTFFOOLLIIOO UUSSIINNGG
SSHHAARRPPEE IINNDDEEXX MMOODDEELL””
This Winter Project report entitled, “CONSTRUCTION OF OPTIMAL
PORTFOLIO USING SHARPE INDEX MODEL” has been submitted to
DEPARTMENT OF BUSINESS AND INDUSTRIAL MANAGEMENT at
Veer Narmad South Gujarat University, Surat in partially fulfillment of M.B.A.
Degree.
Hereby I undersign that this Project Report has been completed by me under the
guidance of Mr.Hitesh Parmar, (Faculty Member, Department of Business
and Industrial Management, V.N.S.G.U. Surat.)
Study of this Project Report is entirely result of my own efforts and research and
is original in nature. All the information provided is true and authentic and is not
provided artificially. This project report is not submitted either in part or whole to
any other institute or university of any degree.
PLACE: SURAT DHAVAL A SHAH,
MBA (FT) (Finance), SEMIV,
DBIM, VNSGU
DATE:-____________________

Department of Business & Industrial Management
Department Certificate
This to certify that Mr. Dhaval Ajaykumar Shah, student of
MBA (Finance) Semester Four, DEPARTMENT OF BUSINESS AND
INDUSTRIAL MANAGEMENT, V.N.S.G.U. has submitted his Winter
Project report entitled “CONSTRUCTION OF OPTIMAL
PORTFOLIO USING SHARPE INDEX MODEL” have been duly
completed in satisfactory manner in partial fulfillment for award of
Degree of MBA, Veer Narmad South Gujarat University, Surat
under our guidance and supervision.
It also certifies that the project is the research of own works and is of
sufficient management slander warrant is presented for examination.
Mr. HITESH PARMAR DR, RENUKA GARG (MENTOR & FACULTY MEMBER, (Head of Department) DBIM, VNSGU) DBIM, VNSGU

ACKNOWLEDGEMENT
To improve a little we need to make efforts. Not one or two but till the results. And to learn and
act we need guidance. No study however big or small can be undertaken by our own self behind
every act there are unforget0table memories, efforts, guidance and blessings if those persons
without whom this training would not have gone even a small distance.
To be successful in any field practical knowledge is most important and MBA is incomplete
without having a practical knowledge in this era of professionalism. The theoretical knowledge
is only a half way in study network.
First of all I thank our DEPARTMENT OF BUSINESS AND INDUSTRIAL MANAGEMENT of MBA
for giving me an opportunity to practically learn about the real happenings in this field and even
the faculty member who spent valuable time in helping me to reach the best possible extent.
Ms. Renuka Garg (Head of Department, DBIM, V.N.S.G.U., Surat).
Mr. Hitesh Parmar (Mentor and Faculty Member at DBIM, V.N.S.G.U., Surat).
They guided and motivated me whenever required. In spite of their busy schedule they spend
their precious time with me and also gave all practical knowledge of real world which has to be
faced by us and experience sharing moments which will be helpful in future life.
Thanking You.
DHAVAL A SHAH,
MBA (FT) (Finance), SEMIV,
DBIM, VNSGU

ABSTRACT
There are several authors Markowitz (1991), Elton and Gruber (1997) that discuss the main
issues that an investor faces when investing, for example how to allocate resources among the
variety of different securities. These issues have led to the discussion of portfolio theories,
especially the Modern Portfolio Theory (MPT), which is developed by Nobel Prize awarded
economist Harry Markowitz and The theory of portfolio Optimization (OPT), which was
developed by an American economist who won the 1990 Nobel Prize in Economics, along with
Harry Markowitz and Merton Miller, for developing models to assist with investment decision
making.
The theory that is used to analyze the problem and the empirical findings provide the essential
concepts such as standard deviation, risk and return of the portfolio. Further, Beta, correlation
and covariance are used to achieve the optimal portfolio.
The purpose of this study is to investigate if an investor can apply Sharpe’s portfolio
optimization model in order to achieve a higher return than investing in an index portfolio.
Constructing a strong portfolio that beats the market in the long-run would be the ultimate goal
for most investors.
The methodology constitutes as the frame for the thesis. The quantitative method is used since
the data input is gathered from historical data. This thesis is based on existing theory, and the
deductive approach aims to use these theories in order to accomplish a valid and accurate
analysis. The benchmark that is used to compare the results from the portfolio is the BSE
SENSEX 30. This index mimics and reflects the market as a whole.
The finding from this study indicates that the optimal portfolio outperforms the passive
benchmark BSE 30 during the selected timeframe.

EXECUTIVE SUMMARY
Every time and for everybody it is not possible to read the whole Report but if a person wants to
have a quick overview but at a same time not a superficial look, executive summary serves the
purpose. Executive Summary has the brief introduction of each chapter and even incorporating
few details where necessary.
This report is about the Construction of Optimal Portfolio Using Sharpe Index Model. The
report begins with the introduction of Sharpe index Model and topic.
The second part is the theoretical framework where all the focus is on financial terms expected
return, standard deviation, portfolio risk and return, etc. The complete study is based on the
application of covariance and relation between risk and return for means so it becomes very
necessary that the person using this report should have detail knowledge as what is portfolio
theory.
The next comes the very essential part that is the Research Methodology, here how has the
researcher progressed in the entire report is given, starting with the Title of the study, the
objectives as to why this study has been carried, the research design applied, where are data
collected from, the population and the sample size, the analysis and structure of report. Here the
benefits of the report to Researcher and others are also listed along with the limitations of the
study.
The next is the most important and the core part of the study that is the Data analysis, which is
the heart of the report as to whatever calculation done to get the desired solutions is shown here
in the detail format. Step by step progress of the study is shown so that the reader gets the
complete idea on the ways the final solution is arrived at, here a small interpretation is also
given as to what is the result of the calculations.
The later part consists of Conclusion that is from the whole study what the final word is and
whether the objective for which the study is undertaken is served or not. Followed by the
recommendations that arises out of the study and also the further scope of the study
The Report ends with the Bibliography where all the sources from where various data are
collected including books, various researches and websites are enlisted.

INDEX
SR NO TITLE PAGE NO CHAPTER 1 INTRODUCTION 10-13
1.1 Review of Literature 14
1.2 Problem Discussion 14
1.3 Pre-Study Approach 15
CHAPTER 2 THEORITICAL FREAMWORK 16
2.1 Expected Return 17
2.2 Portfolio Risk 17
2.3 BETA of the portfolio 18
2.4 Standard Deviation 18
2.5 Theory of Portfolio Construction 19
2.6 Approaches in portfolio construction 19
2.6.1 Traditional Approach 19
2.6.2 Modern Approach 20
2.7 Portfolio Management 20
CHAPTER 3 RESEARCH METHODOLOGY 21
3.1 Research Objective 22
3.2 Sub objectives 22
3.3 List of Information Needed 23
3.4 Variables Under Study 23
3.5 Research Design 23
3.6 Data Collection Plan 23
3.6.1 Type of Data Collection 24
3.6.2 Sources Of Data Collection 24
3.6.3 Tools of Data collection 24
3.7 Sampling Plan 24
3.7.1 Sampling Population 25
3.7.2 Sample Size 25
3.7.3 Sampling Decision 25
3.7.4 Sampling Selection Criteria 25
3.8 Benefits of Study 26
3.9 Limitations of the Study 27
CHAPTER 4 DATA ANALYSIS 28-39 CHAPTER 5 MAJOR FINDINGS 40-42 CHAPTER 6 CONCLUSION 43-44 CHAPTER 7 FINAL DECISION 46-47 CHAPTER 8 SUGGESTION FOR FURTHER RESEARCH 48-49
BIBLIOGRAPHY
ANNEXURE

CChhaapptteerr
11
IInnttrroodduuccttiioonn

Chapter 1 Introduction
This chapter aims to give an understanding and perspective of The Sharpe Index Model. The
review of literature gives a historical view within the topic, which is followed by the problem
discussion that will discharge into a narrowed down research objectives that are of significance
to fulfill the purpose of this study. Further, pre study approach and as a final point the
disposition of this study.
The investor always likes to purchase a combination of stocks that provides the highest returns
and has lowest risk. He wants to maintain a satisfactory reward ratio. Traditionally analysts paid
more attention to maintain the return aspect of the stocks. But now-a-days risk has increased
attention and analysts are providing estimates of risk as well as return.
The foundation of Modern Portfolio Theory was laid by Markowitz in 1951. He began with the
simple premise that since almost all investors invest in multiple securities rather than one, there
must be some benefit in investing in a portfolio of securities. He measured riskiness of a
portfolio through variability of returns and showed that investment in several securities reduced
this risk. His work won him the Nobel Prize for Economics in 1990. Markowitz’s work was
extended by Sharpe in 1964, Lintner in 1965 and Mossin in 1966. Sharpe shared the Nobel
Prize for Economics in 1990 with Markowitz and Miller for his contribution to the Capital
Asset Pricing Model (CAPM). This model breaks up the riskiness of each security into two
components - the market related risk which cannot be diversified called systematic risk
measured by the beta coefficient and another component which can be eliminated through
diversification called unsystematic risk.
The Markowitz Model is adequate and conceptually sound in analyzing the risk of the portfolio.
But the problem with Markowitz Model is that a number of co-variances are to be estimated.
The Markowitz model is extremely demanding in its data needs for generating the desired
efficient portfolio. If a financial institution buys 150 stocks, it has to estimate about 11,175 i.e.
[(N2-N)/2] (N expected returns + N variances of returns + N*(N-1)/2 unique covariances of
returns) correlations co-efficients. Because of this limitation the single index model with less
input data requirements has emerged. Sharpe has developed a simplified model to analyze the
portfolio. He assumed that the return of a security is linearly related to single index like the

market index. Strictly speaking, the market should consist of all the securities traded on the
exchange. In absence of it, a popular index can be treated as surrogate for the market index.
For example, even though BSE-Sensex, BSE-100, and NSE-50 do not use all the scrips’ prices
to construct their indices, they can be used as surrogates. This would dispense the need for
calculating hundreds of covariances. Any movement in security prices could be understood with
movement in the market index. Further it only needs 3N+2 bits of information compared to [N
(N+3)]/2 bits of information needed in the Markowitz analysis.
Sharpe Single Index Model
Casual observation of the stock prices over a period of time most of the stock prices move with
the market index. When the Sensex increases, stock prices also tend to increase and vice-a-
versa. This indicates that some underlying factors affect the market index as well as the stock
prices. Stock prices are related to market index this relationship could be useful to estimate the
return on stock.
Towards this purpose, the following equation can be use:
Ri = αi +βiRm+ ei
Where,
Ri = Expected return on Security i
αi = Intercept of straight line for α Coefficient
βi= Slope of the straight line or the Beta coefficient.
Rm = the rate of return on Market Index
ei = The Error Term
According to the equation, the return on stock can be divided into two components. The return
due to market and return independent of the market. β indicates the sensitivity of stock return to
the changes in the market return.

For E.g. β of 1.5 means the stock return is expected to increase 1.5% then the market index
return increases by 1% and vice versa. Likewise β of 0.5 expresses that the individual stock
return would change by 0.5% when there is a change in 1% in the market rate. β of 1 indicates
that market return and security return are moving in tandem. The estimate of β & α can be
obtained from regression analysis.
The single index model is based on assumption that stock varies together because of common
movement in stock market and there are no effects beyond the market (i.e. any fundamental
factors effects) that account the stocks co- movement. The basic equation underlying the single
index model is:
Ri = αi +βiRm
where
Ri = Return on the ith stock
αi = component of security i that is independent of market performance
βi = coefficient that measures expected change in Ri given a change in Rm
Rm = rate of return on market index.
The term αi in the above equation is usually broken down into two elements αi which is the
expected value of αi and ei which is the random element of αi . The expected return standard
deviation and covariance of the single index model represent then joint movement of securities
The single index model equation, therefore, becomes:
Ri = αi +βiRm+ ei
1The Single index model requires 3N+2 estimates (estimates of alpha for each stock, estimates
of beta for each stock, estimates of variance for each stock, estimate for expected return on
market index and an estimate of the variance of returns on the market index) to use the
Markowitz optimization framework.
1 All the statistical terms mentioned in bracket are explained in further part of this project.

1.1 REVIEW OF LITERATURE
There have been a lot of previous studies within the field of portfolio theory. One article written
by Cowles (1933), examined the outcome from passive versus active managed portfolios. The
result from this research was that the managed portfolio underperformed the passive
benchmark. Cowles examined return but did not take into consideration risk, but the Modern
Portfolio Theory (MPT) states that risk as well as return must be considered according to Elton
and Gruber (1997). This makes the use of risk as an important factor when constructing a
portfolio. Markowitz (1959) argues that risk can be minimized but not eliminated, and this
without changing a portfolios’ return.
A similar study was been undertaken by Debasish Dutt. AICWA & Jt. General Manager,
Simplex Concrete Piles (India) Ltd. In his study he used NSE 100 as the benchmark market
Index to construct an optimal portfolio using Sharpe model in 1998. Outcome of his study was:
only 5 stocks out of 100 listed stocks were selected and this portfolio yielded better return than
market return. Interestingly all the stocks selected turned out to be bank stocks
1.2 Problem discussion
There are thousands of different investments to choose from with different risk and return
levels. With so many different options, the investor may feel unsettled to take the right direction
when picking stocks that fulfills the expectations.
There are several different areas to discover before allocating in specific stocks. How has it
performed historically? How risky has it been? And what does it cost? When judging the
performance of an asset it is important to make comparisons with similar assets in the same
industry
The return of an asset is commonly compared to an index. The benchmark index is the most
frequent tool to estimate the fluctuation and trend on the stock market. In the long run a stock
index will grow accordingly to the development of the general economy. What most investors
strive for is to beat the index, generating a surplus return. Beating an index is often more
difficult than one would assume. Looking only at historically high performance of an asset is
not a guarantee for a future performance with a high return. The business cycle has a large
impact on certain assets and less impact on others.
When investing in stocks the investor are forecasting that the time and money invested will
grow and in the future become more valuable in relationship to the risk that the investor are
willing to deal with. The Nobel Prize awarded economist William F Sharpe has developed a
model which help investors to solve many of their problems regarding investing in a portfolio.
Researchers’ debate on this topic has ever since been controversial; the debate about investing
strategies is always under expansion and will probably forever be. This is one of the reasons
that make this topic so interesting to focus on.
1.3 Pre-study & Approach
The authors want to create an optimal portfolio and compare its development with an index.
The first step in this thesis was to collect knowledge about the topic. How to create an optimal
risky portfolio, financial parameters and other factors with potential impact was of interest.
The achieved knowledge in the pre-study phase, created a solid base for the authors to advance
with more specific studies in the subject. The pre-study was constituted by using databases in the
university library, and its resources were used as a primary tool to find books, articles and
supportive information.
By using specific keywords such as portfolio construction, Sharpe model, optimal portfolio, risk
and return, the researcher have been able to find accurate information. The historical data input
for the selected stocks used to create the portfolio was gathered from BSE India and Yahoo
Finance websites, they keep records of historical stock prices. The data input are then put into
the mathematical tools provided by the theory and tested in order to analyze and discover major
tests. The result from the tests will be the conclusion originated from the purpose statement
which the thesis is based upon.

CChhaapptteerr 22
TThheeoorreettiiccaall
FFrraammeewwoorrkk

Chapter 2 : Theoretical framework
This chapter will be the guide through the theory associated with Sharpe model and other
theories that are connected to this topic. To illustrate the theory the researcher will start by
defining the fundamental concepts which lie as a foundation for the study.
2.1 Expected Return
Sharpe states that a portfolio’s expected return is the weighted average of the expected return of the
individual assets. Depending on the weight of an individual asset this asset will have a larger or smaller
impact on the return of the portfolio. Alternative assets differ in their terms of expected return, but the
expected return is only a part of the asset’s future performance. What may influence the expected return
is volatility of the asset.
Towards this purpose, the following equation can be use:
Ri = αi +βiRm+ ei
Where,
Ri = Expected return on Security i
αi = Intercept of straight line for α Coefficient
βi= Slope of the straight line or the Beta coefficient.
Rm = the rate of return on Market Index
ei = The Error Term
2.2 Risk of the portfolio
Portfolio risk is the possibility that an investment portfolio may not achieve its objectives. There are a
number of factors that contribute to portfolio risk, and while you are able to minimize them, you will
never be able to fully eliminate them. The risk that is inherent to the entire market or market segment is
called systematic risk, also known as undiversifiable risk or market risk.

Systematic Risk: The risk that is inherent to the entire market or market segment is called systematic
risk, also known as undiversifiable risk or market risk
Systematic risk = β2 x Variance of the market
Unsystematic risks: These are risks that are unique to a firm or industry. Factors such as
management capability, consumer preferences, labour, etc. contribute to unsystematic risks.
Unsystematic risks are controllable by nature and can be considerably reduced by sufficiently
diversifying one's portfolio
Unsystematic risk = (Total Variance of the security) -( Systematic risk)
2.3 BETA of the portfolios
The degree to which different portfolios are affected by these systematic risks as compared to
the effect on the market as a whole, is different and is measured by Beta. To put it differently,
the systematic risks of various securities differ due to their relationships with the market. The
Beta factor describes the movement in a stock's or a portfolio's returns in relation to that of the
market returns. For all practical purposes, the market returns are measured by the returns on the
index (BSE Sensex.), since the index is a good reflector of the market.
BETA = Covariance(X, Y)/X
2.4 Standard Deviation
Standard Deviation is a statistical tool, which measures the variability of returns from the
expected value, or volatility. It is denoted by sigma(σ). It is calculated using the formula
mentioned below:
Where, is the sample mean, xi’s are the observations (returns), and N is the total number of
observations or the sample size.

2.5 THEORY OF PORTFOLIO CONSTRUCTION
Portfolio is a combination of security such as stock, bonds and money market instrument. The
process of blending together the broad asset classes so as to obtain optimum return with
minimum risk is called portfolio construction. Diversification of investments helps to spread
risk over many assets. A diversification of securities gives the assurance of obtaining the
anticipated return on the portfolio. In a diversified portfolio, some securities may not perform as
expected, but others may exceed the expectation and making actual return of the portfolio
reasonably close to the anticipated one. Keeping a portfolio of single security may lead to a
greater likelihood of the actual return somewhat different from that of the expected return.
Hence, it is a common practice to diversify securities in the portfolio.
2.6 APPROACHES IN PORTFOLIO CONSTRUCTION
Commonly, there are two approaches in the construction of the portfolio of securities viz.
Traditional approach and Markowitz efficient frontier approach. In the traditional approach,
investor’s needs in terms of income and capital appreciation are evaluated and appropriate
securities are selected to meet the needs of the investors. The common practice in the traditional
approach is to evaluate the entire financial plan of the individual. In the modern approach,
portfolios are constructed to maximize the expected return for a given level of risk. It views
portfolio construction in terms of the expected return and the risk associated with obtaining the
expected return.
2.6.1 Traditional approach
The traditional approach basically deals with two major decisions. They are:
(a) Determining the objectives of the portfolio.
(b) Selection of securities to be included in the portfolio.
Normally, this is carried out in four to six steps, before formulating the objectives, the
constraints of the investor should be analysed. Within the given frame work of constraints,
objectives are formulated. Then based on the objectives, securities are selected. After that, the
risk and return of the securities should be studied. The investor has to assess the major risk

categories that he or she is trying to minimise. Compromise on risk and non-risk factors has to
be carried out. Finally relative’s portfolio weights are assigned to securities like bonds, stocks
and debentures and then diversification is carried out.
2.6.2 Modern approach
The traditional approach is a comprehensive financial plan for the individual. It takes into
account the individual needs such as housing, life insurance and pension plan. But these types
of financial planning approaches are not done in the Markowitz approach. Markowitz gives
more attention to the process of selecting the portfolio. His planning can be applied more in the
selection of common stocks portfolio than the bond portfolio. The stocks are not selected on the
basis of need for income or appreciation. But the selection is based on the risk and return
analysis. Return includes the market return and dividend. The investor needs return and it may
be either in the form of market return or dividend. They are assumed to be indifferent towards
the form of return.
From the list of stocks quoted at the Bombay stock exchange or at any other regional stock
exchange, the investor selects roughly some group of shares say of 10 or 15 stocks. For these
stocks expected return and risk would be calculated. The investor is assumed to have the
objective of maximizing the expected return and minimizing the risk. Further, it is assumed that
investors would take up risk in a situation when adequately rewarded for it
In the Modern approach the final step is asset allocation process that to choose the portfolio that
meets the requirement of the investors.
2.7 Managing the portfolio
After establishing the asset allocation the investor has to decide how to manage the portfolio
over-time. He can adopt passive approach or active approach towards the portfolio
management.

CChhaapptteerr
33
RReesseeaarrcchh
MMeetthhooddoollooggyy

Chapter 3 Research Methodology
3.1 Research objective:
“To construct an optimal portfolio using Sharpe’s index model”
The primary objective this study is to investigate if an investor can apply Sharpe’s
portfolio optimization model in order to achieve a higher return than investing in an
index portfolio. Constructing a strong portfolio that beats the market in the long-run
would be the ultimate goal for most investors.
3.2 Sub objectives
1. To find out optimal portfolio, which will yield optimal returns at a minimum risk to
the investor
2. To study whether the portfolio risk is less than individual risk on whose basis the
portfolios are constituted.
3. To analyze whether the selected portfolio is yielding a satisfactory return to the
investor.
4. To suggest better investment decision based on calculated beta of BSE index.
3.3 List of information needed2
In this study BSE 30(Sensex) has been taken as the sample population so the information which
is to be needed to construct an optimal portfolio out if these 30 scrips would be as follows:
Daily closing values of market index (here SENSEX)
Daily closing prices of the selected stocks to calculate variance , standard deviation,
correlation and co-variances
Constant Beta values of the stocks during this period.
Average returns of the stock at the end of this period.
The current risk free rate of return. 2 The time frame for which the information is needed is from 1
st Jan- 31
st Dec 2010.

3.4 Variables Under study
Market Return (Rm)
Security Return (Ri)
Risk-free rate of return (Rf)
Beta Values (βi) of the securities.
Market Variance (σm2)
Security Variance (σi2)
Security standard deviation (σi)
3.5 Research design
In this step we specify as what methods and procedures are being used for conducting a
particular study. A research design is the specification of methods and procedures acquiring the
information needed. It is the overall operational framework of the project that stipulates what
information is to be collected from which sources and by what procedure. There are different
categories of research designs. Here the research design is descriptive based on secondary
database.
Descriptive Research:
Project is totally based on descriptive research. It is prepared in more structures way to find out
problem question. Under such research, the researcher have undergone through calculative
study for optimal proportion of portfolio and the risk & return for the Optimal Portfolio
Preparation.
3.6 Data collection plan
The next step followed after choosing the research design is to determine the sources of data to
be used in the research process. Data are available mainly in 2 forms, out of which either choice
is made or as per the requirement both are used.

3.6.1Type of Data collected
Secondary data:
Basically, the data used in this dissertation are secondary in nature, the secondary data are those,
which are already collected by someone for some purpose and are available for the present
study.
3.6.2 Sources of data Collection:
The data which appeared in Yahoo Finance and Business line and from the Web Site of
Bombay Stock Exchange, Historic daily closing price of indices in Bombay Stock Exchange
Sensex has been used in this dissertation. Historic daily closing prices have been used for
selected company to test the applicability of Beta, SD, Variance, Co- Variance and Coefficient
Correlation, which are used for this purpose.
3.6.3 Tools and techniques of data collection & analysis:
Basically whole data analysis has been performed using spreadsheet in Microsoft Excel 2007 by
using different statistical functions inbuilt in Excel. The following statistical functions have
been employed during the data analysis.
Average: Calculates the average of a given data.
Correlation: Calculates the coefficient of correlation between Market Return and
security return.
Co-variance: Calculates the Co-variance of correlation between Market Return and
security return.
Sigma: Calculates the summation of data.
3.7 Sampling Plan
This is perhaps the most important part of research being undertaken. Once the data is collected
the next step is to imply a suitable sampling plan.

3.7.1 Sampled Population:
Universe:
Population Study of BSE Sensex (30) scrips.3
3.7.2 Sample Size :
Out of 30 scrips, 13 scrips have been selected as sample size as they fulfill the criteria of
yielding positive returns during the time frame of the research.
3.7.3 Sampling decision: Convenient Sampling.
3.7.4. Sampling selection criteria :
The following are the criteria on the basis of which the sample size of 11 stocks have
been decided in this study:
Stage 1: Positive Historic returns :
The study is based on the assumption that stock prices follow historic trends so for
the purpose only those securities which yielded positive returns in duration are to be
considered and securities with negative returns must be excluded from the sample
size.
Stage 2 : Positive Beta Values :
Next criterion is that all the selected securities in stage 1 must have positive Beta
values and securities with negative Beta must be \excluded from the sample size.
Stage 3: Returns more than risk free rate of return.
Once 1st and 2
nd criteria are satisfied the next step is to select only those securities
whose returns are more than risk free rate of return and securities yielding returns
less than risk free rate of return must be excluded from the sample size.
Stage 4 : Data availability
This is perhaps the last stage of sample selection, if stage 1, 2 & 3 are satisfied than
finally it is necessary to check if the yearly data for such selected stocks are
available.
3 Refer annexure for the sample population and sample size.

3.8 Benefits of the Study
3.8.1 Benefits of the Study to the Researcher:
The study helps the researcher in getting exposure to the real world of stock market.
Researcher gets to know how to construct a portfolio.
It helped in further enhancing the theoretical knowledge of portfolio theory, Sharpe
model of portfolio construction, technical aspects of the stock market like Beta,
Variance, Standard Deviation, and Correlation & Covariances.
According to the theory researcher constructs an optimal portfolio offering the
maximum possible expected return for a given level of risk.
3.8.2 Benefits of the Study to others:
To investors:
Potential Investors: This report would help the potential investors by providing
them the information regarding to risk, returns and construct a portfolio according
to their priorities and proportions which would ultimately result in their wealth
creation.
Risk-averse investors: Such investors generally don’t prefer to take much risk and
invest their money into safer avenues but this report would help such investors to
understand that even they can maximize their return if they invest in right
proportion in stock market rather than selecting just an average return yielding
instrument. For E.g. Govt. Bonds
To Students:
This report will definitely help students especially studying finance; they can undertake a
study and understand their practical implications of various portfolio theories, models &
methods of portfolio construction.

3.9 Limitations of the study
This study is restricted only to BSE INDEX.
Only 1 year (1st January 2010 to 31th
December2010) duration has been taken for the study.
The BSE SENSEX taken as benchmark has its own limitations. The BSE Sensex consists of
30 scripts. So it does not truly reflect as a whole. Hence there is a limitation that the true
returns from the market are not reflected indices.
Beta of individual security is assumed to be constant but in reality it fluctuates daily.
Only quantitative aspect of stock market is being considered but in reality security prices are
affected by infinite reasons.
Due to some technical error data for some scrips’ were not available so they were excluded even
they fulfilled the criteria to be included in sample size
The risk free rate of return is also assumed to be known but in reality it may depend on
investor’s perception as according to him what is the risk free rate of return. For E.g. If his
business would yield more than 8.04% which is higher than investing in so called risk free
return bearing instrument like 10 yr Govt. of India Bond than in such case he would
compare all other avenues’ performances with the performance of his business’ return.

CChhaapptteerr 44
DDaattaa
aannaallyyssiiss
IInntteerrpprreettaattiioonn

Chapter 4: Data Analysis & Interpretation
According to the definition given by Wikipedia, Data Analysis is a process of inspecting,
cleaning, transforming, and modeling data with the goal of highlighting useful information,
suggesting conclusions, and supporting decision making. Data analysis has multiple facets and
approaches, encompassing diverse techniques under a variety of names, in different business,
science, and social science domains
As mentioned earlier in research methodology, the data has been collected solely from the
secondary sources for which official websites of BSE SENSEX and Yahoo Finance are used for
finding out daily closing values of the BSE INDEX and daily closing prices of some selected
stocks for constructing a portfolio.
By Portfolio we mean a range of investments held by a person or organization and by an
optimal portfolio we mean the portfolio that has the highest possible potential return at a given
level of risk. Thus, an optimal portfolio is the portfolio that considers
the investor's own greed and/or how risk averse he/she is. Optimizing a portfolio is not
something one can calculate in your head. There are computer programs that are dedicated to
determining optimal portfolios by estimating hundreds (and sometimes thousands) of different
expected returns for each given amount of risk. But over here Microsoft excel 2007 has been
used as an electronic media through which all the manual calculations are carried out.
At the initial stage data has been collected to find out and analyze as to which are the stocks that
constitute BSE 30 as our main objective is to construct an optimal portfolio from these 30
scrips. Here is the table which shows that which companies constitute BSE 30 INDEX. The first
column shows name of the companies and next shows to which industry/sector they belong to.
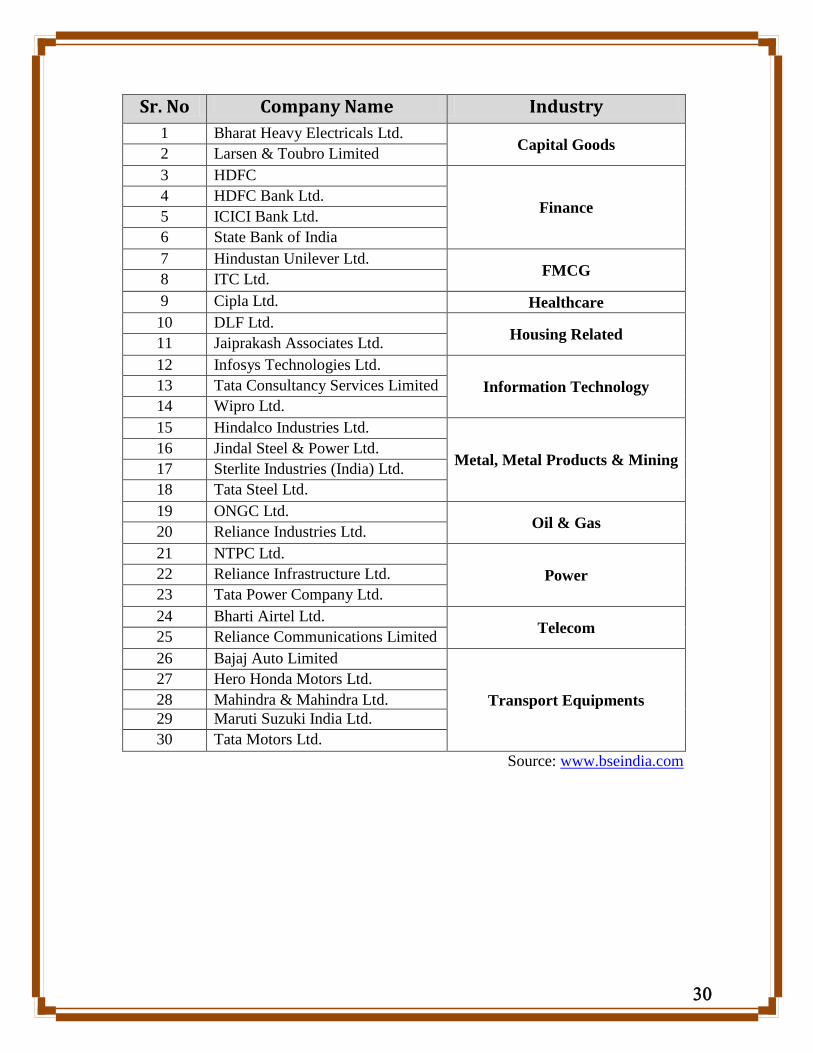
Sr. No Company Name Industry
1 Bharat Heavy Electricals Ltd. Capital Goods
2 Larsen & Toubro Limited
3 HDFC
Finance 4 HDFC Bank Ltd.
5 ICICI Bank Ltd.
6 State Bank of India
7 Hindustan Unilever Ltd. FMCG
8 ITC Ltd.
9 Cipla Ltd. Healthcare
10 DLF Ltd. Housing Related
11 Jaiprakash Associates Ltd.
12 Infosys Technologies Ltd.
Information Technology 13 Tata Consultancy Services Limited
14 Wipro Ltd.
15 Hindalco Industries Ltd.
Metal, Metal Products & Mining 16 Jindal Steel & Power Ltd.
17 Sterlite Industries (India) Ltd.
18 Tata Steel Ltd.
19 ONGC Ltd. Oil & Gas
20 Reliance Industries Ltd.
21 NTPC Ltd.
Power 22 Reliance Infrastructure Ltd.
23 Tata Power Company Ltd.
24 Bharti Airtel Ltd. Telecom
25 Reliance Communications Limited
26 Bajaj Auto Limited
Transport Equipments
27 Hero Honda Motors Ltd.
28 Mahindra & Mahindra Ltd.
29 Maruti Suzuki India Ltd.
30 Tata Motors Ltd.
Source: www.bseindia.com
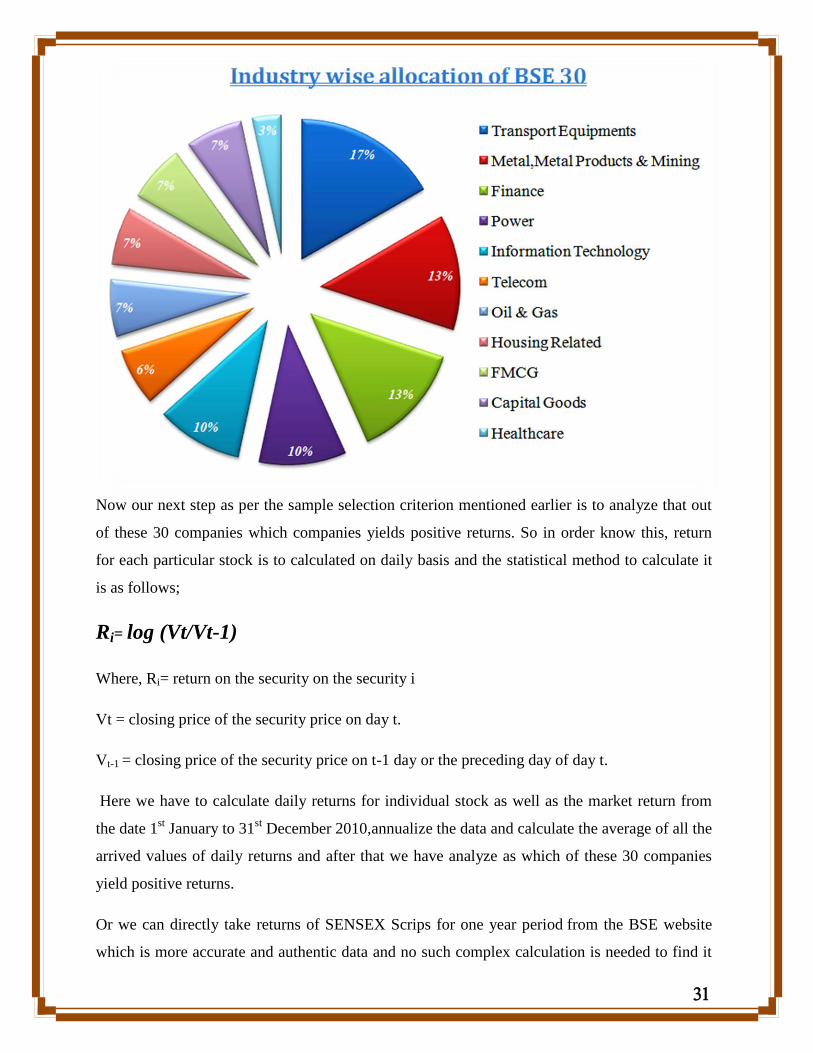
Now our next step as per the sample selection criterion mentioned earlier is to analyze that out
of these 30 companies which companies yields positive returns. So in order know this, return
for each particular stock is to calculated on daily basis and the statistical method to calculate it
is as follows;
Ri= log (Vt/Vt-1)
Where, Ri= return on the security on the security i
Vt = closing price of the security price on day t.
Vt-1 = closing price of the security price on t-1 day or the preceding day of day t.
Here we have to calculate daily returns for individual stock as well as the market return from
the date 1st January to 31
st December 2010,annualize the data and calculate the average of all the
arrived values of daily returns and after that we have analyze as which of these 30 companies
yield positive returns.
Or we can directly take returns of SENSEX Scrips for one year period from the BSE website
which is more accurate and authentic data and no such complex calculation is needed to find it

as they are readily available. Also the same is the case with beta values even they are readily
available on BSE website. Here is the table which shows last one returns of each security and
BSE 30 market index as a whole along with their Beta values.
From the above table it can be seen that out of 30 stocks, 15 stocks gave negative returns. This
could be due to a host of reasons including bear hammering in a sluggish secondary market.
TABLE 1 BSE 30 Stock List
Sr. No. Company Beta Values Returns (1 year) (%)
1 Tata Motors Ltd. 1.47 65.08%
2 Tata Consultancy Services Limited 0.86 51.54%
3 ITC Ltd. 0.73 37.91%
4 State Bank of India 1.15 33.14%
5 HDFC Ltd. 1.11 28.81%
6 Mahindra & Mahindra Ltd. 1.12 28.14%
7 Infosys Technologies Ltd. 0.79 23.77%
8 HDFC Bank Ltd. 0.98 21.24%
9 Hindustan Unilever Ltd. 0.51 19.23%
10 ICICI Bank Ltd 1.47 16.8%
11 Hindalco Industries Ltd. 1.58 14.83%
12 Bharti Airtel Ltd. 0.77 14.62%
13 Wipro Ltd. 0.8 17.79%
14 ONGC Ltd. 0.66 5.63%
15 Larsen & Toubro Limited 1.07 1.65%
16 Jindal Steel & Power Ltd. 1.03 -0.52%
17 Tata Steel Ltd. 1.3 -1.92%
18 Reliance Industries Ltd. 1 -2.5%
19 Tata Power Company Ltd. 0.62 -3.08%
20 Cipla Ltd. 0.47 -4.76%
21 NTPC Ltd. 0.66 -6.76%
22 Maruti Suzuki India Ltd. 0.79 -10.78%
23 DLF Ltd. 1.5 -13.5%
24 Bharat Heavy Electricals Ltd. 0.82 -13.6%
25 Sterlite Industries (India) Ltd. 1.49 -18.16%
26 Hero Honda Motors Ltd. 0.51 -18.33%
27 Bajaj Auto Limited 0.64 -27.41%
28 Reliance Infrastructure Ltd. 1.24 -31.11%
29 Reliance Communications Limited 1.21 -36.91%
30 Jaiprakash Associates Ltd. 1.66 -38.19%
SENSEX 1 10.94%
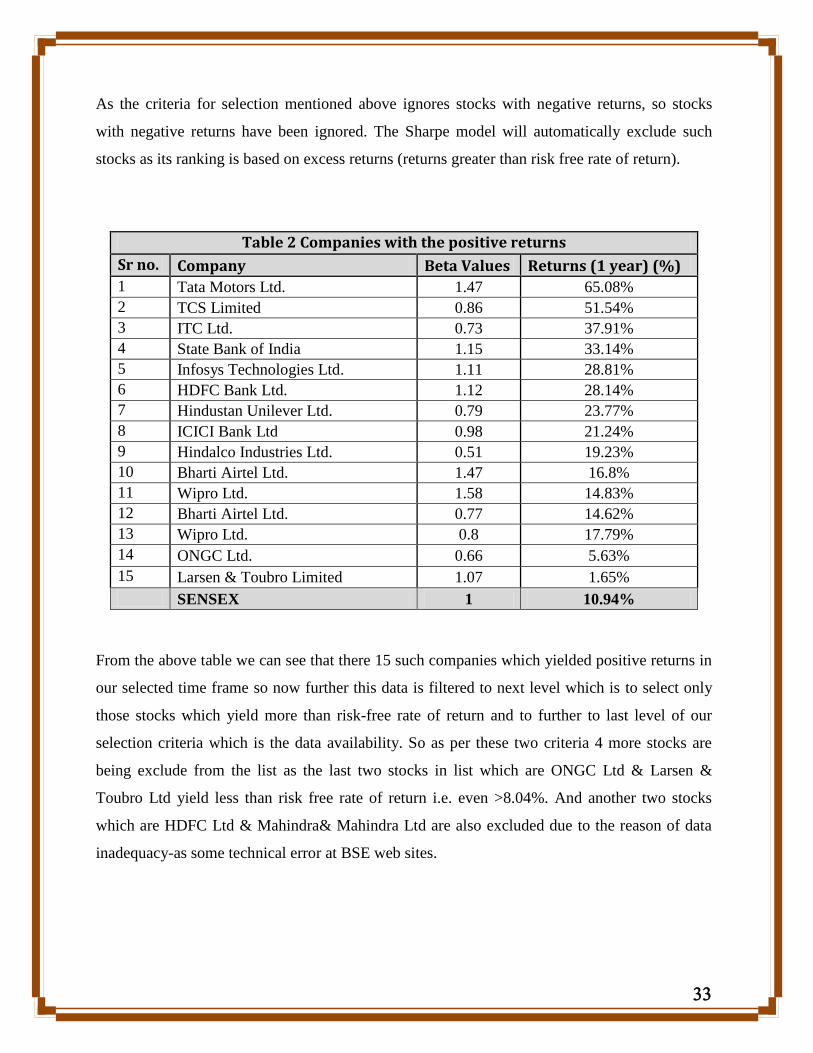
As the criteria for selection mentioned above ignores stocks with negative returns, so stocks
with negative returns have been ignored. The Sharpe model will automatically exclude such
stocks as its ranking is based on excess returns (returns greater than risk free rate of return).
Table 2 Companies with the positive returns
Sr no. Company Beta Values Returns (1 year) (%)
1 Tata Motors Ltd. 1.47 65.08%
2 TCS Limited 0.86 51.54%
3 ITC Ltd. 0.73 37.91%
4 State Bank of India 1.15 33.14%
5 Infosys Technologies Ltd. 1.11 28.81%
6 HDFC Bank Ltd. 1.12 28.14%
7 Hindustan Unilever Ltd. 0.79 23.77%
8 ICICI Bank Ltd 0.98 21.24%
9 Hindalco Industries Ltd. 0.51 19.23%
10 Bharti Airtel Ltd. 1.47 16.8%
11 Wipro Ltd. 1.58 14.83%
12 Bharti Airtel Ltd. 0.77 14.62%
13 Wipro Ltd. 0.8 17.79%
14 ONGC Ltd. 0.66 5.63%
15 Larsen & Toubro Limited 1.07 1.65%
SENSEX 1 10.94%
From the above table we can see that there 15 such companies which yielded positive returns in
our selected time frame so now further this data is filtered to next level which is to select only
those stocks which yield more than risk-free rate of return and to further to last level of our
selection criteria which is the data availability. So as per these two criteria 4 more stocks are
being exclude from the list as the last two stocks in list which are ONGC Ltd & Larsen &
Toubro Ltd yield less than risk free rate of return i.e. even >8.04%. And another two stocks
which are HDFC Ltd & Mahindra& Mahindra Ltd are also excluded due to the reason of data
inadequacy-as some technical error at BSE web sites.

Table 3 Sample portfolio
Sr. No Company Beta Values Returns (1 year) (%)
1 TCS Limited 1.47 65.08%
2 ITC Ltd. 0.86 51.54%
3 Tata Motors Ltd. 0.73 37.91%
4 State Bank of India 1.15 33.14%
5 HDFC Bank Ltd 1.11 28.81%
6 Infosys Technologies Ltd. 0.79 23.77%
7 Hindustan Unilever Ltd. 0.51 19.23%
8 Bharti Airtel Ltd. 1.47 16.8%
9 ICICI Bank Ltd 1.58 14.83%
10 Wipro Ltd. 0.77 14.62%
11 Hindalco Industries Ltd. 0.8 17.79%
SENSEX 1 10.94%
So as per above table only 11 stocks out of 30 stocks in BSE are finally selected as the sample
size on which Sharpe model will be applied to find out how many stocks should be included in a
portfolio and what should be the optimal proportion of these stocks in the portfolio
SHARPE’S OPTIMAL PORTFOLIO
The steps for finding out the stocks to be included in optimal portfolio are given below
PART A:
Finding out the cut-off rate and selecting the securities.
PART B:
Finding out the optimal proportion of investment to be made in the selected securities.
We begin with PART A
1) Find out “excess return to beta” ratio for each stock under consideration.
2) Rank them from highest to lowest.
3) Proceed to calculate Ci for all the stocks according to the ranked order using the
following formula.

σm2 = variance of the market index
σei2
= variance of the stock movement that is not associated with the movement of
market index i.e. stock’s unsystematic risk.
4) The cumulated values of Ci start declining after a particular Ci and that point is taken as
cut-off and that stock ratio is the cut-off ratio C
STEP 1 FINDING“EXCESS RETURN TO BETA” RATIO OF EACH SECURITY
Table 4
Sr Name of Return Excess Return Beta Excess Return to Beta
No. the Security Ri (Ri-Rf) β (Ri-Rf)/β1 Tata Motors Ltd. 65.08 57.04 1.47 38.80
2 TCS Limited 51.45 43.41 0.86 50.48
3 ITC Ltd. 37.91 29.87 0.73 40.92
4 State Bank of India 33.14 25.1 1.15 21.83
5 Infosys Technologies Ltd. 23.77 15.73 0.79 19.91
6 Hindustan Unilever Ltd. 21.24 13.2 0.98 13.47
7 HDFC Bank Ltd. 19.32 11.28 0.51 22.12
8 ICICI Bank Ltd 16.8 8.76 1.47 5.96
9 Hindalco Industries Ltd. 14.83 6.79 1.58 4.30
10 Bharti Airtel Ltd. 14.62 6.58 0.77 8.55
11 Wipro Ltd. 12.79 4.75 0.8 5.94

STEP 2 RANKING OF STOCKS BASED ON EXCESS RETURN TO BETA (Ri-Rf)/Β
Table 5
Name of Excess Return to Beta
the Security (Ri-Rf)/β1 TCS Limited 50.48
2 ITC Ltd. 40.92
3 Tata Motors Ltd. 38.80
4 State Bank of India 22.83
5 Hindustan Unilever Ltd. 21.12
6 Infosys Technologies Ltd. 19.91
7 HDFC Bank Ltd. 13.47
8 Bharti Airtel Ltd. 8.55
9 ICICI Bank Ltd 5.96
10 Wipro Ltd. 5.94
11 Hindalco Industries Ltd. 4.30
Ranks
Table 6
1 2 4 5 6 Unsystemetic 7 8 9 10
Sr Name of Excess Return Beta Risk Cummulative of 7 Cumm of 9
No. the security (Ri-Rf) β σei2 (Ri-Rf)*β/σei
2 ∑(Ri-Rf )*β/σei2 β2/σei
2 ∑β2/σei2
1 TCS Limited 43.41 0.86 1.80 20.72 20.72 0.41 0.41
2 ITC Ltd. 29.87 0.73 21.49 1.01 21.74 0.25 0.66
3 Tata Mtrs Ltd. 57.04 1.47 3.24 25.88 47.62 0.67 1.33
4 SBI 25.1 1.15 1.81 15.98 63.60 0.73 2.06
5 Hind Unil Ltd. 11.28 0.51 1.85 3.11 66.71 0.14 2.20
6 Infosys Tech Ltd. 15.73 0.79 1.30 9.53 76.24 0.48 2.69
7 HDFC Bank Ltd. 13.2 0.98 1.01 12.76 89.00 0.95 3.63
8 Bharti Airtel Ltd. 6.58 0.77 3.84 1.32 90.32 0.15 3.79
9 ICICI Bank Ltd 8.76 1.47 1.60 8.05 98.37 1.35 5.14
10 Wipro Ltd. 4.75 0.8 12.20 0.31 98.68 0.05 5.19
11 Hindlco Ind Ltd. 6.79 1.58 3.31 3.24 101.92 0.75 5.95

Table 7
1 2 3 4 5 6
Sr Name of Market Variance Cutoff rates
No. the Security σm2
∑(Ri-Rf)*β/σei2
∑β2/σei
2 Ci
1 TCS Limited 1.0206 20.74 0.41 15.01
2 ITC Ltd. 1.0206 21.74 0.66 13.38
3 Tata Motors Ltd. 1.0206 47.62 1.33 20.90
4 State Bank of India 1.0206 63.60 2.51 18.51
5 Hindustan Unil Ltd. 1.0206 66.71 2.92 17.38
6 Infosys Tech Ltd. 1.0206 76.24 2.69 21.10
7 HDFC Bank Ltd. 1.0206 89.00 3.62 19.64
8 Bharti Airtel Ltd. 1.0206 90.32 3.78 19.29
9 ICICI Bank Ltd 1.0206 98.37 5.13 16.38
10 Wipro Ltd. 1.0206 98.67 5.18 16.29
11 Hindalco Ind Ltd. 1.0206 101.92 5.94 15.00
σm2 = variance of the market index = 1.026 (Refer Annexure)
Therefore, Ci for TCS ltd = (1.026)2 x (20.7424)
1 + [(1.026)2 x (0.4105)]
=> 15.0086% Similarly we can calculate cutoff rate all other securities in the portfolio.
Ci for ITC ltd = 13.37%
Ci for TATA Motors Ltd = 20.89%
Ci for State Bank of India Ltd =18.50%
Ci for Hindustan Unilever Ltd =17.37%
Ci for Infosys Technologies Ltd =21.10%

Ci for ITC ltd HDFC Bank Ltd =19.64%
Ci for ICICI Bank Ltd =19.29%
Ci for Wipro Ltd = 16.37%
Ci for Hindalco Industries Ltd=14.99%
The highest Ci is taken as the cut-off point i.e. C*. The stocked ranked above C* have high
excess returns to beta than cutoff Ci and all the stocks ranked below C* have high excess
returns to beta. Here the cut-off rate C*is 21.10%. Hence first 5 securities are selected.
NOTE: If the number of stocks are larger than no need to calculate Ci values after ranking has
been done. It can be calculated until the C*value is found and after calculating one or two
stocks below it the calculations can be terminated.
PART B:
After determining the securities to be selected, the next step is to find out how much should be
invested in each security. The percentage of funds to invest in security can be estimated as
follows.
Table 8
1 2 3 4 Unystemetic 5 Excess Return 6=cutoff rate 7 8
Sr Name of Beta Risk to Beta Optimal Proportion
No. the Security β σei2 (Ri-Rf)/β X i = Z i/∑Z i
1 TCS Limited 0.86 1.8014 50.4767 20.1046 14.49983679 56.41%
2 ITC Ltd. 0.73 21.4918 40.9178 20.1046 0.706950372 2.75%
3 Tata Mtrs Ltd. 1.47 3.2399 38.8027 20.1046 8.483659064 33.01%
4 SBI 1.15 1.8067 22.826 20.1046 1.732224498 6.74%
5 Hind Unil Ltd. 0.51 1.848 21.1176 20.1046 0.279561688 1.09%
Ci Zi=[β/σ ei2 ({(R i-R f )/β i}-C i)]
∑ Z i =25.70223241 100.00%

Calculation for finding Portfolio Return
Sr Name of Expected Return Weightage Portfolio Return
No. the Security E W (E)*(W)1 TCS Limited 51.54 0.56 29.07
2 ITC Ltd. 37.91 0.03 1.04
3 Tata Motors Ltd. 65.08 0.33 21.48
4 State Bank of India 33.14 0.07 2.23
5 Hindustan Unilever Ltd. 21.24 0.01 0.23
1.00 54.06
Table 9 Return On Portfolio.
Portfolio Beta Calculation
Sr Name of Beta Weightage Portfolio Beta
No. the Security βi Wi βiWi
1 TCS Limited 0.86 0.5641 0.485126
2 ITC Ltd. 0.73 0.0275 0.020075
3 Tata Motors Ltd. 1.47 0.3301 0.485247
4 State Bank of India 1.15 0.0674 0.07751
5 Hindustan Unilever Ltd. 0.51 0.0109 0.005559
1 1.073517
Table 10 Beta Of the Portfolio
Portfolio Variance Calculation
TABLE 11
Wi βi (σm)2 σei2 (Wi *βi)
2 (σm)2 (Wi2)(σei
2) Portfolio variance
0.5641 0.86 1.026 1.8 0.2415 0.5728 0.8142
0.0275 0.73 1.026 21.49 0.0004 0.0163 0.0167
0.3301 1.47 1.026 3.23 0.2416 0.3520 0.5935
0.0674 1.15 1.026 1.8 0.0062 0.0082 0.0143
0.0109 0.51 1.026 1.84 0.0000 0.0002 0.0003
1.4390

CChhaapptteerr
55
FFiinnddiinnggss
Chapter 5 Findings
“The main purpose of the study is to investigate if an investor can apply Sharpe’s
portfolio optimization model in order to achieve a higher return than investing in an
index”
From the above data analysis researcher arrives at following result.
At the initial stage, all stocks of BSE 30 were considered as the portfolio but after conducting
through secondary research and data analysis it was found that out of given 30 stocks
constituting the index there were only 15 stocks which yielded positive return during the
selected time frame i.e. from 1st January 2010 to 31
st December 2010.
The reason for selecting the stocks with positive returns only is because the Sharpe model will
automatically exclude such stocks as its ranking is based on excess returns (returns greater than
risk free rate of return).
As the risk free rate of return considered under this study is 8.04%, only 14 stocks yielded
returns more than 8.04% so after analyzing all criteria only 11 stocks out of 30 were selected in
the portfolio.
After selecting the portfolio, Sharpe model was applied to find out the most suitable stocks for
the purpose of investment.
It was found that all the stocks had positive Beta values and all the selected stocks belonged to
different industry sector
The optimum portfolio can be broken down into two parts viz the stocks that it comprises and
the percentage of funds that go to acquire such stocks. From the above study it was found that
out of 11 stocks selected for analysis only 5 stocks proved to outperforming and providing the
better returns than cut off rate of return. The cut-off rate calculated was 21.10%.
So according to Sharpe that fair rate of return on investment in market 21.10% so only those
stocks having return greater than cut-off rate should be selected for the purpose of investment.
A perfect combination of such securities in portfolio would yield maximum possible return at
given level of risk.

Once the cut-off rate was decided, 5 stocks were selected in portfolio and their composition in
optimal proportion was found out which was as follows:
56.41% of funds invested in TATA Consultancy Ltd.
33.01% of funds invested in ITC Ltd.
6.74% of funds invested in TATA Motor Ltd.
2.75% of funds invested in State Bank of India Ltd.
And 1.05% of funds invested in Hindustan Unilever Ltd.
Further it was found that the securities selected in optimal portfolio yielded a better than in
positive market conditions i.e. the portfolio returns as according to table 9 is 54.06 % which is
considered to be more than an average return.
The portfolio yielded 54.06% which also higher than returns of the individual securities in the
portfolio leaving the exception of TATA Motors ltd which had return than 54.06% i.e. 65.08%
but it’s not a better investment decision to keep all your eggs into one nest.
It was also found that the portfolio Beta value is also more than 1 i.e. 1.07 which indicates that
in favorable economic conditions this portfolio will definitely perform better than market as a
whole. And the variance of the portfolio arrived was 1.43.

CChhaapptteerr
66
CCoonncclluussiioonn

Chapter 6 Conclusion
In this chapter the researcher gives a summary of the conclusions from the study. The findings
are analyzed in relation to the purpose of the thesis.
This study has discovered that an optimal portfolio influenced by Sharpe Portfolio optimization
Theory of Capital Asset Pricing actually provides the investor with a higher return during the
timeframe the researcher has chosen. Investing merely in a passive index cannot be considered
an efficient investment alternative. However, the research questions also calls for an analysis of
the portfolio’s inherent risk, and its impact on the risk adjusted return.
The analysis and conclusion is therefore more extensive than simply comparing the simple
compounded return during the investigation period.
“The purpose of this study is to investigate if an investor can apply Sharpe portfolio
optimization model in order to achieve a higher return than investing in an index portfolio.”
During the one year investigation period the optimal portfolio had a significantly yielded higher
return than the passive index portfolio. Investing accordingly to Sharpe’s model would have
yielded an investor a return of 54.06% percent rather than 10.94% return of BSE30 index. This
is evidence that our primary objective is accomplished.
As per the findings the portfolio Beta comes to 1.07 which is higher than Beta values of
individual stocks leaving an exception of TATA Motors Ltd i.e. 1.47
Moreover the portfolio variance calculated was 1.43 which is less than variance of individual
securities in the portfolio so this is also a favorable outcome of the study and accomplishes our
secondary objectives also.
To conclude, the optimal portfolio had over the full one year time span a significantly higher
return than a passive index portfolio. However, the researcher is disinclined to argue that
investing accordingly to Sharpe Model, forecasting merely on historical data, would be a
consequently better alternative than an index portfolio.

To further investigate the advantage of Sharpe model, one would have to base the forecast on a
stock picking approach rather than using only historical data. The authors believe a fundamental
analysis of the individual assets included in the portfolio would to a great extent improve the
performance of a diversified portfolio.

CChhaapptteerr
77
FFiinnaall
DDiissccuussssiioonn

Chapter 7 Final Discussion
In this final chapter, the researcher reflects and comments on the obtained result. Further, the
researcher reflects upon the findings, and evaluates their performance in order to display what
could have been done differently to improve the findings of the thesis. Finally, the optimal
portfolio’s development is revised from different perspectives in order to provide some leads for
future research.
Reflections and Criticism
The time that the researcher spent on this thesis has been very valuable. The knowledge of
making a successful investment has broadened, since several theories and academic journals
have been analyzed and interpreted. Further, all the practical work that a study demand have
improved the researcher analytical ability and skills in terms of constructing an academic report.
In order to conclude the optimal portfolio as the superior one depends upon what perspective
that is of interest. The findings do not provide a total picture that consistently recommends the
optimal portfolio as the most successful. One important parameter that might have an impact on
the result is the investor’s wisdom of a certain asset, a specific asset class may be totally
overvalued and should be excluded from the portfolio, but since the researchers’ optimal risky
portfolio is based upon historical data, the individual investor’s preferences are totally
disregarded in this study.
Finally, the timeframe should be extended in order to achieve a more reliable result; the optimal
portfolio is based upon a 1 year period of historical data. A short investigation period increase
the risk for error, hence a longer timeframe will be preferred to lessen the risk for error and to
accomplish a more trustworthy result.

CChhaapptteerr
88
SSuuggggeessttiioonnss
ffoorr FFuurrtthheerr
RReesseeaarrcchh

Chapter 8 Suggestions for Further Research
In this chapter, the researcher explains the scope of present study and also provides suggestions
for improvement further study.
This type of study was extremely interesting and the researcher was pleased with the
outcome of research. Although the researcher would find it interesting to perform a similar
test but with several ongoing portfolios compared to different index types to be able to
achieve a conclusion statement that is more valid and reliable. Each parameter can be
analyzed separately but still with the same objective to achieve a greater development than
index, that would be a great complement to the research study.
Moreover this study is exclusively based upon historical data, adding a parameter that
includes the investor’s preferences would make this type of study even more interesting and
would highlight the pros and cons with the human impact.
To construct an optimal portfolio, that is fully diversified the global perspective should be
taken into consideration. It is acknowledged in research that a globally diversified portfolio
will provide the investor with even more valuable diversification opportunities;
consequently it would be interesting to investigate if a portfolio with globally diversified
assets would show a different pattern of the result.
In this research, only a sample population of 30 stocks of BSE Sensex is taken under
consideration, one can take NSE 50, BSE 100, BSE 200, BSE 500 etc and can construct a
portfolio which shows different consequences in fact may be more interesting than the
present work.
Apart from selecting the home country stocks, one can also diversify internationally and
find out the stock which can yield a higher return even at international markets.

BBiibblliiooggrraapphhyy

Bibliography
Books Referred
Punithavanthy Pandian, “Security Analysis portfolio Managent”
Donald E. Fischer, Ronaki J.Jordan “Security Analysis and Portfolio
Management”
Edwin J. Elton and Martin J. Gruber “Modern Portfolio
Theory and Investment Analysis”
M. Obaidullah “Indian Stock Market - Theories and Evidence”
Prasanna Chandra “The Investment Game - How to win”
Web Sources
http://www.slideshare.net/hemanthcrpatna/a-study-on-construction-of-
optimal-portfolio-using-sharpes-single-index-model
http://www.bseindia.com/stockinfo/indices.aspx
http://in.finance.yahoo.com/q?s=^BSESN
http://www.investopedia.com/terms/u/unsystematicrisk.asp
http://www.investopedia.com/terms/s/systematicrisk.asp
Articles
Debasish Dutt “Valuation of common stock -an overview”
The Management Accountant November 1998.

AAnnnneexxuurree