Master Thesis of Mr. Praseed Thapa
79
UNIVERSITY OF HOHENHEIM Institute for Social Science of the Agricultural Sector Department of Rural Communication and Extension Master Thesis related to the module Knowledge and Innovation Management Prof. Dr. Volker Hoffmann Development of Visual Extension Material: A case of potato IPM in Kavre District, Nepal Submitted by Praseed Thapa Hohenheim, December 2012 This work was financially supported by the Centro Internacional de la Papa / International Potato Center, Peru
-
Upload
independent -
Category
Documents
-
view
0 -
download
0
Transcript of Master Thesis of Mr. Praseed Thapa

UNIVERSITY OF HOHENHEIM
Institute for Social Science of the Agricultural Sector Department of Rural Communication and Extension
Master Thesis related to the module
Knowledge and Innovation Management
Prof. Dr. Volker Hoffmann
Development of Visual Extension Material: A case of potato
IPM in Kavre District, Nepal
Submitted by
Praseed Thapa
Hohenheim, December 2012
This work was financially supported by the
Centro Internacional de la Papa / International Potato Center, Peru

ii
Acknowledgements
It gives me immense pleasure to thank all those who helped me directly or indirectly to
complete my study.
I would like to thank my first supervisor Prof. Dr. Volker Hoffmann for providing me the
opportunity to conduct this thesis under his direct supervision. In addition to this, his
continuous advice and support during my entire work of thesis is highly appreciable.
I also want to thank Dr. Jürgen Kroschel, my second supervisor, from CIP for his valuable
guidance and support in the beginning phase of the thesis. Also, I would like to thank Dr.
Marc Sporledor, country director of CIP, Nepal, for the guidance and logistic support
during my stay in Nepal. I owe much appreciation to CIP, Peru for funding me to conduct
this study.
Deep appreciation goes to all the farmers from Kavre and Lalitpur District who actively
took part and provided me their valuable time to conduct this work.
My special thanks go to Mr. Diwakar Rupakheti, Ms. Bandana Bista Rupakheti for their
special care during my stay in Nepal. Also, the co-operation from the driver Mr. Dipak
K.C. is appreciated.
I would also like to take this opportunity to thank University of Hohenheim, Stuttgart,
Germany for providing me platform to accomplish my master degree.
Lastly, my sincere thanks goes to my mother Ms. Sita Devi Thapa Chhetri and father Mr.
Ashok Thapa, entire family members and all the friends and coordinators from University
of Hohenheim for their support during my study period in Germany. Also special thanks to
my wife, Ms. Anju Adhikari for her comments, suggestions, support, love and care in
helping me to complete this study.
Thank you all.

iii
Declaration
I, Praseed Thapa Born on 12th of April 1985, Matriculation Number 514567, hereby
declare on my honor that the attached declaration, Master Thesis, has been independently
prepared, solely with the support of the listed literature references, and that no information
has been presented that has not been officially acknowledged.
Supervisor: Prof. Dr. Volker Hoffmann
Thesis topic: Development of Visual Extension Material: A case of potato IPM in Kavre
District, Nepal
Semester: 5
I declare, here within, that I have transferred the final digital text document (in the format
doc, docx, odt, pdf, or rtf) to my mentoring supervisor and that the content and wording is
entirely my own work. I am aware that the digital version of my document can and/or will
be checked for plagiarism with the help of an analysis software program.
Stuttgart, Date, Signature

iv
Table of contents
Acknowledgements ii
Declaration iii
Table of contents iv
List of abbreviations vi
List of figures vi
List of tables vii
List of boxes viii
List of annexes viii
1 Introduction 1
1.1 General Background 1
1.2 Statement of the problem 2
1.2.1 Need of visuals as extension materials 2
1.2.2 Importance of visual aids/material 3
1.3 Objectives 4
1.4 Organization of the work 4
2 Literature Review 5
2.1 Definition of Illiteracy and its types 5
2.2 Visual aids and their importance 6
2.2.1 Dale’s Cone of Experience 6
2.3 Defining Visual Literacy and Its Importance 8
2.4 Picture Materials as a Means of Communication for Illiterates or
Low-Literates 10
2.5 Factors of Comprehensibility and Role of Pictures 12
2.5.1 Superiority of picture materials over other visual media 13
3 Methodology 16
3.1 Site description 16
3.2 Selection of Painter 17
3.3 Selection of extension worker 18

v
3.4 Selection of the visuals 18
3.5 Selection of respondents 19
3.6 Data Collection and Analysis 19
3.6.1 Primary Data 19
3.6.1.1 Pre-testing of pictures 19
3.6.1.1.1 First pre-test 20
3.6.1.1.2 Second pre-test 20
3.6.1.2 An illustration on modification of pictures 21
3.6.1.3 Gender, education level and age of participating respondents 24
3.6.2 Secondary data 25
3.7 Data analysis, reliability and validity 26
4 Results and Discussion 29
4.1 Economic feasibility analysis 29
4.1.1 Difference in production level 29
4.1.2 Labor time saving 29
4.1.3 Cost effectiveness of materials 30
4.2 Mobile yellow sticky trap as a technology 30
4.3 Technical feasibility analysis of mobile yellow sticky trap 31
4.4 Developing visual extension materials 33
4.4.1 Process of developing visual extension material 33
4.5 Results observed under picture validation 36
4.6 Extension system in Nepal 42
4.6.1 Top down approach 42
4.6.2 Major obstacles of extension system observed in Nepalese context 43
4.6.3 Extension workers 44
5 Summary and Conclusions 45
6 Recommendations 48
7 References 49
8 Annexes 53

vi
List of Abbreviations
@ at the rate
ASC Agriculture Service Center
CIP Centro Internacional de la Papa / International Potato Center
DADO District Agriculture Development Office
$ Dollar
FGD Focus Group Discussion
gm gram
INGO International Non-governmental organization
IPM Integrated Pest Management
JTA Junior Technical Assistant
km Kilometer
LMF Leaf Miner Fly
m meter
masl meter above sea level
mm millimeter
MYST Mobile Yellow Sticky Trap
NARC National Agriculture Research Council
NGO Non-governmental organization
Rs. Rupees
sq square
UN United Nations
VDC Village Development Committee
List of Figures
Figure 1: Comparison of Adult Literacy Rate 5

vii
Figure 2: Dale's Cone of Experience 7
Figure 3: Location of the study area 17
Figure 4: Overview of the picture validation process 21
Figure 5a: First draft of handling technique of MYST 22
Figure 5b: First modification of figure 5a 22
Figure 5c: Second modification of figure 5a 23
Figure 6: Overview of the data analysis process 27
Figure 7: Handling of MYST to capture LMF 31
Figure 8: Picture attracting farmer's attention 36
Figure 9: Picture making farmers to go for discussion and
stimulate thinking 37
Figure 10: Difficulty in understanding picture of life cycle of LMF 38
Figure 11: Easily understood picture of spider 38
Figure 12: Comparison of various climatic conditions favorable
for the multiplication of LMF 38
Figure 13: An adult LMF 39
Figure 14: Yellow flex print 39
Figure 15: Use of conventional signals to convey the information 40
Figure 16: Comparison of harvest between MYST adopted field and
non-MYST adopted field 41
List of Tables
Table 1: Education level of participating farmers in Nala, Kavre District 24
Table 2: Education level of participating farmers in Tukucha,
Lalitpur District 24
Table 3: Overview of activities of study, concerned stakeholders,
methods and location 25
Table 4: Results obtained after three weeks 34
Table 5: Results obtained after six weeks 35

viii
List of Boxes
Box 1: Response from the farmer from Nala, Kavre District 32
Box 2: Response from the chief of Loktantrik IPM group 41
Box 3: Response from the extension worker of ASC, Banepa 44
List of Annexes
Annex 1: Comparison of production level between mobile yellow sticky
trap and control field 53
Annex 2: Comparison of labor time saving between mobile yellow sticky
trap and control field 54
Annex 3: Comparison of cost effectiveness of materials required between
mobile yellow sticky trap and control field 56
Annex 4: List of participants used for the discussions with farmers,
extension worker and painter 57
Annex 5: List of questions asked to differentiate the perceiving capacity
of key messages between picture shown and verbal group 58
Annex 6: Series of final pictures drawn to prepare teaching guide for the
illiterate and/or low-literates to control Leaf Miner Fly (LMF)
using Mobile Yellow Sticky Trap (MYST) 60

1
1 Introduction
This study was done in collaboration with International Potato Center (CIP), Peru and the
Department of Rural Communication and Extension of University of Hohenheim,
Germany, as a part of the project “Sustainable Potato Cultivation in Hindu Kush Region”
from March to May, 2012. The project was jointly conducted by CIP and the National
Agricultural Research Center (NARC) in Nala of Kavre District, Nepal since 2008 till
2012.
1.1 General Background
Nepal, a country of Himalayas, is landlocked between two populous countries, India and
China. It has a total area of 147,181 sq. km and a total population of 26.62 million
(POPULATION CENSUS, 2011). Ecologically, the country is divided into three regions viz;
Mountain, Hills and Terai which covers 41, 42 and 17% of its total area respectively.
Nepal, with an annual per capita income of around US$ 200, is one of the poorest
countries in the world (WORLD BANK, 1997). Agriculture is the mainstay of the Nepalese
economy, providing employment opportunities to 66% of the population and contributes
about 39% share in Gross Domestic Products with 13% of the total foreign trade of the
country (DOA, 2012). Likewise, major portion of household income comes from
agriculture sector. Thus, the agriculture sector is pivotal to alleviate poverty and to uplift
the living standard of the people in Nepal.
Potato (Solanum tuberosum L.), is one of the important crops in Nepal. It ranks on the
fourth position in total production and first in productivity compared with the main staple
crops rice, maize, wheat and millet (APSD, 2009). It is used as a major vegetable in Terai
and mid-hills and as a staple food in the high hills and mountains with per capita
consumption of 30kg/year (CIP, 1998) being higher that the world average of 28kg/year.
So, it is considered as an important crop for both producers and consumers (SHRESTHA
and KHATRI, 2000). Despite the fact of higher per capita consumption than the world
average, the production of potato in Nepal is below its potential and still among the
lowest in the world. Various factors such as diseases, insects and pests are contributing

2
for the low production of potato. Diseases like late blight (Phytophthora infestans) and
bacterial wilt (Ralstonia solanacearum) are the most devastating ones (HIDALGO, 1998)
and insect pests like leaf miner fly (L. huidobrensis) and potato tuber moths (Phthorimaea
operculella) are also major constraints for potato cultivation. However, a large number of
technologies have already been developed to control such insect pests. The grim reality is
that such technologies are still unfamiliar among the majority of farmers worldwide and if
familiar too, they are not in a position to grab the information that are printed in the
extension materials which are supposed to communicate information to target farmers as
they are not able to read and write.
1.2 Statement of the problem
1.2.1 Need of visuals as extension materials
The majority of Nepalese population (66%) relies on agriculture and 64% of the total
population is illiterate of which 67% reside in the rural area (PRENNUSHI, 1999). Thus, a
conclusion can be derived that the large population of farmers are illiterate. In Nepal,
varieties of extension materials are in use to transfer information to farmers. Despite the
availability of numerous extension materials, most of the printed materials are written at a
too high level for the low-literate or illiterate farmers to understand. A similar case was
reported by DOAK et al. (1998); DOLLAHITE et al. (1996); MAYER and RUSHTON (2002)
where most printed materials are written at reading levels that are higher than the literacy
level of many of the people for whom the materials were intended. As a result, such
farmers may not recognize messages from the materials even though they are extremely
useful and therefore, we have to create such materials that are more accessible and easy
for the intended people to understand. On the other side, lack of such extension material
also creates difficulty for the extension workers who are working closely with illiterate
farmers. This results the bad fit between extension worker and farmers. So, a need of
effective communication to make illiterate farmers adopt the appropriate technology is
imperative if agricultural production is to be increased. This calls for an approach of
developing appropriate visual aids/material especially in developing countries like Nepal.

3
1.2.2 Importance of visual aids/materials
The fact that illiterates cannot understand the information within the extension materials
does not necessarily mean that there are no other options for them to learn new issues on
their own. One possible option, as reported by FOESENEK (2006) could be direct contact
between the extension persons and target groups or between researchers and target groups
directly. He continues to add on that, though this could be a very effective method but
also is equally expensive and time consuming. Several other studies on visual aids have
shown to be effective to communicate with non-literate people in their understanding
(DOAK et al. 1985; WILEMAN, 1993). According to HARFORD and BAIRD (1997), visual
aids help people learn and remember information which are also more important where
linguistic literacy is a barrier in the dissemination of innovation. Studies on visual aids
like video (TENDER et al. 2001, KELLY et al. 2003); radio (de SILVA and GARFORTH, 1997);
drama (KLEPP et al. 1997; HARVEY et al. 2000; MITCHELL et al. 2001) and posters
(OLADEPO et al. 1996) showed the success of a number of different media for knowledge
dissemination. In the Nepalese context, however, most of the farmers don’t own
television, reside in rural areas where there are no good roads or sometimes even no
roadways at all to reach them, and more than that, unavailability of electric power
completely or if available, power cut off of almost half a day makes it impossible to reach
them through electronic media. In this perspective, picture communication is the only
possibility to relay information as pictures are easy to transport and handle and are
independent of electricity (FEIL; HUMMLER; KACHELRIESS, 1997). It is one of the
recommended media channels that can be used for people with low reading skills
(KALICHMAN et al. 1999).
The pictures or images now-a-days no longer exist primarily to entertain and illustrate but
are becoming central means to communication and meaning-making (FELTEN, 2008).
They are frequently considered to be part of a universal language and it is often assumed
that they can be recognized with ease by all and can convey meaning with little or no
dependence on language or cultural background (HARDIE et al. 1979; WORK, 1990; REED
and HOFFMAN, 1986). The pictures not only increase the success of the messages
(KALICHMAN et al. 1999; DOAK et al. 1998; FINAN, 2002) but also due to the
omnipresence of pictorial communication in industrialized countries, it is assumed that

4
such media provide a “language-independent and supra-cultural means of
communication”, which can be used for rural development programs and for reaching
illiterate people (HOFFMANN, 2000), but testing shows that it is a rather complicated
process to create pictures that are correctly interpreted by illiterates.
1.3 Objectives
Analyzing the technical feasibility of the Mobile Yellow Sticky Trap
Analyzing the economic feasibility of the Mobile Yellow Sticky Trap
Developing visual extension material for the control of Leaf Miner Fly in potato
using Mobile Yellow Sticky Trap
1.4 Organization of the work
The research report is divided into six main parts. The first part introduces about the
general background to the topic, the statement of the problem and the objectives of this
research. The second part describes the research site, methodologies used and procedure
followed for the data collection and the way of data processing. In the third part, the
theoretical background on definition of illiteracy, visual literacy and their importance,
picture materials as a means of communication, superiority of picture over words and
processing of visual information among low-literates are presented. The results of own
development of pictorial visual aids are presented and discussed in part four of this report
and in part five, summary and conclusions are presented. Last but not the least, the thesis
report is finalized in part six where recommendations are presented.

5
2 Literature Review
2.1 Definition of Illiteracy and its types
Illiteracy is defined as “a) the quality or state of being literate, esp. the ability to read and
write. b) possession of education” (STEIN, 1966, 836). According to the Oxford English
Dictionary online, illiteracy is defined as “the inability to read and write”. SIMPSON and
WEINER (1989, Vol. 9, p. 656) define illiteracy as “the quality or state of being literate;
knowledge of letters; condition in respect to education, esp. an error due to want of
learning”. LAUBACH LITERACY INTERNATIONAL (1989) argues the definition of illiteracy
is not only as a deficiency of reading ability but also as the lack of basic listening,
speaking, reading, writing, or mathematical skills that an adult needs in his/her daily life
to solve the problems faced and to participate fully in their society. According to MYRES
(1926), there are at least two distinct types of illiteracy as follows:
(a) Pre-literacy, i.e. the illiteracy of an entire society, and
(b) The illiteracy of a subgroup within a literate society.
Figure 1: Comparison of Adult Literacy Rate
Source: UN data (2012)
0
20
40
60
80
100
120
Developing
Countries
Industrialized
Countries
Nepal World
% of people aged 15+ (2005-2010)
6
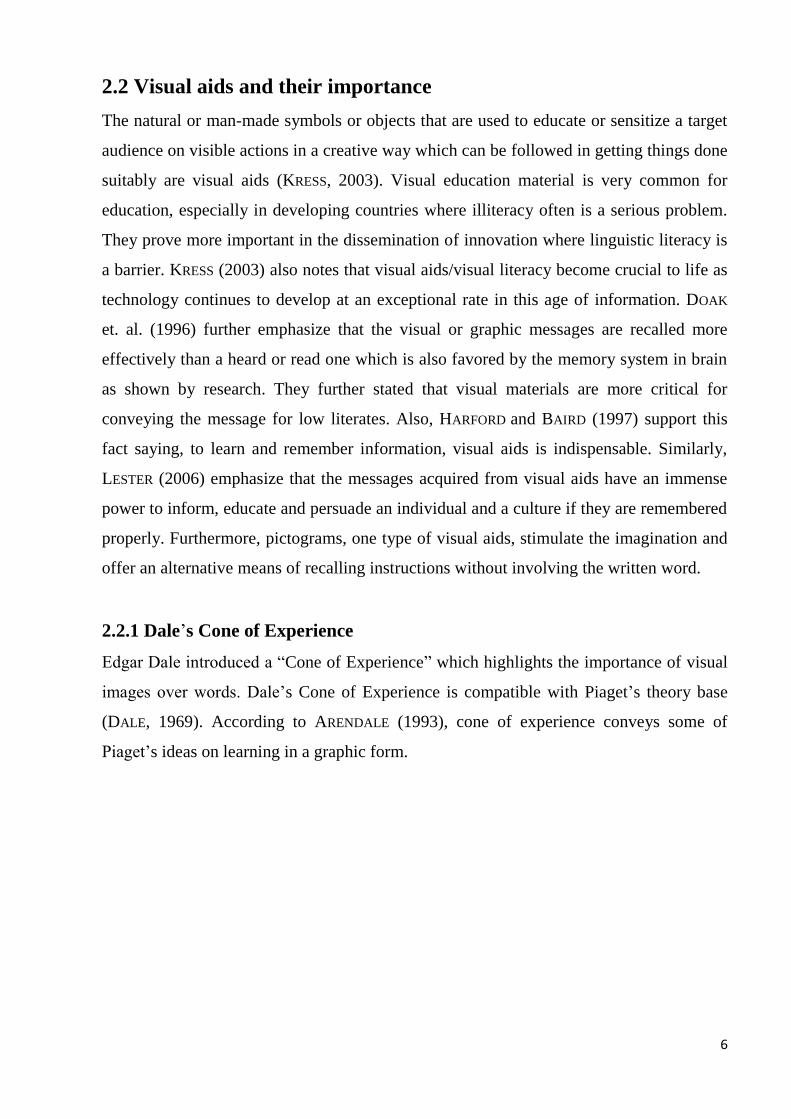
2.2 Visual aids and their importance
The natural or man-made symbols or objects that are used to educate or sensitize a target
audience on visible actions in a creative way which can be followed in getting things done
suitably are visual aids (KRESS, 2003). Visual education material is very common for
education, especially in developing countries where illiteracy often is a serious problem.
They prove more important in the dissemination of innovation where linguistic literacy is
a barrier. KRESS (2003) also notes that visual aids/visual literacy become crucial to life as
technology continues to develop at an exceptional rate in this age of information. DOAK
et. al. (1996) further emphasize that the visual or graphic messages are recalled more
effectively than a heard or read one which is also favored by the memory system in brain
as shown by research. They further stated that visual materials are more critical for
conveying the message for low literates. Also, HARFORD and BAIRD (1997) support this
fact saying, to learn and remember information, visual aids is indispensable. Similarly,
LESTER (2006) emphasize that the messages acquired from visual aids have an immense
power to inform, educate and persuade an individual and a culture if they are remembered
properly. Furthermore, pictograms, one type of visual aids, stimulate the imagination and
offer an alternative means of recalling instructions without involving the written word.
2.2.1 Dale’s Cone of Experience
Edgar Dale introduced a “Cone of Experience” which highlights the importance of visual
images over words. Dale’s Cone of Experience is compatible with Piaget’s theory base
(DALE, 1969). According to ARENDALE (1993), cone of experience conveys some of
Piaget’s ideas on learning in a graphic form.

7
Figure 2: Dale’s Cone of Experience
Source: Adapted and modified from DALE (1946)
Note: A: Symbolic experience; B: Iconic experience; C: Direct experience
The “Cone of Experience” is a visual device that is meant to summarize Dale’s
classification system for the varied types of mediated learning experiences. The
organizing principle of the cone is a series from most concrete experiences (at the bottom
of the cone) to most abstract (at the top). The arrangement of three classes of experience
in cone formation implies that each builds upon the previous one in the sequence stated
(HOFFMANN, 2000). It maintains that iconic experiences (images, visiting site, and
demonstrations) are more effective than symbolic experiences (spoken or written words).
The image retains 30% of what we see but retains only 10% and 20% when we read and
hear respectively. The symbolism can act as a short-term memory, unless it is converted
into images in the mind of the learner, or applied through a concrete experience. To take
abstract ideas to reality, visual aids and hands-on exercise help significantly. Only then,
visual aids have a chance to be stored in a memory for a long time (improved retention
and recall). However, Dale places direct experience (participating in hands-on workshop,
design collaborative lessons etc.) as the most important for greater learning and retention.
According to Dale, one can retain 70% of what they say and write and 90% of what they
say as they do a thing.
A
B
C
8
However, the formal education level of target audience is to be taken into account to
know if they are visually literate or not when considering the visual aids (LINNEY, 1995).
The same fact was observed by MANGAN (1978). He said that a degree of visual literacy is
required for the accurate interpretation of any pictorial material. It refers to the ability to
understand, create and use visual symbols for thinking, learning and communicating, and
also to learn the conventions on how to represent three-dimensional reality into two-
dimensional surface. The visual images prove meaningless to communicate a message
from one person to another if any of these learning processes are absent.
2.3 Defining Visual Literacy and Its Importance
John Debes in 1969 coined the term visual literacy for the first time (WILLIAMS and
DEBES, 1970). In the history of visual literacy, John Debes is one of the most important
figures (FRANSECKY and DEBES, 1972). Debes suggested that visual literacy was
significantly important in study areas like linguistics, psychology, art and media education
(JOHNSON 1978, 11). The definition of visual literacy that Debes gave is as follows:
“Visual literacy refers to a group of vision competencies a human being can develop by
seeing and at the same time having and integrating other sensory experiences. The
development of these competencies is fundamental to normal human learning. When
developed, they enable a visually literate person to discriminate and interpret visual
actions, objects, and symbols, natural and manmade, that he encounters in the
environment. Through creative use of these competencies, he is able to comprehend and
enjoy the masterworks of visual communication.”(FRANSECKY and DEBES, 1972, 7)
However, there exist numerous definitions about visual literacy today. Thus, in this
context, BURBANK and PETT (1983, 1) described that “Defining visual literacy is
comparable to the problem the six blind men faced when describing an elephant. The man
who felt just the side of the elephant described the animal as being like a wall while the
man who felt the tusk said the elephant was like a spear. The men who felt just the trunk
or tail or ear or leg were certain the elephant was like a snake, a rope, a fan or a tree.
Their description depended on the part they were examining. Visual literacy is also a
different thing depending on one’s viewpoint.”

9
DOWSE and EHLERS (2004) mentioned that visual literacy is acquired informally through
constant exposure to pictorial material and to the mass media and is a skill that is often
neglected in the formal curriculum. They further add that, to acquire visual literacy skills
at an early age, the pictures are to be read to a young child and their meanings should be
explained frequently. However, for this informal educational process to occur, book is a
rare commodity. There is a restricted opportunity resulting in a reduced ability to interpret
visual media for many people in this world.
The visual literacy is the ability to read, understand and interpret the information that is
presented in pictorial or graphic images (WILEMAN, 1993, 114). A similar definition is
“the learned ability to interpret visual messages accurately and to create such messages”
(HEINICH et. al. 1999, 64). Likewise, visual literacy relates to the ability of a person to
understand and interpret an image accurately when presented to them (LINNEY, 1995).
According to AUSBURN and AUSBURN (1978b, 291), “Visual literacy can be defined as a
group of skills which enable an individual to understand and use visuals for intentionally
communicating with others.” Also HORTIN (1983, 99) defined as “Visual literacy is the
ability to understand (read) and use (write) images and to think and learn in terms of
images i.e. to think visually”. In the view of SINATRA (1986, 5) visual literacy is an active
reconstruction of past experiences with incoming visual information to obtain meaning.
We live in an image-rich world (SMELIK et al. 1999). But, FELTEN (2008) opposes that
being in an image-rich world does not naturally mean that we have sophisticated skills on
visual literacy. Instead visual literacy involves the ability to understand, produce, and use
culturally significant images, objects and visible actions (FELTEN, 2008). According to
ZIMMER and ZIMMER (1978), visual literacy is the ability to comprehend the visual
language used within a particular culture or cultures at a conscious level. The ability to
recognize, interpret, and employ the distinct syntax and semantics of different visual
forms is visual literacy as described by FELTEN (2008) and MATHUR (2006). Similarly,
visual literacy is also about making judgments of accuracy, validity and worth of images
(MATHUR, 2006). Visual literacy is explored in terms of two constant components – first,
the ability to understand visual images, and the next, the ability to create or use images as
means of expression and communication (MESSARIS and MORIARTY, 2005, 482). Finally,
10
DONDIS (1974) says that a major part of what you know is what you see and visual
literacy can help us to see what we see and know what we know. That is why DONDIS
(1974) further says that, we know more, if we see more and we can see more, if we know
more and this would be an ideal situation within the visual literacy theories.
A person with visual literacy has the following visual abilities as stated by JOHNSON
(1978, 12).
See the difference between light and dark
Recognize differences in brightness
See similarities and differences in shapes
Distinguish color from grey
Recognize differences and similarities in colors
See distance, height and depth
See movement
Recognize a whole shape when parts are covered or hidden
Understand simple body language
Recognize groups of objects that are commonly seen together (e.g. knife fork and
spoon)
Sequence objects that are not commonly seen together into some kind of meaning.
For a visually literate person, to make meaning from what they see, the above are the list
of skills. However, according to ZIMMER and ZIMMER (1978), visuals are based on
mistaken ideas so they frequently do a poor job in communication for development.
2.4 Picture Materials as a Means of Communication for Illiterates or
Low-Literates
“If a picture can save you a thousand words, then the same picture can save you another
ten thousand words if it is in a document that will be translated into ten other languages”.
(VOGT, 1986, 330)
The above statement clearly shows the superiority of a picture over words. This
superiority have been emphasized by many scholars like PAIVIO (1986); SINATRA (1986);

11
MAYER and GALLINNI (1990); WILEMAN (1993); MAYER and SIMS (1994); MAYER (1999).
They elucidated that pictures attract attention, stimulating motivation, increase the speed
of message transfer and thus recalls information more effectively than a heard or a read
one.
The printed materials are common for farmers in developing countries to communicate
any kind of information related to agriculture. These common printed materials include
leaflets, brochures, manual etc. Despite the availability of such materials, majority of
them are written at too high level for low-literate and/or illiterate farmers to comprehend
key points. Mostly many of the printed materials are written in a complex way that makes
many targeted people unable to read and understand the information (DOAK et al. 1998;
DOLLAHITE et al. 1996; and MAYER and RUSHTON, 2002). Consequently, the farmers
whom the materials were intended may not benefit from such printed materials due to
their inadequate literacy. Thus, it is a common phenomenon to have a mismatch between
the printed materials and the literacy level of the targeted people. So, we have to create
such materials that are more accessible and easy for the intended people to understand. In
this perspective, for the people with low reading skills, pictorial guides or visual
education material is one of the recommended media channels (KALICHMAN et al. 1999).
Furthermore, success of messages can be improved by using pictures which is also
supported by KALICHMAN et al. (1999); DOAK et al. (1998) and FINAN (2002).
A number of success studies have been recorded for the transformation of information to
the target groups in which texts were accompanied by pictures. This is further exemplified
and supported by ALESANDRINI (1984); LEVIE and LENTZ (1982); SCHALLERT (1980);
WILLOWS and HOUGHTON (1987). Most of these studies revealed that illustrations
improved that retention of the text content. Also, a learner might be motivated to study the
supplementary text because of pictures; these illustrations might focus to gain attention or
induce more detailed processing of text information, the text content that is difficult to
understand is clarified and interpreted through pictures, or these pictures help in
establishing non-verbal codes with verbal ones and consequently, retrieval potential for
the illustrated text content increases (cf. KULHAVY; LEE and CATERINO, 1985; PAIVIO,
1986).

12
The inclusion of pictures in the form of photographs in the printing materials provides an
abundant opportunity for low literate target people to visualize their ideas and thus, be
more accurate. It seems obvious and thus, Family Health International (FHI) and the
program for Appropriate Technology in Health (FHI/PATH 2002, 67) summed up that if
we place the illustrations throughout the text, it makes the material more attractive and
helps the reader to absorb the information presented. Furthermore, STEFANO (2004) stated
that pictures are good and easy to understand and if there are pictures, he became
interested in the story and reads about it. MAES and SCHILPEROORD (2002, 158) also
reported that our eyes are attracted towards pictures during reading and thus increase
interest and motivation. BRODY (1982) also mentions that pictures explain difficult
concepts and expand the written narrative and, thus excite the learner. The pictures also
affect intellectual skills and processes in addition to helping in the gaining of information
(PEECK, 1993). Also, pictures decrease the probability of interference and/or decay in
memory of the material concerned by promoting greater distinctiveness at encoding and
facilitate subsequent retrieval (RUSTED, 1984). Thus, to convey the message for illiterate
and low-literate viewers, illustrations are crucial and are targeted at educationally
deprived or illiterate audiences and support, strengthen or illustrate meaning in text. In
this regard, HOFFMANN (2000, iv) argues that, because of the omnipresence of pictorial
communication in industrialized countries, it is assumed that such media provide a
‘language-independent and supra-cultural means of communication’, which can be used
for rural development programs and for reaching illiterate people.
2.5 Factors of Comprehensibility and Role of Pictures
As mentioned by CARSTENS and SNYMAN (2003), comprehensibility consists of four
factors: attention, understanding, remembering and being motivated to change behavior.
They all can improve when pictures are involved as supported by following literatures.
1. The use of pictures attracts the attention (HOFFMANN, 2000; WALKER, 1979).
Moreover, MAES and SCHILPEROORD (2002, 158) reported that the interest and
motivation during reading is increased if images are used.
2. A mental modal is built by the help of images and while reading a text, information
from the text and visual integrates that makes it easier to decode and understand

13
the information (GLENBERG and LANGSTON, 1992; DOAK et. al. 1996, MAES and
SCHILPEROORD, 2002).
3. The likelihood of better remembrance of information is improved if it is processed
using a mental modal. The storage capacity and access routes of brain are more for
pictorial images than for words (DOAK et. al. 1996, 92).
4. According to DOAK et. al. (1996), the convincing power of visual presentations has
been shown to be 43 percent more than unaided presentations. They also help to
form opinions and change behavior (MAES and SCHILPEROORD, 2002).
Similarly, to communicate with low literate people, print materials prove to be much
beneficial, especially in the field of health promotion and agricultural extension
(ZIMMERMAN and PERKIN, 1982; PATH 2002, 5; MORRIS and STILWELL, 2003, 72).
Production and delivery: inexpensive production and distribution, easy storage,
repeated use, transfer to others, tailored to specific geographical, linguistic and
cultural needs.
Information transfer: awareness creation, instruction, persuasion (behavior
change), reinforcement, and accurate and uniform transmission of factual and
technical information.
Literacy promotion: enrichment of visual and verbal reading skills.
HOFFMANN (2000, 137) strongly supported that the illiterates can be communicated in a
best way through pictures and he further mentions that illiterates do not face any kind of
difficulties in recognizing objects presented to them if these are known and represented in
a reasonable and realistic manner. Thus, he assures that a picture serves in a better way of
communication to the illiterates.
2.5.1 Superiority of picture materials over other visual media
According to HOFFMANN (2000, 298), the important criteria for picture material
production is that it should be simple and economically reproducible. These two criteria
can determine a centralized or decentralized pattern of picture use. For example, the film
with only one copy or only one projection unit has the centralized use as a sole option. In

14
this case, the individual showing must be followed one after the other and it creates a
difficulty of either transporting the target groups to the film or the film to the target
groups. Beside this, the desirable training effects for field staff are lost as the field staffs
are no longer involved and thus at the field level, there is a limited integration of the
communication process within the general assistance program. On the other hand, if we
can produce at least one copy of these picture materials for every field extension workers,
decentralized manner can be followed. An individual communication specialists or a
centralized department is of no use now whose task is only to manage the picture material
use, instead this tasks can be done by field staffs as one task among many. This helps the
field staffs in gaining both substantive and methodological knowledge and thus can
integrate this communication work within the rule of their other tasks and activities.
Similarly, HOFFMANN (2000, 298) continues to add on that the other forms of visual
media not only incurs a high cost of production, but also have cost on transportation. They
also have costs upon multipliabilty and decentralized use. For example, slide series can be
reproduced at relatively low cost, but there is difficulty in transportation of the projector
and the energy source. Conversely, these problems are not associated with the drawn
pictures. They are easy to handle, to transport and work without electricity. These special
characteristics of drawn pictures contribute greatly to communicate with farmers in the
remote areas without roads and electricity as stated by (FEIL; HUMMLER; KACHELRIESS,
1997).
The next important benefit, as described by HOFFMANN (2000, 298), of drawing materials
is its independency of events. For example, we need long waiting times and a long
distance travel in order to capture the crop pest on the image after locating it first. It is
generally impossible to simulate this event for biological process and unacceptably
expensive for social processes as historical films within the context of development
communication. In this regard, drawings are superior to any other visual materials as we
can represent the events at any desired point of time. All available photographic records
can be utilized at any point of time. The entire context of the pictures can be adapted and
used according to our will and the requirements. In some cases, the problem of
photographic images can also be solved by photographing or reproducing an existing

15
photo or drawing. This has been possible because of the recent development of scanners,
printers and image processing software. Similar is the case with film where we can exploit
its downward compatibility by introducing a series of pictures in the form of animated
film by filming still images or by using simple still drawings.

16
3 Methodology
The field study was undertaken for three months from March to May 2012. The six
experienced farmers of Nala, Kavre district were selected purposively as key respondents
as they were the farmers directly involved in the research conducted by CIP/NARC,
Nepal since 2008. Since the aim of this study was to develop visual extension materials
(picture materials) for the control of LMF in potato using MYST technology and to
analyze its economic and technical feasibility, ‘Focus Group (FG) Discussion’ method
was conducted. To analyze the economic feasibility of the technology, three different
simple, clear and less time consuming calculus formats were developed to compare the
production level (Annex 1), labor time saving (Annex 2) and cost effectiveness of
materials required between MYST adopted field and non-MYST adopted field or control
field (Annex 3). This format was given to the selected three farmers who were, at least,
able to do simple mathematical calculations.
3.1 Site description
The study site for conducting first pre-test of images, Nala, is located about 45 Km North-
East from the capital city of Nepal, Kathmandu. It is a small village in Kavre district of
Bagmati zone. The place is at a height of approximately 1,500 masl. The geographical
distribution of Nepal categorizes this village as the mid-hill which is very popular for
potato cultivation. The study was mainly focused with the farmers of ‘Dulal Gaon’ within
Nala of Kavre. Similarly, the second pre-test of the pictures was conducted in Tukucha,
Lalitpur district which is about 12 km from the capital city.

17
Figure 3: Location of the study area
Source: http://www.mapsofworld.com/nepal/nepal-district-map.html (Accessed: 08.12.2012)
The study in Nala was conducted in Nepali language. However, in Tukucha, a need of
translator was mandatory to translate Newari language, a local dialect, into Nepali
language. The need of translator was obligatory as the researcher could not understand the
accent of their Nepali language though he is from Nepal.
The following section describes how the selection of a painter, extension worker,
respondents, pictures and pre-testing of the materials was done.
3.2 Selection of Painter
The first step towards the development of visual extension material was initiated with the
selection of a painter. The following different criteria were followed in order to select a
painter.
Agriculture background
Handicraft person, not a pure artist
Understand and show main characteristics of the picture (focus should be only on
key information)
Familiar with the local conditions, cultures, traditions etc.
Polite and have a tendency to listen to others
Kavre District
Lalitpur District

18
Not hesitate to modify the pictures unless the key information is perceived
For this study, a painter was chosen by the joint decision of CIP, Nepal and researcher on
the basis of above mentioned criteria who was already available working as a research
assistant in the Entomology division of NARC, Khumaltar, Nepal.
3.3 Selection of extension worker
A meeting with two agricultural officers, five extension workers, a painter and researcher
was conducted on 03/04/2012 at DADO, Kavre to select the extension worker. In addition
to this, the objectives of the study were also to be highlighted during the meeting. After
some hours of discussion, finally one extension worker from Agriculture Service Center
(ASC), Banepa was appointed to assist the work. The selection was done on the basis of
knowledge in IPM, familiarity with the study site, farmer’s local condition, knowledge
etc., the motivation to work and that he was also familiar with the problem of LMF to
some extent.
3.4 Selection of the visuals
For selection of the pictures, an initial group discussion was conducted between
researcher, painter and the extension worker. The discussion concluded to include pictures
under the following topic. However, there was not any restriction on the number of
pictures to be drawn initially.
Biology of LMF
Symptoms and nature of damage of LMF
Causes of LMF infestation
Identifying the beneficial insects
Control Measures (Biological and Chemical)
Effect of chemical on environment, human health and beneficial insects
Materials required for MYST technology
Preparation and implementing technique of MYST in the field
Difference in harvest between MYST and non-MYST adopted field

19
For the selection of initial reference of the drawing pictures, the discussion decided to
draw most pictures from the photographs which were taken in the field and some from the
internet source. It was then provided to the painter as a reference for drawing. The
pictures were drawn on A4 size paper with the use of pencil only. Altogether, 29 pencil
drawn pictures (Annex 6) were drawn as research materials to be tested and finalized.
3.5 Selection of respondents
The recruitment of the respondents was done in two different places for carrying out two
pre-tests of the pictures viz; first pre-test and the second pre-test in Nala of Kavre District
and Tukucha of Lalitpur District respectively.
For the first pre-test, six out of twenty farmers were selected from Nala of Kavre district
purposively. The main reason was that these farmers were directly involved in the
research conducted for LMF control conducted by CIP/NARC since 2008. However,
other remaining fourteen farmers were selected by the joint decision of researcher and six
farmers under the following criteria.
Trivial knowledge about the technology
Neighborhood of selected six farmers
Motivation to learn and contribute for the development of visual materials.
For the second pre-test, farmers from the Loktantrik IPM group of Tukucha, Lalitpur
district was selected purposively. This site was selected on the basis of the severity of
LMF infestation. A brief meeting with the chief of this IPM group was made before by
the researcher who was informed about the objectives of the study in detail. Remaining all
the selection of nineteen farmers was done by the chief of the IPM group who was also
present each time during the pre-testing of pictures.
3.6 Data Collection and Analysis
3.6.1 Primary Data
The primary data obtained for this study is explained below.
3.6.1.1 Pre-testing of pictures

20
The pre-testing of the pictures was conducted in two different places. The following
section gives the detail explanation of the processes.
3.6.1.1.1 First pre-test
As said above, the first pre-test of the pictures was done with the farmers of Nala, Kavre
District who were familiar and experienced with the MSYT technology. The objective
was to know whether the content of the pictures represented their experience or not and
also to be sure that if the key elements are represented in the pictures. For this, a copy of
the initial draft of the pictures was made and the lines of the copied images were further
highlighted with black felt tip pen (2mm size) to ensure the clear visibility. The pictures
were then showed one at a time by fastening on the white board with the help of paper
tape while maintaining a distance of 2-3m between farmers and pictures. They were
allowed enough time to interpret the pictures. The pictures were modified repeatedly and
the above process was repeated unless the pictures represented their experience and the
key elements. The old version of the pictures was retained for reference purposes. Each
FG discussion was facilitated by an extension worker and the presence of the painter was
also made imperative to avoid information loss through partial or distorted transmission.
3.6.1.1.2 Second pre-test
The second pre-test of the pictures was conducted with the ten farmers of the Loktantrik
IPM groups from Tukucha; Lalitpur district following a similar procedure above and
Tukucha is one hour drive from Nala. The reason for the selection of these farmers was
that they were also facing the problem of LMF and had not any prior knowledge about the
MYST technology. The objective of the second pre-test was to verify the key messages in
the pictures without having experience of the technology. The pictures which were not
easily perceived in the second pre-test group were taken back to the first pre-test group
and modified where necessary, to make it more simple and clear for better insight. This
process was repeated until the second pre-test group clearly obtained the key information
of the pictures.

21
Figure 4: Overview of the picture validation process
Selection of the Painter
Selection of the Extension Worker
Selection of Pictures to be drawn
Validation
First pre-test Second pre-test
Final pictures
Source: Own illustration, 2012
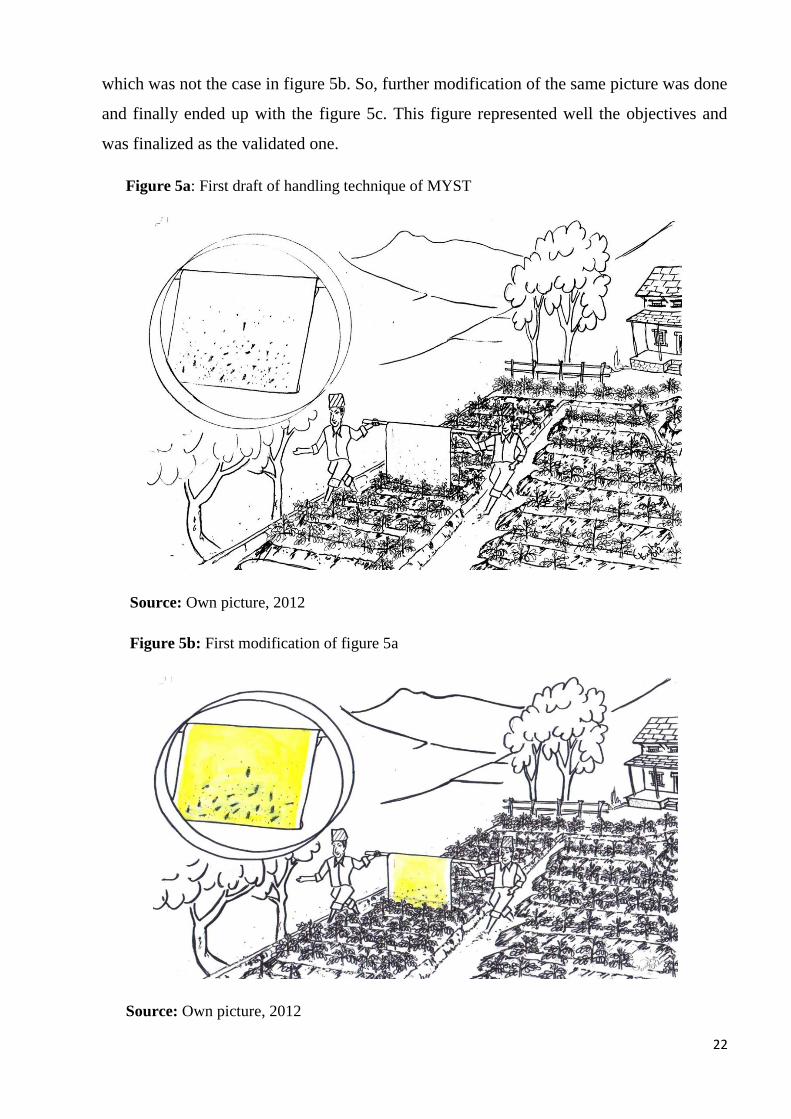
3.6.1.2 An illustration on modification of pictures
Figure 5a below shows the first draft prepared by the painter. The essence of information
from the first draft was not understood in a clear and simple way by the farmers. The
reason behind this was unused yellow color in the flex print. So the first modification was
done to make it more clearly by coloring the flex print with yellow color keeping every
other information as it is which is shown in figure 5b. During the next validation, farmers
were seen to stick in the house, hills, eye glass piece (shown to magnify the LMF attached
in flex) rather than the handling technique of MYST which was the main information to
be understood. Also, the picture of farmers was a little bit too small to understand it
clearly. Furthermore, in principle, the flex print containing bamboo attached in the lower
end should gently touch the upper part of the plants so that LMF fly and sticks in glue
22
which was not the case in figure 5b. So, further modification of the same picture was done
and finally ended up with the figure 5c. This figure represented well the objectives and
was finalized as the validated one.
Figure 5a: First draft of handling technique of MYST
Source: Own picture, 2012
Figure 5b: First modification of figure 5a
Source: Own picture, 2012

23
Figure 5c: Second modification of figure 5a
Source: Own picture, 2012
A separate group of ten farmers from the same IPM group was selected randomly to
compare the effectiveness of the pictures over words. The same key information which
was supposed to be communicated through the drawn picture was delivered to them
verbally without showing the pictures. Both groups were tested at two different slots; one
after three weeks and the other after six weeks of pre-test asking ten random questions
(Annex 5). The objective of this test was to examine the differences in the level of
perception and understanding of key information between the picture shown group and
the verbal group.
An economic feasibility analysis of the MYST was also performed with the three farmers
of Nala who were selected purposively on the basis of their ability to do simple
calculations. To perform this analysis, three different simple, clear and less time
consuming calculus formats were developed to compare the production level (Annex 1),
labor time saving (Annex 2) and cost effectiveness of materials (Annex 3) between
MYST adopted field and non-MYST adopted field or control field or chemical applied
field.

24
3.6.1.3 Gender, education level and age of participating respondents
Since the objective of this study is to develop visual extension materials to transfer
technology to the low literate or illiterate target groups, the education level of all the
participating farmers was recorded.
Table 1: Education level of participating farmers in Nala, Kavre District
S.N. Education Level No. of farmers
1. Nil 6
2. Primary school education (less than 5 years of
education)
10
3. Secondary level education (ten years of education) 3
4. Higher secondary education level (12 years of
education)
1
Total 20
Out of these 20 respondents, only one was female who showed up only once on the first
day of the study. The age of the respondents varied from eighteen to sixty seven years
with the mean age of thirty eight.
Table 2: Education level of participating farmers in Tukucha, Lalitpur District
S.N. Education Level No. of farmers
1. Nil 9
2. Primary school education (less than 5 years of
education)
5
3. Secondary level education (ten years of education) 3
4. Higher secondary education level (12 years of
education)
3
Total 20
Out of these 20 respondents, all of them were male. However, the target in both these
groups was to balance the gender. In the second pre-test group, the age of the respondents
varied from sixteen to fifty eight years with the mean age of thirty four.

25
Out of the forty participating respondents, the majority was involved in agricultural
activities only and had no any other things to do. However, one of the respondents was a
retired policeman, two had a small grocery shop and eight were students.
While showing the pictures to the respondents, the entry question asked by the extension
worker was “what do you see in this picture?” followed by “what do you think are we
going to discuss with this picture?”. The end question was “what does this picture want
to communicate to you?”. However, several other questions were also asked in between
concerning the main information of the pictures.
3.6.2 Secondary data
The study used a variety of secondary sources. To illustrate, reports from the project
“Sustainable Potato Cultivation in Hindu Kush Region” was obtained and analyzed that
helped to be familiar with the project activities. In addition, other secondary sources was
also used to define illiteracy and its types, define visual literacy, picture materials as a
means of communication, superiority of pictures over words etc. These sources include
various scientific publications.
Table 3: Overview of activities of study, concerned stakeholders, methods and location
Date Activities Stakeholders Methods Location Number
of
events
14/03/2012 Meeting with
representatives
of CIP, Nepal
and NARC,
Nepal
Dr. Marc Sporledor
(CIP), Mr. Yagya
Prasad Giri (NARC),
Mr. Sunil Paudel
(NARC)
Group
Discussions
Entomology
Division,
Khumaltar,
Kathmandu
1
16/03/2012
to
20/03/2012
Visiting other
NGOs, INGOs
in Kathmandu
Staff personals of
NGOs and INGOs
Discussions At respective
offices
3
25/03/2012
to
29/03/2012
Attended
review
workshop of
CIP, Nepal
Representatives from
CIP (Peru), project
partners from NARC
(Nepal), CABI
(Pakistan), Bhutan
Group
discussions
Dhulikhel Resort,
Dhulikhel
1
30/03/2012 Field visit to
identify the
first farmers
Specific first farmers
group
Discussions Nala, Kavre 1

26
group
01/04/2012 Selection of
Painter
Researcher and NARC
officers
Research
Conversation
Entomology
Division,
Khumaltar,
Kathmandu
1
03/04/2012 Meeting with
DADO, Kavre
officers and
JTAs for
selection of
extension
worker
Researcher, DADO
officers, JTAs
Group
discussions
DADO, Kavre 1
03/04/2012 Meeting to
select pictures
for validation
Researcher, extension
worker and painter
Discussions DADO, Kavre 1
08/04/2012
to
10/06/2012
Picture
validation with
first group
Specific first farmers
group
Focus Group
Discussions
Nala, Kavre 20
13/04/2012 Field visit to
identify second
farmers group
and meeting
with chief of
Loktantrik
IPM group
Specific second
farmers group and
chief of IPM group
Conversation
and
discussions
Tukucha, Lalitpur 1
20/04/2012
to
10/04/2012
Picture
validation with
second group
Specific second
farmers group
Focus Group
Discussions
Tukucha, Lalitpur 8
3.7 Data analysis, reliability and validity
The analysis of the data collected was performed following the steps suggested by
CRESWELL (2009, 185). The raw data collected from the field such as pictures, field notes etc.
were organized and prepared for analysis. After this step, all of the data were perused which
enabled to obtain better understanding of the information in a general sense and to reflect on its
overall meaning. This step is followed by coding which is “the process of organizing the
material into chunks or segments of text before bringing meaning to information” (ROSSMAN
and RALLIS, 1998, 171). The coding process was gathered during data collection by taking
pictures, categorizing them into different parts and labeling them by a term in a participant’s
actual language to make it easy to comprehend. The main themes/descriptions were analyzed

27
and elaborated in detail after they were indicated by differentiating codes. The conclusions were
derived by interpreting the meaning of the themes or descriptions.
Figure 6: Overview of the data analysis process
Source: Adapted and modified from CRESWELL (2009, 185)
“The use of reliability and validity are common in quantitative research and now it is
reconsidered in the qualitative research paradigm" (GOLAFSHANI, 2003, 597). However,
the same connotations are not carried by validity in qualitative research as it does in
quantitative research, nor it is a companion of reliability (CRESWELL, 2009). According to
CRESWELL (2009, 190), the scholar gave the meaning of qualitative validity and
qualitative reliability based on GIBBS (2007) i.e. “Qualitative validity means that the
researcher checks for the accuracy of the findings by employing certain procedures, while
qualitative reliability indicates that the researcher’s approach is consistent across
different researchers and different projects”.
Interpreting the Meaning of
Themes/Descriptions
Interrelating
Themes/Description
Coding the data by hand
Reading through the
data
Organizing and preparing
data for analysis
Raw data (pictures, field
notes, transcripts)
Validating the
accuracy of the
information
28
Several strategies were followed to ensure the reliability of data and interpretation from
ethnic languages. Though the researcher is from Nepal and a native speaker of Nepalese
language, the researcher is unable to speak other dialects (Newari in this case when
collecting data from Tukucha, Lalitpur Districts where the research was conducted in
Newari community and majority of them enjoy speaking their own dialect, Newari).
Though they speak Nepali too, the accent was difficult to understand by the researcher.
So, a speaker of Newari dialect was appointed as the interpreter only in the Lalitpur
District. However in Kavre District, there was no any problem with this barrier.
Sometimes, to prevent the losses of data from forgetting implicit information, analysis of
data took place immediately after or during the discussions which maintained the
originality of information. In addition to this, exclusion of common errors by checking
transcripts and comparing data with codes in order to avoid shift in the meaning of the
codes during coding process was followed as suggested by CRESWELL (2009). The
validity of the study was also ensured by following some strategies recommended by
CRESWELL (2009) viz; triangulating the data by examining evidence from the sources,
spending more time in the field and providing sufficient description to convey the
findings.

29
4 Results and Discussion
This part of the thesis is divided into two categories viz; economic and technical
feasibility analysis and development of visual extension material.
4.1Economic feasibility analysis
An economic feasibility analysis for Mobile Yellow Sticky Trap (MYST) technology was
performed in Nala of Kavre District where three farmers were selected purposively. The
main motive of doing this analysis was that, if farmers realize the technology is cost
effective, the chances of adoption will be very high. It was performed with the selected
farmers from the group. Literacy level was the basis of selecting these three farmers
where all three had pre-secondary level education. The simple, clear and comprehensible
calculus format was developed to analyze the economic feasibility. It was filled by the
farmers themselves. The developed format had three different criteria viz; difference in
production level (Annex 1), labor time saving (Annex 2) and cost effectiveness of
materials (Annex 3) needed for technology adopted field and non-adopted field (control
field). The area of the field under research trial was 0.102 hectare (2 ropani) for
technology (MYST) adopted field and same area was allocated for non-adopted field
practiced by each of the six farmers. On the basis of the calculus format filled by the
selected farmers, the following results were obtained.
4.1.1 Difference in production level
The production level varied in MYST adopted field and non-adopted field. On an average,
production of potato was 7.5 quintals per ropani (i.e. 14.745 tons per hectare) for MYST
adopted field and 5.52 quintals per ropani (i.e. 10.85 tons per hectare) for non-adopted
field. This shows that 3.892 tons per hectare was produced more in technology adopted
field than in non-adopted field which is worth of Rs. 77,840/hectare more (local farm gate
price @ Rs. 20,000/ton).
4.1.2 Labor time saving
On an average, the saving of labor time was significantly more in MYST adopted field
than in non-adopted field. The result showed that the labor time for chemical application

30
to control LMF for two ropani was 1,295 minutes (21.58 hours) for seven applications
and labor time consumed was only 850 minutes (14.16 hours) for eight applications if
MYST technology is adopted. This indicates that the saving of labor time for two ropani
is 445 minutes (7.41 hours) or 222.5 minutes (3.70 hours) per ropani which is equivalent
to saving of Rs. 208.125 per ropani (labor cost @Rs. 450/day of eight working hours).
This is saving of Rs. 4,091.73/hectare (1 hectare = 19.66 ropani). In this study, the
frequency of application of chemicals and use of MYST technology was taken into
consideration only after 50 days of planting. However, the frequency can vary on the
basis of severity of LMF infestation on the potato field.
4.1.3 Cost effectiveness of the materials
On an average, the cost of materials for MYST technology was almost half of that of
materials needed for chemical application. The total cost of materials required for MYST
technology was Rs. 575 and that for chemical application was Rs. 998 which shows that it
is Rs. 423 cheaper if we follow MYST technology.
Overall, it was found out that it is cheaper to produce potato using MYST technology than
using chemicals which is a normal practice followed by farmers in Nepal. Furthermore,
the production of potato tubers is also more in MYST adopted field as compared to non-
adopted field. Thus, farmers are in great advantage if they follow this technology to get
control over LMF. Thus, it was seen that the total net profit for the farmers will be more
than Rs. 80,000/hectare if MYST technology is applied instead of chemicals.
4.2 Mobile yellow sticky trap as a technology
The MYST is the technology used to control the infestation of LMF in potato field of
Nala, Kavre District. As name signifies, it is a sticky trap which is yellow in color,
smeared with some adhesive glue and is mobile. The working principle is that the LMF
gets attached to the yellow greasy surface of the flex print. The upper and lower end of
the flex print is sewed holding appropriate size of bamboo stick. The two people lifting
the trap side by side should walk in the potato field in such a way that the lower portion

31
just touches the upper parts of the plants. This makes plants move gently and ultimately
makes the LMF to fly which consequently gets attached to the yellow sticky material
lifted vertically (Figure7). The idea behind using yellow color flex print is that most of the
insects are attracted towards yellow color as indicated by many studies.
Figure 7: Handling of MYST to capture LMF
Source: Own picture, 2012
4.3 Technical feasibility analysis of mobile yellow sticky trap
During the feedback session conducted at the end of study, the farmers evaluated and
ranked this technology as a best effective IPM option to restrict the population of LMF.
The farmers reported that about 50–80% of the LMF population was controlled and the
technology was promising. In addition to its effectiveness, they informed that it is easy to
understand, easy to hold during application and more than that, it can be implemented by
any members of the family. Likewise, it is also cost effective as most of the materials can
be used again (except sticky glue which should be smeared each time before application)
if kept appropriately. Furthermore, they mentioned that it can be prepared easily in home
even with unskilled hands.

32
Box 1: Response from the farmer from Nala, Kavre District
“When the officials from CIP and NARC came to our place and requested us to
implement the MYST technology as a research trial, we were skeptic about it and
could not decide what to do. Seeing our undecided situation, we were assured of
giving compensation if losses occur in potato production due to this technology and
then we finally agreed to adopt it. Eventually, we saw significant progress in
controlling LMF with this technology. Beside this, it is easy to understand and can be
made in home, easy to handle and easy to implement. This technology is amazing for
farmers. Now, almost after four years of field trial, we are in a situation of
recommending this technology to other farmers as well who are suffering from LMF
infestation in their field without any hesitation.”
However, they figured out some hindrances and obstacles to implement this technology
which is listed below.
Inappropriate plot size (since the implementation of MYST requires two people, it
is difficult to walk if the width of field is small. This was the problem seen in field
of some farmers where the cultivation of potato was done in small contour plot and
the movement of two people at a time holding MYST was difficult.
Long distance to buy the materials (from the field site, farmers should walk for
more than three hours to get into the market as there is no good road and public
transportation) which incurs high transaction costs.
The appropriate greasy material was also unavailable in the nearest market.
However, one of the farmers named Hiramani Dulal tried an alternate option. He
collected the glues from pine trees and smeared in the yellow flex print but didn’t
work out well as the glue was deposited at the lower end of flex and LMF could
not be captured efficiently.
This evidence shows that though the technology is popular among the farmers, there are
still some hindrances for the adoption of this technology which may differ from place to
place. In this study, unavailability of appropriate greasy material in the nearest market,

33
appropriate plot size and long distance to buy materials was observed as the major
obstacles. Nevertheless, this technology can be made familiar with farmers around the
world where they can benefit from it to cope with the problems of LMF in an eco-friendly
way i.e. IPM. But one should keep in mind the possible hindrances and transaction costs
that can be incurred.
4.4 Developing visual extension material
4.4.1 Process of developing visual extension material
The research carried out by CIP/NARC since 2008 shows that the MYST was an
appropriate IPM technology for the control of LMF. So, the main focus of this study is to
transform research results into appropriate visual extension materials. For this, the
following different processes were followed.
a) Selection of painter and extension worker
A painter and extension worker were selected following appropriate criteria as mentioned
in above section 2.2 and 2.3 respectively. An initial group discussion was conducted
between researcher, painter and extension worker for the selection of the pictures. The
group decided to take photographs from the internet sources and some from the
photographs taken from the field. For this, browsing the internet and collection of the
photographs was done.
b) Drawing of pencil pictures
The photographs collected served as the initial reference for drawing felt pictures for a
painter. The picture was drawn in A4 size paper and a copy of initial draft was made
which was further highlighted with black felt tip pen to ensure the clear visibility.
c) Validation of pictures
For the validation of pictures, pre-testing was done in two different places. The first pre-
test was done with the experienced farmers in the MSYT technology of Nala VDC of
Kavre district. The objective was to know if the content represented their experience and
to be sure that the key elements are represented. The images were showed by fastening on
the white board. Enough time was allocated to read, analyze and interpret them. If needed,
the images were modified repeatedly and the above process was repeated unless the

34
picture represented key information. The old version of the pictures was retained for the
purpose of reference. Each discussion was facilitated by an extension worker in the
presence of the painter during each field visit to avoid information loss through partial or
distorted transmission.
The second pre-test of the pictures was conducted following the similar procedure. For
this, ten farmers from the Loktantrik IPM group from Tukucha, Lalitpur district was
selected who were facing similar problem of LMF but had no knowledge about the
technology (MYST). The objective was to verify the key messages without having
experience of the technology. The pictures which were not easily perceived in the second
pre-test group was taken to the first pre-test group and modified where necessary, until the
second pre-test group clearly obtained the key information of the pictures.
In addition to this, other ten farmers from this IPM group were selected randomly to
compare the difference in the level of perception of key information between pictures
shown and verbal group. For this, the same key information which was drawn in the
pictures was delivered to them verbally. Both groups were examined in two different
slots; first after three weeks and second after six weeks of pre-test, asking ten questions
randomly (Annex 5). The following were the results obtained.
Table 4: Results obtained after three weeks
S.N. Variety of group Number of
questions asked
Correct
answers given
% of correct
answers
1. Picture shown group 10 6 60
2. Verbal group 10 3 30
This table show that the number of answers given correctly by the picture shown group
and verbal group was sixty percent and thirty percent respectively. Similar procedure was
repeated again after another three weeks with the same group where they were asked the
same questions. The result obtained is given in table 5.

35
Table 5: Results obtained after six weeks
S.N. Variety of group Number of
questions asked
Correct
answers given
% of correct
answers
1. Picture shown group 10 5 50
2. Verbal group 10 2 20
This table show that the number of answers given correctly by the picture shown group
and verbal group was fifty percent and twenty percent respectively. This confirms the fact
that those who were shown pictures remember more information that those who hear.
This fact is also supported by Edgar Dale in his famous “Cone of Experience” where he
mentioned that the remembering capacity of a people is more in seeing images than
hearing. However, his classification highlights that 20% is remembered by hearing and
30% is remembered by seeing images. Similar case was also reported by many scholars
like PAIVIO (1986); SINATRA (1986); MAYER and GALLINNI (1990); WILEMAN (1993);
MAYER and SIMS (1994); MAYER (1999). They explained that pictures attract attention,
stimulating motivation, increase the speed of message transfer and thus recalls
information more effectively than a heard or a read one. Likewise, BOWER (1972); PAIVIO
et al. (1968) and SAMPSON (1970) also highlighted that pictures are remembered better
than words because pictures are more likely to be encoded both as images and as verbal
traces. According to DOAK et. al. (1996), the graphic messages are recalled more
effectively than a heard or read one which is also favored by the memory system in brain.
However, the above table 4 and 5 also indicate that even if the picture is a better way for
transforming information, their capacity of holding information decreases if the
technology/innovation is not practiced. In the long run, there is a possibility of fading out
of the information from the memory permanently. This shows that the picture series only
creates awareness and basic information. However, it does not guarantee the process of
learning. But ‘learning by doing’ always helps better in perceiving information
permanently. This is also in line with Dale’s cone of experience where he mentions that
people can retain up to 90 % of what they say as they do a thing.

36
4.5 Results observed under picture validation
When the series of pictures were shown one at a time, all the farmers were attracted
towards each picture. The fact that pictures attract attention were also supported many
scholars like HOFFMANN (2000); WALKER (1979); PAIVIO (1986); SINATRA (1986);
MAYER and GALLINNI (1990); WILEMAN (1993); MAYER and SIMS (1994); MAYER (1999).
According to STEFANO (2004), pictures are good and easy to understand and if there are
pictures, he became interested in the story and read about it. They also stared pictures and
finally made them think for few minutes motivating to go for the discussion about what
the picture wants to communicate. This might be because the pictures make any person to
stimulate his/her thinking.
Figure 8: Picture attracting farmer’s attention
Source: Own photograph, 2012

37
Figure 9: Picture making farmers to go for discussion and stimulate thinking
Source: Own photograph, 2012
Though all the pictures attracted their attention and stimulated thinking, there were some
pictures in which they were struggling to identify the objects. The respondents informed
that they had never seen or experienced such objects before and had not any previous idea
about it. This fact is also supported by HOFFMANN (2000, 73) where he mentioned that
when we interpret the pictures, the interpretation is solely based on comparing perceived
elements of the pictures with the contents of memory. Thus, HOFFMANN (2000, 73)
concluded that, we must have previous cognitive knowledge of any objects in order to
recognize them in a picture. For instance, when the picture of life cycle of LMF was
shown, they identified only the adults as they were familiar and saw it before but were in
dilemma about the egg, larva and pupae which they never saw. The key message from this
picture was to deliver the information that an adult LMF comes from different phases via;
egg, larva and pupa. However, seeing a symbol arrow on it, only one farmer’s guess was
correct where he identified it as the life cycle of LMF and explained the phenomenon. On
the other hand, some other pictures were recognized without any hesitation. For example,
an adult of LMF is captured in the web of spider as shown in figure 11 next page.

38
Figure 10: Difficulty in understanding picture Figure 11: Easily understood picture of spider
of life cycle of LMF
Source: Own picture, 2012 Source: Own picture, 2012
In some case, for the efficient relay of information, different parts of a single picture were
drawn in the single page. For instance, figure 12 was drawn as a validated one in which
the main idea was to give information about the idea of suitable temperature or main
cause that promotes the increase in number of LMF. The figure below shows that warm
and sunny day are favorable for the rapid multiplication of LMF (shown by many
numbers of adult LMF in circle in middle part of the picture) while its multiplication is
low (shown by highlighting only three adult LMF in circle in right hand side of the
picture) in cool temperature.
Figure 12: Comparison of climatic conditions favorable for the multiplication of LMF
Source: Own picture, 2012

39
It was also found out that the use of color was mandatory in some case. This indicates
that, though the felt pictures are cheap to produce without using color, the use of color at
some instance cannot be avoided. Many scholars have supported that color is one of the
important aspect of picture. According to KATZMAN and NYENHUIS (1972), to recall either
relevant or irrelevant objects, it is the color that improves the ability of learners.
Furthermore, WINN (1976) also highlight the importance of color to the meaning of
picture when it is a critical attribute of the picture object. Likewise, CARTER; PATTY;
VREDENBERG (1967) and PATTY and VREDENBERG (1970) came up with notion that color
helped to attract initial attention but that recognition was difficult if too many colors were
used. For example, figure 13 below was first shown to farmers without the yellow colors
where they recognized it as a housefly but when the color was added on the back of insect
and shown next time, they quickly identified it as an adult LMF. Furthermore, figure 14
was also only identified as a yellow flex when it was colored otherwise they identified it
as a white board.
Figure 13: An adult LMF Figure 14: Yellow flex print
Source: Own picture, 2012 Source: Own picture, 2012
In some pictures, the use of a conventional symbol, such as a cross or a tick was made in
order to express modality. The modality is clearly recognized if that symbol is
understood. For instance, figure 15 makes the use of conventional signals to recognize
the modality.

40
Figure 15: Use of conventional signals to convey the information
Source: Own picture, 2012
After showing this picture, a question “What do you think this picture wants to tell you?”
was asked to the farmers. Almost all of the respondents were able to identify the ticks and
crosses and answered the picture correctly that the cultivation of potato, maize and again
potato in same year (shown by month flag) is wrong but instead a rotation of wheat, maize
and potato is appropriate. But they only knew that following wheat, maize and potato
helps to minimize the population of LMF only when they were told that this picture
comes under the heading of some control measures of LMF. However, LINNEY (1995)
reported that in Nepal in 1976, the difficulty of understanding symbols like crosses, ticks
and arrows were common among respondents which were not the case with the
respondents of Nala.
The use of different facial expressions was also helpful to relay specific information about
the state of mind of human depicted in pictures. The following figure better illustrates this
point.
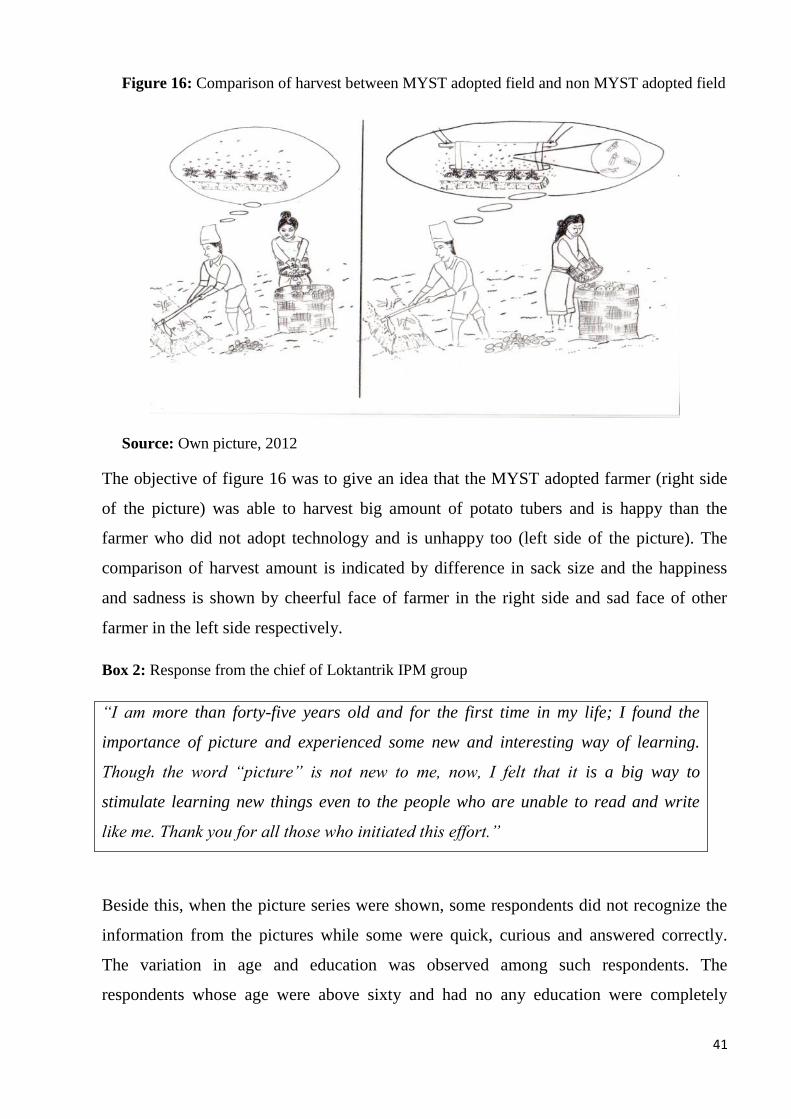
41
Figure 16: Comparison of harvest between MYST adopted field and non MYST adopted field
Source: Own picture, 2012
The objective of figure 16 was to give an idea that the MYST adopted farmer (right side
of the picture) was able to harvest big amount of potato tubers and is happy than the
farmer who did not adopt technology and is unhappy too (left side of the picture). The
comparison of harvest amount is indicated by difference in sack size and the happiness
and sadness is shown by cheerful face of farmer in the right side and sad face of other
farmer in the left side respectively.
Box 2: Response from the chief of Loktantrik IPM group
“I am more than forty-five years old and for the first time in my life; I found the
importance of picture and experienced some new and interesting way of learning.
Though the word “picture” is not new to me, now, I felt that it is a big way to
stimulate learning new things even to the people who are unable to read and write
like me. Thank you for all those who initiated this effort.”
Beside this, when the picture series were shown, some respondents did not recognize the
information from the pictures while some were quick, curious and answered correctly.
The variation in age and education was observed among such respondents. The
respondents whose age were above sixty and had no any education were completely

42
unable to identify the central messages of pictures while the respondents aged below forty
with at least some years of education recognized the information precisely. This might be
because of the fact that difference in age and level of education also play an important
role in the identification of picture messages.
It was also observed that none of the farmers who attended the discussion were females
exception being for one female respondents from Nala who showed up only once in the
beginning of the study. This might be because, in rural areas of developing countries,
females are not allowed to come in direct face to face contact with males except with the
males of their family members. In addition to this, it might also be because the shy nature
of rural female to talk with other male person. It was found out that none of the extension
workers working in the whole Kavre district were female. Thus, in this context, the
inclusion of female extension worker to reach such female farmers would be a better
solution. This was also supported by DUE et. al. (1997) in a research conducted in
Tanzania where the scholar concluded that inclusion of female as an extension worker
reached more number of female farmers as they preferred female extension workers than
male extension workers.
Sometimes, the discussion lasted for more than three hours and the effectiveness of
discussion was very low either. This might be because the farmers and extension worker
were fatigued. This is further supported by FEIL; HUMMLER; KACHELRIESS (1997) where
they said that the discussion session should not last for more than two hours because of
the tiredness of the farmers and facilitator.
4.6 Extension system in Nepal
4.6.1 Top down approach
A poor linkage between researcher, farmers and the extension workers was observed in
Nepal. The problems of farmers were not addressed accordingly; instead a trend of
imposing some innovations or findings directly to the farmers regardless of its long term
effects was noticed. The feedback of the farmers to any innovations was not reported back
to the concerned stakeholders. So, a top down approach of extension system was
43
prevalent. When this study was conducted, many farmers reported that this was the first
case in their life when a research was conducted in their field with their direct
involvement.
4.6.2 Major obstacles of extension system observed in Nepalese context
The extension system of Nepal was not seen to be effective as it should be. Lack of good
roads and transportations was a major hindrance for the extension workers to reach the
farmers and vice versa limiting the access of farmers to new information. This fact is also
supported by ADHIKARYA (1994) in which the scholar highlight that large number of
farmers living in remote areas and due to poor transportation facilities, the access to new
information is limited. In addition to this, the extension offices are located mostly in semi-
urban areas. For instance, the site where this research was conducted is approximately
thirteen km far from the nearest extension office and has no good road condition and
access to any public transportation. A farmer has to spend his whole day to visit the
extension office. Also, only two extension workers, one for agriculture and one for
veterinary service, are stationed in this extension office and are responsible to look after
the problems of farmers from five VDCs around. Thus, it is also seen as one of the major
obstacles for the efficient performance of extension services in Nepal. This is also
supported by scholar AGBAMU (1998) in a research conducted in Nigeria where poor
performance of extension services was noted due to low extension agent farmers’ ratio;
which is 1:2100 in Edo state, 1: 2131in Ogun state, 1:16917 in Oyo state, 1: 1496 in
Lagos state (ADEBOWALE et al. 2006). It was also seen that the extension worker
preferring to work with the farmers having at least some level of education rather than the
illiterate one. This might be because extension workers have to spend less time with those
farmers to convey the same information than to the illiterate farmers. A double
discrimination was seen to the illiterate farmers from both extension office and from
extension workers.
Box 3: Response from the extension worker of ASC, Banepa
“Here, we are only two extension workers stationed in this office; one for each
agriculture and veterinary service and I am the only agriculture related extension
worker responsible to look after five VDCs. I am unable to go to the farmers place

44
due to lack of time as I have to look after large area. Furthermore, my salary is not
enough to feed my family and send children to school. So, I have raised chicken as an
alternative income source. Thus, I sometimes cannot fully give attention to my main
job as an extension worker. This is my compulsion.”
4.6.3 Extension workers
Lack of motivation is the major problem with most of the extension workers in Nepal.
This might be because of low salary scale and a large working area. This low salary
compels them to have a side job or business to earn their livings except their regular duty
as an extension worker. Besides, it was also observed that the extension offices had very
little effort on the capacity building of these extension workers. They were updated very
little about the recent information they should possess at minimum as an extension
worker. Not only this, extension workers are also supposed to answer every question of
the farmers. This compels them to have information on every topic related to agriculture
leading them to ‘Jack of all, master of none’.

45
5 Summary and Conclusions
This study was done with a collaboration of International Potato Center (CIP), Peru and
the Department of Agricultural Extension and Communication of University of
Hohenheim, Germany, as a part of the project “Sustainable Potato Cultivation in Hindu
Kush Region” from March to May, 2012. The project was jointly conducted by CIP and
the National Agricultural Research Center (NARC) in Nala of Kavre District, Nepal since
2008 to end of 2012.
Mobile Yellow Sticky Trap (MYST) was selected as the recommended suitable
technology to control Leaf Miner Fly (LMF) by CIP. In this study, the technology was
analyzed economically, technically and finally developing a pictorial guide which consists
of the series of pencil drawn pictures that shows the detail information on symptoms,
nature of damage, biology and causes of LMF. The final part of the guide gives a clear
pictorial explanation of the materials required for MYST, its preparation and
implementation technique. The visual extension material i.e. picture guide is especially
designed for the low literate and/or illiterate target farmers.
Regarding economic feasibility analysis, the field where MSYT adopted technology
produced 3.892 tons/hectare more than the control field i.e. chemical applied field which
is worth of Rs. 77,840 more per hectare (local farm gate price @ 20,000/ton). Likewise,
the MYST adopted field saved twice the labor hours than control field which is worth of
saving of Rs. 4,091.73 per hectare. The technology was also seen to be twice effective
than the control field regarding the cost of materials needed. Overall, it was found that the
farmers can prevent a loss of more than Rs. 80, 000 per hectare if MYST technology is
adopted instead of control field with chemical treatment.
Similarly, technical feasibility of the MYST was also performed to know if the
technology is appropriate for the farmers. It was found that the technology was very
promising and preferred by the farmers. It was observed that the technology was effective
in controlling the population of LMF by 50-80%. Furthermore, the technology was easy
to understand and to prepare, easy to use and most important, it could be implemented by

46
any member of the family either skilled or unskilled. However, inappropriate plot size of
the field, difficulty in buying the materials and high transaction cost to buy materials were
some hindrances observed in the study site. These hindrances may differ from place to
place but the possibility of adoption of this technology is very high if one can overcome
such hindrances.
For the development of visual extension materials, a painter and extension worker were
selected and the pictures were drawn using pencil as such pictures are cheap to produce.
First, the pictures were validated among the group of farmers of Nala, Kavre District
selected purposively who were experiencing the technology in their field and then re-
validated with the other groups of farmers of Tukucha, Lalitpur District who were not
experiencing the technology but facing similar problems of LMF. Each of the validation
process was facilitated by the extension worker. To differentiate the perception level of
the key messages between pictures and words, the same message which is supposed to be
obtained from the pictures was relayed verbally to the second farmers group of Tukucha
asking ten questions to examine both of the picture shown group and verbal group at two
slots; first after three weeks and second after six weeks. The result observed is given
below.
After three weeks, the farmers who were shown pictures answered sixty percent of
the answers correctly and the verbal group answered only thirty percent of the
questions correctly.
After six weeks, the process was repeated where fifty percent of the correct
answers were obtained by the farmers who were shown pictures and only twenty
percent by the verbal group.
This shows that pictures are more effective than hearing. However, it also indicates that
even if the picture is a better way for transferring information, their capacity of holding
information decreases if the technology is not practiced. Thus, it can be concluded that the
picture series only creates awareness and basic information but does not guarantee the
process of learning. During the validation process, it was observed that the pictures
attracted attention of the farmers and stimulated their thinking. It was also observed that
the objects in some pictures were identified easily and some were not. Likewise, the use

47
of conventional signals like crosses, ticks and facial expressions were helpful in relaying
the information. Though the pencil drawn pictures i.e. black and white picture series are
cheap to produce, in some cases, the use of color was mandatory.
Overall, it was seen that the pictures were helpful in conveying the information
effectively among the illiterates and the farmers with low literacy level. Not only this,
such pictures are cheap to produce, easy to carry, independent of technical device and
electricity, can be shown in open air and can be easily modified, if needed, than compared
to movie or other forms of visual materials. Furthermore, the pictures can be enlarged and
modified in the computer according to our wish and be printed time and again. From this
simple image, other forms of extension materials like slide shows can be developed. Thus,
we can say that pencil drawn pictures are best entrance point for preparing most of the
communication materials.
Lastly, in addition to the feasibility analysis and developing visual extension materials,
the ineffectiveness of the extension system was also observed. A poor linkage between
researchers, farmers and extension workers was seen. Likewise, a top down approach of
extension system was observed. A lack of motivation was seen among extension workers
as they were paid low. Similarly, lack of access to extension service due to bad condition
of roads and unavailability of public transportations, extension offices being far from
farmers’ place, limited numbers of extension workers that results in much work load for
them and lack of sufficient capacity building trainings for extension workers were some
other reasons that were observed in determining the ineffectiveness of the extension
system of Nepal further.

48
6 Recommendations
This study has proved that the Mobile Yellow Sticky Trap (MYST) technology is
technically and economically sound in Kavre District of Nepal. Thus, it can be
recommended as a better eco-friendly option for potato growing farmers in other
parts of the world as well to control Leaf Miner Fly (LMF) unless they are able to
cope the hindrances that arise during its implementation.
The use of pictures to communicate with the low literates and/or illiterates was also
seen of much importance and equally beneficial. This way of transferring
information to such target groups could be equally beneficial not only in the
agricultural field but also in the field of veterinary service, health and sanitation,
forestry etc.
It is highly recommended that the use of any pictures that is to be included in
leaflets, brochures or any other extension materials should be validated prior with
those target groups for whom the materials are intended to.
Though the black and white pictures are easy and cheap to produce, sometime the
use of color in such pictures is highly recommended in order to disseminate the
right information from the pictures.
The extension service in any field should follow bottom up approach rather than
top down approach.
The extension service of Nepal and many other developing countries should
promote female extension workers to increase the participation of female farmers
as well as to increase the effectiveness of extension service.
The government should formulate effective policies for regular capacity building
of extension workers and also motivate them better and pay higher salaries.

49
7 References
ADEBOWALE, E.A.; OGUNBODE B.A.; SALAWU, R.A. (Eds) 2006: “Farming Systems Research and
Extension”. Proceedings of the 13th Annual Southwest Zonal OFAR and Extension Workshop.Institute of
Agricultural Research and TraningObafemiAwolowo University. Moor Plantation, Ibadan. pp180.
ADHIKARYA, R. 1994: Strategic extension campaign — a participatory oriented method of agricultural
extension. Rome, Italy: FAO of the United Nations.
AGBAMU, J.U. 1998: A study on Agricultural Research- Extension linkages: with focus on Nigeria and Japan,
Ph.D Thesis, Tokyo University of Agriculture, Tokyo, pp 194-195
APSD, 2009: Statistical information on Nepalese agriculture.Agri-Businee Promotion and Statistics Division,
Ministry of Agriculture and Co-operatives.Singh Durbar, Kathmandu, Nepal.
ARENDALE, D. 1993: Foundation and theoretical framework for Supplemental Instruction, ln D. C. Martin &
D. Arendale (Eds.), Supplemental Instruction: Improving first-year student success in high-risk courses. 2nd
ed., (pp. 19-26).
AUSBURN, L. and AUSBURN, F. 1978b: Visual literacy: background, theory and practice, PLET 15 (4) 291-
297.
BARHAM, B.; CARTER, M.R.; SIGEL, W. 1995: Agroexport production and peasant landaccess: Examining the
dynamics between adoption and accumulation. Journal of development Economics 46: 85-107.
BOWER, G.H. 1972: Mental imagery and associative learning.In Lee Gregg (Ed.), Cognition in learning and
memory. New York: Wiley.
BRODY, P.J. 1982: Affecting instructional textbooks through pictures. In D. H. Jonassen (Ed.), Thetechnology of text(pp. 301-316). Englewood Cliffs, NJ: Educational Technology Publishers.
BURBANK, L. and PETT, D. (Eds.) 1983: Contributions to the study of visual literacy. IVLA, Inc.
CARSTENS, A. and SNYMAN, M. 2003: How effective is the Department of Health's leaflet on HIV/AIDS
Counselling for low-literate South Africans? TydskrifvirNederlandsenAfrikaans 10 (1):112-136.
CARTER, F.C.; VREDENBERG, H.L.; PATTY, C.R. 1967: A historical, economic and statistical study of the electric sign industry. Fort Collins: Colorado State University.
CIP (International Potato Center) 1998: Potato Facts: A compendium of key figures and analysis for 32
important potato-producing countries. Lima, Peru.
CRESWELL, J.W. 2009: Research Design Qualitative, Quantitative, and Mixed Methods Approaches Third
Edition. SAGE Publications, Inc.
DALE, E. 1946: Audio-visual methods in teaching, New York: The Dryden Press,
DALE, E. 1969: Audiovisual methods in teaching. New York: Holt. Rinehard and Winston, Inc,.
DE FRANCO, M. and GODOY, R. 1993: Potato-led growth. The role of agricultural innovations in transforming
Bolivian agriculture: A macroeconomic perspective .Journal of Development Studies 29(3): 561-587.
de SILVA, D.N. and GARFORTH, C.J. 1997: The effectiveness of different radio programme formats for the
dissemination of information on the safe use of insecticides in paddy cultivation in Mahaweli system-C of
Sri Lanka. TropicalAgric. R. 9, 302–316.
DOA, 2012: http://www.doanepal.gov.np/ Accessed date: 15/12/2012
DOAK, C.C.; DOAK, L.G.; FRIEDELL, G.H.; MEADE, C.D. 1998: Improving comprehension for cancer patients
with low literacy skills: Strategies for clinicians. CA: A Cancer Journal for Clinicians, 48, 151-162.
DOAK, C.C.; DOAK, L.G.; ROOT, J.H. 1996: Teaching patients with low literacy skills.Philadelphia: J. B.
Lippincott Company.
DOLLAHITE, J.; THOMPSON, C.; MCNEW, R. 1996: Readability of printed sources of diet and health
information. Patient Education and Counseling, 27, 123-134.
DONDIS, D.A. 1974: A primer of visual literacy. Cambridge, Massachusetts: The MITPress.
DOWSE, R. and EHLERS, M. 2004:Pictograms for conveying medicine instructions: comprehension in various South African language groups.South African Journal of Science, 100 (11 & 12). pp. 687-693. ISSN 0038-
2353
DUE, J.M.; MAGAYANE, F.; TEMU, A. 1997: Gender again-views of female agricultural extension officers by smallholder farmers in Tanzania. World Development, 25, 713-725.
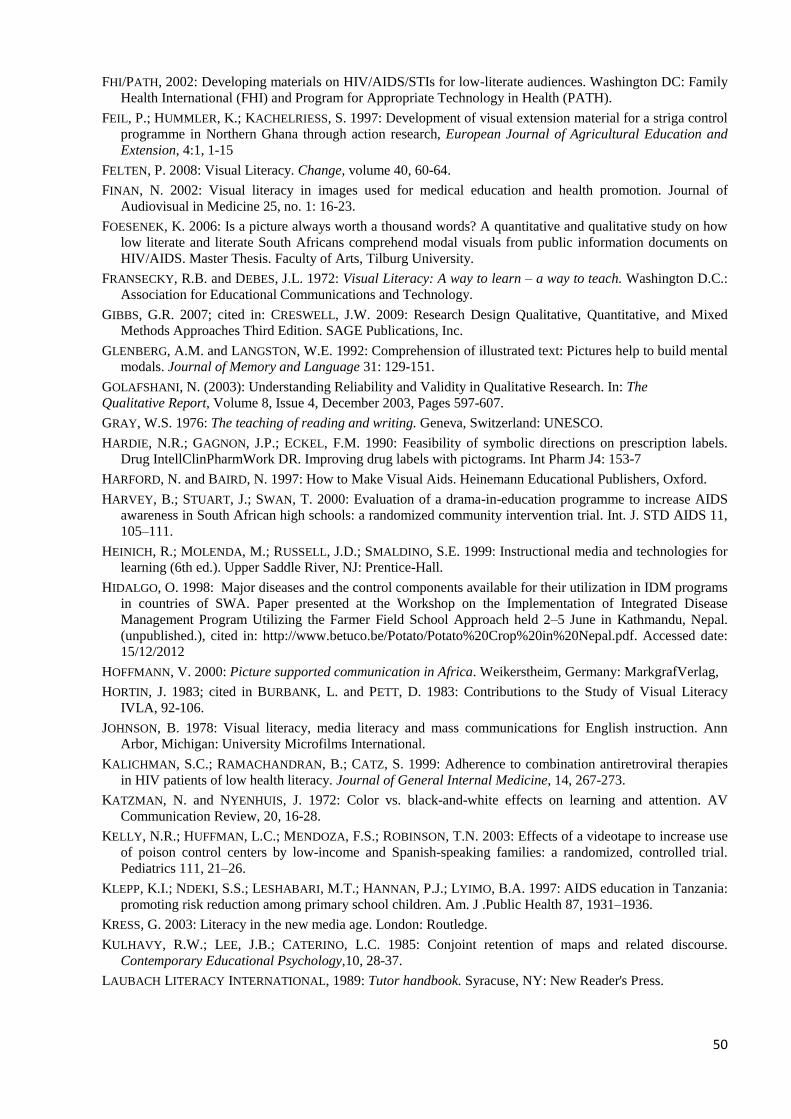
50
FHI/PATH, 2002: Developing materials on HIV/AIDS/STIs for low-literate audiences. Washington DC: Family
Health International (FHI) and Program for Appropriate Technology in Health (PATH).
FEIL, P.; HUMMLER, K.; KACHELRIESS, S. 1997: Development of visual extension material for a striga control
programme in Northern Ghana through action research, European Journal of Agricultural Education and
Extension, 4:1, 1-15
FELTEN, P. 2008: Visual Literacy. Change, volume 40, 60-64.
FINAN, N. 2002: Visual literacy in images used for medical education and health promotion. Journal of
Audiovisual in Medicine 25, no. 1: 16-23.
FOESENEK, K. 2006: Is a picture always worth a thousand words? A quantitative and qualitative study on how
low literate and literate South Africans comprehend modal visuals from public information documents on
HIV/AIDS. Master Thesis. Faculty of Arts, Tilburg University.
FRANSECKY, R.B. and DEBES, J.L. 1972: Visual Literacy: A way to learn – a way to teach. Washington D.C.:
Association for Educational Communications and Technology.
GIBBS, G.R. 2007; cited in: CRESWELL, J.W. 2009: Research Design Qualitative, Quantitative, and Mixed
Methods Approaches Third Edition. SAGE Publications, Inc.
GLENBERG, A.M. and LANGSTON, W.E. 1992: Comprehension of illustrated text: Pictures help to build mental
modals. Journal of Memory and Language 31: 129-151.
GOLAFSHANI, N. (2003): Understanding Reliability and Validity in Qualitative Research. In: The
Qualitative Report, Volume 8, Issue 4, December 2003, Pages 597-607.
GRAY, W.S. 1976: The teaching of reading and writing. Geneva, Switzerland: UNESCO.
HARDIE, N.R.; GAGNON, J.P.; ECKEL, F.M. 1990: Feasibility of symbolic directions on prescription labels.
Drug IntellClinPharmWork DR. Improving drug labels with pictograms. Int Pharm J4: 153-7
HARFORD, N. and BAIRD, N. 1997: How to Make Visual Aids. Heinemann Educational Publishers, Oxford.
HARVEY, B.; STUART, J.; SWAN, T. 2000: Evaluation of a drama-in-education programme to increase AIDS
awareness in South African high schools: a randomized community intervention trial. Int. J. STD AIDS 11,
105–111.
HEINICH, R.; MOLENDA, M.; RUSSELL, J.D.; SMALDINO, S.E. 1999: Instructional media and technologies for
learning (6th ed.). Upper Saddle River, NJ: Prentice-Hall.
HIDALGO, O. 1998: Major diseases and the control components available for their utilization in IDM programs
in countries of SWA. Paper presented at the Workshop on the Implementation of Integrated Disease
Management Program Utilizing the Farmer Field School Approach held 2–5 June in Kathmandu, Nepal.
(unpublished.), cited in: http://www.betuco.be/Potato/Potato%20Crop%20in%20Nepal.pdf. Accessed date:
15/12/2012
HOFFMANN, V. 2000: Picture supported communication in Africa. Weikerstheim, Germany: MarkgrafVerlag,
HORTIN, J. 1983; cited in BURBANK, L. and PETT, D. 1983: Contributions to the Study of Visual Literacy
IVLA, 92-106.
JOHNSON, B. 1978: Visual literacy, media literacy and mass communications for English instruction. Ann
Arbor, Michigan: University Microfilms International.
KALICHMAN, S.C.; RAMACHANDRAN, B.; CATZ, S. 1999: Adherence to combination antiretroviral therapies
in HIV patients of low health literacy. Journal of General Internal Medicine, 14, 267-273.
KATZMAN, N. and NYENHUIS, J. 1972: Color vs. black-and-white effects on learning and attention. AV
Communication Review, 20, 16-28.
KELLY, N.R.; HUFFMAN, L.C.; MENDOZA, F.S.; ROBINSON, T.N. 2003: Effects of a videotape to increase use
of poison control centers by low-income and Spanish-speaking families: a randomized, controlled trial.
Pediatrics 111, 21–26.
KLEPP, K.I.; NDEKI, S.S.; LESHABARI, M.T.; HANNAN, P.J.; LYIMO, B.A. 1997: AIDS education in Tanzania:
promoting risk reduction among primary school children. Am. J .Public Health 87, 1931–1936.
KRESS, G. 2003: Literacy in the new media age. London: Routledge.
KULHAVY, R.W.; LEE, J.B.; CATERINO, L.C. 1985: Conjoint retention of maps and related discourse.
Contemporary Educational Psychology,10, 28-37.
LAUBACH LITERACY INTERNATIONAL, 1989: Tutor handbook. Syracuse, NY: New Reader's Press.

51
LEONARD, K.D. 1977: Reaching the peasant farmer: organization, theory and practice in Kenya. Chicago,
University of Chicago Press
LESTER, P.M. 2006: Visual communication: Images with messages (4thed.). Belmont, CA: Wadsworth
Thomson.
LINNEY, B. 1995: Pictures, people and power: Hong Kong: Macmillan.
LIPTON, M. and LONGHURST, R. 1989: New Seeds and Poor People. Unwin Hyman Ltd., Longon.
MAES, A. and SCHILPEROORD, J. 2002: Moeilijklezenmakkelijkmaken, of omgekeerd?Heteffect van beeld op
tekst. In: Moeilijklezenmakkelijkmaken: De veelzijdigzwakkelezer,edited by Kurvers, J. & Mooren, P., 157-
175. Leidschendam: Biblion.
MANANDHAR, M.K. 1990: Communication behaviour of extension workers. Paper presented in extension
research workshop, Dec. 13-14, 1990. LAC, Pokhara, Nepal.
MANGAN J. 1978: Cultural conventions of pictorial representation: Iconic literacy and education. Educational
Communication and Technology Journal, 26 (3), 245–267.
MATHUR, P.K. 2006: Visual Communication: Beyond Words. Delhi: GNOSIS.
MAYER, G.G. and RUSHTON, N. 2002: Writing easy-to-read teaching aids. Nursing, 32, 48-49.
MAYER, R. 1999: Research-based principles for the design of instructional messages. The case of multimedia
explanations. Document Design 1 (1):7±19.
MAYER, R.E. and GALLINI, J.K. 1990: When is an illustration worth ten thousand words? Journal of
Educational Psychology 82:715±726.
MAYER, R.E. and SIMS, V.K. 1994: For whom is a picture worth a thousand words? Extensions of a dual-
coding theory of multimedia learning. Journal of Educational Psychology 86:389±401.
MESSARIS, P. and MORIARTY, S. 2005: Visual Literacy Theory. In: Smith, K., Moriarty, S, Barbatis, G. and
Kenney, K. (ed.), Handbook of Visual Communication: Theory, Methods and Media. New Jersey: Lawrence
Erlbaum Associates.
MITCHELL, K.; NAKAMANYA, S.; KAMALI, A.; WHITWORTH, J.A.G. 2001: Community-based HIV/AIDS
education in rural Uganda: which channel is most effective. Health Educ. Res. 16, 411–423.
MORRIS, C.D. and STILWELL, C. 2003: Getting the write message right: Review of guidelines for producing
readable print agricultural information materials. South African Journal for Library and Information
Science 69 (1):71±83.
MYRES, J.L. 1926: "Folk Memory ", Folklore, 37, 13-24, and Bauml, in The Role of the Woman . . ., ed.
Morewedge.
OLADEPO, O.; OKUNADE, A.; BRIEGER, W.R.; OSHINAME, F.O.; AJUWON, A.J. 1996: Outcome of two
patient education methods on recruitment and compliance with ivermectin in the treatment of
onchocerciasis. Patient Educ.Couns. 29, 237–245.
PAIVIO, A. 1986: Mental representations: A dual coding approach. New York: Oxford University Press.
PAIVIO, A.; ROGERS, T.B.; SMYTHE, P.C. 1968: Why are pictures easier to recall than words? Psychonomic
Science, 11, 137-138.
PATH (Program for Appropriate Technology in Health). 2002: Developing materials on HIV/AIDS/STIs for
low-literate audiences. [O]. Available:
http://www.fhi.org/en/HIVAIDS/Publications/manualsguidebooks/lowliteracyquide.htm. Accessed date:
05/11/2012.
PATTY, C.R. and VREDENBERG, H.L. 1970: Electric signs: Contribution to the communications spectrum. Fort
Collins: Colorado State University.
PEECK, J. 1993. Increasing picture effects in learning from illustrated text. Learn Instruct 3. 227-238.
POPULATION CENSUS, 2011: Available at http://www.http://census.gov.np/. Accessed date: 19.12.2012
PRENNUSHI, G. 1999: Nepal: Poverty at the Turn of the Twenty-First Century. South Asia RegionInternal
Discussion Paper. Washington D.C.: World Bank.
REED L.A. and HOFFMAN L.G.: Pictorial cues and enhancement of patient recall of instructions or information.
J Am OptomAssoc1986; 57:312- 5.
ROSSMAN, G. and RALLIS, S.F. 1998; in: CRESWELL, J.W. 2009: Research Design Qualitative, Quantitative, and Mixed Methods Approaches Third Edition. SAGE Publications, Inc.

52
RUSTED, J.M. 1984: Differential facilitation by pictures of children’s retention of written texts: A review.
Current Psychological Research and Reviews, 3, 61-71.
RUTTAN, V. 1977: The green revolution: Seven generalizations. International Development Review 19: 16-23.
SAMPSON, J.R. 1970: Free recall of verbal and nonverbal stimuli. Quarterly Journal of Experimental
Psychology, 1970, 22, 215-221.
SHRESTHA, S.L. and KHATRI, B.B. 2000: Specific gravity and dry matter content of some local cultivars of
potato in Nepal. Nepal Agri. Res. J. 3, 102-106.
SIMPSON, J.A. and WEINER, E.S.C. (Eds.).1989: The Oxford English Dictionary (2nd ed., Vols. 1-20). Oxford,
England: Oxford University Press.
SINATRA, R. 1986: Visual Literacy Connections to Thinking, Reading and Writing. Springfield, IL: Charles C.
Thomas.
SMELIK, A.; BUIKEMA, R.; Meijer, M. 1999: EffectiefBeeldvormen.Assen: Van Gochum& Comp.
STEFANO, L. 2004: Printed information access, preferences and use by farmers with potential for small-scale
organic production, KwaZulu-Natal.M.Agric (Food Security) thesis, University of KwaZulu-Natal,
Pietermaritzburg.
STEIN, J. (Ed.). 1966: The Random House dictionary of the English language. New York: Random House.
TENDER, J.A.; TAFT, C.H.; FREY, C.; MICKALIDE, A.; GITTERMAN, B.A. 2001: Pediatric residents buckle up:
a child safety seat training program for pediatric residents. Ambul.Pediatr. 1, 333–337.
UN DATA, 2012: Available online at
http://data.un.org/Data.aspx?d=SOWC&f=inID%3a74%3bcrID%3a343%2c489%2c490%2c536&c=1,2,3,4,
6&s=crEngName:asc,sgvEngName:asc,timeEngName:desc&v=1 (Accessed date: 19/12/2012).
VOGT, H.E. 1986: “Graphic ways to eliminate problems associated with translating technical documentation.”
ln Proceedings of the 33rd
International Technical Communication Conference, 330-333. Arlington, VA:
Society for Technical Communication.
WALKER, D.A. 1979: Understanding pictures: Designing appropriate visual materials for education in
developing countries. Massachusetts, USA; University of Massachusetts, Center for International Education
Hills South.
WILEMAN, R.E. 1993: Visual communicating. Englewood Cliffs, NJ: Educational Technology Publications.
WILLIAMS, C.M. and DEBES, J.L. 1970: Proceedings Of The First National Conference On Visual Literacy. New York: Pitman Publishing Corporation.
WINN, W.D. 1976: The structure of multiple free associations to words, black-and-white pictures and color
pictures. AV Communication Review, 24, 273-293.
WORLD BANK, 1997: Nepal Economic Update: The Challenge of Accelerating Economic Growth. Report No.
17034-NEP. Washington, D.C.
ZIMMER, A. and ZIMMER, F. 1978: Visual literacy in communication: designing for development. Amersham:
Hulton Educational Publications Ltd.
ZIMMERMAN, M.L. and PERKIN, G.W. 1982: Instructing through pictures: Print materials for people who do
not read. Information Design Journal 3 (2):119±134.

53
8 Annex
Annex 1: Comparison of production level between mobile yellow stick trap and control
field
Plot Size:
Ropani × 0.0508647 = hectare
Mobile Yellow Sticky Trap Control Field
Total production Kg Kg
Total value of potato Rs. Rs.
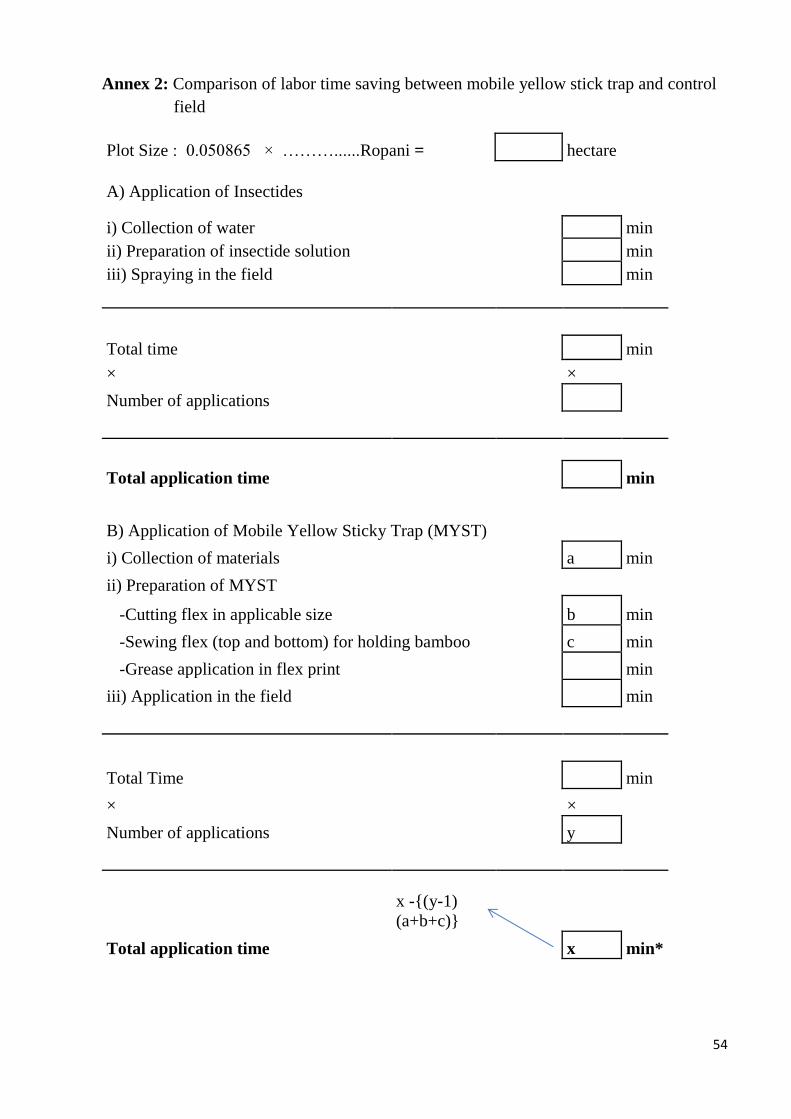
54
Annex 2: Comparison of labor time saving between mobile yellow stick trap and control
field
Plot Size : 0.050865 × ………......Ropani = hectare
A) Application of Insectides
i) Collection of water
min
ii) Preparation of insectide solution
min
iii) Spraying in the field
min
Total time
min
×
×
Number of applications
Total application time
min
B) Application of Mobile Yellow Sticky Trap (MYST)
i) Collection of materials
a min
ii) Preparation of MYST
-Cutting flex in applicable size
b min
-Sewing flex (top and bottom) for holding bamboo c min
-Grease application in flex print
min
iii) Application in the field
min
Total Time
min
×
×
Number of applications
y
x -{(y-1)
(a+b+c)}
Total application time
x min*

55
Total Labor Saving**
min
*After the first application, for other application, only grease application in flex
print and application in the field time should be included because the flex can be
re-used for other applications. So we carefully include time to avoid doubling.
** Difference between the total application time of insectides and mobile
yellow sticky trap.

56
Annex 3: Comparison of cost effectiveness of materials required between mobile yellow
stick trap and control field
Plot Size:
Ropani × 0.0508647 = hectare
Mobile Yellow Sticky Trap Control Field
Particulars Unit Rate Qty Cost Particulars Unit Rate Qty Cost
Materials required Materials required
Yellow Flex Print m Insectides (A)
Bamboo piece
Painting Brush piece 1st application gm
Sticky Grease kg 2nd
application gm
Needle piece 3rd
application gm
Thread roll 4th
application gm
Total (A)
Insectides (B)
1st application gm
2nd
application gm
3rd
application gm
4th
application gm
Total (B)
Spraying tank hour
Total (Rs.) Total (A +B) (Rs.)

57
Annex 4: List of participants used for the discussions with farmers, extension worker and
painter
Developing visual extension material and analyzing technical and economic feasibility
analysis of mobile yellow sticky trap
Location:
Date:
Researcher: Mr. Praseed Thapa
S.N. Name of the participants Address Occupation Signature Remarks
1.
2.
3.
4.
5.
6.
7.
8.
9.
10.
11.
12.
13.
14.
15.
16.

58
Annex 5: List of questions asked to differentiate the perceiving capacity of key messages
between picture shown and verbal group
List of questions with possible answer(s)
1) How do you identify if the potato plants are infested by Leaf Miner Fly (LMF) or
not?
Possible answer: Seeing the leaves with many small holes
2) How do you identify the LMF?
Possible answer: Small fly (like housefly but very tiny in size) with yellow spot on
the back
3) Which parts of the plants are infected most? Is it leaves, stem or tubers and where?
Possible answer: Lower leaves most
4) In which temperature condition do the LMF population gets multiply rapidly?
Possible answer: Warm and dry and sunny
5) Name some natural predators for the control of LMF?
Possible answers: Spider, Dragon fly, Hover fly, Lady Bird beetle (7 spotted)
6) What are the negative effects of chemical applications?
Possible answers: Impact on human health, death of natural predators, effect on
water creatures like fish, reptiles and also indirect effect on birds
that drink water from same reservoir
7) Can you name what technology did we talk about?
Possible answer: Mobile yellow sticky trap
8) What are the materials required for this technology?
Possible answers: Bamboo, yellow flex, sticky grease, painting brush, thread and
needle
9) What is the color of flex and why?
Possible answer: Yellow because most of the insects are attracted towards yellow
color
10) How should we implement this mobile yellow stick trap in the field?

59
Possible answer: Holding flex by two people and walking in the field in such a way
that the lower end just touches the upper part of the potato plants

60
Annex 6: Series of final pictures drawn to prepare teaching guide for the illiterate and/or
low-literates to control Leaf Miner Fly (LMF) using Mobile Yellow Sticky
Trap (MYST)
Cover Page
Page 1: Introduction to LMF and its biology
Adult Leaf Miner Fly

61
Page 2: Biology of LMF
Life Cycle of Leaf Miner Fly
Page 3: Symptoms and nature of damage
A) Leaf puncture (Ovipositor deposit) B) Tunneling

62
Page 4: Severity of LMF infestation in lower leaves
Leaves damages most in the lower part of potato plant
Page 5: Cause of LMF
Intensity of Leaf Miner Fly in different climatic conditions

63
Page 6: Identification of natural predators
Spider Lady Bird beetle
Parasitoids Hover Fly
Dragon Fly

64
Page 7: Control measures
Beans used as a trap crop
Page 8: Control Measures (Contd.)
Crop rotation

65
Page 9: Control Measures (Contd.)
Pa
Earthing up burying pupa of leaf miner fly
Page 10: Control Measures (Contd.)
Chemical spraying
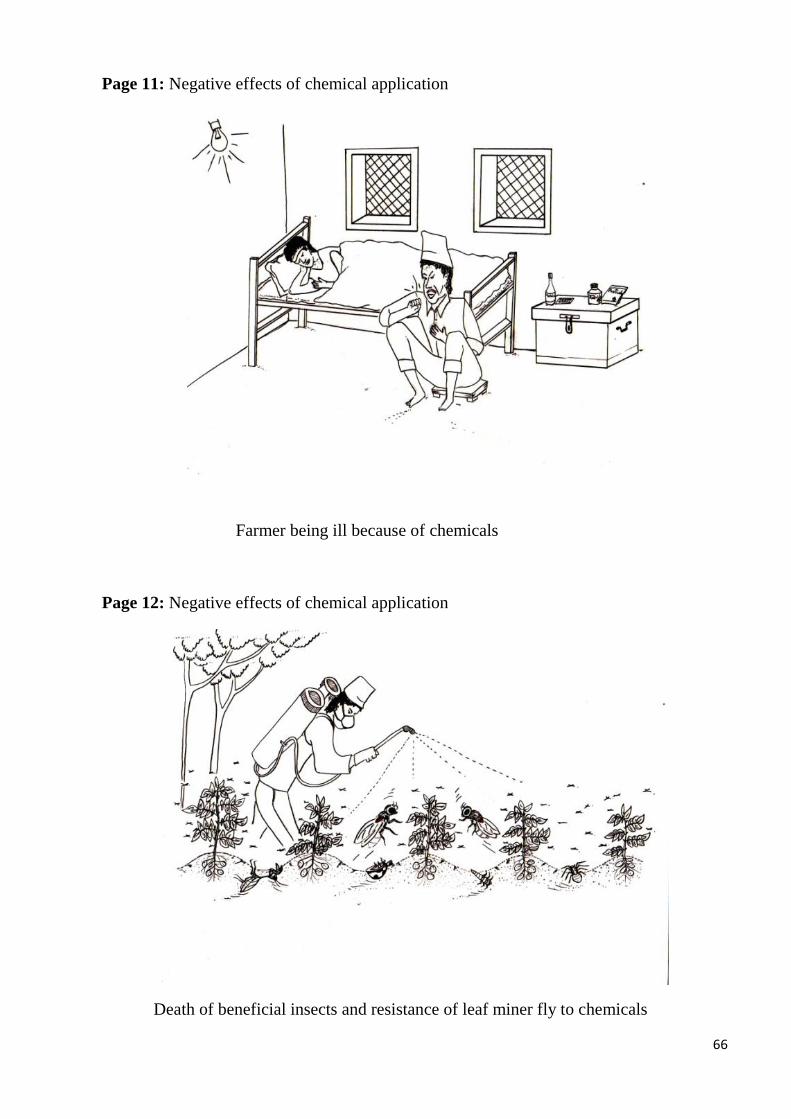
66
Page 11: Negative effects of chemical application
Farmer being ill because of chemicals
Page 12: Negative effects of chemical application
Death of beneficial insects and resistance of leaf miner fly to chemicals

67
Page 13: Negative effects of chemical application (Contd.)
Death of fish, crabs birds because of chemicals
Page 14: Control of LMF using MYST technology
Materials Required
Yellow Flex Bamboo

68
Page 15: Materials Required (Contd.)
Painting brush Sticky grease
Page 16: Method of preparing MYST
Sewing the borders for holding the flex

69
Page 17: Method of preparing MYST
Inserting bamboo
Page 18: Method of preparing MYST (Contd.)
Smearing grease in flex

70
Page 19: Handling of MYST in the field
Handling of mobile yellow sticky trap in the field
Page 20: Handling of MYST in the field
Showing leaf miner flies sticked in flex

71
Page 21: Harvesting of potato tubers
Harvesting of potato
Page 22: Comparison of potato tubers between MYST adopted field and control field
(non-MYST adopted field)
Comparison between MYST adopted and non-adopted field