
Master Thesis in Finance
41
Master Thesis in Finance The market Reaction to International cross-listings: Evidence from Hong Kong and Mainland China cross-listed firms Faculty of Economics and Business Administration Msc.Financial Management J.Yin U1232926 Supervisor from the University: Dr.L.T.M. Baele
-
Upload
khangminh22 -
Category
Documents
-
view
2 -
download
0
Transcript of Master Thesis in Finance

Master Thesis in Finance
The market Reaction to International cross-listings:
Evidence from Hong Kong and Mainland China cross-listed
firms
Faculty of Economics and Business Administration
Msc.Financial Management
J.Yin
U1232926
Supervisor from the University: Dr.L.T.M. Baele
2
Abstract
This paper examines the impact of international cross-listing on the firstly listed stock exchange
by focusing on the experience of Hong Kong and Chinese cross-listed stocks and the impacts
include the price effect, liquidity effect and risk effect. The sample consists of 30 firms that are
listed on the Hong Kong stock exchange firstly and then return to Chinese stock exchange to
fulfill their cross-listing during the period 2000-2009.
In the first place, during the 90 days period before the announcement of cross-listing, (risk –
adjusted) stock prices of Hong Kong shares rise (on average) by over 23%,and there is an
additional 4.4% rise during the announcement week, but this increase in stock price is followed
by an decrease after cross-listing. There is a 2.69% decrease in stock price during the second
month subsequent to the announcement of cross-listing. In the second place, the risk (beta) of
domestic stocks (Hong Kong) decrease after cross-listing. In the third place, the trading volume
increase in the Hong Kong market after cross-listings. We interpret this evidence to be consistent
with the market segmentation, liquidity and risk hypotheses, and this evidence explains why the
Chinese companies choose such a path of cross-listing.

3
TABLE OF CONTENTS
1. Introduction ............................................................................................................................................... 4
2 Literature review ..................................................................................................................................... 7
2.1 Related theories about Cross-Listing .................................................................................................. 7
2.2 Empirical literatures ............................................................................................................................ 9
2.2.1 Price Effect ................................................................................................................................... 9
2.2.2 Risk Effect ................................................................................................................................. 10
2.2.3 Liquidity Effect .......................................................................................................................... 11
2.3 Conclusion about literatures.............................................................................................................. 12
3 Research Methodology ....................................................................................................................... 13
3.1 Event Study Methodology .......................................................................................................... 14
3.2 Method to test risk effect ............................................................................................................ 16
3.3 Method to test liquidity effect ..................................................................................................... 18
4 Data Gathering and Analysis .............................................................................................................. 18
5 Results .................................................................................................................................................. 21
5.1 Price effect to announcement of cross-listing .......................................................................... 22
5.2 Risk effect of Cross-listing ..................................................................................................... 27
5.3 Liquidity effect of Cross-listing .............................................................................................. 30
6 Conclusions and Recommendations ................................................................................................... 31
7 List of definitions ………………………………………………………………………… ……….. 35
8 References……………………………………………………………………………………………36
9 Appendix …………………………………………………………………………………………….39
4
1 Introduction
Cross-listing means the activity that a company lists its stocks on two or more stock exchanges at
the same time. Usually it refers to the fact that the stock of a same company is listed on the stock
exchanges of two different countries. Firms may have different motives for cross-listings.
Financial motives include raising fund, reducing cost of capital, and increasing liquidity. Firms
may also benefit commercially from cross-listing, e.g. expanded markets, increased reputation,
and improved competitiveness. Meanwhile, stock exchanges around the world, for their own
competitive positions and interests, try to attract foreign companies of high quality to list on their
stock exchanges. These factors together promote the wave of cross listing. Therefore, related
research about cross-listing has become an important theme of financial research. According to
the investigations of Pagano (2002) and Erruna (2003), there are five main motivations on cross-
listing for enterprises. In the first place, it can reduce the cost of capital and meet the large
demand of funds. In the second place, it can enlarge the investor base and reduce the risk. In the
third place, it can enhance the reputation of enterprises in home or foreign countries, and this will
further improve the exports or sales force. In the fourth place, it can improve the liquidity of
underlying stocks through transactions in different stock exchanges. In the last place, when
managers regard their stocks are undervalued, they will choose to list their stocks overseas to
overcome this problem .This view point is supported by the investigation of Karl-Markus (1997),
and they believe that the cause of undervaluation is information asymmetry between investors
and managers, which will be solved or reduced by improved disclosure level after cross-listing.
Over the earlier twenty years, China‟s economy is growing rapidly, and a large number of
enterprises have grown up and gone to operate internationally. The rapid growth stimulates the
need of a mature and efficient equity market. China's equity market, which came into existence
since 1990s, is developing quickly in these years, but as an emerging capital market with a short
history, there are still many imperfections. These include China‟s non-full market economy
status, the limitation of government policy and the legal system, poor corporate governance and
information disclosure system. All these have limited the development of Chinese equity market.
The mismatch between the development of Chinese economic and Chinese equity market has
been an obstacle for the development of these enterprises. In such a case, cross border listing is a
5
good option for these enterprises. Hong Kong, as an international financial center, has a mature
and free capital market. What‟s more important, it has similar culture with Mainland China.
Hong Kong and Mainland China also have close geopolitical relationship, and close economic
ties. Especially after the handover of authority in 1997, Hong Kong and Mainland economy are
more closely tied. Listing in Hong Kong becomes the first choice for Chinese companies to enter
international capital market.
On July 15th, 1993, Tsingtao Brewery Co., Ltd was listed on Hong Kong stock exchange as the
first Chinese stock listed overseas. By the end of 2007, there were 146 Chinese companies listed
on Hong Kong stock exchange. In order to fully enjoy the benefits of rapid development of
China‟s economy and make better use of resources in both foreign and domestic markets, these
overseas-listed companies seek to return to Chinese equity market after their listing overseas.
Tsingtao Brewery Co., Ltd issued stocks on Shanghai stock exchange and returned to Chinese
equity market after ten days of its Hong Kong listing and since that more and more Hong Kong
listed stocks returned to Chinese equity market to fulfill cross-listing. Especially during the year
of 2006 to year of 2007, when the Shanghai Stock Exchange Index rose from less than 2000
point to more than 5000 point, a large number of companies chose to return to the Mainland
market. Up to now, there are 50 companies that issue their A-share on Chinese stock exchange
and H-share on Hong Kong stock exchange together.
I find that there is an interesting phenomenon about the Chinese cross-listed companies. For
most cross-listed companies, the common path is to list their stocks on domestic market in the
first step, and then go to the international markets to fulfill cross-listing. While for the Chinese
and Hong Kong cross-listed companies, the common path is to first list stocks on Hong Kong
stock exchange to return to Mainland exchanges at a later stage. Why the Chinese companies
choose such a different path of cross-listing, and what‟s the expectations of investors when they
make the decision to list their stocks on Chinese equity markets? To further investigate the
market reaction to the announcement of Cross-listing and the expectations of investors behind
their decision, i will analyse it from three perspectives: price effect of the announcement of
cross-listing, risk effect of cross-listing, and liquidity effect of cross-listing. If capital markets

6
between China and Hong Kong are segmented and cross-listing is an effective mechanism to
reduce the degree to market segmentation, there should be some change in the stock performance
around the event of cross-listing.
Based on the extension of these motivations, in this research, I will try to figure out these
questions:
1. The price effect on the underlying stocks when the decision of cross-listing becomes public
2. The risk effect on the underlying stocks after cross-listing
3. The liquidity effect on the underlying stocks after cross-listing
The remainder of this thesis is organized as follows: Section two describes the main theories and
empirical findings with respect to cross-listing. Section three describes the methodologies used
in this research, to be followed by section four describing the data collection. Sector five
describes the main empirical findings, and section six concludes and makes some
recommendations for the future research.
7
2 Literature review
2.1 Related Theories about Cross-Listing
(1) Information Content Theory
Beaver (1986) proposes the information content hypothesis, and analyses that if markets are
efficient, when new information enters markets, markets will react to the new information. To be
more specific, when new information becomes public, expectations of investors about the future
stock price will change, and this will lead to the fluctuations in stock price. This kind of
information is called information content or useful information content. If new information has
information content, the volatility of stock price will be more obvious than normal period, when
it is disclosed.
(2) Market Segmentation Theory
Stapleton and Subrahmanyam (1977) were the first to propose the Market Segmentation
Hypothesis the first time, and investigations by Stulz (1981), Errunza and Losq (1985),
Alexander et al. (1987), Karl-Markus (1997), Errunza and Miller (2000), Pagano (2002) all
support this theory from the management perspective or by evidence. Market Segmentation
Theory refers to the fact that capital cannot flow freely between different markets, and it is
caused by the existence of investment barriers. For example, state protective legislations,
exchange rates and tax rates system difference, or information asymmetry et al. These
investment barriers make markets segmented in different countries or areas. Scholars who are
supporting the market segmentation theory believe that when investors make direct investment in
these countries with investment barriers, they would require extra return (premium) to
compensate their potential risks or additional cost. Because cross-listing is viewed as a useful
mechanism to reduce the degree of market segmentation, so when the enterprises list their stocks
overseas, the stock market would react to the benefits of removed investment barriers. This is
accompanied with a reduction in the expected return, and an increase in stock price.

8
(3) Liquidity Theory
Liquidity Hypothesis is proposed by Amihud and Mendelson (1986) the first time. They believe
that the liquidity of underlying stock and required return is negative correlated. Investigations of
Kadlec and McConnel (1994), Foerster and Karolyi (1999) all support this hypothesis by
evidence .Simply, because cross-listing will enlarge the trading markets, if two trading markets
have different trading time, then the trading time of underlying stock will be extended, which
will further lead to the increase of liquidity. Chowdhry and Nanda (1991) investigated this
problem, and proposed that cross-listing would lead to a “winner takes most” situation. It means
that if the domestic market and foreign market have difference in trading cost, investors will
allocate their trading to the market with the lowest cost, and maximize their profits. In this case,
if the trading cost in Hong Kong market is different from that in Chinese market. Investors will
allocate more trading to the market with lower cost.
(4) Investor Recognition Theory
Investor recognition hypothesis is proposed by Merton (1987) in his research. He indicates that
in the case of information asymmetry, the larger investor base of underlying company, the more
information of this company will be disclosed. As cross-listing is an effective mechanism to
attract investors, the degree of investor recognition will be improved after cross-listing. This will
further lead to lower degree of information asymmetry between managers and investors. Lower
information asymmetry will reduce the risk of investment and this accompanies a reduction in
expected return of investors and higher stock price.
9
2.2 Empirical literatures
2.2.1 Price Effect
Assuming that the capital markets are either completely or mildly segmented, Alexander, Eun
and Janakiramanan (1987) investigated the stock price performance of 34 foreign firms that list
their stocks on U.S. stock exchanges during the period from 1969 to 1982,and divided the sample
companies into two groups: Canadian and non-Canadian firms ,which were tested separately.
This is the first literature that focuses on the relationship between market segmentation and stock
price performance. They choose the listing day as the event day to test the change of stock price
during the pre and post listing periods. Empirical result shows that there is a persistent reduction
in Cumulative Abnormal Return after the information of cross-listing becoming public .This
result supports the market segmentation hypothesis, which indicates that if two markets are
segmented, there should be a reduction of expected return of underlying stocks subsequent to
cross-listing.
Jayaraman et al. (1993) choose 95 foreign stocks which are listed on U.S. stock exchanges for
the first time by the method of American Depository Receipts (ADRs) as samples, and
investigate the price and risk effects of cross-listing on these underlying stocks. They choose a
shorter investigation period, which runs from year 1983 to year 1988. The hypothesis that if
capital markets are segmented among U.S and other countries, listing ADRs on U.S. stock
exchanges will provide the companies an access to another capital market to choose lower cost
capital source, and it should accompany a lower expected return of investors. Empirical result
shows that the listing announcement causes a positive abnormal return. This result is consistent
with the finding of Alexander et al. (1987), and supports the market segmentation hypothesis.
In the research of Foerster and Karolyi (1993), they choose the Canadian and US case to
investigate the price and risk effect of cross-listing. Their sample contains fifty three Canadian
stocks which are listed on US exchanges over the period between 1981 and 1990, and these
Sample companies were divided into several groups by the difference of industries and listing

10
locations. They find significant abnormal return during the prelisting period, and the abnormal
return varies among different industry groups. This finding supports the hypothesis that market
segmentation exists between US and Canadian, even they are closely connected in economy, and
the degree of segmentation varies among different industry groups.
In the paper written by Foerster and Karolyi (1996), they investigate the performance of 161
foreign stocks which are listed on US stock exchange by the method of American Depository
Receipts during the period from 1976 to 1992. Daily and weekly data was used in this
investigation. Empirical result shows that there is 15% cumulative abnormal return during the
prelisting period, and the excess return on the listing day is 1%, while there is negative abnormal
return during the post listing period, which is approximately 12%. Similar result is found in the
investigations of Foerster and Karolyi (1999) about foreign companies which are listed on US
stock exchange.
These findings suggest that these firms benefit from cross-listing, which supply them a
mechanism to overcome investment barriers caused by market segmentation, get access to
foreign capital markets and raise lower cost funds, so as to expand their shareholder base,
increase exposure for their products. Because these investment barriers have disappeared after
cross-listing, the expected return of investors is expected to fall, and this leads to the increase of
enterprise value.
2.2.2 Risk Effect
The literature of Howe and Madura (1990) is the first one to investigate the impact of cross-
listing on risk of common stock. They investigate the risk effect of cross-listing on the
performance of 68 American stocks that are listed on Europe and Japan stock exchanges between
1969 and 1984. Sixteen quarters prior to listing date is chosen as the prelisting period, and
sixteen quarters after listing date is chosen as post listing period. They propose the hypothesis
that if capital markets are segmented and cross-listing is an effective way to reduce the degree of
market segmentation; risk should be diversified among domestic market and international market
after cross-listing, and the sensitivity of the stock return to the movement of domestic markets

11
would decrease, while the sensitivity to foreign markets will increase. To test this hypothesis,
they investigate the change in standard deviation of stock return and change in betas. Betas here
measure the risk of an asset relative to the systematic factor in the markets. To be more specific,
it measures the sensitivity of stock return to the market return. Empirical result shows that the
average standard deviation of return decreases from 15.5% in the prelisting period to 14.4% in
the post-listing period, while the pre and post difference is not statistics significant. There is a
slight upward shift of foreign market betas, while the domestic beta of American market
decreases from 1.10 to 0.97. This result is consistent with the hypothesis that capital markets are
segmented, and cross-listing can diversify the risk between domestic market and international
market.
Jayaraman (1993) investigates the impact of cross-listing on the risk factor of underlying stocks.
Their sample contains 95 foreign companies which are listed on US stock exchanges by the
method of ADR (American Depository Receipt), and the investigation period runs from year
1983 to year 1988.They use the same method which is used in the investigation of Howe and
Madura (1990) to test the risk effect of cross-listing. Both domestic beta and foreign beta are
detected ,and domestic beta experiences a decrease after cross-listing, while the US beta
experiences a slight increase. Although the pre and post difference is not significant, it is still
consistent with the market segmentation hypothesis.
In the research of Foerster and Karolyi (1993), they do similar research about the risk effect, and
investigate 56 US listed Canadian firms during the period from year 1976 to year 1992.
Empirical result shows that the domestic beta decreases from 1.23 to 1.11 after 100 days of
cross-listing. Foerster &Karolyi (1999) also did similar investigation, and they found significant
decrease in domestic market betas.
2.2.3 Liquidity Effect
An important attraction of cross-listing is the potential increased liquidity. Kyle (1985) and
Admati and Nanda (1991) proposed that cross-listing would lead to a situation of “Winner take
most”. If the trading cost in the foreign market is lower, there will be transactions of trading from
12
domestic market to foreign market. This will lead to the decrease of domestic market trading
volume and increase of foreign market trading volume. In our case, if there is difference between
the trading costs in stock markets of Hong Kong and Mainland China, Investors will allocate
more trading to the market with lower cost. In the paper written by Foerster and Karolyi (1993),
they investigate 56 Canadian firms that are dual listed on US stock exchanges during the period
from 1976 to 1992.To overcome the temporary market fluctuation, they define the listing month
as month zero, the six months prior to the moths zero and the six months subsequent to the
month zero as prelisting and post-listing periods relatively. The average stock volume in the two
periods is calculated separately. Empirical result shows that there is a significant increase of
trading volume in the domestic market after cross-listing, and this increase is not a temporary
phenomenon, since the increase in months four to six of post-listing period is still significant. In
the investigation of Barcylay et al. (1990), they choose 16 American companies that are cross-
listed on both New York Stock Exchange and Tokyo Stock Exchange during the period from
year 1973 to1989 as sample companies, and investigate their change in trading volume.
Empirical result shows that trading volume only increase by 0.17% in Tokyo exchange. Stoyan
et al. (1996) investigate the change of trading volume of 126 American firms that are listed on
London or Tokyo Exchanges during the period from 1983 to 1992, and they did not find
significant change in liquidity after 250 days of cross listing.
2.3 Conclusion about literatures
From the perspective of price effect, results vary from one to another, because of different
samples and different time periods. However, there is a consensus that cross-listing is an
effective mechanism to reduce the degree of market segmentation and this is accompanied with a
reduction in expected return and an increase in stock price.
From the perspective of risk effect, a large number of scholars believe that cross-listing is an
effective mechanism to reduce the degree of market segmentation and diversify the risk among
domestic market and foreign markets. This should accompany a reduction in volatility of stock
return and local market beta, and an increase in foreign betas. While some other scholars indicate
13
that Cross-listing enlarges the trading volume and trading time, so the return of stocks should be
more fluctuated.
From the perspective of liquidity effect, the scholars reach a consensus that if the trading cost
between the domestic market and foreign market are different, there will be a situation of
“winners take most”. Investors will allocate more trading to the market with lower cost, and it
will lead to the increase of liquidity in the market with lower cost.
3 Research Methodology
Based on the literature review, I choose the appropriate research methodology in my thesis. In
this chapter, i will introduce the Event Study Methodology and ordinary least squares (OLS)
regression. The former method is used to analyze the price effect to announcement of cross-
listing, the later one is used to analyze the risk effect .In the follow part. To test the liquidity
effect, I choose the methodology used by Foerster and Karolyi (1993) in their investigation.
Based on the fact of Chinese cross-listed enterprises, I investigate the following related
hypotheses:
1. If the Chinese and Hong Kong equity markets are segmented, cross-listing should lead to
higher stock prices and lower (post-listing) expected returns
2. If these two markets are segmented, cross- listing should lead to diversification of risk
between these two markets, and reduce the sensitivity of stock return to the Hong Kong
market return.
3. If these two markets are segmented, cross-listing should cause an increase in trading volume
in the Hong Kong market.

14
3.1 Event Study Methodology
One purpose of this thesis is to investigate whether there is significant abnormal return when the
information of cross-listing becomes public. To test abnormal returns, i choose the mostly used
Event Study Methodology. Normally, there are four steps about event study methodology. In the
first place, choose the event date, in the second place, define and forecast excess abnormal return,
in the third place, do statistical test of abnormal return, in the fourth place, analyze the result and
interpret the economic implication. In this chapter, I will make an explanation for the first two
steps.
Step One: Choose appropriate event date
In this thesis, all the sample companies are Chinese companies, which are qualified that they are
listed on Hong Kong stock exchange firstly, and then return to Mainland China stock exchange
to fulfill their cross-listing. I choose the announcement day of initial public offering (IPO) for the
Chinese A-share as event date. To overcome the potential fluctuation of return caused by other
factors during a short estimation period, and get an accurate estimation for the benchmark
(normal return), I choose a longer time period which runs from 12 months prior to the event date
to 4 months before the event date as estimation period. It is 240 days in total (t =-360 to -120).
The event period runs from three months prior to the event date to two months after the event
date, which is 150 days in total ( t=-90 to 60). This period is divided into prelisting and post-
listing periods by the event date.
Step Two: Calculate the abnormal return
To calculate the abnormal return of underlying stocks, normal return must be detected during the
estimation period firstly. Then I can use the parameters of normal return to calculate abnormal
return during event period. According to the investigation of Brown and Warner (1980) about
measuring security price performance, I choose the widely used Mean Adjusted Return Model to
calculate the normal return (expected return) of underlying stocks. It is used in the investigations

15
of Alexander (1988), Jayaraman (1993) and Foerster and Karolyi (1993). The equation is shown
as follows:
2
1
1 t
tT
itit RT
NR
(3.1.1)
1,, lnln titiit ppR
t=1, 2, 3 t1, t2 …N
i=1, 2, 3….N
tiR , is the return of underlying stock I on date t in Hong Kong market
tiP, is the price of underlying stock I on date t in Hong Kong market (it will be called the price of H-
share for short)
The normal return (expected return) of every individual stock can be calculated by equation 3.1.1,
And then the abnormal return of every stock during event period can be calculated by actual
daily return minus daily expected return .The equation is shown as follows:
tititi NRR ,,, (3.1.2)
i=1, 2, 3…N

16
In this equation, tiR , is the actual daily return of stock I on date t, tiNR ,
is the expected return of
underlying stock I on date t. ti, is the residual parameter, and it stands for abnormal return of
stock I on date t during event period.
To further investigate whether the effect of cross-listing is statistical significant over the whole
sample companies, the average abnormal return of entire stocks on any day during the event
period must be calculated. The equation is shown as follows:
n
i
tit ARN
AR1
,
1
(3.1.3)
i=1, 2, 3…N
n= quantity of sample companies
To investigate when the abnormal return starts, when it maximizes, and when it ends, cumulative
abnormal return (CAR) during the event period must be calculated. The equation is shown as
follows:
2
1
2,1
t
tt
ttt ARCAR (3.1.4)
In the equation 3.1.4, 2,1 ttCAR means the cumulative abnormal return from time 1t to time 2t
during the event period.
3.2 Method to investigate Risk effect
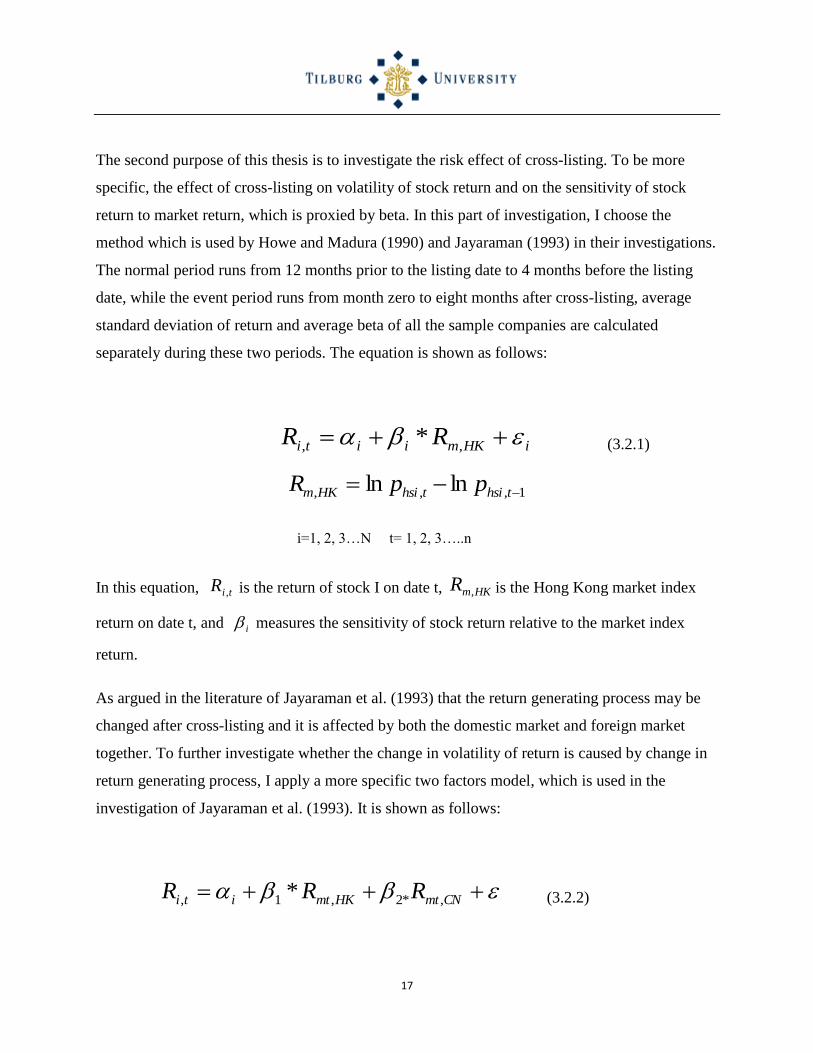
17
The second purpose of this thesis is to investigate the risk effect of cross-listing. To be more
specific, the effect of cross-listing on volatility of stock return and on the sensitivity of stock
return to market return, which is proxied by beta. In this part of investigation, I choose the
method which is used by Howe and Madura (1990) and Jayaraman (1993) in their investigations.
The normal period runs from 12 months prior to the listing date to 4 months before the listing
date, while the event period runs from month zero to eight months after cross-listing, average
standard deviation of return and average beta of all the sample companies are calculated
separately during these two periods. The equation is shown as follows:
iHKmiiti RR ,, * (3.2.1)
1,,, lnln thsithsiHKm ppR
i=1, 2, 3…N t= 1, 2, 3…..n
In this equation, tiR , is the return of stock I on date t, HKmR , is the Hong Kong market index
return on date t, and i measures the sensitivity of stock return relative to the market index
return.
As argued in the literature of Jayaraman et al. (1993) that the return generating process may be
changed after cross-listing and it is affected by both the domestic market and foreign market
together. To further investigate whether the change in volatility of return is caused by change in
return generating process, I apply a more specific two factors model, which is used in the
investigation of Jayaraman et al. (1993). It is shown as follows:
CNmtHKmtiti RRR ,*2,1, * (3.2.2)

18
tiR , : Return of underlying stock I on date t in Hong Kong market
HKmtR ,
: Hong Kong stock market index (HSI) return on date t
CNmtR , : Chinese stock market index (SSI) return on date t
i : intercept parameter
: Residual parameter
3.3 Method to test liquidity effect
To investigate the liquidity effect, I apply the methodology which is used by Foerster and
Karolyi (1993) in their investigation. The month when cross-listing happens is defined as “month
zero” and then the average trading volume across all the sample during the normal period and
event period can be calculated separately. Normal period runs from 12 months prior to month
zero to 4 months before month zero, and the event period runs from month zero to eight months
after that month.
4 Data Gathering and Analysis
My investigation period runs from year 2000 to year 2009. I identify thirty qualified companies,
which are listed on the Hong Kong stock exchange firstly and then return to Chinese stock
exchanges during this period. Characteristics of these cross-listing firms are shown in Table one
as follows:
19
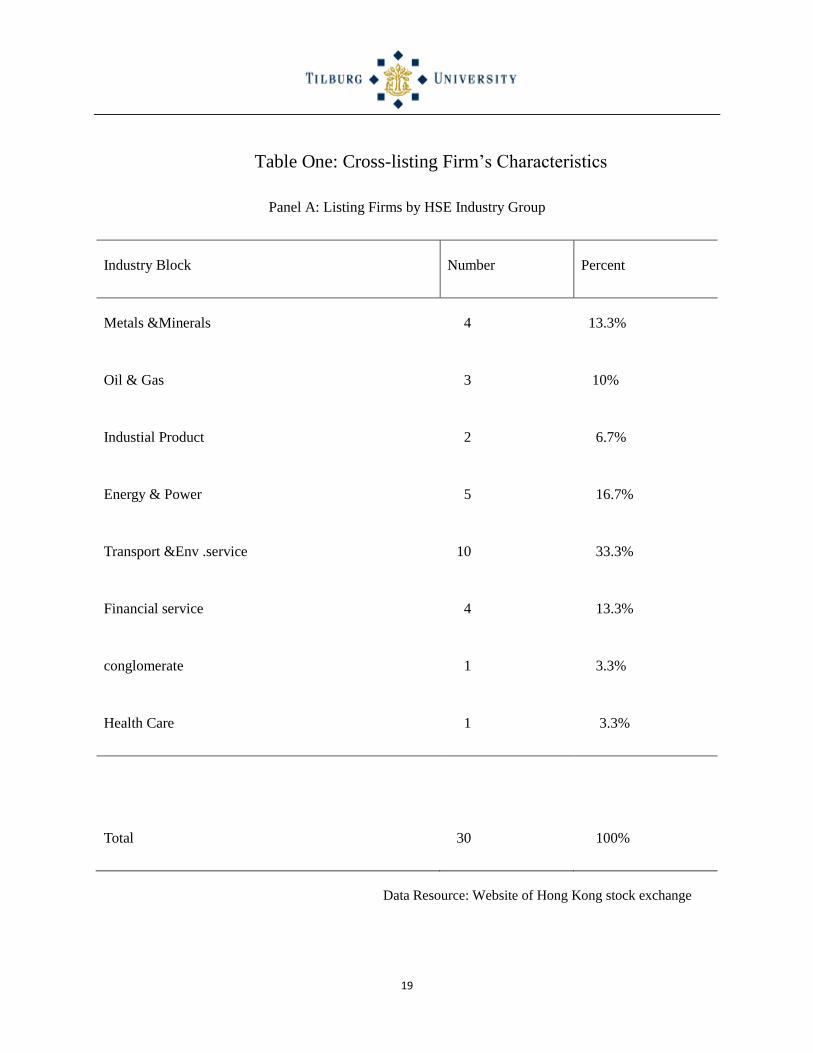
Table One: Cross-listing Firm‟s Characteristics
Panel A: Listing Firms by HSE Industry Group
Industry Block Number Percent
Metals &Minerals 4 13.3%
Oil & Gas 3 10%
Industial Product 2 6.7%
Energy & Power 5 16.7%
Transport &Env .service 10 33.3%
Financial service 4 13.3%
conglomerate 1 3.3%
Health Care 1 3.3%
Total 30 100%
Data Resource: Website of Hong Kong stock exchange

20
Panel B: Listing Frequency for these cross-listed firms
Year Number Percentage
2000 2 6.7%
2001 4 13.3%
2002 3 10%
2003 1 3.3%
2004 0 0%
2005 1 3.3%
2006 5 16.6%
2007 10 33.4%
2008 3 10%
2009 1 3.3%
Total 30 100%
Data Resource: Website of Hong Kong stock exchange

21
As we can find in panel A of Table one that among all the cross-listing companies, a large
number of them are from the resource-based industries, which include Metal & Minerals, Oil
&Gas, Energy &Power industries. In Panel B of Table one, we can find that most of the cross-
listing activities took place in year 2006, 2007, 2008. Especially in year 2007, ten companies
returned to Chinese stock market, and it comprises 33.4% of the whole cross-listing in the ten
years.
Daily close price of every individual stock on the HSE (Hong Kong Stock Exchange) and daily
close price of Heng sheng Index (H S I) and SSI (Shanghai Stock Exchange Index) is collected.
Most of this data is collected from Data Stream, and the missing data is collected from Yahoo
Finance Hong Kong. The information about announcement date of initial public offering and
actual listing date is collected from the websites of Hong Kong Stock Exchange and Shanghai
Stock Exchange.
22
5 Results
5.1 Price Effect to Announcement of cross-listing
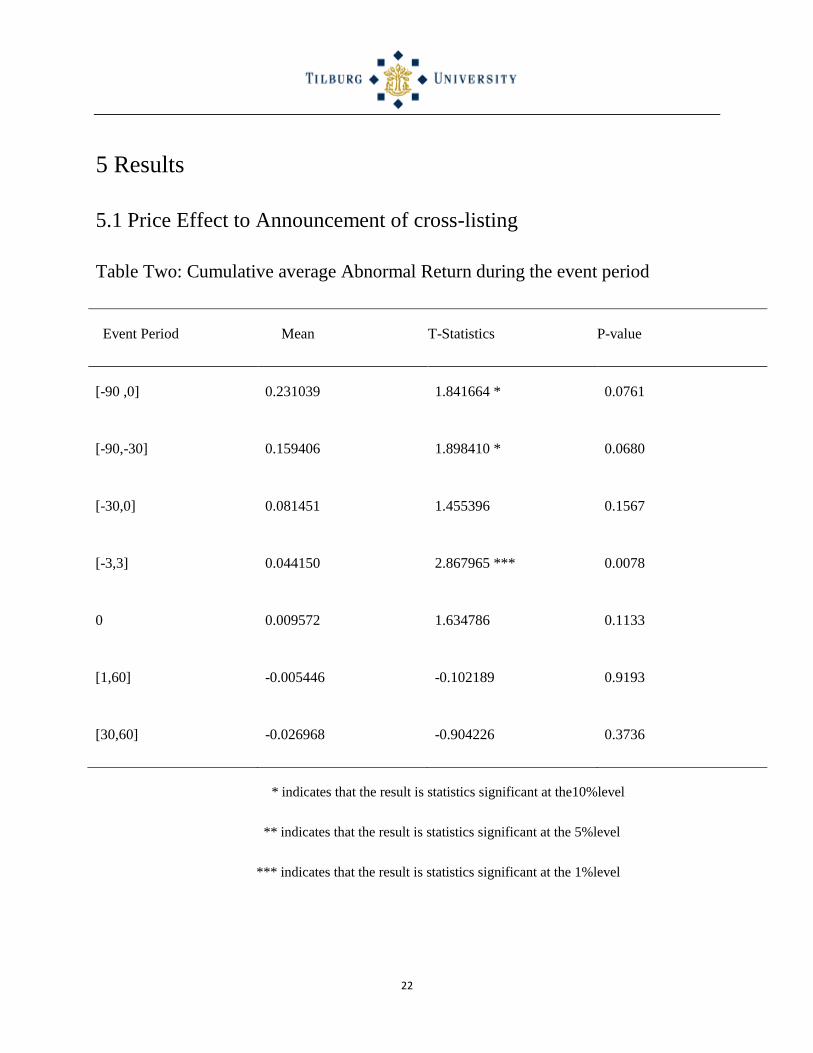
Table Two: Cumulative average Abnormal Return during the event period
Event Period Mean T-Statistics P-value
[-90 ,0] 0.231039 1.841664 * 0.0761
[-90,-30] 0.159406 1.898410 * 0.0680
[-30,0] 0.081451 1.455396 0.1567
[-3,3] 0.044150 2.867965 *** 0.0078
0 0.009572 1.634786 0.1133
[1,60] -0.005446 -0.102189 0.9193
[30,60] -0.026968 -0.904226 0.3736
* indicates that the result is statistics significant at the10%level
** indicates that the result is statistics significant at the 5%level
*** indicates that the result is statistics significant at the 1%level

23
In this section, we present the result of cumulative average abnormal return of underlying 30
stocks over the 150-day event period in Table two. In the first column of this table, the time
calendar of event period is presented. To show the process of change in abnormal return more
clearly, we divided the 150-day time period into seven short time periods. Three days prior to the
announcement day to three days after announcement day is chosen as the “event week”. In the
second column, the cumulative average abnormal return of entire sample during the event period
is presented. Column three shows the result of Statistics test, in this part, we choose T-Statistics
to check whether the abnormal return is significantly different from zero. Column four reports
the result of the P-value.
As we can see in table one, there is a 23.1% cumulative abnormal return (CAR) during the 90
days prelisting period, and the result is significant at the 10% level. To further investigate the
shift trend of the abnormal return, we investigate the CAR during the periods of (-90,-30) and (-
30, 0) separately. We can find that the upward shift of cumulative abnormal return is a persistent
trend. There is a significant and positive 15.9% CAR during the period of (-90,-30), and an 8.15%
positive CAR during the one month period prior to the announcement of cross-listing. Moreover,
during the listing week (-3, 3), there is a 4.4% positive cumulative abnormal return, which is
significant different from zero at the 1% level (p-value is 0). The mean CAR on the
announcement day is a positive 0.96%, and it is nearly significant (t=1.63).While, the cumulative
abnormal return experiences a downward shift during the post-listing period, though it is not
statistics significant during the 60 days post-listing period. There is an obvious 2.7% decrease of
CAR during the second month subsequent to the announcement of cross-listing.
Interpretation of the result
The shift trend of CAR and the results of statistics test are consistent with our first hypothesis
that Hong Kong equity market and Chinese equity market are segmented, and cross-listing
accompanies an increase in stock price and a reduction in expected return. This result is also
consistent with previous investigations about market segmentation, so it supports the Market
segmentation hypothesis. While, based on the truth that the path of cross-listing for Chinese

24
companies are contrary to the common path of cross-listing in most countries. The expectations
of investors may be different when they make this decision of cross-listing.
According to the investigations about market segmentation of Stapleton and Subrahmanyam
(1977) and Stulz (1981) et al., market segmentation refers to the situation that capital cannot
flow freely among the international capital markets, because of investment barriers. Such as
government‟s protective legalizations and the difference of tax rates and exchange rates system
or information asymmetry. How about the specific market segmentation between Mainland
China and Hong Kong equity markets? In the paper written by Albert J .Menkveld et al (2008),
they tested the relationship between Chinese and world equity markets. Empirical result shows
that the correlations between Chinese equity markets and world equity markets are close to zero
and insignificant, and there the correlation between A-share returns( A-share means shares
available to domestic investors) and world market returns does not increase over time in spite of
China‟s growing importance to the world‟s economy. This finding is in sharp contrast to the
general upward trend of correlations within the world‟s main equity markets ( Cappiello, Engle&
Sheppard 2003). In Chinese equity market, A-share is domestic ordinary shares that are available
to Chinese citizens. A-shares are divided into three classes:(i) State- owned shares, which are
held by the government agency (ii) legal shares, which are held by “legal person”, it includes
enterprises, economic entities, but not individuals (iii) public shares, which are owned by
ordinary Chinese citizens. Among these three classes of shares, only the public shares are
allowed to trade on the exchanges. The other two classes of shares are issued when the company
is incorporated, but they are not allowed to trade. Normally two- thirds of shares are classified
into the former two classes. These policies ensure the absolute control of government about the
listed companies, while it limits the liquidity of the stock market and decrease the efficiency of
market. This evidence demonstrates that the Chinese capital markets are segmented with world
markets and government policy plays an important role for changes in volatility and in
correlation. While at the same time, as the booming of Chinese economy, a large number of
enterprises, especially government-owned enterprises develop very quickly and go to operate
overseas. This simulates their great demand of capital for operating and developing and a mature

25
equity market; however the mismatch between the development of Chinese economy and that of
Chinese equity market limits their development and drives these enterprises to list overseas.
The existence of non-tradable legal share and government share also lead to the conflict of
interest between big shareholders, i.e. Government and big economic entities, and small
shareholders. According to the investigations of Coffee (1999) and Stulz (1999) et al., the cost of
capital for an enterprise to raise external fund can be affected by the degree of investor protection
in that market. Listing stocks on a capital market with higher degree of information disclosure
and investor protection can reduce the expected return of investors and increase the value of
company (Doidge, Karolyi&Stulz, 2004). According to the classification of law system, the
Hong Kong legal system is classified into common law system and the Chinese legal system is
more like Civil law system. The degree of investor protection in Civil law countries is much
lower than that in Common law countries. As the problem of interest conflict caused by
government policies cannot be solved in short time, this further stimulates these enterprises to
list their stocks on international market with higher level of investor protections, in order to
meet the requirement of investors, and reduce the expected return.
Since the Chinese stock markets are not well developed, why these listed overseas companies
choose to return. What are the expectations of investors behind this decision? As we mentioned
earlier, the investor protection level in Chinese market is lower than that in Hong Kong market.
Obviously, the optimistic expectation of investors is not from the potential improved investor
protection level. According to the market segmentation theory, the main purpose of cross-listing
is to overcome the investment barriers and get lower cost capital. This suggests that the Hong
Kong listed companies may get lower cost capital after cross-listing.
It suggests that there are two main reasons why the Hong Kong listed companies return to
Mainland China to list. In the first place, the large lag of prices between H-shares (Hong Kong
listed shares) and A-shares (Chinese listed shares),and the higher IPO (initial public offering)
premium of A-shares will bring these companies lower cost capital source and increase the
value of equity assets for H-shareholders at lower cost. For the “A+H” investors, no matter how
26
high the initial price they buy the stocks at, the raised fund through cross-listing will be allocated
to net asset of the companies. This net asset will be shared by all the investors of both the H-
share holders and A-share holders. The higher IPO premium of the A-shares, the lower cost of
funds for the company and the higher value of equity assets for H-share holders. I make a
statistic about IPO price of the returned stocks, and find that the average IPO premium for the A-
share is as much as 2.6 times of the H-share premium. The yearly average P/E ratio is 17.24 of
the H-share from 2001to 2007, while it is 46.24 of the A-share. This large gap of P/E ratio
means that the H-shareholder only need to pay 17.24 dollar to get one dollar equity asset, while
for the A-shareholder, they need to pay 46.24 dollar to get the same one dollar equity asset. As
the existence of large price lag, these enterprises can raise funds at relatively lower cost in the A-
share market. Especially, in year 2006& 2007, trillions of funds were invested into the Chinese
stock market, and the SSI (Shanghai stock exchange index) rose from 1258 point to 5261 point.
These returned shares are popular among A-share investors, and they are issued at relatively
high price. For example, the A-share of returned companies was issued at a premium as 4.63
times as that of H-share averagely in year 2007. This explains why 10 companies returned to the
A-share market to fulfill cross-listing on that year.
In the second place, according to the investigation of Merton (1987) who indicates that in the
case of information asymmetry, investors have different degree of recognition about all the
stocks, and they will only invest the stocks they are familiar with. In this case, if a stock can be
recognized by more investors, the expected return of investors will decrease and this will further
increase the value of company. For the Hong Kong listed stocks, the former cross-listed
companies normally get high IPO premium. This gives a signal to enterprises and investors that
cross-listing provides them an access to raise funds at lower cost and increase value of equity
asset. Then the H-share investors reach a consensus that the Cross-listed firms are companies of
high quality, and they can benefit from cross-listing. This leads to a decrease in expected return
of investors, and it accompanies increase in stock prices.
In conclusion, the imperfections of government policy dominated Chinese equity market drive
these enterprises to list in Hong Kong. To better share the benefits of rapid growth of Chinese

27
economy, and get lower cost capital source and increased company value, these companies
return to Chinese equity market to cross-listing. This is consistent with market segmentation
hypothesis, though the path of Cross-listing for the Chinese companies is contrary to the
common path.
5.2 Risk effect of Cross-listing
In this section, we present the result about risk impact of Cross-listing on the underlying stocks.
The volatility comparison is based on difference of the average standard deviation of returns and
average beta of underlying stocks during the prelisting period and post-listing periods. Two
models are used in this part as indicated in part 3.2. In table three, i present the result of the first
one factor model, and in table four, i present result of the two factors model. They are shown as
follows:
Table Three: Change of volatility during the pre and post period
Prelisting period
(mean)
Post-listing period
(mean)
Pre-post difference T-statistics
Of
difference
P-value
Standard deviation 3.16% 3.42% 0.26% 0.813137 0.4235
Beta 1.131958 1.042053 -0.08990563
-0.865685 0.3946
As we can find in the first row of table three, there is a slight upward shift (0.26%) in volatility
(standard deviation of return). This is not consistent with our hypothesis that the standard

28
deviation will decrease after cross-listing. While the difference is slight and not statistics
significant, so it lacks explanatory power. According to the investigation of Jayaraman et al.
(1993), who find increase in standard deviation of return after cross-listing of foreign firms that
are listed on US stock exchanges, the slight increase of standard deviation may be caused by
increased trading volume after cross-listing. This explanation is supported by evidence in later
investigation, as we find significant increase of trading volume in the Hong Kong market after
cross-listing.
Row two indicates a 9% decrease of beta (or market risk) from 1.13 to 1.04. This result is
consistent with the second hypothesis that cross-listing diversify the risk among these two
markets, if Hong Kong equity market and Chinese equity market are segmented beforehand. The
evidence here is a little weak, since the decrease is not statistics significant. This result is
consistent with the findings of Foerster and Karolyi (1993) about the U.S and Canadian market
segmentation, and Howe and Madura (1990) who examine the impact on US firms cross-listed
overseas, they find non-significant decrease in betas and standard deviation of return. To further
examine the risk effect of cross-listing, a two index model is applied here. In this model, we
compare the estimated coefficients of the Hong Kong market and Chinese market factors in the
pre and post-listing periods. Result of this test is presented in Table four, which is shown as
follows:

29
Table Four: Change of betas in the two index model
Prelisting
period
(mean)
Post-listing
period
(mean)
Pre-post
difference
Pre-post
difference
T-statistics
P-value
Beta One
(Hong Kong)
1.009908 0.954606138 -0.05530186 -0.84339 0.4062
Beta Two
(Chinese)
0.264236448
0.249140862
-0.0150956
-0.128778 0.8985
As we can find in this table, there is a 5.5% decrease of Beta one (beta of Hong Kong market)
from 1.01 to 0.95, and a slight decrease of Beta two (Beta of Chinese market) from 0.26 to 0.25,
while the statistics test of beta two is not significant at all (-0.12). The result of change in beta of
Hong Kong market is consistent with the finding of the one index model in table three. These
results together support the second hypothesis that the Hong Kong equity market and Chinese
equity market are segmented and cross-listing is a useful method to reduce the degree of market
segmentation, diversify the risk between the domestic markets and foreign markets. Beta two
(beta of Chinese market), both before and after listing, are very small. Indeed they are (on
average) not significant from zero. This result is consistent with the finding of Howe and Madura
(1990) about the risk effect of cross-listing to U.S. firms listed overseas.

30
5.3 Liquidity Effect of Cross-listing
In this part, we investigate the liquidity effect of cross-listing. As indicated in part 3.3, the
methodology used in the investigation of Foerster and Karolyi (1993) is applied here. I calculate
the average trading volume across the entire sample companies during the pre-listing and post –
listing periods separately, and compare them to find out the change. The result of change in
liquidity is presented in Table five as follows:
Table Five: Liquidity effect of cross-listing
Stock Volume T-Statistics
Prelisting period 1,287,916,498
Post-listing period 1,752,104,279
Pre-post difference 464,187,781 2.82517***
* indicates that the result is statistics significant at the 10%level
** indicates that the result is statistics significant at the 5%level
*** indicates that the result is statistics significant at the 1%level
As we can find in table five, on average, the monthly trading volume increase from
1,287,916,498 shares in the prelisting period to 1,752,104,279 shares in the post-listing period
and the pre and post difference is statistics significant at a high level (t=2.82). This result is

31
consistent with the finding of Foerster and Karolyi (1996) about liquidity effect of listing
Canadian stocks on US exchanges and the finding of Chowdhry &Nanda (1991) about liquidity
effect of cross-listing. It supports our third hypothesis that if markets are segmented, cross-listing
is associated with an increase of liquidity in the Hong Kong market. As we mentioned in the part
of price effect, the H-share price is much lower than that of A-share, so it is consistent with the
situation of “Winners take most”. This increase appears to be more than a temporary
phenomenon, since the trading volume during the period from 4 months after the cross-listing to
8 months after the cross-listing is still larger than the average volume in the prelisting period. To
control for the impact of outliers, i also calculate the median increase in volume during the
prelisting and post-listing period separately. There is a 26.3% increase in the median trading
volume, which is still substantial. This increase is pervasive across all the sample companies,
because there are 75% of all the sample companies experience increase in trading volume.
6 Conclusions and Recommendations
What‟s the effect of cross-listing on the underlying Chinese companies, why these companies
choose such a contrary path of cross-listing, and what are the expectations of investors behind
this decision? In this study of thirty Mainland China and Hong Kong cross-listed companies, we
try to figure out these questions. Based on the assumption that Hong Kong equity market and
Chinese equity market are segmented, we investigate the impact of cross-listing from these three
perspectives: price effect, risk effect and liquidity effect. Empirical results show that there is an
increase of stock prices for our whole sample companies during the prelisting period. A slight
downward shift of expected returns was detected subsequent to the cross-listing. This result is
similar with findings of Foerster and Karolyi (1993) about the segmentation between Canadian
market and US market and others about market segmentation. However, as the Chinese
companies choose a different path of cross-listing (they list their stocks firstly in the developed
Hong Kong equity market and then return to the emerging Chinese equity market), we then
investigate whether the expectations of investors and companies behind this decision of cross-
listing are similar with that in other countries. It suggests that the optimistic expectations of H-

32
share investors about cross-listing is not caused by potential improved level of corporate
governance, while it is caused by the great lag between the price of A-share and H-share.
Because A-share is issued at a much higher premium relative to the H-share, the H-share investor
can achieve a quick increase in value of their equity assets and the enterprises can raise funds at
lower cost through cross-listing. The high IPO premium of returned stocks also give a signal to
the H-share investors of other Chinese stocks that cross-listing can increase value of their equity
assets at lower cost. This leads to a decrease in expected return of investors, and an increase in
stock price. This followed process is what we have seen on the Chinese stock markets in recent
years: returned stocks with high issuance premium – investors‟ expectations about increased
equity asset value - stock prices of other H-shares grow rapidly before cross-listing – later
returned A-share stocks with higher issuance premium.
To test the effect of cross-listing on the risk factor of underlying stocks, we investigate the
difference in volatility of returns and betas of the stocks during the pre and post-listing periods.
In this part of research, slight upward shift in volatility of returns was detected. This may be
caused by the increased trading volume subsequent to cross-listing, as we find significant
increase in trading volume after cross-listing. To test whether this difference is caused by change
in return generating process, i investigate the change in average beta of these underlying stocks
in both the one factor model and two factors model. Both tests indicate decrease in beta, which
means the sensitivity of stock return to Hong Kong market return decrease after cross-listing.
This result is consistent with our hypothesis that in this case of market segmentation, cross-
listing is an effective way to diversify the risk between these two markets.
It also documents a substantial increase in liquidity of the sample stocks on the Hong Kong stock
exchange subsequent to cross-listing. To overcome the effect of market fluctuation, we choose a
relative long eight months pre and post listing periods to test the change in liquidity. In this case
of a longer period, it demonstrates that the increase in liquidity is not a temporary jump during
the month following cross-listing, because the trading volume remains high in the subsequent
seven months as well.
33
In conclusion, due to the market segmentation between Hong Kong and Chinese equity markets,
these Chinese companies choose a contrary path of cross-listing. Cross-listing supplies them an
access t to raise funds at lower cost, increase their enterprise value, diversify the risk, and
increase stocks liquidity. For the H-share investors, they can increase the value of their equity
assets at lower cost. These factors promote the Hong Kong listed Chinese stocks to return to
Chinese equity market.
As a final note to this research I would like to bring forth the limitations of this study including
some recommendations and suggestions for further research.
In the first place, as there are seldom international literatures directly about Chinese cross-listing,
so the references I can learn from are limited.
In the second place, due to the limitation of quantity of sample and investigation period, the
sample size is relatively small, which may limit the accuracy of empirical result.
In the third place, as inside information is popular in Chinese equity market, the announcement
date of cross-listing may be not the actual day when the information enters markets. I choose the
date of initial public offering as announcement date; however, this information may have been
leaked out and broadcasted in the equity markets. This may lead to inside trading before the
announcement date, and the result during actual event period may be not significant.
If more specific sample resource can be obtained, there are some perspectives deserve further
investigations in future.
1. All the returned stocks fulfill their cross-listing through the way of IPO in our
research, and in recent years, the government is loosening their restrictions gradually,
and some companies may fulfill their cross-listing by the way of depository receipt in
future. The effects of cross-listing on these two different methods can be compared.
2. In our sample, most of companies are government dominated companies, and in
recent years, more and more private companies are going to list overseas. The effect

34
of cross-listing on these two different kinds of companies can be compared in future
investigations.

35
7 List of definitions
Cross-listing A firm lists their equity shares on one or more foreign stock exchanges in
addition to its domestic exchange
A-share A-share on the Shanghai and Shenzhen stock exchanges refer to those shares
that are available to Chinese citizens and are traded in Renminbi, the currency
in Mainland China
H-share H-share refers to the shares of companies incorporated in mainland China that
are traded on the Hong Kong Stock Exchange
Depositary
Receipt (DR)
(DR) is a type of negotiable (transferable) financial security that is traded on a
local stock exchange but represents a security, usually in the form of equity,
that is issued by a foreign publicly listed company
Initial public
offering
An IPO refers to simply as an „offering” or “flotation”, is when a company
(called the issuer) issue common shares to the public for the first time
Beta In finance ,the beta (β) of a stock or portfolio is a number describing the
relation of its returns with that of the financial markets as a whole
Standard
deviation
In finance, standard deviation is a representation of the risk associated with a
given security
P/E Ratio
(price to
earnings ratio)
It is a measure of the price paid for a share relative to the annual net income
or profit earned by the firm per share
Cumulative
abnormal return
(CAR)
In finance, CAR is the buildup of the difference between the expected return
of a security and the actual return. It is the sum of all abnormal returns up to
time . If no "event" occurs then CAR equals zero.

36
8 References
1. Alexander, G.J., Eun, C.S., & Janakiramanan, S. (1987). Asset Pricing and Dual Listing
on Foreign Capital Markets: A note. The Journal of Finance ,42(1),151-158
2. Amihuid, Y., & Mendelson, H. (1986).Asset Pricing and the Bid-Asked Spread .Journal
of Financial Economics, 17(2), 223-249.
3. Barclay, M.J., Litzenberger, R.H., & Warner, J.B. (1990) .Private information, trading
volume, and stock –return variances. Review of Financial Studies,3,233-253
4. Craig Doidge, G. Andrew Karolyi and René M. Stulz. (2004). Why are foreign firms
listed in the U.S. worth more? Journal of Financial Economics, 71(2), 205-238.
5. Chowdry, B., &Vikram, Nanda. (1991).Multimarket Trading and Market Liquidity. The
Review of Financial Studies, 4(3), 483.
6. Damodaran, Aswath, C.Liu &W.van Harlow. (1992). The effects of international dual
listings on stock price behavior. New York: Stern School of Business, New York
University.
7. Errunza,V.,&Losq,E(1985).International Asset Pricing under Mild Segmentation: Theory
and Test. The Journal of Finance, 40(1), 105-124.
8. Foerster, S.R., &Karolyi, G.A. (1993).International Listing of Stocks: The case of
Canada and US. Journal of International Business Studies, 24(4), 763-784.
9. Foerster, S.R.,& Karolyi, G.A.(1996). The Effects of Market Segmentation and Illiquidity
on Asset Prices: Evidence from Foreign Stocks Listing in the US: Richard Ivey School of
Business, University of Western Ontario.

37
10. Foerster, S.R.,& Karolyi, G.A.(1999). The Effects of Market Segmentation and Investor
Recognition on Asset Prices: Evidence from Foreign Stocks Listing in the United States.
The Journal of Finance, 54(3), 981-1013.
11. Howe, J., &Madura, J. (1990).The impact of international Listings on risk: Implications
for capital market integration. Journal of Banking and Finance, 14(6), 1133-1142.
12. Jayaraman,N.,Shastri,K.,& Tandon,K.(1993).The impact of International Cross Listings
on Risk and Return :The Evidence from American Depository Receipts .Journal Banking
and Finance ,17(1) ,91-104 .
13. John C.Coffee,Jr. (1999). Privatization and Corporate Governance: The Lessons frm
Securities Market Failure. Journal of Corporation Law, volume 29.
14. Kadlec, G.B., & Mc Connell, J.J. (1994).The Effect of Market Segmentation and
Illiquidity on Asset Prices: Evidence from Exchange Listings. The Journal of Finance,
49(2), 611-636.
15. Karl-Markus Moden, Lars Oxelheim(1997). Why issue equity abroad? Corporate reasons
and stock market responses. Management International Review, 37(3), 223-241.
16. Kuan-Pin LIN, Albert J .Menkveld, Zhishu Yang (2008).Chinese and World Equity
markets: A review of the Volatilities and Correlations in the first fifteen years. China
Economic Review, 20(1), 29-45.
17. Kyle, A., (1985). Continuous Auctions and Insider Trading. Econometrica, 53, 1315-
1335.
18. Macro Pagano, Alisa A.Roell & Josef Zechner (2002) .The Geography of Equity Listing:
Why Do Companies List Abroad? Journal of Finance, 57(6), page 2651-2694.
19. Merton, R.C. (1987). A simple Model of Capital Market Equilibrium with Incomplete
Information .Journal of Finance, 42(3), 483.

38
20. Rene M. Stulz (1981). On the Effects of Barriers to International Investment. Journal of
Finance, 36(4), 923-934.
21. Stapleton,R.c.,&Subrahmanyam,M.G.(1977).Market Imperfections, Capital Market
Equilibrium and Corporate Finance .The Journal of Finance ,32(2),307-319
22. Stoyan,Y.G.,Novozhilova,M.V.,Kartashov,A.V.,Ting,F.C.K.,Lemasson,W.J.,Noronha,G.
M.,et al.(1996).Testing for micro-structure effects of international dual listings using
intraday data. Journal of Banking and Finance, 20(6), 843-863.
23. R.M. Stutz, Globalization, corporate finance, and the cost of capital. Journal of Applied
Corporate Finance 12 (1999), pp. 8–25
24. Vihang R. Errunza and Darius P. Miller (2000). Market Segmentation and the Cost of the
Capital in International Equity Markets. Journal of Finance and Quantitative Analysis, 35,
577-600.
25. Vihang R.Errunza and Darius P. Miller (2003).Valuation effects of seasoned global
equity offerings. Journal of Banking and Finance, 27(9), 1611-1623.

39
9 Appendixes
Appendix I – Information about the cross-listed stocks
Company H-share code Announcement date List date
Huaneng power 902 2001-11-13 2001-12-6
Anhui expressway 995 2002-11-21 2003-1-7
China Ship Dev 1138 2002-4-30 2002-5-3
Huadian Power 1071 2005-1-4 2005-2-3
Sinopec crop 386 2001-6-22 2001-8-8
China Southern Air 1055 2003-7-7 2003-7-25
Guangzhou
Pharmaceutics
874 2000-12-29 2001-2-6
Jiang Xi Cooper 358 2001-12-18 2002-1-11
Shenzhen expressway 548 2001-11-29 2001-12-25
Anhui conch cement 914 2002-1-21 2002-2-7
Da tang int Power 991 2006-11-28 2006-12-20
Chongqing iron steel 1053 2007-1-22 2007-2-28
China COSCO 1919 2007-6-8 2007-6-26
Aluminum Crop 2600 2007-4-21 2007-4-30
Shanghai Electric 2727 2008-11-11 2008-12-5
CNOOC limited 883 2007-9-12 2007-9-28
Bank of Communication 3328 2007-4-18 2007-5-15
Guangshen Railway 525 2006-12-7 2006-12-22
Air China 753 2006-7-31 2006-8-18

40
Beijing North star 588 2006-9-13 2006-10-16
Sichuan Expressway 107 2009-7-6 2009-7-27
Jiangsu Expressway 177 2000-12-14 2001-1-16
Petro China 857 2007-11-2 2007-11-5
China Construct Bank 939 2007-9-22 2007-9-25
China Shenhua 1088 2007-9-29 2007-10-9
China Coal 1898 2008-1-21 2008-2-1
Ping An inc 2318 2007-2-2 2007-3-1
China Life ins 2628 2006-12-19 2007-1-9
China Shipping 2866 2007-11-28 2007-12-12
Zijin Mining 2899 2008-4-7 2008-4-25

41
Appendix II –Yearly average P/E ratio for the Cross-listed stocks (A-
share, and H-share respectively)
Year A-share p/E
ratio
H-share P/E
ratio
Difference T-Statistics P-value
2000 64.33 12.34 51.99 7.48 0.000
2001 63.23 13.44 49.79 12.02 0.000
2002 53.05 19.16 33.89 8.62 0.000
2003 45.69 16.79 28.90 11.58 0.000
2004 42.96 17.67 25.28 11.52 0.000
2005 29.03 15.43 13.60 5.94 0.000
2006 33.34 21.06 11.43 5.08 0.000