MASTER OF PHARMACY
127
DEVELOPMENT NEWER ANALYTICAL TECHNIQUES FOR THE ESTIMATION OF BENFOTIAMINE AND ITS COMBINATION WITH PYRIDOXAMINE DIHYDROCHLORIDE AND RESVERATROL A Dissertation submitted to THE TAMIL NADU Dr. M.G.R. MEDICAL UNIVERSITY, CHENNAI – 600 032 In partial fulfilment of the requirements for the award of the Degree of MASTER OF PHARMACY IN BRANCH–V- PHARMACEUTICAL ANALYSIS Submitted by GOBI.A REGISTRATION No.261530102 Under the guidance of Dr. M.GANDHIMATHI, M.Pharm., Ph.D., Department of Pharmaceutical Analysis COLLEGE OF PHARMACY SRI RAMAKRISHNA INSTITUTE OF PARAMEDICAL SCIENCES Coimbatore - 641 044. APRIL 2017
-
Upload
khangminh22 -
Category
Documents
-
view
0 -
download
0
Transcript of MASTER OF PHARMACY

DEVELOPMENT NEWER ANALYTICAL TECHNIQUES FOR THE
ESTIMATION OF BENFOTIAMINE AND ITS COMBINATION WITH
PYRIDOXAMINE DIHYDROCHLORIDE AND RESVERATROL
A Dissertation submitted to
THE TAMIL NADU Dr. M.G.R. MEDICAL UNIVERSITY,
CHENNAI – 600 032
In partial fulfilment of the requirements for the award of the Degree of
MASTER OF PHARMACY IN
BRANCH–V- PHARMACEUTICAL ANALYSIS
Submitted by
GOBI.A REGISTRATION No.261530102
Under the guidance of
Dr. M.GANDHIMATHI, M.Pharm., Ph.D., Department of Pharmaceutical Analysis
COLLEGE OF PHARMACY
SRI RAMAKRISHNA INSTITUTE OF PARAMEDICAL SCIENCES Coimbatore - 641 044.
APRIL 2017

CERTIFICATE
This is to certify that the dissertation entitled “Development Newer
Analytical Techniques for the Estimation of Benfotiamine and its
Combination with Pyridoxamine dihydrochloride and Resveratrol” being
submitted to The Tamil Nadu Dr.M.G.R Medical University, Chennai was carried
out by GOBI. A in the Department of Pharmaceutical Analysis, College of
Pharmacy, Sri Ramakrishna Institute of Paramedical Sciences, Coimbatore, under
the supervision and guidance of Dr. M.Gandhimathi, M.Pharm., Ph.D.,
Associate Professor, Department of Pharmaceutical Analysis, College of
Pharmacy, Sri Ramakrishna Institute of Paramedical Sciences, Coimbatore.
Dr. T. K. RAVI, M. Pharm., Ph.D., FAGE.,
Principal & HOD,
Department of Pharmaceutical Analysis,
College of Pharmacy,
SRIPMS,
Coimbatore-641 044.
Place: Coimbatore
Date:

CERTIFICATE
This is to certify that the dissertation entitled “Development Newer
Analytical Techniques for the Estimation of Benfotiamine and its
Combination with Pyridoxamine dihydrochloride and Resveratrol” being
submitted to The Tamil Nadu Dr. M.G.R Medical University, Chennai was carried
out by GOBI.A in the Department of Pharmaceutical Analysis, College of
Pharmacy, Sri Ramakrishna Institute of Paramedical Sciences, Coimbatore under
my direct supervision and guidance to my fullest satisfaction.
Dr. M. GANDHIMATHI, M.Pharm., Ph.D.,
Associate Professor,
Department of Pharmaceutical Analysis,
College of Pharmacy,
SRIPMS,
Coimbatore-641 044
Place: Coimbatore
Date:

CERTIFICATE
This is to certify that the dissertation entitled “Development Newer
Analytical Techniques for the Estimation of Benfotiamine and its
Combination with Pyridoxamine dihydrochloride and Resveratrol being
submitted to The Tamil Nadu Dr. M.G.R Medical University, Chennai was carried
out by GOBI.A in the Department of Pharmaceutical Analysis, College of
Pharmacy, Sri Ramakrishna Institute of Paramedical Sciences, Coimbatore under
my co-guidance to my fullest satisfaction.
Mrs. SANGEETHA SUDHAKARAN , M.Pharm.,(Ph.D).,
Associate Professor,
Department of Pharmaceutical Analysis,
College of Pharmacy,
SRIPMS,
Coimbatore-641 044
Place: Coimbatore
Date:

ACKNOWLEDGEMENT
I would like to devote my sincere gratitude to my guide
Dr. M. Gandhimathi, M.Pharm., Ph.D., Associate Professor, Department
of Pharmaceutical Analysis, College of Pharmacy, SRIPMS, Coimbatore
for her remarkable guidance and valuable suggestion during the tenure of
my work. I wish to convey my deep sense to her for all the guidance she
provided me over the time of my academic years. There is no doubt that
without her efforts the task would not be achieved. It is my great privilege
to have such dedicated guide like her that provides dynamic encouragement
to me.
It is my pleasure to express my sedulous gratitude to our Principal
Dr. T. K.Ravi, M.Pharm., Ph.D., FAGE., College of Pharmacy, SRIPMS,
Coimbatore for giving us an opportunity to do this project work and for
providing all necessary facilities for it.
I extend my gratitude and respectful regards to our Managing
Trustee, Thiru.K.Vijayakumhar and the Management of SRIPMS for
providing complete facilities required for the work.
My solemn thanks to my dear teachers, Dr. R. Jayaprakasam,
M.Pharm, Ph.D., Dr. A. Suganthi, M.Pharm., Ph.D., Dr. Susheel John
Varghese, M.Pharm., Ph.D., and Mrs. Sangeetha sudhakaran, M.Phram.,
(Ph.D)., Department of Pharmaceutical Analysis, College of Pharmacy,
SRIPMS, Coimbatore for their timely help and guidance during the course
of the work.
A special thanks to Mrs. Kalaivani and Mrs. Dhanalakshmi for
unstinted support at the time of need.
My lovable special thanks to Kasthuri. S helpful for providing drug
during my project and their valuable support and advice at all the time.

I extended my thanks to Miss. Manimegalai and Mr. Palaimuthu
Mr. Raja for providing drug during my project work.
My heartfelt thanks to my dear friends Arthi, Dhivya,
Veerapandiyan, Sangeetha, Aravind Raj, Sumithra, Naveen, Sathesh,
Arthi priya, Anandhi, Sneha, Shelsia, Titto, Ashiq, Deviaka, Jupin, and
Sneha who have helped me during my project work.
Above all I dedicate myself before the constant love and
encouragement given to me by my beloved Parents Mr. Annamalai. R and
Mrs. Mallika. A and my lovable sweet sister Baby. A and my family
members Mr. subramaniam. T, Mrs. Rajeswari. S, Raghu, Vinotha,
Revanth, Mukunth who have been the backbones of all my achievements.
Above all, I bow with reverence before the gracious presence and
boundless blessings of "The Almighty" who is the source of all wisdom and
knowledge for the successful completion of this thesis work.

CONTENTS
CHAPTER
NO.
TITLE PAGE
NO.
LIST OF ABBREVIATIONS
I INTRODUCTION 1
II REVIEW OF LITERATURE 7
III AIM AND OBJECTIVE 10
IV DRUG PROFILE 11
V MATERIAL AND INSTRUMENTS 15
VI EXPERIMENTAL SECTION
17 1. Development and validation of UV
spectroscopic method for the estimation of
benfotiamine in bulk drug and tablet formulation
2. Development and validation of stability
indicating HPTLC method for the determination
of benfotiamine and its application to
accelerated stability studies of benfotiamine
tablets.
21
3. Development and validation of HPTLC method
for estimation of benfotiamine in combination
with pyridoxamine dihydrochloride and
resveratrol in combined dosage form.
29
4. Development and validation of RP-HPLC
method for estimation of benfotiamine in
combination with pyridoxamine dihydrochloride
and resveratrol tablet formulation.
37
VII RESULTS AND DISCUSSION 44
VIII SUMMARY 112
IX CONCLUSION 117
BIBLIOGRAPHY

List of Abbreviations
Department of Pharmaceutical Analysis
LIST OF ABBREVATIONS
HPTLC High Performance Thin Layer Chromatography
HPLC High Performance Liquid Chromatography
RP-HPLC Reverse Phase High Performance Liquid Chromatography
ICH International Conference on Harmonization
BEN Benfotiamine
PYR Pyridoxamine dihydrochloride
RES Resveratrol
gm Gram
M Molar
mM Millimolar
mg Milligram
µL Microliter
µg Microgram
ng Nanogram
min Minute
Rt Retention time
Tf Tailing factor
Rs Resolution
LOD Limit of detection
LOQ Limit of quantification
RSD Relative standard deviation
UV Ultra violet
KH2PO4 Potassium dihydrogen ortho phosphate
Introduction
Department of Pharmaceutical Analysis 1
INTRODUCTION (1-12)
The analytical method is a generic process combining the power of the
scientific method with the use of formol process to solve any type of research
problem. It involves the steps like identify the problem to solve, choose an
appropriate process, use the process to hypothesize analysis or solution elements,
design an experiment to test the hypothesis perform the experiments to accept,
reject or modify the hypothesis, check the performance before steps until the
hypothesis is accepted, implement the solution continuously to improve process as
opportunities arise.
The need of new analytical methods is vital in new drug development
pharmaceutical products formulated with one or more than one drug was referred
to be combination drug products, which are intended to meet previously unmet
patient needs by combining the therapeutic effects of two or more drugs in one
product. These combination products can produce daunting challenges to the
analytical chemist responsible for the validation of analytical methods.
As a result of new drug research, number of drugs introduced into the
market is increasing every year. These drugs may be either new entities or partial
structural modification of the existing one. Often there is a time lag from the date
of introduction of a drug into the market to the date of its inclusion in
pharmacopoeias because of the possible uncertainties in the continuous and wider
usage of these drugs, reports of new toxicities, development of patient resistance
and introduction of better drugs to competitors, under these conditions, standards
and analytical procedures for these drugs may not be available in the
pharmacopoeias. It becomes necessary to develop newer analytical method for
drugs.

Introduction
Department of Pharmaceutical Analysis 2
The information obtained from analytical research is used to identify
potential sources of safety problems in the products. The analytical effort required
to provide this information can be divided into a number of analytical tasks which
are as below,
Determination of identify, purity of starting materials and intermediates
used in manufacturing the drug substance.
Isolation and identification of trace impurities in drug substance.
Determination of degradation rates and products.
Establishment of an analytical reference standard for the drug substance.
The analytical methods require the meet crieterian like sensitivity,
specificity, precise, robust and raggedness. The degrees of complexity acceptable
in the analytical procedure vary considerably from task to task and therefore
require a variety of analytical techniques to satisfy them.
Basic criteria for new method development of drug analysis:
Drug or drug combination may not be official in pharmacopoeia.
A proper analytical procedure for the drug may not be available in the
literature.
Analytical methods for the quantitation of the drug may not be available.
Analytical methods for a drug in combination with other drugs only
available.
The existing analytical procedures may require expensive reagents and
solvents.
Analysis of drugs by UV – Visible spectrophotometry
Analytical samples absorption in the UV-Visible region is often strong and
therefore allows many substances to be measured in the low part per million
ranges in non-absorbing media. Good sensitivity combined with ready availability
of simple, accurate and inexpensive spectrophotometers have made UV- Visible
spectrophotometry one of the most widely used instrumental techniques in organic
analysis.

Introduction
Department of Pharmaceutical Analysis 3
There are various spectrophotometric methods are available which can be
used for the analysis of a samples.
Simultaneous equation method
Derivative spectrophotometric method
Absorbance ratio method
Difference spectrophotometry
Chromatography
Chromatography is the most powerful and versatile technique available to
the modern analyst. A chromatographic procedure can separate a mixture of
components into individual components and quantitatively determine the amount
of each component present.
Development of chromatography has been quite remarkable in many ways.
On one side the development of liquid chromatography was vens slow and
arduous, particularly in the early years, whereas in comparison, the rate of
development of gas chromatography was almost meteoric. HPTLC method for
analyzing drug in single or multicomponent dosage forms required only primary
knowledge, about the nature of sample namely, structure, polarity, volatility,
stability and solubility parameters. An exact recipe for HPTLC, however also
same like HPLC cannot be provided because method development involves
considerable error and trial procedures.
The availability of disposable TLC plates, the problem caused by samples
with high matrix contents, which block the HPLC columns and likely to give
ghost peaks is eliminated by HPTLC system is automated and controlled
throughout by software and is fully responsible and standardized cGMP -
compliant technique.
Introduction
Department of Pharmaceutical Analysis 4
It generates comparable analytical data with low level of uncertainly and is
suitable for in process control for product analysis in simultaneous long-term
comparison as batch-to-batch conformity for stability testing.
Stability indicating analysis method is employed for the analysis of sample
stability in pharmaceutical industry. ICH guidelines explicity requires conduct of
forced decomposition studies under a variety of conditions like pH, light,
oxidation, dry heat and separation of drug from degradation products. Drugs
containing functional groups such amides, esters, lactams, lactones easily undergo
hydrolysis. Drug containing functional groups such as thiols, thioesters, easily
undergo oxidation. Drug containing functional groups such as olefins, aryl halo
derivatives, aryl acetic acids, aromatic nitro groups, N- oxide easily undergoes
photo decomposition. This was the first step carried out in a drug structure to
assess the likely decomposition route; secondly, collection of information on
physicochemical properties was done which may be an easy exercise when the
degradation products are known and available in the pure form.
HPLC systems can be modular basis in which the users can use different
modules (e.g. Column and detector) depending on the analytical requirements. All
basic compounds are difficult to be separated or purified on silica based reversed
phase material for liquid chromatography because undesired adsorption of the
basic nitrogen containing group to acidic sites on the silica surface.
The HPLC method developments focus specifically a suitable approach for
isocratic reversed phase method development, since this is most commonly used
in pharmaceutical field.
Samples description includes the number of compounds: chemical
structure/function, molecular weight, pKa, UV spectra, matrix, solubility
and analyte concentration.

Introduction
Department of Pharmaceutical Analysis 5
Specification of goals includes analysis, purification or preparation?
Qualitative and quantative analysis? Resolve all compounds and what is
precision needed?
Pretreatment of sample includes ready to inject or clean up needed? For
example, dilution, buffering or solubility.
Selection of detector where UV is the most desirable detector.
The order of selection of method is,
1st choices: RPLC, ION PAIR OR NPLC
2st choices: IEC, SEC, HIC
Special cases: high molecular weight, isomers, inorganic, carbohydrates
Initial runs can be isocratic and gradient.
Optimization of resolution includes how much resolution needed? Time
per run? Operating pressure? Solvent consumption and narrow peaks?
Validate before the release of method which meets all goals, robust,
routine method.
Validation as such cannot improve the process but it confirms and assures
that the process has been well maintained and operates as it should validation is a
basic requirement to ensure quality and reliability of the results for all analytical
applications. It is essential to employ well characterized and fully validated
analytical methods to yield reliable and recognized results in the laboratories
while analyzing the registration batch and accelerated stability testing samples. It
is also essential to emphasize that each analytical technique has its own
characteristics, which will vary from analyte to analyte. The importance of
validation is producing reliable, repeatable and accurate results for routine
analysis and stability analysis studies carried out during the entire period of work.
Validation of analytical procedures is directed to the four most common types of
analytical procedures such as identification tests, quantitative test for impurity
content, limit test for control of impurities and quantitative test for the active
moiety in samples of drug substance or drug product.

Introduction
Department of Pharmaceutical Analysis 6
Key parameters of the analytical method validation includes, precision
(repeatability and reproducibility), linearity and range, limit of detection (LOD),
limit of quantification (LOQ), selectivity/specificity, robustness, stability system
suitability studies.
Statistics is a wide tool useful in all disciplines especially in research
studies. One should know about the importance of statistical tools and how to use
them in their research o survey. The quality assurance of the work must be dealt
with the statistical operations to control and verify the analytical procedures as
well as the resulting data making mistakes in analytical work is unavoidable. This
is the reason why a multitude of different statistical tools is required some of them
simple, some complicated and often very specific for certain purposes. In analytic
work, the most important common operation is the comparison of data or sets of
data, to quantity of accuracy and precision. Fortunately with a few simple
convenient statistical tools most of the information needed in regular laboratory
work can be obtained in t-test, F-test, ANOVA test and regression analysis.
Clearly statistics are a tool not an aim. The value of statistics lies with organizing
and simplifying data to permit some objective estimate showing that an analysis is
under control or that a change has occurred.

Review of Literature
Department of Pharmaceutical Analysis 7
REVIEW OF LITERATURE (13-18)
The need of survey of literature is to see what has and has not been
investigated and identify data sources that other researchers have used. To learn
how others have defined and measured key concepts and develop alternative
research projects. Review of literature helps to demonstrate understanding and
ability to critically evaluate research in the field and to provide evidence that may
be used to support one’s own findings.
A review of literature was conducted for the analysis of Benfotiamine, and
its combination with Pyridoxamine dihydrochloride and Resveratrol are described
below,
Siva sankari K.A (2016) et al., have developed and validated UV
spectroscopic method for the estimation of Benfotiamine in bulk and solid dosage
form. The simple, precision, accurate, UV spectrophotometric methods namely
dual wavelength spectrophotometric method and difference UV
spectrophotometric method have been developed using 0.1 N HCL as solvent. The
HCL drug obeyed Beer’s law in range of 5-25µg/ml. The overall percentage
recovery found to be 99-100%.
B. Pavan aditya (2016) et al., have developed a new simple, precision,
sensitive and validated RP-HPLC method for the estimation of Benfotiamine in
bulk and pharmaceutical dosage form. The chromatographic conditions used for
the separation was phenomenox Luna C18 (4.6×250mm.5µ) and mobile phase
comprised of acetonitrile: methanol: water: 0.1% OPA (40: 20: 35:5 v/v). The
flow rate was 1.0ml with detection at 249nm. The retention time was found to be
3.84 min. The linearity was found to be in the range of 5-35µg/ml for
benfotiamine with correlation coefficient of 0.999. The method was successfully
applied to pharmaceutical formulation.

Review of Literature
Department of Pharmaceutical Analysis 8
Deepali A. Nanaware (2011) et al., have developed a simple, sensitive
and rapid RP-HPLC method for the estimation of Benfotiamine and Metformin
hydrochloride in pure and in pharmaceutical dosage forms. Thermo hypersil BDS-
C18 column (250mm×4.6mm, 5µ Germany) with isocratic conditions was used
with mobile phase containing mixture of methanol and aqueous phosphate buffer
(10mM of potassium phosphate adjusted with 3.2 with OPA) in the ratio of 80: 20.
The flow rate was 1ml/min and effluents were monitored at 239nm and eluted at
2,583 min (BEN) and 3.233 min (MET). Calibration curve was plotted with range
of 1-6µg/ml for BEN and 0.1-5µg/ml.
S. Poongothai (2014) et al., have developed a simple, precise, rapid and
validated selective RP-HPLC method for the simultaneous determination of
Benfotiamine (B1) 100mg, Pyridoxine hydrochloride (B6) 100mg Mecolamine
(B12)100mcg and Alpha-lipoic acid 100mg in Multivitamin capsules. The method
was x- tetra reverse phase (RP-18, 250×4.6mm, 5µm) column and gradient
elution. The aqueous mobile phase contained 0.05M phosphate buffer adjusted pH
2.5 and acetonitrile. Separation and quantification was achieved by changing the
proportion of the system linearity. Detection was carried out in the range of 200 to
600nm using photodiode array detector set at 320 nm and further analysis was
carried out using UV detector.
Marsza. M (2013) et al., have developed a rapid and sensitive HPLC
method with coulometric electrochemical and UV detection for analysis of
vitamin (B1) Thiamine, (B6) Pyridoxamine, Pyridoxal and Pyridoxine and (B12)
in Animal and Plant foods has been developed. A combination of acid digestion
and enzymatic extraction of release protein bound and a phosphorylated vitamin
followed by HPLC analysis was applied. The analysis were carried out on a LC 18
column 5µ (250cm×4.6mm) using the mobile phase consisting of methanol:
phosphate buffer (10:90) and 0.018M Triethylamine, adjusted pH 3.5
following 1.0ml/min. The method offer excellent linearity with regression
coefficient r > 0.998.

Review of Literature
Department of Pharmaceutical Analysis 9
Roopa.S. Pai (2013) et al., have developed a new formulation of t-Rvt
loaded PLGA nanoparticle with potential stearth properties was prepared by nano
precipitation method in our laboratory. The desired chromatographic separation
was achieved on a phenomenox C18 column under isocratic conditions using UV
detection as 306nm. The optimized mobile phase consisted of a mixture of
methanol: 10mM potassium dihydrogen phosphate (pH 6.8): Acetonitrile
(63:30:7 v/v/v) at a flow rate of 1.0ml/min. The linear regression analysis for the
calibration curves showed a good linear correlation over the concentration range
0.025-2.0µg/ml with determination co-efficient exceeding 0.9997.

Aim & Objective
Department of Pharmaceutical Analysis 10
AIM AND OBJECTIVE
Benfotiamine is an antioxidant dietary supplement drug used in diabetic
neuropathy. The US FDA approved benfotiamine in January 18, 2006 to diabetic
neuropathy and benfotiamine in combination of pyridoxamine dihydrochloride
and resveratrol.
Literature reveals very few analytical techniques for the estimation of
benfotiamine from tablets. Also there is no analytical method reported for the
combination of benfotiamine with pyridoxamine dihydrochloride and resveratrol,
till date.
Hence the major objective of the present research work is,
To develop and validate UV spectroscopic method for the estimation of
benfotiamine in bulk drug and tablet formulation.
To develop and validate stability indicating HPTLC method for the
determination of benfotiamine and its application of accelerated stability
studies of benfotiamine tablets.
To develop and validate a HPTLC method for estimation of benfotiamine
in combination with pyridoxamine dihydrochloride and resveratrol in
combined dosage from.
To develop a validated RP-HPLC method for estimation of benfotiamine
in combination with pyridoxamine dihydrochloride and resveratrol tablet
formulation.

Drug Profile
Department of Pharmaceutical Analysis 11
DRUG PROFILE(13,14,16,18)
Name : Benfotiamine
IUPAC Name : S-[2-{[(4-amino-2-methylpyrimidin-5-yl) methyl]
(Formyl) amino}-5-(phosphonooxy) pent-2-en-3yl]
Benzenecarbothioate.
Empirical Formula : C19H23N4O6PS.
Structure Formula :
Molecular Weight : 466.448 g/mol.
Description : White to off white powder.
Solubility : water, aqueous solvents.
Melting point : 165ºC
Bioavailability : 33.8%
Storage : Stored in tightly closed container in a drug &
ventilated place.
Category : Vitamin B1
Action and use : Vitamin B1 analog. Synthetic S-acyl derivative of
Thiamine, antioxidant, advanced glycation end
Product supplement, treating diabetic complications.
Available dosage forms: Tablets, Capsule.

Drug Profile
Department of Pharmaceutical Analysis 12
Name : Pyridoxamine Dihydrochloride.
IUPAC Name : 4-(amino methyl)-5-hydroxy-6-methyl-3-pyridine
Methanol dihydrochloride.
Empirical Formula : C8H14CI2N2O2
Structural Formula :
Molecular Weight : 241.11 g/mol.
Description : Yellow to green powder.
Solubility : Water, DMSO, Methanol, Ethanol, Acetone.
Melting point : 226- 227ºC
Bioavailability : 65%
Storage : Stored in tightly closed container in a drug &
ventilated place.
Category : Vitamin B6.
Action and use : An inhibitor of advanced glycation reactions, also
Inhibits advanced lip oxidation reactions.
Dietary supplement and prevent the progression of
Diabetic nephropathy.
Available dosage forms : Tablet.

Drug Profile
Department of Pharmaceutical Analysis 13
Name : Resveratrol
IUPAC Name : 3, 5, 4’-trihydroxy-Trans –stilbene.
Empirical Formula : C14H12O3
Structural Formula :
Molecular Weight : 228.25g/mol.
Descriptions : White powder with slight yellow cast.
Solubility : Water, DMSO, Ethanol, Methanol, Acetone.
Melting point : 261-263ºC
Bioavailability : 70%
Storage : Stored in a dry and cleaned place.
Category : Antioxidant.
Action and use : NF-Kb inhibitory action of resveratrol a probable
Mechanism of neuroprotection in
Diabetic neuropathy revolves around oxidative
Stress, AGE formation, lipid peroxidation.
Available dosage form : Tablet.

Drug Profile
Department of Pharmaceutical Analysis 14
Benfotiamine is available as single and in combination with pyridoxamine
dihydrochloride & resveratrol as shown in below,
BRANDS AVAILABLE
Brand Name Composition Company
BENALGIS tab Benfotiamine 75mg/100mg FRANCO
FOTIA tab Benfotiamine 150mg BESTOCHEM
BENFAGE tab Benfotiamine 100mg/200mg ORCHID
BENFORCE tab Benfotiamine 150mg SHIELD
VITAMER-EA cap Benfotiamine 50mg CARSYON
AGELESS tab
Benfotiamine 50mg,
pyridoxamine dihydrochloride
25mg, resveratrol 25mg
APEX
ASIA tab
Benfotiamine 50mg,
pyridoxamine dihydrochloride
25mg, resveratrol 25mg
APEX

Materials & Instruments
Department of Pharmaceutical Analysis 15
MATERIALS AND INSTRUMENTS
CHEMICALS AND SOLVENTS USED
Water for HPLC
Methanol HPLC grade (99.8%)
Methanol AR grade (99.0%)
Acetonitrile HPLC grade (99.9%)
Triethylamine AR grade (99.0%)
Petroleum ether AR grade (99.0%)
Acetone AR grade (99.5%)
Tetra butyl ammonium bromide
Potassium dihydrogen orthophosphate
Glacial acetic acid (99.0%)
Orthophosphoric acid
Distilled water
All the above chemicals and solvents were supplied by S.D fine chemicals
Ltd, India, qualigens fine chemicals Ltd, Mumbai, India, sigma – Aldrich
chemicals Pvt. Ltd., Maharashtra, India.
MATERIALS USED
Pre- coated silica gel 60F254 on aluminum sheets were procured from
Merck, Germany.
Cellulose filters 0.45µm.
Poly tetra fluoro ethylene filter 0.45µm, dimension 47mm.
LICHRO. SPHER ®100 RP-18e (5µ), (250×4.6MM column).
Whattmann filter paper

Materials & Instruments
Department of Pharmaceutical Analysis 16
INSTRUMENTS
Shimadzu digital electronic balance
Elico Pvt, Limited, india, pH meter.
Camag HPTLC system (with TLC scanner-3) wins CATS software and
Linomat 5 as application device.
Shimadzu HPLC system with SPD-M10 A VP system PDA with 20µl
fixed volume manual injector and LC-MS solution software.
Jasco V-630 spectrophotometer with a pair of 1 cm quartz cuvette.
Sonicator (leelasonic ultrasonic Sonicator)

Experimental Section
Department of Pharmaceutical Analysis 17
I. DEVELOPMENT AND VALIDATION OF UV
SPECTROSCOPIC METHOD FOR THE ESTIMATION
OF BENFOTIAMINE IN BULK DRUG AND TABLET
FORMULATION
Benfotiamine is having chromosphores in its structure and hence it will
absorb electromagnetic radiation between 200-400nm. This character is used for
estimating Benfotiamine by UV spectroscopic method.
OPTIMIZATION OF EXPERIMENTAL CONDITION:
Selection of solvent:
The solubility of drug was checked in different solvents and found to be
completely soluble in methanol. A UV spectrum of drug solution in methanol was
recorded. Smooth spectrum with reasonable absorbance was obtained and hence it
was selected as solvent for further studies.
Preparation of stock solution:
Stock solution Benfotiamine (1000µg/ml) was prepared LR grade 99%
methanol in 10ml glass volumetric flask.
Selection of wavelength:
The working standard solutions were scanned in UV range of (200-400nm)
using a Jasco V-630 UV-Visible spectrophotometer with cells of 10mm length
against the same solvent used as blank. It was scanned in the range of 200-400 nm
and it shows absorbance maxima at a maximum wavelength of 240nm.

Experimental Section
Department of Pharmaceutical Analysis 18
VALIDATION OF THE METHOD
The developed method was validated as per ICH guidelines (19) in terms
linearity, accuracy, precision, repeatability, LOD, LOQ and robustness.
Linearity and range:
Various aliquots were prepared from the secondary stock solution
(100µg/ml) concentration ranging from 4-24µg/ml. The samples were scanned in
UV-Visible spectrophotometer against methanol as blank. At 240nm the
absorbance of standards were measured. The calibration graph was plotted against
concentration versus absorbance. The slope, intercept and correlation coefficient
values were calculated.
Accuracy:
Solutions were prepared in at levels 50% and 100% of test concentration
using Benfotiamine working standard as per the test method and taken absorbance
of each solution in triplicate. The Recovery results showed that the proposed
method has an acceptable level of accuracy.
Precision:
Precision of the method was demonstrated by intra-day, inter-day and
repeatability variation studies.
Precision of the method was studied by
Intra-day precision
Inter-day precision
Repeatability
Intra-day precision:
In intra-day variation study nine different solutions of same concentration
12µg/ml and 16µg/ml were analyzed three times in a day i.e. morning, afternoon,
and evening and the absorbance is noted and from the mean, standard deviation
and RSD% were calculated.

Experimental Section
Department of Pharmaceutical Analysis 19
Inter-day precision:
In inter-day variation studies, solution of same concentration 12µg/ml and
16µg/ml were analyzed three times for the consecutive days and the absorbance
result mean, standard deviation and RSD% was calculated.
Repeatability:
The repeatability was studied by carrying out the analysis of the standard
drug concentration 12µg/ml in the linearity range of the drug for six times on the
same day and the response for each concentration was recorded and %RSD was
calculated.
Limit of detection (LOD) and limit of quantification (LOQ):
The lowest concentration detected (LOD) and lowest concentration
quantified (LOQ) were estimated from the set of five calibration curves used to
determine method linearity.
LOD = 3.3×σ/S and LOQ = 10×σ/S
Where, σ = the standard deviation of y intercepts of regression lines
S = the slope of the calibration curve
Solution stability:
The stock solution of Benfotiamine was stored at room temperature and under
refrigeration. The absorbance of solution was measured at different time interval.
The % reductions in absorbance were noted to calculate stability of solution.

Experimental Section
Department of Pharmaceutical Analysis 20
Analysis of formulation:
Benalgis (100mg) was assayed by developed UV spectrophotometric
method. Twenty tablets were weighed and finely pulverized and the quantity of
homogenized powder equivalent to 10mg of Benfotiamine was transferred to 10ml
volumetric flask. It was dissolved by adding small volume of methanol and
sonicated for five minutes. The volume was made up with the same solvent. The
solution was filtered using whattmann filter paper. Suitable dilution was made and
the corresponding UV spectrum of formulation solution was recorded. The
absorbance was noted at 240nm and the amount per tablet and % label claim were
calculated.

Experimental Section
Department of Pharmaceutical Analysis 21
II. DEVELOPMENT AND VALIDATION OF STABILITY
INDICATING HPTLC METHOD FOR THE
DETERMINATION OF BENFOTIAMINE AND ITS
APPLICATION TO ACCELERATED STABILITY
STUDIES OF BENFOTIAMINE TABLETS
The present work is to develop an economic accurate, reproducible and
stability indicating HPTLC method for the determination of benfotiamine in the
presence of its degradation products and related impurities from pharmaceutical
formulation.
Selection of plate
A pre-coated silica gel G60 F254 coated on aluminum sheet was selected for
the study.
Selection of solvent
Drug should be soluble in the solvent used.
Drug should show stability in the solvent used.
Solvent should be volatile.
Ideal properties of a solvent employed for HPTLC are,
Methanol was selected as the solvent here for further studies as the
benfotiamine was soluble and fulfilling above criteria.
Selection of wavelength
The sensitivity of HPTLC method depends upon the proper selection of
wavelength for UV detection. An ideal wavelength is the one that gives maximum
absorbance and good response for the drug at the lower concentration is to be
selected. The UV spectrum of Benfotiamine was recorded in HPTLC scanner and
maximum wavelength was found to be 275nm. This wavelength selected
for the study.

Experimental Section
Department of Pharmaceutical Analysis 22
Detection of optimum mobile phase
A mobile phase system that would give dense compact spots and good
separation from solvent and application position was to be selected. Initially,
different solvent systems were tried and there observations were as given below:
Table 1: Selection of Mobile Phase
Solvent system tried Observation
100% Methanol Drug move but spot not clear.
100% Acetic acid Drug move but spot not clear.
Acetic acid: Methanol(1:9v/v) Drug retained. tailed spot
Acetic acid: Methanol(2:8v/v) Drug retained, tailed spot
Acetic acid: Methanol: Tetra butyl
ammonium bromide(9:1v/v:2 drops) Drug retained, tailed spot
Acetic acid: Methanol:
Triethylamine(8:2v/v: 2drops) Drug retained, tailed spot
Acetic acid: Methanol:
Triethylamine(9:1v/v: 2drops) Good separation with compact spot.
Chromatographic development procedure:
Suitable volume of standard solution was spotted in the form of bands
having a band width of 6mm on precoated silica gel G60 F254 HPTLC plate, 8mm
from the bottom and 15mm from the side edges in the form of bands. Linear
ascending development was carried out and the optimized mobile phase consisted
of glacial acetic acid: methanol: Triethylamine (9:1v/v: 2 drops). The optimized
chamber saturation time before chromatographic development was
15 min and the length of chromatographic run was 8cm. Subsequent to the
development, HPTLC plates were dried in a current of air with help of an air
dryer. Densitometric scanning was performed and all measurements were made in
the reflectance absorbance mode at 275nm, with slit dimension (5.00 × 0. mm)

Experimental Section
Department of Pharmaceutical Analysis 23
the source of radiation was deuterium lamp emitting a continuous UV spectrum
between 200-400nm. Concentrations of the compound chromatographed were
determined from the intensity of diffusely reflected light and evaluation was done
by ordinary linear regression analysis.
Optimization of chamber saturation
The above fixed mobile phase was added to one side of twin trough
chamber previously rinsed with acetone and dried then saturation times fixed as
15 minutes.
Fixed Experimental Conditions
Stationary phase : Pre-coated silica gel G60F254 on aluminum sheets
Mobile phase : Glacial acetic acid: Methanol: Triethylamine
Chamber saturation time : 15 min
Plate migration distance : 80mm
Band width : 6mm
Slit dimension : 5 × 0.45mm
Source of radiation : Deuterium lamp
RF value : 0.29±0.02
Detection wavelength : 275nm
Preparation of stock solutions
10mg of Benfotiamine were taken into a 10ml standard flask and made up
to the volume with methanol to get a stock solution of 1000µg/ml.

Experimental Section
Department of Pharmaceutical Analysis 24
VALIDATION OF THE METHOD:
The developed method was validated as per ICH guidelines. The validated
method was carried out in terms of linearity, accuracy, precision, repeatability,
LOD and LOQ.
Linearity and range:
A solution containing 1000µg/ml of Benfotiamine was prepared in
methanol. Different volumes from 0.2 – 1.2µl of this solution were applied on the
plate. After development the plate was scanned and peak area were noted. Linear
regression data showed good correlation coefficient over a concentration range of
200-1200ng/spot.
Accuracy:
Recovery study was in order to ensure the suitability and reliability of
HPTLC method, recovery studies were carried out. It was done by mixing known
quantities of the standard drug (50 & 100% level) with the analyzed sample
formulation and the contents were reanalyzed by proposed method.
Precision:
Precision of the method was studied by
Intra-day precision
Inter-day precision
Repeatability precision
Repeatability of sample measurement
Repeatability of sample application

Experimental Section
Department of Pharmaceutical Analysis 25
Intra-day precision:
Intra-day precision was studied by carrying out the analysis of the standard
drug for two different concentrations for three times on the same day and %RSD
was calculated.
Inter-day precision:
Inter-day precision was studied by carrying out the analysis of the standard
drug for two different concentrations for three different days over a period of one
week and %RSD was calculated.
Repeatability:
Repeatability of sample measurement:
Repeatability of measurement was determined by spotting 600ng/spot of
drug solution on a pre-coated TLC plate and developed the plate and scanned six
times %RSD was calculated.
Repeatability of sample application:
Repeatability of sample application was carried by spotting 4µl of drug
solution is about six times on pre-coated TLC plate followed by development of
plate and %RSD was calculated.
Limit of detection (LOD) and limit of quantification (LOQ):
The lowest concentration detected (LOD) and lowest concentration
quantified (LOQ) were estimated from the set of five calibration curves used to
determine method linearity.
LOD = 3.3×σ/S and LOQ = 10×σ/S
Where, σ = the standard deviation of y intercepts of regression lines
S = the slope of the calibration curve
Experimental Section
Department of Pharmaceutical Analysis 26
Robustness:
The robustness of the method is its ability to remain unaffected by small
changes in practical conditions. Here the effect of change in conditions such as
ratio of mobile phase (±0.1ml) and (±0.2min) were studied to prove robustness.
Specificity:
The peak purity of Benfotiamine was assessed by comparing its respective
spectra at peak start, peak apex and peak end positions of the spot.
Stability studies:
When the developed chromatographic plate is exposed to atmosphere, the
analytes are likely to be decomposed. It is necessary to study the stability of drug
on TLC plate. It was studied by scanning the plate at different time interval and
peak areas were compared with the peak area of freshly scanned plate. The
developed TLC plate was found to be stable for about 12 hours for Benfotiamine.
ANALYSIS OF TABLET FORMULATION
To determine the amount of Benfotiamine in various tablet dosage forms
(label claim 100mg per tablet), the contents of 20 tablets were weighed, their
mean weight was determined, and they are finely powdered. An accurately
weighed powder sample equivalent to 10mg of Benfotiamine was transferred into
a 100ml volumetric flask containing 10ml methanol, followed by sonication for
10min. The resulting solution was filtered through whattmann filter. A volume of
0.6µl of the filtered solution (600ng/band) was applied on the HPTLC plate
followed by development and scanning as per optimized chromatographic
conditions.

Experimental Section
Department of Pharmaceutical Analysis 27
Application of HPTLC method to Accelerated stability study of benfotiamine
Forced degradation studies:
To evaluate the stability indicating property of the developed HPTLC
method, standard drug was subjected to acid/base hydrolysis, and oxidation.
100mg of pure drug Benfotiamine was accurately weighed and transferred to
100ml volumetric flask and diluted with methanol to obtain a final concentration
of 1000µg/ml. The solution was further subjected to following forced degradation
study.
Acid- induced degradation study:
To 15ml of the above methanolic standard drug solution 10ml of 1N, 0.1N,
and 0.01N hydrochloric acid was added in three different 25ml volumetric flask
and this solution was refluxed at 40ºC for 5 hrs. Neutralized solution was directly
applied to HPTLC plate followed by development and scanning under optimized
chromatographic conditions.
Base – induced degradation study:
To 15ml of the above methanolic standard drug solution 10ml of 1N, 0.1N,
and 0.01N sodium hydroxide was added in three different 25ml volumetric flask
and this solution was refluxed at 40ºC for 5 hrs. Neutralized solution was directly
applied to HPTLC plate followed by development and scanning under optimized
chromatographic conditions.
Hydrogen peroxide – induced degradation study:
To 15ml of the above methanolic standard drug solution 10ml of 30%
hydrogen peroxide solution was added in 25ml volumetric flask and this solution
was refluxed at 40ºC for 5 hrs. Neutralized solution was directly applied to
HPTLC plate followed by development and scanning under optimized
chromatographic conditions.

Experimental Section
Department of Pharmaceutical Analysis 28
Degradation of placebo of formulation:
A placebo (or dummy pill) (20) is an inert substance, typically a tablet,
capsule, or other dose form that does not contain an active drug ingredient. For
example, placebo pills or liquids may contain starch, sugar, or saline.
The fixed chromatographic condition was applied to estimate placebo
ingredients. The placebo was subjected for acid/base hydrolysis and oxidation as
per the procedure monitored in degradation study. The placebo was prepared
using excipients as below.
Excipients Weight taken
Lactose 0.45g
Calcium carbonate 0.25g
Magnesium stearate 0.01g
Gelatin 0.24g
Poly vinyl pyrrolidine 0.05g
The placebo mixture was weighed dissolved and subjected to various
stress conditions a volume of 0.6µl was spotted on TLC plate in triplicate
analyzed using fixed chromatographic conditions described earlier.
Degradation of Benfotiamine in formulation:
The fixed chromatographic condition was applied to estimate
Benfotiamine from tablets. The Benfotiamine tablet was subjected for acid
hydrolysis, base hydrolysis, oxidative degradation, thermal degradation and
photolytic degradation same as that bulk drug.
From the various stress samples prepared 0.6µl was spotted on TLC plate
in triplicates analyzed using fixed chromatographic conditions described earlier.
The chromatograms were obtained for any addition peak and change in
benfotiamine peak.
Experimental Method
Department of Pharmaceutical Analysis 29
III. DEVELOPMENT AND VALIDATION OF HPTLC
METHOD FOR ESTIMATION OF BENFOTIAMINE
IN COMBINATION WITH PYRIDOXAMINE
DIHYDROCHLORIDE AND RESVERATROL IN
COMBINED DOSAGE FORM.
The experimental work consists of optimization of chromatographic
conditions development and validation of HPTLC method of Benfotiamine in
combination of Pyridoxamine dihydrochloride and Resveratrol.
Selection of plate
A pre-coated silica gel G60 F254 coated on aluminum sheet was selected for
the study.
Selection of solvent
Drug should be soluble in the solvent used.
Drug should show stability in the solvent used.
Solvent should be volatile.
Ideal properties of a solvent employed for HPTLC are,
Methanol was selected as the solvent of sample for further studies, as the
drug was soluble and fulfilling above criteria.
Selection of wavelength
The sensitivity of HPTLC method depends upon the proper selection of
wavelength for UV detection. An ideal wavelength is that the overlay that give
maximum absorbance and good response for the drug to be selected at the lower
concentration is to be selected. The UV spectrum of Benfotiamine, pyridoxamine
and resveratrol was recorded in HPTLC scanner and maximum wavelength was
found to be 285nm. This wavelength was selected for the study.

Experimental Method
Department of Pharmaceutical Analysis 30
Detection of optimum mobile phase
A mobile phase system that would give dense compact spots and good
separation from solvent and application position was to be selected. Initially,
different solvent systems were tried and there observations were as given below:
Table 1: SELECTION OF MOBILE PHASE
Solvent system tried Observation
Methanol: Ethanol: Chloroform:
Acetone(1:1:5:3v:v:v:v) Drugs move along with solvent front.
Methanol: Ethanol: Ether:
Acetone(0.5:0.5:6:3v:v:v:v)
Pyridoxamine dihydrochloride and
resveratrol spot separated and
benfotiamine did not moved from starting
position.
Methanol: Ethanol: Ether: Acetone:
water(0.5:0.5:6:3v:v:v:2drops)
Pyridoxamine dihydrochloride and
resveratrol spot separated and
benfotiamine did not moved from starting
position.
Methanol: Ether: Acetone:
water(0.5:6.5:3v:v:v:2 drops)
Pyridoxamine dihydrochloride and
resveratrol spot separated and
benfotiamine did not moved from starting
position.
Methanol: Ether:
Acetone(0.5:6.5:3v:v:v) Drugs move along with solvent front
Tetrahydrofuran: Chloroform:
Isopropyl alcohol( 1:8:1v:v:v)
Pyridoxamine dihydrochloride and
resveratrol move along with solvent front
and benfotiamine did not moved from
starting position.
Methanol: Ethanol: Ether: Acetone:
Glacial acetic
acid(0.5:0.5:5.5:3:0.5v:v:v:v:v)
Pyridoxamine dihydrochloride and
resveratrol move along with solvent front
and benfotiamine did not moved from
starting position.
Methanol: Ethanol: Ether: Acetone:
Ammonia(0.5:0.5:6:3v:v:v:v:2
drops)
Pyridoxamine dihydrochloride and
resveratrol move along with solvent front
and benfotiamine did not moved from
starting position.
Methanol: Ethanol: Ether: Acetone:
Triethylamine(0.5:0.5:6:3v:v:v:v:2
drops)
Pyridoxamine dihydrochloride and
resveratrol move along with solvent front
and benfotiamine did not moved from
starting position.

Experimental Method
Department of Pharmaceutical Analysis 31
Solvent system tried Observation
Glacial Acetic acid: Ether: Acetone:
Triethylamine(7:2:1v:v:v:2 drops) Drugs retained, tailed spot
Glacial Acetic acid: Ether: Acetone:
Triethylamine(8:1:1v:v:v:2 drops) Drugs retained, tailed spot
Glacial Acetic acid: Ether: Acetone:
Triethylamine(6:2:2v:v:v:2 drops) Drugs retained, tailed spot
Glacial Acetic acid: Ether: Acetone:
Triethylamine(6:3:1v:v:v:2 drops) Drugs retained, tailed spot
Glacial Acetic acid: Ether: Acetone:
Triethylamine(5:4:1:v:v:v:2 drops) Drugs retained, tailed spot
Glacial Acetic acid: Ether: Acetone:
Triethylamine(6:3:1v:v:v:4 drops) Drugs retained, tailed spot
Glacial Acetic acid: Ether: Acetone:
Triethylamine(5:4:1v:v:v:2 drops) Drugs retained, tailed spot
Glacial Acetic acid: Ether: Acetone:
Triethylamine(5.5:3:1:0.5v:v:v:v) Drugs retained, tailed spot
Glacial Acetic acid: Ether: Acetone:
Triethylamine(5:3:1:1v:v:v:v) Drugs retained, tailed spot
Glacial Acetic acid: Ether: Acetone:
Triethylamine(5.5:2:2:0.5v:v:v:v) Drugs retained, tailed spot
Glacial Acetic acid: Ether: Acetone:
Triethylamine(5.5:1:3:0.5v:v:v:v) Drugs retained, tailed spot
Glacial Acetic acid: Ether: Acetone:
Triethylamine(6:2:2v:v:v:4 drops) Drugs retained, tailed spot
Glacial Acetic acid: Ether: Acetone:
Triethylamine(6:1.5:2.5v:v:v:4
drops)
Drugs retained, tailed spot
Glacial Acetic acid: Ether: Acetone:
Triethylamine(5.5:1.5:2.5:0.5v:v:v:v) Drugs retained, tailed spot
Glacial Acetic acid: Ether: Acetone:
Triethylamine(5.5:1.5:2.6:0.4v:v:v:v) Drugs retained, tailed spot
Glacial Acetic acid: Ether: Acetone:
Triethylamine(4:2:3.5:0.5v:v:v:v) Drugs retained, tailed spot
Glacial Acetic acid: Ether: Acetone:
Triethylamine(4:1:4.5:0.5v:v:v:v) Drugs retained, tailed spot
Glacial Acetic acid: Ether: Acetone:
Triethylamine(4:0.5:5:0.5v:v:v:v) Drugs retained, tailed spot
Glacial Acetic acid: Ether: Acetone:
Triethylamine(5.5:1.5:3v:v:v:5 Drugs retained, tailed spot

Experimental Method
Department of Pharmaceutical Analysis 32
Solvent system tried Observation
drops)
Glacial Acetic acid: Ether:
Acetone: Triethylamine: Tetra
butyl ammonium
bromide(5.5:1.5:3v:v:v:5 drops:2
drops)
Good separation all three drugs with
compact spot.
Separation using glacial Acetic acid: Ether: Acetone: Triethylamine: Tetra
butyl ammonium bromide
Different ratios of Glacial acetic acid: Ether: Acetone: Triethylamine:
Tetra butyl ammonium bromide was tried, from which the ratio of
(5.5:1.5:3v/v:5drops:2drops) was selected because it gave good separation with
compact spots and three times check mobile phase the same separation in UV
chamber. The peaks are symmetric with acceptable Rf value.
Optimization of chamber saturation
The above fixed mobile phase was added to one side of twin trough
chamber previously rinsed with acetone and dried then saturation times from 15
minutes.
Fixed Experimental Conditions
Stationary phase : Pre-coated silica gel G60F254 on aluminum sheets
Mobile phase : Glacial acetic acid: Ether: Acetone: Triethylamine:
Tetra butyl Ammonium bromide
Chamber saturation time : 15 min
Plate migration distance : 80mm
Band width : 6mm

Experimental Method
Department of Pharmaceutical Analysis 33
Slit dimension : 5 × 0.45mm
Source of radiation : Deuterium lamp
Rf value : 0.12, 0.33, 0.86±0.02
Detection wavelength : 285nm
Preparation of stock solutions
Stock solutions prepared in ratio (2:1:1) of Benfotiamine (200µg/ml),
Pyridoxamine dihydrochloride (100µg/ml) and Resveratrol (100µg/ml) was
prepared with methanol in 10ml volumetric flask.
VALIDATION OF THE METHOD:
The developed method was validated as per ICH guidelines. The validated
method was carried out in terms of linearity, accuracy, precision, repeatability,
LOD and LOQ.
Linearity and range:
The linearity of response for the stock solution was assessed using
different volume of stock solution. Via., 1, 2, 3, 4, 5, 6µl were spotted on TLC
plate to obtain the concentration of 100-600ng/spot. The spots were developed and
evaluated densitometrically using CAMAG HPTLC system. Peak area were noted
for each spot and plotted against concentration to get a linear graph.
Accuracy:
Accuracy of method was ascertained by performing recovery at two
concentration level of 50% and 100% by spiking standard solution (400ng and
600ng) to the dosage form (600ng/band). A recovery study was performed in
triplicate.

Experimental Method
Department of Pharmaceutical Analysis 34
Precision:
Precision of the method was studied by
Intra-day precision
Inter-day precision
Repeatability precision
Repeatability of sample measurement
Repeatability of sample application
Intra-day precision:
Intra-day precision was studied by carrying out the analysis of the
standard drug of two different concentrations for three times on the same day and
%RSD was calculated.
Inter-day precision:
Inter-day precision was studied by carrying out the analysis of the standard
drug of two different concentrations for three different days over a period of one
week and %RSD was calculated.
Repeatability:
Repeatability of sample measurement:
Repeatability of measurement was determined by spotting 600ng/spot of
drug solution on a pre-coated TLC plate and developed the plate and scanned six
times and %RSD was calculated.
Repeatability of sample application:
Repeatability of sample application was carried by spotting 6 times of 4µl
of drug solution on pre-coated TLC plate followed by development of plate and
%RSD was calculated.

Experimental Method
Department of Pharmaceutical Analysis 35
Limit of detection (LOD) and limit of quantification (LOQ):
The lowest concentration detected (LOD) and lowest concentration
quantified (LOQ) were estimated from the set of five calibration curves used to
determine method linearity.
LOD = 3.3×σ/S and LOQ = 10×σ/S
Where, σ = the standard deviation of y intercepts of regression lines
S = the slope of the calibration curve
Robustness:
The effect of deliberate variations on method parameters like the
composition of the mobile phase saturation time, development distance spot
scanning time interval, wavelength scan time from spotting to chromatography
and mobile phase volume was evaluated.
Specificity:
The peak purity of Benfotiamine was assessed by comparing its respective
spectra at the three different levels, that is, peak start (S), peak apex (M) and peak
end (E) positions of the spot.
Stability studies:
When the developed chromatographic plate is exposed to atmosphere, the
analytes are likely to decomposed. It is necessary to study the stability of drug on
plate. It was studied by scanning the plate at different time interval and peak areas
were compared with the peak area of freshly scanned plate. The developed plate
was found to be stable for about 24 hours for benfotiamine.

Experimental Method
Department of Pharmaceutical Analysis 36
ANALYSIS OF TABLET FORMULATION
To determine the amount of Benfotiamine, Pyridoxamine dihydrochloride
and Resveratrol in tablet dosage form (label claim 50, 25, 25mg per tablet
respectively) 20 tablets were weighed, their mean weight was determined, and
they were finely powdered. An accurately weighed powder sample equivalent to
10mg of Pyridoxamine dihydrochloride, Resveratrol and 20mg of Benfotiamine
was transferred into a 10ml volumetric flask then added 5ml methanol, followed
by sonication for 10 min and further dilution up to the mark with methanol. The
resulting solution was filtered through whattmann filter paper and three
microliters of the filtered solution (600ng/spot) was applied on the TLC plate
followed by development and scanning as per optimized chromatographic
conditions.

Experimental Section
Department of Pharmaceutical Analysis 37
IV. DEVELOPMENT AND VALIDATION OF RP-HPLC
METHOD FOR ESTIMATION OF BENFOTIAMINE IN
COMBINATION WITH PYRIDOXAMINE DIHYDRO-
CHLORIDE AND RESVERATROL TABLET
FORMULATION
Chromatographic method for separation:
Since the drug Benfotiamine, Pyridoxamine dihydrochloride and
Resveratrol is polar in nature, RP-HPLC method was selected as separation
technique.
Selection of solvent:
The drugs are soluble in methanol and also showed good stability. Hence
methanol was selected as the solvent.
Selection of wavelength:
Good analytical separation can be obtained only by careful selection of
wavelength for the detection. This choice requires knowledge of the UV spectrum
of the sample component. A UV spectrum of Benfotiamine, Pyridoxamine
dihydrochloride and Resveratrol was recorded in methanol and the overlays have
shown good maximum absorbance at 254nm for all three drugs and it was selected
for the study.

Experimental Section
Department of Pharmaceutical Analysis 38
OPTIMIZATION OF CHROMATOGRAPHIC CONDITIONS
Optimization of mobile phase:
Optimization of mobile phase was carried out in order to obtain ideal peak
of benfotiamine, pyridoxamine dihydrochloride and resveratrol.
The mobile phase system consisting of potassium dihydrogen phosphate
(KH2PO4) and methanol and acetonitrile was optimized for their ratio and pH of
the buffer.
Effect of mobile phase ratio:
The effect of ratio was studied by varying strength such as given below,
Mobile phase solvent Ratio
Binary pumps used mobile phases 10: 90, 20: 80 &
40: 60
50: 50, 20: 80 &
30: 70 Buffer:
Acetonitrile % v/v
Buffer: Methanol
% v/v
Isocratic pumps used mobile phases
Buffer: Methanol: Acetonitrile % v/v
50: 25+25, 50: 35+15, 60: 40, 65:
17.5+17.5 & 70: 15+15
Effect of pH:
Keeping the ratio of mobile phase constant (70:15+15 % v/v), the
chromatograms were recorded at different pH between 3- 5.20. A good resolution
and symmetrical peak was obtained at a pH of 4.90 and selected for further
studies.

Experimental Section
Department of Pharmaceutical Analysis 39
FIXED CHROMATOGRAPHIC CONDITIONS
Chromatographic method : RP-HPLC
Column (stationary phase) : LichroCart®250-4 column
Mobile phase : 10mM KH2PO4: Methanol + Resveratrol
Ratio of mobile phase : 70: 15 + 15v/v
Detection of wavelength : 254nm
Flow rate : 1.0ml/min
Retention time : 2.20, 4.28 and 20.68± 0.02min.
Temperature : Room temperature
Chromatographic development procedure:
The HPLC system was stabilized for 40min, by passing mobile phase and
detector was set as 254nm and flow rate of 1.0ml/min was maintained to get a
stable baseline. One blank followed by six replicate of a single standard solution
were injected to check the system suitability.

Experimental Section
Department of Pharmaceutical Analysis 40
VALIDATION OF THE METHOD
The developed HPLC method was validated according to ICH guidelines
in terms of specificity, linearity, accuracy, precision, robustness and LOD and
LOQ.
Specificity:
The specificity of the method towards the drug was established through
study of resolution factor of the drug peak from the nearest resolving peak. The
peak purity of BEN, PYR, and RES was determined by comparing the spectrum at
three different regions of the spot i.e. peak start (S), peak apex (M) and peak end
(E). Effect of excipients of formulation was studied for whether it interfered with
the assay.
Linearity and range:
The mixed standard stock solution (200µg/ml of BEN, 100µg/ml of PYR
and RES) was further diluted to get BEN, PYR and RES concentration in the
range of 10-50µg/ml and 5-25µg/ml respectively. Linearity of the method was
studied by injecting six concentration of the drug prepared in the mobile phase in
triplicate into the LC system keeping the injection volume constant, The peak
areas were plotted against the corresponding concentration to obtain the
calibration graphs.
Accuracy:
Accuracy of the method was carried out by applying the method to drug
sample ( BEN, PYR and RES combination tablet) to which known amount of
BEN, PYR and RES standard powder corresponding to 50 and 100% of label
claim had been added (standard addition method) mixed and the powder was
extracted and analyzed by running chromatogram in optimized mobile phase.

Experimental Section
Department of Pharmaceutical Analysis 41
Precision:
The precision of the method was verified by intraday, interday and
repeatability precision studies.
Intra-day precision
Inter-day precision
Repeatability
Intra-day precision:
Intraday precision was determined by injecting standard solutions in
between linearity range (20, 30µg/ml for BEN and 10, 15µg/ml for PYR and RES)
were injected three times on the same day and % RSD was calculated.
Inter-day precision:
Inter-day precision was determined by injecting standard solutions in
between linearity range (20, 30µg/ml for BEN and 10, 15µg/ml for PYR and RES)
were injected for three days and % RSD was calculated.
Repeatability:
Repeatability studies were performed by analysis of different
concentration 10µg/ml of BEN and 5µg/ml of PYR and RES six times on the
same day and %RSD was calculated.
Limit of detection (LOD) and Limit of quantitation (LOQ):
Limits of detection (LOD) and quantification (LOQ) represent the
concentration of the analyte that would yield signal-to-noise ratios of 3 for LOD
and 10 for LOQ respectively.

Experimental Section
Department of Pharmaceutical Analysis 42
LOD is the lowest concentration of the analyte that can produce a response
detectable above the noise level of the system.
S/N = 2/1 or 3/1
LOQ is the lowest of the analyte that can be accurately and precisely
measured.
S/N = 10/1
Robustness of method:
To evaluate robustness of a HPLC method, few parameters were
deliberately varied. The parameters included variation of flow rate, percentage of
methanol in the mobile phase and solvents. The response factors like retention
time, resolution, asymmetric factor for these changed conditions were noted.
Stability of solution:
The standard solution of benfotiamine, pyridoxamine and resveratrol kept
under room temperature. It was injected periodically. Stability was studied by
looking for any change in retention time, resolution and peak shape, when
compared to chromatogram of freshly prepared solution. The solution was stable
24hrs under room temperature.
System suitability parameters:
The system suitability parameters like peak area, tailing factor, theoretical
plate count, and resolution and retention time were calculated from the standard
chromatograms.

Experimental Section
Department of Pharmaceutical Analysis 43
Analysis of a marketed formulation:
To determine the content of BEN, PYR and RES in conventional tablet
(brand name: Ageless, label claim 50mg of BEN, 25mg of PYR and RES per
tablet) twenty tablets were weight, their mean weight determined and finely
powdered. The weight of the tablet triturate equivalent to 20mg of BEN and 10mg
of PYR and RES was transferred into a 10ml volumetric flask containing 6ml
methanol, sonicated for 5min and diluted up to 10ml with methanol. The sample
solution was then filtered using 0.45µm filter. The above stock solution was
further diluted to get sample solution of 20µg/ml BEN and 10µg/ml PYR and
RES respectively. A 20µl volume of sample solution was injected into HPLC, six
times, under the conditions described above. The peak areas were measured at
254nm.

Results & Discussion
Department of Pharmaceutical Analysis 44
RESULTS AND DISCUSSION
I. DEVELOPMENT AND VALIDATION OF UV
SPECTROSCOPIC METHOD FOR THE ESTIMATION OF
BENFOTIAMINE IN BULK DRUG AND TABLET
FORMULATION
The stock solution containing 1000µg/ml of Benfotiamine was diluted
using methanol to get a concentration of solution 10µg/ml. The resulting solution
was scanned in the UV spectrometer in the range of 200-400nm. The maximum
absorbance was found to be at 240nm. The conjugated chromophore system of
Benfotiamine shown smooth and it is shown fig 1.
Fig 1: UV spectrum of Benfotiamine in methanol
VALIDATION PARAMETERS
Linearity and range
The stock solution of Benfotiamine was diluted to get the concentration of 4-
24µg/ml. The absorbance of these solutions was noted at selected λ max of
240nm. The calibration curve was plotted using concentration versus absorbance
(fig 2 and table 1). The slope, intercept and correlation coefficient values were
0.034, 0.0016 and 0.9990, respectively. The overlay spectra of standards shown in
fig 3.

Results & Discussion
Department of Pharmaceutical Analysis 45
VALIDATION PARAMETERS
Linearity and range:
A calibration graph concentration between range of Benfotiamine (2-
24µg/ml) and its absorbance shown in fig, 2. The calibration data table shown in
table 1. The slope, intercept and correlation coefficient values were 0.034, 0.0016
and 0.9990, respectively. The overlay spectrum of all concentration shown in
fig,3.
Fig 2: Calibration graph of Benfotiamine (4-24µg/ml)

Results & Discussion
Department of Pharmaceutical Analysis 46
Table 1: Calibration table for Benfotiamine (4-24µg/ml)
Concentration (µg/ml) Absorbance
4 0.1512
8 0.2776
12 0.3959
16 0.5474
20 0.6884
24 0.8368
Fig 3: Overlay spectrum of Benfotiamine

Results & Discussion
Department of Pharmaceutical Analysis 47
Precision:
The method precision was obtained by determining the assay by preparing
six sample of selected concentration its 12 & 16µg/ml of Benfotiamine. The
method precisions for intraday, interday, repeatability were studied and %RSD are
shown in table 2,3&4, respectively.
Table 2: Intra-day precision
Concentration(µg/ml) Absorbance %RSD
12
0.4010
0.29 0.4026
0.4035
16
0.5458
0.21 0.5468
0.5482
Table 3: Inter-day precision
Concentration(µg/ml) Absorbance %RSD
12
0.4018
0.09 0.4026
0.4022
16
0.5678
0.08 0.5687
0.5678

Results & Discussion
Department of Pharmaceutical Analysis 48
Table 4: Repeatability
Concentration(µg/ml) Absorbance %RSD
12
0.4010
0.19
0.4026
0.4035
0.4018
0.4026
0.4022
Solution stability:
The working standard solutions of Benfotiamine were stored at room
temperature and refrigerated. They were analyzed at different time interval. From
the absorbance noted it was seen that the solution is stable up to 24hrs at room
temperature (table 5). The solution stored under refrigeration was found to be
stable up to 30hrs.
Table 5: Solution stability
Concentration(µg/ml) Time(hours) Absorbance
12
0 0.4010
3 0.4026
6 0.4035
12 0.3959
24 0.3902
30 0.3752

Results & Discussion
Department of Pharmaceutical Analysis 49
ANALYSIS OF FORMULATION:
The solution of formulation was prepared and UV spectra was recorded
and shown in fig 4. The amount present per tablet, % label claim, and %RSD were
calculated and presented in table 6. The result obtained by UV spectroscopic
method for Benfotiamine is satisfiable and there was no interference due to
excipients.
Fig 4: UV spectrum of Benfotiamine formulation
Table 6: Results of analysis of formulation
Trade name Amount of drug/
tab
% label
claim % RSD SEM
Benalgis
Labeled Found 99 0.87 0.03
100mg 99mg
*Average of six observation

Results & Discussion
Department of Pharmaceutical Analysis 50
Recovery study:
Recovery studies were carried out at 50% and 100% levels. The
percentage recovery and percentage RSD of the results were calculated and shown
in table 7. They were found to be good.
Table 7: Recovery study
Level % recovery % RSD SEM
50% 96.54% 0.35 0.16
100% 98.87% 0.69 0.22
*Average of six observation

Results & Discussion
Department of Pharmaceutical Analysis 51
II. DEVELOPMENT AND VALIDATION OF STABILITY
INDICATING HPTLC METHOD FOR THE DETERMINATION OF
BENFOTIAMINE AND ITS APPLICATION OF ACCELERATED
STABILITY STUDIES OF BENFOTIAMINE TABLETS
Method development and optimization for stability indicating HPTLC
method
Different mobile phase compositions are tried for development and
validation of benfotiamine by stability indicating HPTLC method. Among these
mobile phase systems, Glacial acetic acid: Methanol: Triethylamine (9:1
%v/v: 2drops) was selected because in this system compact spot and dense spot
with good separation were obtained.
METHOD VALIDATION
The results of validation of the stability indicating method of Benfotiamine
using Glacial acetic acid: Methanol: Triethylamine (9:1%v/v: 2drops) as the
mobile phase are described below.
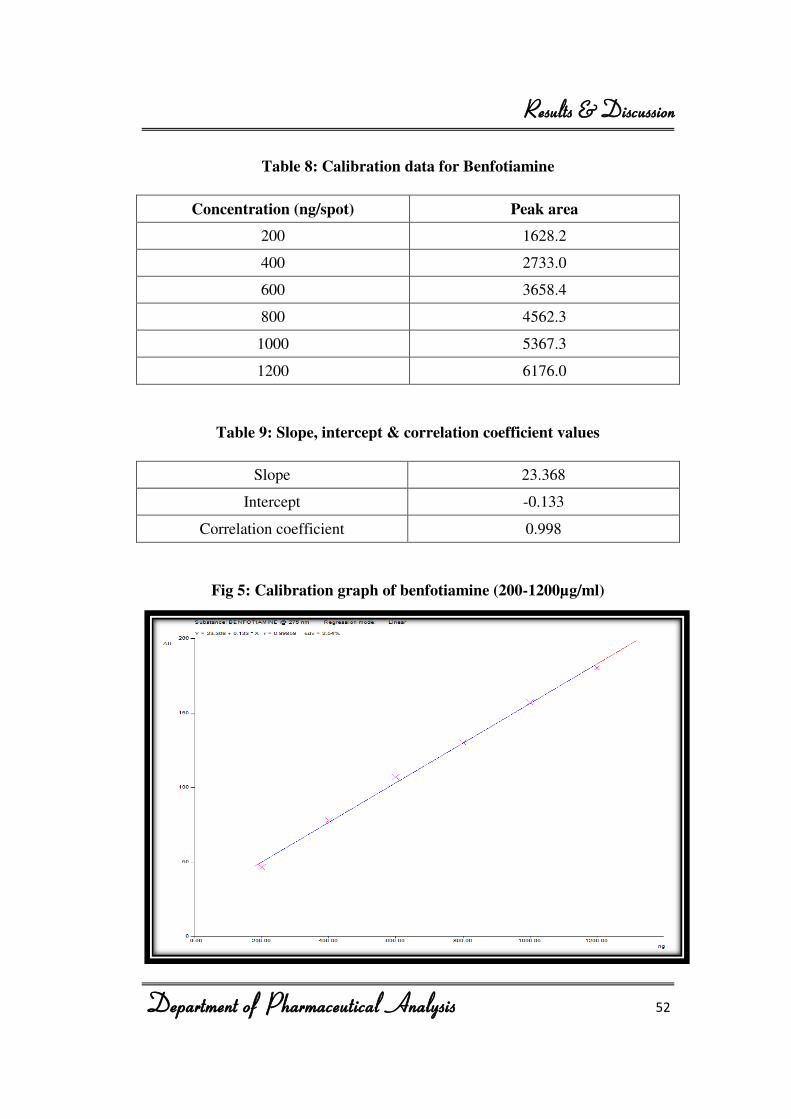
Linearity and range
Linear regression data showed a good correlation coefficient over a
concentration range of 200-1200ng/spot. The calibration data are shown in table 8,
and the slope, intercept and correlation coefficient values were found are
presented in table 9. The calibration graph is shown fig 5. The standard spectrum
and chromatograms obtained at different concentrations of Benfotiamine are
shown in fig 6-12.
Results & Discussion
Department of Pharmaceutical Analysis 52
Table 8: Calibration data for Benfotiamine
Concentration (ng/spot) Peak area
200 1628.2
400 2733.0
600 3658.4
800 4562.3
1000 5367.3
1200 6176.0
Table 9: Slope, intercept & correlation coefficient values
Slope 23.368
Intercept -0.133
Correlation coefficient 0.998
Fig 5: Calibration graph of benfotiamine (200-1200µg/ml)

Results & Discussion
Department of Pharmaceutical Analysis 53
Standard spectrum and chromatograms
Fig 6: Spectrum of Benfotiamine
Fig 7: Benfotiamine 200ng/spot

Results & Discussion
Department of Pharmaceutical Analysis 54
Fig 8: Benfotiamine 400ng/spot
Fig 9: Benfotiamine 600ng/spot

Results & Discussion
Department of Pharmaceutical Analysis 55
Fig 10: Benfotiamine 800ng/spot
Fig 11: Benfotiamine 1000ng/spot

Results & Discussion
Department of Pharmaceutical Analysis 56
Fig 12: Benfotiamine 1200ng/spot
Precision
The results of repeatability of sample application and sample measurement
are given in the table 10 and 11. The tables 12 and 13 summarizes the results of
intra-day and inter-day precision. The % RSD values were found to be less than 2.
Table 10: Repeatability of sample application
Concentration(ng) Peak area %RSD
600
3658.4
0.57 3666.3
3480.7
3618.8
3654.8
3643.4

Results & Discussion
Department of Pharmaceutical Analysis 57
Table 11: Repeatability of measurement
Concentration(ng) Peak area %RSD
200
1628.2
1.13
1640.2
1643.1
1682.3
1640.3
1652.9
Table 12: Intraday precision
Concentration(ng) Peak area %RSD
400
2712.0
0.58 2733.0
2701.5
800
4562.3
0.36
4571.7
4594.6
Table 13: Interday precision
Concentration(ng) Peak area %RSD
400
2601.0
0.38 2621.9
2617.0
800
4503.6
0.61 4559.1
4529.3
Limit of detection (LOD) and Limit of quantification (LOQ)
LOD and LOQ were determined by applying decreasing amount of the
drug in triplicate on the plate. The lowest concentration at which the peak is
detected is called ‘limit of detection’ which was found out to be 10ng/spot.
The lowest concentration at which peak is quantified is called ‘limit of
quantification’ which was found to be 50ng/spot.

Results & Discussion
Department of Pharmaceutical Analysis 58
Robustness
The robustness of the method is its ability to remain unaffected by small
changes in the parameter such as ratio of mobile phase and saturation time. The
method is said to be robust as minor variation (as shown below) not affected
quantification.
Parameters Observation
Ratio of mobile phase ( Glacial Acetic
acid: Methanol:
Triethylamine(8:2v/v:2drops ±0.1ml,)
Very slight changes in Rf but no
change in peak area
Saturation time(15 ±0.1, minutes) peak symmetry retained.
Stability studies
Stability of chromatographic plate
When the developed method chromatographic plate was expose to
atmosphere, the analytes are likely to decompose. Hence it is necessary to conduct
stability studies of the plate.
Stability of the analyte on the plate was studied at different time intervals
and peak areas were compared with peak area of freshly scanned plate. The
developed plate was found to be stable for less than 24hrs, (stable 14).
Table 14: Stability of chromatographic plate
Time (hr) Concentration(ng/spot) Peak area
0
200 1628.2
3658.4 600
12
200 1478.1
3447.4 600
24
200 1425.1
3406.6 600

Results & Discussion
Department of Pharmaceutical Analysis 59
ANALYSIS OF FORMULATION
Preparation of sample solution for benfotiamine:
Each of 20 tablets containing 100mg of Benfotiamine was taken for the
study and average weight was determined. Quantity equivalent to 10mg
Benfotiamine was weighed and transferred into a 10ml standard flask and after
dissolving it was made up to volume with methanol. It was filtered and used for
analysis.
Recording chromatogram:
The fixed chromatographic condition, a suitable volume of sample solution
was applied on the precoated TLC plate. The plate was analyzed and
chromatogram as recorded. The amount present per tablet, % label claim were
calculated and shown in table 15, and chromatogram shown in fig 13.
Fig 13: Chromatogram of Benfotiamine formulation

Results & Discussion
Department of Pharmaceutical Analysis 60
Table 15: Results of analysis formulation
Brand name
Amount of
drug/tab % label
claim % RSD SEM
Labeled Found
Benalgis 100mg 98.54mg 98.54% 0.98 0.13
*Average of six observations
Rovers:
Recovery studies were carried out at 50% and 100% levels. The
percentage recovery and percentage % RSD of the results were calculated and
shown in table 16. The value proves the accuracy of the method
Table 16: recovery
Level % recovery % RSD SEM
50% 92.36% 0.28 0.23
100% 95.25% 0.86 0.11
*Average of six observations

Results & Discussion
Department of Pharmaceutical Analysis 61
Forced degradation studies:
HPTLC studies of samples obtained by stress testing of benfotiamine
under different conditions suggested the following degradation behavior.
Acid hydrolysis:
Under given conditions of acid hydrolysis(0.01N HCL), it was found that
at 0 hour 6.17% of the drug degraded (fig, 14) and on further degradation, i.e.
after refluxing at 40ºC 2 hour 10% degradation was found out (fig, 15) and after
highest 5 hour 13% drug degradation was found out (fig, 16). No degradant peak
was found in the chromatogram.
Fig 14: Acid hydrolysis at 0 hour

Results & Discussion
Department of Pharmaceutical Analysis 62
Fig 15: Acid hydrolysis at 2 hour
Fig 16: Acid hydrolysis at 5 hour

Results & Discussion
Department of Pharmaceutical Analysis 63
Alkaline hydrolysis:
In alkaline hydrolysis (0.01N NAOH), it was observed that 17.03% of the
drug degraded at 0 hour, (fig, 17). On further degradation it was found that after
refluxing at 40ºC for 5 hour 13.15% of the degraded (fig, 18). No degradation
products were observed.
Fig 17: Alkaline hydrolysis at 0 hour
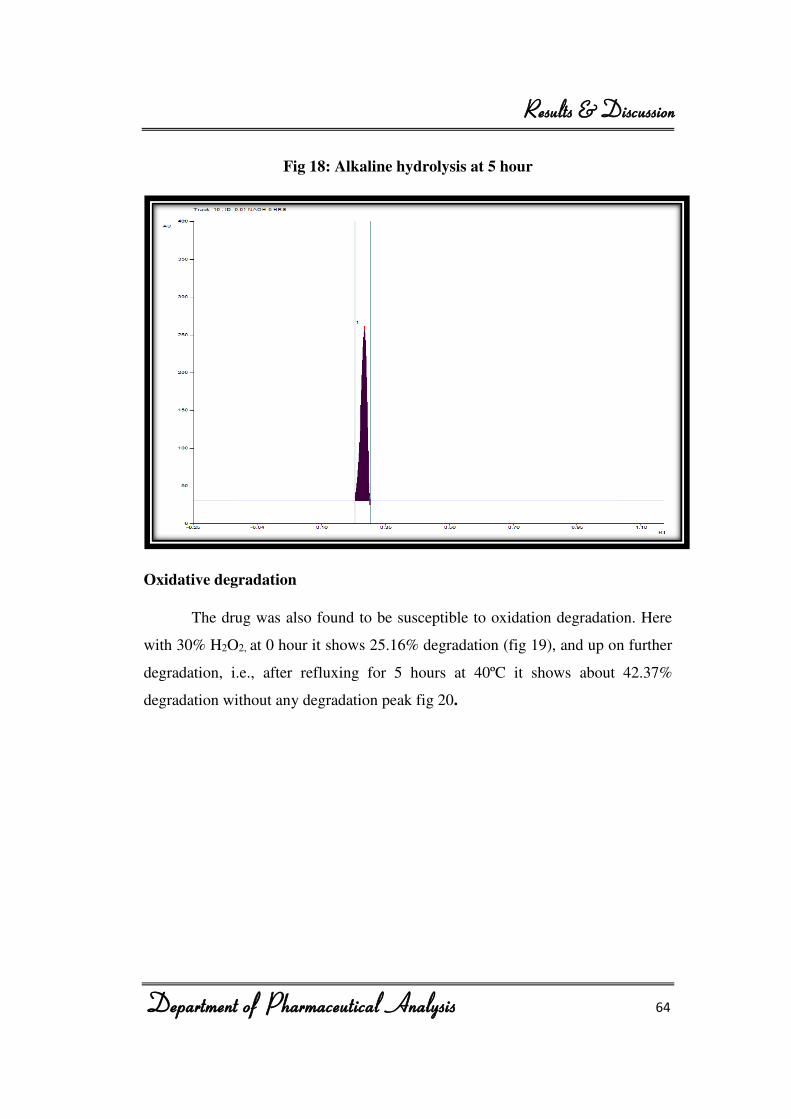
Results & Discussion
Department of Pharmaceutical Analysis 64
Fig 18: Alkaline hydrolysis at 5 hour
Oxidative degradation
The drug was also found to be susceptible to oxidation degradation. Here
with 30% H2O2, at 0 hour it shows 25.16% degradation (fig 19), and up on further
degradation, i.e., after refluxing for 5 hours at 40ºC it shows about 42.37%
degradation without any degradation peak fig 20.

Results & Discussion
Department of Pharmaceutical Analysis 65
Fig 19: Oxidative degradation at 0 hour
Fig 20: Oxidative degradation at 5 hour

Results & Discussion
Department of Pharmaceutical Analysis 66
The drug shows extensive degradation in acid, alkaline and oxidative
degradation respectively (Table 17) presents the result of the studies.
Table 17: Results of degradation studies of Benfotiamine
Type of stress Condition % degradation
Rf
0 hour 5 hour
Acid hydrolysis 0.01 N HCL 6.01% 11.30% 0.29
Alkaline hydrolysis 0.01 N NAOH 17.03% 5.44% 0.29
Oxidation 30% H2O2 25.16% 42.37% 0.29
Forced degradation studies resulted in considerable degradation as
evidenced by the reduction in the peak area when subjected to acid/base/oxidation
degradation. The degradants formed were not detected but showed a marked
decrease in the peak area of the parent drug. No significant change in the Rf value
shows the evidence for the analyte peak after significant degradation.
Degradation of placebo in formulation:
The fixed chromatographic condition was applied to estimate placebo
inactive ingredients. The placebo was subjected for acid/base hydrolysis and
oxidation and used the some excipients in degradation study. The results
chromatogram given below, fig 21. There was an interference seen at Rf 0.36
which was not interfering with benfotiamine Rf value (0.29).

Results & Discussion
Department of Pharmaceutical Analysis 67
Fig 21: Alkaline hydrolysis placebo at 0 hour
Degradation of Benfotiamine in formulation:
From the various stress samples prepared 0.6µl was spotted on TLC plate
in triplicates analyzed using fixed chromatographic conditions described earlier.
(Fig, 22,-24).

Results & Discussion
Department of Pharmaceutical Analysis 68
Fig 22: Acid hydrolysis of formulation
Fig 23: Alkaline hydrolysis of formulation

Results & Discussion
Department of Pharmaceutical Analysis 69
Fig 24: Oxidative degradation of formulation
Amount of benfotiamine reminded after degradation studies:
Degradation studies
Maximum degradation
time % of Benfotiamine
remaining
interferents Temperature Retention
time
Acid hydrolysis 40ºC 4 hours Rf -29 7.79
Alkaline hydrolysis 40ºC 4 hours Rf -29 61.23
Oxidative degradation 40ºC 4 hours Rf -29 66.25

Results & Discussion
Department of Pharmaceutical Analysis 70
III. DEVELOPMENT AND VALIDATION OF HPTLC METHOD FOR
ESTIMATION OF BENFOTIAMINE IN COMBINATION WITH
PYRIDOXAMINE DIHYDROCHLORIDE AND RESVERATROL
IN COMBINED DOSAGE FORM
Among various mobile phase system tried the one contain a mixture of
Glacial acetic acid: Ether: Acetone: Triethylamine: Tetra butyl ammonium
bromide (5.5:1.5:3 % v/v: 5 drops: 2 drops) gave compact dense spot was chosen
for the estimation of benfotiamine by HPTLC method. The plate used was pre-
coated silica gel G60F254. The method was for the validated and details given
below.
Linearity and range:
A 200µg/ml and 100µg/ml of BEN, PYR and RES was prepared in methanol.
Aliquots of this solution (1-6µl) were applied on the plate. The plate was
developed, scanned and peak areas were noted. Linear regression data showed
good correlation coefficient over a concentration range of (200-1200ng/spot and
100-600ng/spot). The calibration graphs are shown in fig 25, 26 and 27. The
slope, intercept, and correlation coefficient values were in noted respectively
(table 18). The spectra recorded on HPTLC scanner and the standard densitograms
are shown in fig.28 to 31, and calibration data were shown table, 19, 20, and 21.
Table 18: Regression data
Linear regression Benfotiamine Pyridoxamine Resveratrol
Slope 5753 3053.43 11440.3
Intercept -241.4 -90.4 -696.2
Correlation
coefficient 0.998 0.997 0.998

Results & Discussion
Department of Pharmaceutical Analysis 71
Table 19: Calibration data for Benfotiamine
Concentration (ng/spot) Peak area
200 948.5
400 2093.5
600 3242.6
800 4089.8
1000 5626.1
1200 6713.7
Fig 25: Calibration graph of Benfotiamine (200-1200ng/spot)
Concentration (ng/ml)

Results & Discussion
Department of Pharmaceutical Analysis 72
Table 20: Calibration data for Pyridoxamine dihydrochloride
Concentration (ng/spot) Peak area
100 281.8
200 680.5
300 902.3
400 1330.9
500 1691.4
600 1607.4
Fig 26: Calibration graph of Pyridoxamine dihydrochloride (100-600ng/spot)
Concentration (ng/ml)

Results & Discussion
Department of Pharmaceutical Analysis 73
Table 21: Calibration data for Resveratrol
Concentration(ng/spot) Peak area
100 454.8
200 1441.9
300 3310.1
400 3923.9
500 4977.8
600 6138.7
Fig 27: Calibration graph of Resveratrol (100-600ng/spot)
)
Concentration (ng/ml)

Results & Discussion
Department of Pharmaceutical Analysis 74
Fig 28: Spectrum of Benfotiamine
Fig29: Spectrum of Pyridoxamine dihydrochloride

Results & Discussion
Department of Pharmaceutical Analysis 75
Fig 30: Spectrum of resveratrol
Fig 31: Chromatogram of Benfotiamine, Pyridoxamine dihydrochloride
and Resveratrol

Results & Discussion
Department of Pharmaceutical Analysis 76
Precision
The method precision was obtained by determining the assay by preparing
six samples of selected concentration (600 & 1000ng/spot) of Benfotiamine and
300 & 500ng/spot Pyridoxamine dihydrochloride and Resveratrol. The % RSD
calculated for method precision of inter-day, intra-day (table 22, 23 and 24) and
repeatability (repeatability of sample measurement and sample application
respectively) are shown in table 25, 26 and 27.
Table 22: Intra-day and inter-day precision of Benfotiamine
Concentration (ng/spot)
Peak area %RSD
Intra-day Inter-day Intra-day Inter-day
600
3242.6 3230.8
0.58
1.34 3218.7 3291.3
3256.5 3263.3
1000
5626.1 5523.7
0.19
0.16 5617.4 5545.7
5639.2 5587.4
Table 23: Intra-day and inter-day precision of Pyridoxamine dihydrochloride
Concentration (ng/spot)
Peak area %RSD
Intra-day Inter-day Intra-day Inter-day
300
719.8 704.7
0.62
0.62 714.5 708.3
710.9 699.5
500
1258.7 1153.8
0.64
1.44 1262.2 1132.2
1264.8 1121.5
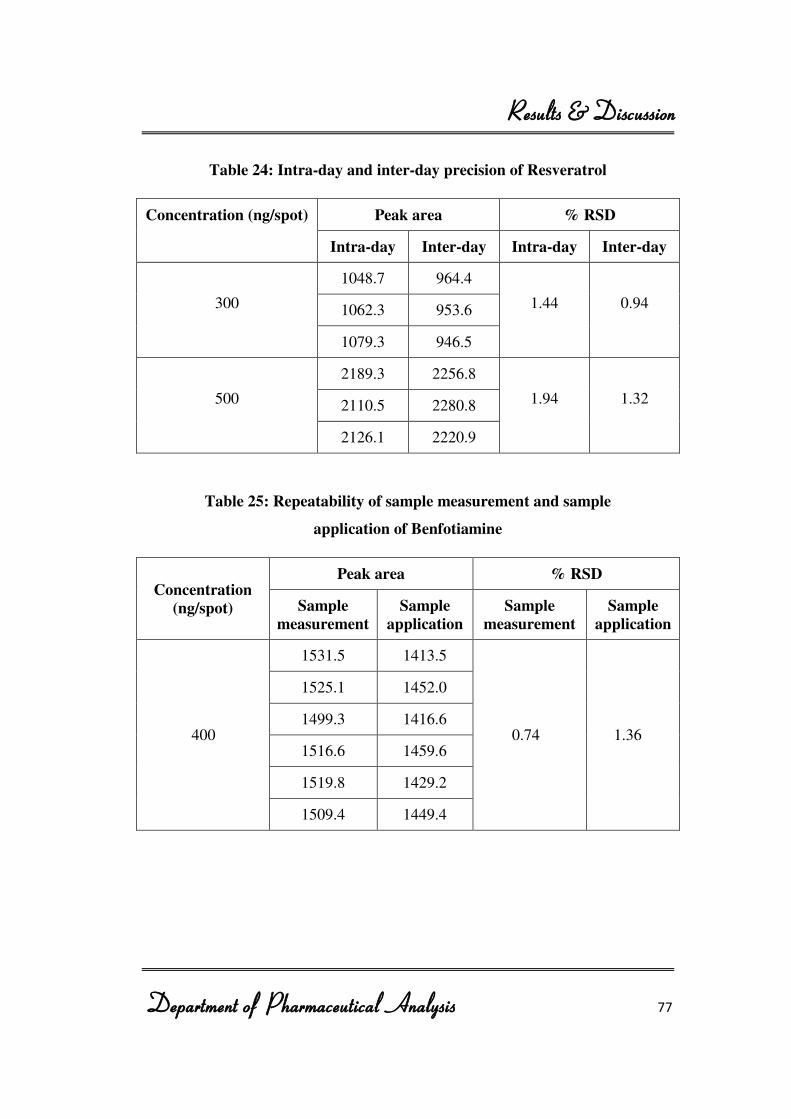
Results & Discussion
Department of Pharmaceutical Analysis 77
Table 24: Intra-day and inter-day precision of Resveratrol
Concentration (ng/spot) Peak area % RSD
Intra-day Inter-day Intra-day Inter-day
300
1048.7 964.4
1.44
0.94 1062.3 953.6
1079.3 946.5
500
2189.3 2256.8
1.94
1.32 2110.5 2280.8
2126.1 2220.9
Table 25: Repeatability of sample measurement and sample
application of Benfotiamine
Concentration
(ng/spot)
Peak area % RSD
Sample
measurement
Sample
application
Sample
measurement
Sample
application
400
1531.5 1413.5
0.74
1.36
1525.1 1452.0
1499.3 1416.6
1516.6 1459.6
1519.8 1429.2
1509.4 1449.4

Results & Discussion
Department of Pharmaceutical Analysis 78
Table 26: Repeatability of sample measurement & sample application of
Pyridoxamine dihydrochloride
Concentration
(ng/spot)
Peak area %RSD
Sample
measurement
Sample
application
Sample
measurement
Sample
application
200
602.1 584.2
0.74 0.84
614.5 599.0
604.7 594.9
608.0 593.2
602.8 589.4
607.3 592.7
Table 27: Repeatability of sample measurement & sample application
of Resveratrol
Concentration
(ng/spot)
Peak area %RSD
Sample
measurement
Sample
application
Sample
measurement
Sample
application
200
1235.4 1355.0
1.18 0.73
1254.2 1345.4
1224.6 1342.6
1214.0 1332.1
1247.3 1336.2
1237.2 1327.6

Results & Discussion
Department of Pharmaceutical Analysis 79
Robustness
The robustness of the method is its ability to remain unaffected by small
changes in the parameter such as ratio of mobile phase and saturation time. The
method is said to be robust as minor variation (as shown below) not affected
quantification.
Parameters Observation
Ratio of mobile phase ± 0.1 (Acetic
acid: Ether: Acetone: Triethylamine:
tetra butyl ammonium
bromide(5:5:1.5:3:5 drops: 2drop ±
0.1ml)
Slight changes in Rf, but no different in
peak area
Saturation time10 (±0.1,minutes, ) Peak symmetry retained.
Stability studies
Stability of chromatographic plate
When the developed method chromatographic plate was exposed to
atmosphere, the analytes are likely to decomposed. Hence it was necessary to
conduct stability studies of the plate.
Stability of the analyte on the plate was studied at different time intervals
and peak areas were compared with peak area of freshly scanned plate. The
developed plate was found to be stable for less than 24hrs, table 28, 29, and 30.

Results & Discussion
Department of Pharmaceutical Analysis 80
Table 28: Benfotiamine
Time (hr) Concentration(ng/spot) Peak area
0
400
800
2093.5
4089.8
6
400
800
1616.6
3248.0
22
400
800
1452.0
3134.2
Table 29: Pyridoxamine dihydrochloride
Time (hr) Concentration(ng/spot) Peak area
0 200
400
680.8
1330.9
6 200
400
374.9
925.6
22 200
400
359.4
825.6
Table 30: Resveratrol
Time (hr) Concentration(ng/spot) Peak area
0 200
400
1441.9
3923.9
6 200
400
942.7
3278.8
22 200
400
912.5
3014.4
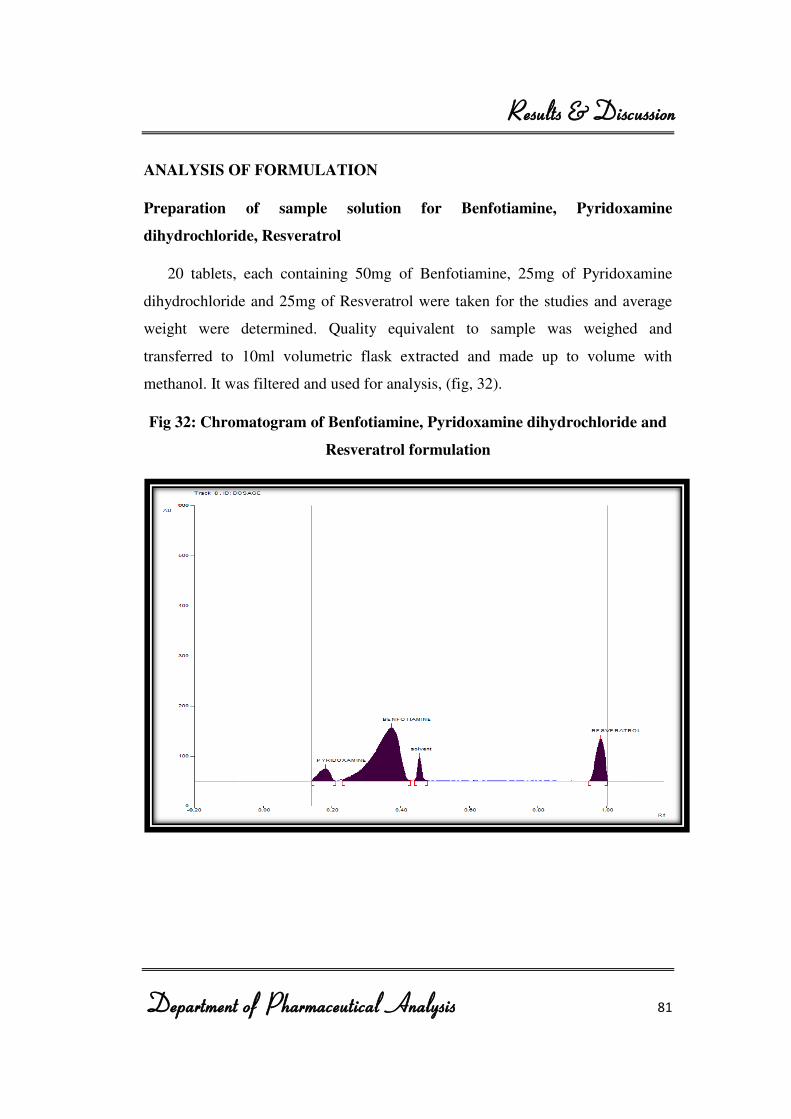
Results & Discussion
Department of Pharmaceutical Analysis 81
ANALYSIS OF FORMULATION
Preparation of sample solution for Benfotiamine, Pyridoxamine
dihydrochloride, Resveratrol
20 tablets, each containing 50mg of Benfotiamine, 25mg of Pyridoxamine
dihydrochloride and 25mg of Resveratrol were taken for the studies and average
weight were determined. Quality equivalent to sample was weighed and
transferred to 10ml volumetric flask extracted and made up to volume with
methanol. It was filtered and used for analysis, (fig, 32).
Fig 32: Chromatogram of Benfotiamine, Pyridoxamine dihydrochloride and
Resveratrol formulation

Results & Discussion
Department of Pharmaceutical Analysis 82
Recording chromatogram
With the fixed chromatographic condition, a suitable volume of sample
solutions was applied on the precoated TLC plate. The plate was analyzed and
chromatogram was recorded, fig 32.
Peak areas of sample chromatograms were noticed and the amount of
drugs was calculated, table 31.
Table 31: Results analysis of formulation
Brand name Amount of
drug/tab
% label
claim % RSD SEM
Ageless Labeled Found
96.42% 0.74
0.17 Benfotiamine 50mg 48.21mg
Pyridoxamine
dihydrochloride 25mg 24.15mg 96.60% 0.45
0.03
Resveratrol 25mg 23.48mg 93.92% 0.65 0.08
*average of six observations

Results & Discussion
Department of Pharmaceutical Analysis 83
IV. DEVELOPMENT AND VALIDATION OF RP-HPLC METHOD FOR
ESTIMATION OF BENFOTIAMINE IN COMBINATION WITH
PYRIDOXAMINE DIHYDRO-CHLORIDE AND RESVERATROL
TABLET FORMULATION
The drugs is a polar in nature hence RP-HPLC method and C18 column
was used for the HPLC method development for the estimation of benfotiamine in
combination of pyridoxamine dihydrochloride and resveratrol.
Selection of wavelength:
Good analytical separation can be obtained only by careful selection of
wavelength for the detection (fig.33, 34 and 35). The smooth spectrum obtained
from which 254nm was selected for the drug. The overlay spectrum of all three
drugs shown in fig 36.
Fig 33: Spectrum of Benfotiamine
Fig 34: Spectrum of Pyridoxamine dihydrochloride

Results & Discussion
Department of Pharmaceutical Analysis 84
Fig 35: Spectrum of Resveratrol

Results & Discussion
Department of Pharmaceutical Analysis 85
Fig 36: Overlay spectrum of Benfotiamine, Pyridoxamine dihydrochloride &
Resveratrol

Results & Discussion
Department of Pharmaceutical Analysis 86
Selection of mobile phase:
For developing HPLC method, mobile phase system containing potassium
dihydrogen phosphate (pH adjusted with ortho phosphoric acid): methanol and
acetonitrile was tried at different ratios and different pH. The observations are
given below, table 32.
Table 32: Selection of mobile phase
Mobile phase Ratio
% v/v Effect of pH Observation
10mM
ammonium acetate:
Acetonitrile
10:90 4.65
Benfotiamine, pyridoxamine
dihydrochloride & resveratrol
retention time is same
BEN- symmetry peak
PYR- symmetry peak
RES- peak tailing
10mM ammonium
acetate: Acetonitrile 20:80 4.62
Benfotiamine, pyridoxamine
dihydrochloride & resveratrol
retention time is same
BEN- symmetry peak
PYR- peak tailing
RES- peak tailing
10mM ammonium
acetate: Acetonitrile 20:80 3.05
Benfotiamine, pyridoxamine
dihydrochloride & resveratrol
retention time is same
EN- peak tailing
PYR- peak tailing
RES- peak tailing
10mM ammonium
acetate: Acetonitrile 20:80 3.50
Benfotiamine, pyridoxamine
dihydrochloride & resveratrol
retention time is same
BEN- peak tailing
PYR- peak tailing
RES- peak tailing

Results & Discussion
Department of Pharmaceutical Analysis 87
Mobile phase Ratio
% v/v Effect of pH Observation
10mM ammonium
acetate: Acetonitrile 20:80 2.80
Benfotiamine, pyridoxamine
dihydrochloride & resveratrol
retention time is same
BEN- peak tailing
PYR- peak tailing
RES- peak tailing
10mM ammonium
acetate: Acetonitrile 40:60 2.80
Benfotiamine, pyridoxamine
dihydrochloride & resveratrol
retention time is same
BEN- peak tailing
PYR- peak tailing
RES- peak tailing
10mM potassium
dihydrogen
phosphate:
Methanol
20:80 5.20
Benfotiamine, pyridoxamine
dihydrochloride & resveratrol is
resolution less than 2
BEN- peak tailing
PYR- peak tailing
RES- peak tailing
10mM potassium
dihydrogen
phosphate:
Methanol
20:80 4.50
Benfotiamine, pyridoxamine
dihydrochloride & resveratrol
retention time is same
BEN- peak tailing
PYR- peak tailing
RES- peak tailing
10mM potassium
dihydrogen
phosphate:
Methanol
30:70 4.50
Benfotiamine, pyridoxamine
dihydrochloride & resveratrol
retention time is same
BEN- peak tailing
PYR- peak tailing
RES- peak tailing
10mM potassium
dihydrogen
phosphate:
50:25+
25 5.21
Benfotiamine, pyridoxamine
dihydrochloride & resveratrol
retention time is separate

Results & Discussion
Department of Pharmaceutical Analysis 88
Mobile phase Ratio
% v/v Effect of pH Observation
Methanol+
Acetonitrile
BEN- peak spilt
PYR- peak tailing
RES- peak symmetry
10mM potassium
dihydrogen
phosphate:
Methanol+
Acetonitrile
50:35+
15 5.22
Benfotiamine, pyridoxamine
dihydrochloride & resveratrol
retention time is separate
BEN- peak spilt
PYR- peak tailing
RES- peak symmetry
10mM potassium
dihydrogen
phosphate:
Methanol+
Acetonitrile
60:20+
20 5.21
Benfotiamine, pyridoxamine
dihydrochloride & resveratrol
retention time is separate
BEN- peak spilt
PYR- peak symmetry
RES- peak symmetry
10mM potassium
dihydrogen
phosphate:
Methanol+
Acetonitrile
65:17.
5+17.5 5.21
Benfotiamine, pyridoxamine
dihydrochloride & resveratrol
retention time is separate
BEN- peak tailing
PYR- peak symmetry
RES- peak symmetry
10mM potassium
dihydrogen
phosphate:
Methanol+
Acetonitrile
70:15+
15 5.24
Benfotiamine, pyridoxamine
dihydrochloride & resveratrol
retention time is separate
BEN- peak symmetry
PYR- peak fronting
RES- peak symmetry
10mM potassium
dihydrogen
phosphate:
Methanol+
Acetonitrile
70:15
+15 4.90
Good resolution between all
drugs with acceptable peak
shape.
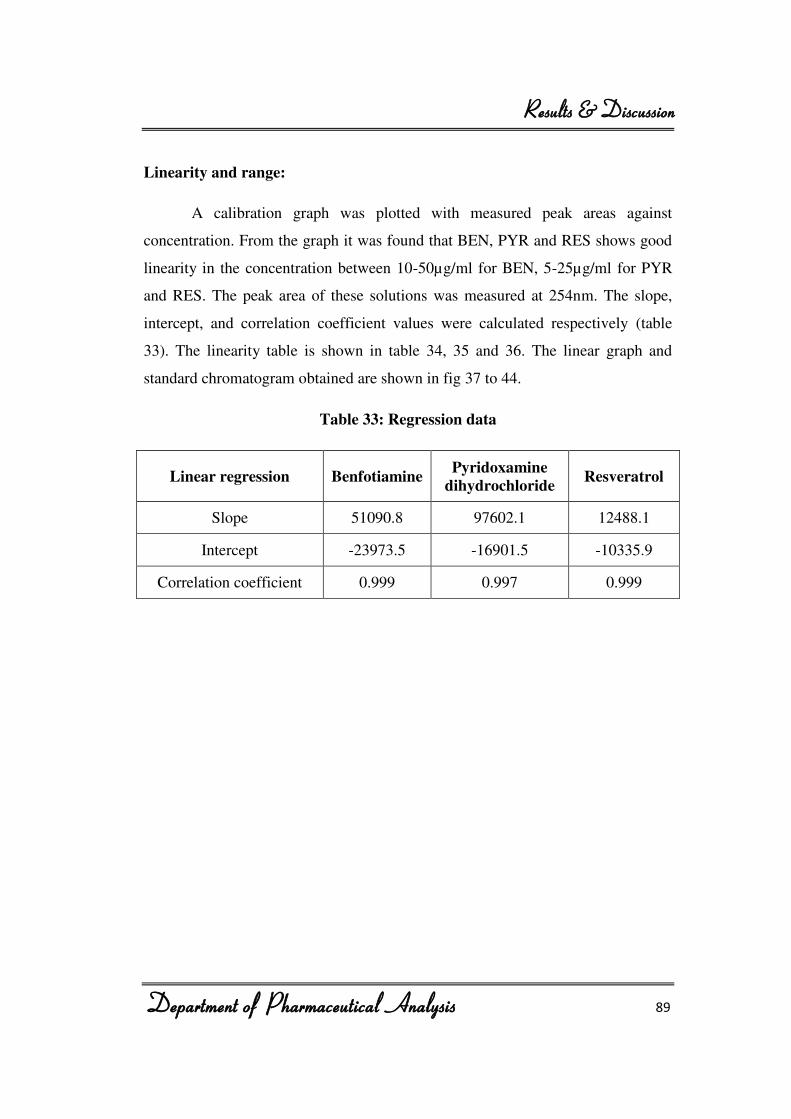
Results & Discussion
Department of Pharmaceutical Analysis 89
Linearity and range:
A calibration graph was plotted with measured peak areas against
concentration. From the graph it was found that BEN, PYR and RES shows good
linearity in the concentration between 10-50µg/ml for BEN, 5-25µg/ml for PYR
and RES. The peak area of these solutions was measured at 254nm. The slope,
intercept, and correlation coefficient values were calculated respectively (table
33). The linearity table is shown in table 34, 35 and 36. The linear graph and
standard chromatogram obtained are shown in fig 37 to 44.
Table 33: Regression data
Linear regression Benfotiamine Pyridoxamine
dihydrochloride Resveratrol
Slope 51090.8 97602.1 12488.1
Intercept -23973.5 -16901.5 -10335.9
Correlation coefficient 0.999 0.997 0.999
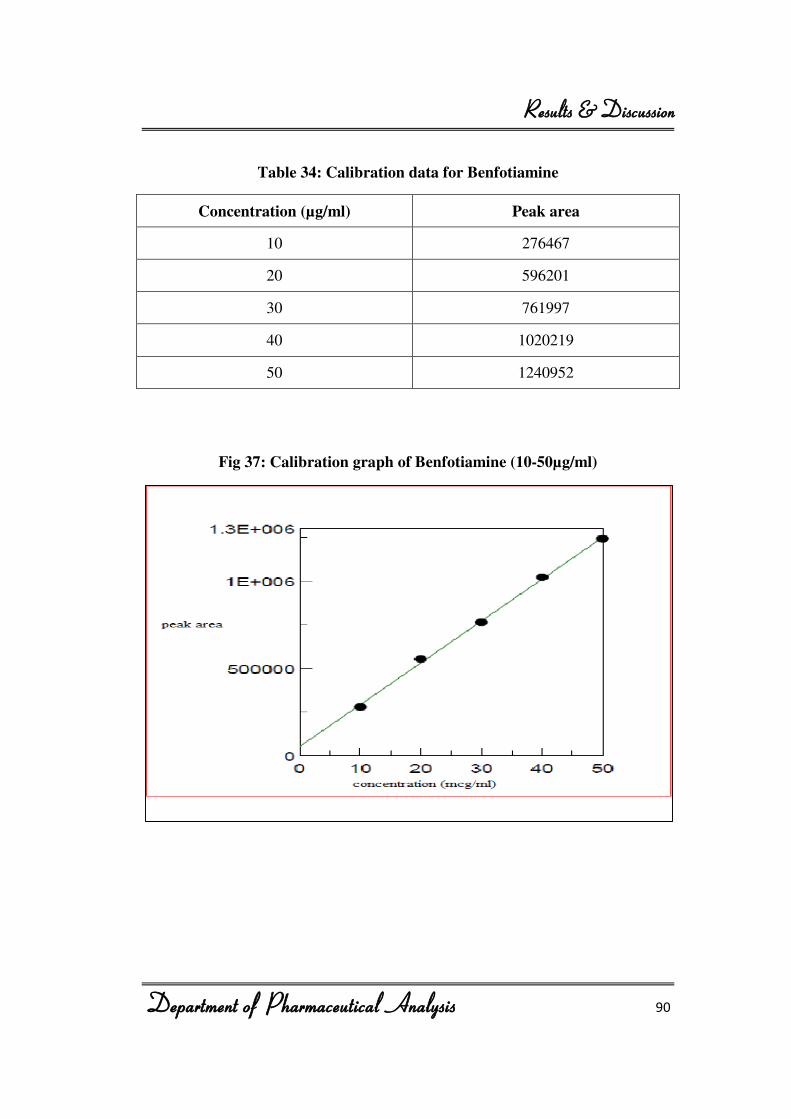
Results & Discussion
Department of Pharmaceutical Analysis 90
Table 34: Calibration data for Benfotiamine
Concentration (µg/ml) Peak area
10 276467
20 596201
30 761997
40 1020219
50 1240952
Fig 37: Calibration graph of Benfotiamine (10-50µg/ml)

Results & Discussion
Department of Pharmaceutical Analysis 91
Table 35: Calibration data for Pyridoxamine dihydrochloride
Concentration (µg/ml) Peak area
5 172106
10 273347
15 365260
20 427182
25 517725
Fig 38 : Calibration graph of Pyridoxamine dihydrochloride (5-25 µg/ml)
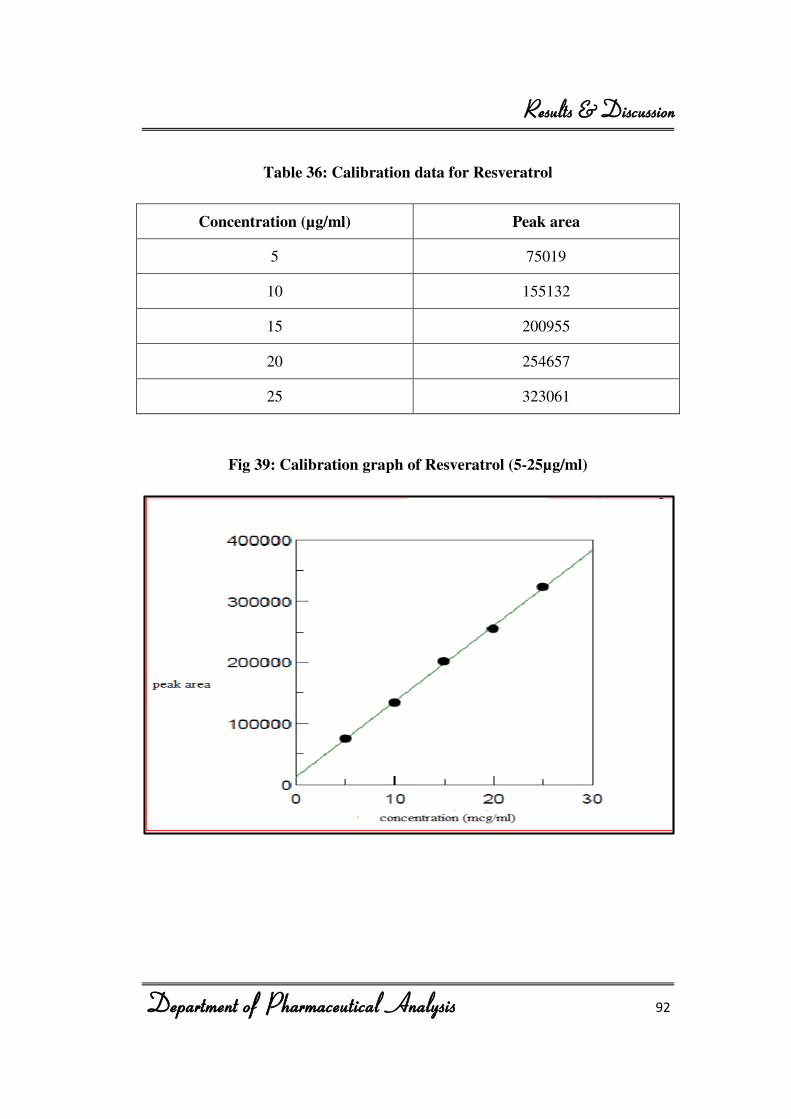
Results & Discussion
Department of Pharmaceutical Analysis 92
Table 36: Calibration data for Resveratrol
Concentration (µg/ml) Peak area
5 75019
10 155132
15 200955
20 254657
25 323061
Fig 39: Calibration graph of Resveratrol (5-25µg/ml)

Results & Discussion
Department of Pharmaceutical Analysis 93
Fig 40: Chromatogram of BEN (10µg/ml), PYR and PYR (5µg/ml)
Fig 41: Chromatogram of BEN (20µg/ml), PYR and PYR (10µg/ml)

Results & Discussion
Department of Pharmaceutical Analysis 94
Fig 42: Chromatogram of BEN (30µg/ml), PYR and PYR (15µg/ml)
Fig 43: Chromatogram of BEN (40µg/ml), PYR and PYR (20µg/ml)

Results & Discussion
Department of Pharmaceutical Analysis 95
Fig 44: Chromatogram of BEN (50µg/ml), PYR and PYR (25µg/ml)
Precision:
Intra-day and inter-day precision:
Intra-day and inter-day precision was determined by injecting standard
solutions in between linearity range (20 and 30µg/ml for BEN, 10 and 15µg/ml
for PYR and RES) were injected for three times and % RSD was calculated (table
37, 38 and 39).
Table 37: Intraday and interday precision of Benfotiamine
Concentration (µg/ml)
Peak area %RSD
Intraday Interday Intraday Interday
20
593475 589287
0.16
0.06 592474 589054
591473 588542
30
761997 758985
0.56
0.53 762874 753214
769820 751208

Results & Discussion
Department of Pharmaceutical Analysis 96
Table 38: Intraday and interday precision of Pyridoxamine dihydrochloride
Concentration (µg/ml)
Peak area % RSD
Intraday Interday Intraday Interday
10
273347 271245
0.29 0.22 274852 270236
273654 270148
15
365260 367854
0.57
1.09 361245 360214
364153 362148
Table 39: Intraday and interday precision of Resveratrol
Concentration (µg/ml)
Peak area % RSD
Intraday Interday Intraday Interday
10
155132 154726
0.98 1.32 158642 158742
152485 155874
15
200955 218752
0.94 1.24 210584 214754
214820 213654
Repeatability:
Repeatability of injection was determined by injecting standard solutions
(10µg/ml) of BEN and (5µg/ml) of PYR and RES for six times, noted peak areas
and % RSD was calculated (table 40, 41 and 42).

Results & Discussion
Department of Pharmaceutical Analysis 97
Table 40: Repeatability injection of Benfotiamine
Concentration (µg/ml) Repeatability % RSD
10
276467
1.10
278562
274856
276984
278102
270254
Table 41: Repeatability injection of Pyridoxamine dihydrochloride
Concentration (µg/ml) Repeatability % RSD
5
172106
0.18
173258
174852
170235
174714
179680
Table 42: Repeatability injection of Resveratrol
Concentration (µg/ml) Repeatability % RSD
5
75019
0.20
75128
75365
75054
75147
75365

Results & Discussion
Department of Pharmaceutical Analysis 98
Limit of detection and limit of quantification (LOD and LOQ):
The LOD and LOQ were found to be respectively in shown, (table 43)
Table 43: LOD and LOQ
Benfotiamine Pyridoxamine
dihydrochloride Resveratrol
LOD LOQ LOD LOQ LOD LOQ
0.2µg/ml 0.7µg/ml 0.3µg/ml 0.9 µg/ml 0.3µg/ml 1µg/ml
Specificity:
There were no additional peaks observed while injecting solvents or
mobile phase alone. The peak purity index of standard BEN 0.9998, PYR 0.9979
and RES 0.9998.
Robustness:
In order to demonstrate the robustness of the method, the following
optimized conditions were slightly changed.
± 0.1ml flow rate
± 0.5% organic solvent
± 0.1 PH
The responses for these changed chromatographic parameters were almost
same for the fixed chromatographic parameters and hence the developed method
was said to be robustness.
Stability of solution:
The solution under room temperature was stable for 24 hours. (Table 44)

Results & Discussion
Department of Pharmaceutical Analysis 99
Table 44: Stability of solution
Hours
Benfotiamine Pyridoxamine Resveratrol
Concentration
(µg/ml)
Peak
area
Concentration
(µg/ml)
Peak
area
Concentration
(µg/ml)
Peak
area
0 hrs 20 570535 10 270137 10 159877
6 hrs 20 577376 10 273347 10 155132
24 hrs 20 567586 10 266242 10 148883
System suitability studies:
The system suitability parameters like peak area, tailing factor, theoretical
plate count, resolution, and retention time were calculated from the standard
chromatogram (table 45).
Table 45: System suitability studies
Drug Theoretical
plate(N)
Retention
time(min)
Tailing
factor Resolution
Benfotiamine 3574.368 4.290 1.36 -
Pyridoxamine 3141.052 2.195 1.40 4.790
Resveratrol 3220.258 20.589 1.18 14.451

Results & Discussion
Department of Pharmaceutical Analysis 100
Analysis of formulation
Twenty tablets each containing 50mg of BEN, 25mg of PYR and RES was
taken for the study and average weight was determined. Quantity equivalent to
20mg of BEN, 10mg of PYR and RES was weight and transferred to 10ml
standard flask and it was dissolved and made up to volume with methanol. Further
dilutions were made and injected. The chromatogram is shown in fig 45. The
result of an analysis of formulation is shown in table 46.
Fig 45: Chromatogram of BEN, PYR and RES equivalent to 10µg/ml

Results & Discussion
Department of Pharmaceutical Analysis 101
Table 46: Analysis of formulation
Drug Amount of
drug/tab % label
claim % RSD SEM
Ageless Label Found
Benfotiamine 50mg 50.5mg 101% 0.18 0.16
Pyridoxamine
dihydrochloride 25mg 24.2mg 96.8% 0.58
0.15
Resveratrol 25mg 24.8mg 99.2% 0.38 0.13
*Average of six observation
Recovery study:
Recovery studies were carried out at 50% and 100% levels. The
percentage recovery and % RSD of the results were calculated, table 47. The high
% recovery values shows accuracy of the method.
Table 47: Recovery study
% Level Drug % Recovery % RSD SEM
50
BEN 99.61% 0.84 0.21
PYR 98.23% 0.47 0.14
RES 99.47% 0.36 0.23
100
BEN 102.21% 0.96 0.13
PYR 101.01% 1.14 0.26
RES 103.24% 0.54 0.14

Results & Discussion
Department of Pharmaceutical Analysis 102
STATISTICAL ANALYSIS
To ascertain the result obtain in the four methods developed, the statistical
analysis was carried out.
Unpaired‘t’ test
Accuracy of UV method:
The % RSD values of the UV method are shown in table 48
Table 48: % RSD of accuracy
Parameter % RSD
UV
99.00
98.42
99.32
99.41
99.02
97.02
These values were evaluated on statistical tool graphpad instant. The
calculated P ˂ 0.05 values were found to be 0.5316 which is greater than P value
so consider to not significant.

Results & Discussion
Department of Pharmaceutical Analysis 103
Accuracy of HPTLC method:
The % RSD values of the HPTLC method are shown in table 49.
Table 49: % RSD of Accuracy
Parameter % RSD
HPTLC
98.54
99.02
98.14
97.54
98.56
98.75
These values were evaluated on statistical tool graphpad instant. The calculated P
˂ 0.05 values were found to be 0.0942 which is greater than P value so consider to
not significant.
The unpaired‘t’ test carried out for the precision that all the methods are
equally precise.

Results & Discussion
Department of Pharmaceutical Analysis 104
Paired‘t’ test
Comparison of accuracy of existing UV method with developed UV
method. The % RSD values of the two methods shown in table 50.
Table 50: % RSD of accuracy
UV Existing UV
99.00 100.10
98.42 99.97
99.32 98.27
99.41 98.02
99.02 99.91
97.02 100.27
These values were evaluated on statistical tool graphpad instant. The
calculated P ˂ 0.05 values were found to be 0.2149 which is greater than P value
so consider to not significant.

Results & Discussion
Department of Pharmaceutical Analysis 105
ANOVA
One way analysis of variance (ANOVA) test was applied on precision
(intraday and interday precision) studies of the UV and HPTLC methods for
Benfotiamine.
Precision of assay:
Intraday precision:
The % RSD values of three methods are shown in table 51.
Table 51: % RSD of intraday precision
UV HPTLC
0.29 0.58
0.47 1.27
0.97 0.97
0.84 0.74
0.79 0.86
0.68 0.69
These values were evaluated on statistical tool graphpad instant. The
calculated P ˂ 0.05 values were found to be 0.2207 which is greater than P value
so consider to not significant.

Results & Discussion
Department of Pharmaceutical Analysis 106
Interday precision:
The % RSD values are shown in table 52.
Table 52: % RSD of interday precision
UV HPTLC
0.09 0.38
0.37 1.24
0.98 0.91
0.83 0.89
1.72 0.68
0.76 0.79
The values were evaluated on statistical tool graphpad instant. The
calculated P ˂ 0.05 values were found to be 0.2501 which is greater than P value
so consider to not significant.
Table 53: statistical comparison
Parameter
Intraday Interday
Mean
difference
‘t’ value
‘p’ value
Mean
difference
‘t’ value
‘p’ value
UV Vs HPTLC 0.11 7.27 >0.05 0.018 6.54 >0.05
Statistical studies were carried out for HPLC and HPTLC method
development of Benfotiamine in combination with Pyridoxamine dihydrochloride
and Resveratrol.
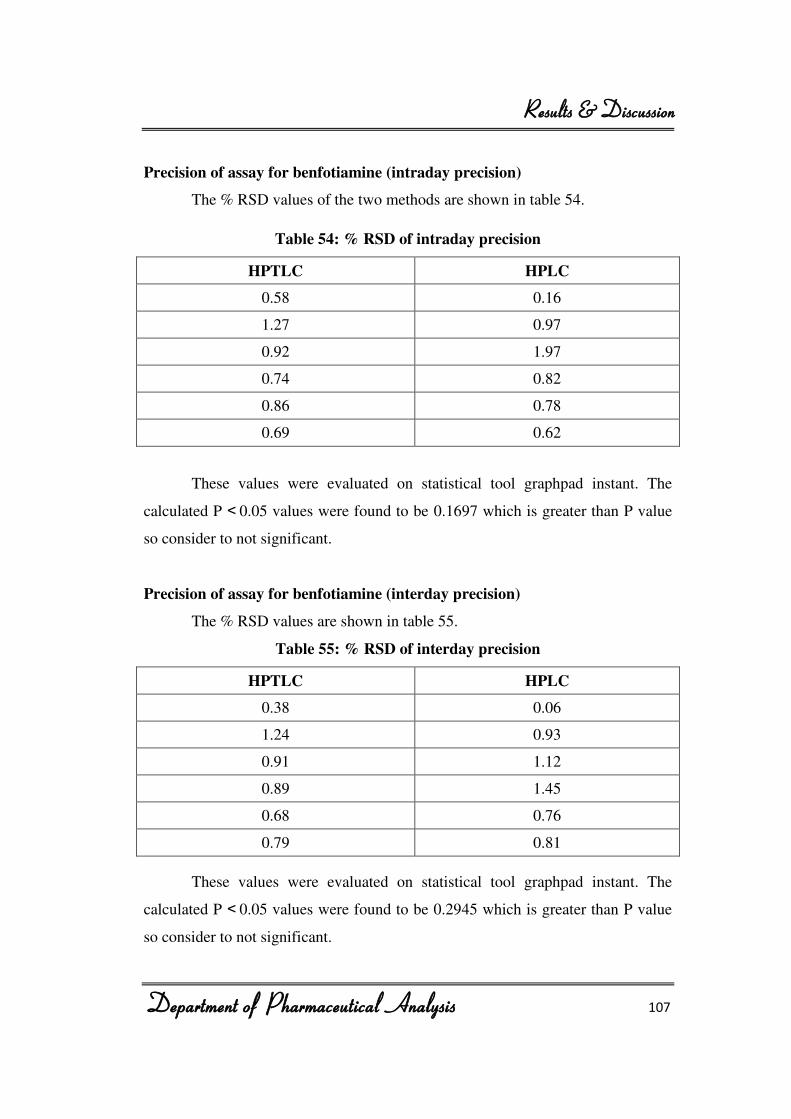
Results & Discussion
Department of Pharmaceutical Analysis 107
Precision of assay for benfotiamine (intraday precision)
The % RSD values of the two methods are shown in table 54.
Table 54: % RSD of intraday precision
HPTLC HPLC
0.58 0.16
1.27 0.97
0.92 1.97
0.74 0.82
0.86 0.78
0.69 0.62
These values were evaluated on statistical tool graphpad instant. The
calculated P ˂ 0.05 values were found to be 0.1697 which is greater than P value
so consider to not significant.
Precision of assay for benfotiamine (interday precision)
The % RSD values are shown in table 55.
Table 55: % RSD of interday precision
HPTLC HPLC
0.38 0.06
1.24 0.93
0.91 1.12
0.89 1.45
0.68 0.76
0.79 0.81
These values were evaluated on statistical tool graphpad instant. The
calculated P ˂ 0.05 values were found to be 0.2945 which is greater than P value
so consider to not significant.

Results & Discussion
Department of Pharmaceutical Analysis 108
Table 56: Statistical comparison
Parameter Mean difference ‘t’ value ‘p’
value Intraday Interday Intraday Interday
HPTLC Vs HPLC -0.0350 0.040 0.8476 0.7802 >0.05
Precision of assay for Pyridoxamine dihydrochloride (intraday precision)
The % RSD values of the two methods shown in table 57.
Table 57: % RSD of intraday precision
HPTLC HPLC
0.62 0.29
0.64 0.57
0.72 0.71
1.02 0.82
0.68 0.62
0.47 0.47
These values were evaluated on statistical tool graphpad instant. The
calculated P ˂ 0.05 values were found to be 0.2980 which is greater than P value
so consider to not significant.

Results & Discussion
Department of Pharmaceutical Analysis 109
Precision of assay for Pyridoxamine dihydrochloride (interday precision)
The % RSD values are shown in table 58.
Table 58: % RSD of interday precision
HPTLC HPLC
0.62 0.22
1.44 1.09
0.76 0.94
0.51 0.82
0.49 0.76
0.91 0.54
These values were evaluated on statistical tool graphpad instant. The
calculated P ˂ 0.05 values were found to be 0.4245 which is greater than P value
so consider to not significant.
Table 59: Statistical comparison
Parameter
Mean difference ‘t’ value
‘p’ value
Intraday Interday Intraday Interday
HPTLC Vs HPLC -0.036 0.060 0.8670 0.6888 >0.05

Results & Discussion
Department of Pharmaceutical Analysis 110
Precision of assay for Resveratrol (intraday precision)
The % RSD values of the two methods shown in table 60
Table 60: % RSD of intraday precision
HPTLC HPLC
1.44 0.98
1.94 0.94
0.97 0.49
0.25 1.21
0.37 0.80
0.72 0.79
These values were evaluated on statistical tool graphpad instant. The
calculated P ˂ 0.05 values were found to be 0.2763 which is greater than P value
so consider to not significant.
Precision of assay for Resveratrol (interday precision)
The % RSD values are shown in table 61
Table 61: % RSD of interday precision
HPTLC HPLC
0.94 1.32
1.32 1.24
0.85 0.69
0.71 0.35
0.35 0.47
0.55 0.78

Results & Discussion
Department of Pharmaceutical Analysis 111
These values were evaluated on statistical tool graphpad instant. The
calculated P ˂ 0.05 values were found to be 0.1950 which is greater than P value
so consider to not significant.
Table 62: Statistical comparison
Parameter Mean difference ‘t’ value
‘p’ value Intraday Interday Intraday Interday
HPTLC Vs
HPLC 0.080 0.021 0.7934 0.8531 >0.05
The paired‘t’ test carried out for the precision that all the methods are
equally precise.

Summary
Department of Pharmaceutical Analysis 112
SUMMARY
In current research work newer analytical methods were developed and
validated for benfotiamine in single dosage form and its combination with
pyridoxamine dihydrochloride and resveratrol. An UV spectroscopy and stability
indicating HPTLC methods were developed for the quantification of benfotiamine
in single dosage form and for the estimation of benfotiamine in combined dosage
form two chromatographic methods viz a HPTLC and HPLC were developed.
Analytical methods for benfotiamine in single dosage form
The development of UV spectrophotometric method involved scanning of
the standard and sample solutions in the UV range using UV visible
spectrophotometer. Benfotiamine showed maximum absorbance at 240nm. The
method was validated for linearity, precision, accuracy and stability. An overly of
different concentrations of benfotiamine was noted with absorbance at λmax. The
linear concentration was 4-24µg/ml and the correlation value was 0.999. The
percentage RSD values of repeatability, interday and intraday were found to be
˂ 2, which proves precision of the method. The drug solution was found to be
stable up to 48hrs at room temperature. The method was the applied to estimation
of Benfotiamine bulk drug and tablet formulation.
For the estimation of Benfotiamine by HPTLC method, the sample
solutions were applied on silica gel G60F254 TLC plates and the chromatogram was
developed using mobile phase comprising of Glacial acetic acid : Methanol :
Triethylamine ( 9: 1% v/v, 2drops) and detection was carried out at 275 nm using
densitometer. The Rf value of Benfotiamine was 0.29±0.02, which showed
linearity range from 0.1 – 0.6µg/spot and correlation coefficient 0.998. The
percentage RSD values of repeatability, intraday and interday were found to be
˂ 2. It proves precision of the method.

Summary
Department of Pharmaceutical Analysis 113
HPTLC method was applied for accelerated stability studies of
Benfotiamine in bulk drug and tablet formulation for acid, alkali and oxidative
degradation. The degradation study indicated benfotiamine is more susceptible to
acid hydrolysis than other conditions. There were no additional peak observed
when treated with all the degradation conditions, but reduction in peak area was
found. The tablet placebo was prepared and subjected to degradation studies as
like formulation, to know if any interferences due to this. It was observed that
there was no additional peak at the Rf value of benfotiamine due to excipients.
The statistical analysis was applied to the assay results obtained by two
newly developed methods (UV and HPTLC). The results of an unpaired’t’ test
conducted is shown in table below.
Parameter UV HPTLC
Mean (assay) 98.63 98.42
Number of points 6 6
SD 0.982 0.520
SEM 0.364 0.212
Median 99.010 98.550
P 0.5316
F 2.937
For the statistical comparison of the developed UV method and existing
UV method (13) for benfotiamine a paired ‘t’ test was conducted the results as
shown in table below.
Parameter UV UV
Mean (assay) 98.69 99.42
Number of points 6 6
SD 0.892 1.001
SEM 0.364 0.408
Median 99.10 99.940
P 0.2149
F 1.258
Summary
Department of Pharmaceutical Analysis 114
The results proved that there is no statistical significant difference among
two developed methods for estimation of benfotiamine.
One way ANOVA was carried out for the intraday and interday precision
of UV and HPTLC method for benfotiamine estimation from tablets. The average
mean difference was 0.11, t- value, 7.27 and p- value was >0.05 for intraday
precision. For interday precision was mean difference 0.018, t- value 6.54 and p-
value was>0.05.
Analytical method for benfotiamine in combination with pyridoxamine
dihydrochloride and resveratrol
A newer HPTLC method was developed for estimation of benfotiamine in
combination of pyridoxamine dihydrochloride and resveratrol combined dosage
form. The sample solutions were applied TLC plates and the chromatogram was
developed using mobile phase separation of Glacial acetic acid: petroleum ether:
Acetone: Triethylamine: Tetra butyl ammonium bromide (5.5:1.5:3% v/v, 5drops,
and 2drops) and detection was carried out a 285nm. The linearity range from
benfotiamine 200-1200ng/spot, pyridoxamine dihydrochloride 100-600ng/spot
and respectively for benfotiamine, pyridoxamine dihydrochloride and resveratrol.
The method was successfully applied to the formulation containing these three
drugs.
A new high performance liquid chromatographic method was developed
for determination of benfotiamine in combination with pyridoxamine
dihydrochloride and resveratrol in tablet formulation. The chromatographic
separation was performed on stationary phase of Lichrospher®100 RP – 18e
(5µm) and mobile phase of 10mM KH2PO4 (pH- 4.9): Methanol + Acetonitrile
and solvent ratio of 70: 15+15 %v/v, flow rate: 1.0ml/min. The detection
wavelength was at 254nm.

Summary
Department of Pharmaceutical Analysis 115
The method was validated for linearity, precision, stability and robustness.
The linear concentration benfotiamine was 10-50µg/ml, pyridoxamine
dihydrochloride 5-25µg/ml and resveratrol 5-25µg/ml. The correlation value was
0.999, 0.997 and 0.999 respectively for benfotiamine, pyridoxamine
dihydrochloride and resveratrol. The percentage RSD values of repeatability,
interday and intraday precision were found to be ˂ 2. It proves precision of the
method. The solution was stable up to 36 hours at room temperature. The method
was robust for very minor change in the changed chromatographic parameters.
A paired‘t’ test was conducted to test the precision of the two methods for every single drug present in combined dosage form. The results of paired t-test are
benfotiamine in shown table below.
Parameter HPTLC HPLC
Intraday Interday Intraday Interday
Mean (precision) 0.84 0.88 0.81 0.85
Number of points 6 6 6 6
SD 0.241 0.599 0.284 0.463
SEM 0.098 0.244 0.116 0.189
Median 0.800 0.800 0.368
P 0.063 0.060
T 0.2024 0.2945
The statistical comparison of precision pyridoxamine dihydrochloride by
paired ‘t’ test in shown table below.
Parameter HPTLC HPLC
Intraday Interday Intraday Interday
Mean (precision) 0.69 0.58 0.78 0.72
Number of points 6 6 6 6
SD 0.182 0.185 0.356 0.309
SEM 0.074 0.075 0.145 0.126
Median 0.660 0.595 0.690 0.790
P 0.08 0.17
T 2.217 0.424

Summary
Department of Pharmaceutical Analysis 116
The paired t-test results of resveratrol is shown table below.
Parameter HPTLC HPLC
Intraday Interday Intraday Interday
Mean (precision) 0.94 0.86 0.78 0.80
Number of points 6 6 6 6
SD 0.648 0.240 0.336 0.396
SEM 0.264 0.098 0.137 0.162
Median 0.845 0.870 0.780 0.735
P 0.793 0.853
T 0.276 0.195
The results proved that there is no statistical significant difference among
two and three developed methods for estimation of benfotiamine and it
combination with pyridoxamine dihydrochloride and resveratrol.

Conclusion
Department of Pharmaceutical Analysis 117
CONCLUSION
The UV, HPTLC and HPLC methods developed were validated as per ICH
guidelines and found to be specific, accurate and precise. The results of all the
methods were ascertained by statistical analysis.
Among the two analytical methods developed, HPTLC is more sensitive
technique, whereas UV is a simpler technique for the estimation of Benfotiamine in
single dosage form. The HPTLC is more sensitive than HPLC method for the
analysis of Benfotiamine in combination with Pyridoxamine dihydrochloride and
Resveratrol. However HPLC offers a more reliable quantification than HPTLC for
combination.
All the four methods were successfully employed to analyse benfotiamine
from single dosage form or in combination with Pyridoxamine dihydrochloride and
Resveratrol. They would serve as good analytical tools for the quality control and
research involving Benfotiamine and its combined dosage form with Pyridoxamine
dihydrochloride and Resveratrol.

Bibliography
Department of Pharmaceutical Analysis
BIBLIOGRAPHY
1. Roger E. Schirmer Modern Methods of pharmaceutical analysis 2nd ed.
Volume 1 CRC press: corporate Blvd., N.W., Boca Raton, Florida:2000.
p.1-15, 31-34.
2. Raymand P.W. Scott. Techniques and practice of chromatography special
indian ed. Vol 70. New York, 270 Madison Avenue: 1995. p.3-4, 12-13.
3. Graham Currell. Analytical instrumentation performance characteristics
and quality. New Delhi, Wiley india: 2000. p.4-14.
4. Snyder LR, Kirkland JJ, Glajch JL. Practical HPLC method development.
2nd ed. New York: John Wiley & Sons, Inc: 1997. p.1-15, 205-213, 234-
266,656-659.
5. Beckett AH, Stenlake JB. Practical pharmaceutical chemistry. 4th ed. Vol
II. New Delhi: CBS publishers and distributors: 2005.p.1-3, 279-281,
164-165.
6. Sethi PD. HPTLC: High Performance Liquid Chromatography.
Quantitative Analysis of Pharmaceutical formulations. New Delhi: CBS
publishers and distributors: 1997. p.3-92
7. Willam.V. Willis. Laboratory experiments in liquid chromatography CRC
press: corporate Blvd., N,W., Boca Raton. Florida.p.1-15.
8. Sethi PD. Quantitative analysis of drugs in pharmaceutical formulation
3rd ed. New Delhi; CBS publishers distributors: 1997.p.1-56.
9. Connor K.A., A text book of pharmaceutical analysis. 3rd ed. John Wiley
and Sons: 1999.p.221-224.
10. Willard HH, Merit LL, Dean JA and Frank A. Instrumental Methods of
Analysis. 7th ed. New Delhi: CBS publishers: 1986.p.580-610.
11. Sharma BK. Instrumental methods of chemical analysis. 18th ed. Meerut:
Krishna Prakashan Pvt: 1999.p.S10-S30.
Bibliography
Department of Pharmaceutical Analysis
12. Skoog DA, Holler JF, Nieman TA. Principles of instrumental analysis.
5th ed. Singapore: Thomson learning Inc: 1998.p.1-3.
13. Siva Sankari K.A, Development and validation of UV Method for
benfotiamine bulk and solid dosage form; EJPMR: 2017,4(2),706-709.
14. Pavan aditya B and vijayalakshmi M. Development and validation of RP-
HPLC method for the estimation of benfotiamine in bulk and dosage form;
J.Pharm sci: 2016, 2(3),354-360.
15. Deepali A. Nanaware, Simple, sensitive and rapid RP-HPLC method for
the estimation of benfotiamine and metformin hydrochloride in pure and in
pharmaceutical dosage forms; IJPPS: 2014;5(2):138-142.
16. Poogothai S, R. Ilavarasan , C.M Karrunakaran, simultaneous and accurate
determination of vitamin B1,B6,B12 and alpha lipoic acid in multivitamin
capsule by RP-HPLC method; IJPPS: 2010;2(4): 133-139.
17. Marsza. M, A rapid and sensitive HPLC method with coulometric
electrochemical and UV detection for analysis of vitamin B1, B6, B12 in
animal and plant foods; Journal of Chromatography A: 2007;1173(1-2):
71-80.
18. Roopa.S Pai, A new formulation by RP-HPLC method for t-Rvt loaded
PLGA nanoparticle with stealth properties; ISRN Chromatography:
2013,50-61.
19. ICH harmonized tripartite guideline, validation of analytical procedures:
text and methodology. Q2 (R1), (November 2005). Geneva. Switzerland.
20. Ravi Teja Pusapati. MVR Kalyan Kumar, development of co-processed
excipients in the design and evaluation of atorvastatin tablets by
compression method; International Journal of Pharmaceutical
Investigation: 2014 (2):102-6.
21. http://www.actavis.co.uk.
22. http://www.ivtnetwork.com.