Master of Pharmacy in Pharmaceutics
205
“FORMULATION, CHARACTERIZATION AND EVALUATION OF M I MATRIX TYPE TRANSDERMAL PATCHES OF CARVEDILOL” By Mr. KAILASH VISHVANATHRAO VILEGAVE B. Pharm. Dissertation Submitted to the Rajiv Gandhi University of Health Sciences, Karnataka, Bangalore In partial fulfillment of the requirements for the degree of Master of Pharmacy in Pharmaceutics Under the guidance of Shri. S.P. HIREMATH M. Pharm, Associate Professor Department of Pharmaceutics, K.L.E.S’s College of Pharmacy, Hubli -580031, Karnataka, India. February 2010
-
Upload
khangminh22 -
Category
Documents
-
view
3 -
download
0
Transcript of Master of Pharmacy in Pharmaceutics
““FFOORRMMUULLAATTIIOONN,, CCHHAARRAACCTTEERRIIZZAATTIIOONN AANNDD EEVVAALLUUAATTIIOONN OOFF
M
I
MAATTRRIIXX TTYYPPEE TTRRAANNSSDDEERRMMAALL PPAATTCCHHEESS OOFF CCAARRVVEEDDIILLOOLL””
By MMrr.. KKAAIILLAASSHH VVIISSHHVVAANNAATTHHRRAAOO VVIILLEEGGAAVVEE
B. Pharm.
Dissertation Submitted to the
Rajiv Gandhi University of Health Sciences, Karnataka, Bangalore
In partial fulfillment of the requirements for the degree of
Master of Pharmacy
in
Pharmaceutics Under the guidance of
Shri. S.P. HIREMATH
M. Pharm, Associate Professor
Department of Pharmaceutics, K.L.E.S’s College of Pharmacy,
Hubli -580031, Karnataka, India.
February 2010

RAJIV GANDHI UNIVERSITY OF HEALTH SCIENCES,
KARNATAKA, BANGALORE.
DECLARATION BY THE CANDIDATE
I hereby declare that this dissertation entitled “
“FFOORRMMUULLAATTIIOONN,,
C
CHHAARRAACCTTEERRIIZZAATTIIOONN AANNDD EEVVAALLUUAATTIIOONN OOFF MMAATTRRIIXX TTYYPPEE
T
TRRAANNSSDDEERRMMAALL PPAATTCCHHEESS OOFF CCAARRVVEEDDIILLOOLL”” is a bonafide and genuine
research work carried out by me under the guidance of S
Shhrrii.. SS..PP.. HHiirreemmaatthh.
Associate Professor, Department of Pharmaceutics, K.L.E.S’s College of
Pharmacy, Hubli.
Date:
Place: Hubli M
Mrr.. KKAAIILLAASSHH VV..VVIILLEEGGAAVVEE
II

RAJIV GANDHI UNIVERSITY OF HEALTH SCIENCES,
KARNATAKA, BANGALORE.
CERTIFICATE BY THE GUIDE
This is to certify that the dissertation entitled ““FFOORRMMUULLAATTIIOONN,,
C CHHAARRAACCTTEERRIIZZAATTIIOONN AANNDD EEVVAALLUUAATTIIOONN OOFF MMAATTRRIIXX TTYYPPEE
T TRRAANNSSDDEERRMMAALL PPAATTCCHHEESS OOFF CCAARRVVEEDDIILLOOLL”” is a bonafide research
work done by M Mrr.. KKaaiillaasshh VViilleeggaavvee in partial fulfillment of the
requirement for the degree of MASTER OF PHARMACY IN
PHARMACEUTICS.
S Shhrrii.. SS..PP.. HHiirreemmaatthh M.Pharm, Associate Professor
Department of Pharmaceutics, Date: K.L.E.S’s College of Pharmacy, Place: Hubli Hubli- 580031.
Karnataka. (India)
III
RAJIV GANDHI UNIVERSITY OF HEALTH SCIENCES,
KARNATAKA, BANGALORE.
ENDORSEMENT BY THE HOD, PRINCIPAL/ HEAD OF THE
INSTITUTION
This is to certify that the dissertation entitled “FORMULATION,
CHARACTERIZATION AND EVALUATION OF MATRIX TYPE
TRANSDERMAL PATCHES OF CARVEDILOL” is a bonafide research work
done by M
Mrr.. KKAAIILLAASSHH VVIISSHHVVAANNAATTHHRRAAOO VVIILLEEGGAAVVEE under the
guidance of Shri. S. P. HIREMATH Associate Professor, Department of
Pharmaceutics, K.L.E.S’s College of Pharmacy, Hubli.
Shri. V.G. Jamakandi Dr. B. M. Patil M.Pharm, M.Pharm, PhD.
Professor & Head, Principal & Professor Department of Pharmaceutics, Department of Pharmacology,
K.L.E.S’s College of Pharmacy, K.L.E.S’s College of Pharmacy, Hubli – 580031. Hubli – 580031. Date:
Place: Hubli
IV

COPYRIGHT
Declaration by the Candidate
I hereby declare that the RRaajjiivv GGaannddhhii UUnniivveerrssiittyy ooff HHeeaalltthh
S
Scciieenncceess,, KKaarrnnaattaakkaa,, shall have the rights to preserve, use and
disseminate this dissertation/thesis in print or electronic format for
academic/research purpose.
Date:
Place: Hubli M Mrr.. KKaaiillaasshh VViisshhvvaannaatthhrraaoo VViilleeggaavvee B.Pharm.
© Rajiv Gandhi University of Health Sciences, Karnataka.
V
LIST OF ABBREVIATIONS USED
Abs - Absorbance
AR - Analytical reagent
B.P - British Pharmacoepia
cp - Centipoise
Conc. - Concentration
0C - Degree centigrade
CDR - Cumulative drug release
%CDR - Percentage cumulative drug release
Cm2 - Centimeter square
DBP - Dibutyl phthalate
D.F - Dilution factor
DSC - Differential Scanning Calorimetry
EC - Ethyl cellulose
FTIR - Fourier transform infrared
Fig - Figure
gms - Grams
μgm/µg - Micro gram
HPMC - Hydroxy propyl methyl cellulose (6 cps)
hrs - Hours
ICH - International Conference on Harmonisation
Kp - Permeability coefficient
Kg - Kilo grams
Kg/cm2 - Kilograms per square centimeter
LR - Laboratory reagent
I
λ Max - Absorption maxima
mg - Milligram
min - Minute
MIPB - 30% v/v methanolic isotonic phosphate buffer of pH 7.4
ml - Milliliter
mm - Millimeter
nm - Nanometer
Ph Eur - European Pharmacoepia
RH - Relative humidity
RFCL Ltd. – Ranbaxy Fine Chemicals Limited
rpm - Revolutions per minute
SEM - Scanning electron microscopy
SS-I - Stock solution – I
SS-II - Stock solution – II
S.D. value - Standard deviation value
TEC - Tri ethyl citrate
Temp - Temperature
TDDS - Transdermal drug delivery system
UV - Ultra violet spectroscopy
USP - United States Pharmacopoeia
v/v - Volume/volume
wt. – Weight
w/v - Weight/volume
w/w - Weight/weight.
XRD - X-Ray Diffractometer
II
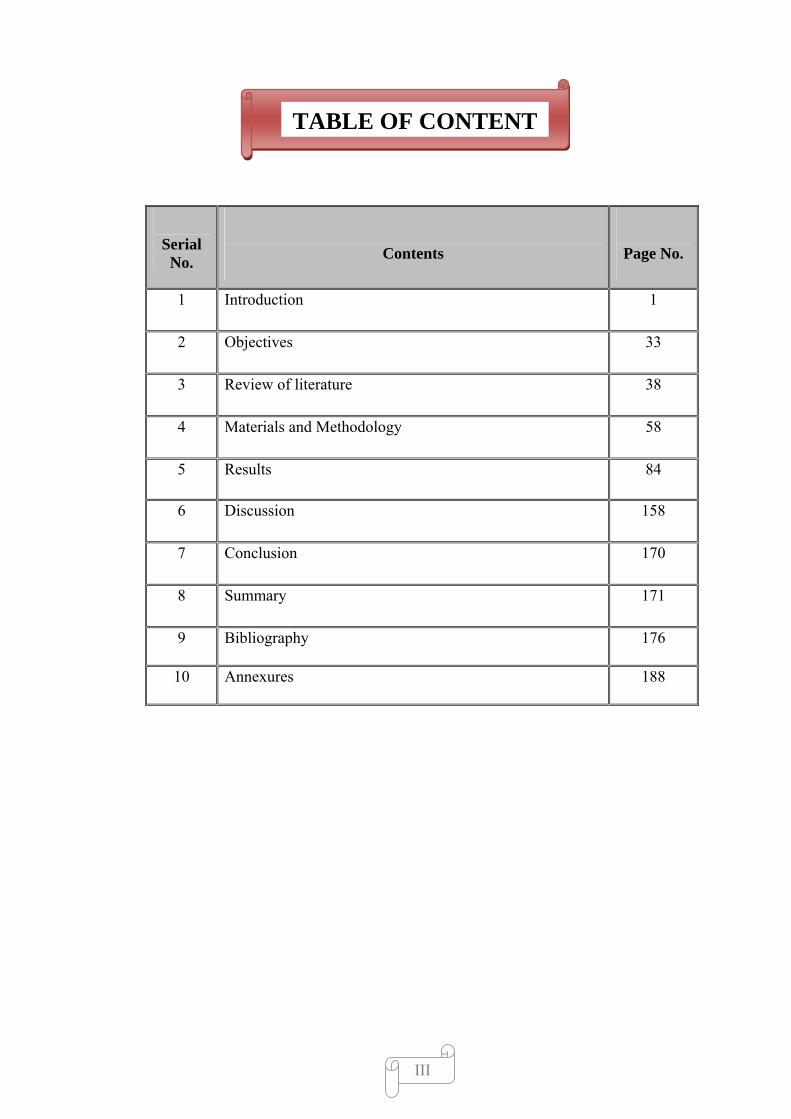
TABLE OF CONTENT
Serial No.
Contents
Page No.
1 Introduction 1
2 Objectives 33
3 Review of literature 38
4 Materials and Methodology 58
5 Results 84
6 Discussion 158
7 Conclusion 170
8 Summary 171
9 Bibliography 176
10 Annexures 188
III
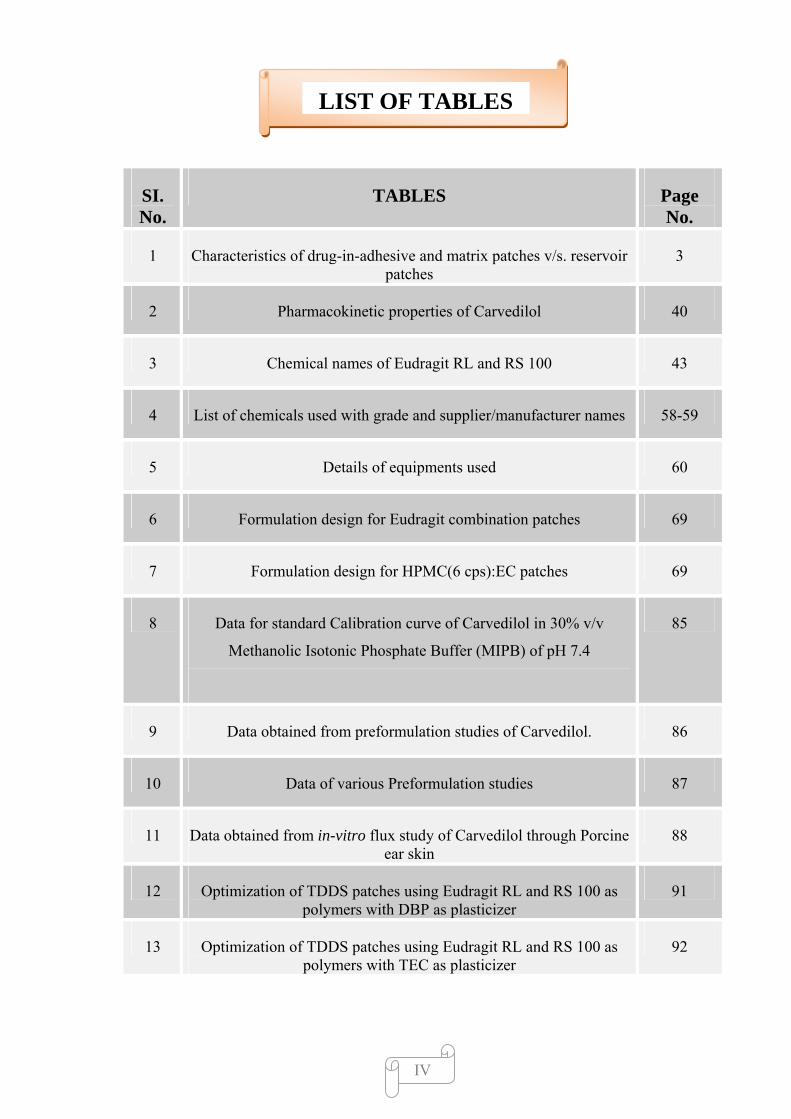
LIST OF TABLES
SI. No.
TABLES Page No.
1 Characteristics of drug-in-adhesive and matrix patches v/s. reservoir patches
3
2 Pharmacokinetic properties of Carvedilol 40
3 Chemical names of Eudragit RL and RS 100 43
4 List of chemicals used with grade and supplier/manufacturer names 58-59
5 Details of equipments used 60
6 Formulation design for Eudragit combination patches 69
7 Formulation design for HPMC(6 cps):EC patches 69
8 Data for standard Calibration curve of Carvedilol in 30% v/v
Methanolic Isotonic Phosphate Buffer (MIPB) of pH 7.4
85
9 Data obtained from preformulation studies of Carvedilol. 86
10 Data of various Preformulation studies 87
11 Data obtained from in-vitro flux study of Carvedilol through Porcine ear skin
88
12 Optimization of TDDS patches using Eudragit RL and RS 100 as polymers with DBP as plasticizer
91
13 Optimization of TDDS patches using Eudragit RL and RS 100 as polymers with TEC as plasticizer
92
IV
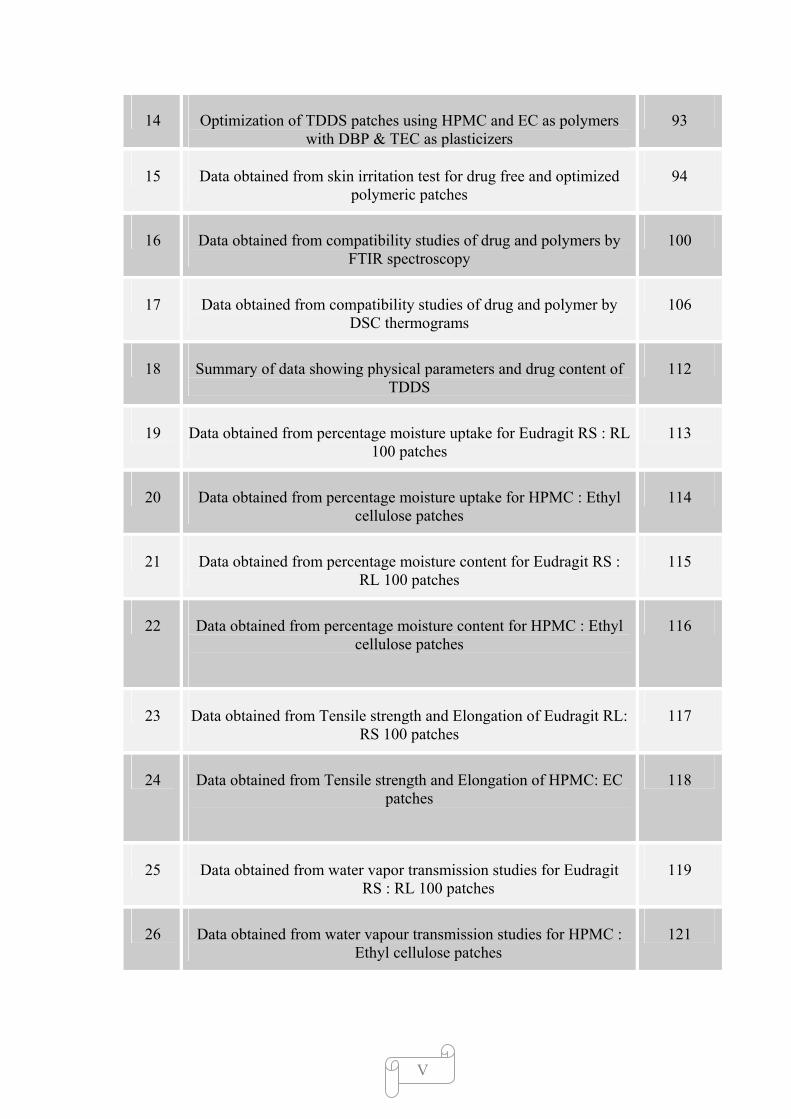
14 Optimization of TDDS patches using HPMC and EC as polymers with DBP & TEC as plasticizers
93
15 Data obtained from skin irritation test for drug free and optimized polymeric patches
94
16 Data obtained from compatibility studies of drug and polymers by FTIR spectroscopy
100
17 Data obtained from compatibility studies of drug and polymer by DSC thermograms
106
18 Summary of data showing physical parameters and drug content of TDDS
112
19 Data obtained from percentage moisture uptake for Eudragit RS : RL 100 patches
113
20 Data obtained from percentage moisture uptake for HPMC : Ethyl cellulose patches
114
21 Data obtained from percentage moisture content for Eudragit RS : RL 100 patches
115
22 Data obtained from percentage moisture content for HPMC : Ethyl cellulose patches
116
23 Data obtained from Tensile strength and Elongation of Eudragit RL: RS 100 patches
117
24 Data obtained from Tensile strength and Elongation of HPMC: EC patches
118
25 Data obtained from water vapor transmission studies for Eudragit RS : RL 100 patches
119
26 Data obtained from water vapour transmission studies for HPMC : Ethyl cellulose patches
121
V
27 Data obtained from Adhesive property of patches by Thumb tack test
128
28 Data obtained from dissolution study of optimized patches using USP paddle method
129
29 In vitro release study of formulation RSL 1 through dialysis membrane
131
30 In vitro release study of formulation RLS 2 through dialysis membrane
132
31 In vitro release study of formulation RLS 3 through dialysis membrane
133
32 In vitro release study of formulation RLS 4 through dialysis membrane
134
33 In vitro release study of formulation RLS 5 through dialysis membrane
135
34 In vitro release study of formulation RLS 6 through dialysis membrane
136
35 In vitro release study of formulation RLS 7 through dialysis membrane
137
36 In vitro release study of formulation RLS 8 through dialysis membrane
138
37 In vitro release study of formulation RHE 1 through dialysis membrane
141
38 In vitro release study of formulation RHE 2 through dialysis membrane
142
39 In vitro release study of formulation RHE 3 through dialysis membrane
143
40 In vitro release study of formulation RHE 4 through dialysis membrane
144
VI
41 In vitro release study of formulation RHE 5 through dialysis membrane
145
42 In vitro release study of formulation RHE 6 through dialysis membrane
146
43 In vitro release study of formulation RHE 7 through dialysis membrane
147
44 In vitro release study of formulation optimized with Eudragit RS : RL 100 (RSL 2) through
Porcine ear skin
149
45 In vitro release study of formulation optimized with HPMC : EC (RHE 3) through
Porcine ear skin
150
46 : In vitro release study of formulation optimized with HPMC : EC (RHE 3) through
Porcine ear skin
152
47 Kinetic data of various models applied to release study of best formulations
154
48 Data obtained from stability studies for physico-chemical parameters of optimized patches
155
VII
LIST OF FIGURES
SI. No.
FIGURES Page No.
1 Simplified structure of skin 5
2 Transport pathways of drugs through stratum corneum 9
3 A) Process of percutaneous absorption & transdermal delivery
10
4 B) Dermal absorption, sites of action & toxicity 10
5 Polymer membrane permeation controlled TDDS 16
6 Polymer Matrix Diffusion-Controlled TDDS 17
7 Drug Reservoir Gradient-Controlled TDD System 18
8 Microreservoir Dissolution Controlled TDDS 19
9 Release Liner 21
10 Backing Layer 22
11 Shimadzu, DSC Q20 V24.4, Japan. DSC Instrument 67
12 Universal Strength Testing Machine 72
13 JEOL, JSM-6360A, Japan Scanning Electron Microscope. 74
14 Stability Chamber 75
15 Magnetic Stirrer with Franz Diffussion cell 78
VIII
16 Albino Wistar rats prepared for in vivo study 80
17 Biopack Machine
81
18 Photographs of Eudragit RS: RL 100 patches 123
19 Photographs of HPMC: Ethyl cellulose patches 124
20 Scanning Electron Microscopy of formulation RSL 2 125
21 SEM photograph of the transdermal film (RSL2) showing the patch behaviour after the release of drug
126
22 Scanning Electron Microscopy of formulation RHE 3 127
IX
LIST OF GRAPHS
SI. No. GRAPHS Page No.
1 Standard Calibration curve of Carvedilol 85
2 Flux of Carvedilol through porcine ear skin 89
3 Water vapour transmission profile for Eudragit RL: RS 100 patches
120
4 Water vapor transmission profile for HPMC : EC patches 122
5 Dissolution profile for Eudragit RL:RS 100 and HPMC patches 130
6A In vitro release profile for Eudragit formulations through dialysis membrane
139
6B In vitro release profile for Eudragit formulations through dialysis membrane
140
7 In vitro release profile for HPMC : EC formulations through dialysis membrane
148
8 In vitro permeation profile for optimized formulations RLS 1 and RHE 4 through porcine ear skin.
151
X
LIST OF SPECTRA
SI. No. SPECTRA Page No.
1 UV spectra of Carvedilol 84
2 FTIR spectra of Carvedilol 94
3 FTIR spectra of Eudragit RL and RS 100 96
4 FTIR spectra of Eudragit RL 100, RS 100 and Carvedilol 97
5 FTIR spectra of HPMC (6 cps) and EC 98
6 FTIR spectra of HPMC (6 cps), EC and Carvedilol 99
7 DSC thermogram of Carvedilol 101
8 DSC thermogram of Eudragit RL and RS 100 102
9 DSC thermogram of Carvedilol, Eudragit RL and RS 100 103
10 DSC thermogram of HPMC (6 cps) and EC 104
11 DSC thermogram of Carvedilol, HPMC (6 cps) and EC 105
12 XRD spectra of Carvedilol 107
13 XRD spectra of Eudragit RL100:RS100 and Carvedilol Transdermal patch
108
14 XRD spectra of HPMC: EC and Carvedilol Transdermal patch 109
15 XRD spectra of Eudragit RL100:RS100 Blank Transdermal patch
110
16 XRD spectra of HPMC: EC Blank Transdermal patch 111
17 Stability studies: FTIR spectra of formulation RLS 2 156
18 Stability studies: FTIR spectra of formulation RHE 3 157
XI

XII
ABSTRACT
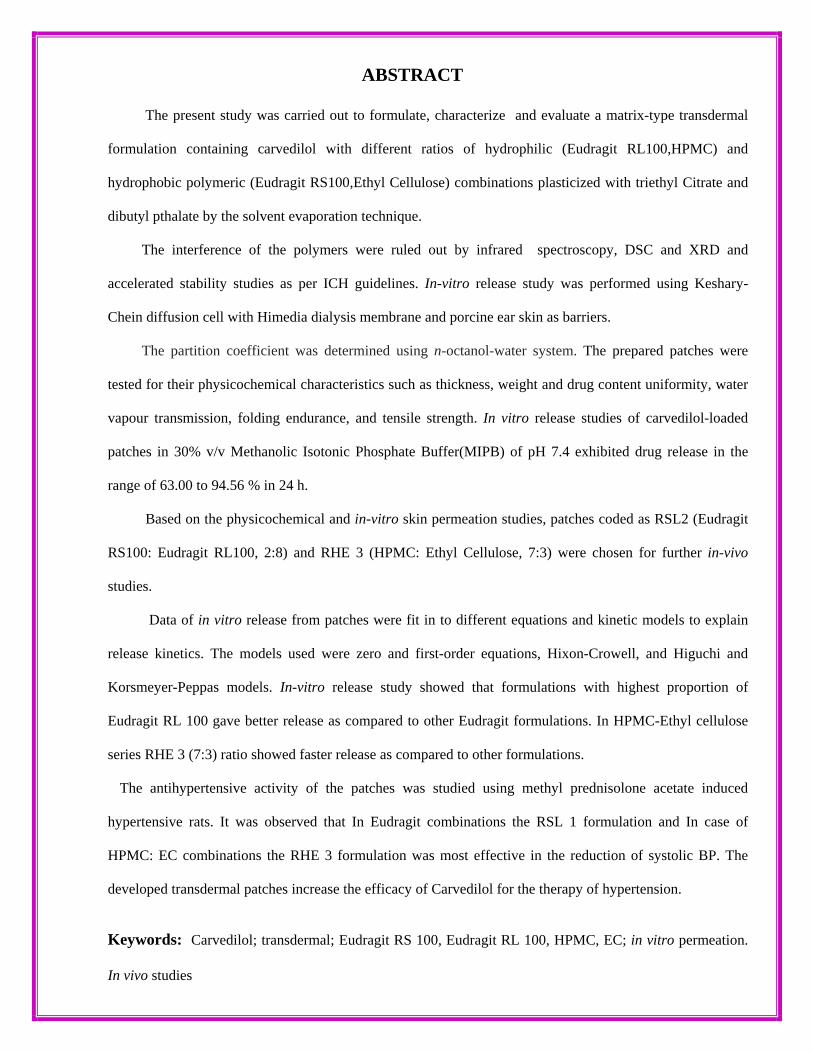
The present study was carried out to formulate, characterize and evaluate a matrix-type transdermal
formulation containing carvedilol with different ratios of hydrophilic (Eudragit RL100,HPMC) and
hydrophobic polymeric (Eudragit RS100,Ethyl Cellulose) combinations plasticized with triethyl Citrate and
dibutyl pthalate by the solvent evaporation technique.
The interference of the polymers were ruled out by infrared spectroscopy, DSC and XRD and
accelerated stability studies as per ICH guidelines. In-vitro release study was performed using Keshary-
Chein diffusion cell with Himedia dialysis membrane and porcine ear skin as barriers.
The partition coefficient was determined using n-octanol-water system. The prepared patches were
tested for their physicochemical characteristics such as thickness, weight and drug content uniformity, water
vapour transmission, folding endurance, and tensile strength. In vitro release studies of carvedilol-loaded
patches in 30% v/v Methanolic Isotonic Phosphate Buffer(MIPB) of pH 7.4 exhibited drug release in the
range of 63.00 to 94.56 % in 24 h.
Based on the physicochemical and in-vitro skin permeation studies, patches coded as RSL2 (Eudragit
RS100: Eudragit RL100, 2:8) and RHE 3 (HPMC: Ethyl Cellulose, 7:3) were chosen for further in-vivo
studies.
Data of in vitro release from patches were fit in to different equations and kinetic models to explain
release kinetics. The models used were zero and first-order equations, Hixon-Crowell, and Higuchi and
Korsmeyer-Peppas models. In-vitro release study showed that formulations with highest proportion of
Eudragit RL 100 gave better release as compared to other Eudragit formulations. In HPMC-Ethyl cellulose
series RHE 3 (7:3) ratio showed faster release as compared to other formulations.
The antihypertensive activity of the patches was studied using methyl prednisolone acetate induced
hypertensive rats. It was observed that In Eudragit combinations the RSL 1 formulation and In case of
HPMC: EC combinations the RHE 3 formulation was most effective in the reduction of systolic BP. The
developed transdermal patches increase the efficacy of Carvedilol for the therapy of hypertension.
Keywords: Carvedilol; transdermal; Eudragit RS 100, Eudragit RL 100, HPMC, EC; in vitro permeation.
In vivo studies
Chapter 1 Introduction
1.0 INTRODUCTION
Transdermal drug delivery systems are devices containing drug of defined
surface area that delivers a pre-determined amount of drug to the surface of intact skin at
a pre-predefined rate.1 The skin as a route for systemic drug administration has become
very attractive since the introduction of transdermal therapeutic systems in the form of
patches.2 A transdermal patch is a medicated adhesive patch that is placed on the skin to
deliver a time-released dose of medication systemically for treating illnesses. Since early
1980s, this dosage form of transdermal therapeutic system has been available in the
pharmaceutical market.3 The discovery of transdermal drug delivery systems (TDDS) is
a breakthrough in the field of controlled drug delivery systems. The ability of TDDS to
deliver drugs for systemic effect through intact skin while bypassing first pass
metabolism has accelerated transdermal drug delivery research in the field of
pharmaceutics. Over a decade of such extensive research activities, many transdermal
patches have been developed and successfully commercialized.4
Preparation of TDDS consists of three basic designs: membrane control or
reservoir patches (RPs), matrix or monolithic patches (MPs), and Drug in adhesive
patches (DIAPs).5
The earliest TDDS were reservoir-type devices that used membranes to control
the rate of drug release.6 Reservoir patches contain the drug in a raised compartment,
diffusing it through a polymeric membrane that controls the release rate, usually
providing true zero-order kinetics. Matrix patches combine the drug, polymeric
membrane, and adhesive into a single layer, the polymeric matrix. Drug is diffused
through the polymeric matrix and through the skin. The drug closest to the skin is
Dept. of pharmaceutics, KLES’s COP, Hubli 1
Chapter 1 Introduction
released first, and drug deeper within the patch travels a longer diffusional path before
being released. This pattern departs slightly from zero-order kinetics, but the difference is
generally not clinically significant. Matrix patches are smaller and thinner than reservoir
patches, features that have increased patch acceptability among patients.7
Monolithic matrix systems consist of a polymeric material in which the drug is
dispersed or dissolved, acting simultaneously as a combined drug reservoir and skin
contact adhesive layer.8 Today a drug is more commonly dispersed or dissolved in a
pressure-sensitive adhesive (PSA) matrix also called as drug in adhesive patches.6
In the simplest form, the adhesive matrix or drug-in-adhesive (DIA) design, the
drug is directly loaded or dispersed into the PSA polymer. The adhesive matrix provides
several functions, including skin adhesion, storage of the drug, and control over
drug/enhancer delivery rate, and it also governs their partitioning into the stratum
corneum.9
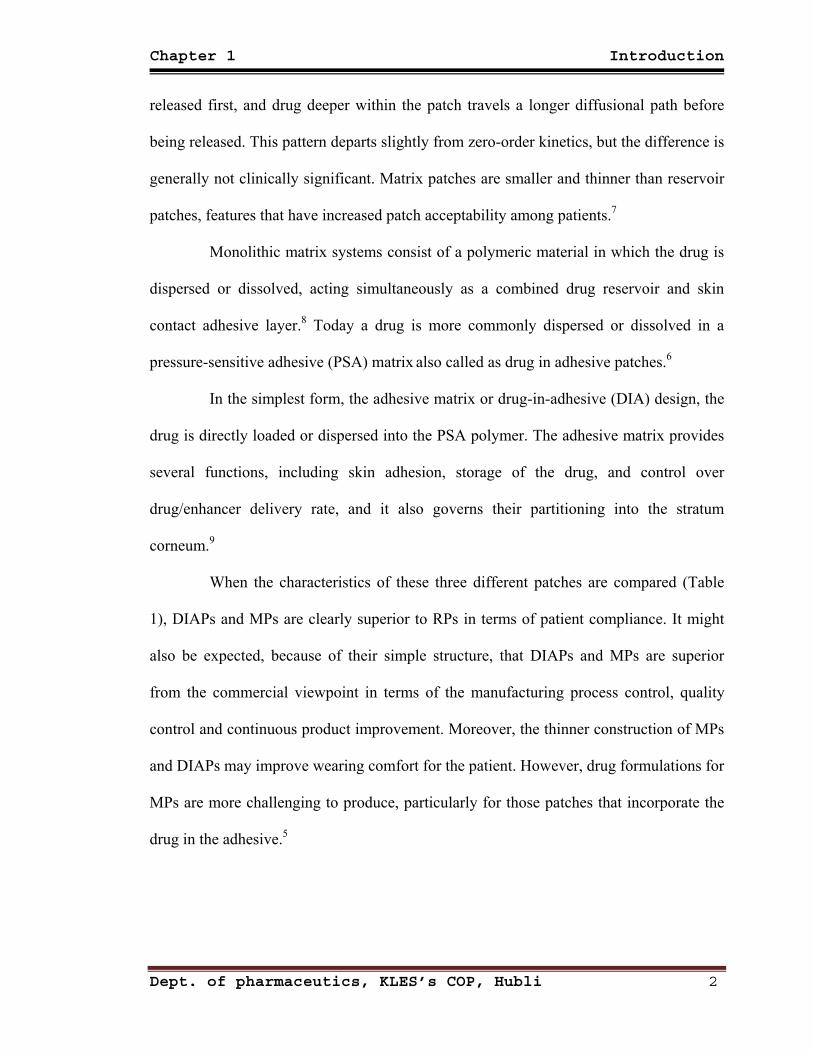
When the characteristics of these three different patches are compared (Table
1), DIAPs and MPs are clearly superior to RPs in terms of patient compliance. It might
also be expected, because of their simple structure, that DIAPs and MPs are superior
from the commercial viewpoint in terms of the manufacturing process control, quality
control and continuous product improvement. Moreover, the thinner construction of MPs
and DIAPs may improve wearing comfort for the patient. However, drug formulations for
MPs are more challenging to produce, particularly for those patches that incorporate the
drug in the adhesive.5
Dept. of pharmaceutics, KLES’s COP, Hubli 2
Chapter 1 Introduction
Table 1. Characteristics of drug-in-adhesive and matrix patches vs. reservoir patches:5
Type Structure Formulation Skin conformability
Size adjustment Dose dumping
Drug in adhesive (DIA) or matrix
patch (MP)
Simple thin layer
Complex Good Easy Low potential
Reservoir Patch (RP)
Complex multi-layer
Simple Some
discomfort
Difficult
Possible breakage of
rate controlling layer.
Several factors should be considered before choosing an appropriate design for a
particular compound: drug solubility, stability and release rate. As a rule of thumb, if a
drug permeates or crosses the skin faster than desired, RPs can slow down or control the
permeation. Alternatively, if a drug passes through skin at a slower rate than the patch
releases it, MPs probably containing a suitable chemical penetration enhancer may
suffice.5
1.1 The Skin site for transdermal drug administration: 10
The skin constitutes one of the largest interfaces between the body and the
environment. On the one hand, the function of human skin is to protect our body against
chemical, physical, and microbial injury, loss of water, and other endogenous substances;
on the other hand, it is involved in the thermoregulation of the body and serves as an
excretory organ. This bifunctional nature of the skin depends on its highly differentiated
structure, with the main barrier function being located in the outermost skin layer, the
stratum corneum.
The skin is one of the most extensive and readily accessible organs of the
human body. The skin of an average adult body covers a surface area of approximately
Dept. of pharmaceutics, KLES’s COP, Hubli 3
Chapter 1 Introduction
2m2 (or 3000 inch2) and receives about one third of the blood circulating through the
body.
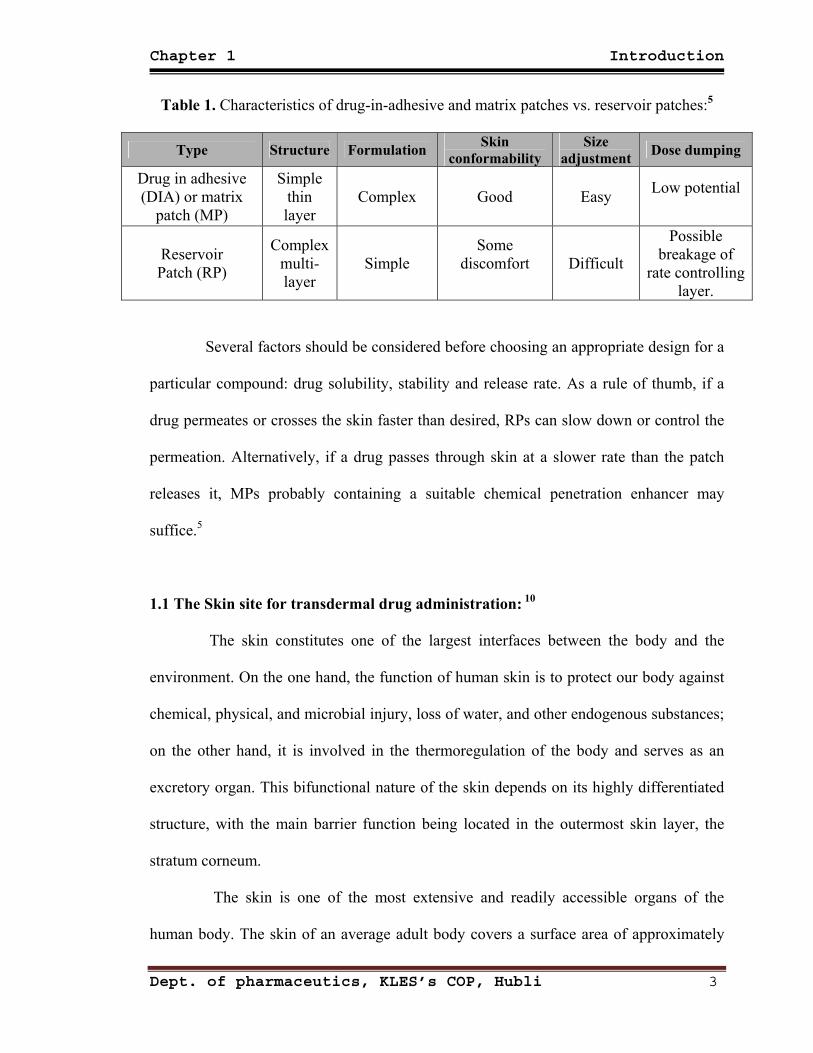
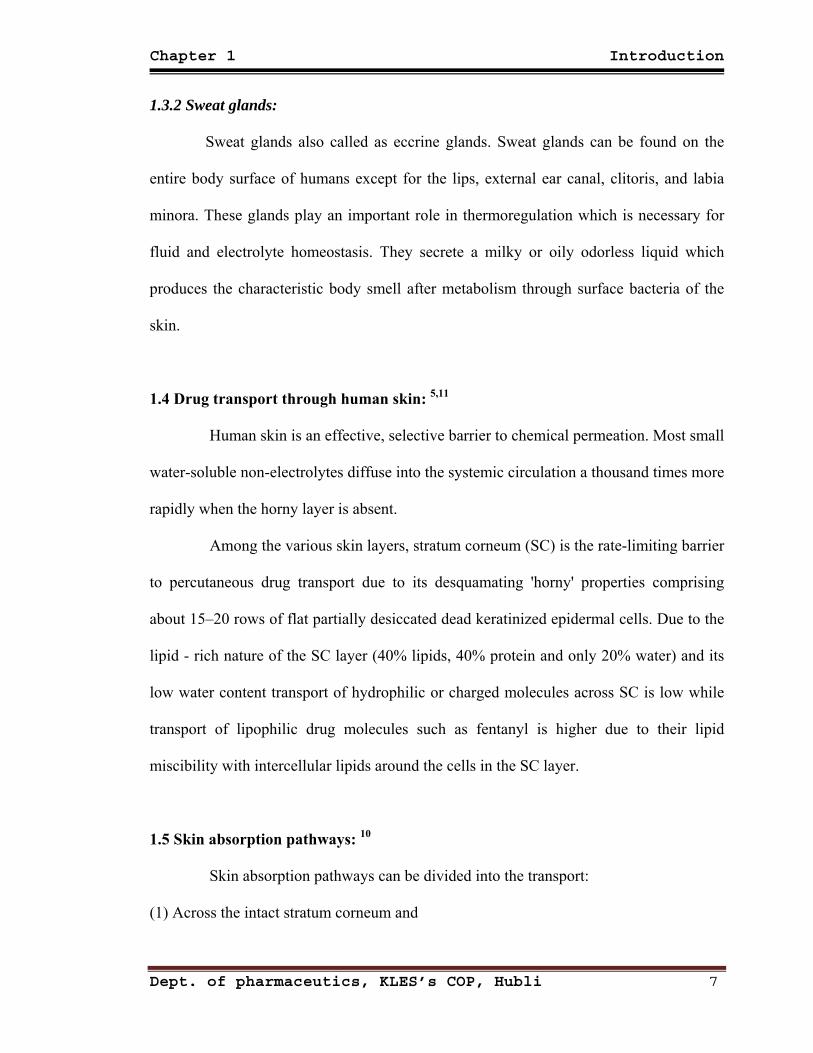
1.2 Anatomical structure of human skin:10 (Figure 1)
The multitude of different functions of the human skin can only be achieved by
a unique anatomical structure of the different skin layers. These are as follows:
A ) Epidermis consisting of:
-- Stratum corneum (outermost layer)
-- Viable epidermis
B) Dermis
C) Subcutis or subcutaneous fatty tissue
1.2.1 Epidermis:
Because of practical reasons, the human epidermis can be generally divided into
two main layers, the stratum corneum and the viable epidermis. The stratum corneum
consists of separated nonviable cornified almost nonpermeable corneocytes embedded
into a continuous lipid bilayer made of various classes of lipids, for example, ceramides,
cholesterol, cholesterol esters, free fatty acids, and triglycerides. Structurally, this
epidermis layer is best described by the so-called brick-and-mortar model.
The stratum corneum is crucial for the barrier function of the skin, controlling
percutaneous absorption of dermally applied substances and regulating fluid homeostasis.
The thickness of the stratum corneum is usually 10–25 μm, with exceptions at the soles of
the feet and the palms, which swells several-fold when hydrated. All components of the
Dept. of pharmaceutics, KLES’s COP, Hubli 4
Chapter 1 Introduction
stratum corneum originate from the basal layer of the epidermis, the stratum
germinativum.
Fig. no.1: Simplified structure of Skin
The viable epidermis is made of several layers starting with the innermost
layer called stratum germinativum (the basal layer), followed by the stratum spinosum,
the stratum granulosum, and the stratum lucidum, which is present only at the palm of the
hand and at the sole of the foot. Over the course of 28 days cells originating from the
stratum germinativium migrate to the skin surface undergoing various states of
differentiation. The cells in doing so lose their nuclei, get flattened, discharge lipids into
the intercellular space (stratum granulosum) and are cornified building up the unique
stratum corneum structure.
Dept. of pharmaceutics, KLES’s COP, Hubli 5

Chapter 1 Introduction
1.2.2 Dermis:
Depending on the body site, the thickness of the dermis ranges from 3 to 5 mm.
The dermis consists of a matrix of connective tissue composed of collagen, elastin, and
reticulin and is interspersed by skin appendages such as sweat glands, pilosebaceous units
and hair follicles. Furthermore nerves, lymphatic and blood vessels are located in this
skin layer. Blood vessels are found directly beneath the stratum germinativum of the
viable epidermis supplying nutrients and removing metabolites.
For systemic drug absorption, both the blood system and the lymphatic system
are responsible, acting as sinks and hence keeping the drug concentration in the dermis
low.
1.2.3 Subcutis or subcutaneous fatty tissue:
The subcutaneous fatty layer acts mainly as a heat insulator and a mechanical
cushion and stores readily available high-energy chemicals.
1.3 Skin appendages:10
Skin appendages can be distinguished into hair follicles with their associated
sebaceous glands, eccrine sweat glands, apocrine sweat glands, and nails.
1.3.1 Hair follicles:
Hair follicles with their associated sebaceous glands are present all over the skin
surface with the exception of lips, palms, and soles. Furthermore, hair follicles intersperse
down to the subcutis offering permeation pathways deep into the skin. The density of hair
follicles varies with species and body site. The sebaceous glands produce the sebum,
which lubricates and protects the skin and is involved in the regulation of the pH on the
skin surface.
Dept. of pharmaceutics, KLES’s COP, Hubli 6
Chapter 1 Introduction
1.3.2 Sweat glands:
Sweat glands also called as eccrine glands. Sweat glands can be found on the
entire body surface of humans except for the lips, external ear canal, clitoris, and labia
minora. These glands play an important role in thermoregulation which is necessary for
fluid and electrolyte homeostasis. They secrete a milky or oily odorless liquid which
produces the characteristic body smell after metabolism through surface bacteria of the
skin.
1.4 Drug transport through human skin: 5,11
Human skin is an effective, selective barrier to chemical permeation. Most small
water-soluble non-electrolytes diffuse into the systemic circulation a thousand times more
rapidly when the horny layer is absent.
Among the various skin layers, stratum corneum (SC) is the rate-limiting barrier
to percutaneous drug transport due to its desquamating 'horny' properties comprising
about 15–20 rows of flat partially desiccated dead keratinized epidermal cells. Due to the
lipid - rich nature of the SC layer (40% lipids, 40% protein and only 20% water) and its
low water content transport of hydrophilic or charged molecules across SC is low while
transport of lipophilic drug molecules such as fentanyl is higher due to their lipid
miscibility with intercellular lipids around the cells in the SC layer.
1.5 Skin absorption pathways: 10
Skin absorption pathways can be divided into the transport:
(1) Across the intact stratum corneum and
Dept. of pharmaceutics, KLES’s COP, Hubli 7
Chapter 1 Introduction
(2) Along the skin appendages.
The physicochemical properties of the drug as well as the nature of the formulation are
the main factors influencing the choice of pathway.
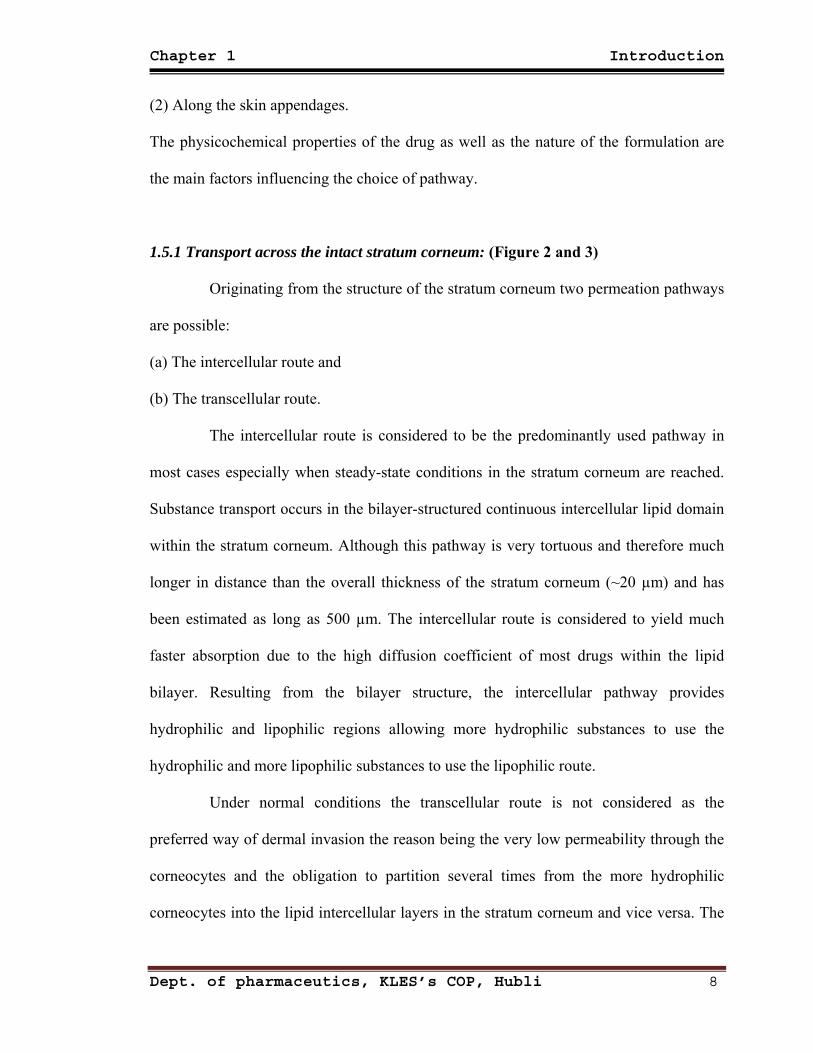
1.5.1 Transport across the intact stratum corneum: (Figure 2 and 3)
Originating from the structure of the stratum corneum two permeation pathways
are possible:
(a) The intercellular route and
(b) The transcellular route.
The intercellular route is considered to be the predominantly used pathway in
most cases especially when steady-state conditions in the stratum corneum are reached.
Substance transport occurs in the bilayer-structured continuous intercellular lipid domain
within the stratum corneum. Although this pathway is very tortuous and therefore much
longer in distance than the overall thickness of the stratum corneum (~20 µm) and has
been estimated as long as 500 µm. The intercellular route is considered to yield much
faster absorption due to the high diffusion coefficient of most drugs within the lipid
bilayer. Resulting from the bilayer structure, the intercellular pathway provides
hydrophilic and lipophilic regions allowing more hydrophilic substances to use the
hydrophilic and more lipophilic substances to use the lipophilic route.
Under normal conditions the transcellular route is not considered as the
preferred way of dermal invasion the reason being the very low permeability through the
corneocytes and the obligation to partition several times from the more hydrophilic
corneocytes into the lipid intercellular layers in the stratum corneum and vice versa. The
Dept. of pharmaceutics, KLES’s COP, Hubli 8
Chapter 1 Introduction
transcellular pathway can gain an importance when a penetration enhancer is used, for
example, urea which increases the permeability of the corneocytes by altering the keratin
structure.
Fig 2: Transport of drugs through stratum corneum
1.5.2 The appendages route:
The appendages route consists of the glandular and the follicular pathways with
the latter one being the more important. However, since appendages cover only 0.1% of
the whole skin surface area these pathways do not contribute significantly to dermal
absorption during steady-state conditions of skin absorption. In contrast, in the initial
stages of a skin absorption process and in the case of large hydrophilic compounds and
ions invasion through the appendages may play a considerable role. Recent studies also
report that the appendages route may be involved in the absorption of liposomes,
nanoparticles, and cyclodextrin-inclusion complexes.
Dept. of pharmaceutics, KLES’s COP, Hubli 9
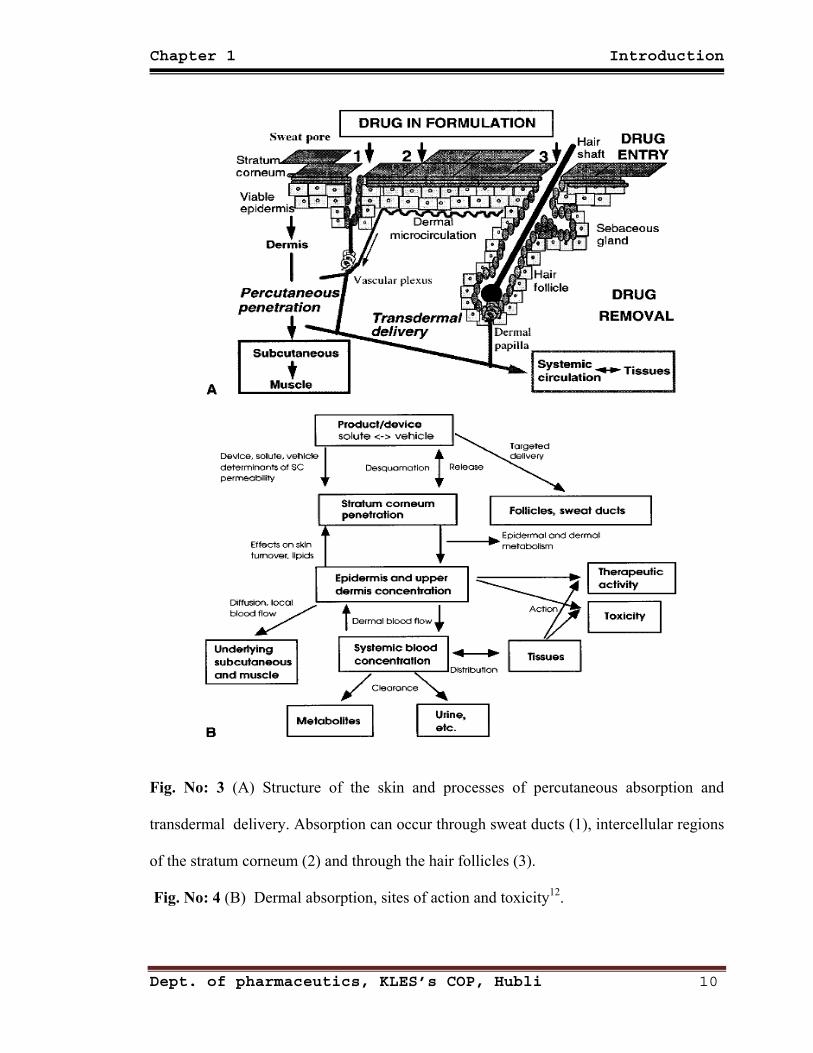
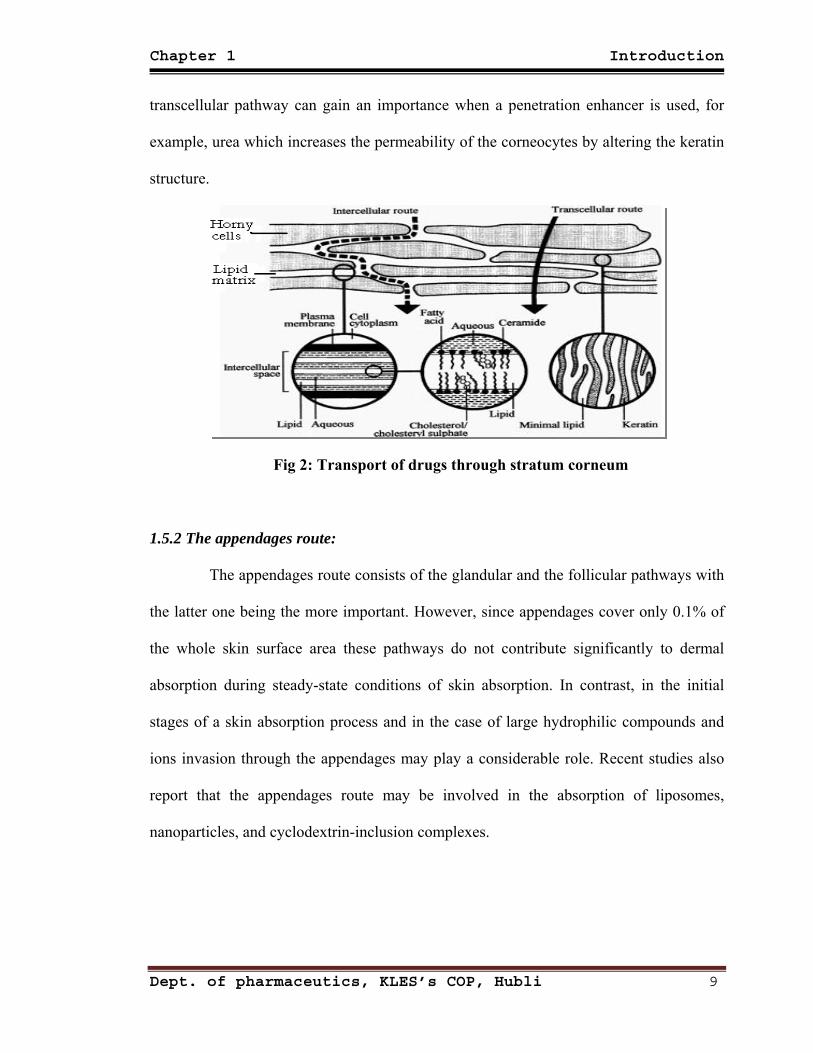
Chapter 1 Introduction
Fig. No: 3 (A) Structure of the skin and processes of percutaneous absorption and
transdermal delivery. Absorption can occur through sweat ducts (1), intercellular regions
of the stratum corneum (2) and through the hair follicles (3).
Fig. No: 4 (B) Dermal absorption, sites of action and toxicity12.
Dept. of pharmaceutics, KLES’s COP, Hubli 10
Chapter 1 Introduction
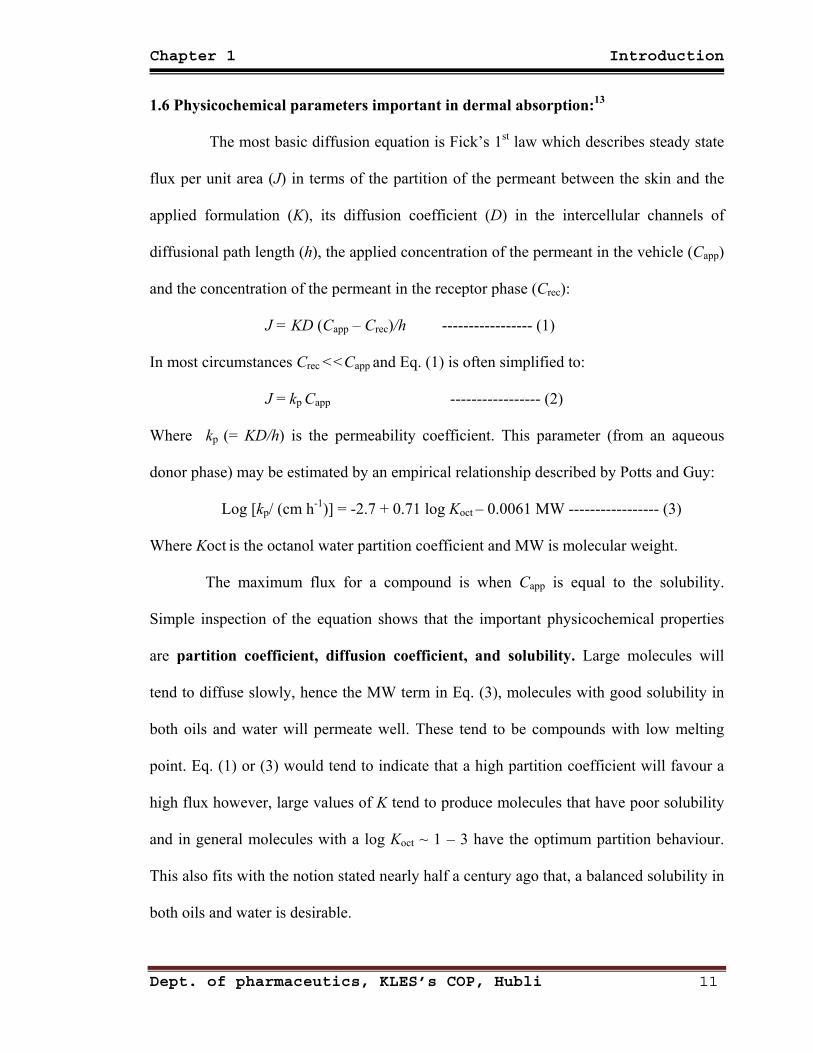
1.6 Physicochemical parameters important in dermal absorption:13
The most basic diffusion equation is Fick’s 1st law which describes steady state
flux per unit area (J) in terms of the partition of the permeant between the skin and the
applied formulation (K), its diffusion coefficient (D) in the intercellular channels of
diffusional path length (h), the applied concentration of the permeant in the vehicle (Capp)
and the concentration of the permeant in the receptor phase (Crec):
J = KD (Capp – Crec)/h ----------------- (1)
In most circumstances Crec <<Capp and Eq. (1) is often simplified to:
J = kp Capp ----------------- (2)
Where kp (= KD/h) is the permeability coefficient. This parameter (from an aqueous
donor phase) may be estimated by an empirical relationship described by Potts and Guy:
Log [kp/ (cm h-1)] = -2.7 + 0.71 log Koct – 0.0061 MW ----------------- (3)
Where Koct is the octanol water partition coefficient and MW is molecular weight.
The maximum flux for a compound is when Capp is equal to the solubility.
Simple inspection of the equation shows that the important physicochemical properties
are partition coefficient, diffusion coefficient, and solubility. Large molecules will
tend to diffuse slowly, hence the MW term in Eq. (3), molecules with good solubility in
both oils and water will permeate well. These tend to be compounds with low melting
point. Eq. (1) or (3) would tend to indicate that a high partition coefficient will favour a
high flux however, large values of K tend to produce molecules that have poor solubility
and in general molecules with a log Koct ~ 1 – 3 have the optimum partition behaviour.
This also fits with the notion stated nearly half a century ago that, a balanced solubility in
both oils and water is desirable.
Dept. of pharmaceutics, KLES’s COP, Hubli 11

Chapter 1 Introduction
1.7 The potential advantages of transdermal rate-controlled therapy include the
following: 15, 16
• Improved bioavailability for many drugs.
• Reliable blood levels of drug.
• Sustained therapeutic effect, allowing use of drugs with short half-lives.
• Diminished side effects.
• Improving patient compliance in long term therapy.
• Simple, noninvasive administration particularly important for patients who
are unable to take medication orally.
• Reduced overall treatment costs in many instances.
• Minimizing inter- and intra-patient variability.
• Making it possible to interrupt or terminate treatment when necessary.
These advantages of transdermal therapy may yield enhanced safety,
efficacy, reliability and acceptability of drug treatment.
1.8 Limitations of transdermal delivery:3,15,17
• As with the other routes of drug delivery, transport across the skin is also
associated with several disadvantages, the main drawback being that not
all compounds are suitable candidates.
• A number of physicochemical parameters have been identified that
influence the diffusion process and variations in permeation rates can
occur between individuals, different races and between the old and young.
Dept. of pharmaceutics, KLES’s COP, Hubli 12
Chapter 1 Introduction
• Furthermore, diseased skin, as well as the extent of the disease can also
affect permeation rates.
• The metabolic enzymes in the skin can also pose a problem and some
drugs are almost completely metabolized before they reach the cutaneous
vasculature.
• Another problem that can arise which is sometimes overlooked is that,
some drugs can be broken down before penetration through the SC by the
bacteria that live on the skin surface.
One of the major limitations of TDDS is that sometimes it may induce an
irritation or sensitization reaction of the skin.
1.9 Factors affecting transdermal permeability:14
The factors controlling transdermal permeability can be broadly placed in the
following cases:
I. Physico-chemical properties of the penetrant molecules:
1. Partition coefficient: Drugs having both lipid and water solubilities are favorably
absorbed through skin. Transdermal permeability coefficient shows a linear
dependency on partition coefficient. A lipid /water partition coefficient of one or
greater is generally required.
2. pH conditions: The pH value of high or low can be destructive to the skin. With
moderate pH values, the flux of ionisable drugs can be affected by changes in pH that
alter the ratio of charged to uncharged species and their transdermal permeability.
Dept. of pharmaceutics, KLES’s COP, Hubli 13
Chapter 1 Introduction
3. Penetrant concentration: Increasing concentration of dissolved drug causes a
proportional increase in flux. At higher concentration excess solid drug function as
reservoir and help to maintain a constant drug concentration for a prolonged period of
time.
II. Physico-chemical properties of drug delivery systems:
1. Release Characteristic: Solubility of the drug in the vehicle determines the release
rate. The mechanism of drug release depend on the following factors:
a) Whether the drug molecules are dissolved or suspended in the delivery system.
b) The interfacial partition coefficient of the drug from the delivery system to skin.
c) pH of the vehicle.
2. Enhancement of transdermal permeation: Majority of drugs will not penetrate the
skin at rates sufficiently high for therapeutic efficacy. The permeation can be
improved by the addition of permeation enhancer into the system.
III. Physiological and pathological condition of skin:
1. Reservoir effect of horny layer: The horny layer especially is deeper layer can
sometimes act as a depot & modify the transdermal permeation of drugs. This effect is
due to irreversible binding of a part of the applied drug with the skin.
2. Lipid film: The lipid film on the skin surface acts as a protective layer to prevent the
removal of moisture from the skin and helps in maintaining the barrier function of
stratum corneum.
Dept. of pharmaceutics, KLES’s COP, Hubli 14
Chapter 1 Introduction
3. Skin hydration: Hydration of stratum corneum can enhance permeability. Skin
hydration can be achieved simply by covering or occluding the skin with plastic
sheeting, leading to accumulation of sweat. Increased hydration appears to open up the
dense closely packed cells of the skin and increases its porosity.
4. Skin temperature: Raising the skin temperature results in an increase in the rate of
skin permeation; this may be due to availability of thermal energy required for
diffusivity.
5. Regional variation: Differences in nature and thickness of the barrier layer of skin
causes variation in permeability.
6. Pathological injuries to the skin: Injuries that disrupt the continuity of the stratum
corneum increases permeability due to increased vasodilatation caused by removal of
the barrier layer.
7. Cutaneous self metabolism: Catabolic enzymes present in the epidermis may render
the drug inactive by metabolism and the topical bioavailability of the drug is greatly
reduced.
1.10 Transdermal drug delivery system designs:9
Transdermal drug delivery can be achieved via active or passive systems
depending on whether external energy is used to assist the transport of the drug through
the skin. The active systems use heat, electric current (iontophoresis), sound waves
(sonophoresis), or transient high-voltage electrical pulses (electroporation) to enhance the
delivery of drugs into the systemic circulation.
In passive transdermal drug delivery systems, the drug diffuses through the skin
into the systemic circulation by passive means. The concentration gradient of the drug
Dept. of pharmaceutics, KLES’s COP, Hubli 15
Chapter 1 Introduction
across the skin and the difference in solubility between the adhesive and skin are the
driving force for delivery to the surface of the skin. In general, chemical permeation
enhancers (pharmaceutical excipients) are required for passive delivery to achieve the
required delivery of the drug from a patch of a reasonable size (that is, a surface area of ≤
40 cm2).There are four major designs of the conventional passive transdermal drug
delivery patches.
1.11 Different technologies employed in the development of TDDS:14
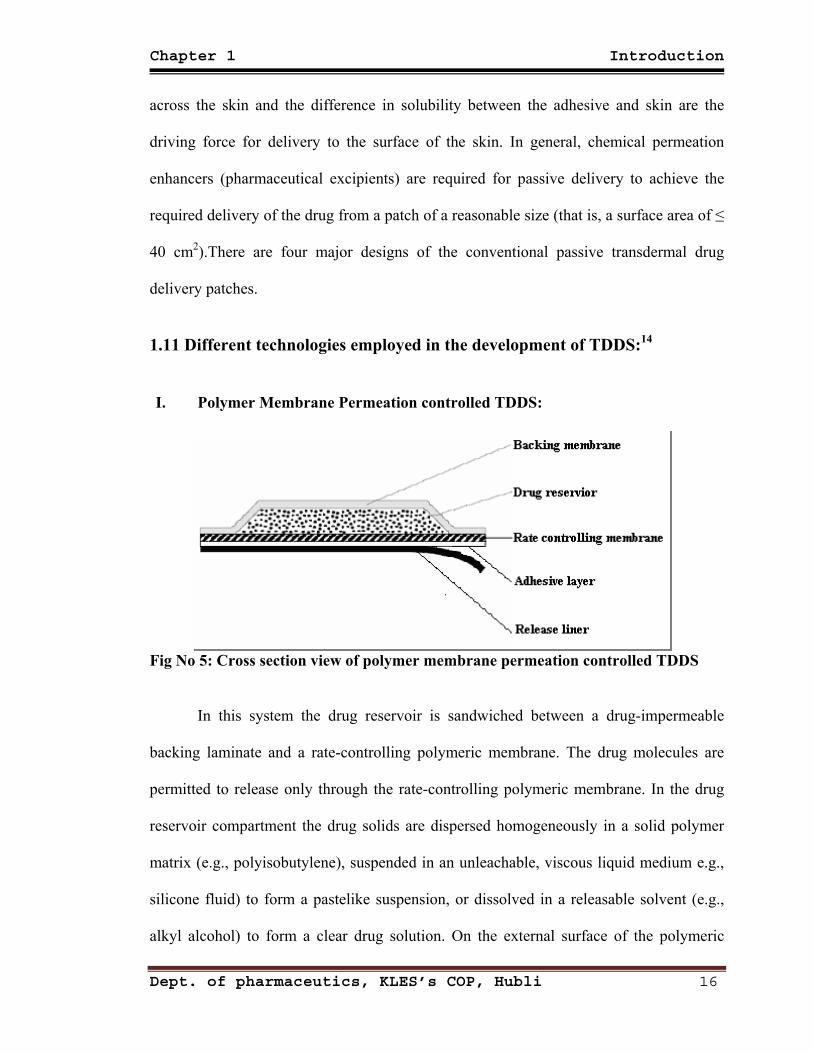
I. Polymer Membrane Permeation controlled TDDS:
Fig No 5: Cross section view of polymer membrane permeation controlled TDDS
In this system the drug reservoir is sandwiched between a drug-impermeable
backing laminate and a rate-controlling polymeric membrane. The drug molecules are
permitted to release only through the rate-controlling polymeric membrane. In the drug
reservoir compartment the drug solids are dispersed homogeneously in a solid polymer
matrix (e.g., polyisobutylene), suspended in an unleachable, viscous liquid medium e.g.,
silicone fluid) to form a pastelike suspension, or dissolved in a releasable solvent (e.g.,
alkyl alcohol) to form a clear drug solution. On the external surface of the polymeric
Dept. of pharmaceutics, KLES’s COP, Hubli 16
Chapter 1 Introduction
membrane a thin layer of drug-compatible, hypoallergenic pressure-sensitive adhesive
polymer, e.g., silicone adhesive, may be applied to provide intimate contact of the TDD
system with the skin surface. The intrinsic rate of drug release from this type of TDD
system is defined by:
dt =
Km/r Ka/m Da Dm
Km/r Dm ha + Ka/m Da hmCR (4) dQ
Where: CR ― Drug concentration in the reservoir compartment.
Km/r & Ka/m ― Are the partition coefficients for the interfacial partitioning of
drug from the reservoir to the membrane and from the membrane
to the adhesive.
Dm & Da ― Are the diffusion coefficients in the rate-controlling membrane
and in the adhesive layer.
hm & ha ― Are the thickness of rate controlling membrane and adhesive layer.
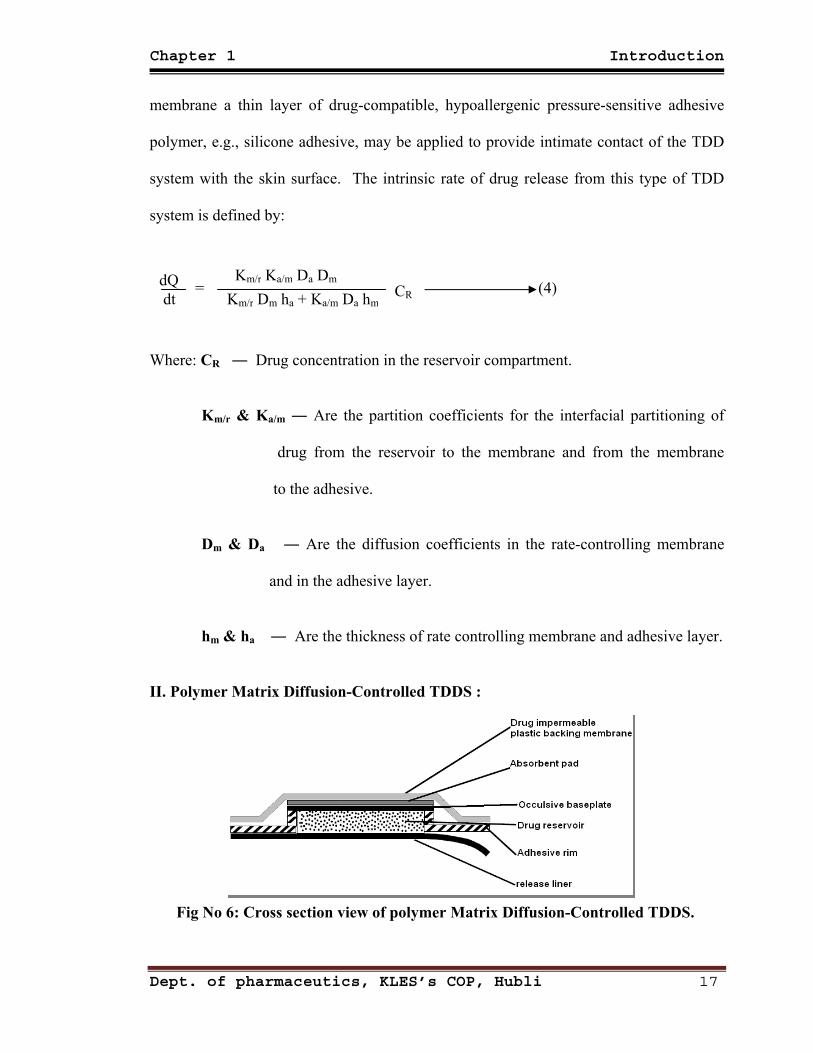
II. Polymer Matrix Diffusion-Controlled TDDS :
Fig No 6: Cross section view of polymer Matrix Diffusion-Controlled TDDS.
Dept. of pharmaceutics, KLES’s COP, Hubli 17
Chapter 1 Introduction
In this approach the drug reservoir is formed by homogeneously dispersing the
drug solid in a hydrophilic or lipophilic polymer matrix and the medicated polymer
formed is then molded into medicated disks with a defined surface area and controlled
thickness. This drug reservoir-containing polymer disk is then mounted onto an occlusive
baseplate in a compartment fabricated from a drug-impermeable plastic backing. In this
system the adhesive polymer is applied along the circumference of the patch to form a
strip of adhesive rim surrounding the medicated disk. The rate of drug release from this
polymer matrix drug dispersion-type TDD system is given by:
dQ dt
= Ld Cp Dp
2t
1/2
(5)
Where: Ld ― Drug loading dose initially dispersed in the polymer matrix.
Cp & Dp ― Solubility and diffusivity of the drug in the polymer matrix.
t ― Time.
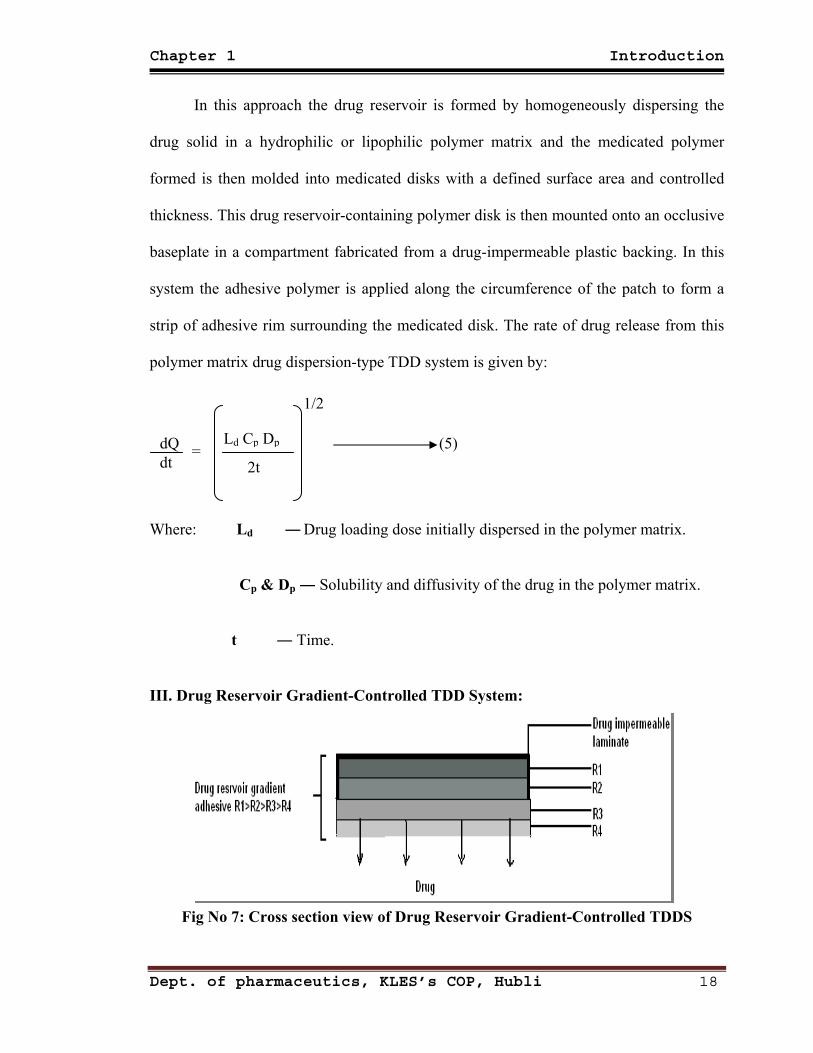
III. Drug Reservoir Gradient-Controlled TDD System:
Fig No 7: Cross section view of Drug Reservoir Gradient-Controlled TDDS
Dept. of pharmaceutics, KLES’s COP, Hubli 18
Chapter 1 Introduction
The polymer matrix drug dispersion-type TDD system can be modified to have the
drug loading level varied in an incremental manner, forming a gradient of drug reservoir
along the diffusional path across the multilaminate adhesive layers. The rate of drug
release from this type of drug reservoir gradient-controlled TDD system can be expressed
by:
dQ dt
= Ka/r Da
ha (t) Ld (ha) (6)
In this system the thickness of diffusional path through which drug molecules
diffuse increase with time, i.e., ha(t). To compensate for this time-dependent increase in
diffusional path as a result of drug depletion due to release, the drug loading level in the
multilaminate adhesive layers is also designed to increase proportionally, i.e., Ld(ha).
This, in theory should yield a more constant drug release profile.
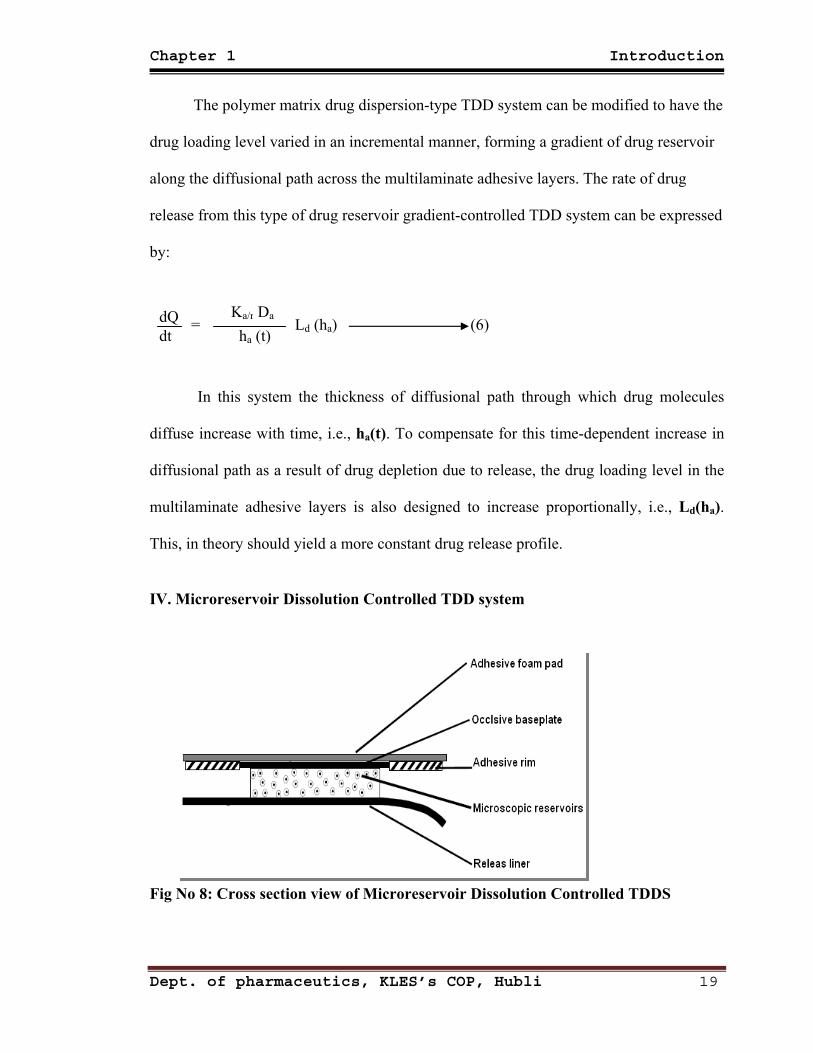
IV. Microreservoir Dissolution Controlled TDD system
Fig No 8: Cross section view of Microreservoir Dissolution Controlled TDDS
Dept. of pharmaceutics, KLES’s COP, Hubli 19
Chapter 1 Introduction
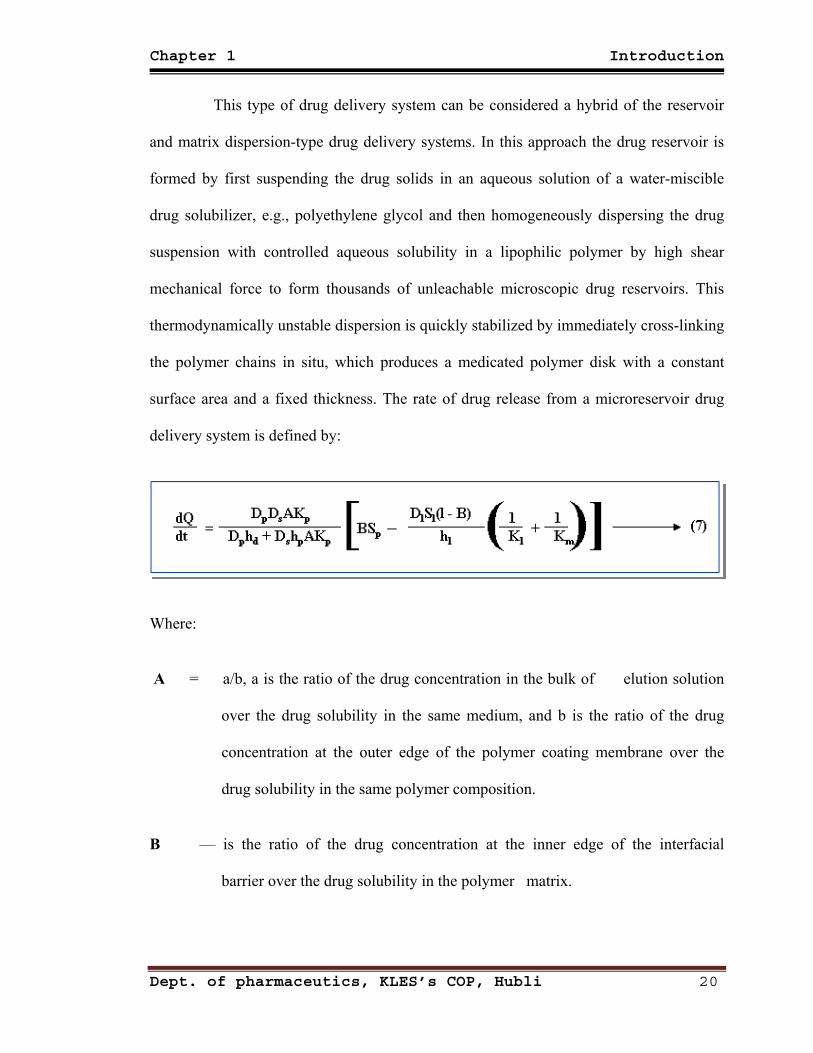
This type of drug delivery system can be considered a hybrid of the reservoir
and matrix dispersion-type drug delivery systems. In this approach the drug reservoir is
formed by first suspending the drug solids in an aqueous solution of a water-miscible
drug solubilizer, e.g., polyethylene glycol and then homogeneously dispersing the drug
suspension with controlled aqueous solubility in a lipophilic polymer by high shear
mechanical force to form thousands of unleachable microscopic drug reservoirs. This
thermodynamically unstable dispersion is quickly stabilized by immediately cross-linking
the polymer chains in situ, which produces a medicated polymer disk with a constant
surface area and a fixed thickness. The rate of drug release from a microreservoir drug
delivery system is defined by:
Where:
A = a/b, a is the ratio of the drug concentration in the bulk of elution solution
over the drug solubility in the same medium, and b is the ratio of the drug
concentration at the outer edge of the polymer coating membrane over the
drug solubility in the same polymer composition.
B — is the ratio of the drug concentration at the inner edge of the interfacial
barrier over the drug solubility in the polymer matrix.
Dept. of pharmaceutics, KLES’s COP, Hubli 20
Chapter 1 Introduction
Kl, Km & Kp ―are the partition coefficients for the interfacial partitioning of
drug from the liquid compartment to the polymer matrix, from the
polymer matrix to the polymer coating membrane, and from the
polymer coating membrane to the elution solution (or skin).
Dl , Dp & Ds ―are the drug diffusivities in the liquid compartment, polymer
coating membrane, and elution solution (or skin), respectively.
Sl & Sp ― are the solubilities of the drug in the liquid compartment and in the
polymer matrix, respectively and
hl, hp & hd ―are the thickness of the liquid layer surrounding the drug
particles, the polymer coating membrane around the polymer
matrix, and the hydrodynamic diffusion layer surrounding the
polymer coating membrane, respectively.
1.12 Anatomy of Transdermal drug delivery systems:
І. Additives:
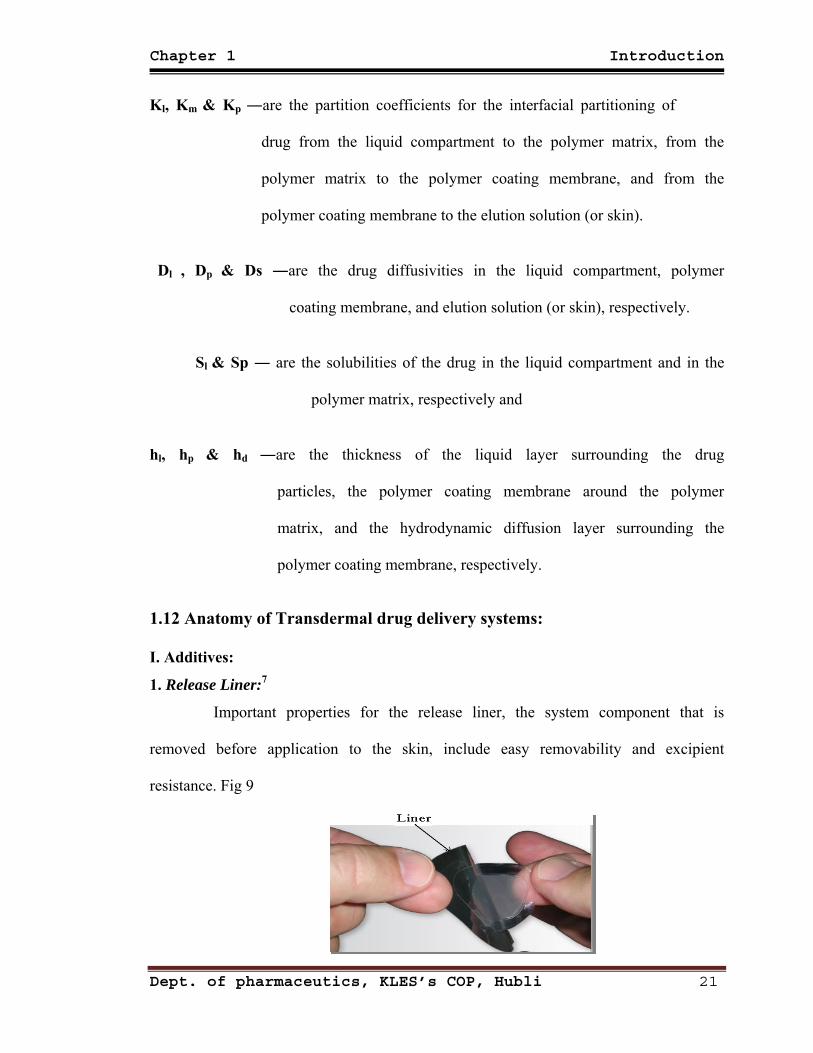
1. Release Liner:7
Important properties for the release liner, the system component that is
removed before application to the skin, include easy removability and excipient
resistance. Fig 9
Dept. of pharmaceutics, KLES’s COP, Hubli 21
Chapter 1 Introduction
To maintain potency and predictable delivery characteristics, the liner must be
resistant to drugs within the preparation and to humidity.
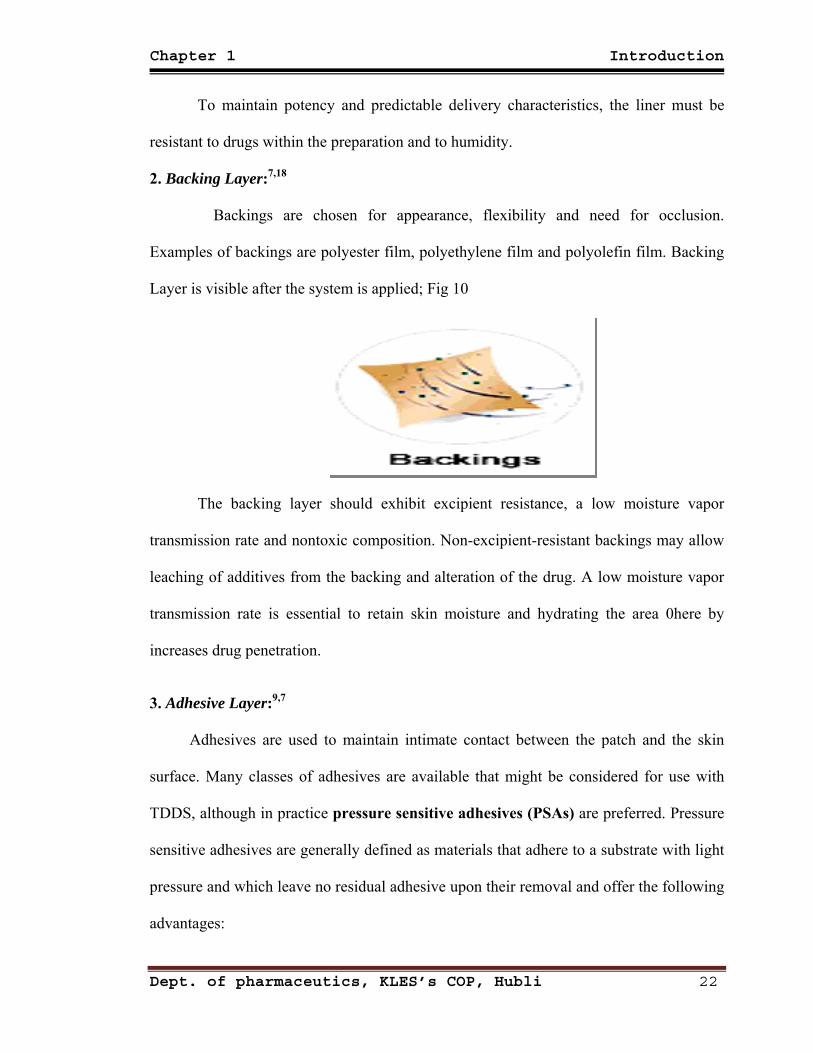
2. Backing Layer:7,18
Backings are chosen for appearance, flexibility and need for occlusion.
Examples of backings are polyester film, polyethylene film and polyolefin film. Backing
Layer is visible after the system is applied; Fig 10
The backing layer should exhibit excipient resistance, a low moisture vapor
transmission rate and nontoxic composition. Non-excipient-resistant backings may allow
leaching of additives from the backing and alteration of the drug. A low moisture vapor
transmission rate is essential to retain skin moisture and hydrating the area 0here by
increases drug penetration.
3. Adhesive Layer:9,7
Adhesives are used to maintain intimate contact between the patch and the skin
surface. Many classes of adhesives are available that might be considered for use with
TDDS, although in practice pressure sensitive adhesives (PSAs) are preferred. Pressure
sensitive adhesives are generally defined as materials that adhere to a substrate with light
pressure and which leave no residual adhesive upon their removal and offer the following
advantages:
Dept. of pharmaceutics, KLES’s COP, Hubli 22
Chapter 1 Introduction
Convenience of use (PSAs do not require water/solvents or heat in order to
achieve adhesion)
Good stability (PSAs are generally not sensitive to environmental humidity or
temperature degradation)
Simplicity of manufacture
Good appearance.
Three types of PSAs are commonly used in TDD devices: polyisobutylenes (PIBs),
polysiloxanes (silicones) and polyacrylate copolymers (acrylics). Natural rubber / karaya
gum-based adhesives are another class of PSAs used in many over the counter (OTC)
dermal therapeutic systems.
Adhesives in transdermal drug delivery systems must be effective for 1 to 7
days, allow reasonably atraumatic removal, leave the skin, residue free after removal and
worn comfortably without any local, mechanical, chemical or allergic reactions.
4. Overlay:16
A TDDS may include a drug free adhesive coated film, foam or nonwoven
component
designed to be placed over a transdermal patch that has been applied onto the skin. This
overlay secures the medicated patch to the skin of the patient.
5. Membrane:18
A membrane may be sealed to the backing to form a pocket to enclose the drug
contain-ing matrix or used as a single layer in the patch construction. The diffusion
properties of the membrane are used to control availability of the drug and/or excipients
to the skin.
Dept. of pharmaceutics, KLES’s COP, Hubli 23
Chapter 1 Introduction
6. Chemical Permeation Enhancers:16,19,21
The skin’s physical structure provides a barrier that may limit the permeation
of some agents. Skin permeation enhancers broaden the range of drugs that can be
delivered transdermally by increasing the penetration of permeants through enhanced
diffusion of the stratum corneum and/or by increasing the solubility of the penetrant.
Protein denaturation may disrupt the barrier as may fluidization and randomization of
intercellular lipids or intercellular delamination and expansion.
Ideally, a permeation enhancer functions only to reduce the barrier resistance
of the stratum corneum and does not damage any viable cells. The ideal enhancer is:
Pharmacologically inert
Nontoxic
Nonirritating
Nonallergenic
Rapid-acting with a duration of activity that is predictable and suited to its use
Chemically compatible and easily formulated into a variety of systems
Inexpensive
Odorless
Tasteless
Colorless
The enhancer should not extract endogenous material out of the skin but should
spread well on skin and have a suitable skin feel. If the substance is a liquid and is to be
used at high volume fractions, it should be a suitable solvent for drugs.
Dept. of pharmaceutics, KLES’s COP, Hubli 24
Chapter 1 Introduction
Due to their systemic and localized toxicity, many effective chemical
permeation enhancers have not been explored yet. Hence natural products have
increasingly been used as enhancers due to their better safety profile. Terpenes are
essential oils, which are used as fragrance, flavourings, and medicines. They have been
found effective penetration enhancers for a number of hydrophilic and lipophilic drugs.
Terpenes are highly lipophilic due to their isoprene (C5H8) units. They are generally
recognized as safe (GRAS) by the FDA. They increase the drug diffusivity in the stratum
corneum for hydrophilic drugs and they enhance partitioning of drug into the stratum
corneum for lipophilic drugs, besides causing increased diffusivity.
П. Selection of Drug:14,15,
Drug should be chosen with great care, various parameters to be considered for
the selection of drug includes:
1) Physicochemical properties of drug
1. Should have molecular weight less than 1000 daltons.
2. Should have affinity for both lipophilic and hydrophilic phase.
3. Should have low melting point.
2) Biological properties of drug.
1. Should be potent with daily dose of few mg.
2. Should have short half life.
3. Drug must not induce cutaneous irritation or allergic response.
4. Drug which degrade in GIT or are inactivated by hepatic first pass effect
are suitable candidates.
Dept. of pharmaceutics, KLES’s COP, Hubli 25
Chapter 1 Introduction
5. Tolerance to drug must be developed under near zero order release profile
of transdermal delivery.
6. Drugs which have to be administered for long period of time or which
causes adverse effect to non target tissues can also be formulated.
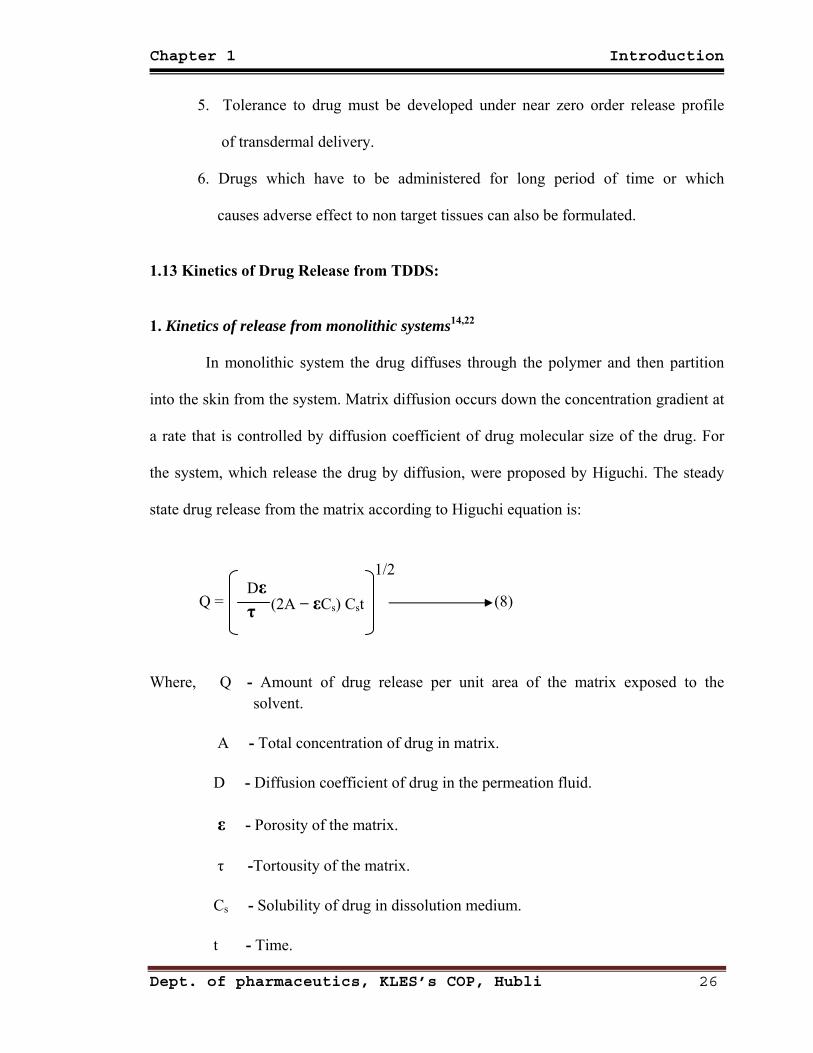
1.13 Kinetics of Drug Release from TDDS:
1. Kinetics of release from monolithic systems14,22
In monolithic system the drug diffuses through the polymer and then partition
into the skin from the system. Matrix diffusion occurs down the concentration gradient at
a rate that is controlled by diffusion coefficient of drug molecular size of the drug. For
the system, which release the drug by diffusion, were proposed by Higuchi. The steady
state drug release from the matrix according to Higuchi equation is:
Q = Dε
(2A − εCs) Cst τ
1/2
(8)
Where, Q - Amount of drug release per unit area of the matrix exposed to the solvent.
A - Total concentration of drug in matrix.
D - Diffusion coefficient of drug in the permeation fluid.
ε - Porosity of the matrix.
τ -Tortousity of the matrix.
Cs - Solubility of drug in dissolution medium.
t - Time.
Dept. of pharmaceutics, KLES’s COP, Hubli 26
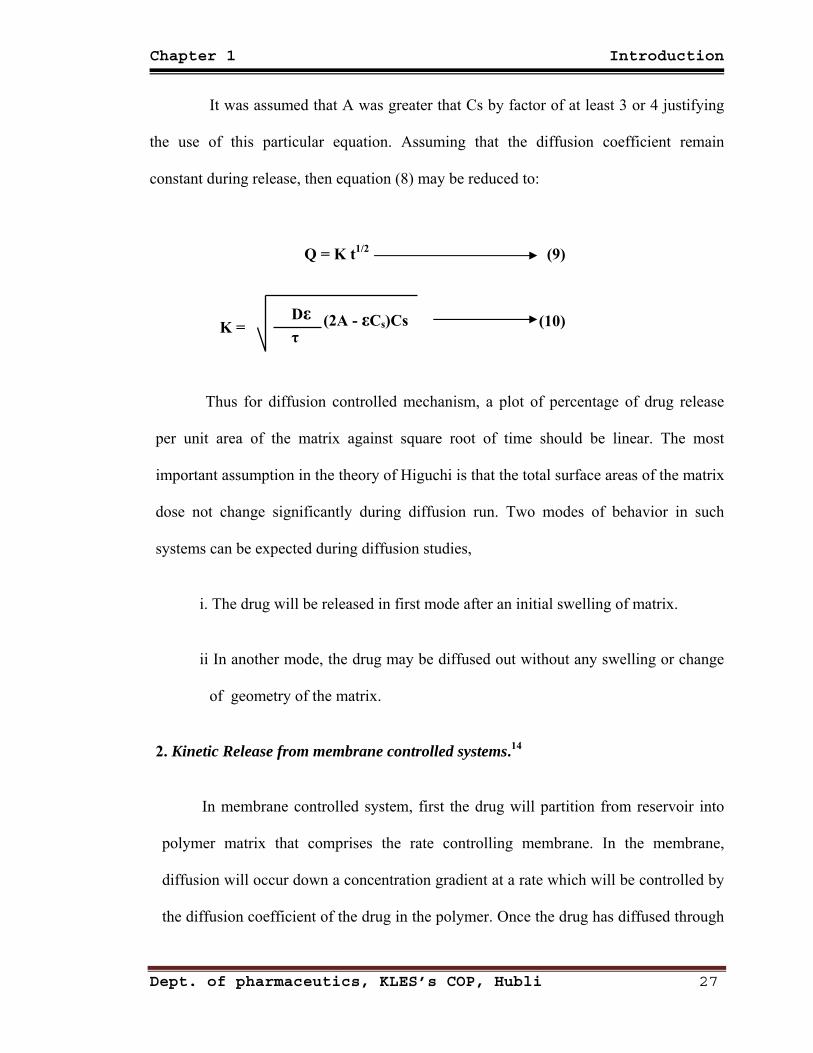
Chapter 1 Introduction
It was assumed that A was greater that Cs by factor of at least 3 or 4 justifying
the use of this particular equation. Assuming that the diffusion coefficient remain
constant during release, then equation (8) may be reduced to:
Q = K t1/2 (9)
K =
Dε τ
(2A - εCs)Cs (10)
Thus for diffusion controlled mechanism, a plot of percentage of drug release
per unit area of the matrix against square root of time should be linear. The most
important assumption in the theory of Higuchi is that the total surface areas of the matrix
dose not change significantly during diffusion run. Two modes of behavior in such
systems can be expected during diffusion studies,
i. The drug will be released in first mode after an initial swelling of matrix.
ii In another mode, the drug may be diffused out without any swelling or change
of geometry of the matrix.
2. Kinetic Release from membrane controlled systems.14
In membrane controlled system, first the drug will partition from reservoir into
polymer matrix that comprises the rate controlling membrane. In the membrane,
diffusion will occur down a concentration gradient at a rate which will be controlled by
the diffusion coefficient of the drug in the polymer. Once the drug has diffused through
Dept. of pharmaceutics, KLES’s COP, Hubli 27
Chapter 1 Introduction
the rate controlling membrane it will partition into skin, diffusion occurs down the
concentration gradient at a rate that is controlled by diffusion coefficient of drug in the
polymer. The rate of permeation dq/dt across various layers of skin tissue can be
expressed as.21
dq dt = Ps (Cd − Cr) (11)
Where,
Cd - Concentration of drug in donor compartment.
Cr - Concentration of drug in receptor compartment.
Ps - Overall permeability coefficient.
Where as Ps can be defined as:
Ps = Ks/d Dss
hs (12)
Where, Ks/d - Partition coefficient.
Dss - Apparent diffusivity.
hs - Thickness of the skin tissues.
Ps can be considered as constant, if Ks/d, Dss and hs terms in above equation are
constant under a given set of conditions. Equation (12) suggest that to achieve a constant
rate of drug permeation, one needs to maintain a condition in which the drug
concentration on the surface of stratum corneum (Cd) is consistently and substantially
Dept. of pharmaceutics, KLES’s COP, Hubli 28
(13)
Chapter 1 Introduction
greater than the drug concentration in the receptor side (Cr) i.e., Cd>>Cr under such
condition the above equation is reduced to:
dQ dt
= Ps Cd (13)
By making Cd greater than Cr, the drug concentration on the skin surface is
maintained at level equal to or greater than equilibrium (or saturation) solubility of drug
in stratum corneum Cse i.e., Cd ≥Cs
e then equation (13) can be written as:
dQ dt m
= Ps Cse (14)
1.14 Antihypertention:23,24,25,26
Hypertension is the most common of cardiovascular disease; elevated arterial
pressure causes pathological changes in the vasculature and hypertrophy of the left
ventricle. As a consequence, hypertension is the principal cause of the stroke, leads to
disease of the coronary arteries with myocardial infarction and sudden death, and is a
major contributor to cardiac failure. Hypertension is defined as a conventionally blood
pressure ≥140/90. It should be noted that the risk of both fatal and non-fatal
cardiovascular disease in adults is lowest with systolic blood pressure of less than 120
mm Hg and diastolic is less than 80 mm Hg. These risk increase progressively with
higher levels of both systolic and diastolic blood pressure. Although many of clinical
trials classify the severity of hypertension of diastolic pressure, at every level of diastolic
pressure risks are greater with higher levels of systolic blood pressure.
Dept. of pharmaceutics, KLES’s COP, Hubli 29
Chapter 1 Introduction
Hypertension, which is associated with rapidly progressive micro vascular
occlusive disease in the kidney, brain, retina and other organs. The severe endothelial
disruption can lead to microangiopathy hemolytic anemia also untreated malignant
hypertension is rapidly fatal and requires in hospitalization on an emergency basis. Left
ventricular hypertrophy defined by electrocardiogram, or more accurately by
echocardiography is associated with substantially worse long term outcome that includes
the higher risk of sudden cardiac death. The risk of cardiovascular diseases, disability and
death in hypertensive patients also is increased markedly by concomitant cigarette
smoking and by elevated low-density lipoprotein; Effective antihypertensive therapy will
almost completely prevent the hemorrhagic strokes, cardiac failure and renal
insufficiency due to hypertension. As arterial pressure is the product of cardiac output
and peripheral vascular resistance, it can be lowered by action of drugs on either the
peripheral resistance or the cardiac output, or both. Drug may reduce the cardiac output
by either inhibiting myocardial contractility or decreasing ventricular filling pressure
.reduction in ventricular filling pressure may be achieved by action on the venous tone or
on blood volume via renal effects.
Drug can reduce peripheral resistance by acting on a smooth muscle to cause
relaxation of resistance vessels or by interfering with the activity of systems that produce
constriction of resistance vessel.
Several recent clinical trials suggest that reduction of diastolic blood pressure to
85 mm Hg confers a greater therapeutic benefit then reduction to 90 mm Hg, particularly
in patients with diabetes.
Dept. of pharmaceutics, KLES’s COP, Hubli 30
Chapter 1 Introduction
The simultaneous use of the drugs with similar mechanism of action and
hemodynamic effect often produce little additional benefit. However concurrent use of
drugs from different classes is a strategy for achieving effective control of blood pressure
while minimizing dose related adverse effects. 25
1. Mechanism for controlling Blood Pressure
Arterial blood pressure is regulated within a narrow range to provide adequate
perfusion of the tissue with out causing damage to the vascular system, particularly the
arterial anemia .Arterial blood pressure is directly proportional to the product of the
cardiac output and the peripheral vascular resistance cardiac output and peripheral
resistance are controlled by two overlapping mechanisms.
A. Baroreceptors and the sympathetic nervous system
B. Renin-angiotensin-aldesterone system 23
It has avoided fluctuations in clonidine blood level and has a lower incidence of
side effects; withdrawal reaction is also less alarming 24
2. Antihypertensive drugs. 24
These drugs used to lower BP in Hypertension.
# Classification of antihypertensive drugs.
1. ACE inhibitors
Captopril,
Enalapril,
Lisinopril,
Ramipril.
Dept. of pharmaceutics, KLES’s COP, Hubli 31
Chapter 1 Introduction
2. Angiotensin (AT1) Antagonist.
Losartan,
Candesartan,
Irbesartan.
3. Calcium channel Blockers
Verapamil,
Diltiazem,
Nifidepine,
Amlodipine,
Nitrendipine.
4. Diuretics
Thiazides : Hydrochlorothiazides,
Chlorthalidone,
Indepamide.
High ceiling : Furosemide.
K + Sparing : Sparinolactone,
5. β Adrenergic Blockers: Propranolol.
Atenolol,
Metoprolol.
6. β + α Adrenergic Blockers: Labetolol.
Carvedilol.
7. α Adrenergic Blockers : Prazosin,
Terazocin.
8. Central sympatholytics : Clonidin,
Methyldopa,
9. Vasodilators :
Arteriolars : Hydralazine,
Diazoxide.
Arteriolars + Venous: Sodium Nitropruside.
Dept. of pharmaceutics, KLES’s COP, Hubli 32
Chapter 2 Objectives
2.0 OBJECTIVES
2.1 Need for the study: The transdermal route is an alternative for administration of such drugs. This route
improving patient compliance in long term therapy, bypassing first-pass metabolism,
sustaining drug delivery, maintaining a constant and prolonged drug level in plasma,
minimizing inter- and intra patient variability, and making it possible to interrupt or
terminate treatment when necessary. 15
Transdermal drug delivery (TDD) systems are drug-loaded adhesive patches
which, when applied to the skin, deliver the therapeutic agent, at a controlled rate, through
the skin to the systemic circulation and to the target organs.9
Transdermal systems are ideally suited for diseases that demand chronic treatment.
Hypertension, a disease equally prevalent in the developed and the treatment. Under
developed countries, demands chronic An analysis shows that cardiovascular disease (CVD)
was responsible for the highest mortality rate, and mild hypertension may be the humble
beginning for the fatal cardiovascular ailments. Hypertensive patients need to be on
prolonged medication, and sometimes lifelong therapy is advised. Hence noncompliance of
the therapy, especially in cases where dosing frequency is high, is a major problem.
Transdermal delivery is considered to be the ideal method which can bypass the difficulties
of first- pass metabolism, enable absolute elimination of GIT toxic
Dept. of pharmaceutics, KLES’s COP, Hubli
effects, maintain the steady plasma level of drug for a prolonged period and deliver the drug
at predetermined rate without the hazards of specialist care as is required in the intravenous
infusion Since transdermal patches offer a better quality of life, they are more popular than
33
Chapter 2 Objectives
the oral dosage forms Sizeable number of anti hypertensives undergo extensive first-pass
metabolism, the patches used to prevent cardiovascular disorders are
of higher clinical benefit. 27
Dept. of pharmaceutics, KLES’s COP, Hubli
Since hypertension itself has no symptoms, patients often do not take their
medication. Furthermore, many patients with high blood pressure are treated with several
drugs; as the complexity of the treatment increases, so do the problems of patient
compliance. Patients who take their medications regularly renew their prescriptions more
often than those who do not. For organizations such as Medicaid, which help support the
cost of prescriptions, this means greater expenditures. However, investigation of Medicaid
records shows that although greater patient compliance means more money spent on drugs,
the reductions in complications of hypertension more than compensate for the drug cost.
The net effect of greater patient compliance is a savings of money. In a study of Medicaid
recipients in the state of South Carolina, the costs associated with the use of nine different
antihypertensive drugs were analyzed. Among a total of 8,894 beneficiaries receiving
antihypertensive drugs, the 278 using the transdermal clonidine patch showed significantly
greater patient compliance, as evidence by prescription renewals. The transdermal patch,
which is worn for a week, was associated with better compliance even when used as a part
of a multi-drug regimen. The health care expenditures for patients using the transdermal
patch were significantly less than for those patients who were advised to take
antihypertensive medication more than once a day. There was no significant difference;
however, between patients using the transdermal patch and patients whose antihypertensive
regimen required only one dose per day. The results indicate that simpler drug regimens are
more likely to result in patient compliance. Such regimens result in an overall cost savings
34
Chapter 2 Objectives
for medical care. 29
Carvedilol is the most widely prescribed drug in the long term treatment of
Hypertension. Following oral administration, Carvedilol is rapidly absorbed from the
gastrointestinal tract (80%), but the oral bioavailability remains low (23%) because of
significant first-pass hepatic metabolism by Cytochrome P450 (urinary recovery as
unchanged carvedilol is less than 0.3% of the oral administered dose). Carvedilol also has
a short plasma half-life of 6 hours Long term therapy of hypertension by carvedilol oral
administration may result in poor patient compliance because of low bioavailability and
short plasma half-life, leading to increased frequency of administration. The transdermal
route is an alternative for administration of such drugs. Carvedilol also possesses some
ideal characteristics— such as a low molecular weight (406.5), smaller dose range (25- 50
mg), short plasma half-life, and poor oral bioavailability— for formulation as a transdermal
patch.15
The absorption of drugs through the transdermal route improves bioavailability of
drugs that might otherwise be metabolized by first-pass effect (pre-systemic drug
elimination) during their passage through the gastrointestinal tract. Drug absorption from
the transdermal route is mainly via passive diffusion through the lipoidal membrane. Thus,
transdermal route of drug delivery has attracted the attention worldwide for optimizing the
drug delivery.28
Dept. of pharmaceutics, KLES’s COP, Hubli
35
Chapter 2 Objectives
2.2 Aim and objectives of the study:
Aim and objective of the present study are to perform “Formulation,
characterization and evaluation of matrix type transdermal patches of Carvedilol ”
This study includes:
• Determination of λ max and preparation of standard calibration curve of
Carvedilol:
1. Preparation of standard solution of Carvedilol.
2. Preparation of working standard solutions
• Preformulation studies:
1. Solubility
2. Partition Coefficient
3. Melting point
4. Permeability of drug through porcine ear skin
5. Formulation of Transdermal patches with different plasticizers.
6. Optimization of patches
7. Permeability Characters of polymers
8. Polymer-skin compatibility
• Compatibility studies of drug and polymers:
1. F.T I.R. Spectroscopy
2. Differential Scanning Calorimetry (DSC).
Dept. of pharmaceutics, KLES’s COP, Hubli
36
Chapter 2 Objectives
• Formulation design:
A) Preparation of transdermal patches.
B) Evaluation of transdermal formulation:
I. Physico-chemical evaluation
1. Physical appearance
2. Folding endurance
3. Thickness of the film
4. Weight uniformity
5. Drug content
6. Percentage moisture uptake
7. Percentage moisture content
8. Water vapour Transmission
9. Skin irritation test
10. Scanning Electron Microscopy (SEM).
11. X-Ray Diffractometry (XRD)
12.Stability studies according to ICH guidelines.
II. Adhesive test:
1. Thumb tack test
III. In-vitro release study:
1. USP Paddle method
IV. In-vitro membrane permeation study:
1. Keshary-Chien diffusion cell using dialysis membrane.
V. In-vitro skin permeation study:
1. Keshary-Chien diffusion cell using porcine ear skin.
VI. In-vivo study
Dept. of pharmaceutics, KLES’s COP, Hubli
1. Using Wistar albino rats.
37
Chapter 3 Review of Literature
3.0 REVIEW OF LITERATURE
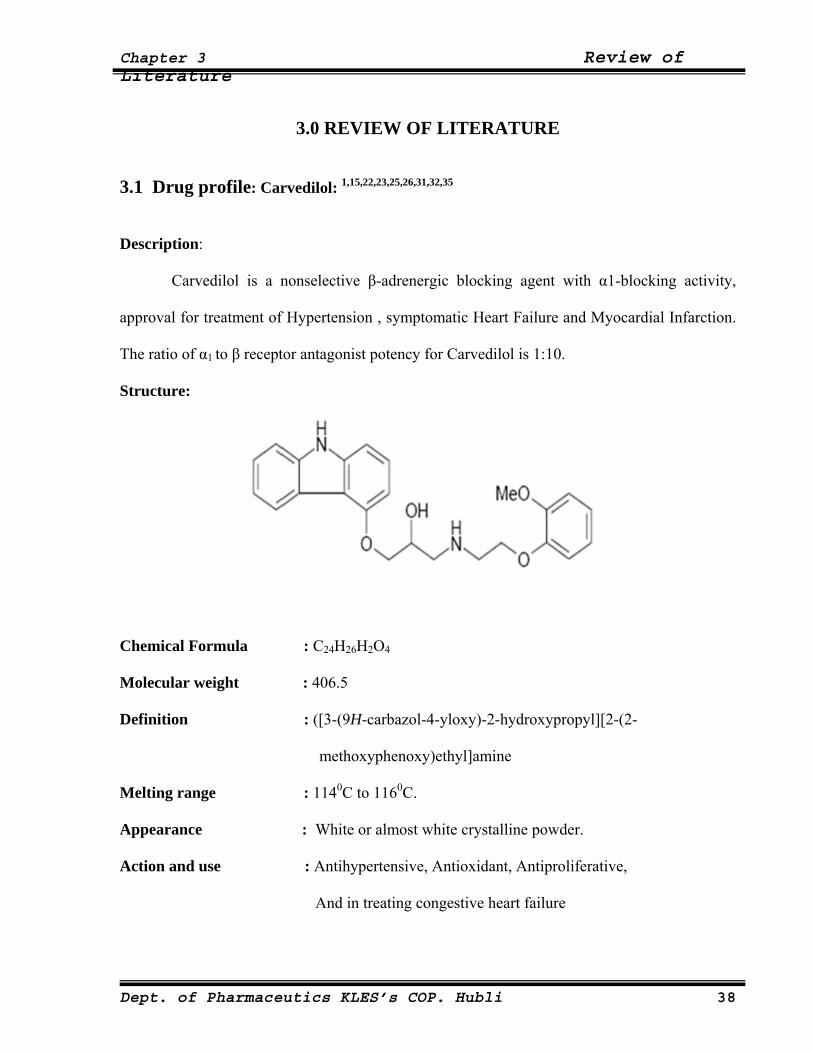
3.1 Drug profile: Carvedilol: 1,15,22,23,25,26,31,32,35
Description:
Carvedilol is a nonselective β-adrenergic blocking agent with α1-blocking activity,
approval for treatment of Hypertension , symptomatic Heart Failure and Myocardial Infarction.
The ratio of α1 to β receptor antagonist potency for Carvedilol is 1:10.
Structure:
Chemical Formula : C24H26H2O4
Molecular weight : 406.5
Definition : ([3-(9H-carbazol-4-yloxy)-2-hydroxypropyl][2-(2-
methoxyphenoxy)ethyl]amine
Melting range : 1140C to 1160C.
Appearance : White or almost white crystalline powder.
Action and use : Antihypertensive, Antioxidant, Antiproliferative,
And in treating congestive heart failure
Dept. of Pharmaceutics KLES’s COP. Hubli 38
Chapter 3 Review of Literature
Solubility : Practically insoluble in water, dilute acid. Slightly soluble in
Alcohol, Ethyl Ether. Freely soluble in DMSO. Soluble in Methyl
Chloride, Methanol, Isopropanol,
Storage : Store below 30°C (86°F). Protect from moisture. Dispense in a
tight, light-resistant container
Pharmacokinetics:
Absorption :Carvedilol is rapidly absorbed following oral administration, with peak plasma
concentrations occurring in 1 to 2 hours. It is highly lipophilic and thus is
extensively distributed into extravascular tissues.
Metabolism :Carvedilol is >95% protein bound and is extensively metabolized in the liver
(hepatic), predominantly by CYP2D6 and CYP2C9. The primary P450 enzymes
responsible for the metabolism of both R(+) and S(-)-carvedilol in human Liver
microsomes were CYP2D6 and CYP2C9 and to a lesser extent CYP3A4, 2C19,
1A2, and 2E1. CYP2D6 is thought to be the major enzym in the 4'- and 5'-
hydroxylation of Carvedilol, with a potential contribution from 3A4. CYP2C9 is
thought to be of primary importance in the O-methylation pathway of S(-)-
Carvedilol.
Excretion :About 16% of the drug is excreted via the renal, 60% in Feccal. And < 2% by
urine.
Dept. of Pharmaceutics KLES’s COP. Hubli 39
Chapter 3 Review of Literature
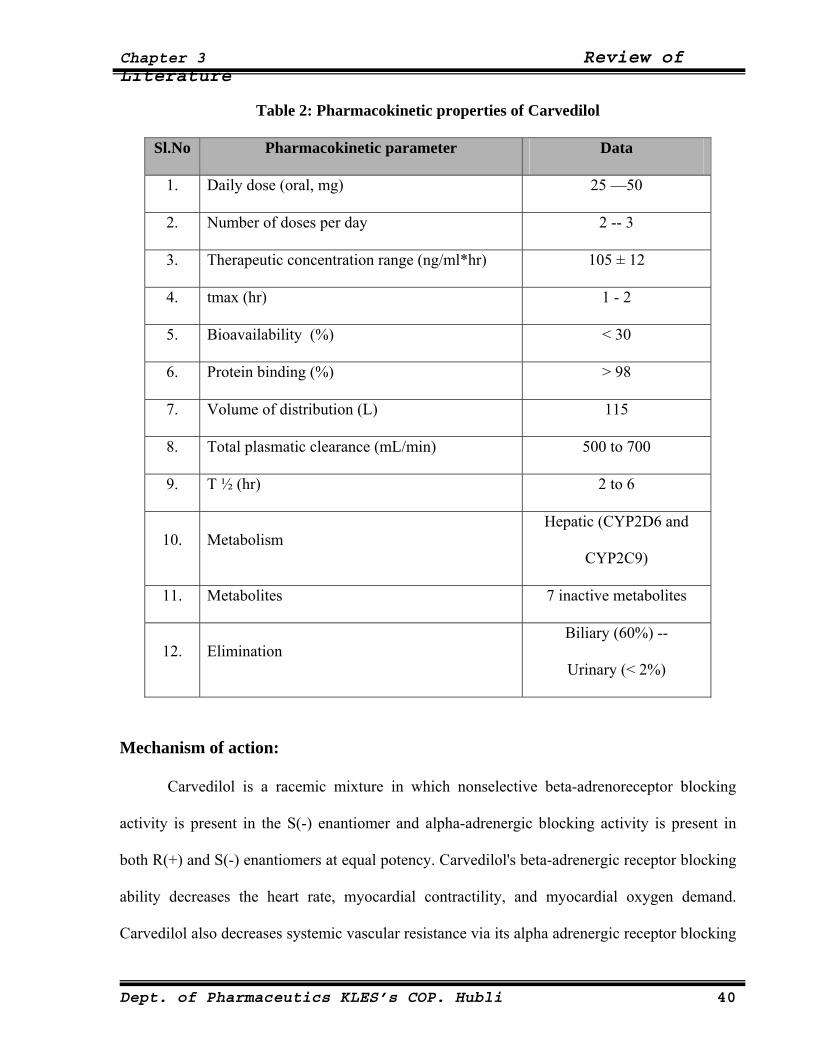
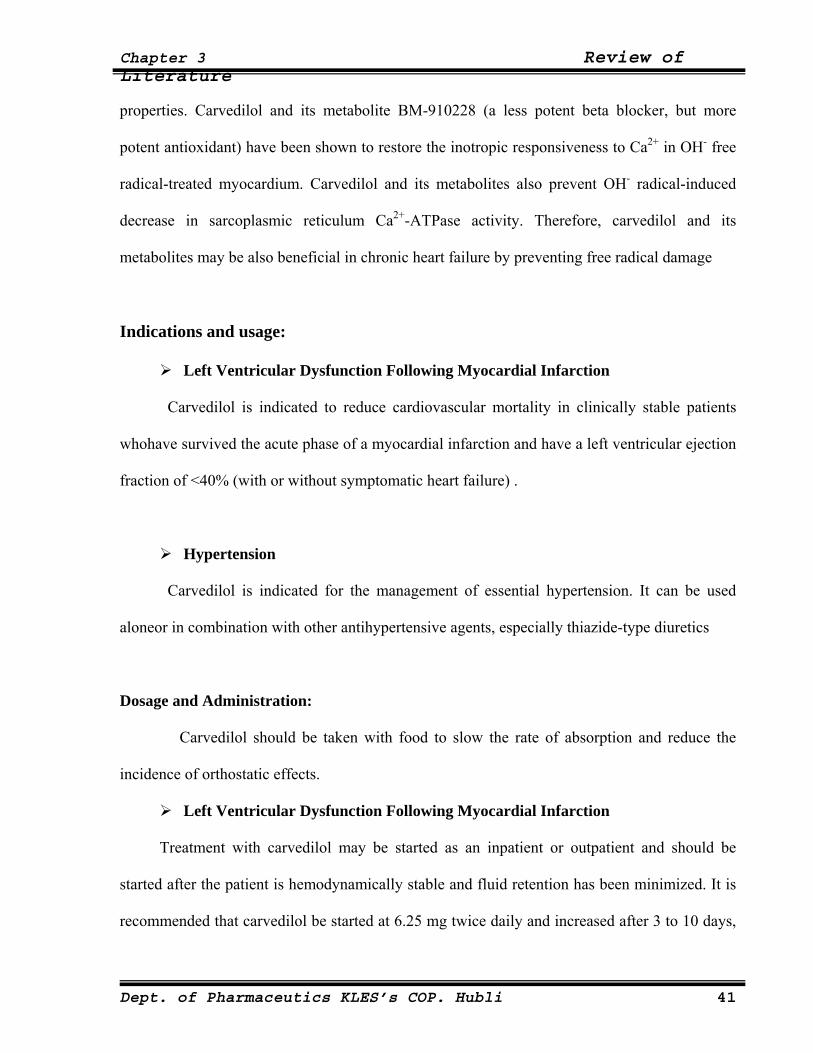
Table 2: Pharmacokinetic properties of Carvedilol
Sl.No Pharmacokinetic parameter Data
1. Daily dose (oral, mg) 25 —50
2. Number of doses per day 2 -- 3
3. Therapeutic concentration range (ng/ml*hr) 105 ± 12
4. tmax (hr) 1 - 2
5. Bioavailability (%) < 30
6. Protein binding (%) > 98
7. Volume of distribution (L) 115
8. Total plasmatic clearance (mL/min) 500 to 700
9. T ½ (hr) 2 to 6
10. Metabolism Hepatic (CYP2D6 and
CYP2C9)
11. Metabolites 7 inactive metabolites
12. Elimination Biliary (60%) --
Urinary (< 2%)
Mechanism of action:
Carvedilol is a racemic mixture in which nonselective beta-adrenoreceptor blocking
activity is present in the S(-) enantiomer and alpha-adrenergic blocking activity is present in
both R(+) and S(-) enantiomers at equal potency. Carvedilol's beta-adrenergic receptor blocking
ability decreases the heart rate, myocardial contractility, and myocardial oxygen demand.
Carvedilol also decreases systemic vascular resistance via its alpha adrenergic receptor blocking
Dept. of Pharmaceutics KLES’s COP. Hubli 40
Chapter 3 Review of Literature
properties. Carvedilol and its metabolite BM-910228 (a less potent beta blocker, but more
potent antioxidant) have been shown to restore the inotropic responsiveness to Ca2+ in OH- free
radical-treated myocardium. Carvedilol and its metabolites also prevent OH- radical-induced
decrease in sarcoplasmic reticulum Ca2+-ATPase activity. Therefore, carvedilol and its
metabolites may be also beneficial in chronic heart failure by preventing free radical damage
Indications and usage:
Left Ventricular Dysfunction Following Myocardial Infarction
Carvedilol is indicated to reduce cardiovascular mortality in clinically stable patients
whohave survived the acute phase of a myocardial infarction and have a left ventricular ejection
fraction of <40% (with or without symptomatic heart failure) .
Hypertension
Carvedilol is indicated for the management of essential hypertension. It can be used
aloneor in combination with other antihypertensive agents, especially thiazide-type diuretics
Dosage and Administration:
Carvedilol should be taken with food to slow the rate of absorption and reduce the
incidence of orthostatic effects.
Left Ventricular Dysfunction Following Myocardial Infarction
Treatment with carvedilol may be started as an inpatient or outpatient and should be
started after the patient is hemodynamically stable and fluid retention has been minimized. It is
recommended that carvedilol be started at 6.25 mg twice daily and increased after 3 to 10 days,
Dept. of Pharmaceutics KLES’s COP. Hubli 41
Chapter 3 Review of Literature
based on tolerability, to 12.5 mg twice daily, then again to the target dose of 25 mg twice daily.
A lower starting dose may be used (3.125 mg twice daily) and/or the rate of up-titration may be
slowed if clinically indicated (e.g., due to low blood pressure or heart rate, or fluid retention).
Patients should be maintained on lower doses if higher doses are not tolerated. The
recommended dosing regimen need not be altered in patients who received treatment with an IV
or oral ß-blocker during the acute phase of the myocardial infarction.
Hypertension
DOSAGE MUST BE INDIVIDUALIZED. The recommended starting dose of
carvedilol is 6.25 mg twice daily. If this dose is tolerated, using standing systolic pressure
measured about 1 hour after dosing as a guide, the dose should be maintained for 7 to 14 days,
and then increased to 12.5 mg twice daily if needed, based on trough blood pressure, again
using standing systolic pressure one hour after dosing as a guide for tolerance. This dose should
also be maintained for 7 to 14 days and can then be adjusted upward to 25 mg twice daily if
tolerated and needed. The full antihypertensive effect of carvedilol is seen within 7 to 14 days.
Total daily dose should not exceed 50 mg. Concomitant administration with a diuretic can be
expected to produce additive effects and exaggerate the orthostatic component of carvedilol
action.
Side effect: The major side effect of Carvedilol is Hypotension.
Dept. of Pharmaceutics KLES’s COP. Hubli 42
Chapter 3 Review of Literature
3.2 Polymer review34
3.2.1 Polymethacrylates (Eudragit RL and RS 100)
1. Nonproprietary Names:
USPNF: Ammonio methacrylate copolymer
USPNF: Methacrylic acid copolymer
2. Synonyms:
Eudragit; polymeric methacrylates.
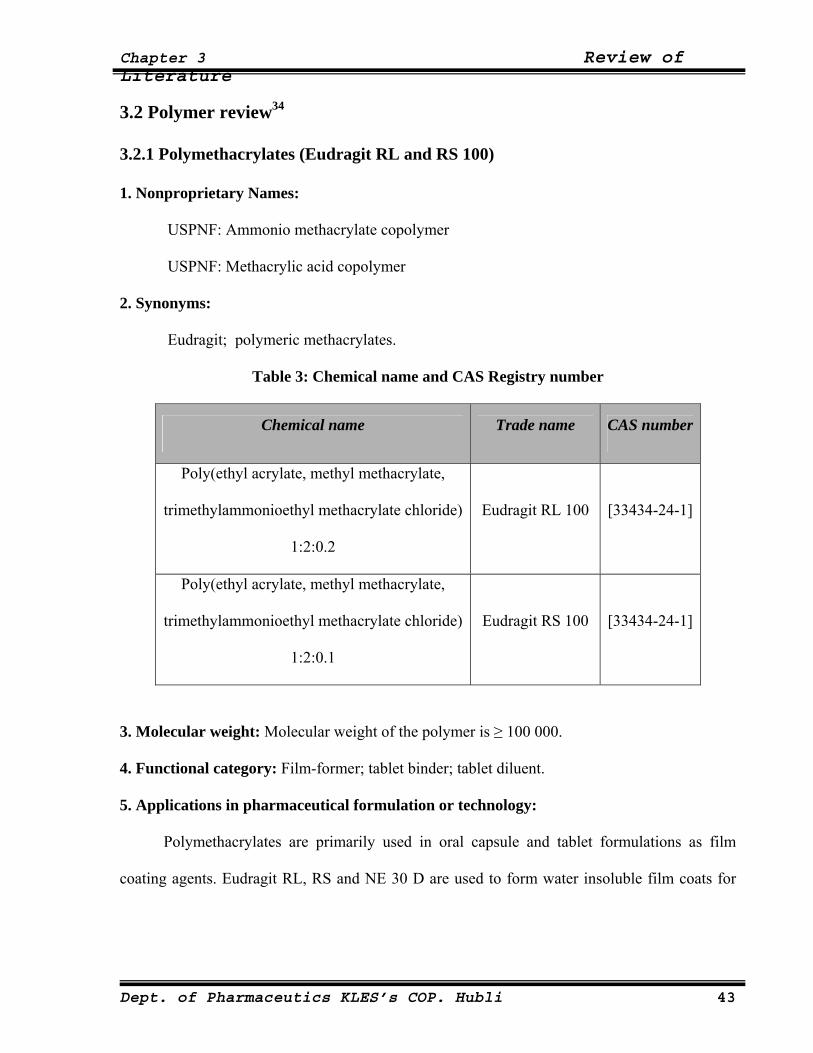
Table 3: Chemical name and CAS Registry number
Chemical name Trade name CAS number
Poly(ethyl acrylate, methyl methacrylate,
trimethylammonioethyl methacrylate chloride)
1:2:0.2
Eudragit RL 100 [33434-24-1]
Poly(ethyl acrylate, methyl methacrylate,
trimethylammonioethyl methacrylate chloride)
1:2:0.1
Eudragit RS 100 [33434-24-1]
3. Molecular weight: Molecular weight of the polymer is ≥ 100 000.
4. Functional category: Film-former; tablet binder; tablet diluent.
5. Applications in pharmaceutical formulation or technology:
Polymethacrylates are primarily used in oral capsule and tablet formulations as film
coating agents. Eudragit RL, RS and NE 30 D are used to form water insoluble film coats for
Dept. of Pharmaceutics KLES’s COP. Hubli 43
Chapter 3 Review of Literature
sustained release products. Eudragit RL films are more permeable than those of Eudragit RS,
and by mixing the two types together films of varying permeability can be obtained.
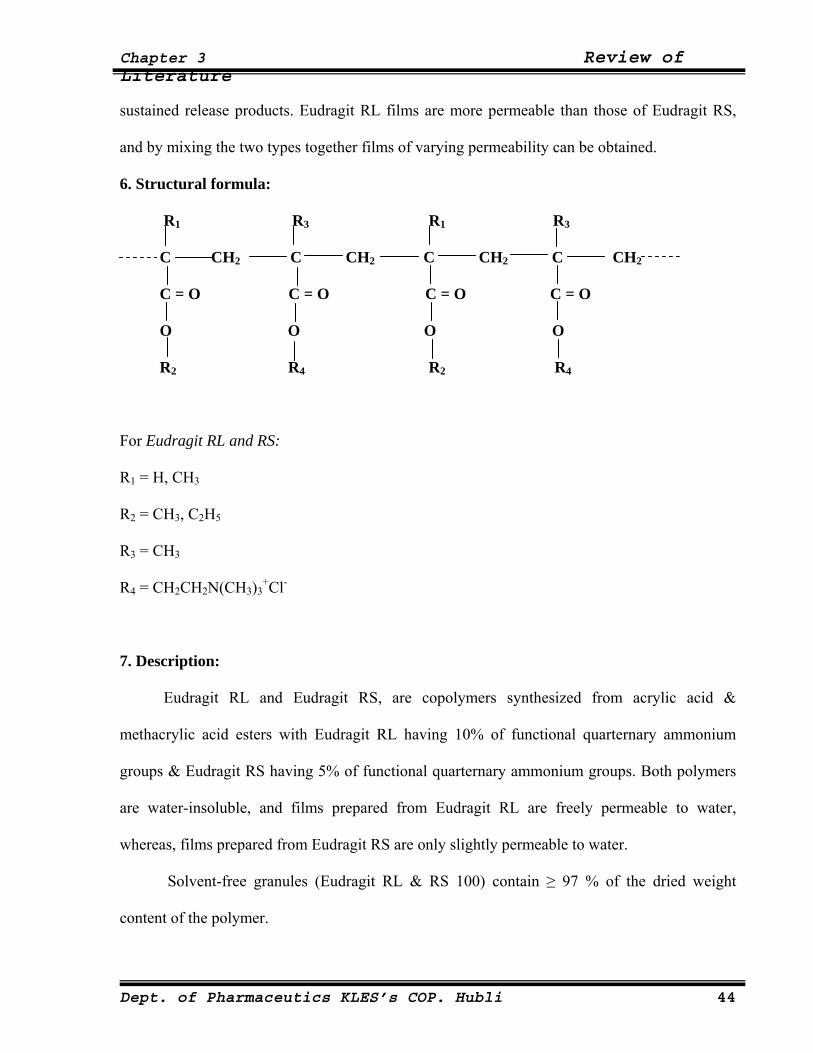
6. Structural formula:
R1 R3 R1 R3
C CH2 C CH2 C CH2 C CH2
C = O C = O C = O C = O
O O O O
R2 R4 R2 R4
For Eudragit RL and RS:
R1 = H, CH3
R2 = CH3, C2H5
R3 = CH3
R4 = CH2CH2N(CH3)3+Cl-
7. Description:
Eudragit RL and Eudragit RS, are copolymers synthesized from acrylic acid &
methacrylic acid esters with Eudragit RL having 10% of functional quarternary ammonium
groups & Eudragit RS having 5% of functional quarternary ammonium groups. Both polymers
are water-insoluble, and films prepared from Eudragit RL are freely permeable to water,
whereas, films prepared from Eudragit RS are only slightly permeable to water.
Solvent-free granules (Eudragit RL & RS 100) contain ≥ 97 % of the dried weight
content of the polymer.
Dept. of Pharmaceutics KLES’s COP. Hubli 44
Chapter 3 Review of Literature
8. Stability and storage condition:
Dry powder polymer forms are stable at temperature less than 300C. Dry powders are stable
for at least two years if stored in a tightly closed container at less than 300C.
3.2.2 Hydroxypropyl methylcellulose (HPMC):
1. Nonproprietary names:
BP: Hypromellose
Ph Eur: Methylhydroxypropylcellulosum
USP: Hydroxypropyl methylcellulose
2. Synonyms:
Cellulose, hydroxypropyl methyl ether; Methocel; Metolose; Pharmacoat; Culminal.
3. Chemical name: Cellulose, 2-Hydroxypropyl methyl ether.
4. Empirical formula:
The PhEur 1992 describes hydroxypropyl methylcellulose as partly O-methylated and O-
(2-hydroxypropylated) cellulose. It is available in several grades which vary in viscosity &
extent of substitution. Grades may be distinguished by appending a number indicative of the
apparent viscosity, in mPa s, of a 2% w/w aqueous solution at 200C.
Dept. of Pharmaceutics KLES’s COP. Hubli 45
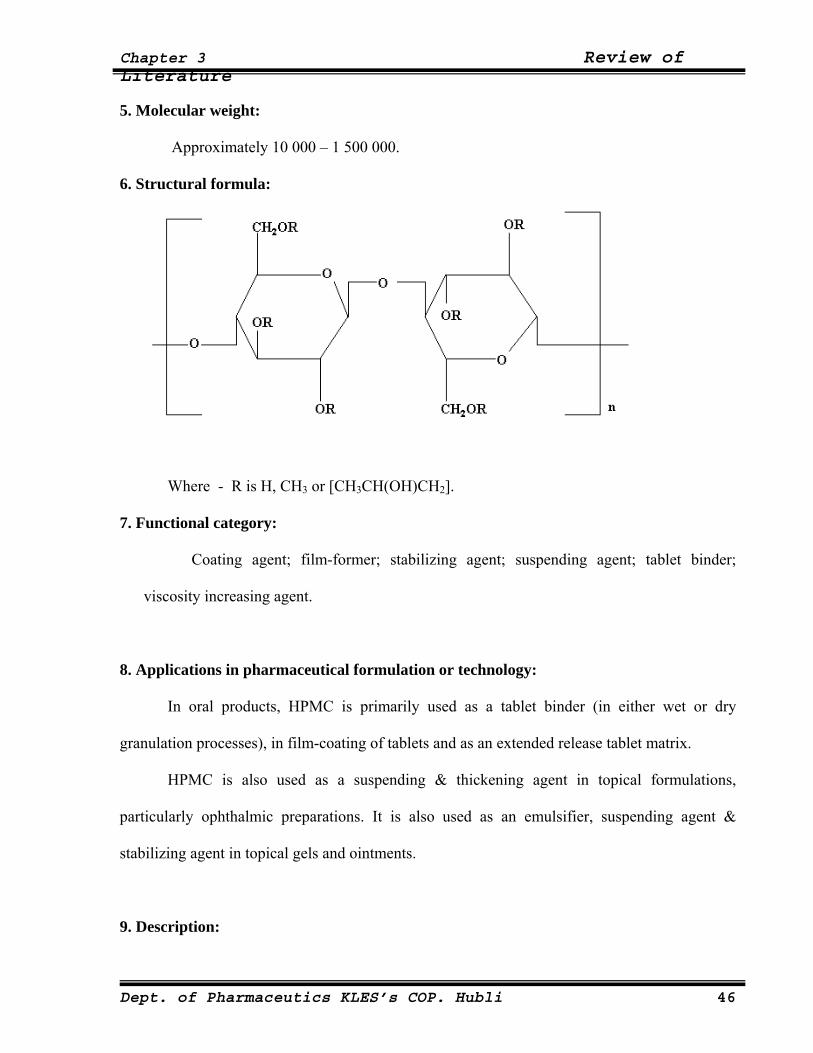
Chapter 3 Review of Literature
5. Molecular weight:
Approximately 10 000 – 1 500 000.
6. Structural formula:
Where - R is H, CH3 or [CH3CH(OH)CH2].
7. Functional category:
Coating agent; film-former; stabilizing agent; suspending agent; tablet binder;
viscosity increasing agent.
8. Applications in pharmaceutical formulation or technology:
In oral products, HPMC is primarily used as a tablet binder (in either wet or dry
granulation processes), in film-coating of tablets and as an extended release tablet matrix.
HPMC is also used as a suspending & thickening agent in topical formulations,
particularly ophthalmic preparations. It is also used as an emulsifier, suspending agent &
stabilizing agent in topical gels and ointments.
9. Description:
Dept. of Pharmaceutics KLES’s COP. Hubli 46
Chapter 3 Review of Literature
Hydroxypropyl methylcellulose is an odorless and tasteless, white or creamy-white
coloured fibrous or granular powder.
10. Typical properties:
pH (1% w/w solution): 5.5 — 8.0
Density (tapped): 0.50 — 0.70 g/cm3 for Pharmacoat.
Melting point: Browns at 190-2000C; chars at 225-2300C.
Solubility: Soluble in cold water, forming a viscous colloidal solution;
practically insoluble in chloroform, ethanol (95%) and ether, but
soluble in mixtures of ethanol and dichloromethane and mixtures
of methanol and dichloromethane. Certain grades of HPMC are
soluble in aqueous acetone solutions, mixtures of dichloromethane
& propan-2-ol.
Specific gravity: 1.26
11. Stability and storage conditions:
HPMC powder is a stable material although it is hygroscopic after drying.
HPMC powder should be stored in a well-closed container, in a cool, dry, place.
3.2.3 Ethylcellulose:
1. Nonproprietary names:
BP: Ethylcellulose
PhEur: Ethylcellulosum
2. Synonyms:
Aquacoat; E462; Ethocel; Surelease.
Dept. of Pharmaceutics KLES’s COP. Hubli 47
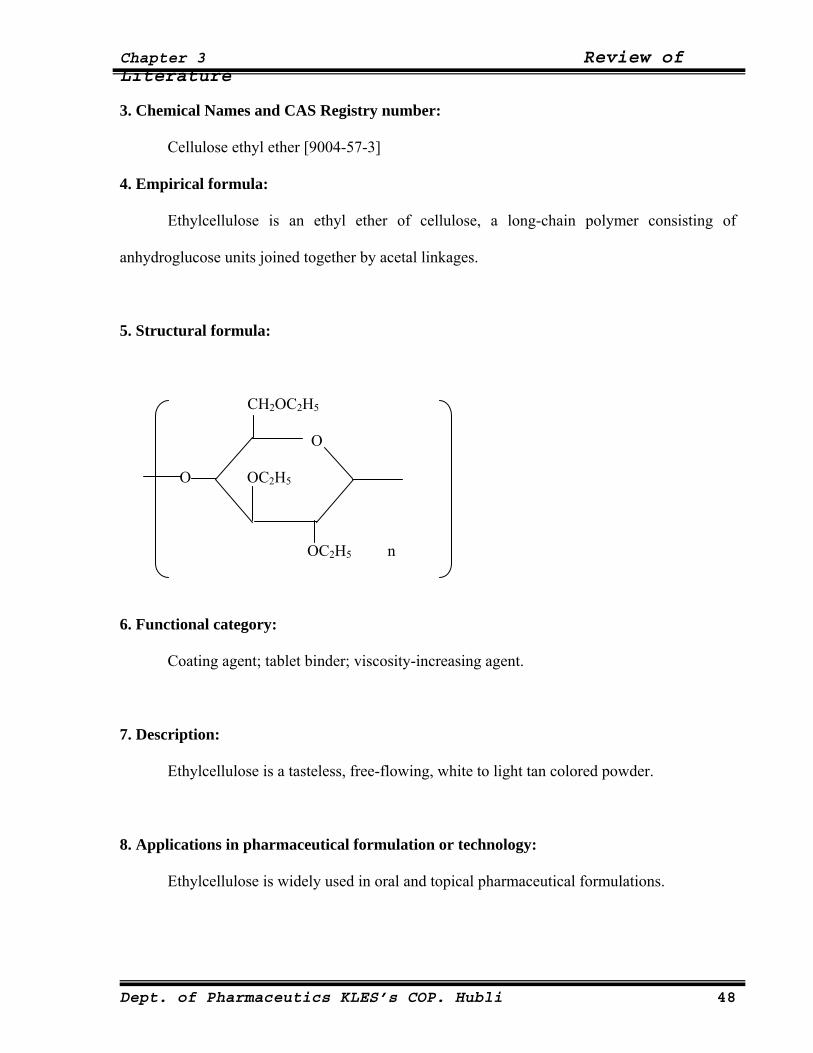
Chapter 3 Review of Literature
3. Chemical Names and CAS Registry number:
Cellulose ethyl ether [9004-57-3]
4. Empirical formula:
Ethylcellulose is an ethyl ether of cellulose, a long-chain polymer consisting of
anhydroglucose units joined together by acetal linkages.
5. Structural formula:
CH2OC2H5
O
O OC2H5
OC2H5 n
6. Functional category:
Coating agent; tablet binder; viscosity-increasing agent.
7. Description:
Ethylcellulose is a tasteless, free-flowing, white to light tan colored powder.
8. Applications in pharmaceutical formulation or technology:
Ethylcellulose is widely used in oral and topical pharmaceutical formulations.
Dept. of Pharmaceutics KLES’s COP. Hubli 48
Chapter 3 Review of Literature
The main use of ethylcellulose in oral formulations is as a hydrophobic coating agent
for tablets and granules. Ethylcellulose is also widely used in drug microcapsulation. In topical
formulations, ethylcellulose is used as a thickening agent in creams, lotions or gels, provided an
appropriate solvent is used.
9. Typical properties:
Density (bulk): 0.4 g/cm3.
Glass transition temperature: 130 — 1330C.
Solubility: Practically insoluble in glycerin, propylene glycol and water.
Freely soluble in chloroform, methyl acetate, tetrahydrofuran, and in
mixtures of aromatic hydrocarbons with ethanol (95%).
Specific gravity: 1.12 — 1.15.
pH (2% w/w suspension): 5.0 — 7.5
10. Stability and Storage Conditions:
Ethylcellulose is a stable, slightly hygroscopic material. It is chemically resistant to
alkalis, both dilute and concentrated and to salt solutions although it is more sensitive to acidic
materials than cellulose esters.
The bulk material should be stored in a dry place, in a well-closed container at a
temperature between 7-320C.
Dept. of Pharmaceutics KLES’s COP. Hubli 49
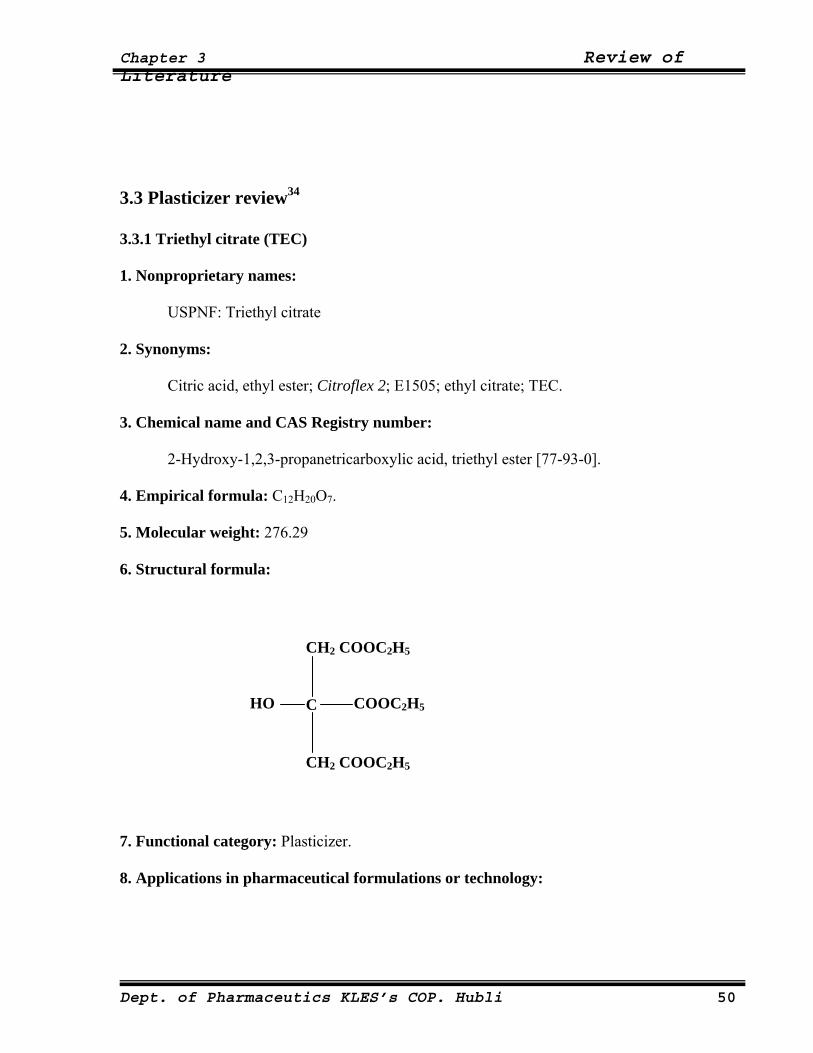
Chapter 3 Review of Literature
3.3 Plasticizer review34
3.3.1 Triethyl citrate (TEC)
1. Nonproprietary names:
USPNF: Triethyl citrate
2. Synonyms:
Citric acid, ethyl ester; Citroflex 2; E1505; ethyl citrate; TEC.
3. Chemical name and CAS Registry number:
2-Hydroxy-1,2,3-propanetricarboxylic acid, triethyl ester [77-93-0].
4. Empirical formula: C12H20O7.
5. Molecular weight: 276.29
6. Structural formula:
CH2 COOC2H5
CH2 COOC2H5
C COOC2H5HO
7. Functional category: Plasticizer.
8. Applications in pharmaceutical formulations or technology:
Dept. of Pharmaceutics KLES’s COP. Hubli 50
Chapter 3 Review of Literature
Triethyl citrate and other citrate esters are used as plasticizers for aqueous based
coatings in oral sustained release or enteric coated capsule and tablet formulations. Triethyl
citrate is also used in food products as a sequestrant and in cosmetics as a deodorizing agent.
9. Description:
Triethyl citrate occurs as a bitter tasting, odorless, practically colorless, oily liquid.
10. Typical properties:
Boiling point: 2880C
Flash point : 1550C
Pour point: -450C
Solubility: soluble 1 in 125 of peanut oil, 1 in 15 of water.
Miscible with ethanol (95%) and ether.
Viscosity (dynamic): 35.2 mPa s (35.2 cP) at 250C.
11. Stability and storage conditions:
Triethyl citrate and other citrate esters are stable if stored in a well-closed container in a
cool, dry, place.
3.3.2 Dibutyl phthalate:
1. Synonyms:
1,2-benzenedicarboxylic acid dibutyl ester; n-butyl phthalate; DBP; dibutyl benzene-1,2-
dicarboxylate; di-n-butyl phthalate; Kodaflex DBP; phthalic acid dibutyl ester.
2. Empirical formula: C16H22O4.
3. Molecular weight: 278.35
Dept. of Pharmaceutics KLES’s COP. Hubli 51
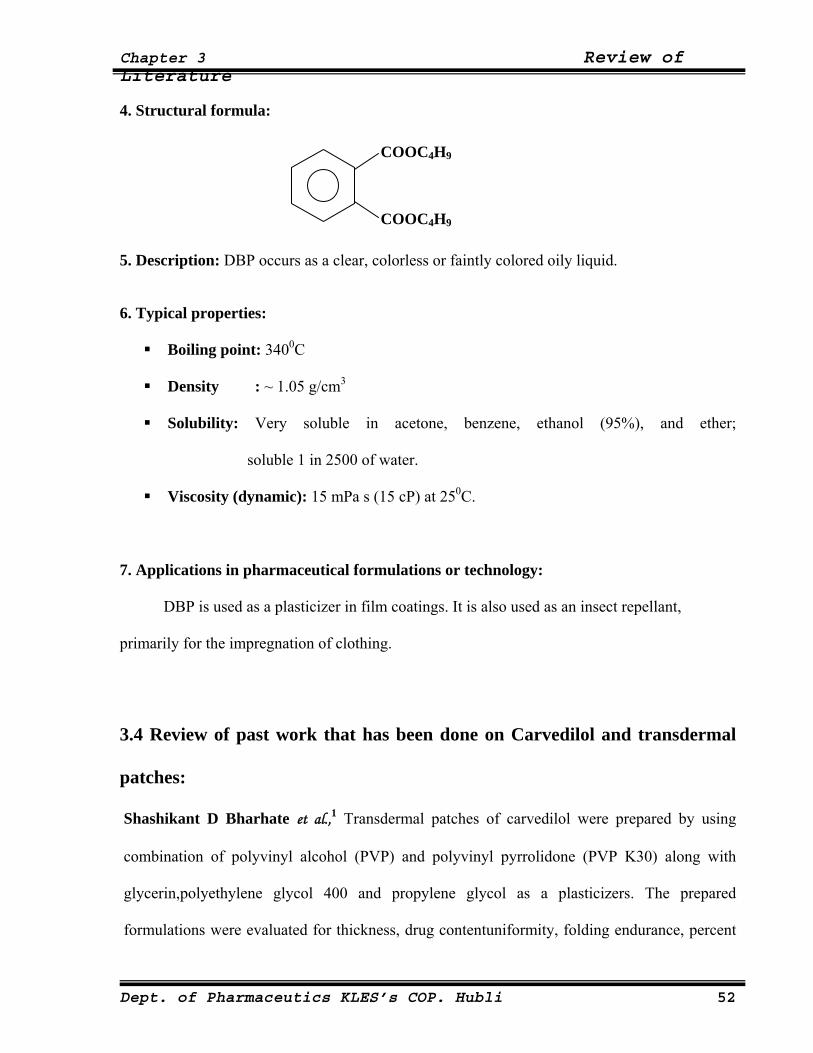
Chapter 3 Review of Literature
4. Structural formula:
COOC4H9
COOC4H9
5. Description: DBP occurs as a clear, colorless or faintly colored oily liquid.
6. Typical properties:
Boiling point: 3400C
Density : ~ 1.05 g/cm3
Solubility: Very soluble in acetone, benzene, ethanol (95%), and ether;
soluble 1 in 2500 of water.
Viscosity (dynamic): 15 mPa s (15 cP) at 250C.
7. Applications in pharmaceutical formulations or technology:
DBP is used as a plasticizer in film coatings. It is also used as an insect repellant,
primarily for the impregnation of clothing.
3.4 Review of past work that has been done on Carvedilol and transdermal
patches:
Shashikant D Bharhate et al.,1 Transdermal patches of carvedilol were prepared by using
combination of polyvinyl alcohol (PVP) and polyvinyl pyrrolidone (PVP K30) along with
glycerin,polyethylene glycol 400 and propylene glycol as a plasticizers. The prepared
formulations were evaluated for thickness, drug contentuniformity, folding endurance, percent
Dept. of Pharmaceutics KLES’s COP. Hubli 52

Chapter 3 Review of Literature
elongation at break, tensile strength, in-vitro permeation studies. It was observed that the
system with PVA:PVP in the ratio 8:6 along with used plasticizers was a promising controlled
release transdermal drug delivery system for carvedilol. Formulated transdermal patches of
carvedilol, exhibits zero-order release kinetics.
Sara Nicoli et al.,2 investigated the in vitro kinetics of release and permeation of caffeine from
bioadhesive transdermal films made of polyethylene membrane impregnated with isopropyl
myristate. These films are not self-adhesive but become adhesive when applied to wet skin.
The data obtained in the present work suggest that caffeine release from transdermal
bioadhesive films was controlled either by the permeability characteristics of the skin or by the
film itself, depending on drug loading.
Amir Mehdizadeh et al.,5 evaluated different matrix, drug-in-adhesive (DIA) and reservoir
transdermal formulations of fentanyl with a target of designing a suitable DIA formulation of
fentanyl. Different types & amounts of liquid, pressure-sensitive adhesives (PSAs) were used
and evaluated with respect to drug release and adhesive properties. It was concluded that acrylic
PSAs showed the best adhesion and release properties.
Hock S. Tan et al.,9 reviewed the use of Pressure-sensitive adhesives for transdermal drug
delivery systems (TDDS). Adhesives are a critical component in TDDS. This review discusses
the three most commonly used adhesives (polyisobutylenes, polyacrylates and silicones) in
TDDS and provides an update on recently introduced TDD products and recent developments
of new adhesives.
Dept. of Pharmaceutics KLES’s COP. Hubli 53
Chapter 3 Review of Literature
Ubaidulla U. et al,15 formulated transdermal therapeutic system of carvedilol. And also studied
the effect of hydrophilic and hydrophobic matrix on in vitro and in vivo characteristics. And the
evaluation of physiochemical properties. The carvedilol transdermal patches developed in this
study have grate utility and are a viable option for effective and controlled management
Anna M Wokovich et al.,18 provided an overview on types of transdermal delivery system, their
anatomy, the role of adhesion failure modes and how adhesion can be measured to improve
transdermal adhesive performance.
Adrian C. Williams et al.,19 have discussed a detailed review on Penetration enhancers which
penetrate into skin to reversibly decrease the barrier resistance and improve transdermal
delivery of drugs. Many potential sites and modes of action have been identified for skin
penetration enhancers that are considered in this review.
Naseem Ahmad Charoo et al.,21 investigated the penetration enhancing potential of tulsi and
turpentine oil on transdermal delivery of flurbiprofen. In the present work, the authors have
optimized a flurbiprofen loaded binary solvent mixture composition of propylene glycol :
isopropyl alcohol (30:70%v/v) which is then fabricated into a reservoir type of transdermal
formulation by encapsulating the drug reservoir solution within a shallow compartment,
moulded from polyester backing film & microporous ethyl vinyl acetate membrane. The
prepared patches were subjected to in-vitro drug permeation through rat abdominal skin &
various in-vivo pharmacodynamic studies. In conclusion, the turpentine oil showed superior
absorption enhancing properties on rat skin as compared to the tulsi oil treated, solvent treated
and normal control groups due to increased disruption of stratum corneum with negligible skin
irritation.
Dept. of Pharmaceutics KLES’s COP. Hubli 54

Chapter 3 Review of Literature
Umesh D Shivhare et al.,35 Transdermal films of carvedilol were prepared by using Eudragit
RL100 (ERL100) either alone or in combination with Eudragit RS100 (ERS100),
hydroxypropyl methylcellulose K15LV (HPMC), and ethyl cellulose (EC). The drug release
was extended over a period of 24 h from all formulations. The formulation A5 showed 98.33
cumulative % drug releases in 24 h and followed zero order kinetics. The drug transport
mechanism was observed to be Fickian. The cumulative % drug diffused through artificial
permeation membrane (cellophane A 393) from same formulation was 100.52 % over a 12 h.
The mechanism of dug release was governed by Peppas model and the drug diffusion rate
followed zero order kinetics. The formulation A5 comprising of polymers ERL 100, ERS 100,
EC and HPMC in 7:1:1:1 ratio fulfills the requirement of good TDDS.
Bijaya Ghosh et al.,36 carried out in vitro iontophoretic delivery of glipizide across the pig skin.
The target flux of glipizide was calculated to be 0.4147 µmol h-1. As the highest flux obtained
was 0.2727 µmol cm-2 h-1, the author says that glipizide is a promising candidate for
iontophoretic delivery.
Ubaidulla U. et al,37 has studied the effect of iontophoresis and permeation enhancer on
Carvedilol from Transdermal films. And concluded that the combination of permeation
enhancers and iontophoresis could be useful for increasing the skin permeability of Carvedilol
through the matrix TDDS.
Tashiro Y. et al,38 has studied effect of lipophilicity on in-vivo iontophoretic delivery of β
blockers. In many β -blockers, the relationships between plasma drug concentrations and
pharmacological effects (decreasing heart rate and blood pressure, etc.) has been estimated and
Dept. of Pharmaceutics KLES’s COP. Hubli 55
Chapter 3 Review of Literature
the effect of drug properties on the absorption processes in the iontophoretic transdermal
delivery of beta blocker.
G. D. Gupta et al., 41 prepared matrix type transdermal polymeric membrane systems of
Carvedilol by using eudragit NE 30D as polymer. Various formulations were prepared using
oleic acid, tween-60, span-80 & isopropyl myristate as permeation enhancers at a concentration
of 15% w/w based on polymer weight & subsequently evaluated for in-vitro permeation
enhancing effect by using 30% v/v methanolic isotonic phosphate buffer pH 7.4 as receiver
phase & human cadaver skin as barrier. Different models were applied to evaluate release
mechanism and kinetics. It was found that span-80 showed the best enhancement effect.
Prepared patches were also evaluated for various physico-chemical characteristics.
Srinivas Mutalik et al.,43 prepared reservoir type transdermal systems of glipizide using drug-
containing carbopol gel as drug reservoir and ethyl cellulose as well as Eudragit RS-100,
Eudragit-RL 100 and ethylene vinyl acetate (EVA) as rate-controlling membranes. The
prepared patches were subsequently evaluated for in vitro: drug content and drug permeation
studies and in vivo for: acute and long-term hypoglycaemic activity, effect on glucose tolerance,
biochemical and histopathological studies, skin irritation test and pharmacokinetic studies in
mice. Based on the in vivo study the authors have concluded that a 1 cm2 glipizide transdermal
system prepared with EVA19% membrane showed a cumulative amount of 269.05 µg drug
permeation at the end of 24 h. Hence, a transdermal system of glipizide with an area of
approximately 18 cm2 would be sufficient to provide an optimum effect in humans.
Srinivas Mutalik et al.,44 have prepared glipizide matrix transdermal systems for diabetes
mellitus using the combinations of ethyl cellulose/polyvinylpyrrolidone-K30 (PVP) and
Dept. of Pharmaceutics KLES’s COP. Hubli 56
Chapter 3 Review of Literature
Eudragit RL-100 (ERL)/Eudragit RS-100 (ERS). The systems were evaluated for various in
vitro and in vivo parameters as mentioned in the above article. The in vitro drug release study
through albino mice skin revealed that glipizide release was influenced by PVP and ERL 100
content of the patches. The in vivo results revealed that the patches successfully prevented the
severe hypoglycemia in the initial hours and they were also effective on chronic application.
The present study showed that matrix transdermal patches of glipizide exhibited better in vivo
performance than oral glipizide administration in mice as well reversing the diabetic
complications.
Prakash V. Diwan et al.,45 developed acrylate based transdermal drug delivery system for
glibenclamide by mercury substrate method. Patches were evaluated for its hypoglycemic
activity in normal and streptozotocin induced diabetic rats in comparision with its oral therapy.
In vivo results concluded that, the developed transdermal system is effective in preventing the
frequent hypoglycemic episodes encountered after oral glibenclamide administration in diabetic
rats.
Troy Purvis et al.,46 had produced rapidly dissolving formulations of the poorly water-soluble
drug Carvedilol using an innovative new technology, ultra-rapid freezing (URF), and
investigated the influence of different types and levels of excipients on Carvedilol stability. It
was found that URF process yielded fast-dissolving formulations that were physically &
chemically stable, resistant to alkali.
Ekapol Limpongsa et al.,47 prepared a diltiazem hydrochloride transdermal drug delivery
system by using hydroxypropyl methylcellulose (HPMC) and ethylcellulose (EC) as hydrophilic
& hydrophobic film formers respectively. Dibutyl phthalate & triethyl citrare were used as
Dept. of Pharmaceutics KLES’s COP. Hubli 57
Chapter 3 Review of Literature
hydrophobic and hydrophilic plasticizers. Effects of HPMC/EC ratios and plasticizers on
mechanical & physical properties of free films were studied. Influence of various enhancers on
in vitro release and permeation through Pig ear skin of diltiazem HCl films were evaluated. It
was found that, the film composed of 8:2 HPMC/EC, 30% DBP and 10% isopropyl myristate,
isopropyl palmitate or Tween 80 loaded with 25% diltiazem HCl should be selected for
manufacturing transdermal patch by using a suitable adhesive layer and backing membrane.
Dept. of Pharmaceutics KLES’s COP. Hubli 58
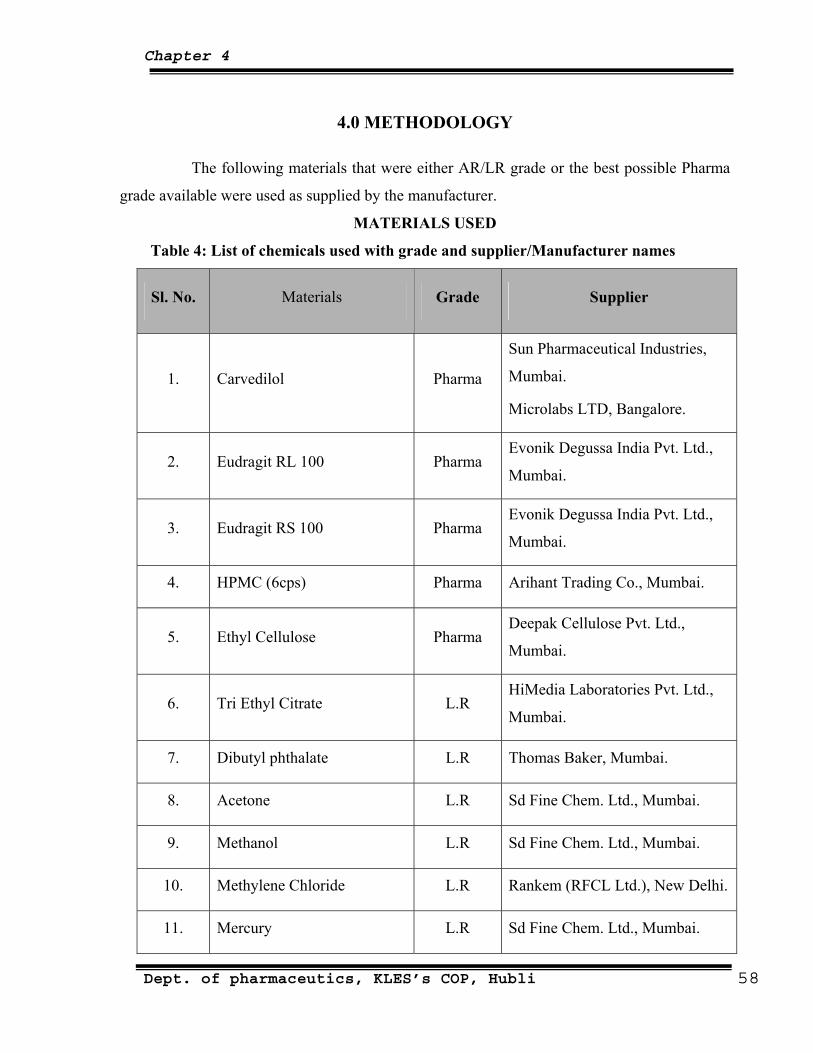
Chapter 4
4.0 METHODOLOGY
The following materials that were either AR/LR grade or the best possible Pharma
grade available were used as supplied by the manufacturer.
MATERIALS USED
Table 4: List of chemicals used with grade and supplier/Manufacturer names
Sl. No. Materials Grade Supplier
1. Carvedilol Pharma
Sun Pharmaceutical Industries,
Mumbai.
Microlabs LTD, Bangalore.
2. Eudragit RL 100 Pharma Evonik Degussa India Pvt. Ltd.,
Mumbai.
3. Eudragit RS 100 Pharma Evonik Degussa India Pvt. Ltd.,
Mumbai.
4. HPMC (6cps) Pharma Arihant Trading Co., Mumbai.
5. Ethyl Cellulose Pharma Deepak Cellulose Pvt. Ltd.,
Mumbai.
6. Tri Ethyl Citrate L.R HiMedia Laboratories Pvt. Ltd.,
Mumbai.
7. Dibutyl phthalate L.R Thomas Baker, Mumbai.
8. Acetone L.R Sd Fine Chem. Ltd., Mumbai.
9. Methanol L.R Sd Fine Chem. Ltd., Mumbai.
10. Methylene Chloride L.R Rankem (RFCL Ltd.), New Delhi.
11. Mercury L.R Sd Fine Chem. Ltd., Mumbai.
Dept. of pharmaceutics, KLES’s COP, Hubli 58
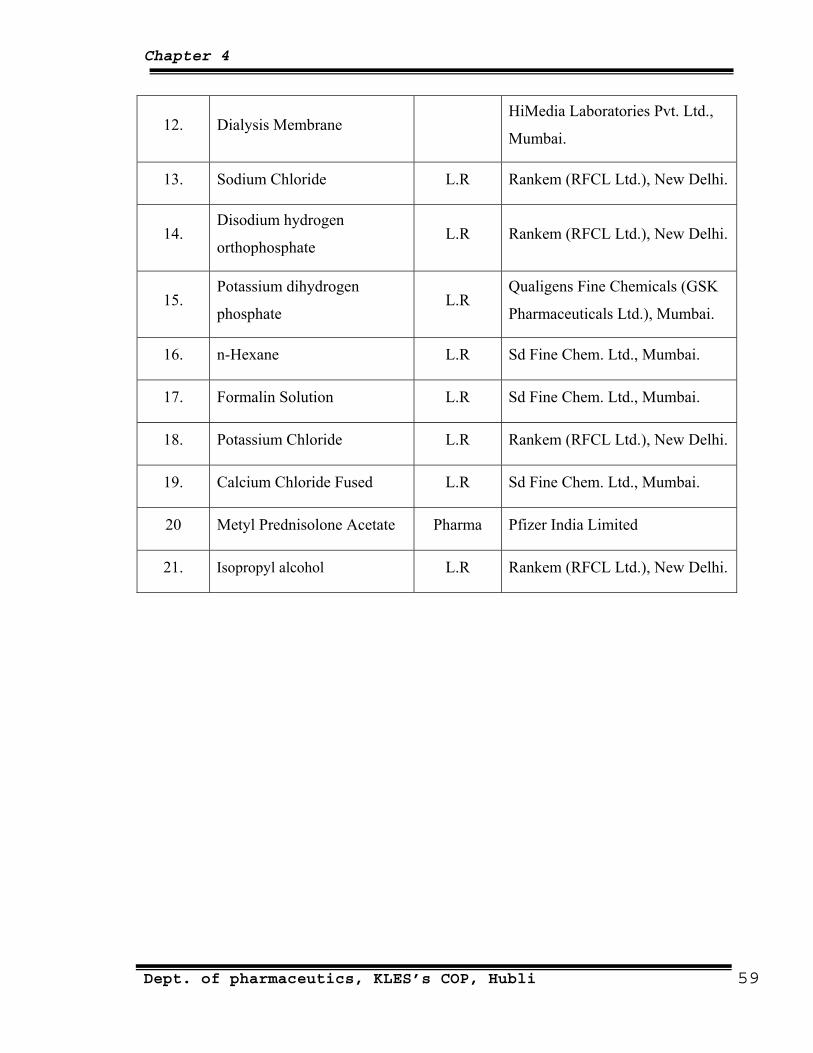
Chapter 4
12. Dialysis Membrane HiMedia Laboratories Pvt. Ltd.,
Mumbai.
13. Sodium Chloride L.R Rankem (RFCL Ltd.), New Delhi.
14. Disodium hydrogen
orthophosphate L.R Rankem (RFCL Ltd.), New Delhi.
15. Potassium dihydrogen
phosphate L.R
Qualigens Fine Chemicals (GSK
Pharmaceuticals Ltd.), Mumbai.
16. n-Hexane L.R Sd Fine Chem. Ltd., Mumbai.
17. Formalin Solution L.R Sd Fine Chem. Ltd., Mumbai.
18. Potassium Chloride L.R Rankem (RFCL Ltd.), New Delhi.
19. Calcium Chloride Fused L.R Sd Fine Chem. Ltd., Mumbai.
20 Metyl Prednisolone Acetate Pharma Pfizer India Limited
21. Isopropyl alcohol L.R Rankem (RFCL Ltd.), New Delhi.
Dept. of pharmaceutics, KLES’s COP, Hubli 59
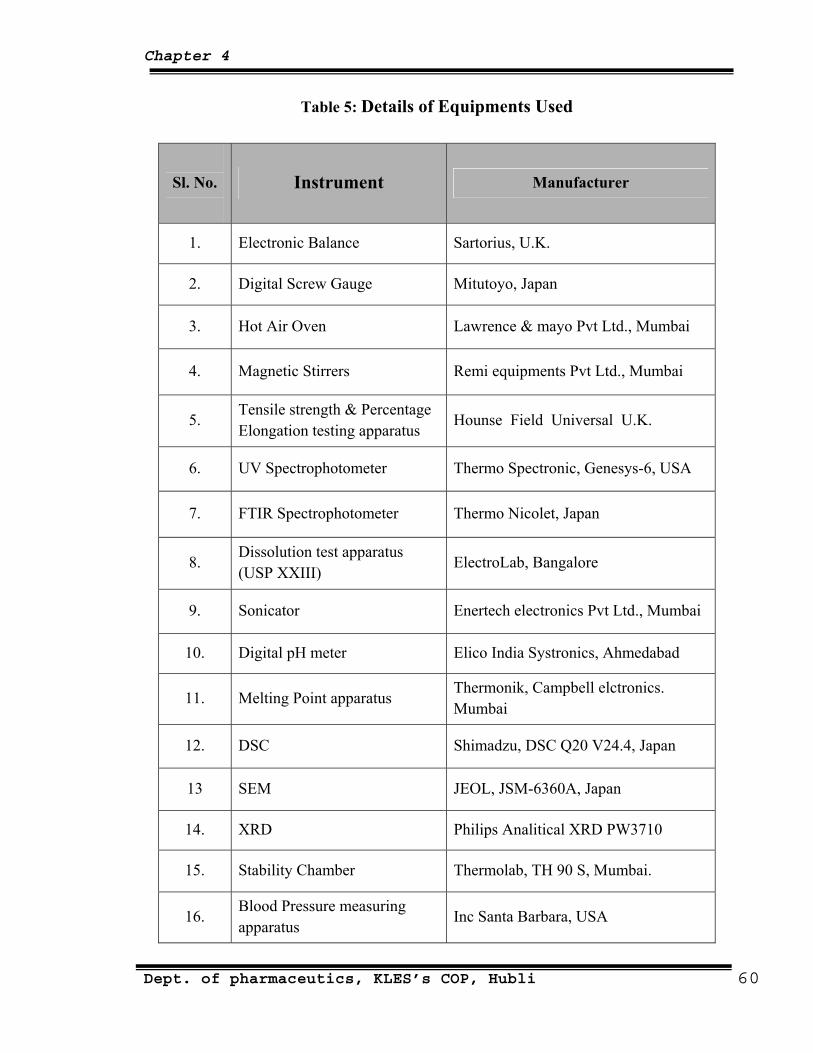
Chapter 4
Table 5: Details of Equipments Used
Sl. No.
Instrument Manufacturer
1. Electronic Balance Sartorius, U.K.
2. Digital Screw Gauge Mitutoyo, Japan
3. Hot Air Oven Lawrence & mayo Pvt Ltd., Mumbai
4. Magnetic Stirrers Remi equipments Pvt Ltd., Mumbai
5. Tensile strength & Percentage Elongation testing apparatus
Hounse Field Universal U.K.
6. UV Spectrophotometer Thermo Spectronic, Genesys-6, USA
7. FTIR Spectrophotometer Thermo Nicolet, Japan
8. Dissolution test apparatus (USP XXIII)
ElectroLab, Bangalore
9. Sonicator Enertech electronics Pvt Ltd., Mumbai
10. Digital pH meter Elico India Systronics, Ahmedabad
11. Melting Point apparatus Thermonik, Campbell elctronics. Mumbai
12. DSC Shimadzu, DSC Q20 V24.4, Japan
13 SEM JEOL, JSM-6360A, Japan
14. XRD Philips Analitical XRD PW3710
15. Stability Chamber Thermolab, TH 90 S, Mumbai.
16. Blood Pressure measuring apparatus
Inc Santa Barbara, USA
Dept. of pharmaceutics, KLES’s COP, Hubli 60

Chapter 4
Experimental Methods
1. Analytical methods of Carvedilol
1) Determination of λmax of Carvedilol in 30% v/v Methanolic Isotonic Phosphate
Buffer (MIPB) of pH 7.4
2) Calibration curve of Carvedilol in 30% v/v Methanolic Isotonic Phosphate Buffer
(MIPB) of pH 7.4
2. Preformulation Studies
1) Determination of Melting point.
2) Determination of Partition coefficient
3) Permeability studies through porcine ear skin
4) Optimization of transdermal patches with different plasticizers and in
different concentrations.
5) Polymer-Skin compatibility.
6) Determination of drug-excipient compatibility studies
3. Formulation design
4. Evaluation of film
1) Thickness uniformity
2) Weight uniformity
3) Tensile strength
4) Folding endurance
5) Water vapour transmission rate
6) Percentage elongation
7) Drug content uniformity of films
8) In vitro drug release studies
9) In vitro skin permeation studies
10) In vitro skin irritation studies
11) In vivo studies,
12) Stability studies
Dept. of pharmaceutics, KLES’s COP, Hubli 61

Chapter 4
METHODS: 4.1 Determination of λmax and preparation of standard calibration curve for
Carvedilol:41
Principle: Carvedilol exhibits absorption maxima at 242 nm in 30% v/v
Methanolic isotonic phosphate buffer (MIPB) pH 7.4.
Procedure:
1. Preparation of standard solution:
100 mg of Carvedilol was accurately weighed into a 100 ml volumetric flask and
dissolved in small volume of MIPB pH 7.4 with sonication. The volume was made up to
100 ml with MIPB to get a concentration of 1000 µg/ml (SS-I). From the above solution 10
ml was pipetted in a 100 ml volumetric flask and the volume was made up with MIPB to
get a concentration of 100 μg/ml (SS-II). From this, working standard solutions were
prepared.
2. Preparation of working standard solutions:
From (SS-II) aliquots of 0.2, 0.4, 0.6, 0.8., 1.0, 1.2, 1.4, 1.6, 1.8 and 2.0 ml were
pipetted out into a series of 10 ml volumetric flasks and the volume was made with MIPB
to get a concentration ranging from 2-20 µg/ml.
The absorbance of the resulting solutions was then measured at 242 nm using UV
spectrophotometer against respective parent solvent as a blank. The standard curve was
obtained by plotting absorbance v/s concentration in µg/ml. The standard calibration curve
is shown in Graph 1 and the values are tabulated in Table 9.
Beer’s range: 2 to 20 µg/ml.
Dept. of pharmaceutics, KLES’s COP, Hubli 62
Chapter 4
4.2. Pre-formulation studies:
Prior to the development of the dosage form preformulation studies were carried out
on parameters like solubility, partition coefficient, melting point and diffusion rate constant
of Carvedilol
4.2.1 Partition coefficient:75,78
The oil-water partition coefficient is a measure of lipophilicity of a molecule, which
can be used to predict its capability to cross biological membrane. One of the most
common ways of measuring partition coefficient is shake flask method.
Procedure: The Carvedilol was added little at once into 5 ml of n-octanol until
saturated solution was obtained. This solution was filtered to get a clear solution. Three ml
of the saturated solution was mixed with 2 ml of fresh n-octanol. In total 5 ml of n-
octanol containing Carvedilol was mixed with 15 ml of water. Then two phases were
allowed to equilibrate at 37 oC for 24 h, on cryostatic constant temperature shaker bath
(Research and Test Equipments, Bangalore, India). The concentration of the drug in the
aqueous phase and organic phase was determined by UV spectroscopic method after
necessary dilution. The apparent partition coefficient (Kp) was calculated as the ratio of
drug concentration in each phase by the following equation.
where, Corg is concentration of drug in organic phase and Caq is the concentration
of drug in aqueous phase.
Dept. of pharmaceutics, KLES’s COP, Hubli 63
Chapter 4
4.2.2 Melting point determination:
Melting point of drug was determined by taking a small amount of drug in a
capillary tube closed at one end and was placed in melting point apparatus and temperature
at which the drug melts was noted. Values for different physicochemical parameters are
tabulated in table 10.
4.2.3 Permeability studies through porcine ear skin:36,41,47,55,57,72
a) Preparation of the skin barrier:
From a local abattoir, ears were obtained from freshly slaughtered pigs. The ears were
cleaned with water to remove blood stains. The fresh full thickness (0.95 mm) porcine
ear skin was used for the study. The epidermis was prepared by soaking the ear in water
at 600C for 1 min. The intact epidermis from the dorsal side was subsequently teased
off from dermis with forceps, rapidly rinsed with isopropyl alcohol to remove the fat
adhering to the dermal side, washed with water & used immediately.
b) Determination of drug permeability through porcine ear skin:
The permeability study of the drug was carried out across the porcine ear skin using a
Keshary-Chien diffusion cell. A 5 mg/ml drug suspension was prepared in phosphate
buffer pH 7.4 and sonicated to ensure uniform drug distribution. One ml of the above
suspension was taken in the donor compartment. The barrier was mounted between the
donor & the receptor compartments in a way that, the dermal side of the skin was
facing receptor compartment. The receptor cell contained MIPB of pH 7.4 as the
elution medium. The medium was magnetically stirred for uniform drug distribution
and was maintained at 37±10C. The samples were withdrawn every hour upto 8 hours
Dept. of pharmaceutics, KLES’s COP, Hubli 64

Chapter 4
and estimated spectrophotometrically (UV) at 242 nm after suitable dilutions to
determine the amount of drug diffused.
The flux (µg/cm2/hr) of Carvedilol was calculated from the slope of the plot of
cumulative amount of drug permitted per square centimeter of skin at steady state
against the time using linear regression analysis.
The steady state permeability coefficient (Kp) of the drug diffused through the
porcine skin was calculated using the equation:
Kp = ---------- (15) J
C
Where, J = Steady state flux
C = Concentration of Carvedilol in donor compartment.
The flux data are tabulated in table 11 and graph 2.
4.2.4 Optimization of transdermal patches with different plasticizers and in
different concentrations:44,45,47,58
Drug free patches of Eudragit RL : RS 100 and HPMC 6cps : Ethyl cellulose
were prepared by casting on mercury surface (mercury substrate method) along with two
different plasticizers i.e. dibutyl phthalate (DBP) and triethyl citrate (TEC).
Polymer solutions were prepared by dissolving in respective solvents by
sonication with the aid of a sonicator for 12 mins. For Eudragit and HPMC : Ethyl cellulose
patches acetone and a mixture of methylene chloride & methanol were used as solvents
respectively. Plasticizers like DBP and TEC at different concentrations based on dry weight
of polymer were used to optimize the patches (Table 12 to 14). The prepared patches were
then evaluated for physical appearance and folding endurance.
Dept. of pharmaceutics, KLES’s COP, Hubli 65

Chapter 4
4.2.5 Polymer-Skin compatibility: 15,59,60,61
Compatibility of polymers with skin was determined by performing skin irritation
test. The skin irritation test was performed on two healthy albino rabbits weighing between
2.0 to 3.5 kg. Aqueous solution of formalin 0.8% was used as standard irritant. Drug free
polymeric patches of 4.5 cm2 were used as test patches. 0.8% of formalin is applied on the
left dorsal surface of each rabbit, where as the test patches were placed on identical site, on
the right dorsal surface of the rabbit. The patches were removed after a period of 24 hrs
with the help of alcohol swab. The skin was examined for erythema/oedema. The data are
tabulated in table 15.
4.2.6 Compatibility studies of drug and polymers:
a) FTIR studies: 44, 61,62,64,65
The application of infrared spectroscopy lies more in the qualitative
identification of substances either in pure form or in the mixtures and as a tool in
establishment of the structure. Since I.R. is related to covalent bonds, the spectra can
provide detailed information about the structure of molecular compounds. In order to
establish this point, comparisons were made between the spectrum of the substance and
the pure compound. The infrared data is helpful to confirm the identity of the drug and
to detect the interaction of the drug with the polymers. Infrared spectra of drug &
polymers, alone and in physical mixtures were taken. Then it was investigated for any
possible interaction between polymer and drug. I.R spectral data are shown in spectra
2–6 & their results are tabulated in table 16.
Dept. of pharmaceutics, KLES’s COP, Hubli 66
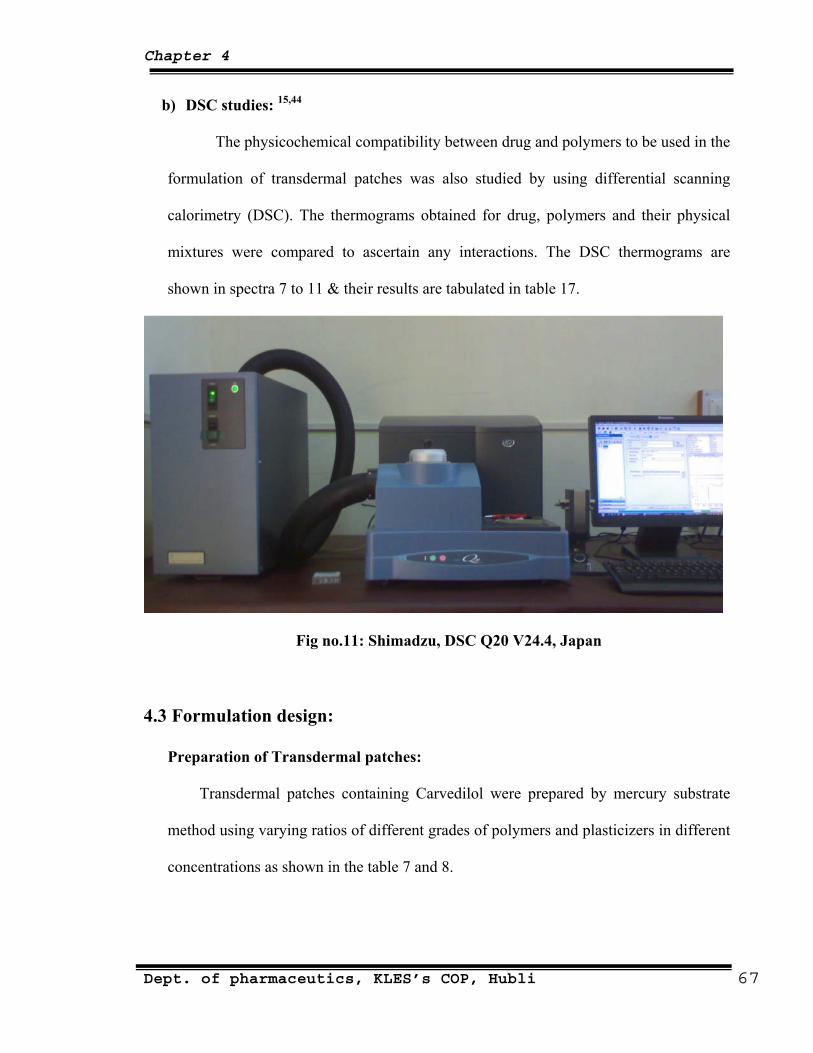
Chapter 4
b) DSC studies: 15,44
The physicochemical compatibility between drug and polymers to be used in the
formulation of transdermal patches was also studied by using differential scanning
calorimetry (DSC). The thermograms obtained for drug, polymers and their physical
mixtures were compared to ascertain any interactions. The DSC thermograms are
shown in spectra 7 to 11 & their results are tabulated in table 17.
Fig no.11: Shimadzu, DSC Q20 V24.4, Japan
4.3 Formulation design:
Preparation of Transdermal patches:
Transdermal patches containing Carvedilol were prepared by mercury substrate
method using varying ratios of different grades of polymers and plasticizers in different
concentrations as shown in the table 7 and 8.
Dept. of pharmaceutics, KLES’s COP, Hubli 67
Chapter 4
a) Procedure for preparation of Eudragit patches: 15,44,58
The polymers Eudragit RL and RS 100 (total weight = 1000 mg) were weighed
in requisite ratios and dissolved in 10 ml of acetone to form a 10% w/v solution.
Plasticizers like DBP and TEC were added to the above solution, 25 mg of Carvedilol
is then added under mild agitation until drug dissolves. The solution was poured on the
mercury placed in a glass Petri dish of 63 cm2 area and dried at room temperature for
24 hours. The organic solvent evaporates to leave stable Eudragit RL/RS patches (Table
7).
b) Procedure for preparation of HPMC : Ethyl cellulose (EC) patches:47
Films composed of different ratios of HPMC (6 cps) and EC (total polymer
weight = 600 mg) were prepared by mercury substrate method. HPMC and EC were
weighed and dissolved in 10 ml of an equal volume of methylene chloride and
methanol (5:5 ratio) to form a 6 % w/v solution, which is then plasticized with either
TEC or DBP. 25 mg of Carvedilol is added to the above polymer solution under mild
agitation until the drug dissolves. The resultant solution was poured on the mercury
placed in a glass Petri dish of 63 cm2 area, dried at room temperature for 24 hours and
subsequently oven-dried at 450C for 30 min to remove the residual organic solvents
(Table 8).
Dept. of pharmaceutics, KLES’s COP, Hubli 68
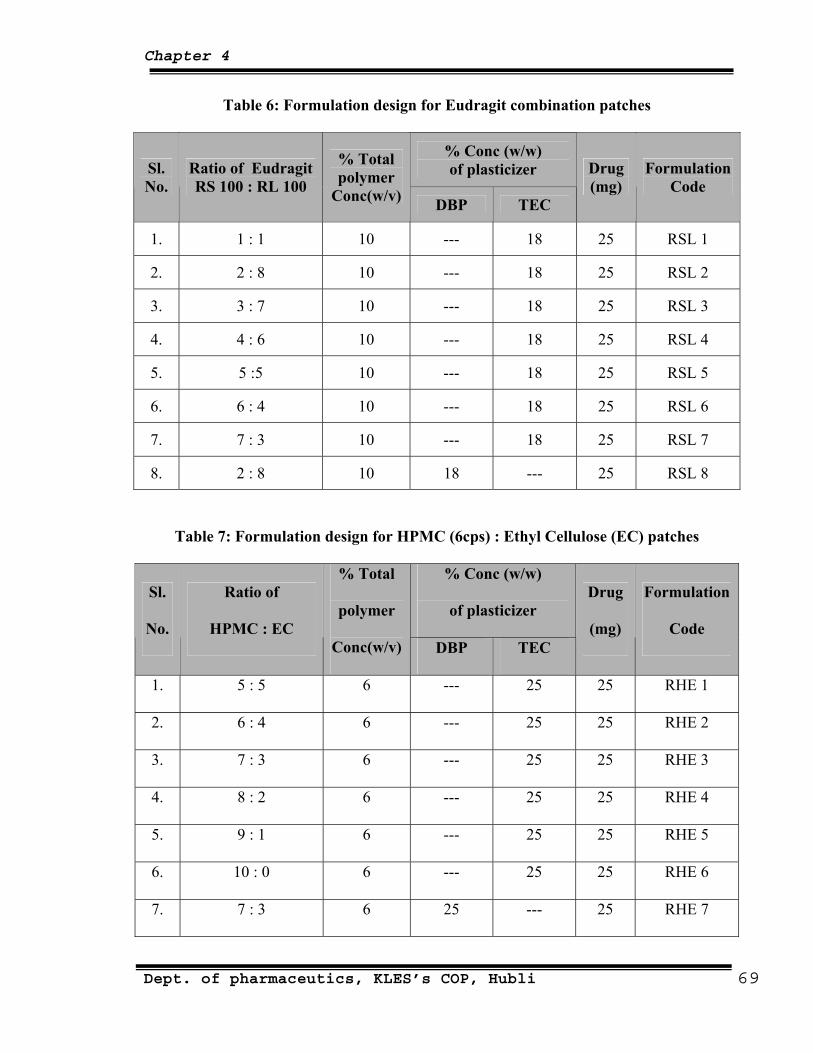
Chapter 4
Table 6: Formulation design for Eudragit combination patches
% Conc (w/w) of plasticizer Sl.
No. Ratio of Eudragit RS 100 : RL 100
% Total polymer
Conc(w/v) DBP TEC
Drug (mg)
Formulation Code
1. 1 : 1 10 --- 18 25 RSL 1
2. 2 : 8 10 --- 18 25 RSL 2
3. 3 : 7 10 --- 18 25 RSL 3
4. 4 : 6 10 --- 18 25 RSL 4
5. 5 :5 10 --- 18 25 RSL 5
6. 6 : 4 10 --- 18 25 RSL 6
7. 7 : 3 10 --- 18 25 RSL 7
8. 2 : 8 10 18 --- 25 RSL 8
Table 7: Formulation design for HPMC (6cps) : Ethyl Cellulose (EC) patches
% Conc (w/w)
of plasticizer Sl.
No.
Ratio of
HPMC : EC
% Total
polymer
Conc(w/v) DBP TEC
Drug
(mg)
Formulation
Code
1. 5 : 5 6 --- 25 25 RHE 1
2. 6 : 4 6 --- 25 25 RHE 2
3. 7 : 3 6 --- 25 25 RHE 3
4. 8 : 2 6 --- 25 25 RHE 4
5. 9 : 1 6 --- 25 25 RHE 5
6. 10 : 0 6 --- 25 25 RHE 6
7. 7 : 3 6 25 --- 25 RHE 7
Dept. of pharmaceutics, KLES’s COP, Hubli 69
Chapter 4
4.4 Evaluation of transdermal formulation:
I. Physicochemical evaluation:
1. Physical appearance:
All the transdermal systems were visually inspected for colour, clarity, flexibility
and smoothness.
2. Folding Endurance:15,59,63,
Folding endurance of the film was determined manually by folding a small strip of
the film (4×3 cms) at the same place till it breaks. The maximum number of folding
operation done at the same place of the film without breaking, gives the value of folding
endurance, where the cracking point of the films were considered as the end point.
3. Thickness of the films: 39,47,63,
The thickness of the patches was measured at three different places by using a
Digital Screw Gauge micrometer (Mitutoyo, Japan) and mean thickness was calculated.
4. Weight uniformity:15,39
The dried patches were weighed on electronic balance (Sartorius UK). The average
of 3 observations was calculated.
5. Drug content:15,39,67
Transdermal systems of specified area (5.088 cm2) was cut into small pieces and
taken into 50 ml volumetric flask, 25ml of MIPB pH 7.4 was added and gently heated
to 450 C for 15 min and kept for 24 hrs with occasional shaking. Then the volume was
made up to 50ml again with MIPB pH 7.4 and further dilutions were made from this
solution. Similarly, a blank was carried out using a drug free patch. The solutions
Dept. of pharmaceutics, KLES’s COP, Hubli 70
Chapter 4
were filtered and absorbances were read at 238 nm by UV spectrophotometer. The
values for different physicochemical parameters are tabulated in Table 18.
6. Percentage moisture uptake:15,63,64,66
The weighed films were kept in a dessicator at room temperature for 24 hours.
They were then taken out and exposed to 84% relative humidity using a saturated
solution of potassium chloride in a dessicator until a constant weight was achieved.
Then the films were weighed and percentage moisture uptake was calculated by using
the following formula:
Percentage moisture uptake = [Final wt.−Initial wt./Initial wt.]×100 -------- (16)
The values are tabulated in table 19 and 20.
7. Percentage moisture content:15,63,64,65,66
The prepared films were weighed individually and kept in a desiccator
containing fused calcium chloride at room temperature for 24 hours. The films were
weighed repeatedly until they showed a constant weight. The percentage moisture
content was calculated using the following formula:
Percentage moisture content = [Initial wt.−Final wt./Final wt.]×100 -------- (17)
The values are tabulated in table 21 and 22.
8. Tensile Strength & Percentage Elongation:15,39
Tensile strength of the film was determined with Universal Strength Testing
Machine (Hounsfield, Slinfold, Horsham, U.K.) as shown in Figure 7. The
sensitivity of the machine was 1 gram. It consisted of two load cell grips. The
Dept. of pharmaceutics, KLES’s COP, Hubli 71
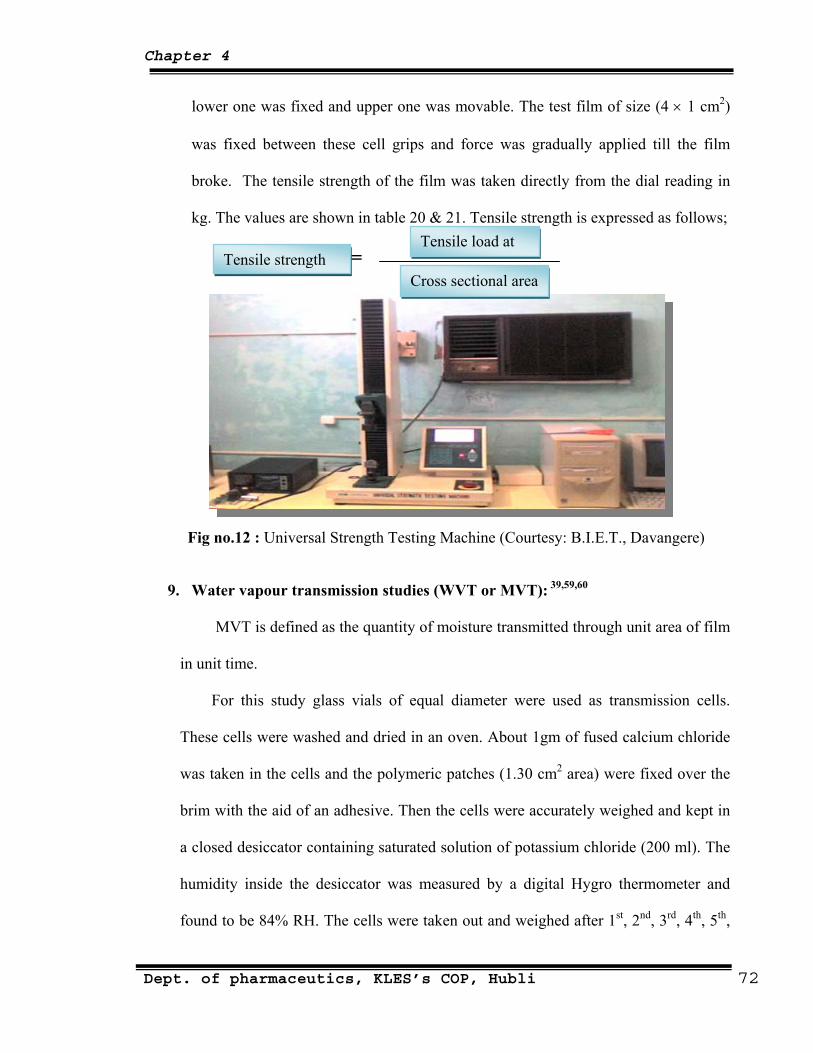
Chapter 4
lower one was fixed and upper one was movable. The test film of size (4 × 1 cm2)
was fixed between these cell grips and force was gradually applied till the film
broke. The tensile strength of the film was taken directly from the dial reading in
kg. The values are shown in table 20 & 21. Tensile strength is expressed as follows;
= Tensile load at
Tensile strength
Cross sectional area
Fig no.12 : Universal Strength Testing Machine (Courtesy: B.I.E.T., Davangere)
9. Water vapour transmission studies (WVT or MVT): 39,59,60
MVT is defined as the quantity of moisture transmitted through unit area of film
in unit time.
For this study glass vials of equal diameter were used as transmission cells.
These cells were washed and dried in an oven. About 1gm of fused calcium chloride
was taken in the cells and the polymeric patches (1.30 cm2 area) were fixed over the
brim with the aid of an adhesive. Then the cells were accurately weighed and kept in
a closed desiccator containing saturated solution of potassium chloride (200 ml). The
humidity inside the desiccator was measured by a digital Hygro thermometer and
found to be 84% RH. The cells were taken out and weighed after 1st, 2nd, 3rd, 4th, 5th,
Dept. of pharmaceutics, KLES’s COP, Hubli 72
Chapter 4
6th & 7th days of storage and weighed accuratly. The amount of water vapour
transmitted and rate of WVT were calculated and plotted. The values are shown in
table 23 & 24 and graph 3 & 4.
The rate of water vapour transmission (WVT) was calculated using the formula:
WVT Rate = WL S
(18)
Where, W = gm of water transmitted
L = Thickness of the film in cm
S = Exposed surface area of the film in cm2.
10. Skin irritation test: 15,39,60,61
The skin irritation test was performed on two healthy albino rabbits weighing
between 2.0 to 3.5 kg. Aqueous solution of formalin 0.8% was used as standard
irritant. Polymeric patches containing drug of 5.088 cm2 were used as test patches.
0.8% formalin is applied on the left dorsal surface of each rabbit, where as the test
patches were placed on identical site, on the right dorsal surface of the rabbit. The
patches were removed after a period of 24hours with the help of alcohol swab. The
skin was examined for erythema/oedema. The values are tabulated in table 15.
11. Scanning electron microscopy (SEM):44,63,65
The surface morphologies of the transdermal patches were analyzed by using a
JEOL, JSM-6360A, Japan scanning electron microscope. The samples placed on the
stubs were coated finely with gold palladium alloy and examined under the microscope.
Fig No: 10.
Dept. of pharmaceutics, KLES’s COP, Hubli 73
Chapter 4
Fig No: 13. JEOL, JSM-6360A, Japan scanning electron microscope
12.
Samples of Carvedilol its pure crystalline state and the transdermal patches were assessed
for ps analytica X- Raydiffractometer (Model:PW 3710). The
ra
ccelerated stability studies of the optimized formulation:68,69
Stability of a pharmaceutical preparation can be defined as “the capability of a
main within its
XRD studies: 49,50
crystallinity using Phili
voltage and current was 25 kv and 25 mA, respectively. Measurements were carried out in
the angular scan range from 10° to 70° (2θ). The XRD spectral data are shown in spect
12 to 16.
13. A
particular formulation in a specific container/closure system to re
Dept. of pharmaceutics, KLES’s COP, Hubli 74
Chapter 4
physical, chemical, microbiological, therapeutic and toxicological specifications
throughout its shelf life”.
Studies are designed to increase the rate of chemical degradation or physical
change of an active drug substance or drug product by using exaggerated storage
2 months.
months.
conditions as a part of the formal, definitive, storage program.
ICH specifies the length of study and storage conditions:
Long term testing: 250C ± 20C / 60% RH ± 5% RH for 1
Accelerated testing: 400C ± 20C / 75% RH ± 5% RH for 6
Fig no.14 . Stability Chamber
Procedure:
th TEC as plasticizer (RSL 2)
asticizer (RHE 3) were selected for accelerated stability
studies as per ICH guidelines. These two batches were subjected for 400C ± 20C / 75%
Optimized formulation of Eudragit RL : RS 100 wi
and HPMC : EC with TEC as pl
Dept. of pharmaceutics, KLES’s COP, Hubli 75
Chapter 4
RH ± 5% RH for a period of 3 months. These patches were analyzed for physical
appearance, folding endurance, weight variation, content uniformity and finally the
patches were studied for interaction studies.
Results of stability studies are represented in table 45 and spectra 12 and 13.
Adhesive test:
1. Thumb tack test:
II.
as pressed
atch for about 5 seconds and then quickly withdrawn. By varying the
ontact and considering the difficulty of pulling the thumb from
III. I
1.
The release rate determination is one of the most important studies to be
trolled release delivery systems. The dissolution studies of
ne needs to maintain the drug concentration on the
ire and
5
One week after the preparation of transdermal patches, the thumb w
lightly on a p
pressure and time of c
the patch, it was possible to set a scoring as to how easily, quickly and strongly the
polymer can form a bond with the skin. The entire test was simultaneously performed
in blind way on all samples (Table 25).
n-vitro release study:
USP Paddle method:47,64,66
conducted for all con
patches are crucial because o
surface of the stratum corneum consistently and keep it substantially higher than the
drug concentration in the body, to achieve a constant rate of drug permeation.
The dissolution study using USP Paddle Type Dissolution Apparatus was
carried out at 32±10C at 50 rpm frequency of the paddle. 500 ml of MIPB of pH 7.4
was used as the dissolution media. The patches were tied with a thin copper w
Dept. of pharmaceutics, KLES’s COP, Hubli 76
Chapter 4
then placed in a jar. Samples were withdrawn at different time intervals and then
analyzed using a UV Spectrophotometer at 238 nm against blank.
Percentage of drug released was determined using the formula:
% of drug released = Da/Dt × 100 --------- (19)
Where, Dt ― indicates the total amount of drug in the patch and
Da — the amount of drug released.
The values are tab in graph 5.
IV. In
using
dialysis membrane as barrier. The optimized patches (patches which showed
subjected for in-vitro release through
porcine
1.
fixed carefully to the receptor compartment of the diffusion cell so that it just touches
area was placed
ulated in table 26 and the release pattern is shown
-vitro membrane/skin permeation study:
In-vitro permeation studies were carried out for all the formulations
highest release in 8 hours) were further
ear skin.
Keshary-Chien diffusion cell using dialysis membrane:71,72,73,74
The dialysis membrane soaked in phosphate buffer pH 7.4 for overnight was
the receptor fluid surface. The transdermal system of 5.088 cm2
above the dialysis membrane fixed to the donor compartment. The receptor
compartment was filled with 48 ml of MIPB of pH 7.4 as diffusion medium. The
receptor medium was magnetically stirred using a magnetic bead for uniform drug
distribution and was maintained at 37±10C. The samples (3 ml) were withdrawn
every hour upto 8 hours and estimated spectrophotometrically (UV) at 238 nm to
Dept. of pharmaceutics, KLES’s COP, Hubli 77

Chapter 4
determine the amount of drug released. The volumes withdrawn at each interval were
replaced with an equal volume of fresh, pre warmed buffer solution.
Fig. no.15: Magnetic
rer with Franz
Diffussion cell
eated was plotted against time and
steady state flux as well as Kp value was determined. The values are tabulated in
2.
arlier in permeability
diffusion cell with a
Stir
The cumulative amount of drug perm
table 27 to 41 and the release pattern is shown in graph 6 and 7.
Keshary-Chien diffusion cell using porcine ear skin: 47,55
The porcine ear skin sample was prepared as described e
studies of drug through porcine skin. A Keshary-Chien
diffusional surface area of 5.088 cm2 and receptor volume capacity of 48 ml was used
for the release study. MIPB of pH 7.4 was used as receptor medium. The transdermal
patch was firmly pressed onto the centre of the porcine skin and then the skin along
with the patch was mounted on the donor compartment. The donor compartment was
then placed in position such that the surface of dermis side skin just touches the
receptor fluid surface.
Dept. of pharmaceutics, KLES’s COP, Hubli 78
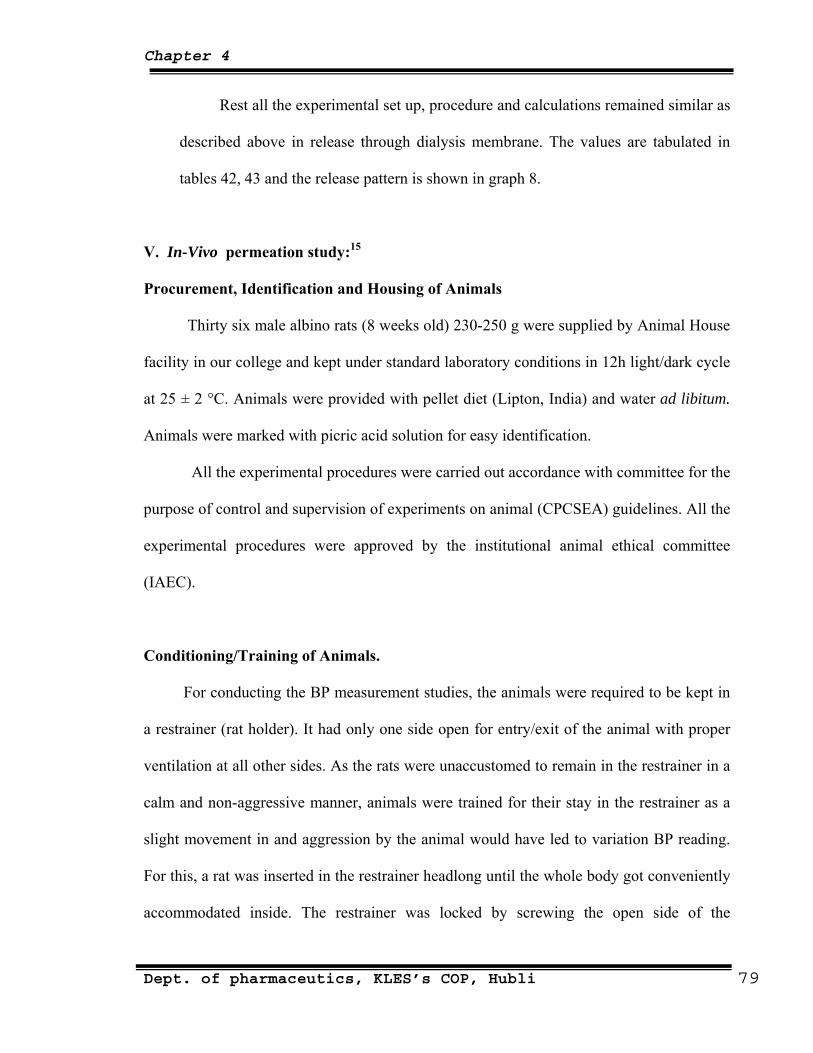
Chapter 4
ase through dialysis membrane. The values are tabulated in
V. In
rocurement, Identification and Housing of Animals
mal House
conditions in 12h light/dark cycle
) guidelines. All the
ning/Training of Animals.
For conducting the BP measurement studies, the animals were required to be kept in
ne side open for entry/exit of the animal with proper
Rest all the experimental set up, procedure and calculations remained similar as
described above in rele
tables 42, 43 and the release pattern is shown in graph 8.
-Vivo permeation study:15
P
Thirty six male albino rats (8 weeks old) 230-250 g were supplied by Ani
facility in our college and kept under standard laboratory
at 25 ± 2 °C. Animals were provided with pellet diet (Lipton, India) and water ad libitum.
Animals were marked with picric acid solution for easy identification.
All the experimental procedures were carried out accordance with committee for the
purpose of control and supervision of experiments on animal (CPCSEA
experimental procedures were approved by the institutional animal ethical committee
(IAEC).
Conditio
a restrainer (rat holder). It had only o
ventilation at all other sides. As the rats were unaccustomed to remain in the restrainer in a
calm and non-aggressive manner, animals were trained for their stay in the restrainer as a
slight movement in and aggression by the animal would have led to variation BP reading.
For this, a rat was inserted in the restrainer headlong until the whole body got conveniently
accommodated inside. The restrainer was locked by screwing the open side of the
Dept. of pharmaceutics, KLES’s COP, Hubli 79
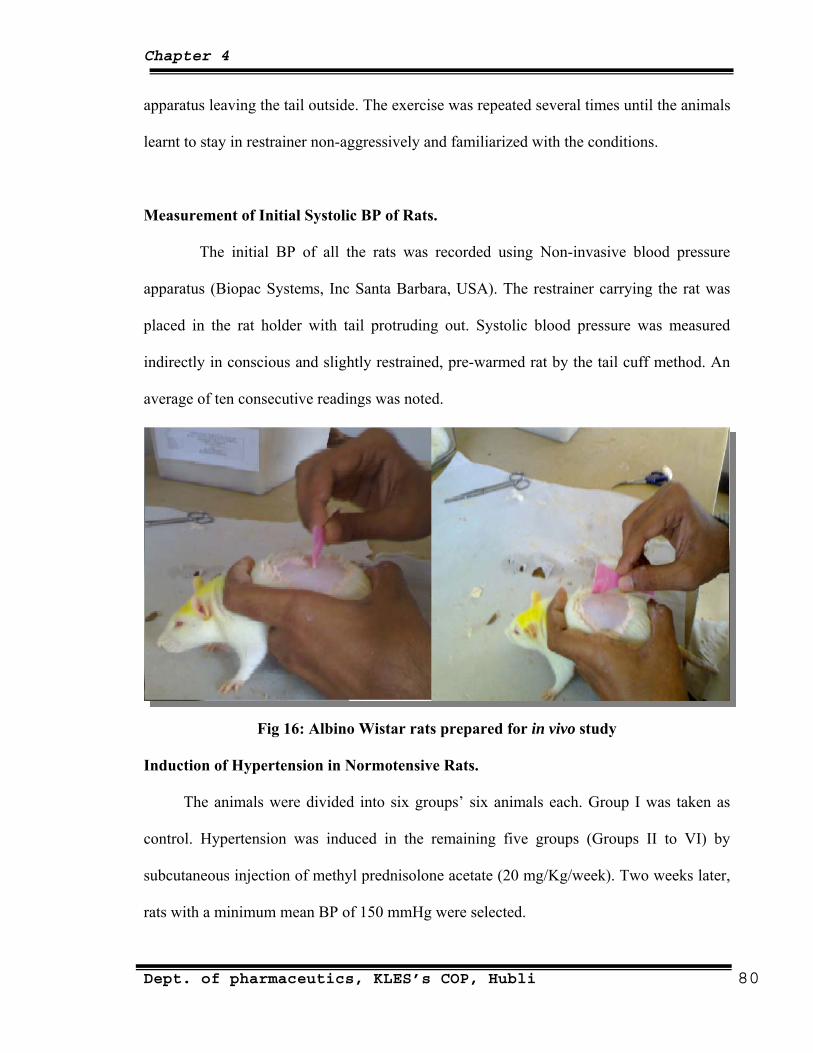
Chapter 4
apparatus leaving the tail outside. The exercise was repeated several times until the animals
learnt to stay in restrainer non-aggressively and familiarized with the conditions.
Measurement of Initial Systolic BP of Rats.
The initial BP of all the rats was recorded using Non-invasive blood pressure
, USA). The restrainer carrying the rat was apparatus (Biopac Systems, Inc Santa Barbara
placed in the rat holder with tail protruding out. Systolic blood pressure was measured
indirectly in conscious and slightly restrained, pre-warmed rat by the tail cuff method. An
average of ten consecutive readings was noted.
Fig 16: Albino Wistar rats prepared for in vivo study
Induction of Hypertension in Normotensive Rats.
The anima I was taken as
g five groups (Groups II to VI) by
ls were divided into six groups’ six animals each. Group
control. Hypertension was induced in the remainin
subcutaneous injection of methyl prednisolone acetate (20 mg/Kg/week). Two weeks later,
rats with a minimum mean BP of 150 mmHg were selected.
Dept. of pharmaceutics, KLES’s COP, Hubli 80
Chapter 4
Fig no.17: Biopack Machine
ed Hypertensive Rats
After MPA treatment, groups III, IV, V and VI were subjected to TDDS
(formulations RSL-2, RSL-8, RHE-3 and RHE-7, respectively). Group II served as toxic
Post TDDS Treatment BP Assessment of MPA induc
control and received no further treatment. The TDDS was applied to the previously shaven
abdominal area of rat skin with the entire release surface in intimate contact with the
stratum corneum. The patch was applied over the stratum corneum, over the patch an
aluminum foil was placed for avoid the backward movement of drug through the adhesive
tape. A microporous adhesive tape (Johnson and Johnson) was then rolled over to keep the
patch secured at the site of application. The rat was then placed in the restrainer and the
Systolic BP was recorded upto 12 hours. Results of Systolic BP are represented in table 40.
Dept. of pharmaceutics, KLES’s COP, Hubli 81

Chapter 4
4.5 Data analysis:70
The matrix systems were reported to follow the zero order release rate and the
the release of the drug.
t order, Higuchi matrix and Korsmeyer’s
elease
e area does not change and no equilibrium conditions are
itial amount of drug in the solution
etics the release rate data were fitted to the following
ount of drug released in time t, Qo is the initial amount of drug
the fi
e release of water-soluble and low
soluble drugs incorporated in semisolids and or solid matrices. Mathematical expressions
diffusion mechanism for
To analyze the mechanism for the release and release rate kinetics of the dosage form, the
data obtained was fitted in to Zero order, Firs
Peppas model. By comparing the r-values obtained, the best-fit model was selected.
1. Zero order kinetics:
Drug dissolution from pharmaceutical dosage forms that do not disaggregate and r
the drug slowly, assuming that th
obtained can be represented by the following equation
Q t = Q o + K o t (20)
Where Q t = amount of drug dissolved in time t, Q o = in
and K o = zero order release constant.
2. First order kinetics:
To study the first order release rate kin
equation.
Log Qt = log Qo + K1t / 2.303 (21)
Where Qt is the am
in the solution and K1 is rst order release constant.
3. Higuchi model:
Higuchi developed several theoretical models to study th
Dept. of pharmaceutics, KLES’s COP, Hubli 82
Chapter 4
were obtained for drug particles dispersed in a uniform matrix behaving as the diffusion
Mt / M ∞ = K × t n (23)
e, K is the release constant, t is the release time
e shape of the
1.0, or n=1.0, for mass transfer following a non-Fickian model.
5. Hixson- Crowell model:
To study the Hixson – Crowell model the release rate data are fitted to the following
equation:
(24)
drug in the pharmaceutical dosage form, Ks is a constant incorporating the
study of best
media. And the equation is
Q t = KH × t ½ (22)
Where Q t = Amount of drug released in time t, K H = Higuchi dissolution constant.
4. Korsmeyer and Peppas release model:
To study this model the release rate data are fitted to the following equation
Where Mt / M ∞ is the fraction of drug releas
and n is the diffusional exponent for the drug release that is dependent on th
matrix dosage form.
Peppas (1985) used this n value in order to characterize different release
mechanisms, concluding for values for a slab, of n=0.5 for Fick diffusion and higher values
of n, between 0.5 and
Wo1/3 – Wt
1/3 = Kst
Where Wo is the amount of drug in the pharmaceutical dosage form, Wt is the remaining
amount of
surface-volume relation. Kinetic data of various models applied to release
formulations is shown in table 44.
Dept. of pharmaceutics, KLES’s COP, Hubli 83
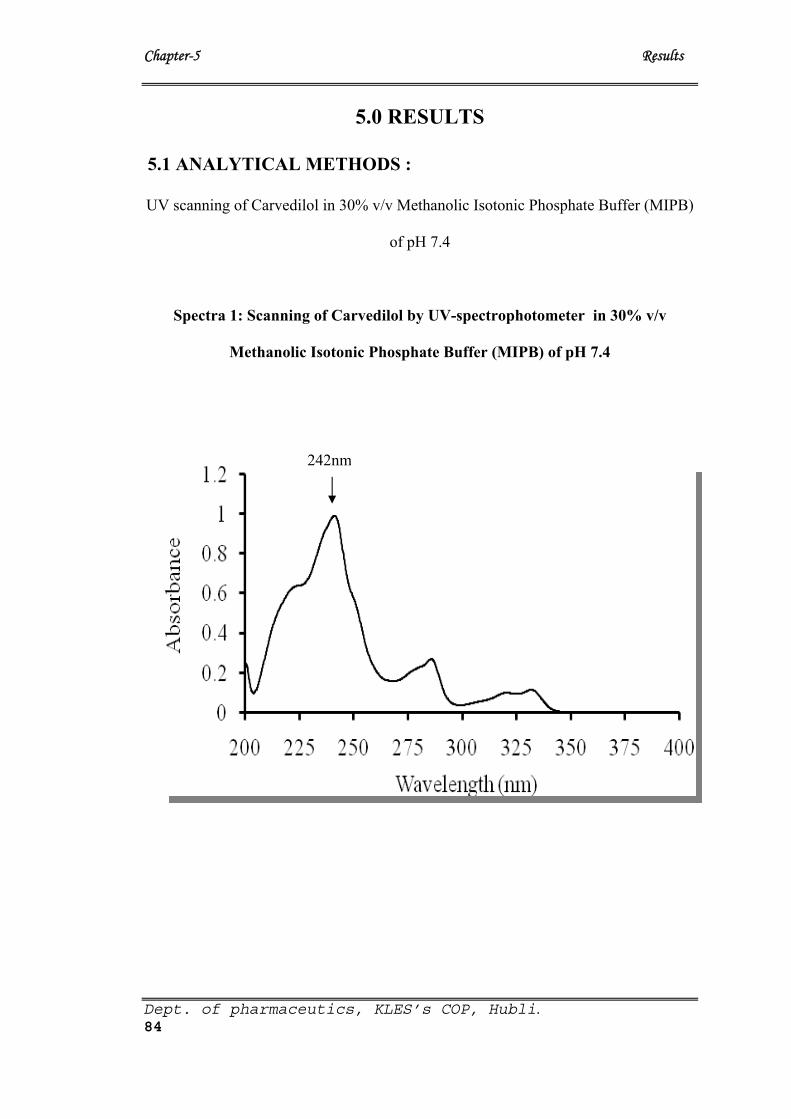
Chapter-5 Results
5.0 RESULTS
5.1 ANALYTICAL METHODS :
UV scanning of Carvedilol in 30% v/v Methanolic Isotonic Phosphate Buffer (MIPB)
of pH 7.4
Spectra 1: Scanning of Carvedilol by UV-spectrophotometer in 30% v/v
Methanolic Isotonic Phosphate Buffer (MIPB) of pH 7.4
242nm
Dept. of pharmaceutics, KLES’s COP, Hubli. 84
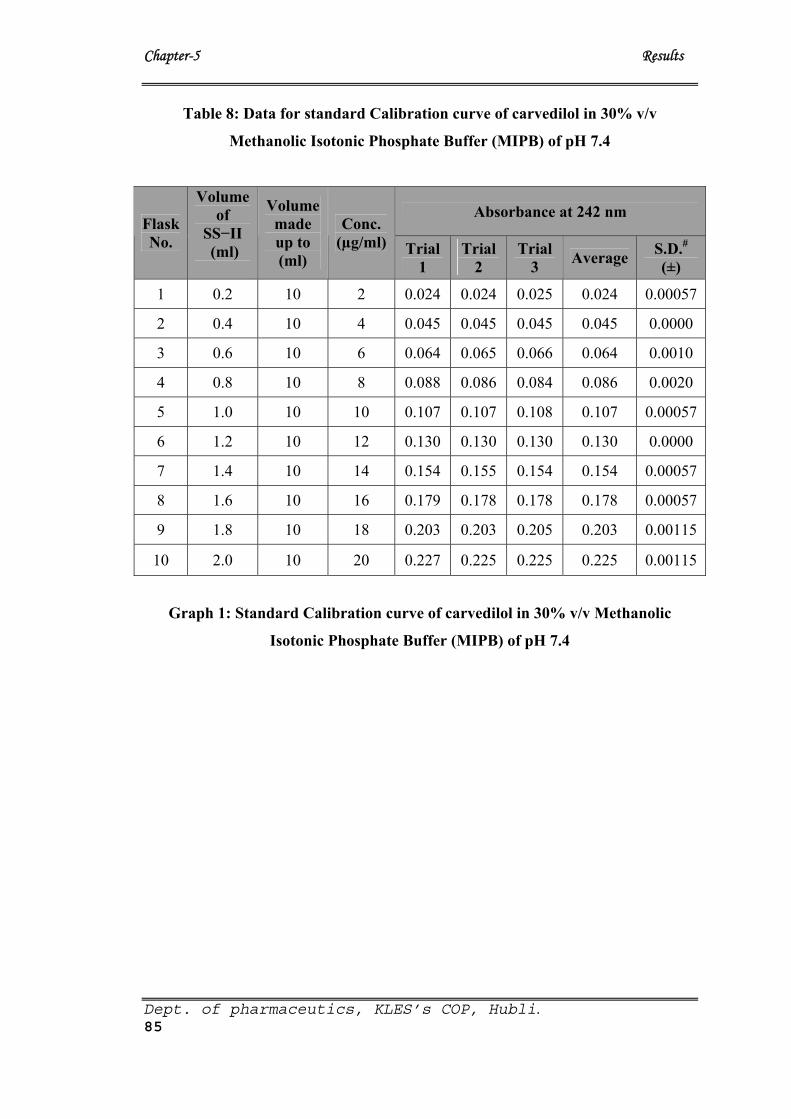
Chapter-5 Results
Dept. of pharmaceutics, KLES’s COP, Hubli. 85
Table 8: Data for standard Calibration curve of carvedilol in 30% v/v
Methanolic Isotonic Phosphate Buffer (MIPB) of pH 7.4
Absorbance at 242 nm Flask No.
Volume of
SS−II (ml)
Volume made up to (ml)
Conc. (µg/ml) Trial
1 Trial
2 Trial
3 Average S.D.#(±)
1 0.2 10 2 0.024 0.024 0.025 0.024 0.00057
2 0.4 10 4 0.045 0.045 0.045 0.045 0.0000
3 0.6 10 6 0.064 0.065 0.066 0.064 0.0010
4 0.8 10 8 0.088 0.086 0.084 0.086 0.0020
5 1.0 10 10 0.107 0.107 0.108 0.107 0.00057
6 1.2 10 12 0.130 0.130 0.130 0.130 0.0000
7 1.4 10 14 0.154 0.155 0.154 0.154 0.00057
8 1.6 10 16 0.179 0.178 0.178 0.178 0.00057
9 1.8 10 18 0.203 0.203 0.205 0.203 0.00115
10 2.0 10 20 0.227 0.225 0.225 0.225 0.00115
Graph 1: Standard Calibration curve of carvedilol in 30% v/v Methanolic
Isotonic Phosphate Buffer (MIPB) of pH 7.4
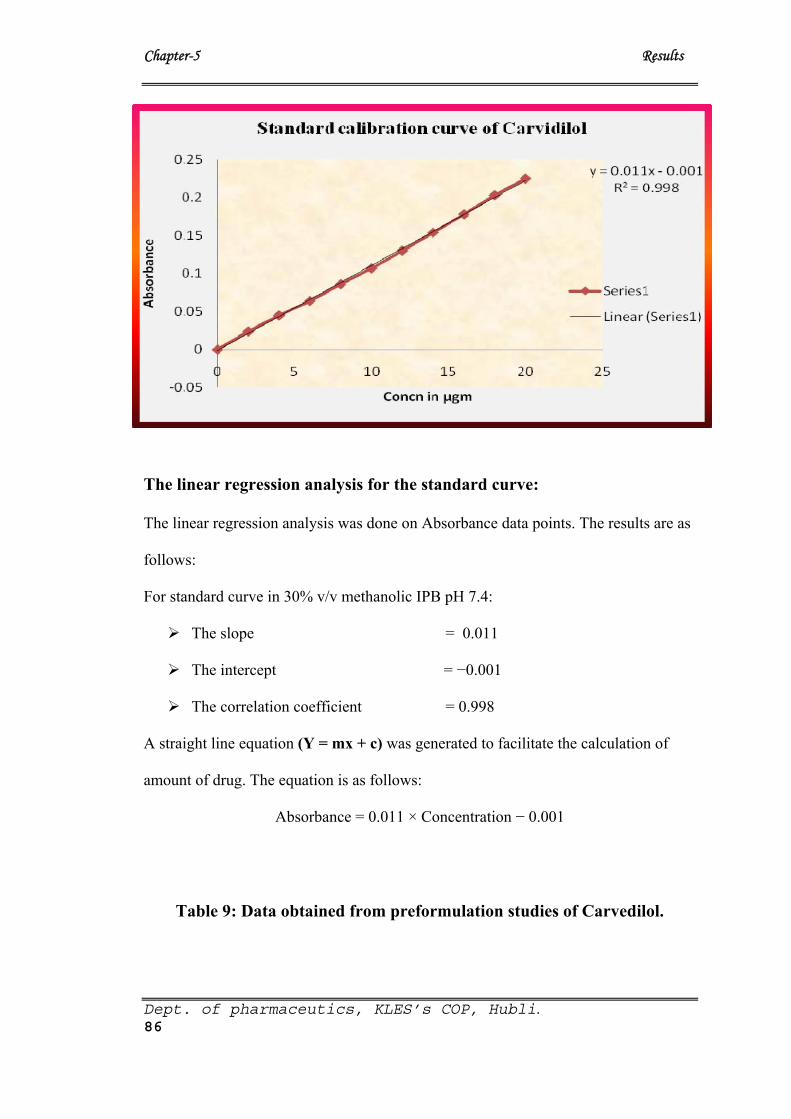
Chapter-5 Results
The linear regression analysis for the standard curve:
The linear regression analysis was done on Absorbance data points. The results are as
follows:
For standard curve in 30% v/v methanolic IPB pH 7.4:
The slope = 0.011
The intercept = −0.001
The correlation coefficient = 0.998
A straight line equation (Y = mx + c) was generated to facilitate the calculation of
amount of drug. The equation is as follows:
Absorbance = 0.011 × Concentration − 0.001
Table 9: Data obtained from preformulation studies of Carvedilol.
Dept. of pharmaceutics, KLES’s COP, Hubli. 86
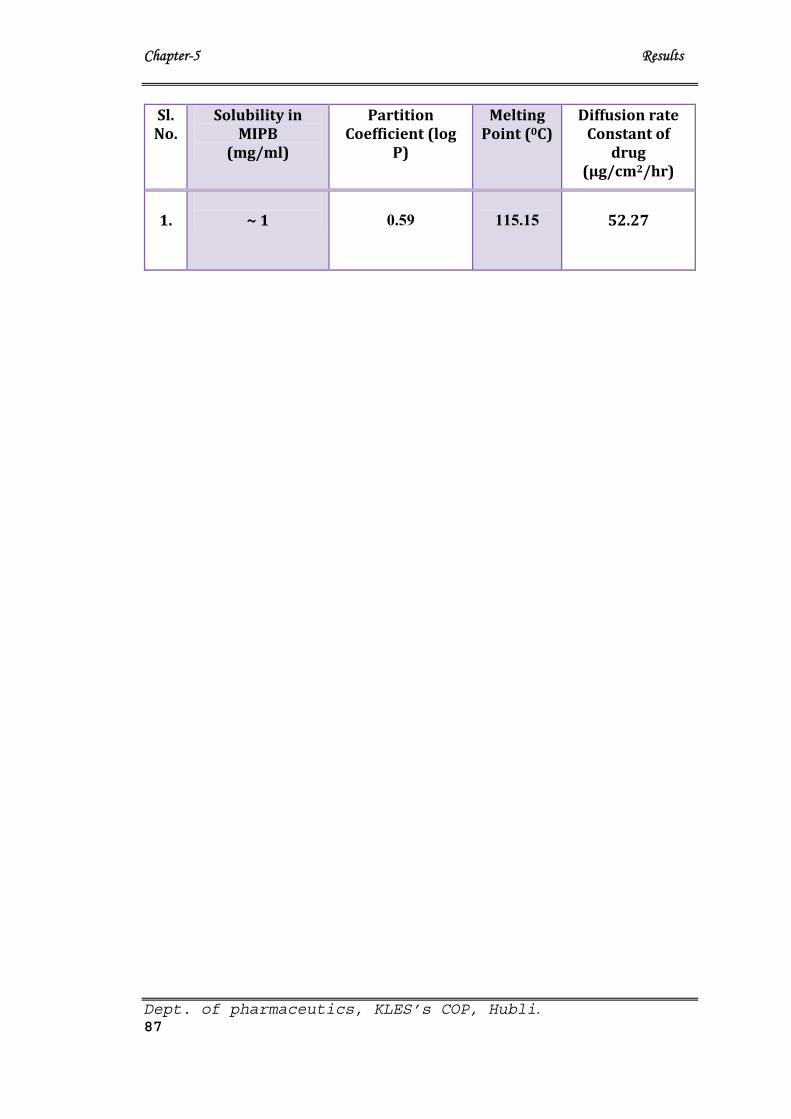
Chapter-5 Results
Dept. of pharmaceutics, KLES’s COP, Hubli. 87
Sl. No.
Solubility in MIPB
(mg/ml)
Partition Coefficient (log
P)
Melting Point (0C)
Diffusion rate Constant of
drug (µg/cm2/hr)
1.
~ 1
0.59
115.15
52.27
Chapter-5 Results
Dept. of pharmaceutics, KLES’sCOP, Hubli. 90
5.2.3. Optimization of TDDS patches using Eudragit RL:RS 100 and HPMC:Ethyl
cellulose as polymers with DBP and TEC as plasticizers
Eudragit RL/RS 100 patches: Preformulation study involved using Eudragit RL and RS 100
in various ratios with different concentrations of plasticizers DBP and TEC. In total 56
formulations were prepared involving different ratios of polymers and different concentrations
of plasticizers.
Among the 21 patches containing 3 different concentrations of DBP as plasticizer,
patches with 20% w/w showed good physico-chemical characters, seven of these were
subjected for further development. Similarly out of 5 different concentrations of TEC, patches
with 18% w/w of TEC as plasticizer showed good physico-chemical characters, seven of these
were also subjected for further development (Table 12 and 13).
HPMC/EC patches: All the TDDS patches fabricated with HPMC and EC individually and in
combination were prepared with 15, 20 and 25% w/w of DBP and TEC as plasticizers. Among
36 formulated patches only 6 patches each with DBP and TEC at 25% w/w concentration
showed good physico-chemical characteristics. Hence these were also subjected for further
investigation (Table 14).
Plain HPMC patches with or without plasticizers were very hard, non brittle, made
cracking sound (crackle) when folded. The combination patches of HPMC:EC containing no or
with either DBP and TEC as plasticizers at other than 25% w/w concentration were found to be
hard to brittle, either transparent (in case of TEC) or translucent (in case of DBP) and patches
made cracking sound when folded.
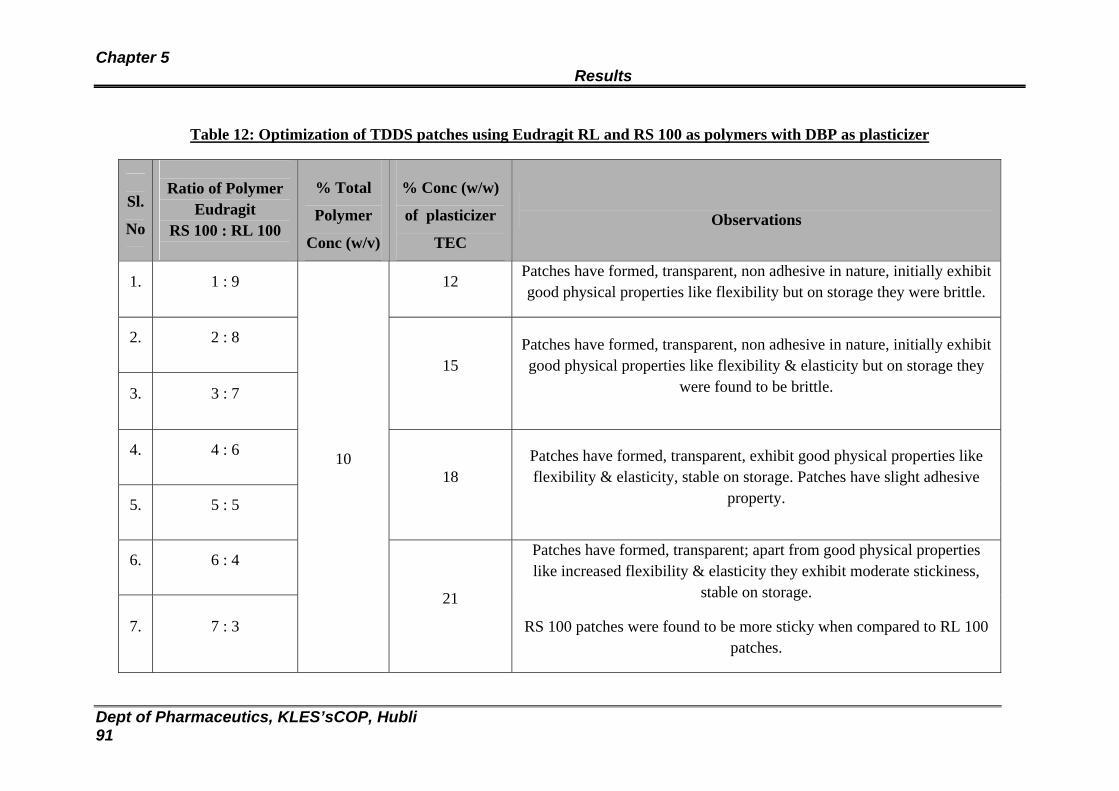
Chapter 5 Results
Dept of Pharmaceutics, KLES’sCOP, Hubli 91
Table 12: Optimization of TDDS patches using Eudragit RL and RS 100 as polymers with DBP as plasticizer
Sl.
No
Ratio of Polymer
Eudragit RS 100 : RL 100
% Total
Polymer
Conc (w/v)
% Conc (w/w)
of plasticizer
TEC
Observations
1. 1 : 9 12 Patches have formed, transparent, non adhesive in nature, initially exhibit good physical properties like flexibility but on storage they were brittle.
2. 2 : 8
3. 3 : 7
15 Patches have formed, transparent, non adhesive in nature, initially exhibit good physical properties like flexibility & elasticity but on storage they
were found to be brittle.
4. 4 : 6
5. 5 : 5
18 Patches have formed, transparent, exhibit good physical properties like flexibility & elasticity, stable on storage. Patches have slight adhesive
property.
6. 6 : 4
7. 7 : 3
10
21
Patches have formed, transparent; apart from good physical properties like increased flexibility & elasticity they exhibit moderate stickiness,
stable on storage.
RS 100 patches were found to be more sticky when compared to RL 100 patches.
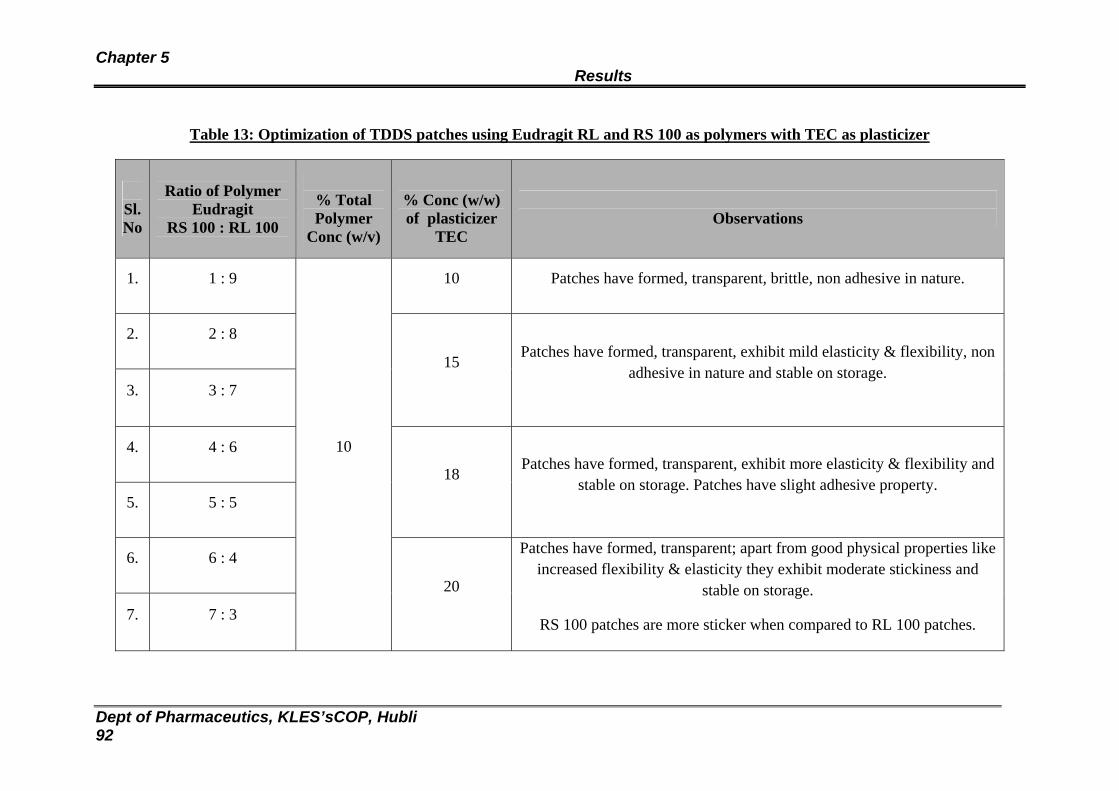
Chapter 5 Results
Dept of Pharmaceutics, KLES’sCOP, Hubli 92
Table 13: Optimization of TDDS patches using Eudragit RL and RS 100 as polymers with TEC as plasticizer
Sl. No
Ratio of Polymer
Eudragit RS 100 : RL 100
% Total Polymer
Conc (w/v)
% Conc (w/w) of plasticizer
TEC
Observations
1. 1 : 9 10 Patches have formed, transparent, brittle, non adhesive in nature.
2. 2 : 8
3. 3 : 7
15 Patches have formed, transparent, exhibit mild elasticity & flexibility, non
adhesive in nature and stable on storage.
4. 4 : 6
5. 5 : 5
18 Patches have formed, transparent, exhibit more elasticity & flexibility and
stable on storage. Patches have slight adhesive property.
6. 6 : 4
7. 7 : 3
10
20
Patches have formed, transparent; apart from good physical properties like increased flexibility & elasticity they exhibit moderate stickiness and
stable on storage.
RS 100 patches are more sticker when compared to RL 100 patches.
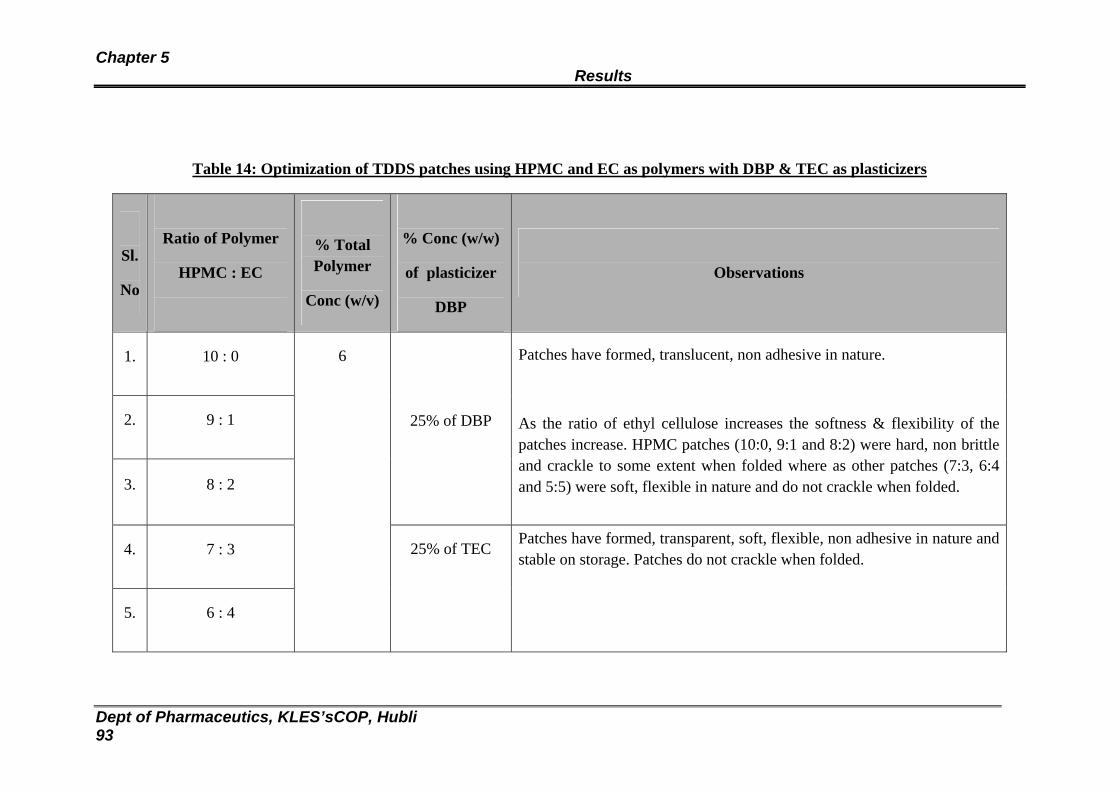
Chapter 5 Results
Dept of Pharmaceutics, KLES’sCOP, Hubli 93
Table 14: Optimization of TDDS patches using HPMC and EC as polymers with DBP & TEC as plasticizers
Sl.
No
Ratio of Polymer
HPMC : EC
% Total Polymer
Conc (w/v)
% Conc (w/w)
of plasticizer
DBP
Observations
1. 10 : 0
2. 9 : 1
3. 8 : 2
25% of DBP
Patches have formed, translucent, non adhesive in nature.
As the ratio of ethyl cellulose increases the softness & flexibility of the patches increase. HPMC patches (10:0, 9:1 and 8:2) were hard, non brittle and crackle to some extent when folded where as other patches (7:3, 6:4 and 5:5) were soft, flexible in nature and do not crackle when folded.
4. 7 : 3
5. 6 : 4
6
25% of TEC Patches have formed, transparent, soft, flexible, non adhesive in nature and stable on storage. Patches do not crackle when folded.
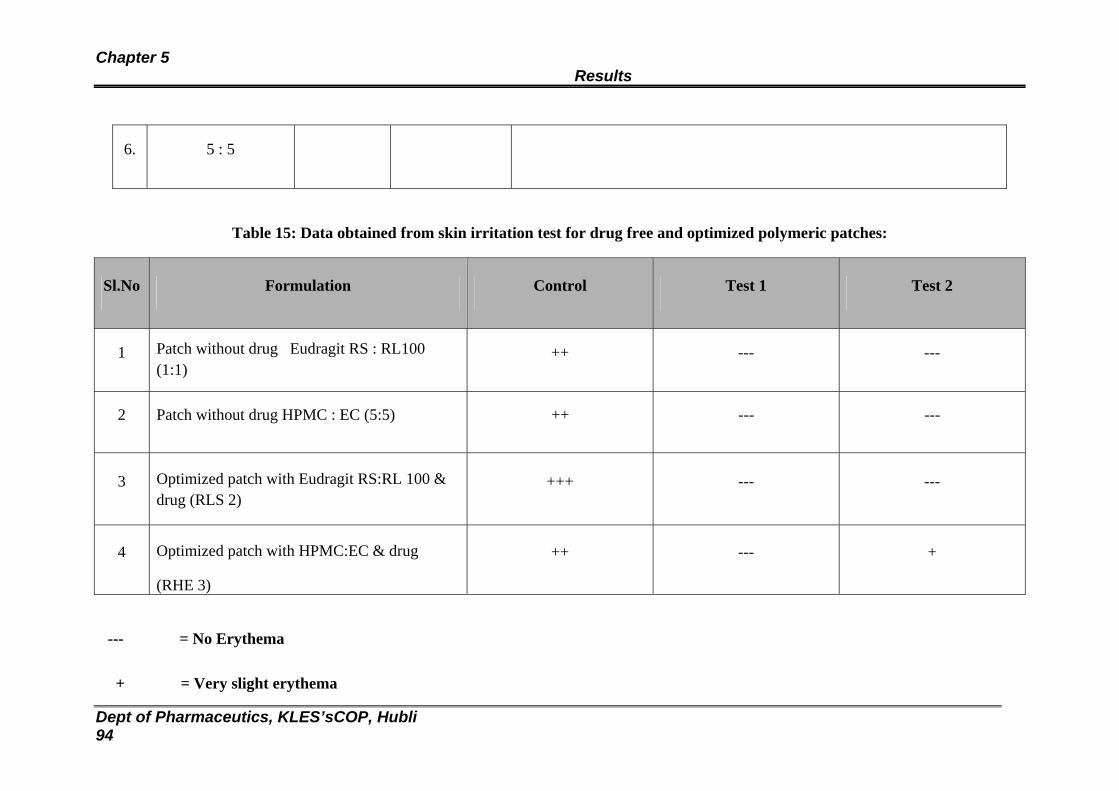
Chapter 5 Results
Dept of Pharmaceutics, KLES’sCOP, Hubli 94
6. 5 : 5
Table 15: Data obtained from skin irritation test for drug free and optimized polymeric patches:
Sl.No Formulation Control Test 1 Test 2
1 Patch without drug Eudragit RS : RL100 (1:1)
++ --- ---
2 Patch without drug HPMC : EC (5:5) ++ --- ---
3 Optimized patch with Eudragit RS:RL 100 & drug (RLS 2)
+++ --- ---
4 Optimized patch with HPMC:EC & drug
(RHE 3)
++ --- +
--- = No Erythema
+ = Very slight erythema

Chapter 5 Results
Dept of Pharmaceutics, KLES’sCOP, Hubli 95
+ + = Well defined erythema
+ + + = Moderate to severe erythema
Compatibility studies of drug and polymers by FTIR spectroscopy:
Spectra 2: FTIR spectra of Carvedilol
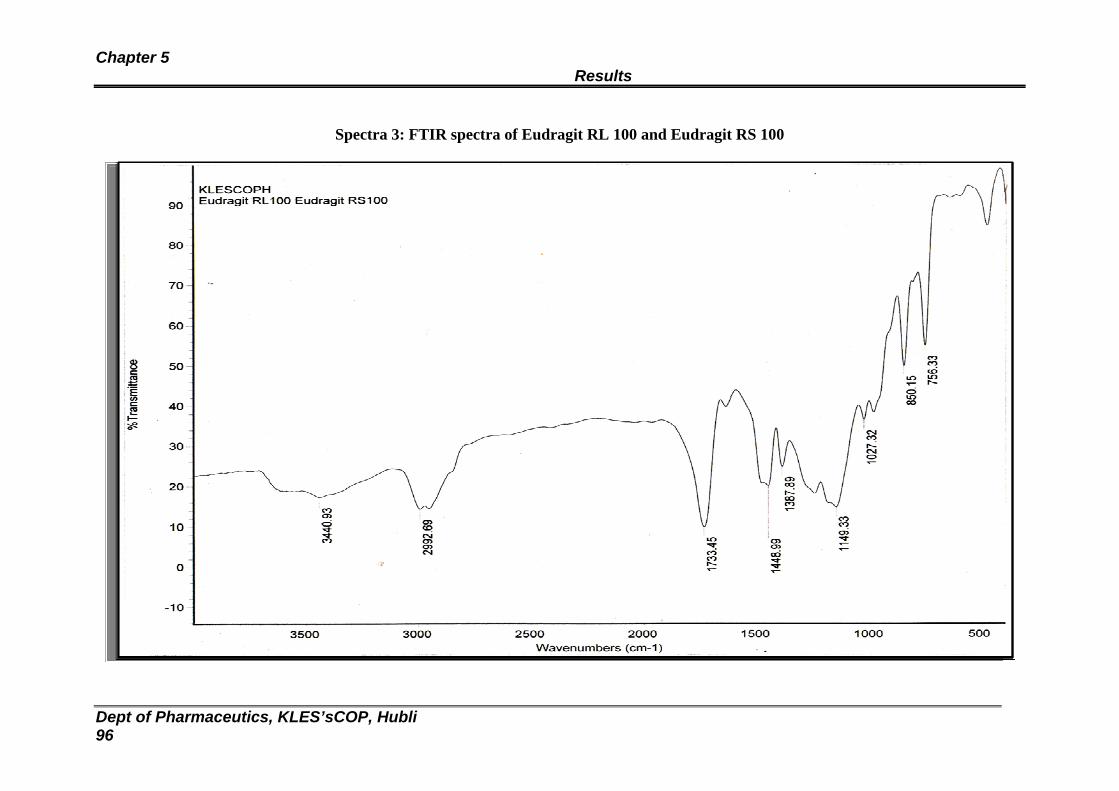
Chapter 5 Results
Dept of Pharmaceutics, KLES’sCOP, Hubli 96
Spectra 3: FTIR spectra of Eudragit RL 100 and Eudragit RS 100
Chapter 5 Results
Dept of Pharmaceutics, KLES’sCOP, Hubli 97
Spectra 4: FTIR spectra of Eudragit RL 100, Eudragit RS 100 and Carvedilol
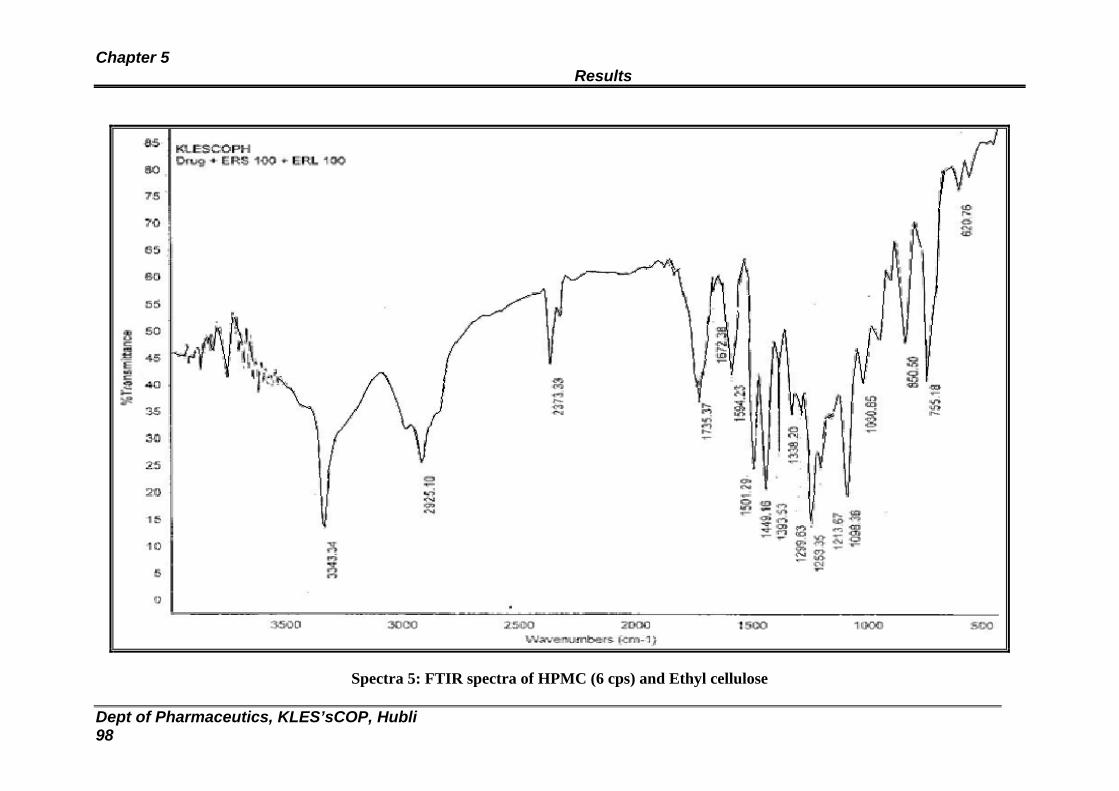
Chapter 5 Results
Dept of Pharmaceutics, KLES’sCOP, Hubli 98
Spectra 5: FTIR spectra of HPMC (6 cps) and Ethyl cellulose
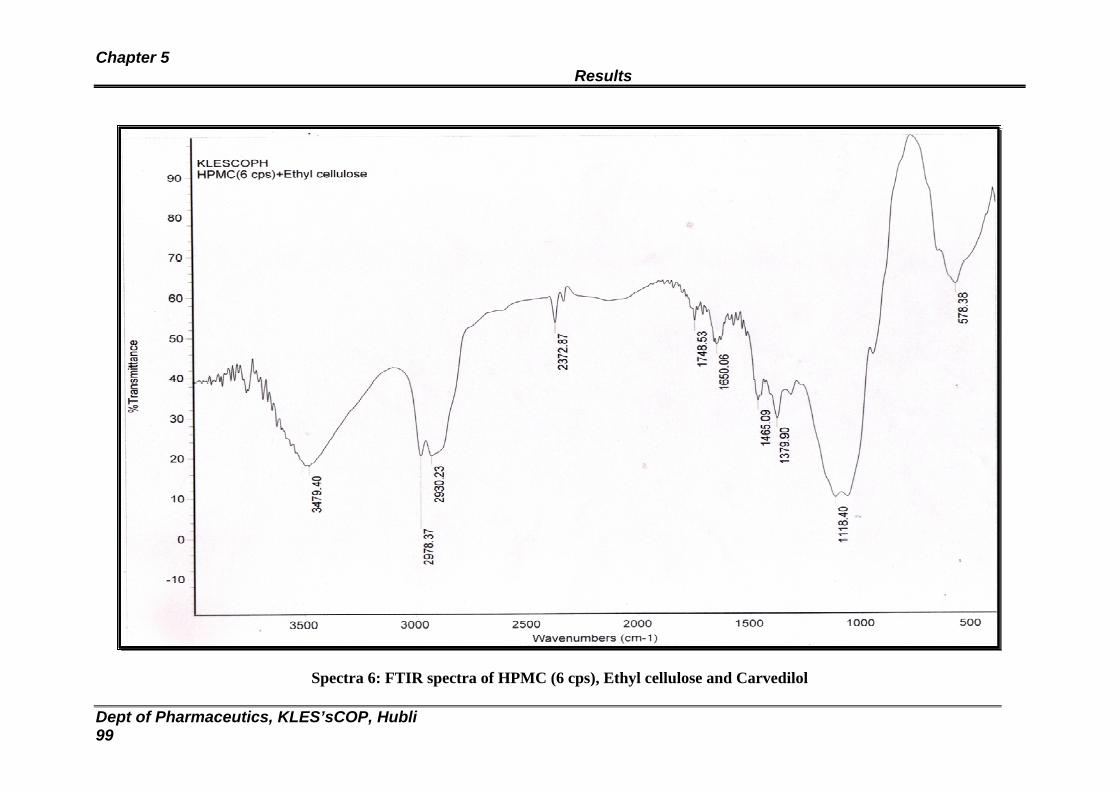
Chapter 5 Results
Dept of Pharmaceutics, KLES’sCOP, Hubli 99
Spectra 6: FTIR spectra of HPMC (6 cps), Ethyl cellulose and Carvedilol
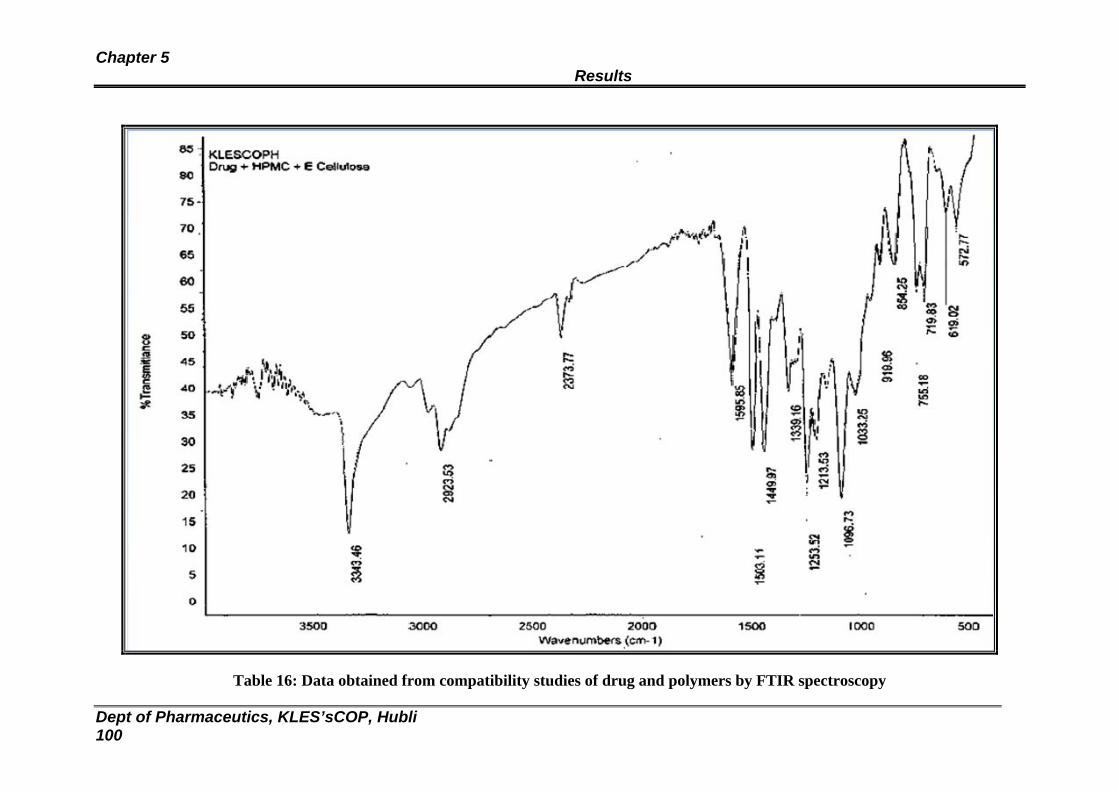
Chapter 5 Results
Dept of Pharmaceutics, KLES’sCOP, Hubli 100
Table 16: Data obtained from compatibility studies of drug and polymers by FTIR spectroscopy
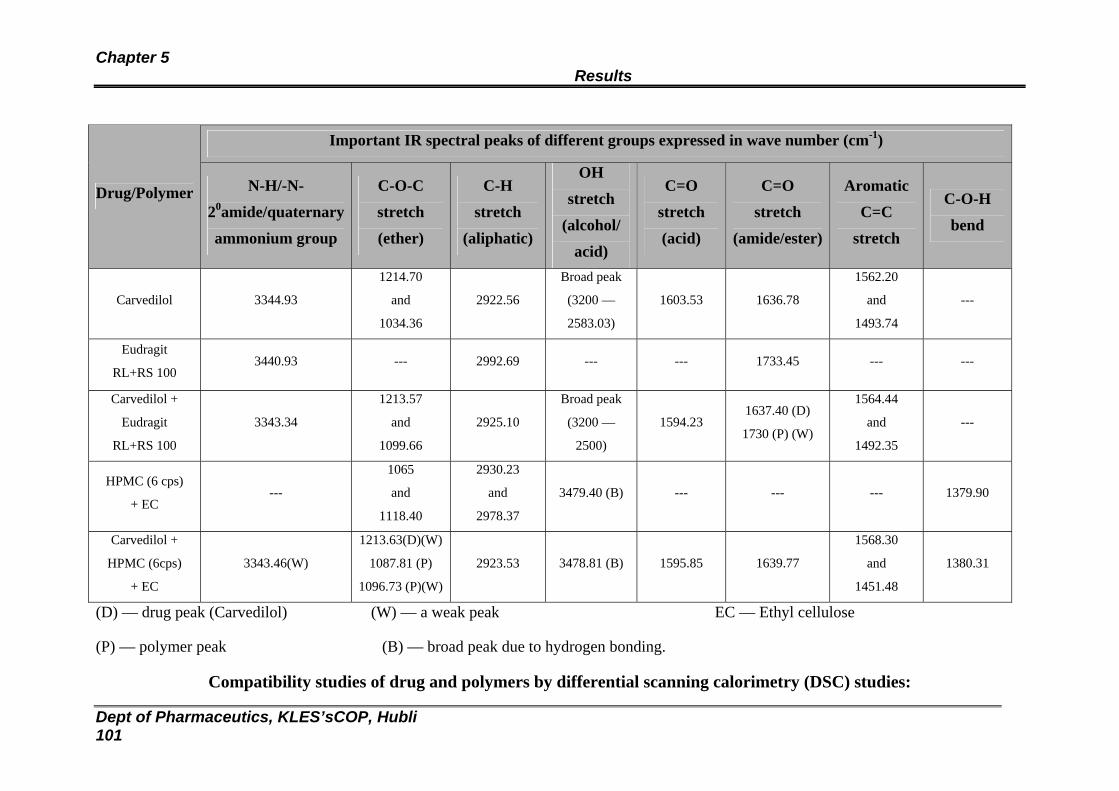
Chapter 5 Results
Dept of Pharmaceutics, KLES’sCOP, Hubli 101
Important IR spectral peaks of different groups expressed in wave number (cm-1)
Drug/Polymer N-H/-N-
20amide/quaternary
ammonium group
C-O-C
stretch
(ether)
C-H
stretch
(aliphatic)
OH
stretch
(alcohol/
acid)
C=O
stretch
(acid)
C=O
stretch
(amide/ester)
Aromatic
C=C
stretch
C-O-H
bend
Carvedilol 3344.93
1214.70
and
1034.36
2922.56
Broad peak
(3200 —
2583.03)
1603.53 1636.78
1562.20
and
1493.74
---
Eudragit
RL+RS 100 3440.93 --- 2992.69 --- --- 1733.45 --- ---
Carvedilol +
Eudragit
RL+RS 100
3343.34
1213.57
and
1099.66
2925.10
Broad peak
(3200 —
2500)
1594.23 1637.40 (D)
1730 (P) (W)
1564.44
and
1492.35
---
HPMC (6 cps)
+ EC ---
1065
and
1118.40
2930.23
and
2978.37
3479.40 (B) --- --- --- 1379.90
Carvedilol +
HPMC (6cps)
+ EC
3343.46(W)
1213.63(D)(W)
1087.81 (P)
1096.73 (P)(W)
2923.53
3478.81 (B) 1595.85 1639.77
1568.30
and
1451.48
1380.31
(D) — drug peak (Carvedilol) (W) — a weak peak EC — Ethyl cellulose
(P) — polymer peak (B) — broad peak due to hydrogen bonding.
Compatibility studies of drug and polymers by differential scanning calorimetry (DSC) studies:
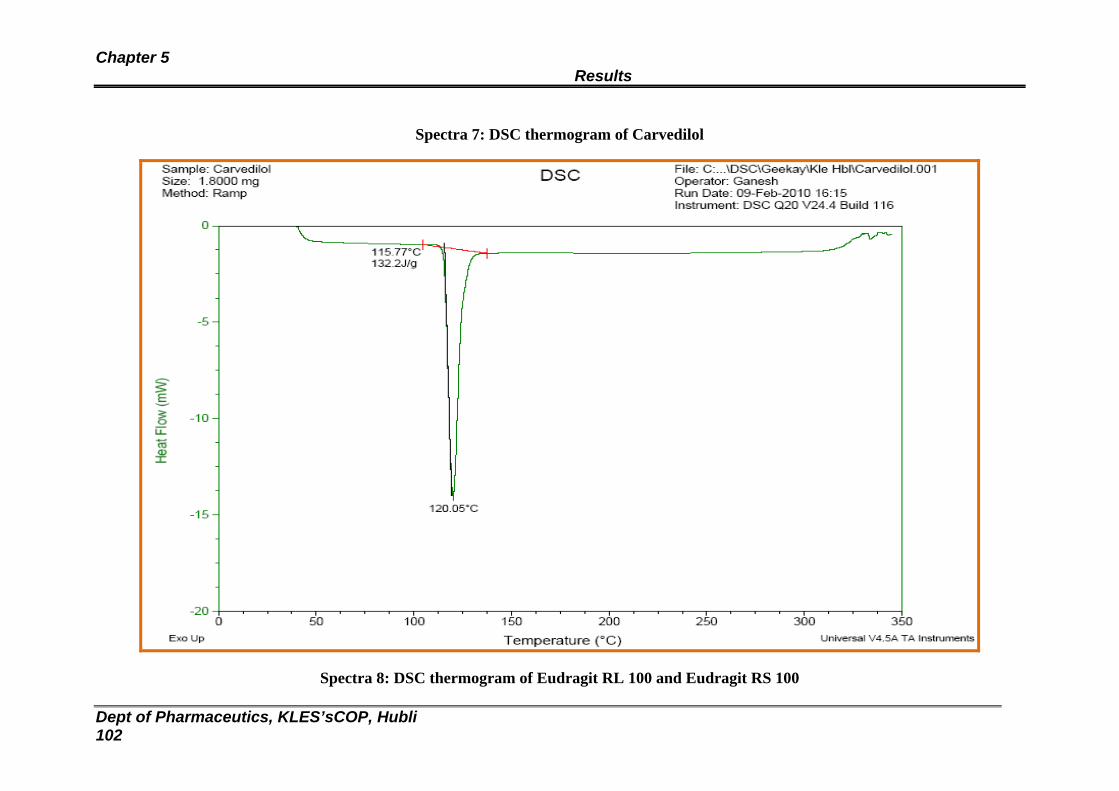
Chapter 5 Results
Dept of Pharmaceutics, KLES’sCOP, Hubli 102
Spectra 7: DSC thermogram of Carvedilol
Spectra 8: DSC thermogram of Eudragit RL 100 and Eudragit RS 100
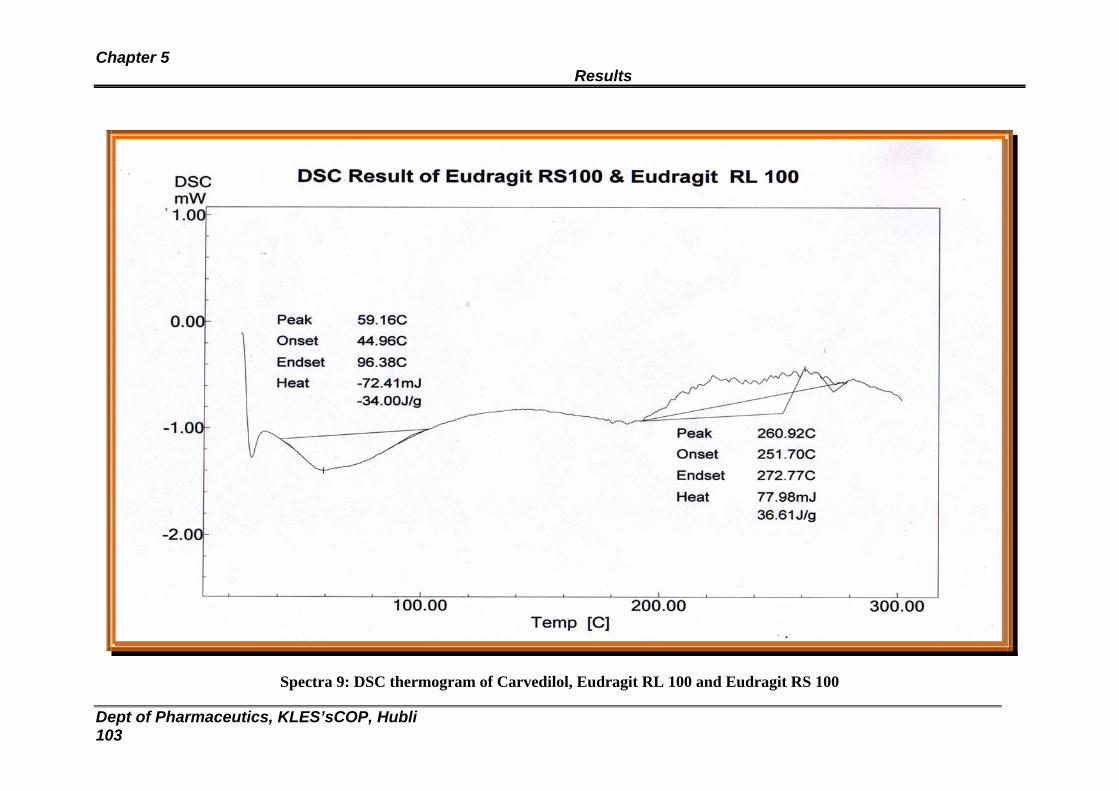
Chapter 5 Results
Dept of Pharmaceutics, KLES’sCOP, Hubli 103
Spectra 9: DSC thermogram of Carvedilol, Eudragit RL 100 and Eudragit RS 100
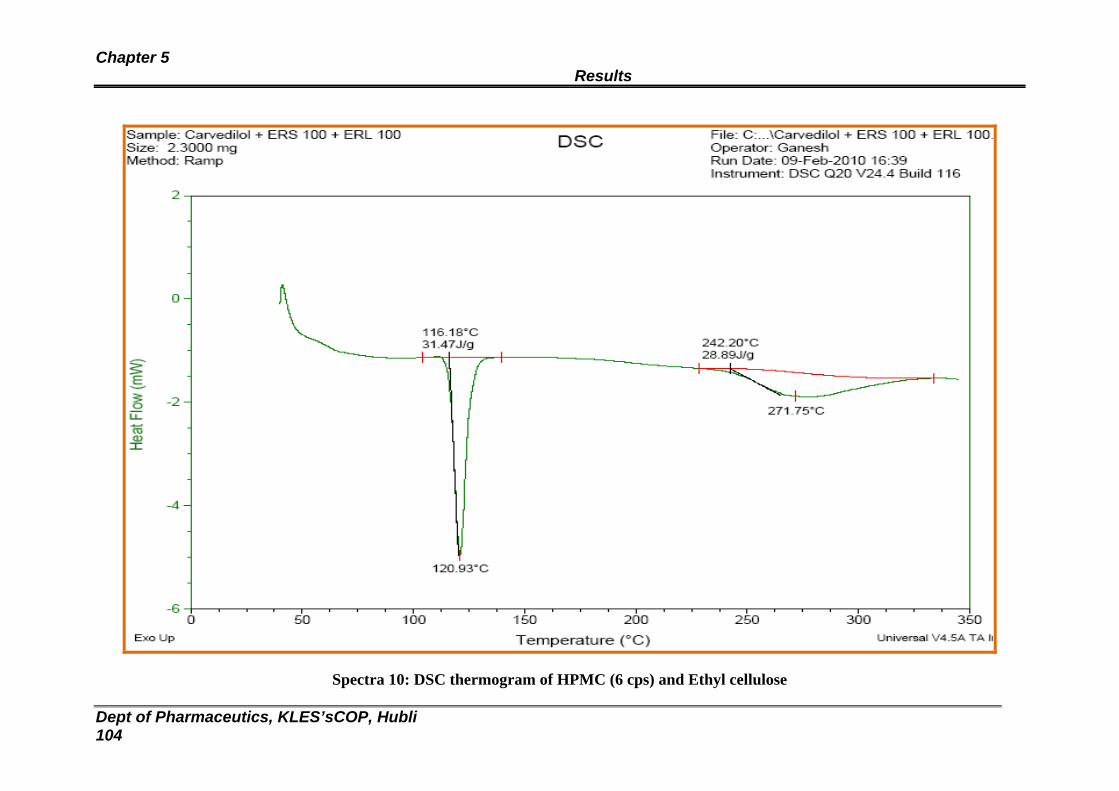
Chapter 5 Results
Dept of Pharmaceutics, KLES’sCOP, Hubli 104
Spectra 10: DSC thermogram of HPMC (6 cps) and Ethyl cellulose
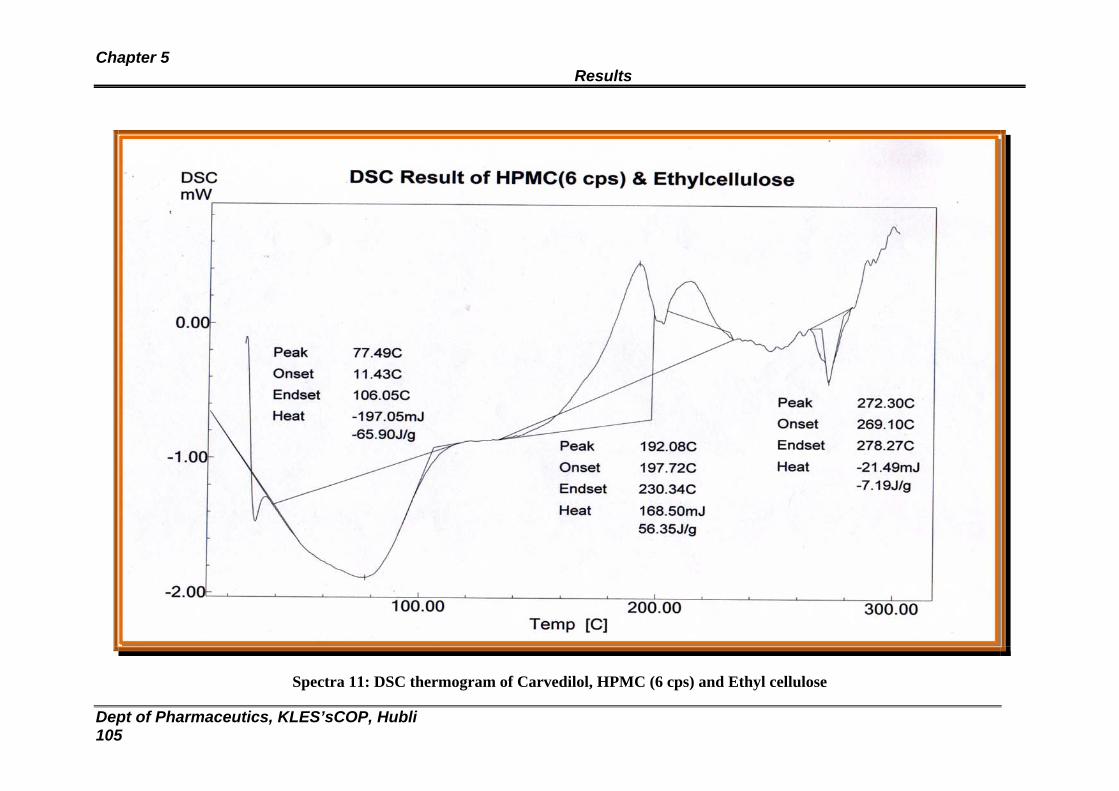
Chapter 5 Results
Dept of Pharmaceutics, KLES’sCOP, Hubli 105
Spectra 11: DSC thermogram of Carvedilol, HPMC (6 cps) and Ethyl cellulose
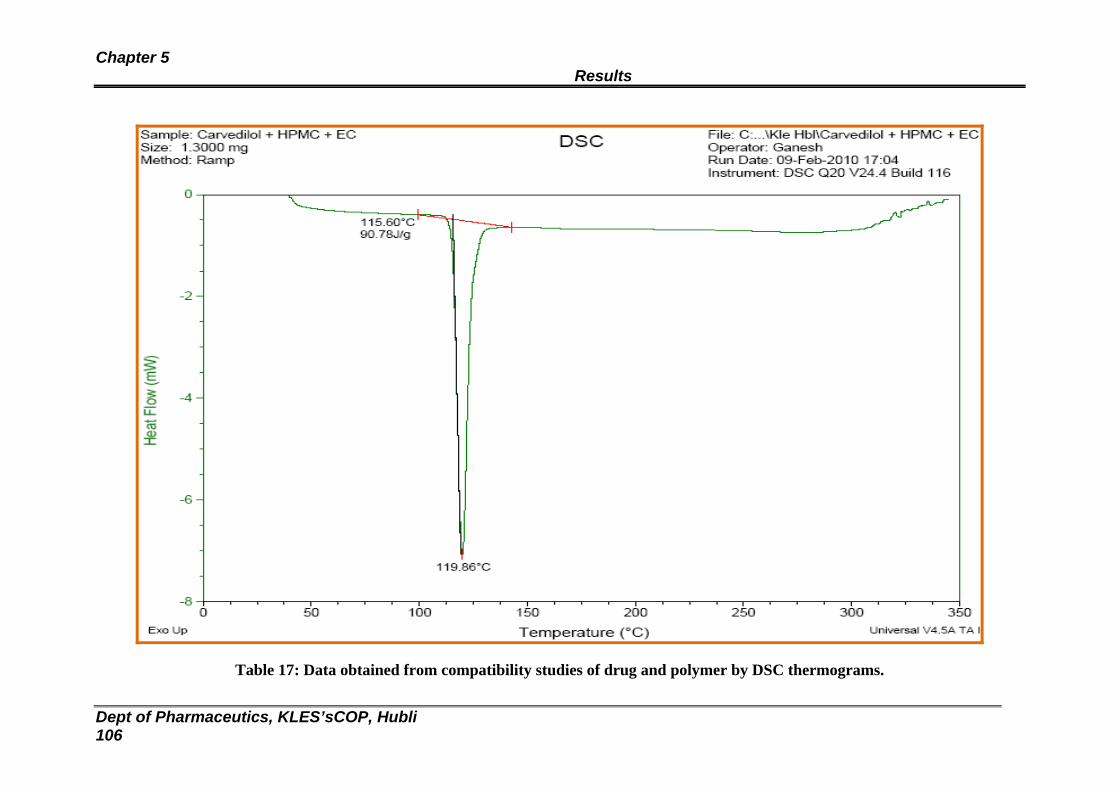
Chapter 5 Results
Dept of Pharmaceutics, KLES’sCOP, Hubli 106
Table 17: Data obtained from compatibility studies of drug and polymer by DSC thermograms.
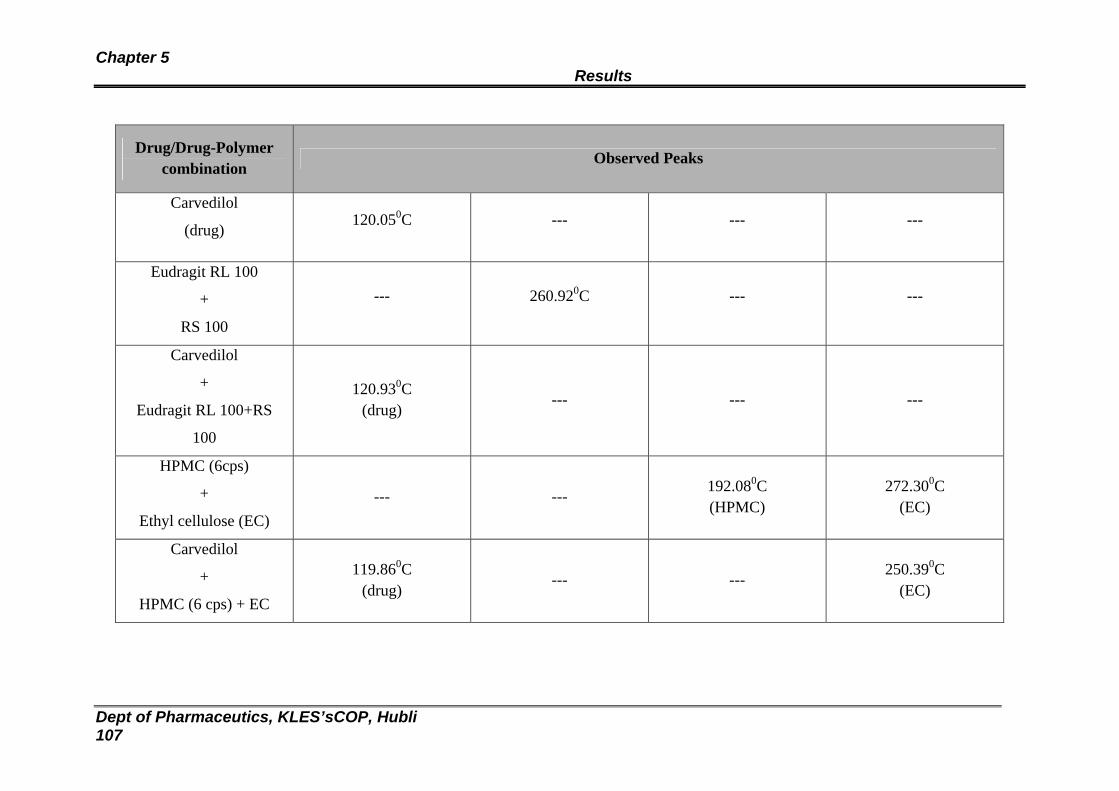
Chapter 5 Results
Dept of Pharmaceutics, KLES’sCOP, Hubli 107
Drug/Drug-Polymer combination
Observed Peaks
Carvedilol
(drug) 120.050C --- --- ---
Eudragit RL 100
+
RS 100
--- 260.920C --- ---
Carvedilol
+
Eudragit RL 100+RS
100
120.930C (drug) --- --- ---
HPMC (6cps)
+
Ethyl cellulose (EC) --- ---
192.080C (HPMC)
272.300C (EC)
Carvedilol
+
HPMC (6 cps) + EC
119.860C (drug)
--- --- 250.390C
(EC)
Chapter 5 Results
Dept of Pharmaceutics, KLES’sCOP, Hubli 108
Compatibility studies of drug and polymers by X-Ray Difractometry (XRD):

Chapter 5 Results
Dept of Pharmaceutics, KLES’sCOP, Hubli 109
Spectra 12: XRD spectra of Carvedilol.
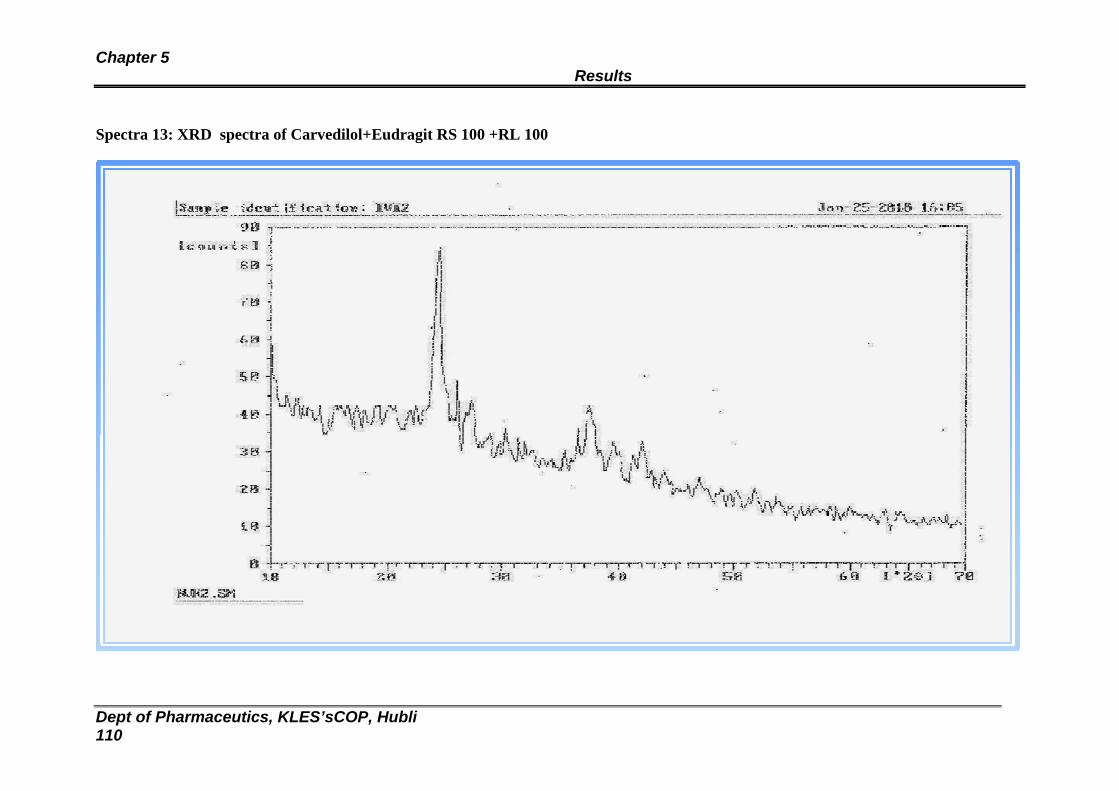
Chapter 5 Results
Dept of Pharmaceutics, KLES’sCOP, Hubli 110
Spectra 13: XRD spectra of Carvedilol+Eudragit RS 100 +RL 100

Chapter 5 Results
Dept of Pharmaceutics, KLES’sCOP, Hubli 111
Spectra 14:XRD spectra of Carvedilol+HPMC+EC
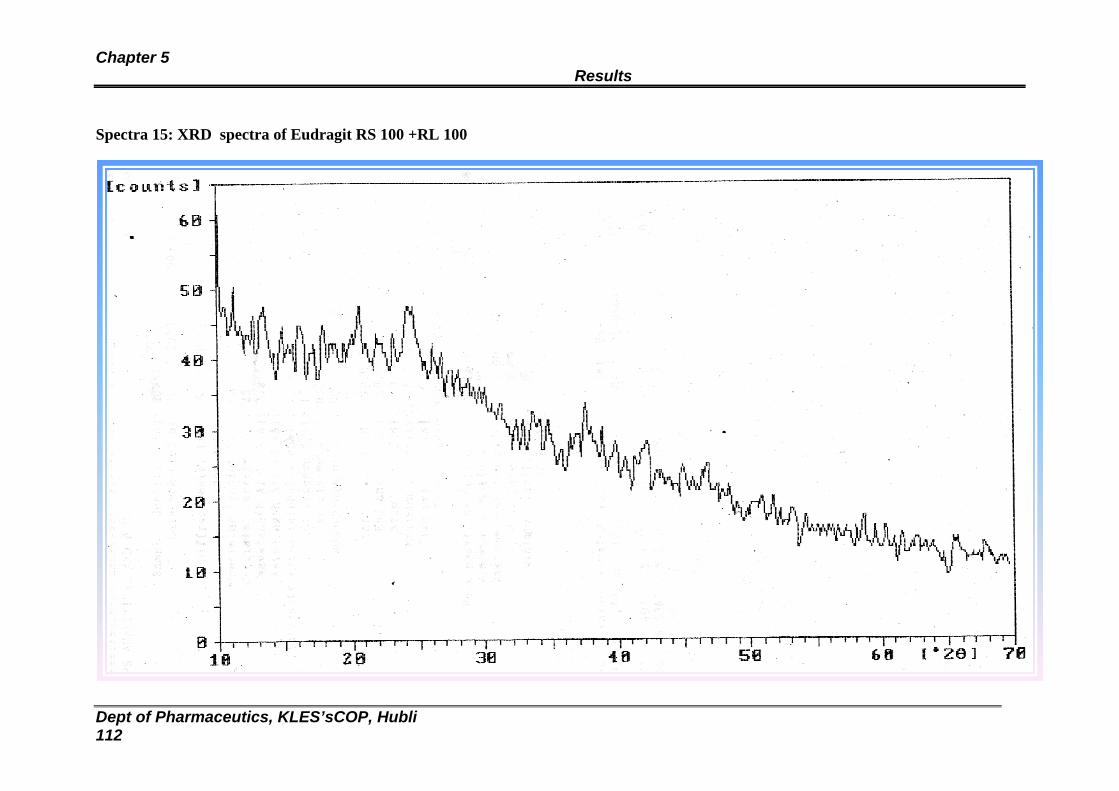
Chapter 5 Results
Dept of Pharmaceutics, KLES’sCOP, Hubli 112
Spectra 15: XRD spectra of Eudragit RS 100 +RL 100
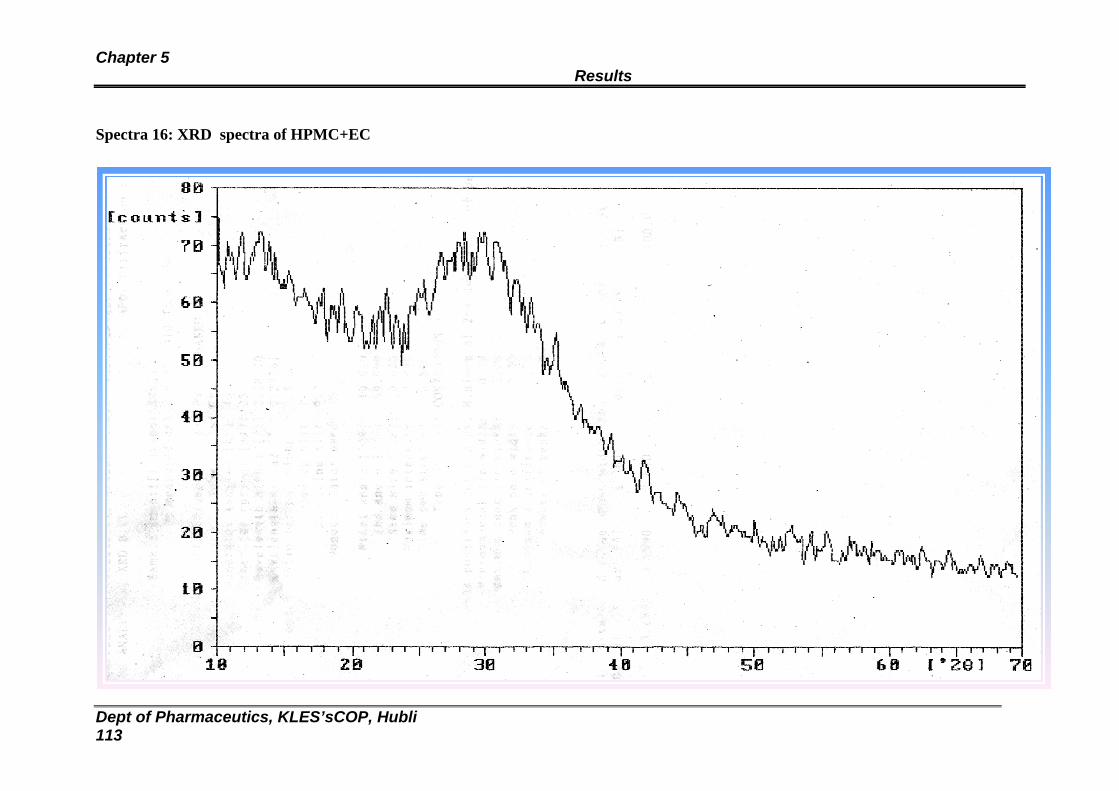
Chapter 5 Results
Dept of Pharmaceutics, KLES’sCOP, Hubli 113
Spectra 16: XRD spectra of HPMC+EC
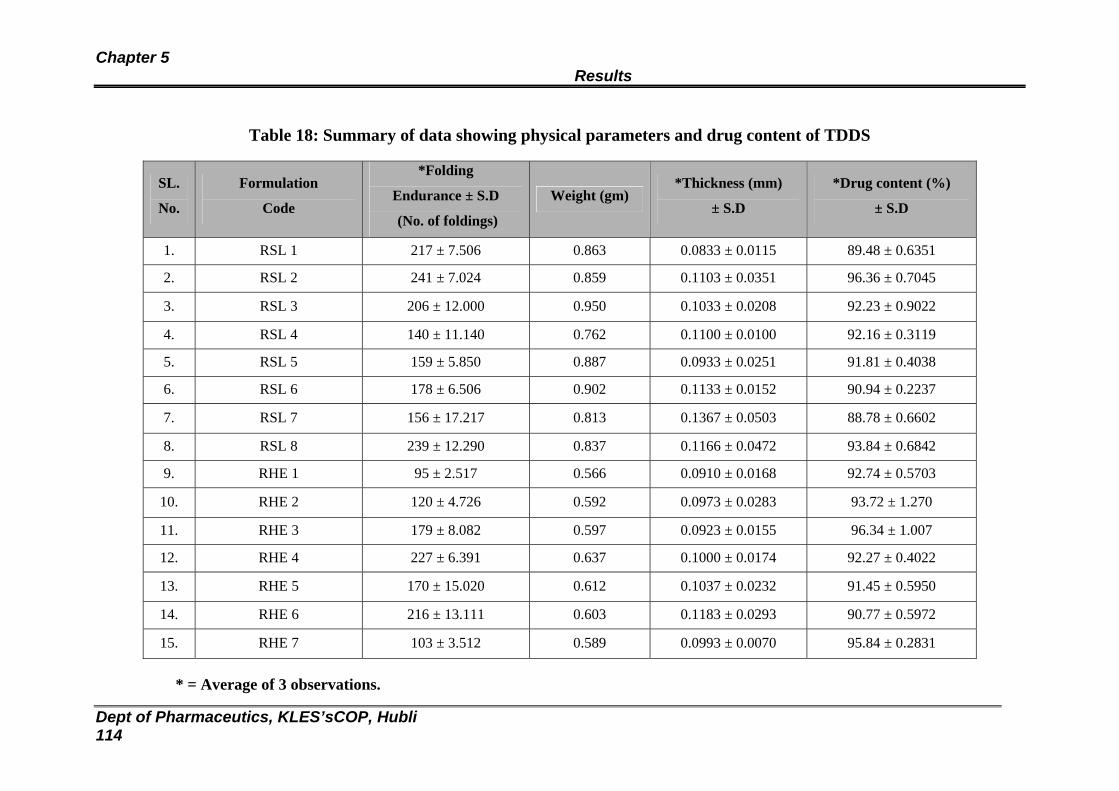
Chapter 5 Results
Dept of Pharmaceutics, KLES’sCOP, Hubli 114
Table 18: Summary of data showing physical parameters and drug content of TDDS
SL.
No.
Formulation
Code
*Folding
Endurance ± S.D
(No. of foldings)
Weight (gm) *Thickness (mm)
± S.D
*Drug content (%)
± S.D
1. RSL 1 217 ± 7.506 0.863 0.0833 ± 0.0115 89.48 ± 0.6351
2. RSL 2 241 ± 7.024 0.859 0.1103 ± 0.0351 96.36 ± 0.7045
3. RSL 3 206 ± 12.000 0.950 0.1033 ± 0.0208 92.23 ± 0.9022
4. RSL 4 140 ± 11.140 0.762 0.1100 ± 0.0100 92.16 ± 0.3119
5. RSL 5 159 ± 5.850 0.887 0.0933 ± 0.0251 91.81 ± 0.4038
6. RSL 6 178 ± 6.506 0.902 0.1133 ± 0.0152 90.94 ± 0.2237
7. RSL 7 156 ± 17.217 0.813 0.1367 ± 0.0503 88.78 ± 0.6602
8. RSL 8 239 ± 12.290 0.837 0.1166 ± 0.0472 93.84 ± 0.6842
9. RHE 1 95 ± 2.517 0.566 0.0910 ± 0.0168 92.74 ± 0.5703
10. RHE 2 120 ± 4.726 0.592 0.0973 ± 0.0283 93.72 ± 1.270
11. RHE 3 179 ± 8.082 0.597 0.0923 ± 0.0155 96.34 ± 1.007
12. RHE 4 227 ± 6.391 0.637 0.1000 ± 0.0174 92.27 ± 0.4022
13. RHE 5 170 ± 15.020 0.612 0.1037 ± 0.0232 91.45 ± 0.5950
14. RHE 6 216 ± 13.111 0.603 0.1183 ± 0.0293 90.77 ± 0.5972
15. RHE 7 103 ± 3.512 0.589 0.0993 ± 0.0070 95.84 ± 0.2831
* = Average of 3 observations.
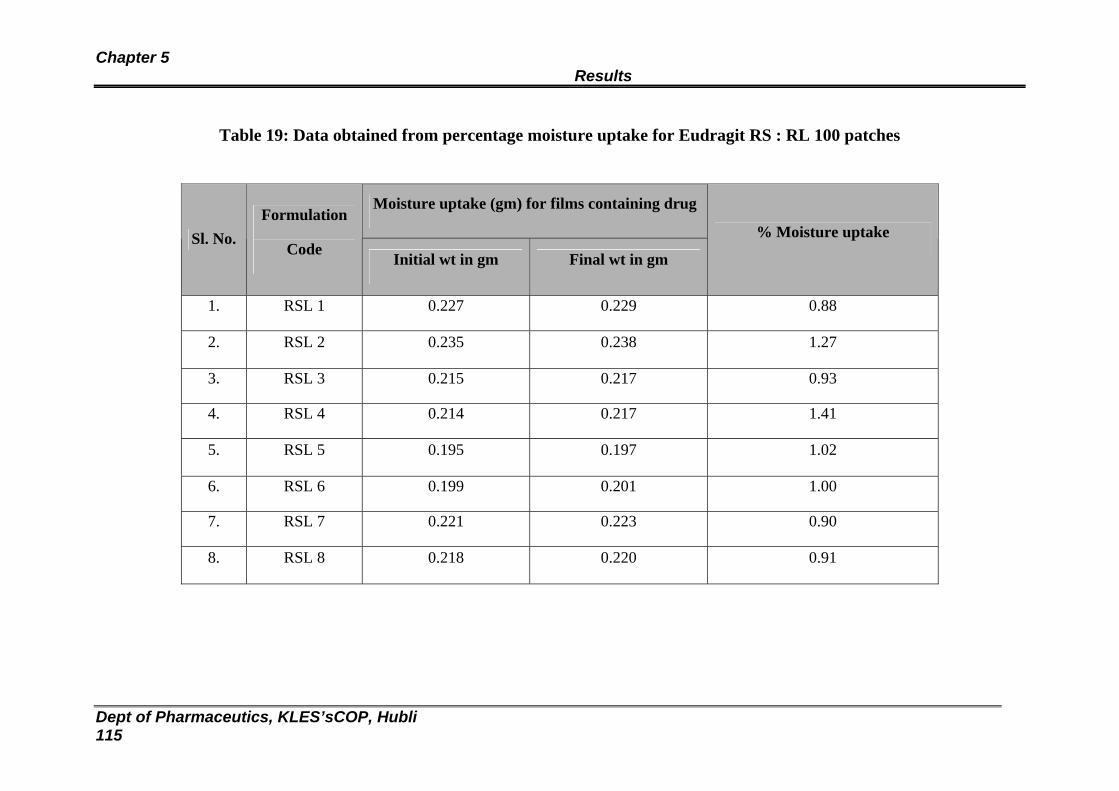
Chapter 5 Results
Dept of Pharmaceutics, KLES’sCOP, Hubli 115
Table 19: Data obtained from percentage moisture uptake for Eudragit RS : RL 100 patches
Moisture uptake (gm) for films containing drug
Sl. No. Formulation
Code Initial wt in gm Final wt in gm
% Moisture uptake
1. RSL 1 0.227 0.229 0.88
2. RSL 2 0.235 0.238 1.27
3. RSL 3 0.215 0.217 0.93
4. RSL 4 0.214 0.217 1.41
5. RSL 5 0.195 0.197 1.02
6. RSL 6 0.199 0.201 1.00
7. RSL 7 0.221 0.223 0.90
8. RSL 8 0.218 0.220 0.91
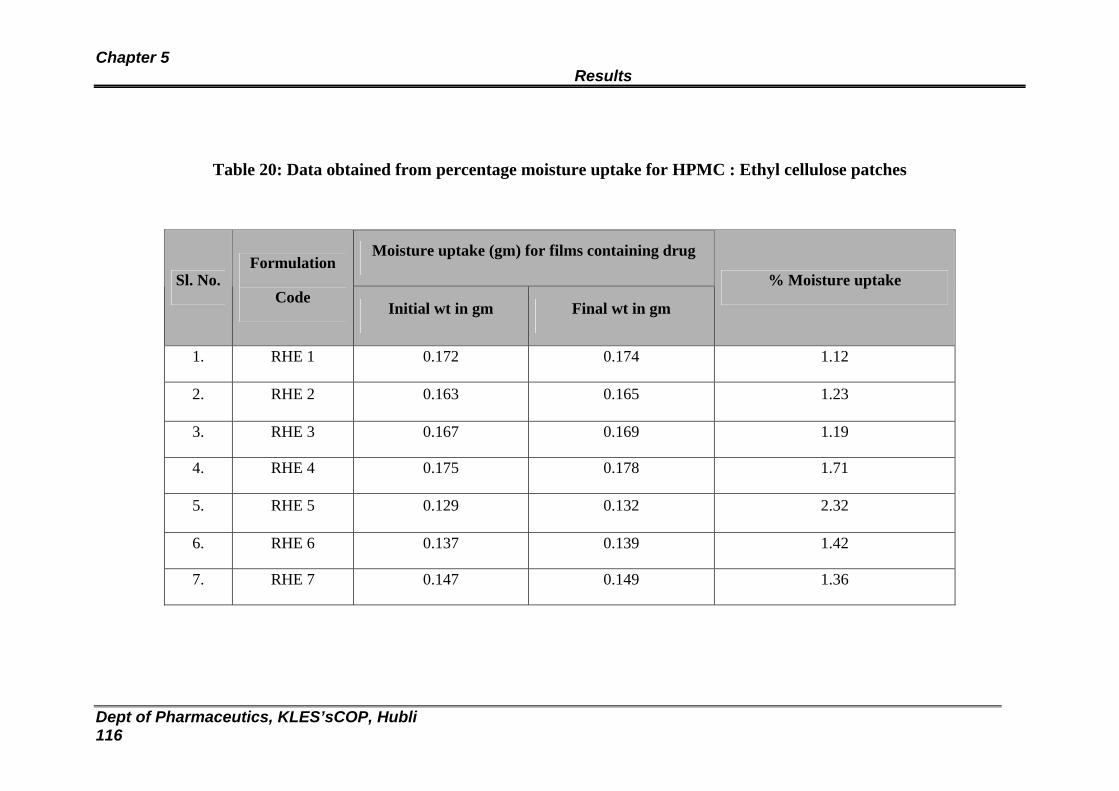
Chapter 5 Results
Dept of Pharmaceutics, KLES’sCOP, Hubli 116
Table 20: Data obtained from percentage moisture uptake for HPMC : Ethyl cellulose patches
Moisture uptake (gm) for films containing drug
Sl. No. Formulation
Code Initial wt in gm Final wt in gm
% Moisture uptake
1. RHE 1 0.172 0.174 1.12
2. RHE 2 0.163 0.165 1.23
3. RHE 3 0.167 0.169 1.19
4. RHE 4 0.175 0.178 1.71
5. RHE 5 0.129 0.132 2.32
6. RHE 6 0.137 0.139 1.42
7. RHE 7 0.147 0.149 1.36
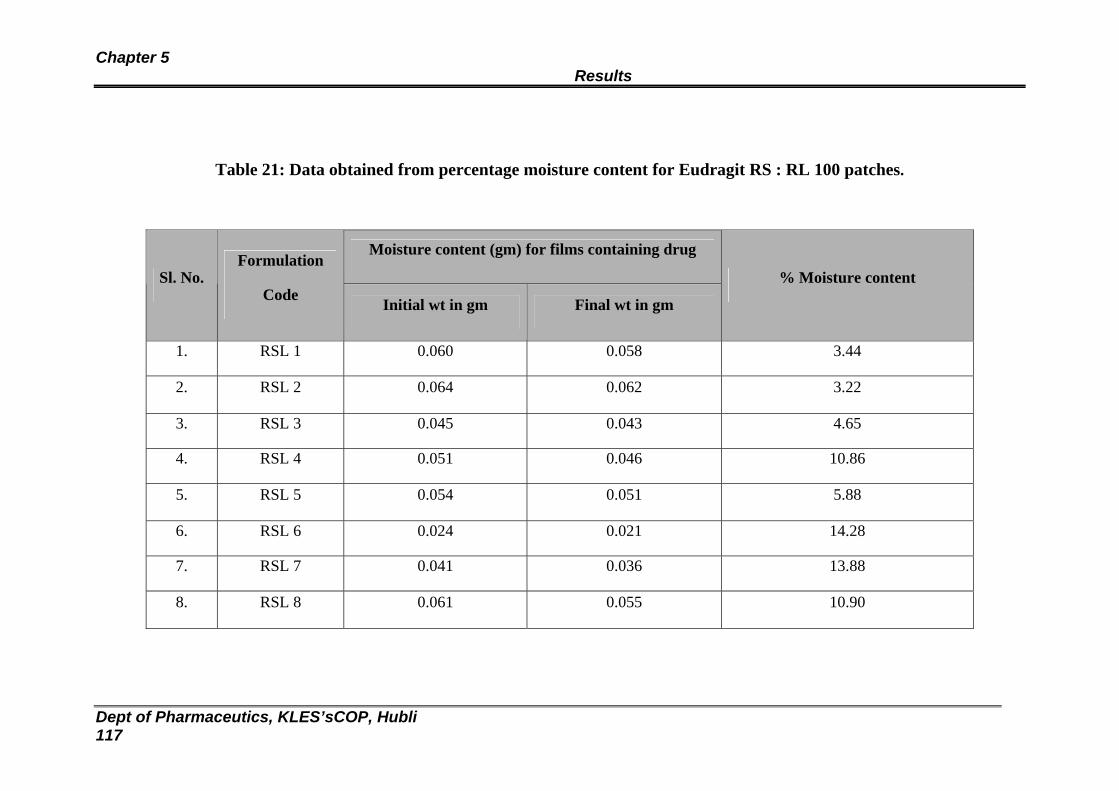
Chapter 5 Results
Dept of Pharmaceutics, KLES’sCOP, Hubli 117
Table 21: Data obtained from percentage moisture content for Eudragit RS : RL 100 patches.
Moisture content (gm) for films containing drug
Sl. No. Formulation
Code Initial wt in gm Final wt in gm
% Moisture content
1. RSL 1 0.060 0.058 3.44
2. RSL 2 0.064 0.062 3.22
3. RSL 3 0.045 0.043 4.65
4. RSL 4 0.051 0.046 10.86
5. RSL 5 0.054 0.051 5.88
6. RSL 6 0.024 0.021 14.28
7. RSL 7 0.041 0.036 13.88
8. RSL 8 0.061 0.055 10.90
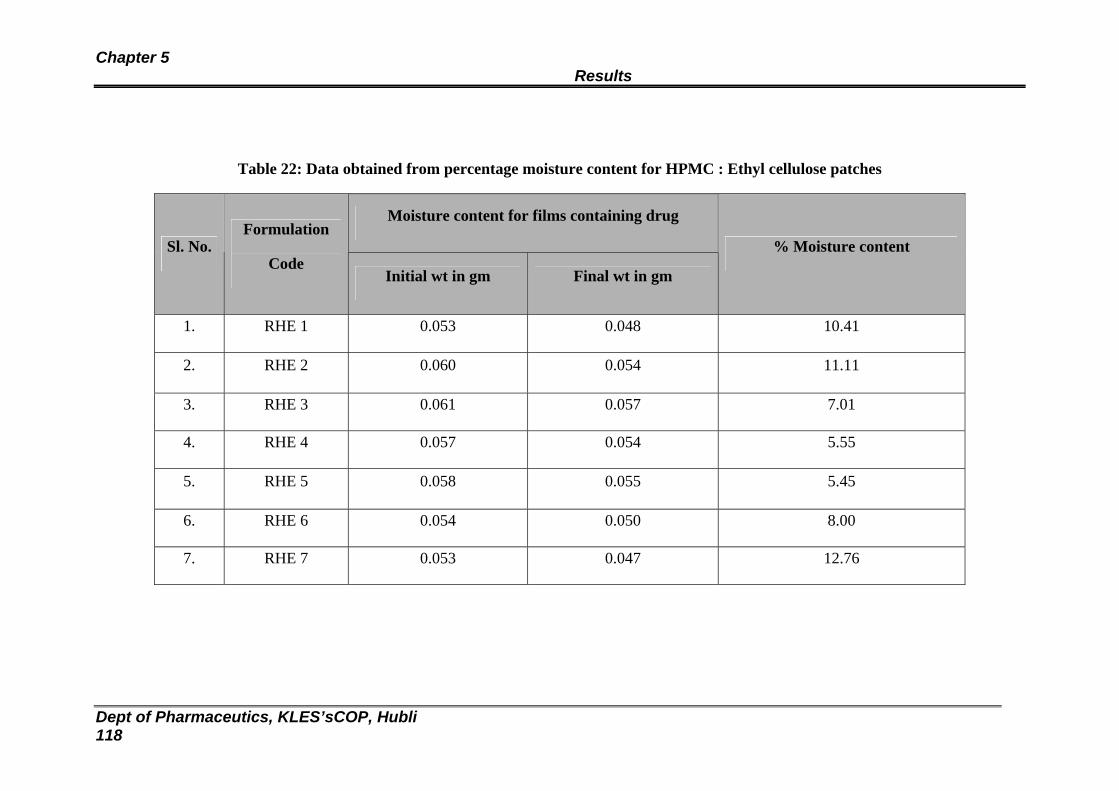
Chapter 5 Results
Dept of Pharmaceutics, KLES’sCOP, Hubli 118
Table 22: Data obtained from percentage moisture content for HPMC : Ethyl cellulose patches
Moisture content for films containing drug
Sl. No. Formulation
Code Initial wt in gm Final wt in gm
% Moisture content
1. RHE 1 0.053 0.048 10.41
2. RHE 2 0.060 0.054 11.11
3. RHE 3 0.061 0.057 7.01
4. RHE 4 0.057 0.054 5.55
5. RHE 5 0.058 0.055 5.45
6. RHE 6 0.054 0.050 8.00
7. RHE 7 0.053 0.047 12.76
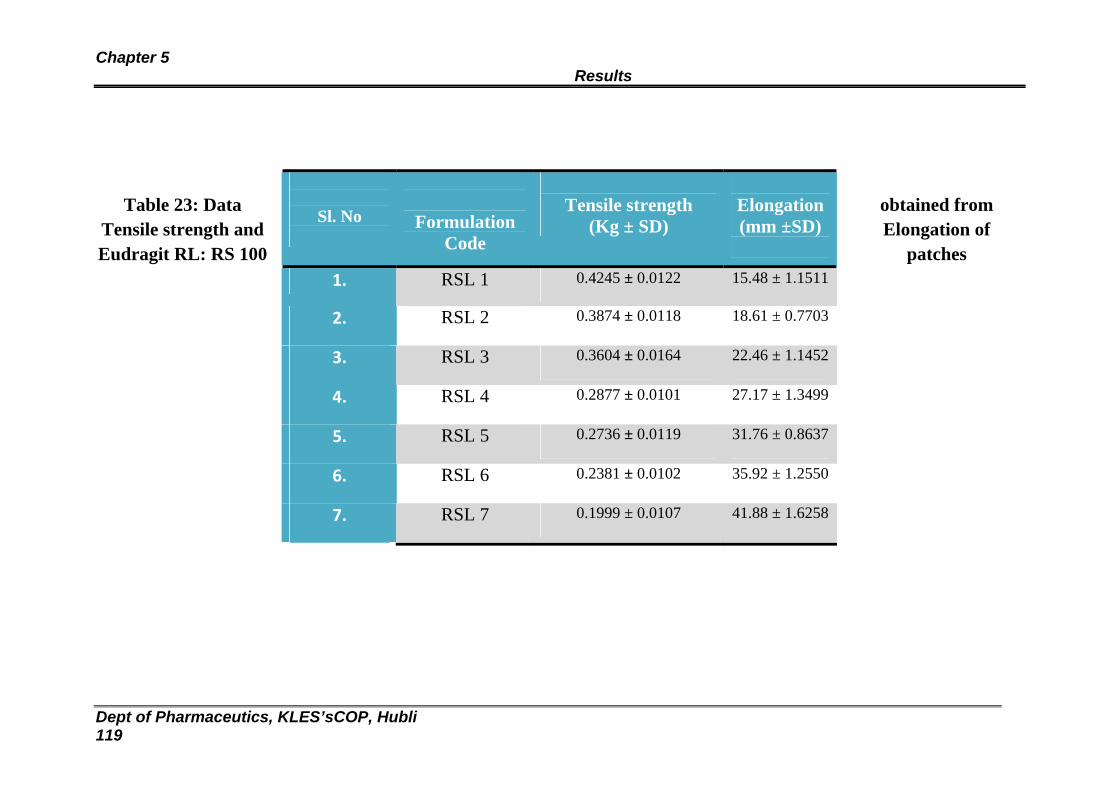
Chapter 5 Results
Dept of Pharmaceutics, KLES’sCOP, Hubli 119
Table 23: Data obtained from Tensile strength and Elongation of Eudragit RL: RS 100 patches
Sl. No
Formulation Code
Tensile strength
(Kg ± SD)
Elongation (mm ±SD)
1. RSL 1 0.4245 ± 0.0122 15.48 ± 1.1511
2. RSL 2 0.3874 ± 0.0118 18.61 ± 0.7703
3. RSL 3 0.3604 ± 0.0164 22.46 ± 1.1452
4. RSL 4 0.2877 ± 0.0101 27.17 ± 1.3499
5. RSL 5 0.2736 ± 0.0119 31.76 ± 0.8637
6. RSL 6 0.2381 ± 0.0102 35.92 ± 1.2550
7. RSL 7 0.1999 ± 0.0107 41.88 ± 1.6258
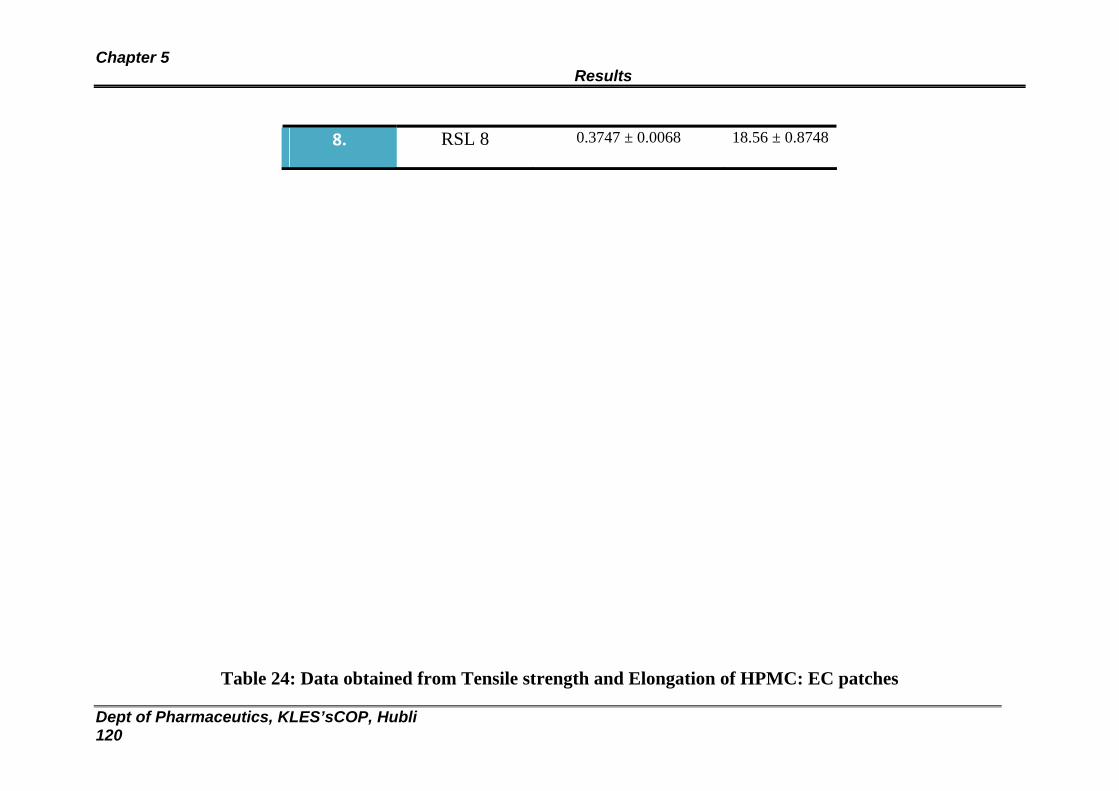
Chapter 5 Results
Dept of Pharmaceutics, KLES’sCOP, Hubli 120
Table 24: Data obtained from Tensile strength and Elongation of HPMC: EC patches
8. RSL 8 0.3747 ± 0.0068 18.56 ± 0.8748
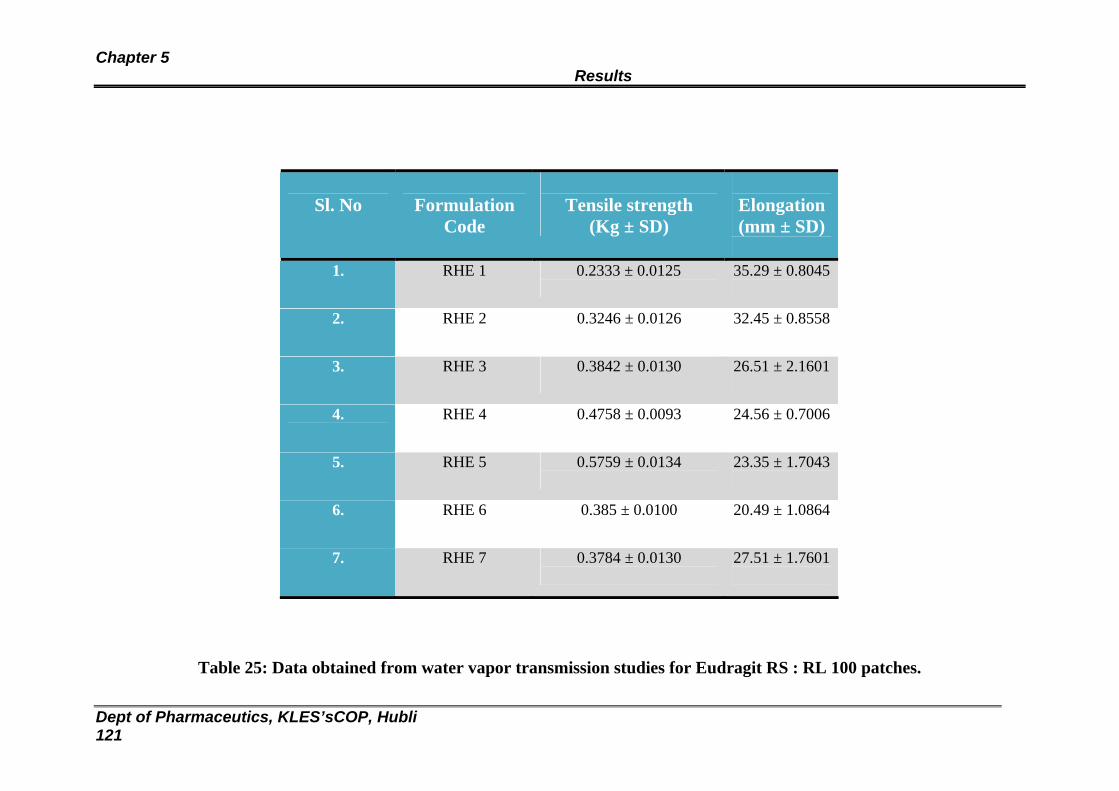
Chapter 5 Results
Dept of Pharmaceutics, KLES’sCOP, Hubli 121
Table 25: Data obtained from water vapor transmission studies for Eudragit RS : RL 100 patches.
Sl. No
Formulation
Code
Tensile strength
(Kg ± SD)
Elongation (mm ± SD)
1. RHE 1 0.2333 ± 0.0125
35.29 ± 0.8045
2. RHE 2 0.3246 ± 0.0126
32.45 ± 0.8558
3. RHE 3 0.3842 ± 0.0130
26.51 ± 2.1601
4. RHE 4 0.4758 ± 0.0093
24.56 ± 0.7006
5. RHE 5 0.5759 ± 0.0134
23.35 ± 1.7043
6. RHE 6 0.385 ± 0.0100
20.49 ± 1.0864
7. RHE 7 0.3784 ± 0.0130
27.51 ± 1.7601
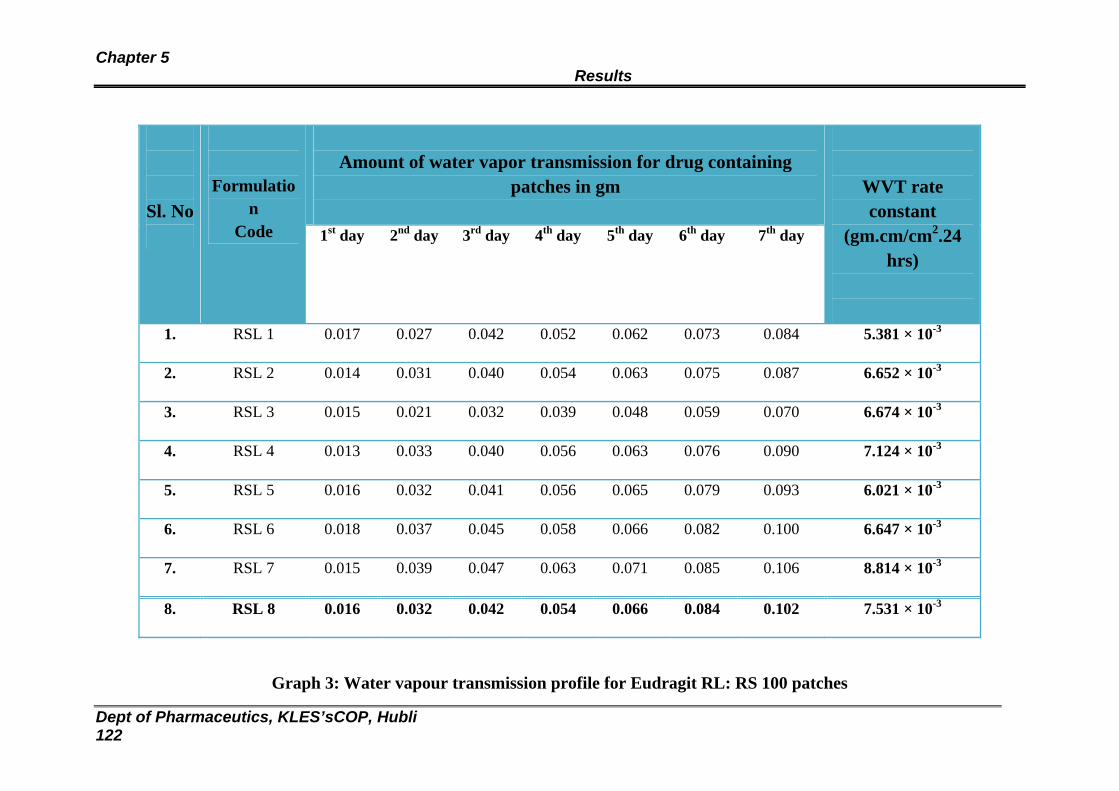
Chapter 5 Results
Dept of Pharmaceutics, KLES’sCOP, Hubli 122
Amount of water vapor transmission for drug containing
patches in gm
Sl. No
Formulation
Code 1st day 2nd day 3rd day 4th day 5th day 6th day 7th day
WVT rate constant
(gm.cm/cm2.24 hrs)
1. RSL 1 0.017 0.027 0.042 0.052 0.062 0.073 0.084 5.381 × 10⁻³
2. RSL 2 0.014 0.031 0.040 0.054 0.063 0.075 0.087 6.652 × 10⁻³
3. RSL 3 0.015 0.021 0.032 0.039 0.048 0.059 0.070 6.674 × 10⁻³
4. RSL 4 0.013 0.033 0.040 0.056 0.063 0.076 0.090 7.124 × 10⁻³
5. RSL 5 0.016 0.032 0.041 0.056 0.065 0.079 0.093 6.021 × 10⁻³
6. RSL 6 0.018 0.037 0.045 0.058 0.066 0.082 0.100 6.647 × 10⁻³
7. RSL 7 0.015 0.039 0.047 0.063 0.071 0.085 0.106 8.814 × 10⁻³
8. RSL 8 0.016 0.032 0.042 0.054 0.066 0.084 0.102 7.531 × 10⁻³
Graph 3: Water vapour transmission profile for Eudragit RL: RS 100 patches
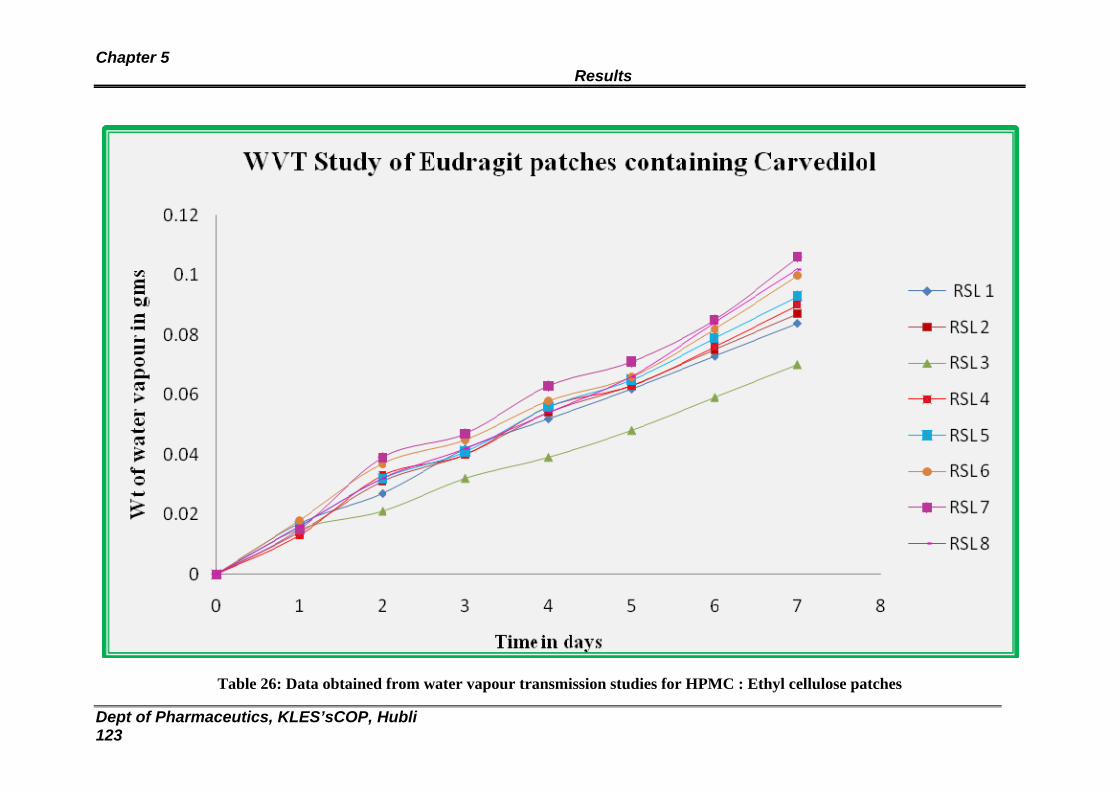
Chapter 5 Results
Dept of Pharmaceutics, KLES’sCOP, Hubli 123
Table 26: Data obtained from water vapour transmission studies for HPMC : Ethyl cellulose patches
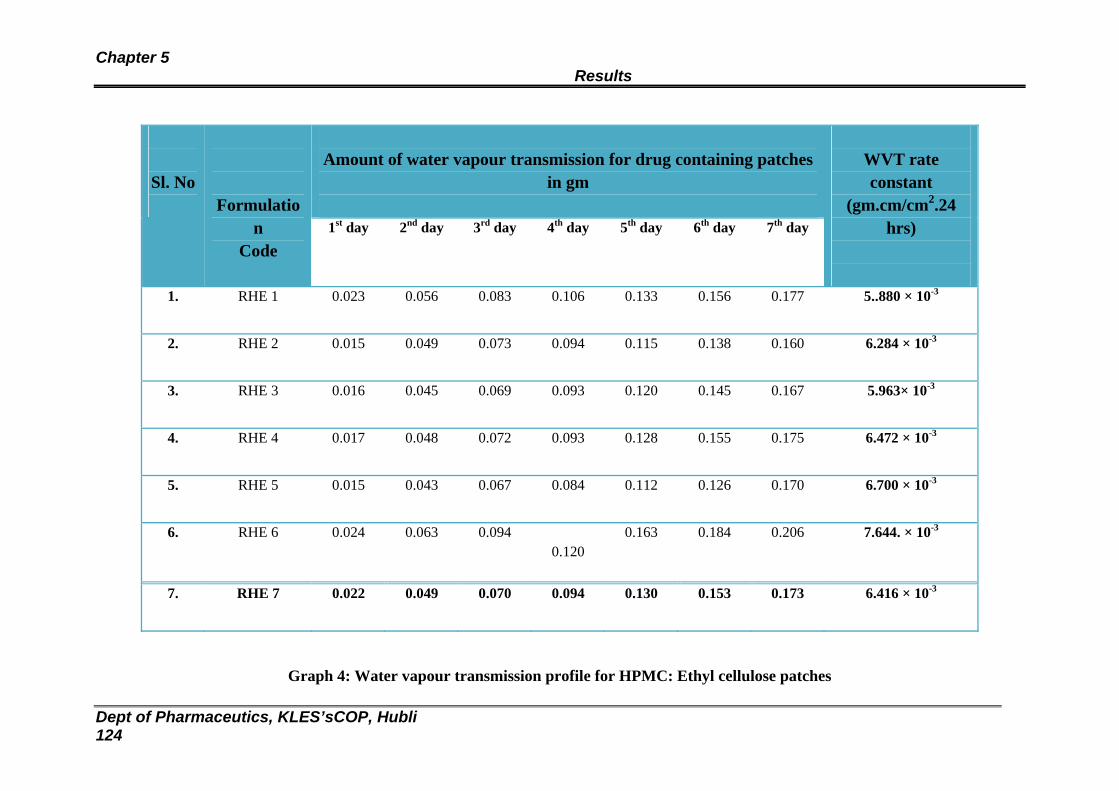
Chapter 5 Results
Dept of Pharmaceutics, KLES’sCOP, Hubli 124
Amount of water vapour transmission for drug containing patches
in gm
Sl. No
Formulation
Code 1st day 2nd day 3rd day 4th day 5th day 6th day 7th day
WVT rate constant
(gm.cm/cm2.24 hrs)
1. RHE 1 0.023 0.056 0.083 0.106 0.133 0.156 0.177
5..880 × 10-3
2. RHE 2 0.015 0.049 0.073 0.094 0.115 0.138 0.160
6.284 × 10⁻³
3. RHE 3 0.016 0.045 0.069 0.093 0.120 0.145 0.167
5.963× 10⁻³
4. RHE 4 0.017 0.048 0.072 0.093 0.128 0.155 0.175
6.472 × 10⁻³
5. RHE 5 0.015 0.043 0.067 0.084 0.112 0.126 0.170
6.700 × 10⁻³
6. RHE 6 0.024 0.063 0.094 0.120
0.163 0.184 0.206 7.644. × 10-3
7. RHE 7 0.022 0.049 0.070 0.094 0.130 0.153 0.173 6.416 × 10⁻³
Graph 4: Water vapour transmission profile for HPMC: Ethyl cellulose patches
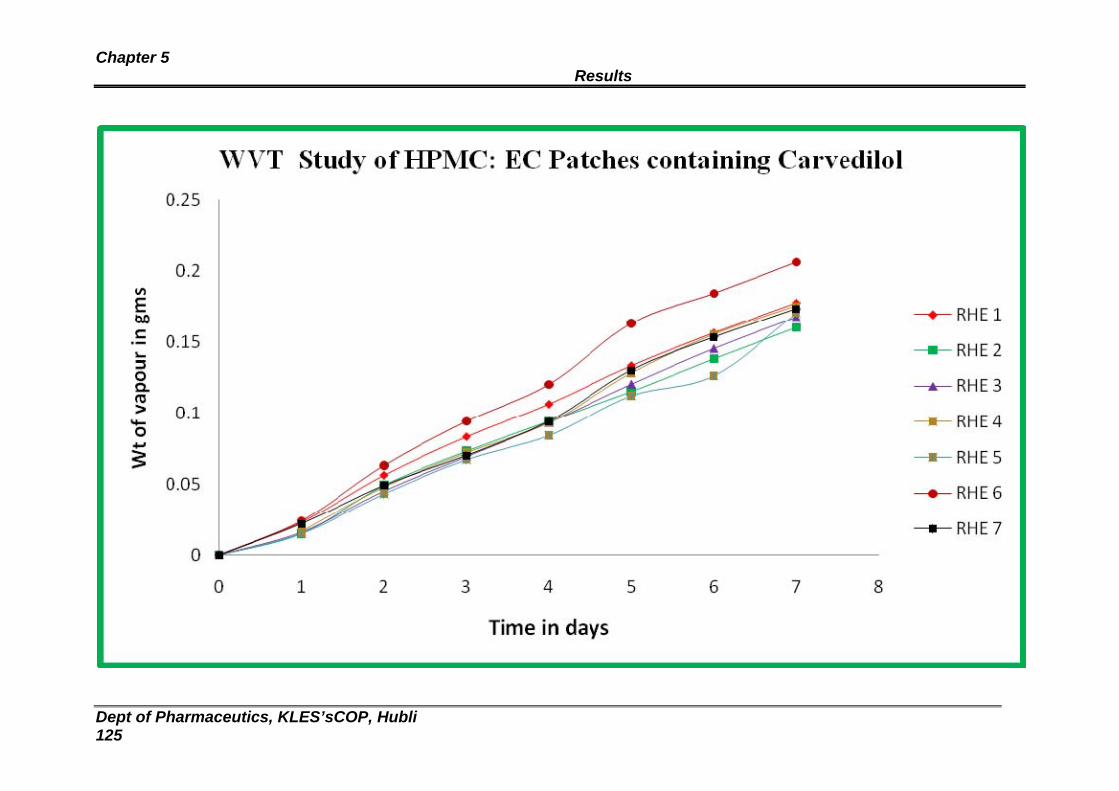
Chapter 5 Results
Dept of Pharmaceutics, KLES’sCOP, Hubli 125
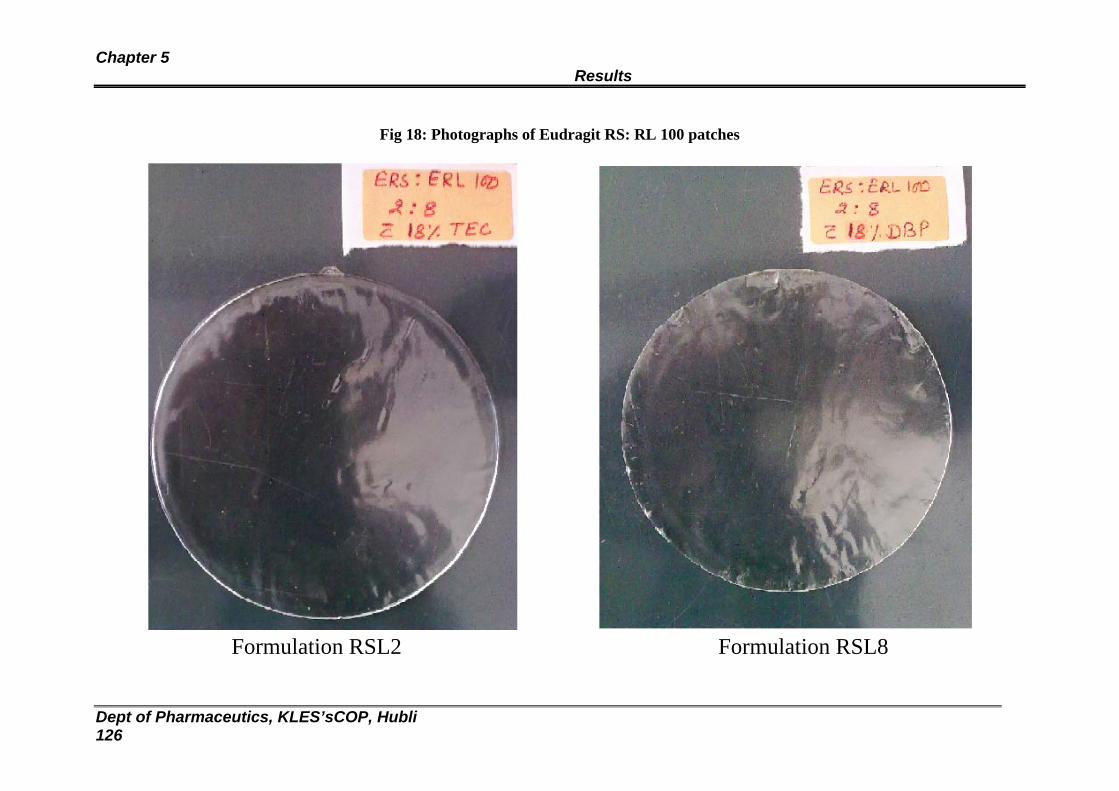
Chapter 5 Results
Dept of Pharmaceutics, KLES’sCOP, Hubli 126
Fig 18: Photographs of Eudragit RS: RL 100 patches
Formulation RSL2 Formulation RSL8
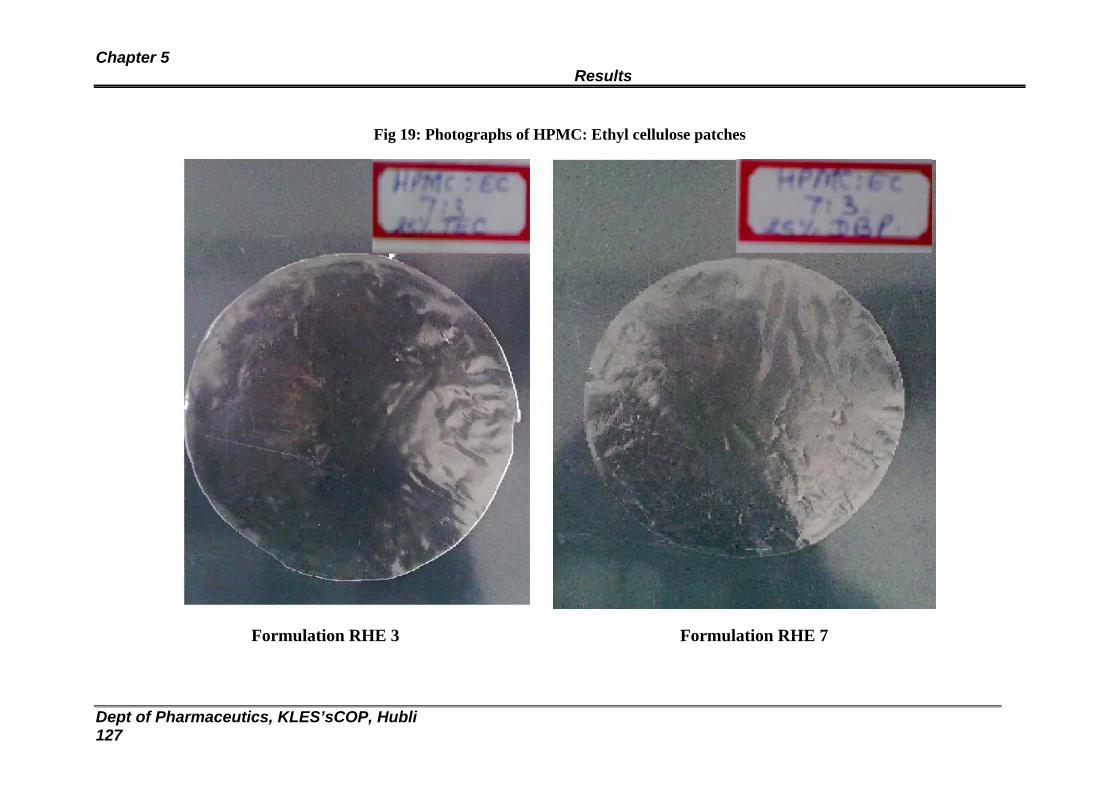
Chapter 5 Results
Dept of Pharmaceutics, KLES’sCOP, Hubli 127
Fig 19: Photographs of HPMC: Ethyl cellulose patches
Formulation RHE 3 Formulation RHE 7
Chapter 5 Results
Dept of Pharmaceutics, KLES’sCOP, Hubli 128
Fig 20: Scanning Electron Microscopy of formulation RSL 2
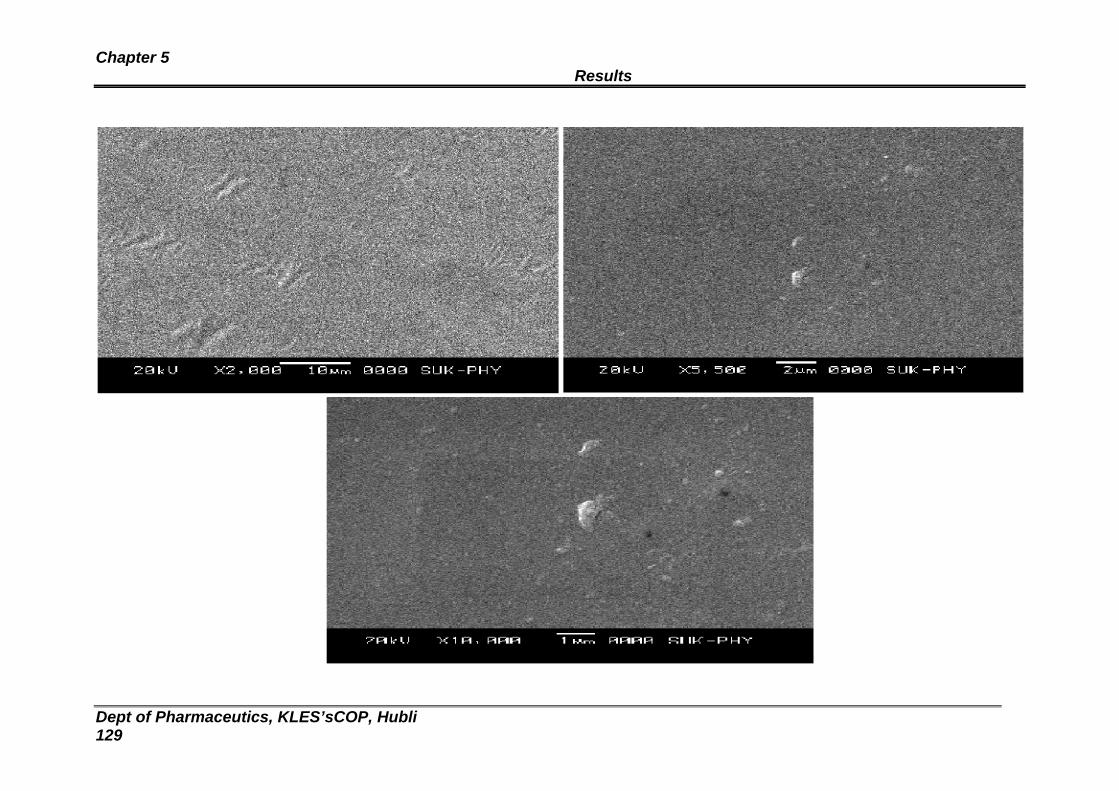
Chapter 5 Results
Dept of Pharmaceutics, KLES’sCOP, Hubli 129
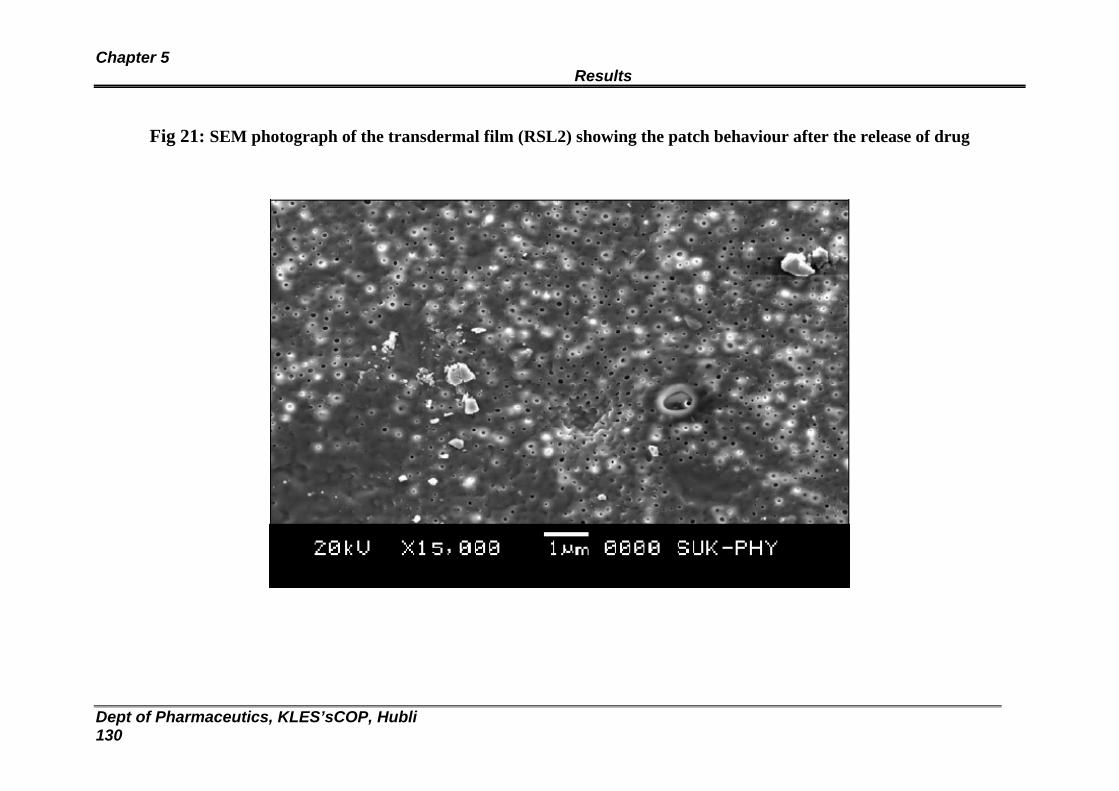
Chapter 5 Results
Dept of Pharmaceutics, KLES’sCOP, Hubli 130
Fig 21: SEM photograph of the transdermal film (RSL2) showing the patch behaviour after the release of drug
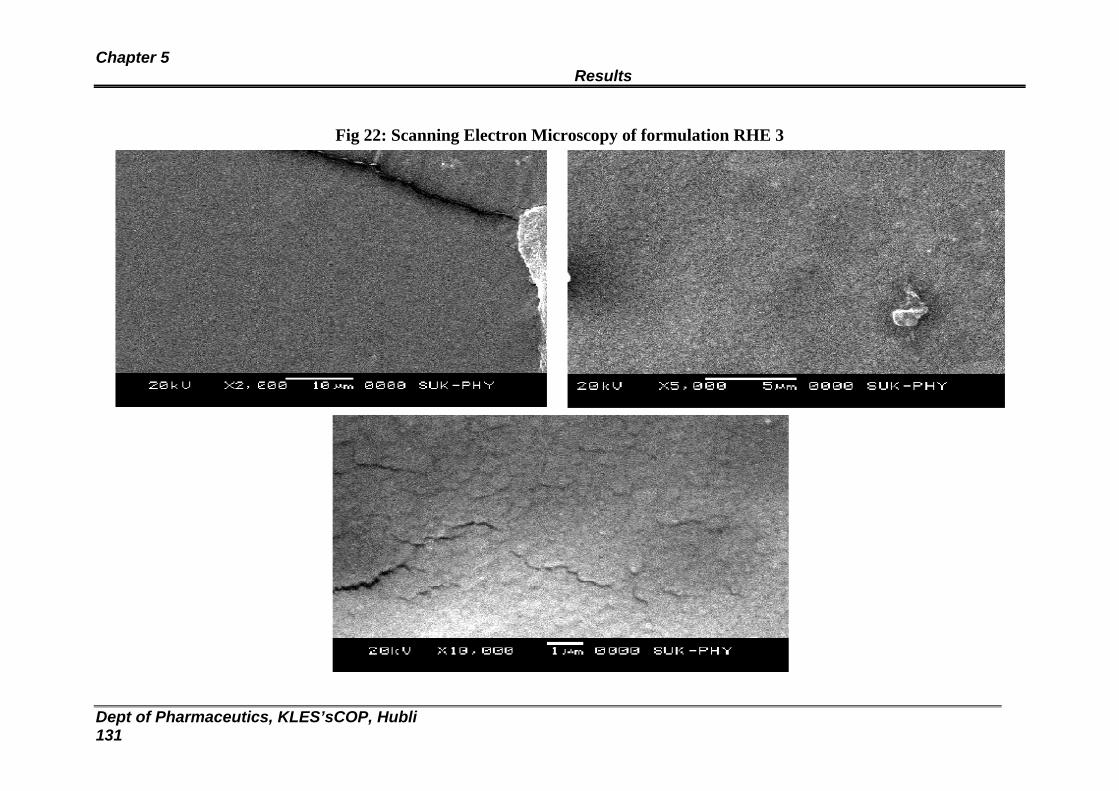
Chapter 5 Results
Dept of Pharmaceutics, KLES’sCOP, Hubli 131
Fig 22: Scanning Electron Microscopy of formulation RHE 3
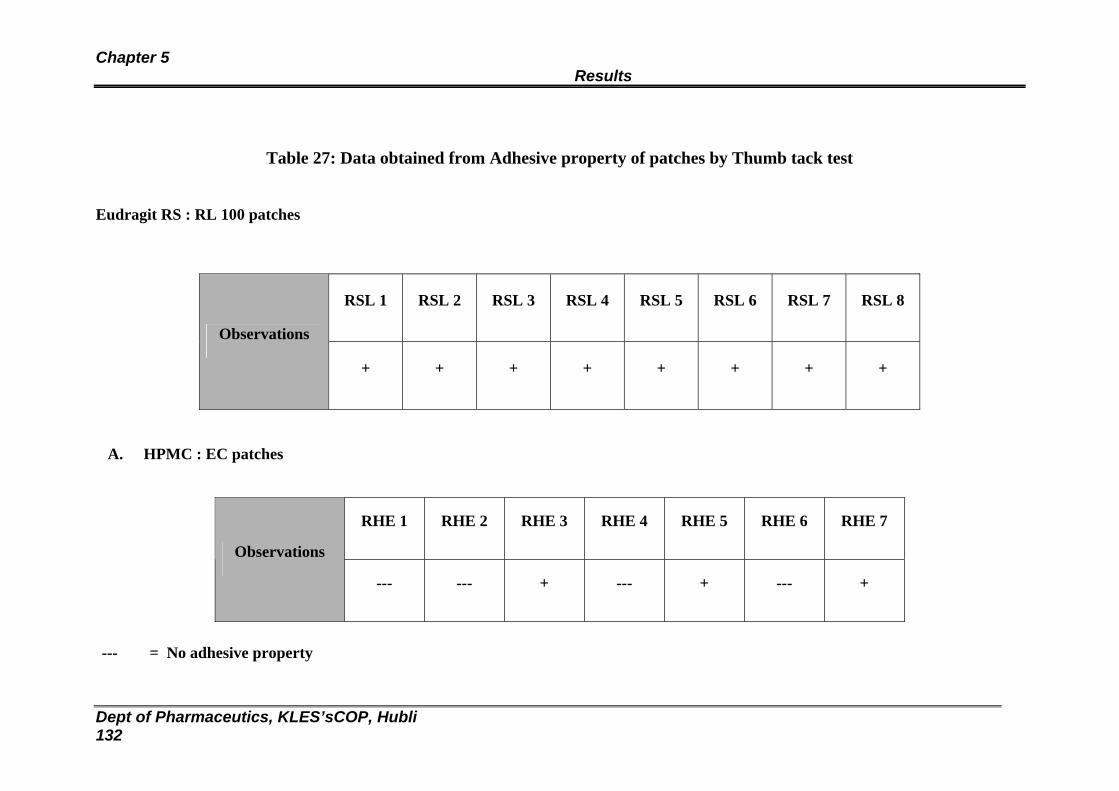
Chapter 5 Results
Dept of Pharmaceutics, KLES’sCOP, Hubli 132
Table 27: Data obtained from Adhesive property of patches by Thumb tack test
Eudragit RS : RL 100 patches
RSL 1 RSL 2 RSL 3 RSL 4 RSL 5 RSL 6 RSL 7 RSL 8
Observations
+ + + + + + + +
A. HPMC : EC patches
RHE 1 RHE 2 RHE 3 RHE 4 RHE 5 RHE 6 RHE 7
Observations
--- --- + --- + --- +
--- = No adhesive property
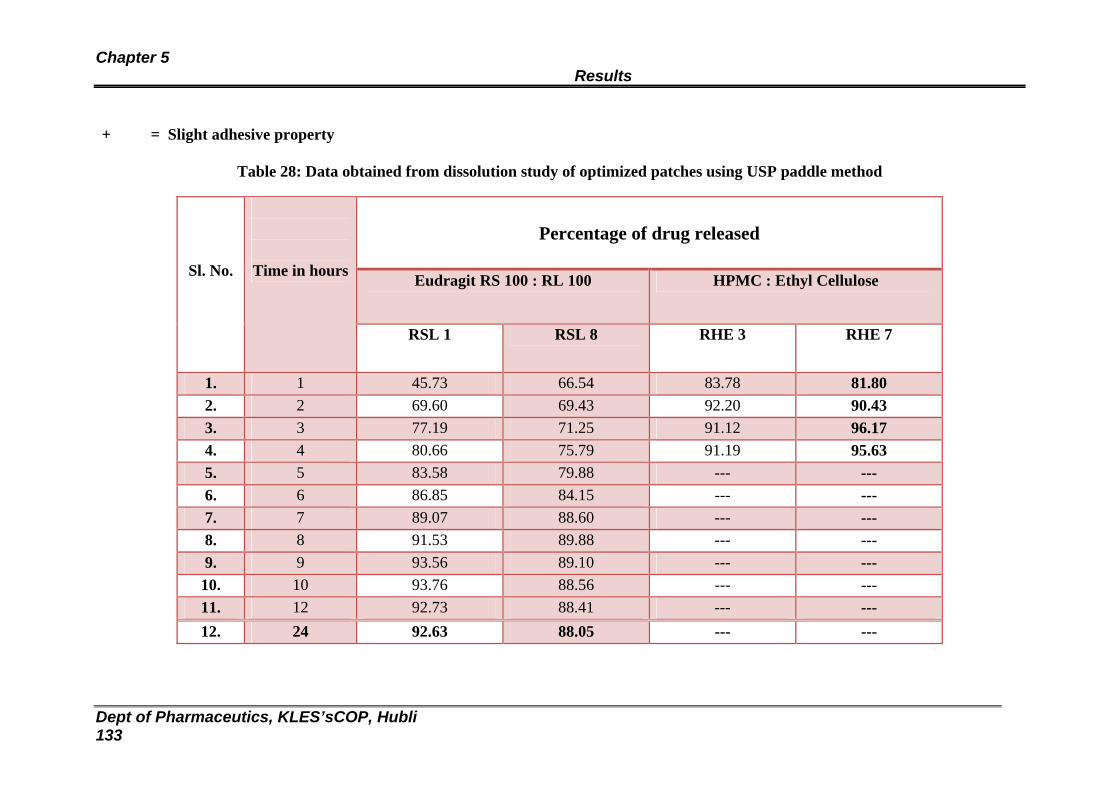
Chapter 5 Results
Dept of Pharmaceutics, KLES’sCOP, Hubli 133
+ = Slight adhesive property
Table 28: Data obtained from dissolution study of optimized patches using USP paddle method
Percentage of drug released
Eudragit RS 100 : RL 100 HPMC : Ethyl Cellulose
Sl. No.
Time in hours
RSL 1 RSL 8 RHE 3 RHE 7
1. 1 45.73 66.54 83.78 81.80 2. 2 69.60 69.43 92.20 90.43 3. 3 77.19 71.25 91.12 96.17 4. 4 80.66 75.79 91.19 95.63 5. 5 83.58 79.88 --- --- 6. 6 86.85 84.15 --- --- 7. 7 89.07 88.60 --- --- 8. 8 91.53 89.88 --- --- 9. 9 93.56 89.10 --- --- 10. 10 93.76 88.56 --- --- 11. 12 92.73 88.41 --- --- 12. 24 92.63 88.05 --- ---
Chapter 5 Results
Dept of Pharmaceutics, KLES’sCOP, Hubli 134
Graph 5: Dissolution profile for Eudragit RL:RS 100 and HPMC : EC patches
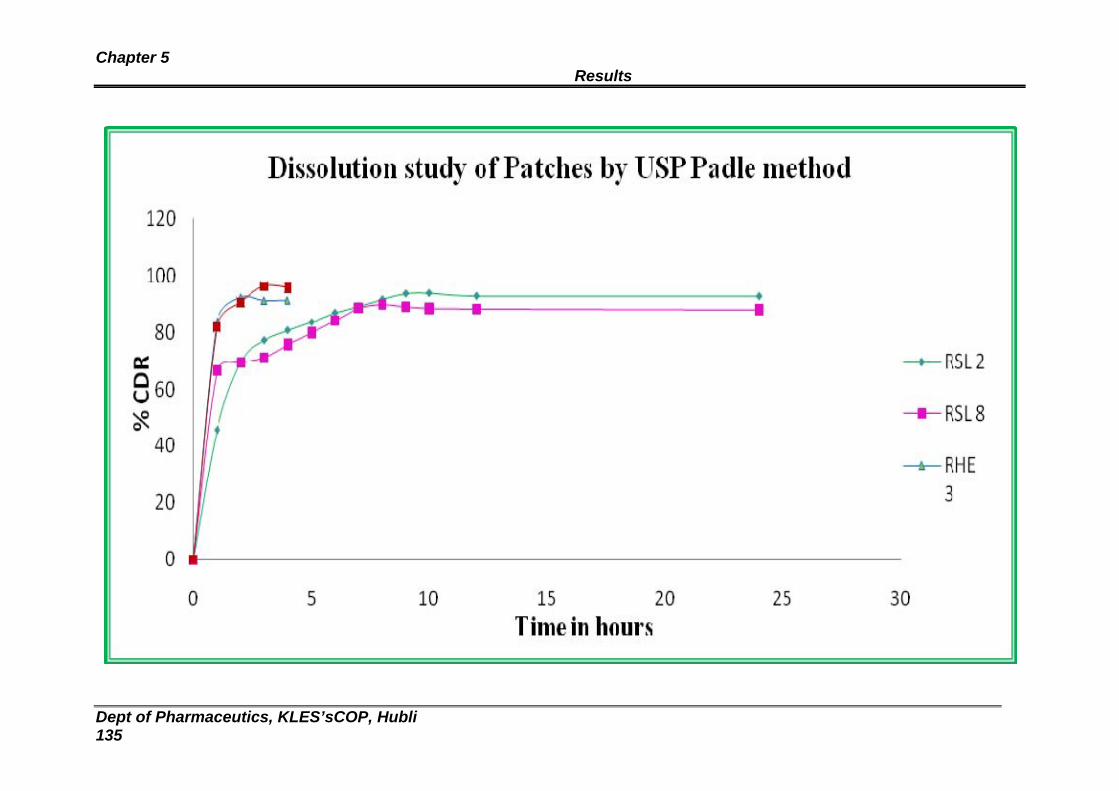
Chapter 5 Results
Dept of Pharmaceutics, KLES’sCOP, Hubli 135
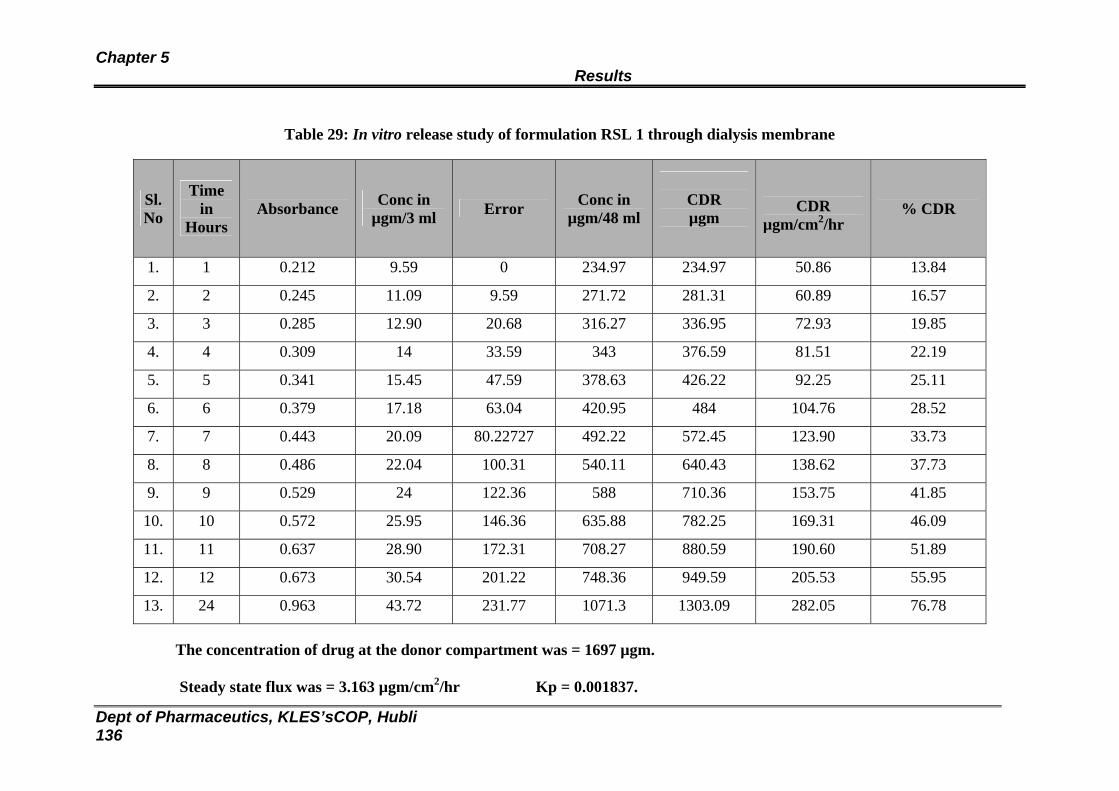
Chapter 5 Results
Dept of Pharmaceutics, KLES’sCOP, Hubli 136
Table 29: In vitro release study of formulation RSL 1 through dialysis membrane
Sl. No
Time in
Hours Absorbance Conc in
µgm/3 ml Error Conc in µgm/48 ml
CDR µgm
CDR µgm/cm2/hr
% CDR
1. 1 0.212 9.59 0 234.97 234.97 50.86 13.84
2. 2 0.245 11.09 9.59 271.72 281.31 60.89 16.57
3. 3 0.285 12.90 20.68 316.27 336.95 72.93 19.85
4. 4 0.309 14 33.59 343 376.59 81.51 22.19
5. 5 0.341 15.45 47.59 378.63 426.22 92.25 25.11
6. 6 0.379 17.18 63.04 420.95 484 104.76 28.52
7. 7 0.443 20.09 80.22727 492.22 572.45 123.90 33.73
8. 8 0.486 22.04 100.31 540.11 640.43 138.62 37.73
9. 9 0.529 24 122.36 588 710.36 153.75 41.85
10. 10 0.572 25.95 146.36 635.88 782.25 169.31 46.09
11. 11 0.637 28.90 172.31 708.27 880.59 190.60 51.89
12. 12 0.673 30.54 201.22 748.36 949.59 205.53 55.95
13. 24 0.963 43.72 231.77 1071.3 1303.09 282.05 76.78
The concentration of drug at the donor compartment was = 1697 µgm.
Steady state flux was = 3.163 µgm/cm2/hr Kp = 0.001837.

Chapter 5 Results
Dept of Pharmaceutics, KLES’sCOP, Hubli 137
Table 30: In vitro release study of formulation RLS 2 through dialysis membrane
Sl. No
Time in
Hours Absorbance Conc in
µgm/3 ml Error Conc in µgm/48 ml
CDR µgm
CDR µgm/cm2/hr % CDR
1. 1 0.256 11.59 0 283.97 283.97 61.46 16.73
2. 2 0.289 13.09 11.59 320.72 332.31 71.93 19.58
3. 3 0.315 14.27 24.68 349.68 374.36 81.031 22.060
4. 4 0.347 15.72 38.95 385.31 424.27 91.833 25.00
5. 5 0.368 16.68 54.68 408.70 463.38 100.30 27.30
6. 6 0.409 18.54 71.36 454.36 525.72 113.79 30.97
7. 7 0.449 20.36 89.90 498.90 588.81 127.44 34.69
8. 8 0.492 22.31 110.2 546.79 657.06 142.22 38.71
9. 9 0.537 24.36 132.59 596.90 729.5 157.90 42.987
10. 10 0.588 26.68 156.95 653.70 810.65 175.46 47.77
11. 11 0.643 29.18 183.63 714.95 898.59 194.50 52.95
12. 12 0.698 31.68 212.81 776.20 989.02 214.07 58.28
13. 24 0.996 45.22 244.5 1108.068 1352.56 292.76 79.70
The concentration of drug at the donor compartment was = 1697 µgm.
Steady state flux was = 3.078183 µgm/cm2/hr Kp = 0.001852.

Chapter 5 Results
Dept of Pharmaceutics, KLES’sCOP, Hubli 138
Table 31: In vitro release study of formulation RLS 3 through dialysis membrane
Sl. No
Time in
Hours Absorbance Conc in
µgm/3 ml Error Conc in µgm/48 ml
CDR µgm
CDR
µgm/cm2/hr % CDR
1. 1 0.208 9.40 0 230.52 230.52 49.89 13.58
2. 2 0.231 10.45 9.40 256.13 265.54 57.47 15.64
3. 3 0.278 12.59 19.86 308.47 328.34 71.06 19.34
4. 4 0.302 13.68 32.45 335.20 367.65 79.57 21.66
5. 5 0.332 15.04 46.13 368.61 414.75 89.77 24.44
6. 6 0.357 16.18 61.18 396.45 457.63 99.05 26.96
7. 7 0.398 18.04 77.36 442.11 519.47 112.44 30.61
8. 8 0.461 20.90 95.40 512.27 607.68 131.53 35.80
9. 9 0.589 26.72 116.3 654.81 771.13 166.91 45.44
10. 10 0.621 28.18 143.0 690.45 833.5 180.41 49.11
11. 11 0.653 29.63 171.22 726.09 897.31 194.22 52.87
12. 12 0.669 30.36 200.86 743.90 944.77 204.49 55.67
13. 24 0.927 42.09 231.22 1031.22 1262.45 273.25 74.39
The concentration of drug at the donor compartment was = 1697 µgm.
Steady state flux was = 3.143 µgm/cm2/hr Kp = 0.001852.
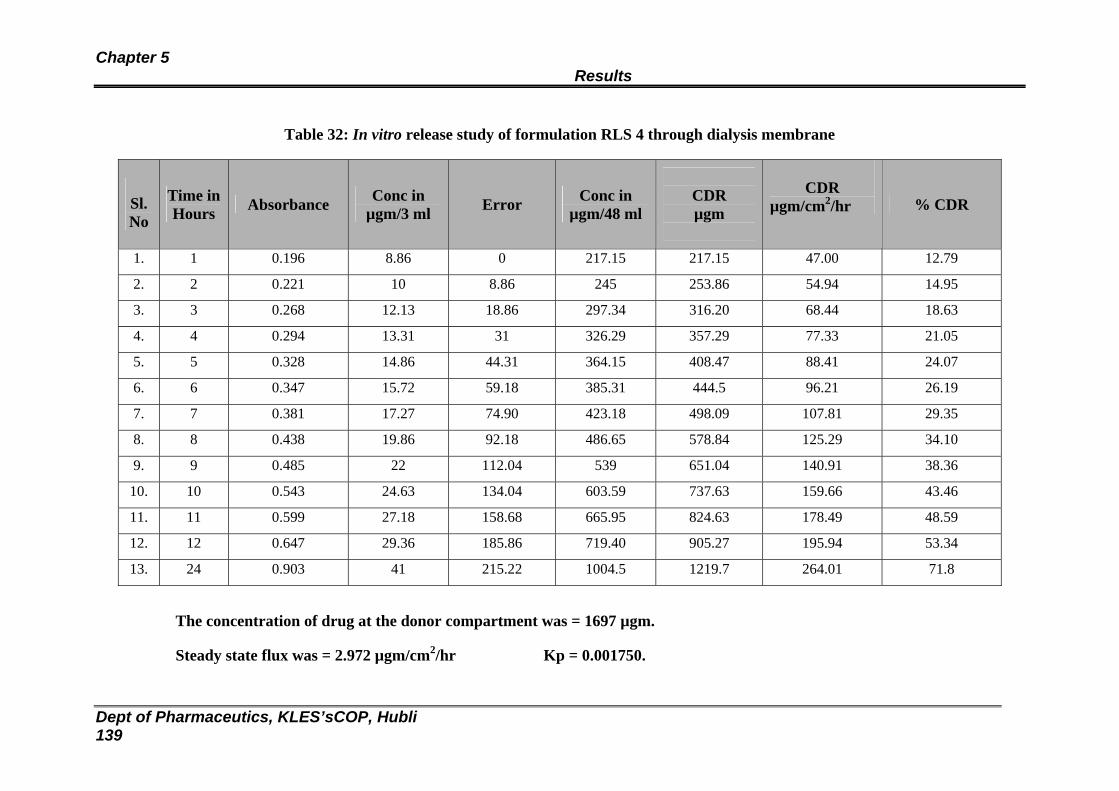
Chapter 5 Results
Dept of Pharmaceutics, KLES’sCOP, Hubli 139
Table 32: In vitro release study of formulation RLS 4 through dialysis membrane
Sl. No
Time inHours Absorbance Conc in
µgm/3 ml Error Conc in µgm/48 ml
CDR µgm
CDR
µgm/cm2/hr % CDR
1. 1 0.196 8.86 0 217.15 217.15 47.00 12.79
2. 2 0.221 10 8.86 245 253.86 54.94 14.95
3. 3 0.268 12.13 18.86 297.34 316.20 68.44 18.63
4. 4 0.294 13.31 31 326.29 357.29 77.33 21.05
5. 5 0.328 14.86 44.31 364.15 408.47 88.41 24.07
6. 6 0.347 15.72 59.18 385.31 444.5 96.21 26.19
7. 7 0.381 17.27 74.90 423.18 498.09 107.81 29.35
8. 8 0.438 19.86 92.18 486.65 578.84 125.29 34.10
9. 9 0.485 22 112.04 539 651.04 140.91 38.36
10. 10 0.543 24.63 134.04 603.59 737.63 159.66 43.46
11. 11 0.599 27.18 158.68 665.95 824.63 178.49 48.59
12. 12 0.647 29.36 185.86 719.40 905.27 195.94 53.34
13. 24 0.903 41 215.22 1004.5 1219.7 264.01 71.8
The concentration of drug at the donor compartment was = 1697 µgm.
Steady state flux was = 2.972 µgm/cm2/hr Kp = 0.001750.
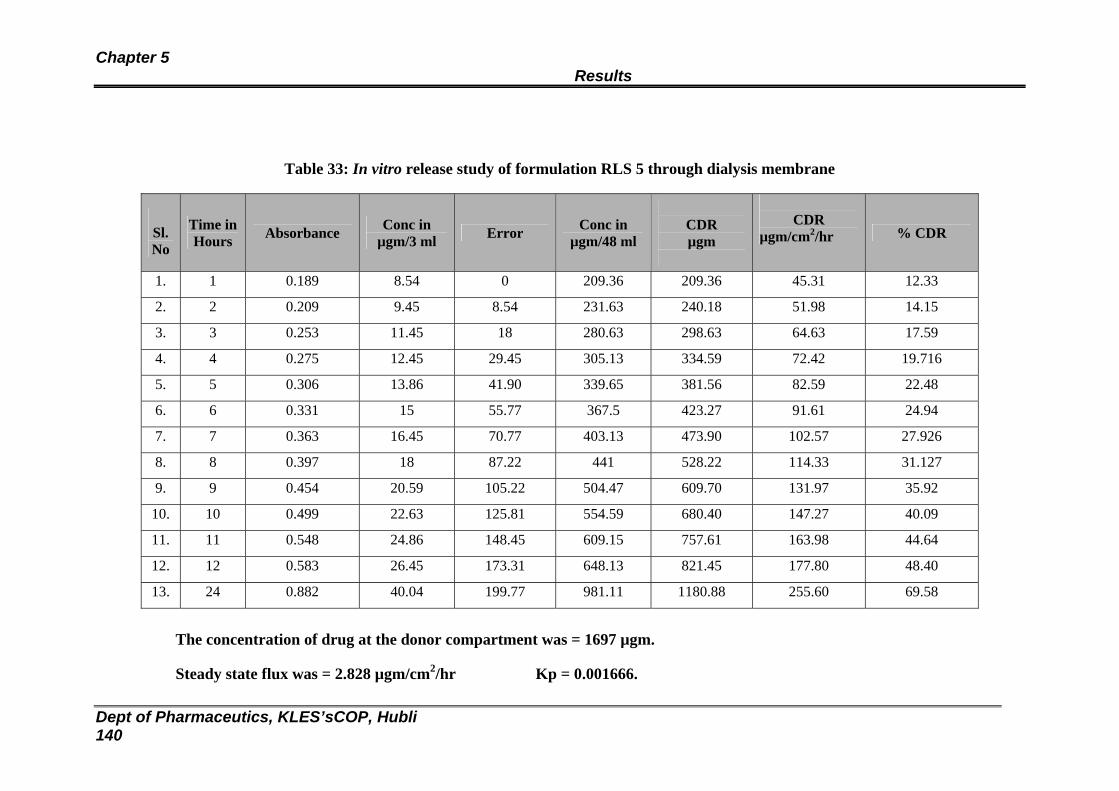
Chapter 5 Results
Dept of Pharmaceutics, KLES’sCOP, Hubli 140
Table 33: In vitro release study of formulation RLS 5 through dialysis membrane
Sl. No
Time in Hours Absorbance Conc in
µgm/3 ml Error Conc in µgm/48 ml
CDR µgm
CDR
µgm/cm2/hr % CDR
1. 1 0.189 8.54 0 209.36 209.36 45.31 12.33
2. 2 0.209 9.45 8.54 231.63 240.18 51.98 14.15
3. 3 0.253 11.45 18 280.63 298.63 64.63 17.59
4. 4 0.275 12.45 29.45 305.13 334.59 72.42 19.716
5. 5 0.306 13.86 41.90 339.65 381.56 82.59 22.48
6. 6 0.331 15 55.77 367.5 423.27 91.61 24.94
7. 7 0.363 16.45 70.77 403.13 473.90 102.57 27.926
8. 8 0.397 18 87.22 441 528.22 114.33 31.127
9. 9 0.454 20.59 105.22 504.47 609.70 131.97 35.92
10. 10 0.499 22.63 125.81 554.59 680.40 147.27 40.09
11. 11 0.548 24.86 148.45 609.15 757.61 163.98 44.64
12. 12 0.583 26.45 173.31 648.13 821.45 177.80 48.40
13. 24 0.882 40.04 199.77 981.11 1180.88 255.60 69.58
The concentration of drug at the donor compartment was = 1697 µgm.
Steady state flux was = 2.828 µgm/cm2/hr Kp = 0.001666.
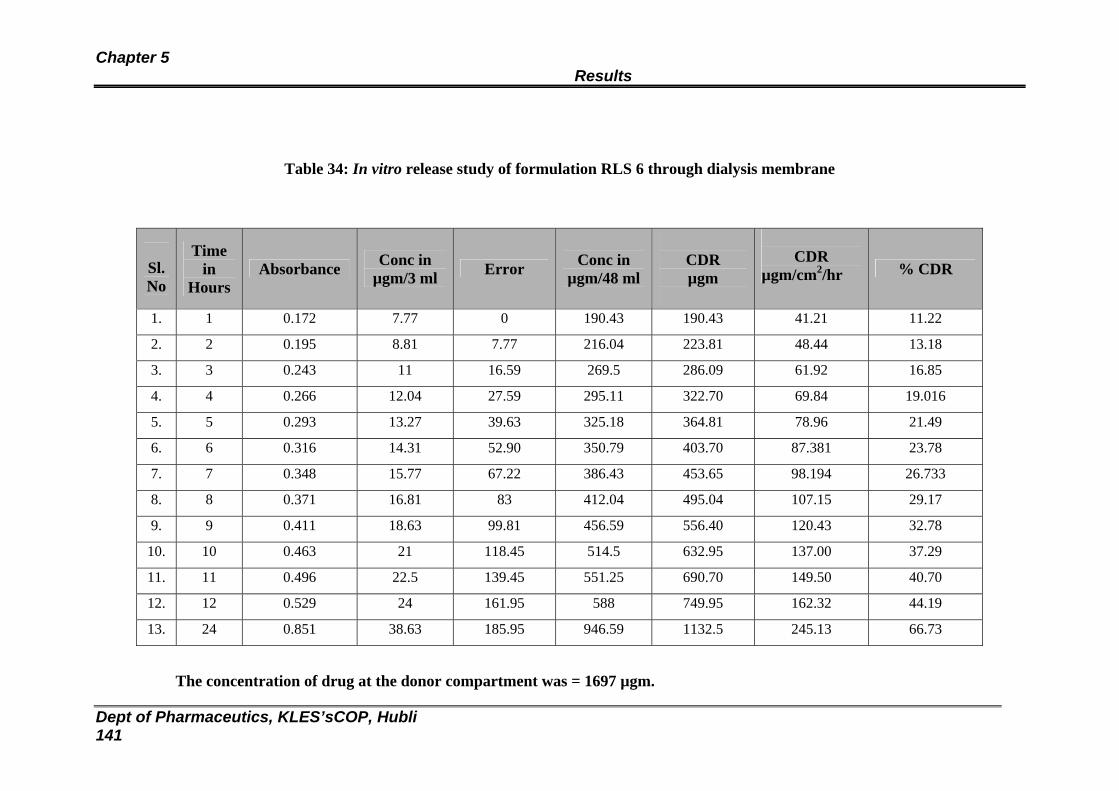
Chapter 5 Results
Dept of Pharmaceutics, KLES’sCOP, Hubli 141
Table 34: In vitro release study of formulation RLS 6 through dialysis membrane
Sl. No
Time in
Hours Absorbance Conc in
µgm/3 ml Error Conc in µgm/48 ml
CDR µgm
CDR
µgm/cm2/hr % CDR
1. 1 0.172 7.77 0 190.43 190.43 41.21 11.22
2. 2 0.195 8.81 7.77 216.04 223.81 48.44 13.18
3. 3 0.243 11 16.59 269.5 286.09 61.92 16.85
4. 4 0.266 12.04 27.59 295.11 322.70 69.84 19.016
5. 5 0.293 13.27 39.63 325.18 364.81 78.96 21.49
6. 6 0.316 14.31 52.90 350.79 403.70 87.381 23.78
7. 7 0.348 15.77 67.22 386.43 453.65 98.194 26.733
8. 8 0.371 16.81 83 412.04 495.04 107.15 29.17
9. 9 0.411 18.63 99.81 456.59 556.40 120.43 32.78
10. 10 0.463 21 118.45 514.5 632.95 137.00 37.29
11. 11 0.496 22.5 139.45 551.25 690.70 149.50 40.70
12. 12 0.529 24 161.95 588 749.95 162.32 44.19
13. 24 0.851 38.63 185.95 946.59 1132.5 245.13 66.73
The concentration of drug at the donor compartment was = 1697 µgm.
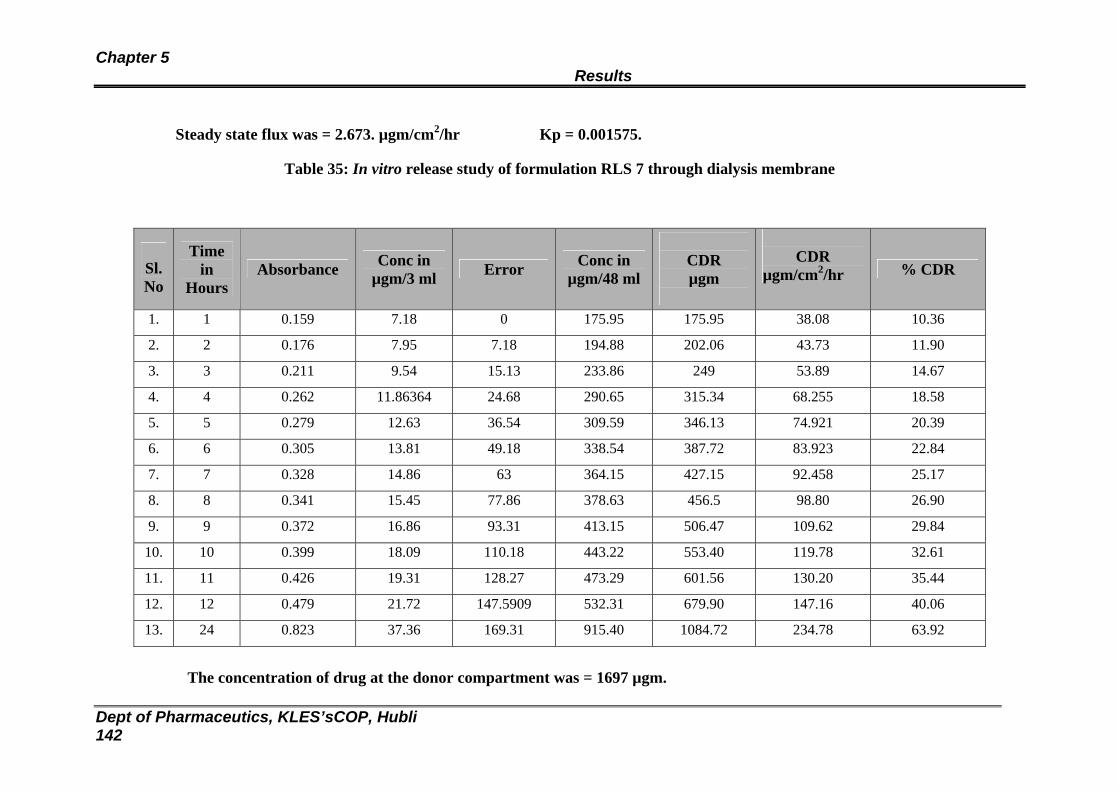
Chapter 5 Results
Dept of Pharmaceutics, KLES’sCOP, Hubli 142
Steady state flux was = 2.673. µgm/cm2/hr Kp = 0.001575.
Table 35: In vitro release study of formulation RLS 7 through dialysis membrane
Sl. No
Time in
Hours Absorbance Conc in
µgm/3 ml Error Conc in µgm/48 ml
CDR µgm
CDR
µgm/cm2/hr % CDR
1. 1 0.159 7.18 0 175.95 175.95 38.08 10.36
2. 2 0.176 7.95 7.18 194.88 202.06 43.73 11.90
3. 3 0.211 9.54 15.13 233.86 249 53.89 14.67
4. 4 0.262 11.86364 24.68 290.65 315.34 68.255 18.58
5. 5 0.279 12.63 36.54 309.59 346.13 74.921 20.39
6. 6 0.305 13.81 49.18 338.54 387.72 83.923 22.84
7. 7 0.328 14.86 63 364.15 427.15 92.458 25.17
8. 8 0.341 15.45 77.86 378.63 456.5 98.80 26.90
9. 9 0.372 16.86 93.31 413.15 506.47 109.62 29.84
10. 10 0.399 18.09 110.18 443.22 553.40 119.78 32.61
11. 11 0.426 19.31 128.27 473.29 601.56 130.20 35.44
12. 12 0.479 21.72 147.5909 532.31 679.90 147.16 40.06
13. 24 0.823 37.36 169.31 915.40 1084.72 234.78 63.92
The concentration of drug at the donor compartment was = 1697 µgm.
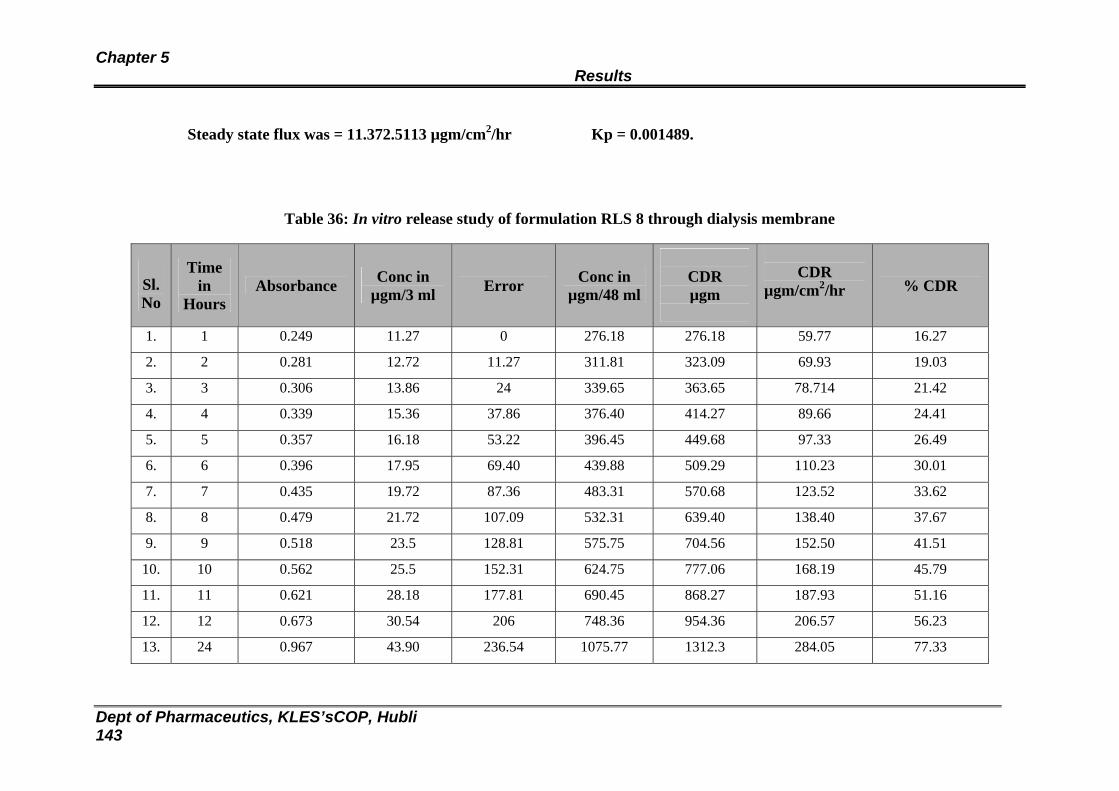
Chapter 5 Results
Dept of Pharmaceutics, KLES’sCOP, Hubli 143
Steady state flux was = 11.372.5113 µgm/cm2/hr Kp = 0.001489.
Table 36: In vitro release study of formulation RLS 8 through dialysis membrane
Sl. No
Time in
Hours Absorbance Conc in
µgm/3 ml Error Conc in µgm/48 ml
CDR µgm
CDR
µgm/cm2/hr % CDR
1. 1 0.249 11.27 0 276.18 276.18 59.77 16.27
2. 2 0.281 12.72 11.27 311.81 323.09 69.93 19.03
3. 3 0.306 13.86 24 339.65 363.65 78.714 21.42
4. 4 0.339 15.36 37.86 376.40 414.27 89.66 24.41
5. 5 0.357 16.18 53.22 396.45 449.68 97.33 26.49
6. 6 0.396 17.95 69.40 439.88 509.29 110.23 30.01
7. 7 0.435 19.72 87.36 483.31 570.68 123.52 33.62
8. 8 0.479 21.72 107.09 532.31 639.40 138.40 37.67
9. 9 0.518 23.5 128.81 575.75 704.56 152.50 41.51
10. 10 0.562 25.5 152.31 624.75 777.06 168.19 45.79
11. 11 0.621 28.18 177.81 690.45 868.27 187.93 51.16
12. 12 0.673 30.54 206 748.36 954.36 206.57 56.23
13. 24 0.967 43.90 236.54 1075.77 1312.3 284.05 77.33
Chapter 5 Results
Dept of Pharmaceutics, KLES’sCOP, Hubli 144
The concentration of drug at the donor compartment was = 1697 µgm.
Steady state flux was = 3.078 µgm/cm2/hr Kp = 0.001821.
Graph 6A: In vitro release profile for Eudragit patches containing 25 mgs of Carvedilol through dialysis membrane
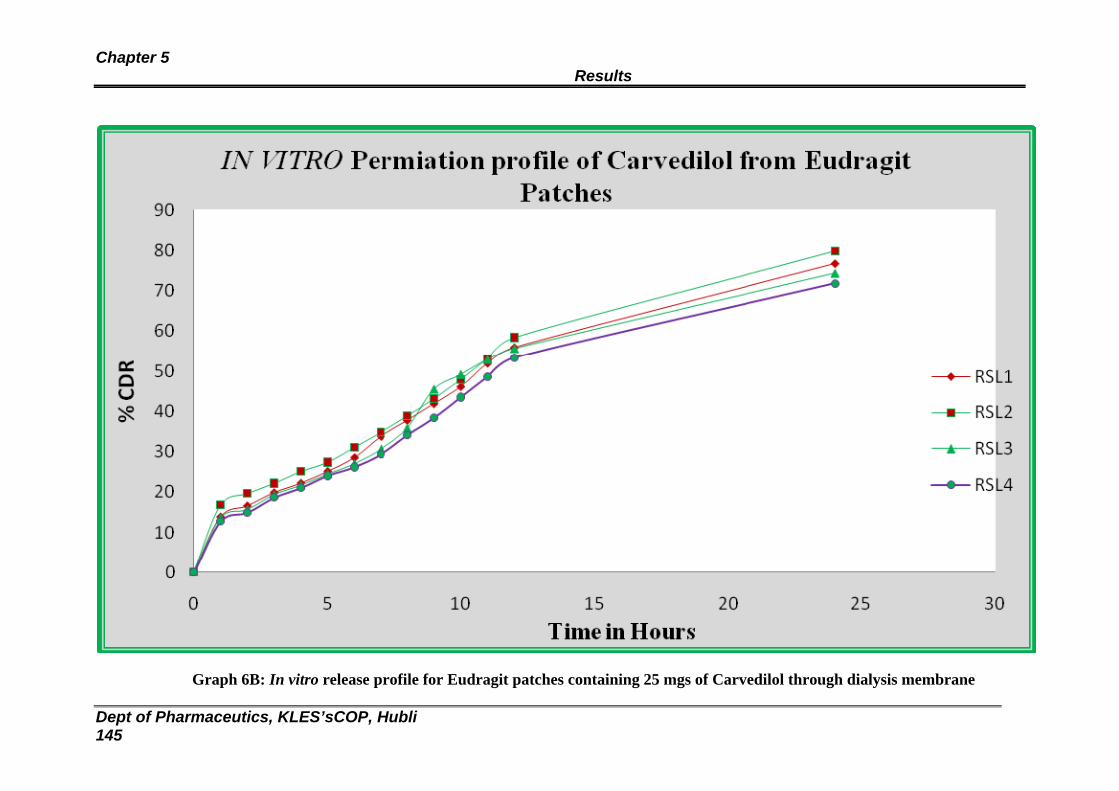
Chapter 5 Results
Dept of Pharmaceutics, KLES’sCOP, Hubli 145
Graph 6B: In vitro release profile for Eudragit patches containing 25 mgs of Carvedilol through dialysis membrane
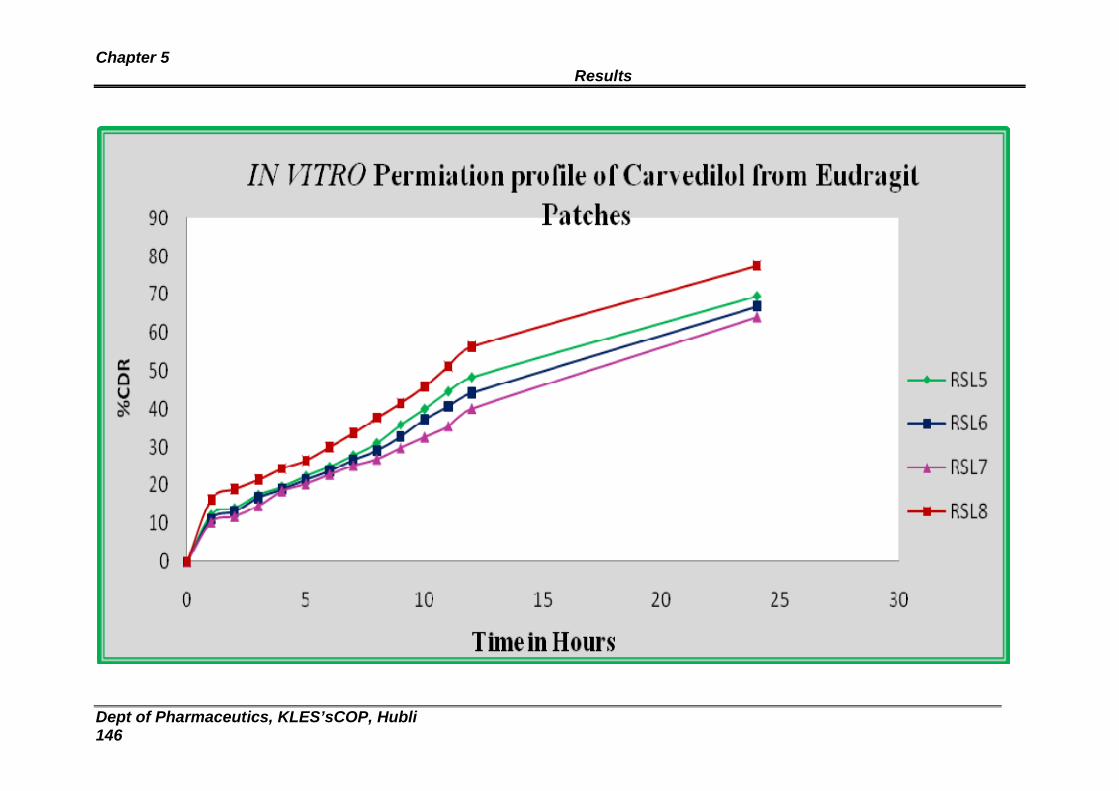
Chapter 5 Results
Dept of Pharmaceutics, KLES’sCOP, Hubli 146

Chapter 5 Results
Dept of Pharmaceutics, KLES’sCOP, Hubli 147
Table 37: In vitro release study of formulation RHE 1 through dialysis membrane
Sl. No
Time inHours Absorbance Conc in
µgm/3 ml Error Conc in µgm/48 ml
CDR µgm
CDR
µgm/cm2/hr % CDR
1. 1 0.18 8.13 0 199.34 199.34 43.147 11.74
2. 2 0.194 8.77 8.13 214.93 223.06 48.28 13.14
3. 3 0.199 9 16.90 220.5 237.40 51.38 13.98
4. 4 0.21 9.5 25.90 232.75 258.65 55.98 15.24
5. 5 0.236 10.68 35.40 261.70 297.11 64.31 17.50
6. 6 0.254 11.5 46.09 281.75 327.84 70.96 19.31
7. 7 0.265 12 57.59 294 351.59 76.10 20.71
8. 8 0.278 12.59 69.59 308.47 378.06 81.83 22.27
9 9 0.29 13.13 82.18 321.84 404.02 87.45 23.80
10 10 0.304 13.77 95.31 337.43 432.75 93.66 25.50
11 11 0.315 14.27 109.09 349.68 458.77 99.30 27.03
12 12 0.326 14.77 123.36 361.93 485.29 105.04 28.59
13 24 0.347 15.72 138.13 385.31 523.45 113.30 30.84 The concentration of drug at the donor compartment was = 1697µgm.
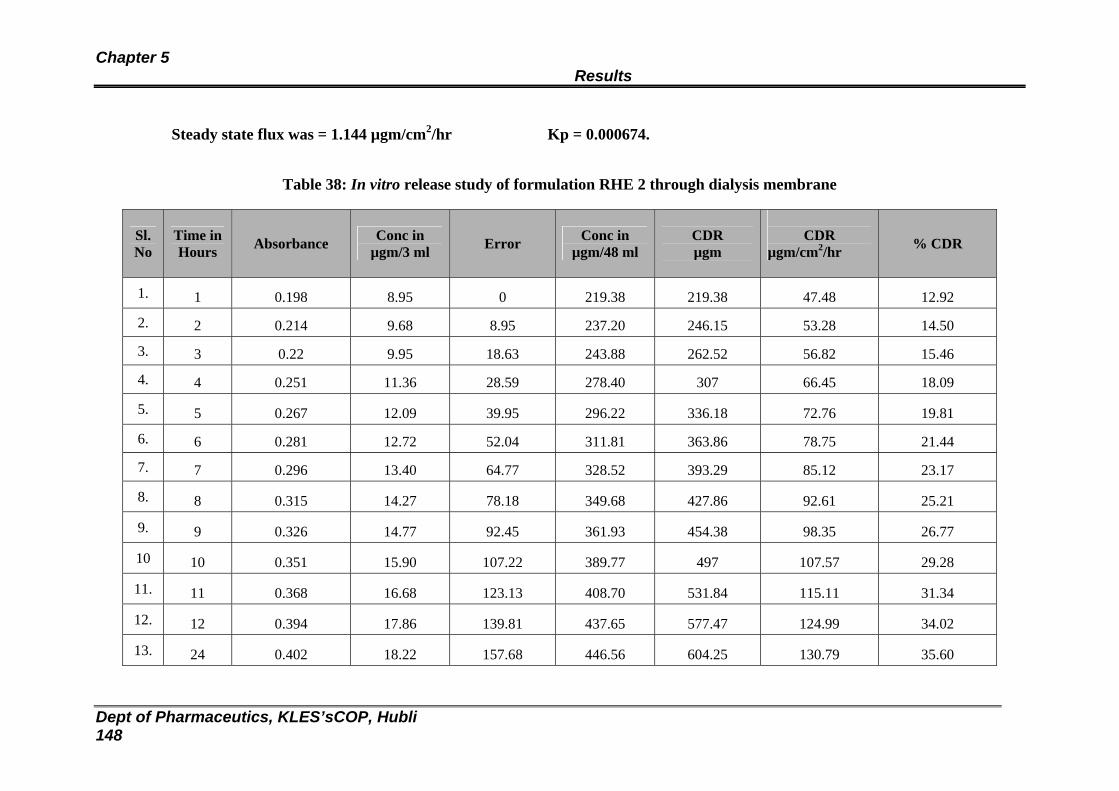
Chapter 5 Results
Dept of Pharmaceutics, KLES’sCOP, Hubli 148
Steady state flux was = 1.144 µgm/cm2/hr Kp = 0.000674.
Table 38: In vitro release study of formulation RHE 2 through dialysis membrane
Sl. No
Time in Hours Absorbance Conc in
µgm/3 ml Error Conc in µgm/48 ml
CDR µgm
CDR
µgm/cm2/hr % CDR
1. 1 0.198 8.95 0 219.38 219.38 47.48 12.92
2. 2 0.214 9.68 8.95 237.20 246.15 53.28 14.50
3. 3 0.22 9.95 18.63 243.88 262.52 56.82 15.46
4. 4 0.251 11.36 28.59 278.40 307 66.45 18.09
5. 5 0.267 12.09 39.95 296.22 336.18 72.76 19.81
6. 6 0.281 12.72 52.04 311.81 363.86 78.75 21.44
7. 7 0.296 13.40 64.77 328.52 393.29 85.12 23.17
8. 8 0.315 14.27 78.18 349.68 427.86 92.61 25.21
9. 9 0.326 14.77 92.45 361.93 454.38 98.35 26.77
10 10 0.351 15.90 107.22 389.77 497 107.57 29.28
11. 11 0.368 16.68 123.13 408.70 531.84 115.11 31.34
12. 12 0.394 17.86 139.81 437.65 577.47 124.99 34.02
13. 24 0.402 18.22 157.68 446.56 604.25 130.79 35.60
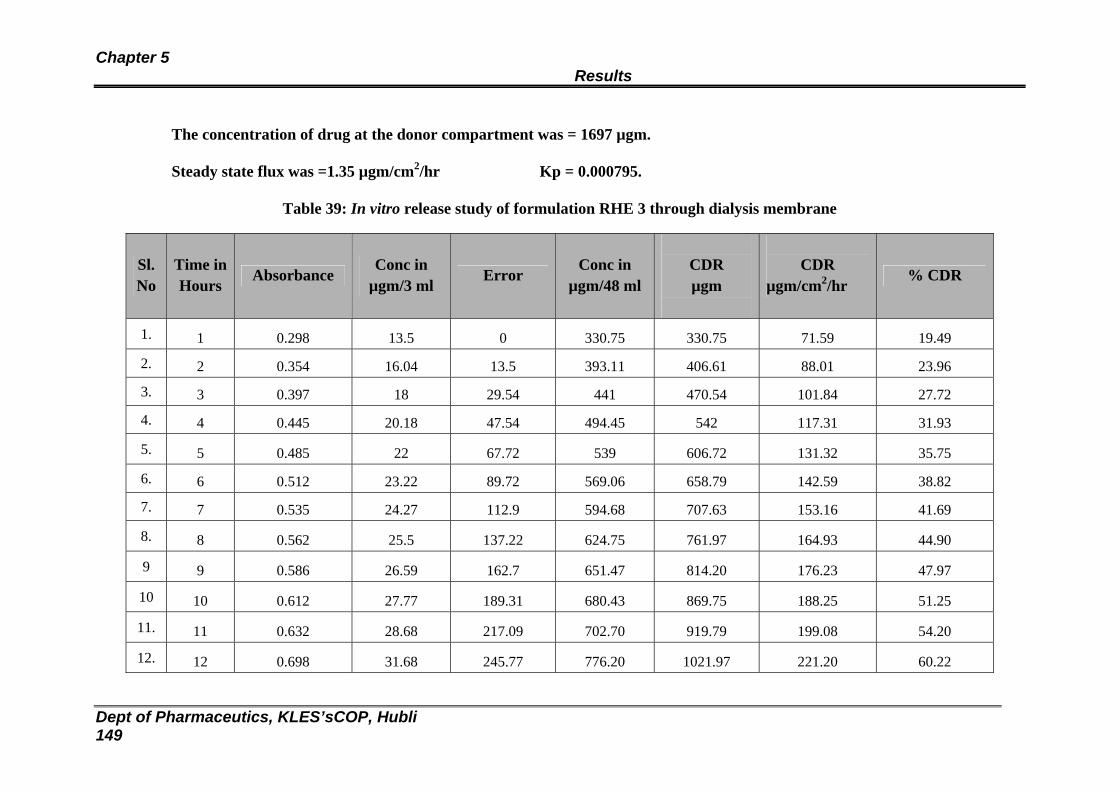
Chapter 5 Results
Dept of Pharmaceutics, KLES’sCOP, Hubli 149
The concentration of drug at the donor compartment was = 1697 µgm.
Steady state flux was =1.35 µgm/cm2/hr Kp = 0.000795.
Table 39: In vitro release study of formulation RHE 3 through dialysis membrane
Sl. No
Time inHours Absorbance
Conc in µgm/3 ml Error
Conc in µgm/48 ml
CDR µgm
CDR
µgm/cm2/hr % CDR
1. 1 0.298 13.5 0 330.75 330.75 71.59 19.49
2. 2 0.354 16.04 13.5 393.11 406.61 88.01 23.96
3. 3 0.397 18 29.54 441 470.54 101.84 27.72
4. 4 0.445 20.18 47.54 494.45 542 117.31 31.93
5. 5 0.485 22 67.72 539 606.72 131.32 35.75
6. 6 0.512 23.22 89.72 569.06 658.79 142.59 38.82
7. 7 0.535 24.27 112.9 594.68 707.63 153.16 41.69
8. 8 0.562 25.5 137.22 624.75 761.97 164.93 44.90
9 9 0.586 26.59 162.7 651.47 814.20 176.23 47.97
10 10 0.612 27.77 189.31 680.43 869.75 188.25 51.25
11. 11 0.632 28.68 217.09 702.70 919.79 199.08 54.20
12. 12 0.698 31.68 245.77 776.20 1021.97 221.20 60.22
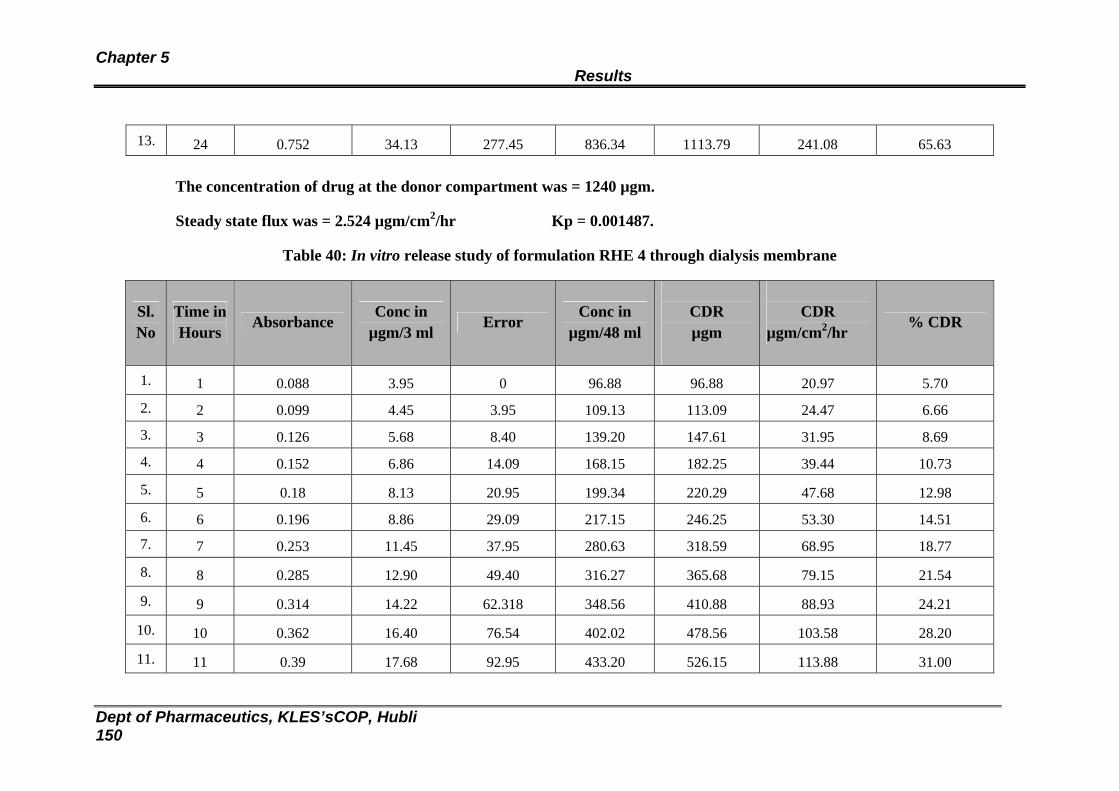
Chapter 5 Results
Dept of Pharmaceutics, KLES’sCOP, Hubli 150
13. 24 0.752 34.13 277.45 836.34 1113.79 241.08 65.63
The concentration of drug at the donor compartment was = 1240 µgm.
Steady state flux was = 2.524 µgm/cm2/hr Kp = 0.001487.
Table 40: In vitro release study of formulation RHE 4 through dialysis membrane
Sl. No
Time inHours Absorbance
Conc in µgm/3 ml Error
Conc in µgm/48 ml
CDR µgm
CDR
µgm/cm2/hr % CDR
1. 1 0.088 3.95 0 96.88 96.88 20.97 5.70
2. 2 0.099 4.45 3.95 109.13 113.09 24.47 6.66
3. 3 0.126 5.68 8.40 139.20 147.61 31.95 8.69
4. 4 0.152 6.86 14.09 168.15 182.25 39.44 10.73
5. 5 0.18 8.13 20.95 199.34 220.29 47.68 12.98
6. 6 0.196 8.86 29.09 217.15 246.25 53.30 14.51
7. 7 0.253 11.45 37.95 280.63 318.59 68.95 18.77
8. 8 0.285 12.90 49.40 316.27 365.68 79.15 21.54
9. 9 0.314 14.22 62.318 348.56 410.88 88.93 24.21
10. 10 0.362 16.40 76.54 402.02 478.56 103.58 28.20
11. 11 0.39 17.68 92.95 433.20 526.15 113.88 31.00
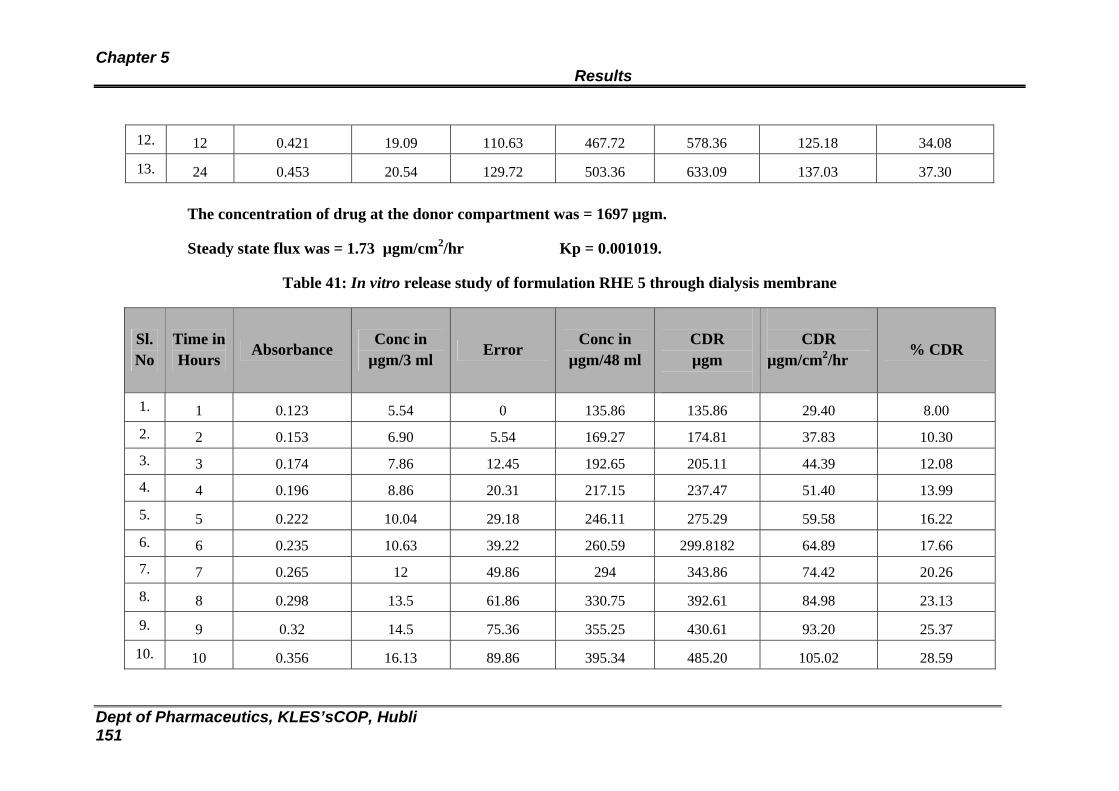
Chapter 5 Results
Dept of Pharmaceutics, KLES’sCOP, Hubli 151
12. 12 0.421 19.09 110.63 467.72 578.36 125.18 34.08
13. 24 0.453 20.54 129.72 503.36 633.09 137.03 37.30
The concentration of drug at the donor compartment was = 1697 µgm.
Steady state flux was = 1.73 µgm/cm2/hr Kp = 0.001019.
Table 41: In vitro release study of formulation RHE 5 through dialysis membrane
Sl. No
Time inHours Absorbance
Conc in µgm/3 ml Error
Conc in µgm/48 ml
CDR µgm
CDR
µgm/cm2/hr % CDR
1. 1 0.123 5.54 0 135.86 135.86 29.40 8.00 2. 2 0.153 6.90 5.54 169.27 174.81 37.83 10.30 3. 3 0.174 7.86 12.45 192.65 205.11 44.39 12.08 4. 4 0.196 8.86 20.31 217.15 237.47 51.40 13.99
5. 5 0.222 10.04 29.18 246.11 275.29 59.58 16.22 6. 6 0.235 10.63 39.22 260.59 299.8182 64.89 17.66 7. 7 0.265 12 49.86 294 343.86 74.42 20.26
8. 8 0.298 13.5 61.86 330.75 392.61 84.98 23.13
9. 9 0.32 14.5 75.36 355.25 430.61 93.20 25.37
10. 10 0.356 16.13 89.86 395.34 485.20 105.02 28.59
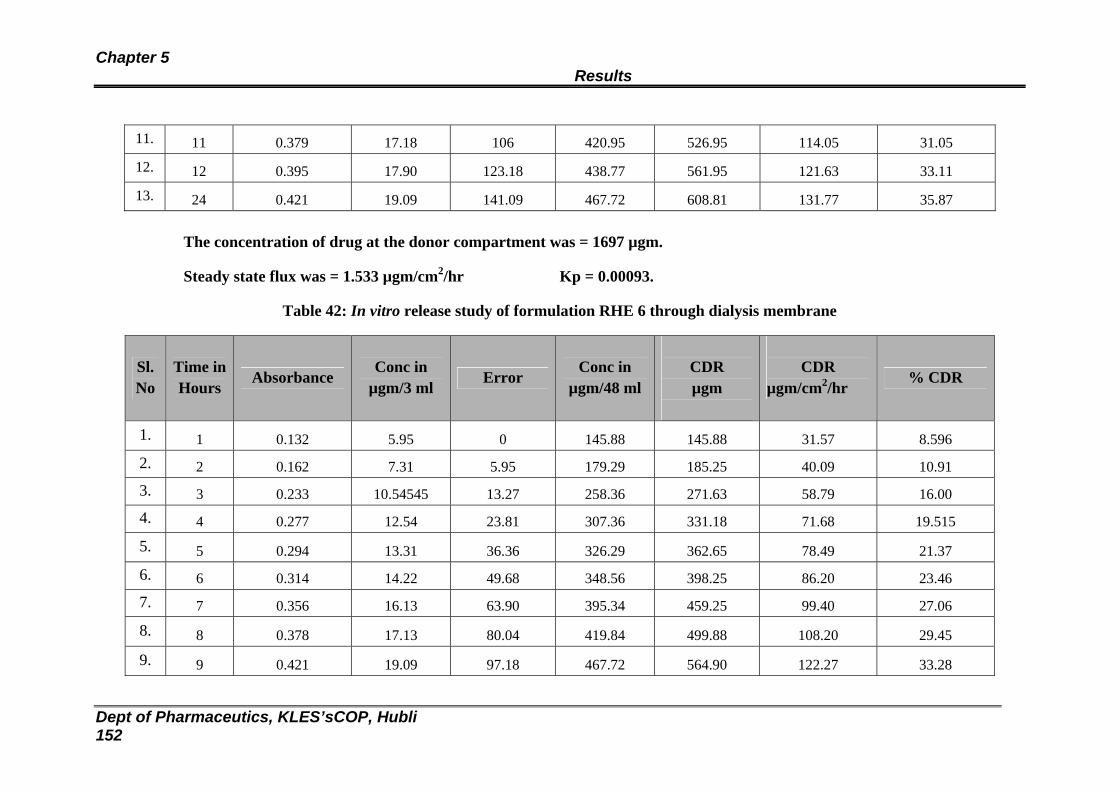
Chapter 5 Results
Dept of Pharmaceutics, KLES’sCOP, Hubli 152
11. 11 0.379 17.18 106 420.95 526.95 114.05 31.05
12. 12 0.395 17.90 123.18 438.77 561.95 121.63 33.11
13. 24 0.421 19.09 141.09 467.72 608.81 131.77 35.87
The concentration of drug at the donor compartment was = 1697 µgm.
Steady state flux was = 1.533 µgm/cm2/hr Kp = 0.00093.
Table 42: In vitro release study of formulation RHE 6 through dialysis membrane
Sl. No
Time inHours Absorbance
Conc in µgm/3 ml Error
Conc in µgm/48 ml
CDR µgm
CDR
µgm/cm2/hr % CDR
1. 1 0.132 5.95 0 145.88 145.88 31.57 8.596
2. 2 0.162 7.31 5.95 179.29 185.25 40.09 10.91
3. 3 0.233 10.54545 13.27 258.36 271.63 58.79 16.00
4. 4 0.277 12.54 23.81 307.36 331.18 71.68 19.515
5. 5 0.294 13.31 36.36 326.29 362.65 78.49 21.37
6. 6 0.314 14.22 49.68 348.56 398.25 86.20 23.46
7. 7 0.356 16.13 63.90 395.34 459.25 99.40 27.06
8. 8 0.378 17.13 80.04 419.84 499.88 108.20 29.45
9. 9 0.421 19.09 97.18 467.72 564.90 122.27 33.28
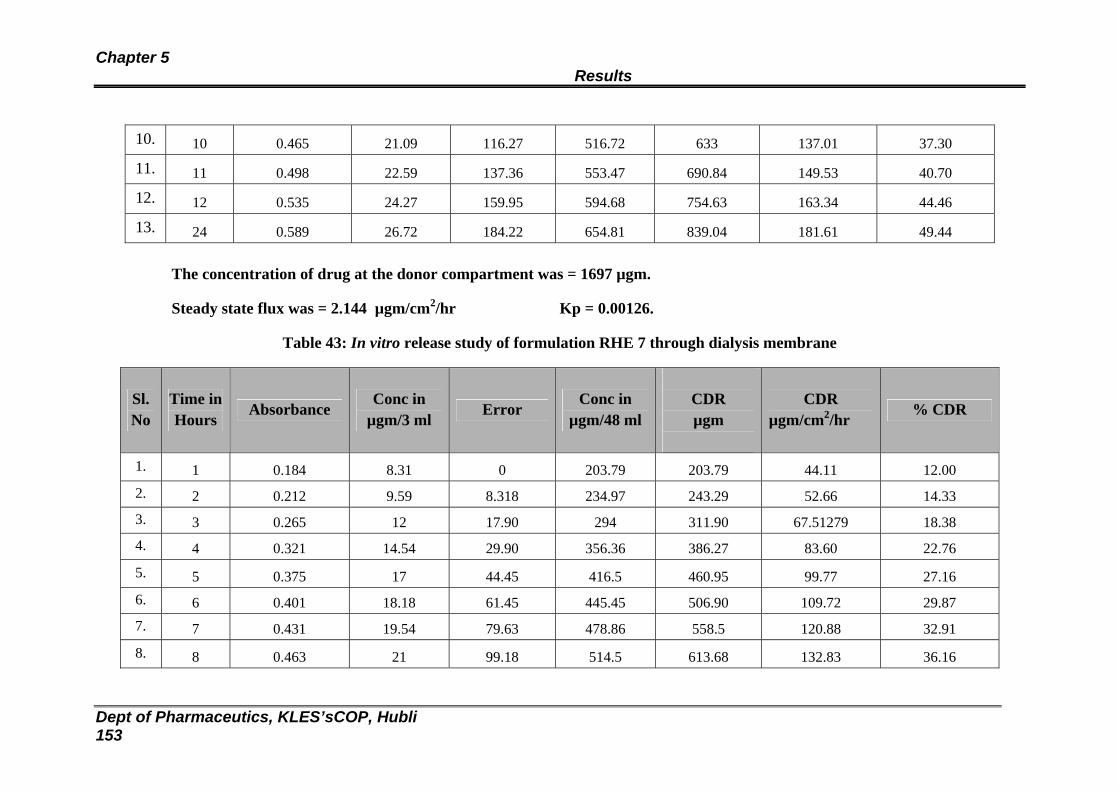
Chapter 5 Results
Dept of Pharmaceutics, KLES’sCOP, Hubli 153
10. 10 0.465 21.09 116.27 516.72 633 137.01 37.30
11. 11 0.498 22.59 137.36 553.47 690.84 149.53 40.70
12. 12 0.535 24.27 159.95 594.68 754.63 163.34 44.46
13. 24 0.589 26.72 184.22 654.81 839.04 181.61 49.44
The concentration of drug at the donor compartment was = 1697 µgm.
Steady state flux was = 2.144 µgm/cm2/hr Kp = 0.00126.
Table 43: In vitro release study of formulation RHE 7 through dialysis membrane
Sl. No
Time inHours
Absorbance Conc in
µgm/3 ml Error
Conc in µgm/48 ml
CDR µgm
CDR
µgm/cm2/hr % CDR
1. 1 0.184 8.31 0 203.79 203.79 44.11 12.00 2. 2 0.212 9.59 8.318 234.97 243.29 52.66 14.33 3. 3 0.265 12 17.90 294 311.90 67.51279 18.38 4. 4 0.321 14.54 29.90 356.36 386.27 83.60 22.76
5. 5 0.375 17 44.45 416.5 460.95 99.77 27.16 6. 6 0.401 18.18 61.45 445.45 506.90 109.72 29.87 7. 7 0.431 19.54 79.63 478.86 558.5 120.88 32.91
8. 8 0.463 21 99.18 514.5 613.68 132.83 36.16
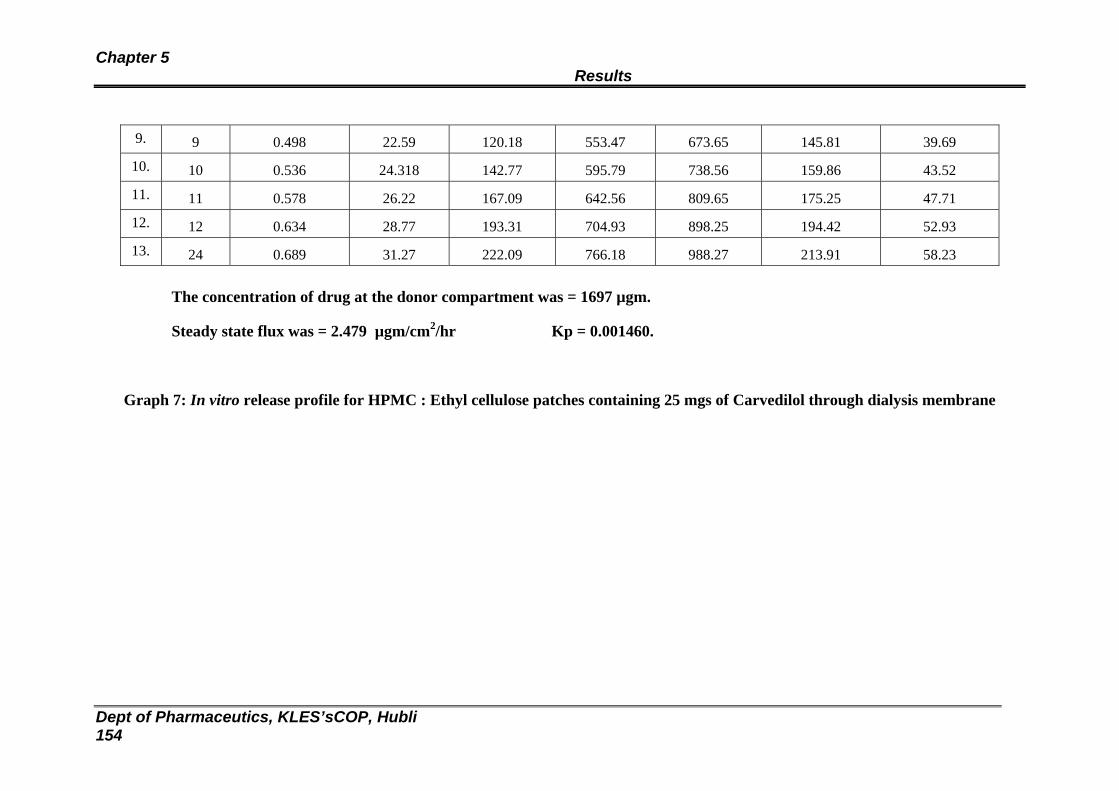
Chapter 5 Results
Dept of Pharmaceutics, KLES’sCOP, Hubli 154
9. 9 0.498 22.59 120.18 553.47 673.65 145.81 39.69
10. 10 0.536 24.318 142.77 595.79 738.56 159.86 43.52
11. 11 0.578 26.22 167.09 642.56 809.65 175.25 47.71
12. 12 0.634 28.77 193.31 704.93 898.25 194.42 52.93
13. 24 0.689 31.27 222.09 766.18 988.27 213.91 58.23
The concentration of drug at the donor compartment was = 1697 µgm.
Steady state flux was = 2.479 µgm/cm2/hr Kp = 0.001460.
Graph 7: In vitro release profile for HPMC : Ethyl cellulose patches containing 25 mgs of Carvedilol through dialysis membrane

Chapter 5 Results
Dept of Pharmaceutics, KLES’sCOP, Hubli 155
Table 44: In vitro release study of formulation optimized with Eudragit RS : RL 100 (RSL 2) through
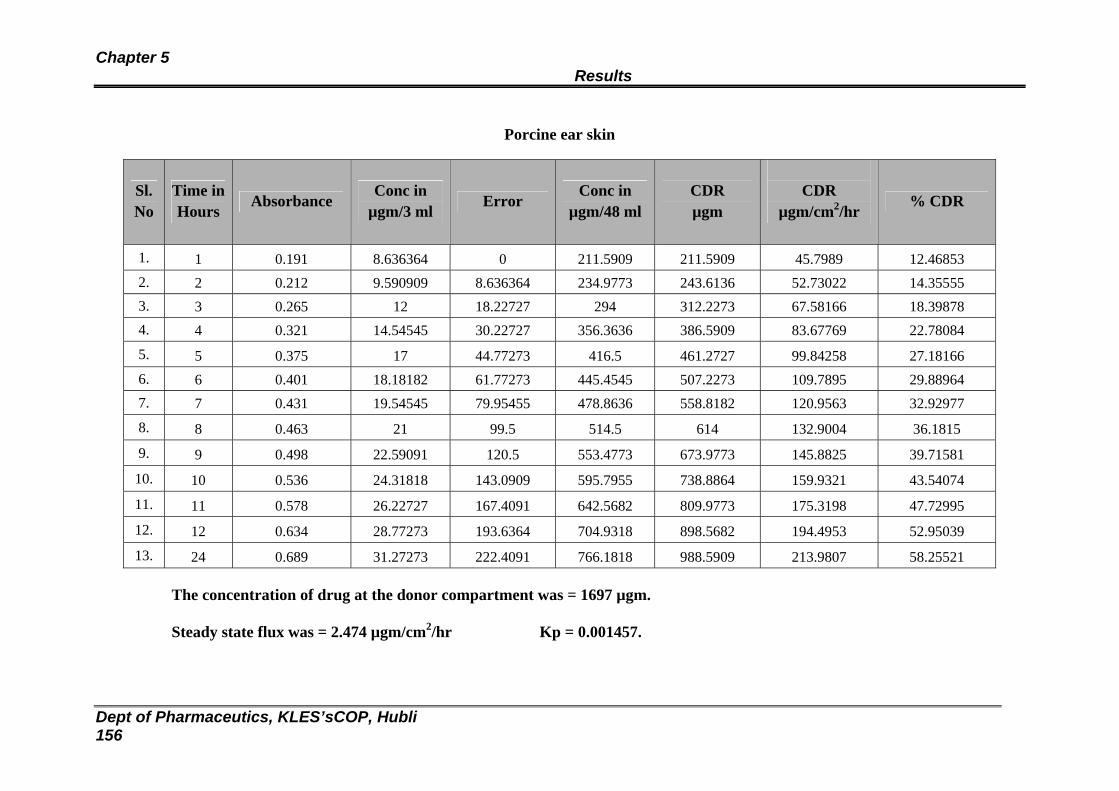
Chapter 5 Results
Dept of Pharmaceutics, KLES’sCOP, Hubli 156
Porcine ear skin
Sl. No
Time inHours Absorbance
Conc in µgm/3 ml Error
Conc in µgm/48 ml
CDR µgm
CDR
µgm/cm2/hr % CDR
1. 1 0.191 8.636364 0 211.5909 211.5909 45.7989 12.46853 2. 2 0.212 9.590909 8.636364 234.9773 243.6136 52.73022 14.35555 3. 3 0.265 12 18.22727 294 312.2273 67.58166 18.39878 4. 4 0.321 14.54545 30.22727 356.3636 386.5909 83.67769 22.78084
5. 5 0.375 17 44.77273 416.5 461.2727 99.84258 27.18166 6. 6 0.401 18.18182 61.77273 445.4545 507.2273 109.7895 29.88964 7. 7 0.431 19.54545 79.95455 478.8636 558.8182 120.9563 32.92977
8. 8 0.463 21 99.5 514.5 614 132.9004 36.1815
9. 9 0.498 22.59091 120.5 553.4773 673.9773 145.8825 39.71581
10. 10 0.536 24.31818 143.0909 595.7955 738.8864 159.9321 43.54074
11. 11 0.578 26.22727 167.4091 642.5682 809.9773 175.3198 47.72995
12. 12 0.634 28.77273 193.6364 704.9318 898.5682 194.4953 52.95039
13. 24 0.689 31.27273 222.4091 766.1818 988.5909 213.9807 58.25521
The concentration of drug at the donor compartment was = 1697 µgm.
Steady state flux was = 2.474 µgm/cm2/hr Kp = 0.001457.
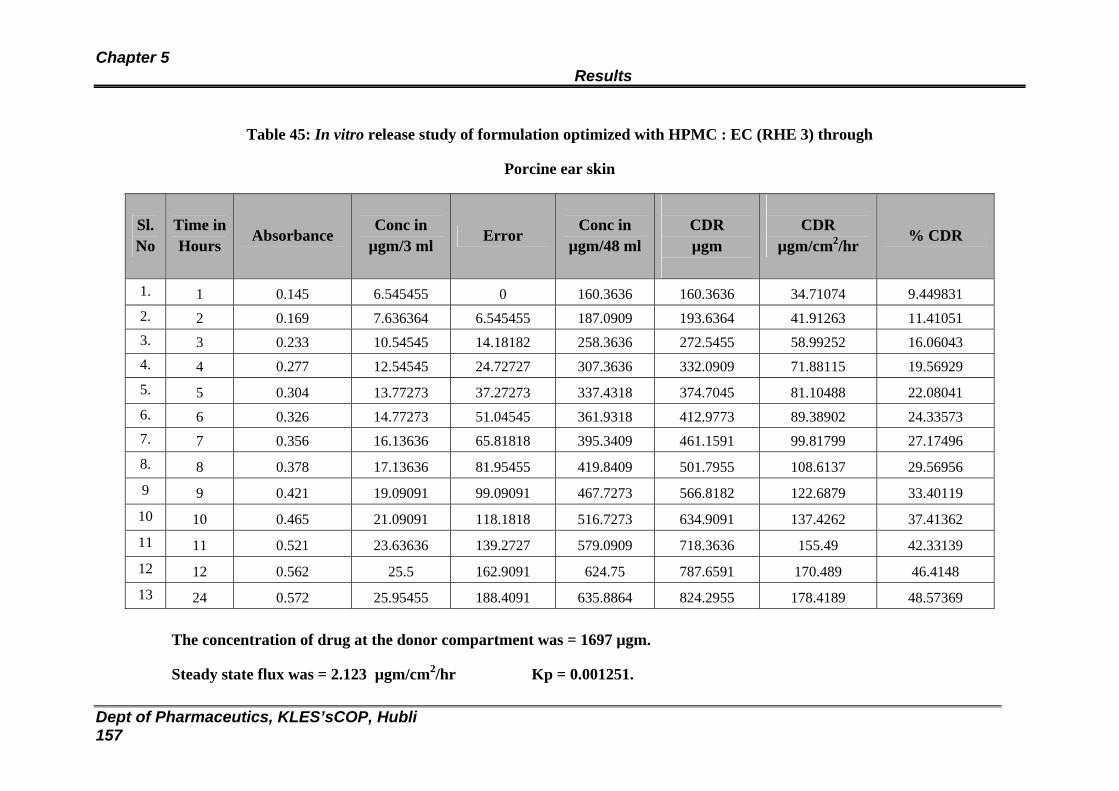
Chapter 5 Results
Dept of Pharmaceutics, KLES’sCOP, Hubli 157
Table 45: In vitro release study of formulation optimized with HPMC : EC (RHE 3) through
Porcine ear skin
Sl. No
Time inHours Absorbance
Conc in µgm/3 ml Error
Conc in µgm/48 ml
CDR µgm
CDR
µgm/cm2/hr % CDR
1. 1 0.145 6.545455 0 160.3636 160.3636 34.71074 9.449831 2. 2 0.169 7.636364 6.545455 187.0909 193.6364 41.91263 11.41051 3. 3 0.233 10.54545 14.18182 258.3636 272.5455 58.99252 16.06043 4. 4 0.277 12.54545 24.72727 307.3636 332.0909 71.88115 19.56929 5. 5 0.304 13.77273 37.27273 337.4318 374.7045 81.10488 22.08041 6. 6 0.326 14.77273 51.04545 361.9318 412.9773 89.38902 24.33573 7. 7 0.356 16.13636 65.81818 395.3409 461.1591 99.81799 27.17496 8. 8 0.378 17.13636 81.95455 419.8409 501.7955 108.6137 29.56956 9 9 0.421 19.09091 99.09091 467.7273 566.8182 122.6879 33.40119
10 10 0.465 21.09091 118.1818 516.7273 634.9091 137.4262 37.41362 11 11 0.521 23.63636 139.2727 579.0909 718.3636 155.49 42.33139 12 12 0.562 25.5 162.9091 624.75 787.6591 170.489 46.4148 13 24 0.572 25.95455 188.4091 635.8864 824.2955 178.4189 48.57369
The concentration of drug at the donor compartment was = 1697 µgm.
Steady state flux was = 2.123 µgm/cm2/hr Kp = 0.001251.
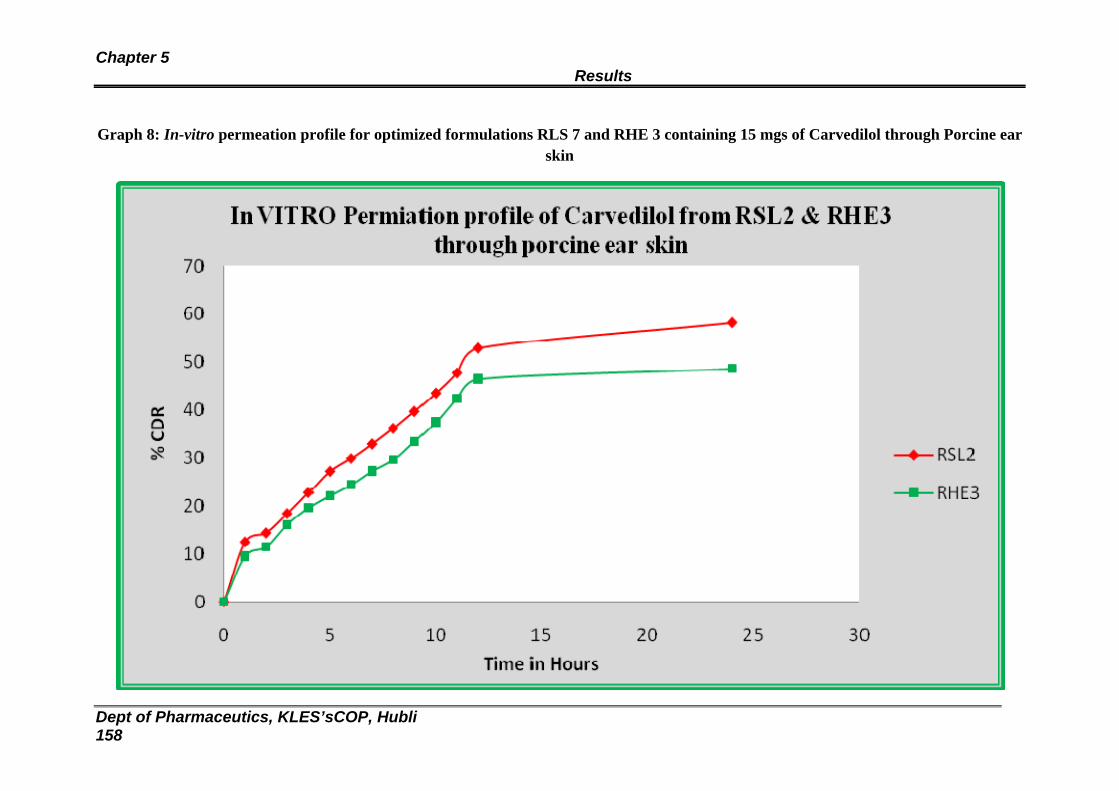
Chapter 5 Results
Dept of Pharmaceutics, KLES’sCOP, Hubli 158
Graph 8: In-vitro permeation profile for optimized formulations RLS 7 and RHE 3 containing 15 mgs of Carvedilol through Porcine ear skin
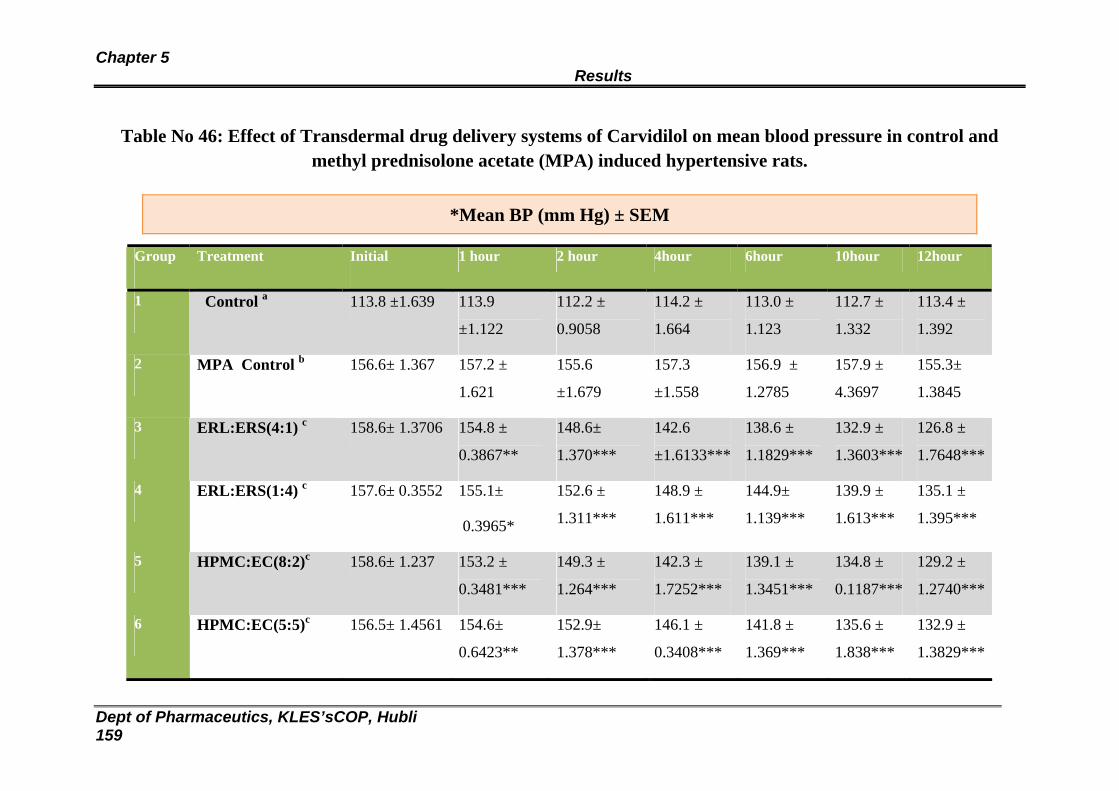
Chapter 5 Results
Dept of Pharmaceutics, KLES’sCOP, Hubli 159
Table No 46: Effect of Transdermal drug delivery systems of Carvidilol on mean blood pressure in control and methyl prednisolone acetate (MPA) induced hypertensive rats.
Group Treatment Initial 1 hour 2 hour 4hour 6hour 10hour 12hour
1 Control a 113.8 ±1.639 113.9
±1.122
112.2 ±
0.9058
114.2 ±
1.664
113.0 ±
1.123
112.7 ±
1.332
113.4 ±
1.392
2 MPA Control b 156.6± 1.367 157.2 ±
1.621
155.6
±1.679
157.3
±1.558
156.9 ±
1.2785
157.9 ±
4.3697
155.3±
1.3845
3 ERL:ERS(4:1) c 158.6± 1.3706 154.8 ±
0.3867**
148.6±
1.370***
142.6
±1.6133***
138.6 ±
1.1829***
132.9 ±
1.3603***
126.8 ±
1.7648***
4 ERL:ERS(1:4) c 157.6± 0.3552 155.1±
0.3965*
152.6 ±
1.311***
148.9 ±
1.611***
144.9±
1.139***
139.9 ±
1.613***
135.1 ±
1.395***
5 HPMC:EC(8:2)c 158.6± 1.237 153.2 ±
0.3481***
149.3 ±
1.264***
142.3 ±
1.7252***
139.1 ±
1.3451***
134.8 ±
0.1187***
129.2 ±
1.2740***
6 HPMC:EC(5:5)c 156.5± 1.4561 154.6±
0.6423**
152.9±
1.378***
146.1 ±
0.3408***
141.8 ±
1.369***
135.6 ±
1.838***
132.9 ±
1.3829***
*Mean BP (mm Hg) ± SEM
Chapter 5 Results
Dept of Pharmaceutics, KLES’sCOP, Hubli 160
aControl Group: Received no treatment.
bToxic Control Group: Received Methyl prednisolone acetate s.c. 20mg/Kg/week for two weeks.
cTreatment Groups: Received Methylprednisolone acetate s.c. 20mg/Kg/week for two weeks followed by
Carvidilol(Drug) loaded Transdermal Patches.
*Significant compared with MPA control (P < 0.05).
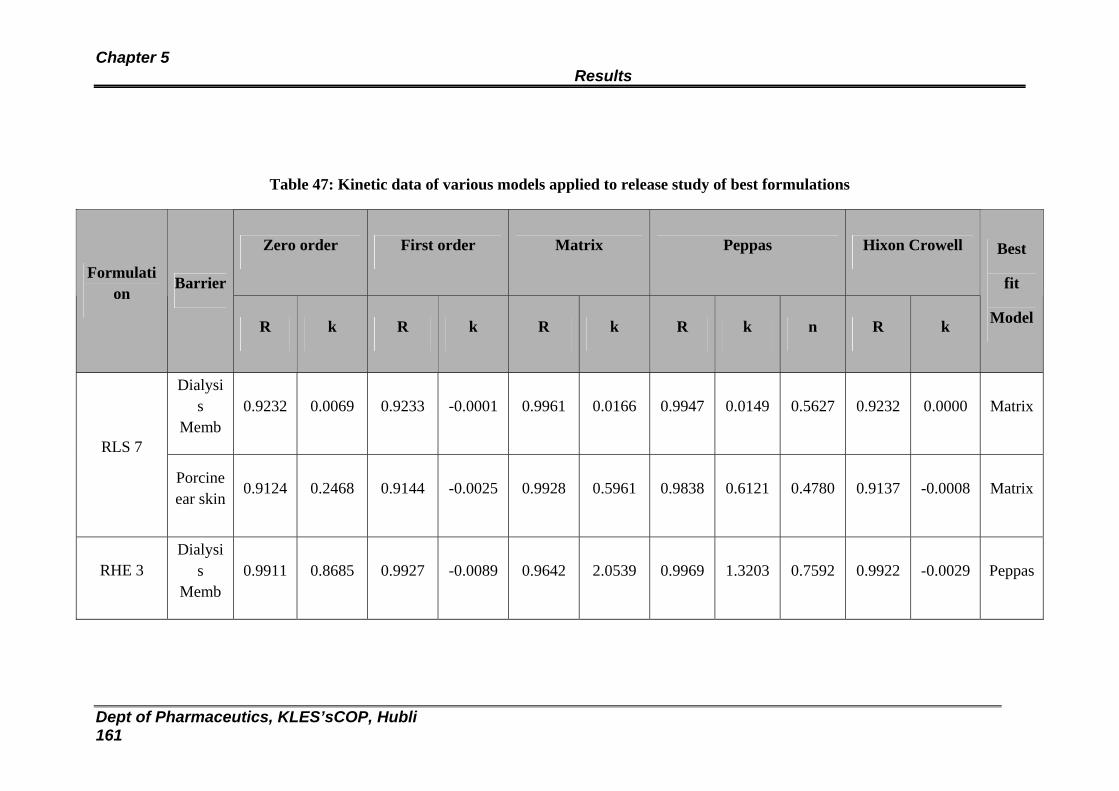
Chapter 5 Results
Dept of Pharmaceutics, KLES’sCOP, Hubli 161
Table 47: Kinetic data of various models applied to release study of best formulations
Zero order First order Matrix Peppas Hixon Crowell
Formulation
Barrier
R k R k R k R k n R k
Best
fit
Model
Dialysis
Memb 0.9232 0.0069 0.9233 -0.0001 0.9961 0.0166 0.9947 0.0149 0.5627 0.9232 0.0000 Matrix
RLS 7
Porcine ear skin
0.9124 0.2468 0.9144 -0.0025 0.9928 0.5961 0.9838 0.6121 0.4780 0.9137 -0.0008 Matrix
RHE 3 Dialysi
s Memb
0.9911 0.8685 0.9927 -0.0089 0.9642 2.0539 0.9969 1.3203 0.7592 0.9922 -0.0029 Peppas
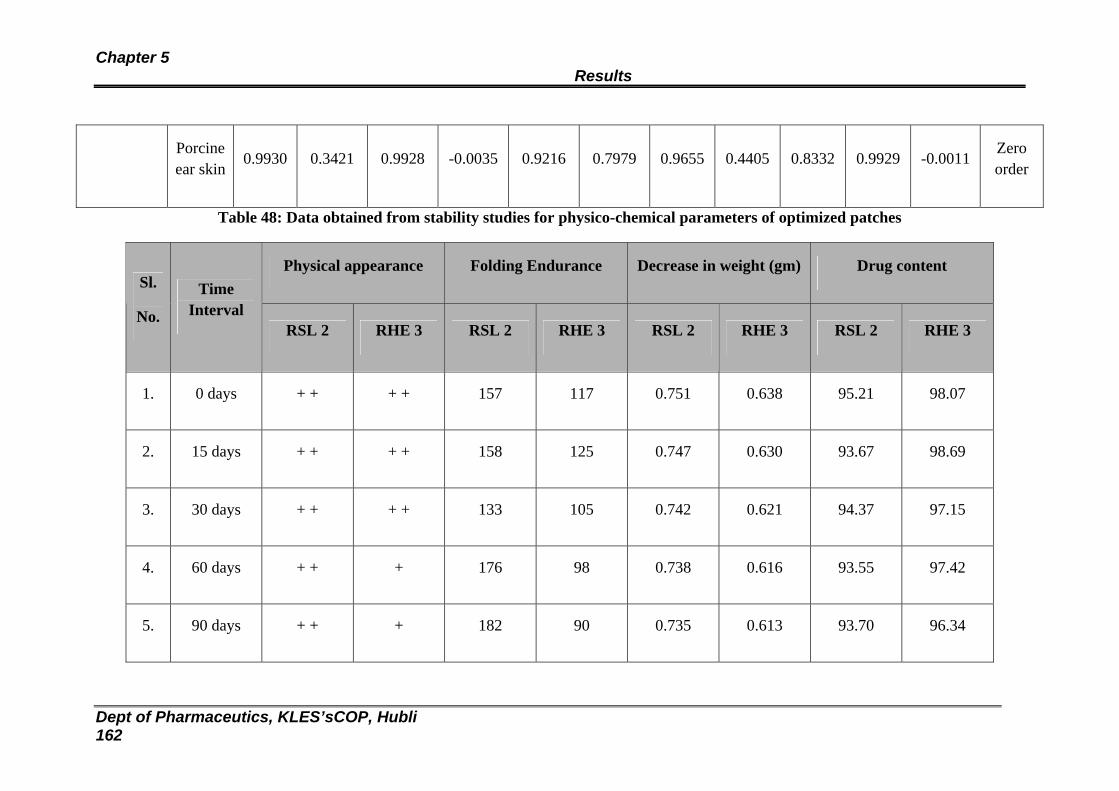
Chapter 5 Results
Dept of Pharmaceutics, KLES’sCOP, Hubli 162
Porcine ear skin
0.9930 0.3421 0.9928 -0.0035 0.9216 0.7979 0.9655 0.4405 0.8332 0.9929 -0.0011 Zero order
Table 48: Data obtained from stability studies for physico-chemical parameters of optimized patches
Physical appearance Folding Endurance Decrease in weight (gm) Drug content Sl.
No.
Time Interval
RSL 2 RHE 3 RSL 2 RHE 3 RSL 2 RHE 3 RSL 2 RHE 3
1. 0 days + + + + 157 117 0.751 0.638 95.21 98.07
2. 15 days + + + + 158 125 0.747 0.630 93.67 98.69
3. 30 days + + + + 133 105 0.742 0.621 94.37 97.15
4. 60 days + + + 176 98 0.738 0.616 93.55 97.42
5. 90 days + + + 182 90 0.735 0.613 93.70 96.34

Chapter 5 Results
Dept of Pharmaceutics, KLES’sCOP, Hubli 163
+ + — No change in physical appearance
+ — Slight change in physical appearance.
STABILITY STUDIES » Spectra 17: IR spectra of formulation RSL 2 at 400C ± 20C / 75% RH ± 5% RH
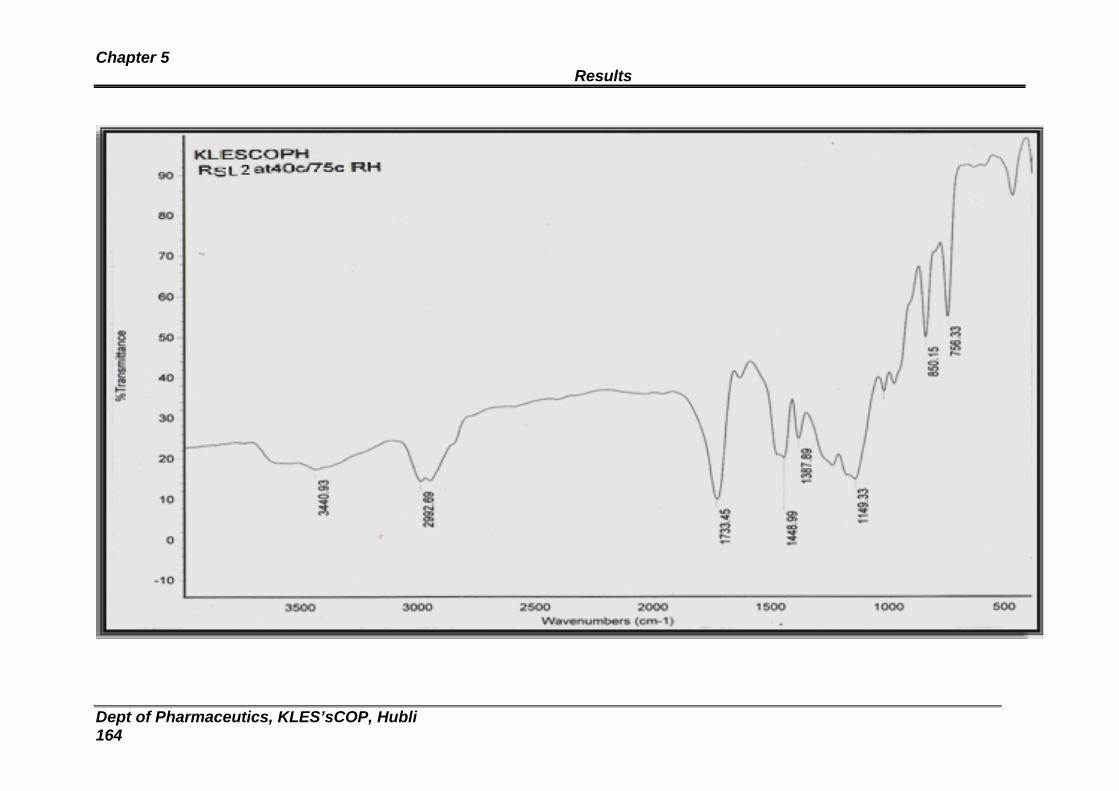
Chapter 5 Results
Dept of Pharmaceutics, KLES’sCOP, Hubli 164
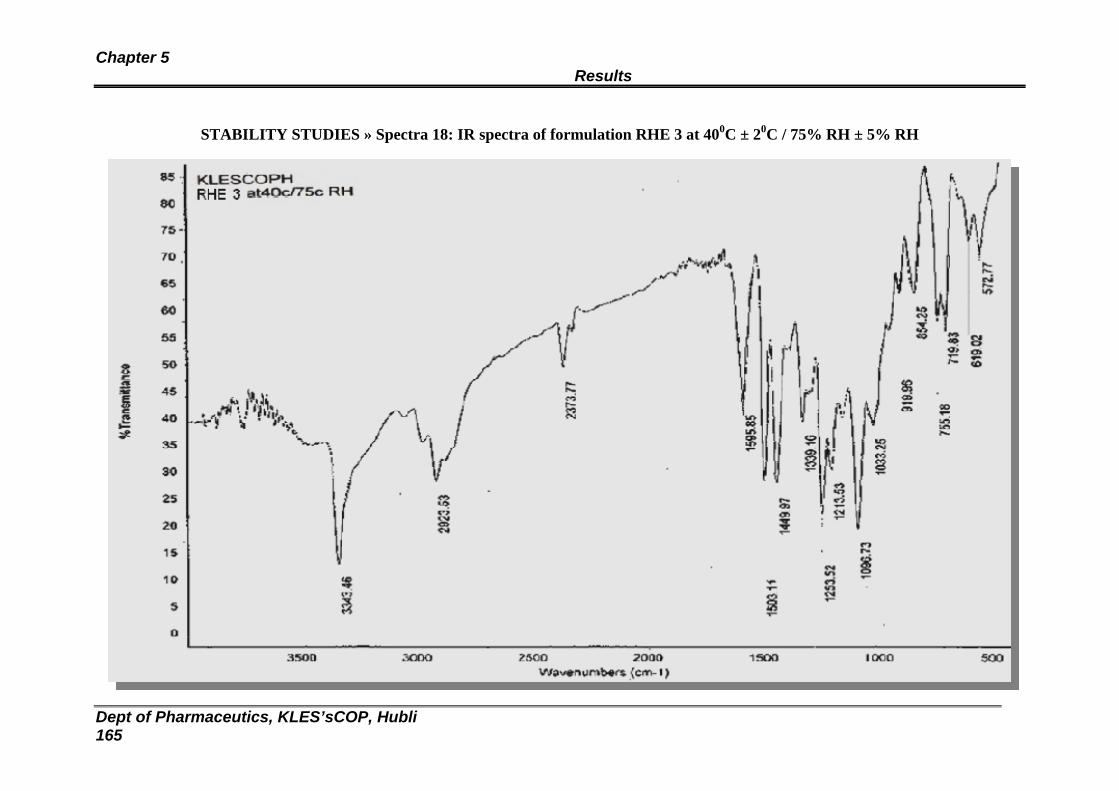
Chapter 5 Results
Dept of Pharmaceutics, KLES’sCOP, Hubli 165
STABILITY STUDIES » Spectra 18: IR spectra of formulation RHE 3 at 400C ± 20C / 75% RH ± 5% RH
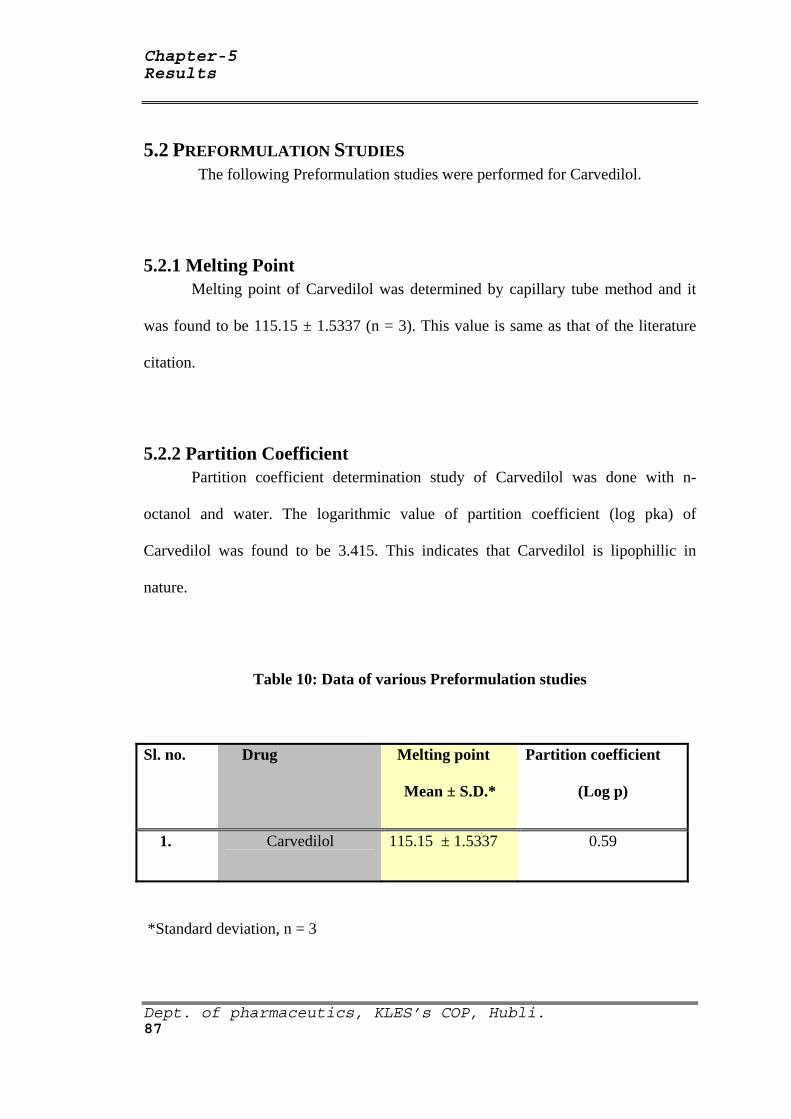
Chapter-5 Results
Dept. of pharmaceutics, KLES’s COP, Hubli. 87
5.2 PREFORMULATION STUDIES The following Preformulation studies were performed for Carvedilol.
5.2.1 Melting Point Melting point of Carvedilol was determined by capillary tube method and it
was found to be 115.15 ± 1.5337 (n = 3). This value is same as that of the literature
citation.
5.2.2 Partition Coefficient Partition coefficient determination study of Carvedilol was done with n-
octanol and water. The logarithmic value of partition coefficient (log pka) of
Carvedilol was found to be 3.415. This indicates that Carvedilol is lipophillic in
nature.
Table 10: Data of various Preformulation studies
Sl. no. Drug Melting point
Mean ± S.D.*
Partition coefficient
(Log p)
1. Carvedilol 115.15 ± 1.5337 0.59
*Standard deviation, n = 3
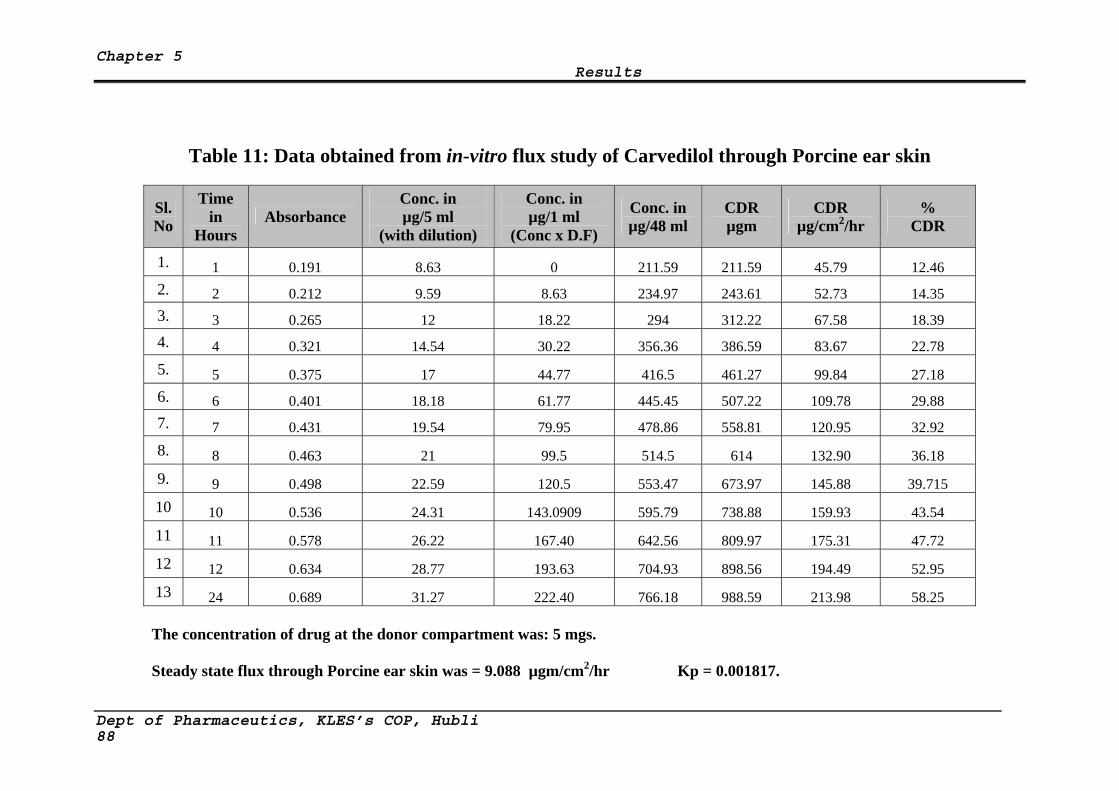
Chapter 5 Results
Table 11: Data obtained from in-vitro flux study of Carvedilol through Porcine ear skin
Sl. No
Time in
Hours Absorbance
Conc. in µg/5 ml
(with dilution)
Conc. in µg/1 ml
(Conc x D.F)
Conc. in µg/48 ml
CDR µgm
CDR µg/cm2/hr
% CDR
1. 1 0.191 8.63 0 211.59 211.59 45.79 12.46 2. 2 0.212 9.59 8.63 234.97 243.61 52.73 14.35 3. 3 0.265 12 18.22 294 312.22 67.58 18.39 4. 4 0.321 14.54 30.22 356.36 386.59 83.67 22.78 5. 5 0.375 17 44.77 416.5 461.27 99.84 27.18 6. 6 0.401 18.18 61.77 445.45 507.22 109.78 29.88 7. 7 0.431 19.54 79.95 478.86 558.81 120.95 32.92 8. 8 0.463 21 99.5 514.5 614 132.90 36.18 9. 9 0.498 22.59 120.5 553.47 673.97 145.88 39.715 10 10 0.536 24.31 143.0909 595.79 738.88 159.93 43.54 11 11 0.578 26.22 167.40 642.56 809.97 175.31 47.72 12 12 0.634 28.77 193.63 704.93 898.56 194.49 52.95 13 24 0.689 31.27 222.40 766.18 988.59 213.98 58.25
The concentration of drug at the donor compartment was: 5 mgs.
Steady state flux through Porcine ear skin was = 9.088 µgm/cm2/hr Kp = 0.001817.
Dept of Pharmaceutics, KLES’s COP, Hubli 88
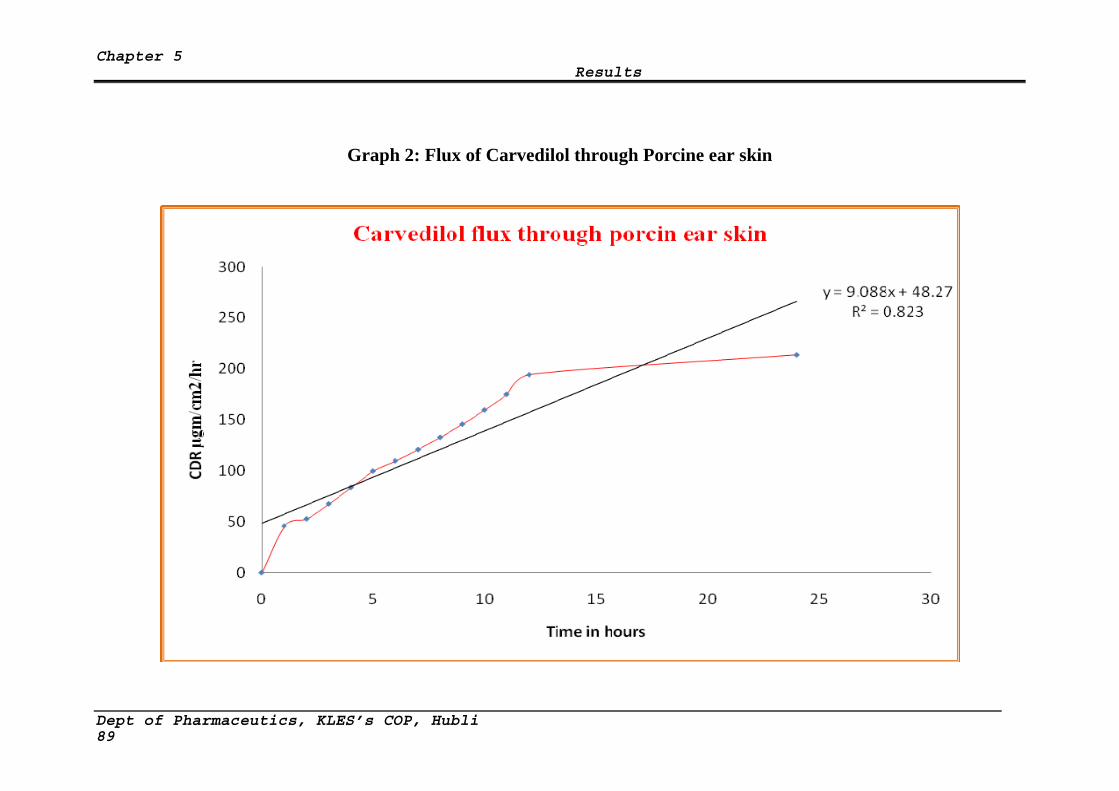
Chapter 5 Results
Graph 2: Flux of Carvedilol through Porcine ear skin
Dept of Pharmaceutics, KLES’s COP, Hubli 89
Chapter 7 Conclusion
7.0 CONCLUSION
From the above experimental results it can be reasonably concluded that:
The formulated TDD patches of both Eudragit and HPMC-Ethyl cellulose series showed
good physical properties.
18% w/w of TEC and 25% w/w of DBP were suitable plasticizers for Eudragit and
HPMC:EC combinations respectively.
All the optimized patches formulated were stable at room temperature.
FTIR and DSC studies indicated compatibility between the drug and the excipients employed
in the fabrication of TDDS, which was further confirmed by accelerated stability studies as
per ICH guidelines.
SEM micrographs (HPMC:EC, RHE 3) revealed the rough & porous surface nature of the
patches.
Formulated patches did not show any skin irritation reaction as compared to standard.
In Eudragit series, RLS 2 showed highest release (79.70 %) and in case of HPMC:EC series a
maximum of 65.63 % release was obtained for RHE 3 during in vitro drug permeation
studies through dialysis membrane.
The release of Carvedilol appears to be dependent on lipophilicity of the matrix. Moderately
lipophilic matrices showed best release. The predominant release mechanism of drug through
the fabricated matrices was believed to be by diffusion mechanism.
The in vitro release study between dialysis membrane and porcine skin could not be
correlated because of difference in release behaviour.
Dept. of pharmaceutics, KLES’s COP, Hubli
The in vivo release study the groups 3 (RSL 2), and 5 (RHE 3) were showed significant fall
in BP compared to groups 4(RSL 8) and 6(RHE 7).
170

Chapter 8 Summary
8.0 SUMMARY
Introduction
Transdermal drug delivery systems (TDDS) are adhesive drug containing devices of
defined surface area that delivers predetermined amount of drug to the intact skin at a
preprogrammed rate. The transdermal delivery has gained importance in recent years. The
transdermal drug delivery system has potential advantages of avoiding hepatic first pass
metabolism, maintaining constant blood levels for longer period of time resulting in a
reduction of dosing frequency, improved bioavailability, decreased gastrointestinal irritation
that occur due to local contact with gastric mucosa, and improved patient compliance. Some
of the anti hypertensive drugs already have been formulated and evaluated as transdermal
patches but most of them still been unexplored. Transdermal formulation of anti
hypertensive drug is promising aspect in near future. A few anti hypertensive drugs like
pinacidil, timolol, bupranolol, propranolol, verapamil, nifedipine, metoprolol have been
incorporated in transdermal dosage form and been evaluated.
Objectives
In the present study transdermal films of the carvedilol were prepared using
polymers like Eudragit RS100, Eudragit RL100, hydroxypropylmethyl cellulose and Ethyl
cellulose in different ratios. These transdermal films will be characterized for their
physicochemical properties including drug release.
Industrial Pharmacy, B.P.C., Davangere
171

Chapter 8 Summary
Review of Literature
The chapter ‘Literature Review’ contained the general concepts of transdermal drug
delivery and its applications. Advantages and limitations of drug delivery through
transdermal route were listed. Description of the physiology of skin for drug delivery was
explained. Factors affecting transdermal drug delivery system and possible routes for drug
transport across the skin layer were discussed. Basic components and modern approaches of
transdermal drug delivery systems were described.
Methodology
At the outset, method for estimation of the drug was developed. Carvedilol showed
maximum absorption at wavelength 242 nm in 30% v/v Methanolic isotonic phosphate
buffer (MIPB) pH 7.4. Standard calibration curve obeyed Beer’s law at given concentration
range of 2µg/ml to 20 µg/ml which one subjected to regression analysis.
The value of regression coefficient was found to be 0.998, which showed linear
relationship between concentration and absorbance. The FT-IR peak of carvedilol displayed
some parent peaks at 400 to 4000 cm-1nm. The physical mixture of drug with selected
polymers gave peak which corresponded to the parent peaks of the pure drug which
confirmed the compatibility between drug and selected polymers.
Industrial Pharmacy, B.P.C., Davangere
The various formulations of films were developed for carvedilol, dose in given area
of 64 cm2 was 25 mg using various bioadhesive and film forming polymers like Eudragit
RS100, Eudragit RL100, hydroxypropylmethyl cellulose and Ethyl cellulose in different
172
Chapter 8 Summary
ratios by solvent casting method with the incorporation of Tri ethyl citrate and Dibutyl
phthalate as plasticizer.
Physicochemical parameters such as Physical appearance, folding endurance, weight
uniformity, thickness uniformity, Drug content, tensile strength determination, Percentage
moisture uptake, Percentage moisture content, and Water vapour transmission studies were
carried out. In order to know the pattern of release of carvedilol from patches, in vitro
release and skin permeation studies were carried out with dissolution apparatus and
diffusion cell using 30% v/v Methanolic isotonic phosphate buffer (MIPB) pH 7.4 as
receptor medium,
In the present study a total of 14 formulations were formulated and subjected to various
in-vitro evaluation parameters such as Tensile strength, % elongation, % moisture
transmission, % moisture uptake and Drug content, skin irritation test, SEM analysis, XRD
studies, accelerated stability studies as per ICH guidelines, drug-polymer interaction by
FTIR and DSC studies,
In-vitro release study was performed using Keshary-Chein diffusion cell with Himedia
dialysis membrane and porcine ear skin as barriers.
In-vivo method for measurement of systolic BP in Rats.
Short-term stability studies were conducted.
Results and Discussion
Industrial Pharmacy, B.P.C., Davangere
The results and discussion obtained from different methods of this thesis were described
under different tables and graphs. From the results of the drug content determination, it was
173
Chapter 8 Summary
inferred that there was proper distribution of drug in the films and the deviations were
within the acceptable limits. Films exhibited higher tensile strength as the concentration of
HPMC was increased. The prepared film exhibited satisfactory physical characteristics such
as weight uniformity, thickness uniformity, and folding endurance. Results revealed that
prepared patches showed good physical characteristics, no drug-polymer interaction and no
skin irritation as compared to standard.
X-Ray Diffraction studies indicated that Carvedilol was not crystalline in both Eudragit
and HPMC:Ethyl Cellulose polymer matrix.
The in-vitro release study through dialysis membrane revealed that formulations RHE 4
and RLS 1 showed maximum release.
The release kinetics of formulations RHE 4 and RLS 1 shows a good correlation value
of zero order model.
In the In-vivo studies, In Eudragit combinations the RLS 1 formulation was most
effective in the reduction of systolic BP (157.8 ± 0.6145 mm Hg to 129.3 ± 0.7398 mm
Hg). In case of HPMC:EC combinations the RHE 4 formulation was most effective in
the reduction of systolic BP (157.8 ± 0.6145 mm Hg to 127.9 ± 0.9940mm Hg).
Formulations RLS 1 and RHE 4 were subjected for accelerated stability studies. Both
formulations were found to be stable as there was no drastic change in the physico-
chemical properties of the patches, which was also confirmed by FTIR.
Industrial Pharmacy, B.P.C., Davangere
Thus conclusion can be made that stable transdermal patches of Carvedilol has
been developed.
174
Chapter 8 Summary
Future prospects:
In-vitro skin permeation study using porcine ear or human cadaver skin containing a
suitable penetration enhancer.
Preclinical and clinical studies of the developed formulation can be carried out.
Pharmacokinetic evaluation studies of the developed formulations can be carried out.
Conclusion
From the results obtained and discussion generated there from, encouraged
conclusions were drawn and written in chapter. On the basis of the in vitro characterization
it was concluded that carvedilol could be administered transdermally through matrix type
TDDS developed in our laboratory. Transdermal patches consisting of the rate-controlling
polymer Eudragit RS100, Eudragit RL100 and polymer HPMC, EC demonstrated sustained
and controlled release of the drug across rat abdominal skin during in vitro permeation and
in vivo studies. The drug remained intact and stable in the TDDS during storage, with no
significant chemical interaction between the drug and the excipient. Further work is to
establish the therapeutic utility of this system by pharmacokinetics and pharmacodynamic
studies on human beings.
Industrial Pharmacy, B.P.C., Davangere
175
Chapter 9 Bibliography
9.0 BIBLIOGRAPHY
1. Shashikant D. Barhate, Dr. M. M. Patel, Ankit S.Sharma, Prashant Nerkar and Gaurav
Shankhpal. Formulation and evaluation of transdermal drug delivery system of
Carvedilol. Journal of Pharmacy Research 2009, 2(4),663-665.
2. Sara Nicoli, Paolo Colombo, and Patrizia Santi. Release and permeation kinetics of
Caffeine from bioadhesive transdermal films. The AAPS Journal 2005; 7 (1) Article
20:E218 - E223.
3. Ji-Hui Zhao, Ji-Hua Fu, Shu-Ming Wang, Chang-Hai Su, Ying Shan, Shu-Jia Kong,
Yuan Wang, Wan-Liang Lu, Hua Zhang, Shuang Zhang, Lin Li,En-Hong Zhang, Li
Wang, Qiu-Ling Pei, Jian-Cheng Wang, Xuan Zhang, Qiang Zhang. A novel
transdermal patch incorporating isosorbide dinitrate with bisoprolol: In vitro and
in vivo characterization. Int J Pharm 2007; 337: 88–101.
4. D. Thacharodi and K. Panduranga Rao. Development and in Vitro evaluation of
chitosan-based transdermal drug delivery systems for the controlled delivery of
propranolol hydrochloride. Biomaterials 1995; 16(2): 145 -148.
5. Amir Mehdizadeh, Tayebe Toliate, Mohammad Reza Rouini, Sharyar Abashzadeh,
Farid Dorkoosh. Design and in vitro evaluation of new drug-in-adhesive formulations
of Fentanyl transdermal patches. Aact Pharm 2004; 54: 301-317.
6. Adam S. Cantor and David J. Wirtanen. Novel Acrylate adhesives for transdermal
drug delivery. Pharmaceutical Technology Jan 2002; 28-38.
K.L.E.S s College of Pharmacy, Hubli. 176
Chapter 9 Bibliography
7. Victor W. Nitti, Steven Sanders, David R. Staskin, Roger R. Dmochowski, Peter K.
Sand, Scott MacDiarmid, and Howard I. Maibach. Transdermal delivery of drugs for
urologic applications: basic principles and applications. J urology 2006; 67(4): 657–
664.
8. Ikuhiro Kakubari, Norihiro Shinkai, Junji Kawakami, AkemUruno, Toshiyuki
Takayasuka, Hitoshi Yamauchi, Satoshi Takayama, and Kozo Takayama.
Formulation and Evaluation of Ethylene–Vinyl Acetate Copolymer Matrix Patches
Containing Formoterol Fumarate. Biol Pharm Bull 2006; 29(3): 513-516.
9. Hock S. Tan and William R. Pfister. Pressure-sensitive adhesives for transdermal drug
delivery systems. PSTT 1999; 2(2): 60 - 69.
10. Ulrich F. Schaefer, Steffi Hansen, Marc Schneider, Javiana Luengo Contreras, and
Claus-Michael Lehr. Chapter 1. Models for Skin Absorption and Skin Toxicity
Testing: 3 - 33. www.springerlink.com/locate/pdf.
11. B.W. Barry. Novel mechanisms and devices to enable successful transdermal drug
delivery. Euro J pharm Sc 2001; 14: 101-114.
12. Kenneth A. Walters and Michael S. Roberts. Chapter 1. The Structure and Function
of Skin. Marcel Dekker, Inc : 2002.
13. Jonathan Hadgraft. Skin deep, Review article. Euro J pharm and Bio pharm 2004;
(58): 291-299.
K.L.E.S s College of Pharmacy, Hubli. 177
Chapter 9 Bibliography
14. Yie W Chein. Eds. Yie W. Chein-Transdermal Drug Delivery Systems. 2n Edn.
Marcel Dekker, INC; 1992: 301
15. Udhumansha Ubaidulla, Molugu V.S. Reddy, Kumaresan Ruckmani, Farhan J.
Ahmad, and Roop K. Khar. Transdermal Therapeutic System of Carvedilol: Effect
of Hydrophilic and Hydrophobic Matrix on In Vitro and in vivo Characteristics.
AAPS PharmSciTech 2007; 8 (1) Article 2. (http://www.aapspharmscitech.org)
16. Robert Gale, James Hunt, Mary E. Prevo. Transdermal drug delivery, passive.
Encyclopedia of controlled drug delivery, Vol 2: 975-990. Edited by Edith
Mathiowitz; Wiley-Interscience publication: copyright 1999 by John Wiley & Sons,
Inc.
17. Michael S. Roberts, Sheree Elizabeth Cross and Mark A. Pellett. Chapter 4. Skin
Transport. Marcel Dekker, Inc : 2002.
18. Anna M Wokovich , Suneela Prodduturi, William H. Doub, Ajaz S Hussain,
Lucinda F Buhse .Transdermal drug delivery system (TDDS) adhesion as a critical
safety, efficacy and quality attribute. Euro J pharm and Bio pharm 2006; (64): 1-8.
19. Adrian C. Williams & Brian W. Barry. Penetration enhancers. Adv Drug Delivery
Reviews 2004; (56): 603-618.
20. Claudia Valenta & Barbara G. Auner. Review article, The use of polymers for dermal
and transdermal delivery. Euro J pharm and Bio pharm 2004; (58): 279-289.
K.L.E.S s College of Pharmacy, Hubli. 178
Chapter 9 Bibliography
21. Naseem Ahmad Charoo, Areeg Anwer Ali Shamsher, Kanchan Kohli, Krishna Pillai,
Ziyaur Rahman. Improvement in bioavailability of transdermally applied
flurbiprofen using tulsi (Ocimum sanctum) and turpentine oil. J colloids and
surfaces B:Biointerfaces 2008; (65): 300–307.
22. Libermann and Lachman - Pharmaceutical Dosage Forms. 2nd Edn. LEA &
FEBIGER; 1990: 265.
23. Lippincott’s Illustrated Reviews 4th edition Published by Wolters Kluwor(India)Pvt.
Ltd; NewDelhi. 215-226.
24. Tripathi KD. Essentials of medical pharmacology, 5thed. India: Jaypee Brothers
Medical Publishers Pvt. Ltd; 2002. 131.
25. Gilman AG. The pharmacological basis of therapeutics. New York: McGraw
Hill; 1996.
26. Martindale. The complete drug reference.34th ed. Great Britain: Pharmaceutical
Press; 2004: 881.
27. V. G. Jamkandi, B Ghosh, B.G. Desai.Khanam.Recent trends in Transdermal
Cardiovoscular theropy. Ind Journal of Pharm Sci September - October 2006
28. Jain NK. Advances in controlled and novel drug delivery.1st ed. Delhi: CBS
Publishers; 2001: 426-48.
29. Joseph RR, Vincent HL. Controlled drug delivery fundamentals and applications. 2nd
ed. New York: Marcel Dekker; 1987: 523-31.
K.L.E.S s College of Pharmacy, Hubli. 179
Chapter 9 Bibliography
30. Vyas SP, Khar RK. Controlled drug delivery concepts and advances. 1st ed. New
Delhi: Vallabh Prakashan; 2002: 411-47.
31. Europian pharmacopoeia commission. 5.0th edition 15 June 2004 1193-1194
32. Mercks Index 14th edition monograph no 1873, Published by Merck Research
laboratories Division of Merck & Co.Inc. Whitehouse Station NJ.
USA.2006.page no.306.
33 British Pharmacoepia 2007. British Pharmacoepia commission. The Department of
Health, Great Britain and The Department of Health, Social Services and Public
Safety, Northern Ireland. Published by The Stationery Office on behalf of MHRA;
1745.
34. Ainley Wade, Paul J. Weller. Handbook of Pharmaceutical Excipients. 2nd ed.
American pharmaceutical association Washington and The pharmaceutical press,
London; 1994: 167,186,229,362,540.
35. Umesh d Shivhare, Vikrant. P. Dorlikar, Kishore. P. Bhusari, Vijay. B. Mathur,
Bhiku. N. Mirani. Effect of Polymeric Compositions on Pharmacotechnical
Properties of Carvedilol Transdermal Film. International Journal of
Pharmaceutical Sciences and Nanotechnology Volume 2 Issue 1 April – June 2009
36. Ashish Jain, Bijaya Ghosh, Naresh Rajgor and B.G. Desai. Passive and iontophoretic
permeation of glipizide. Euro J pharm and Bio pharm 2008; 69(3): 958-963.
K.L.E.S s College of Pharmacy, Hubli. 180
Chapter 9 Bibliography
37. Ubaidulla U, Sentil KB, Ramu P, Sreenivasa PP, Upendra KS, Effect of iontophoresis
and permeation enhancer on Carvedilol from transdermal films. Indian Pharm. ISSN
0972-7914.
38. Tashiro Y., Sami m., Shichibe S., Kato Y., Hayakawa E., Itoh K., Effect of
lipophilicity on in-vivo iontophoretic delivery. II. Beta blockers, Bio Pharm Bull.
2001;24:671-677.
39. Tanwar YS, Chauhan CS, Sharma A, Development and evaluation of carvedilol
transdermal patches, Acta Pharm. 2007;57:151-159.
40. M. Gandhimathi, T. K. Ravi, and Susan Kurian Renu. Determination of Repaglinide
in Pharmaceutical Formulations by HPLC with UV Detection. Analytical Sciences
2003; (19): 1675-1677.
41. G D Gupta, Parul Patel, Amit Chaudhary and Y S Tanwar. In-vitro permeation of
repaglinide from polymeric membrane systems across human cadaver system.
Priory Medical Journals, January 1995. www.priory.com/index.html
42. Sunil K. Jain, A. M. Awasthi, N. K. Jain and G. P. Agrawal. Calcium silicate based
microspheres of repaglinide for gastroretentive floating drug delivery: Preparation
and in vitro characterization. J of Contr Rel 2005; (107): 300-309.
43. Srinivas Mutalik and Nayanabhirama Udupa. Pharmacological evaluation of
membrane-moderated transdermal system of glipizide. Clin. Exp. Pharmacol.
Physiol. 2006; (33): 17–26.
K.L.E.S s College of Pharmacy, Hubli. 181
Chapter 9 Bibliography
44. Srinivas Mutalik, Nayanabhirama Udupa, Sharath Kumar, Sunil Agarwal, Ganesh
Subramanian, Averineni K. Ranjith. Glipizide matrix transdermal systems for
diabetes mellitus: Preparation, in vitro and preclinical studies. Life Sciences 2006;
(79): 1568-1577.
45. S. Sridevi, M.G. Chary, D.R. Krishna, Prakash V. Diwan. Pharmacodynamic
evaluation of transdermal drug delivery system of glibenclamide in rats. Indian J
pharmacol 2000; (32): 309-312.
46. Troy Purvis, Michal E. Mattucci, M. Todd Crisp, Keith P. Johnston and Robert O.
Williams. Rapidly dissolving repaglinide powders produced by the Ultra-Rapid
Freezing process. AAPS PharmSciTech 2007; 8(3) Article 58: E1-E9
47. Ekapol Limpongsa and Kraisri Umprayn. Preparation and evaluation of diltiazem
hydrochloride diffusion-controlled transdermal delivery system. AAPS
PharmSciTech 2008; 9(2): 464-470.
48. Padula C, Nicoli S, Colombo P, Patrizia S, Single-layer transdermal film containing
lidocaine: modulation of drug release, Euro J Pharm Biopharm, 2007;66:422-428.
49. Kalpana swain, satyanarayan pattnaik, surat Chandra sahu, subrata mallick.Feasibility
of assessment of ondansetron Hydrochoride transdermal systems: physicochemical
characterization and invitro permeation studies.Lat.Am.J.Pharm.2009; 28(5):706-
714.
50. Cheong-Weon Cho, Jun-Shik Choi , Sang-Chul Shin Physicochemical characteristics
of quinupramine in the EVA matrix. Int J Pharm.2006;320:1-3.
K.L.E.S s College of Pharmacy, Hubli. 182
Chapter 9 Bibliography
51. Panchagnula R, Bokalial R, Sharma P, Khandavilli S. Transdermal delivery of
naloxone: skin permeation, pharmacokinetic, irritancy and stability studies. Int J
Pharm. 2005;293:213-223
52. Poulo C, Jose MLS. Modeling and comparison of dissolution profiles. Euro J
pharm Sci 2001; 13: 123-133.
53. Michele Trotta, Elena Peira, Maria Eugenia Carlotti, Marina Gallarate. Deformable
liposomes for dermal administration of Methotrexate. Int J Pharm 2004; (270): 119-
125.
54. Hiremat Doddaya, Ragavendra V kulkarni. Development and evaluation studies on
transdermal drug delivery system of Verapamil Hydrochloride. M Pharm
Dissertation submitted to Rajiv Gandhi University of Health Sciences, Karnataka,
Banglore; 1999.
55. Charles M. Heard, Sarah Johnson, Gary Moss, Chris P. Thomas. In vitro transdermal
delivery of caffeine, theobromine, theophylline and catechin from extract of Guarana,
Paullinia Cupana. Int J Pharm 2006; (317): 26–31.
56. Sean C. Sweetman editor. Martindale, The Complete Drug Reference. 35th edition:
415.
57. R. J. Babu and J. K. Pandit. Effect of cyclodextrins on the complexation and
transdermal delivery of bupranolol through rat skin. Int J Pharm 2004; 271(1-2):
155-165.
K.L.E.S s College of Pharmacy, Hubli. 183
Chapter 9 Bibliography
58. Fusun Acarturk, Ahmet Sencan. Investigation of the effect of different adjuvants on
felodipine release kinetics from sustained release monolithic films. Int J Pharm
1996; (131): 183-189.
59. V. Sankar, D. Benito Johnson, V. Sivanand, V. Ravichandran, S. Raghuraman, G.
Velrajan, R. Palaniappan, S. Rajasekar, A. K. Chandrasekaran. Design and
evaluation of Nifedipine transdermal patches. Indian J Pharm Sci 2003; 65(5): 510-
515.
60. F. V. Manvi, P. M. Dandagi, A. P. Gadad, V. S. Mastiholimath, Jagadeesh T.
Formulation of a Transdermal drug delivery system of ketotifen fumarate. Indian J
Pharma Sci 2003; 65 (3): 239-243.
61. R. R. Katkam, S. Chakkapan, Kiran Gandhi, Suja Thomas, C. P. Puri, R. Shrivastava.
Studies in transdermal drug delivery system for Estradiol. Indian J pharm Sci 1994;
56(4): 121-125.
62. M. K. Das, A. Bhattacharya, S. K. Ghosal. Transdermal Delivery of Trazodone
Hydrochloride from Acrylic films prepared from Aqueous latex. Indian J Pharm
Sci 2006; 41-46.
63. Dey B. K, Nath L. K, Mohanti B and Bhowmik B. B. Development and evaluation
of propranolol hydrochloride transdermal patches by using hydrophilic and
hydrophobic polymer. Indian J Pharm Educ Res. 2007; 41(4): 388-393.
64 Janardhanan Bagyalakshmi, Ramachandra Purapu Vamsikrishna, Rajappan
Manavalan, Thengungal Kochupappy Ravi and Probal Kumar Manna. Formulation
K.L.E.S s College of Pharmacy, Hubli. 184
Chapter 9 Bibliography
development and in-vitro and in-vivo evaluation of membrane-moderated
transdermal systems of Ampicillin sodium in ethanol: pH 4.7 buffer solvent system.
AAPS PharmSciTech 2007; 8(1) Article 7: E1-E6.
65. Biswajit Mukherjee, Sushmita Mahapatra, Ritu Gupta, Balaram Patra, Amit Tiwari,
Priyanka Arora. A comparision between povidone-ethylcellulose and povidone-
eudragit transdermal dexamethasone matrix patches based on in vitro skin
permeation. Euro J pharm and Bio pharm 2005; (59); 475-483.
66. Biswajit Mukherjee, Kanupriya, Sushmita Mahapatra, Surajit Das, Balaram Patra.
Sorbitan Monolaurate 20 as a potential skin permeation enhancer in transdermal
patches. J App Res 2005; 5(1): 96-108.
67. Rama Roa P, Diwan PV. Drug diffusion from Cellulose acetate, Polyvinyl
pyrrolidone free films for transdermal administration. IJPS 1996: Nov; 246.
68. Yoshioka S, Stella V. J. Regulations. Stability of Drugs and Dosage Forms. India:
Springer; 2006.p.205-225.
69. Aqil M, Asgar Ali, Monolithic matrix type transdermal drug delivery systems of
pinacidil monohydrate: in vitro characterization. Euro J pharm and Bio pharm 2002;
(54): 161–164.
70. Paulo Costa, Jose Manuel Sousa Lobo. Modeling and comparison of dissolution
profiles. Euro J Pharm Sci 2001; (13): 123-133.
K.L.E.S s College of Pharmacy, Hubli. 185
Chapter 9 Bibliography
71. Michele Trotta, Elena Peira, Maria Eugenia Carlotti, Marina Gallarate. Deformable
liposomes for dermal administration of Methotrexate. Int J Pharm 2004; (270): 119-
125.
72. Katrin Kriwet, Christel C. Muller-Goymann. Diclofenac release from phospholipid
drug systems and permeation through excised human stratum corneum. Int J Pharm
1995; (125): 231-242.
73. Siamak parsaee, Mohammad N. Sarbolouki and Mohamad Parnianpour. In vitro
release of diclofenac diethylammonium from lipid-based formulations. Int J Pharm
2002; (241): 185-190.
74. Francesca Maestrelli, Maria Luisa Gonzalez-Rodriguez, Antonio Maria Rabasco
and Paola Mura. Effect of preparation technique on the properties of liposomes
encapsulating ketoprofen–cyclodextrin complexes aimed for transdermal delivery. Int
J Pharm 2006; (312): 53-60.
75. Zoran Mandic and Vesna Gabelica. Ionization, lipophilicity and solubility properties
of repaglinide. J Pharm and Biomed Anal 2006; (41): 866-871.
76. CERTIFICATE OF ANALYSIS, Quality Assurance Department. Tested by Sun
Pharmaceutical limited, Paroli Bharuch, Gujrat. www.sunpharma.com.
77. Krishnaiah YSR, Satyanarayan V, Bhaskar P. Influence of limonene on the
bioavailability of nicardipine hydrochlorothiazide from membrane modulated
transdermal therapeutic systems in human volunteers. Int J Pharm Oct 2002; 247(1-
2): 91-102.
K.L.E.S s College of Pharmacy, Hubli. 186
Chapter 9 Bibliography
78. Bijaya Ghosh, Harivardhan Reddy L, Raghvendra V Kulkarni, Jasmina Khanam.
Comparison of skin permeability of drugs in mice and human cadaver skin. Indian J
Exp Bio 2000; (38): 42-45.
79. Nuntakan Suwanpidokkul, Phensri Thongnopnua and Kaisri Umprayn. Transdermal
delivery of Zidovudine (AZT): The effects of vehicles, enhancers and polymer
membranes on permeation across cadaver pig skin. AAPS PharmSciTech 2004; 5(3)
Article 48: 1-8.
K.L.E.S s College of Pharmacy, Hubli. 187
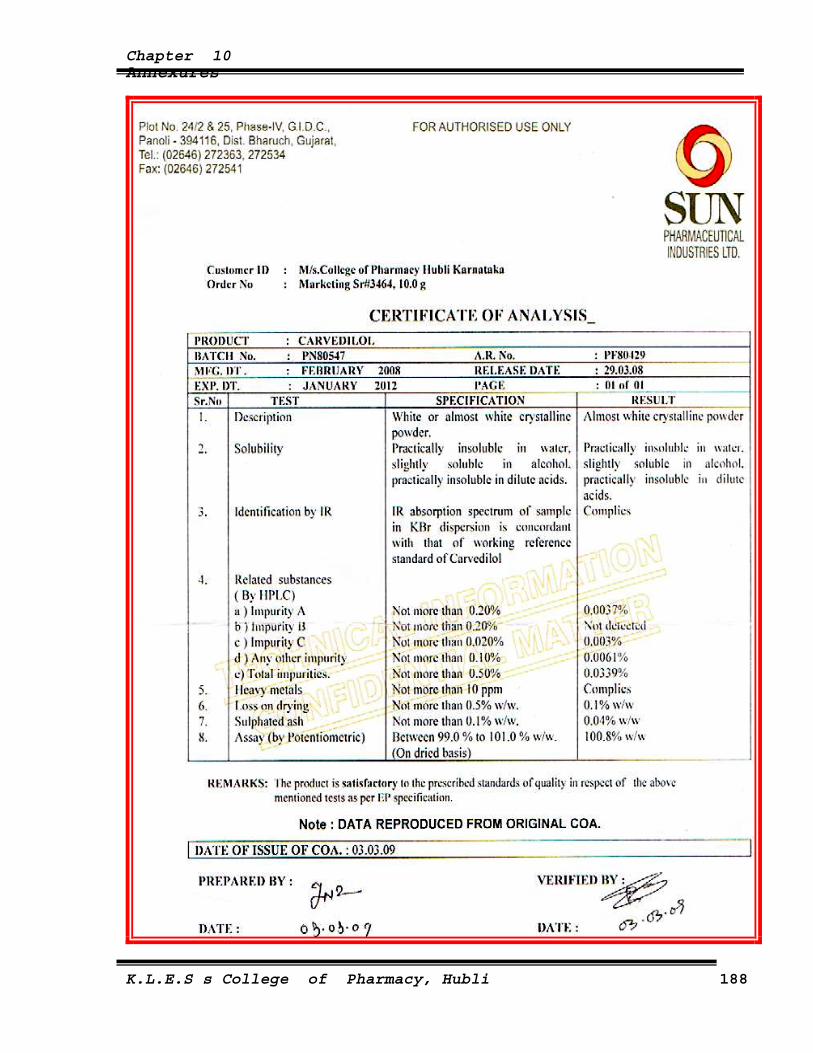
Chapter 10 Annexures
K.L.E.S s College of Pharmacy, Hubli 188
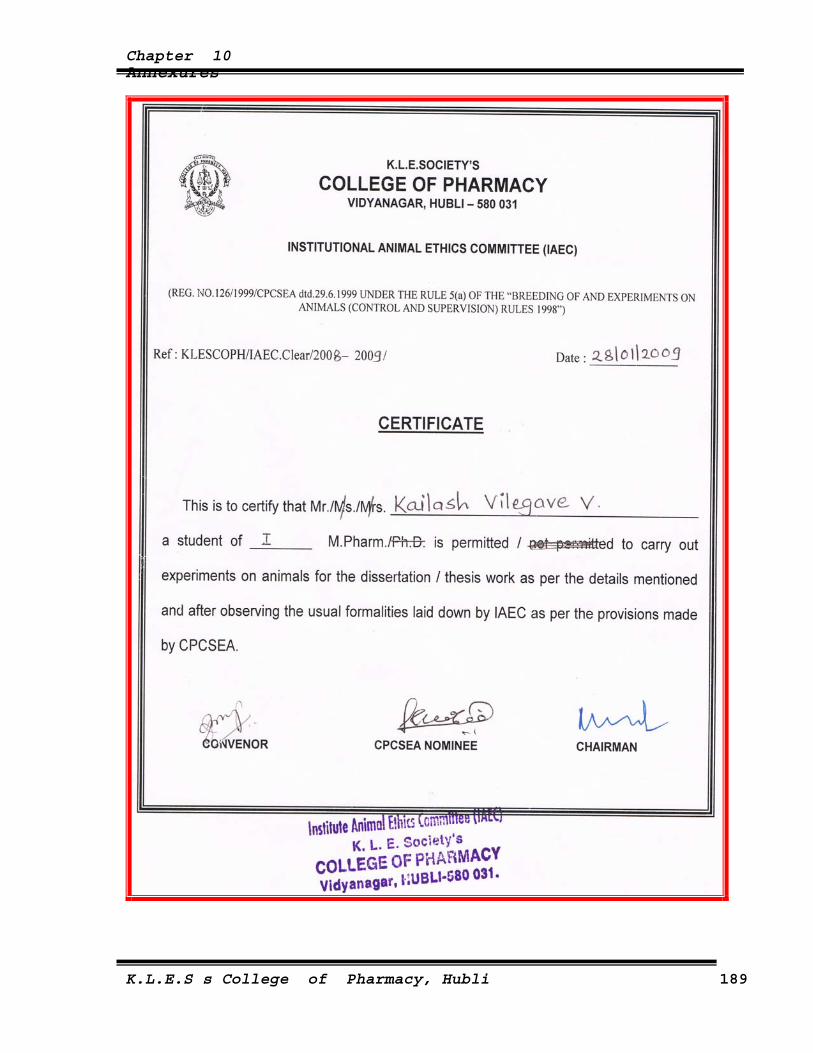
Chapter 10 Annexures
K.L.E.S s College of Pharmacy, Hubli 189