APEC Workshop on Integrated Energy Water Planning and ...
46
APEC Workshop on Integrated Energy Water Planning and Policy Formulation APEC Energy Working Group December 2019
-
Upload
khangminh22 -
Category
Documents
-
view
2 -
download
0
Transcript of APEC Workshop on Integrated Energy Water Planning and ...
APEC Workshop on Integrated Energy Water Planning and Policy Formulation
APEC Energy Working GroupDecember 2019

APEC Project: EWG 13 2018A
Produced by: Mike Hightower Research Professor, University of New Mexico Center for Water and the Environment MSC01 1070 1 University of New Mexico Albuquerque, New Mexico 87131 [email protected]
Dr Vince Tidwell Distinguished Member of the Technical Staff Sandia National Laboratories 1515 Eubank SE Albuquerque, New Mexico 87123 [email protected]
For: Asia-Pacific Economic Cooperation Secretariat 35 Heng Mui Keng Terrace Singapore 119616 Tel: (65) 68919 600 Fax: (65) 68919 690 Email: [email protected] Website: www.apec.org
© 2019 APEC Secretariat
APEC#219-RE-04.5
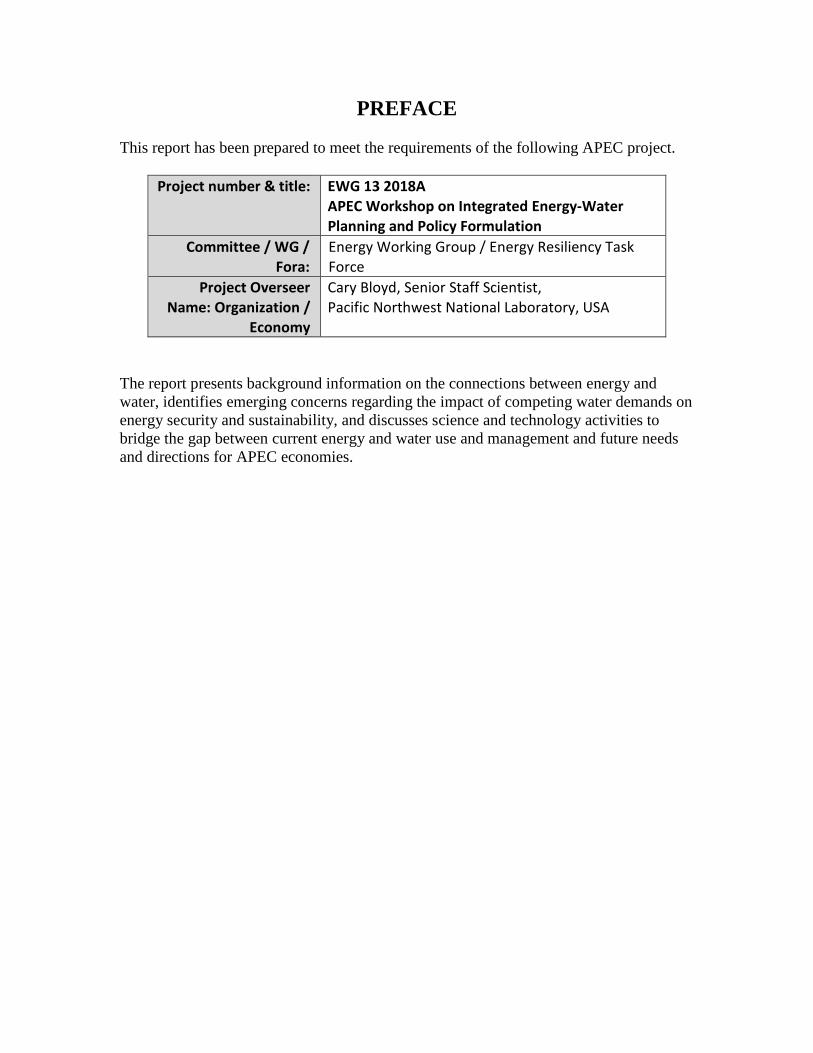
PREFACE This report has been prepared to meet the requirements of the following APEC project.
Project number & title: EWG 13 2018A APEC Workshop on Integrated Energy-Water Planning and Policy Formulation
Committee / WG / Fora:
Energy Working Group / Energy Resiliency Task Force
Project Overseer Name: Organization /
Economy
Cary Bloyd, Senior Staff Scientist, Pacific Northwest National Laboratory, USA
The report presents background information on the connections between energy and water, identifies emerging concerns regarding the impact of competing water demands on energy security and sustainability, and discusses science and technology activities to bridge the gap between current energy and water use and management and future needs and directions for APEC economies.

Acronyms
APEC Asia-Pacific Economic Cooperation DOE US Department of Energy EWG Energy Working Group GHG Green-house gases GW Giga watts (1000 MW) LNG Liquefied Natural Gas MW Megawatt (million watts) MWh Megawatt hour MEDRC Middle East Desalination Research Center NREL National Renewable Energy Laboratory PNNL Pacific Northwest National Laboratory ReDS Regional Energy Deployment System USA United States of America WEC World Energy Council WEF World Economic Forum
CONTENTS
EXECUTIVE SUMMARY ................................................................................................. 7 SESSION 1. Energy Water Issues and Economic Development Challenges ............... 12 SESSION 2. Mapping Energy Water Risk Around the Pacific Rim .............................. 16 SESSION 3. Energy-Water-Food-Climate Linkages in the Mekong Region of Asia .... 17 SESSION 4. Integrated Management of Water-Energy-Food in the Asia Pacific Region
................................................................................................................. 19 SESSION 5. Parched Power: The Water Demands, Risks, and Opportunities of India’s
Power Sector ............................................................................................ 20 SESSION 6. Modeling Future Electricity-Water-Climate Interactions in the United
States ....................................................................................................... 22 SESSION 7. Discussion by APEC Economies on Specific Water-Energy Challenges 23 SESSION 8. The Water Nexus in the Energy Transition to a Lower Carbon Economy in
Australia ................................................................................................... 27 SESSION 9: Multi-scale Water-Energy-Food Nexus Under Industrialization and
Urbanization ............................................................................................. 28 SESSION 10: Water-risk Tools for Global and Regional Analysis and Applications .... 29 SESSION 11: Exercise 1 – Constructing an Electricity-Water Scenario Analysis with the
ReEDS Capacity Expansion Model .......................................................... 31 SESSION 12: Exercise 2 – Energy Water Calculator ................................................... 33 SESSION 13: Brainstorming of Opportunities for Integrated Energy Water Planning
Projects in APEC Economies – Potential Projects in 2020 ....................... 37 References and Bibliography ........................................................................................ 41 Appendix A: Energy Water Workshop Focus ............................................................... 42 Appendix B: Energy Water Workshop Agenda ............................................................. 43 Appendix C: Energy Water Workshop Participants ...................................................... 45

6
Figures
Figure 1-1. Examples of Interrelationships Between Water and Energy ...................... 12 Figure 1-2. Projected Changes in Precipitation ............................................................ 14 Figure 3-1. Energy Water Food Nexus ......................................................................... 17 Figure 10-1. Aqueduct Water Risk Map ....................................................................... 30 Figure 12-1. Slider bars in the Energy Water Calculator for inputting initial conditions. 34 Figure 12-2. Energy Water Calculator interface example – Electricity Production Mix .. 34 Figure 12-3. Energy Water Calculator – Water withdrawal results for one scenario ..... 35 Figure 12-4: Energy Water Calculator - Interface model operation instructions ............ 36
Tables
Table 1-1. Energy Sector Operational Impact on Water Quantity and Quality ............. 13 Table 1-2. Water Use by Sector for Developing and Developed Economies ............... 15 Table 5-1. Water Use Intensity for Electric Power Generation Technologies ............... 20 Table 11-1. Electricity-Water-Climate-Scenarios for Evaluating the ReEDS Model ..... 32

7
EXECUTIVE SUMMARY 1.1 Background on the APEC Integrated Energy Water Planning Workshop
Scarce water supplies are impacting energy development across APEC economies, while also putting increased demands on the energy sector to pump, treat, convey and distribute drinking and wastewater. Rapid population growth, urbanization and intensifying extreme climate events further threaten the resilience and sustainability of the region’s connected energy-water systems. Additionally, each economy requires unique solutions tailored to their specific needs due to unique social, cultural, geographical, and natural resource issues. In support of APEC’s Energy Working Group, the Energy Resiliency Task Force established an Integrated Energy-Water Planning and Policy Formulation Project [Appendix A]. The project was designed to support a three-day workshop focused on capacity-building and training of representatives from APEC economies on integrated planning of connected energy-water systems [Appendix B]. The workshop was specifically designed to help participants: 1) identify unique risks posed by the energy-water nexus in APEC economies; 2) formulate adaptive measures to address emerging risks and enhance resiliency; 3) identify best practices and explore frameworks for integrated energy-water planning and policy formulation, and 4) provide a networking opportunity for APEC members, energy-water experts, and international development institutions to discuss ideas for regional APEC projects in the future. The project brought together representatives and practitioners from 9 different APEC economies to exchange experiences on local energy-water issues and challenges, and on measures and approaches being considered or utilized to enhance energy-water resilience and sustainability in these APEC economies. The intent of the workshop was to promote a better understanding of energy-water interdependencies and the potential impacts on energy system and water system operation and performance, and on ways to minimize potential future economic and social impacts of these interdependencies on APEC economies. 1.2 APEC Energy Water Workshop Agenda
The three-day workshop agenda included twelve technical sessions on energy water interdependencies issues and challenges, highlighting emerging interdependencies between energy, water, land, food, and climate in the APEC region and the associated impacts on economic and social development and resiliency, as well as trends in water use between developed and developing economies [Appendix C]. The sessions utilized APEC-based studies and non-APEC studies in proximity to APEC regions to demonstrate successes and lessons learned in several practical applications of considerations needed for integrated energy and water planning and the inherent advantages of coordinated planning. The Day 1 technical sessions included: Session 1: Energy Water Issues and Economic Development Challenges – Workshop Overview Session 2: Mapping Energy Water Risk around the Pacific Rim
8
Session 3: Energy, Water, Food, and Climate linkages in the Mekong Region of Asia Session 4: Integrated Management of the Water Energy Food Nexus in the Asia-Pacific Session 5: Parched Power - Water Demands, Risks and Opportunities of India’s Power Sector Session 6: Modeling Future Electricity-Water-Climate Interactions in the United States Following the first day of introductory presentations, Day 2 of the workshop, started with Session 7 that allowed each of the APEC economies to discuss the focus of their economy-specific energy planning efforts, directions they are pursuing, relative to the energy and water considerations and issues highlighted in Sessions 1-6 in Day 1. In many cases, the APEC economies represented are pursuing generally similar energy development directions with similar challenges. The general trends and issues identified included:
• A focus on integrating electric transmission with their neighbors to share power, • Increased use of renewables and distributed generation to reduce water use, but that could
cause instabilities in power supply and availability that will need to be addressed to improve overall energy resiliency,
• Often a focus on developing additional hydropower, including pumped-hydro storage, low-head hydro, and the potential to cause negative impacts on fisheries (food), and public water supply reliability,
• Many APEC economies are considering the import of LNG for electric power generation. But there is the potential for shale oil and shale gas development and production in many APEC economies with water needs for fracking a major concern.
• Finally, some APEC economies are considering major expansion of biofuels, with a serious concern being the potential impact on water for food and municipal supplies.
Following Session 7 on the current energy planning initiatives by the different APEC economies represented, five additional technical workshop sessions were conducted during Day 2 and 3, which included case studies or examples of integrating energy-water policy and planning and modeling. These five sessions were designed to highlight to the workshops participants the use of integrated system-level resource modeling and analysis tools to help assess and initiate a robust and resilient energy and natural resource development strategy. The Day 2 and Day 3 technical sessions and modeling exercises included: Session 8: The Water Nexus in the Energy Transition to a Lower Carbon Economy in Australia Session 9: Multi-scale Water-Energy-Food Nexus Under Industrialization and Urbanization Session 10: Water-risk Tools for Global and Regional Analysis and Applications Session 11: Exercise 1 – Constructing an Electricity Water Scenario Analysis with the ReEDS Capacity Expansion Model Session 12: Exercise 2 - Energy Water Calculator – Use and Examples 1.3. Energy Water Workshop Summary Results and Recommendations Following the technical sessions on the emerging energy-water-climate-food challenges, case studies, and example problems, and the session on APEC economy integrated energy water issues and needs, a final workshop brainstorming session, Session 13 on Day 3 was conducted with all workshop attendees to help identify, discuss, and rank major ideas and potential projects for 2020 that address the identified challenges and issues with the goal of helping to improve long-term

9
energy planning and energy policy formulation in the APEC economies by integrating energy and water interdependencies. During this final session, the workshop participants identified five follow-on energy-water planning priorities for 2020 and beyond. These included: 1. Develop Energy Water System Modeling Tools Applicable to Needs of APEC Economies
Changes to energy systems impact water resources (and often changes in water availability often impact energy demand also). These often have unexpected, negative impacts. To help governments identify potential negative outcomes and manage these conflicts, systems dynamics type models should be used. These should be developed to identify the positive and negative synergies between the energy sector and other sectors to inform decision making and policy. System-level dynamic models have been developed and used successfully over the past decade for several river basins including the Mekong, the Rio Grande and Colorado River systems in the US, and in Japan to look at strategies to improve societal, energy, water, and food security and resiliency. The APEC representatives suggested several potential next steps that would include: a) collating information on available planning models, b) communicating case studies of the application of these models, c) identifying standards for data collection and formats, and d) development of preliminary models adaptable to individual economies that are simple to use and can be used for preliminary scoping analyses. 2. Develop Electric Power Transmission Models for APEC Economies
Electricity generation technologies with minimal water use, such as solar and wind, may be geographical restricted to places at some distance from energy storage (such as pumped storage hydropower stations) and places with high power demand. Significant electric power transmission capacity is being considered to link islands and grids within APEC economies, and to link the different economies. This integration would help increase electricity supply options and redundancy, and hopefully create a greater use of renewable energy. At the workshop several examples were given of potential transmission upgrades in Australia, Indonesia, Malaysia, the Philippines, Viet Nam and Japan that would enhance regional energy security. Therefore, the development and use of transmission planning models capable of including the use of different mixes of renewables, fossil fuels, and considering energy reliability and water use should be developed. While this type of model been developed and used by the US National Renewable Energy Laboratory (NREL) for the western US and India, the APEC participants agreed further developing these type of analysis tool for use by APEC economies would be useful in identifying: a) extensions to transmission systems that would facilitate greater use of renewable electricity generation (including hydropower), b) grid connections between APEC economies that would increase security of supply, c) mechanisms to help finance the transmission system improvements, and d) the ability of major energy export economies to adequately meet regional electricity export requirements without impacting regional water supply security and reliability. These models would help APEC economies better assess the security and resiliency of different regional electricity export and import options under climate change scenarios and renewables integration goals. 3. Improve Modeling and Analysis of Pumped Storage Hydropower

10
Pumped storage hydropower uses excess electricity, such as that generated by wind turbines in the night, to pump water from a lower to an upper reservoir where it can be used later to generate hydropower to meet peak demands. Pumped storage developments act like big batteries for electricity storage. They can be built with minor additions to some existing reservoirs or in abandoned mine pits, and so have lower environmental and social impacts than new run of river hydropower projects. Since many APEC economies are considering additional hydropower and renewable energy projects, pumped storage hydropower capacity will likely become more a viable and more important element of many APEC economies for managing future grid stability – preventing black outs – and enabling intermittent renewable electricity generators (wind and solar) to provide base load power. Therefore, the APEC participants noted it would be useful to better model pumped hydropower storage benefits and costs in order to: a) assess how additional energy storage could increase their energy security, b) model how pumped storage could enable greater use of solar and wind generation, and c) identify sites in their economies that may most readily facilitate pumped hydropower storage development. 4. Improved Water Management in Unconventional Gas Production
It was noted by the APEC participants that shale oil and shale and coal bed (coal seam) methane deposits underlie extensive regions in APEC economies. At the same time, many of the APEC economies are considering the import of LNG to support high reliability electric power at lower emissions, approximately about a 50% reduction of an equivalent coal fired power. Therefore, is might be appropriate for APEC economies to utilize their own shale gas and other indigenous natural gas supplies. Therefore, APEC participants agreed that it would be useful to explore lessons on regulations and other practices to use unconventional gas resources and reducing water impacts. 5. Utilization of Advanced Microgrids to Improve Energy Resiliency Many APEC economies are accelerating the movement to higher penetration of renewables that are often intermittent, such as solar and wind and even some hydropower where irrigation or municipal supplies are high priorities relative to electricity generation. At the same time, if substantial amounts of additional electricity transmission capacity is created to move electricity between islands or economies, the loss of this transmission capability from storms of other events could threaten regional energy security, reliability, and resiliency. One approach to reduce the impact of such events is to integrate the use of advanced microgrids with distributed energy supplies to create ‘resiliency nodes’ throughout the grid to support critical community functions and services and critical infrastructure operations during an extended outage. APEC participants agreed that consideration of the designs and use of advanced microgrid or advanced mini-grid designs and operations be integrated into electric power transmission development policies and planning to ensure secure, resilient, and reliable power to support social and economic needs. This is a very important issue as identified in the Session1presentation on the growing severity and number of extreme events and the associated expansion of power outages from high intensity storms driven by climate change. 1.4. Energy Water Workshop Materials and Presentations
11
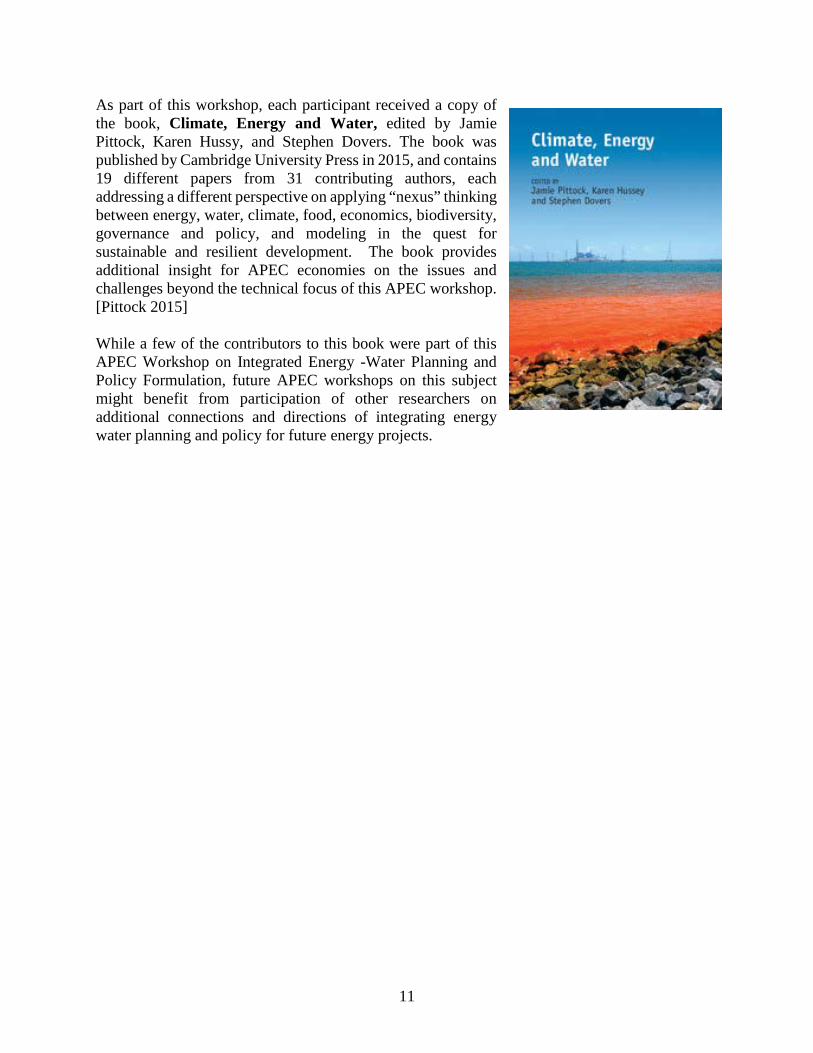
As part of this workshop, each participant received a copy of the book, Climate, Energy and Water, edited by Jamie Pittock, Karen Hussy, and Stephen Dovers. The book was published by Cambridge University Press in 2015, and contains 19 different papers from 31 contributing authors, each addressing a different perspective on applying “nexus” thinking between energy, water, climate, food, economics, biodiversity, governance and policy, and modeling in the quest for sustainable and resilient development. The book provides additional insight for APEC economies on the issues and challenges beyond the technical focus of this APEC workshop. [Pittock 2015] While a few of the contributors to this book were part of this APEC Workshop on Integrated Energy -Water Planning and Policy Formulation, future APEC workshops on this subject might benefit from participation of other researchers on additional connections and directions of integrating energy water planning and policy for future energy projects.

12
SESSION 1. Energy Water Issues and Economic Development Challenges Session Presenter– Mike Hightower, Research Professor, Center for Water and the Environment, University of New Mexico, Albuquerque, NM, USA Session Summary and Highlights – In recent decades the development of energy systems globally has often focused primarily on addressing carbon and green-house gas emission concerns. But it has become increasingly clear that long-term energy sustainability must be balanced across many natural resources including water, air, land, and food to maintain appropriate energy and economic development and societal resiliency. This suggests that long-term energy policies and energy development strategies must integrate natural resource, societal, and economic metrics and considerations into the planning process. As an overview, Figure 1-1 highlights how energy and water are linked [USDOE 2006].
Figure 1-1. Examples of Interrelationships Between Water and Energy The general energy sector operational connections and impacts on water are shown below in Table 1-1. [USDOE 2006]

13
Table 1-1. Energy Sector Operational Impact on Water Quantity and Quality
Refining and Processing Traditional Oil and Gas Refining Water needed to refine oil and gas End use can impact water
quality Biofuels and Ethanol Water for growing and refining Refinery waste-water
treatment Synfuels and Hydrogen
Water for synthesis or steam reforming Wastewater treatment
Energy Transportation and Storage Energy Pipelines Water for hydrostatic testing Wastewater requires treatment
Coal Slurry Pipelines
Requires water for slurry transport; water not returned
Final water is poor quality; requires treatment
Barge Transport of Energy River flows and stages impact fuel delivery Spills or accidents can impact
water quality Oil and Gas Storage Caverns
Slurry mining of caverns requires large quantities of water
Slurry disposal impacts water quality and ecology
Additional trends include an increase in the energy needed to pump, treat, and transport water for municipal and industrial applications, especially increased energy needed for the utilization of non-traditional water resources such as seawater and brackish water desalination to supplement dwindling fresh water supplies. This need is increasing as fresh water supplies are seeing increased risks due to overuse and mismanagement across the globe, as well as increasing limitations on precipitation from climate change. An example is shown in Figure 1-2 based on climate modeling that shows that many APEC economies could see reductions in precipitation by 20-40 % by 2040-2070. [National Geographic 2008].
Energy Element Connection to Water Quantity
Connection to Water Quality
Energy Extraction and Production Oil and Gas Exploration Water for drilling, completion, and fracturing Impact on shallow groundwater
quality Oil and Gas Production Large volume of produced, impaired water Produced water can impact
surface and ground water Coal and Uranium Mining Mining can generate large quantities of water
Tailings and drainage can impact surface water and ground-water
Electric Power Generation Thermo-electric (fossil, biomass, nuclear)
Surface and groundwater for cooling and emissions scrubbing
Thermal and air emission impacts surface waters and ecology
Hydro-electric Reservoirs lose large quantities to evaporation Can impact water temperatures, quality, ecology
Solar PV and Wind Generation None during operation; minimal water use in panel and blade washing

14
Figure 1-2. Projected Changes in Precipitation This potential reduction in precipitation is expected to limit fresh surface water flows and ground water recharge, resulting in a potential reduction in water availability for the energy sector. For example, this lack of water could impact the thermoelectric power plant cooling and hydropower generation, contributing to power shortages and increasing the vulnerability of many electrical grids to additional unplanned generation outages, especially in hot weather or during severe events. Unfortunately, under current climate change projections, the frequency and magnitude of these severe events are also projected to increase significantly, exacerbating risks to the energy infrastructure. The lack of water will also negatively impact biofuels production and refining, limiting production of irrigated biofuels, and with increasing droughts due to climate change, even limiting production of non-irrigated biofuels. This could put the need for increasing water resource use for biofuels production and refining into direct conflict with maintaining water supplies for food production and social stability. Finally, as APEC economies continue to grow and evolve, water resource use and supply needs for energy development, manufacturing, and municipal uses will grow, with water use likely transitioning away from agriculture to these other sectors. This is highlighted in Table 1-1 that shows water use by sector as economies become more industrially developed and more economically diverse [WEF 2009, WEC 2010]. The World Energy Council report in 2010 suggested that the three continents most at risk to water stress impacts on energy production and generation were South America, Asia, and Africa. Therefore, the APEC region could be considered as one of the most at risk for water limitations impacting future energy development.

15
Table 1-2. Water Use by Sector for Developing and Developed Economies
Water Use by Sector
Sector Developed Economies
Developing Economies
Energy and Manufacturing 27 – 40% 8-10%
Domestic Supplies 9-10% 6-8%
Agriculture 60-70% 80-90%
Overall, the past decade of energy water research and evaluations has shown that the energy and water infrastructures and natural resources are closely linked together, but are also linked to sustainable and resilient economic and social development. Emerging risks from climate change and its impacts on water availability and water and energy infrastructure vulnerability, suggest that management of critical water and energy resources must be integrated at the national level and coordinated across regional and local boundaries to maintain reliable energy and water supplies to help sustain future economic growth and development in the Asia-Pacific region. As discussed in the following sessions of this Energy Water Workshop, these water and energy challenges will require improvement in the underlying foundation of water and energy resource data, better technologies to reduce the water use intensity of energy , decision-support tools and models to support better energy and water management, and improved policy directions that must be applied and fully implemented regionally to achieve sustainable energy and water resource management in a changing climate and economic landscape.

16
SESSION 2. Mapping Energy Water Risk Around the Pacific Rim Session Presenter - Vincent Tidwell, PhD, Distinguished Member of the Technical Staff, Sandia National Laboratories, Albuquerque, NM USA Session Summary and Highlights - In 2010, global energy production was responsible for 15% of the world’s water withdrawals. Management of this energy-water nexus requires a clear understanding of the inter-related demands of these resources as well as their regional distribution. Toward this need the water consumed for energy production was mapped for almost 12,000 watersheds distributed across the 21-economies comprising the Asia-Pacific Economic Cooperation. Water consumption was estimated for 9 different sectors including thermoelectric and hydroelectric power; energy extraction including coal, oil, natural gas, uranium and unconventional oil/gas; and, energy processing including oil and biofuels. Several reports exist to calculate the water consumption by each of these different sectors based on power plant type and cooling type, dam type, location, and flow used for power generation, oil and natural gas drilling and extraction, and coal and uranium mining. These water consumption values were first published in 2006 in a report prepared by Sandia National Laboratories for the US Department of Energy [DOE 2006]. An extensive compilation of water consumption values for the energy sector in SI units was published in Sustainability in the Mineral and Energy Sectors, Chapter 20 – Water and Energy Nexus, published in 2017 by CRC Press. [CRC 2017]. The measures of water consumption were put in context by drawing comparison with published measures of water risk. In total, 792 watersheds were designated at energy-water risk; that is, where High to Extreme water stress was co-located with a basin where water was used in energy production. For six economies, watersheds at energy-water risk represented half or more of all basins where water was used in energy production, while four additional economies exceeded 30%. Overall, essentially half of the 21 APEC economies have a significant percentage of watersheds at high to extreme risk. Since APEC economies account for approximately 50% of the global GDP, it is clear that reducing water risk to current and future energy development in the APEC region is important not only to APEC economies, but to the global economy as well.
17
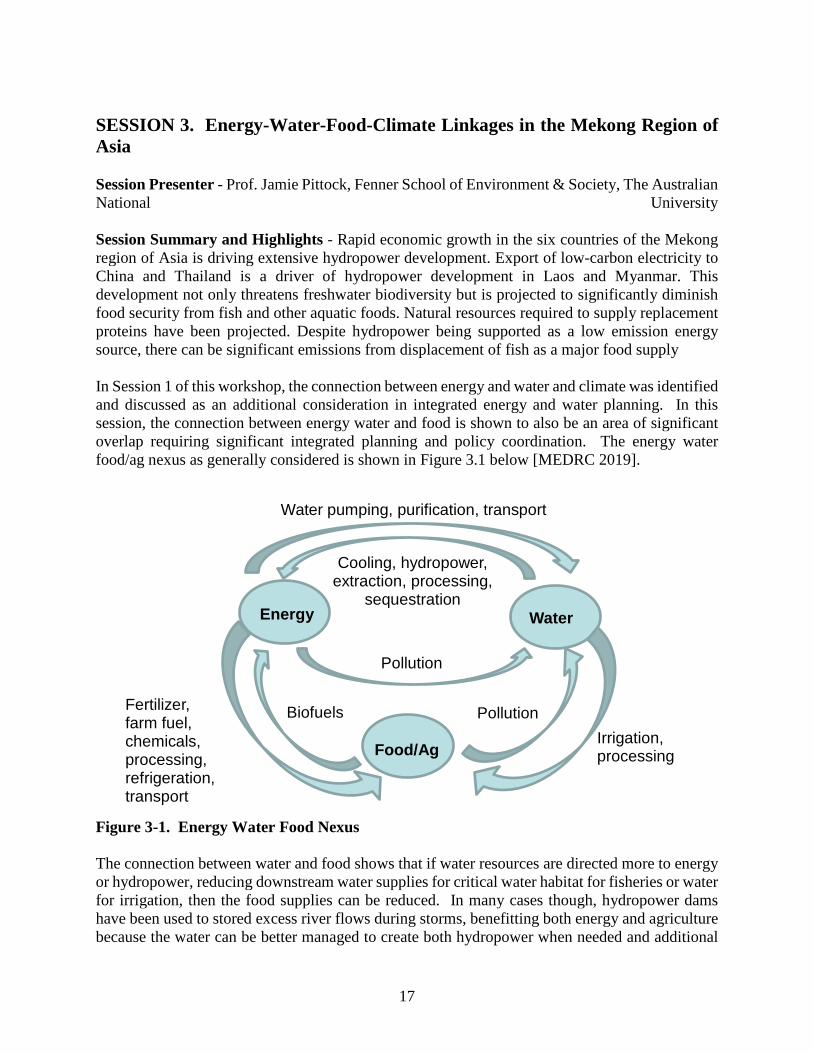
SESSION 3. Energy-Water-Food-Climate Linkages in the Mekong Region of Asia Session Presenter - Prof. Jamie Pittock, Fenner School of Environment & Society, The Australian National University Session Summary and Highlights - Rapid economic growth in the six countries of the Mekong region of Asia is driving extensive hydropower development. Export of low-carbon electricity to China and Thailand is a driver of hydropower development in Laos and Myanmar. This development not only threatens freshwater biodiversity but is projected to significantly diminish food security from fish and other aquatic foods. Natural resources required to supply replacement proteins have been projected. Despite hydropower being supported as a low emission energy source, there can be significant emissions from displacement of fish as a major food supply In Session 1 of this workshop, the connection between energy and water and climate was identified and discussed as an additional consideration in integrated energy and water planning. In this session, the connection between energy water and food is shown to also be an area of significant overlap requiring significant integrated planning and policy coordination. The energy water food/ag nexus as generally considered is shown in Figure 3.1 below [MEDRC 2019]. Figure 3-1. Energy Water Food Nexus The connection between water and food shows that if water resources are directed more to energy or hydropower, reducing downstream water supplies for critical water habitat for fisheries or water for irrigation, then the food supplies can be reduced. In many cases though, hydropower dams have been used to stored excess river flows during storms, benefitting both energy and agriculture because the water can be better managed to create both hydropower when needed and additional
Energy Water
Water pumping, purification, transport
Cooling, hydropower, extraction, processing,
sequestration
Biofuels Irrigation, processing
Pollution
Pollution
Food/Ag
Fertilizer, farm fuel, chemicals, processing, refrigeration, transport
18
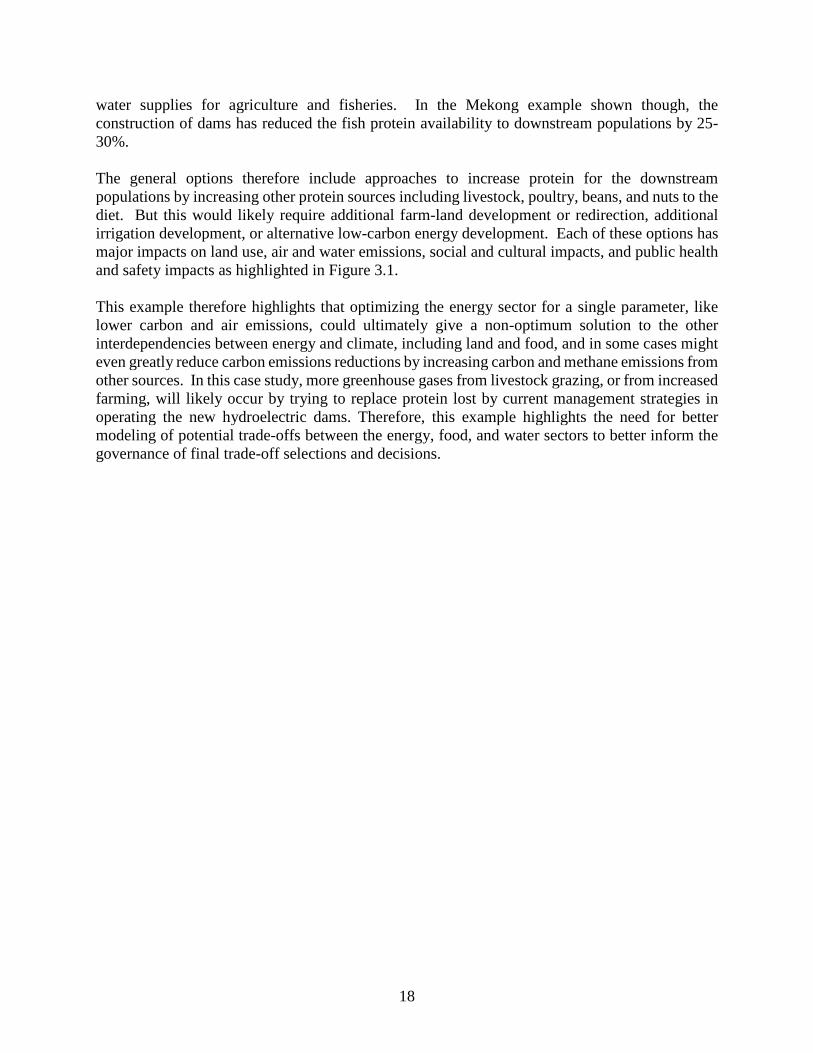
water supplies for agriculture and fisheries. In the Mekong example shown though, the construction of dams has reduced the fish protein availability to downstream populations by 25-30%. The general options therefore include approaches to increase protein for the downstream populations by increasing other protein sources including livestock, poultry, beans, and nuts to the diet. But this would likely require additional farm-land development or redirection, additional irrigation development, or alternative low-carbon energy development. Each of these options has major impacts on land use, air and water emissions, social and cultural impacts, and public health and safety impacts as highlighted in Figure 3.1. This example therefore highlights that optimizing the energy sector for a single parameter, like lower carbon and air emissions, could ultimately give a non-optimum solution to the other interdependencies between energy and climate, including land and food, and in some cases might even greatly reduce carbon emissions reductions by increasing carbon and methane emissions from other sources. In this case study, more greenhouse gases from livestock grazing, or from increased farming, will likely occur by trying to replace protein lost by current management strategies in operating the new hydroelectric dams. Therefore, this example highlights the need for better modeling of potential trade-offs between the energy, food, and water sectors to better inform the governance of final trade-off selections and decisions.

19
SESSION 4. Integrated Management of Water-Energy-Food in the Asia Pacific Region Session Presenter: Makoto Taniguchi, Research Institute for Humanity and Nature, Japan Summary and Highlights of Presentation: Water, energy, and food (WEF) are fundamental resources for human beings and sustainable society, and these resources are interlinked with each other. Therefore, we need integrated management and governance of the WEF nexus to improve the synergies and reduce non-optimal trade-offs among the three resources. This is especially important where we have limited land and water conditions under emerging climate change scenarios as highlighted in Sessions 1, and 2, and where we are already seeing the impacts of non-optimum energy development decisions as highlighted in Session 3. Relationships between water-food-energy nexus and environmental/ economical/social impacts, are currently being analyzed in a Belmont Forum project on Urban water-energy-food (WEF) nexus in the Asia-Pacific region. The Forum includes 17 international groups. Also participating is the US National Science Foundation as part of their nation-wide, energy-water-food research program. The effort will conclude in 2021. Known as the “Nexus Network”, the group is focused on data sharing among all groups, and collecting all applicable local and regional energy-water-food data. The Nexus Network efforts are focused on developing a sound, integrated, water-energy-food decision support model to better analyze the WEF nexus decisions to include both environmental and economic impacts. The approach is based on using databases of the three individual resource but including interlinkages, and synergies among the three resource categories. The intent is to be able to assess different development scenarios and identify and evaluate the different impacts among the three resources. The final goal is to be able to analyze and assess different tradeoffs and synergies among the three resources to identify options with the most beneficial environmental and economic impact. As the decision support tool is completed and undergoing evaluation in 2020 and 2021, APEC economies may be interested in initiating projects with the “Nexus Network” to participate with individual or a group of regional economies to assess the tool and help move toward to better inform the energy-water-food governance and selection of trade-off actions and decisions.
20
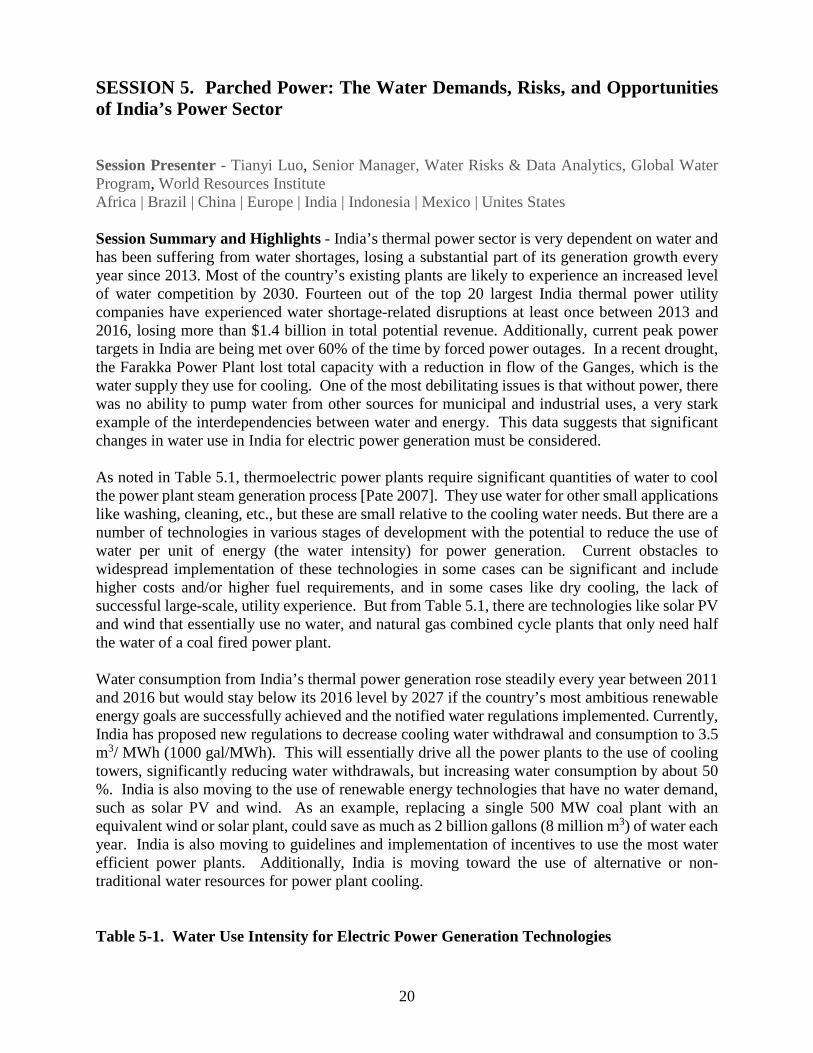
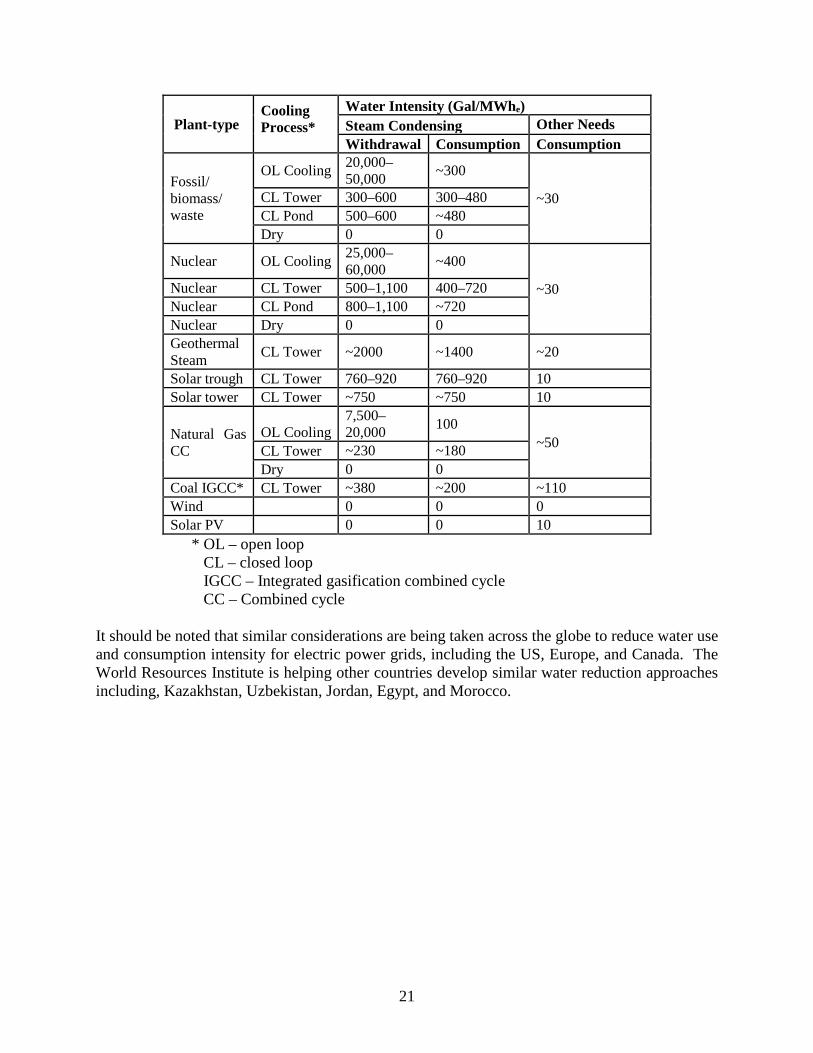
SESSION 5. Parched Power: The Water Demands, Risks, and Opportunities of India’s Power Sector Session Presenter - Tianyi Luo, Senior Manager, Water Risks & Data Analytics, Global Water Program, World Resources Institute Africa | Brazil | China | Europe | India | Indonesia | Mexico | Unites States Session Summary and Highlights - India’s thermal power sector is very dependent on water and has been suffering from water shortages, losing a substantial part of its generation growth every year since 2013. Most of the country’s existing plants are likely to experience an increased level of water competition by 2030. Fourteen out of the top 20 largest India thermal power utility companies have experienced water shortage-related disruptions at least once between 2013 and 2016, losing more than $1.4 billion in total potential revenue. Additionally, current peak power targets in India are being met over 60% of the time by forced power outages. In a recent drought, the Farakka Power Plant lost total capacity with a reduction in flow of the Ganges, which is the water supply they use for cooling. One of the most debilitating issues is that without power, there was no ability to pump water from other sources for municipal and industrial uses, a very stark example of the interdependencies between water and energy. This data suggests that significant changes in water use in India for electric power generation must be considered. As noted in Table 5.1, thermoelectric power plants require significant quantities of water to cool the power plant steam generation process [Pate 2007]. They use water for other small applications like washing, cleaning, etc., but these are small relative to the cooling water needs. But there are a number of technologies in various stages of development with the potential to reduce the use of water per unit of energy (the water intensity) for power generation. Current obstacles to widespread implementation of these technologies in some cases can be significant and include higher costs and/or higher fuel requirements, and in some cases like dry cooling, the lack of successful large-scale, utility experience. But from Table 5.1, there are technologies like solar PV and wind that essentially use no water, and natural gas combined cycle plants that only need half the water of a coal fired power plant. Water consumption from India’s thermal power generation rose steadily every year between 2011 and 2016 but would stay below its 2016 level by 2027 if the country’s most ambitious renewable energy goals are successfully achieved and the notified water regulations implemented. Currently, India has proposed new regulations to decrease cooling water withdrawal and consumption to 3.5 m3/ MWh (1000 gal/MWh). This will essentially drive all the power plants to the use of cooling towers, significantly reducing water withdrawals, but increasing water consumption by about 50 %. India is also moving to the use of renewable energy technologies that have no water demand, such as solar PV and wind. As an example, replacing a single 500 MW coal plant with an equivalent wind or solar plant, could save as much as 2 billion gallons (8 million m3) of water each year. India is also moving to guidelines and implementation of incentives to use the most water efficient power plants. Additionally, India is moving toward the use of alternative or non-traditional water resources for power plant cooling. Table 5-1. Water Use Intensity for Electric Power Generation Technologies
21
Plant-type Cooling Process*
Water Intensity (Gal/MWhe) Steam Condensing Other Needs Withdrawal Consumption Consumption
Fossil/ biomass/ waste
OL Cooling 20,000–50,000 ~300
~30 CL Tower 300–600 300–480 CL Pond 500–600 ~480 Dry 0 0
Nuclear OL Cooling 25,000–60,000 ~400
~30 Nuclear CL Tower 500–1,100 400–720 Nuclear CL Pond 800–1,100 ~720 Nuclear Dry 0 0 Geothermal Steam CL Tower ~2000 ~1400 ~20
Solar trough CL Tower 760–920 760–920 10 Solar tower CL Tower ~750 ~750 10
Natural Gas CC
OL Cooling 7,500–20,000 100
~50 CL Tower ~230 ~180 Dry 0 0
Coal IGCC* CL Tower ~380 ~200 ~110 Wind 0 0 0 Solar PV 0 0 10
* OL – open loop CL – closed loop IGCC – Integrated gasification combined cycle CC – Combined cycle It should be noted that similar considerations are being taken across the globe to reduce water use and consumption intensity for electric power grids, including the US, Europe, and Canada. The World Resources Institute is helping other countries develop similar water reduction approaches including, Kazakhstan, Uzbekistan, Jordan, Egypt, and Morocco.

22
SESSION 6. Modeling Future Electricity-Water-Climate Interactions in the United States Session Leader - Stuart Cohen, National Renewable Energy Laboratory, Golden, Colorado USA Session Summary and Highlights – In this session we examined how climate change can influence electric sector operations and planning when changing precipitation patterns alter water availability for hydropower and power plant cooling, and changing temperatures affect electricity demand and power system performance. Two modeling approaches were discussed that have been used in the United States. These include: (1) the Regional Energy Deployment System (ReEDS) electric sector capacity expansion model, and (2) PLEXOS – a production-cost model of electricity dispatch. These models have been used by the National Renewable Energy Laboratory (NREL) in the US to study electricity-water-climate interactions to support integrated energy-water-climate analysis for electricity system investment and operational decisions. The major focus of this session was to discuss some of the electricity planning applications of the ReEDS models as they might apply to other APEC economies. ReEDS currently represents generation, storage, and transmission system planning through 2050 among up to 135 regions, with 17 intra-annual time periods in each solution year. These time periods include the morning, afternoon, evening, and night for each season as well as a peak time period representing the top 40 demand hours. The model can consider scenarios with renewable resources, variable generation options, inter-region transfers, grid-level energy storage, roof top PV use, demand-response policies, electric transportation demand and availability, as well as other generation and use options. Additionally, it includes endogenous constraints on water use and the ability to use climate projection data to adjust electricity demand, system performance, and water availability to the power sector. These features allow possible climate and water variations to be included in energy reliability and risk estimates. ReEDS has already been adapted by NREL for use in India for their electric transmission system, and it has been used to model the three different electric transmission grids in the US, which highlights possible ways to connect isolated, or nearly isolated, individual transmission grids. This could be of interest to APEC economies that are considering additional interconnections among economies. ReEDS has also been used recently to explore interconnection and large-scale renewable energy integration of the entire North American (Canada, US, and Mexico) grid. The overview of recent analyses demonstrated some of the interesting findings and results, and highlighted the importance of integrating climate-water considerations in long-term transmission planning. Therefore, this session showed how emerging integrated energy-water-climate transmission modeling tools can be used by APEC economies to assess grid and electricity generation and demand scenarios. Based on the NREL experience with India, it is estimated that $500K to $1M could fund the development of a new economy-specific model and scenario analysis, depending on available data and the level of detail required. The ReEDS model exists on an open-source platform that could be the basis for future economy-specific model development. Session 11 of this workshop demonstrated example of ReEDS modeling for several scenarios selected by the workshop participants.
23
SESSION 7. Discussion by APEC Economies on Specific Water-Energy Challenges Session Leader– APEC member economy participants Session Summary and Highlights - After finishing the first six sessions and providing background information on energy water issues currently under evaluation in the APEC region, the APEC member economy participants were provided the opportunity to identify some of the major energy-water interdependencies issues they are encountering or might encounter in their economy-specific future energy planning efforts. The intent of this session was to provide the technical presenters the regional context of issues of importance in later discussions of examples, case studies, and exercises. Highlighted below are the specific energy and water interdependencies directions and challenges identified by each economy. Following these individual economy issues and challenges, we then worked with the workshop participants to summarize current or emerging similarities that could be used to focus follow-on energy water opportunities in potentially APEC supported follow-on workshops. Australia – Australia has initiated several initiatives to reduce water use by the fuels and electric power energy sectors and reduce greenhouse gas (GHG) emissions. These include:
• To reduce electricity generation water use, investing in renewables. This drives down GHG emissions, and increases local energy resiliency and water reliability.
• Looking at the use of pumped hydro to support renewables variability – 1/3 of storage capacity from mine sites, and 2/3 from run of river.
• Designing transmission system for more renewables penetration. Tying in new DC line from Tasmania, linking Australia grid to SE Asia to link solar resources to Indonesia.
• Plan to transfer water from closing coal power plants to other uses. • Initiating GHG trading to reduce emissions – including efforts to increasing forest
management to reduce emissions, replanting forests to increase GHG capture, change farming practices to enhance soil carbon sequestration.
• Reducing water impacts of fuels development - reduce coal bed methane development impacts on shallow ground water, reduce fresh water use for shale fracking on Aboriginal lands.
Indonesia – Indonesia will make a significant shift in electric power generation of their 45 GW demand, as well as changes in fuel sources from 2015 to 2025. Some of the changes could reduce water use by the electric sector, but some may increase water demands.
• Coal will remain at 30% of electric supply, but looking for additional water for cooling. • Oil will reduce from 42% to 25% for electricity supply, so could save some water. • Renewables increasing from 6% to 23%, but most is hydropower and therefore need to
insure water security for hydropower. • Natural gas changing from 20% to 22% of electricity generation.
24
• Fuel mix includes biofuel, biomass, biogas, and coal bed methane. Expect large increase in the use of palm oil (up to 12 M hectares of palm oil) and need to insure water supply.
Japan – Japan has traditionally been seen as an economy with a large nuclear energy generation presence. That is being reduced from 28% of the electric power to a much smaller amount. But Japan is increasing renewables from 15% to 25 %, with some prefectures, such as Kyoto wanting to be at 100% renewables by 2030. Therefore, need the maturation of the technology with controls and backup power to be effective.
• Micro-hydropower is very common throughout Japan. • Most large power plants are on the coast and use sea water for cooling, so use of fresh
water for electric power is uncommon. • Japan has a lot of geothermal resources, but there is competition with social/cultural
interests in its use as recreational hot springs. • The population is decreasing and rural and urban water and energy needs are different and
becoming a point of contention, mostly around water and land issues. • Issues of the use of land for solar and hydropower, or efforts to place solar PV on rooftops
and save land is an issue.
Malaysia – Malaysia has 98.7% of population with access to electric power and 96% with access to water. They have 250 cm (100 inches) of rain a year and 4 large dams, and most power plants on the coast using sea water for cooling.
• Electric power is 30 GW with 18% hydro, 44% natural gas, 20 % coal, and 10% renewable. Malaysia will increase renewables to 20% by 2025.
• The big direction is for trans-border power lines with interconnections to move electricity to Laos, Thailand, and Singapore from Malaysia by 2020.
• Key challenge is capital funding for renewable and interconnections efforts.
Philippines – The Philippines is looking at a major increase in electric power from 60 GW in 2017 to 140GW by 2040. Most power plants are on the coast and use sea water for cooling and hydropower is most of the renewable portfolio.
• Energy supply will change from 27% coal, 5% gas, 34% oil, and 33% renewable in 2017 to 30% coal, 12 % natural gas, 21% oil, 35% renewable in 2040.
• With plants using seawater, fresh water use is not currently a large issue. • With hydropower being 35% of mix, water security in droughts could become an issue. • Does not expect to pursue electric grid interconnection with SE Asia economies due to the
expense. • Energy is the #4 priority in the Philippines.
Thailand – Thailand’s current mix of electricity generation is 76% fossil fuel, 15% renewable energy, and 10% from other sources including 1000 MW of wood -fired generation. They have initiated long-term development plans for electric power, energy efficiency, LNG, and renewable energy, with a plant to increase renewables to 30% of the generation mix by 2036.
• Biomass will expand with addition of biogas and waste to energy plants
25
• Biofuel production will move to production of B20 from the current B7 fuel production in the transportation sector
• Moving to the use of rooftop solar and floating solar panels on reservoirs. • Considering mini hydropower to better support agriculture and to support transmission of
water, additional generation of electricity not currently a priority. The big issue is the impacts in the dry season when there is no water for hydropower.
• Current major issues are the lack of land for power plants, and the lack of water to support new power plants.
United States – The United States has been evaluating the energy water connections since 2005. During that time there have been two major reports by the US DOE on energy water directions and five reports from the US General Accountability Office, several reports for the US Congress from the Congressional Research Service, several reports from other US agencies including the US Departments of Agriculture and the Interior, and the Environmental Protection Agency. There have also been a number of reports from the US laboratories and the US National Science Foundation. The current focus is broad and includes [USDOE 2014]:
• Reduce water use intensity in thermoelectric power by cooling technology improvements • Improve waste heat recovery in energy systems • Improve process water use and reuse efficiency and quality • Using advanced materials and processes increase non-traditional water use in energy • Improve traditional and non-traditional hydropower • Improve the energy efficiency of desalination to
create more usable water • Net-Zero municipal wastewater treatment through
biogas recovery and use • Development of new sensors for real-time
monitoring and control Sensors • Improved and integrated data and analytical
platforms • Improved decision support tools for energy and
water engineers • Integrated energy-water-climate considerations for
improved policy framework • Stakeholder engagement including international
diplomacy and cooperation • Establish large-scale demos to support rapid deployment
As identified by other participants, the US is moving to the use of more renewables to reduce water use and reduce GHG emissions, looking at ways to encourage grid-scale energy storage to support renewables, including pumped hydro in many western states, and the use of non-traditional water, such as seawater, brackish ground water, and produced water to replace the use of fresh water. Several grid studies are being undertaken to look at where different waters are available to enable optimization of power plants to ensure reliable grid operation. As the cost of renewables have gone
26
down, they are quickly replacing older coal power plants across the US economy so grid reliability is a major modeling and analysis effort. Several states, including Hawaii and New Mexico have pledged to have carbon free electric power by 2040-2045. Viet Nam – Viet Nam currently has 100% electrification. The electric grid is currently 40% hydropower, 38% coal, 18 %oil and natural gas, and 1.5 % other renewables. By 2020, they will have over 5000 MW of hydropower.
• New energy projects will have power purchase agreements of 20 years and the current prices are wind 8-9 cents/kWh, solar PV 9 cents/kWh, solid waste 7-10 cents/kWh, and biomass/combined heat and power 6 cents/kWh.
• The transmission grid was not designed for solar PV and wind and therefore there is no experience operating these kind of intermittent renewable generation systems for grid stability and reliability, although there are over 4000 MW of renewable energy in the master plan by 2026.
• Some pumped hydro is planned to come on line by 2030.
Summary - In many cases, the economies are pursuing similar energy development trends and challenges. These were summarized by the participants as the following thoughts:
• Some economies will focus on integrating electric transmission with their neighbors to share power, and therefore there us a need for modeling of interconnected grids to assess reliability and resiliency with different generation mixes in some of these soon to be interconnected economies.
• All economies are interested in the increased use of renewables and distributed generation that reduces water use, but thus could cause potential instabilities in power supply and availability that needs to be addressed to improve overall energy resiliency.
• Often a focus on developing additional hydropower, including pumped hydro storage, low-head hydro, and the negative impact on fisheries (food), and public water supplies by this approach unless well planned and coordinated,
• Many APEC economies are considering the import of LNG for electric power generation. But there is the potential for shale oil and shale gas development in many APEC economies with water needs for fracking a major challenge.
• Also, some economies are looking at major biofuel expansions and the need to better understand the associated impact on water availability for food and municipal water supplies.

27
SESSION 8. The Water Nexus in the Energy Transition to a Lower Carbon Economy in Australia Session Leader– Prof. Jamie Pittock, Fenner School of Environment & Society, The Australian National University Session Summary and Highlights - There are significant implications for water use on the driest inhabited continent as Australia transitions away from coal-fired electricity. Lacking coherent government policy, the energy sector is opting for significant increases in use of unconventional gas, solar and wind generation, backed up by a massive expansion in pumped storage hydropower. The country is looking at 22 pumped hydro plants of up to 2000 MW each, which will triple current pumped hydro storage. Water use will therefore increase or decrease at different locations. For example, it could make more water available in areas where renewables are replacing coal plants, enabling environmental flows on some rivers and reducing thermal pollution of the rivers. But it could increase water use in some dry areas. Other options could include the recycling and reuse of coal bed methane water and shale gas produced water for use in these industrial processes, or to use as the water used in pumped hydro application in the arid environments where these oil and gas production technologies are being used. The National Water Initiative policy to govern water use is therefore being applied inconsistently. One example is carbon-offset reforestation threatens to significantly increase evapotranspiration from fresh ground water systems. As climate change impacts water availability, the next loop of the hydro-illogical cycle is being triggered in an effort to manage the nexus. Suggested solutions to this problem might be the following:
1. Use of market mechanisms to specifically internalize water needs regionally based on sustainability rather that only consider as an externality, which is often lost when looking only at a domestic scale rather than a more local scale.
2. Integrated governance - coordinated natural resources planning based on regional and domestic sustainability requirements.
3. Better data and modeling to create knowledge and inform decisions through validated energy water decision support tools.
4. Tie technology improvement goals to regional and domestic energy water sustainable and security performance goals. The metrics should be set for both regional and domestic requirements and goals.

28
SESSION 9: Multi-scale Water-Energy-Food Nexus Under Industrialization and Urbanization Session Leader– Makoto Taniguchi, Research Institute for Humanity and Nature, Japan Session Summary and Highlights - Water, energy, and food (WEF) are interlinked with each other beyond the boundaries of each watershed as well as trans-spatially, such as local, domestic, regional and global scales. The WEF nexus also has a tradeoff and synergy not only among these three resources, but also among the economy, environment, and society. Therefore, we need multi-scale analyses of the WEF nexus to address increasing interdependencies and trade-offs among the conditions of climate and social change. Some of these important considerations include relationships between social/cultural/economic development across different sectors of society such as rural and urban groups, or efforts to drive to either industrialization or urbanization. The WEF nexus will need to be considered within these social /cultural issues to have effective metrics for both regional and domestic considerations. Therefore, several metrics have been developed and have been analyzed with various indices including self-sufficiency as a part of security, and water footprints for food production as WEF interlinkages in Japan, depending on different spatial scales. One example is the increasing use of solar PV. Should large plants be established in rural areas, making it more industrialized, or put on rooftops in urban areas to save the land and water for agricultural uses in rural areas. Selection of metrics such as food and water security, food resiliency, food self-sufficiency, and energy cost are all reasonable metrics that if not used in conjunction with the others, could lead decisions with some very devastating consequences. Therefore, not only does the water-energy-food nexus require integrated planning, but a broad range of potential evaluation metrics are needed to develop a cost-effective and robust regional and domestic planning strategies that can take into consideration social/cultural, and economic factors.

29
SESSION 10: Water-risk Tools for Global and Regional Analysis and Applications Session Leader– Tianyi Luo, Senior Manager, Water Risks & Data Analytics, Global Water Program, World Resources Institute Africa | Brazil | China | Europe | India | Indonesia | Mexico | Unites States Session Summary and Highlights - The availability and quality of fresh water to meet human needs is a top-tier global issue for environment and development. Risks associated with water availability are further compounded by uncertainties in the distribution of future climatic and rainfall patterns. High and unsustainable water use forces competition or compromises that may lead to conflict among users. Water managers must balance the needs of growing populations, energy production, and food irrigation requirements, as well as threats to ecosystems and the services they provide.
Water scarcity is one of the defining issues of the 21st century. In its Global Risks 2013 report, the World Economic Forum identified water supply crises as one of the highest impacts and most likely risks facing the planet. With the support of a diverse group of partners, the World Resources Institute built Aqueduct to help companies, investors, governments, and communities better understand where and how water risks are emerging around the world. To fill this gap, the World Resources Institute’s Aqueduct information platform compiles advancements in hydrological modeling, remotely sensed data, and published datasets into an online platform. The Atlas uses a robust, peer reviewed methodology and the best-available data to create high-resolution, customizable global maps of water risk.
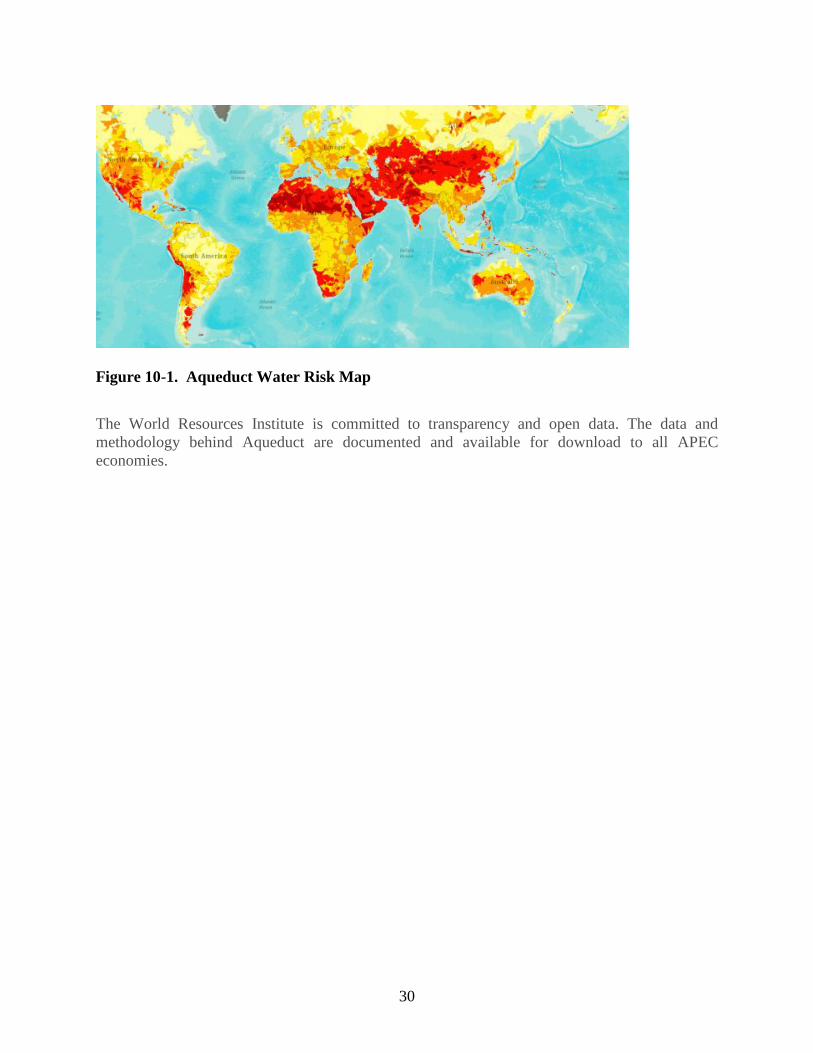
The session was organized to give the participants an introduction to Aqueduct and how it could be used by APEC economies to integrate energy and water analysis and applications. Aqueduct's global water risk mapping tool is designed to help companies, investors, governments, and other users understand where and how water risks and opportunities are emerging locally and worldwide. As such, the Atlas can be used in helping economies coordinate energy planning with water planning, providing one link to integrated energy water planning and policy. As can be seen in Figure 10.1, many of the economies in the Asia-Pacific region are already at high water risk indicating integrating energy and water planning and policy will be a must. Therefore, familiarity with Aqueduct could provide APEC participants with a good approach to quickly help integrate water risk into near-term and future energy planning and policy.
In this session, several examples of how to use Aqueduct were demonstrated by Tianyi Luo of the World Resources Institute, to familiarize the APEC workshop participants with the types of information and data available to assess current water risk in individual economies and regional economies.
30
Figure 10-1. Aqueduct Water Risk Map
The World Resources Institute is committed to transparency and open data. The data and methodology behind Aqueduct are documented and available for download to all APEC economies.

31
SESSION 11: Exercise 1 – Constructing an Electricity-Water Scenario Analysis with the ReEDS Capacity Expansion Model Session Leader - Stuart Cohen, National Renewable Energy Laboratory, Golden, Colorado USA Session Summary and Highlights - In this exercise, participants helped establish a set of electricity scenarios to simulate and analyze using the NREL ReEDS capacity expansion model of the US electric power sector. In this Day 2 and 3 effort, we described available scenario drivers, such as: (1) available cooling system technologies, (2) available water resource types for thermal cooling, (3) future climate projections, (4) fuel prices, (5) technology costs, and (6) emissions policies. Participants were then asked to decide upon key scenario drivers to produce a unique scenario suite for the workshop. The final scenarios selected included alternative pumped hydropower storage costs, transmission costs, climate futures, water availability, electricity demand, and emissions policy changes. The 10 different scenarios utilized are shown in Table 11-1. Many of these scenarios were based on emerging water, climate, demand, and renewables and storage issues currently under consideration by several of the participating APEC economies. For example, high electricity growth, energy storage and renewables, and water availability are currently of concern to many APEC economies. Also, on Day 2 participants identified model output metrics to be examined and presented on Day 3. Metrics included electricity capacity, generation, and transmission; economics; water withdrawal and consumption; and other environmental impacts. Each of the scenarios developed was evaluated overnight, and the results of the simulations presented on Day 3. On Day 3, the group explored the model results in real-time using an NREL-developed visualization tool to quickly navigate through the results of the ReEDS scenario analyses to assess available spatial, temporal, and technology options. Overall, the exercise was used to demonstrate:
1. The speed at which different energy planning scenarios can be evaluated with a built capacity expansion model – less than a day with current modeling and computing approaches,
2. Show how stakeholder input, represented by the different workshop participants, can be used to establish a range of reasonable metrics and scenarios in a relatively short time frame, and
3. Demonstrate the current state of the art of capacity expansion modeling relative to domestic and regional energy-water interactions and decision-making needs.
The group explored the modeling results and discussed the relative importance of the different scenario drivers in the US model to consider how a similar exercise might apply to APEC economies. There was interest in better understanding data needs and assumptions necessary for ReEDS and its ability to consider a wide range of policy options that might be proposed by different APEC member economies.

32
Table 11-1. Electricity-Water-Climate-Scenarios for Evaluating the ReEDS Model
Scenario Name
Technology Cost
Climate Scenario
Water Availability
Electricity Demand Growth
Emissions Policy
Baseline scenario NREL ATB18 Mid Cost
Static climate
All waters available
EIA AEO18 Reference
None
High electricity demand growth
* * * +60% by 2050
*
High CO2 penalty and higher electricity demand
* * * +60% by 2050
$90/tCO2 by 2050
High pumped hydropower storage growth and higher electricity demand
50% lower capital costs of pumped hydro
* * +60% by 2050
*
Transmission constrained and higher electricity demand
2X loss, 3X cost
* * +60% by 2050
*
Better transmission costs and efficiency and higher electricity demand
½ losses, ½ costs
* * +60% by 2050
*
High climate temperatures and higher electricity demand
* HADGEM2-ES RCP8.5
* +60% by 2050
*
Moderate climate temperatures and higher electricity demand
* MIROC5 RCP8.5
* +60% by 2050
*
Lower Battery Costs NREL ATB18 Low Cost
* * * *
No new freshwater use for electricity generation
* * No fresh water available for new generation
* *
Overall, this exercise highlighted that high-level integrated energy-water planning and policy analysis is currently technically feasible and possible without the need to develop extensive APEC economy-specific rapid modeling and scenario analysis frameworks. Generalized modeling approaches are currently available to provide rapid integrated energy and water impact analysis for a wide range of scenarios and drivers.
33
SESSION 12: Exercise 2 – Energy Water Calculator Session Leader - Vincent Tidwell, PhD, Distinguished Member of the Technical Staff, Sandia National Laboratories, Albuquerque, NM USA Session Summary and Highlights - Water is a critical element in electric power production. Water use varies greatly across economies, in large part due to the comparative differences in the amount of electricity generated and the mix of technologies used. This exercise was designed to explored how different energy generation portfolios affect water demands and water resources. The analytical and modeling platform used in this exercise is based on system dynamics approaches. System dynamics is over 50 years old and is based on evaluating the time variation in inflows and outflows of stocks, commodities, and their storage over time. This could be widgets, dollars, cubic meters of water, water, kilowatt hours of energy, tons of greenhouse gases, etc. This modeling approach has been used extensively over the past 25 years in the water management community for river and reservoir management and routing. In the past decade, Sandia National Laboratories has pioneered the use of this modeling approach for integrated energy and water analyses. The focus has been to look at renewables, alternative cooling upgrades, and the use of non-traditional water in the electric power generation sector to assess changes in overall water availability and water stress relative to other competing water demands, electric reliability issues, greenhouse gas reductions, and economic improvements in different basins and regions. The modeling can also look at both surface and ground water changes when climate changes in precipitation and river flows are included. The big advantage of the system dynamics modeling approaches is that the system interconnections are directly included in the model, and the associated calculations can be done exceeding fast, even on small computers, providing answers for different scenario evaluations in minutes rather than hours or days. This is one reason the approach is used for river and reservoir routing, because changes in conditions can be analyzed in minutes, and changes in water pumping, control of gates, etc. can be done almost in real-time. For planning purposes, once the model of a basin or region has been developed, the approach allows a wide range of complex scenarios and options to be evaluated in days rather than months. The purpose of this workshop exercise was to familiarize participants with some of the uses of system dynamics modeling using a relatively simple basin-level integrated energy water analysis model developed for the workshop, called the Energy Water Calculator. The Energy Water Calculator was used in real-time during the workshop, allowing participants to develop a sense of key tradeoffs between power generation and water use in managing the energy-water nexus. During this exercise, participants used the Energy Water Calculator to show water demand requirements based on selecting different initial power generation portfolios, future power generation mixes, potential growth rates, and other energy factors. Final example results were presented in terms of future water use, installed capacities required, and carbon emissions. The results were used to highlight to the participants some of the various interdependencies and tradeoffs that can occur in integrated energy and water planning.

34
The Energy Water Calculator includes all required software for its application. Once installed on the user’s computer analyses can be tailored to the specific needs of the analysis. This is accomplished through a simple user interface. Analyses begin by inputting key data characterizing the electric energy and water system of interest. Analyses can be implemented at any scale (local, regional, domestic) by simply adjusting the domain represented by the input data. Analyses begin by inputting information on the current energy-water system, including: fuel mix of current electric power generation portfolio (percentages); current annual electricity production; current water withdrawals in the municipal, industrial and agricultural sectors; 2005 and 2015 population values; and estimated renewable freshwater as shown in Figure 12-1. Next, future energy scenarios of interest can be sequentially investigated. This is accomplished by inputting: population growth rate; growth rate in electricity demand; future mix of generation by fuel type; and mix of cooling type for each future scenario. An example is shown in Figure 12-2. Inputting the data is easily accomplished by clicking on hyperlinked buttons and adjusting slider bars in the model interface. The model interface automatically adjusts the energy mix to equal 100%.
Figure 12-2. Energy Water Calculator interface example – Electricity Production Mix Once the data is entered, each scenario is simulated and results saved. The model operates on an annual timestep from 2020 to 2040. Model results provided in the Energy Water Calculator include; projections of future electricity production and capacity (by fuel type), total air emissions, thermoelectric water withdrawal and consumption (by fuel and cooling type), and other sector water withdrawals (compared to renewable freshwater). The results of each scenario evaluation is presented as a sequence of graphs and bar charts, with an example shown in Figure 12-3. Note the hyperlinked buttons at the bottom of each analysis that can be used to quickly navigate around the interface to look at different impacts, factors, and results for each scenario.
Electricity Production Shares
Coal PV
0306090
GasStm
04080
Gas CC
0306090
GasCmb
0306090
Oil Stm
0306090
Oil CC
0306090
Oil Cmb
0306090
Nuclear
0306090
Geo
0306090
BioFuel
0306090
Coal IG
0306090
Sol CSP
0306090
Sol PV
0306090
Wind
0306090
Hydro
0306090
0.25 0.10 0.17 0.00 0.02 0.00 0.00 0.00 0.000.00 0.00 0.00 0.00 0.02 0.44
Production Shares ResultsCooling Shares HomeInitial Conditions
Initial Conditions
Renewable Resources
200,000 600,000 1,000,000MM3
884,100.00 MM3
2005 Population
200,000,000 600,000,000 1,000,000,000People
84,310,000.00 People
Figure 12-1. Slider bars in the Energy Water Calculator for inputting initial conditions.

35
Figure 12-3. Energy Water Calculator – Water withdrawal results for one scenario
Water Withdrawals
Water Withdrawals
Jan 1, 2019 Jan 1, 2024 Jan 1, 2029 Jan 1, 2034 Jan 1, 2039
1,800
1,900
2,000
2,100MM3
Total Electric Sector Water Withdrawal Initial Withdrawal
Wit
hd
raw
als
Water Withdrawals
Once through Cooling tower Cooling pond Air cooling0
500
1,000
1,500
MM3
electric withdrawalby cooling type Initial withdrawalby coolng type
Cooling Type
Wit
hd
raw
al
Water Withdrawals
Coa
l PC
Gas
Ste
am
Gas
CC
Gas
Com
bust
ion
Oil
Ste
am
Oil
CC
Oil
Com
bust
ion
Nuc
lear
New
Geo
ther
m
Bio
fuel
Coa
l IG
CC
Sol
ar C
SP
Sol
ar P
V
Win
d N
ew
Hyd
ro0
500
1,000
1,500
MM3
electric withdrawal by fuel type Initial withdrawal by fuel type
Fuel Type
Wit
hd
raw
al
Controls
Sector Water Use
Electricity Results
Emissions
Home
Withdrawals
Consumption

36
The simplified model is being made available to all participants and APEC economies along with a short overview and tutorial for further use and understanding of trends and the basics of potential tradeoffs. Instructions for installing the model are included in the associated readme file. Once installed, instructions for operating the model are provided in the model interface shown in Figure 12-4.
Figure 12-4: Energy Water Calculator - Interface model operation instructions

37
SESSION 13: Brainstorming of Opportunities for Integrated Energy Water Planning Projects in APEC Economies – Potential Projects in 2020 Session Leader – Cary Bloyd, APEC Project Overseer, Pacific Northwest National Laboratory, Richland, Washington, USA Session Summary and Highlights – Following the presentations, case studies, and example problems, the workshop participants were asked to discuss as a group some of the major challenges and issues they faced collectively, as well as suggestions for next steps in addressing integrating energy and water planning and policy. The comments centered around two major areas, the needs and requirements by the member economies for integrated energy and water modeling and analysis tools, and what types of follow-on projects through APEC would be of most value to all the economies. The highlights and summaries of these discussions are presented below. 13.1 Energy Water Integrated Modeling and Analysis Needs Following the presentations and exercise around the three different modeling and analysis approaches presented as examples of techniques available to support integrated energy-water planning:
• the Aqueduct water risk analysis tool; • the ReEDS electricity planning model for evaluating tradeoffs in generation and
renewables mix on water, GHG, and electricity reliability. • and the system dynamics approach for looking at the energy and cooling system impact on
basin and region water supplies, participants made the following suggestions on the types of functionality they most need. These included:
• Applications must be broad and enable analysis of a number of emerging ideas, including biofuels, pumped hydro, low-head hydro, interconnections with other economies, etc.
• The models and tools must be relatively easy to use, provide analyses in a timely manner for planning - weeks to a few months - not years.
• Integrated such that they are appropriate for available data, and includes data collection as part of effort.
• Includes costs and can clarify advantages and disadvantages of different options, and will provide the ability to summarize best approaches based on a range of identified metrics.
13.2 Priority Follow-on Integrated Energy Water Planning Projects The participants identified five major follow-on efforts that they thought would support member economies in improving long-term energy planning and energy policy formulation to better understand the impacts and consequences of energy planning when integrated with water and climate challenges. The five priority follow-on efforts identified included:

38
1. Develop Energy Water System Modeling Tools Applicable to Needs of APEC Economies
Changes to energy systems impact water resources (and often changes in water impact energy demand too). There are often unexpected, negative impacts. To help governments identify potential negative outcomes and manage these conflicts, systems dynamics type models should be used. These should be developed to identify the positive and negative synergies between the energy sector and other sectors to inform decision making and policy. System-level dynamic models have been developed over the past decade for several river basins including the Mekong, for example: Pittock, J., D. Dumaresq and A. M. Bassi (2016). "Modeling the hydropower-food nexus in large river basins: A Mekong case study." Water 8(10), and the Rio Grande and Colorado River systems in the US. Japan has also started using system dynamics models to look at optimization of strategies to improve societal, energy, water, and food security and resiliency. The APEC participants agreed that while collecting the data needed to develop system-level decision-support models could be a challenge, these modeling approaches would allow a broader look at a wide range of energy and water use options and could be useful for policy and regulatory planning. The representatives suggested next steps could include: a) collating information on available models, b) communicating case studies of the application of these models, c) identifying standards for data collection and formats, and d) development of preliminary models adaptable to individual economies that are simple to use. 2. Develop Electric Transmission Models for APEC Economies Electricity generation technologies with minimal water use, such as solar and wind, may be geographical restricted to places at some distance from energy storage (such as pumped storage hydropower stations) and places with high power demand. Significant electric power transmission capacity is being considered to link islands and grids within APEC economies, and to link the different economies. This should help increase electricity supply options and redundancy, and hopefully create a greater use of renewable energy. At the workshop several examples were given of potential transmission upgrades in Australia, Indonesia, Japan, Malaysia, the Philippines, the US, and Viet Nam that would enhance regional energy security. The development and use of transmission planning models utilizing different mixes of renewables, fossil fuels, and considering energy reliability and water use have been developed and were demonstrated by the US National Renewable Energy Laboratory for the western US and India. Additionally, examples of APEC economy transmission and renewable planning scenarios were evaluated to look at water, energy reliability, and energy resiliency impacts. The APEC participants agreed that this type of analysis tool could be used to help identify: a) extensions to transmission systems that would facilitate greater use of renewable electricity generation (including hydropower), b) grid connections between APEC economies that would increase security of supply, c) mechanisms to help finance the transmission system improvements, and d) the ability of major energy export economies to meet regional electricity export requirements easily without impacting regional water supply security and reliability. This would help the APEC economies assess the security and resiliency of different regional electricity export

39
and import options under climate change scenarios that could impact renewables and hydropower and individual economy security and resiliency. 3. Improved Modeling and Analysis of Pumped Storage Hydropower
Pumped storage hydropower uses excess electricity, such as that generated by wind turbines in the night, to pump water from a lower to an upper reservoir where it can be used later to generate hydropower to meet peak demands. Pumped storage developments act like big batteries for electricity storage. They can be built with minor additions to some existing reservoirs or in abandoned mine pits, and therefore often have lower environmental and social impacts than new run of river hydropower projects. Many APEC economies are considering additional hydropower and renewable energy projects. New pumped storage hydropower capacity will likely be more important in many economies for managing future grid stability – preventing black outs – and enabling intermittent renewable electricity generators (wind and solar) to provide base load power at low energy storage costs. APEC economies would find it useful to better model pumped hydropower storage benefits and costs in order to: a) assess how additional energy storage could increase their energy security, b) model how pumped storage could enable greater use of solar and wind generation, and c) identify sites in their economies that may most readily facilitate pumped storage hydropower developments. For example, This might include modifying existing dams, integrating new mini-hydro projects, re-using large abandoned mine sites, or co-locating pumped hydropower near existing transmission infrastructure or renewable generation sites. 4. Improved Water Management in Unconventional Gas Production
It was noted by the APEC economy participants that shale oil and shale and coal bed (seam) methane deposits underlie extensive regions in APEC economies. At the same time, many of the APEC economies are considering the import of LNG to support high reliability electric power at lower emissions. The unconventional gas produced has around 40% of the GHG emissions of equivalent coal fired power. Therefore, it might be appropriate and cost effective for APEC economies to utilize their own shale gas and other indigenous natural gas supplies. But exploitation could requires extensive de-watering of shallow coal bed methane deposits, or water to frack deeper shale gas formations. The United States is one APEC economy that has extensive experience with these problems and often better practices to minimize the negative impacts of shale and coal bed methane production on water resources. APEC participants agreed that while many other APEC economies have more centralized regulatory systems for environmental approvals for such gas production, the evaluation of current and emerging best practices could help APEC economies usefully explore lessons for better regulations and other practices for exploitation of regional unconventional gas resources. This could include the current trend of eliminating the use of fresh water for fracking, recycling of fracking and produced water, and the environmental management and disposal of waste brines to eliminate impacts on fresh water resources.
40
5. Utilization of Advanced Microgrids to Improve Energy Resiliency Many APEC economies are accelerating the movement to higher penetration of renewables that are often intermittent, such as solar and wind and even some hydropower where irrigation or municipal supplies are higher priorities than electricity generation. At the same time, if substantial amounts of additional electricity transmission capacity are created to move electricity between islands or economies, the loss of this transmission capability from storms of other events could threaten regional energy security, reliability, and resiliency of many economies. One approach to reduce the impact of such events is to integrate the use of advanced microgrids with distributed energy supplies to create ‘resiliency nodes’ throughout the grid to support critical community functions and services and critical infrastructure operations during an extended outage. APEC participants agreed that consideration of the designs and use of advanced microgrid or advanced mini-grid designs and operations should be integrated into electric power transmission development policies and planning to help ensure secure, resilient, and reliable power to support social and economic needs. This is very important as identified in one of the technical presentations on the growing severity and number of extreme events and the associated expansion of power outages and high impact storm events from climate change. The use of advanced microgrids can improve the safe use of renewable energy resources during power outages to help better support critical community functions, rather than having to be disconnected during power outages to ensure physical safety. 1.3 Summary As identified in this report, there are a variety of indicators that suggest that many APEC economies need to improve the integration of future energy and water resource planning and development to maintain economic growth and support long-term energy and water supply reliability, security, and sustainability. As discussed in this report, to accomplish this goal, APEC economies will need to actively encourage integrated domestic and regional energy and water-resource management, implement the best mix of water-efficient energy technologies to match regional water availability, and develop ways to implement new technologies and approaches that significantly improve energy and water use efficiency, while maintaining energy and electric power reliability, resiliency, and sustainability. This workshop provided an initial foundation for the development of future APEC projects or programs on efforts and directions to help minimize the impact of future water availability on energy generation and production and accelerate the integration of energy and water resource planning for improved sustainable energy policy development.
41
References and Bibliography CRC (2017). Sustainability in the Mineral and Energy Sectors, Chapter 20 – Water and Energy Nexus: Impact of Energy Development on Water Resources, Michael Hightower, CRC Press, Boca Raton, FL, 2017. MEDRC (2019). Hightower, M. “Energy-Water-Food Nexus”, Transboundary Waters – Practitioner Briefing, Middle East Desalination Research Consortium, Oman, Issue 4, June 2019.
National Geographic (2008). National Geographic Partners, Washington, DC, April 2008.
Pate (2007). Pate, R., Hightower, M., Cameron, C., Einfeld, W., “Overview of Energy-Water Interdependencies and the Emerging Energy Demands on Water Resources”, SAND2007- 1349C, Sandia National Laboratories, Albuquerque, New Mexico, March 2007.
Pittock (2015). Pittock, J., et. al, Climate, Energy and Water, Cambridge University Press, 2015. USDOE (2014). “The Water-Energy Nexus: Challenges and Opportunities”, US Department of Energy, Washington, DC, June 2014. USDOE (2006). “Energy Demands on Water Resources, Report to Congress on the Interdependency of Energy and Water”, US Department of Energy, Washington, DC, December 2006. World Economic Forum (2009). “Energy Vision Update 2009: Thirsty Energy: Water and Energy in the 21st Century”, Geneva, Switzerland, 2009. World Energy Council (2010). “Water for Energy Report”, London, 2010.
42
Appendix A: Energy Water Workshop Focus
APEC Workshop on Integrated Energy-Water Planning and Policy Formulation May 6-8, 2019 - Honolulu, Hawaii
Scarce water supplies are impacting energy development across APEC economies while also putting increased demands on the energy sector to pump, treat, convey and distribute drinking and wastewater. Rapid population growth, urbanization and intensifying extreme climate events further threaten the resilience and sustainability of the region’s connected energy-water systems. Furthermore, each economy requires unique solutions tailored to their specific needs. This three-day workshop on Integrated Energy-Water Planning and Policy Formulation has been developed to provide capacity-building and training on integrated planning for connected energy-water systems. The workshop will help APEC economies: 1) identify risks posed by the energy-water nexus issues across sectors; 2) discuss adaptive measures to address emerging risks and enhance resiliency; 3) identify best practices and explore frameworks for integrated energy-water planning and policy formulation, and 4) provide a networking opportunity for APEC members and energy-water experts to discuss ideas for regional projects. The workshop brings together representatives and practitioners from APEC economies to exchange experiences on local energy-water issues and challenges, and on measures that have or could be taken to enhance energy-water resilience and sustainability. The workshop will also present case-studies to demonstrate to APEC economies the principles obtained in the practical applications of integrated energy and water planning. In addition, past experiences from several APEC economies, including energy water impact assessments in the western United States, Australia, Japan, and other Asia economies will be discussed, and modeling frameworks presented that can be used to assess direct environmental, economic, and energy and water resource impacts to changes in energy mix and/or energy policy. The workshop objectives are to build both understanding and APEC capacity on the use and application of methodologies to evaluate water risks to energy and economic development and on integrated energy and water resource planning, while improving natural resource sustainability and economic resiliency compatible with funding mechanisms from international lending organizations. Workshop presentations, discussions, and case study examples will be compiled in a report that includes energy water issues and trends, emerging concerns, information on modeling and analysis tools, and discussion of analysis results from workshop examples. The outputs will be used to assist the different APEC economies and decision makers across the region to help identify potential integrated energy water project studies and conceptual design evaluations in 2020, that could be used to fast-track future infrastructure projects, funded by international lending institutions, in a way that can improve natural resource, societal, and economic resiliency in APEC economies.

43
Appendix B: Energy Water Workshop Agenda FINAL AGENDA
APEC Workshop on Integrated Energy-Water Planning and Policy Formulation May 6-8, 2019 - Hyatt Place Waikiki Hotel, Honolulu
Day 1: Introduction to the Workshop and Energy Water Interdependencies 8:30 AM - 9:00 AM Arrival & Registration 9:00 AM - 9:15 AM Opening Remarks Cary Bloyd,
PNNL, Project Overseer
9:15 AM - 9:30 AM Welcome Leon Roose, Hawaii Natural Energy Institute
9:30 AM - 9:45 AM Workshop Objectives and Agenda Cary Bloyd 9:45 AM - 10:00 AM Participant Introductions All 10:00 AM - 10:15 AM Coffee Break 10:15 AM - 11:15 AM Energy Water Issues and Economic Development
Challenges - Workshop Focus and Overview Mike Hightower, University of New Mexico, USA
11:15 AM - 12:15 PM Mapping Energy Water Risk Around the Pacific Rim
Vince Tidwell, Sandia National Laboratories, USA
12:15 PM - 1:30 PM Lunch 1:30 PM - 2:30 PM Energy, Water, Food, and Climate Linkages in the
Mekong Region of Asia Jamie Pittock, Australian National University
2:30 PM - 3:30 PM Integrated Management of Water-Energy-Food Nexus in Asia-Pacific Region
Makoto Taniguchi, Research Institute for Humanity and Nature, Japan
3:30 PM - 3:45 PM Coffee Break 3:45 PM - 4:45 PM Parched Power: The Water Demands, Risks, and
Opportunities of India’s Power Sector Tianyi Luo, World Resources Institute
4:45 PM - 5:00 PM Day 1 Discussions and Conclusions Cary Bloyd Day 2: Understanding Energy Water Risks in Planning 8:00 AM - 8:30 AM Arrival, Coffee, Discussion 8:30 AM - 9:00 AM Comments & Summary of Day 1 Cary Bloyd 9:00 AM - 10:00 AM Modeling Future Electricity-Water-Climate
Interactions in the United States Stuart Cohen, National Renewable Energy Laboratory, USA

44
10:00 AM - 10:15 AM Coffee Break 10:15 AM - 11:45 PM Discussion by APEC Economies on Their Specific
Water, Energy, Climate, and Food Challenges APEC Economy Participant Open Presentations
11:45 PM - 1:00 PM Lunch 1:00 PM - 1:35 PM The Water Nexus in the Energy Transition to a
Lower Carbon Economy in Australia Jamie Pittock
1:35 PM - 2:10 PM Multi-scale Water-Energy-Food Nexus Under Industrialization and Urbanization
Makoto Taniguchi
2:10 PM - 2:45 PM Water-risk Tools for Global and Regional Analysis and Applications
Tianyi Luo
2:45 PM - 3:00 PM Coffee Break 3:00 PM - 4:00 PM Panel Discussion: Lessons Learned and Application
of Integrated Energy Water Planning and Policy in APEC Economies
Tidwell, Cohen, Pittock, Luo, Tanaguchi, Hightower
4:00 PM - 5:00 PM Exercise 1: Constructing an Electricity-Water Scenario Analysis with the ReEDS Capacity Expansion Model
Cohen and APEC Economy Participants
Day 3: A Focus on Solutions 8:00 AM - 8:30 AM Arrival, Coffee, Discussion 8:30 AM - 9:00 AM Opening Comments & Summary of Day 2 Cary Bloyd 9:00 AM - 10:30 AM Exercise 1 Continued APEC Economy
Participants 10:30 AM - 10:45 AM Coffee Break 10:45 AM - 12:00 PM Exercise 2: Energy Water Calculator Tidwell and
APEC Economy Participants
12:00 PM - 1:15 PM Lunch 1:15 PM - 2:30 PM Exercise 2 Continued APEC Economy
Participants 2:30 PM - 2:45 PM Coffee Break 2:45 PM - 4:00 PM Brainstorming of Opportunities for Integrated
Energy Water Planning Projects in APEC Economies and Approaches – Identification of potential of potential projects for 2020
All Participants
4:00 PM - 5:00 PM Wrap Up and Workshop Summary Bloyd and All Participants
45
Appendix C: Energy Water Workshop Participants
Attendees of APEC Workshop on Integrated Energy Water Planning May 6-8, 2019 – Hyatt Place Waikiki, Honolulu
Attendee Organization Country Contact Information
Mr James Pittock
Fenner School of Environment and Society, Australian National University
Australia [email protected]
Mr Tianyi Luo World Resources Institute China [email protected]
Mr Andi Novianto Coordinating Ministry for Economic Affairs Indonesia [email protected]
Mr Makoto Taniguchi Research Institute for Humanity and Nature Japan [email protected]
Mr Amisam Ismail
Ministry of Energy, Science, Technology, Environment and Climate Change
Malaysia [email protected]
Mrs. Melita Carmen Obillo Department of Energy Philippines [email protected]
Mr Weera Sriwarom
Department of Alternative Energy Development and Efficiency
Thailand [email protected]
Mr Sompong Pongsuwaparp
Department of Alternative Energy Development and Efficiency
Thailand [email protected]
Mr Cary Bloyd Pacific Northwest National Laboratory USA [email protected]
Mr Richard Rocheleau
Director, Hawaii Natural Energy Institute – University of Hawaii
Mr Terry Surles
California Institute for Energy and the Environment
Mr Michael Hightower
Center for Energy and the Environment, University of New Mexico
USA
Mr Vince Tidwell Sandia National Laboratories USA [email protected]
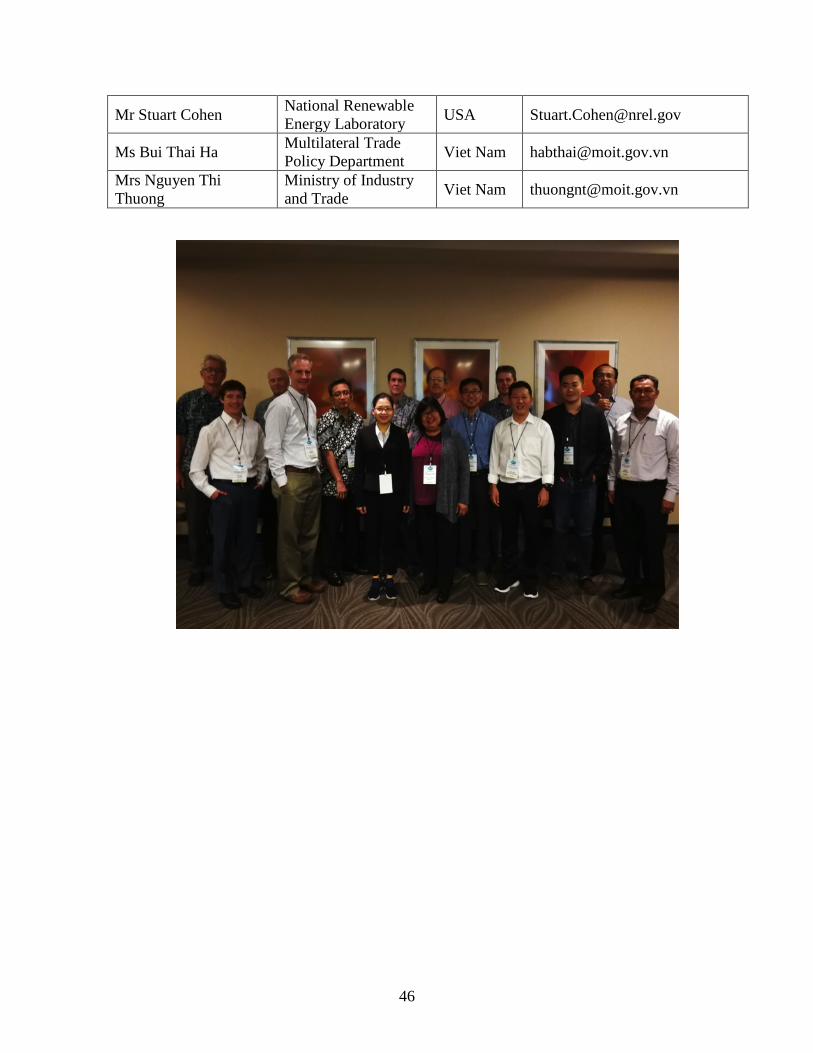
46
Mr Stuart Cohen National Renewable Energy Laboratory USA [email protected]
Ms Bui Thai Ha Multilateral Trade Policy Department Viet Nam [email protected]
Mrs Nguyen Thi Thuong
Ministry of Industry and Trade Viet Nam [email protected]