APEC Energy Demand and Supply Outlook 4th Edition
114
APEC Energy Demand and Supply Outlook 4th Edition
-
Upload
khangminh22 -
Category
Documents
-
view
0 -
download
0
Transcript of APEC Energy Demand and Supply Outlook 4th Edition

背幅 8.5mm
仕上がりA4
APECEnergy Demand and
Supply Outlook4th Edition
APEC
Energy Dem
and and Supply Outlook 4th Edition
APER
C
APEC # 209-RE-01.6 ISBN 978-4-931482-42-5

APEC ENERGY DEMAND AND SUPPLY OUTLOOK
4TH EDIT ION
ASIA PACIFIC ENERGY RESEARCH CENTRE
This report is posted on the website at
www.ieej.or.jp/aperc.
2009

Published by
Asia Pacific Energy Research Centre Institute of Energy Economics, Japan Inui Building Kachidoki 11F, 1-13-1 Kachidoki Chuo-ku, Tokyo 104-0054 Japan Tel: (813) 5144-8551 Fax: (813) 5144-8555 Email: [email protected] (administration)
2009 Asia Pacific Energy Research Centre November 2009
APEC Energy Demand and Supply Outlook – 4th edition Foreword
iii
FOREWORD
We are pleased to present the report, APEC Energy Demand and Supply Outlook – 4th Edition. This outlook is designed to provide a basic point of reference for anyone wishing to become more informed about the energy choices facing the APEC region.
Concerns about energy security, the impacts of energy on the economy, and environmental sustainability are becoming increasingly important drivers of policy in every APEC economy. The ‘business-as-usual’ projections presented here illustrate the risks of the development path the APEC region is currently on. At the same time, the text of this report suggests a number of possible alternative directions that should be considered.
Readers who desire a quick overview of our most important findings should read Chapter 1, “Summary of Key Trends”. Readers who would like a quick overview of our ‘business-as-usual’ projections should read Chapter 2, “Demand and Supply Overview”. Because of the summaries provided in these two chapters, an executive summary would be redundant and is not included.
This report is the work of the Asia Pacific Energy Research Centre (the ‘we’ used throughout this report). It is an independent study, and does not necessarily reflect the views or policies of the APEC Energy Working Group or individual member economies. But we hope that it will serve as a useful basis for discussion and analysis of energy issues both within and among APEC member economies.
I would like to express a special thanks to the many people outside APERC who have assisted us in preparing this report, as well as to the entire team here at APERC.
Kenji Kobayashi
President
Asia Pacific Energy Research Centre (APERC)

APEC Energy Demand and Supply Outlook – 4th edition Acknowledgements
iv
ACKNOWLEDGEMENTS
The development of the APEC Energy Demand and Supply Outlook – 4th Edition could not have been accomplished without the contributions of many individuals and organizations. We would like to thank all those whose efforts made this outlook possible, in particular those named below.
We wish to express our appreciation to the APERC conference and workshop participants who met with us and provided invaluable insights into the issues raised in the draft report.
We also would like to thank members of the APEC Energy Working Group (EWG), APEC Expert Group on Energy Data and Analysis (EGEDA), and APERC Advisory Board, along with numerous government officials, for their helpful information and comments.
PROJECT MANAGER
Ralph D Samuelson
MAIN CONTRIBUTORS
Summary of Key Trends (Volume 1): Ralph D Samuelson
Demand and Supply Overview (Volume 1): Ralph D Samuelson and Kate Penney
Final Energy Demand (Volume 1): Norihiro Okumura, Mardrianto Kadri, Ralph D Samuelson, and Tran Thanh Lien
Electricity (Volume 1): Huang Yi Hsieh and Kate Penney
Primary Energy Supply (Volume 1): Chandran Sundaraj, Joel Hernández-Santoyo, Kate Penney, Mardrianto Kadri, Sergey Petrovich Popov, Satoshi Nakanishi, and James C Russell
Energy Investment (Volume 1): Sergey Petrovich Popov
Carbon Dioxide Emissions (Volume 1): James C Russell and Ralph D Samuelson
Modelling and Economy Reviews (Volume 2): Chandran Sundaraj (Australia, Malaysia, Singapore), Huang Yi-Hsieh (China; Hong Kong, China; Chinese Taipei), James C Russell (United States), Joel Hernández-Santoyo (Chile, Mexico, Peru), Mardrianto Kadri (Brunei Darussalam, Papua New Guinea, Indonesia), Norihiro Okumura (Japan), Ralph D Samuelson (New Zealand), Sergey Petrovich Popov (Russia), Tomoko Matsumoto (Canada, Korea) and Tran Thanh Lien (Philippines, Thailand, Viet Nam).
GRAPHICS
Chandran Sundaraj
EDITORS
Naomi O’Connor, Kate Penney and Lyn Fletcher
PUBLICATION
Kate Penney and Norihiro Okumura
ADMINISTRATIVE SUPPORT
Nobuo Mouri, Mizuho Fueta and Kaori Najima

APEC Energy Demand and Supply Outlook – 4th edition Acknowledgements
v
ACKNOWLEDGEMENT OF APERC ADVISORY BOARD MEMBERS
Institute of Energy Economics, Japan. Kenichi Matsui.
Australian Bureau of Agricultural and Resource Economics, Australia. Terence C Sheales.
Canadian Energy Research Institute, Canada. Marwan Masri.
Energy Research Institute of National Development and Reform Commission, China. Fengqi Zhou.
Tsinghua University, China. Zongxin Wu.
ASEAN Center for Energy, Indonesia. Nguyen Manh Hung.
Institute of Energy Economics, Japan. Masahisa Naitoh.
Korea Energy Economics Institute, Korea. Ki-Yual Bang.
Energy Systems Institute, Siberian Branch Russian Academy of Sciences, Russia. Nikolay I Vorapay.
Center for Energy-Environment Resources Development, Foundation for International Human Resource Development, Thailand. Thierry Lefevre.
Lawrence Berkeley National Laboratory, USA. Mark Levine.
ACKNOWLEDGEMENT OF EXPERTS OUTSIDE THE APERC
MODELLING CONSULTANTS
The Institute of Energy Economics, Japan Energy Data and Modelling Center, Japan. Kokichi Itoh, Shigeru Suehiro, Shen Zhungyuen, Naoko Doi and Yuji Matsuo.
Shonan Econometrics, Japan. Yasuhiro Murota and Yuko Yano.
AUSTRALIA
Australian Bureau of Agricultural and Resource Economics, Australia. Jane Melanie, Trish Gleeson and Suwin Sandu.
BRUNEI DARUSSALAM
Prime Minister's Office, Brunei Darussalam. Haji Alidi Haji Mahmud and Siti Hafsah Haji Abd Hamid.
CANADA
Natural Resources Canada. Robert St-Jean.
CHILE
National Energy Commission, Chile. Marcelo Tokman, Carlos Piña R and Corissa Petro.
National Energy Efficiency Program, Chile. Iván Jaques.
CHINA
National Bureau of Statistics, China. Geng Qin, Meng Hehe and Hong Zhu.
Energy Research Institute of National Development and Reform Commission, China. Liu Xiaoli.
Tsinghua University: Zhao Xiusheng.
HONG KONG, CHINA
Electrical & Mechanical Services Department, Hong Kong, China. Ping-kuen Cheung, Ming Sang Kam and Cho-Yee Ip.
INDONESIA
Ministry of Energy and Mineral Resources, Indonesia. Farida Zed and Saleh Abdurrahaman.
JAPAN
Ashikaga Institute of Technology, Japan. Izumi Ushiyama.

APEC Energy Demand and Supply Outlook – 4th edition Acknowledgements
vi
Atomic Energy Commission of Japan. Sueo Machi.
BHP Billiton Japan. Grant G Burns.
Carbon Finance and Japan Carbon Fund, Japan Bank for International Cooperation. Hitoshi Kurihara.
Central Research Institute of Electric Power Industry, Japan. Norihisa Sakurai.
Economic Research Institute for Northeast Asia, Japan. Vladimir Ivanov.
The Institute of Energy Economics, Japan. Kokichi Itoh, Shigeru Suehiro.
KOREA
Korea Energy Economics Institute, Korea. Gue Jae Jeong and Park Tae Sik.
MALAYSIA
Ministry of Energy, Green Technology and Water, Malaysia. Loo Took Gee and Badriyah Abd Malek.
Pusat Tenaga Malaysia. Siti Indati Mustapa.
MEXICO
Ministry of Energy, Mexico. Georgina Kessel, Leonardo Beltrán-Rodríguez, Leydi Barceló-Córdova, Verónica Irastorza, Virginia Doniz and Gumersindo Cué.
NEW ZEALAND
Ministry of Economic Development, New Zealand. Simon Lawrence, Mark Dean, Mark Walkington, and Hien Dang.
PAPUA NEW GUINEA
Department of Petroleum and Energy, Papua New Guinea. Vore Veve.
PERU
Ministerio de Energia y Minas, Peru. Daniel Cámac-Gutiérrez, Ismael Aragón-Castro and Orlando Chávez-Chacaltana.
PHILIPPINES
Department of Energy, Philippines. Jesus T Tamang.
RUSSIA
Federal State Statistics Service, Russia. Alexander Goncharov.
SINGAPORE
Energy Market Authority, Singapore. Latha R Ganesh.
National Environment Agency, Singapore. A Ram Bhaskar.
CHINESE TAIPEI
Ministry of Economic Affairs, Chinese Taipei. Jui-Hsiang Yao and Juen-Shen Wei.
National Taipei University, Chinese Taipei. Ssu-li Chang.
THAILAND
Ministry of Energy, Thailand. Boonli Sillavatkul and Jarasphan Phumpuang.
UNITED STATES
Department of Energy, USA. Linda Doman.
VIET NAM
Ministry of Industry, Viet Nam. Vu Van Thai and Pham Khanh Toan.

APEC Energy Demand and Supply Outlook – 4th edition Acknowledgements
vii
INTERNATIONAL ORGANIZATION
International Energy Agency, France. Amos G. Bromhead, Chen Xiaobao and Nigel Alan Jollands.

APEC Energy Demand and Supply Outlook – 4th edition Contents
viii
CONTENTS
Foreword ........................................................................................................................................................... iii
Acknowledgements .......................................................................................................................................... iv
List of tables ....................................................................................................................................................... x
List of figures .................................................................................................................................................... xi
List of abbreviations ...................................................................................................................................... xiv
1 Summary of Key Trends ................................................................................................ 1
Key assumptions .................................................................................................................................... 1
Oil security remains a major threat to the economy of the APEC region ................................... 3
The long-term impacts of the economic crisis ................................................................................ 3
Minimum APEC intensity goals will be met under business-as-usual .......................................... 4
Business-as-usual is still environmentally unsustainable ................................................................. 4
The push for sustainability ................................................................................................................... 6
New technologies .................................................................................................................................. 7
References ............................................................................................................................................. 11
2 APEC Demand and Supply Overview .......................................................................... 13
GDP per capita .................................................................................................................................... 13
Final energy .......................................................................................................................................... 13
Electricity supply ................................................................................................................................. 14
Primary energy supply ......................................................................................................................... 15
Energy imports from outside the APEC region ............................................................................. 16
References ............................................................................................................................................. 19
3 Final Energy Demand .................................................................................................. 21
Key assumptions .................................................................................................................................. 21
Total final energy demand .................................................................................................................. 23
Market failures and energy efficiency ............................................................................................... 29
Transport demand ............................................................................................................................... 31
Industrial demand ................................................................................................................................ 37
Other sector .......................................................................................................................................... 41
References ............................................................................................................................................. 46
4 Electricity .................................................................................................................... 49
Historical trend .................................................................................................................................... 49
Outlook results..................................................................................................................................... 49
Access to electricity ............................................................................................................................. 55
Electricity technology development ................................................................................................. 55
References ............................................................................................................................................. 57

APEC Energy Demand and Supply Outlook – 4th edition Contents
ix
5 Primary Energy supply ................................................................................................ 59
Total primary energy supply .............................................................................................................. 59
Oil .......................................................................................................................................................... 62
Gas ......................................................................................................................................................... 66
Coal ........................................................................................................................................................ 71
Nuclear .................................................................................................................................................. 73
Renewables ........................................................................................................................................... 74
References ............................................................................................................................................. 79
6 Energy investments ...................................................................................................... 81
Introduction ......................................................................................................................................... 81
Energy investment requirements in the APEC region .................................................................. 82
Financing energy investments ........................................................................................................... 85
References ............................................................................................................................................. 86
7 Carbon Dioxide Emissions .......................................................................................... 91
CO2 emission results ........................................................................................................................... 91
The way forward .................................................................................................................................. 94
References ............................................................................................................................................. 96

APEC Energy Demand and Supply Outlook – 4th edition List of Tables
x
LIST OF TABLES
Table 1.1: Climate change stabilization scenarios ................................................................................... 5
Table 3.1: Population growth by economy (average annual growth rates in percent) .................... 21
Table 3.2: Population of urban and rural areas (millions).................................................................... 21
Table 3.3: Real GDP growth by economy (average annual growth rates) ........................................ 22
Table 3.4: GDP per capita growth by economy (average annual growth rates in percent)............ 22
Table 3.5: Motor vehicles per 1,000 population in APEC: history and projection (1990–2030) .......................................................................................................................................... 33
Table 3.6: Overview of energy consumption, density and proportion of alternative transport modes in cities worldwide (2001 data) ................................................................ 36
Table 4.1: APEC’s electricity demand (TWh) ........................................................................................ 49
Table 4.2: APEC electricity as percentage of TFED ............................................................................ 49
Table 4.3: ASEAN power grid projects .................................................................................................. 56
Table 5.1: Net oil trade for APEC economies, Mtoe ........................................................................... 62
Table 5.2: APEC petroleum products demand ..................................................................................... 66
Table 5.3: Projected APEC coal production, in Mtoe ......................................................................... 71
Table 6.1: Typical energy facilities by energy source and supply chain stage ................................... 81
Table 6.2: Net energy exports as a percent of total primary energy supply in the APEC region ......................................................................................................................................... 83
Table 6.3: Energy investments in the APEC region by energy supply chain stage (billion 2006 US dollars) ....................................................................................................................... 87
Table 6.4: Energy investments in the APEC region by energy supply chain stage (percent) ........ 87
Table 6.5: Energy investments in the APEC region by energy source (billion 2006 US dollars) ....................................................................................................................................... 88
Table 6.6: Energy investments in the APEC region by energy source (percent) ............................. 88
Table 6.7: Energy investments as percent of GDP by energy supply chain stage ........................... 89
Table 6.8: Energy investments in the electricity and heat industry in the APEC region (billion 2006 US dollars) ......................................................................................................... 89

APEC Energy Demand and Supply Outlook – 4th edition List of Figures
xi
LIST OF FIGURES
Figure 1.1: Projected APEC region GDP ..................................................................................................... 2
Figure 1.2: Projected APEC region population ............................................................................................ 2
Figure 1.3: Assumed oil prices ........................................................................................................................ 3
Figure 1.4: APEC oil production and imports ............................................................................................. 3
Figure 1.5: APEC primary energy demand, GDP, and energy intensity .................................................. 4
Figure 1.6: CO2 emissions for a range of stabilization levels ..................................................................... 5
Figure 1.7: APEC CO2 emissions from fuel combustion ........................................................................... 6
Figure 1.8: United States gas import projections (tcf) EIA Annual Energy Outlooks 2007 vs 2009 ................................................................................................................................................. 8
Figure 1.9: Projected residential solar photovoltaic electricity cost in New Zealand ............................. 8
Figure 2.1: APEC average GDP per capita ................................................................................................. 13
Figure 2.2: APEC final energy demand by energy type ............................................................................ 14
Figure 2.3: APEC final energy demand by sector ...................................................................................... 14
Figure 2.4: Electricity generation by primary energy source .................................................................... 15
Figure 2.5: APEC primary energy supply by energy source ..................................................................... 15
Figure 2.6: APEC net imports from outside the APEC region ............................................................... 16
Figure 2.7: Gas production in the lower 48 states ..................................................................................... 17
Figure 3.1: Population by economy (millions), larger economies .......................................................... 21
Figure 3.2: Population by economy (millions), smaller economies ........................................................ 21
Figure 3.3: Annual percentage growth rates in final energy demand by economy ............................... 23
Figure 3.4: Final energy demand by energy source in APEC ................................................................... 23
Figure 3.5: Final energy demand by energy source, larger economies .................................................... 24
Figure 3.6: Final energy demand by energy source, smaller economies ................................................. 24
Figure 3.7: Final energy demand by energy source per capita – economies with highest final demand per capita ....................................................................................................................... 25
Figure 3.8: Final energy demand by energy source per capita – economies with lowest final demand per capita ....................................................................................................................... 26
Figure 3.9: Final energy demand by sector in APEC ................................................................................ 26
Figure 3.10: Final energy demand by sector, larger economies ............................................................... 27
Figure 3.11: Final energy demand by sector, smaller economies ............................................................. 27
Figure 3.12: Final energy demand by sector per capita – economies with highest final demand per capita .................................................................................................................................... 28
Figure 3.13: Final energy demand by sector per capita – economies with lowest final demand per capita .................................................................................................................................... 28
Figure 3.14: Transport sector energy demand by energy source, larger economies ............................. 32
Figure 3.15: Transport sector energy demand by energy source, smaller economies .......................... 32
Figure 3.16: Motor vehicles per 1,000 population in APEC vs income: history and projection (1990–2030) ............................................................................................................................... 33

APEC Energy Demand and Supply Outlook – 4th edition List of Figures
xii
Figure 3.17: Actual and projected fuel economy for new passenger vehicles by economy, 2002–2018 ................................................................................................................................. 35
Figure 3.18: Actual and projected GHG emissions for new passenger vehicles by economy, 2002–2018 ................................................................................................................................. 35
Figure 3.19: Energy consumption for passenger transport versus modal share ................................... 36
Figure 3.20: Industrial sector energy demand, larger economies ............................................................. 38
Figure 3.21: Industrial sector energy demand, smaller economies .......................................................... 38
Figure 3.22: Annual percentage growth rates in industrial final energy demand by economy ........... 39
Figure 3.23: Projection of energy demand for industry in the APEC region ........................................ 39
Figure 3.24: Projection of electricity demand for industry by economy ................................................ 40
Figure 3.25: Projection of gas demand for industry by economy ............................................................ 40
Figure 3.26: Projection of coal demand for industry ................................................................................. 41
Figure 3.27: Other sector energy demand by energy source, larger economies .................................... 42
Figure 3.28: Other sector energy demand by energy source, smaller economies ................................. 43
Figure 3.29: Annual percentage growth rates in other sector energy demand by economy ............... 43
Figure 3.30: Other sector energy demands by energy source .................................................................. 44
Figure 3.31: Percent of population using solid fuels vs GDP per capita for APEC economies ........ 46
Figure 4.1: APEC electricity generation mix (1990–2030) ....................................................................... 50
Figure 4.2: APEC projected electricity generating capacity ...................................................................... 50
Figure 4.3: Generating capacity by energy source, larger APEC economies ......................................... 51
Figure 4.4: Generating capacity by energy source, smaller APEC economies ...................................... 52
Figure 4.5: Generation capacity growth rates ............................................................................................. 52
Figure 4.6: Electricity supply by energy type, larger APEC economies ................................................. 53
Figure 4.7: Electricity supply by energy type, smaller APEC economies ............................................... 54
Figure 4.8: Electricity generation growth rates of APEC economies between 2005–2015 and 2005–2030 .................................................................................................................................... 54
Figure 5.1: Total primary energy supply by energy source, larger economies ....................................... 59
Figure 5.2: Total primary energy supply by energy source, smaller economies .................................... 60
Figure 5.3: Annual percentage growth rates in primary energy supply by economy ............................ 61
Figure 5.4: Energy intensity of APEC economies ..................................................................................... 61
Figure 5.5: Oil demand patterns in APEC region, Mtoe .......................................................................... 62
Figure 5.6: Projected oil production, larger oil-producing economies ................................................... 63
Figure 5.7: Projected oil production, smaller oil-producing economies ................................................. 63
Figure 5.8: Net oil exports, largest oil-exporting and smallest oil-importing economies .................... 64
Figure 5.9: Net oil exports, largest oil-importing economies ................................................................... 64
Figure 5.10: Crude oil refining capacity in the APEC region and the world ......................................... 65
Figure 5.11: Projected gas production, larger gas producing economies ............................................... 67
Figure 5.12: Projected gas production, smaller gas producing economies ............................................ 67
Figure 5.13: Projected net exports of gas, gas-exporting or self-sufficient economies ........................ 69
APEC Energy Demand and Supply Outlook – 4th edition List of Figures
xiii
Figure 5.14: Projected net exports of gas, gas-importing economies ..................................................... 69
Figure 5.15: The ‘S-curve’ .............................................................................................................................. 70
Figure 5.16: Crude oil and Henry Hub gas prices ...................................................................................... 70
Figure 5.17: Projected coal production, in Mtoe ........................................................................................ 71
Figure 5.18: Projected net exports of coal, APEC coal-exporting economies, in Mtoe ...................... 72
Figure 5.19: Projected net exports of coal, APEC coal importing economies ...................................... 72
Figure 5.20: Projected net exports of coal, all APEC economies ............................................................ 73
Figure 5.21: World nuclear plant construction start/reactivation 2004–mid 2009 (GW) ................... 74
Figure 5.22: Nuclear energy share in total electricity generation in the APEC region (percent of total generation) ................................................................................................................... 74
Figure 5.23: Nuclear electricity generation in 2005 and 2030 (TWh) ..................................................... 74
Figure 5.24: Electricity generation mix ........................................................................................................ 75
Figure 5.25: NRE resources breakdown in electricity generation mix ................................................... 75
Figure 5.26: Wind power generation by APEC economies ...................................................................... 75
Figure 5.27: Geothermal electricity generation by APEC economies .................................................... 76
Figure 5.28: Solar electricity generation by APEC economies ................................................................. 76
Figure 5.29: Direct use of biomass resources in APEC economies ........................................................ 77
Figure 5.30: Biofuels use in APEC economies ........................................................................................... 77
Figure 6.1: Total investment requirements by energy supply chain, in billion 2006 US dollars ......... 82
Figure 6.2: Total investment requirements by economy, in percent ...................................................... 82
Figure 6.3: Total investment requirements by energy source, in billion 2006 US dollars ................... 82
Figure 6.4: Total investment requirements by energy source within APEC region, in percent ......... 82
Figure 6.5: Total energy investment requirements by region, in billion 2006 US dollars .................... 83
Figure 6.6: Total transportation investment requirements for international trade between APEC economies, in billion 2006 US dollars....................................................................... 83
Figure 6.7: Primary energy extraction/production investments as percent of cumulative GDP ....... 84
Figure 6.8: Total investment requirements for electricity industry, in billion 2006 US dollars ......... 84
Figure 6.9: Energy investments for transformation, transportation and distribution as percent of cumulative GDP .................................................................................................................... 85
Figure 7.1: APEC projected business-as-usual CO2 emissions from fuel combustion ........................ 91
Figure 7.2: APEC projected shares of CO2 emissions from fuel combustion by sector in 2030....... 91
Figure 7.3: CO2 emissions from fuel combustion by sector, larger economies .................................... 92
Figure 7.4: CO2 emissions from fuel combustion by sector, smaller economies.................................. 92
Figure 7.5: APEC projected business-as-usual CO2 emissions from fuel combustion, by fuel ......... 93
Figure 7.6: APEC projected shares of CO2 emissions from fuel combustion by fuel in 2030 .......... 93
Figure 7.7: CO2 emissions from fuel combustion by fuel, larger economies ........................................ 93
Figure 7.8: CO2 emissions from fuel combustion by fuel, smaller economies...................................... 94

APEC Energy Demand and Supply Outlook – 4th edition List of Abbreviations
xiv
LIST OF ABBREVIATIONS
AUS Australia
BD Brunei Darussalam
CDA Canada
CHL Chile
CT Chinese Taipei
HKC Hong Kong, China
INA Indonesia
JPN Japan
MAS Malaysia
MEX Mexico
NZ New Zealand
PE Peru
PNG Papua New Guinea
PRC People’s Republic of China
ROK Republic of Korea
RP the Republic of the Philippines
RUS the Russian Federation
SIN Singapore
THA Thailand
US or USA United States of America
VN Viet Nam
ABARE Australian Bureau of Agricultural and Resource Economics
APEC Asia Pacific Economic Cooperation
APERC Asia Pacific Energy Research Centre
ASEAN Association of Southeast Asian Nations
bcm billion cubic metres
CCGT combined cycle gas turbine
CNG compressed natural gas
CO2 carbon dioxide
DOE Department of Energy (USA)
DSM demand-side management
EDMC Energy Data and Modelling Center (Japan)
EIA Energy Information Administration (USA)
EWG Energy Working Group (APEC)
FEC final energy consumption
FED final energy demand
FDI foreign direct investment
FPI foreign portfolio investment
FSU former Soviet Union
FT Fischer-Tropsch technology
GDP gross domestic product
GHG greenhouse gases

APEC Energy Demand and Supply Outlook – 4th edition List of Abbreviations
xv
g/kWh grams per kilowatt-hour (used to measure the emissions caused by the generation of one unit of electricity)
GMS Greater Mekong Subregion
GNP gross national product
GTL gas to liquids
GW gigawatt
GWh gigawatt-hour
GWP gross world product
IEA International Energy Agency
IEEJ Institute of Energy Economics, Japan
IPCC Intergovernmental Panel on Climate Change
IPP independent power producers
kgoe kilogram of oil equivalent
ktoe thousand tonnes of oil equivalent
LEAP Long-term Energy Analysis Programme
LHV lower heating value
LNG liquefied natural gas
LPG liquefied petroleum gas
mbd million barrels per day
mcm million cubic metres
MBTU million British thermal units
MOU memorandum of understanding
MSW municipal solid waste
Mtoe million tonnes of oil equivalent
MWp megawatts peak
NAFTA North American Free Trade Agreement
NGV natural gas vehicle
NRE new renewable energy
NYMEX New York Mercantile Exchange
PPP purchasing power parity
PV photovoltaic
R&D research and development
R/P reserves-to-production ratio
SUVs sports utility vehicles
tcf trillion cubic feet
toe tonnes of oil equivalent
TPED total primary energy demand
TPES total primary energy supply
TWh terawatt hours
WTO World Trade Organization


APEC Energy Demand and Supply Outlook – 4th edition Summary of Key Trends
1
1 SUMMARY OF KEY TRENDS The APEC Demand and Supply Outlook – 4th
Edition is designed to present policymakers with an understanding of the energy trends and issues facing the APEC region to the year 2030. With this goal in mind, this first chapter presents an overview of the most important trends that deserve the attention of policymakers.
In order to highlight the key issues facing the region, in this chapter and in Chapter 2 we view APEC as if it were a single economy. Later chapters will discuss individual economies.
KEY ASSUMPTIONS
The trends discussed in this chapter and throughout this report are shaped by some specific assumptions about the future. This section explains those assumptions and why we make them.
Business-as-usual
As this report is being written, the energy policies of APEC governments are changing rapidly. These changes are driven by at least three factors.
1. This decade so far has seen a dramatic rise in world oil prices, followed by a precipitous drop in late 2008. 1 Oil’s price volatility has been damaging to business and consumers throughout the APEC region, and has highlighted the threats to the economy posed by oil supply insecurity. Governments are increasingly seeking policies that will reduce dependence on oil in general and imported oil in particular.
2. The consensus in the scientific community on the seriousness and urgency of the threats posed by climate change has continued to grow stronger.2 Governments are seeking policies that will reduce greenhouse gas emissions. Since the production and use of energy accounts for more than two-thirds of greenhouse gas emissions on a world scale,3 these policies are likely to have a profound effect on the energy sector.
3. Governments are moving very rapidly to address the threats of the world economic crisis that began in late 2008. One way to mitigate the threat is through government expenditures to stimulate the economy. Given the needs to
1 See the daily NYMEX light sweet crude oil prices in EIA
(2009B). 2 IPCC (2007B). 3 In 2005, an estimated 68.5 percent of CO2-equivalent
emissions were from energy. See IEA (2008A), pp III.43.
improve oil security and reduce greenhouse gas emissions, as well as the continuing need for investment in energy infrastructure, the energy sector is a natural focus for these expenditures.
Specific policies that governments are typically pursuing include measures to improve energy efficiency, promote research and commercialization of new technology for alternative energy and energy efficiency, upgrades to energy infrastructure such as electricity transmission grids, improvements to public transportation, and promotion of carbon capture and storage as well as nuclear power.
Clearly the future will not be business as usual. Yet what will it be? Governments have announced many ambitious goals, but are typically still in the process of fleshing out how they will be implemented. There are, of course, many challenges that can arise in government between goals and implementation.
There is also the question of how sustained these new policies will be once they are implemented. Governments also had ambitious goals in response to the oil shocks of the late 1970s and early 1980s, but many of these were put aside when oil prices dropped in the late 1980s and early 1990s. Will this happen again? This concern is especially relevant for policies adopted in response to the economic crisis, which could turn out to be a short-term event.
The safest course under the circumstances would appear to be to assume ‘business-as-usual’ in our projections. Any other approach has a very real risk of ‘counting our chickens before they are hatched’, and the result of that could be an overly optimistic view of the current situation. Also, policymakers need an independent standard of comparison. Any projection that has built into it assumptions about what policymakers themselves are going to do in the future fails to provide this standard, and is likely to cause confusion.
So, except as noted, we assume business-as-usual throughout this report. The definition of business-as-usual includes policies that are already being implemented; that is, any necessary legislation has already been passed and there is little uncertainty that the policy is really going to happen. The new CAFE standards4 for vehicle efficiency in the United States are an example of such a policy already being implemented. On the other hand, the definition does not include ‘targets’, ‘goals’, or policies governments
4 Technology Review (2008).

APEC Energy Demand and Supply Outlook – 4th edition Summary of Key Trends
2
may have announced whose implementation is not yet certain and well-defined.
GDP and population
Despite the current economic crisis, we assume that the APEC region will continue to enjoy economic growth and progress over the long term, especially in the developing economies. In developing economies, this will include increasing use of commercial fuels, increasing access to electricity, and increasing use of motorized vehicles for transportation. Figure 1.1 shows our specific assumptions about GDP for the APEC region as a whole. GDP growth over the 25 years following 2005 is expected to be about the same as GDP growth over the 15 years up to 2005.
Figure 1.1: Projected APEC region GDP
0
10000
20000
30000
40000
50000
60000
70000
80000
90000
100000
1990 2000 2005 2015 2030
Bil
lio
n 2
00
5 U
S$ P
PP
GDP (Billion 2005 US$ PPP)
3.3 %
3.6 %
3.5 %
3.5 %
Source: APERC analysis (2009)
As shown in Figure 1.2, population in the APEC region is also assumed to continue to rise, but at a diminishing rate. GDP and population assumptions for specific APEC economies and their sources are discussed in Chapter 3.
Figure 1.2: Projected APEC region population
0
500
1000
1500
2000
2500
3000
3500
1990 2000 2005 2015 2030
Mil
lio
n
Population (million)
0.65 %0.42 %
1.08 %
0.76 %
Source: APERC analysis (2009)
Oil prices and resource availability
Oil prices have been highly volatile since the oil shocks of the 1970s, and there is no reason to think that the future will be any different. There are many diverse opinions as to the future of oil prices offered by well-informed people. Probably the most thorough, publicly available analysis of the long-term future of the oil market is that of the International Energy Agency (IEA) in its World Energy Outlook 2008. They assumed that oil prices would rise to $122/barrel in 2007 US dollars by 2030.5
One might object that the IEA’s analysis of the world oil market was mostly completed in mid-2008, and did not take subsequent events into account, including the full onset of the economic crisis and the late 2008 decline in oil prices. However, the IEA’s analysis also points to a very real risk of a ‘post-2010 oil supply crunch’ if upstream investment in the industry is not adequate.6 The economic crisis and lower oil prices increase the difficulty of financing investments in the oil industry and thereby increase the risk that investment will be inadequate, which would lead to higher prices over the longer term. Hence, no lowering of the long-term price assumption would appear to be justified.
Of course, over the shorter term, the oil price outlook has changed from the IEA’s, which assumed a year 2015 oil price of around $100/barrel in 2007 US dollars. A more current, and arguably better, oil price projection for the shorter term may be obtained by looking at oil prices quoted in the futures markets. These oil price quotes are not just results of a model, they are real prices at which one can buy and sell oil, that have been determined by the actions of knowledgeable people who are risking real money on them. As of February 2009, when our assumptions were established, the price for ‘light sweet crude’ for delivery in 2015 on the NYMEX futures market was around $72/barrel in nominal US dollars. Assuming a 2.5 percent inflation rate, this works out to about $60/barrel in real 2007 US dollars. Figure 1.3 shows our resulting oil price assumptions, using the futures market quotations as the basis for the 2015 price and the IEA’s analysis as the basis for the 2030 price.
A larger issue is whether oil resources are adequate to support the world’s oil demand to 2030 at these prices. There is a view among some analysts that world oil production is at its peak and will begin a long decline as resources are exhausted.7 There are certainly some trends that are cause for concern, 5 This is the price for IEA crude oil imports, as in IEA
(2008B), Table 1.4, p 68. 6 IEA (2008B), box 3.2, p 104 and chapter 13, especially p 303. 7 Simmons (2005) and Deffeyes (2005).
APEC Energy Demand and Supply Outlook – 4th edition Summary of Key Trends
3
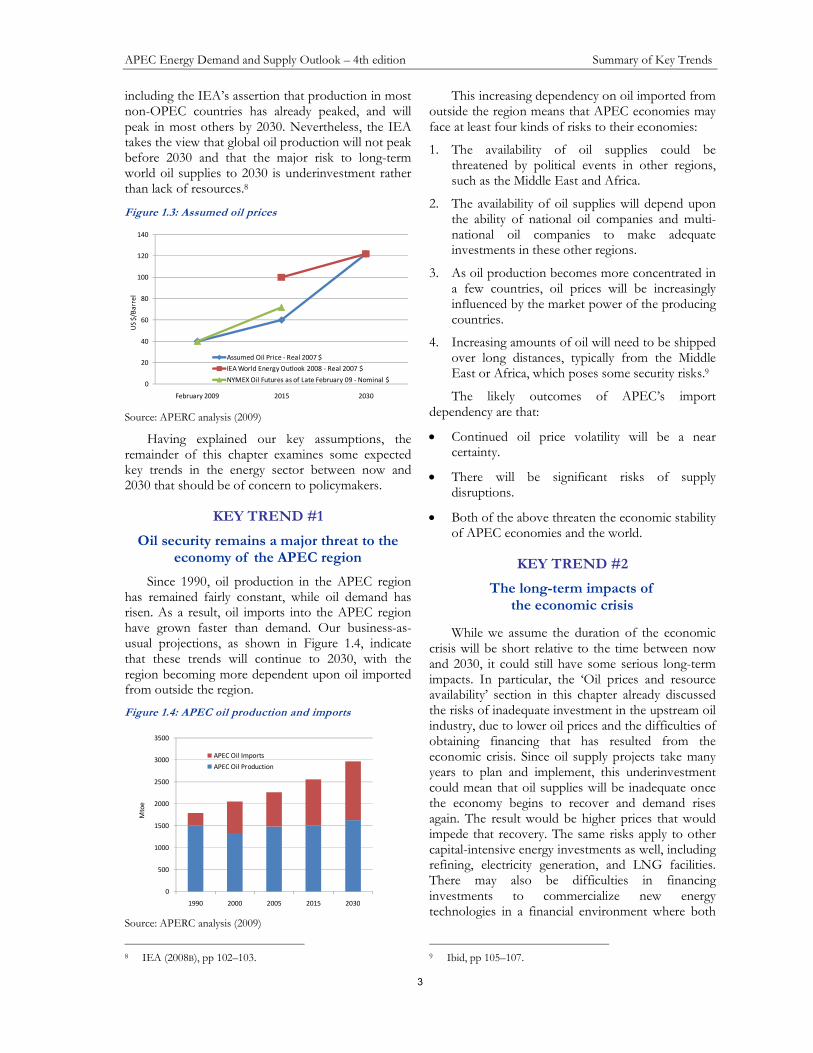
including the IEA’s assertion that production in most non-OPEC countries has already peaked, and will peak in most others by 2030. Nevertheless, the IEA takes the view that global oil production will not peak before 2030 and that the major risk to long-term world oil supplies to 2030 is underinvestment rather than lack of resources.8
Figure 1.3: Assumed oil prices
0
20
40
60
80
100
120
140
February 2009 2015 2030
US
$/B
arr
el
Assumed Oil Price - Real 2007 $
IEA World Energy Outlook 2008 - Real 2007 $
NYMEX Oil Futures as of Late February 09 - Nominal $
Source: APERC analysis (2009)
Having explained our key assumptions, the remainder of this chapter examines some expected key trends in the energy sector between now and 2030 that should be of concern to policymakers.
KEY TREND #1
Oil security remains a major threat to the economy of the APEC region
Since 1990, oil production in the APEC region has remained fairly constant, while oil demand has risen. As a result, oil imports into the APEC region have grown faster than demand. Our business-as-usual projections, as shown in Figure 1.4, indicate that these trends will continue to 2030, with the region becoming more dependent upon oil imported from outside the region.
Figure 1.4: APEC oil production and imports
0
500
1000
1500
2000
2500
3000
3500
1990 2000 2005 2015 2030
Mto
e
APEC Oil Imports
APEC Oil Production
Source: APERC analysis (2009)
8 IEA (2008B), pp 102–103.
This increasing dependency on oil imported from outside the region means that APEC economies may face at least four kinds of risks to their economies:
1. The availability of oil supplies could be threatened by political events in other regions, such as the Middle East and Africa.
2. The availability of oil supplies will depend upon the ability of national oil companies and multi-national oil companies to make adequate investments in these other regions.
3. As oil production becomes more concentrated in a few countries, oil prices will be increasingly influenced by the market power of the producing countries.
4. Increasing amounts of oil will need to be shipped over long distances, typically from the Middle East or Africa, which poses some security risks.9
The likely outcomes of APEC’s import dependency are that:
• Continued oil price volatility will be a near certainty.
• There will be significant risks of supply disruptions.
• Both of the above threaten the economic stability of APEC economies and the world.
KEY TREND #2
The long-term impacts of the economic crisis
While we assume the duration of the economic crisis will be short relative to the time between now and 2030, it could still have some serious long-term impacts. In particular, the ‘Oil prices and resource availability’ section in this chapter already discussed the risks of inadequate investment in the upstream oil industry, due to lower oil prices and the difficulties of obtaining financing that has resulted from the economic crisis. Since oil supply projects take many years to plan and implement, this underinvestment could mean that oil supplies will be inadequate once the economy begins to recover and demand rises again. The result would be higher prices that would impede that recovery. The same risks apply to other capital-intensive energy investments as well, including refining, electricity generation, and LNG facilities. There may also be difficulties in financing investments to commercialize new energy technologies in a financial environment where both
9 Ibid, pp 105–107.

APEC Energy Demand and Supply Outlook – 4th edition Summary of Key Trends
4
venture capital and capital from established companies is difficult to obtain.
Fortunately, governments are working together aggressively to unlock the financial markets. A positive impact of this intervention may be to direct energy investment in a more secure and environmentally sustainable direction.
KEY TREND #3
Minimum APEC intensity goals will be met under business-as-usual
At their meeting in Sydney in September 2007, APEC leaders called for APEC economies to work toward achieving an APEC-wide regional aspirational goal of a reduction in energy intensity of at least 25 per cent by 2030 (with 2005 as the base year). 10 Assuming energy intensity is defined as primary energy supply per US dollar of GDP at purchasing power parity, this goal can easily be met under business-as-usual assumptions. By 2030, we would expect the APEC region primary energy supply to increase by about 45 percent compared to 2005, while GDP will increase by about 235 percent. As shown in Figure 1.5, the net impact will be a decrease in energy intensity of about 38 percent.
Figure 1.5: APEC primary energy demand, GDP, and
energy intensity
0
50
100
150
200
250
1990 2000 2005 2015 2030
Ind
ex
(20
05
= 1
00
)
Primary Energy Supply GDP Index Intensity Index
Source: APERC analysis 2009
This improvement in energy intensity is in line with past trends. Between 1990 and 2005, energy intensity declined at a rate of about 1.4 percent per year. Under our business-as-usual assumptions, between 2005 and 2030 it will decline at a rate of about 1.9 percent per year. This decline primarily reflects improvements in technology driven by market forces and the impacts of existing government policies promoting energy efficiency.
10 APEC (2007).
The APEC leaders specified an improvement of ‘at least’ 25 percent, with more being better. It is good news that the APEC region is likely to exceed this goal even under business-as-usual assumptions.
KEY TREND #4
Business-as-usual is still environmentally unsustainable
The expected improvement in energy intensity is, unfortunately, not sufficient to put the APEC region on a path toward environmental sustainability. In fact, the best science suggests that the path we are on has a great probability of disastrous climate change consequences.
To understand why this is, we must first understand what science is saying needs to happen to greenhouse gas emissions to mitigate the risks of climate change. In fact, managing greenhouse gas emissions is a problem very different from managing other types of air pollution. With most air pollution, if the emissions can be stabilized, the impacts can be stabilized, and if the emissions can be reduced, the impacts will be reduced. This is not true of greenhouse gas emissions, since they build up cumulatively in the atmosphere and break down only over extremely long time periods (typically decades or centuries). Hence, only very large reductions in greenhouse gas emissions can stabilize the impacts.
Table 1.1 following, taken from the Intergovernmental Panel on Climate Change (IPCC) Fourth Assessment Report, summarizes the challenges posed by climate change. The IPCC is the scientific body set up by the World Meteorological Organization (WMO) and by the United Nations Environment Programme (UNEP) to provide objective information about climate change.11
The table shows five possible scenarios for greenhouse gas emissions. Category I, which limits the average global temperature increase to 2.0–2.4 degrees Celsius, requires concentrations of greenhouse gases in the atmosphere to stabilize at a level of 445–490 ppm of CO2-equivalent. To achieve stabilization at this level would require global CO2 emissions in the year 2050 to be reduced by 50–85 percent compared to the year 2000, with global CO2 emissions peaking between the year 2000 and 2015. The green range in Figure 1.6 following illustrates the path of emissions under such a scenario.
The impacts of climate change are wide-ranging, complex, and vary by location. A fair summary of the
11 IPCC (2009).
Energy Intensity down 38% from 2005

APEC Energy Demand and Supply Outlook – 4th edition Summary of Key Trends
5
IPCC’s assessment of the impacts of climate change is that there are a mixture of beneficial and damaging impacts in the 2.0–2.4 degrees Celsius range of
warming, but beyond this, most impacts turn out to be damaging, some significantly so.
Table 1.1: Climate change stabilization scenarios
Notes (from IPCC): a) The emission reductions to meet a particular stabilization level reported in the mitigation studies assessed here might be underestimated due to missing carbon cycle feedbacks (see also Topic 2.3). b) Atmospheric CO2 concentrations were 379ppm in 2005. The best estimate of total CO2-eq concentration in 2005 for all long-lived GHGs is about 455ppm, while the corresponding value including the net effect of all anthropogenic forcing agents is 375ppm CO2-eq. c) Ranges correspond to the 15th to 85th percentile of the post-TAR scenario distribution. CO2 emissions are shown so multi-gas scenarios can be compared with CO2-only scenarios (see Figure 2.1). d) The best estimate of climate sensitivity is 3°C. e) Note that global average temperature at equilibrium is different from expected global average temperature at the time of stabilization of GHG concentrations due to the inertia of the climate system. For the majority of scenarios assessed, stabilization of GHG concentrations occurs between 2100 and 2150 (see also Footnote 30). f) Equilibrium sea level rise is for the contribution from ocean thermal expansion only and does not reach equilibrium for at least many centuries. These values have been estimated using relatively simple climate models (one low-resolution AOGCM and several EMICs based on the best estimate of 3°C climate sensitivity) and do not include contributions from melting ice sheets, glaciers and ice caps. Long-term thermal expansion is projected to result in 0.2 to 0.6m per degree Celsius of global average warming above pre-industrial. (AOGCM refers to Atmosphere-Ocean General Circulation Model and EMICs to Earth System Models of Intermediate Complexity.)
Source: Intergovernmental Panel on Climate Change (2007A), table 5.1, p 67.
Figure 1.6: CO2 emissions for a range of stabilization levels
Source: IPCC (2007A), figure 5.1, p 66.

APEC Energy Demand and Supply Outlook – 4th edition Summary of Key Trends
6
The damaging impacts of climate change include:
• rising sea levels: by the 2080s many millions more people are likely to experience coastal flooding each year, especially in the low-lying mega deltas of Asia12
• declines in global food production potential13
• future tropical cyclones (typhoons and hurricanes) becoming more intense14
• widespread loss of glaciers and snow cover, reducing water availability, hydro potential, and changing the seasonality of water flows in regions supplied by melt water from major mountain ranges (Hindu-Kush, Himalaya, Andes) where one-sixth of the world population currently lives15
• adverse health impacts, including increased diarrhoeal, cardio-respiratory, and infectious diseases16
• increases in rainfall in some wet, tropical areas, including East and Southeast Asia, accompanied by decreases in rainfall in many semi-arid areas including the western United States; drought-affected areas are expected to increase in extent17
• widespread damage to coral reefs and their dependent species, including Australia’s Great Barrier Reef, due to ocean acidification18
• greater frequency of extreme weather events, including heat waves and heavy precipitation19
• widespread extinctions of wildlife: 20–30 percent of species assessed so far are at risk of extinction if global average warming exceeds 1.5 to 2.5 degrees Celsius relative to 1980–1999 levels; as global average warming exceeds 3.5 degrees Celsius, this rises to 40–70 percent of species assessed.20
This need to dramatically reduce emissions may be contrasted with the business-as-usual projection of APEC region CO2 emissions from fuel combustion, shown in Figure 1.7. CO2
12 IPCC (2007A), p 48. 13 Ibid, p 48. 14 Ibid, p 46 and table 3.2, p 53. 15 Ibid, box “Climate Change and Water”, p 49. 16 Ibid, box “Examples of Impacts Associated with Global
Average Temperature Change”, p 51. 17 Ibid, box “Climate Change and Water”, p 49. 18 Ibid, box “Examples of Impacts Associated with Global
Average Temperature Change”, pp 51 and 50. 19 Ibid, table 3.2, p 53. 20 IPCC (2007A), p 54.
emissions from fuel combustion account for over 90 percent of energy-related greenhouse gas emissions worldwide on a CO2-equivalent basis, while energy-related greenhouse gas emissions in turn account for about two-thirds of total greenhouse gas emissions on a CO2-equivalent basis. 21 (Non-CO2 energy emissions are extraordinarily difficult to model because they depend not just on the quantity of fuel burned, but also on the details of the conditions under which the fuel was burned or escaped into the environment.)
Figure 1.7: APEC CO2 emissions from fuel
combustion
0
5000
10000
15000
20000
25000
1990 2000 2005 2015 2030
CO
2(M
t)
Others
Transport
Industry
Own Use & Losses
Electricity Generation
Source: APERC analysis (2009)
The figure shows that APEC region CO2 emissions are expected to rise by about 40 percent between 2005 and 2030. The threat these emissions pose to humanity, to the environment, and to the economies of the APEC region and the world certainly make it one of the greatest challenges facing the region.
KEY TREND #5
The push for sustainability
Fortunately, many APEC governments are recognizing the risks posed by climate change and energy security, and are greatly expanding their efforts to promote energy efficiency and low-carbon energy. Some examples:
• China has adopted the 11th Plan for Economic and Social Development, which calls for energy use per unit of production to decline by 20 percent between 2006 and 2010, as well as a new emphasis on renewable energy.22
21 IEA (2008A), pp III–43. 22 APERC (2008) and APERC (2009).

APEC Energy Demand and Supply Outlook – 4th edition Summary of Key Trends
7
• Japan has proposed the “Cool Earth 50” initiative, challenging other economies to join Japan in reducing emissions by 50 percent by 2050.23
• The United States congress approved the American Recovery and Reinvestment Act of 2009, which authorizes US$60 billion in clean energy investments.24
Initiatives such as these are a good start, but clearly sustained action and enhanced international cooperation will be needed to put APEC and the world on a more sustainable path.
KEY TREND #6
New technologies
New technologies are also rapidly changing the energy picture throughout the APEC region, and their potential is often underestimated.
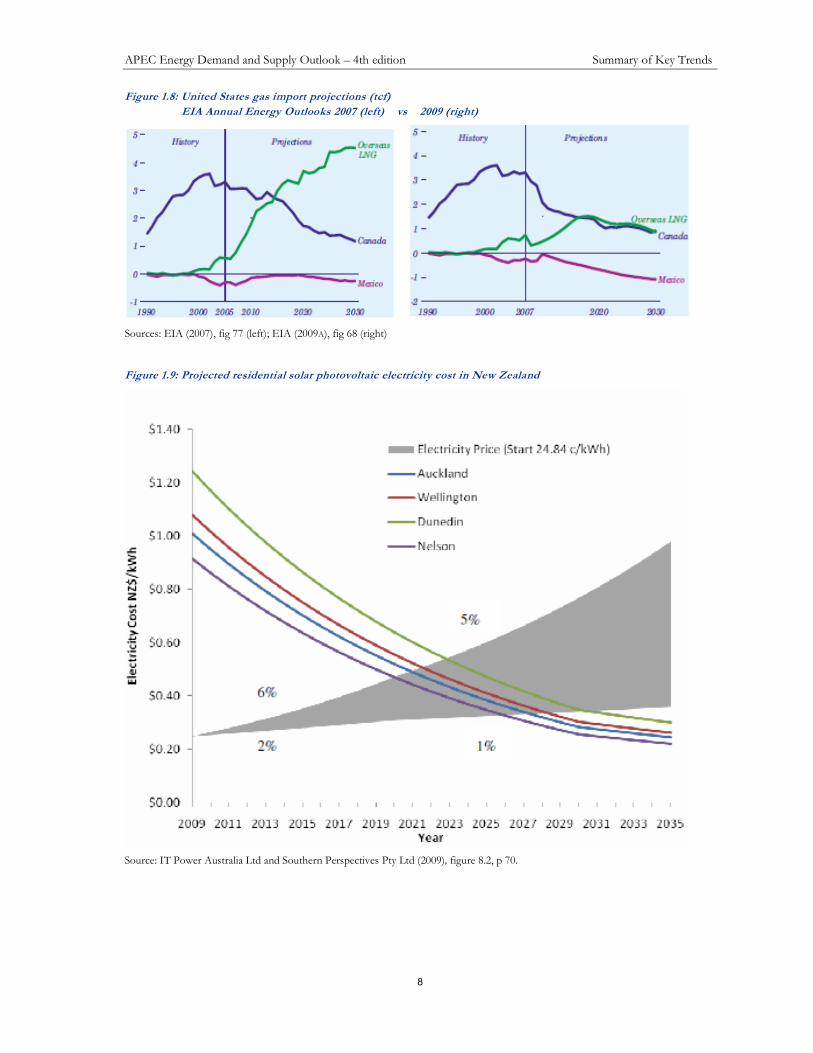
One of the most dramatic recent examples of the impact of new technology is the rise of unconventional gas production in the United States – this is discussed in the “Gas supply” section of Chapter 5 and the box on “Prospects for unconventional gas in the APEC region” in Chapter 2. Until recently, the conventional wisdom has been that US gas production would not be able to keep pace with demand, resulting in the US needing to import large quantities of liquefied natural gas (LNG). However, this outlook has changed significantly just between 2007 and 2009. Figure 1.8 compares the US Energy Information Administration (EIA) reference case gas import projections from the 2007 edition of their Annual Energy Outlook, and the 2009 edition of the same publication. (Our own gas import projection has changed since the 2006 edition of this publication, but not quite as dramatically.)
The effects of this change are significant. With the US no longer likely to be a large importer of LNG, those LNG supplies can flow to other economies, where it can reduce the need for LNG imports from outside APEC, such as from the Middle East or Africa. It is likely that this technology could be applied elsewhere as well, allowing more domestic gas production throughout the APEC region. These additional gas supplies could help to reduce greenhouse gas emissions by displacing the use of coal.
23 Aso (2009). 24 White House (2009).
Another example of a new technology whose potential may be underestimated is solar photovoltaics (PV) – see the box “Why the potential of solar photovoltaics may be underestimated” in this chapter. Solar PV has historically been uncompetitive with fossil fuels. However, solar PV is a solid-state technology that is declining rapidly in cost, and likely to continue to decline in the future. Since it can be installed at the customer’s site, solar PV has an additional advantage in that its cost only needs to compete with the retail price of electricity. As a result, the unsubsidized cost of solar PV is approaching competitiveness with conventional electricity in some areas.
Figure 1.9 illustrates the projected cost situation for residential customers in New Zealand. Solar PV costs in New Zealand are expected to reach competitiveness with conventional electricity sometime in the mid 2020s. Yet New Zealand has relatively low-cost electricity. A recent article in the McKinsey Quarterly projects that the unsubsidized cost of solar PV could reach competitiveness with conventional electricity in some higher-cost electricity markets, such as California and Japan, within three to seven years.25
If these projections come to pass, it could be a dramatic ‘game changer’ in the energy market, since solar PV could become a renewable electricity source available almost anywhere in almost unlimited quantities.
The proven impacts of unconventional gas technology and the projected potential impacts of solar PV illustrate the importance of government policies that are supportive of new technology and entrepreneurship. 26 These technologies hold the keys to an energy future that is secure, prosperous, and sustainable.
25 McKinsey Quarterly (2008). 26 See Heaney et al (2005), for discussion of the potential
impacts of new energy technologies in APEC, especially in the electricity and iron and steel sectors.
APEC Energy Demand and Supply Outlook – 4th edition Summary of Key Trends
8
Figure 1.8: United States gas import projections (tcf)
EIA Annual Energy Outlooks 2007 (left) vs 2009 (right)
Sources: EIA (2007), fig 77 (left); EIA (2009A), fig 68 (right)
Figure 1.9: Projected residential solar photovoltaic electricity cost in New Zealand
Source: IT Power Australia Ltd and Southern Perspectives Pty Ltd (2009), figure 8.2, p 70.

APEC Energy Demand and Supply Outlook – 4th edition Summary of Key Trends
9
Why the potential of solar photovoltaics may be underestimated
Solar photovoltaics are an expensive source of energy today, even compared to other renewables. It is therefore easy
to dismiss their potential future contribution. But before doing so, it is important to consider where costs may be
headed in the future. As Wayne Gretzky is reputed to have said about ice hockey, one should not skate to where the
puck is, one should skate to where it is going to be. The same logic applies to energy outlooks.
Most energy technologies, including most new renewable energy technologies, are essentially mechanical or thermal
devices. Examples of such new renewable energy devices include turbines (wind, water, or geothermal/solar steam),
drilling rigs (geothermal), ethanol plants, and solar thermal collectors. The cost of such devices and their application
can be reduced through improvements in materials, more sophisticated control systems, and larger scale manufacture,
among others. However, mechanical and thermal technology is fairly mature, and improvements are likely to come
slowly and be limited in extent. Other technologies are more on the cutting edge of scientific research, such as solid-
state devices (LED lamps, batteries, fuel cells), bio-engineered ‘devices’ (algae for biofuel), or devices based on
particle physics (fusion, advanced nuclear). Although in many cases the technologies in the latter category are still far
from being cost competitive today, they have much greater potential for future cost reduction.
There is an interesting historical analogy that illustrates the dangers of underestimating the technologies that can
benefit most from the application of science.27 In the late nineteenth century there was something of an ‘energy crisis’
in industry. Energy was available in the form of large steam engines and waterpower, but these sources were
uneconomic in small units, and small units were what was needed to improve the productivity of craftsmen in
workshops and factories.28 The traditional solution—millwork (networks of overhead belts, shafts, and pulleys) – was
increasingly constraining; millwork was expensive, difficult to maintain, dangerous, energy inefficient, and inflexible.
The problem was especially acute in industrial facilities that were very large or very small, and in mines.29 There was
an obvious need to find a better way to ‘subdivide’ power under such conditions.30
To deal with this problem, there were hundreds of solutions that were proposed, dozens that were developed, and a
few that enjoyed brief success.31 Most of the later were mechanical or thermal in nature. Small steam engines driven
from a central boiler were the most obvious alternative and achieved some popularity in both the US and Britain,
especially for applications such as rock drills, pumps, and pile drivers, where the steam could directly drive the
machine.32 Other alternatives included wire rope transmission (good for transmission over several miles, and widely
used in continental Europe in the 1860–70s, including the development of several large central power stations33);
hydraulic transmission (widely used in Britain from the 1850s, with London having a central station hydraulic system
with 184 miles of distribution lines at its peak in 192734), motors powered by city water (moderately popular in the US,
but the extent of its use is hard to document due to its often illegal nature35); internal combustion engines powered by
illuminating gas36; and compressed air (applied in several European cities, including Paris, which had a central station
compressed air system with over 100 miles of distribution lines by 189937).
And where was the obvious solution, electricity? It was emerging at the same time, but primarily for lighting, not
power.38 At first it was hard to get people to take electricity seriously as a source of industrial power. In the 1890s
electric power was not cheap and motors were still very expensive.39 Mill and factory owners were slow to grasp the
concept of electricity and slower to embrace it even when they did understand, due to engineering difficulties and the
high costs of the changeover.40 As late as 1900, only 5 percent of the power used in American manufacturing and
27 The historical discussions in this section are drawn from Hunter and Bryant (1991). 28 Hunter and Bryant (1991), p xxii. 29 Ibid, pp 115–120. 30 Hunter and Bryant (1991), pp 134–136. 31 Ibid, p xxii. 32 Ibid, pp 135–139. 33 Ibid, pp 141–146. 34 Ibid, pp 145–146. 35 Ibid, pp 155–165. 36 Ibid, pp 165–166. 37 Ibid, pp 176–180. 38 Ibid, pp 192–193. 39 Ibid, pp 214–216, 232. 40 Ibid, pp 202, 225.

APEC Energy Demand and Supply Outlook – 4th edition Summary of Key Trends
10
mining industries was transmitted electrically.41 When the Niagara International Commission held a competition in
1891 for proposals to harness the power of Niagara Falls and transmit it to Buffalo, 20 miles away, compressed air
was seriously considered. Doubts about the feasibility of electricity were expressed in the technical literature right up to
the opening of the first Niagara powerhouse.42
Electricity may have arrived slowly, but, of course, it ultimately became the leading power source for industry and
solved the late nineteenth century industrial ‘energy crisis’. What made electricity different? The pre-electric
technologies all shared the characteristic that they were the product of practical inventors and engineers. Electricity
stood apart in benefitting from the application of scientific research. And it was this application of science that made
possible the cost reductions and increased ‘user friendliness’ that gave it the ultimate edge.43
Today, solar photovoltaics clearly fall into the category of technologies that can benefit from the application of science.
It is a solid-state technology, closely related to computer chips, whose costs were also once prohibitively expensive. In
fact, the cost of solar photovoltaics has fallen by a factor of 100 since the 1950s, more than any other energy
technology in that period,44 and there is every reason to expect these cost declines to continue.
In addition to a potential cost advantage, solar photovoltaics have other potential advantages as well. They are safe,
environmentally benign, require little new public infrastructure, and are potentially available anywhere energy is
needed in almost unlimited quantities.
Like electricity itself in the late nineteenth century, the potential of solar photovoltaics should not be under-estimated. It
is not hard to see how continued advances in solar photovoltaic technology, combined with similar continued advances
in battery technology, could provide the secure, affordable, and environmentally sustainable energy source that we
need.
41 Ibid, p 242. 42 Ibid, p 266. 43 Ibid, p 193. 44 Nemet (2006), p 3218.

APEC Energy Demand and Supply Outlook – 4th edition Summary of Key Trends
11
REFERENCES
APEC(2007), “Sydney APEC Leaders’ Declaration on Climate Change, Energy Security and Clean Development”, Sydney, Australia http://www.apec.org/etc/medialib/apec_media_library/downloads/news_uploads/2007aelm.Par.0001.File.tmp/07_aelm_ClimateChangeEnergySec.pdf
APERC (2008) Understanding Energy in China. Asia Pacific Energy Research Centre, Tokyo, Japan. http://www.ieej.or.jp/aperc/2008pdf/2008_Reports/APERC_China_2008_rev.pdf.
APERC (2009) Understanding Energy in China—Geographies of Energy Efficiency (forthcoming) Asia Pacific Energy Research Centre, Tokyo, Japan.
Aso, T (2009) “Special Address by H.E. Mr Taro Aso, Prime Minister of Japan, On the Occasion of the Annual Meeting of the World Economic Forum: My Prescriptions for Reviving the World Economy”, Davos, Switzerland, 31 January 2009, http://www.mofa.go.jp/policy/economy/wef/2009/address.html.
Deffeyes, K S (2005) Beyond Oil: the View from Hubbert’s Peak. Hill and Wang, 2005.
EIA (2007) Annual Energy Outlook 2007, US Energy Information Administration Washington, DC, http://tonto.eia.doe.gov/ftproot/forecasting/0383(2007).pdf
EIA (2009A) Annual Energy Outlook 2009, US Energy Information Administration, Washington DC, http://www.eia.doe.gov/oiaf/aeo/pdf/0383(2009).pdf
EIA (2009B) “Cushing, OK Crude Oil Future Contract 1”, US Energy Information Administration, Washington DC, http://tonto.eia.doe.gov/dnav/pet/hist/rclc1d.htm
Heaney, et al (2005) New Energy Technologies: Measuring Potential Impacts in APEC, ABARE Research Report 05.1 to the APEC Energy Working Group, April 2005, http://www.abare.gov.au/publications_html/climate/climate_05/05_APEC.pdf.
Hunter, L C, and Bryant, L (1991) A History of Industrial Power in the United States 1780–1930, MIT Press.
IEA (2008A) CO2 Emissions from Fuel Combustion, 2008 edition, International Energy Agency, Paris, France. http://www.iea.org/textbase/publications/free_new_Desc.asp?PUBS_ID=1825
IEA (2008B) World Energy Outlook 2008, International Energy Agency, Paris, France. http://www.iea.org/Textbase/publications/free_new_Desc.asp?PUBS_ID=2056
IPCC (2007A) Climate Change 2007: Synthesis Report, Intergovernmental Panel on Climate Change http://www.ipcc.ch/pdf/assessment-report/ar4/syr/ar4_syr.pdf
IPCC (2007B) Fourth Assessment Report 2007, Intergovernmental Panel on Climate Change http://www.ipcc.ch/
IPCC (2009) “Organization” page of the Intergovernmental Panel on Climate Change website, http://www.ipcc.ch/organization/organization.htm
IT Power Australia Ltd and Southern Perspectives Pty Ltd (2009) Assessment of the Future Costs and Performance of Solar Photovoltaic Technologies in New Zealand, New Zealand Ministry of Economic Development, April 2009, Wellington. http://www.med.govt.nz/templates/MultipageDocumentTOC____40501.aspx
McKinsey Quarterly (2008) “The Economics of Solar Power”, June 2008, http://www.mckinseyquarterly.com/The_economics_of_solar_power_2161
Nemet, Gregory F (2006) “Beyond the Learning Curve: Factors Influencing Cost Reductions in Photovoltaics”, Energy Policy 34.
Simmons, M W (2005) Twilight in the Desert: The Coming Saudi Oil Shock and the World Economy, John Wiley and Sons, 2005.
Technology Review (2008) “The New CAFE Standards”, 15 January 2008, http://www.technologyreview.com/read_article.aspx?ch=specialsections&sc=transportation&id=20067
White House (2009) “Energy and Environment” page of the White House website, http://www.whitehouse.gov/issues/energy_and_environment/


APEC Energy Demand and Supply Outlook – 4th edition APEC Demand and Supply Overview
13
2 APEC DEMAND AND SUPPLY OVERVIEW
This chapter presents an overview of the ‘business-as-usual’ demand and supply results for the APEC region as a whole. We also discuss the drivers behind these results, and, where appropriate, some policy implications.
GDP PER CAPITA
Chapter 1 discussed our assumptions about economic growth and population growth. Before examining our business-as-usual demand and supply projections, it is worthwhile to examine the implications of economic growth and population growth for average GDP per capita in the APEC region, as this will shape the kind of energy services consumers are able to afford.
Figure 2.1 shows that average GDP per capita in the APEC region will rise from $11,699 (US$ PPP) in 2005 to $24,125. To put these figures in perspective, the average APEC GDP per capita in 2005 is comparable to the 2005 GDP per capita of Malaysia ($11,678), Chile ($12,248), Mexico ($11,387), or Russia ($11,859). By 2030, APEC GDP per capita will be comparable to the 2005 GDP per capita of Chinese Taipei ($26,067), Republic of Korea ($21,273), or New Zealand ($24,566). Since the economies that currently have the lowest income per capita will tend to have the largest increases in GDP per capita, there will also be a tendency in the APEC region toward less income disparity between economies.
Figure 2.1: APEC average GDP per capita
$8,181 $10,205$11,699
$15,394
$24,125
0
5000
10000
15000
20000
25000
30000
1990 2000 2005 2015 2030
GDP per Capita (2005 US $ PPP)
GDP per Capita
Source: APERC analysis (2009)
As a result of the approximate doubling of GDP per capita, we can expect to see energy used throughout the APEC region in ways typical of the wealthier APEC economies today. This will include much wider use of energy in motor vehicles, in intercity travel, in more spacious and more climate-controlled housing, in more home appliances, in commercial services (such as restaurants, hotels, healthcare facilities, retail stores, entertainment and recreational facilities, and educational institutions), as well as in industry. Hundreds of millions more people in the APEC region will be rising out of poverty. This is a generally good economic future if it can be achieved.
FINAL ENERGY
The consequence of this increase in wealth, at least under our business-as-usual assumptions, will be a corresponding increase in final demand for energy. As shown in Figure 2.2, demand for every form of final energy will rise. The largest absolute increase between 2005 and 2030 will be in demand for oil products (up 643 Mtoe), reflecting the increase in motor vehicle use, offset somewhat by increasing vehicle fuel efficiency.
However, electricity demand will grow by almost as much as oil product demand in absolute terms (up 607 Mtoe), reflecting demand growth in the residential and commercial (‘other’) sectors and industry. In percentage terms, electricity is the fastest growing final energy source by far, growing by 75 percent between 2005 and 2030.
Figure 2.3 shows that between 2005 and 2030, final demand will grow in all four sectors that we model. In percentage terms, the differences in growth between sectors are not that dramatic: the highest percentage growth is in the non-energy sector (45 percent), while the lowest percentage growth is in the industrial sector (37 percent). However, in absolute terms, the ‘other’ (residential and commercial) sector has a clear lead (up 621 Mtoe).

APEC Energy Demand and Supply Outlook – 4th edition APEC Demand and Supply Overview
14
Figure 2.2: APEC final energy demand by energy type
488375
501586 567
1,433
1,754
1,948
2,246
2,609
550631 630
726
894
336 393
412 457545492
669807
1,042
1,414
219 172 173 199 238
0
500
1000
1500
2000
2500
3000
1990 2000 2005 2015 2030
Final E
nergy Demand (Mtoe)
Coal Oil Gas NRE Electricity Heat
Source: APERC analysis (2009)
Figure 2.3: APEC final energy demand by sector
1,0121,114
1,271
1,519
1,743
907
1,1071,235
1,459
1,736
1,311
1,4071,519
1,748
2,140
288
366 446530
647
0
500
1000
1500
2000
2500
1990 2000 2005 2015 2030
Final E
nergy Demand (M
toe)
Industry Transportation Other Non-Energy
Source: APERC analysis (2009)
ELECTRICITY SUPPLY
As shown in Figure 2.4 following, coal was by far the dominant source of primary energy for electricity generation in the APEC region in 2005, and under our business-as-usual assumptions, will be even more so by 2030. Coal has the advantages of being widely available and relatively inexpensive in many APEC economies. In absolute terms, coal-generated electricity shows the largest growth of 3,222 TWh. China accounts for more than 60 percent of this increase.
Gas and nuclear generation also show large absolute growths of 2,084 TWh and 1,570 TWh, respectively. Gas has the advantage of also being widely available in many APEC economies, and
environmentally preferable to coal, since its greenhouse gas emissions are generally lower. Nuclear has very low greenhouse gas emissions and is especially attractive in economies that lack significant domestic fossil fuel resources. However, use of nuclear may be inhibited in some economies by difficulties obtaining public acceptance.
In percentage terms, the picture is different, with new renewable energy (NRE) having the largest percentage growth of 428 percent, followed by gas (104 percent), and nuclear (98 percent). Although NRE has large growth in percentage terms, its absolute size is still relatively small at 1,016 TWh in 2030. As discussed in Chapter 5 (see Figure 5.25), the growth of NRE in electricity generation is dominated by wind energy.

APEC Energy Demand and Supply Outlook – 4th edition APEC Demand and Supply Overview
15
Figure 2.4: Electricity generation by primary energy source
2,732
4,204
5,362
6,836
8,571
758 590 562351 336
1,146 1,5942,011
2,664
4,107
1,073 1,252
1,4581,928 2,224
138 156 192
4811,016
1,094
1,496 1,6082,066
3,177
0
1000
2000
3000
4000
5000
6000
7000
8000
9000
1990 2000 2005 2015 2030
Electricity Generation (TWh)
Coal Oil Gas Hydro NRE Nuclear
Source: APERC analysis (2009)
PRIMARY ENERGY SUPPLY
As shown in Figure 2.5, oil and coal run a very close competition to be APEC’s leading primary energy source, with oil having a slight lead in 2005. Under our business-as-usual projection, coal will overtake oil by 2015, reflecting the huge growth we anticipate in coal electricity generation.
In absolute terms, coal will have the fastest demand growth between 2005 and 2030 (up 901 Mtoe), followed by gas (up 725 Mtoe) and oil (up 667 Mtoe). However, in percentage terms, nuclear will have the largest growth (96 percent), followed by gas (57 percent), NRE (56 percent) and hydro (53 percent). Gas supply is benefiting from new technology that allows the economic development of unconventional gas resources, especially in North America (see box “Prospects for unconventional gas in the APEC region”, this chapter).
As discussed above, use of NRE grows quickly in electricity generation, predominantly in the form of wind. It also grows quickly in the transport sector in the form of biofuels (about 1,600 percent). In both sectors, this growth will be spurred by favourable existing government policies toward NRE in many APEC economies, as well as technological improvements. However, use of NRE in the residential and commercial (‘other’) sectors, which accounted for about two-thirds of the NRE demand in 2030, is not expected to show significant growth. The reason for this lack of growth is that many residential and commercial consumers in developing economies could be expected to switch their cooking and heating from biomass to commercial fuels as they become able to afford it (see the box in Chapter 3 on “Residential biomass use and poverty”).
Figure 2.5: APEC primary energy supply by energy source
1,3671,572
2,110
2,595
3,008
1,7932,054
2,260
2,545
2,945
9981,193
1,268
1,552
1,995
92 108 125 166 191
424 475 497593
775
286390 419
532
822
0
500
1000
1500
2000
2500
3000
3500
1990 2000 2005 2015 2030
Primary Energy Supply (Mtoe)
Coal Oil Gas Hydro NRE Nuclear
Source: APERC analysis (2009)

APEC Energy Demand and Supply Outlook – 4th edition APEC Demand and Supply Overview
16
ENERGY IMPORTS FROM OUTSIDE THE APEC REGION
As shown in Figure 2.6, over the 2005–2030 period APEC as a whole will be a modest exporter of coal to the rest of the world, roughly self-sufficient in gas, and a large and growing importer
of oil. In 2005, the APEC region imported about 34 percent of its oil. By 2030, this will rise to about 45 percent of a significantly larger primary supply of oil. As discussed in the previous chapter, this rising dependence on imported oil poses a serious threat to the economic stability and energy security of the APEC region.
Figure 2.6: APEC net imports from outside the APEC region
-52 -9
-117 -251
-327
285
715 775
1,047
1,323
-158 -98 -104 -130
81
-600
-400
-200
0
200
400
600
800
1000
1200
1400
1600
1990 2000 2005 2015 2030
Imports from Outside APEC Region (M
toe)
Coal Oil Gas
Source: APERC analysis (2009)
Prospects for unconventional gas in the APEC region
The difference between conventional and unconventional gas is in the geological reservoirs in which it is located and
the technologies required for its extraction. The characteristics of unconventional gas resources vary across deposits.
However, they typically are a lower grade, have lower permeability and are more widely dispersed than conventional
gas deposits.45 The most common unconventional gas formations are tight gas, shale gas, coalbed methane and gas
hydrates. Tight gas is methane confined in a tight formation underground, usually in an impermeable hard rock, or in
impermeable and non-porous limestone or sandstone formations (tight sand).46 Shale gas is methane contained in
fine-grained, layered, organic rich rocks with low permeability – most commonly shale. Coalbed methane (CBM) is
gas located in coal seams held in place by water pressure. CBM is also referred to as coal seam gas (CSG), coal
seam methane (CSM) and coalbed gas (CBG). Gas hydrates are methane molecules trapped in a lattice of frozen
water that resembles melting snow. These resources are typically found in regions with cold climates such as the polar
zones and deep-water continental shelves.47
To date, most unconventional gas production has been sourced from tight gas and CBM resources. However, shale
gas is beginning to emerge as an economic resource and production has been expanding rapidly. Gas hydrates are
considered a frontier resource and are not expected to be developed commercially within the outlook period. However,
it is believed that there is considerable resource potential in gas hydrates, with recoverable resource estimates
between 200 and 2,000 trillion cubic metres – more than all known conventional hydrocarbon resources.48
Unconventional gas typically requires some form of stimulation to increase the permeability of the reservoirs so that
project developers can begin and maintain commercial production. These resources have different and more complex
extraction techniques than conventional gas and as such are more expensive to develop. However, technological
advancements have contributed to declining costs of production.
45 INGAA Foundation (2008), p 9. 46 Gas Supply Association (2004). 47 IEA (2008), pp 227–228. 48 Ibid, p 228.
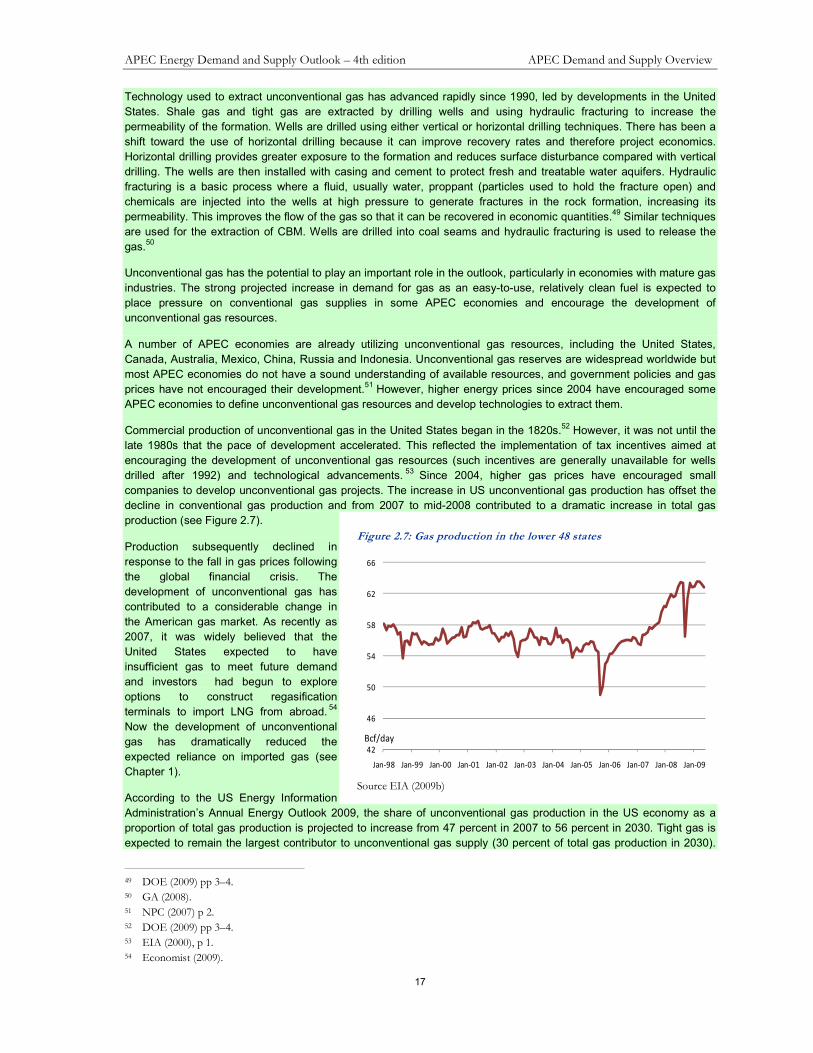
APEC Energy Demand and Supply Outlook – 4th edition APEC Demand and Supply Overview
17
Technology used to extract unconventional gas has advanced rapidly since 1990, led by developments in the United
States. Shale gas and tight gas are extracted by drilling wells and using hydraulic fracturing to increase the
permeability of the formation. Wells are drilled using either vertical or horizontal drilling techniques. There has been a
shift toward the use of horizontal drilling because it can improve recovery rates and therefore project economics.
Horizontal drilling provides greater exposure to the formation and reduces surface disturbance compared with vertical
drilling. The wells are then installed with casing and cement to protect fresh and treatable water aquifers. Hydraulic
fracturing is a basic process where a fluid, usually water, proppant (particles used to hold the fracture open) and
chemicals are injected into the wells at high pressure to generate fractures in the rock formation, increasing its
permeability. This improves the flow of the gas so that it can be recovered in economic quantities.49 Similar techniques
are used for the extraction of CBM. Wells are drilled into coal seams and hydraulic fracturing is used to release the
gas.50
Unconventional gas has the potential to play an important role in the outlook, particularly in economies with mature gas
industries. The strong projected increase in demand for gas as an easy-to-use, relatively clean fuel is expected to
place pressure on conventional gas supplies in some APEC economies and encourage the development of
unconventional gas resources.
A number of APEC economies are already utilizing unconventional gas resources, including the United States,
Canada, Australia, Mexico, China, Russia and Indonesia. Unconventional gas reserves are widespread worldwide but
most APEC economies do not have a sound understanding of available resources, and government policies and gas
prices have not encouraged their development.51 However, higher energy prices since 2004 have encouraged some
APEC economies to define unconventional gas resources and develop technologies to extract them.
Commercial production of unconventional gas in the United States began in the 1820s.52 However, it was not until the
late 1980s that the pace of development accelerated. This reflected the implementation of tax incentives aimed at
encouraging the development of unconventional gas resources (such incentives are generally unavailable for wells
drilled after 1992) and technological advancements.53 Since 2004, higher gas prices have encouraged small
companies to develop unconventional gas projects. The increase in US unconventional gas production has offset the
decline in conventional gas production and from 2007 to mid-2008 contributed to a dramatic increase in total gas
production (see Figure 2.7).
Production subsequently declined in
response to the fall in gas prices following
the global financial crisis. The
development of unconventional gas has
contributed to a considerable change in
the American gas market. As recently as
2007, it was widely believed that the
United States expected to have
insufficient gas to meet future demand
and investors had begun to explore
options to construct regasification
terminals to import LNG from abroad.54
Now the development of unconventional
gas has dramatically reduced the
expected reliance on imported gas (see
Chapter 1).
According to the US Energy Information
Administration’s Annual Energy Outlook 2009, the share of unconventional gas production in the US economy as a
proportion of total gas production is projected to increase from 47 percent in 2007 to 56 percent in 2030. Tight gas is
expected to remain the largest contributor to unconventional gas supply (30 percent of total gas production in 2030).
49 DOE (2009) pp 3–4. 50 GA (2008). 51 NPC (2007) p 2. 52 DOE (2009) pp 3–4. 53 EIA (2000), p 1. 54 Economist (2009).
Figure 2.7: Gas production in the lower 48 states
42
46
50
54
58
62
66
Jan-98 Jan-99 Jan-00 Jan-01 Jan-02 Jan-03 Jan-04 Jan-05 Jan-06 Jan-07 Jan-08 Jan-09
Bcf/day
Source EIA (2009b)

APEC Energy Demand and Supply Outlook – 4th edition APEC Demand and Supply Overview
18
However, the strongest growth will come from shale gas. There is still considerable uncertainty surrounding the
resource potential of shale gas and continued exploration is required to define the resource. Looking forward, the
major challenges for the United States will be to expand the resource base; encourage technological development to
improve recovery rates and reduce costs; and address environmental issues such as environmental permitting, land
access, water use and disposal and surface disturbance.
Despite the strong long-term potential for unconventional gas in the APEC region, the development of unconventional
gas projects over the outlook period will be determined by gas prices, technological development and government
policies. While each resource is different and will present its own learning curve, APEC economies will benefit
significantly from the development of technology in the United States. This will allow APEC economies to utilize these
resources, improve recovery rates and extract more challenging resources. The pace of technology transfer could be
important in the timing of the development of these resources in some APEC economies.
As in the United States, unconventional gas will play an important role in gas production over the outlook period in
other APEC economies, such as Australia and Canada. Production of CBM in Australia has increased significantly
since 2001-02 — its share of total gas production increased from 2 percent in 2001/02 to 7 percent in 2007/08. The
development of CBM resources has helped bridge the gap between gas demand and conventional gas supply in the
Eastern gas market (Queensland, New South Wales, Victoria, South Australia, Tasmania and the Australian Capital
Territory). Australian production of CBM is expected to grow strongly over the outlook period, reflecting development
plans for five projects in Queensland and three projects in New South Wales. These projects could be accompanied by
five planned LNG plants in Queensland with a combined capacity of around 17 million tonnes, which is equivalent to
the capacity of the North West Shelf Joint Venture.55
In Canada, production economics for shale and tight gas have improved considerably following improvements in
technology. Production of gas from these sources in British Colombia is expected to offset declining production of
conventional gas over the outlook period, but will still be reliant on the development of suitable infrastructure to
transport the gas to the market.56
55 ABARE (2009), p 48. 56 NRCan (2008) p 29.

APEC Energy Demand and Supply Outlook – 4th edition APEC Demand and Supply Overview
19
REFERENCES
ABARE (2009) Energy in Australia 2009. Published for the Australian Government Department of Resources, Energy and Tourism, Canberra.
DOE (2009) Modern Shale Gas Development in the United States: A Primer, US Department of Energy, Washington DC.
Economist, The (2009) “Drowning in it”, The Economist, 13 August 2009, http://www5.economist.com/world/unitedstates/displayStory.cfm?story_id=14222281.
EIA (2000) Impact of Unconventional Gas Technology in the Annual Energy Outlook 2000, US Energy Information Administration, Washington DC.
EIA (2009a) Annual Energy Outlook 2009, US Energy Information Administration, Washington DC, http://www.eia.doe.gov/oiaf/aeo/pdf/0383(2009).pdf
EIA (2009b), Office of Oil and Gas, Form EIA-914 Monthly Natural Gas Production Report, Washington DC.
GA (2008) Coal Bed Methane Factsheet. Geoscience Australia, Canberra. http://www.australianminesatlas.gov.au/education/fact_sheets/coal_bed_methane.jsp
Gas Supply Association (2004) Unconventional Gas Resources, Washington DC. http://www.naturalgas.org/overview/unconvent_ng_resource.asp
IEA (2008) Gas Market Review 2008, International Energy Agency, Paris, France.
INGAA Foundation (2008) Availability, Economics and Production Potential of North American Unconventional Gas Supplies, Interstate Gas Association of America, Fairfax, Virginia, United States.
NPC (2007) Topic Paper #29: Unconventional Gas, Working Document of the NPC Global Oil and Gas Study, National Petroleum Council, Washington DC.
NRCan (2008) Canadian Gas: Review of 2007/08 and Outlook to 2020, Natural Resources Canada, Ottawa.


APEC Energy Demand and Supply Outlook – 4th edition Final Energy Demand
21
3 F INAL ENERGY DEMAND KEY ASSUMPTIONS
Population and GDP are the two most significant drivers of energy demand in APERC’s modelling work. This section discusses our assumptions about them.
Population
The population assumptions for each economy in this outlook are based on the United Nations projections. 57 Figures 3.1 and 3.2 show these assumptions. Note the difference in scale between the two figures.
Figure 3.1: Population by economy (millions),
larger economies
1,308
297
221
103
143
85
128
83
63
48
1,452
359
272
125
123
122
117
110
69
49
0 500 1,000 1,500 2,000
China
United States
Indonesia
Mexico
Russia
Philippines
Japan
Viet Nam
Thailand
Korea
2005
2030
million
Source: UN (2007B)
Figure 3.2: Population by economy (millions),
smaller economies
32
27
26
20
23
16
6
7
4
4
0
39
36
35
26
23
20
9
8
6
5
1
0 10 20 30 40 50
Canada
Peru
Malaysia
Australia
Chinese Taipei
Chile
Papua New Guinea
Hong Kong, China
Singapore
New Zealand
Brunei Darussalam
2005
2030
million
Source: UN (2007B)
The population of the APEC region is projected to grow by 0.5 percent per year on average, from 2.6 billion in 2005 to over 3.0 billion in 2030. Population growth will slow progressively over the outlook period, from 0.7 percent per year in 2005–2015 to 0.4 percent per year in 2015–2030 (Table 3.1).
57 United Nations (2007B).
The population increase over the period is projected to be 361 million. Most of the increase comes from China (144 million), United States (62 million), Indonesia (51 million), the Philippines (37 million), and Viet Nam (27 million).
Table 3.1: Population growth by economy
(average annual growth rates in percent)
1990-2005 2005-2015 2015-2030 2005-2030
Australia 1.2 1.0 0.8 0.9
Brunei Darussalam 2.6 1.9 1.4 1.6
Canada 1.0 0.9 0.7 0.8
Chile 1.4 0.9 0.7 0.8
China 0.9 0.6 0.3 0.4
Hong Kong, China 1.2 1.0 0.7 0.8
Indonesia 1.4 1.0 0.7 0.8
Japan 0.2 -0.2 -0.5 -0.4
Korea 0.8 0.2 -0.1 0.0
Malaysia 2.4 1.6 1.1 1.3
Mexico 1.4 0.9 0.7 0.8
New Zealand 1.2 0.9 0.6 0.7
Papua New Guinea 2.5 1.9 1.5 1.7
Peru 1.5 1.2 1.0 1.1
The Philippines 2.2 1.8 1.3 1.5
Russia -0.2 -0.5 -0.6 -0.6
Singapore 2.3 1.3 1.5 1.4
Chinese Taipei 0.8 0.2 -0.1 0.0
Thailand 1.0 0.5 0.2 0.4
United States 1.2 0.9 0.7 0.8
Viet Nam 1.5 1.5 0.9 1.1
APEC 1.0 0.7 0.4 0.5 Source: UN (2007B)
The population of every APEC economy will expand, with the exception of Japan and Russia. Japan’s population is projected to fall by 0.4 percent per year and Russia’s population is expected to fall by 0.6 percent per year.
Table 3.2: Population of urban and rural areas (millions)
2005 2025 2005 2025
Australia 17.8 22.3 2.4 2.1
Brunei Darussalam 0.3 0.4 0.1 0.1
Canada 25.9 31.4 6.4 6.5
Chile 14.3 17.7 2.0 1.6
China 531.8 822.2 784.0 623.6
Hong Kong, China 7.0 8.3 0.0 0.0
Indonesia 107.2 178.7 115.5 92.5
Japan 84.3 86.5 43.8 35.2
Korea 38.6 41.8 9.2 7.2
Malaysia 17.1 27.2 8.3 6.6
Mexico 81.3 102.3 25.7 22.4
New Zealand 3.5 4.2 0.6 0.5
Papua New Guinea 0.8 1.4 5.1 7.2
Peru 20.3 25.6 7.7 8.6
The Philippines 52.1 86.4 31.0 29.5
Russia 104.5 96.1 38.7 32.1
Singapore 4.3 5.1 0.0 0.0
Chinese Taipei - - - -
Thailand 20.7 29.1 43.5 39.7
United States 240.9 305.1 57.3 49.8
Viet Nam 22.2 40.5 62.0 65.9
Total 1394.9 1932.3 1243.3 1031.1
Urban Rural
Source: UN (2007A)
Essentially all of the increase in the population of the APEC region will occur in urban areas. The

APEC Energy Demand and Supply Outlook – 4th edition Final Energy Demand
22
population of rural areas is expected to decline over the period (see Table 3.2 on previous page).58
GDP
The world economy is mired in the worst financial crisis since the Great Depression. Policy reactions to the crisis have been swift, and have so far succeeded in preventing a broader failure among financial institutions, and thereby avoided a much more severe collapse in production.
This outlook assumes that economic growth will hit the lowest point of the downturn in 2009 and that a recovery will be in progress by 2011. Our projections are based on recent projections by the United Nations 59 and the International Monetary Fund60.
GDP growth in the APEC region is assumed to average 3.5 percent per year over the outlook period. The growth over the period is lower than assumed in APEC Energy Demand and Supply Outlook 2006, in part because of weaker prospects for global economic growth in the near term and because of the longer term impacts of higher energy prices (Table 3.3).
China and Viet Nam are expected to continue to grow faster than other economies; they are followed by Indonesia, the Philippines, Malaysia, and Peru. China is assumed to grow at an average annual rate of 6.1 percent between 2005 and 2030, the highest rate in the APEC region. Other Asian economies are also expected to grow relatively quickly, as are the Latin American APEC economies.
The GDP growth rates of the more developed economies – the United States, Canada, Australia, and New Zealand – are assumed to be considerably lower. Japan and Brunei Darussalam have the lowest expected GDP growth rates.
Based on our assumptions about population and GDP growth, the per capita income of the entire APEC region is assumed to grow at an average annual rate of 2.9 percent over the outlook period (Table 3.4). As for the rates of increase of total GDP, developing economies will experience the fastest growth rates.
58 UN (2007A). 59 UN (2009B). 60 IMF (2009).
Table 3.3: Real GDP growth by economy
(average annual growth rates)
1990-2005 2005-2015 2015-2030 2005-2030
Australia 3.5 2.0 2.3 2.2
Brunei Darussalam 1.7 1.5 1.7 1.6
Canada 2.8 2.0 2.7 2.4
Chile 5.7 3.2 3.2 3.2
China 10.1 7.7 5.0 6.1
Hong Kong, China 10.9 4.4 3.3 3.7
Indonesia 4.4 4.4 4.2 4.3
Japan 0.9 1.2 1.2 1.2
Korea 5.6 3.6 3.1 3.3
Malaysia 6.2 4.2 4.3 4.2
Mexico 2.9 2.9 3.2 3.1
New Zealand 3.0 1.7 2.0 1.9
Papua New Guinea 3.5 4.2 3.0 3.5
Peru 4.0 4.4 4.0 4.2
The Philippines 3.5 4.3 4.2 4.3
Russia -0.7 3.9 3.1 3.4
Singapore 6.0 4.1 3.5 3.8
Chinese Taipei 8.9 3.8 3.0 3.3
Thailand 5.1 4.3 4.7 4.5
United States 3.0 1.8 2.8 2.4
Viet Nam 7.6 6.2 6.2 6.2
APEC 3.5 3.5 3.5 3.5 Note: The aggregate growth rates of economies are calculated
based on GDP expressed in purchasing-power-parity terms.
Source: APERC analysis (2009)
Table 3.4: GDP per capita growth by economy
(average annual growth rates in percent)
1990-2005 2005-2015 2015-2030 2005-2030
Australia 2.3 1.0 1.5 1.3
Brunei Darussalam -0.8 -0.4 0.3 0.0
Canada 1.8 1.1 2.0 1.7
Chile 4.2 2.3 2.5 2.4
China 9.2 7.1 4.7 5.6
Hong Kong, China 9.5 3.4 2.6 2.9
Indonesia 2.9 3.4 3.4 3.4
Japan 0.7 1.4 1.7 1.6
Korea 4.7 3.3 3.2 3.3
Malaysia 3.7 2.6 3.2 2.9
Mexico 1.4 1.9 2.5 2.3
New Zealand 1.8 0.8 1.4 1.1
Papua New Guinea 1.0 2.3 1.5 1.8
Peru 2.5 3.2 3.0 3.1
The Philippines 1.3 2.5 2.9 2.8
Russia -0.4 4.4 3.8 4.1
Singapore 3.6 2.8 2.0 2.3
Chinese Taipei 8.1 3.6 3.1 3.3
Thailand 4.1 3.8 4.4 4.2
United States 1.8 1.0 2.1 1.7
Viet Nam 5.9 4.7 5.2 5.0
APEC 2.5 2.8 3.0 2.9 Source: APERC analysis (2009)

APEC Energy Demand and Supply Outlook – 4th edition Final Energy Demand
23
TOTAL FINAL ENERGY DEMAND
The projected APEC final energy demand will increase from 4,471 Mtoe in 2005 to 6,248 Mtoe in 2030. This represents an increase of 40 percent, and an average annual growth rate of 1.3 percent between 2005 and 2030.
Figure 3.3 shows the growth rates by economy for the periods 2005–2015 and 2015–2030. As one would expect, the developing economies tend to have the faster growth rates, while final energy demand in the developed economies grows more slowly or, in the case of Japan, actually declines.
Figure 3.3: Annual percentage growth rates in final energy demand by economy
-1.0%
0.0%
1.0%
2.0%
3.0%
4.0%
5.0%
6.0%
7.0%
CH
L
MA
S
VN
BD
TH
A
PN
G PE
PR
C
INA
SIN RP
CT
ME
X
NZ
RO
K
AU
S
RU
S
CD
A
HKC
USA JPN
05-15 05-30
Source: APERC analysis (2009)
Final energy by energy source
Figure 3.4 shows the total APEC final energy demand by energy source. Figures 3.5 and 3.6 following show these results broken out by economy. Note the difference in the vertical axis scales for the two graphs.
Figure 3.4: Final energy demand by energy source in
APEC
0
1000
2000
3000
4000
5000
6000
7000
1990 2000 2005 2015 2030
MT
OE
Coal Oil Gas Electricity NRE Heat
Source: APERC analysis (2009)

APEC Energy Demand and Supply Outlook – 4th edition Final Energy Demand
24
Figure 3.5: Final energy demand by energy source, larger economies
-
250.0
500.0
750.0
1,000.0
1,250.0
1,500.0
1,750.0
2,000.0
05
15
30
05
15
30
05
15
30
05
15
30
05
15
30
05
15
30
05
15
30
05
15
30
05
15
30
05
15
30
PRC USA RUS JPN CDA INA ROK MEX THA AUS
Mto
e
Coal Oil Gas NRE Electricity Heat
Source: APERC analysis (2009)
Figure 3.6: Final energy demand by energy source, smaller economies
-
10.0
20.0
30.0
40.0
50.0
60.0
70.0
80.0
90.0
100.0
110.0
05
15
30
05
15
30
05
15
30
05
15
30
05
15
30
05
15
30
05
15
30
05
15
30
05
15
30
05
15
30
05
15
30
VN CT MAS CHL RP SIN PE NZ HKC PNG BD
Mto
e
Coal Oil Gas NRE Electricity Heat
Source: APERC analysis (2009)

APEC Energy Demand and Supply Outlook – 4th edition Final Energy Demand
25
Figures 3.5 and 3.6 show that China and the US will dominate the final energy demand in the APEC region; together they will account for about 60 percent of the APEC final energy demand in 2030. China’s final energy demand is projected to overtake that of the US by 2030, with demand in China growing over the outlook period at an average annual rate of 2.4 percent, compared to 0.4 percent in the US.
China will also clearly dominate the final demand for coal in the region, accounting for about 75 percent of the APEC region’s final coal demand in 2030. (Note that final demand for coal excludes the demand for coal in power plants, which will be much more widely distributed across the APEC economies.) The US, in turn, will dominate, though to a lesser degree, the demand for oil in the region, accounting for about 33 percent of the APEC region’s final oil demand.
Figures 3.7 and 3.8 show the final energy demands by energy source on a per capita basis. Again, note the differences in the vertical axis scale between the two graphs. There are stark differences in final energy demand per capita between the economies with the highest per capita demand and the economies with the lowest per capita demand. Naturally, per capita consumption tends to be highest in the developed economies and lowest in the developing economies. Some developing economies are projected to show large increases in per capita final energy demand.
There is little that can be said in general regarding the differences in per capita use of various energy sources between economies, except that the developed economies tend to use more of just about every energy source. The notable exception is new renewable energy sources (NRE), which tend to be more heavily used in developing economies, in the form of biomass used in the residential sector.
Figure 3.7: Final energy demand by energy source per capita – economies with highest final demand per capita
-
1.0
2.0
3.0
4.0
5.0
6.0
7.0
8.0
05
15
30
05
15
30
05
15
30
05
15
30
05
15
30
05
15
30
05
15
30
05
15
30
05
15
30
05
15
30
CDA USA SIN RUS CT ROK AUS BD NZ CHL
toe
/ca
pit
a
Coal Oil Gas NRE Electricity Heat
Source: APERC analysis (2009)

APEC Energy Demand and Supply Outlook – 4th edition Final Energy Demand
26
Figure 3.8: Final energy demand by energy source per capita – economies with lowest final demand per capita
-
0.5
1.0
1.5
2.0
2.5
3.0
3.5
05
15
30
05
15
30
05
15
30
05
15
30
05
15
30
05
15
30
05
15
30
05
15
30
05
15
30
05
15
30
05
15
30
JPN MAS THA HKC PRC MEX VN INA PE RP PNG
toe
/ca
pit
a
Coal Oil Gas NRE Electricity Heat
Source: APERC analysis (2009)
Final energy by sector
Figure 3.9 shows the total APEC final energy demand by sector. Figures 3.10 and 3.11 show these results broken out by economy. Figures 3.12 and 3.13 show the same results on a per capita basis.
The only observation to be made of the differences in per capita use of energy by sector between economies is that the developed economies tend to use more energy in every sector. Transport demand tends to be especially large in the developed economies and, not surprisingly, non-energy use tends to be largest in economies that have large refinery industries.
Figure 3.9: Final energy demand by sector in APEC
0
1000
2000
3000
4000
5000
6000
7000
1990 2000 2005 2015 2030
MT
OE
Industry Transport Others Non-Energy
Source: APERC analysis (2009)

APEC Energy Demand and Supply Outlook – 4th edition Final Energy Demand
27
Figure 3.10: Final energy demand by sector, larger economies
-
500.0
1,000.0
1,500.0
2,000.0
2,500.0
05
15
30
05
15
30
05
15
30
05
15
30
05
15
30
05
15
30
05
15
30
05
15
30
05
15
30
05
15
30
PRC USA RUS JPN CDA INA ROK MEX THA AUS
Mto
e
Industry Transport Others Non-Energy
Source: APERC analysis (2009)
Figure 3.11: Final energy demand by sector, smaller economies
-
20.0
40.0
60.0
80.0
100.0
120.0
05
15
30
05
15
30
05
15
30
05
15
30
05
15
30
05
15
30
05
15
30
05
15
30
05
15
30
05
15
30
05
15
30
CT VN MAS CHL RP SIN PE NZ HKC PNG BD
Mto
e
Industry Transport Others Non-Energy
Source: APERC analysis (2009)

APEC Energy Demand and Supply Outlook – 4th edition Final Energy Demand
28
Figure 3.12: Final energy demand by sector per capita – economies with highest final demand per capita
-
1.0
2.0
3.0
4.0
5.0
6.0
7.0
8.0
05
15
30
05
15
30
05
15
30
05
15
30
05
15
30
05
15
30
05
15
30
05
15
30
05
15
30
05
15
30
CDA USA SIN RUS CT ROK AUS BD NZ CHL
toe
/ca
pit
a
Industry Transport Others Non-Energy
Source: APERC analysis (2009)
Figure 3.13: Final energy demand by sector per capita – economies with lowest final demand per capita
-
0.5
1.0
1.5
2.0
2.5
3.0
3.5
05
15
30
05
15
30
05
15
30
05
15
30
05
15
30
05
15
30
05
15
30
05
15
30
05
15
30
05
15
30
05
15
30
JPN MAS THA HKC PRC MEX VN INA PE RP PNG
toe
/ca
pit
a
Industry Transport Others Non-Energy
Source: APERC analysis (2009)

APEC Energy Demand and Supply Outlook – 4th edition Final Energy Demand
29
MARKET FAILURES AND ENERGY EFFICIENCY
The following sections of this chapter discuss the energy challenges and opportunities in specific energy-using sectors. Before examining specific sectors, however, it is appropriate to examine the challenges and opportunities presented by energy demand in general. The key message of this section, and the remainder of this chapter, is that there are many opportunities to improve the efficiency with which energy is used. These opportunities should be viewed as equal in significance to measures on the supply side for achieving a more sustainable energy future.
At first glance, saying that there are many opportunities to improve energy efficiency does not sound like a particularly useful insight. After all, by ‘working smarter’ (such as better planning, better engineering, or improved technology) the efficiency of virtually every economic activity could be, and probably will be, improved. But the key point of this section is that the opportunities to improve energy efficiency are particularly large and often obvious because energy demand is different from other economic activities.
In the case of energy demand, there are strong economic barriers that tend to deter people from ‘working smarter’. The result is that there are many actions that energy users could take to improve energy efficiency that do not get taken, even though they would be economic from the perspective of society as whole. These actions do not get taken because they are not economic, or perhaps not even possible, from the perspective of the energy user. Before we can improve energy efficiency, we need to address the market failures that cause the behaviour of energy users and the interests of society as a whole to diverge.
The market failures
There are at least four kinds of market failures that lead to energy inefficiency.
1. Lack of information. Energy users generally want to compare the energy efficiency of the options they face, but may be unable to do so due to lack of information. This may occur in several ways.
• Lack of data. Energy users shopping for a place to live, a vehicle or an appliance, may want to compare the energy efficiency of the various alternatives, but are unable to do so due to a lack of reliable data.
• Lack of skills. Most consumers are not engineers, and may find the calculations involved in comparing options with different
upfront and ongoing costs to be difficult or beyond their capabilities.
• Lack of time. Even those energy users who have the skills to compare alternatives may not have the time to actually perform the analysis.
2 Split incentives. Frequently the person who makes a decision that affects energy use is not the person who pays the resulting energy costs. Consequently, the decision that gets made is not the correct one from the perspective of society. Some examples:
• Landlord/tenants. The landlord generally pays the cost of energy-efficiency improvements in apartments and offices. The tenant, however, typically pays the energy bills, and thus receives the benefits of these investments.
• Building developers/buyers. The developer pays the cost of energy-efficiency-enhancing features in buildings, but the ultimate buyer receives the benefits.
• Internal organization. In many governments and companies, the administrative unit that manages the capital budget is not the administrative unit that manages the operating budget. Each may seek to minimize their own costs without regard to the impact on the overall organization.
• Free energy. In some situations, customers are not expected to pay separately for the energy they use. Hotel guests, for example, have no incentive to limit their use of air conditioners, heaters, hot water, and lights.
3. Underpricing of energy. In most parts of the world, energy is underpriced relative to its real costs to society. Consequently, energy users have less incentive to improve the efficiency of their activities than would be socially optimal. Some examples:
• Externalities. In most economies, the energy price typically includes the costs of producing the energy, but not the costs of its adverse impacts on the environment, including greenhouse gas emissions and local pollution. In some economies, the costs of energy also do not include substantial military expenditures to protect the security of energy supplies.
• Subsidies. In some economies, energy is explicitly subsidized, so its price does not even cover the full costs of production.
4. Financing constraints. Energy users may wish to make an investment that would improve their
APEC Energy Demand and Supply Outlook – 4th edition Final Energy Demand
30
energy efficiency, but lack the capital or the access to financing that is required. This is a particular problem not only for low-income consumers, but also in the public and non-profit sectors (such as schools, hospitals, and municipal governments), where capital budgets are often tightly constrained.
The policy remedies
Improving energy efficiency is generally a very attractive approach, both politically and economically, for creating a more sustainable energy future. Because of the market failures outlined above, energy efficiency improvements offer a unique opportunity to protect the environment, help the economy, and save money for energy users all at the same time.
The policy prescriptions for improving energy efficiency generally directly address the market failures outlined above.
1. Provide better information. This may take the form of requiring labels or ratings on appliances, vehicles, and residential/commercial buildings. Ideally, the labels or ratings should be easily understood by people with limited technical training and/or limited time.
2. Set minimum energy-efficiency standards for appliances, vehicles, buildings, and commercial/industrial equipment. As long as the standards are set at a level that energy users would choose for themselves if they had the option to choose, then both energy users and society will be better off. These standards should include active devices to help energy users monitor and reduce waste, such as devices to shut off the heat and air conditioning in unoccupied hotel rooms. For major projects in the commercial and industrial sectors, it may make sense to require an analysis of the project by an accredited energy-efficiency auditor.
3. Raise the price of energy to reflect its full costs to society. This should include putting a price on carbon in some fashion (such as a carbon tax or emissions trading) as well as additional charges to cover the costs of local pollution, other environmental damage, and military expenditures related to energy production and use. In those economies that subsidize energy, the subsidies should be phased out as quickly as possible. Even with higher costs for energy, energy users can be made better off if the extra tax revenues or savings from reduced subsidies are rebated to energy users as a lump sum. The energy users can use the payment to cover their additional energy costs or, better yet, they can find ways reduce their energy use and have extra money to spend on something else.
4. Ensure that financing is available for cost-justified energy-efficiency investments. These investments will provide benefits that exceed their costs. Therefore, given proper legal and regulatory frameworks, there should be little risk to the lender and little cost to the taxpayer.
The potential emission reductions
The potential benefits from energy-efficiency improvements are quite significant. Most of the studies that have looked at the potential on a global basis have focused on potential greenhouse gas emission savings rather than energy savings. The most comprehensive review of these studies is probably that of the Intergovernmental Panel on Climate Change (IPCC). They concluded that a mid-range estimate of the potential emission reductions on the demand side (transport, buildings, and industry sectors) achievable at low cost (less than US$20/tonne CO2-equivalent) in 2030 would be 8.35 gigatonnes of CO2-equivalent. 61 A carbon price of US$20/tonne CO2-equivalent is comparable to raising the price of petrol by about US$0.05/litre.62
This 8.35 gigatonnes of CO2-equivalent compares to baseline emissions from all sources (including non-energy) in 2030 of 57.0 gigatonnes of CO2-equivalent, and baseline emissions from energy sources only in 2030 of 40.8 gigatonnes of CO2-equivalent. 63 . So the potential reduction in 2030 would be about 15 percent of all emissions and about 20 percent of energy-related emissions. Since global energy-related emissions in 2004 were about 32.5 gigatonnes of CO2-equivalent,64 the reduction would just about cut the growth in energy-related greenhouse gas emissions between 2004 and 2030 to zero.
This level of reduction seems to be a fairly robust number. A recent analysis by the IEA 65 of the impacts of implementing their 25 energy-saving recommendations was 8.2 gigatonnes of CO2-equivalent in 2030, or again about 20 percent.
61 IPCC (2007), table 11.3. Figure obtained by summing the
total potentials in the US$0 and US$0–20 cost categories for the transport, buildings, and industry sectors.
62 This figure assumes 0.033 net GJ/litre petrol x 0.070t CO2/GJ x US$20/tonne CO2 = US$0.046/litre. See Ministry of Economic Development (2006), footnote 94.
63 IPCC (2007), table 11.1. The 2030 figure for all sectors was obtained by adding the figures in the ‘Global emissions 2030 (point of emissions)’ column. Figure for ‘energy sources only’ obtained by adding the figures for the energy supply, transport, buildings, and industry sectors in this column.
64 IPCC (2007), table 11.1. The 2004 figure for ‘energy sources only’ obtained by adding the figures for the energy supply, transport, buildings, and industry sectors in the ‘Global emissions 2004 (point of emissions)’ column.
65 IEA (2009), p 3.
APEC Energy Demand and Supply Outlook – 4th edition Final Energy Demand
31
Another recent study by the McKinsey Global Institute 66 looked at global energy-saving potential from an energy perspective, and concluded that improved energy efficiency could reduce global energy consumption by about 20 percent by 2030.
These results suggest that a good rule of thumb for policymakers in dealing with the climate change problem is to look to energy-efficiency improvements to stabilize the world’s demand for energy and emissions, and then look to alternative energy supply options to achieve the additional reductions that will be needed to mitigate climate change.
TRANSPORT DEMAND
This section examines the energy challenges and opportunities in the transport sector.
Under business-as-usual assumptions, transportation energy use in the APEC region is projected to increase from 1,235 Mtoe in 2005 to 1,718 Mtoe in 2030, at an average annual rate of 1.3 percent over the outlook period. Figures 3.14 and 3.15 following show the projected transport energy demand by economy and by energy source. Note the differences in the scale of the vertical axes.
The figures show that transport energy demand will increase in all economies in the APEC region except for Japan. Japan’s transport energy demand is expected to fall, due to a decrease in the population and associated decline in the size of the vehicle stock, as well as vehicle efficiency improvements. The US transport energy demand is expected to decline after 2015 due to the impacts of more stringent Corporate Average Fuel Economy (CAFE) standards contained in the Energy Independence and Security Act of 2007 (see the United States economy review in Volume 2).
The transport sector continues to rely heavily on oil, which will account for 87 percent of transport sector demand in 2030 – this is down from 94 percent in 2005, due to the growing use of biofuels. Demand for renewables, mainly in the form of biofuels, is projected to increase at an average annual rate of 11.7 percent between 2005 and 2030, compared with an average annual growth rate of 1.1 percent per year for oil demand.
Much of the growth in transport energy demand is projected for the developing economies, where rising standards of living will increase the demand for motor vehicle ownership (see Figure 3.16 and Table 3.5 following). Though motorization rates (vehicles per 1,000 people) of the developed economies in the APEC region will probably reach saturation by 2030, the developing and transition economies in the
66 McKinsey Global Institute (2008), exhibit 3.
APEC region will experience rapid increases in motorization levels as their income per capita increases. As a whole, vehicle ownership (vehicles per 1,000 people) in the APEC region is projected to grow at an average annual rate of 2.2 percent throughout the outlook period.
CHALLENGES AND IMPLICATIONS
Some economies in the APEC region are on the threshold of becoming a motorized society, while others are fast becoming more motorized as their standards of living improve. While access to motor vehicles represents a significant increase in living standards for many people, as in other sectors, rising energy demand may result in increasing greenhouse gas emissions. In addition, since transport energy demand is overwhelmingly for oil, the energy security risks posed by imported oil and the economic risks posed by volatile oil prices are especially serious.
For example, in China the automobile holdings are expected to increase from 32 million in 2005 to 224 million in 2030, which is close to the current US level of automobile holdings. On a ‘vehicles per 1,000 population’ basis, car ownership in China will increase from 24 in 2005 to 154 in 2030. The expected 2030 figure is still quite modest when compared with other developed economies, such as the United States (819 in 2005), and Japan (581 in 2005). This suggests there is considerable potential for further motorization in China, and thus a risk that our projections may be too low. China’s oil demand could expand even more rapidly than projected given such rapid motorization.
Despite continuing improvements in average vehicle fuel efficiency, accelerated in part by high oil prices, the rapid growth of the APEC vehicle fleet is expected to continue to push up total oil use for the transport sector. Under our business-as-usual assumptions, we would not expect any major shift away from conventionally fuelled vehicles before 2030, although the penetration of hybrid vehicles, including plug-in hybrids (see below), is expected to rise and so contribute to an overall improvement in fuel economy. The average size and power of new cars in the APEC region is expected to be significantly less than in the current average in developed economies.
There are several approaches that could be used to reduce the energy security risks posed by imported oil and also the greenhouse gas emissions from transport, including:
• energy-efficiency improvements
• fuel switching
• modal shift
• transport demand reduction.
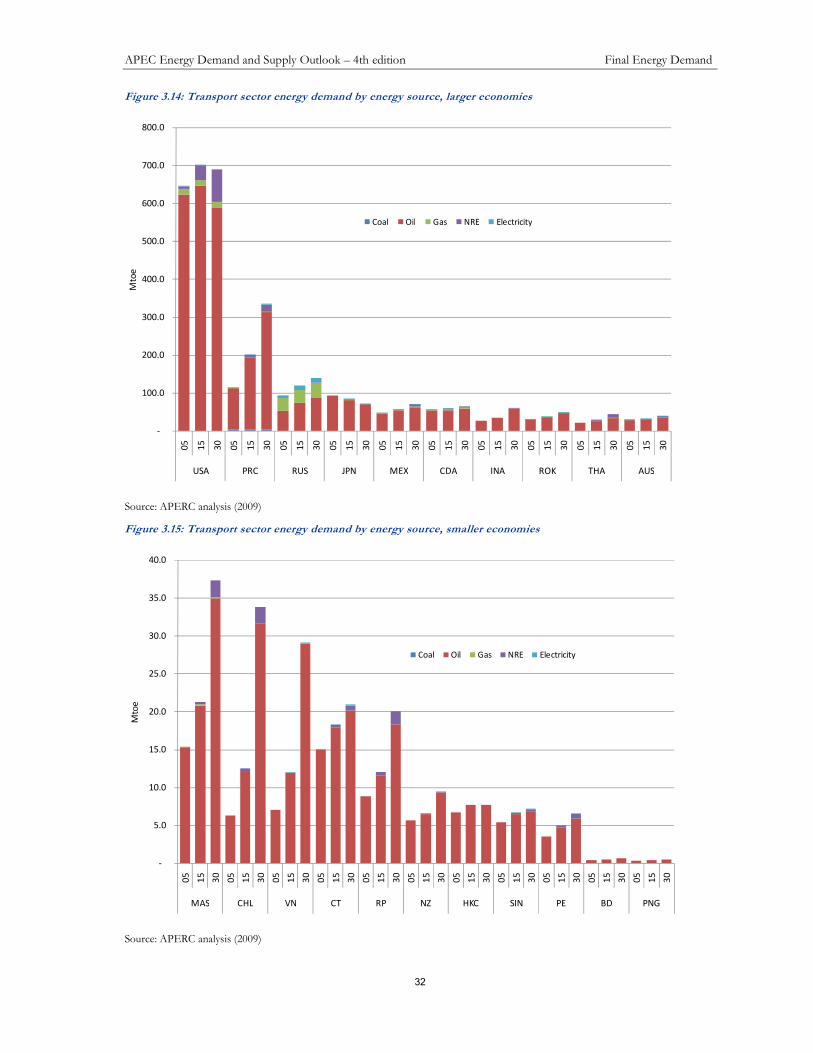
APEC Energy Demand and Supply Outlook – 4th edition Final Energy Demand
32
Figure 3.14: Transport sector energy demand by energy source, larger economies
-
100.0
200.0
300.0
400.0
500.0
600.0
700.0
800.0
05
15
30
05
15
30
05
15
30
05
15
30
05
15
30
05
15
30
05
15
30
05
15
30
05
15
30
05
15
30
USA PRC RUS JPN MEX CDA INA ROK THA AUS
Mto
e
Coal Oil Gas NRE Electricity
Source: APERC analysis (2009)
Figure 3.15: Transport sector energy demand by energy source, smaller economies
-
5.0
10.0
15.0
20.0
25.0
30.0
35.0
40.0
05
15
30
05
15
30
05
15
30
05
15
30
05
15
30
05
15
30
05
15
30
05
15
30
05
15
30
05
15
30
05
15
30
MAS CHL VN CT RP NZ HKC SIN PE BD PNG
Mto
e
Coal Oil Gas NRE Electricity
Source: APERC analysis (2009)
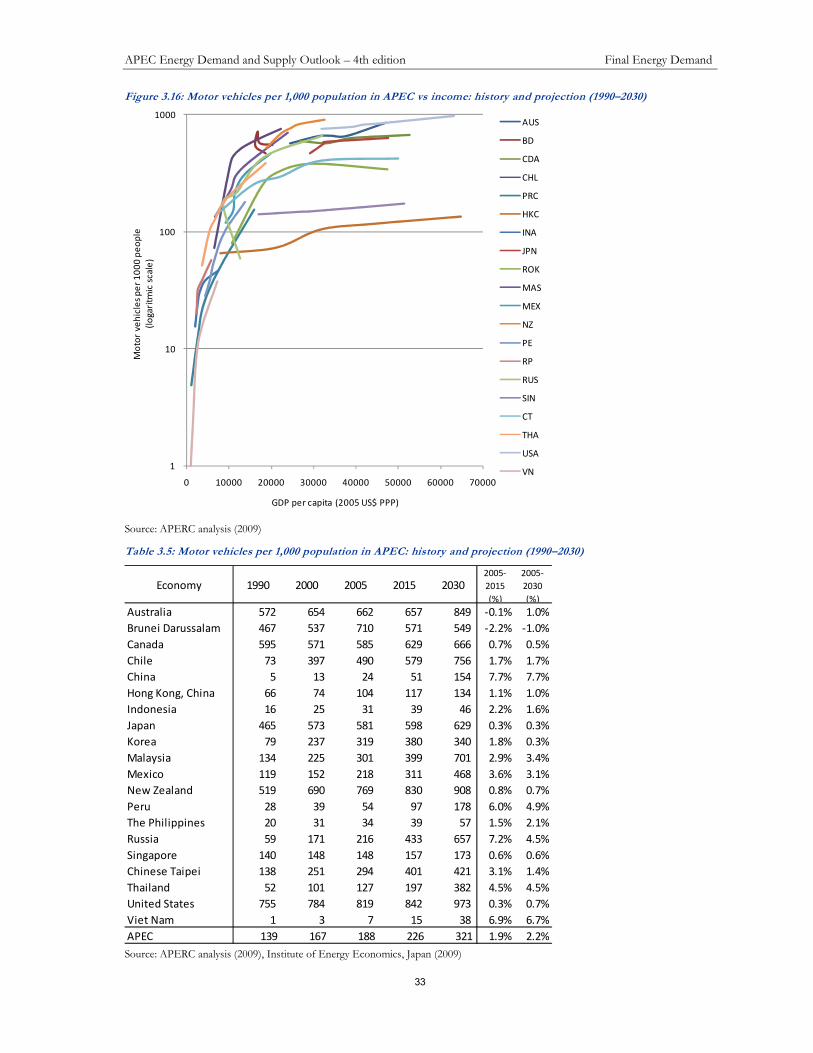
APEC Energy Demand and Supply Outlook – 4th edition Final Energy Demand
33
Figure 3.16: Motor vehicles per 1,000 population in APEC vs income: history and projection (1990–2030)
1
10
100
1000
0 10000 20000 30000 40000 50000 60000 70000
Mo
tor
veh
icle
s p
er
10
00
pe
op
le
(lo
gari
tmic
sca
le)
GDP per capita (2005 US$ PPP)
AUS
BD
CDA
CHL
PRC
HKC
INA
JPN
ROK
MAS
MEX
NZ
PE
RP
RUS
SIN
CT
THA
USA
VN
Source: APERC analysis (2009)
Table 3.5: Motor vehicles per 1,000 population in APEC: history and projection (1990–2030)
Economy 1990 2000 2005 2015 20302005-
2015
(%)
2005-
2030
(%)
Australia 572 654 662 657 849 -0.1% 1.0%
Brunei Darussalam 467 537 710 571 549 -2.2% -1.0%
Canada 595 571 585 629 666 0.7% 0.5%
Chile 73 397 490 579 756 1.7% 1.7%
China 5 13 24 51 154 7.7% 7.7%
Hong Kong, China 66 74 104 117 134 1.1% 1.0%
Indonesia 16 25 31 39 46 2.2% 1.6%
Japan 465 573 581 598 629 0.3% 0.3%
Korea 79 237 319 380 340 1.8% 0.3%
Malaysia 134 225 301 399 701 2.9% 3.4%
Mexico 119 152 218 311 468 3.6% 3.1%
New Zealand 519 690 769 830 908 0.8% 0.7%
Peru 28 39 54 97 178 6.0% 4.9%
The Philippines 20 31 34 39 57 1.5% 2.1%
Russia 59 171 216 433 657 7.2% 4.5%
Singapore 140 148 148 157 173 0.6% 0.6%
Chinese Taipei 138 251 294 401 421 3.1% 1.4%
Thailand 52 101 127 197 382 4.5% 4.5%
United States 755 784 819 842 973 0.3% 0.7%
Viet Nam 1 3 7 15 38 6.9% 6.7%
APEC 139 167 188 226 321 1.9% 2.2% Source: APERC analysis (2009), Institute of Energy Economics, Japan (2009)
APEC Energy Demand and Supply Outlook – 4th edition Final Energy Demand
34
Efficiency improvement
In total, energy efficiency improvements could be the single largest contributor to energy saving and CO2 emission reductions, and the easiest to implement. Figures 3.17 and 3.18 show the expected impacts of the existing standards. The IEA estimates that both gasoline and diesel light-duty vehicles could achieve close to 50 percent reductions in fuel intensity even without hybridization, and over 50 percent with hybridization.67
Fuel switching
Alternative transport energy sources could have an important role in reducing fossil fuel demand and CO2 emissions. Biofuels are already in use in some economies, although their impacts are controversial (see box “What are the pros and cons of biofuels” in Chapter 5).
Electric vehicles or vehicles powered by hydrogen fuel cells could offer an alternative to oil over the longer term, provided the costs of batteries and fuel cells could be reduced to make them cost-competitive with conventional vehicles.68 Plug-in hybrid vehicles, which could run on batteries over short distances and conventional fuels over longer distances, are a possible transition technology. Since most vehicle trips are short, plug-in hybrids could offer significant fuel savings, while still offering the unlimited driving range of a conventional vehicle. Since plug-in hybrids would need much smaller batteries than a fully electric vehicle, they could also be lower in cost than a fully electric vehicle. 69 Although electric and hydrogen vehicles offer an alternative to oil, their greenhouse gas reduction benefits depend heavily on the source of the electricity or hydrogen.70
67 IEA (2008), p 440. 68 IEA (2008), pp 445–447. 69 Ibid, pp 443–445. 70 Voelcker (2009) and Electric Power Research Institute
(2007).
Modal shift
There is a wide range of transport modal mixes in cities around the world (Table 3.6 and Figure 3.19). Cities with high densities of population and jobs, and with a high share of public transport, walking and cycling, are the most energy efficient. While improvements to public transport and facilities for walking and cycling can greatly improve urban transportation efficiency, their success hinges on being well designed so they achieve high levels of use. 71 Some of the most important potential benefits of improvements to urban public transport are through their long-term impacts on land-use patterns, by encouraging higher density development and transit-oriented land-use planning. Some studies estimate that the long-term reductions in CO2 emissions of improvements to public transportation are 5 to 10 times the short-run impacts.72
There are also opportunities to achieve energy savings and CO2 emission reductions through mode shifts in freight transport. In general, freight transport by rail or waterway is at least twice as energy efficient as by truck, although, as with passenger transport, the actual savings depend greatly upon the circumstances.73
Transport demand reduction
Clearly the most energy-saving and emission-reducing option in the transport sector would be to reduce the demand for transport. Over the longer term, as information technologies continue to improve, telecommuting could offer an alternative for many people to the daily commute to work (see box in this chapter on “Removing the barriers to telecommuting”).
71 APERC (2007), chapters 1 and 2 and Joint Expert Group
on Transport and the Environment (2006), chapter V. 72 IEA (2001), pp 92–99 and 119–125. 73 IEA (2001), figure 5.3, pp 157 and 178–179.

APEC Energy Demand and Supply Outlook – 4th edition Final Energy Demand
35
Figure 3.17: Actual and projected fuel economy for new passenger vehicles by economy, 2002–2018
Notes: 1 The relative stringency of Europe’s CO2-based standards is enhanced under a fuel economy standard because diesel vehicles achieve a boost in fuel economy ratings due to the higher energy content of diesel fuel.
2 For Canada, the programme includes in-use vehicles. The resulting uncertainty of this impact on new vehicle emissions was not quantified.
3 Shaded area under the California trend line represents the uncertain amount of non-fuel economy related GHG reductions (N2O, CH4, HFCs, and upstream emissions related to fuel production) that manufacturers will generate from measures such as low-leak, high-efficiency air conditioners, alternative fuel vehicles, and plug-in hybrid electric vehicles.
Source: International Council on Clean Transportation (2007)
Figure 3.18: Actual and projected GHG emissions for new passenger vehicles by economy, 2002–2018
Note: Solid lines denote actual performance or projected performance due to adopted regulations; dotted lines denote proposed standards; values normalized to NEDC test cycle in grams of CO2-equivalent per km.
Source: International Council on Clean Transportation (2007)
US
EU
JAPAN
AUSTRALIA
CANADA
CHINA
CALIFORNIA
KOREA
US
EU
JAPAN
AUSTRALIA
CANADA
CHINA
CALIFORNIA
KOREA
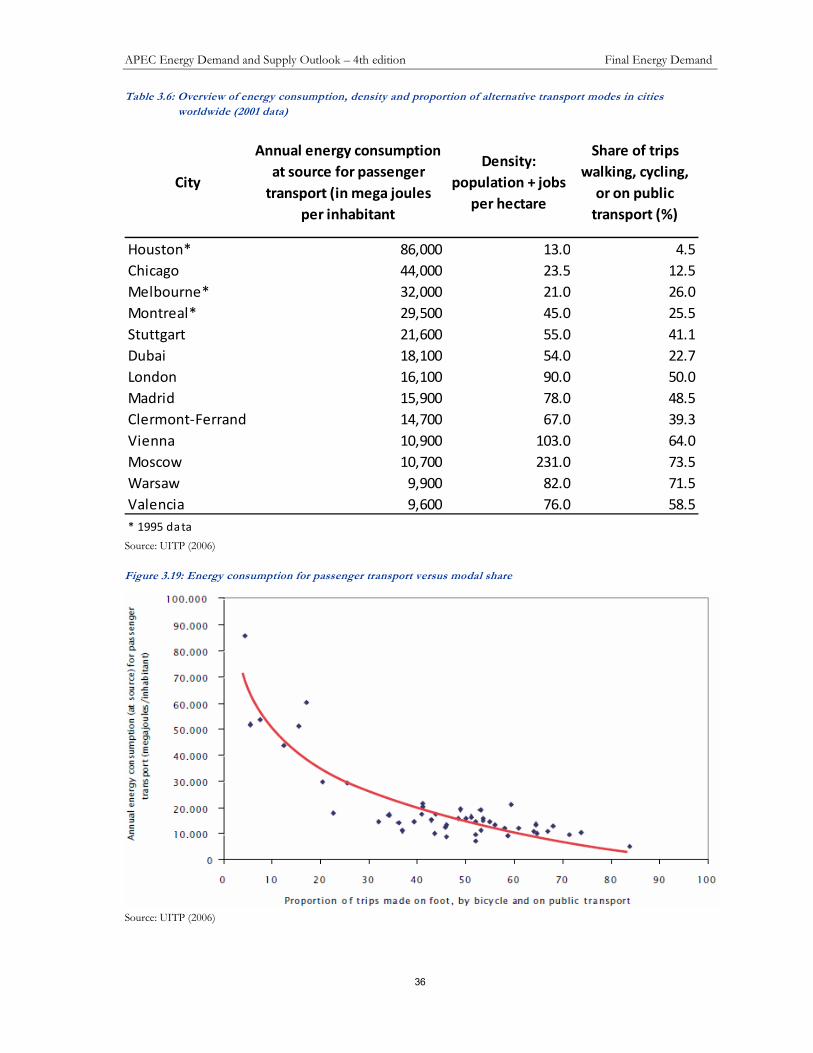
APEC Energy Demand and Supply Outlook – 4th edition Final Energy Demand
36
Table 3.6: Overview of energy consumption, density and proportion of alternative transport modes in cities
worldwide (2001 data)
City
Annual energy consumption
at source for passenger
transport (in mega joules
per inhabitant
Density:
population + jobs
per hectare
Share of trips
walking, cycling,
or on public
transport (%)
Houston* 86,000 13.0 4.5
Chicago 44,000 23.5 12.5
Melbourne* 32,000 21.0 26.0
Montreal* 29,500 45.0 25.5
Stuttgart 21,600 55.0 41.1
Dubai 18,100 54.0 22.7
London 16,100 90.0 50.0
Madrid 15,900 78.0 48.5
Clermont-Ferrand 14,700 67.0 39.3
Vienna 10,900 103.0 64.0
Moscow 10,700 231.0 73.5
Warsaw 9,900 82.0 71.5
Valencia 9,600 76.0 58.5
* 1995 data Source: UITP (2006)
Figure 3.19: Energy consumption for passenger transport versus modal share
Source: UITP (2006)

APEC Energy Demand and Supply Outlook – 4th edition Final Energy Demand
37
Removing the barriers to telecommuting
‘Telecommuting’, or more specifically having office workers work in their homes rather than in offices, could theoretically offer huge benefits.
74 The energy-saving and
environmental benefits to society of not having to commute are obvious. In addition, employers could reduce the cost of maintaining physical offices, employees could save the time and expense of commuting, and governments could save on the cost of building and maintaining transport infrastructure. The technology for accessing office documents and files from home, and for teleconferencing, exists today, so telecommuting is technically feasible. Yet despite the clear benefits, to date the use of telecommuting has been limited.
There appear to be two barriers that inhibit the widespread adoption of telecommuting. First, employers are understandably reluctant to allow their employees to work in an environment where they cannot be closely supervised. Second, if employees are not physically near each other, casual interactions become more difficult; the need to make a phone call or arrange a teleconference just to talk with someone in your own department tends
to inhibit teamwork.
Both problems could be addressed with proper software for a ‘virtual office’. Imagine a system where each employee had a video camera (or two) mounted over his/her desk at home. Each employee would also have a dedicated monitor on his/her desk that would ordinarily display, in tiled fashion, the video image of the desk of every other employee in their department. Thus, each employee could see at a glance who was at their desk and what everyone else in the department was doing, just as they would in a real office. A touch or two to the screen could show similar views of other departments—the digital equivalent of a walk down the hall. Want a closer view of what a colleague is doing? Just touch his/her picture for a full-screen view – the digital equivalent to walking up to his/her desk. Want to ask that colleague a question, or talk with him/her about something? Just touch his/her picture again and your face will pop up on his/her monitor and an audio connection will be established. A few more screen touches could bring a third colleague into the instant meeting.
Such a ‘virtual office’ could give employers an ability to supervise their employees’ work at home as closely as they could in a physical office. It would also allow spontaneous interactions of the type that makes physical offices conducive to teamwork. Thus, it could remove the major remaining barriers to telecommuting. Such systems would appear to be feasible today – in fact, mobile phones are increasingly offering similar features. Is there a significant, little recognized opportunity here to address our energy challenges, while improving
productivity at the same time?
74 For a review of the literature on the benefits of
telecommuting, see Walls and Safirova (2004).
INDUSTRIAL DEMAND
This section examines the energy challenges and opportunities in the industry sector.
Industrial demand in the APEC region under business-as-usual assumptions is projected to grow at an average annual rate of 1.3 percent between 2005 and 2030 period; this is in line with the average annual growth rate of 1.3 percent for the total APEC region energy demand.
The level of industrial energy demand and the mix of energy sources used vary greatly across the APEC economies. Figures 3.20 and 3.21 following show the projected industrial energy demands by energy source for each APEC economy. Note the difference in the scale of the vertical axis in the two figures.
The top five APEC economies in terms of industrial energy demand in 2005 – China, the United States, Russia, Japan, and Canada – are expected to together claim a 76.2 percent share of the total APEC industrial energy demand in 2030. This is down from their combined 82.5 percent share in 2005. China alone will use 41.7 percent of the total APEC industrial energy demand in 2030, up from 37.6 percent in 2005.
Rapid industrial energy demand growth is expected in Viet Nam (5.7 percent annually), Singapore (4.0 percent), Chile (3.9 percent), Peru (3.5 percent) and Malaysia (3.4 percent); this reflects rapid industrial development in these economies. Final energy demand in the industry sector in the United States, Japan and Hong Kong China is expected to decline over the 2005–2030 period, due to changes in the industrial structure and efficiency improvements in those economies.
Figure 3.22 following shows that industrial energy demand growth is expected to be more rapid in the 2005–2015 period than in the 2015–2030 period. By the later period, some developing economies will have more mature economies, and thus slower industrial demand growth. The most notable declines in the industrial energy demand growth rate are expected for China and Russia. Between the first and second halves of the outlook period, China’s industrial final energy demand growth rate is expected to decline from 3.2 percent to 0.7 percent, while Russia’s will decline from 1.5 percent to 0.4 percent.

APEC Energy Demand and Supply Outlook – 4th edition Final Energy Demand
38
Figure 3.20: Industrial sector energy demand, larger economies
-
100.0
200.0
300.0
400.0
500.0
600.0
700.0
800.0
05
15
30
05
15
30
05
15
30
05
15
30
05
15
30
05
15
30
05
15
30
05
15
30
05
15
30
05
15
30
PRC USA RUS JPN CDA INA ROK MEX THA AUS
Mto
e
Coal Oil Gas NRE Electricity Heat
Source: APERC analysis (2009)
Figure 3.21: Industrial sector energy demand, smaller economies
-
5.0
10.0
15.0
20.0
25.0
30.0
35.0
40.0
05
15
30
05
15
30
05
15
30
05
15
30
05
15
30
05
15
30
05
15
30
05
15
30
05
15
30
05
15
30
05
15
30
VN MAS CT CHL RP PE NZ SIN PNG HKC BD
Mto
e
Coal Oil Gas NRE Electricity Heat
Source: APERC analysis (2009)

APEC Energy Demand and Supply Outlook – 4th edition Final Energy Demand
39
Figure 3.22: Annual percentage growth rates in industrial final energy demand by economy
-3.0%
-2.0%
-1.0%
0.0%
1.0%
2.0%
3.0%
4.0%
5.0%
6.0%
7.0%
VN
SIN
CH
L
PE
BD
MA
S
PN
G
ME
X
TH
A
INA
PR
C
AU
S
CT
RO
K
RP
NZ
RU
S
CD
A
USA JPN
HKC
05-15 05-30
Source: APERC analysis (2009)
As shown in Figure 3.23, we expect the total APEC industrial demand for electricity and natural gas to increase rapidly over the 2005–2030 period, while demand for coal is projected to level off in the second half of the outlook period. Oil will retain a significant role in industry, especially in applications where mobile equipment is required, such as in construction and mining. However, due to its assumed relatively high price, the oil demand in industry is not expected to increase very rapidly. (Industrial energy demand for transport, such as for trucks used by industrial firms, is not included here; it is counted in the transport sector.)
Figure 3.23: Projection of energy demand for industry
in the APEC region
0
100
200
300
400
500
600
700
1990 2000 2005 2005 2015 2030
Mto
e
Coal
Oil
Gas
NRE
Electricity
Heat
Source: APERC analysis (2009)
Figure 3.24 (following) shows a projection of industrial electricity demand by economy. The most substantial absolute increase is expected for China. The most rapidly increasing average annual growth rate is expected for Viet Nam (8.3 percent), The Philippines (5.9 percent), Thailand (5.5 percent) and Malaysia (5.1 percent).
Figure 3.25 (following) shows the projected industrial gas demand. The United States is the largest consumer of natural gas for industrial use in the APEC region; however its demand is projected to decline from 107 Mtoe in 2005 to 94 Mtoe in 2030. Natural gas demand for industry is expected to increase in other APEC economies. The largest increase in both absolute and percentage terms is expected for China, rising at an average annual rate of 6.1 percent, from 12 Mtoe to 54 Mtoe in 2030. Substantial average annual increases are also expected for Korea (5.1 percent), Chile (4.0 percent), Indonesia (2.5 percent) and Mexico (2.1 percent).

APEC Energy Demand and Supply Outlook – 4th edition Final Energy Demand
40
Figure 3.24: Projection of electricity demand for industry by economy
0
50
100
150
200
250
PR
C
USA
RU
S
JPN
CD
A
INA
RO
K
ME
X
TH
A
AU
S
VN
MA
S
CT
CH
L
RP
PE
NZ
SIN
PN
G
HKC BD
Mto
e
2005 2015 2030
Source: APERC analysis (2009
Figure 3.25: Projection of gas demand for industry by economy
0
20
40
60
80
100
120
PR
C
USA
RU
S
JPN
CD
A
INA
RO
K
ME
X
TH
A
AU
S
VN
MA
S
CT
CH
L
RP
PE
NZ
SIN
PN
G
HKC BD
Mto
e
2005 2015 2030
Source: APERC analysis (2009)

APEC Energy Demand and Supply Outlook – 4th edition Final Energy Demand
41
Figure 3.26: Projection of coal demand for industry
0
50
100
150
200
250
300
350
400M
toe
2005 2015 2030
Source: APERC analysis (2009)
China is the largest consumer of coal for industrial use in the APEC region; this economy alone accounts for 70.8 percent of APEC industrial coal demand in 2005. The industrial coal demand in China is expected to decline slightly, from 349.5 Mtoe in 2015 to 335.7 Mtoe in 2030 (see Figure 3.26). The decline reflects efficiency improvements and government restrictions placed on further industrial capacity expansion, particularly in the iron and steel industry. The most notable increases in demand for coal for industrial use are projected for Indonesia (2.8 percent), Viet Nam (2.8 percent) and Chinese Taipei (2.1 percent).
CHALLENGES AND IMPLICATIONS
The APEC economies are making significant gains in energy efficiency improvements in industry. Most notably, China is implementing a range of aggressive industrial energy-efficiency measures that include elimination of substantial ‘backward’ energy-intensive plants.75 Nonetheless, the potential for further energy savings in industry remains significant.76
Given that industry currently accounts for more than a quarter of APEC’s final energy demand, improving the energy efficiency of
75 APERC (2009). 76 IEA (2007).
industry, and shifting to low-carbon energy sources, will be critical to achieving environmental sustainability. The diversity of the sector requires a diverse set of tools and policy measures to meet this considerable challenge.
Although the role of oil is less significant for industry than it is for other sectors (oil accounted for 14 percent of the total APEC industrial energy demand in 2005), oil remains a major input to industry. Given the generally higher cost of oil products compared to other fuels, it is reasonable to assume that oil remains in use in industry primarily in applications where it is difficult to substitute other fuels. This means oil security is a significant concern for industry, just as it is for other sectors.
OTHER SECTOR
This section examines the energy challenges and opportunities in the ‘other’ sector, which encompasses residential, commercial, agriculture, forestry, fishing and all other public services.
Energy demand trend by energy source
Over the period 1990–2005, the energy demand in the ‘other’ sector of APEC economies grew at average annual rate of 1.0 percent; at the same time the average annual APEC income growth was 3.4 percent, while population growth was 1.1 percent.

APEC Energy Demand and Supply Outlook – 4th edition Final Energy Demand
42
In 2005, energy use in the ‘other’ sector accounted for 34 percent of the total APEC final energy consumption. The energy sources and amount of energy used in the ‘other’ sector vary greatly from economy to economy. Not surprisingly, developed economies had much higher per capita energy use than did developing economies. Also, electricity and gas were the dominant energy sources in developed economies’ ‘other’ sectors, while some developing economies still relied heavily on biomass and coal. For example, in the US, where GDP per capita was about US$41,813, energy consumption per capita in the ‘other’ sector was 1.689 toe/capita, with electricity and gas as the main energy sources. In China, on the other hand, where GDP per capita was only US$4,079, energy consumption per capita in the other sectors was 0.331 toe/capita, and NRE (primarily biomass) and coal remained important energy sources.
Figures 3.27 and 3.28 show the projected ‘other’ sector demand in each APEC economy, under business-as-usual. Note that the vertical axes of the two graphs have different scales. Over the period 2005–2030, the total ‘other’ sector demand is projected to increase from 1,519 Mtoe in 2005 to 2,140 Mtoe in 2030, an annual average increase of 1.4 percent. By 2030, the ‘other’ sector will account for 34.2 percent of the total APEC final energy demand.
By 2030, China will become the economy consuming the largest amount of energy in the ‘other’ sector (805.7 Mtoe), which accounts for 37.6 percent of the total APEC ‘other’ sector demand. The US will be second, with 574.8 Mtoe (26.9 percent). However, the US will still be using far more energy per capita in the ‘other’ sector in 2030 (at 1.60 toe/capita) than China (0.55 toe/capita).
Figure 3.27: Other sector energy demand by energy source, larger economies
-
100.0
200.0
300.0
400.0
500.0
600.0
700.0
800.0
900.0
05
15
30
05
15
30
05
15
30
05
15
30
05
15
30
05
15
30
05
15
30
05
15
30
05
15
30
05
15
30
PRC USA RUS JPN CDA INA ROK VN THA MEX
Mto
e
Coal Oil Gas NRE Electricity Heat
Source: APERC analysis (2009)

APEC Energy Demand and Supply Outlook – 4th edition Final Energy Demand
43
Figure 3.28: Other sector energy demand by energy source, smaller economies
-
5.0
10.0
15.0
20.0
25.0
30.0
05
15
30
05
15
30
05
15
30
05
15
30
05
15
30
05
15
30
05
15
30
05
15
30
05
15
30
05
15
30
05
15
30
AUS CT MAS RP CHL HKC PE SIN NZ BD PNG
Mto
e
Coal Oil Gas NRE Electricity Heat
Source: APERC analysis (2009)
Figure 3.29: Annual percentage growth rates in other sector energy demand by economy
-1.0%
0.0%
1.0%
2.0%
3.0%
4.0%
5.0%
SIN
MA
S
TH
A
PN
G
PR
C
HKC
CH
L
RP
CT
AU
S
BD
INA
CD
A
RO
K
NZ
ME
X
VN PE
RU
S
USA
JPN
05-15 05-30
Source: APERC analysis (2009)

APEC Energy Demand and Supply Outlook – 4th edition Final Energy Demand
44
Figure 3.29 shows the projected growth rates in the ‘other’ sector energy demand. The higher growth rates tend to be in the developing economies, although the highest is expected to be Singapore – this is driven by the projected growth of Singapore’s commercial sector.
Figure 3.30 shows the ‘other’ sector energy demand by energy source. Among these sources, electricity will be both fastest growing and, by 2030, the largest. Electricity demand will grow at an annual average rate of 2.3 percent over the outlook period, driven by increasing income levels and growing activity in the commercial sector. These factors result in an increasing requirement for air conditioning, space and water heating, lighting, and home appliances. Expansion of rural electrification and the wider use of air conditioning and refrigerators in China and Southeast Asia is a significant factor contributing to increased demand for electricity in the residential sector. By 2030, China will account for 26.3 percent of the total APEC ‘other’ sector electricity demand, second only to the US at 40.3 percent.
Natural gas is projected to be the second fastest growing and, by 2030, the second largest energy source for the ‘other’ sector. Gas demand will grow at an average annual rate of 1.6 percent. Rapid growth in natural gas demand is expected as income levels expand and extensive development of gas infrastructure continues, allowing gas to replace non-commercial biomass for heating and cooking. Natural gas demand in China, in particular, is expected to grow at 9.3 percent per year.
Demand for petroleum products, which is dominated in the ‘other’ sector by LPG, will increase faster between 2005 and 2015 (an average annual rate of 1.6 percent) than between 2015 and 2030 (0.9 percent). In the second half of the outlook period, LPG will increasingly be replaced by natural gas, due to expanded coverage of pipeline distribution networks.
Demand for heat (mainly district heating systems) is projected to grow at 1.3 percent per year throughout the outlook period. China and Russia represent 95 percent of the total APEC heat demand.
Coal demand is expected to have the lowest growth among the commercial fuels in the ‘other’ sector at 0.1 percent annually. Coal will be increasingly replaced by electricity, natural gas and LPG. In 2030, China will remain the largest ‘other sector’ coal consumer in the APEC region, consuming 89 percent of total ‘other’ sector coal demand.
Commercial fuels will increasingly replace biomass in the ‘other’ sector. However, while the biomass share of ‘other’ sector energy demand will decline overall, its use is expected to persist in rural areas, especially in China and Southeast Asia, as a fuel for cooking and water heating (see box “Residential biomass use and poverty” this chapter). In regard to other NRE sources, there will also be some growth in the demand for solar water heating in the ‘other’ sector; however, it is not expected to be large compared to biomass. The net result will be more or less stable demand for NRE in the ‘other’ sector over the outlook period.
Figure 3.30: Other sector energy demands by energy source
168
75 78 81 80
205240 250
294338
260 300 302
348
448
303 319337 337 336
264
377
461
585
813
110 96 91 104 126
0
100
200
300
400
500
600
700
800
900
1990 2000 2005 2015 2030
Mtoe
Coal Oil Gas NRE Electricity Heat
Source: APERC analysis (2009)

APEC Energy Demand and Supply Outlook – 4th edition Final Energy Demand
45
CHALLENGES AND SOLUTIONS
Growth of nearly 40 percent in the ‘other’ sector energy demand over 2005–2030 will have a number of favourable consequences. In many economies, it will bring more healthy living conditions, greatly improved standards of living, will help provide easier access to education and health care, give children more time to pursue education, and give women more time to pursue both education and income earning opportunities.
It does, however, pose some challenges. These include those related to greenhouse gas emissions, security of supply, and price risks for fossil fuels. There are also issues in the residential sector related to poverty and affordability. Although, even in rural
areas, people will increasingly have access to electricity and commercial fuels, many people may still not be able to afford to use much of them.
All APEC economies recognize these issues, and are working to address them. Approaches that should be considered include:
• greater use of low-carbon energy sources, such as solar water heaters and cleaner, more efficient use of biomass
• improved energy efficiency, such as higher energy-efficiency standards for buildings and appliances, and a phase-out of incandescent light bulbs
• targeted assistance for those who would otherwise be facing energy poverty.
Residential biomass use and poverty
The use of more biomass (plant and animal matter) as fuel is widely regarded as one of the ways to move toward a
more sustainable energy future. Greenhouse gas emissions from biomass use are potentially low, biomass is
renewable, and biomass can be produced in abundant quantities in most economies. With modern equipment, it can
be burned cleanly and efficiently.77
However, there is a dark side to the use of biomass. Today in many parts of the world biomass – including wood,
animal dung, and agricultural residues – is the cooking and heating fuel used by the poor, an estimated 2.5 billion of
them.78 It is easy to see why this is the case, since in rural areas the fuel can generally be gathered at no cost.
This use of biomass by the poor can have some serious impacts. First, there are health consequences. Biomass is
often burned in a way that produces severe indoor air pollution resulting in a wide variety of diseases and respiratory
problems. According to the World Health Organization, 1.5 million deaths a year worldwide can be attributed to indoor
air pollution from solid fuels.79 The International Energy Agency estimates that about 85 percent of these deaths are
attributable to smoke from biomass (the remainder to coal).80 Women and children who spend the most time at home
are the most vulnerable, with children under five accounting for an estimated 56 percent of the deaths attributed to
indoor air pollution.81 Second, the gathering of biomass can degrade the land. Dung and agricultural residues that are
gathered for fuel cannot be ploughed back into the soil, reducing soil fertility. The impacts on forests are less clear, but
certainly not good in some cases.82 Third, fuel collection is a time-consuming and exhausting task. It is a task that
usually falls on women and children, reducing their opportunities for education and income generating activities. The
strenuous efforts involved may also lead to serious long-term body damage, not to mention the risks of falls, animal
bites, and assault.83
The impacts of residential biomass use vary widely by economy, and these impacts may not apply to every economy.
The situation in most APEC economies is not very clear. Even basic data on residential biomass use is notoriously
difficult to obtain; since the fuel is generally not traded commercially, it is not possible to survey producers or
marketers. Government estimates of percentages of the population using solid fuels suggest that the use of solid fuels
is significant in some APEC economies and is strongly correlated with low incomes (see Figure 3.31). Much of this
solid fuel use is probably biomass, especially wood, although in China many households use coal.84
77 EPA (2009). 78 IEA (2006), table 15.1. 79 WHO (2006), p 4. 80 IEA (2006), pp 424–425. 81 WHO (2005). 82 IEA (2006), pp 427–428. 83 Ibid (2006), p 428. 84 Ibid (2006), p 421.

APEC Energy Demand and Supply Outlook – 4th edition Final Energy Demand
46
One would logically expect that the growth in incomes we anticipate in the developing economies in the APEC region
would cause a shift away from traditional residential biomass use by 2030. However, the consensus among APERC’s
researchers from APEC’s developing economies is that residential biomass use is likely to persist in at least some
economies as a matter of choice. Many people will continue to use biomass for reasons including its affordability,
availability, and cultural preferences for cooking with wood. Given the potential contributions of biomass to a
sustainable energy future, this is a good thing.
Nevertheless, governments need to be recognizing the possible health and social risks that may be posed by biomass
use. This would include making sure that everyone has access to commercial fuels so use of biomass is not a poverty-
induced necessity. Also, governments need to work to insure that all biomass is produced in an environmentally
sustainable fashion and consumed in a way that does not degrade indoor or outdoor air quality.
Figure 3.31: Percent of population using solid fuels vs GDP per capita for APEC economies
China
Indonesia
Mexico
Papua New Guinea
Peru
Philippines
Russia
Thailand
Viet Nam
0%
10%
20%
30%
40%
50%
60%
70%
80%
90%
100%
$0 $2,000 $4,000 $6,000 $8,000 $10,000 $12,000 $14,000
Pe
rce
nt
of P
op
ula
tio
n U
sin
g S
olid
Fu
els
GDP per Capita 2005 US $ PPP
Notes: Data on percent of population using solid fuels from UN (2009A). Data is for the year 2003 or the most recent year available and was obtained from economy governments. The United Nations assumed that all economies with a Gross National Income (GNI) per capita above US$10,500 have made a complete transition to using non-solid fuels as the primary source of domestic energy for cooking and heating, so these economies are not shown. Data on GDP per capita from Appendix to Volume 2 of this document.
REFERENCES
APERC (2007) Urban Transport Energy Use in the APEC Region, Asia Pacific Energy Research Centre, Tokyo, Japan. http://www.ieej.or.jp/aperc/
APERC (2009) Understanding Energy in China—Geographies of Energy Efficiency, Asia Pacific Energy Research Centre, Tokyo, Japan. http://www.ieej.or.jp/aperc/2009pdf/APERC_China_2009_rev.pdf
Electric Power Research Institute (2007) Environmental Assessment of Plug-in Hybrid Electric Vehicles, Palo Alto, United States, http://mydocs.epri.com/docs/public/PHEV-ExecSum-vol1.pdf
EPA (2009) “Cleaner Burning Wood Stoves and Fireplaces” US Environmental Protection Agency, http://www.epa.gov/woodstoves/
IEA (2001) Saving Oil and Reducing CO2 Emissions in Transport: Options and Strategies, International Energy Agency, Paris.

APEC Energy Demand and Supply Outlook – 4th edition Final Energy Demand
47
IEA (2006) World Energy Outlook 2006, International Energy Agency, Paris, France.
IEA (2007) Tracking Industrial Energy Efficiency and CO2 Emissions, International Energy Agency, Paris, http://www.iea.org/w/bookshop/add.aspx?id=298
IEA (2008a) Energy Technology Perspectives 2008, International Energy Agency, Paris, http://www.iea.org/W/bookshop/add.aspx?id=330
IEA (2009) Energy Efficiency Policy Recommendations, International Energy Agency, Paris, http://www.iea.org/Textbase/Papers/2008/ee_recommendations_brochure.pdf
IEEJ (2009) Handbook of Energy & Economic Statistics in Japan, Institute of Energy Economics, Japan http://www.ieej.or.jp/edmc/public/publication-e.html.
IMF (2009) World Economic Outlook Update, International Monetary Fund, Washington DC, http://www.imf.org/external/pubs/ft/weo/2009/update/01/
Intergovernmental Panel on Climate Change (2007) Climate Change 2007: Mitigation of Climate Change, Geneva, www.ipcc.ch
International Council on Clean Transportation (2007) Passenger Vehicle Greenhouse Gas and Fuel Economy Standards: A Global Update, http://www.theicct.org/documents/ICCT_GlobalStandards_2007_revised.pdf
Joint Expert Group on Transport and the Environment (2006), Reduction of Energy Use in Transport, report prepared for the European Commission.
McKinsey Global Institute (2008) The Case for Investing in Energy Productivity, http://www.mckinsey.com/mgi/reports/pdfs/Investing_Energy_Productivity/Investing_Energy_Productivity.pdf
Ministry of Economic Development (2006) New Zealand’s Energy Outlook to 2030, Wellington, New Zealand http://www.med.govt.nz/templates/MultipageDocumentTOC____21862.aspx
UITP (2006) “The Role of Public Transport to Reduce Green House Gas Emissions and Improve Energy Efficiency”, International Association of Public Transport, Brussels, Belgium, http://www.uitp.com/eupolicy/positions/2006/03/Climate_Change_EN.pdf
UN (2007b) Urban and Rural Areas 2007, United Nations, New York, http://www.un.org/esa/population/publications/wup2007/2007_urban_rural_chart.pdf
UN (2007a) World Population Prospects: The 2006 Revision. United Nations, New York, http://www.un.org/esa/population/publications/wpp2006/wpp2006.htm
UN (2009A) United Nations Statistics Division Millennium Development Goals website, http://millenniumindicators.un.org/unsd/mdg/SeriesDetail.aspx?srid=712&crid=
UN (2009B) World Economic Situation and Prospects 2009, United Nations, New York, http://www.unctad.org/en/docs/wesp2009pr_en.pdf
Voelcker, John (2009) “How Green Is My Plug-in”, IEEE Spectrum, March 2009, http://www.spectrum.ieee.org/energy/the-grid/how-green-is-my-plugin
Walls, M and Safirova, E (2004) A Review of the Literature on Telecommuting and Its Implications for Vehicle Travel and Emissions, Resources for the Future, Washington, DC, http://www.rff.org/Documents/RFF-DP-04-44.pdf
WHO (2005) “Indoor Air Pollution and Health”, Fact Sheet 292, June 2005, World Health Organization, http://www.who.int/mediacentre/factsheets/fs292/en/index.html
WHO (2006) “Fuel for Life: Household Energy and Health”, World Health Organization, http://www.who.int/indoorair/publications/fuelforlife.pdf


APEC Energy Demand and Supply Outlook – 4th edition Electricity
49
4 ELECTRICITY HISTORICAL TREND
APEC’s electricity demand has grown robustly between 1990 and 2005 at an average annual rate of 3.4 percent per year, from 5716.9 TWh in 1990 to 9385.2 TWh in 2005. Rapid growth was observed in Viet Nam (14.3 percent), followed by China (9.9 percent), Malaysia (9.8 percent) and Indonesia (9.6 percent), as shown in Table 4.1.
In 1990, developed economies such as Australia, Canada, Japan and the US accounted for 70 percent of the APEC region’s total electricity consumption, with the US alone consuming 47 percent. However, in 2005, the total share consumed by these economies decreased to 58 percent; this was due mainly to China’s increasing electricity demand as a result of its rapid economic growth. China’s share has increased from 8 percent in 1990 to 21 percent in 2005, as calculated from Table 4.1.
OUTLOOK RESULTS
ELECTRICITY DEMAND
Electricity demand is expected to continue to grow between 2005 and 2030, at a rate of 2.3 percent per year. By region, North America, especially the US, is projected to contribute most significantly to demand for electricity. Electricity demand in the US is projected to reach 5,023 TWh in 2030 or about 30.5 percent of APEC’s total electricity demand in 2030. However, China’s expected high economic growth will mean its electricity demand will surpass all other APEC economies’ by the end of the outlook period. In 2030 it is expected to reach 5,197 TWh or 31.6 percent of APEC’s total electricity demand in 2030, as shown in Table 4.1.
Table 4.2 shows the share of electricity in projected total final energy demand (TFED) for each APEC member economy. Electricity share in TFED is expected to increase for all economies during the outlook period, with the exception of Brunei Darussalam. This economy’s share of electricity in its TFED is projected to decrease steadily over the outlook period, from 32 percent in 2005 to 20 percent in 2030. This anomalous result for Brunei Darussalam’s electricity demand is mainly due to the fact that the economy has extensive gas resources, and domestic gas use is being encouraged, and is expected to meet most of the growth in energy demand.
Table 4.1: APEC’s electricity demand (TWh)
Economy 1990 2005 2030
1990-2005
(%)
2005-2030
(%)
Australia 129.2 206.5 310.7 3.2% 1.6%
Brunei Darussalam 1.0 3.1 4.2 7.7% 1.2%
Canada 418.1 512.2 688.9 1.4% 1.2%
Chile 15.4 48.1 121.6 7.9% 3.8%
China 481.8 1994.9 5196.8 9.9% 3.9%
Hong Kong, China 23.8 40.1 69.0 3.5% 2.2%
Indonesia 27.1 107.1 275.8 9.6% 3.9%
Japan 749.7 976.7 1202.1 1.8% 0.8%
Korea 94.4 357.7 575.3 9.3% 1.9%
Malaysia 19.9 80.8 245.1 9.8% 4.5%
Mexico 100.2 184.2 425.5 4.1% 3.4%
New Zealand 27.8 38.1 56.3 2.1% 1.6%
Papua New Guinea 1.7 2.8 7.5 3.6% 4.0%
Peru 11.8 22.7 59.2 4.5% 3.9%
Philippines 20.9 45.3 136.5 5.3% 4.5%
Russia 826.8 650.1 1000.9 -1.6% 1.7%
Singapore 12.6 32.4 91.4 6.5% 4.2%
Chinese Taipei 76.0 199.0 319.1 6.6% 1.9%
Thailand 38.4 121.3 401.1 8.0% 4.9%
United States 2634.0 3716.3 5023.0 2.3% 1.2%
Viet Nam 6.2 46.1 232.1 14.3% 6.7%
APEC 5716.9 9385.2 16442.1 3.4% 2.3%
Source: APERC analysis (2009)
Table 4.2: APEC electricity as percentage of TFED
Economy 1990 2005 2030
Australia 19 23 24
Brunei Darussalam 20 32 20
Canada 22 22 23
Chile 12 19 20
China 6 15 22
Hong Kong, China 29 29 39
Indonesia 3 7 10
Japan 21 24 30
Korea 12 21 23
Malaysia 12 17 23
Mexico 10 15 22
New Zealand 25 25 25
Papua New Guinea 23 24 32
Peru 12 17 26
Philippines 12 15 26
Russia 11 13 16
Singapore 16 18 29
Chinese Taipei 21 27 27
Thailand 11 15 24
United States 17 20 25
Viet Nam 2 9 19
APEC 14 18 23
Source: APERC analysis (2009)

APEC Energy Demand and Supply Outlook – 4th edition Electricity
50
ELECTRICITY SUPPLY
Electricity supply across the APEC region is expected to grow at an average annual rate of 2.2 percent between 2005 and 2030. Figure 4.1 shows the historical and future APEC electricity generation mix in percentage terms. (See Chapter 2 for a discussion of projected electricity supply in absolute quantities.)
Figure 4.1: APEC electricity generation mix (1990–2030)
39%45% 48% 48% 44%
11%6% 5% 2%
2%
17% 17% 18% 19%21%
15% 13% 13% 13% 11%
16% 16% 14% 14% 16%
2% 2% 2% 3% 5%
1990 2000 2005 2015 2030
Coal Oil Natural Gas Hydro Nuclear NRE
Source: APERC analysis (2009)
Electricity generating capacity
To meet the projected increase in total electricity supply, total generating capacity in the APEC region is projected to roughly double over the outlook period, from 2,286 GW in 2005 to 4,361 GW in 2030. As new generating capacity is added, the supply mix is expected to change, driven by a number of factors, including fuel costs, local environmental regulations, capital availability, acceptability of nuclear generation, and concerns about the price risks for LNG. Figure 4.2 shows the projected electricity generating capacity by energy type.
Over the outlook period, oil and LNG prices are expected to continue to increase while the price for coal is expected to remain stable and relatively low, as it is an energy resource with abundant deposits worldwide. For these reasons, coal is likely to remain the dominant energy source for electricity generation in the APEC region. Coal, however, generates more greenhouse gases than any other fossil fuel. Even under business-as-usual assumptions, concerns about climate change may limit the growth of coal-fired generating capacity.
Coal-fired generating capacity is expected to grow at an average annual rate of 2.3 percent, while the share of generating capacity that is coal fired will decrease slightly, from 38 percent in 2005 to 35 percent in 2030. The decrease in share is mainly due to the more rapid increases expected for renewable and nuclear generation capacity.
Natural-gas-fired combined-cycle gas turbines (CCGT) are very efficient at converting gas to electricity, have little local environmental impact, can be built quickly, have fairly low initial capital cost, and have less greenhouse gas emissions than coal. Despite these significant advantages, limitations on local gas supplies and the risks of volatile prices for imported LNG are expected to prevent dramatic increases in the penetration of natural gas in many APEC economies.
Natural-gas-fired generating capacity is expected to grow at an average annual rate of 2.3 percent, and the share of generating capacity that is natural gas fired will decrease slightly, from 28 percent in 2005 to 25 percent in 2030. Again, this decrease in share is mainly due to the more rapid increases expected for renewable and nuclear generation capacity.
Figure 4.2: APEC projected electricity generating capacity
873
1,214
1,522
169245 241
631734
1,115
365
584
689
50
153
369
199281
427
0
200
400
600
800
1000
1200
1400
1600
2005 2015 2030
Generating Capacity (GW)
Coal Oil Gas Hydro NRE Nuclear
Source: APERC analysis (2009)

APEC Energy Demand and Supply Outlook – 4th edition Electricity
51
Oil-fired electricity generation is expected to maintain a strong presence only in areas where no other fuels are readily available – this is due primarily to high costs and security of supply risks. Oil-fired generating capacity is expected to grow at an average annual rate of 1.4 percent, and the share of generating capacity that is oil fired will decrease from 7 percent in 2005 to 6 percent in 2030.
The development of new nuclear electricity generating capacity is projected to gain momentum; again this is due to price risks associated with oil and LNG and concerns about greenhouse gas emissions. Asian APEC member economies, in particular, are expected to start revitalizing their nuclear programmes to meet rising electricity demand. Nuclear generating capacity is expected to grow at an average annual rate of 3.1 percent, and the nuclear share of generating capacity will increase from 9 percent in 2005 to 10 percent in 2030.
Although hydro is an attractive option, as it has no fuel costs and low greenhouse gas emissions (see Chapter 5), its further development will be hindered in many economies by a lack of suitable sites. Hydro generating capacity is expected to grow at an average annual rate of 2.6 percent, and the hydro share of
generating capacity will remain constant at 16 percent between 2005 and 2030.
A number of initiatives are expected to be taken by APEC member economies to promote the development of new renewable energy sources (NRE) – that is renewable energy other than hydro – even under our business-as-usual assumptions. Therefore, the installed capacity of NRE is projected to increase at the fastest rate of any generation energy source, 8.4 percent per year. However, the NRE share of generating capacity will increase from 2 percent in 2005 to only 8 percent in 2030.
In order to reduce greenhouse gas emissions and control costs, APEC economies are expected to focus on reducing transmission and distribution loss, as well as increasing the efficiency of electricity generation from fossil fuels. Our business-as-usual projections indicate that average coal generation efficiency will increase from 34 percent in 2005 to 36 percent in 2030 and average gas generation efficiency will increase from 43 percent to 46 percent. Similarly, we expect that transmission and distribution losses will be reduced from 6.7 percent in 2005 to 5.4 percent in 2030.
Figure 4.3: Generating capacity by energy source, larger APEC economies
-
200,000
400,000
600,000
800,000
1,000,000
1,200,000
1,400,000
1,600,000
05
15
30
05
15
30
05
15
30
05
15
30
05
15
30
05
15
30
05
15
30
05
15
30
05
15
30
05
15
30
PRC USA JPN RUS CDA ROK MEX CT THA AUS
MW
Coal Oil Gas Hydro NRE Nuclear
Source: APERC analysis (2009)

APEC Energy Demand and Supply Outlook – 4th edition Electricity
52
Figure 4.4: Generating capacity by energy source, smaller APEC economies
-
10,000
20,000
30,000
40,000
50,000
60,000
70,000
05
15
30
05
15
30
05
15
30
05
15
30
05
15
30
05
15
30
05
15
30
05
15
30
05
15
30
05
15
30
05
15
30
INA MAS VN CHL RP SIN PE HKC NZ BD PNG
MW
Coal Oil Gas Hydro NRE Nuclear
Source: APERC analysis (2009)
Figure 4.5: Generation capacity growth rates
0.0%
1.0%
2.0%
3.0%
4.0%
5.0%
6.0%
7.0%
VN PE
CH
L
MA
S
PR
C
PN
G
TH
A
SIN
INA
ME
X
CT
RP
RO
K
AU
S
CD
A
NZ
BD
USA
RU
S
HKC
JPN
05-15 05-30
Source: APERC analysis (2009)

APEC Energy Demand and Supply Outlook – 4th edition Electricity
53
Generating capacity by economy
In 2005, the largest installed generation capacity was in the US. Its total capacity, of over 1,047 GW, was dominated by gas (42 percent) and coal (32 percent). China’s 2005 installed capacity was the second highest, at 524 GW, of which coal was 73 percent and hydro was 22 percent. However, in 2030, China’s installed capacity is expected to exceed that of the US, reaching 1,460 GW compared to the US’s 1,370 GW. After these two economies, Japan and Russia will have the next largest installed capacities, in both 2005 and 2030.
Figures 4.3 and 4.4 (on previous pages) show the installed generation capacities by energy source and economy. Note the two graphs have different scales on the vertical axes.
It is notable that China, recognizing the importance of securing energy for its economy and
the imperative of mitigating climate change, is expected to increase its utilization of renewable energy, natural gas, and nuclear.
Figure 4.5 (on previous page) shows the growth rates for generating capacity across all APEC economies.
Electricity generation mix and growth rate
Figures 4.6 and 4.7 (following) show the electricity supply by energy type by economy. Again, note that the vertical axes of the two graphs have different scales. The results are very much in line with the graphs of generating capacity by economy presented in Figures 4.3 and 4.4 above.
Figure 4.8 (following) shows the electricity supply growth rates for the APEC economies. Again, the results are in line with the graph of generating capacity in Figure 4.5 above.
Figure 4.6: Electricity supply by energy type, larger APEC economies
TWh
1,000
2,000
3,000
4,000
5,000
6,000
7,000
05
15
30
05
15
30
05
15
30
05
15
30
05
15
30
05
15
30
05
15
30
05
15
30
05
15
30
05
15
30
PRC USA RUS JPN CDA ROK MEX THA AUS CT
TW
h
Coal Oil Gas Hydro NRE Nuclear
Source: APERC analysis (2009)

APEC Energy Demand and Supply Outlook – 4th edition Electricity
54
Figure 4.7: Electricity supply by energy type, smaller APEC economies
-
50
100
150
200
250
300
350
05
15
30
05
15
30
05
15
30
05
15
30
05
15
30
05
15
30
05
15
30
05
15
30
05
15
30
05
15
30
05
15
30
INA MAS VN RP CHL SIN PE NZ HKC PNG BD
TW
h
Coal Oil Gas Hydro NRE Nuclear
Source: APERC analysis (2009)
Figure 4.8: Electricity generation growth rates of APEC economies between 2005–2015 and 2005–2030
0.0%
1.0%
2.0%
3.0%
4.0%
5.0%
6.0%
7.0%
VN
MA
S
TH
A
RP
SIN
PR
C
PE
PN
G
INA
CH
L
ME
X
HKC
RO
K
CT
AU
S
RU
S
NZ
CD
A
BD
USA
JPN
05-15 05-30
Source: APERC analysis (2009)
APEC Energy Demand and Supply Outlook – 4th edition Electricity
55
ACCESS TO ELECTRICITY
The APEC economies are striving to provide access to electricity for all their people, and they have made impressive progress toward achieving this critical development milestone. China’s achievement in providing 99 percent of their population with access to electricity by 2006 is especially impressive. Only five APEC economies still had access rates less than 98 percent in 2005: Viet Nam (84 percent), the Philippines (81 percent), Peru (72 percent), Indonesia (54 percent),85 and Papua New Guinea (estimated at 7 percent) 86 . These economies are moving aggressively to provide increased access, and we expect nearly universal access by 2030.
ELECTRICITY TECHNOLOGY DEVELOPMENT
There are two main goals for future electricity technology development: to reduce greenhouse gas emissions, and to increase generation, transmission, and distribution efficiency. In order to achieve these two goals, a number of highly efficient and/or low emission technologies are commercially available or in development. Some of these are discussed elsewhere in this volume, including solar photovoltaics (see box “Why the potential of solar photovoltaics may be underestimated” in Chapter 1 and the Chapter 5 section on renewable energy), hydro, wind, geothermal, biomass (all in the Chapter 5 section on renewable energy), and nuclear (Chapter 5 section on nuclear).
In addition, the following technologies should be mentioned:
85 IEA (2006), pp 565–572. 86 World Bank (2007).
1. High-efficiency natural gas electricity generation, such as combined-cycle gas turbines (CCGT), the efficiency of which can be increased above 50 percent.87
2. High-efficiency coal-fired electricity generation, such as ultra supercritical coal (USC) power plants, which use increased boiler temperature to increase its efficiency above 40 percent. 88 Another coal generation technology to consider is integrated gasification combined cycle (IGCC), 89 which turns coal into a synthetic gas for cleaner burning, resulting in increased efficiency and reduced greenhouse gas emissions. IGCC technology has the additional advantage of allowing the easy capture of CO2, thus facilitating carbon capture and storage (CCS). CCS would allow the burning of coal with minimal CO2 emissions.
3. Smart grids: using modern information technology, it should be possible to re-engineer the electric power grid for greater reliability, higher efficiency, and reduced emissions. Such a smart grid might be able to save consumers money by signalling certain consumer devices, such as electric vehicle battery chargers, when to turn on and off. With more control over electricity demand, the smart grid would also be better able to utilize intermittent renewables, such as wind. The smart grid would be able to more quickly sense, and respond to, developing problems, thus reducing the risk of outages. And the smart grid would be in a better position to optimize the use of electricity generation and storage facilities at any given time for lowest cost and highest reliability.90
87 NEDO (2006), p 42. 88 Greenfacts (2008), p 1. 89 NEDO (2006), p 42. 90 DOE (2008).

APEC Energy Demand and Supply Outlook – 4th edition Electricity
56
Electricity trade in the APEC region
The APEC region encompasses a diverse set of economies in terms of energy demand and supply patterns (some
economies are operating near capacity, while others have surplus capacity), demand growth potential, and natural
resource endowment. These differences provide an opportunity for greater electricity trade that can result in benefits
such as reduced costs of electricity supply and improved electricity availability. A detailed discussion of the benefits of
electricity interconnection in APEC can be found in APERC (2000) and APERC (2004).
There are a number of ways in which electricity can be traded; the arrangements are generally determined by the
volume of trade and the level of integration required between trading partners. Trading arrangements can range from
simple two-way bilateral trades to complex trades involving multiple parties and economies.91
The simplest arrangement is cross-border electricity exchanges between neighbouring economies. This is often used
to take advantage of conveniently timed surpluses/deficits in electricity supply. Sometimes trade occurs via a transit
economy that may or may not be involved in the transaction. These agreements can expand beyond small trades as
the relationships between utilities and governments develop.92 A number of APEC economies are engaged in bilateral
electricity trade with both APEC and non-APEC member economies. These include links between the United States –
Mexico; United States – Canada, Thailand – Laos, Thailand – Malaysia, Malaysia – Singapore, China – Thailand,
China – Viet Nam, China – Hong Kong, China, and Russia (in this last case a number of neighbouring economies).
The relative simplicity of these arrangements and the benefits that can accrue to participating parties will encourage
increased cross-border electricity exchange in the APEC region over the outlook period. There are a number of plans
either under construction or being considered that are scheduled to be completed during the outlook period. For
example, there have been many studies conducted to assess the viability of increased electricity interconnection in
northeast Asia (Japan, China, Korea and Russia).93
System harmonization between economies is a more advanced trading arrangement. It involves the establishment of a
common operating environment through the synchronization of member electricity systems and harmonization of
financial, legal, political, social and environmental frameworks. This creates a single market with common procedures
and standards for arranging electricity sales, day-to-day operations, dispute settlement, maintenance, system
expansion, and governance. A feature of this arrangement is that the independent systems are managed by a single
market operator and governed by a common body. This trading
arrangement can bring greater benefits than cross-border exchange, but
requires a coordinated approach by participating economies, which can
take years to achieve.94
To achieve system harmonization within a set of economies as
economically, culturally and socially diverse as APEC would be
extremely challenging. However, there are plans to harmonize the
electricity grid by APEC members of ASEAN (Brunei Darussalam,
Singapore, Malaysia, Philippines, Indonesia, Thailand and Viet Nam).
The ASEAN Power Grid energy plan 2010–2015 aims to encourage
“interconnections of 15 identified projects, first on cross-border bilateral
terms, then gradually expand to sub-regional basis and, finally to a
totally integrated Southeast Asian power grid system”.95 There are four
projects in operation, three projects that are under construction, and an
additional eight projects scheduled to start within the first half of the
outlook period.96 The ASEAN power grid has been endorsed by the
governments of the participating economies and proposals for the grid
have been extensively analyzed. It is unlikely that full integration will be
achieved during the outlook period.
91 World Bank (2008) p 52–55. 92 Ibid, p 53. 93 APERC (2004), p 9. 94 World Bank (2009), p 70. 95 ASEAN (2009), p 12. 96 Ibid, p 14.
Table 4.3: ASEAN power grid projects
Connection
Expected
completion
Under construction
Thailand - Lao PDR
Roi Et - Nam Theun 2 2009
Udon Tani - Nabong 2011
Lao PDR - Viet Nam 2010
Lao PDR - Cambodia 2011
Projects at a less advanced stage
Sarawak - Peninsular Malaysia 2015
Peninsular Malaysia - Sumatra 2012
Batam - Bintam - Singapore 2015
Sarawak - West Kalimantan 2012
Philippines - Sabah 2015
Sarawak - Sabah - Brunei 2015
Thailand - Myanmar 2014
East Kalimanton - Sabah na
Source: ASEAN (2009)

APEC Energy Demand and Supply Outlook – 4th edition Electricity
57
REFERENCES
APERC (2000) Power interconnection in the APEC region. Asia Pacific Energy Research Centre, Tokyo, Japan. http://www.ieej.or.jp/aperc/final/interconnection.pdf
APERC (2004) Electric Power Interconnection in the APEC region. Asia Pacific Energy Research Centre, Tokyo, Japan. http://www.ieej.or.jp/aperc/pdf/grid_combined_draft.pdf
ASEAN (2009) ASEAN Energy Plan 2010–2015. Association of Southeast Asian Nations, Jakarta, Indonesia. http://www.aseansec.org/22675.pdf
DOE (2008) “The Smart Grid: An Introduction”. US Department of Energy, Washington DC. http://www.oe.energy.gov/DocumentsandMedia/DOE_SG_Book_Single_Pages(1).pdf
IEA (2006) World Energy Outlook 2006. International Energy Agency, Paris, France. http://www.worldenergyoutlook.org/docs/weo2006/electricity.pdf
Greenfacts (2008) “Supercritical and ultra supercritical technology”, Greenfacts, http://www.greenfacts.org/glossary/pqrs/supercritical-ultra-supercritical-technology.htm
NEDO (2006) Clean coal technologies in Japan. New Energy and Industrial Technology Development Organization. http://www.nedo.go.jp/kankobutsu/pamphlets/sekitan/cct2006e.pdf
World Bank (2007) “Papua New Guinea Country Brief”, on World Bank website, http://web.worldbank.org/wbsite/external/countries/eastasiapacificext/papuanewguineaextn/0,,menuPK:333777~pagePK:141132~piPK:141107~theSitePK:333767,00.html
World Bank (2008) Trading Arrangements and Risk Management in International Electricity Trade, Energy Sector Management Assistance Program, Washington DC. http://www.esmap.org/filez/pubs/113200824354_Trade_ArragnementFINAL_Web.pdf


APEC Energy Demand and Supply Outlook – 4th edition Primary Energy Supply
59
5 PRIMARY ENERGY SUPPLY APEC contains some of the world’s largest
energy producers, but also some of the world’s largest energy importers. Most coal, gas and nuclear fuels used in the APEC region are sourced from within the APEC region. Conversely, much of the oil used is sourced from outside the APEC region.
This chapter discusses the outlook for primary energy supply in the APEC region. Given that supply must equal demand, the term ‘primary energy supply’ can be used interchangeably with ‘primary energy demand’. However, for the purpose of this analysis, the term ‘primary energy supply’ is used. Primary energy supply includes both domestic and imported energy.
TOTAL PRIMARY ENERGY SUPPLY
Total primary energy supply (TPES) in the APEC region is projected under business-as-usual assumptions to grow at an average annual rate of 1.5 percent, from 6,680 Mtoe in 2005 to 9,723 Mtoe in 2030. This growth is expected to be underpinned by relatively strong GDP and population growth.
Total primary energy supply by energy source is shown in Figures 5.1 and 5.2. Note the difference in the scale of the vertical axis of the two figures.
China and the United States are projected to account for almost two-thirds of TPES in the APEC region by 2030. China’s TPES is projected to grow at an average annual rate of 2.6 percent, from 1,721 Mtoe in 2005 to 3,281 Mtoe in 2030; this is driven by growth in demand for gas, oil, coal and nuclear energy. The greatest growth is expected to occur in nuclear; gas and oil, increasing at an average annual rate of 11.9 percent, 7.7 percent and 3.1 percent over the outlook period, respectively. This reflects the development of major gas projects and associated infrastructure, and the Chinese Government’s ambitious plans to expand nuclear power generation capacity. By the end of the outlook period, China is expected to account for more than one-third of APEC TPES (compared with around one quarter in 2005).
In the United States, TPES is projected to grow at a more moderate 0.5 percent a year, from 2,342 Mtoe in 2005 to 2,641 Mtoe in 2030. Growth is expected for all energy sources except oil, which is affected by policies promoting the use of biofuels and more stringent vehicle fuel economy regulations. The strongest growth is expected to occur in new renewable energy sources, reflecting existing policies encouraging the use of these resources.
Figure 5.1: Total primary energy supply by energy source, larger economies
-
500.0
1,000.0
1,500.0
2,000.0
2,500.0
3,000.0
3,500.0
05
15
30
05
15
30
05
15
30
05
15
30
05
15
30
05
15
30
05
15
30
05
15
30
05
15
30
05
15
30
PRC USA RUS JPN CDA INA ROK MEX THA AUS
Mto
e
Coal Oil Gas Hydro NRE Nuclear
Source: APERC analysis (2009)

APEC Energy Demand and Supply Outlook – 4th edition Primary Energy Supply
60
Figure 5.2: Total primary energy supply by energy source, smaller economies
-
20.0
40.0
60.0
80.0
100.0
120.0
140.0
160.0
05
15
30
05
15
30
05
15
30
05
15
30
05
15
30
05
15
30
05
15
30
05
15
30
05
15
30
05
15
30
05
15
30
CT MAS VN CHL RP SIN PE NZ HKC BD PNG
Mto
e
Coal Oil Gas Hydro NRE Nuclear
Source: APERC analysis (2009)
As shown in Figure 5.3 (following), the strongest growth in TPES over the outlook period is expected to occur in developing APEC economies. Details on the outlook for each energy source are discussed in the remaining sections of this chapter.
Energy intensity (primary energy supply/GDP)
Changes in energy intensity result from changes in energy efficiency and changes in economic structure (where economic sectors with different energy intensities grow or contract at different rates). Changes in economic structure, such as a transition from the production of energy-intensive raw materials to less-energy-intensive manufactured products can significantly change the energy efficiency of an economy.
Energy intensity (TPES/GDP) in the APEC region under business-as-usual assumptions is projected to decline from 216 toe/US$ million GDP (2005 PPP) to 134 toe/US$ million GDP in 2030. This represents a 38 percent improvement in energy intensity over the outlook period, which is expected to be underpinned by ongoing energy-saving policies, high energy prices and an ongoing shift toward more information- and service-based economies.
As shown in Figure 5.4 (following), Hong Kong, China, Peru, Japan, Mexico and the Philippines are projected to have the lowest energy intensity by the end of the outlook period, while Brunei Darussalam, Russia, Papua New Guinea, Chile and New Zealand are projected to have the highest energy intensity. With the exception of Brunei Darussalam, Papua New Guinea, Chile and New Zealand, the energy intensity of all other APEC economies is projected to decline.
There are a number of factors that can explain variations in energy intensity among APEC economies. The ratio can be affected by many non-energy factors such as climate, geography, travel distance, home size and industrial structure. 97 As such, it would be misleading to judge an economy’s energy-efficiency performance based on their energy intensity.
97 IEA (2008B), p 20.

APEC Energy Demand and Supply Outlook – 4th edition Primary Energy Supply
61
Figure 5.3: Annual percentage growth rates in primary energy supply by economy
0.0%
1.0%
2.0%
3.0%
4.0%
5.0%
6.0%
7.0%
8.0%
9.0%
PN
G
CH
L
BD
VN PE
TH
A
MA
S
PR
C
INA
RP
SIN NZ
ME
X
AU
S
CT
RO
K
RU
S
CD
A
HKC
USA
JPN
05-15 05-30
Source: APERC analysis (2009)
Figure 5.4: Energy intensity of APEC economies
0
100
200
300
400
500
600
700
800
HKC P
E
JPN
ME
X
RP
USA
RO
K
CT
PR
C
AU
S
MA
S
VN
TH
A
SIN
INA
CD
A
NZ
CH
L
PN
G
RU
S
BD
toe
pe
r U
S$ m
illi
on
GD
P
05 15 30
Source: APERC analysis (2009)

APEC Energy Demand and Supply Outlook – 4th edition Primary Energy Supply
62
OIL
Oil production
The APEC region produced around 38 percent of the world’s oil in 2005 and included five of the top ten crude oil producers in the world. 98 Under business-as-usual assumptions, and the oil price assumptions discussed in Chapter 1, production of crude oil and natural gas liquids (NGLs) in the APEC region is expected to increase from 1,485 Mtoe in 2005 to 1,629 Mtoe in 2030, an average annual growth rate of about 0.4 percent. Figures 5.6 and 5.7 (following) show projected oil production in the APEC economies. Note the difference in the scale of the vertical axis between the two figures.
All five of the major APEC oil-producing economies (Russia, US, Canada, Mexico and China) are projected to increase their crude oil production between 2005 and 2030; however, the increases for Mexico and China are expected to be very small. Among the remaining APEC economies, the results are expected to be more mixed, including possible declines in production in Brunei Darussalam, Indonesia, Malaysia, and Viet Nam.
The North America region (Canada, US and Mexico) had the largest share of APEC crude oil production in 2005 (45 percent) and its share is expected to be about the same in 2030 (47 percent).
Imports and exports
Oil demand in the APEC region is expected to increase more quickly than production, leading to increasing levels of oil imports into the region. Chapter 3 discusses final energy demand by sector. It is worth noting here, however, that the growth in oil demand in the APEC region is primarily driven by increasing demand in the transport sector (see Figure 5.5).
Figure 5.5: Oil demand patterns in APEC region, Mtoe
0
500
1,000
1,500
2,000
2,500
3,000
1990 2000 2005 2015 2030
Industry
Transport
Other
Non-energy use
Power plants
Oil
De
ma
nd
, M
toe
Source: APERC analysis (2009)
98 BP (2008).
Total primary oil demand (which must equal primary oil supply) was 2,092 Mtoe in 2005; it is expected to reach 2,682 Mtoe in 2030 in the APEC region, at an average annual growth rate of 1.0 percent. This implies net imports will grow from 775.1 Mtoe in 2005 to 1,337.9 Mtoe in 2030, at an average annual growth rate of 2.2 percent. The APEC region had an oil import dependency of 34 percent in 2005, and this is expected to rise to 45 percent by 2030.
Figures 5.8 and 5.9 (following) show the net exports of oil by economy. These figures include crude oil, NGLs, and all oil products. Note the difference in the scale of the vertical axis between the two figures. Table 5.1 summarizes this information.
Table 5.1: Net oil trade for APEC economies, Mtoe
Economy
2005 2015 2030 05-15 15-30 05-30
Australia 13.8 14.7 22.6 0.7 2.9 2.0
BD -10.3 -8.4 -5.3 -2.1 -2.9 -2.6
Canada -49.9 -92.8 -96.3 6.4 0.2 2.7
Chile 11.3 17.3 22.8 4.4 1.8 2.8
China 137.0 291.8 486.5 7.9 3.5 5.2
HKC 8.6 9.5 9.2 1.0 -0.2 0.3
Indonesia 12.2 16.6 67.0 3.1 9.8 7.1
Japan 249.8 229.6 199.8 -0.8 -0.9 -0.9
Korea 96.4 115.2 7.4 0.2 1.2 0.8
Malaysia -12.5 -7.7 23.4 -4.7 0.0 0.0
Mexico -93.5 -81.5 -89.3 -1.4 0.6 -0.2
NZ 5.8 6.2 8.4 0.8 2.0 1.5
PNG -1.2 -0.9 0.2 -2.6
Peru 2.1 6.6 11.0 12.0 3.5 6.8
Philippines 14.7 19.2 26.4 2.7 2.2 2.4
Russia -334.4 -325.8 -303.8 -0.3 -0.5 -0.4
Singapore 25.0 -325.8 -303.8 1.3 1.5 1.4
CT 46.3 53.3 67.3 1.4 1.6 1.5
Thailand 33.1 49.3 81.1 4.1 3.4 3.6
USA 629.6 673.3 554.1 0.7 -1.3 -0.5
Viet Nam -6.9 6.6 40.4 12.8
APEC total 775.1 1001.9 1276.1 2.6 1.6 2.0
Oil imports (>0) ; Oil exports (<0)
Imports / Exports AAGR, %
Source: APERC analysis (2009)
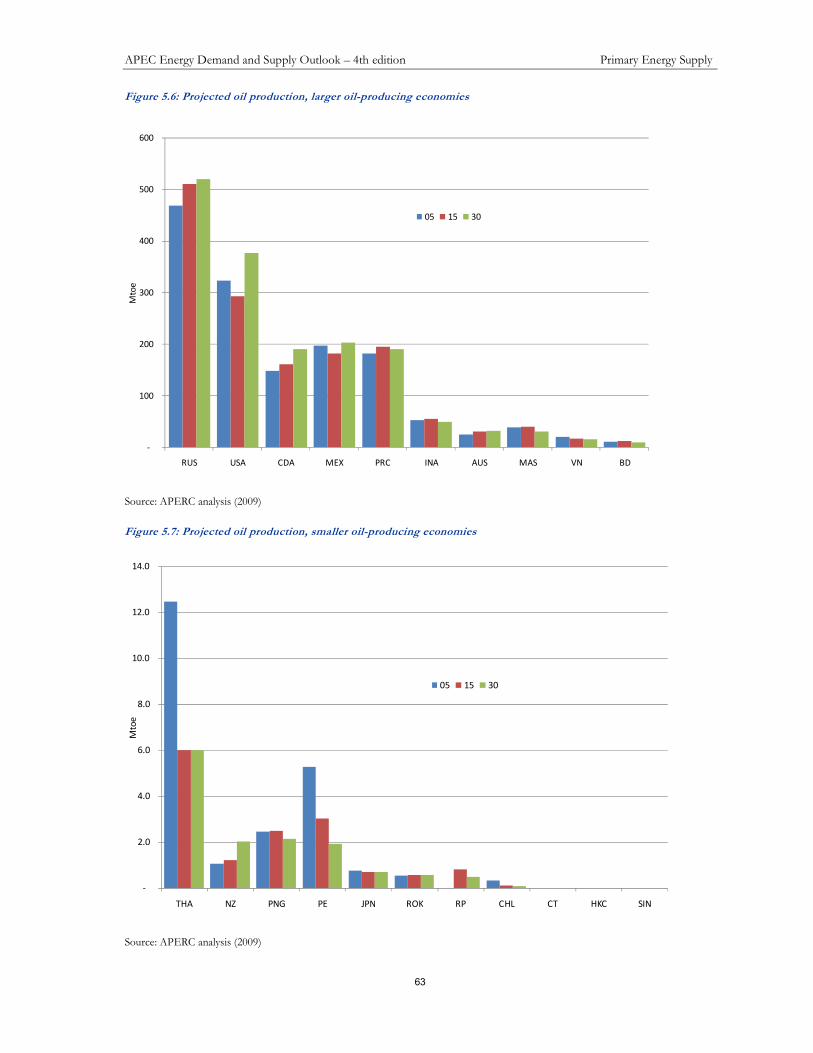
APEC Energy Demand and Supply Outlook – 4th edition Primary Energy Supply
63
Figure 5.6: Projected oil production, larger oil-producing economies
-
100
200
300
400
500
600
RUS USA CDA MEX PRC INA AUS MAS VN BD
Mto
e
05 15 30
Source: APERC analysis (2009)
Figure 5.7: Projected oil production, smaller oil-producing economies
-
2.0
4.0
6.0
8.0
10.0
12.0
14.0
THA NZ PNG PE JPN ROK RP CHL CT HKC SIN
Mto
e
05 15 30
Source: APERC analysis (2009)

APEC Energy Demand and Supply Outlook – 4th edition Primary Energy Supply
64
Figure 5.8: Net oil exports, largest oil-exporting and smallest oil-importing economies
(50)
-
50
100
150
200
250
300
350
400
RUS CDA MEX BD PNG NZ HKC PE AUS MAS
Mto
e
05 15 30
Source: APERC analysis (2009)
Figure 5.9: Net oil exports, largest oil-importing economies
(800.0)
(700.0)
(600.0)
(500.0)
(400.0)
(300.0)
(200.0)
(100.0)
-
100.0
RP SIN CHL VN INA CT THA ROK JPN PRC USA
Mto
e
05 15 30
Source: APERC analysis (2009)
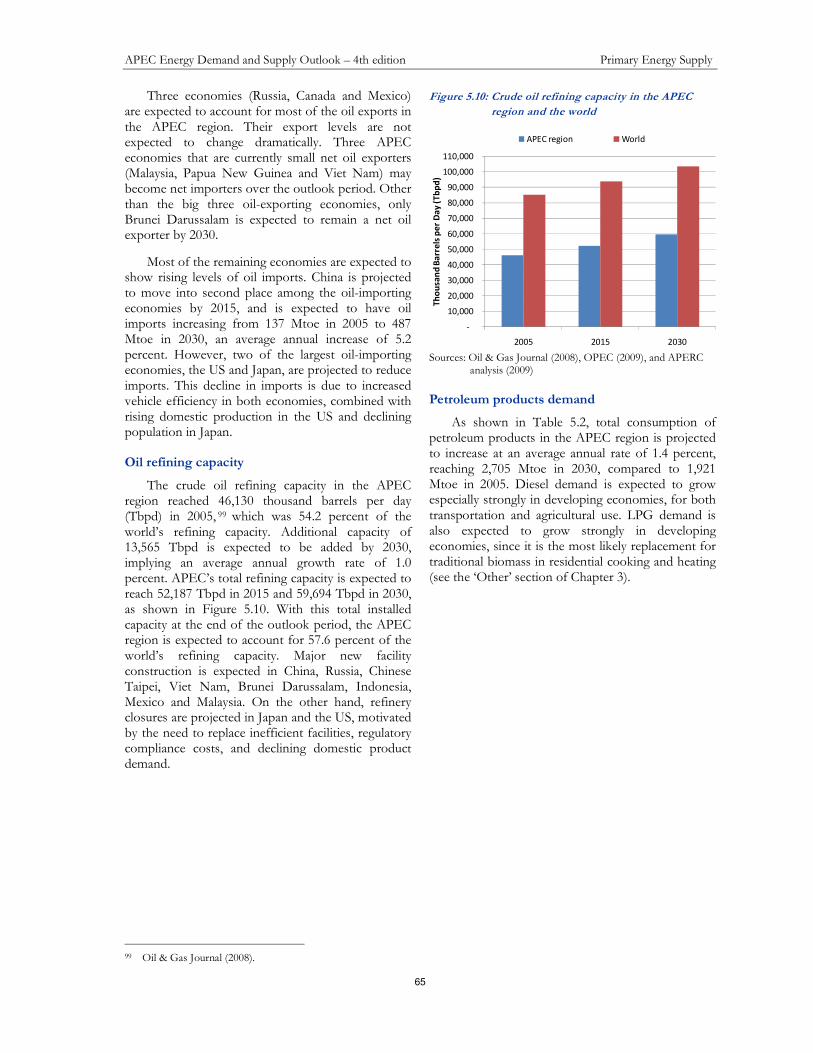
APEC Energy Demand and Supply Outlook – 4th edition Primary Energy Supply
65
Three economies (Russia, Canada and Mexico) are expected to account for most of the oil exports in the APEC region. Their export levels are not expected to change dramatically. Three APEC economies that are currently small net oil exporters (Malaysia, Papua New Guinea and Viet Nam) may become net importers over the outlook period. Other than the big three oil-exporting economies, only Brunei Darussalam is expected to remain a net oil exporter by 2030.
Most of the remaining economies are expected to show rising levels of oil imports. China is projected to move into second place among the oil-importing economies by 2015, and is expected to have oil imports increasing from 137 Mtoe in 2005 to 487 Mtoe in 2030, an average annual increase of 5.2 percent. However, two of the largest oil-importing economies, the US and Japan, are projected to reduce imports. This decline in imports is due to increased vehicle efficiency in both economies, combined with rising domestic production in the US and declining population in Japan.
Oil refining capacity
The crude oil refining capacity in the APEC region reached 46,130 thousand barrels per day (Tbpd) in 2005, 99 which was 54.2 percent of the world’s refining capacity. Additional capacity of 13,565 Tbpd is expected to be added by 2030, implying an average annual growth rate of 1.0 percent. APEC’s total refining capacity is expected to reach 52,187 Tbpd in 2015 and 59,694 Tbpd in 2030, as shown in Figure 5.10. With this total installed capacity at the end of the outlook period, the APEC region is expected to account for 57.6 percent of the world’s refining capacity. Major new facility construction is expected in China, Russia, Chinese Taipei, Viet Nam, Brunei Darussalam, Indonesia, Mexico and Malaysia. On the other hand, refinery closures are projected in Japan and the US, motivated by the need to replace inefficient facilities, regulatory compliance costs, and declining domestic product demand.
99 Oil & Gas Journal (2008).
Figure 5.10: Crude oil refining capacity in the APEC
region and the world
-
10,000
20,000
30,000
40,000
50,000
60,000
70,000
80,000
90,000
100,000
110,000
2005 2015 2030
Th
ou
san
d B
arr
els
pe
r D
ay
(T
bp
d)
APEC region World
Sources: Oil & Gas Journal (2008), OPEC (2009), and APERC
analysis (2009)
Petroleum products demand
As shown in Table 5.2, total consumption of petroleum products in the APEC region is projected to increase at an average annual rate of 1.4 percent, reaching 2,705 Mtoe in 2030, compared to 1,921 Mtoe in 2005. Diesel demand is expected to grow especially strongly in developing economies, for both transportation and agricultural use. LPG demand is also expected to grow strongly in developing economies, since it is the most likely replacement for traditional biomass in residential cooking and heating (see the ‘Other’ section of Chapter 3).

APEC Energy Demand and Supply Outlook – 4th edition Primary Energy Supply
66
Table 5.2: APEC petroleum products demand
Product 1990 2000 2005 2015 2030 90-00 00-05 05-15 15-30 05-30
Gasoline 509.8 573.0 665.3 769.7 877.0 1.2 3.0 1.5 0.9 1.1
Diesel 357.1 412.2 530.2 652.2 816.2 1.4 5.2 2.1 1.5 1.7
Kerosene 150.6 182.7 199.8 223.6 261.4 2.0 1.8 1.1 1.0 1.1
LPG 77.6 110.8 121.0 155.4 190.8 3.6 1.8 2.5 1.4 1.8
Heavy Fuel Oil 123.2 96.6 99.4 115.0 129.1 -2.4 0.6 1.5 0.8 1.0
Other 175.0 238.0 305.1 377.8 430.5 3.1 5.1 2.2 0.9 1.4
APEC 1393.3 1613.2 1920.9 2293.7 2705.0 1.5 3.6 1.8 1.1 1.4
Sector 1990 2000 2005 2015 2030 90-00 00-05 05-15 15-30 05-30
Gasoline 37% 36% 35% 34% 32% -0.3 -0.5 -0.3 -0.2 -0.3
Diesel 26% 26% 28% 28% 30% 0.0 1.6 0.3 0.4 0.4
Kerosene 11% 11% 10% 10% 10% 0.5 -1.7 -0.6 -0.1 -0.3
LPG 6% 7% 6% 7% 7% 2.1 -1.7 0.7 0.3 0.5
Heavy Fuel Oil 9% 6% 5% 5% 5% -3.8 -2.9 -0.3 -0.3 -0.3
Other 13% 15% 16% 16% 16% 1.6 1.5 0.4 -0.2 0.0
Total 100% 100% 100% 100% 100%
Petroleum Products (Refining products) demand (Mtoe) Growth rate (%)
Petroleum Products demand (percent shares) Growth rate (%)
Source: APERC analysis (2009)
GAS
Gas production
There is resource potential in the APEC region to support a significant increase in gas production. Further, continued technological development can reduce drilling costs and improve recovery rates, thereby improving the prospects for gas production over the outlook period.
Production of gas in the APEC region is projected to grow at an average annual rate of 2.1 percent, from 1,372 Mtoe in 2005 to 1,681 Mtoe in 2015. This growth is expected to be underpinned by the development of new projects in response to high prices and strong demand for gas as an easy to use, relatively clean fuel.
The rate of production growth is projected to be slower in the second half of the outlook period as projects under construction are completed and fewer new projects are developed. From 2005 to 2030, APEC production of gas is projected to increase at an average annual rate of 1.3 percent to 1,912 Mtoe.
Figures 5.11 and 5.12 show projected gas production by economy. Note the difference in the scales of the vertical axis in the two figures.
Large absolute increases in gas production over this period are expected to occur in Russia, Australia, China and the US. Russia is projected to exhibit the strongest absolute increase in gas production over the outlook period. Production is expected to move away from mature, existing fields to new and more difficult to develop regions that will require significant investment in infrastructure.100
Increased production in Australia, China, Canada and the US is expected to come from a combination of conventional and unconventional sources. In the US and Canada, the development of unconventional gas resources (see box “Prospects for unconventional gas in the APEC region” in Chapter 2) has offset the decline in conventional gas production. Unconventional gas production could play an important role in other APEC economies over the outlook period.
Strong growth in production is also expected to occur in Papua New Guinea, Peru and Viet Nam, but starting from a much smaller base. In Papua New Guinea, the PNG LNG project is expected to produce 8.6 bcm of gas a year from 2014. Increased gas supply from Viet Nam is expected to be sourced from the Nam Con Son and South West Basins. While in Peru, strong production growth can be attributed to the development of the Camisea project.
100 IEA (2008A), p 155.

APEC Energy Demand and Supply Outlook – 4th edition Primary Energy Supply
67
Figure 5.11: Projected gas production, larger gas producing economies
-
100
200
300
400
500
600
700
RUS USA AUS CDA PRC MEX MAS INA THA PNG
Mto
e
05 15 30
Source: APERC analysis (2009)
Figure 5.12: Projected gas production, smaller gas producing economies
-
2.0
4.0
6.0
8.0
10.0
12.0
14.0
16.0
VN PE BD NZ JPN CHL RP ROK CT HKC SIN
Mto
e
05 15 30
Source: APERC analysis (2009)

APEC Energy Demand and Supply Outlook – 4th edition Primary Energy Supply
68
New gas projects are capital intensive, are taking longer to develop, and are becoming increasingly complex (for example unconventional gas and projects located in deeper water). Following the 2008 global financial crisis and subsequent tighter credit conditions, firms are expected to take a more cautious approach to investment decisions, which is likely to result in delays or smaller projects. There is considerable uncertainty about how long demand for gas will be depressed as a result of the global financial crisis and the speed of any future recovery. As such, there is a risk that some investments could be postponed. Given the asymmetry between the construction times for new projects (around 4–5 years for a greenfield gas development) and new power plants (around 2–3 years) this could result in a tight market for gas when demand rebounds.101
Project developers require price certainty to ensure that they can make a return on their investment. As such, long-term contracts with prices generally linked to oil prices will continue to be a major part of global LNG trade over the outlook period (see box “The oil-gas price relationship” in this chapter). These contracts allow companies to share project risk and obtain debt finance. 102 It is important for project developers to have a stable regulatory framework so they can be certain that there will be no sharp and sudden changes to regulations or legislation.
Governments can promote gas development by striving to keep regulatory processes (such as planning approval and licensing) short and simple. In addition, governments can avoid policies which can act as a disincentive to investment such as domestic reservation schemes and resource nationalization. These policies have slowed gas development in some economies.103
Gas imports and exports
APEC is expected to be largely self sufficient in gas over the outlook period. Net exports are projected to increase from 104 Mtoe in 2005 to 130 Mtoe in 2015. But by 2030, APEC is projected to have net imports of 81 Mtoe. These figures are small relative to the total primary supply of gas in the APEC region, and there are many uncertainties that could change them.
101 IEA (2009), pp 45–46. 102 Energy Charter Secretariat (2009), p 20. 103 IEA (2009), pp 46–47.
As shown in Figures 5.13 and 5.14, in 2005 there were eight exporters of gas in APEC – Australia, Russia, Malaysia, Brunei Darussalam, Indonesia, Viet Nam, Canada and China. (Viet Nam is considered a gas exporter since their share of gas in the joint production area with Malaysia is sold to Malaysia.) With the exception of Australia, Russia and Malaysia, each of these economies are expected to significantly reduce exports or become net importers of gas over the outlook period, as production wanes and domestic gas consumption expands.
Gas exports from Indonesia and Brunei Darussalam are projected to decline at an average annual rate of 2.7 percent and 2.6 percent over the outlook period, respectively. This reflects a combination of static production and rising domestic demand. The largest change is expected to occur in China, which is projected to move from being a minor exporter in 2005 to a major importer by 2030. Despite projected growth in Chinese production, demand is expected to grow at a much faster pace. Papua New Guinea and Peru are expected to become modest exporters of gas by 2015 as new export projects are commissioned.
The APEC region contains some of the largest importers of LNG in the world including Japan, Korea, Chinese Taipei and the US. LNG is expected to remain an important component of the energy mix in APEC over the outlook period.
Imports of gas are projected to increase significantly in all importing economies over the outlook period with the exception of the US. In the US, the development of unconventional gas resources has reduced the reliance on imported gas.

APEC Energy Demand and Supply Outlook – 4th edition Primary Energy Supply
69
Figure 5.13: Projected net exports of gas, gas-exporting or self-sufficient economies
-
50
100
150
200
250
RUS AUS CDA MAS INA PNG BD PE VN NZ
Mto
e
05 15 30
Source: APERC analysis (2009)
Figure 5.14: Projected net exports of gas, gas-importing economies
(180)
(160)
(140)
(120)
(100)
(80)
(60)
(40)
(20)
-
20
HKC RP SIN CT CHL MEX THA ROK USA JPN PRC
Mto
e
05 15 30
Source: APERC analysis (2009)

APEC Energy Demand and Supply Outlook – 4th edition Primary Energy Supply
70
Figure 5.15: The ‘S-curve’
Pcrude
Inflection points (“S”)
Oil price parity
LNG pricing formula
PLNG
The oil–gas price relationship
Compared with oil, moving gas around the world requires more capital investment and is more expensive. As such, regional gas markets tend to be less globally integrated than oil markets. Price behaviour in each of these markets is determined by the source of supply (domestic, pipeline imports, LNG imports), contracting customs and the extent of gas market liberalization. Gas is generally sold via two mechanisms – through short-term trading or long-term contracts. Long-term contracts have traditionally shared project risk between the buyer and seller. The buyer takes on volume risk through take-or-pay clauses (where they are obliged to either take delivery of the gas or pay for a prescribed volume). The seller takes on price risk through pricing clauses (typically a peg to the oil price).
104
North America (the United States, Canada and Mexico) has liberalized gas markets and most gas is sourced from domestic suppliers. As a result, short-term trading is more prevalent than long-term contracts. Existing long-term contracts are mainly for cross-border trade and are pegged to indicators of ‘gas to gas’ competition. The largest centralized trading point for gas in North America is the Henry Hub, which services the Midwest, Northeast, Southeast, and Gulf Coast regions of the United States. It is the delivery point for New York Mercantile Exchange (NYMEX) futures contracts. Gas prices at other hubs are regularly reported against the Henry Hub price (the difference in price is referred to as basis differentials).
105
The European gas market is not as liberalized as North America, with little or no competition in a number of economies. There is a combination of short-term trading, regulated prices and long-term contracts. European LNG contracts are typically linked to Brent (United Kingdom) oil prices. However, they must compete with indigenous supplies and pipeline imports.
106
In East Asia there is limited competition from indigenous supplies or pipeline imports in the major purchasing economies of Japan, Korea and Chinese Taipei and most gas is imported through long-term LNG contracts. These contracts are generally indexed to a basket of crude oil prices commonly known as the Japanese Crude Cocktail. The pricing formula is often different above and below specified oil prices (referred to as an ‘S-curve’) thus creating a price floor and a price cap – as shown in Figure 5.15.
107
Historically, oil and gas prices have tended to move together (see Figure 5.16). However, there have been several instances when the relationship between oil and spot gas prices has weakened, such as in 2001, 2003 and 2005. The decoupling of oil and gas prices has been occurring more regularly over the past decade.
108
The relationship between gas and oil prices often breaks down when there is an oversupply of gas, as ample gas supply tends to reduce prices. The relationship between oil and gas prices can also be affected by exogenous factors that cause short-term market disruptions, including weather and geopolitical issues. In East Asian LNG contracts, the S-curve can have the effect of limiting the price response when oil prices are outside the inflection points. This results in a decoupling of oil prices and contract gas prices, particularly when prices are above the upper inflection point.
Further, spot (contracts of less than one year duration) and short-term (contracts of less than three years duration) LNG trades have been growing over the past decade. These prices are typically not as closely linked to the oil price.
109
Over the outlook period, there is likely to remain a linkage between crude oil and gas prices. However, the strength of the linkage may weaken and the frequency of decoupling may increase, reflecting APERC’s assumption of higher oil prices, projected strong growth in gas production, a more globalized LNG market, and increased short-term trading.
104 Energy Charter Secretariat (2009), p 7. 105 Ibid, p 20. 106 Eng (2006), p 2. 107 Ibid. 108 Ibid. 109 Energy Charter Secretariat (2009), p 22.
Figure 5.16: Crude oil and Henry Hub gas prices
0
2
4
6
8
10
12
14
16
0
20
40
60
80
100
120
140
160
1993 1996 1999 2002 2005 2008
WTI oil (LHS)
Henry Hub gas (RHS)
$U
S/M
Btu$
US/
Bb
l
Source: Federal Reserve Bank of St Louis

APEC Energy Demand and Supply Outlook – 4th edition Primary Energy Supply
71
COAL
Coal production
Fifteen APEC economies produce coal. The region’s leading coal producers are China, the United States, Australia, Indonesia and Russia (see Table 5.3 and Figure 5.17); the combined coal production of these five economies constitutes 97 percent of total APEC coal production in 2005.
Table 5.3: Projected APEC coal production, in Mtoe
growth-rate growth-rate
2005 2015 2030 2005-2015 2015-2030
Australia 202.0 264.7 319.1 2.7% 1.3%
Canada 33.1 31.6 32.3 -0.5% 0.2%
Chile 0.4 0.5 0.6 3.7% 0.7%
China 1144.8 1852.0 2379.0 4.9% 1.7%
Indonesia 103.7 208.4 288.5 7.2% 2.2%
Korea 1.2 0.8 0.4 -3.5% -4.6%
Malaysia 0.4 1.0 1.0 8.8% 0.0%
Mexico 5.2 7.1 8.8 3.3% 1.4%
New Zealand 3.1 4.2 4.8 3.2% 0.9%
Peru 0.0 0.5 0.6 33.3% 0.7%
Philippines 1.4 2.7 4.8 6.8% 4.0%
Russia 142.5 150.0 180.0 0.5% 1.2%
Thailand 6.1 7.0 6.0 1.5% -1.0%
United States 564.2 586.9 651.9 0.4% 0.7%
Viet Nam 18.1 28.3 38.6 4.5% 2.1% Source: APERC analysis (2009)
Coal production in the APEC region is projected to increase at an average annual rate of 1.6 percent per year, from 2,227 Mtoe in 2005 to 3,339 Mtoe in 2030. Most of the increases in coal production in
APEC are projected to occur within the five major coal-producing economies, and they are expected to maintain their 97 percent share of coal production throughout the outlook period.
Coal imports and exports
APEC is a net coal-exporting region. Australia, Indonesia, Russia and China are the region’s major coal exporters; other smaller coal-exporting economies are the United States, Viet Nam, Canada and New Zealand. Figure 5.18 (following) shows net exports by economy. China’s future status as an exporter is more uncertain than the other economies, since their net exports are small relative to both their coal production and demand.
In addition to the eight net coal-exporting economies shown in Figure 5.18, there are ten more APEC economies that are net importers of coal. Their (negative) net exports of coal are shown in Figure 5.19. The largest coal importers are Japan, Korea and Chinese Taipei, with Japan’s coal imports project to decline in both the 2005–2015 and 2015–2030 periods. Brunei Darussalam, Papua New Guinea and Singapore report no production, consumption, imports, or exports of coal.
As shown in Figure 5.20, coal exports from APEC to the rest of the world are expected to increase from 117 Mtoe in 2005 to 328 Mtoe in 2030.
Figure 5.17: Projected coal production, in Mtoe
0
500
1000
1500
2000
2500
2005 2015 2030
Source: APERC analysis (2009)

APEC Energy Demand and Supply Outlook – 4th edition Primary Energy Supply
72
Figure 5.18: Projected net exports of coal, APEC coal-exporting economies, in Mtoe
-
50
100
150
200
250
300
PRC AUS INA RUS USA VN CDA NZ BD PNG SIN
Mto
e
05 15 30
Source: APERC analysis (2009)
Figure 5.19: Projected net exports of coal, APEC coal importing economies
(120)
(100)
(80)
(60)
(40)
(20)
-
PE HKC CHL RP MEX MAS THA CT ROK JPN
Mto
e
05 15 30
Source: APERC analysis (2009)

APEC Energy Demand and Supply Outlook – 4th edition Primary Energy Supply
73
Figure 5.20: Projected net exports of coal, all APEC economies
2,227 2,846
3,357
(2,110) (2,597) (3,029)
(117)(248)
(328)
2005 2015 2030
Production Supply Exports
Source: APERC analysis (2009)
NUCLEAR
Considerable growth of nuclear energy utilization in the APEC region is projected over the outlook period, on the basis of economic and environmental advantages. The economic advantages include low fuel cost and less exposure to fuel price volatility. The environmental advantages include the technology’s relatively low greenhouse gas emissions throughout its supply chain. In addition to its traditional role as an electricity source, nuclear energy is a likely means of large-scale hydrogen production and water desalination. The growth of nuclear energy utilization is expected to be predominantly centred in the traditional nuclear APEC economies, with Viet Nam also expected to add nuclear to its energy mix sometime after 2015.
The main impediment to nuclear expansion is low public acceptance of nuclear energy due to safety issues. Such concerns arise from nuclear fuel handling and the operation of assets belonging to the global nuclear power supply chain. Enormous effort will need to be made worldwide by the scientific, business and governmental communities to overcome this impediment. At its cornerstone, initiatives to develop advanced nuclear technologies should be considered, which would further strengthen operational safety, increase proliferation resistance, and alleviate public risks of radioactivity exposures.
Historical trend and outlook projections
Over the past 25 years electricity generation from nuclear power plants in the APEC region has grown at an average annual rate of 6.1 percent, despite the setbacks of several accidents including Three Mile Island (1979) and Chernobyl (1986). In 2005 Korea and Japan had the largest share of nuclear energy in total electricity generation in the APEC region (38 and 28 percent, respectively), followed by the US (19 percent) and Chinese Taipei (18 percent).
There has been renewed interest in nuclear energy worldwide in recent years, sometimes referred to as a “nuclear renaissance”. Since 2004 there has been an escalation in construction of new nuclear plants, led by APEC economies, and in particular by China (see Figure 5.21). The pace of new construction in China in the first half of 2009 reached almost one unit per six weeks, and in 2010 it could be as high as one GW-level unit per month. 110 The share of nuclear energy in total primary energy demand in the APEC region is expected to grow from 6.4 percent in 2005 to 8.6 percent in 2030, reflecting the growing share of nuclear generation in total electricity production (rising from 14.8 percent in 2005 to 16.6 percent in 2030). Figure 5.22 shows the projections by economy.
110 IAEA (2009).

APEC Energy Demand and Supply Outlook – 4th edition Primary Energy Supply
74
Figure 5.21: World nuclear plant construction
start/reactivation 2004–mid 2009 (GW)
0
2
4
6
8
10
12
2004 2005 2006 2007 2008 up to
August 2009
World APEC China
GW
Source: IAEA (2009)
Figure 5.22: Nuclear energy share in total electricity
generation in the APEC region (percent
of total generation)
0% 10% 20% 30% 40% 50%
Mexico
Viet Nam
China
Canada
USA
Chinese Taipei
Russia
Japan
Korea
1980
2005
2030
Source: APERC analysis (2009)
In terms of installed generation capacity in the APEC region, nuclear power plants accounted for 9 percent (199 GW) in 2005, while in 2030 their share is projected to increase to 10 percent. In absolute values electricity generation from nuclear energy is expected to grow from 1,608 TWh in 2005 to 3,177 TWh in 2030. However, the annual average growth rate for nuclear generation (2.8 percent) is projected to be well behind NRE (6.9 percent) and very close to that of natural gas (2.9 percent), while the pace of growth for coal, oil, and hydro generation is expected to be lower. Figure 5.23 shows projected nuclear electricity production by economy.
Figure 5.23: Nuclear electricity generation in 2005
and 2030 (TWh)
2
7
30
33
108113
179
230
840
0 500 1000
Mexico
Chinese Taipei
Viet Nam
Canada
USA
Korea
Japan
Russia
China
2005 2030
TWh
Note: Numbers show additional production in 2030 compared to 2005.
Source: APERC analysis (2009)
In the APEC region, China is expected to be the clear leader in growth in nuclear power generation, adding about 113 GW of capacity by 2030 to their 2005 capacity of about 7 GW. Russia, Japan, Korea, and the US are each expected to add about 20 GW of new capacity by 2030. Viet Nam’s official projection stands at a 4 GW capacity in 2030.
RENEWABLES
Renewable energy resources could contribute significantly to the APEC region’s future energy demand. They are potentially secure, sustainable, and low in greenhouse gas emissions. The quantity of resource potentially available is enormous. For example, the amount of solar energy reaching the earth from the sun exceeds human primary energy consumption by some four orders of magnitude.111 However, although renewable energy resources are abundant, except for hydro, their commercial use has historically been limited. The major obstacle to greater use of renewable resources has been the ineffectiveness of the conversion technologies, which has made renewable energies costly relative to conventional energy.
The role of hydro
Use of renewable energy resources is not something new in the APEC region. New Zealand, Canada and Peru used hydropower – mostly large-scale hydro – to generate more than 50 percent of their total electricity needs in 2005. Large-scale
111 Lackner and Sachs (2006), p 219.

APEC Energy Demand and Supply Outlook – 4th edition Primary Energy Supply
75
hydro is a mature technology with generally favourable economic viability. However, further potential development options are limited in many APEC economies, as the best sites have already been developed. In addition, large-scale hydro has substantial social and environmental effects, such as dislocation of large numbers of people, loss of considerable amounts of productive land, and downstream impacts including diversion of water and trapping of silt. Hydro reservoirs may also emit methane, a potent greenhouse gas. However, the Intergovernmental Panel on Climate Change (IPCC) notes that for most hydro projects, life-cycle assessments have shown low overall net greenhouse gas emissions.112
In 2005, hydro energy contributed about 1.9 percent (125.3 Mtoe) of the total primary energy supply in the APEC region. In 2030, hydro’s contribution is projected to constitute about 2.0 percent (191.2 Mtoe) of the total primary energy supply, growing at an average annual rate of 2 percent. The share of hydro in the electricity generation mix in the APEC region is shown in Figure 5.24. The share of hydro in electricity generation is projected to decline from 13 percent (1,457.5 TWh) in 2005 to 11 percent (2,223.9 TWh) in 2030. (Hydro’s share of primary energy supply increases slightly while its share of electricity generation decreases, since electricity production is growing faster than primary energy supply.)
Figure 5.24: Electricity generation mix
39%45% 48% 48% 44%
11%6% 5% 2%
2%
17% 17% 18% 19%21%
15% 13% 13% 13% 11%
16% 16% 14% 14% 16%
2% 2% 2% 3% 5%
1990 2000 2005 2015 2030
Coal Oil Natural Gas Hydro Nuclear NRE
Source: APERC analysis (2009)
The role of non-hydro renewable energy in electricity generation
Since hydro is a mature energy source, while most other forms of renewable energy are still in development, we treat them separately in our analysis. Non-hydro renewable energy is referred to as ‘new renewable energy’, which we abbreviate throughout this report as ‘NRE’.
112 IPCC (2007), p 274.
In the electricity generation mix, NRE’s share is projected to increase from 1.7 percent (192.4 TWh) in 2005 to 5.2 percent (1,016.5 TWh) in 2030. The production grows at an average rate of 6.9 percent per year. The breakdown of NRE resources in the electricity generation mix is shown in Figure 5.25.
Figure 5.25: NRE resources breakdown in electricity
generation mix
TWh
200
400
600
800
1,000
1,200
1990 2000 2005 2015 2030
Biomass Geothermal Wind Solar
Source: APERC analysis (2009)
Under a ‘business-as-usual’ scenario, APERC projects wind power to grow the fastest among the NRE electricity generation resources over the outlook period. In 2005, total APEC electricity generation from wind was 25.9 TWh, and this value is projected to reach 609.9 TWh in 2030, which is an average annual increase of 13.5 percent. Wind power costs have declined by a factor of approximately 20 since 1980,113 which has made wind power increasingly competitive in many locations. The US and China are expected to generate most of the wind power in the APEC region. These economies are projected to generate about 320.2 TWh and 219.0 TWh of wind power in 2030, respectively. Wind power generation in other APEC member economies over the outlook period is shown in Figure 5.26.
Figure 5.26: Wind power generation by APEC
economies
TWh
5
10
15
20
25
30
35
CDA CT JPN MEX AUS NZ PE VN HKC ROK RP
2005 2015 2030
Source: APERC analysis (2009)
113 DOE (2009B).

APEC Energy Demand and Supply Outlook – 4th edition Primary Energy Supply
76
Biomass is expected to remain one of the main NRE resources for electricity generation in APEC. Biomass-generated electricity amounted to about 124.2 TWh in 2005. In 2030, biomass-generated electricity is projected to reach 208.2 TWh, growing at an average annual rate of 2.1 percent. Biomass resources are largely agricultural and forestry residues such as wood chips; oil palm shell, kernel and empty fruit bunches; rice husk, and bagasse. In developed APEC economies, municipal solid waste incineration produces electricity as a by-product and this electricity is accounted for under the biomass category.
Biomass resources are also used in combination with coal in coal-fired power plants, a process known as co-firing. 114 Co-firing offers a low cost opportunity to reduce greenhouse gas emissions from coal-fired power plants. However, since biomass has a low energy density and cannot be economically transported very far, the economics of co-firing depend upon the availability of a reliable local source of biomass. In the APEC region, biomass is frequently used to supply industrial heat, with electricity generated as an incidental output.
Geothermal energy is another major NRE electricity generation resource in the APEC region. Geothermal energy is heat extracted from below the earth’s surface. Geothermally-generated electricity is reliable and continuous, which gives it an ability to supply base-load electricity. However, suitable geothermal energy locations are limited, with most situated in volcanic areas. Currently, only a few APEC economies are producing electricity from geothermal electricity. In 2005, the APEC region produced 46.0 TWh of electricity from geothermal energy. This value is projected to grow at an average annual rate of 5.8 percent, reaching 189.0 TWh by 2030. Figure 5.27 shows geothermal electricity generation by APEC member economies. Indonesia, China, the US, the Philippines and Viet Nam are projected to increase their geothermal electricity generation rapidly. The availability of suitable geothermal locations and favourable government policy are the main reasons.
114 Fairley (2009).
Figure 5.27: Geothermal electricity generation by
APEC economies
TWh
10
20
30
40
50
60
INA PRC USA RP VN MEX NZ JPN CT PNGAUS
2005 2015 2030
Source: APERC analysis (2009)
In 2005, the APEC region generated 2.3 TWh of electricity from solar energy. By 2030, solar generated electricity is projected to reach 26.9 TWh, growing at an average annual rate of 10.4 percent. Figure 5.28 shows solar electricity generation by APEC member economies. Japan continues to be the biggest solar electricity generator in the APEC region, followed by the US and China.
Figure 5.28: Solar electricity generation by APEC
economies
TWh
2
4
6
8
10
12
14
16
18
JPN USA PRC ROK HKC AUS VN MAS CT RP
2005 2015 2030
Source: APERC analysis (2009)
Most of this solar electricity generation is from solar photovoltaics, which convert sunlight directly into electricity using a solid-state device. Concentrating solar power is an alternative technology using mirrors to concentrate sunlight and convert it to heat, which then can drive a steam turbine or heat engine. 115 Despite rapid growth rates of solar electricity generation, the share of solar in electricity generation under our business-as-usual projection is still marginal in the APEC region in 2030. More widespread adoption of this technology is currently constrained by high investment cost. However, with supportive government policies and continued technological
115 DOE (2009A).
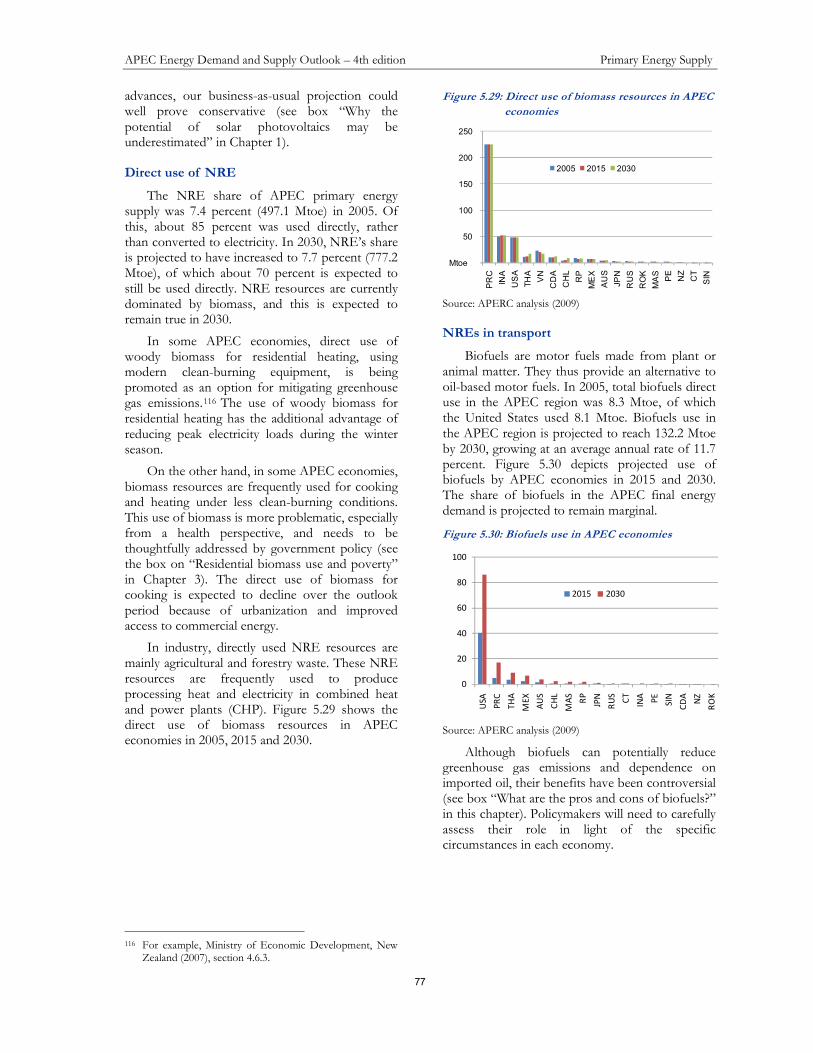
APEC Energy Demand and Supply Outlook – 4th edition Primary Energy Supply
77
advances, our business-as-usual projection could well prove conservative (see box “Why the potential of solar photovoltaics may be underestimated” in Chapter 1).
Direct use of NRE
The NRE share of APEC primary energy supply was 7.4 percent (497.1 Mtoe) in 2005. Of this, about 85 percent was used directly, rather than converted to electricity. In 2030, NRE’s share is projected to have increased to 7.7 percent (777.2 Mtoe), of which about 70 percent is expected to still be used directly. NRE resources are currently dominated by biomass, and this is expected to remain true in 2030.
In some APEC economies, direct use of woody biomass for residential heating, using modern clean-burning equipment, is being promoted as an option for mitigating greenhouse gas emissions.116 The use of woody biomass for residential heating has the additional advantage of reducing peak electricity loads during the winter season.
On the other hand, in some APEC economies, biomass resources are frequently used for cooking and heating under less clean-burning conditions. This use of biomass is more problematic, especially from a health perspective, and needs to be thoughtfully addressed by government policy (see the box on “Residential biomass use and poverty” in Chapter 3). The direct use of biomass for cooking is expected to decline over the outlook period because of urbanization and improved access to commercial energy.
In industry, directly used NRE resources are mainly agricultural and forestry waste. These NRE resources are frequently used to produce processing heat and electricity in combined heat and power plants (CHP). Figure 5.29 shows the direct use of biomass resources in APEC economies in 2005, 2015 and 2030.
116 For example, Ministry of Economic Development, New
Zealand (2007), section 4.6.3.
Figure 5.29: Direct use of biomass resources in APEC
economies
Mtoe
50
100
150
200
250
PRC
INA
USA
THA
VN
CDA
CHL
RP
MEX
AUS
JPN
RUS
ROK
MAS
PE
NZ
CT
SIN
2005 2015 2030
Source: APERC analysis (2009)
NREs in transport
Biofuels are motor fuels made from plant or animal matter. They thus provide an alternative to oil-based motor fuels. In 2005, total biofuels direct use in the APEC region was 8.3 Mtoe, of which the United States used 8.1 Mtoe. Biofuels use in the APEC region is projected to reach 132.2 Mtoe by 2030, growing at an average annual rate of 11.7 percent. Figure 5.30 depicts projected use of biofuels by APEC economies in 2015 and 2030. The share of biofuels in the APEC final energy demand is projected to remain marginal.
Figure 5.30: Biofuels use in APEC economies
0
20
40
60
80
100
USA
PR
C
TH
A
ME
X
AU
S
CH
L
MA
S
RP
JPN
RU
S
CT
INA PE
SIN
CD
A
NZ
RO
K
2015 2030
Source: APERC analysis (2009)
Although biofuels can potentially reduce greenhouse gas emissions and dependence on imported oil, their benefits have been controversial (see box “What are the pros and cons of biofuels?” in this chapter). Policymakers will need to carefully assess their role in light of the specific circumstances in each economy.

APEC Energy Demand and Supply Outlook – 4th edition Primary Energy Supply
78
What are the pros and cons of biofuels?
Facing record high oil prices and the threat of climate change, many APEC economies have adopted policies to
promote biofuels as a petroleum substitute. Such policies include voluntary and mandatory biofuel sales targets, tax
credits, and other subsidies.117
But as the use of biofuels has grown rapidly in recent years, their sustainability has
been called into question. Biofuels have been shown to provide negligible climate benefits, contribute to rising food
prices, and drive environmental degradation. New feedstocks and advanced production technologies are hoped to
resolve these obstacles to a major increase of biofuels.
Current biofuels, known as first generation biofuels, are derived from sugars, starches or oils, that are yielded by crops
such as sugarcane, maize or palm oil. Cultivating and processing these crops requires energy and this, together with
their end use, produces emissions. Biofuels have been shown to provide net energy benefits, from a modest ratio of
output-to-input energy of 1.2 for corn feedstock, to 8 or more for sugarcane.118
However, when all associated
emissions are accounted for, including those of land use change, expanding production of first generation biofuels is
estimated to produce more greenhouse gas emissions than it avoids.119
Thus, while biofuels offer increased energy
security in the near term, new feedstocks and production methods are required to achieve climate benefits.
Other negative externalities of biofuels relate to food prices and the environmental impacts of intensive agriculture. At
a time when several global trends are tightening food supply (such as population growth and increasing meat
consumption) and raising production costs (rising energy prices), competition by biofuels for crops and cropland puts
further upward pressure on food prices.120
Higher crop prices benefit some farmers, but they represent a hardship for
many of the world’s poor.121
High prices also encourage the conversion of natural areas and conservation set-asides to
intensive agriculture.122
Together with other environmental impacts of intensive agriculture, such as nitrogen run-off,
this transformation may damage or destroy local ecosystems.123
Second generation technology is expected to solve some of the problems of today’s commercial biofuels. ‘Cellulosic’
biofuel technology would allow the production of biofuels from the stalks and stems of almost any plant. Feedstock
could then be derived from forestry and agricultural residues or non-food crops produced on land that is unsuitable for
food production.124
This would reduce pressure on food prices, and under careful management, certain energy crops
could be used to produce biofuels with little or no net greenhouse gas emissions.125
Many companies are working,
some with government support, to commercialize different pathways for producing cellulosic biofuels.126
Until the
second generation technologies are deployed, the increased energy security offered by biofuels comes at a high cost.
117 Milbrant and Overend (2008), pp 33–34. 118 Farrell et al (2006) and IEA (2004), p 60. 119 Fargione et al (2008). 120 Rosegrante (2008). 121 Runge and Senauer (2007). 122 Fargione et al (2008). 123 UN Energy (2007), p 43. 124 Technology Review (2007). 125 Tilman et al (2006). 126 Milbrant and Overend (2008), p 16; as an example of government support, see DOE (2009).

APEC Energy Demand and Supply Outlook – 4th edition Primary Energy Supply
79
REFERENCES
BP (2008) BP Statistical Review of World Energy, June 2008, British Petroleum, London. http://www.bp.com/productlanding.do?categoryId=6929&contentId=7044622
Bullis, K (2007) “Will Cellulosic Ethanol Take Off?” Technology Review, 26 February 2007. http://www.technologyreview.com/Energy/18227/
DOE (2009A) “Concentrating Solar Power Basics” web page of the Solar Energies Technologies Program, US Department of Energy, Washington DC. http://www1.eere.energy.gov/solar/csp_basics.html
DOE (2009B) “Cost Trends” web page of the New England Wind Forum, US Department of Energy, Washington DC. http://www.windpoweringamerica.gov/ne_economics_cost.asp
DOE (2009C) “DOE Selects Biofuels Projects to Receive up to $21 Million in Funding” press release, 31 August. US Department of Energy, Washington DC.
EIA (2009A) 2009 Annual Energy Outlook. US Energy Information Administration, Washington DC.
EIA (2009B) Office of Oil and Gas, Form EIA-914 Monthly Natural Gas Production Report. US Energy Information Administration, Washington DC.
Energy Charter Secretariat (2009) Fostering LNG Trade: Developments in LNG Trade and Pricing. Brussels, Belgium.
Eng, G (2006) A formula for LNG pricing, report prepared for the New Zealand Ministry of Economic Development, Wellington.
Fairley, P (2009) “King Coal Eats Its Vegetables”, IEEE Spectrum, July 2009, p 12. http://www.spectrum.ieee.org/energy/fossil-fuels/king-coal-eats-its-vegetables
Fargione, J et al (2008) “Land Clearing and the Biofuel Carbon Debt”, Science, vol 319.
Farrell, AE et al (2006) “Ethanol Can Contribute to Energy and Environmental Goals”, Science, vol 311.
IAEA (2009) IAEA Power Reactor Information System. International Atomic Energy Agency. http://www.iaea.org/programmes/a2/
IEA (2004) Biofuels for Transport; an International Perspective. International Energy Agency, Paris, France.
IEA (2008A) Gas Market Review 2008. International Energy Agency, Paris, France.
IEA (2008B) Worldwide Trends in Energy Use and Efficiency. International Energy Agency, Paris, France.
IEA (2009) Gas Market Review 2009. International Energy Agency, Paris, France.
IPCC (2007) Fourth Assessment Report 2007: Mitigation of Climate Change. Intergovernmental Panel on Climate Change. http://www.ipcc.ch/publications_and_data/publications_ipcc_fourth_assessment_report_wg3_report_mitigation_of_climate_change.htm
Lackner, KS and Sachs, JD (2006) “A Robust Strategy for Sustainable Energy”, Brookings Papers on Economic Activity, 2. http://www.energy.columbia.edu/files/lacknersachs.pdf
Milbrant, A and Overend, RP (2008) The Future of Liquid Biofuels for APEC Economies. APEC Energy Working Group. http://www.biofuels.apec.org/pdfs/ewg_2008_liquid_biofuels.pdf
Ministry of Economic Development, New Zealand (2007) New Zealand Energy Strategy to 2050: Powering Our Future. http://www.med.govt.nz/upload/52164/nzes.pdf
Oil & Gas Journal (2008) “World Refinery Survey”, 22 December 2008, PennWell Editors, Houston, US. http://ogjresearch.stores.yahoo.net/hisrefsurpur.html
OPEC (2009) World Oil Outlook 2009. Organization of the Petroleum Exporting Countries. http://www.opec.org/library/World%20Oil%20Outlook/WorldOilOutlook09.htm
Rosegrante, MW (2008) “Biofuels and Grain Prices: Impacts and Policy Response”. Testimony for the US Senate. http://www.ifpri.org/sites/default/files/publications/rosegrant20080507.pdf
Runge, CF and Senaur, B (2007) “How Biofuels Could Starve the Poor”, Foreign Affairs, May/June.
Tilman, D et al (2006) “Carbon-negative Biofuels from Low-input High-diversity Grassland Biomass”, Science, vol 314.
UN Energy (2007) Sustainable Bioenergy: A Framework for Decision Makers. United Nations. http://esa.un.org/un-energy/pdf/susdev.Biofuels.FAO.pdf


APEC Energy Demand and Supply Outlook – 4th edition Energy Investments
81
6 ENERGY INVESTMENTS
INTRODUCTION
Adequate investment in energy infrastructure is essential to the economic stability and growth of APEC economies, as well as to insuring energy security and environmental sustainability. Therefore, APERC has assessed the capital investments in energy infrastructure that are likely to be required under business-as-usual assumptions between 2006 and 2030.
Investment estimates are based on the amount of physical capacity in the energy supply chain that will be required in each economy to meet the energy demand projected in this business-as-usual outlook. An investment requirement for each specific type of facility in each economy was estimated by multiplying an economy-specific capital cost per unit of capacity by the estimated capacity requirement for that type of facility. Capacity requirements took into account the need for replacement of existing facilities at the end of their normal operating life as well as new facilities needed to expand capacity.
The energy supply chain is broken into four stages: extraction, transformation, transportation, and distribution. Four energy industries are considered: coal, oil, gas, and electricity and heat. The electricity and heat industry includes all facilities used to generate electricity from nuclear or renewable sources, including hydro, wind, geothermal, and solar. Investment requirements for nuclear fuel processing, directly utilized renewables (such as biofuels and biomass), and non-commercial energy supply were not considered. Investments for international energy transportation within the APEC region were shared equally between exporter and importer. Investments
for international energy transportation between a non-APEC economy and an APEC economy were attributed entirely to the APEC economy.
Table 6.1 shows typical facilities for each combination of energy supply chain stage and energy source. The actual investment calculations were, however, done on a much more detailed level, taking into account the specific type of facility or technology being utilized. Examples of the level of detail considered would be the cost per MW of combined cycle gas turbine generating facilities, or the cost per Mtoe per year for an LNG liquefaction plant. APERC’s researchers estimated the projected unit costs of each type of facility in each economy based on published engineering studies or actual project plans.
Unless otherwise noted, all figures presented are simple sums of the investments required each year over the 2006–2030 period, with no adjustments for the time value of money. Results are reported in 2006 US dollars, with appropriate current exchange rates used to convert from local currency.
There are several tables at the end of this chapter summarizing the energy investment requirements for APEC economies. Tables 6.3–6.4 and 6.5–6.6 summarize the investment requirements by supply chain stage and by energy source, respectively. Table 6.7 summarizes the energy investment requirements as a percentage of GDP. Table 6.8 summarizes investments in the electricity and heat industry by its major stages – generation, transmission and distribution.
Table 6.1: Typical energy facilities by energy source and supply chain stage
Coal Oil Gas Electricity and Heat
Extraction Coal mines Oil wells and field facilities
Gas wells and field facilities
(not applicable)
Transformation Coal cleaning and processing facilities
Oil refining facilities Gas processing facilities
Electricity generation (Including all nuclear, hydro, and renewables)
Transportation Domestic and international coal transportation facilities and equipment (rail, water, trucks)
Domestic and international oil transportation facilities and equipment (pipelines, rail, water, trucks)
Domestic and international gas transportation facilities and equipment (pipelines, LNG shipping)
Electricity transmission lines and substations
Distribution Local delivery terminals and equipment
Local delivery terminals and equipment
Gas distribution pipelines
Electricity distribution lines and equipment
Source: APERC analysis (2009)

APEC Energy Demand and Supply Outlook – 4th edition Energy Investments
82
ENERGY INVESTMENT REQUIREMENTS IN THE APEC REGION
To meet projected energy demand growth, APEC economies will require between US$11.1 and US$15.0 trillion to be spent for energy infrastructure development (see Figure 6.1). The energy transformation sector dominates energy investments with a 46 percent share, followed by transportation and distribution with a 33 percent share. Extraction of primary energy will require 21 percent of future energy investments in the APEC region.
Figure 6.1: Total investment requirements by energy
supply chain, in billion 2006 US dollars
2230
5111
3027
7042981
6897
4156
932
Extraction
Transformation
Transportation
Distribution
11072 - 14965
Source: APERC analysis (2009)
However, these proportions vary significantly between APEC economies depending on resource availability, geography, and energy infrastructure maturity (see Figure 6.2). Geography impacts heavily on transportation investments, as higher spending for transportation is needed when energy production and consumption are separated by long distances. Papua New Guinea, Russia, Chile, Peru, and Hong Kong, China demonstrate this point. Russia’s seemingly low share for energy extraction at 22 percent is compensated for by a 40 percent share of investments in energy transportation, both to domestic consumers and for export.
Figure 6.2: Total investment requirements by economy,
in percent
0% 20% 40% 60% 80% 100%
Viet Nam
United States
Thailand
Chinese Taipei
Singapore
Russia
Philippines
Peru
Papua New Guinea
New Zealand
Mexico
Malaysia
Korea
Japan
Indonesia
Hong Kong, China
China
Chile
Canada
Brunei Darussalam
Australia
Extraction/
ProductionTransformation
Transportation
Distribution
Source: APERC analysis (2009)
Turning to energy sources, Figure 6.3 shows that electricity and heat supply accounts for the largest share of investment requirements at 58 percent. Oil will require 20 percent, natural gas 14 percent, and coal 8 percent of total energy investment in the APEC region for the 2006–2030 period.
Figure 6.3: Total investment requirements by energy
source, in billion 2006 US dollars
908
2164
1561
6439
1201
2964
20978703
Coal
Oil
Gas
Electricity
11072 - 14965
Source: APERC analysis (2009)
As shown in Figure 6.4, the electricity share can exceed 80 percent in economies that lack indigenous energy resources, such as Japan and Hong Kong, China. A notable exception is Singapore, which will need to make substantial investments in the refurbishing of its refining industry, and in petroleum products shipping, as well as in diversifying its natural gas supply through construction of a new LNG-receiving terminal.
Figure 6.4: Total investment requirements by energy
source within APEC region, in percent
0% 20% 40% 60% 80% 100%
Viet Nam
United States
Thailand
Chinese Taipei
Singapore
Russia
Philippines
Peru
Papua New Guinea
New Zealand
Mexico
Malaysia
Korea
Japan
Indonesia
Hong Kong, China
China
Chile
Canada
Brunei Darussalam
Australia
Crude oil and
petroleum
Natural gas
Coal
Power & Heat
Generation,
Transmission,
Distribution
Source: APERC analysis (2009)
As shown in Figure 6.5, the Americas and China will have the largest shares of total APEC region energy investment, accounting for 33 and 29 percent respectively. The three top economies – China, the United States and Russia – will require US$7.9–10.6

APEC Energy Demand and Supply Outlook – 4th edition Energy Investments
83
trillion to be spent on energy infrastructure through to 2030, or 71 percent of the total for the APEC region.
Figure 6.5: Total energy investment requirements by
region, in billion 2006 US dollars
981
821
457
3780
3122
1912
1291
1169
608
4970
4406
2522
Northeast Asia
Southeast Asia
Oceania
Americas
China
Russia
Source: APERC analysis (2009)
International energy trade
To support international energy trade between APEC economies, about US$384–539 billion will need to be invested in international energy transportation. The bulk of this (78 percent) will go into the LNG business; including LNG liquefaction, transportation, and regasification facilities (see Figure 6.6). However, it should be emphasized that these figures are for energy trade between APEC member economies only. Investments in transportation facilities outside the APEC region should also be counted to estimate the full investment requirements to support secure energy supply to all APEC member economies.
Figure 6.6: Total transportation investment
requirements for international trade between
APEC economies, in billion 2006 US dollars
87
291
5.9112
418
8.2
Oil
Gas
Coal
384 - 539
Source: APERC analysis (2009)
About 21 percent of the investment for oil, gas and coal extraction to be made in the APEC region will be needed to enable the export of primary energy from APEC’s nine net energy exporters (see Table 6.2). This amounts to US$440–$620 billion over the 2006–2030 period. Net energy exports clearly correlate with primary energy extraction investments as a percent of GDP (see Figure 6.7). For net energy exporters this percentage is above 0.4, while it ranges from zero to 0.25 percent for net energy importers.
Table 6.2: Net energy exports as a percent of total
primary energy supply in the APEC region
2005 2015 2030
Brunei Darussalam 703 297 169
Australia 122 175 188
Papua New Guinea 63 227 192
Russia 81 75 71
Indonesia 57 76 49
Canada 47 37 29
Mexico 47 33 17
Malaysia 47 27 -14
Viet Nam 36 13 -24
Source: APERC analysis (2009)
The APEC region is not self sufficient in oil or natural gas, but it will remain a net coal exporter throughout the 2006–2030 period. To support the APEC region’s oil and natural gas demand will require an investment of US$496–672 billion in the Middle East, Africa and Latin America, including US$400–538 billion for oil and gas exploration and production, and US$96–135 billion for primary energy transportation. Three-quarters of these investments will be for crude oil, the remainder of it for natural gas. A relatively small investment (US$2–3 billion) will be needed to support the shipping of coal from the APEC region, primarily to Europe.
Overall, the total investment to meet the energy import requirements of APEC economies in the 2006–2030 period, including primary energy extraction and/or production and international energy transportation within and from outside the APEC region, is estimated at US$1.3–1.8 trillion, of which US$0.5–0.7 trillion (40 percent) will be made outside the APEC region.

APEC Energy Demand and Supply Outlook – 4th edition Energy Investments
84
Figure 6.7: Primary energy extraction/production investments as percent of cumulative GDP
Australia
Canada
Chile
China
Hong Kong, China
Indonesia
JapanKorea
Malaysia
Mexico
New Zealand
Papua New Guinea
PeruPhilippines
Russia
Singapore
Chinese TaipeiThailand
United States
Viet Nam
0.0%
0.5%
1.0%
1.5%
0 10,000 20,000 30,000 40,000 50,000 60,000 70,000
En
erg
y p
rod
uct
ion
/ext
ract
ion
co
st a
s p
erc
en
t o
f G
DP
GDP per capita 2030, 2006 US dollars
^ 8.1% Brunei Darussalam
Source: APERC analysis (2009)
Electricity and heat supply
Investment requirements for the electricity and heat industry in the APEC region are estimated at US$6.2–8.4 trillion (see Figure 6.8). Generation of electricity and heat will dominate investment requirements for the industry at 58 percent, while transmission will take 33 percent, and the remaining 9 percent will be invested in distribution networks.
Figure 6.8: Total investment requirements for
electricity industry, in billion 2006
US dollars
36782016
552
49242787
726
Power
generation
Transmission
Distribution
6246 - 8436
Source: APERC analysis (2009)

APEC Energy Demand and Supply Outlook – 4th edition Energy Investments
85
FINANCING ENERGY INVESTMENTS
The necessary energy investments over the outlook period will generally require only a small share of total GDP. The average for the APEC region is 0.9 percent to 1.2 percent (see Table 6.7). It should be noted that the GDP and investment figures are not strictly comparable – GDP is measured in US dollars at purchasing power parity (PPP), while energy investments have been converted to US dollars based on appropriate current exchange rates. However, the key conclusion still stands: only a small share of GDP will be needed for energy investment.
Energy investments in transformation, transportation and distribution of energy as a percent of cumulative GDP within the APEC region for most economies fall in the range of 0.6–1.2 percent of GDP, regardless of their stage of energy infrastructure development (see Figure 6.9 and Table 6.7), with the APEC average being 0.7–0.9 percent. The higher values for the three major outliers – Brunei Darussalam, Papua New Guinea and Russia – are a result of their large investments in energy export facilities. For example, in the case of Papua New Guinea, if investments in LNG export facilities are excluded, energy supply investments for Papua New Guinea would require only 0.5 to 0.7 percent of GDP.
Figure 6.9: Energy investments for transformation, transportation and distribution as percent of cumulative GDP
Australia
Canada
Chile
China
Hong Kong, China
Indonesia
JapanKorea
Malaysia
Mexico
New Zealand
Papua New Guinea
Peru
PhilippinesSingapore
Chinese TaipeiThailand
United States
Viet Nam
0.0%
0.5%
1.0%
1.5%
2.0%
0 10,000 20,000 30,000 40,000 50,000 60,000 70,000
En
erg
y su
pp
ly c
ost
as
pe
rce
nt
of
GD
P
GDP per capita in 2030 , 2006 US dollars
^ 8.6% Brunei Darussalam
APEC average 0.69-0.94 percent
^ 2.7% Russia
Source: APERC analysis (2009)
APEC Energy Demand and Supply Outlook – 4th edition Energy Investments
86
Given the generally small shares of total GDP that energy investment will require, and the generally highly profitable nature of these investments, this analysis suggests that the necessary energy investments in the 2006–2030 period should be affordable in every APEC economy.
Energy-related projects are distinguished by their capital intensity and long construction lead times. They are also vulnerable to construction and operating cost risks, as well as energy price volatility. Hence a necessary pre-condition for adequate investment is a regulatory regime in each economy that fosters a stable investment climate and that permits returns on investment reflective of the high degree of risk often involved.
The current financial crisis poses a special set of challenges to the APEC economies. A recent IEA background paper for G8 Ministers 127 notes that energy investments worldwide are being sharply cut back due to lack of finance or lowered price expectations. Energy investment is expected to drop sharply in 2009 compared to 2008: by around 21 percent for upstream oil and gas investments, 40 percent for coal, and 38 percent for renewables. Given the long lead times required by energy projects, these cutbacks pose a risk that energy supplies could be inadequate as the global economy recovers. In this case, a recovery could cause energy prices to spike, dampening the recovery. APEC governments will need to tread wisely to insure that an adequate flow of energy investment is maintained, while avoiding unnecessary expenditure.
REFERENCES
IEA (2009) The Impact of the Financial and Economic Crisis on Global Energy Investment, International Energy Agency, Paris, France. http://www.iea.org/textbase/Papers/2009/G8_FinCrisis_Impact.pdf
127 IEA (2009).

APEC Energy Demand and Supply Outlook – 4th edition Energy Investments
87
Table 6.3: Energy investments in the APEC region by energy supply chain stage (billion 2006 US dollars)
Member
economy/region Total Extraction/
production Transformation Transportation Distribution
Australia 414 - 546 222 - 283 72 - 95 111 - 155 9 - 12
Brunei Darussalam 22 - 33 10.0 - 16.0 8.4 - 12.1 3.2 - 4.7 0.2 - 0.2
Canada 522 - 719 113 - 163 212 - 291 180 - 242 17 - 23
Chile 51 - 72 0.5 - 0.7 20.9 - 28.2 24.1 - 35.7 5.7 - 7.4
China 3122 - 4406 535 - 725 1714 - 2405 620 - 923 254 - 352
Hong Kong, China 10 - 13 .. - .. 8.3 - 10.7 1.3 - 1.7 0.5 - 0.7
Indonesia 296 - 412 107 - 149 94 - 124 74 - 110 21 - 30
Japan 616 - 798 2.6 - 3.7 390 - 493 146 - 208 77 - 93
Korea 234 - 313 0.8 - 1.1 165 - 219 47 - 67 21 - 26
Malaysia 151 - 219 57 - 84 46 - 63 37 - 56 11 - 15
Mexico 339 - 471 136 - 182 116 - 167 73 - 102 15 - 20
New Zealand 32 - 46 3.6 - 5.2 13.5 - 20.2 11.3 - 15.9 3.6 - 4.8
Papua New Guinea 11 - 16 3.5 - 4.7 1.3 - 1.8 6.0 - 8.7 0.3 - 0.4
Peru 44 - 60 3.1 - 4.6 17.6 - 22.2 19.1 - 27.4 4.6 - 6.2
Philippines 70 - 104 1.8 - 2.8 35.9 - 50.6 25.5 - 40.0 7.1 - 10.6
Russia 1912 - 2522 423 - 544 585 - 801 757 - 983 147 - 193
Singapore 37 - 52 .. - .. 29.0 - 41.7 6.7 - 9.5 0.8 - 1.1
Chinese Taipei 120 - 166 .. - .. 90.2 - 124.9 22.4 - 31.4 7.8 - 10.1
Thailand 120 - 174 21.3 - 30.8 58.3 - 82.1 32.3 - 50.0 8.0 - 10.6
United States 2822 - 3647 567 - 748 1378 - 1770 793 - 1026 85 - 103
Viet Nam 126 - 175 23.4 - 31.9 57.8 - 73.3 37.0 - 58.7 7.6 - 11.3
APEC 11072 - 14964 2230 - 2981 5111 - 6897 3027 - 4156 704 - 931
Northeast Asia 981 - 1291 3 - 5 653 - 848 217 - 308 107 - 130
Southeast Asia 821 - 1169 220 - 315 329 - 447 216 - 328 56 - 79
Oceania 457 - 608 229 - 293 86 - 117 128 - 180 13 - 17
Americas 3780 - 4970 819 - 1098 1744 - 2278 1089 - 1433 128 - 160
China 3122 - 4406 535 - 725 1714 - 2405 620 - 923 254 - 352
Russia 1912 - 2522 423 - 544 585 - 801 757 - 983 147 - 193
Note: “..” means non-existent or insignificant Source: APERC analysis (2009)
Table 6.4: Energy investments in the APEC region by energy supply chain stage (percent)
Member
economy/region Total Extraction/
production Transformation Transportation Distribution
Australia 100 54 - 52 17 - 17 27 - 28 2 - 2
Brunei Darussalam 100 46 - 48 38 - 37 15 - 14 1 - 1
Canada 100 22 - 23 41 - 40 34 - 34 3 - 3
Chile 100 1 - 1 41 - 39 47 - 50 11 - 10
China 100 17 - 16 55 - 55 20 - 21 8 - 8
Hong Kong, China 100 .. - .. 83 - 82 12 - 13 5 - 5
Indonesia 100 36 - 36 32 - 30 25 - 27 7 - 7
Japan 100 .. - .. 63 - 62 24 - 26 13 - 12
Korea 100 .. - .. 70 - 70 20 - 21 9 - 8
Malaysia 100 38 - 38 30 - 29 25 - 25 7 - 7
Mexico 100 40 - 39 34 - 35 21 - 22 4 - 4
New Zealand 100 11 - 11 42 - 44 35 - 35 11 - 11
Papua New Guinea 100 32 - 30 12 - 12 54 - 56 3 - 3
Peru 100 7 - 8 40 - 37 43 - 45 10 - 10
Philippines 100 3 - 3 51 - 49 36 - 38 10 - 10
Russia 100 22 - 22 31 - 32 40 - 39 8 - 8
Singapore 100 .. - .. 80 - 80 18 - 18 2 - 2
Chinese Taipei 100 .. - .. 75 - 75 19 - 19 6 - 6
Thailand 100 18 - 18 49 - 47 27 - 29 7 - 6
United States 100 20 - 21 49 - 49 28 - 28 3 - 3
Viet Nam 100 19 - 18 46 - 42 29 - 33 6 - 6
APEC 100 20 - 20 46 - 46 27 - 28 6 - 6
Northeast Asia 100 .. - .. 67 - 66 22 - 24 11 - 10
Southeast Asia 100 27 - 27 40 - 38 26 - 28 7 - 7
Oceania 100 50 - 48 19 - 19 28 - 30 3 - 3
Americas 100 22 - 22 46 - 46 29 - 29 3 - 3
China 100 17 - 16 55 - 55 20 - 21 8 - 8
Russia 100 22 - 22 31 - 32 40 - 39 8 - 8
Note: “..” means non-existent or insignificant Source: APERC analysis (2009)

APEC Energy Demand and Supply Outlook – 4th edition Energy Investments
88
Table 6.5: Energy investments in the APEC region by energy source (billion 2006 US dollars)
Member
economy/region Total Crude oil and
petroleum products Natural gas Coal Electricity and Heat
Australia 414 - 546 33 - 51 180 - 235 105 - 130 96 - 131
Brunei Darussalam 22 - 33 12 - 18 8 - 13 .. - .. 1.2 - 1.7
Canada 522 - 719 165 - 233 104 - 143 12 - 16 241 - 328
Chile 51 - 72 8 - 12 6 - 9 0.3 - 0.4 36 - 51
China 3122 - 4406 385 - 558 89 - 129 502 - 671 2147 - 3048
Hong Kong, China 10 - 13 0.3 - 0.4 0.4 - 0.6 .. - .. 9 - 12
Indonesia 296 - 412 70 - 92 59 - 86 43 - 57 124 - 177
Japan 616 - 798 66 - 94 21 - 33 2.0 - 2.8 526 - 669
Korea 234 - 313 51 - 72 12 - 19 1.5 - 2.1 170 - 221
Malaysia 151 - 219 30 - 46 62 - 91 0.6 - 0.9 58 - 81
Mexico 339 - 471 165 - 226 65 - 91 3.2 - 4.3 106 - 150
New Zealand 32 - 46 5 - 7 3 - 4 1.4 - 2.0 23 - 33
Papua New Guinea 11 - 16 1.3 - 2.0 8 - 11 .. - .. 2.1 - 3.0
Peru 44 - 60 5.2 - 7.3 6.6 - 9.3 0.3 - 0.4 32 - 43
Philippines 70 - 104 19 - 27 3.6 - 5.5 1.0 - 1.4 47 - 70
Russia 1912 - 2522 306 - 430 531 - 659 55 - 73 1020 - 1360
Singapore 37 - 52 31 - 44 3.1 - 4.9 .. - .. 2.5 - 3.6
Chinese Taipei 120 - 166 40 - 56 4.2 - 6.7 0.9 - 1.3 75 - 102
Thailand 120 - 174 41 - 59 27 - 39 2.6 - 3.3 50 - 72
United States 2822 - 3647 714 - 907 354 - 492 171 - 227 1582 - 2020
Viet Nam 126 - 175 15 - 22 13 - 16 7 - 9 91 - 127
APEC 11072 - 14964 2164 - 2964 1561 - 2097 908 - 1201 6439 - 8703
Northeast Asia 981 - 1291 157 - 223 38 - 59 4 - 6 781 - 1004
Southeast Asia 821 - 1169 219 - 309 175 - 256 54 - 71 373 - 532
Oceania 457 - 608 39 - 60 190 - 249 106 - 132 121 - 167
Americas 3780 - 4970 1058 - 1385 537 - 744 187 - 248 1998 - 2592
China 3122 - 4406 385 - 558 89 - 129 502 - 671 2147 - 3048
Russia 1912 - 2522 306 - 430 531 - 659 55 - 73 1020 - 1360
Note: “..” means non-existent or insignificant Source: APERC analysis (2009)
Table 6.6: Energy investments in the APEC region by energy source (percent)
Member
economy/region Total Crude oil and
petroleum products Natural gas Coal Electricity and
Heat
Australia 100 8 - 9 44 - 43 25 - 24 23 - 24
Brunei Darussalam 100 57 - 55 37 - 40 .. - .. 6 - 5
Canada 100 32 - 32 20 - 20 2 - 2 46 - 46
Chile 100 16 - 16 12 - 13 1 - 1 71 - 70
China 100 12 - 13 3 - 3 16 - 15 69 - 69
Hong Kong, China 100 3 - 3 4 - 5 1 - 1 92 - 91
Indonesia 100 24 - 22 20 - 21 14 - 14 42 - 43
Japan 100 11 - 12 3 - 4 .. - .. 85 - 84
Korea 100 22 - 23 5 - 6 1 - 1 73 - 70
Malaysia 100 20 - 21 41 - 42 .. - .. 38 - 37
Mexico 100 49 - 48 19 - 19 1 - 1 31 - 32
New Zealand 100 15 - 15 8 - 8 4 - 4 72 - 72
Papua New Guinea 100 11 - 13 70 - 69 .. - .. 19 - 19
Peru 100 12 - 12 15 - 16 1 - 1 73 - 72
Philippines 100 27 - 26 5 - 5 1 - 1 66 - 67
Russia 100 16 - 17 28 - 26 3 - 3 53 - 54
Singapore 100 85 - 84 9 - 9 .. - .. 7 - 7
Chinese Taipei 100 33 - 34 4 - 4 1 - 1 63 - 61
Thailand 100 34 - 34 22 - 23 2 - 2 41 - 41
United States 100 25 - 25 13 - 14 6 - 6 56 - 55
Viet Nam 100 12 - 13 10 - 9 6 - 5 72 - 73
APEC 100 20 - 20 14 - 14 8 - 8 58 - 58
Northeast Asia 100 16 - 17 4 - 5 .. - .. 80 - 78
Southeast Asia 100 27 - 26 21 - 22 7 - 6 45 - 46
Oceania 100 9 - 10 42 - 41 23 - 22 26 - 28
Americas 100 28 - 28 14 - 15 5 - 5 53 - 52
China 100 12 - 13 3 - 3 16 - 15 69 - 69
Russia 100 16 - 17 28 - 26 3 - 3 53 - 54
Note: “..” means non-existent or insignificant Source: APERC analysis (2009)
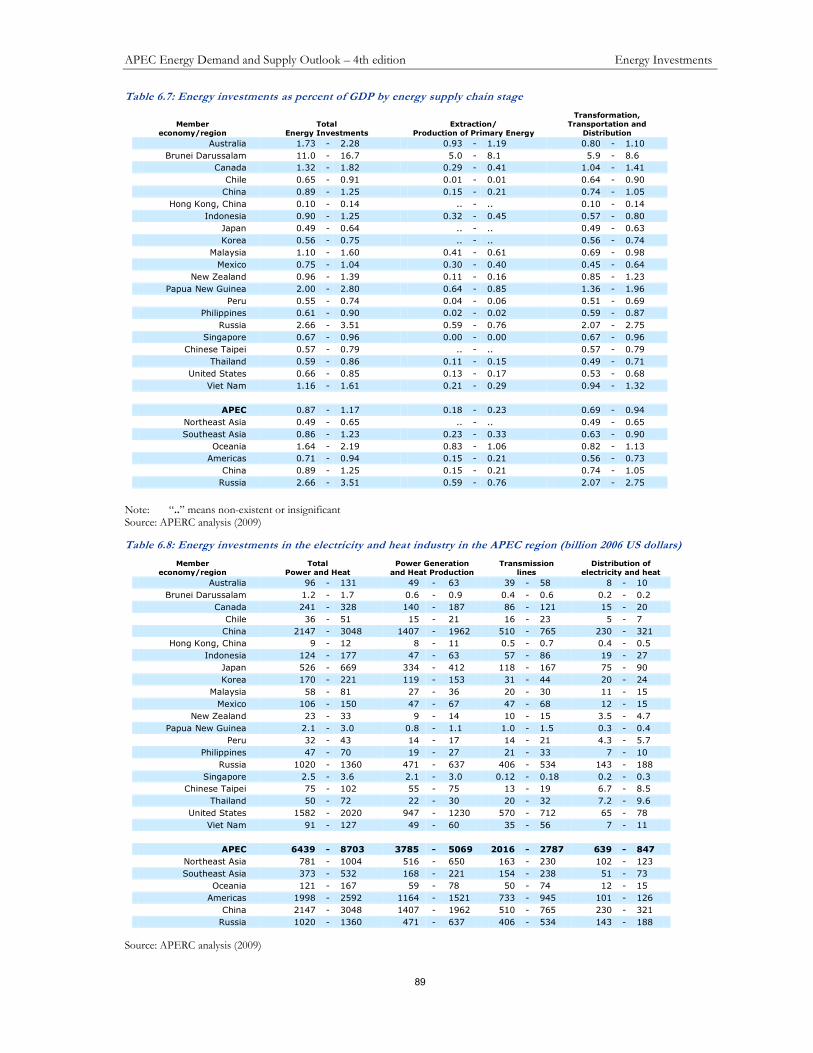
APEC Energy Demand and Supply Outlook – 4th edition Energy Investments
89
Table 6.7: Energy investments as percent of GDP by energy supply chain stage
Member
economy/region Total
Energy Investments
Extraction/
Production of Primary Energy
Transformation,
Transportation and
Distribution
Australia 1.73 - 2.28 0.93 - 1.19 0.80 - 1.10
Brunei Darussalam 11.0 - 16.7 5.0 - 8.1 5.9 - 8.6
Canada 1.32 - 1.82 0.29 - 0.41 1.04 - 1.41
Chile 0.65 - 0.91 0.01 - 0.01 0.64 - 0.90
China 0.89 - 1.25 0.15 - 0.21 0.74 - 1.05
Hong Kong, China 0.10 - 0.14 .. - .. 0.10 - 0.14
Indonesia 0.90 - 1.25 0.32 - 0.45 0.57 - 0.80
Japan 0.49 - 0.64 .. - .. 0.49 - 0.63
Korea 0.56 - 0.75 .. - .. 0.56 - 0.74
Malaysia 1.10 - 1.60 0.41 - 0.61 0.69 - 0.98
Mexico 0.75 - 1.04 0.30 - 0.40 0.45 - 0.64
New Zealand 0.96 - 1.39 0.11 - 0.16 0.85 - 1.23
Papua New Guinea 2.00 - 2.80 0.64 - 0.85 1.36 - 1.96
Peru 0.55 - 0.74 0.04 - 0.06 0.51 - 0.69
Philippines 0.61 - 0.90 0.02 - 0.02 0.59 - 0.87
Russia 2.66 - 3.51 0.59 - 0.76 2.07 - 2.75
Singapore 0.67 - 0.96 0.00 - 0.00 0.67 - 0.96
Chinese Taipei 0.57 - 0.79 .. - .. 0.57 - 0.79
Thailand 0.59 - 0.86 0.11 - 0.15 0.49 - 0.71
United States 0.66 - 0.85 0.13 - 0.17 0.53 - 0.68
Viet Nam 1.16 - 1.61 0.21 - 0.29 0.94 - 1.32
APEC 0.87 - 1.17 0.18 - 0.23 0.69 - 0.94
Northeast Asia 0.49 - 0.65 .. - .. 0.49 - 0.65
Southeast Asia 0.86 - 1.23 0.23 - 0.33 0.63 - 0.90
Oceania 1.64 - 2.19 0.83 - 1.06 0.82 - 1.13
Americas 0.71 - 0.94 0.15 - 0.21 0.56 - 0.73
China 0.89 - 1.25 0.15 - 0.21 0.74 - 1.05
Russia 2.66 - 3.51 0.59 - 0.76 2.07 - 2.75
Note: “..” means non-existent or insignificant Source: APERC analysis (2009)
Table 6.8: Energy investments in the electricity and heat industry in the APEC region (billion 2006 US dollars)
Member
economy/region Total
Power and Heat
Power Generation
and Heat Production
Transmission
lines
Distribution of
electricity and heat
Australia 96 - 131 49 - 63 39 - 58 8 - 10
Brunei Darussalam 1.2 - 1.7 0.6 - 0.9 0.4 - 0.6 0.2 - 0.2
Canada 241 - 328 140 - 187 86 - 121 15 - 20
Chile 36 - 51 15 - 21 16 - 23 5 - 7
China 2147 - 3048 1407 - 1962 510 - 765 230 - 321
Hong Kong, China 9 - 12 8 - 11 0.5 - 0.7 0.4 - 0.5
Indonesia 124 - 177 47 - 63 57 - 86 19 - 27
Japan 526 - 669 334 - 412 118 - 167 75 - 90
Korea 170 - 221 119 - 153 31 - 44 20 - 24
Malaysia 58 - 81 27 - 36 20 - 30 11 - 15
Mexico 106 - 150 47 - 67 47 - 68 12 - 15
New Zealand 23 - 33 9 - 14 10 - 15 3.5 - 4.7
Papua New Guinea 2.1 - 3.0 0.8 - 1.1 1.0 - 1.5 0.3 - 0.4
Peru 32 - 43 14 - 17 14 - 21 4.3 - 5.7
Philippines 47 - 70 19 - 27 21 - 33 7 - 10
Russia 1020 - 1360 471 - 637 406 - 534 143 - 188
Singapore 2.5 - 3.6 2.1 - 3.0 0.12 - 0.18 0.2 - 0.3
Chinese Taipei 75 - 102 55 - 75 13 - 19 6.7 - 8.5
Thailand 50 - 72 22 - 30 20 - 32 7.2 - 9.6
United States 1582 - 2020 947 - 1230 570 - 712 65 - 78
Viet Nam 91 - 127 49 - 60 35 - 56 7 - 11
APEC 6439 - 8703 3785 - 5069 2016 - 2787 639 - 847
Northeast Asia 781 - 1004 516 - 650 163 - 230 102 - 123
Southeast Asia 373 - 532 168 - 221 154 - 238 51 - 73
Oceania 121 - 167 59 - 78 50 - 74 12 - 15
Americas 1998 - 2592 1164 - 1521 733 - 945 101 - 126
China 2147 - 3048 1407 - 1962 510 - 765 230 - 321
Russia 1020 - 1360 471 - 637 406 - 534 143 - 188
Source: APERC analysis (2009)


APEC Energy Demand and Supply Outlook – 4th edition Carbon Dioxide Emissions
91
7 CARBON DIOXIDE EMISS IONS The APEC region’s CO2 emissions from fuel
combustion are projected to rise by about 40 percent between 2005 and 2030. These emissions pose a threat to humanity, to the environment, and to the economies of the APEC region and the world. This chapter discusses the details of these emission results and their implications for policymakers.
APERC has modelled only the emissions of carbon dioxide (CO2) from fuel combustion. As noted in Chapter 1, CO2 emissions from fuel combustion account for over 90 percent of energy-related greenhouse gas emissions worldwide on a CO2-equivalent basis, and these energy-related emissions in turn account for about two-thirds of total greenhouse gas emissions on a CO2-equivalent basis.128 Non-CO2 energy emissions are difficult to model because they depend not just on the quantity of fuel burned, but also on the details of the conditions under which the fuel was burned or escaped into the environment.
CO2 EMISSION RESULTS
CO2 emissions from the APEC economies under our business-as-usual assumptions are projected to increase from 16.6 billion tonnes in 2005 to 23.2 billion tonnes in 2030 (Figure 7.1). Electricity and heat generation (Figure 7.2) alone will account for 11.2 billion tonnes, or about 48 percent of these emissions in 2030. Transport will be a distant second, accounting for 4.4 billion tonnes or about 19 percent. As shown in Figure 7.3 and Figure 7.4 (following), the importance of each sector in contributing to emissions growth varies considerably by economy. However, in 15 economies, electricity and heat generation will be the leading source of CO2
emissions.
Among the fossil fuels, coal is projected to provide the largest contribution to APEC’s primary energy supply. As it is also the most carbon intensive of the fossil fuels, coal not surprisingly also contributes the most to CO2 emissions (Figure 7.5, following). Coal contributes 52 percent of greenhouse gas emissions in 2030, whereas oil and gas contribute 29 and 19 percent, respectively (Figure 7.6, following). However, as shown in Figure 7.7 and Figure 7.8 (following), the share of the three fuels in CO2 emissions varies dramatically among the economies.
128 IEA (2008), p III–43.
Figure 7.1: APEC projected business-as-usual CO2
emissions from fuel combustion
0
5,000
10,000
15,000
20,000
25,000
05
15
30
APEC
MtC
O2
Electricity and
Heat Generation
Other
Transformations
Industry
Transport
Others
Source: APERC analysis (2009)
Figure 7.2: APEC projected shares of CO2 emissions
from fuel combustion by sector in 2030
48%
8%
14%
19%
10%
Electricity and Heat
Generation
Other
Transformations
Industry
Transport
Others
Source: APERC analysis (2009)

APEC Energy Demand and Supply Outlook – 4th edition Carbon Dioxide Emissions
92
Figure 7.3: CO2 emissions from fuel combustion by sector, larger economies
-
1,000.0
2,000.0
3,000.0
4,000.0
5,000.0
6,000.0
7,000.0
8,000.0
9,000.0
10,000.0
05
15
30
05
15
30
05
15
30
05
15
30
05
15
30
05
15
30
05
15
30
05
15
30
05
15
30
05
15
30
PRC USA RUS JPN CDA INA MEX ROK AUS THA
MtC
O2
Electricity and Heat Generation Other Transformations Industry Transport Others
Source: APERC analysis (2009)
Figure 7.4: CO2 emissions from fuel combustion by sector, smaller economies
-
50.0
100.0
150.0
200.0
250.0
300.0
350.0
400.0
05
15
30
05
15
30
05
15
30
05
15
30
05
15
30
05
15
30
05
15
30
05
15
30
05
15
30
05
15
30
05
15
30
MAS CT VN CHL RP SIN PE HKC NZ PNG BD
MtC
O2
Electricity and Heat Generation Other Transformations Industry Transport Others
Source: APERC analysis (2009)

APEC Energy Demand and Supply Outlook – 4th edition Carbon Dioxide Emissions
93
Figure 7.5: APEC projected business-as-usual CO2
emissions from fuel combustion, by fuel
0
5,000
10,000
15,000
20,000
25,000
05
15
30
APEC
MtC
O2
Coal
Oil
Gas
Source: APERC analysis (2009)
Figure 7.6: APEC projected shares of CO2 emissions
from fuel combustion by fuel in 2030
52%
29%
19%
Coal
Oil
Gas
Source: APERC analysis (2009)
Figure 7.7: CO2 emissions from fuel combustion by fuel, larger economies
-
1,000
2,000
3,000
4,000
5,000
6,000
7,000
8,000
9,000
10,000
05
15
30
05
15
30
05
15
30
05
15
30
05
15
30
05
15
30
05
15
30
05
15
30
05
15
30
05
15
30
PRC USA RUS JPN CDA INA MEX ROK AUS THA
MtC
O2
Coal Oil Gas
Source: APERC analysis (2009)
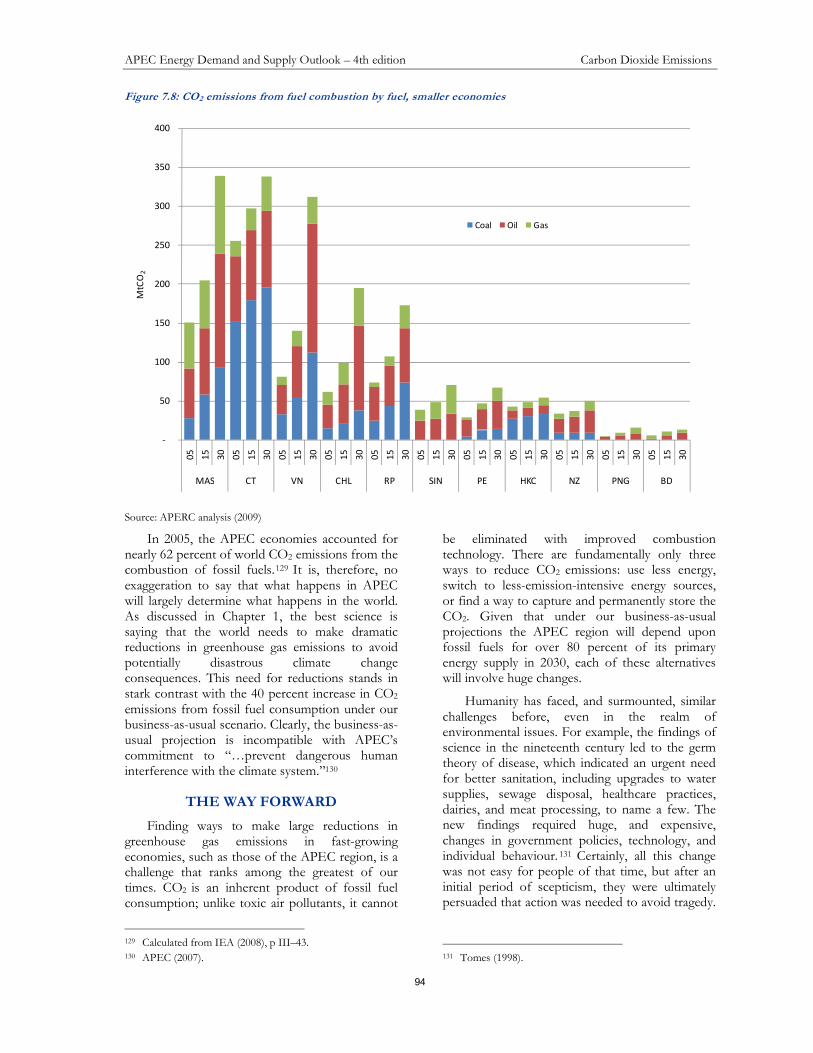
APEC Energy Demand and Supply Outlook – 4th edition Carbon Dioxide Emissions
94
Figure 7.8: CO2 emissions from fuel combustion by fuel, smaller economies
-
50
100
150
200
250
300
350
400
05
15
30
05
15
30
05
15
30
05
15
30
05
15
30
05
15
30
05
15
30
05
15
30
05
15
30
05
15
30
05
15
30
MAS CT VN CHL RP SIN PE HKC NZ PNG BD
MtC
O2
Coal Oil Gas
Source: APERC analysis (2009)
In 2005, the APEC economies accounted for nearly 62 percent of world CO2 emissions from the combustion of fossil fuels.129 It is, therefore, no exaggeration to say that what happens in APEC will largely determine what happens in the world. As discussed in Chapter 1, the best science is saying that the world needs to make dramatic reductions in greenhouse gas emissions to avoid potentially disastrous climate change consequences. This need for reductions stands in stark contrast with the 40 percent increase in CO2 emissions from fossil fuel consumption under our business-as-usual scenario. Clearly, the business-as-usual projection is incompatible with APEC’s commitment to “…prevent dangerous human interference with the climate system.”130
THE WAY FORWARD
Finding ways to make large reductions in greenhouse gas emissions in fast-growing economies, such as those of the APEC region, is a challenge that ranks among the greatest of our times. CO2 is an inherent product of fossil fuel consumption; unlike toxic air pollutants, it cannot
129 Calculated from IEA (2008), p III–43. 130 APEC (2007).
be eliminated with improved combustion technology. There are fundamentally only three ways to reduce CO2 emissions: use less energy, switch to less-emission-intensive energy sources, or find a way to capture and permanently store the CO2. Given that under our business-as-usual projections the APEC region will depend upon fossil fuels for over 80 percent of its primary energy supply in 2030, each of these alternatives will involve huge changes.
Humanity has faced, and surmounted, similar challenges before, even in the realm of environmental issues. For example, the findings of science in the nineteenth century led to the germ theory of disease, which indicated an urgent need for better sanitation, including upgrades to water supplies, sewage disposal, healthcare practices, dairies, and meat processing, to name a few. The new findings required huge, and expensive, changes in government policies, technology, and individual behaviour. 131 Certainly, all this change was not easy for people of that time, but after an initial period of scepticism, they were ultimately persuaded that action was needed to avoid tragedy.
131 Tomes (1998).

APEC Energy Demand and Supply Outlook – 4th edition Carbon Dioxide Emissions
95
Today we take most of the measures they adopted for granted.
While this study has not attempted a detailed analysis of alternatives, there are some general recommendations that emerge from the analysis presented here.
1. Educate. Dealing with a challenge the size of the climate change problem will require a serious commitment from a lot of people. Policymakers will need support and cooperation from their stakeholders and constituents if effective policies are to be agreed upon and adopted. This kind of support and cooperation will only come if those stakeholders and constituents understand the magnitude of the challenge and the consequences of an inadequate response. Since climate change is a challenge that will have to be dealt with over a time span of decades, it makes sense to insure that young people are appropriately educated on climate change science, technology, and institutions in schools of all levels. And no opportunity should be lost to educate their elders as well.
2. Promote energy efficiency. As discussed in Chapter 3, there are a variety of market barriers preventing the most efficient use of energy resources. Removing these barriers, or adopting policies to offset them, can often reduce emissions, reduce costs, and promote energy security simultaneously. Improved energy efficiency is likely to be the quickest and least-cost first line of attack on the climate change problem.
3. Promote energy research. As discussed in Chapter 4, there are a variety of promising low-emission energy supply technologies, including various types of renewable energy, carbon capture and storage, and advanced nuclear. Technology can also improve energy efficiency using advanced vehicles, smart grids, better communication as an alternative to transportation, and in many other ways. The cheaper and more convenient emissions-reducing technology can be made, the easier it will be to deal with the challenges of climate change. Technology will be especially important over the longer term, since once the economic emission reductions from the technology available today have been achieved, further reductions will require new technology.
4. Put a price on emissions. As noted in Chapter 3, a major market failure results from the fact that those who emit greenhouse gases pay no cost for the damage they are doing. Some kind of scheme for putting a price on emissions, such as an emissions cap and trade programme, or a carbon tax, would address this market failure. Some low-emission technologies, such as carbon capture and storage, can probably never be cheaper than conventional technology, while others may take a long time to get there. A price on emissions will pave the way for low-emissions technology to move from research to commercialization.
5. Address the trade implications of efforts to reduce emissions. There are significant trade implications to many measures governments might take to reduce emissions, such as carbon pricing (including ‘border taxes’ on imports and exemptions on exports), efficiency standards, and targeted government procurement policies. The consistency of many of these policies with the rules of the World Trade Organization is currently unclear. 132 Early and freely negotiated resolutions to these issues would help governments move ahead more quickly with their climate change policies. These issues need to be addressed in way that can allow governments to adopt effective policies for dealing with climate change, while at the same time not disrupting the free and open trade that it is APEC’s mission to promote.133
6. Cooperate. Climate change is a global challenge. No one economy can deal with it alone. Trade is a key example of where cooperation will be required, but there are a number of others, including infrastructure development, financial mechanisms, regulatory frameworks, research and development, information sharing, and education and capacity-building. 134 APEC could play an important role in many of these areas.
132 IPCC (2007), box 13.7 and p 282. 133 APEC (2009). 134 APERC (2008).

APEC Energy Demand and Supply Outlook – 4th edition Carbon Dioxide Emissions
96
REFERENCES
APEC (2007) “Sydney APEC Leaders’ Declaration on Climate Change, Energy Security and Clean Development”, Sydney, Australia, http://www.apec.org/etc/medialib/apec_media_library/downloads/news_uploads/2007aelm.Par.0001.File.tmp/07_aelm_ClimateChangeEnergySec.pdf
APEC (2009) “Mission Statement” page on APEC website. http://www.apec.org/apec/about_apec/mission_statement.html
APERC (2008) Understanding International Energy Initiatives in the APEC Region, Asia Pacific Energy Research Centre, Tokyo, Japan. http://www.ieej.or.jp/aperc/2008pdf/2008_Reports/APERC_2008_UIEI2.pdf
IPCC (2007) “2007: Policies, Instruments and Co-operative Arrangements”. [S Gupta, DA Tirpak, N Burger, J Gupta, N Höhne, A I. Boncheva, GM Kanoan, C Kolstad, JA Kruger, A Michaelowa, S Murase, J Pershing, T Saijo, A Sari, from Intergovernmental Panel on Climate Change.] In Climate Change 2007: Mitigation: Contribution of Working Group III to the Fourth Assessment Report of the Intergovernmental Panel on Climate Change [B Metz, OR Davidson, PR Bosch, R Dave, LA Meyer (eds)], Cambridge University Press, Cambridge, UK and New York, USA. http://www.ipcc.ch/pdf/assessment-report/ar4/wg3/ar4-wg3-chapter13.pdf
IEA (2008) CO2 Emissions from Fossil Fuel Combustion 2008. International Energy Agency, Paris, France.
Tomes, N (1998) The Gospel of Germs: Men, Women, and the Microbe in American Life, Harvard University Press, Cambridge, USA.

背幅 16.5mm
仕上がりA4
APECEnergy Demand and
Supply Outlook4th Edition
Economy Review
APEC
Energy Dem
and and Supply Outlook 4th Edition Econom
y Review
APER
C
APEC # 209-RE-01.6 ISBN 978-4-931482-42-5