The Social Impact of APEC TILF: The Philippine Case
17
PASCN Philippine APEC Study Center Network PASCN Discussion Paper No. 99-14 The Social Impact of APEC TILF: The Philippine Case Leonardo A. Lanzona, Jr. The PASCN Discussion Paper Series constitutes studies that are preliminary and subject to further revisions and review. They are being circulated in a limited number of copies only for purposes of soliciting comments and suggestions for further refinements. The views and opinions expressed are those of the author(s) and do not neces- sarily reflect those of the Network. Not for quotation without permission from the author(s) and the Network.
Transcript of The Social Impact of APEC TILF: The Philippine Case

PASCNPhilippineAPECStudy CenterNetwork
PASCN Discussion Paper No. 99-14
The Social Impact of APEC TILF:The Philippine Case
Leonardo A. Lanzona, Jr.
The PASCN Discussion Paper Series constitutes studies that are preliminary andsubject to further revisions and review. They are being circulated in a limitednumber of copies only for purposes of soliciting comments and suggestions forfurther refinements.
The views and opinions expressed are those of the author(s) and do not neces-sarily reflect those of the Network.
Not for quotation without permission from the author(s) and the Network.

Working DraftPlease do not quote
The Social Impact of APEC TILF: The Philippine Case
Leonardo A. LanzonaAteneo de Manila University
This paper gives a broad overview, with supporting statistical evidence, of therelationship and interrelationships between trade liberalization and the inflow offoreign direct investment and social development in the Philippines during the late1980s and the 1990s. The APEC Trade and Investment Liberalization and Facilitation(TILF) agenda is seen as the major event that has overshadowed as well as influencedeconomic and social conditions in the Philippines. However, this program seemed tohave overplayed the short-run, and in the process underplayed its long-term,implications. In particular, in the case of the Philippines, the focus of the program isprimarily on expanding investments and freeing financial markets. This emphasis hasled to a disproportionate process of liberalization and facilitation that favored capital-and skill-intensive industries, resulting in an increase in poverty incidence andmagnitude in the rural areas.

1
I. Introduction
Globalization refers to the rising levels of involvement in the world economy,increasing interdependence, the establishment of global markets, prices andproduction, and the diffusion of technology and ideas (Lairson and Skidmore, 1997).Three main components of globalization are: (1) the growth of foreign directinvestments (FDI) due to financial liberalization and relatively costless internationalfinancial transactions; (2) the growth of trade due to the emergence of global marketsand the reduction of trade barriers; and (3) the diffusion of global technology andinnovation due to easier communication. These changes can be categorized jointly interms of financial and trade liberalization.
In this context, tariffs and non-tariff measures are considered to be marketdistortions that impede trade and cause trade and welfare losses to the economies. Thetrade liberalization and facilitation measures, incorporated in the globalizationprocess, are then understood as the removal as well as the reduction of thesedistortions. Such measures reduce import barriers, which lower import prices to thedomestic market and increase imports. Less expensive imports, in turn, lead to lowerproduction costs for other domestic industries. The improvement in the general worldeconomy ultimately leads to a relocation of labor and capital to other, more efficientsectors away from the protected sectors. Moreover, the improved efficiency of theexport goods industries is expected to accelerate the exports of the economy. If tradeaccounts tend to be balanced in the long run, then the exports of the economy willincrease until balanced trade is eventually recovered.
On the social aspect, liberalization and facilitation are expected to improve thewelfare of society. The Hecksher-Ohlin theory maintains that countries export goodsthat use intensively those goods that are relatively abundant at home and import goodsthat use intensively those products that are scarce. Trade therefore increases thedemand for the abundant factors, assuming the expansion of the export sector, andreduces the demand for scarce factors, assuming the contraction of the import-competing sectors. In low-income developing countries, where abundant unskilledlabor is found and skilled labor is scarce, trade tends to increase unskilled labor wagesand lower skilled wages, thereby narrowing the gap between them.
With this perspective, APEC Economic Leaders at their meeting in Bogor inNovember 1994 set a number of specific goals and objectives, including (1) free andopen trade and investment in the Asia-Pacific region no later than 2010 forindustrialized economies and 2020 for developing economies; (2) expansion andacceleration of trade and investment facilitation programs; and (3) intensifieddevelopment cooperation. In Osaka in November 1995, APEC adopted the OsakaAction Agenda (OAA), which has become the guide for future APEC work towardthe common goals. In November 1996, APEC released the Manila Action Plan forAPEC (MAPA), which is the first action plan toward the goals set in the BogorDeclaration and the OAA. MAPA consists of individual action plans (IAPs),collective action plans (CAPs) and other joint activities in various APEC fora.
In this paper, I will consider more closely the recent performance of thePhilippine economy, a period that is marked by substantial economic growth, as the
2
country has become more open and globalized. One of the results of this progresshowever was the huge internal public debt that has been reported to have increased by1.5 percent to P1.37 trillion as of the end of May last year from P1.35 trillion as of theend of 1997. This development comes also at the heels of the debilitating effects ofthe Asian financial crisis. This means that on top of the weakening foreign exchangerates, the declining international reserves, and the rising inflation, the governmentdoes not have enough resources to restore both external and internal stability.
This paper then will examine the reasons for the apparent weakness of thePhilippine economy to sustain its growth and to improve its social conditions despitethe promotion of trade and investment liberalization. The APEC Trade and InvestmentLiberalization and Facilitation (TILF) agenda is seen as the major event that hasovershadowed as well as influenced economic and social conditions in the Philippines.However, this program seemed to have overplayed the short-run concerns, and in theprocess underplayed its long-term implications. In particular, at least in the case of thePhilippines, the focus of liberalization and facilitation is primarily on expandinginvestments and freeing financial markets. This emphasis has led to a disproportionateprocess of growth that favored capital- and skill-intensive industries, resulting in anincrease in poverty incidence and magnitude in the rural areas.
The rest of the paper is divided into the following parts: Section II discussesthe financial and trade liberalization programs as these were implemented in thePhilippines in the last 10 years or so. Section III provides data that will then show theconsequences of such programs. These two sections will demonstrate the unevenpace of implementation between trade and financial policies, resulting to somedeterioration in social welfare. Section III presents the conceptual framework thatwill explain the adverse consequences of disproportionate policies on trade andcapital market liberalization. Section V will make concluding remarks, particularlythe policy implications of the paper’s findings.
II. Financial and trade liberalization and facilitation in the Philippines
The APEC financial liberalization and facilitation program is based onindividual initiatives and action plans of the different economies. Given the diversity ofthe APEC members, the program then has been implemented in varied ways. Despitethis diversity, however, two general trends are clear from the experience of the pastdecade. First, APEC member economies across the spectrum of stages of developmenthave gradually moved toward more open investment regimes. Second, thoughinvestment liberalization has been approached in a more cautious and generally lessthoroughgoing fashion than has trade liberalization, many economies have liberalizedtheir investment regimes, resulting in substantial increases in FDI inflows.
The investment policies of the Philippines have changed substantially alongwith the Philippine’s economic condition and development strategies. Unlike othercountries in Asia, the Philippines adopted the strategy of import substitutionindustrialization as a response to severe balance-of-payments. Because of theshortage of government resources and domestic savings, foreign direct investment(FDI) was considered desirable. However, in line with the protectionist and politicalstrategy of the time, the import substituting industries were the only ones that gained
3
from these inflows through such devices such as tax exemptions, favorable creditterms, and market protection.
The situation changed in 1990 drastically with the implementation of aneconomic stabilization program spurred primarily by a stand-by credit facility fromthe International Monetary Fund. This paved the way for reforms in trade andinvestment that were subsequently expanded in the Ramos administration althoughimportant measures were made just before the end of Aquino administration. Themost important of these was the passage of the Foreign Investment Act of 1991 thatliberalized investment by allowing 100 percent foreign equity in a domestic or exportenterprise as long as its activity did not fall under a negative list. Furthermore, thislaw simplified the procedure for the entry of foreign investments by requiring foreigninvestors to register only with the Securities and Exchange Commission (SEC), unlessincentives from the Board of Investments (BOI) are sought.
Since 1992, a more comprehensive market-oriented approach to economicstructural reform has been followed. Under this approach, many key sectors,including the downstream oil, shipping, domestic and international aviation,telecommunications, and mining industries, as well as infrastructure, have beenopened to the private sector, including to foreign investors. Ten foreign banks alsowere initially allowed to open branches.
As a result of this, foreign equity investment in the Philippines grew by 136percent from the 1990-1992 level of US$ 2 billion to US$ 4.7 billion in 1993-95. Asa matter of fact, almost two-thirds of the total foreign investment that had beenaccumulated since 1968 came in during the last five years. In addition, BOI-approvedinvestments have accumulated to about US$ 66.3 billion as of the first half of 1996.The surge of FDI in the 1990s cannot however be attributed solely to the FDIliberalization policies, since the investment procedures were only one of the packagesof the general economic reform (APEC, 1997).
Trade policies on the other hand have implemented since 1980, though thishas been met with some resistance. So far, there have been four major programs thatresulted in substantial reduction in tariffs. The first phase of the Tariff ReformProgram (TRP-I) was implemented in 1981 covering a five-year period, aimed atleveling-off protection rates across industries and at achieving effective protectionrates (EPRs) within the range of 30-80 percent. The second phase of TRP becameeffective on August 1991. Under TRP-II, locally produced and imported rawmaterials would have a tax of 10% and 3% rates of duty, respectively, whileintermediate goods were levied at 20% and finished goods at 30%. TRP-II (EO 470)was supposed to end by December 1995, but was overtaken by the third phase of TRPin August 1995. TRP-III liberalized further the trade environment by reducing thelevel and spread of tariffs towards a uniform level of EPRs across all sectors, in orderto promote global competitiveness and simplify tariff structure for ease of customsadministration, and providing a level playing field for local manufacturers vis-à-visforeign competitors. Finally, because TRP-III led to a number of objections from thebusiness sector, the government considered a tariff calibration scheme to serve as aframework for TRP-IV vis-à-vis the pace of liberalization in the ASEAN countries.The next tariff adjustments, TRP-IV, provided a structure of 30-25-20-15-10-7-5-3

4
tariff reduction scheme, instead of the previous 30-20-10-3 structure to respond to thebusiness sector’s clamor for further protection to “assist them compete globally.”
In general, the existing efforts of APEC have been very weak to affect thePhilippine tariff structure significantly. One way of assessing the likely impact of theAPEC TILF program of the Philippine trade liberalization is to compare the effectiveprotection rates (EPRs) of commodities considered in the APEC Early VoluntarySectoral Liberalization (EVSL) Program and the other commodities. The APECEconomic Leaders endorsed the EVSL of the fifteen sectors in their Fifth Meeting(AELM) in Canada in November 1997. These sectors were identified to have likelypositive impacts on trade, investments and economic growth in the respectiveeconomies and the whole APEC region. These sectors are: environmental goods,services, toys, fish and fish products, forest products, gems and jewelry, oilseeds andoilseed products, chemicals, telecommunications mutual recognition arrangement,energy sector, food sector, natural and synthetic rubber, fertilizers, automotive,medical equipment and instruments, and civil aircraft. The problem however is thatthese sectors are not those that require liberalization the most. Table 1 shows theEPRs of commodities considered to the APEC EVSL Program and the othercommodities that possess the highest EPRs.
Three points can be made. First, those highly protected sectors are categorizedas sensitive agricultural products which in some cases are also the inefficient ones(e.g., sugar milling and refining). Second, the average protection rate to the EVSLsectors is roughly 6 times lower than the selected industries, thereby showing thesignificant difference between the EVSL sectors and those sectors that need to beliberalized the most. Third, while these selected sectors on the average haveexperienced reduced protection rates in 1997, the rate of decline for the EVSL sectorsis greater. This suggests the difficulty of liberalizing these heavily protected sectorsas well as the discriminatory nature of this type of liberalization.
This discussion suggests that certain industries for a long period of time havereceived some protection from the government. Because trade restrictions have beenin place for a significant period of time, it is particularly difficult to remove themwithin a short period and almost impossible for all countries to remove suchdistortions simultaneously. Moreover, in face of the Asian crisis, the countries maybe hard-pressed to liberalize multilaterally those activities that are deemed strategic tothe development. This is particularly true in the present crisis and especially so forAsian nations -- except the Philippines-- where trade with countries outside the APECis as important as trade within the bloc (see, e.g., Haggard, 1995). Because of thepotential free-rider problem of the most favored nation (MFN) principle, the option tolimit tariff reductions to member countries may be a sensible response. Thus, strongopposition within Asia to create a trading arrangement within the MFN mould asdesigned in APEC can be expected.
What this discussion demonstrates is the greater difficulty in liberalizing trade ingoods relative to the opening of capital markets. While it is clear that protection isharmful to the economy, the present industrial sector is characterized both by the lack ofunderstanding of the economic costs of tariff and the presence of powerful political-social forces that strongly oppose any change in the status quo. This system of

5
protection creates substantial rents to the producers of import-competing goods, to theimporters that benefit from the allocation of (non-marketed) import rights, to organizedlabor that is sharing part of the monopoly rents resulting from the protection, and to thegovernment bureaucracy that was administering the restrictive trade policies. Sincegoods markets affect a greater number of the sectors in society, it is not surprising thatinvestment liberalization has been pursued more vigorously than trade.
Table 1. Estimated effective protection rate (EPR) of EVSL products and selected sectors with the highestrates, 1996-1997 (in percent).
1996 1997 PercentageChangeEVSL Products
Civil Aircraft 2.30 2.47 7.28Energy 3.44 2.61 -24.15Environmental Goods 15.81 12.44 -21.33Chemicals 13.72 10.68 -22.18Fertilizer 2.30 2.33 1.68Fish and Fish Products 10.63 9.97 -6.20Forest Products 15.67 15.80 0.84Food 17.43 9.05 -48.08Gems and Jewelry -1.09 -1.04 -3.77Medical Equipment and Instruments 19.40 17.23 -11.19Oilseeds and Oilseed Products 14.83 13.29 -10.35Toys 11.26 12.25 8.79Natural and Synthetic Rubber 15.96 15.30 -4.11Average 11.20 10.12 -9.68
Selected Sectors with the highest EPRsCoffee Roasting and Processing 210.28 166.94 -20.61Sugar Milling and Refining 105.92 84.72 -20.02Meat and Meat Processing 93.09 86.30 -7.29Manufacture of structural concrete products 80.52 50.73 -37.00Coffee 64.60 51.64 -20.06Manufacture of soap and detergents 62.07 62.35 0.46Rice and Corn Milling 60.22 58.23 -3.30Slaughtering and Meat Packing 58.07 36.84 -36.55Manufacture of wire nails 55.54 56.45 1.66Palay 53.14 53.15 0.02Manufacture of metal containers 46.83 47.03 0.43Manufacture of hardboard and particle board 45.48 45.54 0.13Manufacture and repair of other furniture and fixtures 42.83 45.56 6.39Sawmills and planing mills 42.55 42.58 0.05Manufacture of flat glass 38.67 38.72 0.13Manufacture of other fabricated wire and cable products 38.32 35.64 -6.99Manufacture and repair of metal furniture and fixtures 37.50 39.48 5.29Other agricultural production, n.e.c. 36.55 30.19 -17.40Manufacture of Animal Feeds 35.44 34.07 -3.88Noodles Manufacturing 34.19 35.79 4.68Average 62.09 55.10 -7.69Source of basic data: Philippine Tariff Commission
6
III. The Effects of Trade and Investment Liberalization and Facilitation
The effects of the existing combination of trade and investment programs canbe divided into two main components: the economic effects and the social effects.Such changes can be noted from the following indicators.
A. Economic Indicators
Even before 1992, reforms have already been in place to allow greater foreigngoods and investments in the country. The General Agreement of Tariffs and Trade(GATT) and the commitment to currency convertibility under the InternationalMonetary Fund (IMF) have mainly influenced the governments to sweep away mostof the restrictions to the international markets. However, this movement towardstrade and investment liberalization has been intensified during the last ten years.
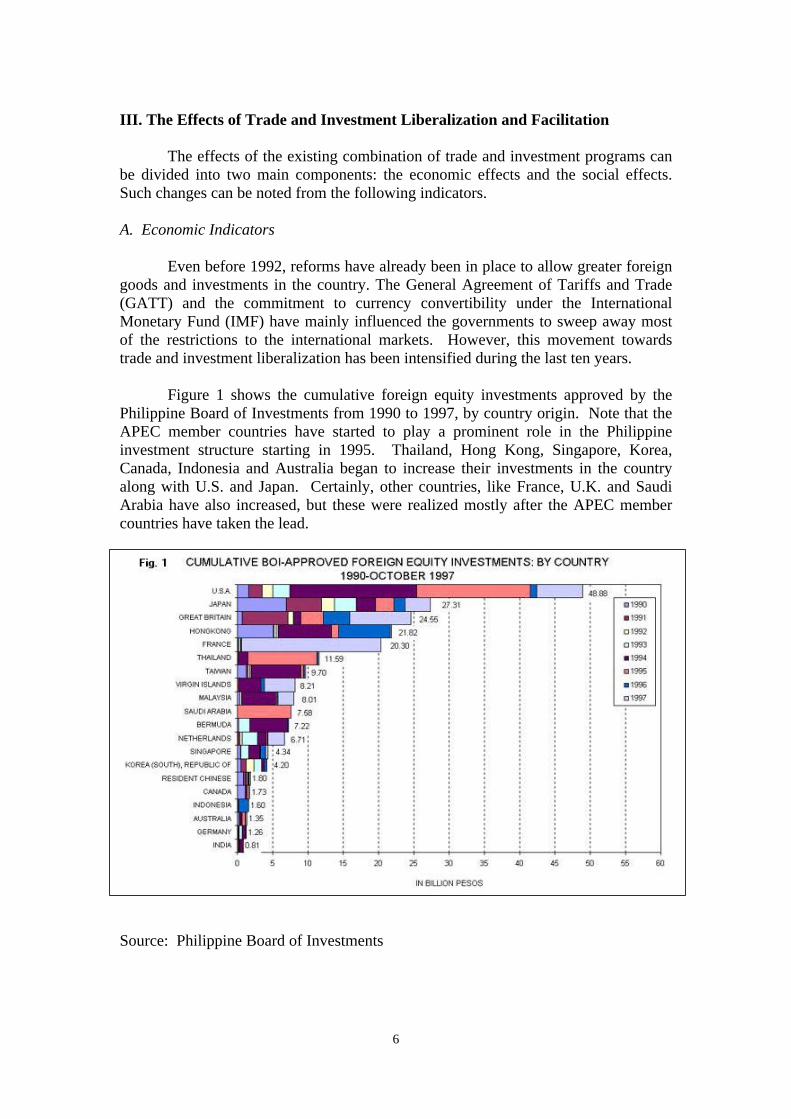
Figure 1 shows the cumulative foreign equity investments approved by thePhilippine Board of Investments from 1990 to 1997, by country origin. Note that theAPEC member countries have started to play a prominent role in the Philippineinvestment structure starting in 1995. Thailand, Hong Kong, Singapore, Korea,Canada, Indonesia and Australia began to increase their investments in the countryalong with U.S. and Japan. Certainly, other countries, like France, U.K. and SaudiArabia have also increased, but these were realized mostly after the APEC membercountries have taken the lead.
Source: Philippine Board of Investments

7
The direct effect of these capital inflows on the country’s industries can befound in Figure 2 which shows the foreign equity investments approved by thePhilippine Board of Investments (BOI), by sector from 1990 to October 1997.
Source: Philippine Board of Investments
Several key points can be made about this figure. First, the effects of theinvestment liberalization have been felt more in the manufacturing sector than in anyother sector. This may suggest that the returns to capital are greater in themanufacturing sector primarily because the country’s main exports, such asmicrocircuits, are produced in this sector. Second, the increases in the later years forthe top investment receiving sectors have more than doubled. This indicates that theefficacy of many trade and investment policies can be realized only gradually. Third,while the change in more recent has been significant, the increases have becomegradual for those sectors that had peaked earlier. This may to some extent denotesome uncertainty in the sustainability of these increases in investments. By the endof 1997, much of these investments have diminished.
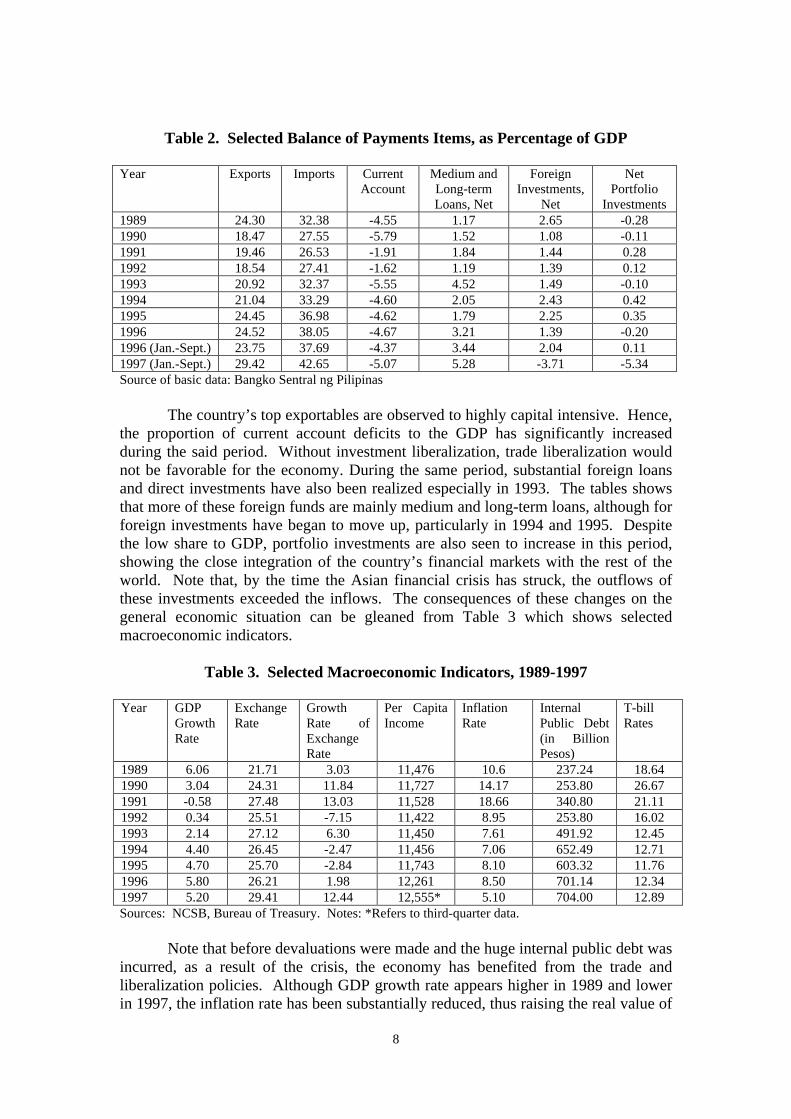
The economic impact of these developments can further be seen in Table 2,which features selected items from the country’s Balance of Payments, as apercentage of the Gross Domestic Product (GDP).
If one uses the ratio of exports to GDP as indicator of openness, theliberalization process can be seen to have accelerated in the period from 1992 to thethird quarter of 1997. At the same time, a growing dependence of goods (includingexports) on imports can also be noted.
8
Table 2. Selected Balance of Payments Items, as Percentage of GDP
Year Exports Imports CurrentAccount
Medium andLong-termLoans, Net
ForeignInvestments,
Net
NetPortfolio
Investments1989 24.30 32.38 -4.55 1.17 2.65 -0.281990 18.47 27.55 -5.79 1.52 1.08 -0.111991 19.46 26.53 -1.91 1.84 1.44 0.281992 18.54 27.41 -1.62 1.19 1.39 0.121993 20.92 32.37 -5.55 4.52 1.49 -0.101994 21.04 33.29 -4.60 2.05 2.43 0.421995 24.45 36.98 -4.62 1.79 2.25 0.351996 24.52 38.05 -4.67 3.21 1.39 -0.201996 (Jan.-Sept.) 23.75 37.69 -4.37 3.44 2.04 0.111997 (Jan.-Sept.) 29.42 42.65 -5.07 5.28 -3.71 -5.34Source of basic data: Bangko Sentral ng Pilipinas
The country’s top exportables are observed to highly capital intensive. Hence,the proportion of current account deficits to the GDP has significantly increasedduring the said period. Without investment liberalization, trade liberalization wouldnot be favorable for the economy. During the same period, substantial foreign loansand direct investments have also been realized especially in 1993. The tables showsthat more of these foreign funds are mainly medium and long-term loans, although forforeign investments have began to move up, particularly in 1994 and 1995. Despitethe low share to GDP, portfolio investments are also seen to increase in this period,showing the close integration of the country’s financial markets with the rest of theworld. Note that, by the time the Asian financial crisis has struck, the outflows ofthese investments exceeded the inflows. The consequences of these changes on thegeneral economic situation can be gleaned from Table 3 which shows selectedmacroeconomic indicators.
Table 3. Selected Macroeconomic Indicators, 1989-1997
Year GDPGrowthRate
ExchangeRate
GrowthRate ofExchangeRate
Per CapitaIncome
InflationRate
InternalPublic Debt(in BillionPesos)
T-billRates
1989 6.06 21.71 3.03 11,476 10.6 237.24 18.641990 3.04 24.31 11.84 11,727 14.17 253.80 26.671991 -0.58 27.48 13.03 11,528 18.66 340.80 21.111992 0.34 25.51 -7.15 11,422 8.95 253.80 16.021993 2.14 27.12 6.30 11,450 7.61 491.92 12.451994 4.40 26.45 -2.47 11,456 7.06 652.49 12.711995 4.70 25.70 -2.84 11,743 8.10 603.32 11.761996 5.80 26.21 1.98 12,261 8.50 701.14 12.341997 5.20 29.41 12.44 12,555* 5.10 704.00 12.89Sources: NCSB, Bureau of Treasury. Notes: *Refers to third-quarter data.
Note that before devaluations were made and the huge internal public debt wasincurred, as a result of the crisis, the economy has benefited from the trade andliberalization policies. Although GDP growth rate appears higher in 1989 and lowerin 1997, the inflation rate has been substantially reduced, thus raising the real value of

9
production. The country’s per capita income had also been improved significantly.Furthermore, the t-bill rates, an indicator of domestic interest rates, have been lowerthan the levels before 1992, although these indices have shown signs of weakening inthe wake of the financial crisis.
Two major areas of concern however are the management of the foreignexchange rate and the public debt. One would have expected that with the growingcurrent accounts deficit, the foreign exchange rate would have slowly depreciated.However, in 1994 and 1995, the exchange rate has even appreciated. This may havebeen significant in reducing inflation since an overvalued currency will reduce thecosts of import. However, as clearly shown by the data and as evident by the crisisthat still affects us, such controls, while inducing capital inflows, are inconsistent withthe goal of external stability. The trade and investment liberalization policiesespoused by the previous governments have made such controls veritable sources ofinstability and speculation by investors. The only reason for adopting such policieshas been the lack of domestic savings and hence the need to attract foreign capital.
On the other hand, the internal debt, that has already been increasing, had risensignificantly more recently, especially in 1998 when the full impact of the economicslowdown due to the Asian crisis and the El Nino weather have been felt. However, itcan be noted that the t-bill rates have not been affected notably by the increases inpublic debt. This can mean that the government has other sources of funding than thedomestic market. Another interesting note is that inflation has hardly been affectedby the government's debt during the years internal public debt has risen.
B. Social Indicators
There are several social indicators that can be considered in the light ofglobalization. I focus here on the employment and wages since labor continues to bethe more abundant resource in the country. Conceptually, increasing trade andfinancial openness would have led to improvements in the use and returns to labor.Table 4 presents some statistics on the population, the labor force participation rate,the employment, unemployment and underemployment rates, and the real wage ratefrom 1989 to 1997.
Table 4. Labor Employment Statistics, 1989-1997
Year Population15 years andolder
Labor forceparticipationrate %
Employmentrate
Unemploy-ment
Underem-ployment rate(%)
Real Wage(1985=100)
1989 36,916 64.6 91.4 8.60 23.2 137.01990 37,636 64.5 91.9 9.53 22.1 135.71991 39,114 64.5 91.0 10.50 22.1 119.81992 40,265 65.0 91.4 9.82 19.8 121.81993 41,453 64.7 91.1 9.27 21.4 116.61994 42,670 64.4 91.6 9.48 20.9 112.01995 42,770 65.6 91.6 9.52 19.8 117.71996 45,034 65.8 92.6 8.58 19.4 115.41997 46,214 65.5 92.1 8.70 20.8 n.a.
Source: Philippine National Coordination Statistical Board

10
The major observation that can be made from this table is that no perceptibleeffect can be found in the use of labor. This suggests that the productivity returns tolabor have not improved, with the increasing liberalization. While there may havebeen some slight improvements in the employment and underemployment rates, thechanges have not been substantial enough to reduce the unemployment rates, giventhe increases in the labor force participation rates. Moreover, real wages havesubstantially decreased from the rate in 1995, a result that is contrary to what isexpected from the Stolper-Samuelson theory, assuming that the good that uses themore abundant resource is exported.
The total effect of these real wage movements on social welfare however canbe more clearly seen if we consider the changes in real incomes by industries and byeducational attainments of workers. Figures 3a and 3b show the real wage incomes ofhouseholds across industries and across two levels of educational levels: householdswith high education or with high school degree or higher; and those with loweducation or with no high school degrees.
Source: Family Income and Expenditure Survey, 1991 and 1994. Note: Real wageincomes are based on the average wage incomes reported.
Three points are important. First, despite the fall in the real wage rates, realwage incomes are nonetheless higher in 1994, suggesting perhaps that production mayhave been more labor-intensive at least in terms of physical number or hours. Second,although there were increases in real incomes found for both households, a noticeabledifference in the wages can found between the more educated and less educatedfamilies, suggesting that education is crucial factor in the determination of wageincomes. Second, the improvements from 1991 to 1994, when globalization andAPEC were operative, are seen to be greater for the highly educated families thantheir counterparts. This is particularly so for such industries such as agriculture,manufacturing, utilities, wholesale and finance. This suggests the high premiumplaced on education by much of these globalization trends. Moreover, these areindustries that are to a certain extent either highly protected (e.g., agriculture), orhighly capital-intensive (such manufacturing and utilities). Note also that thefinancial sector has the highest increase in real wage incomes for the households
These highly skewed movements may have led to some inequality in thedistribution of income. Table 5 presents the percentage distribution of total family
0
20
40
60
80
Thou
sand
s
Industry
Wag
e In
com
es
AgriMining
MnfgUtilities
ConstrWholesale
TranspFinance
Services
1991
1994
Fig. 3a. Real Wage Incomes of Households with Low Education1991 and 1994, By Industry
0
50
100
150
200
Thou
sand
s
Industry
Wag
e In
com
es
AgriMining
MnfgUtilities
ConstrWholesale
TranspFinance
Services
1991
1994
Figure 3b. Real Wage Incomes of Households with High Education1991 and !994, By Industry

11
income by income decile for the years, 1988, 1991 and 1994. The year 1988 is usedas reference since this was the period when the influx of foreign capital have not yetbeen experienced.
Table 5. Percentage Distribution of Total Family Income by Income Decile
Income Decile 1988 1991 1994Total 100.0 100.0 100.0First Decile 2.0 1.8 1.9Second Decile 3.2 2.9 3.0Third Decile 4.1 3.8 3.9Fourth Decile 5.0 4.7 4.9Fifth Decile 6.0 5.7 6.0Sixth Decile 7.3 7.0 7.4Seventh Decile 9.1 8.8 9.1Eighth Decile 11.6 11.4 11.8Ninth Decile 16.0 16.1 16.4Tenth Decile 35.8 37.8 35.6Source: Family Income and Expenditure Survey, National Statistics Office, 1988, 1991, and 1994.
There are two key points in this table. First, there was no significant shift inthe distribution in the succeeding years after 1988, suggesting that capital marketmovements are hardly evident in affecting equity. Nevertheless, recall that the realwage incomes were highly skewed in favor of the educated households. This maythen indicate that, to a certain extent, the less educated households may havebenefited from the foreign capital inflows, particularly in 1994 when most of thesecapital resources were being invested. Second, despite the seeming stability found inincome distribution, the trend towards greater globalization has resulted in somedownward shifts for the eight poorest deciles in 1991. Although these deciles wereable to recover their previous 1988 share in 1994, these policy changes appear to havemade them more vulnerable to capital market movements. The last three deciles, onthe other hand seemed to have consolidated their share in income distribution.
Assuming that the social returns to capital are greater than the returns to labor(at least for particular types of labor), those who have more access to capital should beclearly better off than who have less. One way of determining this is to examine thepoverty incidence and magnitude for these three periods for different residents.Presumably, those residing in the urban areas, particularly in the National CapitalRegion (NCR), should benefit those from these capital market movements. Table 6shows the poverty incidence and magnitude for the three periods across severalregions.

12
Table 6. Poverty Incidence and Magnitude, 1988, 1991 and 1994
1988 1991 1994Areas/Regions Poverty
IncidencePovertyMagnitude
PovertyIncidence
PovertyMagnitude
PovertyIncidence
PovertyMagnitude
Philippines 45.5 25,005,345 45.3 28,119,758 40.6 27,274,205
Urban 34.3 7,154,196 35.6 11,037,596 28.0 9,367,263Rural 52.3 17,841,149 55.1 17,082,163 53.1 17,906,942
NCR 25.2 1,909,886 16.7 1,439,613 10.5 975,263Outside NCR 48.7 23,095,459 49.9 26,608,145 45.5 26,298,942
Source of basic data: National Statistical Coordination Board. Notes: Poverty incidence refers to theproportion of individuals whose annual income falls below the annual per capita. Poverty magnitudemeasures the number of people whose annual income falls below the annual per capita povertythreshold.
The following points are noteworthy. First, while the poverty incidence hasbeen reduced, the total number of poor families has increased in 1991 and settled to alevel in 1994 that is still higher than the level in 1988. The declining povertyincidence merely suggests that the increase in the number of people receiving anincome less than average per capita is not as much as the increase in the number ofpeople. The liberalization and globalization policies then have not solved the age-oldPhilippine problem of poverty. Second, the poverty incidence increased in the ruralareas, as the number of poor people in the urban areas decreased substantially in 1994,the year when the capital inflows were growing. Third, the reduction in povertyincidence has even been more pronounced in the National Capital Region than in theother regions, indicating the people are receiving higher incomes, above the averageper capita. This suggest that the decline in poverty incidence is primarily an urbanand an NCR phenomenon since the poverty incidence increased in the rural areas, andthe number of poor persons increased in the areas outside NCR. In summary, the datasuggest that while those who has greater access to free capital markets have improvedtheir welfare, the majority who have no access to such benefits were in effect“immiserized” by the policies of liberalization and facilitation.
IV. A Source of “Immiserising” Growth: Disproportionate Trade and FinancialLiberalization
Contrary to the standard international trade theory, the inflow of capital into amore liberalized country, such as the Philippines, has evidently been unable toinfluence the social conditions favorably. A number of authors in fact have indicatedthat, under certain conditions, there is some connection between capital inflows andgovernment trade policy. Bhagwati and Srinivasan (1983) explained how“immiserizing” growth can be caused by a tariff-induced inflow of foreign capital,given that the country is small and continues to import capital-intensive inputs whileremaining unspecialized. The decline in welfare may be attributed to three factors:(1) the usual tariff-created distortions in consumption and production, given only theinitial factor endowments; (2) the probable loss that would result even from anincrease in nationally owned capital in the presence of a tariff; and (3) the loss arisingfrom the subtraction of foreign capital profits in the determination of national income.The basic idea is that immiserizing growth results from any kind of distortion,

13
whether locally induced or foreign policy created. An endogenous distortion occurswhen an imperfect domestic factor market creates a distortionary wage differential.The distortion may on the other hand be caused by foreign sources if monopoly powerin trade is involved or if the country is engaged in optimal tariff policies before tradeoccurs.
Uzawa (1962) and Brecher and Diaz (1977) independently showed that in aconventional Hecksher-Ohlin model, direct foreign investments (DFIs) necessarilylowers (raises) the host country’s social welfare if the import competing sector iscapital-intensive and protected by tariff. Given that the Philippines’ import-competing industries are capital intensive, this theory suggests that the DFI will bewelfare worsening if inward protectionist policies are not modified. Many authorshave suggested that this may be one particular reason why countries that have pursuedoutward-oriented policies have been successful.
Buffie (1987) however claims that given domestic labor market distortions,export subsidies and trade in intermediate goods, the inflow of DFI, regardless ofwhether this is pursued in a liberalized economy or not may be welfare worsening.Under these static conditions, welfare worsens as the capital inflows lower traderevenues. If some part of the capital stock is foreign owned, the domestic economycan run a trade surplus only to pay for the foreign capital service and interestpayments. In effect, as a result of growth, a negative income effect may be felt as aresult of capital expenses because export earnings may not be large enough to servicethe capital payments. A larger foreign investment increases naturally the requireddebt service and acts as a drain on the net trade revenues, when export subsidies aregreater than tariffs. Moreover, if trade in intermediate goods is present, the increasein DFI can be immiserising if the import competing sector is relatively capitalintensive and uses these intermediate inputs. Export subsidies can favor unduly otherindustries, and the inflow of capital investments can further reinforce such bias,bringing about unbalanced revenue effects and overall decline in welfare. In thesecases, restrictive quotas on consumer imports may be welfare-improving.
Other than these issues already raised, another source of immiserising growthis the uneven and disproportionate implementation of capital as opposed to tradeliberalization. Consider the case where the growth in one country is accompanied byfurther capital liberalization. If we view the change in the scenario as such, there is adistinct possibility that the primary gain in from growth, derived from an assumedfixed foreign offer curve facing one country can be offset by a reduction in trade gainsdue to a shift in the foreign offer curve facing the country as a result of the capitalliberalization. In this case, a reduction in the gains from trade occurs, despitepursuing what the state perceives as “optimal” policies.
The possibility can be seen easily with respect to a country that is neitheraffected by monopoly power nor domestic distortions. The problem is that capitalliberalization without any accompanying change in the international tariff structurecreates a wedge between the selling price of output and the buying price of the output.The reduction in the costs of borrowings reduces the marginal cost of output,particularly for capital-intensive product. However, because trade liberalization does
14
not progress as quickly, consumers are forced to purchase these products at arelatively higher cost.
This price wedge between goods and factor prices will have three mainconsequences. First, this reduces the demand for the product, and since the producersdo not receive the same price charged to buyers, quantity supplied is reduced. Hence,the uneven implementation of the trade and capital liberalization and facilitationresults in a quantity distortion, leading to deadweight losses.
Second, with the availability of more capital, local producers will be inducedto produce more capital-intensive goods. It is expected that the price of such goods inthe world market will also decrease, given the additional supply of these goods.However, because of the distortions in the world market, the price of such goods mayindefinitely remain high. Thus, producers of these goods are drawn towards them.
Third, for the local producers of goods whose prices have not been rising inthe world market, the restricted entry to world markets and the inflow of foreigncapital can induced them to shift their production into non-tradables. This may havecontributed to increased investments in real estate and non-traded services that wereobserved before the crisis. Moreover, as production is restricted by numerous worldtrade barriers, the import-competing sectors will be strengthened by easy access toworld capital markets. In this way, capital liberalization may run contrary to freer andmore open world trade as the domestic non-tradable industries are encouraged.
The interesting point about the above discussion is that the primary cause ofimmiserization is a shift of the opportunities found in the world market. Hence, eventhough optimal policies are being implemented by a small country before and aftergrowth, there is no assurance that the intervening policies can avoid suchimmiserization. Given the overemphasis place on capital markets, which arebeneficial in the short-run, and the dereliction of trade policies, which would havebeen more productive over the long-term, the country is made more susceptible todrastic changes in demand for capital and production structures abroad.
V. Policy Implications
The immiserization process described in the previous section results from theassumption that the primary gain from growth is outweighed by the reduced gainsfrom trade. This means that such an eventuality can be addressed either by a shiftin foreign market opportunities that reinforces the gains from trade, or an initialgrowth that is large enough to absorb the maximum level of reduction in the gainsfrom trade (Bhagwati, 1969). The probability of immiserization then increases onlyin so far as the growth is unable to counteract the offsetting forces introduced by freecapital markets.
The first point then indicates the precedence of trade over investmentliberalization. If capital mobility had been used to complement trade liberalization,the influx of short-term investments would have been limited as the investments innon-tradables would not have been profitable. Moreover, the shift towards more

15
capital-intensive and skill-intensive goods would also have not occurred the way itdid, as the country’s comparative advantage would have been emphasized. Thus, theAPEC program should concentrate on the disputes relating to trade openness andfacilitation.
The second point suggests the importance of economic and technicalcooperation cannot be overemphasized. The emphasis placed on the short-termreturns of capital account convertibility particularly in this period of crisis should bereplaced by greater focus on freeing international trade barriers and an internalrestructuring of financial institutions that will encourage investments leading to thetransfer of skills and technology.
References
Asian Pacific Economic Cooperation (APEC) Economic Committee. 1997. TheImpact of Investment Liberalization in APEC. Singapore: APEC Secretariat.
Bangko Sentral ng Pilipinas, Philippines Selected Economic and Financial Indicators,1991-1998, Philippines.
Bhagwati, J. 1969. “Optimal Policies and Immiserizing Growth,” AmericanEconomic Review, 59, 967-970.
Bhagwati, J. and T. N. Srinivasan. 1983. Lectures on International Trade. Cambridge,MA: MIT Press.
Board of Investments, Planning and Research Department, Philippines.
Brecher, R. and C.F. Diaz. 1977. Tariffs, Foreign Capital and National Welfare,”Journal of International Economics, 7, 317-322.
Buffie, E. 1987. “Labor Market Distortions, the Structure of Protection and DirectForeign Investments,” Journal of Development Economics, 27, 149-163.
Haggard, S. 1995. Developing Nations and the Politics of Global Integration.Washington: The Brookings Insitution.
Lairson, T. and D. Skidmore. 1997. International Political Economy:The Strugglefor Power and Wealth (Second Edition). Fort Worth, TX: Harcourt Brace CollegePublishers.
National Statistical Coordination Board, Economic and Social Statistics, 1984-1997,Philippines.
National Statistics Office, Family Income and Expenditure Survey, 1988-1994,Philippines.
Uzawa, H. 1962. “Production Functions with Constant Elasticities of Substitution,”Review of Economic Studies, 29, 291-299.