World Safety Journal
99
1 • Hours of Work for Tugboat Operators • Safety Committee Tool-Its Effectiveness in Nigeria Industries • Worker Complacency Towards Work Method Statements in the Australian Construction Industry • Wokrplace Human Factors Affecting the Commercial Fishing Industry: A Review of International and National Studies • Possibilities and Challenges of Making Safety a ‘Way of life’ in Indian Society • Safe Distance Analysis and Modelling of Fire and Explosion of the LPG Storage Tanks at PT XYZ Gresik Regency East Java, Indonesia Using ALOHA • Who is Responsible? An examination of the ‘Chain of Responsibility’ in heavy vehicle crashes - an Australian Perspective 2020 ISSN 1015-5589 Vol. XXIX No. 2 World Safety Journal © Copyright 2020 | WSO WSO’s Certification Program is accredited in compliance with ISO/IEC 17024:2012 In This Edition
-
Upload
khangminh22 -
Category
Documents
-
view
0 -
download
0
Transcript of World Safety Journal

1
• Hours of Work for Tugboat Operators
• Safety Committee Tool-Its Effectiveness in Nigeria Industries
• Worker Complacency Towards Work Method Statements in the Australian
Construction Industry
• Wokrplace Human Factors Affecting the Commercial Fishing Industry: A
Review of International and National Studies
• Possibilities and Challenges of Making Safety a ‘Way of life’ in Indian
Society
• Safe Distance Analysis and Modelling of Fire and Explosion of the LPG
Storage Tanks at PT XYZ Gresik Regency East Java, Indonesia Using
ALOHA
• Who is Responsible? An examination of the ‘Chain of Responsibility’ in
heavy vehicle crashes - an Australian Perspective
2020 ISSN 1015-5589 Vol. XXIX No. 2
World Safety Journal © Copyright 2020 | WSO
WSO’s Certification Program is
accredited in compliance with
ISO/IEC 17024:2012
In
Th
is E
dit
ion

World Safety Organisation
Statement of Purpose
and Objective
WSO’s purpose is to internationalize all
safety fields, including occupational and en-
vironmental safety and health, accident pre-
vention movement, etc., and to disseminate
throughout the world the practices skills,
arts, and technologies of safety and accident
prevention.
WSO’s objective is to protect people, prop-
erty, resources, and the environment on lo-
cal, regional, national, and international lev-
els. WSO membership is open to all indi-
viduals and entities involved in the safety
and accident prevention field, regardless of
race, color, creed, ideology, religion, social
status, sex, or political beliefs.
WSO is in Consultative Category II Status
(Non-Governmental Organisation-NGO) to
the Economic and Social Council of the
United Nations.
The WSO is a Not-for-Profit Corporation (Missouri, USA),
non-sectarian, non-political movement dedicated to
“Making Safety a Way of Life…Worldwide.”

WSJ Editor Dr. Janis K. Jansz
Curtin University
Western Australia Director of the WSO National Office
for Australia
WSJ Editorial Board
Zahra Etemadi Curtin University
Western Australia
Jerel Harris Georgia Institute of Technology
USA
Dr. Elias M. Choueiri
Lebanese University
Lebanon
Dr. Richard Franklin
James Cook University
Queensland
Dr. Charles H. Baker
WSO World Management Center
USA
Dr. Milos Nedved
Central Queensland University Australia
Dr. David P. Gilkey Montana Tech University
USA
Cover Photo retrieved from
https://www.smh.com.au/business/companies/wa
-tug-company-wins-200m-rio-tinto-pilbara-
ports-contract-20180711-p4zqvy.html
.
Disclaimer Opinions expressed by contributors in articles or
reproduced articles are the individual opinions of such
contributors or the authors and not necessarily those
of the World Safety Organization. Reproduction of
articles or abstracts contained in this journal is
approved providing the source is acknowledged.
Article Submission
Articles for inclusion in this journal will be accepted at any time; however, there can be no guarantee that the article will appear in the following journal issue.
All articles shall be written in concise English and typed with a minimum font size of 11 point. Articles should have an abstract of not more than 200 words. Articles shall be submitted as Times New Roman print and presented in the form the writer wants published. On a separate page, the author should supply the author’s name, contact details, professional qualifications, current employment position, a brief bio, and a photo of the author. This should be submitted with the article.
Writers should include all references and acknowledgments. Authors are responsi- ble for ensuring that their works do not infringe on any copyright. Failure to do so can result in the writer being accountable for breach of copyright. The accuracy of the references is the author’s responsibility.
References
Articles should be referenced according to the Publication Manual of the American Psychological Association 7th ed.
Books are referenced as follows: Author. (Year of publication). Title of publication. Publisher.
Articles are referenced as follows: Author (Year). Title of article. Name of Journal. Volume (Issue), Page numbers of article.
Internet information is referenced as follows: Name of author. (Year of publication). Title. DOI or web address of no DOI.
Submissions should be mailed to: WSO World Management Center
Attn: Editorial Staff / Dr. Janis K. Jansz PO Box 518, Warrensburg, MO 64093, USA
or emailed to: [email protected]
Articles, wherever possible, must be up-to-date and relevant to the Safety Industry. All articles are Blind Peer Reviewed by at least two referees before being accepted for publication.
Hours of Work for Tugboat Operators
Dr. Janis Jansz and Dr. Sherrilyn Mills .................................................................. 3–15
Safety Committee Tool-Its Effectiveness in Nigeria Industries
Ikpesu Jasper Eiovwokoghene, Uzoh Samuel Chukwuka, Deborah Adojor
Ogheneochuko & Olatunji Ojeaburu Bukola ...................................................... 16–28
Worker Complacency Towards Work Method Statements
in the Australian Construction Industry
Ms Joanna Krenske, Ms Allison Hutton, Dr. Karen Klockner & Mr Darren Delaney
.............................................................................................................................. 29–42
Workplace Human Factors Affecting the Commercial Fishing Industry: A Review of
International and National Studies
Luke Masters ....................................................................................................... 43–50
Possibilities and Challenges of Making Safety a ‘Way of Life’ in Indian Society
Harbans Lal .......................................................................................................... 51–61
Safe Distance Analysis and Modelling of Fire and
Explosion of the LPG Storage Tanks at PT XYZ
Gresik Regency East Java, Indonesia Using ALOHA
Ni’mat Hikmatullah, Kholil & Soehatman Ramli ................................................ 62–73
Who is Responsible? An examination of the ‘Chain of Responsibility; in heavy
vehicle crashes - an Australian Perspective
Ivan Cikara, Geoff Dell, Yvonne Toft & Shevaun Dell......................................... 74–91
Pages Table of Contents

1

3
Hours of Work for Tugboat Operators
Dr Janis Jansz a,b and Dr Sherrilyn Mills b. Email: [email protected] a Curtin University. b Healthforce Group.
Abstract The purpose of this research was to review legal requirements, relevant government and professional
organisation requirements for hours of work and fatigue management for tugboat crews in Australia.
Results indicated that a general duty of care for the safety and health of employee and contractor
tugboat crew was required by the employer. Risk control and mitigation recommendations related to
hours of work, health and safety are included. It is also recommended that the health of employees,
their levels of work related fatigue and fitness for work are monitored. The company has, and uses,
a safety management and fatigue reporting procedure and has a just culture. The contribution of
fatigue to reported incidents and accidents are assessed. Annual (or more frequent) employee
interviews, employee survey and an audit are conducted to monitor the effectiveness of the rostered
hours of work and the fatigue management risk control, mitigation and risk treatment measures used.
Opportunities identified for improvements are implemented.
Key words: Tugboat crew. Hours of work. Fatigue management. Risk control.
1. Introduction In June in 2014 in Western Australia at Port
Headland there was an industrial dispute
between the shipping company Tekay and the
Maritime Union of Australia, the Australian
Institute of Marine and Power Engineers and
the Australian Maritime Officers Union. The
reason for this dispute was that the tugboat
engineers, deckhands and Master workers
were working for as long as 18 hours with
shifts beginning as early as 1.37am [01.37
hours] and not finishing until 9.56pm [21.56
hours] (Ker, 2014). They were called in to
work when a ship was coming into the port,
worked for several hours and then returned to
their accommodation to wait for the next call
to work. In 2014 the deckhands were earning
about $140,000 and Masters were earning
about $300,000 Australian a year. They had a
roster of working for 28 days and then having
28 days off work. There was no annual leave
or overtime payments and the tugboat workers
were complaining that doing unpaid overtime
work was having a negative health impact on
their health and life (Ker, 2014).
2. Research method In 2020 research was commissioned to develop
fatigue management recommendations for a
company that uses contract companies to
supply vessel crews for tugboats use in
Australian waters. Documents requested to be
reviewed were Australian legal requirements
for fatigue management and relevant
government and professional guidance
materials in relation to their recommendations
on safe hours of work. Australian has 6 States
and 2 Territories. Each state and territory has
separate laws and jurisdictions that govern
employer obligations in that state or territory
that each business operates in. In addition to
the above, there are Federal laws and marine
jurisdiction laws that employers must comply
with if the employer operates in trade or
commerce in that jurisdiction. A review of
relevant Codes of Practice, Guidance Notes
and Guidelines for the Marine and other
industries published by governments and
professional organisations was conducted, in
addition to the review of legislation, to
determine each state, territory and federal
jurisdictional requirements in relation to hours
of work and fatigue management. A total of 27
Australian laws and 18 fatigue management
and hours of work guidance documents were
reviewed.
3. Results and Discussion First reviewed was the Commonwealth

4
Offshore Petroleum and Greenhouse Gas
Storage (Safety) Regulations 2009, Petroleum
(Submerged Lands) (Occupational Safety and
Health) Regulations 2007 and the National
Offshore Petroleum Safety and Environmental
Management Authority (NOPSEMA)
Guidance Note for Avoiding Fatigue. A
summary of these requirements were that the
person who is in control should not allow a
member of the workforce to work for a
continuous period, or successive continuous
periods of time that could have an adverse
effect on their health or safety, or the health or
safety of other people. (Commonwealth
Offshore Petroleum and Greenhouse Gas
Storage (Safety) Regulations, 2009, Chapter 3,
Part 1, Regulation 3.1; Petroleum (Submerged
Lands) (Occupational Safety and Health)
Regulations, 2007, Regulation 27). This is an
important legal requirement to consider when
organising the hours of work for tugboat
operators (NOPSEMA, 2020a).
The Western Australian (WA) Mine Safety &
Inspection Act 1994; WA Occupational Safety
and Health Act 1984; Northern Territory (NT)
Work Health & Safety (National Uniform
Legislation) Act 2011; Queensland Work
Health & Safety Act 2011; New South Wales
(NSW) Work Health & Safety Act 2011;
Victorian Occupational Health and Safety Act
2004; South Australian (SA) Work Health &
Safety Act 2012; Tasmanian Work Health &
Safety Act 2012; Australian Capital Territory
(ACT) Work Health & Safety Act 2011 and the
Commonwealth Work Health and Safety Act
2011 all required the employer to have a
general duty of care for their employees. If
independent contractors are used all of these
laws gave the company who employed the
contractors the duties of an employer to the
independent contractor engaged by the
employer and any employees of the
independent contractor in relation to matters
over which the employer has control or would
have control over. Part of this duty of care
would relate to hours of work and fatigue
management of the workers.
The Western Australian Occupational Safety
and Health Regulations 1996 has regulations
that apply to the hours of work for commercial
vehicle drivers, but not for off shore workers.
However this legislation, and the following
legislation, all have requirements for the
employer to identify hazards, assess the risks
of these hazards causing harm and eliminate
the risks of the hazards causing harm as far as
is reasonably practical. NT Work Health &
Safety (National Uniform Legislation) Act
2011 and the NT Work Health & Safety
(National Uniform Legislation) Regulations
2011. The Queensland Work Health & Safety
Act 2011 and Work Health & Safety
Regulations 2011. The NSW Work Health &
Safety Act 2011 and the NSW Work Health &
Safety Regulations 2017. The Victorian
Occupational Health and Safety Act 2004. The
SA Work Health & Safety Act 2012 and SA
Work Health & Safety Regulations 2012. The
Tasmanian Work Health & Safety Act 2012;
Mines Work Health & Safety (Supplementary
Requirements) Regulations 2012 and their
Work Health & Safety Regulations 2012. The
ACT Work Health & Safety Act 2011 and
ACT Work Health & Safety Regulations 2011.
The Commonwealth Work Health and Safety
Act 2011 and their Work Health and Safety
Regulations 2011. Fatigue due to hours of
work can be a hazard so all of the above
legislation requires the employer to provide
employees with hours of work that do not
create a health or safety hazard. Similarly the
Code of Practice. Working Hours published by
the Commission for OSH (2006) and
Bourgeois-Bougrine (2020) all required a risk
management approach to managing
employees’ hours of work and fatigue.
The Victorian Occupational Health and Safety
Act 2004 was the only Australian legislation
assessed that specifically required the
employer to monitor the health of their
employees and keep health records (section
22). Section 35 of this legislation required the
employer to consult with employees when
making decisions related to workers health
and/or safety. Australian legislation reviewed
that did not have specific information in it
related to hours of work and fatigue
management was the Australian Maritime
Safety Authority Act 1990; Port Authorities
Act 1999; WA Mines Safety and Inspection
Regulations 1995; Dangerous Goods Safety
Act 2004; Victorian Occupational Health and
Safety Regulations 2017 and the Tasmanian
Mines Work Health & Safety (Supplementary
Requirements) Act 2012.
Useful guidelines were the Australian

5
Maritime Safety Authority Fatigue Guidelines,
2020, published by the Australian
Government. It included reference to the
Guidelines on Fatigue (MSC.1/Circ. 1598)
(2019) and Maritime Labour Convention
(MLC), 2006. The following regulations are
important to consider in relation to rostering
hours of work for tugboat operators.
Regulation 2.3: To ensure that seafarers have
regulated hours of work or hours of rest.
Regulation 2.4: To ensure that seafarers have
adequate leave. Regulation 2.7: To ensure that
seafarers work on board ships with sufficient
personnel for the safe, efficient and secure
operation of the ship. Regulation 3.1: To
ensure that seafarers have decent
accommodation and recreational facilities on
board. Regulation 3.2: To ensure that seafarers
have access to good quality food and drinking
water provided under regulated hygienic
conditions. Regulation 4.3: To ensure that
seafarers' work environment on board ships
promotes occupational safety and health. All of
these Australian Maritime Safety (2020)
guidelines are important to consider in relation
to hours of work and fatigue management.
Also included in this guideline was the
International Labour Organization (ILO)
Maritime Labour Convention (MLC), 2006,
regulation 2.3 Hours of work and rest which
states that the normal working hours’ standard
for seafarers shall be based on an eight-hour
day with one day of rest per week and rest on
public holidays. The limits on hours of work or
rest shall be as follows:
(a) maximum hours of work shall not exceed:
(i) 14 hours in any 24-hour period; and
(ii) 72 hours in any seven-day period; or
(b) minimum hours of rest shall not be less
than:
(i) ten hours in any 24-hour period; and
(ii) 77 hours in any seven-day period.
Hours of rest may be divided into no more than
two periods, one of which shall be at least six
hours in length, and the interval between
consecutive periods of rest shall not exceed 14
hours.
Tugboat operators may be required to work
long, irregular hours and on call hours
(International Maritime Organisation, 2019).
A reason that it is important to consider hours
of work (which can affect the person’s body
clock circadian rhythms) and fatigue
management is because not considering this
can cause ill health effects as documented in
table one.
Table 1. Health effects of circadian rhythm disruptions that can be caused by irregular hours of
work and/or by inadequate sleep (Maru, 2016, p.39-41).
Health effects Causes References
Raised blood pressure Low melatonin secretion & production of
enough vasointestinal peptide that lowers blood
pressure due to insufficient sleep time.
Bridger (2009)
Kroemer (2008)
Roberts (2010)
Headaches Long working hours can cause static muscle
loading and contraction of neck and shoulder
muscles.
Sato et al., (2012)
Coronary Heart Disease
and cardiomyopathic
heart disease
Increase in parasympathetic nervous activity
and increased blood pressure levels. Reduced
parasympathetic nervous system activity with
long working hours
Poor eating habits develop due to sleep loss
resulting in increase in Body Mass Index and
Cholesterol level due to poor eating habits
which increases cardiovascular risk.
Chronic desynchronization of circadian
rhythms
Sokejima &
Kagamimori, (1998)
Anujuo et al., (2015)
Chung, et al., (2011)
Obesity Sleep deprivation decreases leptin level and
increases ghrelin levels. These hormones
control the appetite, elevates appetite resulting
in increased BMI.
Scheer, Hilton,
Mantzoros, & Shea,
(2009)
6
Health effects Causes References
Unconventional meal times rather than routine
meal times.
Markwald et al., (2013)
Lee, Ng, & Chin, (2016)
Diabetes Inadequate sleep affects the molecular
metabolism of the adipocytes causing a
reduction in insulin production.
Melatonin decreases glucose tolerance & this
can occur if a person is eating when their
circadian rhythm cycle is in normal sleep time.
Impact on carbohydrate metabolism and
endocrine function
Sleep restriction disturbs energy balance via
upregulation of appetite, increased time for
eating and reduced energy expenditure.
Nocturnal awakening and arousal alter leptin
levels and leptin resistance leading to
dysregulation of the HPA Axis resulting in
glucose metabolism impairment.
Arble, et al., (2015).
Spiegel et al., (1999);
Barone & Menna-
Barreto, (2011)
Gastro intestinal
disorders
Decrease in Melatonin secretion and increase
in inflammatory cytokine levels with
inadequate sleep.
Cause various types of autonomic nervous
disorders due to a disturbance in circadian
rhythm
Ali, et al., (2013)
Segawa et al., (1987)
Prostate Cancer The altered exposure to light-dark and feeding
cycles causes desynchronization among
internal timing systems that impact the
temporal alignment of genetic and metabolic
processes. Overexpression of Period2 gene
(Per2) has tumour-suppressive properties.
Lower expression levels of Per2 causes
prostate diseases
Sigurdardottir et al.,
(2012)
Breast Cancer Increased likelihood of light exposure at night
and decreased length of sleep, both of which
influence the circadian rhythm.
Suppression of melatonin, a hormone capable
of regulating the initiation, promotion and
progression of cancer
He, Anand, Ebell, Vena,
& Robb, (2015)
Endometrial Cancer Less sleep decreases Melatonin secretion
which lowers body immune responses and cell
repairs.
Viswanathan, Hankinson,
& Schernhammer, (2007)
Cognitive impairment ‘Increased cortisol levels are closely related to
cognitive defects in airline crews repeatedly
exposed to jet lag’ (p.588).
Disruptions in circadian rhythm can lead to
reduced brain temporal lobe size
Chung, Son & Kim
(2011)
Poor mental health Disruption in both melatonin (suppresses) and
cortisol production (arouses) affect brain
function. Poor mental health is caused by high
need for recovery (more melatonin production
needed) from fatigue and stress developed
van der Starre, Coffeng,
Hendriksen, van
Mechelen, & Boot,
(2013)

7
Health effects Causes References
(high cortisol production) due to long working
hours
Lowered immune
response to infections
Melatonin is produced when the body is at
sleep. This hormone helps to reduce body’s
temperature, promotes an anti-inflammatory
response, activates the immune system, and is
an antioxidant. Inadequate sleep does not allow
the production of adequate melatonin for these
responses to occur adequately.
Exposure to light can modify the immune
response. Light of wavelengths more than 400
nm can penetrate through skin and interacts
with circulating lymphocytes that modulate
immune functions.
Bridger, (2009)
Roberts, (2000)
Low fertility Sleep loss causes a decrease in Testosterone
production which reduces male reproductive
fertility
Alvarenga et al., (2015)
Depression Disrupted sleep stimulates the pacemaker in
the hypothalamus of the brain. This can result
in daytime production of melatonin that can
cause difficulty in clear thinking, irritability
and depression. Postmortem examination of
people with depression identified that only 2 of
16 genes in the brain had a clear cycle pattern
with the circadian rhythm flattened out and
their body clock shifted by several hours or
disrupted for the remaining genes.
Virtanen et al., (2011)
Fatigue Chronic sleep loss causes fatigue Golombek, et al., 2013.
Niu et al., (2011)
Insomnia With irregular hours of sleep-increased cortisol
levels cause increased activeness and inhibits
sleep at night.
Espie, (2002)
Anxiety Increase in production of adrenal
glucocorticoid due to longer waking hours can
result in increased anxiety.
Chung, Son & Kim
(2011)
Samaha, Lal, Samaha, &
Wyndham, (2007)
High blood cholesterol Changed eating habits caused by sleep
disruption increases blood cholesterol level
Anujuo et al., (2015)
Impaired cognitive
function.
Desynchronization of circadian rhythm
oscillators can affect neuro-behavioural
functions and cause slower reaction times,
increased variability in work performance,
reduced vigilance, poor motivation, poor
memory, increased errors, reduced learning
ability, poorer decision making ability and
reduced alertness. Chronic jet-lag is associated
with a reduction in the size of the brain
temporal lobe and increased cortisol levels.
Golombek, et al., 2013.

8
To complement and add to the information
about hours of work and fatigue management
Codes of Practice and guidance materials from
the shipping and other industries that have shift
work were reviewed. NOPSEMA conducted a
survey in March 2020 on variable work
schedules: fatigue and psychosocial risk and
published best practice responses for the
people working offshore. Recommendations
included fatigue assessments to be introduced
for any personnel working over‐cycle and
ensuring high-risk work is avoided for the last
week of the swing. For tugboat staff this would
be week 4 of their 28 day work cycle.
The Safe Work Australia Guide for managing
the risk of fatigue at work. Code of Practice
(2013b) and Fatigue Management: A Worker’s
Guide (2013a) both emphasized meeting the
legal requirements as documented in the
Australian States and Territories legislation.
There were also specific guidelines for shift
work that included the requirement to plan an
appropriate and varied workload. Offer a
choice of permanent roster or rotating shifts
and limit shifts to 12 hours including overtime,
or to 8 hours if they are night shifts and/or the
work is demanding, monotonous, dangerous
and/or safety critical. Restrict number of
successive night shifts to no more than 3 to 4 if
possible. Shifts involving an early start should
be shorter in length to counter the impact of
fatigue later in the shift. If 12-hour shifts are
worked then no overtime should be worked in
addition. Avoid long working hours (more than
50 hours per week). Limit consecutive
workdays to a maximum of seven. Allow a
minimum of 12 hours between shifts as rest
period between shifts should permit enough
time for commuting, meals and sleep. Build
regular free weekends into the shift schedule,
advisably at least every 3 weeks. Use forward
rotation (morning / afternoon / night) if there is
a requirement for rotating shifts of work to
cover a 24 business operation period. A shift
design should take into account individual
differences and preferences, allow individual
choice where possible to accommodate family
and other commitments, offer alternatives
where workers have difficulty adjusting to
shift times and keep the timing of shifts
predictable.
In the aviation industry the International Civil
Aviation Organisation (2016) manual for the
oversight of fatigue management approaches,
similar to Safe Work Australia’s Code of
Practice, made recommendations for having
the timing of work shifts predictable and the
type of work to be performed, as too high or
too low a workload can contribute to an
individual’s level of fatigue. Other
recommendations and information in relation
to hours of work and fatigue management
included when on call minimize interruptions
during circadian rhythm times when sleep is
more likely. Minimize continuous hours of
wakefulness before and during duty periods
that are unscheduled. The least amount of sleep
is obtained before an early morning shift and
ratings of fatigue are highest and performance
poorest at the end of a night shift, regardless of
the direction of shift rotation. Changes within
patterns of work for operational personnel may
have an impact on fatigue. An example of this
would be rapid changes between work periods
during the day and during the night. In order to
avoid any detriment to individuals’
performance, opportunities to eat, drink and
meet biological needs were recommended to
be provided. This recommendation is the same
as that of the Australian Maritime Safety
Authority Fatigue Guidelines (2020). Fatigue
was found to be a contributing cause in
incidents in the shipping industry that occurred
between midnight and 6 am (International
Maritime Organisation, 2019).
In the Fatigue Management. A Code of
Practice for the Western Australian Taxi
Industry (nd) published by the Department of
Transport it stated that drivers should not
exceed 14 hours of operation (including
breaks) in any shift. Drivers should have a 10-
hour continuous break in every 24 hours. This
is the same recommendation as is in the ILO
MLC (2006). Work time for drivers should not
exceed 168 hours, spread over 12 days, in any
14-day period. If working a 28-day cycle the
cycle there should be a minimum of four 24-
hour breaks and it is preferable that the breaks
are evenly spaced throughout the 28 days. If a
driver works for 24 days without a break then
he or she must take 4 days off. The last
recommendations exceed the rest times
provided in the ILO MLC (2006),
requirements.

9
Similarly the Tasmanian Fact Sheet Fatigue
management (2013) documented that it was
important to ensure the roster provided for a
continuous seven to eight hours of sleep in
each 24 hours, at least 50 hours sleep for every
seven days and ensure there was a minimum of
12 hours between consecutive work shifts.
Other relevant recommendations were to allow
short naps of up to 15 to 20 minutes during the
shift if this fitted in with the type of work that
was being done, and to avoid more than five
consecutive early morning starts.
Unlike the shipping industry, the aviation
industry makes a Safety Case to the Regulator
that the risks of employee fatigue are
controlled, that mitigation measures are used,
that the effectiveness of fatigue management is
monitored and is reviewed with audits and
surveys. The aviation industry is required to
have continuous improvement of the fatigue
risk management through the elimination
and/or modification of risk controls that had
unintended consequences or that were no
longer needed due to changes in the
operational or organizational environment and
to identify the need to introduce new processes
and procedures to mitigate emerging fatigue‐
related risks.
The Australian Government Civil Aviation
Authority (CASA) (2019) in the publication
Fatigue risk management systems: A step by
step guide, reported that aviation operators can
submit a fatigue management safety case to
CASA to demonstrate that they meet the
International Civil Aviation Organisation
standards. CASA recommended that airlines
use a fatigue management system that
includes:
(1) A fatigue Management Policy and
Objectives.
(2) Fatigue risk management that includes
identification and assessment of fatigue-
related risks. Fatigue-related risk
controls/mitigation/treatment. Implementation
and evaluation.
(3) Fatigue risk management safety assurance
that includes monitoring fatigue risk
management effectiveness. Predictive,
proactive and reactive monitoring to be
conducted. Processes for managing change (to
the operational/organisation environment
and/or to the fatigue risk management system)
were to be documented and there was to be
continuous improvement of the fatigue risk
management system where opportunities for
improvements were identified.
(4) Fatigue risk management system
promotion that includes training programs and
a communication plan. The fatigue risk
management system was to be part of the
organisation’s safety management system.
The United Kingdom Health and Safety
Executive (2006; 2019) when providing advice
about rostering hours of work and fatigue
management recommended offering
employees a choice of permanent or rotating
shifts and try to avoid permanent night shifts.
If there was a business need to rotate shifts do
this every 3-4 weeks - otherwise adopt forward
rotating shifts. Limit shifts to 12 hours
including overtime, or to 8 hours if the work is
night shifts and/or the work is demanding,
monotonous, dangerous and/or safety critical.
This was also a recommendation of Safe Work
Australia (2013b). Encourage workers to take
regular breaks and allow some choice as to
when breaks are taken. Similarly this was a
recommendation of the Maritime Labour
Convention (2006). Health and Safety
Executive (2019) stated that it was important
to consider the needs of vulnerable workers,
such as young or aging workers. Similar to
Safe Work Australia (2013b) the Health and
Safety Executive (2019) recommended to limit
consecutive workdays to a maximum of 7 days
and added to restrict long shifts, night shifts
and early morning shifts to 2-3 consecutive
shifts. Allow 2 nights full sleep when
switching from day to night shifts and vice
versa and build regular free weekends into the
shift work schedule (Health and Safety
Executive, 2006).
Also assessed was the United Kingdom Office
of Rail Regulation guide for managing rail
staff fatigue (2012) which promoted managing
employee hours of work through having a
policy, organising, planning, implementing,
measuring, auditing and reviewing. Other
information included that with the constant
strive for improved efficiency, a significant
contributory factor to fatigue can often be
resource allocation and the availability of
competent staff. If fewer competent staff are
available, workload demands on individuals
may rise, increasing the likelihood of fatigue.
Organisational changes which could impact on

10
staffing resources should be safety validated,
and the validation process should consider
risks from staff fatigue. Staff should feel able
to cope with the demands of their jobs, and
systems should be in place locally to pick up
and respond to any individual concerns. The
organisation should provide staff with
adequate and achievable demands in relation to
the agreed hours of work. People’s skills and
abilities should be matched to their job
demands. Jobs should be designed to be within
the capabilities of staff. Employees’ concerns
about demands on them should be addressed.
Minimum staffing levels for safety critical
posts should, where possible, be specified and
arrangements should include contingency
arrangements for foreseeable abnormal
conditions such as sickness absence, network
disruption and emergencies. Employers should
not rely on voluntary overtime arrangements to
cover normal working periods – all duty hours
of work should be covered in a planned way.
The United Kingdom Office of Rail
Regulation (2012) documented that companies
should have fitness for duty checking
arrangements to ensure that staff reporting for
safety critical work are not suffering, or likely
to suffer during their shift, from fatigue. Such
arrangements seek to identify any issues which
may reduce the individual’s ability to work
safely including not only fatigue but any drug
and alcohol use, illness or its after-effects,
potential distraction or other psychological
effects from any recent incident, work related
or domestic problems. The system should seek
to establish whether the individual has had
sufficient sleep in the hours before starting
work, such that they should be able to carry out
their work safely for the whole of their shift.
The system should identify not just whether the
individual is fit at the start of the shift, but is
likely to remain fit until the end of their shift –
being awake too long before work greatly
increases the risk of fatigue later in the work
period.
There is evidence that human performance
deteriorates significantly when people have
been at work for more than 12 hours (Office of
Rail Regulation, 2012). In a review of the
relative risk of accidents or injuries, the risk of
an incident was shown to increase with
increasing shift length over eight hours.
Relative to eight hour shifts, 10-hour shifts
were associated with a 13% increased risk, and
12-hour shifts with a 27% increase. hours
(Office of Rail Regulation, 2012). This finding
was similar to that of the International
Maritime Organisation, (2019) who
documented that long work hours were
associated with poor performance, higher
injury rates, and poorer safety and health
outcomes (both mental and physical) and that
accident rates rise exponentially after 12 hours
of consecutive work, particularly when
working at night. Good practice for maximum
shift lengths would be day shift – twelve hours;
night and early shifts – ten hours and shifts
starting before 0500 - eight hours. It was
recommended to include a minimum rest
period of 12 hours between consecutive shifts,
increasing to 14 hours rest in the case of
consecutive night shifts hours (Office of Rail
Regulation, 2012).
People differ in their ability to adapt to and
tolerate shift work. For instance, studies of
ageing and the ability to cope with shift work
have suggested that older workers generally
cope well with the demands of early shifts but
may experience more difficulties with the
night shift – with ageing there is a tendency to
become more of a ‘lark’ (waking earlier and
most alert in the first part of the day) than an
‘owl’ (waking later and most alert later in the
day or evening). When allocating individuals
to particular shift patterns, employers should
make reasonable efforts to accommodate
personal preferences, some of which may stem
from such trends in shift work tolerance. Staff
should be consulted on the proposed working
patterns, their views on fatigue risk aspects
considered and soon after its introduction, ask
staff about how tiring they find the working
pattern in reality (Office of Rail Regulation,
2012).
Tasks that require sustained vigilance, or
where the employee may have low levels of
workload, may be more susceptible to fatigue.
The timing of breaks is important. General
advice for tasks that require continuous
sustained attention, with no natural breaks in
the task and where a lapse in attention can lead
to safety implications, is for a regular 10-15
minute break every two hours during the day
and every hour during the night. In the case of
safety critical workers on night shift, the
facility to take a short nap during a break can
11
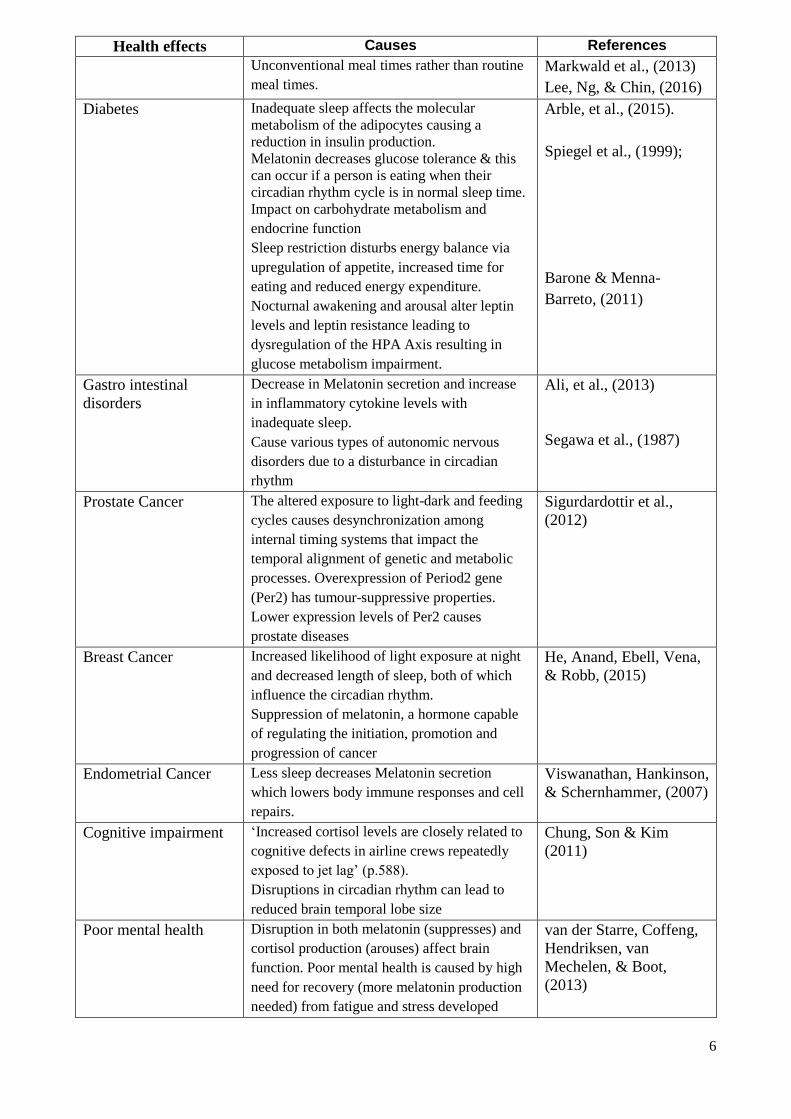
be especially beneficial. Naps of no more than
10 minutes are advisable if safety critical tasks
are to be resumed within 20 minutes of waking.
This is to avoid any grogginess on waking
from a nap (sleep inertia) (Office of Rail
Regulation, 2012). The International Maritime
Organisation, (2019, p.9) documented that
when a person ‘is woken up suddenly, the brain
can have difficulty transitioning out of deep
sleep. This sleep inertia causes feelings of
grogginess and disorientation, with impaired
short-term memory and decision-making, and
can last longer than 30 minutes. Sleep inertia
can also occur following lighter sleep, but it
tends to be longer and more disorienting when
someone is woken abruptly out of deeper
sleep.’ This is important to consider if tugboat
staff are on call and have an opportunity to
sleep between bringing ships into port.
4. Conclusions and Recommendations
The Federal Government, all Australian States
and Territories have legislation that requires a
general duty of care for employees and for the
company to conduct risk management in
relation to hours of work and fatigue
management.
For best practice in fatigue management, and
to meet minimum requirements for contractor
vessel crews, it is recommended that the
following should be included.
• Normal working hours should be an 8 hour
day with at least one day (24 continuous
hours) of rest every 7 days. There is
evidence that human performance
deteriorates significantly when people have
been at work for more than 12 hours so
hours of work on any one day should not
exceed 12 hours (Australian Maritime
Safety Authority Fatigue Guidelines, 2020;
ILO Maritime Labour Convention, 2006;
Office of Rail Regulation, Managing rail
staff fatigue, 2012).
• Have an adequate number of competent
staff for the safety and security of work
functions (Australian Maritime Safety
Authority Fatigue Guidelines, 2020; ILO
Maritime Labour Convention, 2006; Office
of Rail Regulation, Managing rail staff
fatigue, 2012)
• Tugboat crew to have regulated hours of
work and rest functions. Keep timing of
shifts predictable. (Australian Maritime
Safety Authority Fatigue Guidelines, 2020;
Safe Work Australia, Guide for managing
the risk of fatigue at work. Code of Practice,
2013)
• Minimum hours of rest shall not be less than
10 continuous hours in any 24 hour period
and 77 hours in any seven day period
(Australian Maritime Safety Authority
Fatigue Guidelines, 2020; ILO Maritime
Labour Convention, 2006; Fatigue
Management. A Code of Practice for the
Western Australian Taxi Industry.
Department of Transport, nd.)
• Consult with employees about their hours of
work and proposed work patterns. Give
employees reasonable opportunity to
express their views and take into account
their views (Victorian Occupational Health
& Safety Act, 2004; Office of Rail
Regulation, Managing rail staff fatigue,
2012).
• A shift design should take into account
individual differences and preferences as
far as possible (Safe Work Australia, Guide
for managing the risk of fatigue at work.
Code of Practice, 2013; Office of Rail
Regulation, Managing rail staff fatigue,
2012).
• Have access to good quality food and water.
Opportunities to eat, drink and meet
biological needs must be provided
(Australian Maritime Safety Authority
Fatigue Guidelines, 2020; ILO Maritime
Labour Convention, 2006; International
Civil Aviation Organisation, Manual for the
Oversight of Fatigue Management
Approaches, 2016).
• Encourage workers to take regular breaks
and allow some choice as to when they are
taken (Health & Safety Executive, 2019).
• Too high or too low a workload can
contribute to an individual’s level of fatigue
so the monitor workload of individuals
(International Civil Aviation Organisation,
Manual for the Oversight of Fatigue
Management Approaches, 2016; Office of
Rail Regulation, Managing rail staff
fatigue, 2012).
• Monitor the health of employees, their
levels of work related fatigue and fitness for
work (Safe Work Australia, Guide for
managing the risk of fatigue at work. Code
of Practice, 2013; Victorian Occupational
Health & Safety Act, 2004; Office of Rail

12
Regulation, Managing rail staff fatigue,
2012).
This research was carried out for an employing
company to also check that any contractor
companies that they hired to supply and
manage tugboat crew had legally compliant
hours of work for their tugboat crew, had
effective fatigue management strategies in
place, that the effectiveness of the rostered
hours of work and fatigue management were
monitored and improved as required. The
document in Appendix one, based on the
review of legislation, codes of practice and
other guidance materials, has been designed as
a tool to achieve this.
References Australian Maritime Safety Authority Fatigue
Guidelines. (2020). Australian Government.
https://www.amsa.gov.au/sites/default/files/am
sa-fatigue-guidelines-web.pdf
Bourgeois-Bougrine, S. (2020, March). The
illusion of aircrews' fatigue risk control.
Transportation Research Interdisciplinary
Perspectives. 4
http://dx.doi.org/10.1016/j.trip.2020.100104
Civil Aviation Authority (CASA). (2019). Fatigue
risk management systems: A step by step guide.
Australian Government.
https://www.casa.gov.au/sites/default/files/fati
gue-risk-management-systems-step-by-step-
guide.pdf
Commission for Occupational Safety and Health.
(2006). Code of Practice. Working Hours.
https://www.commerce.wa.gov.au/sites/default
/files/atoms/files/copworkinghours.pdf
Department of Transport, Western Australia.
(nd). Fatigue Management. A Code of Practice
for the Western Australian Taxi Industry.
www.transport.wa.gov.au/taxis
Health and Safety Executive. (2006). Managing
Shift work.
https://www.hse.gov.uk/pubns/books/hsg256.h
tm
Health and Safety Executive. (2019). Human
factors: Fatigue.
http://www.hse.gov.uk/humanfactors/topics/
Ker, P. (2014, June 5). Port Headland tug workers
did 18-hour shifts, according to leaked
documents. The Sydney Morning Herald.
https://www.smh.com.au/business/companies/
port-hedland-tug-workers-did-18hour-shifts-
according-to-leaked-documents-20140605-
39jxg.html
International Civil Aviation Organisation. (2016).
Manual for the Oversight of Fatigue
Management Approaches (2nd ed.).
https://www.icao.int/safety/fatiguemanagement
/FRMS%20Tools/Doc%209966.FRMS.2016%
20Edition.en.pdf
International Labour Organisation (ILO). (2006).
Maritime Labour Convention, 2006, as
amended (MLC,2006).
https://www.ilo.org/dyn/normlex/en/f?p=NOR
MLEXPUB:91:0::NO::P91_SECTION:MLCA
_AMEND_A2
International Maritime Organisation. (2019).
Guidelines on fatigue. https://www.register-
iri.com/wp-content/uploads/MSC.1-
Circ.1598.pdf
Maru, D. (2016). The hours of work and effects on
humans. Master’s research report. Curtin
University.
National Offshore Petroleum Safety Environment
Management Authority (NOPSEMA). (2020,
May 21a).Guidance Note, Avoiding fatigue.
https://www.nopsema.gov.au/assets/Guidance-
notes/A392817.pdf
National Offshore Petroleum Safety Environment
Management Authority (NOPSEMA). (2020b).
Novel coronavirus (COVID-19) survey -
variable work schedules.
https://www.safertogether.com.au/news/covid-
19-updates/nopsema-publishes-better-practice-
examples-of-how-offshore-operators-are-
managing-risks-of-fatigue-and-psychosocial-
hazards-during-covid-19
Office of Rail Regulation. (2012). Managing Rail
Staff Fatigue.
https://www.orr.gov.uk/media/10934
Safe Work Australia. (2013a). Fatigue
Management: A Worker’s Guide.
https://www.safeworkaustralia.gov.au/doc/fati
gue-management-workers-guide
Safe Work Australia. (2013b). Guide for
managing the risk of fatigue at work. Code of
Practice.
https://www.safeworkaustralia.gov.au/doc/guid
e-managing-risk-fatigue-work
Work Safe Tasmania. (2013). Fact sheet: Fatigue
management.
https://www.worksafe.tas.gov.au/
Legislation Australian Maritime Safety Authority Act 1990.
https://www.legislation.gov.au/Details/C2014
C00368
Commonwealth Offshore Petroleum and
Greenhouse Gas Storage (Safety) Regulations
2009.
https://www.legislation.gov.au/Details/F2010C
00422
Commonwealth Work Health and Safety Act 2011.
https://www.legislation.gov.au/Details/C2018
C00293
Commonwealth Work Health and Safety

13
Regulations 2011.
https://www.legislation.gov.au/Details/F2011L
02664
Dangerous Goods Safety Act 2004.
https://www.slp.wa.gov.au/statutes/swans.nsf/(
DownloadFiles)/Dangerous+Goods+Safety+A
ct+2004.pdf/$file/Dangerous+Goods+Safety+
Act+2004.pdf
Mine Safety & Inspection Act 1994 Western
Australia.
https://www.legislation.wa.gov.au/legislation/p
rod/filestore.nsf/FileURL/mrdoc_43435.pdf/$F
ILE/Mines%20Safety%20And%20Inspection
%20Act%201994%20-%20%5B06-d0-
02%5D.pdf?OpenElement
Mines Safety and Inspection Regulations 1995
Western Australia.
https://www.legislation.wa.gov.au/legislation/s
tatutes.nsf/main_mrtitle_1819_homepage.html
Mines Work Health & Safety (Supplementary
Requirements) Act 2012 Tasmania.
https://www.legislation.tas.gov.au/view/html/i
nforce/current/act-2012-046
Mines Work Health & Safety (Supplementary
Requirements) Regulations 2012 Tasmania.
https://www.legislation.tas.gov.au/view/html/i
nforce/current/sr-2012-134
Occupational Safety and Health Act 1984 Western
Australia.
https://www.slp.wa.gov.au/pco/prod/filestore.n
sf/FileURL/mrdoc_43441.pdf/$FILE/Occupati
onal%20Safety%20And%20Health%20Act%2
01984%20-%20%5B07-k0-
00%5D.pdf?OpenElement
Occupational Safety and Health Regulations 1996
Western Australia.
https://www.slp.wa.gov.au/pco/prod/filestore.n
sf/FileURL/mrdoc_43452.pdf/$FILE/Occupati
onal%20Safety%20and%20Health%20Regulat
ions%201996%20-%20%5B10-n0-
00%5D.pdf?OpenElement
Occupational Health and Safety Act 2004
Victoria.
https://content.legislation.vic.gov.au/sites/defa
ult/files/2020-10/04-
107aa034%20authorised.PDF
Occupational Health and Safety Regulations 2017
Victoria.
https://content.legislation.vic.gov.au/sites/defa
ult/files/2020-09/17-
22sra007%20authorised_0.pdf
Petroleum (Submerged Lands) (Occupational
Safety and Health) Regulations 2007.
https://www.legislation.wa.gov.au/legislation/s
tatutes.nsf/main_mrtitle_1899_homepage.html
Port Authorities Act 1999.
https://www.legislation.wa.gov.au/legislation/p
rod/filestore.nsf/FileURL/mrdoc_41782.pdf/$F
ILE/Port%20Authorities%20Act%201999%20
-%20%5B03-g0-02%5D.pdf?OpenElement
Work Health & Safety Act 2011 Australian
Capital Territory.
https://www.legislation.act.gov.au/View/a/201
1-35/current/PDF/2011-35.PDF
Work Health & Safety Regulations 2011
Australian Capital Territory.
https://www.legislation.act.gov.au/View/sl/201
1-36/current/PDF/2011-36.PDF
Work Health & Safety Act 2011 New South Wales.
https://legacy.legislation.nsw.gov.au/~/pdf/vie
w/act/2011/10/whole
Work Health & Safety Regulations 2017 New
South Wales.
https://legacy.legislation.nsw.gov.au/~/pdf/vie
w/regulation/2017/404/whole
Work Health & Safety (National Uniform
Legislation) Act 2011 Northern Territory.
file:///C:/Users/230151j/Downloads/Repw025
%2001022020%20pdf.pdf
Work Health & Safety (National Uniform
Legislation) Regulations 2011 Northern
Territory.
https://legislation.nt.gov.au/Legislation/WOR
K-HEALTH-AND-SAFETY-NATIONAL-
UNIFORM-LEGISLATION-
REGULATIONS-2011
Work Health & Safety Act 2011 Queensland.
https://www.legislation.qld.gov.au/view/pdf/in
force/current/act-2011-018
Work Health & Safety Regulations 2011
Queensland.
https://www.legislation.qld.gov.au/view/pdf/in
force/current/sl-2011-0240
Work Health & Safety Act 2012 South Australia.
https://www.legislation.sa.gov.au/LZ/C/A/WO
RK%20HEALTH%20AND%20SAFETY%20
ACT%202012/CURRENT/2012.40.AUTH.PD
F
Work Health & Safety Regulations 2012 South
Australia.
https://www.legislation.sa.gov.au/LZ/C/R/WO
RK%20HEALTH%20AND%20SAFETY%20
REGULATIONS%202012/CURRENT/2012.2
68.AUTH.PDF
Work Health & Safety Act 2012 Tasmania.
https://www.legislation.tas.gov.au/view/html/i
nforce/current/act-2012-001
Work Health & Safety Regulations 2012
Tasmania.
https://www.legislation.tas.gov.au/view/html/i
nforce/current/sr-2012-122

14
Appendix 1.
Hours of Work and Fatigue Management.
It is a requirement of the Work Health & Safety Act and Regulations that the occupational health and safety
of all employees are cared for and that the risks of harm to their health and safety are reduced to as low as is
reasonably practical. To demonstrate that your company will meet these requirements in relation to hours of
work and employee fatigue management please answer the following questions with yes or no and provide the
reason for your answer next to the word explanation.
Hours of work
1. Employee normal work hours are an 8 hour day with at least one day (24 continuous hours)
of rest every 7 days. Yes [] No []
Explanation ____________________________________________________________________________
2. Employee work hours on any one day do not exceed 12 hours. This includes on call and
overtime work hours. Yes [] No []
Explanation ____________________________________________________________________________
3. Minimum employee hours of rest are not less than 10 continuous hours in any 24 hour
period and 77 hours in any seven day period. Yes [] No []
Explanation _____________________________________________________________________________
4. Timing of work shifts are regular and predictable. Yes [] No []
Explanation ____________________________________________________________________________
5. Employees are consulted about their hours of work and proposed work patterns with
employees given the opportunity to express their views and these views are taken into
account. Individual differences and preferences are accommodated as much as possible. Yes [] No []
Explanation ____________________________________________________________________________
Occupational Health & Safety.
1. An adequate number of competent staff for the safety and security of work functions are
rostered to work at all work times. Yes [] No []
Explanation ____________________________________________________________________________
2. Workers are provided with regular scheduled breaks and are allowed some choice as to
when their breaks are taken. Yes [] No []
Explanation ____________________________________________________________________________
3. During their work time employees have access to good quality food and water. Opportunities
to eat, drink and meet biological needs are provided. Yes [] No []
Explanation ____________________________________________________________________________
4. Workload of individuals is monitored to ensure that it is not too high or too low. Yes [] No []
Explanation ____________________________________________________________________________
5. Training and education on fatigue management and reporting is provided to employees. Yes [] No []
Explanation ____________________________________________________________________________
6. The company has measures in place to enable employee recovery from fatigue and for mitigation
of the effects of fatigue. Yes [] No []
Explanation ____________________________________________________________________________
7. The risk management and other relevant requirements of the Western Australian Code of Practice.
Working Hours (2006) are met in relation to hours of work and fatigue management. Yes [] No []
Explanation ____________________________________________________________________________
Monitoring and Improving
1. The health of employees, their levels of work related fatigue and fitness for work are monitored.
Yes [] No []
Explanation ____________________________________________________________________________

15
2. The company has, and uses, a safety management and fatigue reporting procedure and has
a just culture. Yes [] No []
Explanation ____________________________________________________________________________
3. The contribution of fatigue to reported incidents and accidents is assessed. Yes [] No []
Explanation ____________________________________________________________________________
4. Annual (or more frequent) employee interviews, employee survey and an audit are conducted
to monitor the effectiveness of the rostered hours of work and the fatigue management risk
control, mitigation and risk treatment measures used. Opportunities identified for
improvements are implemented. Yes [] No []
Explanation ____________________________________________________________________________
Authors
Dr Janis Jansz, RN, RM., Dip. Tch, BSc.
Grad. Dip. OHS, MPH, PhD, FSIA is an
Associate Professor in Occupational Health,
Safety and Environmental Health in the
Western Australian School of Mines:
Minerals, Energy and Chemical Engineering at
Curtin University in Western Australia and a
Professor at the Xi’an University of Science
and Technology, China. She also works for the
Healthforce Group. Janis is the Director of the
World Safety Organization National Office for
Australia and Vice President of the
Occupational Health Society of Australia. She
has been awarded Life Membership of the
Australian Institute of Health and Safety for
many years of work improving, teaching and
conducting research to advance occupational
safety and health practices and for taking a
leadership role the safety and health
profession.
Dr Sherrilyn Mills, Bachelor of Business
(HRM, IR), Master OSH, PhD has been
involved in workers’ compensation, injury
management, vocational rehabilitation and
occupational health and safety since 1997.
Together with her extensive research and PhD
on individual, organisational and psychosocial
factors, that prevent return to work and post
workplace injury, Sherrilyn is known as an
authority in her field providing
transformational change in culture, systems,
engagement and in people management.
Sherrilyn has established significant
experience and credibility throughout her
career predominantly consulting with a variety
of national companies to prevent and mitigate
the effects of illhealth and injuries in sectors
including government, oil and gas, mining,
transport and engineering. Also through
disability and employment services in Jobnet
and Job skills programs, through being an
approved workplace rehabilitation provider,
her occupational health and safety roles and
more recently consulting to organisation on a
broad range of services. Together with her
team at HealthForce Group, Sherrilyn aims to
deliver exceptional service and create happy,
healthy, harmonious workplaces where
employees are engaged and productive.

16
Safety Committee Tool-Its Effectiveness in Nigeria Industries Ikpesu Jasper Ejovwokoghenea,b, Uzoh Samuel Chukwukaa, Deborah Adojor Ogheneochukoa, Olatunji
Ojeaburu Bukolaa a Department of Industrial Safety and Environmental Technology, Petroleum Training Institute, Effurun,
Delta State, Nigeria. b Department of Chemical and Metallurgical Engineering, University of Witwatersrand, Johannesburg,
South Africa.
Corresponding email: [email protected], [email protected]
Abstract This research considered the effectiveness of Safety Committees in industries in the Delta State, Nigeria.
The study assessed the level of safety committee effectiveness in oil and gas, construction and flour Mill
Companies. Survey questions were adopted from the National Health and Safety Division (2018), Oregon
Occupational Safety and Health Administration Guidelines (2014) and Ontario Guide on Workplace
Health and Safety (2011). This questionnaire was distributed to the companies understudy to collect data.
The overall purpose of this study was to evaluate the application and effectiveness of safety committees
in the oil and gas, road construction and flour mill companies (three companies from each sector; Oil and
Gas Companies (A,B,C), Construction Companies (D,E,F) and Flour Mill Companies (G,H,I) in Delta
State using the safety committee audit tool. The results indicated that the application and effectiveness
of safety committee in companies A, B, C on the average were 74%, 67% and 64%. In companies D, E,
F it was 57%, 62%, 55% and companies G, H, I were 81%, 74% and 0% (because information was not
provided by company I which showed non application of safety committee in that company) respectively.
Companies A, B, C, G and H performed within an acceptable range. Since the effectiveness of safety
committee for company “D”,” E”,” F” were low, it was recommended that an internal audit be conducted
twice a year using the National Health and Safety Division, Safety Committee Audit Tool. The
companies have communication problem and managements should be committed to improve this vital
indicator.
Key words: Safety Committee, effectiveness, Audit Tool, Guideline
1. Introduction The construction industry is an important part of
the economy in many countries and often seen as
a driver of economic growth, especially in
developing countries. Typically, construction
industry contributes to 11% of Gross Domestic
Products (GDP) in most developing countries
(Giang and Pheng, (2010). However, many
construction activities are inherently health and
safety risks such as working at height, working
underground, working in confined spaces and
close proximity to falling materials, handling
loads manually, handling hazardous substances,
noises, dusts, using plant and equipment, fire,
exposure to live cables, poor housekeeping and
ergonomic miss match hazards. The
construction industry has therefore earned the
reputation of being a dangerous or highly
hazardous industry, because of the
disproportionately high incidence of accidents
and fatalities that occur on construction sites
around the world (Smallwood et al., 2008;
Newman, 2017). Internationally, construction
workers are two to three times more likely to die
on the job than workers in other industries while
the risk of serious injury is almost three times
higher. Health and safety therefore are economic
as well as humanitarian concern that requires
proper management risk control. One of the
most common myths that has plagued this
industry is that workplace health and safety
comes at a cost. Construction managers tend to
believe that introducing and executing measures
that ensure health and safety in the construction
sector will lead to higher cost, and hence lower
profitability. It has been proven that investment

17
in construction health and safety actually
increases the profitability by increasing
productivity rates, boosting employee morale
and decreasing attrition (Muiruri and Mulinge,
2014).
The promotion of safety and health at work is not
only a function of good management but it is, or
ought to be, a normal management function.
Safety and health objectives should be
effectively incorporated into a company's
overall management system along with other
management objectives such as production and
quality control. If standards of safety and health
at work are to be improved, full co-operation and
commitment of all employees are absolutely
essential.
All employees must be able to participate fully
in the making and monitoring arrangements for
safety and health at their place of work in order
to arouse their interest in accepting their full
share of responsibility. The appointment of a
safety committee is one of the methods of
increasing the involvement and commitment of
employees. Given the diversity of operations and
variability of workplace hazards, safety
committees will need to be developed to take full
account of all the relevant circumstances
(Amund et al., 2014; Canada Center for
Occupational Health and Safety Council
(CCOHS), 2018).
There are numerous safety and health hazards
associated with grain handling operations,
among them suffocation and falls are the two
leading causes of deaths. Other hazards include
fires, explosions, and injuries from improperly
guarded machinery. Exposure to grain dust and
associated airborne contaminants can also occur.
Such contaminants include molds, chemical
fumigant and gases associated with decaying
and fermenting silage.
Health and safety have continued to be a priority
issues for the Nigeria oil and gas industry, as
they are pertinent to other sector’s overall
success. Multinational oil companies operating
in Nigeria have been criticized severely by both
local and international pressure groups for
engaging in unwholesome health, safety and
environmental practices; resulting in widespread
ecological disturbances, including pollution
from pipeline leaks; blowouts; drilling fluids and
refinery effluents; land alienation; and
disruption of the natural terrain during oil and
gas operations (Ibebuike, 2018).
Since the 19th century, workers have been
organized in trade unions and parties to
strengthen their efforts at improving workplace
health and safety, job conditions, working hours,
wages, job contracts, and social security.
Cooperation between workers, worker
organizations and occupational health
professionals is widely believed to be
instrumental in improving regulation and
legislation affecting workers’ health. The theory
behind requiring joint worker-employer health
and safety committees is that a safer workplace
is best achieved through empowering workers
and managers to ensure that standards and
regulatory provision are met (Baldauf. 2010;
Yassi et al., 2013; Holl et al., 2016).
Safety is a team effort and one of the most
effective ways to start addressing safety in the
workplace is by developing a safety committee
(Newman, 2017). A safety and health
committee is a committee made up of workers
and employer representatives working together
to identify and resolve health and safety
problems in the workplace. The safety
committee is established to be of benefit first and
foremost to the employees it represents, but it is
also as a safeguard and protector of the
company’s asset. A safety committee is set up by
an organization to create a forum where issues
concerning the safety of the organization such as
accidents, near misses, corrective actions and
opportunities for improvement are discussed.
Since it consists of staff from various
departments up to and including management
level it was anticipated that there would be
interest for the betterment of the company to
reduce accident. (Uwerevu, 2011).
(Duke, 2012) noted that most safety committee
meetings are not really productive and
recommendations made are not taken seriously
by management. Thus, safety committees don’t
really effect the needed changes, leading to poor
committee performance. A safety committee
18
should measure its performance to identify
opportunities for improvement and continue to
do what is working. According to a fact sheet
from the Canadian Centre of Occupational
Health & Safety (CCOHS), an improved safety
performance indicates that a safety committee is
effective (Tuohy & Simard, 2011; Manoukian,
2015). The health and safety committee is an
advisory committee to ensure a healthy and safe
workplace and not as a body responsible for
enforcing legislation. The committee
recommends actions to management who has the
authority to make changes to meet goals and
objectives.
In the United States data from 113 companies in
Maine over a six-year period was collected and
analyzed. Researchers found out that the
presence of a safety committee in those
companies was associated with a small decrease
in time loss claims due to injury. In contrast, in
a study of 127 manufacturing firms in
Massachusetts, (Boden et al., 1984; Spath, 2010;
Milgate et al., 2012; Kellerman, 2015) the
researchers determined that the presence of a
safety committee did not reduce the number of
health and safety complaint. The study appeared
to indicate that the presence of a safety
committee may not be enough and that the key
to success with these committees may be in
ensuring their effectiveness.
Tuohy & Simard (2011) found in a study of
Quebec and Ontario workplaces that Joint
Health and Safety Committees with equal
number of worker and management
representatives had both lower injury rates and
demonstrated enhanced problem-solving
expertise compared to workplace without these
committees. The existence of safety committees
is associated with appropriate measures to
confront hazard and increase safety.
2. Elements of An Effective Safety
Committee Communication/Information Dissemination
According to Tuohy & Simard, (2011);
Bukowski, (2014) and Kellerman, (2015) the
flow of information between Safety Committee
members and workers needed to be regular and
timely. This thus shows staff the organization is
improving health and safety by addressing
problems, which encourages workers to take an
interest in their own health and safety, and that
of their work colleagues. Uncommunicative or
unsupportive management reduces the
effectiveness of committees.
If management disagrees with a
recommendation, the response must give the
reasons for disagreement. Having an agenda and
having goals set ahead of time are of primary
importance to a safety committee, according to
Geldart & Smith, (2010) and Pratt et al., (2010).
They noted that when the safety committee in
their company organized a kick-off meeting at
the beginning of the year, set the goals for that
year and published it in the company’s
newsletter, everyone got involved and got things
done.
Information on potential hazard and actual
accident should be available for members of the
safety committee. Minutes of safety committee
meetings should be distributed to all committee
members and various departments. The
committee should keep record of each meeting
for three years. The information of each meeting
should include; meeting date, attendees’ names,
safety and health issues discussed,
recommendations for correcting hazards and
reasonable deadlines for management to
respond. Feedback meeting with workers
affected by the safety committee’s decision
should be held as this will assure workers of
management’s commitmentt (Burke et al., 2012;
Manoukian, 2015).
Membership Representation and Management
Support:
According to Burke et al., (2012); Holl et al.,
(2016); Ikpesu, (2016) and CCOHS, (2018)
periodically changing the employee membership
of the committee allows the greatest possible
number of employees to take an active part in the
safety effort of the organization. It also provides
the committee with a constant influx of different
viewpoint and new ideas, provides a challenge
to existing members, prevents them and the
committee from becoming stale and preoccupied
with routine work.
19
In his research, Plischke, (2014) found that
committees that made a meaningful impact on
workplace safety had clear and visible upper
management support. This allowed committees
to secure funding or support to quickly address a
safety hazard. Similarly, according to
Wanderhoof, (2012) and Tuohy & Simard,
(2011), an effective safety committee will have
appropriate senior management representatives,
so that decisions can be approved and actioned
without needing to refer them for further
approval. Management participation in meetings
is important for the committee to make realistic
decisions and recommendations.
Milgate et al., (2012) reported that the
effectiveness of a safety committee depends on
the results it achieves, and this in turn depends
on action being taken by management to
implements the committee’s recommendations.
Results that include correspondence, briefs,
reports, test results, records of employee training
and/or hazard documentation should be recorded
and kept.
Self-Evaluation:
Kellerman, (2015) noted that a safety committee
measures its effectiveness by frequently
checking if goals and expectations are being
met. According to Geldart & Smith, (2010) and
Holls, (2016), follow-up reports assess the status
of the action items. Baldauf, (2010) and Bill,
(2015) noted that Key Performance indicators
(leading and lagging) are to be measured to
assess the effectiveness of a safety committee,
and to determine what needs to be done to
improve the safety culture of an organization.
According to Manoukian, (2015) laging
indicators are reactive in nature. They measure
the effectiveness of a safety program after the
facts. Typical lagging indicators include the
number of incidents, injuries, days away from
work (DAFW). In contrast, leading indicators
are proactive in nature. They consist of safety
initiatives or reported activities, with the aim of
preventing adverse events before they happen.
Hence leading indicators: contribute to:
1) Improving safety through insight and
prevention and
2)Showing stakeholders that the organization is
taking proactive steps to attain safety excellence.
According to Spath, (2010). Workplace Safety
Committee Guide, (2012); Plischke, (2014) and
Boden et al., (2015), minutes of meeting is
another way to examine safety committee’s
performance. Minutes should reflect what
actions and decisions the group made. Minutes
of safety committee meetings keep a track record
of safety problems and state what
recommendations have been made (CCOHS,
2018).
Member Training
Assessment of the safety committees in over 20
companies was carried out by Tuohy & Simard,
(2011), and their findings showed that there was
a greater decreases in injury rates in companies
whose committee members received training.
They stressed the importance of training, stating
that members of a safety committee will not be
able to conduct their task effectively if not
trained. Burke (2012) and Wanderhoof, (2012)
noted that all committee members are needed to
be trained on the task and procedures of the
safety committee, on hazard identification,
accident investigation, raising and solving health
and safety issues. Other elements of effective
safety committee are structure/composition of
the committee, management of the committee,
frequency of meetings, agenda and minutes of
meeting, location and timing of meetings (Boden
et al., 1984; Pratt, 2010; Bukowski, 2014;
Silburn, 2015; Greeley, 2016; Iteire, 2019,
Workplace Safety Committee Guide, 2012)
3. Methods It is important that the Safety Committee should
not only be set up in the industries, but must be
effective in applying safety policies. This study
was therefore designed to evaluate the
effectiveness of the Health and Safety
committees in the selected oil/ gas, construction,
and flour mill companies in Delta State.
A questionnaire was use to gather data in this
research. 34 questionnaires were distributed to
company A, B, C but retrieved 26; 36 questionnaires
were distributed to company D, E, F and 33 were
retrieved; while 34 were sent to company G, H, I. The
34 were retrieved from company G. and H but no
questionnaires were retrieved from company I. Data
collected was evaluated statistically using a safety
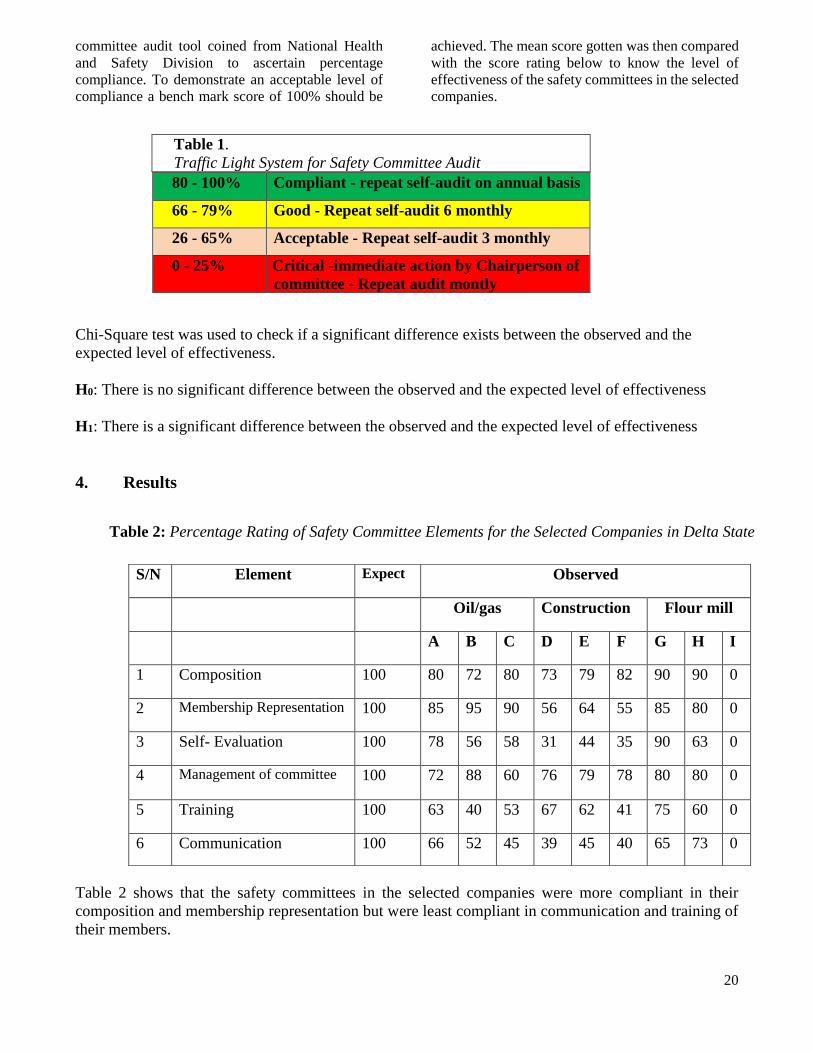
20
committee audit tool coined from National Health
and Safety Division to ascertain percentage
compliance. To demonstrate an acceptable level of
compliance a bench mark score of 100% should be
achieved. The mean score gotten was then compared
with the score rating below to know the level of
effectiveness of the safety committees in the selected
companies.
Chi-Square test was used to check if a significant difference exists between the observed and the
expected level of effectiveness.
H0: There is no significant difference between the observed and the expected level of effectiveness
H1: There is a significant difference between the observed and the expected level of effectiveness
4. Results
Table 2: Percentage Rating of Safety Committee Elements for the Selected Companies in Delta State
Table 2 shows that the safety committees in the selected companies were more compliant in their
composition and membership representation but were least compliant in communication and training of
their members.
Table 1.
Traffic Light System for Safety Committee Audit
80 - 100% Compliant - repeat self-audit on annual basis
66 - 79% Good - Repeat self-audit 6 monthly
26 - 65% Acceptable - Repeat self-audit 3 monthly
0 - 25% Critical -immediate action by Chairperson of
committee - Repeat audit montly
S/N Element Expect Observed
Oil/gas Construction Flour mill
A B C D E F G H I
1 Composition 100 80 72 80 73 79 82 90 90 0
2 Membership Representation 100 85 95 90 56 64 55 85 80 0
3 Self- Evaluation 100 78 56 58 31 44 35 90 63 0
4 Management of committee 100 72 88 60 76 79 78 80 80 0
5 Training 100 63 40 53 67 62 41 75 60 0
6 Communication 100 66 52 45 39 45 40 65 73 0

21
Table 3: Safety Committee Effectiveness Average for the Selected Companies in Delta State
The table above shows that the safety committee in company G has the highest percentage rating, while
that company F has the lowest rating.
Figure 1
Graphical Presentation of Safety Committee Effectiveness
74
6764
5762
55
81
74
100 100 100 100 100 100 100 100
0
20
40
60
80
100
120
A B C D E F G H
Observed Expected
Oil/gas Construction Flour mill
COMPANY A B C D E F G H I
OBSERVED 74 67 64 57 62 55 81 74 0
EXPECTED 100 100 100 100 100 100 100 100 100

22
Table 4. Chi-Square Calculations
Company A B C D E F G H I
Observed (Oi) 0.740 0.672 0.553 0.572 0.622 0.552 0.808 0.743 0
Expected (Ei) 1.000 1.000 1.000 1.000 1.000 1.000 1.000 1.000 1.00
𝑥2 = ∑(Oi − Ei)2
Ei
𝑎
𝑖=1
= (0.740−1)2
1 +
(0.672−1)2
1 +
(0.553−1)2
1 +
(0.572−1)2
1 +
(0.622−1)2
1 +
(0.552−1)2
1 +
(0.808−1)2
1 +
(0.743−1)2
1
= 0.0676+0.1076+0.1998+0.1832+0.1429+0.2285+0.0369+0.0660 = 1.03
𝑥0.025, 7 = 1.69 𝑥0.975, 7 = 16.0
5. Discussion of Results The results obtained from the study showed that
the selected oil/gas, construction, and flour mill
companies in Delta state have safety committees
except Company I.
Six elements were used to assess the
effectiveness of the safety committees in each
selected company, which was compared to
different Safety body standards. The overall
performance of each company’s safety
committee was determined with the aid of a
safety committee audit tool and the assessment
of their Key performance Indicators, in which
Company G was ranked the most effective with
an average of 81%, while Company F the least
effective with average of 55%.
Composition/structure of the committees
In Company A and B, the Managing Director is
the Chairman of the Central Safety Committee,
while in Company C, the General Manager,
Process is the Chairman of the Committee. This
is in line with what is recommended by OSH,
1996 Regulation, CCOHS, (2018) which noted
that an employer or his authorized manager can
be the chairman of the safety committee.
Still on the composition of the committee,
Company A has four subcommittees along with
a central safety committee, Company B has two
subcommittees along with their management
safety committee but this could not be
determined in Company C as such information
was withheld. This, thus ensured more workers
involvement and participation in safety in
Companies A and B. This is in agreement with
the findings of Tuohy & Simard, (2011).
The lagging issues in Companies A and B is that
they have more employer-selected members
than employee-elected members. This is against
the Oregon OSHA guide, (2014) requirements.
Company F had an equal number of
management and employee representatives in
accordance with Karl, (1997) and CCOHS,
(2018) but company D and company E had fewer
member representatives.
Membership Representation
In the selected oil/gas companies assessed, the
safety committees present in Companies A and
B have representatives from senior management,
departmental heads, safety personnel and
administrative support. The committees consist
of members from various departments. The KPI
observed in respect to this showed that one out
of the two recommendations made were
implemented by management within the last five
months at Companies A and B. The safety
committees in company B had members from
various department including a Medical officer.

23
The KPI observed in respect to this showed that
81 recommendations have been implemented
within the last two years. This is in agreement
with Morse et al., (2012) who noted that
recommendations made by any safety committee
with appropriate management representation
will be easily implemented.
The safety committee members in Company B
serve a maximum of two years. This is
acceptable when compared with standards on
safety committee. On the contrary, members of
safety committee in Company A served for more
than two or three years. The information
obtained from this research shows that the term
of service for members of the committee in
company A is position based, meaning that
members continue to serve until their job title is
changed or on retirement. The safety committee
in Company C do not have members from
various department but members serve on the
committee only for one year. It was only the
safety committee in Company B that had a
medical representative in accordance with Karl,
(1997) recommendations. It was also noted that
all the safety committees have an appropriate
number of committee members. This made
company B more compliant with standards and
more effective.
In the selected flour mill companies assessed,
company G had a better membership
representation. The members of the committee
consist of a senior manager/chairperson of
committees, departmental heads, safety
representatives. Also, committee members are
allowed to serve a minimum of two years. This
ensured a good number of employees to take an
active part in the society effort. This is in
agreement with South Australia Work Health
and Safety Regulation (2012).
Management of the Committee
Company B was found to be more effective in
the management of their safety committee. This
was due to the fact that the committees have
established terms of reference which includes;
the objectives of the committee, roles and
responsibilities, membership, and frequency of
meetings, and their terms of reference were
constantly being reviewed every year. This
yearly review of reference ensured that meetings
were up to date, more than half of the objectives
were achieved, and resources to carry out their
responsibilities were sufficiently provided. This
is in agreement with Geldart & Smith, (2010)
who noted that any safety committee with
established procedure for self-monitoring would
meet their targeted objectives. Another reason is
that the safety committee has a quorum
consisting of the chairman, secretary, and five
other workers. This is in accordance with
(Oregon OSHA guide, 2014) on safety
committee.
The safety committee in three companies meet
on a quarterly basis. Minutes of meetings
observed showed that the meetings of the safety
committee in companies A and C spend more
than one hour, but that of company B lasted
mostly for one hour.
KPI observed shows that the safety committee in
Company B has conducted a total number of
thirty-six (36) inspections, two (2) management
walkabouts, and twelve (12) committee
meetings in five (5) months. This shows its
effectiveness. Also, the KPI observed in
Company A showed that the number of
inspections carried out increased from 12 to 17,
the number of management walkthrough
increased from 3 to 4 in a period of two years.
The table 1 shows that Companies D, E & F have
poor committee management with company D
as 31%, company E 35%, Company F 44%. This
is in agreement with Hayes et al., (2016) who
noted from their findings that most safety
committee members lacked understanding of the
roles and responsibilities of the safety committee
and thus reduced its effectiveness.
Performance/self-evaluation The safety committee in Company G had the
highest percentage average. This was due to the
safety committee regularly reviewing records on
work-related injury/illness. Judging from their
key performance indicators, there have been a
significant reduction in lost time injuries and
First Aid cases. This is in agreement with Bryce
et al., (2010) research findings. Minutes of
meetings examined also showed that most
recommendations made have been implemented

24
by management. This is in agreement with
CCOHS, (2018) and Manoukian, (2015)
anticipated outcomes. The key performance
indicators also show that the management has
implemented more recommendation within the
last two years. While assessing a few minutes of
meetings of Company G, it was noted that the
safety committee kept track on things that
needed management intervention, and it was
only after such recommendations had been
actioned it was closed out. This observation is in
agreement with Boden et al., (1984) who noted
that minutes of meetings helps to show trends
and reveal problems requiring more
investigation, the training of a new committee
members, or the determination of safety training
topics.
Training
In company A, only but a few members of the
safety committee had been trained in safety
related courses, while in company B, only the
safety representative had received training. This
was prior to the inception of the safety
committee. Information from the questionnaires
retrieved showed that members of the safety
committee in Company C had been trained on
hazard identification, workplace inspection and
accident investigation. Since the Key
Performance Indicators for Company C were not
assessed, this study could not agree or disagree
with Burke et al., (2012) who noted in his
findings that training of committee members
resulted in the significant reduction of accidents.
The training matrix from Company D indicates
the almost all safety committee members have
received safety related training. While going
through the HSE Records of company E, only a
few members had been trained in safety related
topics. It was observed that the number of safety
committee meetings and the number of
emergency drill had decreased drastically within
the period of 5 years. This is in agreement with
Hayes et al., (1998) who noted that most safety
committee members lacked awareness of safety
related issues and stressed the need for educating
and training of safety committee members. In
company G and H, only the safety officers had
received safety training.
Communication
From the result, it can be seen that the safety
committees in all the companies evaluated, lack
good communication systems with both workers
and management. This is said because workers
in company A only made use of minutes of
meeting and memorandum to communicate
ideas and recommendations to management and
vice versa. From the KPI observed, only three
staff feedback/input was achieved and there was
just one learning from incidents. The number of
HSE awareness campaign reduced drastically
from 266 to 15 in a two (2) year period.
The KPI observed for Company B showed that
there is zero staff/feedback input and only one
learning from incidents but there were 61 HSE
awareness campaigns.
Information from the questionnaires completed
showed that the safety committee and
management of Company D only communicates
through minutes of meetings, the committee
only communicates to workers through notice
boards and workers do not have access to the
committee’s activities. Data collected also
revealed that workers in Company E only
communicate to the safety committee through
the suggestion box. This method is said to be
ineffective since members of the committee
hardly visit the suggestion box, thus reduces
workers involvement in safety. This is in
agreement with Dey and Malik, (2017) who
noted that an uncommunicative management
reduces the effectiveness of a safety committee.
Discussion of Chi-Square test
The Chi-Square Test is used to evaluate
differences between experimental or observed
data and expected or hypothetical data. As a
“goodness of fit” test, it tells us how well a set
of observations fits the outcome predicted by the
hypothesis being tested.
Since chi-square cannot be calculated using
percentages, the percentage effectiveness was
converted to actual figures by dividing by 100.
The expected data was then 100% that is 1 when
converted to actual numbers. The X2 calculated
was found to be 1.03, while the X2 tabulated
ranges were between 1.69 and 16.0 as lower and
upper region respectively.

25
Since X2 calculated falls in the lower critical
region, we rejected the null hypothesis, and
therefore conclude that there is a significant
difference between the observed and expected
level of effectiveness at 5% level of significance.
This suggests that the safety committees in the
companies evaluated need to address the areas
where they are lagging and make necessary
changes in order to increase the level of
effectiveness.
6. Conclusions Despite various limitations, this project work
was able to achieve its aim as the level of safety
committee application and effectiveness in the
selected oil/gas, construction and flour mill
companies were determined. The effectiveness
of the safety committees on a percentage level in
company A was 74%. 67% in company B. 64%
in company C. 57% in company D. 62% in
company E. 55% in company F. 81% in
company G, and 74% in company H. Using the
Traffic Light System for the Safety Committee
Audit Tool the level of safety committee
effectiveness in the selected companies is
acceptable.
7. Recommendations From the various observations made, the
following are recommended;
1. It is recommended that Employee
participation on the Safety Committee is
rotated as this raises awareness and
promotes engagement by including a wider
group of people.
2. Each year the safety committee’s progress
should be reviewed in order to evaluate the
group’s success in helping the organization
to meet its safety goals and objectives.
3. It is recommended that safety committees
develop and maintain an effective system of
communication with employees, keeping
them informed of the committee’s activities.
References Amund, O., Sowole, A. & Ibebuike, F (2014).
Health and Safety Issues in Nigeria’s Oil and
Gas Sector. http://www.energymixreport.com.
Badaulf, J. (2010). Measuring Safety Performance.
Key Performance Indicators (Leading and
Lagging Indicators). http://ehsjournal.org/jan-
baldauf/measuring-safety-performance-
kpis/2010/.
Bill, S. (2015). Developing an effective Safety
Committee. A practical Guide to Selecting and
Operating a Safety Committee.
http://www.ehstoday.com/safety.
Boden, L., Hall, J. & Levenstein, C. (1984). The
impact of health and safety committees. A study
based on survey, interview, and occupational
safety and health administration data. Journal of
Occupational medicine; 26(11):829-34.
http://www.ncbi.nlm.nih.gov/m/pubmed/650228
6/.
Bukowski, J.T. (2014). How to improve your safety
committee performance. Safety & Health
Magazine.
http://www.safetyandhealthmagazine.com/article
s/10413-effective-safety-committees.
Burke, K., Cullen, K. & Schullk, P. (2012). A
Systematic Review of The Effectiveness of
Occupational Health and Safety training.
Scandivian Journal of Work, Environment &
Health. .38(3), 93-208.
http://www.jstor.org/stable/4150885.
Bryce, M., Cheng, P. and Gutierrez, A.K. (2010).
Clones, Hybrids and Organ Transplants in
Manga and Anime. The International Journal of
the Humanities 8.5. 279-290
Canadian Centre of Occupational Health & Safety
(CCOHS) (2018). OSH Answers Fact Sheets.
Joint Health and Safety Committee-measuring
Effectiveness.
http://www.ccohs.ca/oshanswers/hsprograms/hsc
ommittees.html.
Dey, A., & Malik, V. K. (2017). Book Review. Current Medicine Research and Practice, 7(1), 31. doi:10.1016/j.cmrp.2016.12.005
Duke, L. P (2012). How to Reinvent an Ineffective
Safety Committee .Industrial Safety and Health
News. http://www.ishn.com/blogs/16-thought-
leadership/post/94507.
Federal Subsidiary Legislation (1996). Meetings of
safety and health committee (Part II,III,IV,V)
Occupational Safety and Health Act
Geldart, S. & Smith, C. (2010). Oraganizational
Practices and Workplace Health and safety. A
Cross-sectional Study in Manufacturing
Companies: Safety Science 48(5):562-569. http://www.google.com/amp/s/www.researchgate.net/
publication/245130789_Organizational_practices_an
d_workplace_health_and_safety_A_cross-
sectional_study_in_manufacturing_companies/amp
Greeley, S. (2016). Bureau of Labor Statictics.
Workplace Safety and Health.
http://www.maine.gov/labour/safety/index.

26
Giang, D. & Pheng, S., (2011). Role of construction
in economic development; Review of key
concepts in the past 40years. Habitat
International 35(1):118-125.
http://www.researchgate.net.
Hayes B. E., Jill Perander, Tara Smecko, and
Jennifer Trask (1998). Measuring Perceptions of
Workplace Safety: Development and Validation
of the Work Safety Scale, Volume 29/Number 3,
145-161
Holl, P., Paci, P.& Reilly, B. (2016). Unions, Safety
Committees and Workplace Injuries,
https://doi.org/10.1111/j.1467-
8543.1995.tb00435.x.
Ibenegbu, G (2018). Best oil and gas companies in
Nigeria.
http://www.google.com/amp/s/www.legit.ng/am
p/1130136-list-oil-gas-companies-nigeria-
websites.html
Ikpesu, J.E (2016). Safety Management, Jonokase
Nig. Co, Nigeria.
Karl Kjaer (1997). Handbook for Joint Safety and
Health Committees in the English-Speaking
Caribbean, ILO Consultant on Occupational
Safety and Health. Copyright © 1998
International Labour Organization (ILO)
Caribbean Office and Multidisciplinary
Advisory Team
Kochan, M. & George, K. (1985). The
Effectiveness of Health and safety Committees.
Relations Industrielles/Industrial RElations.
40(2), 257-283.
http://www.jstor.org/stable/23072264.
Kellerman.M, (2015). How effective is your safety
committee. Workplace Safety News.
http://safety.blr.com/workplace-safety-
news/safety-administration/safety-
committees/How-effective-is-your-safety-
committee/
Manoukian, J. (2015). Measure the Effectiveness of
Your Safety Committee. Enablon
Insights.Safetip #122.
http://www.enablon.com/blog/safetip.
Milgate,P., Loughling,K. & Innes, E. (2012).
Examining the Effectiveness of Health and Safety
Committee.
http://www.researchgate.net/public/10933325.
Morse, T., Bracker, A., Warren, N., Goyzueta, J., &
Cook, M. (2012). Characteristics of effective
health and safety committees: Survey results.
American Journal of Industrial Medicine, 56(2),
163–179. doi:10.1002/ajim.22096
Muiruri, G, & Mulinge, C. (2014). Health and
Safety Management of Construction Project
Sites in Kenya. http://www.academia.edu.
Newman, D. (2017). Address Safety in Your
workplace with a Safety Committee. Smart
Business. http://www.sbnonline.com.
Oregon OSHA guide, (2014). Oregon Occupational
Safety and Health Division, Oregon
Administrative Rules AO 3-2019 Division 1,
USA
Plischke, H. (2014). Best Practices for Workplace
Safety Committee. Worksafe MT.
http://www.worksafemt.com.
Pratt, D., Mackenzie, K. & Miller, D., (2010). Tips
for Safety Committee Effectiveness.
ehstoday.com/safety/best-
practices/ehs_imp_39324.
Silburn,J. (2015). Best Practice Safety Committee.
Forming Your Safety Committee. Environmental
Health and Safety Oregon State University
http://ehs.oregonstate.edu.
Smallwood, J., Haupt, T. & Shakantu, A., (2008).
Construction Health and Safety in South Africa:
Status and recommendations. CIDBreport.
http://www.tandfonline.com
South Australia Work Health and Safety
Regulations (2012). This version is not
published under the Legislation Revision and
Publication Act 2002 [7.7.2017]
Spath, J. (2010). Building a Better Safety and
Health Committee. Gulf Coast Books LLC.
ISBN-13: 978-1885581112
http://www.amazon.com/Building-Better-Safety-
Health-Committee/dp/1885581114
Tuohy, C. & Simard, M. (2011). The Impact of
Joint Health and Safety Committees in Ontario
and Quebec: A Study Prepared for the Canadian
Association of Administrators of Labour
Legislation.
http://books.google.com.ng/books/about/The_im
pact_of_Joint_Health_and_Safety_Co.html
Uwerevu, E. O. (2011). Accident Prevention in
Workplace. Mareh Publishers.
Wanderhoof, G. (2012). How effective is your
safety committee. Workplace Safety News
http://safety.blr.com/workplace-safety-
news/safety-administration/safety-
committees/How-effective-is-your-safety-
committee/
Workplace Safety Committee Guide (WSCG)
(2012). Elements of an Effective Safety
Committee. http://www.safetyhealth.ufcw.org
Yassi, A., Lockhart, K., Sykes, M., Buck, B. &
Spiegel, J. (2013).Effectiveness of a Joint Health
and Safety Committee: A Realistic Review.
http://www.ncbi.nlm.nih.gov/m/pub

27
Authors
Amb. Jasper E. Ikpesu is currently the HSE
Manager [the Head, Department of HSE (also a
Lecturer)] in Petroleum Training Institute,
Effurun, Delta State, Nigeria. He is a Certified
Occupational Safety Specialist (COSS),
Certified ISO 45001:2018 OHS MS, ISO
9001:2015 QMS. He is a Certified PT and MPT
Level 2 (NDT). He has completed a M.Sc. in
Solid State Physics and B.Sc. in Physics at the
Delta State University, Abraka, and has a Post
Graduate Diploma in HSE Management from
University of Lagos, Nigeria. He won the
International award as the Father of Modern
Safety in Industrial Toxicology (World
Championship Award in 2018) - the best
researcher out of 5205 nominations from 65
countries. He is a Fellow of the International
Agency for Standard and Rating (FIASR);
Institute of Management and Consultancy
(FIMC) and Ambassador of the World Safety
Organisation. He is an author and member of
different professional associations/bodies;
American Society of Safety Professionals,
Institute of Safety Professionals of Nigeria,
Nigerian Environmental Society, Institute of
Non-Destructive Testing, Nigeria (where he is
also a Director), American Society of Non-
Destructive Testing.
Uzoh Samuel Chukwuka is an HND holder
from the renowned Petroleum Training Institute,
Effurun Delta State. He graduated with a
distinction grade in Industrial Safety
Technology (2019). He obtained his National
Diploma from the same Institute in 2016 of
which he was awarded the Best Graduating
Student (Safety Option) for 2015/2016 academic
session. He was also awarded Best Student
Academics by the Industrial Safety and
Environmental Technology Department during
his HND programme in 2018 and in the 2019
academic year. He has done certification courses
which includes Fundamentals of Process Safety
Engineering (module 1) in the Department of
Industrial Safety, PTI, The COSHH Risk
Assessor Certification organized by the
International Association for Chemical Safety
and HSE Competence Development Training
(level 3) at ISPON Secretariat, Warri, Delta
State. He was a student member of the American
Society of Safety Professionals (ASSP) PTI
Chapter, in which he served as the Program
Coordinator. He was also a student member of
Institute of Safety Professionals of Nigeria
(ISPON).

28
Olatunji Ojeaburu Bukola hails from Edo
State, Nigeria. She is a Graduate of the
Petroleum Training Institute (PTI) Delta State,
where she obtained her Higher National
Diploma in Industrial Safety Technology. She
was a student member of the Institute of Safety
Professionals of Nigeria (ISPON).
Miss Deborah Adojor Ogheneochuko is a
HND holder from the Petroleum Training
Institute Effurun Delta State. She graduated with
upper credit grade from the Department of
Industrial Safety Technology. Deborah has done
certification courses on QA/QC (Quality
Assurance/ Quality Control) in the Department
of Mechanical Engineering at the Petroleum
Training Institute, Certificate of Fundamentals
of Process Safety Engineering (module 1) in the
Department of Industrial Safety, Petroleum
Training Institute, Certificate of HSE
Competence Development Training (level 3) at
ISPON secretariat, Warri, Delta State. She was a
student member of American Society of Safety
Professionals and student member of Institute of
Safety Professionals of Nigeria.

1
Worker Complacency Towards Work Method Statements in the
Australian Construction Industry
Ms Joanna Krenske. Ms Allison Hutton. Dr Karen Klockner. Mr Darren Delaney. All Central
Queensland University. Email: [email protected]
Abstract Work Method Statements (WMS) are a key strategy relied upon in the Construction industry
to ensure that safe work is conducted, and safe work practices are followed. However, an
increase in a number of observed behaviours indicate that employee complacency is a major
issue regarding the adherence of WMS practices for this industry. Employee’s beliefs about
complacency towards WMS was therefore explored with employees indicating that
repetition/routine, lack of interest, boredom, poor communication and personality
clashes/conflict were the main factors that drive complacency. Employees identified that
complacency was more prevalent at the end of the working week or shift cycle for some
employee groups, however this was not reflected across all job divisions. Results also identified
that a high percentage of employees supported positive communication in the form of
encouragement, humour, personal discussions and job-related issues to reduce this workplace
complacency. Suggestions for stopping complacency also included encouraging increased
interactions between workers and management in order to guide and support employees, as
well as identifying which tasks contributed to increased levels of complacency. Employees
identified that increased site visits, having positive interactions and discussions as well as
implementing group reviews would see a demonstrated greater sense of active involvement in
workplace safety in order to reduce complacency.
Keywords: Complacency. Safety Culture. Work Method Statements. Positive Interactions.
1. Introduction In Australia the Construction Industry
remains one of the top three most dangerous
industries just behind Transport, postal and
warehousing (38 fatalities), followed
closely by Agriculture, forestry and fishing
(37 fatalities) and the Construction industry
had 24 fatalities in 2018 (Safe Work
Australia, 2020). Over the five-year period
from 2014 to 2018, there were 156 worker
fatalities in the Construction industry in
Australia. These are not attributed to
industry size but to a disproportionately
high fatality rate for this industry with falls
from height being the main mechanism of
fatality. The construction industry also
averages 12,652 serious injury claims each
year (2001-2016) (Safe Work Australia,
2018). An investigation into issues being
faced by the Construction Industry in an
attempt to reduce these numbers (Safe
Work Australia, 2012) has pointed towards
a culture of safety becoming a mere paper-
based exercise and made seven
recommendations for the industry related to
work safety culture, consultation and
collaboration. The report emphasised the
importance of a collaborative approach to
resolving safety issues on construction sites
(Safe Work Australia, 2012).
There has been an increase in the number of
employees working on a commercial
construction project demonstrating
observable behaviours that indicate
employee complacency regarding the
following of the information contained in
all Work Method Statements (WMS)
and/or any organisational policies and
procedures that relate to the work method
statements. Injury reports also confirmed
and suggested that causes of some injuries
were due to employees not following the
work method statement provided.
2. Worker Complacency
Complacency is a natural function and is
defined by the Merriam-Webster
Dictionary (2018) as self-satisfaction,
especially when accompanied by
unawareness of actual dangers or
deficiencies, and has numerous driving
30
factors. Poisseroux (2010) highlights that
complacency in the workplace often occurs
when employees become accustomed to
completing tasks in a defined manner as it
cultivates a culture where employees
become oblivious to the hazards that may
be encountered during the task.
Whilst Guo, Yiu and González (2016)
suggest that level of experience, knowledge
and skills will contribute to an accident
occurring in the construction industry, Zin
and Ismail (2012) suggest that the main
contributor to workplace accidents
occurring is attitude and behaviour. Hale et
al. (2012) also point out that safety
occurrences can be associated with
motivation, morale, compliance,
complacency, overconfidence and
perception of risk. Individual workers have
differences in perceived levels of risk and
complacency which will vary depending on
the duration between changes in work
environments, the allocation of new tasks,
the level of interest in new tasks, the use of
new equipment and personality clashes
with team members (Hayes, McDermott &
Lingard, 2015). It has recently been stated
that most risk analysis methods in the
construction industry lack a theoretical
background and therefore the analysis of
safety risk has traditionally had limited
measurable factors, making the assessment
and understanding of why accidents occur
now needing to be more practical in relation
to understanding risk generation and
mitigation (Choe & Leite, 2020).
Multiple factors drive complacency and in
attempting to understand the behavioural
traits that drive complacency, it is noted
that several key factors increased the level
of complacency experienced by employees,
including proceduralised or repetitious
tasks that led to disinterested or bored
employees (Hayes, McDermott & Lingard,
2015). Other contributing factors comprise
poor communication, conflict of ideas,
personality clashes that cause conflict, as
well as issues being poorly discussed,
poorly communicated, poorly instructed, no
positive feedback systems in place as well
as directions or instructions not being
understood by all employees on the site
(Krishnamurthy, 2015).
Later research into safety complacency by
Årstad and Aven (2017) identify that
complacency should be looked at as an
issue which not only affects the system, but
one which reflects what is happening in the
wider organisational system. Their
examination of complexity in major safety
events points towards management over
confidence and conclude that “the notion of
complacency is used to express concerns
about a systemic issue and reveals concerns
about relating to complexity in practice”
(Årstad & Aven, 2017, p. 121).
Complacency around following workplace
safety processes and procedures can
therefore point towards dysfunctional
current practices.
3. Work Method Statements A Work Method Statement (WMS) is
described by the Office of the Federal
Safety Commissioner (2018) as a document
that identifies all hazards that may be found
in a workplace and assesses the risk these
hazards may present as well as identifying
the control measures that must be
implemented. Furthermore, Work Health
and Safety Regulations in Queensland,
Australia mandate that a Person
Conducting Business or Undertaking
(PCBU) in the construction industry must
develop and publish a WMS which will (a)
identify the work that is high-risk
construction work; (b) state hazards
relating to the high-risk construction work
and risks to health and safety associated
with those hazards; (c) describe the
measures to be implemented to control the
risks; and (d) describe how the control
measures are to be implemented, monitored
and reviewed.
A WMS is similar to a Job Safety Analysis
(JSA), as they both guide safe work
practices for all workers, by breaking down
all work activities into a series of steps to
recognise the hazards that may be
encountered and identify the risk controls
that may be introduced into each step to
eliminate the risk or reduce the risk to an
acceptable level (Sanchez, Pelaez & Alis,
2017). Saunders et al. (2016) suggest that
the organisation must include reference to
the WMS in their risk management
practices, to ensure that all the hazards for

31
a specific work function have been
identified and documented, in consultation
with all employees and contractors
performing the tasks. Recent research by
Arstad and Aven (2017) has concluded that
‘the notion of complacency is used to
express concerns about a systemic issue and
reveals concerns relating to complexity in
practice’ (p. 121) as well as it leading to
major accidents.
4. The Construction Project This research was conducted in an
Australian commercial construction setting.
The construction project contained
numerous work functions in cross-harbour
coordination, purchasing and expediting,
inventory management, transport and
logistics, materials management, IT
systems management and interaction with
the client. Responsibilities found in the
project site encompassed all mainland
facilities which included multiple laydown
yards, transport and logistics to include
warehouses, truck marshalling yards and
marine loading facilities. Furthermore, the
commercial construction company
embedded the legislative principles of all
industrial, safety and environment
legislation, enacted by the Commonwealth
and State jurisdictions, as well as ensured
that organisational environmental, safety
and health requirements and all relevant
policies and procedures of the client were
implemented at the project site (Saunders et
al., 2016).
5. Methodology The principal methodology employed for
this research was ethnography, to identify
complacency and determine if a worker had
been affected by complacency, as well as
having an outcome of providing
suggestions on how to identify
complacency in the workplace. The
rationale for undertaking an ethnographic
approach was to subjectively identify the
reason employees are experiencing feelings
of complacency into following the work
method statement approved by the
construction company (Albert, Hallowell &
Kleiner, 2013).
As there are numerous different job titles
throughout the construction process it was
decided to collect data via job divisions.
These job divisions include operators and
truck drivers, cranes rigging and doggers,
warehousing and stores, and others
consisting of labourers, peggies and
tradesman. These job divisions were chosen
due to the fact that the nature of the work
would have them signing on to similar work
method statements (in most cases). The way
in which data was collected was a sensitive
issue due to the stage of the project. A
questionnaire was developed in order to
survey employees with 140 participants
completing the questionnaire. These
participants worked in the operational areas
of transportation (truck drivers and
operators n=42), warehousing (store-
persons, forklift drivers n= 30), crane
operators (riggers, doggman n= 45),
labourers (veggies, trades-persons, others
n=23), as these operational areas had
agreed to similar work method statements.
Participants were given the definition of
complacency and asked a series of
questions covering two main areas, one
being their knowledge, input and
suggestions for WMS and the second area
being about complacency. Questions asked
a serious of yes or no response questions to
things like Do you input to WMS? Do you
think you or others are affected by
complacency? Other questions were open
ended such as If you could suggest
something to stop complacency in the
workplace what would it be?
6. Results Results indicated that all employees had a
wide understanding of complacency, with
87% admitting they had been affected by
complacency or knew somebody who is or
has been affected by complacency as shown
in Figure 1.

32
Figure 1
Percentage of Employees Affected by Complacency by Operational Area
Due to the diverse nature of the project
and with employees frequenting
multiple locations, the survey also
found that 61% of employees had
worked in multiple locations within the
project and 25% of these acknowledged
the same level of complacency was
experienced in all locations. However,
78% indicated that the complacency
level varied between locations with a
higher percentage of reporting a
growing increase in levels of
complacency experienced.
6.1 Complacency Drivers
Over all employees identified that
repetition/routine (83 responses), lack
of interest and boredom (38 responses)
and poor communication/personality
clashes/conflict (22 responses) as the
three highest factors that drive
complacency. Several other factors
were identified in relation to why
complacency was occurring in relation
to the SWM as shown in Figure 2.
Repetition was acknowledged as being
the biggest contributor for all workers,
followed by boredom, morale and to a
lesser extent issues such as
communication, distraction and
external issues were reported.
Figure 2
Complacency Driving Factors
0%
20%
40%
60%
80%
100%
Transport Worker Crane Operators Warehousing Other Occupations
0
5
10
15
20
25
30
Transport Workers Crane Operators Warehousing Other Occupations
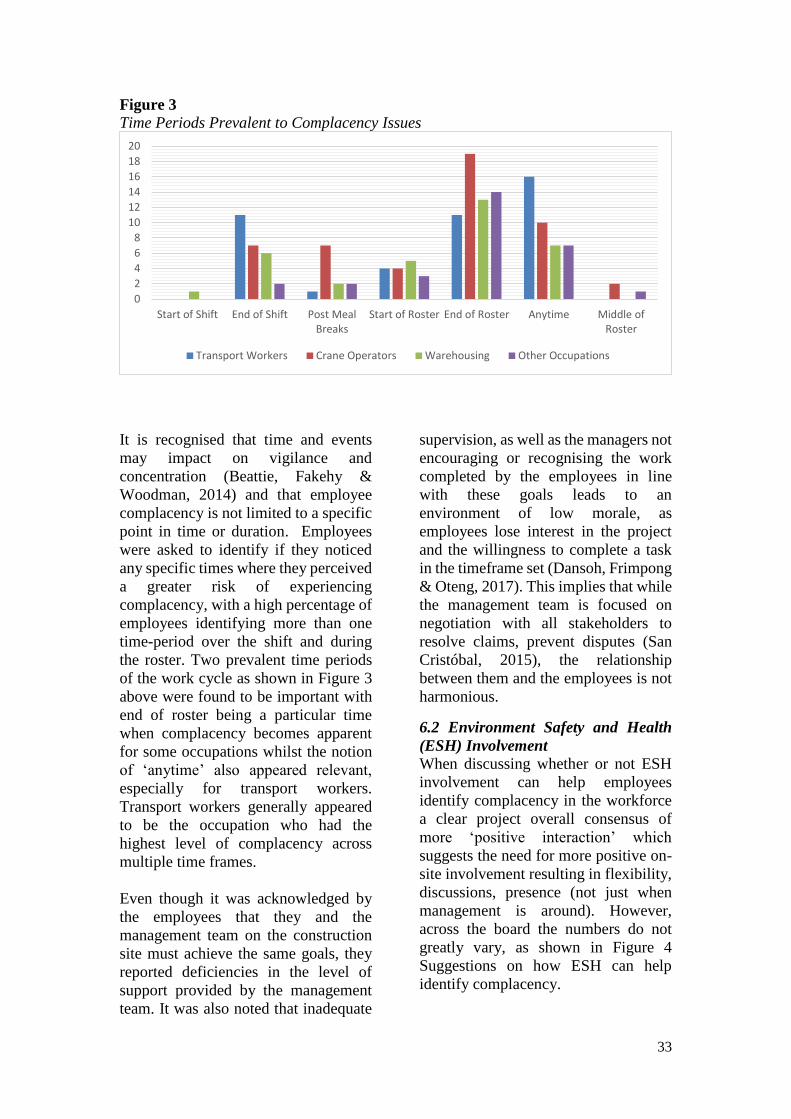
33
Figure 3
Time Periods Prevalent to Complacency Issues
It is recognised that time and events
may impact on vigilance and
concentration (Beattie, Fakehy &
Woodman, 2014) and that employee
complacency is not limited to a specific
point in time or duration. Employees
were asked to identify if they noticed
any specific times where they perceived
a greater risk of experiencing
complacency, with a high percentage of
employees identifying more than one
time-period over the shift and during
the roster. Two prevalent time periods
of the work cycle as shown in Figure 3
above were found to be important with
end of roster being a particular time
when complacency becomes apparent
for some occupations whilst the notion
of ‘anytime’ also appeared relevant,
especially for transport workers.
Transport workers generally appeared
to be the occupation who had the
highest level of complacency across
multiple time frames.
Even though it was acknowledged by
the employees that they and the
management team on the construction
site must achieve the same goals, they
reported deficiencies in the level of
support provided by the management
team. It was also noted that inadequate
supervision, as well as the managers not
encouraging or recognising the work
completed by the employees in line
with these goals leads to an
environment of low morale, as
employees lose interest in the project
and the willingness to complete a task
in the timeframe set (Dansoh, Frimpong
& Oteng, 2017). This implies that while
the management team is focused on
negotiation with all stakeholders to
resolve claims, prevent disputes (San
Cristóbal, 2015), the relationship
between them and the employees is not
harmonious.
6.2 Environment Safety and Health
(ESH) Involvement
When discussing whether or not ESH
involvement can help employees
identify complacency in the workforce
a clear project overall consensus of
more ‘positive interaction’ which
suggests the need for more positive on-
site involvement resulting in flexibility,
discussions, presence (not just when
management is around). However,
across the board the numbers do not
greatly vary, as shown in Figure 4
Suggestions on how ESH can help
identify complacency.
0
2
4
6
8
10
12
14
16
18
20
Start of Shift End of Shift Post MealBreaks
Start of Roster End of Roster Anytime Middle ofRoster
Transport Workers Crane Operators Warehousing Other Occupations

1
Figure 4
Suggestions for ESH Assistance to Identify Complacency
However, the suggestion for more
‘positive interaction’ can be
incorporated into not only positive
interaction in the field but in the second
suggestion of more toolbox/feedback
and communication. It should also be
noted that individuals had trouble in
coming up with suggestions for this
issue. Conversely some employees did
show an interest in training as
mentioned above and the possibility of
having toolbox meetings earlier in the
week to promote safety early instead of
later/mid-week.
The most identified methods of
stopping complacency were positive
communication (74%) in the form of
encouragement, humour, personal
discussions (caring) and job-related
issues. Employees identified numerous
possible times that complacency may
become more prevalent with the end of
the week (37%) being the most
common throughout the project but not
necessarily across all job divisions.
When looking at data collected across
the project in regard to suggestions to
stopping complacency and ESH
involvement in helping employees
identify complacency, there were many
suggestions, all of which would aid the
project in complying with Queensland
Workplace Health and Safety Act and
Regulations.
6.3 Employee Input into WMS
Employees recognised that there are
many benefits of having WMS other
than just to be law abiding. Many of
these benefits were discussed and
pointed out when talking to employees
in regard to why they have WMS.
Employees identified that WMS were
beneficial to them as a hazard
identification tool and a point of
reference for tasks, it was a positive tool
in allowing everyone to work in a
similar/same fashion safely. When
looking at employees’ beliefs of
whether or not they have input into their
WMS 84% of employees believed that
they have positive input as shown in
Figure 5.
02468
1012141618
Transport Workers Crane Operators Warehousing Other Occupations
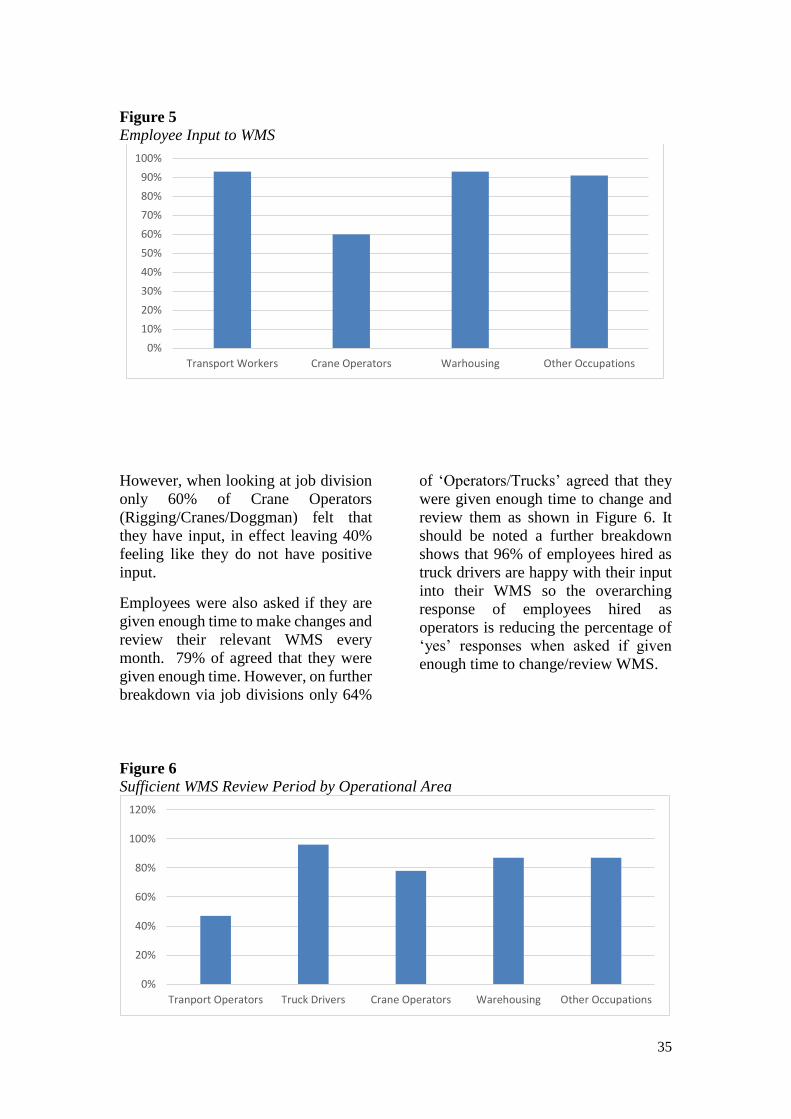
35
Figure 5
Employee Input to WMS
However, when looking at job division
only 60% of Crane Operators
(Rigging/Cranes/Doggman) felt that
they have input, in effect leaving 40%
feeling like they do not have positive
input.
Employees were also asked if they are
given enough time to make changes and
review their relevant WMS every
month. 79% of agreed that they were
given enough time. However, on further
breakdown via job divisions only 64%
of ‘Operators/Trucks’ agreed that they
were given enough time to change and
review them as shown in Figure 6. It
should be noted a further breakdown
shows that 96% of employees hired as
truck drivers are happy with their input
into their WMS so the overarching
response of employees hired as
operators is reducing the percentage of
‘yes’ responses when asked if given
enough time to change/review WMS.
Figure 6
Sufficient WMS Review Period by Operational Area
0%
10%
20%
30%
40%
50%
60%
70%
80%
90%
100%
Transport Workers Crane Operators Warhousing Other Occupations
0%
20%
40%
60%
80%
100%
120%
Tranport Operators Truck Drivers Crane Operators Warehousing Other Occupations
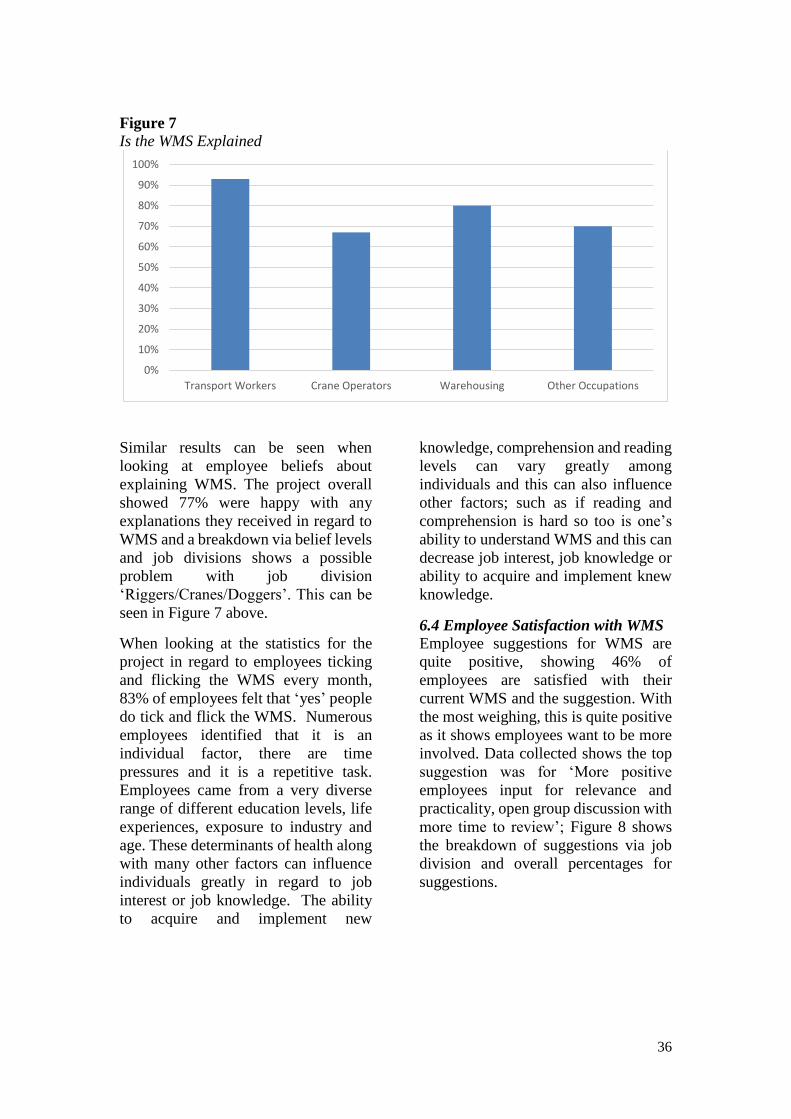
36
Figure 7
Is the WMS Explained
Similar results can be seen when
looking at employee beliefs about
explaining WMS. The project overall
showed 77% were happy with any
explanations they received in regard to
WMS and a breakdown via belief levels
and job divisions shows a possible
problem with job division
‘Riggers/Cranes/Doggers’. This can be
seen in Figure 7 above.
When looking at the statistics for the
project in regard to employees ticking
and flicking the WMS every month,
83% of employees felt that ‘yes’ people
do tick and flick the WMS. Numerous
employees identified that it is an
individual factor, there are time
pressures and it is a repetitive task.
Employees came from a very diverse
range of different education levels, life
experiences, exposure to industry and
age. These determinants of health along
with many other factors can influence
individuals greatly in regard to job
interest or job knowledge. The ability
to acquire and implement new
knowledge, comprehension and reading
levels can vary greatly among
individuals and this can also influence
other factors; such as if reading and
comprehension is hard so too is one’s
ability to understand WMS and this can
decrease job interest, job knowledge or
ability to acquire and implement knew
knowledge.
6.4 Employee Satisfaction with WMS
Employee suggestions for WMS are
quite positive, showing 46% of
employees are satisfied with their
current WMS and the suggestion. With
the most weighing, this is quite positive
as it shows employees want to be more
involved. Data collected shows the top
suggestion was for ‘More positive
employees input for relevance and
practicality, open group discussion with
more time to review’; Figure 8 shows
the breakdown of suggestions via job
division and overall percentages for
suggestions.
0%
10%
20%
30%
40%
50%
60%
70%
80%
90%
100%
Transport Workers Crane Operators Warehousing Other Occupations

37
Figure 8
Employee Satisfaction with WMS
7. Identified Complacency
Solution Strategies Employees were surveyed on what
strategies they felt would resolve the
issues of complacency and identified
effective communication an essential
solution strategy to eliminate
complacency in the site (Sutherland &
Wordley, 2017). Ross (2015) also links
positive communication with employee
engagement and agrees with the
employees surveyed that this may
include conversations about work-
related activities, encouragement and
positive reinforcement, while other
conversations could be light-hearted
and on personal matters. Employees
also pointed out other solution
strategies included varying the tasks
assigned to them and introducing
additional rest periods for mundane and
repetitious tasks as shown in Figure 9.
Figure 9
Solution Strategies Suggested by Employees
Whilst solution strategies are designed
to identify and change workplace
behaviours, patterns of inadequate
training, poor communication, task
variety and job rotation, as well as
limited supervision, have been observed
(Hyten & Ludwig, 2017). Although
most of the employees surveyed
presented a wide range of ideas and
suggestions to eliminate complacency
0
5
10
15
20
25
Satisfied Increased Consitency Increase Review Period Simplify
Transport Worker Crane Operators Warehousing Other Occupations
104
2015
2 1 2
0
20
40
60
80
100
120
Communication Task Variety Additional RestPeriods
KeepingOccupied
Refocus Unable / TaskRestraints

38
at the project, a large percentage
focused of task variety and job rotation
as the most appropriate strategy, as this
would both reduce complacency and
optimise the performance of each
employee (Salim & Viswanadham,
2017) as shown in Figure 10.
Figure 10
Complacency Solution Strategies
Workplace training was also discussed
as a solution strategy because
employees in the construction industry
appear to have limited skills to
complete increasingly complex tasks
(Detsimas et al., 2016). Although
employees suggested that any training
program developed and introduced
should not be limited to the classroom,
videos and other visual aids provide the
employee with a visual representation
of the information provided so that it is
easier to understand (Shabiralyani et al.,
2015). However, employees preferred
tactile learning methods, which enables
small and large teams to collaborate by
applying their fine motor skills to
handle materials while learning new or
difficult work (Ihsan & Diem, 2016).
Employees were also asked ‘what
would you change to enhance the
Project’s safety program?’ Results
show that employees’ top three ways to
enhance the safety programme were
communication, safety staff and
training based as shown in Figure 11.
Figure 11
Safety Survey Results Overview
Stim
ula
tio
n
Task
Var
iety
Ret
rain
ing
Ref
ocu
ssin
g
Man
agem
ent
Co
mm
un
icat
ion
Kee
p A
ctiv
e
Ind
ivid
ual
Ap
pro
ach
Cle
ar S
up
ervi
sio
n
Ince
nti
ves
No
Res
po
nse
Transport Workers Crane Operators Warehousing Other Occupations
0%
5%
10%
15%
20%
25%
Communcation Training Safety Personnel

1
8. Discussion The majority of participants surveyed
reported being affected by complacency
and had experienced it across multiple
construction work site locations and
construction occupations. Employees
identified that repetition/routine, lack of
interest and boredom and poor
communication / personality clashes /
conflict as the three highest factors that
drove complacency. The time period
where complacency towards WMS was
most prevalent was identified as the end
of roster. This would make sense if
most workers were keen to get home
from work rather than completing work
procedures and processes.
Generally, the employees identified that
WMS were beneficial to them as a
hazard identification tool and a point of
reference for tasks as well as being a
positive tool in allowing everyone to
work in a similar/same fashion safely.
The majority of employees felt that they
had some form of positive input into
their WMS. Overall results showed that
employees were mostly happy with any
explanations they received in regard to
WMS but felt that the process was a tick
and flick exercise with numerous
employees identifying that this might be
due to individual factors, time pressures
and the repetitive nature of the task.
Employees reported being satisfied
with their current WMS but wanted to
be more involved and have a more
positive input to WMS to make them
more relevant and practical as well as
wanting to open up group discussions
and have more time to review WMS.
Employees highlighted the desire for
more positive interactions in respect of
the use of WMS with a view to more
discussion and flexibility with an
increase in presence. Increasing
feedback and communication across
sites would also increase employees’
awareness of changes, incidents and
lessons learnt and aid in general
compliance. The allocation of specific
time for reviewing WMS with a
suggested once every two months being
sufficient in regard to group/team
reviews as WMS were not changing
every month. A whole group review
lasting or scheduled less than one hour
was proposed.
Procedures for implementing changes
to WMS that result in more positive
communication and contact between
relevant parties (employees/
supervision/ ES&H) when
implementing changes were seen as
important. This would be required to
eliminate the possibility of ES&H
changes not being identified by
employees (by the tick and flick
phenomenon as identified above) and to
allow employees more of an input into
the discussions around WMS.
Changing training and toolbox
meetings to be more tactile on job
training (not just classroom based) was
seen as beneficial in keeping employees
interested and engaged. Having toolbox
discussion early in week was seen as
beneficial to encourage people to think
about safety earlier in the week.
9. Conclusions Complacency is a multi-faceted feeling
that can be driven by numerous factors.
Employees generally identify the
common driving factor, of repetition
and routine, as a major contributing
factor to their complacency. Employees
indicated that they would actually like
more active involvement in the forms of
more site visits, more positive
interactions and discussions, and the
possibility of implementing wider
group reviews. Several suggestions
were offered to reduce the continuing
‘tick and flick’ phenomenon in regard
to WMS at construction sites.

40
References Albert, A., Hallowell, M.R. & Kleiner,
B.M. (2013). Enhancing construction
hazard recognition and communication
with energy-based cognitive
mnemonics and safety meeting
maturity model: Multiple baseline
study. Journal of Construction
Engineering and Management, 140(2),
04013042.
Årstad, I. &Aven, T. (2017). Managing
major accident risk: Concerns about
complacency and complexity in
practice. Safety Science, 91, 114-121.
Beattie, S., Fakehy, M. & Woodman, T.
(2014). Examining the moderating
effects of time on task and task
complexity on the within person self-
efficacy and performance relationship.
Psychology of Sport and Exercise,
15(6), 605-610.
Business dictionary 2014, Employee
Morale.
http://www.businessdictionary.com/def
inition/employee-morale.html
Choe, S. & Leite, F. (2020). Transforming
inherent safety risk in the construction
industry: A safety risk generation and
control model. Safety Science, 124,
104594.
Dansoh, A., Frimpong, S. & Oteng, D.
(2017). Challenges associated with
project teams in managing variations
on construction projects. Conference:
6th International Conference on
Infrastructure Development in Africa
(ICIDA 2017).
http://ir.knust.edu.gh/handle/12345678
9/10882
Detsimas, N., Coffey, V., Sadiqi, Z. & Li,
M. (2016). Workplace training and
generic and technical skill development
in the Australian construction industry.
Journal of Management Development,
35(4), 486-504.
Gahan, P., Harbridge, R., Healy, J. &
Williams, R. (2017). The ageing
workforce: policy dilemmas and
choices. Australian Journal of Public
Administration, 76(4), 511-523.
Guo, B.H.W., Yiu, T.W. & González,
V.A. (2016). Predicting safety behavior
in the construction industry:
Development and test of an integrative
model. Safety Science, 84, 1-11.
Hale, A., Walker, D., Walters., N & Bolt,
H. (2012). Developing the
understanding of underlying causes of
construction fatal accidents. Safety
Science, 50(10), 2020-2027.
Hayes, J. McDermott, V. & Lingard H.
(2015). What is risk? Construction
activity near hazardous infrastructure.
In: Raidén, A B and Aboagye-Nimo, E
(Eds) Procs 31st Annual ARCOM
Conference, 79 September 2015,
Lincoln, UK, Association of
Researchers in Construction
Management, 105-114.
Hor, J. (2012). Managing Workplace
Behaviour. Sydney, NSW: CCH.
Hyten, C. & Ludwig, T.D. (2017).
Complacency in Process Safety: A
Behavior Analysis Toward Prevention
Strategies', Journal of Organizational
Behavior Management, 37(3-4), 240-
260.
Ihsan, D. & Diem, C.D. (2016). The
learning styles and language learning
strategies of the EFL students at
tertiary level. Jurnal Ilmu Pendidikan,
4.
Krishnamurthy, N. (2015). Construction
productivity and risk management in
Singapore. The Singapore
Engineer’The Magazine of the
Institution of Engineers, Singapore, 22-
29.
Merriam-Webster M-W Inc (ed) (2018).
'Complacency', Merriam-Webster Inc,
Springfield.
Office of the Federal Safety Commissioner
(2018), Guidance for Producing Safe
Work Method Statements (SWMS),
Commonwealth of Australia, Canberra.
Poisseroux, M.L. (2010), Making a
difference: A grounded theory study of
employee involvement in the
workplace, Capella University.
(Doctoral dissertation, Capella University, Minneapolis, MN).
https://search.proquest.com/openview/2
3fc7bddee380f8c00e8af060434ebf5/1?
pq-
origsite=gscholar&cbl=18750&diss=y
Ross, C. (2015). Effective Communication
Skills for Safety Professionals. ASSE
Professional Development Conference
and Exposition, American Society of
Safety Engineers.

41
Safe Work Australia. (2012). ACT acts to
improve safety in construction.
https://www.safeworkaustralia.gov.au/b
ook/act-acts-improve-safety-
construction
Safe Work Australia. (2020).Work-
Related Traumatic Injuries, Australia.
https://www.safeworkaustralia.gov.au/s
ystem/files/documents/2002/work_relat
ed_traumatic_injury_fatalities_report_2
018.pdf retrieved 27 March 2020.
Salim, R. & Viswanadham, N. (2017).
Rotation Practices: Perceptions and
Challenges Associated with University
of Dodoma, Tanzania. International
Journal of Research in Management &
Social Science, 5(3,) 118-124.
San Cristóbal, J.R. (2015). The use of
Game Theory to solve conflicts in the
project management and construction
industry. Int. J. Inf. Syst. Proj. Manag,
3, 43-58.
Sanchez, F.A.S., Pelaez, G.I.C. & Alis,
J.C. (2017). Occupational safety and
health in construction: a review of
applications and trends. Industrial
health, 55(3), 210-218.
Saunders, L.W., McCoy, A.P., Kleiner,
B.M., Lingard, H., Cooke, T., Mills, T.,
Blismas, N. & Wakefield, R. (2016).
International benchmarking for
performance improvement in
construction safety and health.
Benchmarking: An International
Journal, 23(4), 916-936.
Shabiralyani, G., Hasan, K.S., Hamad, N.
& Iqbal, N. (2015). Impact of visual
aids in enhancing the learning process
case research: District Dera Ghazi
Khan., Journal of Education and
Practice, 6(19), 226-233.
Sutherland, W.J. & Wordley, C.F. (2017).
Evidence complacency hampers
conservation. Nature Ecology &
Evolution, 1(9), 1215-1216.
Zin, S.M. & Ismail, F. (2012). Employers’
Behavioural Safety Compliance Factors
toward Occupational, Safety and
Health Improvement in the
Construction Industry. Procedia -
Social and Behavioral Sciences, 36,
742-751.
Authors
Ms Joanna Krenske is a proactive
safety leader with attentiveness towards
developing effective, functional safety
health management systems in the mining,
construction and government industries.
Joanna specialises in driving improvements
and compliance within her technical field
of Occupational Health and Safety. She is
currently a Senior Safety Advisor in a Local
Government Organisation where she
actively engages with the workforce to
deliver a safe workplace for all.
Mr Darren Delaney’s career in road
transport spans over three decades and
includes a variety of senior operational
roles in the industry where he has
implemented numerous practices that were
intended to make the industry a safer place
to work. Based in Brisbane, Darren has a
Bachelor of Occupational Health and
Safety and Master of Advanced Safety
Science Practice. His major fortes include
Human Factors, Transport safety, Fatigue
and Accident investigation. He now is
undertaking his Doctor of Professional
Studies at CQUniversity Australia, where
he endeavours to develop a contributing
factors framework that will extend beyond
the current investigation methodology
applied to the road transport sector.

42
Ms A Hutton. After a 20-year career as
a safety professional in construction,
mining and heavy industry, and several
years teaching at CQUniversity, Allison
was recently appointed as Head of Course
– Accident Forensics. Allison is a member
of ASASI, a Fellow of the Australian
Institute of Health and Safety, a Fellow of
the Institute of Managers and Leaders and a
PhD Researcher with CQUniversity.
Dr Karen Klockner is the Head of
Postgraduate Courses Transport and Safety
Science at Central Queensland University
and teaches across Human Factors, OH&S,
Accident Forensics, and Psychology units
in the School of Health, Medical and
Applied Sciences. She is a Senior Fellow of
the Higher Education Academy UK and a
member of the Office of Industrial
Relations Queensland, Work Health and
Safety, Transport and Storage Industry
Sector Standing Committee (ISSC). Prior
to joining CQUniversity Karen was the
Manager of Human Factors at the Rail
Safety Regulation Branch for the
Department of Transport and Main Roads
in Queensland and has many years’
experience as a safety professionals
working in safety critical industries.

43
Workplace Human Factors Affecting the Commercial Fishing Industry:
A Review of International and National Studies Luke Masters – Bachelor of Science (Health, Safety and Environment) at Curtin University,
Western Australia. Email: [email protected]
Key words: Commercial, Fishing, Industry, Workplace Human factors, Ergonomics.
1. Introduction The global fishing industry employs
roughly 35 million people working on 4.5
million fishing vessels (Lucas et al., 2014).
The majority (97%) of this workforce are
employed in developing countries (Lucas et
al., 2014). In Australia 17,000 people were
estimated to be employed in fishing and
aquaculture from 2017-2018 (Steven et al.,
2020). Fishing is critical to much of the
world’s population, providing a significant
source of animal protein to approximately 2
billion people (Lucas et al., 2014). Fishing
is widely regarded as one of the most
dangerous professions in the world, even
when factoring in the advancement in
equipment technology, fishing methods and
automation (Berg-Beckhoff et al., 2016).
Developed countries with stringent
occupational health and safety laws such as
the United States of America (USA),
Australia and many European countries still
record injury and fatality rates within the
commercial fishing industry 25-40 times
higher than any other industry, with
developing countries recording 3 – 10 times
higher than those countries (Havold, 2010).
The international labour organisation
estimates that around 24000 deaths a year
worldwide are attributable to fishing
activities, with a further 24 million non-
fatal injuries occurring each year (Havold,
2010).
Research into occupational safety in the
fishing industry was reported in the 1950s
on the injury burden of Polish and United
Kingdom (UK) workers in deep sea fishing
industries. Since then, research into the
commercial fishing industry has resulted in
many more publications on the topic of
occupational safety in the commercial
fishing industry (Lucas et al., 2014).
Regarding research into the workplace
factors related to commercial fishing the
common consensus outlined by articles
describes an industry of highly physically
demanding workloads. Typical work tasks
undertaken as part of routine fish harvesting
are recognised to require that the worker
have a high level of endurance,
coordination and strength (Kucera et al.,
2009). The working life of a commercial
fisherman requires long working hours,
which are typically longer than 12 hours in
a day and are at irregular times which are
usually governed by factors beyond the
control of fishing operations (Berg-
Beckhoff et al., 2016; Dabholklar et al.,
2014).
Life as a fisherman is usually characterised
by long periods of time spent away from
home (Dabholklar et al., 2014).
Professional fisherman are often required to
undertake demanding industrial type tasks
whilst being exposed to hostile
environmental work conditions of cold,
heat and precipitation (Kucera et al., 2009).
The natural environment hazards of the
workplace are confounded by the
workplace environment at sea (Østergaard
et al., 2016). Workers are required to
Abstract The commercial fishing industry is a major component of global food supply, with a
significant number of people directly employed in the commercial fishing industry. These
people routinely work in an environment that is inhospitable to humans, whilst dealing with
physical and psychological stressors. Workplace human factors in the commercial fishing
industry are widely regarded as not ideal. A review of published literature was conducted
to explore commonly identified workplace factors experienced by commercial fishermen
and recommendations have been made on ways to improve workplace human factors in the
commercial fishing industry.

44
perform tasks on an often cluttered, wet and
moving deck of a vessel (McGuinness et
al., 2013). The unpredictable nature of
work at sea and the dynamic load bearing
due to manual handling heightens the risk
factor for musculoskeletal disorders
(MSDs) within the fishing industry which
have been identified in multiple research
papers as a major area of concern for
workers in the fishing industry (Kucera et
al., 2009; McGuinness et al., 2013).
Safe Work New South Wales (NSW) (n.d)
recognises the physically demanding work
environment of commercial fishing and the
risk it poses to the worker. The common
causes of injury for the forestry fishing and
agricultural workers are defined as manual
tasks, repetitive motion, hearing loss from
machinery and animal handling (Safe Work
NSW, n.d). This assessment is concurrent
with most international literature that
describes a poor ergonomic work
environment where most recordable
incidents resulting in injury involve lifting
and carrying.
Ergonomics is defined by Pheasant (1991,
p. 4) as ‘fitting the task to the person and
the product to the user.’ ‘Ergonomics (or
human factors) is the scientific discipline
concerned with the understanding of
interactions among humans and other
elements of a system, and the profession
that applies theory, principles, data and
methods to design in order to optimize
human well-being and overall system
performance. Ergonomists contribute to the
design and evaluation of tasks, jobs,
products, environments and systems in
order to make them compatible with the
needs, abilities and limitations of people’
(Human Factors and Ergonomic Society,
2020, p.1).
2. Methodology The research for this paper consisted of
secondary data collected through freely
available search engines; Google Scholar
was first used to gather data for this paper.
All papers in English were included, those
not in English were excluded. The topic
was defined by the key terms, ‘fishing’,
‘commercial’ and ‘ergonomic’ which
resulted in 9,000 initial results. A second
search included the term ‘risk’ that yielded
12,000 results. The key word risks was
selected as this was an aid in identifying the
ergonomic risks in the workplace of a
commercial fisherman. A limitation was
placed on searches to only include articles
published between 2010 and 2020 to reflect
the recent developments of ergonomic
consideration for commercial; fishing
workplaces and to ensure information
included was recent and relevant. This
yielded limited sources as most of the
publications were then excluded, so an
allowance was made to include some older
resources due to the scarce nature of
published literature regarding workplace
human factors in the commercial fishing
sector during the last 10 years. After
reading article abstracts 13 selected
publications from these databases were
used in this article.
Further searches were undertaken using the
Curtin University online library search
which included the key terms ‘ergonomic’,
‘fishing’ ‘commercial’ which returned 812
results. Five resources were selected from
this search. These articles were retrieved
through an online link to ProQuest, Taylor
and Francis online and Elsevier. An
exception was made to include an article
from 1994 due to the scarce nature of
published literature on the impact of ship
movements on load bearing. The databases
of Safe Work Australia, Safe Work New
South Wales, Department of Commerce
Western Australia, Department of
Agriculture, Water and the Environment
and the Australian Maritime Safety
Authority were searched. Three
publications were used from these searches.
Most of the world’s fishing workforce
resides in developing countries. The
limitations of the article selection criteria
may not be entirely representative of the
global fishing workforce. This makes the
generalisation of the human factors
identified difficult due to the non-
homogeneity of fishing fleets around the
world.
3. Discussion Introduction
The workplace human factors affecting

45
commercial fishermen have been
investigated and identified by multiple
studies in the United States of America
(USA), Europe and India (Dabholkar et al.,
2014). A wide variety of fishing operations
have been studied by these articles which
have returned similar findings on the
human factors affecting commercial
fisherman. Through these findings, the
relevant ergonomic factors affecting
commercial fisherman have been identified
as included in this article.
A Moving Workplace
A moving working environment produces
many problems for a worker that include
motion sickness, reduced balance and the
need to counterbalance ship movements
which results in physical fatigue and overall
reduction in worker performance (Ning &
Mirka, 2010). These problems are often
exacerbated in rough weather conditions
while fishermen were expected to
undertake the same work rate with
increasing unpredictability of the
movement of the vessel (Matthews et al.,
2007). The workplace of a fishing vessel
has been described as a “typical example of
a risky work environment marked by severe
occupational hazards” (Zhang et al., 2010,
p. 8). The deck is the primary area where
work is undertaken and represents the
convergence of mechanical and
environmental factors (McGuinness et al.,
2013).
The deck of a fishing vessel is a dynamic
work environment, workers are in close
proximity to moving hydraulic equipment,
moving ropes, waves coming onto the deck
and other workers (Donald & Dzugan,
2014; McGuinness et al., 2013). The
working environment is often cluttered and
hard to navigate; confounded with these
factors is the constant motion a vessel
experiences whilst at sea (McGuinness et
al., 2013; Donald 2014). One Norwegian
study analysed 2,359 nonfatal injuries of
the fishing fleet workers and found that
69% of all injuries occurred on the deck of
the fishing vessel (McGuinness et al.,
2013). Across all studies, ship motion was
identified as a significant hazard of the
working environment for a commercial
fisherman. When a worker lifts a load in an
unstable environment the body responds by
over stabilising those joints to cope with the
unpredictable environment (Torner, et al.,
1994). Research conducted by Torner, et
al. (1994) found that a worker performing
the same manual lifting tasks undertaken in
a static environment experienced a 40
percent increase in spinal compression due
to the motions of an environment.
Matthews et al. (2007) highlighted the
importance of stability when performing
manual handling, which are typically the
primary tasks undertaken by commercial
fishermen. The variability of injury results
is high due to smaller ships experiencing
increased ship movement and the
differences in hull design of fishing vessels
(Torner et al., 1994).
The findings of Torner et al., (1994)
explicitly link the movement of ships with
increased risk of back injury. A study
undertaken by Ning and Mirka (2010)
found that boat motions tend to amplify the
lifting forces encountered from slant
surfaces. This finding is in agreeance with
previous findings from Matthews et al.,
(2007) that the pitch condition of a vessel is
the most difficult to maintain stability even
when not handling a load. However, a cross
sectional study of 270 fishermen looking at
the prevalence and predictors of muscular
skeletal diseases (MSD) among Danish
fishermen found no association between
ship design and MSD (Berg-Beckhoff et al.,
2016). Another study examining reported
occupational injuries from the Norwegian
fishing fleet from 2000 to 2011 (2,359 non-
fatal injuries) conducted by McGuinness et
al., (2013) in the Norwegian fishing fleet
found that the movement of a fishing vessel
requires a fisherman to bend, clamber,
stretch, reach, extend and perform heavy
physical exertion whilst constantly
adjusting to a moving workplace. The exact
role the movement of a vessel has on a
fisherman physically is somewhat unclear
due to some conflicting evidence and the
diversity of vessel design in fishing fleets
around the world.
Manual Handling
A simplistic view of a fisherman’s job is
that of someone who catches fish, stores
those fish and returns to shore to sell

46
(Dabholklar et al., 2014). In reality, the job
of a fisherman is that of hard physical
labour characterised primarily by manual
handling (Østergaard et al., 2016). Manual
handling is defined as the movement of
heavy loads by hand or bodily force (Zhang
et al., 2010). The physical job demands on
the fisherman leads to various
musculoskeletal conditions commonly
identified to affect the areas of the back,
shoulder, hand and knee (Dabholklar et al.,
2014; McGuinness et al., 2013). These
problems are almost always associated with
lifting of heavy weights or repetition of a
particular activity that arises through the
repetitive cyclic nature of commercial
fishing (Dabholkar et al., 2014). Manual
handling is identified in most studies as a
significant factor in the prevalence of
MSDs amongst fisherman (Dabholkar et
al., 2014; Kucera et al., 2009; Østergaard et
al., 2016; Torner, et al., 1994;). The
handling of heavy materials, being either
fishing gear, ice, supplies or boxes are
commonplace in the fishing industry and
considered a normal part of a fisherman’s
working day (Ning & Mirka, 2010).
In a Danish cross sectional survey study
with 637 participants, manual handling
tasks performed by a fisherman were
identified by 36 percent of respondents of
making up more than half of the workday
(Østergaard et al., 2016). In this study the
majority of respondents were skippers of
the vessels which may mean that working
conditions reported in the study may not be
applicable to deckhands. An interview
study with 105 USA participants who were
crab pot and gillnet fisherman found that 90
percent of fisherman reported loading
bait/supplies, pulling in/emptying and
setting gear and cleaning the boat, while a
only a third operated mechanical pullers
and net reals for more than half the fishing
period (Kucera et al., 2009). A majority of
these fisherman did not report using
mechanical aids such as a wheeled platform
when loading/unloading supplies (Kucera
et al., 2009). Those fishermen who
performed the aforementioned activities for
more than half the period of fishing time
were found to be strongly associated with
severe lower back pain (Kucera et al.,
2009).
Most people attribute a relationship
between manual handling injuries to poor
knowledge of lifting techniques in the
fishing industry, Østergaard et al. (2016)
found that 96% of the 637 research
participant fishermen indicated they knew
how to lift properly but only 55% actually
did. Out of the entire sample 42% indicated
it was not possible to implement those
correct lifting methods in their workplace
and 59% stated that lifting aids were not
used for heavy loads (Østergaard et al.,
2016). This may help to explain the
alarmingly high rates of MSDs reported in
the fishing industry by almost all studies
reviewed. An Indian cross sectional study
with 110 randomly selected workers from
the fishing industry found that 92% of
workers experienced intermittent lower
back pain in the last 12 months (Dabholkar
et al., 2014). Similarly, in Denmark 80% of
the 637 research participant fishermen
reported lower back pain in the past year
(Østergaard et al., 2016). A cross-sectional
survey undertaken in Sweden with 1,243
participants found that 50% of deep-sea
fishermen said that they experienced lower
back pain symptoms in the past 12 months
(Torner et al., 1988 as cited in Kucera et al.,
2009). Of these research participants 228
worked only as skippers, 805 worked only
as deckhands and the other 210 participants
were both skippers and deckhands.
Workloads
Despite the technological advancements in
the fishing industry that allow for easier
fishing gear haulage, processing of fish and
handling of materials, fishing remains a
profession linked with high physical
workloads (Østergaard et al., 2016; Torner
et al., 1994; Ning & Mirka, 2010).
Economic success in the fishing industry is
defined by the amount of catch hauled on
board a fishing vessel (Fulmer & Buchholz,
2002). Many fisheries are heavily regulated
in relation to their fishing gear
requirements, species of fish and catch
limits within the industry (Fulmer &
Buchholz, 2002). This level of regulation
varies vastly between regions, states and
countries (Fulmer & Buchholz, 2002).
Most fishing crews will try to maximise the

47
catch landed whilst minimising time at sea.
This results in an increased risk of MSDs
due to the increased workload as a result of
fishing pressure (Fulmer & Buchholz,
2002).
Heavy physical workloads, in awkward
postures for long working hours are typical
descriptions of work within the fishing
industry (Torner et al., 1994). On a fishing
vessel two roles were defined by
Østergaard et al. (2016), first the skipper,
who is responsible for
navigating/identifying fishing ground and
planning the daily operations on board. The
second role is that of the deckhand, who
performs the practical work. This entails
setting/retrieving gear, as well as icing and
storing of the catch (Østergaard et al.,
2016). The perceived workloads self-
reported by skippers and deckhands varied
significantly in the study undertaken by
Østergaard et al. (2016). This is indicative
of the variation of roles within the
workplace of a commercial fisherman.
Dabhoklar et al. (2014) and Østergaard et
al. (2016) both describe long hours standing
upright, pushing and pulling and
bending/twisting of the back for both roles.
Even perceived sedentary tasks are
demanding at sea. A skipper was found to
use 37% of maximum aerobic power whilst
steering the vessel (Rdahl & Vokac, 1979
as cited in Torner et al., 1994). This was
attributed to counterbalancing the
movement of the vessel (Rdahl & Vokac,
1979 as cited in Torner et al., 1994).
The high workloads in the commercial
fishing may be linked with psychological
stress. Anecdotal evidence in the USA from
Fulmer and Buchholz (2002) suggested that
many fishing operators faced increased
mental stress due to failure of their
government to effectively manage the fish
resource. Fulmer and Bucholz (2002)
identified an area of interest that was that of
overfishing. Many operators feared an
overreaction in fishing regulations due to a
lack of government action would inherently
increase economic pressure and force
fishermen to expose themselves to more
risk as higher workloads were needed to
ensure economic survival (Fulmer &
Buchholz, 2002).
Work Patterns Commercial fishing is characterised by
irregular working patterns, high levels of
stress due to performance goals and heavy
workloads (Dabhoklar 2014; McGuinness
et al., 2013; Zhang et al., 2010). Dabhoklar
et al. (2014) described the work patterns of
Indian fishermen as consisting of a 12-hour
day of repetitive hard physical labour. In
Australia, the Australian Maritime Safety
Authority (2020) recognises that seafarers
may work long irregular hours, live away
from home for weeks or months at a time in
an environment that is both their workplace
and home. Specific information of the
effect fatigue has on fishermen was not
obtainable in this publication.
A study in Norway still regarded fishing to
not be conductive of good rest periods due
to abnormal mealtimes and long working
hours (McGuinness et al., 2013). It is
noteworthy that Norway does not regulate
the working hours of seafarers
(McGuinness et al., 2013). Injuries in the
Norwegian fishing fleet were found to be
highest between 9 am and 6 pm, where
workers often forgo the routine lunch and
dinner hours (McGuinness et al., 2013). A
fisherman structures rest periods when time
permits, as work is often undertaken around
the clock (McGuinness et al., 2013). The
allocation of rest time is more dynamic than
in land-based industries which means
fisherman often receive less restorative
sleep, thus their circadian rhythm is often
out of normal synchronisation
(McGuinness et al., 2013). The culmination
of these factors is a worker who lacks
concentration and slower reaction times in
a profession that requires situational
awareness, concentration and physical
strength (McGuinness et al., 2013).
The study undertaken by McGuinness et al.
(2013) in Norway was the only literature
that was found to specifically identify the
irregular working patterns of fisherman and
attribute those work hours to increased
injuries. Government literature in Australia
published by the Australian Maritime
Safety Authority (2020) considered the
effect of fatigue on seafarers with no
specific mention of fisherman. The impact
of work patterns and injury in the fishing

48
industry was identified as a key area in
addressing injuries within the Norwegian
fishing fleet, the problems of fatigue were
also stated as being not dissimilar to fatigue
problems in other industries (McGuinness
et al., 2013).
Safety Culture
The fishery people are going to take risks,
while the fishing is there and take bigger
risks than the other people (Murray and
Dolomount, 1994 as cited in Håvold, 2010).
One study that examined the safety culture
aboard fishing vessels through a
questionnaire, completed by 209
participants, stated that between 75 and
96% of accidents in the fishing industry
were caused by human error (Havold,
2010). The fishing industry was identified
as being subject to a multitude of
international regulations implemented by
the International Maritime Organisation
(IMO) (Havold, 2010). These regulations
are often difficult to enforce due to the
differences between fishing fleets in
countries around the world, particularly
between developed and developing
countries (Havold, 2010). Secondly, fishing
work generally takes place far out at sea,
out of the reach of most enforcement
agencies and most fishing industries are
reluctant to adopt safety measures for their
fishing fleet (Havold, 2010).
The conclusions made by Havold (2010)
were that fishermen accept the risk of their
occupation, but often do not treat this risk
seriously. Havold (2010) identified eight
factors that may influence the safety culture
of fisherman at sea. (1) Attitudes to rules
and regulation. (2) Attitudes to safety and
training drills. (3) Job satisfaction. (4)
Fisherman’s safety attitude. (5)
Cooperation and working conditions. (6)
Pressure. (6) Stress and negative influence
from work. (7) Conflict between work and
safety and (8) management safety attitude.
Havold (2010) identified through a
questionnaire, that fishermen who were
involved in a serious incident in the last 12
months were found to be more positive to
safety within the workplace. This is was
contrasted against the negative views of
fisherman towards rules and regulation.
Further findings were that fishermen felt
more satisfied with their job when more
than one family member was involved in
the industry. Money was also identified as
a major reason why operators cut corners
on maintenance and in turn safety at sea.
This was attributed to increasing economic
pressure fisherman are facing which is
consistent with the anecdotal evidence
given by Fulmer (2002) and Havold (2010).
The Fishing Industry in Australia
Data for the fishing sector in Australia is
amalgamated with forestry and terrestrial
agriculture making distinction between
incidents that are reported and factors
affecting the fishing industry in Australia
challenging.
Workplace human factors in the fishing
industry in Australia have been seldom
explored. Three studies were identified
which assessed work related fatalities in the
fishing industry. Between 1982-1984 the
fatality rate was 143 per 100,000 person
years (Driscoll et al., 1994). From 1989-
1992 the fatality rate per 100,000 person
years (89.2) compared to all other industry
(5.5) (Hull et al., 2001). Finally, from 1992-
1998 the fatality rate per 100,000 person
years was 56 per 100,000 person years
(O’Connor & O’Connor, 2006). These
studies show a negative trend of fatality rate
amongst commercial fisherman in
Australia over time. All studies found that
environmental conditions significantly
contributed to the fatality of a fisherman but
did not solely attribute this factor to
fisherman deaths (Driscoll et al., 1994; Hull
et al., 2001; O’Connor & O’Connor, 2006).
Alcohol and drug usage, unsafe work
practises, inadequate emergency
procedures and failure to wear personal
floatation devices were found to also
contribute to the circumstances that
produced a death of a fisherman (Driscoll et
al., 1994; Hull et al., 2001; O’Connor &
O’Connor, 2006). These articles recognised
the hazards fishermen face in the workplace
as involving a harsh environment and
interaction with mechanical systems
(O’Connor & O’Connor, 2006). However,
the purpose of these articles was to assess
fatality rates within the fishing industry and
not explore specific ergonomic risk factors
in the workplace of a fisherman.

49
Research into the progress of occupational
health and safety in the fishing industry
undertaken by Lucas et al., (2014) found
that only six articles relating to
occupational health and safety were
published in Australia. By comparison the
USA had over 50, the UK had 30 and
Poland had 11. This alludes to a
considerable gap in knowledge in relation
to workplace human factors in Australia’s
fishing industry due to this lack of
published literature on the topic. It offers
opportunities for research to be conducted
to identify how work can better be fitted to
commercial fishermen’s capabilities to
improve their productivity and reduce
injuries, particularly muscular skeletal
injuries.
4. Conclusions Working in the commercial fishing industry
is a dangerous and physically demanding
job. Countries such as the USA, Norway,
Denmark and India have taken an
ergonomic approach to fishing and
identified specific human factors that make
the job of a commercial fisherman
dangerous and demanding.
In Australia, little published literature
exists on workplace human factors within
the commercial fishing industry and this
needs to be addressed to improve fisherman
safety. Most international studies identify
the role of manual handling, ship
movement, workloads and work patterns as
influencing the high prevalence deaths and
injuries within this industry.
To conclude, the published literature
detailing human factors in the fishing
industry is limited, especially in developing
countries. The lack of literature is
surprising considering the extremely high
fatality and injury rates reported within the
commercial fishing industry. The lack of
cohesion in studies of ergonomic factors in
the fishing industry needs to be addressed,
specifically regarding the role of ship
movement. Further exploration into
organisational factors that include the
safety culture in the commercial fishing
industry should move from anecdotal
evidence and be verified through scientific
research to assess the true effect. Research
can identify strategies to make the
workplace, work processes and actions of
commercial fishermen as safe as reasonably
practicable with physical, cognitive,
organisational, social and environmental
ergonomic factors addressed.
References Australian Maritime Safety Authority. (2020).
Fatigue guidelines: Managing and reducing
the risk of fatigue at sea.
https://www.amsa.gov.au/sites/default/files/am
sa-fatigue-guidelines-web.pdf
Berg-Beckhoff, G., Østergaard, H., & Jepsen, J.
R. (2016). Prevalence and predictors of
musculoskeletal pain among Danish
fishermen–results from a cross-sectional
survey. Journal of Occupational Medicine and
Toxicology, 11(1), 51.
https://doi.org/10.1186/s12995-016-0140-7
Bloswick, D. S., & Dzugan, J. (2014).
Ergonomics training in the commercial fishing
industry: emerging issues and gaps in
knowledge. Journal of agromedicine, 19(2),
87-89. https://doi.org
10.1080/1059924X.2014.910063
Dabholkar, T. A., Nakhawa, P., & Yardi, S.
(2014). Common musculoskeletal problem
experienced by fishing industry
workers. Indian journal of occupational and
environmental medicine, 18(2), 48.
https://doi.org/10.4103/0019-5278.146888
Driscoll, T. R., Ansari, G., Harrison, J. E.,
Frommer, M. S., & Ruck, E. A. (1994).
Traumatic work related fatalities in
commercial fishermen in
Australia. Occupational and environmental
medicine, 51(9), 612-616.
https://oem.bmj.com/content/oemed/51/9/612.f
ull.pdf
Fulmer, S., & Buchholz, B. (2002). Ergonomic
exposure case studies in Massachusetts fishing
vessels. American journal of industrial
medicine, 42(S2), 10-18.
https://doi.org/10.1016/j.apergo.2010.06.001
Håvold, J. I. (2010). Safety culture aboard fishing
vessels. Safety science, 48(8), 1054-1061.
https://doi.org/10.1016/j.ssci.2009.11.004
Hull, B. P., Mitchell, R., Driscoll, T., Mandryk,
J., Hendrie, L., & Healey, S. (2001). Work-
related fatal injuries in the fishing industry in
Australia, 1989 to 1992. Journal of
Occupational Health and Safety, Australia and
New Zealand, 17(4), 375. https://search-
informit-com-
au.dbgw.lis.curtin.edu.au/fullText;dn=200115
165;res=IELAPA

50
Human Factors and Ergonomic Society. (2020).
What is Human Factors and Ergonomics?
https://www.hfes.org/About-HFES/What-is-
Human-Factors-and-
Ergonomics#:~:text=on%20their%20website
%3A-
,Ergonomics%20(or%20human%20factors)%2
0is%20the%20scientific%20discipline%20con
cerned%20with,overall%20system%20perfor
mance%20(definition%20adopted
Kucera, K. L., Loomis, D., Lipscomb, H. J.,
Marshall, S. W., Mirka, G. A., & Daniels, J. L.
(2009). Ergonomic risk factors for low back
pain in North Carolina crab pot and gill net
commercial fishermen. American journal of
industrial medicine, 52(4), 311-321.
https://doi.org/10.1002/ajim.20676
Lucas, D. L., Kincl, L. D., Bovbjerg, V. E., &
Lincoln, J. M. (2014). Application of a
translational research model to assess the
progress of occupational safety research in the
international commercial fishing
industry. Safety Science, 64, 71-81.
https://doi.org/10.1016/j.ssci.2013.11.023
Matthews, J. D., MacKinnon, S. N., Albert, W. J.,
Holmes, M., & Patterson, A. (2007). Effects of
moving environments on the physical demands
of heavy materials handling
operators. International Journal of Industrial
Ergonomics, 37(1), 43-50.
https://doi.org/10.1016/j.ergon.2006.09.018
McGuinness, E., Aasjord, H. L., Utne, I. B., &
Holmen, I. M. (2013). Injuries in the
commercial fishing fleet of Norway 2000–
2011. Safety Science, 57, 82-99.
https://doi.org/10.1016/j.ssci.2013.01.008
Ning, X., & Mirka, G. A. (2010). The effect of
sinusoidal rolling ground motion on lifting
biomechanics. Applied ergonomics, 42(1),
131-137.
https://doi.org/10.1016/j.apergo.2010.06.001
O’Connor, P. J., & O’Connor, N. (2006). Work-
related maritime fatalities. Accident Analysis
& Prevention, 38(4), 737-741.
https://doi.org/10.1016/j.aap.2006.01.004
Østergaard, H., Jepsen, J. R., & Berg-Beckhoff,
G. (2016). The workload of fishermen: a cross
sectional survey among Danish commercial
fishermen. International maritime
health, 67(2), 97-103.
https://doi.org/10.5603/IMH.2016.0019
Pheasant, S. (1991). Ergonomics, Work and
Health. The MacMillan Press Ltd.
Safe Work NSW. (n.d). Agriculture forestry and
fishing.
https://www.safework.nsw.gov.au/your-
industry/agriculture,-forestry-and-fishing
Steven, AH, Mobsby, D and Curtotti, R. (2020).
Australian fisheries and aquaculture statistics
2018, Fisheries Research and Development
Corporation project (2019-093) ABARES.
https://doi.org/10.25814/5de0959d55bab.
Törner, M., Almström, C., Karlsson, R., &
Kadefors, R. (1994). Working on a moving
surface—a biomechanical analysis of
musculoskeletal load due to ship motions in
combination with work. Ergonomics, 37(2),
345-362.
https://doi.org/10.1080/00140139408963651
Zhang, B., Álvarez Casado, E., Tello Sandoval,
S., & Mondelo, P. (2010). Using ergonomic
digital human modeling in evaluation of
workplace design and prevention of
occupational hazards onboard fishing vessels.
In Proceedings of the 8th International
conference on occupational risk
prevention (pp. 1-9).
http://hdl.handle.net/2117/16042
Author
Luke Masters is completing a Bachelor
of Science (Health, Safety and
Environment) at Curtin University in
Western Australia. Luke is the President of
the Health, Safety and Environment
Student Club at this university. His health
and safety involvement has been limited so
far but he is eager to undertake work
opportunities in any area when they arise.
Luke is passionate about occupational
health and safety, particularly in areas
regarding construction, mining, offshore
operations and primary production. He is
also eager to explore the role of automation
on a modern workforce and the
occupational safety issues surrounding
future technologies. Luke aims to gather
practical experience for his degree and
complete his undergraduate course in 2021.
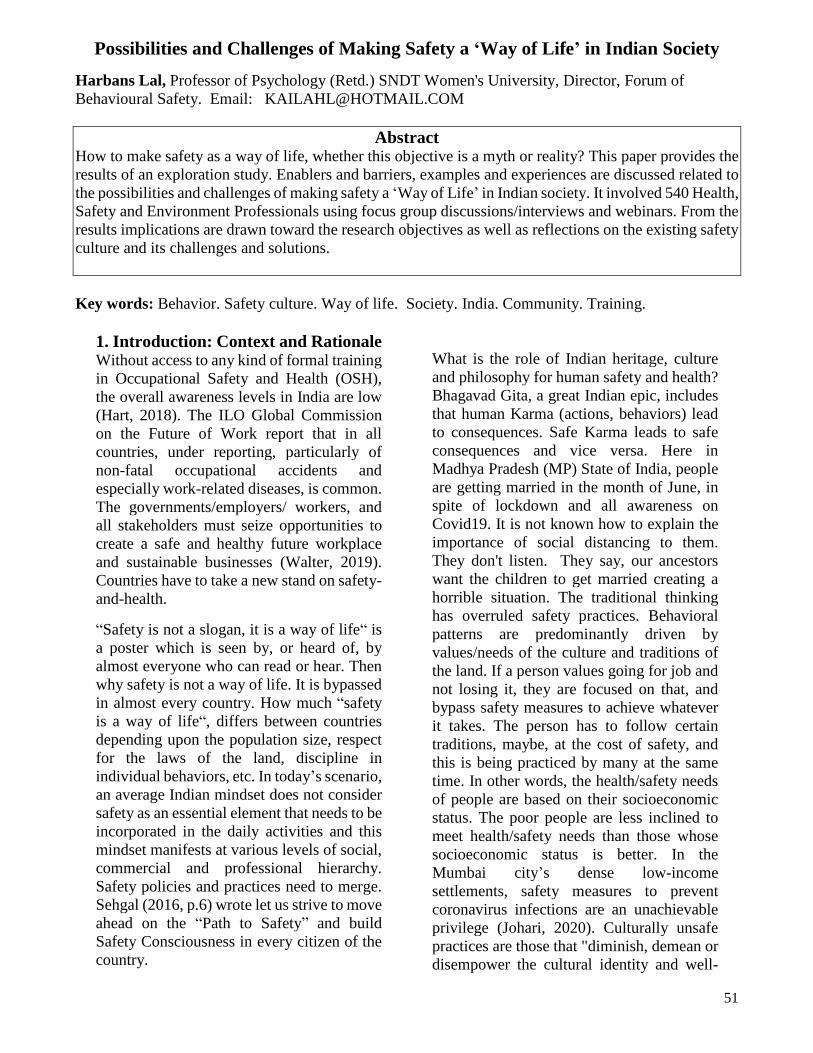
51
Possibilities and Challenges of Making Safety a ‘Way of Life’ in Indian Society
Harbans Lal, Professor of Psychology (Retd.) SNDT Women's University, Director, Forum of
Behavioural Safety. Email: [email protected]
Abstract How to make safety as a way of life, whether this objective is a myth or reality? This paper provides the
results of an exploration study. Enablers and barriers, examples and experiences are discussed related to
the possibilities and challenges of making safety a ‘Way of Life’ in Indian society. It involved 540 Health,
Safety and Environment Professionals using focus group discussions/interviews and webinars. From the
results implications are drawn toward the research objectives as well as reflections on the existing safety
culture and its challenges and solutions.
Key words: Behavior. Safety culture. Way of life. Society. India. Community. Training.
1. Introduction: Context and Rationale Without access to any kind of formal training
in Occupational Safety and Health (OSH),
the overall awareness levels in India are low
(Hart, 2018). The ILO Global Commission
on the Future of Work report that in all
countries, under reporting, particularly of
non-fatal occupational accidents and
especially work-related diseases, is common.
The governments/employers/ workers, and
all stakeholders must seize opportunities to
create a safe and healthy future workplace
and sustainable businesses (Walter, 2019).
Countries have to take a new stand on safety-
and-health.
“Safety is not a slogan, it is a way of life“ is
a poster which is seen by, or heard of, by
almost everyone who can read or hear. Then
why safety is not a way of life. It is bypassed
in almost every country. How much “safety
is a way of life“, differs between countries
depending upon the population size, respect
for the laws of the land, discipline in
individual behaviors, etc. In today’s scenario,
an average Indian mindset does not consider
safety as an essential element that needs to be
incorporated in the daily activities and this
mindset manifests at various levels of social,
commercial and professional hierarchy.
Safety policies and practices need to merge.
Sehgal (2016, p.6) wrote let us strive to move
ahead on the “Path to Safety” and build
Safety Consciousness in every citizen of the
country.
What is the role of Indian heritage, culture
and philosophy for human safety and health?
Bhagavad Gita, a great Indian epic, includes
that human Karma (actions, behaviors) lead
to consequences. Safe Karma leads to safe
consequences and vice versa. Here in
Madhya Pradesh (MP) State of India, people
are getting married in the month of June, in
spite of lockdown and all awareness on
Covid19. It is not known how to explain the
importance of social distancing to them.
They don't listen. They say, our ancestors
want the children to get married creating a
horrible situation. The traditional thinking
has overruled safety practices. Behavioral
patterns are predominantly driven by
values/needs of the culture and traditions of
the land. If a person values going for job and
not losing it, they are focused on that, and
bypass safety measures to achieve whatever
it takes. The person has to follow certain
traditions, maybe, at the cost of safety, and
this is being practiced by many at the same
time. In other words, the health/safety needs
of people are based on their socioeconomic
status. The poor people are less inclined to
meet health/safety needs than those whose
socioeconomic status is better. In the
Mumbai city’s dense low-income
settlements, safety measures to prevent
coronavirus infections are an unachievable
privilege (Johari, 2020). Culturally unsafe
practices are those that "diminish, demean or
disempower the cultural identity and well-

52
being of an individual" (Nursing Council of
New Zealand, 2002, p.628). Williams (1999)
defined cultural safety as an environment that
is spiritually, socially and emotionally safe,
as well as physically safe for people.
The government of India is committed to
regulate all economic activities for the
management of safety and health risks at
workplaces and to provide measures so as to
ensure safe and healthy working conditions
for every working man and woman in the
nation as per National policy on safety,
health and environment at the workplace.
But, the citizens need adequate infrastructure
and life support systems to conduct
themselves in safe and healthy ways. Also, it
would not be possible to achieve ‘safety as a
way of life’ without the corporate social
responsibility (CSR) and social change
initiatives at community levels. Indian cities
rank low according to Safe Cities Index.
Mumbai ranks 45th and Delhi 52nd on the
Economist Intelligence Unit's Safe Cities
Index, which ranks 60 countries worldwide
across indicators including digital,
infrastructure, health and personal security
(Khanna, 2019).
The safety topic was discussed as hundreds
of thousands of fatalities occurred across
countries due to coronavirus risk exposure, in
spite of rigorous awareness campaigns by
governments to wear masks, maintain
physical distancing etc. On the 18th of
December, 2020, the John Hopkins
University COVID-19 Dashboard showed
that there were 9,956,557 cases in India
(74,875 world wide) and 144,451 COVID-19
related deaths (world wide 1,660,032 deaths)
from March in 2020 in India.
Normally, we say "safety as a way of life".
We want to know, what do we mean by this.
Secondly, have we done any activity to
promote 'safety as a way of life' beyond our
cites. Safety awareness should extend
beyond the workplace (Van Oord, 2020).
A safety professional provides an anecdote,
“can enforcement bring behavioral safety
culture in the community at this stage? Yes,
if the residential building management puts
the rules in writing and enforcing done
through housing society security, the
discipline is well maintained. But practically,
does it get sustained? There are one, two
violations that happened in the past and a
warning notice was put in the WhatsApp
group to conduct safe behaviors and inform
others of the same” (Maheshwaran, 2020, p1).
2. Research Objectives Despite emphasis by Indian culture and laws,
there are problems in seeing safety culture as
a way of life among Indian society, the
implications of which are seen in terms of
hundred thousands of fatalities due to
Covid19. Hence this research leads to find
out ways for the same.
Research objective one. To identify ways to
make safety a way of life in the Indian
Society.
Behavioral safety culture in industry has
been successfully practiced but how it can be
followed as a way of life among sociocultural
settings, is a difficult research question which
was approached for this article? This
question became increasingly relevant during
Covid19 scenario among all countries.
Research objective two. To identify how a
behavioral safety culture can be included in
sociocultural settings.
3. Methodology Participants, measures, procedure, analysis
Focused group discussions (FGD)/
interviews/ webinars with 540 Health, Safety
and Environment (HSE) professionals/
trainers were conducted through remote data
collection techniques over 2-months (May-
June 2020) in India from diverse locations
and organizations. FGDs are used to
understand an issue at a deeper level than can
be achieved with a survey (Monishankar &
Garcia, 2017). Broad themes/sub-themes
were identified for data interpretations.
Behavioral safety training methodology for
planned interventions were followed at sites
(see figures 1 and 2).

53
4. Results and Findings
The results and findings of this qualitative
research study are presented in three
broad themes or categories as stated here
below:
- Enablers and Barriers
- Examples and Experiences
- Behaviour Based Safety Management
Enablers and Barriers in making safety and
health a way of life in India
Jansz et al. (2020) presented an exhaustive
list of enablers and barriers of 12 countries
for workplace safety and health. In India, the
safety professionals during the FGDs
envisaged positive and negative correlates of
establishing a safety culture in terms of the
enablers and barriers as stated here below.
Enablers or Leading Indicators are: the
education right from school days, efforts by
non-government organisations (NGO) and
the Government on health, motivation by
Institutions and industries, promotion of
safety by elders at home after current
COVID19 education was provided. Other
enablers are:
*Improvement trend in community
awareness,
*Increase in community engagement
programs in health and safety,
*Improvement in infrastructures,
*New technologies,
*Building of cultures including people
getting sensitized and management control,
*Belief in Omni-energy (God), respect to
mythology,
*Respect for Elders,
*Belief in "Vasudheiva Kutumbakam"
(world as one family)
*Market requirements,
*Goodwill.
Barriers or Lagging Indicators are poverty,
behavior of educated people, Indian tradition
and customs, lack of safety leadership by top
management of industries, non-stringent
enforcement of law, corruption among law
enforcers and government spending on
health and safety. Some more barriers are:
*Negative example setting by leaders,
*Low literacy,
*Risk taking nature,
*Lack of risk assessment ability,
*Tendency to act safe only under
supervision,
*Lack of systematic approach,
*Believing in quick wins (shortcuts),
*Priorities of management towards
production and quality,
*Low and loose involvement of
governments’ body towards standards,
*Do not take Hygiene related issues
seriously,
*Do not get safety education since
childhood,
*Education system as a whole does not
speak about basic Safety Standards and
Precautions,
*Insurance,
*Human cost,
*Failure of Enforcement agency
(Corruption).
One needs to ponder over an upward trends
of incidents and fatalities over the past
decades. It needs to be understood that the
above set of barriers are responsible for
deteriorating safety and health environment
as well as hundred thousand fatalities every
year that can be averted provided there are
focused efforts to contain these barriers and
at the same time, the enablers of safety and
health are taken forward by all concerned.
Examples and Experiences of HSE
professionals on ‘safety as a way of life’
From the 540 Health, Safety and
Environment Professionals that took part in
focus group discussions, the following are
the seven main sub-themes of experiences to
emerge, in addition to the above-said
enablers and barriers in making safety and
health a way of life in India.
Sub-theme 1
In my building, all delivery is done at gate.
No delivery personnel are allowed to enter
the building. If plumber or service provider

54
to come in to the building, mask is a must and
his hands are sanitized by the security
personnel. If he is coming from a
containment zone, he is not allowed. Any
residents coming back to the building after
visiting worst affected places such as
Chennai or Ahmedabad, 14 days quarantine
is mandatory. No visitors are allowed inside
the building. All residents shall wear masks
when they go out of the building.
Sub-theme 2
I have done programs for behavioral aspect
of road safety. This program was conducted
in school, colleges and some of residential
societies. This was done as a service to the
nation to improve safety perceptions.
Sub-theme 3
The COVID-19 itself has taught us the many
examples as lessons of societal behavior.
Like people are keeping away from others.
Using mask and reminding others who are
not using. Most of the people are keeping
mask with them all times. People started
cleaning hand with sanitizers. Many more
such examples are there.
Sub-theme 4
Raising concerns and real life story sharing
and learnings. Some still don’t relate as they
feel, this will not happen to me. Many people
worked without domestic help for last 3
months and now are desperate. But still few
senior citizen still manage without maids as
they think it is a high risk and can reduce one
of the chance of infection.
Sub-theme 5
Enforcement is key to the successful
implementation of any initiative in India due
to our mind set which is different from the
world. Inherited from our predecessors but is
changing now and a time consuming process.
Sub-theme 6
Corona virus numbers in India are rising.
Why? We are in community transmission
phase, though Government is not agreeing.
Government is trying to open the market, on
basis of building back the lost economy. But
people think that COVID19 has come down
and that's why Government has opened up
the market. So communication is not clear.
Myth is that COVID19 cannot affect me.
People are in stress due to this lockdown.
When someone is in prolonged stress, their
body immunity becomes weak. So even a
minor infection could result in major.
Sub-theme 7
Some safety professionals voiced, we
have received the Certificates of Safety,
but major question is, how to make safety
a way of life in India? Whether by
changing attitude and creating awareness
about safety? Indian Society, very
difficult as people are focused on GOD.
Nevertheless, we transformed
organizations, we would transform
society too.
Hiranandani Fortune City (HFC) has
assimilated all COVID-19 related safe
behaviors for its residents and the staff (See
Figure 1) to make it as a way of life.
In spite of the HSE professionals’ efforts, it
is relevant to note that as per recent estimates
released by the ILO, each year 2.78 million
workers die from occupational accidents and
work-related diseases (of which 2.4 million
are disease-related) and an additional 374
million workers suffer from non-fatal
occupational accidents (ILO, 2019). ‘Safety
as a way of life’ objective seems far away.
Nevertheless, 'Safety to be a way of life' is to
be in the syllabus for all education levels as a
reinforcement constantly from school to
university to employment, etc. Life-long
learning helps to achieve such global
perspective to save human lives. Education is
the great equalizer, wrote the American
educational reformer Horace Mann (1848).
A motherly-motivational observer who
would use social-media to reflect
observations / spot-correction of self and
others daily is all what is needed everywhere
in society to make safety a way of life.

55
Figure 1:
COVID-19 related safe behaviors
Source: Image shared by a FGD respondents from a construction site of Tata Projects

56
5. HSE Professionals Question
Behavior Based Safety
Management Behavior based safety (BBS) can spread
from industry to community through
awareness webinars, sessions by trained
BBS Mentors and experts for developing
observers in communities for observation
and spot-correction to make safety and
health a way of life (Kaila, 2019). In this
regard, the HSE professionals clarified the
below questions and answers that arose as
the result of the focus group discussions.
• Do you think behavior based safety
management (BBSM) is the future of safety
culture?
HSE professionals’ answer.
Yes, as behavior is the root cause of all
incidents, as also emphasized in ISO45001.
Also culture drives the behaviors, hence
BBS implementation focuses on
developing safety culture.
• How can an organization successfully
implement BBSM?
HSE professionals’ answer.
In three phases.
Introduction of behavioral safety to top
management and development of roadmap.
Rolling out BBS in entire workforce.
Sustain it by monitoring and rewarding
employees every month.
• What are the challenges faced during the
implementation of BBSM?
HSE professionals’ answer.
Challenges were passive involvement of
Head of Departments (HODs) not letting
behavior based safety management be
known till the last person at site shows
appreciation of observations by seniors.
• What are the advantages of successful
implementing BBSM?
HSE professionals’ answer.
Advantages are incidents control, saving
from injuries, increased productivity
without loss. As long as, there is a focus on
BBSM, that would bring business
outcomes and positive implications.
Further, link BBS with CSR and its
community application especially in
Covid19 scenario.
• Who benefits through BBSM?
HSE professionals’ answer.
Employees, management, contractors, even
casual visitors and all stakeholders benefit.
• What type of environment requires a
change in its safety culture?
HSE professionals’ answer.
A reactive and dependent safety
culture/environment.
• What are the important aspects of
BBSM?:
HSE professionals’ answer.
The important aspects are observation,
observers and spot-correction of at-risk
behaviors. Forming BBS steering team, and
sensitivity and communication of leaders
for implementation. Overall, behavioral
safety and health approach is a ‘caring’ way
of life and an art of positive living. It is an
intense conversation and counselling for
getting rid of any risks around.
• Who should take the first step in
implementing BBSM?
HSE professionals’ answer.
Top management by involving all HODs
and stakeholders.
• Do you think BBSM implementation has
improved over the past decade?
HSE professionals’ answer.
Yes, almost 10,000 units in India have
implemented and frequency and severity of
incidents have significantly reduced at
sites.
• Why do you think BBSM must be an
integral part of safety systems?
HSE professionals’ answer.
BBS focus is on behavioral issues of safety,
no other systems do that. Moreover BBS
alone can’t bring total safety culture so
BBS is to be integrated with safety systems.
Question remains whether safe conditions
prevail to live safely or are we privileged
for conditions to live safely. Essentially,
safe behaviors plus safe conditions would
rebuild safe-societies.

57
6. Conclusions, Recommendations
and Implications for social policy
and planning Research conclusions and
recommendations in this section should
help to identify ways to make safety a way
of life in the Indian Society, and to identify
how a behavioral safety culture can be
included in sociocultural settings.
Conclusions related to research objective
one
Research objective one was to identify
ways to make safety a way of life in the
Indian Society.
Managing safety culture is a big challenge,
as it is hard for people to perceive the safety
and health risks, for those who belong to
communities that do not emphasize an
interdependent safety culture. It is personal
behavioral safety pattern of individuals that
is influenced by social cognition and
culture. Social cognition perspectives shape
social milieu and social response. Most
behavioral applications use social cognition
frameworks for social change management,
like establishing behavioral safety culture
as a way of life in societies (Vinney, 2020).
Department of Science and Technology,
Govt. of India (2020) emphasized that
safety should evolve as a habit of every
person, and needs to be propagated as the
culture. Safety should be of prime concern
as it plays an important role in the socio-
economic sectors in a significant way that
will affect the growth of the institutions and
have an impact on a national level. Thus,
safety implementation and financial
performances are correlated vertically and
horizontally.
Difference between safety cultures of
Indian and other countries needs to be
understood. Yet, to date, the relationship
between national culture and safety culture
has received relatively little attention. The
researchers have examined the relationship
between organizational culture and the
dimensions of national culture (Mark et al.,
2015). Organizational culture and behavior
in multinational organizations vary
according to the national cultural norms of
the countries. Associations exist between
safety culture and Hofstede's (2001) five
critical dimensions of national culture
namely Power Distance, Individualism -
Collectivism, Masculinity, Uncertainty
Avoidance, Long-term Orientation.
Moreover, the management of occupational
safety and health in a culturally diverse
working environment demands an
approach that includes multiple voices, and
one in which it is possible to considerably
broaden the knowledge base for alternative
decisions and to increase the number of
possible paths leading to solutions to
problems (European Agency for Safety and
Health at Work, 2020).
Conclusions related to research objective
two
Research objective 2 was to identify how a
behavioral safety culture can be included in
sociocultural settings.
Research conclusions are that 'safety-
culture-as-a-way-of-life' mission is
possible to prevail among societies when it
is not reactive, least dependent on others, its
independent and also interdependent. The
distancing between these cultures is crucial
to manage. This mission is possible when it
begins with family, school and social
values and a long-term orientation and
uncertainty situations are not avoided. It is
a planned intervention. When this is
achieved the societies are believed to be
safe for their futures. The unplanned would
not be safe. 'Safety as a way of life' is a
conscious effort of everyone.
The findings of this research could raise
certain questions as to whether the Indian
way-to-life itself is on right path. 148,000
people were killed in traffic accidents in
India during 2019. By 2030, traffic deaths
are expected to account 1.25 million deaths
across the world each year according to the
World Health Organization (2020).
Fortunately, a planned intervention called
the Swedish Indian Transport Innovation
and Safety Partnership (SITIS), comprised
of companies that include Volvo Group,
Autoliv, SAAB, Manipal Hospitals, and
Altair; research institutes such as Chalmers,
RISE, IIT-TRIPP and IISC and authorities
such as VTI, ARAI, Swedish

58
Administration Authority, and Niti Aayog,
could help put a stop to these unnecessary
suffering (Hogman, 2020) and make road
safety a way of life.
Though there are efforts being put in the
direction that would ensure “safety to be a
part of our daily lives”, it is a long time
multi-pronged journey for countries. It is
increasingly recognised that the ambitious
initiatives such as safety-as-a-way-of-life is
complexly determined by socio-cultural
factors at many different levels of scale
(Lomas, 2015). Toward this, some specific
suggestions are described below that could
help consolidate our deeds and increase the
probability to make safety a way of life.
Recommendations
“Safety and health - a way of life” needs to
be definable, observable, correctable on-
the-spot, measurable, implementable and
sustainable. The difference between a
planned/long-term and unplanned/short-
term behavioral safety and health culture
intervention, is to be made for effective
social change program as a way of life
(New Brunswick Department of Education
Instructional Resources Branch, 2000). For
an example, Health & Safety - Choices for
Life: An activity-based resource was
developed for New Brunswick schools,
grades K to 12 to make it as a way of life
for children. This is the right time to
introduce safety and health in schools
syllabus in India.
There is a need to work with people down
the levels in their language to make safety
culture as a way of life (Jansz et al. 2020).
India witnesses a life casualty every 4
minutes in a road accident. Mother India
Care is working as a pressure group to
educate and encourage the people in
general, and drivers in particulars, for safe
driving (Mother India Care, 2020).
There are a hundred thousand or more
community groups across the globe that
organize people towards social goals and
indirectly contribute to providing safe mind
sets and behaviors. On the other hand,
certain sections of society that are not
organized, or part of any planned group,
and remain at higher risk whenever any
health or safety disaster occurs. (WHO,
2020). CSR projects in India focused on
community development, skill
development as well as road safety (Mitra,
2018).
Several companies organized behavioral
safety programs for organisational
transformation and emphasised need to
involve everyone empowering them to
bring a change. Many companies’ sites
initiated behavioral safety culture programs
for communities under CSR and BBS
Project activities like road/home
safety/employee
families/villages/school/college etc.
Figure 2: Empowering employees to be
the change catalysts (Author’s photo).
Dorf Ketal, under CSR, adopted certain
schools, and prepared a manual for them
that covered precautions to be taken by all
students/teachers, staff and parents with
regard to COVID-19. Precautions included
what they should do at home, during travel,
in school and after returning back to home.
It focused on how to maintain social
distancing, sanitization, use of mask, hand
wash, disinfection of vehicles, school
premises etc. the objective was to see
behavioral safety as way of life. Dorf
Ketal’s quality, health, safety, security and
environmental systems are purposely
designed to maintain corporate and
community resiliency for the long-haul in
every country where they operate (Dorf
Ketal, 2020).
In order to make safety and health a way of
life, the change leaders/catalysts need to
monitor regularly, monitor personally,
monitor frequently, monitor numbers of

59
change, interact with change observers
team, make site visits, be an inclusive
catalyst with vision and mission (Hariton,
2020). Leaders need to review whether
empowerment is going down, core
incompetence of organizations need to be
managed, evaluate to develop, and check
whether most human abilities are being
wasted rather than being used.
Strong leaders drive culture of safety and
health. They influence to make it a way of
life through their programs and actions.
Organisational cultures and community
expectations are powerful drivers of change
and collectively influence the nation’s
health and safety culture (Safe Work
Australia, 2020). Organizations, through
their CSR activities, need to raise
community’s awareness levels on safety
and health. Frequency and clarity of
communication of safety behaviors among
communities improve safety culture.
Critically speaking, the enablers and
barriers would keep interplaying and safety
and health at-risk behaviours would
continue as it is, depending upon the
cultural values and compliances of the
country’s population, and so would be
implications in terms of incidents, injuries
and fatalities, as being witnessed.
Developing and maintaining HSE culture
remains a continual journey for all.
However, a collective mind set of the world
leaders might help move India out of an
array of the multiple crises (HSE crisis,
natural and political disasters) that have
gathered the humanity. The losses are
certain and immense whether they are of
human lives or economic ones. It would
obviously be a long term affairs and testing
times ahead across the globe. An elevated
mind is a solution toward the united goals
with myriad wisdoms, that would prevail
with a practice of education, meditation and
continuation of persuasion, for safe life of
everyone with a sense of equality and
quality of caring, and making it a way of
life (Long, 2015). For example, the UN-
Volunteers supported the COVID-19
response efforts through the network of
Indian District Youth Volunteer
Coordinators (UNV, 2020) as a social
reform.
Thus, the safety/health culture is to be
elevated to a symbolic level of solar energy
for an immense power, so as to make
safety-a-way-of-life in communities with
support of government/non-government
bodies. A new thinking, focus and energy
are needed to meet this goal in question,
which would involve many factors like
change concept and process, leaders,
educational tools, timeframes, coordinators
and volunteers, monitoring and tracking
procedures, government controls, projects
management strategies etc. In this regard,
an exemplary services of India needs a
mention of the hundred thousands of
Accredited Social Health Activists who are
large scale grass root community health
workers (CHWs like ASHA/AWW/ANMs)
across the nation to combat the health
disaster (Government of India, 2020).
Similar multilevel national safety
initiatives would help and are a need of the
times. It is crucial to unite more such
initiatives, and the national budget must
support considerably to make ‘safety and
health a way of life’.
References Department of Science & Technology, Govt.
of India (2020, March, 9). Need to evolve
safety as a habit highlighted in celebration
of National Safety Day 2020 at ARCI.
https://dst.gov.in/pressrelease/need-evolve-
safety-habit-highlighted-celebration-
national-safety-day-2020-arci
Dorf Ketal. (2020). Sustainability is Smart
Business.
https://www.dorfketal.com/about-dorf-ketal/sustainability
European Agency for Safety and Health at
Work (2013). Diverse cultures at work:
ensuring safety and health through
leadership and participation. Luxembourg:
Publications Office of the European Union.
(http://europa.eu).
Government of India (2020). National Health
Mission.
https://nhm.gov.in/index1.php?lang=1&lev
el=1&sublinkid=150&lid=226
Hariton, L. (2020). Why Inclusive Workplaces
Matter in a Time of Crisis.
https://www.catalyst.org/2020/03/24/inclus
ion-in-crisis/
60
Hart I. (2018). Health & safety culture in
India.
https://www.shponline.co.uk/occupational-
health/health-safety-culture-in-india/amp/
Hofstede, G. (2001). Culture's consequences:
Comparing values, behaviors, institutions
and organizations across nations. Beverly
Hills, CA: Sage.
Hogman, Rowan (2020, February, 24). Can
tens of thousands of lives be saved every
year in India?
https://www.ericsson.com/en/blog/2020/2/s
itis-technology-traffic-safety-india
Horace, M. (1848). Twelfth Annual Report to
the Secretary of the Massachusetts State
Board of Education. Retrieved on 2 July
2020. https://genius.com/Horace-mann-
twelfth-annual-report-to-the-secretary-of-
the-massachusetts-state-board-of-
education-1848-annotated
ILO (2019). Safety and health at the heart of
the future of work. Building on 100 years of
experience.
https://www.ilo.org/safework/events/safeda
y/WCMS_686645/lang--en/index.htm
Jansz, J., Ulomka, U., Shadgett, A., Brown,
M., Sarmiento, E., Logan, M., Choueiri, E.,
Zakaria, R., Hsu, Y., De La Rosa, A.,
Gilkey, D., Perryman, D., Ramli, S. &
Kimeu, J. (2020). Workplace Safety,
Enablers and Barriers. World Safety
Journal, 24(2), 1–23.
Johari, A. (2020, April, 1). ‘Not much we can
do to keep ourselves safe’: Fear grips
Mumbai’s slums as Covid-19 cases rise.
https://scroll.in/topic/56256/coronavirus-
crisis.
Kaila H. (2019). Behaviouralizing Safety
Implementation among Indian Corporates:
A Research Review. University News, 57
(20), May 20- 26, 2019, 14-16.
Khanna, P. (2019). Indian cities rank low
according to Safe Cities Index.
https://www.livemint.com/news/india/india
n-cities-rank-low-according-to-safe-cities-
index-1567061693906.html
Lomas, T. (2015). Positive Social Psychology:
A Multilevel Inquiry Into Sociocultural
Well-Being Initiatives. Psychology Public
Policy and Law. 21. 338-347.
10.1037/law0000051.
Long, R. (2015). A Philosophy of Safety.
https://safetyrisk.net/a-philosophy-of-
safety/
Mark, C. Noort, T., Reader, S. & Shorrock, B.
(2015, December 12). The relationship
between national culture and safety culture:
Implications for international safety culture
assessments. Journal of Occupational and
Organizational Psychology.
https://doi.org/10.1111/joop.12139
Mitra, M. (2018). India's Best Companies For
CSR 2014: Community development and
road safety propel Maruti in the fast lane.
https://m.economictimes.com/indias-best-
companies-for-csr-2014-community-
development-and-road-safety-propel-
maruti-in-the-fast-
lane/articleshow/45296152.cms
Mother India Care (2020). Mother India Care
- Road Safety is Life.
Safetyhttps://www.motherindiacare.com/ro
ad_safety_is_life_safety
New Brunswick Department of Education
Instructional Resources Branch. (2000).
Health & Safety - Choices for Life. Audio
Visual, 2000 Media Catalogue.
Fredericton, New Brunswick.
Nursing Council of New Zealand. (2002).
Guidelines for cultural safety, the treaty of
Waitangi, and Maori health in nursing and
midwifery education and practice.
Wellington: Nursing Council of New
Zealand.
Prasad, M. & Garcia, C. (2017, September,
11). How to Conduct a Successful Focus
Group Discussion.
https://humansofdata.atlan.com/2017/09/co
nduct-successful-focus-group-discussion/
Safe Work Australia (2020). Leadership and
culture.
https://www.safeworkaustralia.gov.au/lead
ership-culture
Sehgal, S. (2016, May, 26). Concept of safety
in India - a perspective.
https://indianlawwatch.com/concept-of-
safety-in-india-a-perspective/
UNV. (2020). The fight against COVID-19:
keeping communities safe in India.
https://www.unv.org/Multimedia/fight-
against-COVID-19-keeping-communities-
safe-India
Van Oord (2020). Safety is a way of life.
https://www.vanoord.com/safety/safety-is-a-way-of-life.
Vinney, C. (2020 February, 11). "Social
Cognitive Theory: How We Learn
From the Behavior of Others." Thought
Co, thoughtco.com/social-cognitive-
theory-4174567
Walter, D. (2019, May, 20). India must
seize the opportunity to create safe and
healthy workplace.,
https://www.hindustantimes.com/analys
is/india-must-seize-the-opportunity-to-
create-safe-and-healthy-

61
workplace/story-
6MNrICCxTNcc4N3azhWZaO.html
WHO (2020). High-risk groups.
https://www.who.int/malaria/areas/high
_risk_groups/en/
Williams, R. (1999). Cultural safety – what
does it mean for our work practice?
Australian and New Zealand Journal of
Public Health, 23(2), 213-214.
Author
Harbans Lal, earned his Masters’ degree
in Psychology from the Guru Nanak Dev
University and PhD from the Tata Institute
of Social Sciences, Mumbai. Served SNDT
Women’s University and the Central
Labour Institute, Mumbai for >28 years.
Represented India in Conferences in New
York, Berlin, Muscat, Rome, New Zealand,
Japan, London, Dubai, Cairo and Sydney.
Is the Editor of the Journal of Psychosocial
Research. Director of the Forum of
Behavioural Safety and has conducted
>1000 behavioural safety programs for
industry.
Acknowledgment: contributions from all
HSE professionals are thankfully
acknowledged.

1
Safe Distance Analysis and Modelling of Fire and Explosion
of the LPG Storage Tanks at PT XYZ Gresik Regency East Java, Indonesia
Using ALOHA (Areal Locations of Hazardous Atmosphere.)
Ni’mat Hikmatullaha, KHOLILb*, Ni’mat HIKMATILLAHb Soehatman RAMLIc
a Post Graduate School of Sahid University, South Jakarta 12870, Indonesia b Faculty of Engineering Sahid University Jakarta c Politechnik of Saince and Technology Bekasi, West Jawa
Email: [email protected] and [email protected]
Abstract Oil and gas industries are categorized as high risk activities. Fire and explosion incident in
Liquefied Petroleum Gas (LPG) storage tanks illustrates the high safety risks of Liquefied
Petroleum Gas storage tanks at oil and gas processing facilities. PT XYZ is an oil and gas company
that has LPG storage tanks, which have a potential for fire and explosion incident. Therefore it is
necessary to study the possible impact of fire and explosion incident. This research was conducted
to analyze safe distance, and modeling the size of fire and explosion of LPG storage tanks at PT
XYZ, and determine the appropriate control measure to reduce the impact of the incident, using
Areal Location of Hazardous Atmospheres (ALOHA) Software simulation. The result of this
study can also be an input for the Company to ensure the level of safety and reliability of their
installation. There were 3 (three) steps in this research. Identification of fire and explosion
incident scenario in the LPG storage tanks, the range of fire and explosion modeling of the LPG
storage tanks, and the safe distance analysis of LPG storage tanks to other facilities in the vicinity.
The results of the research showed that explosion of and fire in the tank caused the spread of heat
radiation to the farthest distance of 188 meters from the location of the leak. The worst impact for
residents of the settlement is the potential to cause second-degree burns with a thermal radiation
level of> 5.0 kW / m2 within 60 seconds. The LPG tank explosion and fire distance models are: a
distance of 0- 1.3 km high risk; 1.3-2.8 moderate risk; and> = 2.8 km low risk.
Keywords: LPG Storage Tank. Safe Distance. Fire. Explosion. ALOHA.
1. Introduction Development of oil and gas industries is very
large in Indonesia. The oil and gas industry
is a dominant factor in the strategy of
Indonesia’s development, especially in the
globalization and free trade era. The activities
of oil and gas industries starting from
production, processing, and transportation,
all have potential hazards, such as fire and
explosion. To prevent or reduce these
potential hazards, oil and gas industries have
to develop process safety management.
The oil and gas sector is a large industry that
has a high risks in processing and drilling
activities. In the past ten years, there have
been many accident for this industry, such as
fire, blasting, environmental pollution and
others causes which are a high potential
hazards. In past five years 17 of 36 accident
were in the drilling area with enormous
losses. In Indonesia, especially in the oil and
gas sector, each company is required to
conduct a risk assessment before a
production facility is built and operated, such
as identifying, analyzing and evaluating
hazards in each work activity (Ramli, 2010).
Law No. 1 of 1970 concerning Work Safety
states that one of the requirements for work
safety is to prevent, reduce and extinguish

63
fires, as well as to prevent and reduce the
danger of blasting (Article 3, Law No. 1 of
1970). The regulation becomes one of the
basis for the mandatory efforts to control risk
against fire and explosion hazards. Violation
of the regulation has an impact on giving
sanctions (legal actions) in accordance with
Article 15, Law no. 1 of 1970.
In addition, based on the Instruction of the
Head of Oil and Gas Inspection No. 69 /
18.01 / DMT / 2013 concerning efforts to
increase vigilance over the process safety in
LPG storage, both new and existing LPG
storage installations with storage capacity
more than 4,000 g.w.c. (gallons water
capacity) must be assessed with the FSA
(Fire Safety Analysis).
Fire and explosion cases due to LPG leak had
occurred at the LPG distribution terminal
owned by Pemex Oil Company, Mexico on
November 19, 1984. The incident originated
from the pipeline damage that caused the
occurrence of a boiling liquid expanding
vapor explosion (BLEVE) which can occur
when pressurized liquid inside of a pipe or
storage tank reaches temperatures higher than
that liquid's boiling point. This was followed
by dozens of other explosions, so that as
many as 500 people were killed, 5000-7000
suffered seriously injuries and the LPG
distribution terminal was destroyed. Losses
were US $ 31 Billion and the BLEVE
destroyed one third of Mexico's LPG supply
(Ramli, 2017).
On April 9, 1998, an 18,000 gallon LPG
(propane) storage tank explosion and fire
occurred in Albert City, Lowa, United States.
The incident began with a tank leak that
caused fire and explosion, resulting in 2
firefighters being killed, 7 others seriously
injured and material losses from this incident
were $ 250,000 (Permatasari, et al., 2016).
Some of major accidents in oil and gas
exploitation and exploration indonesia are a
gas leak during transfer (loading) from an
LPG tanker to a 60-ton holding tank owned
by PT Surya Artha Chanya, Bogor in 2012.
This incident caused hundreds of residents to
fret and three people fainted due to the smell
of mercaptan in LPG.
In addition, on November 20, 2015 there was
an explosion at the Tanjung Sekong LPG
Terminal. This LPG terminal was the largest
LPG terminal in Indonesia. It was equipped
with 4 storage tanks and jetty facilities to
unload and load LPG. Fire was caused by the
presence of hydrocarbon gas mixed with air
which forms a mixture of explosive gases.
This incident caused 2 people to suffer
serious burns (Tim Independen Pengendalian
Keselamatan Migas, 2017). A fire case at one
of the LPG processing facilities at PT XYZ
had occurred on March 7, 2018 which caused
many losses, including: cessation of LPG
production due to damage to some
equipment. Environmental factors have an
enormous influences on the safety of the
drilling process. Environmental factors
include human activity and many buildings
around the drilling location (Winarno, Deny
& Kurniawan, 2016). The main problem
faced by PT XZ is increasing public activity
around the drilling location which interferes
with drilling safety. The purpose of this
research was to determine the model of safe
distance of LPG Storage tank location from
public activites.
2. Literature Review The oil and gas drilling industry is a high-risk
activity because gas pipelines often leak
which can result in fire and blasting (Ansori;
2016). The hydrocarbons release in the
petroleum industry consists of gas, mist or
liquid under atmospheric or pressurized
conditions. The release of gas and mist is
considered to be more hazardous because the
substance is easily ignited (Ramli, 2010). In
addition, the presence of a vapor cloud
which, if it is ignited, will have a worse
impact than liquid fires which are less likely
to spread, are usually local and relatively
manageable. Such release can be caused by
external corrosion, internal erosion,
metallurgical damage and by operator error.

64
According to Bjerketvedt et al. (2006), releasing flammable gas or liquid evaporation into the
atmosphere will cause several dangerous events as show in the following figure 1.
Figure 1.
Gas Explosion Tree.
From Gas Explosion Handbook (p.20) by Bjerketvedt, et al., 2006, GexCon. Copyright 2006
GexCon.
In Indonesia among the most frequent
disasters in the gas industry are fires due to
the release of hydrocarbon (Ramli, 2010;
Ansori, 2016; Permatasari et al 2016).
Generally there are 4 types of fires due to
hydrocarbon release (Bjerketvedt, et al.,
2006).
(1) Flash Fire. This type of fire occurs
when a hydrocarbon vapor is in the air or
when a vapor cloud suddenly ignites. The
fire will glow like lightning in the navel of
the fire and usually lasts a short time. This
type of fire will release high heat energy
which reaches 0.1 - 0.3 psi, so that it can
scorch nearby objects or people . These
fires often occur in cases of indoors LPG
gas leaks (Ramli, 2010).
(2) Jet Fire. If the hydrocarbon comes out
through a small hole with high pressure it is
called a jet fire (Ramli, 2010). Fire in the oil
and gas industry is usually always
associated with this type of jet fire. Jet fire
is a pressurized flow of flammable gas or
atomized liquid (such as the release of high
pressure from a gas pipe or an oil well blast
event) that burns. If the discharge occurs
and then ignited immediately after it occurs
(within 2-3 minutes), the result is a jet fire.
The jet fire is stable to a point close to the
source of release, until the release stops. Jet
fires usually occur very locally, but are very
damaging to everything that is nearby
(Nolan, 2014).
(3) Pool Fire, occurs when a hydrocarbon
liquid spills and hits a place or in an open
container such as a storage tank. The
amount of fire is determined by the amount
of fuel, chemical, physical properties of the
material and by the environmental
conditions such as wind direction and
weather (Ramli, 2010).
(4) Fire Ball, usually occurs due to
pressurized gas in a container that suddenly
leaks due to rupture. For example LPG
tanks that suddenly leak, causing the gas to
rapidly expand into the air and suddenly
catch fire. One of the fireball causes is the
BLEVE (Boiling Liquid Expanding Vapor

65
Explosion) event (Ramli, 2010).
Assael & Kakosimos (2010) added another
one called BLEVE which occurs as a
consequence of failure caused by external
factors (such as fire) of pressurized
containers filled with gas or liquid which
are stored at a higher pressure than the
environment. The absorption of heat causes
boiling and an increase in internal pressure.
This is associated with a decrease in the
resistance of the metal surface due to
increased temperatures resulting in
container damage and explosion. The
release of energy produces very fast
airwaves, heat radiation, and fragments
from flying containers. Kamaei, et al.
(2016) stated that a tank explosion
occurred, due to a high-pressure explosion
wave.
Another danger for the gas industry is an
explosion when there is very high pressure
on the pipeline. Bakke, van Wingerden,
Hoorelbeke & Brewerton (2010) stated that
the impact of a gas explosion is a very
broad impact, and even at greater range.
Determining the fire and explosion size of
LPG tanks can be done by simulating the
modeling of fire and explosion size using
ALOHA (Areal Location of Hazardous
Atmospheres) Software. The results of this
analysis can predict the risk zone (threat
zone) due to fire and explosion of the LPG
storage tank. The risk areas are then
mapped with MARPLOT Software
Bhattacharya & Kumar, (2015) wrote that
ALOHA software can be used to simulate
hazardous chemicals release to the
atmosphere. This software is widely used
by DOE (Department of Energy) Complex
for safety analysis applications. United
States Environmental Protection Agency
(EPA), through the Chemical Preparedness
and Prevention Office (CEPPO), and the
National Oceanic and Atmosphere
Administration (NOAA) office).
To determine the safe distance, the LPG
installation technical guidance from the
Directorate General of Oil and Gas through
the Instruction of the Head of Oil and Gas
Inspection No. 69 / 18.01 / DMT / 2013 was
used. The instruction states that in the
context of increasing process safety level in
LPG storage, both new and existing LPG
storage installations with storage capacity
of more than 4,000 g.w.c. (gallons water
capacity) must be assessed with the FSA
(Fire Safety Analysis). In addition to these
guidelines, there are a number of standards
related to LPG installations, such as: NFPA
(National Fire Protection Association) 58
and API (American Petroleum Institute)
2510 as a reference for the Company in
carrying out the FSA and determining the
safe distance of LPG tanks to other
facilities and equipment around it.
3. Methodology
This research used a quantitative approach
and was conducted by collecting data at the
location of the oil and gas drilling industry
XYZ located in Gresik, East Java
Indonesia. Data collection and analysis
included simulations using ALOHA and
MARPLOT Software and interpreting the
simulation results for the fire and explosion
size due to LPG storage tank leak at PT
XYZ and determining the safe distance by
referring to the technical guidelines for
LPG installations from the Directorate
General (Ditjen) of Oil and Gas as well as
international standards related to the
installation of LPG tanks, i.e. the National
Fire Protection Association (NFPA) 58 and
the American Petroleum Institute (API)
2510.
Data obtained was analyzed using
analytical tools in accordance with the
variables to be examined and the
conceptual framework. The stages of data
analysis were as follows:
LPG Tank Fire and Explosion Risk
Analysis. The process for analyzing the
risk of fire and explosion of LPG tanks
was by reviewing historical HAZID and
HAZOP study data at PT XYZ.
Modeling of LPG Tank Fire and
Explosion Size. The process to find out

66
the impact of fire and explosion of LPG
tanks was by simulating fire size models
using ALOHA and MARPLOT
Software.
Analysis of Safe Distance LPG Storage
Tanks. The process for analyzing the safe
distance of LPG tanks to the surrounding
facilities refered to the technical
guidelines for LPG installations from the
relevant Directorate General (DG) of Oil
and Gas (NFPA 58 and API 2510).
4. Results and Discussion PT XYZ is an oil and gas drilling company that
was established on the 27th of June in 2011. It is
located in East Java with an area of 784 km2
and consists of onshore facilities (Onshore
Processing Facilities [OPF]). Gas Processing
Facility (GPF). Oil Treating Facilities (OTF).
LPG Facilities (LPGF). Metering,Export
pipeline to PLN Gresik. Loading Facility at
Maspion Jetty and offshore facilities (Well
Head Platform A (WHP-A). Well Head
Platform B (WHP-B). Central Processing
Facilities (CPP). Accomodation and Utility
Platform (AUP).
LPG produced from the processing
facilities at OPF and is stored in a storage
tank before being flowed to the PT.
Pertamina that is managed by PT. Miratama
Energy Maspion (MEM). The types and
characteristics of LPG storage tanks at PT
XYZ are Spherical Tanks with a diameter
of 18 meters. The type of Liquid stored in
these tanks is LPG (Propane & Butane);
Tanks have an Inlet Nozzle that is 6 inches
and an Outlet Nozzle that is 12 inches.
Based on PT XYZ's Basis of Design
document (Doc. No. UPD-TJ-P2-PR-BD-
0001), weather conditions data at the site
that were taken from BMKG (Meteorology,
Climatology & Geophysics Agency)
calculations were made. Weather
conditions data can be seen in the following
Table 1 that indicates that the temperature
is not too hot and the humidity is sufficient.
Table 1. Weather conditions around the factory
Determining Scenario of Events
The event scenario is based on the point or
location of the leak in the LPG storage tank
and its leak size (diameter) which refers to
the International Association of Oil and Gas
Producers Report No. 434-1
regarding Process Release Frequencies.
The following is a table of event scenarios
that was simulated by using ALOHA and
MARPLOT Software:

67
Table 2. List of Scenario
No. Scenario Leak
Location
Leak Height
(m)
Leak
Diameter
(cm)
Remarks
1.
Jet Fire
Bottom of the
Tank 0
0.5 Scenario 1
2. 5 Scenario 2
3. 15 Scenario 3
4. Middle of the
Tank 9
0.5 Scenario 4
5. 5 Scenario 5
6. 15 Scenario 6
7. Top of the
Tank 18
0.5 Scenario 7
8. 5 Scenario 8
9. 15 Scenario 9
10. Fire Ball
(BLEVE) - - - Scenario 10
Based on scenarios (table2) the simulation results of PT XYZ LPG tank fire and explosion size
can be seen in the following table:
Table 3. Analysis of Modeling Result
From 10 scenarios that have been
simulated by the ALOHA soft ware, it
can be concluded that each scenario has
different results. One of the
distinguishing parameters is the
difference in the location of the leakage
point, the height of the leak and the
diameter of the leak.The difference of
these event scenarios is the leak height
(in meters) and leak size (in
centimeters).
Leak Height Leak Diameter
meter
(m)
centimeter
(cm)
Red Zone
(100% LEL)
Orange Zone
(60% LEL)
Yellow Zone
(10% LEL)
1 0.5 Scenario 1 < 10 meter < 10 meter 12 meter LPG Tanks Area
2 5 Scenario 2 38 meter 67 meter 102 meter Crude Oil Tanks Area
3 15 Scenario 3 132 meter 188 meter 290 meter Residential Area
4 0.5 Scenario 4 < 10 meter < 10 meter 12 meter LPG Tanks Area
5 5 Scenario 5 48 meter 66 meter 101 meter Crude Oil Tanks Area
6 15 Scenario 6 131 meter 186 meter 287 meter Residential Area
7 0.5 Scenario 7 < 10 meter < 10 meter 11 meter LPG Tanks Area
8 5 Scenario 8 46 meter 63 meter 97 meter Crude Oil Tanks Area
9 15 Scenario 9 125 meter 178 meter 274 meter Residential Area
10Fire Ball
(BLEVE)- - - Scenario 10 1,3 kilometer 1,8 kilometer 2,8 kilometer
All Industrial Estate and
Residential Area
Jet Fire
Bottom of the
Tank0
Middle of the
Tank9
Top of the
Tank18
No. ScenarioLeak
LocationScenario
Size Distance
Impacted Area

68
The worst impact of the fire and
explosion from the above modeling
results showed that the furthest thermal
radiation is seen in scenario 3, which is
up to 188 meters from the leakage
location. The simulated jetfire event in
scenario 3 shows that its thermal
radiation size can reach residential
areas around PT XYZ. The worst
impact of this scenario for residents is
the potential of second-degree burns
with thermal radiation exposure of of >
5.0 kW / m2 (orange zone) within 60
seconds,as shown in figure 3.
Figure 2.
“JET FIRE” Modeling Scenario 3 using ALOHA Software
The thermal radiation size based on the jet fire modelling (figure 2) includes:Red Zone with
size Distance 132 meters. It is an affected area with thermal radiation > 10.0 kW / m2 and
within 60 seconds has the potential to cause death. While orange Zone is size with distance 188
meters, and it is an area affected by thermal radiation > 5.0 kW / m2 and within 60 seconds has
the potential to cause second-degree burns. The yellow Zone is size distance 290 meters, where
it is an affected area with thermal radiation > 2.0 kW / m2 and within 60 seconds has the
potential to cause pain. Explosion size modeling by using ALOHA and MARPLOT software
shows that the furthest thermal radiation is seen in scenario 10 (figure 3), i.e. the fireball event
caused by BLEVE. The simulated BLEVE event in scenario 10 shows that its thermal radiation

69
size can reach all industrial area and residential areas around PT XYZ. The worst impact of
this scenario for residents and all industrial area has the potential to cause death with thermal
radiation exposure of of > 10 kW / m2 (red zone) within 60 seconds.
Figure 3.
“BLEVE” Modeling Scenario 10 by ALOHA and MARPLOT
The thermal radiation size based on the
explosion “BELVE” modeling are:
(a) red Zone is size distance 1.3 kilometers.
It is an affected area with thermal radiation
> 10.0 kW / m2 and within 60 seconds has
the potential to cause death,
(b) Orange Zone is size distance 1,8
kilometers, it is an area affected by thermal
radiation > 5.0 kW / m2 and within 60
seconds has the potential to cause second-
degree burns, and
(c) Yellow Zone is size distance 2,8
kilometers, and it is an affected area with
thermal radiation > 2.0 kW / m2 and within
60 seconds has the potential to cause pain.
Safe Distance Analysis
To determine the safe distance, the LPG
installation technical guidelines from the
Directorate General of Oil and Gas through
the Instruction of the Head of Oil and Gas
Inspection No. 69 / 18.01 / DMT / 2013 and
several standards related to LPG tank
installations, i.e. NFPA (National Fire
Protection Association) 58 and API
(American Petroleum Institute) 2510, are
used.

70
Table 4. Safe Distance Analysis Result
Based on the above results, it can be concluded that the LPG storage tank of PT XYZ has
fulfilled the Fire Safety Analysis (FSA) requirements related to safe distance analysis. The
mapping of PT XYZ's LPG storage tank safe distance can be seen in the following OPF
(Onshore Processing Facilities) Layout (Figure 4).
Figure 4. Safe Distance Mapping of LPG Storage Tank

71
5. Conclusions Based on previous safety studies (HAZOP
and HAZID Study) of PT XYZ, several
potential hazards in PT XYZ LPG storage
tanks are identified as causing potential fire
and explosion.
Fire size modeling by using ALOHA and
MARPLOT software shows that the furthest
thermal radiation is seen in scenario 3, which
is up to 188 meters from the leakage location.
The simulated jetfire event in scenario 3
shows that its heat radiation size can reach
residential areas around PT XYZ. The worst
impact of this scenario for residents is the
potential of second-degree burns with
thermal radiation exposure of of > 5.0 kW /
m2 (orange zone) within 60 seconds.
Explosion size modeling by using ALOHA
and MARPLOT software shows that the
furthest thermal radiation is seen in scenario
10, i.e. the fireball event caused by BLEVE.
The thermal radiation size includes:
o Red Zone: Size Distance 1.3 kilometers.
It is an affected area with thermal
radiation > 10.0 kW / m2 and within 60
seconds has the potential to cause death.
o Orange Zone: Size Distance 1,8
kilometers. It is an area affected by
thermal radiation > 5.0 kW / m2 and
within 60 seconds has the potential to
cause second-degree burns; and
o Yellow Zone: Size Distance 2,8
kilometers. It is an affected area with
thermal radiation > 2.0 kW / m2 and
within 60 seconds has the potential to
cause pain.
References Assael, Marc J., Kakosimus, Konstantinos E.
(2010): Fires, Explosions, and Toxic Gas
Dispersion: Effects Calculation and Risk
Analysis. Boca Ralon. CRC Press.
Ansori. 2016. Analisa Resiko Kebakaran dan
Ledakan Akibat Kebocoran Perpipaan Gas
Hidrogen di HRU (Hydrogen Recovery Unit)
Ammonia Plant dengan Metode QRA
(Quantitative Risk Analysis). Surabaya:
Politeknik Perkapalan Negeri Surabaya.
Indonesia
Bhattacharya,R.,Ganesh Kumar. (2015).
Consequence analysis for simulation of
hazardous chemicals release using ALOHA
software. International Journal of ChemTech
Research 8(4):2038-2046
Bakke,J.R.,Kees van Wingerden, Pol
Hoorelbeke, Bob Brewerton. (2010).A study
on the effect of trees on gas explosions.
Journal of Loss Prevention in the Process
Industries 23(6):878-884.
DOI: 10.1016/j.jlp.2010.08.007
Bjerketvedt, D., Bakke, J.& Van Wingerden, K.
(2006): Gas Explosion Handbook. Gexcon.
Kamei, Mohammad., Alizadeh, Seyed Shams
Aladin., Keshvari, Abdolrahman., Kheyrkhah,
Zeynab., Moshashaei, Parisa. (2016): Risk
Assessment and Consequence Modelin of
BLEVE Explosion Wave Phenomenon of
LPG Spherical Tank in a refinery. Journal of
Health and Safety at Work; (6)2. Iran.
Nolan, D. P. (2014): Handbook of Fire &
Explosion Protection Engineering Principles
for Oil, Gas, Chemical, and Related Facilities.
USA: ELSEVIER.
Permatasari, Indah, Desy., Sunarsih, Elvi., Faisya
H.A Fickry. (2016): Analisis Konsekuensi
Kebakaran dan Ledakan Pada Tangki LPG
(Liquefied Petroleum Gas) di PT Surya Eka
Perkasa TBK Palembang. Palembang:
Universitas Sriwijaya. Indonesia
Ramli, Soehatman. (2010): Petunjuk Praktis
Manajemen Kebakaran. Jakarta: PT. Dian
Rakyat. Indonesia
Ramli, Soehatman. (2017): Manajemen
Keselamatan Proses Berbasis Risiko. Jakarta:
Prosafe Institute. Indonesia
Tim Independen Pengendalian Keselamatan
Migas. (2017): Atlas Keselamatan Migas,
Jakarta. Kementerian Energi Dan Sumber
Daya Mineral Direktorat Jenderal Minyak dan
Gas Bumi. Indonesia
Winarto,S., Hanifa M. Denny, Bina Kurniawan.
(2016). Studi Kasus Kecelakaan Kerja pada
Pekerja Pengeboran Migas Seismic Survey
PT. X di Papua Barat. Jurnal Promosi
Kesehatan Indonesia, 11(1), hal : 51-65.
Indoneisa

72
Bibliography American Petroleum Institute. (2001): API 2510
Design and Construction of LPG
Installations. United States of America.
Bird. F. & Germain, G. (1992): Practical Loss
Control Leadership. International Loss
Control Institute Inc.
CCPS, (2000): Guidelines For Chemical Process
Quantitative Risk Analysis. New York.
CCPS, (2003): Guidelines for Fire Protection in
Chemical, Petrochemical, and Hydrocarbon
Processing Facilities. New York: American
Institute of Chemical Engineers
Chang, James I., Lin, Cheng-Chung. (2005): A
Study of Storage Tank Accidents. Journal of
Loss Prevention in the Process Industries.
Taiwan: ELSEVIER.
Depnaker. (2002): Himpunan Perundangan
Keselamatan dan Kesehatan Kerja. Indonesia
Environmental Protection Agency dan National
Oceanic and Atmospheric Administration.
(2007): ALOHA User’s Manual.
Washington.
Fire Risk UK. (2012): Theory of Fire.
http://www.fireriskuk.com/training./theory_o
f_fire.htm (downloaded 15 March 2019).
Guojun Wu; Shanpo Jia; Bailin Wu. (2019).
Comparison of a novel coupled hydro-
mechanical model with typical analytical
models in subsidence of coal seam gas
extraction. International Journal of Oil, Gas
and Coal Technology (IJOGCT), 22(2), 246-
268.
International Association of Oil and Gas
Producers. (2010). Process Release
Frequencies. Risk Assessment Data
Directory. Report No. 434-1.
International Labour Organization. (1989): Buku
pedoman pencegahan kecelakaan. Geneva.
PT. Pustaka Binaman Pressindo.
International Organization for Standardization.
(2015): ISO 14001 Environmental
Management System - Requirements with
Guidance for Use. Geneva.
International Organization for Standardization.
(2018): ISO 45001 Occupational Health and
Safety Management System Requirements
with Guidance for Use. Geneva.
International Organization for Standardization.
(2018): ISO 31001 Risk Management
Guidelines. Geneva.
International Organization for Standardization.
(2000): ISO 17776 Petroleum and Natural
Gas Industries-Offshore Production
Installations-Guidelines on Tools and
Techniques for Hazard Identification and
Risk Assessment. Geneva.
Mannan, Sam (Ed.). (2005). Loss Prevention
in The Process Industries. Oxford: Elsevier
Inc.
National Fire Protection Association. (2004):
NFPA 58 Liquefied Petroleum Gas Code.
United States of America.
NIOSH. (2007): NIOSH Pocket Guide to
Chemical Hazard. National Institute on
Occupational Safety and Health.
Ohmiya , Y., Seunggoo Kang, MasakiNoaki,
M.A.Delichatsios. (2020),. Effects of
opening aspect ratio on facade gas
temperatures with and without sidewalls
for underventilated conditions. Fire
Safety Journal. Volume 113, May 2020,
102944.
Roy, VasantMatsagar. (2020). Fire fragility
of reinforced concrete panels under
transverse out-of-plane and compressive
in-plane loads. Fire Safety
Journal,Volume 113, May 2020, 102976
Singh,J.K., Gautam Banerjee, Arvind Kumar
Singh, Rajendra Kumar Vishwakarma.
(2019). Modelling of design parameters of
intrinsically safe instruments for the safety of
oil, gas and coal industries. International
Journal of Oil, Gas and Coal Technology.
22(3) , P : 417-431.
Tauseef, S.M., Abbasi, Tasneem., Thiruselvi, D.,
Abbasi, S.A. (2017): The Risk of Domino
Effect Associated with the sotrage of
Liquified Petroleum Gas (LPG) and the
Safety Codes for Accident Prevention.
International Journal of Engineering Science
and Mathematics. India.
Tim Independen Pengendalian Keselamatan
Migas. (2017): Atlas Keselamatan Migas,
Jakarta. Kementerian Energi Dan Sumber
Daya Mineral Direktorat Jenderal Minyak
dan Gas Bumi. Indonesia
UPD-TJ-P2-PR-BD-0001 Rev. D, Sec-3.5 cited
that meteorological data should refer to
Metocean Study Oceanographist and
Meteorologist Report (2002) – Study for
Ujung Pangkah Platform and Associated
Pipeline – Surabaya Strait, Indonesia Doc.
No. R1129, Ver. 1, Sept 2002

73
Authors
Prof. Dr. K. Kholil, M.Com. Graduate/BSc Statistics and Mathematic (IPB),
Master of Technical of Information (STIIBI);
Ph.D. completed for Environmental Modeling
(IPB). Professor Kholil is Rector (Chancellor) of
Sahid University Jakarta Indonesia, Centre
Director for System and Director of the Post
Garduate Program Faculty of Environmental
Engineering. He has had wide experience in
designing public policy for government, and
private sector and has expertise in design
planning & evaluation of government policies,
and private sector to improve safety performance.
He has worked as a Senior Lecture and Senior
Researcher in environmental management and
modelling from 1997 to the present. A lot of Prof.
Dr Kholil’s research and publication have been
conducted in collaboration with national and
international institutions. He is active in several
national and international scientific institution in
environmental management fields, has been an
expert staff member of the People’s
Representative Council of Indonesia (2004-
2009), is Chief of the Institute of Regional
Development study. a World Bank Consultants
for Institutional Strengthening and Alignment of
Government Institution from 2013 to the present,
is a Consultants for Resolution Conflict of Water
Resource Management from 2017 to the present,
has been the Chief Editor of the Scientific
Tourism Journal of Sahid University from 2010
to the present, has been a Board Editor for
Petroleum Scientific Contribution from 2010 to
the present, was the Director of Research Centre
and Development of Indonesia from 2010 to
2014, was Chief of Research and Public Service
Institute of Sahid University from 2010 to 2016,
Editorial Board Member of the Indonesia
Scientific Petroleum Journal and to Chemistry
Journal and a Reviewer of Advance in Research
Journal & Asian Journal of Economic Business &
Accounting. Email [email protected] and
NI’MAT HIKMATILLAH has a Bachelor
Degree in Occupational Health and Safety from
the University of Indonesia. He has had 14+ years
experiences as HSE Professional in the Oil & Gas
Industry (Onshore and Offshore). He possesses
some professional HSE Certifications that
include the NEBOSH International General
Certificate, IOSH Managing Safely, TapRooT®
Advance Investigation Team Leader, Certified
Lead Auditor - CLA for OHSMS, EMS, EnMS,
QMS Auditor, National HSE Expert -
Government of Indonesia, Certified Industrial
Hygienist - CIH for HIMu and HIMa, First Aider,
Fire Fighter, etc. He has a proven track record in
developing and maintaining Company HSE
Management System to achieve the high levels of
HSE performance for E&P Field Operations,
Drilling & Completion Campaign and EPCI
Project. His specialties are HSE Management
System Development and Implementation, HSE
Audit and Inspections, Promoting and Delivering
HSE Orientation / Training, Reviewing and
Monitoring HSE Performance Statistics,
Managing Contractors (CSMS) and Participating
in Process Safety Studies (HAZOP, HAZID and
SIL). Social Skills and Competences. Highly
motivated person, proactive and willing to grow
resource, strong leadership, eager and fast
learner, taking new challenge without concern,
excellent communication skills and excellent
computer skills. Organizational Skills and
Competences. Strong planning, organizational
skills, good adaptation skills in completely new
working environment, strong knowledge of HSE
Standards, regulations and working practice.
Technical Skills and Competences. Strong
Knowledge of HSE Management System
Development and Implementation, HSE Audit
and Inspections, Promoting and Delivering HSE
Orientation / Training, Reviewing and
Monitoring HSE Performance Statistics,
Managing Contractors and Participating in HSE
Studies (HAZOP, HAZID and SIL).
74
Who is responsible? An examination of the ‘Chain of Responsibility’ in heavy
vehicle crashes - an Australian perspective
Ivan Cikara*, Geoff Dell, Yvonne Toft and Shevaun Dell. Central Queensland University.
Email: [email protected]
Abstract The aim of this study was to examine the role of the ‘Chain of Responsibility’ legislation in heavy
vehicle crashes within the Heavy Vehicle Transport System. The Heavy Vehicle National Law and
the Compliance and Enforcement legislation, commonly referred to as the ‘Chain of Responsibility’
legislation, were compared to identify differences and determine whether the legislation created a
transparent system that identified those responsible in the chain of events leading up to a heavy
vehicle crash. The roles and responsibilities of nominated parties, identified as ‘actors’ were mapped
using Rasmussen’s ActorMap framework, which added to mapping a structural hierarchy identifying
the various actors and their responsibilities. The study identified that both the Heavy Vehicle National
Law and the Compliance and Enforcement legislation-imposed duties and obligations on the same
actors within the Heavy Vehicle Transport System, however there were differences in the
requirements the legislation imposed. Additionally, it was identified there was a lack of vertical
integration from the lower levels of the Heavy Vehicle Transport System to the upper levels of the
system. In particular, there was no feedback loop to Regulators and the Government of information
needed to inform strategy and policy development to improve heavy vehicle safety. It is clear the
legislation imposes obligations on actors beyond the driver and yet in reality the heavy vehicle driver
is still the focus of blame.
This study recommended the need to implement national harmonisation of the legislation and the
introduction of an independent national investigation agency to investigate heavy vehicle crashes. It
also recommended the need to implement a national reporting and data base system where heavy
vehicle crash information can be analysed.
Key words: Chain of Responsibility. Heavy Vehicles. Compliance. Safety, Crashes.
1. Introduction Fatal and serious injuries resulting from heavy
vehicle crashes represent a significant
workplace and societal problem both in
Australia and globally. Within Australia the
Heavy Vehicle Transport System has been
identified as the most dangerous industry, with
the highest death rate of its workers compared
to that of other industries (Transport Workers
Union [TWU], 2015b). From March 2017 to
March 2018 there were 184 deaths from 163
fatal crashes (Bureau of Infrastructure
Transport and Regional Economics [BITRE],
2018). According to the IBIS World report into
Road Freight Transport in Australia (IBIS,
2017), the national freight task is projected to
double by 2030 which will see an increase in
growth of heavy vehicles on Australian roads.
With this prediction it is reasonable to expect
that the number and proportion of heavy
vehicles will significantly increase the pressure
on the road transport system which is likely to
increase the number of crash-related deaths
and injuries. Internationally, the statistics
cause great concern. In the United States, data
released by the National Highway Traffic
Safety Administration (2017) identified there
were 4,317 heavy vehicle crash-related
fatalities recorded in 2016, which represented
a 5.4 percent increase from 2015. In the United
Kingdom in 2013, more than 5,200 people
were killed in crashes involving heavy vehicles
(European Road Safety Observatory [ERSO],
2017).
The current legislative regimes for the Heavy
Vehicle Transport System that focus on road
safety are designed to protect workers and the
broader community through organisational
75
implementation of structures that mitigate
crashes and injuries (Stuckey and
LaMontagne, 2005). Legislative frameworks
are designed so that decisions made at the top
level of the system (e.g., policies, strategies
etc.), that emanate from Government, set the
boundaries for safety within the heavy vehicle
industry and identify what is required of the
heavy vehicle industry to be compliant
(Anderson and Bailey, 2005). It is expected
that decisions made by Government and the
Regulators cascade to the actors in the lower
levels of the system (i.e. supply chain and other
networks etc.) who implement internal policies
to manage driver behaviour and mitigate crash
and injury risk. For example, New Zealand’s
legislation identifies the roles and
responsibilities of parties, including
customers, and what they must do to prevent a
driver from committing a breach of their
legislation (NZTA, 2009). In 2012, South
Africa implemented new legislation for
transport operators that extended liability to
industry actors and third parties (Onanchenko,
2012). Similarly, Canada implemented a Road
Safety Strategy (RSS) in 2015 in which all
stakeholders were encouraged to ‘Rethink
Road Safety’ and included recommendations
to change driver behaviour and split
responsibilities between parties who are
involved in the transport of freight
(Onanchenko, 2012; Canadian Council of
Motor Transport Administrator [CCMTA],
2011).
Although the safety responsibilities of these
actors are clear under these legislative regimes,
it is unclear whether these responsibilities are
enforced or monitored to ensure that the actors
are compliant. This question is important to
answer, considering that research conducted in
the United States and Australia has established
that there are multiple factors across the Heavy
Vehicle Transport System that contribute to
heavy vehicle crashes (Newnam and Goode,
2015; Newnam et al., 2017); many of which
involve lack of oversight in legislative
compliance, such as load restraint, mass and
dimension management and vehicle
maintenance. It is important to note that the
efficacy of the legislation in supporting a safe
working environment has not yet been
conclusively validated.
The aim of the current study was to identify
and map the roles and responsibilities of actors
in the Heavy Vehicle National Law,
Compliance and Enforcement legislation that
has been implemented in Australia. This study
was used to illustrate the strengths and
weaknesses of the legislation, as well as
identify opportunities for improvement.
2. Background 2.1 The Australian Context
Australia has a vast geographic expanse with
numerous isolated communities where heavy
vehicles are the only practical mode of freight
transport and distribution that can reach every
location. The Australian heavy vehicle
transport industry employs in excess of
149,871 employees, has over 46,087
businesses and an annual market revenue of
approximately AUD$42 billion (IBIS, 2017).
In an attempt to reduce the number of deaths
and injuries within the heavy vehicle transport
industry, Governments around Australia, in
consultation with key industry stakeholders,
have implemented legislation to make all
parties involved in the movement of freight,
responsible for breaches of the legislation.
Specifically, the laws recognise that it is not
just the driver who is responsible for road
safety breaches and crashes; they assert that
those who exercise control or have influence
over the transport task are also responsible.
Therefore, the objective of the laws is to ensure
all parties in the supply chain share equal
responsibility for road safety by ensuring
compliance in every aspect of the Heavy
Vehicle Transport System. This legislative
framework is colloquially known as the ‘Chain
of Responsibility’ (National Heavy Vehicle
Regulator [NHVR], 2017).
In Australia, the Chain of Responsibility is
captured under two differing pieces of
legislation. These are the National Heavy
Vehicle Law Act 2012 (and its accompanying
Regulations) and Western Australia’s
Compliance and Enforcement legislation,
which includes the Road Traffic [Vehicles]
Act 2012 and Road Traffic (Vehicles)
Regulations 2014.
Currently the Heavy Vehicle National Law is
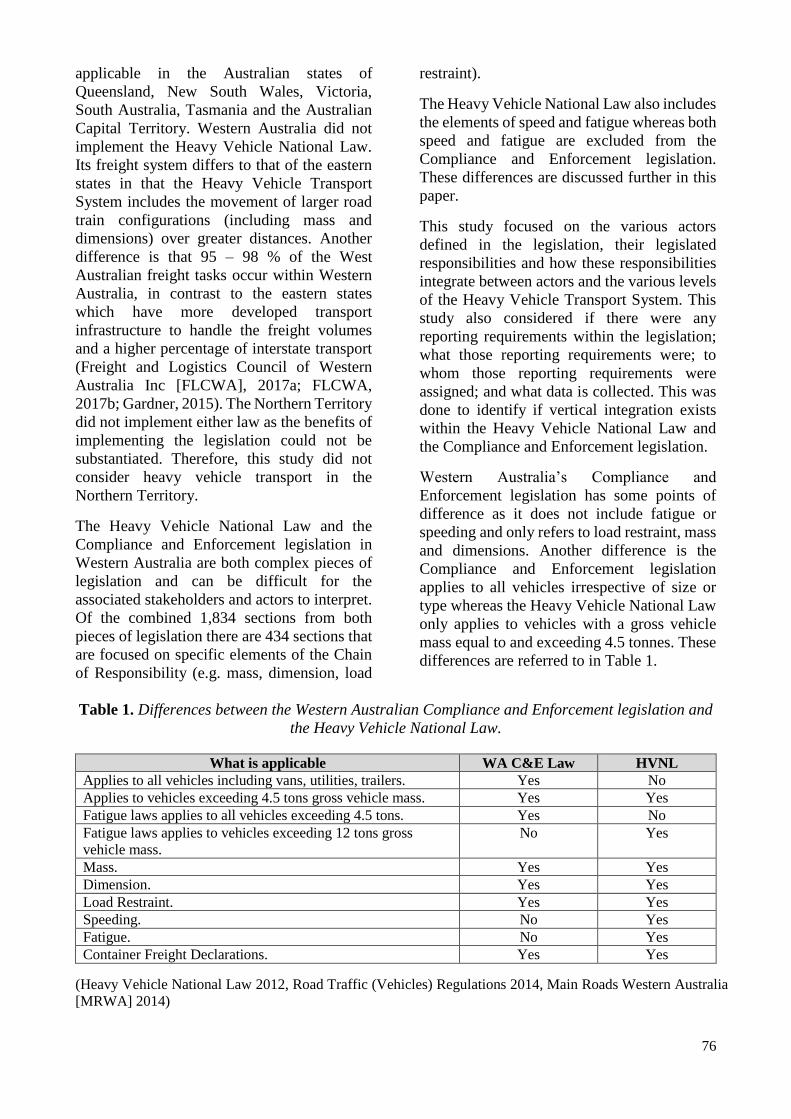
76
applicable in the Australian states of
Queensland, New South Wales, Victoria,
South Australia, Tasmania and the Australian
Capital Territory. Western Australia did not
implement the Heavy Vehicle National Law.
Its freight system differs to that of the eastern
states in that the Heavy Vehicle Transport
System includes the movement of larger road
train configurations (including mass and
dimensions) over greater distances. Another
difference is that 95 – 98 % of the West
Australian freight tasks occur within Western
Australia, in contrast to the eastern states
which have more developed transport
infrastructure to handle the freight volumes
and a higher percentage of interstate transport
(Freight and Logistics Council of Western
Australia Inc [FLCWA], 2017a; FLCWA,
2017b; Gardner, 2015). The Northern Territory
did not implement either law as the benefits of
implementing the legislation could not be
substantiated. Therefore, this study did not
consider heavy vehicle transport in the
Northern Territory.
The Heavy Vehicle National Law and the
Compliance and Enforcement legislation in
Western Australia are both complex pieces of
legislation and can be difficult for the
associated stakeholders and actors to interpret.
Of the combined 1,834 sections from both
pieces of legislation there are 434 sections that
are focused on specific elements of the Chain
of Responsibility (e.g. mass, dimension, load
restraint).
The Heavy Vehicle National Law also includes
the elements of speed and fatigue whereas both
speed and fatigue are excluded from the
Compliance and Enforcement legislation.
These differences are discussed further in this
paper.
This study focused on the various actors
defined in the legislation, their legislated
responsibilities and how these responsibilities
integrate between actors and the various levels
of the Heavy Vehicle Transport System. This
study also considered if there were any
reporting requirements within the legislation;
what those reporting requirements were; to
whom those reporting requirements were
assigned; and what data is collected. This was
done to identify if vertical integration exists
within the Heavy Vehicle National Law and
the Compliance and Enforcement legislation.
Western Australia’s Compliance and
Enforcement legislation has some points of
difference as it does not include fatigue or
speeding and only refers to load restraint, mass
and dimensions. Another difference is the
Compliance and Enforcement legislation
applies to all vehicles irrespective of size or
type whereas the Heavy Vehicle National Law
only applies to vehicles with a gross vehicle
mass equal to and exceeding 4.5 tonnes. These
differences are referred to in Table 1.
Table 1. Differences between the Western Australian Compliance and Enforcement legislation and
the Heavy Vehicle National Law.
What is applicable WA C&E Law HVNL
Applies to all vehicles including vans, utilities, trailers. Yes No
Applies to vehicles exceeding 4.5 tons gross vehicle mass. Yes Yes
Fatigue laws applies to all vehicles exceeding 4.5 tons. Yes No
Fatigue laws applies to vehicles exceeding 12 tons gross
vehicle mass.
No Yes
Mass. Yes Yes
Dimension. Yes Yes
Load Restraint. Yes Yes
Speeding. No Yes
Fatigue. No Yes
Container Freight Declarations. Yes Yes
(Heavy Vehicle National Law 2012, Road Traffic (Vehicles) Regulations 2014, Main Roads Western Australia
[MRWA] 2014)

77
In addition to the driver, the Heavy Vehicle
National Law and the Compliance and
Enforcement legislation identifies the supply
chain parties, employers, loaders, packers,
managers, supervisors, consignors,
consignees, receivers and owners who have
responsibilities under the legislation. The
Chain of Responsibility recognises that the
actions, inactions and demands of these actors
can influence and impact the driver’s on-road
behavior and adversely impact on road safety
(Anderson and Bailey, 2005).
2.2 Systems-approach to Heavy Vehicle
Safety
Cassano-Piche et al. (2009) suggest that
Rasmussen’s Risk Management Framework is
a useful way to systematically analyse the
Heavy Vehicle Transport System because it is
able to represent the relationships between the
levels of the system and between the various
actors prescribed in the Heavy Vehicle
National Law and Compliance and
Enforcement legislation.
The Heavy Vehicle Transport System has been
described as a complex socio-technical system
of technical, psychological and social elements
that is unpredictable and influences safety
outcomes (Newnam and Goode, 2015).
Rasmussen’s (1997) Risk Management
Framework is a systems-based analysis
approach that was designed to analyse the
series of interacting events and decision-
making processes involving all actors
throughout socio-technical systems such as
this. The Risk Management Framework does
not solely focus on the front-line workers
(Newnam and Goode, 2015; Underwood and
Waterson, 2014; Bradford et al., 2009). It
examines contributing factors from multiple
factors, not just the one action, inaction, error
or incorrect decision that contributed to the
incident (Newnam and Goode, 2015).
The Risk Management Framework examines
contributing factors in the hierarchy of actors
within the system whose decisions, actions and
relationships interact with other actors across
the levels to influence safety. It identifies that
decisions made at higher levels of the system
are reflected in the behaviours of actors in the
lower levels, while the decisions by actors at
the lower levels should inform actions and
decisions by actors at the higher levels of the
system. This process is known as vertical
integration (Rasmussen, 1997).
Research conducted by Newnam and
colleagues (Newnam and Goode, 2015;
Newnam et al., 2017) suggests that driver
accountability in the transportation industry is
only one element in the system and additional
focus should be given to understanding the
enforcement and monitoring processes of other
actors, if prevention efforts are to be optimised.
To illustrate, the work environment for a heavy
vehicle driver exposes them to external
pressures that pose many risks. These risks
may include: driving long distances, being
isolated, striving to meet unrealistic deadlines
and delivery schedules i.e. fatigue, stress,
working to unregulated freight rates and
remuneration or the carriage of perishables and
dangerous goods as well as the potential crash
and injury risk posed by other road users
(Stevenson et al., 2010). This is supported by
Quinlan and Wright (2008) as well as Jones et
al. (2003) who have suggested that drivers who
exhibited poor driving behaviours and who
breached the legislation did so because of
multiple pressures such as: financial impact of
low freight rates, intensive competition, poor
loading and unloading practices, unrealistic
schedules and the impact of increased
workloads caused by the growing demand for
services and organisational profitability.
Despite this, blame for breaches in road safety
historically has focused almost exclusively on
the driver whilst other contributory system
factors have largely been overlooked
(Newnam and Goode, 2015; Scott-Parker et
al., 2015).
All factors in the system need to be considered
if a reduction in crashes is to be achieved. One
method of approaching this issue within the
Heavy Vehicle Transport System is to apply
Rasmussen’s (1997) ActorMap, a key
component of the Risk Management
Framework, as well as examine the extent of
the vertical integration between the levels of
the system.
Additionally, the Heavy Vehicle Transport
System presents an ideal exemplar for
application of the ActorMap, given the size,
breadth and scope as well as the number of

78
deaths that occur within the industry (TWU,
2015a).
2.4 An Overview of the Heavy Vehicle
Transport System
2.4.1 The Heavy Vehicle Transport System
In 2015 Newnam and Goode applied
Rasmussen’s ActorMap to the Heavy Vehicle
Transport System. Their analysis was based on
Coroners’ investigation reports into heavy
vehicle crashes and identified six levels that
represent the actors and their responsibilities
within the Heavy Vehicle Transport System.
The six levels as defined in Newnam and
Goode’s (2015) framework are outlined in
Table 2.
Newnam and Goode’s (2015) sixth level
(Environment, Road and Vehicle) is not
considered in this study, as no actors are
identified within the Heavy Vehicle National
Law and the Compliance and Enforcement
legislation at this level of the system.
Table 2: The actors in the Heavy Vehicle Transport System and their responsibilities at the specific
levels.
Levels of the Heavy Vehicle
Transport System
The Responsibilities of the Levels
1. Government Policy development and decision making regarding heavy vehicle
transport safety, including the development of legislation and oversight
of regulatory and enforcement bodies
2. Regulator/Enforcement Enforcement and management of legislative requirements of actors to
ensure compliance with the laws, planning strategy, implementing
government policy involving action and decisions made by personnel
working for regulatory agencies.
3. Supply Chain Parties Adapting to the legislation, integrating and promoting compliance
within the industry and workplace, planning, budgeting. Making
decisions, actions, inactions and demands that may have an impact on
heavy vehicle transport safety activities, setting remuneration methods,
freight rates, working conditions and contractual requirements.
4. Heavy Vehicle Companies These included the Board of Directors and Executive Officers who are
required to Integrate and embed legislative requirements within the
organisation, ensuring compliance, adhering to the regulatory mandate
set and enforced by the regulators. Implementing processes, policies
and systems to ensure organisation-wide compliance. To ensure the
actions, inactions and demands made by upper level management,
including the board, supervisors, other employees (such as loaders,
packers, schedulers etc.) do not cause a driver to breach the Chain of
Responsibility. Also includes interventions such as budgets, company
policy, procedures, training, education, skills competencies and
scheduling.
5. Drivers Actions and decisions, being compliant to the legislation, following and
abiding by the policies and processes implemented by the organisation
however the overarching compliance being mandated by government
legislation. Directly involves heavy vehicle operators such as the driver,
co-driver, other road users, truck owners, contractors, and sub-
contractors etc.
6. Environment/Road/Vehicle Road design, environmental conditions, speed zones, rest areas,
maintenance, servicing, vehicle being fit for purpose etc.
Newnam and Goode (2015) Heavy Vehicle Transport System ActorMap.
2. Method and Data Sources
In this study the roles and responsibilities of
actors in the Chain of Responsibility were
mapped using Rasmussen’s ActorMap
(Rasmussen, 1997) and the two main
components of Waterson and Jenkins’ (2010)
framework, which added to the mapping a
structural hierarchy describing the various

79
actors and their responsibilities. The mapping
provided an overview of the actors involved in
the Heavy Vehicle Transport System and was
used to validate the relationships between the
actors as required in the responsibilities set by
the Heavy Vehicle National Law, the
Compliance and Enforcement legislation and
their subordinate Acts and Regulations.
Additionally, a logic diagram was devised
using the AcciMap process, developed by
Rasmussen (1997), to illustrate the links
between the actors of the various levels of the
Heavy Vehicle Transport System. To review
and access the most recent versions of the
above legislation the documents were obtained
from the Regulators’ websites, being the
National Heavy Vehicle Regulator and Main
Roads, Western Australia, websites as well as
legal websites such as ‘Austlii’ which were
also accessed to obtain up to date copies of the
legislation. These sites were checked monthly
to capture any amendments.
4. Results and Discussion 4.1. Actors Identified within the Legislation
Mapped Against the Levels of the Heavy
Vehicle Transport System
The mapping of the Chain of Responsibility in
this study revealed some differences between
the actors identified by the Heavy Vehicle
National Law and the Compliance and
Enforcement legislation, as Table 3 shows.
Table 3 - Actors identified within the legislation mapped against the levels of the Heavy Vehicle
Transport System.
Heavy Vehicle
Transport System Levels
Actors identified in the
National Heavy Vehicle Law
Actors identified in the
Compliance and Enforcement
Legislation
Government National Heavy Vehicle Regulator.
Regulator/Enforcement A person appointed under HVA
accreditation for monitoring or other
responsibilities under the accreditation
i.e., certifying, approving or monitoring
the use of a heavy vehicle.
National heavy vehicle regulator (s656) -
providing administrative services for the
operation of law.
Authorised Officer.
National Heavy Vehicle Regulator.
Police.
Member of the police force
of another jurisdiction.
Wardens.
Public Authority.
Supply Chain Parties Owner, operator or occupier of a weigh
bridge.
A person who provides to an owner or
registered operator of a vehicle, or a
combination an intelligent transport
system.
An owner or operator of a weighbridge,
or weighing facility, used to weigh the
vehicle, or an occupier of premises
where such a weighbridge or weighing
facility is located.
Owner, operator or
occupier of a weigh bridge.
A person who provides to
an owner or registered
operator of a vehicle, or a
combination and
intelligent transport
system.
An owner or operator of a
weighbridge, or weighing
facility used to weigh the
vehicle, or an occupier of
premises where such a
weighbridge or weighing
facility is located.
Heavy Vehicle
Companies Consignor, consignee, packer, loader,
loading manager, operator, manager,
scheduler, partners (business
partnerships), executive officers,
Consignor, consignee,
packer, loader, loading
manager, operator,
manager, partners

80
employer, contractor, owner of a heavy
vehicle or any part of a combination or
registered operator of a heavy vehicle or
any part of a combination of a heavy
vehicle.
A person in charge of the base of the
vehicle driver.
A person in charge of a place entered by
an authorised officer of the law.
A prime contractor of the driver if the
driver is a self-employed driver.
A person in charge, or apparently in
charge, of the vehicle or of a base of the
driver of the vehicle.
A person who is accredited under Part 4
Division 4 in relation to the vehicle.
A person who is responsible for
performing a function of a prescribed
kind in relation to the vehicle by way of
complying with a requirement of
accreditation.
An employer, employee, agent or
subcontractor of all of the above.
(business partnerships),
executive officers,
employer.
Contractor, owner of a
heavy vehicle or any part
of a combination or
registered operator of a
heavy vehicle or any part
of a combination of a
heavy vehicle.
A person in charge of the
base of the vehicle driver.
A person in charge of a
place entered by an
authorised officer of the
law.
A prime contractor of the
driver if the driver is a
self-employed driver.
A person in charge, or
apparently in charge, of the
vehicle or of a base of the
Driver of the vehicle.
An employer, employee,
agent or subcontractor of
all of the above.
Drivers and Co-Drivers Driver and co-driver.
A person who is involved in the transport
of goods by road by means of a vehicle.
Driver and co-driver.
A person who is involved
in the transport of goods
by road by means of a
vehicle.
4.2 Responsibilities of Actors Identified within the Legislation
The mapping of the Chain of Responsibility in this study also revealed some differences in the
responsibilities of the actors between those identified in the Heavy Vehicle National Law and the
Compliance and Enforcement legislation, as Table 4 shows.
Table 4. Actors within the legislation and their respective responsibilities under the relevant
legislation.
Heavy Vehicle
Transport
System Actors
Responsibilities identified within the Heavy
Vehicle National Law
Responsibilities identified within
the Compliance and Enforcement
legislation
Government Administration and delegation of legislation. Provide delegation authorities to
the regulator.
Administration and delegation of
legislation.
Regulator/
Enforcement
Part 12.2 National Heavy Vehicle Regulator s659
Functions of Regulator subsection 2)
Monitor and review and report to the
responsible Ministers compliance and non-
compliance to the legislation.
Monitor and investigate compliance with this
Law.
Identify and promote best practice methods
Wardens and Police Officers can
exercise powers to ensure and
enforce compliance to mass
dimension and loading
requirement.

81
Manage risks to public safety arising from the
use of heavy vehicles on roads.
Encourage and promote safe and productive
business practices.
Collaborate with other law enforcement
agencies to ensure a nationally consistent
approach.
Collaborate with road managers, the National
Transport Commission and industry.
Supply Chain
Parties Must not cause a driver to breach any part of the
law.
Must not cause a driver to breach
any part of the law.
Heavy Vehicle
Companies
Loader Must ensure loading will not cause or
contribute to the driver driving while impaired
by fatigue.
Loading manager must work with other off-
road parties to manage loading/unloading time
slots.
Ensure vehicles are loaded/unloaded as
quickly and efficiently as possible.
Putting systems in place for unexpected
events.
Ensure vehicle loads do not exceed a vehicle’s
mass or dimensions.
Ensure the load is placed in a way that it does
not become displaced, unstable or move or fall
off the vehicle.
Loaders have the responsibility
for ensuring a vehicle’s load.
Does not exceed vehicle or
permitted dimension limits.
Does not cause vehicle or
permitted mass limits to be
exceeded.
Is placed /secured in a way that
it does not become unstable,
move or fall off a vehicle.
Is accurately recorded in any
manifest and other
documentation relating to that
load.
When packed in a freight
container, it does not exceed or
cause the containers gross
weight or safety approval rating
to be exceeded.
Packer Ensure the weight information of freight is
reliable.
Ensure the documentation about the vehicle’s
load is not false or misleading.
Any goods packed in a freight container do
not cause the container’s gross weight or
safety approval rating to be exceeded.
A packer has the same duties
as the loader.
Consignor Ensure loads do not exceed vehicle mass or
dimensions limits.
Goods carried on are appropriately secured.
Operators carrying freight containers have
valid Container Weight declarations.
Delivery requirements do not require or
encourage drivers to exceed speed limits,
exceed regulated driving hours, fail to meet
the minimum regulated driving hours.
Ensuring goods carried do not
exceed vehicle or permitted
dimension limits.
Do not cause vehicle or
permitted mass limits to be
exceeded.
Are appropriately secured.
Consignee/
Receiver
A consignee has the same duties as the
consignor.
A consignee has the same
duties as the consignor.
Scheduler Rosters and schedules do not require drivers to
exceed the driving hours’ regulations or speed
limits.
Record keeping of driver’s activities,
including work and rest times.

82
4.3 Findings in Relation to Vertical
Integration Figure 1 shows findings regarding the
relationships between the actors of the various
levels of the Heavy Vehicle Transport System.
Those findings were:
4.3.1 Vertical integration between the upper
two levels of the Heavy Vehicle
Transport System and the lower three
levels were not apparent.
4.3.2 The system was top level driven with a
lack of feedback loops from the lower
levels to inform the upper levels who
therefore do not attain the necessary
information to inform, review and revise
strategy and regulations to improve the
Heavy Vehicle Transport System.
4.3.3 There was no legislated requirement for
a driver, or a heavy vehicle company, to
report breaches to the Regulator, whereas
this is not the case in other transport
modalities such as rail, aviation or
mining who are required to report
significant breaches (Rail Safety
National Law [RSNL], 2015; Transport
Safety Investigations Act [TSI Act],
2003; Occupational Safety and Health
Act [OSH Act], 1984; and Work Health
Take all reasonable steps to ensure drivers do
not work while impaired by fatigue or drive in
breach of their work or rest options.
Vehicles regularly maintained. If speed
limiters fitted they are functioning properly.
Vehicles are not loaded in a way that exceeds
mass or dimension limits.
Drivers moving containers have valid
container weight declarations.
Loads are properly restrained with appropriate
restraint equipment.
Manager
A manager has the same duties as a scheduler.
Must ensure drivers are medically fit to drive.
Must ensure all loads are
properly restrained and do not
exceed mass and dimension
limits.
Must ensure drivers are
medically fit to drive.
Operator An operator has the same duties as a scheduler
and a driver.
Must ensure drivers are medically fit to drive.
An operator has the same duties
as a manager.
Must ensure drivers are
medically fit to drive.
Drivers Comply with relevant fatigue management
work and rest laws and procedures to
implement them.
Make the most of rest breaks by sleeping in
dark, quiet and comfortable places.
Respond to changes in circumstances such as
delays and report these to the base to
implement short-term fatigue management
measures.
Ensure vehicle does not exceed mass or
dimension limits.
Ensure load is appropriately restrained.
Must ensure they are medically fit to drive.
Ensure vehicles are road worthy and well
maintained.
Keep full and accurate records as required by
law.
A driver must ensure that the
vehicle does not exceed mass
limits.
Ensure vehicle does not exceed
dimension limits.
Ensure load is appropriately
restrained.

83
and Safety Act [WHS Act] 2011).
4.3.4 A search of the legislation did not
identify an enforceable accountability on
the Regulator for breaches that occur
within the lower levels of the system
where the Regulator has an opportunity
to influence or change safety behaviours.
4.3.5 Current information sharing did not
identify the system failures that
contributed to the breach rather the Chain
of Responsibility focuses on the actors
that are currently identified in the
legislation.
Figure 1
Logic diagram showing the links between the actors of the various levels of the Heavy Vehicle
Transport System.
The Levels of the
Heavy Vehicle Transport
System
Actors within the system
Government
Regulator /
Enforcement
Supply Chain
Parties
Heavy Vehicle
Companies
Drivers
Heavy Vehicle
Regulator
Customers Clients Corporations
Supervisor Manager
Co- Driver Driver
Receiver
Relevant
Party
Involved Person
WorkSafe
Agencies
State Government Federal Government
Police
Loader Packer
Consignor Scheduler
Executive Officers
Responsible Person
Employer Connected Person
Various state heavy vehicle compliance
divisions
Consignee
Government Insurers

84
6.0 Discussion
The study identified several strengths and
weaknesses within the current Chain of
Responsibility legislation in Australia. From a
theoretical perspective, the Chain of
Responsibility legislation is a good illustration
of how safe working practices are intended to
operate within a complex socio-technical
system (Newnam and Goode, 2015). The study
identified the Chain of Responsibility
legislation assigns responsibilities to actors
across the lower three levels of the Heavy
Vehicle Transport System, rather than being
driver centric (Scott-Parker et al., 2015). The
Chain of Responsibilities’ intent is to ensure
the blame for a safety breach does not fall on
the driver but makes those who are involved
with the driver’s day-to-day driving activities
responsible as well. In other words, the blame
for a safety breach can be placed on other
actors and hold them accountable for the
driver’s actions. Multiple parties within the
supply chain are identified as being
responsible for safety and can be held liable for
their actions, inactions or demands that could
influence driver behaviour.
The strength in this approach is that the Chain
of Responsibility shifts the focus from blaming
away from the driver and ensures others in the
supply chain who influenced the driver are also
held accountable should any breach occur.
This risk management approach is similar to
other industries, such as rail, where they have
legislated the responsibility for safety within
the system is a shared. For example, section 50
of the Rail Safety National Law 2012,
‘Principles of shared responsibility,
accountability and integrated risk
management’, specifies that the safety of the
rail network is a shared responsibility between
the rail transport operators, the rail safety
workers, other persons, the Regulator and the
public. This section clearly defines the actors
who have responsibility in ensuring rail safety.
The Heavy Vehicle National Law prescribes a
broad range of safety-critical elements
including mass, dimension, loading, speed and
fatigue, whereas the Compliance and
Enforcement regulates a reduced scope of
elements limited to mass, dimension and
loading. The advantage of the Heavy Vehicle
National Law’s broad scope is that it ensures
there is harmonisation across how the elements
are regulated and by whom, and reduces the
risk of duplication and inconsistencies across
the States where the legislation applies. For
example, the Heavy Vehicle National Law has
the one Regulator, the National Heavy Vehicle
Regulator, who manages the legislation,
regulates the actors within the three lower
levels of the system and ensures compliance.
Whereas in Western Australia there are
multiple agencies attempting to enforce the
legislation who do not coordinate or
communicate effectively to ensure integrity of
the Heavy Vehicle Transport System.
Furthermore, the reduced scope within the
Compliance and Enforcement legislation,
where speeding and fatigue are not legislated,
is a weakness. This means that information
regarding an actor who is caught speeding or
breaching fatigue is not captured under the
Western Australian Compliance and
Enforcement legislation and is treated under
separate legislation. This is further
complicated given that speeding and fatigue
are regulated by differing regulators; speeding
is regulated by Police and fatigue is regulated
by WorkSafe Western Australia. In Western
Australia, speeding is an offence that is driver
centric. That is, the accountabilities for any
speeding breach are the sole responsibility of
the driver. Whereas under the Heavy Vehicle
National Law, if a driver is caught speeding,
other actors whose decisions, actions or
inactions that have contributed to the driver’s
speeding behaviour, are also held responsible
for that speeding breach. In the case of fatigue,
which is superficially regulated in Western
Australia under the Occupational Safety and
Health Regulations 1996, there are other
parties who should be held responsible for a
driver committing a fatigue-related offence,
but who avoid liability because of the limited
scope and application of the legislation. In
contrast the Heavy Vehicle National Law
captures the element of fatigue in both the
Heavy Vehicle National Law Act 2012 and
Heavy Vehicle (Fatigue Management)
National Regulations 2012 that holds a number
of actors responsible for a driver who breaches
the fatigue related aspects of the legislation.

85
This omission within the Compliance and
Enforcement legislation is a significant area of
weakness as both speed and fatigue are
significant contributory factors in safety
breaches and crashes (Aliakbari and
Moridpoure, 2016; Aliakbari and Moridpoure,
2017; Mooren et al., 2014; Mooren et al.,
2015).
A significant finding of this study was that the
majority of actors within the system who have
responsibilities assigned by the legislation
primarily resided within the lower three levels
of the Chain of Responsibility, namely the
supply chain parties, heavy vehicle companies
and drivers. There is limited responsibilities
and vertical integration extending up to the
Regulator and Government, which highlights
that the Chain of Responsibility legislation
does not capture the entire Heavy Vehicle
Transport System. For example, while the
Regulators and Government have obligations
to ensure they have systems in place, the
legislation is silent on such things as
compulsory reporting of incidents and
breaches, proactive auditing and surveillance
and crash investigations. As a result of this
there is very little effective data analysis.
Newnam and Good (2015) identified the need
for capturing the complex tapestry of factors
influencing road transport crashes. Salmon and
Lenne (2015) suggested one of the key barriers
preventing systems thinking in road safety was
the lack of appropriate systems analysis
methods. For example, Police investigations
are driver centric and do not consider the
influencing actions of other actors in the Heavy
Vehicle Transport System. These
shortcomings are significant because they lead
to inappropriate causation findings that
adversely impact upon the lower levels of the
Heavy Vehicle Transport System. There is a
need to implement a systems analysis method
of investigating the cause of incidents so that
Government and Regulators can be better
informed when determining policy and
strategy.
Government should play a critical role in
engaging all levels of the system to obtain
information that is relevant to policy reform.
However, this study identified that the Heavy
Vehicle National Law and the Compliance and
Enforcement legislation has not included the
Government in that role. The Australian
Trucking Association has called for the
Australian Transport Safety Bureau (ATSB) to
take over the responsibility for investigating
truck crashes (Kozoil, 2018) but by their own
admissions the ATSB currently take 14 months
to complete an investigation (ATSB, 2017).
This will be a significant negative influence on
driving improvement in heavy vehicle
transport safety.
The ATSB operates entirely separately from
transport regulators, policy makers and service
providers (ATSB, 2018). Under existing
legislative arrangements, they do not presently
investigate heavy vehicle transport crashes;
they only investigate aviation, rail and
maritime incidents. This is despite the number
of yearly deaths in the heavy vehicle transport
industry being over triple that of aviation, rail
and maritime combined (Safework Australia,
2017; ATSB, 2017). The ATSB has significant
powers contained within the Transport Safety
Investigation Act (2003) and Regulations
(2003) that requires any rail, maritime or
aviation organisation to notify them of certain
events such as fatalities. Similar powers would
benefit heavy vehicle transport safety and
learnings from crashes that occur.
In 2012 a Government Senate Committee was
set up to inquire into the ATSB in the wake of
their investigation into the ‘Pel-Air’ flight that
ditched into the ocean off Norfolk Island. The
Committee was scathing (Australian
Broadcasting Commission [ABC], 2013) of
the investigation and described it to be
seriously deficient (Woodley, 2013).
Additionally, media coverage of the ATSB’s
poor performance and lack of resources
highlighted the difficulties being experienced
by the ATSB in completing its investigations,
with only one in three investigations being
completed inside the targeted 12-month time
frame (ABC, 2017). This supports the ABC’s
(2017) criticism that the ATSB does not have
the capacity and resources to investigated
aviation crashes let alone all three transport
modalities equally. This draws into question
the ATSB’s ability to take over investigations
into heavy vehicle crashes and questions
whether they have the resources, expertise and

86
capabilities to do heavy vehicle crash
investigations.
A review of the ATSB’s website into
investigations conducted and completed in
2016 – 2018 show there is a primary focus on
aviation with limited investigations being
conducted into rail and maritime.
The results of this study also act as a starting
point to inform international regulatory bodies
of the importance in identifying and
implementing systems that ensure
harmonisation, congruence and vertical
integration to minimise risk within the heavy
vehicle transport industry. There is similar
legislation in New Zealand, Canada and South
Africa. However, there is limited Chain of
Responsibility legislation elsewhere
internationally.
7.0 Conclusions It is clearly evident that driving heavy vehicles
in Australia, as well as in other parts of the
world, is a dangerous and deadly occupation.
Australia has implemented innovative
legislation, albeit two different pieces with the
same intent, to make sure that it is not just the
driver who is held accountable, or blamed,
when a fatality occurs. The ‘blame game’ does
not help identify where the system failed, nor
does it help improve the system. It simply takes
the focus away from the gaps that lead to
incidents occurring. In contrast the Chain of
Responsibility legislation ensures system
weaknesses are uncovered. However, this
study revealed that there is still more room for
improvement in the legislation.
This study identified and mapped the actors
and their responsibilities within the Heavy
Vehicle Transport System to gain an
understanding of how the legislation is
intended to work as well as identify the factors
that influence the actors within the complex
socio-technical system that is the Heavy
Vehicle Transport System.
There is a need to provide clear responsibilities
for all actors identified in the Heavy Vehicle
National Law and the Compliance and
Enforcement legislation. This study identified
differences between the two pieces of
legislation, in particular the exclusion of
speeding and fatigue from the Compliance and
Enforcement legislation. Additionally, this
study found there were differences between
who regulates and enforces the Heavy Vehicle
National Law and the Compliance and
Enforcement legislation, as well as differences
in the scope between the two. The differences
also included the number and type of actors
identified within the Heavy Vehicle National
Law that is more expansive than that captured
in the Compliance and Enforcement
legislation.
It would be more effective to have one
nationally harmonised law governed by one
Regulator with a national reporting and
database system. This harmonisation would
provide additional opportunities to improve
safety within the Heavy Vehicle Transport
System through regulated requirements for
actors at all levels of the system to become
involved. There is currently no national
reporting and database system to underpin the
effective research and analysis to make
informed decisions. A national reporting and
database system would capture information
that would allow and support Regulators and
Legislators to make informed decisions to
improve and focus on safety policy and
strategy.
This study also revealed opportunities to
improve vertical integration within, and across,
all levels of the Heavy Vehicle Transport
System. The responsibilities of the actors
within the Chain of Responsibility were
primarily focused at the lower levels of the
system, with limited vertical integration to the
upper Regulatory and Government levels of
the system. The lack of vertical integration
between the lower levels of the system and the
upper levels, primarily due to their being no
compulsory reporting requirement, leaves a
significant gap in capturing critical
information that can be used to improve the
Heavy Vehicle Transport System.
Furthermore, this study identified that a
nationally consistent approach to how
significant breaches of the Chain of
Responsibility legislation are investigated
would also assist in improving vertical
integration. Although a recommendation has
been made for the Government to amend the

87
legislation that governs the ATSB to include
heavy vehicle crash investigations within their
scope and charter (Kozoil, 2018), there is some
evidence the ATSB does not have the
resources, expertise and capabilities to
properly undertake investigations into heavy
vehicle transport crashes.
Who is responsible? It is clear the legislation
imposes obligations on actors beyond the
driver and yet in reality the heavy vehicle
driver is still the focus of blame.
8. Recommendations 8.1 Recommendations relating to national
amalgamation of legislation
8.1.1 To overcome the current weaknesses in
the Heavy Vehicle Transport System, the
Heavy Vehicle National Law and the
Compliance and Enforcement legislation
should be amalgamated into a single body of
legislation that prescribes and addresses the
full spectrum of actors, their responsibilities,
all of the Chain of Responsibility elements,
and be enforced nationally by the one national
Regulator.
8.1.2 Include in the amalgamated legislation
a requirement for all actors in the heavy vehicle
industry to report serious breaches, incidents
and crashes.
8.1.3 Develop and implement a heavy
vehicle ‘list of incidents’ to inform the heavy
vehicle industry of what incidents, breaches
and crashes must be reported. Use the Rail
Safety National Law and Work Health Safety
Act framework as guides to develop a usable
document (RSNL, 2015; OSH Act, 1984;
WHS Act, 2011).
8.2 Recommendations relating to the
implementation of an independent national
heavy vehicle transport investigation agency.
8.2.1 Implement an Independent National
Heavy Vehicle Transport Investigation
Agency that has the same powers and
authorities of the ATSB, Police and WorkSafe,
to conduct investigations into heavy vehicle
crashes.
8.2.2 Implement a national investigative
process with standardised methods so that all
heavy vehicle crashes are investigated in the
same manner, irrespective of who conducts the
investigation and where the incident occurs, to
guarantee continuity and quality outcomes.
8.2.3 Implement a national information
database that captures, collates and provides
information from heavy vehicle transport
incidents so that the results can be analysed
and information can be shared within the
Heavy Vehicle Transport System to inform
policy, strategy development and improve
safety decision making at all levels of the
Heavy Vehicle Transport System and help
deliver a step change in heavy vehicle transport
safety.
9.0 References Aliakbari, M., & Moridpoure, S., (2016).
Management of truck loading weight: A
critical review of the literature and
recommended remedies. MATEC Web of
Conferences, 81, 03007 ICTTE 2016.
Doi:10.1051/matecconf/20168103007
Aliakbari, M., & Moridpoure, S., (2017).
Managing heavy vehicle drivers fatigue: A
critical review of the literature and safety
system interventions. Journal of Geotechnical
Transport Engineering, 3(10), 20–24.
Anderson, T., & Bailey, S., (2005). Heavy load:
New laws on trucking lengthen chain of
responsibility. [online] Law Society Journal:
43(8). September 2005: 47–49. Retrieved from
http://search.informit.com.au.ezyproxy.lib.mon
ash.edu.au/fulltext:dn+2005347(;res=AGISPT
> ISSN:1839-5287
Australian Broadcasting Commission (ABC).,
(2013). Aviation accident report released into
Norfolk Island crash. Retrieved from
http://www.abc.net.au/7.30/content/2013/s376
6257.htm
Australian Broadcasting Commission (ABC).,
(2017). Air safety watchdog ‘clearly failing’:
Two thirds of investigations not completed in
required time. Lauren Daly, 7 March 2017.
Retrieved from
https://www.abc.net.au/news/2017-03-07/two-
thirds-of-air-safety-investigations-not-
completed-in-12-mths/8322446
Australian Transport Safety Bureau (ATSB).,
(2018). Overview of the ATSB. Retrieved
from http://www:atsb.gov.au_overview-of-the-
ATSB-2018/
Australian Transport Safety Bureau (ATSB).,
(2017). Correcting the record. In accurate
reporting on the completion of ATSB
investigations by the ABC 7.30, 8 March 2017.
Retrieved from
https://www.atsb.gov.au/newsroom/correcting-
records/innacurate-reporting-on-the-

88
completion-of-atsb-investigations-by-the-atsb-
730/
Bradford, K., Hopkins, A., & Naikar, N., (2009).
Guidelines for accimap analysis. Learning
from high reliability organisations. Journal of
Applied Sociology, 1, 193-212.
Bureau of Infrastructure Transport and Regional
Economics (BITRE)., (2018). Fatal heavy
vehicle crashes Australia quarterly bulletin,
Jan–Mar, 2018.
Canadian Council of Motor Transport
Administrator (CCMTA)., (2011). “Rethink
road safety, own it”. CCMTA News Journal,
19(1), 1-4.
Cassano-Pichea, A., Vicente, K.J., & Jamieson,
G., (2009). A test of Rasmussen’s risk
management framework in the food safety
domain: BSE in the UK. Theoretical Issues in
Ergonomics Science, 10(4), 283–304.
European Road Safety Observatory (ERSO).,
(2017). Road safety of heavy goods vehicles
and buses- EU facts and figures 2010, National
technical University of Athens. Retrieved
from https://www.nrso.ntua.gr/road-safety-of-
heavy-goods-vehicles-and-buses-eu-facts-
figures-2010/
Freight and Logistics Council of Western
Australia Inc (FLCWA)., (2017a). Submission
to national freight and supply chain inquiry.
Retrieved from
http://freightandlogisticscouncil.com.au/docum
ents/submissions/Freight-and-Logistics-
Council-of-Westerrn-Australia-Submission-to-
Inquiry-into-National-Freight-and-Supply-
Chain-Priorities.pdf
Freight and Logistics Council of Western
Australia Inc (FLCWA)., (2017b) Show WA
remain outside nhvr. Retrieved from
http://freightandlogisticscouncil.com.au/docum
ents/meetings/Should-WA-Remain-Outside-of-
the-NHVR.pdf
Gardner, B., (2015) National trucking law still
unattractive to Western Australia. Owner
driver. Retrieved from
https://www.ownerdriver.com.au/industry-
news/1505/national-trucking-law-still-
unattractive-to-western-australia
Heavy Vehicle National Law Act (2012), (Qld).
Available from http://www.austlii.edu.au/
Heavy Vehicle (Fatigue Management) National
Regulations, (Qld). Available from
http://www.austlii.edu.au/
Heavy Vehicle (General) National Regulations,
(Qld). Available from
http://www.austlii.edu.au/
Heavy Vehicle (Mass, Dimension and Loading)
National Regulations, (Qld). Available from
http://www.austlii.edu.au/
Heavy Vehicle (Vehicle Standards) National
Regulations, (Qld). Available from
http://www.austlii.edu.au/
IBISWorld Industry (2017, September). Road
Freight Transport (Report 14610). Australian
market research report. Retrieved from
https://www.ibisworld.com.au/industry-
trends/market-research-reports/transport-
postal-warehousing/road/road-freight-
transport.html
Jones, J., Dorrian, J., & Dawson, D., (2003).
Legal implications of fatigue in the Australian
transportation industry. The Journal of
Industrial Relations, 45(3), 344–359.
Kozoil, M., (2018). Truck industry demands $12
million to tackle soaring death toll. Retrieved
from
https://www.smh.com.au/politics/federal/truck-
industry-demands-12-million-to-tackle-
soaring-death-toll-20180109-h0fkso.html
Ministry of Transport, New Zealand (MoTNZ).,
(2016). Truck casualties and crashes. Retrieved
from
http://www.transport.govt.nz/research/roadcras
hstatistics/motorvehiclecrashesinnewzealand/m
otor-vehicle-crashes-in-new-zealand-2016/
Mooren, L., Grzebieta, R., Williamson, A., Oliver,
J., & Friswell, R., (2014). Safety management
for heavy vehicle transport. A review of the
literature. Journal of Safety Science, 62, 79–
89.
Mooren, L., Williamson, A., & Grzebieta, R.,
(2015, October). Evidence that truck driver
remuneration is linked to safety outcomes: A
review of the literature, Transport and Road
Safety Research. Paper presented at the
Australasian Road Safety Conference, 14-16th
October, Gold Coast, Australia.
National Heavy Vehicle Regulator (NHVR).,
(2017): About the chain of responsibility.
Retrieved from
https://www.nhvr.gov.au/safety-accreditation-
compliance/chain-of-responsibility/about-the-
chain-of-responsibility
National Highway Traffic Safety Administration
National Centre for Statistics and Analysis,
(2017). Traffic safety facts research note, 2016
fatal motor vehicle crashes: Overview, report
nr USDOT HS 812 456, US Department of
Transportation, Washington DC 20590.
Retrieved from https://www.nhtsa.gov/press-
releases/usdot-releases-2016-fatal-traffic-
crash-data
Newnam, S., Goode, N., Salmon, P., &
Stevenson, M., (2017). Reforming the road
freight transportation system using systems

89
thinking: An investigation of coronial inquests
in Australia. Accident Analysis & Prevention,
101, 28-36.
http://dx.doi.org.exyproxy.lib.monash.edu.au/1
0.1016/j.aap.2017.01.016
Newnam, S., & Goode, N., (2015). Don’t blame
the driver: A systems analysis of the causes of
road freight crashes. Accident Analysis and
Prevention, 76, 141-151,
http://dx.doi.org/10.1016/j.aap.2015.01.016
New Zealand Transport Agency (NZTA)., (2009).
Chain of responsibility. Retrieved from
https://www.nzta.govt.nz/assets/resources/chai
n-of-responsibility/docs/chain-of-
responsibility.pdf
Occupational Health and Safety Act (1984),
(WA). Available from
http://www.austlii.edu.au/
Occupational Safety and Health Regulations
(1996), (WA). Available from
http://www.austlii.edu.au/
Onanchenko, K., (2012, September). Chain of
responsibility law and the comparison with
international experience. Paper presented at the
HVTT12-Heavy vehicle industry, international
symposium on heavy vehicle transport
technology, 1-11, Stockholm, Sweden,
Conference Committee.
Quinlan, M., & Wright, L., (2008). Safe
payments: Addressing the underlying causes of
unsafe practices in the road transport industry.
National Transport Commission, ISBN 1
921168 98 6. Retrieved from
https://www.ntc.gov.au/Media/Reports/(98BF9
D12-47C6-5EAF-EEA8-
BCE6B19EAEB8).pdf
Rail Safety National Law (WA) Act, (2015).
Available from http://www.austlii.edu.au/
Rasmussen, J., (1997). Risk management in a
dynamic society. A modeling problem. Journal
of Safety Science, 27(2/3), 183-213.
Road Traffic Act 1974, (WA). Available from
http://www.austlii.edu.au/
Road Traffic (Vehicles) Act 2012 (WA).
Available from http://www.austlii.edu.au/
Road Traffic (Vehicles) Regulations 2014 (WA).
Available from http://www.austlii.edu.au/
Safework Australia., (2017). Fatality statistics.
Retrieved from
https://www.safeworkaustralia.gov.au/statistics
-and-research/statistics/fatalities/fatality-
statistics
Salmon, P.M., & Lenne, M.G., (2015). Miles
away or just around the coroner? Systems
thinking in road safety research and practice.
Accident Analysis & Prevention, 74, 243-249.
Scott-Parker, B., Goode, N., & Salmon, P.M.,
(2015). The driver, the road, the rules… and
the rest? A systems-based approach to young
driver safety. Accident. Analysis & Prevention,
74, 297-305.
http://dx.doi.org/10.1016/j.aap.2014.01.027
Stuckey, R., & LaMontagne, A.D., (2005).
Occupational light vehicle use and OSH
legislative framework. An Australian
example. International Journal of
Occupational and Environmental Health,
11(2), 167–179.
Stevenson, M., Sharwood, LN., Wong, K.,
Elkington, J., Leuleners, L., Ivers, R.,
Grunstein, R.R., Williamson, A., Haworth, N.,
& Norton, R., (2010). The heavy vehicle study:
A case control study investigating risk
interventions for crash in long distance heavy
vehicle drivers in Australia. BMC Public
Health, 10,162, 1–5.
Transport Safety Investigations Act (2003)
(NSW): Available from
http://www.austlii.edu.au/
Transport Safety Investigations Regulations
(2003) (NSW): Available from
http://www.austlii.edu.au/
Transport Workers Union (TWU)., (2015b). Fatal
truck crash on M2 a tragic reminder of the
risks in Australia’s most dangerous industry, 7
January 2015. Retrieved from,
http://www.twu.com.au/home/media/fatal-
truck-crash-on-m2-a-tragic-reminder-of-the-r/
Transport Workers Union (TWU)., (2015a). Truck
crash deaths highlight crisis in industry, TWU
warns, media release, 10 June 2015. Retrieved
from, http://saferates.org.au/truck-crash-
deaths- highlight-crisis-in-industry-twu-warns/
Underwood, P., & Waterson, P., (2014). Systems
thinking, the swiss cheese model and accident
analysis: a comparative systemic analysis of
the Grayrigg train derailment using ATSB,
Accimap and STAMP models. Accident
Analysis & Prevention, 64, 75-94.
Waterson, P., & Jenkins, D.P., (2010, October).
Methodological considerations in using
accimaps and the risk management framework
to analyse large-scale systemic failures. Paper
presented at the 5th IET International Systems
Safety Conference, 10–20th October,
Manchester UK. Doi 10.1049/cp.2010.0830.
Woodley, N., (2013). Senate Committee release
damning report into Australia’s aviation
authorities. ABC News, 2013, May 23.
Retrieved from
https://www.abc.net.au/news/2013-05-
23/senate-committee-raises-concerns-about-
authorities-ovrseeing-a/4709104
Work Health and Safety Act, (2011).
90
Authors
Ivan Cikara has a Masters in Occupational
Health and Safety, Masters in Business
Administration, Advanced Diploma Public
Safety (Investigations) and an Advanced
Diploma Government (Fraud Control). His
current employment position is Safety
Management System - Continuous
Improvement Manager. At the time of writing
this article, Ivan was studying a PhD at the
Central Queensland University
(CQUniversity) on the impacts of the heavy
vehicle national law on the heavy vehicle
transport industry, specifically the
investigative methodologies used in heavy
vehicle fatal crash investigations. Ivan has over
30 years’ experience working in both the
Government and private sectors. This includes
working in Policing where the main focus of
his duties was in fatal crash investigations,
before progressing to the Homicide Squad as a
Senior Detective. Ivan’s career continued into
investigations management in the medical and
health industry as well as safety management
in the maritime, rail, mining and oil and gas
sectors and to having a National Senior Group
Safety Management role in heavy vehicle
transport. Most recently Ivan has worked as
the Manager of Safety Investigations for the
Government, progressing into the management
of continuous improvement of safety
management systems.
Associate Professor Yvonne Toft is an
Associate Professor in Human Factors and
Systems Safety in the Transport and Safety
Sciences group at CQUniversity, Australia.
Yvonne currently teaches and conducts
research in areas related to human factors
engineering, occupational health and safety,
accident forensics and investigation,
operational systems safety and technology in
public safety, in industrial and transport related
contexts. Yvonne has a long history of active
involvement and leadership in multiple
professional associations nationally and
internationally spanning safety, engineering,
human factors, learning and teaching.
Specialties: reduction of design-induced end
user error sources in original engineering
design, accident analysis, prediction of error
sources, systems safety, transdisciplinary
communication and design, professional
communities of practice, innovation of
curriculum design in flexible learning

91
Dr Geoff Dell is an Adjunct Professor at
Federation University and former Head of
Safety Science Courses at Central Queensland
University. He is a career Safety Scientist with
40 years of senior safety management roles in
aviation, rail and other industries. Dr Dell was
National President of the Safety Institute of
Australia for 9 years and the Independent
Safety Adviser and Member of the Board of
Directors of Cobham Aviation Services, the
third largest airline in Australia, and was the
independent Chairman of the Board Safety
Sub-committee of Nauru Airlines for 2 years.
In 2010 he joined CQUniversity to develop and
implement the world first tertiary education
courses in accident investigation including the
unique Bachelor of Accident Forensics and the
Master of Accident Investigation with majors
in air safety investigation, rail safety
investigation, road safety investigation,
occupational safety investigation, risk
engineering and human factors engineering.
This work included the development of the
world’s first genuine multi-modal forensic
investigation teaching laboratory (Crash Lab).
In addition to aviation, rail and road crashes,
Dr Dell has led major investigations in many
other industries, including mining where he
was commissioned by the Western Australian
Government to conduct the independent
Section 45b investigation into the fatal
explosion at Boodarie Iron, Port Hedland in
2004. He has over 40 papers published in peer
reviewed and refereed journals, has presented
over 100 invited papers at safety conferences
globally and is sought after by the media in
Australia and overseas as a commentator on
aviation and other crashes, including MH370,
MH17, German Wings 9525, Air ASIA 8501
and more recently the Lion Air and Egypt Air
B737 Max crashes.
Shevaun Dell is an accident forensics
educator who is passionate about improving
the quality and transparency of the
communication of research and scientific
findings to the broader community. Trained in
forensic science, psychology and criminology,
she has taught at Centrel Queensland
University for over four years and been
involved in a variety of safety science research
projects ranging from transport domain
accident investigations to workplace bullying
and stress. She is currently completing a
forensic psychology-related PhD research
study.

World Safety Organization (WSO) The WSO was founded in 1975 in Manila, The Republic of the Philippines, as a result of a gathering of over 1,000 represent- atives of safety professionals from all continents at the First World Safety and Accident Prevention Congress. The WSO World Management Center was established in the United States of America in 1985 to be responsible for all WSO activities, the liaison with the United Nations, the co-operation with numerous Safety Councils, professional safety/environmental (and allied areas) organizations, WSO International Chapters/Offices, Member Corporations, companies, groups, societies, etc. The WSO is a not-for-profit corporation, non-sectarian, non-political movement to “Make Safety a Way of Life… Worldwide.”
World Safety Organization Activities
WSO publishes WSO Newsletters, World Safety Journal, and WSO Conference Proceedings.
WSO provides a network program linking various areas of pro- fessional expertise needed in today’s international communi- ty.
WSO develops and accredits educational programs essential to national and international safety and establishes centers to support these programs.
WSO receives proposals from professional safety groups/ societies for review and, if applicable, submits them to the United Nations for adoption.
WSO presents annual awards: The James K. Williams Award, Glenn E. Hudson International Award, J. Peter Cunliffe Trans-
portation Award, Concerned Citizen, Concerned Professional, Company/Corporation, Concerned Organization, Educational
Award, WSO Chapter/National Office of the Year, and Award for Achievement in Scientific Research and
Development.
WSO provides recognition for safety publications, films, vide- os, and other training and media materials that meet the WSO required educational standards.
WSO establishes and supports divisions and committees to assist members in maintaining and updating their professional qualifi- cations and expertise.
WSO has Chapters and National/International Offices located throughout the world, providing contact with local communi- ties, educational institutions, and industrial entities.
The WSO organizes and provides professional support for inter- national and national groups of experts on all continents who are available to provide expertise and immediate help in times of emergencies.
Benefits of Membership
WSO publishes the “WSO Consultants Directory” as a service to its Members and to the Professional Community. Only Certified Members may be listed.
WSO collects data on the professional skills, expertise, and experience of its Members in the WSO Expertise Bank for a reference when a request is received for professional exper- tise, skill, or experience.
WSO provides a network system to its Members whereby pro- fessional assistance may be requested by an individual, organ- ization, state, or country or a personal basis. Members needing assistance may write to the WSO with a specific request, and the WSO, through its
Membership and other professional resources, will try to link the requester with a person, organization, or other resource that may be of assistance.
WSO provides all Members with a Membership Certificate for
display on their office wall and with a WSO Membership Identification Card. The WSO awards a Certificate of Honor- ary Membership to the corporations, companies, and other entities paying the WSO Membership and/or WSO Certifica- tion fees for their employees.
Members have access to WSO Newsletters and other member- ship publications of the WSO on the WSO website, and may request hard copies by contacting the WSO World Manage- ment Center. Subscription fees apply to certain publications.
Members are entitled to reduced fees at seminars, conferences, and classes given by the WSO. This includes local, regional, and international programs. When Continuing Education Units (CEUs) are applicable, an appropriate certificate is issued.
Members who attend conferences, seminars, and classes receive a Certificate of Attendance from the WSO. For individuals attending courses sponsored by the WSO, a Certificate of Completion is issued upon completion of each course.
Members receive special hotel rates when attending safety pro- grams, conferences, etc., sponsored by the WSO.
Membership
The World Safety Organization has members who are full time professionals, executives, directors, etc., working in the safety and accident prevention fields, including university professors, private consultants, expert witnesses, researchers, safety manag- ers, directors of training, etc. They are employees of multi- na- tional corporations, local industries, private enterprises, govern- ments, and educational institutions. Membership in the World Safety Organization is open to all individuals and entities in- volved in the safety and accident prevention field, regardless of race, color, creed, ideology, religion, social status, sex, or politi- cal beliefs.
Membership Categories
Associate Membership: Individuals connected with safety and accident prevention in their work or individuals interested in the safety field, including students, interested citizens, etc.
Affiliate Membership: Safety, hazard, risk, loss, and accident prevention practitioners working as full time practitioners in the safety field. Only Affiliate Members are eligible for the WSO Certification and Registration Programs. Institutional Member- ship: Organizations, corporations, agencies, and other entities directly or indirectly involved in safety activities and other relat- ed fields. Sustaining/Corporate Member: Individuals, companies, corporations, organizations or other entities and selected groups, interested in the international effort to “Make Safety A Way Of Life...Worldwide.”
The WSO Membership Application is included on the following pages and is also available on the WSO website: https://worldsafety.org/application- for-wso-membership/ https://worldsafety.org/quick- downloads/


WSO National and International Offices and Directors
WSO National Office for Australia Dr. Janis Jansz, Director c/o Curtin University Phone: (618)9266-3006; Fax: (618)9266-2958 Contact: [email protected]
WSO National Office for Austria Dr. Majid Alizadeh, Director c/o Payesh System Mehr Engineering Company Contact: [email protected]
WSO National Office for Cameroon Mr. Clement Bantar Nyong, Director c/o Cameroon Safety Services Contact: [email protected]
WSO National Office for Canada Mr. Michael Brown, Director c/o Apex One Management Group Contact: [email protected]
[email protected] [email protected]
Website: www.worldsafetycanada.ca
WSO National Office for Ghana Mr. Peter Oko Ahunarh, Director c/o Ghana National Fire Service Contact: [email protected]
WSO National Office for Guam Mr. James H. Akin, Director c/o Safeworx Training Solutions and Consulting Contact: [email protected]
WSO National Office for India Mr. C. Kannan, Director c/o Indian Society of Safety Engineers (ISSE) Contact: [email protected] Website: www.worldsafety.org.in
WSO National Office for Indonesia Mr. Soehatman Ramli, Director c/o Prosafe Institute Contact: [email protected]
WSO National Office for Iran Mrs. Fatemeh Gilani, Director c/o Payesh System Mehr Engineering Company Contact: [email protected]
WSO National Office for Iraq Dr. Eng. Khaldon Waled Suliman, Director c/o NAYA Engineering Services & Training Contact: [email protected]
WSO National Office for Lebanon Dr. Elias M. Choueiri, Director c/o Ministry of Transportation Contact: [email protected]
WSO National Office for Myanmar Mr. Win Bo, Director c/o OSHE Services Company, Ltd. Phone: (95)936091909 Contact: [email protected]
WSO National Office for Nigeria Mr. Olalokun Soji Solomon, Director c/o Danarich Creative Concept Limited Phone: (234) 08121697235 Contact: [email protected] Website: www.worldsafety.org.ng
WSO National Office for Pakistan Mr. Syed Tayyeb Hussain, Director c/o Greenwich Training & Consulting Contact: [email protected]
WSO International Office for Philippines Eng. Alfredo A. De La Rosa, Jr., Director Phone: (63) 2 709-1535, (63) 2 709-1738 Fax: (63) 2 709-1737 Contact: [email protected]
WSO National Office for Qatar Mr. Allan N. Milagrosa, Director c/o Bright Services Contact: [email protected]
WSO National Office for Saudi Arabia (KSA) Mr. Garry A. Villamil, Director c/o The Academy of Sciences for Medical Education Contact: [email protected]; [email protected] Website: www.worldsafetygcc.com
WSO National Office for Taiwan, Republic of China Dr. Shuh Woei Yu, Director c/o Safety and Health Technology Center/SAHTECH Contact: [email protected]
WSO National Office for Vietnam Mr. Binh Pham, Director Contact: [email protected] Website: www.worldsafety.org.vn

World Safety Organization
Code of Ethics
Members of the WSO,
by virtue of their acceptance of membership into the
WSO,
are bound to the following Code of Ethics
regarding their activities associated with the
WSO:
Members must be responsible for ethical and professional conduct in relationships
with clients, employers, associates, and the public.
Members must be responsible for professional competence in performance of all their professional activities.
Members must be responsible for the protection of professional interest, reputation, and
good name of any deserving WSO member or member of other professional organization involved in safety or associate disciplines.
Members must be dedicated to professional development of new members in the safety profession
and associated disciplines.
Members must be responsible for their complete sincerity in professional service to the
world.
Members must be responsible for continuing improvement and development of professional competencies
in safety and associated disciplines.
Members must be responsible for their professional efforts to support the WSO motto:
“Making Safety a Way of Life…Worldwide.”

Published by the WSO National Office for Australia www.worldsafety.org
[email protected] | [email protected]
© 2020