40 - World Journal of Gastroenterology - F6Publishing
273
World Journal of Gastroenterology ISSN 1007-9327 (print) ISSN 2219-2840 (online) World J Gastroenterol 2021 October 28; 27(40): 6737-7004 Published by Baishideng Publishing Group Inc
-
Upload
khangminh22 -
Category
Documents
-
view
1 -
download
0
Transcript of 40 - World Journal of Gastroenterology - F6Publishing

World Journal ofGastroenterology
ISSN 1007-9327 (print)ISSN 2219-2840 (online)
World J Gastroenterol 2021 October 28; 27(40): 6737-7004
Published by Baishideng Publishing Group Inc
WJG https://www.wjgnet.com I October 28, 2021 Volume 27 Issue 40
World Journal of
GastroenterologyW J GContents Weekly Volume 27 Number 40 October 28, 2021
FRONTIER
Hepatocellular carcinoma risk after viral response in hepatitis C virus-advanced fibrosis: Who to screen and for how long?
6737
Ahumada A, Rayón L, Usón C, Bañares R, Alonso Lopez S
OPINION REVIEW
Higher doses of ascorbic acid may have the potential to promote nutrient delivery via intestinal paracellular absorption
6750
Sequeira IR
EVIDENCE REVIEW
Venous and arterial thromboembolism in patients with inflammatory bowel diseases6757
Stadnicki A, Stadnicka I
REVIEW
Understanding the immune response and the current landscape of immunotherapy in pancreatic cancer6775
Ostios-Garcia L, Villamayor J, Garcia-Lorenzo E, Vinal D, Feliu J
Artificial intelligence in gastroenterology: A state-of-the-art review6794
Kröner PT, Engels MM, Glicksberg BS, Johnson KW, Mzaik O, van Hooft JE, Wallace MB, El-Serag HB, Krittanawong C
MINIREVIEWS
Emerging artificial intelligence applications in liver magnetic resonance imaging6825
Hill CE, Biasiolli L, Robson MD, Grau V, Pavlides M
Role of human nucleoside transporters in pancreatic cancer and chemoresistance6844
Carter CJ, Mekkawy AH, Morris DL
Management of hepatitis B and C in special population6861
Kulkarni AV, Duvvuru NR
Endoscopic ultrasound-guided vascular interventions: Current insights and emerging techniques6874
Mann R, Goyal H, Perisetti A, Chandan S, Inamdar S, Tharian B

WJG https://www.wjgnet.com II October 28, 2021 Volume 27 Issue 40
World Journal of GastroenterologyContents
Weekly Volume 27 Number 40 October 28, 2021
ORIGINAL ARTICLE
Basic Study
Metabolomics of Fuzi-Gancao in CCl4 induced acute liver injury and its regulatory effect on bile acid profile
in rats
6888
Wang MF, Zhao SS, Thapa DM, Song YL, Xiang Z
Transforming growth factor beta-1 upregulates glucose transporter 1 and glycolysis through canonical and noncanonical pathways in hepatic stellate cells
6908
Zhou MY, Cheng ML, Huang T, Hu RH, Zou GL, Li H, Zhang BF, Zhu JJ, Liu YM, Liu Y, Zhao XK
Retrospective Cohort Study
Serum hepatitis B core-related antigen as a surrogate marker of hepatitis B e antigen seroconversion in chronic hepatitis B
6927
Chi XM, Wang XM, Wang ZF, Wu RH, Gao XZ, Xu HQ, Ding YH, Niu JQ
Long-term follow-up of liver alveolar echinococcosis using echinococcosis multilocularis ultrasound classification
6939
Schuhbaur J, Schweizer M, Philipp J, Schmidberger J, Schlingeloff P, Kratzer W
Observational Study
Hepatic and gastrointestinal disturbances in Egyptian patients infected with coronavirus disease 2019: A multicentre cohort study
6951
Shousha HI, Afify S, Maher R, Asem N, Fouad E, Mostafa EF, Medhat MA, Abdalazeem A, Elmorsy H, Aziz MM, Mohammed RS, Ibrahem M, Elgarem H, Omran D, Hassany M, Elsayed B, Abdelaziz AY, El Kassas M
Factors affecting anxiety, depression, and self-care ability in patients who have undergone liver transplantation
6967
Akbulut S, Ozer A, Saritas H, Yilmaz S
META-ANALYSIS
Prophylactic transcatheter arterial embolization reduces rebleeding in non-variceal upper gastrointestinal bleeding: A meta-analysis
6985
Boros E, Sipos Z, Hegyi P, Teutsch B, Frim L, Váncsa S, Kiss S, Dembrovszky F, Oštarijaš E, Shawyer A, Erőss B
LETTER TO THE EDITOR
Gastrointestinal and hepatic involvement during COVID-19 pandemic: A focus on pediatric population and possible future implications
7000
Sica R, Pennoni S, Penta L, Riccioni S, Di Cara G, Verrotti A

WJG https://www.wjgnet.com III October 28, 2021 Volume 27 Issue 40
World Journal of GastroenterologyContents
Weekly Volume 27 Number 40 October 28, 2021
ABOUT COVER
Editorial Board Member of World Journal of Gastroenterology, Pietro Fusaroli, MD, Associate Professor, Chief, Gastrointestinal Unit, University of Bologna at the Hospital of Imola, Via Montericco 4, Imola 40026, Italy. [email protected]
AIMS AND SCOPE
The primary aim of World Journal of Gastroenterology (WJG, World J Gastroenterol) is to provide scholars and readers from various fields of gastroenterology and hepatology with a platform to publish high-quality basic and clinical research articles and communicate their research findings online. WJG mainly publishes articles reporting research results and findings obtained in the field of gastroenterology and hepatology and covering a wide range of topics including gastroenterology, hepatology, gastrointestinal endoscopy, gastrointestinal surgery, gastrointestinal oncology, and pediatric gastroenterology.
INDEXING/ABSTRACTING
The WJG is now indexed in Current Contents®/Clinical Medicine, Science Citation Index Expanded (also known as SciSearch®), Journal Citation Reports®, Index Medicus, MEDLINE, PubMed, PubMed Central, and Scopus. The 2021 edition of Journal Citation Report® cites the 2020 impact factor (IF) for WJG as 5.742; Journal Citation Indicator: 0.79; IF without journal self cites: 5.590; 5-year IF: 5.044; Ranking: 28 among 92 journals in gastroenterology and hepatology; and Quartile category: Q2. The WJG’s CiteScore for 2020 is 6.9 and Scopus CiteScore rank 2020: Gastroenterology is 19/136.
RESPONSIBLE EDITORS FOR THIS ISSUE
Production Editor: Jia-Hui Li; Production Department Director: Yu-Jie Ma; Editorial Office Director: Ze-Mao Gong.
NAME OF JOURNAL INSTRUCTIONS TO AUTHORS
World Journal of Gastroenterology https://www.wjgnet.com/bpg/gerinfo/204
ISSN GUIDELINES FOR ETHICS DOCUMENTS
ISSN 1007-9327 (print) ISSN 2219-2840 (online) https://www.wjgnet.com/bpg/GerInfo/287
LAUNCH DATE GUIDELINES FOR NON-NATIVE SPEAKERS OF ENGLISH
October 1, 1995 https://www.wjgnet.com/bpg/gerinfo/240
FREQUENCY PUBLICATION ETHICS
Weekly https://www.wjgnet.com/bpg/GerInfo/288
EDITORS-IN-CHIEF PUBLICATION MISCONDUCT
Andrzej S Tarnawski, Subrata Ghosh https://www.wjgnet.com/bpg/gerinfo/208
EDITORIAL BOARD MEMBERS ARTICLE PROCESSING CHARGE
http://www.wjgnet.com/1007-9327/editorialboard.htm https://www.wjgnet.com/bpg/gerinfo/242
PUBLICATION DATE STEPS FOR SUBMITTING MANUSCRIPTS
October 28, 2021 https://www.wjgnet.com/bpg/GerInfo/239
COPYRIGHT ONLINE SUBMISSION
© 2021 Baishideng Publishing Group Inc https://www.f6publishing.com
© 2021 Baishideng Publishing Group Inc. All rights reserved. 7041 Koll Center Parkway, Suite 160, Pleasanton, CA 94566, USA
E-mail: [email protected] https://www.wjgnet.com

WJG https://www.wjgnet.com 6737 October 28, 2021 Volume 27 Issue 40
World Journal of
GastroenterologyW J GSubmit a Manuscript: https://www.f6publishing.com World J Gastroenterol 2021 October 28; 27(40): 6737-6749
DOI: 10.3748/wjg.v27.i40.6737 ISSN 1007-9327 (print) ISSN 2219-2840 (online)
FRONTIER
Hepatocellular carcinoma risk after viral response in hepatitis C virus-advanced fibrosis: Who to screen and for how long?
Adriana Ahumada, Laura Rayón, Clara Usón, Rafael Bañares, Sonia Alonso Lopez
ORCID number: Adriana Ahumada 0000000329653016; Laura Rayón 0000-0002-0240-1858; Clara Usón 0000-0002-7896-4278; Rafael Bañares 0000-0002-0412-8437; Sonia Alonso Lopez 0000000276270846.
Author contributions: Ahumada A, Bañares R and Alonso López S have been involved in conception and drafting the article; Bañares R and Alonso López S have made critical revisions related to important intellectual content of the manuscript; Rayón L and Usón C have been involved in acquisition of data and drafting the article; Ahumada A, Rayón L, Usón C, Bañares R and Alonso López S have read and approved the final manuscript.
Conflict-of-interest statement: Adriana Ahumada has received fees for serving as a speaker and a grant from Abbvie and personal fees for serving as a speaker and for Gilead. Laura Rayón, Clara Usón and Rafael Bañares have nothing to disclose. Sonia Alonso has received fees for serving as a speaker and consultant from Abbvie and Gilead.
Open-Access: This article is an open-access article that was selected by an in-house editor and fully peer-reviewed by external reviewers. It is distributed in accordance with the Creative
Adriana Ahumada, Laura Rayón, Clara Usón, Rafael Bañares, Sonia Alonso Lopez, Liver Unit, Hospital General Universitario Gregorio Marañón, Madrid 28007, Spain
Adriana Ahumada, Rafael Bañares, Sonia Alonso Lopez, Liver Unit, Instituto de Investigación Sanitaria Gregorio Marañón (IiSGM), Madrid 28007, Spain
Rafael Bañares, Medicine, Universidad Complutense de Madrid, Madrid 28006, Spain
Rafael Bañares, Sonia Alonso Lopez, Centro de Investigación Biomédica En Red de Enfermedades Hepáticas y Digestivas (CIBERehd), Instituto de Salud Carlos III, Madrid 28029, Spain
Corresponding author: Sonia Alonso Lopez, MD, PhD, Attending Doctor, Consultant Physician-Scientist, Doctor, Senior Researcher, Liver Unit, Hospital General Universitario Gregorio Marañón, Doctor Esquerdo 46, Madrid 28007, Spain. [email protected]
AbstractHepatitis C virus (HCV) chronic infection is associated with fibrosis progression, end-stage liver complications and HCC. Not surprisingly, HCV infection is a leading cause of liver-related morbidity and mortality worldwide. After sustained virological response (SVR), the risk of developing hepatocellular carcinoma is not completely eliminated in patients with established cirrhosis or with advanced fibrosis. Therefore, lifelong surveillance is currently recommended. This strategy is likely not universally cost-effective and harmless, considering that not all patients with advanced fibrosis have the same risk of developing HCC. Factors related to the severity of liver disease and its potential to improve after SVR, the molecular and epigenetic changes that occur during infection and other associated comorbidities might account for different risk levels and are likely essential for identifying patients who would benefit from screening programs after SVR. Efforts to develop predictive models and risk calculators, biomarkers and genetic panels and even deep learning models to estimate the individual risk of HCC have been made in the direct-acting antiviral agents era, when thousands of patients with advanced fibrosis and cirrhosis have reached SVR. These tools could help to identify patients with very low HCC risk in whom surveillance might not be justified. In this review, factors affecting the probability of HCC development after SVR, the benefits and risks of surveillance, suggested strategies to estimate individualized HCC risk and the current evidence to recommend lifelong surveillance are discussed.

Ahumada A et al. HCC risk after viral response in HCV-advanced fibrosis
WJG https://www.wjgnet.com 6738 October 28, 2021 Volume 27 Issue 40
Commons Attribution NonCommercial (CC BY-NC 4.0) license, which permits others to distribute, remix, adapt, build upon this work non-commercially, and license their derivative works on different terms, provided the original work is properly cited and the use is non-commercial. See: http://creativecommons.org/Licenses/by-nc/4.0/
Manuscript source: Invited manuscript
Specialty type: Gastroenterology and hepatology
Country/Territory of origin: Spain
Peer-review report’s scientific quality classificationGrade A (Excellent): 0 Grade B (Very good): B Grade C (Good): 0 Grade D (Fair): 0 Grade E (Poor): 0
Received: April 11, 2021 Peer-review started: April 11, 2021 First decision: June 13, 2021 Revised: June 24, 2021 Accepted: September 19, 2021 Article in press: September 19, 2021 Published online: October 28, 2021
P-Reviewer: Djuric O S-Editor: Wang LL L-Editor: A P-Editor: Yu HG
Key Words: Hepatitis C virus; Hepatocellular carcinoma; Liver fibrosis; Surveillance; Sustained virologic response; Epigenetic changes; Predictive models; Cost-effectiveness
©The Author(s) 2021. Published by Baishideng Publishing Group Inc. All rights reserved.
Core Tip: Hepatocellular carcinoma (HCC) risk is reduced after sustained viral response, but a substantial threat persists over time. Understanding the natural history of hepatitis C virus infection and the variable influence of viral eradication in the molecular and epigenetic changes that occur during infection are essential to explain the different risk of developing HCC in patients with advanced fibrosis. The definition of the appropriate tools to estimate the individual risk of HCC after antiviral treatment providing reliable recommendations about HCC surveillance is probably the most important challenge to be clarified in this field.
Citation: Ahumada A, Rayón L, Usón C, Bañares R, Alonso Lopez S. Hepatocellular carcinoma risk after viral response in hepatitis C virus-advanced fibrosis: Who to screen and for how long? World J Gastroenterol 2021; 27(40): 6737-6749URL: https://www.wjgnet.com/1007-9327/full/v27/i40/6737.htmDOI: https://dx.doi.org/10.3748/wjg.v27.i40.6737
INTRODUCTIONHepatitis C virus (HCV) chronic infection is a major cause of liver-related morbidity and mortality worldwide. Direct-acting antiviral agents (DAAs) have definitely changed the natural history of the disease by reducing liver-related complications in patients with advanced liver fibrosis (including those with cirrhosis) and improving the survival rate. Nonetheless, the risk of developing hepatocellular carcinoma is not completely eliminated with viral clearance. Not surprisingly, clinical guidelines still recommend life-long ultrasound surveillance in all patients with advanced fibrosis (F3) and cirrhosis (F4)[1,2].
However, the risk of HCC occurrence is not homogenous within the spectrum of compensated advanced chronic liver disease (c-ACLD). Therefore, surveillance strategies might not be cost-effective or harmless in all patients. Thus, the identi-fication of patients who truly benefit from screening programs and for how long is a matter of debate.
HCC risk factors are associated with the severity of liver disease and the degree of improvement after sustained virological response but also with the presence of other comorbidities and preneoplastic changes induced by HCV. All of them are discussed in this review, as well as their predictive capacity to estimate individualized HCC risk. We also discuss the current evidence to recommend surveillance.
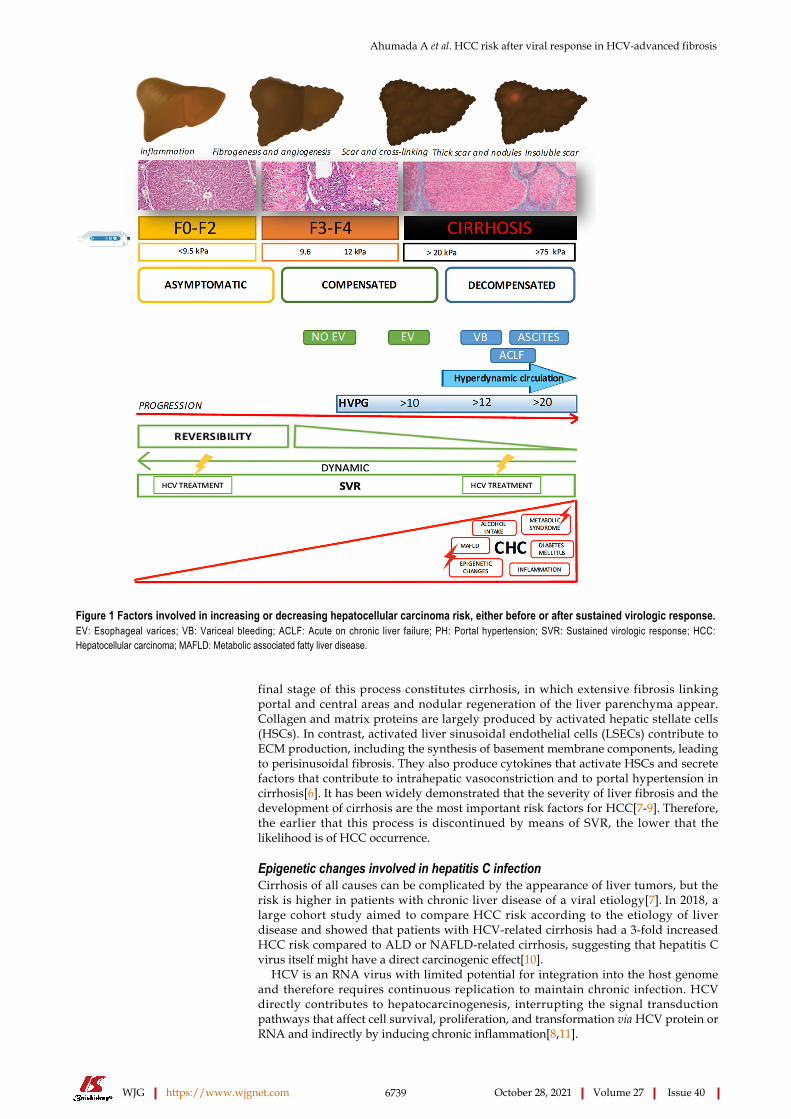
FACTORS AFFECTING HCC OCCURRENCE IN HCV PATIENTSA combination of different factors, occurring either before or after SVR, is involved in the risk of HCC associated with HCV chronic infection (Figure 1).
Development of fibrosis during HCV infectionChronic HCV infection typically causes damage and inflammation in the liver parenchyma, which can be followed by fibrosis deposition of different severities. Fibrogenesis is a dynamic process characterized by the synthesis of extracellular matrix (ECM), composed of a mixed complex of glycoproteins (collagen, elastin, fibronectin, laminin) and proteoglycans organized in a three-dimensional network[3]. Therefore, fibrosis is a physiological mechanism that can become pathological when viral infection and chronic hepatocellular injury persist[4].
In chronic hepatitis, including hepatitis C, active fibrosis begins around the portal areas (periportal or zone 1 fibrosis) and gradually extends out into the lobules toward the central veins (zone 3), with septum formation and then bridging fibrosis[5]. The
Ahumada A et al. HCC risk after viral response in HCV-advanced fibrosis
WJG https://www.wjgnet.com 6739 October 28, 2021 Volume 27 Issue 40
Figure 1 Factors involved in increasing or decreasing hepatocellular carcinoma risk, either before or after sustained virologic response. EV: Esophageal varices; VB: Variceal bleeding; ACLF: Acute on chronic liver failure; PH: Portal hypertension; SVR: Sustained virologic response; HCC: Hepatocellular carcinoma; MAFLD: Metabolic associated fatty liver disease.
final stage of this process constitutes cirrhosis, in which extensive fibrosis linking portal and central areas and nodular regeneration of the liver parenchyma appear. Collagen and matrix proteins are largely produced by activated hepatic stellate cells (HSCs). In contrast, activated liver sinusoidal endothelial cells (LSECs) contribute to ECM production, including the synthesis of basement membrane components, leading to perisinusoidal fibrosis. They also produce cytokines that activate HSCs and secrete factors that contribute to intrahepatic vasoconstriction and to portal hypertension in cirrhosis[6]. It has been widely demonstrated that the severity of liver fibrosis and the development of cirrhosis are the most important risk factors for HCC[7-9]. Therefore, the earlier that this process is discontinued by means of SVR, the lower that the likelihood is of HCC occurrence.
Epigenetic changes involved in hepatitis C infectionCirrhosis of all causes can be complicated by the appearance of liver tumors, but the risk is higher in patients with chronic liver disease of a viral etiology[7]. In 2018, a large cohort study aimed to compare HCC risk according to the etiology of liver disease and showed that patients with HCV-related cirrhosis had a 3-fold increased HCC risk compared to ALD or NAFLD-related cirrhosis, suggesting that hepatitis C virus itself might have a direct carcinogenic effect[10].
HCV is an RNA virus with limited potential for integration into the host genome and therefore requires continuous replication to maintain chronic infection. HCV directly contributes to hepatocarcinogenesis, interrupting the signal transduction pathways that affect cell survival, proliferation, and transformation via HCV protein or RNA and indirectly by inducing chronic inflammation[8,11].

Ahumada A et al. HCC risk after viral response in HCV-advanced fibrosis
WJG https://www.wjgnet.com 6740 October 28, 2021 Volume 27 Issue 40
Epigenetic regulation is an indispensable process for the normal development and preservation of tissue-specific gene expression profiles. Thus, any perturbation of the epigenetic landscape can lead to shifted gene function and malignant cellular transformation. The changed epigenome of HCC is characterized by gene-specific hypermethylation or hypomethylation, global genomic hypomethylation, abnormal expression of DNA methyltransferases and histone modifying enzymes, altered histone modification patterns, and aberrant expression of microRNAs, which can affect the expression of oncogenes, tumor suppressor genes and other tumor-related genes altering the cancer development pathways over time[12]. In fact, a recent study showed a clear, positive correlation between epigenetic changes and fibrosis stages in HCV chronic infection[13], which persist after SVR.
Reversibility of liver fibrosisEffective antiviral treatment has proved to change the natural history of HCV-related liver disease, reducing the risk of liver events and HCC, even in patients with advanced liver disease and cirrhosis. A recent meta-analysis[14] showed a significant absolute risk reduction in HCC after SVR, which was even greater in patients with cirrhosis (22%; 95%CI: 13-31) than in patients with any stage of fibrosis (6.7%; 95%CI: 5-8). It has been suggested that regression of fibrosis is one of the key mechanisms. In contrast to what was previously believed, there is currently substantial evidence indicating that the removal of fibrosis, hepatocyte repopulation and microvasculature remodeling occur after SVR following several cellular processes[15,16]. Mechanisms of the resolution of liver fibrosis involve senescence and apoptosis of activated HSCs/myofibroblasts caused by deprivation of fibrogenic cytokines. Reversal of these cells to an inactive phenotype during liver fibrosis regression[6,15] has also been described. However, regression of liver disease depends on the severity of fibrosis before antiviral therapy, with total regression being more likely in patients with mild/moderate fibrosis than in those with established cirrhosis due to the presence of a stronger cross-linking matrix, which is more difficult to remove by methaloproteases. Furthermore, the presence of architectural distortion with vascular shunts also contributes to the persistence of architectural changes[17-21]. However, the “point of no return” is controversial. A Canadian study[16] examined explants of patients with cirrhosis or precirrhosis who underwent transplantation, in which the causative agent of the liver disease was controlled or had been removed. The authors found that regression involves two main processes: removal of fibrosis and repopulation of scarred regions with hepatocytes, concluding that reversibility is possible in all stages of fibrosis, including precirrhotic stages and even macronodular cirrhosis. Interestingly, “sinusoidal capillarization” was considered the “point of no return”. Moreover, advanced stages of cirrhosis with thicker septa and smaller micronodules are associated with the presence of clinically significant portal hypertension and therefore with a lower likelihood of reversibility[20].
An Italian study including patients with cirrhosis with paired biopsies after achieving SVR with PEGINF/RBV showed that, in more than half of the patients, regression of cirrhosis was observed during follow-up. Patients who did not change their METAVIR scores after SVR also presented a decrease in the amount of collagen fibers, coinciding with the transformation of micronodular cirrhosis into a macronodular form or incomplete septal cirrhosis[21]. Finally, a Spanish study published in 2018 evaluated the regression of fibrosis using paired biopsies in 112 patients with posttransplant recurrence of HCV infection after treatment with DAAs[22]. Fibrosis regression occurred in 72-85% of the patients without liver cirrhosis (F1-F3) and in 43% of the patients with cirrhosis. Interestingly, in this study, more than 50% of the cirrhotic patients had a history of decompensation, suggesting that patients with liver cirrhosis without clinically significant portal hypertension are more likely to have improved liver injury, likely decreasing the risk of developing HCC after SVR.
Therefore, among patients with advanced fibrosis and cirrhosis, the risk of HCC seems to be lower in patients with less severe disease, who are in fact those who benefit the most after SVR.
One important issue is how to assess fibrosis regression since liver biopsy is an invasive procedure, does not distinguish early from advanced stages of cirrhosis and cannot be performed repeatedly after SVR. Not surprisingly, noninvasive elastographic and direct or indirect serological markers have been widely used to assess fibrosis regression[23]. However, in regressed cirrhosis, macronodules and aberrant vasculature with capillarization of the sinusoids can persist despite a decrease in liver stiffness assessed by TE. The study from D’ Ambrosio et al[24] revealed that, after 61 mo of follow-up, 38% of patients with biopsy-proven F4 had liver stiffness < 12 kPa, resulting in low predictive power of TE to diagnose cirrhosis after viral

Ahumada A et al. HCC risk after viral response in HCV-advanced fibrosis
WJG https://www.wjgnet.com 6741 October 28, 2021 Volume 27 Issue 40
eradication. Thus, a combination of TE and serological noninvasive markers might improve the capacity to assess fibrosis regression.
Inflammation and liver cancerAnother factor specifically affecting HCC risk during HCV chronic infection is the presence of inflammation. Various types of cancer arise in the setting of chronic inflammation, indicating a strong link between inflammation and cancer. It has been estimated that approximately 15% of all human cancers are associated with inflam-mation and chronic infections[25]. During chronic viral hepatitis, host immune responses to HBV or HCV are often not sufficiently strong to completely eradicate the infection, inducing persistent stimulation of antigen-specific immune responses. Host immune cells are known to destroy virus-infected liver cells, resulting in the production of different cytokines and growth factors, consequently inducing compensatory regeneration of hepatocytes. The persistent cycle of hepatocyte necroin-flammation and regeneration has a synergistic effect with the severity of liver fibrosis and cirrhosis, promoting architectural distortion and portal hypertension with reduced sinusoidal perfusion favoring hypoxia, which is the substrate for the formation of hypervascular tumors. These factors increase the risk of genetic changes in hepatocytes, promoting the survival and expansion of the initiated cells and leading to dysregulated hepatocyte proliferation, which contributes to the development and progression of liver cancer. Furthermore, oxidative stress accelerates hepatocarcino-genesis through several mechanisms, including transcription and activation of cytokines and growth factors, oxidative DNA damage, DNA methylation, and hepatocyte injury[26-30]. Therefore, HCC risk is expected to decrease after eradicating infection and the subsequent decrease in inflammation mechanisms.
HCC RISK CAN PERSIST AFTER SUSTAINED VIROLOGICAL RESPONSEAlthough SVR is associated with a reduction in some of the HCC pathogenetic factors mentioned above, there are many other contributors to HCC occurrence that can persist after viral eradication, related either to the stage of liver disease (e.g., Child B, portal hypertension, low platelet count) or to the presence of comorbidities, such as diabetes, alcohol consumption, smoking and older age[31-34].
A recent publication suggested that regression of liver damage after SVR can last for years, with HCC risk persisting during this period; in other patients, liver injury is not reversed due to advanced cirrhosis stage, or it progresses because of the coexistence of other factors, such as obesity, diabetes, and alcohol intake[35]. In addition, older age contributes, even years after SVR, to the progression of liver fibrosis and to an increased risk of HCC.
Epigenetic memory is another of the possible mechanisms involved in HCC risk persistence after SVR. As mentioned above, HCV infection induces epigenetic alterations. DAA treatment eliminates the virus inside cells, but it is not able to restore the concomitant epigenetic signatures already produced and associated with the risk of HCC. Available data suggest that, when infection has already induced epigenetic changes, gene expression is conserved in cells; therefore, the presence of the virus is no longer necessary to exert oncogenic effects on host cells, producing what is known as epigenetic memory or persistent epigenetic changes[13,36].
HCC SURVEILLANCE AFTER SVR: CURRENT RECOMMENDATIONSCurrent guidelines from EASL[1] and AASLD[37] agree regarding the recommen-dation of hepatocellular carcinoma surveillance after SVR in all patients with cirrhosis. However, EASL recommends indefinite HCC screening in patients with advanced fibrosis (F3) by ultrasound every six months, whereas AASLD does not. These differences are likely related to controversy regarding the risk of developing HCC in F3 patients due to the heterogeneity of this population, which could include misclas-sified patients (over- or underestimating the severity of fibrosis).
Ahumada A et al. HCC risk after viral response in HCV-advanced fibrosis
WJG https://www.wjgnet.com 6742 October 28, 2021 Volume 27 Issue 40
ACCURACY IN THE DIAGNOSIS OF ADVANCED FIBROSIS AND CIRRHOSISConsidering that advanced fibrosis and especially cirrhosis are the main factors contributing to HCC risk, an accurate diagnosis prior to antiviral therapy is mandatory to predict individual risk after SVR. Liver biopsy remains the gold standard for the assessment of hepatic fibrosis, although noninvasive methods for estimating liver fibrosis are increasingly used. However, the accuracy of fibrosis staging in the noninvasive assessment era is imperfect -- even more so after sustained virological response. This fact is especially important in patients with advanced fibrosis but without cirrhosis, in which liver stiffness measurements (LSMs) can occasionally overestimate fibrosis, especially when marked inflammation is present[38]. Another problem is the definition of F3 stage by LSM, with cutoffs varying from 9.5 kPa to 14.5 kPa according to Castera’s[39] study or up to 12.5 kPa as Ziol et al[40] suggested. Therefore, a substantial proportion of patients might be misclassified, overestimating or underestimating fibrosis and leading to an indefinite link to medical care or, altern-atively, mistaken discharge. Thus, other clinical or serological markers should be available to accurately define the severity of compensated advanced liver disease and the remaining HCC risk after SVR.
COST-EFFECTIVENESS, BENEFITS AND RISKS OF HCC SURVEILLANCEHCC surveillance aims to prolong patient survival and quality of life by improving early diagnosis and curative therapy. Based on estimated tumor doubling times, current guidelines recommend ultrasound every six months, and they establish an incidence of at least 1.5% per year to justify HCC surveillance. Although this threshold is likely too high due to the clinical benefits induced by DAA after SVR and the improvement in HCC therapies, it is not clear whether HCC surveillance remains cost effective in all patients with advanced fibrosis after SVR. Regarding this point, a study suggested that HCC surveillance is unlikely to be cost effective in patients with F3 fibrosis, whereas both annual and biannual modalities are likely to be cost effective for patients with cirrhosis compared with no surveillance[41]. The study suggested that an annual HCC incidence greater than 0.5% might be currently cost-effective, and it proved that both an APRI greater than 2 or an FIB-4 greater than 3.25 allow for the identification of patients for whom HCC surveillance becomes cost effective, suggesting that patients with values less than these thresholds should be discharged from follow-up evaluation. Another study evaluated the cost-effectiveness of risk-stratified HCC screening in cirrhosis based on a combination of biomarkers and clinical variables, including epidermal growth factor single-nucleotide polymorphism, age, sex, smoking status, alkaline phosphatase level, and platelet count. The study showed that HCC surveillance strategies targeting high- and intermediate-risk patients with cirrhosis are cost-effective. Finally, the authors suggested that omitting screening in the lowest-risk subjects was cost-effective compared with biannual screening, without sacrificing net survival benefit[42].
Moreover, in a recent opinion article, Jepsen et al[43] argued that randomized trials of HCC surveillance vs no surveillance are necessary to make formal recommendations involving thousands of patients. The authors made their arguments indicating that universal surveillance could negatively impact patients’ quality of life by generating anxiety about the possibility of a cancer diagnosis. Furthermore, the problems associated with false positives in screening procedures and the need to be connected for life to hospital care in patients with negligible HCC risk are also matters of concern. Therefore, accurate models including predictive factors to identify different risk levels are likely the key to adequate follow-up of patients after SVR.
PREDICTIVE FACTORS OF HCC RISKMultiple models including clinical, serological, molecular and elastographic variables have attempted to stratify HCC risk in patients with advanced fibrosis. Importantly, there are controversies about the markers that should be used and when they should be measured, considering the dynamic changes that occur after SVR. Table 1 summarizes some studies that have assessed the risk of HCC according to both baseline and dynamic risk factors.

Ahumada A et al. HCC risk after viral response in HCV-advanced fibrosis
WJG https://www.wjgnet.com 6743 October 28, 2021 Volume 27 Issue 40
Table 1 Studies assessing the risk of hepatocellular carcinoma according to baseline and dynamic risk factors
Ref. Country n Population at risk Diagnosis of cirrhosis Treatment regimens Baseline risk factors Dynamic risk factors
Lleo et al[33], 2019
Italy 1766 All cirrhosis 11.4% Child B/C
1 or more of the following: Stage 4 fibrosis by METAVIR score, esophageal and/or gastric varices at endoscopy, LSM > 12.5 kPa
All were treated with DAA
Age > 50 years old and presence of esophageal varices, platelets < 110000/L and LSM > 25 kPa
Lack of SVR
Ioannou et al[44], 2018
United States
45810 23% cirrhosis Clinical, based on ICD-9 or 10 codes for cirrhosis or its complications
Either IFN or DAA
Cirrhosis, SVR, ALT, AST, platelets, albumin, age
Ioannou et al[45], 2019
United States
48135 9784 with pretreatment cirrhosis
Clinical, based on ICD-9 or 10 codes for cirrhosis or its complications
Either IFN or DAA
Cirrhosis and FIB-4 ≥ 3.25 before treatment
FIB-4 ≥ 3.25 post-SVR
Ravaioli et al[47], 2018
Italy 139 All cirrhosis; Included previous HCC 11.5% Child B
All were treated with DAA
History of previous HCC Child B and LSM reduction after DAA treatment < 30%
Pons et al[48], 2019
Spain 572 All LSM ≥ 10 kPa; All compensated
cACLD defined by LSM ≥ 10 kPa All were treated with DAA
High risk: baseline albumin < 4 g/dL; Low risk: Baseline albumin ≥ 4 g/dL
High risk: LSM ≥ 20 kPa or LSM 10-20 kPa and albumin < 4.4 g/dL; Low risk: LSM < 10 kPa or LSM 10-20 kPa and albumin ≥ 4.4 g/dL
Fan et al[50], 2020
China 3566 75.3% cirrhosis compensated and decompensated
Histological and/or radiological Either IFN or DAA
aMAP score; Low risk: 0-50; Intermediate risk: 50-60; High risk: 60-100
Alonso et al[49], 2020
Spain 993 Advanced fibrosis or compensated cirrhosis
Clinical or histological; advanced fibrosis defined by a LSM by TE > 9.5 Kpa
All were treated with DAA
Albumin < 4.2 g/dL; LSM > 17,3 kPaFIB-4 > 3.7
Delta LSM < 25.5%; FIB-4 > 3.3; GGT > 42 IU
Deep learning RNN modelIoannou et al[62], 2020
United States
48151 All cirrhosis compensated and decompensated
Clinical, based on ICD-9 or 10 codes for cirrhosis or its complications
Either IFN or DAA
Cirrhosis diagnosis, sex, race and HCV genotype 3
Development of cirrhosis, SVR, BMI, AST, ALT, bilirubin, FIB-4, APRI, platelets
LSM: Liver stiffness measurement; TE: Transient elastography; INF: Interferon, DAA: Direct-acting antiviral agent; HCV: Hepatitis C virus; SVR: Sustained virologic response; FIB-4: Fibrosis 4; HCC: Hepatocellular carcinoma; c-ACLD: Compensated advanced chronic liver disease; CP: Child-Pugh; FU: Follow-up; amap: age, male, ALBI and platelets; GGT: Gamma-glutamyltransferase; RNN: Recurrent neural networks; APRI: AST to platelet ratio index; ALT: Alanine aminotransferase; AST: Aspartate aminotransferase; BMI: Body mass index.
The study by Ioannou et al[44] introduced the need for risk modeling, suggesting that screening strategies based on HCC risk models were superior to “screen-all” or “screen-none” strategies. The proposed HCC risk model, which included the presence of cirrhosis, SVR, baseline ALT, AST, platelets, albumin and age, allowed us to calculate the individual risk of HCC. However, the definition of cirrhosis was made based on the presence of portal hypertension signs and/or clinical complications, suggesting that perhaps patients with advanced fibrosis or with early stages of cirrhosis could be misclassified as not having cirrhosis.
In a further study, the authors used a different evaluation of liver disease severity, introducing not only baseline data but also changes in FIB-4 over time, to assess

Ahumada A et al. HCC risk after viral response in HCV-advanced fibrosis
WJG https://www.wjgnet.com 6744 October 28, 2021 Volume 27 Issue 40
different HCC risk levels. In this second study, the authors showed that patients in whom FIB-4 was less than 3.25 before treatment and after SVR had a lower risk of HCC[45].
Other predictive models have included different combinations of laboratory and elastographic parameters. A study from Italy[33] aimed to evaluate the risk of HCC occurrence and recurrence in cirrhotic patients after DAA therapy. The authors identified a subgroup of patients with SVR and the “Extended Baveno Criteria”[46] (> 110000 platelets and LSM < 25 kPa), with an HCC incidence of 0.5%/per year, suggesting that the Baveno Criteria could be an appropriate tool for stratification, advising less frequent follow-up in this population.
Models that include dynamic changes after SVR could be especially relevant since they can identify patients with less severe disease more likely to regress or improve after SVR. The dynamic change in LSM as an HCC risk factor was previously described in a study showing that a reduction in liver stiffness > 30% at the end of treatment was associated with a significantly lower risk of HCC at one year after EOT[47]. In this study, TE was likely performed too early to detect regression or improvement, although it could identify those patients with overestimated fibrosis at baseline, in whom the resolution of inflammatory activity accounts for the rapid decrease in liver stiffness.
A Spanish study developed a model to estimate HCC risk in patients with c-ACLD after SVR. This study revealed that the combination of follow-up LSM and serum albumin levels at one year after SVR was able to identify different HCC risk groups. The authors observed that patients with LSM < 10 kPa or with LSM between 10-20 kPa and high albumin levels at follow-up had an incidence rate of HCC of less than 1/100 patients per year; thus, the authors considered them a low-risk group[48].
Furthermore, a recent large, multicenter cohort study performed in our unit[49] confirmed the impact of both baseline and dynamic changes in noninvasive markers on the risk of HCC development. We constructed two simple models: the first one included baseline albumin (g/dL) and LSM (Kpa) and the percentage of LSM variation one year after EOT. Patients with baseline albumin > 4.2 g/dL, baseline LSM ≤ 17.3 kPa, and 1-year DeltaLSM > 25.5% had the lowest HCC risk (cumulative incidence of HCC at 3 years of 0%). Considering that LSM might not be universally available, we also built a second model that exclusively included noninvasive serological markers. Similarly, the FIB-4-based model identified patients with baseline albumin > 4.2 g/dL, baseline FIB-4 ≤ 3.7, 1-year FIB-4 score ≤ 3.3, and 1-year GGT ≤ 42 IU/mL as the group with the lowest HCC risk (cumulative incidence of 0.4% at 3 years). Notably, our results suggested that baseline and dynamic LSM (or FIB-4, when TE is not available) could identify patients with a lower incidence of HCC after SVR that does not justify continuous HCC screening. Approximately 20% of the patients were considered to have low or very low HCC risk, and according to our findings, they could be safely discharged from surveillance.
Another recently validated predictive model is the aMAP score[50], which includes laboratory and clinical parameters such as the albumin-bilirubin score (ALBI score) platelets, age and sex. The score identifies two different risk groups, suggesting that only patients belonging to the high-risk group (aMAP score > 60) should undergo intensive surveillance to detect early HCC. This prognostic tool was externally validated in patients with different cirrhosis etiologies from 11 global prospective studies; interestingly, the score properly discriminated 5-year HCC irrespective of etiology of liver disease and ethnicity.
Thus, predictive models and risk scores, preferably based on baseline data and dynamic changes, are likely the best approach for determining the individual risk of HCC after SVR.
LONG-TERM RISK OF HCC: DOES IT DECREASE OVER TIME?Different long-term studies in HCV patients treated with IFN-based regimens have documented a reduction in the incidence of HCC by 75% in patients with SVR[51-53]. Currently, there is growing evidence that the same occurs after DAA therapy. Several data have shown that SVR after DAAs does not have a significant impact on the development of HCC in the short or medium term since many of the patients were treated with a more advanced disease, it but reduces the risk of HCC in the medium and long term, like what occurs in patients treated with IFN-based regimens[9].
Conversely, it has been suggested that HCC risk persists for up to 10 years after HCV eradication in patients with baseline cirrhosis or high FIB-4 scores[45]. In this

Ahumada A et al. HCC risk after viral response in HCV-advanced fibrosis
WJG https://www.wjgnet.com 6745 October 28, 2021 Volume 27 Issue 40
study, HCC incidence remained > 2% per year even 10 years after antiviral treatment in patients with a high baseline FIB-4 ≥ 3.25, especially if it remained ≥ 3.25 after SVR. Conversely, patients with baseline FIB-4 < 3.25 had an HCC incidence < 1%.
Moreover, aging and comorbidities that can occur or progress over time could have an additive effect on HCC risk. Consequently, there is no strong evidence to support a dynamic assessment of HCC risk over time, and the best strategy is likely to continue screening patients with intermediate and high HCC risk until they reach an age when it is no longer cost effective.
HCC SCREENING: WHO DOES BENEFIT AND FOR HOW LONG?It seems clear that the current recommendations regarding HCC screening after SVR in HCV patients with advanced fibrosis at baseline should be modified in the future. While changes become formal, we provide below a proposal based on the current data (Figure 2).
Cirrhotic patients with baseline decompensated or compensated advanced liver disease with significant portal hypertension. HCC risk in this population remains greater than the accepted threshold for surveillance; therefore, biannual US screening is recommended.
Patients with findings of advanced chronic liver disease without clear evidence of baseline portal hypertension. In our opinion, these patients should be screened for HCC at least 1 year after EOT to evaluate early dynamic changes and make more accurate estimations of the individual HCC risk.
FUTURE STRATEGIES IN SURVEILLANCEAs previously stated, several questions remain concerning surveillance strategies. Most likely, the most important concern is that we do not have accurate information about whether HCC risk persists constantly over the long term and therefore for how long patients with medium or high risk should continue HCC surveillance.
It is possible that, in the near future, patients will benefit from a more specific biomarker panel, genetic and molecular profiles and even deep learning models to predict the risk of developing HCC.
Circulating biomarkers are promising tools for better stratification of patients[54-56]. Biomarker panels, such as the GALAD score, are excellent tools for the detection of early-stage HCC, including tumors with negative AFP (AUC of 0.96 for detection of early-stage HCC)[57,58]. As previously exposed, HCV induces epigenetic alterations persisting after DAA cure[13], so the opportunity to detect epigenetic changes of histones bound to circulating DNA in plasma represents a new opportunity to uncover biomarkers of HCC risk. These approaches could represent personalized, noninvasive and cost-effective alternatives based on clinical and biological findings for HCC screening.
The use of deep learning models, which have also been successfully applied in other settings to predict clinical events[59], could also be relevant. Various types of model architectures, such as recurrent neural networks, have been used to capture temporal dynamics and long-term information over time[60]. Recently, it was suggested that some machine-learning algorithms accurately stratify the risk of HCC in patients with cirrhosis, identifying those at high risk for developing HCC[61]. Additionally, it has been shown that, in terms of cost-effectiveness, deep learning and recurrent neural network models were able to improve HCC surveillance strategies in HCV patients, thereby identifying high-risk cases[62].
CONCLUSIONIn conclusion, HCC surveillance in HCV patients should likely be based on an evaluation of individualized risk rather than exclusively based on baseline fibrosis stage. Currently available risk scores should be improved and validated, likely by including novel approaches, such as personalized biomarkers and deep learning methods.

Ahumada A et al. HCC risk after viral response in HCV-advanced fibrosis
WJG https://www.wjgnet.com 6746 October 28, 2021 Volume 27 Issue 40
Figure 2 Surveillance hepatocellular carcinoma algorithm proposed. 1Most likely, annual incidence < 0.5% per year. FIB-4: Fibrosis 4; LSM: Liver stiffness measurement; TE: Transient elastography; PHT: Portal hypertension; DM: Diabetes mellitus; MS: Metabolic syndrome; MAFLD: Metabolic associated fatty liver disease.
REFERENCESEuropean Association for the Study of the Liver. EASL Recommendations on Treatment of Hepatitis C 2018. J Hepatol 2018; 69: 461-511 [PMID: 29650333 DOI: 10.1016/j.jhep.2018.03.026]
1
Singal AG, Lim JK, Kanwal F. AGA Clinical Practice Update on Interaction Between Oral Direct-Acting Antivirals for Chronic Hepatitis C Infection and Hepatocellular Carcinoma: Expert Review. Gastroenterology 2019; 156: 2149-2157 [PMID: 30878469 DOI: 10.1053/j.gastro.2019.02.046]
2
Schuppan D, Ruehl M, Somasundaram R, Hahn EG. Matrix as a modulator of hepatic fibrogenesis. Semin Liver Dis 2001; 21: 351-372 [PMID: 11586465 DOI: 10.1055/s-2001-17556]
3
Marcellin P, Asselah T, Boyer N. Fibrosis and disease progression in hepatitis C. Hepatology 2002; 36: S47-S56 [PMID: 12407576 DOI: 10.1053/jhep.2002.36993]
4
Goodman ZD, Ishak KG. Histopathology of hepatitis C virus infection. Semin Liver Dis 1995; 15: 70-81 [PMID: 7597446 DOI: 10.1055/s-2007-1007264]
5
Jung YK, Yim HJ. Reversal of liver cirrhosis: current evidence and expectations. Korean J Intern Med 2017; 32: 213-228 [PMID: 28171717 DOI: 10.3904/kjim.2016.268]
6
European Association for the Study of the Liver. EASL Clinical Practice Guidelines: Management of hepatocellular carcinoma. J Hepatol 2018; 69: 182-236 [PMID: 29628281 DOI: 10.1016/j.jhep.2018.03.019]
7
Bandiera S, Billie Bian C, Hoshida Y, Baumert TF, Zeisel MB. Chronic hepatitis C virus infection and pathogenesis of hepatocellular carcinoma. Curr Opin Virol 2016; 20: 99-105 [PMID: 27741441 DOI: 10.1016/j.coviro.2016.09.010]
8
Rinaldi L, Nevola R, Franci G, Perrella A, Corvino G, Marrone A, Berretta M, Morone MV, Galdiero M, Giordano M, Adinolfi LE, Sasso FC. Risk of Hepatocellular Carcinoma after HCV Clearance by Direct-Acting Antivirals Treatment Predictive Factors and Role of Epigenetics. Cancers (Basel) 2020; 12 [PMID: 32466400 DOI: 10.3390/cancers12061351]
9
Ioannou GN, Green P, Lowy E, Mun EJ, Berry K. Differences in hepatocellular carcinoma risk, predictors and trends over time according to etiology of cirrhosis. PLoS One 2018; 13: e0204412 [PMID: 30260995 DOI: 10.1371/journal.pone.0204412]
10
Hoshida Y, Villanueva A, Sangiovanni A, Sole M, Hur C, Andersson KL, Chung RT, Gould J, Kojima K, Gupta S, Taylor B, Crenshaw A, Gabriel S, Minguez B, Iavarone M, Friedman SL, Colombo M, Llovet JM, Golub TR. Prognostic gene expression signature for patients with hepatitis C-related early-stage cirrhosis. Gastroenterology 2013; 144: 1024-1030 [PMID: 23333348 DOI: 10.1053/j.gastro.2013.01.021]
11
Zhang Y. Detection of epigenetic aberrations in the development of hepatocellular carcinoma. Methods Mol Biol 2015; 1238: 709-731 [PMID: 25421688 DOI: 10.1007/978-1-4939-1804-1_37]
12
Hamdane N, Jühling F, Crouchet E, El Saghire H, Thumann C, Oudot MA, Bandiera S, Saviano A, Ponsolles C, Roca Suarez AA, Li S, Fujiwara N, Ono A, Davidson I, Bardeesy N, Schmidl C, Bock C, Schuster C, Lupberger J, Habersetzer F, Doffoël M, Piardi T, Sommacale D, Imamura M, Uchida T, Ohdan H, Aikata H, Chayama K, Boldanova T, Pessaux P, Fuchs BC, Hoshida Y, Zeisel MB, Duong FHT, Baumert TF. HCV-Induced Epigenetic Changes Associated With Liver Cancer Risk Persist
13

Ahumada A et al. HCC risk after viral response in HCV-advanced fibrosis
WJG https://www.wjgnet.com 6747 October 28, 2021 Volume 27 Issue 40
After Sustained Virologic Response. Gastroenterology 2019; 156: 2313-2329.e7 [PMID: 30836093 DOI: 10.1053/j.gastro.2019.02.038]Messori A, Badiani B, Trippoli S. Achieving Sustained Virological Response in Hepatitis C Reduces the Long-Term Risk of Hepatocellular Carcinoma: An Updated Meta-Analysis Employing Relative and Absolute Outcome Measures. Clin Drug Investig 2015; 35: 843-850 [PMID: 26446006 DOI: 10.1007/s40261-015-0338-y]
14
Sun M, Kisseleva T. Reversibility of liver fibrosis. Clin Res Hepatol Gastroenterol 2015; 39 Suppl 1: S60-S63 [PMID: 26206574 DOI: 10.1016/j.clinre.2015.06.015]
15
Wanless IR, Nakashima E, Sherman M. Regression of human cirrhosis. Morphologic features and the genesis of incomplete septal cirrhosis. Arch Pathol Lab Med 2000; 124: 1599-1607 [PMID: 11079009 DOI: 10.1043/0003-9985(2000)124<1599:ROHC>2.0.CO;2]
16
Shiratori Y, Imazeki F, Moriyama M, Yano M, Arakawa Y, Yokosuka O, Kuroki T, Nishiguchi S, Sata M, Yamada G, Fujiyama S, Yoshida H, Omata M. Histologic improvement of fibrosis in patients with hepatitis C who have sustained response to interferon therapy. Ann Intern Med 2000; 132: 517-524 [PMID: 10744587 DOI: 10.7326/0003-4819-132-7-200004040-00002]
17
Poynard T, McHutchison J, Manns M, Trepo C, Lindsay K, Goodman Z, Ling MH, Albrecht J. Impact of pegylated interferon alfa-2b and ribavirin on liver fibrosis in patients with chronic hepatitis C. Gastroenterology 2002; 122: 1303-1313 [PMID: 11984517 DOI: 10.1053/gast.2002.33023]
18
Romero-Gómez M, Del Mar Viloria M, Andrade RJ, Salmerón J, Diago M, Fernández-Rodríguez CM, Corpas R, Cruz M, Grande L, Vázquez L, Muñoz-De-Rueda P, López-Serrano P, Gila A, Gutiérrez ML, Pérez C, Ruiz-Extremera A, Suárez E, Castillo J. Insulin resistance impairs sustained response rate to peginterferon plus ribavirin in chronic hepatitis C patients. Gastroenterology 2005; 128: 636-641 [PMID: 15765399 DOI: 10.1053/j.gastro.2004.12.049]
19
Nagula S, Jain D, Groszmann RJ, Garcia-Tsao G. Histological-hemodynamic correlation in cirrhosis-a histological classification of the severity of cirrhosis. J Hepatol 2006; 44: 111-117 [PMID: 16274836 DOI: 10.1016/j.jhep.2005.07.036]
20
D'Ambrosio R, Aghemo A, Rumi MG, Ronchi G, Donato MF, Paradis V, Colombo M, Bedossa P. A morphometric and immunohistochemical study to assess the benefit of a sustained virological response in hepatitis C virus patients with cirrhosis. Hepatology 2012; 56: 532-543 [PMID: 22271347 DOI: 10.1002/hep.25606]
21
Mauro E, Crespo G, Montironi C, Londoño MC, Hernández-Gea V, Ruiz P, Sastre L, Lombardo J, Mariño Z, Díaz A, Colmenero J, Rimola A, Garcia-Pagán JC, Brunet M, Forns X, Navasa M. Portal pressure and liver stiffness measurements in the prediction of fibrosis regression after sustained virological response in recurrent hepatitis C. Hepatology 2018; 67: 1683-1694 [PMID: 28960366 DOI: 10.1002/hep.29557]
22
Poynard T, Moussalli J, Munteanu M, Thabut D, Lebray P, Rudler M, Ngo Y, Thibault V, Mkada H, Charlotte F, Bismut FI, Deckmyn O, Benhamou Y, Valantin MA, Ratziu V, Katlama C; FibroFrance-GHPS group. Slow regression of liver fibrosis presumed by repeated biomarkers after virological cure in patients with chronic hepatitis C. J Hepatol 2013; 59: 675-683 [PMID: 23712051 DOI: 10.1016/j.jhep.2013.05.015]
23
D'Ambrosio R, Aghemo A, Fraquelli M, Rumi MG, Donato MF, Paradis V, Bedossa P, Colombo M. The diagnostic accuracy of Fibroscan for cirrhosis is influenced by liver morphometry in HCV patients with a sustained virological response. J Hepatol 2013; 59: 251-256 [PMID: 23528378 DOI: 10.1016/j.jhep.2013.03.013]
24
Coussens LM, Werb Z. Inflammation and cancer. Nature 2002; 420: 860-867 [PMID: 12490959 DOI: 10.1038/nature01322]
25
Wang YH, Huang JH, Tian ZF, Zhou YF, Yang J. The role of CXC cytokines as biomarkers and potential targets in hepatocellular carcinoma. Math Biosci Eng 2019; 17: 1381-1395 [PMID: 32233584 DOI: 10.3934/mbe.2020070]
26
Nakagawa H, Maeda S. Inflammation- and stress-related signaling pathways in hepatocarcinogenesis. World J Gastroenterol 2012; 18: 4071-4081 [PMID: 22919237 DOI: 10.3748/wjg.v18.i31.4071]
27
Marra M, Sordelli IM, Lombardi A, Lamberti M, Tarantino L, Giudice A, Stiuso P, Abbruzzese A, Sperlongano R, Accardo M, Agresti M, Caraglia M, Sperlongano P. Molecular targets and oxidative stress biomarkers in hepatocellular carcinoma: an overview. J Transl Med 2011; 9: 171 [PMID: 21985599 DOI: 10.1186/1479-5876-9-171]
28
Bishayee A. The role of inflammation and liver cancer. Adv Exp Med Biol 2014; 816: 401-435 [PMID: 24818732 DOI: 10.1007/978-3-0348-0837-8_16]
29
Morse MA, Sun W, Kim R, He AR, Abada PB, Mynderse M, Finn RS. The Role of Angiogenesis in Hepatocellular Carcinoma. Clin Cancer Res 2019; 25: 912-920 [PMID: 30274981 DOI: 10.1158/1078-0432.CCR-18-1254]
30
Poynard T, Bedossa P, Opolon P. Natural history of liver fibrosis progression in patients with chronic hepatitis C. The OBSVIRC, METAVIR, CLINIVIR, and DOSVIRC groups. Lancet 1997; 349: 825-832 [PMID: 9121257 DOI: 10.1016/S0140-6736(96)07642-8]
31
Finkelmeier F, Dultz G, Peiffer KH, Kronenberger B, Krauss F, Zeuzem S, Sarrazin C, Vermehren J, Waidmann O. Risk of de novo Hepatocellular Carcinoma after HCV Treatment with Direct-Acting Antivirals. Liver Cancer 2018; 7: 190-204 [PMID: 29888208 DOI: 10.1159/000486812]
32
Lleo A, Aglitti A, Aghemo A, Maisonneuve P, Bruno S, Persico M; collaborators. Predictors of hepatocellular carcinoma in HCV cirrhotic patients treated with direct acting antivirals. Dig Liver Dis
33

Ahumada A et al. HCC risk after viral response in HCV-advanced fibrosis
WJG https://www.wjgnet.com 6748 October 28, 2021 Volume 27 Issue 40
2019; 51: 310-317 [PMID: 30473220 DOI: 10.1016/j.dld.2018.10.014]van der Meer AJ, Feld JJ, Hofer H, Almasio PL, Calvaruso V, Fernández-Rodríguez CM, Aleman S, Ganne-Carrié N, D'Ambrosio R, Pol S, Trapero-Marugan M, Maan R, Moreno-Otero R, Mallet V, Hultcrantz R, Weiland O, Rutter K, Di Marco V, Alonso S, Bruno S, Colombo M, de Knegt RJ, Veldt BJ, Hansen BE, Janssen HLA. Risk of cirrhosis-related complications in patients with advanced fibrosis following hepatitis C virus eradication. J Hepatol 2017; 66: 485-493 [PMID: 27780714 DOI: 10.1016/j.jhep.2016.10.017]
34
Ioannou GN. HCC surveillance after SVR in patients with F3/F4 fibrosis. J Hepatol 2021; 74: 458-465 [PMID: 33303216 DOI: 10.1016/j.jhep.2020.10.016]
35
Perez S, Kaspi A, Domovitz T, Davidovich A, Lavi-Itzkovitz A, Meirson T, Alison Holmes J, Dai CY, Huang CF, Chung RT, Nimer A, El-Osta A, Yaari G, Stemmer SM, Yu ML, Haviv I, Gal-Tanamy M. Hepatitis C virus leaves an epigenetic signature post cure of infection by direct-acting antivirals. PLoS Genet 2019; 15: e1008181 [PMID: 31216276 DOI: 10.1371/journal.pgen.1008181]
36
Ghany MG, Morgan TR; AASLD-IDSA Hepatitis C Guidance Panel. Hepatitis C Guidance 2019 Update: American Association for the Study of Liver Diseases-Infectious Diseases Society of America Recommendations for Testing, Managing, and Treating Hepatitis C Virus Infection. Hepatology 2020; 71: 686-721 [PMID: 31816111 DOI: 10.1002/hep.31060]
37
Coco B, Oliveri F, Maina AM, Ciccorossi P, Sacco R, Colombatto P, Bonino F, Brunetto MR. Transient elastography: a new surrogate marker of liver fibrosis influenced by major changes of transaminases. J Viral Hepat 2007; 14: 360-369 [PMID: 17439526 DOI: 10.1111/j.1365-2893.2006.00811.x]
38
Castéra L, Vergniol J, Foucher J, Le Bail B, Chanteloup E, Haaser M, Darriet M, Couzigou P, De Lédinghen V. Prospective comparison of transient elastography, Fibrotest, APRI, and liver biopsy for the assessment of fibrosis in chronic hepatitis C. Gastroenterology 2005; 128: 343-350 [PMID: 15685546 DOI: 10.1053/j.gastro.2004.11.018]
39
Ziol M, Handra-Luca A, Kettaneh A, Christidis C, Mal F, Kazemi F, de Lédinghen V, Marcellin P, Dhumeaux D, Trinchet JC, Beaugrand M. Noninvasive assessment of liver fibrosis by measurement of stiffness in patients with chronic hepatitis C. Hepatology 2005; 41: 48-54 [PMID: 15690481 DOI: 10.1002/hep.20506]
40
Farhang Zangneh H, Wong WWL, Sander B, Bell CM, Mumtaz K, Kowgier M, van der Meer AJ, Cleary SP, Janssen HLA, Chan KKW, Feld JJ. Cost Effectiveness of Hepatocellular Carcinoma Surveillance After a Sustained Virologic Response to Therapy in Patients With Hepatitis C Virus Infection and Advanced Fibrosis. Clin Gastroenterol Hepatol 2019; 17: 1840-1849.e16 [PMID: 30580095 DOI: 10.1016/j.cgh.2018.12.018]
41
Goossens N, Singal AG, King LY, Andersson KL, Fuchs BC, Besa C, Taouli B, Chung RT, Hoshida Y. Cost-Effectiveness of Risk Score-Stratified Hepatocellular Carcinoma Screening in Patients with Cirrhosis. Clin Transl Gastroenterol 2017; 8: e101 [PMID: 28640287 DOI: 10.1038/ctg.2017.26]
42
Jepsen P, West J. We need stronger evidence for (or against) hepatocellular carcinoma surveillance. J Hepatol 2021; 74: 1234-1239 [PMID: 33465402 DOI: 10.1016/j.jhep.2020.12.029]
43
Ioannou GN, Green PK, Beste LA, Mun EJ, Kerr KF, Berry K. Development of models estimating the risk of hepatocellular carcinoma after antiviral treatment for hepatitis C. J Hepatol 2018; 69: 1088-1098 [PMID: 30138686 DOI: 10.1016/j.jhep.2018.07.024]
44
Ioannou GN, Beste LA, Green PK, Singal AG, Tapper EB, Waljee AK, Sterling RK, Feld JJ, Kaplan DE, Taddei TH, Berry K. Increased Risk for Hepatocellular Carcinoma Persists Up to 10 Years After HCV Eradication in Patients With Baseline Cirrhosis or High FIB-4 Scores. Gastroenterology 2019; 157: 1264-1278.e4 [PMID: 31356807 DOI: 10.1053/j.gastro.2019.07.033]
45
Augustin S, Pons M, Maurice JB, Bureau C, Stefanescu H, Ney M, Blasco H, Procopet B, Tsochatzis E, Westbrook RH, Bosch J, Berzigotti A, Abraldes JG, Genescà J. Expanding the Baveno VI criteria for the screening of varices in patients with compensated advanced chronic liver disease. Hepatology 2017; 66: 1980-1988 [PMID: 28696510 DOI: 10.1002/hep.29363]
46
Ravaioli F, Conti F, Brillanti S, Andreone P, Mazzella G, Buonfiglioli F, Serio I, Verrucchi G, Bacchi Reggiani ML, Colli A, Marasco G, Colecchia A, Festi D. Hepatocellular carcinoma risk assessment by the measurement of liver stiffness variations in HCV cirrhotics treated with direct acting antivirals. Dig Liver Dis 2018; 50: 573-579 [PMID: 29567413 DOI: 10.1016/j.dld.2018.02.010]
47
Pons M, Rodríguez-Tajes S, Esteban JI, Mariño Z, Vargas V, Lens S, Buti M, Augustin S, Forns X, Mínguez B, Genescà J. Non-invasive prediction of liver-related events in patients with HCV-associated compensated advanced chronic liver disease after oral antivirals. J Hepatol 2020; 72: 472-480 [PMID: 31629779 DOI: 10.1016/j.jhep.2019.10.005]
48
Alonso López S, Manzano ML, Gea F, Gutiérrez ML, Ahumada AM, Devesa MJ, Olveira A, Polo BA, Márquez L, Fernández I, Cobo JCR, Rayón L, Riado D, Izquierdo S, Usón C, Real Y, Rincón D, Fernández-Rodríguez CM, Bañares R. A Model Based on Noninvasive Markers Predicts Very Low Hepatocellular Carcinoma Risk After Viral Response in Hepatitis C Virus-Advanced Fibrosis. Hepatology 2020; 72: 1924-1934 [PMID: 33022803 DOI: 10.1002/hep.31588]
49
Fan R, Papatheodoridis G, Sun J, Innes H, Toyoda H, Xie Q, Mo S, Sypsa V, Guha IN, Kumada T, Niu J, Dalekos G, Yasuda S, Barnes E, Lian J, Suri V, Idilman R, Barclay ST, Dou X, Berg T, Hayes PC, Flaherty JF, Zhou Y, Zhang Z, Buti M, Hutchinson SJ, Guo Y, Calleja JL, Lin L, Zhao L, Chen Y, Janssen HLA, Zhu C, Shi L, Tang X, Gaggar A, Wei L, Jia J, Irving WL, Johnson PJ, Lampertico P, Hou J. aMAP risk score predicts hepatocellular carcinoma development in patients with chronic
50
Ahumada A et al. HCC risk after viral response in HCV-advanced fibrosis
WJG https://www.wjgnet.com 6749 October 28, 2021 Volume 27 Issue 40
hepatitis. J Hepatol 2020; 73: 1368-1378 [PMID: 32707225 DOI: 10.1016/j.jhep.2020.07.025]D'Ambrosio R, Della Corte C, Colombo M. Hepatocellular Carcinoma in Patients with a Sustained Response to Anti-Hepatitis C Therapy. Int J Mol Sci 2015; 16: 19698-19712 [PMID: 26295392 DOI: 10.3390/ijms160819698]
51
Morgan RL, Baack B, Smith BD, Yartel A, Pitasi M, Falck-Ytter Y. Eradication of hepatitis C virus infection and the development of hepatocellular carcinoma: a meta-analysis of observational studies. Ann Intern Med 2013; 158: 329-337 [PMID: 23460056 DOI: 10.7326/0003-4819-158-5-201303050-00005]
52
Nahon P, Bourcier V, Layese R, Audureau E, Cagnot C, Marcellin P, Guyader D, Fontaine H, Larrey D, De Lédinghen V, Ouzan D, Zoulim F, Roulot D, Tran A, Bronowicki JP, Zarski JP, Leroy V, Riachi G, Calès P, Péron JM, Alric L, Bourlière M, Mathurin P, Dharancy S, Blanc JF, Abergel A, Serfaty L, Mallat A, Grangé JD, Attali P, Bacq Y, Wartelle C, Dao T, Benhamou Y, Pilette C, Silvain C, Christidis C, Capron D, Bernard-Chabert B, Zucman D, Di Martino V, Thibaut V, Salmon D, Ziol M, Sutton A, Pol S, Roudot-Thoraval F; ANRS CO12 CirVir Group. Eradication of Hepatitis C Virus Infection in Patients With Cirrhosis Reduces Risk of Liver and Non-Liver Complications. Gastroenterology 2017; 152: 142-156.e2 [PMID: 27641509 DOI: 10.1053/j.gastro.2016.09.009]
53
Qiu L, Xu H, Ji M, Shang D, Lu Z, Wu Y, Tu Z, Liu H. Circular RNAs in hepatocellular carcinoma: Biomarkers, functions and mechanisms. Life Sci 2019; 231: 116660 [PMID: 31319086 DOI: 10.1016/j.lfs.2019.116660]
54
Mücke VT, Thomas D, Mücke MM, Waidmann O, Zeuzem S, Sarrazin C, Pfeilschifter J, Vermehren J, Finkelmeier F, Grammatikos G. Serum sphingolipids predict de novo hepatocellular carcinoma in hepatitis C cirrhotic patients with sustained virologic response. Liver Int 2019; 39: 2174-2183 [PMID: 31207039 DOI: 10.1111/Liv.14178]
55
Pascut D, Cavalletto L, Pratama MY, Bresolin S, Trentin L, Basso G, Bedogni G, Tiribelli C, Chemello L. Serum miRNA Are Promising Biomarkers for the Detection of Early Hepatocellular Carcinoma after Treatment with Direct-Acting Antivirals. Cancers (Basel) 2019; 11 [PMID: 31717959 DOI: 10.3390/cancers11111773]
56
Johnson PJ, Pirrie SJ, Cox TF, Berhane S, Teng M, Palmer D, Morse J, Hull D, Patman G, Kagebayashi C, Hussain S, Graham J, Reeves H, Satomura S. The detection of hepatocellular carcinoma using a prospectively developed and validated model based on serological biomarkers. Cancer Epidemiol Biomarkers Prev 2014; 23: 144-153 [PMID: 24220911 DOI: 10.1158/1055-9965.EPI-13-0870]
57
Yang JD, Addissie BD, Mara KC, Harmsen WS, Dai J, Zhang N, Wongjarupong N, Ali HM, Ali HA, Hassan FA, Lavu S, Cvinar JL, Giama NH, Moser CD, Miyabe K, Allotey LK, Algeciras-Schimnich A, Theobald JP, Ward MM, Nguyen MH, Befeler AS, Reddy KR, Schwartz M, Harnois DM, Yamada H, Srivastava S, Rinaudo JA, Gores GJ, Feng Z, Marrero JA, Roberts LR. GALAD Score for Hepatocellular Carcinoma Detection in Comparison with Liver Ultrasound and Proposal of GALADUS Score. Cancer Epidemiol Biomarkers Prev 2019; 28: 531-538 [PMID: 30464023 DOI: 10.1158/1055-9965.EPI-18-0281]
58
Shickel B, Tighe PJ, Bihorac A, Rashidi P. Deep EHR: A Survey of Recent Advances in Deep Learning Techniques for Electronic Health Record (EHR) Analysis. IEEE J Biomed Health Inform 2018; 22: 1589-1604 [PMID: 29989977 DOI: 10.1109/JBHI.2017.2767063]
59
Xiao C, Choi E, Sun J. Opportunities and challenges in developing deep learning models using electronic health records data: a systematic review. J Am Med Inform Assoc 2018; 25: 1419-1428 [PMID: 29893864 DOI: 10.1093/jamia/ocy068]
60
Singal AG, Mukherjee A, Elmunzer BJ, Higgins PD, Lok AS, Zhu J, Marrero JA, Waljee AK. Machine learning algorithms outperform conventional regression models in predicting development of hepatocellular carcinoma. Am J Gastroenterol 2013; 108: 1723-1730 [PMID: 24169273 DOI: 10.1038/ajg.2013.332]
61
Ioannou GN, Tang W, Beste LA, Tincopa MA, Su GL, Van T, Tapper EB, Singal AG, Zhu J, Waljee AK. Assessment of a Deep Learning Model to Predict Hepatocellular Carcinoma in Patients With Hepatitis C Cirrhosis. JAMA Netw Open 2020; 3: e2015626 [PMID: 32870314 DOI: 10.1001/jamanetworkopen.2020.15626]
62

WJG https://www.wjgnet.com 6750 October 28, 2021 Volume 27 Issue 40
World Journal of
GastroenterologyW J GSubmit a Manuscript: https://www.f6publishing.com World J Gastroenterol 2021 October 28; 27(40): 6750-6756
DOI: 10.3748/wjg.v27.i40.6750 ISSN 1007-9327 (print) ISSN 2219-2840 (online)
OPINION REVIEW
Higher doses of ascorbic acid may have the potential to promote nutrient delivery via intestinal paracellular absorption
Ivana Roosevelt Sequeira
ORCID number: Ivana Roosevelt Sequeira 0000-0001-5414-9925.
Author contributions: Sequeira IR conceptualized, drafted and wrote the manuscript.
Conflict-of-interest statement: The author declares no conflict of interest.
Open-Access: This article is an open-access article that was selected by an in-house editor and fully peer-reviewed by external reviewers. It is distributed in accordance with the Creative Commons Attribution NonCommercial (CC BY-NC 4.0) license, which permits others to distribute, remix, adapt, build upon this work non-commercially, and license their derivative works on different terms, provided the original work is properly cited and the use is non-commercial. See: http://creativecommons.org/Licenses/by-nc/4.0/
Manuscript source: Unsolicited manuscript
Specialty type: Gastroenterology and hepatology
Country/Territory of origin: New Zealand
Peer-review report’s scientific quality classification
Ivana Roosevelt Sequeira, Human Nutrition Unit, School of Biological Science, University of Auckland, Auckland 1024, New Zealand
Corresponding author: Ivana Roosevelt Sequeira, PhD, Research Fellow, Human Nutrition Unit, School of Biological Science, University of Auckland, 18 Carrick Place, Mount Eden, Auckland 1024, New Zealand. [email protected]
AbstractThe significance of plasma ascorbic acid (AA) is underscored by its enzymatic and antioxidant properties as well as involvement in many aspects of health including the synthesis of biomolecules during acute illness, trauma and chronic health conditions. Dietary intake supports maintenance of optimal levels with supple-mentation at higher doses more likely pursued. Transient increased intestinal paracellular permeability following high dose AA may be utilised to enhance delivery of other micronutrients across the intestinal lumen. The potential mechanism following dietary intake however needs further study but may provide an avenue to increase small intestinal nutrient co transport and absorption, including in acute and chronic illness.
Key Words: Aspirin; Ascorbic acid; Paracellular permeability; Antioxidant; Lactulose mannitol test
©The Author(s) 2021. Published by Baishideng Publishing Group Inc. All rights reserved.
Core Tip: The significance of plasma ascorbic acid (AA) is underscored by its enzymatic and antioxidant properties as well as involvement in many aspects of health including the synthesis of biomolecules during acute illness, trauma and chronic health conditions. Dietary intake supports maintenance of optimal levels with supple-mentation at higher doses more likely pursued. Transient increased intestinal paracellular permeability following high dose AA may be utilised to enhance delivery of other micronutrients across the intestinal lumen. The potential mechanism following dietary intake however needs further study but may provide an avenue to increase small intestinal nutrient co transport and absorption, including in acute and chronic illness.

Sequeira IR et al. Ascorbic acid and intestinal permeability
WJG https://www.wjgnet.com 6751 October 28, 2021 Volume 27 Issue 40
Grade A (Excellent): 0 Grade B (Very good): B Grade C (Good): 0 Grade D (Fair): 0 Grade E (Poor): 0
Received: July 1, 2021 Peer-review started: July 1, 2021 First decision: July 13, 2021 Revised: July 16, 2021 Accepted: September 19, 2021 Article in press: September 19, 2021 Published online: October 28, 2021
P-Reviewer: Subramanian VS S-Editor: Wang JJ L-Editor: A P-Editor: Li JH
Citation: Sequeira IR. Higher doses of ascorbic acid may have the potential to promote nutrient delivery via intestinal paracellular absorption. World J Gastroenterol 2021; 27(40): 6750-6756URL: https://www.wjgnet.com/1007-9327/full/v27/i40/6750.htmDOI: https://dx.doi.org/10.3748/wjg.v27.i40.6750
INTRODUCTIONAscorbic acid (AA) or Vitamin C is an essential micronutrient in the human diet, due to the non-functional gene encoding L-glucono lactone oxidase that is involved in the catalysis of the last biosynthetic step in the pathway. The physiology and pathophysiology of AA has been extensively studied and the estimated plasma half-life reported to be between 7-14 d on the basis of depletion-repletion studies, conducted in healthy male subjects. Ergo, providing an approximation of the plasma half-life in those individuals that may have acute illness, trauma or chronic health conditions. The importance of maintaining optimal AA levels is underscored by both its antioxidant and non-antioxidant, i.e., enzymatic roles and involvement in many aspects of health which include being an essential factor in the synthesis of collagen, carnitine and norepinephrine. Reduced dietary consumption, due to lower intake of fresh fruit and vegetables, or increased utilization via intracellular uptake are important aspects in the maintenance of plasma AA levels. Increased cellular distri-bution of AA has been shown to be associated with high leukocyte turnover and oxidative stress, whereby the redox potential of AA mitigates the production of reactive oxygen species (ROS). Dehydroascorbic acid (DHA), formed by the loss of electron by the ascorbic radical, has the same biological activity as the reduced form. The subsequent hydrolysis of DHA, if not reduced back to AA, to 2,3-diketogulonic acid is an irreversible step that results in the loss of antioxidant properties and its degradation.
Exogenous AA uptake is provided by, but not limited to, dietary intake. Due to AAs proposed antioxidant as well as enzymatic health benefits it is a widely sought-after dietary supplement that is available for consumption alone or as a multivitamin. Notably, AA has been co-formulated not only with other vitamins but also with anti-inflammatory pharmacological agents[1-3], in particular with aspirin. Monotherapy with aspirin has been shown to decrease the concentration of AA not only within the intestinal enterocytes[4] but also in gastric juice[5] potentiating negative impacts by reducing the ability of intestinal mucosal cells to manage oxidative stress[4]. Therefore, the co-formulation of AA with aspirin is considered to mitigate and ameliorate ROS induced gastrointestinal damage that has been implicated with the etiology of aspirin monotherapy[6].
Of interest is, a body of work conducted by our group that demonstrated that a single dose of aspirin has the potential to cause transient increases in small intestinal permeability over a 6 h period in healthy individuals. More importantly that rather than mitigating the aspirin induced increase in intestinal permeability[7], assessed by the lactulose mannitol test[8], the administration of 500 mg AA augmented absorption of lactulose either when given alone or in combination with the single 500 mg dose of aspirin (Table 1).
Therefore, it appears that while simultaneous dosage of AA with aspirin may potentially have longer term beneficial effects, related to the antioxidant properties of AA, in the short term however it may not mitigate the aspirin-induced increase in intestinal permeability. It is notable that, in the investigation, participants received an aspirin drink thirty minutes prior to the AA drink[7] in contrast to other studies where AA and aspirin were administered together as a single solution or in the form of a tablet[1-3,5,9]. Hence, it may be considered that the extent of ionization of each of these weak organic acids could have differed in the intestinal lumen consequentially affecting their ability to access transporters in the gut wall. The proportion of unionized AA increases to 99% and 15% in the stomach (pH 1) and small intestine (pH 5) respectively, and under these conditions passive diffusion is thought to play a significant role in AA uptake[10]. Indeed, it has been previously shown that co-administration of aspirin with AA decreased the rate at which AA was absorbed in vivo[11] and could have resulted from interference with sodium dependent secondary active transport via sodium-dependent vitamin C transporters (SVCT1 and SVCT2)[12]. These transporters are differentially expressed along the length of the gastrointestinal tract, with the pattern of expression mediated in part by transcrip-tional and epigenetic mechanisms[13].

Sequeira IR et al. Ascorbic acid and intestinal permeability
WJG https://www.wjgnet.com 6752 October 28, 2021 Volume 27 Issue 40
Table 1 Variation in the cumulative excretion of lactulose in bulked urine samples collected over two time periods (first three hours and the second three hours) during a six hours collection period in 28 healthy female participants
Lactulose excretion (% recovery of ingested dose)Treatment
First 3 h Second 3 hAspirin 0.37 ± 0.05a,b 0.46 ± 0.05d
Ascorbic acid 0.47 ± 0.05a,c 0.53 ± 0.04
Combined dosage 0.68 ± 0.09b,c 0.77 ± 0.14d
aStatistically significant (P < 0.05) differences between treatments during the first 3 h, results expressed as mean ± SEM.bStatistically significant (P < 0.05) differences between treatments during the first 3 h, results expressed as mean ± SEM.cStatistically significant (P < 0.05) differences between treatments during the first 3 h, results expressed as mean ± SEM.dStatistically significant (P < 0.05) differences between treatments during the second 3 h during the lactulose mannitol test, results expressed as mean ± SEM.
Pertinent however is that increased small intestinal mucosal permeability, even if transient, following dosage with AA raises questions as to whether similar changes may occur following dietary ingestion of foods that are rich in AA. It is noteworthy that the dose of 500 mg AA administered in our study[7] is higher than the recommended daily allowance (RDA 60-120 mg)[14], guidelines for which are variable. An increase in the RDA to 200 mg has been proposed[15] to maximize the attributed health benefits, with evidence suggesting that regular supplement users consume more than 1 g AA per day[16]. Whether the increase in intestinal permeability detected in our study was dose dependent is not known and a comparison with other publications is not possible as the effect of AA on intestinal permeability has not been previously studied. We hypothesize that the dose of AA induced increase in intestinal permeability could be due to its action on apical transporters. Glucose has been shown to modulate vitamin C transport at the small intestinal brush border membrane with similar rates of uptake of DHA and AA reported in the absence of glucose[17]. The reduced form, AA, is absorbed via SVCT1 and SVCT2[18]. Given that the stoichiometry of the SVCTs are similar to those of the sodium dependent glucose transporter (SGLT1)[19,20] it is possible that absorption of AA may bring about intracellular changes that modulate, i.e., relax, tight junctions in a manner similar to that of glucose transport via SGLT1[21]. Additionally, the oxidised form DHA has been shown to compete with glucose for transport via glucose transporters[22] in particular GLUT2 and GLUT8[23], which have been suggested along with SGLT1 to cause cytoskeletal contraction[24]. The modulation of the tight junctions in this manner has been shown to increase mucosal permeability[25], allowing greater quantities of larger molecules to be absorbed via the paracellular pathway[26].
Relating and extending the results of our study to AA levels from dietary intake maybe difficult and may necessitate human intervention studies using whole foods or extracts at comparable doses. However, an extrapolation of the effect of foods/extract would require careful study design as the amount of available AA in different foods may vary widely[27]. Particularly in fruits and vegetables where the quantity of AA is determined by a variety of factors which include cultivars, environmental conditions including regional and seasonal conditions as well as maturation[28]. Additionally, depending on the levels of hydration it is very likely that there may be inherent variability in the proportion of reduced and oxidized AA within fruits and vegetables, much like AA in solutions which have a greater susceptibility to oxidation. At pH < 4[29] the concentration of AA deteriorates, with greater losses shown to occur in frozen products that are processed/canned [mean: 26 % (0% - 78 %)] than from frozen fresh products [mean: 18 % (0% - 50 %)][30]. Furthermore, supplementation of products with synthetic AA has been shown to facilitate oxidation within products[31].
The degradation of AA not only occurs during processing and storage of the food/extract but also once it is consumed and introduced into the gastrointestinal lumen. Being an antioxidant, AA gets oxidized in the gastrointestinal tract to maintain the reduced state of other nutrients, e.g., iron or form metal-oxygen-ascorbate complexes[32]. However, the acidic conditions of the gastrointestinal tract protect AA against chemical and enzymatic oxidation[32] with 93% of AA from bioactive broccoli inflorescence[33] and 71% from pomegranate juice[34] shown to be stable following in vitro gastric digestion. Conversely, in the small intestinal environment greater amounts

Sequeira IR et al. Ascorbic acid and intestinal permeability
WJG https://www.wjgnet.com 6753 October 28, 2021 Volume 27 Issue 40
of AA was oxidized, with 39% of AA recovered[35] in this segment of the gut following in vitro small intestinal digestion of blended fruit juice. While this information is pertinent to our understanding, the bioavailability of luminal AA also requires consideration of the interaction with other contained dietary constituents e.g., fiber and other bioflavanoids. Micronutrients within fruit juice have been shown to inhibit the absorption of AA[36] at doses between 50-500 mg. One mechanism for the inhibition is thought to occur via competition with transporters which has been partic-ularly attributed to flavanoids such as quercetin and myricetin that are shown to decrease ascorbate as well as DHA absorption in in vitro models[37,38]. Vinson et al[39] further demonstrated in guinea pigs that dosage with a citrus fruit extract, containing 18% bioflavonoids, 15% proteins and 30% carbohydrates, resulted in a significantly slower rise in plasma ascorbate concentrations in comparison to a simple ascorbate solution. In alignment with these findings, a similar effect was also reported in human participants following the intake of citrus fruit extract[40].
Contrary to these findings it has also been shown that flavonoids, following consumption of half a golden kiwi fruit a day (50 g) over six weeks, did not alter the bioavailability of contained AA when compared to 50 g of synthetic AA[41]. This inferred effect appeared consistent as the administration of AA with blackcurrant juice[42] or orange juice[43] containing flavonoids did not impede absorption. Therefore, it seems likely that these differences in the manner in which AA is absorbed when co-administered could have arisen due to the differential gastric transit times[44]. Gastric emptying of liquid meals or beverages is dependent on the pressure gradient across the gastroduodenal junction and in part by the composition of the duodenal content, and hence it is conceivable that the nutrient content and composition of these different solutions or fruit slowed down gastric emptying[44]. Alternatively, these incongruent results may in part have been due to the different forms and dosages at which AA was administered, i.e., as solutions or gels. Ergo resulting in potentially variable gastrointestinal residence and emptying times to influence absorption and the subsequent appearance of AA in sampled biological fluids i.e., plasma, urine etc.
Given these inconsistencies in evidence regarding the bioavailability when co-administered with other substances, it remains unclear as to whether the effects of AA on intestinal permeability can be extended to situations when it is delivered in foods. This in particular considering the dose and quantity of the foods/extract that would have to be consumed to show comparable effects. All the same, the ability of a pharmaceutical dose of 500 mg AA to augment absorption of larger inert sugars such as lactulose does raise the possibility that AA could be a putative agent that could be co-administered with poorly absorbed drugs, nutrients or food substances of similar or larger molecular weight to enhance their absorption[45,46].
Increased paracellular permeability, via the modulation of tight junctions, has been reported after consumption of a meal especially in the presence of glucose[47] and alanine[48]. Using Caco 2 models, food components such as plant extracts[49-51] and isolated food components[52-54] have been shown to increase paracellular permeability with a the resultant flux in macromolecules, such as mannitol[51,55,56]. These authors, including Kosińska et al[57], postulated that food components could be safe alternatives to reversibly ‘open’ tight junctions in order to enhance the absorption of molecules of interest. Conversely, glutamine, polyunsaturated fatty acids and polyphenols have been shown to ‘tighten’ tight junctions through increased expression of tight junction associated proteins[58].
CONCLUSIONWhilst the molecular mechanism by which AA increases paracellular permeability remains to be elucidated, a dose of 500 mg, which is higher than the current RDA, has been shown to increase small intestinal permeability in healthy individuals. Whether this effect is dose dependent requires further exploration however together with its antioxidant properties, the alteration of intestinal permeability by AA can be potentially explored as a safe and novel application for the delivery of molecules via the paracellular pathway. Indeed it is also conceivable the co-administration of AA, as a supplement or through consumption of a rich food source, with aspirin may potentiate its serum levels and analgesic effects.

Sequeira IR et al. Ascorbic acid and intestinal permeability
WJG https://www.wjgnet.com 6754 October 28, 2021 Volume 27 Issue 40
ACKNOWLEDGEMENTSThe studies were conducted at the Human Nutrition Unit at Massey University, Palmerston North under the supervision of Prof Roger G Lentle, Prof Marlena C Kruger and Dr Roger D Hurst.
REFERENCESKonturek PC, Kania J, Hahn EG, Konturek JW. Ascorbic acid attenuates aspirin-induced gastric damage: role of inducible nitric oxide synthase. J Physiol Pharmacol 2006; 57 Suppl 5: 125-136 [PMID: 17218764]
1
Dammann HG, Saleki M, Torz M, Schulz HU, Krupp S, Schürer M, Timm J, Gessner U. Effects of buffered and plain acetylsalicylic acid formulations with and without ascorbic acid on gastric mucosa in healthy subjects. Aliment Pharmacol Ther 2004; 19: 367-374 [PMID: 14984384 DOI: 10.1111/j.1365-2036.2004.01742.x]
2
McAlindon ME, Muller AF, Filipowicz B, Hawkey CJ. Effect of allopurinol, sulphasalazine, and vitamin C on aspirin induced gastroduodenal injury in human volunteers. Gut 1996; 38: 518-524 [PMID: 8707080 DOI: 10.1136/gut.38.4.518]
3
Buffinton GD, Doe WF. Altered ascorbic acid status in the mucosa from inflammatory bowel disease patients. Free Radic Res 1995; 22: 131-143 [PMID: 7704184 DOI: 10.3109/10715769509147535]
4
Pohle T, Brzozowski T, Becker JC, Van der Voort IR, Markmann A, Konturek SJ, Moniczewski A, Domschke W, Konturek JW. Role of reactive oxygen metabolites in aspirin-induced gastric damage in humans: gastroprotection by vitamin C. Aliment Pharmacol Ther 2001; 15: 677-687 [PMID: 11328262 DOI: 10.1046/j.1365-2036.2001.00975.x]
5
Patel V, Fisher M, Voelker M, Gessner U. Gastrointestinal effects of the addition of ascorbic acid to aspirin. Pain Pract 2012; 12: 476-484 [PMID: 22151399 DOI: 10.1111/j.1533-2500.2011.00517.x]
6
Sequeira IR, Kruger MC, Hurst RD, Lentle RG. Ascorbic Acid may Exacerbate Aspirin-Induced Increase in Intestinal Permeability. Basic Clin Pharmacol Toxicol 2015; 117: 195-203 [PMID: 25641731 DOI: 10.1111/bcpt.12388]
7
Sequeira IR, Lentle RG, Kruger MC, Hurst RD. Standardising the lactulose mannitol test of gut permeability to minimise error and promote comparability. PLoS One 2014; 9: e99256 [PMID: 24901524 DOI: 10.1371/journal.pone.0099256]
8
Hanan S. Ahmed S. Zolfakar. Effect of aspirin versus aspirin and vitamin C on gastric mucosa [fundus] of adult male albino rats: histological and morphometric study. Egypt J of Histol 2010; 33: 313-326
9
Lykkesfeldt J, Tveden-Nyborg P. The Pharmacokinetics of Vitamin C. Nutrients 2019; 11 [PMID: 31601028 DOI: 10.3390/nu11102412]
10
Ioannides C, Stone AN, Breacker PJ, Basu TK. Impairment of absorption of ascorbic acid following ingestion of aspirin in guinea pigs. Biochem Pharmacol 1982; 31: 4035-4038 [PMID: 6818974 DOI: 10.1016/0006-2952(82)90652-9]
11
Tsukaguchi H, Tokui T, Mackenzie B, Berger UV, Chen XZ, Wang Y, Brubaker RF, Hediger MA. A family of mammalian Na+-dependent L-ascorbic acid transporters. Nature 1999; 399: 70-75 [PMID: 10331392 DOI: 10.1038/19986]
12
Subramanian VS, Srinivasan P, Wildman AJ, Marchant JS, Said HM. Molecular mechanism(s) involved in differential expression of vitamin C transporters along the intestinal tract. Am J Physiol Gastrointest Liver Physiol 2017; 312: G340-G347 [PMID: 27932501 DOI: 10.1152/ajpgi.00369.2016]
13
Carr AC, Lykkesfeldt J. Discrepancies in global vitamin C recommendations: a review of RDA criteria and underlying health perspectives. Crit Rev Food Sci Nutr 2021; 61: 742-755 [PMID: 32223303 DOI: 10.1080/10408398.2020.1744513]
14
Frei B, Birlouez-Aragon I, Lykkesfeldt J. Authors' perspective: What is the optimum intake of vitamin C in humans? Crit Rev Food Sci Nutr 2012; 52: 815-829 [PMID: 22698272 DOI: 10.1080/10408398.2011.649149]
15
Johnston CS. Biomarkers for establishing a tolerable upper intake level for vitamin C. Nutr Rev 1999; 57: 71-77 [PMID: 10101920 DOI: 10.1111/j.1753-4887.1999.tb06926.x]
16
Malo C, Wilson JX. Glucose modulates vitamin C transport in adult human small intestinal brush border membrane vesicles. J Nutr 2000; 130: 63-69 [PMID: 10613768 DOI: 10.1093/jn/130.1.63]
17
Wilson JX. Regulation of vitamin C transport. Annu Rev Nutr 2005; 25: 105-125 [PMID: 16011461 DOI: 10.1146/annurev.nutr.25.050304.092647]
18
Lindblad M, Tveden-Nyborg P, Lykkesfeldt J. Regulation of vitamin C homeostasis during deficiency. Nutrients 2013; 5: 2860-2879 [PMID: 23892714 DOI: 10.3390/nu5082860]
19
Goldenberg H, Schweinzer E. Transport of vitamin C in animal and human cells. J Bioenerg Biomembr 1994; 26: 359-367 [PMID: 7844110 DOI: 10.1007/BF00762776]
20
Turner JR. Show me the pathway! Adv Drug Deliv Rev 2000; 41: 265-281 [PMID: 10854686 DOI: 10.1016/s0169-409x(00)00046-6]
21
Vera JC, Rivas CI, Fischbarg J, Golde DW. Mammalian facilitative hexose transporters mediate the transport of dehydroascorbic acid. Nature 1993; 364: 79-82 [PMID: 8316303 DOI:
22
Sequeira IR et al. Ascorbic acid and intestinal permeability
WJG https://www.wjgnet.com 6755 October 28, 2021 Volume 27 Issue 40
10.1038/364079a0]Corpe CP, Eck P, Wang J, Al-Hasani H, Levine M. Intestinal dehydroascorbic acid (DHA) transport mediated by the facilitative sugar transporters, GLUT2 and GLUT8. J Biol Chem 2013; 288: 9092-9101 [PMID: 23396969 DOI: 10.1074/jbc.M112.436790]
23
Schmitt CC, Aranias T, Viel T, Chateau D, Le Gall M, Waligora-Dupriet AJ, Melchior C, Rouxel O, Kapel N, Gourcerol G, Tavitian B, Lehuen A, Brot-Laroche E, Leturque A, Serradas P, Grosfeld A. Intestinal invalidation of the glucose transporter GLUT2 delays tissue distribution of glucose and reveals an unexpected role in gut homeostasis. Mol Metab 2017; 6: 61-72 [PMID: 28123938 DOI: 10.1016/j.molmet.2016.10.008]
24
Pappenheimer JR. Intestinal absorption of hexoses and amino acids: from apical cytosol to villus capillaries. J Membr Biol 2001; 184: 233-239 [PMID: 11891547 DOI: 10.1007/s00232-001-0094-1]
25
Groschwitz KR, Hogan SP. Intestinal barrier function: molecular regulation and disease pathogenesis. J Allergy Clin Immunol 2009; 124: 3-20; quiz 21 [PMID: 19560575 DOI: 10.1016/j.jaci.2009.05.038]
26
Gregory JF, III. Ascorbic acid bioavailability in foods and supplements. Nutr Rev 1993; 51: 301-303 [DOI: 10.1111/j.1753-4887.1993.tb03059.x]
27
Erdman JW, Klein BP. Harvesting, processing, and cooking influences on vitamin C in foods. In: Seib PA, Tolbert BM, eds. Ascorbic Acid: Chemistry, Metabolism, and Uses. 1982: 499-532
28
Jeney‐Nagymate E, Fodor P. The stability of vitamin C in different beverages. Brit Food J 2008; 110: 296-309 [DOI: 10.1108/00070700810858709]
29
Belitz H-D, Grosch W, Schieberle P. Vitamins. Food Chemistry. Germany: Springer, 2009: 403-42030 May J, Asard H. Ascorbate recycling. In: Asard H, May J, Smirnoff N. Vitamin C: its functions and biochemistry in animals and plants. Taylor & Francis, 2003; 153-175
31
Ball GFM. Intestinal absorption and bioavailability of vitamins. In: Vitamins in foods: analysis, bioavailability, and stability. Boca Raton: CRC Press, 2005; 23-3
32
Vallejo F, Gil-Izquierdo A, Pérez-Vicente A, García-Viguera C. In vitro gastrointestinal digestion study of broccoli inflorescence phenolic compounds, glucosinolates, and vitamin C. J Agric Food Chem 2004; 52: 135-138 [PMID: 14709026 DOI: 10.1021/jf0305128]
33
Pérez-Vicente A, Gil-Izquierdo A, García-Viguera C. In vitro gastrointestinal digestion study of pomegranate juice phenolic compounds, anthocyanins, and vitamin C. J Agric Food Chem 2002; 50: 2308-2312 [PMID: 11929289 DOI: 10.1021/jf0113833]
34
Rodríguez-Roque MJ, Rojas-Graü MA, Elez-Martínez P, Martín-Belloso O. Changes in vitamin C, phenolic, and carotenoid profiles throughout in vitro gastrointestinal digestion of a blended fruit juice. J Agric Food Chem 2013; 61: 1859-1867 [PMID: 23374081 DOI: 10.1021/jf3044204]
35
Uchida E, Kondo Y, Amano A, Aizawa S, Hanamura T, Aoki H, Nagamine K, Koizumi T, Maruyama N, Ishigami A. Absorption and excretion of ascorbic acid alone and in acerola (Malpighia emarginata) juice: comparison in healthy Japanese subjects. Biol Pharm Bull 2011; 34: 1744-1747 [PMID: 22040889 DOI: 10.1248/bpb.34.1744]
36
Song J, Kwon O, Chen S, Daruwala R, Eck P, Park JB, Levine M. Flavonoid inhibition of sodium-dependent vitamin C transporter 1 (SVCT1) and glucose transporter isoform 2 (GLUT2), intestinal transporters for vitamin C and Glucose. J Biol Chem 2002; 277: 15252-15260 [PMID: 11834736 DOI: 10.1074/jbc.M110496200]
37
Park JB, Levine M. Intracellular accumulation of ascorbic acid is inhibited by flavonoids via blocking of dehydroascorbic acid and ascorbic acid uptakes in HL-60, U937 and Jurkat cells. J Nutr 2000; 130: 1297-1302 [PMID: 10801933 DOI: 10.1093/jn/130.5.1297]
38
Vinson J BP. Comparative bioavailability of synthetic and natural vitamin C in guinea pigs. Nutr Rep Int 1983; 27: 875-879
39
Vinson JA, Bose P. Comparative bioavailability to humans of ascorbic acid alone or in a citrus extract. Am J Clin Nutr 1988; 48: 601-604 [PMID: 3414575 DOI: 10.1093/ajcn/48.3.601]
40
Carr AC, Bozonet SM, Pullar JM, Simcock JW, Vissers MC. A randomized steady-state bioavailability study of synthetic versus natural (kiwifruit-derived) vitamin C. Nutrients 2013; 5: 3684-3695 [PMID: 24067392 DOI: 10.3390/nu5093684]
41
E J, RE H. The influence of bioflavonoids on the absorption of vitamin C. IRCS Med Sci 1984; 12: 320
42
Pelletier O, Keith MO. Bioavailability of synthetic and natural ascorbic acid. J Am Diet Assoc 1974; 64: 271-275 [PMID: 4813067]
43
Collins PJ, Horowitz M, Cook DJ, Harding PE, Shearman DJ. Gastric emptying in normal subjects--a reproducible technique using a single scintillation camera and computer system. Gut 1983; 24: 1117-1125 [PMID: 6642275 DOI: 10.1136/gut.24.12.1117]
44
Deli MA. Potential use of tight junction modulators to reversibly open membranous barriers and improve drug delivery. Biochim Biophys Acta 2009; 1788: 892-910 [PMID: 18983815 DOI: 10.1016/j.bbamem.2008.09.016]
45
Salama NN, Eddington ND, Fasano A. Tight junction modulation and its relationship to drug delivery. Adv Drug Deliv Rev 2006; 58 (1): 15-28 [PMID: 16517003 DOI: 10.1016/j.addr.2006.01.003]
46
Pappenheimer JR, Reiss KZ. Contribution of solvent drag through intercellular junctions to absorption of nutrients by the small intestine of the rat. J Membr Biol 1987; 100: 123-136 [PMID: 3430569 DOI: 10.1007/BF02209145]
47
Sadowski DC, Meddings JB. Luminal nutrients alter tight-junction permeability in the rat jejunum: an 48

Sequeira IR et al. Ascorbic acid and intestinal permeability
WJG https://www.wjgnet.com 6756 October 28, 2021 Volume 27 Issue 40
in vivo perfusion model. Can J Physiol Pharmacol 1993; 71: 835-839 [PMID: 7511482 DOI: 10.1139/y93-125]Hashimoto K, Matsunaga N, Shimizu M. Effect of vegetable extracts on the transepithelial permeability of the human intestinal Caco-2 cell monolayer. Biosci, Biotech, and Bioch 1994; 58: 1345-1346 [DOI: 10.1271/bbb.58.1345]
49
Konishi Y. Modulations of food-derived substances on intestinal permeability in Caco-2 cell monolayers. Biosci Biotechnol Biochem 2003; 67: 2297-2299 [PMID: 14586128 DOI: 10.1271/bbb.67.2297]
50
Epriliati I, D'Arcy B, Gidley M. Nutriomic analysis of fresh and processed fruit products. 2. During in vitro simultaneous molecular passages using Caco-2 cell monolayers. J Agric Food Chem 2009; 57: 3377-3388 [PMID: 19290640 DOI: 10.1021/jf802226n]
51
Ohno Y, Naganuma T, Ogawa T, Muramoto K. Effect of lectins on the transport of food factors in caco-2 cell monolayers. J Agric Food Chem 2006; 54: 548-553 [PMID: 16417319 DOI: 10.1021/jf052040y]
52
Isoda H, Han J, Tominaga M, Maekawa T. Effects of capsaicin on human intestinal cell line Caco-2. Cytotechnology 2001; 36: 155-161 [PMID: 19003326 DOI: 10.1023/A:1014053306343]
53
Rapin JR, Wiernsperger N. Possible links between intestinal permeability and food processing: A potential therapeutic niche for glutamine. Clinics (Sao Paulo) 2010; 65: 635-643 [PMID: 20613941 DOI: 10.1590/S1807-59322010000600012]
54
Laitinen LA, Tammela PS, Galkin A, Vuorela HJ, Marvola ML, Vuorela PM. Effects of extracts of commonly consumed food supplements and food fractions on the permeability of drugs across Caco-2 cell monolayers. Pharm Res 2004; 21: 1904-1916 [PMID: 15553239 DOI: 10.1023/b:pham.0000045246.94064.ab]
55
Vaidyanathan JB, Walle T. Cellular uptake and efflux of the tea flavonoid (-) epicatechin-3-gallate in the human intestinal cell line Caco-2. J Pharmacol Exp Ther 2003; 307: 745-752 [PMID: 12970388 DOI: 10.1124/jpet.103.054296]
56
Kosińska A, Andlauer W. Modulation of tight junction integrity by food components. Food Res Int 2013; 54: 951-960 [DOI: 10.1016/j.foodres.2012.12.038]
57
Amasheh M, Andres S, Amasheh S, Fromm M, Schulzke JD. Barrier effects of nutritional factors. Ann N Y Acad Sci 2009; 1165: 267-273 [PMID: 19538315 DOI: 10.1111/j.1749-6632.2009.04063.x]
58

WJG https://www.wjgnet.com 6757 October 28, 2021 Volume 27 Issue 40
World Journal of
GastroenterologyW J GSubmit a Manuscript: https://www.f6publishing.com World J Gastroenterol 2021 October 28; 27(40): 6757-6774
DOI: 10.3748/wjg.v27.i40.6757 ISSN 1007-9327 (print) ISSN 2219-2840 (online)
EVIDENCE REVIEW
Venous and arterial thromboembolism in patients with inflammatory bowel diseases
Antoni Stadnicki, Izabela Stadnicka
ORCID number: Antoni Stadnicki 0000-0003-2675-3732; Izabela Stadnicka 0000-0003-3522-4058.
Author contributions: Both authors designated the overall study, collected information, drafted the manuscript, revised the manuscript critically, and approved the final version of manuscript.
Conflict-of-interest statement: Authors declare no conflict of interests and no financial support for this article.
Open-Access: This article is an open-access article that was selected by an in-house editor and fully peer-reviewed by external reviewers. It is distributed in accordance with the Creative Commons Attribution NonCommercial (CC BY-NC 4.0) license, which permits others to distribute, remix, adapt, build upon this work non-commercially, and license their derivative works on different terms, provided the original work is properly cited and the use is non-commercial. See: http://creativecommons.org/Licenses/by-nc/4.0/
Manuscript source: Invited manuscript
Specialty type: Gastroenterology and hepatology
Antoni Stadnicki, Department of Physiology, Faculty of Medicine, University of Technology, Katowice 41-209, Poland
Izabela Stadnicka, Department of Molecular Medicine, Medical University of Silesia, Faculty of Pharmacy, Sosnowiec 41-200, Poland
Corresponding author: Antoni Stadnicki, DSc, MD, PhD, Professor, Department of Physiology, Faculty of Medicine, University of Technology, Ul. Rolna, Katowice 41-209, Poland. [email protected]
AbstractThe risk of thromboembolism (TE) is increased in patients with inflammatory bowel disease (IBD), mainly due to an increased risk of venous TE (VTE). The risk of arterial TE (ATE) is less pronounced, but an increased risk of cardiovascular diseases needs to be addressed in IBD patients. IBD predisposes to arterial and venous thrombosis through similar prothrombotic mechanisms, including triggering activation of coagulation, in part mediated by impairment of the intestinal barrier and released bacterial components. VTE in IBD has clinical specificities, i.e., an earlier first episode in life, high rates during both active and remission stages, higher recurrence rates, and poor prognosis. The increased likelihood of VTE in IBD patients may be related to surgery, the use of medications such as corticosteroids or tofacitinib, whereas infliximab is antith-rombotic. Long-term complications of VTE can include post-thrombotic syndrome and high recurrence rate during post-hospital discharge. A global clot lysis assay may be useful in identifying patients with IBD who are at risk for TE. Many VTEs occur in IBD outpatients; therefore, outpatient prophylaxis in high-risk patients is recommended. It is crucial to continue focusing on prevention and adequate treatment of VTE in patients with IBD.
Key Words: Inflammatory bowel disease; Thrombosis; Coagulation; Bacterial components; Prophylaxis; Post-thrombotic syndrome
©The Author(s) 2021. Published by Baishideng Publishing Group Inc. All rights reserved.
Core Tip: Patients with inflammatory bowel disease (IBD) are at significantly higher

Stadnicki A et al. Venous and arterial thromboembolism in IBD
WJG https://www.wjgnet.com 6758 October 28, 2021 Volume 27 Issue 40
Country/Territory of origin: Poland
Peer-review report’s scientific quality classificationGrade A (Excellent): 0 Grade B (Very good): B Grade C (Good): 0 Grade D (Fair): 0 Grade E (Poor): E
Received: March 29, 2021 Peer-review started: March 29, 2021 First decision: June 14, 2021 Revised: June 22, 2021 Accepted: August 19, 2021 Article in press: August 19, 2021 Published online: October 28, 2021
P-Reviewer: Kitamura K, Pop TL S-Editor: Wang LL L-Editor: Kerr C P-Editor: Liu JH
risk for venous thromboembolism (VTE) than patients with other inflammatory and immune-mediated diseases. The prevalence of arterial vascular disease is also higher in IBD. Inflammatory and molecular aspects of coagulation cascades are strictly linked and share several common mediators, including bacterial components as a possible link between intestinal microbiota and coagulation. We explored risk factors of thrombosis in IBD including clinical specificity, fibrin clot phenotype, Clostridium difficile infection, medication and surgery. We also present long-lasting thromboembolic complications and consider the advantage of post-discharge VTE prophylaxis.
Citation: Stadnicki A, Stadnicka I. Venous and arterial thromboembolism in patients with inflammatory bowel diseases. World J Gastroenterol 2021; 27(40): 6757-6774URL: https://www.wjgnet.com/1007-9327/full/v27/i40/6757.htmDOI: https://dx.doi.org/10.3748/wjg.v27.i40.6757
INTRODUCTIONInflammatory bowel disease (IBD) includes ulcerative colitis (UC) that primarily involves the large intestine, and Crohn’s disease (CD) that may affect any part of the gastrointestinal tract, from the oral cavity to the rectum. However, about 20%–30% of IBD cases are associated with manifestations in other organs[1]. Venous thromboem-bolism (VTE) is a common extraintestinal complication in CD and UC, which is related to significant morbidity and mortality[2,3].
The number of hospitalizations of adults with VTE in the USA was estimated at more than 500 000 individuals each year, and 100 000 deaths are attributed to VTE annually, as indicated by data from the National Hospital Discharge Survey[4]. VTE is the third most common cause of vascular death after myocardial infarction and stroke. In recent years, there have been a growing number of reports on the VTE mechanism, risk factors, including medication and surgery, and the management of IBD patients. In light of the recent evidence, this review is focused on prothrombotic factors of VTE and arterial thromboembolism (ATE) and clinical complications of thrombotic events in patients with IBD, and summarizes the approach to the prevention during hospital-ization and in the post-discharge period, and treatment of VTE in IBD.
EPIDEMIOLOGY AND LOCATION OF VTEPopulation–based cohort studies have shown that patients with IBD seem to have an approximately threefold increased risk for developing VTE compared to the general population, and this relative risk is significantly higher during active IBD[2,3,5-7]. In their cohort study, Bernstein et al[5] found that the incidence rate of deep venous thrombosis (DVT) was 31.4/10000 person-years and the incidence rate of pulmonary embolism (PE) was 10.3/10000 person-years in CD, while the incidence rates were 30.0/10000 person-years for DVT and 19.8/10000 person-years for PE in UC. In an Austrian multicenter study, the incidence rate of all VTE was 6.3 per 1000 person-years, which was similar to the rate reported in the earlier study[7]. The incidence of VTE increases with age. However, no significant sex-related differences have been found[7,8]. The mortality associated with IBD-related VTE ranges from 8% to 22%[9,10]. Nguyen and Sam showed a significant, 2.5-fold-increased odds [odds ratio (OR): 1.83–3.43] of mortality associated with VTE-related hospitalization in patients with IBD compared to patients without VTE[2] .
In terms of VTE location, DVT of the lower extremity and PE are the most common VTE complications in IBD. However, VTE may occur in the abdominal (portal, mesenteric and splenic) veins[11]. VTE is also reported in the arm vein, and unusual sites such as the retinal vein, and cerebral sinus veins[7,12]. In an Austrian multicenter study among patients with IBD with a history of VTE, 90.4% of patients presented with DVT and/or PE, whereas 9.6% had portal, mesenteric, cerebral or internal jugular vein thrombosis[7]. The most commonly applied procedures for diagnosis of DVT include ultrasound and venography[13,14].Ventilation-perfusion scan and multide-tector helical computer axial tomography are tools for the diagnosis of PE[14].

Stadnicki A et al. Venous and arterial thromboembolism in IBD
WJG https://www.wjgnet.com 6759 October 28, 2021 Volume 27 Issue 40
ATE COMPLICATIONSATE occur less frequently than VTE in IBD, including the limb arteries, and even central vessels including the aorta[15-17]. In the past few years, studies have suggested that patients with IBD might also be at an increased risk of coronary heart disease and stroke[16,18]. In a recent meta-analysis, IBD was associated with a modest increase in the risk of cerebrovascular disease incidence [hazard ratio (HR: 1.29)], in both CD (HR: 1.32) and UC (HR: 1.18)[18]. In another meta-analysis, patients with IBD were associated with a modest increase in the risk of coronary artery disease (OR: 1.19) in patients with CD and UC[19]. After adjusting for potential confounders, the meta-analysis of five studies revealed an 18% higher risk of cerebrovascular events in both CD and UC, with no significant differences between the two forms, but a higher risk for women compared to men [OR: 1.28 adjusted, 95% confidence interval (CI): 1.17–1.41]. No increased risk of ATE was found in a French study, including 33 studies with a large cohort of hospitalized IBD patients and controls. However, an increased risk of coronary heart disease and mesenteric ischemia was found[20]. An increased risk for potentially life-threatening arterial vascular diseases in patients with IBD also requires assessment of conventional risk factors such as hypertension, obesity, diabetes and dyslipidemia. However, typical cardiovascular risk factors other than hypertension have not been confirmed in IBD[21].
ETIOPATHOGENESIS OF VTE AND ATE IN IBDImpairment of hemostasis in patients with IBD Unregulated activation of the coagulation system may cause thrombosis or embolism. Local hemostasis is initiated when chronic inflammation, surgery or trauma disrupts the vascular endothelial lining, and blood is exposed to subendothelial connective tissue. In primary hemostasis, a platelet plug is formed, and then plasma coagulation proteins are activated to initiate secondary hemostasis. The complex of tissue factor (TF) and active factor VII is the most important initiator of coagulation. Activation of coagulation results in thrombin generation, and in turn may generate fibrin formation as well as platelet activation via the cleavage of and binding to thrombin receptors (Figure 1)[22]. Several authors have indicated systemic evidence for impairment of fibrinolysis and intravascular thrombin generation in patients with IBD to measure prothrombin fragments (formed during the conversion of prothrombin to thrombin, F1+2) and thrombin–antithrombin complexes[23,24]. The plasma level of protein C, a natural coagulation inhibitor, has been shown to be unchanged or decreased in IBD[25,26], while its decreased cofactor, the protein S plasma level, was demonstrated in most studies[27]. Importantly, in some studies, thrombin-activatable fibrinolysis inhibitor (TAFI) which provides a link between coagulation and fibrinolysis, has been found to be increased in patients with IBD[28,29]. Activated by thrombin, TAFI removes lysine residues from fibrin, which is essential for plasmin formation in the fibrin network, and in turn inhibits fibrinolysis, which contributes to the prothrombotic state. Elevated D-dimer levels were found mainly in active IBD patients, which provides evidence of fibrin formation and reactive fibrinolysis (Figure 1)[24,25].
The increased platelet count correlates with IBD activity, and higher platelet count is even proposed to distinguish IBD from infectious diarrhea. Abnormal platelet aggregation in vitro, and activation in vivo are found in both active and inactive IBD[24,25,30]. Thus, platelet activation is a feature of IBD, and along with thrombocytosis, it may have a role in the development of thrombosis. Systemic endothelial cell dys-function has been reported in UC and CD. Serum concentration of von Willebrand factor and thrombomodulin level, which are the markers of vascular injury, are also increased in the serum of IBD patients in relation to the disease activity[31,32]. In their large epidemiological study, Thompson et al[33] indicated an opposite approach showing that IBD occurred less frequently as expected in large cohort patients with the main inherited coagulation deficiency disorders, including hemophilia or von Willebrand disease.
Mutual activation of coagulation and inflammation in IBDActivation of coagulation is a significant constituent of the inflammatory response and probably is involved in the pathogenesis of IBD[34,35]. Proinflammatory cytokines, such as tumor necrosis factor-α (TNF-α) and interleukin-1 (IL-1), which are elevated in circulation and intestinal lesions in IBD, may initiate coagulation by induction of the TFs in monocytes/macrophages, endothelial cells and platelets. IL-1 and TNF–α are

Stadnicki A et al. Venous and arterial thromboembolism in IBD
WJG https://www.wjgnet.com 6760 October 28, 2021 Volume 27 Issue 40
Figure 1 Diagram of the main pathways of the hemostatic process. Solid arrows designate activation, dashed arrows conversion, open arrow indicates release, and interrupted lines indicate inhibition. EC: Endothelial cell; M: Monocyte; MP: Microparticle; PL: Platelet; TF: Tissue factor; TAFI: Thrombin activatable fibrinolysis inhibitor; FDP: Fibrin degradation product.
capable of inducing procoagulant activity and suppressing the anticoagulant activity of thrombomodulin, in part due to a downregulation of endothelial protein C receptor, which is expressed normally by endothelial cells[36]. In addition, the cell components, known as microparticles, are found in plasma of adult and pediatric IBD patients[37-39]. There are vesicles of cell membranes mainly from activated platelets with the expression of TFs on their surface, suggesting their role in the activation of coagulation. Importantly, platelets may mediate leukocyte recruitment to the inflamed colon via surface CD40 ligand (CD40L). Danese et al[40] found an increased platelet expression of CD40L, and an increased plasma level of platelet soluble CD40L in both UC and CD compared to normal controls. Taken together, it seems that platelets are involved in hemostasis and thrombosis. They also act as inflammatory cells in IBD.
Evidence suggests that thrombin may, in turn, mediate and amplify inflammatory cascades in IBD via activating protease activated receptors (PARs), which have been identified as mediators of cellular responses, especially in the context of a link between coagulation and inflammation. Thrombin is an essential mediator of PAR activation as this enzyme can activate PAR1, 3 and 4, and in turn mediate detrimental cellular effects, especially barrier disruption in endothelial cells[41]. In addition, recent studies have shown that the protein C pathway is expressed not only in endothelial cells of the mucosal microvasculature, but also in intestinal epithelial cells and plays a unique role in controlling the integrity of tight junctions[42]. Expression of epithelial protein C pathway is altered in patients with CD and UC, which may enhance intestinal permeability[43].
Due to the overlapping risk factors, patients with VTE are at increased risk for arterial thrombotic events, including coronary heart disease and stroke. Endothe-liopathy and abnormalities in the coagulation cascade and their cellular components play a role for the development of VTE and ATE. A growing number of studies have indicated that patients with IBD are at an increased risk of developing cardiovascular disease (CVD). Both diseases are chronic inflammatory conditions and share certain pathophysiological mechanisms that may influence each other. High levels of cytokines, C-reactive protein, and homocysteine in IBD patients may lead to endothelial dysfunction, which is an early sign of atherosclerosis. Platelet–leukocyte

Stadnicki A et al. Venous and arterial thromboembolism in IBD
WJG https://www.wjgnet.com 6761 October 28, 2021 Volume 27 Issue 40
interaction and an increased CD40/CD40L system may be important links in the generation of atherosclerosis and IBD[40]. Higher levels of coagulation factors and an increased number of activated circulating platelets frequently occur in IBD, which may predispose to ATE events[32].
Bacterial components and gut microbiotaEndotoxins (lipopolysaccharide; LPS) are glycolipids found on the outer membrane of Gram-negative bacteria, which originate from the intestine and may activate receptors in monocytes, endothelial cells and platelets directly or via augmentation of cytokines, promoting a procoagulant state. The epithelium of the intestine creates a barrier to potentially immunogenic and noxious factors, including microorganisms and dietary components within the intestinal lumen. Luminal proteases include the host’s digestive enzymes and the proteases released by the microbiota. PAR1 and PAR2 are expressed throughout the gastrointestinal (GI) tract[41]. Although PARs are traditionally known to affect several vascular responses, recent studies have indicated the functional role of PAR signaling in the GI tract. Proteases A, either from the gut lumen or from the mucosa, are capable of activating PARs, thus influencing gut permeability regulation[44].
Both endothelial cells and platelets possess innate immunity receptors, such as Toll-like receptors (TLRs). After being activated by bacterial components, TLR2 and TLR4 promote cell activation and the subsequent release of different procoagulant molecules[45,46]. The role of the impairment of the intestinal barrier has been recently indicated by Pastorelli et al[47] who showed that LPS level increased in systemic circulation of IBD patients and correlated with TLR4 concentrations in both active and remission phases of IBD. Simultaneously, serum LPS level correlated with both D-dimer and F1+2 levels, which supports the role of the impairment of the intestinal barrier in triggering the activation of the coagulation cascade in IBD. In fact, LPS might act as the link between the microbiome and hypercoagulability.
Gut microbiome and TERecent reports have suggested that alterations in gut microbiome due to a decrease in commensal anaerobic bacteria and an increase in the abundance of the Gram-negative Enterobacteriaceae family may increase the risk of TE[48]. It was found that dietary nutrients, such as choline, carnitine and butyrobetaine, common in a western diet, can be used by gut microbes to produce trimethylamine (TMA), which is converted into TMA N-oxide (TMAO)[49]. Clinical studies have revealed that TMAO level is associated with thrombotic risk of CVD[49-51]. The mechanisms in which TMAO may enhance CVD risk include endothelial cell activation and vascular inflammation, as well as alterations in tissue sterol metabolism[50]. A recent study has revealed that gut microbes directly contribute to platelet hyper-reactivity through generation of TMAO and increased plasma TMAO levels independently predicted the event of thrombosis[51]. Patients with IBD show microbial imbalance, and a less diverse gut microbiome compared to healthy individuals[52]. Currently, there are no data showing metabolic pathways by specific gut microbiota in IBD that might cause the risk of thrombosis.
RISK FACTORS OF THROMBOEMBOLIC COMPLICATIONS IN IBDDisease activity and hospitalization Several IBD-specific risk factors are responsible for the increased risk of VTE, especially in hospitalized IBD patients, which in part may reflect periods of increased inflammation[2,3,53]. The disease phenotype, e.g., pancolitis in patients with UC, extensive colonic involvement and active fistulizing CD are significantly associated with VTE in IBD patients[2,3,10]. Similar data reported by a recent large cohort Swiss study and a recent cohort multinational study in East Asia demonstrated that VTEs were prevalent in CD patients with ileocolonic involvement, and in UC patients with pancolitis[54,55]. During hospitalization, VTE events are also related to immobility, the use of a venous catheter for parenteral nutrition, and fluid depletion due to diarrhea.
Clinical and biochemical specificitiesVTEs in IBD patients are characterized by unusual clinical and biochemical specificities (an earlier first episode in life, high rates of remission, and high recurrence rates). The incidence of VTE increases with age. However, it occurs more frequently in younger patients with IBD than in those without this condition[2,3,53,56]. A large
Stadnicki A et al. Venous and arterial thromboembolism in IBD
WJG https://www.wjgnet.com 6762 October 28, 2021 Volume 27 Issue 40
population-based study from Denmark showed that the risk of VTE was particularly high (sixfold higher HR) in young patients with IBD as compared to age and sex-matched patients without IBD[53]. VTE events are more frequent in active IBD. However, in one-third of the patients with IBD, VTE was observed during clinical remission[7,56,57]. Although the epidemiological data demonstrate a relative prevalence of VTE in some immune-mediated disorders[58], especially among many inflammatory and/or immune-mediated conditions, IBD is related to a significantly more prominent risk of VTE[56]. Therefore, IBD is itself prothrombotic.
Polish studies have shown that plasma fibrin clot permeability is reduced and fibrin network is mostly resistant to lysis in patients with IBD, which may represent a mechanism for increasing the thrombotic risk in IBD[59]. Recently, the investigators at the University of Leuven, Belgium indicated that clot lysis parameters (area under the curve, 50% clot lysis time, and amplitude) were significantly higher in IBD compared to controls and in IBD with thrombotic events and a history of thrombosis compared to IBD without thrombosis[60]. Taken together, fibrin clot phenotype in IBD may be considered a potential novel risk factor for TE.
Recurrence of VTE IBD represents an independent risk factor for the recurrence of VTE. Novacek et al[61] showed that patients with IBD who experienced their first episode of unprovoked VTE had 33% likelihood of the second episode of VTE within 5 years compared to 21% in non-IBD patients (HR: 2.5). Recently, Bollen et al[62] presented a monocentric cohort of IBD patients with a history of VTE and ATE and focused on the recurrence rate. These authors confirmed the high recurrence rate of thrombotic events in patients with IBD. They found that 30% of patients were identified to have recurrent TE events. In this group, 83% developed VTE, with DVT as the major manifestation (40%), followed by PE (23%). However, a relatively high number of thrombotic events (i.e. 17%) became recurrent in arterial circulation. De Fonseka et al[63] found that a history of TE was the most significant predictor of VTE in IBD. Similarly, Faye et al[64] showed that in patients with IBD, prior VTE was associated with readmission for VTE within 2 mo.
Post-thrombotic syndromePost-thrombotic syndrome (PTS) may increase the likelihood of VTE recurrence among IBD patients. It is the most frequent complication of VTE located in the lower limbs, which develops in 20%–50% of cases after proximal DVT and is severe in 5%–10% of cases[65]. Reported risk factors of PTS include extensive proximal character of DVT, involving the popliteal vein or above. Other reported risk factors include pre-existing chronic venous insufficiency (especially with mild or severe contralateral leg venous ectasia), older age and high body mass index[65]. The risk of PTS is substantial but significantly lower after an isolated distal infrapopliteal DVT. Since signs and symptoms of DVT and PTS may be similar, diagnosis of PTS should be delayed for 3–6 mo after DVT diagnosis. Compression ultrasonography, which is based on leg vein compression using the ultrasound probe, should be performed to evaluate the degree of obstruction by clots, the location of these clots, and the detection of venous insuffi-ciency[13].
Clostridium difficile infection IBD has been shown to be a specific risk factor for the development of C. difficile infection, which may lead to higher morbidity and mortality[66]. A large cohort retrospective study assessing the Nationwide Inpatient Sample in the USA found that the rate of VTE was twofold higher in hospitalized patients with IBD and C. difficile infection than in those without C. difficile infection (adjusted OR: 1.7)[67]. In their most recent study, Faye et al[64] found that C. difficile infection was an independent risk factor of readmission for VTE in patients with IBD during a 2-month time period. Therefore, clinicians need to be vigilant to assess C. difficile infections in patients with IBD with a flare of diarrhea to counteract C. difficile and minimize the risk of VTE.
Nonspecific risk factorsIBD-associated comorbidity is prothrombotic in itself and is an independent predictor of VTE; e.g., congestive heart failure, chronic obstructive pulmonary disease, obesity, Behcet’s disease, myeloproliferative diseases (polycythemia vera, paroxysmal nocturnal hemoglobinuria, paraproteinemia), liver cirrhosis, or diabetes mellitus[68].
Low serum albumin is a well-recognized risk factor for VTE in nephrotic syndrome[69]. In patients with IBD, low albumin levels may reflect excess loss of intestinal protein, and particularly circulating antithrombotic proteins, especially antithrombin.

Stadnicki A et al. Venous and arterial thromboembolism in IBD
WJG https://www.wjgnet.com 6763 October 28, 2021 Volume 27 Issue 40
Serum level of antithrombin may be a marker of underlying inflammation as a negative acute phase reactant.
An increased level of lipoprotein(a), an independent risk factor for TE, has been shown to account for a tendency toward TE in some CD patients[70]. Autoimmune abnormalities and increased production of various antibodies are often associated with IBD. Serum cardiolipin autoantibodies involved in higher risk of arterial and venous thrombosis are increased in patients with IBD. However, their elevated titer is not associated with higher VTE rates[71]. Similarly, in a recent IBD cohort study, a higher prevalence of various types of antiphospholipid antibodies was documented in patients with CD. However, this status was not associated with more TE events[72].
Provoked VTE and ATE may occur in hyperhomocysteinemia due to deficiency of vitamins B12, B6 or folate, or hereditary genetic abnormalities such as gene mutation of methylenetetrahydrofolate reductase (MTHFR)[73]. In a meta-analysis, the mean plasma homocysteine level was significantly higher in IBD patients compared to controls. However, in this study the risk of hyperhomocysteinemia was not higher among IBD patients who presented with TE complications[74].
In CD patients, oral contraceptive drugs are well-known risk factors for TE[75]. In spite of this, Cotton et al[76] in a large internet-based cohort of patients with IBD found that use of hormonal contraceptives in women with multiple risk factors for TE was similar to that in women without risk factors. Thus, patients with IBD should be asked about risk factors for thromboembolic disease to have an opportunity for alternative contraception. Patients with CD are more likely to be smokers, which increases the risk of vascular disease in this condition. However, UC is generally a disease of non-smokers and exsmokers[77].
Extended traveling with prolonged sitting is known as a risk factor for VTE, although it is currently recognized that reduced movement on long distance flights is more significant than immobilization. As summarized by Byard, long-distance flights of ≥ 8 h are associated with a 2–4-fold increased risk of VTE, but only in those individuals who have underlying risk factors. Importantly, the potential impact of lethal pulmonary VTE exists with increasing numbers of flights of > 16-h duration[78].
IBD medications Some drugs used in IBD treatment can be considered potential thrombotic factors. Glucocorticosteroids used to maintain remission in IBD by multifactorial anti-inflam-matory effects are also known to induce hypercoagulability, increasing plasma fibrinogen level, and decreasing tissue plasminogen activator activity and prostacyclin synthesis[79]. The use of corticosteroids prior to hospitalization is an independent risk for VTE[68]. Nguyen et al[80] in their large retrospective cohort study compared the risk of postoperative complications between preoperative steroid users and nonusers. They found that preoperative steroid use was associated with an increased risk of VTE in CD (OR: 1.66) and UC (OR: 2.66).
The role of TNF-α that occupies a central position to generate the inflammatory and coagulation cascade has been well defined in CD and UC. Compounds that contain anti-TNF-α antibody are currently the most recommended for biological treatment of moderate and active CD and UC[81]. Hommes et al[82] demonstrated that treatment with infliximab decreased thrombin generation, indicating that coagulation activation is mediated by TNF-α or a subsequent cascade of cytokines. In addition, treatment with infliximab reduces the level of circulating and prothrombotic serum-soluble CD40L in patients with CD[83]. Anti-TNF-α therapy with infliximab also downreg-ulates isoprostane generation and thromboxane synthesis, which may reduce thromboxane-dependent platelet activation in IBD patients[84]. Bollen et al[85] in a prospective study investigated the effect of infliximab therapy on the hemostatic profile. They documented normalization of the clot lysis profile in responders to infliximab treatment, suggesting that infliximab is especially advisable for patients with IBD with an activated hemostatic profile. Swiss investigators in their single-center retrospective study found that in patients with IBD, TNF-α inhibitor therapy was associated with a reduced risk of TE (OR: 0.20), whereas corticosteroid use increased (OR: 4.62) TE[63]. A recent meta-analysis conducted by Hungarian investigators showed that systemic corticosteroids were associated with a significantly higher rate of VTE complications in IBD patients as compared to IBD patients without steroid medication (OR: 2.202). In contrast, treatment with anti-TNF-α agents resulted in a fivefold decreased risk of VTE compared to steroid medication (OR: 0.267)[86].
Tofacitinib, a small-molecule Janus kinase inhibitor, has been used for the treatment of moderate and severe UC. Recently, safety data for tofacitinib in rheumatology studies showed that tofacitinib 10 mg twice daily increased the frequency of VTE, although the study comprised patients aged ≥ 50 years who presented with other

Stadnicki A et al. Venous and arterial thromboembolism in IBD
WJG https://www.wjgnet.com 6764 October 28, 2021 Volume 27 Issue 40
cardiovascular risk factors[87]. The US Food and Drug Administration has indicated that tofacitinib 10 mg twice daily may increase the risk of VTE[88]. The most recent preliminary analysis of UC patients treated with tofacitinib 10 mg twice daily demonstrated that five presented with VTE (four PE, and one DVT), as compared to two patients receiving placebo[89]. The analysis was limited by the small group of patients, and hence further studies are warranted. At present, since uncertainty exists, the lower dose of tofacitinib (5 mg twice daily) is indicated.
SurgeryColorectal surgery is a strong predictor of developing VTE[90]. A combination of pathophysiology of IBD and surgical risk factors increases the risk of postoperative VTE in IBD patients. A recently conducted Canadian meta-analysis showed that IBD patients undergoing colorectal surgery were at a higher risk for postoperative VTE as compared to patients undergoing surgery for colorectal cancer[91]. Patients with UC may be at higher risk for postoperative VTE as compared to those with CD. Wilson et al[92] found that during admission and within 30 d of hospital discharge, the incidence of VTE was higher in UC patients (2.74%) than in patients with colorectal cancer (1.74%). However, the lowest incidence was seen in patients with CD (1.2%). Similarly, McCurdy et al[93] reported that the cumulative incidence of VTE at 1 mo after discharge was higher in surgical patients with UC (HR: 1.68; 95%CI: 1.16–2.45) but not in surgical patients with CD. In UC patients, the risk of VTE is mostly higher in patients after colectomy[94,95]. McKenna et al[95] using the American College of Surgeons-National Surgical Quality Improvement Project database found that surgically urgent UC cases showed a higher rate of VTE than non-IBD patients undergoing colorectal resections (6.9% vs 3.1%).
PROPHYLAXIS OF VTE IN IBDOf note, controlling the disease activity as the primary aim of IBD treatment may partly prevent VTE events and also reduce the risk of recurrent VTE episodes. Correction of vitamin deficiencies (particularly B6, B12 and folic acid) can reduce homocysteine levels[74]. In addition, therapy with sulfasalazine or methotrexate may induce folate deficiency, thus supplementation of folic acid is advocated.
Pharmacological prophylaxisIt has been confirmed that that IBD patients have an elevated risk of VTE compared to the general population. Consequently, GI societies from North America and Europe have advocated the use of pharmacological prophylaxis among hospitalized IBD patients[15,96,97]. Low molecular-weight heparin (LMWH) and unfractionated heparin are recommended for thromboprophylaxis in IBD patients. Primary prophylaxis is advocated for all hospitalized IBD patients, because the higher risk of VTE in hospitalized IBD patients also includes those hospitalized for non-IBD related reasons[96-98]. In the period of active bleeding, mechanical prophylaxis is temporarily advisable. If bleeding is not severe, anticoagulant thromboprophylaxis should be substituted for mechanical thromboprophylaxis. Anticoagulant thromboprophylaxis during hospitalization is recommended for IBD patients who underwent major abdominal-pelvic or general surgery. Similarly, anticoagulant thromboprophylaxis during hospitalization is indicated for pregnant women with IBD who underwent cesarean section. Another recommendation for pharmacological prophylaxis is advocated (related to secondary prophylaxis) during moderate-severe IBD flares in outpatients with a history of VTE. The unresolved question is whether thrombopro-phylaxis should be extended to all outpatients with the disease flare. Thus, the absolute risk of VTE should be assessed for each ambulatory patient with active IBD, including co-morbidity, previous VTE events, the use of oral contraceptives, smoking, and the presence of venous catheters[68,98]. Moreover, disease features could be useful in assessing the individual prothrombotic risk. Another question arises whether thromboprophylaxis should be extended after hospitalization to IBD patients with a higher risk for VTE. In a recent population-based study, McCurdy et al[93] found that surgical IBD patients with UC and non-surgical IBD patients were 1.7-fold more likely to develop post-discharge VTE than non-IBD matched controls. These authors showed that the risk score of post-discharge VTE for IBD patients included age over 45 years and the length of admission (more than 7 d), which would indicate prolonged post-hospitalization VTE prophylaxis. In another recent study evaluating predictors of post-hospitalization VTE in patients with IBD, Faye et al[64] showed that risk factors such as
Stadnicki A et al. Venous and arterial thromboembolism in IBD
WJG https://www.wjgnet.com 6765 October 28, 2021 Volume 27 Issue 40
older age, discharge to a nursing facility, and a previous C. difficile infection at the time of admission increased this risk. In addition, they found that over 90% of VTE readmissions occurred within 60 d post-discharge, with the majority in the first 20 d. These findings should increase alertness and consideration of thromboprophylaxis in this population.
Finally, it is well known that surgery represents a major risk factor for VTE, partic-ularly in patients with IBD, and thromboprophylaxis is universally performed from the day of surgery to discharge. However, as reported before, in the IBD patient population, colorectal surgery is related to an additional VTE risk, including post-discharge period[93,95]. Recent meta-analyses in the United States indicated that IBD patients undergoing colorectal surgery were at a higher in-hospital and post-discharge risk for postoperative VTE compared to non-IBD patients undergoing surgery for colorectal cancer[91,99]. Current prophylaxis may not be sufficient to prevent VTE, especially for UC patients undergoing emergency colorectal procedures who might benefit from extended TE prophylaxis[92,94]. Kaplan et al[94] presented a population-based surveillance of UC hospitalized patients during a flare and compared VTE events between UC patients who responded to medical management and patients who underwent colectomy. These authors showed that VTE was significantly higher among patients who underwent colectomy, and mostly higher in patients after emergency colectomy, although more than 90% of surgical patients were given heparin prophylaxis. Despite a large amount of evidence demonstrating the high VTE risk in IBD, no randomized controlled trials specifically assessed the efficacy of anticoagu-lation in reducing the rate of VTE in IBD patients or in applying extended-duration prophylaxis after surgery to this population.
Implementation of prophylaxis in IBD Although the increased risk of VTE among IBD patients has been documented, thromboprophylaxis rates in hospitalized patients with IBD seem to be low[98]. Recent and prior studies showed that patients with IBD admitted to surgical service received anticoagulation prophylaxis more often than those admitted to medical centers. In a multicenter retrospective study from Canada, patients with IBD admitted to the surgical setting were more likely to receive VTE prophylaxis than those admitted to medical service (84% vs 74%)[100]. Implementation of an electronic alert system seems to be an effective tool for increasing VTE prophylaxis rates in hospitalized patients with IBD. The introduction of this system was associated with a significant impro-vement in prophylaxis rates in both medical (26.3% vs 62.8%) and surgical (83.7% vs 95.5%) services[101]. All providers should be educated on the increased risk of VTE as well as the safety of pharmacologic prophylaxis. Inadequate implementation of VTE prophylaxis in patients with IBD is still mainly due to the concern about the safety of anticoagulation. Although prior data of Ra et al[102] indicated that the rate of major and minor bleeding was not significantly higher in the group who received pharmaco-logical VTE prophylaxis compared to those who did not receive it, Faye et al[103] showed that IBD patients with minor hematochezia (OR: 0.27) were significantly less likely to receive VTE prophylaxis. In addition, these investigators concluded that VTE prophylaxis was not associated with increased blood transfusion rates or a clinically significant decline in hemoglobin level during hospitalization]. It should be underlined that most patients with hematochezia will have a disease flare, and they are at a significantly increased risk for VTE during this time.
Mechanical prophylaxisMechanical thromboprophylaxis, graduated compression stockings, and/or intermittent pneumatic compression devices are indicated for IBD patients hospit-alized with major GI bleeding[96]. Early mobilization in hospitalized surgical and non- surgical IBD patients should be always considered. These methods address the venous stasis portion of the Virchow triad by increasing venous blood flow. There are several proposed mechanism for the efficacy of induced venous stasis, including increased level of tissue factor inhibitor, the resultant factor Xa–related coagulation inhibition, and promotion of fibrinolysis by increased release of t-PA from the endothelium[104]. However, in cases of severe limb ischemia, the use of mechanical prophylaxis could worsen the ischemia and should not be used in these patients.
TEST SCREENING FOR THROMBOSIS RISKThrombophilia is related to acquired or inherited susceptibility to thrombosis.

Stadnicki A et al. Venous and arterial thromboembolism in IBD
WJG https://www.wjgnet.com 6766 October 28, 2021 Volume 27 Issue 40
However, thrombophilia testing in IBD patients is not routinely recommended. In general, no interaction between IBD and inherited factors of thrombophilia was found. Study results showed that the prevalence of factor V Leiden (which makes factor V resistant to inactivation by activated protein C) in IBD is not different compared to the general population. Studies failed to demonstrate the prevalence of the genetic variant prothrombin G20210A, and MTHFR, or gene mutation related to hyperhomo-cysteinemia in IBD patients[105,106]. However, hereditary genetic screening should be performed in IBD when a familial history of thrombosis, myocardial infarction, or stroke before the age of 50 is confirmed in first-degree relatives[107]. In addition, myeloproliferative neoplasms should be considered in patients with splanchnic vein thrombosis, particularly in the absence of an additional provoking factor. In these cases, testing for the JAK2V617F mutation, which is present in most patients with a myeloproliferative neoplasm is useful for identifying this disorder[100].
D-dimer, a fibrin degradation product, is effective for VTE screening, and adequately demonstrates the occurrence of VTE in the general population, although this test is characterized by low specificity[108]. However, high prevalence of elevated D-dimer in active patients with IBD usually rules out its utility in IBD[24,25,109].
Search for a biomarker which could select patients with and increased risk for thrombosis among IBD subjects is a challenging dilemma for clinicians. The endogenous thrombin potential (ETP) test may be considered a new tool for prospective studies on IBD patients to assess the risk of TE[110]. As opposed to coagulation intermediates or fragments which are markers of thrombin already generated, the ETP quantifies thrombin activity that can be generated in plasma. The increased ETP has been demonstrated in adult patients with IBD, and in active and quiescent stages in pediatric IBD patients, which indicates that procoagulant potential is a feature of the disease[38,110]. Probably the prospective studies are needed to evaluate clinical value of ETP, which stratifies the VTE risk, especially in pediatric IBD patients, in whom anticoagulation prophylaxis is not routinely recommended. Recently, investigators at the University of Leuven have determined the clot lysis profiles in patients with IBD before and after developing thrombosis and showed that clot lysis parameters differed significantly between IBD patients with and without a history of TE[62]. Therefore, a functional clot lysis assay could be included in the assessment of TE risk[60]. Nevertheless, it should be noted that both ETP test and clot lysis assay have sophisticated methodology, and hence are not routinely used.
TREATMENT OF VTE IN PATIENTS WITH IBD The general approach to treatment of VTE in patients with IBD is similar to patients without IBD. If there is no hemodynamically significant bleeding, LMWH is the most appropriate treatment. LMWH is usually switched to an oral vitamin K antagonist (e.g. warfarin). In terms of VTE treatment, strong recommendations are made for a period of minimum 3 mo of anticoagulant therapy for adult and pediatric IBD patients with a symptomatic VTE, including symptomatic splanchnic vein thrombosis. In patients with active IBD, in the first event of VTE, anticoagulation therapy should be continued until IBD has been in remission for at least 3 mo. For IBD patients with unprovoked VTE presenting during clinical remission, indefinite anticoagulant therapy is recommended with a periodic analysis of the decision. In similar cases, if there is a reversible risk factor, anticoagulation therapy is recommended for at least three months until a risk factor has resolved. In addition, in those cases it is recommended that therapy should be prolonged for at least 1 mo until the risk factor has resolved. The risk-benefit ratio of long-term therapy should be evaluated on an individual basis. Anticoagulant treatment should aim not only at preventing thrombus extension but also at preventing early and late recurrences[111].
Treatment of PTSThe presence of residual vein thrombosis (partial recanalization) at 3 to 6 mo post-DVT is associated with symptomatic PTS and an increased risk of VTE recurrence in about one third in the post-DVT patients after regular discontinuation of anticoagulant treatment. Patients with PTS with delayed recanalization, and venous reflux confirmed by compression ultrasonography should receive extended anticoagulation treatment[112]. In addition, in patients hospitalized at risk of PTS, recurrence prevention includes immediate mobilization and compression stockings[65]. Vitamin K antagonists (mainly warfarin) are effective in treating VTE, but they require frequent monitoring. Poor quality of anticoagulation control (e.g., too low doses during

Stadnicki A et al. Venous and arterial thromboembolism in IBD
WJG https://www.wjgnet.com 6767 October 28, 2021 Volume 27 Issue 40
treatment) may explain why at least some patients develop PTS[65].
OTHER TREATMENT MODALITIESNew oral anticoagulantsAnticoagulation treatment options have undergone a significant change within the last 10 years due to the development of direct oral anticoagulants (DOACs). Direct factor Xa inhibitors (rivaroxaban, apixaban, and edoxaban), and thrombin inhibitor (dabigatran) are currently available. In patients on DOACs, it is not necessary to monitor the INR ratio or heparin bridging. DOACs may allow stable patients with VTE to be treated at home earlier than in the case of warfarin. In fact, DOACs might be superior to vitamin K antagonists in treatment of VTE and prevention of PTS[113]. VTE is a dynamic process resulting from clot propagation exceeding clot lysis over time[114]. Anticoagulant therapy attenuates thrombin generation and promotes clot lysis by preventing thrombin activation of TAFI, and in turn inhibition of clot lysis. A failure to adequately suppress thrombin generation and/or activity will permit continued feedback activation of thrombin generation, fibrin formation, and inhibition of fibrinolysis by activation of TAFI. Some reports indicated that treatment with DOACs of acute symptomatic VTE was associated with a significantly lower risk of bleeding complications as compared with the vitamin K antagonist[115]. However, in case of overdose, there is no reversing agent for these drugs. In relation to IBD, currently there are no data related to the use of these promising drugs. DOACs, and perhaps low-dose DOACs, could have a particularly important role in the management of outpatients with IBD in remission and in outpatients with IBD-associated PTS. In such cases, controlled trials are warranted.
Acetylsalicylic acid Acetylsalicylic acid (ASA) is commonly used for preventing arterial thrombosis. Some studies showed that aspirin reduced the relative risk of recurrent VTE by 30% in the high risk population compared to placebo[116]. However, the use of ASA in prevention of VTE is currently not routinely recommended. It should be underlined that if patients are scheduled for anticoagulation therapy, and have been on ASA for another indication, the risk of bleeding might be increased. A new generation of antiplatelet compounds which selectively inhibit platelet activation rather than platelet aggregation merits future studies.
Local thrombolysisCatheter-directed thrombolysis (CDT) is increasingly used to treat acute TE. Currently used thrombolytic agents include t-PA, urokinase or streptokinase. It is accepted that systemic thrombolytic therapy should be considered in patients with massive PE, defined by hemodynamic compromise[117]. The cases of severe thrombosis causing limb ischemia may also require CDT. The role for thrombolysis, particularly CDT in other patients with DVT is less well established. CDT would be favorable in otherwise healthy patients with significant iliofemoral DVT. The rationale here is that CDT may decrease the incidence and severity of PTS. In IBD, a systematic review of outcomes with anticoagulation vs CDT was compared. It was found that CDT was more effective to achieve complete or partial symptomatic and radiologic resolution of thrombus in patients with IBD. Although hemorrhagic complication tended to occur more frequently in patients treated with CDT, no statistically significant differences were found in terms of complications between the two groups[118].
CONCLUSIONVTE events in IBD may increase as the incidence of IBD and life expectancy also increase. The risk of arterial TE is significantly lower than VTE, but an increased risk of cardiovascular diseases need to be monitored in IBD patients. Patients with IBD have a higher baseline risk of VTE, which further increases with surgery and corticosteroid therapy. Long-term complications of VTE can include post-thrombotic syndrome or chronic thromboembolic pulmonary hypertension. Thus focus on prevention and consideration of the utility of post-discharge prophylaxis and effort of implementation of VTE prophylaxis should be continued. The pathogenesis of TE in IBD is multifactorial and incompletely understood. The activation of coagulation is

Stadnicki A et al. Venous and arterial thromboembolism in IBD
WJG https://www.wjgnet.com 6768 October 28, 2021 Volume 27 Issue 40
recognized as an important component of the inflammatory response in IBD, and is also significant in the progression and possible pathogenesis. Whereas intestinal bacterial components may trigger the coagulation cascade in IBD, the gut microbiome could be an innovative approach for decreasing the risk of thrombosis in IBD.
REFERENCESVegh Z, Kurti Z, Gonczi L, Golovics PA, Lovasz BD, Szita I, Balogh M, Pandur T, Vavricka SR, Rogler G, Lakatos L, Lakatos PL. Association of extraintestinal manifestations and anaemia with disease outcomes in patients with inflammatory bowel disease. Scand J Gastroenterol 2016; 51: 848-854 [PMID: 26880133 DOI: 10.3109/00365521.2016.1140807]
1
Nguyen GC, Sam J. Rising prevalence of venous thromboembolism and its impact on mortality among hospitalized inflammatory bowel disease patients. Am J Gastroenterol 2008; 103: 2272-2280 [PMID: 18684186 DOI: 10.1111/j.1572-0241.2008.02052.x]
2
Grainge MJ, West J, Card TR. Venous thromboembolism during active disease and remission in inflammatory bowel disease: a cohort study. Lancet 2010; 375: 657-663 [PMID: 20149425 DOI: 10.1016/S0140-6736(09)61963-2]
3
Centers for Disease Control and Prevention (CDC). Venous thromboembolism in adult hospitalizations - United States, 2007-2009. MMWR Morb Mortal Wkly Rep 2012; 61: 401-404 [PMID: 22672974]
4
Bernstein CN, Blanchard JF, Houston DS, Wajda A. The incidence of deep venous thrombosis and pulmonary embolism among patients with inflammatory bowel disease: a population-based cohort study. Thromb Haemost 2001; 85: 430-434 [PMID: 11307809]
5
Murthy SK, Nguyen GC. Venous thromboembolism in inflammatory bowel disease: an epidemiological review. Am J Gastroenterol 2011; 106: 713-718 [PMID: 21407182 DOI: 10.1038/ajg.2011.53]
6
Papay P, Miehsler W, Tilg H, Petritsch W, Reinisch W, Mayer A, Haas T, Kaser A, Feichtenschlager T, Fuchssteiner H, Knoflach P, Vogelsang H, Platzer R, Tillinger W, Jaritz B, Schmid A, Blaha B, Dejaco C, Sobala A, Weltermann A, Eichinger S, Novacek G. Clinical presentation of venous thromboembolism in inflammatory bowel disease. J Crohns Colitis 2013; 7: 723-729 [PMID: 23127785 DOI: 10.1016/j.crohns.2012.10.008]
7
Nylund CM, Goudie A, Garza JM, Crouch G, Denson LA. Venous thrombotic events in hospitalized children and adolescents with inflammatory bowel disease. J Pediatr Gastroenterol Nutr 2013; 56: 485-491 [PMID: 23232326 DOI: 10.1097/MPG.0b013e3182801e43]
8
Quera R, Shanahan F. Thromboembolism--an important manifestation of inflammatory bowel disease. Am J Gastroenterol 2004; 99: 1971-1973 [PMID: 15447758 DOI: 10.1111/j.1572-0241.2004.40923.x]
9
Solem CA, Loftus EV, Tremaine WJ, Sandborn WJ. Venous thromboembolism in inflammatory bowel disease. Am J Gastroenterol 2004; 99: 97-101 [PMID: 14687149 DOI: 10.1046/j.1572-0241.2003.04026.x]
10
Landman C, Nahon S, Cosnes J, Bouhnik Y, Brixi-Benmansour H, Bouguen G, Colombel JF, Savoye G, Coffin B, Abitbol V, Filippi J, Laharie D, Moreau J, Veyrac M, Allez M, Marteau P; Groupe d'Etude Thérapeutique des Affections Inflammatoires du Tube Digestif. Portomesenteric vein thrombosis in patients with inflammatory bowel disease. Inflamm Bowel Dis 2013; 19: 582-589 [PMID: 23385240 DOI: 10.1097/MIB.0b013e31827eea5f]
11
DeFilippis EM, Barfield E, Leifer D, Steinlauf A, Bosworth BP, Scherl EJ, Sockolow R. Cerebral venous thrombosis in inflammatory bowel disease. J Dig Dis 2015; 16: 104-108 [PMID: 25395041 DOI: 10.1111/1751-2980.12212]
12
Michiels JJ, Michiels JM, Moossdorff W, Lao M, Maasland H, Palareti G. Diagnosis of deep vein thrombosis, and prevention of deep vein thrombosis recurrence and the post-thrombotic syndrome in the primary care medicine setting anno 2014. World J Crit Care Med 2015; 4: 29-39 [PMID: 25685720 DOI: 10.5492/wjccm.v4.i1.29]
13
Van Assche G, Dignass A, Reinisch W, van der Woude CJ, Sturm A, De Vos M, Guslandi M, Oldenburg B, Dotan I, Marteau P, Ardizzone A, Baumgart DC, D'Haens G, Gionchetti P, Portela F, Vucelic B, Söderholm J, Escher J, Koletzko S, Kolho KL, Lukas M, Mottet C, Tilg H, Vermeire S, Carbonnel F, Cole A, Novacek G, Reinshagen M, Tsianos E, Herrlinger K, Bouhnik Y, Kiesslich R, Stange E, Travis S, Lindsay J; European Crohn's and Colitis Organisation (ECCO). The second European evidence-based Consensus on the diagnosis and management of Crohn's disease: Special situations. J Crohns Colitis 2010; 4: 63-101 [PMID: 21122490 DOI: 10.1016/j.crohns.2009.09.009]
14
Vrij AA, Rijken J, van Wersch JW, Stockbrügger RW. Coagulation and fibrinolysis in inflammatory bowel disease and in giant cell arteritis. Pathophysiol Haemost Thromb 2003; 33: 75-83 [PMID: 14624048 DOI: 10.1159/000073850]
15
Bernstein CN, Wajda A, Blanchard JF. The incidence of arterial thromboembolic diseases in inflammatory bowel disease: a population-based study. Clin Gastroenterol Hepatol 2008; 6: 41-45 [PMID: 18063423 DOI: 10.1016/j.cgh.2007.09.016]
16
Lin TY, Chen YG, Lin CL, Huang WS, Kao CH. Inflammatory Bowel Disease Increases the Risk of Peripheral Arterial Disease: A Nationwide Cohort Study. Medicine (Baltimore) 2015; 94: e2381
17

Stadnicki A et al. Venous and arterial thromboembolism in IBD
WJG https://www.wjgnet.com 6769 October 28, 2021 Volume 27 Issue 40
[PMID: 26717386 DOI: 10.1097/MD.0000000000002381]Xiao Z, Pei Z, Yuan M, Li X, Chen S, Xu L. Risk of Stroke in Patients with Inflammatory Bowel Disease: A Systematic Review and Meta-analysis. J Stroke Cerebrovasc Dis 2015; 24: 2774-2780 [PMID: 26360973 DOI: 10.1016/j.jstrokecerebrovasdis.2015.08.008]
18
Singh S, Singh H, Loftus EV Jr, Pardi DS. Risk of cerebrovascular accidents and ischemic heart disease in patients with inflammatory bowel disease: a systematic review and meta-analysis. Clin Gastroenterol Hepatol 2014; 12: 382-393.e1 quiz e22 [PMID: 23978350 DOI: 10.1016/j.cgh.2013.08.023]
19
Fumery M, Xiaocang C, Dauchet L, Gower-Rousseau C, Peyrin-Biroulet L, Colombel JF. Thromboembolic events and cardiovascular mortality in inflammatory bowel diseases: a meta-analysis of observational studies. J Crohns Colitis 2014; 8: 469-479 [PMID: 24183231 DOI: 10.1016/j.crohns.2013.09.021]
20
Gandhi S, Narula N, Marshall JK, Farkouh M. Are patients with inflammatory bowel disease at increased risk of coronary artery disease? Am J Med 2012; 125: 956-962 [PMID: 22840916 DOI: 10.1016/j.amjmed.2012.03.015]
21
Colman RW. Are hemostasis and thrombosis two sides of the same coin? J Exp Med 2006; 203: 493-495 [PMID: 16533890 DOI: 10.1084/jem.20060217]
22
Hudson M, Hutton RA, Wakefield AJ, Sawyerr AM, Pounder RE. Evidence for activation of coagulation in Crohn's disease. Blood Coagul Fibrinolysis 1992; 3: 773-778 [PMID: 1489898 DOI: 10.1097/00001721-199212000-00011]
23
Stadnicki A, Gonciarz M, Niewiarowski TJ, Hartleb J, Rudnicki M, Merrell NB, Dela Cadena RA, Colman RW. Activation of plasma contact and coagulation systems and neutrophils in the active phase of ulcerative colitis. Dig Dis Sci 1997; 42: 2356-2366 [PMID: 9398817 DOI: 10.1023/a:1018891323205]
24
Souto JC, Martínez E, Roca M, Mateo J, Pujol J, González D, Fontcuberta J. Prothrombotic state and signs of endothelial lesion in plasma of patients with inflammatory bowel disease. Dig Dis Sci 1995; 40: 1883-1889 [PMID: 7555437 DOI: 10.1007/BF02208650]
25
Larsen TB, Nielsen JN, Fredholm L, Lund ED, Brandslund I, Munkholm P, Hey H. Platelets and anticoagulant capacity in patients with inflammatory bowel disease. Pathophysiol Haemost Thromb 2002; 32: 92-96 [PMID: 12214155 DOI: 10.1159/000065082]
26
Saibeni S, Vecchi M, Valsecchi C, Faioni EM, Razzari C, de Franchis R. Reduced free protein S levels in patients with inflammatory bowel disease: prevalence, clinical relevance, and role of anti-protein S antibodies. Dig Dis Sci 2001; 46: 637-643 [PMID: 11318545 DOI: 10.1023/a:1005675921664]
27
Saibeni S, Bottasso B, Spina L, Bajetta M, Danese S, Gasbarrini A, de Franchis R, Vecchi M. Assessment of thrombin-activatable fibrinolysis inhibitor (TAFI) plasma levels in inflammatory bowel diseases. Am J Gastroenterol 2004; 99: 1966-1970 [PMID: 15447757 DOI: 10.1111/j.1572-0241.2004.30203.x]
28
Owczarek D, Undas A, Foley JH, Nesheim ME, Jabłonski K, Mach T. Activated thrombin activatable fibrinolysis inhibitor (TAFIa) is associated with inflammatory markers in inflammatory bowel diseases TAFIa level in patients with IBD. J Crohns Colitis 2012; 6: 13-20 [PMID: 22261523 DOI: 10.1016/j.crohns.2011.06.005]
29
Collins CE, Cahill MR, Newland AC, Rampton DS. Platelets circulate in an activated state in inflammatory bowel disease. Gastroenterology 1994; 106: 840-845 [PMID: 8143990 DOI: 10.1016/0016-5085(94)90741-2]
30
Meucci G, Pareti F, Vecchi M, Saibeni S, Bressi C, de Franchis R. Serum von Willebrand factor levels in patients with inflammatory bowel disease are related to systemic inflammation. Scand J Gastroenterol 1999; 34: 287-290 [PMID: 10232874 DOI: 10.1080/00365529950173708]
31
Boehme MW, Autschbach F, Zuna I, Scherbaum WA, Stange E, Raeth U, Sieg A, Stremmel W. Elevated serum levels and reduced immunohistochemical expression of thrombomodulin in active ulcerative colitis. Gastroenterology 1997; 113: 107-117 [PMID: 9207268 DOI: 10.1016/s0016-5085(97)70086-6]
32
Thompson NP, Wakefield AJ, Pounder RE. Inherited disorders of coagulation appear to protect against inflammatory bowel disease. Gastroenterology 1995; 108: 1011-1015 [PMID: 7698567 DOI: 10.1016/0016-5085(95)90197-3]
33
Yoshida H, Granger DN. Inflammatory bowel disease: a paradigm for the link between coagulation and inflammation. Inflamm Bowel Dis 2009; 15: 1245-1255 [PMID: 19253306 DOI: 10.1002/ibd.20896]
34
Stadnicki A. Involvement of coagulation and hemostasis in inflammatory bowel diseases. Curr Vasc Pharmacol 2012; 10: 659-669 [PMID: 22272910 DOI: 10.2174/157016112801784495]
35
Van de Wouwer M, Collen D, Conway EM. Thrombomodulin-protein C-EPCR system: integrated to regulate coagulation and inflammation. Arterioscler Thromb Vasc Biol 2004; 24: 1374-1383 [PMID: 15178554 DOI: 10.1161/01.ATV.0000134298.25489.92]
36
Andoh A, Tsujikawa T, Hata K, Araki Y, Kitoh K, Sasaki M, Yoshida T, Fujiyama Y. Elevated circulating platelet-derived microparticles in patients with active inflammatory bowel disease. Am J Gastroenterol 2005; 100: 2042-2048 [PMID: 16128950 DOI: 10.1111/j.1572-0241.2005.50381.x]
37
Deutschmann A, Schlagenhauf A, Leschnik B, Hoffmann KM, Hauer A, Muntean W. Increased procoagulant function of microparticles in pediatric inflammatory bowel disease: role in increased thrombin generation. J Pediatr Gastroenterol Nutr 2013; 56: 401-407 [PMID: 23164759 DOI: 10.1097/MPG.0b013e31827daf72]
38

Stadnicki A et al. Venous and arterial thromboembolism in IBD
WJG https://www.wjgnet.com 6770 October 28, 2021 Volume 27 Issue 40
Stadnicki A. Thrombin generation and microparticles in inflammatory bowel diseases. J Pediatr Gastroenterol Nutr 2013; 56: 343 [PMID: 23531480 DOI: 10.1097/MPG.0b013e31827daf94]
39
Danese S, Katz JA, Saibeni S, Papa A, Gasbarrini A, Vecchi M, Fiocchi C. Activated platelets are the source of elevated levels of soluble CD40 ligand in the circulation of inflammatory bowel disease patients. Gut 2003; 52: 1435-1441 [PMID: 12970136 DOI: 10.1136/gut.52.10.1435]
40
Steinhoff M, Buddenkotte J, Shpacovitch V, Rattenholl A, Moormann C, Vergnolle N, Luger TA, Hollenberg MD. Proteinase-activated receptors: transducers of proteinase-mediated signaling in inflammation and immune response. Endocr Rev 2005; 26: 1-43 [PMID: 15689571 DOI: 10.1210/er.2003-0025]
41
Vetrano S, Ploplis VA, Sala E, Sandoval-Cooper M, Donahue DL, Correale C, Arena V, Spinelli A, Repici A, Malesci A, Castellino FJ, Danese S. Unexpected role of anticoagulant protein C in controlling epithelial barrier integrity and intestinal inflammation. Proc Natl Acad Sci U S A 2011; 108: 19830-19835 [PMID: 22109555 DOI: 10.1073/pnas.1107140108]
42
Faioni EM, Ferrero S, Fontana G, Gianelli U, Ciulla MM, Vecchi M, Saibeni S, Biguzzi E, Cordani N, Franchi F, Bosari S, Cattaneo M. Expression of endothelial protein C receptor and thrombomodulin in the intestinal tissue of patients with inflammatory bowel disease. Crit Care Med 2004; 32: S266-S270 [PMID: 15118529 DOI: 10.1097/01.ccm.0000128032.85396.83]
43
Pontarollo G, Mann A, Brandão I, Malinarich F, Schöpf M, Reinhardt C. Protease-activated receptor signaling in intestinal permeability regulation. FEBS J 2020; 287: 645-658 [PMID: 31495063 DOI: 10.1111/febs.15055]
44
Cognasse F, Hamzeh H, Chavarin P, Acquart S, Genin C, Garraud O. Evidence of Toll-like receptor molecules on human platelets. Immunol Cell Biol 2005; 83: 196-198 [PMID: 15748217 DOI: 10.1111/j.1440-1711.2005.01314.x]
45
Faure E, Equils O, Sieling PA, Thomas L, Zhang FX, Kirschning CJ, Polentarutti N, Muzio M, Arditi M. Bacterial lipopolysaccharide activates NF-kappaB through toll-like receptor 4 (TLR-4) in cultured human dermal endothelial cells. Differential expression of TLR-4 and TLR-2 in endothelial cells. J Biol Chem 2000; 275: 11058-11063 [PMID: 10753909 DOI: 10.1074/jbc.275.15.11058]
46
Pastorelli L, Dozio E, Pisani LF, Boscolo-Anzoletti M, Vianello E, Munizio N, Spina L, Tontini GE, Peyvandi F, Corsi Romanelli MM, Vecchi M. Procoagulatory state in inflammatory bowel diseases is promoted by impaired intestinal barrier function. Gastroenterol Res Pract 2015; 2015: 189341 [PMID: 25767508 DOI: 10.1155/2015/189341]
47
Hasan RA, Koh AY, Zia A. The gut microbiome and thromboembolism. Thromb Res 2020; 189: 77-87 [PMID: 32192995 DOI: 10.1016/j.thromres.2020.03.003]
48
Warrier M, Shih DM, Burrows AC, Ferguson D, Gromovsky AD, Brown AL, Marshall S, McDaniel A, Schugar RC, Wang Z, Sacks J, Rong X, Vallim TA, Chou J, Ivanova PT, Myers DS, Brown HA, Lee RG, Crooke RM, Graham MJ, Liu X, Parini P, Tontonoz P, Lusis AJ, Hazen SL, Temel RE, Brown JM. The TMAO-Generating Enzyme Flavin Monooxygenase 3 Is a Central Regulator of Cholesterol Balance. Cell Rep 2015; 10: 326-338 [PMID: 25600868 DOI: 10.1016/j.celrep.2014.12.036]
49
Wang Z, Klipfell E, Bennett BJ, Koeth R, Levison BS, Dugar B, Feldstein AE, Britt EB, Fu X, Chung YM, Wu Y, Schauer P, Smith JD, Allayee H, Tang WH, DiDonato JA, Lusis AJ, Hazen SL. Gut flora metabolism of phosphatidylcholine promotes cardiovascular disease. Nature 2011; 472: 57-63 [PMID: 21475195 DOI: 10.1038/nature09922]
50
Zhu W, Gregory JC, Org E, Buffa JA, Gupta N, Wang Z, Li L, Fu X, Wu Y, Mehrabian M, Sartor RB, McIntyre TM, Silverstein RL, Tang WHW, DiDonato JA, Brown JM, Lusis AJ, Hazen SL. Gut Microbial Metabolite TMAO Enhances Platelet Hyperreactivity and Thrombosis Risk. Cell 2016; 165: 111-124 [PMID: 26972052 DOI: 10.1016/j.cell.2016.02.011]
51
Alam MT, Amos GCA, Murphy ARJ, Murch S, Wellington EMH, Arasaradnam RP. Microbial imbalance in inflammatory bowel disease patients at different taxonomic levels. Gut Pathog 2020; 12: 1 [PMID: 31911822 DOI: 10.1186/s13099-019-0341-6]
52
Kappelman MD, Horvath-Puho E, Sandler RS, Rubin DT, Ullman TA, Pedersen L, Baron JA, Sørensen HT. Thromboembolic risk among Danish children and adults with inflammatory bowel diseases: a population-based nationwide study. Gut 2011; 60: 937-943 [PMID: 21339206 DOI: 10.1136/gut.2010.228585]
53
Alatri A, Schoepfer A, Fournier N, Engelberger RP, Safroneeva E, Vavricka S, Biedermann L, Calanca L, Mazzolai L; Swiss IBD Cohort Study Group. Prevalence and risk factors for venous thromboembolic complications in the Swiss Inflammatory Bowel Disease Cohort. Scand J Gastroenterol 2016; 51: 1200-1205 [PMID: 27211077 DOI: 10.1080/00365521.2016.1185464]
54
Weng MT, Park SH, Matsuoka K, Tung CC, Lee JY, Chang CH, Yang SK, Watanabe M, Wong JM, Wei SC. Incidence and Risk Factor Analysis of Thromboembolic Events in East Asian Patients With Inflammatory Bowel Disease, a Multinational Collaborative Study. Inflamm Bowel Dis 2018; 24: 1791-1800 [PMID: 29726897 DOI: 10.1093/ibd/izy058]
55
Miehsler W, Reinisch W, Valic E, Osterode W, Tillinger W, Feichtenschlager T, Grisar J, Machold K, Scholz S, Vogelsang H, Novacek G. Is inflammatory bowel disease an independent and disease specific risk factor for thromboembolism? Gut 2004; 53: 542-548 [PMID: 15016749 DOI: 10.1136/gut.2003.025411]
56
van Bodegraven AA, Schoorl M, Linskens RK, Bartels PC, Tuynman HA. Persistent activation of coagulation and fibrinolysis after treatment of active ulcerative colitis. Eur J Gastroenterol Hepatol 2002; 14: 413-418 [PMID: 11943956 DOI: 10.1097/00042737-200204000-00014]
57

Stadnicki A et al. Venous and arterial thromboembolism in IBD
WJG https://www.wjgnet.com 6771 October 28, 2021 Volume 27 Issue 40
Zöller B, Li X, Sundquist J, Sundquist K. Autoimmune diseases and venous thromboembolism: a review of the literature. Am J Cardiovasc Dis 2012; 2: 171-183 [PMID: 22937487]
58
Owczarek D, Cibor D, Sałapa K, Głowacki MK, Mach T, Undas A. Reduced plasma fibrin clot permeability and susceptibility to lysis in patients with inflammatory bowel disease: a novel prothrombotic mechanism. Inflamm Bowel Dis 2013; 19: 2616-2624 [PMID: 24108112 DOI: 10.1097/01.MIB.0000437041.59208.44]
59
Bollen L, Vande Casteele N, Peeters M, Van Assche G, Ferrante M, Van Moerkercke W, Declerck P, Vermeire S, Gils A. The Occurrence of Thrombosis in Inflammatory Bowel Disease Is Reflected in the Clot Lysis Profile. Inflamm Bowel Dis 2015; 21: 2540-2548 [PMID: 26313696 DOI: 10.1097/MIB.0000000000000531]
60
Novacek G, Weltermann A, Sobala A, Tilg H, Petritsch W, Reinisch W, Mayer A, Haas T, Kaser A, Feichtenschlager T, Fuchssteiner H, Knoflach P, Vogelsang H, Miehsler W, Platzer R, Tillinger W, Jaritz B, Schmid A, Blaha B, Dejaco C, Eichinger S. Inflammatory bowel disease is a risk factor for recurrent venous thromboembolism. Gastroenterology 2010; 139: 779-787, 787.e1 [PMID: 20546736 DOI: 10.1053/j.gastro.2010.05.026]
61
Bollen L, Vande Casteele N, Ballet V, van Assche G, Ferrante M, Vermeire S, Gils A. Thromboembolism as an important complication of inflammatory bowel disease. Eur J Gastroenterol Hepatol 2016; 28: 1-7 [PMID: 26513610 DOI: 10.1097/MEG.0000000000000495]
62
deFonseka AM, Tuskey A, Conaway MR, Behm BW. Antitumor Necrosis Factor-α Therapy Is Associated With Reduced Risk of Thromboembolic Events in Hospitalized Patients With Inflammatory Bowel Disease. J Clin Gastroenterol 2016; 50: 578-583 [PMID: 26368297 DOI: 10.1097/MCG.0000000000000408]
63
Faye AS, Wen T, Ananthakrishnan AN, Lichtiger S, Kaplan GG, Friedman AM, Lawlor G, Wright JD, Attenello FJ, Mack WJ, Lebwohl B. Acute Venous Thromboembolism Risk Highest Within 60 D After Discharge From the Hospital in Patients With Inflammatory Bowel Diseases. Clin Gastroenterol Hepatol 2020; 18: 1133-1141.e3 [PMID: 31336196 DOI: 10.1016/j.cgh.2019.07.028]
64
Galanaud JP, Holcroft CA, Rodger MA, Kovacs MJ, Betancourt MT, Wells PS, Anderson DR, Chagnon I, Le Gal G, Solymoss S, Crowther MA, Perrier A, White RH, Vickars LM, Ramsay T, Kahn SR. Predictors of post-thrombotic syndrome in a population with a first deep vein thrombosis and no primary venous insufficiency. J Thromb Haemost 2013; 11: 474-480 [PMID: 23279046 DOI: 10.1111/jth.12106]
65
Anderson A, Click B, Ramos-Rivers C, Cheng D, Babichenko D, Koutroubakis IE, Hashash JG, Schwartz M, Swoger J, Barrie AM 3rd, Dunn MA, Regueiro M, Binion DG. Lasting Impact of Clostridium difficile Infection in Inflammatory Bowel Disease: A Propensity Score Matched Analysis. Inflamm Bowel Dis 2017; 23: 2180-2188 [PMID: 29084081 DOI: 10.1097/MIB.0000000000001251]
66
Bhandari S, Mohammed Abdul MK, Dhakal B, Kreuziger LB, Saeian K, Stein D. Increased Rate of Venous Thromboembolism in Hospitalized Inflammatory Bowel Disease Patients with Clostridium Difficile Infection. Inflamm Bowel Dis 2017; 23: 1847-1852 [PMID: 28837518 DOI: 10.1097/MIB.0000000000001218]
67
Ananthakrishnan AN, Cagan A, Gainer VS, Cheng SC, Cai T, Scoville E, Konijeti GG, Szolovits P, Shaw SY, Churchill S, Karlson EW, Murphy SN, Kohane I, Liao KP. Thromboprophylaxis is associated with reduced post-hospitalization venous thromboembolic events in patients with inflammatory bowel diseases. Clin Gastroenterol Hepatol 2014; 12: 1905-1910 [PMID: 24632349 DOI: 10.1016/j.cgh.2014.02.034]
68
Ismail G, Mircescu G, Ditoiu AV, Tacu BD, Jurubita R, Harza M. Risk factors for predicting venous thromboembolism in patients with nephrotic syndrome: focus on haemostasis-related parameters. Int Urol Nephrol 2014; 46: 787-792 [PMID: 24078010 DOI: 10.1007/s11255-013-0574-0]
69
van Bodegraven AA, Meuwissen SG. Lipoprotein (a), thrombophilia and inflammatory bowel disease. Eur J Gastroenterol Hepatol 2001; 13: 1407-1409 [PMID: 11742187 DOI: 10.1097/00042737-200112000-00002]
70
Koutroubakis IE, Petinaki E, Anagnostopoulou E, Kritikos H, Mouzas IA, Kouroumalis EA, Manousos ON. Anti-cardiolipin and anti-beta2-glycoprotein I antibodies in patients with inflammatory bowel disease. Dig Dis Sci 1998; 43: 2507-2512 [PMID: 9824143 DOI: 10.1023/a:1026602803622]
71
Sipeki N, Davida L, Palyu E, Altorjay I, Harsfalvi J, Szalmas PA, Szabo Z, Veres G, Shums Z, Norman GL, Lakatos PL, Papp M. Prevalence, significance and predictive value of antiphospholipid antibodies in Crohn's disease. World J Gastroenterol 2015; 21: 6952-6964 [PMID: 26078573 DOI: 10.3748/wjg.v21.i22.6952]
72
Bjerregaard LT, Nederby NJ, Fredholm L, Brandslund I, Munkholm P, Hey H. Hyperhomocysteinaemia, coagulation pathway activation and thrombophilia in patients with inflammatory bowel disease. Scand J Gastroenterol 2002; 37: 62-67 [PMID: 11843038 DOI: 10.1080/003655202753387374]
73
Oussalah A, Guéant JL, Peyrin-Biroulet L. Meta-analysis: hyperhomocysteinaemia in inflammatory bowel diseases. Aliment Pharmacol Ther 2011; 34: 1173-1184 [PMID: 21967576 DOI: 10.1111/j.1365-2036.2011.04864.x]
74
Danese S, Sans M, Fiocchi C. Inflammatory bowel disease: the role of environmental factors. Autoimmun Rev 2004; 3: 394-400 [PMID: 15288007 DOI: 10.1016/j.autrev.2004.03.002]
75
Cotton CC, Baird D, Sandler RS, Long MD. Hormonal Contraception Use is Common Among 76

Stadnicki A et al. Venous and arterial thromboembolism in IBD
WJG https://www.wjgnet.com 6772 October 28, 2021 Volume 27 Issue 40
Patients with Inflammatory Bowel Diseases and an Elevated Risk of Deep Vein Thrombosis. Inflamm Bowel Dis 2016; 22: 1631-1638 [PMID: 27306071 DOI: 10.1097/MIB.0000000000000800]Stadnicki A, Bojko B, Myczkowska K, Witalińska-Łabuzek J. [Selected risk factors of thrombotic complications in patients with ulcerative colitis]. Wiad Lek 2003; 56: 341-347 [PMID: 14969162]
77
Byard RW. Deep venous thrombosis, pulmonary embolism and long-distance flights. Forensic Sci Med Pathol 2019; 15: 122-124 [PMID: 29948593 DOI: 10.1007/s12024-018-9991-9]
78
Maxwell SR, Moots RJ, Kendall MJ. Corticosteroids: do they damage the cardiovascular system? Postgrad Med J 1994; 70: 863-870 [PMID: 7870631 DOI: 10.1136/pgmj.70.830.863]
79
Nguyen GC, Elnahas A, Jackson TD. The impact of preoperative steroid use on short-term outcomes following surgery for inflammatory bowel disease. J Crohns Colitis 2014; 8: 1661-1667 [PMID: 25107847 DOI: 10.1016/j.crohns.2014.07.007]
80
Błoński W, Stadnicki A, Lichtenstein G, Burke A. Infliximab use in ulcerative colitis. In: Ulcerative Colitis. The complete quid to medical management. Ed: GR Lichtenstein, EJ Scherl. New York, Slack Inc, 2011: 237-254
81
Hommes DW, van Dullemen HM, Levi M, van der Ende A, Woody J, Tytgat GN, van Deventer SJ. Beneficial effect of treatment with a monoclonal anti-tumor necrosis factor-alpha antibody on markers of coagulation and fibrinolysis in patients with active Crohn's disease. Haemostasis 1997; 27: 269-277 [PMID: 9731107 DOI: 10.1159/000217467]
82
Danese S, Sans M, Scaldaferri F, Sgambato A, Rutella S, Cittadini A, Piqué JM, Panes J, Katz JA, Gasbarrini A, Fiocchi C. TNF-alpha blockade down-regulates the CD40/CD40L pathway in the mucosal microcirculation: a novel anti-inflammatory mechanism of infliximab in Crohn's disease. J Immunol 2006; 176: 2617-2624 [PMID: 16456024 DOI: 10.4049/jimmunol.176.4.2617]
83
Di Sabatino A, Santilli F, Guerci M, Simeone P, Ardizzone S, Massari A, Giuffrida P, Tripaldi R, Malara A, Liani R, Gurini E, Aronico N, Balduini A, Corazza GR, Davě G. Oxidative stress and thromboxane-dependent platelet activation in inflammatory bowel disease: effects of anti-TNF-α treatment. Thromb Haemost 2016; 116: 486-495 [PMID: 27305860 DOI: 10.1160/TH16-02-0167]
84
Bollen L, Vande Casteele N, Peeters M, Bessonov K, Van Steen K, Rutgeerts P, Ferrante M, Hoylaerts MF, Vermeire S, Gils A. Short-term effect of infliximab is reflected in the clot lysis profile of patients with inflammatory bowel disease: a prospective study. Inflamm Bowel Dis 2015; 21: 570-578 [PMID: 25659086 DOI: 10.1097/MIB.0000000000000301]
85
Szemes K, Soós A, Hegyi P, Farkas N, Erős A, Erőss B, Mezősi E, Szakács Z, Márta K, Sarlós P. Comparable Long-Term Outcomes of Cyclosporine and Infliximab in Patients With Steroid-Refractory Acute Severe Ulcerative Colitis: A Meta-Analysis. Front Med (Lausanne) 2019; 6: 338 [PMID: 32039218 DOI: 10.3389/fmed.2019.00338]
86
Desai RJ, Pawar A, Weinblatt ME, Kim SC. Comparative Risk of Venous Thromboembolism in Rheumatoid Arthritis Patients Receiving Tofacitinib Versus Those Receiving Tumor Necrosis Factor Inhibitors: An Observational Cohort Study. Arthritis Rheumatol 2019; 71: 892-900 [PMID: 30552833 DOI: 10.1002/art.40798]
87
Communication, FDS FDA approves Boxed Warning about increased risk of blood clots and death with higher dose of arthritis and ulcerative colitis medicine tofacitinib (Xeljanz, Xeljanz XR); FDA Drug Safety Communication 2019. [cited 20 February 2021]. Available from: https://www.fda.gov/drugs/drug-safety-and-availability/
88
Sandborn WJ, Panés J, Sands BE, Reinisch W, Su C, Lawendy N, Koram N, Fan H, Jones TV, Modesto I, Quirk D, Danese S. Venous thromboembolic events in the tofacitinib ulcerative colitis clinical development programme. Aliment Pharmacol Ther 2019; 50: 1068-1076 [PMID: 31599001 DOI: 10.1111/apt.15514]
89
Fleming F, Gaertner W, Ternent CA, Finlayson E, Herzig D, Paquette IM, Feingold DL, Steele SR. The American Society of Colon and Rectal Surgeons Clinical Practice Guideline for the Prevention of Venous Thromboembolic Disease in Colorectal Surgery. Dis Colon Rectum 2018; 61: 14-20 [PMID: 29219916 DOI: 10.1097/DCR.0000000000000982]
90
McKechnie T, Wang J, Springer JE, Gross PL, Forbes S, Eskicioglu C. Extended thromboprophylaxis following colorectal surgery in patients with inflammatory bowel disease: a comprehensive systematic clinical review. Colorectal Dis 2020; 22: 663-678 [PMID: 31490000 DOI: 10.1111/codi.14853]
91
Wilson MZ, Connelly TM, Tinsley A, Hollenbeak CS, Koltun WA, Messaris E. Ulcerative Colitis Is Associated With an Increased Risk of Venous Thromboembolism in the Postoperative Period: The Results of a Matched Cohort Analysis. Ann Surg 2015; 261: 1160-1166 [PMID: 24983992 DOI: 10.1097/SLA.0000000000000788]
92
McCurdy JD, Kuenzig ME, Smith G, Spruin S, Murthy SK, Carrier M, Nguyen GC, Benchimol EI. Risk of Venous Thromboembolism After Hospital Discharge in Patients With Inflammatory Bowel Disease: A Population-based Study. Inflamm Bowel Dis 2020; 26: 1761-1768 [PMID: 31995204 DOI: 10.1093/ibd/izaa002]
93
Kaplan GG, Lim A, Seow CH, Moran GW, Ghosh S, Leung Y, Debruyn J, Nguyen GC, Hubbard J, Panaccione R. Colectomy is a risk factor for venous thromboembolism in ulcerative colitis. World J Gastroenterol 2015; 21: 1251-1260 [PMID: 25632199 DOI: 10.3748/wjg.v21.i4.1251]
94
McKenna NP, Behm KT, Ubl DS, Glasgow AE, Mathis KL, Pemberton JH, Habermann EB, Cima RR. Analysis of Postoperative Venous Thromboembolism in Patients With Chronic Ulcerative Colitis: Is It the Disease or the Operation? Dis Colon Rectum 2017; 60: 714-722 [PMID: 28594721
95

Stadnicki A et al. Venous and arterial thromboembolism in IBD
WJG https://www.wjgnet.com 6773 October 28, 2021 Volume 27 Issue 40
DOI: 10.1097/DCR.0000000000000846]Nguyen GC, Bernstein CN, Bitton A, Chan AK, Griffiths AM, Leontiadis GI, Geerts W, Bressler B, Butzner JD, Carrier M, Chande N, Marshall JK, Williams C, Kearon C. Consensus statements on the risk, prevention, and treatment of venous thromboembolism in inflammatory bowel disease: Canadian Association of Gastroenterology. Gastroenterology 2014; 146: 835-848.e6 [PMID: 24462530 DOI: 10.1053/j.gastro.2014.01.042]
96
Mowat C, Cole A, Windsor A, Ahmad T, Arnott I, Driscoll R, Mitton S, Orchard T, Rutter M, Younge L, Lees C, Ho GT, Satsangi J, Bloom S. IBD Section of the British Society of Gastroenterology. Guidelines for the management of inflammatory bowel disease in adults. Gut 2011; 60: 571-607 [PMID: 21464096 DOI: 10.1136/gut.2010.224154]
97
Scoville EA, Konijeti GG, Nguyen DD, Sauk J, Yajnik V, Ananthakrishnan AN. Venous thromboembolism in patients with inflammatory bowel diseases: a case-control study of risk factors. Inflamm Bowel Dis 2014; 20: 631-636 [PMID: 24552828 DOI: 10.1097/MIB.0000000000000007]
98
Alhassan N, Trepanier M, Sabapathy C, Chaudhury P, Liberman AS, Charlebois P, Stein BL, Lee L. Risk factors for post-discharge venous thromboembolism in patients undergoing colorectal resection: a NSQIP analysis. Tech Coloproctol 2018; 22: 955-964 [PMID: 30569263 DOI: 10.1007/s10151-018-1909-8]
99
Nguyen GC, Murthy SK, Bressler B, Lam MCW, Alali A, Toumi A, Reinglas J, Rampersad A, Weizman AV, Afif W; CINERGI group. Quality of Care and Outcomes Among Hospitalized Inflammatory Bowel Disease Patients: A Multicenter Retrospective Study. Inflamm Bowel Dis 2017; 23: 695-701 [PMID: 28426451 DOI: 10.1097/MIB.0000000000001068]
100
Mathers B, Williams E, Bedi G, Messaris E, Tinsley A. An Electronic Alert System Is Associated With a Significant Increase in Pharmacologic Venous Thromboembolism Prophylaxis Rates Among Hospitalized Inflammatory Bowel Disease Patients. J Healthc Qual 2017; 39: 307-314 [PMID: 27153049 DOI: 10.1097/JHQ.0000000000000021]
101
Ra G, Thanabalan R, Ratneswaran S, Nguyen GC. Predictors and safety of venous thromboembolism prophylaxis among hospitalized inflammatory bowel disease patients. J Crohns Colitis 2013; 7: e479-e485 [PMID: 23537817 DOI: 10.1016/j.crohns.2013.03.002]
102
Faye AS, Hung KW, Cheng K, Blackett JW, Mckenney AS, Pont AR, Li J, Lawlor G, Lebwohl B, Freedberg DE. Minor Hematochezia Decreases Use of Venous Thromboembolism Prophylaxis in Patients with Inflammatory Bowel Disease. Inflamm Bowel Dis 2020; 26: 1394-1400 [PMID: 31689354 DOI: 10.1093/ibd/izz269]
103
Laryea J, Champagne B. Venous thromboembolism prophylaxis. Clin Colon Rectal Surg 2013; 26: 153-159 [PMID: 24436666 DOI: 10.1055/S-0033-135113]
104
Papa A, De Stefano V, Gasbarrini A, Chiusolo P, Cianci R, Casorelli I, Paciaroni K, Cammarota G, Leone G, Gasbarrini G. Prevalence of factor V Leiden and the G20210A prothrombin-gene mutation in inflammatory bowel disease. Blood Coagul Fibrinolysis 2000; 11: 499-503 [PMID: 10937811 DOI: 10.1097/00001721-200007000-00013]
105
Guédon C, Le Cam-Duchez V, Lalaude O, Ménard JF, Lerebours E, Borg JY. Prothrombotic inherited abnormalities other than factor V Leiden mutation do not play a role in venous thrombosis in inflammatory bowel disease. Am J Gastroenterol 2001; 96: 1448-1454 [PMID: 11374681 DOI: 10.1111/j.1572-0241.2001.03797.x]
106
Tsiolakidou G, Koutroubakis IE. Thrombosis and inflammatory bowel disease-the role of genetic risk factors. World J Gastroenterol 2008; 14: 4440-4444 [PMID: 18680221 DOI: 10.3748/wjg.14.4440]
107
Jacobs B, Obi A, Wakefield T. Diagnostic biomarkers in venous thromboembolic disease. J Vasc Surg Venous Lymphat Disord 2016; 4: 508-517 [PMID: 27639008 DOI: 10.1016/j.jvsv.2016.02.005]
108
Nguyen GC, Wu H, Gulamhusein A, Rosenberg M, Thanabalan R, Yeo EL, Bernstein CN, Steinhart AH, Margolis M. The utility of screening for asymptomatic lower extremity deep venous thrombosis during inflammatory bowel disease flares: a pilot study. Inflamm Bowel Dis 2013; 19: 1053-1058 [PMID: 23429463 DOI: 10.1097/MIB.0b013e3182802a65]
109
Saibeni S, Saladino V, Chantarangkul V, Villa F, Bruno S, Vecchi M, de Franchis R, Sei C, Tripodi A. Increased thrombin generation in inflammatory bowel diseases. Thromb Res 2010; 125: 278-282 [PMID: 19914688 DOI: 10.1016/j.thromres.2009.10.012]
110
Kearon C, Akl EA, Ornelas J, Blaivas A, Jimenez D, Bounameaux H, Huisman M, King CS, Morris TA, Sood N, Stevens SM, Vintch JRE, Wells P, Woller SC, Moores L. Antithrombotic Therapy for VTE Disease: CHEST Guideline and Expert Panel Report. Chest 2016; 149: 315-352 [PMID: 26867832 DOI: 10.1016/j.chest.2015.11.026]
111
Prandoni P, Prins MH, Lensing AW, Ghirarduzzi A, Ageno W, Imberti D, Scannapieco G, Ambrosio GB, Pesavento R, Cuppini S, Quintavalla R, Agnelli G; AESOPUS Investigators. Residual thrombosis on ultrasonography to guide the duration of anticoagulation in patients with deep venous thrombosis: a randomized trial. Ann Intern Med 2009; 150: 577-585 [PMID: 19414836 DOI: 10.7326/0003-4819-150-9-200905050-00003]
112
Rennenberg RJ. Oral anticoagulants, effect on thrombus resolution and post-thrombotic syndrome. Phlebology 2016; 31: 24-27 [PMID: 26916765 DOI: 10.1177/0268355516632101]
113
Sweetland S, Green J, Liu B, Berrington de González A, Canonico M, Reeves G, Beral V; Million Women Study collaborators. Duration and magnitude of the postoperative risk of venous thromboembolism in middle aged women: prospective cohort study. BMJ 2009; 339: b4583 [PMID: 19959589 DOI: 10.1136/bmj.b4583]
114

Stadnicki A et al. Venous and arterial thromboembolism in IBD
WJG https://www.wjgnet.com 6774 October 28, 2021 Volume 27 Issue 40
van der Hulle T, Kooiman J, den Exter PL, Dekkers OM, Klok FA, Huisman MV. Effectiveness and safety of novel oral anticoagulants as compared with vitamin K antagonists in the treatment of acute symptomatic venous thromboembolism: a systematic review and meta-analysis. J Thromb Haemost 2014; 12: 320-328 [PMID: 24330006 DOI: 10.1111/jth.12485]
115
Brighton TA, Eikelboom JW, Mann K, Mister R, Gallus A, Ockelford P, Gibbs H, Hague W, Xavier D, Diaz R, Kirby A, Simes J; ASPIRE Investigators. Low-dose aspirin for preventing recurrent venous thromboembolism. N Engl J Med 2012; 367: 1979-1987 [PMID: 23121403 DOI: 10.1056/NEJMoa1210384]
116
Comerota AJ. Pharmacologic and Pharmacomechanical Thrombolysis for Acute Deep Vein Thrombosis: Focus on ATTRACTCME. Methodist Debakey Cardiovasc J 2018; 14: 219-227 [PMID: 30410653 DOI: 10.14797/mdcj-14-3-219]
117
Tabibian JH, Streiff MB. Inflammatory bowel disease-associated thromboembolism: a systematic review of outcomes with anticoagulation vs catheter-directed thrombolysis. Inflamm Bowel Dis 2012; 18: 161-171 [PMID: 21805543 DOI: 10.1002/ibd.21307]
118

WJG https://www.wjgnet.com 6775 October 28, 2021 Volume 27 Issue 40
World Journal of
GastroenterologyW J GSubmit a Manuscript: https://www.f6publishing.com World J Gastroenterol 2021 October 28; 27(40): 6775-6793
DOI: 10.3748/wjg.v27.i40.6775 ISSN 1007-9327 (print) ISSN 2219-2840 (online)
REVIEW
Understanding the immune response and the current landscape of immunotherapy in pancreatic cancer
Lorena Ostios-Garcia, Julia Villamayor, Esther Garcia-Lorenzo, David Vinal, Jaime Feliu
ORCID number: Lorena Ostios-Garcia 0000-0001-9052-5609; Julia Villamayor 0000-0002-9980-9971; Esther Garcia-Lorenzo 0000-0001-5574-9180; David Vinal 0000-0002-9905-3270; Jaime Feliu 0000-0003-4867-1420.
Author contributions: Ostios-Garcia L performed the review, wrote the manuscript and reviewed the data; Villamayor J and Garcia-Lorenzo E helped write the manuscript; Vinal D and Feliu J reviewed the data.
Supported by the Instituto de Salud Carlos III, Ministerio de Economia, Industria y Competitividad, No. PI18/01604.
Conflict-of-interest statement: Authors declare no conflict of interest for this manuscript.
Open-Access: This article is an open-access article that was selected by an in-house editor and fully peer-reviewed by external reviewers. It is distributed in accordance with the Creative Commons Attribution NonCommercial (CC BY-NC 4.0) license, which permits others to distribute, remix, adapt, build upon this work non-commercially, and license their derivative works on different terms, provided the original work is properly cited and the use is non-commercial. See: htt
Lorena Ostios-Garcia, Julia Villamayor, Esther Garcia-Lorenzo, David Vinal, Jaime Feliu, Department of Oncology, La Paz University Hospital, IDIPAZ, CIBERONC, Cátedra UAM-AMGEN, Madrid 28046, Spain
Corresponding author: Jaime Feliu, MD, PhD, Associate Professor, Chief Physician, Department of Oncology, La Paz University Hospital, IDIPAZ, CIBERONC, Cátedra UAM-AMGEN, Paseo de la Castellana, 261, Madrid 28046, Spain. [email protected]
AbstractPancreatic ductal adenocarcinoma (PDAC) is an aggressive tumor with high lethality. Even with surgery, radiotherapy, chemotherapy, and other locoregional or systemic therapies, the survival rates for PDAC are low and have not signi-ficantly changed in the past decades. The special characteristics of the PDAC’s microenvironment and its complex immune escape mechanism need to be considered when designing novel therapeutic approaches in this disease. PDAC is characterized by chronic inflammation with a high rate of tumor-associated macrophages and myeloid-derived suppressor cells and a low rate of natural killer and effector T cells. The pancreatic microenvironment is a fibrotic, microvas-cularized stroma that isolates the tumor from systemic vascularization. Immuno-therapy, a novel approach that has demonstrated effectiveness in certain solid tumors, has failed to show any practice-changing results in pancreatic cancer, with the exception of PDACs with mismatch repair deficiency and high tumor mutational burden, which show prolonged survival rates with immunotherapy. Currently, numerous clinical trials are attempting to assess the efficacy of immunotherapeutic strategies in PDAC, including immune checkpoint inhibitors, cancer vaccines, and adoptive cell transfer, alone or in combination with other immunotherapeutic agents, chemoradiotherapy, and other targeted therapies. A deep understanding of the immune response will help in the development of new therapeutic strategies leading to improved clinical outcomes for patients with PDAC.
Key Words: Pancreatic cancer; Immunity; Immune evasion; Tumor microenvironment; Immunotherapy; Cancer vaccines
©The Author(s) 2021. Published by Baishideng Publishing Group Inc. All rights reserved.

Ostios-Garcia et al. Immunotherapy in pancreatic cancer
WJG https://www.wjgnet.com 6776 October 28, 2021 Volume 27 Issue 40
p://creativecommons.org/Licenses/by-nc/4.0/
Manuscript source: Invited manuscript
Specialty type: Gastroenterology and hepatology
Country/Territory of origin: Spain
Peer-review report’s scientific quality classificationGrade A (Excellent): 0 Grade B (Very good): B Grade C (Good): 0 Grade D (Fair): 0 Grade E (Poor): 0
Received: February 23, 2021 Peer-review started: February 23, 2021 First decision: June 14, 2021 Revised: June 28, 2021 Accepted: September 19, 2021 Article in press: September 19, 2021 Published online: October 28, 2021
P-Reviewer: Chawla S S-Editor: Wang LL L-Editor: A P-Editor: Yu HG
Core Tip: Immunotherapy has demonstrated effectiveness in treating several solid tumors and has become a major revolution in oncology. In pancreatic ductal adenocar-cinoma, however, the outcomes continue to be poor due to its special immune response and microenvironmental characteristics. In this review, we summarize the most important concepts of the immune system and the current landscape of immunotherapy in pancreatic cancer.
Citation: Ostios-Garcia L, Villamayor J, Garcia-Lorenzo E, Vinal D, Feliu J. Understanding the immune response and the current landscape of immunotherapy in pancreatic cancer. World J Gastroenterol 2021; 27(40): 6775-6793URL: https://www.wjgnet.com/1007-9327/full/v27/i40/6775.htmDOI: https://dx.doi.org/10.3748/wjg.v27.i40.6775
INTRODUCTIONPancreatic ductal adenocarcinoma cancer (PDAC) derives from pancreatic glandular tissue and is considered the fourth most lethal malignant tumor worldwide, with high mortality and poor prognosis[1]. The aggressive nature of PDAC is the result of a multifactorial condition related to its desmoplastic stroma and characteristic tumor microenvironment (TME), the ability to evade the immune response, the low tumor mutational burden (TMB) and the lack of effective treatments[2].
Despite the use of various approaches and therapies such as surgical resection, radiotherapy, systemic chemotherapy and the combination of these therapies[3], 80% of such patients will die within a year of the diagnosis[4]. Even for patients with resectable disease who undergo R0 pancreatic surgery, the 5-year survival rate is less than 20%[5,6], and the 5-year overall survival (OS) is lower than 7% for those with metastatic PDAC[7]. Novel therapeutic strategies such as adjuvant modified FOLFIRINOX (folinic acid, 5-fluorouracil, irinotecan, and oxaliplatin) have improved postoperative survival rates[8]. For advanced and metastatic PDAC, chemotherapy is the only treatment option. Despite the new chemotherapy regimens developed over the past few years (FOLFIRINOX and gemcitabine plus nab-paclitaxel), however, the median OS is still under 12 mo[1,8]. Most of the driver mutations identified in PDAC lack targeted therapies. Nevertheless, patients might benefit from platinum-based chemotherapy and poly (ADP-ribose) polymerase (PARP) inhibitors in the case of BRCA1/2 mutation[9], immune checkpoint inhibitors in microsatellite instability[10] and tyrosine-kinase inhibitors for patients harboring neurotrophic-tropomyosin receptor kinase (NTRK) gene fusions[11], although the improvement in survival is not as successful as in other tumors. Even with all these advances, the OS for PDAC has hardly improved in recent decades.
Immunotherapy is a classic treatment approach and has been recognized since 2017 as the fourth pillar of treatment for many solid tumors[12]. A high number of preclinical and clinical studies are evaluating the efficacy of immunotherapeutic strategies in PDAC, including immune checkpoint inhibitors, cancer vaccines, and adoptive cell transfer, combined with other immunotherapeutic agents, chemoradio-therapy or other molecularly targeted agents. However, this new strategy still fails to meet the clinical needs of patients with PDAC, a consequence of the complex immune escape mechanisms, which need to be understood to improve the efficacy of new therapies.
In this review, we summarize the immune response mechanisms, the current landscape and the limitations of immunotherapy in PDAC.
IMMUNE RESPONSE IN PANCREATIC CANCERThe immune system and inflammatory state involve numerous interactions with premalignant and malignant lesions. While chronic inflammation induced by the immune system is associated with tumor growth[13], tumors cause tissue destruction and trigger inflammatory signals leading to the recruitment of cells of the innate immune system such as natural killer (NK), T cells, macrophages, and dendritic cells

Ostios-Garcia et al. Immunotherapy in pancreatic cancer
WJG https://www.wjgnet.com 6777 October 28, 2021 Volume 27 Issue 40
(DCs)[13]. Inflammation is characterized by supporting hallmarks capabilities that contribute to tumor progression by providing cytokines, chemokines, proteases, and growth and proangiogenic factors; encouraging angiogenesis and tissue remodeling, assisting in the invasion and metastasis and ultimately driving local and systemic immune suppression[13].
In an effort to understand the dynamics of the immune response from preinvasive pancreatic intraepithelial neoplasia (PanIN) to invasive and metastatic PDAC, a study with genetically engineered KRAS and p53 mutant mice showed that immune system cells with suppressive properties are involved from the earliest stages of tumori-genesis. The RAS oncogene induces inflammation and immune suppression in the microenvironment, and both carry immune privilege in the tumor[14]. The predominant cells in the tumor stroma are immunosuppressive leukocytes that weakens the antitumor functions of lymphocytes infiltrating the pancreas and promote disease progression[15]. In contrast, many other solid tumors harbor a larger infilt-ration of effector T cells, which has been associated with enhanced clinical outcomes[14].
Immune system cells in pancreatic ductal adenocarcinomaThe most common immune cells in the tumor microenvironment (from PanIN to PDAC) include tumor-associated macrophages (TAM), myeloid-derived suppressor cells (MDSC), neutrophils, regulatory T cells (Treg), a smaller number of effector T cells and, rarely, NK cells[13-15].
TAMs and MDSCs are innate immune cells that play a dual role in PDAC and are involved in cancer cell recognition and antitumor response but also lead to chronic inflammation[16,17]. Macrophages are predominant in the initial stages of the disease, but the ratio of TAMs and MDSCs becomes similar as the disease progresses[15]. There are very few lymphocytes in the tumor; CD4+ T cells, along with a high portion of Tregs, are the most frequent. NK and CD8+ T cells are extremely rare at any stage[15].
Tumor-associated macrophages Two types of TAMs have been identified: M1 and M2 macrophages. M1 macrophages secrete proinflammatory cytokines with antineoplastic effects, while M2 macrophages release cytokines that lead to tumor progression[18,19]. Macrophages are the most common immune cells in the tumor microenvironment at the early stage. Several reports have shown an inverse correlation between the prognosis and M2 TAM infilt-ration in vairous tumors, including PDAC[20,21].
TAMs produce cytokines, proteases and metabolites, such as indoleamine dioxy-genase and reactive oxygen species, which inhibit T-cell activity against tumor and attract Tregs to the tumor site[22]. Moreover, TAMs facilitate tumor angiogenesis by releasing pro-angiogenic factors such as vascular endothelial growth factor (VEGF) and participate in matrix remodeling to facilitate invasion and metastasis[23].
Myeloid derived suppressor cellsMDSCs are a heterogeneous group of immature cells divided into polymorphonuclear (PMN-MDSC) and monocytic (M-MDSC), resembling neutrophils and monocytes, respectively[24,25]. Myeloid cells are more frequent in the advanced stages of PDAC, when the number of these cells is comparable to TAMs’. MDSCs inhibit the innate antitumor immunity[26].
MDSCs have a variety of mechanisms to attenuate immune response. They inhibit the antigen-specific response of CD4+ and CD8+ T cells. Some of these mechanisms occur through direct cell-to-cell contact between MDSCs and lymphocytes with the participation of programmed death-ligand 1 (PD-L1) and programmed death-1 (PD-1). MDSCS therefore induce the suppression of T-cell activation and self-tolerance[26]. In addition, MDSCs suppress the proliferation, cytokine production, and cytotoxic function of T cells[27]; decrease T-cell receptor signaling[28]; and induce apoptosis of intratumor T cells[28]. Furthermore, MDSCs induce Treg expansion through inter-leukin (IL)-10[29], resulting in additional suppression of T-cell function. As with TAMs, an increase in MDSCs in patients with cancer is related to high levels of VEGF[30].
Natural Killer cellsNK cells are an important immune component in controlling the antitumor immune response. These immune cells can interact with DCs, macrophages, T cells and endothelial cells through cell-to-cell contact and secreting cytokines[31]. A number of studies have found that natural killer (NK) cells are positively correlated with survival

Ostios-Garcia et al. Immunotherapy in pancreatic cancer
WJG https://www.wjgnet.com 6778 October 28, 2021 Volume 27 Issue 40
in patients with PDAC[32]. However, PDAC is characterized by a very low count of NK cells in the tumor site ( < 0.5%)[33]. Furthermore, the antitumor effect of NK cells decreases by the action of pancreatic stellate cells[34] and the expression of IL-10, transforming growth factor beta (TGF-b), indoleamine 2,3-dioxygenase (IDO), and matrix metalloproteinases (MMPs)[35].
Tumor associated Neutrophils Tumor associated neutrophils (TANs) are typically localized at the periphery of the tumor site in early stages of the disease and infiltrate the center of the tumor in advanced stages. The neutrophil-to-lymphocyte ratio (NLR) has been studied as a predictor, and high TAN counts are correlated with poor prognoses[36-38]. However, the value of the NLR with regard to prognosis and survival prediction requires further validation.
There are two types of TANs: N1 and N2 which have different functions[39]. N1 TANs are proinflammatory and releases IL-12, tumor necrosis factor (TNF)-a and other immunostimulatory cytokines involved in the migration and activation of CD8+ T cells[40]. N2 TANs are immunosuppressive and promote angiogenesis, invasion and metastases. These tumor-promoting activities are mediated by hepatocyte growth factor (HGF), oncostatin M, reactive oxygen species (ROS), reactive nitrogen species (RNS), matrix metalloproteinase (MMPS), and neutrophil elastase (NE)[39].
T cells PDAC presents a variable number of T cells, encompassing several T-cell subpopu-lations. The immunosuppressive microenvironment, compounded by fibroblast and desmoplastic stroma, prevents T-cell infiltration and influences their spatial distri-bution in the tumor site[41]. CD4+ and CD8+ T cells have specific regulation, produce several cytokines, and have different functions in immunity[42]. Consequently, the effects of T cells in PDAC depend on the subpopulation type, their spatial distribution, and macrophage infiltration. A high infiltration of CD4+ and CD8+ T cells, low infilt-ration of Treg cells, and high ratio of M1/M2 macrophages are therefore associated with greater survival in PDAC[43,44].
CD4+ lymphocytes are differentiated into T helper (Th) 1, Th2, Th17 and Treg subpopulations. Th1 produces interferon gamma (IFN-γ) and cytotoxic molecules that support cellular type I immunity (priming, activation and recruitment of cytotoxic T lymphocytes, M1 macrophages and NK cells) that attack intracellular pathogens and tumors immunity[45]. Th2 produces IL-4, IL-5 and IL-3, participates in humoral type II immunity (inducing M2 macrophages) and contributes to allergy and asthma[45]. Th2 is predominant in PDAC and is associated with disease progression[46] and shorter OS[47]. Th17 produces IL-17, IL-21 and IL-22 and protects against extracellular bacterial and fungal infections[48]. Oncogenic KRAS, expressed in pancreatic cells, induces the recruitment of Th17 cells into the TME[49]. Th17 and IL-17 are involved in PDAC progression[49]. A high proportion of Th17 cells in tumor site is correlated with shorter OS and distant disease.
Regulatory T cells or suppressor T cells are a subpopulation of CD4+ lymphocytes that infiltrate the tumor. The main function of Treg in healthy patients is to maintain tolerance to self-antigen and prevent autoimmune disease[50]. Treg counts increases from PanIN to advanced PDAC[15]. In case of PDAC, Tregs have differing roles depending on the tumor stage. Tregs promote tumorigenesis by suppressing the cytotoxic function of T cells, IFN- γ and IL-2, induced by tumor antigens[15]. In contrast, Tregs can delay tumor progression by assessing the suppressive myeloid cells[51]. Tregs are associated with worse prognosis and decreased survival[52].
CD8+ T cells, also Known as cytotoxic T lymphocytes and effector T lymphocytes, produce IFN-γ, TNF and cytotoxic molecules against tumor cells and protect from cancer recurrence[53]. CD8+ T cells are scarce in PDAC.
T cell evasionThe most well-known mechanism of immune tolerance in cancer is the exhaustion of effector T cells (CD8+ T lymphocytes), produced by the binding of cytotoxic T lymphocyte antigen 4 (CTLA-4) to CD80 and of PD-L1 (CD86) to PD-1. However, effector T lymphocytes are scarce in pancreatic cancer, and the inflammatory immune reaction develops early, suppressing the development of an adaptative immune response.
T cell evasion in PDAC has been describe as a 4-step process[14,15]: 1) Induction: mutations in oncogenes (i.e., KRAS) and tumor suppressor genes initiate the process of tumorigenesis from normal pancreatic cells to PDAC. 2) Inflammation: PanIN, a

Ostios-Garcia et al. Immunotherapy in pancreatic cancer
WJG https://www.wjgnet.com 6779 October 28, 2021 Volume 27 Issue 40
preinvasive lesion, produces soluble factors inducing local inflammation and recruitment of immune cells in the tumor site. 3) Immunosuppression: chronic inflam-matory reaction and enrollment of TAMs, MDSCs and Treg cells produce immunosup-pressive cytokines and suppressive response with cell-to-cell contact. Macrophages and suppressive T cells prevent effector T cells from entering the TME[54], while cytokines such as IL-10 and TGF inactivate the few effector T cells present in TME[55]. This condition prevents an efficient adaptive response against the tumor. 4) Immune Privilege: in the advanced stage of the disease, immune evasion persists, and the TME becomes a site of immune privilege for pancreatic tumor cells.
Tumor microenvironment: A barrier for immunotherapyThe PDAC microenvironment is a classical barrier involved in tumor progression[56], and low microvascular density hinders the diffusion of therapeutic agents[57,58]. This fibroinflammatory structure is a mixture of immune cells, malignant cells, and a dense desmoplastic stroma, which includes fibroblasts, blood vessels, and pancreatic stellate cells[59,60]. The stroma is a traditional characteristic of PDAC that participates in tumor growth, vascularization, drug diffusion, resistance to treatment, and metastasis[61]. Tumor cells and stromal cells undergo into a continuous change throughout the transformation process from a healthy pancreatic tissue to an invasive malignance[13]. TME plays a key role in this immunosuppression and presents similar characteristics in both primary and metastatic lesions[62].
Based on the biological, prognostic, and predictive characteristics, it is possible to differentiate two molecular subtypes (classical and basal-like)[63-65] and two stromal subtypes of PDAC (normal and activated)[66]. The basal-like subtype is associated with an activated stroma and poor prognosis[64,65]. Patients with the activated stromal PDAC subtype have a poorer prognosis compared with the normal stromal subtype, presenting a median OS of 15 vs 24 mo, respectively[66]. Activated stroma is associated with a greater presence of macrophages and activated fibroblasts, both responsible for poor clinical outcomes[66]. Modulating the TME would possibly redirect the immune system to eliminate the tumor, achieving greater efficiency in antitumor therapies.
Tumor mutational burden and mismatch repair deficiency: Assistance for immunotherapyTMB is defined as the total number of nonsynonymous mutations per coding area of a tumor gene[67]. A high number of somatic mutations produces and releases neoantigens in the TME which lead to increase in inflammatory cytokines and effector T cells[2,10,68]. A high TMB therefore stimulates the efficacy of immunotherapy[67,69]. PDAC is characterized by low immunogenicity and low TMB (1 mutation/ megabase) compared with other tumors such as melanoma (10 mutations/megabase)[67] and lung or bladder cancer (just under 10 mutations/megabase)[70].
There is a known association between mismatch repair deficiency (dMMR) and high TMB, and PDAC is not an exception[71]. dMMR represents a loss of function of the mismatch repair (MMR) pathway, a DNA repair pathway that plays a key role in maintaining genomic stability. Random mutations occurring in small repetitive elements define microsatellite instability (MSI)[72]. dMMR is defined as the loss of expression of one or more of the MLH1, MSH2, MSH6, and PMS2 proteins. Character-istically, dMMR is correlated with high TMB[72] and increased effector T cells in tumor site[63]. A high MSI status, an emerging predictor of immunotherapy response in PDAC, has a prevalence of 0.3-1.3% in this tumor type[73]. Patients with this condition present prolonged survival rates[71,74]. Neoantigens must be presented by antigen-presenting cells (APCs) to achieve a T-cell response and, in the case of PDAC, DCs (the major APCs), are usually immature or scarce, causing weakened T-cell activation[75].
LANDSCAPE OF IMMUNOTHERAPY IN PANCREATIC DUCTAL ADENO-CARCINOMAOur understanding of the immune response in cancer is still incomplete and continues to be investigated, with the reported relationships between the various cell populations and microenvironment composition[59,60] the basis for the development of immune-based therapies in PDAC. The combination of several immune strategies, such as checkpoints inhibitors, immune checkpoints inhibitors or vaccines plus

Ostios-Garcia et al. Immunotherapy in pancreatic cancer
WJG https://www.wjgnet.com 6780 October 28, 2021 Volume 27 Issue 40
chemotherapy, and the use of adoptive cellular therapy are some of these new approaches[76].
Immune checkpoints agentsWhereas immune checkpoint inhibitors have proven their efficacy in many tumors, they have falied to do so in PDAC due to its low immunogenicity and low TMB[67]. These inhibitors help to interrupt the intratumoral T-cell dysfunction and provide the block of the overexpressed receptors involved in its exhaustion such as PD-1 and CTLA-4[77]. The union between PD-L1 or PD-L2 and PD-1 induces the cessation of T-cell effector functions causing a suppression in T-cell motility[78], an antagonization of T cell receptor (TCR) signaling[79] and a suppression in gene transcription[80]. PD-L1 expression is therefore inversely correlated with survival. Thus, anti-PD-L1 and anti-PD-1 therapies have been shown to reduce tumor volume in mice that were subcutaneously injected with a murine PDAC cell line[81].
Antibody anticytotoxic T lymphocyte antigen-4Several phase II clinical trials in PDAC have been developed using antibodies against CTLA-4, such as Ipilimumab[82] and Tremelimumab[83] as single agents; however, these studies have not achieved an impact in OS[82,83]. Ipilimumab in a phase II trial (NCT00112580) of pretreated patients with locally advanced and metastatic pancreatic cancer showed a median OS of 4.5 mo, with no responders except for one patient who had a delayed objective response. A phase II trial of Tremelimumab (NCT02527434) in metastatic pancreatic cancer had a median OS of 4 mo (95%CI 2.83-5.42), with 18 out 20 patients with progressive disease.
Antibody anti-programmed death-1 The efficacy of pembrolizumab in MSI-H PDAC has been reported in the phase II NTC02628067 study. The OS and progression-free survival (PFS) were 4 mo and 2.1 mo, respectively[76], highly disappointing results compared with those obtained in other tumors such as colorectal cancer in which a PFS of 16.5 mo was reported in the KEYNOTE-177 trial[84]. We do not have results for nivolumab or pembrolizumab as single agents in microsatellite stable tumors.
Antibody anti-programmed death-ligand 1A phase I/II clinical trial (NCT03829501) assessing the efficacy of atezolizumab in advanced PDAC and other tumors refractory to first-line treatment is currently ongoing.
Combination of immune checkpoints agentsThe combination of anti–PD-1/anti–PD-L1 and anti–CTLA-4 might have additive or synergistic activity[85]. In fact, the combination has shown enhanced activity in certain tumor types such as melanoma and non-small cell-lung cancer[85]. Several clinical trials have therefore sought to assess the efficacy of this combination.
Durvalumab alone or in combination with tremelimumab for patients with previously treated metastatic PDAC (NCT 02558894) did not achieved any impro-vement in OS. The combination achieved a median of 3.1 mo, while durvalumab alone achieved 3.6 mo[85]. However, the evaluation of the combination of other immuno-therapy agents such as nivolumab and ipilimumab (NCT01928394) is still ongoing, with no results posted yet[86]. Table 1 Lists other immunotherapy agents that have been employed in treating PDAC.
Combination of immune checkpoints and chemotherapyIt has been suggested that the efficacy of immune checkpoint inhibitors could improve when combined with chemotherapy, the latter acting by activating the intratumoral immune response when inducing immunogenic cell death. This type of cell death is characterized by a necrolytic release of danger signals that can modify the stroma, change cytokine rates, reduce the presence of suppressive cells such as MDSCs and Tregs, promote the expression of molecules of the major histocompatibility complex (MHC) in cancerous cells and stimulate DC maturation[87]. In animal models, a synergetic effect has been observed between the combination of gemcitabine and anti-PDL1[88].
Several clinical trials have investigated the combination of immune checkpoint inhibitors and chemotherapy in PDAC. Table 2 Lists the main clinical trials in this field.
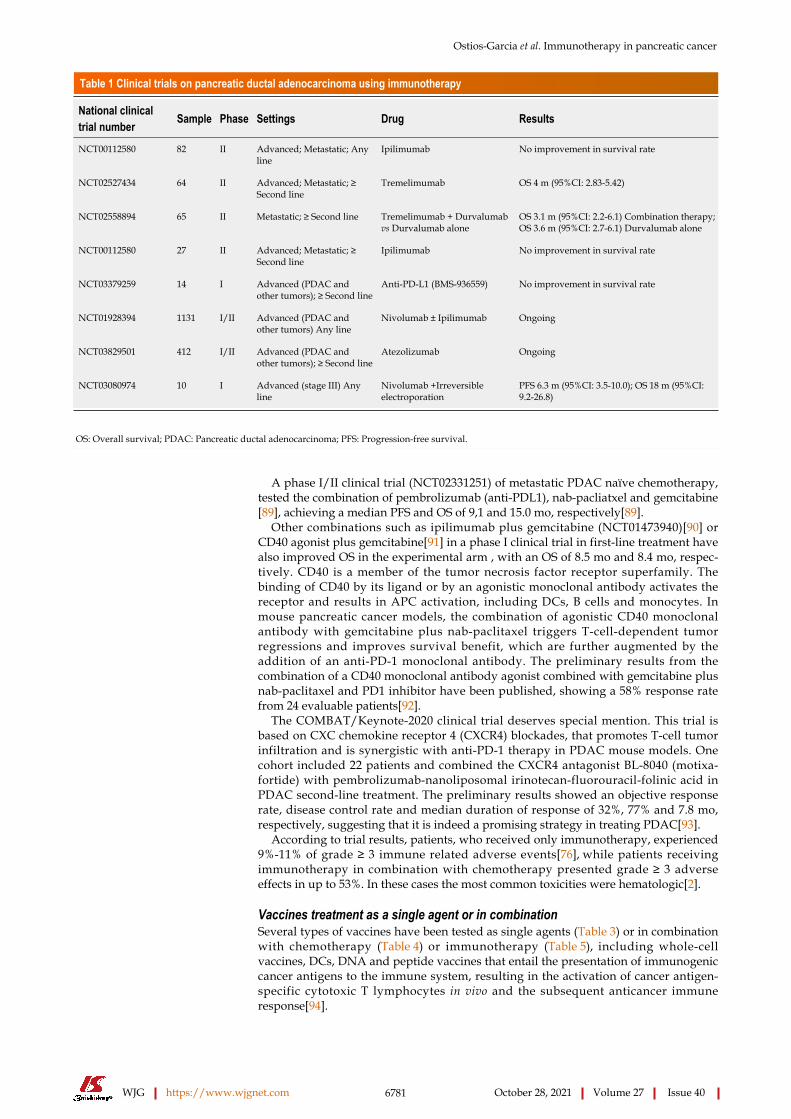
Ostios-Garcia et al. Immunotherapy in pancreatic cancer
WJG https://www.wjgnet.com 6781 October 28, 2021 Volume 27 Issue 40
Table 1 Clinical trials on pancreatic ductal adenocarcinoma using immunotherapy
National clinical trial number Sample Phase Settings Drug Results
NCT00112580 82 II Advanced; Metastatic; Any line
Ipilimumab No improvement in survival rate
NCT02527434 64 II Advanced; Metastatic; ≥ Second line
Tremelimumab OS 4 m (95%CI: 2.83-5.42)
NCT02558894 65 II Metastatic; ≥ Second line Tremelimumab + Durvalumab vs Durvalumab alone
OS 3.1 m (95%CI: 2.2-6.1) Combination therapy; OS 3.6 m (95%CI: 2.7-6.1) Durvalumab alone
NCT00112580 27 II Advanced; Metastatic; ≥ Second line
Ipilimumab No improvement in survival rate
NCT03379259 14 I Advanced (PDAC and other tumors); ≥ Second line
Anti-PD-L1 (BMS-936559) No improvement in survival rate
NCT01928394 1131 I/II Advanced (PDAC and other tumors) Any line
Nivolumab ± Ipilimumab Ongoing
NCT03829501 412 I/II Advanced (PDAC and other tumors); ≥ Second line
Atezolizumab Ongoing
NCT03080974 10 I Advanced (stage III) Any line
Nivolumab +Irreversible electroporation
PFS 6.3 m (95%CI: 3.5-10.0); OS 18 m (95%CI: 9.2-26.8)
OS: Overall survival; PDAC: Pancreatic ductal adenocarcinoma; PFS: Progression-free survival.
A phase I/II clinical trial (NCT02331251) of metastatic PDAC naïve chemotherapy, tested the combination of pembrolizumab (anti-PDL1), nab-pacliatxel and gemcitabine[89], achieving a median PFS and OS of 9,1 and 15.0 mo, respectively[89].
Other combinations such as ipilimumab plus gemcitabine (NCT01473940)[90] or CD40 agonist plus gemcitabine[91] in a phase I clinical trial in first-line treatment have also improved OS in the experimental arm , with an OS of 8.5 mo and 8.4 mo, respec-tively. CD40 is a member of the tumor necrosis factor receptor superfamily. The binding of CD40 by its ligand or by an agonistic monoclonal antibody activates the receptor and results in APC activation, including DCs, B cells and monocytes. In mouse pancreatic cancer models, the combination of agonistic CD40 monoclonal antibody with gemcitabine plus nab-paclitaxel triggers T-cell-dependent tumor regressions and improves survival benefit, which are further augmented by the addition of an anti-PD-1 monoclonal antibody. The preliminary results from the combination of a CD40 monoclonal antibody agonist combined with gemcitabine plus nab-paclitaxel and PD1 inhibitor have been published, showing a 58% response rate from 24 evaluable patients[92].
The COMBAT/Keynote-2020 clinical trial deserves special mention. This trial is based on CXC chemokine receptor 4 (CXCR4) blockades, that promotes T-cell tumor infiltration and is synergistic with anti-PD-1 therapy in PDAC mouse models. One cohort included 22 patients and combined the CXCR4 antagonist BL-8040 (motixa-fortide) with pembrolizumab-nanoliposomal irinotecan-fluorouracil-folinic acid in PDAC second-line treatment. The preliminary results showed an objective response rate, disease control rate and median duration of response of 32%, 77% and 7.8 mo, respectively, suggesting that it is indeed a promising strategy in treating PDAC[93].
According to trial results, patients, who received only immunotherapy, experienced 9%-11% of grade ≥ 3 immune related adverse events[76], while patients receiving immunotherapy in combination with chemotherapy presented grade ≥ 3 adverse effects in up to 53%. In these cases the most common toxicities were hematologic[2].
Vaccines treatment as a single agent or in combinationSeveral types of vaccines have been tested as single agents (Table 3) or in combination with chemotherapy (Table 4) or immunotherapy (Table 5), including whole-cell vaccines, DCs, DNA and peptide vaccines that entail the presentation of immunogenic cancer antigens to the immune system, resulting in the activation of cancer antigen-specific cytotoxic T lymphocytes in vivo and the subsequent anticancer immune response[94].

Ostios-Garcia et al. Immunotherapy in pancreatic cancer
WJG https://www.wjgnet.com 6782 October 28, 2021 Volume 27 Issue 40
Table 2 Clinical trials on pancreatic ductal adenocarcinoma combining immunotherapy and chemotherapy
National clinical trial number Sample Phase Settings Drug Results
NCT01473940 21 I Advanced; Metastatic; Any line
Ipilimumab; Gemcitabine OS 8,5 m (95%CI: 2.2-10.3)
NCT00556023 34 I Metastatic Chemotherapy naïve
Tremelimumab Gemcitabine OS 7.4 m (95%CI: 5.8-9.4)
NCT02331251 81 I/II Metastatic (PDAC and other tumors) Chemotherapy naïve
Pembrolizumab; Nab-Paclitaxel Gemcitabine
OS 15 m (95%CI: 6.8-22.6)
Beatty et al, Clin Cancer Res 2013; 19: 6286–6295
22 I Advanced; First line CD40 agonist (CP-870893); Gemcitabine
PFS 5.2 m (95%CI: 1.9-7.4); OS 8.4 m (95%CI: 5.3-11.8); 1-y OS 28.6%
NCT01413022 47 I Borderline; Locally advanced Chemotherapy naïve
CCR2 inhibitor (PF-04136309); FOLFIRINOX
Combination arm: 49% OR Chemotherapy arm: 0% OR
NCT02268825 39 I Advanced; Metastatic (gastrointestinal malignancies) ; Any line
Pembrolizumab mFOLFOX No results posted
NCT02309177 138 I Advanced; Metastatic (PDAC and other tumors); Any treatment naive
Nivolumab; Nab-Paclitaxel Gemcitabine
No results posted
NCT02077881 98 I/II Metastatic; First line IDO inhibitor (indoximod); Nab-Paclitaxel; Gemcitabine
No results posted
NCT04045730 17 I/II Metastatic First line Gemcitabine; Nab-Pacliatxel; Pembrolizumab
PFS 9.1 m (95%CI: 4.9-13.3); OS 15 m (95%CI: 6.8-23)
NCT03214250 30 I Metastatic; First line Gemcitabine; Nab-Paclitaxel; Nivolumab; CD40 (agonistic monoclonal antibody) APX005M (sotigalimab)
Ongoing
NCT02826486 80 II Metastatic; Any line BL-8040; Pembrolizumab; Pegylated liposomal Irinotecan + 5FU
Disease Control Rate 34.5%; OS: 3.3 m Patients receiving study drugs as second-line therapy: 7.5 m
OS: Overall survival; PDAC: Pancreatic ductal adenocarcinoma; PFS: Progression-free survival; OR: Objective response.
GVAXThe mechanism of actions of GVAX vaccines is the stimulation of APC antigen uptake and T-cell priming through PDAC cell modification to express granulocyte-macrophage colony-stimulating factor (GM-CSF)[95].
A number of phase I and II clinical trials have been conducted on localized PDAC. A phase II clinical trial (NCT00084383) with 60 randomized patients evaluated the effectiveness of the GVAX vaccine administrated in two times: 1) after surgery and before 5-fluoracil based chemotherapy and 2) after chemotherapy had finished. The median PFS was 17.3 mo, and the median OS of 24.8 mo[96].
The GVAX vaccine has also been tested in metastatic PDAC. A phase II clinical trial (NCT01417000) in which 93 patients were randomized to the combination of GVAX plus cyclophosphamide with or without CRS-207 reported an OS of 6.1 mo in the experimental arm vs 3.9 mo in the control arm[97]. However, a phase IIb clinical trial (NCT02004262) showed no benefit in its primary endpoint of OS[98].
AlgenpantucelAlgenpantucel is a whole cell vaccine that works by harnessing a natural robust immune response against pancreatic cancer[99]. The vaccine has been tested in combination with gemcitabine plus 5-Fluoracil chemoraditherapy in patients with resected PDAC, achieving a 12 mo PFS of 65% and a 12 mo OS of 83% (vs 45% and 63% in the control arm, respectively)[99]. This trial is still on-going for patients with borderline and locally advanced PDAC[99].
KIF20A-66 and survivin-2B 80-88 peptidesKIF20A and survivin are two up-regulated HLA-A24-restricted peptides that have been employed as epitopes in vaccines development[100,101]. KIF20A-66 was tested in a phase I/II clinical trial for patients with metastatic HLA-2402-positive PDAC who

Ostios-Garcia et al. Immunotherapy in pancreatic cancer
WJG https://www.wjgnet.com 6783 October 28, 2021 Volume 27 Issue 40
Table 3 Clinical trials on pancreatic ductal adenocarcinoma using vaccines
National clinical trial number Sample Phase Settings Drug Results
UMIN000004919 31 I/II Metastatic ≥ Second line KIF20A-66 KIF20A-66 vaccine: OS 4.7 m ± 0.8; Best supportive care: OS 2.7 m ± 1.1
UMIN000000905 6 I Advanced (gastrointestinal and endocrine malignancies) ; Any line
SVN-2B; IFA; INFa > 50% of the patients had positive clinical and immunological responses
NCT00569387 73 II Adjuvant treatment Algenpantucel-L 12-m OS: 86%
Kaufman et al, J Transl Med 2007; 5: 60
10 I Advanced; Metastatic; Any line MUC1; HLA-A2; ICAM-1; LFA-3; CM-CSF
antiCEA/MUC-1 positive: OS 15.1 m; antiCEA/MUC-1 negative: OS 3.9 m
Lepisto et al, Cancer Ther 2008; 6: 955–964
12 I/II Adjuvant treatment MUC1 peptide-loaded DC vaccine
Four of twelve patients are still alive without disease recurrence
NCT01410968 12 I Advanced; Metastatic; Any line w/Poly-ICLC peptide-pulsed DC-CIK
OS 7.7 m
Gjertsen et al, Int J Cancer 2001; 92: 441–50
48 I/II Surgically resected; Advanced; Any line
K-Ras vaccine GM-CSF Resected: OS 25.6 m (95%CI: 10-39); Unresectable: OS 10.2 m (95%CI: 3-28)
Abou-Alfa et al, Am J Clin Oncol 2011; 34: 321–5
24 I Adjuvant (KRAS mutant) Ras-peptide GM-CSF OS 20.3 (95%CI: 11.6-45.3)
Bernhardt et al, Br J Cancer 2006; 95: 1474–1482
48 I/II Advanced Treatment naive GV1001; GM-CSF Responders: OS 7.2 m (95%CI: 4.8-10.7); Non-responders: OS 2.9 m (95%CI: 1.7-6.30)
Shima et al, Cancer Sci 2019; 110: 2378-2385
83 II Unresectable ≥ Second line Survivin 2B peptide (SVN-2B); Interferon-β
SVN-2B + IFNβ: OS 312 d (95%CI: 43-460); IFNβ: OS 39 d (95%CI: 13-153)
CIK: cytokine-induced killer ; DC: dendritic cells; GM-CSF: granulocyte-macrophage colony-stimulating factor; IFN: interferon; m: months; OS: overall survival; PDAC: pancreatic ductal adenocarcinoma; PFS: progression-free survival.
had progressed to first-line gemcitabine chemotherapy (UMIN000004919). The OS was 4.7 mo in the treated arm vs 2.7 mo in the best supportive care arm. The PFS was 1.8 mo in the vaccine arm[100].
Survivine-2B (SVN-2B) is an HLA-A24 restricted peptide that has been investigated since 2003 with inconspicuous results. A clinical trial (UMIN000000905) with 6 HLA-A2402-positive patients was conducted, resulting in a clinical y immunogenic response in 50% of patients[101].
Other vaccines targeting KRAS and MUC-1These vaccines target distinct tumor antigens based on the identification of mutated oncogenes, such as KRAS, altered tumor suppressor genes, such as TP53, CDKN2A, DPC4, BRCA2, and ERBB2, as well as the overexpression of tumor-associated antigens, such as CEA and MUC-1, in pancreatic carcinoma cells[102]. A phase I clinical trial was conducted using MUC-1 vaccines in advanced PDAC, the results of which confirmed that a specific T-cell immune response was obtained, achieving a significant impro-vement in OS (15.3 mo vs 3.9 mo)[103].
A phase I/II clinical trial was conducted in the adjuvant setting, the results of which revealed that 4 out of 12 patients survived without disease recurrence[104].
Clinical trials using KRAS against vaccines have also been developed. There is a phase I/II study that combines mutant RAS peptides and GM-CSF in patients with resected or locally advanced PDAC, with an OS of 25.6 mo and 10.2 mo, respectively[105].
GV1001 is another tested vaccine. A phase I/II trial combining this vaccine with GM-CSF for unresectable PDAC[106], and observed an immune response in 63% of patients, with an OS of 7.2 mo vs 2.9 mo in no-immune responders. After these encouraging results, a phase III study for locally advanced PDAC was conducted[107]. However, the combination of GV1001 plus gemcitabine plus capecitabine did not improve OS compared with chemotherapy alone (6.9 mo vs 7.9 mo).
Combination of vaccines treatment with immune checkpointsPreclinical reports have supported the concept of synergy between cancer vaccines and immune checkpoint blockade in non-immunogenic tumors. Based on these results, several clinical trials have been conducted to assess the efficacy of this combination in

Ostios-Garcia et al. Immunotherapy in pancreatic cancer
WJG https://www.wjgnet.com 6784 October 28, 2021 Volume 27 Issue 40
Table 4 Clinical trials on pancreatic ductal adenocarcinoma combining vaccines and chemotherapy
National clinical trial number Sample Phase Settings Drug Results
Jaffee et al, J Clin Oncol 2001; 19: 145–56
14 I Adjuvant (stage I/II/III) CVAX, Chemorradiation Effective anti-tumor immunty
NCT00084383 60 II Adjuvant (stage I/II) GVAX; 5FU; Chemorradiation Combination: OS 24.8 m (95%CI: 21.2-31.6); 5FU/Chemorradiation: OS 20.3 m (95%CI: 18-23.9)
NCT01417000 93 IIa Metastatic ≥ Second line GVAX/Cy CRS-207 Combination: OS 6.28 m (95%CI: 4.47-9.40); GVAX/Cy: OS 4.07 m (95%CI: 3.32-5.42)
NCT02004262 303 IIb Metastatic ≥ Second line GVAX/Cy CRS-207 Chemotherapy
Combination: OS 3.7 m (95%CI: 2.9-5.3); CRS-207 alone: OS 5.4 m (95%CI: 4.2-6.4); Chemotherapy: OS 4.6 m (95%CI: 4.2-5.7)
UMIN000008082 60 II Advanced First line KIF20A; VEGFR1/2; Gemcitabine OS 9 m HLA matched; OS 10 m HLA unmatched
NCT01072981 722 III Adjuvant treatment Algenpantucel-L; Gemcitabine-5FU
1-y DFS 86% algenpantucel-L vs 63% Gemcitabine-5FU; 1-y OS 65% algenpantucel-L vs 45% Gencitabine-5FU
NCT01836432 302 III Borderline resectable; Locally advanced usresectable; First line
Algenpantucel-L; FOLFIRINOX; Gemcitabine; Nab-Paclitaxel; Capecitabine; 5FU
No results posted
NCT01781520 47 I/II Unresectable locally advancedMetastatic Chemotherapy naïve
DC-CIK Chemotherapy S-1 DC-CIK+Chemotherapy S-1: OS 7 m; DC-CIK alone: OS 4.2 m; Chemotherapy S-1 alone: OS 4.7 m; Supportive care only: OS 1.73 m
Muscarella et al, J Clin Oncol 2012; 30: e14501-e.
176 II Resected (KRAS mutant) adjuvant
GI-4000 Gemcitabine GI-4000+Gemcitabine OS 19.8 m; Placebo-gemcitabine: OS 14.8 m
Middleton et al, Lancet Oncol 2014; 15: 829–840
1062 III AdvancedMetastatic Chemotherapy naïve
GV1001 Gemcitabine Capecitabine Treated group: OS 6.9 m (95%CI: 6.4-7.6); Chemotherapy alone: OS 7.9 m (95% 7.1-8.8)
Yanagisawa et al, Anticancer Res 2018; 38: 2217-2225
8 I Adjuvant (I, II, III) WT1-DC VaccineS-1 Chemotherapy Gemcitabine
No results posted
Suzuki et al, Cancer Sci 2017; 108: 73-80
66 II Advanced First line Antiangiogenic cancer vaccines targeting VEGFR1 and VEGFR2 in addition to the KIF20A peptide; Gemcitabine
PFS HLA matched: 4.7 m; PFS HLA unmatched: 5.2 m
OS: overall survival; PDAC: pancreatic ductal adenocarcinoma: PFS: progression-free survival; Cy: Cyclophosphamide; VEGFR: vascular endothelial growth factor receptor.
PDAC therapy[108].In clinical trial NCT00836407, 30 patients with previously treated metastatic PDAC
were randomized to a high dose of Ipilimumab (10mg/kg) as the single agent or in combination with the GVAX vaccine. Five patients showed stable disease, and an OS of 5.7 mo was achieved in the experimental arm compared with 3.6 mo in the control arm[108].
Other studies that included patients with metastatic PDAC combined with nivolumab and ipilimumab, with or without GVAX and CRS-207, showed enhanced T-cell responses. Studies are currently evaluating the role of immune checkpoint inhibitors in combination with cyclophosphamide/GVAX and CRS-207 vaccines (NCT02243371, NCT02451982), and the results have yet to be published[99].
Pembrolizumab combined with the modified p53-expressing Ankara virus (p53MVA) vaccine has been studied in patients with several malignancies included PDAC, with clinical responses observed in 3 of 11 patients and disease stabilization for 30, 32 and 49 wk[109].
Vaccines were well tolerated. Most common toxicities were grade 1-2 induration/erythema or pain/soreness at the vaccine sites, pyrexia, chills, fatigue and nausea, with < 5% of patients reporting serious adverse events[96,98-99,106]. There were not reported clinical signs of auto-immune disease, abnormal biochemical or
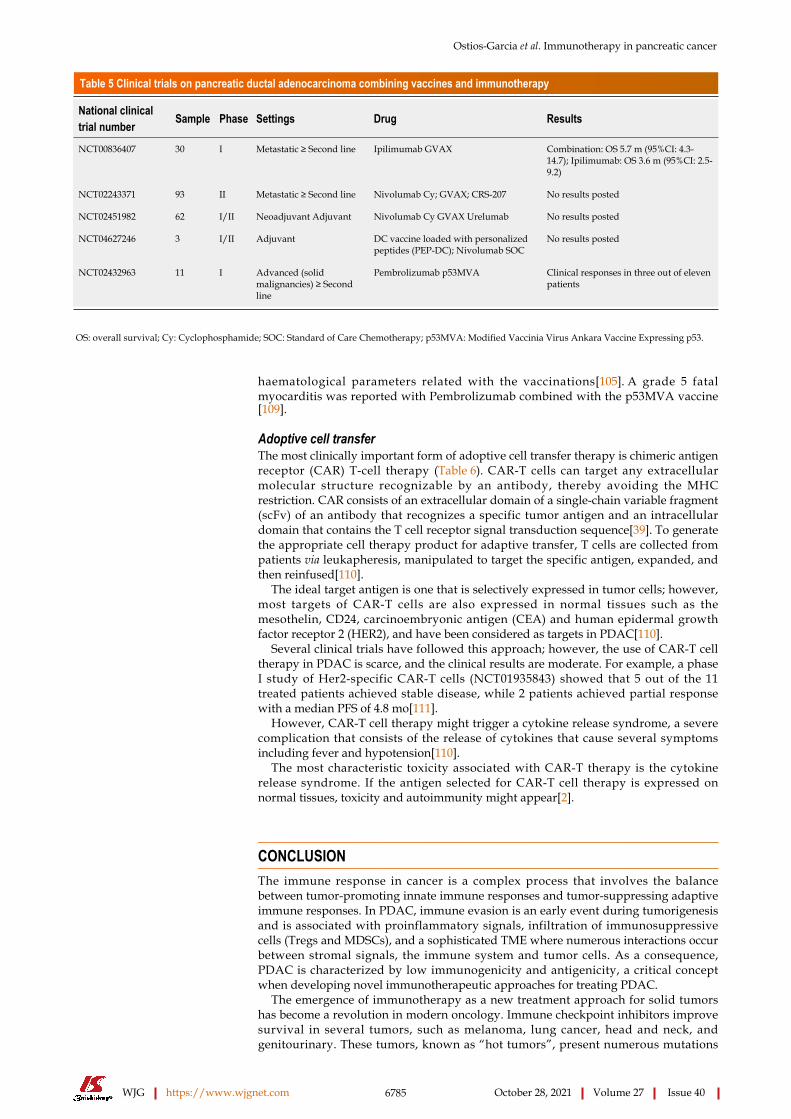
Ostios-Garcia et al. Immunotherapy in pancreatic cancer
WJG https://www.wjgnet.com 6785 October 28, 2021 Volume 27 Issue 40
Table 5 Clinical trials on pancreatic ductal adenocarcinoma combining vaccines and immunotherapy
National clinical trial number Sample Phase Settings Drug Results
NCT00836407 30 I Metastatic ≥ Second line Ipilimumab GVAX Combination: OS 5.7 m (95%CI: 4.3-14.7); Ipilimumab: OS 3.6 m (95%CI: 2.5-9.2)
NCT02243371 93 II Metastatic ≥ Second line Nivolumab Cy; GVAX; CRS-207 No results posted
NCT02451982 62 I/II Neoadjuvant Adjuvant Nivolumab Cy GVAX Urelumab No results posted
NCT04627246 3 I/II Adjuvant DC vaccine loaded with personalized peptides (PEP-DC); Nivolumab SOC
No results posted
NCT02432963 11 I Advanced (solid malignancies) ≥ Second line
Pembrolizumab p53MVA Clinical responses in three out of eleven patients
OS: overall survival; Cy: Cyclophosphamide; SOC: Standard of Care Chemotherapy; p53MVA: Modified Vaccinia Virus Ankara Vaccine Expressing p53.
haematological parameters related with the vaccinations[105]. A grade 5 fatal myocarditis was reported with Pembrolizumab combined with the p53MVA vaccine[109].
Adoptive cell transferThe most clinically important form of adoptive cell transfer therapy is chimeric antigen receptor (CAR) T-cell therapy (Table 6). CAR-T cells can target any extracellular molecular structure recognizable by an antibody, thereby avoiding the MHC restriction. CAR consists of an extracellular domain of a single-chain variable fragment (scFv) of an antibody that recognizes a specific tumor antigen and an intracellular domain that contains the T cell receptor signal transduction sequence[39]. To generate the appropriate cell therapy product for adaptive transfer, T cells are collected from patients via leukapheresis, manipulated to target the specific antigen, expanded, and then reinfused[110].
The ideal target antigen is one that is selectively expressed in tumor cells; however, most targets of CAR-T cells are also expressed in normal tissues such as the mesothelin, CD24, carcinoembryonic antigen (CEA) and human epidermal growth factor receptor 2 (HER2), and have been considered as targets in PDAC[110].
Several clinical trials have followed this approach; however, the use of CAR-T cell therapy in PDAC is scarce, and the clinical results are moderate. For example, a phase I study of Her2-specific CAR-T cells (NCT01935843) showed that 5 out of the 11 treated patients achieved stable disease, while 2 patients achieved partial response with a median PFS of 4.8 mo[111].
However, CAR-T cell therapy might trigger a cytokine release syndrome, a severe complication that consists of the release of cytokines that cause several symptoms including fever and hypotension[110].
The most characteristic toxicity associated with CAR-T therapy is the cytokine release syndrome. If the antigen selected for CAR-T cell therapy is expressed on normal tissues, toxicity and autoimmunity might appear[2].
CONCLUSIONThe immune response in cancer is a complex process that involves the balance between tumor-promoting innate immune responses and tumor-suppressing adaptive immune responses. In PDAC, immune evasion is an early event during tumorigenesis and is associated with proinflammatory signals, infiltration of immunosuppressive cells (Tregs and MDSCs), and a sophisticated TME where numerous interactions occur between stromal signals, the immune system and tumor cells. As a consequence, PDAC is characterized by low immunogenicity and antigenicity, a critical concept when developing novel immunotherapeutic approaches for treating PDAC.
The emergence of immunotherapy as a new treatment approach for solid tumors has become a revolution in modern oncology. Immune checkpoint inhibitors improve survival in several tumors, such as melanoma, lung cancer, head and neck, and genitourinary. These tumors, known as “hot tumors”, present numerous mutations

Ostios-Garcia et al. Immunotherapy in pancreatic cancer
WJG https://www.wjgnet.com 6786 October 28, 2021 Volume 27 Issue 40
Table 6 Clinical trials on pancreatic ductal adenocarcinoma using adoptive cell transfer
National clinical trial number Sample Phase Settings Drug Results
NCT00570713 155 II Unresectable First-line MORb-009 Gemcitabine Combination: OS 6.5 m (95%CI: 4.5-8.10); Placebo plus Gemcitabine: OS 6.9 m (95%CI: 5.4-8.8)
NCT01935843 10 I/II Advanced (PDAC and other tumors Her2-positive) ≥ Second line
Her2-specific CAR-T cells OS 4.8 m (95%CI: 1.5-8.3)
NCT01781520 47 I/II Advanced; Any line DC-CIK Chemoterapy S-1 DC-CIK + Chemotherapy S-1: OS 7 m DC-CIK alone: OS 4.2 m; Chemotherapy S-1 alone: OS 4.7 m; Supportive care only: OS 1.73 m
Aoki et al, Cytotherapy 2017; 19: 473-485
48 I Adjuvant Gemcitabine; Autologous γδ; T-cell transfer
PFS 26 m (no statistical diference); OS No statistical difference
NCT01959672 11 I/II Neoadjuvant Gemcitabine; Leucovorin-Fluorouracil; Oregovomab; Nelfinavir + SBRT
Prematurely closed; PFS 8.6 m; OS 13 m (95%CI: 7-22)
NCT00720785 40 I Metastatic (PDAC and other tumors) ≥ Second line
Irreversible electroporation (IRE); Allogeneic natural killer cell therapy
No results posted
NCT04212026 67 I Metastatic ≥ Second line Irreversible electroporation; Allogeneic natural killer cell therapy
Stage III PFS 9,1 m (IRE-NK) vs 7.9 m (IRE); Stage III OS 13.6 m (IRE-NK) vs 12.2 m (IRE); Stage IV OS 10.2 m (IRE-NK) vs 9.1 m (IRE)
NCT01583686 6 I Metastatic ≥ Second line Mesothelin-CART 2 patients stabilized diseasePFS patient 1: 3.8 mPFS patient 2: 5.4 m
CAR: chimeric antigen receptor; DC-CIK: dendritic cell-activated cytokine-induced killer cell; IRE: irreversible electroporation; OS: overall survival; NK: natural killer; PFS: progression-free survival; SBRT: stereotactic body radiation therapy.
that create a high number of neoantigens recognized by effector T cells that are released to fight the cancerous cells. However, in the case of PDAC, these results have not been as spectacular as other tumors’ due to the intrinsic characteristics of PDAC, which enable it to self-isolate through a complex stroma, thereby evading the immune system.
Immune checkpoint inhibitors as single agents do not provide a benefit in PDAC. However, their combination with chemotherapy may transform PDAC into a “hot tumor” that is more susceptible to immunotherapy. The outcomes in phase I/II clinical trials using this approach are encouraging, with a benefit in OS in several combin-ations. Cancer vaccines employed as single-agent treatments or combined with classical chemotherapy, chemoradiotherapy or immunotherapy have promising results in the early phases of clinical trials. However, these outcomes have not been confirmed in more advanced studies. Lastly, adoptive cell transfer, specifically the CART-T cell approach, is still in very early phase of development.
Despite advances in treating PDAC, this tumor continues to be associated with extremely poor outcomes and high mortality. Systemic therapies and new strategies therefore need to be developed to improve patient prognoses, which will depend on an ever-increasing understanding of basic immunity and its role in PDAC. They keys to achieving significant changes in the treatment of PDAC include research into safe novel inhibitors (such as immunosuppressive factor, TAMs, MDSCs, and Tregs), increasing the prophylactic efforts in the early stages of carcinogenesis, deepening the understanding of molecular subtyping in PDAC and conducting appropriate patient selection.
REFERENCESVon Hoff DD, Ervin T, Arena FP, Chiorean EG, Infante J, Moore M, Seay T, Tjulandin SA, Ma WW, Saleh MN, Harris M, Reni M, Dowden S, Laheru D, Bahary N, Ramanathan RK, Tabernero J, Hidalgo M, Goldstein D, Van Cutsem E, Wei X, Iglesias J, Renschler MF. Increased survival in pancreatic cancer with nab-paclitaxel plus gemcitabine. N Engl J Med 2013; 369: 1691-1703 [PMID: 24131140 DOI: 10.1056/NEJMoa1304369]
1

Ostios-Garcia et al. Immunotherapy in pancreatic cancer
WJG https://www.wjgnet.com 6787 October 28, 2021 Volume 27 Issue 40
Young K, Hughes DJ, Cunningham D, Starling N. Immunotherapy and pancreatic cancer: unique challenges and potential opportunities. Ther Adv Med Oncol 2018; 10: 1758835918816281 [PMID: 30574212 DOI: 10.1177/1758835918816281]
2
Ilic M, Ilic I. Epidemiology of pancreatic cancer. World J Gastroenterol 2016; 22: 9694-9705 [PMID: 27956793 DOI: 10.3748/wjg.v22.i44.9694]
3
Seufferlein T, Bachet JB, Van Cutsem E, Rougier P; ESMO Guidelines Working Group. Pancreatic adenocarcinoma: ESMO-ESDO Clinical Practice Guidelines for diagnosis, treatment and follow-up. Ann Oncol 2012; 23 Suppl 7: vii33-vii40 [PMID: 22997452 DOI: 10.1093/annonc/mds224]
4
Mayo SC, Nathan H, Cameron JL, Olino K, Edil BH, Herman JM, Hirose K, Schulick RD, Choti MA, Wolfgang CL, Pawlik TM. Conditional survival in patients with pancreatic ductal adenocarcinoma resected with curative intent. Cancer 2012; 118: 2674-2681 [PMID: 21935914 DOI: 10.1002/cncr.26553]
5
Hidalgo M. Pancreatic cancer. N Engl J Med 2010; 362: 1605-1617 [PMID: 20427809 DOI: 10.1056/NEJMra0901557]
6
Kamisawa T, Wood LD, Itoi T, Takaori K. Pancreatic cancer. Lancet 2016; 388: 73-85 [PMID: 26830752 DOI: 10.1016/S0140-6736(16)00141-0]
7
Conroy T, Hammel P, Hebbar M, Ben Abdelghani M, Wei AC, Raoul JL, Choné L, Francois E, Artru P, Biagi JJ, Lecomte T, Assenat E, Faroux R, Ychou M, Volet J, Sauvanet A, Breysacher G, Di Fiore F, Cripps C, Kavan P, Texereau P, Bouhier-Leporrier K, Khemissa-Akouz F, Legoux JL, Juzyna B, Gourgou S, O'Callaghan CJ, Jouffroy-Zeller C, Rat P, Malka D, Castan F, Bachet JB; Canadian Cancer Trials Group and the Unicancer-GI–PRODIGE Group. FOLFIRINOX or Gemcitabine as Adjuvant Therapy for Pancreatic Cancer. N Engl J Med 2018; 379: 2395-2406 [PMID: 30575490 DOI: 10.1056/NEJMoa1809775]
8
Golan T, Hammel P, Reni M, Van Cutsem E, Macarulla T, Hall MJ, Park JO, Hochhauser D, Arnold D, Oh DY, Reinacher-Schick A, Tortora G, Algül H, O'Reilly EM, McGuinness D, Cui KY, Schlienger K, Locker GY, Kindler HL. Maintenance Olaparib for Germline BRCA-Mutated Metastatic Pancreatic Cancer. N Engl J Med 2019; 381: 317-327 [PMID: 31157963 DOI: 10.1056/NEJMoa1903387]
9
Le DT, Durham JN, Smith KN, Wang H, Bartlett BR, Aulakh LK, Lu S, Kemberling H, Wilt C, Luber BS, Wong F, Azad NS, Rucki AA, Laheru D, Donehower R, Zaheer A, Fisher GA, Crocenzi TS, Lee JJ, Greten TF, Duffy AG, Ciombor KK, Eyring AD, Lam BH, Joe A, Kang SP, Holdhoff M, Danilova L, Cope L, Meyer C, Zhou S, Goldberg RM, Armstrong DK, Bever KM, Fader AN, Taube J, Housseau F, Spetzler D, Xiao N, Pardoll DM, Papadopoulos N, Kinzler KW, Eshleman JR, Vogelstein B, Anders RA, Diaz LA Jr. Mismatch repair deficiency predicts response of solid tumors to PD-1 blockade. Science 2017; 357: 409-413 [PMID: 28596308 DOI: 10.1126/science.aan6733]
10
O'Reilly EM, Hechtman JF. Tumour response to TRK inhibition in a patient with pancreatic adenocarcinoma harbouring an NTRK gene fusion. Ann Oncol 2019; 30: viii36-viii40 [PMID: 31605106 DOI: 10.1093/annonc/mdz385]
11
Emens LA, Ascierto PA, Darcy PK, Demaria S, Eggermont AMM, Redmond WL, Seliger B, Marincola FM. Cancer immunotherapy: Opportunities and challenges in the rapidly evolving clinical landscape. Eur J Cancer 2017; 81: 116-129 [PMID: 28623775 DOI: 10.1016/j.ejca.2017.01.035]
12
Hanahan D, Weinberg RA. Hallmarks of cancer: the next generation. Cell 2011; 144: 646-674 [PMID: 21376230 DOI: 10.1016/j.cell.2011.02.013]
13
Vonderheide RH, Bayne LJ. Inflammatory networks and immune surveillance of pancreatic carcinoma. Curr Opin Immunol 2013; 25: 200-205 [PMID: 23422836 DOI: 10.1016/j.coi.2013.01.006]
14
Clark CE, Beatty GL, Vonderheide RH. Immunosurveillance of pancreatic adenocarcinoma: insights from genetically engineered mouse models of cancer. Cancer Lett 2009; 279: 1-7 [PMID: 19013709 DOI: 10.1016/j.canlet.2008.09.037]
15
de Visser KE, Eichten A, Coussens LM. Paradoxical roles of the immune system during cancer development. Nat Rev Cancer 2006; 6: 24-37 [PMID: 16397525 DOI: 10.1038/nrc1782]
16
Hinshaw DC, Shevde LA. The Tumor Microenvironment Innately Modulates Cancer Progression. Cancer Res 2019; 79: 4557-4566 [PMID: 31350295 DOI: 10.1158/0008-5472.CAN-18-3962]
17
Mosser DM, Edwards JP. Exploring the full spectrum of macrophage activation. Nat Rev Immunol 2008; 8: 958-969 [PMID: 19029990 DOI: 10.1038/nri2448]
18
Biswas SK, Mantovani A. Macrophage plasticity and interaction with lymphocyte subsets: cancer as a paradigm. Nat Immunol 2010; 11: 889-896 [PMID: 20856220 DOI: 10.1038/ni.1937]
19
Zhang R, Liu Q, Peng J, Wang M, Li T, Liu J, Cui M, Zhang X, Gao X, Liao Q, Zhao Y. CXCL5 overexpression predicts a poor prognosis in pancreatic ductal adenocarcinoma and is correlated with immune cell infiltration. J Cancer 2020; 11: 2371-2381 [PMID: 32201508 DOI: 10.7150/jca.40517]
20
Hu H, Hang JJ, Han T, Zhuo M, Jiao F, Wang LW. The M2 phenotype of tumor-associated macrophages in the stroma confers a poor prognosis in pancreatic cancer. Tumour Biol 2016; 37: 8657-8664 [PMID: 26738860 DOI: 10.1007/s13277-015-4741-z]
21
Pollard JW. Tumour-educated macrophages promote tumour progression and metastasis. Nat Rev Cancer 2004; 4: 71-78 [PMID: 14708027 DOI: 10.1038/nrc1256]
22
Wyckoff J, Wang W, Lin EY, Wang Y, Pixley F, Stanley ER, Graf T, Pollard JW, Segall J, Condeelis J. A paracrine loop between tumor cells and macrophages is required for tumor cell migration in mammary tumors. Cancer Res 2004; 64: 7022-7029 [PMID: 15466195 DOI: 10.1158/0008-5472.CAN-04-1449]
23

Ostios-Garcia et al. Immunotherapy in pancreatic cancer
WJG https://www.wjgnet.com 6788 October 28, 2021 Volume 27 Issue 40
Thyagarajan A, Alshehri MSA, Miller KLR, Sherwin CM, Travers JB, Sahu RP. Myeloid-Derived Suppressor Cells and Pancreatic Cancer: Implications in Novel Therapeutic Approaches. Cancers (Basel) 2019; 11 [PMID: 31652904 DOI: 10.3390/cancers11111627]
24
Trovato R, Fiore A, Sartori S, Canè S, Giugno R, Cascione L, Paiella S, Salvia R, De Sanctis F, Poffe O, Anselmi C, Hofer F, Sartoris S, Piro G, Carbone C, Corbo V, Lawlor R, Solito S, Pinton L, Mandruzzato S, Bassi C, Scarpa A, Bronte V, Ugel S. Immunosuppression by monocytic myeloid-derived suppressor cells in patients with pancreatic ductal carcinoma is orchestrated by STAT3. J Immunother Cancer 2019; 7: 255 [PMID: 31533831 DOI: 10.1186/s40425-019-0734-6]
25
Pinton L, Solito S, Damuzzo V, Francescato S, Pozzuoli A, Berizzi A, Mocellin S, Rossi CR, Bronte V, Mandruzzato S. Activated T cells sustain myeloid-derived suppressor cell-mediated immune suppression. Oncotarget 2016; 7: 1168-1184 [PMID: 26700461 DOI: 10.18632/oncotarget.6662]
26
Gabrilovich DI, Velders MP, Sotomayor EM, Kast WM. Mechanism of immune dysfunction in cancer mediated by immature Gr-1+ myeloid cells. J Immunol 2001; 166: 5398-5406 [PMID: 11313376 DOI: 10.4049/jimmunol.166.9.5398]
27
Otsuji M, Kimura Y, Aoe T, Okamoto Y, Saito T. Oxidative stress by tumor-derived macrophages suppresses the expression of CD3 zeta chain of T-cell receptor complex and antigen-specific T-cell responses. Proc Natl Acad Sci U S A 1996; 93: 13119-13124 [PMID: 8917554 DOI: 10.1073/pnas.93.23.13119]
28
Huang B, Pan PY, Li Q, Sato AI, Levy DE, Bromberg J, Divino CM, Chen SH. Gr-1+CD115+ immature myeloid suppressor cells mediate the development of tumor-induced T regulatory cells and T-cell anergy in tumor-bearing host. Cancer Res 2006; 66: 1123-1131 [PMID: 16424049 DOI: 10.1158/0008-5472.CAN-05-1299]
29
Melani C, Chiodoni C, Forni G, Colombo MP. Myeloid cell expansion elicited by the progression of spontaneous mammary carcinomas in c-erbB-2 transgenic BALB/c mice suppresses immune reactivity. Blood 2003; 102: 2138-2145 [PMID: 12750171 DOI: 10.1182/blood-2003-01-0190]
30
Chiossone L, Dumas PY, Vienne M, Vivier E. Natural killer cells and other innate lymphoid cells in cancer. Nat Rev Immunol 2018; 18: 671-688 [PMID: 30209347 DOI: 10.1038/s41577-018-0061-z]
31
Davis M, Conlon K, Bohac GC, Barcenas J, Leslie W, Watkins L, Lamzabi I, Deng Y, Li Y, Plate JM. Effect of pemetrexed on innate immune killer cells and adaptive immune T cells in subjects with adenocarcinoma of the pancreas. J Immunother 2012; 35: 629-640 [PMID: 22996369 DOI: 10.1097/CJI.0b013e31826c8a4f]
32
Lim SA, Kim J, Jeon S, Shin MH, Kwon J, Kim TJ, Im K, Han Y, Kwon W, Kim SW, Yee C, Kim SJ, Jang JY, Lee KM. Defective Localization With Impaired Tumor Cytotoxicity Contributes to the Immune Escape of NK Cells in Pancreatic Cancer Patients. Front Immunol 2019; 10: 496 [PMID: 31024520 DOI: 10.3389/fimmu.2019.00496]
33
Huang Q, Huang M, Meng F, Sun R. Activated pancreatic stellate cells inhibit NK cell function in the human pancreatic cancer microenvironment. Cell Mol Immunol 2019; 16: 87-89 [PMID: 29628497 DOI: 10.1038/s41423-018-0014-2]
34
Peng YP, Zhang JJ, Liang WB, Tu M, Lu ZP, Wei JS, Jiang KR, Gao WT, Wu JL, Xu ZK, Miao Y, Zhu Y. Elevation of MMP-9 and IDO induced by pancreatic cancer cells mediates natural killer cell dysfunction. BMC Cancer 2014; 14: 738 [PMID: 25274283 DOI: 10.1186/1471-2407-14-738]
35
Arima K, Okabe H, Hashimoto D, Chikamoto A, Tsuji A, Yamamura K, Kitano Y, Inoue R, Kaida T, Higashi T, Taki K, Imai K, Komohara Y, Beppu T, Takeya M, Baba H. The diagnostic role of the neutrophil-to-lymphocyte ratio in predicting pancreatic ductal adenocarcinoma in patients with pancreatic diseases. Int J Clin Oncol 2016; 21: 940-945 [PMID: 27023215 DOI: 10.1007/s10147-016-0975-z]
36
Tao L, Zhang L, Peng Y, Tao M, Li G, Xiu D, Yuan C, Ma C, Jiang B. Preoperative neutrophil-to-lymphocyte ratio and tumor-related factors to predict lymph node metastasis in patients with pancreatic ductal adenocarcinoma (PDAC). Oncotarget 2016; 7: 74314-74324 [PMID: 27494847 DOI: 10.18632/oncotarget.11031]
37
Pu N, Yin H, Zhao G, Nuerxiati A, Wang D, Xu X, Kuang T, Jin D, Lou W, Wu W. Independent effect of postoperative neutrophil-to-lymphocyte ratio on the survival of pancreatic ductal adenocarcinoma with open distal pancreatosplenectomy and its nomogram-based prediction. J Cancer 2019; 10: 5935-5943 [PMID: 31762803 DOI: 10.7150/jca.35856]
38
Huber M, Brehm CU, Gress TM, Buchholz M, Alashkar Alhamwe B, von Strandmann EP, Slater EP, Bartsch JW, Bauer C, Lauth M. The Immune Microenvironment in Pancreatic Cancer. Int J Mol Sci 2020; 21 [PMID: 33022971 DOI: 10.3390/ijms21197307]
39
Mollinedo F. Neutrophil Degranulation, Plasticity, and Cancer Metastasis. Trends Immunol 2019; 40: 228-242 [PMID: 30777721 DOI: 10.1016/j.it.2019.01.006]
40
Balli D, Rech AJ, Stanger BZ, Vonderheide RH. Immune Cytolytic Activity Stratifies Molecular Subsets of Human Pancreatic Cancer. Clin Cancer Res 2017; 23: 3129-3138 [PMID: 28007776 DOI: 10.1158/1078-0432.CCR-16-2128]
41
Ino Y, Yamazaki-Itoh R, Shimada K, Iwasaki M, Kosuge T, Kanai Y, Hiraoka N. Immune cell infiltration as an indicator of the immune microenvironment of pancreatic cancer. Br J Cancer 2013; 108: 914-923 [PMID: 23385730 DOI: 10.1038/bjc.2013.32]
42
Feig C, Jones JO, Kraman M, Wells RJ, Deonarine A, Chan DS, Connell CM, Roberts EW, Zhao Q, Caballero OL, Teichmann SA, Janowitz T, Jodrell DI, Tuveson DA, Fearon DT. Targeting CXCL12 from FAP-expressing carcinoma-associated fibroblasts synergizes with anti-PD-L1 immunotherapy
43

Ostios-Garcia et al. Immunotherapy in pancreatic cancer
WJG https://www.wjgnet.com 6789 October 28, 2021 Volume 27 Issue 40
in pancreatic cancer. Proc Natl Acad Sci U S A 2013; 110: 20212-20217 [PMID: 24277834 DOI: 10.1073/pnas.1320318110]Hiraoka N, Onozato K, Kosuge T, Hirohashi S. Prevalence of FOXP3+ regulatory T cells increases during the progression of pancreatic ductal adenocarcinoma and its premalignant lesions. Clin Cancer Res 2006; 12: 5423-5434 [PMID: 17000676 DOI: 10.1158/1078-0432.CCR-06-0369]
44
Huber M, Lohoff M. IRF4 at the crossroads of effector T-cell fate decision. Eur J Immunol 2014; 44: 1886-1895 [PMID: 24782159 DOI: 10.1002/eji.201344279]
45
De Monte L, Reni M, Tassi E, Clavenna D, Papa I, Recalde H, Braga M, Di Carlo V, Doglioni C, Protti MP. Intratumor T helper type 2 cell infiltrate correlates with cancer-associated fibroblast thymic stromal lymphopoietin production and reduced survival in pancreatic cancer. J Exp Med 2011; 208: 469-478 [PMID: 21339327 DOI: 10.1084/jem.20101876]
46
Galon J, Bruni D. Tumor Immunology and Tumor Evolution: Intertwined Histories. Immunity 2020; 52: 55-81 [PMID: 31940273 DOI: 10.1016/j.immuni.2019.12.018]
47
Dobrzanski MJ. Expanding roles for CD4 T cells and their subpopulations in tumor immunity and therapy. Front Oncol 2013; 3: 63 [PMID: 23533029 DOI: 10.3389/fonc.2013.00063]
48
Vizio B, Novarino A, Giacobino A, Cristiano C, Prati A, Ciuffreda L, Montrucchio G, Bellone G. Potential plasticity of T regulatory cells in pancreatic carcinoma in relation to disease progression and outcome. Exp Ther Med 2012; 4: 70-78 [PMID: 23060925 DOI: 10.3892/etm.2012.553]
49
Wing K, Fehérvári Z, Sakaguchi S. Emerging possibilities in the development and function of regulatory T cells. Int Immunol 2006; 18: 991-1000 [PMID: 16720616 DOI: 10.1093/intimm/dxl044]
50
Chellappa S, Hugenschmidt H, Hagness M, Line PD, Labori KJ, Wiedswang G, Taskén K, Aandahl EM. Regulatory T cells that co-express RORγt and FOXP3 are pro-inflammatory and immunosuppressive and expand in human pancreatic cancer. Oncoimmunology 2016; 5: e1102828 [PMID: 27141387 DOI: 10.1080/2162402X.2015.1102828]
51
Curiel TJ, Coukos G, Zou L, Alvarez X, Cheng P, Mottram P, Evdemon-Hogan M, Conejo-Garcia JR, Zhang L, Burow M, Zhu Y, Wei S, Kryczek I, Daniel B, Gordon A, Myers L, Lackner A, Disis ML, Knutson KL, Chen L, Zou W. Specific recruitment of regulatory T cells in ovarian carcinoma fosters immune privilege and predicts reduced survival. Nat Med 2004; 10: 942-949 [PMID: 15322536 DOI: 10.1038/nm1093]
52
Tassi E, Gavazzi F, Albarello L, Senyukov V, Longhi R, Dellabona P, Doglioni C, Braga M, Di Carlo V, Protti MP. Carcinoembryonic antigen-specific but not antiviral CD4+ T cell immunity is impaired in pancreatic carcinoma patients. J Immunol 2008; 181: 6595-6603 [PMID: 18941250 DOI: 10.4049/jimmunol.181.9.6595]
53
Blazquez JL, Benyamine A, Pasero C, Olive D. New Insights Into the Regulation of γδ T Cells by BTN3A and Other BTN/BTNL in Tumor Immunity. Front Immunol 2018; 9: 1601 [PMID: 30050536 DOI: 10.3389/fimmu.2018.01601]
54
von Bernstorff W, Voss M, Freichel S, Schmid A, Vogel I, Jöhnk C, Henne-Bruns D, Kremer B, Kalthoff H. Systemic and local immunosuppression in pancreatic cancer patients. Clin Cancer Res 2001; 7: 925s-932s [PMID: 11300493]
55
Torphy RJ, Zhu Y, Schulick RD. Immunotherapy for pancreatic cancer: Barriers and breakthroughs. Ann Gastroenterol Surg 2018; 2: 274-281 [PMID: 30003190 DOI: 10.1002/ags3.12176]
56
Heinemann V, Reni M, Ychou M, Richel DJ, Macarulla T, Ducreux M. Tumour-stroma interactions in pancreatic ductal adenocarcinoma: rationale and current evidence for new therapeutic strategies. Cancer Treat Rev 2014; 40: 118-128 [PMID: 23849556 DOI: 10.1016/j.ctrv.2013.04.004]
57
Feig C, Gopinathan A, Neesse A, Chan DS, Cook N, Tuveson DA. The pancreas cancer microenvironment. Clin Cancer Res 2012; 18: 4266-4276 [PMID: 22896693 DOI: 10.1158/1078-0432.CCR-11-3114]
58
Watt J, Kocher HM. The desmoplastic stroma of pancreatic cancer is a barrier to immune cell infiltration. Oncoimmunology 2013; 2: e26788 [PMID: 24498555 DOI: 10.4161/onci.26788]
59
Neesse A, Algül H, Tuveson DA, Gress TM. Stromal biology and therapy in pancreatic cancer: a changing paradigm. Gut 2015; 64: 1476-1484 [PMID: 25994217 DOI: 10.1136/gutjnl-2015-309304]
60
Kleeff J, Beckhove P, Esposito I, Herzig S, Huber PE, Löhr JM, Friess H. Pancreatic cancer microenvironment. Int J Cancer 2007; 121: 699-705 [PMID: 17534898 DOI: 10.1002/ijc.22871]
61
Whatcott CJ, Diep CH, Jiang P, Watanabe A, LoBello J, Sima C, Hostetter G, Shepard HM, Von Hoff DD, Han H. Desmoplasia in Primary Tumors and Metastatic Lesions of Pancreatic Cancer. Clin Cancer Res 2015; 21: 3561-3568 [PMID: 25695692 DOI: 10.1158/1078-0432.CCR-14-1051]
62
Bailey P, Chang DK, Nones K, Johns AL, Patch AM, Gingras MC, Miller DK, Christ AN, Bruxner TJ, Quinn MC, Nourse C, Murtaugh LC, Harliwong I, Idrisoglu S, Manning S, Nourbakhsh E, Wani S, Fink L, Holmes O, Chin V, Anderson MJ, Kazakoff S, Leonard C, Newell F, Waddell N, Wood S, Xu Q, Wilson PJ, Cloonan N, Kassahn KS, Taylor D, Quek K, Robertson A, Pantano L, Mincarelli L, Sanchez LN, Evers L, Wu J, Pinese M, Cowley MJ, Jones MD, Colvin EK, Nagrial AM, Humphrey ES, Chantrill LA, Mawson A, Humphris J, Chou A, Pajic M, Scarlett CJ, Pinho AV, Giry-Laterriere M, Rooman I, Samra JS, Kench JG, Lovell JA, Merrett ND, Toon CW, Epari K, Nguyen NQ, Barbour A, Zeps N, Moran-Jones K, Jamieson NB, Graham JS, Duthie F, Oien K, Hair J, Grützmann R, Maitra A, Iacobuzio-Donahue CA, Wolfgang CL, Morgan RA, Lawlor RT, Corbo V, Bassi C, Rusev B, Capelli P, Salvia R, Tortora G, Mukhopadhyay D, Petersen GM; Australian
63

Ostios-Garcia et al. Immunotherapy in pancreatic cancer
WJG https://www.wjgnet.com 6790 October 28, 2021 Volume 27 Issue 40
Pancreatic Cancer Genome Initiative, Munzy DM, Fisher WE, Karim SA, Eshleman JR, Hruban RH, Pilarsky C, Morton JP, Sansom OJ, Scarpa A, Musgrove EA, Bailey UM, Hofmann O, Sutherland RL, Wheeler DA, Gill AJ, Gibbs RA, Pearson JV, Waddell N, Biankin AV, Grimmond SM. Genomic analyses identify molecular subtypes of pancreatic cancer. Nature 2016; 531: 47-52 [PMID: 26909576 DOI: 10.1038/nature16965]Aguirre AJ, Nowak JA, Camarda ND, Moffitt RA, Ghazani AA, Hazar-Rethinam M, Raghavan S, Kim J, Brais LK, Ragon D, Welch MW, Reilly E, McCabe D, Marini L, Anderka K, Helvie K, Oliver N, Babic A, Da Silva A, Nadres B, Van Seventer EE, Shahzade HA, St Pierre JP, Burke KP, Clancy T, Cleary JM, Doyle LA, Jajoo K, McCleary NJ, Meyerhardt JA, Murphy JE, Ng K, Patel AK, Perez K, Rosenthal MH, Rubinson DA, Ryou M, Shapiro GI, Sicinska E, Silverman SG, Nagy RJ, Lanman RB, Knoerzer D, Welsch DJ, Yurgelun MB, Fuchs CS, Garraway LA, Getz G, Hornick JL, Johnson BE, Kulke MH, Mayer RJ, Miller JW, Shyn PB, Tuveson DA, Wagle N, Yeh JJ, Hahn WC, Corcoran RB, Carter SL, Wolpin BM. Real-time Genomic Characterization of Advanced Pancreatic Cancer to Enable Precision Medicine. Cancer Discov 2018; 8: 1096-1111 [PMID: 29903880 DOI: 10.1158/2159-8290.CD-18-0275]
64
Aung KL, Fischer SE, Denroche RE, Jang GH, Dodd A, Creighton S, Southwood B, Liang SB, Chadwick D, Zhang A, O'Kane GM, Albaba H, Moura S, Grant RC, Miller JK, Mbabaali F, Pasternack D, Lungu IM, Bartlett JMS, Ghai S, Lemire M, Holter S, Connor AA, Moffitt RA, Yeh JJ, Timms L, Krzyzanowski PM, Dhani N, Hedley D, Notta F, Wilson JM, Moore MJ, Gallinger S, Knox JJ. Genomics-Driven Precision Medicine for Advanced Pancreatic Cancer: Early Results from the COMPASS Trial. Clin Cancer Res 2018; 24: 1344-1354 [PMID: 29288237 DOI: 10.1158/1078-0432.CCR-17-2994]
65
Moffitt RA, Marayati R, Flate EL, Volmar KE, Loeza SG, Hoadley KA, Rashid NU, Williams LA, Eaton SC, Chung AH, Smyla JK, Anderson JM, Kim HJ, Bentrem DJ, Talamonti MS, Iacobuzio-Donahue CA, Hollingsworth MA, Yeh JJ. Virtual microdissection identifies distinct tumor- and stroma-specific subtypes of pancreatic ductal adenocarcinoma. Nat Genet 2015; 47: 1168-1178 [PMID: 26343385 DOI: 10.1038/ng.3398]
66
Champiat S, Ferté C, Lebel-Binay S, Eggermont A, Soria JC. Exomics and immunogenics: Bridging mutational load and immune checkpoints efficacy. Oncoimmunology 2014; 3: e27817 [PMID: 24605269 DOI: 10.4161/onci.27817]
67
Upadhrasta S, Zheng L. Strategies in Developing Immunotherapy for Pancreatic Cancer: Recognizing and Correcting Multiple Immune "Defects" in the Tumor Microenvironment. J Clin Med 2019; 8 [PMID: 31527414 DOI: 10.3390/jcm8091472]
68
Kleeff J, Korc M, Apte M, La Vecchia C, Johnson CD, Biankin AV, Neale RE, Tempero M, Tuveson DA, Hruban RH, Neoptolemos JP. Pancreatic cancer. Nat Rev Dis Primers 2016; 2: 16022 [PMID: 27158978 DOI: 10.1038/nrdp.2016.22]
69
Alexandrov LB, Nik-Zainal S, Wedge DC, Aparicio SA, Behjati S, Biankin AV, Bignell GR, Bolli N, Borg A, Børresen-Dale AL, Boyault S, Burkhardt B, Butler AP, Caldas C, Davies HR, Desmedt C, Eils R, Eyfjörd JE, Foekens JA, Greaves M, Hosoda F, Hutter B, Ilicic T, Imbeaud S, Imielinski M, Jäger N, Jones DT, Jones D, Knappskog S, Kool M, Lakhani SR, López-Otín C, Martin S, Munshi NC, Nakamura H, Northcott PA, Pajic M, Papaemmanuil E, Paradiso A, Pearson JV, Puente XS, Raine K, Ramakrishna M, Richardson AL, Richter J, Rosenstiel P, Schlesner M, Schumacher TN, Span PN, Teague JW, Totoki Y, Tutt AN, Valdés-Mas R, van Buuren MM, van 't Veer L, Vincent-Salomon A, Waddell N, Yates LR; Australian Pancreatic Cancer Genome Initiative; ICGC Breast Cancer Consortium; ICGC MMML-Seq Consortium; ICGC PedBrain, Zucman-Rossi J, Futreal PA, McDermott U, Lichter P, Meyerson M, Grimmond SM, Siebert R, Campo E, Shibata T, Pfister SM, Campbell PJ, Stratton MR. Signatures of mutational processes in human cancer. Nature 2013; 500: 415-421 [PMID: 23945592 DOI: 10.1038/nature12477]
70
Nakata B, Wang YQ, Yashiro M, Nishioka N, Tanaka H, Ohira M, Ishikawa T, Nishino H, Hirakawa K. Prognostic value of microsatellite instability in resectable pancreatic cancer. Clin Cancer Res 2002; 8: 2536-2540 [PMID: 12171881]
71
Salem ME, Puccini A, Grothey A, Raghavan D, Goldberg RM, Xiu J, Korn WM, Weinberg BA, Hwang JJ, Shields AF, Marshall JL, Philip PA, Lenz HJ. Landscape of Tumor Mutation Load, Mismatch Repair Deficiency, and PD-L1 Expression in a Large Patient Cohort of Gastrointestinal Cancers. Mol Cancer Res 2018; 16: 805-812 [PMID: 29523759 DOI: 10.1158/1541-7786.MCR-17-0735]
72
Hu ZI, Shia J, Stadler ZK, Varghese AM, Capanu M, Salo-Mullen E, Lowery MA, Diaz LA Jr, Mandelker D, Yu KH, Zervoudakis A, Kelsen DP, Iacobuzio-Donahue CA, Klimstra DS, Saltz LB, Sahin IH, O'Reilly EM. Evaluating Mismatch Repair Deficiency in Pancreatic Adenocarcinoma: Challenges and Recommendations. Clin Cancer Res 2018; 24: 1326-1336 [PMID: 29367431 DOI: 10.1158/1078-0432.CCR-17-3099]
73
Fraune C, Burandt E, Simon R, Hube-Magg C, Makrypidi-Fraune G, Kluth M, Büscheck F, Höflmayer D, Blessin NC, Mandelkow T, Li W, Perez D, Izbicki JR, Wilczak W, Sauter G, Schrader J, Neipp M, Mofid H, Daniels T, Isbert C, Clauditz TS, Steurer S. MMR Deficiency is Homogeneous in Pancreatic Carcinoma and Associated with High Density of Cd8-Positive Lymphocytes. Ann Surg Oncol 2020; 27: 3997-4006 [PMID: 32108923 DOI: 10.1245/s10434-020-08209-y]
74
Fukunaga A, Miyamoto M, Cho Y, Murakami S, Kawarada Y, Oshikiri T, Kato K, Kurokawa T, Suzuoki M, Nakakubo Y, Hiraoka K, Itoh T, Morikawa T, Okushiba S, Kondo S, Katoh H. CD8+
75
Ostios-Garcia et al. Immunotherapy in pancreatic cancer
WJG https://www.wjgnet.com 6791 October 28, 2021 Volume 27 Issue 40
tumor-infiltrating lymphocytes together with CD4+ tumor-infiltrating lymphocytes and dendritic cells improve the prognosis of patients with pancreatic adenocarcinoma. Pancreas 2004; 28: e26-e31 [PMID: 14707745 DOI: 10.1097/00006676-200401000-00023]Schizas D, Charalampakis N, Kole C, Economopoulou P, Koustas E, Gkotsis E, Ziogas D, Psyrri A, Karamouzis MV. Immunotherapy for pancreatic cancer: A 2020 update. Cancer Treat Rev 2020; 86: 102016 [PMID: 32247999 DOI: 10.1016/j.ctrv.2020.102016]
76
Hodi FS, O'Day SJ, McDermott DF, Weber RW, Sosman JA, Haanen JB, Gonzalez R, Robert C, Schadendorf D, Hassel JC, Akerley W, van den Eertwegh AJ, Lutzky J, Lorigan P, Vaubel JM, Linette GP, Hogg D, Ottensmeier CH, Lebbé C, Peschel C, Quirt I, Clark JI, Wolchok JD, Weber JS, Tian J, Yellin MJ, Nichol GM, Hoos A, Urba WJ. Improved survival with ipilimumab in patients with metastatic melanoma. N Engl J Med 2010; 363: 711-723 [PMID: 20525992 DOI: 10.1056/NEJMoa1003466]
77
Freeman GJ, Long AJ, Iwai Y, Bourque K, Chernova T, Nishimura H, Fitz LJ, Malenkovich N, Okazaki T, Byrne MC, Horton HF, Fouser L, Carter L, Ling V, Bowman MR, Carreno BM, Collins M, Wood CR, Honjo T. Engagement of the PD-1 immunoinhibitory receptor by a novel B7 family member leads to negative regulation of lymphocyte activation. J Exp Med 2000; 192: 1027-1034 [PMID: 11015443 DOI: 10.1084/jem.192.7.1027]
78
Zinselmeyer BH, Heydari S, Sacristán C, Nayak D, Cammer M, Herz J, Cheng X, Davis SJ, Dustin ML, McGavern DB. PD-1 promotes immune exhaustion by inducing antiviral T cell motility paralysis. J Exp Med 2013; 210: 757-774 [PMID: 23530125 DOI: 10.1084/jem.20121416]
79
Patsoukis N, Brown J, Petkova V, Liu F, Li L, Boussiotis VA. Selective effects of PD-1 on Akt and Ras pathways regulate molecular components of the cell cycle and inhibit T cell proliferation. Sci Signal 2012; 5: ra46 [PMID: 22740686 DOI: 10.1126/scisignal.2002796]
80
Pauken KE, Sammons MA, Odorizzi PM, Manne S, Godec J, Khan O, Drake AM, Chen Z, Sen DR, Kurachi M, Barnitz RA, Bartman C, Bengsch B, Huang AC, Schenkel JM, Vahedi G, Haining WN, Berger SL, Wherry EJ. Epigenetic stability of exhausted T cells limits durability of reinvigoration by PD-1 blockade. Science 2016; 354: 1160-1165 [PMID: 27789795 DOI: 10.1126/science.aaf2807]
81
Royal RE, Levy C, Turner K, Mathur A, Hughes M, Kammula US, Sherry RM, Topalian SL, Yang JC, Lowy I, Rosenberg SA. Phase 2 trial of single agent Ipilimumab (anti-CTLA-4) for locally advanced or metastatic pancreatic adenocarcinoma. J Immunother 2010; 33: 828-833 [PMID: 20842054 DOI: 10.1097/CJI.0b013e3181eec14c]
82
Study of Tremelimumab in Patients With Advanced Solid Tumors - Study Results - ClinicalTrials.gov. [cited 20 January 2021]. Available from: https://clinicaltrials.gov/ct2/show/results/NCT02527434
83
Pembrolizumab in Microsatellite-Instability–High Advanced Colorectal Cancer | NEJM. [cited 20 January 2021]. Available from: https://www.nejm.org/doi/full/10.1056/NEJMoa2017699
84
O’Reilly EM, Oh D-Y, Dhani N, Renouf DJ, Lee MA, Sun W, Fisher G, Hezel A, Chang S-C, Vlahovic G, Takahashi O, Yang Y, Fitts D, Philip PA. Durvalumab With or Without Tremelimumab for Patients With Metastatic Pancreatic Ductal Adenocarcinoma: A Phase 2 Randomized Clinical Trial. JAMA Oncol (e-pub ahead of print 18 July 2019 [DOI: 10.1001/jamaoncol.2019.1588]
85
Bristol-Myers Squibb. A Phase 1/2, Open-label Study of Nivolumab Monotherapy or Nivolumab Combined With Ipilimumab in Subjects With Advanced or Metastatic Solid Tumors. ClinicalTrials.gov. [cited 20 January 2021]. Available from: https://clinicaltrials.gov/ct2/show/NCT01928394
86
Beatty GL, Gladney WL. Immune escape mechanisms as a guide for cancer immunotherapy. Clin Cancer Res 2015; 21: 687-692 [PMID: 25501578 DOI: 10.1158/1078-0432.CCR-14-1860]
87
Ho TTB, Nasti A, Seki A, Komura T, Inui H, Kozaka T, Kitamura Y, Shiba K, Yamashita T, Mizukoshi E, Kawaguchi K, Wada T, Honda M, Kaneko S, Sakai Y. Combination of gemcitabine and anti-PD-1 antibody enhances the anticancer effect of M1 macrophages and the Th1 response in a murine model of pancreatic cancer liver metastasis. J Immunother Cancer 2020; 8 [PMID: 33188035 DOI: 10.1136/jitc-2020-001367]
88
Weiss GJ, Blaydorn L, Beck J, Bornemann-Kolatzki K, Urnovitz H, Schütz E, Khemka V. Phase Ib/II study of gemcitabine, nab-paclitaxel, and pembrolizumab in metastatic pancreatic adenocarcinoma. Invest New Drugs 2018; 36: 96-102 [PMID: 29119276 DOI: 10.1007/s10637-017-0525-1]
89
Mohindra NA, Kircher SM, Nimeiri HS, Benson AB, Rademaker A, Alonso E, Blatner N, Khazaie K, Mulcahy MF. Results of the phase Ib study of ipilimumab and gemcitabine for advanced pancreas cancer. J Clin Oncol 2015; 33: e15281-e15281 [DOI: 10.1200/jco.2015.33.15_suppl.e15281]
90
Aglietta M, Barone C, Sawyer MB, Moore MJ, Miller WH Jr, Bagalà C, Colombi F, Cagnazzo C, Gioeni L, Wang E, Huang B, Fly KD, Leone F. A phase I dose escalation trial of tremelimumab (CP-675,206) in combination with gemcitabine in chemotherapy-naive patients with metastatic pancreatic cancer. Ann Oncol 2014; 25: 1750-1755 [PMID: 24907635 DOI: 10.1093/annonc/mdu205]
91
O'Hara MH, O'Reilly EM, Varadhachary G, Wolff RA, Wainberg ZA, Ko AH, Fisher G, Rahma O, Lyman JP, Cabanski CR, Mick R, Gherardini PF, Kitch LJ, Xu J, Samuel T, Karakunnel J, Fairchild J, Bucktrout S, LaVallee TM, Selinsky C, Till JE, Carpenter EL, Alanio C, Byrne KT, Chen RO, Trifan OC, Dugan U, Horak C, Hubbard-Lucey VM, Wherry EJ, Ibrahim R, Vonderheide RH. CD40 agonistic monoclonal antibody APX005M (sotigalimab) and chemotherapy, with or without
92

Ostios-Garcia et al. Immunotherapy in pancreatic cancer
WJG https://www.wjgnet.com 6792 October 28, 2021 Volume 27 Issue 40
nivolumab, for the treatment of metastatic pancreatic adenocarcinoma: an open-label, multicentre, phase 1b study. Lancet Oncol 2021; 22: 118-131 [PMID: 33387490 DOI: 10.1016/S1470-2045(20)30532-5]Bockorny B, Semenisty V, Macarulla T, Borazanci E, Wolpin BM, Stemmer SM, Golan T, Geva R, Borad MJ, Pedersen KS, Park JO, Ramirez RA, Abad DG, Feliu J, Muñoz A, Ponz-Sarvise M, Peled A, Lustig TM, Bohana-Kashtan O, Shaw SM, Sorani E, Chaney M, Kadosh S, Vainstein Haras A, Von Hoff DD, Hidalgo M. BL-8040, a CXCR4 antagonist, in combination with pembrolizumab and chemotherapy for pancreatic cancer: the COMBAT trial. Nat Med 2020; 26: 878-885 [PMID: 32451495 DOI: 10.1038/s41591-020-0880-x]
93
Janikashvili N, Larmonier N, Katsanis E. Personalized dendritic cell-based tumor immunotherapy. Immunotherapy 2010; 2: 57-68 [PMID: 20161666 DOI: 10.2217/imt.09.78]
94
Le DT, Pardoll DM, Jaffee EM. Cellular vaccine approaches. Cancer J 2010; 16: 304-310 [PMID: 20693840 DOI: 10.1097/PPO.0b013e3181eb33d7]
95
Lutz E, Yeo CJ, Lillemoe KD, Biedrzycki B, Kobrin B, Herman J, Sugar E, Piantadosi S, Cameron JL, Solt S, Onners B, Tartakovsky I, Choi M, Sharma R, Illei PB, Hruban RH, Abrams RA, Le D, Jaffee E, Laheru D. A lethally irradiated allogeneic granulocyte-macrophage colony stimulating factor-secreting tumor vaccine for pancreatic adenocarcinoma. A Phase II trial of safety, efficacy, and immune activation. Ann Surg 2011; 253: 328-335 [PMID: 21217520 DOI: 10.1097/SLA.0b013e3181fd271c]
96
Whiting C, Lutz E, Nair N, Chang S, Lemmens E, Chen S-Y, Solt S, Ferber S, Maecker H, Murphy A, Brockstedt DG, Jaffee EM, Le DT. Phase II, randomized study of GVAX pancreas and CRS-207 immunotherapy in patients with metastatic pancreatic cancer: Clinical update on long term survival and biomarker correlates to overall survival. J Clin Oncol 2015; 33: 261-261 [DOI: 10.1200/jco.2015.33.3_suppl.261]
97
Le DT, Picozzi VJ, Ko AH, Wainberg ZA, Kindler H, Wang-Gillam A, Oberstein P, Morse MA, Zeh HJ 3rd, Weekes C, Reid T, Borazanci E, Crocenzi T, LoConte NK, Musher B, Laheru D, Murphy A, Whiting C, Nair N, Enstrom A, Ferber S, Brockstedt DG, Jaffee EM. Results from a Phase IIb, Randomized, Multicenter Study of GVAX Pancreas and CRS-207 Compared with Chemotherapy in Adults with Previously Treated Metastatic Pancreatic Adenocarcinoma (ECLIPSE Study). Clin Cancer Res 2019; 25: 5493-5502 [PMID: 31126960 DOI: 10.1158/1078-0432.CCR-18-2992]
98
McCormick KA, Coveler AL, Rossi GR, Vahanian NN, Link C, Chiorean EG. Pancreatic cancer: Update on immunotherapies and algenpantucel-L. Hum Vaccin Immunother 2016; 12: 563-575 [PMID: 26619245 DOI: 10.1080/21645515.2015.1093264]
99
Asahara S, Takeda K, Yamao K, Maguchi H, Yamaue H. Phase I/II clinical trial using HLA-A24-restricted peptide vaccine derived from KIF20A for patients with advanced pancreatic cancer. J Transl Med 2013; 11: 291 [PMID: 24237633 DOI: 10.1186/1479-5876-11-291]
100
Kameshima H, Tsuruma T, Kutomi G, Shima H, Iwayama Y, Kimura Y, Imamura M, Torigoe T, Takahashi A, Hirohashi Y, Tamura Y, Tsukahara T, Kanaseki T, Sato N, Hirata K. Immunotherapeutic benefit of α-interferon (IFNα) in survivin2B-derived peptide vaccination for advanced pancreatic cancer patients. Cancer Sci 2013; 104: 124-129 [PMID: 23078230 DOI: 10.1111/cas.12046]
101
Laheru D, Jaffee EM. Immunotherapy for pancreatic cancer-science driving clinical progress. Nat Rev Cancer 2005; 5: 459-467 [PMID: 15905855 DOI: 10.1038/nrc1630]
102
Kaufman HL, Kim-Schulze S, Manson K, DeRaffele G, Mitcham J, Seo KS, Kim DW, Marshall J. Poxvirus-based vaccine therapy for patients with advanced pancreatic cancer. J Transl Med 2007; 5: 60 [PMID: 18039393 DOI: 10.1186/1479-5876-5-60]
103
Lepisto AJ, Moser AJ, Zeh H, Lee K, Bartlett D, McKolanis JR, Geller BA, Schmotzer A, Potter DP, Whiteside T, Finn OJ, Ramanathan RK. A phase I/II study of a MUC1 peptide pulsed autologous dendritic cell vaccine as adjuvant therapy in patients with resected pancreatic and biliary tumors. Cancer Ther 2008; 6: 955-964 [PMID: 19129927]
104
Gjertsen MK, Buanes T, Rosseland AR, Bakka A, Gladhaug I, Søreide O, Eriksen JA, Møller M, Baksaas I, Lothe RA, Saeterdal I, Gaudernack G. Intradermal ras peptide vaccination with granulocyte-macrophage colony-stimulating factor as adjuvant: Clinical and immunological responses in patients with pancreatic adenocarcinoma. Int J Cancer 2001; 92: 441-450 [PMID: 11291084 DOI: 10.1002/ijc.1205]
105
Bernhardt SL, Gjertsen MK, Trachsel S, Møller M, Eriksen JA, Meo M, Buanes T, Gaudernack G. Telomerase peptide vaccination of patients with non-resectable pancreatic cancer: A dose escalating phase I/II study. Br J Cancer 2006; 95: 1474-1482 [PMID: 17060934 DOI: 10.1038/sj.bjc.6603437]
106
Middleton G, Silcocks P, Cox T, Valle J, Wadsley J, Propper D, Coxon F, Ross P, Madhusudan S, Roques T, Cunningham D, Falk S, Wadd N, Harrison M, Corrie P, Iveson T, Robinson A, McAdam K, Eatock M, Evans J, Archer C, Hickish T, Garcia-Alonso A, Nicolson M, Steward W, Anthoney A, Greenhalf W, Shaw V, Costello E, Naisbitt D, Rawcliffe C, Nanson G, Neoptolemos J. Gemcitabine and capecitabine with or without telomerase peptide vaccine GV1001 in patients with locally advanced or metastatic pancreatic cancer (TeloVac): an open-label, randomised, phase 3 trial. Lancet Oncol 2014; 15: 829-840 [PMID: 24954781 DOI: 10.1016/S1470-2045(14)70236-0]
107
Le DT, Lutz E, Uram JN, Sugar EA, Onners B, Solt S, Zheng L, Diaz LA Jr, Donehower RC, Jaffee EM, Laheru DA. Evaluation of ipilimumab in combination with allogeneic pancreatic tumor cells transfected with a GM-CSF gene in previously treated pancreatic cancer. J Immunother 2013; 36:
108
Ostios-Garcia et al. Immunotherapy in pancreatic cancer
WJG https://www.wjgnet.com 6793 October 28, 2021 Volume 27 Issue 40
382-389 [PMID: 23924790 DOI: 10.1097/CJI.0b013e31829fb7a2]Chung V, Kos FJ, Hardwick N, Yuan Y, Chao J, Li D, Waisman J, Li M, Zurcher K, Frankel P, Diamond DJ. Evaluation of safety and efficacy of p53MVA vaccine combined with pembrolizumab in patients with advanced solid cancers. Clin Transl Oncol 2019; 21: 363-372 [PMID: 30094792 DOI: 10.1007/s12094-018-1932-2]
109
Sunami Y, Kleeff J. Immunotherapy of pancreatic cancer. In: Progress in Molecular Biology and Translational Science. Elsevier, 2019: 189–216
110
Feng K, Liu Y, Guo Y, Qiu J, Wu Z, Dai H, Yang Q, Wang Y, Han W. Phase I study of chimeric antigen receptor modified T cells in treating HER2-positive advanced biliary tract cancers and pancreatic cancers. Protein Cell 2018; 9: 838-847 [PMID: 28710747 DOI: 10.1007/s13238-017-0440-4]
111

WJG https://www.wjgnet.com 6794 October 28, 2021 Volume 27 Issue 40
World Journal of
GastroenterologyW J GSubmit a Manuscript: https://www.f6publishing.com World J Gastroenterol 2021 October 28; 27(40): 6794-6824
DOI: 10.3748/wjg.v27.i40.6794 ISSN 1007-9327 (print) ISSN 2219-2840 (online)
REVIEW
Artificial intelligence in gastroenterology: A state-of-the-art review
Paul T Kröner, Megan ML Engels, Benjamin S Glicksberg, Kipp W Johnson, Obaie Mzaik, Jeanin E van Hooft, Michael B Wallace, Hashem B El-Serag, Chayakrit Krittanawong
ORCID number: Paul T Kröner 0000-0002-7361-7883; Megan ML Engels 0000-0002-4708-3750; Benjamin S Glicksberg 0000-0003-4515-8090; Kipp W Johnson 0000-0002-5102-741X; Obaie Mzaik 0000-0001-7315-2548; Jeanin E van Hooft 0000-0002-4424-0079; Michael B Wallace 0000-0002-6446-5785; Hashem B El-Serag 0000-0001-5964-7579; Chayakrit Krittanawong 0000-0001-7953-335X.
Author contributions: Kröner PT contributed complete manuscript drafting, review of literature and data adquisition, critical manuscript revision; Engels MM contributed review of the literature, data adquisition, figure construction, table construction, manuscript review; Mzaik O contributed literature review, table construction; van Hooft JE and El-Serag HB contributed critical manuscript review; Wallace MB contributed manuscript structure, critical manuscript review; Krittanawong C contributed literature review, editing, critical manuscript review.
Conflict-of-interest statement: Dr. Krittanawong C discloses the following relationships – Member of the American College of Cardiology Solution Set Oversight Committee, the American Heart Association Committee of the Council on Genomic and Precision Medicine, and the American College of Cardiology/American
Paul T Kröner, Megan ML Engels, Obaie Mzaik, Michael B Wallace, Division of Gastroenterology and Hepatology, Mayo Clinic, Jacksonville, FL 32224, United States
Megan ML Engels, Cancer Center Amsterdam, Department of Gastroenterology and Hepatology, Amsterdam UMC, Location AMC, Amsterdam 1105, The Netherlands
Benjamin S Glicksberg, Kipp W Johnson, The Hasso Plattner Institute for Digital Health, Icahn School of Medicine at Mount Sinai, New York, NY 10029, United States
Jeanin E van Hooft, Department of Gastroenterology and Hepatology, Leiden University Medical Center, Amsterdam 2300, The Netherlands
Michael B Wallace, Division of Gastroenterology and Hepatology, Sheikh Shakhbout Medical City, Abu Dhabi 11001, United Arab Emirates
Hashem B El-Serag, Section of Gastroenterology and Hepatology, Michael E. DeBakey VA Medical Center and Baylor College of Medicine, Houston, TX 77030, United States
Hashem B El-Serag, Chayakrit Krittanawong, Section of Health Services Research, Michael E. DeBakey VA Medical Center and Baylor College of Medicine, Houston, TX 77030, United States
Chayakrit Krittanawong, Section of Cardiology, Michael E. DeBakey VA Medical Center, Houston, TX 77030, United States
Corresponding author: Chayakrit Krittanawong, MD, Doctor, Section of Health Services Research, Michael E. DeBakey VA Medical Center and Baylor College of Medicine, 1 Baylor Plaza, Houston, TX 77030, United States. [email protected]
AbstractThe development of artificial intelligence (AI) has increased dramatically in the last 20 years, with clinical applications progressively being explored for most of the medical specialties. The field of gastroenterology and hepatology, substan-tially reliant on vast amounts of imaging studies, is not an exception. The clinical applications of AI systems in this field include the identification of premalignant or malignant lesions (e.g., identification of dysplasia or esophageal adenocar-cinoma in Barrett’s esophagus, pancreatic malignancies), detection of lesions (e.g., polyp identification and classification, small-bowel bleeding lesion on capsule endoscopy, pancreatic cystic lesions), development of objective scoring systems for risk stratification, predicting disease prognosis or treatment response [e.g.,
Kröner PT et al. AI in GI review
WJG https://www.wjgnet.com 6795 October 28, 2021 Volume 27 Issue 40
Heart Association (ACC/AHA) Task Force on Performance Measures, The Lancet Digital Health (Advisory Board), European Heart Journal Digital Health (Editorial board), Journal of the American Heart Association (Editorial board), JACC: Asia (Section Editor), The Journal of Scientific Innovation in Medicine (Associate Editor), and Frontiers in Cardiovascular Medicine (Associate Editor).
Open-Access: This article is an open-access article that was selected by an in-house editor and fully peer-reviewed by external reviewers. It is distributed in accordance with the Creative Commons Attribution NonCommercial (CC BY-NC 4.0) license, which permits others to distribute, remix, adapt, build upon this work non-commercially, and license their derivative works on different terms, provided the original work is properly cited and the use is non-commercial. See: http://creativecommons.org/Licenses/by-nc/4.0/
Manuscript source: Invited manuscript
Specialty type: Gastroenterology and hepatology
Country/Territory of origin: United States
Peer-review report’s scientific quality classificationGrade A (Excellent): 0 Grade B (Very good): B Grade C (Good): 0 Grade D (Fair): 0 Grade E (Poor): 0
Received: May 11, 2021 Peer-review started: May 11, 2021 First decision: June 12, 2021 Revised: June 15, 2021 Accepted: September 15, 2021 Article in press: September 15, 2021 Published online: October 28, 2021
P-Reviewer: Shafqat S S-Editor: Gao CC L-Editor: A P-Editor: Yuan YY
determining survival in patients post-resection of hepatocellular carcinoma), determining which patients with inflammatory bowel disease (IBD) will benefit from biologic therapy], or evaluation of metrics such as bowel preparation score or quality of endoscopic examination. The objective of this comprehensive review is to analyze the available AI-related studies pertaining to the entirety of the gastrointestinal tract, including the upper, middle and lower tracts; IBD; the hepatobiliary system; and the pancreas, discussing the findings and clinical applications, as well as outlining the current limitations and future directions in this field.
Key Words: Artificial intelligence; Machine learning; Deep learning; Clinical applications; Gastroenterology
©The Author(s) 2021. Published by Baishideng Publishing Group Inc. All rights reserved.
Core Tip: Artificial intelligence (AI) clinical applications in gastroenterology and hepatology, which heavily relies on imaging, have dramatically expanded in the last 20 years. These applications include the detection of lesions, identification of pre-malignant or malignant lesions, development of objective scoring systems for risk stratification, predicting disease prognosis or treatment response, or evaluation of metrics such as bowel preparation score or quality of endoscopic examination. The objective of this review is to pool the available AI-related studies pertaining to the entire gastrointestinal tract, discussing findings and clinical applications, as well as outlining the current limitations and future directions in this field.
Citation: Kröner PT, Engels MM, Glicksberg BS, Johnson KW, Mzaik O, van Hooft JE, Wallace MB, El-Serag HB, Krittanawong C. Artificial intelligence in gastroenterology: A state-of-the-art review. World J Gastroenterol 2021; 27(40): 6794-6824URL: https://www.wjgnet.com/1007-9327/full/v27/i40/6794.htmDOI: https://dx.doi.org/10.3748/wjg.v27.i40.6794
INTRODUCTIONAs artificial intelligence (AI) continues to rapidly evolve in medicine, the clinical applications of this technology are becoming increasingly evident[1]. Relying heavily on endoscopic and radiologic imaging, gastroenterology has become an attractive field in which to apply AI. Special interest has already been devoted to several areas, including the detection of gastrointestinal neoplastic lesions to assist with rapid diagnosis, reduction of misdiagnosis, improvement in quality of imaging, reduction of interobserver variability in visual classifications, and radiologic and histopathologic interpretation[2-4].
AI is a broad term that encompasses disciplines such as machine learning (ML) and subdisciplines or specific techniques such as deep learning (DL) (Figure 1). The central motivation of ML to use large datasets to recognize patterns of interactions between variables, often ultimately in a way that allows the learned function to be applied to new data[5]. ML is composed of both “supervised” and “unsupervised” learning methods. The goal of supervised learning is to predict a labelled output focusing primarily on classifying data input into specific subgroups, or alternately for prediction of quantitative outcomes[6]. An example of supervised learning is training a system to assist in identifying gastric intestinal metaplasia (GIM) using a large database of lesions that have previously been identified by an operator as corres-ponding to GIM. In comparison, unsupervised learning does not have an output to predict. It relies on attempting to identify naturally occurring patterns from within the input, often to then group them accordingly (e.g., tissue sample clustering based on similar gene expression values)[6]. DL is a subset of ML, based on artificial neural networks (ANN), which are loosely inspired by the neuronal interplay in the human brain. DL autonomously utilizes the data input to learn, identify, and leverage predictive factors of an outcome, which can use multi-layered systems [i.e., convolu-tional neural networks (CNN)] to process complex information[3,7]. The realization of

Kröner PT et al. AI in GI review
WJG https://www.wjgnet.com 6796 October 28, 2021 Volume 27 Issue 40
Figure 1 Primary concepts of artificial intelligence.
the concept of DL has recently become possible with rapid advancements in spe-cialized computer hardware, such as increased graphics processing unit power, and accompanying software and algorithmic achievements.
With increased recognition of the importance of AI in gastroenterology, the first global AI in gastroenterology and endoscopy summit was held in Washington D.C. in late 2019, which included multiple experts in the domains of academia, industry and regulatory institutions. The consortium anticipated that in the next 10 years the clinical applications of AI in gastroenterology will positively influence patient care and clinical workflow. The consortium recognized the importance of a close multidisciplinary collaboration between gastroenterologists, industry, and regulatory institutions in the development and application of new technologies in the clinical setting[8]. Therefore, the main objective of this review is to introduce the topic of AI and its clinical applic-ations, outline current limitations and knowledge gaps, and trace the future directions in each field by summarizing the global rapidly expanding pool of ever-changing literature to date (Figures 2 and 3).
UPPER GASTROINTESTINAL TRACTDetection of premalignant and malignant lesionsThe upper gastrointestinal tract has several areas of interest for detection of pre-malignant and malignant lesions, such as identification of dysplasia and early neo-plasia in Barrett’s esophagus (BE), esophageal squamous cell carcinoma (SCC), and gastric cancer (GC)[9] (Supplementary Table 1).
Despite the fact that histopathologic analysis is the gold standard to establish the diagnosis of BE and determine the presence of dysplasia, it is of paramount importance for endoscopists to obtain targeted biopsies from specific locations that harbor the actual lesion. By identifying areas that may harbor BE with or without dysplasia, AI can orient the clinician in performing directed biopsies instead of relying on random sampling. Importantly, detection of early esophageal neoplasia with conventional white light imaging (WLI) and digital chromoendoscopy [i.e., narrow band imaging (NBI)] represents a challenge, an issue for which AI has been proposed as a possible solution[10,11].
In total, we included 8 studies that examined BE, all of which addressed the detection of dysplasia or early esophageal adenocarcinoma (EAC) based on endo-scopic imaging or laser endomicroscopy[10-17]. The most popular analytic models were CNNs and support vector machines (SVMs), while cross-validation techniques were the primary basis of validation methods. In general, the models were able to discern between normal and dysplastic/neoplastic images with an accuracy of at least 89.9%, performing better than nonexpert endoscopists. De Groof et al[12] developed a DL algorithm based on a hybrid ResNet-UNet model using 4-fold per-patient cross-validation to detect early neoplasia in BE. The model was trained in a stepwise fashion, using a database with over 490000 endoscopic still images of the gastro-intestinal tract for training, out of which 1247 corresponded to early BE neoplasia. This model achieved higher level of accuracy than non-expert endoscopists and could also detect the optimal biopsy site in up to 97% of patients. Ebigbo et al[14] developed a

Kröner PT et al. AI in GI review
WJG https://www.wjgnet.com 6797 October 28, 2021 Volume 27 Issue 40
Figure 2 Geographic distribution of country from which the included studies originated.
Figure 3 Scatterplot depicting distribution of studies across the organ systems in gastroenterology and hepatology. GI: Gastrointestinal; GIB: Gastrointestinal bleeding; IBD: Inflammatory bowel disease; HB: Hepatobiliary.
computer-aided diagnosis model based on ResNet that differentiated between normal BE and early EAC, with 89.9% accuracy, 83.7 sensitivity and 100% specificity.
Similarly, identification of SCC poses a similar clinical challenge, as traditional diagnostic techniques (e.g., chromoendoscopy with lugol or NBI) have relatively low specificity[18]. As complex novel methods that rely heavily on endoscopic imaging such as endocytoscopy or volumetric laser endomicroscopy have been progressively implemented in clinical practice, the interpretation of large volumes of images has been noted to be a challenging and time-consuming issue[19]. Therefore, AI-assisted image interpretation has also found a use in identifying abnormalities in the image inputs[17].
Thirteen studies examining esophageal cancer were examined, of which 11 specifically studied SCC. Nine of the studies targeted to develop DL models for malignancy detection, while two studies aimed to develop models that predict malignancy depth of invasion with DL models. Most studies (8) were based on CNN models, while others used joint diagonalization principal component analysis (JDPCA), VGG16 Net, or GoogLeNet as classifiers. Although the values of accuracy, sensitivity and specificity in esophageal SCC detection varied between the studies, all models performed at least as good as endoscopists in lesion detection and character-ization or substantially improved the endoscopists’ lesion detection[20-30]. Fukuda et al[21] developed a DL model aimed at detecting suspicious lesions and characterize SCC using more than 28000 NBI-enhanced images in the construction of the model. The model achieved a higher sensitivity for SCC detection and higher accuracy for

Kröner PT et al. AI in GI review
WJG https://www.wjgnet.com 6798 October 28, 2021 Volume 27 Issue 40
SCC characterization from normal tissue than endoscopic experts. Two studies by Nakagawa et al[31] and Shimamoto et al[32] aimed at developing models that pre-dicted esophageal malignancy depth utilizing a DL model based on a CNN with a belief-propagation decoder using independent validation datasets. These models achieved an accuracy of 89.2% and 91% in predicting invasion depth, with sensitivities of 70.8% and 90.1%, and specificities of 94.4% and 95.8%, respectively.
GC is the fourth most common cause of cancer-related death in the world. Identi-fication of premalignant lesions or early gastric neoplasia is of paramount importance. Unfortunately, as with esophageal diseases, several studies have shown that conven-tional endoscopic imaging (e.g., WLI or NBI) or other advanced endoscopic modalities (e.g., magnifying endoscopy, blue laser imaging) have relatively low sensitivity and specificity in identifying premalignant or early neoplastic gastric lesions[33-36].
Twenty-four studies examined gastric malignancy or premalignant conditions. Eleven (46%) studies directly addressed early GC (EGC) detection, of which eight models used DL, two used SVM and one used JDPCA. The sample size in the training and validation datasets varied from less than 100 million to 1.03 million. The accuracy in EGC detection of all models ranged from 86.5%-98.7%, with sensitivity of 80.0%-96.7% and specificity of 89.2%-100%[30-37-51]. Specifically, Wu et al[52] developed a CNN-based model using over 9000 images to train the algorithm, which not only detected EGC lesions with a 92.5% accuracy, 94.0% sensitivity and 91.0% specificity but also performed significantly better than expert endoscopists at this task. Two studies, one based on faster region-based CNNs and another one based on quantum neural networks, used biomarkers, histology and computed tomography (CT) images to predict metastasis to the liver or lymph nodes. These models predicted metastasis to liver and lymph nodes with sensitivity of 66.7%, specificity 97.1% and an area under the curve (AUC) of 0.95[53,54]. Four studies developed models predicting survival in GC or stratification of risk of developing GC[55,56]. While 1 model based on SVM achieved higher accuracy than the tumor, nodes, metastasis cancer staging (TNM) system to predict overall survival and disease-free survival[57], another model based on a preoperative ANN was not superior in predicting survival compared to TNM[58]. Zhu et al[59] developed a ResNet50-based computer-aided detection and diag-nosis (CAD) model to predict GC invasion depth, based on endoscopic images. The model achieved an accuracy of 89.16% in identifying GC invasion depth, compared to 71.49% in endoscopists.
Non-malignant conditionsCurrently, diagnosis of Helicobacter pylori (H. pylori) infection (a known risk factor for the development of peptic ulcer disease and GC) relies on stool or breath testing and histopathology (invasive and expensive). Endoscopic identification of H. pylori has been a target for AI-assisted systems[60,61]. For H. pylori detection and classification, 4 of 4 studies used a CNN model[62-65]. A study by Martin et al[62] using gastric biopsy histopathology images as an input with small number of samples (n = 210 in training dataset and 90-106 in 2 test datasets) had diagnostic accuracy of 98.9%-99.1% for detecting current H. pylori infection. This result was higher than the accuracy achieved in 2 studies using esophagogastroduodenoscopy images as an input with higher number of samples (98.9%-99.1% vs 77.5%-87.7%). The mean accuracy of endoscopists for detecting currently infected H. pylori in 2 studies was around 79.0%-79.4%[62]. A study by Shichijo et al[64] found that the average H. pylori diagnostic time for the AI model was 194 s, while it was 230 ± 65 min for endoscopists. The AI model also had a significantly higher accuracy than the endoscopists by 5.3%, demonstrating that AI algorithms had significantly better accuracy and faster diagnostic time for H. pylori than the endoscopists. More recently, Nakashima et al[63] developed a CAD system based on linked color imaging combined with DL, which achieved 82.5% accuracy, demonstrating comparable diagnostic accuracy of H. pylori to that of experienced endoscopists.
In the area of gastrointestinal bleeding (GIB), risk stratification is of paramount importance not only to identify high-risk patients and guide clinical decision-making but to also identify areas where relatively scarce resources require allocation. In general, risk-stratification tools examine risk factors that are associated with a condition to predict one or several outcomes (e.g., survival, length of hospitalization, rebleeding rates, need for endoscopic therapy, response to treatment)[66-68]. Re-garding upper GIB, studies focused on developing prognostic models that predict rebleeding or the need for endoscopic/surgical therapy[69].
Seven studies examining outcome measures in GIB were included, all of which were developed by reviewing medical record parameters to construct ML algorithms, which were primarily based on ANN[67-73]. Half of the studies had both internal and
Kröner PT et al. AI in GI review
WJG https://www.wjgnet.com 6799 October 28, 2021 Volume 27 Issue 40
external validation cohorts, and patient sample sizes varied from 147 to over 22800. Shung et al[69] developed a gradient-boosting ML model that identified patients with upper GIB who met a composite endpoint with superior AUC, sensitivity and specificity to that of the Glasgow-Blatchford (GBS), Rockall and AIMS-65 scores. Seo et al[68] developed 4 different ML algorithms in patients with nonvariceal upper GIB that achieved superior AUC for mortality, rebleeding and hypotension than that of the GBS, particularly with the use of the random forest (RF) analytic model. However, for rebleeding prediction, a gradient-boosting model developed by Ayaru et al[73] showed a higher accuracy than the VC model in the aforementioned study (88% vs 78.5%). Das et al[70] developed a predictive ML model in lower GIB and compared it in internal and external validation cohorts to the validated BLEED score. Both internal and external validation cohorts reached accuracies, sensitivities, and specificities that were superior to the BLEED score.
LOWER GASTROINTESTINAL TRACTDirect endoscopic visualization of the colon continues to be the gold standard for detection and resection of colonic premalignant lesions. In addition, patient- and polyp-specific characteristics have also been identified as predictors of missed colorectal cancer (CRC)[74]. Therefore, quality measures such as cecal intubation time, withdrawal time, bowel preparation quality and adenoma detection rates (ADR) have been instituted to attempt and standardize practice and mitigate the rates of missed CRC[74,75]. Since colonoscopy is an operator-dependent procedure, this may lead to variability in polyp detection rates, polyp characterization and estimation of depth of invasion of malignant lesions between endoscopists. CAD has been studied to address these current shortcomings, as well as to improve ADR and reduce CRC risk and colon cancer-related deaths[76] (Supplementary Table 2).
Detection of premalignant and malignant lesionsPolyp detection during colonoscopy is the cornerstone of CRC prevention. It is estimated that CRC develops in 2%-6% of cases after colonoscopy but before the next scheduled surveillance and, therefore, could represent missed or new postcolonoscopy CRC[74,77]. A large number of research studies have been devoted to identifying factors that play a role in the detection of premalignant lesions during colonoscopy, as well as factors that are associated with missed CRC[77]. An observation that has gained considerable attention is that the presence of experienced endoscopy nurses, fellows or any trained second observer during the procedure itself improves ADR[78,79]. Therefore, and answering the call for improved polyp detection measures during colonoscopy, AI has become a promising technology serving the role of a more standardized “second observer,” appropriately termed “computer-aided detection” (CADe).
Eighteen studies that evaluated polyp detection were included in this review, thirteen of which employed DL models, while five used other ML models. Nearly all the studies were limited to having internal validation only. The training datasets in these studies utilized still images from colonoscopy videos ranging from 176 to more than 8600 images. Seven studies calculated the ADR of the developed model and compared it to that of endoscopists, most of which found that the AI had significantly higher ADR than endoscopists, with a decreased reaction time, while the remaining studies showed equivalent ADR[80-87]. Repici et al[82] conducted a multicenter study showing that the ADR was 40.4% in the study’s participating endoscopists alone, while it was 54.8% in the group using the CADe-based GI-Genius (®Medtronic, Minneapolis, MN) module. Similarly, Wang et al[85] conducted a study that evaluated over 520 colonoscopies, also examining the use of a CADe model, and found that the ADR increased from 20.34% in endoscopists alone to 29.12% in the CADe-assisted group. Other studies explored the accuracy, sensitivity and specificity of polyp-detection AI models, displaying accuracies of up to 96.4%, sensitivity of up to 99.7% and specificity of up to 93.7%[88-98]. Kominami et al[93] designed an SVM-based model using real-time images with NBI and magnification enhancement to detect colon polyps, achieving an accuracy, sensitivity, and specificity of 93.2%, 93.0%, and 93.3%, respectively. Three studies addressed subjects in the realm of CRC, specifically detecting malignancy on colonoscopy with chromoendoscopy and NBI enhancement, hematoxylin-eosin histopathology slides, or estimating invasion depth on regular WLI colonoscopy images[99-101]. Ito et al[100] developed a DL model based on CNN to detect deeply invasive CRC based on WLI colonoscopy, which utilized over 9900

Kröner PT et al. AI in GI review
WJG https://www.wjgnet.com 6800 October 28, 2021 Volume 27 Issue 40
images from 41 patients to train the model. Furthermore, over 5000 images were used in the testing cohort, achieving an accuracy, sensitivity and specificity in differen-tiating invasion depth of 81.2%, 67.5%, and 89.0%, respectively. Kudo et al[101] developed a model based on EndoBRAIN (®Cybernet Systems Co., Tokyo, Japan) using colonoscopy with chromoendoscopy and NBI enhancement to detect malignant lesions in the colon. The training sample used over 69000 images and achieved accuracies of 98.0% and 96.0% for chromoendoscopy and NBI enhancement, respec-tively. These diagnostic parameters were higher than those of expert and nonexpert endoscopists.
In an attempt to morphologically classify polyps according to their malignant potential, numerous classification systems have been developed. As an example, the Paris classification classifies polyps according to whether they are pedunculated, sessile, slightly raised, or excavated[102]. These visual characteristics are then used to predict whether the polyp has invasive potential or lymph node involvement and potentially contribute to clinical decision-making, such as determining whether the polyp is resectable endoscopically[103]. Unfortunately, research has shown that interobserver variability with this classification is moderately high, suggesting that this visual classification should not be routinely used in research or practice[104]. In addition, considering that most resected polyps during colonoscopy are diminutive and that histopathologic analysis of resected polyps is costly, optical diagnosis has been proposed in this subset of polyps and termed “optical biopsy”[105]. The concept of optical biopsy has been proposed to support cost-effective strategies in CRC screening such as resecting-and-discarding, as well as diagnosing-and-leaving this subset of polyps[106]. However, the concept of optical biopsy has the same limitations as endoscopic polyp characterization does: relatively high interobserver variability. Hence, computer-aided diagnosis has been proposed as a potential solution to stan-dardization of interpretation of endoscopic images.
Nine studies pertaining to colonic polyp classification or differentiation were included in this review[107-115]. While some studies did not report on validation methods, others had cross-validation, internal, and external methods. Most studies relied on ML-based algorithms to assess colonoscopy with enhancement measures (e.g., magnification, NBI, endocytoscopy), while deep CNN models were used in studies evaluating real-time polyp differentiation. Sánchez-Montes et al[114] develop-ed an SVM-based model to predict polyp histologic classification using high-definition WLI from 225 colonoscopies, achieving accuracy, sensitivity, and specificity of 91.1%, 92.3%, and 89.2%, respectively. Additionally, Misawa et al[111] evaluated the per-formance of EndoBRAIN (®Cybernet Systems Co., Tokyo) analyzing endocytoscopic images obtained during colonoscopy to characterize polyps as neoplastic vs non-neoplastic with an accuracy, sensitivity, and specificity of 96.9%, 97.6%, and 95.8%, respectively. These findings hold promise in determining screening and surveillance schedules, and in instituting cost-effective strategies such as “resect-and-leave”.
Knowledge on the depth of invasion of early CRC is critical for determining resection modality. Intramucosal and submucosal cancerous lesions can be resected with endoscopic techniques such as endoscopic mucosal resection or endoscopic submucosal dissection[116]. However, lesions that invade the deeper layers have a higher association with lymph node metastasis and, hence, may require a combined surgical and oncologic approach[116,117]. Several features on direct endoscopic visual-ization have been associated with deep invasion of a lesion, including lesion de-pression, fold convergence, and significantly irregular, and heterogeneous surface capillary pattern[118]. As with any image-based field, a significant degree of interob-server variability exists in characterizing lesions and determining their depth or invasion, for which CAD represents an attractive option to standardize the approach of estimating lesion invasion depth.
Finally, 6 studies assessed other subjects within the realm of the lower gastro-intestinal tract, including developing models that predict outcomes in patients with CRC, models examining quality of colonoscopy performance, and studies estimating cost reductions of the use of AI[119-122]. Of 4 studies examining prediction of outcomes, 2 were based on DL (i.e., CNN-based) models, using a wide numerical range of histopathologic images: from 300 million to 12 million. Skrede et al[123] developed a DL model using over 12 million histopathological images to develop a biomarker for automatic prediction of cancer-specific survival, which outperformed existing markers. The authors conclude this strategy can potentially be utilized in the treatment selection process by identifying high-risk groups. Thakkar et al[120] recently developed a DL model aimed at automatically quantifying quality metrics during colonoscopy, providing intra-procedural feedback to the performing endoscopist.

Kröner PT et al. AI in GI review
WJG https://www.wjgnet.com 6801 October 28, 2021 Volume 27 Issue 40
Non-malignant conditionsVideo capsule endoscopy: Owing to its ease of use and noninvasiveness, video capsule endoscopy (VCE) is the current diagnostic method of choice to assess the small bowel for conditions such as occult GIB and Crohn’s disease (CD). However, since it lacks self-locomotion, it relies on the motility of the bowel to advance within the gastrointestinal tract. Therefore, it requires a very large number of images (up to 60000 per examination) to be automatically obtained, rendering the process of interpretation lengthy and tedious[124]. VCE has been an area of focus for AI since its early stages, seeing the initial AI classifying methods such as SVM and multilayer perceptron network[125-127]. With faster processors, increased computational power by impro-ved graphics processing units and evolving CNNs, DL algorithms have become the modality of choice for image analysis in VCE[128,129]. As in the lower gastrointestinal tract, the same principles of CADe and computer-aided diagnosis could be applied to deep balloon-assisted or motorized enteroscopy systems (Supplementary Table 3).
A total of 31 studies pertaining to VCE were identified. Fifteen studies (48%) developed models to assist in detection of active GIB or angioectasia. Four studies used CNN, five used SVM, and the remaining ones used ML-based analytic models. Five studies reported cross-validation methods. All studies reported accuracy ranging from 94% to 98% in identifying GIB and angioectasias, with sensitivity of 92.0%-100% and specificity of 82.9%-99.9%[130-142]. Specifically, Tsuboi et al[140] developed a DL model based on CNN for angioectasia detection, which achieved an AUC of 0.998, with a sensitivity and specificity of 98.8% and 98.4%, respectively.
Six studies assessed for the presence of small-intestinal ulcers, of which five used DL models based on CNN and one used SVM[128,134,143-146]. Aoki et al[128,143] conducted 2 studies in testing DL models to detect ulcerations, yielding a sensitivity of 88.2%, a specificity of 90.9%, and an AUC of 0.958, respectively. Two more studies evaluated the detection of small-bowel CD by identifying ulcers on VCE[147,148]. Klang et al[147] developed a DL model based on CNN that used over 17000 VCE images to identify CD ulcers, achieving an AUC of 0.99. Two studies examined small intestinal polyp detection using NN-based models, both achieving an accuracy of at least 98%, with sensitivity and specificity of up to 95.5% and 98.5%, respectively[149,150].
Regarding celiac disease (CeD) detection, 4 studies were evaluated, 3 of which used CNN and 1 that used a clinical decision support system[151]. A study by Zhou et al[152] reported 100% sensitivity and specificity in detecting CeD using GoogLeNet as classifier. A study by Wimmer et al[153] using AlexNet, VGGf net, and VGG-16 net as classifiers obtained an optimal accuracy of 92.5% using VGG-16, although the report did not include sample size. More recently, Wang et al[154] developed a DL model using the CNN-based InceptionV3 as well as the SVM-based ResNet50 that was 95.94% accurate, 97.20% sensitive and 95.63% specific in identifying CeD in VCE images.
Hookworm infection represents a significant healthcare issue in the developing world, with an estimated 600 million people harboring this infection[155]. As this helminth typically dwells in the small bowel, it may occasionally be a finding in VCE. Three studies evaluated hookworm detection, of which two used CNN and one used SVM with all using cross-validation[156-158]. Specifically, He et al[157] developed a DL model based on deep CNN, which was trained on a large VCE dataset consisting of more than 440000 images. The model outperformed other handcrafted, feature-based methods, reaching an accuracy of 88.5% and a sensitivity of 84.6% in detecting hookworm in the small bowel.
To assess for quality of bowel preparation during VCE Leenhardt et al[159] and Noorda et al[160] developed a DL models based on CNN. Both models achieved accuracy of over 95%, with sensitivity and specificity of 94.7%-96.18% and 94.0%-94.33%, respectively. Overall, Ding et al[131] developed a DL model based on CNN to identify and categorize all small-bowel ulcers, polyps, bleeding, lymphangiectasia, follicular hyperplasia, protruding lesions, diverticula or inflammation using over 100 million VCE images. The model achieved an impressive 99.90% overall sensitivity and 99.88% specificity, whereas gastroenterologists identified lesions with a 74.57% sensitivity in the per-patient analysis and 76.89% sensitivity in the per-lesion analysis. Furthermore, the reading time per patient was 5.9 min by the CNN model, compared to 96.6 min by conventional reading.
Inflammatory bowel disease: The complex interplay of pathophysiological factors in inflammatory bowel disease (IBD) has led to the realization that differences in patients’ biology may confer differences in disease activity and response to therapy- an example of “precision medicine”[161]. Integration of AI algorithms into the IBD realm

Kröner PT et al. AI in GI review
WJG https://www.wjgnet.com 6802 October 28, 2021 Volume 27 Issue 40
brings promise not only in diagnosis or reducing interobserver variability in severity grading but also opens up the possibility of analyzing large databases to identify complex or occult patterns of disease[162-167].
A total of 25 studies pertaining to IBD were included in this review, of which 9 dealt with CD, 6 studied ulcerative colitis (UC,) and 10 investigated both. Five studies aimed to detect CD, UC, or IBD in general from VCE images, endoscopic images, histology, magnetic resonance imaging (MRI) images, and genetics. Most of the studies used cross-validated ML methods, of which SVM was the method of choice; while another study used DL-based CNN. These studies displayed high levels of accuracy in detecting IBD, from 83.3%-90.8%[143,168-171]. Aoki et al[143] developed a DL model based on CNN that used more than 10000 VCE images in the validation dataset to detect CD ulcers in the small bowel, achieving an accuracy, sensitivity and specificity of 90.8%, 88.2% and 90.9%, respectively.
Nine studies that addressed predicting disease severity were primarily based on endoscopic imaging; although other studies also used laboratory studies, demo-graphics, histopathology and CT enterography[172-179]. Five studies utilized ML-based analytic models, while the remaining four utilized DL-based models, of which CNNs were the preferred ones. Five studies reported internal validation, and two studies had external validation cohorts; while two studies did not report validation. The size of patient cohorts varied greatly, from 87 to over 3000, with studies reporting up to 40000 images in the validation datasets. Yao et al[179] designed a DL model based on CNN to grade the severity of UC using colonoscopy images, which was constructed with over 16000 images from 3000 patients. The reported accuracy, sensitivity, and specificity was 87.6%, 90.2%, and 87.0%, respectively. The authors concluded that these results support the use of AI in UC severity grading , which approximates the scoring of experienced human reviewers. Maeda et al[172] designed a ML model with CAD to detect histologic inflammation based on colonoscopy images enhanced with endocytoscopy. The model achieved an accuracy, sensitivity and specificity of 90.0%, 74.0%, and 91.0%, respectively, using over 9900 images from 100 patients in the validation cohort.
To predict therapeutic response in patients with IBD treated with thiopurines or biologics seven studies constructed internally validated ML algorithms, based on RF analytic models. All models achieved an accuracy of 80.0%-89.8% or an AUC of 0.73-0.846 in identifying patients who will respond at 6-8 wk to therapeutic regimens[180-186]. Waljee et al[186] designed a model using only demographic and laboratory data from 401 patients to predict response at 8 wk in patients receiving ustekinumab with an AUC of 0.78, potentially laying the foundation to avoid costly therapeutic drug monitoring. Waljee et al[184] also constructed a model based on laboratory values and demographics with a validation dataset of over 6100 patients to predict IBD-related hospitalization and outpatient steroid use, achieving an AUC of 0.87, suggesting such AI models could be used to identify patients at risk of an IBD flare and enable precision medicine-based therapeutic approaches (Supplementary Table 4).
A further 2 internally validated ML models using SVM and RF were developed to predict the risk of IBD based on a genomic datasets[187,188]. Isakov et al[187] de-veloped a gene prioritization model using 4 combined analytic models (RF, SVM GB, and an elastic net regularized generalized linear model) to identify genes related to IBD, achieving an accuracy of 80.8%. An internally validated natural language processing (NLP) model by Hou et al[189] used histopathology reports to identify surveillance vs nonsurveillance colonoscopy in patients with IBD, with an accuracy of 80.0%. Lastly, Firouzi et al[190] developed an internally validated model based on Waikato Environment for Knowledge Analysis that identified, with an accuracy of up to 89.8%, patients with IBD who required a bone mineral density scan, using electronic health record data.
HEPATOBILIARY SYSTEMLiver diseases are broad and complex, ranging from asymptomatic liver chemistry elevation to life-threatening conditions such as acute liver failure or orthotopic liver transplantation (OLT). Hepatology is can be a fertile ground for applying AI in survival models (e.g., model for end-stage liver disease), disease detection models [e.g., early detection of non-alcoholic fatty liver disease (NAFLD)], disease severity models (e.g., alcoholic hepatitis discriminant function), or disease estimation models (e.g., aspartate aminotransferase-to-platelet ratio index), but also for pattern recognition in radiological images, histopathology and even selection of LT candidates[191,192]. A

Kröner PT et al. AI in GI review
WJG https://www.wjgnet.com 6803 October 28, 2021 Volume 27 Issue 40
total of eighty-five studies pertaining to hepatology were examined, out of which twenty assessed prediction of outcome measures, forty-one examined prediction or detection of steatosis, fibrosis or cirrhosis, nine studies examined differentiation of malignant liver neoplasms, six studies explored predictive models for portal hyper-tension, and eight studies investigated AI models for other purposes.
Nine studies developed models that assisted with detection or classification of hepatobiliary neoplastic lesion, six of which involved DL-based CNN[193-202]. Schmauch et al[197] constructed an internally validated CNN-based DL model using ultrasonographic images of the liver to detect and classify focal liver lesions, achieving an overall AUC of 0.891. Six studies constructed models assisting in predicting the presence of portal hypertension complications in patients with all-cause cirrhosis, based on clinical data or radiological images obtained from modalities such as CT scans[203-208]. Dong et al[204] constructed an ML-based model on an RF analytic model that used clinical data and predicted the presence of esophageal varices in patients with cirrhosis with an AUC of 0.82, potentially being useful in performing a better triage of patients who actually require an upper endoscopy for variceal screening. Liu et al[206] developed an ML model that had a higher diagnostic per-formance than conventional noninvasive tools (either conventional image-based or serum-based tools) in identifying clinically significant portal hypertension from contrast-enhanced CT or MRI, with an accuracy of 91.1% and 88.9%, respectively.
Forty-two studies developed models addressing detection of steatosis, fibrosis, or cirrhosis based on clinical data, shear-wave elastography, CT or MRI scans, his-topathology, or genetics. Of these, 27 studies developed models to detect, quantify, or predict steatosis, fibrosis, or cirrhosis[202,209-234]. Forlano et al[215] developed a ML-based model for quantification of steatosis, inflammation, ballooning, and fibrosis using biopsies from patients with NAFLD. The model identified characteristics of NAFLD with intra- and inter-observer agreement from 0.95-0.99, and has a potential use in objective assessment of treatment response in patients with NAFLD. Yasaka et al[202] constructed a DCCN model based on over 144000 MRI images from 534 patients to stage hepatic fibrosis, achieving AUCs of 0.84, 0.84, and 0.85 for F4, F3, and F2 fibrosis, respectively. In assessing fibrosis in patients with hepatitis B virus, Wang et al[232] created a DL-based CNN model that used ultrasonographic and elastography data from 132 patients to predict fibrosis, with AUCs of 0.97, 0.98 and 0.82 for F4, F3 and F2 fibrosis, respectively. Eight studies developed AI models to establish the diagnosis of fatty liver disease or distinguish between the causes of liver disease[235-242]. In distinguishing NAFLD from non-alcoholic steatohepatitis (NASH), Fialoke et al[237] constructed an ML model testing decision tree, linear regression,, RF, and extreme gradient boosting (XGB) analytic models, of which the XGB achieved the highest accuracy, AUC, sensitivity, and specificity at 79.7%. 0.876, 77.4%, and 80.8%, respectively. Taylor-Weiner et al[239] constructed an ML model that enabled quan-titative measurement of liver histology and disease monitoring in NASH, charac-terizing disease severity, heterogeneity and treatment response in NASH.
Of 20 studies examining outcome predictors, 8 evaluated predictor models in OLT involving donor-recipient matching, recipient survival at determined time frame, graft survival at different time frames, survival predictors, and morbidity predictors[243-250]. Bertsimas et al[245] constructed an internally-validated decision tree-based ML model using clinical data that predicted 3-mo waitlist mortality or removal with an AUC of 0.895. Five studies designed models for outcome prediction in patients with hepatocellular carcinoma (HCC), including response to trans-arterial chemoembol-ization (TACE), recurrence or survival after resection, most of which were based on CNN[251-255]. Saillard et al[254] designed an externally-validated model based on a pre-trained CNN based on histology slides from 328 patients that independently predicted survival after HCC resection with a c-index of 0.75. Other studies evaluated outcomes in patients with acetaminophen-related ALF, primary sclerosing cholangitis, predicted the presence of choledocholithiasis, predicted hepatotoxicity of stereotactic body radiation, or mortality in patients with cirrhosis[256-263]. Eaton et al[256] constructed a ML model with XGB that accurately predicted hepatic decompensation in patients with primary sclerosing cholangitis with a C-statistic of 0.90.
Other studies focused on developing models for miscellaneous topics such as estimating liver stiffness from MRI, assessing pretransplant cognitive impairment, detecting spectral differences between normal and hepatitis B virus serum samples, classifying seroconversion to HBeAg, predicting hepatotoxicity in early stages of drug development, predicting fibrosis in hepatitis C virus, or AI-assisted liver tumor seg-mentation[264-272]. Williams et al[271] developed a ML model based on a Bayesian network using hepatic safety assays to predict drug-induced liver injury in com-pounds during drug development, achieving an accuracy, sensitivity, and specificity

Kröner PT et al. AI in GI review
WJG https://www.wjgnet.com 6804 October 28, 2021 Volume 27 Issue 40
of 86.0%, 87.0%, and 85.0%, respectively. An externally-validated ML model based on SVM and radiomics by He et al[267] used MRI and clinical data to estimate liver stiffness, achieving an AUC of 0.80, with an accuracy, sensitivity, and specificity of 75.0%, 63.6%, and 82.4%, respectively. Lastly, models addressing prediction of NAFLD or NASH based on clinical or genetic data, as well as models analyzing donor liver texture for steatosis, have also been developed[272-278] (Supplementary Table 5).
PANCREATIC DISEASESPancreatic diseases contain areas where AI can be effectively applied. Of primary interest is the use of AI in improving existing disease severity scoring systems or prognostic models in complicated acute pancreatitis (AP) or chronic pancreatitis (CP), based on clinical and radiological data, detection and differentiation of pancreas cystic neoplasms (PCN) with prediction of malignant potential, radiologic early detection of pancreatic ductal adenocarcinoma (PDAC), radiologic differentiation between PDAC and benign pancreatic conditions [e.g., autoimmune pancreatitis (AIP)], and histopath-ologic interpretation of tissue samples[279-282]. A total of 59 studies pertaining to the pancreas were reviewed. Of these, 20 (34%) addressed prediction of outcomes in patients with pancreatic diseases ranging from AP to neoplasia.
Eleven of these studies examined outcome prediction in AP. All of the studies’ ANN models outperformed logistic regression models, Glasgow, and APACHE-II scoring systems in predicting AP severity; while requiring less number of parameters[283-293]. Qiu et al[292] compared the performance of SVM, logistic regression analysis, and ANN models to predict multiorgan failure in AP. All 3 models predicted multiorgan failure, with AUC of 0.840, 0.832, and 0.834, respectively, with ANN requiring a lesser number of parameters.
Seven (12%) studies used AI algorithms to construct clinical registries, segment the pancreas based on imaging, or differentiate between certain pancreatic diseases based on cross-sectional imaging or endoscopic ultrasound (EUS)[294-300]. Zhang et al[298] constructed a DL station classification model and a segmentation model to reduce the difficulty in EUS interpretation for trainees. The trainee station recognition accuracy improved from 67.2% to 78.4% in the crossover study. Interobserver agreement between endoscopists and deep CNN with Cohen’s kappa coefficient was substantial, ranging from 0.826-0.879. The authors conclude that this technology may play a key role in shortening the learning curve of EUS among trainees.
Fifteen studies (25%) addressed prediction of malignancy based on imaging fin-dings, or differentiation of benign from malignant pancreatic conditions[280,301-315]. Marya et al[280] developed an EUS-based CNN model that distinguished AIP from normal pancreas with 99% sensitivity and 98% specificity, AIP from CP with 94% sensitivity and 71% specificity, and AIP from PDAC with 90% sensitivity and 93% specificity. Chu et al[301] conducted a study utilizing CT radiomics features to differ-entiate PDAC from normal pancreas tissue. The accuracy of the RF binary classi-fication was 99.2%, with an AUC of 99.9%. All cases of PDAC were correctly identified, with a sensitivity of 100% and specificity of 98.5%.
Eleven studies (19%) evaluated differentiation of PCNs by classifying them into their respective subtypes based on their characteristics on imaging[316-326]. Springer et al[324] developed a multimodality ML model that integrated clinical, radiological and genetic/biochemical markers data to determine whether patients with pancreas cyst should undergo surgery, monitoring, or no further surveillance. The model correctly identified serous cystic neoplasms in 65% of the cases with 99% specificity, clearly outperforming the current standard of care of clinical identification in only 18% of cases. The authors conclude that these systems may serve an adjunct role in clinical practice, enabling the clinician to take better-informed clinical decisions[324].
Eight studies addressed PDAC, from developing risk scores for development of PDAC based on urinary biomarkers, predicting clinical performance and response to celiac plexus neurolysis, to prediction of survival time. AI models performed at least as well as the logistic regression models in predicting the selected outcome[327-334].
Six studies directly examined early pancreatic cancer detection in PDAC or PCN by examining the imaging characteristics or identifying high-risk patients on electronic health records based on factors such as family history of pancreatic cancer[335-340]. Roch et al[339] developed NLP-based algorithms based on common terminology used by physicians in describing pancreatic cysts and applied them to automatically conduct searches in electronic health records. The algorithm tracked patients with cysts with a 99.9% sensitivity and 98.8% specificity, demonstrating its utility in

Kröner PT et al. AI in GI review
WJG https://www.wjgnet.com 6805 October 28, 2021 Volume 27 Issue 40
capturing patients swiftly and with more ease than manual review. Ozkan et al[338] developed a CAD image-processing system using EUS images to diagnose PDAC, taking patient age into consideration. The accuracy of the model was 87.5, with sensitivity and specificity of 83.3% and 93.3%, respectively (Supplementary Table 6).
CURRENT LIMITATIONS AND KNOWLEDGE GAPSDespite the numerous positive advances in AI, there remain several limitations to current studies and obstacles to overcome for future studies. Most current models are based on labeled data and, hence, interpretation is only as good as the observer who labeled the “gold-standard” data. Current algorithms are specifically fitted for a determined dataset. A sizeable proportion of the AI models applied to the clinical setting are only internally validated. Ideally, models should be externally validated on diverse cohorts to ensure that overfitting does not become an issue. Therefore, this issue could be potentially addressed by the creation of a universal, well-annotated, high-quality dataset, and by creating algorithms with more plasticity. However, creating “universal datasets” creates additional challenges, particularly related to data integrity and privacy. A potential solution to this is the decentralized “federated datasets”, which involves combining multiple datasets stored on their respective servers, addressing these challenges[341]. Specific protocols are required for choosing an analytic model and selecting or developing validation techniques (e.g., external-, internal-, cross-validation) for data fine-tuning or augmentation. Algorithms that yield the best accuracy should be promoted. Calibration has translated into improvements in probability prediction, for which they should be instituted in all models. Most current studies were cohort studies, whereas well-designed randomized controlled trials would be needed to better support conclusions. Some studies utilized custom-built models, which are not explained in detail. Therefore, custom-built algorithms should have their background and processes thoroughly declared. The studies presented numerous different newly developed models, which would require vali-dation to determine whether these can be applied to other datasets. Several studies examine different techniques during an equivalent endoscopic procedure (e.g., endoscopic image processing in NBI, WLI, or chromoendoscopy), which renders comparisons between techniques cumbersome or not possible. Data matrixes should be completely reported[342]. Significant efforts have been devoted to developing guidelines, such as the CONSORT-AI extension, to standardize reporting in trials evaluating performance of the AI. Adherence to current guidelines and flexibility to revise them as technology continues to advance is of paramount importance. The majority of studies use still images and high-definition images, which is not in line with the “real-world experience” of real-time settings, imaging affected by motion artifact or poor image processing from outdated technical equipment.
APPLICATION IN CLINICAL CARE (ARTICLE HIGHLIGHTS)ML and DL could assist clinicians in the diagnosis of gastrointestinal and liver neoplasms, bleeding, infection, and inflammatory process, and also predict outcome measures in these conditions.
The initial use of ML or DL models might be used in backing up clinicians in establishing diagnoses or determining a treatment plan.
Given its high predictive value, if AI suggestions match the clinician’s reasoning, clinicians could make a decision more confidently. If the answers are discrepant, careful investigation should be undertaken.
In the future, if ML or DL models find a place to be integrated in standard clinical care, to guide in establishing diagnoses, selecting treatment interventions, predicting outcomes, and influencing clinical decision-making. However, future studies are also necessary to explore avenues of how these measures can be better instituted in clinical practice as a whole.
FUTURE DIRECTIONSAs demonstrated by this review, AI applications in clinical gastroenterology and hepatology continue to rapidly expand and evolve at many different levels. For

Kröner PT et al. AI in GI review
WJG https://www.wjgnet.com 6806 October 28, 2021 Volume 27 Issue 40
general clinical care, the recent proliferation in AI applications is likely to enable “precision medicine” on a broader scale. Clinically, it is predicted that invasive diagnostic interventions will generally fall out of favor for some conditions, as better noninvasive ML-based algorithms pave the way for improved clinical prediction models. Some diagnostic interventions, such as VCE interpretation, may see a consid-erable decrease in human interpretation, minimizing the human role to that of supervision and attestation of findings of the model. AI-assisted technology will prove important in real-time clinical settings (e.g., polyp detection during colonoscopy). Integration of monitoring devices (e.g., smartphones, smart watches) with ML in the management of selected diseases is also predicted to significantly receive more attention the coming years. The creation of a universal, large, high-quality, well-labelled dataset is a necessity, from which algorithms could be developed to better define the epidemiology and risk factors of diseases. Well-harnessed AI assistance should decrease physician workload or at least maximize their productivity by allowing them to shift from menial tasks to faster, more accurate clinical decision-making. ML algorithms based on these datasets can also be used for other quality measures, such as improvement of process efficiency or identifying cost-effective interventions. In terms of data analysis, traditional analytic models (e.g., logistic regression and clinical scoring systems) may be substituted or augmented by ML algorithms to achieve greater capability and accuracy. Developing and maintaining multidisciplinary teams of data scientists, physicians, content subject experts and industry is of paramount importance in the advancement of AI in gastroenterology and hepatology. Finally, educating clinicians and patients in the future paths of AI applications is critical to increase understanding of future value and decrease reluc-tance in engagement.
CONCLUSIONThe latest advances in AI in gastroenterology and hepatology are promising for aspect many fields of clinical care, from detection of neoplastic lesions on endoscopic assessment and improving current survival models to predicting treatment response. The application of AI to large and complex datasets may assist in the identification of new associations between variables, potentially leading to changes in clinical practice. Furthermore, the use of AI-assisted technologies has the potential to dramatically improve the quality of care. Finally, the time for assisted precision medicine is at hand, with the AI being able to tailor a treatment regimen or potentially predict the response to treatment in a specific patient based on extensive amounts of clinical data from large patient datasets. It is important to realize that, while AI currently does not substitute human clinical reasoning, it has a bright future in the betterment of patient care.
ACKNOWLEDGEMENTSThe authors are grateful to for Wang Z, PhD, Zhang HJ, PhD, Sun T, MD, PhD, Hassan Virk H, MD, and Aiumtrakul N, MD assistance with the additional literature search.
REFERENCESNoorbakhsh-Sabet N, Zand R, Zhang Y, Abedi V. Artificial Intelligence Transforms the Future of Health Care. Am J Med 2019; 132: 795-801 [PMID: 30710543 DOI: 10.1016/j.amjmed.2019.01.017]
1
Calderaro J, Kather JN. Artificial intelligence-based pathology for gastrointestinal and hepatobiliary cancers. Gut 2021; 70: 1183-1193 [PMID: 33214163 DOI: 10.1136/gutjnl-2020-322880]
2
Le Berre C, Sandborn WJ, Aridhi S, Devignes MD, Fournier L, Smaïl-Tabbone M, Danese S, Peyrin-Biroulet L. Application of Artificial Intelligence to Gastroenterology and Hepatology. Gastroenterology 2020; 158: 76-94.e2 [PMID: 31593701 DOI: 10.1053/j.gastro.2019.08.058]
3
Kather JN, Calderaro J. Development of AI-based pathology biomarkers in gastrointestinal and liver cancer. Nat Rev Gastroenterol Hepatol 2020; 17: 591-592 [PMID: 32620817 DOI: 10.1038/s41575-020-0343-3]
4
Hoogenboom SA, Bagci U, Wallace MB. Artificial intelligence in gastroenterology. The current state of play and the potential. How will it affect our practice and when? Tech Gastrointest Endosc 2019; 22: 42-47 [DOI: 10.1016/j.tgie.2019.150634]
5

Kröner PT et al. AI in GI review
WJG https://www.wjgnet.com 6807 October 28, 2021 Volume 27 Issue 40
Deo RC. Machine Learning in Medicine. Circulation 2015; 132: 1920-1930 [PMID: 26572668 DOI: 10.1161/CIRCULATIONAHA.115.001593]
6
Wu J, Chen J, Cai J. Application of Artificial Intelligence in Gastrointestinal Endoscopy. J Clin Gastroenterol 2021; 55: 110-120 [PMID: 32925304 DOI: 10.1097/MCG.0000000000001423]
7
Parasa S, Wallace M, Bagci U, Antonino M, Berzin T, Byrne M, Celik H, Farahani K, Golding M, Gross S, Jamali V, Mendonca P, Mori Y, Ninh A, Repici A, Rex D, Skrinak K, Thakkar SJ, van Hooft JE, Vargo J, Yu H, Xu Z, Sharma P. Proceedings from the First Global Artificial Intelligence in Gastroenterology and Endoscopy Summit. Gastrointest Endosc 2020; 92: 938-945.e1 [PMID: 32343978 DOI: 10.1016/j.gie.2020.04.044]
8
Mori Y, Kudo SE, Mohmed HEN, Misawa M, Ogata N, Itoh H, Oda M, Mori K. Artificial intelligence and upper gastrointestinal endoscopy: Current status and future perspective. Dig Endosc 2019; 31: 378-388 [PMID: 30549317 DOI: 10.1111/den.13317]
9
Hashimoto R, Requa J, Dao T, Ninh A, Tran E, Mai D, Lugo M, El-Hage Chehade N, Chang KJ, Karnes WE, Samarasena JB. Artificial intelligence using convolutional neural networks for real-time detection of early esophageal neoplasia in Barrett's esophagus (with video). Gastrointest Endosc 2020; 91: 1264-1271.e1 [PMID: 31930967 DOI: 10.1016/j.gie.2019.12.049]
10
van der Sommen F, Zinger S, Curvers WL, Bisschops R, Pech O, Weusten BL, Bergman JJ, de With PH, Schoon EJ. Computer-aided detection of early neoplastic lesions in Barrett's esophagus. Endoscopy 2016; 48: 617-624 [PMID: 27100718 DOI: 10.1055/s-0042-105284]
11
de Groof AJ, Struyvenberg MR, van der Putten J, van der Sommen F, Fockens KN, Curvers WL, Zinger S, Pouw RE, Coron E, Baldaque-Silva F, Pech O, Weusten B, Meining A, Neuhaus H, Bisschops R, Dent J, Schoon EJ, de With PH, Bergman JJ. Deep-Learning System Detects Neoplasia in Patients With Barrett's Esophagus With Higher Accuracy Than Endoscopists in a Multistep Training and Validation Study With Benchmarking. Gastroenterology 2020; 158: 915-929.e4 [PMID: 31759929 DOI: 10.1053/j.gastro.2019.11.030]
12
de Groof J, van der Sommen F, van der Putten J, Struyvenberg MR, Zinger S, Curvers WL, Pech O, Meining A, Neuhaus H, Bisschops R, Schoon EJ, de With PH, Bergman JJ. The Argos project: The development of a computer-aided detection system to improve detection of Barrett's neoplasia on white light endoscopy. United European Gastroenterol J 2019; 7: 538-547 [PMID: 31065371 DOI: 10.1177/2050640619837443]
13
Ebigbo A, Mendel R, Probst A, Manzeneder J, Prinz F, de Souza LA Jr, Papa J, Palm C, Messmann H. Real-time use of artificial intelligence in the evaluation of cancer in Barrett's oesophagus. Gut 2020; 69: 615-616 [PMID: 31541004 DOI: 10.1136/gutjnl-2019-319460]
14
Riaz F, Ribeiro MD, Pimentel-Nunes P, Coimbra MT. Integral scale histogram local binary patterns for classification of narrow-band gastroenterology images. Annu Int Conf IEEE Eng Med Biol Soc 2013; 2013: 3714-3717 [PMID: 24110537 DOI: 10.1109/EMBC.2013.6610350]
15
Swager AF, van der Sommen F, Klomp SR, Zinger S, Meijer SL, Schoon EJ, Bergman JJGHM, de With PH, Curvers WL. Computer-aided detection of early Barrett's neoplasia using volumetric laser endomicroscopy. Gastrointest Endosc 2017; 86: 839-846 [PMID: 28322771 DOI: 10.1016/j.gie.2017.03.011]
16
Trindade AJ, McKinley MJ, Fan C, Leggett CL, Kahn A, Pleskow DK. Endoscopic Surveillance of Barrett's Esophagus Using Volumetric Laser Endomicroscopy With Artificial Intelligence Image Enhancement. Gastroenterology 2019; 157: 303-305 [PMID: 31078625 DOI: 10.1053/j.gastro.2019.04.048]
17
Morita FH, Bernardo WM, Ide E, Rocha RS, Aquino JC, Minata MK, Yamazaki K, Marques SB, Sakai P, de Moura EG. Narrow band imaging vs lugol chromoendoscopy to diagnose squamous cell carcinoma of the esophagus: a systematic review and meta-analysis. BMC Cancer 2017; 17: 54 [PMID: 28086818 DOI: 10.1186/s12885-016-3011-9]
18
Pannala R, Krishnan K, Melson J, Parsi MA, Schulman AR, Sullivan S, Trikudanathan G, Trindade AJ, Watson RR, Maple JT, Lichtenstein DR. Artificial intelligence in gastrointestinal endoscopy. VideoGIE 2020; 5: 598-613 [PMID: 33319126 DOI: 10.1016/j.vgie.2020.08.013]
19
Cai SL, Li B, Tan WM, Niu XJ, Yu HH, Yao LQ, Zhou PH, Yan B, Zhong YS. Using a deep learning system in endoscopy for screening of early esophageal squamous cell carcinoma (with video). Gastrointest Endosc 2019; 90: 745-753.e2 [PMID: 31302091 DOI: 10.1016/j.gie.2019.06.044]
20
Fukuda H, Ishihara R, Kato Y, Matsunaga T, Nishida T, Yamada T, Ogiyama H, Horie M, Kinoshita K, Tada T. Comparison of performances of artificial intelligence vs expert endoscopists for real-time assisted diagnosis of esophageal squamous cell carcinoma (with video). Gastrointest Endosc 2020; 92: 848-855 [PMID: 32505685 DOI: 10.1016/j.gie.2020.05.043]
21
Guo L, Xiao X, Wu C, Zeng X, Zhang Y, Du J, Bai S, Xie J, Zhang Z, Li Y, Wang X, Cheung O, Sharma M, Liu J, Hu B. Real-time automated diagnosis of precancerous lesions and early esophageal squamous cell carcinoma using a deep learning model (with videos). Gastrointest Endosc 2020; 91: 41-51 [PMID: 31445040 DOI: 10.1016/j.gie.2019.08.018]
22
Horie Y, Yoshio T, Aoyama K, Yoshimizu S, Horiuchi Y, Ishiyama A, Hirasawa T, Tsuchida T, Ozawa T, Ishihara S, Kumagai Y, Fujishiro M, Maetani I, Fujisaki J, Tada T. Diagnostic outcomes of esophageal cancer by artificial intelligence using convolutional neural networks. Gastrointest Endosc 2019; 89: 25-32 [PMID: 30120958 DOI: 10.1016/j.gie.2018.07.037]
23
Kumagai Y, Takubo K, Kawada K, Aoyama K, Endo Y, Ozawa T, Hirasawa T, Yoshio T, Ishihara S, Fujishiro M, Tamaru JI, Mochiki E, Ishida H, Tada T. Diagnosis using deep-learning artificial
24

Kröner PT et al. AI in GI review
WJG https://www.wjgnet.com 6808 October 28, 2021 Volume 27 Issue 40
intelligence based on the endocytoscopic observation of the esophagus. Esophagus 2019; 16: 180-187 [PMID: 30547352 DOI: 10.1007/s10388-018-0651-7]Li B, Cai SL, Tan WM, Li JC, Yalikong A, Feng XS, Yu HH, Lu PX, Feng Z, Yao LQ, Zhou PH, Yan B, Zhong YS. Comparative study on artificial intelligence systems for detecting early esophageal squamous cell carcinoma between narrow-band and white-light imaging. World J Gastroenterol 2021; 27: 281-293 [PMID: 33519142 DOI: 10.3748/wjg.v27.i3.281]
25
Ohmori M, Ishihara R, Aoyama K, Nakagawa K, Iwagami H, Matsuura N, Shichijo S, Yamamoto K, Nagaike K, Nakahara M, Inoue T, Aoi K, Okada H, Tada T. Endoscopic detection and differentiation of esophageal lesions using a deep neural network. Gastrointest Endosc 2020; 91: 301-309.e1 [PMID: 31585124 DOI: 10.1016/j.gie.2019.09.034]
26
Tan MC, Bhushan S, Quang T, Schwarz R, Patel KH, Yu X, Li Z, Wang G, Zhang F, Wang X, Xu H, Richards-Kortum RR, Anandasabapathy S. Automated software-assisted diagnosis of esophageal squamous cell neoplasia using high-resolution microendoscopy. Gastrointest Endosc 2021; 93: 831-838.e2 [PMID: 32682812 DOI: 10.1016/j.gie.2020.07.007]
27
Zhao YY, Xue DX, Wang YL, Zhang R, Sun B, Cai YP, Feng H, Cai Y, Xu JM. Computer-assisted diagnosis of early esophageal squamous cell carcinoma using narrow-band imaging magnifying endoscopy. Endoscopy 2019; 51: 333-341 [PMID: 30469155 DOI: 10.1055/a-0756-8754]
28
Liu G, Hua J, Wu Z, Meng T, Sun M, Huang P, He X, Sun W, Li X, Chen Y. Automatic classification of esophageal lesions in endoscopic images using a convolutional neural network. Ann Transl Med 2020; 8: 486 [PMID: 32395530 DOI: 10.21037/atm.2020.03.24]
29
Liu DY, Gan T, Rao NN, Xing YW, Zheng J, Li S, Luo CS, Zhou ZJ, Wan YL. Identification of lesion images from gastrointestinal endoscope based on feature extraction of combinational methods with and without learning process. Med Image Anal 2016; 32: 281-294 [PMID: 27236223 DOI: 10.1016/j.media.2016.04.007]
30
Nakagawa K, Ishihara R, Aoyama K, Ohmori M, Nakahira H, Matsuura N, Shichijo S, Nishida T, Yamada T, Yamaguchi S, Ogiyama H, Egawa S, Kishida O, Tada T. Classification for invasion depth of esophageal squamous cell carcinoma using a deep neural network compared with experienced endoscopists. Gastrointest Endosc 2019; 90: 407-414 [PMID: 31077698 DOI: 10.1016/j.gie.2019.04.245]
31
Shimamoto Y, Ishihara R, Kato Y, Shoji A, Inoue T, Matsueda K, Miyake M, Waki K, Kono M, Fukuda H, Matsuura N, Nagaike K, Aoi K, Yamamoto K, Nakahara M, Nishihara A, Tada T. Real-time assessment of video images for esophageal squamous cell carcinoma invasion depth using artificial intelligence. J Gastroenterol 2020; 55: 1037-1045 [PMID: 32778959 DOI: 10.1007/s00535-020-01716-5]
32
Pimentel-Nunes P, Libânio D, Lage J, Abrantes D, Coimbra M, Esposito G, Hormozdi D, Pepper M, Drasovean S, White JR, Dobru D, Buxbaum J, Ragunath K, Annibale B, Dinis-Ribeiro M. A multicenter prospective study of the real-time use of narrow-band imaging in the diagnosis of premalignant gastric conditions and lesions. Endoscopy 2016; 48: 723-730 [PMID: 27280384 DOI: 10.1055/s-0042-108435]
33
White JR, Sami SS, Reddiar D, Mannath J, Ortiz-Fernández-Sordo J, Beg S, Scott R, Thiagarajan P, Ahmad S, Parra-Blanco A, Kasi M, Telakis E, Sultan AA, Davis J, Figgins A, Kaye P, Robinson K, Atherton JC, Ragunath K. Narrow band imaging and serology in the assessment of premalignant gastric pathology. Scand J Gastroenterol 2018; 53: 1611-1618 [PMID: 30600732 DOI: 10.1080/00365521.2018.1542455]
34
Kimura-Tsuchiya R, Dohi O, Fujita Y, Yagi N, Majima A, Horii Y, Kitaichi T, Onozawa Y, Suzuki K, Tomie A, Okayama T, Yoshida N, Kamada K, Katada K, Uchiyama K, Ishikawa T, Takagi T, Handa O, Konishi H, Kishimoto M, Naito Y, Yanagisawa A, Itoh Y. Magnifying Endoscopy with Blue Laser Imaging Improves the Microstructure Visualization in Early Gastric Cancer: Comparison of Magnifying Endoscopy with Narrow-Band Imaging. Gastroenterol Res Pract 2017; 2017: 8303046 [PMID: 28947900 DOI: 10.1155/2017/8303046]
35
Mouri R, Yoshida S, Tanaka S, Oka S, Yoshihara M, Chayama K. Evaluation and validation of computed virtual chromoendoscopy in early gastric cancer. Gastrointest Endosc 2009; 69: 1052-1058 [PMID: 19152892 DOI: 10.1016/j.gie.2008.08.032]
36
Guimarães P, Keller A, Fehlmann T, Lammert F, Casper M. Deep-learning based detection of gastric precancerous conditions. Gut 2020; 69: 4-6 [PMID: 31375599 DOI: 10.1136/gutjnl-2019-319347]
37
Hirasawa T, Aoyama K, Tanimoto T, Ishihara S, Shichijo S, Ozawa T, Ohnishi T, Fujishiro M, Matsuo K, Fujisaki J, Tada T. Application of artificial intelligence using a convolutional neural network for detecting gastric cancer in endoscopic images. Gastric Cancer 2018; 21: 653-660 [PMID: 29335825 DOI: 10.1007/s10120-018-0793-2]
38
Ishioka M, Hirasawa T, Tada T. Detecting gastric cancer from video images using convolutional neural networks. Dig Endosc 2019; 31: e34-e35 [PMID: 30449050 DOI: 10.1111/den.13306]
39
Korhani Kangi A, Bahrampour A. Predicting the Survival of Gastric Cancer Patients Using Artificial and Bayesian Neural Networks. Asian Pac J Cancer Prev 2018; 19: 487-490 [PMID: 29480983 DOI: 10.22034/APJCP.2018.19.2.487]
40
Li L, Chen Y, Shen Z, Zhang X, Sang J, Ding Y, Yang X, Li J, Chen M, Jin C, Chen C, Yu C. Convolutional neural network for the diagnosis of early gastric cancer based on magnifying narrow band imaging. Gastric Cancer 2020; 23: 126-132 [PMID: 31332619 DOI: 10.1007/s10120-019-00992-2]
41
Kröner PT et al. AI in GI review
WJG https://www.wjgnet.com 6809 October 28, 2021 Volume 27 Issue 40
Miyaki R, Yoshida S, Tanaka S, Kominami Y, Sanomura Y, Matsuo T, Oka S, Raytchev B, Tamaki T, Koide T, Kaneda K, Yoshihara M, Chayama K. A computer system to be used with laser-based endoscopy for quantitative diagnosis of early gastric cancer. J Clin Gastroenterol 2015; 49: 108-115 [PMID: 24583752 DOI: 10.1097/MCG.0000000000000104]
42
Togo R, Yamamichi N, Mabe K, Takahashi Y, Takeuchi C, Kato M, Sakamoto N, Ishihara K, Ogawa T, Haseyama M. Detection of gastritis by a deep convolutional neural network from double-contrast upper gastrointestinal barium X-ray radiography. J Gastroenterol 2019; 54: 321-329 [PMID: 30284046 DOI: 10.1007/s00535-018-1514-7]
43
Wang S, Zhu Y, Yu L, Chen H, Lin H, Wan X, Fan X, Heng PA. RMDL: Recalibrated multi-instance deep learning for whole slide gastric image classification. Med Image Anal 2019; 58: 101549 [PMID: 31499320 DOI: 10.1016/j.media.2019.101549]
44
Luo H, Xu G, Li C, He L, Luo L, Wang Z, Jing B, Deng Y, Jin Y, Li Y, Li B, Tan W, He C, Seeruttun SR, Wu Q, Huang J, Huang DW, Chen B, Lin SB, Chen QM, Yuan CM, Chen HX, Pu HY, Zhou F, He Y, Xu RH. Real-time artificial intelligence for detection of upper gastrointestinal cancer by endoscopy: a multicentre, case-control, diagnostic study. Lancet Oncol 2019; 20: 1645-1654 [PMID: 31591062 DOI: 10.1016/S1470-2045(19)30637-0]
45
Namikawa K, Hirasawa T, Nakano K, Ikenoyama Y, Ishioka M, Shiroma S, Tokai Y, Yoshimizu S, Horiuchi Y, Ishiyama A, Yoshio T, Tsuchida T, Fujisaki J, Tada T. Artificial intelligence-based diagnostic system classifying gastric cancers and ulcers: comparison between the original and newly developed systems. Endoscopy 2020; 52: 1077-1083 [PMID: 32503056 DOI: 10.1055/a-1194-8771]
46
Ueyama H, Kato Y, Akazawa Y, Yatagai N, Komori H, Takeda T, Matsumoto K, Ueda K, Hojo M, Yao T, Nagahara A, Tada T. Application of artificial intelligence using a convolutional neural network for diagnosis of early gastric cancer based on magnifying endoscopy with narrow-band imaging. J Gastroenterol Hepatol 2021; 36: 482-489 [PMID: 32681536 DOI: 10.1111/jgh.15190]
47
Zhou C, Hu J, Wang Y, Ji MH, Tong J, Yang JJ, Xia H. A machine learning-based predictor for the identification of the recurrence of patients with gastric cancer after operation. Sci Rep 2021; 11: 1571 [PMID: 33452440 DOI: 10.1038/s41598-021-81188-6]
48
Zhang Y, Li F, Yuan F, Zhang K, Huo L, Dong Z, Lang Y, Zhang Y, Wang M, Gao Z, Qin Z, Shen L. Diagnosing chronic atrophic gastritis by gastroscopy using artificial intelligence. Dig Liver Dis 2020; 52: 566-572 [PMID: 32061504 DOI: 10.1016/j.dld.2019.12.146]
49
Kanesaka T, Lee TC, Uedo N, Lin KP, Chen HZ, Lee JY, Wang HP, Chang HT. Computer-aided diagnosis for identifying and delineating early gastric cancers in magnifying narrow-band imaging. Gastrointest Endosc 2018; 87: 1339-1344 [PMID: 29225083 DOI: 10.1016/j.gie.2017.11.029]
50
Sakai Y, Takemoto S, Hori K, Nishimura M, Ikematsu H, Yano T, Yokota H. Automatic detection of early gastric cancer in endoscopic images using a transferring convolutional neural network. Annu Int Conf IEEE Eng Med Biol Soc 2018; 2018: 4138-4141 [PMID: 30441266 DOI: 10.1109/EMBC.2018.8513274]
51
Wu L, Zhou W, Wan X, Zhang J, Shen L, Hu S, Ding Q, Mu G, Yin A, Huang X, Liu J, Jiang X, Wang Z, Deng Y, Liu M, Lin R, Ling T, Li P, Wu Q, Jin P, Chen J, Yu H. A deep neural network improves endoscopic detection of early gastric cancer without blind spots. Endoscopy 2019; 51: 522-531 [PMID: 30861533 DOI: 10.1055/a-0855-3532]
52
Gao Y, Zhang ZD, Li S, Guo YT, Wu QY, Liu SH, Yang SJ, Ding L, Zhao BC, Lu Y. Deep neural network-assisted computed tomography diagnosis of metastatic lymph nodes from gastric cancer. Chin Med J (Engl) 2019; 132: 2804-2811 [PMID: 31856051 DOI: 10.1097/CM9.0000000000000532]
53
Jagric T, Potrc S, Jagric T. Prediction of liver metastases after gastric cancer resection with the use of learning vector quantization neural networks. Dig Dis Sci 2010; 55: 3252-3261 [PMID: 20186483 DOI: 10.1007/s10620-010-1155-z]
54
Chen T, Zhang C, Liu Y, Zhao Y, Lin D, Hu Y, Yu J, Li G. A gastric cancer LncRNAs model for MSI and survival prediction based on support vector machine. BMC Genomics 2019; 20: 846 [PMID: 31722674 DOI: 10.1186/s12864-019-6135-x]
55
Nakahira H, Ishihara R, Aoyama K, Kono M, Fukuda H, Shimamoto Y, Nakagawa K, Ohmori M, Iwatsubo T, Iwagami H, Matsuno K, Inoue S, Matsuura N, Shichijo S, Maekawa A, Kanesaka T, Yamamoto S, Takeuchi Y, Higashino K, Uedo N, Matsunaga T, Tada T. Stratification of gastric cancer risk using a deep neural network. JGH Open 2020; 4: 466-471 [PMID: 32514455 DOI: 10.1002/jgh3.12281]
56
Jiang Y, Xie J, Han Z, Liu W, Xi S, Huang L, Huang W, Lin T, Zhao L, Hu Y, Yu J, Zhang Q, Li T, Cai S, Li G. Immunomarker Support Vector Machine Classifier for Prediction of Gastric Cancer Survival and Adjuvant Chemotherapeutic Benefit. Clin Cancer Res 2018; 24: 5574-5584 [PMID: 30042208 DOI: 10.1158/1078-0432.CCR-18-0848]
57
Que SJ, Chen QY, Qing-Zhong, Liu ZY, Wang JB, Lin JX, Lu J, Cao LL, Lin M, Tu RH, Huang ZN, Lin JL, Zheng HL, Li P, Zheng CH, Huang CM, Xie JW. Application of preoperative artificial neural network based on blood biomarkers and clinicopathological parameters for predicting long-term survival of patients with gastric cancer. World J Gastroenterol 2019; 25: 6451-6464 [PMID: 31798281 DOI: 10.3748/wjg.v25.i43.6451]
58
Zhu Y, Wang QC, Xu MD, Zhang Z, Cheng J, Zhong YS, Zhang YQ, Chen WF, Yao LQ, Zhou PH, Li QL. Application of convolutional neural network in the diagnosis of the invasion depth of gastric cancer based on conventional endoscopy. Gastrointest Endosc 2019; 89: 806-815.e1 [PMID: 30452913 DOI: 10.1016/j.gie.2018.11.011]
59
Kröner PT et al. AI in GI review
WJG https://www.wjgnet.com 6810 October 28, 2021 Volume 27 Issue 40
Nakashima H, Kawahira H, Kawachi H, Sakaki N. Artificial intelligence diagnosis of Helicobacter pylori infection using blue laser imaging-bright and linked color imaging: a single-center prospective study. Ann Gastroenterol 2018; 31: 462-468 [PMID: 29991891 DOI: 10.20524/aog.2018.0269]
60
Shichijo S, Endo Y, Aoyama K, Takeuchi Y, Ozawa T, Takiyama H, Matsuo K, Fujishiro M, Ishihara S, Ishihara R, Tada T. Application of convolutional neural networks for evaluating Helicobacter pylori infection status on the basis of endoscopic images. Scand J Gastroenterol 2019; 54: 158-163 [PMID: 30879352 DOI: 10.1080/00365521.2019.1577486]
61
Martin DR, Hanson JA, Gullapalli RR, Schultz FA, Sethi A, Clark DP. A Deep Learning Convolutional Neural Network Can Recognize Common Patterns of Injury in Gastric Pathology. Arch Pathol Lab Med 2020; 144: 370-378 [PMID: 31246112 DOI: 10.5858/arpa.2019-0004-OA]
62
Nakashima H, Kawahira H, Kawachi H, Sakaki N. Endoscopic three-categorical diagnosis of Helicobacter pylori infection using linked color imaging and deep learning: a single-center prospective study (with video). Gastric Cancer 2020; 23: 1033-1040 [PMID: 32382973 DOI: 10.1007/s10120-020-01077-1]
63
Shichijo S, Nomura S, Aoyama K, Nishikawa Y, Miura M, Shinagawa T, Takiyama H, Tanimoto T, Ishihara S, Matsuo K, Tada T. Application of Convolutional Neural Networks in the Diagnosis of Helicobacter pylori Infection Based on Endoscopic Images. EBioMedicine 2017; 25: 106-111 [PMID: 29056541 DOI: 10.1016/j.ebiom.2017.10.014]
64
Zheng W, Zhang X, Kim JJ, Zhu X, Ye G, Ye B, Wang J, Luo S, Li J, Yu T, Liu J, Hu W, Si J. High Accuracy of Convolutional Neural Network for Evaluation of Helicobacter pylori Infection Based on Endoscopic Images: Preliminary Experience. Clin Transl Gastroenterol 2019; 10: e00109 [PMID: 31833862 DOI: 10.14309/ctg.0000000000000109]
65
Yang YJ, Bang CS. Application of artificial intelligence in gastroenterology. World J Gastroenterol 2019; 25: 1666-1683 [PMID: 31011253 DOI: 10.3748/wjg.v25.i14.1666]
66
Wong GL, Ma AJ, Deng H, Ching JY, Wong VW, Tse YK, Yip TC, Lau LH, Liu HH, Leung CM, Tsang SW, Chan CW, Lau JY, Yuen PC, Chan FK. Machine learning model to predict recurrent ulcer bleeding in patients with history of idiopathic gastroduodenal ulcer bleeding. Aliment Pharmacol Ther 2019; 49: 912-918 [PMID: 30761584 DOI: 10.1111/apt.15145]
67
Seo DW, Yi H, Park B, Kim YJ, Jung DH, Woo I, Sohn CH, Ko BS, Kim N, Kim WY. Prediction of Adverse Events in Stable Non-Variceal Gastrointestinal Bleeding Using Machine Learning. J Clin Med 2020; 9 [PMID: 32796647 DOI: 10.3390/jcm9082603]
68
Shung DL, Au B, Taylor RA, Tay JK, Laursen SB, Stanley AJ, Dalton HR, Ngu J, Schultz M, Laine L. Validation of a Machine Learning Model That Outperforms Clinical Risk Scoring Systems for Upper Gastrointestinal Bleeding. Gastroenterology 2020; 158: 160-167 [PMID: 31562847 DOI: 10.1053/j.gastro.2019.09.009]
69
Das A, Ben-Menachem T, Cooper GS, Chak A, Sivak MV Jr, Gonet JA, Wong RC. Prediction of outcome in acute lower-gastrointestinal haemorrhage based on an artificial neural network: internal and external validation of a predictive model. Lancet 2003; 362: 1261-1266 [PMID: 14575969 DOI: 10.1016/S0140-6736(03)14568-0]
70
Das A, Ben-Menachem T, Farooq FT, Cooper GS, Chak A, Sivak MV Jr, Wong RC. Artificial neural network as a predictive instrument in patients with acute nonvariceal upper gastrointestinal hemorrhage. Gastroenterology 2008; 134: 65-74 [PMID: 18061180 DOI: 10.1053/j.gastro.2007.10.037]
71
Loftus TJ, Brakenridge SC, Croft CA, Smith RS, Efron PA, Moore FA, Mohr AM, Jordan JR. Neural network prediction of severe lower intestinal bleeding and the need for surgical intervention. J Surg Res 2017; 212: 42-47 [PMID: 28550920 DOI: 10.1016/j.jss.2016.12.032]
72
Ayaru L, Ypsilantis PP, Nanapragasam A, Choi RC, Thillanathan A, Min-Ho L, Montana G. Prediction of Outcome in Acute Lower Gastrointestinal Bleeding Using Gradient Boosting. PLoS One 2015; 10: e0132485 [PMID: 26172121 DOI: 10.1371/journal.pone.0132485]
73
Bressler B, Paszat LF, Chen Z, Rothwell DM, Vinden C, Rabeneck L. Rates of new or missed colorectal cancers after colonoscopy and their risk factors: a population-based analysis. Gastroenterology 2007; 132: 96-102 [PMID: 17241863 DOI: 10.1053/j.gastro.2006.10.027]
74
Jover R, Zapater P, Polanía E, Bujanda L, Lanas A, Hermo JA, Cubiella J, Ono A, González-Méndez Y, Peris A, Pellisé M, Seoane A, Herreros-de-Tejada A, Ponce M, Marín-Gabriel JC, Chaparro M, Cacho G, Fernández-Díez S, Arenas J, Sopeña F, de-Castro L, Vega-Villaamil P, Rodríguez-Soler M, Carballo F, Salas D, Morillas JD, Andreu M, Quintero E, Castells A; COLONPREV study investigators. Modifiable endoscopic factors that influence the adenoma detection rate in colorectal cancer screening colonoscopies. Gastrointest Endosc 2013; 77: 381-389.e1 [PMID: 23218945 DOI: 10.1016/j.gie.2012.09.027]
75
Hassan C, Spadaccini M, Iannone A, Maselli R, Jovani M, Chandrasekar VT, Antonelli G, Yu H, Areia M, Dinis-Ribeiro M, Bhandari P, Sharma P, Rex DK, Rösch T, Wallace M, Repici A. Performance of artificial intelligence in colonoscopy for adenoma and polyp detection: a systematic review and meta-analysis. Gastrointest Endosc 2021; 93: 77-85.e6 [PMID: 32598963 DOI: 10.1016/j.gie.2020.06.059]
76
Samadder NJ, Curtin K, Tuohy TM, Pappas L, Boucher K, Provenzale D, Rowe KG, Mineau GP, Smith K, Pimentel R, Kirchhoff AC, Burt RW. Characteristics of missed or interval colorectal cancer and patient survival: a population-based study. Gastroenterology 2014; 146: 950-960 [PMID: 24417818 DOI: 10.1053/j.gastro.2014.01.013]
77
Lee CK, Park DI, Lee SH, Hwangbo Y, Eun CS, Han DS, Cha JM, Lee BI, Shin JE. Participation by 78

Kröner PT et al. AI in GI review
WJG https://www.wjgnet.com 6811 October 28, 2021 Volume 27 Issue 40
experienced endoscopy nurses increases the detection rate of colon polyps during a screening colonoscopy: a multicenter, prospective, randomized study. Gastrointest Endosc 2011; 74: 1094-1102 [PMID: 21889137 DOI: 10.1016/j.gie.2011.06.033]Aslanian HR, Shieh FK, Chan FW, Ciarleglio MM, Deng Y, Rogart JN, Jamidar PA, Siddiqui UD. Nurse observation during colonoscopy increases polyp detection: a randomized prospective study. Am J Gastroenterol 2013; 108: 166-172 [PMID: 23381064 DOI: 10.1038/ajg.2012.237]
79
Gong D, Wu L, Zhang J, Mu G, Shen L, Liu J, Wang Z, Zhou W, An P, Huang X, Jiang X, Li Y, Wan X, Hu S, Chen Y, Hu X, Xu Y, Zhu X, Li S, Yao L, He X, Chen D, Huang L, Wei X, Wang X, Yu H. Detection of colorectal adenomas with a real-time computer-aided system (ENDOANGEL): a randomised controlled study. Lancet Gastroenterol Hepatol 2020; 5: 352-361 [PMID: 31981518 DOI: 10.1016/S2468-1253(19)30413-3]
80
Klare P, Sander C, Prinzen M, Haller B, Nowack S, Abdelhafez M, Poszler A, Brown H, Wilhelm D, Schmid RM, von Delius S, Wittenberg T. Automated polyp detection in the colorectum: a prospective study (with videos). Gastrointest Endosc 2019; 89: 576-582.e1 [PMID: 30342029 DOI: 10.1016/j.gie.2018.09.042]
81
Repici A, Badalamenti M, Maselli R, Correale L, Radaelli F, Rondonotti E, Ferrara E, Spadaccini M, Alkandari A, Fugazza A, Anderloni A, Galtieri PA, Pellegatta G, Carrara S, Di Leo M, Craviotto V, Lamonaca L, Lorenzetti R, Andrealli A, Antonelli G, Wallace M, Sharma P, Rosch T, Hassan C. Efficacy of Real-Time Computer-Aided Detection of Colorectal Neoplasia in a Randomized Trial. Gastroenterology 2020; 159: 512-520.e7 [PMID: 32371116 DOI: 10.1053/j.gastro.2020.04.062]
82
Su JR, Li Z, Shao XJ, Ji CR, Ji R, Zhou RC, Li GC, Liu GQ, He YS, Zuo XL, Li YQ. Impact of a real-time automatic quality control system on colorectal polyp and adenoma detection: a prospective randomized controlled study (with videos). Gastrointest Endosc 2020; 91: 415-424.e4 [PMID: 31454493 DOI: 10.1016/j.gie.2019.08.026]
83
Urban G, Tripathi P, Alkayali T, Mittal M, Jalali F, Karnes W, Baldi P. Deep Learning Localizes and Identifies Polyps in Real Time With 96% Accuracy in Screening Colonoscopy. Gastroenterology 2018; 155: 1069-1078.e8 [PMID: 29928897 DOI: 10.1053/j.gastro.2018.06.037]
84
Wang P, Berzin TM, Glissen Brown JR, Bharadwaj S, Becq A, Xiao X, Liu P, Li L, Song Y, Zhang D, Li Y, Xu G, Tu M, Liu X. Real-time automatic detection system increases colonoscopic polyp and adenoma detection rates: a prospective randomised controlled study. Gut 2019; 68: 1813-1819 [PMID: 30814121 DOI: 10.1136/gutjnl-2018-317500]
85
Wang P, Liu X, Berzin TM, Glissen Brown JR, Liu P, Zhou C, Lei L, Li L, Guo Z, Lei S, Xiong F, Wang H, Song Y, Pan Y, Zhou G. Effect of a deep-learning computer-aided detection system on adenoma detection during colonoscopy (CADe-DB trial): a double-blind randomised study. Lancet Gastroenterol Hepatol 2020; 5: 343-351 [PMID: 31981517 DOI: 10.1016/S2468-1253(19)30411-X]
86
Liu WN, Zhang YY, Bian XQ, Wang LJ, Yang Q, Zhang XD, Huang J. Study on detection rate of polyps and adenomas in artificial-intelligence-aided colonoscopy. Saudi J Gastroenterol 2020; 26: 13-19 [PMID: 31898644 DOI: 10.4103/sjg.SJG_377_19]
87
Bernal J, Tajkbaksh N, Sanchez FJ, Matuszewski BJ, Hao Chen, Lequan Yu, Angermann Q, Romain O, Rustad B, Balasingham I, Pogorelov K, Sungbin Choi, Debard Q, Maier-Hein L, Speidel S, Stoyanov D, Brandao P, Cordova H, Sanchez-Montes C, Gurudu SR, Fernandez-Esparrach G, Dray X, Jianming Liang, Histace A. Comparative Validation of Polyp Detection Methods in Video Colonoscopy: Results From the MICCAI 2015 Endoscopic Vision Challenge. IEEE Trans Med Imaging 2017; 36: 1231-1249 [PMID: 28182555 DOI: 10.1109/TMI.2017.2664042]
88
Blanes-Vidal V, Baatrup G, Nadimi ES. Addressing priority challenges in the detection and assessment of colorectal polyps from capsule endoscopy and colonoscopy in colorectal cancer screening using machine learning. Acta Oncol 2019; 58: S29-S36 [PMID: 30836800 DOI: 10.1080/0284186X.2019.1584404]
89
Fernández-Esparrach G, Bernal J, López-Cerón M, Córdova H, Sánchez-Montes C, Rodríguez de Miguel C, Sánchez FJ. Exploring the clinical potential of an automatic colonic polyp detection method based on the creation of energy maps. Endoscopy 2016; 48: 837-842 [PMID: 27285900 DOI: 10.1055/s-0042-108434]
90
Figueiredo PN, Figueiredo IN, Pinto L, Kumar S, Tsai YR, Mamonov AV. Polyp detection with computer-aided diagnosis in white light colonoscopy: comparison of three different methods. Endosc Int Open 2019; 7: E209-E215 [PMID: 30705955 DOI: 10.1055/a-0808-4456]
91
Hassan C, Wallace MB, Sharma P, Maselli R, Craviotto V, Spadaccini M, Repici A. New artificial intelligence system: first validation study vs experienced endoscopists for colorectal polyp detection. Gut 2020; 69: 799-800 [PMID: 31615835 DOI: 10.1136/gutjnl-2019-319914]
92
Kominami Y, Yoshida S, Tanaka S, Sanomura Y, Hirakawa T, Raytchev B, Tamaki T, Koide T, Kaneda K, Chayama K. Computer-aided diagnosis of colorectal polyp histology by using a real-time image recognition system and narrow-band imaging magnifying colonoscopy. Gastrointest Endosc 2016; 83: 643-649 [PMID: 26264431 DOI: 10.1016/j.gie.2015.08.004]
93
Lequan Yu, Hao Chen, Qi Dou, Jing Qin, Pheng Ann Heng. Integrating Online and Offline Three-Dimensional Deep Learning for Automated Polyp Detection in Colonoscopy Videos. IEEE J Biomed Health Inform 2017; 21: 65-75 [PMID: 28114049 DOI: 10.1109/JBHI.2016.2637004]
94
Misawa M, Kudo SE, Mori Y, Cho T, Kataoka S, Yamauchi A, Ogawa Y, Maeda Y, Takeda K, Ichimasa K, Nakamura H, Yagawa Y, Toyoshima N, Ogata N, Kudo T, Hisayuki T, Hayashi T, Wakamura K, Baba T, Ishida F, Itoh H, Roth H, Oda M, Mori K. Artificial Intelligence-Assisted Polyp Detection for Colonoscopy: Initial Experience. Gastroenterology 2018; 154: 2027-2029.e3
95
Kröner PT et al. AI in GI review
WJG https://www.wjgnet.com 6812 October 28, 2021 Volume 27 Issue 40
[PMID: 29653147 DOI: 10.1053/j.gastro.2018.04.003]Misawa M, Kudo SE, Mori Y, Hotta K, Ohtsuka K, Matsuda T, Saito S, Kudo T, Baba T, Ishida F, Itoh H, Oda M, Mori K. Development of a computer-aided detection system for colonoscopy and a publicly accessible large colonoscopy video database (with video). Gastrointest Endosc 2021; 93: 960-967.e3 [PMID: 32745531 DOI: 10.1016/j.gie.2020.07.060]
96
Mori Y, Kudo SE, Misawa M, Saito Y, Ikematsu H, Hotta K, Ohtsuka K, Urushibara F, Kataoka S, Ogawa Y, Maeda Y, Takeda K, Nakamura H, Ichimasa K, Kudo T, Hayashi T, Wakamura K, Ishida F, Inoue H, Itoh H, Oda M, Mori K. Real-Time Use of Artificial Intelligence in Identification of Diminutive Polyps During Colonoscopy: A Prospective Study. Ann Intern Med 2018; 169: 357-366 [PMID: 30105375 DOI: 10.7326/M18-0249]
97
Wang P, Xiao X, Glissen Brown JR, Berzin TM, Tu M, Xiong F, Hu X, Liu P, Song Y, Zhang D, Yang X, Li L, He J, Yi X, Liu J, Liu X. Development and validation of a deep-learning algorithm for the detection of polyps during colonoscopy. Nat Biomed Eng 2018; 2: 741-748 [PMID: 31015647 DOI: 10.1038/s41551-018-0301-3]
98
Echle A, Grabsch HI, Quirke P, van den Brandt PA, West NP, Hutchins GGA, Heij LR, Tan X, Richman SD, Krause J, Alwers E, Jenniskens J, Offermans K, Gray R, Brenner H, Chang-Claude J, Trautwein C, Pearson AT, Boor P, Luedde T, Gaisa NT, Hoffmeister M, Kather JN. Clinical-Grade Detection of Microsatellite Instability in Colorectal Tumors by Deep Learning. Gastroenterology 2020; 159: 1406-1416.e11 [PMID: 32562722 DOI: 10.1053/j.gastro.2020.06.021]
99
Ito N, Kawahira H, Nakashima H, Uesato M, Miyauchi H, Matsubara H. Endoscopic Diagnostic Support System for cT1b Colorectal Cancer Using Deep Learning. Oncology 2019; 96: 44-50 [PMID: 30130758 DOI: 10.1159/000491636]
100
Kudo SE, Misawa M, Mori Y, Hotta K, Ohtsuka K, Ikematsu H, Saito Y, Takeda K, Nakamura H, Ichimasa K, Ishigaki T, Toyoshima N, Kudo T, Hayashi T, Wakamura K, Baba T, Ishida F, Inoue H, Itoh H, Oda M, Mori K. Artificial Intelligence-assisted System Improves Endoscopic Identification of Colorectal Neoplasms. Clin Gastroenterol Hepatol 2020; 18: 1874-1881.e2 [PMID: 31525512 DOI: 10.1016/j.cgh.2019.09.009]
101
. The Paris endoscopic classification of superficial neoplastic lesions: esophagus, stomach, and colon: November 30 to December 1, 2002. Gastrointest Endosc 2003; 58: S3-43 [PMID: 14652541 DOI: 10.1016/s0016-5107(03)02159-x]
102
Endoscopic Classification Review Group. Update on the paris classification of superficial neoplastic lesions in the digestive tract. Endoscopy 2005; 37: 570-578 [PMID: 15933932 DOI: 10.1055/s-2005-861352]
103
van Doorn SC, Hazewinkel Y, East JE, van Leerdam ME, Rastogi A, Pellisé M, Sanduleanu-Dascalescu S, Bastiaansen BA, Fockens P, Dekker E. Polyp morphology: an interobserver evaluation for the Paris classification among international experts. Am J Gastroenterol 2015; 110: 180-187 [PMID: 25331346 DOI: 10.1038/ajg.2014.326]
104
Wang TD, Van Dam J. Optical biopsy: a new frontier in endoscopic detection and diagnosis. Clin Gastroenterol Hepatol 2004; 2: 744-753 [PMID: 15354274 DOI: 10.1016/S1542-3565(04)00345-3]
105
Hassan C, Pickhardt PJ, Rex DK. A resect and discard strategy would improve cost-effectiveness of colorectal cancer screening. Clin Gastroenterol Hepatol 2010; 8: 865-869, 869.e1 [PMID: 20621680 DOI: 10.1016/j.cgh.2010.05.018]
106
Byrne MF, Chapados N, Soudan F, Oertel C, Linares Pérez M, Kelly R, Iqbal N, Chandelier F, Rex DK. Real-time differentiation of adenomatous and hyperplastic diminutive colorectal polyps during analysis of unaltered videos of standard colonoscopy using a deep learning model. Gut 2019; 68: 94-100 [PMID: 29066576 DOI: 10.1136/gutjnl-2017-314547]
107
Chen PJ, Lin MC, Lai MJ, Lin JC, Lu HH, Tseng VS. Accurate Classification of Diminutive Colorectal Polyps Using Computer-Aided Analysis. Gastroenterology 2018; 154: 568-575 [PMID: 29042219 DOI: 10.1053/j.gastro.2017.10.010]
108
Gross S, Trautwein C, Behrens A, Winograd R, Palm S, Lutz HH, Schirin-Sokhan R, Hecker H, Aach T, Tischendorf JJ. Computer-based classification of small colorectal polyps by using narrow-band imaging with optical magnification. Gastrointest Endosc 2011; 74: 1354-1359 [PMID: 22000791 DOI: 10.1016/j.gie.2011.08.001]
109
Horiuchi H, Tamai N, Kamba S, Inomata H, Ohya TR, Sumiyama K. Real-time computer-aided diagnosis of diminutive rectosigmoid polyps using an auto-fluorescence imaging system and novel color intensity analysis software. Scand J Gastroenterol 2019; 54: 800-805 [PMID: 31195905 DOI: 10.1080/00365521.2019.1627407]
110
Misawa M, Kudo SE, Mori Y, Nakamura H, Kataoka S, Maeda Y, Kudo T, Hayashi T, Wakamura K, Miyachi H, Katagiri A, Baba T, Ishida F, Inoue H, Nimura Y, Mori K. Characterization of Colorectal Lesions Using a Computer-Aided Diagnostic System for Narrow-Band Imaging Endocytoscopy. Gastroenterology 2016; 150: 1531-1532.e3 [PMID: 27072671 DOI: 10.1053/j.gastro.2016.04.004]
111
Mori Y, Kudo SE, Chiu PW, Singh R, Misawa M, Wakamura K, Kudo T, Hayashi T, Katagiri A, Miyachi H, Ishida F, Maeda Y, Inoue H, Nimura Y, Oda M, Mori K. Impact of an automated system for endocytoscopic diagnosis of small colorectal lesions: an international web-based study. Endoscopy 2016; 48: 1110-1118 [PMID: 27494455 DOI: 10.1055/s-0042-113609]
112
Mori Y, Kudo SE, Wakamura K, Misawa M, Ogawa Y, Kutsukawa M, Kudo T, Hayashi T, Miyachi H, Ishida F, Inoue H. Novel computer-aided diagnostic system for colorectal lesions by using endocytoscopy (with videos). Gastrointest Endosc 2015; 81: 621-629 [PMID: 25440671 DOI:
113
Kröner PT et al. AI in GI review
WJG https://www.wjgnet.com 6813 October 28, 2021 Volume 27 Issue 40
10.1016/j.gie.2014.09.008]Sánchez-Montes C, Sánchez FJ, Bernal J, Córdova H, López-Cerón M, Cuatrecasas M, Rodríguez de Miguel C, García-Rodríguez A, Garcés-Durán R, Pellisé M, Llach J, Fernández-Esparrach G. Computer-aided prediction of polyp histology on white light colonoscopy using surface pattern analysis. Endoscopy 2019; 51: 261-265 [PMID: 30360010 DOI: 10.1055/a-0732-5250]
114
Tischendorf JJ, Gross S, Winograd R, Hecker H, Auer R, Behrens A, Trautwein C, Aach T, Stehle T. Computer-aided classification of colorectal polyps based on vascular patterns: a pilot study. Endoscopy 2010; 42: 203-207 [PMID: 20101564 DOI: 10.1055/s-0029-1243861]
115
Ikehara H, Saito Y, Matsuda T, Uraoka T, Murakami Y. Diagnosis of depth of invasion for early colorectal cancer using magnifying colonoscopy. J Gastroenterol Hepatol 2010; 25: 905-912 [PMID: 20546444 DOI: 10.1111/j.1440-1746.2010.06275.x]
116
Kitajima K, Fujimori T, Fujii S, Takeda J, Ohkura Y, Kawamata H, Kumamoto T, Ishiguro S, Kato Y, Shimoda T, Iwashita A, Ajioka Y, Watanabe H, Watanabe T, Muto T, Nagasako K. Correlations between lymph node metastasis and depth of submucosal invasion in submucosal invasive colorectal carcinoma: a Japanese collaborative study. J Gastroenterol 2004; 39: 534-543 [PMID: 15235870 DOI: 10.1007/s00535-004-1339-4]
117
Matsuda T, Saito Y, Nakajima T, Sakamoto T, Ikematsu H, Sano Y, Fu KI, Fujii T. Macroscopic estimation of submucosal invasion in the colon. Tech Gastrointest Endosc 2011; 13: 24-32 [DOI: 10.1016/j.tgie.2011.01.004]
118
Mori Y, Kudo SE, East JE, Rastogi A, Bretthauer M, Misawa M, Sekiguchi M, Matsuda T, Saito Y, Ikematsu H, Hotta K, Ohtsuka K, Kudo T, Mori K. Cost savings in colonoscopy with artificial intelligence-aided polyp diagnosis: an add-on analysis of a clinical trial (with video). Gastrointest Endosc 2020; 92: 905-911.e1 [PMID: 32240683 DOI: 10.1016/j.gie.2020.03.3759]
119
Thakkar S, Carleton NM, Rao B, Syed A. Use of Artificial Intelligence-Based Analytics From Live Colonoscopies to Optimize the Quality of the Colonoscopy Examination in Real Time: Proof of Concept. Gastroenterology 2020; 158: 1219-1221.e2 [PMID: 31945357 DOI: 10.1053/j.gastro.2019.12.035]
120
Reichling C, Taieb J, Derangere V, Klopfenstein Q, Le Malicot K, Gornet JM, Becheur H, Fein F, Cojocarasu O, Kaminsky MC, Lagasse JP, Luet D, Nguyen S, Etienne PL, Gasmi M, Vanoli A, Perrier H, Puig PL, Emile JF, Lepage C, Ghiringhelli F. Artificial intelligence-guided tissue analysis combined with immune infiltrate assessment predicts stage III colon cancer outcomes in PETACC08 study. Gut 2020; 69: 681-690 [PMID: 31780575 DOI: 10.1136/gutjnl-2019-319292]
121
Kather JN, Krisam J, Charoentong P, Luedde T, Herpel E, Weis CA, Gaiser T, Marx A, Valous NA, Ferber D, Jansen L, Reyes-Aldasoro CC, Zörnig I, Jäger D, Brenner H, Chang-Claude J, Hoffmeister M, Halama N. Predicting survival from colorectal cancer histology slides using deep learning: A retrospective multicenter study. PLoS Med 2019; 16: e1002730 [PMID: 30677016 DOI: 10.1371/journal.pmed.1002730]
122
Skrede OJ, De Raedt S, Kleppe A, Hveem TS, Liestøl K, Maddison J, Askautrud HA, Pradhan M, Nesheim JA, Albregtsen F, Farstad IN, Domingo E, Church DN, Nesbakken A, Shepherd NA, Tomlinson I, Kerr R, Novelli M, Kerr DJ, Danielsen HE. Deep learning for prediction of colorectal cancer outcome: a discovery and validation study. Lancet 2020; 395: 350-360 [PMID: 32007170 DOI: 10.1016/S0140-6736(19)32998-8]
123
Yang YJ. The Future of Capsule Endoscopy: The Role of Artificial Intelligence and Other Technical Advancements. Clin Endosc 2020; 53: 387-394 [PMID: 32668529 DOI: 10.5946/ce.2020.133]
124
Liu G, Yan G, Kuang S, Wang Y. Detection of small bowel tumor based on multi-scale curvelet analysis and fractal technology in capsule endoscopy. Comput Biol Med 2016; 70: 131-138 [PMID: 26829705 DOI: 10.1016/j.compbiomed.2016.01.021]
125
Li B, Meng MQ. Tumor recognition in wireless capsule endoscopy images using textural features and SVM-based feature selection. IEEE Trans Inf Technol Biomed 2012; 16: 323-329 [PMID: 22287246 DOI: 10.1109/TITB.2012.2185807]
126
Li B, Meng MQ. Computer-based detection of bleeding and ulcer in wireless capsule endoscopy images by chromaticity moments. Comput Biol Med 2009; 39: 141-147 [PMID: 19147126 DOI: 10.1016/j.compbiomed.2008.11.007]
127
Aoki T, Yamada A, Aoyama K, Saito H, Fujisawa G, Odawara N, Kondo R, Tsuboi A, Ishibashi R, Nakada A, Niikura R, Fujishiro M, Oka S, Ishihara S, Matsuda T, Nakahori M, Tanaka S, Koike K, Tada T. Clinical usefulness of a deep learning-based system as the first screening on small-bowel capsule endoscopy reading. Dig Endosc 2020; 32: 585-591 [PMID: 31441972 DOI: 10.1111/den.13517]
128
Soffer S, Klang E, Shimon O, Nachmias N, Eliakim R, Ben-Horin S, Kopylov U, Barash Y. Deep learning for wireless capsule endoscopy: a systematic review and meta-analysis. Gastrointest Endosc 2020; 92: 831-839.e8 [PMID: 32334015 DOI: 10.1016/j.gie.2020.04.039]
129
Aoki T, Yamada A, Kato Y, Saito H, Tsuboi A, Nakada A, Niikura R, Fujishiro M, Oka S, Ishihara S, Matsuda T, Nakahori M, Tanaka S, Koike K, Tada T. Automatic detection of blood content in capsule endoscopy images based on a deep convolutional neural network. J Gastroenterol Hepatol 2020; 35: 1196-1200 [PMID: 31758717 DOI: 10.1111/jgh.14941]
130
Ding Z, Shi H, Zhang H, Meng L, Fan M, Han C, Zhang K, Ming F, Xie X, Liu H, Liu J, Lin R, Hou X. Gastroenterologist-Level Identification of Small-Bowel Diseases and Normal Variants by Capsule Endoscopy Using a Deep-Learning Model. Gastroenterology 2019; 157: 1044-1054.e5 [PMID: 31251929 DOI: 10.1053/j.gastro.2019.06.025]
131

Kröner PT et al. AI in GI review
WJG https://www.wjgnet.com 6814 October 28, 2021 Volume 27 Issue 40
Fu Y, Zhang W, Mandal M, Meng MQ. Computer-aided bleeding detection in WCE video. IEEE J Biomed Health Inform 2014; 18: 636-642 [PMID: 24608063 DOI: 10.1109/JBHI.2013.2257819]
132
Hassan AR, Haque MA. Computer-aided gastrointestinal hemorrhage detection in wireless capsule endoscopy videos. Comput Methods Programs Biomed 2015; 122: 341-353 [PMID: 26390947 DOI: 10.1016/j.cmpb.2015.09.005]
133
Iakovidis DK, Koulaouzidis A. Automatic lesion detection in capsule endoscopy based on color saliency: closer to an essential adjunct for reviewing software. Gastrointest Endosc 2014; 80: 877-883 [PMID: 25088924 DOI: 10.1016/j.gie.2014.06.026]
134
Leenhardt R, Vasseur P, Li C, Saurin JC, Rahmi G, Cholet F, Becq A, Marteau P, Histace A, Dray X; CAD-CAP Database Working Group. A neural network algorithm for detection of GI angiectasia during small-bowel capsule endoscopy. Gastrointest Endosc 2019; 89: 189-194 [PMID: 30017868 DOI: 10.1016/j.gie.2018.06.036]
135
Lv G, Yan G, Wang Z. Bleeding detection in wireless capsule endoscopy images based on color invariants and spatial pyramids using support vector machines. Annu Int Conf IEEE Eng Med Biol Soc 2011; 2011: 6643-6646 [PMID: 22255862 DOI: 10.1109/IEMBS.2011.6091638]
136
Noya F, Alvarez-Gonzalez MA, Benitez R. Automated angiodysplasia detection from wireless capsule endoscopy. Annu Int Conf IEEE Eng Med Biol Soc 2017; 2017: 3158-3161 [PMID: 29060568 DOI: 10.1109/EMBC.2017.8037527]
137
Pan G, Yan G, Song X, Qiu X. BP neural network classification for bleeding detection in wireless capsule endoscopy. J Med Eng Technol 2009; 33: 575-581 [PMID: 19639509 DOI: 10.1080/03091900903111974]
138
Sainju S, Bui FM, Wahid KA. Automated bleeding detection in capsule endoscopy videos using statistical features and region growing. J Med Syst 2014; 38: 25 [PMID: 24696394 DOI: 10.1007/s10916-014-0025-1]
139
Tsuboi A, Oka S, Aoyama K, Saito H, Aoki T, Yamada A, Matsuda T, Fujishiro M, Ishihara S, Nakahori M, Koike K, Tanaka S, Tada T. Artificial intelligence using a convolutional neural network for automatic detection of small-bowel angioectasia in capsule endoscopy images. Dig Endosc 2020; 32: 382-390 [PMID: 31392767 DOI: 10.1111/den.13507]
140
Xing X, Jia X, Meng MQ. Bleeding Detection in Wireless Capsule Endoscopy Image Video Using Superpixel-Color Histogram and a Subspace KNN Classifier. Annu Int Conf IEEE Eng Med Biol Soc 2018; 2018: 1-4 [PMID: 30440286 DOI: 10.1109/EMBC.2018.8513012]
141
Yuan Y, Li B, Meng MQ. Bleeding Frame and Region Detection in the Wireless Capsule Endoscopy Video. IEEE J Biomed Health Inform 2016; 20: 624-630 [PMID: 25675468 DOI: 10.1109/JBHI.2015.2399502]
142
Aoki T, Yamada A, Aoyama K, Saito H, Tsuboi A, Nakada A, Niikura R, Fujishiro M, Oka S, Ishihara S, Matsuda T, Tanaka S, Koike K, Tada T. Automatic detection of erosions and ulcerations in wireless capsule endoscopy images based on a deep convolutional neural network. Gastrointest Endosc 2019; 89: 357-363.e2 [PMID: 30670179 DOI: 10.1016/j.gie.2018.10.027]
143
Otani K, Nakada A, Kurose Y, Niikura R, Yamada A, Aoki T, Nakanishi H, Doyama H, Hasatani K, Sumiyoshi T, Kitsuregawa M, Harada T, Koike K. Automatic detection of different types of small-bowel lesions on capsule endoscopy images using a newly developed deep convolutional neural network. Endoscopy 2020; 52: 786-791 [PMID: 32557474 DOI: 10.1055/a-1167-8157]
144
Fan S, Xu L, Fan Y, Wei K, Li L. Computer-aided detection of small intestinal ulcer and erosion in wireless capsule endoscopy images. Phys Med Biol 2018; 63: 165001 [PMID: 30033931 DOI: 10.1088/1361-6560/aad51c]
145
Wang S, Xing Y, Zhang L, Gao H, Zhang H. A systematic evaluation and optimization of automatic detection of ulcers in wireless capsule endoscopy on a large dataset using deep convolutional neural networks. Phys Med Biol 2019; 64: 235014 [PMID: 31645019 DOI: 10.1088/1361-6560/ab5086]
146
Klang E, Barash Y, Margalit RY, Soffer S, Shimon O, Albshesh A, Ben-Horin S, Amitai MM, Eliakim R, Kopylov U. Deep learning algorithms for automated detection of Crohn's disease ulcers by video capsule endoscopy. Gastrointest Endosc 2020; 91: 606-613.e2 [PMID: 31743689 DOI: 10.1016/j.gie.2019.11.012]
147
Charisis VS, Hadjileontiadis LJ. Potential of hybrid adaptive filtering in inflammatory lesion detection from capsule endoscopy images. World J Gastroenterol 2016; 22: 8641-8657 [PMID: 27818583 DOI: 10.3748/wjg.v22.i39.8641]
148
Saito H, Aoki T, Aoyama K, Kato Y, Tsuboi A, Yamada A, Fujishiro M, Oka S, Ishihara S, Matsuda T, Nakahori M, Tanaka S, Koike K, Tada T. Automatic detection and classification of protruding lesions in wireless capsule endoscopy images based on a deep convolutional neural network. Gastrointest Endosc 2020; 92: 144-151.e1 [PMID: 32084410 DOI: 10.1016/j.gie.2020.01.054]
149
Yuan Y, Meng MQ. Deep learning for polyp recognition in wireless capsule endoscopy images. Med Phys 2017; 44: 1379-1389 [PMID: 28160514 DOI: 10.1002/mp.12147]
150
Tenório JM, Hummel AD, Cohrs FM, Sdepanian VL, Pisa IT, de Fátima Marin H. Artificial intelligence techniques applied to the development of a decision-support system for diagnosing celiac disease. Int J Med Inform 2011; 80: 793-802 [PMID: 21917512 DOI: 10.1016/j.ijmedinf.2011.08.001]
151
Zhou T, Han G, Li BN, Lin Z, Ciaccio EJ, Green PH, Qin J. Quantitative analysis of patients with celiac disease by video capsule endoscopy: A deep learning method. Comput Biol Med 2017; 85: 1-6 [PMID: 28412572 DOI: 10.1016/j.compbiomed.2017.03.031]
152

Kröner PT et al. AI in GI review
WJG https://www.wjgnet.com 6815 October 28, 2021 Volume 27 Issue 40
Wimmer G, Vécsei A, Uhl A. CNN transfer learning for the automated diagnosis of celiac disease. IEEE 2016; 1-6 [DOI: 10.1109/IPTA.2016.7821020]
153
Wang X, Qian H, Ciaccio EJ, Lewis SK, Bhagat G, Green PH, Xu S, Huang L, Gao R, Liu Y. Celiac disease diagnosis from videocapsule endoscopy images with residual learning and deep feature extraction. Comput Methods Programs Biomed 2020; 187: 105236 [PMID: 31786452 DOI: 10.1016/j.cmpb.2019.105236]
154
Fenwick A. The global burden of neglected tropical diseases. Public Health 2012; 126: 233-236 [PMID: 22325616 DOI: 10.1016/j.puhe.2011.11.015]
155
Chen H, Chen J, Peng Q, Sun G, Gan T. Automatic hookworm image detection for wireless capsule endoscopy using hybrid color gradient and contourlet transform. Int Conf Biomed Eng Inf 2013; 116-120 [DOI: 10.1109/BMEI.2013.6746918]
156
He JY, Wu X, Jiang YG, Peng Q, Jain R. Hookworm Detection in Wireless Capsule Endoscopy Images With Deep Learning. IEEE Trans Image Process 2018; 27: 2379-2392 [PMID: 29470172 DOI: 10.1109/TIP.2018.2801119]
157
Wu X, Chen H, Gan T, Chen J, Ngo CW, Peng Q. Automatic Hookworm Detection in Wireless Capsule Endoscopy Images. IEEE Trans Med Imaging 2016; 35: 1741-1752 [PMID: 26886971 DOI: 10.1109/TMI.2016.2527736]
158
Leenhardt R, Souchaud M, Houist G, Le Mouel JP, Saurin JC, Cholet F, Rahmi G, Leandri C, Histace A, Dray X. A neural network-based algorithm for assessing the cleanliness of small bowel during capsule endoscopy. Endoscopy 2021; 53: 932-936 [PMID: 33137834 DOI: 10.1055/a-1301-3841]
159
Noorda R, Nevárez A, Colomer A, Pons Beltrán V, Naranjo V. Automatic evaluation of degree of cleanliness in capsule endoscopy based on a novel CNN architecture. Sci Rep 2020; 10: 17706 [PMID: 33077755 DOI: 10.1038/s41598-020-74668-8]
160
Borg-Bartolo SP, Boyapati RK, Satsangi J, Kalla R. Precision medicine in inflammatory bowel disease: concept, progress and challenges. F1000Res 2020; 9 [PMID: 32047622 DOI: 10.12688/f1000research.20928.1]
161
Seyed Tabib NS, Madgwick M, Sudhakar P, Verstockt B, Korcsmaros T, Vermeire S. Big data in IBD: big progress for clinical practice. Gut 2020; 69: 1520-1532 [PMID: 32111636 DOI: 10.1136/gutjnl-2019-320065]
162
Olivera P, Danese S, Jay N, Natoli G, Peyrin-Biroulet L. Big data in IBD: a look into the future. Nat Rev Gastroenterol Hepatol 2019; 16: 312-321 [PMID: 30659247 DOI: 10.1038/s41575-019-0102-5]
163
Bossuyt P, Vermeire S, Bisschops R. Scoring endoscopic disease activity in IBD: artificial intelligence sees more and better than we do. Gut 2020; 69: 788-789 [PMID: 30954951 DOI: 10.1136/gutjnl-2019-318235]
164
Iacucci M, Furfaro F, Matsumoto T, Uraoka T, Smith S, Ghosh S, Kiesslich R. Advanced endoscopic techniques in the assessment of inflammatory bowel disease: new technology, new era. Gut 2019; 68: 562-572 [PMID: 30580249 DOI: 10.1136/gutjnl-2017-315235]
165
Ozawa T, Ishihara S, Fujishiro M, Saito H, Kumagai Y, Shichijo S, Aoyama K, Tada T. Novel computer-assisted diagnosis system for endoscopic disease activity in patients with ulcerative colitis. Gastrointest Endosc 2019; 89: 416-421.e1 [PMID: 30367878 DOI: 10.1016/j.gie.2018.10.020]
166
Zezos P, Borowski K, Bajaj G, Boland K, Sheasgreen C, Tessolini JM, Silverberg MS. 439 - Toward Computer-Based Automated Mayo Score Classification in Ulcerative Colitis through Classical and Deep Machine Learning. Gastroenterology 2018; 154: S-99 [DOI: 10.1016/S0016-5085(18)30773-X]
167
Khorasani HM, Usefi H, Peña-Castillo L. Detecting ulcerative colitis from colon samples using efficient feature selection and machine learning. Sci Rep 2020; 10: 13744 [PMID: 32792678 DOI: 10.1038/s41598-020-70583-0]
168
Kumar R, Zhao Q, Seshamani S, Mullin G, Hager G, Dassopoulos T. Assessment of Crohn's disease lesions in wireless capsule endoscopy images. IEEE Trans Biomed Eng 2012; 59: 355-362 [PMID: 22020661 DOI: 10.1109/TBME.2011.2172438]
169
Mahapatra D, Vos FM, Buhmann JM. Active learning based segmentation of Crohns disease from abdominal MRI. Comput Methods Programs Biomed 2016; 128: 75-85 [PMID: 27040833 DOI: 10.1016/j.cmpb.2016.01.014]
170
Mossotto E, Ashton JJ, Coelho T, Beattie RM, MacArthur BD, Ennis S. Classification of Paediatric Inflammatory Bowel Disease using Machine Learning. Sci Rep 2017; 7: 2427 [PMID: 28546534 DOI: 10.1038/s41598-017-02606-2]
171
Maeda Y, Kudo SE, Mori Y, Misawa M, Ogata N, Sasanuma S, Wakamura K, Oda M, Mori K, Ohtsuka K. Fully automated diagnostic system with artificial intelligence using endocytoscopy to identify the presence of histologic inflammation associated with ulcerative colitis (with video). Gastrointest Endosc 2019; 89: 408-415 [PMID: 30268542 DOI: 10.1016/j.gie.2018.09.024]
172
Matalka II, Al-Omari FA, Salama RM, Mohtaseb AH. A novel approach for quantitative assessment of mucosal damage in inflammatory bowel disease. Diagn Pathol 2013; 8: 156 [PMID: 24053788 DOI: 10.1186/1746-1596-8-156]
173
Niehaus KE, Uhlig HH, Clifton DA. Phenotypic characterisation of Crohn's disease severity. Annu Int Conf IEEE Eng Med Biol Soc 2015; 2015: 7023-7026 [PMID: 26737909 DOI: 10.1109/EMBC.2015.7320009]
174
Reddy BK, Delen D, Agrawal RK. Predicting and explaining inflammation in Crohn's disease patients using predictive analytics methods and electronic medical record data. Health Informatics J
175

Kröner PT et al. AI in GI review
WJG https://www.wjgnet.com 6816 October 28, 2021 Volume 27 Issue 40
2019; 25: 1201-1218 [PMID: 29320910 DOI: 10.1177/1460458217751015]Stidham RW, Enchakalody B, Waljee AK, Higgins PDR, Wang SC, Su GL, Wasnik AP, Al-Hawary M. Assessing Small Bowel Stricturing and Morphology in Crohn's Disease Using Semi-automated Image Analysis. Inflamm Bowel Dis 2020; 26: 734-742 [PMID: 31504540 DOI: 10.1093/ibd/izz196]
176
Stidham RW, Liu W, Bishu S, Rice MD, Higgins PDR, Zhu J, Nallamothu BK, Waljee AK. Performance of a Deep Learning Model vs Human Reviewers in Grading Endoscopic Disease Severity of Patients With Ulcerative Colitis. JAMA Netw Open 2019; 2: e193963 [PMID: 31099869 DOI: 10.1001/jamanetworkopen.2019.3963]
177
Takenaka K, Ohtsuka K, Fujii T, Negi M, Suzuki K, Shimizu H, Oshima S, Akiyama S, Motobayashi M, Nagahori M, Saito E, Matsuoka K, Watanabe M. Development and Validation of a Deep Neural Network for Accurate Evaluation of Endoscopic Images From Patients With Ulcerative Colitis. Gastroenterology 2020; 158: 2150-2157 [PMID: 32060000 DOI: 10.1053/j.gastro.2020.02.012]
178
Yao H, Najarian K, Gryak J, Bishu S, Rice MD, Waljee AK, Wilkins HJ, Stidham RW. Fully automated endoscopic disease activity assessment in ulcerative colitis. Gastrointest Endosc 2021; 93: 728-736.e1 [PMID: 32810479 DOI: 10.1016/j.gie.2020.08.011]
179
Doherty MK, Ding T, Koumpouras C, Telesco SE, Monast C, Das A, Brodmerkel C, Schloss PD. Fecal Microbiota Signatures Are Associated with Response to Ustekinumab Therapy among Crohn's Disease Patients. mBio 2018; 9 [PMID: 29535202 DOI: 10.1128/mBio.02120-17]
180
Douglas GM, Hansen R, Jones CMA, Dunn KA, Comeau AM, Bielawski JP, Tayler R, El-Omar EM, Russell RK, Hold GL, Langille MGI, Van Limbergen J. Multi-omics differentially classify disease state and treatment outcome in pediatric Crohn's disease. Microbiome 2018; 6: 13 [PMID: 29335008 DOI: 10.1186/s40168-018-0398-3]
181
Waljee AK, Joyce JC, Wang S, Saxena A, Hart M, Zhu J, Higgins PD. Algorithms outperform metabolite tests in predicting response of patients with inflammatory bowel disease to thiopurines. Clin Gastroenterol Hepatol 2010; 8: 143-150 [PMID: 19835986 DOI: 10.1016/j.cgh.2009.09.031]
182
Waljee AK, Lipson R, Wiitala WL, Zhang Y, Liu B, Zhu J, Wallace B, Govani SM, Stidham RW, Hayward R, Higgins PDR. Predicting Hospitalization and Outpatient Corticosteroid Use in Inflammatory Bowel Disease Patients Using Machine Learning. Inflamm Bowel Dis 2017; 24: 45-53 [PMID: 29272474 DOI: 10.1093/ibd/izx007]
183
Waljee AK, Liu B, Sauder K, Zhu J, Govani SM, Stidham RW, Higgins PDR. Predicting corticosteroid-free endoscopic remission with vedolizumab in ulcerative colitis. Aliment Pharmacol Ther 2018; 47: 763-772 [PMID: 29359519 DOI: 10.1111/apt.14510]
184
Waljee AK, Sauder K, Patel A, Segar S, Liu B, Zhang Y, Zhu J, Stidham RW, Balis U, Higgins PDR. Machine Learning Algorithms for Objective Remission and Clinical Outcomes with Thiopurines. J Crohns Colitis 2017; 11: 801-810 [PMID: 28333183 DOI: 10.1093/ecco-jcc/jjx014]
185
Waljee AK, Wallace BI, Cohen-Mekelburg S, Liu Y, Liu B, Sauder K, Stidham RW, Zhu J, Higgins PDR. Development and Validation of Machine Learning Models in Prediction of Remission in Patients With Moderate to Severe Crohn Disease. JAMA Netw Open 2019; 2: e193721 [PMID: 31074823 DOI: 10.1001/jamanetworkopen.2019.3721]
186
Isakov O, Dotan I, Ben-Shachar S. Machine Learning-Based Gene Prioritization Identifies Novel Candidate Risk Genes for Inflammatory Bowel Disease. Inflamm Bowel Dis 2017; 23: 1516-1523 [PMID: 28795970 DOI: 10.1097/MIB.0000000000001222]
187
Wei Z, Wang W, Bradfield J, Li J, Cardinale C, Frackelton E, Kim C, Mentch F, Van Steen K, Visscher PM, Baldassano RN, Hakonarson H; International IBD Genetics Consortium. Large sample size, wide variant spectrum, and advanced machine-learning technique boost risk prediction for inflammatory bowel disease. Am J Hum Genet 2013; 92: 1008-1012 [PMID: 23731541 DOI: 10.1016/j.ajhg.2013.05.002]
188
Hou JK, Chang M, Nguyen T, Kramer JR, Richardson P, Sansgiry S, D'Avolio LW, El-Serag HB. Automated identification of surveillance colonoscopy in inflammatory bowel disease using natural language processing. Dig Dis Sci 2013; 58: 936-941 [PMID: 23086115 DOI: 10.1007/s10620-012-2433-8]
189
Firouzi F, Rashidi M, Hashemi S, Kangavari M, Bahari A, Daryani NE, Emam MM, Naderi N, Shalmani HM, Farnood A, Zali M. A decision tree-based approach for determining low bone mineral density in inflammatory bowel disease using WEKA software. Eur J Gastroenterol Hepatol 2007; 19: 1075-1081 [PMID: 17998832 DOI: 10.1097/MEG.0b013e3282202bb8]
190
Ahn JC, Connell A, Simonetto DA, Hughes C, Shah VH. Application of Artificial Intelligence for the Diagnosis and Treatment of Liver Diseases. Hepatology 2021; 73: 2546-2563 [PMID: 33098140 DOI: 10.1002/hep.31603]
191
Spann A, Yasodhara A, Kang J, Watt K, Wang B, Goldenberg A, Bhat M. Applying Machine Learning in Liver Disease and Transplantation: A Comprehensive Review. Hepatology 2020; 71: 1093-1105 [PMID: 31907954 DOI: 10.1002/hep.31103]
192
Chen T, Tu S, Wang H, Liu X, Li F, Jin W, Liang X, Zhang X, Wang J. Computer-aided diagnosis of gallbladder polyps based on high resolution ultrasonography. Comput Methods Programs Biomed 2020; 185: 105118 [PMID: 31671340 DOI: 10.1016/j.cmpb.2019.105118]
193
Hamm CA, Wang CJ, Savic LJ, Ferrante M, Schobert I, Schlachter T, Lin M, Duncan JS, Weinreb JC, Chapiro J, Letzen B. Deep learning for liver tumor diagnosis part I: development of a convolutional neural network classifier for multi-phasic MRI. Eur Radiol 2019; 29: 3338-3347
194
Kröner PT et al. AI in GI review
WJG https://www.wjgnet.com 6817 October 28, 2021 Volume 27 Issue 40
[PMID: 31016442 DOI: 10.1007/s00330-019-06205-9]Kim DW, Lee G, Kim SY, Ahn G, Lee JG, Lee SS, Kim KW, Park SH, Lee YJ, Kim N. Deep learning-based algorithm to detect primary hepatic malignancy in multiphase CT of patients at high risk for HCC. Eur Radiol 2021; 31: 7047-7057 [PMID: 33738600 DOI: 10.1007/s00330-021-07803-2]
195
Kim JW, Ye Q, Forgues M, Chen Y, Budhu A, Sime J, Hofseth LJ, Kaul R, Wang XW. Cancer-associated molecular signature in the tissue samples of patients with cirrhosis. Hepatology 2004; 39: 518-527 [PMID: 14768006 DOI: 10.1002/hep.20053]
196
Schmauch B, Herent P, Jehanno P, Dehaene O, Saillard C, Aubé C, Luciani A, Lassau N, Jégou S. Diagnosis of focal liver lesions from ultrasound using deep learning. Diagn Interv Imaging 2019; 100: 227-233 [PMID: 30926443 DOI: 10.1016/j.diii.2019.02.009]
197
Singal AG, Mukherjee A, Elmunzer BJ, Higgins PD, Lok AS, Zhu J, Marrero JA, Waljee AK. Machine learning algorithms outperform conventional regression models in predicting development of hepatocellular carcinoma. Am J Gastroenterol 2013; 108: 1723-1730 [PMID: 24169273 DOI: 10.1038/ajg.2013.332]
198
Sun C, Xu A, Liu D, Xiong Z, Zhao F, Ding W. Deep Learning-Based Classification of Liver Cancer Histopathology Images Using Only Global Labels. IEEE J Biomed Health Inform 2020; 24: 1643-1651 [PMID: 31670686 DOI: 10.1109/JBHI.2019.2949837]
199
Wang CJ, Hamm CA, Savic LJ, Ferrante M, Schobert I, Schlachter T, Lin M, Weinreb JC, Duncan JS, Chapiro J, Letzen B. Deep learning for liver tumor diagnosis part II: convolutional neural network interpretation using radiologic imaging features. Eur Radiol 2019; 29: 3348-3357 [PMID: 31093705 DOI: 10.1007/s00330-019-06214-8]
200
Yasaka K, Akai H, Abe O, Kiryu S. Deep Learning with Convolutional Neural Network for Differentiation of Liver Masses at Dynamic Contrast-enhanced CT: A Preliminary Study. Radiology 2018; 286: 887-896 [PMID: 29059036 DOI: 10.1148/radiol.2017170706]
201
Yasaka K, Akai H, Kunimatsu A, Abe O, Kiryu S. Liver Fibrosis: Deep Convolutional Neural Network for Staging by Using Gadoxetic Acid-enhanced Hepatobiliary Phase MR Images. Radiology 2018; 287: 146-155 [PMID: 29239710 DOI: 10.1148/radiol.2017171928]
202
Abd El-Salam SM, Ezz MM, Hashem S, Elakel W, Salama R, ElMakhzangy H, ElHefnawi M. Performance of machine learning approaches on prediction of esophageal varices for Egyptian chronic hepatitis C patients. Inform Med Unlocked 2019; 17: 100267 [DOI: 10.1016/j.imu.2019.100267]
203
Dong TS, Kalani A, Aby ES, Le L, Luu K, Hauer M, Kamath R, Lindor KD, Tabibian JH. Machine Learning-based Development and Validation of a Scoring System for Screening High-Risk Esophageal Varices. Clin Gastroenterol Hepatol 2019; 17: 1894-1901.e1 [PMID: 30708109 DOI: 10.1016/j.cgh.2019.01.025]
204
Hong WD, Ji YF, Wang D, Chen TZ, Zhu QH. Use of artificial neural network to predict esophageal varices in patients with HBV related cirrhosis. Hepat Mon 2011; 11: 544-547 [PMID: 22087192]
205
Liu Y, Ning Z, Örmeci N, An W, Yu Q, Han K, Huang Y, Liu D, Liu F, Li Z, Ding H, Luo H, Zuo C, Liu C, Wang J, Zhang C, Ji J, Wang W, Wang Z, Yuan M, Li L, Zhao Z, Wang G, Li M, Liu Q, Lei J, Tang T, Akçalar S, Çelebioğlu E, Üstüner E, Bilgiç S, Ellik Z, Asiller ÖÖ, Liu Z, Teng G, Chen Y, Hou J, Li X, He X, Dong J, Tian J, Liang P, Ju S, Zhang Y, Qi X. Deep Convolutional Neural Network-Aided Detection of Portal Hypertension in Patients With Cirrhosis. Clin Gastroenterol Hepatol 2020; 18: 2998-3007.e5 [PMID: 32205218 DOI: 10.1016/j.cgh.2020.03.034]
206
Marozas M, Zykus R, Sakalauskas A, Kupčinskas L, Lukoševičius A. Noninvasive Evaluation of Portal Hypertension Using a Supervised Learning Technique. J Healthc Eng 2017; 2017: 6183714 [PMID: 29158886 DOI: 10.1155/2017/6183714]
207
Qi X, An W, Liu F, Qi R, Wang L, Liu Y, Liu C, Xiang Y, Hui J, Liu Z, Qi X, Peng B, Ding H, Yang Y, He X, Hou J, Tian J, Li Z. Virtual Hepatic Venous Pressure Gradient with CT Angiography (CHESS 1601): A Prospective Multicenter Study for the Noninvasive Diagnosis of Portal Hypertension. Radiology 2019; 290: 370-377 [PMID: 30457484 DOI: 10.1148/radiol.2018180425]
208
Ahmed Y, Hussein RS, Basha TA, Khalifa AM, Ibrahim AS, Abdelmoaty AS, Abdella HM, Fahmy AS. Detecting liver fibrosis using a machine learning-based approach to the quantification of the heart-induced deformation in tagged MR images. NMR Biomed 2020; 33: e4215 [PMID: 31730265 DOI: 10.1002/nbm.4215]
209
Byra M, Styczynski G, Szmigielski C, Kalinowski P, Michałowski Ł, Paluszkiewicz R, Ziarkiewicz-Wróblewska B, Zieniewicz K, Sobieraj P, Nowicki A. Transfer learning with deep convolutional neural network for liver steatosis assessment in ultrasound images. Int J Comput Assist Radiol Surg 2018; 13: 1895-1903 [PMID: 30094778 DOI: 10.1007/s11548-018-1843-2]
210
Chang EK, Yu CY, Clarke R, Hackbarth A, Sanders T, Esrailian E, Hommes DW, Runyon BA. Defining a Patient Population With Cirrhosis: An Automated Algorithm With Natural Language Processing. J Clin Gastroenterol 2016; 50: 889-894 [PMID: 27348317 DOI: 10.1097/MCG.0000000000000583]
211
Chen Y, Luo Y, Huang W, Hu D, Zheng RQ, Cong SZ, Meng FK, Yang H, Lin HJ, Sun Y, Wang XY, Wu T, Ren J, Pei SF, Zheng Y, He Y, Hu Y, Yang N, Yan H. Machine-learning-based classification of real-time tissue elastography for hepatic fibrosis in patients with chronic hepatitis B. Comput Biol Med 2017; 89: 18-23 [PMID: 28779596 DOI: 10.1016/j.compbiomed.2017.07.012]
212
Choi KJ, Jang JK, Lee SS, Sung YS, Shim WH, Kim HS, Yun J, Choi JY, Lee Y, Kang BK, Kim 213

Kröner PT et al. AI in GI review
WJG https://www.wjgnet.com 6818 October 28, 2021 Volume 27 Issue 40
JH, Kim SY, Yu ES. Development and Validation of a Deep Learning System for Staging Liver Fibrosis by Using Contrast Agent-enhanced CT Images in the Liver. Radiology 2018; 289: 688-697 [PMID: 30179104 DOI: 10.1148/radiol.2018180763]Cui E, Long W, Wu J, Li Q, Ma C, Lei Y, Lin F. Predicting the stages of liver fibrosis with multiphase CT radiomics based on volumetric features. Abdom Radiol (NY) 2021; 46: 3866-3876 [PMID: 33751193 DOI: 10.1007/s00261-021-03051-6]
214
Forlano R, Mullish BH, Giannakeas N, Maurice JB, Angkathunyakul N, Lloyd J, Tzallas AT, Tsipouras M, Yee M, Thursz MR, Goldin RD, Manousou P. High-Throughput, Machine Learning-Based Quantification of Steatosis, Inflammation, Ballooning, and Fibrosis in Biopsies From Patients With Nonalcoholic Fatty Liver Disease. Clin Gastroenterol Hepatol 2020; 18: 2081-2090.e9 [PMID: 31887451 DOI: 10.1016/j.cgh.2019.12.025]
215
Gatos I, Tsantis S, Spiliopoulos S, Karnabatidis D, Theotokas I, Zoumpoulis P, Loupas T, Hazle JD, Kagadis GC. A new computer aided diagnosis system for evaluation of chronic liver disease with ultrasound shear wave elastography imaging. Med Phys 2016; 43: 1428-1436 [PMID: 26936727 DOI: 10.1118/1.4942383]
216
Gatos I, Tsantis S, Spiliopoulos S, Karnabatidis D, Theotokas I, Zoumpoulis P, Loupas T, Hazle JD, Kagadis GC. A Machine-Learning Algorithm Toward Color Analysis for Chronic Liver Disease Classification, Employing Ultrasound Shear Wave Elastography. Ultrasound Med Biol 2017; 43: 1797-1810 [PMID: 28634041 DOI: 10.1016/j.ultrasmedbio.2017.05.002]
217
Gatos I, Tsantis S, Spiliopoulos S, Karnabatidis D, Theotokas I, Zoumpoulis P, Loupas T, Hazle JD, Kagadis GC. Temporal stability assessment in shear wave elasticity images validated by deep learning neural network for chronic liver disease fibrosis stage assessment. Med Phys 2019; 46: 2298-2309 [PMID: 30929260 DOI: 10.1002/mp.13521]
218
Heinemann F, Birk G, Stierstorfer B. Deep learning enables pathologist-like scoring of NASH models. Sci Rep 2019; 9: 18454 [PMID: 31804575 DOI: 10.1038/s41598-019-54904-6]
219
Huang H, Shiffman ML, Friedman S, Venkatesh R, Bzowej N, Abar OT, Rowland CM, Catanese JJ, Leong DU, Sninsky JJ, Layden TJ, Wright TL, White T, Cheung RC. A 7 gene signature identifies the risk of developing cirrhosis in patients with chronic hepatitis C. Hepatology 2007; 46: 297-306 [PMID: 17461418 DOI: 10.1002/hep.21695]
220
Konerman MA, Beste LA, Van T, Liu B, Zhang X, Zhu J, Saini SD, Su GL, Nallamothu BK, Ioannou GN, Waljee AK. Machine learning models to predict disease progression among veterans with hepatitis C virus. PLoS One 2019; 14: e0208141 [PMID: 30608929 DOI: 10.1371/journal.pone.0208141]
221
Konerman MA, Zhang Y, Zhu J, Higgins PD, Lok AS, Waljee AK. Improvement of predictive models of risk of disease progression in chronic hepatitis C by incorporating longitudinal data. Hepatology 2015; 61: 1832-1841 [PMID: 25684666 DOI: 10.1002/hep.27750]
222
Kuppili V, Biswas M, Sreekumar A, Suri HS, Saba L, Edla DR, Marinho RT, Sanches JM, Suri JS. Extreme Learning Machine Framework for Risk Stratification of Fatty Liver Disease Using Ultrasound Tissue Characterization. J Med Syst 2017; 41: 152 [PMID: 28836045 DOI: 10.1007/s10916-017-0797-1]
223
Lara J, López-Labrador F, González-Candelas F, Berenguer M, Khudyakov YE. Computational models of liver fibrosis progression for hepatitis C virus chronic infection. BMC Bioinformatics 2014; 15 Suppl 8: S5 [PMID: 25081062 DOI: 10.1186/1471-2105-15-S8-S5]
224
Li W, Huang Y, Zhuang BW, Liu GJ, Hu HT, Li X, Liang JY, Wang Z, Huang XW, Zhang CQ, Ruan SM, Xie XY, Kuang M, Lu MD, Chen LD, Wang W. Multiparametric ultrasomics of significant liver fibrosis: A machine learning-based analysis. Eur Radiol 2019; 29: 1496-1506 [PMID: 30178143 DOI: 10.1007/s00330-018-5680-z]
225
Meffert PJ, Baumeister SE, Lerch MM, Mayerle J, Kratzer W, Völzke H. Development, external validation, and comparative assessment of a new diagnostic score for hepatic steatosis. Am J Gastroenterol 2014; 109: 1404-1414 [PMID: 24957156 DOI: 10.1038/ajg.2014.155]
226
Perakakis N, Polyzos SA, Yazdani A, Sala-Vila A, Kountouras J, Anastasilakis AD, Mantzoros CS. Non-invasive diagnosis of non-alcoholic steatohepatitis and fibrosis with the use of omics and supervised learning: A proof of concept study. Metabolism 2019; 101: 154005 [PMID: 31711876 DOI: 10.1016/j.metabol.2019.154005]
227
Piscaglia F, Cucchetti A, Benlloch S, Vivarelli M, Berenguer J, Bolondi L, Pinna AD, Berenguer M. Prediction of significant fibrosis in hepatitis C virus infected liver transplant recipients by artificial neural network analysis of clinical factors. Eur J Gastroenterol Hepatol 2006; 18: 1255-1261 [PMID: 17099373 DOI: 10.1097/01.meg.0000243885.55562.7e]
228
Raoufy MR, Vahdani P, Alavian SM, Fekri S, Eftekhari P, Gharibzadeh S. A novel method for diagnosing cirrhosis in patients with chronic hepatitis B: artificial neural network approach. J Med Syst 2011; 35: 121-126 [PMID: 20703578 DOI: 10.1007/s10916-009-9348-8]
229
Redman JS, Natarajan Y, Hou JK, Wang J, Hanif M, Feng H, Kramer JR, Desiderio R, Xu H, El-Serag HB, Kanwal F. Accurate Identification of Fatty Liver Disease in Data Warehouse Utilizing Natural Language Processing. Dig Dis Sci 2017; 62: 2713-2718 [PMID: 28861720 DOI: 10.1007/s10620-017-4721-9]
230
Sowa JP, Heider D, Bechmann LP, Gerken G, Hoffmann D, Canbay A. Novel algorithm for non-invasive assessment of fibrosis in NAFLD. PLoS One 2013; 8: e62439 [PMID: 23638085 DOI: 10.1371/journal.pone.0062439]
231
Wang K, Lu X, Zhou H, Gao Y, Zheng J, Tong M, Wu C, Liu C, Huang L, Jiang T, Meng F, Lu Y, 232

Kröner PT et al. AI in GI review
WJG https://www.wjgnet.com 6819 October 28, 2021 Volume 27 Issue 40
Ai H, Xie XY, Yin LP, Liang P, Tian J, Zheng R. Deep learning Radiomics of shear wave elastography significantly improved diagnostic performance for assessing liver fibrosis in chronic hepatitis B: a prospective multicentre study. Gut 2019; 68: 729-741 [PMID: 29730602 DOI: 10.1136/gutjnl-2018-316204]Wei R, Wang J, Wang X, Xie G, Wang Y, Zhang H, Peng CY, Rajani C, Kwee S, Liu P, Jia W. Clinical prediction of HBV and HCV related hepatic fibrosis using machine learning. EBioMedicine 2018; 35: 124-132 [PMID: 30100397 DOI: 10.1016/j.ebiom.2018.07.041]
233
Lee JH, Joo I, Kang TW, Paik YH, Sinn DH, Ha SY, Kim K, Choi C, Lee G, Yi J, Bang WC. Deep learning with ultrasonography: automated classification of liver fibrosis using a deep convolutional neural network. Eur Radiol 2020; 30: 1264-1273 [PMID: 31478087 DOI: 10.1007/s00330-019-06407-1]
234
Canbay A, Kälsch J, Neumann U, Rau M, Hohenester S, Baba HA, Rust C, Geier A, Heider D, Sowa JP. Non-invasive assessment of NAFLD as systemic disease-A machine learning perspective. PLoS One 2019; 14: e0214436 [PMID: 30913263 DOI: 10.1371/journal.pone.0214436]
235
Docherty M, Regnier SA, Capkun G, Balp MM, Ye Q, Janssens N, Tietz A, Löffler J, Cai J, Pedrosa MC, Schattenberg JM. Development of a novel machine learning model to predict presence of nonalcoholic steatohepatitis. J Am Med Inform Assoc 2021; 28: 1235-1241 [PMID: 33684933 DOI: 10.1093/jamia/ocab003]
236
Fialoke S, Malarstig A, Miller MR, Dumitriu A. Application of Machine Learning Methods to Predict Non-Alcoholic Steatohepatitis (NASH) in Non-Alcoholic Fatty Liver (NAFL) Patients. AMIA Annu Symp Proc 2018; 2018: 430-439 [PMID: 30815083]
237
Sowa JP, Atmaca Ö, Kahraman A, Schlattjan M, Lindner M, Sydor S, Scherbaum N, Lackner K, Gerken G, Heider D, Arteel GE, Erim Y, Canbay A. Non-invasive separation of alcoholic and non-alcoholic liver disease with predictive modeling. PLoS One 2014; 9: e101444 [PMID: 24988316 DOI: 10.1371/journal.pone.0101444]
238
Taylor-Weiner A, Pokkalla H, Han L, Jia C, Huss R, Chung C, Elliott H, Glass B, Pethia K, Carrasco-Zevallos O, Shukla C, Khettry U, Najarian R, Taliano R, Subramanian GM, Myers RP, Wapinski I, Khosla A, Resnick M, Montalto MC, Anstee QM, Wong VW, Trauner M, Lawitz EJ, Harrison SA, Okanoue T, Romero-Gomez M, Goodman Z, Loomba R, Beck AH, Younossi ZM. A Machine Learning Approach Enables Quantitative Measurement of Liver Histology and Disease Monitoring in NASH. Hepatology 2021; 74: 133-147 [PMID: 33570776 DOI: 10.1002/hep.31750]
239
Van Vleck TT, Chan L, Coca SG, Craven CK, Do R, Ellis SB, Kannry JL, Loos RJF, Bonis PA, Cho J, Nadkarni GN. Augmented intelligence with natural language processing applied to electronic health records for identifying patients with non-alcoholic fatty liver disease at risk for disease progression. Int J Med Inform 2019; 129: 334-341 [PMID: 31445275 DOI: 10.1016/j.ijmedinf.2019.06.028]
240
Vanderbeck S, Bockhorst J, Kleiner D, Komorowski R, Chalasani N, Gawrieh S. Automatic quantification of lobular inflammation and hepatocyte ballooning in nonalcoholic fatty liver disease liver biopsies. Hum Pathol 2015; 46: 767-775 [PMID: 25776030 DOI: 10.1016/j.humpath.2015.01.019]
241
Vanderbeck S, Bockhorst J, Komorowski R, Kleiner DE, Gawrieh S. Automatic classification of white regions in liver biopsies by supervised machine learning. Hum Pathol 2014; 45: 785-792 [PMID: 24565203 DOI: 10.1016/j.humpath.2013.11.011]
242
Andres A, Montano-Loza A, Greiner R, Uhlich M, Jin P, Hoehn B, Bigam D, Shapiro JAM, Kneteman NM. A novel learning algorithm to predict individual survival after liver transplantation for primary sclerosing cholangitis. PLoS One 2018; 13: e0193523 [PMID: 29543895 DOI: 10.1371/journal.pone.0193523]
243
Ayllón MD, Ciria R, Cruz-Ramírez M, Pérez-Ortiz M, Gómez I, Valente R, O'Grady J, de la Mata M, Hervás-Martínez C, Heaton ND, Briceño J. Validation of artificial neural networks as a methodology for donor-recipient matching for liver transplantation. Liver Transpl 2018; 24: 192-203 [PMID: 28921876 DOI: 10.1002/lt.24870]
244
Bertsimas D, Kung J, Trichakis N, Wang Y, Hirose R, Vagefi PA. Development and validation of an optimized prediction of mortality for candidates awaiting liver transplantation. Am J Transplant 2019; 19: 1109-1118 [PMID: 30411495 DOI: 10.1111/ajt.15172]
245
Bhat V, Tazari M, Watt KD, Bhat M. New-Onset Diabetes and Preexisting Diabetes Are Associated With Comparable Reduction in Long-Term Survival After Liver Transplant: A Machine Learning Approach. Mayo Clin Proc 2018; 93: 1794-1802 [PMID: 30522594 DOI: 10.1016/j.mayocp.2018.06.020]
246
Briceño J, Cruz-Ramírez M, Prieto M, Navasa M, Ortiz de Urbina J, Orti R, Gómez-Bravo MÁ, Otero A, Varo E, Tomé S, Clemente G, Bañares R, Bárcena R, Cuervas-Mons V, Solórzano G, Vinaixa C, Rubín A, Colmenero J, Valdivieso A, Ciria R, Hervás-Martínez C, de la Mata M. Use of artificial intelligence as an innovative donor-recipient matching model for liver transplantation: results from a multicenter Spanish study. J Hepatol 2014; 61: 1020-1028 [PMID: 24905493 DOI: 10.1016/j.jhep.2014.05.039]
247
Kazemi A, Kazemi K, Sami A, Sharifian R. Identifying Factors That Affect Patient Survival After Orthotopic Liver Transplant Using Machine-Learning Techniques. Exp Clin Transplant 2019; 17: 775-783 [PMID: 30968757 DOI: 10.6002/ect.2018.0170]
248
Lau L, Kankanige Y, Rubinstein B, Jones R, Christophi C, Muralidharan V, Bailey J. Machine-Learning Algorithms Predict Graft Failure After Liver Transplantation. Transplantation 2017; 101:
249

Kröner PT et al. AI in GI review
WJG https://www.wjgnet.com 6820 October 28, 2021 Volume 27 Issue 40
e125-e132 [PMID: 27941428 DOI: 10.1097/TP.0000000000001600]Lee HC, Yoon SB, Yang SM, Kim WH, Ryu HG, Jung CW, Suh KS, Lee KH. Prediction of Acute Kidney Injury after Liver Transplantation: Machine Learning Approaches vs. Logistic Regression Model. J Clin Med 2018; 7 [PMID: 30413107 DOI: 10.3390/jcm7110428]
250
Abajian A, Murali N, Savic LJ, Laage-Gaupp FM, Nezami N, Duncan JS, Schlachter T, Lin M, Geschwind JF, Chapiro J. Predicting Treatment Response to Intra-arterial Therapies for Hepatocellular Carcinoma with the Use of Supervised Machine Learning-An Artificial Intelligence Concept. J Vasc Interv Radiol 2018; 29: 850-857.e1 [PMID: 29548875 DOI: 10.1016/j.jvir.2018.01.769]
251
Chaudhary K, Poirion OB, Lu L, Garmire LX. Deep Learning-Based Multi-Omics Integration Robustly Predicts Survival in Liver Cancer. Clin Cancer Res 2018; 24: 1248-1259 [PMID: 28982688 DOI: 10.1158/1078-0432.CCR-17-0853]
252
Morshid A, Elsayes KM, Khalaf AM, Elmohr MM, Yu J, Kaseb AO, Hassan M, Mahvash A, Wang Z, Hazle JD, Fuentes D. A machine learning model to predict hepatocellular carcinoma response to transcatheter arterial chemoembolization. Radiol Artif Intell 2019; 1 [PMID: 31858078 DOI: 10.1148/ryai.2019180021]
253
Saillard C, Schmauch B, Laifa O, Moarii M, Toldo S, Zaslavskiy M, Pronier E, Laurent A, Amaddeo G, Regnault H, Sommacale D, Ziol M, Pawlotsky JM, Mulé S, Luciani A, Wainrib G, Clozel T, Courtiol P, Calderaro J. Predicting Survival After Hepatocellular Carcinoma Resection Using Deep Learning on Histological Slides. Hepatology 2020; 72: 2000-2013 [PMID: 32108950 DOI: 10.1002/hep.31207]
254
Shan QY, Hu HT, Feng ST, Peng ZP, Chen SL, Zhou Q, Li X, Xie XY, Lu MD, Wang W, Kuang M. CT-based peritumoral radiomics signatures to predict early recurrence in hepatocellular carcinoma after curative tumor resection or ablation. Cancer Imaging 2019; 19: 11 [PMID: 30813956 DOI: 10.1186/s40644-019-0197-5]
255
Eaton JE, Vesterhus M, McCauley BM, Atkinson EJ, Schlicht EM, Juran BD, Gossard AA, LaRusso NF, Gores GJ, Karlsen TH, Lazaridis KN. Primary Sclerosing Cholangitis Risk Estimate Tool (PREsTo) Predicts Outcomes of the Disease: A Derivation and Validation Study Using Machine Learning. Hepatology 2020; 71: 214-224 [PMID: 29742811 DOI: 10.1002/hep.30085]
256
Garcia MS, Agarwal B, Mookerjee RP, Jalan R, Doyle G, Ranco G, Arroyo V, Pavesi M, Garcia E, Saliba F, Banares R, Fernandez J. An Accurate Data Preparation Approach for the Prediction of Mortality in ACLF Patients using the CANONIC Dataset. Annu Int Conf IEEE Eng Med Biol Soc 2019; 2019: 1371-1377 [PMID: 31946148 DOI: 10.1109/EMBC.2019.8857239]
257
Ibragimov B, Toesca D, Chang D, Yuan Y, Koong A, Xing L. Development of deep neural network for individualized hepatobiliary toxicity prediction after liver SBRT. Med Phys 2018; 45: 4763-4774 [PMID: 30098025 DOI: 10.1002/mp.13122]
258
Jovanovic P, Salkic NN, Zerem E. Artificial neural network predicts the need for therapeutic ERCP in patients with suspected choledocholithiasis. Gastrointest Endosc 2014; 80: 260-268 [PMID: 24593947 DOI: 10.1016/j.gie.2014.01.023]
259
Kanwal F, Taylor TJ, Kramer JR, Cao Y, Smith D, Gifford AL, El-Serag HB, Naik AD, Asch SM. Development, Validation, and Evaluation of a Simple Machine Learning Model to Predict Cirrhosis Mortality. JAMA Netw Open 2020; 3: e2023780 [PMID: 33141161 DOI: 10.1001/jamanetworkopen.2020.23780]
260
Speiser JL, Karvellas CJ, Wolf BJ, Chung D, Koch DG, Durkalski VL. Predicting daily outcomes in acetaminophen-induced acute liver failure patients with machine learning techniques. Comput Methods Programs Biomed 2019; 175: 111-120 [PMID: 31104700 DOI: 10.1016/j.cmpb.2019.04.012]
261
Speiser JL, Lee WM, Karvellas CJ; US Acute Liver Failure Study Group. Predicting outcome on admission and post-admission for acetaminophen-induced acute liver failure using classification and regression tree models. PLoS One 2015; 10: e0122929 [PMID: 25885260 DOI: 10.1371/journal.pone.0122929]
262
Konerman MA, Lu D, Zhang Y, Thomson M, Zhu J, Verma A, Liu B, Talaat N, Balis U, Higgins PDR, Lok ASF, Waljee AK. Assessing risk of fibrosis progression and liver-related clinical outcomes among patients with both early stage and advanced chronic hepatitis C. PLoS One 2017; 12: e0187344 [PMID: 29108017 DOI: 10.1371/journal.pone.0187344]
263
Ai H, Chen W, Zhang L, Huang L, Yin Z, Hu H, Zhao Q, Zhao J, Liu H. Predicting Drug-Induced Liver Injury Using Ensemble Learning Methods and Molecular Fingerprints. Toxicol Sci 2018; 165: 100-107 [PMID: 29788510 DOI: 10.1093/toxsci/kfy121]
264
Banerjee I, Choi HH, Desser T, Rubin DL. A Scalable Machine Learning Approach for Inferring Probabilistic US-LI-RADS Categorization. AMIA Annu Symp Proc 2018; 2018: 215-224 [PMID: 30815059]
265
Dickerson LK, Rouhizadeh M, Korotkaya Y, Bowring MG, Massie AB, McAdams-Demarco MA, Segev DL, Cannon A, Guerrerio AL, Chen PH, Philosophe BN, Mogul DB. Language impairment in adults with end-stage liver disease: application of natural language processing towards patient-generated health records. NPJ Digit Med 2019; 2: 106 [PMID: 31701020 DOI: 10.1038/s41746-019-0179-9]
266
He L, Li H, Dudley JA, Maloney TC, Brady SL, Somasundaram E, Trout AT, Dillman JR. Machine Learning Prediction of Liver Stiffness Using Clinical and T2-Weighted MRI Radiomic Data. AJR Am J Roentgenol 2019; 213: 592-601 [PMID: 31120779 DOI: 10.2214/AJR.19.21082]
267

Kröner PT et al. AI in GI review
WJG https://www.wjgnet.com 6821 October 28, 2021 Volume 27 Issue 40
Khan S, Ullah R, Khan A, Ashraf R, Ali H, Bilal M, Saleem M. Analysis of hepatitis B virus infection in blood sera using Raman spectroscopy and machine learning. Photodiagnosis Photodyn Ther 2018; 23: 89-93 [PMID: 29787817 DOI: 10.1016/j.pdpdt.2018.05.010]
268
Li X, Chen H, Qi X, Dou Q, Fu CW, Heng PA. H-DenseUNet: Hybrid Densely Connected UNet for Liver and Tumor Segmentation From CT Volumes. IEEE Trans Med Imaging 2018; 37: 2663-2674 [PMID: 29994201 DOI: 10.1109/TMI.2018.2845918]
269
Mueller-Breckenridge AJ, Garcia-Alcalde F, Wildum S, Smits SL, de Man RA, van Campenhout MJH, Brouwer WP, Niu J, Young JAT, Najera I, Zhu L, Wu D, Racek T, Hundie GB, Lin Y, Boucher CA, van de Vijver D, Haagmans BL. Machine-learning based patient classification using Hepatitis B virus full-length genome quasispecies from Asian and European cohorts. Sci Rep 2019; 9: 18892 [PMID: 31827222 DOI: 10.1038/s41598-019-55445-8]
270
Williams DP, Lazic SE, Foster AJ, Semenova E, Morgan P. Predicting Drug-Induced Liver Injury with Bayesian Machine Learning. Chem Res Toxicol 2020; 33: 239-248 [PMID: 31535850 DOI: 10.1021/acs.chemrestox.9b00264]
271
Shousha HI, Awad AH, Omran DA, Elnegouly MM, Mabrouk M. Data Mining and Machine Learning Algorithms Using IL28B Genotype and Biochemical Markers Best Predicted Advanced Liver Fibrosis in Chronic Hepatitis C. Jpn J Infect Dis 2018; 71: 51-57 [PMID: 29279441 DOI: 10.7883/yoken.JJID.2017.089]
272
Garcia-Carretero R, Vigil-Medina L, Barquero-Perez O, Ramos-Lopez J. Relevant Features in Nonalcoholic Steatohepatitis Determined Using Machine Learning for Feature Selection. Metab Syndr Relat Disord 2019; 17: 444-451 [PMID: 31675274 DOI: 10.1089/met.2019.0052]
273
Ma H, Xu CF, Shen Z, Yu CH, Li YM. Application of Machine Learning Techniques for Clinical Predictive Modeling: A Cross-Sectional Study on Nonalcoholic Fatty Liver Disease in China. Biomed Res Int 2018; 2018: 4304376 [PMID: 30402478 DOI: 10.1155/2018/4304376]
274
Moccia S, Mattos LS, Patrini I, Ruperti M, Poté N, Dondero F, Cauchy F, Sepulveda A, Soubrane O, De Momi E, Diaspro A, Cesaretti M. Computer-assisted liver graft steatosis assessment via learning-based texture analysis. Int J Comput Assist Radiol Surg 2018; 13: 1357-1367 [PMID: 29796834 DOI: 10.1007/s11548-018-1787-6]
275
Perveen S, Shahbaz M, Keshavjee K, Guergachi A. A Systematic Machine Learning Based Approach for the Diagnosis of Non-Alcoholic Fatty Liver Disease Risk and Progression. Sci Rep 2018; 8: 2112 [PMID: 29391513 DOI: 10.1038/s41598-018-20166-x]
276
Wu CC, Yeh WC, Hsu WD, Islam MM, Nguyen PAA, Poly TN, Wang YC, Yang HC, Jack Li YC. Prediction of fatty liver disease using machine learning algorithms. Comput Methods Programs Biomed 2019; 170: 23-29 [PMID: 30712601 DOI: 10.1016/j.cmpb.2018.12.032]
277
Yip TC, Ma AJ, Wong VW, Tse YK, Chan HL, Yuen PC, Wong GL. Laboratory parameter-based machine learning model for excluding non-alcoholic fatty liver disease (NAFLD) in the general population. Aliment Pharmacol Ther 2017; 46: 447-456 [PMID: 28585725 DOI: 10.1111/apt.14172]
278
Gorris M, Hoogenboom SA, Wallace MB, van Hooft JE. Artificial intelligence for the management of pancreatic diseases. Dig Endosc 2021; 33: 231-241 [PMID: 33065754 DOI: 10.1111/den.13875]
279
Marya NB, Powers PD, Chari ST, Gleeson FC, Leggett CL, Abu Dayyeh BK, Chandrasekhara V, Iyer PG, Majumder S, Pearson RK, Petersen BT, Rajan E, Sawas T, Storm AC, Vege SS, Chen S, Long Z, Hough DM, Mara K, Levy MJ. Utilisation of artificial intelligence for the development of an EUS-convolutional neural network model trained to enhance the diagnosis of autoimmune pancreatitis. Gut 2021; 70: 1335-1344 [PMID: 33028668 DOI: 10.1136/gutjnl-2020-322821]
280
Tonozuka R, Mukai S, Itoi T. The Role of Artificial Intelligence in Endoscopic Ultrasound for Pancreatic Disorders. Diagnostics (Basel) 2020; 11 [PMID: 33374181 DOI: 10.3390/diagnostics11010018]
281
van den Heever M, Mittal A, Haydock M, Windsor J. The use of intelligent database systems in acute pancreatitis--a systematic review. Pancreatology 2014; 14: 9-16 [PMID: 24555973 DOI: 10.1016/j.pan.2013.11.010]
282
Andersson B, Andersson R, Ohlsson M, Nilsson J. Prediction of severe acute pancreatitis at admission to hospital using artificial neural networks. Pancreatology 2011; 11: 328-335 [PMID: 21757970 DOI: 10.1159/000327903]
283
Fei Y, Gao K, Li WQ. Artificial neural network algorithm model as powerful tool to predict acute lung injury following to severe acute pancreatitis. Pancreatology 2018; 18: 892-899 [PMID: 30268673 DOI: 10.1016/j.pan.2018.09.007]
284
Fei Y, Gao K, Li WQ. Prediction and evaluation of the severity of acute respiratory distress syndrome following severe acute pancreatitis using an artificial neural network algorithm model. HPB (Oxford) 2019; 21: 891-897 [PMID: 30591306 DOI: 10.1016/j.hpb.2018.11.009]
285
Fei Y, Hu J, Li WQ, Wang W, Zong GQ. Artificial neural networks predict the incidence of portosplenomesenteric venous thrombosis in patients with acute pancreatitis. J Thromb Haemost 2017; 15: 439-445 [PMID: 27960048 DOI: 10.1111/jth.13588]
286
Hong WD, Chen XR, Jin SQ, Huang QK, Zhu QH, Pan JY. Use of an artificial neural network to predict persistent organ failure in patients with acute pancreatitis. Clinics (Sao Paulo) 2013; 68: 27-31 [PMID: 23420153 DOI: 10.6061/clinics/2013(01)rc01]
287
Keogan MT, Lo JY, Freed KS, Raptopoulos V, Blake S, Kamel IR, Weisinger K, Rosen MP, Nelson RC. Outcome analysis of patients with acute pancreatitis by using an artificial neural network. Acad Radiol 2002; 9: 410-419 [PMID: 11942655 DOI: 10.1016/s1076-6332(03)80186-1]
288
Mofidi R, Duff MD, Madhavan KK, Garden OJ, Parks RW. Identification of severe acute 289

Kröner PT et al. AI in GI review
WJG https://www.wjgnet.com 6822 October 28, 2021 Volume 27 Issue 40
pancreatitis using an artificial neural network. Surgery 2007; 141: 59-66 [PMID: 17188168 DOI: 10.1016/j.surg.2006.07.022]Pearce CB, Gunn SR, Ahmed A, Johnson CD. Machine learning can improve prediction of severity in acute pancreatitis using admission values of APACHE II score and C-reactive protein. Pancreatology 2006; 6: 123-131 [PMID: 16327290 DOI: 10.1159/000090032]
290
Pofahl WE, Walczak SM, Rhone E, Izenberg SD. Use of an artificial neural network to predict length of stay in acute pancreatitis. Am Surg 1998; 64: 868-872 [PMID: 9731816 DOI: 10.1016/S0016-5085(98)81989-6]
291
Qiu Q, Nian YJ, Guo Y, Tang L, Lu N, Wen LZ, Wang B, Chen DF, Liu KJ. Development and validation of three machine-learning models for predicting multiple organ failure in moderately severe and severe acute pancreatitis. BMC Gastroenterol 2019; 19: 118 [PMID: 31272385 DOI: 10.1186/s12876-019-1016-y]
292
Qiu Q, Nian YJ, Tang L, Guo Y, Wen LZ, Wang B, Chen DF, Liu KJ. Artificial neural networks accurately predict intra-abdominal infection in moderately severe and severe acute pancreatitis. J Dig Dis 2019; 20: 486-494 [PMID: 31328389 DOI: 10.1111/1751-2980.12796]
293
Al-Haddad MA, Friedlin J, Kesterson J, Waters JA, Aguilar-Saavedra JR, Schmidt CM. Natural language processing for the development of a clinical registry: a validation study in intraductal papillary mucinous neoplasms. HPB (Oxford) 2010; 12: 688-695 [PMID: 21083794 DOI: 10.1111/j.1477-2574.2010.00235.x]
294
Gao X, Wang X. Performance of deep learning for differentiating pancreatic diseases on contrast-enhanced magnetic resonance imaging: A preliminary study. Diagn Interv Imaging 2020; 101: 91-100 [PMID: 31375430 DOI: 10.1016/j.diii.2019.07.002]
295
Mashayekhi R, Parekh VS, Faghih M, Singh VK, Jacobs MA, Zaheer A. Radiomic features of the pancreas on CT imaging accurately differentiate functional abdominal pain, recurrent acute pancreatitis, and chronic pancreatitis. Eur J Radiol 2020; 123: 108778 [PMID: 31846864 DOI: 10.1016/j.ejrad.2019.108778]
296
Roth HR, Lu L, Lay N, Harrison AP, Farag A, Sohn A, Summers RM. Spatial aggregation of holistically-nested convolutional neural networks for automated pancreas localization and segmentation. Med Image Anal 2018; 45: 94-107 [PMID: 29427897 DOI: 10.1016/j.media.2018.01.006]
297
Zhang J, Zhu L, Yao L, Ding X, Chen D, Wu H, Lu Z, Zhou W, Zhang L, An P, Xu B, Tan W, Hu S, Cheng F, Yu H. Deep learning-based pancreas segmentation and station recognition system in EUS: development and validation of a useful training tool (with video). Gastrointest Endosc 2020; 92: 874-885.e3 [PMID: 32387499 DOI: 10.1016/j.gie.2020.04.071]
298
Zheng H, Chen Y, Yue X, Ma C, Liu X, Yang P, Lu J. Deep pancreas segmentation with uncertain regions of shadowed sets. Magn Reson Imaging 2020; 68: 45-52 [PMID: 31987903 DOI: 10.1016/j.mri.2020.01.008]
299
Zhu J, Wang L, Chu Y, Hou X, Xing L, Kong F, Zhou Y, Wang Y, Jin Z, Li Z. A new descriptor for computer-aided diagnosis of EUS imaging to distinguish autoimmune pancreatitis from chronic pancreatitis. Gastrointest Endosc 2015; 82: 831-836.e1 [PMID: 25952089 DOI: 10.1016/j.gie.2015.02.043]
300
Chu LC, Park S, Kawamoto S, Fouladi DF, Shayesteh S, Zinreich ES, Graves JS, Horton KM, Hruban RH, Yuille AL, Kinzler KW, Vogelstein B, Fishman EK. Utility of CT Radiomics Features in Differentiation of Pancreatic Ductal Adenocarcinoma From Normal Pancreatic Tissue. AJR Am J Roentgenol 2019; 213: 349-357 [PMID: 31012758 DOI: 10.2214/AJR.18.20901]
301
Das A, Nguyen CC, Li F, Li B. Digital image analysis of EUS images accurately differentiates pancreatic cancer from chronic pancreatitis and normal tissue. Gastrointest Endosc 2008; 67: 861-867 [PMID: 18179797 DOI: 10.1016/j.gie.2007.08.036]
302
Gao X, Wang X. Deep learning for World Health Organization grades of pancreatic neuroendocrine tumors on contrast-enhanced magnetic resonance images: a preliminary study. Int J Comput Assist Radiol Surg 2019; 14: 1981-1991 [PMID: 31555998 DOI: 10.1007/s11548-019-02070-5]
303
Kaissis G, Ziegelmayer S, Lohöfer F, Steiger K, Algül H, Muckenhuber A, Yen HY, Rummeny E, Friess H, Schmid R, Weichert W, Siveke JT, Braren R. A machine learning algorithm predicts molecular subtypes in pancreatic ductal adenocarcinoma with differential response to gemcitabine-based vs FOLFIRINOX chemotherapy. PLoS One 2019; 14: e0218642 [PMID: 31577805 DOI: 10.1371/journal.pone.0218642]
304
Kaissis GA, Ziegelmayer S, Lohöfer FK, Harder FN, Jungmann F, Sasse D, Muckenhuber A, Yen HY, Steiger K, Siveke J, Friess H, Schmid R, Weichert W, Makowski MR, Braren RF. Image-Based Molecular Phenotyping of Pancreatic Ductal Adenocarcinoma. J Clin Med 2020; 9 [PMID: 32155990 DOI: 10.3390/jcm9030724]
305
E L, Xu Y, Wu Z, Li L, Zhang N, Yang H, Schwartz LH, Lu L, Zhao B. Differentiation of Focal-Type Autoimmune Pancreatitis From Pancreatic Ductal Adenocarcinoma Using Radiomics Based on Multiphasic Computed Tomography. J Comput Assist Tomogr 2020; 44: 511-518 [PMID: 32697521 DOI: 10.1097/RCT.0000000000001049]
306
Momeni-Boroujeni A, Yousefi E, Somma J. Computer-assisted cytologic diagnosis in pancreatic FNA: An application of neural networks to image analysis. Cancer Cytopathol 2017; 125: 926-933 [PMID: 28885766 DOI: 10.1002/cncy.21915]
307
Norton ID, Zheng Y, Wiersema MS, Greenleaf J, Clain JE, Dimagno EP. Neural network analysis of EUS images to differentiate between pancreatic malignancy and pancreatitis. Gastrointest Endosc
308
Kröner PT et al. AI in GI review
WJG https://www.wjgnet.com 6823 October 28, 2021 Volume 27 Issue 40
2001; 54: 625-629 [PMID: 11677484 DOI: 10.1067/mge.2001.118644]Qiu W, Duan N, Chen X, Ren S, Zhang Y, Wang Z, Chen R. Pancreatic Ductal Adenocarcinoma: Machine Learning-Based Quantitative Computed Tomography Texture Analysis For Prediction Of Histopathological Grade. Cancer Manag Res 2019; 11: 9253-9264 [PMID: 31802945 DOI: 10.2147/CMAR.S218414]
309
Săftoiu A, Vilmann P, Dietrich CF, Iglesias-Garcia J, Hocke M, Seicean A, Ignee A, Hassan H, Streba CT, Ioncică AM, Gheonea DI, Ciurea T. Quantitative contrast-enhanced harmonic EUS in differential diagnosis of focal pancreatic masses (with videos). Gastrointest Endosc 2015; 82: 59-69 [PMID: 25792386 DOI: 10.1016/j.gie.2014.11.040]
310
Săftoiu A, Vilmann P, Gorunescu F, Gheonea DI, Gorunescu M, Ciurea T, Popescu GL, Iordache A, Hassan H, Iordache S. Neural network analysis of dynamic sequences of EUS elastography used for the differential diagnosis of chronic pancreatitis and pancreatic cancer. Gastrointest Endosc 2008; 68: 1086-1094 [PMID: 18656186 DOI: 10.1016/j.gie.2008.04.031]
311
Săftoiu A, Vilmann P, Gorunescu F, Janssen J, Hocke M, Larsen M, Iglesias-Garcia J, Arcidiacono P, Will U, Giovannini M, Dietrich CF, Havre R, Gheorghe C, McKay C, Gheonea DI, Ciurea T; European EUS Elastography Multicentric Study Group. Efficacy of an artificial neural network-based approach to endoscopic ultrasound elastography in diagnosis of focal pancreatic masses. Clin Gastroenterol Hepatol 2012; 10: 84-90.e1 [PMID: 21963957 DOI: 10.1016/j.cgh.2011.09.014]
312
Yeaton P, Sears RJ, Ledent T, Salmon I, Kiss R, Decaestecker C. Discrimination between chronic pancreatitis and pancreatic adenocarcinoma using artificial intelligence-related algorithms based on image cytometry-generated variables. Cytometry 1998; 32: 309-316 [PMID: 9701400 DOI: 10.1002/(sici)1097-0320(19980801)32:4<309::aid-cyto8>3.0.co;2-c]
313
Zhu M, Xu C, Yu J, Wu Y, Li C, Zhang M, Jin Z, Li Z. Differentiation of pancreatic cancer and chronic pancreatitis using computer-aided diagnosis of endoscopic ultrasound (EUS) images: a diagnostic test. PLoS One 2013; 8: e63820 [PMID: 23704940 DOI: 10.1371/journal.pone.0063820]
314
Luo Y, Chen X, Chen J, Song C, Shen J, Xiao H, Chen M, Li ZP, Huang B, Feng ST. Preoperative Prediction of Pancreatic Neuroendocrine Neoplasms Grading Based on Enhanced Computed Tomography Imaging: Validation of Deep Learning with a Convolutional Neural Network. Neuroendocrinology 2020; 110: 338-350 [PMID: 31525737 DOI: 10.1159/000503291]
315
Chakraborty J, Midya A, Gazit L, Attiyeh M, Langdon-Embry L, Allen PJ, Do RKG, Simpson AL. CT radiomics to predict high-risk intraductal papillary mucinous neoplasms of the pancreas. Med Phys 2018; 45: 5019-5029 [PMID: 30176047 DOI: 10.1002/mp.13159]
316
Corral JE, Hussein S, Kandel P, Bolan CW, Bagci U, Wallace MB. Deep Learning to Classify Intraductal Papillary Mucinous Neoplasms Using Magnetic Resonance Imaging. Pancreas 2019; 48: 805-810 [PMID: 31210661 DOI: 10.1097/MPA.0000000000001327]
317
Dmitriev K, Kaufman AE, Javed AA, Hruban RH, Fishman EK, Lennon AM, Saltz JH. Classification of Pancreatic Cysts in Computed Tomography Images Using a Random Forest and Convolutional Neural Network Ensemble. Med Image Comput Comput Assist Interv 2017; 10435: 150-158 [PMID: 29881827 DOI: 10.1007/978-3-319-66179-7_18]
318
Kurita Y, Kuwahara T, Hara K, Mizuno N, Okuno N, Matsumoto S, Obata M, Koda H, Tajika M, Shimizu Y, Nakajima A, Kubota K, Niwa Y. Diagnostic ability of artificial intelligence using deep learning analysis of cyst fluid in differentiating malignant from benign pancreatic cystic lesions. Sci Rep 2019; 9: 6893 [PMID: 31053726 DOI: 10.1038/s41598-019-43314-3]
319
Kuwahara T, Hara K, Mizuno N, Okuno N, Matsumoto S, Obata M, Kurita Y, Koda H, Toriyama K, Onishi S, Ishihara M, Tanaka T, Tajika M, Niwa Y. Usefulness of Deep Learning Analysis for the Diagnosis of Malignancy in Intraductal Papillary Mucinous Neoplasms of the Pancreas. Clin Transl Gastroenterol 2019; 10: 1-8 [PMID: 31117111 DOI: 10.14309/ctg.0000000000000045]
320
Li H, Shi K, Reichert M, Lin K, Tselousov N, Braren R, Fu D, Schmid R, Li J, Menze B. Differential Diagnosis for Pancreatic Cysts in CT Scans Using Densely-Connected Convolutional Networks. Annu Int Conf IEEE Eng Med Biol Soc 2019; 2019: 2095-2098 [PMID: 31946314 DOI: 10.1109/EMBC.2019.8856745]
321
Okoń K, Tomaszewska R, Nowak K, Stachura J. Application of neural networks to the classification of pancreatic intraductal proliferative lesions. Anal Cell Pathol 2001; 23: 129-136 [PMID: 12082293 DOI: 10.1155/2001/657268]
322
Song JW, Lee JH, Choi JH, Chun SJ. Automatic differential diagnosis of pancreatic serous and mucinous cystadenomas based on morphological features. Comput Biol Med 2013; 43: 1-15 [PMID: 23200461 DOI: 10.1016/j.compbiomed.2012.10.009]
323
Springer S, Masica DL, Dal Molin M, Douville C, Thoburn CJ, Afsari B, Li L, Cohen JD, Thompson E, Allen PJ, Klimstra DS, Schattner MA, Schmidt CM, Yip-Schneider M, Simpson RE, Fernandez-Del Castillo C, Mino-Kenudson M, Brugge W, Brand RE, Singhi AD, Scarpa A, Lawlor R, Salvia R, Zamboni G, Hong SM, Hwang DW, Jang JY, Kwon W, Swan N, Geoghegan J, Falconi M, Crippa S, Doglioni C, Paulino J, Schulick RD, Edil BH, Park W, Yachida S, Hijioka S, van Hooft J, He J, Weiss MJ, Burkhart R, Makary M, Canto MI, Goggins MG, Ptak J, Dobbyn L, Schaefer J, Sillman N, Popoli M, Klein AP, Tomasetti C, Karchin R, Papadopoulos N, Kinzler KW, Vogelstein B, Wolfgang CL, Hruban RH, Lennon AM. A multimodality test to guide the management of patients with a pancreatic cyst. Sci Transl Med 2019; 11 [PMID: 31316009 DOI: 10.1126/scitranslmed.aav4772]
324
Wei R, Lin K, Yan W, Guo Y, Wang Y, Li J, Zhu J. Computer-Aided Diagnosis of Pancreas Serous Cystic Neoplasms: A Radiomics Method on Preoperative MDCT Images. Technol Cancer Res Treat
325

Kröner PT et al. AI in GI review
WJG https://www.wjgnet.com 6824 October 28, 2021 Volume 27 Issue 40
2019; 18: 1533033818824339 [PMID: 30803366 DOI: 10.1177/1533033818824339]Yang J, Guo X, Ou X, Zhang W, Ma X. Discrimination of Pancreatic Serous Cystadenomas From Mucinous Cystadenomas With CT Textural Features: Based on Machine Learning. Front Oncol 2019; 9: 494 [PMID: 31245294 DOI: 10.3389/fonc.2019.00494]
326
Blyuss O, Zaikin A, Cherepanova V, Munblit D, Kiseleva EM, Prytomanova OM, Duffy SW, Crnogorac-Jurcevic T. Development of PancRISK, a urine biomarker-based risk score for stratified screening of pancreatic cancer patients. Br J Cancer 2020; 122: 692-696 [PMID: 31857725 DOI: 10.1038/s41416-019-0694-0]
327
Facciorusso A, Del Prete V, Antonino M, Buccino VR, Muscatiello N. Response to repeat echoendoscopic celiac plexus neurolysis in pancreatic cancer patients: A machine learning approach. Pancreatology 2019; 19: 866-872 [PMID: 31375433 DOI: 10.1016/j.pan.2019.07.038]
328
Hayward J, Alvarez SA, Ruiz C, Sullivan M, Tseng J, Whalen G. Machine learning of clinical performance in a pancreatic cancer database. Artif Intell Med 2010; 49: 187-195 [PMID: 20483571 DOI: 10.1016/j.artmed.2010.04.009]
329
Kaissis G, Ziegelmayer S, Lohöfer F, Algül H, Eiber M, Weichert W, Schmid R, Friess H, Rummeny E, Ankerst D, Siveke J, Braren R. A machine learning model for the prediction of survival and tumor subtype in pancreatic ductal adenocarcinoma from preoperative diffusion-weighted imaging. Eur Radiol Exp 2019; 3: 41 [PMID: 31624935 DOI: 10.1186/s41747-019-0119-0]
330
Li K, Xiao J, Yang J, Li M, Xiong X, Nian Y, Qiao L, Wang H, Eresen A, Zhang Z, Hu X, Wang J, Chen W. Association of radiomic imaging features and gene expression profile as prognostic factors in pancreatic ductal adenocarcinoma. Am J Transl Res 2019; 11: 4491-4499 [PMID: 31396352]
331
Walczak S, Velanovich V. An Evaluation of Artificial Neural Networks in Predicting Pancreatic Cancer Survival. J Gastrointest Surg 2017; 21: 1606-1612 [PMID: 28776157 DOI: 10.1007/s11605-017-3518-7]
332
Xu W, Liu Y, Lu Z, Jin ZD, Hu YH, Yu JG, Li ZS. A new endoscopic ultrasonography image processing method to evaluate the prognosis for pancreatic cancer treated with interstitial brachytherapy. World J Gastroenterol 2013; 19: 6479-6484 [PMID: 24151368 DOI: 10.3748/wjg.v19.i38.6479]
333
Zhang Y, Lobo-Mueller EM, Karanicolas P, Gallinger S, Haider MA, Khalvati F. CNN-based survival model for pancreatic ductal adenocarcinoma in medical imaging. BMC Med Imaging 2020; 20: 11 [PMID: 32013871 DOI: 10.1186/s12880-020-0418-1]
334
Li S, Jiang H, Wang Z, Zhang G, Yao YD. An effective computer aided diagnosis model for pancreas cancer on PET/CT images. Comput Methods Programs Biomed 2018; 165: 205-214 [PMID: 30337075 DOI: 10.1016/j.cmpb.2018.09.001]
335
Liu SL, Li S, Guo YT, Zhou YP, Zhang ZD, Lu Y. Establishment and application of an artificial intelligence diagnosis system for pancreatic cancer with a faster region-based convolutional neural network. Chin Med J (Engl) 2019; 132: 2795-2803 [PMID: 31856050 DOI: 10.1097/CM9.0000000000000544]
336
Mehrabi S, Krishnan A, Roch AM, Schmidt H, Li D, Kesterson J, Beesley C, Dexter P, Schmidt M, Palakal M, Liu H. Identification of Patients with Family History of Pancreatic Cancer--Investigation of an NLP System Portability. Stud Health Technol Inform 2015; 216: 604-608 [PMID: 26262122]
337
Ozkan M, Cakiroglu M, Kocaman O, Kurt M, Yilmaz B, Can G, Korkmaz U, Dandil E, Eksi Z. Age-based computer-aided diagnosis approach for pancreatic cancer on endoscopic ultrasound images. Endosc Ultrasound 2016; 5: 101-107 [PMID: 27080608 DOI: 10.4103/2303-9027.180473]
338
Roch AM, Mehrabi S, Krishnan A, Schmidt HE, Kesterson J, Beesley C, Dexter PR, Palakal M, Schmidt CM. Automated pancreatic cyst screening using natural language processing: a new tool in the early detection of pancreatic cancer. HPB (Oxford) 2015; 17: 447-453 [PMID: 25537257 DOI: 10.1111/hpb.12375]
339
Zhang MM, Yang H, Jin ZD, Yu JG, Cai ZY, Li ZS. Differential diagnosis of pancreatic cancer from normal tissue with digital imaging processing and pattern recognition based on a support vector machine of EUS images. Gastrointest Endosc 2010; 72: 978-985 [PMID: 20855062 DOI: 10.1016/j.gie.2010.06.042]
340
Liu X, Rivera SC, Moher D, Calvert MJ, Denniston AK; SPIRIT-AI and CONSORT-AI Working Group. Reporting guidelines for clinical trial reports for interventions involving artificial intelligence: the CONSORT-AI Extension. BMJ 2020; 370: m3164 [PMID: 32909959 DOI: 10.1136/bmj.m3164]
341
Krittanawong C, Johnson KW, Rosenson RS, Wang Z, Aydar M, Baber U, Min JK, Tang WHW, Halperin JL, Narayan SM. Deep learning for cardiovascular medicine: a practical primer. Eur Heart J 2019; 40: 2058-2073 [PMID: 30815669 DOI: 10.1093/eurheartj/ehz056]
342

WJG https://www.wjgnet.com 6825 October 28, 2021 Volume 27 Issue 40
World Journal of
GastroenterologyW J GSubmit a Manuscript: https://www.f6publishing.com World J Gastroenterol 2021 October 28; 27(40): 6825-6843
DOI: 10.3748/wjg.v27.i40.6825 ISSN 1007-9327 (print) ISSN 2219-2840 (online)
MINIREVIEWS
Emerging artificial intelligence applications in liver magnetic resonance imaging
Charles E Hill, Luca Biasiolli, Matthew D Robson, Vicente Grau, Michael Pavlides
ORCID number: Charles E Hill 0000-0001-5825-030X; Luca Biasiolli 0000-0002-0452-8756; Matthew D Robson 0000-0002-5902-1012; Vicente Grau 0000-0001-8139-3480; Michael Pavlides 0000-0001-9882-8874.
Author contributions: Hill CE did the literature search and drafted the manuscript; all other authors revised the manuscript for important intellectual content.
Supported by the Engineering and Physical Sciences Research Council and Medical Research Council, No. EP/L016052/1.
Conflict-of-interest statement: Pavlides M is a shareholder for the company Perspectum Ltd. and has applied for a patent for medical imaging; All other authors declare no conflicts of interest; Robson M is an employee and shareholder for the company Perspectum Ltd.; Hill CE is partially funded by the company Perspectum Ltd.
Open-Access: This article is an open-access article that was selected by an in-house editor and fully peer-reviewed by external reviewers. It is distributed in accordance with the Creative Commons Attribution NonCommercial (CC BY-NC 4.0) license, which permits others to distribute, remix, adapt, build upon this work non-commercially,
Charles E Hill, Department of Engineering Science, University of Oxford, Oxford OX3 7DQ, United Kingdom
Luca Biasiolli, Radcliffe Department of Medicine, University of Oxford, Oxford OX3 9DU, United Kingdom
Matthew D Robson, MR Physics, Perspectum Ltd, Oxford OX4 2LL, United Kingdom
Vicente Grau, Department of Engineering, University of Oxford, Oxford OX3 7DQ, United Kingdom
Michael Pavlides, Oxford Centre for Clinical Magnetic Resonance Research, Division of Cardiovascular Medicine, Radcliffe Department of Medicine, University of Oxford, Oxford OX3 9DU, United Kingdom
Michael Pavlides, Translational Gastroenterology Unit, University of Oxford, Oxford OX3 9DU, United Kingdom
Michael Pavlides, Oxford NIHR Biomedical Research Centre, University of Oxford, Oxford OX3 9DU, United Kingdom
Corresponding author: Michael Pavlides, BSc, DPhil, MBBS, MRCP, Consultant Physician-Scientist, Doctor, Oxford Centre for Clinical Magnetic Resonance Research, Division of Cardiovascular Medicine, Radcliffe Department of Medicine, University of Oxford, Level 0, John Radcliffe Hospital, Headley Way, Headington, Oxford OX3 9DU, United Kingdom. [email protected]
AbstractChronic liver diseases (CLDs) are becoming increasingly more prevalent in modern society. The use of imaging techniques for early detection, such as magnetic resonance imaging (MRI), is crucial in reducing the impact of these diseases on healthcare systems. Artificial intelligence (AI) algorithms have been shown over the past decade to excel at image-based analysis tasks such as detection and segmentation. When applied to liver MRI, they have the potential to improve clinical decision making, and increase throughput by automating analyses. With Liver diseases becoming more prevalent in society, the need to implement these techniques to utilize liver MRI to its full potential, is paramount. In this review, we report on the current methods and applications of AI methods in liver MRI, with a focus on machine learning and deep learning methods. We
Hill CE et al. AI for liver MRI
WJG https://www.wjgnet.com 6826 October 28, 2021 Volume 27 Issue 40
and license their derivative works on different terms, provided the original work is properly cited and the use is non-commercial. See: http://creativecommons.org/Licenses/by-nc/4.0/
Manuscript source: Invited manuscript
Specialty type: Gastroenterology and hepatology
Country/Territory of origin: United Kingdom
Peer-review report’s scientific quality classificationGrade A (Excellent): A Grade B (Very good): B Grade C (Good): 0 Grade D (Fair): 0 Grade E (Poor): 0
Received: February 6, 2021 Peer-review started: February 6, 2021 First decision: March 29, 2021 Revised: April 16, 2021 Accepted: September 26, 2021 Article in press: September 30, 2021 Published online: October 28, 2021
P-Reviewer: Karavaş E, Wang CY S-Editor: Gong ZM L-Editor: A P-Editor: Gong ZM
assess four main themes of segmentation, classification, image synthesis and artefact detection, and their respective potential in liver MRI and the wider clinic. We provide a brief explanation of some of the algorithms used and explore the current challenges affecting the field. Though there are many hurdles to overcome in implementing AI methods in the clinic, we conclude that AI methods have the potential to positively aid healthcare professionals for years to come.
Key Words: Liver diseases; Magnetic resonance imaging; Machine learning; Deep learning; Artificial intelligence; Computer vision
©The Author(s) 2021. Published by Baishideng Publishing Group Inc. All rights reserved.
Core Tip: Artificial Intelligence (AI) algorithms are becoming increasingly prevalent in magnetic resonance imaging (MRI) after their proven success in computer vision tasks. With regards to liver MRI, these methods have been shown to be successful in tasks from hepatocellular carcinoma detection, to motion reduction to improve undiagnostic scans. They have also been shown in some cases to outperform radiographer level performance. The widespread use of these techniques could positively aid clinicians for years to come, if implemented properly into clinical workflows.
Citation: Hill CE, Biasiolli L, Robson MD, Grau V, Pavlides M. Emerging artificial intelligence applications in liver magnetic resonance imaging. World J Gastroenterol 2021; 27(40): 6825-6843URL: https://www.wjgnet.com/1007-9327/full/v27/i40/6825.htmDOI: https://dx.doi.org/10.3748/wjg.v27.i40.6825
INTRODUCTIONSince the advent of magnetic resonance imaging (MRI) in the 1970s, its use has grown exponentially worldwide, due to its ability to give high resolution images in the body, allowing the early diagnosis and accurate prognosis of many diseases[1,2]. In contrast to computed tomography (CT), MRI uses no ionising radiation, has superior soft tissue contrast and allows the probing of metabolic processes due to the ubiquitous nature of water in our bodies. With regards to the liver, it has become an essential tool for anatomical assessment. In addition, current cutting edge methods allow for quanti-fication of liver fat, liver iron and staging of fibrosis levels within the liver[3-5]. These methods have the possibility to provide early detection and staging of many chronic liver diseases (CLDs), and are becoming more in demand with the rising prevalence in liver disease in western society. With 1/3 of adults believed to have non-alcoholic fatty liver disease (NAFLD) and 12% the more severe non-alcoholic steatohepatitis (NASH), NAFLD has been defined as a silent pandemic and the most prevalent liver disease in human history[6-9]. As there is currently no medical treatment for NAFLD beyond lifestyle interventions, the need for early detection is paramount, so that the disease progression can be halted and reversed, and MRI can play an important role in this[10].
The need for early detection is not only limited to CLDs but is also important in detection of liver cell cancer (hepatocellular cancer; HCC). With mortality rates from HCC predicted to rise to become the third highest leading cause of cancer-related deaths in the US by 2030, the need for early diagnosis is needed so that treatment can be effective[11]. Currently this requires expert radiologists studying liver MRI scans trying to find a tumour. Though many tumours are identified, some tumours can also be missed, with one study finding that 16% of lesions were missed in multiparametric MR imaging of the prostate, highlighting the need for a method for identifying these missed cases[12].
Early detection can be addressed in many liver diseases using liver MRI. The current gold standard for staging is liver biopsy, however, it is invasive, is localized (sampling error) and has risk of complications[13]. Liver MRI is overtaking this standard, due to being non-invasive and allowing global metrics to be calculated across the whole liver. When diagnosing liver fibrosis stage, an important biomarker

Hill CE et al. AI for liver MRI
WJG https://www.wjgnet.com 6827 October 28, 2021 Volume 27 Issue 40
in staging NAFLD, many different sequences have predictive potential, such as MRE, T1 and T2* mapping, diffusion weighted imaging (DWI) and hepatocellular function imaging using contrast agents[14]. When identifying HCC within the liver, hepato-cellular function imaging is commonly used, however DWI also has good predictive power[15,16]. These methods all require a level of expert analysis to interpret the images, similarly to biopsies, which means they are prime candidates for automation using AI methods.
Artificial intelligence (AI) techniques, have been shown to perform well when applied to computer vision problems, from classification of objects in a photograph to fast object segmentation of video frames for self-driving cars[17,18]. These techniques have also been applied successfully to many areas of MRI in the body, such as segmentation of brain tissue, ejection fraction prediction and diagnosis of heart conditions[19-21]. An AI approach to report mammograms for the presence of breast cancer has been shown to outperform radiologist reporting[22]. AI techniques in Liver MRI are relatively underdeveloped compared to brain and cardiac MRI, but nevertheless, they provide opportunities to alleviate workload in many settings.
In this review, we assess the current gold standard of AI in liver imaging. Specifically, we review the recent application of AI techniques for segmentation (Table 1), classification (Table 2) and image synthesis for different CLDs and MR imaging techniques. We briefly provide an overview of AI techniques in the field, describe the implementation of AI to achieve these applications and explain how they are quantitatively and qualitatively assessed. We explore the publications that have sought to solve these problems and assess the challenges that still face the field.
AI ALGORITHMSWe broadly focus on two subsets of AI algorithms: traditional machine learning (ML) algorithms and deep learning (DL) algorithms. Traditional machine learning algorithms often rely on the input of handcrafted features, an additional piece of data which has been derived from acquired data. In the case of MR images, these handcrafted features are often statistical measurements such as the mean intensity of the image or a sub region of the image, and are called radiomic features as they are derived from medical images. These radiomic features are then passed to a statistical model, such as a support vector machine (SVM), kMeans Clustering, random forests or a naïve bayes algorithm among many others[23,24]. These models can either be supervised, where you have a desired target outcome, or unsupervised, where no target outcome is enforced. When you have selected the appropriate model for your task, the model is then trained. In the case of supervised models, the model updates its parameters to minimise the error between your desired output and the model output, as new data is sequentially passed to it. An example would be inputting radiomic features extracted from tumours and the model getting better at classifying the tumours into their classes, such as hepatocellular carcinoma (HCC) or intrahepatic cholangiocarcinoma (ICC), as it updates its parameters to minimise the error between its output prediction and the ground truth. In the case of unsupervised models, the model updates its parameters to be able to separate input data into a predefined number of classes, without knowledge of what those classes may be. In the above example, you would input the radiomic features from different tumours and ask the model to output two distinct classes for HCC and ICC, without explicitly giving the model information about which tumour corresponds to which class. During training you monitor the success at a desired task and stop training once the model performance meets some predefined criteria, such as the model no longer improving even when new data is added. If the model is accurate, i.e., it rivals human performance, it can then be used in a research or clinical setting.
LeCun et al[25] defines DL methods as ML methods with multiple levels of features, obtained by composing simple but non-linear modules that each transform the feature at one level (starting with the raw input) into a feature at a higher, slightly more abstract level. In essence, this means that DL algorithms calculate successive features based on the features or data that you provide it. The most common way of doing this in MR images is to employ convolutional layers. A convolution, in terms of images, is a filter of a defined size, which when applied to a portion of an MR image of the liver equal to the size of the filter, outputs a singular value, as shown in Figure 1. When applied sequentially to a whole scan, it outputs an image containing these values, known as a feature map. Additional convolutional layers are applied to these feature maps, to produce feature maps with deeper information. When these layers are

Hill CE et al. AI for liver MRI
WJG https://www.wjgnet.com 6828 October 28, 2021 Volume 27 Issue 40
Table 1 Applications of artificial intelligence segmentation methods to liver magnetic resonance imaging
Ref. Task Method MR image DICE
Mole et al[37], 2020 Segment liver from T1 mapping technique to aid surgical planning
3D U-Net T1 map 0.97
Winther et al[27], 2020 Segment liver from Gd-EOB-DTPA-enhanced MRI for volume calculations
3D U-Net Gadoxetic acid-enhanced MRI 0.96 ± 1.9
Liu et al[30], 2020 Segment liver for automated liver iron quantification
2D U-Net T2* map 0.86 ± 0.01
T1-w: 0.95 ± 0.03Wang et al[43], 2019 Segment Liver across multiple imaging modalities and techniques
2D U-Net T1- and T2*- weighted
T2-w: 0.92 ± 0.05
Cunha et al[46], 2020 Segment liver to classify if adequate contrast uptake has occurred in contrast enhanced scans
2D U-Net Pre- and post-contrast T1- weighted, and T2- weighted
Not reported
Chen et al[31], 2020 Segment multiple organs in abdominal scans, to aid radiotherapy planning
2D Dense U-Net T1-weighted Liver: 0.96 ± 0.009
Liver: 0.91 ± 0.01Bousabarah et al[36], 2020
Segment and delineate HCCs 2D U-Net Gadoxetic acid-enhanced MRI
Tumour: 0.68 ± 0.03
Ivashchenko et al[41], 2019
Segment liver, vasculature and biliary tree 4D k-mean clustering Gadoxetic acid-enhanced MRI Liver: 0.95 ± 0.01
Irving et al[44], 2017 Segment liver with vessel exclusion to assist in liver assessment
2D U-Net T1 map 0.95
Yang et al[45], 2019 Segment liver across multiple domains via domain transfer
Cycle GAN and 2D U-Net
Gadoxetic acid-enhanced MRI 0.891 ± 0.040
Liver: 0.87Christ et al[39], 2017 Segment liver and tumours within, in CT and MRI
Two sequential 2D U-Nets
Diffusion-weighted
Tumour: 0.697
Fu et al[35], 2018 Segment multiple organs in abdominal scans, to aid radiotherapy planning
Three Dense CNNs T2/T1-weighted Liver: 0.953 ± 0.007
Valindria et al[33], 2018
Segment multiple organs in multi-modal (MR,CT) scans
ResNet Encoder Decoder
T2-weighted Liver: 0.914
Masoumi et al[42], 2012
Segment the liver Watershed (non-AI) + ANN
Abdominal MRI 0.94 (IoU not DICE)
Jansen et al[40], 2019 Segment liver and metastases CNN DCE-MR and diffusion-weighted Liver: 0.95
MRI: Magnetic resonance imaging; CT: Computed tomography; DCE-MR: Dynamic contrast enhanced magnetic resonance; HCC: Hepatocellular carcinoma; GAN: Generative adversarial network; CNN: Convolutional neural network; ANN: Artificial neural network; IoU: Intersect over union.
stacked together, a convolutional neural network (CNN) is generated. The final convolutional layer generates the desired size of your output, anything from a single value to classify the disease state, or a new image which could be a segmentation map of the liver. Like traditional machine learning, the accuracy of the output compared to a gold standard measurement, is maximised during training.
SEGMENTATIONSegmentation describes the process by which anatomical structures can be selected from a radiological image. Anatomical structures can be organs like the liver, tissues like subcutaneous and visceral fat or malignant deposits. Metrics resulting from the segmentation process and segmentation maps can help with estimation of volumes (e.g., liver volume), important metabolic ratios (ratio of visceral to subcutaneous fat) and provide important anatomical information that can help in the radiotherapy and surgical planning for the treatment of malignant tumours[26,27]. Segmentation can therefore play an important role in many aspects of clinical decision making. Segmentation maps are also often used in quantitative techniques, such as T1 mapping and MRE, to give accurate measurements across the whole liver and not just in a region of interest[26,28].

Hill CE et al. AI for liver MRI
WJG https://www.wjgnet.com 6829 October 28, 2021 Volume 27 Issue 40
Table 2 Applications of artificial intelligence classification methods using liver magnetic resonance imaging
Ref. Task Method MR image Accuracy Sensitivity Specificity AUROC
F1-4: 0.69 F1-4: 0.64 F1-4: 0.90 F1-4: 0.77
F2-4: 0.85 F2-4: 0.82 F2-4: 0.93 F2-4: 0.91
F3-4: 0.85 F3-4: 0.87 F3-4: 0.83 F3-4: 0.90
Hectors et al[60], 2020
Stage liver fibrosis VGG16 CNN Gadoxetic acid-enhanced MRI
F4: 0.78 F4: 0.73 F4: 0.81 F4: 0.85
cHCC-CC vs non-cHCC-CC: 0.77
cHCC-CC vs non-cHCC-CC: 0.65
cHCC-CC vs non-cHCC-CC: 0.81
cHCC-CC vs non-cHCC-CC: 0.77
Liu et al[55], 2021
Classify cHCC-CC vs non-cHCC-CC and HCC vs non-HCC
Radiomics + SVM Gadoxetic acid-enhanced MRI
HCC vs non-HCC: -
HCC vs non-HCC: 0.68
HCC vs non-HCC: 0.88
HCC vs non-HCC: 0.79
Wu et al[48], 2020
Classify tumours according to their LI-RADS grade
AlexNet CNN Gadoxetic acid-enhanced MRI
0.9 1 0.835 0.95
Messaoudi et al[50], 2020
Classify tumours into HCC or non-HCC
Patch based CNN Multiphase 3D fast spoiled gradient echo T1
0.9 ? ? ?
Lesion class: 0.919
Lesion class: 0.90
Lesion class: 0.98
Hamm et al[51], 2019
Classify tumours into type and LI-RADS derived classes
CNN Multiphase contrast-enhanced T1-weighted MRI
LI-RADS: 0.943
LI-RADS: 0.92 LI-RADS: 0.97
LI-RADS (HCC): 0.922
Trivizakis et al[54], 2018
Classify tumours into primary or metastatic
3D CNN + SVM Diffusion weighted MRI
0.83 0.93 0.67 0.8
He et al[65], 2019
Correctly predict liver stiffness using clinical and radiomic data
Radiomics + SVM T2-weighted MRI 0.818 0.722 0.87 0.84
T1-w: 0.82 T1-w: 0.857 Schawkat et al[61], 2020
Stage liver fibrosis into low-stage (F0-2) and high-stage (F3-4)
Radiomics + SVM T1-weighted MRI, T2-weighted MRI
T2-w: 0.619
? ?
T2-w: 0.57
Observer 1: 0.815
Observer 1: 0.793
Observer 1: 0.889
Observer 1: 0.90
Lewis et al[56], 2019
Distinguish HCC from other primary cancers
Radiomics + Binary logistic regression
Diffusion weighted MRI
Observer 2: 0.80
Observer 2: 0.862
Observer 2: 0.778
Observer 2: 0.89
Wu et al[57], 2019
Classify tumours into HCC and HH
Radiomics + logistic regression
T2-weighted MRI, Diffusion weighted MRI, T1-weighted GRE in phase and out of phase MRI
? 0.822 0.714 0.89
HCC vs MT: 0.92
HCC vs MT: 1.0
HCC vs MT: 0.84
HCC vs MT: 0.95
HCC vs HH: 0.9
HCC vs HH: 0.96
HCC vs HH: 0.84
HCC vs HH: 0.95
Oyama et al[58], 2019
Classification of hepatic tumours into HCC, HH and MT
Radiomics + logistic regression/XGBoost
T1-weighted MRI
MT vs HH: 0.73
MT vs HH: 0.72
MT vs HH: 0.74
MT vs HH: 0.75
Wu et al[59], 2019
Predict pre-operative HCC grade
Combined clinical data and Radiomics + logistic regression
T2/T1-weighted 0.761 0.85 0.65 0.8
Chen et al[69], 2019
Predict pre-treatment immunscore in HCC
Combined clinical data and radiomics + multi-vote decision trees
Gadoxetic acid-enhanced MRI
0.842 0.846 0.841 0.934
F2-4: 0.803 F2-4: 0.814 F2-4: 0.784 F2-4: 0.91
F3-4: 0.803 F3-4: 0.789 F3-4: 0.820 F3-4: 0.88
Park et al[63], 2019
Stage liver fibrosis Radiomics + logistic regression
Gadoxetic acid-enhanced MRI
F4: 0.813 F4: 0.921 F4: 0.754 F4: 0.87
Zhao et al[67], 2019
Predict early reoccurrence of IMCC
Combined clinical data and radiomics + logistic regression
T2-weighted MRI, gadoxetic acid-enhanced MRI
0.872 0.938 0.839 0.949

Hill CE et al. AI for liver MRI
WJG https://www.wjgnet.com 6830 October 28, 2021 Volume 27 Issue 40
Arterial phase: 0.83
Arterial phase: 0.62
Arterial phase: 0.73
Reimer et al[68], 2018
Predict therapy response to transarterial radioembolization
Radiomics + logistic regression
Gadoxetic acid-enhanced MRI
?
Venous phase: 0.71
Venous phase: 0.85
Venous phase: 0.76
HCC: 0.957 HCC: 0.904 HCC: 0.951
Metastatic: 0.946
Metastatic: 1.0 Metastatic: 0.985
Zhen et al[53], 2020
Classify liver tumours into benign , HCC, metastatic or other primary malignancy
CNN with clinical input T2, diffusion, Pre- contrast T1, late arterial, portal venous, and equilibrium phase
0.919
Other primary: 0.733
Other primary: 0.964
Other primary: 0.989
F4 vs F3-0: 0.75
F4 vs F3-0: 0.76
F4 vs F3-0: 0.76
F4 vs F3-0: 0.84
F4-3 vs F2-0: 0.77
F4-3 vs F2-0: 0.78
F4-3 vs F2-0: 0.74
F4-3 vs F2-0: 0.84
Yasaka et al[62], 2017
Stage liver fibrosis CNN Gadoxetic acid-enhanced MRI
F4-2 vs F1-0: 0.80
F4-2 vs F1-0: 0.84
F4-2 vs F1-0: 0.65
F4-2 vs F1-0: 0.84
Kim et al[70], 2019
Predict postoperative early and late recurrence of single HCC
Radiomics + random forests
Gadoxetic acid-enhanced MRI
Harrel C-statistic: 0.716 in combined radiomic and clinicopathologic model, no significant difference to clinicopathologic model (0.696)
Kim et al[52], 2020
Detect HCC CNN Gadoxetic acid-enhanced MRI
0.937 0.94 0.99 0.97
Liu et al[71], 2020
Identify clinically significant portal hypertension
CNN + logistic regression
? ? 0.929 0.846 0.94
MRI: Magnetic resonance imaging; GRE: Gradient recalled echo; LI-RADS: Liver Imaging Reporting and Data System; HCC: Hepatocellular carcinoma; HH: Hepatic hemangioma; MT: Metastatic tumour; CC: Cholangiocarcinoma; cHCC-CC: Combined hepatocellular cholangiocarcinoma; IMCC: Intrahepatic mass-forming cholangiocarcinoma; CNN: Convolutional neural network; SVM: Support vector machine; AUROC: Area under the receiver operating characteristic curve.
Figure 1 A deep convolutional network. An example deep learning segmentation network, the U-Net. A series of convolutions, combined with downsampling and upsampling to learn feature maps at different scales, are used to output a segmentation map. An example of a convolution, and feature map are shown on the right.
The segmentation processes are usually carried out manually using software tools for this purpose. However, these manual processes can be time consuming and inaccurate, and the introduction of automated AI methods can reliably supersede these methods, improving output and reliability by performing close to the level of expert radiologists in a much shorter time[28]. For example, automatic segmentation to measure liver fat, adipose tissue depots and muscle volume and fat content led to an improved risk stratification for the presence of type 2 diabetes and cardiovascular disease compared to discrete categorisations of body composition in a large population study (n = 10000)[29]. Such a study would not be possible without automatic segmentation to measure the parameters of interest.
When applying AI algorithms to segmentation tasks, the aim is to highlight every voxel in an MR image that applies to a certain class. For example, this could be that the voxel contains the liver, a tumour, or neither. Though different algorithms have different approaches to achieving this goal, they are all evaluated by their ability to

Hill CE et al. AI for liver MRI
WJG https://www.wjgnet.com 6831 October 28, 2021 Volume 27 Issue 40
correctly identify which voxel of the MR image corresponds to which class. One common metric for evaluating this is the DICE score, which is defined as follows (Formula 1):
Where TP is the number of true positives, where the voxel has been correctly classified, FP the false positives, where the voxel has been incorrectly given a class instead of no class, and FN the false negatives, where a voxel which belongs to a desired class has been labelled as belonging to no class. If the DICE score is high, then the segmentation map is accurate. Additional metrics of performance do exist, such as intersect over union (IoU), where the closer to 1 the result is, the better the segmentation.
Though non-deep learning AI segmentation methods do exist, the majority of papers presented here are based on deep learning methods due to the successful application of these methods in natural image space, an example being the U-Net, as shown in Figure 1[30]. Though other methods are used, the U-Net is the most common due to its proven performance in segmentation maps, in part down to its ability to learn features at different scales due to the downsampling, and inclusion of previous feature maps in the concatenation steps.
Segmentation for surgical and radiotherapy planningSegmentation maps are crucial in surgical planning, especially in giving the clinician information of the size and location of tumours, to allow for safe and successful surgery. They are also useful in radiotherapy planning, allowing the therapy to be performed such that there is minimal risk to organs and maximal damage to tumours.
Chen et al[31] and Huang et al[32] implemented a 2D U-Net, with densely connected blocks, to segment up to 10 organs at risk in radiotherapy. They achieved a DICE coefficient of 0.963 ± 0.0010 in the liver with high metrics in most of all the other organs studied. Likewise, Valindria et al[33] and He et al[34] trained a 2D residual network to segment out multiple organs in CT or MR scans which can similarly be used for radiotherapy planning. The use of both modalities increased performance in both their segmentation maps, achieving a DICE score of 0.914 in the liver, when compared to training with just one modality. This is still less than that achieved by Chen et al[31], even with the additional information from the CT scans used in the Valindria study. This may be due to the use of T2-weighted MR images being used by Valindria et al[33] as opposed to T1 -weighted. Fu et al[35] used a trio of CNNs to segment multiple organs in images acquired on a dual radiotherapy MR machine, in order to expediate the MRI guided adaptive radiotherapy. They achieved a DICE score of 0.953 ± 0.007 in the liver. The segmentations took approximately 5 s to produce and as such could not be used yet in a real-time radiotherapy setting, however, the method does still alleviate radiologist workflow, where they only quality control the output which takes a quarter of the time of a full manual segmentation. Bousabarah et al[36] automate the segmentation of the liver and classification of tumours within into the Liver Imaging Reporting and Data System (LI-RADS) classes. They used a 2D U-Net to segment contrast enhanced MR images into two segmentation maps, one of the liver and one of any tumours within. The proposed tumour segmentation then undergoes post-processing by using a random forest classifier using radiomic features extracted from the proposed region. The combined model detected 75% of lesions in the test data, when there was a DICE score of 0.2 or greater between the detected and actual tumour. The output could not only be used in surgery and radiotherapy planning, but also be used in conjunction with a radiologist’s assessment to improve detection accuracy. They achieved a similar performance as Valindria et al[33], but with the harder task of segmenting out bodies within the liver itself, which will likely decrease performance in liver segmentation. Mole et al[37] and Owler et al[38] used a 3D U-Net to segment out the liver in a pipeline for surgical planning. They segmented the liver in a T1-mapping acquisition with a DICE score of 0.970. The metrics calculated using this segmentation map were used to predict post-operative liver function with a high degree of accuracy. This shows that the method could be used in determining whether a patient should go for surgery or whether other treatments should be considered. Christ et al[39] implemented two 2D U-Nets to segment out the liver and metastases within the liver, in both CT and MRI images, which could be used both for radiotherapy planning and measuring response to therapy. The first U-Net segments out the liver region, which is used to process the input MR image. The second U-Net segments out any tumours within this identified region. They achieved a DICE score of 0.87 when applied to diffusion weighted MRI images. Jansen et al[40] utilised

Hill CE et al. AI for liver MRI
WJG https://www.wjgnet.com 6832 October 28, 2021 Volume 27 Issue 40
information from both dynamic contrast enhanced MRI (DCE-MRI) and DW-MRI to segment out the liver and metastases within, achieving a DICE score of 0.95 in the liver, and an accuracy of 96% in detecting the liver metastases.
Non-CNN based methods have also been used to segment out the liver in multi-phase contrast enhanced MRI[41]. Ivashchenko et al[41] used a K-means clustering algorithm on multiple phases of the contrast enhancement to generate 8 initial compartments. They then select a best candidate and apply multiple post-processing non-AI methods to generate a full segmentation of the liver, achieving a DICE score of 0.949 ± 1.2. This method could also be used to segment out the vessels and biliary tree, allowing safer execution of complicated liver resections. Masoumi et al[42] also used a non -CNN based method using both traditional non-AI methods, the watershed algorithm, and an artificial neural network (ANN) to automate the traditional algorithm. Six ANNs were trained to estimate 6 chosen features from the image, such as the ratio of the maximum and minimum diameter of the liver. These also extracted from the watershed algorithm and the error between the two feature sets calculated. This error is then iteratively used to update the watershed algorithm parameters until there is no longer a reduction in the error between the two feature sets. They achieved a mean Intersect over Union (IoU) of 0.94.
Segmentation of the liver when applied to surgical planning is, in most studies covered, exceeding a DICE score of 0.9. Variations in this value for the liver will likely be down to imaging protocol used (T1-weighted, T2-weighted, etc.), the patient group of interest, and the target outcome, in this case whether you are optimising to segment out the liver or whether it is a subtask among others, e.g., segmenting out metastases or multiple over organs.
Segmentation for liver function assessment Another application area for AI segmentation methods is liver function assessment. A full liver segmentation provides a more comprehensive estimation of liver function compared to region of interest placement. To get an overview of whole liver quantitative measures, radiologists must take the time to create these segmentations, that can easily be automated. Winther et al[27] showed that it is possible to segment out Gd-EOB-DTPA-enhanced liver MR images to calculate liver volumetry to assess hepatic functional reserve. They trained a 3D U-Net using the liver images of 100 patients, achieving a DICE score of 0.967 ± 0.019, when compared to two experts who had a corresponding DICE score of 0.952 ± 0.028. The segmentation time using a 3D U-Net took on average 60 s to generate a 3D segmentation map, compared to 10 min for an expert. Another study seeks to automate quantification of liver iron using a liver segmentation[30]. Liu et al[30] used a 2D U-Net to output a segmentation map for a T2* quantitative map, generated using 16 slices from the T2* relaxometry method used to calculate it. They achieved a DICE score of 0.86 ± 0.01 with the manual segment-ations and subsequently a strong correlation of the liver iron in mg/g calculated using the automated and manual methods. This lower DICE score in T2*-weighted images correlates with the lower DICE score seen in the Valindria et al[33] study above, suggesting that it is harder for these networks to segment the liver in T2* weighted images, or that it is harder for humans to segment out the liver accurately in T2*-weighted images leading to a larger variation in your training dataset. Wang et al[43] implemented a 2D U-Net to segment the liver from abdominal MRI and CT scans. They achieved a DICE score of 0.95 in 100 T1-weighted MRI scans, and 0.92 in T2*-weighted MRI scans. They used the segmentations to automate the calculation of liver volumetry and hepatic PDFF, both of which had good agreement with manual segmentation derived values. Liver function assessment can also be performed during scanning. Irving et al[44], used a 2D U-Net to segment out the liver with exclusion of internal vasculature, so that quantitative liver T1 scores could be calculated. They achieved a DICE score of 0.95. The above four studies, all showed to have liver function assessment measurements that correlate with the current methods. Though, most of the measurements derived from the automated segmentations are usually derived from manual segmentations and so if the segmentation is accurate, then it should be expected that the output measurement would correlate highly. Yang et al[45] also used a 2D U-Net to generate segmentation maps of the liver, however by using a process known as disentangled representation, they were able to transform MR and CT images into a shared image space which contains only shared content. On these images, they achieved a DICE score or 0.891 ± 0.040. This segmentation network could be applied to multiple imaging modalities, which could be useful in clinical uptake as the end user won’t have to carefully choose which model they apply. However, if accuracy of segmentation is the most important outcome, then many of the papers

Hill CE et al. AI for liver MRI
WJG https://www.wjgnet.com 6833 October 28, 2021 Volume 27 Issue 40
covered here have shown better performance when seeking to maximise the segmentation accuracy in a single use case. Cunha et al[46] used AI methods to determine the optimal point for hepatobiliary phase acquisition in contrast enhanced MRI, thus avoiding overwaiting. They used a 2D U-Net to segment out a liver mask, which is applied to the original image. This masked liver is then passed to a classi-fication CNN, which outputs a contrast uptake quality ranging from 0, minimal uptake, to 1, adequate uptake. They achieve an area under the receiver operating characteristic (AUROC) curve of 0.952 in the test set, indicating good classification accuracy. By applying their model in situ, they could reduce examination time in 48% of patients, by detecting when optimal uptake of contrast has occurred.
CLASSIFICATIONClassification or stratification is an important step in any disease treatment in healthcare. Without a proper classification of the disease causing symptoms, it is not possible to implement the correct medical response. Unfortunately, some diseases are hard to differentiate, even by experienced healthcare professionals. Providing additional support in this task could help ensure that patients are stratified correctly and swiftly. AI algorithms have been shown to deal well with image-to-class-based tasks, as demonstrated in applications to the ImageNet dataset[47].
AI classification algorithms are almost identical in their approach as segmentation networks. Whereas segmentation networks classify each voxel in an image, a classi-fication seeks to classify all voxel in an image into a single class. They are evaluated against their ability to do this, by use of metrics such as accuracy, the percentage true positives and true negatives, sensitivity, the rate of true positives, specificity, the true negative rate, and by using receiver operating characteristic (ROC) curves, the true positive rate vs the false positive rate (1 – true negative rate/specificity), as shown in Figure 2.
Tumour detection and classificationTumour classification is a useful tool in staging the severity of the cancer. The ability to differentiate between the various types of liver tumours would give the ability to medical professionals to implement an optimised treatment plan. Wu et al[48] used the AlexNet network architecture to classify cropped HCC tumours into either LR-3 (intermediate probability for HCC) or the combined class LR-4/LR-5 (likely/definite HCC respectively)[48,49]. They achieved a 90% accuracy in classification and an AUROC 0.95 with reference to an expert radiologist. Messaoudi et al[50] achieved similar accuracy when applying a CNN to classify HCC tumours from liver dynamic contrast enhanced (DCE) MRI sequences with an accuracy of 90% when classifying between HCC and non-HCC. Hamm et al[51] also implemented a CNN for the classi-fication of tumours into both the LI-RADS grading system and the lesion class. Their input to the network was the three phases, arterial, venous and equilibrium phases, of the contrast enhanced scans. They achieved an accuracy of 91.9% when classifying into the distinct lesion classes, and an accuracy of 94.3% when classifying into the LI-RADS score. This was both more accurate and faster (1.0ms runtime of the model) than two radiologists on the same dataset. When comparing to the study by Wu et al[48], though they both sought to differentiate cases using the LI-RADS system, Hamm et al[51] differentiated into more classes (LR-1,LR-4,LR-M) instead of just between LR-3 and LR-4/5. Hamm et al[51] outperformed the performance of Wu et al[48], however it is likely that it is harder to differentiate between LR-3 and 4/5, so they are not directly comparable. Ideally a neural network would be able to differentiate between all LI-RADS classes. Kim et al[52] used a CNN to detect presence of HCC in liver MRI scans. By simplifying the problem into detection without segmentation, they get a high accuracy of 93.7% in detecting liver HCC lesions. This was comparable to the performance of a junior radiologist with an AUROC of 0.9 compared to 0.893, though was outperformed by an expert radiologist who had an AUROC of 0.957. Zhen et al[53] used a CNN to classify tumours into multiple classes of benign, primary malignant and metastatic tumours using a combination of MR, clinical data and laboratory results. When using all the data together they achieved their best model performance with AUROCs of 0.951, 0.985 and 0.989 when classifying HCC, metastatic malignancy and primary malignancy (excluding HCC) respectively. Trivizakis et al[54] trained both a 2D and 3D CNN to classify liver tumours into primary and metastatic classes. The 2D network took the axial slices as input, whereas the 3D network took the abdominal volume. Unlike the papers above, they then used the features learnt

Hill CE et al. AI for liver MRI
WJG https://www.wjgnet.com 6834 October 28, 2021 Volume 27 Issue 40
Figure 2 Classification algorithms and their performance metrics. Artificial intelligence classification algorithms use the combination of data provided to them and output a class probability. They are often evaluated according to the metrics on the right. MR: Magnetic resonance; AUROC: Area under the receiver operating characteristic curve.
during the training of these networks to train a support vector machine (SVM), a non-CNN based AI approach. They achieved an accuracy of 83% in the SVM trained on the features from the 3D network, and 67.4% in the SVM trained on the features from the 2D network. When not using the SVM as an additional step, they achieved an accuracy of 85.5% in the 3D network, with unreported accuracy in the 2D network though they conclude that the 3D model outperforms this. It shows that the inclusion of additional data, in this case more slices as a volume, often leads to an increased performance in the network performance. Though that does not always hold true, as in the study by Hamm et al[51] where the inclusion of all phases of a gadoxetic acid-enhanced MRI scan produced worse results that selected phases. It is important that the addition of data is performed with care, such that you are not adding more noise to the data.
Radiomic-based approaches have also been shown to be successful in classifying detected tumours into potential classes. Liu et al[55] extract radiomic features from tumours manually segmented from Gd-EOB-DTPA-enhanced liver MR images. These features are input into two support vector machines (SVM), with the first classifying into combined hepatocellular cholangiocarcinoma (cHCC-CC) or non-cHCC-CC, and the second classifying into HCC and non-HCC. They achieved a mean AUROC of 0.77 ± 0.19 and 0.81 ± 0.13 for the first and second methods respectively. Conversely, radiologists misdiagnosed cHCC-CC as HCC or CC in 69% of cases. With the model accuracy higher than that of the radiologists, having the model available as an additional tool for radiologists would help improve the diagnostic accuracy. Lewis et al[56] used extracted radiomic features from diffusion weighted imaging (DWI) MR, combined with LI-RADS category, to classify whether a tumour is HCC or another primary liver cancer such as intrahepatic cholangiocarcinoma (ICC) and combined HCC-ICC. Using binary logistic regression, they achieved an AUROC of 0.9 and 0.89 when compared to two observers. This is comparable in performance to similar LI-RADS based studies above, but without the expertise an training time needed for a large neural network. Another radiomic based study, by Wu et al[57], similarly extracted radiomic features from lesions detected in T2-weighted and DWI images. They achieved a similar AUROC score of 0.89, when compared to Lewis et al[56], by also using logistic regression on their extracted features. They additionally showed that their model outperformed a junior radiologist with 2 years’ experience and rivalled a senior radiographer with 10 years’ experience. Other radiomic based studies have shown similar performance, when applied to tumour classification, when using a variety of MR sequences and often the addition of additional non-MR features such as BMI and medical records[58,59].
Liver disease staging and responseLiver fibrosis staging is used clinically in predicting the prognosis of liver diseases and helps in determining the appropriate action to take in treatment[60]. Several approaches of AI applications on liver MR have been described for the assessment of liver fibrosis. Hectors et al[60], used a VGG16 network to predict the fibrosis stage from F1-4 using Gd-EOB-DTPA-enhanced liver MR images. The network, which was

Hill CE et al. AI for liver MRI
WJG https://www.wjgnet.com 6835 October 28, 2021 Volume 27 Issue 40
pretrained on image net with only the last few layers being trainable, predicted a class from F1-F4, F2-F4, F3-F4 and F4, achieving an AUROC of 0.77, 0.91, 0.91 and 0.85 respectively, showing good diagnostic ability. This was comparable to the use of MRE with no significant difference between MRE and the use of deep learning methods for fibrosis prediction. The diagnostic performance of combined MRE and AI classification of contrast enhanced MRI was better overall at 0.87, 0.93, 0.95 and 0.87 for F1-F4, F2-F4, F3-F4, and F4 respectively, but was not significantly better than MRE alone. Schawkat et al[61] also sought to quantify the liver fibrosis from T1- or T2-weighted MR images. To do this, they did an initial texture analysis, to extract handmade features from the data. These handmade features underwent some pre-processing, then were input into an SVM which was trained to output whether the patient had a high fibrosis score, 3-4 on a standardized scale using multiple different scoring approaches, or low fibrosis score, 0-2. They achieved an AUROC of 0.82 for T1 and an AUROC of 0.57 for T2. However, when applied to MRE they achieved an AUROC of 0.92. This shows that machine learning methods are only as good as the data that is input. In the above two cases, MRE contains the information needed to output an accurate classification. However, MRE is often expensive and limited to highly funded MRI centres, therefore it is still important that techniques that don’t use MRE are explored and developed while uptake of MRE is limited. The two studies above have shown in this case that deep learning methods are outperforming more traditional methods, however the use of two different scanning sequences doesn’t allow for a direct comparison, as any difference in performance could be down to the data provided. Yasaka et al[62] also used a CNN with contrast enhanced MR images and clinical information as input, to stage liver fibrosis. They achieved AUROCs of 0.84, 0.84 and 0.85 for classifying into cirrhosis, advanced fibrosis and substantial fibrosis respectively. They were unable to differentiate fibrosis scores as well as Hectors et al[60] with similar methods, likely due to the Hectors study pre-training on Image Net data and so compensating for the small datasets that these study have to train on. Radiomics combined with a logistic regression model has also been used to classify into liver fibrosis scores. Park et al[63] extracted radiomic features from Gd-EOB-DTPA-enhanced liver MR images, and used these to classify into F0 to F4 fibrosis stages, achieving an accuracy of 80.3% in classifying F2-F4, 80.3% in F3-F4 and 81.3% in F4. Gallego-Duran et al[64] used radiomics approaches, combined with a logistic regression classifier, on non-contrast enhanced MRI scans to define the NASH-MRI and fibro-MRI score that could diagnose non-alcoholic steatohepatitis and advanced fibrosis with an AUROC of 0.83 and 0.85 respectively. He et al[65] utilised an SVM to classify patient groups into MR elastography liver stiffness measurement of ≤ 3 kPa and ≥ 3 kPa as surrogates of low and high fibrosis burden respectively, They combine radiomic features derived from T2-weighted images, with clinical data such as blood scores, BMI and their medical history. The SVM achieves an accuracy of 81.8% with an AUROC of 0.84.
Portal hypertension is one of the complications of liver fibrosis and develops in late stage disease. Portal hypertension is usually assessed by the hepatic vein pressure gradient with a gradient of ≥ 10 mmHg signifying “clinically significant portal hypertension (CSPH)” which is associated with a higher risk of adverse outcomes. AI techniques to identify CSPH have been applied to CT and MR images with some promising results. Liu et al[66], used a CNN to predict the presence of CSPH in both the liver and the spleen, which were then input into a logistic regression model to output an overall prediction. They achieved an AUROC of 0.940 in their test set when classifying between CSPH and non-CSPH.
Zhao et al[67] extracted radiomics from four MRI acquisitions (fat suppressed T2-weighted images, arterial phase, portal venous phase and delayed phase of contrast enhanced imaging) to predict early recurrence of intrahepatic mass-forming cholan-giocarcinoma (IMCC). This was combined with biomarkers from histology studies, and input into a logistic regression model, to achieve an AUROC of 0.949 in predicting early recurrence of IMCC. This would assist in personalising a treatment plan for each patient. Reimer et al[68] utilised a radiomics approach combined with logistic regression, to predict the response to therapy in patients with liver metastases. They classified patients into two classes of stable disease and progressive disease based on features extracted from dynamic contrast enhanced MR images taken at a mean of 2.2 d after transarterial radioembolization. They achieved an AUROC of 0.73 and 0.76 in the radiomics extracted from the arterial and venous phase respectively. Chen et al[69] used a combination of clinical data and radiomics with decision trees to predict the immunoscore of HCC pre-treatment and therefore its response to therapy. Their best model, when using all the clinical and radiomics data, achieved and AUROC of 0.926 when classifying into high (≥ 3) and low (≤ 2) immunoscores. Finally Kim et al[70] utilise random forests with radiomics to predict the postoperative reoccurrence time of

Hill CE et al. AI for liver MRI
WJG https://www.wjgnet.com 6836 October 28, 2021 Volume 27 Issue 40
single HCC. Additionally, they combine their radiomics model with a clinicopath-ologic model. When evaluating their model using Harrell c-index, a measure where higher than 0.5 has predictive value, their combined model was 0.716. This was better than the current clinicopathologic model (0.696), however the difference was not significant. As Kim et al[70] and Zhao et al[67] use different performance metrics, it is hard to compare their ability in tumour reoccurrence, regardless of each study focusing on different tumour types. It is important that these studies, where possible, quote similar metrics so that future researchers can determine which one is best for their task.
IMAGE SYNTHESISIt is often the case that, when training an AI model, we are limited by the data that we have available. This is also true in healthcare settings when making clinical decisions. The simplest way to rectify this lack of data is to find more, however, this is not always possible due to many reasons both medical and logistical. The field of image synthesis or domain transfer seeks to address this. These algorithms can generate synthetic MR data based on information they are provided with, allowing this data to be either used in a setting where you might not have access to a particular technique, e.g., hospitals without an MR scanner, or used to improve AI algorithms by giving it more data to train on. A common group of networks for image synthesis are conditional generative adversarial networks (cGAN). A cGAN combines a generator network, e.g., a U-Net for generating the new MR image, and a discriminator network, a classification network to distinguish between real ground truth MR image and fake generated image. These networks compete against each other. The generator seeks to create an output that the discriminator believes is anatomically plausible, and the discriminator seeks to detect the output of the generator. This adversarial training often leads to improved results in segmentation or domain transfer tasks.
Liu et al[71] developed a cGAN to generate CT images from T1-weighted MR images, also to aid clinicians in radiotherapy treatment planning. They achieved a low mean absolute error of 72.87 HU in their generated CT scans. Jiang et al[72] used a cGAN to perform the opposite transformation of synthesising MR images from CT images in order to improve segmentation maps of organs at risk in MR for radiotherapy planning. They achieve a DICE score of 0.91, 0.92 in the liver when applied to real non-synthesised T2-weighted images and T1-weighted images respectively.
GANs were also implemented in Zhao et al[73] study to synthesise contrast enhanced MR images from non-contrast enhanced images, in order to improve tumour detection. They combined this with an additional tumour detection CNN which was applied to synthetic images in order to help improve the quality of the synthesised image, and the detection of tumours. The combined synthesis and detection networks achieved a classification accuracy of 91.3% when classifying between healthy and hemangioma present, 88.4% when classifying between healthy and HCC present and 89.2% when classifying between hemangioma and HCC. This combination of networks not only allows for accurate detection of tumours, but also supersedes the need for a contrast enhanced scan, while still giving the radiographer a proposed contrast scan to aid in their diagnosis.
ARTEFACT DETECTION Motion detection and removalArtefacts can occur in many forms in MRI scans, from patient induced breathing artefacts to scanner related field susceptibility artefacts. AI based methods, as shown with classification and image synthesis, have the potential to detect these artefacts and generate artefact free images which can then be used in a clinical setting. Motion is the dominating artefact present in many MR techniques. Breath holding is necessary in most scanning protocols to reduce movement artefacts. New scanning sequences are specifically designed to be shorter (i.e., shorter breath-holds) and produce the same output in order to reduce these problems[74,75]. However, motion still occurs even when these steps are implemented. AI offers us the opportunity to detect, so that re-acquisition of the scans can occur; remove, so that a motion degraded scan can be used clinically; and predict, so that free-breathing methods can be used with optimal

Hill CE et al. AI for liver MRI
WJG https://www.wjgnet.com 6837 October 28, 2021 Volume 27 Issue 40
acquisition.Romaguera et al[76] have developed a spatial transformer network that takes an
image sequence and predicts the next image in the sequence with an error in vessel localisation of 0.45 ± 0.55 mm when 320 ms has passed. This rises to 0.77 ± 1.36 mm at 1.6 s, but still allows the accurate prediction of frames in the future based on what has been acquired so far. This would be useful in predicting when to acquire a scan so that any data is motion free, and can also be useful in the MR-Linac systems so that radiotherapy is only applied to any tumours within the liver, reducing damage to the organs. Esses et al[77] used a CNN, similar to those presented in the classification section, to classify artefact degraded images into a quality score of diagnostic to non-diagnostic. They achieve a concordance rate with two trained radiographers of 79% and 73%. Tamada et al[78] utilise a CNN to reduce motion artefacts caused by respiratory motion in DCE-MRI. They generated simulated motion data from the ground truth data and then trained a network to predict the residual between that and collected ground truth data. They then tested on non-simulated motion degraded data, with radiographers rating on a scale of no artefact (0) to non-diagnostic (5). The output of the network was better by a mean score of 0.37 and 0.35 when rated by two radiologists. Kromrey et al[79] utilised the same CNN to reduce motion artifacts in arterial phase contrast enhanced MRI by 0.56 on average, on a scale of no artifact (0) to severe artifact (4). Küstner et al[80] try both a GAN and a variational autoencoder to remove motion artefacts from both brain and abdominal liver scans. The GAN was able to reduce the presence of motion artefacts by 67% and 65% when evaluated by two experienced radiologists. The same group had also previously used a patch based CNN to predict the amount of motion in a specific region of an image, achieving an accuracy of 72% ± 5% in classifying the images into motion from no motion to strong motion[81]. As many of the above techniques rely on radiologist qualitative assessment, they can be heavily biased by the skill of those doing the check, and as such can’t be compared well as the improvement is highly subjective. More importantly though all studies showed an improvement when comparing before and after, and all the radiologists were suitably blinded. Oh et al[82] used an unsupervised GAN to correct for motion in Gd-EOB-DTPA-enhanced MR images. They did this by down sampling k space in each input image and regenerating the fully sampled image. This would train the network to reconstruct the missing data from what it is given, and so generate data without artefacts if clean data is given. They then apply it to artefact degraded images, achieving an improvement from 3.20 ± 1.28 to 1.95 ± 0.94 on a scale of 1 (no artefacts) to 5 (non-diagnostic) when applied to artefact degraded images. Wang et al[83] used a two-step approach by segmenting the liver from MR scans using a U-Net, then using this to extract patches from the liver which are classified into diagnostic and non-diagnostic. They achieved a DICE of 0.90 ± 0.05 in their liver segmentation, and an AUROC of 0.911 [95% confidence interval (CI): 0.882-0.939, P < 0.05] when classifying. The predictive performance when using patches extracted from the liver was better than trying to directly classify from the whole image (AUROC of 0.802, 95%CI: 0.759-0.846, P < 0.05). Though this final method shows a greater performance when using patches, we believe it is unlikely that each individual patch was classified for whether it was diagnostic or non-diagnostic, therefore this process would fail if applied to artefacts which only have affect a sub region of an image.
IMAGE REGISTRATIONRegistration of two MR images into a shared cartesian space is an important step in allowing comparisons to be made. This could be longitudinal comparisons in a single participant in order to stage disease progression and treatment response, or it could be latitudinal comparisons within a patient cohort for research studies. Additionally, the registration of two different modalities is important when differing but complimentary clinical information is in different scan types such as CT and MR. In all cases, the manual task of registering images can be time consuming and is often composed of rigid body transformations and as such it is hard to compare between two participants of differing dimensions. AI methods can help solve these issues by introducing fast, reliable non-rigid deformation techniques for image registration.
Kuznetsova et al[84] looked into the use of a commercial AI based registration software for the registration of CT and MRI. They assessed the performance of their registration for three different seed points, using the liver contour, using an internal liver structures such as the inferior vena cava (IVC) or portal region (PR), and using
Hill CE et al. AI for liver MRI
WJG https://www.wjgnet.com 6838 October 28, 2021 Volume 27 Issue 40
internal liver structures along with the liver contour. They achieved the highest performance when using just the liver contour, with a DICE score of 0.89 in the liver segmentation and 0.76 in the IVC segmentation when compared between MR and CT segmentations. As they used commercial software, we are not able to comment on the model used, however it does show that these methods have already been developed for those who need them. Fu et al[85] similarly assessed the performance of their bespoke MRI and CT registration CNN by assessing the DICE score between the two segmentations. They achieved a score of 0.93 ± 0.02 in the whole liver segmentation, outperforming the previous study.
CONCLUSIONCurrent challenges and future directionsThough the benefits of AI algorithms in Liver MRI have been displayed above, there are also many obstacles in the way of application in the clinic where they can have an impact. The first and foremost is that of open data, i.e., the access to large publicly-available clinical databanks. Many of the studies above have used internal datasets which are specific to a certain hospital or patient group. Though performing well in their specific setting, they are limited in scope and generalizability due to un-modelled variations across different hospitals. Additionally, these datasets are rather small for the purpose of training ML algorithms which perform better when trained on more data, and will thus benefit from a larger suitable dataset. However, of the large datasets available, such as UKBiobank, most are focused on healthy volunteers and not clinically relevant patient cohorts. This means any AI algorithm trained on these datasets must be applied with care and knowledge of their limitations. By pooling datasets of clinical patients, the AI algorithms will both perform better, due to the increased data to learn from, and be universally applicable, due to the increased variation.
The second challenge will be overcoming scepticism towards AI algorithms. Deep learning algorithms are often termed “black boxes”, due to their lack of interpretability. This is problematic when the model fails, as it is impossible to reason why. Therefore, care must be taken to apply models in their correct setting, i.e., on data that fits within the distribution of that which the model was trained and tested. If interpretability is desired and a-priori knowledge and physical/biological assumptions are to be incorporated in the model, then traditional ML methods should be used, as they allow to select features and focus on ROIs more easily than with DL. Radiomics is an example of this, as you are able to determine how the model you use weighs the importance of each input feature. From this you can start to reason why the model might fail. As with deep learning methods though, when used in conjunction with radiologists, it can be a vital tool in getting the cases which are traditionally missed.
Finally, the third challenge is translating these networks into clinical workflows. The above papers have shown an ability to either speed up or achieve a radiologist level accuracy in many tasks they perform. However, until recently, there was no standard protocol into getting these networks approved for mainstream use. In April 2019, the US Food and Drug Administration published a paper on the proposed regulatory framework for AI/ML based software as a medical device and have since developed new rules and processes for approval of AI assisted software[86]. Since these new rules have been implemented, multiple AI methods have been given approval, but their wide spread use is still limited. Therefore, developing a framework for widespread distribution should be implemented.
If the above challenges can be addressed, the techniques shown in this review and those yet to be invented can positively transform many aspects of medical imaging in years to come.
REFERENCESTenner S, Baillie J, DeWitt J, Vege SS; American College of Gastroenterology. American College of Gastroenterology guideline: management of acute pancreatitis. Am J Gastroenterol 2013; 108: 1400-15; 1416 [PMID: 23896955 DOI: 10.1038/ajg.2013.218]
1
Kasivisvanathan V, Rannikko AS, Borghi M, Panebianco V, Mynderse LA, Vaarala MH, Briganti A, Budäus L, Hellawell G, Hindley RG, Roobol MJ, Eggener S, Ghei M, Villers A, Bladou F, Villeirs GM, Virdi J, Boxler S, Robert G, Singh PB, Venderink W, Hadaschik BA, Ruffion A, Hu JC,
2
Hill CE et al. AI for liver MRI
WJG https://www.wjgnet.com 6839 October 28, 2021 Volume 27 Issue 40
Margolis D, Crouzet S, Klotz L, Taneja SS, Pinto P, Gill I, Allen C, Giganti F, Freeman A, Morris S, Punwani S, Williams NR, Brew-Graves C, Deeks J, Takwoingi Y, Emberton M, Moore CM; PRECISION Study Group Collaborators. MRI-Targeted or Standard Biopsy for Prostate-Cancer Diagnosis. N Engl J Med 2018; 378: 1767-1777 [PMID: 29552975 DOI: 10.1056/nejmoa1801993]Pavlides M, Banerjee R, Tunnicliffe EM, Kelly C, Collier J, Wang LM, Fleming KA, Cobbold JF, Robson MD, Neubauer S, Barnes E. Multiparametric magnetic resonance imaging for the assessment of non-alcoholic fatty liver disease severity. Liver Int 2017; 37: 1065-1073 [PMID: 27778429 DOI: 10.1111/Liv.13284]
3
Loomba R, Cui J, Wolfson T, Haufe W, Hooker J, Szeverenyi N, Ang B, Bhatt A, Wang K, Aryafar H, Behling C, Valasek MA, Lin GY, Gamst A, Brenner DA, Yin M, Glaser KJ, Ehman RL, Sirlin CB. Novel 3D Magnetic Resonance Elastography for the Noninvasive Diagnosis of Advanced Fibrosis in NAFLD: A Prospective Study. Am J Gastroenterol 2016; 111: 986-994 [PMID: 27002798 DOI: 10.1038/ajg.2016.65]
4
St Pierre TG, El-Beshlawy A, Elalfy M, Al Jefri A, Al Zir K, Daar S, Habr D, Kriemler-Krahn U, Taher A. Multicenter validation of spin-density projection-assisted R2-MRI for the noninvasive measurement of liver iron concentration. Magn Reson Med 2014; 71: 2215-2223 [PMID: 23821350 DOI: 10.1002/mrm.24854]
5
Wong VW, Chu WC, Wong GL, Chan RS, Chim AM, Ong A, Yeung DK, Yiu KK, Chu SH, Woo J, Chan FK, Chan HL. Prevalence of non-alcoholic fatty liver disease and advanced fibrosis in Hong Kong Chinese: a population study using proton-magnetic resonance spectroscopy and transient elastography. Gut 2012; 61: 409-415 [PMID: 21846782 DOI: 10.1136/gutjnl-2011-300342]
6
Williams CD, Stengel J, Asike MI, Torres DM, Shaw J, Contreras M, Landt CL, Harrison SA. Prevalence of nonalcoholic fatty liver disease and nonalcoholic steatohepatitis among a largely middle-aged population utilizing ultrasound and liver biopsy: a prospective study. Gastroenterology 2011; 140: 124-131 [PMID: 20858492 DOI: 10.1053/j.gastro.2010.09.038]
7
Lazarus JV, Colombo M, Cortez-Pinto H, Huang TT, Miller V, Ninburg M, Schattenberg JM, Seim L, Wong VWS, Zelber-Sagi S. NAFLD - sounding the alarm on a silent epidemic. Nat Rev Gastroenterol Hepatol 2020; 17: 377-379 [PMID: 32514153 DOI: 10.1038/s41575-020-0315-7]
8
Younossi ZM, Koenig AB, Abdelatif D, Fazel Y, Henry L, Wymer M. Global epidemiology of nonalcoholic fatty liver disease-Meta-analytic assessment of prevalence, incidence, and outcomes. Hepatology 2016; 64: 73-84 [PMID: 26707365 DOI: 10.1002/hep.28431]
9
Romero-Gómez M, Zelber-Sagi S, Trenell M. Treatment of NAFLD with diet, physical activity and exercise. J Hepatol 2017; 67: 829-846 [PMID: 28545937 DOI: 10.1016/j.jhep.2017.05.016]
10
Rahib L, Smith BD, Aizenberg R, Rosenzweig AB, Fleshman JM, Matrisian LM. Projecting cancer incidence and deaths to 2030: the unexpected burden of thyroid, liver, and pancreas cancers in the United States. Cancer Res 2014; 74: 2913-2921 [PMID: 24840647 DOI: 10.1158/0008-5472.CAN-14-0155]
11
Hajdinjak T, Pelzer AE. Re: What Are We Missing? Eur Urol 2018; 73: 637 [PMID: 29273407 DOI: 10.1016/j.eururo.2017.12.006]
12
Sumida Y, Nakajima A, Itoh Y. Limitations of liver biopsy and non-invasive diagnostic tests for the diagnosis of nonalcoholic fatty liver disease/nonalcoholic steatohepatitis. World J Gastroenterol 2014; 20: 475-485 [PMID: 24574716 DOI: 10.3748/wjg.v20.i2.475]
13
Petitclerc L, Sebastiani G, Gilbert G, Cloutier G, Tang A. Liver fibrosis: Review of current imaging and MRI quantification techniques. J Magn Reson Imaging 2017; 45: 1276-1295 [PMID: 27981751 DOI: 10.1002/jmri.25550]
14
Roberts LR, Sirlin CB, Zaiem F, Almasri J, Prokop LJ, Heimbach JK, Murad MH, Mohammed K. Imaging for the diagnosis of hepatocellular carcinoma: A systematic review and meta-analysis. Hepatology 2018; 67: 401-421 [PMID: 28859233 DOI: 10.1002/hep.29487]
15
Sutherland T, Watts J, Ryan M, Galvin A, Temple F, Vuong J, Little AF. Diffusion-weighted MRI for hepatocellular carcinoma screening in chronic liver disease: Direct comparison with ultrasound screening. J Med Imaging Radiat Oncol 2017; 61: 34-39 [PMID: 27558976 DOI: 10.1111/1754-9485.12513]
16
Redmon J, Divvala S, Girshick R, Farhadi A. You only look once: Unified, real-time object detection. Proc IEEE Comput Soc Conf Comput Vis Pattern Recognit 2016; 779-788 [DOI: 10.1109/CVPR.2016.91]
17
Tao A, Sapra K, Catanzaro B. Hierarchical Multi-Scale Attention for Semantic Segmentation. arXiv 2020; 1-11
18
Dolz J, Desrosiers C, Ben Ayed I. 3D fully convolutional networks for subcortical segmentation in MRI: A large-scale study. Neuroimage 2018; 170: 456-470 [PMID: 28450139 DOI: 10.1016/j.neuroimage.2017.04.039]
19
Oktay O, Ferrante E, Kamnitsas K, Heinrich M, Bai W, Caballero J, Cook SA, de Marvao A, Dawes T, O'Regan DP, Kainz B, Glocker B, Rueckert D. Anatomically Constrained Neural Networks (ACNNs): Application to Cardiac Image Enhancement and Segmentation. IEEE Trans Med Imaging 2018; 37: 384-395 [PMID: 28961105 DOI: 10.1109/TMI.2017.2743464]
20
Ko WY, Siontis KC, Attia ZI, Carter RE, Kapa S, Ommen SR, Demuth SJ, Ackerman MJ, Gersh BJ, Arruda-Olson AM, Geske JB, Asirvatham SJ, Lopez-Jimenez F, Nishimura RA, Friedman PA, Noseworthy PA. Detection of Hypertrophic Cardiomyopathy Using a Convolutional Neural Network-Enabled Electrocardiogram. J Am Coll Cardiol 2020; 75: 722-733 [PMID: 32081280 DOI: 10.1016/j.jacc.2019.12.030]
21

Hill CE et al. AI for liver MRI
WJG https://www.wjgnet.com 6840 October 28, 2021 Volume 27 Issue 40
McKinney SM, Sieniek M, Godbole V, Godwin J, Antropova N, Ashrafian H, Back T, Chesus M, Corrado GS, Darzi A, Etemadi M, Garcia-Vicente F, Gilbert FJ, Halling-Brown M, Hassabis D, Jansen S, Karthikesalingam A, Kelly CJ, King D, Ledsam JR, Melnick D, Mostofi H, Peng L, Reicher JJ, Romera-Paredes B, Sidebottom R, Suleyman M, Tse D, Young KC, De Fauw J, Shetty S. International evaluation of an AI system for breast cancer screening. Nature 2020; 577: 89-94 [PMID: 31894144 DOI: 10.1038/s41586-019-1799-6]
22
Cortes C, Vapnik V. Support-vector networks. Mach Learn 1995; 20: 273-297 [DOI: 10.1007/BF00994018]
23
Ho TK. Random decision forests. Proc Int Conf Doc Anal Recognition 1995; 1: 278-282 [DOI: 10.1109/ICDAR.1995.598994]
24
LeCun Y, Bengio Y, Hinton G. Deep learning. Nature 2015; 521: 436-444 [PMID: 26017442 DOI: 10.1038/nature14539]
25
Dzyubak B, Glaser K, Yin M, Talwalkar J, Chen J, Manduca A, Ehman RL. Automated liver stiffness measurements with magnetic resonance elastography. J Magn Reson Imaging 2013; 38: 371-379 [PMID: 23281171 DOI: 10.1002/jmri.23980]
26
Winther H, Hundt C, Ringe KI, Wacker FK, Schmidt B, Jürgens J, Haimerl M, Beyer LP, Stroszczynski C, Wiggermann P, Verloh N. A 3D Deep Neural Network for Liver Volumetry in 3T Contrast-Enhanced MRI. Rofo 2021; 193: 305-314 [PMID: 32882724 DOI: 10.1055/a-1238-2887]
27
Mio M, Fujiwara Y, Tani K, Toyofuku T, Maeda T, Inoue T. Quantitative evaluation of focal liver lesions with T1 mapping using a phase-sensitive inversion recovery sequence on gadoxetic acid-enhanced MRI. Eur J Radiol Open 2021; 8: 100312 [PMID: 33392362 DOI: 10.1016/j.ejro.2020.100312]
28
Linge J, Whitcher B, Borga M, Dahlqvist Leinhard O. Sub-phenotyping Metabolic Disorders Using Body Composition: An Individualized, Nonparametric Approach Utilizing Large Data Sets. Obesity (Silver Spring) 2019; 27: 1190-1199 [PMID: 31094076 DOI: 10.1002/oby.22510]
29
Liu M, Vanguri R, Mutasa S, Ha R, Liu YC, Button T, Jambawalikar S. Channel width optimized neural networks for liver and vessel segmentation in liver iron quantification. Comput Biol Med 2020; 122: 103798 [PMID: 32658724 DOI: 10.1016/j.compbiomed.2020.103798]
30
Chen Y, Ruan D, Xiao J, Wang L, Sun B, Saouaf R, Yang W, Li D, Fan Z. Fully automated multiorgan segmentation in abdominal magnetic resonance imaging with deep neural networks. Med Phys 2020; 47: 4971-4982 [PMID: 32748401 DOI: 10.1002/mp.14429]
31
Huang G, Liu Z, Van Der Maaten L, Weinberger KQ. Densely connected convolutional networks. 2017 IEEE Conference on Computer Vision and Pattern Recognition (CVPR) 2017; 2261-2269 [DOI: 10.1109/CVPR.2017.243]
32
Valindria VV, Pawlowski N, Rajchl M, Lavdas I, Aboagye EO, Rockall AG, Rueckert D. Multi-modal Learning from Unpaired Images: Application to Multi-organ Segmentation in CT and MRI. 2018 IEEE Winter Conference on Applications of Computer Vision (WACV) 2018; 547-556 [DOI: 10.1109/WACV.2018.00066]
33
He K, Zhang X, Ren S, Sun J. Deep residual learning for image recognition. 2016 IEEE Conference on Computer Vision and Pattern Recognition (CVPR) 2016; 770-778 [DOI: 10.1109/CVPR.2016.90]
34
Fu Y, Mazur TR, Wu X, Liu S, Chang X, Lu Y, Li HH, Kim H, Roach MC, Henke L, Yang D. A novel MRI segmentation method using CNN-based correction network for MRI-guided adaptive radiotherapy. Med Phys 2018; 45: 5129-5137 [PMID: 30269345 DOI: 10.1002/mp.13221]
35
Bousabarah K, Letzen B, Tefera J, Savic L, Schobert I, Schlachter T, Staib LH, Kocher M, Chapiro J, Lin M. Automated detection and delineation of hepatocellular carcinoma on multiphasic contrast-enhanced MRI using deep learning. Abdom Radiol (NY) 2021; 46: 216-225 [PMID: 32500237 DOI: 10.1007/s00261-020-02604-5]
36
Mole DJ, Fallowfield JA, Sherif AE, Kendall T, Semple S, Kelly M, Ridgway G, Connell JJ, McGonigle J, Banerjee R, Brady JM, Zheng X, Hughes M, Neyton L, McClintock J, Tucker G, Nailon H, Patel D, Wackett A, Steven M, Welsh F, Rees M; HepaT1ca Study Group. Quantitative magnetic resonance imaging predicts individual future liver performance after liver resection for cancer. PLoS One 2020; 15: e0238568 [PMID: 33264327 DOI: 10.1371/journal.pone.0238568]
37
Owler J, Irving B, Ridgway G, Wojciechowska M, McGonigle J, Brady M. Comparison of Multi-atlas Segmentation and U-Net Approaches for Automated 3D Liver Delineation in MRI. In: Zheng Y, Williams BM, Chen K, eds. Medical Image Understanding and Analysis. Springer International Publishing, 2020 [DOI: 10.1007/978-3-030-39343-4_41]
38
Christ PF, Ettlinger F, Grün F, Elshaera MEA, Lipkova J, Schlecht S, Freba A, Tatavarty S, Bickel M, Bilic P, Rempfler M, Hofmann F, Anastasi MD, Ahmadi SA, Kaissis G, Holch J, Sommer W, Braren R, Heinemann V, Menze B. Automatic liver and tumor segmentation of CT and MRI volumes using cascaded fully convolutional neural networks. arXiv 2017; 1-20
39
Jansen MJA, Kuijf HJ, Niekel M, Veldhuis WB, Wessels FJ, Viergever MA, Pluim JPW. Liver segmentation and metastases detection in MR images using convolutional neural networks. J Med Imaging (Bellingham) 2019; 6: 044003 [PMID: 31620549 DOI: 10.1117/1.JMI.6.4.044003]
40
Ivashchenko OV, Rijkhorst EJ, Ter Beek LC, Hoetjes NJ, Pouw B, Nijkamp J, Kuhlmann KFD, Ruers TJM. A workflow for automated segmentation of the liver surface, hepatic vasculature and biliary tree anatomy from multiphase MR images. Magn Reson Imaging 2020; 68: 53-65 [PMID: 31935445 DOI: 10.1016/j.mri.2019.12.008]
41
Masoumi H, Behrad A, Pourmina MA, Roosta A. Automatic liver segmentation in MRI images using an iterative watershed algorithm and artificial neural network. Biomed Signal Process Control 2012;
42

Hill CE et al. AI for liver MRI
WJG https://www.wjgnet.com 6841 October 28, 2021 Volume 27 Issue 40
7: 429-437 [DOI: 10.1016/j.bspc.2012.01.002]Wang K, Mamidipalli A, Retson T, Bahrami N, Hasenstab K, Blansit K, Bass E, Delgado T, Cunha G, Middleton MS, Loomba R, Neuschwander-Tetri BA, Sirlin CB, Hsiao A; members of the NASH Clinical Research Network. Automated CT and MRI Liver Segmentation and Biometry Using a Generalized Convolutional Neural Network. Radiol Artif Intell 2019; 1 [PMID: 32582883 DOI: 10.1148/ryai.2019180022]
43
Irving B. Deep Quantitative Liver Segmentation and Vessel Exclusion to Assist in Liver Assessment. In: Valdés Hernández M, González-Castro V. eds. Medical Image Understanding and Analysis. Springer International Publishing, 2017: 663-673
44
Yang J, Dvornek NC, Zhang F, Chapiro J, Lin M, Duncan JS. Unsupervised Domain Adaptation via Disentangled Representations: Application to Cross-Modality Liver Segmentation. Med Image Comput Comput Assist Interv 2019; 11765: 255-263 [PMID: 32377643 DOI: 10.1007/978-3-030-32245-8_29]
45
Cunha GM, Hasenstab KA, Higaki A, Wang K, Delgado T, Brunsing RL, Schlein A, Schwartzman A, Hsiao A, Sirlin CB, Fowler KJ. Convolutional neural network-automated hepatobiliary phase adequacy evaluation may optimize examination time. Eur J Radiol 2020; 124: 108837 [PMID: 31958630 DOI: 10.1016/j.ejrad.2020.108837]
46
Russakovsky O, Deng J, Su H, Krause J, Satheesh S, Ma S, Huang Z, Karpathy A, Khosla A, Bernstein M, Berg AC, Li FF. ImageNet Large Scale Visual Recognition Challenge. Int J Comput Vis 2015; 115: 211-252 [DOI: 10.1007/s11263-015-0816-y]
47
Wu Y, White GM, Cornelius T, Gowdar I, Ansari MH, Supanich MP, Deng J. Deep learning LI-RADS grading system based on contrast enhanced multiphase MRI for differentiation between LR-3 and LR-4/LR-5 Liver tumors. Ann Transl Med 2020; 8: 701 [PMID: 32617321 DOI: 10.21037/atm.2019.12.151]
48
Krizhevsky A, Sutskever I, Hinton GE. ImageNet classification with deep convolutional neural networks. Commun. ACM 2017; 60: 84-90 [DOI: 10.1145/3065386]
49
Messaoudi R, Jaziri F, Vacavant A, Mtibaa A, Gargouri F. A Novel Deep Learning Approach for Liver MRI Classification and HCC Detection. In: Lu Y. eds. Pattern Recognition and Artificial Intelligence. Springer International Publishing, 2020: 635-645
50
Hamm CA, Wang CJ, Savic LJ, Ferrante M, Schobert I, Schlachter T, Lin M, Duncan JS, Weinreb JC, Chapiro J, Letzen B. Deep learning for liver tumor diagnosis part I: development of a convolutional neural network classifier for multi-phasic MRI. Eur Radiol 2019; 29: 3338-3347 [PMID: 31016442 DOI: 10.1007/s00330-019-06205-9]
51
Kim J, Min JH, Kim SK, Shin SY, Lee MW. Detection of Hepatocellular Carcinoma in Contrast-Enhanced Magnetic Resonance Imaging Using Deep Learning Classifier: A Multi-Center Retrospective Study. Sci Rep 2020; 10: 9458 [PMID: 32527998 DOI: 10.1038/s41598-020-65875-4]
52
Zhen SH, Cheng M, Tao YB, Wang YF, Juengpanich S, Jiang ZY, Jiang YK, Yan YY, Lu W, Lue JM, Qian JH, Wu ZY, Sun JH, Lin H, Cai XJ. Deep Learning for Accurate Diagnosis of Liver Tumor Based on Magnetic Resonance Imaging and Clinical Data. Front Oncol 2020; 10: 680 [PMID: 32547939 DOI: 10.3389/fonc.2020.00680]
53
Trivizakis E, Manikis GC, Nikiforaki K, Drevelegas K, Constantinides M, Drevelegas A, Marias K. Extending 2-D Convolutional Neural Networks to 3-D for Advancing Deep Learning Cancer Classification With Application to MRI Liver Tumor Differentiation. IEEE J Biomed Health Inform 2019; 23: 923-930 [PMID: 30561355 DOI: 10.1109/JBHI.2018.2886276]
54
Liu X, Khalvati F, Namdar K, Fischer S, Lewis S, Taouli B, Haider MA, Jhaveri KS. Can machine learning radiomics provide pre-operative differentiation of combined hepatocellular cholangiocarcinoma from hepatocellular carcinoma and cholangiocarcinoma to inform optimal treatment planning? Eur Radiol 2021; 31: 244-255 [PMID: 32749585 DOI: 10.1007/s00330-020-07119-7]
55
Lewis S, Peti S, Hectors SJ, King M, Rosen A, Kamath A, Putra J, Thung S, Taouli B. Volumetric quantitative histogram analysis using diffusion-weighted magnetic resonance imaging to differentiate HCC from other primary liver cancers. Abdom Radiol (NY) 2019; 44: 912-922 [PMID: 30712136 DOI: 10.1007/s00261-019-01906-7]
56
Wu J, Liu A, Cui J, Chen A, Song Q, Xie L. Radiomics-based classification of hepatocellular carcinoma and hepatic haemangioma on precontrast magnetic resonance images. BMC Med Imaging 2019; 19: 23 [PMID: 30866850 DOI: 10.1186/s12880-019-0321-9]
57
Oyama A, Hiraoka Y, Obayashi I, Saikawa Y, Furui S, Shiraishi K, Kumagai S, Hayashi T, Kotoku J. Hepatic tumor classification using texture and topology analysis of non-contrast-enhanced three-dimensional T1-weighted MR images with a radiomics approach. Sci Rep 2019; 9: 8764 [PMID: 31217445 DOI: 10.1038/s41598-019-45283-z]
58
Wu M, Tan H, Gao F, Hai J, Ning P, Chen J, Zhu S, Wang M, Dou S, Shi D. Predicting the grade of hepatocellular carcinoma based on non-contrast-enhanced MRI radiomics signature. Eur Radiol 2019; 29: 2802-2811 [PMID: 30406313 DOI: 10.1007/s00330-018-5787-2]
59
Hectors SJ, Kennedy P, Huang KH, Stocker D, Carbonell G, Greenspan H, Friedman S, Taouli B. Fully automated prediction of liver fibrosis using deep learning analysis of gadoxetic acid-enhanced MRI. Eur Radiol 2020 [PMID: 33201285 DOI: 10.1007/s00330-020-07475-4]
60
Schawkat K, Ciritsis A, von Ulmenstein S, Honcharova-Biletska H, Jüngst C, Weber A, Gubler C, Mertens J, Reiner CS. Diagnostic accuracy of texture analysis and machine learning for quantification of liver fibrosis in MRI: correlation with MR elastography and histopathology. Eur Radiol 2020; 30:
61

Hill CE et al. AI for liver MRI
WJG https://www.wjgnet.com 6842 October 28, 2021 Volume 27 Issue 40
4675-4685 [PMID: 32270315 DOI: 10.1007/s00330-020-06831-8]Yasaka K, Akai H, Kunimatsu A, Abe O, Kiryu S. Liver Fibrosis: Deep Convolutional Neural Network for Staging by Using Gadoxetic Acid-enhanced Hepatobiliary Phase MR Images. Radiology 2018; 287: 146-155 [PMID: 29239710 DOI: 10.1148/radiol.2017171928]
62
Park HJ, Lee SS, Park B, Yun J, Sung YS, Shim WH, Shin YM, Kim SY, Lee SJ, Lee MG. Radiomics Analysis of Gadoxetic Acid-enhanced MRI for Staging Liver Fibrosis. Radiology 2019; 290: 380-387 [PMID: 30615554 DOI: 10.1148/radiol.2018181197]
63
Gallego-Durán R, Cerro-Salido P, Gomez-Gonzalez E, Pareja MJ, Ampuero J, Rico MC, Aznar R, Vilar-Gomez E, Bugianesi E, Crespo J, González-Sánchez FJ, Aparcero R, Moreno I, Soto S, Arias-Loste MT, Abad J, Ranchal I, Andrade RJ, Calleja JL, Pastrana M, Iacono OL, Romero-Gómez M. Imaging biomarkers for steatohepatitis and fibrosis detection in non-alcoholic fatty liver disease. Sci Rep 2016; 6: 31421 [PMID: 27514671 DOI: 10.1038/srep31421]
64
He L, Li H, Dudley JA, Maloney TC, Brady SL, Somasundaram E, Trout AT, Dillman JR. Machine Learning Prediction of Liver Stiffness Using Clinical and T2-Weighted MRI Radiomic Data. AJR Am J Roentgenol 2019; 213: 592-601 [PMID: 31120779 DOI: 10.2214/AJR.19.21082]
65
Liu Y, Ning Z, Örmeci N, An W, Yu Q, Han K, Huang Y, Liu D, Liu F, Li Z, Ding H, Luo H, Zuo C, Liu C, Wang J, Zhang C, Ji J, Wang W, Wang Z, Yuan M, Li L, Zhao Z, Wang G, Li M, Liu Q, Lei J, Tang T, Akçalar S, Çelebioğlu E, Üstüner E, Bilgiç S, Ellik Z, Asiller ÖÖ, Liu Z, Teng G, Chen Y, Hou J, Li X, He X, Dong J, Tian J, Liang P, Ju S, Zhang Y, Qi X. Deep Convolutional Neural Network-Aided Detection of Portal Hypertension in Patients With Cirrhosis. Clin Gastroenterol Hepatol 2020; 18: 2998-3007.e5 [PMID: 32205218 DOI: 10.1016/j.cgh.2020.03.034]
66
Zhao L, Ma X, Liang M, Li D, Ma P, Wang S, Wu Z, Zhao X. Prediction for early recurrence of intrahepatic mass-forming cholangiocarcinoma: quantitative magnetic resonance imaging combined with prognostic immunohistochemical markers. Cancer Imaging 2019; 19: 49 [PMID: 31307551 DOI: 10.1186/s40644-019-0234-4]
67
Reimer RP, Reimer P, Mahnken AH. Assessment of Therapy Response to Transarterial Radioembolization for Liver Metastases by Means of Post-treatment MRI-Based Texture Analysis. Cardiovasc Intervent Radiol 2018; 41: 1545-1556 [PMID: 29881933 DOI: 10.1007/s00270-018-2004-2]
68
Chen S, Feng S, Wei J, Liu F, Li B, Li X, Hou Y, Gu D, Tang M, Xiao H, Jia Y, Peng S, Tian J, Kuang M. Pretreatment prediction of immunoscore in hepatocellular cancer: a radiomics-based clinical model based on Gd-EOB-DTPA-enhanced MRI imaging. Eur Radiol 2019; 29: 4177-4187 [PMID: 30666445 DOI: 10.1007/s00330-018-5986-x]
69
Kim S, Shin J, Kim DY, Choi GH, Kim MJ, Choi JY. Radiomics on gadoxetic acid-enhanced magnetic resonance imaging for prediction of postoperative early and late recurrence of single hepatocellular carcinoma. Clin Cancer Res 2019; 25: 3847-3855 [PMID: 30808773 DOI: 10.1158/1078-0432.CCR-18-2861]
70
Liu Y, Lei Y, Wang T, Kayode O, Tian S, Liu T, Patel P, Curran WJ, Ren L, Yang X. MRI-based treatment planning for liver stereotactic body radiotherapy: validation of a deep learning-based synthetic CT generation method. Br J Radiol 2019; 92: 20190067 [PMID: 31192695 DOI: 10.1259/bjr.20190067]
71
Jiang J, Hu YC, Tyagi N, Rimner A, Lee N, Deasy JO, Berry S, Veeraraghavan H. PSIGAN: Joint Probabilistic Segmentation and Image Distribution Matching for Unpaired Cross-Modality Adaptation-Based MRI Segmentation. IEEE Trans Med Imaging 2020; 39: 4071-4084 [PMID: 32746148 DOI: 10.1109/TMI.2020.3011626]
72
Zhao J, Li D, Kassam Z, Howey J, Chong J, Chen B, Li S. Tripartite-GAN: Synthesizing liver contrast-enhanced MRI to improve tumor detection. Med Image Anal 2020; 63: 101667 [PMID: 32375101 DOI: 10.1016/j.media.2020.101667]
73
Messroghli DR, Radjenovic A, Kozerke S, Higgins DM, Sivananthan MU, Ridgway JP. Modified Look-Locker inversion recovery (MOLLI) for high-resolution T1 mapping of the heart. Magn Reson Med 2004; 52: 141-146 [PMID: 15236377 DOI: 10.1002/mrm.20110]
74
Piechnik SK, Ferreira VM, Dall'Armellina E, Cochlin LE, Greiser A, Neubauer S, Robson MD. Shortened Modified Look-Locker Inversion recovery (ShMOLLI) for clinical myocardial T1-mapping at 1.5 and 3 T within a 9 heartbeat breathhold. J Cardiovasc Magn Reson 2010; 12: 69 [PMID: 21092095 DOI: 10.1186/1532-429X-12-69]
75
Romaguera LV, Plantefève R, Romero FP, Hébert F, Carrier JF, Kadoury S. Prediction of in-plane organ deformation during free-breathing radiotherapy via discriminative spatial transformer networks. Med Image Anal 2020; 64: 101754 [PMID: 32580056 DOI: 10.1016/j.media.2020.101754]
76
Esses SJ, Lu X, Zhao T, Shanbhogue K, Dane B, Bruno M, Chandarana H. Automated image quality evaluation of T2 -weighted liver MRI utilizing deep learning architecture. J Magn Reson Imaging 2018; 47: 723-728 [PMID: 28577329 DOI: 10.1002/jmri.25779]
77
Tamada D, Kromrey ML, Ichikawa S, Onishi H, Motosugi U. Motion Artifact Reduction Using a Convolutional Neural Network for Dynamic Contrast Enhanced MR Imaging of the Liver. Magn Reson Med Sci 2020; 19: 64-76 [PMID: 31061259 DOI: 10.2463/mrms.mp.2018-0156]
78
Kromrey ML, Tamada D, Johno H, Funayama S, Nagata N, Ichikawa S, Kühn JP, Onishi H, Motosugi U. Reduction of respiratory motion artifacts in gadoxetate-enhanced MR with a deep learning-based filter using convolutional neural network. Eur Radiol 2020; 30: 5923-5932 [PMID: 32556463 DOI: 10.1007/s00330-020-07006-1]
79
Küstner T, Armanious K, Yang J, Yang B, Schick F, Gatidis S. Retrospective correction of motion-80

Hill CE et al. AI for liver MRI
WJG https://www.wjgnet.com 6843 October 28, 2021 Volume 27 Issue 40
affected MR images using deep learning frameworks. Magn Reson Med 2019; 82: 1527-1540 [PMID: 31081955 DOI: 10.1002/mrm.27783]Küstner T, Liebgott A, Mauch L, Martirosian P, Bamberg F, Nikolaou K, Yang B, Schick F, Gatidis S. Automated reference-free detection of motion artifacts in magnetic resonance images. MAGMA 2018; 31: 243-256 [PMID: 28932991 DOI: 10.1007/s10334-017-0650-z]
81
Oh G, Lee JE, Ye JC. Unsupervised MR Motion Artifact Deep Learning using Outlier-Rejecting Bootstrap Aggregation. 2020: 1-10
82
Wang Y, Song Y, Wang F, Sun J, Gao X, Han Z, Shi L, Shao G, Fan M, Yang G. A two-step automated quality assessment for liver MR images based on convolutional neural network. Eur J Radiol 2020; 124: 108822 [PMID: 31951895 DOI: 10.1016/j.ejrad.2020.108822]
83
Kuznetsova S, Grendarova P, Ploquin N, Thind K. Multimodality Image Fusion of the Liver Using Structure-Guided Deformable Image Registration in Velocity AI---What Is the Preferred Approach? In: Lhotska L, Sukupova L, Lacković I, Ibbott G (eds). World Congress on Medical Physics and Biomedical Engineering 2018. IFMBE Proceedings, Singapore, 2019: 273-277 [DOI: 10.1007/978-981-10-9035-6_49]
84
Fu Y, Lei Y, Wang T, Zhou J, Curran WJ, Patel P, Liu T, Yang X. Deformable MRI-CT liver image registration using convolutional neural network with modality independent neighborhood descriptors. In: Mazurowski MA, Drukker K (eds). Medical Imaging 2021: Computer-Aided Diagnosis 2021; 11597: 102-107 [DOI: 10.1117/12.2581082]
85
FDA. Proposed Regulatory Framework for Modifications to Artificial Intelligence/Machine Learning (AI/ML)-Based Software as a Medical Device (SaMD)-Discussion Paper and Request for Feedback. 2019: 1-20
86

WJG https://www.wjgnet.com 6844 October 28, 2021 Volume 27 Issue 40
World Journal of
GastroenterologyW J GSubmit a Manuscript: https://www.f6publishing.com World J Gastroenterol 2021 October 28; 27(40): 6844-6860
DOI: 10.3748/wjg.v27.i40.6844 ISSN 1007-9327 (print) ISSN 2219-2840 (online)
MINIREVIEWS
Role of human nucleoside transporters in pancreatic cancer and chemoresistance
Carly Jade Carter, Ahmed H Mekkawy, David L Morris
ORCID number: Carly Jade Carter 0000-0003-3219-4076; Ahmed H Mekkawy 0000-0001-7162-8936; David L Morris 0000-0001-9377-8521.
Author contributions: Carter CJ wrote the manuscript and designed the figures with the support of Mekkawy AH; Mekkawy AH and Morris DL revised and supervised the manuscript; all authors have read and approved the final manuscript.
Conflict-of-interest statement: Morris DL is one of the inventors of BromAc and owns stocks in Mucpharm. Carter CJ and Mekkawy AH are employees of Mucpharm Pty Ltd.
Open-Access: This article is an open-access article that was selected by an in-house editor and fully peer-reviewed by external reviewers. It is distributed in accordance with the Creative Commons Attribution NonCommercial (CC BY-NC 4.0) license, which permits others to distribute, remix, adapt, build upon this work non-commercially, and license their derivative works on different terms, provided the original work is properly cited and the use is non-commercial. See: http://creativecommons.org/Licenses/by-nc/4.0/
Carly Jade Carter, Ahmed H Mekkawy, David L Morris, Hepatobiliary and Surgical Oncology Unit, Department of Surgery, St George Hospital, University of New South Wales, Sydney 2217, New South Wales, Australia
Carly Jade Carter, Ahmed H Mekkawy, David L Morris, Mucpharm Pty Ltd, Australia
Corresponding author: David L Morris, FRCS, FRCS (Ed), MBChB, MD, PhD, Professor, Hepatobiliary and Surgical Oncology Unit, Department of Surgery, St George Hospital, University of New South Wales, Kogarah, Sydney 2217, New South Wales, Australia. [email protected]
AbstractThe prognosis of pancreatic cancer is poor with the overall 5-year survival rate of less than 5% changing minimally over the past decades and future projections predicting it developing into the second leading cause of cancer related mortality within the next decade. Investigations into the mechanisms of pancreatic cancer development, progression and acquired chemoresistance have been constant for the past few decades, thus resulting in the identification of human nucleoside transporters and factors affecting cytotoxic uptake via said transporters. This review summaries the aberrant expression and role of human nucleoside transports in pancreatic cancer, more specifically human equilibrative nucleoside transporter 1/2 (hENT1, hENT2), and human concentrative nucleoside transporter 1/3 (hCNT1, hCNT3), while briefly discussing the connection and importance between these nucleoside transporters and mucins that have also been identified as being aberrantly expressed in pancreatic cancer. The review also discusses the incidence, current diagnostic techniques as well as the current therapeutic treatments for pancreatic cancer. Furthermore, we address the importance of chemoresistance in nucleoside analogue drugs, in particular, gemcitabine and we discuss prospective therapeutic treatments and strategies for overcoming acquired chemoresistance in pancreatic cancer by the enhancement of human nucleoside transporters as well as the potential targeting of mucins using a combination of mucolytic compounds with cytotoxic agents.
Key Words: Pancreatic cancer; Gemcitabine; Human nucleoside transporters; Human equilibrative nucleoside transporters; Human concentrative nucleotide transporters; Mucins

Carter CJ et al. Nucleoside transporters in pancreatic cancer
WJG https://www.wjgnet.com 6845 October 28, 2021 Volume 27 Issue 40
Manuscript source: Unsolicited manuscript
Specialty type: Gastroenterology and hepatology
Country/Territory of origin: Australia
Peer-review report’s scientific quality classificationGrade A (Excellent): 0 Grade B (Very good): B, B Grade C (Good): 0 Grade D (Fair): 0 Grade E (Poor): 0
Received: February 17, 2021 Peer-review started: February 17, 2021 First decision: April 5, 2021 Revised: April 19, 2021 Accepted: September 14, 2021 Article in press: September 14, 2021 Published online: October 28, 2021
P-Reviewer: Fernández-Placencia RM, Jin Y S-Editor: Gong ZM L-Editor: A P-Editor: Ma YJ
©The Author(s) 2021. Published by Baishideng Publishing Group Inc. All rights reserved.
Core Tip: Pancreatic cancer continues to be one of the leading causes of cancer-related mortality worldwide, with prevalence expected to increase drastically within the next decade primarily due to difficulties in diagnosis and acquired resistance to chemothera-peutic drugs. Due to this, in-depth work is extremely important for the future diagnosis and treatment of the disease. Human Nucleoside Transporters have been identified as a key target in not only diagnosis but also overcoming chemoresistance. Here, we summarize the information currently available on Pancreatic Cancer and the role of Nucleoside Transporters in chemoresistance.
Citation: Carter CJ, Mekkawy AH, Morris DL. Role of human nucleoside transporters in pancreatic cancer and chemoresistance. World J Gastroenterol 2021; 27(40): 6844-6860URL: https://www.wjgnet.com/1007-9327/full/v27/i40/6844.htmDOI: https://dx.doi.org/10.3748/wjg.v27.i40.6844
INTRODUCTIONPancreatic cancer is the seventh leading cause of cancer-related mortality[1], and is ranked as the 14th most common cancer worldwide[2]. The prognosis of pancreatic cancer is often poor with an average five-year survival rate of less than 5%[3]. This poor prognosis has been attributed, in part, to the difficulties in early-stage detection, advancement of disease at the time of diagnosis, frequent recurrence and lack of effective treatment therapies specifically targeting tumour cells[4,5].
Pancreatic ductal adenocarcinoma (PDAC), which accounts for > 90% of all pancreatic cancer cases is characterized by dense desmoplastic stromal development proximal to cancerous tissue, as well as the aberrant expression of mucins and nucleoside transporters[6,7]. Three different preneoplastic lesions of the pancreatic duct have been identified as precursors of PDAC those being, pancreatic intrae-pithelial neoplasia (PanIN), mucinous cystic neoplasm (MCN) and intraductal papillary mucinous neoplasm (IPMN)[3].
PanIN accounts for 85% of PDAC cases and is categorised into PanIN1A, PanIN1B, PanIN2 and PanIN3[8]. Prior to PanIN progression, normal pancreatic ductal cells express mucin proteins MUC1/5AB/6/17 which have been identified in assisting cancer cell in evading immune systems[3]. PanIN1A/1B is described as hyperplasia without dysplasia, followed by PanIN2 with dysplasia at variable rates and a loss of polarity and finally PanIN3, representative of an in-situ carcinoma. For all PanIN, increased expression can be seen for MUC1/6/16 and neoexpression is observed for MUC3/4/5AC (Figure 1)[4,9].
MCN and IPMN account for the remainder 15% of PDAC cases, with MCN charac-terized as cyst forming pancreatic epithelial neoplasms that produce mucin, have a distinct stroma type, and have a broad spectrum of dysplasia. Importantly, MCN’s are also representative of early Kras mutations as well as late oncogene SMAD4 and proto-oncogene TP53 inactivation and lastly, increased MUC1 expression and neoexpression of MUC2/5AC [2-4].
IPMN which originates from the main pancreatic duct is characterized by the increased secretion of select mucins (MUC1/6), neoexpression of MUC2/4/5AC, and a large dilation of the ducts or cysts formation. Much like MCN, IPMN presents with a Kras mutation and the inactivation of TP53 and P16/CDKN2A. MCN and IPMN may further progress into adenocarcinoma where an increased expression of MUC1/6 and neoexpression of MUC3/4/5AC/5AB/7/13/16/17 is observed (Figure 1)[3,4].
The aim of this review is to outline the role of nucleoside transporters in pancreatic cancer progression and their contribution to chemotherapeutic drug resistance. This review will also examine the current treatments and therapies to overcome cancer progression and acquired resistance to nucleoside analogue drugs, specifically, gemcitabine.
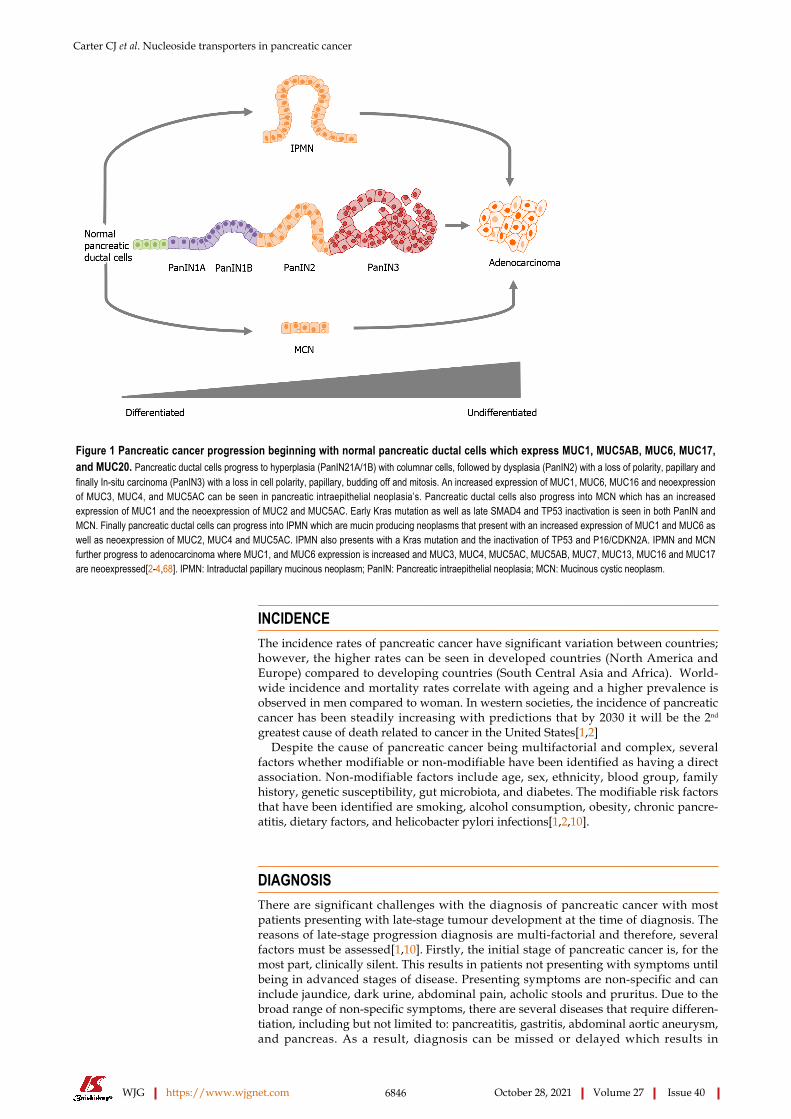
Carter CJ et al. Nucleoside transporters in pancreatic cancer
WJG https://www.wjgnet.com 6846 October 28, 2021 Volume 27 Issue 40
Figure 1 Pancreatic cancer progression beginning with normal pancreatic ductal cells which express MUC1, MUC5AB, MUC6, MUC17, and MUC20. Pancreatic ductal cells progress to hyperplasia (PanIN21A/1B) with columnar cells, followed by dysplasia (PanIN2) with a loss of polarity, papillary and finally In-situ carcinoma (PanIN3) with a loss in cell polarity, papillary, budding off and mitosis. An increased expression of MUC1, MUC6, MUC16 and neoexpression of MUC3, MUC4, and MUC5AC can be seen in pancreatic intraepithelial neoplasia’s. Pancreatic ductal cells also progress into MCN which has an increased expression of MUC1 and the neoexpression of MUC2 and MUC5AC. Early Kras mutation as well as late SMAD4 and TP53 inactivation is seen in both PanIN and MCN. Finally pancreatic ductal cells can progress into IPMN which are mucin producing neoplasms that present with an increased expression of MUC1 and MUC6 as well as neoexpression of MUC2, MUC4 and MUC5AC. IPMN also presents with a Kras mutation and the inactivation of TP53 and P16/CDKN2A. IPMN and MCN further progress to adenocarcinoma where MUC1, and MUC6 expression is increased and MUC3, MUC4, MUC5AC, MUC5AB, MUC7, MUC13, MUC16 and MUC17 are neoexpressed[2-4,68]. IPMN: Intraductal papillary mucinous neoplasm; PanIN: Pancreatic intraepithelial neoplasia; MCN: Mucinous cystic neoplasm.
INCIDENCEThe incidence rates of pancreatic cancer have significant variation between countries; however, the higher rates can be seen in developed countries (North America and Europe) compared to developing countries (South Central Asia and Africa). World-wide incidence and mortality rates correlate with ageing and a higher prevalence is observed in men compared to woman. In western societies, the incidence of pancreatic cancer has been steadily increasing with predictions that by 2030 it will be the 2nd greatest cause of death related to cancer in the United States[1,2]
Despite the cause of pancreatic cancer being multifactorial and complex, several factors whether modifiable or non-modifiable have been identified as having a direct association. Non-modifiable factors include age, sex, ethnicity, blood group, family history, genetic susceptibility, gut microbiota, and diabetes. The modifiable risk factors that have been identified are smoking, alcohol consumption, obesity, chronic pancre-atitis, dietary factors, and helicobacter pylori infections[1,2,10].
DIAGNOSISThere are significant challenges with the diagnosis of pancreatic cancer with most patients presenting with late-stage tumour development at the time of diagnosis. The reasons of late-stage progression diagnosis are multi-factorial and therefore, several factors must be assessed[1,10]. Firstly, the initial stage of pancreatic cancer is, for the most part, clinically silent. This results in patients not presenting with symptoms until being in advanced stages of disease. Presenting symptoms are non-specific and can include jaundice, dark urine, abdominal pain, acholic stools and pruritus. Due to the broad range of non-specific symptoms, there are several diseases that require differen-tiation, including but not limited to: pancreatitis, gastritis, abdominal aortic aneurysm, and pancreas. As a result, diagnosis can be missed or delayed which results in

Carter CJ et al. Nucleoside transporters in pancreatic cancer
WJG https://www.wjgnet.com 6847 October 28, 2021 Volume 27 Issue 40
pancreatic cancer being the most commonly detected tumour during autopsy studies[2,10,11].
Currently, several diagnostic tools are available for the diagnosis of pancreatic cancer, such as magnetic resonance imaging (MRI), abdominal ultrasonography, endoscopic ultrasound-guided fine-needle aspiration and the standard for staging and diagnosis tri-phase pancreatic protocol CT. Additionally, the cancer biomarker serum cancer antigen 19-9 (CA 19-9) is the only approved marker for pancreatic cancer and is used to assist in diagnosis and to predict patient prognosis and recurrence post resection. Unfortunately, the CA19-9 biomarker is not tumour-specific and therefore is not capable for use as a screening tool for the patients that are asymptomatic[1,2,10].
Recently, biomarkers for early diagnosis have been investigated, including plasma-based metabolite panels, increased concentrations of volatile organic compounds in exhaled air, DNA mutations such as p53 in pancreatic juice, and tumour markers such as CA125, CA242, CEA, NSE[2,12]. Despite continued investigation into diagnostic biomarkers, the lack of a specific and validated biomarker as well as sensitive screening programs remains a major issue.
TREATMENTThe treatment strategy for pancreatic cancer is dependent on the primary tumour resectability, which is defined by the absence of distance metastasis as well as the locoregional anatomical contacts allowing for a R0 resection. For patients eligible, the primary treatment that presents a possible cure for pancreatic cancer is surgical resection in addition to chemotherapy[2,13].
The surgical options for achieving surgical resection are open Pacnreatico-duoden-ectomy and total or distal pancreatectomy, either open or laparoscopic. The surgical method employed is dependent on the tumour or tumour’s anatomical location. It is important to mention that the survival rates following surgical resection alone are low with approximately 10% after 5 years. Despite observed benefits when adjuvant therapies are utilised, the recurrence rates remain high, with a 2-year relapse of approximately 70%[2,13,14].
Unfortunately, as previously mentioned, at the time of diagnosis approximately 90% of patients present with tumours that are locally advanced or metastatic, making them ineligible for surgical resection. The only options for these patients are the management of jaundice, system control, palliative radiotherapy, and chemotherapy. A variety of chemotherapeutic drugs are used to treat pancreatic cancer including Oxaliplatin, Paclitaxel, Leucovorin, Irinotecan, Doxorubicin, and 5-fluorouracil (5-FU) (Table 1)[15,16]. Currently, the standard of care for patient’s ineligible for surgical resection remains FOLFIRINOX (Fluorouracil, Oxaliplatin, Leucovorin and Irinotecan) or Gemcitabine (2’,2’-diflurodeoxyxytidine) either in combination with Paclitaxel or as a single agent[3,4,14,17,18].
The most effective treatment regimen is guided by patient fitness, FOLFIRNOX is administered to fit patients with tumours in the tail, body, and head of the pancreas, with treatment resulting in significant longer cancer-specific, metastasis-free, disease-free, and overall survival (11.1 mo) when compared to Gemcitabine (6.8 mo). However, a significantly increased risk of adverse effects and complications is seen in patients that receive FOLFIRNOX when compared to Gemcitabine. Gemcitabine +/- Capecitabine is relative safe compared to other chemotherapy options and is therefore the standard treatment for patients that are ineligible for FOLFIRNOX treatment regimens. It has been found to provide improved system control, a higher response rate and a greater overall survival rate compared to 5-FU (4.41 mo)[2,14,19]. Despite the poor survival outcomes, 5-FU is used for periampullary tumours primarily due to insufficient evidence for other chemotherapeutic agents specifically targeting said tumour types[2]. Due to the clinical benefits of Gemcitabine compared to other treatment regimes, it has become the standard reference agent in the first line treatment choice of pancreatic cancer[20,21]. This shows that the patient benefit to current treatments is minimal, hence identifying better targets and more efficient treatments is required.
GEMCITABINE Gemcitabine is a cytotoxic pyrimidine nucleoside analogue that has been utilized as a chemotherapeutic agent for not only pancreatic cancer but for a variety of solid

Carter CJ et al. Nucleoside transporters in pancreatic cancer
WJG https://www.wjgnet.com 6848 October 28, 2021 Volume 27 Issue 40
Table 1 The current chemotherapeutic and chemoprotectant agents used to treat pancreatic cancer, their classification, action, and chemical structure
Drug Classification Action
Gemcitabine (Gemzar) Antimetabolite Pyrimidine antagonist
Doxorubicin (Rubex) Anthracycline Antibiotic Cell-cycle specific antagonist
Fluorouracil (5-FU) Antimetabolite Pyrimidine antagonist
Paclitaxel (Abraxane) Plant alkaloid, Taxane, Antimircotubule Inhibition of cell microtubule structures
Oxaliplatin (Eloxatin) Alkylating agent Cell-cycle non-specific antagonist
Leucovorin (Folinic acid) Chemoprotectant Enhancement anti-cancer effects
Irinotecan (Camptosar) Plant alkaloid, Topoisomerase I inhibitor Camptothecan analogs
Erlotinib (Tarceva) Tyrosine kinase inhibitor Ant-EGFR
Cetuximab (Erbitux) Biologic Anti-EGFR
Bevacizumab (Avastin) Biologic Anti-VEGF
Citation: National Center for Biotechnology Information, 2021 [cited 12 April 2021]. Database: PubChem Compound Summary [Internet]. Available from: https://pubchem.ncbi.nlm.nih.gov/compound/Gemcitabine[70,71].
tumours and more recently in certain lymphomas[22]. Due to the hydrophilic nature of gemcitabine, passive diffusion is slow through cellular membranes and therefore requires transportation into cells by specialized integral membrane proteins known as human nucleotide transporters (NTs)[16,23,24].
To exert clinical action, gemcitabine needs to be metabolized and requires multiple kinases to initiate serial phosphorylation. Once transported intracellularly, gemci-tabine (dFdC) is catalyzed by deoxycytidine kinase (dCK) resulting in gemcitabine monophosphate (dFdCMP) and is then phosphorylated to gemcitabine diphosphate (dFdCDP) by nucleotide monophosphate kinase (NMPK) and finally gemcitabine triphosphate (dFdCTP) by nucleoside-diphosphate kinase (NDPK). The successful uptake and metabolism of gemcitabine to results in the inhibition of DNA repair and replication (Figure 2). Finally, Gemcitabine or its phosphorylated metabolites are exported into the extracellular space by multidrug resistance protein 5 (MRP5). An additional mechanism that gemcitabine exerts actions is self-potentiation by the inhibition of enzymes associated with deoxynucleotide metabolism[22,25-27].
Although gemcitabine and other chemotherapeutic drugs have been proven effective among patients with various stages of pancreatic cancer, the effectiveness of gemcitabine is severely limited due to the development of chemoresistance[19]. Chemoresistance is simply the ability of cancer cells to survive or evade therapeutics and can be intrinsic or acquired during treatment[28]. Chemotherapeutic drug resistance is widely common in pancreatic cancer with less than 30% of patients showing improvement post treatment and previous studies have identifying a heightened resistance to gemcitabine in comparison to other chemotherapeutic drugs in pancreatic cancer cells[19,29,30].
To date, several mechanisms have been identified as contributors to acquired gemcitabine resistance in pancreatic cancer due to the drugs rapid metabolism and hydrophilic nature including increased levels of ribonucleotide reductase subunit II and II (RRM1/2), mucins, deoxycytidine kinase (dCK), as well as concentrative and equilibrative nucleoside transporters (hCNT/hENT). Regrettably, many of these mechanisms are complex and the identification of their specific roles and conse-quences in chemoresistance remains unclear[19,31,32]. As nucleoside transporters are required for gemcitabine uptake into pancreatic cancer cells, they have been identified as key contributing factors to chemoresistance which will be discussed in the following sections.
NUCLEOSIDE TRANSPORTERS Nucleoside transporters (NTs) are a group of membrane proteins that transport the analogs of both natural and synthetic nucleosides that act as anticancer agents across

Carter CJ et al. Nucleoside transporters in pancreatic cancer
WJG https://www.wjgnet.com 6849 October 28, 2021 Volume 27 Issue 40
Figure 2 Schematic representation of Gemcitabine transport, metabolism, intracellular activation, and deactivation. Gemcitabine (dFdC) is transported into the cell by nucleoside transporters: human equilibrative nucleoside transporter (hENT) human concentrative nucleoside transporter (hCNT) and is then catalysed by deoxycytidine kinase (dCK), which results in gemcitabine monophosphate (dFdCMP). It is then phosphorylated by nucleotide monophosphate kinase (NMPK) to gemcitabine diphosphate (dFdCDP). Finally, it is phosphorylated into gemcitabine triphosphate (dFdCTP) by nucleoside-diphosphate kinase (NDPK). Once metabolism is completed, gemcitabine enters the DNA resulting in the inhibition of DNA repair and replication. Gemcitabine or its phosphorylated metabolites are finally exported into the extracellular matrix by multidrug resistance protein 5 (MRP5)[22,26,27,41,69]. RRM1: Ribonucleotide reductase; CDA: Cytidine deaminase; DCTD: Deoxycytidylate deaminase; NDP: Nucleotide diphosphate.
the membranes of vesicles and cells. There are two classes of transporter proteins that are encoded by two different solute carrier families (SLC), SLC28 known as human concentrative nucleoside transports and SLC29 also known as human equilibrative nucleoside transporters[33].
There are three members of the human concentrative nucleoside transporter family including, hCNT1, hCNT2 and hCNT3. These transporters mediate the unidirectional co-transport of Na+ and/or H+ and nucleosides into cells at a 1:1 coupling ratio for hCNT1 and hCNT2 and a 2:1 ratio for hCNT3. Initially, hCNTs were believed to be expressed only in polarized epithelia, however, recent studies have identified the expression to be considerably broader. These proteins favour nucleoside transe-pithelial flux as they present at an ideal localization on the apical side of polarized epithelial tissue[33].
Human equilibrative nucleoside transporters include four members, hENT1, hENT2, hENT3 and hENT4. These proteins are bio-directional and mediate the facilitative transport of nucleosides and select hENTs also facilitate the transportation of nucleobases dependent on their concentration gradient. Except for hENT4, hENT proteins can transport both pyrimidines and purines, they have a broad permeant selectivity, and are widely distributed in a variety of cell types. Despite their similarities, hENT1, 2 and 3 differ in in nucleoside specificity, however, they all present with a lower substrate affinity then the members of the hCNT family[16,23,33].
NUCLEOSIDE TRANSPORTERS AND PANCR-EATIC CANCERDue to the importance of gemcitabine in pancreatic cancer treatment and the requirement of transporters for drug uptake, extensive research has been undertaken

Carter CJ et al. Nucleoside transporters in pancreatic cancer
WJG https://www.wjgnet.com 6850 October 28, 2021 Volume 27 Issue 40
on transports and their role in tumorigenesis. Alterations in the expression of transporters have been identified in the progression of normal pancreatic cells to malignant pancreatic cancer cells. Despite significant efforts of researchers to identify the roles transporters undertake in substrate translocation and their functions in cell physiology, more research evaluating the clinical application of transporters as potential biomarkers or therapeutical targets is required. The primary transporter that efficiently mediates the cellular uptake of gemcitabine is hENT1 (SLC29A1), however, evidence suggests minor cellular uptake of gemcitabine via hENT2 (SLC29A2), hCNT1 (SLC28A1) and hCNT3 (SLC28A3)[15,16,23,26]. Each transporter undertakes specific functions (Table 2), and each will be discussed as follows:
HUMAN EQUILIBRATIVE NUCLEOSIDE TRANSPORTERS IN PANCREATIC CANCERhENT1The hENT1 protein is a transmembrane glycoprotein that is localized to plasma membranes and is widely expressed with a broad selectivity for pyrimidines and purines[16]. In a healthy pancreas, hENT1 has medium expression in exocrine glandular cells and low expression in islets of Langerhans. In comparison, pancreatic tumours present with a decrease in hENT1 expression[34].
Previous clinical studies on pancreatic cancer patients and various cell lines have identified that that low levels of hENT1 expression on pancreatic tumour cells correlates with a significant reduction in progression free survival (PFS) and disease-free survival (DFS) when compared to patients with medium to high levels of hENT1 expression[7,35]. If gemcitabine is incapable of cellular uptake due to a lack of transportation into the cell, it is unable to inhibit cell growth and therefore the abundance of hENT1 may contribute to gemcitabine resistance as a result of reduced intracellular build-up. In fact, previous studies reported the inhibition of hENT1 in cancer cell lines with NBMPR (nucleoside analogue nitrobenzylmercaptopurine ribonucleoside - a potent inhibitor of hENT1) resulted in cell chemoresistance to gemcitabine[34,36,37]. Thus, further supporting the importance of hENT1 in gemcitabine sensitivity.
This research indicates that hENT1 Levels are correlated with gemcitabine response as the upregulation of hENT1 proteins results in the enhancement of gemcitabine’s cytotoxic effects, while the loss of hENT1 protein expression results in the development of gemcitabine resistance. Due to this, hENT1 is an attractive potential prognostic biomarker in pancreatic cancer patients for gemcitabine treated patients[7,19].
It is important to note that the hENT1 gene itself is not reduced in the development of chemoresistance to gemcitabine, nor does it correlate with gemcitabine's IC50 values for several pancreatic cancer cell lines. This suggests that hENT1 expression is not solely alone in patients acquired and inherent chemoresistance to gemcitabine[34].
hENT2The hENT2 protein is encoded by the gene SLC29A2 and transports a range purine and pyrimidine nucleosides as well as select nucleobases across cells membranes with broad affinity. The protein is present in a wide range of cell types though its gene expression is greatest in the skeletal muscle. The hENT2 protein is highly expressed in the pancreatic cells of healthy individuals but is shown to be reduced in pancreatic cancer patients and pancreatic cancer cell lines[38,39].
hENT2 has recently been identified as being a key element in the regulation of nucleotide and nucleoside pool for effective cell cycle progression and synthesis of DNA. This evidence indicates that hENT2 is partly responsible for transporting, into the nucleus, the supply of nucleotides required for DNA replication. Therefore, the dysregulation of this transporter protein may have adverse effects on cell homeostasis and possibly contribute to tumour progression[33].
hENT2 has also been the subject of several investigations due to its ability to transport gemcitabine into cells. It is however proven to transport the chemothera-peutic drug with a much lower affinity when compared to hENT1[38]. Unlike the extensive research undertaken on hENT1 which has proven a link between the protein and chemoresistance, there are few studies investigating the importance of hENT2[22]. hENT2 protein expression has been identified in various pancreatic cancer cell lines, although less than the expression of hENT1 transporters[25].

Carter CJ et al. Nucleoside transporters in pancreatic cancer
WJG https://www.wjgnet.com 6851 October 28, 2021 Volume 27 Issue 40
Table 2 The mechanisms, efficacy, toxicity, affinity, and disadvantages of human nucleoside transporters
Transporter Mechanisms of action Efficacy, toxicity, and affinity Known disadvantages Ref.
hENT1 (SLC29A1)
Nucleoside-derived anticancer drug update. Antiviral drug uptake. Cellular uptake of nucleosides for RNA or DNA synthesis. Adenosine signalling
Clear correlation between the efficacy of nucleoside analog chemotherapeutic treatment and expression of hENT1. Increase in chemotherapeutic drug efficacy with an increase in transporter expression. Highly sensitive to NBMPR, draflazine, dilazep, and dipyridamole.Increase in cell toxicity with an increase in transporter expression. Highest affinity for gemcitabine uptake
Mutations in the SLC29A1 gene associated with Faisalabad histiocytosis, pigmented hypertrichosis including insulin dependent diabetes, and H syndrome. Select variants of the gene highly immunogenic, may result in haemolytic disease of newborns and foetus as well as acute haemolytic transfusion reaction
[72-77]
hENT2 (SLC29A2)
Nucleoside-derived anticancer drug update. Antiviral drug uptake Mediates the influx and efflux of pyrimidine and purine nucleosides as well as the purine base hypoxanthine. Transport’s bile salts, metal ions, organic acids, amine compounds, glucose and other sugars
Although identified to transport gemcitabine into cells, it is less effective than hENT1 at cytotoxic drug uptake. Minimally sensitive to inhibition via NBMPR, draflazine, dilazep, and dipyridamole. Higher affinity for nucleobases when compared to hENT1
Mutations in the SLC29A2 gene associated with familial and Histiocytosis-Lymphadenopathy Plus Syndrome and hepatic Adenomas. Dysregulation may result in have adverse effects on cell homeostasis and possibly contribute to tumour progression
[33,37,38,40,78]
hCNT1 (SLC28A1)
Transport’s bile salts, metal ions, organic acids, amine compounds, glucose and other sugars. Transport’s nucleosides, related molecules, and vitamins. Nucleoside binding. Nucleoside sodium symporter activity. Nucleoside-derived anticancer drug update. Antiviral pyrimidine nucleoside analog drug uptake
Minimally effective at cytotoxic drug uptake. Expression is negatively regulated by MUC4 in gemcitabine resistant pancreatic cancer cells. Has a selective inhibition for thymidine, adenosine, uridine, inosine, guanosine, and cytidine
Mutations in the SLC28A1 gene are associated with Uridine-Cytidineuria disease. Overexpression of protein may result in translocation of pyrimidine alone, resulting in modifications of cell physiology
[16,45,51,79]
hCNT3 (SLC28A3)
Regulates cellular processes, such as vascular tone, neurotransmission, surface receptors, the concentration of adenosine in the vicinity of cell as well as transport, and finally the metabolism of nucleoside drugs. hCNT3 has a broad specificity for pyrimidine and purine nucleosides
Clear correlation between hCNT3 downregulation and gemcitabine toxicity
Mutations in the SLC28A3 gene results in the altered sensitivity to the compound BMS-536924
[80-82]
hENT1/2: Human equilibrative nucleoside transporter 1/2; hCNT1/3: Human concentrative nucleoside transporter 1/3.
Previous studies aimed at investigating hENT2 Levels in chemoresistance pancreatic cancer cell lines identified the expressed protein had a lower expression after gemcitabine treatment[37,40]. In cohesion with the reduction in protein expression, hENT2 mRNA levels are also reduced following gemcitabine treatment. Furthering these studies, the inactivation of hENT2 via exposure to dilazep (a hENT2 inhibitor), in conjunction with the inhibition of hENT1 via NBMPR, results in a reduction of gemcitabine uptake and sensitivity. However, the decrease in hENT2 expression may not provide an explanation for the limited uptake of gemcitabine into cells and therefore chemoresistance, as the expression of other gemcitabine transporters are not affected by hENT2 downregulation[37,40].
These results provide evidence that hENT2 when aberrantly expressed may contribute to gemcitabine resistance, however, more extensive research is required to understand the exact impact hENT2 expression has on other mechanisms of chemores-istance in addition to pancreatic cancer cells.
HUMAN CONCENTRATIVE NUCLEOTIDE TRANSPORTERS IN PANCREATIC CANCERhCNT1The hCNT1 protein, encoded by the SLAC28A1 gene, is a sodium dependant transporter with a high affinity for pyrimidines[25]. It is broadly detected in epithelia with a moderate to high expression in healthy pancreatic tissue. The expression of hCNT1 is decreased to an almost negligible in undifferentiated states such as fetal hepatocytes, intestinal crypt cells and human tumours, namely pancreatic and breast tumours[41].

Carter CJ et al. Nucleoside transporters in pancreatic cancer
WJG https://www.wjgnet.com 6852 October 28, 2021 Volume 27 Issue 40
The exact role hCNT1 undertakes in the regulation of gemcitabine resistance and cytotoxicity in pancreatic cancer cells is yet to be described, however, data obtained from multiple studies have indicated that the hCNT1 expression is frequently reduced in pancreatic cancer cell lines and tumours when compared to unaffected pancreatic cells[42-44]. In chemoresistant pancreatic cancer cells, hCNT1 expression is limited and can be correlated with limited influx of gemcitabine into target cells. However, invest-igations into the pharmacological inhibition of the degradation of hCNT1 results in a moderate increase of the cellular transport of gemcitabine thus suggesting the transporter as a possible target mechanism for increasing chemosensitivity and drug transport[42].
Due to the correlation between decreased hCNT1 expression levels and the increased chemoresistance of pancreatic cancer cells, recent research has investigated the mechanisms that decrease transporter expression. As a result, it has been identified that the transmembrane mucin MUC4 utilises the NF-KB pathway to inhibit hCNT1[45]. The increase of MUC4 expression is commonly observed in pancreatic cancer cells, which results in a higher rate of inhibition of hCNT1 transporters and therefore an increase in chemoresistance. Importantly, studies have shown that the inhibition of MUC4 oncogenic receptor Erb2 resulted in the increase of hCNT1 expression and an increased uptake and sensitivity to gemcitabine[42]. Although more extensive work is needed to determine the processes affecting hCNT1 expression, mucins are an interesting contributing factor.
hCNT3The hCNT3 transporter belongs to the SLC28 family and is characterized by the broadest tissue specificity and tissue distribution. It is a symporter that couples the transportation of a nucleoside to the symport of one proton or two Na+ ions. In healthy individuals the transporter is expressed at high levels in the pancreas, mammary glands and in bone marrow. HCNT3 is also expressed in low levels in the prostate, liver, testis, lungs, and intestines[46].
The importance of hCNT3 in pancreatic cancer is of clinical and pharmacological significance due to its ability to transport a large variety of nucleoside-derived drugs such as valacyclovir for viral infections and more importantly gemcitabine for solid tumors. Due to this, it is identified as a crucial mediator of drug response and the development of resistance to anti-cancer drugs[46].
The aberrant expression of hCNT3 has been observed in various pancreatic tumors and pancreatic cancer cell lines. More specifically, a decrease in expression is observed which has been correlated with increased gemcitabine cytotoxicity[45]. Furthermore, uncharacterized polymorphisms of hCHT3 such as the nonsynonymous A25G mutation, have been associate with tumor response to drug toxicity and therapy in pancreatic cancer patients[24]. It has also been shown that hCNT3 expression in pancreatic tumors correlates with overall patient survival, with an increased expression of the transporter associated with a longer overall patient survival[45]. Recent studies investigating the mechanisms that regulate hCNT3 expression in tumor cells suggest that ErbB2 expression and epithelial to mesenchymal transition (EMT) have a negative impact on the regulation of transporter expression[47].
hCNT3 has been observed to have multiple advantages over other NTs capable of gemcitabine uptake, primarily as a potential therapeutic target for reducing resistance of toxic nucleoside analog treatments. Despite extensive research aimed at hENT1 as a therapeutic target for overcoming gemcitabine resistance in pancreatic cancer patients, Paproski et al[23] identified an 8-fold uptake of gemcitabine in hCNT3 transfected cells with functional hENTs and 142-434-fold uptake in cells without hENT activity. The evidence suggesting that functional hENTs present in cells result in a decrease in gemcitabine uptake. However, another study undertaken by Maréchal et al[26] identified pancreatic cancer patients that presented with both high hENT1 and high hCNT3 expression had a 5-fold longer overall survival than those with one favorable prognostic factor and a 7-fold overall survival length than individuals with no favorable prognostic factors.
POSSIBLE STRATEGIES TO OVERCOME CHEMORESISTANCETo date, several strategies aim at effectively treating pancreatic cancer and overcoming chemoresistance commonly seen in patients undertaking chemotherapeutic treatments. A variety of techniques and agents are currently or have previously been investigated for their effectiveness against not only pancreatic cancer, but also

Carter CJ et al. Nucleoside transporters in pancreatic cancer
WJG https://www.wjgnet.com 6853 October 28, 2021 Volume 27 Issue 40
gastrointestinal, peritoneal, and respiratory mucous tumours[3,48].Numerous target treatments have been investigated and evaluated either alone or in
combination with chemotherapeutic agents for pancreatic cancer. Currently, the only targeted therapeutic agent to have statistically significant benefit for patient survival is the tyrosine kinase inhibitor (TKI) erlotinib in combination with gemcitabine with a 2-week mean survival benefit over gemcitabine as a single agent. Though promising, erlotinib is clinically marginal and further investigations are required[48,49].
Other investigated drugs include multikinase inhibitors exhibiting antiangiogenic activity like axitinib, sunitinib and sorafenib and antiangiogenic drugs including vascular endothelial growth factor (VEGF) inhibitors aflibercept and bevacizumab. Recently, compounds targeting signalling cascades such as the multikinase inhibitor masitinib67, phosphoinositide 3-kinase inhibitor rigosertib, and anti-insulin-like growth factor 1 receptor antibodies cixutumumab65,66 and ganitumab have been investigated in combination with gemcitabine. Regrettably, these agents have shown no improvement in patient survival, they have however, provided insight into the cause of futility, with the dense stroma surrounding pancreatic cancer cells speculated to be a key contributor[48,50].
The microenvironment of pancreatic tumours is composed of fibrotic stroma including inflammatory cells, fibroblasts, nerve cells, blood vessels, hyaluronan, fibronectin, and collagen. The theory of targeting the stroma of pancreatic tumours to enhance the effectiveness of chemotherapeutic drugs is of great interest. It is hypothesised that due to the poor vascularization and deposition of extracellular matrix component causes increased hydrostatic pressure and stiffness resulting in a barrier of drug uptake. Currently investigated treatments included calcipotriol for the inactivation of pancreatic stellate cells (PSCs), smoothened homologue inhibitor IPI-926 for the inhibition of collagen deposition and myofibroblast growth and finally evofosfamide which inhibits DNA replication. As seen with other therapeutic treatments, agents attacking the stroma are still in the early stages of investigation and more work is required[48,50].
POSSIBLE STRATEGIES TO ENHANCE NUCLEOSIDE TRANSPORTERSTo date, no viable agents specifically targeting nucleoside transporters in relation to chemoresistance has been developed. Though in vivo investigations into the upregu-lation of hCNT1 expression have shown promising results, the clinical application of these techniques is not yet applicable[51,52]. Although, it has been hypothesised that the overexpression of selected mucins in pancreatic cancer is a contributing factor to nucleoside transporter efficacy and therefore chemoresistance[53]. This mucin overex-pression results in the production of a thick, mucinous physical barrier between cancer cells and the extracellular matrix, thus inhibiting the ability of intracellular drug uptake via nucleoside transporters and affecting the drugs cytotoxicity. Due to this, several agents have been investigated for their mucolytic properties[42,53].
Much of this research has focused on agents that involve the immune system, such as adoptive immunotherapy, oncolytic viral therapy, peptide vaccines to enhance the cytotoxic T cell or T helper cell response, or specific antibodies. These techniques have shown promising results for patients with metastasised disease, when implemented in pre-clinical as well as early-stage clinical trials. However, many of these approaches are limited in their targeting abilities and have only been examined in small patient cohorts[2,3].
Another avenue readily investigated is gene editing technology specifically targeting the mechanisms that have been identified as contributors of disease progression. These methods can include transfection of cells, silencing, and upregu-lating genes via gene promotors, and at the transcriptional level, targeting epigenetic regulation. It is important to note, despite the promising results obtained in vitro and in early clinical stages for these treatments, there are issues surrounding the effect-iveness of treatment delivery in vivo. Due to this, further research is required on the feasibilities of implementing these treatments to patients[2,3,54].
A variety of micro RNAs (miRs), pharmacological and natural agents have also been investigated for their ability to limit pancreatic cancer progression by specifically targeting and downregulating well known mucins such as MUC1 and MUC4[54,55].
miRs are small noncoding RNAs that occur naturally, functioning in gene regulation and have been identified as possible regulators of mucin expression in pancreatic cancer. Four key miRs have been investigated and provided positive results, those being, miR-Let-7b, miR-150, miR-219-1-3p, and miR-200c. All mentioned miRs have

Carter CJ et al. Nucleoside transporters in pancreatic cancer
WJG https://www.wjgnet.com 6854 October 28, 2021 Volume 27 Issue 40
been found to downregulate MUC4 expression, miR-150 directly targets MUC4 resulting in inhibition and is therefore a MUC4-regulating miR. Despite the promising effect of miRs in regulating mucins, there are minimal studies aimed at assessing their viability against established pancreatic tumors in vivo and further studies are required prior to clinical application[36,56-58].
Regarding pharmacological agents, the modulation of mucins, specifically MUC4, is achieved through anti-inflammatory drugs, corticosteroids. Key investigated corticost-eroids include dexamethasone, as well as afatinib and canertinib, two pan-EGFR family inhibitors. These agents had various levels of effectiveness with dexamethasone providing variable modulation results, while afatinib and canertinib resulted in the downregulation of MUC4 expression. Interestingly, canertinib, unlike afatinib, is an irreversible inhibitor and treatment resulted in not only downregulation of MUC4, but also reduction in tumor growth. Though promising, the variable effects due to corticosteroids not only on mucins, but other mechanisms of disease have limited the possibility of clinical application[54,59,60].
Natural agents are of great significance in the treatment of pancreatic cancer due to their ability to target inflammation signaling pathways and regulate the expression of mucins. Several of these agents have been identified as possible pancreatic cancer treatments, including, Thymoquinone, Guggulsterone, Graviola extract, Bromelain and N-acetylcysteine.
Guggulsterone is a phytosteroid derived from the resin of Commiphora Mukul plants. Historically, it has been utilized for the treatment of atherosclerosis, hyperlip-idemia, diabetes, hypertension, and obesity. More recently, it has been investigated for its anti-proliferative activity, ability to induce apoptosis and inhibit cell invasion and motility in various tumor types whether in vitro or vivo. Furthermore, Guggulsterone has shown a synergistic effect with gemcitabine against pancreatic cancer, as well as the reversal of multidrug resistance in breast cancer cell lines. In addition to its anti-tumor properties, Guggulsterone has been identified to decrease the activation of STAT/JAK pathways, downregulating MUC4 as a result. Accounting for all the possible benefits of Guggulsterone it is an attractive agent for clinical application in combination with Gemcitabine against pancreatic cancer[54,61].
Thymoquinone is a bioactive constitute derived from black seed oil (Nigella sativa). It has previously been identified as having several promising pharmacological properties against diseases due to its anti-inflammatory, antioxidant, and anticancer activities. More recently, it has been shown to exhibit antineoplastic properties against pancreatic cancer cell lines FG/ COLO357 and CD18/HPAF. Treatment with Thymoquinone against these cell lines resulted in the downregulation of MUC4 resulting in the increased apoptosis and decrease of migration of tumor cells. The downregulation of MUC4 results in the activation of c-Jun-(NH2)-terminal kinase and p38 MAP kinase, thereby implicating MUC4 as a key target of Thymoquinone. As seen with other natural agents, synergistic effects have been observed both in vitro and vivo with Thymoquinone and chemotherapeutic agents, specifically, Gemcitabine and Oxaliplatin[54,62,63].
Annona muricata (Graviola) evergreen trees are the source of medicinal treatment for inflammatory conditions such as insomnia, hypertension, rheumatism, diabetes, and neuralgia. Within the last decade, investigations into the effect of extracted graviola on pancreatic cancer cell lines have been undertaken in vitro and vivo. It has been identified that graviola downregulated genes associated with glycolysis and hypoxia, and more importantly, downregulated MUC4, while exhibiting antimeta-static and antiproliferative effects[54,64]. Interestingly, graviola has been shown effective in destroying chemoresistant breast cancer cells[65]. This study indicating graviola to be an attractive agent of investigation for chemoresistant cancer cells.
Bromelain is a cysteine proteolytic enzyme extracted from the stem of immature pineapple plants (Ananas comosus). The enzyme is well known for its anti-inflam-matory and mucolytic properties as well as its uses for relief of indigestion, thrombosis, fevers, wound debridement, and edema. Bromelain was originally utilised for its anti-cancer properties in ovarian and breast cancer, with clinical trials of administration resulting in a decrease of metastasis and the resolution of tumour masses. When administered in combination treatments with chemotherapeutic agents such as 5-FU greater patient outcomes and further tumour regression has been observed[66]. Interestingly, bromelain has been recently investigated for its proteolytic properties, specifically its ability to target and disrupt glycosidic linkages in mucins resulting in the disruption of the protective mucolytic layer. The disruption of mucolytic layers produced by mucins on cancerous cells enables the effective uptake of cytotoxic drugs into cells resulting in better patient survival[3,53,66].

Carter CJ et al. Nucleoside transporters in pancreatic cancer
WJG https://www.wjgnet.com 6855 October 28, 2021 Volume 27 Issue 40
N-acetyl cystine (NAC) is a sulphur containing amino acid that is commonly used for the treatment of acetaminophen toxicity and to liquify the thick mucus formed in respiratory diseases such as chronic obstructive pulmonary disorder (COPD) and cystic fibrosis[66]. Due to its chemical composition, NAC holds the ability to reduce disulphide bonds (S-S) to sulphydryl (S-H) bonds in glycoproteins and therefore convert purulent and viscous mucin into an aqueous state resulting in ciliary elimination in the respiratory system[66].
A further strategy for overcoming chemoresistance and increasing patient survival is combination therapy with chemotherapeutic and mucolytic agent. Two natural agents have been identified as effective against mucous cancers when combined, those being bromelain and NAC[67].
Recently, studies into the efficiency of these agents as single agents, in combination with each other and in combination with gemcitabine and 5-FU against pancreatic cancer cell lines has been investigate with promising results[53]. This can present beneficial outcomes for clinical application due to the ease of application as well as a reduction in required chemotherapeutic doses therefore reduced toxicity when compared to currently utilised chemotherapeutic drugs[3,53].
The combination of bromelain and NAC has been shown to have a synergistic cytotoxic effect against several tumour types. It is known that late-stage pancreatic tumours express high amounts of MUC1, MUC4, MUC16 which have been associated with invasiveness, cellular proliferation, metastasis and chemoresistance. Previous studies have shown that a bromelain and NAC combination treatment resulted in the reduction of mucin expression both in vitro and vivo[53,68]. Recent in vivo investig-ations into combination therapy of bromelain and NAC with the addition of cytotoxic agents such as gemcitabine resulted in observed synergism and introduce the possibility of reducing the clinical cytotoxic dosage required for treatment and therefore reducing side effects that commonly present with high dose treatments[53]. It is thought that the combination of bromelain and NAC will disrupt the glycosylic linkages and disulphate bonds within mucins allowing for gemcitabine to effectively enter the cells via nucleoside transporters resulting in its ability to incite its cytotoxic effect[53].
CONCLUSIONPancreatic cancer is a deadly disease with a high mortality rate attributed to late tumour detection, disease aggressiveness and chemoresistance. Although predicted to be the second leading cause of cancer associated mortality within the next 10 years, steady progress has been achieved in determining the mechanisms that contributes to the poor progression of the disease, which, in turn contributes to the development of diagnostic and therapeutic targets.
One of these mechanisms has been identified as human nucleoside transporters, namely for their importance in the transportation of chemotherapeutic drugs into diseased cells along with their contribution to acquired chemoresistance. Primarily, investigations have been undertaken on the nucleoside transporters hENT1, hENT2, hCNT1, and hCNT3, namely due to their ability to transport the nucleoside analogue gemcitabine, however, more research is needed to evaluate their use not only as diagnostic markers but as therapeutic targets.
The expression of nucleoside transporter proteins has been shown to be adverse in pancreatic cancer cells, with decreased protein expression correlating with not only reductions in progression and disease-free patient survival but also an increase in acquired chemoresistance. The lack or inability of nucleoside transporter proteins to facilitate the uptake of chemotherapeutic drugs has been identified as a contributor of gemcitabine chemoresistance and although the majority of research has been focused on hENT1, all examine nucleoside transporters have exhibited this correlation.
There have been several suggestions on overcoming the factors contributing to nucleoside transport related chemoresistance, with treatment options such as mucins being of great interest. Specific mucins have been shown to be overexpressed in pancreatic cancer cells and new combination treatment therapies, such as bromelain + NAC + gemcitabine, targeting the linkages seen in mucins expose the encased nucleoside transporters, allowing for the uptake of cytotoxic drugs which is advant-ageous for several reasons. The two main benefits being increased drug uptake, and reduction of required cytotoxic dose although further research of this strategy for not only the treatment of pancreatic cancer but also overcoming chemoresistance is required.

Carter CJ et al. Nucleoside transporters in pancreatic cancer
WJG https://www.wjgnet.com 6856 October 28, 2021 Volume 27 Issue 40
ACKNOWLEDGEMENTSWe would like to thank the team at the Department of Surgery at St George Hospital, UNSW for all of their support.
REFERENCESRawla P, Sunkara T, Gaduputi V. Epidemiology of Pancreatic Cancer: Global Trends, Etiology and Risk Factors. World J Oncol 2019; 10: 10-27 [PMID: 30834048 DOI: 10.14740/wjon1166]
1
McGuigan A, Kelly P, Turkington RC, Jones C, Coleman HG, McCain RS. Pancreatic cancer: A review of clinical diagnosis, epidemiology, treatment and outcomes. World J Gastroenterol 2018; 24: 4846-4861 [PMID: 30487695 DOI: 10.3748/wjg.v24.i43.4846]
2
Suh H, Pillai K, Morris DL. Mucins in pancreatic cancer: biological role, implications in carcinogenesis and applications in diagnosis and therapy. Am J Cancer Res 2017; 7: 1372-1383 [PMID: 28670497]
3
Jonckheere N, Skrypek N, Van Seuningen I. Mucins and pancreatic cancer. Cancers (Basel) 2010; 2: 1794-1812 [PMID: 24281201 DOI: 10.3390/cancers2041794]
4
Kaur S, Kumar S, Momi N, Sasson AR, Batra SK. Mucins in pancreatic cancer and its microenvironment. Nat Rev Gastroenterol Hepatol 2013; 10: 607-620 [PMID: 23856888 DOI: 10.1038/nrgastro.2013.120]
5
Murthy D, Attri KS, Singh PK. Phosphoinositide 3-Kinase Signaling Pathway in Pancreatic Ductal Adenocarcinoma Progression, Pathogenesis, and Therapeutics. Front Physiol 2018; 9: 335 [PMID: 29670543 DOI: 10.3389/fphys.2018.00335]
6
Attia F, Fathy S, Anani M, Hassan A, Attia F, Ibrahim G, Elazab M. Human equilibrative nucleoside transporter-1 and deoxycytidine kinase can predict gemcitabine effectiveness in Egyptian patients with Hepatocellular carcinoma. J Clin Lab Anal 2020; 34: e23457 [PMID: 32671914 DOI: 10.1002/jcla.23457]
7
Ringel J, Löhr M. The MUC gene family: their role in diagnosis and early detection of pancreatic cancer. Mol Cancer 2003; 2: 9 [PMID: 12556240]
8
Moniaux N, Andrianifahanana M, Brand RE, Batra SK. Multiple roles of mucins in pancreatic cancer, a lethal and challenging malignancy. Br J Cancer 2004; 91: 1633-1638 [PMID: 15494719 DOI: 10.1038/sj.bjc.6602163]
9
Zhang L, Sanagapalli S, Stoita A. Challenges in diagnosis of pancreatic cancer. World J Gastroenterol 2018; 24: 2047-2060 [PMID: 29785074 DOI: 10.3748/wjg.v24.i19.2047]
10
Mohammed S, Van Buren G 2nd, Fisher WE. Pancreatic cancer: advances in treatment. World J Gastroenterol 2014; 20: 9354-9360 [PMID: 25071330 DOI: 10.3748/wjg.v20.i28.9354]
11
Liu F, Du F, Chen X. Multiple tumor marker protein chip detection system in diagnosis of pancreatic cancer. World J Surg Oncol 2014; 12: 333 [PMID: 25381564 DOI: 10.1186/1477-7819-12-333]
12
Yamamoto T, Uchida Y, Terajima H. Clinical impact of margin status on survival and recurrence pattern after curative-intent surgery for pancreatic cancer. Asian J Surg 2019; 42: 93-99 [PMID: 29249392 DOI: 10.1016/j.asjsur.2017.09.003]
13
Conroy T, Hammel P, Hebbar M, Ben Abdelghani M, Wei AC, Raoul JL, Choné L, Francois E, Artru P, Biagi JJ, Lecomte T, Assenat E, Faroux R, Ychou M, Volet J, Sauvanet A, Breysacher G, Di Fiore F, Cripps C, Kavan P, Texereau P, Bouhier-Leporrier K, Khemissa-Akouz F, Legoux JL, Juzyna B, Gourgou S, O'Callaghan CJ, Jouffroy-Zeller C, Rat P, Malka D, Castan F, Bachet JB; Canadian Cancer Trials Group and the Unicancer-GI–PRODIGE Group. FOLFIRINOX or Gemcitabine as Adjuvant Therapy for Pancreatic Cancer. N Engl J Med 2018; 379: 2395-2406 [PMID: 30575490 DOI: 10.1056/NEJMoa1809775]
14
Tsujie M, Nakamori S, Nakahira S, Takahashi Y, Hayashi N, Okami J, Nagano H, Dono K, Umeshita K, Sakon M, Monden M. Human equilibrative nucleoside transporter 1, as a predictor of 5-fluorouracil resistance in human pancreatic cancer. Anticancer Res 2007; 27: 2241-2249 [PMID: 17695509]
15
Spratlin JL, Mackey JR. Human Equilibrative Nucleoside Transporter 1 (hENT1) in Pancreatic Adenocarcinoma: Towards Individualized Treatment Decisions. Cancers (Basel) 2010; 2: 2044-2054 [PMID: 24281217 DOI: 10.3390/cancers2042044]
16
Conroy T, Desseigne F, Ychou M, Bouché O, Guimbaud R, Bécouarn Y, Adenis A, Raoul JL, Gourgou-Bourgade S, de la Fouchardière C, Bennouna J, Bachet JB, Khemissa-Akouz F, Péré-Vergé D, Delbaldo C, Assenat E, Chauffert B, Michel P, Montoto-Grillot C, Ducreux M; Groupe Tumeurs Digestives of Unicancer; PRODIGE Intergroup. FOLFIRINOX versus gemcitabine for metastatic pancreatic cancer. N Engl J Med 2011; 364: 1817-1825 [PMID: 21561347 DOI: 10.1056/NEJMoa1011923]
17
Jonckheere N, Skrypek N, Van Seuningen I. Mucins and tumor resistance to chemotherapeutic drugs. Biochim Biophys Acta 2014; 1846: 142-151 [PMID: 24785432 DOI: 10.1016/j.bbcan.2014.04.008]
18
Zeng S, Pöttler M, Lan B, Grützmann R, Pilarsky C, Yang H. Chemoresistance in Pancreatic Cancer. Int J Mol Sci 2019; 20 [PMID: 31514451 DOI: 10.3390/ijms20184504]
19
Manji GA, Olive KP, Saenger YM, Oberstein P. Current and Emerging Therapies in Metastatic Pancreatic Cancer. Clin Cancer Res 2017; 23: 1670-1678 [PMID: 28373365 DOI:
20

Carter CJ et al. Nucleoside transporters in pancreatic cancer
WJG https://www.wjgnet.com 6857 October 28, 2021 Volume 27 Issue 40
10.1158/1078-0432.Ccr-16-2319]Conroy T, Bachet JB, Ayav A, Huguet F, Lambert A, Caramella C, Maréchal R, Van Laethem JL, Ducreux M. Current standards and new innovative approaches for treatment of pancreatic cancer. Eur J Cancer 2016; 57: 10-22 [PMID: 26851397 DOI: 10.1016/j.ejca.2015.12.026]
21
Alvarellos ML, Lamba J, Sangkuhl K, Thorn CF, Wang L, Klein DJ, Altman RB, Klein TE. PharmGKB summary: gemcitabine pathway. Pharmacogenet Genomics 2014; 24: 564-574 [PMID: 25162786 DOI: 10.1097/fpc.0000000000000086]
22
Paproski RJ, Yao SY, Favis N, Evans D, Young JD, Cass CE, Zemp RJ. Human concentrative nucleoside transporter 3 transfection with ultrasound and microbubbles in nucleoside transport deficient HEK293 cells greatly increases gemcitabine uptake. PLoS One 2013; 8: e56423 [PMID: 23441192 DOI: 10.1371/journal.pone.0056423]
23
Maréchal R, Bachet JB, Mackey JR, Dalban C, Demetter P, Graham K, Couvelard A, Svrcek M, Bardier-Dupas A, Hammel P, Sauvanet A, Louvet C, Paye F, Rougier P, Penna C, André T, Dumontet C, Cass CE, Jordheim LP, Matera EL, Closset J, Salmon I, Devière J, Emile JF, Van Laethem JL. Levels of gemcitabine transport and metabolism proteins predict survival times of patients treated with gemcitabine for pancreatic adenocarcinoma. Gastroenterology 2012; 143: 664-674.e6 [PMID: 22705007 DOI: 10.1053/j.gastro.2012.06.006]
24
García-Manteiga J, Molina-Arcas M, Casado FJ, Mazo A, Pastor-Anglada M. Nucleoside transporter profiles in human pancreatic cancer cells: role of hCNT1 in 2',2'-difluorodeoxycytidine- induced cytotoxicity. Clin Cancer Res 2003; 9: 5000-5008 [PMID: 14581375]
25
Maréchal R, Mackey JR, Lai R, Demetter P, Peeters M, Polus M, Cass CE, Young J, Salmon I, Devière J, Van Laethem JL. Human equilibrative nucleoside transporter 1 and human concentrative nucleoside transporter 3 predict survival after adjuvant gemcitabine therapy in resected pancreatic adenocarcinoma. Clin Cancer Res 2009; 15: 2913-2919 [PMID: 19318496 DOI: 10.1158/1078-0432.Ccr-08-2080]
26
Hagmann W, Jesnowski R, Löhr JM. Interdependence of gemcitabine treatment, transporter expression, and resistance in human pancreatic carcinoma cells. Neoplasia 2010; 12: 740-747 [PMID: 20824050 DOI: 10.1593/neo.10576]
27
Yeldag G, Rice A, Del Río Hernández A. Chemoresistance and the Self-Maintaining Tumor Microenvironment. Cancers (Basel) 2018; 10 [PMID: 30487436 DOI: 10.3390/cancers10120471]
28
Shukla SK, Purohit V, Mehla K, Gunda V, Chaika NV, Vernucci E, King RJ, Abrego J, Goode GD, Dasgupta A, Illies AL, Gebregiworgis T, Dai B, Augustine JJ, Murthy D, Attri KS, Mashadova O, Grandgenett PM, Powers R, Ly QP, Lazenby AJ, Grem JL, Yu F, Matés JM, Asara JM, Kim JW, Hankins JH, Weekes C, Hollingsworth MA, Serkova NJ, Sasson AR, Fleming JB, Oliveto JM, Lyssiotis CA, Cantley LC, Berim L, Singh PK. MUC1 and HIF-1alpha Signaling Crosstalk Induces Anabolic Glucose Metabolism to Impart Gemcitabine Resistance to Pancreatic Cancer. Cancer Cell 2017; 32: 71-87.e7 [PMID: 28697344 DOI: 10.1016/j.ccell.2017.06.004]
29
Dauer P, Nomura A, Saluja A, Banerjee S. Microenvironment in determining chemo-resistance in pancreatic cancer: Neighborhood matters. Pancreatology 2017; 17: 7-12 [PMID: 28034553 DOI: 10.1016/j.pan.2016.12.010]
30
de Sousa Cavalcante L, Monteiro G. Gemcitabine: metabolism and molecular mechanisms of action, sensitivity and chemoresistance in pancreatic cancer. Eur J Pharmacol 2014; 741: 8-16 [PMID: 25084222 DOI: 10.1016/j.ejphar.2014.07.041]
31
Mittal A, Chitkara D, Behrman SW, Mahato RI. Efficacy of gemcitabine conjugated and miRNA-205 complexed micelles for treatment of advanced pancreatic cancer. Biomaterials 2014; 35: 7077-7087 [PMID: 24836307 DOI: 10.1016/j.biomaterials.2014.04.053]
32
Pastor-Anglada M, Pérez-Torras S. Emerging Roles of Nucleoside Transporters. Front Pharmacol 2018; 9: 606 [PMID: 29928232 DOI: 10.3389/fphar.2018.00606]
33
Nakano Y, Tanno S, Koizumi K, Nishikawa T, Nakamura K, Minoguchi M, Izawa T, Mizukami Y, Okumura T, Kohgo Y. Gemcitabine chemoresistance and molecular markers associated with gemcitabine transport and metabolism in human pancreatic cancer cells. Br J Cancer 2007; 96: 457-463 [PMID: 17224927 DOI: 10.1038/sj.bjc.6603559]
34
Farrell JJ, Elsaleh H, Garcia M, Lai R, Ammar A, Regine WF, Abrams R, Benson AB, Macdonald J, Cass CE, Dicker AP, Mackey JR. Human equilibrative nucleoside transporter 1 levels predict response to gemcitabine in patients with pancreatic cancer. Gastroenterology 2009; 136: 187-195 [PMID: 18992248 DOI: 10.1053/j.gastro.2008.09.067]
35
Wang C, Lin W, Playa H, Sun S, Cameron K, Buolamwini JK. Dipyridamole analogs as pharmacological inhibitors of equilibrative nucleoside transporters. Identification of novel potent and selective inhibitors of the adenosine transporter function of human equilibrative nucleoside transporter 4 (hENT4). Biochem Pharmacol 2013; 86: 1531-1540 [PMID: 24021350 DOI: 10.1016/j.bcp.2013.08.063]
36
Paproski RJ, Young JD, Cass CE. Predicting gemcitabine transport and toxicity in human pancreatic cancer cell lines with the positron emission tomography tracer 3'-deoxy-3'-fluorothymidine. Biochem Pharmacol 2010; 79: 587-595 [PMID: 19788890 DOI: 10.1016/j.bcp.2009.09.025]
37
Liu Y, Zuo T, Zhu X, Ahuja N, Fu T. Differential expression of hENT1 and hENT2 in colon cancer cell lines. Genet Mol Res 2017; 16 [PMID: 28218790 DOI: 10.4238/gmr16019549]
38
Griffiths M, Yao SY, Abidi F, Phillips SE, Cass CE, Young JD, Baldwin SA. Molecular cloning and characterization of a nitrobenzylthioinosine-insensitive (ei) equilibrative nucleoside transporter from human placenta. Biochem J 1997; 328 ( Pt 3): 739-743 [PMID: 9396714 DOI: 10.1042/bj3280739]
39

Carter CJ et al. Nucleoside transporters in pancreatic cancer
WJG https://www.wjgnet.com 6858 October 28, 2021 Volume 27 Issue 40
Zhang S, Furugawa T, Takahashi H, Che X, Zhao H, Akiyama S, Li Y. Analysis of gene expression in gemcitabine resistant cells derived from human pancreatic cancer cell. Proceedings of the Proceedings 2011 International Conference on Human Health and Biomedical Engineering. 2011: 182-185
40
Amrutkar M, Gladhaug IP. Pancreatic Cancer Chemoresistance to Gemcitabine. Cancers (Basel) 2017; 9 [PMID: 29144412 DOI: 10.3390/cancers9110157]
41
Spratlin J, Sangha R, Glubrecht D, Dabbagh L, Young JD, Dumontet C, Cass C, Lai R, Mackey JR. The absence of human equilibrative nucleoside transporter 1 is associated with reduced survival in patients with gemcitabine-treated pancreas adenocarcinoma. Clin Cancer Res 2004; 10: 6956-6961 [PMID: 15501974 DOI: 10.1158/1078-0432.Ccr-04-0224]
42
Bhutia YD, Hung SW, Patel B, Lovin D, Govindarajan R. CNT1 expression influences proliferation and chemosensitivity in drug-resistant pancreatic cancer cells. Cancer Res 2011; 71: 1825-1835 [PMID: 21343396 DOI: 10.1158/0008-5472.Can-10-2736]
43
Skrypek N, Duchêne B, Hebbar M, Leteurtre E, van Seuningen I, Jonckheere N. The MUC4 mucin mediates gemcitabine resistance of human pancreatic cancer cells via the Concentrative Nucleoside Transporter family. Oncogene 2013; 32: 1714-1723 [PMID: 22580602 DOI: 10.1038/onc.2012.179]
44
Stecula A, Schlessinger A, Giacomini KM, Sali A. Human Concentrative Nucleoside Transporter 3 (hCNT3, SLC28A3) Forms a Cyclic Homotrimer. Biochemistry 2017; 56: 3475-3483 [PMID: 28661652 DOI: 10.1021/acs.biochem.7b00339]
45
Hesler RA, Huang JJ, Starr MD, Treboschi VM, Bernanke AG, Nixon AB, McCall SJ, White RR, Blobe GC. TGF-β-induced stromal CYR61 promotes resistance to gemcitabine in pancreatic ductal adenocarcinoma through downregulation of the nucleoside transporters hENT1 and hCNT3. Carcinogenesis 2016; 37: 1041-1051 [PMID: 27604902 DOI: 10.1093/carcin/bgw093]
46
Neoptolemos JP, Kleeff J, Michl P, Costello E, Greenhalf W, Palmer DH. Therapeutic developments in pancreatic cancer: current and future perspectives. Nat Rev Gastroenterol Hepatol 2018; 15: 333-348 [PMID: 29717230 DOI: 10.1038/s41575-018-0005-x]
47
Moore MJ, Goldstein D, Hamm J, Figer A, Hecht JR, Gallinger S, Au HJ, Murawa P, Walde D, Wolff RA, Campos D, Lim R, Ding K, Clark G, Voskoglou-Nomikos T, Ptasynski M, Parulekar W; National Cancer Institute of Canada Clinical Trials Group. Erlotinib plus gemcitabine compared with gemcitabine alone in patients with advanced pancreatic cancer: a phase III trial of the National Cancer Institute of Canada Clinical Trials Group. J Clin Oncol 2007; 25: 1960-1966 [PMID: 17452677 DOI: 10.1200/jco.2006.07.9525]
48
Michl P, Gress TM. Current concepts and novel targets in advanced pancreatic cancer. Gut 2013; 62: 317-326 [PMID: 23112132 DOI: 10.1136/gutjnl-2012-303588]
49
Pérez-Torras S, Vidal-Pla A, Cano-Soldado P, Huber-Ruano I, Mazo A, Pastor-Anglada M. Concentrative nucleoside transporter 1 (hCNT1) promotes phenotypic changes relevant to tumor biology in a translocation-independent manner. Cell Death Dis 2013; 4: e648 [PMID: 23722537 DOI: 10.1038/cddis.2013.173]
50
Pastor-Anglada M, Pérez-Torras S. Nucleoside transporter proteins as biomarkers of drug responsiveness and drug targets. Front Pharmacol 2015; 6: 13 [PMID: 25713533 DOI: 10.3389/fphar.2015.00013]
51
Pillai K, Mekkawy AH, Akhter J, Badar S, Dong L, Liu AI, Morris DL. Enhancing the potency of chemotherapeutic agents by combination with bromelain and N-acetylcysteine - an in vitro study with pancreatic and hepatic cancer cells. Am J Transl Res 2020; 12: 7404-7419 [PMID: 33312377]
52
Gautam SK, Kumar S, Cannon A, Hall B, Bhatia R, Nasser MW, Mahapatra S, Batra SK, Jain M. MUC4 mucin- a therapeutic target for pancreatic ductal adenocarcinoma. Expert Opin Ther Targets 2017; 21: 657-669 [PMID: 28460571 DOI: 10.1080/14728222.2017.1323880]
53
Torres MP, Chakraborty S, Souchek J, Batra SK. Mucin-based targeted pancreatic cancer therapy. Curr Pharm Des 2012; 18: 2472-2481 [PMID: 22372499 DOI: 10.2174/13816128112092472]
54
Srivastava SK, Bhardwaj A, Singh S, Arora S, Wang B, Grizzle WE, Singh AP. MicroRNA-150 directly targets MUC4 and suppresses growth and malignant behavior of pancreatic cancer cells. Carcinogenesis 2011; 32: 1832-1839 [PMID: 21983127 DOI: 10.1093/carcin/bgr223]
55
Arora S, Swaminathan SK, Kirtane A, Srivastava SK, Bhardwaj A, Singh S, Panyam J, Singh AP. Synthesis, characterization, and evaluation of poly (D,L-lactide-co-glycolide)-based nanoformulation of miRNA-150: potential implications for pancreatic cancer therapy. Int J Nanomedicine 2014; 9: 2933-2942 [PMID: 24971005 DOI: 10.2147/ijn.S61949]
56
Lahdaoui F, Delpu Y, Vincent A, Renaud F, Messager M, Duchêne B, Leteurtre E, Mariette C, Torrisani J, Jonckheere N, Van Seuningen I. miR-219-1-3p is a negative regulator of the mucin MUC4 expression and is a tumor suppressor in pancreatic cancer. Oncogene 2015; 34: 780-788 [PMID: 24608432 DOI: 10.1038/onc.2014.11]
57
Seshacharyulu P, Ponnusamy MP, Rachagani S, Lakshmanan I, Haridas D, Yan Y, Ganti AK, Batra SK. Targeting EGF-receptor(s) - STAT1 axis attenuates tumor growth and metastasis through downregulation of MUC4 mucin in human pancreatic cancer. Oncotarget 2015; 6: 5164-5181 [PMID: 25686822 DOI: 10.18632/oncotarget.3286]
58
Gollub EG, Waksman H, Goswami S, Marom Z. Mucin genes are regulated by estrogen and dexamethasone. Biochem Biophys Res Commun 1995; 217: 1006-1014 [PMID: 8554551 DOI: 10.1006/bbrc.1995.2870]
59
Macha MA, Rachagani S, Gupta S, Pai P, Ponnusamy MP, Batra SK, Jain M. Guggulsterone decreases proliferation and metastatic behavior of pancreatic cancer cells by modulating JAK/STAT
60

Carter CJ et al. Nucleoside transporters in pancreatic cancer
WJG https://www.wjgnet.com 6859 October 28, 2021 Volume 27 Issue 40
and Src/FAK signaling. Cancer Lett 2013; 341: 166-177 [PMID: 23920124 DOI: 10.1016/j.canlet.2013.07.037]Torres MP, Ponnusamy MP, Chakraborty S, Smith LM, Das S, Arafat HA, Batra SK. Effects of thymoquinone in the expression of mucin 4 in pancreatic cancer cells: implications for the development of novel cancer therapies. Mol Cancer Ther 2010; 9: 1419-1431 [PMID: 20423995 DOI: 10.1158/1535-7163.Mct-10-0075]
61
Woo CC, Kumar AP, Sethi G, Tan KH. Thymoquinone: potential cure for inflammatory disorders and cancer. Biochem Pharmacol 2012; 83: 443-451 [PMID: 22005518 DOI: 10.1016/j.bcp.2011.09.029]
62
Torres MP, Rachagani S, Purohit V, Pandey P, Joshi S, Moore ED, Johansson SL, Singh PK, Ganti AK, Batra SK. Graviola: a novel promising natural-derived drug that inhibits tumorigenicity and metastasis of pancreatic cancer cells in vitro and in vivo through altering cell metabolism. Cancer Lett 2012; 323: 29-40 [PMID: 22475682 DOI: 10.1016/j.canlet.2012.03.031]
63
Syed Najmuddin SU, Romli MF, Hamid M, Alitheen NB, Nik Abd Rahman NM. Anti-cancer effect of Annona Muricata Linn Leaves Crude Extract (AMCE) on breast cancer cell line. BMC Complement Altern Med 2016; 16: 311 [PMID: 27558166 DOI: 10.1186/s12906-016-1290-y]
64
Pillai K. Anti-Tumour and Chemosensitising Effect of a Combination of Bromelain + N-Acetyl Cysteine with Cisplatin or 5-Fu on Malignant Peritoneal Mesothelioma Cells. J Glycobiol 2013; s1 [DOI: 10.4172/2168-958X.S1-005]
65
Amini A, Masoumi-Moghaddam S, Ehteda A, Liauw W, Morris DL. Potentiation of chemotherapeutics by bromelain and N-acetylcysteine: sequential and combination therapy of gastrointestinal cancer cells. Am J Cancer Res 2016; 6: 350-369 [PMID: 27186409]
66
Zheng HC. The molecular mechanisms of chemoresistance in cancers. Oncotarget 2017; 8: 59950-59964 [PMID: 28938696 DOI: 10.18632/oncotarget.19048]
67
Goral V. Pancreatic Cancer: Pathogenesis and Diagnosis. Asian Pac J Cancer Prev 2015; 16: 5619-5624 [PMID: 26320426 DOI: 10.7314/apjcp.2015.16.14.5619]
68
Maher DM, Gupta BK, Nagata S, Jaggi M, Chauhan SC. Mucin 13: structure, function, and potential roles in cancer pathogenesis. Mol Cancer Res 2011; 9: 531-537 [PMID: 21450906 DOI: 10.1158/1541-7786.Mcr-10-0443]
69
Chemocare. Chemotherapy Drugs and Drugs Often Used During Chemotherapy. 2020 [cited 12 April 2021] Available from: https://pubchem.ncbi.nlm.nih.gov/compound/Gemcitabine
70
National Center for Biotechnology Information. PubChem Compound Summary for CID 60750, Gemcitabine. 2020 [cited 12 April 2021] Available from: https://pubchem.ncbi.nlm.nih.gov/compound/Gemcitabine
71
Wright NJ, Lee SY. Structures of human ENT1 in complex with adenosine reuptake inhibitors. Nat Struct Mol Biol 2019; 26: 599-606 [PMID: 31235912 DOI: 10.1038/s41594-019-0245-7]
72
Rehan S, Paavilainen VO, Jaakola VP. Functional reconstitution of human equilibrative nucleoside transporter-1 into styrene maleic acid co-polymer lipid particles. Biochim Biophys Acta Biomembr 2017; 1859: 1059-1065 [PMID: 28254415 DOI: 10.1016/j.bbamem.2017.02.017]
73
Vincenzi B, Stacchiotti S, Collini P, Pantano F, Rabitti C, Perrone G, Iuliani M, Baldi A, Badalamenti G, Sanfilippo R, Santini D, Muda AO, Gronchi A, Casali P, Dei Tos AP, Tonini G. Human equilibrative nucleoside transporter 1 gene expression is associated with gemcitabine efficacy in advanced leiomyosarcoma and angiosarcoma. Br J Cancer 2017; 117: 340-346 [PMID: 28641307 DOI: 10.1038/bjc.2017.187]
74
Kim J, Kim H, Lee JC, Kim JW, Paik WH, Lee SH, Hwang JH, Ryu JK, Kim YT. Human equilibrative nucleoside transporter 1 (hENT1) expression as a predictive biomarker for gemcitabine chemotherapy in biliary tract cancer. PLoS One 2018; 13: e0209104 [PMID: 30557411 DOI: 10.1371/journal.pone.0209104]
75
Bolze A, Abhyankar A, Grant AV, Patel B, Yadav R, Byun M, Caillez D, Emile JF, Pastor-Anglada M, Abel L, Puel A, Govindarajan R, de Pontual L, Casanova JL. A mild form of SLC29A3 disorder: a frameshift deletion leads to the paradoxical translation of an otherwise noncoding mRNA splice variant. PLoS One 2012; 7: e29708 [PMID: 22238637 DOI: 10.1371/journal.pone.0029708]
76
Daniels G. An update on the Augustine blood group system. Immunohematology 2019; 35: 1-2 [PMID: 30908068]
77
Owen RP, Lagpacan LL, Taylor TR, De La Cruz M, Huang CC, Kawamoto M, Johns SJ, Stryke D, Ferrin TE, Giacomini KM. Functional characterization and haplotype analysis of polymorphisms in the human equilibrative nucleoside transporter, ENT2. Drug Metab Dispos 2006; 34: 12-15 [PMID: 16214850 DOI: 10.1124/dmd.105.006270]
78
Cano-Soldado P, Gorraitz E, Errasti-Murugarren E, Casado FJ, Lostao MP, Pastor-Anglada M. Functional analysis of the human concentrative nucleoside transporter-1 variant hCNT1S546P provides insight into the sodium-binding pocket. Am J Physiol Cell Physiol 2012; 302: C257-C266 [PMID: 21998139 DOI: 10.1152/ajpcell.00198.2011]
79
Koczor CA, Torres RA, Lewis W. The role of transporters in the toxicity of nucleoside and nucleotide analogs. Expert Opin Drug Metab Toxicol 2012; 8: 665-676 [PMID: 22509856 DOI: 10.1517/17425255.2012.680885]
80
Yao SYM, Young JD. Inward- and outward-facing homology modeling of human concentrative nucleoside transporter 3 (hCNT3) predicts an elevator-type transport mechanism. Channels (Austin) 2018; 12: 291-298 [PMID: 30096006 DOI: 10.1080/19336950.2018.1506665]
81
Ritzel MW, Ng AM, Yao SY, Graham K, Loewen SK, Smith KM, Ritzel RG, Mowles DA, 82

Carter CJ et al. Nucleoside transporters in pancreatic cancer
WJG https://www.wjgnet.com 6860 October 28, 2021 Volume 27 Issue 40
Carpenter P, Chen XZ, Karpinski E, Hyde RJ, Baldwin SA, Cass CE, Young JD. Molecular identification and characterization of novel human and mouse concentrative Na+-nucleoside cotransporter proteins (hCNT3 and mCNT3) broadly selective for purine and pyrimidine nucleosides (system cib). J Biol Chem 2001; 276: 2914-2927 [PMID: 11032837 DOI: 10.1074/jbc.M007746200]

WJG https://www.wjgnet.com 6861 October 28, 2021 Volume 27 Issue 40
World Journal of
GastroenterologyW J GSubmit a Manuscript: https://www.f6publishing.com World J Gastroenterol 2021 October 28; 27(40): 6861-6873
DOI: 10.3748/wjg.v27.i40.6861 ISSN 1007-9327 (print) ISSN 2219-2840 (online)
MINIREVIEWS
Management of hepatitis B and C in special population
Anand V Kulkarni, Nageshwar Reddy Duvvuru
ORCID number: Anand V Kulkarni 0000-0002-1240-1675; Nageshwar Reddy Duvvuru 0000-0001-7540-0496.
Author contributions: Kulkarni AV and Duvvuru NR made the study concept; Kulkarni AV did the initial drafting and DNR critically assessed and edited the manuscript; all authors approved the final manuscript.
Conflict-of-interest statement: The authors declare no conflicts of interest.
Open-Access: This article is an open-access article that was selected by an in-house editor and fully peer-reviewed by external reviewers. It is distributed in accordance with the Creative Commons Attribution NonCommercial (CC BY-NC 4.0) license, which permits others to distribute, remix, adapt, build upon this work non-commercially, and license their derivative works on different terms, provided the original work is properly cited and the use is non-commercial. See: http://creativecommons.org/Licenses/by-nc/4.0/
Manuscript source: Invited manuscript
Specialty type: Gastroenterology and hepatology
Country/Territory of origin: India
Anand V Kulkarni, Department of Hepatology, Asian Institute of Gastroenterology, Hyderabad 500032, Telangana, India
Nageshwar Reddy Duvvuru, Department of Gastroenterology, Asian Institute of Gastroen-terology, Hyderabad 500032, Telanagana, India
Corresponding author: Anand V Kulkarni, MD, Consultant Physician-Scientist, Department of Hepatology, Asian Institute of Gastroenterology, 6-3-661, Somajiguda, Hyderabad 500032, Telangana, India. [email protected]
AbstractChronic viral hepatitis is one of the leading causes of cirrhosis worldwide. Chronic hepatitis B is more common in the Asia-Pacific region due to the larger population and lower screening availability. Hepatitis C predominates in the west due to injection drug abuse. The discovery of (oral) direct-acting antiviral agents (DAAs) has changed the landscape of chronic hepatitis C (CHC) management. Nucleos(t)ide analogs (NUCs) have also changed the approach to the treatment of chronic hepatitis B (CHB). Oral NUCs and DAAs have excellent efficacy and patient acceptance as well as a lower risk of resistance. However, certain popu-lations have no robust data and safety and efficacy of such oral drugs is still evolving. In this review, we provide an overview of the management of CHB and CHC in special populations, such as those with chronic kidney disease, pregnant women, healthcare workers, and those undergoing chemo- or immunosup-pressive therapy.
Key Words: Chronic kidney disease; Pregnancy; Hepatitis B; Hepatitis C; Health care professionals; Tenofovir
©The Author(s) 2021. Published by Baishideng Publishing Group Inc. All rights reserved.
Core Tip: Hepatitis B and hepatitis C are leading causes of liver disease and pose significant burdens on healthcare and the economy, especially in developing countries. The management of chronic hepatitis B and C in special populations is less known. In this review, we discuss the indications, timing of treatment, and safety of drugs in special populations infected with hepatitis B or C. The special populations discussed herein are those with chronic kidney disease, pregnant women, coinfected patients, healthcare workers, and patients undergoing chemotherapy.

Kulkarni AV et al. Chronic viral hepatitis in special population
WJG https://www.wjgnet.com 6862 October 28, 2021 Volume 27 Issue 40
Peer-review report’s scientific quality classificationGrade A (Excellent): 0 Grade B (Very good): B Grade C (Good): 0 Grade D (Fair): 0 Grade E (Poor): 0
Received: February 22, 2021 Peer-review started: February 22, 2021 First decision: May 13, 2021 Revised: May 30, 2021 Accepted: September 14, 2021 Article in press: September 14, 2021 Published online: October 28, 2021
P-Reviewer: Ikegami T S-Editor: Wu YXJ L-Editor: A P-Editor: Wu RR
Citation: Kulkarni AV, Duvvuru NR. Management of hepatitis B and C in special population. World J Gastroenterol 2021; 27(40): 6861-6873URL: https://www.wjgnet.com/1007-9327/full/v27/i40/6861.htmDOI: https://dx.doi.org/10.3748/wjg.v27.i40.6861
INTRODUCTIONHepatitis B and C together constitute a major etiology of cirrhosis of the liver, especially in the Asia-Pacific region[1-3]. Nucleos(t)ide analogs and direct-acting antivirals (DAAs) are breakthrough treatments for chronic hepatitis B (CHB) and chronic hepatitis C (CHC), respectively. The management of Hepatitis B and C in an adult population without comorbidities is well known. Special population groups are those who are less often studied, and the drugs cannot be tested in such populations due to ethical reasons. The data on management strategies are still evolving for special populations. Such populations include patients with chronic kidney disease (CKD), patients on hemodialysis (HD), pregnant women, coinfected patients, healthcare workers, and patients undergoing chemotherapy[4]. In this review, we discuss the indications and safety of antiviral agents in special populations.
CHRONIC KIDNEY DISEASE AND HEMODIALYSIS Hepatitis B and CKDHepatitis B is associated with proteinuria and a higher risk of CKD[5,6]. Hepatitis B virus (HBV)-infected treatment naïve patients have a higher incidence of hematuria, glycosuria, and leukocyturia[7]. Nearly 28%-40% of CHB patients have a glomerular filtration rate (GFR) < 90 mL/min/1.73 m2[7,8]. The prevalence of CKD in CHB patients is 3%-8%, with increasing prevalence with age[9]. This translates into an enormous burden of CKD due to the higher prevalence of CHB in the Asia-Pacific region. The presence of hypertension, diabetes mellitus, and cirrhosis further increases the risk of CKD in CHB[9]. Smoking and physical inactivity can also increase the risk of CKD[10]. The presence of CKD can also increase the risk of HBV infection due to immuno-suppression (rising the risk of viral infections), frequent requirements of blood transfusions (for anemia of chronic disease), and HD. The ideal endpoints of CHB treat-ment are HBsAg loss and anti-HBs seroconversion, which are challenging to attain. Long-term DNA suppression, normalization of alanine transaminase (ALT), and HBeAg loss (in those who are HBe-positive with or without anti-HBe serocon-version) remain the primary achievable endpoints in the treatment of CHB[4]. The data on the management of CHB in CKD are limited. Since ALT levels are suppressed in CKD (and those on HD), initiating treatment in individuals with HBV DNA > 2000 IU/mL (irrespective of ALT levels) is recommended, especially if > F1 fibrosis is documented either by biopsy or noninvasively[11]. Vaccination remains the best preventive strategy for CKD and HD patients. One milliliter each (containing 20 mcg) should be given intramuscularly (in deltoid muscle) four times at 0, 1 mo, 2 mo and 6 mo. The initial anti-HBs titer should be done two months after the first schedule and then annually thereafter. A booster dose is recommended if the anti-HBs is < 10 IU/mL in CKD patients[12]. Tenofovir disoproxil fumarate (TDF), tenofovir alafe-namide fumarate (TAF), and entecavir (ETV) have a low risk of resistance and high efficacy in CKD patients[11,13]. Lamivudine, telbivudine, and adefovir are less effective, nephrotoxic, and are associated with risk of resistance. Interferon-α therapy is less tolerated and is not preferred over NUCs, although the advantage of IFN-α of limited duration therapy cannot be ignored. IFN-α can be used in young patients without cirrhosis, psychosis, or autoimmune disease and GFR > 30 mL/min/1.73 m213(Table 1).
Hepatitis C and CKDExtrahepatic manifestations are more common in hepatitis C virus (HCV) than HBV[14]. CHC patients may have renal failure even in the absence of liver disease[15]. HCV-infected individuals have a 23% higher risk of developing CKD than non-HCV-infected individuals[16]. Hepatitis C is a leading cause of liver disease among patients with CKD, particularly those on dialysis. The seroprevalence of HCV in the Asian population in patients on dialysis ranges between 1%-18%, with higher a prevalence in

Kulkarni AV et al. Chronic viral hepatitis in special population
WJG https://www.wjgnet.com 6863 October 28, 2021 Volume 27 Issue 40
Table 1 Hepatitis B in chronic kidney disease
HBV and CKD
Prevalence of CKD in HBV patients
8%
Pathogenesis Direct cytopathic effect of the HBV on cells of the kidney; Glomerular deposition of immune complexes; Virus-induced specific immunological effector mechanisms (specific T lymphocyte or antibody); CHB induced cytokine toxicity on renal tissue
Risk factors Smoking, diabetes mellitus, hypertension, cirrhosis.
Common type of renal injury
Membranous GN; Membranoproliferative GN; Polyarteritis nodosa; IgA nephropathy
Treatment indication HBV DNA 2000 IU/mL with or without elevated ALT; Liver biopsy-chronic hepatitis with > F1 fibrosis; If planned for renal transplant, initiate NUCs 2 wk before transplant even if DNA ≤ 2000 IU/mL
Safe drugs TAF (no dose adjustment till eGFR < 15 mL); ETV and TDF (If GFR > 50: ETV 0.5 mg/d or TDF 300 mg/d; GFR 30-49: ETV 0.5 mg alternate day or TDF 300 mg alternate day; GFR 10-29: ETV 0.5 mg once in 3 d and TDF 300 mg once in 3 d; on HD-ETV 0.5 mg or TDF 300 mg after every dialysis or every 7 d)
Prevention Regular screening; Vaccination (double dose); Serology should be performed every year, and a booster dose should be given if antibody titers are below 10 mIU/mL.
HBV: Hepatitis B virus; CKD: Chronic kidney disease; CHB: Chronic hepatitis B; NUC: Nucleos(t)ide analogues; TDF: Tenofovir disoproxil fumarate; TAF: Tenofovir alafenamide fumarate; ETV: Entecavir; GFR: Glomerular filtration rate; GN: Glomerulonephritis; ALT: Alanine transaminase.
those on HD than in those on peritoneal dialysis, i.e., 8 ± 5.5%[17]. Due to a higher number of adverse effects, the use of pegylated IFN plus ribavirin is not recommended[18]. Glecaprevir and pibrentasvir are NS3/4A protease and NS5A inhibitors, respectively, which have pangenotypic activity. Glecapravir 300 mg and pibrentasvir 120 mg in a fixed-dose combination are the treatments of choice for patients with chronic hepatitis C and stage 4 or 5 CKD (including those on HD)[19,20]. In patients with stage 1-3 CKD, similar dosing of DAA without dose adjustments is recom-mended. However, glecaprevir and pibrentasvir are not available in all countries. Another option for genotype 1b CHC is grazoprevir, 100 mg and elbasvir, 50 mg for 12 wk, which is still unavailable in many countries[21]. Sofosbuvir-based regimens are also safe in patients with renal impairment and cirrhosis (both decompensated and compensated)[22]. Sofosbuvir 400 mg and velpatasvir 100 mg fixed-dose combination is safe and effective for renal impairment patients (even HD patients) with CHC[23]. In patients with CHC and compensated cirrhosis, the recommended duration is 12 wk, while it is 24 wk for decompensated cirrhosis[20]. Sofosbuvir (400 mg) + ledipasvir (90 mg) also has proven efficacy for Genotype 1b with renal impairment but not on HD[24]. Ribavirin may be added for decompensated cirrhosis patients in combination with sofosbuvir-ledipasvir or in persons with HCV genotype 1a who are receiving treatment with elbasvir-grazoprevir and who have baseline NS5A resistance-associated variants for elbasvir. The dose of ribavirin is 200 mg/d for patients with creatinine clearance < 30 mL/min and 200/400 mg alternate day for patients with creatinine clearance between 30 mL/min and 50 mL/min. American Association for the study of Liver Disease (AASLD)/Infectious Disease Society of America (IDSA) has approved the use of sofosbuvir-velpatasvir; however, in some countries, it is still used as an off-label indication in patients with renal impairment[25]. Strict adherence to infection control protocols during dialysis is the only way to prevent HCV spread[26]. To date, no vaccines have succeeded in preventing chronic HCV infection[27]. Anti-HCV antibodies should be tested before initiation of dialysis and then biannually[28]. Monthly ALT estimation is also recommended for those on dialysis (Table 2).
PregnancyPregnancy is an opportunity to diagnose chronic viral hepatitis. Screening for hepatitis B and C is recommended for all individuals to prevent mother-to-child transmission (MTCT) and prevent transmission to health care professionals[29].
HBV and pregnancy: Nearly 10% of childbearing women in the Asia-Pacific region are infected with HBV[30]. There can be four situations in pregnancy: (1) First time incidentally diagnosed CVH during pregnancy; (2) Individuals are infected and are already on treatment with antiviral therapy; (3) Individuals are under surveillance for CVH and are contemplating pregnancy; and (4) Cirrhosis due to viral hepatitis.

Kulkarni AV et al. Chronic viral hepatitis in special population
WJG https://www.wjgnet.com 6864 October 28, 2021 Volume 27 Issue 40
Table 2 Hepatitis C in chronic kidney disease
HCV and CKD
Prevalence of HCV in CKD patients
10%-14%
Pathogenesis Pronounced leucocyte infiltration of glomerular capillaries and the precipitation of immunoglobulins, immune complexes/cryoglobulins; Glomerular deposition of HCV protein
Risk factors Age, male gender, lack of HCV treatment, concomitant HAV/HBV infection; Diabetes mellitus
Common types of renal injury
Membranous GN; Membranoproliferative GN; Essential mixed cryoglobulinemia (type II); IgA nephropathy; Polyarteritis nodosa
Treatment indication Viremia
Safe drugs Glecapravir + Pibrentasvir; Sofofbuvir + Velpatasvir; Sofosbuvir + Ledipasvir; Grazoprevir + Elbasvir
Prevention Regular screening and strict infection control procedures; Effective dialysis machine decontamination
HCV: Hepatitis C virus; CKD: Chronic kidney disease; HAV: Hepatitis A virus; GN: Glomerulonephritis.
The risk of transmission to the newborn is as high as 90% if the mother is HBeAg (e antigen)-positive and 10%-12% if the mother is HBeAg-negative and HBeAb (e antibody)-positive[31]. The risk of transmission is also directly proportional to viral load. The risk of progression to chronicity is nearly 90% if the newborn becomes infected[30]. Hence, preventing MTCT is of utmost importance. Screening for HBsAg is mandatory for all pregnant individuals in the first trimester. It is prudent to test HBeAg, HBeAb, and DNA levels by the end of the second trimester. Treatment is indicated if HBV DNA > 200000 IU/mL or HBsAg levels > 4 Log10 IU/mL. TDF can be started at 24-32 wk of gestation and must be continued for up to 12 wk after delivery[4]. Currently, TAF has no data to support its use during pregnancy. However, an initial review of data on TAF in pregnancy is encouraging[32]. If a woman is infected and is already on treatment with antivirals, the treatment must be continued. TDF is the recommended drug of choice during pregnancy, and if the individual is on ETV or any other antivirals, she should be switched to TDF[29]. If the individual is infected and is contemplating pregnancy, it is advised to postpone the treatment until childbirth unless the woman fulfills CHB treatment criteria (presence of advanced fibrosis or high viral load)[29]. Cirrhosis patients who wish to becomes pregnant should be counseled about the risk of decompensations during pregnancy. Pregnancy-induced volume disturbances are similar to cirrhosis, i.e., reduction in systemic vascular resistance and rise in blood volume and splanchnic vasodilation, which may exacerbate pre-existing portal hypertension[29]. Newborns of HBV-positive mothers should receive active and passive immunization. The newborn should be tested for HBsAb 3 mo after complete immunization (i.e., > 9 mo of age)[33]. Chronic HBV infection may not influence pregnancy outcomes; however, postpregnancy, there may be a flare of HBV due to immune restoration[29,30]. Breastfeeding is not contrain-dicated, and cesarean section is not indicated for HBV-infected mothers.
HCV and pregnancy: The prevalence of HCV infection is high in Western countries due to injection drug abuse; however, the Asia-Pacific region has a lower prevalence than the west. Due to the large population, the incidence of HCV is considered high in the Asia-Pacific region. The prevalence of HCV in the Asia-Pacific region is 0.1%-5%[34]. The lack of sensitive universal testing in developing countries is a major hindrance to diagnose HCV infection. Further transient elastography is not recommended in pregnant individuals to stage fibrosis.
HCV can affect pregnancy outcomes. HCV, a cytopathic virus, has been linked to intrahepatic cholestasis of pregnancy[35]. HCV can also downregulate multidrug resistance protein 2 (MRP2), which would induce a failure to transport toxic substances and subsequent defects in bile transport; high estrogen and progesterone levels would further compound this effect on MRP2 during pregnancy[35,36]. HCV-infected women also have a higher risk of preterm birth[37]. In contrast, pregnancy being immunosuppressed does not affect HCV. However, in the postpartum period, women may clear the virus spontaneously due to immune reconstitution and HCV-specific T-cell response development[36]. The pooled incidence of MTCT is 6%[38]. Concomitant human immunodeficiency virus (HIV) infection, high HCV viral load, and injection drug abusers (due to acute hepatitis) are at higher risk of transmitting the infection to the newborn[38,39]. MTCT occurs most often in late stages, either during

Kulkarni AV et al. Chronic viral hepatitis in special population
WJG https://www.wjgnet.com 6865 October 28, 2021 Volume 27 Issue 40
intrauterine or intrapartum transmission[29]. There is no added benefit of cesarean section and hence is not indicated for patients with HCV infection to prevent transmission. Breastfeeding is not contraindicated[40]. Prolonged rupture of membranes (> 6 h) and invasive tests such as internal fetal monitoring, amniocentesis, and chorionic villous sampling have the potential risk of transmission[41]. Episiotomy should also be avoided, if possible, in HCV-infected pregnant individuals[41]. None of the DAAs have been approved to be used in pregnancy yet. DAAs are category B drugs in pregnancy. Sofosbuvir with ledipasvir has been shown to be effective and safe in pregnancy[42]. The drug was initiated in the 2nd or early third trimester. There are two trials underway assessing DAAs in pregnancy. The first trial evaluating sofosbuvir plus ledipasvir initiated at 24 wk of gestation (ClinicalTrials.gov Identifier: NCT02683005). Another trial assessing sofosbuvir plus velpatasvir commenced six months postpartum (ClinicalTrials.gov Identifier: NCT03570112). The results of these trials are expected soon. Differences in HBV and HCV management are shown in Table 3.
HEALTHCARE WORKERSHealthcare workers (HCWs) are attending clinicians, surgeons, employees, students, contractors, public-safety workers, or volunteers whose activities involve contact with patients or with blood or other body fluids from patients in healthcare, laboratory, or public-safety settings[43]. HCWs are at risk of becoming infected and can also be a potential source of transmission to patients. The risk of transmission is, although rare from providers to patients, it is recommended to treat HCWs even with a low viral load (HBV DNA < 1000 IU/mL)[44]. Prior to universal vaccination, the risk of transmission was 5%-13% from HBeAg-positive HCWs to patients and 0.8%-3.5% from HBeAg-negative HCWs to patients[45]. The prevalence of HBV among HCWs ranges between 5%-7% in developing countries[46,47]. The presence of HBV infection does not preclude the HCWs from practicing medicine (dentistry or surgery, or any allied health care work) as per the Centers for Disease control and Prevention (CDC) [44]. The European Association for the Study of the Liver recommends treating HCWs if DNA levels are more than 200 IU/mL[4]. The CDC recommends treating HCWs if DNA >1000 IU/mL and prohibits HCWs from performing exposure-prone procedures if DNA >1000 IU/mL[44]. In contrast, transmission of HCV from HCWs to patients is rare. HCWs are at higher risk of becoming infected by patients. A meta-analysis reported higher odds of infection among HCWs than controls[48]. HCWs with viremia should be treated.
COINFECTION HBV with HIV: The prevalence of HBV HIV coinfection ranges between 5%-20%, with a higher prevalence among injection drug abusers[49]. The risk of liver-related mortality is twice as high in patients with coinfection as in those with HIV monoin-fection[50]. HBV also increases overall mortality and hepatocellular carcinoma in HIV-infected patients[51,52]. Coinfected patients have higher levels of HBV viremia and lower rates of HBeAg clearance[53]. HIV-infected patients are prone to drug-induced liver injuries (especially from nevirapine-based regimens) and hepatitis flares[54]. HBV is reported to increase the risk of acquired immunodeficiency syndrome development, but this report was contraindicated in later studies[55]. All coinfected patients should be treated with ART (antiretroviral therapy) irrespective of the CD4 count[4,56]. ART should contain tenofovir as a part of the regimen. Lamivudine + emtricitabine and tenofovir (TDF or TAF) should be used for treating coinfected patients. TDF + lamivudine+ efavirenz or nevirapine combination has a lower attrition rate and is associated with lower mortality in HIV/HBV infected patients[57]. A fixed drug combination of elvitegravir, cobicistat, emtricitabine, and TAF has excellent efficacy in HIV/HBV coinfected patients[58]. Dolutegravir, emtricitabine and TDF/TAF fixed dose combinations may also be considered for patients with HIV/HBV coinfection[59]. All HBsAg patients should be screened for HIV infection prior to initiating tenofovir-based therapy (to prevent resistance), and HIV-infected patients should be screened for HBsAg prior to initiation of ART[56]. If negative, it is recommended to vaccinate the individual to achieve an anti-HBs of ≥ 10 mIU/mL.

Kulkarni AV et al. Chronic viral hepatitis in special population
WJG https://www.wjgnet.com 6866 October 28, 2021 Volume 27 Issue 40
Table 3 Hepatitis B and Hepatitis C in pregnancy
HBV HCV
MTCT 90% if HBeAg+; 10% if HBeAg-; Directly proportional to viral load
6%; Higher risk with concomitant HIV infection, higher viral load, IV drug abuse; Higher risk with PROM and CVS
Treatment TDF is safe; Can be initiated in third trimester DAAs are not approved; Treat prior to pregnancy or 6 mo postpartum
Effect on pregnancy outcome None Preterm birth, ICP
Effect of pregnancy on virus None None
Effect of postpartum (immune restoration) on virus
Risk of HBV flares Higher chance of viral clearance
Timing of transmission Intrapartum > intrauterine Intrapartum > intrauterine
C-section for all Not indicated Not indicated
Breastfeeding Not contraindicated Not contraindicated
Prevention Active and passive immunization to child prevents 90% of transmission; Failure is nearly 15% if the viral load in mother is > log6
None
Confirming the perinatal transmission
Persistence of HBsAg in newborn for > 6 mo Anti-HCV positive at 18 mo of age HCV RNA positive after 2 mo on 2 different samples
Confirming the protection Anti-HBs titers at 9 mo Negative Anti-HCV at 18 mo
HBV: Hepatitis B virus; HCV: Hepatitis C virus; HIV: Human immunodeficiency virus; IV: Intravenous; MTCT: Mother-to-child transmission; PROM: Prolonged rupture of membranes; CVS: Chorionic villous sampling; Ag: Antigen; ICP: Intrahepatic cholestasis of pregnancy; C-section: Cesarean section.
HCV and HIV coinfection is common in injection drug abusers. HCV does not alter the natural history of HIV; however, HIV infection significantly alters the natural history of HCV. HIV leads to a rapid worsening of liver disease, shortens survival, and increases the risk of decompensations in HCV-related cirrhosis patients[60]. HIV also hastens fibrosis progression in CHC patients. Spontaneous clearance of HCV is noted in 5%-10% of patients with HIV infection, whereas nearly 15%-30% of HIV noninfected patients clear HCV spontaneously[61]. The indication for treating HCV and HIV is similar to those infected with either alone. However, it is recommended to avoid HCV treatment until the CD4 count > 200/μL in coinfected patients[62]. Sofosbuvir (400 mg) plus velpatasvir (100 mg) is the recommended drug of choice for HCV for 12 wk in cirrhosis and noncirrhosis[63]. Glecapravir and pibrentasvir are other options for HIV and HCV coinfected patients for 8 wk (no cirrhosis) or 12 wk (cirrhosis)[20] (Figure 1).
HBV with HCV coinfection: The prevalence of HBV/HCV coinfection varies across the globe. The prevalence of HBV coinfection in HCV-positive individuals ranges from 0.7%-5.8%, and the prevalence of HCV coinfection in HBsAg-positive individuals is between 3.4%-23.0%[64,65]. The presence of HCV coinfection leads to rapid progression of liver disease, fibrosis and accelerates the development of hepatocellular carcinoma (HCC)[65]. Patients with HCV viremia should be treated with DAAs, and those satisfying criteria for treatment for HBV should be treated with NUCs. However, if the patient is HBsAg-positive (not satisfying the treatment criteria for HBV) but requires DAA therapy for HCV, NUCs should be initiated[4]. NUCs should be continued for 12 wk post DAA to prevent reactivation of HBV[4]. HCV core protein strongly inhibits HBV replication, and post DAA lack of HCV core poses a risk for HBV reactivation. The incidence of HBV reactivation is around 12%-14% after HCV treatment[66].
CHEMOTHERAPY AND HEMATOLOGICAL MALIGNANCIES Patients planned for chemotherapy or immunosuppression should be evaluated for HBV and HCV infection[4]. HBV and HCV are strongly associated with non-Hodgkin’s lymphoma[67-69]. Approximately 7%-23% of NHL patients have HBV infection, and 3%-10% harbor HCV infection[69-71]. The risk of HBV reactivation in HBsAg-positive patients undergoing chemotherapy ranges from 26%-53%[72]. HCV

Kulkarni AV et al. Chronic viral hepatitis in special population
WJG https://www.wjgnet.com 6867 October 28, 2021 Volume 27 Issue 40
Figure 1 Management of coinfection. Created with biorender.com. HIV: Human immunodeficiency virus; ART: Antiretroviral therapy; 3TC: Lamivudine; FTC: Emtricitabine; TDF: Tenofovir disoproxil fumarate; TAF: Tenofovir alafenamide fumarate; DAA: Directly acting antiviral agents; SOF: Sofosbuvir; VEL: Velpatasvir; GLE: Glecaprevir; PIB: Pibrentasvir.
reactivation is noted in 11% of patients undergoing chemotherapy[73]. If the surface antigen is positive (irrespective of viremia), it is recommended to start NUCs (TDF, TAF, or ETV)[4,72]. Therapy should be continued for 12 mo (18 mo for those on rituximab) after the cessation of immunosuppressive therapy. The stopping rules for those satisfying the standard treatment criteria are the same as those not on immunosuppression.
Patients with HCV viremia should be treated with DAA therapy; however, the timing of therapy is still controversial. If malignancy treatment is deemed urgent, then DAA can be initiated six months after malignancy remission. However, the patient should be monitored for flares. If the malignancy is suspected to be related to the virus itself, then DAAs should be initiated, and viral suppression should be documented prior to chemotherapy initiation[74].
CHILDREN HBV and childrenChronicity in children is common and depends on the age of acquisition of infection. Perinatally infected patients have a 90% chance of progression to chronicity, while patients infected before 5 years of age have a 25%-50% chance of progression to chronicity. Data on the treatment of the pediatric population are limited. The global prevalence of HBsAg positivity of among children < 5 years of age is 1.3%[75]. The indication for treatment is slightly different from that in the adult population. The presence of cirrhosis (regardless of decompensation status) requires treatment[56]. However, it is recommended to assess the inflammation and stage of fibrosis via liver biopsy in all patients prior to therapy. Children with persistently elevated ALT levels (> 1.5 times the upper limit) for ≥ 6 mo who are HBeAg-positive (or ≥ 1 year for HBeAg-negative) with a DNA > 2000 IU/mL and biopsy evidence of moderate to severe necroinflammation or fibrosis require treatment[76]. For patients with a family history of HCC treatment should be initiated even if necroinflammation/fibrosis is mild or absent provided that DNA is > 2000 IU/mL and the ALT levels are elevated[56,76]. TAF (25 mg/d) and ETV (0.015 mg/kg; maximum of 0.5 mg/d) are drugs with high genetic barriers to resistance that are approved for patients aged ≥ 12 years and ≥ 2 years, respectively[75,77]. Last, interferon α-2b (6 million IU/m2 thrice weekly) is also approved for children aged ≥ 1 year[75]. For HBeAg-positive children, the drug can be stopped 1 year after HBeAg seroconversion[77]. However, the duration of therapy for HBeAg-negative patients is unknown.
HCV and Children: Nearly 0.15% of the global population aged < 18 years has HCV viremia, which corresponds to 3.26 million (2.07-3.9) children. The seropositivity ranges between 0.2% and 0.4% of the population aged < 18 years[78,79]. Interestingly,
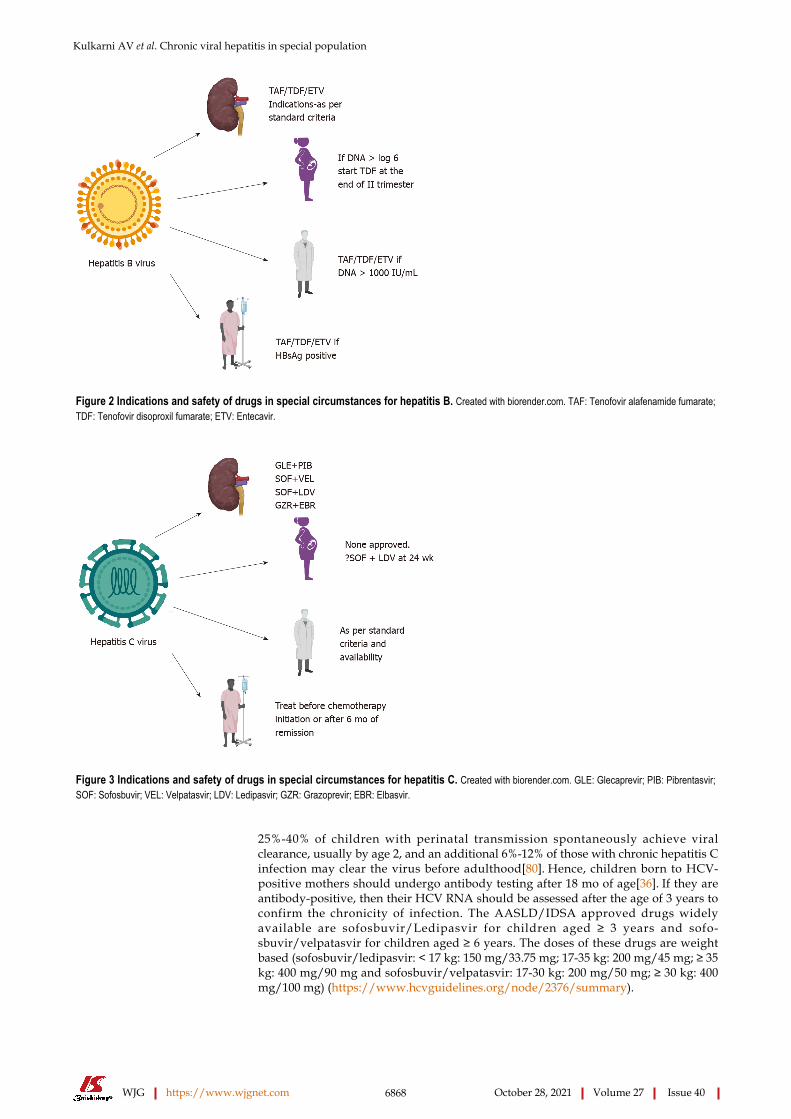
Kulkarni AV et al. Chronic viral hepatitis in special population
WJG https://www.wjgnet.com 6868 October 28, 2021 Volume 27 Issue 40
Figure 2 Indications and safety of drugs in special circumstances for hepatitis B. Created with biorender.com. TAF: Tenofovir alafenamide fumarate; TDF: Tenofovir disoproxil fumarate; ETV: Entecavir.
Figure 3 Indications and safety of drugs in special circumstances for hepatitis C. Created with biorender.com. GLE: Glecaprevir; PIB: Pibrentasvir; SOF: Sofosbuvir; VEL: Velpatasvir; LDV: Ledipasvir; GZR: Grazoprevir; EBR: Elbasvir.
25%-40% of children with perinatal transmission spontaneously achieve viral clearance, usually by age 2, and an additional 6%-12% of those with chronic hepatitis C infection may clear the virus before adulthood[80]. Hence, children born to HCV-positive mothers should undergo antibody testing after 18 mo of age[36]. If they are antibody-positive, then their HCV RNA should be assessed after the age of 3 years to confirm the chronicity of infection. The AASLD/IDSA approved drugs widely available are sofosbuvir/Ledipasvir for children aged ≥ 3 years and sofo-sbuvir/velpatasvir for children aged ≥ 6 years. The doses of these drugs are weight based (sofosbuvir/ledipasvir: < 17 kg: 150 mg/33.75 mg; 17-35 kg: 200 mg/45 mg; ≥ 35 kg: 400 mg/90 mg and sofosbuvir/velpatasvir: 17-30 kg: 200 mg/50 mg; ≥ 30 kg: 400 mg/100 mg) (https://www.hcvguidelines.org/node/2376/summary).
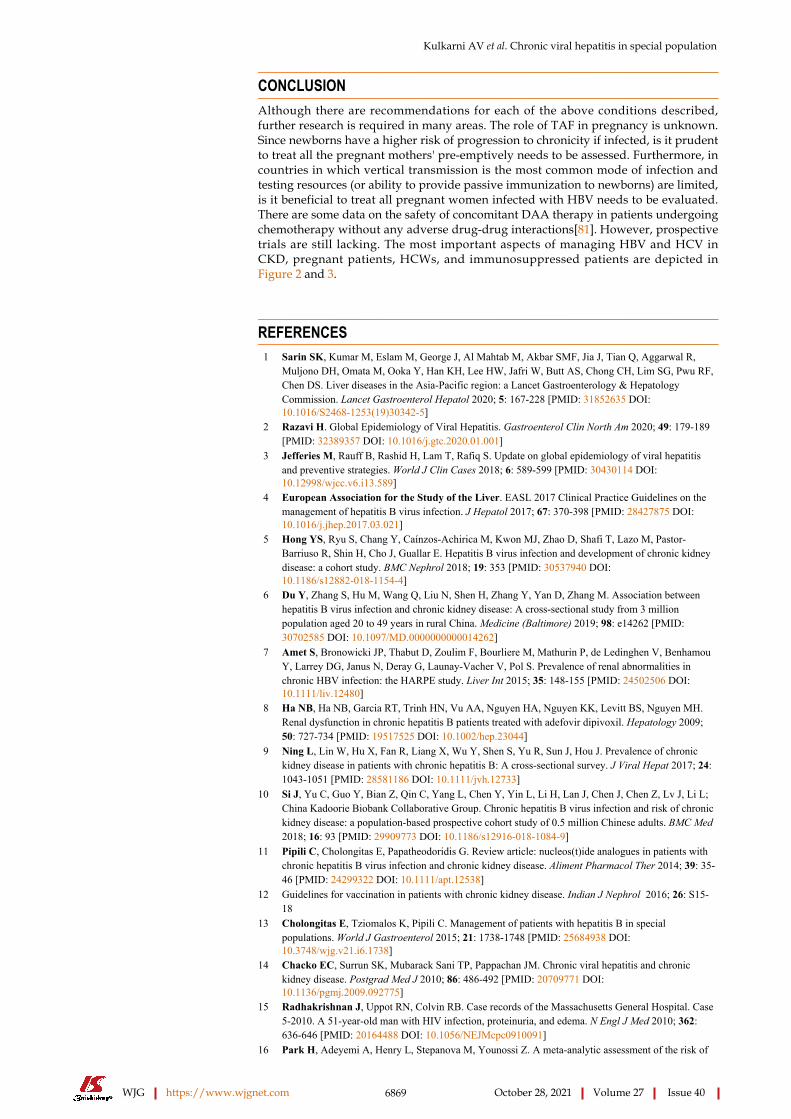
Kulkarni AV et al. Chronic viral hepatitis in special population
WJG https://www.wjgnet.com 6869 October 28, 2021 Volume 27 Issue 40
CONCLUSIONAlthough there are recommendations for each of the above conditions described, further research is required in many areas. The role of TAF in pregnancy is unknown. Since newborns have a higher risk of progression to chronicity if infected, is it prudent to treat all the pregnant mothers' pre-emptively needs to be assessed. Furthermore, in countries in which vertical transmission is the most common mode of infection and testing resources (or ability to provide passive immunization to newborns) are limited, is it beneficial to treat all pregnant women infected with HBV needs to be evaluated. There are some data on the safety of concomitant DAA therapy in patients undergoing chemotherapy without any adverse drug-drug interactions[81]. However, prospective trials are still lacking. The most important aspects of managing HBV and HCV in CKD, pregnant patients, HCWs, and immunosuppressed patients are depicted in Figure 2 and 3.
REFERENCESSarin SK, Kumar M, Eslam M, George J, Al Mahtab M, Akbar SMF, Jia J, Tian Q, Aggarwal R, Muljono DH, Omata M, Ooka Y, Han KH, Lee HW, Jafri W, Butt AS, Chong CH, Lim SG, Pwu RF, Chen DS. Liver diseases in the Asia-Pacific region: a Lancet Gastroenterology & Hepatology Commission. Lancet Gastroenterol Hepatol 2020; 5: 167-228 [PMID: 31852635 DOI: 10.1016/S2468-1253(19)30342-5]
1
Razavi H. Global Epidemiology of Viral Hepatitis. Gastroenterol Clin North Am 2020; 49: 179-189 [PMID: 32389357 DOI: 10.1016/j.gtc.2020.01.001]
2
Jefferies M, Rauff B, Rashid H, Lam T, Rafiq S. Update on global epidemiology of viral hepatitis and preventive strategies. World J Clin Cases 2018; 6: 589-599 [PMID: 30430114 DOI: 10.12998/wjcc.v6.i13.589]
3
European Association for the Study of the Liver. EASL 2017 Clinical Practice Guidelines on the management of hepatitis B virus infection. J Hepatol 2017; 67: 370-398 [PMID: 28427875 DOI: 10.1016/j.jhep.2017.03.021]
4
Hong YS, Ryu S, Chang Y, Caínzos-Achirica M, Kwon MJ, Zhao D, Shafi T, Lazo M, Pastor-Barriuso R, Shin H, Cho J, Guallar E. Hepatitis B virus infection and development of chronic kidney disease: a cohort study. BMC Nephrol 2018; 19: 353 [PMID: 30537940 DOI: 10.1186/s12882-018-1154-4]
5
Du Y, Zhang S, Hu M, Wang Q, Liu N, Shen H, Zhang Y, Yan D, Zhang M. Association between hepatitis B virus infection and chronic kidney disease: A cross-sectional study from 3 million population aged 20 to 49 years in rural China. Medicine (Baltimore) 2019; 98: e14262 [PMID: 30702585 DOI: 10.1097/MD.0000000000014262]
6
Amet S, Bronowicki JP, Thabut D, Zoulim F, Bourliere M, Mathurin P, de Ledinghen V, Benhamou Y, Larrey DG, Janus N, Deray G, Launay-Vacher V, Pol S. Prevalence of renal abnormalities in chronic HBV infection: the HARPE study. Liver Int 2015; 35: 148-155 [PMID: 24502506 DOI: 10.1111/liv.12480]
7
Ha NB, Ha NB, Garcia RT, Trinh HN, Vu AA, Nguyen HA, Nguyen KK, Levitt BS, Nguyen MH. Renal dysfunction in chronic hepatitis B patients treated with adefovir dipivoxil. Hepatology 2009; 50: 727-734 [PMID: 19517525 DOI: 10.1002/hep.23044]
8
Ning L, Lin W, Hu X, Fan R, Liang X, Wu Y, Shen S, Yu R, Sun J, Hou J. Prevalence of chronic kidney disease in patients with chronic hepatitis B: A cross-sectional survey. J Viral Hepat 2017; 24: 1043-1051 [PMID: 28581186 DOI: 10.1111/jvh.12733]
9
Si J, Yu C, Guo Y, Bian Z, Qin C, Yang L, Chen Y, Yin L, Li H, Lan J, Chen J, Chen Z, Lv J, Li L; China Kadoorie Biobank Collaborative Group. Chronic hepatitis B virus infection and risk of chronic kidney disease: a population-based prospective cohort study of 0.5 million Chinese adults. BMC Med 2018; 16: 93 [PMID: 29909773 DOI: 10.1186/s12916-018-1084-9]
10
Pipili C, Cholongitas E, Papatheodoridis G. Review article: nucleos(t)ide analogues in patients with chronic hepatitis B virus infection and chronic kidney disease. Aliment Pharmacol Ther 2014; 39: 35-46 [PMID: 24299322 DOI: 10.1111/apt.12538]
11
Guidelines for vaccination in patients with chronic kidney disease. Indian J Nephrol 2016; 26: S15-18
12
Cholongitas E, Tziomalos K, Pipili C. Management of patients with hepatitis B in special populations. World J Gastroenterol 2015; 21: 1738-1748 [PMID: 25684938 DOI: 10.3748/wjg.v21.i6.1738]
13
Chacko EC, Surrun SK, Mubarack Sani TP, Pappachan JM. Chronic viral hepatitis and chronic kidney disease. Postgrad Med J 2010; 86: 486-492 [PMID: 20709771 DOI: 10.1136/pgmj.2009.092775]
14
Radhakrishnan J, Uppot RN, Colvin RB. Case records of the Massachusetts General Hospital. Case 5-2010. A 51-year-old man with HIV infection, proteinuria, and edema. N Engl J Med 2010; 362: 636-646 [PMID: 20164488 DOI: 10.1056/NEJMcpc0910091]
15
Park H, Adeyemi A, Henry L, Stepanova M, Younossi Z. A meta-analytic assessment of the risk of 16

Kulkarni AV et al. Chronic viral hepatitis in special population
WJG https://www.wjgnet.com 6870 October 28, 2021 Volume 27 Issue 40
chronic kidney disease in patients with chronic hepatitis C virus infection. J Viral Hepat 2015; 22: 897-905 [PMID: 25904153 DOI: 10.1111/jvh.12413]Johnson DW, Dent H, Yao Q, Tranaeus A, Huang CC, Han DS, Jha V, Wang T, Kawaguchi Y, Qian J. Frequencies of hepatitis B and C infections among haemodialysis and peritoneal dialysis patients in Asia-Pacific countries: analysis of registry data. Nephrol Dial Transplant 2009; 24: 1598-1603 [PMID: 19096083 DOI: 10.1093/ndt/gfn684]
17
Gordon CE, Berenguer MC, Doss W, Fabrizi F, Izopet J, Jha V, Kamar N, Kasiske BL, Lai CL, Morales JM, Patel PR, Pol S, Silva MO, Balk EM, Earley A, Di M, Cheung M, Jadoul M, Martin P. Prevention, Diagnosis, Evaluation, and Treatment of Hepatitis C Virus Infection in Chronic Kidney Disease: Synopsis of the Kidney Disease: Improving Global Outcomes 2018 Clinical Practice Guideline. Ann Intern Med 2019; 171: 496-504 [PMID: 31546256 DOI: 10.7326/M19-1539]
18
Gane E, Lawitz E, Pugatch D, Papatheodoridis G, Bräu N, Brown A, Pol S, Leroy V, Persico M, Moreno C, Colombo M, Yoshida EM, Nelson DR, Collins C, Lei Y, Kosloski M, Mensa FJ. Glecaprevir and Pibrentasvir in Patients with HCV and Severe Renal Impairment. N Engl J Med 2017; 377: 1448-1455 [PMID: 29020583 DOI: 10.1056/NEJMoa1704053]
19
European Association for the Study of the Liver. Clinical Practice Guidelines Panel: Chair; EASL Governing Board representative; Panel members:. EASL recommendations on treatment of hepatitis C: Final update of the series. J Hepatol 2020; 73: 1170-1218 [PMID: 32956768 DOI: 10.1016/j.jhep.2020.08.018]
20
Roth D, Nelson DR, Bruchfeld A, Liapakis A, Silva M, Monsour H Jr, Martin P, Pol S, Londoño MC, Hassanein T, Zamor PJ, Zuckerman E, Wan S, Jackson B, Nguyen BY, Robertson M, Barr E, Wahl J, Greaves W. Grazoprevir plus elbasvir in treatment-naive and treatment-experienced patients with hepatitis C virus genotype 1 infection and stage 4-5 chronic kidney disease (the C-SURFER study): a combination phase 3 study. Lancet 2015; 386: 1537-1545 [PMID: 26456905 DOI: 10.1016/S0140-6736(15)00349-9]
21
Cox-North P, Hawkins KL, Rossiter ST, Hawley MN, Bhattacharya R, Landis CS. Sofosbuvir-based regimens for the treatment of chronic hepatitis C in severe renal dysfunction. Hepatol Commun 2017; 1: 248-255 [PMID: 29404457 DOI: 10.1002/hep4.1035]
22
Borgia SM, Dearden J, Yoshida EM, Shafran SD, Brown A, Ben-Ari Z, Cramp ME, Cooper C, Foxton M, Rodriguez CF, Esteban R, Hyland R, Lu S, Kirby BJ, Meng A, Markova S, Dvory-Sobol H, Osinusi AO, Bruck R, Ampuero J, Ryder SD, Agarwal K, Fox R, Shaw D, Haider S, Willems B, Lurie Y, Calleja JL, Gane EJ. Sofosbuvir/velpatasvir for 12 weeks in hepatitis C virus-infected patients with end-stage renal disease undergoing dialysis. J Hepatol 2019; 71: 660-665 [PMID: 31195062 DOI: 10.1016/j.jhep.2019.05.028]
23
Lawitz E, Landis CS, Flamm SL, Bonacini M, Ortiz-Lasanta G, Huang J, Zhang J, Kirby BJ, De-Oertel S, Hyland RH, Osinusi AO, Brainard DM, Robson R, Maliakkal BJ, Gordon SC, Gane EJ. Sofosbuvir plus ribavirin and sofosbuvir plus ledipasvir in patients with genotype 1 or 3 hepatitis C virus and severe renal impairment: a multicentre, phase 2b, non-randomised, open-label study. Lancet Gastroenterol Hepatol 2020; 5: 918-926 [PMID: 32531259 DOI: 10.1016/S2468-1253(19)30417-0]
24
AASLD/IDSA HCV Guidance Panel. Hepatitis C guidance: AASLD-IDSA recommendations for testing, managing, and treating adults infected with hepatitis C virus. Hepatology 2015; 62: 932-954 [PMID: 26111063 DOI: 10.1002/hep.27950]
25
Nguyen DB, Bixler D, Patel PR. Transmission of hepatitis C virus in the dialysis setting and strategies for its prevention. Semin Dial 2019; 32: 127-134 [PMID: 30569604 DOI: 10.1111/sdi.12761]
26
Page K, Melia MT, Veenhuis RT, Winter M, Rousseau KE, Massaccesi G, Osburn WO, Forman M, Thomas E, Thornton K, Wagner K, Vassilev V, Lin L, Lum PJ, Giudice LC, Stein E, Asher A, Chang S, Gorman R, Ghany MG, Liang TJ, Wierzbicki MR, Scarselli E, Nicosia A, Folgori A, Capone S, Cox AL. Randomized Trial of a Vaccine Regimen to Prevent Chronic HCV Infection. N Engl J Med 2021; 384: 541-549 [PMID: 33567193 DOI: 10.1056/NEJMoa2023345]
27
Roth D, Bloom RD, Molnar MZ, Reese PP, Sawinski D, Sise ME, Terrault NA. KDOQI US Commentary on the 2018 KDIGO Clinical Practice Guideline for the Prevention, Diagnosis, Evaluation, and Treatment of Hepatitis C. Am J Kidney Dis 2020; 75: 665-683 [PMID: 32279907 DOI: 10.1053/j.ajkd.2019.12.016]
28
Sarkar M, Brady CW, Fleckenstein J, Forde KA, Khungar V, Molleston JP, Afshar Y, Terrault NA. Reproductive Health and Liver Disease: Practice Guidance by the American Association for the Study of Liver Diseases. Hepatology 2021; 73: 318-365 [PMID: 32946672 DOI: 10.1002/hep.31559]
29
Trehanpati N, Hissar S, Shrivastav S, Sarin SK. Immunological mechanisms of hepatitis B virus persistence in newborns. Indian J Med Res 2013; 138: 700-710 [PMID: 24434322]
30
Borgia G, Carleo MA, Gaeta GB, Gentile I. Hepatitis B in pregnancy. World J Gastroenterol 2012; 18: 4677-4683 [PMID: 23002336 DOI: 10.3748/wjg.v18.i34.4677]
31
Eke AC, Brooks KM, Gebreyohannes RD, Sheffield JS, Dooley KE, Mirochnick M. Tenofovir alafenamide use in pregnant and lactating women living with HIV. Expert Opin Drug Metab Toxicol 2020; 16: 333-342 [PMID: 32125906 DOI: 10.1080/17425255.2020.1738384]
32
Nelson NP, Jamieson DJ, Murphy TV. Prevention of Perinatal Hepatitis B Virus Transmission. J Pediatric Infect Dis Soc 2014; 3 Suppl 1: S7-S12 [PMID: 25232477 DOI: 10.1093/jpids/piu064]
33
Lim SG, Aghemo A, Chen PJ, Dan YY, Gane E, Gani R, Gish RG, Guan R, Jia JD, Lim K, Piratvisuth T, Shah S, Shiffman ML, Tacke F, Tan SS, Tanwandee T, Win KM, Yurdaydin C. Management of hepatitis C virus infection in the Asia-Pacific region: an update. Lancet Gastroenterol
34
Kulkarni AV et al. Chronic viral hepatitis in special population
WJG https://www.wjgnet.com 6871 October 28, 2021 Volume 27 Issue 40
Hepatol 2017; 2: 52-62 [PMID: 28404015 DOI: 10.1016/S2468-1253(16)30080-2]Wijarnpreecha K, Thongprayoon C, Sanguankeo A, Upala S, Ungprasert P, Cheungpasitporn W. Hepatitis C infection and intrahepatic cholestasis of pregnancy: A systematic review and meta-analysis. Clin Res Hepatol Gastroenterol 2017; 41: 39-45 [PMID: 27542514 DOI: 10.1016/j.clinre.2016.07.004]
35
Kushner T, Terrault NA. Hepatitis C in Pregnancy: A Unique Opportunity to Improve the Hepatitis C Cascade of Care. Hepatol Commun 2019; 3: 20-28 [PMID: 30619991 DOI: 10.1002/hep4.1282]
36
Huang QT, Huang Q, Zhong M, Wei SS, Luo W, Li F, Yu YH. Chronic hepatitis C virus infection is associated with increased risk of preterm birth: a meta-analysis of observational studies. J Viral Hepat 2015; 22: 1033-1042 [PMID: 26081198 DOI: 10.1111/jvh.12430]
37
Benova L, Mohamoud YA, Calvert C, Abu-Raddad LJ. Vertical transmission of hepatitis C virus: systematic review and meta-analysis. Clin Infect Dis 2014; 59: 765-773 [PMID: 24928290 DOI: 10.1093/cid/ciu447]
38
Syriopoulou V, Nikolopoulou G, Daikos GL, Theodoridou M, Pavlopoulou I, Nicolaidou P, Manolaki N. Mother to child transmission of hepatitis C virus: rate of infection and risk factors. Scand J Infect Dis 2005; 37: 350-353 [PMID: 16051571 DOI: 10.1080/00365540510032105]
39
Cottrell EB, Chou R, Wasson N, Rahman B, Guise JM. Reducing risk for mother-to-infant transmission of hepatitis C virus: a systematic review for the U.S. Preventive Services Task Force. Ann Intern Med 2013; 158: 109-113 [PMID: 23437438 DOI: 10.7326/0003-4819-158-2-201301150-00575]
40
Society for Maternal-Fetal Medicine (SMFM), Hughes BL, Pag CM, Kuller JA. Hepatitis C in pregnancy: screening, treatment, and management. Am J Obstet Gynecol 2017; 217: B2-B12 [PMID: 28782502 DOI: 10.1016/j.ajog.2017.07.039]
41
Yattoo N. Treatment of chronic hepatitis C with ledipasvir/sofosbuvir combination during pregnancy. Hepatol Int 2018; 12: S292-S293
42
Singhal V, Bora D, Singh S. Hepatitis B in health care workers: Indian scenario. J Lab Physicians 2009; 1: 41-48 [PMID: 21938248 DOI: 10.4103/0974-2727.59697]
43
Centers for Disease Control and Prevention (CDC). Updated CDC recommendations for the management of hepatitis B virus-infected health-care providers and students. MMWR Recomm Rep 2012; 61: 1-12 [PMID: 22763928]
44
Gerlich WH. Reduction of infectivity in chronic hepatitis B virus carriers among healthcare providers and pregnant women by antiviral therapy. Intervirology 2014; 57: 202-211 [PMID: 25034489 DOI: 10.1159/000360949]
45
Ganju SA, Goel A. Prevalence of HBV and HCV infection among health care workers (HCWs). J Commun Dis 2000; 32: 228-230 [PMID: 11407011]
46
Mueller A, Stoetter L, Kalluvya S, Stich A, Majinge C, Weissbrich B, Kasang C. Prevalence of hepatitis B virus infection among health care workers in a tertiary hospital in Tanzania. BMC Infect Dis 2015; 15: 386 [PMID: 26399765 DOI: 10.1186/s12879-015-1129-z]
47
Westermann C, Peters C, Lisiak B, Lamberti M, Nienhaus A. The prevalence of hepatitis C among healthcare workers: a systematic review and meta-analysis. Occup Environ Med 2015; 72: 880-888 [PMID: 26438666 DOI: 10.1136/oemed-2015-102879]
48
Singh KP, Crane M, Audsley J, Avihingsanon A, Sasadeusz J, Lewin SR. HIV-hepatitis B virus coinfection: epidemiology, pathogenesis, and treatment. AIDS 2017; 31: 2035-2052 [PMID: 28692539 DOI: 10.1097/QAD.0000000000001574]
49
van Griensven J, Phirum L, Choun K, Thai S, De Weggheleire A, Lynen L. Hepatitis B and C co-infection among HIV-infected adults while on antiretroviral treatment: long-term survival, CD4 cell count recovery and antiretroviral toxicity in Cambodia. PLoS One 2014; 9: e88552 [PMID: 24533106 DOI: 10.1371/journal.pone.0088552]
50
Shiels MS, Engels EA. Evolving epidemiology of HIV-associated malignancies. Curr Opin HIV AIDS 2017; 12: 6-11 [PMID: 27749369 DOI: 10.1097/coh.0000000000000327]
51
Pinchoff J, Tran OC, Chen L, Bornschlegel K, Drobnik A, Kersanske L, Fuld J. Impact of hepatitis B on mortality and specific causes of death in adults with and without HIV co-infection in NYC, 2000-2011. Epidemiol Infect 2016; 144: 3354-3364 [PMID: 27510414 DOI: 10.1017/S0950268816001801]
52
Thio CL. Hepatitis B in the human immunodeficiency virus-infected patient: epidemiology, natural history, and treatment. Semin Liver Dis 2003; 23: 125-136 [PMID: 12800066 DOI: 10.1055/s-2003-39951]
53
Yang R, Gui X, Xiong Y, Gao SC, Yan Y. Impact of hepatitis B virus infection on HIV response to antiretroviral therapy in a Chinese antiretroviral therapy center. Int J Infect Dis 2014; 28: 29-34 [PMID: 25236390 DOI: 10.1016/j.ijid.2014.07.018]
54
Rockstroh JK. Influence of viral hepatitis on HIV infection. J Hepatol 2006; 44: S25-S27 [PMID: 16338020 DOI: 10.1016/j.jhep.2005.11.007]
55
Sarin SK, Kumar M, Lau GK, Abbas Z, Chan HL, Chen CJ, Chen DS, Chen HL, Chen PJ, Chien RN, Dokmeci AK, Gane E, Hou JL, Jafri W, Jia J, Kim JH, Lai CL, Lee HC, Lim SG, Liu CJ, Locarnini S, Al Mahtab M, Mohamed R, Omata M, Park J, Piratvisuth T, Sharma BC, Sollano J, Wang FS, Wei L, Yuen MF, Zheng SS, Kao JH. Asian-Pacific clinical practice guidelines on the management of hepatitis B: a 2015 update. Hepatol Int 2016; 10: 1-98 [PMID: 26563120 DOI: 10.1007/s12072-015-9675-4]
56
Zhu J, Yang W, Feng Y, Lo C, Chen H, Zhu Q, Shen Z, Lan G, Chen Y, Tang Z, Xing H, Shao Y, Ruan Y, Li L. Treatment effects of the differential first-line antiretroviral regimens among HIV/HBV
57

Kulkarni AV et al. Chronic viral hepatitis in special population
WJG https://www.wjgnet.com 6872 October 28, 2021 Volume 27 Issue 40
coinfected patients in southwest China: an observational study. Sci Rep 2019; 9: 1006 [PMID: 30700732 DOI: 10.1038/s41598-018-37148-8]Gallant J, Brunetta J, Crofoot G, Benson P, Mills A, Brinson C, Oka S, Cheng A, Garner W, Fordyce M, Das M, McCallister S; GS-US-292-1249 Study Investigators. Brief Report: Efficacy and Safety of Switching to a Single-Tablet Regimen of Elvitegravir/Cobicistat/Emtricitabine/Tenofovir Alafenamide in HIV-1/Hepatitis B-Coinfected Adults. J Acquir Immune Defic Syndr 2016; 73: 294-298 [PMID: 27171740 DOI: 10.1097/qai.0000000000001069]
58
Venter WDF, Moorhouse M, Sokhela S, Fairlie L, Mashabane N, Masenya M, Serenata C, Akpomiemie G, Qavi A, Chandiwana N, Norris S, Chersich M, Clayden P, Abrams E, Arulappan N, Vos A, McCann K, Simmons B, Hill A. Dolutegravir plus Two Different Prodrugs of Tenofovir to Treat HIV. N Engl J Med 2019; 381: 803-815 [PMID: 31339677 DOI: 10.1056/NEJMoa1902824]
59
Pineda JA, Romero-Gómez M, Díaz-García F, Girón-González JA, Montero JL, Torre-Cisneros J, Andrade RJ, González-Serrano M, Aguilar J, Aguilar-Guisado M, Navarro JM, Salmerón J, Caballero-Granado FJ, García-García JA; Grupo Andaluz para el Estudio de las Enfermedades Infecciosas; Grupo Andaluz para el Estudio del Hígado. HIV coinfection shortens the survival of patients with hepatitis C virus-related decompensated cirrhosis. Hepatology 2005; 41: 779-789 [PMID: 15800956 DOI: 10.1002/hep.20626]
60
Thomas DL. Hepatitis C and human immunodeficiency virus infection. Hepatology 2002; 36: S201-S209 [PMID: 12407595 DOI: 10.1053/jhep.2002.36380]
61
Omata M, Kanda T, Wei L, Yu ML, Chuang WL, Ibrahim A, Lesmana CR, Sollano J, Kumar M, Jindal A, Sharma BC, Hamid SS, Dokmeci AK, Mamun-Al-Mahtab, McCaughan GW, Wasim J, Crawford DH, Kao JH, Yokosuka O, Lau GK, Sarin SK. APASL consensus statements and recommendation on treatment of hepatitis C. Hepatol Int 2016; 10: 702-726 [PMID: 27130427 DOI: 10.1007/s12072-016-9717-6]
62
Wyles D, Bräu N, Kottilil S, Daar ES, Ruane P, Workowski K, Luetkemeyer A, Adeyemi O, Kim AY, Doehle B, Huang KC, Mogalian E, Osinusi A, McNally J, Brainard DM, McHutchison JG, Naggie S, Sulkowski M; ASTRAL-5 Investigators. Sofosbuvir and Velpatasvir for the Treatment of Hepatitis C Virus in Patients Coinfected With Human Immunodeficiency Virus Type 1: An Open-Label, Phase 3 Study. Clin Infect Dis 2017; 65: 6-12 [PMID: 28369210 DOI: 10.1093/cid/cix260]
63
Holmes JA, Yu ML, Chung RT. Hepatitis B reactivation during or after direct acting antiviral therapy - implication for susceptible individuals. Expert Opin Drug Saf 2017; 16: 651-672 [PMID: 28471314 DOI: 10.1080/14740338.2017.1325869]
64
Caccamo G, Saffioti F, Raimondo G. Hepatitis B virus and hepatitis C virus dual infection. World J Gastroenterol 2014; 20: 14559-14567 [PMID: 25356020 DOI: 10.3748/wjg.v20.i40.14559]
65
Chen G, Wang C, Chen J, Ji D, Wang Y, Wu V, Karlberg J, Lau G. Hepatitis B reactivation in hepatitis B and C coinfected patients treated with antiviral agents: A systematic review and meta-analysis. Hepatology 2017; 66: 13-26 [PMID: 28195337 DOI: 10.1002/hep.29109]
66
Li M, Gan Y, Fan C, Yuan H, Zhang X, Shen Y, Wang Q, Meng Z, Xu D, Tu H. Hepatitis B virus and risk of non-Hodgkin lymphoma: An updated meta-analysis of 58 studies. J Viral Hepat 2018; 25: 894-903 [PMID: 29532605 DOI: 10.1111/jvh.12892]
67
Rattotti S, Ferretti VV, Rusconi C, Rossi A, Fogazzi S, Baldini L, Pioltelli P, Balzarotti M, Farina L, Ferreri AJM, Laszlo D, Speziale V, Varettoni M, Sciarra R, Morello L, Tedeschi A, Frigeni M, Defrancesco I, Zerbi C, Flospergher E, Nizzoli ME, Morra E, Arcaini L; “Rete Ematologica Lombarda” (REL - Hematology Clinical Network of Lombardy - Lymphoma Workgroup). Lymphomas associated with chronic hepatitis C virus infection: A prospective multicenter cohort study from the Rete Ematologica Lombarda (REL) clinical network. Hematol Oncol 2019; 37: 160-167 [PMID: 30726562 DOI: 10.1002/hon.2575]
68
Kang J, Cho JH, Suh CW, Lee DH, Oh HB, Sohn YH, Chi HS, Park CJ, Jang SS, Lee KH, Lee JH, Lee SW, Chung YH, Kim TH, Shin HR, Huh J. High prevalence of hepatitis B and hepatitis C virus infections in Korean patients with hematopoietic malignancies. Ann Hematol 2011; 90: 159-164 [PMID: 20821327 DOI: 10.1007/s00277-010-1055-5]
69
Takai S, Tsurumi H, Ando K, Kasahara S, Sawada M, Yamada T, Hara T, Fukuno K, Takahashi T, Oyama M, Onishi H, Tomita E, Takami T, Imawari M, Moriwaki H. Prevalence of hepatitis B and C virus infection in haematological malignancies and liver injury following chemotherapy. Eur J Haematol 2005; 74: 158-165 [PMID: 15654908 DOI: 10.1111/j.1600-0609.2004.00376.x]
70
Chen MH, Hsiao LT, Chiou TJ, Liu JH, Gau JP, Teng HW, Wang WS, Chao TC, Yen CC, Chen PM. High prevalence of occult hepatitis B virus infection in patients with B cell non-Hodgkin's lymphoma. Ann Hematol 2008; 87: 475-480 [PMID: 18327583 DOI: 10.1007/s00277-008-0469-9]
71
Huang H, Li X, Zhu J, Ye S, Zhang H, Wang W, Wu X, Peng J, Xu B, Lin Y, Cao Y, Li H, Lin S, Liu Q, Lin T. Entecavir vs lamivudine for prevention of hepatitis B virus reactivation among patients with untreated diffuse large B-cell lymphoma receiving R-CHOP chemotherapy: a randomized clinical trial. JAMA 2014; 312: 2521-2530 [PMID: 25514302 DOI: 10.1001/jama.2014.15704]
72
Mahale P, Kontoyiannis DP, Chemaly RF, Jiang Y, Hwang JP, Davila M, Torres HA. Acute exacerbation and reactivation of chronic hepatitis C virus infection in cancer patients. J Hepatol 2012; 57: 1177-1185 [PMID: 22871500 DOI: 10.1016/j.jhep.2012.07.031]
73
Torres HA, McDonald GB. How I treat hepatitis C virus infection in patients with hematologic malignancies. Blood 2016; 128: 1449-1457 [PMID: 27443290 DOI: 10.1182/blood-2016-05-718643]
74
Indolfi G, Easterbrook P, Dusheiko G, Siberry G, Chang MH, Thorne C, Bulterys M, Chan PL, El-Sayed MH, Giaquinto C, Jonas MM, Meyers T, Walsh N, Wirth S, Penazzato M. Hepatitis B virus
75

Kulkarni AV et al. Chronic viral hepatitis in special population
WJG https://www.wjgnet.com 6873 October 28, 2021 Volume 27 Issue 40
infection in children and adolescents. Lancet Gastroenterol Hepatol 2019; 4: 466-476 [PMID: 30982722 DOI: 10.1016/S2468-1253(19)30042-1]Sokal EM, Paganelli M, Wirth S, Socha P, Vajro P, Lacaille F, Kelly D, Mieli-Vergani G; European Society of Pediatric Gastroenterology, Hepatology and Nutrition. Management of chronic hepatitis B in childhood: ESPGHAN clinical practice guidelines: consensus of an expert panel on behalf of the European Society of Pediatric Gastroenterology, Hepatology and Nutrition. J Hepatol 2013; 59: 814-829 [PMID: 23707367 DOI: 10.1016/j.jhep.2013.05.016]
76
Lai MW, Chang MH. Updates in the management of hepatitis B in children. Expert Rev Gastroenterol Hepatol 2019; 13: 1065-1076 [PMID: 31663387 DOI: 10.1080/17474124.2019.1686975]
77
Schmelzer J, Dugan E, Blach S, Coleman S, Cai Z, DePaola M, Estes C, Gamkrelidze I, Jerabek K, Ma S, Montoya S, Razavi-Shearer D, Razavi-Shearer K, Robbins-Scott S, Razavi H, El Sayed MH. Global prevalence of hepatitis C virus in children in 2018: a modelling study. Lancet Gastroenterol Hepatol 2020; 5: 374-392 [PMID: 31954439 DOI: 10.1016/S2468-1253(19)30385-1]
78
Pawlowska M, Sobolewska-Pilarczyk M, Domagalski K. Hepatitis C virus infection in children in the era of direct-acting antiviral. World J Gastroenterol 2018; 24: 2555-2566 [PMID: 29962813 DOI: 10.3748/wjg.v24.i24.2555]
79
Squires JE, Balistreri WF. Hepatitis C virus infection in children and adolescents. Hepatol Commun 2017; 1: 87-98 [PMID: 29404447 DOI: 10.1002/hep4.1028]
80
Economides MP, Mahale P, Kyvernitakis A, Turturro F, Kantarjian H, Naing A, Hosry J, Shigle TL, Kaseb A, Torres HA. Concomitant use of direct-acting antivirals and chemotherapy in hepatitis C virus-infected patients with cancer. Aliment Pharmacol Ther 2016; 44: 1235-1241 [PMID: 27730654 DOI: 10.1111/apt.13825]
81

WJG https://www.wjgnet.com 6874 October 28, 2021 Volume 27 Issue 40
World Journal of
GastroenterologyW J GSubmit a Manuscript: https://www.f6publishing.com World J Gastroenterol 2021 October 28; 27(40): 6874-6887
DOI: 10.3748/wjg.v27.i40.6874 ISSN 1007-9327 (print) ISSN 2219-2840 (online)
MINIREVIEWS
Endoscopic ultrasound-guided vascular interventions: Current insights and emerging techniques
Rupinder Mann, Hemant Goyal, Abhilash Perisetti, Saurabh Chandan, Sumant Inamdar, Benjamin Tharian
ORCID number: Rupinder Mann 0000-0001-9139-7411; Hemant Goyal 0000-0002-9433-9042; Abhilash Perisetti 0000-0003-4074-6395; Saurabh Chandan 0000-0002-2661-6693; Sumant Inamdar 0000-0002-1002-2823; Benjamin Tharian 0000-0002-7797-3738.
Author contributions: Perisetti A, Goyal H and Mann R concepted and designed the article, did a literature search; Mann R finished the first draft; all authors critically revised and edited manuscript.
Conflict-of-interest statement: Rupinder Mann, Hemant Goyal, Abhilash Perisetti, Saurabh Chandan, Sumant Inamdar has nothing to disclose; Benjamin Tharian acts as a consultant to Boston Scientific and Medtronic which are not relevant for this manuscript.
Open-Access: This article is an open-access article that was selected by an in-house editor and fully peer-reviewed by external reviewers. It is distributed in accordance with the Creative Commons Attribution NonCommercial (CC BY-NC 4.0) license, which permits others to distribute, remix, adapt, build upon this work non-commercially, and license their derivative works on different terms, provided the original work is properly cited and
Rupinder Mann, Department of Internal Medicine, Saint Agnes Medical Center, Fresno, CA 93730, United States
Hemant Goyal, Department of Internal Medicine, The Wright Center for Graduate Medical Education, Scranton, PA 18503, United States
Abhilash Perisetti, Department of Gastroenterology and Hepatology, The University of Arkansas for Medical Sciences, Little Rock, AR 72205, United States
Saurabh Chandan, Department of Gastroenterology and Hepatology, CHI Creighton University Medical Center, Omaha, NE 68107, United States
Sumant Inamdar, Benjamin Tharian, Department of Internal Medicine, Gastroenterology and Hepatology Division, University of Arkansas for Medical Sciences, Little Rock, AR 72205, United States
Corresponding author: Abhilash Perisetti, FACP, MBBS, MD, Academic Fellow, Department of Gastroenterology and Hepatology, The University of Arkansas for Medical Sciences, 4301 W Markham St, Little Rock, AR 72205, United States. [email protected]
AbstractEndoscopic ultrasound (EUS) is one of the significant breakthroughs in the field of advanced endoscopy. In the last two decades, EUS has evolved from a diagnostic tool to a real-time therapeutic modality. The luminal gastrointestinal (GI) tract provides a unique opportunity to access multiple vascular structures, especially in the mediastinum and abdomen, thus permitting a variety of EUS-guided vascular interventions. The addition of the doppler and contrast-enhanced capability to EUS has further helped provide real-time visualization of blood flow in vessels through the GI tract. EUS-guided vascular interventions rely on standard endoscopic accessories and interventional tools such as fine-needle aspiration needles and fine-needle biopsy. EUS allows the visualization of various structures in real-time by differentiating tissue densities and vascularity, thus, avoiding radiation exposure. EUS-guided techniques also allow real-time microscopic examination after target biopsy. Furthermore, many necessary interventions can be done during the same procedure after diagnosis. This article provides an overview of EUS-guided vascular interventions such as variceal, non-variceal bleeding interventions, EUSguided portal vein (PV) access with the formation of an intrahepatic portosystemic shunt, and techniques related to diagnosis of GI malignancies. Furthermore, we discuss current insights and future outlook of
Mann R et al. EUS-guided vascular interventions
WJG https://www.wjgnet.com 6875 October 28, 2021 Volume 27 Issue 40
the use is non-commercial. See: http://creativecommons.org/Licenses/by-nc/4.0/
Manuscript source: Invited manuscript
Specialty type: Gastroenterology and hepatology
Country/Territory of origin: United States
Peer-review report’s scientific quality classificationGrade A (Excellent): A Grade B (Very good): B Grade C (Good): 0 Grade D (Fair): 0 Grade E (Poor): 0
Received: March 16, 2021 Peer-review started: March 16, 2021 First decision: May 1, 2021 Revised: May 3, 2021 Accepted: September 14, 2021 Article in press: September 14, 2021 Published online: October 28, 2021
P-Reviewer: Harada R, Mitri RD S-Editor: Fan JR L-Editor: A P-Editor: Liu JH
therapeutic modalities like PV embolization, PV sampling, angiography, drug administration, and portal pressure measurement.
Key Words: Endoscopic ultrasound; Vascular intervention; Esophageal varices; Gastric varices; Portal vein; Therapeutic endoscopy
©The Author(s) 2021. Published by Baishideng Publishing Group Inc. All rights reserved.
Core Tip: Endoscopic ultrasound (EUS) technology has evolved rapidly in clinical practice, first as merely a diagnostic tool and now a therapeutic modality. EUS-guided interventions involve combining real-time imaging capability with invasive therapeutic interventions. The gastrointestinal (GI) tract has proximity to various vascular structures in the abdomen and mediastinum and thus provides a unique window to access these structures with EUS to render EUS-guided vascular interventions. Herein, this article provides an overview of EUS-guided vascular interventions for GI bleeding, portal vein access, and therapeutic implications, tumor diagnosis, and access to non-GI structures.
Citation: Mann R, Goyal H, Perisetti A, Chandan S, Inamdar S, Tharian B. Endoscopic ultrasound-guided vascular interventions: Current insights and emerging techniques. World J Gastroenterol 2021; 27(40): 6874-6887URL: https://www.wjgnet.com/1007-9327/full/v27/i40/6874.htmDOI: https://dx.doi.org/10.3748/wjg.v27.i40.6874
INTRODUCTIONEndoscopic ultrasound (EUS) is a minimally invasive specialized procedure that blends endoscopy with ultrasound. The endoscope allows visualizing the gastrointestinal (GI) tract lining, and ultrasound allows visualization of the GI tract walls, surrounding organs, and blood vessels with high-frequency waves. Three different types of echoendoscopes are available: Linear, radial, and mini-probes. Linear echoendoscopes are preferred for pancreaticobiliary interventions such as acquiring tissue, drainage of collections, and injections. Radial echoendoscopes are preferred for the staging of esophageal and gastric cancers[1,2]. Mini probes are more useful in diagnosing mucosal malignancy, pancreaticobiliary diseases (such as malignancy or stricture) because of their high frequency[1]. EUS can visualize both solid and fluid structures in the GI lumen and extraluminal. Various structures accessible with EUS include the luminal wall of the GI tract (esophagus, stomach, duodenum, and rectum), liver, pancreas, gallbladder, biliary tree, mediastinum, and lymph nodes. In addition, EUS can identify various arterial and venous vascular structures in proximity to the GI tract are accessible. Feeding vessels from small branches of vessels and aberrant vascular shunts can also be visualized by EUS[2,3].
Since the introduction of EUS in 1980 for diagnostic purposes, significant evolution has occurred (Figures 1 and 2). Its application on humans dates back to 1982[4]. This evolved in 1991 when EUS-guided fine-needle aspiration (FNA) was first introduced, and it allowed to do therapeutic interventions outside the lumen of the GI tract[5]. In 1996, EUS-guided cholangiography and EUS-guided biliary drainage were introduced[6]. Furthermore, the role of EUS expanded rapidly over the last 20 years from the diagnostic to the therapeutic tool as it provides direct visualization, access to structures within and outside the GI tract. Several new advancements in EUS-guided vascular procedures have emerged due to the proximity of many blood vessels to the GI tract and the ability to deliver precise real-time interventions. It has been further expanded to target gastric variceal bleeding by cyanoacrylate (CYA) injection[7]. In 2008, EUS-guided glue injection and micro coil embolization were used to treat a patient with refractory gastric variceal bleeding. Additionally, EUS can obtain real-time portal pressures in patients suspected of portal hypertension (PH) and obtain liver core biopsies to evaluate for fibrosis in one setting. Given its ability to access the portal vein (PV), interventions such as PV thrombectomy have been possible. Given these advances, we aim to discuss updates and emerging trends in EUS related

Mann R et al. EUS-guided vascular interventions
WJG https://www.wjgnet.com 6876 October 28, 2021 Volume 27 Issue 40
Figure 1 Endoscopic ultrasound history. EUS: Endoscopic ultrasound; FNA: Fine-needle aspiration; Rx: Treatment.
Figure 2 Different types of endoscopic ultrasound guided vascular interventions. PV: Portal vein; EUS: Endoscopic ultrasound; GI: Gastrointestinal.
vascular interventions.
ROLE OF EUS IN THE MANAGEMENT OF GI BLEEDINGVariceal bleedingEsophageal varices: Endoscopic band ligation (EBL) is the preferred treatment for bleeding and non-bleeding esophageal varices. However, endoscopic sclerotherapy is an additional treatment that is still used, especially when EBL is not feasible[8]. Although these therapies are successful, the rate of recurrent bleeding can range up to 15%-65%[9]. The higher recurrence is most likely due to failure to treat perforating and collateral vessels. Echoendoscope provides benefits over endoscope due to its ability to visualize and target these high-risk vessels under direct visualization[10,11]. EUS-guided sclerotherapy for esophageal varices was first described in 2000 by Lahoti et al[12] in a study of 5 patients. A sclerosing agent such as sodium morrhuate was injected into target perforating vessels under EUS guidance until complete blood flow cessation was confirmed with the doppler. A mean of 2.2 sessions (range 2-3 sessions) were required to achieve the complete eradication of varices. No recurrence of bleeding or death was reported during 15 mo follow-up. Only one patient developed esophageal stricture, which was managed with balloon dilation[12].
The above study showed comparable results of EUS-guided sclerotherapy for esophageal varices. Therefore, EBL is still a preferred treatment for esophageal varices. Large, randomized trials are needed to show the clinical benefits of EUS-guided sclero-therapy compared to EBL to consider it as one of the first-line treatments.
Gastric varices: Although gastric varices (GV) are less common than esophageal varices, it affects around 20% of patients with PH[13,14]. GV can occasionally cause bleeding, leading to iron deficiency anemia, and the risk of rebleeding (34%-89%) is much higher than compared to esophageal varices (15%-65%)[13]. There are no well-
Mann R et al. EUS-guided vascular interventions
WJG https://www.wjgnet.com 6877 October 28, 2021 Volume 27 Issue 40
established treatment guidelines for the management of GV compared to esophageal varices[15]. EBL is not recommended for managing GV as they are larger in size, with thick overlying gastric mucosa making it difficult to band. EBL of GV can lead to life-threatening bleeding due to post-band ulcerations, developed due to a failure to capture the contralateral wall of varices during the procedure[16]. In a study of 22 patients with bleeding GV treated with EBL, 18.2% developed early rebleeding even after complete hemostasis was achieved in all cases on EBL[17]. Endoscopic sclerosing therapy should also be avoided in bleeding GV as it provides only temporary control of bleed and a higher incidence of adverse events like gastric ulcerations, perforations, and rebleeding in 37%–53% of cases[18 ].
Glue therapy with CYA is the primary treatment of choice for GV. It was first described in 1986 as it has higher rates (> 90%) of achieving hemostasis and a lower rate of rebleeding (0%-40%) compared to other therapies (EBL and sclerotherapy)[19,20]. However, there are reports of significant adverse effects associated with CYA injections like systemic embolization (cardiac embolism, pulmonary embolism, splenic vein thrombosis, splenic artery embolism, renal vein thrombosis, and cerebral infarct), which is thought to be related to the volume of CYA injection[21]. EUS assists in both the diagnosis and treatment of GV. It helps in diagnosis and allows a precise evaluation of pathological vessels, improving therapeutic targeting. Color doppler also permits to differentiation of GV from other structures and can help confirm eradication of varices. EUS has provided us a new array of treatment options, inclu-ding coil embolization with or without glue therapy and thrombin injection etc., in the treatment of GV[13,20].
Glue therapy. Endoscopic-CYA injection has been shown to control bleeding, but there is a high recurrence of bleeding, probably due to incomplete obliteration of varices. EUS-guided CYA glue injection can minimize recurrent bleeding and decrease CYA volume by directly visualizing the perforating vessels, thus more precise obliteration of varices. Theoretically, the risk of embolization also decreases as it allows precise CYA injection into the target vessel[7].
A total of six patients with GV, including four for secondary prophylaxis, were treated with EUS-guided coil embolization followed by CYA glue injection in a single-center retrospective study. Complete eradication of GV was achieved in 3 patients. One patient had pulmonary embolism as a complication of CYA glue injection[22]. In a large single-center study, 40 patients underwent EUS-guided n-butyl-2-CYA for GV. Out of 40 patients, 13 patients were treated during active bleeding and another 23 within 24 h of bleeding. Thus, bleeding was acutely controlled in 100% of cases after treatment with EUS-guided n-butyl-2-CYA therapy. Only six patients required additional intervention for long-term management (Table 1)[23].
In a single-center study, 40 patients with actively/recently bleeding or high-risk GV treated with direct endoscopic injection of CYA were compared with 64 patients treated prospectively with EUS-guided fine needle injection CYA. Gastroesophageal varices type 2 was the most common type of varices seen in both groups. During the procedure, a greater number of varices were obliterated in EUS-guided fine needle injection of the CYA group (1.6 ± 0.7) than the direct endoscopic injection of the CYA group (1.1 ± 0.4, P < 0.001). Whereas the mean volume of CYA was injected more in the direct endoscopic injection-CYA group (3.3 ± 1.3 mL) compared to EUS-guided fine needle injection of the CYA group (2.0 ± 0.8 mL, P < 0.001). Overall post-procedure GV rebleeding (23.7% vs 8.8%, P = 0.045) and non-GV-related GI bleeding (GIB) (27.5% vs 10.9%, P = 0.030) were found to be higher in the direct endoscopic injection of CYA group compared to EUS-guided fine needle injection of CYA group. No significant difference was found in the overall rate of adverse events in the direct endoscopic injection of CYA group (17.5%) and EUS-guided fine needle injection of CYA (20.3%, P = 0.361)[24]. EUS-guided glue injection appears to be safe and effective in decreasing the risk of rebleeding in patients with active or recent bleeding GV when compared to the endoscopic injection of CYA.
Coil embolization. EUS-guided coil application is another treatment modality for GV. Coils are commonly used for various interventional radiology procedures (Table 1). These micro coils can obliterate GV and avoids adverse effects associated with CYA use, such as embolization coils are made up of light metal alloy and are covered with synthetic fibers to induce clot formation and subsequent hemostasis. Furthermore, fibers can act as a scaffold for CYA if injected during the same procedure. Varices are identified and punctured through standard FNA size needles like 19G (0.035-inch coil) or a 22G (0.018-inch coil). These coils are then advanced from the needle into varix using the stylet as a pusher. The coil sizes are selected based on the size of varix[25,26].

Mann R et al. EUS-guided vascular interventions
WJG https://www.wjgnet.com 6878 October 28, 2021 Volume 27 Issue 40
Table 1 Endoscopic ultrasound-guided gastric varices treatment
Type of Intervention Year Ref. Number of
patients, n (%)Follow up (mo)
Obliteration of varices/Clinical success %
Recurrent bleeding rate %
Adverse events %
CYA glue 2019 Lôbo et al[13] 16 9.9 75% - 50%
CYA glue 2014 Gubler and Bauerfeind[23]
40 - 100% 15% 5%
CYA glue 2019 Bick et al[24] 64 6.6 96.9% 8.8% 17.5%
CYA glue 2013 Romero-Castro et al[26]
19 6 94.7% 0% 57.9%
CYA glue 2018 Krill et al[62] 10 4 100% - 0%
Coil 2013 Romero-Castro et al[26]
11 6 90.9% 0% 9.1%
Coil 2018 Krill et al[62] 6 4 100% - 0%
Coil 2010 Romero-Castro et al[63]
4 5 (1-3) 75% 0% 0%
Coil and CYA Glue
2019 Lôbo et al[13] 16 9.9 73.3% - 25%
Coil and CYA Glue
2019 Kozieł et al[14] 16 10.9 100% - 37.5%
Coil and CYA Glue
2018 Krill et al[62] 12 4 100% - 8%
CYA: Cyanoacrylate.
A retrospective multicenter study compared EUS-guided CYA injection (n = 19) to EUS-guided coil embolization (n = 11) patients with GV. There was no statistically significant difference in obliteration rate, the mean number of sessions required, and recurrence noted during follow-up. However, adverse events were reported to be higher in the CYA group in [11/19 (57%)] when compared to EUS-guided coil embolization [1/11 (9.1%), P < 0.01]. A post-procedure computed tomography (CT) scan was performed in all patients, and nine patients in the CYA group were found to have asymptomatic glue embolism on imaging[26] (Table 1). This was the first study to compare coil embolization and CYA directly. Both procedures showed comparable results in terms of GV obliteration, but fewer adverse events were noted with coil embolization.
In another study, ten patients with GV underwent EUS-guided coil embolization and then reinforcement by gelatin sponges. Nine patients had either active bleeding or recently bled GV. A 100% obliteration of GV was achieved. Patients were followed for six mo, and only 1/10 patients developed severe abdominal pain as a complication. Further large prospective studies are needed describing its direct comparison with other treatment modalities like CYA or CYA and coil embolization combined[27].
Combined coiling and glue therapy. Although endoscopic CYA injection is considered primary therapy for GV, it is associated with systemic glue embolization. Synthetic fibers in the covering of coils function as a scaffold to keep CYA in varices; thus, a decrease of CYA reagent is needed to eradicate gastric fundal varices (GFV) and also may reduce the risk of glue embolization. In another study by Kozieł et al[14], four patients were treated with coils, and 12 patients were treated with EUS-guided coil and CYA injection. These patients were followed for an average of 327 d. The technical success rate was 94%, and the mean number of CYA volume and coils needed per procedure was 2 mL and 1.7, respectively. No serious complications like embolization or death were noted (Table 1).
A randomized pilot trial was conducted comparing the safety and efficacy of EUS-guided coil and CYA (n = 16) to EUS-guided CYA in GV patients, and these patients were followed for an average of 9.9 mo. EUS doppler was done in all cases to determine flow within varix after the procedure, and thoracic and abdomen CT was done in all cases 1 wk after the procedure. Repeat CT scans were done in symptomatic cases only afterward. In the EUS-guided coil and CYA vs EUS-guided CYA group, the total reduction inflow in the treated vessel was 37.5% vs 50% (P = 0.476) and 73% vs 80% (P = 1) immediately and at 30 d after the procedure, respectively. In addition,

Mann R et al. EUS-guided vascular interventions
WJG https://www.wjgnet.com 6879 October 28, 2021 Volume 27 Issue 40
asymptomatic pulmonary embolism was found to be in 25%, and 50% cases (P = 0.144) in EUS-guided combined coil and CYA and EUS-guided CYA, respectively[13] (Table 1).
A metanalysis and systematic review was conducted comparing EUS-guided CYA injection, EUS-guided coil embolization and CYA injection combined, and EUS-guided coil injection alone. Combined EUS-guided CYA and coiling were found to have better technical and clinical success rate compared coil embolization alone (99% vs 97%; P < 0.001 and 96% vs 90%; P < 0.001) and CYA alone (100% vs 97%; P < 0.001 and 98% vs 96%; P < 0.001). Similarly, lower adverse events were found to be with EUS-guided CYA and coil combined compared to coil embolization (10% vs 3%; P = 0.057) and CYA alone (10% vs 21%; P < 0.001)[15]. Given the above results from various studies, EUS-guided coil embolization and CYA injection combined therapy could be preferred compared to EUS-guided monotherapy with either coil or CYA injection alone.
Thrombin injection. Recently, a study of eight patients (three with active bleeding and five as elective prevention) with GFV treated with EUS-guided thrombin injection was published. About 2/3 of patients with active bleeding had successful hemostasis and obliteration of varices. All five patients who underwent the procedure for prevention of future bleeding had complete obliteration of varices. No direct procedure-related complications were observed. Although this series showed positive results, further large prospective studies are needed[19].
Ectopic varices: Ectopic varices can develop at any site, including duodenal, small bowel, colon, rectum, common bile duct, and peristomal, with duodenum ectopic varices are being the most frequent to bleed[25,28]. Many case reports have described the use of EUS for variceal bleeding at ectopic sites. Cases of duodenal variceal bleed treated with EUS-guided coil and CYA have been described without any complic-ations[29].
Rectal varies are reported in 44%-89% of cirrhosis patients because of PH[30]. It can also be seen in patients with vascular anomalies, mesenteric vein obstruction, adhesions, and heart failure. However, rectal varices are a lower bleeding risk than esophageal and GV[11]. EUS can help detect and treat the presence of rectal varices better than the endoscopy (Table 2). Although most of the data for EUS-guided intervention for bleeding ectopic varices is based on case reports/series, it is emerging as a viable option.
Non-variceal GIBGIB can be due to variceal or non-variceal causes[31]. Standard endoscopic treatments for non-variceal bleeding include injection (epinephrine), thermal (argon plasma coagulation, electrosurgical coagulation), and mechanical therapy (such as clipping). Despite these interventions, rebleeding or refractory bleeding is reported as high as 10%-24% in these patients[31]. EUS-guided therapies are advantageous over endoscopic therapy due to the ability to directly visualize target vessels buried in the walls of the organ along with real-time doppler. A literature review of 35 patients who underwent EUS-guided treatment of non-variceal GIB (NVGIB) showed a favorable clinical outcome in 32/35 (91.4%) patients, with recurrent bleeding in only three patients. Moreover, bleeding eventually stopped in all cases. The median follow-up time was 11 mo, and no complications or adverse events were reported during or after the procedure[32]. EUS-guided treatment can also be used as an adjunct treatment in refractory and recurrent disease.
Dieulafoy’s lesionsThe first use of EUS-guided therapy for Dieulafoy’s lesion was described in 1996 when EUS was used to detect and treat eight patients referred for suspicion of Dieulafoy’s lesion. A large vessel was identified in the stomach wall in all eight patients, which was treated with adrenaline/polidocanol injection using a sclerotherapy needle. Two patients had rebleeding during follow-up, one with recurrent bleeding from Dieulafoy’s lesion and the other from duodenal ulcer. EUS-guided angiotherapy was described by Levy et al[33] in a case series of five patients with refractory bleeding due to hemosuccus pancreaticus, Dieulafoy lesion, duodenal ulcer, GI stromal tumor (GIST), and occult GIB. These patients had failed at least two conventional treatment options and received an average of 18 units of packed red blood cell transfusions. Patients were treated by injecting CYA (3-5 mL) or 99% alcohol into a feeding vessel using a 22G FNA needle under EUS-guidance. Doppler was used to ensuring the absence of blood flow after treatment. These patients were followed up for a mean 12-mo period (range 0.4-23 mo), no rebleeding or complication was reported[33].

Mann R et al. EUS-guided vascular interventions
WJG https://www.wjgnet.com 6880 October 28, 2021 Volume 27 Issue 40
Table 2 Case report studies on endoscopic ultrasound-guided rectal varices treatment
Ref. Presenting symptom
Number of patients, age, sex
Rectal varices size Therapy Results Follow
up Results on follow up
Philips and Augustine[64], 2017
Rectal bleeding
1, 48 yr, M Large rectal varix
EUS-guided embolization coil and glue
No further bleeding
1 mo No rebleeding
Bazarbashi et al[65], 2020
Rectal bleeding
1, 71 yr, M Large rectal varices (4 mm in diameter)
EUS-guided coil embolization No further bleeding
6 mo No bleeding
Mukkada et al[66], 2017
Rectal bleeding
1, 65 yr, M Large rectal varices
First EUS-guided sclerotherapy, but unable to achieve hemostasis, EUS guided glue
No further bleeding
1 wk Rebleeding and then required EUS-guided coil embolization
F: Female; M: Male; EUS: Endoscopic ultrasound; N/A: Not applicable.
Law et al[34] performed EUS-guided hemostatic interventions between June 2003 to May 2014 for 17 patients with refractory NVGIB. Causes of GIB were GIST, colorectal, vascular malformations, Dieulafoy lesions, duodenal ulcers, masses or polyps, rectally invasive prostate cancer, pancreatic pseudoaneurysms, ulcerated esophageal cancer, and ulceration after Roux-en-Y gastric bypass. These patients were treated with epinephrine, 99% ethanol, coil embolization, band ligation, hyaluronate, and CYA using a therapeutic curvilinear echoendoscope with a 22G standard FNA needle. On median follow-up of 12 mo (range 3 wk-120 mo), 15/17 (88%) patients didn’t have any recurrence. However, one patient required repeat EUS-guided band ligation for gastric Dieulafoy lesion, and another patient with rectally invasive prostate cancer experienced ongoing bleeding despite a decrease in vessel flow after treatment with 99% ethanol injection.
PseudoaneurysmsPseudoaneurysms are a known complication of pancreatitis with a risk of rupture and life-threatening bleeding. The risk of rupture is as high as 50%, with 15%-40% of mortality after rupture. Gamanagatti et al[35] described a case series of three patients with pancreatitis-related pseudoaneurysm, which were technically challenging to treat by the endovascular route. These cases were managed with EUS-guided thrombin injection, which resulted in complete thrombosis of the pseudoaneurysms. There were no immediate or late complications on follow-up. In a prospective study, eight patients with symptomatic visceral artery pseudoaneurysm who were unable to undergo angioembolization underwent EUS-guided thrombin injection for pseudoaneurysm. Out of eight patients, 5 had pseudoaneurysm of the splenic artery, 2 had pseudoan-eurysm of the hepatic artery, and one patient had pseudoaneurysm of the gastroduodenal artery. Five patients with splenic artery and gastroduodenal artery aneurysms had chronic pancreatitis due to alcohol abuse. The pseudoaneurysm's median size was 2.9 cm × 2.6 cm (range 1.8 cm × 1.9-4 cm × 5 cm), and the median dose of thrombin injected was 400 IU (200-500 IU). Thrombin was injected under EUS guidance with 100% technical success. Repeat EUS after 72 h and 4 wk showed obliteration of pseudoaneurysm in all patients. Whereas on median six mo (1-9 mo) follow up, EUS showed obliterated pseudoaneurysm in 7 patients, and one patient had recurrence requiring recanalization after 6 wk[36]. There are few case reports describing the use of EUS-guided intervention for pseudoaneurysms (Table 3).
GISTEUS is traditionally used to evaluate GI luminal tumors and obtain a tissue diagnosis. Bleeding GISTs are traditionally managed by either surgical resection, radiologic embolization, or rarely with endoscopic therapies like hemoclips and endoloop® ligation. In an elderly patient with a bleeding ulcer due to GIST who was not a candidate for surgery due to comorbidities, EUS-guided angiotherapy was done. A deep vessel was identified to bleeding GIST ulcer via echoendoscope, and the target vessel was treated with CYA, which stopped bleeding. Doppler confirmed the absence of vascularity, and the patient had no further bleeding at 6 mo follow-up[37]. In a study, 32 consecutive patients with submucosal tumors of the upper GI tracts underwent EUS examination with either radial or linear echoendoscope with color and

Mann R et al. EUS-guided vascular interventions
WJG https://www.wjgnet.com 6881 October 28, 2021 Volume 27 Issue 40
Table 3 Case report studies on endoscopic ultrasound-guided treated for pseudoaneurysm
Ref. Presenting symptom
Number of patients, age and sex
Pseudoaneurysm artery Therapy Results Follow
upResults on follow up
Gamanagatti et al[35], 2015
Pancreatitis with upper GI bleed in all three cases
3; 56, 45 and 30 yr; M
Gastroduodenal artery-1, splenic artery for 2 patients
EUS-guided thrombin injection
Bleeding stopped, Obliteration of pseudoaneurysm
1 mo No bleeding
Robb et al[67], 2012
Infected pseudoaneurysm
1, 54 yr, M Superior mesenteric artery branch
EUS-guided embolization
Obliteration of pseudoaneurysm
5 mo Asymptomatic
Somani et al[68], 2017
Melena 1, 50 yr, M Gastroduodenal artery EUS-guided coil embolization and thrombin injection
Obliteration of pseudoaneurysm
2 wk No further bleeding
Jhajharia et al[69], 2018
Chronic pancreatitis, GI bleed
3; 43, 25 and 55 yr; M
Gastroduodenal artery, hepatic artery, splenic artery
EUS-guided thrombin injection
Obliteration of pseudoaneurysm
14 d No rebleeding
F: Female; M: Male; EUS: Endoscopic ultrasound; GI: Gastrointestinal; N/A: Not applicable.
Doppler capabilities: 51.4% had a discrepancy between suspected endoscopic and EUS diagnosis, 83.3% of malignant GISTs had significant intratumoral vessels seen on doppler or color EUS compared to 28% in benign GIST. Three patients were found to have vascular lesions, hemangioma on color Doppler EUS. In two patients, these lesions were treated with EUS-directed therapy consisted of ligation, coagulation, injection of sclerosing agents, or histoacryl resulting in complete eradication of lesions. One patient required surgery due to the severity of the bleeding. The patients remained asymptomatic on a mean follow-up of 48 mo[38].
Although the results of EUS-guided therapies in non-variceal bleeding are encouraging, most of the data is based on case reports and case series. No studies have compared EUS treatment with other management therapies such as endoscopic, surgical, and interventional radiology. Further large-scale studies comparing the standard treatment are needed. At present, EUS-guided therapies are available only at high-level care centers when other treatment options fail.
EUS-GUIDED PV INTERVENTIONS PV access and pressure measurement PV access can help to manage patients with the hepatobiliary diseases and PH. PV is not easy to access with traditional routes. Nevertheless, PV can easily be seen from the stomach and duodenum with EUS and accessed using a standard FNA needle. EUS, along with doppler, is used for needle puncture and withdrawal without hemorrhage[39]. Initial studies of EUS-guided PV access were performed in animals.
The measurement of PH can help to stage cirrhosis and thus prognosis. Portal pressure gradient (PPG) reflects the degree of PH. PPG ≥ 10 mmHg is associated with esophageal varices, and ≥ 12 mmHg is associated with variceal bleeding[40]. Currently, PH is evaluated by indirect measurement of the hepatic venous pressure gradient (HVPG), which poorly correlates with directly measured portal pressure in presinusoidal PH. Presinusoidal PH can be seen in the case of PV thrombosis, schisto-somiases, and non-cirrhotic portal fibrosis[41-43].
The first human pilot study conducted to measure EUS-guided PPG measurement included 28 patients with a history of liver disease or suspected cirrhosis. The PV and hepatic vein (or inferior vena cava) were punctured with a 25G FNA needle under EUS guidance either through a transgastric or transduodenal approach. A 100% technical success with no complications was reported. PPG measurement showed a correlation with clinical and endoscopic parameters of PH, including the presence of varices (P = 0.0002), portal hypertensive gastropathy (P = 0.007), and thrombocyt-openia (P = 0.036). PPG was shown to increase in patients with high clinical evidence of cirrhosis (P = 0.005)[40]. This study showed that the EUS-guided PPG measurement is safe in humans and further large clinical trials to evaluate safety and efficacy, especially compared to standard HVPG measurement methods, as intrahepatic portosystemic shunt (IPSS).

Mann R et al. EUS-guided vascular interventions
WJG https://www.wjgnet.com 6882 October 28, 2021 Volume 27 Issue 40
Transjugular IPSS (TIPS) is performed by interventional radiologists to reduce the PPG. TIPS decompresses the portal system and reduces complications due to PH, such as recurrent variceal bleeding and refractory ascites. It is usually performed in patients with refractory variceal bleed. TIPS involves catheter advancement and guidewire through the right heart and then inferior venacava (IVC) via transjugular route. It can expose patients to unintentional carotid or tracheal puncture, cardiac arrhythmias, and pneumothorax. Also, the transjugular approach for TIPS can be technically challenging in patients with IVC and hepatic vein obstruction, including Budd-Chiari syndrome. EUS-guided IPSS offer benefit as it does not involve heart catheterization, avoiding the related complications[44-48].
A study was conducted to create IPSS using lumen opposing metal stent (LAMS) in a porcine model. PV was accessed by puncturing through the stomach wall and IVC with a 19G needle under EUS guidance. A distal flange of the stent was deployed in the PV and the proximal flange in IVC. Gross necropsy of all five animals showed the correct placement of a stent and no tissue injury or hematoma[49]. Although IPSS has shown promising results in animal models, more studies are needed to evaluate the efficacy and safety of this technique.
PV embolizationPreoperative PV embolization induces the atrophy of the embolized liver lobe to be resected and compensatory hypertrophy of non-embolized remnant liver to increase future liver volume to prevent postoperative liver dysfunction. It is performed in patients with hepatocellular carcinoma (HCC), intrahepatic or hilar cholangiocar-cinoma receiving extensive liver resection[25,50]. Liver resection should be performed 2 to 6 wk after PV embolization as compensatory hypertrophy of non-embolized remnant liver occurs in 6 wk with a maximum in the first 2 wk after the procedure. Proceduralists should have meticulous knowledge of liver and portal venous system anatomy before performing this procedure[51]. Presently it is performed through a percutaneous transhepatic approach by vascular interventional radiologist[50]. In a live porcine model to study EUS-guided selective intrahepatic PV embolization, PV was punctured with a 19G FNA needle under EUS guidance, the first coil, and then CYA was injected through the same FNA needle. Doppler was used to evaluating the blood flow. Coil and CYA delivery had a success rate of 88.9% and 87.5%, respectively. In one case, the embolized coil migrated to hepatic parenchyma, and CYA injection failed one case due to the early clogging of CYA in the FNA needle. One wk later, postoperative necropsy showed total occlusion of selected PV with embolus and no evidence of damage to any other organ[50]. Further studies are needed comparing the EUS-guided PV embolization to the percutaneous approach and evaluate the long-term effects.
Portal venous blood samplingPancreaticobiliary cancers (PBCs) are usually at advance to late stages at the time of diagnosis. Circulating tumor cells (CTCs) circulate from the primary tumor to distant sites through vascular supply, and their number is usually low in peripheral blood. In the case of PBCs, CTCs can be detected in the portal circulation before the peripheral blood and can be used to detect metastasis[25,52,53].
In a single-center cohort study, 18 patients with suspected PBCs had blood aspirated from PV via a 19G FNA needle through a EUS-guided transhepatic approach. Paired peripheral blood samples were also collected. Epithelial-derived CTCs were isolated. CTCs were detected from PV samples in all 18 patients (100%), whereas only in peripheral blood samples of four patients (22.2%). These CTCs isolated from PV can also provide sufficient cells to do genomic and proteomic tumor profiling[52].
In another study performed on patients undergoing pancreaticoduodenectomy for presumed periampullary or pancreatic adenocarcinoma without metastatic disease, PV and peripheral venous samples were collected simultaneously at the time of surgery. Sixty patients were monitored postoperatively every three months for one year with imaging for liver metastasis. CTCs were detected in 58% of cases in PV blood compared to 40% in a peripheral blood sample (P = 0.0098). CTCs count was also high PV sample than peripheral blood sample (mean, 230.1 vs 71.7, P = 0.0002). Liver metastasis was detected in 11 of 13 patients with high portal CTCs count (> 112 CMx Platform estimated CTCs in 2 mL blood) compared to 6 of 47 patients with low portal CTCs count (P < 0.0001) at 6-mo follow-up after surgery. The results of this study concluded that the CTCs can be used as a predictor for liver metastases within six months after surgery in patients undergoing pancreaticoduodenectomy for presumed periampullary or pancreatic adenocarcinoma[53]. Unfortunately, PV blood sampling with an evaluation of CTCs is only available in the limited number of specialized

Mann R et al. EUS-guided vascular interventions
WJG https://www.wjgnet.com 6883 October 28, 2021 Volume 27 Issue 40
tertiary care centers. Further larger studies are needed to ensure the efficacy and safety of the procedure before making it standard of care to predict hepatic metastasis in patients with pancreatic adenocarcinoma.
FNA of PV thrombusPV thrombosis due to tumor invasion by direct venous extension or metastasis is seen in up to 70% of cases of HCC[54]. Patients with HCC can also have nontumor (bland) thrombosis of PV. It could be challenging to differentiate PV tumor thrombosis (PVTT) from bland PV thrombosis based on routine radiographic imaging. It is essential to diagnose PVTT as it is a poor prognostic sign, and curative resection or liver transplantation is contraindicated if the patient has PVTT. Transabdominal ultrasound-guided FNA has limited utility due to the difficulty of sample thrombus in the central main PV without contaminating with normal hepatocytes or liver mass, which can affect results. Furthermore, this procedure can have several complications, including vascular injury, pseudoaneurysm formation, and bile duct injury. EUS-guided FNA can directly access the extrahepatic PV without passing the needle through liver tissue[54,55]. Several case reports of EUS-guided FNA of PV thrombosis for diagnosis and staging of HCC even in patients when imaging did not show any liver mass[54-56].
Liver-directed PV injection chemotherapy The liver is a common site of metastasis from other primary tumors. Patients with diffuse liver metastasis usually resort to palliative systemic chemotherapy given limited options available. It is hypothesized that the direct injection of chemotherapy into PV may increase the drug level in hepatic tissue while decreasing systemic side effects[25,57]. In a study, EUS-guided portal injection chemotherapy (EPIC) was performed by injecting irinotecan (100 mg) loaded microbeads by using a 22G FNA needle, and the control group had saline injected to PV and irinotecan (100 mg) injected into the jugular vein. EPIC resulted in twice a level of irinotecan in hepatic tissue after 1 h. and half the irinotecan level in plasma after 15 min[57]. These animal studies showed that EPIC could be an option for patients with diffuse liver metastasis; however, no human studies are available currently.
ROLE IN TUMOR DIAGNOSISInvasion of the vascular structures by tumor impacts staging and therapeutic options, including tumor resectability. Vascular invasion can often be diagnosed based on radiographic imaging like CT, magnetic resonance imaging (MRI), or positron emission tomography scans. However, sometimes it is difficult to judge based on the imaging as in pancreatic ductal adenocarcinoma. Similarly, tumor thrombi can be challenging to differentiate from bland thrombi based on imaging. EUS-guided FNA and elastography can be helpful in these cases.
In a retrospective study, forty-four patients with pancreatic ductal adenocarcinoma underwent dynamic CT and EUS, EUS-B mode imaging was taken, and also EUS elastography was done in all cases. Sensitivity, specificity and accuracy (95%CI) for vascular invasion were 0.733, 0.697 and 0.708 on dynamic CT; 0.733, 0.606 and 0.646 in EUS B-mode; and 0.917, 0.900 and 0.906 in EUS elastography. EUS-B mode and EUS elastography should be considered in patients with pancreatic ductal adenocarcinoma, where dynamic cannot detect vascular invasion[58].
ACCESS TO NON-GI STRUCTURESThe heart and pulmonary vascular systems can be easily accessed via EUS because of their proximity to the esophagus. Transesophageal echocardiography is routinely done in cardiac patients for various conditions[59]. Fritscher-Ravens et al[60] conducted a study where they performed EUS-guided puncture of the heart in a porcine model using a linear array echoendoscope followed by three clinical cases. In the porcine study, 22- and 19-gauge EUS needles were used to access the left atrium, left ventricle, coronary arteries, and aortic valve. In the porcine group, procedures performed included needle biopsy of cardiac muscle; contrast injection into the left atrium, ventricle, coronary arteries; radiofrequency ablation of aortic and mitral valves; and passage of a guidewire. No arrhythmias were reported during the procedures. During

Mann R et al. EUS-guided vascular interventions
WJG https://www.wjgnet.com 6884 October 28, 2021 Volume 27 Issue 40
necropsy, penetration sites were identified, but they were unremarkable in appearance; no bleeding or hematoma was noticed. Subsequently, EUS-guided cardiac access was performed in three patients. In two patients, pericardial fluid was aspirated for diagnostic purposes using a 22-gauge EUS needle, and the third patient had the FNA of atrial mass. No adverse events were observed after procedures in these patients.
Somani et al[61] described EUS-guided thrombolysis of pulmonary artery thrombus in a 57-year-old patient who presented with shortness of breath, shock, and acute abdominal pain. The patient had a superior mesenteric vein and right pulmonary artery thrombus. Given the shock state and history of recent hemorrhagic stroke, EUS-guided thrombolysis of pulmonary artery thrombus was done with Tenecteplase using 25G needle. Repeat EUS after 48 h and one before 15 d showed a reduction in the volume of thrombus.
Gaps in knowledgeThe GI tract provides access to several vascular structures in the mediastinum, abdominal, and pelvis. Currently, most vascular interventions are done by an interventional radiologist through a percutaneous route. EUS provides access to most of the vasculature through the GI tract and the ability to do real-time interventions. Various studies have shown promising results for the safety, clinical and technical success of EUS-guided vascular intervention concluding that it should be considered either as first-line therapy or when conventional treatment fails. Although results are promising, it is based on case reports and series except in GV management, for which relatively more extensive studies are available.
Given that most data is available from case studies and series, it increases the risk of selection bias. Furthermore, these studies are available from tertiary care centers due to the limited availability of EUS and specialist trained in echoendoscope. EUS will eventually offer a less invasive and safer approach to various vascular interventions as this field expands further.
CONCLUSIONThe GI tract provides a unique window to vascular structures in the mediastinum and abdomen, which can be accessed through FNA needle. Various studies have shown promising results for the safety, clinical and technical success of EUS-guided vascular intervention concluding that it should be considered either as first-line therapy or when conventional treatment fails. Although results are promising, it is based on case reports and series except in GV management for which relatively more extensive studies are available. Given that most data is available from case studies and series, it increases the risk of selection bias. Furthermore, these studies are available from tertiary care centers due to the limited availability of EUS and specialist trained in echoendoscope. As this field advances, EUS will offer a less invasive and safer approach to various vascular interventions.
REFERENCESDeprez PH. Choice of endosonographic equipment and normal endosonographic anatomy. Best Pract Res Clin Gastroenterol 2009; 23: 623-637 [PMID: 19744628 DOI: 10.1016/j.bpg.2009.07.001]
1
Burmester E, Tiede U. Longitudinal Endoscopic Ultrasound–Anatomical Guiding Structures in the Upper Abdomen (Cranial–Right). J Enc GI End 2013; 1: 501-504 [DOI: 10.1016/s2212-0971(13)70220-6]
2
Snady H. Identification of major retroperitoneal vascular anatomy with endoscopic ultrasonography. Acta Endosc 1995; 25: 491-498 [DOI: 10.1007/bf02966485]
3
DiMagno EP, DiMagno MJ. Endoscopic Ultrasonography: From the Origins to Routine EUS. Dig Dis Sci 2016; 61: 342-353 [PMID: 26694170 DOI: 10.1007/s10620-015-3999-8]
4
Friedberg SR, Lachter J. Endoscopic ultrasound: Current roles and future directions. World J Gastrointest Endosc 2017; 9: 499-505 [PMID: 29085560 DOI: 10.4253/wjge.v9.i10.499]
5
Prachayakul V, Aswakul P. Endoscopic ultrasound-guided interventions in special situations. World J Gastrointest Endosc 2016; 8: 104-112 [PMID: 26839650 DOI: 10.4253/wjge.v8.i2.104]
6
Oleas R, Robles-Medranda C. Insights into the role of endoscopic ultrasound-guided vascular therapy. Ther Adv Gastrointest Endosc 2019; 12: 2631774519878282 [PMID: 31633107 DOI: 10.1177/2631774519878282]
7
Krige JE, Bornman PC, Goldberg PA, Terblanche J. Variceal rebleeding and recurrence after 8

Mann R et al. EUS-guided vascular interventions
WJG https://www.wjgnet.com 6885 October 28, 2021 Volume 27 Issue 40
endoscopic injection sclerotherapy: a prospective evaluation in 204 patients. Arch Surg 2000; 135: 1315-1322 [PMID: 11074888 DOI: 10.1001/archsurg.135.11.1315]Hou MC, Lin HC, Lee FY, Chang FY, Lee SD. Recurrence of esophageal varices following endoscopic treatment and its impact on rebleeding: comparison of sclerotherapy and ligation. J Hepatol 2000; 32: 202-208 [PMID: 10707859 DOI: 10.1016/s0168-8278(00)80064-1]
9
Bokun T, Grgurevic I, Kujundzic M, Banic M. EUS-Guided Vascular Procedures: A Literature Review. Gastroenterol Res Pract 2013; 2013: 865945 [PMID: 23737766 DOI: 10.1155/2013/865945]
10
Artifon ELA, Marson FP, Khan MA. Endoscopic Ultrasonography-Guided Hemostasis Techniques. Gastrointest Endosc Clin N Am 2017; 27: 741-747 [PMID: 28918809 DOI: 10.1016/j.giec.2017.06.011]
11
Lahoti S, Catalano MF, Alcocer E, Hogan WJ, Geenen JE. Obliteration of esophageal varices using EUS-guided sclerotherapy with color Doppler. Gastrointest Endosc 2000; 51: 331-333 [PMID: 10699783 DOI: 10.1016/s0016-5107(00)70363-4]
12
Lôbo MRA, Chaves DM, DE Moura DTH, Ribeiro IB, Ikari E, DE Moura EGH. Safety and efficacy of EUS-guided coil plus cyanoacrylate versus conventional cyanoacrylate technique in the treatment of gastric varices: A randomized controlled trial. Arq Gastroenterol 2019; 56: 99-105 [PMID: 31141079 DOI: 10.1590/S0004-2803.201900000-08]
13
Kozieł S, Pawlak K, Błaszczyk Ł, Jagielski M, Wiechowska-Kozłowska A. Endoscopic Ultrasound-Guided Treatment of Gastric Varices Using Coils and Cyanoacrylate Glue Injections: Results after 1 Year of Experience. J Clin Med 2019; 8 [PMID: 31731504 DOI: 10.3390/jcm8111786]
14
McCarty TR, Bazarbashi AN, Hathorn KE, Thompson CC, Ryou M. Combination therapy versus monotherapy for EUS-guided management of gastric varices: A systematic review and meta-analysis. Endosc Ultrasound 2020; 9: 6-15 [PMID: 31417066 DOI: 10.4103/eus.eus_37_19]
15
Ríos Castellanos E, Seron P, Gisbert JP, Bonfill Cosp X. Endoscopic injection of cyanoacrylate glue versus other endoscopic procedures for acute bleeding gastric varices in people with portal hypertension. Cochrane Database Syst Rev 2015; CD010180 [PMID: 25966446 DOI: 10.1002/14651858.CD010180.pub2]
16
Lee TH, Shih LN. Clinical experience of endoscopic banding ligation for bleeding gastric varices. Hepatogastroenterology 2008; 55: 766-769 [PMID: 18613450]
17
Sarin SK, Lahoti D, Saxena SP, Murthy NS, Makwana UK. Prevalence, classification and natural history of gastric varices: a long-term follow-up study in 568 portal hypertension patients. Hepatology 1992; 16: 1343-1349 [PMID: 1446890 DOI: 10.1002/hep.1840160607]
18
Frost JW, Hebbar S. EUS-guided thrombin injection for management of gastric fundal varices. Endosc Int Open 2018; 6: E664-E668 [PMID: 29868631 DOI: 10.1055/a-0599-0440]
19
Wang X, Yu S, Chen X, Duan L. Endoscopic ultrasound-guided injection of coils and cyanoacrylate glue for the treatment of gastric fundal varices with abnormal shunts: a series of case reports. J Int Med Res 2019; 47: 1802-1809 [PMID: 30819006 DOI: 10.1177/0300060519830207]
20
Hwang SS, Kim HH, Park SH, Kim SE, Jung JI, Ahn BY, Kim SH, Chung SK, Park YH, Choi KH. N-butyl-2-cyanoacrylate pulmonary embolism after endoscopic injection sclerotherapy for gastric variceal bleeding. J Comput Assist Tomogr 2001; 25: 16-22 [PMID: 11176287 DOI: 10.1097/00004728-200101000-00003]
21
George N, Perisetti A, Banerjee D, Raghavapuram S, Garcia-Saenz-de-Sicilia M, Tharian B. EUS-Guided Treatment of Gastric Varices: A Single Center Experience: 783. Am J Gastroenterol 2017; 112 [DOI: 10.14309/00000434-201710001-00784]
22
Gubler C, Bauerfeind P. Safe and successful endoscopic initial treatment and long-term eradication of gastric varices by endoscopic ultrasound-guided Histoacryl (N-butyl-2-cyanoacrylate) injection. Scand J Gastroenterol 2014; 49: 1136-1142 [PMID: 24947448 DOI: 10.3109/00365521.2014.929171]
23
Bick BL, Al-Haddad M, Liangpunsakul S, Ghabril MS, DeWitt JM. EUS-guided fine needle injection is superior to direct endoscopic injection of 2-octyl cyanoacrylate for the treatment of gastric variceal bleeding. Surg Endosc 2019; 33: 1837-1845 [PMID: 30259158 DOI: 10.1007/s00464-018-6462-z]
24
Anastasiou J, Berzin TM. Endoscopic Ultrasound-Guided Vascular Interventions: From Diagnosis to Treatment. Saudi J Med Med Sci 2018; 6: 61-67 [PMID: 30787823 DOI: 10.4103/sjmms.sjmms_131_17]
25
Romero-Castro R, Ellrichmann M, Ortiz-Moyano C, Subtil-Inigo JC, Junquera-Florez F, Gornals JB, Repiso-Ortega A, Vila-Costas J, Marcos-Sanchez F, Muñoz-Navas M, Romero-Gomez M, Brullet-Benedi E, Romero-Vazquez J, Caunedo-Alvarez A, Pellicer-Bautista F, Herrerias-Gutierrez JM, Fritscher-Ravens A. EUS-guided coil versus cyanoacrylate therapy for the treatment of gastric varices: a multicenter study (with videos). Gastrointest Endosc 2013; 78: 711-721 [PMID: 23891417 DOI: 10.1016/j.gie.2013.05.009]
26
Bazarbashi AN, Wang TJ, Thompson CC, Ryou M. Endoscopic ultrasound-guided treatment of gastric varices with coil embolization and absorbable hemostatic gelatin sponge: a novel alternative to cyanoacrylate. Endosc Int Open 2020; 8: E221-E227 [PMID: 32010757 DOI: 10.1055/a-1027-6708]
27
Grgurevic I, Kujundzic M, Banic M, Kusec R, Bokun T, Vukelic-Markovic M, Bogdanovic Z, Lukic A, Tsochatzis E, Brkljacic B. Subtypes and clinical significance of common bile duct varices in portal vein thrombosis: diagnosis and follow-up by Doppler US and EUS. Abdom Radiol (NY) 2016; 41: 476-484 [PMID: 27039318 DOI: 10.1007/s00261-015-0596-4]
28
Kinzel J, Pichetshote N, Dredar S, Aslanian H, Nagar A. Bleeding from a duodenal varix: a unique case of variceal hemostasis achieved using EUS-guided placement of an embolization coil and
29
Mann R et al. EUS-guided vascular interventions
WJG https://www.wjgnet.com 6886 October 28, 2021 Volume 27 Issue 40
cyanoacrylate. J Clin Gastroenterol 2014; 48: 362-364 [PMID: 24518801 DOI: 10.1097/MCG.0000000000000004]Sharma M, Rai P, Bansal R. EUS-Assisted Evaluation of Rectal Varices before Banding. Gastroenterol Res Pract 2013; 2013: 619187 [PMID: 23781241 DOI: 10.1155/2013/619187]
30
Maggio D, Barkun AN, Martel M, Elouali S, Gralnek IM; Reason Investigators. Predictors of early rebleeding after endoscopic therapy in patients with nonvariceal upper gastrointestinal bleeding secondary to high-risk lesions. Can J Gastroenterol 2013; 27: 454-458 [PMID: 23936874 DOI: 10.1155/2013/128760]
31
De Angelis CG, Cortegoso Valdivia P, Rizza S, Venezia L, Rizzi F, Gesualdo M, Saracco GM, Pellicano R. Endoscopic Ultrasound-Guided Treatments for Non-Variceal Upper GI Bleeding: A Review of the Literature. J Clin Med 2020; 9 [PMID: 32245209 DOI: 10.3390/jcm9030866]
32
Levy MJ, Wong Kee Song LM, Farnell MB, Misra S, Sarr MG, Gostout CJ. Endoscopic ultrasound (EUS)-guided angiotherapy of refractory gastrointestinal bleeding. Am J Gastroenterol 2008; 103: 352-359 [PMID: 17986314 DOI: 10.1111/j.1572-0241.2007.01616.x]
33
Law R, Fujii-Lau L, Wong Kee Song LM, Gostout CJ, Kamath PS, Abu Dayyeh BK, Gleeson FC, Rajan E, Topazian MD, Levy MJ. Efficacy of endoscopic ultrasound-guided hemostatic interventions for resistant nonvariceal bleeding. Clin Gastroenterol Hepatol 2015; 13: 808-12.e1 [PMID: 25245627 DOI: 10.1016/j.cgh.2014.09.030]
34
Gamanagatti S, Thingujam U, Garg P, Nongthombam S, Dash NR. Endoscopic ultrasound guided thrombin injection of angiographically occult pancreatitis associated visceral artery pseudoaneurysms: Case series. World J Gastrointest Endosc 2015; 7: 1107-1113 [PMID: 26421108 DOI: 10.4253/wjge.v7.i13.1107]
35
Maharshi S, Sharma SS, Sharma D, Sapra B, Nijhawan S. Endoscopic ultrasound-guided thrombin injection, a management approach for visceral artery pseudoaneurysms. Endosc Int Open 2020; 8: E407-E412 [PMID: 32118114 DOI: 10.1055/a-1070-9168]
36
Kumbhari V, Gondal B, Okolo Iii PI, Lennon AM, Law JK, Singh VK, Saxena P, Shin EJ, Canto MI, Kalloo AN, Khashab MA. Endoscopic ultrasound-guided angiotherapy of a large bleeding gastrointestinal stromal tumor. Endoscopy 2013; 45 Suppl 2 UCTN: E326-E327 [PMID: 24101603 DOI: 10.1055/s-0033-1344875]
37
Săftoiu A, Vilmann P, Hassan H, Krag Jacobsen G. Utility of colour Doppler endoscopic ultrasound evaluation and guided therapy of submucosal tumours of the upper gastrointestinal tract. Ultraschall Med 2005; 26: 487-495 [PMID: 16453220 DOI: 10.1055/s-2005-858905]
38
Crowe DR, Eloubeidi MA, Chhieng DC, Jhala NC, Jhala D, Eltoum IA. Fine-needle aspiration biopsy of hepatic lesions: computerized tomographic-guided versus endoscopic ultrasound-guided FNA. Cancer 2006; 108: 180-185 [PMID: 16634071 DOI: 10.1002/cncr.21912]
39
Huang JY, Samarasena JB, Tsujino T, Lee J, Hu KQ, McLaren CE, Chen WP, Chang KJ. EUS-guided portal pressure gradient measurement with a simple novel device: a human pilot study. Gastrointest Endosc 2017; 85: 996-1001 [PMID: 27693644 DOI: 10.1016/j.gie.2016.09.026]
40
Sarin SK, Khanna R. Non-cirrhotic portal hypertension. Clin Liver Dis 2014; 18: 451-476 [PMID: 24679506 DOI: 10.1016/j.cld.2014.01.009]
41
Suk KT. Hepatic venous pressure gradient: clinical use in chronic liver disease. Clin Mol Hepatol 2014; 20: 6-14 [PMID: 24757653 DOI: 10.3350/cmh.2014.20.1.6]
42
Pomier-Layrargues G, Kusielewicz D, Willems B, Villeneuve JP, Marleau D, Côté J, Huet PM. Presinusoidal portal hypertension in non-alcoholic cirrhosis. Hepatology 1985; 5: 415-418 [PMID: 3997071 DOI: 10.1002/hep.1840050312]
43
Colombato L. The role of transjugular intrahepatic portosystemic shunt (TIPS) in the management of portal hypertension. J Clin Gastroenterol 2007; 41 Suppl 3: S344-S351 [PMID: 17975487 DOI: 10.1097/MCG.0b013e318157e500]
44
Wong F. The use of TIPS in chronic liver disease. Ann Hepatol 2006; 5: 5-15 [PMID: 16531959]45 Quateen A, Pech M, Berg T, Bergk A, Podrabsky P, Felix R, Ricke J. Percutaneous transjugular direct porto-caval shunt in patients with Budd-Chiari syndrome. Cardiovasc Intervent Radiol 2006; 29: 565-570 [PMID: 16729230 DOI: 10.1007/s00270-005-0103-3]
46
Perry BC, Kwan SW. Portosystemic Shunts: Stable Utilization and Improved Outcomes, Two Decades After the Transjugular Intrahepatic Portosystemic Shunt. J Am Coll Radiol 2015; 12: 1427-1433 [PMID: 26410348 DOI: 10.1016/j.jacr.2015.06.037]
47
Silva RF, Arroyo PC Jr, Duca WJ, Silva AA, Reis LF, Cabral CM, Sgnolf A, Domingues RB, Barao GT, Coelho DJ, Deberaldini M, Felício HC, Silva RC. Complications following transjugular intrahepatic portosystemic shunt: a retrospective analysis. Transplant Proc 2004; 36: 926-928 [PMID: 15194319 DOI: 10.1016/j.transproceed.2004.03.117]
48
Kenneth F. Janak NS. Sa1428 EUS-Guided Transgastric Intrahepatic Portosystemic Shunt Using the Axios Stent. Gastro Endos 2011; 73 [DOI: 10.1016/j.gie.2011.03.162]
49
Park TY, Seo DW, Kang HJ, Song TJ, Park DH, Lee SS, Lee SK, Kim MH. Feasibility and safety of EUS-guided selective portal vein embolization with a coil and cyanoacrylate in a live porcine model. Endosc Ultrasound 2018; 7: 389-394 [PMID: 30246708 DOI: 10.4103/eus.eus_18_18]
50
Loffroy R, Favelier S, Chevallier O, Estivalet L, Genson PY, Pottecher P, Gehin S, Krausé D, Cercueil JP. Preoperative portal vein embolization in liver cancer: indications, techniques and outcomes. Quant Imaging Med Surg 2015; 5: 730-739 [PMID: 26682142 DOI: 10.3978/j.issn.2223-4292.2015.10.04]
51
Catenacci DV, Chapman CG, Xu P, Koons A, Konda VJ, Siddiqui UD, Waxman I. Acquisition of 52

Mann R et al. EUS-guided vascular interventions
WJG https://www.wjgnet.com 6887 October 28, 2021 Volume 27 Issue 40
Portal Venous Circulating Tumor Cells From Patients With Pancreaticobiliary Cancers by Endoscopic Ultrasound. Gastroenterology 2015; 149: 1794-1803.e4 [PMID: 26341722 DOI: 10.1053/j.gastro.2015.08.050]Tien YW, Kuo HC, Ho BI, Chang MC, Chang YT, Cheng MF, Chen HL, Liang TY, Wang CF, Huang CY, Shew JY, Chang YC, Lee EY, Lee WH. A High Circulating Tumor Cell Count in Portal Vein Predicts Liver Metastasis From Periampullary or Pancreatic Cancer: A High Portal Venous CTC Count Predicts Liver Metastases. Medicine (Baltimore) 2016; 95: e3407 [PMID: 27100430 DOI: 10.1097/MD.0000000000003407]
53
Kayar Y, Turkdogan KA, Baysal B, Unver N, Danalioglu A, Senturk H. EUS-guided FNA of a portal vein thrombus in hepatocellular carcinoma. Pan Afr Med J 2015; 21: 86 [PMID: 26491529 DOI: 10.11604/pamj.2015.21.86.6991]
54
Michael H, Lenza C, Gupta M, Katz DS. Endoscopic Ultrasound -guided Fine-Needle Aspiration of a Portal Vein Thrombus to Aid in the Diagnosis and Staging of Hepatocellular Carcinoma. Gastroenterol Hepatol (N Y) 2011; 7: 124-129 [PMID: 21475421]
55
Storch I, Gomez C, Contreras F, Schiff E, Ribeiro A. Hepatocellular carcinoma (HCC) with portal vein invasion, masquerading as pancreatic mass, diagnosed by endoscopic ultrasound-guided fine needle aspiration (EUS-FNA). Dig Dis Sci 2007; 52: 789-791 [PMID: 17268833 DOI: 10.1007/s10620-006-9325-8]
56
Faigel D, Lake D, Landreth T, Kelman C, Marler R. Endoscopic ultrasonography-guided portal injection chemotherapy for hepatic metastases. Endosc Ultrasound 2014; 3: S1 [PMID: 26425503]
57
Yamada K, Kawashima H, Ohno E, Ishikawa T, Tanaka H, Nakamura M, Miyahara R, Ishigami M, Hirooka Y, Fujishiro M. Diagnosis of vascular invasion in pancreatic ductal adenocarcinoma using endoscopic ultrasound elastography. BMC Gastroenterol 2020; 20: 81 [PMID: 32228472 DOI: 10.1186/s12876-020-01228-9]
58
Kühl HP, Hanrath P. The impact of transesophageal echocardiography on daily clinical practice. Eur J Echocardiogr 2004; 5: 455-468 [PMID: 15556822 DOI: 10.1016/j.euje.2004.04.007]
59
Fritscher-Ravens A, Ganbari A, Mosse CA, Swain P, Koehler P, Patel K. Transesophageal endoscopic ultrasound-guided access to the heart. Endoscopy 2007; 39: 385-389 [PMID: 17516342 DOI: 10.1055/s-2007-966440]
60
Somani P, Talele R, Sharma M. Endoscopic Ultrasound-Guided Thrombolysis of Pulmonary Artery Thrombus and Mesenteric Vein Thrombus. Am J Gastroenterol 2019; 114: 379 [PMID: 30840604 DOI: 10.14309/ajg.0000000000000139]
61
Krill JT, Othman MO, Munot K, Jalal PK, Patel K. Su1411 EUS-Guided coil application with glue injection for gastric variceal obliteration is associated with less endoscopic reintervention compared to glue injection alone. Gastro Endos 2018; 87: AB345 [DOI: 10.1016/j.gie.2018.04.1741]
62
Romero-Castro R, Pellicer-Bautista F, Giovannini M, Marcos-Sánchez F, Caparros-Escudero C, Jiménez-Sáenz M, Gomez-Parra M, Arenzana-Seisdedos A, Leria-Yebenes V, Herrerias-Gutiérrez JM. Endoscopic ultrasound (EUS)-guided coil embolization therapy in gastric varices. Endoscopy 2010; 42 Suppl 2: E35-E36 [PMID: 20073010 DOI: 10.1055/s-0029-1215261]
63
Philips CA, Augustine P. Endoscopic Ultrasound-Guided Management of Bleeding Rectal Varices. ACG Case Rep J 2017; 4: e101 [PMID: 28879206 DOI: 10.14309/crj.2017.101]
64
Bazarbashi AN, Thompson CC, Ryou M. Targeting the perforator vein: EUS-guided coil embolization for the treatment of bleeding rectal varices. VideoGIE 2020; 5: 434-436 [PMID: 32954109 DOI: 10.1016/j.vgie.2020.05.008]
65
Mukkada RJ, Mathew PG, Francis Jose V, Paul Chettupuzha A, Antony R, Koshy A. EUS-guided coiling of rectal varices. VideoGIE 2017; 2: 208-210 [PMID: 30175307 DOI: 10.1016/j.vgie.2017.05.005]
66
Robb PM, Yeaton P, Bishop T, Wessinger J. Endoscopic Ultrasound Guided Embolization of a Pancreatic Pseudoaneurysm. Gastroenterology Res 2012; 5: 239-241 [PMID: 27785215 DOI: 10.4021/gr500w]
67
Somani P, Sharma M, Jindal S. EUS-Guided Coil Embolization and Thrombin Injection of Bleeding Gastroduodenal Artery Pseudoaneurysm: 1611. Am College Gastroenterol 2017; 112: S876 [DOI: 10.14309/00000434-201710001-01612]
68
Jhajharia A, Wanjari S, Ashdhir P, Sharma D, Pokharna R, Nijhawan S. Endoscopic ultrasound-guided thrombin injection for management of visceral artery pseudoaneurysm: A novel approach. Indian J Gastroenterol 2018; 37: 271-275 [PMID: 29971689 DOI: 10.1007/s12664-018-0865-6]
69

WJG https://www.wjgnet.com 6888 October 28, 2021 Volume 27 Issue 40
World Journal of
GastroenterologyW J GSubmit a Manuscript: https://www.f6publishing.com World J Gastroenterol 2021 October 28; 27(40): 6888-6907
DOI: 10.3748/wjg.v27.i40.6888 ISSN 1007-9327 (print) ISSN 2219-2840 (online)
ORIGINAL ARTICLE
Basic Study
Metabolomics of Fuzi-Gancao in CCl4 induced acute liver injury and its regulatory effect on bile acid profile in rats
Mo-Fei Wang, Song-Song Zhao, Dil Momin Thapa, Yu-Ling Song, Zheng Xiang
ORCID number: Mo-Fei Wang 0000-0002-3221-608X; Song-Song Zhao 0000-0003-2401-8769; Dil Momin Thapa 0000-0003-2856-6324; Yu-Ling Song 0000-0002-6330-957X; Zheng Xiang 0000-0003-4983-1019.
Author contributions: Xiang Z and Wang MF designed and coordinated the study; Wang MF, Thapa DM, and Song YL performed the experiments and acquired and analyzed the data; Wang MF and Zhao SS wrote the manuscript; all authors approved the final version of the article.
Supported by Scientific Research Projects for Higher Education in Inner Mongolia Autonomous Region, No. NJZZ21027; Support Plan for the Innovation and Entrepreneurship Initiation Plan for Overseas Students in Inner Mongolia Autonomous Region, No. MOHRSS2020122; Doctoral Start-up Fund of the Affiliated Hospital of Inner Mongolia University for the Nationalities, No. MDFY2020001.
Institutional animal care and use committee statement: All animal experiments conformed to the internationally accepted principles for the care and use of laboratory animals. The study was reviewed and approved by the Liaoning
Mo-Fei Wang, Dil Momin Thapa, Yu-Ling Song, The Second Department of General Surgery, The Affiliated Hospital of Inner Mongolia University for the Nationalities, Tongliao 028000, Inner Mongolia Autonomous Region, China
Song-Song Zhao, Department of Educational Administration, The First Affiliated Hospital of Liaoning Medical University, Jinzhou 121000, Liaoning Province, China
Zheng Xiang, School of Pharmaceutical Science, Liaoning University, Shenyang 110032, Liaoning Province, China
Corresponding author: Mo-Fei Wang, PhD, Professor, The Second Department of General Surgery, The Affiliated Hospital of Inner Mongolia University for the Nationalities, No. 1742 East Section of Huolinhe Street, Tongliao 028000, Inner Mongolia Autonomous Region, China. [email protected]
AbstractBACKGROUND Fuzi (Radix aconiti lateralis)-Gancao (Radix glycyrrhizae) is one of the most classical drug pairs of traditional Chinese medicine. In clinical practice, decoctions containing Fuzi-Gancao (F-G) are often used in the treatment of liver diseases such as hepatitis and liver failure.
AIM To investigate the metabolomics of F-G in CCl4 induced acute liver injury in rats and its regulatory effect on the bile acid profile.
METHODS The pharmacodynamic effect of F-G on CCl4 induced acute liver injury in rats was evaluated, and an ultra performance liquid chromatography-tandem mass spectrometry (UPLC-MS/MS) method for the simultaneous determination of 92 metabolites from multiple pathways was established to explore the protective metabolic mechanism of F-G in serum on the liver.
RESULTS Twenty-four differential metabolites were identified in serum samples. The primary bile acid biosynthetic metabolic pathway was the major common pathway in the model group and F-G group. Subsequently, a UPLC-MS/MS method for simultaneous determination of 11 bile acids, including cholic acid,

Wang MF et al. Metabolomics of Fuzi-Gancao in acute liver injury in rats
WJG https://www.wjgnet.com 6889 October 28, 2021 Volume 27 Issue 40
University Research Ethics Committee.
Conflict-of-interest statement: There are no conflicts of interest to disclose.
Data sharing statement: No additional data are available.
ARRIVE guidelines statement: The authors have read the ARRIVE guidelines, and the manuscript was prepared and revised according to the ARRIVE guidelines.
Open-Access: This article is an open-access article that was selected by an in-house editor and fully peer-reviewed by external reviewers. It is distributed in accordance with the Creative Commons Attribution NonCommercial (CC BY-NC 4.0) license, which permits others to distribute, remix, adapt, build upon this work non-commercially, and license their derivative works on different terms, provided the original work is properly cited and the use is non-commercial. See: http://creativecommons.org/Licenses/by-nc/4.0/
Manuscript source: Unsolicited manuscript
Specialty type: Gastroenterology and hepatology
Country/Territory of origin: China
Peer-review report’s scientific quality classificationGrade A (Excellent): 0 Grade B (Very good): B Grade C (Good): 0 Grade D (Fair): 0 Grade E (Poor): 0
Received: April 17, 2021 Peer-review started: April 17, 2021 First decision: June 23, 2021 Revised: June 28, 2021 Accepted: August 25, 2021 Article in press: August 25, 2021 Published online: October 28, 2021
P-Reviewer: Saraiva MM S-Editor: Wu YXJ L-Editor: Wang TQ
ursodeoxycholic acid, glycochenodeoxycholic acid, glycochenodeoxycholic acid, taurocholic acid, glycocholic acid, chenodeoxycholic acid, deoxycholic acid, taurochenodeoxycholic acid, taurocholic acid, and glycinic acid, was established to analyze the regulatory mechanism of F-G in serum. F-G decreased the contents of these 11 bile acids in serum in a dose-dependent manner compared with those in the model control group.
CONCLUSION F-G could protect hepatocytes by promoting the binding of free bile acids to glycine and taurine, and reducing the accumulation of free bile acids in the liver. F-G could also regulate the compensatory degree of taurine, decreasing the content of taurine-conjugated bile acids to protect hepatocytes.
Key Words: Radix aconiti lateralis; Radix glycyrrhizae; Liver injury; Metabolites; Bile acid; Fuzi-Gancao
©The Author(s) 2021. Published by Baishideng Publishing Group Inc. All rights reserved.
Core Tip: Fuzi-Gancao (F-G) could protect hepatocytes by promoting the binding of free bile acids to glycine and taurine, and reducing the accumulation of free bile acids in the liver. F-G could also regulate the compensatory degree of taurine, decreasing the content of taurine-conjugated bile acids to protect hepatocytes.
Citation: Wang MF, Zhao SS, Thapa DM, Song YL, Xiang Z. Metabolomics of Fuzi-Gancao in CCl4 induced acute liver injury and its regulatory effect on bile acid profile in rats. World J Gastroenterol 2021; 27(40): 6888-6907URL: https://www.wjgnet.com/1007-9327/full/v27/i40/6888.htmDOI: https://dx.doi.org/10.3748/wjg.v27.i40.6888
INTRODUCTIONThe liver is an important metabolic organ of the human body that has the physiological functions of detoxification, phagocytosis, and defense[1]. With the development of modern industry, liver injury caused by environmental pollution is gradually increasing. Liver injury is an important pathophysiological process in the development of hepatitis, liver fibrosis, liver cirrhosis, and liver cancer. Therefore, the treatment of liver injury is important for the prevention, treatment, and recovery of a variety of liver diseases[2,3].
Bile acids are one of the most sensitive indicators for the clinical diagnosis of liver diseases[4,5]. When the liver system is diseased, it can cause a disturbance in the metabolism of bile acids in the body, thus causing a significant change in the amount of bile acids in the blood. Therefore, biomarkers of the bile acid metabolism pathway are very important diagnostic and therapeutic indicators for liver disease[4-6]. Liver diseases such as liver injury, hepatitis, cirrhosis, and hepatocellular carcinoma have significantly increased serum total bile acid levels, and changes in total bile acid levels are usually analyzed in clinical tests but are not highly specific[6,7]. Therefore, the changes in the bile acid profile based on the metabolic pathway of bile acids have important significance for the prevention and treatment of liver diseases. Bile acids can be divided into primary and secondary bile acids[8,9]. Primary bile acids are bile acids synthesized directly from cholesterol by hepatocytes and mainly include cholic acid (CA) and chenodeoxycholic acid (CDCA). Secondary bile acids are free bile acids produced by the primary bile acids deoxycholic acid (DCA) and lithocholic acid (LCA) after 7α-hydroxy deoxygenation of the intestinal flora. These free bile acids bind with glycine and taurine to form conjugated secondary bile acids such as glycocholic acid (GCA), glycochenodeoxycholic acid (GCDCA), glycochenodeoxycholic acid (GDCA), taurocholic acid (TCA), taurochenodeoxycholic acid (TCDCA), ursodeoxycholic acid (UDCA), glycinic acid (GLCA), and taurocholic acid (TUDCA).
Chinese herbal compounds have been used clinically for thousands of years in the treatment of liver system diseases, among which Fuzi (Radix aconiti Lateralis)-Gancao (
Wang MF et al. Metabolomics of Fuzi-Gancao in acute liver injury in rats
WJG https://www.wjgnet.com 6890 October 28, 2021 Volume 27 Issue 40
P-Editor: Li JH Radix glycyrrhizae) is one of the most common drug pairs in Chinese herbal compounds, and Chinese herbal compounds containing Fuzi-Gancao (F-G), such as Yinchen Sifu decoction, Sini decoction, and Fuzi Lizhong decoction, are often used in the treatment of liver diseases such as hepatitis and liver failure[10-13]. Modern pharma-cological studies have shown that herbal compounds containing Fuzi and Gancao can reduce the biochemical indexes of liver injury model animals by inhibiting inflam-matory stress, lipid peroxidation, and apoptosis and have significant pharmacological activity to prevent liver injury[14-16].
Fuzi and Gancao are important medicinal materials in classic prescriptions, such as Sini decoction and Fuzi Lizhong decoction. Aconite alkaloids in Fuzi and flavonoids in Gancao are the main active ingredients in F-G drug pairs. Alkaloids are the main active ingredients in aconite, and thus far, nearly 200 alkaloids have been isolated and identified. These alkaloids are mainly classified into nonester alkaloids, monoester diterpene alkaloids (MDAs), diester diterpene alkaloids (DDAs), and lipoalkaloids according to their structural properties[17]. MDAs and DDAs have very well-defined pharmacological activities, such as cardiotonic[18-20], anti-inflammatory and analgesic[21], antitumor[22], antioxidation[23], and hepatoprotective[24,25] activities. Flavonoids are the main active ingredients of Gancao and have well-defined pharmaco-logical anti-inflammatory[26-28], antibacterial[29], antioxidant[30], hepatoprotective, and antitumor[31] activities. The Chinese Pharmacopoeia (2015 edition) prescribes the compatibility ratio of Fuzi and Gancao as 1:1, which could decrease the toxins caused by aconite alkaloids and enhance the treatment effect compared with other ratios[32-34].
In a previous study, a rapid, convenient, and stable method for the simultaneous quantitative determination of six alkaloids and three flavonoids in Radix aconiti lateralis and Radix glycyrrhizae by ultra performance liquid chromatography-tandem mass spectrometry (UPLC-MS/MS) was established[17]. In this study, the effects of the F-G water extract on the prevention of liver injury induced by tetrachloride (CCl4) were evaluated. Then, the metabolic mechanism was studied by UPLC-MS/MS. Finally, a method of simultaneous quantitative detection of 11 bile acids was established, and the mechanism of F-G in the regulation of the serum bile acid profile was analyzed by UPLC-MS/MS.
MATERIALS AND METHODSPlant materialsRadix aconiti lateralis (Fuzi) pieces were purchased from Huang Gang Jingui Traditional Chinese Medicine Industry Development Co., Ltd. (Sichuan, China), and Radix glycyrrhizae (Gancao) was purchased from Bozhou Jinshaotang Herbal Decoction Co., Ltd. (Anhui, China). The medicinal materials were identified by Professor Fu Xiao at the First Affiliated Hospital of Jinzhou Medical University.
Chemicals and ReagentsThe aspartate aminotransferase (AST) and alanine aminotransferase (ALT) assay kits were purchased from Nanjing Jiancheng Bioengineering Co., Ltd.; silybin was purchased from Solarbio Biotech Co., Ltd.; L-leucine, L-tryptophan, L-kynurenine, 5-Hydroxytryptamine (5-HT), 5-hydroxytryptophan (5-HTP), cholic acid, N-pheny-lacetylglycine, glutathione (GSH), glutathione oxidized (GSSG), N-ethylmaleimide, and formic acid were purchased from Sigma-Aldrich (United States); L-phenylalanine (Ring-D5) was purchased from Cambridge isotope laboratories; UDCA, GDCA, GCDCA-Na, TCA-Na, and GCA were purchased from Meryer Co., Ltd.; CDCA, DCA, TCDCA, TUDCA, and GLCA were obtained from Shanghai Macklin Biochemical Co., Ltd; d4-GCDCA was purchased from Shanghai Zhenzun Biochemical Co., Ltd; MS-grade methanol and acetonitrile were purchased from Merck; water for MS analysis was prepared using a Milli-Q water purification system; phosphate buffered solution (PBS) was purchased from HyClone Co., Ltd; CCl4 was purchased from Yongsheng Chemical Co., Ltd; alcohol was purchased from Kermel Chemical Co.; pentobarbital sodium was purchased from Shanghai Experimental Chemical Reagent Co., Ltd.; and normal saline was purchased from Qingdao Huaren Pharmaceutical Co., Ltd.
AnimalsMale Sprague-Dawley rats (200 g ± 20 g) were purchased from the Laboratory Animal Center of Chinese Medical University (animal license No.: SCXK (Liao) 2008-0005). The rats were housed under SPF laboratory conditions at a temperature of 25 ± 2 °C, a

Wang MF et al. Metabolomics of Fuzi-Gancao in acute liver injury in rats
WJG https://www.wjgnet.com 6891 October 28, 2021 Volume 27 Issue 40
Figure 1 Histological changes in various groups of rats. HE staining, magnification: 400 ×. A: Normal control group; B: Model control group; C: Fuzi-Gancao (F-G) group (15 g/kg); D: F-G group (30 g/kg); E: Positive control group (silybin).
relative humidity of 40 ± 5%, and a 12-h circadian cycle for 1 wk. All procedures were performed according to the National Institute of Health guidelines regarding the principles of animal care.
Preparation of the F-G extractFuzi (1.3 kg) and Gancao (1.3 kg) were mixed and soaked in water (26 L) for 0.5 h, and then the mixture was refluxed for 2 h. The supernatant was then concentrated under vacuum to obtain the F-G extract. The extract was diluted with water to a final concen-tration of 1.5 g/mL (crude drug), and all the extracts were stored at 4 °C before use.
Protective effect of F-G on acute liver injury induced by CCl4
Forty male rats were randomly divided into five groups (n = 8): Normal control group, model control group, positive control group, F-G group with 15 g/kg crude drug, and F-G group with 30 g/kg crude drug. The positive control group was orally administered with silybin at 50 mg/kg daily, and the normal control group and model control group were given the same volume of normal saline daily by gavage once a day for 8 d.
On the 7th day, 40% CCl4 (v/v, olive oil) was intraperitoneally injected in the positive control group, model control group, and F-G groups at a dose of 2 mL/kg. The rats were anesthetized using sodium pentobarbital 2 h after administration on the 8th day. Blood samples were collected from the abdominal aorta and centrifuged at 3500 rpm for 10 min (4 °C) to obtain serum samples for transaminase (ALT and AST) and metabolic analysis. Liver tissue samples were taken for pathological analysis.
Metabolic analysisTo elucidate the mechanism of F-G in the treatment of liver injury, three groups of serum samples, including that from the normal control group, model control group, and F-G group (30 g/kg), were used for metabolic analysis by UPLC-MS according to a method published by the authors with minor modifications[35].
Preparation of “stripped” serum: One hundred milliliters of rat serum including activated charcoal powder (6 g) was incubated at room temperature for 2 h. After centrifugation at 13000 rpm for 20 min (4 °C), the supernatant was filtered successively through microporous membranes with pore sizes of 5 μm, 1.2 μm, and 0.45 μm to obtain “stripped” serum.
Samples for metabolic analysis: Two hundred microliters of the serum sample was pipetted into a 1.5 mL centrifuge tube, followed by adding 200 μL of PBS solution containing NEM (10 mmol/L) and 1000 μL of methanol solution with L-phenylalanine (Ring-D5; 10 ng/mL, internal standard) in sequence, vortexing for 30 s, and incubating

Wang MF et al. Metabolomics of Fuzi-Gancao in acute liver injury in rats
WJG https://www.wjgnet.com 6892 October 28, 2021 Volume 27 Issue 40
Figure 2 Serum metabolites in rats. A: Partial Least-Squares Discriminant Analysis; B: P-test analysis. M: Model control group; N: Negative control group; F-G: Fuzi-Gancao group.
Figure 3 Metabolic pathway analysis of serum in rats. A: Negative control group vs model control group; B: Fuzi-Gancao group vs model control group.
the sample at -20 °C for 15 min after mixing. After incubation, 1000 μL of supernatant

Wang MF et al. Metabolomics of Fuzi-Gancao in acute liver injury in rats
WJG https://www.wjgnet.com 6893 October 28, 2021 Volume 27 Issue 40
Figure 4 Bile acids in rats (n = 6, mean ± SD). aP < 0.05, bP < 0.01 for each treatment group and model control group, respectively; cP < 0.05, dP < 0.01 for the model control group and normal control group, respectively.
Preparation of standard solution: L-Leucine, 5-HT, N-phenylacetylglycine, L-tryptophan, L-kynurenine, 5-HTP, cholic acid, and GSSG were accurately weighed and dissolved in methanol to make stock solutions at a concentration of 1 mg/mL. GSH was accurately weighed and dissolved in methanol containing NEM (10 mmol/L) to make a solution at a concentration of 0.5 mg/mL. Each standard solution was mixed proportionally and serially diluted with 50% methanol-water to obtain a series of mixed standard solutions.
Method validation: Calibrators of the nine metabolites (L-Leu, 5-HT, N-Phe, L-Try, L-Kyn, 5-HTP, CA, GSH, and GSSG) were generated from the mixed standard working solutions in “stripped” serum. The linear regression standard curve was calculated with 1/x weighting and plotted with the concentrations and the peak area ratio of each analyte to the internal standard.
Pooled standard solutions were added to “stripped” serum to prepare QC samples of three different concentrations, which were then processed as described in “Samples for metabolic analysis”. Intraday precision was calculated according to the content of nine metabolites from the QC sample in six consecutive analyses. The interday precision was obtained after continuous analysis of the QC sample for 3 d. Precision is expressed as the relative standard deviation (RSD, %).
Three concentrations of the mixed standard solutions were added to the samples of a definite content and processed for analysis six times to obtain recovery. Recovery was calculated according to the formula:

Wang MF et al. Metabolomics of Fuzi-Gancao in acute liver injury in rats
WJG https://www.wjgnet.com 6894 October 28, 2021 Volume 27 Issue 40
Figure 5 Bile acids in rats. A: Partial Least-Squares Discriminant Analysis; B: P-test analysis.
Recovery (%) = (C-A)/B × 100% (A is the measured content of the test sample, B is the amount of standard content, and C is the measured content).
UPLC-MS/MS analysis: Samples were separated using a Waters ACQUITY ultra-performance liquid chromatographer with a Waters BEH column (1.7 μm, 2.1 × 50 mm, C-18) and a mobile phase consisting of 0.1% formic acid in water (A) and acetonitrile (B) using a gradient system with the following elution procedures: 0-2.0 min, 5% B; 2.0-5.0 min, 5-50% B; 5.0-6.0 min, 50% B; 6.0-17.0 min, 50-95% B; 18.0-22.0 min, 95-5% B; and 22.0-25.0 min, 5% B. The flow rate was 0.3 mL/min, and the column temperature was set at 25 °C. Mass spectral analysis was achieved using an AB 4000 Q-TRAP system with ESI in positive and negative ionization modes and multiple reaction monitoring (MRM) mode. The MS parameters were as follows: Ion spray voltage, ± 4500 V; curtain gas, 20 psi; temperature, 450 °C; and ion source gas, 40 psi. All the metabolites were analyzed using precursor ions (Q1), product ions (Q3), declustering energy, entrance pressure, collision energy, and collision cell exit potential as detection parameters.
Bile acid analysisThirty-six male SD rats were randomly divided into six groups (n = 6): Normal control group, model control group, positive control group, and F-G groups including FGL (10 g/kg), FGM (20 g/kg), and FGH (30 g/kg). The positive control group was given 50 mg/kg silybin, the normal group and model group were given the same volume of normal saline, and all the groups were administered for 8 d.
On the 7th day, 40% CCl4 (v/v, olive oil) solution was injected intraperitoneally (2 mL/kg), and the same dose of olive oil was injected intraperitoneally in the control group. The rats were anesthetized 2 h after administration on the 8th day. Blood

Wang MF et al. Metabolomics of Fuzi-Gancao in acute liver injury in rats
WJG https://www.wjgnet.com 6895 October 28, 2021 Volume 27 Issue 40
Table 1 Alanine aminotransferase and aspartate aminotransferase in serum of rats (n = 8)
Group ALT (U/L) AST (U/L)
Normal control 43.6 ± 8.7 131.6 ± 25.1
Model control 187.3 ± 29.6a 285.1 ± 31.5a
Positive control 86.7 ± 13.7c 184.2 ± 37.8c
F-G (15 g/kg) 151.2 ± 24.3 246.2 ± 39.8
F-G (30 g/kg) 119.4 ± 19.5c 224.0 ± 34.1b
aP < 0.01 for the model control group and normal control group.bP < 0.05.cP < 0.01 for each treatment group and model control group, respectively. F-G: Fuzi-Gancao; ALT: Alanine aminotransferase; AST: Aspartate aminotransferase.
Table 2 Calibration curve, R², and concentration range of nine metabolites
Compound Standard curve R2 Range (ng/mL)
L-Leu Y = 0.0627X - 4.9797 0.9952 100-10000
5-HT Y = 0.0385X - 0.0269 0.9939 0.8-80
N-phe Y = 0.0229X - 4.9120 0.9958 250-25000
L-Try Y = 0.0048X - 2.4673 0.9926 600-60000
L-Kyn Y = 0.0331X + 0.0123 0.9960 5-500
5-HTP Y = 0.0492X - 0.0001 0.9983 0.2-20
CA Y = 0.00004X - 0.0010 0.9959 40-4000
GSH Y = 0.0032X - 0.2362 0.9975 150-20000
GSSG Y = 0.0001X + 0.0010 0.9949 50-10000
L-Leu: L-leucine; 5-HT: 5-Hydroxytryptamine; N-phe: N-phenylacetylglycine; L-Try: L-tryptophan; L-Kyn: L-kynurenine; 5-HTP: 5-hydroxytryptophan; CA: Cholic acid; GSH: Glutathione; GSSG: Glutathione oxidized.
samples were collected from the abdominal aorta and centrifuged at 4000 rpm for 10 min (4 °C) to obtain serum samples for the analysis of bile acids.
Preparation of standard solutions: CDCA, DCA, UDCA, GLCA, GCDCA, GDCA, GCA, TCDCA, TCDCA, TUDCA, and TCA were accurately weighed and dissolved in methanol to prepare stock solutions at a concentration of 1 mg/mL and stored at -80 °C. Solutions were serially diluted with 50% methanol-water prior to testing. d4-GCDCA was accurately weighed and dissolved in methanol to make an internal standard solution. All the solutions were stored at -80 °C prior to use.
Sample preparation: Two hundred microliters of serum was added to 1000 μL of methanol containing internal standard (d4-GCDCA, 20 ng/mL). The samples were centrifuged at 12000 rpm for 15 min (4 °C) after mixing, and then 1000 μL of the supernatant was dried with nitrogen and stored at -80 °C. The dried residue was reconstituted with 50 μL of 80% methanol-water solution prior to analysis, vortexed for 1 min, and centrifuged at 12000 rpm for 15 min (4 °C). Then, 30 μL of supernatant was aspirated accurately into an injection vial, and 10 μL of each sample was injected into the UPLC-MS/MS system for bile acid quantification.
UPLC-MS analysis: Samples were separated using a Waters Acquity Uplc instrument and an Agilent ZORBAX SB-C18 column (3.5 μm, 2.1 mm × 100 mm) and a mobile phase consisting of 0.1% formic acid in water (A) and methanol (B) using a gradient system with the following elution procedure: 0-2.0 min, 10% B; 2.0-9.0 min, 10%-80% B; 9.0-11.0 min, 80% B; 11.0-20.0 min, 80%-90% B; and 20.0-25.0 min, 90%-10% B. Ten microliters of the sample was injected at a flow rate of 0.4 mL/min and column temperature of 25 °C. Mass spectral analysis was achieved using a Thermo Scientific
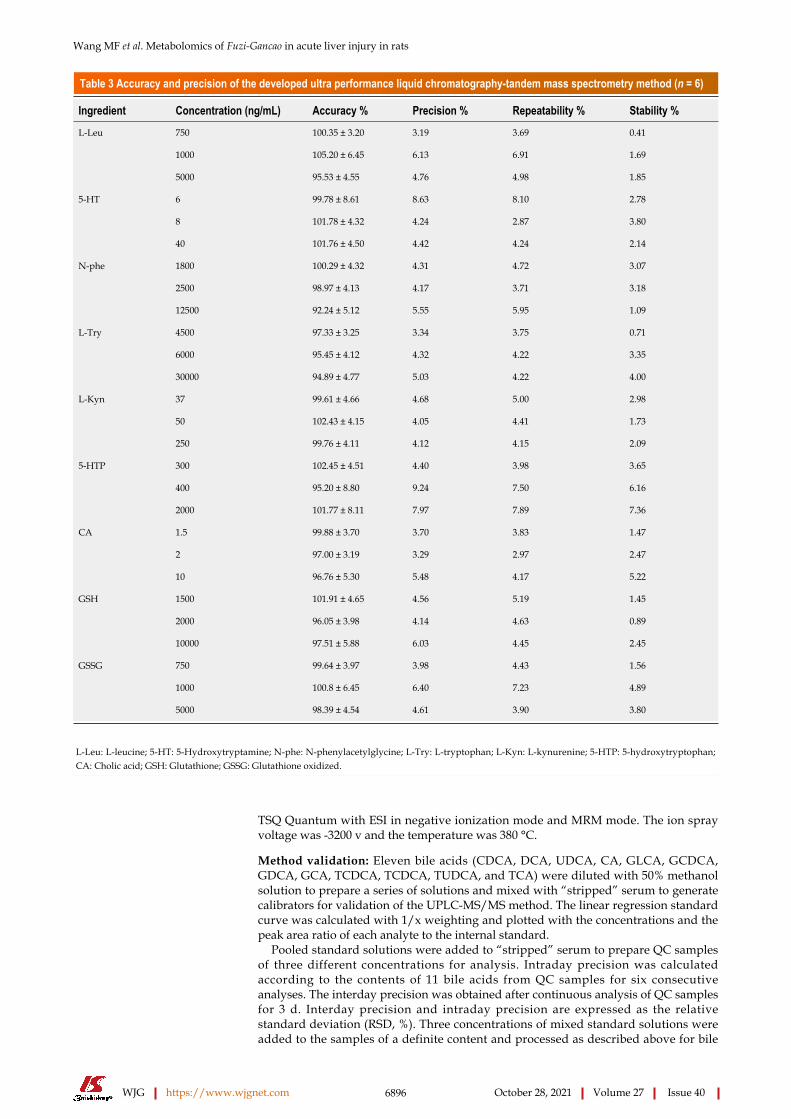
Wang MF et al. Metabolomics of Fuzi-Gancao in acute liver injury in rats
WJG https://www.wjgnet.com 6896 October 28, 2021 Volume 27 Issue 40
Table 3 Accuracy and precision of the developed ultra performance liquid chromatography-tandem mass spectrometry method (n = 6)
Ingredient Concentration (ng/mL) Accuracy % Precision % Repeatability % Stability %
750 100.35 ± 3.20 3.19 3.69 0.41
1000 105.20 ± 6.45 6.13 6.91 1.69
L-Leu
5000 95.53 ± 4.55 4.76 4.98 1.85
6 99.78 ± 8.61 8.63 8.10 2.78
8 101.78 ± 4.32 4.24 2.87 3.80
5-HT
40 101.76 ± 4.50 4.42 4.24 2.14
1800 100.29 ± 4.32 4.31 4.72 3.07
2500 98.97 ± 4.13 4.17 3.71 3.18
N-phe
12500 92.24 ± 5.12 5.55 5.95 1.09
4500 97.33 ± 3.25 3.34 3.75 0.71
6000 95.45 ± 4.12 4.32 4.22 3.35
L-Try
30000 94.89 ± 4.77 5.03 4.22 4.00
37 99.61 ± 4.66 4.68 5.00 2.98
50 102.43 ± 4.15 4.05 4.41 1.73
L-Kyn
250 99.76 ± 4.11 4.12 4.15 2.09
300 102.45 ± 4.51 4.40 3.98 3.65
400 95.20 ± 8.80 9.24 7.50 6.16
5-HTP
2000 101.77 ± 8.11 7.97 7.89 7.36
1.5 99.88 ± 3.70 3.70 3.83 1.47
2 97.00 ± 3.19 3.29 2.97 2.47
CA
10 96.76 ± 5.30 5.48 4.17 5.22
1500 101.91 ± 4.65 4.56 5.19 1.45
2000 96.05 ± 3.98 4.14 4.63 0.89
GSH
10000 97.51 ± 5.88 6.03 4.45 2.45
750 99.64 ± 3.97 3.98 4.43 1.56
1000 100.8 ± 6.45 6.40 7.23 4.89
GSSG
5000 98.39 ± 4.54 4.61 3.90 3.80
L-Leu: L-leucine; 5-HT: 5-Hydroxytryptamine; N-phe: N-phenylacetylglycine; L-Try: L-tryptophan; L-Kyn: L-kynurenine; 5-HTP: 5-hydroxytryptophan; CA: Cholic acid; GSH: Glutathione; GSSG: Glutathione oxidized.
TSQ Quantum with ESI in negative ionization mode and MRM mode. The ion spray voltage was -3200 v and the temperature was 380 °C.
Method validation: Eleven bile acids (CDCA, DCA, UDCA, CA, GLCA, GCDCA, GDCA, GCA, TCDCA, TCDCA, TUDCA, and TCA) were diluted with 50% methanol solution to prepare a series of solutions and mixed with “stripped” serum to generate calibrators for validation of the UPLC-MS/MS method. The linear regression standard curve was calculated with 1/x weighting and plotted with the concentrations and the peak area ratio of each analyte to the internal standard.
Pooled standard solutions were added to “stripped” serum to prepare QC samples of three different concentrations for analysis. Intraday precision was calculated according to the contents of 11 bile acids from QC samples for six consecutive analyses. The interday precision was obtained after continuous analysis of QC samples for 3 d. Interday precision and intraday precision are expressed as the relative standard deviation (RSD, %). Three concentrations of mixed standard solutions were added to the samples of a definite content and processed as described above for bile

Wang MF et al. Metabolomics of Fuzi-Gancao in acute liver injury in rats
WJG https://www.wjgnet.com 6897 October 28, 2021 Volume 27 Issue 40
Table 4 Recovery of the developed ultra performance liquid chromatography-tandem mass spectrometry method (n = 6)
Ingredient Baseline (ng/mL) Spiked (ng/mL) Recovery %
250 92.53 ± 7.13
500 93.42 ± 11.52
L-Leu 1000
750 87.53 ± 9.59
2 85.37 ± 9.79
4 90.52 ± 13.47
5-HT 8
6 93.05 ± 10.16
625 94.54 ± 12.15
1250 89.46 ± 6.54
N-phe 2500
1875 86.72 ± 8.19
1500 93.04 ± 13.23
3000 85.42 ± 7.12
L-Try 6000
4500 91.16 ± 12.25
12.5 90.48 ± 6.18
25 85.30 ± 10.42
L-Kyn 50
37.5 86.20 ± 6.13
0.5 91.49 ± 5.36
1 94.64 ± 7.46
5-HTP 2
1.5 93.58 ± 5.15
100 91.83 ± 12.12
200 93.29 ± 8.62
CA 400
300 90.22 ± 7.28
250 88.17 ± 6.33
500 91.16 ± 6.15
GSH 1000
750 90.85 ± 9.81
500 91.15 ± 10.08
1000 93.92 ± 12.15
GSSG 2000
1500 89.27 ± 10.92
L-Leu: L-leucine; 5-HT: 5-Hydroxytryptamine; N-phe: N-phenylacetylglycine; L-Try: L-tryptophan; L-Kyn: L-kynurenine; 5-HTP: 5-hydroxytryptophan; CA: Cholic acid; GSH: Glutathione; GSSG: Glutathione oxidized.
acid analysis six times to obtain recovery.Three concentrations of 11 mixed bile acid standard solutions were used to
investigate the stability of QC samples under different storage conditions and processing procedures. Short-term stability was assessed by analyzing the QC samples that were kept at room temperature for 12 h. Long-term stability was assessed by storing the QC samples at -20 °C for 20 d. Freeze-thaw stability was assessed after the QC samples were frozen at -80 °C and thawed at 4 °C in 1 d for 3 consecutive days. Postpreparation stability was assessed by analyzing the QC samples that were kept at 4 °C for 12 h.
Data analysisMetabolic analysis was calibrated and integrated using AB Analyst (version 1.6.2, AB Applied Biosystems). Quantitative analyses of bile acids were performed using Thermo Scientific TSQ Quantum Workstation analysis software. Pathway analyses were achieved using SIMCA-P, Metaboanalyst, and KEGG software. The experimental data are expressed as the mean ± SD. The data were analyzed with SPSS 19.0 statistical software (P < 0.05 and P < 0.01).

Wang MF et al. Metabolomics of Fuzi-Gancao in acute liver injury in rats
WJG https://www.wjgnet.com 6898 October 28, 2021 Volume 27 Issue 40
Table 5 Serum metabolites in CCl4-induced acute liver injury in rats (n = 8)
Metabolite Model group Control group FG group
L-leucine 431.1 ± 54.32 331.4 ± 48.78d 393.5 ± 53.83
N-phenylacetylglycine 5.350 ± 0.938 1.417 ± 0.351d 2.915 ± 0.496b,d
L-tryptophan 17.96 ± 3.014 14.63 ± 2.724c 17.05 ± 2.679a
L-kynurenine 6.270 ± 0.729 3.948 ± 0.450d 6.646 ± 1.214b
Cholic acid 1.342 ± 0.230 0.047 ± 0.004d 1.001 ± 0.124b,d
GSH 2.562 ± 0.433 0.991 ± 0.285d 2.317 ± 0.632b
GSSG 0.108 ± 0.016 0.021 ± 0.002d 0.051 ± 0.009b,d
lactate 257.8 ± 32.57 230.8 ± 37.30 185.3 ± 31.52b,d
Choline 3.548 ± 0.539 2.639 ± 0.451 2.802 ± 0.413
(E)-butenedioic acid 163.6 ± 18.57 79.48 ± 8.625d 87.82 ± 10.55d
Hypoxanthine 0.052 ± 0.003 0.021 ± 0.002d 0.022 ± 0.003d
Carnitine 23.55 ± 5.024 13.52 ± 1.370d 20.05 ± 1.323b
Phenylalanine 289.5 ± 37.51 165.6 ± 23.76d 261.4 ± 32.33b
Uric acid 4.523 ± 0.863 2.769 ± 0.474d 2.927 ± 0.488d
Hippuric acid 95.58 ± 16.47 65.78 ± 13.92d 76.53 ± 16.92d
Citric acid 11.86 ± 1.531 15.62 ± 2.437d 13.51 ± 2.002
Pantothenic acid 7.852 ± 0.953 4.602 ± 0.560d 4.831 ± 0.693d
Uridine 19.37 ± 2.772 6.816 ± 0.829d 17.53 ± 2.503b
Glucosamine-1-phosphate 0.025 ± 0.005 0.017 ± 0.004c 0.020 ± 0.004
8-OH-dG 0.008 ± 0.001 0.007 ± 0.001c 0.007 ± 0.001c
C16:1 Lyso PC 3.215 ± 0.491 4.813 ± 0.503d 6.293 ± 1.337b,d
C16:0 Lyso PC 13.37 ± 2.434 16.62 ± 3.027 18.39 ± 3.316c
C18:1 Lyso PC 16.837 ± 2.392 23.699 ± 4.427d 26.647 ± 4.339a,d
C18:0 LysoPC 11.42 ± 1.130 18.332 ± 1.833d 16.66 ± 2.603a,d
aP < 0.05.bP < 0.01 compared with the negative control group.cP < 0.05.dP < 0.01 compared with the model control group. GSH: Glutathione; GSSG: Glutathione oxidized.
RESULTSEffects of F-G on acute liver injuryHistological analysis: The liver tissue of rats in each group was macroscopically observed. The livers of the normal control group rats had a normal morphology, a red color, no adhesion between the lobules, a smooth surface, and no bleeding spots. In the model group, the surface of the liver was milky white, and there was obvious adhesion between the lobules of the liver and the mucous membranes. In the F-G group, the adhesion degree between the lobules and mucous membrane was significantly decreased, and the color was rosier than that of the model rats. The morphological results showed that F-G extract could significantly relieve liver injury induced by CCl4 (Figure 1).
Histological analysis indicated that the structure of liver tissue in the normal control group was normal, the liver cells were neatly arranged, and there were no pathological changes, such as hepatocyte swelling, inflammatory cell infiltration, blood stasis, or steatosis of hepatocytes. Compared with the normal control group, the model control group showed a significant increase in the number of hepatocytes with extensive hydrodegeneration, steatosis, hepatocyte necrosis, and inflammatory cell infiltration. Compared with the model control group, F-G groups (15 g/kg and 30 g/kg) indicated
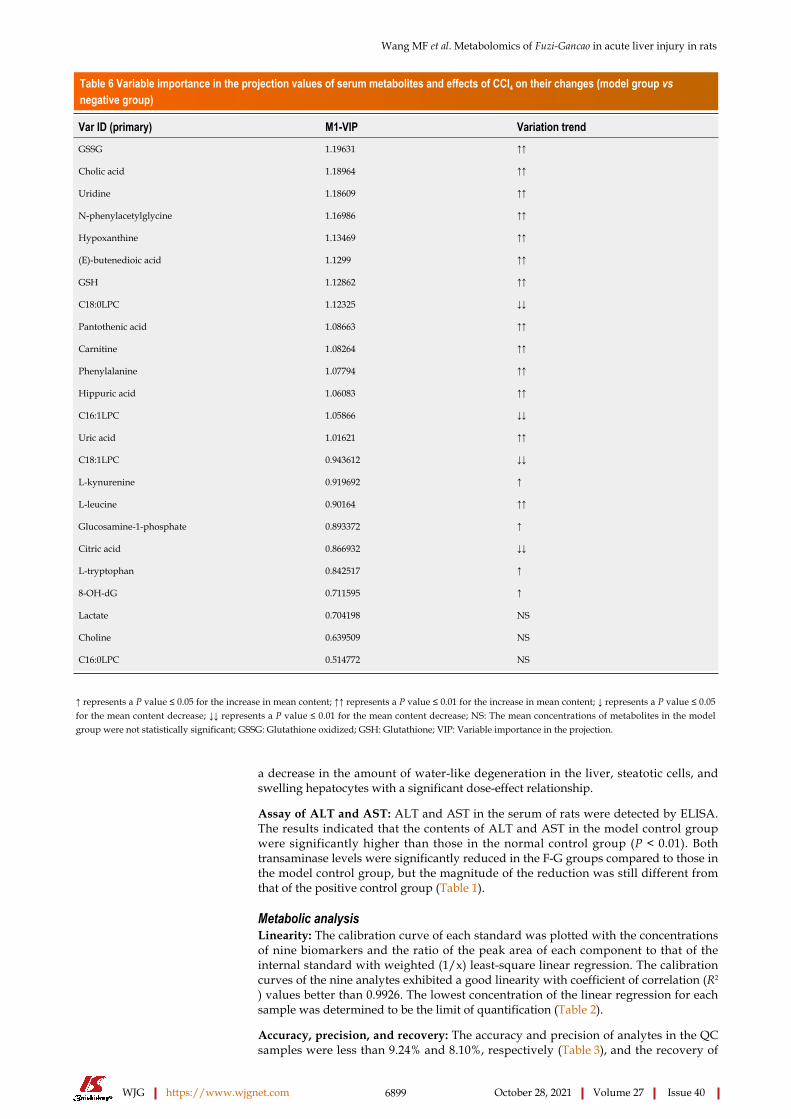
Wang MF et al. Metabolomics of Fuzi-Gancao in acute liver injury in rats
WJG https://www.wjgnet.com 6899 October 28, 2021 Volume 27 Issue 40
Table 6 Variable importance in the projection values of serum metabolites and effects of CCl4 on their changes (model group vs negative group)
Var ID (primary) M1-VIP Variation trend
GSSG 1.19631 ↑↑
Cholic acid 1.18964 ↑↑
Uridine 1.18609 ↑↑
N-phenylacetylglycine 1.16986 ↑↑
Hypoxanthine 1.13469 ↑↑
(E)-butenedioic acid 1.1299 ↑↑
GSH 1.12862 ↑↑
C18:0LPC 1.12325 ↓↓
Pantothenic acid 1.08663 ↑↑
Carnitine 1.08264 ↑↑
Phenylalanine 1.07794 ↑↑
Hippuric acid 1.06083 ↑↑
C16:1LPC 1.05866 ↓↓
Uric acid 1.01621 ↑↑
C18:1LPC 0.943612 ↓↓
L-kynurenine 0.919692 ↑
L-leucine 0.90164 ↑↑
Glucosamine-1-phosphate 0.893372 ↑
Citric acid 0.866932 ↓↓
L-tryptophan 0.842517 ↑
8-OH-dG 0.711595 ↑
Lactate 0.704198 NS
Choline 0.639509 NS
C16:0LPC 0.514772 NS
↑ represents a P value ≤ 0.05 for the increase in mean content; ↑↑ represents a P value ≤ 0.01 for the increase in mean content; ↓ represents a P value ≤ 0.05 for the mean content decrease; ↓↓ represents a P value ≤ 0.01 for the mean content decrease; NS: The mean concentrations of metabolites in the model group were not statistically significant; GSSG: Glutathione oxidized; GSH: Glutathione; VIP: Variable importance in the projection.
a decrease in the amount of water-like degeneration in the liver, steatotic cells, and swelling hepatocytes with a significant dose-effect relationship.
Assay of ALT and AST: ALT and AST in the serum of rats were detected by ELISA. The results indicated that the contents of ALT and AST in the model control group were significantly higher than those in the normal control group (P < 0.01). Both transaminase levels were significantly reduced in the F-G groups compared to those in the model control group, but the magnitude of the reduction was still different from that of the positive control group (Table 1).
Metabolic analysisLinearity: The calibration curve of each standard was plotted with the concentrations of nine biomarkers and the ratio of the peak area of each component to that of the internal standard with weighted (1/x) least-square linear regression. The calibration curves of the nine analytes exhibited a good linearity with coefficient of correlation (R2
) values better than 0.9926. The lowest concentration of the linear regression for each sample was determined to be the limit of quantification (Table 2).
Accuracy, precision, and recovery: The accuracy and precision of analytes in the QC samples were less than 9.24% and 8.10%, respectively (Table 3), and the recovery of

Wang MF et al. Metabolomics of Fuzi-Gancao in acute liver injury in rats
WJG https://www.wjgnet.com 6900 October 28, 2021 Volume 27 Issue 40
Table 7 Variable importance in the projection values of serum metabolites and effects of Fuzi-Gancao on their changes (Fuzi-Gancao group vs model group)
Var ID (primary) M1-VIP Variation trend
Hypoxanthine 1.37706 ↓↓
GSSG 1.36516 ↓↓
Pantothenic acid 1.28548 ↓↓
C18:1LPC 1.27880 ↑↑
C16:1LPC 1.25881 ↑↑
N-phenylacetylglycine 1.22022 ↓↓
Lactate 1.21835 ↓↓
Hippuric acid 1.21598 ↓↓
Uric acid 1.21291 ↓↓
(E)-butenedioic acid 1.21107 ↓↓
Cholic acid 1.17091 ↓↓
C18:0LPC 1.15078 ↑↑
C16:0LPC 1.00088 ↑
Choline 0.906949 NS
L-kynurenine 0.893225 ↑↑
Uridine 0.810356 NS
8-OH-dG 0.777736 NS
Citric acid 0.633654 NS
GSH 0.512313 NS
L-leucine 0.497685 NS
Carnitine 0.447434 NS
Phenylalanine 0.427897 NS
Glucosamine-1-phosphate 0.312245 NS
L-tryptophan 0.0800812 NS
↑ represents a P value ≤ 0.05 for the increase in mean content; ↑↑ represents a P value ≤ 0.01 for the increase in mean content; ↓ represents a P value ≤ 0.05 for the mean content decrease; ↓↓ represents a P value ≤ 0.01 for the mean content decrease; NS: No statistically significant change in the mean concentration of metabolites in the Fuzi-Gancao group; GSSG: Glutathione oxidized; GSH: Glutathione; VIP: Variable importance in the projection.
analytes is shown in Table 4. All the analytical values of the nine analytes had satisfactory results within the acceptable criteria according to the bioanalytical method validation guidance of the United States FDA.
Metabolic analysis: Analysis of 92 metabolites was achieved by UPLC-QTRAP-LC-MS/MS. NEM was used to improve the stability of GSH. Twenty-four differential metabolites in the serum (normal control group vs model control group and F-G groups vs model control group) were confirmed according to statistical analysis (Table 5).
Partial Least-Squares Discriminant Analysis (PLS-DA) (Figure 2) was performed on the data matrix of the variation in individual metabolites in Table 4. The results showed that the samples of the negative control group, model control group, and F-G groups were distributed in different areas and could be separated completely, but samples of the same group had the tendency to aggregate (Figure 2A). The results showed that the difference in all metabolites between the negative control group and the model control group was significant, indicating that the contents of these 24 metabolites were significantly changed in acute liver injury induced by CCl4. The difference in all metabolites between the F-G groups and the model control group was also significant, indicating that the administration of the F-G extract could cause a

Wang MF et al. Metabolomics of Fuzi-Gancao in acute liver injury in rats
WJG https://www.wjgnet.com 6901 October 28, 2021 Volume 27 Issue 40
Table 8 Standard curve, R2, and concentration range of 11 bile acids in serum
Compound Standard curve R² Range (ng/mL)
CDCA Y = 0.0235X - 0.0056 0.9981 2.5-1000
UDCA Y = 0.0013X + 0.2156 0.9972 1.25-500
GCA Y = 0.0164X + 1.1577 0.9956 1.25-500
GDCA Y = 0.0025X + 0.833 0.9982 1.25-500
TCA Y = 0.0198X - 0.0113 0.9953 1.25-500
TUDCA Y = 0.0332X + 0.0023 0.9985 2.5-1000
TCDCA Y = 0.0306X + 0.00422 0.9923 2.5-1000
GCDCA Y = 0.0133X - 0.00324 0.9915 2.5-1000
GLCA Y = 0.0018X + 0.00242 0.9931 2.5-1000
DCA Y = 0.0076X + 0.00614 0.9956 2.5-1000
CA Y = 0.0916X - 0.00465 0.9987 2.5-1000
CDCA: Chenodeoxycholic acid; UDCA: Ursodeoxycholic acid; GCA: Glycocholic acid; GDCA: Glycochenodeoxycholic acid; TCA: Taurocholic acid; TUDCA: Taurocholic acid; GCDCA: Glycochenodeoxycholic acid; GLCA: Glycinic acid; DCA: Deoxycholic acid; CA: Cholic acid.
significant reduction in the metabolite contents in the serum of rats with acute liver injury induced by CCl4, which could cause a significant change in the metabolic network. In the PLS-DA plot, samples of the F-G groups were closer to those of the negative control group than those of the model control group, indicating a significant difference in the metabolite contents in rats with liver injury compared to those in the negative control group after treatment with F-G. P-test analysis (Figure 2B) showed that there was no overfitting of the separation model between groups.
Combined with the variable importance in the projection (VIP) value based on PLS-DA, it was shown that the metabolites with a VIP value greater than 1.0 contributed greatly to the difference before and after treatment with the F-G extract and were the key metabolites. There were 14 key metabolites in the model control group vs the negative control group (Table 6) and 13 key metabolites in the F-G groups vs the model control group (Table 7). Ten common metabolites, namely, GSSG, cholic acid, N-phenylacetylglycine, hippuric acid, uric acid, hypoxanthine, (E)-butenedioic acid, pantothenic acid, C16:1 LPC, and C18:0 LPC, were observed.
Pathway analysis: Metaboanalyst software was used to analyze the metabolic mechanism. Metabolic pathway differences between the negative control group and model control group and between the model control group and F-G group were analyzed by topological and enrichment analyses to confirm the important metabolic pathway effects of F-G in acute liver injury induced by CCl4.
The results indicated that the primary bile acid biosynthesis pathway was the most important metabolic pathway affected in the model control group vs the negative control group (Figure 3A). Other pathways, such as pyrimidine metabolism, glutathione metabolism, glutamate metabolism, and phenylalanine metabolism, are also affected by CCl4. The pantothenate and CoA biosynthesis, primary bile acid biosynthesis, and pyruvate metabolism pathways were significantly affected by the administration of the F-G extract (Figure 3B).
Bile acids analysisMethod validation: The calibration curve of each standard was plotted on the concen-trations of 11 bile acids and the ratio of the peak area of each component to that of the internal standard with weighted (1/x) least square linear regression. The calibration curves of the 11 analytes exhibited a good linearity (Table 8).
The intraday precision of QC samples with three concentrations of bile acids ranged from 1.20% to 6.57%, the interday precision ranged from 2.10% to 6.35%, and the recovery of each analyte was greater than 80% (Table 9). Eleven bile acid analytes exhibited good stability (short-term stability, long-term stability, freeze-thaw stability, and postpreparation stability) (Table 10). All the analytical values of the 11 analytes had satisfactory results within the acceptable criteria.

Wang MF et al. Metabolomics of Fuzi-Gancao in acute liver injury in rats
WJG https://www.wjgnet.com 6902 October 28, 2021 Volume 27 Issue 40
Table 9 Precision, accuracy, and recovery of bile acids in serum samples (n = 6, mean ± SD)
Intraday InterdayCompound Concentration (ng/mL) Recovery (%)
Accuracy (%) Precision (%) Accuracy (%) Precision (%)
2.5 90.12 ± 2.16 96.44 ± 2.05 4.26 91.83 ± 3.32 5.03
500 88.21 ± 5.34 91.65 ± 4.14 3.60 94.42 ± 4.55 4.36
CA
2000 85.60 ± 7.22 92.11 ± 4.11 5.42 94.54 ± 8.35 6.00
1.25 91.52 ± 5.51 92.13 ± 2.97 5.71 98.48 ± 2.22 3.75
250 86.74 ± 7.12 87.31 ± 1.92 4.23 93.42 ± 3.67 5.40
GLCA
1000 90.48 ± 3.31 91.55 ± 5.31 6.13 89.24 ± 4.63 4.57
1.25 88.54 ± 2.93 90.67 ± 6.87 6.22 88.55 ± 3.87 3.28
250 98.43 ± 1.26 97.24 ± 7.86 6.38 101.53 ± 2.54 2.76
GDCA
1000 95.56 ± 4.01 89.34 ± 2.65 2.81 89.23 ± 6.25 6.16
1.25 96.02 ± 3.11 93.24 ± 3.78 6.30 89.32 ± 4.32 3.19
250 90.13 ± 3.42 97.43 ± 2.82 5.03 88.54 ± 4.75 2.10
GCDCA
1000 89.32 ± 3.13 86.53 ± 4.27 2.96 89.52 ± 3.63 3.28
1.25 80.87 ± 3.83 99.31 ± 5.19 4.18 89.42 ± 1.71 2.32
250 91.43 ± 6.38 101.33 ± 2.23 2.59 112.53 ± 5.76 2.29
GCA
1000 92.43 ± 2.14 88.76 ± 1.46 1.20 89.16 ± 3.46 3.09
2.5 84.77 ± 2.38 103.55 ± 1.27 1.50 98.24 ± 2.14 5.51
500 86.92 ± 4.96 89.04 ± 6.42 5.53 95.33 ± 2.86 3.82
TCA
2000 81.34 ± 1.84 88.57 ± 4.85 4.77 97.81 ± 3.08 4.50
1.25 80.33 ± 3.23 94.33 ± 4.62 4.39 90.49 ± 4.83 5.18
250 86.34 ± 2.45 92.33 ± 4.93 3.70 91.49 ± 7.39 4.49
CDCA
1000 84.62 ± 3.21 92.33 ± 6.03 5.58 92.77 ± 4.83 6.18
1.25 95.54 ± 2.17 94.67 ± 4.93 5.88 104.21 ± 7.22 3.87
250 82.56 ± 4.32 106.33 ± 7.37 4.36 99.31 ± 5.66 5.57
DCA
1000 94.45 ± 5.34 101.33 ± 5.77 6.31 89.83 ± 4.53 4.71
1.25 83.32 ± 1.43 91.67 ± 4.62 6.41 93.43 ± 4.63 3.38
250 88.13 ± 5.94 95.33 ± 4.73 6.57 92.12 ± 4.49 2.84
UDCA
1000 85.26 ± 3.01 94 ± 4.58 2.90 91.79 ± 5.74 6.35
1.25 86.04 ± 3.36 93.67 ± 5.86 6.49 92.77 ± 4.83 3.28
250 87.98 ± 3.11 94.67 ± 4.93 5.18 89.83 ± 4.53 2.17
TCDCA
1000 83.72 ± 2.19 91.67 ± 4.62 3.05 92.77 ± 7.36 3.38
1.25 87.17 ± 4.61 94.67 ± 7.51 4.31 96.69 ± 9.82 2.39
250 87.41 ± 4.09 98.67 ± 10.02 2.66 98.33 ± 8.33 2.36
TUDCA
1000 99.06 ± 3.56 100.33 ± 8.5 1.23 92.45 ± 4.53 3.18
CDCA: Chenodeoxycholic acid; UDCA: Ursodeoxycholic acid; GCA: Glycocholic acid; GDCA: Glycochenodeoxycholic acid; TCA: Taurocholic acid; TUDCA: Taurocholic acid; GCDCA: Glycochenodeoxycholic acid; GLCA: Glycinic acid; DCA: Deoxycholic acid; CA: Cholic acid.
Bile acids analysis: Liver injury induced by CCl4 in rats could reduce bile secretion and rapidly alter the distribution of bile acid stores, resulting in a significant increase in serum bile acid concentrations. The results indicated that the contents of 11 analytes (CDCA, DCA, UDCA, GLCA, GLCA, GCDCA, GDCA, GCA, TCDCA, TUDCA, and TCA) in the serum of the model control group, compared with the negative control group, were significantly increased (P < 0.01), and the contents of the 11 bile acids in
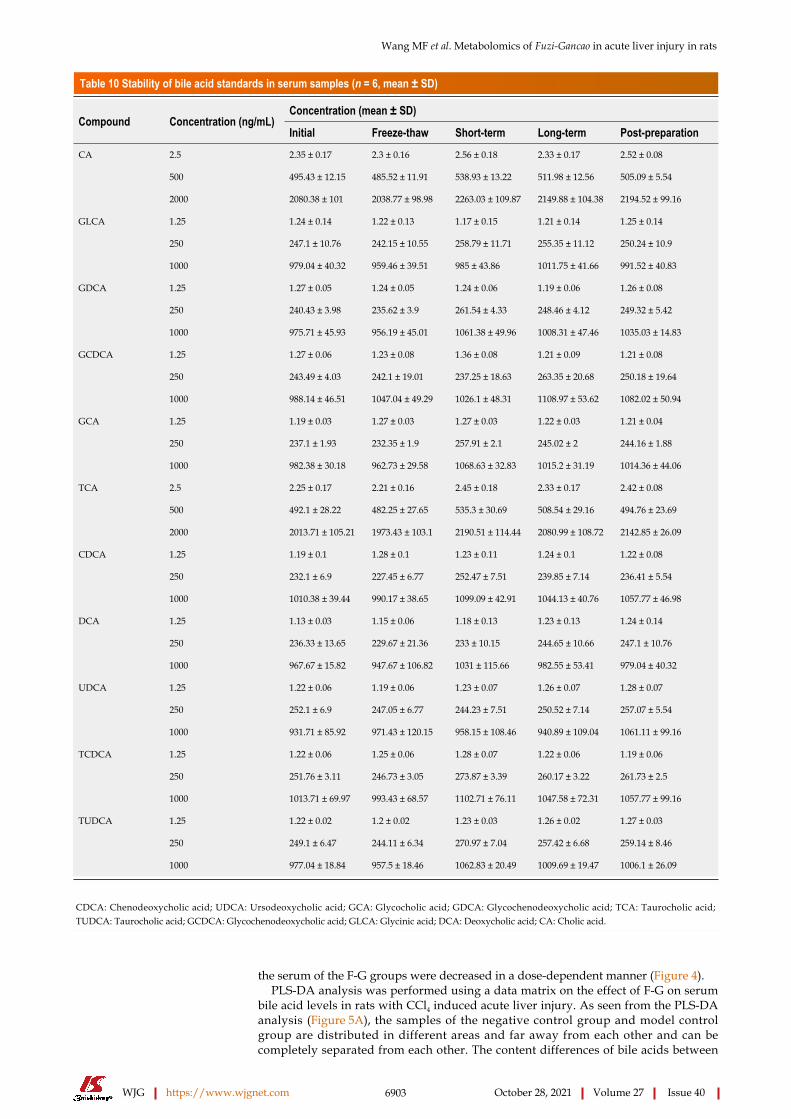
Wang MF et al. Metabolomics of Fuzi-Gancao in acute liver injury in rats
WJG https://www.wjgnet.com 6903 October 28, 2021 Volume 27 Issue 40
Table 10 Stability of bile acid standards in serum samples (n = 6, mean ± SD)
Concentration (mean ± SD)Compound Concentration (ng/mL)
Initial Freeze-thaw Short-term Long-term Post-preparation
2.5 2.35 ± 0.17 2.3 ± 0.16 2.56 ± 0.18 2.33 ± 0.17 2.52 ± 0.08
500 495.43 ± 12.15 485.52 ± 11.91 538.93 ± 13.22 511.98 ± 12.56 505.09 ± 5.54
CA
2000 2080.38 ± 101 2038.77 ± 98.98 2263.03 ± 109.87 2149.88 ± 104.38 2194.52 ± 99.16
1.25 1.24 ± 0.14 1.22 ± 0.13 1.17 ± 0.15 1.21 ± 0.14 1.25 ± 0.14
250 247.1 ± 10.76 242.15 ± 10.55 258.79 ± 11.71 255.35 ± 11.12 250.24 ± 10.9
GLCA
1000 979.04 ± 40.32 959.46 ± 39.51 985 ± 43.86 1011.75 ± 41.66 991.52 ± 40.83
1.25 1.27 ± 0.05 1.24 ± 0.05 1.24 ± 0.06 1.19 ± 0.06 1.26 ± 0.08
250 240.43 ± 3.98 235.62 ± 3.9 261.54 ± 4.33 248.46 ± 4.12 249.32 ± 5.42
GDCA
1000 975.71 ± 45.93 956.19 ± 45.01 1061.38 ± 49.96 1008.31 ± 47.46 1035.03 ± 14.83
1.25 1.27 ± 0.06 1.23 ± 0.08 1.36 ± 0.08 1.21 ± 0.09 1.21 ± 0.08
250 243.49 ± 4.03 242.1 ± 19.01 237.25 ± 18.63 263.35 ± 20.68 250.18 ± 19.64
GCDCA
1000 988.14 ± 46.51 1047.04 ± 49.29 1026.1 ± 48.31 1108.97 ± 53.62 1082.02 ± 50.94
1.25 1.19 ± 0.03 1.27 ± 0.03 1.27 ± 0.03 1.22 ± 0.03 1.21 ± 0.04
250 237.1 ± 1.93 232.35 ± 1.9 257.91 ± 2.1 245.02 ± 2 244.16 ± 1.88
GCA
1000 982.38 ± 30.18 962.73 ± 29.58 1068.63 ± 32.83 1015.2 ± 31.19 1014.36 ± 44.06
2.5 2.25 ± 0.17 2.21 ± 0.16 2.45 ± 0.18 2.33 ± 0.17 2.42 ± 0.08
500 492.1 ± 28.22 482.25 ± 27.65 535.3 ± 30.69 508.54 ± 29.16 494.76 ± 23.69
TCA
2000 2013.71 ± 105.21 1973.43 ± 103.1 2190.51 ± 114.44 2080.99 ± 108.72 2142.85 ± 26.09
1.25 1.19 ± 0.1 1.28 ± 0.1 1.23 ± 0.11 1.24 ± 0.1 1.22 ± 0.08
250 232.1 ± 6.9 227.45 ± 6.77 252.47 ± 7.51 239.85 ± 7.14 236.41 ± 5.54
CDCA
1000 1010.38 ± 39.44 990.17 ± 38.65 1099.09 ± 42.91 1044.13 ± 40.76 1057.77 ± 46.98
1.25 1.13 ± 0.03 1.15 ± 0.06 1.18 ± 0.13 1.23 ± 0.13 1.24 ± 0.14
250 236.33 ± 13.65 229.67 ± 21.36 233 ± 10.15 244.65 ± 10.66 247.1 ± 10.76
DCA
1000 967.67 ± 15.82 947.67 ± 106.82 1031 ± 115.66 982.55 ± 53.41 979.04 ± 40.32
1.25 1.22 ± 0.06 1.19 ± 0.06 1.23 ± 0.07 1.26 ± 0.07 1.28 ± 0.07
250 252.1 ± 6.9 247.05 ± 6.77 244.23 ± 7.51 250.52 ± 7.14 257.07 ± 5.54
UDCA
1000 931.71 ± 85.92 971.43 ± 120.15 958.15 ± 108.46 940.89 ± 109.04 1061.11 ± 99.16
1.25 1.22 ± 0.06 1.25 ± 0.06 1.28 ± 0.07 1.22 ± 0.06 1.19 ± 0.06
250 251.76 ± 3.11 246.73 ± 3.05 273.87 ± 3.39 260.17 ± 3.22 261.73 ± 2.5
TCDCA
1000 1013.71 ± 69.97 993.43 ± 68.57 1102.71 ± 76.11 1047.58 ± 72.31 1057.77 ± 99.16
1.25 1.22 ± 0.02 1.2 ± 0.02 1.23 ± 0.03 1.26 ± 0.02 1.27 ± 0.03
250 249.1 ± 6.47 244.11 ± 6.34 270.97 ± 7.04 257.42 ± 6.68 259.14 ± 8.46
TUDCA
1000 977.04 ± 18.84 957.5 ± 18.46 1062.83 ± 20.49 1009.69 ± 19.47 1006.1 ± 26.09
CDCA: Chenodeoxycholic acid; UDCA: Ursodeoxycholic acid; GCA: Glycocholic acid; GDCA: Glycochenodeoxycholic acid; TCA: Taurocholic acid; TUDCA: Taurocholic acid; GCDCA: Glycochenodeoxycholic acid; GLCA: Glycinic acid; DCA: Deoxycholic acid; CA: Cholic acid.
the serum of the F-G groups were decreased in a dose-dependent manner (Figure 4).PLS-DA analysis was performed using a data matrix on the effect of F-G on serum
bile acid levels in rats with CCl4 induced acute liver injury. As seen from the PLS-DA analysis (Figure 5A), the samples of the negative control group and model control group are distributed in different areas and far away from each other and can be completely separated from each other. The content differences of bile acids between

Wang MF et al. Metabolomics of Fuzi-Gancao in acute liver injury in rats
WJG https://www.wjgnet.com 6904 October 28, 2021 Volume 27 Issue 40
the negative control group and model control group were significant. At the same time, the samples of the F-G group (10 g/kg) were partially overlapping those of the model control group, but with increasing dose, the samples of the mid-dose and high-dose F-G groups (20 g/kg and 30 g/kg) were clearly separated from those of the model control group, indicating that the dose-dependent relationship between the bile acid level and the dose of F-G extract was apparent in the overall analysis. P-test analysis showed that there was no overfitting of the between-group separation model (Figure 5B).
DISCUSSIONAnalysis of 24 differential metabolites by UPLC-QTRAP-LC-MS/MS showed that CCl4 could affect a variety of metabolic pathways, such as primary bile acid biosynthesis, glutathione metabolism, pyrimidine metabolism, and phenylalanine metabolism. The F-G extract could affect the metabolic pathways of pantothenic acid and CoA biosyn-thesis, primary bile acid biosynthesis, and pyruvate biosynthesis. The primary bile acid synthesis pathway was the most important common pathway affected by CCl4 and the F-G extract. Subsequently, a UPLC-QQQ-LC-MS/MS method was established for the simultaneous quantitative detection of 11 bile acids, and the regulatory mechanism of the F-G extract on bile acids in the prevention of acute liver injury induced by CCl4 was obtained.
Since the content of different bile acids varied greatly in the serum, we first used the relative variation in each bile acid for analysis. This analysis evaluated the relative changes in bile acids for each group based on their primary contents (1.0) in the negative control group (Table 11). Free and conjugated bile acids are the two bile acid types in the liver and blood. CA, CDCA, and DCA are the main free bile acids, and bile acids conjugated with glycine or taurine compose the combined bile acids. In this study, a relatively higher increase in taurine-conjugated bile acids, except TCA, was observed in the model control group than in the negative control group (TUDCA, 6.00; TCDCA, 3.24), whereas the increase in glycine conjugated bile acids, except GDCA, was relatively low (GLCA, 1.61; GCDCA, 1.74; GCA, 1.30). Taurine possessed protective effects on hepatocellular injury and apoptosis. When hepatocellular injury occurs, the body can regulate the compensatory increase in taurine and further increase the content of taurine-conjugated bile acids[36]. The content of taurine conjugated bile acids was significantly decreased after treatment with the F-G extract in a dose-dependent manner.
Bile acids exhibit different hydrophilic and hydrophobic properties according to their chemical structure. Hydrophobic bile acids can lyse cell membrane lipids, exhibiting “decontamination”, resulting in hepatocellular necrosis. Therefore, the accumulation of hydrophobic bile acids in the liver is a major and important cause of liver injury. UDCA is a nontoxic hydrophilic bile acid. Taurine conjugated bile acids (TCA, TCDCA, and TDCA) and glycine conjugated bile acids (GLCA, GDCA, GCDCA, and GCA) exhibit low toxicity due to some hydrophobicity, while CA, CDCA, and DCA are free and hydrophobic bile acids that show strong hepatotoxicity. DCA is one of the most toxic bile acids. The accumulation of DCA in the liver or blood leads to mitochondrial destruction, cell membrane rupture, and the production of reactive oxygen species in hepatocytes, leading to apoptosis and necrosis[36,37]. In this study, three hydrophobic components, CA, CDCA, and DCA, were significantly increased in the model control group, showing a positive correlation with the toxic effects reported[38]. The F-G extract can promote the binding of CA, CDCA, and DCA to taurine and glycine to reduce the accumulation of free CA, CDCA, and DCA in vivo, thus preventing acute liver injury induced by CCl4.
When acute liver injury was caused by CCl4 in rats, the hepatocytes were damaged, and the activities of cholesterol 7α-hydroxylase and cholesterol 12α-hydroxylase in hepatocytes were decreased, resulting in decreased CA and CDCA produced by cholesterol synthesis. However, due to impaired hepatic uptake of bile acids, the uptake of these two bile acids in the enterohepatic circulation is greatly reduced, resulting in a significant increase in the concentrations of bile acids in the serum. In this study, CA and CDCA were significantly increased in the model control group, showing liver damage and leading to bile acid malabsorption in the hepatoenteric circulation. The F-G extract decreased the contents of CA and CDCA in serum in a dose-dependent manner, indicating that the F-G extract could repair liver injury, improve enterohepatic circulation, and promote the absorption of CA and CDCA, exhibiting almost the same pharmacological effect as silybin.

Wang MF et al. Metabolomics of Fuzi-Gancao in acute liver injury in rats
WJG https://www.wjgnet.com 6905 October 28, 2021 Volume 27 Issue 40
Table 11 Ratio of bile acids in each experimental group to corresponding composition of negative control group
Bile acid Negative Model Positive FGL FGM FGH
CA 1.00 2.57 1.38 2.16 1.92 1.40
GLCA 1.00 1.61 1.08 1.45 1.17 1.15
GDCA 1.00 4.45 2.43 3.53 2.78 2.14
GCDCA 1.00 1.74 1.18 1.85 1.28 1.09
GCA 1.00 1.30 1.25 1.22 1.16 1.12
TCA 1.00 1.99 1.11 1.90 1.37 1.31
CDCA 1.00 4.12 2.08 3.76 2.90 2.03
UDCA 1.00 5.68 3.17 4.87 3.72 3.62
TUDCA 1.00 6.00 3.08 4.73 4.13 3.87
TCDCA 1.00 3.24 1.57 2.92 2.63 2.03
DCA 1.00 5.16 2.40 4.48 3.84 2.95
CDCA: Chenodeoxycholic acid; UDCA: Ursodeoxycholic acid; GCA: Glycocholic acid; GDCA: Glycochenodeoxycholic acid; TCA: Taurocholic acid; TUDCA: Taurocholic acid; GCDCA: Glycochenodeoxycholic acid; GLCA: Glycinic acid; DCA: Deoxycholic acid; CA: Cholic acid.
CONCLUSIONIn this study, the effects of F-G extract in preventing acute liver injury induced by CCl4 have been assayed. The F-G extract decreases the adhesion between the lobules and the mucosa, reduces the bleeding point on the surface of the liver, effectively decreases ALT and AST in a rat model of acute liver injury in a dose-dependent manner, and reduces hepatocellular swelling, inflammatory cell infiltration, blood stasis, hepatic steatosis, and other pathological changes in rats.
ARTICLE HIGHLIGHTSResearch backgroundFuzi (Radix aconiti lateralis)-Gancao (Radix glycyrrhizae) (F-G) is often used in the treatment of liver diseases such as hepatitis and liver failure.
Research motivationThis study can clarify the bile acid mechanism of F-G in the treatment of liver injury, and establish a complete bile acid spectrum research method, so as to provide reference for future research.
Research objectivesTo study the molecular mechanism and action mechanism of F-G in the treatment of liver injury, and to provide a theoretical basis for the clinical research of F-G.
Research methodsAn ultra performance liquid chromatography tandem mass spectrometry (UPLC-MS/MS) method for the simultaneous determination of 92 metabolites from multiple pathways was established to explore the protective metabolic mechanism of F-G in serum on the liver.
Research resultsA UPLC-MS/MS method for simultaneous determination of 11 bile acids was established to analyze the regulatory mechanism of F-G in serum. F-G decreased the contents of 11 bile acids in the serum in a dose-dependent manner.
Research conclusionsF-G could promote the conjugation of free bile acids to glycine and taurine, reduce the

Wang MF et al. Metabolomics of Fuzi-Gancao in acute liver injury in rats
WJG https://www.wjgnet.com 6906 October 28, 2021 Volume 27 Issue 40
accumulation of free bile acids in the liver, regulate the compensatory degree of taurine, and decrease the content of taurine conjugated bile acids.
Research perspectivesThe research group will continue to study the effect of bile acid metabolism regulation on molecular regulation in the body.
REFERENCESWu H, Zhang G, Huang L, Pang H, Zhang N, Chen Y, Wang G. Hepatoprotective Effect of Polyphenol-Enriched Fraction from Folium Microcos on Oxidative Stress and Apoptosis in Acetaminophen-Induced Liver Injury in Mice. Oxid Med Cell Longev 2017; 2017: 3631565 [PMID: 28626497 DOI: 10.1155/2017/3631565]
1
Yang Y, He Q, Wang H, Hu X, Luo Y, Liang G, Kuang S, Mai S, Ma J, Tian X, Chen Q, Yang J. The protection of meloxicam against chronic aluminium overload-induced liver injury in rats. Oncotarget 2017; 8: 23448-23458 [PMID: 28423583 DOI: 10.18632/oncotarget.15588]
2
Navarro VJ, Khan I, Björnsson E, Seeff LB, Serrano J, Hoofnagle JH. Liver injury from herbal and dietary supplements. Hepatology 2017; 65: 363-373 [PMID: 27677775 DOI: 10.1002/hep.28813]
3
Russell DW, Setchell KD. Bile acid biosynthesis. Biochemistry 1992; 31: 4737-4749 [PMID: 1591235 DOI: 10.1021/bi00135a001]
4
Chiang JY. Bile acids: regulation of synthesis. J Lipid Res 2009; 50: 1955-1966 [PMID: 19346330 DOI: 10.1194/jlr.R900010-JLR200]
5
Li T, Chiang JY. Bile acid signaling in metabolic disease and drug therapy. Pharmacol Rev 2014; 66: 948-983 [PMID: 25073467 DOI: 10.1124/pr.113.008201]
6
Trauner M, Boyer JL. Bile salt transporters: molecular characterization, function, and regulation. Physiol Rev 2003; 83: 633-671 [PMID: 12663868 DOI: 10.1152/physrev.00027.2002]
7
Maillette de Buy Wenniger L, Beuers U. Bile salts and cholestasis. Dig Liver Dis 2010; 42: 409-418 [PMID: 20434968 DOI: 10.1016/j.dld.2010.03.015]
8
Russell DW. The enzymes, regulation, and genetics of bile acid synthesis. Annu Rev Biochem 2003; 72: 137-174 [PMID: 12543708 DOI: 10.1146/annurev.biochem.72.121801.161712]
9
Zhou W. Clinical observation on treatment of acute-on-chronic liver failure with Traditional Chinese Medicine. Zhongguo Xiandai Yaowu Yingyong Zazhi 2016; 10: 263-264 [DOI: 10.14164/j.cnki.cn11-5581/r.2016.17.172]
10
Liu QL, Sun YW. Clinical observation of Fuzi Lizhong decoction combined with western medicine in the treatment of chemotherapy-induced liver injury. Zhongguo Laonian Baojian Yixue13: 73-74 [DOI: 10.3969/j.issn.1672-4860.2015.02.027]
11
Luo JX, Zhang Y, Hu XY, Yu C. The Effect of Modified Sini Decoction on Survival Rates of Patients with Hepatitis B Virus Related Acute-on-Chronic Liver Failure. Evid Based Complement Alternat Med 2019; 2019: 2501847 [PMID: 30915144 DOI: 10.1155/2019/2501847]
12
Li RX, Chen ZY, Liu X, Yang CS. Effect of modified Sini decoction combined with magnesium isoglycyrrhizinate on acute drug-induced liver injury and its influence on oxidative stress and humoral immune function. Xiandai Zhongxiyi Jiehe Zazhi 2018; 27: 25-29 [DOI: 10.3969/j.issn.1008-8849.2018.36.005]
13
Chen L, Yang H, Zhang FX, Liu N, Li XY, Zhao F. Protective effects of modified Sini decoction on hepatocyte apopto-sis induced by Con A. Yunnan Daxue Zhongyiyao Zazhi 2014; 37: 5-7
14
Yang JH, Shi SH, Ma W, Tao DQ, Liu S, Chen L, Zhou XL. Effect of Fuzi Lizhong decoction in reducing fiver injury of rats with non-alcoholic fatty liver via activating AMPK and suppressing NF-κBp65 pathway. Zhongguo Zhongyao Zazhi 2018; 43: 3176-3183
15
Luo J, Zhang Y, Hu X, Zhong S, Chen G, Wang Y, Lin W, Yi C, Zhu H. The effects of modified sini decoction on liver injury and regeneration in acute liver failure induced by D-galactosamine in rats. J Ethnopharmacol 2015; 161: 53-59 [PMID: 25499312 DOI: 10.1016/j.jep.2014.12.003]
16
Fu X, Lu R, Zhao S. Simultaneous quantitation of six aconitum alkaloids and three flavonoids in the herb couple of radix aconiti lateralis-radix glycyrrhizae (Fuzi-Gancao) by UHPLC-ESI-MS/MS. Pharmacogn Mag 2017; 13: 425-429 [PMID: 28839367 DOI: 10.4103/pm.pm_141_16]
17
Liu XX, Jian XX, Cai XF, Chao RB, Chen QH, Chen DL, Wang XL, Wang FP. Cardioactive C₁₉-diterpenoid alkaloids from the lateral roots of Aconitum carmichaeli "Fu Zi". Chem Pharm Bull (Tokyo) 2012; 60: 144-149 [PMID: 22223386 DOI: 10.1248/cpb.60.144]
18
Wang L, Ding JY, Liu XX, Tang MH, Chao RB, Wang FP. [Identification of aminoalcohol-diterpenoid alkaloids in Aconiti Lateralis Radix Praeparata and study of their cardiac effects]. Yao Xue Xue Bao 2014; 49: 1699-1704 [PMID: 25920200]
19
Lu ZQ, Zhang YJ, Zhuang PW, Zhang JB, Zhou HF, Chen Z, Sun M, Xu LM. Effect of Aconiti Lateralis Radix Preparata on hemodynamics of rats with acute heart failure and its mechanism. Zhong Cao Yao 2015; 46: 3223-3234
20
Shao F, Li SL, Liu RH, Huang HL, Ren G, Yao YX, Hao XC. Analgesic and Anti-inflammatory Effects of Different Processed Products of Aconiti lateralis radix praeparata. Shizhen Guoyi Guoyao 2011; 22: 2329-2330 [DOI: 10.3969/j.issn.1008-0805.2011.10.006]
21

Wang MF et al. Metabolomics of Fuzi-Gancao in acute liver injury in rats
WJG https://www.wjgnet.com 6907 October 28, 2021 Volume 27 Issue 40
Gao F, Li YY, Wang D, Huang X, Liu Q. Diterpenoid alkaloids from the Chinese traditional herbal "Fuzi" and their cytotoxic activity. Molecules 2012; 17: 5187-5194 [PMID: 22628040 DOI: 10.3390/molecules17055187]
22
Zhang T, Wang GJ, Bai SG. Effect of Aconiti Lateralis Radix Preparata on antioxidant system in aged rats. Zhongguo Laonianxue Zazhi 2001; 21: 135-136 [DOI: 10.3969/j.issn.1005-9202.2001.02.031]
23
Luo JX, Zhang Y, Hu XY, Chen G, Liu XY, Nie HM, Liu JL, Wen DC. Aqueous extract from Aconitum carmichaelii Debeaux reduces liver injury in rats via regulation of HMGB1/TLR4/NF-ΚB/caspase-3 and PCNA signaling pathways. J Ethnopharmacol 2016; 183: 187-192 [PMID: 26806574 DOI: 10.1016/j.jep.2016.01.020]
24
Konda VGR, Eerike M, Prabhu L. Evaluation of hepatoprotective activity of ethanolic extract of aconitum heterophyllum root in paracetamol induced liver toxicity. Int J Pharma Bio Sci 2013; 4: 714-721
25
Yang XX, Liu D, Bian K, Zhang DD. Study on in vitro anti-inflammatory activity of total flavonoids from Glycyrrhizae Radix et Rhizoma and its ingredients. Zhongguo Zhongyao Zazhi 2013; 38: 99-104 [DOI: 10.4268/cjcmm20130120]
26
Furusawa J, Funakoshi-Tago M, Tago K, Mashino T, Inoue H, Sonoda Y, Kasahara T. Licochalcone A significantly suppresses LPS signaling pathway through the inhibition of NF-kappaB p65 phosphorylation at serine 276. Cell Signal 2009; 21: 778-785 [PMID: 19168128 DOI: 10.1016/j.cellsig.2009.01.021]
27
Fu Y, Chen J, Li YJ, Zheng YF, Li P. Antioxidant and anti-inflammatory activities of six flavonoids separated from licorice. Food Chem 2013; 141: 1063-1071 [PMID: 23790887 DOI: 10.1016/j.foodchem.2013.03.089]
28
Ahn SJ, Cho EJ, Kim HJ, Park SN, Lim YK, Kook JK. The antimicrobial effects of deglycyrrhizinated licorice root extract on Streptococcus mutans UA159 in both planktonic and biofilm cultures. Anaerobe 2012; 18: 590-596 [PMID: 23123832 DOI: 10.1016/j.anaerobe.2012.10.005]
29
Dong Y, Zhao M, Zhao T, Feng M, Chen H, Zhuang M, Lin L. Bioactive profiles, antioxidant activities, nitrite scavenging capacities and protective effects on H2O2-injured PC12 cells of Glycyrrhiza glabra L. leaf and root extracts. Molecules 2014; 19: 9101-9113 [PMID: 24983860 DOI: 10.3390/molecules19079101]
30
Kim YW, Park SM, Seo HL, Jang MH, Jung JY, Lee JH, Jang EJ, Cho IJ, Byun SH, Kim SC. Licorice and its flavonoids inhibit oxidative damage in the liver. Integr Med Res 2015; 4: 77 [DOI: 10.1016/j.imr.2015.04.109]
31
Zhang GP, Xie SH, Zhu XG, Zhang SY, Zhai JY, Meng H, Ye ZG. Experimental Study on Effects of Radix Glycyr-rhizae on Toxicity and Efficacy of Radix Aconiti Carmichaeli in Compatibility. Zhongguo Zhongyiyao Xinxi Zazhi 2012; 19: 31-34 [DOI: 10.3969/j.issn.1005-5304.2012.06.012]
32
Ma LN, Ye ZG, Zhang GP. Detoxification mechanism of Aconiti lateralis radix praeparata with Glycyrrhizae Radix et Rhizoma compatibility based on the change of components in vitro-metabolism in vivo-antagonism of biological effects. Zhongguo Zhongyao Zazhi 2019; 44: 99-104 [DOI: 10.19540/j.cnki.cjcmm.20190701.404]
33
Li H, Zhang GP, Ma M, Su P, Yang YF, Chen TF, Ye ZG. Attenuation Mechanism of Aconti Lateralis Radix Praeparata Combined with Glycyrrhizae Radix et Rhizoma Based on Heart CYP450 Isozymes. Zhongguo Shiyan Fangjixue Zazhi 2020; 26: 59-64 [DOI: 10.13422/j.cnki.syfjx.20192026]
34
Song H, Li W, Liu B, Sun X, Ding J, Chen N, Ji Y, Xiang Z. Study of the estrogenic-like mechanism of glycosides of cistanche using metabolomics. RSC Adv 2017; 7: 39403-39410 [DOI: 10.1039/C7RA06930H]
35
Xu Y, Chen CC, Yang L, Wang JM, Ji LL, Wang ZT, Hu ZB. Evaluation on hepatotoxicity caused by Dioscorea bulbifera based on analysis of bile acids. Acta Pharm Sin 2011; 46: 39-44 [DOI: 10.1007/s11606-010-1517-4]
36
He XL, Guan H, Li PF. Research progress of taurochodeoxycholic acid. Anim Husb Feed Sci 2008; 29: 57-60
37
Zheng JC, Wang WF, Pei XT. Effects of bile acids metabolism on hepatocytes function. Ganzhang 2007; 12: 308-310 [DOI: 10.3969/j.issn.1008-1704.2007.04.032]
38

WJG https://www.wjgnet.com 6908 October 28, 2021 Volume 27 Issue 40
World Journal of
GastroenterologyW J GSubmit a Manuscript: https://www.f6publishing.com World J Gastroenterol 2021 October 28; 27(40): 6908-6926
DOI: 10.3748/wjg.v27.i40.6908 ISSN 1007-9327 (print) ISSN 2219-2840 (online)
ORIGINAL ARTICLE
Basic Study
Transforming growth factor beta-1 upregulates glucose transporter 1 and glycolysis through canonical and noncanonical pathways in hepatic stellate cells
Ming-Yu Zhou, Ming-Liang Cheng, Tao Huang, Rui-Han Hu, Gao-Liang Zou, Hong Li, Bao-Fang Zhang, Juan-Juan Zhu, Yong-Mei Liu, Yang Liu, Xue-Ke Zhao
ORCID number: Ming-Yu Zhou 0000-0002-5130-5950; Ming-Liang Cheng 0000-0001-6962-4012; Tao Huang 0000-0001-6849-5378; Rui-Han Hu 0000-0003-0668-2025; Gao-Liang Zou 0000-0002-9460-0802; Hong Li 0000-0003-0601-3198; Bao-Fang Zhang 0000-0002-5396-540X; Juan-Juan Zhu 0000-0003-0692-9200; Yong-Mei Liu 0000-0003-4334-4340; Yang Liu 0000-0002-1140-2588; Xue-Ke Zhao 0000-0002-3032-4933.
Author contributions: Zhao XK and Cheng ML designed the study; Zhou MY, Huang T and Hu RH performed most of the experiments and wrote the article; all authors contributed to the design and interpretation of the study; Zhou MY, Huang T and Hu RH contributed equally to this work; all authors approved the final version of the article.
Supported by National Natural Science Foundation of China, No. 82060116, No. 81860115 and No. 81960118; and Guizhou Science and Technology Support Project Fund, No. [2021] 058.
Institutional review board statement: This study was approved by the Institutional Review Board of the Affiliated
Ming-Yu Zhou, Ming-Liang Cheng, Tao Huang, Rui-Han Hu, Xue-Ke Zhao, Department of Internal Medicine, Guizhou Medical University, Guiyang 550001, Guizhou Province, China
Ming-Yu Zhou, Ming-Liang Cheng, Gao-Liang Zou, Hong Li, Bao-Fang Zhang, Juan-Juan Zhu, Yang Liu, Xue-Ke Zhao, Department of Infectious Diseases, Affiliated Hospital of Guizhou Medical University, Guiyang 550004, Guizhou Province, China
Yong-Mei Liu, Clinical Laboratory Center, Affiliated Hospital of Guizhou Medical University, Guiyang 550004, Guizhou Province, China
Corresponding author: Xue-Ke Zhao, MD, PhD, Chief Physician, Professor, Department of Infectious Diseases, Affiliated Hospital of Guizhou Medical University, No. 28 Guiyi Road, Guiyang 550004, Guizhou Province, China. [email protected]
AbstractBACKGROUND Hepatic stellate cells (HSCs) are the key effector cells mediating the occurrence and development of liver fibrosis, while aerobic glycolysis is an important metabolic characteristic of HSC activation. Transforming growth factor-β1 (TGF-β1) induces aerobic glycolysis and is a driving factor for metabolic reprogramming. The occurrence of glycolysis depends on a high glucose uptake level. Glucose transporter 1 (GLUT1) is the most widely distributed glucose transporter in the body and mainly participates in the regulation of carbohydrate metabolism, thus affecting cell proliferation and growth. However, little is known about the relationship between TGF-β1 and GLUT1 in the process of liver fibrosis and the molecular mechanism underlying the promotion of aerobic glycolysis in HSCs.
AIM To investigate the mechanisms of action of GLUT1, TGF-β1 and aerobic glycolysis in the process of HSC activation during liver fibrosis.
METHODS Immunohistochemical staining and immunofluorescence assays were used to examine GLUT1 expression in fibrotic liver tissue. A Seahorse extracellular flux (XF) analyzer was used to examine changes in aerobic glycolytic flux, lactate
Zhou MY et al. GLUT1 promotes HSC glycolysis and activation
WJG https://www.wjgnet.com 6909 October 28, 2021 Volume 27 Issue 40
Hospital of Guizhou Medical University.
Institutional animal care and use committee statement: All animal experiments conformed to the internationally accepted principles for the care and use of laboratory animals (license No. 2000719). All animal interventions were approved by the Institutional Animal Care and Use Committee (IACUC) of Guizhou Medical University.
Conflict-of-interest statement: The authors declare no conflicts of interest related to this study.
Data sharing statement: No additional data are available.
ARRIVE guidelines statement: The authors have read the ARRIVE Guidelines, and the manuscript was prepared and revised according to the ARRIVE Guidelines.
Open-Access: This article is an open-access article that was selected by an in-house editor and fully peer-reviewed by external reviewers. It is distributed in accordance with the Creative Commons Attribution NonCommercial (CC BY-NC 4.0) license, which permits others to distribute, remix, adapt, build upon this work non-commercially, and license their derivative works on different terms, provided the original work is properly cited and the use is non-commercial. See: http://creativecommons.org/Licenses/by-nc/4.0/
Manuscript source: Unsolicited manuscript
Specialty type: Gastroenterology and hepatology
Country/Territory of origin: China
Peer-review report’s scientific quality classificationGrade A (Excellent): 0 Grade B (Very good): B, B, B Grade C (Good): 0 Grade D (Fair): 0 Grade E (Poor): 0
production levels and glucose consumption levels in HSCs upon TGF-β1 stimulation. The mechanism by which TGF-β1 induces GLUT1 protein expression in HSCs was further explored by inhibiting/promoting the TGF-β1/mothers-against-decapentaplegic-homolog 2/3 (Smad2/3) signaling pathway and inhibiting the p38 and phosphoinositide 3-kinase (PI3K)/AKT signaling pathways. In addition, GLUT1 expression was silenced to observe changes in the growth and proliferation of HSCs. Finally, a GLUT1 inhibitor was used to verify the in vivo effects of GLUT1 on a mouse model of liver fibrosis.
RESULTS GLUT1 protein expression was increased in both mouse and human fibrotic liver tissues. In addition, immunofluorescence staining revealed colocalization of GLUT1 and alpha-smooth muscle actin proteins, indicating that GLUT1 expression was related to the development of liver fibrosis. TGF-β1 caused an increase in aerobic glycolysis in HSCs and induced GLUT1 expression in HSCs by activating the Smad, p38 MAPK and P13K/AKT signaling pathways. The p38 MAPK and Smad pathways synergistically affected the induction of GLUT1 expression. GLUT1 inhibition eliminated the effect of TGF-β1 on HSC prolif-eration and migration. A GLUT1 inhibitor was administered in a mouse model of liver fibrosis, and GLUT1 inhibition reduced the degree of liver inflammation and liver fibrosis.
CONCLUSION TGF-β1 induces GLUT1 expression in HSCs, a process related to liver fibrosis progression. In vitro experiments revealed that TGF-β1-induced GLUT1 expression might be one of the mechanisms mediating the metabolic reprogramming of HSCs. In addition, in vivo experiments also indicated that the GLUT1 protein promotes the occurrence and development of liver fibrosis.
Key Words: Gene regulation; Glycolysis; Liver fibrosis; Glucose transporter 1; Transforming growth factor-β1
©The Author(s) 2021. Published by Baishideng Publishing Group Inc. All rights reserved.
Core Tip: Liver fibrosis is a repair response of the liver to various chronic injuries. However, fibrosis may eventually evolve into liver cirrhosis or even liver cancer if it progresses. Hepatic stellate cell activation is the initiating factor for liver fibrosis. Transforming growth factor-β1 (TGF-β1) is a pleiotropic cytokine that induces aerobic glycolysis. Glucose transporter 1 (GLUT1) regulates glucose metabolism. This study examined the effects of TGF-β1-mediated pathways on GLUT1 expression in vivo and in vitro, explored the relationship between GLUT1 and TGF-β1 and further invest-igated the potential underlying mechanisms.
Citation: Zhou MY, Cheng ML, Huang T, Hu RH, Zou GL, Li H, Zhang BF, Zhu JJ, Liu YM, Liu Y, Zhao XK. Transforming growth factor beta-1 upregulates glucose transporter 1 and glycolysis through canonical and noncanonical pathways in hepatic stellate cells. World J Gastroenterol 2021; 27(40): 6908-6926URL: https://www.wjgnet.com/1007-9327/full/v27/i40/6908.htmDOI: https://dx.doi.org/10.3748/wjg.v27.i40.6908
INTRODUCTIONLiver fibrosis is the inevitable result of chronic liver inflammation caused by various etiologies. With progressive destruction of liver parenchymal cells, liver fibrosis eventually develops into liver cirrhosis and even liver cancer[1,2]. Although liver cirrhosis and liver cancer are irreversible, liver fibrosis can be reversed. Therefore, the mechanism of and clinical studies on liver fibrosis have always been the focus of liver disease research. The main pathological feature of liver fibrosis is the excessive

Zhou MY et al. GLUT1 promotes HSC glycolysis and activation
WJG https://www.wjgnet.com 6910 October 28, 2021 Volume 27 Issue 40
Received: April 30, 2021 Peer-review started: April 30, 2021 First decision: July 2, 2021 Revised: July 19, 2021 Accepted: September 8, 2021 Article in press: September 8, 2021 Published online: October 28, 2021
P-Reviewer: Rojas A, Vela D, Wang Z S-Editor: Gao CC L-Editor: A P-Editor: Xing YX
deposition of extracellular matrix (ECM), while the key initiating factors are activation of quiescent hepatic stellate cells (HSCs) and transformation of their phenotypes and functions[3]. The transforming growth factor-β1 (TGF-β1) pathway is the key fibrogenic pathway that drives HSC activation and induces ECM production. HSC activation requires metabolic reprogramming and a continuous energy supply[4,5]. Aerobic glycolysis is an important metabolic characteristic of the transdifferentiation of quiescent stellate cells, a process similar to the Warburg effect in tumor cells, and the core metabolic changes include a transition from oxidative phosphorylation to aerobic glycolysis[6]. Dysregulated glycolysis has been implicated in experimental models of lung and liver fibrosis, and inhibition of glycolysis reduces ECM accumu-lation[7]. In view of the mechanisms involved, targeting and inhibiting the metabolic reprogramming of activated HSCs during liver fibrosis may be a promising anti-liver fibrosis strategy.
TGF-β1 is a multifunctional cytokine and a major profibrotic cytokine that regulates cell differentiation, cell proliferation and ECM production and directly regulates multiple cellular signal transduction networks[8]. In the canonical TGF-β1/mothers-against-decapentaplegic-homolog 2/3 (Smad2/3) pathway, ligands induce the assembly of the TGF-β1 receptor I (TβRI)/TGF-β1 receptor II (TβRII) heterocomplex, which targets Smad4 via Smad2 and Smad3 proteins to form the Smad complex, leading to phosphorylation and nuclear translocation of Smad2/3; this R-Smad/Co-Smad4 complex translocates to the nucleus where it binds to DNA either directly or in association with other DNA-binding proteins[9-11]. Phosphorylated Smad2/3 binds to specific Smad binding elements (SBEs) in gene promoter regions to activate/suppress the expression of target genes[12,13]. In addition to Smads, TGF-β1 also triggers other protein-mediated signaling pathways, e.g., p38, mitogen-activated protein kinases (MAPKs) and phosphoinositide 3-kinase (PI3K). Some functions of TGF-β1 have been studied in depth, such as the mediation of cell differentiation and proliferation. However, TGF-β1 has recently been reported to induce aerobic glycolysis and is considered a driving factor in metabolic reprogramming[14]. TGF-β is also a strong activator of glycolysis in mesenchymal cells[15]. Extracellular accumulation of lactic acid induces epithelial-mesenchymal transition (EMT) by directly reconstituting the ECM and releasing activated TGF-β1. EMT induced by TGF-β in hepatocellular carcinoma cells reprograms lipid metabolism to sustain the elevated energy requirements associated with this process[16]. Research on the mechanism of idiopathic pulmonary fibrosis has shown that TGF-β1-induced aerobic glycolysis causes lactic acid accumulation and changes the cellular microenvironment, thereby activating latent TGF-β1 in the ECM and eventually forming a positive feedback loop to promote the effects of TGF-β1[17].
Glucose transporter 1 (GLUT1) is a member of the GLUT transporter family, the most conserved and most widely distributed glucose transporter in mammals and the main transporter regulating glucose uptake[18]. An increasing number of studies have found that GLUT1 plays an important role in accelerated metabolism. Research on the mechanism of neurodegenerative diseases has revealed that GLUT1 controls the activation of microglia by promoting aerobic glycolysis[19]. GLUT1 enhances the stimulating effect of TGF-β1 on mesangial cells, breast cancer cells and pancreatic cancer cells. As glucose uptake increases during TGF-β1-induced EMT of breast cancer cells, GLUT1 expression also increases and is correlated with EMT markers (including E-cadherin and vimentin). GLUT1 is the key mediator of the aerobic glycolysis phenotype in ovarian cancer and is required to maintain a high level of basic aerobic glycolysis. In models of bleomycin-induced pulmonary fibrosis, GLUT1-dependent aerobic glycolysis has been reported to be essential for pulmonary parenchymal fibrosis[20-23]. Certain signaling molecules (such as cAMP, p53, PI3K and AKT) reduce alpha-smooth muscle actin (α-SMA) protein expression in primary mouse fibroblasts by inhibiting GLUT1 expression. Exosomes secreted by activated HSCs affect the metabolic switch of liver nonparenchymal cells through delivery of the glycolysis-related proteins GLUT1 and PKM2; GLUT1 is involved in metabolic reprogramming of HSCs[24]. TGF-β1 and GLUT1 play important regulatory roles in metabolic reprogramming. To date, however, researchers have not explored whether the increases in TGF-β1 and GLUT1 Levels during HSC activation are related. Therefore, this study investigated the effect of the TGF-β1 signaling pathway on the regulation of GLUT1 and aerobic glycolysis. We hypothesized that TGF-β1 drives HSC activation and aerobic glycolysis by inducing GLUT1 expression, thereby promoting liver fibrosis progression. As shown in the present study, GLUT1 expression was significantly increased in mouse and human fibrotic liver tissue samples. Further in vitro experiments showed that the aerobic glycolysis capacity of HSCs was enhanced and GLUT1 expression increased with increasing TGF-β1 Levels. Inhibition/

Zhou MY et al. GLUT1 promotes HSC glycolysis and activation
WJG https://www.wjgnet.com 6911 October 28, 2021 Volume 27 Issue 40
promotion of the Smad2/3 signaling pathway and inhibition of the p38 and PI3K/AKT signaling pathways confirmed that TGF-β1 induced GLUT1 expression by targeting the pSmad2/3, p38 and PI3K/AKT pathways, thus promoting HSC activation. Finally, administration of a specific GLUT1 inhibitor in a mouse model of liver fibrosis resulted in a significant reduction in liver fibrosis. Based on these findings, the TGF-β1 signaling pathway enhances aerobic glycolysis by promoting GLUT1 expression, thereby promoting the development of liver fibrosis.
MATERIALS AND METHODSReagents and antibodiesThe TGF-β1 antibody was purchased from R&D Systems (Minneapolis, MN, United States); antibodies against GLUT1, p-Smad2/3, Smad2/3, p-P38, p-AKT and desmin were purchased from Abcam (Cambridge, MA, United States), and the tubulin antibody was purchased from Research Diagnostics (Flanders, NJ, United States). The anti-α-SMA antibody, carbon tetrachloride (CCl4), corn oil, OptiPrep and other chemicals and reagents were purchased from Sigma-Aldrich (St. Louis, MO, United States) and Fisher Scientific (Waltham, MA, United States). A TβRI/II inhibitor (APExBIO Technology, United States) was used at 2 μmol/L. Inhibitors of p38 MAPK and PI3K, namely, SB203580 and LY294002, respectively, were purchased from Abcam (Cambridge, MA, United States). The Smad3 inhibitors SIS3 and phloretin were purchased from Abcam (Cambridge, MA, United States).
Generation of a mouse model of liver fibrosisThe animal protocol was designed to minimize pain or discomfort to the animals. The animals were acclimated to laboratory conditions (22 °C, 12-h/12-h light/dark cycle, 50% humidity, ad libitum access to food and water) for 1 wk prior to experimentation. The methods and experimental procedures were carried out in accordance with the relevant guidelines and regulations. Mice (C57BL6, eight to ten weeks old) were housed in standard conditions, and sex-matched mice were treated with 2.0 μL/g body weight CCl4 [diluted 1:10 (v/v) with corn oil] or corn oil as a control by intraperi-toneal (i.p.) injections three times per week for 4 wk[25]. Mice were challenged with CCl4 or corn oil (control), followed by an i.p. injection of phloretin (10 mg/kg, three times per week for 2 wk) or 0.9% saline (vehicle). Mice were sacrificed at 48 h after the experiment ended, and tissues were harvested.
Patient liver samplesNormal and liver fibrosis tissue samples were obtained from patients treated at the Department of Hepatobiliary Surgery of the Affiliated Hospital of Guizhou Medical University (Guiyang, China). Written informed consent was obtained from the patients.
Western blot analysisImmunoblotting was performed using whole-liver tissue lysates or whole-cell lysates prepared in buffer containing 1% NP-40 as described previously[26]. Total proteins were extracted and quantified using Bradford protein quantification kits. Protein samples (40 μg each) were resolved by sodium dodecyl sulfate-polyacrylamide gel electrophoresis (SDS-PAGE). The proteins were transferred onto polyvinylidene fluoride (PVDF) membranes and incubated with primary antibodies overnight at 4 °C. On the next day, signals were developed with an electrochemiluminescence detection kit after incubation with the appropriate secondary antibodies.
Cells and cell culturePrimary mouse HSCs were isolated and cultured as described previously[26]. Briefly, cells were isolated from livers through in situ liver perfusion with pronase, Liberase and collagenase followed by density gradient centrifugation. The dispersed cell suspension was filtered and gradiently centrifuged for 2 min to remove hepatocytes. The remaining cell fraction was washed and resuspended in 11.5% OptiPrep and then gently transferred to a tube containing 15% OptiPrep at the bottom, followed by PBS addition as the top layer. The cell fraction was then centrifuged at 1400 rpm/min for 20 min. The HSC fraction layer was obtained at the interface between the top and intermediate layers. The purity of the HSC fraction was estimated based on autofluor-escence 1 d after isolation and was always greater than 97%. Flow cytometry was used

Zhou MY et al. GLUT1 promotes HSC glycolysis and activation
WJG https://www.wjgnet.com 6912 October 28, 2021 Volume 27 Issue 40
to identify the purity of primary cells. In brief, the cells were digested with trypsin, centrifuged at 1000 rpm/min for 10 min, washed twice with PBS, resuspended in EP tubes (100 μL/tube) and centrifuged at 2000 rpm/min for 6 min. Then, the supernatant was discarded, 100 μL of PBS was added, and the cells were resuspended and dispersed. A mouse monoclonal antibody against desmin (desmin is a typical molecular marker of HSCs) was added, and the cells were incubated at 1:100 for 1.5 h and centrifuged at 2000 rpm/min for 6 min. Centrifugation was repeated twice. The cells were resuspended and dispersed by adding 100 μL of PBS. Fluorescence-labeled anti-mouse secondary antibody (1:1000) was added, followed by incubation at 4 °C for 30 min in the dark. Next, 1 mL of PBS was added to each tube, followed by centrifu-gation at 2000 rpm/min for 6 min, which was repeated twice. Finally, 0.5 mL of PBS was added to resuspend the cells, and then the cells were subjected to flow cytometry measurements. HSCs were also confirmed to lack E-cadherin expression. Cell viability was also examined, and HSCs were maintained in Dulbecco’s modified Eagle’s medium (DMEM) supplemented with 10% fetal bovine serum and antibiotics as described previously[26]. Cells were starved or treated on day 2 after isolation, and the duration of starvation or treatment is described in each figure legend. The duration of the whole experiment was 5-7 d after HSC isolation, and cells at passages 1-2 were used (as cells were passaged from regular culture flasks to experimental cell culture wells for some experiments).
Histological and immunohistochemical studiesLiver samples were fixed with formalin, embedded in paraffin, sectioned and processed routinely for Masson’s trichrome and Sirius red staining. Antibodies used for immunohistochemical (IHC) staining of GLUT1 and α-SMA were purchased from Abcam Technology, United States.
RNA interferenceCells were transfected with small interfering RNAs (siRNAs) using Lipofectamine 3000 (Invitrogen, Carlsbad, CA, United States) according to the manufacturer’s recommendations. The siRNAs used were an siRNA mix targeting sequences in Smad2 and Smad3 purchased from Santa Cruz Biotechnology (siRNA Smad2/3) and siRNAs targeting four different sequences of Smad4 purchased from Santa Cruz Biotechnology. GLUT1 siRNA was purchased from Cell Signaling Technology. The sequences of the siRNAs used are shown in Table 1.
Glycolytic function assay and lactate measurementsPrimary mouse HSCs were plated on XF96 cell culture microplates. The extracellular acidification rate (ECAR), a glycolytic flux parameter, was measured with a Seahorse XF96 bioanalyzer using the XF Glycolysis Stress Test kit according to the manufacturer’s instructions (102194-100, Seahorse Bioscience). Lactate levels were measured spectrophotometrically in 700 μL of supernatants from cells receiving the corresponding treatment using standard enzymatic methods.
Cell counting kit-8 assayPrimary mouse HSCs were seeded in a 96-well plate at a density of 3000 cells per well. CCK-8 reagent was added to each well every 24 h, and the plates were incubated for an additional 1 h at 37 °C and measured by recording the absorbance at 450 nm with an Elx800™ spectrophotometer (BioTek, Winooski, VT, United States).
Biochemical function analysisAlanine aminotransferase (ALT) and aspartate transaminase (AST) levels in mouse serum samples and the supernatant of cell culture medium were detected using an automatic biochemical analyzer (Siemens Advia 1650; Siemens, Bensheim, Germany).
RNA extraction and real-time polymerase chain reactionGLUT1, hexokinase 2 (HK-2), pyruvate kinase 2 (PKM-2) and α-SMA mRNA levels were determined using real-time polymerase chain reaction (RT-PCR) with a SYBR Green Master Mix Kit (Roche, Indianapolis, IN, United States). The primer sequences used are shown in Table 2.
Transwell migration assayThe migratory properties of HSCs were assessed using a Transwell assay. Cells were seeded at a density of 4 × 10⁵ cells/well in the upper compartment of Transwell chambers with serum-free medium, and the lower compartment contained 700 μL of

Zhou MY et al. GLUT1 promotes HSC glycolysis and activation
WJG https://www.wjgnet.com 6913 October 28, 2021 Volume 27 Issue 40
Table 1 Small interfering RNA sequences
Forward ReversesiGlut1-1 5′-CACCGGGAGTGACAAAGACTTTGTTCAAGCA-3′ 5′-GATCCAAAAAAGGGAGTGACAAAGACTTCTC-3′
Negative control 5′-ATCCGACTTCATAAGGCGCATGCT-3′ 5′-AGTATTCCGCGTACGAAGTTCTGC-3′
siRNA Smad4 targeting four different sequences1
GCAAUUGAAAGUUUGGUAA, CCCACAACCUUUAGACUGA, GAAUCCAUAUCACUACGAA and GUACAGAGUUACUACUUAG
siRNA Smad2/31
Sense Antisense
sc-37239A CUUGCUGGAUUGAACUUCAtt UGAAGUUCAAUCCAGCAAGtt
sc-37239B CCGUCGUAGUAUUCAUGUAtt UACAUGAAUACUACGACGGtt
sc-37239C CUGACUCCUUGUUUAAUGAtt UCAUUAAACAAGGAGUCAGtt
sc-37239D GGAAGCUGAGAGUUAUAGAtt UCUAUAACUCUCAGCUUCCtt
1Purchased from Santa Cruz Biotechnology. sc-37239: Smad2/3 siRNA (m) is a pool of four different siRNA duplexes.
Table 2 Primer sequences for real-time polymerase chain reaction
Gene Forward sequence Reverse sequenceHK2 5’-GGGTAGCCACGGAGTACAAA-3’ 5’-TGGATTGAAAGCCAACTTCC-3’
GLUT1 5’-GCTTCTCCAACTGGACCTC-3’ 5’-AAGAAGAGCACGAGGAGCAC-3’
PKM2 5’-TGGGATGGAAACTGTGAAGAG-3’ 5’-CGGAGTTCCTCGAATAGCTG-3’
α-SMA 5’-AAGAGCATCCGACACTGCTGAC-3’ 5’-AGCACAGCCTGAATAGCCACATAC-3’
5% glucose-containing medium per well. Migration was subsequently observed and measured.
Tissue immunofluorescence stainingTissue sections were placed at room temperature for 10 min and deparaffinized in water for further antigen retrieval. After the sections were dried slightly, a histochemical pen was used to draw circles around the tissue, and 3%-5% BSA was added dropwise inside the circle for blocking, followed by incubation for 30 min. The primary antibody was added dropwise at the recommended ratio to the sections, and the sections were placed in a refrigerator (4 °C) and incubated overnight. After 3 washes, the sections were incubated with a FITC (CK-18)-labeled secondary antibody at room temperature for 45 min, and nuclei were stained with DAPI (300 nmol/L) for 1-5 min. After 3 washes, an antifluorescence quencher was added, and the sections were sealed with resin. Photographs of random fields were taken under an upright fluorescence microscope (ZEISS Axiovert).
Statistical analysisData were analyzed using Student’s t test (SigmaPlot, SPSS 17.0, United States) to determine differences between two groups and are presented as the mean ± SE. For comparisons between multiple groups, three-way analysis of variance was performed, followed by t tests with Bonferroni correction using SAS 9.3 software (SAS Institute Inc., Cary, NC, United States). In addition, a log-rank test was used for survival analysis. All experiments were repeated at least three times. Differences were considered statistically significant at P < 0.05 (aP < 0.05, bP < 0.01).

Zhou MY et al. GLUT1 promotes HSC glycolysis and activation
WJG https://www.wjgnet.com 6914 October 28, 2021 Volume 27 Issue 40
RESULTSGLUT1 expression is correlated with liver fibrosis progressionThe classic mouse model of CCl4-induced liver fibrosis was used to first clarify whether GLUT1 is related to liver fibrosis. Successful establishment of the liver fibrosis model was confirmed by Sirius red staining and α-SMA IHC staining (Figure 1A-C). Notably, a significant increase in GLUT1 expression was detected in the liver tissue specimens from the model group (Figure 1A and D). Subsequently, tissue immuno-fluorescence staining was performed, and the results showed significantly increased GLUT1 expression in liver tissue samples from the CCl4 liver fibrosis model. More importantly, GLUT1 colocalized with α-SMA, indicating a correlation between GLUT1 and liver fibrosis (Figure 1E). IHC staining for GLUT1 and α-SMA was performed using human liver fibrosis specimens and liver specimens from a healthy control group; as expected, GLUT1 expression was significantly higher in the human liver fibrosis specimens (Figure 1F). Finally, whole-liver lysates were prepared from human liver tissue specimens and specimens from the mouse liver fibrosis model, and GLUT1 protein expression was analyzed. The results were consistent with the IHC data (Figure 1G-H). In summary, these results indicate that GLUT1 expression is related to liver fibrosis progression.
TGF-β1 stimulates HSC activation by inducing GLUT1 expression and promoting aerobic glycolysisWe found that GLUT1 colocalized with α-SMA, indicating that GLUT1 expression was increased mainly in activated HSCs because α-SMA is a major marker of HSC transdif-ferentiation. TGF-β1 is a very important profibrotic factor and regulates metabolic reprogramming in pulmonary fibrosis[27], as reported in some studies. Therefore, we questioned whether the increase in GLUT1 expression in liver fibrosis and TGF-β1 are related. This study first determined the effect of TGF-β1 on glycolysis in HSCs. To assess the dose responses to TGF-β1, we incubated HSCs with different TGF-β1 concentrations ranging from 3 ng/mL to 5 ng/mL, and the results showed similar effects on GLUT1 protein levels (Supplementary Figure 1). Therefore, a TGF-β1 concentration of 3 ng/mL was used for subsequent experiments. Mouse primary HSCs were isolated and cultured, and the cells were stimulated with TGF-β1 for 24 h prior to the experiments. TGF-β1 stimulation led to an early and continuous increase in the ECAR (an indicator of extracellular acid production) in HSCs, indicating that glycolysis was enhanced in these cells (Figure 2A and B). In addition, the intracellular and extracellular levels (in the medium) of lactic acid were examined to further confirm the glycolytic changes in HSCs. Both intracellular and extracellular lactic acid levels were significantly increased. Consistent with the increase in glycolysis, the level of glucose consumption also increased in these cells (Figure 2C and D). Therefore, TGF-β1 induces glycolysis during the process of HSC transdifferentiation. The expression levels of key glycolytic enzymes in these cells were evaluated; the expression levels of HK-2, PKM-2 and GLUT1 were upregulated, and the increase in GLUT1 expression was particularly significant (Figure 2F-H). Based on these findings, the increase in glycolysis during HSC transdifferentiation is related to the upregu-lation of key glycolysis enzymes. Similarly, the expression of α-SMA, a marker of transdifferentiation, also increased during the TGF-β1-mediated activation of HSCs (Figure 2I). GLUT1 protein expression was examined at various time points after stimulating HSCs with TGF-β1 (3 ng/mL) to determine whether TGF-β1 stimulates GLUT1 expression in a time-dependent manner, and the results showed that GLUT1 expression increased 2 h after stimulation with TGF-β1 and peaked at 8 h. These results indicate a time-dependent relationship between the increase in GLUT1 expression and TGF-β1 stimulation, which is consistent with the early increase in aerobic glycolysis in HSCs (Figure 2J). Finally, the addition of an inhibitor of the type 1 TGF-β1 receptor inhibited TGF-β1-induced GLUT1 expression in HSCs, suggesting that GLUT1 induction was mediated by TGF-β1 (Figure 2K). Based on these data, TGF-β1 is involved in glycolysis during HSC transdifferentiation and mediates GLUT1 expression, thereby promoting HSC transdifferentiation.
TGF-β1 induces GLUT1 expression through the Smad pathwayAfter finding that TGF-β1 stimulation induces GLUT1 expression, the specific mechanism by which TGF-β1 induces GLUT1 expression was further explored. Changes in the expression levels of Smad proteins in the canonical pathway activated by TGF-β1 stimulation were first examined. Western blot analysis revealed a time-dependent relationship between Smad2/Smad3 phosphorylation and TGF-β1

Zhou MY et al. GLUT1 promotes HSC glycolysis and activation
WJG https://www.wjgnet.com 6915 October 28, 2021 Volume 27 Issue 40
Figure 1 Glucose transporter 1 expression is correlated with liver fibrosis progression. A-D: The classic mouse model of CCl4-induced liver fibrosis was used to first clarify whether glucose transporter 1 (GLUT1) is related to liver fibrosis. Sirius red staining and alpha-smooth muscle actin (α-SMA) immunohistochemical (IHC) staining were used to confirm that the liver fibrosis model was successfully established, and then the mice were randomly divided into the CCl4 group and the control oil group (n = 6-10 mice/group) (A); Evaluation of liver fibrosis using Sirius red staining (B); Determination of the area ratio of positive IHC staining for α-SMA in the mouse CCl4-induced liver fibrosis model (C); GLUT1 expression was more abundant in the liver tissue samples from the model group (D); E and F: Immunofluorescence staining for GLUT1 (red) and α-SMA (green) in the CCl4 model. Cell nuclei were counterstained with DAPI. Scale bar for immunofluorescence staining, 200 μm; scale bars for IHC staining and Sirius red staining, 200 μm; G: IHC staining for α-SMA and GLUT1 in the healthy control and liver fibrosis groups (scale bar, 100 μm); H: Western blot analysis of changes in GLUT1 protein levels in the oil group and the CCl4 model group; I: Western blot analysis of GLUT1 protein expression in human liver tissues from the healthy control group and the liver fibrosis group. Data in B-D, G and H are presented as the mean ± SE. Statistically significant differences were detected (compared with the oil group, aP < 0.05 and bP < 0.01; compared with the healthy control group, dP < 0.05). GLUT1: Glucose transporter 1; α-SMA: Alpha-smooth muscle actin.
stimulation (Figure 3A and B), and phosphorylation occurred at time points close to when GLUT1 expression increased. Next, the direct role of Smads in GLUT1 induction was explored. Smad3 or Smad4 overexpression plasmids were first transiently transfected into HSCs, and then certain groups of HSCs were induced with TGF-β1 for 4 h. Smad3 or Smad4 overexpression promoted GLUT1 expression, and TGF-β1 addition amplified these effects, resulting in a further increase in GLUT1 expression (Figure 3C and D). Smad2/3 and/or Smad4 siRNAs were used to silence their expression levels and to better understand the roles of Smads in the relationship between TGF-β1 and GLUT1 expression, and the analysis performed at 48 h after the transfection of Smad2/3 and/or Smad4 siRNAs showed that TGF-β1-mediated GLUT1 expression was significantly reduced. This change was more significant and the decrease in GLUT1 expression was more substantial when the cells were transfected simultaneously with both siRNAs (Figure 3G and H). Finally, HSCs were sequentially treated with the Smad inhibitor SIS3 for 2 h and then with TGF-β1 for 4 h, resulting in

Zhou MY et al. GLUT1 promotes HSC glycolysis and activation
WJG https://www.wjgnet.com 6916 October 28, 2021 Volume 27 Issue 40
Figure 2 Stimulation of hepatic stellate cells with transforming growth factor-β1 induces glucose transporter 1 expression and promotes glycolysis. A: Serum-starved (for 20 h) primary mouse hepatic stellate cells (HSCs) were seeded into Seahorse XF-24 cell culture microplates (5 × 10⁴ cells/well). The cells were first treated with transforming growth factor-β1 (TGF-β1) (3 ng/mL) for 0, 6 or 24 h, followed by sequential treatment with oligomycin (Oligo) and carbonyl cyanide 4-(trifluoromethoxy)phenylhydrazone (FCCP). The extracellular acidification rate (ECAR) was recorded in real time; B: The basic ECAR. n = 6; the mean ± SE; aP < 0.05 compared to the level before TGF-β1 treatment (0 h); unpaired t test; C and D: Mouse HSCs were treated with or without TGF-β1 (3 ng/mL) for 24 h. The cells were then lysed, and the lactic acid contents in the cell lysate (C) and the culture medium (D) were examined; E: Determination of glucose consumption in the culture medium; F-I: Mouse HSCs were treated with or without TGF-β1 (3 ng/mL) for 24 h. RNA was purified, and RT-PCR was performed to examine the expression levels of glucose transporter 1 (GLUT1) (F), HK-2 (G), PKM-2 (H) and α-SMA (I), n = 5, the mean ± SE; aP < 0.05, bP < 0.01 and cP < 0.001 compared with those at 0 h or those in the TGF-β1-untreated group; one-way analysis of variance (ANOVA); J: Western blot analysis of the expression levels of

Zhou MY et al. GLUT1 promotes HSC glycolysis and activation
WJG https://www.wjgnet.com 6917 October 28, 2021 Volume 27 Issue 40
GLUT1 and tubulin at various time points after HSCs were treated with TGF-β1 (3 ng/mL); K: Examination of the changes in GLUT1 and tubulin levels after sequential treatment with a type 1 TGF-β receptor inhibitor (LY2109761, 2 μm) for 1 h and then with TGF-β1 (3 ng/mL) for 0, 8 or 24 h. All experiments shown in A-E and F-I were performed 2-3 times. Inhi: Inhibitor; Con: Control; FCCP: Carbonyl cyanide 4-(trifluoromethoxy)phenylhydrazone; ECAR: Extracellular acidification rate; GLUT1: Glucose transporter 1; TGF-β1: Transforming growth factor-β1.
Figure 3 Transforming growth factor-β1 induces glucose transporter 1 expression through the Smad pathway. A and B: Serum-starved (for 20 h) primary mouse hepatic stellate cells (HSCs) were treated with transforming growth factor-β1 (TGF-β1) (3 ng/mL) and examined at various time points. Western blot analysis using specific antibodies (A). Quantitative analysis of the levels of the p-Smad2 and p-Smad3 proteins in five independent experiments (B); C and D: After transiently transfecting HSCs with 2 μg of Smad3 and/or Smad4 expression plasmids, the cells were cultured in serum-free medium for 48 h and then treated with TGF-β1 (3 ng/mL) for 4 h. Green fluorescent protein (GFP) was used as a transfection control. Western blot analysis using specific antibodies (C). Quantitative analysis of glucose transporter 1 (GLUT1) protein expression in five independent experiments (D); E and F: HSCs were first pretreated with a Smad3 inhibitor (SIS3, 20 μm) for 1 h and then treated with TGF-β1 (3 ng/mL) for 4 h. Western blot analysis using specific antibodies (E). Quantitative analysis of the GLUT1 protein level in five independent experiments (F); G and H: Mouse primary HSCs were transfected with 20 μmol/L control small interfering RNAs (siRNAs) or siRNAs targeting Smad2/3 and Smad4. After transfection in serum-free medium for 48 h, the cells were treated with TGF-β1 (3 ng/mL) for 4 h. Western blot analysis using specific antibodies (G). Quantitative analysis of the GLUT1 protein level in five independent experiments (H) (the mean ± SE; aP < 0.05, bP < 0.01 and cP < 0.001 compared with that in the group of cells without TGF-β1; dP < 0.05 for the comparison of the groups treated with TGF-β1 and the groups treated with TGF-β1 and different additional reagents; Student’s t test). GLUT1: Glucose transporter 1; TGF-β1: Transforming growth factor-β1; Con: Control; siRNAs: Small interfering RNAs.
a significant decrease in GLUT1 protein expression (Figure 3E and F). These results preliminarily indicate the important regulatory role of Smad proteins in TGF-β1-mediated GLUT1 expression and suggest that Smad proteins directly participate in the regulation of GLUT1 by TGF-β1.
The noncanonical p38 MAPK and PI3K/AKT signaling pathways are also involved in TGF-β1-mediated GLUT1 inductionDuring fibrosis development, TGF-β1 activates not only the canonical Smad pathway

Zhou MY et al. GLUT1 promotes HSC glycolysis and activation
WJG https://www.wjgnet.com 6918 October 28, 2021 Volume 27 Issue 40
but also noncanonical pathways (such as the PI3K/AKT and p38 MAPK signaling pathways). In addition, the Smad pathway and non-Smad pathways are mutually dependent[28]. Therefore, we questioned whether a non-Smad pathway is involved in the TGF-β1-mediated induction of GLUT1. Changes in the phosphorylation levels of p38 and AKT in HSCs after TGF-β1 stimulation were examined to answer this question. Western blot analyses showed increased levels of phosphorylated p38 and AKT in HSCs after TGF-β1 treatment (Figure 4A-C). HSCs were pretreated with the specific p38 MAPK inhibitor SB203580 and the PI3K inhibitor LY294002 for 1 h and then induced with TGF-β1 to understand the bridging role of p38 MAPK and AKT in TGF-β1-mediated GLUT1 expression. Western blot analyses showed that p-AKT activity was significantly inhibited and that GLUT1 protein expression was significantly reduced (Figure 4D). S6 ribosomal protein and heat shock protein 25 (Hsp25) are downstream proteins in the PI3K/AKT and p38 MAPK pathways, and their phosphorylation was also inhibited. Addition of the p38 inhibitor reduced the phosphorylation of the S6 protein, and the phosphorylation level of Smad2 was also affected; however, Smad3 was not significantly affected (Figure 4D and E). The above results indicate that (1) GLUT1 expression in HSCs did not rely solely on the TGF-β1-mediated Smad pathway, i.e., the p38 MAPK and PI3K/AKT signaling pathways were also involved in TGF-β1-mediated GLUT1 expression, and (2) TGF-β1-mediated pathways did not act independently, as mutual restrictions and interactions between the pathways were observed. Based on the results described above, the effects of inhibiting the Smad3, p38 MAPK and PI3K/AKT pathways on GLUT1 expression were analyzed, and the simultaneous addition of inhibitors of the Smad3, p38 MAPK and PI3K/AKT pathways significantly reduced TGF-β1-mediated GLUT1 expression (Figure 4F and G). In summary, TGF-β1 requires the participation of non-Smad pathways to induce GLUT1 expression during HSC activation.
The effect of GLUT1 on HSC migration and proliferationCells were first treated with phloretin (a specific inhibitor of GLUT1) for 30 min or transfected with an siRNA targeting GLUT1, followed by treatment with TGF-β1 for 4 h. The targeted inhibition of GLUT1 by phloretin and the siRNA suppressed the effect of TGF-β1 on the migration and proliferation of HSCs (Figure 5A, B and E). Western blot analyses also showed that siRNA transfection effectively inhibited TGF-β1-induced GLUT1 expression (Figure 5C and D). Therefore, inhibition of GLUT1 expression reverses the effect of TGF-β1 on the migration and proliferation of HSCs and delays the process of HSC transdifferentiation into myofibroblasts. No noticeable effect of the control siRNA on proliferation was identified between TGF-β1-treated cells and TGF-β1/siRNA-control-treated cells or between control/saline-treated cells and saline/siRNA-control-treated cells (Figure 5E). In addition, no obvious effect of siRNA interference on cell viability (Supplementary Figure 2) or the expression of TGF-β receptors was found (Supplementary Figure 3).
GLUT1 inhibition delays the development of liver fibrosis in a mouse model of liver fibrosisIn vitro experiments confirmed the importance of GLUT1 in liver fibrosis. Next, we examined whether inhibition of GLUT1 expression suppressed liver fibrosis in vivo. Phloretin, a specific inhibitor of GLUT1, was used, and its effect on CCl4-induced liver fibrosis was examined. After successful establishment of the CCl4-induced model, an i.p. injection of phloretin was administered three times a week; the intervention was discontinued after 2 wk. A simple technical roadmap is shown in Figure 6A. Compared with those in the model group, the areas of collagen fiber deposition were significantly reduced in the liver tissues from mice in the drug intervention group; these findings were confirmed by Masson’s trichrome and Sirius red staining (Figure 6B-D). The degree of liver inflammation was determined by performing serological assessments of changes in ALT and AST levels, and the results indicated that the degree of inflammation was significantly reduced in the drug intervention group (Figure 6E and F). Therefore, the in vivo results revealed that GLUT1 inhibition reduces CCl4-induced liver fibrosis.
DISCUSSIONIn normal liver tissues, quiescent HSCs express TGF-β1 at low levels, while TGF-β1 is immediately upregulated after acute or chronic liver injury and interacts with multiple signaling pathways to induce HSC activation and proliferation and extensive ECM

Zhou MY et al. GLUT1 promotes HSC glycolysis and activation
WJG https://www.wjgnet.com 6919 October 28, 2021 Volume 27 Issue 40
Figure 4 The noncanonical p38 MAPK and PI3K/AKT signaling pathways are also involved in transforming growth factor-β1-mediated glucose transporter 1 expression. A-C: Serum-starved (for 20 h) primary mouse hepatic stellate cells (HSCs) were treated with transforming growth factor-β1 (TGF-β1) (3 ng/mL) and examined at different time points. Western blot analysis using specific antibodies (A). Five independent experiments were performed to quantitatively analyze the levels of phosphorylated p38 (B) MAPK and AKT (C); D and E: HSCs cultured in serum-free medium were pretreated with the p38 MAPK inhibitor SB203580 (10 μm) or the PI3K inhibitor LY294002 (10 μm) for 1 h and then treated with TGF-β1 (3 ng/mL) for 4 h. Western blot analysis using specific antibodies (D). Quantitative analysis of the levels of glucose transporter 1 (GLUT1) and phosphorylated Smad2 and Smad3 proteins (E); F and G: HSCs cultured in serum-free medium were pretreated with the p38 MAPK inhibitor SB203580 (10 μm), the PI3K inhibitor LY294002 (10 μm) and the Smad inhibitor SIS3 (20 μm) for 1 h and then treated with TGF-β1 (3 ng/mL) for 4 h. Western blot analysis using specific antibodies (F). Quantitative analysis of the GLUT1 protein level (G) (the mean ± SE; aP < 0.05, bP < 0.01 and cP < 0.001 compared with the TGF-β1-treated group or the TGF-β1-untreated group, dP < 0.05, eP < 0.01 and fP < 0.001 for the comparison of the group treated with TGF-β1 and the groups treated with TGF-β1 and the corresponding inhibitors; Student’s t test). GLUT1: Glucose transporter 1; TGF-β1: Transforming growth factor-β1.
production[29,30]. TGF-β1 enhances aerobic glycolysis, amino acid uptake and lactic acid production in Ras- and Myc-transformed cells. TGF-β1 contributes to the metabolic reprogramming of cancer cells and tumor-associated stromal cells[31]. When used to replace a peritoneal dialysis solution, TGF-β1 stimulates glycolysis and inhibits mitochondrial respiration of mesothelial cells, thus promoting the development of peritoneal fibrosis[32]. Preliminary yet strong evidence supporting the importance of

Zhou MY et al. GLUT1 promotes HSC glycolysis and activation
WJG https://www.wjgnet.com 6920 October 28, 2021 Volume 27 Issue 40
Figure 5 The effect of glucose transporter 1 on the growth and proliferation of hepatic stellate cell. Mouse primary hepatic stellate cells (HSCs) were 1) pretreated with the glucose transporter 1 (GLUT1) inhibitor phloretin (50 μm) for 30 min and then treated with transforming growth factor-β1 (TGF-β1) (3 ng/mL) for 4 h or 2) transiently transfected with small interfering RNAs that inhibited GLUT1 expression, cultured in serum-free medium for 24 h and then treated with TGF-β1 (3 ng/mL) for 4 h. A: Cells were seeded in serum-free medium (4 × 10⁵ cells/well) in the upper chambers of a Transwell system. The lower chambers were filled with 5% glucose medium (700 μL per well). Changes in cell migration were observed. Representative images of crystal violet staining are shown; B: Quantitative data showing the number of migrating cells in each group; C: Western blot analysis using specific antibodies; D: Quantitative analysis of GLUT1 protein expression in three independent experiments; E: The effect of GLUT1 inhibition on the growth/proliferation of HSCs (mean ± SE; bP < 0.01 and cP < 0.001 compared with the group without TGF-β1; eP < 0.01 for the comparison of the TGF-β1-treated group with the groups subjected to TGF-β1 treatment and different interventions; Student’s t test). GLUT1: Glucose transporter 1; TGF-β1: Transforming growth factor-β1; siRNAs: Small interfering RNAs.
metabolic reprogramming in the activation of fibroblasts is steadily accumulating. Research on the mechanism of organ fibrosis also shows that TGF-β1 is related to the occurrence of aerobic glycolysis and mitochondrial dysfunction. The transdifferen-tiation of resting HSCs into hepatic fibroblasts has been confirmed to be related to mutual transformation between glycolytic enzymes and gluconeogenic enzymes triggered by Hedgehog signaling[33]. Glycolysis is an important pathway of glucose metabolism, and GLUT1 is the most widely expressed glucose transporter in mammals; its expression is regulated by changes in metabolic status and oxidative stress. GLUT1 is also an important marker of liver carcinogenesis and metabolic liver diseases[34]. GLUT1-dependent glycolysis exacerbates lung fibrogenesis during Streptococcus pneumoniae infection via AIM2 inflammasome activation[35]. In the pathogenesis of diabetic glomerulosclerosis, TGF-β1 triggers GLUT1 activation by stretching glomerular mesangial cells. In breast cancer cells, long-term exposure to TGF-β1 restores GLUT1 expression and results in stable EMT and unlimited cell prolif-eration[36,37]. Therefore, we questioned whether TGF-β1 and GLUT1 are related to liver fibrosis.
This study showed a significant increase in GLUT1 expression in human and mouse fibrotic liver tissues, which is consistent with the research results of Wan et al[24]. With the increase in TGF-β1 Levels, the gene expression levels of key enzymes, including GLUT1, in the glycolytic pathway are elevated, glucose consumption and intracellular lactate production are also increased, and glycolytic flux by HSCs is enhanced. As expected, the results of this study are consistent with those of previous studies

Zhou MY et al. GLUT1 promotes HSC glycolysis and activation
WJG https://www.wjgnet.com 6921 October 28, 2021 Volume 27 Issue 40
Figure 6 Glucose transporter 1 inhibition delays the development of liver fibrosis in a mouse model of liver fibrosis. A: Schematic diagram of the experiment. C57BL/6 mice were injected intraperitoneally with CCl4 to induce liver fibrosis. The model was successfully established after 4 wk. Among the treatment groups, the CCl4 + phloretin group was intraperitoneally injected with phloretin (10 mg/kg) three times a week, and the CCl4 group was injected with normal saline as a control. The treatments were discontinued after 2 wk; B: Mouse livers were collected, and liver tissue sections were prepared. The sections were subjected to Masson’s trichrome staining, Sirius red staining and alpha-smooth muscle actin (α-SMA) immunohistochemical (IHC) staining (original magnification, × 10); C: The positive area ratio detected using Sirius red staining; D: The positive area ratio for α-SMA IHC staining; E and F: Serological analysis of ALT (E) and AST (F) levels (n = 5-7; the mean ± SE; scale bar, 100 μm; aP < 0.05 for the comparison between the CCl4 group and the CCl4 + phloretin group; Student’s t test). α-SMA: Alpha-smooth muscle actin.
assessing the mechanism of metabolic reprogramming of pulmonary fibrotic fibroblasts[38], indicating that TGF-β1 induces aerobic glycolysis and drives the occurrence of metabolic reprogramming during the process of stromal cell transdiffer-entiation. Increased GLUT1 expression also contributes to an elevated glycolytic rate, increased lactic acid production and enhanced glucose-dependent metabolic pathways in cells. In contrast, GLUT1 expression decreased significantly after the addition of a TGF-β1 receptor inhibitor, indicating that GLUT1 expression is related to TGF-β1 signaling. Experiments involving Smad overexpression, siRNA-mediated knockout and Smad inhibitors showed that the response of GLUT1 to TGF-β1 was at least partially dependent on the Smad pathway. Studies have identified a cascade of related pathways activated by TGF-β1. Therefore, this study attempted to verify whether non-Smad pathways were also involved in the induction of GLUT1 expression in HSCs. The noncanonical PI3K/AKT and p38 MAPK pathways activated by TGF-β1 were examined. In colorectal cancer (CRC) cells, silencing GLUT1 expression inactivates the TGF-β1/PI3K/AKT signaling pathway, inhibits the proliferation of CRC cells and promotes apoptosis. MAPK activation by TGF-β1 may trigger GLUT1 synthesis[39,40]. Based on the results of the present study, the simultaneous addition of specific inhibitors of the PI3K/AKT and p38 pathways, i.e., SB203580 and LY294002, respectively, reduced TGF-β1-induced GLUT1 protein expression. The addition of the p38 pathway inhibitor resulted in a decrease in Smad2 protein phosphorylation, changes in the phosphorylated AKT level and changes in the phosphorylation level of a protein downstream of PI3K/AKT signaling (namely, S6); therefore, we speculated that the p38 MAPK pathway acted as a bridge between the TGF-β1-mediated Smad and AKT pathways in HSCs and that reduced activation of the p38 MAPK pathway would inhibit the latter two pathways. In addition, the p38 MAPK pathway might limit Smad pathway-mediated GLUT1 expression to a certain extent. These results are consistent with the previously reported crosstalk between Smad and p38 MAPK in

Zhou MY et al. GLUT1 promotes HSC glycolysis and activation
WJG https://www.wjgnet.com 6922 October 28, 2021 Volume 27 Issue 40
Figure 7 Schematic representation of the mechanisms implicated in canonical and noncanonical transforming growth factor-β pathways regulating glucose transporter 1 expression. TGF-β1: Transforming growth factor-β1; GLUT1: Glucose transporter 1; MF-HSC: Myofibroblasts-hepatic stellate cells; α-SMA: Alpha-smooth muscle actin.
TGF-β1 signal transduction in human glioblastoma cells[41]. However, the specific mechanism underlying the interaction among TGF-β1 pathways in the induction of aerobic glycolysis in stellate cells requires further study. The significant reduction in GLUT1 protein expression was related to the simultaneous inhibition of the Smad3, p38 MAPK and PI3K signaling pathways, indicating that GLUT1 protein expression during stellate cell activation requires the activation and signaling of these three pathways. Moreover, activation of the p38 MAPK pathway might result in a certain synergistic effect with the Smad2/3 pathway (Figure 7).
TGF-β1 is a pleiotropic cytokine with an important role in the occurrence of liver fibrosis. According to previous studies, TGF-β1 signaling clearly promotes cell migration, matrix synthesis and HSC differentiation toward myofibroblasts. Moreover, the effect of TGF-β1 on fibroblast migration and proliferation depends on changes in the microenvironment[42]. As shown in the present study, TGF-β1 promoted the proliferative and migratory capabilities of HSCs, functions that are hallmarks of cell transformation. The addition of a pharmacological inhibitor of GLUT1 activity (phloretin, an effective GLUT1 inhibitor capable of inhibiting bleomycin-induced pulmonary fibrosis in vivo[43]) and silencing of the GLUT1 gene eliminated TGF-β1-induced proliferation, growth and migration. Finally, a GLUT1 inhibitor was used in in vivo experiments, and the degree of mouse liver fibrosis improved, collagen fiber deposition decreased, and the degree of inflammation decreased. Given the importance of GLUT1, the experimental results revealed that GLUT1 is involved in aerobic glycolysis during HSC activation and that aerobic glycolysis is a response to TGF-β1 signaling mediated by the Smad, PI3K/AKT and p38 MAPK pathways.
CONCLUSIONIn summary, TGF-β1-induced GLUT1 expression may be one of the mechanisms involved in the reprogramming of HSCs, providing an expanded basis and new insights for the mechanism of action of TGF-β1 in metabolic reprogramming during liver fibrosis. GLUT1 plays an important role in aerobic glycolysis in HSCs and in promoting cell proliferation and transformation. GLUT1 inhibition may be an alternative therapy to the current traditional treatments for liver fibrosis. However, the extent to which GLUT1 inhibition contributes to elimination of the profibrotic effect of TGF-β1 and the specific molecular mechanisms of the interaction between the two may require verification using approaches combining proteomics and single-cell sequencing, which may be an attractive research direction in the future.

Zhou MY et al. GLUT1 promotes HSC glycolysis and activation
WJG https://www.wjgnet.com 6923 October 28, 2021 Volume 27 Issue 40
ARTICLE HIGHLIGHTSResearch backgroundLiver fibrosis is a refractory disease that develops progressively and eventually evolves into liver cirrhosis or even liver cancer. Hepatic stellate cell (HSC) activation is the initiating factor for liver fibrosis, while aerobic glycolysis is one of the main metabolic characteristics. Transforming growth factor-β1 (TGF-β1) is the most important profibrotic factor in HSCs, and TGF-β1 drives metabolic reprogramming. Glucose transporter 1 (GLUT1) is the most widely distributed glucose transporter in mammals and is related to glycolytic metabolism. However, the role of GLUT1 in liver fibrosis and the relationship between GLUT1 and TGF-β1 remain unclear and require further investigation.
Research motivationThe results of this study might provide a basis for the application of GLUT1 in the treatment of liver fibrosis and provide an expanded basis for understanding the mechanism of action of TGF-β1 in metabolic reprogramming during liver fibrosis.
Research objectivesThis study examined changes in GLUT1 expression in human and mouse fibrotic liver tissues and differences in extracellular acid production and in the expression levels of key glycolytic enzymes and GLUT1 during HSC activation induced by TGF-β1-related pathways. In addition, this study further explored the relationship between TGF-β1 pathways and GLUT1 expression and the potential underlying molecular mechanisms.
Research methodsIHC was employed to examine changes in GLUT1 expression in human and mouse fibrotic liver tissues. Immunofluorescence staining was performed to examine changes in GLUT1 and alpha-smooth muscle actin (α-SMA) expression in mouse fibrotic liver tissue. Primary mouse stellate cells were isolated. After activation of the cells by TGF-β1 stimulation, changes in extracellular acid production, key glycolytic enzymes and glucose consumption were examined. In addition, changes in GLUT1 expression were explored by activating/inhibiting the Smad2/3 pathway and inhibiting the expression of proteins related to the p38 and PI3K/AKT pathways. Finally, in mice with liver fibrosis, the effect of a GLUT1 inhibitor on liver fibrosis was investigated by performing Masson’s trichrome staining and Sirius red staining and analyzing serological inflammatory markers.
Research resultsThe expression of the GLUT1 protein was increased in both mouse and human fibrotic liver tissue.immunofluorescence staining revealed the colocalization of GLUT1 and α-SMA proteins, indicating that GLUT1 expression was related to the development of liver fibrosis. TGF-β1 induced an increase in aerobic glycolysis in HSCs and induced GLUT1 expression in HSCs by activating the canonical and noncanonical signaling pathways. The p38 MAPK pathway and the Smad pathway synergistically affected the induction of GLUT1 expression. GLUT1 inhibition eliminated the effect of TGF-β1 on the proliferation and migration of HSCs. A GLUT1 inhibitor was administered to a mouse model of liver fibrosis, and GLUT1 inhibition reduced the degree of liver inflammation.
Research conclusionsGLUT1 expression was upregulated in liver fibrosis, and the underlying mechanism was related to activation of the Smad2/3, p38 and PI3K/AKT pathways by TGF-β1, which directly induced GLUT1 expression and promoted glycolysis. GLUT1 inhibition eliminated TGF-β1-induced HSC activation, proliferation and migration, and GLUT1 inhibition exerted an antifibrotic effect.
Research perspectivesThe results of this study reveal that the TGF-β1 pathway directly induces GLUT1 expression and aerobic glycolysis, thus promoting liver fibrosis. This study prelim-inarily clarified the mechanism underlying the interaction between TGF-β1 and GLUT1 in liver fibrosis, thus providing a deeper understanding of the mechanism of liver fibrosis and providing guidance for the selection of targets to treat liver fibrosis. The results from this study indicate that GLUT1 inhibitors may have certain

Zhou MY et al. GLUT1 promotes HSC glycolysis and activation
WJG https://www.wjgnet.com 6924 October 28, 2021 Volume 27 Issue 40
prospective applications as therapeutic drugs for liver fibrosis.
ACKNOWLEDGEMENTSThe authors thank Dr. Ding Q for expert technical assistance.
REFERENCESNi Y, Li JM, Liu MK, Zhang TT, Wang DP, Zhou WH, Hu LZ, Lv WL. Pathological process of liver sinusoidal endothelial cells in liver diseases. World J Gastroenterol 2017; 23: 7666-7677 [PMID: 29209108 DOI: 10.3748/wjg.v23.i43.7666]
1
Hernandez-Gea V, Friedman SL. Pathogenesis of liver fibrosis. Annu Rev Pathol 2011; 6: 425-456 [PMID: 21073339 DOI: 10.1146/annurev-pathol-011110-130246]
2
Higashi T, Friedman SL, Hoshida Y. Hepatic stellate cells as key target in liver fibrosis. Adv Drug Deliv Rev 2017; 121: 27-42 [PMID: 28506744 DOI: 10.1016/j.addr.2017.05.007]
3
Vallée A, Lecarpentier Y, Vallée JN. Thermodynamic Aspects and Reprogramming Cellular Energy Metabolism during the Fibrosis Process. Int J Mol Sci 2017; 18 [PMID: 29186898 DOI: 10.3390/ijms18122537]
4
Vander Heiden MG, Cantley LC, Thompson CB. Understanding the Warburg effect: the metabolic requirements of cell proliferation. Science 2009; 324: 1029-1033 [PMID: 19460998 DOI: 10.1126/science.1160809]
5
Chen Y, Choi SS, Michelotti GA, Chan IS, Swiderska-Syn M, Karaca GF, Xie G, Moylan CA, Garibaldi F, Premont R, Suliman HB, Piantadosi CA, Diehl AM. Hedgehog controls hepatic stellate cell fate by regulating metabolism. Gastroenterology 2012; 143: 1319-1329.e11 [PMID: 22885334 DOI: 10.1053/j.gastro.2012.07.115]
6
Henderson NC, Rieder F, Wynn TA. Fibrosis: from mechanisms to medicines. Nature 2020; 587: 555-566 [PMID: 33239795 DOI: 10.1038/s41586-020-2938-9]
7
Syed V. TGF-β Signaling in Cancer. J Cell Biochem 2016; 117: 1279-1287 [PMID: 26774024 DOI: 10.1002/jcb.25496]
8
Zhang YE. Non-Smad Signaling Pathways of the TGF-β Family. Cold Spring Harb Perspect Biol 2017; 9 [PMID: 27864313 DOI: 10.1101/cshperspect.a022129]
9
Derynck R, Budi EH. Specificity, versatility, and control of TGF-β family signaling. Sci Signal 2019; 12 [PMID: 30808818 DOI: 10.1126/scisignal.aav5183]
10
Heldin CH, Moustakas A. Signaling Receptors for TGF-β Family Members. Cold Spring Harb Perspect Biol 2016; 8 [PMID: 27481709 DOI: 10.1101/cshperspect.a022053]
11
Wrana JL, Attisano L, Wieser R, Ventura F, Massagué J. Mechanism of activation of the TGF-beta receptor. Nature 1994; 370: 341-347 [PMID: 8047140 DOI: 10.1038/370341a0]
12
Dennler S, Itoh S, Vivien D, ten Dijke P, Huet S, Gauthier JM. Direct binding of Smad3 and Smad4 to critical TGF beta-inducible elements in the promoter of human plasminogen activator inhibitor-type 1 gene. EMBO J 1998; 17: 3091-3100 [PMID: 9606191 DOI: 10.1093/emboj/17.11.3091]
13
Dewidar B, Meyer C, Dooley S, Meindl-Beinker AN. TGF-β in Hepatic Stellate Cell Activation and Liver Fibrogenesis-Updated 2019. Cells 2019; 8 [PMID: 31718044 DOI: 10.3390/cells8111419]
14
Zhao X, Kwan JYY, Yip K, Liu PP, Liu FF. Targeting metabolic dysregulation for fibrosis therapy. Nat Rev Drug Discov 2020; 19: 57-75 [PMID: 31548636 DOI: 10.1038/s41573-019-0040-5]
15
Soukupova J, Malfettone A, Bertran E, Hernández-Alvarez MI, Peñuelas-Haro I, Dituri F, Giannelli G, Zorzano A, Fabregat I. Epithelial-Mesenchymal Transition (EMT) Induced by TGF-β in Hepatocellular Carcinoma Cells Reprograms Lipid Metabolism. Int J Mol Sci 2021; 22 [PMID: 34073989 DOI: 10.3390/ijms22115543]
16
Kottmann RM, Kulkarni AA, Smolnycki KA, Lyda E, Dahanayake T, Salibi R, Honnons S, Jones C, Isern NG, Hu JZ, Nathan SD, Grant G, Phipps RP, Sime PJ. Lactic acid is elevated in idiopathic pulmonary fibrosis and induces myofibroblast differentiation via pH-dependent activation of transforming growth factor-β. Am J Respir Crit Care Med 2012; 186: 740-751 [PMID: 22923663 DOI: 10.1164/rccm.201201-0084OC]
17
Chen LQ, Cheung LS, Feng L, Tanner W, Frommer WB. Transport of sugars. Annu Rev Biochem 2015; 84: 865-894 [PMID: 25747398 DOI: 10.1146/annurev-biochem-060614-033904]
18
Wang L, Pavlou S, Du X, Bhuckory M, Xu H, Chen M. Glucose transporter 1 critically controls microglial activation through facilitating glycolysis. Mol Neurodegener 2019; 14: 2 [PMID: 30634998 DOI: 10.1186/s13024-019-0305-9]
19
Hua W, Ten Dijke P, Kostidis S, Giera M, Hornsveld M. TGFβ-induced metabolic reprogramming during epithelial-to-mesenchymal transition in cancer. Cell Mol Life Sci 2020; 77: 2103-2123 [PMID: 31822964 DOI: 10.1007/s00018-019-03398-6]
20
Liu M, Quek LE, Sultani G, Turner N. Epithelial-mesenchymal transition induction is associated with augmented glucose uptake and lactate production in pancreatic ductal adenocarcinoma. Cancer Metab 2016; 4: 19 [PMID: 27777765 DOI: 10.1186/s40170-016-0160-x]
21
Li W, Wei Z, Liu Y, Li H, Ren R, Tang Y. Increased 18F-FDG uptake and expression of Glut1 in the 22

Zhou MY et al. GLUT1 promotes HSC glycolysis and activation
WJG https://www.wjgnet.com 6925 October 28, 2021 Volume 27 Issue 40
EMT transformed breast cancer cells induced by TGF-beta. Neoplasma 2010; 57: 234-240 [PMID: 20353274 DOI: 10.4149/neo_2010_03_234]Inoki K, Haneda M, Maeda S, Koya D, Kikkawa R. TGF-beta 1 stimulates glucose uptake by enhancing GLUT1 expression in mesangial cells. Kidney Int 1999; 55: 1704-1712 [PMID: 10231432 DOI: 10]
23
Wan L, Xia T, Du Y, Liu J, Xie Y, Zhang Y, Guan F, Wu J, Wang X, Shi C. Exosomes from activated hepatic stellate cells contain GLUT1 and PKM2: a role for exosomes in metabolic switch of liver nonparenchymal cells. FASEB J 2019; 33: 8530-8542 [PMID: 30970216 DOI: 10.1096/fj.201802675R]
24
Zhao XK, Yu L, Cheng ML, Che P, Lu YY, Zhang Q, Mu M, Li H, Zhu LL, Zhu JJ, Hu M, Li P, Liang YD, Luo XH, Cheng YJ, Xu ZX, Ding Q. Focal Adhesion Kinase Regulates Hepatic Stellate Cell Activation and Liver Fibrosis. Sci Rep 2017; 7: 4032 [PMID: 28642549 DOI: 10.1038/s41598-017-04317-0]
25
Zou GL, Zuo S, Lu S, Hu RH, Lu YY, Yang J, Deng KS, Wu YT, Mu M, Zhu JJ, Zeng JZ, Zhang BF, Wu X, Zhao XK, Li HY. Bone morphogenetic protein-7 represses hepatic stellate cell activation and liver fibrosis via regulation of TGF-β/Smad signaling pathway. World J Gastroenterol 2019; 25: 4222-4234 [PMID: 31435175 DOI: 10.3748/wjg.v25.i30.4222]
26
Morikawa M, Derynck R, Miyazono K. TGF-β and the TGF-β Family: Context-Dependent Roles in Cell and Tissue Physiology. Cold Spring Harb Perspect Biol 2016; 8 [PMID: 27141051 DOI: 10.1101/cshperspect.a021873]
27
Xu F, Liu C, Zhou D, Zhang L. TGF-β/SMAD Pathway and Its Regulation in Hepatic Fibrosis. J Histochem Cytochem 2016; 64: 157-167 [PMID: 26747705 DOI: 10.1369/0022155415627681]
28
Simeone DM, Zhang L, Graziano K, Nicke B, Pham T, Schaefer C, Logsdon CD. Smad4 mediates activation of mitogen-activated protein kinases by TGF-beta in pancreatic acinar cells. Am J Physiol Cell Physiol 2001; 281: C311-C319 [PMID: 11401854 DOI: 10.1152/ajpcell.2001.281.1.C311]
29
Fan W, Liu T, Chen W, Hammad S, Longerich T, Hausser I, Fu Y, Li N, He Y, Liu C, Zhang Y, Lian Q, Zhao X, Yan C, Li L, Yi C, Ling Z, Ma L, Xu H, Wang P, Cong M, You H, Liu Z, Wang Y, Chen J, Li D, Hui L, Dooley S, Hou J, Jia J, Sun B. ECM1 Prevents Activation of Transforming Growth Factor β, Hepatic Stellate Cells, and Fibrogenesis in Mice. Gastroenterology 2019; 157: 1352-1367.e13 [PMID: 31362006 DOI: 10.1053/j.gastro.2019.07.036]
30
Olsson N, Piek E, Sundström M, ten Dijke P, Nilsson G. Transforming growth factor-beta-mediated mast cell migration depends on mitogen-activated protein kinase activity. Cell Signal 2001; 13: 483-490 [PMID: 11516623 DOI: 10.1016/s0898-6568(01)00176-0]
31
Si M, Wang Q, Li Y, Lin H, Luo D, Zhao W, Dou X, Liu J, Zhang H, Huang Y, Lou T, Hu Z, Peng H. Inhibition of hyperglycolysis in mesothelial cells prevents peritoneal fibrosis. Sci Transl Med 2019; 11 [PMID: 31167927 DOI: 10.1126/scitranslmed.aav5341]
32
Nigdelioglu R, Hamanaka RB, Meliton AY, O'Leary E, Witt LJ, Cho T, Sun K, Bonham C, Wu D, Woods PS, Husain AN, Wolfgeher D, Dulin NO, Chandel NS, Mutlu GM. Transforming Growth Factor (TGF)-β Promotes de Novo Serine Synthesis for Collagen Production. J Biol Chem 2016; 291: 27239-27251 [PMID: 27836973 DOI: 10.1074/jbc.M116.756247]
33
Cho SJ, Moon JS, Nikahira K, Yun HS, Harris R, Hong KS, Huang H, Choi AMK, Stout-Delgado H. GLUT1-dependent glycolysis regulates exacerbation of fibrosis via AIM2 inflammasome activation. Thorax 2020; 75: 227-236 [PMID: 31822523 DOI: 10.1136/thoraxjnl-2019-213571]
34
Chadt A, Al-Hasani H. Glucose transporters in adipose tissue, liver, and skeletal muscle in metabolic health and disease. Pflugers Arch 2020; 472: 1273-1298 [PMID: 32591906 DOI: 10.1007/s00424-020-02417-x]
35
Jiang L, Deberardinis R, Boothman DA. The cancer cell 'energy grid': TGF-β1 signaling coordinates metabolism for migration. Mol Cell Oncol 2015; 2: e981994 [PMID: 27308459 DOI: 10.4161/23723556.2014.981994]
36
Nilchian A, Giotopoulou N, Sun W, Fuxe J. Different Regulation of Glut1 Expression and Glucose Uptake during the Induction and Chronic Stages of TGFβ1-Induced EMT in Breast Cancer Cells. Biomolecules 2020; 10 [PMID: 33271824 DOI: 10.3390/biom10121621]
37
Xie N, Tan Z, Banerjee S, Cui H, Ge J, Liu RM, Bernard K, Thannickal VJ, Liu G. Glycolytic Reprogramming in Myofibroblast Differentiation and Lung Fibrosis. Am J Respir Crit Care Med 2015; 192: 1462-1474 [PMID: 26284610 DOI: 10.1164/rccm.201504-0780OC]
38
Fujishiro M, Gotoh Y, Katagiri H, Sakoda H, Ogihara T, Anai M, Onishi Y, Ono H, Funaki M, Inukai K, Fukushima Y, Kikuchi M, Oka Y, Asano T. MKK6/3 and p38 MAPK pathway activation is not necessary for insulin-induced glucose uptake but regulates glucose transporter expression. J Biol Chem 2001; 276: 19800-19806 [PMID: 11279172 DOI: 10.1074/jbc.M101087200]
39
Yamamoto Y, Yoshimasa Y, Koh M, Suga J, Masuzaki H, Ogawa Y, Hosoda K, Nishimura H, Watanabe Y, Inoue G, Nakao K. Constitutively active mitogen-activated protein kinase kinase increases GLUT1 expression and recruits both GLUT1 and GLUT4 at the cell surface in 3T3-L1 adipocytes. Diabetes 2000; 49: 332-339 [PMID: 10868953 DOI: 10.2337/diabetes.49.3.332]
40
Dziembowska M, Danilkiewicz M, Wesolowska A, Zupanska A, Chouaib S, Kaminska B. Cross-talk between Smad and p38 MAPK signalling in transforming growth factor beta signal transduction in human glioblastoma cells. Biochem Biophys Res Commun 2007; 354: 1101-1106 [PMID: 17276399 DOI: 10.1016/j.bbrc.2007.01.113]
41
Lu Y, Jiang F, Zheng X, Katakowski M, Buller B, To SS, Chopp M. TGF-β1 promotes motility and invasiveness of glioma cells through activation of ADAM17. Oncol Rep 2011; 25: 1329-1335 [PMID:
42

Zhou MY et al. GLUT1 promotes HSC glycolysis and activation
WJG https://www.wjgnet.com 6926 October 28, 2021 Volume 27 Issue 40
21359495 DOI: 10.3892/or.2011.1195]Cho SJ, Moon JS, Lee CM, Choi AM, Stout-Delgado HW. Glucose Transporter 1-Dependent Glycolysis Is Increased during Aging-Related Lung Fibrosis, and Phloretin Inhibits Lung Fibrosis. Am J Respir Cell Mol Biol 2017; 56: 521-531 [PMID: 27997810 DOI: 10.1165/rcmb.2016-0225OC]
43

WJG https://www.wjgnet.com 6927 October 28, 2021 Volume 27 Issue 40
World Journal of
GastroenterologyW J GSubmit a Manuscript: https://www.f6publishing.com World J Gastroenterol 2021 October 28; 27(40): 6927-6938
DOI: 10.3748/wjg.v27.i40.6927 ISSN 1007-9327 (print) ISSN 2219-2840 (online)
ORIGINAL ARTICLE
Retrospective Cohort Study
Serum hepatitis B core-related antigen as a surrogate marker of hepatitis B e antigen seroconversion in chronic hepatitis B
Xiu-Mei Chi, Xiao-Mei Wang, Zhong-Feng Wang, Rui-Hong Wu, Xiu-Zhu Gao, Hong-Qin Xu, Yan-Hua Ding, Jun-Qi Niu
ORCID number: Xiu-Mei Chi 0000-0002-6291-8496; Xiao-Mei Wang 0000-0003-2606-4013; Zhong-Feng Wang 0000-0001-9588-4985; Rui-Hong Wu 0000-0001-7585-0059; Xiu-Zhu Gao 0000-0001-6310-1456; Hong-Qin Xu 0000-0002-5841-2230; Yan-Hua Ding 0000-0003-2320-4404; Jun-Qi Niu 0000-0001-5415-2024.
Author contributions: Chi XM contributed to design and data analysis and drafted the manuscript; Wang XM contributed to data analysis and critically revised the manuscript; Wang ZF, Wu RH, Gao XZ and Xu HQ contributed to data acquisition and analysis; Ding YH critically revised the manuscript; Niu JQ contributed to the conception and critically revised the manuscript; All authors read and approved the final manuscript.
Supported by National Science and Technology Major Project, No. 2017ZX10302201, No. 2017ZX09304004 and No. 2014ZX10002002; and National Program on Key Basic Research Project (973 Program), No. 2015CB554304.
Institutional review board statement: This study was approved by the ethics committee of the First Hospital of Jilin
Xiu-Mei Chi, Xiao-Mei Wang, Zhong-Feng Wang, Rui-Hong Wu, Xiu-Zhu Gao, Hong-Qin Xu, Jun-Qi Niu, Department of Hepatology, Key Laboratory of Zoonosis Research, Ministry Education, The First Hospital of Jilin University, Changchun 130021, Jilin Province, China
Xiu-Mei Chi, Yan-Hua Ding, Phase I Clinical Trials Unit, The First Hospital of Jilin University, Changchun 130021, Jilin Province, China
Corresponding author: Jun-Qi Niu, MD, PhD, Academic Research, Dean, Director, Doctor, Professor, Research Scientist, Department of Hepatology, Key Laboratory of Zoonosis Research, Ministry Education, The First Hospital of Jilin University, No. 71 Xinmin Street, Changchun 130021, Jilin Province, China. [email protected]
AbstractBACKGROUND Quantitative hepatitis B core-related antigen (qHBcrAg) has a better correlation with intrahepatic hepatitis B virus (HBV) covalently closed circular DNA (cccDNA) than HBV DNA or hepatitis B e antigen (HBeAg), but data are still lacking for its clinical application.
AIM The aim was to investigate serum qHBcrAg levels in patients with chronic hepatitis B and assess the correlation of serum qHBcrAg with pregenomic RNA (pgRNA), cccDNA, and HBeAg seroconversion.
METHODS This study was a secondary analysis of patients who underwent percutaneous liver biopsy between July 2014 and June 2019 in two multicenter randomized controlled clinical trials of peginterferon vs nucleos(t)ide analog (NUC)-based therapy (NCT03509688 and NCT03546530). Serum qHBcrAg, pgRNA, HBV DNA, hepatitis B core antigen, HBeAg, liver cccDNA, and HBV DNA were measured. The correlations of serum qHBcrAg with other biomarkers were analyzed.
RESULTS A total of 139 patients were included. The mean qHBcrAg levels were 5.32 ± 1.18 log10 U/mL at baseline and decreased during treatment (all P < 0.0001). Serum qHBcrAg levels were positively correlated with pgRNA (r = 0.597, P < 0.0001) and cccDNA (r = 0.527, P < 0.0001) levels. The correlation of serum qHBcrAg level and

Chi XM et al. HBcrAg predicts HBeAg seroconversion in CHB
WJG https://www.wjgnet.com 6928 October 28, 2021 Volume 27 Issue 40
University.
Informed consent statement: Informed consent was obtained from each patient for the original trials, with clauses for possibly secondary analyses. The original studies were registered (ClinicalTrials.gov NCT03509688 and NCT03546530).
Conflict-of-interest statement: The authors declare that they have no conflicting interests.
Data sharing statement: The datasets used and/or analyzed during the current study are available from the corresponding author on reasonable request.
STROBE statement: The authors have read the STROBE Statement-checklist of items, and the manuscript was prepared and revised according to the STROBE Statement-checklist of items.
Open-Access: This article is an open-access article that was selected by an in-house editor and fully peer-reviewed by external reviewers. It is distributed in accordance with the Creative Commons Attribution NonCommercial (CC BY-NC 4.0) license, which permits others to distribute, remix, adapt, build upon this work non-commercially, and license their derivative works on different terms, provided the original work is properly cited and the use is non-commercial. See: http://creativecommons.org/Licenses/by-nc/4.0/
Manuscript source: Unsolicited manuscript
Specialty type: Gastroenterology and hepatology
Country/Territory of origin: China
Peer-review report’s scientific quality classificationGrade A (Excellent): 0 Grade B (Very good): 0 Grade C (Good): C, C Grade D (Fair): 0 Grade E (Poor): 0
Received: March 11, 2021
intrahepatic HBV DNA levels at baseline was weak but significant (r = 0.399, P < 0.0001). HBcrAg predicted HBeAg seroconversion, with areas under the receiver operating characteristics curve of 0.788 at 24 wk and 0.825 at 48 wk. Log HBcrAg at wk 24 and 48 was independently associated with HBeAg seroconversion [odds ratio (OR) = 2.402, 95% confidence interval (CI): 1.314-4.391, P = 0.004; OR = 3.587, 95%CI: 1.315-9.784, P = 0.013].
CONCLUSION Serum HBcrAg levels were correlated with HBV virological markers and could be used to predict HBeAg seroconversion.
Key Words: Hepatitis B virus; Hepatitis B core antigen; Hepatitis B virus DNA; Detection; Liver biopsy; Pregenomic RNA; Quantitative hepatitis B core-related antigen; Receiver operating characteristic; Seroconversion; Correlation
©The Author(s) 2021. Published by Baishideng Publishing Group Inc. All rights reserved.
Core Tip: The mean quantitative hepatitis B core-related antigen (qHBcrAg) levels were decreased post treatment. Serum qHBcrAg levels were positively associated with pregenomic RNA and covalently closed circular DNA levels. qHBcrAg predicted hepatitis B e antigen (HBeAg) seroconversion with an area under the receiver ope-rating characteristics curve of 0.788 at 24 wk and 0.825 at 48 wk. Log qHBcrAg at wk 24 and wk 48 was independently associated with HBeAg seroconversion (odds ratio = 2.402, 95% confidence interval: 1.314-4.391, P = 0.004; odds ratio = 3.587, 95% confidence interval: 1.315-9.784, P = 0.013, respectively).
Citation: Chi XM, Wang XM, Wang ZF, Wu RH, Gao XZ, Xu HQ, Ding YH, Niu JQ. Serum hepatitis B core-related antigen as a surrogate marker of hepatitis B e antigen seroconversion in chronic hepatitis B. World J Gastroenterol 2021; 27(40): 6927-6938URL: https://www.wjgnet.com/1007-9327/full/v27/i40/6927.htmDOI: https://dx.doi.org/10.3748/wjg.v27.i40.6927
INTRODUCTIONChronic hepatitis B (CHB) is a liver disease caused by a chronic infection with the hepatitis B virus (HBV) and is potentially life-threatening. CHB is a global health problem that affects about 250 million people worldwide, with a prevalence of < 2% in the United States and other Western countries and > 5% in East Asia, Southeast Asia, and sub-Saharan Africa[1-3]. The disease is particularly endemic in China, where there are about 84 million individuals infected with HBV[4], with a prevalence as high as 6.3% in some rural areas[5]. All-cause mortality associated with HBV infection is about 6%-8%, and 15%-40% of untreated patients with CHB develop serious conditions such as cirrhosis and hepatocellular carcinoma[3,6].
The HBV genome exists in the nuclei of infected hepatocytes as a 3.2-kb double-stranded episomal DNA called covalently closed circular DNA (cccDNA). cccDNA is a key component in the HBV life cycle since it is the template for all viral genomic and subgenomic transcripts, including pregenomic RNA (pgRNA), and its level is correlated with the proliferative potential of HBV[7]. cccDNA serves as the template for pgRNA production, which is the main step in HBV replication[7]. The control of intrahepatic levels of HBV cccDNA and/or controlling the transcriptional activity of cccDNA are critical to prevent the occurrence of decompensated cirrhosis and hepato-cellular carcinoma, which is the ultimate goal of anti-HBV therapies[8,9]. Hence, changes in the intrahepatic level of cccDNA can be used to monitor the efficacy of antiviral therapies and evaluate the possibility of viral rebound after stopping treatment[10-12]. The direct method to measure liver cccDNA levels is liver biopsy, but it is an invasive procedure not easily accepted by the patients[13]. Therefore, searching for surrogate indicators of intrahepatic HBV cccDNA is important to optimize patient management and quality of life.

Chi XM et al. HBcrAg predicts HBeAg seroconversion in CHB
WJG https://www.wjgnet.com 6929 October 28, 2021 Volume 27 Issue 40
Peer-review started: March 11, 2021 First decision: April 5, 2021 Revised: May 6, 2021 Accepted: September 1, 2021 Article in press: September 1, 2021 Published online: October 28, 2021
P-Reviewer: El-Nakeep S, Simsek H S-Editor: Gao CC L-Editor: Filipodia P-Editor: Yuan YY
Although sustained serum HBV DNA suppression and hepatitis B e antigen (HBeAg) seroconversion are associated with disease remission[8], their performance in reflecting the changes in intrahepatic cccDNA is poor[14,15]. Hepatitis B core-related antigen (HBcrAg) is an emerging marker of HBV DNA suppression[16,17]. HBcrAg consists of hepatitis B core antigen (HBcAg), HBeAg, and p22cr. HBcAg and HBeAg share the first 149 amino acids (aa) encoded by the core gene, overlapping the -10 to 183 aa region[18]. A study showed that quantitative HBcrAg (qHBcrAg) better reflects intrahepatic cccDNA levels than HBV DNA or HBeAg[15]. In addition, intrahepatic cccDNA can be determined with an enzyme immunoassay for HBcrAg[19,20]. Ne-vertheless, HBcrAg is still not widely used by clinicians worldwide because not enough data are currently available.
Therefore, this study aimed to investigate the serum qHBcrAg levels of patients with CHB and assess the correlation of serum qHBcrAg with pgRNA, cccDNA, and HBeAg seroconversion. The results will add to the sparse literature about qHBcrAg and could eventually lead to its wider use in the clinical setting.
MATERIALS AND METHODSStudy design and patientsThis study was a secondary analysis of a cohort of patients who underwent per-cutaneous liver biopsy at baseline and after 48 wk of therapy between July 2014 and June 2019 during their participation in two multicenter randomized controlled clinical trials of peginterferon (Peg-IFN) or nucleos(t)ide analog (NUC)-based therapy. The study was approved by the ethics committee of the First Hospital of Jilin University. Informed consent was obtained from each patient for the original trials, with clauses for possible secondary analyses. The original studies were registered (ClinicalTrials. gov NCT03509688 and NCT03546530).
All patients were diagnosed with CHB according to the criteria of detectable HBV DNA ≥ 105 IU/mL, alanine aminotransferase (ALT) 1.5-10 times the upper limit of normal, and HBeAg positivity[3,6]. The inclusion criteria were: (1) Diagnosis of CHB; (2) Treatment with Peg-IFN or NUC-based therapy for at least 48 wk; and (3) Available serum samples and liver specimens at baseline and 48 wk. The exclusion criteria were: (1) A history of hepatitis C virus or hepatitis D virus infection; (2) Human immunode-ficiency virus; (3) Inflammatory diseases such as rheumatoid arthritis, diabetes, auto-immune hepatitis, hypertension, or kidney disease; or (4) Recent infectious disease.
TreatmentThe treatment regimens followed the clinical practice guidelines OF the Asian-Pacific Association for the Study of the Liver on the management of hepatitis B[21]. In one of the original trials, the patients received entecavir (ETV) (Cosunter Pharmaceutical, China) 0.5 mg once daily po for 144 wk with/without resveratrol 1000 mg once daily for 48 wk or thymosin α1 twice-weekly sc for 24 wk. In the other trial, the patients received interferon (IFN, Kawin Technology, China) 1.5 μg/kg per week sc for 48 wk with/without resveratrol 1000 mg once daily for 48 wk. The patients who underwent liver biopsy before and after 48 wk of treatment were included in the present study. In the two trials, 139 patients completed 48 wk treatment with both biopsies (Figure 1). In each original trial[22-24], the patients were randomly assigned to the trial drugs.
Quantitative serum HBcrAg assayThe quantification of HBcrAg was performed using a fully automated Lumipulse chemiluminescence enzyme immunoassay analyzer (Fujirebio Inc., Tokyo, Japan) according to the manufacturer’s instructions. Serum was pretreated with sodium dodecyl sulfate and incubated with monoclonal antibodies against denatured HBcAg and HBeAg. After washing and incubation with secondary antibodies, the concen-trations of HBcrAg were determined by relative chemiluminescence intensity and compared with a standard curve. Because the general analytic measurement range of the assay was between 1000 U/mL (3 log10 U/mL) and 10000000 U/mL (7 log10 U/mL), serial dilutions of the serum sample were needed when the serum qHBcrAg level was above the detection limit of the assay.
Biochemistry and other indicatorsFasting venous blood was centrifuged at 4000 rpm for 10 min to obtain serum. All laboratory assessments were performed at baseline and weeks 4, 12, 24, 48, and 96.

Chi XM et al. HBcrAg predicts HBeAg seroconversion in CHB
WJG https://www.wjgnet.com 6930 October 28, 2021 Volume 27 Issue 40
Figure 1 Patient flowchart. NUC: Nucleos(t)ide analog; Peg-IFN: Peginterferon.
HBV DNA was detected by quantitative polymerase chain reaction (PCR) using the Roche COBAS AmpliPrep/COBAS TaqMan system (Roche Diagnostics, Basel, Switzerland). The lowest detection limit was 20 IU/mL. Hepatitis B surface antigen (HBsAg), anti-HBs, HBeAg, anti-HBe, and anti-HBc were detected by chemilumin-escence microparticle immunoassays using the Architect i2000SR platform and Abbott Architect reagents (Abbott Laboratories, Abbott Park, IL, United States). Serum HBsAg levels were measured with a dynamic range of 0-250 IU/mL. If qHBsAg levels were > 250 IU/mL, the samples were retested with a stepwise dilution of 1:10,000. ALT and aspartate aminotransferase were measured at each participating medical site. ALT, HBsAg, HBeAg, and HBV DNA were directly detected immediately at each time point. The HBV genotype was determined at screening. HBV pgRNA was measured at Peking University Health Science Center (Beijing, China), as previously described[25]. HBV genotypes were determined by real-time PCR with Taqman probe technology (Shanghai ZJ Bio-Tech, Shanghai, China). A FibroScan system was used to measure liver stiffness (Echosens, Paris, France).
Intrahepatic indicatorsAll patients in this study underwent liver biopsy before treatment and after 48 wk of treatment. The remaining liver tissue was stored in liquid nitrogen. Quantitative intrahepatic cccDNA was detected by PCR-fluorescent probing (SUPBIO Biotech-nology, Beijing, China) following the manufacturer’s instructions. Intrahepatic HBV DNA was detected by quantitative PCR using the Roche COBAS AmpliPrep/COBAS TaqMan system (Roche Diagnostics, Basel, Switzerland).
Statistical analysesContinuous data were expressed as means ± SD and analyzed using Student’s t-test or Mann-Whitney U-test, as appropriate based on the results of the Kolmogorov-Smirnov test. Intragroup analyses were performed using the paired ˆ-test or repeated-measure analysis of variance. Categorical variables were reported as numbers and percentages (%) and analyzed using Fisher’s exact test. The correlation between two continuous variables was analyzed using Spearman’s bivariate correlation, with a two-tailed significance level of P < 0.01. Receiver operating characteristic (ROC) curves were generated to compare the relative sensitivity and specificity of HBcrAg as a predictor of HBeAg seroconversion. A multivariable logistic regression model was used to determine whether the level of HBcrAg was a risk factor of HBeAg seroconversion. Otherwise, two-tailed P values of < 0.05 were considered statistically significant in all analyses. The statistical analysis were performed with SPSS 18.0 (IBM, Armonk, NY, United States).

Chi XM et al. HBcrAg predicts HBeAg seroconversion in CHB
WJG https://www.wjgnet.com 6931 October 28, 2021 Volume 27 Issue 40
RESULTSPatient CharacteristicsFrom the two original trials, 139 patients were eligible (Table 1). Among them, 69.1% were men, and 30.9% were women. There were more patients with HBV genotype C (79.9%) than B (20.1%). At baseline, the mean levels of intrahepatic HBV cccDNA were 26.65 ± 11.03 copies/cell. The mean levels of serum HBV DNA and HBsAg were 7.59 ± 1.05 log10 IU/mL and 3.81 ± 0.69 log10 IU/mL, respectively. The detailed baseline characteristics of the patients in the ETV and Peg-IFN cohorts are shown in Supple-mentary Table 1. The patients in the Peg-IFN cohort were younger than those in the ETV cohort (P = 0.045); there were no significant differences in the other character-istics.
Serum HBcrAg distributionThe serum qHBcrAg levels were different among the 139 patients with different phases of HBV infection and treatment. Indeed, the levels of qHBcrAg were 2.30-7.80 log10 U/mL. The mean levels were 5.24 ± 1.07 log10 U/mL in the ETV group (Figure 2A) and 5.38 ± 1.22 in the Peg-IFN group (Figure 2B) at baseline. The mean levels of qHBcrAg were 5.32 ± 1.18 log10 U/mL at baseline and 3.50 ± 1.31 log10 U/mL at week 48, showing decreases at each time point after treatment initiation (all P < 0.0001. Figure 2A-C), and there were no differences between the two groups (P = 0.6291, Figure 2D).
Comparison of the changes in qHBcrAg with other markers during treatmentAmong the 139 patients, the serum qHBcrAg levels were positively correlated with cccDNA (r = 0.527, P < 0.0001; r = 0.323, P = 0.0001) and pgRNA (r = 0.597, P < 0.0001; r = 0.592, P = 0.0001) levels before and after treatment (Figure 3A and B). The correlation of serum qHBcrAg levels and intrahepatic HBV DNA levels was statistically sig-nificant at week 0 (r = 0.399, P < 0.0001, Figure 3A) and at week 48 (r = 0.213, P = 0.001) (Figure 3B). The serum qHBcrAg levels and FibroScan score weakly correlated (r = −0.278, P = 0.0099) (Supplementary Figure 1). Correlations were also observed bet-ween serum HBsAg (r = 0.514, P < 0.0001) and HBeAg (r = 0.744, P < 0.0001), but there was no significant correlation with HBcAb (r = −0.151, P = 0.0758) (Supplementary Figure 1).
Correlation between serum HBsAg and cccDNASerum HBsAg was weakly correlated with cccDNA levels at baseline (r = 0.265, P < 0.001) and week 48 (r = 0.141, P = 0.092; Figure 4A and B). The correlation between HBsAg and cccDNA levels at week 48 was weak in both treatment cohorts (Figure 4C and D).
Performance of HBcrAg levels for HBeAg negative conversion predictionThe levels of serum HBcrAg were significantly lower in patients with HBeAg conversion compared with those without (Figure 5A). The area under the ROC curve of HBcrAg levels for the prediction of HBeAg seroconversion was 0.643 [95% con-fidence interval (CI): 0.484-0.802, P = 0.072], 0.750 (95%CI: 0.629-0.872, P = 0.002), 0.794 (95%CI: 0.679-0.908, P < 0.001), and 0.825 (95%CI: 0.738-0.913, P < 0.001) at baseline, 12, 24, and 48 wk, respectively (Figure 5B). At baseline, the best cutoff of HBcrAg was 5.29 log10 U/mL, with 73.3% sensitivity and 66.5% specificity for predicting HBeAg sero-conversion. At 12 wk, the cutoff of HBcrAg was 3.22 log10 U/mL, with 66.7% sen-sitivity and 78.2% specificity. At 24 wk, the cutoff of HBcrAg was 3.00 log10 U/mL, with 86.7% sensitivity and 74.8% specificity. At 48 wk, the cutoff of HBcrAg was 2.68 log10 U/mL, with 80.0% sensitivity and 78.6% specificity. In the multivariable model of HBeAg seroconversion, Log10 HBcrAg at weeks 24 and 48 was independently asso-ciated with HBeAg [odds ratio (OR) = 2.402, 95%CI: 1.314-4.391, P = 0.004; OR = 3.587, 95%CI: 1.315-9.784, P = 0.013].
DISCUSSIONqHBcrAg better represents intrahepatic levels of HBV cccDNA than HBV DNA or HBeAg[19,20,26], but data are still lacking in support of its wide clinical application. Therefore, this study aimed to investigate serum qHBcrAg levels in patients with CHB and assess the correlation of serum qHBcrAg with pgRNA and cccDNA. As expected,

Chi XM et al. HBcrAg predicts HBeAg seroconversion in CHB
WJG https://www.wjgnet.com 6932 October 28, 2021 Volume 27 Issue 40
Table 1 Baseline characteristics of the patients
Characteristic n = 139
Age, yr, median (range) 30.4 (19-62)
Sex (male/female, %) 96/43 (69.1/30.9)
HBV genotype, n (%)
B 28 (20.1)
C 111 (79.9)
ALT, U/mL, mean ± SD 174.07 ± 119.82
Serum HBV DNA, log10 IU/mL, mean ± SD 7.59 ± 1.05
Serum pgRNA, log10 copies/mL, mean ± SD 7.82 ± 1.17
ihHBV cccDNA, copies/cell 26.65 ± 11.03
ihHBV DNA, copies/cell 385.13 ± 86.09
Serum HBsAg, log10 IU/mL, mean ± SD 3.81 ± 0.69
Serum HBeAg, log10 S/CO, mean ± SD 2.49 ± 0.82
HBcrAg, log10 U/mL, mean ± SD 5.32 ± 1.18
ALT: Alanine transaminase; cccDNA: Covalently closed circular DNA; HBcrAg: Hepatitis B core-related antigen. HBeAg: Hepatitis B e antigen; HBsAg: Hepatitis B surface antigen; HBV: Hepatitis B virus; ihHBV: Intrahepatic hepatitis B virus.
Figure 2 Time-dependent distribution of serum quantitative hepatitis B core-related antigen in patients with chronic hepatitis B and treated with different regimens. A: Changes in hepatitis B core-related antigen (HBcrAg) levels during treatment in the entecavir group; B: Changes in HBcrAg levels during treatment in the peginterferon group; C: Changes in HBcrAg levels during treatment in all patients; D: Comparison of the decrease in HBcrAg levels from baseline to week 48 between the entecavir and peginterferon groups. cP < 0.0001. HBcrAg: Hepatitis B core-related antigen; IFN: Interferon.
serum qHBcrAg was significantly and positively associated with the intrahepatic levels of cccDNA in CHB, and the association was stronger than the correlation between serum qHBsAg and intrahepatic cccDNA. Furthermore, antiviral therapy reduced the serum levels of HBcrAg and HBV DNA and the intrahepatic levels of cccDNA. The results suggest that serum HBcrAg levels correlate with HBV virological markers and could be used to predict CHB treatment outcomes, especially HBeAg seroconversion.
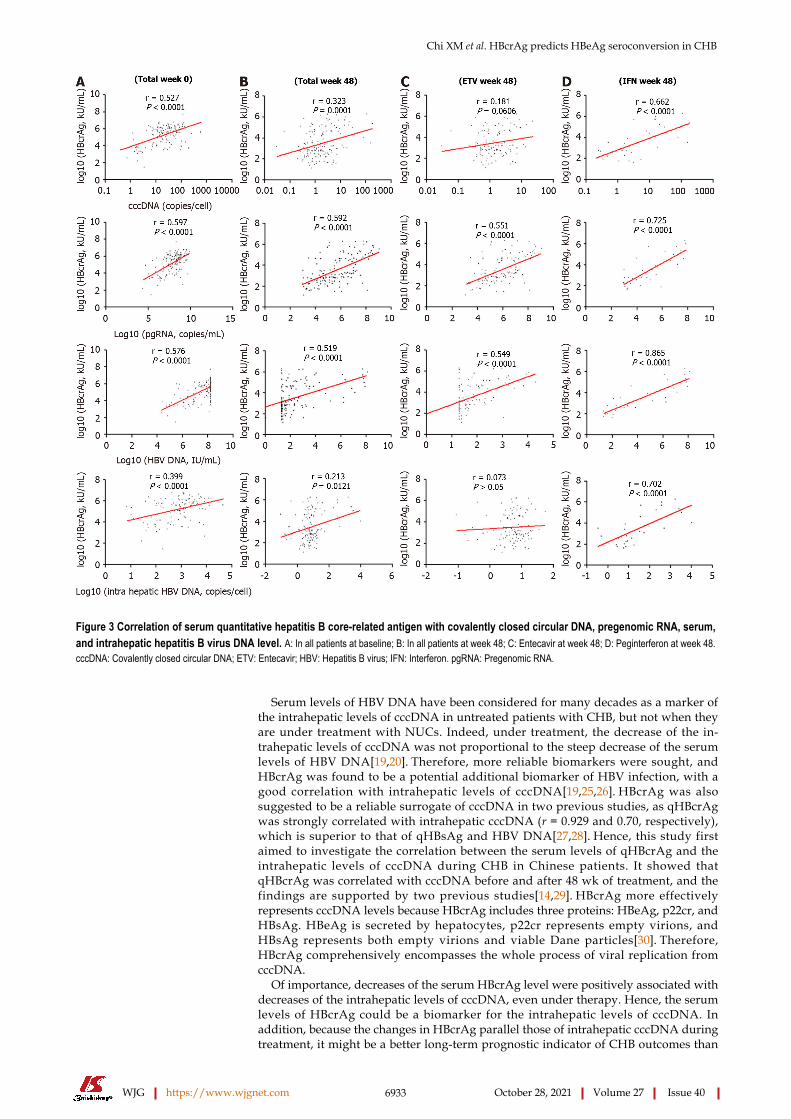
Chi XM et al. HBcrAg predicts HBeAg seroconversion in CHB
WJG https://www.wjgnet.com 6933 October 28, 2021 Volume 27 Issue 40
Figure 3 Correlation of serum quantitative hepatitis B core-related antigen with covalently closed circular DNA, pregenomic RNA, serum, and intrahepatic hepatitis B virus DNA level. A: In all patients at baseline; B: In all patients at week 48; C: Entecavir at week 48; D: Peginterferon at week 48. cccDNA: Covalently closed circular DNA; ETV: Entecavir; HBV: Hepatitis B virus; IFN: Interferon. pgRNA: Pregenomic RNA.
Serum levels of HBV DNA have been considered for many decades as a marker of the intrahepatic levels of cccDNA in untreated patients with CHB, but not when they are under treatment with NUCs. Indeed, under treatment, the decrease of the in-trahepatic levels of cccDNA was not proportional to the steep decrease of the serum levels of HBV DNA[19,20]. Therefore, more reliable biomarkers were sought, and HBcrAg was found to be a potential additional biomarker of HBV infection, with a good correlation with intrahepatic levels of cccDNA[19,25,26]. HBcrAg was also suggested to be a reliable surrogate of cccDNA in two previous studies, as qHBcrAg was strongly correlated with intrahepatic cccDNA (r = 0.929 and 0.70, respectively), which is superior to that of qHBsAg and HBV DNA[27,28]. Hence, this study first aimed to investigate the correlation between the serum levels of qHBcrAg and the intrahepatic levels of cccDNA during CHB in Chinese patients. It showed that qHBcrAg was correlated with cccDNA before and after 48 wk of treatment, and the findings are supported by two previous studies[14,29]. HBcrAg more effectively represents cccDNA levels because HBcrAg includes three proteins: HBeAg, p22cr, and HBsAg. HBeAg is secreted by hepatocytes, p22cr represents empty virions, and HBsAg represents both empty virions and viable Dane particles[30]. Therefore, HBcrAg comprehensively encompasses the whole process of viral replication from cccDNA.
Of importance, decreases of the serum HBcrAg level were positively associated with decreases of the intrahepatic levels of cccDNA, even under therapy. Hence, the serum levels of HBcrAg could be a biomarker for the intrahepatic levels of cccDNA. In addition, because the changes in HBcrAg parallel those of intrahepatic cccDNA during treatment, it might be a better long-term prognostic indicator of CHB outcomes than

Chi XM et al. HBcrAg predicts HBeAg seroconversion in CHB
WJG https://www.wjgnet.com 6934 October 28, 2021 Volume 27 Issue 40
Figure 4 Correlation of serum hepatitis B surface antigen with covalently closed circular DNA. A: Correlation between serum hepatitis B surface antigen (HBsAg) and intrahepatic covalently closed circular DNA (cccDNA) at baseline; B: Correlation between serum HBsAg and intrahepatic cccDNA and at week 48; C: Correlation between cccDNA and HBsAg levels at weeks 48 in the entecavir cohort; D: Correlation between cccDNA and HBsAg levels at weeks 48 in the interferon cohort. HBsAg: Hepatitis B surface antigen; cccDNA: Covalently closed circular DNA.
Figure 5 Hepatitis B core-related antigen prediction of hepatitis B e antigen seroconversion at 48 wk. A: Concentration of hepatitis B core-related antigen (HBcrAg) at different times in the two groups of hepatitis B e antigen (HBeAg) seroconversion; B: Receiver operating characteristic curve analysis of HBcrAg to predict HBeAg seroconversion. HBcrAg: Hepatitis B core-related antigen; HBeAg: Hepatitis B e antigen; ROC: Receiver operating characteristic; W: Week.
other biomarkers (i.e. serum HBV DNA and HBeAg). HBcrAg levels are determined by the transcription level of cccDNA. Therefore, decline of the HBcrAg levels with NUCs is slower than the decline of the serum levels of HBV DNA in patients. The slower decline might also explain why the serum levels of HBcrAg were positively correlated with the intrahepatic levels of cccDNA, either before or after ETV treatment.

Chi XM et al. HBcrAg predicts HBeAg seroconversion in CHB
WJG https://www.wjgnet.com 6935 October 28, 2021 Volume 27 Issue 40
In addition, the levels of serum qHBcrAg were higher in this study than in a previous study[31], which might have been the result of the high proportion of HBeAg-positive patients in this study. Considering that viral replication and host immune responses can be influenced by the HBV genotype, the distribution of the serum levels of HBcrAg was examined between patients carrying the HBV genotypes B and C, but the difference was not statistically significant. HBcrAg is a pre-core protein encoded by the pre-core/core regions of the HBV genome. Hence, the production of HBcrAg is not affected by the promoters found in the S region[18], possibly explaining the similar distribution of HBcrAg between the genotypes.
The serum levels of qHBsAg reflect the intrahepatic levels of cccDNA[19,20]. Still, in this study, the correlation between qHBsAg and intrahepatic cccDNA was weaker than the correlation between serum qHBcrAg and intrahepatic cccDNA, both without and under treatment. Most patients with HBsAg loss or seroconversion still had detectable levels of intrahepatic cccDNA and HBV DNA. Thus, according to the currently available evidence, serum levels of qHBcrAg could be more appropriate than HBsAg as a biomarker of the intrahepatic levels of cccDNA, but that needs to be confirmed in larger studies. The predictive value of qHBcrAg for HBeAg serocon-version was the best at 24 and 48 wk. That could be because baseline qHBcrAg is not predictive of the response to treatment, and that 12 wk is too early to observe a proper response. Additional studies are necessary to determine the best timing of qHBcrAg measurement for the prognosis of CHB. Nevertheless, qHBcrAg levels at the other time points were still associated with HBeAg seroconversion, as observed in previous studies[32-35]. HBsAg and HBeAg each represent only a part of the process of HBV production and assembly, and that could explain why they have a lower prognostic value, especially HBsAg at 48 wk[30].
The study has limitations. It was a secondary analysis of patients from two different trials with two different antiviral treatments and different regimens. Not all patients underwent two biopsies, leading to a selection bias and a small sample size. Im-portantly, a biopsy was performed at 48 wk in both studies. Still, the patients were followed for up to 144 wk in the ETV group and 96 wk in the Peg-IFN group, but the patients were only treated with Peg-IFN for 48 wk, and the long-term changes in HBcrAg are unknown. HBV genotype D is very rare in China and was not included in the two trials. Therefore, future studies should address those points.
CONCLUSIONSerum qHBcrAg levels were correlated with the intrahepatic levels of cccDNA in patients with CHB and might be an acceptable surrogate marker for cccDNA. HBcrAg levels correlated with HBV virological markers and could be used to predict CHB treatment outcomes, especially HBeAg seroconversion. Hence, serum qHBcrAg might be used in the clinical setting for monitoring intrahepatic HBV status and determining the long-term prognosis of patients with CHB.
ACKNOWLEDGMENTSWe are very grateful to the following professors for their selfless help in the process of collecting and treating clinical cases: Yu L, Chen YP, Shang J, Liu LG, Zhang SQ, Jiang YF, Zhang MX, Tong QX, Zhang LL, Tan YW, Ma AL, Dang SS, Xu B, Jin ZJ, Li J and Li XB.
ARTICLE HIGHLIGHTSResearch backgroundQuantitative hepatitis B core-related antigen (qHBcrAg) had a better correlation with intrahepatic hepatitis B virus (HBV) covalently closed circular DNA (cccDNA) than either HBV DNA or hepatitis B e antigen (HBeAg).
Research motivationData are still lacking for the widespread clinical application of qHBcrAg.

Chi XM et al. HBcrAg predicts HBeAg seroconversion in CHB
WJG https://www.wjgnet.com 6936 October 28, 2021 Volume 27 Issue 40
Research objectivesThis study aimed to investigate the serum qHBcrAg levels in patients with chronic hepatitis B (CHB) and to assess the correlation of serum qHBcrAg with pregenomic RNA (pgRNA), cccDNA, and HBeAg seroconversion.
Research methodsThis was a secondary analysis of patients who underwent percutaneous liver biopsy in two multicenter, randomized, controlled clinical trials. Serum qHBcrAg, pgRNA, HBV DNA, hepatitis B core antigen, and HBeAg and liver cccDNA, and HBV DNA were measured. The correlations of serum qHBcrAg with other biomarkers were tested.
Research resultsSerum qHBcrAg levels were positively associated with pgRNA (r = 0.597, P < 0.0001) and cccDNA (r = 0.527, P < 0.0001) levels. HBcrAg predicted HBeAg seroconversion, with an area under the receiver operating characteristics curve of 0.788 at 24 wk and 0.825 at 48 wk.
Research conclusionsSerum HBcrAg levels correlated with HBV virological markers and could be used to predict HBeAg seroconversion.
Research perspectivesSerum qHBcrAg might be used in the clinical setting to monitor intrahepatic HBV status and determine the long-term prognosis of patients with CHB.
REFERENCESSchweitzer A, Horn J, Mikolajczyk RT, Krause G, Ott JJ. Estimations of worldwide prevalence of chronic hepatitis B virus infection: a systematic review of data published between 1965 and 2013. Lancet 2015; 386: 1546-1555 [PMID: 26231459 DOI: 10.1016/S0140-6736(15)61412-X]
1
Terrault NA, Lok ASF, McMahon BJ, Chang KM, Hwang JP, Jonas MM, Brown RS Jr, Bzowej NH, Wong JB. Update on prevention, diagnosis, and treatment of chronic hepatitis B: AASLD 2018 hepatitis B guidance. Hepatology 2018; 67: 1560-1599 [PMID: 29405329 DOI: 10.1002/hep.29800]
2
Trépo C, Chan HL, Lok A. Hepatitis B virus infection. Lancet 2014; 384: 2053-2063 [PMID: 24954675 DOI: 10.1016/S0140-6736(14)60220-8]
3
Wang H, Men P, Xiao Y, Gao P, Lv M, Yuan Q, Chen W, Bai S, Wu J. Hepatitis B infection in the general population of China: a systematic review and meta-analysis. BMC Infect Dis 2019; 19: 811 [PMID: 31533643 DOI: 10.1186/s12879-019-4428-y]
4
Liu J, Zhang S, Wang Q, Shen H, Zhang M, Zhang Y, Yan D, Liu M. Seroepidemiology of hepatitis B virus infection in 2 million men aged 21-49 years in rural China: a population-based, cross-sectional study. Lancet Infect Dis 2016; 16: 80-86 [PMID: 26268687 DOI: 10.1016/S1473-3099(15)00218-2]
5
Lok AS, McMahon BJ. Chronic hepatitis B: update 2009. Hepatology 2009; 50: 661-662 [PMID: 19714720 DOI: 10.1002/hep.23190]
6
Tang H, Banks KE, Anderson AL, McLachlan A. Hepatitis B virus transcription and replication. Drug News Perspect 2001; 14: 325-334 [PMID: 12813595]
7
Tang CM, Yau TO, Yu J. Management of chronic hepatitis B infection: current treatment guidelines, challenges, and new developments. World J Gastroenterol 2014; 20: 6262-6278 [PMID: 24876747 DOI: 10.3748/wjg.v20.i20.6262]
8
Nassal M. HBV cccDNA: viral persistence reservoir and key obstacle for a cure of chronic hepatitis B. Gut 2015; 64: 1972-1984 [PMID: 26048673 DOI: 10.1136/gutjnl-2015-309809]
9
Yang HC, Kao JH. Persistence of hepatitis B virus covalently closed circular DNA in hepatocytes: molecular mechanisms and clinical significance. Emerg Microbes Infect 2014; 3: e64 [PMID: 26038757 DOI: 10.1038/emi.2014.64]
10
Shi M, Sun WL, Hua YY, Han B, Shi L. Effects of entecavir on hepatitis B virus covalently closed circular DNA in hepatitis B e antigen-positive patients with hepatitis B. PLoS One 2015; 10: e0117741 [PMID: 25647607 DOI: 10.1371/journal.pone.0117741]
11
Zheng Q, Zhu YY, Chen J, Liu YR, You J, Dong J, Zeng DW, Gao LY, Chen LH, Jiang JJ. Decline in intrahepatic cccDNA and increase in immune cell reactivity after 12 weeks of antiviral treatment were associated with HBeAg loss. J Viral Hepat 2014; 21: 909-916 [PMID: 24888640 DOI: 10.1111/jvh.12261]
12
Thampanitchawong P, Piratvisuth T. Liver biopsy:complications and risk factors. World J Gastroenterol 1999; 5: 301-304 [PMID: 11819452 DOI: 10.3748/wjg.v5.i4.301]
13
Tanaka E, Matsumoto A, Yoshizawa K, Maki N. Hepatitis B core-related antigen assay is useful for monitoring the antiviral effects of nucleoside analogue therapy. Intervirology 2008; 51 Suppl 1: 3-6
14

Chi XM et al. HBcrAg predicts HBeAg seroconversion in CHB
WJG https://www.wjgnet.com 6937 October 28, 2021 Volume 27 Issue 40
[PMID: 18544941 DOI: 10.1159/000122592]Liu YY, Liang XS. Progression and status of antiviral monitoring in patients with chronic hepatitis B: From HBsAg to HBV RNA. World J Hepatol 2018; 10: 603-611 [PMID: 30310538 DOI: 10.4254/wjh.v10.i9.603]
15
Mak LY, Wong DK, Cheung KS, Seto WK, Lai CL, Yuen MF. Review article: hepatitis B core-related antigen (HBcrAg): an emerging marker for chronic hepatitis B virus infection. Aliment Pharmacol Ther 2018; 47: 43-54 [PMID: 29035003 DOI: 10.1111/apt.14376]
16
Shimakawa Y, Ndow G, Njie R, Njai HF, Takahashi K, Akbar SMF, Cohen D, Nayagam S, Jeng A, Ceesay A, Sanneh B, Baldeh I, Imaizumi M, Moriyama K, Aoyagi K, D'Alessandro U, Mishiro S, Chemin I, Mendy M, Thursz MR, Lemoine M. Hepatitis B Core-related Antigen: An Alternative to Hepatitis B Virus DNA to Assess Treatment Eligibility in Africa. Clin Infect Dis 2020; 70: 1442-1452 [PMID: 31102406 DOI: 10.1093/cid/ciz412]
17
Kimura T, Rokuhara A, Sakamoto Y, Yagi S, Tanaka E, Kiyosawa K, Maki N. Sensitive enzyme immunoassay for hepatitis B virus core-related antigens and their correlation to virus load. J Clin Microbiol 2002; 40: 439-445 [PMID: 11825954 DOI: 10.1128/jcm.40.2.439-445.2002]
18
Suzuki F, Miyakoshi H, Kobayashi M, Kumada H. Correlation between serum hepatitis B virus core-related antigen and intrahepatic covalently closed circular DNA in chronic hepatitis B patients. J Med Virol 2009; 81: 27-33 [PMID: 19031469 DOI: 10.1002/jmv.21339]
19
Matsuzaki T, Tatsuki I, Otani M, Akiyama M, Ozawa E, Miuma S, Miyaaki H, Taura N, Hayashi T, Okudaira S, Takatsuki M, Isomoto H, Takeshima F, Eguchi S, Nakao K. Significance of hepatitis B virus core-related antigen and covalently closed circular DNA levels as markers of hepatitis B virus re-infection after liver transplantation. J Gastroenterol Hepatol 2013; 28: 1217-1222 [PMID: 23432697 DOI: 10.1111/jgh.12182]
20
Sarin SK, Kumar M, Lau GK, Abbas Z, Chan HL, Chen CJ, Chen DS, Chen HL, Chen PJ, Chien RN, Dokmeci AK, Gane E, Hou JL, Jafri W, Jia J, Kim JH, Lai CL, Lee HC, Lim SG, Liu CJ, Locarnini S, Al Mahtab M, Mohamed R, Omata M, Park J, Piratvisuth T, Sharma BC, Sollano J, Wang FS, Wei L, Yuen MF, Zheng SS, Kao JH. Asian-Pacific clinical practice guidelines on the management of hepatitis B: a 2015 update. Hepatol Int 2016; 10: 1-98 [PMID: 26563120 DOI: 10.1007/s12072-015-9675-4]
21
Sonneveld MJ, van Oord GW, van Campenhout MJ, De Man RA, Janssen HLA, de Knegt RJ, Boonstra A, van der Eijk AA. Relationship between hepatitis B core-related antigen levels and sustained HBeAg seroconversion in patients treated with nucleo(s)tide analogues. J Viral Hepat 2019; 26: 828-834 [PMID: 30896057 DOI: 10.1111/jvh.13097]
22
Song G, Rao H, Feng B, Wei L. Prediction of spontaneous HBeAg seroconversion in HBeAg-positive chronic hepatitis B patients during the immune clearance phase. J Med Virol 2014; 86: 1838-1844 [PMID: 25088043 DOI: 10.1002/jmv.24032]
23
Song G, Yang R, Rao H, Feng B, Ma H, Jin Q, Wei L. Serum HBV core-related antigen is a good predictor for spontaneous HBeAg seroconversion in chronic hepatitis B patients. J Med Virol 2017; 89: 463-468 [PMID: 27505145 DOI: 10.1002/jmv.24657]
24
Maasoumy B, Wiegand SB, Jaroszewicz J, Bremer B, Lehmann P, Deterding K, Taranta A, Manns MP, Wedemeyer H, Glebe D, Cornberg M. Hepatitis B core-related antigen (HBcrAg) levels in the natural history of hepatitis B virus infection in a large European cohort predominantly infected with genotypes A and D. Clin Microbiol Infect 2015; 21: 606.e1-606.10 [PMID: 25700889 DOI: 10.1016/j.cmi.2015.02.010]
25
Wang L, Cao X, Wang Z, Gao Y, Deng J, Liu X, Zhuang H. Correlation of HBcrAg with Intrahepatic Hepatitis B Virus Total DNA and Covalently Closed Circular DNA in HBeAg-Positive Chronic Hepatitis B Patients. J Clin Microbiol 2019; 57 [PMID: 30355757 DOI: 10.1128/JCM.01303-18]
26
Wong DK, Seto WK, Cheung KS, Chong CK, Huang FY, Fung J, Lai CL, Yuen MF. Hepatitis B virus core-related antigen as a surrogate marker for covalently closed circular DNA. Liver Int 2017; 37: 995-1001 [PMID: 27992681 DOI: 10.1111/liv.13346]
27
Chen EQ, Feng S, Wang ML, Liang LB, Zhou LY, Du LY, Yan LB, Tao CM, Tang H. Serum hepatitis B core-related antigen is a satisfactory surrogate marker of intrahepatic covalently closed circular DNA in chronic hepatitis B. Sci Rep 2017; 7: 173 [PMID: 28282964 DOI: 10.1038/s41598-017-00111-0]
28
van Campenhout MJ, Brouwer WP, van Oord GW, Xie Q, Zhang Q, Zhang N, Guo S, Tabak F, Streinu-Cercel A, Wang J, Pas SD, Sonneveld MJ, de Knegt RJ, Boonstra A, Hansen BE, Janssen HL. Hepatitis B core-related antigen levels are associated with response to entecavir and peginterferon add-on therapy in hepatitis B e antigen-positive chronic hepatitis B patients. Clin Microbiol Infect 2016; 22: 571.e5-571.e9 [PMID: 26898481 DOI: 10.1016/j.cmi.2016.02.002]
29
Inoue T, Tanaka Y. The Role of Hepatitis B Core-Related Antigen. Genes (Basel) 2019; 10 [PMID: 31075974 DOI: 10.3390/genes10050357]
30
Wong DK, Tanaka Y, Lai CL, Mizokami M, Fung J, Yuen MF. Hepatitis B virus core-related antigens as markers for monitoring chronic hepatitis B infection. J Clin Microbiol 2007; 45: 3942-3947 [PMID: 17942661 DOI: 10.1128/JCM.00366-07]
31
Ma H, Yang RF, Li XH, Jin Q, Wei L. HBcrAg Identifies Patients Failing to Achieve HBeAg Seroconversion Treated with Pegylated Interferon Alfa-2b. Chin Med J (Engl) 2016; 129: 2212-2219 [PMID: 27625094 DOI: 10.4103/0366-6999.189904]
32
Chuaypen N, Posuwan N, Payungporn S, Tanaka Y, Shinkai N, Poovorawan Y, Tangkijvanich P. Serum hepatitis B core-related antigen as a treatment predictor of pegylated interferon in patients with
33
Chi XM et al. HBcrAg predicts HBeAg seroconversion in CHB
WJG https://www.wjgnet.com 6938 October 28, 2021 Volume 27 Issue 40
HBeAg-positive chronic hepatitis B. Liver Int 2016; 36: 827-836 [PMID: 26678018 DOI: 10.1111/liv.13046]Matsumoto A, Yatsuhashi H, Nagaoka S, Suzuki Y, Hosaka T, Tsuge M, Chayama K, Kanda T, Yokosuka O, Nishiguchi S, Saito M, Miyase S, Kang JH, Shinkai N, Tanaka Y, Umemura T, Tanaka E. Factors associated with the effect of interferon-α sequential therapy in order to discontinue nucleoside/nucleotide analog treatment in patients with chronic hepatitis B. Hepatol Res 2015; 45: 1195-1202 [PMID: 25594111 DOI: 10.1111/hepr.12488]
34
Martinot-Peignoux M, Lapalus M, Maylin S, Boyer N, Castelnau C, Giuily N, Pouteau M, Moucari R, Asselah T, Marcellin P. Baseline HBsAg and HBcrAg titres allow peginterferon-based 'precision medicine' in HBeAg-negative chronic hepatitis B patients. J Viral Hepat 2016; 23: 905-911 [PMID: 27375231 DOI: 10.1111/jvh.12565]
35
WJG https://www.wjgnet.com 6939 October 28, 2021 Volume 27 Issue 40
World Journal of
GastroenterologyW J GSubmit a Manuscript: https://www.f6publishing.com World J Gastroenterol 2021 October 28; 27(40): 6939-6950
DOI: 10.3748/wjg.v27.i40.6939 ISSN 1007-9327 (print) ISSN 2219-2840 (online)
ORIGINAL ARTICLE
Retrospective Cohort Study
Long-term follow-up of liver alveolar echinococcosis using echinococcosis multilocularis ultrasound classification
Jasmin Schuhbaur, Melissa Schweizer, Jana Philipp, Julian Schmidberger, Patrycja Schlingeloff, Wolfgang Kratzer
ORCID number: Jasmin Schuhbaur 0000-0003-2284-9948; Melissa Schweizer 0000-0002-5826-942X; Jana Philipp 0000-0001-8091-1864; Julian Schmidberger 0000-0002-9960-9574; Patrycja Schlingeloff 0000-0003-3514-7347; Wolfgang Kratzer 0000-0002-9727-3843.
Author contributions: Kratzer W and Schuhbaur J planned and designed the study; The data were evaluated by Kratzer W and Schuhbaur J; all authors were involved in the interpretation of the results; Kratzer W, Schuhbaur J, Schmidberger J, Schlingeloff P, Schweizer M and Philipp J prepared the first draft; the statistical analysis was performed by Schmidberger J and Schlingeloff P; all authors read, amended, and approved the final version of the manuscript.
Institutional review board statement: The study was approved by the local ethics committee and conducted in accordance with the Declaration of Helsinki (ref. No. 166/13). Because of its retrospective design and pseudonymised evaluation of imaging, no ethics approval was necessary. All data were analysed anonymously.
Jasmin Schuhbaur, Melissa Schweizer, Jana Philipp, Julian Schmidberger, Patrycja Schlingeloff, Wolfgang Kratzer, Department of Internal Medicine I, University Hospital Ulm, Ulm 89081, Germany
Corresponding author: Wolfgang Kratzer, MD, Professor, Department of Internal Medicine I, University Hospital Ulm, Albert-Einstein-Allee 23, Ulm 89081, Germany. [email protected]
AbstractBACKGROUND When Echinococcus multilocularis infects humans as a false intermediate host, alveolar echinococcosis (AE) usually manifests primarily intrahepatically and is initially asymptomatic. If the disease remains undiagnosed and untreated, progressive growth occurs, reminiscent of malignant tumours. The only curative therapy is complete resection, which is limited to localised stages, and palliative drug therapy is used otherwise. Consequently, early diagnosis and reliable detec-tion of AE lesions are important. For this reason, abdominal ultrasonography, as the most common primary imaging for AE, relies on classification systems.
AIM To investigate how hepatic AE lesion sonomorphology changes over time in the Echinococcosis Multilocularis Ulm Classification (EMUC)-ultrasound (US) classi-fication.
METHODS Based on data from Germany’s national echinococcosis database, we evaluated clinical and US imaging data for 59 patients according to the AE case definition in our preliminary retrospective longitudinal study. There had to be at least two liver sonographies ≥ 6 mo apart, ≥ 1 hepatic AE lesion, and complete documen-tation in all US examinations. The minimum interval between two separately evaluated US examinations was 4 wk. The AE reference lesion was the largest hepatic AE lesion at the time of the first US examination. To classify the sonomor-phologic pattern, we used EMUC-US. In addition to classifying the findings of the original US examiner, all reference lesions at each examination time point were assigned EMUC-US patterns in a blinded fashion by two investigators experienced in US diagnosis. Statistical analysis was performed using SAS version

Schuhbaur J et al. Long-term follow-up of liver alveolar echinococcosis
WJG https://www.wjgnet.com 6940 October 28, 2021 Volume 27 Issue 40
Informed consent statement: Because of retrospective and anonymous character of this study, the need for informed consent was waived by the institutional review board.
Conflict-of-interest statement: The authors declare that they have no competing interests.
Data sharing statement: The datasets used and analyzed during the current study are available from the corresponding author on reasonable request ([email protected]).
STROBE statement: The authors have read the STROBE Statement-checklist of items, and the manuscript was prepared and revised according to the STROBE Statement-checklist of items.
Open-Access: This article is an open-access article that was selected by an in-house editor and fully peer-reviewed by external reviewers. It is distributed in accordance with the Creative Commons Attribution NonCommercial (CC BY-NC 4.0) license, which permits others to distribute, remix, adapt, build upon this work non-commercially, and license their derivative works on different terms, provided the original work is properly cited and the use is non-commercial. See: http://creativecommons.org/Licenses/by-nc/4.0/
Manuscript source: Unsolicited manuscript
Specialty type: Gastroenterology and hepatology
Country/Territory of origin: Germany
Peer-review report’s scientific quality classificationGrade A (Excellent): 0 Grade B (Very good): B Grade C (Good): 0 Grade D (Fair): 0 Grade E (Poor): 0
Received: July 20, 2021 Peer-review started: July 20, 2021
9.4 (SAS Institute Inc., Cary, NC, United Stated). P values < 0.05 were considered statistically significant.
RESULTS The preliminary study included 59 patients, 38 (64.5%) women and 21 (35.6%) men. The mean age at initial diagnosis was 59.9 ± 16.9 years. At the time of initial ultrasonography, a hailstorm pattern was present in 42.4% (25/59) of cases, a hemangioma-like pattern in 16.9% (10/59), a pseudocystic pattern in 15.3% (9/59), and a metastasis-like pattern in 25.4% (15/59). For the hailstorm pattern, the average lesion size was 67.4 ± 26.3 mm. The average lesion size was 113.7 ± 40.8 mm with the pseudocystic pattern and 83.5 ± 27.3 mm with the hemangioma-like pattern. An average lesion size of 21.7 ± 11.0 mm was determined for the metastasis-like pattern. Although the sonomorphologic pattern remained unchanged in 84.7% (50/59) of AE reference lesions, 15.3% (9/59) showed a change over time. A change in pattern was seen exclusively for AE lesions initially classified as hemangioma-like or pseudocystic. A total of 70% (7/10) of AE lesions initially classified as hemangioma-like showed a relevant change in pattern over time, and 85.7% (6/7) of these were secondarily classified as having a hailstorm pattern, with the remainder (1/7; 14.3%) classified as having a pseudocystic pattern. A total of 22.2% (2/9) of AE lesions initially classified as pseudocystic showed a relevant change in pattern over time and were classified as having a hailstorm pattern. For AE lesions initially classified as having a hailstorm or metastatic pattern, no pattern change was evident. All patients with pattern change were on continuous drug therapy with albendazole.
CONCLUSION The sonomorphology of hepatic AE lesions may change over time. The heman-gioma-like and pseudocystic patterns are affected.
Key Words: Alveolar echinococcosis; Echinococcus multilocularis; Ultrasonography; Sonomorphology; Pattern change
©The Author(s) 2021. Published by Baishideng Publishing Group Inc. All rights reserved.
Core Tip: Alveolar echinococcosis is potentially fatal. In approximately 98% of cases, it manifests in the liver, similar to a primary malignant or metastatic tumour. The sonomorphological appearance of the disease is varied and easily confused with other differential diagnoses. Sonography is the most important tool in diagnostics, but how the known patterns change over time is unclear. The evidence that certain sonographic patterns in particular change over time shows a possible evolutionary approach to the disease and may, in the long term, make lifelong drug therapy unnecessary in non-operable patients when non-active stages can be clearly identified.
Citation: Schuhbaur J, Schweizer M, Philipp J, Schmidberger J, Schlingeloff P, Kratzer W. Long-term follow-up of liver alveolar echinococcosis using echinococcosis multilocularis ultrasound classification. World J Gastroenterol 2021; 27(40): 6939-6950URL: https://www.wjgnet.com/1007-9327/full/v27/i40/6939.htmDOI: https://dx.doi.org/10.3748/wjg.v27.i40.6939
INTRODUCTIONFox tapeworm disease (alveolar echinococcosis, AE) is a zoonotic disease caused by the larval stage of the cestode Echinococcus multilocularis, in which humans act as the major false intermediate host[1,2]. After a host accidentally ingests infectious worm eggs, the eggs penetrate the wall of the small intestine and usually first reach the liver, the most common primary site of AE in humans, Via the enterohepatic circulation[1,3,4].
Schuhbaur J et al. Long-term follow-up of liver alveolar echinococcosis
WJG https://www.wjgnet.com 6941 October 28, 2021 Volume 27 Issue 40
First decision: August 19, 2021 Revised: September 1, 2021 Accepted: September 22, 2021 Article in press: September 22, 2021 Published online: October 28, 2021
P-Reviewer: Okasha HH S-Editor: Gao CC L-Editor: A P-Editor: Yu HG
AE is primarily asymptomatic and progressive in the therapy-naive state[5]. Only as the disease progresses do patients develop nonspecific symptoms, including abdominal tenderness or pain, jaundice, unwanted weight loss, and diffuse deteri-oration of general condition[6,7]. In Europe, the diagnosis of AE is usually made as an incidental finding in asymptomatic stages, and in China, diagnosis frequently is made in the setting of locally advanced growth with a complicated clinical course. Radical surgical resection of an AE lesion is considered the only potentially curative therapeutic option, followed by anthelmintic therapy for 2 years[8]. In case of an unre-sectable finding at diagnosis, long-term and often lifelong conservative medical therapy with benzimidazoles is required.
The high rate of advanced AE foci and inoperable disease at diagnosis underscore the need for early, definitive diagnosis. In clinical practice, B-scan ultrasonography is the most common primary imaging modality for evaluating nonspecific abdominal complaints and for the differential diagnostic assessment of hepatic incidentalomas[9].
The sonomorphology of hepatic AE foci is heterogeneous. The Echinococcosis Multilocularis Ulm Classification (EMUC)-ultrasound (US) classification, published in 2015, describes five sonomorphologic appearances of hepatic AE lesions and provides important guidance for their recognition and follow-up[10]. Five patterns are distin-guished: hailstorm, hemangioma-like, pseudocystic, metastasis-like, and ossification. Conventional cross-sectional imaging [computed tomography (CT), magnetic resonance imaging (MRI)], with the appropriate classification schemes, is particularly useful for assessing spatial spread, potential infiltration of adjacent organs, and extrahepatic manifestations[11]. The gold standard for estimating parasitic activity is 18
FDG positron emission tomography (PET)[12,13]. Contrast-enhanced sonography of the liver also plays an increasing role in the evaluation of hepatic AE[14-16]. Available studies and analyses on the sonomorphology of AE have largely been cross-sectional, and we are not aware of any longitudinal studies assessing sonomorphology and a classification scheme for individual AE lesions.
The aim of our preliminary study is to investigate whether a change in pattern and size over time can be identified in patients with hepatic AE during follow-up, using the EMUC-US classification.
MATERIALS AND METHODSEthics statementThe study was approved by the local ethics committee and conducted in accordance with the Declaration of Helsinki (ref. No. 166/13). Because of its retrospective design and pseudonymised evaluation of imaging, no ethics approval was necessary. All data were analysed anonymously.
Study collectiveFor our preliminary retrospective evaluation, we used the clinical and imaging data of the national Echinococcosis Database in Germany. A main prerequisite for inclusion was confirmed or probable AE disease according to the AE case definition “confirmed” or “probable”[5]. Other inclusion criteria were at least two liver sonographies performed over a period of at least 6 mo, the presence of at least one hepatic AE lesion at the time of US 1, and complete documentation of the AE lesion defined as the reference lesion at all further observation time points. In total, 59 patients with data included in the Echinococcosis Database Germany were included (Figure 1 and Table 1).
ParameterInitially, a hepatic AE reference lesion was defined per patient; this was measured by the largest diameter (in mm) at the time of the first US examination (US 1). At each time point, the number of all hepatic AE lesions in each patient was documented. The reference lesion was evaluated according to its maximum diameter and its EMUC-US pattern classification[10]. In addition to the AE case definition (“confirmed”, “pro-bable”, “possible”), the clinical data included the therapy (surgical, conservative). A surgical procedure resulted in study exclusion. All study patients received oral anthel-mintic therapy, and the preparation, time of initiation of therapy, and daily medication dose were documented.
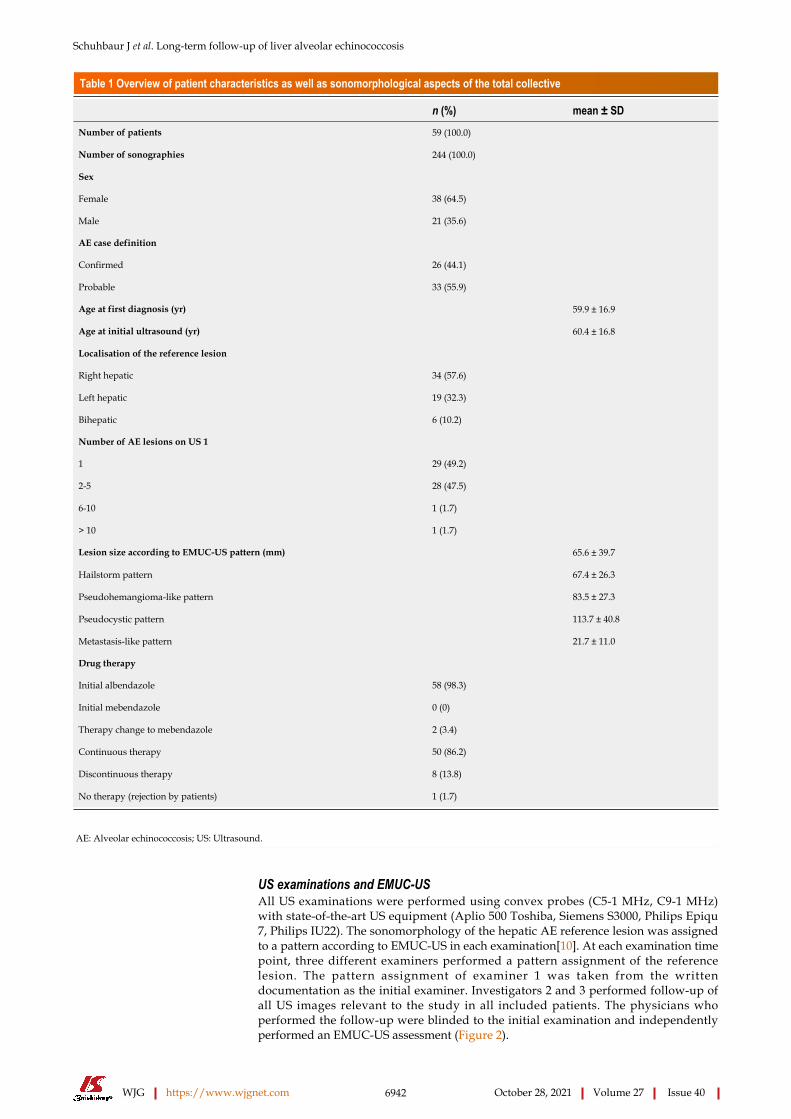
Schuhbaur J et al. Long-term follow-up of liver alveolar echinococcosis
WJG https://www.wjgnet.com 6942 October 28, 2021 Volume 27 Issue 40
Table 1 Overview of patient characteristics as well as sonomorphological aspects of the total collective
n (%) mean ± SDNumber of patients 59 (100.0)
Number of sonographies 244 (100.0)
Sex
Female 38 (64.5)
Male 21 (35.6)
AE case definition
Confirmed 26 (44.1)
Probable 33 (55.9)
Age at first diagnosis (yr) 59.9 ± 16.9
Age at initial ultrasound (yr) 60.4 ± 16.8
Localisation of the reference lesion
Right hepatic 34 (57.6)
Left hepatic 19 (32.3)
Bihepatic 6 (10.2)
Number of AE lesions on US 1
1 29 (49.2)
2-5 28 (47.5)
6-10 1 (1.7)
> 10 1 (1.7)
Lesion size according to EMUC-US pattern (mm) 65.6 ± 39.7
Hailstorm pattern 67.4 ± 26.3
Pseudohemangioma-like pattern 83.5 ± 27.3
Pseudocystic pattern 113.7 ± 40.8
Metastasis-like pattern 21.7 ± 11.0
Drug therapy
Initial albendazole 58 (98.3)
Initial mebendazole 0 (0)
Therapy change to mebendazole 2 (3.4)
Continuous therapy 50 (86.2)
Discontinuous therapy 8 (13.8)
No therapy (rejection by patients) 1 (1.7)
AE: Alveolar echinococcosis; US: Ultrasound.
US examinations and EMUC-USAll US examinations were performed using convex probes (C5-1 MHz, C9-1 MHz) with state-of-the-art US equipment (Aplio 500 Toshiba, Siemens S3000, Philips Epiqu 7, Philips IU22). The sonomorphology of the hepatic AE reference lesion was assigned to a pattern according to EMUC-US in each examination[10]. At each examination time point, three different examiners performed a pattern assignment of the reference lesion. The pattern assignment of examiner 1 was taken from the written documentation as the initial examiner. Investigators 2 and 3 performed follow-up of all US images relevant to the study in all included patients. The physicians who performed the follow-up were blinded to the initial examination and independently performed an EMUC-US assessment (Figure 2).

Schuhbaur J et al. Long-term follow-up of liver alveolar echinococcosis
WJG https://www.wjgnet.com 6943 October 28, 2021 Volume 27 Issue 40
Figure 1 Flowchart illustrating case selection, including inclusion and exclusion criteria starting from the patient collective of the alveolar echinococcosis database in Germany. AE: Alveolar echinococcosis.
Figure 2 Echinococcosis Multilocularis Ulm Classification-ultrasound.
Statistical analysisWe performed statistical analyses using SAS Version 9.4 (SAS Institute Inc., Cary, NC, United Stated). Descriptive analysis of the data was performed to obtain absolute and relative frequencies, as well as measures of central tendency and dispersion. Pearson's χ2 and exact fisher tests were used to determine possible relationships and differences in the frequency distribution between dichotomous variables. Wilcoxon rank sum test was performed to determine differences between variables without a normal distri-bution. All tests were performed two-sided. The level of significance was set at α = 0.05, and a P < 0.05 was considered to be statistically significant with a 5% probability of error.
BiostatisticsThe statistical methods of this study were reviewed by Dr. Schmidberger J, MPH, Ph.D., from the Department of Internal Medicine I, University Hospital Ulm, Albert-Einstein-Allee 23, 89081 Ulm, Germany.

Schuhbaur J et al. Long-term follow-up of liver alveolar echinococcosis
WJG https://www.wjgnet.com 6944 October 28, 2021 Volume 27 Issue 40
RESULTSPatient collectiveThe study included 59 patients, including 38 (64.5%) women and 21 (35.6%) men. The mean age at initial diagnosis was 59.9 ± 16.9 years, with a mean age at first sonographic examination of 60.4 ± 16.8 years. A World Health Organization case definition of “confirmed” was present in 26 (44.1%) patients, and a case definition of “probable” was present in 33 (55.9%). The 59 included patients underwent a total of 244 US examinations for a mean of 4.1 sonographic examinations per patient (2-15 ± 2.1 US examinations). A total of 58/59 (98.3%) received initial benzimidazole therapy using albendazole (Tables 1 and 2).
Lesion sizes, localisation, and distribution of EMUC-US patternsAt the time of initial US, 42.4% (25/59) corresponded to the hailstorm pattern, 16.9% (10/59) to the hemangioma-like pattern, 15.3% (9/59) to the pseudocystic pattern, and 25.4% (15/59) to the metastasis-like pattern. None of the reference lesions were initially assigned to the ossification pattern. For those with the hailstorm pattern, the mean lesion size was 67.4 ± 26.3 mm. The average lesion size with the pseudocystic pattern was 113.7 ± 40.8 mm, and that of the hemangioma-like pattern was 83.5 ± 27.3 mm. An average lesion size of 21.7 ± 11.0 mm was determined for the metastasis-like pattern (Figure 3).
In 34/59 (57.6%) of patients, the reference echinococcosis-associated lesion was right hepatic, and in 19/59 (32.3%), it was left hepatic. Bihepatic involvement was identified in 6/59 (10.2%).
Change in EMUC-US patternsOver the whole observation period, the predominant pattern of hepatic AE reference lesions according to EMUC-US remained unchanged in 50/59 (84.7%). In 9/59 (15.3%) of the findings, however, a change in sonomorphology was observed. Of the 10 reference lesions initially classified as hemangioma-like, 7/10 (70.0%) showed a relevant change in sonomorphologic criteria. Of these, 6/7 (85.7%) were assigned to the hailstorm pattern in subsequent US examinations, and 1/7 (14.3%) showed a change toward the pseudocystic pattern. Lesions initially classified as having a pseudocystic pattern showed a change to a hailstorm pattern over time in 2/9 (22.2%) of cases. In all cases of a change in the pattern of AE reference lesions over time, the patients had taken albendazole continuously through the observation period (Figures 4 and 5). For the metastatic pattern, there were no pattern changes over time, but an increase in the size of the central echo-rich laminar body was observed (Figure 6). The mean time from initial diagnosis of AE to a pattern change was 24.2 ± 35.6 mo.
Number of lesions and lesion size according to EMUC-USThe study further revealed statistically significant differences in the number of hepatic AE lesions among EMUC-US types (P < 0.05) (Table 2). There were further statistically significant differences in lesion size between the metastatic pattern compared to the hailstorm pattern (21.7 ± 11.0 vs 67.4 ± 26.3; P < 0.0001), the pseudocystic pattern (21.7 ± 11.0 vs 113.7 ± 40.8; P < 0.0001), and the hemangioma-like pattern (21.7 ± 11.0 vs 83.5 ± 27.3; P < 0.0001) (Table 3). In the 9/59 (15.3%) cases with morphologic change in the EMUC-US pattern, there was a nonsignificant size regrowth from the initial examination (88.8 ± 30.6 vs 71.9 ± 29.6; P = 0.1641). For the 7/9 (77.8%) cases initially classified as having a hemangioma-like pattern, the mean average lesion size was 81.4 ± 29.4 mm initially vs 72.4 ± 21.4 mm after the pattern change. For the 2/9 (22.2%) cases initially classified as having a pseudocystic pattern, the mean lesion size at initial examination was 114.5 ± 24.8 mm vs 70.0 ± 65.1 mm after the pattern change.
DISCUSSIONOur work is the first preliminary longitudinal study tracking changes in sonomor-phology during the follow-up of hepatic AE lesions using a sonomorphologic classi-fication scheme. We found that the sonographic characteristics of individual subtypes of hepatic AE lesions change over time under anthelmintic therapy and exhibit size regrowth, resulting in a pattern classification that diverges from that assigned at the initial examination. A change in sonomorphology leading to pattern reclassification

Schuhbaur J et al. Long-term follow-up of liver alveolar echinococcosis
WJG https://www.wjgnet.com 6945 October 28, 2021 Volume 27 Issue 40
Table 2 Number of hepatic alveolar echinococcosis reference lesions at the time of ultrasound 1, subdivided by Echinococcosis Multilocularis Ulm Classification-ultrasound classification
Number of AE lesions US 1 n (%) P valueHailstorm pattern (n = 25)
1 15 (60)
> 1 10 (40)
Reference 1.0000 0.4385
2-5 9 (36)
6-10 1 (4)
> 10 0 (0)
-
Pseudohemangioma-like pattern (n = 10)
1 6 (60)
> 1 4 (40)
1.0000 Reference 0.6284
2-5 4 (40)
6-10 0 (0)
> 10 0 (0)
-
Pseudocystic pattern (n = 9)
1 7 (77.8)
> 1 2 (22.2)
0.4385 0.6284 Reference
2-5 2 (22.2)
6-10 0 (0)
> 10 0 (0)
-
Metastasis-like pattern (n = 15)
1 1 (6.7)
> 1 14 (93.4)
0.0009 0.0068 0.0007
2-5 13 (86.7)
6-10 0 (0)
> 10 1 (6.7)
-
AE: Alveolar echinococcosis; US: Ultrasound.
was seen for the hemangioma-like and pseudocystic patterns. A total of 70% of the reference lesions initially classified as hemangioma-like shifted to a different pattern classification. Of these, 85% were assigned to the hailstorm pattern and 15% to the pseudocystic pattern. A total of 22.2% (2/9) of the hepatic AE lesions initially described as pseudocystic were assigned to the hailstorm pattern during follow-up (Figures 5 and 7).
In agreement with our results, a Polish working group using the EMUC-US classi-fication confirmed the hailstorm pattern as the most frequent[14]. However, a correlation between the sonographic EMUC-US patterns and the PNM (P = parasitic mass in the liver, N = involvement of neighbouring organs, and M = metastasis) scheme could not be demonstrated in this retrospective work[16]. In addition to the EMUC-US scheme, classification schemes are currently available for CT and MRI[11]. In a recent 39.8-mo follow-up study of our working group 72 patients on albendazole therapy with hepatic AE using the EMUC-CT classification, only one case had a pattern change reassignment from type IIIa (primarily cystoid) to type V (calcified). This result clearly contrasts with our current findings. To compare the different patterns of hepatic AE between the different imaging modalities, appropriate prospective comparative studies are necessary and as yet are unavailable. However, in a further retrospective study we compared EMUC-US and EMUC-CT, no clear assignment could be found for the sonographic hemangioma-like pattern in the EMUC-CT classification. In that study, the sonographic pseudocystic pattern could be
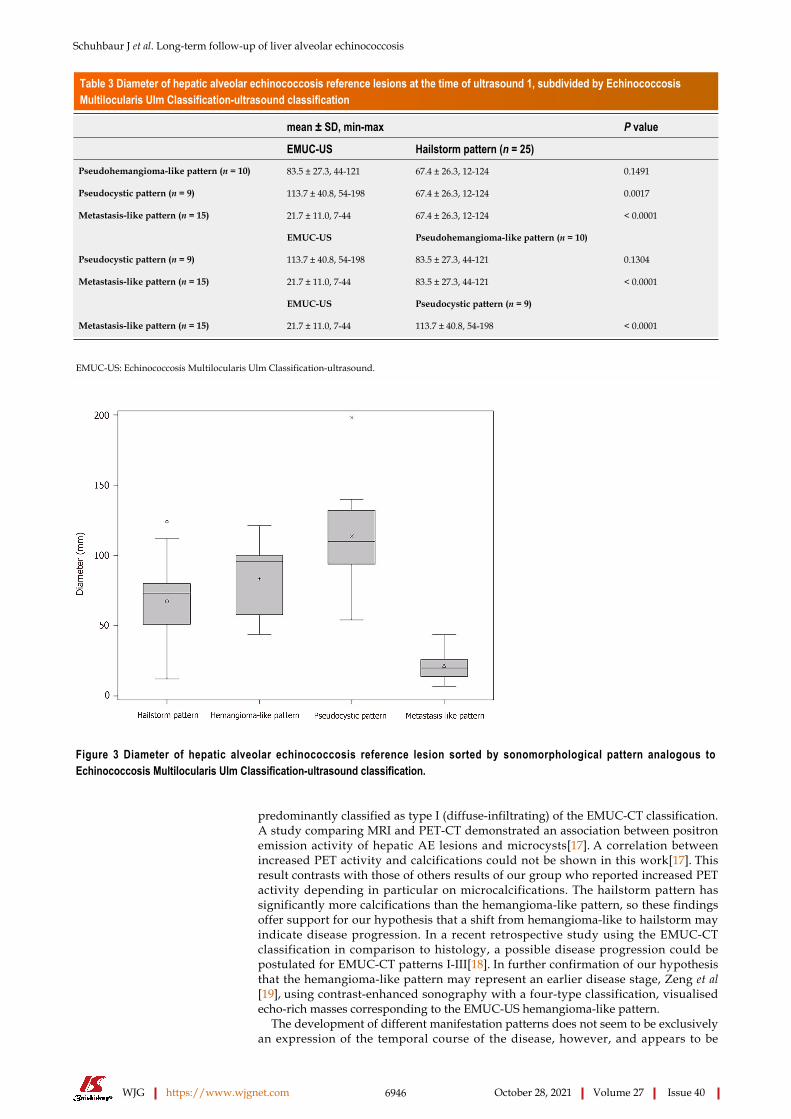
Schuhbaur J et al. Long-term follow-up of liver alveolar echinococcosis
WJG https://www.wjgnet.com 6946 October 28, 2021 Volume 27 Issue 40
Table 3 Diameter of hepatic alveolar echinococcosis reference lesions at the time of ultrasound 1, subdivided by Echinococcosis Multilocularis Ulm Classification-ultrasound classification
mean ± SD, min-max P value
EMUC-US Hailstorm pattern (n = 25)Pseudohemangioma-like pattern (n = 10) 83.5 ± 27.3, 44-121 67.4 ± 26.3, 12-124 0.1491
Pseudocystic pattern (n = 9) 113.7 ± 40.8, 54-198 67.4 ± 26.3, 12-124 0.0017
Metastasis-like pattern (n = 15) 21.7 ± 11.0, 7-44 67.4 ± 26.3, 12-124 < 0.0001
EMUC-US Pseudohemangioma-like pattern (n = 10)
Pseudocystic pattern (n = 9) 113.7 ± 40.8, 54-198 83.5 ± 27.3, 44-121 0.1304
Metastasis-like pattern (n = 15) 21.7 ± 11.0, 7-44 83.5 ± 27.3, 44-121 < 0.0001
EMUC-US Pseudocystic pattern (n = 9)
Metastasis-like pattern (n = 15) 21.7 ± 11.0, 7-44 113.7 ± 40.8, 54-198 < 0.0001
EMUC-US: Echinococcosis Multilocularis Ulm Classification-ultrasound.
Figure 3 Diameter of hepatic alveolar echinococcosis reference lesion sorted by sonomorphological pattern analogous to Echinococcosis Multilocularis Ulm Classification-ultrasound classification.
predominantly classified as type I (diffuse-infiltrating) of the EMUC-CT classification. A study comparing MRI and PET-CT demonstrated an association between positron emission activity of hepatic AE lesions and microcysts[17]. A correlation between increased PET activity and calcifications could not be shown in this work[17]. This result contrasts with those of others results of our group who reported increased PET activity depending in particular on microcalcifications. The hailstorm pattern has significantly more calcifications than the hemangioma-like pattern, so these findings offer support for our hypothesis that a shift from hemangioma-like to hailstorm may indicate disease progression. In a recent retrospective study using the EMUC-CT classification in comparison to histology, a possible disease progression could be postulated for EMUC-CT patterns I-III[18]. In further confirmation of our hypothesis that the hemangioma-like pattern may represent an earlier disease stage, Zeng et al[19], using contrast-enhanced sonography with a four-type classification, visualised echo-rich masses corresponding to the EMUC-US hemangioma-like pattern.
The development of different manifestation patterns does not seem to be exclusively an expression of the temporal course of the disease, however, and appears to be

Schuhbaur J et al. Long-term follow-up of liver alveolar echinococcosis
WJG https://www.wjgnet.com 6947 October 28, 2021 Volume 27 Issue 40
Figure 4 Hepatic alveolar echinococcosis reference lesion in segment II with pseudocystic pattern. A: Initially sharply delineated with individual centrally echo-rich portions; B: Through the disease course, more blurred delineation and increase of centrally echo-rich portions. The ultrasound images shown are from the current patient collective.
Figure 5 Hepatic alveolar echinococcosis reference lesions (arrow) in segment II/IVa/VIII (patient 1) and segment II/III (patient 2), respectively. A and C: initially classified as pseudocystic pattern (patient 1: A, patient 2: C); B and D: In the course of each case loss of the centrally echo-poor, liquid-impressive zone and increasing calcification structures, indicating a change in sonomorphology with a transition to a hailstorm pattern (patient 1: B; patient 2: D). The ultrasound images shown are from the current patient collective.
significantly related to the immunological and constitutional state of the host/ misintermediate host (patient)[20]. In addition to the intraindividual immune response of the patient, one of the major difficulties in performing longitudinal imaging morphological studies is the apparent slow growth of the parasite with corresponding morphological changes in the liver. The use of international prospective database analysis studies could address this problem in the long term.
Limits of the studyThe retrospective design of the preliminary cohort study must be seen as a limitation. It must also be taken into account that the number of cases in the individual EMUC-US patterns is very small, so that small effects may not be validly detected. Due to the sample size and study design, no calculation of interobserver variability between examiner 1 and examiner 2 and 3 was performed. Further prospective studies with larger numbers of cases, especially multicentre and international studies, are necessary

Schuhbaur J et al. Long-term follow-up of liver alveolar echinococcosis
WJG https://www.wjgnet.com 6948 October 28, 2021 Volume 27 Issue 40
Figure 6 Predominant sonomorphological pattern of alveolar echinococcosis reference lesion subdivided according to Echinococcosis Multilocularis Ulm Classification-ultrasound classification, ultrasound 1 to ultrasound 7. US: Ultrasound.
Figure 7 Potential pattern change over time.
to confirm the preliminary study results.

Schuhbaur J et al. Long-term follow-up of liver alveolar echinococcosis
WJG https://www.wjgnet.com 6949 October 28, 2021 Volume 27 Issue 40
CONCLUSIONOur preliminary study demonstrates not only great heterogeneity in the sonomor-phology of hepatic AE lesions at the initial diagnosis but also that sonomorphologic classification can change during disease progression.
ARTICLE HIGHLIGHTSResearch backgroundAlveolar echinococcosis (AE) is a human parasitosis caused by Echinococcus multiloc-ularis.
Research motivationEarly diagnosis of AE is important to initiate prompt therapy and improve patient prognosis. Abdominal ultrasonography is the most common primary imaging modality and allows for classification of hepatic lesion morphology.
Research objectivesWe address the question of whether (and how) the sonomorphology of individual AE lesions can change over time.
Research methodsIn our preliminary retrospective longitudinal study, based on data from the national echinococcosis database in Germany, we evaluated clinical and ultrasound (US) imaging data for 59 patients according to AE case definition of confirmed (n = 26) or probable (n = 33) AE. The AE reference lesion was the largest hepatic AE lesion at the time of the first US examination. We used the Echinococcosis Multilocularis Ulm Classification (EMUC)-US to classify the sonomorphologic pattern.
Research resultsThe study included 59 patients, 38 (64.5%) women and 21 (35.6%) men. The mean median age at initial diagnosis was 59.9 ± 16.9 years. At the time of initial US, 42.4% (25/59) had a hailstorm pattern, 16.9% (10/59) had a pseudohemangioma-like pattern, 15.3% (9/59) had a pseudocystic pattern, and 25.4% (15/59) had a metastasis-like pattern. Although the sonomorphologic pattern remained unchanged in 84.7% (50/59) of the AE reference lesions, 15.3% (9/59) showed a pattern change over time. A change in pattern was seen exclusively for AE lesions initially classified as hemangioma-like or pseudocystic.
Research conclusionsThe sonomorphology of hepatic AE lesions may change over time, particularly hemangioma-like and pseudocystic patterns.
Research perspectivesFurther research should clarify whether the patterns evolve and change according to a sonomorphological evolution.
ACKNOWLEDGEMENTSMembers of the Echinococcosis Working Group Ulm: Barth TFE, Baumann S, Fischer I, Graeter T, Henne-Bruns D, Hillenbrand A, Kratzer W, Schlingeloff P, Schmidberger J, and Shi R.
REFERENCESPawlowski ZS, Vuitton DA, Ammann RW, Kern P, Craig P; World Health Organization. WHO/OIE Manual on echinococcosis in humans and animals: a public health problem of global concern. Paris, France: World Organization for Animal Health, 2001
1
Eckert J, Deplazes P. Biological, epidemiological, and clinical aspects of echinococcosis, a zoonosis 2

Schuhbaur J et al. Long-term follow-up of liver alveolar echinococcosis
WJG https://www.wjgnet.com 6950 October 28, 2021 Volume 27 Issue 40
of increasing concern. Clin Microbiol Rev 2004; 17: 107-135 [PMID: 14726458 DOI: 10.1128/CMR.17.1.107-135.2004]Kantarci M, Bayraktutan U, Karabulut N, Aydinli B, Ogul H, Yuce I, Calik M, Eren S, Atamanalp SS, Oto A. Alveolar echinococcosis: spectrum of findings at cross-sectional imaging. Radiographics 2012; 32: 2053-2070 [PMID: 23150858 DOI: 10.1148/rg.327125708]
3
Polat P, Kantarci M, Alper F, Suma S, Koruyucu MB, Okur A. Hydatid disease from head to toe. Radiographics 2003; 23: 475-94; quiz 536 [PMID: 12640161 DOI: 10.1148/rg.232025704]
4
Brunetti E, Kern P, Vuitton DA; Writing Panel for the WHO-IWGE. Expert consensus for the diagnosis and treatment of cystic and alveolar echinococcosis in humans. Acta Trop 2010; 114: 1-16 [PMID: 19931502 DOI: 10.1016/j.actatropica.2009.11.001]
5
Vuitton DA, Azizi A, Richou C, Vuitton L, Blagosklonov O, Delabrousse E, Mantion GA, Bresson-Hadni S. Current interventional strategy for the treatment of hepatic alveolar echinococcosis. Expert Rev Anti Infect Ther 2016; 14: 1179-1194 [PMID: 27686694 DOI: 10.1080/14787210.2016.1240030]
6
Wen H, Vuitton L, Tuxun T, Li J, Vuitton DA, Zhang W, McManus DP. Echinococcosis: Advances in the 21st Century. Clin Microbiol Rev 2019; 32 [PMID: 30760475 DOI: 10.1128/CMR.00075-18]
7
Yang C, He J, Yang X, Wang W. Surgical approaches for definitive treatment of hepatic alveolar echinococcosis: results of a survey in 178 patients. Parasitology 2019; 146: 1414-1420 [PMID: 31267889 DOI: 10.1017/S0031182019000891]
8
Liu W, Delabrousse É, Blagosklonov O, Wang J, Zeng H, Jiang Y, Qin Y, Vuitton DA, Wen H. Innovation in hepatic alveolar echinococcosis imaging: best use of old tools, and necessary evaluation of new ones. Parasite 2014; 21: 74 [PMID: 25531446 DOI: 10.1051/parasite/2014072]
9
Kratzer W, Gruener B, Kaltenbach TE, Ansari-Bitzenberger S, Kern P, Fuchs M, Mason RA, Barth TF, Haenle MM, Hillenbrand A, Oeztuerk S, Graeter T. Proposal of an ultrasonographic classification for hepatic alveolar echinococcosis: Echinococcosis multilocularis Ulm classification-ultrasound. World J Gastroenterol 2015; 21: 12392-12402 [PMID: 26604646 DOI: 10.3748/wjg.v21.i43.12392]
10
Kodama Y, Fujita N, Shimizu T, Endo H, Nambu T, Sato N, Todo S, Miyasaka K. Alveolar echinococcosis: MR findings in the liver. Radiology 2003; 228: 172-177 [PMID: 12750459 DOI: 10.1148/radiol.2281020323]
11
Brumpt E, Blagosklonov O, Calame P, Bresson-Hadni S, Vuitton DA, Delabrousse E. AE hepatic lesions: correlation between calcifications at CT and FDG-PET/CT metabolic activity. Infection 2019; 47: 955-960 [PMID: 31165442 DOI: 10.1007/s15010-019-01328-z]
12
Yangdan CR, Wang C, Zhang LQ, Ren B, Fan HN, Lu MD. Recent advances in ultrasound in the diagnosis and evaluation of the activity of hepatic alveolar echinococcosis. Parasitol Res 2021; 120: 3077-3082 [PMID: 34370071 DOI: 10.1007/s00436-021-07262-0]
13
Cai D, Li Y, Jiang Y, Wang H, Wang X, Song B. The role of contrast-enhanced ultrasound in the diagnosis of hepatic alveolar echinococcosis. Medicine (Baltimore) 2019; 98: e14325 [PMID: 30702614 DOI: 10.1097/MD.0000000000014325]
14
Wa ZC, Du T, Li XF, Xu HQ, Suo-Ang QC, Chen LD, Hu HT, Wang W, Lu MD. Differential diagnosis between hepatic alveolar echinococcosis and intrahepatic cholangiocarcinoma with conventional ultrasound and contrast-enhanced ultrasound. BMC Med Imaging 2020; 20: 101 [PMID: 32854653 DOI: 10.1186/s12880-020-00499-8]
15
Sulima M, Nahorski W, Gorycki T, Wołyniec W, Wąż P, Felczak-Korzybska I, Szostakowska B, Sikorska K. Ultrasound images in hepatic alveolar echinococcosis and clinical stage of the disease. Adv Med Sci 2019; 64: 324-330 [PMID: 31003201 DOI: 10.1016/j.advms.2019.04.002]
16
Azizi A, Blagosklonov O, Lounis A, Berthet L, Vuitton DA, Bresson-Hadni S, Delabrousse E. Alveolar echinococcosis: correlation between hepatic MRI findings and FDG-PET/CT metabolic activity. Abdom Imaging 2015; 40: 56-63 [PMID: 24970734 DOI: 10.1007/s00261-014-0183-0]
17
Grimm J, Beck A, Nell J, Schmidberger J, Hillenbrand A, Beer AJ, Dezsényi B, Shi R, Beer M, Kern P, Henne-Bruns D, Kratzer W, Moller P, Barth TF, Gruener B, Graeter T. Combining Computed Tomography and Histology Leads to an Evolutionary Concept of Hepatic Alveolar Echinococcosis. Pathogens 2020; 9 [PMID: 32759781 DOI: 10.3390/pathogens9080634]
18
Zeng H, Wang J, Xie W, Liu W, Wen H. Assessment of early hepatic echinococcus multilocularis infection in rats with real-time contrast-enhanced ultrasonography. Ultrasound Med Biol 2012; 38: 1982-1988 [PMID: 22929653 DOI: 10.1016/j.ultrasmedbio.2012.07.007]
19
Deplazes P, Grimm F, Sydler T, Tanner I, Kapel CM. Experimental alveolar echinococcosis in pigs, lesion development and serological follow up. Vet Parasitol 2005; 130: 213-222 [PMID: 15869842 DOI: 10.1016/j.vetpar.2005.03.034]
20

WJG https://www.wjgnet.com 6951 October 28, 2021 Volume 27 Issue 40
World Journal of
GastroenterologyW J GSubmit a Manuscript: https://www.f6publishing.com World J Gastroenterol 2021 October 28; 27(40): 6951-6966
DOI: 10.3748/wjg.v27.i40.6951 ISSN 1007-9327 (print) ISSN 2219-2840 (online)
ORIGINAL ARTICLE
Observational Study
Hepatic and gastrointestinal disturbances in Egyptian patients infected with coronavirus disease 2019: A multicentre cohort study
Hend Ibrahim Shousha, Shimaa Afify, Rabab Maher, Noha Asem, Eman Fouad, Ehab F Mostafa, Mohammed A Medhat, Amr Abdalazeem, Hazem Elmorsy, Miriam M Aziz, Rateba S Mohammed, Mohamed Ibrahem, Hassan Elgarem, Dalia Omran, Mohamed Hassany, Bassem Elsayed, Ahmed Y Abdelaziz, Mohamed El Kassas
ORCID number: Hend Ibrahim Shousha 0000-0002-0928-4738; Shimaa Afify 0000-0001-5937-4240; Rabab Maher 0000-0002-8728-2156; Noha Asem 0000-0003-3400-0159; Eman Fouad 0000-0002-2802-3082; Ehab F Mostafa 0000-0002-9805-3850; Mohammed A Medhat 0000-0002-3866-2283; Amr Abdalazeem 0000-0001-7205-0697; Hazem Elmorsy 0000-0001-7639-7567; Miriam M Aziz 0000-0003-0777-8555; Rateba S Mohammed 0000-0001-7697-0001; Mohamed Ibrahem 0000-0002-4570-2917; Hassan Elgarem 0000-0003-4521-5876; Dalia Omran 0000-0002-5513-6955; Mohamed Hassany 0000-0002-6001-8793; Bassem Elsayed 0000-0003-4806-0443; Ahmed Y Abdelaziz 0000-0002-9389-9371; Mohamed El Kassas 0000-0002-3396-6894.
Author contributions: Shousha HI was the guarantor and designed the study; Afify S, Maher R, Mostafa EF, Medhat MA, Abdelazeem A, Elmorsy H, Mohammed RS, Ibrahem M, Hassany M, Elsayed B, and El Kassas M participated in the acquisition of the data; Asem N and Fouad E participated in the analysis and interpretation of the data; Shousha HI and El Kassas M drafted the initial manuscript; Afify S, Aziz MM, Maher R,
Hend Ibrahim Shousha, Endemic Medicine, Faculty of Medicine, Cairo University, Cairo 11562, Egypt
Shimaa Afify, Mohamed Hassany, Bassem Elsayed, Gastroenterology Department, National Hepatology & Tropical Medicine Research Institute, Cairo 11563, Egypt
Rabab Maher, Hepatology Department, Students Hospital, Cairo University, Giza 12566, Egypt
Noha Asem, Eman Fouad, The Public Health Department, Faculty of Medicine, Cairo University, Cairo 11562, Egypt
Noha Asem, Mohamed Hassany, Egyptian, Ministry of Health and Population, Cairo 11567, Egypt
Ehab F Mostafa, Mohammed A Medhat, Department of Tropical Medicine and Gastroenterology, Faculty of Medicine, Assiut University, Assiut 15655, Egypt
Amr Abdalazeem, Mohamed El Kassas, Endemic Medicine Department, Faculty of Medicine, Helwan University, Cairo 13544, Egypt
Hazem Elmorsy, Internal Medicine, 15 Mayo Smart Hospital, Ministry of Health and Population, Cairo 13488, Egypt
Miriam M Aziz, Pediatrics Department, Faculty of Medicine, Cairo University, Cairo 11562, Egypt
Rateba S Mohammed, Occupational and Environmental Medicine Department, Faculty of Medicine, Cairo University, Cairo 11562, Egypt
Mohamed Ibrahem, Clinical Biochemistry Department, Faculty of medicine, Cairo University, Cairo 11562, Egypt
Hassan Elgarem, Dalia Omran, Endemic Medicine Department, Faculty of Medicine, Cairo University, Cairo 11562, Egypt
Ahmed Y Abdelaziz, Urology Department, Cairo University, Cairo 11562, Egypt
Corresponding author: Hend Ibrahim Shousha, MD, MSc, Associate Professor, Endemic
Shousha HI et al. COVID-19-related hepatic and GI disturbances in Egypt
WJG https://www.wjgnet.com 6952 October 28, 2021 Volume 27 Issue 40
Mostafa EF, Medhat MA, Elgarem H, Omran D, Hassan M, Abdelaziz AY, and Elsayed B critically revised the article for important intellectual content.
Institutional review board statement: This study was approved by the research ethics committee of the Faculty of Medicine at Cairo University (No. N-37-2020, May 14, 2020) and the research ethics committee of the Egyptian Ministry of Health and Population (No. 17-2020/8, June 21, 2020).
Informed consent statement: All study subjects gave written informed consent before study inclusion.
Conflict-of-interest statement: There are no conflicts of interest to report.
Data sharing statement: No additional data are available.
STROBE statement: The authors have read the STROBE Statement checklist of items, and the manuscript was prepared and revised according to the STROBE Statement—checklist of items.
Open-Access: This article is an open-access article that was selected by an in-house editor and fully peer-reviewed by external reviewers. It is distributed in accordance with the Creative Commons Attribution NonCommercial (CC BY-NC 4.0) license, which permits others to distribute, remix, adapt, build upon this work non-commercially, and license their derivative works on different terms, provided the original work is properly cited and the use is non-commercial. See: http://creativecommons.org/Licenses/by-nc/4.0/
Manuscript source: Invited manuscript
Specialty type: Gastroenterology and hepatology
Country/Territory of origin: Egypt
Peer-review report’s scientific quality classification
Medicine, Faculty of Medicine, Cairo University, Kasr Alainy Street, Cairo 11562, Egypt. [email protected]
AbstractBACKGROUND Various liver and gastrointestinal involvements occur in patients with coronavirus disease 2019 (COVID-19) at variable prevalence. Most studies report mild liver function disturbances correlated with COVID-19 severity, though liver failure is unusual.
AIM To study liver and gastrointestinal dysfunctions in Egyptian patients with COVID-19 and their relation to disease outcomes
METHODS This multicentre cohort study was conducted on 547 Egyptian patients from April 15, 2020 to July 29, 2020. Consecutive polymerase chain reaction-confirmed COVID-19 cases were included from four quarantine hospitals affiliated to the Egyptian ministry of health. Demographic information, laboratory characteristics, treatments, fibrosis-4 (FIB-4) index, COVID-19 severity, and outcomes were recorded and compared according to the degree of liver enzyme elevation and the presence of gastrointestinal symptoms. Follow-ups were conducted until discharge or death. Regression analyses were performed to determine the independent factors affecting mortality.
RESULTS This study included 547 patients, of whom 53 (9.68%) died during hospitalization and 1 was discharged upon his request. Patients’ mean age was 45.04 ± 17.61 years, and 21.98% had severe or critical COVID-19. Alanine aminotransferase (ALT) and aspartate aminotransferase (AST) were available for 430 and 428 patients, respectively. In total, 26% and 32% of patients had elevated ALT and AST, respectively. Significant liver injury with ALT or AST elevation exceeding 3-fold was recorded in 21 (4.91%) and 16 (3.73%) patients, respectively. Male gender, smoking, hypertension, chronic hepatitis C, and lung involvement were associated with elevated AST or ALT. AST was elevated in 50% of patients over 60-years-old. FIB-4 was significantly higher in patients admitted to the intensive care unit (ICU), those with more severe COVID-19, and non-survivors. The independent variables affecting outcome were supplementary vitamin C intake (1 g daily capsules) [odds ratio (OR): 0.05, 95% confidence interval (CI): 0.008–0.337]; lung consolidation (OR: 4.540, 95%CI: 1.155–17.840); ICU admission (OR: 25.032, 95%CI: 7.110–88.128); and FIB-4 score > 3.25 (OR: 10.393, 95%CI: 2.459-43.925). Among 60 (13.98%) patients with gastrointestinal symptoms, 52 (86.67%) had diarrhoea. Patients with gastrointestinal symptoms were predominantly females with higher body mass index, and 50 (83.40%) patients had non-severe COVID-19.
CONCLUSION Few Egyptian patients with COVID-19 developed a significant liver injury. The independent variables affecting mortality were supplementary vitamin C intake, lung consolidation, ICU admission, and FIB-4 score.
Key Words: COVID-19; Egypt; Liver injury; Gastrointestinal symptoms; Fibrosis-4; Liver enzymes
©The Author(s) 2021. Published by Baishideng Publishing Group Inc. All rights reserved.
Core Tip: The prevalence and severity of liver and gastrointestinal dysfunction in patients with coronavirus disease 2019 (COVID-19) vary among populations with different underlying characteristics and disease outcomes. This is the first report from Egypt specifically exploring hepatic and gastrointestinal involvement in Egyptian

Shousha HI et al. COVID-19-related hepatic and GI disturbances in Egypt
WJG https://www.wjgnet.com 6953 October 28, 2021 Volume 27 Issue 40
Grade A (Excellent): 0 Grade B (Very good): 0 Grade C (Good): C, C Grade D (Fair): 0 Grade E (Poor): 0
Received: February 4, 2021 Peer-review started: February 4, 2021 First decision: March 6, 2021 Revised: March 17, 2021 Accepted: August 25, 2021 Article in press: August 25, 2021 Published online: October 28, 2021
P-Reviewer: Salvatore S S-Editor: Liu M L-Editor: Filipodia P-Editor: Li JH
patients with COVID-19. In this study, we analyzed multicentre data of patients with polymerase chain reaction-confirmed COVID-19 from April 15, 2020 to July 29, 2020. Based on these data, we assessed the degree of liver injury and presence of gastrointestinal symptoms concerning COVID-19 disease severity, intensive care unit admission, and outcome.
Citation: Shousha HI, Afify S, Maher R, Asem N, Fouad E, Mostafa EF, Medhat MA, Abdalazeem A, Elmorsy H, Aziz MM, Mohammed RS, Ibrahem M, Elgarem H, Omran D, Hassany M, Elsayed B, Abdelaziz AY, El Kassas M. Hepatic and gastrointestinal disturbances in Egyptian patients infected with coronavirus disease 2019: A multicentre cohort study. World J Gastroenterol 2021; 27(40): 6951-6966URL: https://www.wjgnet.com/1007-9327/full/v27/i40/6951.htmDOI: https://dx.doi.org/10.3748/wjg.v27.i40.6951
INTRODUCTIONHepatic and gastrointestinal (GI) involvement occurs in 16% to 78% of patients infected with the novel coronavirus, severe acute respiratory syndrome coronavirus 2 (SARS-CoV-2)[1-3]. In some of these populations, liver enzyme elevation exceeds five times the upper limit of normal (ULN)[4]. Most studies report mild liver function disturbances correlated with coronavirus disease 2019 (COVID-19) severity, though liver failure is unusual[5]. Hepatic and GI involvement can occur with and without pulmonary manifestations of COVID-19[1]. Different underlying mechanisms may contribute to liver injury related to COVID-19, including a direct viral effect, as the virus enters through the angiotensin-converting enzyme-2 receptor on cholangiocytes. Other indirect pathways include sepsis, drug-related hepatic injury, uncontrolled immune reactions, and cytokine storm[6].
Diarrhoea is the most frequently recorded GI symptom reported with COVID-19, ranging from 3% to 30%, followed by anorexia, nausea, vomiting, and abdominal pain[7]. SARS-CoV-2 RNA has been detected in stool specimens from patients with polymerase chain reaction-confirmed COVID-19 in respiratory samples. Those patients showed extended viral shedding in stool up to 11.2 d after viral eradication from respiratory specimens, suggesting faecal-oral transmission and warranting subsequent precautions[8]. The possible underlying mechanisms for GI involvement are the direct viral invasion of cells in the GI tract via the angiotensin-converting enzyme-2 receptor on gastric and duodenal glandular cells and proximal and distal enterocytes[8]. This viral invasion disrupts absorption and intestinal secretions, which activates the enteric nervous system and causes diarrhoea[9]. Other indirect mechanisms include antibiotic-associated diarrhoea, indirect inflammatory damage, and the ‘‘gut-lung axis” theory of immune-mediated effects on the respiratory tract by disturbed digestive tract flora[1,10]. This study aimed to determine the prevalence and extent of liver and GI derangements in Egyptian patients with COVID-19 infection and their relation to COVID-19 disease outcomes.
MATERIALS AND METHODSStudy population and data collectionThis multicentre, prospective cohort study recruited 547 consecutive patients from April 15, 2020 to July 29, 2020 who were hospitalized in four quarantine centres affiliated to the Egyptian Ministry of Health and Population in three Egyptian governorates: 15 Mayo Smart Hospital in Cairo governorate, National Hepatology and Tropical Medicine Research Institute in Cairo governorate, Students Hospital in Giza governorate, and Alraghy Hospital in Assuit Governorate. This study included patients with a confirmed diagnosis of SARS-CoV-2, defined as a positive real-time reverse-transcriptase polymerase chain reaction assay of nasal and pharyngeal swab specimens. Patients were followed until discharge or death.
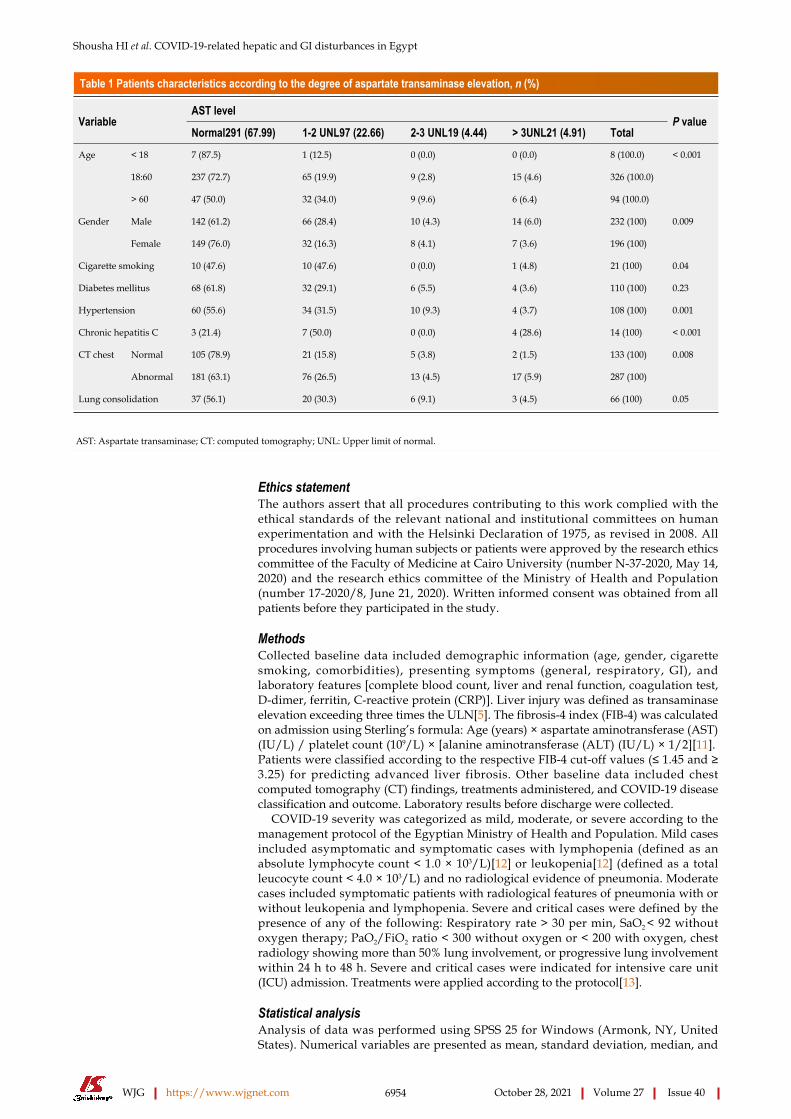
Shousha HI et al. COVID-19-related hepatic and GI disturbances in Egypt
WJG https://www.wjgnet.com 6954 October 28, 2021 Volume 27 Issue 40
Table 1 Patients characteristics according to the degree of aspartate transaminase elevation, n (%)
AST levelVariable
Normal291 (67.99) 1-2 UNL97 (22.66) 2-3 UNL19 (4.44) > 3UNL21 (4.91) TotalP value
< 18 7 (87.5) 1 (12.5) 0 (0.0) 0 (0.0) 8 (100.0)
18:60 237 (72.7) 65 (19.9) 9 (2.8) 15 (4.6) 326 (100.0)
Age
> 60 47 (50.0) 32 (34.0) 9 (9.6) 6 (6.4) 94 (100.0)
< 0.001
Male 142 (61.2) 66 (28.4) 10 (4.3) 14 (6.0) 232 (100)Gender
Female 149 (76.0) 32 (16.3) 8 (4.1) 7 (3.6) 196 (100)
0.009
Cigarette smoking 10 (47.6) 10 (47.6) 0 (0.0) 1 (4.8) 21 (100) 0.04
Diabetes mellitus 68 (61.8) 32 (29.1) 6 (5.5) 4 (3.6) 110 (100) 0.23
Hypertension 60 (55.6) 34 (31.5) 10 (9.3) 4 (3.7) 108 (100) 0.001
Chronic hepatitis C 3 (21.4) 7 (50.0) 0 (0.0) 4 (28.6) 14 (100) < 0.001
CT chest Normal 105 (78.9) 21 (15.8) 5 (3.8) 2 (1.5) 133 (100)
Abnormal 181 (63.1) 76 (26.5) 13 (4.5) 17 (5.9) 287 (100)
0.008
Lung consolidation 37 (56.1) 20 (30.3) 6 (9.1) 3 (4.5) 66 (100) 0.05
AST: Aspartate transaminase; CT: computed tomography; UNL: Upper limit of normal.
Ethics statementThe authors assert that all procedures contributing to this work complied with the ethical standards of the relevant national and institutional committees on human experimentation and with the Helsinki Declaration of 1975, as revised in 2008. All procedures involving human subjects or patients were approved by the research ethics committee of the Faculty of Medicine at Cairo University (number N-37-2020, May 14, 2020) and the research ethics committee of the Ministry of Health and Population (number 17-2020/8, June 21, 2020). Written informed consent was obtained from all patients before they participated in the study.
MethodsCollected baseline data included demographic information (age, gender, cigarette smoking, comorbidities), presenting symptoms (general, respiratory, GI), and laboratory features [complete blood count, liver and renal function, coagulation test, D-dimer, ferritin, C-reactive protein (CRP)]. Liver injury was defined as transaminase elevation exceeding three times the ULN[5]. The fibrosis-4 index (FIB-4) was calculated on admission using Sterling’s formula: Age (years) × aspartate aminotransferase (AST) (IU/L) / platelet count (109/L) × [alanine aminotransferase (ALT) (IU/L) × 1/2][11]. Patients were classified according to the respective FIB-4 cut-off values (≤ 1.45 and ≥ 3.25) for predicting advanced liver fibrosis. Other baseline data included chest computed tomography (CT) findings, treatments administered, and COVID-19 disease classification and outcome. Laboratory results before discharge were collected.
COVID-19 severity was categorized as mild, moderate, or severe according to the management protocol of the Egyptian Ministry of Health and Population. Mild cases included asymptomatic and symptomatic cases with lymphopenia (defined as an absolute lymphocyte count < 1.0 × 10³/L)[12] or leukopenia[12] (defined as a total leucocyte count < 4.0 × 10³/L) and no radiological evidence of pneumonia. Moderate cases included symptomatic patients with radiological features of pneumonia with or without leukopenia and lymphopenia. Severe and critical cases were defined by the presence of any of the following: Respiratory rate > 30 per min, SaO2 < 92 without oxygen therapy; PaO2/FiO2 ratio < 300 without oxygen or < 200 with oxygen, chest radiology showing more than 50% lung involvement, or progressive lung involvement within 24 h to 48 h. Severe and critical cases were indicated for intensive care unit (ICU) admission. Treatments were applied according to the protocol[13].
Statistical analysisAnalysis of data was performed using SPSS 25 for Windows (Armonk, NY, United States). Numerical variables are presented as mean, standard deviation, median, and
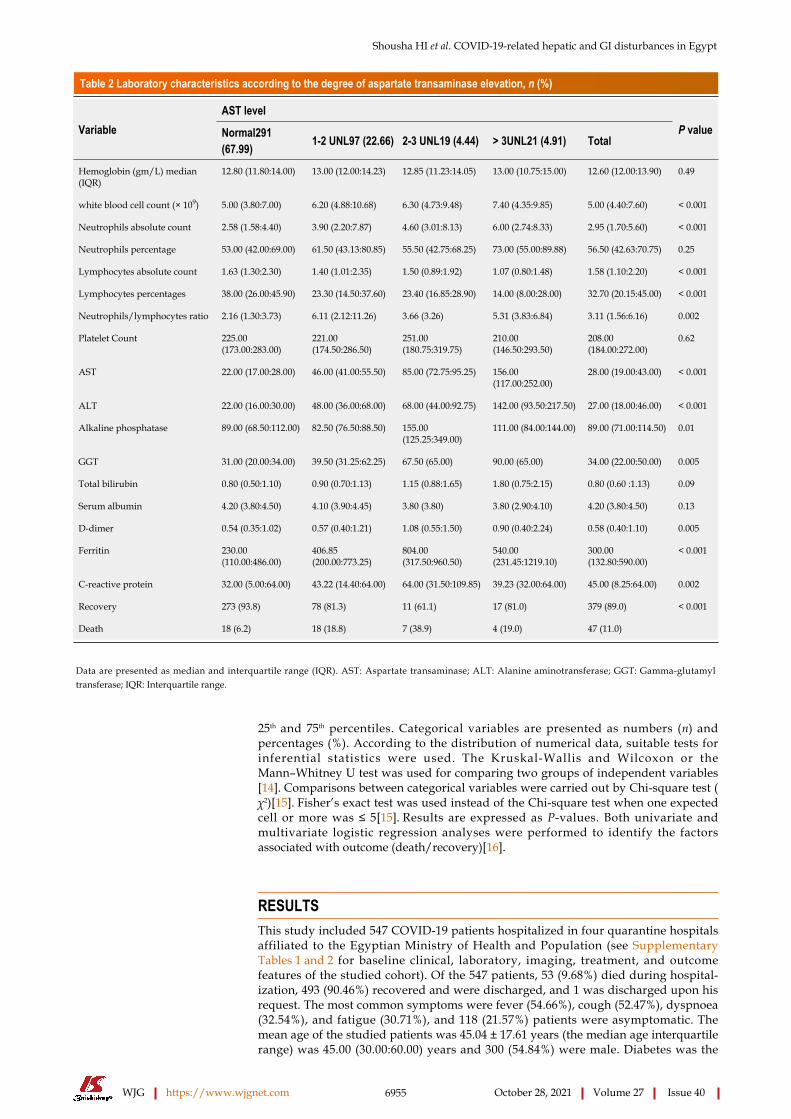
Shousha HI et al. COVID-19-related hepatic and GI disturbances in Egypt
WJG https://www.wjgnet.com 6955 October 28, 2021 Volume 27 Issue 40
Table 2 Laboratory characteristics according to the degree of aspartate transaminase elevation, n (%)
AST levelVariable Normal291
(67.99) 1-2 UNL97 (22.66) 2-3 UNL19 (4.44) > 3UNL21 (4.91) TotalP value
Hemoglobin (gm/L) median (IQR)
12.80 (11.80:14.00) 13.00 (12.00:14.23) 12.85 (11.23:14.05) 13.00 (10.75:15.00) 12.60 (12.00:13.90) 0.49
white blood cell count (× 109) 5.00 (3.80:7.00) 6.20 (4.88:10.68) 6.30 (4.73:9.48) 7.40 (4.35:9.85) 5.00 (4.40:7.60) < 0.001
Neutrophils absolute count 2.58 (1.58:4.40) 3.90 (2.20:7.87) 4.60 (3.01:8.13) 6.00 (2.74:8.33) 2.95 (1.70:5.60) < 0.001
Neutrophils percentage 53.00 (42.00:69.00) 61.50 (43.13:80.85) 55.50 (42.75:68.25) 73.00 (55.00:89.88) 56.50 (42.63:70.75) 0.25
Lymphocytes absolute count 1.63 (1.30:2.30) 1.40 (1.01:2.35) 1.50 (0.89:1.92) 1.07 (0.80:1.48) 1.58 (1.10:2.20) < 0.001
Lymphocytes percentages 38.00 (26.00:45.90) 23.30 (14.50:37.60) 23.40 (16.85:28.90) 14.00 (8.00:28.00) 32.70 (20.15:45.00) < 0.001
Neutrophils/lymphocytes ratio 2.16 (1.30:3.73) 6.11 (2.12:11.26) 3.66 (3.26) 5.31 (3.83:6.84) 3.11 (1.56:6.16) 0.002
Platelet Count 225.00 (173.00:283.00)
221.00 (174.50:286.50)
251.00 (180.75:319.75)
210.00 (146.50:293.50)
208.00 (184.00:272.00)
0.62
AST 22.00 (17.00:28.00) 46.00 (41.00:55.50) 85.00 (72.75:95.25) 156.00 (117.00:252.00)
28.00 (19.00:43.00) < 0.001
ALT 22.00 (16.00:30.00) 48.00 (36.00:68.00) 68.00 (44.00:92.75) 142.00 (93.50:217.50) 27.00 (18.00:46.00) < 0.001
Alkaline phosphatase 89.00 (68.50:112.00) 82.50 (76.50:88.50) 155.00 (125.25:349.00)
111.00 (84.00:144.00) 89.00 (71.00:114.50) 0.01
GGT 31.00 (20.00:34.00) 39.50 (31.25:62.25) 67.50 (65.00) 90.00 (65.00) 34.00 (22.00:50.00) 0.005
Total bilirubin 0.80 (0.50:1.10) 0.90 (0.70:1.13) 1.15 (0.88:1.65) 1.80 (0.75:2.15) 0.80 (0.60 :1.13) 0.09
Serum albumin 4.20 (3.80:4.50) 4.10 (3.90:4.45) 3.80 (3.80) 3.80 (2.90:4.10) 4.20 (3.80:4.50) 0.13
D-dimer 0.54 (0.35:1.02) 0.57 (0.40:1.21) 1.08 (0.55:1.50) 0.90 (0.40:2.24) 0.58 (0.40:1.10) 0.005
Ferritin 230.00 (110.00:486.00)
406.85 (200.00:773.25)
804.00 (317.50:960.50)
540.00 (231.45:1219.10)
300.00 (132.80:590.00)
< 0.001
C-reactive protein 32.00 (5.00:64.00) 43.22 (14.40:64.00) 64.00 (31.50:109.85) 39.23 (32.00:64.00) 45.00 (8.25:64.00) 0.002
Recovery 273 (93.8) 78 (81.3) 11 (61.1) 17 (81.0) 379 (89.0)
Death 18 (6.2) 18 (18.8) 7 (38.9) 4 (19.0) 47 (11.0)
< 0.001
Data are presented as median and interquartile range (IQR). AST: Aspartate transaminase; ALT: Alanine aminotransferase; GGT: Gamma-glutamyl transferase; IQR: Interquartile range.
25th and 75th percentiles. Categorical variables are presented as numbers (n) and percentages (%). According to the distribution of numerical data, suitable tests for inferential statistics were used. The Kruskal-Wallis and Wilcoxon or the Mann–Whitney U test was used for comparing two groups of independent variables[14]. Comparisons between categorical variables were carried out by Chi-square test (χ2)[15]. Fisher’s exact test was used instead of the Chi-square test when one expected cell or more was ≤ 5[15]. Results are expressed as P-values. Both univariate and multivariate logistic regression analyses were performed to identify the factors associated with outcome (death/recovery)[16].
RESULTSThis study included 547 COVID-19 patients hospitalized in four quarantine hospitals affiliated to the Egyptian Ministry of Health and Population (see Supplementary Tables 1 and 2 for baseline clinical, laboratory, imaging, treatment, and outcome features of the studied cohort). Of the 547 patients, 53 (9.68%) died during hospital-ization, 493 (90.46%) recovered and were discharged, and 1 was discharged upon his request. The most common symptoms were fever (54.66%), cough (52.47%), dyspnoea (32.54%), and fatigue (30.71%), and 118 (21.57%) patients were asymptomatic. The mean age of the studied patients was 45.04 ± 17.61 years (the median age interquartile range) was 45.00 (30.00:60.00) years and 300 (54.84%) were male. Diabetes was the

Shousha HI et al. COVID-19-related hepatic and GI disturbances in Egypt
WJG https://www.wjgnet.com 6956 October 28, 2021 Volume 27 Issue 40
Table 3 Patients characteristics according to the degree of alanine transaminase elevation, n (%)
ALT levelsVariable
Normal318 (74.0) 1-2 UNL73 (17.0) 2-3 UNL23 (5.3) > 3UNL16 (3.7) TotalP value
< 18 9 (100.0) 0 (0.0) 0 (0.0) 0 (0.0) 9 (100.0)
18:60 246 (75.0) 53 (16.2) 18 (5.5) 11 (3.4) 328 (100.0)
Age
> 60 63 (67.7) 20 (21.5) 5 (5.4) 5 (5.4) 93 (100.0)
0.53
Male 157 (67.4) 50 (21.5) 16 (6.9) 10 (4.3) 233 (100.0)Gender
Female 160 (81.6) 23 (11.7) 7 (3.6) 6 (3.1) 196 (100.0)
0.02
Cigarette smoking 10 (47.6) 5 (23.8) 4 (19.0) 2 (9.5) 21 (100.0) 0.02
Diabetes mellitus 79 (71.2) 27 (24.3) 3 (2.7) 2 (1.8) 111 (100.0) 0.04
Hypertension 79 (73.1) 25 (23.1) 2 (1.9) 2 (1.9) 108 (100.0) 0.05
Chronic hepatitis C 5 (35.7) 6 (42.9) 1 (7.1) 2 (14.3) 14 (100.0) 0.005
CT chest Normal 110 (82.1) 16 (11.9) 7 (5.2) 1 (.7) 134 (100.0)
Abnormal 203 (70.5) 56 (19.4) 16 (5.6) 13 (4.5) 288 (100.0)
0.04
Consolidation 43 (65.2) 17 (25.8) 3 (4.5) 3 (4.5) 66 (100.0) 0.06
AST: Aspartate transaminase; CT: Computed tomography.
most common comorbidity (24.86%), followed by hypertension (23.77%) and coronary artery disease (4.20%). Chronic liver disease was reported in 18 (3.29%) patients: 14 had chronic hepatitis C (of whom 7 had liver cirrhosis), 2 had chronic hepatitis B, and 2 had fatty liver disease. We confirmed their liver condition using their most recent abdominal ultrasound study before hospitalization for COVID-19. Regarding COVID-19, 427 (78.02%) had mild and moderate disease, 120 (21.98%) had severe or critical disease, and 122 (22.34%) were admitted to the ICU during their hospitalization. Flow chart of the study cohort is illustrated in Figure 1.
In our study, ALT and AST were available for 430 and 428 patients, respectively, and their other liver function tests and inflammatory markers were also available. Most patients had normal AST (291; 67.99%) and normal ALT levels (318; 74%). We divided patients as follows: Those with liver enzyme levels within the normal range, 1–2 fold over the ULN, 2–3 fold over the ULN, or >3 fold over the ULN (Tables 1-4). Among patients who required ICU admission, 48.50% had elevated AST and 35.60% had elevated ALT. On admission, FIB-4 was significantly higher in patients admitted to the ICU, those with more severe COVID-19 disease, and non-survivors (Supple-mentary Table 3).
We found that male gender, cigarette smoking, systemic hypertension, chronic hepatitis C, and abnormal chest CT findings were associated with significant elevation of baseline AST and ALT. Also, AST levels were elevated in patients older than 60 years, and diabetes mellitus was associated with elevation of baseline ALT. Elevated AST was also associated with elevated white blood cell count, absolute neutrophils count, neutrophils/lymphocytes ratio, ALT, gamma-glutamyl transferase (GGT), D-dimer, ferritin, and CRP and negatively correlated with absolute lymphocyte count and serum albumin. Elevated ALT was associated with elevated white blood cell count, Absolute Neutrophils count, neutrophils/lymphocytes ratio, AST, alkaline phosphatase (ALP), GGT, D-dimer, ferritin, and CRP and negatively correlated with absolute lymphocyte count and serum albumin (Tables 1-4).
No patient under 18-years-old showed elevated ALT levels, and only 1 had less than a 2-fold elevation of AST. All patients under 18 recovered and were discharged. Elevated AST levels were observed in 32 (18.4%) patients with mild disease and 23 (44.20%) with the critical disease, whereas elevated ALT levels were observed in 33 (19%) patients with mild disease and 32 (61.5%) with the critical disease (Supple-mentary Table 3).
Univariate analysis revealed several factors associated with survival (age < 60 years; no fever; no dyspnoea; normal findings on chest CT) and several associated with increased mortality (age > 60 years; leucocytosis; increased neutrophil/lymphocyte ratio; elevated AST, CRP, D-dimer or ferritin; baseline renal function impairment with elevations 1–2 above ULN) (Table 5).

Shousha HI et al. COVID-19-related hepatic and GI disturbances in Egypt
WJG https://www.wjgnet.com 6957 October 28, 2021 Volume 27 Issue 40
Table 4 Laboratory characteristics according to the degree of alanine transaminase elevation, n (%)
ALT levelsVariable
Normal318 (74.0) 1-2 UNL73 (17.0) 2-3 UNL23 (5.3) > 3UNL16 (3.7) TotalP value
Hemoglobin (gm/L) median (IQR)
12.75 (11.78:14.00) 13.00 (12.10:14.45) 13.30 (12.30:14.80) 13.35 (10.63:14.98) 12.60 (12.00:13.90) 0.09
white blood cell count (× 109) 5.00 (4.00:7.40) 6.30 (4.70:10.55) 6.30 (4.20:9.80) 7.55 (3.88:9.33) 5.00 (4.40:7.60) 0.003
Neutrophils absolute count 2.70 (1.60:4.69) 4.00 (2.40:7.73) 2.70 (1.80:7.10) 5.00 (2.60:6.97) 2.95 (1.70:5.60) 0.02
Neutrophils percentage 53.00 (41.50:66.50) 57.00 (46.00:77.50) 82.60 (44.93:92.08) 66.50 (53.25:74.50) 56.50 (42.63:70.75) 0.17
Lymphocytes absolute count 1.60 (1.20:2.30) 1.60 (1.02:2.00) 1.26 (1.06:1.80) 1.07 (0.83:1.50) 1.58 (1.10:2.20) 0.04
Lymphocytes percentages 36.00 (24.23:45.00) 22.00 (15.70:43.40) 25.55 (15.05:42.38) 22.60 (13.75:33.75) 32.70 (20.15:45.00) 0.01
Neutrophils/lymphocytes ratio 2.19 (1.40:4.19) 6.07 (2.96:9.15) 6.24 (2.83:7.96) 4.14 (2.70:15.85) 3.11 (1.56:6.16) 0.002
Platelet count 220.00 (168.00:273.25) 238.00 (168.00:309.00)
219.00 (202.00:297.00)
271.00 (160.00:343.75)
208.00 (184.00:272.00)
0.11
AST 23.00 (17.00:31.00) 46.00 (34.00:60.00) 61.00 (52.00:84.00) 154.50 (109.25:236.00)
28.00 (19.00:43.00) < 0.001
ALT 22.00 (16.00:29.25) 56.00 (48.00:63.60) 96.00 (91.00:110.00) 183.50 (144.50:228.50)
27.00 (18.00:46.00) < 0.001
Alkaline phosphatase 88.00 (65.50:108.50) 88.00 (77.50:134.00) 86.00 (86.00:86.00) 120.00 (90.00:151.00) 89.00 (71.00:114.50) 0.19
GGT 23.00 (20.00:34.00) 39.50 (34.00:67.75) 34.00 (22.00:50.00) 77.50 (65.00:101.25) 34.00 (22.00:50.00) 0.001
Total bilirubin 0.80 (0.50:0.90) 1.10 (0.75:1.40) 0.80 (0.35: 0.88) 1.80 (1.25:2.15) 0.80 (0.60 :1.13) 0.01
Serum albumin 4.20 (3.70:4.50) 4.00 (3.83:4.45) 3.10 (2.60) 3.80 (3.50:4.10) 4.20 (3.80:4.50) 0.29
D-dimer 0.55 (0.36:1.02) 0.58 (0.40:1.27) 0.63 (0.36:1.50) 0.58 (0.40:1.48) 0.58 (0.40:1.10) 0.23
Ferritin 245.20M (122.93:540.00)
427.80 (200.00:847.00)
438.00 (86.50:922.00)
430.50 (215.73:1076.00)
300.00 (132.80:590.00)
0.009
C-reactive protein 32.00 (5.00:64.00) 32.00 (20.00:64.00) 32.00 (9.40:64.00) 55.44 (32.00:78.23) 45.00 (8.25:64.00) 0.09
Recovery 286 (90.2) 60 (83.3) 22 (95.7) 13 (81.3) 381 (89.0)
Death 31 (9.8) 12 (16.7) 1 (4.3) 3 (18.8) 47 (11.0)
0.18
AST: Aspartate transaminase; ALT: Alanine aminotransferase; GGT: Gamma-glutamyl transferase; IQR: Interquartile range; UNL: Upper limit normal.
Patients were followed up till discharge or death. On discharge, patients showed significant improvement in haemoglobin, gamma-glutamyl transferase, serum albumin, ferritin, CRP, and lactate dehydrogenase levels with mild elevations in ALT and AST levels (Supplementary Table 4).
Multiple stepwise logistic regression analyses were conducted to identify significant predictors for outcomes of death and recovery. Independent variables included age, asymptomatic status, fever, dry cough, dyspnoea, sore throat, steroid use, supple-mentary vitamin C intake, azithromycin intake, subcutaneous heparin, chest CT findings, ICU admission, FIB-4 score, creatinine level, and urea level. The model was significant [χ2 (144)], and the P-value was < 0.001, meaning the independent variable could explain the change in the dependent variable by up to 90.8%. Significant predictors in our model included treatment with supplementary vitamin C (1 g daily capsules according to the Egyptian Ministry of Health protocol[13]) [odds ratio (OR): 0.05, 95% confidence interval (CI): 0.008–0.337]; lung consolidation (OR: 4.540, 95%CI: 1.155–17.840); ICU admission (OR: 25.032, 95%CI: 7.110–88.128), and FIB-4 score > 3.25 (OR: 10.393, 95%CI: 2.459-43.925). The most significant predictor was ICU admission (Table 6).
Within our cohort, 60 (13.98%) patients presented with GI symptoms in addition to respiratory symptoms. They were predominantly females with significantly higher body mass index. Diarrhoea was the most common symptom, affecting 52 (86.67%) patients. Headache and sore throat were more frequent in patients with GI symptoms compared to those without GI symptoms; 83.4% of patients with GI symptoms had non-severe COVID-19 presentations with fewer ICU admissions. There was no difference in FIB-4 scores among patients with and without GI symptoms (Table 7).
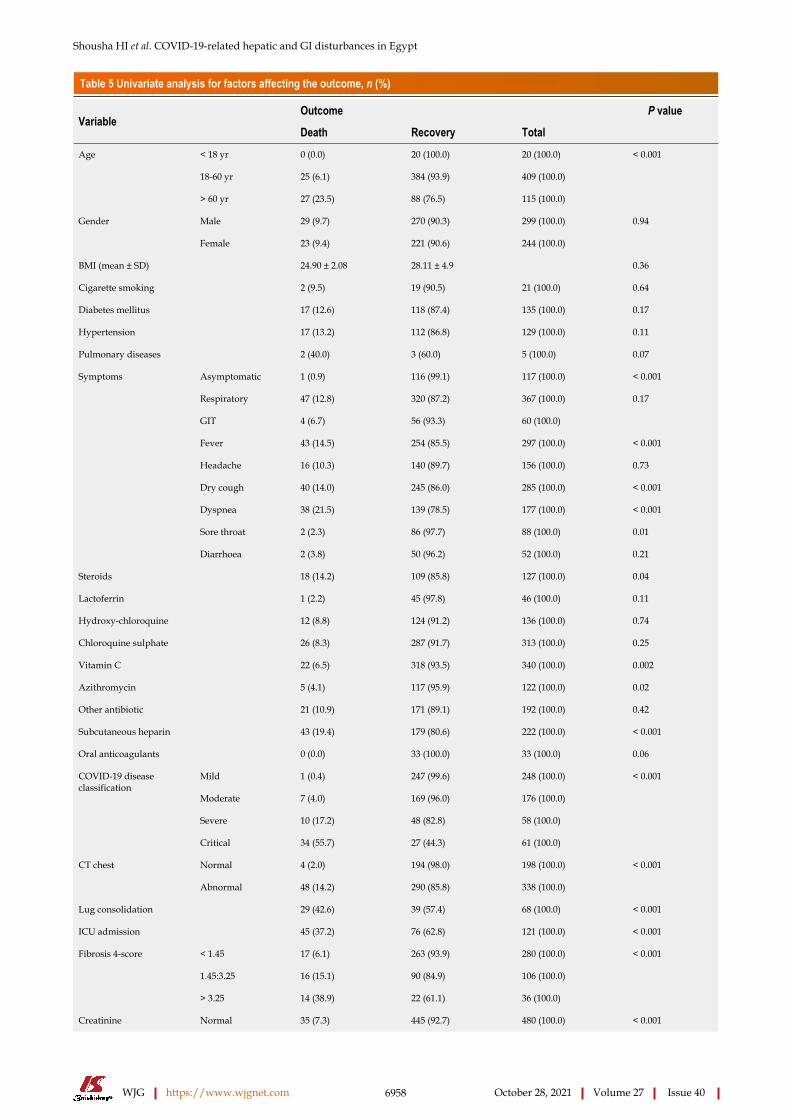
Shousha HI et al. COVID-19-related hepatic and GI disturbances in Egypt
WJG https://www.wjgnet.com 6958 October 28, 2021 Volume 27 Issue 40
Table 5 Univariate analysis for factors affecting the outcome, n (%)
Outcome P valueVariable
Death Recovery Total
< 18 yr 0 (0.0) 20 (100.0) 20 (100.0)
18-60 yr 25 (6.1) 384 (93.9) 409 (100.0)
Age
> 60 yr 27 (23.5) 88 (76.5) 115 (100.0)
< 0.001
Male 29 (9.7) 270 (90.3) 299 (100.0)Gender
Female 23 (9.4) 221 (90.6) 244 (100.0)
0.94
BMI (mean ± SD) 24.90 ± 2.08 28.11 ± 4.9 0.36
Cigarette smoking 2 (9.5) 19 (90.5) 21 (100.0) 0.64
Diabetes mellitus 17 (12.6) 118 (87.4) 135 (100.0) 0.17
Hypertension 17 (13.2) 112 (86.8) 129 (100.0) 0.11
Pulmonary diseases 2 (40.0) 3 (60.0) 5 (100.0) 0.07
Asymptomatic 1 (0.9) 116 (99.1) 117 (100.0) < 0.001
Respiratory 47 (12.8) 320 (87.2) 367 (100.0)
GIT 4 (6.7) 56 (93.3) 60 (100.0)
0.17
Fever 43 (14.5) 254 (85.5) 297 (100.0) < 0.001
Headache 16 (10.3) 140 (89.7) 156 (100.0) 0.73
Dry cough 40 (14.0) 245 (86.0) 285 (100.0) < 0.001
Dyspnea 38 (21.5) 139 (78.5) 177 (100.0) < 0.001
Sore throat 2 (2.3) 86 (97.7) 88 (100.0) 0.01
Symptoms
Diarrhoea 2 (3.8) 50 (96.2) 52 (100.0) 0.21
Steroids 18 (14.2) 109 (85.8) 127 (100.0) 0.04
Lactoferrin 1 (2.2) 45 (97.8) 46 (100.0) 0.11
Hydroxy-chloroquine 12 (8.8) 124 (91.2) 136 (100.0) 0.74
Chloroquine sulphate 26 (8.3) 287 (91.7) 313 (100.0) 0.25
Vitamin C 22 (6.5) 318 (93.5) 340 (100.0) 0.002
Azithromycin 5 (4.1) 117 (95.9) 122 (100.0) 0.02
Other antibiotic 21 (10.9) 171 (89.1) 192 (100.0) 0.42
Subcutaneous heparin 43 (19.4) 179 (80.6) 222 (100.0) < 0.001
Oral anticoagulants 0 (0.0) 33 (100.0) 33 (100.0) 0.06
Mild 1 (0.4) 247 (99.6) 248 (100.0)
Moderate 7 (4.0) 169 (96.0) 176 (100.0)
Severe 10 (17.2) 48 (82.8) 58 (100.0)
COVID-19 disease classification
Critical 34 (55.7) 27 (44.3) 61 (100.0)
< 0.001
Normal 4 (2.0) 194 (98.0) 198 (100.0)CT chest
Abnormal 48 (14.2) 290 (85.8) 338 (100.0)
< 0.001
Lug consolidation 29 (42.6) 39 (57.4) 68 (100.0) < 0.001
ICU admission 45 (37.2) 76 (62.8) 121 (100.0) < 0.001
< 1.45 17 (6.1) 263 (93.9) 280 (100.0)
1.45:3.25 16 (15.1) 90 (84.9) 106 (100.0)
Fibrosis 4-score
> 3.25 14 (38.9) 22 (61.1) 36 (100.0)
< 0.001
Normal 35 (7.3) 445 (92.7) 480 (100.0)Creatinine < 0.001
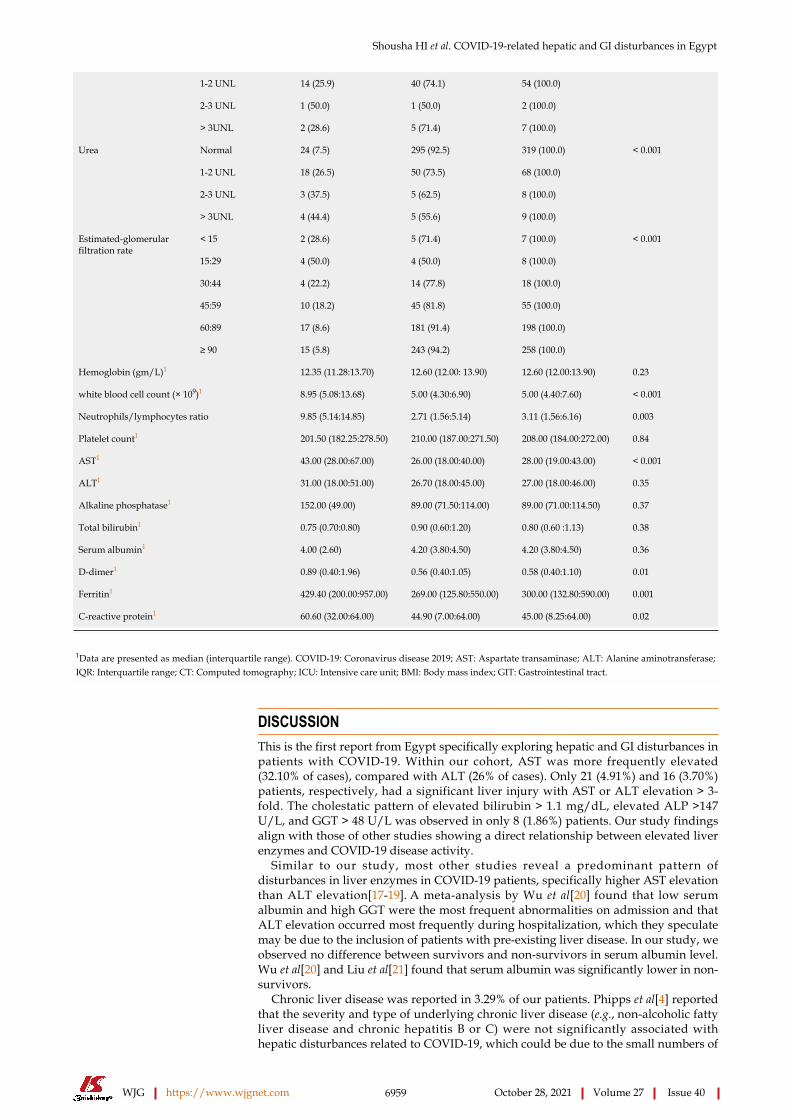
Shousha HI et al. COVID-19-related hepatic and GI disturbances in Egypt
WJG https://www.wjgnet.com 6959 October 28, 2021 Volume 27 Issue 40
1-2 UNL 14 (25.9) 40 (74.1) 54 (100.0)
2-3 UNL 1 (50.0) 1 (50.0) 2 (100.0)
> 3UNL 2 (28.6) 5 (71.4) 7 (100.0)
Normal 24 (7.5) 295 (92.5) 319 (100.0)
1-2 UNL 18 (26.5) 50 (73.5) 68 (100.0)
2-3 UNL 3 (37.5) 5 (62.5) 8 (100.0)
Urea
> 3UNL 4 (44.4) 5 (55.6) 9 (100.0)
< 0.001
< 15 2 (28.6) 5 (71.4) 7 (100.0)
15:29 4 (50.0) 4 (50.0) 8 (100.0)
30:44 4 (22.2) 14 (77.8) 18 (100.0)
45:59 10 (18.2) 45 (81.8) 55 (100.0)
60:89 17 (8.6) 181 (91.4) 198 (100.0)
Estimated-glomerular filtration rate
≥ 90 15 (5.8) 243 (94.2) 258 (100.0)
< 0.001
Hemoglobin (gm/L)1 12.35 (11.28:13.70) 12.60 (12.00: 13.90) 12.60 (12.00:13.90) 0.23
white blood cell count (× 109)1 8.95 (5.08:13.68) 5.00 (4.30:6.90) 5.00 (4.40:7.60) < 0.001
Neutrophils/lymphocytes ratio 9.85 (5.14:14.85) 2.71 (1.56:5.14) 3.11 (1.56:6.16) 0.003
Platelet count1 201.50 (182.25:278.50) 210.00 (187.00:271.50) 208.00 (184.00:272.00) 0.84
AST1 43.00 (28.00:67.00) 26.00 (18.00:40.00) 28.00 (19.00:43.00) < 0.001
ALT1 31.00 (18.00:51.00) 26.70 (18.00:45.00) 27.00 (18.00:46.00) 0.35
Alkaline phosphatase1 152.00 (49.00) 89.00 (71.50:114.00) 89.00 (71.00:114.50) 0.37
Total bilirubin1 0.75 (0.70:0.80) 0.90 (0.60:1.20) 0.80 (0.60 :1.13) 0.38
Serum albumin1 4.00 (2.60) 4.20 (3.80:4.50) 4.20 (3.80:4.50) 0.36
D-dimer1 0.89 (0.40:1.96) 0.56 (0.40:1.05) 0.58 (0.40:1.10) 0.01
Ferritin1 429.40 (200.00:957.00) 269.00 (125.80:550.00) 300.00 (132.80:590.00) 0.001
C-reactive protein1 60.60 (32.00:64.00) 44.90 (7.00:64.00) 45.00 (8.25:64.00) 0.02
1Data are presented as median (interquartile range). COVID-19: Coronavirus disease 2019; AST: Aspartate transaminase; ALT: Alanine aminotransferase; IQR: Interquartile range; CT: Computed tomography; ICU: Intensive care unit; BMI: Body mass index; GIT: Gastrointestinal tract.
DISCUSSIONThis is the first report from Egypt specifically exploring hepatic and GI disturbances in patients with COVID-19. Within our cohort, AST was more frequently elevated (32.10% of cases), compared with ALT (26% of cases). Only 21 (4.91%) and 16 (3.70%) patients, respectively, had a significant liver injury with AST or ALT elevation > 3-fold. The cholestatic pattern of elevated bilirubin > 1.1 mg/dL, elevated ALP >147 U/L, and GGT > 48 U/L was observed in only 8 (1.86%) patients. Our study findings align with those of other studies showing a direct relationship between elevated liver enzymes and COVID-19 disease activity.
Similar to our study, most other studies reveal a predominant pattern of disturbances in liver enzymes in COVID-19 patients, specifically higher AST elevation than ALT elevation[17-19]. A meta-analysis by Wu et al[20] found that low serum albumin and high GGT were the most frequent abnormalities on admission and that ALT elevation occurred most frequently during hospitalization, which they speculate may be due to the inclusion of patients with pre-existing liver disease. In our study, we observed no difference between survivors and non-survivors in serum albumin level. Wu et al[20] and Liu et al[21] found that serum albumin was significantly lower in non-survivors.
Chronic liver disease was reported in 3.29% of our patients. Phipps et al[4] reported that the severity and type of underlying chronic liver disease (e.g., non-alcoholic fatty liver disease and chronic hepatitis B or C) were not significantly associated with hepatic disturbances related to COVID-19, which could be due to the small numbers of

Shousha HI et al. COVID-19-related hepatic and GI disturbances in Egypt
WJG https://www.wjgnet.com 6960 October 28, 2021 Volume 27 Issue 40
Table 6 Multivariate analysis for factors associated with mortality
95% confidence interval for ORVariable B P value adjusted OR
Lower Upper
Vitamin C intake -2.960 0.002 0.05 0.008 0.337
Lung consolidation 1.513 0.030 4.540 1.155 17.840
ICU admission 3.220 < 0.001 25.032 7.110 88.128
FIB-4 score levels 0.001
FIB-4 index levels (1.45:3.25) 0.054 0.921 1.055 0.368 3.025
Fib-4 index levels (above 3.25) 2.341 0.001 10.393 2.459 43.925
Constant -4.821 0.008
ICU: Intensive care unit; FIB-4: Fibrosis-4; OR: Odds ratio.
those cases with chronic liver diseases in their study.In our study, AST was significantly higher in non-survivors, but no significant
difference was observed in ALT levels between survivors and non-survivors, which is similar to previous meta-analyses[17,18]. Patients with severe COVID-19 and patients admitted to the ICU had higher transaminase levels, as confirmed by previous meta-analyses[17-19,21,22]. Ponziani et al[23] reported that alterations in transaminase levels in patients with COVID-19 were mild to moderate, whereas significant liver injury with transaminases > 3 times the ULN and pure cholestatic injuries occurred in a minority of patients[23]. Phipps et al[4] showed that 6.4% of their patients had a severe liver injury with ALT > 5 times above the ULN. They also found that peak ALT, older age, diabetes mellitus, and intubation were independent predictors of mortality. A meta-analysis by Kulkarni et al[22] found that severe liver injury occurred in 10.7% of 3440 patients with COVID-19: 24.9% among 358 patients with the non-severe disease and 41.5% among 317 patients with severe disease.
Other causes of liver injury in patients with COVID-19 include medication, such as acetaminophen at doses exceeding 7.5–10 g and combined use of antivirals and antibiotics. Systemic effects of SARS-CoV-2 infection can be hepatotoxic. For example, hypoxia due to lung injury and, in severe cases, sepsis, acute respiratory distress syndrome, and multi-organ failure precipitate hypoxia and ischemia of the liver, causing elevated serum ALT, AST, and total bilirubin levels[17].
In this study, baseline FIB-4 was an independent factor affecting mortality, and it was significantly higher in patients admitted to the ICU, those with more severe COVID-19 disease, and non-survivors. FIB-4, which predicts significant hepatic fibrosis in patients with liver disease, comprises four variables: Age, AST, ALT, and platelet count[11]. These factors are deranged in COVID-19 disease due to systemic inflammation, bone marrow suppression, injury of the skeletal muscles, elevated pressure in the right heart system with subsequent liver congestion, and elevated liver stiffness that occurs in the disease[24,25]. Sterling et al[23] showed that gender, diabetes mellitus, and FIB-4 ≥ 2.67 were associated with increased mortality. Another recent study by Li et al[25] found that FIB-4 correlated with mortality and severe COVID-19, noting that FIB-4 normalized in the survivors only. They also found that baseline FIB-4 correlated with SARS-CoV-2 viral load and their studied monocyte/ interferon-I-related cytokines (interleukin-6 and interferon-gamma–induced protein 10)[25]. Rentsch et al[26] and Price-Haywood et al[27] found that FIB-4 scores > 3.25 and ≥ 2.67, respectively, were associated with hospitalization and with ICU admission and mechanical support.
Within our cohort, 60 patients (13.98%) presented with GI symptoms in addition to respiratory symptoms. The prevalence of diarrhoea, nausea, vomiting, and abdominal pain was 9.51%, 2.01%, 3.11%, and 3.84%, respectively. Diarrhoea was the most common GI symptom in our cohort, similar to findings from Wang et al[28].
The prevalence of diarrhoea, nausea/vomiting, and abdominal pain in their systematic review and meta-analysis was 9.1%, 5.2%, and 3.5%, respectively. The predominant GI symptoms differ among countries[28-30]. In China, for example, Luo et al[29] reported anorexia, nausea, and vomiting as the frequent symptoms in two-thirds of their patients, while diarrhoea and abdominal pain presented in 37%and 25% of their patients, respectively. A meta-analysis by Wan et al[30] (included 55 studies

Shousha HI et al. COVID-19-related hepatic and GI disturbances in Egypt
WJG https://www.wjgnet.com 6961 October 28, 2021 Volume 27 Issue 40
Table 7 Features of patients with and without gastrointestinal manifestations, n (%)
Variable Respiratory, n = 369 (86.02)
Respiratory and GIT, n = 60 (13.98) Total P value
< 18 2 (0.5) 0 (0.0) 2 (0.5)
18:60 271 (73.4) 51 (85.0) 322 (75.1)
Age
> 60 96 (26.0) 9 (15.0) 105 (24.5)
0.12
Male 210 (56.9) 22 (36.7) 232 (54.1)Gender
Female 159 (43.1) 38 (63.3) 197 (45.9)
0.004
BMI median (IQR) 25.96 (23.34:31.25) 29.02 (26.91:33.36) 27.76 (23.74:32.01) 0.04
Cigarette smoking 15 (18.3) 6 (18.2) 21 (18.3) 1.00
Diabetes mellitus 103 (27.9) 18 (30.0) 121 (28.2) 0.74
Hypertension 101 (27.4) 21 (35.0) 122 (28.4) 0.22
Pulmonary diseases 5 (1.4) 0 (0.0) 5 (1.2) 0.36
Fever 255 (69.1) 44 (73.3) 299 (69.7) 0.51
Headache 124 (33.6) 34 (56.7) 158 (36.8) 0.001
Dry cough 252 (68.3) 35 (58.3) 287 (66.9) 0.13
Dyspnea 154 (41.7) 24 (40.0) 178 (41.5) 0.80
Symptoms
Sore throat 68 (18.4) 20 (33.3) 88 (20.5) 0.008
Steroids 101 (27.4) 24 (40.0) 125 (29.1) 0.05
Lactoferrin 28 (7.6) 18 (30.0) 46 (10.7) <0.001
Hydroxy-chloroquine 101 (27.4) 31 (51.7) 132 (30.8) <0.001
Chloroquine sulfate 200 (54.2) 24 (40.0) 224 (52.2) 0.04
Vitamin C 201 (54.5) 50 (83.3) 251 (58.5) <0.001
Azithromycin 80 (21.7) 33 (55.0) 113 (26.3) <0.001
Other parenteral antibiotics 149 (40.4) 36 (60.0) 185 (43.1) 0.004
Subcutaneous heparin 186 (50.4) 22 (36.7) 208 (48.5) 0.05
Oral anticoagulants 20 (5.4) 13 (21.7) 33 (7.7) <0.001
Mild 122 (33.2) 16 (26.7) 138 (32.2)
Moderate 137 (37.2) 34 (56.7) 171 (40.0)
Severe 53 (14.4) 6 (10.0) 59 (13.8)
COVID-19 disease Classification
Critical 56 (15.2) 4 (6.7) 60 (14.0)
0.03
Recovery 320 (87.2) 56 (93.3) 376 (88.1)Outcome
Death 47(12.8) 4 (6.7) 51(11.9)
0.17
Normal 91 (25.0) 11 (19.3) 102 (24.2)CT chest
Abnormal 273 (75.0) 46 (80.7) 319 (75.8)
0.35
Lug consolidation 61 (17.0) 4 (7.1) 65 (15.7) 0.06
ICU admission 111 (30.2) 10 (16.7) 121 (28.3) 0.03
< 1.45 202 (64.7) 34 (64.2) 236 (64.7)
1.45:3.25 81 (26.0) 14 (26.4) 95 (26.0)
Fibrosis 4-score
> 3.25 29 (9.3) 5 (9.4) 34 (9.3)
0.99
Normal 319 (86.4) 53 (88.3) 372 (86.7)
1-2 UNL 41 (11.1) 7 (11.7) 48 (11.2)
2-3 UNL 2 (0.5) 0 (0.0) 2 (0.5)
Creatinine 0.89

Shousha HI et al. COVID-19-related hepatic and GI disturbances in Egypt
WJG https://www.wjgnet.com 6962 October 28, 2021 Volume 27 Issue 40
> 3UNL 7 (1.9) 0 (0.0) 7 (1.6)
Normal 226 (75.8) 46 (85.2) 272 (77.3)
1-2 UNL 57 (19.1) 7 (13.0) 64 (18.2)
2-3 UNL 7 (2.3) 1 (1.9) 8 (2.3)
Urea
> 3UNL 8 (2.7) 0 (0.0) 8 (2.3)
0.49
< 15 7 (1.9) 0 (0.0) 7 (1.6)
15:29 5 (1.4) 1 (1.7) 6 (1.4)
30:44 17 (4.6) 1 (1.7) 18 (4.2)
45:59 42 (11.4) 8 (13.3) 50 (11.7)
60:89 135 (36.6) 21 (35.0) 156 (36.4)
Estimated-GFR
≥ 90 163 (44.2) 29 (48.3) 192 (44.8)
0.84
Hemoglobin (gm/L) 12.80 (12.00:14.00) 12.05 (11.00:13.35) 12.60 (12.00:13.90) 0.02
White blood cell count (× 109) 5.30 (4.35:8.40) 5.00 (3.63:7.08) 5.00 (4.40:7.60) 0.12
Neutrophils/lymphocytes ratio 3.71 (1.91:6.81) 4.20 (2.13:6.83) 3.11 (1.56:6.16) 0.85
Platelet count 213.00 (175.50:282.50) 225.50 (187.00:278.25) 208.00 (184.00:272.00) 0.87
AST 29.00 (20.00:44.00) 26.00 (17.00:45.63) 28.00 (19.00:43.00) 0.63
ALT 28.00 (19.00:46.00) 27.00 (18.00:55.50) 27.00 (18.00:46.00) 0.96
Alkaline phosphatase 86.50 (70.00:112.25) 99.00 (78.00:117.00) 89.00 (71.00:114.50) 0.18
Total bilirubin 0.80 (0.55:0.90) 0.90 (0.65:1.20) 0.80 (0.60:1.13) 0.06
Serum albumin 4.20 (3.80:4.50) 4.20 (3.70:4.40) 4.20 (3.80:4.50) 0.75
D-dimer 0.58 (0.40:1.10) 0.60 (0.40:1.22) 0.58 (0.40:1.10) 0.08
Ferritin 317.80 (156.10:615.90) 350.00 (112.50:723.98) 300.00 (132.80:590.00) 0.93
C-reactive protein 47.34 (13.81:64.00) 40.00 (7.00:64.00) 45.00 (8.25:64.00) 0.48
AST: Aspartate transaminase; ALT: Alanine aminotransferase; CT: computed tomography; COVID-19: Coronavirus disease 2019; BMI: Body mass index; QR: Interquartile range; GIT: Gastrointestinal tract.
from China, 1 from Austria, 1 from the United States, 1 from Spain, and 2 from Singapore) reported the prevalence of GI symptoms as diarrhoea (53 studies, 8604 patients: 11.2%), nausea and vomiting (33 studies, 6165 patients: 10.0%), loss of appetite (15 studies, 2540 patients: 21.3%), and abdominal pain 14 studies, 2203 patients: (4.6%). Another meta-analysis by Parasa et al[31] reported that diarrhoea occurred in 4.3%–12.2%, and nausea, or vomiting occurred in 2.6%–8.0% of their included 4805 patients[31]. A study from the United States showed that GI symptoms were present in 61.3% of their patients (the most common was loss of appetite (34.8%) followed by diarrhoea (33.7%) and nausea (26.4%))[32].
In our study, 83.4% of patients with GI symptoms had non-severe COVID-19. The presence of diarrhoea or other GI symptoms did not impact COVID-19 mortality. Wang et al[28] also found no difference in the prevalence of diarrhoea among severe and non-severe cases, and the presence of GI symptoms did not affect mortality. Nobel et al[33] found that COVID-19 patients with GI symptoms had lower mortality and no difference in ICU admission rates, compared with patients without GI symptoms[33]. In contrast, Zhong et al[8] and Wan et al[30] reported a correlation between diarrhoea and severity of COVID-19, showing that patients with diarrhoea needed more ICU care and ventilator support.
In our cohort, there was no significant difference in transaminases level among patients with and without GI symptoms, which contrasts with a meta-analysis by Wijarnpreecha et al[17] showing higher transaminases in patients with GI symptoms. The results of our study are similar to Zhou et al[34], who found that GI symptoms were more common in females, sore throat was also more common in their patients with GI symptoms, and haemoglobin level was significantly lower in their patients with GI symptoms. In contrast to our study, ALT was higher in their non-medical group of patients with GI symptoms but not in the medical group, and CRP was

Shousha HI et al. COVID-19-related hepatic and GI disturbances in Egypt
WJG https://www.wjgnet.com 6963 October 28, 2021 Volume 27 Issue 40
Figure 1 Flow chart of the study cohort. COVID-19: Coronavirus disease 2019; ALT: Alanine aminotransferase.
higher in their patients with GI symptoms. Limitations of our study include inconclusive reports about medications received before hospitalization and the possibility of underlying undiagnosed liver disease, such as non-alcoholic fatty liver disease and unavailability of creatine phosphokinase enzyme results, as it was not tested at the time of the study in the quarantine hospitals affiliated with the Egyptian Ministry of Health.
CONCLUSIONIn conclusion, within our cohort of Egyptian patients with COVID-19, elevated AST, ALT, total bilirubin ,and GGT were present in 32.1%, 26%, 5.8%, and 1.86% of our patients, respectively. Significant liver injury (AST and ALT three times higher than the ULN) affected 4.91% and 3.70% of patients, respectively. Male gender, smoking, hypertension, chronic hepatitis C, and lung involvement were significantly associated with elevated AST and ALT. FIB-4 scores were significantly higher in patients admitted to the ICU, those with more severe COVID-19, and non-survivors. The independent variables affecting outcome were supplementary vitamin C intake, lung consolidation, ICU admission, and FIB-4 score. GI symptoms were significantly more frequent in women, patients with higher body mass index, and those with non-severe COVID-19.
ARTICLE HIGHLIGHTSResearch backgroundHepatic and gastrointestinal (GI) disturbances have been reported in patients with coronavirus disease 2019 (COVID-19) with variable prevalence according to disease severity and population characteristics. This could be due to direct severe acute respiratory syndrome coronavirus 2 invasion through the angiotensin-converting enzyme 2 receptors or indirect effects such as an uncontrolled immune response, drug-induced injury, or sepsis.
Shousha HI et al. COVID-19-related hepatic and GI disturbances in Egypt
WJG https://www.wjgnet.com 6964 October 28, 2021 Volume 27 Issue 40
Research motivationComprehensive researches on hepatic and GI derangements in patients with COVID-19 are still lacking, and they are needed for better understanding of the underlying factors, clinical presentations, and disease outcome
Research objectivesWe aimed to study the prevalence and severity of liver and GI derangements in Egyptian patients with COVID-19 infection and their relation to disease outcomes.
Research methodsThis multicentre cohort study was conducted on 547 COVID-19 cases from four quarantine hospitals during the period from April 15, 2020 to July 29, 2020. Clinical, laboratory features, fibrosis-4 (FIB-4) index, COVID-19 severity, and outcomes were recorded. Follow-ups were conducted until discharge or death.
Research resultsAlanine aminotransferase (ALT) and aspartate aminotransferase (AST) were elevated in 26% and 32% of patients while elevations above 3 fold were recorded in 4.91% and 3.73% patients, respectively. Male gender, smoking, hypertension, chronic hepatitis C, and lung involvement were associated with elevated AST or ALT. FIB-4 was significantly higher in patients admitted to the intensive care unit (ICU), those with more severe COVID-19, and non-survivors. The independent variables affecting outcome were supplementary vitamin C intake, lung consolidation, ICU admission, and FIB-4 score > 3.25. GI symptoms were present in 60 (13.98%) patients. They were predominantly females with higher body mass index, and 50 (83.40%) patients had non-severe COVID-19.
Research conclusionsSignificant liver injury was uncommon among Egyptian patients with COVID-19. The independent variables affecting mortality were supplementary vitamin C intake, lung consolidation, ICU admission, and FIB-4 score.
Research perspectivesVariables independently affecting mortality were supplementary vitamin C intake, FIB-4 score > 3.25, lung consolidation, and ICU admission. GI symptoms occurred in patients with non-severe COVID-19.
REFERENCESMusa S. Hepatic and gastrointestinal involvement in coronavirus disease 2019 (COVID-19): What do we know till now? Arab J Gastroenterol 2020; 21: 3-8 [PMID: 32253172 DOI: 10.1016/j.ajg.2020.03.002]
1
Youssef M, H Hussein M, Attia AS, M Elshazli R, Omar M, Zora G, S Farhoud A, Elnahla A, Shihabi A, Toraih EA, S Fawzy M, Kandil E. COVID-19 and liver dysfunction: A systematic review and meta-analysis of retrospective studies. J Med Virol 2020; 92: 1825-1833 [PMID: 32445489 DOI: 10.1002/jmv.26055]
2
Feng G, Zheng KI, Yan QQ, Rios RS, Targher G, Byrne CD, Poucke SV, Liu WY, Zheng MH. COVID-19 and Liver Dysfunction: Current Insights and Emergent Therapeutic Strategies. J Clin Transl Hepatol 2020; 8: 18-24 [PMID: 32274342 DOI: 10.14218/JCTH.2020.00018]
3
Phipps MM, Barraza LH, LaSota ED, Sobieszczyk ME, Pereira MR, Zheng EX, Fox AN, Zucker J, Verna EC. Acute Liver Injury in COVID-19: Prevalence and Association with Clinical Outcomes in a Large U.S. Cohort. Hepatology 2020; 72: 807-817 [PMID: 32473607 DOI: 10.1002/hep.31404]
4
Ghoda A, Ghoda M. Liver Injury in COVID-19 Infection: A Systematic Review. Cureus 2020; 12: e9487 [PMID: 32879813 DOI: 10.7759/cureus.9487]
5
Jothimani D, Venugopal R, Abedin MF, Kaliamoorthy I, Rela M. COVID-19 and the liver. J Hepatol 2020; 73: 1231-1240 [PMID: 32553666 DOI: 10.1016/j.jhep.2020.06.006]
6
Suresh Kumar VC, Harne PS, Mukherjee S, Gupta K, Masood U, Sharma AV, Lamichhane J, Dhamoon AS, Sapkota B. Transaminitis is an indicator of mortality in patients with COVID-19: A retrospective cohort study. World J Hepatol 2020; 12: 619-627 [PMID: 33033568 DOI: 10.4254/wjh.v12.i9.619]
7
Zhong P, Xu J, Yang D, Shen Y, Wang L, Feng Y, Du C, Song Y, Wu C, Hu X, Sun Y. COVID-19-associated gastrointestinal and liver injury: clinical features and potential mechanisms. Signal Transduct Target Ther 2020; 5: 256 [PMID: 33139693 DOI: 10.1038/s41392-020-00373-7]
8
Zhang H, Kang Z, Gong H, Xu D, Wang J, Li Z, Cui X, Xiao J, Zhan J, Meng T, Zhou W, Liu J, Xu 9
Shousha HI et al. COVID-19-related hepatic and GI disturbances in Egypt
WJG https://www.wjgnet.com 6965 October 28, 2021 Volume 27 Issue 40
H. Digestive system is a potential route of COVID-19: an analysis of single-cell coexpression pattern of key proteins in viral entry process. Gut 2020; 69: 1010-1018 [DOI: 10.1136/gutjnl-2020-320953]Villapol S. Gastrointestinal symptoms associated with COVID-19: impact on the gut microbiome. Transl Res 2020; 226: 57-69 [PMID: 32827705 DOI: 10.1016/j.trsl.2020.08.004]
10
Sterling RK, Lissen E, Clumeck N, Sola R, Correa MC, Montaner J, S Sulkowski M, Torriani FJ, Dieterich DT, Thomas DL, Messinger D, Nelson M; APRICOT Clinical Investigators. Development of a simple noninvasive index to predict significant fibrosis in patients with HIV/HCV coinfection. Hepatology 2006; 43: 1317-1325 [PMID: 16729309 DOI: 10.1002/hep.21178]
11
Frater JL, Zini G, d'Onofrio G, Rogers HJ. COVID-19 and the clinical hematology laboratory. Int J Lab Hematol 2020; 42 Suppl 1: 11-18 [PMID: 32311826 DOI: 10.1111/ijlh.13229]
12
Ministry of Health and Population, Egypt Management protocol for COVID-19 Patients. [cited 30 May 2020]. Available from: https://www.elwatannews.com/data/iframe/pdf/17175200761591035127.pdf
13
Chan YH. Biostatistics 102: quantitative data--parametric & non-parametric tests. Singapore Med J 2003; 44: 391-396 [PMID: 14700417]
14
Chan YH. Biostatistics 103: qualitative data - tests of independence. Singapore Med J 2003; 44: 498-503 [PMID: 15024452]
15
Chan YH. Biostatistics 202: logistic regression analysis. Singapore Med J 2004; 45: 149-153 [PMID: 15094982]
16
Wijarnpreecha K, Ungprasert P, Panjawatanan P, Harnois DM, Zaver HB, Ahmed A, Kim D. COVID-19 and liver injury: a meta-analysis. Eur J Gastroenterol Hepatol 2021; 33: 990-995 [PMID: 32639420 DOI: 10.1097/MEG.0000000000001817]
17
Wu ZH, Yang DL. A meta-analysis of the impact of COVID-19 on liver dysfunction. Eur J Med Res 2020; 25: 54 [PMID: 33148326 DOI: 10.1186/s40001-020-00454-x]
18
Xing QQ, Dong X, Ren YD, Chen WM, Zeng DY, Cai YY, Hong MZ, Pan JS. Liver Chemistries in Patients with COVID-19 Who Discharged alive or Died: A Meta-analysis. Hepatol Commun 2020; 5: 12-23 [PMID: 32838104 DOI: 10.1002/hep4.1585]
19
Wu Y, Li H, Guo X, Yoshida EM, Mendez-Sanchez N, Levi Sandri GB, Teschke R, Romeiro FG, Shukla A, Qi X. Incidence, risk factors, and prognosis of abnormal liver biochemical tests in COVID-19 patients: a systematic review and meta-analysis. Hepatol Int 2020; 14: 621-637 [PMID: 32710250 DOI: 10.1007/s12072-020-10074-6]
20
Liu C, Yang J, Wang W, Zheng P, Tang Y. Liver injury could be associated with severe disease in COVID-19 patients: a meta-analysis. Eur J Gastroenterol Hepatol 2020 [PMID: 33031191 DOI: 10.1097/MEG.0000000000001953]
21
Kulkarni AV, Kumar P, Tevethia HV, Premkumar M, Arab JP, Candia R, Talukdar R, Sharma M, Qi X, Rao PN, Reddy DN. Systematic review with meta-analysis: liver manifestations and outcomes in COVID-19. Aliment Pharmacol Ther 2020; 52: 584-599 [PMID: 32638436 DOI: 10.1111/apt.15916]
22
Ponziani FR, Del Zompo F, Nesci A, Santopaolo F, Ianiro G, Pompili M, Gasbarrini A; “Gemelli against COVID-19” group. Liver involvement is not associated with mortality: results from a large cohort of SARS-CoV-2-positive patients. Aliment Pharmacol Ther 2020; 52: 1060-1068 [PMID: 32628793 DOI: 10.1111/apt.15996]
23
Sterling RK, Oakes T, Gal TS, Stevens MP, deWit M, Sanyal AJ. The Fibrosis-4 Index Is Associated With Need for Mechanical Ventilation and 30-Day Mortality in Patients Admitted With Coronavirus Disease 2019. J Infect Dis 2020; 222: 1794-1797 [PMID: 32856702 DOI: 10.1093/infdis/jiaa550]
24
Li Y, Regan J, Fajnzylber J, Coxen K, Corry H, Wong C, Rosenthal A, Atyeo C, Fischinger S, Gillespie E, Chishti R, Baden L, Yu XG, Alter G, Kim A, Li JZ. Liver Fibrosis Index FIB-4 Is Associated With Mortality in COVID-19. Hepatol Commun 2020; 5: 434-445 [PMID: 33363264 DOI: 10.1002/hep4.1650]
25
Rentsch CT, Kidwai-Khan F, Tate JP, Park LS, King JT, Skanderson M, Hauser RG, Schultze A, Jarvis CI, Holodniy M, Lo Re V, Akgun KM, Crothers K, Taddei TH, Freiberg MS, Justice AC. Covid-19 Testing, Hospital Admission, and Intensive Care Among 2,026,227 United States Veterans Aged 54-75 Years. 2020 Preprint. Available from: medRxiv [PMID: 32511595 DOI: 10.1101/2020.04.09.20059964]
26
Price-Haywood EG, Burton J, Fort D, Seoane L. Hospitalization and Mortality among Black Patients and White Patients with Covid-19. N Engl J Med 2020; 382: 2534-2543 [PMID: 32459916 DOI: 10.1056/NEJMsa2011686]
27
Wang H, Qiu P, Liu J, Wang F, Zhao Q. The liver injury and gastrointestinal symptoms in patients with Coronavirus Disease 19: A systematic review and meta-analysis. Clin Res Hepatol Gastroenterol 2020; 44: 653-661 [PMID: 32418852 DOI: 10.1016/j.clinre.2020.04.012]
28
Luo S, Zhang X, Xu H. Don't Overlook Digestive Symptoms in Patients With 2019 Novel Coronavirus Disease (COVID-19). Clin Gastroenterol Hepatol 2020; 18: 1636-1637 [PMID: 32205220 DOI: 10.1016/j.cgh.2020.03.043]
29
Wan J, Wang X, Su S, Zhang Y, Jin Y, Shi Y, Wu K, Liang J. Digestive symptoms and liver injury in patients with coronavirus disease 2019 (COVID-19): A systematic review with meta-analysis. JGH Open 2020; 4: 1047-1058 [PMID: 33319036 DOI: 10.1002/jgh3.12428]
30
Parasa S, Desai M, Thoguluva Chandrasekar V, Patel HK, Kennedy KF, Roesch T, Spadaccini M, Colombo M, Gabbiadini R, Artifon ELA, Repici A, Sharma P. Prevalence of Gastrointestinal Symptoms and Fecal Viral Shedding in Patients With Coronavirus Disease 2019: A Systematic Review and Meta-analysis. JAMA Netw Open 2020; 3: e2011335 [PMID: 32525549 DOI:
31

Shousha HI et al. COVID-19-related hepatic and GI disturbances in Egypt
WJG https://www.wjgnet.com 6966 October 28, 2021 Volume 27 Issue 40
10.1001/jamanetworkopen.2020.11335]Redd WD, Zhou JC, Hathorn KE, McCarty TR, Bazarbashi AN, Thompson CC, Shen L, Chan WW. Prevalence and Characteristics of Gastrointestinal Symptoms in Patients With Severe Acute Respiratory Syndrome Coronavirus 2 Infection in the United States: A Multicenter Cohort Study. Gastroenterology 2020; 159: 765-767. e2 [PMID: 32333911 DOI: 10.1053/j.gastro.2020.04.045]
32
Nobel YR, Phipps M, Zucker J, Lebwohl B, Wang TC, Sobieszczyk ME, Freedberg DE. Gastrointestinal Symptoms and Coronavirus Disease 2019: A Case-Control Study From the United States. Gastroenterology 2020; 159: 373-375. e2 [PMID: 32294477 DOI: 10.1053/j.gastro.2020.04.017]
33
Zhou Z, Zhao N, Shu Y, Han S, Chen B, Shu X. Effect of Gastrointestinal Symptoms in Patients With COVID-19. Gastroenterology 2020; 158: 2294-2297 [PMID: 32199880 DOI: 10.1053/j.gastro.2020.03.020]
34

WJG https://www.wjgnet.com 6967 October 28, 2021 Volume 27 Issue 40
World Journal of
GastroenterologyW J GSubmit a Manuscript: https://www.f6publishing.com World J Gastroenterol 2021 October 28; 27(40): 6967-6984
DOI: 10.3748/wjg.v27.i40.6967 ISSN 1007-9327 (print) ISSN 2219-2840 (online)
ORIGINAL ARTICLE
Observational Study
Factors affecting anxiety, depression, and self-care ability in patients who have undergone liver transplantation
Sami Akbulut, Ali Ozer, Hasan Saritas, Sezai Yilmaz
ORCID number: Sami Akbulut 0000-0002-6864-7711; Ali Ozer 0000-0002-7144-4915; Hasan Saritas 0000-0001-7558-8812; Sezai Yilmaz 0000-0002-8044-0297.
Author contributions: Akbulut S and Saritas H collected the data; Akbulut S and Ozer A performed the statistical analysis; Akbulut S and Ozer A wrote the manuscript; Akbulut S, Ozer A and Yilmaz S reviewed the final version of the manuscript.
Institutional review board statement: This study was reviewed and approved by the Inonu University institutional review board for non-interventional studies (2019/3-27).
Informed consent statement: Verbal and written consents were obtained from all living liver donor candidates.
Conflict-of-interest statement: The authors declare no conflicts of interest regarding this manuscript.
Data sharing statement: There are no additional data available for this study.
STROBE statement: The authors have read the STROBE Statement-checklist of items, and the manuscript was prepared and
Sami Akbulut, Sezai Yilmaz, Liver Transplant Institute, Inonu University Faculty of Medicine, Malatya 44280, Turkey
Sami Akbulut, Ali Ozer, Department of Public Health, Inonu University Faculty of Medicine, Malatya 44280, Turkey
Hasan Saritas, Department of Surgical Nursing, Siirt University Faculty of Nursing, Siirt 56100, Turkey
Corresponding author: Sami Akbulut, MD, PhD, Professor, Liver Transplant Institute, Inonu University Faculty of Medicine, Elazig Yolu 10.Km, Malatya 44280, Turkey. [email protected]
AbstractBACKGROUND Depression, anxiety, and altered self-care ability are among the most important factors affecting the quality of life of liver transplant recipients. Depending on the severity of the underlying liver disease, signs and symptoms of anxiety and depression may become more pronounced.
AIM To evaluate the factors affecting depression, anxiety and self-care abilities of liver transplant recipients.
METHODS Recipients who are ≥ 18 years and who underwent liver transplantation at Inonu University Liver Transplantation Institute were included in this descriptive and cross-sectional study. Sample size analysis showed that the minimum number of recipients should be 301 (confidence level = 95%, confidence interval = 2.5, population = 1382). Three hundred and twenty recipients were interviewed and 316 recipients that have answered the questionnaires accurately were analyzed. The dependent variables were the Beck Depression Scale, State-Trait Anxiety Scale (Form I and II), and Self-Care Agency Scale. The independent variables of the study were sociodemographic characteristics, biliary complications, hepato-cellular carcinoma, recommending liver transplantation to other patients, and the interval of out-patient clinic visits.
RESULTS

Akbulut S et al. QOL in liver transplant recipients
WJG https://www.wjgnet.com 6968 October 28, 2021 Volume 27 Issue 40
revised according to the STROBE Statement-checklist of items.
Open-Access: This article is an open-access article that was selected by an in-house editor and fully peer-reviewed by external reviewers. It is distributed in accordance with the Creative Commons Attribution NonCommercial (CC BY-NC 4.0) license, which permits others to distribute, remix, adapt, build upon this work non-commercially, and license their derivative works on different terms, provided the original work is properly cited and the use is non-commercial. See: http://creativecommons.org/Licenses/by-nc/4.0/
Manuscript source: Invited manuscript
Specialty type: Gastroenterology and hepatology
Country/Territory of origin: Turkey
Peer-review report’s scientific quality classificationGrade A (Excellent): 0 Grade B (Very good): B, B, B Grade C (Good): 0 Grade D (Fair): 0 Grade E (Poor): 0
Received: July 6, 2021 Peer-review started: July 6, 2021 First decision: August 7, 2021 Revised: August 15, 2021 Accepted: October 11, 2021 Article in press: September 30, 2021 Published online: October 28, 2021
P-Reviewer: Goktepe HM, Kowalewski G, Li HL S-Editor: Gao CC L-Editor: Filipodia P-Editor: Gao CC
Self-care ability scores were lower (P = 0.002) and anxiety scores were higher (P = 0.004) in recipients with biliary complications. On the other hand, in recipients with hepatocellular carcinoma, self-care scores were lower (P = 0.006) while depression (P = 0.003) and anxiety scores (P = 0.009) were higher. Liver transplantation recipients with a monthly income < 3000 Turkish liras had higher depression (P < 0.001) and anxiety (P = 0.003) scores. The recipients who stated that they would not recommend liver transplantation to others had lower self-care scores (P = 0.002), higher depression (P < 0.001), higher state anxiety (P = 0.02), and trait anxiety (P < 0.001) scores.
CONCLUSION Presence of biliary complications and hepatocellular carcinoma, low income level, and an obligation for monthly visits to the outpatient clinic are factors that are found to affect self-care capability, depression, and anxiety.
Key Words: Liver transplantation; Biliary complications; Hepatocellular carcinoma; Socioeconomic status; Depression; Anxiety; Self-care capabilities
©The Author(s) 2021. Published by Baishideng Publishing Group Inc. All rights reserved.
Core Tip: Depression, anxiety, and deficiency in self-care ability are among the most important factors affecting the quality of life of liver transplant recipients. This descriptive, cross-sectional questionnaire-based study shows that presence of biliary complications and hepatocellular carcinoma, low monthly income level, and monthly visits to the outpatient clinic are factors that affect self-care capability, depression, and anxiety.
Citation: Akbulut S, Ozer A, Saritas H, Yilmaz S. Factors affecting anxiety, depression, and self-care ability in patients who have undergone liver transplantation. World J Gastroenterol 2021; 27(40): 6967-6984URL: https://www.wjgnet.com/1007-9327/full/v27/i40/6967.htmDOI: https://dx.doi.org/10.3748/wjg.v27.i40.6967
INTRODUCTIONSince the first successful liver transplantation (LT) performed by Starzl et al[1] in 1967, LT has become the gold standard treatment modality for end stage liver failure and acute liver failure. In recent years, advancements in immunosuppressive medication, management of postoperative complications, and surgical technique have resulted in extended survival periods for transplant recipients[2,3]. The expectations in quality of life (QOL) of the LT recipients became more prominent with the increased survival rates of the recipients.
The parameters, signs, and symptoms related to QOL, such as the preoperative depression, anxiety, or need for support of a relative, can be exacerbated or can initially be seen in the postoperative period depending on the severity of preoperative psychosocial problems, operative trauma of a major operation, such as LT, long duration of hospitalization in either intensive care unit or in patient-wards, adverse effects of immunosuppressive agents (diabetes mellitus, osteoporosis, infection risk, hypertension, renal failure etc.), development of postoperative biliary complications that require interventions, the fear of recurrence of the underlying disease, such as hepatocellular carcinoma (HCC), the fear of the risk of acute or chronic organ rejection, loss of occupation that result in economic losses, and the need for regular postoperative follow-up[4-13]. The major factors affecting the QOL related with health are presence of preoperative co-morbidities (diabetes, hypertension, pulmonary disease), advanced age, female gender, occupation, low socioeconomic status, and financial burden[14-16]. Therefore, all these data suggest that strict surveillance of the transplant recipients in the preoperative and postoperative period in terms of psychosocial status and treatment of any psychosocial problems with psychotherapy and medication may increase the physical and mental QOL and may have a positive
Akbulut S et al. QOL in liver transplant recipients
WJG https://www.wjgnet.com 6969 October 28, 2021 Volume 27 Issue 40
impact on the life expectancy of the individuals[7,8].Depression, anxiety, and the ability of self-care seem to be the most important
parameters in the recipients in the postoperative period. Furthermore, some recipients may develop anxiety and depression depending on the risk factors mentioned above that may have an impact on the postoperative mental and physical QOL of the individual. In the present study on patients who received a LT, the anxiety was evaluated by State-Trait Anxiety Scale (STAI; Form I and II), depression was evaluated using the Beck Depression Scale (BDS), and the self-care was evaluated using the Self-Care Agency Scale (SCAS). All these scoring systems and scales were individually used in previous studies involving solid organ transplantation[17-19]. However, we have not encountered any study involving all three scales used together to evaluate a population of recipients. The aim of the present study is to analyze the relationship between sociodemographic characteristics, presence of biliary complications, presence of HCC, preference of recommendation of LT to others, and frequency of out-patient clinic control and some post-transplant QOL indicators (depression, anxiety, self-care ability).
MATERIALS AND METHODSType, duration, and location of the studyThe preset study is descriptive, cross-sectional questionnaire-based study on patients transplanted between March 2002 and December 2018 at Inonu University Liver Transplant Institute. The recipients that are compliant with regular out-patient follow-up were selected for evaluation in the study, and face-to-face interview technique was applied to all these recipients. This study was reviewed and approved by the Inonu University institutional review board for non-interventional studies (3/27/2019).
Study population and sample sizeThe study population included 1382 recipients who met the above-mentioned criteria. The sample size was calculated (from the website https://www.surveysystem.com/sscalc.htm) using the confidence level of 95% and patient population (n = 1382) and the calculation showed that minimum of 301 individuals were required for evaluation in the present study. We interviewed 320 recipients in the present study considering the proportion of the recipients with missing data. Of those, the 316 recipients who answered the questionnaire forms accurately were included in the present study.
Inclusion and exclusion criteriaLT recipients who were discharged that were equal to or greater than 18 years old, who can communicate verbally, and understand and answer the questions were included in the present study. At the time of this study, LT was not performed for patients with intellectual disability in our liver transplant institute. Foreigners who lacked sufficient Turkish to answer the questions and recipients younger than 18 years were excluded from the study.
Parameters and scales used in the studyDemographic and clinical characteristics form: Age, gender, marital status, blood type, residency (city center, town, or village), monthly income [≤ 1000 Turkish liras (TL), 1000-3000 TL, ≥ 3000 TL], underlying liver disease (hepatitis B, hepatitis C, HCC etc.), type of LT (living donor LT, deceased donor LT), smoking status, alcohol consumption, type of immunosuppressive agent that is being used (tacrolimus, everolimus, cyclosporin, mycophenolate mofetil, corticosteroids, etc.), presence of postoperative biliary complications, co-morbidities (cardiac, pulmonary, metabolic etc.), and the frequency of the out-patient visits [monthly or once in every 3 mo (quarterly)] were all evaluated for the present study.
BDS: BDS is designed to evaluate how the individual feels about one-self that was defined by Beck et al[20] for the first time in 1961. Hisli[21] evaluated the validity and reliability of the Turkish version in 1989 (Cronbach's alpha = 0.80). BDS includes 21 articles that are scored between 0 and 3 points. The scores obtained from BDS range between 0 and 63 points and it evaluates the presence and the severity of depression in individuals. The severity of depression according to the scores of the individuals are minimal depression (0-9 points), mild depression (10-16 points), moderate depression (17-29 points), and severe depression (30-63 points)[22].
Akbulut S et al. QOL in liver transplant recipients
WJG https://www.wjgnet.com 6970 October 28, 2021 Volume 27 Issue 40
STAI: STAI was first defined by Spielberger et al[23] in 1970 to define the reaction of individuals with newly-developed or pre-existent anxiety. The validity and reliability of the scale was performed by Oner and LeCompte in 1983[24]. The Cronbach's alpha reliability coefficient for instantaneous and continuous anxiety scores calculated were 0.96 and 0.83, respectively[24]. The scale includes STAI Form-I (State) and STAI Form-II (Trait) parts. The first part of the form evaluates the recent anxiety status of the individual and the later part of the form evaluates the general anxiety status of the patient. The answers to the first part of the form are as follows: not at all (= 1), somewhat (= 2), moderately so (= 3), and very much so (= 4). The answers to the second part of the form are as follows: almost never (= 1), sometime (= 2), often (= 3), and almost always (= 4). In the STAI-I scale questions 1, 2, 5, 8, 10, 11, 15, 16, 19, and 20 are graded inversely (1 = 4 points, 2 = 3 points, 3 = 2 points, and 4 = 1 points). The other questions are graded directly (1 = 1 points, 2 = 2 points, 3 = 3 points, 4 = 4 points). In a similar fashion, in the STAI-II scale, 21, 26, 27, 30, 36, and 39th questions are graded inversely as explained before. At the end of evaluation, the anxiety is classified as high if the points are high; and is considered as low if the points are low. The total points from the instantaneous and the continuous parts is also helpful for the diagnosis of anxiety. If the total points are ≥ 35 points, this indicates the presence of anxiety and if the total points are < 35, this suggests that there is no anxiety in the patients[24,25].
SCAS: SCAS was first developed in 1979 by Kearney and Fleischer[26] to evaluate the self-care ability of individuals. The validation of the Turkish version in healthy subjects was performed by Nahcivan[27] in 1993 (Cronbach's alpha = 0.89). All 35 questions in the questionnaire are designed in a five-point Likert scale: It does not define me at all (= 0), it does not define me entirely (= 1), I have no idea (= 2), it defines me a little (= 3), and it defines me completely (= 4). In the questionnaire, the question 6, 9, 13, 19, 22, 26, and 31 are graded inversely (0 = 4 points, 1 = 3 points, 2 = 2 points, 3 = 1 points, 4 = 1 points). The other questions are graded directly (0 = 1 points, 1 = 1 points, 2 = 2 points, 3 = 3 points, 4 = 4 points). Maximum points obtained from the scale can be 140, and higher scores indicate higher self-care ability.
Statistical analysisAll statistical analyses are performed by Statistical Software Package for Social Sciences (SPSS v. 25). The Kolmogorov-Smirnov test was used to evaluate the normality of distribution of the variables. Some of the variables did not distribute normally and, therefore, all the continuous variables were expressed as median and interquartile range (IQR = Q3-Q1). Qualitative variables were expressed as the number of affected individuals (n) and percentage (%). Two-independent groups were compared using the Mann-Whitney U test, Pearson Chi-Square test, and Chi-Square test with Yates correction. For three-independent group comparisons, the Chi-Square test was used for qualitative variables and the Kruskal-Wallis test was used for continuous variables. For parameters that showed significant differences in the Kruskal-Wallis test, these parameters were further evaluated with Kruskal-Wallis One-way ANOVA (k sample) to determine the source of difference among the multiple groups. The correlation between the discrete variables was evaluated using Spearman’s Rho correlation analysis. The correlation between the qualitative and quantitative variables were evaluated using the Point Double-Series Correlation Coefficient. Partial correlation analysis was performed to evaluate the individual contribution of variables to the correlation. The Correlation coefficient (r) was classified according to the power of the correlation; as defined before: very weak (r = 0.00-0.25), weak (r = 0.00-0.25), moderate (r = 0.50-0.69), high (r = 0.70-0.89), and very high (r = 0.90-1.00). Any P value less than 0.05 was considered as being statistically significant.
RESULTSA total 316 patient with an age ranging from 18 to 76 years (median = 50, IQR = 58-36) were included in the present study. There were 189 (59.8%) male and 127 (40.2%) female patients included in the study. The demographic and sociocultural character-istics, clinical characteristics related with LT, and data regarding self-care ability, depression and anxiety status of the recipients are summarized in Tables 1-3.

Akbulut S et al. QOL in liver transplant recipients
WJG https://www.wjgnet.com 6971 October 28, 2021 Volume 27 Issue 40
Table 1 Sociodemographic characteristics of the study group
Parameters n %
Gender
Female 127 40.2
Male 189 59.8
Age (yr)
Median 50
IQR 58-36
BMI (kg/m2)
Median 25
IQR 28-22
Marital status
Married 245 77.5
Unmarried 58 18.4
Divorced 13 4.1
Residency
City Center 175 55.4
Town 106 33.5
Village 35 11.1
Levels of education
Unschooled 48 15.2
Primary school 156 49.4
Secondary school 23 7.3
High school 61 19.3
Bachelor's degree or more 28 8.9
Career
Housewife 90 28.5
Employed 27 8.6
Retired 78 24.7
Tradesman 40 12.7
Unemployed 81 25.6
Monthly income (Turkish liras)
≤ 1000 18 5.7
1000-3000 260 82.3
≥ 3000 38 12.0
Chronic disease (except liver disease)
Yes 113 35.8
No 203 64.2
Smoking (pre-LT)
Yes 127 40.2
No 189 59.8
Smoking (post-LT)
Yes 12 3.8

Akbulut S et al. QOL in liver transplant recipients
WJG https://www.wjgnet.com 6972 October 28, 2021 Volume 27 Issue 40
No 304 96.2
Alcohol use (pre-LT)
Yes 37 11.7
No 279 88.3
Alcohol use (post-LT)
Yes 7 2.2
No 309 97.8
BMI: Body mass index; IQR (Q3-Q1): Inter-quartile range.
Evaluation of the patients according to the presence of biliary complicationsThe recipients were classified into two groups according to presence (n = 200) and absence (n = 116) of biliary complications. Body mass index (P = 0.038), type of liver graft (P < 0.001), SCAS (P = 0.002), and STAI-I (P = 0.004) were significantly different among the groups. In recipients with biliary complications SCAS scores were found to be low and STAI-I scores were high. The median BDS scores did not significantly change. However, when the BDS scores were classified, there was a significant difference among the recipients with and without biliary complications (P = 0.04). The moderate to severe depression rate was higher in recipients with biliary complications. Total STAI scores were classified according to the anxiety of the recipients and the severity of anxiety was higher in recipients with biliary complications (57.5%, P = 0.009). There was no statistically significant difference in other variables according to the presence of biliary complications (Table 4).
Evaluation of the patients according to the presence of HCCThe recipients were classified according to presence (n = 32) or absence (n = 284) of HCC (Table 5). SCAS (P = 0.006), BDS (P = 0.003), and STAI-II scores (P = 0.009) were significantly different among recipients with and without HCC. While mild and moderate depressive symptoms were more pronounced in recipients with HCC, minimal depressive symptoms were higher in recipients without HCC. Other variables showed no difference according to presence or absence of HCC (Table 5).
Evaluation of the patients according to monthly incomeThe recipients were grouped in to three groups according to their monthly income (TL): ≤ 1000 (n = 18), 1000-3000 (n = 260), and ≥ 3000 (n = 38) (Table 6). There were significant differences in gender (P < 0.001), place or residence (P = 0.002), BDS scores (P < 0.001), and STAI-II scores (P = 0.003) among groups. In recipients with monthly income ≥ 3000 TL, the depressive symptoms were minimal; while, in recipients with low income, higher rates of mild and moderate depressive symptoms were observed. Other parameters did not show difference according to income of the recipients (Table 6).
Evaluation of the patients according to their inclination towards recommendation of LT to othersThe recipients were grouped according to their preference of recommending (n = 285) or not recommending (n = 31) LT to others. The groups showed statistically significant difference in terms of SCAS (P = 0.002), BDS scores (P < 0.001), STAI-I (P = 0.02), and STAI-II scores (P < 0.001). In the group of recipients that do not recommend LT to others, about half of the individuals had moderate to severe depressive symptoms which was significantly higher than the recipients in the group that do recommend LT (48.5% vs 11.6%; P < 0.001). All STAI scores were stratified according to the anxiety of the recipients and the rate of anxiety was significantly higher in recipients in the group that do not recommend LT (100% vs 85.6%; P = 0.021). There was no significant difference in other variables according to inclination towards recommending or not recommending LT to others (Table 7).
Evaluation of the patients according to frequency of out-patient clinic visitsThe data of the 264 LT recipients that come to out-patient clinic monthly were compared to 52 recipients who come to out-patient visits quarterly. Age (P = 0.047) and BDS scores (P = 0.028) showed significant difference among the groups. The
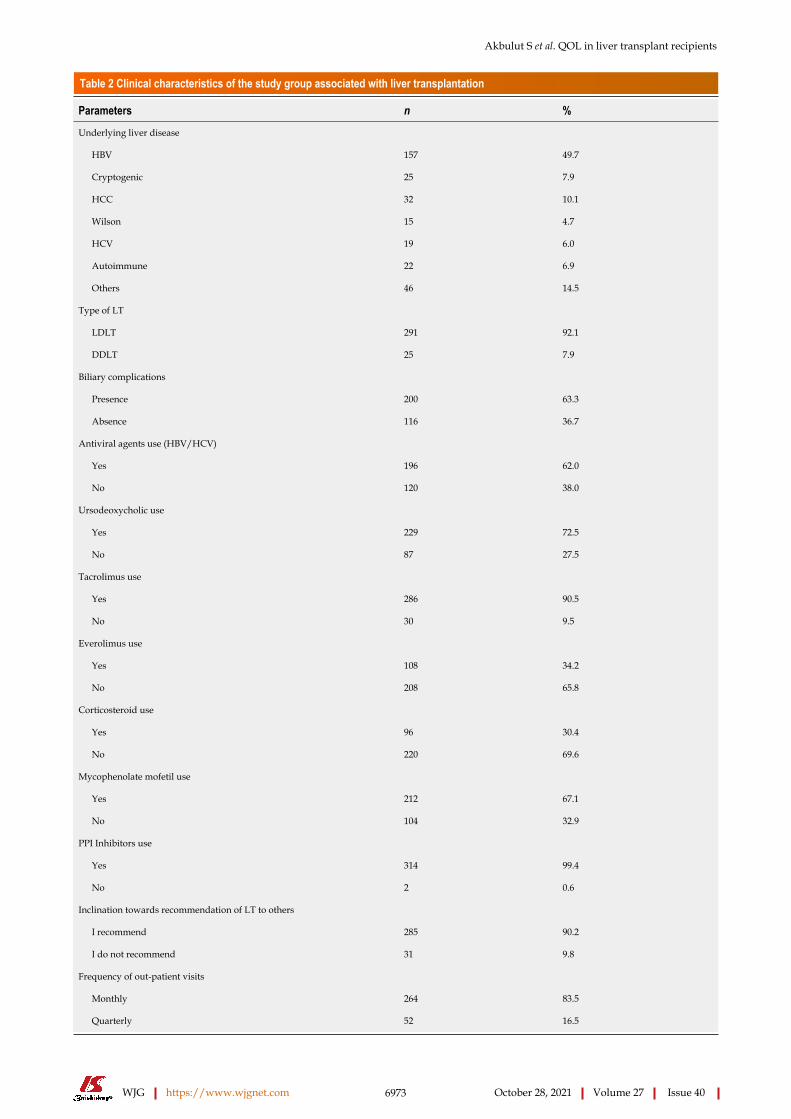
Akbulut S et al. QOL in liver transplant recipients
WJG https://www.wjgnet.com 6973 October 28, 2021 Volume 27 Issue 40
Table 2 Clinical characteristics of the study group associated with liver transplantation
Parameters n %
Underlying liver disease
HBV 157 49.7
Cryptogenic 25 7.9
HCC 32 10.1
Wilson 15 4.7
HCV 19 6.0
Autoimmune 22 6.9
Others 46 14.5
Type of LT
LDLT 291 92.1
DDLT 25 7.9
Biliary complications
Presence 200 63.3
Absence 116 36.7
Antiviral agents use (HBV/HCV)
Yes 196 62.0
No 120 38.0
Ursodeoxycholic use
Yes 229 72.5
No 87 27.5
Tacrolimus use
Yes 286 90.5
No 30 9.5
Everolimus use
Yes 108 34.2
No 208 65.8
Corticosteroid use
Yes 96 30.4
No 220 69.6
Mycophenolate mofetil use
Yes 212 67.1
No 104 32.9
PPI Inhibitors use
Yes 314 99.4
No 2 0.6
Inclination towards recommendation of LT to others
I recommend 285 90.2
I do not recommend 31 9.8
Frequency of out-patient visits
Monthly 264 83.5
Quarterly 52 16.5

Akbulut S et al. QOL in liver transplant recipients
WJG https://www.wjgnet.com 6974 October 28, 2021 Volume 27 Issue 40
DDLT: Deceased donor liver transplantation; HBV: Hepatitis B virus; HCC: Hepatocellular carcinoma; HCV: Hepatitis C virus; LDLT: Living donor liver transplantation; LT: Liver transplantation.
Table 3 Evaluation of the Study group according to the scores obtained Self-Care Agency Scale, Beck Depression Scale and State-Trait Anxiety Scale
Parameters Results
SCAS scores
Median 95
IQR 108-86
BDS scores
Median 9
IQR 14-5
STAI-I (state) scores
Median 35
IQR 41-28
STAI-II (trait) scores
Median 42
IQR 50-36
STAI-I (state) (categorized form)
Presence anxiety (≥ 35 point) 164 (51.9)
Absence anxiety (< 35 point) 152 (48.1)
STAI-II (trait) (categorized form)
Presence anxiety (≥ 35 point) 275 (87.0)
Absence anxiety (< 35 point) 41 (13.0)
BDS (categorized form)
Minimal depression (0-9 point) 183 (57.9)
Mild depression (10-16 point) 85 (26.9)
Moderate depression (17-29 point) 45 (14.2)
Severe depression (30-63 point) 3 (0.9)
BDS: Beck Depression Scale; IQR (Q3-Q1): Inter-quartile range; SCAS: Self-Care Agency Scale; STAI: State-Trait Anxiety Scale.
moderate depression rate of the recipients that come to monthly controls were significantly higher (16.7% vs 1.9%; P = 0.004). Other variables did not show significant difference according to the frequency of out-patient clinical visits (Table 8).
The results of correlation statistics between the scalesSCAS and BDS showed a significant but weak and negative correlation P < 0.001; r = -0.340). There was also a significant but weak and negative correlation between SCAS and STAI-I scales (P < 0.001; r = -0.473) and SCAS and STAI-II scales (P < 0.001; r = -0.391). There was a significant but weak positive correlation between BDS and STAI-I scores (P < 0.001; r = +0.498) and between BDS and STAI-II scores (P < 0.001; r = +0.455). There was a significant, moderate, and positive correlation between STAI-I and STAI-II scores (P < 0.001; r = +0.539). The impact of presence of biliary complic-ations, HCC, and the frequency of out-patient clinic visits on correlations observed between STAI-I, STAI-II, BDS, and SCAS scores were further analyzed using partial correlation analyses techniques which showed that the correlation between different scales were independent from the factors that were investigated.

Akbulut S et al. QOL in liver transplant recipients
WJG https://www.wjgnet.com 6975 October 28, 2021 Volume 27 Issue 40
Table 4 Comparison of various characteristics of the study group according to presence of postoperative biliary complications
Parameters Biliary complications (+) (n = 200) Biliary complications (-) (n = 116) P value
Age (yr)
Median 48 53
IQR 56-36 60-40
0.126
Gender (%)
Female 83 (41.5) 44 (37.9)
Male 117 (58.5) 72 (62.1)
0.533
BMI (kg/m2)
Median 26 25
IQR 28-22 27-22
0.038
Type of LT
LDLT 194 (97) 97 (83.6)
DDLT 6 (3) 19 (16.4)
< 0.001
SCAS scores
Median 94 98
IQR 108-82 107-89
0.002
BDS scores
Median 9 9
IQR 15-5 12-7
0.375
STAI-I (state) scores
Median 37 32
IQR 43-29 41-27
0.004
STAI-II (trait) scores
Median 42 42
IQR 50-36 54-37
0.454
BDS (categorized form)
Minimal depression 114 (57) 69 (59.5)
Mild depression 52 (26) 33 (28.4)
Moderate depression 34 (17) 11 (9.5)
Severe depression 0(0) 3 (2.6)
0.040
STAI-I (state)
Presence anxiety 115(57.5) 49(42.2)
Absence anxiety 85(42.5) 67(57.8)
0.009
STAI-II (trait)
Presence anxiety 174 (87.0) 101 (87.1)
Absence anxiety 26 (13.0) 15 (12.9)
1.000
BDS: Beck Depression Scale; BMI: Body mass index; IQR (Q3-Q1): Inter-quartile range; SCAS: Self-Care Agency Scale; STAI: State-Trait Anxiety Scale.
DISCUSSIONWith the advances in surgical techniques, perioperative patient management, the treatment of postoperative complications with minimally invasive methods, and the development of targeted immunosuppressive treatment protocols with fewer side effects, significant reductions in mortality and morbidity rates have been achieved in

Akbulut S et al. QOL in liver transplant recipients
WJG https://www.wjgnet.com 6976 October 28, 2021 Volume 27 Issue 40
Table 5 Comparison of various characteristics of the study group according to presence of hepatocellular carcinoma
Parameters HCC (+) (n = 32) HCC (-) (n = 284) P value
Age (yr)
Median 52 50
IQR 59-44 58-36
0.195
BMI (kg/m2)
Median 26 25
IQR 29-23 28-22
0.063
Gender (%)
Female 13 (40.6) 114 (40.1)
Male 19 (59.4) 170 (59.9)
1.000
Biliary complications
Presence 16 (50) 184 (64.8)
Absence 16 (50) 100 (35.2)
0.147
SCAS scores
Median 92 96
IQR 95-68 108-86
0.006
BDS scores
Median 13 9
IQR 17-8 13-5
0.003
STAI-I (state) scores
Median 34 35
IQR 50-26 41-28
0.856
STAI-II (trait) scores
Median 45 42
IQR 56-39 50-36
0.009
BDS (categorized form)
Minimal depression 10 (31.3) 173 (60.9)
Mild depression 12 (37.5) 73 (25.7)
Moderate depression 10 (31.3) 35 (12.3)
Severe depression 0 (0) 3 (0.9)
0.004
STAI-I (state) (categorized form)
Presence anxiety 16 (50) 148 (52.1)
Absence anxiety 16 (50) 136 (47.9)
0.968
STAI-II (trait) (categorized form)
Presence anxiety 30 (93.8) 245 (86.3)
Absence anxiety 2 (6.2) 39 (13.7)
0.402
BDS: Beck Depression Scale; BMI: Body mass index; IQR (Q3-Q1): Inter-quartile range; SCAS: Self-Care Agency Scale; STAI: State-Trait Anxiety Scale.
patients who received LT during the last quarter century[8]. The 1- and 5-years survival rates of the patients following LT were 85%-86% and 68%-74%, respectively[28]. On the other hand, together with the long-term survival rates obtained, the QOL of the recipients started to become one of the major concerns for both the physicians and the relatives of the recipients[8].

Akbulut S et al. QOL in liver transplant recipients
WJG https://www.wjgnet.com 6977 October 28, 2021 Volume 27 Issue 40
Table 6 Comparison of various characteristics of the study group according to monthly income
Parameters ≤ 1000 TL (n = 18) 1000-3000 TL (n = 260) ≥ 3000 TL (n = 38) P value
Age (yr)
Median 44 51 50
IQR 60-30 58-36 57-43
0.921
Gender (%)
Female 13 (72.2) 107 (41.2) 7 (18.4)
Male 5 (27.8) 153 (58.8) 31 (81.6)
< 0.001
Residency (%)
City center 12 (66.7) 131 (50.4) 32(84.2)
Town 4 (22.2) 96 (36.9) 6 (15.8)
Village 2 (11.1) 33 (12.7) 0 (0)
0.002
SCAS scores
Median 94 94 97
IQR 109-86 105-86 112-87
0.119
BDS scores
Median 9 9 6
IQR 16-5 15-6 9-3
< 0.001
STAI-I (state) scores
Median 35 35 33
IQR 46-26 42-28 41-25
0.106
STAI-II (trait) scores
Median 48 42 39
IQR 52-43 50-36 45-36
0.003
BDS (categorized form)
Minimal depression 10 (55.6) 139 (53.5) 34 (89.5)
Mild depression 4 (22.2) 78 (30) 3 (7.9)
Moderate depression 4 (22.2) 40 (15.4) 1 (2.6)
Severe depression 0 (0) 3 (1.2) 0 (0)
0.004
BDS: Beck Depression Scale; IQR (Q3-Q1): Inter-quartile range; SCAS: Self-Care Agency Scale; STAI: State-Trait Anxiety Scale; TL: Turkish liras.
According to the World Health Organization (WHO), healthy individual is not only free of disease or disability but also defined as a state of psychological and physical well-being[8-10]. From this WHO’s perspective, technical and medical success following LT does not necessarily indicate health of the individual; the recipients should also be in the acceptable range of well-being in psychosocial terms as well. For this reason, physicians should also aim to mediate the factors that affect the psychosocial QOL of the individuals following the LT procedures. In the last two decades the studies regarding the QOL of the living donors and recipients after LT have increased tremendously[8,29-33].
Biliary complications are frequently encountered following LT and especially after living donor LT[34,35]. The treatment involves a combination of surgical therapy and endoscopic or interventional radiology assisted percutaneous stenting or catheter placement[36-39]. These complications result in prolonged hospitalization, repeated interventions, and frequent outpatient clinic visits. Therefore, the QOL of the recipients with biliary complications are expected to be lower than recipients without biliary complications[6,40-42]. We have seen that there are no studies analyzing the relationship between biliary complications and the QOL of the recipients. The majority of the published studies state that the biliary complications that develop can adversely

Akbulut S et al. QOL in liver transplant recipients
WJG https://www.wjgnet.com 6978 October 28, 2021 Volume 27 Issue 40
Table 7 Evaluation of the study group according to their inclination towards recommendation of liver transplantation to other patients
Parameters I recommend (n = 285) I do not recommend (n = 31) P value
Age (yr)
Median 51 50
IQR 58-36 62-40
0.519
Gender (%)
Female 115 (40.4) 12 (38.7)
Male 170 (59.6) 19 (61.3)
1.000
Residency (%)
City center 155 (54.4) 20 (64.5)
Town 98 (34.4) 8 (25.8)
Village 32 (11.2) 3 (9.7)
0.551
Biliary complications
Presence 182 (63.9) 18 (58.1)
Absence 103 (36.1) 13 (41.9)
0.660
SCAS scores
Median 95 74
IQR 108-87 101-69
0.002
BDS scores
Median 9 15
IQR 13-5 29-9
< 0.001
STAI-I (state) scores
Median 35 42
IQR 41-28 51-27
0.020
STAI-II (trait) scores
Median 42 49
IQR 50-36 53-43
< 0.001
BDS (categorized form)
Minimal depression 173 (60.7) 10 (32.3)
Mild depression 79 (27.7) 6 (19.4)
Moderate depression 33 (11.6) 12 (38.7)
Severe depression 0 (0) 3 (9.8)
< 0.001
STAI-I (state) (categorized form)
Presence anxiety 143 (50.2) 21 (67.7)
Absence anxiety 142 (49.8) 10 (32.3)
0.095
STAI-II (trait) (categorized form)
Presence anxiety 244 (85.6) 31 (100)
Absence anxiety 41 (14.4) 0 (0.0)
0.021
BDS: Beck Depression Scale; IQR (Q3-Q1): Inter-quartile range; SCAS: Self-Care Agency Scale; STAI: State-Trait Anxiety Scale.
affect the QOL of the recipients[6,8,40]. In the present study, the self-care ability of the recipients with biliary complications was found to be low (P = 0.002) and the instant-aneous anxiety index was found to be increased (P = 0.004). Furthermore, in recipients with biliary complications, 17% showed moderate depression and 57.5% showed signs
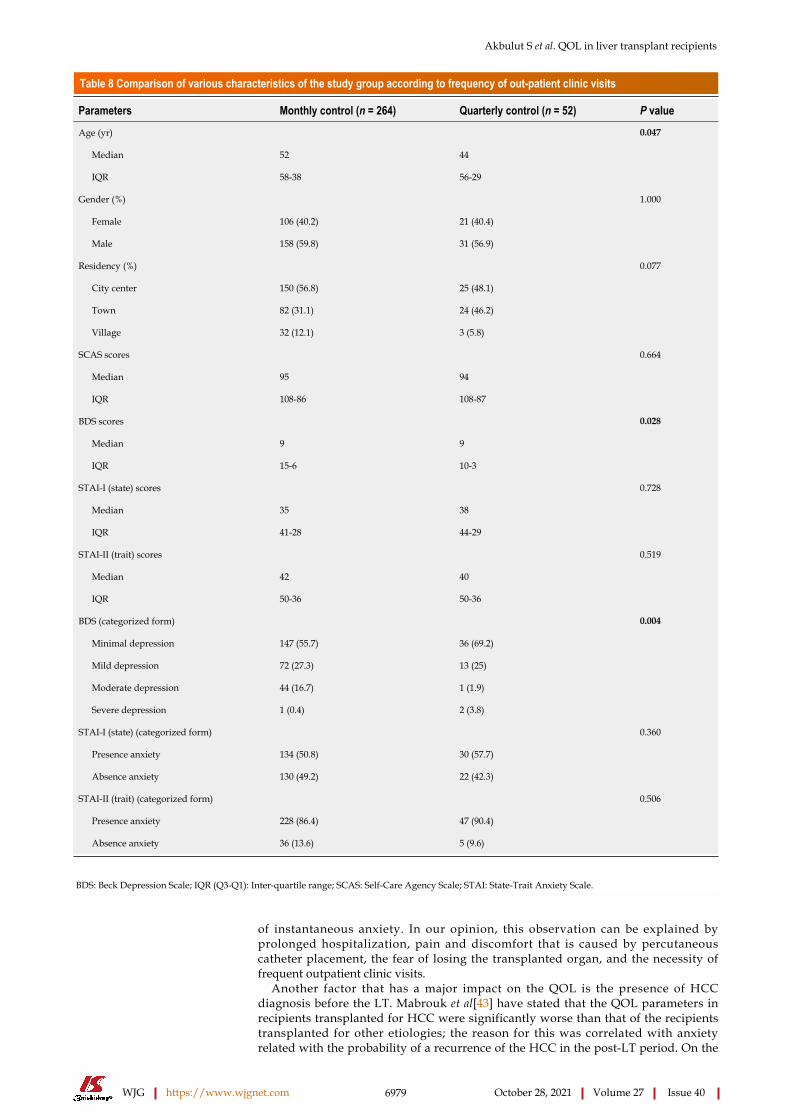
Akbulut S et al. QOL in liver transplant recipients
WJG https://www.wjgnet.com 6979 October 28, 2021 Volume 27 Issue 40
Table 8 Comparison of various characteristics of the study group according to frequency of out-patient clinic visits
Parameters Monthly control (n = 264) Quarterly control (n = 52) P value
Age (yr)
Median 52 44
IQR 58-38 56-29
0.047
Gender (%)
Female 106 (40.2) 21 (40.4)
Male 158 (59.8) 31 (56.9)
1.000
Residency (%)
City center 150 (56.8) 25 (48.1)
Town 82 (31.1) 24 (46.2)
Village 32 (12.1) 3 (5.8)
0.077
SCAS scores
Median 95 94
IQR 108-86 108-87
0.664
BDS scores
Median 9 9
IQR 15-6 10-3
0.028
STAI-I (state) scores
Median 35 38
IQR 41-28 44-29
0.728
STAI-II (trait) scores
Median 42 40
IQR 50-36 50-36
0.519
BDS (categorized form)
Minimal depression 147 (55.7) 36 (69.2)
Mild depression 72 (27.3) 13 (25)
Moderate depression 44 (16.7) 1 (1.9)
Severe depression 1 (0.4) 2 (3.8)
0.004
STAI-I (state) (categorized form)
Presence anxiety 134 (50.8) 30 (57.7)
Absence anxiety 130 (49.2) 22 (42.3)
0.360
STAI-II (trait) (categorized form)
Presence anxiety 228 (86.4) 47 (90.4)
Absence anxiety 36 (13.6) 5 (9.6)
0.506
BDS: Beck Depression Scale; IQR (Q3-Q1): Inter-quartile range; SCAS: Self-Care Agency Scale; STAI: State-Trait Anxiety Scale.
of instantaneous anxiety. In our opinion, this observation can be explained by prolonged hospitalization, pain and discomfort that is caused by percutaneous catheter placement, the fear of losing the transplanted organ, and the necessity of frequent outpatient clinic visits.
Another factor that has a major impact on the QOL is the presence of HCC diagnosis before the LT. Mabrouk et al[43] have stated that the QOL parameters in recipients transplanted for HCC were significantly worse than that of the recipients transplanted for other etiologies; the reason for this was correlated with anxiety related with the probability of a recurrence of the HCC in the post-LT period. On the
Akbulut S et al. QOL in liver transplant recipients
WJG https://www.wjgnet.com 6980 October 28, 2021 Volume 27 Issue 40
other hand, Castaldo et al[44] suggested that the diagnosis of HCC had a positive impact on the physical and mental components of QOL for the recipients. On the other hand, Heits et al[45] have found no relation between HCC and QOL parameters. In Europe and the United States, recipients with HCC receive additional points during the waiting list and recipients are transplanted in early disease stages, which results in a favorable prognosis compared to recipients without HCC. In the present study, in patients with HCC, the self-care ability was low (P = 0.006) while depression (P = 0.003) and continuous anxiety indices (P = 0.009) were higher than recipients without HCC. Furthermore, 31.3% of the patients with HCC had signs and symptoms of moderate depression. We agree with the Mabrouk et al[43] regarding this issue; however, we believe that the negative effect on the QOL parameters should be further investigated regarding the impact of HCC diagnosis and the cumulative effect of the various other factors on this outcome. The cadaveric organ donations in Turkey are significantly lower than that of the developed western countries, and, for this reason, the recipients with HCC have almost no chance for deceased donor LT and the majority need a living liver donation from a family member or a relative[46]. Therefore, the patients have to live with HCC for a period of time before the LT, with some patients requiring bridging procedures, such as chemoembolization, radioembol-ization, microwave or radiofrequency ablation, and surgical resection. This prolonged and hard waiting period may be the cause of the adverse effects observed on the QOL parameters in the post-LT period.
Other important factors that have an impact on the QOL of the recipients following LT is the income and the frequency of the required out-patient clinic visits of the recipients. The studies have shown that the recipients taking long journeys to come for an out-patient control visit had detrimental economical consequences and reduction in QOL of the recipients[47]. Furthermore, the prolonged hospitalization and frequent hospital visits delay the time to return to work, which reduce the household income. This will inevitably result in psychosocial problems in the recipients. Previous studies from our institute have shown that families of pediatric recipients with a low incomes experienced severe social and economic problems following the transplant procedure[48]. In the present study, we have shown that as the monthly income increased, the parameters related with depression (P < 0.001) and continuous anxiety indices (P = 0.003) decreased significantly. The symptoms related with moderate depression was observed in 22.2% of the patients with a monthly income lower than 1000 TL; on the other hand, patients with 1000-3000 TL and ≥ 3000 TL had moderate depression rate of 15.4% and 2.6%, respectively (P = 0.004). Similarly, the depression level of the recipients who were required to attend frequent visits to the out-patient clinic were significantly higher than recipients who only had to attend quarterly (P = 0.028). In other words, 22.2% of the patients that had to come to out-patient clinic monthly showed signs and symptoms of moderate depression (P = 0.004).
Immunosuppressive drugs that are being used to prevent organ rejection also have a significant impact on the QOL of the recipients. Zaydfudim et al[49] have stated that high dose steroid use in recipients have reduced the physical and mental health of the recipients and caused majority of the anxiety related symptoms of the individuals. Lerut[50] stated that reduction or even discontinuation of steroids and other immunosuppressives would eliminate their adverse effects and would increase the QOL of the recipients. In the preset study, we found no difference between the Beck’s depression score, instantaneous or continuous anxiety indices, and self-care ability of the patients who did or did not use steroids. Braun et al[51] have suggested that recipients that are treated with cyclosporin had better QOL when compared to patients treated with tacrolimus. However, there are contradicting studies that show better QOL with tacrolimus treatment when compared to patients that are on cyclosporin treatment[52,53]. In the present study, the type of immunosuppressive (tacrolimus vs cyclosporin) did not have significant impact on the BDS, STAI-I, STAI-II, and SCAS scores of the recipients. Similarly, we found no difference in terms of the BDS, STAI-I, STAI-II, and SCAS among the patients who did or did not receive cyclosporin treatment. However, we found that the BDS scores of the recipients that are on tacrolimus therapy were significantly higher (P = 0.018) and the SCAS scores (P = 0.001) were significantly lower than the recipients that are not receiving tacrolimus therapy. In general, our results suggest that there is no impact of either cyclosporin or tacrolimus on the QOL parameters of the recipients. However, our results regarding the impact of tacrolimus on the self-care abilities of the recipients are original and need to be validated by prospective studies.
The decision to recommend LT to others and its relationship with the QOL parameters requires further analysis. Our review of current literature showed that there are no studies addressing this problem. In the present study, we have found that
Akbulut S et al. QOL in liver transplant recipients
WJG https://www.wjgnet.com 6981 October 28, 2021 Volume 27 Issue 40
the SCAS scores were lower (P = 0.002) and BDS (P < 0.001), STAI-I (P = 0.020), and STAI-II (P < 0.001) scores were higher in patients who stated that they would not to recommend LT to others. Furthermore, moderate depression rate and signs of prominent anxiety was present in 38.7% and 100% of the recipients who did not recommend LT to others, respectively. The recipients that did or did not recommend LT did not differ in terms of incidence of biliary complications (P = 0.660), presence of HCC (P = 1.000), and use of tacrolimus (P = 0.056) as immunosuppressive treatment. However, 36.1% of the recipients that did recommend LT and 16.1% of the recipients that did not recommend LT were using everolimus (P = 0.042). Patients that do or do not use everolimus did not significantly differ in terms of depression, anxiety, and self-care ability. Therefore, our results need validation and further analyses by studies that will be conducted in future.
CONCLUSIONBiliary complications cause depression, reduced self-care ability, and cause anxiety in patients after LT. This has a major impact on the QOL of the recipients. HCC reduces the QOL by increasing depression and anxiety and reducing self-care ability of the recipients. These recipients have HCC that exceed the acceptable limits in the preoperative period, and they receive multiple procedures to down-stage the tumors. This results in frustration and concerns of recurrence of the tumor in the postoperative period. The monthly income and frequent out-patient clinic visits have a significant impact on the QOL of the recipients. The recipients and their relatives cannot return to work until they recover fully after the LT procedure. Furthermore, frequent visits to the out-patient clinic further compromise return to work for the recipients which has a major impact on the income of the recipients. All recipients should be examined by psychiatry in the preoperative period and should receive medico-social therapy in necessary situations. Routine postoperative follow-up of the recipients with a psycho-logist and physiotherapists are very important for physical and mental QOL of the recipients. Transplant centers should also employ physiotherapists and psychologists that will work with specifically with recipients.
ARTICLE HIGHLIGHTSResearch backgroundDepression, anxiety, and status of self-care ability are among the most important factors affecting the quality of life of patients who have undergone liver transplantation. Depending on the severity of the underlying liver disease, signs and symptoms of anxiety and depression may become more pronounced.
Research motivationDepression, anxiety, and deficiency in self-care ability are among the most important factors affecting the quality of life of liver transplant recipients. This descriptive, cross-sectional questionnaire-based study shows that presence of biliary complications and hepatocellular carcinoma, low monthly income level, and monthly visits to the outpatient clinic are factors that are found to affect self-care capability, depression, and anxiety.
Research objectivesThe main objective of this study is to analyze the relationship between sociodemo-graphic characteristics, presence of biliary complications, presence of hepatocellular carcinoma, preference of recommendation of liver transplantation to others, and frequency of out-patient clinic control, and some post-transplant quality of life indicators (depression, anxiety, self-care ability).
Research methodsThis study is descriptive, cross-sectional questionnaire-based study on patients transplanted between 2002 and 2018 at our Liver Transplant Institute. The recipients who were discharged that were equal to or greater than 18-years-old and who can communicate verbally and understand and answer the questions were included in the present study. We interviewed 320 liver transplant recipients in the present study
Akbulut S et al. QOL in liver transplant recipients
WJG https://www.wjgnet.com 6982 October 28, 2021 Volume 27 Issue 40
considering the proportion of the recipients with missing data. Of those, 316 recipients who answered the questionnaire forms accurately were included in the present study. The dependent variables were Beck Depression Scale, State-Trait Anxiety Scale (Form I and II) and Self-Care Agency Scale. The independent variables of the study were sociodemographic characteristics, biliary complications, hepatocellular carcinoma, recommending liver transplantation to other patients, and the interval of out-patient clinic visits.
Research resultsSelf-care ability scores were lower and anxiety scores were higher in recipients with biliary complications. On the other hand, in recipients with hepatocellular carcinoma, self-care scores were lower and depression and anxiety scores were higher. In liver transplantation recipients with a monthly income < 3000 Turkish liras had higher depression and anxiety scores. The recipients who stated that they would not recommend liver transplantation to others had lower self-care scores and higher depression, state anxiety, and trait anxiety scores.
Research conclusionsPresence of biliary complications and hepatocellular carcinoma, low income level, and an obligation monthly visits to the outpatient clinic are factors that are found to affect self-care capability, depression and anxiety.
Research perspectivesTo our knowledge, this study is one of the most comprehensive studies examining the relationships between post liver transplant quality of life indicators and various clinical parameters.
REFERENCESAkbulut S, Yilmaz S. Liver transplantation in Turkey: historical review and future perspectives. Transplant Rev (Orlando) 2015; 29: 161-167 [PMID: 25535023 DOI: 10.1016/j.trre.2014.12.002]
1
Akbulut S, Sahin TT, Yilmaz S. Comment on pediatric living donor liver transplantation decade progress in Shanghai: Characteristics and risks factors of mortality. World J Gastroenterol 2020; 26: 4564-4566 [PMID: 32874065 DOI: 10.3748/wjg.v26.i30.4564]
2
Pillai AA, Levitsky J. Overview of immunosuppression in liver transplantation. World J Gastroenterol 2009; 15: 4225-4233 [PMID: 19750565 DOI: 10.3748/wjg.15.4225]
3
Åberg F. Quality of life after liver transplantation. Best Pract Res Clin Gastroenterol 2020; 46-47: 101684 [PMID: 33158471 DOI: 10.1016/j.bpg.2020.101684]
4
Medved V, Medved S, Skočić Hanžek M. Transplantation Psychiatry: an Overview. Psychiatr Danub 2019; 31: 18-25 [PMID: 30948685 DOI: 10.24869/psyd.2019.18]
5
Coelho JCU, Leite LO, Molena A, Freitas ACT, Matias JEF. Biliary complications after liver transplantation. Arq Bras Cir Dig 2017; 30: 127-131 [PMID: 29257849 DOI: 10.1590/0102-6720201700020011]
6
Benson AA, Rowe M, Eid A, Bluth K, Merhav H, Khalaileh A, Safadi R. Pre-liver transplant psychosocial evaluation predicts post-transplantation outcomes. Psychol Health Med 2018; 23: 788-796 [PMID: 29278010 DOI: 10.1080/13548506.2017.1417610]
7
Onghena L, Develtere W, Poppe C, Geerts A, Troisi R, Vanlander A, Berrevoet F, Rogiers X, Van Vlierberghe H, Verhelst X. Quality of life after liver transplantation: State of the art. World J Hepatol 2016; 8: 749-756 [PMID: 27366301 DOI: 10.4254/wjh.v8.i18.749]
8
Bownik H, Saab S. Health-related quality of life after liver transplantation for adult recipients. Liver Transpl 2009; 15 Suppl 2: S42-S49 [PMID: 19876941 DOI: 10.1002/lt.21911]
9
Jay CL, Butt Z, Ladner DP, Skaro AI, Abecassis MM. A review of quality of life instruments used in liver transplantation. J Hepatol 2009; 51: 949-959 [PMID: 19775771 DOI: 10.1016/j.jhep.2009.07.010]
10
Golfieri L, Gitto S, Vukotic R, Andreone P, Marra F, Morelli MC, Cescon M, Grandi S. Impact of psychosocial status on liver transplant process. Ann Hepatol 2019; 18: 804-809 [PMID: 31471202 DOI: 10.1016/j.aohep.2019.06.011]
11
Duffy JP, Kao K, Ko CY, Farmer DG, McDiarmid SV, Hong JC, Venick RS, Feist S, Goldstein L, Saab S, Hiatt JR, Busuttil RW. Long-term patient outcome and quality of life after liver transplantation: analysis of 20-year survivors. Ann Surg 2010; 252: 652-661 [PMID: 20881772 DOI: 10.1097/SLA.0b013e3181f5f23a]
12
Miller LR, Paulson D, Eshelman A, Bugenski M, Brown KA, Moonka D, Abouljoud M. Mental health affects the quality of life and recovery after liver transplantation. Liver Transpl 2013; 19: 1272-1278 [PMID: 23959592 DOI: 10.1002/lt.23728]
13
Polis S, Fernandez R. Impact of physical and psychological factors on health-related quality of life in 14
Akbulut S et al. QOL in liver transplant recipients
WJG https://www.wjgnet.com 6983 October 28, 2021 Volume 27 Issue 40
adult patients with liver cirrhosis: a systematic review protocol. JBI Database System Rev Implement Rep 2015; 13: 39-51 [PMID: 26447006 DOI: 10.11124/jbisrir-2015-1987]Šumskienė J, Kupčinskas L, Šumskas L. Health-related quality of life measurement in chronic liver disease patients. Medicina (Kaunas) 2015; 51: 201-208 [PMID: 26424183 DOI: 10.1016/j.medici.2015.06.006]
15
Sobhonslidsuk A, Silpakit C, Kongsakon R, Satitpornkul P, Sripetch C, Khanthavit A. Factors influencing health-related quality of life in chronic liver disease. World J Gastroenterol 2006; 12: 7786-7791 [PMID: 17203521 DOI: 10.3748/wjg.v12.i48.7786]
16
Mendes KD, Lopes AR, Martins TA, Lopes GF, Ziviani LC, Rossin FM, Castro-e-Silva O, Galvão CM. Relevance of anxiety and stress levels on sleep quality after liver transplantation. Transplant Proc 2014; 46: 1822-1826 [PMID: 25131046 DOI: 10.1016/j.transproceed.2014.05.051]
17
Mohamed S, Sabki ZA, Zainal NZ. Depression and psychosocial correlates of liver transplant candidates: a systematic review. Asia Pac Psychiatry 2014; 6: 447-453 [PMID: 25132651 DOI: 10.1111/appy.12145]
18
Celikturk N, Edeer AD. Self-Care Agency and Associated Factors in Heart Transplant Patients. Turkiye Klinikleri J Cardiovasc Sci 2019; 31: 148-154 [DOI: 10.5336/cardiosci.2019-70586]
19
Beck AT, Ward CH, Mendelson M, Mock J, Erbaugh J. An inventory for measuring depression. Arch Gen Psychiatry 1961; 4: 561-571 [PMID: 13688369 DOI: 10.1001/archpsyc.1961.01710120031004]
20
Hisli N. Beck depresyon ölçeğinin üniversite öğrencileri için geçerliği, güvenirliği. Psikoloji Dergisi 1989; 7: 3-13
21
Ardic A. The Relationship Between Depression, Anxiety and Stress Levels of Overweight and Obese Adolescents: The Sample of Istanbul. TJFMPC 2020; 14: 384-390
22
Spielberger CD, Gorsuch RL, Lushene RE. Manual for the State-Trait Anxiety Scale (Self Evaluation Questionnaire). Palo Alto, CA: Consulting Psychologists Press, 1970
23
Oner N, LeCompte A. Durumluk Surekli Kaygi Ölçeği El Kitabi. Istanbul: Bogazici Universitesi Yayinlari, 1983: 1-26
24
Kacmaz N, Balas GU. The Psychosocial Status of Liver Transplant Patients and Their Relatives Regarding the Procedure’s Effects on Their Quality of Life. J Psychiat Nursg 2014; 5: 1-8
25
Kearney BY, Fleischer BJ. Development of an instrument to measure exercise of self-care agency. Res Nurs Health 1979; 2: 25-34 [PMID: 254279 DOI: 10.1002/nur.4770020105]
26
Nahcivan NO. A Turkish language equivalence of the Exercise of Self-Care Agency Scale. West J Nurs Res 2004; 26: 813-824 [PMID: 15466617 DOI: 10.1177/0193945904267599]
27
Becchetti C, Dirchwolf M, Banz V, Dufour JF. Medical management of metabolic and cardiovascular complications after liver transplantation. World J Gastroenterol 2020; 26: 2138-2154 [PMID: 32476781 DOI: 10.3748/wjg.v26.i18.2138]
28
Tome S, Wells JT, Said A, Lucey MR. Quality of life after liver transplantation. A systematic review. J Hepatol 2008; 48: 567-577 [PMID: 18279999 DOI: 10.1016/j.jhep.2007.12.013]
29
Yang LS, Shan LL, Saxena A, Morris DL. Liver transplantation: a systematic review of long-term quality of life. Liver Int 2014; 34: 1298-1313 [PMID: 24703371 DOI: 10.1111/liv.12553]
30
Janik MK, Księżopolska A, Kostrzewa K, Kobryń K, Moskwa M, Raszeja-Wyszomirska J, Kornasiewicz O, Patkowski W, Milkiewicz P, Krawczyk M, Zieniewicz K. Long-Term Health-Related Quality of Life in Living Liver Donors. Ann Transplant 2019; 24: 45-51 [PMID: 30666044 DOI: 10.12659/AOT.911109]
31
Ladner DP, Dew MA, Forney S, Gillespie BW, Brown RS Jr, Merion RM, Freise CE, Hayashi PH, Hong JC, Ashworth A, Berg CL, Burton JR Jr, Shaked A, Butt Z. Long-term quality of life after liver donation in the adult to adult living donor liver transplantation cohort study (A2ALL). J Hepatol 2015; 62: 346-353 [PMID: 25195558 DOI: 10.1016/j.jhep.2014.08.043]
32
Chandran B, Bharathan VK, Shaji Mathew J, Amma BSPT, Gopalakrishnan U, Balakrishnan D, Menon RN, Dhar P, Vayoth SO, Surendran S. Quality of life of liver donors following donor hepatectomy. Indian J Gastroenterol 2017; 36: 92-98 [PMID: 28393329 DOI: 10.1007/s12664-017-0743-7]
33
Daniel K, Said A. Early Biliary complications after liver transplantation. Clin Liver Dis (Hoboken) 2017; 10: 63-67 [PMID: 30992762 DOI: 10.1002/cld.654]
34
Simoes P, Kesar V, Ahmad J. Spectrum of biliary complications following live donor liver transplantation. World J Hepatol 2015; 7: 1856-1865 [PMID: 26207167 DOI: 10.4254/wjh.v7.i14.1856]
35
Moy BT, Birk JW. A Review on the Management of Biliary Complications after Orthotopic Liver Transplantation. J Clin Transl Hepatol 2019; 7: 61-71 [PMID: 30944822 DOI: 10.14218/JCTH.2018.00028]
36
Crismale JF, Ahmad J. Endoscopic Management of Biliary Issues in the Liver Transplant Patient. Gastrointest Endosc Clin N Am 2019; 29: 237-256 [PMID: 30846151 DOI: 10.1016/j.giec.2018.11.003]
37
Koksal AS, Eminler AT, Parlak E, Gurakar A. Management of biliary anastomotic strictures after liver transplantation. Transplant Rev (Orlando) 2017; 31: 207-217 [PMID: 28427741 DOI: 10.1016/j.trre.2017.03.002]
38
Czubkowski P, Markiewicz-Kijewska M, Janiszewski K, Rurarz M, Kaliciński P, Jarzębicka D, Pertkiewicz J, Kamińska D, Jankowska I, Teisseyre M, Szymczak M, Pawłowska J. Percutaneous Treatment of Biliary Strictures After Pediatric Liver Transplantation. Ann Transplant 2018; 23: 845-851 [PMID: 30531688 DOI: 10.12659/AOT.910528]
39

Akbulut S et al. QOL in liver transplant recipients
WJG https://www.wjgnet.com 6984 October 28, 2021 Volume 27 Issue 40
Silva ACDS, Andrade AMDF, Lisboa QC, Lima CXD, Araujo JP, Gambogi TR, Borges VO, Filho IJZ. Epidemiologic Study on the Incidence of Biliary Complications after Liver Transplantation. J Liver 2018; 7: 229 [DOI: 10.4172/2167-0889.1000229]
40
Fang C, Yan S, Zheng S. Bile Leakage after Liver Transplantation. Open Med (Wars) 2017; 12: 424-429 [PMID: 29318188 DOI: 10.1515/med-2017-0062]
41
Palanisamy AP, Taber DJ, Sutter AG, Nadig SN, Dowden JE, McGillicuddy JW, Baliga PK, Chavin KD. Clinical outcomes and costs associated with in-hospital biliary complications after liver transplantation: a cross-sectional analysis. J Gastrointest Surg 2015; 19: 282-289 [PMID: 25319035 DOI: 10.1007/s11605-014-2675-1]
42
Mabrouk M, Esmat G, Yosry A, El-Serafy M, Doss W, Zayed N, El-Sahhar M, Awny S, Omar A. Health-related quality of life in Egyptian patients after liver transplantation. Ann Hepatol 2012; 11: 882-890 [PMID: 23109452 DOI: 10.1016/S1665-2681(19)31414-0]
43
Castaldo ET, Feurer ID, Russell RT, Pinson CW. Correlation of health-related quality of life after liver transplant with the Model for End-Stage Liver Disease score. Arch Surg 2009; 144: 167-172 [PMID: 19221329 DOI: 10.1001/archsurg.2008.563]
44
Heits N, Meer G, Bernsmeier A, Guenther R, Malchow B, Kuechler T, Becker T, Braun F. Mode of allocation and social demographic factors correlate with impaired quality of life after liver transplantation. Health Qual Life Outcomes 2015; 13: 162 [PMID: 26420554 DOI: 10.1186/s12955-015-0360-z]
45
Kutluturk K, Akbulut S, Baskiran A, Gonultas F, Dirican A, Isık B, Yilmaz S. Aborted donor hepatectomy in living donor liver transplantation: lessons learned. S Afr J Surg 2020; 58: 91-100 [PMID: 32644313]
46
O'Connell Francischetto E, Damery S, Ferguson J, Combes G; myVideoClinic randomised evaluation steering group. Video clinics vs standard face-to-face appointments for liver transplant patients in routine hospital outpatient care: study protocol for a pragmatic randomised evaluation of myVideoClinic. Trials 2018; 19: 574 [PMID: 30340637 DOI: 10.1186/s13063-018-2953-4]
47
Akbulut S, Gunes G, Saritas H, Aslan B, Karipkiz Y, Demyati K, Gungor S, Yilmaz S. Differences in parents of pediatric liver transplantation and chronic liver disease patients. World J Clin Cases 2020; 8: 2162-2172 [PMID: 32548146 DOI: 10.12998/wjcc.v8.i11.2162]
48
Zaydfudim V, Feurer ID, Landman MP, Moore DE, Wright JK, Pinson CW. Reduction in corticosteroids is associated with better health-related quality of life after liver transplantation. J Am Coll Surg 2012; 214: 164-173 [PMID: 22137824 DOI: 10.1016/j.jamcollsurg.2011.10.006]
49
Lerut J. Minimalization of immunosuppression in liver transplantation: steps from 'how' to 'now'. Interview by Emily Reeve. Expert Rev Clin Immunol 2012; 8: 605-607 [PMID: 23078057 DOI: 10.1586/eci.12.53]
50
Braun F, Teren K, Wilms P, Günther R, Allmann J, Broering DC, Küchler T. Quality of life after liver transplantation. Transplant Proc 2009; 41: 2564-2566 [PMID: 19715975 DOI: 10.1016/j.transproceed.2009.06.030]
51
Felser I, Wagner S, Depee J, Johnson N, Staschak S, Jain A, Fung JJ, Starzl TE. Changes in quality of life following conversion from CyA to FK 506 in orthotopic liver transplant patients. Transplant Proc 1991; 23: 3032-3034 [PMID: 1721350]
52
Scholler G, Rose M, Neuhaus R, Neuhaus P, Klapp BF. Comparison of cyclosporine A and FK506 with regard to complaints and psychosocial characteristics before and after liver transplantation. Transplant Proc 1997; 29: 2491-2493 [PMID: 9270822 DOI: 10.1016/s0041-1345(97)00461-2]
53

WJG https://www.wjgnet.com 6985 October 28, 2021 Volume 27 Issue 40
World Journal of
GastroenterologyW J GSubmit a Manuscript: https://www.f6publishing.com World J Gastroenterol 2021 October 28; 27(40): 6985-6999
DOI: 10.3748/wjg.v27.i40.6985 ISSN 1007-9327 (print) ISSN 2219-2840 (online)
META-ANALYSIS
Prophylactic transcatheter arterial embolization reduces rebleeding in non-variceal upper gastrointestinal bleeding: A meta-analysis
Eszter Boros, Zoltán Sipos, Péter Hegyi, Brigitta Teutsch, Levente Frim, Szilárd Váncsa, Szabolcs Kiss, Fanni Dembrovszky, Eduard Oštarijaš, Andrew Shawyer, Bálint Erőss
ORCID number: Eszter Boros 0000-0002-7831-163X; Zoltán Sipos 0000-0001-7845-8116; Péter Hegyi 0000-0003-0399-7259; Brigitta Teutsch 0000-0002-9530-7886; Levente Frim 0000-0003-0097-6663; Szilárd Váncsa 0000-0002-9347-8163; Szabolcs Kiss 0000-0001-5032-866X; Fanni Dembrovszky 0000-0001-6953-3591; Eduard Oštarijaš 0000-0001-9999-9886; Andrew Shawyer 0000-0003-1700-3307; Bálint Erőss 0000-0003-3658-8427.
Author contributions: Boros E, Sipos Z, Hegyi P, Teutsch B, Frim L, Váncsa S, Kiss S, Dembrovszky F, Oštarijaš E, Shawyer A, and Erőss B provided the conceptualization; Boros E is the project administration; Boros E and Sipos Z formally analyze the original draft; Boros E and Teutsch B did the systematic search and selection, and wrote the original draft; Sipos Z made the visualisation, and wrote the original draft; Hegyi P contributed to the funding acquisition; Hegyi P, Frim L, Váncsa S, Kiss S, Dembrovszky F, Oštarijaš E, and Shawyer A wrote, reviewed and edited the manuscript; Frim L contributed to the data curation, quality and risk assessment; Váncsa S and Kiss S provided the methodology, and made the data curation; Dembrovszky F provided the methodology, and made the
Eszter Boros, Zoltán Sipos, Péter Hegyi, Brigitta Teutsch, Levente Frim, Szilárd Váncsa, Szabolcs Kiss, Fanni Dembrovszky, Eduard Oštarijaš, Bálint Erőss, Institute for Translational Medicine, University of Pecs, Medical School, Pécs 7624, Hungary
Eszter Boros, First Department of Internal Medicine, St. George University Teaching Hospital of County Fejér, Székesfehérvár 8000, Hungary
Péter Hegyi, Szentágothai Research Center, University of Pecs, Pécs 7624, Hungary
Szabolcs Kiss, Doctoral School of Clinical Medicine, University of Szeged, Szeged 6720, Hungary
Andrew Shawyer, Department of Interventional Radiology, University Hospitals Dorset NHS Foundation Trust, Bournemouth BH7 7DW, United Kingdom
Corresponding author: Bálint Erőss, MD, PhD, Assistant Professor, Doctor, Institute for Translational Medicine, University of Pecs, Medical School, 12 Szigeti Street, Pécs 7624, Hungary. [email protected]
AbstractBACKGROUND Despite the improvement in the endoscopic hemostasis of non-variceal upper gastrointestinal bleeding (NVUGIB), rebleeding remains a major concern.
AIM To assess the role of prophylactic transcatheter arterial embolization (PTAE) added to successful hemostatic treatment among NVUGIB patients.
METHODS We searched three databases from inception through October 19th, 2020. Randomized controlled trials (RCTs) and observational cohort studies were eligible. Studies compared patients with NVUGIB receiving PTAE to those who did not get PTAE. Investigated outcomes were rebleeding, mortality, reinter-vention, need for surgery and transfusion, length of hospital (LOH), and intensive care unit (ICU) stay. In the quantitative synthesis, odds ratios (ORs) and weighted mean differences (WMDs) were calculated with the random-effects model and interpreted with 95% confidence intervals (CIs).

Boros E et al. Embolization and rebleeding
WJG https://www.wjgnet.com 6986 October 28, 2021 Volume 27 Issue 40
quality and risk assessment; Oštarijaš E did the visualisation; Erőss B did the conceptualization, supervision, and wrote the original draft; All authors certify that they have participated sufficiently in the work to take public responsibility for the content, including participation in the concept, design, analysis, writing, or revision of the manuscript.
Supported by Economic Development and Innovation Operative Programme Grant, No. GINOP 2.3.2-15-2016-00048 and No. GINOP-2.3.4-15-2020-00010; and Human Resources Development Operational Programme Grant, No. EFOP-3.6.2-16-2017-00006 and No. EFOP-3.6.1.-16-2016-00004.
Conflict-of-interest statement: No conflict of interest to declare.
PRISMA 2009 Checklist statement: The authors have read the PRISMA 2020 Checklist, and was prepared and revised according to the PRISMA 2020 Checklist.
Open-Access: This article is an open-access article that was selected by an in-house editor and fully peer-reviewed by external reviewers. It is distributed in accordance with the Creative Commons Attribution NonCommercial (CC BY-NC 4.0) license, which permits others to distribute, remix, adapt, build upon this work non-commercially, and license their derivative works on different terms, provided the original work is properly cited and the use is non-commercial. See: http://creativecommons.org/Licenses/by-nc/4.0/
Manuscript source: Unsolicited manuscript
Specialty type: Gastroenterology and hepatology
Country/Territory of origin: Hungary
Peer-review report’s scientific quality classificationGrade A (Excellent): A Grade B (Very good): B, B, B
RESULTS We included a total of 3 RCTs and 9 observational studies with a total of 1329 patients, with 486 in the intervention group. PTAE was associated with lower odds of rebleeding (OR = 0.48, 95%CI: 0.29–0.78). There was no difference in the 30-d mortality rates (OR = 0.82, 95%CI: 0.39–1.72) between the PTAE and control groups. Patients who underwent PTAE treatment had a lower chance for reinter-vention (OR = 0.48, 95%CI: 0.31–0.76) or rescue surgery (OR = 0.35, 95%CI: 0.14–0.92). The LOH and ICU stay was shorter in the PTAE group, but the difference was non-significant [WMD = -3.77, 95%CI: (-8.00)–0.45; WMD = -1.33, 95%CI: (-2.84)–0.18, respectively].
CONCLUSION PTAE is associated with lower odds of rebleeding and any reintervention in NVUGIB. However, further RCTs are needed to have a higher level of evidence.
Key Words: Prophylactic transcatheter arterial embolization; Non-variceal upper gastrointestinal bleeding; Rebleeding; Reintervention; Meta-analysis; Review
©The Author(s) 2021. Published by Baishideng Publishing Group Inc. All rights reserved.
Core Tip: Rebleeding remains a significant concern in patients with non-variceal upper gastrointestinal bleeding (NVUGIB), despite the improvements in endoscopic and pharmacologic treatments. Our systematic review and meta-analysis indicate that prophylactic transcatheter arterial embolization (PTAE) compared to standard of care is accompanied by lower odds of rebleeding, need for rescue surgery, and reinter-ventions NVUGIB. However, we could not justify a beneficial effect of PTAE on mortality rates compared with the standard of care. In line with our results, we suggest using PTAE in selected cases, where risk stratification predicts high rebleeding risk or the anatomical situation makes the secure and permanent endoscopic hemostasis impossible.
Citation: Boros E, Sipos Z, Hegyi P, Teutsch B, Frim L, Váncsa S, Kiss S, Dembrovszky F, Oštarijaš E, Shawyer A, Erőss B. Prophylactic transcatheter arterial embolization reduces rebleeding in non-variceal upper gastrointestinal bleeding: A meta-analysis. World J Gastroenterol 2021; 27(40): 6985-6999URL: https://www.wjgnet.com/1007-9327/full/v27/i40/6985.htmDOI: https://dx.doi.org/10.3748/wjg.v27.i40.6985
INTRODUCTIONAcute upper gastrointestinal bleeding (UGIB) remains a common medical emergency with an incidence of 47-90/100000[1-3]. The age-standardized incidence of ulcer bleeding decreased by 41.6% between 1983 and 2004 in a prospective observational study; notable the decrease occurred only in people younger than 70 years of age[1]. Mortality in UGIB ranges between 1.1%–11%[4], although it has significantly decreased due to improvements and innovation in both endoscopic and pharma-cologic treatments[1,4]. The UGIB population characteristics have changed consid-erably, the mean age of the patients has increased, the prevalence of co-morbidities is higher than before, and the use of nonsteroidal anti-inflammatory, antiplatelet and anticoagulant drugs is more widespread[1,5,6].
Rebleeding is a significant concern in patients with UGIB, occurring in 7%–16% of cases despite endoscopic therapy[6]. As published in a study from the United Kingdom in 2007, rebleeding is associated with a higher mortality rate, potentially induces more extended hospital stay and need for reintervention[5]. Thus, preventing rebleeding is a critical factor from the patients' and a healthcare economic view. The management of non-variceal UGIB (NVUGIB) is well established in guidelines based on a high level of evidence. In the post-endoscopy care of NVUGIB, a strong recommendation is to use high-dose proton pump inhibitors and eradicate Helicobacter pylori (H. pylori) if presence is established[7]. On the other hand, if rebleeding happens,

Boros E et al. Embolization and rebleeding
WJG https://www.wjgnet.com 6987 October 28, 2021 Volume 27 Issue 40
Grade C (Good): 0 Grade D (Fair): 0 Grade E (Poor): 0
Received: June 16, 2021 Peer-review started: June 16, 2021 First decision: July 14, 2021 Revised: July 25, 2021 Accepted: September 16, 2021 Article in press: September 16, 2021 Published online: October 28, 2021
P-Reviewer: Liu XM, Papadopoulos VP, Xiong A, Ziogas IA S-Editor: Ma YJ L-Editor: A P-Editor: Ma YJ
the patient should receive a repeat upper gastrointestinal endoscopy[7]. In the case of failure of this second attempt with endoscopic hemostasis, either transcatheter angiographic embolization (TAE) or rescue surgery are indicated, as they provide the same level of efficacy[8,9].
In contrast, there are only a few studies about the potential role of prophylactic transcatheter arterial embolization (PTAE) in the management of NVUGIB. A recent randomized controlled trial suggested that PTAE may reduce the incidence of recurrent bleeding (10.2% vs 11.4%, P = 0.745), but they could not show a clear benefit in adding angiographic embolization to endoscopic hemostasis in NVUGIB patients[10]. Investigating a subset of patients with ulcers 15mm or more in size, PTAE significantly reduced the risk of rebleeding (23.1% vs 4.5%, P = 0.027)[10]. A similar improvement in the rebleeding rate after PTAE was observed in some cohort studies[11-13].
Our study aimed to assess the role of PTAE among NVUGIB patients. We hypothesized that PTAE could reduce the risk of rebleeding and even the mortality rate among NVUGIB patients and improve other outcomes.
MATERIALS AND METHODSWe are reporting our systematic review and meta-analysis in line with the Preferred Reporting Items for Systematic Reviews and Meta-Analyses (PRISMA) 2020 Statement[14] (Supplementary Table 1) and also in line with the Meta-analysis Of Observational Studies in Epidemiology (MOOSE) guidelines[15] because we included both RCTs and observational cohort studies. Methods of the analysis and inclusion criteria were established in advance, and the protocol was documented on the International Prospective Register of Systematic Reviews (PROSPERO, registration number CRD42021223726).
Systematic search Three databases, MEDLINE (via PubMed), EMBASE, and Cochrane Central Register of Controlled Trials (CENTRAL), were searched from inception through October 19th, 2020. We applied the following search key: (embolization OR embolisation) AND (peptic OR ulcer OR "gastrointestinal bleeding" OR nonvariceal OR non-variceal OR "gastrointestinal hemorrhage" OR "gastrointestinal haemorrhage"). We did not use any restrictions or filters during the search. We provide the complete search strategy in Supplementary Appendix 1.
Selection and eligibilityAfter the automatic and manual removal of duplicates with a reference manager software (EndNote X9, Clarivate Analytics, Philadelphia, PA, United States), screening and selection for the title, abstract, and full text were undertaken independently by two review authors. Cohen's kappa coefficient (κ) was calculated after each step to measure inter-reviewer reliability[16]. Disagreements were resolved through discu-ssion with a third author. The references of the selected studies were examined to identify any additional relevant studies.
To identify eligible studies, we used the population-intervention-control-outcome (PICO) framework. Our investigated population (P) consisted of adult patients (age > 18 years) with endoscopy, digital subtraction angiography, or computed tomography angiography proved NVUGIB source, who either underwent successful endoscopic hemostasis or during angiography, there was no detectable contrast extravasation described. Studies compared the outcomes of patients who received PTAE (I) to patients who did not receive PTAE (C). The primary outcomes (O) were rebleeding and 30-d mortality rate, and the secondary outcomes were in-hospital or overall mortality rate, reintervention, need for salvage surgery, need of transfusion, length of hospital (LOH), and intensive care unit (ICU) stay. We pooled studies with different measurement time points regarding rebleeding (such as in-hospital, 28- and 30-d). If articles did not provide a precise measurement time point for mortality, we referred to that as "overall mortality". We defined reintervention as any repeated invasive treatment of rebleeding such as embolization, endoscopy, or surgery. Randomized controlled trials, prospective and retrospective observational cohort studies were eligible. Case reports, case series with less than ten patients, and review articles that did not report original research were excluded. In the case of publications using data with overlapping study populations, we used the one with the bigger sample size.

Boros E et al. Embolization and rebleeding
WJG https://www.wjgnet.com 6988 October 28, 2021 Volume 27 Issue 40
Data collectionTwo independent review authors extracted data from eligible studies into a predesigned data collection form. The following data were collected from each study: first author, year of publication, study design, study period, study site (country), demographic features of the study population, the number of participants with PTAE, the number of patients without PTAE, bleeding etiology, type of embolic agents, data on outcomes (rebleeding, surgery, mortality, reintervention, LOH stay, ICU stay, and blood transfusion) in the intervention and control groups. In the case of the RCTs, intention-to-treat and per-protocol data were collected separately.
Data synthesis and statistical analysisA biomedical statistician performed the statistical analysis of the study. Calculations were made by Stata 16 data analysis and statistical software (Stata Corp LLC, College Station, TX, United States). In the case of dichotomous categorical outcomes (mortality, rebleeding rate, etc.), we determined odds ratios (ORs) with 95% confidence intervals (95%CIs) from two-by-two tables (intervention vs control, outcome present and absent). For continuous variables, weighted mean difference (WMD) with 95%CIs were calculated. A P value less than 0.05 was considered a statistically significant difference. The random-effects model, according to the method of DerSimonian-Laird[17], was used to calculate the pooled estimates. We used forest plots to present the results of the meta-analyses.
I² and χ² tests were performed to assess heterogeneity. I2 values were described as “minimal” (0%–40%), “moderate” (30%–60%), “substantial” (50%–90%), and “consid-erable” (75%–100%) heterogeneity, with a P value < 0.1 considered significant, as suggested by the Cochrane Handbook[18]. For the outcome of rebleeding, publication bias was assessed by visual inspection of a funnel plot and Egger's test. As for the other outcomes, we were unable to determine the presence of publication bias because of the low number of studies included in each analysis.
Sensitivity analysis was carried out by removing each trial analysis in turn in the case of rebleeding, reintervention, surgery, and need of transfusion outcome (the leave-one-out-method).
We performed a subgroup analysis for rebleeding and compared randomized controlled studies (RCTs) with non-randomized studies. For RCTs, we analyzed the intention-to-treat and per-protocol analysis results separately. Trial Sequential Analysis (TSA 0.9.5.10.) was performed for the RCTs regarding rebleeding to control random errors and estimate the optimal information size.
Risk of bias assessment and certainty of the evidenceTwo independent review authors carried out the risk of bias assessment. Discrepancies were resolved by third-party arbitration. We followed the recommendations of the Cochrane Prognosis Methods group, and we used the revised Risk of Bias (RoB) 2 tool for randomized and the Risk of Bias In Non-randomized Studies - of Interventions (ROBINS-I) tool for non-randomized studies[19,20]. We used the Risk-of-bias VISual-ization (robvis) web-based tool[21].
Two independent review authors assessed the overall quality of evidence following the recommendation of the "Grades of Recommendation, Assessment, Development, and Evaluation (GRADE)" workgroup[22]. A third author resolved disagreements. Summary of Findings table and the additional tables were prepared with the GRADE profiler (GRADEpro) tool [GRADEpro Guideline Development Tool (Software)]. McMaster University, 2020 (developed by Evidence Prime, Inc.).
RESULTSSearch and selectionWe identified 10591 records in three databases for evaluation. After removing duplicates and careful selection by title and abstract, 46 articles were eligible for full-text assessment. Altogether, 14 papers were retrieved for qualitative and 12 for quantitative synthesis. Two studies[23,24] were excluded from the quantitative synthesis due to major differences in intervention or outcome compared to other included articles. In the study of Ying et al[23], the intervention group got not only PTAE but also superior mesenteric arterial hypophysin infusion, which was too much alteration from our PICO and inclusion criteria. In the publication of Yonemoto et al[24], different outcomes (statistical analysis for laboratory data, number of endoscopic
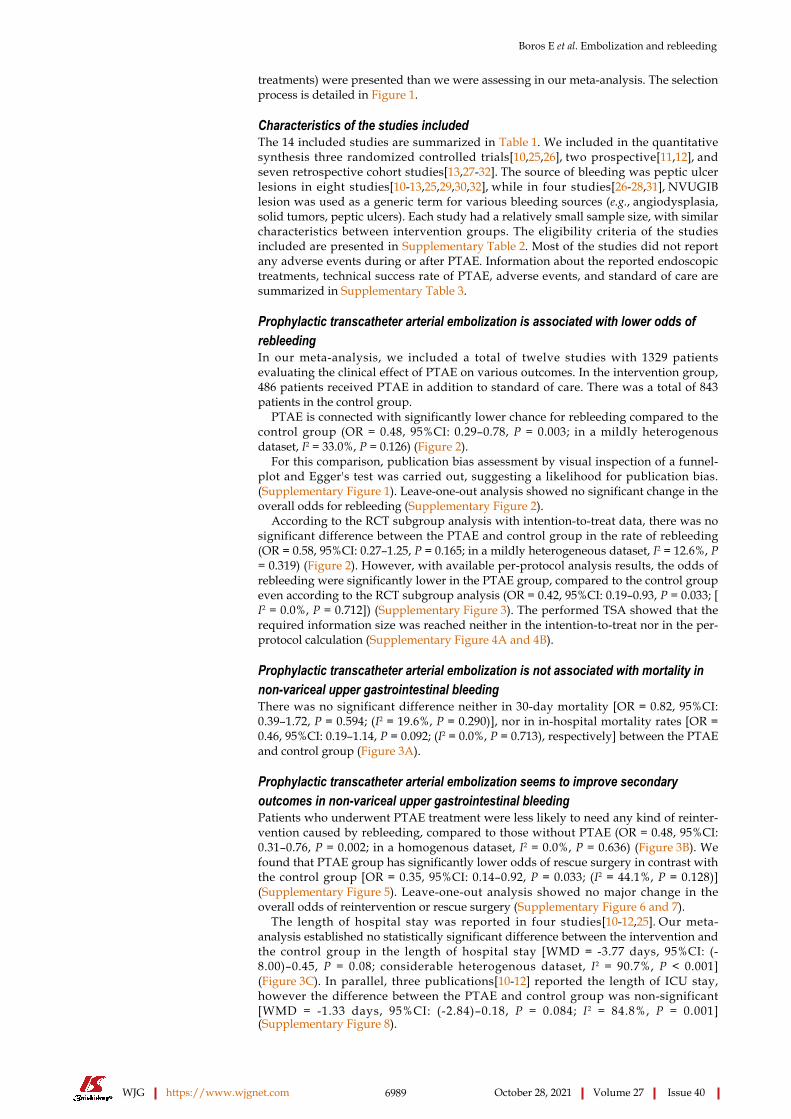
Boros E et al. Embolization and rebleeding
WJG https://www.wjgnet.com 6989 October 28, 2021 Volume 27 Issue 40
treatments) were presented than we were assessing in our meta-analysis. The selection process is detailed in Figure 1.
Characteristics of the studies included The 14 included studies are summarized in Table 1. We included in the quantitative synthesis three randomized controlled trials[10,25,26], two prospective[11,12], and seven retrospective cohort studies[13,27-32]. The source of bleeding was peptic ulcer lesions in eight studies[10-13,25,29,30,32], while in four studies[26-28,31], NVUGIB lesion was used as a generic term for various bleeding sources (e.g., angiodysplasia, solid tumors, peptic ulcers). Each study had a relatively small sample size, with similar characteristics between intervention groups. The eligibility criteria of the studies included are presented in Supplementary Table 2. Most of the studies did not report any adverse events during or after PTAE. Information about the reported endoscopic treatments, technical success rate of PTAE, adverse events, and standard of care are summarized in Supplementary Table 3.
Prophylactic transcatheter arterial embolization is associated with lower odds of rebleedingIn our meta-analysis, we included a total of twelve studies with 1329 patients evaluating the clinical effect of PTAE on various outcomes. In the intervention group, 486 patients received PTAE in addition to standard of care. There was a total of 843 patients in the control group.
PTAE is connected with significantly lower chance for rebleeding compared to the control group (OR = 0.48, 95%CI: 0.29–0.78, P = 0.003; in a mildly heterogenous dataset, I2 = 33.0%, P = 0.126) (Figure 2).
For this comparison, publication bias assessment by visual inspection of a funnel-plot and Egger's test was carried out, suggesting a likelihood for publication bias. (Supplementary Figure 1). Leave-one-out analysis showed no significant change in the overall odds for rebleeding (Supplementary Figure 2).
According to the RCT subgroup analysis with intention-to-treat data, there was no significant difference between the PTAE and control group in the rate of rebleeding (OR = 0.58, 95%CI: 0.27–1.25, P = 0.165; in a mildly heterogeneous dataset, I2 = 12.6%, P = 0.319) (Figure 2). However, with available per-protocol analysis results, the odds of rebleeding were significantly lower in the PTAE group, compared to the control group even according to the RCT subgroup analysis (OR = 0.42, 95%CI: 0.19–0.93, P = 0.033; [I2 = 0.0%, P = 0.712]) (Supplementary Figure 3). The performed TSA showed that the required information size was reached neither in the intention-to-treat nor in the per-protocol calculation (Supplementary Figure 4A and 4B).
Prophylactic transcatheter arterial embolization is not associated with mortality in non-variceal upper gastrointestinal bleedingThere was no significant difference neither in 30-day mortality [OR = 0.82, 95%CI: 0.39–1.72, P = 0.594; (I2 = 19.6%, P = 0.290)], nor in in-hospital mortality rates [OR = 0.46, 95%CI: 0.19–1.14, P = 0.092; (I2 = 0.0%, P = 0.713), respectively] between the PTAE and control group (Figure 3A).
Prophylactic transcatheter arterial embolization seems to improve secondary outcomes in non-variceal upper gastrointestinal bleedingPatients who underwent PTAE treatment were less likely to need any kind of reinter-vention caused by rebleeding, compared to those without PTAE (OR = 0.48, 95%CI: 0.31–0.76, P = 0.002; in a homogenous dataset, I2 = 0.0%, P = 0.636) (Figure 3B). We found that PTAE group has significantly lower odds of rescue surgery in contrast with the control group [OR = 0.35, 95%CI: 0.14–0.92, P = 0.033; (I2 = 44.1%, P = 0.128)] (Supplementary Figure 5). Leave-one-out analysis showed no major change in the overall odds of reintervention or rescue surgery (Supplementary Figure 6 and 7).
The length of hospital stay was reported in four studies[10-12,25]. Our meta-analysis established no statistically significant difference between the intervention and the control group in the length of hospital stay [WMD = -3.77 days, 95%CI: (-8.00)–0.45, P = 0.08; considerable heterogenous dataset, I2 = 90.7%, P < 0.001] (Figure 3C). In parallel, three publications[10-12] reported the length of ICU stay, however the difference between the PTAE and control group was non-significant [WMD = -1.33 days, 95%CI: (-2.84)–0.18, P = 0.084; I2 = 84.8%, P = 0.001] (Supplementary Figure 8).

Boros E et al. Embolization and rebleeding
WJG https://www.wjgnet.com 6990 October 28, 2021 Volume 27 Issue 40
Table 1 Basic characteristics of included studies in the systematic review and meta-analysis
Ref. Country Study design Study period
Number of patients/ intervention group
Female %
Age,1 (yr)
Bleeding etiology Outcome(s) Embolic agents
Arrayeah et al[27]
United States, Israel
Retrospective cohort
1997–2009 73/56 40 61.1 NVUGIB Rebleeding, 30-d mortality, reintervention, surgery
Microcoils, gelatin sponge, polyvinyl alcohol particles
Dixon et al[28]
United Kingdom
Retrospective cohort
05.2008–11.2010 27/20 18.5 66 NVUGIB of duodenal origin
Rebleeding, 30-d mortality, reintervention
Microcoils alone or combined with gelatin/gelfoam sponge, polyvinyl alcohol particles
Kaminskis et al[11]
Latvia Prospective cohort
2014–2018 399/58 44.4 67 High-risk peptic ulcer
Rebleeding, in-hospital mortality, surgery, hospital stay, ICU stay, transfused blood units
ND
Kaminskis et al[12]
Latvia Prospective cohort
2010–2013 75/25 66.6 64 High-risk peptic ulcer
Rebleeding, in-hospital mortality, surgery, hospital stay, ICU stay, transfused blood units
Coil or sandwich technique
Lau et al[10]
China Randomized controlled trial
2010–2014 241/118 24.9 66 High-risk peptic ulcer
Rebleeding, 30-d mortality, reintervention, surgery, hospital stay, ICU stay, transfused blood units
Sandwich technique: Coils and gel foam particles
Laursen et al[25]
Denmark Randomized controlled trial
11.2009–05.2012 105/49 44 73 High-risk peptic ulcer
Rebleeding, in-hospital and 30-d mortality, hospital stay, readmission
Coils
Lebedev et al[29]
Russia Retrospective cohort
1991–2016 90/30 ND ND Peptic ulcer
Rebleeding, mortality
Microcoils, polyvinyl alcohol
Mille et al[30]
Germany Retrospective cohort
2008–2012 102/55 31.4 70.7 Duodenal ulcer
Rebleeding, 30-d mortality, surgery, transfused blood units
Coils, cyanoacrylate glue or both
Sildiroglu et al[31]
United States
Retrospective cohort
10.2001–11.2011 43/18 ND 60.1 NVUGIB Rebleeding, mortality
Coils, gelfoam, polyvinyl alcohol
Tong et al[13]
China Retrospective cohort
2014–2016 74/16 23 57.2 High-risk peptic ulcer
Rebleeding ND
Wu et al[32]
Australia Retrospective cohort
01.2008–12.2012 34/8 ND 70.1 Peptic ulcer
Rebleeding ND
Ying et al[26]
China Randomized controlled trial
05.2012–06.2013 66/33 25 51.5 Upper GIB Rebleeding Gelatin sponge particles
Ying et al[23]
China Randomized controlled trial
06.2010–06.2014 78/39 46.2 46.5 Upper GIB Short term haemostasis, long term haemostasis, hospital stay, transfusion
Coils, gelatin sponge
Yonemoto et al[24]
Japan Retrospective cohort
04.2005–12.2017 141/11 22.7 62.8 Duodenal ulcer
Laboratory data at initial diagnosis, the amount of blood transfusion, 30-d mortality
ND
1Age is given in mean or median. GIB: Gastrointestinal bleeding, ICU: Intensive care unit, ND: No data, NVUGIB: Non-variceal upper GIB.
Lastly, the PTAE group needed significantly more units of blood transfusion, than

Boros E et al. Embolization and rebleeding
WJG https://www.wjgnet.com 6991 October 28, 2021 Volume 27 Issue 40
Figure 1 Preferred reporting in systematic reviews and meta-analyses flowchart showing the selection process.
Risk of bias assessment and quality of evidenceAmong the included studies, four[10-12,25] were of low overall risk of bias, two[29,30] were of high overall risk of bias, all the other studies were rated to carry moderate overall risk of bias. The summary of the risk of bias assessment is shown in Supplementary Figure 11-18.
We included all outcomes in the "Summary of findings table" (Supplementary Table 4). The certainty of the evidence is very low for every outcome because our meta-analysis mainly contained observational studies. We calculated the quality of evidence among the RCT subgroup in rebleeding, and we found a moderate certainty of the evidence for PTAE, lowering the chance of rebleeding.
DISCUSSIONIn this study, we assessed the effect of PTAE in addition to the successful endoscopic treatment of NVGUIB or PTAE as the first treatment option in case of not actively bleeding patients with NVUGIB lesions. Based on our findings, PTAE is associated with lower odds of rebleeding, need for additional reintervention, and rescue surgery compared to standard of care. We found a roughly 50% lower rate of the outcomes mentioned above, which is a considerable proportion, especially considering the prevalence of NVUGIB.
Boros E et al. Embolization and rebleeding
WJG https://www.wjgnet.com 6992 October 28, 2021 Volume 27 Issue 40
Figure 2 Forest plot of studies divided into subgroups representing that the overall odds of rebleeding were significantly lower in the prophylactic transcatheter arterial embolization group. However, among the RCT studies, the difference was not statistically significant. RCT: Randomized controlled trial; OR: Odds ratio; 95%CI: Confidence interval.
A recent meta-analysis of Chang et al[33] attempted to evaluate the role of PTAE in the management of patients with high-risk peptic ulcer bleeding. They included only 2 RCTs and 3 observational studies in their meta-analysis while narrowing their search to patients with a high risk of rebleeding. We designed our systematic search for NVUGIB without restriction to high-risk peptic ulcer bleeding because of the various NVUGIB bleeding etiologies that could be treated with TAE[9].
Rebleeding in the randomized controlled trialsWe found three eligible RCTs[10,25,26], which provide the core of our meta-analysis and the highest level of evidence. When we performed a subgroup analysis of the RCTs for the rebleeding outcome, we found no significant difference between PTAE and the control group. We think that the main reason why with intention-to-treat data, we could not demonstrate the clear beneficial effect of PTAE is that in Lau et al[10]'s study, 22 patients out of 118 (18.6%), and Laursen et al[25], 18 out of 49 (36.7%) did not receive embolization at all despite being in the embolization arm of the studies. When we used per-protocol data, also in the RCT subgroup, there was a significantly lower risk for rebleeding in the PTAE group. However, the TSA calculation showed that the required information size was not reached, and our results are inconclusive.
It is important to note that in Laursen et al[25]'s study, 9% of the potentially eligible patients were excluded because they were admitted to the hospital on weekends. These patients could not receive the allocated intervention due to the lack of staff in interventional radiology. This highlights that PTAE could be the most beneficial treatment option in centers with well-established interventional radiology units.
According to Lau et al[10], the chance of recurrent bleeding was significantly reduced in ulcers 15 mm in size or greater. Unfortunately, there was not enough data on the size of the culprit lesions in the other included studies to perform a meta-analysis. Nevertheless, risk stratification is essential before choosing between multiple possible treatment modalities in the case of NVUGIB. Several studies[10-13,25] used the Forrest classification, Rockall score, or the American Society of Anesthesiologists

Boros E et al. Embolization and rebleeding
WJG https://www.wjgnet.com 6993 October 28, 2021 Volume 27 Issue 40

Boros E et al. Embolization and rebleeding
WJG https://www.wjgnet.com 6994 October 28, 2021 Volume 27 Issue 40
Figure 3 Forest plot of studies. A: Representing no significant difference in mortality rates between the prophylactic transcatheter arterial embolization and the control group; B: Representing significantly lower odds of reintervention in the prophylactic transcatheter arterial embolization than the control group; C: representing no significant difference in length of hospital stay in days between the prophylactic transcatheter arterial embolization and the control group. OR: Odds ratio; 95%CI: Confidence interval; WMD: Weighted mean difference; SD: Standard deviation.
score to assess the baseline risk of rebleeding or mortality among the patients, and it was approximately the same between the PTAE and the control group.
Rebleeding in cohort studiesThe publication of Mille et al[30] described that only high rebleeding risk patients got PTAE, and in the control group were only low-risk patients. We consider this a selection bias, causing confounding of the measured outcomes, which could explain why they did not manage to find any difference in the rebleeding, reintervention, or rescue surgery rate between the intervention and the control group. Applying the leave-one-out method in the case of the study of Mille et al[30], there was no major change in the overall odds for rebleeding, reintervention, and rescue surgery.
The study of Sildiroglu et al[31] was the only one where the PTAE group had a worse rebleeding rate than the control group. There was no data on the baseline characteristics of the two treatment groups, so we cannot explain this contradicting result.
We included in our analyses four studies[26-28,31], with a definition of NVUGIB including various sources such as peptic ulcers, tumors, Dieulafoy lesion, Mallory-Weiss tear. Arrayeh et al[27] carried out a retrospective analysis that compared three therapeutic options: angiography without embolization, PTAE, and TAE with an abnormal angiogram. They published the interesting observation that patients with duodenal bleeding due to a mass (various types of malignant) lesion had a greater primary hemostasis rate 30 d after angiography compared with patients with nonmass (different types of benign) sources of duodenal bleeding (100% vs 54%; P = 0.008). This difference was not detectable between mass and nonmass lesions in the case of gastric bleeding. We did not find data in other studies about the investigated outcomes separated by the type of the bleeding lesion.
The rebleeding rate could also depend on whether NVUGIB has a gastric or duodenal source. According to Arrayeh et al[27], PTAE may be advantageous in patients with a duodenal source of bleeding but not in patients with gastric hemorrhage. We did not identify enough evidence to support this inference because none of the other included studies reported gastric and duodenal bleeding separately.

Boros E et al. Embolization and rebleeding
WJG https://www.wjgnet.com 6995 October 28, 2021 Volume 27 Issue 40
Evidence about secondary outcomesOur results indicated that PTAE does not improve the mortality rates of NVUGIB significantly. We could not draw a clear conclusion about this outcome because of the different time-frames for mortality assessment used between the different studies: 30-d mortality was used in five studies[10,25,27,28,30], in-hospital mortality in three[11,12,25] and two studies[29,31] did not report any time-frame for mortality. Mortality is strongly associated with pre-endoscopy and complete Rockall score, according to Hearnshaw et al[5] We can only speculate that numerous major confounding factors affect the mortality of NVUGIB patients, and only one of them is the chosen treatment modality.
We had predicted a shorter hospital stay and ICU stay in the PTAE group, but our findings could not prove a significant difference between the two groups. Interestingly, if we analyzed only the data coming from RCTs, there was an apparent reduction in the length of hospital and ICU stay in the PTAE group compared with the control group. This result highlights the possible bias of the observational cohort studies.
The PTAE group needed slightly more red blood cell transfusion than the control group, although the heterogeneity between the studies suggests a careful interpre-tation of this finding. Since we assume a major confounding factor in the publication of Mille et al[30], the difference was no longer statistically significant between the PTAE and the control group after applying the leave-one-out method.
Methods reducing rebleeding risk in non-variceal upper gastrointestinal bleedingThere are a few therapies, which are already proved to reduce rebleeding from NVUGIB. Proton pump inhibitors (PPI) significantly decrease the recurrence of bleeding compared to control (placebo or histamine type 2 receptor antagonists); pooled rates were 10.6% with PPI vs 17.3% with control treatment (OR = 0.49; 95%CI: 0.37-0.65) in a Cochrane review comprising 24 RCTs[34]. Our recent meta-analysis showed that PPIs given either orally or intravenously are equally efficacious in preventing rebleeding[35].
After peptic ulcer bleeding, investigation for the presence of H. pylori should be mandatory. Our network meta-analysis[36] demonstrated that none of the individual tests or the strategy of combined tests is superior in detecting H. pylori. Gisbert et al[37] reported that rebleeding did not occur in patients with complicated ulcers after H. pylori eradication; moreover, maintenance of anti-ulcer therapy is unnecessary if eradication was achieved.
Endoscopic Doppler probe guided hemostasis significantly reduced the 30-d rates of rebleeding compared with standard visually guided hemostasis in an RCT (11.1% vs 26.3%), and the use of the endoscopic Doppler probe was suggested for risk strati-fication in the management of NVUGIB[38].
Another promising endoscopic technique to reduce the rebleeding rate of peptic ulcers is over-the-scope clipping (OTSC), which is superior to standard therapy with through-the-scope clips in preventing further bleeding according to the prospective RCT of Schmidt et al[39].
A recent meta-analysis[40] showed that the routine second-look endoscopy was not superior to a single endoscopy with complete endoscopic hemostasis in reducing the risk of recurrent bleeding, mortality, or need for surgery in patients with acute UGIB due to peptic ulcer disease. In contrast, according to our results, PTAE added to the standard of care could decrease the probability of rebleeding. Moreover, PTAE might reduce the need for surgery and any reintervention.
Strengths and limitationsOur work is assessing the potential effects of PTAE compared to the standard of care in the treatment of NVUGIB. We used a rigorous methodology and followed a transparent protocol, combined with a comprehensive statistical analysis as possible. We collected a total of 486 patients who received PTAE, which is an infrequent therapeutic choice so far.
The main limitation of our meta-analysis is that we collected our data mostly from observational cohort studies, and we found only three RCTs comparing PTAE to the standard of care. Thus, the quality of evidence for every outcome in our meta-analysis is very low based on the GRADE framework. When we assessed the quality of evidence regarding rebleeding in the RCT subgroup, we found moderate evidence for the risk reduction with PTAE. The diversity of the NVUGIB population in some studies could also limit our results and explain the statistical heterogeneity in some cases. Significant differences are present in the embolic agents utilized for PTAE

Boros E et al. Embolization and rebleeding
WJG https://www.wjgnet.com 6996 October 28, 2021 Volume 27 Issue 40
among publications. There was very restricted data on the endoscopic treatment before PTAE, which could also influence the outcomes. The included studies contain only limited information on secondary outcomes, so our conclusions about these are less certain.
Implications for practiceIn selected cases, where the previous risk stratification suggests high rebleeding risk or the anatomical situation makes the secure and permanent endoscopic hemostasis impossible, we can consider the routine use of PTAE. Considering the demographic trends of NVUGIB, we predict that elderly, high-risk patients with co-morbidities could benefit the most from PTAE as a therapeutic approach.
Implications for researchFurther RCTs are warranted to achieve a higher level of evidence about the potentially beneficial effects of PTAE. Developing an accurate risk stratification system would be crucial to select the ideal candidates for PTAE. Clinical trials investigating the use of existing risk scores or creating a new risk stratification tool of NVUGIB could help clinicians choose between the emerging number of treatment options.
CONCLUSIONPTAE is accompanied by lower odds of rebleeding, need for surgery, and reinter-ventions in NVUGIB. However, our meta-analysis could not justify a beneficial effect of PTAE on mortality rates compared with the standard of care in NVUGIB.
ARTICLE HIGHLIGHTSResearch backgroundThe prevention of rebleeding is one of the main goals in managing non-variceal upper gastrointestinal bleeding (NVUGIB). Prophylactic transcatheter arterial embolization (PTAE) can be used in NVUGIB as second-line therapy.
Research motivationThe results of the individual studies about the beneficial effects of PTAE among NVUGIB patients were contradictory.
Research objectivesThe authors aimed to carry out a comprehensive systematic review and meta-analysis. The authors compared the PTAE to no embolization as a second line, prophylactic treatment among NVUGIB patients.
Research methodsThe authors conducted a systematic search in three databases (MEDLINE, EMBASE, CENTRAL). The eligible studies compared patients with NVUGIB receiving PTAE to those who did not get PTAE. The authors calculated odds ratios (ORs) with 95% confidence intervals (CI) for rebleeding, mortality, reintervention, need for surgery, and weighted mean differences (WMDs) of need for transfusion, length of hospital (LOH), and intensive care unit (ICU) stay.
Research resultsPTAE was associated with significantly lower odds of rebleeding, reintervention and rescue surgery (OR = 0.48, 95%CI: 0.29–0.78; OR = 0.48, 95%CI: 0.31–0.76; OR = 0.35, 95%CI: 0.14–0.92; respectively). There was no significant difference in the mortality rates, LOH, and ICU stays between the PTAE and control groups. The quality of evidence for every outcome in our meta-analysis is very low based on the GRADE framework.
Research conclusionsThe results suggest that PTAE is a reasonable therapeutic choice to prevent rebleeding or reintervention in NVUGIB, although it did not improve the mortality rates of NVUGIB.

Boros E et al. Embolization and rebleeding
WJG https://www.wjgnet.com 6997 October 28, 2021 Volume 27 Issue 40
Research perspectivesFurther randomized controlled trials are needed about the use of PTAE. We also propose a clinical trial that could recommend a new risk stratification tool of NVUGIB, helping clinicians choose between treatment options.
REFERENCESLoperfido S, Baldo V, Piovesana E, Bellina L, Rossi K, Groppo M, Caroli A, Dal Bò N, Monica F, Fabris L, Salvat HH, Bassi N, Okolicsanyi L. Changing trends in acute upper-GI bleeding: a population-based study. Gastrointest Endosc 2009; 70: 212-224 [PMID: 19409558 DOI: 10.1016/j.gie.2008.10.051]
1
Oakland K. Changing epidemiology and etiology of upper and lower gastrointestinal bleeding. Best Pract Res Clin Gastroenterol 2019; 42-43: 101610 [PMID: 31785737 DOI: 10.1016/j.bpg.2019.04.003]
2
Wuerth BA, Rockey DC. Changing Epidemiology of Upper Gastrointestinal Hemorrhage in the Last Decade: A Nationwide Analysis. Dig Dis Sci 2018; 63: 1286-1293 [PMID: 29282637 DOI: 10.1007/s10620-017-4882-6]
3
Jairath V, Martel M, Logan RF, Barkun AN. Why do mortality rates for nonvariceal upper gastrointestinal bleeding differ around the world? Can J Gastroenterol 2012; 26: 537-543 [PMID: 22891179 DOI: 10.1155/2012/862905]
4
Hearnshaw SA, Logan RF, Lowe D, Travis SP, Murphy MF, Palmer KR. Acute upper gastrointestinal bleeding in the UK: patient characteristics, diagnoses and outcomes in the 2007 UK audit. Gut 2011; 60: 1327-1335 [PMID: 21490373 DOI: 10.1136/gut.2010.228437]
5
van Leerdam ME. Epidemiology of acute upper gastrointestinal bleeding. Best Pract Res Clin Gastroenterol 2008; 22: 209-224 [PMID: 18346679 DOI: 10.1016/j.bpg.2007.10.011]
6
Gralnek IM, Stanley AJ, Morris AJ, Camus M, Lau J, Lanas A, Laursen SB, Radaelli F, Papanikolaou IS, Cúrdia Gonçalves T, Dinis-Ribeiro M, Awadie H, Braun G, de Groot N, Udd M, Sanchez-Yague A, Neeman Z, van Hooft JE. Endoscopic diagnosis and management of nonvariceal upper gastrointestinal hemorrhage (NVUGIH): European Society of Gastrointestinal Endoscopy (ESGE) Guideline - Update 2021. Endoscopy 2021; 53: 300-332 [PMID: 33567467 DOI: 10.1055/a-1369-5274]
7
Nykänen T, Peltola E, Kylänpää L, Udd M. Bleeding gastric and duodenal ulcers: case-control study comparing angioembolization and surgery. Scand J Gastroenterol 2017; 52: 523-530 [PMID: 28270041 DOI: 10.1080/00365521.2017.1288756]
8
Tarasconi A, Baiocchi GL, Pattonieri V, Perrone G, Abongwa HK, Molfino S, Portolani N, Sartelli M, Di Saverio S, Heyer A, Ansaloni L, Coccolini F, Catena F. Transcatheter arterial embolization versus surgery for refractory non-variceal upper gastrointestinal bleeding: a meta-analysis. World J Emerg Surg 2019; 14: 3 [PMID: 30733822 DOI: 10.1186/s13017-019-0223-8]
9
Lau JYW, Pittayanon R, Wong KT, Pinjaroen N, Chiu PWY, Rerknimitr R, Holster IL, Kuipers EJ, Wu KC, Au KWL, Chan FKL, Sung JJY. Prophylactic angiographic embolisation after endoscopic control of bleeding to high-risk peptic ulcers: a randomised controlled trial. Gut 2019; 68: 796-803 [PMID: 29802172 DOI: 10.1136/gutjnl-2018-316074]
10
Kaminskis A, Ivanova P, Kratovska A, Ponomarjova S, Ptašņuka M, Demičevs J, Demičeva R, Boka V, Pupelis G. Endoscopic hemostasis followed by preventive transarterial embolization in high-risk patients with bleeding peptic ulcer: 5-year experience. World J Emerg Surg 2019; 14: 45 [PMID: 31516544 DOI: 10.1186/s13017-019-0264-z]
11
Kaminskis A, Kratovska A, Ponomarjova S, Tolstova A, Mukans M, Stabiņa S, Gailums R, Bernšteins A, Ivanova P, Boka V, Pupelis G. Preventive transarterial embolization in upper nonvariceal gastrointestinal bleeding. World J Emerg Surg 2017; 12: 3 [PMID: 28101125 DOI: 10.1186/s13017-016-0114-1]
12
Tong H, Lan T, Tang CW. Prophylactic angiographic embolisation after endoscopic treatment of bleeding for high-risk peptic ulcers: what are the more appropriate indications? Gut 2020; 69: 1897-1898 [PMID: 31776229 DOI: 10.1136/gutjnl-2019-319818]
13
Page MJ, McKenzie JE, Bossuyt PM, Boutron I, Hoffmann TC, Mulrow CD, Shamseer L, Tetzlaff JM, Akl EA, Brennan SE, Chou R, Glanville J, Grimshaw JM, Hróbjartsson A, Lalu MM, Li T, Loder EW, Mayo-Wilson E, McDonald S, McGuinness LA, Stewart LA, Thomas J, Tricco AC, Welch VA, Whiting P, Moher D. The PRISMA 2020 statement: an updated guideline for reporting systematic reviews. BMJ 2021; 372: n71 [PMID: 33782057 DOI: 10.1136/bmj.n71]
14
Stroup DF, Berlin JA, Morton SC, Olkin I, Williamson GD, Rennie D, Moher D, Becker BJ, Sipe TA, Thacker SB. Meta-analysis of observational studies in epidemiology: a proposal for reporting. Meta-analysis Of Observational Studies in Epidemiology (MOOSE) group. JAMA 2000; 283: 2008-2012 [PMID: 10789670 DOI: 10.1001/jama.283.15.2008]
15
McHugh ML. Interrater reliability: the kappa statistic. Biochem Med (Zagreb) 2012; 22: 276-282 [PMID: 23092060]
16
DerSimonian R, Laird N. Meta-analysis in clinical trials. Control Clin Trials 1986; 7: 177-188 [PMID: 3802833 DOI: 10.1016/0197-2456(86)90046-2]
17
Higgins JPT, Thomas J, Chandler J, Cumpston M, Li T, Page MJ, Welch VA (editors). Cochrane 18

Boros E et al. Embolization and rebleeding
WJG https://www.wjgnet.com 6998 October 28, 2021 Volume 27 Issue 40
Handbook for Systematic Reviews of Interventions version 6.2 (updated February 2021). Cochrane, 2021. Available from: https://training.cochrane.org/handbookSterne JA, Hernán MA, Reeves BC, Savović J, Berkman ND, Viswanathan M, Henry D, Altman DG, Ansari MT, Boutron I, Carpenter JR, Chan AW, Churchill R, Deeks JJ, Hróbjartsson A, Kirkham J, Jüni P, Loke YK, Pigott TD, Ramsay CR, Regidor D, Rothstein HR, Sandhu L, Santaguida PL, Schünemann HJ, Shea B, Shrier I, Tugwell P, Turner L, Valentine JC, Waddington H, Waters E, Wells GA, Whiting PF, Higgins JP. ROBINS-I: a tool for assessing risk of bias in non-randomised studies of interventions. BMJ 2016; 355: i4919 [PMID: 27733354 DOI: 10.1136/bmj.i4919]
19
Sterne JAC, Savović J, Page MJ, Elbers RG, Blencowe NS, Boutron I, Cates CJ, Cheng HY, Corbett MS, Eldridge SM, Emberson JR, Hernán MA, Hopewell S, Hróbjartsson A, Junqueira DR, Jüni P, Kirkham JJ, Lasserson T, Li T, McAleenan A, Reeves BC, Shepperd S, Shrier I, Stewart LA, Tilling K, White IR, Whiting PF, Higgins JPT. RoB 2: a revised tool for assessing risk of bias in randomised trials. BMJ 2019; 366: l4898 [PMID: 31462531 DOI: 10.1136/bmj.l4898]
20
McGuinness LA, Higgins JPT. Risk-of-bias VISualization (robvis): An R package and Shiny web app for visualizing risk-of-bias assessments. Res Synth Methods 2021; 12: 55-61 [PMID: 32336025 DOI: 10.1002/jrsm.1411]
21
Iorio A, Spencer FA, Falavigna M, Alba C, Lang E, Burnand B, McGinn T, Hayden J, Williams K, Shea B, Wolff R, Kujpers T, Perel P, Vandvik PO, Glasziou P, Schunemann H, Guyatt G. Use of GRADE for assessment of evidence about prognosis: rating confidence in estimates of event rates in broad categories of patients. BMJ 2015; 350: h870 [PMID: 25775931 DOI: 10.1136/bmj.h870]
22
Ying Y, Luo JF, He X, Zeng FL, Xie YL. Clinical effects of preventive interventional therapy in gastrointestinal bleeding patients with negative digital subtraction angiography findings. Shijie Huaren Xiaohua Zazhi 2014; 22: 5556-5560 [DOI: 10.11569/wcjd.v22.i35.5556]
23
Yonemoto Y, Fukami Y, Hara H, Mochida T, Machida T, Sugiyama Y, Watanabe A, Kaneshiro M, Ikemiyagi H, Yoshino K, Sakita S. The statistical comparison of endoscopic procedure and transarterial embolization for hemorrhage caused by duodenal ulcer. United European Gastroenterol J 2018; 6: A496-A497 [DOI: 10.1177/2050640618792819]
24
Laursen SB, Hansen JM, Andersen PE, Schaffalitzky de Muckadell OB. Supplementary arteriel embolization an option in high-risk ulcer bleeding--a randomized study. Scand J Gastroenterol 2014; 49: 75-83 [PMID: 24256098 DOI: 10.3109/00365521.2013.854829]
25
Ying Y, Luo JF, Zhang WH, Wang XN, He X. Effects of vasopressin infusion aided prophylactic gastroduodenal artery embolization in DSA-negative gastrointestinal bleeding patients. Shijie Huaren Xiaohua Zazhi 2013; 21: 4180‐4184 [DOI: 10.11569/wcjd.v21.i36.4180]
26
Arrayeh E, Fidelman N, Gordon RL, LaBerge JM, Kerlan RK Jr, Klimov A, Bloom AI. Transcatheter arterial embolization for upper gastrointestinal nonvariceal hemorrhage: is empiric embolization warranted? Cardiovasc Intervent Radiol 2012; 35: 1346-1354 [PMID: 22302348 DOI: 10.1007/s00270-012-0351-y]
27
Dixon S, Chan V, Shrivastava V, Anthony S, Uberoi R, Bratby M. Is there a role for empiric gastroduodenal artery embolization in the management of patients with active upper GI hemorrhage? Cardiovasc Intervent Radiol 2013; 36: 970-977 [PMID: 23152041 DOI: 10.1007/s00270-012-0511-0]
28
Lebedev NV, Belozerov GE, Klimov AE, Sokolova PY, Spasskiy AA, Barkhudarov AA. [Transcatheter embolization in prevention of recurrent bleeding from stomach ulcers]. Khirurgiia (Mosk) 2017; 31-35 [PMID: 28514380 DOI: 10.17116/hirurgia2017531-35]
29
Mille M, Huber J, Wlasak R, Engelhardt T, Hillner Y, Kriechling H, Aschenbach R, Ende K, Scharf JG, Puls R, Stier A. Prophylactic Transcatheter Arterial Embolization After Successful Endoscopic Hemostasis in the Management of Bleeding Duodenal Ulcer. J Clin Gastroenterol 2015; 49: 738-745 [PMID: 25319738 DOI: 10.1097/MCG.0000000000000259]
30
Sildiroglu O, Muasher J, Arslan B, Sabri SS, Saad WE, Angle JF, Matsumoto AH, Turba UC. Outcomes of patients with acute upper gastrointestinal nonvariceal hemorrhage referred to interventional radiology for potential embolotherapy. J Clin Gastroenterol 2014; 48: 687-692 [PMID: 25014238 DOI: 10.1097/MCG.0000000000000181]
31
Wu P, Szczesniak MM, Craig PI, Choo L. A novel predictor of rebleeding in high risk peptic ulcer disease selects patients who would benefit most from prophylactic arterial embolisation. Gastroenterology 2014; 146: S-183 [DOI: 10.1016/S0016-5085(14)60650-8]
32
Chang JHE, Lye TJY, Zhu HZ, Syn NL, Tang SS, Gogna A, Chan WH, Ong HS, Tan JTH, Lim CH. Systematic Review and Meta-Analysis of Prophylactic Transarterial Embolization for High-Risk Bleeding Peptic Ulcer Disease. J Vasc Interv Radiol 2021; 32: 576-584.e5 [PMID: 33526343 DOI: 10.1016/j.jvir.2020.12.005]
33
Leontiadis GI, Sharma VK, Howden CW. Proton pump inhibitor treatment for acute peptic ulcer bleeding. Cochrane Database Syst Rev 2006; CD002094 [PMID: 16437441 DOI: 10.1002/14651858.CD002094.pub3]
34
Csiki E, Szabó H, Hanák L, Szakács Z, Kiss S, Vörhendi N, Pécsi D, Hegyi E, Hegyi P, Erőss B. Oral Proton Pump Inhibitors May Be as Effective as Intravenous in Peptic Ulcer Bleeding: A Systematic Review and Meta-analysis. Clin Transl Gastroenterol 2021; 12: e00341 [PMID: 33988530 DOI: 10.14309/ctg.0000000000000341]
35
Vörhendi N, Soós A, Anne Engh M, Tinusz B, Szakács Z, Pécsi D, Mikó A, Sarlós P, Hegyi P, Eröss B. Accuracy of the Helicobacter pylori diagnostic tests in patients with peptic ulcer bleeding: a systematic review and network meta-analysis. Therap Adv Gastroenterol 2020; 13: 1756284820965324 [PMID: 33403002 DOI: 10.1177/1756284820965324]
36

Boros E et al. Embolization and rebleeding
WJG https://www.wjgnet.com 6999 October 28, 2021 Volume 27 Issue 40
Gisbert JP, Calvet X, Cosme A, Almela P, Feu F, Bory F, Santolaria S, Aznárez R, Castro M, Fernández N, García-Grávalos R, Benages A, Cañete N, Montoro M, Borda F, Pérez-Aisa A, Piqué JM; H. pylori Study Group of the Asociación Española de Gastroenterología (Spanish Gastroenterology Association). Long-term follow-up of 1,000 patients cured of Helicobacter pylori infection following an episode of peptic ulcer bleeding. Am J Gastroenterol 2012; 107: 1197-1204 [PMID: 22613904 DOI: 10.1038/ajg.2012.132]
37
Jensen DM, Kovacs TOG, Ohning GV, Ghassemi K, Machicado GA, Dulai GS, Sedarat A, Jutabha R, Gornbein J. Doppler Endoscopic Probe Monitoring of Blood Flow Improves Risk Stratification and Outcomes of Patients With Severe Nonvariceal Upper Gastrointestinal Hemorrhage. Gastroenterology 2017; 152: 1310-1318.e1 [PMID: 28167214 DOI: 10.1053/j.gastro.2017.01.042]
38
Schmidt A, Gölder S, Goetz M, Meining A, Lau J, von Delius S, Escher M, Hoffmann A, Wiest R, Messmann H, Kratt T, Walter B, Bettinger D, Caca K. Over-the-Scope Clips Are More Effective Than Standard Endoscopic Therapy for Patients With Recurrent Bleeding of Peptic Ulcers. Gastroenterology 2018; 155: 674-686.e6 [PMID: 29803838 DOI: 10.1053/j.gastro.2018.05.037]
39
Kamal F, Khan MA, Lee-Smith W, Sharma S, Imam Z, Henry C, Jowhar D, Khan Z, Petryna E, Iqbal U, Tombazzi C, Ismail MK, Howden CW. Role of routine second-look endoscopy in patients with acute peptic ulcer bleeding: meta-analysis of randomized controlled trials. Gastrointest Endosc 2021; 93: 1228-1237.e5 [PMID: 33417896 DOI: 10.1016/j.gie.2020.12.039]
40

WJG https://www.wjgnet.com 7000 October 28, 2021 Volume 27 Issue 40
World Journal of
GastroenterologyW J GSubmit a Manuscript: https://www.f6publishing.com World J Gastroenterol 2021 October 28; 27(40): 7000-7004
DOI: 10.3748/wjg.v27.i40.7000 ISSN 1007-9327 (print) ISSN 2219-2840 (online)
LETTER TO THE EDITOR
Gastrointestinal and hepatic involvement during COVID-19 pandemic: A focus on pediatric population and possible future implications
Rossella Sica, Serena Pennoni, Laura Penta, Sara Riccioni, Giuseppe Di Cara, Alberto Verrotti
ORCID number: Rossella Sica 0000-0002-3990-4117; Serena Pennoni 0000-0002-4238-436X; Laura Penta 0000-0003-0945-2997; Sara Riccioni 0000-0003-1989-9549; Giuseppe Di Cara 0000-0002-7632-6774; Alberto Verrotti 0000-0001-6323-4187.
Author contributions: Sica R drafted the manuscript; Sica R, Pennoni S, Penta L, Riccioni S, Di Cara G and Verrotti A edited and revised the manuscript; Verrotti A supervised and approved the final version of the manuscript; all authors have read and agreed to the published version of the manuscript.
Conflict-of-interest statement: The authors declare no conflict of interest.
Open-Access: This article is an open-access article that was selected by an in-house editor and fully peer-reviewed by external reviewers. It is distributed in accordance with the Creative Commons Attribution NonCommercial (CC BY-NC 4.0) license, which permits others to distribute, remix, adapt, build upon this work non-commercially, and license their derivative works on different terms, provided the original work is properly cited and the use is non-commercial. See: htt
Rossella Sica, Serena Pennoni, Laura Penta, Sara Riccioni, Giuseppe Di Cara, Alberto Verrotti, Department of Pediatrics, University of Perugia, Perugia 06132, PG, Italy
Corresponding author: Alberto Verrotti, MD, PhD, Chief Doctor, Professor, Department of Pediatrics, University of Perugia, Piazza L Severi 1, Perugia 06132, PG, Italy. [email protected]
AbstractSince the coronavirus disease 2019 (COVID-19) pandemic caused by severe acute respiratory syndrome coronavirus 2 (SARS-CoV-2) has rapidly spread worldwide, there is still limited knowledge about this condition and its natural history. Children have been relatively spared during COVID-19 pandemic but a novel syndrome known as multisystem inflammatory syndrome (MIS-C) has emerged, following a SARS-CoV-2 infection in children and adolescents. This syndrome can lead to shock and multiple organ failure requiring intensive care. Although COVID-19 clinical research focuses on respiratory symptoms, extrapulmonary involvement such as gastrointestinal (GI) and hepatic manifestations should also be considered. In fact, GI and hepatic involvement play an important role among the most common presenting symptoms of both pediatric and adult COVID-19 and MIS-C. This involvement can not only be one of the most common presenting clinical features but also one of the sequelae of these syndromes. Abdominal ultrasonography monitoring could be very useful to identify a potential involvement of the GI tract and liver. Moreover, long-term follow-up is needed and would be essential to define the long-term outcomes of these patients.
Key Words: SARS-CoV-2; COVID-19; Multisystem inflammatory syndrome; Gastroin-testinal tract; Liver; Ultrasonography
©The Author(s) 2021. Published by Baishideng Publishing Group Inc. All rights reserved.
Core Tip: Gastrointestinal and hepatic symptoms are a common clinical feature of the coronavirus disease 2019 (COVID-19). Moreover, a novel syndrome known as multisystem inflammatory syndrome (MIS-C) associated with COVID-19 in children

Sica R et al. GI involvement in COVID-19 and MIS-C
WJG https://www.wjgnet.com 7001 October 28, 2021 Volume 27 Issue 40
p://creativecommons.org/Licenses/by-nc/4.0/
Manuscript source: Unsolicited manuscript
Specialty type: Medicine, research and experimental
Country/Territory of origin: Italy
Peer-review report’s scientific quality classificationGrade A (Excellent): 0 Grade B (Very good): 0 Grade C (Good): C, C Grade D (Fair): 0 Grade E (Poor): 0
Received: August 5, 2021 Peer-review started: August 5, 2021 First decision: August 19, 2021 Revised: August 30, 2021 Accepted: September 15, 2021 Article in press: September 15, 2021 Published online: October 28, 2021
P-Reviewer: Freij BJ, Nabil A S-Editor: Gao CC L-Editor: A P-Editor: Li JH
and adolescents has emerged. Among the most common presenting symptoms of MIS-C, we found gastrointestinal and hepatic involvement. As gastrointestinal and hepatic involvement might play a major role in the clinical spectrum and possible sequelae of this novel condition, physicians should not underestimate these clinical manifestations. Therefore, abdominal ultrasonography monitoring and long-term follow-up could be useful to evaluate this potential damage and the possible outcome of these patients.
Citation: Sica R, Pennoni S, Penta L, Riccioni S, Di Cara G, Verrotti A. Gastrointestinal and hepatic involvement during COVID-19 pandemic: A focus on pediatric population and possible future implications. World J Gastroenterol 2021; 27(40): 7000-7004URL: https://www.wjgnet.com/1007-9327/full/v27/i40/7000.htmDOI: https://dx.doi.org/10.3748/wjg.v27.i40.7000
TO THE EDITORWe read with great interest the review by Mohamed et al[1] about manifestations, mechanisms and management of the gastrointestinal (GI) and hepatic diseases during the coronavirus disease 2019 (COVID-19) pandemic. Although the large majority of concern about COVID-19 and its outcomes is centered on pulmonary manifestations and sequelae, we must be aware that GI and hepatic involvement could play a major role in the clinical spectrum of this novel disease as well as in virus transmission via the fecal-oral route. Hence, we agree with the authors' purpose that physicians should not underestimate digestive symptoms during COVID-19. In fact, GI manifestations in COVID-19 patients, including diarrhea, nausea, vomiting, anorexia and abdominal pain are common features of the disease with diarrhea being the most common among these symptoms[2,3].
The pathophysiologic mechanism of GI and hepatic injury during COVID-19 is still debated. Mohamed et al[1] reported that GI damage might be due to direct infection of GI cells. We appreciate the great relevance the authors gave to angiotensin-converting enzyme 2 (ACE2) receptors’ expression over the small intestine cells, cholangiocytes and hepatocytes and the role it plays in severe acute respiratory syndrome coronavirus 2 (SARS-CoV-2) infection and in the pathophysiology of both GI and hepatic injury. Also, SARS-CoV-2 can induce cells expressing ACE2 to release inflammatory cytokines leading to a cytokine storm and multiple organ failure[4]. As Mohamed et al[1] well reported, SARS-CoV-2 binding to ACE2 receptor can lower the critical receptor level, reducing the absorption of tryptophan on the lumen surface of intestinal epithelial cells. It is known that tryptophan is absorbed on the lumen surface of intestinal epithelial cells via the B0AT1/ACE2 transport route inducing the mammalian target of rapamycin which controls the appearance of antimicrobial peptides influencing the components of gut flora. Therefore, the reduced absorption of tryptophan caused by SARS-CoV-2 can ultimately unbalance the gut flora resulting in diarrhea. The changings in the GI flora also stimulate the polarization of T helper 17 cells, and eventually, interleukin 17A induces the recruitment of neutrophils[1]. Moreover, changes in intestinal flora might affect the respiratory tract and vice versa via the gut-lung axis, subsequently enhancing the inflammatory and immune-mediated damage in the small intestine.
A study by Pirola and Sookoian[5] demonstrates that gene expression levels for ACE2 are highest in cholangiocytes compared to alveolar type 2 cells, followed in turn by sinusoidal endothelial cells and hepatocytes, thus supporting the possibility that SARS-CoV-2 may cause direct liver injury through a viral cytopathic effect. Nevertheless, GI mucosal damage and unbalance in the gut flora may lead to liver dysfunction through the gut-liver axis.
However, we should not forget that GI tract symptoms and liver injury may also be due to cytokine storm, hypoxic-shock conditions due to acute respiratory distress syndrome and drug-induced injury[6,7].
It is generally accepted that the existence of comorbidities in COVID-19 patients can dramatically increase the risk of poor outcome. Besides, the impact of the COVID-19 pandemic on preexisting GI, liver and pancreatic diseases is still under investigation. We appreciate the importance the authors gave to patients affected by inflammatory bowel diseases (IBD). Actually, these patients are more at risk for infectious diseases

Sica R et al. GI involvement in COVID-19 and MIS-C
WJG https://www.wjgnet.com 7002 October 28, 2021 Volume 27 Issue 40
due to the immunosuppressive therapy they undergo. Thus, IBD patients may potentially be more at risk for SARS-CoV-2 infection and severe COVID-19. The prognostic value of the elevation of liver enzymes and indices of cholestasis reflecting hepatic injury and cholangiocellular damage respectively, is still debated. Conversely, pre-existing chronic liver diseases seem to be independent risk factors for poor outcome in COVID-19, and cirrhosis grade has been defined as a predictor of mortality in SARS-CoV-2 infected patients[6].
We are thankful to the authors for their contribution to current literature and we would like to implement the authors' excellent work by reporting our experience with SARS-CoV-2 infection in the Pediatric population.
We would like to emphasize that COVID-19 in children and adolescents may often be asymptomatic or cause only mild symptoms. The most prevalent symptom of COVID-19 in children and adolescents is fever, followed by cough, upper respiratory tract symptoms, diarrhea and nausea/vomiting. In a multinational, multicenter cohort study, 22% of patients had GI symptoms and 7% of those had no respiratory symptoms[8]. Also, neurological manifestations must be considered as they might be a direct result of central nervous system viral invasion or post-infection immuno-mediated disease[9]. Interestingly, in the latter half of April 2020 a previously unknown SARS-CoV-2-related clinical syndrome emerged. Initially this novel entity was named pediatric inflammatory multisystem syndrome temporally associated with SARS-CoV-2 (PIMS-TS) by the European Centre for Disease Prevention and Control and then multisystem inflammatory syndrome in children (MIS-C) by the Centers for Disease Control and Prevention (CDC) in the United States and by the World Health Organization. This syndrome can lead to shock and multiple organ failure requiring a Pediatric Intensive Care Unit. Its features resemble those of known entities such as Kawasaki Disease, toxic shock syndrome, and macrophage activation syndrome. The CDC issued a case definition of MIS-C specifying that the patient should be < 21-year-old, have fever, laboratory evidence of inflammation, and evidence of a clinically severe illness requiring hospitalization, with multisystem (> 2) organ involvement (cardiac, renal, respiratory, hematological, GI, dermatological, or neurological), in the absence of an alternative plausible diagnosis, and evidence of SARS-CoV-2 infection or exposure[10]. It was initially thought that this syndrome was specific of children, but recent reports have shown that it can also occur in adults. In a case series comparing children and adolescents with MIS-C vs those with severe COVID-19, MIS-C was distinguished by having a more severe cardiovascular and mucocutaneous involvement and a worse inflammation with a higher neutrophil/Leukocyte ratio, higher c-reactive protein level and lower thrombocytopenia compared to patients with COVID-19[11].
The pathophysiology of this syndrome is under intense investigation but so far it remains unclear. It is believed that this syndrome results from an abnormal immune response to the virus. Interestingly, among the most common presenting symptoms of MIS-C from reports worldwide we found GI involvement, including vomiting, abdominal pain, and/or diarrhea. Moreover, there are reports in literature reporting cases of MIS-C presenting with acute abdomen and pseudo appendicular syndrome with shock, clinical symptoms suggestive of appendicitis, functional intestinal obstruction and ischemic bowel lesions[12,13]. Furthermore, abdominal imaging findings such as hepatomegaly, nephromegaly, gallbladder wall edema, ascites, intestinal inflammation and mesenteric lymphadenopathy are very common[14]. The role of SARS-CoV-2 in some of these clinical presentations seems more likely to be temporal rather than causative but it causes diagnostic and management dilemmas for treating physicians.
Regarding the experience of our Department of Pediatrics, we recently reported the case of a 14-year-old non-obese boy with MIS-C who presented with jaundiced skin, a diffusely painful abdomen and palpable hepatosplenomegaly. He was in a condition of multiorgan failure with a compromised hemodynamic status with reduction of left ventricular ejection fraction and elevated values of alanine aminotransferase, aspartate aminotransferase and indices of cholestasis. Notably, our patient fully recovered from MIS-C, with an excellent cardiac and renal outcome but during the follow-up visit program he was diagnosed with a new onset hepatic steatosis. Therefore, we suggest that hepatic steatosis might be one of the sequelae following SARS-CoV-2 infection, MIS-C or its treatment, mainly due to prolonged use of corticosteroids, probably through an inhibition of mitochondrial fatty acid oxidation[15].
We fully agree with the authors’ suggestion that liver function should be monitored during COVID-19, particularly in more severe cases. Furthermore, we think that hepatic involvement after COVID-19 and MIS-C could be underdiagnosed as few patients undergo abdominal ultrasonography monitoring. Diagnosis of hepatic
Sica R et al. GI involvement in COVID-19 and MIS-C
WJG https://www.wjgnet.com 7003 October 28, 2021 Volume 27 Issue 40
steatosis is easily accessible through an abdominal ultrasound, which is a low-cost, non-invasive examination. To date, abdominal ultrasound monitoring for these patients is not supported by evidence but we suggest that it could be very useful to identify this potential damage early and evaluate the possible outcome of these patients.
In conclusion, GI and hepatic involvement in COVID-19 and MIS-C should not be underestimated because potential damage could be underdiagnosed. Further studies and long-term follow ups are needed to completely understand the pathophysiology and possible implications that GI and hepatic involvement might have in COVID-19 and MIS-C.
REFERENCESMohamed DZ, Ghoneim ME, Abu-Risha SE, Abdelsalam RA, Farag MA. Gastrointestinal and hepatic diseases during the COVID-19 pandemic: Manifestations, mechanism and management. World J Gastroenterol 2021; 27: 4504-4535 [PMID: 34366621 DOI: 10.3748/wjg.v27.i28.4504]
1
Wang D, Hu B, Hu C, Zhu F, Liu X, Zhang J, Wang B, Xiang H, Cheng Z, Xiong Y, Zhao Y, Li Y, Wang X, Peng Z. Clinical Characteristics of 138 Hospitalized Patients With 2019 Novel Coronavirus-Infected Pneumonia in Wuhan, China. JAMA 2020; 323: 1061-1069 [PMID: 32031570 DOI: 10.1001/jama.2020.1585]
2
Huang C, Wang Y, Li X, Ren L, Zhao J, Hu Y, Zhang L, Fan G, Xu J, Gu X, Cheng Z, Yu T, Xia J, Wei Y, Wu W, Xie X, Yin W, Li H, Liu M, Xiao Y, Gao H, Guo L, Xie J, Wang G, Jiang R, Gao Z, Jin Q, Wang J, Cao B. Clinical features of patients infected with 2019 novel coronavirus in Wuhan, China. Lancet 2020; 395: 497-506 [PMID: 31986264 DOI: 10.1016/S0140-6736(20)30183-5]
3
Gu J, Korteweg C. Pathology and pathogenesis of severe acute respiratory syndrome. Am J Pathol 2007; 170: 1136-1147 [PMID: 17392154 DOI: 10.2353/ajpath.2007.061088]
4
Pirola CJ, Sookoian S. SARS-CoV-2 virus and liver expression of host receptors: Putative mechanisms of liver involvement in COVID-19. Liver Int 2020; 40: 2038-2040 [PMID: 32352224 DOI: 10.1111/liv.14500]
5
Nardo AD, Schneeweiss-Gleixner M, Bakail M, Dixon ED, Lax SF, Trauner M. Pathophysiological mechanisms of liver injury in COVID-19. Liver Int 2021; 41: 20-32 [PMID: 33190346 DOI: 10.1111/liv.14730]
6
McDermott CV, Cox EJ, Scanlan JM, Alicic RZ. COVID-19 and Gastrointestinal Tract Symptoms: Recognition, Containment, and Learning From the Past. Mayo Clin Proc 2020; 95: 2320-2324 [PMID: 33153620 DOI: 10.1016/j.mayocp.2020.08.023]
7
Götzinger F, Santiago-García B, Noguera-Julián A, Lanaspa M, Lancella L, Calò Carducci FI, Gabrovska N, Velizarova S, Prunk P, Osterman V, Krivec U, Lo Vecchio A, Shingadia D, Soriano-Arandes A, Melendo S, Lanari M, Pierantoni L, Wagner N, L'Huillier AG, Heininger U, Ritz N, Bandi S, Krajcar N, Roglić S, Santos M, Christiaens C, Creuven M, Buonsenso D, Welch SB, Bogyi M, Brinkmann F, Tebruegge M; ptbnet COVID-19 Study Group. COVID-19 in children and adolescents in Europe: a multinational, multicentre cohort study. Lancet Child Adolesc Health 2020; 4: 653-661 [PMID: 32593339 DOI: 10.1016/S2352-4642(20)30177-2]
8
Verrotti A, Mazzocchetti C, Iannetti P. Definitive pathognomonic signs and symptoms of paediatric neurological COVID-19 are still emerging. Acta Paediatr 2021; 110: 1774-1777 [PMID: 33641209 DOI: 10.1111/apa.15827]
9
CDC Health Alert Network. Multisystem Inflammatory Syndrome in Children (MIS-C) Associated with Coronavirus Disease 2019 (COVID-19). [cited 14 May 2020]. In: CDC Health Alert Network [Internet]. Available from: https://emergency.cdc.gov/han/2020/han00432.asp
10
Feldstein LR, Tenforde MW, Friedman KG, Newhams M, Rose EB, Dapul H, Soma VL, Maddux AB, Mourani PM, Bowens C, Maamari M, Hall MW, Riggs BJ, Giuliano JS Jr, Singh AR, Li S, Kong M, Schuster JE, McLaughlin GE, Schwartz SP, Walker TC, Loftis LL, Hobbs CV, Halasa NB, Doymaz S, Babbitt CJ, Hume JR, Gertz SJ, Irby K, Clouser KN, Cvijanovich NZ, Bradford TT, Smith LS, Heidemann SM, Zackai SP, Wellnitz K, Nofziger RA, Horwitz SM, Carroll RW, Rowan CM, Tarquinio KM, Mack EH, Fitzgerald JC, Coates BM, Jackson AM, Young CC, Son MBF, Patel MM, Newburger JW, Randolph AG; Overcoming COVID-19 Investigators. Characteristics and Outcomes of US Children and Adolescents With Multisystem Inflammatory Syndrome in Children (MIS-C) Compared With Severe Acute COVID-19. JAMA 2021; 325: 1074-1087 [PMID: 33625505 DOI: 10.1001/jama.2021.2091]
11
Khesrani LS, Chana K, Sadar FZ, Dahdouh A, Ladjadj Y, Bouguermouh D. Intestinal ischemia secondary to Covid-19. J Pediatr Surg Case Rep 2020; 61: 101604 [PMID: 32839689 DOI: 10.1016/j.epsc.2020.101604]
12
Hwang M, Wilson K, Wendt L, Pohlman J, Densmore E, Kaeppler C, Van Arendonk K, Yale S. The Great Gut Mimicker: A case report of MIS-C and appendicitis clinical presentation overlap in a teenage patient. BMC Pediatr 2021; 21: 258 [PMID: 34074244 DOI: 10.1186/s12887-021-02724-x]
13
Morparia K, Park MJ, Kalyanaraman M, McQueen D, Bergel M, Phatak T. Abdominal Imaging Findings in Critically Ill Children With Multisystem Inflammatory Syndrome Associated With COVID-19. Pediatr Infect Dis J 2021; 40: e82-e83 [PMID: 33298763 DOI:
14

Sica R et al. GI involvement in COVID-19 and MIS-C
WJG https://www.wjgnet.com 7004 October 28, 2021 Volume 27 Issue 40
10.1097/INF.0000000000002967]Sica R, Pennoni S, Penta L, Di Cara G, Verrotti A. New Onset of Hepatic Steatosis Post-Severe Multisystem Inflammatory Syndrome in Children (MIS-C): A Case Report. Int J Environ Res Public Health 2021; 18 [PMID: 34209719 DOI: 10.3390/ijerph18136961]
15

Published by Baishideng Publishing Group Inc
7041 Koll Center Parkway, Suite 160, Pleasanton, CA 94566, USA
Telephone: +1-925-3991568
E-mail: [email protected]
Help Desk: https://www.f6publishing.com/helpdesk
https://www.wjgnet.com
© 2021 Baishideng Publishing Group Inc. All rights reserved.