
Journal for Scientists and Engineers - SAFETY ENGINEERING
70
-
Upload
khangminh22 -
Category
Documents
-
view
4 -
download
0
Transcript of Journal for Scientists and Engineers - SAFETY ENGINEERING

UNIVERSITY OF NIŠ
FACULTY OF OCCUPATIONAL SAFETY
Center for Technical Systems Safety
Center for Distribution of Developmental Strategies
Journal for Scientists and Engineers
SAFETY ENGINEERING Naučno stručni časopis
INŽINJERSTVO ZAŠTITE
No1 (2011)
Niš, October 2011

Journal for Scientists and Engineers SAFETY ENGINEERING Naučno stručni časopis INŽINJERSTVO ZAŠTITE
Izdavač I Publisher Fakultet zaštite na radu u Nišu / Faculty of Occupational Safety in Niš Centar za bezbednost tehničkih sistema / Center for Technical Systems safety
Glavni urednik / Editor‐in‐chief
Dr Dejan Krstić
Urednici / Editors
Dr Ivan Krstić Dr Srđan Glišović Dr Vesna Nikolić
Redakcijski odbor /Editorial board (alphabetical order) dr Andres Carrnion Garcia, Technical University of Valencia, Spain dr Boris Đinđić, Medicinski fakultet u Nišu, Srbija dr Branislav Anđelković, Fakultet zaštite na radu u Nišu, Srbija dr Dejan Petković, Fakultet zaštite na radu u Nišu, Srbija dr Desimir Jovanović, Fakultet zaštite na radu u Nišu, Srbija dr Đordje Ćosić, Fakultet tehničkih nauka, Novi Sad, Srbija dr Dragan Mitić, Fakultet zaštite na radu u Nišu, Srbija dr Dusan Sakulski, Faculty of Natural and Agricultural Sciences, DiMTEC, Bloemfontein, South Africa dr Dušan Sokolović, Medicinski fakultet u Nišu, Srbija dr Ivana Banković Ilić, Tehnološki fakultet u Leskovcu, Srbija dr Jirí Pokorný, Academy of Sciences of the Czech Republic, Czech Republic dr Joseph Aronov, VNIIS Mosow, Russia dr Jovica Jovanović, Medicinski fakultet u Nišu, Srbija dr Katarína Senderská, Faculty of Mechanical Engineering, Technical University of Košice, Slovakia dr Ljiljana Živković, Fakultet zaštite na radu u Nišu, Srbija dr Ljubiša Papić, Tehnički fakultetu u Čačku, Srbija dr Miomir Stanković, Fakultet zaštite na radu u Nišu , Srbija dr Mirjana Vidanović, Fakultet zaštite na radu u Nišu, Srbija dr Mirko Marič, Fakultet za menadžment, Kopar, Slovenija dr Nenad Živković, Fakultet zaštite na radu u Nišu , Srbija dr Noam Lior, University of Pennsylvania, USA dr Susana San Matias, Technical University of Valencia, Spain dr Suzana Savić, Fakultet zaštite na radu u Nišu, Srbija dr Vera Marković, Elektronski fakultet u Nišu, Srbija dr Vlada Veljković, Tehnološki fakultet u Leskovcu, Srbija dr Wolfgang Mathis, Institut für Theoretische Elektrotechnik, Hannover, Germany dr Zoran Keković, Fakultet Bezbednosti u Beogradu, Srbija
Tehnički urednik / Technical editor Rodoljub Avramović
Lektor / Proof‐reader Dr Nataša Šelmić‐Milosavljević Aleksandra Petković Časopis izlazi tromesečno / The journal is published quarterly Štampa / Press M KOPS Centar

From Editor’s desk
Blessed is the one who knows that he does not know, but would like to learn. A proverb
Development of technologies and technical disciplines has improved the quality of human life on the one hand, but brought about human influence on the environment on the other. Generally, this impact on the environment represented conscious and unconscious threat to its quality. The need to protect the man in working and living environment, and the environment itself is the goal of the employees at the Faculty of Occupational Safety. This magazine has been developed as a need to present new ideas in the field of occupational and environmental safety to scientific and professional community. The idea was launched by the Centre for Technical Systems Safety and Center for Distribution of Developmental Strategies of the Faculty of Occupational Safety in Niš. Our goal is to promote the journal to become a correlation between the scientific and professional institutions and individuals working towards the improvement of work process and the quality of life.
I sincerely hope that the authors will manage to provide all necessary information to the readers through the articles of high technical and scientific quality that will be published in the journal Safety Engineering.
Blago onome ko zna da ne zna, a hoće da zna. narodna poslovica
Razvoj tehnologija i tehničkih disciplina unapredili su kvalitet čovekovog života sa jedne strane ali i doveli do intervencije čoveka u životnoj sredini. Uglavnom je ovo delovanje na životnu sredinu značilo svesno i nesvesno ugrožavanje njenog kvaliteta. Potreba da se zaštiti čovek u radnoj i životnoj sredini i sama životna sredina je ishodište zaposlenih na Fakultetu zaštite na radu. Časopis koji je pred vama je nastao kao potreba da se naučnoj i stručnoj javnosti izlože nove ideje u oblasti zaštite radne i životne sredine. Ideja je potekla od strane Centra za bezbednost tehničkih sistema i Centra za distibuciju razvojnih strategija, Fakulteta zaštite na radu u Nišu. Želja je da časopis bude sprega između naučnih i stručnih institucija i pojedinaca u napredenju bezbednosti radnog prcesa i samog kvaliteta života.
Iskreno sa nadam, da će autori u radovima visokih tehničkih i naučnih kvaliteta koji budu objavljivani u časopisu Safety engineering pružiti potrebne informacije čitaocima.
On behalf of the editors
Doc. Dejan Krstić, PhD

Contents
Scientific Articles
Petr Kučera, Jiří Pokorný Fire Engineering Approach of People Evacuation Assessment With a Practical Demonstration .......................................... 1 Boris Preshelkov, Rosen Borisov, Radoslav Kartov, Milan Blagojević A Study of Determening Safe Distances Between Ceramic Infrared Gas Heaters and Combustible Materials............... 7 Darko Zigar, Desimir Jovanović, Martina Zdravković CFD Study of Fire Protection Systems in Tunnel Fires ..... 11 Goran Janaćković, Suzana Savić, Miomir Stanković Multi-Criteria Decision Analysis in Occupational Safety Management Systems ......................................................... 17 Milan Protić, Dragan Mitić, Velimir Stefanović Wood Pellets Production Technology ................................ 23 Tomáš Chrebet, Karol Balog, Jozef Martinka, Ivan Hrušovský Monitoring of the Cellulose Pyrolysis in a Modified Electrically Heated Hot Air Furnace ................................. 27
Professional Articles
Miljenko Vrbanec, Franjo Magušić Application of Biometric Systems in Care ......................... 35 Ivan Krstić, Dejan Krstić, Ana Kusalo Analiaza pokazatelja za procenu profesionalnog rizika .... 45
Reviews of publications
Vesna Nikolić, Nenad Živković Bezbednost radne i životne sredine, vanredne situacije i obrazovanje ....................................................................... 59 Snežana Živković Uloga i značaj lica za bezbednost i zdravlje na radu u privrednim društvima u Republici Srbiji............................ 61
Intellectual property, review of technical solution
Miomir Stanković, Suzana Savić, Žarko Janković, Goran Janaćković, Dejan Krstić, Ivan Krstić, Srđan Glišović UpOl - Softverski sistem za evidentiranje otpada u lokalnim zajednicama ....................................................................... 63
Propagation Corner
ZAŠTITA U PRAKSI Časopis za zaštitu na radu, zdravstvenu, ekološku i zaštitu od požara ALEKSANDAR INŽENJERING D.O.O. Novi Sad, Srbija Prodaja i servis mernih instrumenata
Sadržaj
Naučni radovi
Petr Kučera, Jiří Pokorný Fire Engineering Approach of People Evacuation Assessment With a Practical Demonstration...........................................1 Boris Preshelkov, Rosen Borisov, Radoslav Kartov, Milan Blagojević A Study of Determening Safe Distances Between Ceramic Infrared Gas Heaters and Combustible Materials ...............7 Darko Zigar, Desimir Jovanović, Martina Zdravković CFD Study of Fire Protection Systems in Tunnel Fires......11 Goran Janaćković, Suzana Savić, Miomir Stanković Multi-Criteria Decision Analysis in Occupational Safety Management Systems .........................................................17 Milan Protić, Dragan Mitić, Velimir Stefanović Wood Pellets Production Technology ................................23 Tomáš Chrebet, Karol Balog, Jozef Martinka, Ivan Hrušovský Monitoring of the Cellulose Pyrolysis in a Modified Electrically Heated Hot Air Furnace .................................27
Stručni radovi
Miljenko Vrbanec, Franjo Magušić Application of Biometric Systems in Care ..........................35 Ivan Krstić, Dejan Krstić, Ana Kusalo Analiaza pokazatelja za procenu profesionalnog rizika .....45
Prikazi publikacija
Vesna Nikolić, Nenad Živković Bezbednost radne i životne sredine, vanredne situacije i obrazovanje ........................................................................59 Snežana Živković Uloga i značaj lica za bezbednost i zdravlje na radu u privrednim društvima u Republici Srbiji ............................61
Intelektualna svojina, prikaz tehničkih rešenja
Miomir Stanković, Suzana Savić, Žarko Janković, Goran Janaćković, Dejan Krstić, Ivan Krstić, Srđan Glišović UpOl - Softverski sistem za evidentiranje otpada u lokalnim zajednicama........................................................................63
Oglašavanje
ZAŠTITA U PRAKSI Časopis za zaštitu na radu, zdravstvenu, ekološku i zaštitu od požara ALEKSANDAR INŽENJERING D.O.O. Novi Sad, Srbija Prodaja i servis mernih instrumenata

UDC 355.247 : 629.4.042.5 : 519.876.2 Original article
Paper is presented at the "International Conference Safety of Technical Systems in Living and Working Environment", Faculty of Occupational Safety in Niš, October 2011, Niš.
1 | Safety Engineering
PETR KUČERA1
JIŘÍ POKORNÝ2
1VŠB - Technical University
of Ostrava, Faculty of Safety Engineering,
Czech Republic 2Fire Rescue Brigade of the Moravian-Silesian Region,
Czech Republic
[email protected] [email protected]
FIRE ENGINEERING APPROACH OF PEOPLE EVACUATION ASSESSMENT WITH A PRACTICAL DEMONSTRATION Abstract: This article presents some of the possible ways of an examination of people evacuation by fire engineering methods. Application of described methods is illustrated in a practical example of an office object. The expansion of fire in a part of characteristic floor of high-rise office is simulated by the selected zone (CFAST) and field (FDS) fire models. Some of the results obtained by the simulation, especially smoke layer decrease in the area and cumulative gas layer temperature, represent limit criteria for examination of safe evacuation from the assessed area. The article is an example of possible application of combination of manual computational processes and fire models.
Key words: fire safety, evacuation, mathematical modelling. INTRODUCTION With increasing complexity of buildings (more complicated technical and technological systems that are conditioning their operation, and the increase in their area, height, more floors in the underground, more people, etc.) the increase of demands for risks assessment in term of fire safety also increases. In many cases, the application of national safety standards is problematic, almost unrealistic. The way out of these situations is application of more detailed evaluative procedures, fire engineering methods, which can be used as partial or complex evaluative instrument. This article presents one of the possible ways, when a part of the solution is based on the application of fire models. It also presents simplified computational processes connected to it. BASIC DESCRIPTION OF EXAMPLE The method of engineering procedure is applied to multifunctional high-rise object (administrative premises of this object) that are mostly formed by large-area offices, small conference rooms and spaces designed for documents storing. In the case of fire rise in high-rise objects, the principal aim is to prevent casualties and injuries, and thus ensure the possibility of safe evacuation of people from the object. Therefore, the chosen example concerned with the fire rise in the fire cell of office premises on the area 25 × 30m, situated in the 20th floor (see colour coded area in the fig. 1).
FIRE COURSE ASSESSMENT After the qualitative analysis, we have developed a scenario of fire in the kitchen during working time (simplified geometry of the assessing part of the floor is pictured in the fig. 2). There is a colour coded kitchen, denoting the centre of the fire scenario. The kitchen door of high-capacity office is open all the time. It is assumed that users of the object did not manage to extinguish the developing fire on time, so people have been endangered by smoke that will spread to the premises of the high-capacity office. Furthermore, we have assumed the effective function of fire dividing constructions, including fire shutter of openings equipped with self-closing device. Fire development, temperature course and smoke level in the assessed part of the object have been modelled according to the zone model CFAST (Consolidated Model of Fire Growth and Smoke Transport, version 6) [1] and field model FDS (Fire Dynamics Simulator, version 5) [2].
Figure 1. Simplified geometry of assessed part of the floor

SAFETY ENGINEERING - INŽENJERSTVO ZAŠTITE
The results showed that it is possible to characterize the initial phase of the fire by simple, time-dependent parabolic curve. The curve is known as t-quadratic fire curve, where the heat release rate is proportional to square power of time. The equation can be found in the following form:
(1)
For calculation of the value tg from quantities used in Czech technical standards can be used conversion relations, which are stated in the Annex H ČSN 73 0802:2009. For non-productive objects according to ČSN 73 0802 and consequential standards, the value tg is calculated using the fire load and the coefficient of burning rate:
(2)
In the case of the kitchen (p = 25 kg.m-2, a = 1) tg = 2000 / (1⋅ (25)0,5) = 400 s. The course of temperature and smoke layer decrease in assessed premises defined by both fire models can be seen in the Fig. 2 (in the case of FDS fire model, temperature and smoke layer level monitored always in room centres, in the height of 3m). The course of temperature increase and smoke layer decrease in the kitchen and large-area office are represented in the fig. 2.
Figure 2. Illustration of time course of the temperature and smoke layer decrease by models CFAST and FDS
From the curves acquired by both fire models (CFAST vs. FDS) it is obvious that the results are largely comparable. The result supports a presumption that zone models are in many cases very usable, especially when there is a need to acquire source information during situations with limited range of input information or lack of time space necessary while using field models. DESCRIPTION OF BASIC PRINCIPLES USABLE AT FIRE ENGINEERING ASSESSMENT OF EVACUATION During detailed assessment of evacuation is generally always efficient to determine the required safe escape time tc, which consists of partial time intervals:
(3)
Detection and alarm time td is usually split in two time intervals. In the fire detection time, which depends on the design of the device for the early fire detection (e.g.
electrical fire detection and fire alarm systems) or on noticing of fire by an user of the object. Second time period is the alarm time, during which is transmitted the information on fire rising to the users of the object either directly or through the warning signals. Activation of warning signalisation can be either immediate or with time delay. Time to start of evacuation tz consists of detection time, time needed for deciding (perception and processing the information) and time necessary for activities before leaving. Time of persons´ movement through the building tu is time since initiation of persons escape in the object to reaching safe place (e.g. open space). Through suitable calculation methods, it is possible to determine escaping time based on relatively simple relations. With increasing number and density of persons generally rises also complexity of evacuation. The density of persons can be expressed by equation:
(4)
2 | Safety Engineering

P. Kučera, J. Pokorný, Vol 1, No1 (2011) 1-6
Speed of movement and flow can be expressed in the interval from 0,54 persons.m-2 till 3,8 persons.m-2 by the equation [3]:
(5)
Capacity of escape route, also referred to as specific or total flow of persons, represents the number of persons evacuated in time unit by unit of width of escape route, eventually its whole width, and can be expressed by equations:
(6)
Time of movement through the building it is possible to determine by sum of time required for distance overcoming tu1 and time required for passage through the less suitable place on the escape way tu2:
(7)
While solving partial lengths of escape routes it is possible to determine time of persons movement through the building tu by adjustment of the original equation by Kikuja Togawa:
(8)
Analogical equation was presented in lit. [4] and it is also stated in standards of buildings fire safety in the Czech Republic [5]. Time needed for evacuation will be consequently compared with chosen criteria of acceptability. In the given case the criteria of acceptability chosen were unsmoked height of space of 2,5 m and limit temperature of gas layer of 200°C, which cumulates under the ceiling construction. From the previous paragraphs, it is obvious that time of movement through the building tu represents just one of the partial times characterizing required safe escape time tc. While assessing persons’ evacuation by fire engineering methods, there will be probably more often used the very required safe escape time tc which can provide more real image of persons evacuation time from the object and be one of the parameters for design of fire safety devices and arrangements. EVACUATION ASSESSMENT IN THE DEFINED PART OF THE OBJECT Principles for evacuation of persons assessment The following characteristics were among the most important data related to evacuation of people: • dispositional layout of single floors is simple and
well-arranged, • persons are in the visual contact,
• employees are in the productive age, average physical and psychical condition,
• presence of persons with limited movement ability
acquainted with the building,
rotection area,
ct is equipped with electric fire
the announcement of evacuation
will be systemically checked in the ourse of building operation (system of controls in the
etermination of persons movement time t by
nsity of persons in the assessing
Table 1. Input values for evacuation a nt
as t oor
is rare, persons unable of individual movement are not present,
• in the assessing part of the object, there are only persons
• persons are present only in day-time and wide awake,
• persons in assessing spaces are regularly educated in the fire p
• there is periodical fire alarm used for training in the object,
• the objesignalisation device (EFS) with emergency sound system,
• the EFS device works in the two-stage regime of fire alarm, whenby the emergency sound system is in the first stage of signalisation.
At assessing, it is supposed that defined constructional, technical and organisational arrangements will be observed in the course of construction. Fulfilment of defined conditions cregular intervals). D uthe detailed calculation In the following paragraphs, parameters of unprotected escape ways will be considered in the characteristic part of the object floor by the detailed calculation reflecting especially depremises [3], [6], [7]. The most significant input values vare shown in Tab.1.
ssessme in the sessed par of the fl
Room name Number of persons E (pe s) rson
Area A (m2)
Length of
escape r oute lu
Width of
escape ro ute B
(m) (m) Conference
room 67 100,0 12,5 1,6
Office section including 1,41147 636,9 26,0 separate offices,
kitchen and hall
Depending on density of persons, the speeds of persons movement in the premises of conference room and large-area office with related facilities have been determined. Consequently, the specific and total flow of persons for critical places of unprotected escape ways (doorways) up to entry into hall space that is part of t ed.
he protected escape way has been determinOutput values are stated in the tab. 2.
1 On the fixed wing of double wing door between office section and hall there will be installed lever gate.
3 | Safety Engineering

SAFETY ENGINEERING - INŽENJERSTVO ZAŠTITE
Table 2. Output values for determination of the persons movem n the artent time i assessed p of the floor
Room name
Density of persons D (p ) er.m-2
Movement speed of persons (m ) .min-1
Spec w ific floof persons Fs (per.min-1.m-
1)
C e onferencroom 0,67 69,0 46,24
Office section 0,23 (0,54) 2 71,93 38,84
Room name
Total flow of persons Fc (p ) er.min-1
Movement time of persons
tu1 ) (min
Movement ti me of
persons tu2 (min)
C e onferencroom 73,98 0,14 0,90
Office section 54,38 0,27 1,903
Supposed time of persons movement tu to the hspaces is 2,31 minutes.
all
etermination of required safe escape time t
gher values than
revious aragra or
evac
Table 3. Determina f th eeded for h ed e
D cfrom the assessed part of the floor At detailed assessment of the persons evacuation, it is advisable to set necessary time for persons evacuation tc, when is possible to proceed according to the equation (1) of the article. Determination of detection and alarm time td and time to start evacuation tz can pose certain problem in practice, where it is necessary to estimate stated values. It is necessary to realise that stated values can take the same or hiself time of persons movement through the building tu. For assessment, we can use [8]. Based on the assumptions stated in the pp phs, determination of time needed f
uation has been shown in the tab. 3.
tion oe assess
e time n part of thevacuation in t floor tc
Assessing place
Detection and alarm
time t (min) d
Time to start of
evacuation tz ) (min
Time of movement
through the obje in) ct tu (m
Required safe escape time tc
(min)
En tryto the hall
1 0,5 2,31 3,85
Time needed for evacuation to the entry of protected escape way is 3,85 minutes. Time of smoke layer decrease in the premises of large-area office to the level
2 At movement speed determination was respected lower limit of
ted to 70 % of persons of all rooms in the assessing
vacuation
or,
the floor in the time of 00 s, are shown in the fig. 4.
e omplex proceeding of evacuation assessment
sessment of the easiest
sing premises) and changes during building peration.
utility of equation (3), then 0,54 persons.m-2. 3 The value is relapart of the floor.
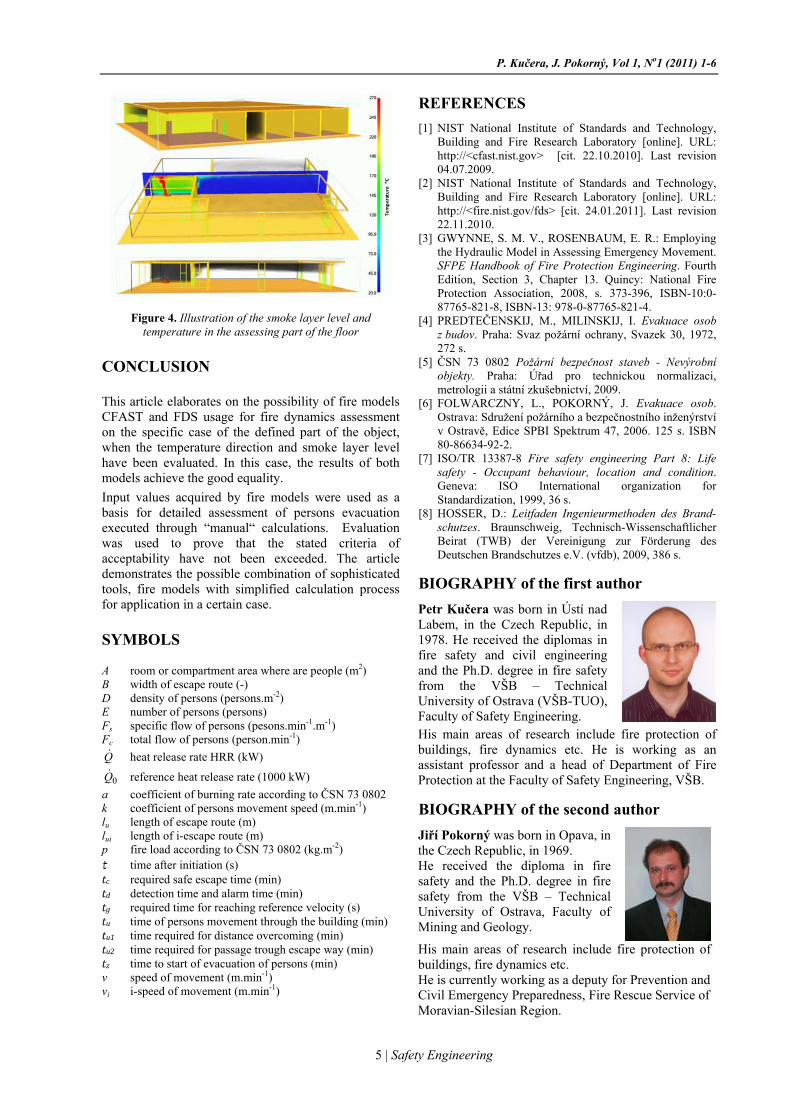
of 2,5m is approximately 4 minutes4 (see fig. 2). Temperature of smoke layer in the assessed premises will not exceed 200°C (see fig. 2). Defined criteria of acceptability in terms of safe persons eassessment can be evaluated as satisfactory. Assessed parameters, i.e. smoke layer decrease and temperature course in the assessed part of the flostated by model CFAST are presented in the fig. 3. Smoke layer level and temperature stated by FDS model in the assessed part of3 Commentary on the possibilities at morc In the previous paragraphs, we described a more detailed proceeding of evaluation of some parameters used at escape ways assessment, i.e. time needed for persons evacuation, time for filling of premises with smoke gases to the level 2,5m and smoke layer temperature course in the characteristic part of the floor. Although similar evaluation of the above described parameters requires using of fire engineering methods, it is the asdeterminable parameters. The safety of persons on the escape ways can be also assessed by another parameters, e.g. visibility in the space, toxicity of combustion products. Determination of these parameters is however usually more complicated, sensitive to precise entering conditions (e.g. type and amount of flammable material, which is in the asseso
Figure 3. Illustration of smoke layer decrease and temperature course in the assessing part of the floor
4 The less suitable value acquired by fire models has been considered
4 | Safety Engineering
P. Kučera, J. Pokorný, Vol 1, No1 (2011) 1-6
Figure 4. Illustration of the smoke layer level and temperature in the assessing part of the floor
CONCLUSION This article elaborates on the possibility of fire models CFAST and FDS usage for fire dynamics assessment on the specific case of the defined part of the object, when the temperature direction and smoke layer level have been evaluated. In this case, the results of both models achieve the good equality. Input values acquired by fire models were used as a basis for detailed assessment of persons evacuation executed through “manual“ calculations. Evaluation was used to prove that the stated criteria of acceptability have not been exceeded. The article demonstrates the possible combination of sophisticated tools, fire models with simplified calculation process for application in a certain case. SYMBOLS A room or compartment area where are people (m2) B width of escape route (-) D density of persons (persons.m-2) E number of persons (persons) Fs specific flow of persons (pesons.min-1.m-1) Fc total flow of persons (person.min-1) Q& heat release rate HRR (kW)
0Q& reference heat release rate (1000 kW) a coefficient of burning rate according to ČSN 73 0802 k coefficient of persons movement speed (m.min-1) lu length of escape route (m) lui length of i-escape route (m) p fire load according to ČSN 73 0802 (kg.m-2) time after initiation (s) tc required safe escape time (min) td detection time and alarm time (min) tg required time for reaching reference velocity (s) tu time of persons movement through the building (min) tu1 time required for distance overcoming (min) tu2 time required for passage trough escape way (min) tz time to start of evacuation of persons (min) v speed of movement (m.min-1) vi i-speed of movement (m.min-1)
REFERENCES [1] NIST National Institute of Standards and Technology,
Building and Fire Research Laboratory [online]. URL: http://<cfast.nist.gov> [cit. 22.10.2010]. Last revision 04.07.2009.
[2] NIST National Institute of Standards and Technology, Building and Fire Research Laboratory [online]. URL: http://<fire.nist.gov/fds> [cit. 24.01.2011]. Last revision 22.11.2010.
[3] GWYNNE, S. M. V., ROSENBAUM, E. R.: Employing the Hydraulic Model in Assessing Emergency Movement. SFPE Handbook of Fire Protection Engineering. Fourth Edition, Section 3, Chapter 13. Quincy: National Fire Protection Association, 2008, s. 373-396, ISBN-10:0-87765-821-8, ISBN-13: 978-0-87765-821-4.
[4] PREDTEČENSKIJ, M., MILINSKIJ, I. Evakuace osob z budov. Praha: Svaz požární ochrany, Svazek 30, 1972, 272 s.
[5] ČSN 73 0802 Požární bezpečnost staveb - Nevýrobní objekty. Praha: Úřad pro technickou normalizaci, metrologii a státní zkušebnictví, 2009.
[6] FOLWARCZNY, L., POKORNÝ, J. Evakuace osob. Ostrava: Sdružení požárního a bezpečnostního inženýrství v Ostravě, Edice SPBI Spektrum 47, 2006. 125 s. ISBN 80-86634-92-2.
[7] ISO/TR 13387-8 Fire safety engineering Part 8: Life safety - Occupant behaviour, location and condition. Geneva: ISO International organization for Standardization, 1999, 36 s.
[8] HOSSER, D.: Leitfaden Ingenieurmethoden des Brand-schutzes. Braunschweig, Technisch-Wissenschaftlicher Beirat (TWB) der Vereinigung zur Förderung des Deutschen Brandschutzes e.V. (vfdb), 2009, 386 s.
BIOGRAPHY of the first author
Petr Kučera was born in Ústí nad Labem, in the Czech Republic, in 1978. He received the diplomas in fire safety and civil engineering and the Ph.D. degree in fire safety from the VŠB – Technical University of Ostrava (VŠB-TUO), Faculty of Safety Engineering. His main areas of research include fire protection of buildings, fire dynamics etc. He is working as an assistant professor and a head of Department of Fire Protection at the Faculty of Safety Engineering, VŠB. BIOGRAPHY of the second author
Jiří Pokorný was born in Opava, in the Czech Republic, in 1969. He received the diploma in fire safety and the Ph.D. degree in fire safety from the VŠB – Technical University of Ostrava, Faculty of Mining and Geology.
His main areas of research include fire protection of buildings, fire dynamics etc. He is currently working as a deputy for Prevention and Civil Emergency Preparedness, Fire Rescue Service of Moravian-Silesian Region.
5 | Safety Engineering
UDC 697.245.7 : 629.7.058.43 Original article
Paper is presented at the "International Conference Safety of Technical Systems in Living and Working Environment", Faculty of Occupational Safety in Niš, October 2011, Niš.
7 | Safety Engineering
BORIS PRESHELKOV1
ROSEN BORISOV2
RADOSLAV KARTOV3
MILAN BLAGOJEVIĆ4
1,2,3Academy at The Ministry of the
Interior in Sofia, Fire Safety and Civil Protection
Faculty 4University of Nis,
Faculty of occupational safety
[email protected] [email protected]
[email protected] [email protected]
A STUDY OF DETERMENING SAFE DISTANCES BETWEEN CERAMIC INFRARED GAS HEATERS AND COMBUSTIBLE MATERIALS Abstract: This is a study of determining the safe distances between combustible materials and ceramic infrared gas heaters. It contains general information about infrared heating, information about the experimental set-up and the results of the study.
Key words: infrared gas heaters, safe distances.
INTRODUCTION An infrared heater uses wavelengths of infrared light to generate heat. Infrared light is not visible to the naked eye because it is not part of the spectrum of light you can see. Unlike traditional heaters, infrared does not heat the air; it heats objects, which then warm the air by contact. Infrared heaters are efficient and cost-effective, though they are not ideal for heating an entire home since they only heat objects in their direct vicinity. They are most commonly used in large open spaces, like warehouses or garages, as a means to offset the loss of heat from large open doors [3, 4, 6, 7, 8, 9, 12].
Safety
For better safety keep infrared heaters at least three feet away from any combustible material. The majority of the body of the heater stays cool and does not present a burning hazard. While it is thought that the radiation from infrared heaters is dangerous, there is no scientific evidence that infrared rays are damaging without ultraviolet light. According to the Infrared Heaters website, infrared heaters are one of the safest forms of heating sources. Infrared heaters are powered by a variety of fuel, including propane, electricity and natural gas. The Infrared Heater Safety Council (IHSC) reports infrared heaters should be kept a safe distance from combustible materials, such as paper, wood and fabrics. The risk of fire can be reduced by following instructions for the safe distance to place heaters from combustible materials usually found in the manufacturer's manual [5].
Installation
Proper installation of infrared heaters can reduce the risk to the safety of an operator or property. The IHSC reports installation of heating equipment following
construction codes and guidelines can reduce the risk of leaks, improper heating ignition and fire [5]. Materials
Some of the polymeric materials - low density polyethylene, polystyrene, polyvinyl chloride etc., began to lose its beneficial properties when heated to temperatures higher than 60 °C. Therefore the research is accepted as critical temperature of 60 °C [1]. Use
Infrared heaters are used under different circumstances than central air heaters which make up the majority of heaters in modern housing. Infrared heaters give direct heat vs. central air heaters, which heat the air within a room; therefore, infrared heating is useful in a variety of circumstances, such as within open rooms or outside. The major disadvantage of infrared heaters is that they are relatively useless in heating anything outside of the direct area around the heater. Since they only provide direct heat on objects around them, it is difficult to use a single heater to heat an entire household. Infrared heaters offer more localized options for heating areas around homes and businesses. A large automotive repair shop can use these heaters at each lift where a mechanic works, rather than attempting to heat the entire shop. The same principle applies to heating an outdoor patio [2,5]. Safety regulations
This type of heating appliances are becoming growingly popular in Bulgaria hence new safety regulations are required, similar to the ones In NFPA 54 ANSI Z223.1–2002 National Fuel Gas Code 2002 Edition. Below is an extract from that code[10]: 9.18 Infrared Heaters. 9.18.1 Support. Suspended-type infrared heaters shall be fixed in position independent of gas and electric

SAFETY ENGINEERING - INŽENJERSTVO ZAŠTITE
supply lines. Hangers and brackets shall be of noncombustible material. Heaters subject to vibration shall be provided with vibration-isolating hangers. 9.18.2 Clearance. The installation of infrared heaters shall meet the following clearance requirements: (1) Listed heaters shall be installed with clearances from combustible material in accordance with their listing and the manufacturers’ instructions. (2) Unlisted heaters shall be installed in accordance with clearances from combustible material acceptable to the authority having jurisdiction. (3) In locations used for the storage of combustible materials, signs shall be posted to specify the maximum permissible stacking height to maintain required clearances from the heater to the combustibles. 9.18.3 Combustion and Ventilation Air. 9.18.3.1 Where unvented infrared heaters are used, natural or mechanical means shall be provided to supply and exhaust at least 4 ft3/min/1000 Btu/hr. (0.38 m3/min/kW) input of installed heaters. 9.18.3.2 Exhaust openings for removing flue products shall be above the level of the heaters [10]. EXPERIMENTAL SET-UP A series of experimental trials is required for determining and defining the safety regulations for the use of Infrared Gas Heaters. An experimental set-up was created in order to conduct the test trials. The set-up consisted of infrared gas heater, 28 ceramic test samples placed around the heater at different distances, LPG supply system and pyrometer for measuring the surface temperature of the samples[11].
Figure 1. Photos of the experimental set-up During the experimental trials we have used infrared heaters which vary in power. The duration of each trial
varies depending on the time it takes for the sample temperature to stabilize.
Figure 2. Photos of the experimental set-up At the end of each trial temperature and distance values are collated in a Microsoft Excel file. Upon completion of all trials the data for each sample is extracted, analyzed and presented in a chart format as shown below.
Figure 3. Temperature graph for Sample 1
The individual graphs for each sample are then used for the creation of temperature fields of area surrounding the infrared gas heater.
8 | Safety Engineering
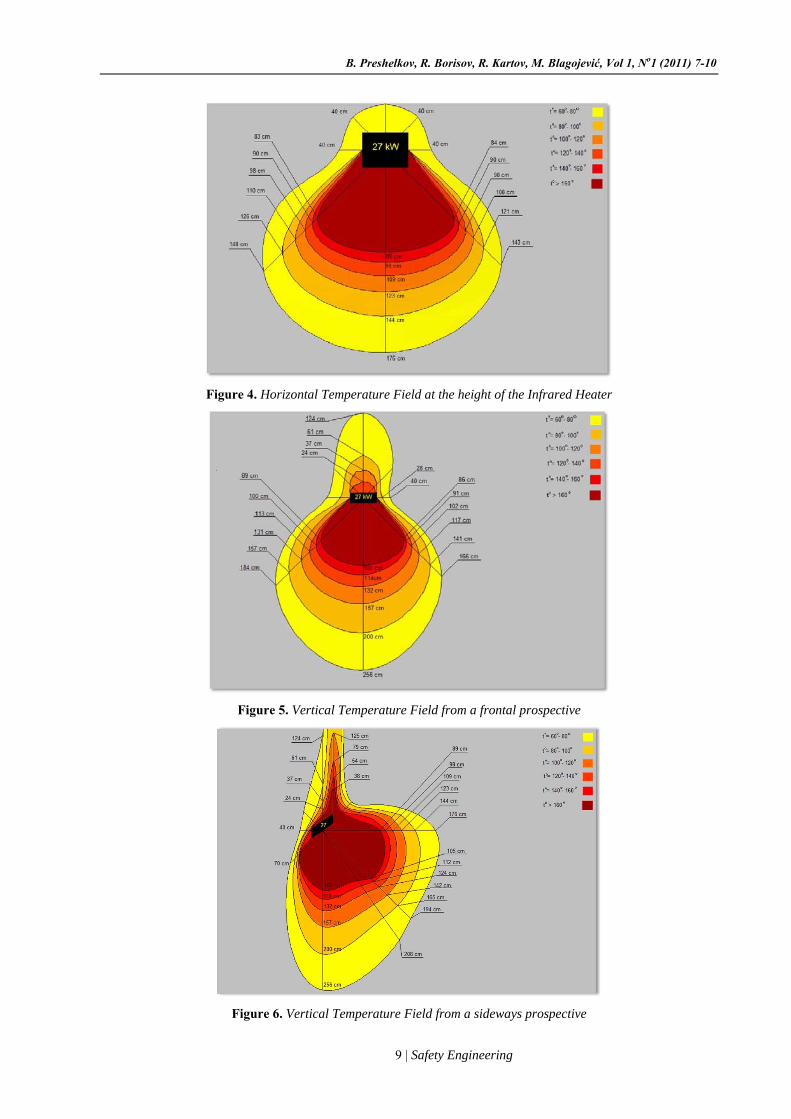
B. Preshelkov, R. Borisov, R. Kartov, M. Blagojević, Vol 1, No1 (2011) 7-10
Figure 4. Horizontal Temperature Field at the height of the Infrared Heater
Figure 5. Vertical Temperature Field from a frontal prospective
Figure 6. Vertical Temperature Field from a sideways prospective
9 | Safety Engineering
SAFETY ENGINEERING - INŽENJERSTVO ZAŠTITE
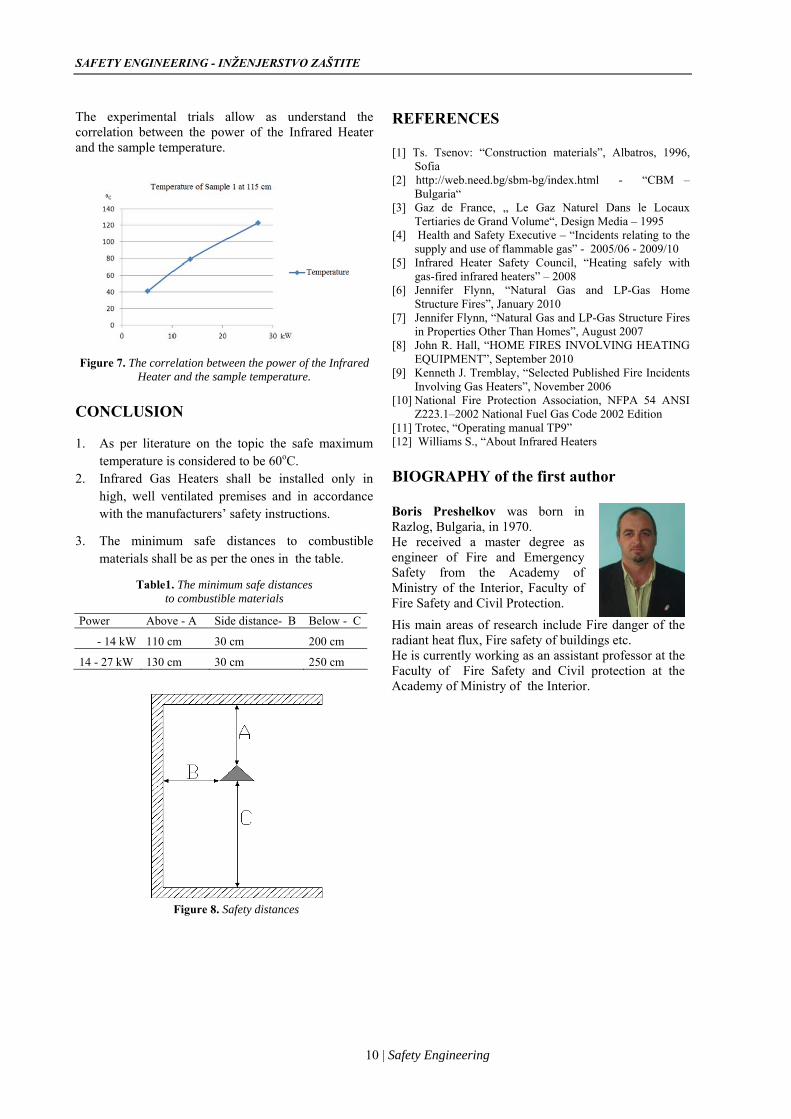
REFERENCES The experimental trials allow as understand the
correlation between the power of the Infrared Heater and the sample temperature.
[1] Ts. Tsenov: “Construction materials”, Albatros, 1996,
Sofia [2] http://web.need.bg/sbm-bg/index.html - “СВМ –
Bulgaria“
[3] Gaz de France, „ Le Gaz Naturel Dans le Locaux Tertiaries de Grand Volume“, Design Media – 1995
[4] Health and Safety Executive – “Incidents relating to the supply and use of flammable gas” - 2005/06 - 2009/10
[5] Infrared Heater Safety Council, “Heating safely with gas-fired infrared heaters” – 2008
[6] Jennifer Flynn, “Natural Gas and LP-Gas Home Structure Fires”, January 2010
[7] Jennifer Flynn, “Natural Gas and LP-Gas Structure Fires in Properties Other Than Homes”, August 2007
[8] John R. Hall, “HOME FIRES INVOLVING HEATING EQUIPMENT”, September 2010 Figure 7. The correlation between the power of the Infrared
Heater and the sample temperature. [9] Kenneth J. Tremblay, “Selected Published Fire Incidents Involving Gas Heaters”, November 2006 [10] National Fire Protection Association, NFPA 54 ANSI Z223.1–2002 National Fuel Gas Code 2002 Edition CONCLUSION
[11] Trotec, “Operating manual TP9” [12] Williams S., “About Infrared Heaters 1. As per literature on the topic the safe maximum
temperature is considered to be 60oC. BIOGRAPHY of the first author 2. Infrared Gas Heaters shall be installed only in
high, well ventilated premises and in accordance with the manufacturers’ safety instructions.
Boris Preshelkov was born in Razlog, Bulgaria, in 1970. He received a master degree as engineer of Fire and Emergency Safety from the Academy of Ministry of the Interior, Faculty of Fire Safety and Civil Protection.
His main areas of research include Fire danger of the radiant heat flux, Fire safety of buildings etc. He is currently working as an assistant professor at the Faculty of Fire Safety and Civil protection at the Academy of Ministry of the Interior.
3. The minimum safe distances to combustible materials shall be as per the ones in the table.
Table1. The minimum safe distances to combustible materials
Power Above - А Side distance- В Below - С
- 14 kW 110 cm 30 cm 200 cm
14 - 27 kW 130 cm 30 cm 250 cm
Figure 8. Safety distances
10 | Safety Engineering

UDC 614.84 : 628.854 : 52-17 Original article
Paper is presented at the "International Conference Safety of Technical Systems in Living and Working Environment", Faculty of Occupational Safety in Niš, October 2011, Niš.
11 | Safety Engineering
DARKO ZIGAR1
DESIMIR JOVANOVIĆ2
MARTINA ZDRAVKOVIĆ3
1-4University of Niš, Faculty of Occupational Safety in Niš
1darko.zigar@ znrfak.ni.ac.rs
2desimir.jovanovic@ znrfak.ni.ac.rs 3martina.zdravkovic@ znrfak.ni.ac.rs
CFD STUDY OF FIRE PROTECTION SYSTEMS IN TUNNEL FIRES Abstract: Field modelling based on the Computational Fluid Dynamics methodology plays an important role in fire research, and in the fire safety design and risk assessment of buildings: CFD codes can potentially be used to evaluate the effects of different designs and of emergency systems, and to assess the performance of safety measures over a wide range of fire scenarios. In this study the NIST Fire Dynamics Simulator version 5 (FDS5), a computational fluid dynamic (CFD) model, was used to simulate a series of full-scale fire tests of ventilation and sprinkler systems conducted in a test tunnel. Key words: tunnel, fire, ventilation, sprinkler, simulation.
INTRODUCTION Fires in road and railway tunnels are particularly dangerous because the amount of firing material can be huge and the length of the way to escape outside the enclosure can be in some cases several kilometres. Fire accidents in road tunnels have proven to be extremely costly in terms of human lives, increased congestion, pollution and reparation. Development of fire and smoke spread are affected by the fire set-up and ventilation conditions in the tunnel. To prevent fires in road and railway tunnels existing tunnels should be upgraded and new tunnels should be equipped with efficient fire protection systems. One of a the adequate methods that may be used to prove the characteristics of a fire safety measures is fire simulations.
PROBLEM DESCRIPTION The ventilation system is used for controlling smoke, hot and toxic combustion gases during a fire emergency, in order to allow safe evacuation and rescue. Ventilation may be provided by natural means (Fig. 1), or by mechanical equipment (longitudinal, semi-transverse or full transverse ventilation systems, (Fig. 3 ).
Figure 1. Natural ventilation
With no air current in the fire zone, the smoke progresses in a symmetrical way on both sides of the fire. The smoke remains stratified until it cools down due to the combined effects of the convective heat exchange with the walls and the mixing between the smoke and the fresh air layer, [1]. A natural ventilation system depends on the pressure differential that is
created by atmospheric conditions and differences in elevation (Fig. 2).
Figure 2. Smoke behaviour in a sloping tunnel
The longitudinal ventilation system (Fig. 3) creates a longitudinal flow along the roadway tunnel by introducing or removing air from the tunnel at a number of points. Longitudinal flow is provided by jet fans.
Figure 3. Longitudinal ventilation system
SAFETY ENGINEERING - INŽENJERSTVO ZAŠTITE
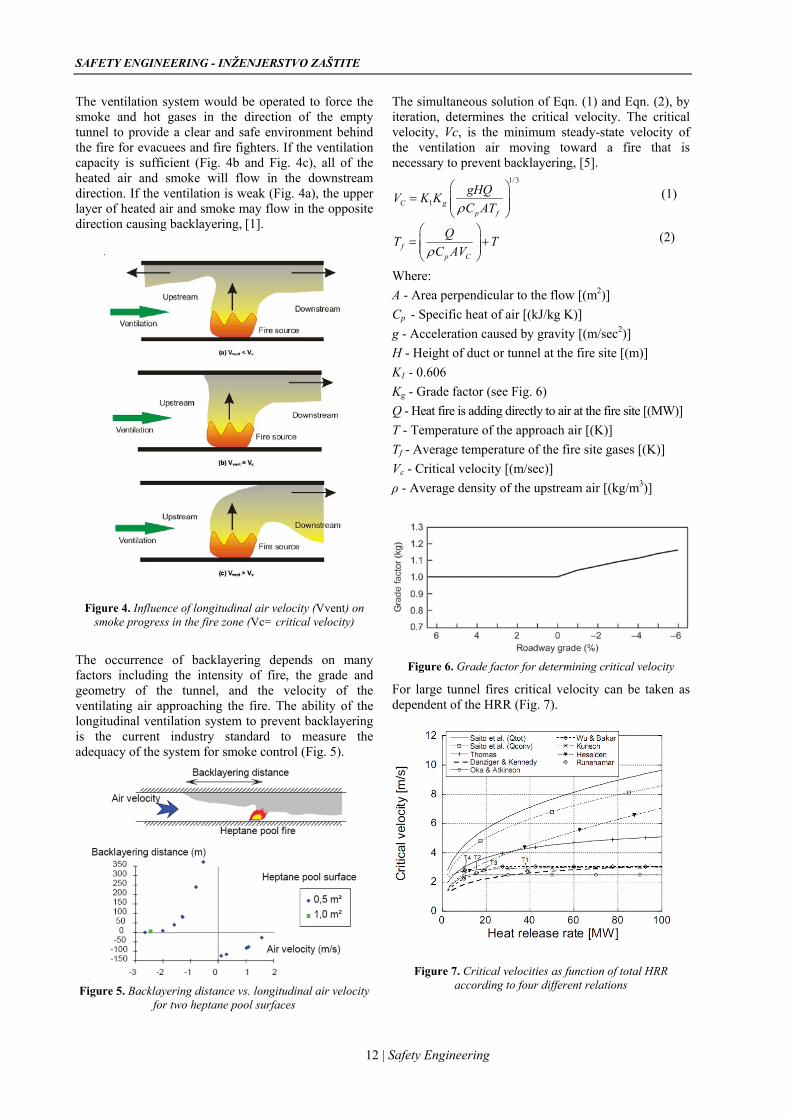
The ventilation system would be operated to force the smoke and hot gases in the direction of the empty tunnel to provide a clear and safe environment behind the fire for evacuees and fire fighters. If the ventilation capacity is sufficient (Fig. 4b and Fig. 4c), all of the heated air and smoke will flow in the downstream direction. If the ventilation is weak (Fig. 4a), the upper layer of heated air and smoke may flow in the opposite direction causing backlayering, [1].
Figure 4. Influence of longitudinal air velocity (Vvent) on smoke progress in the fire zone (Vc= critical velocity)
The occurrence of backlayering depends on many factors including the intensity of fire, the grade and geometry of the tunnel, and the velocity of the ventilating air approaching the fire. The ability of the longitudinal ventilation system to prevent backlayering is the current industry standard to measure the adequacy of the system for smoke control (Fig. 5).
Figure 5. Backlayering distance vs. longitudinal air velocity
for two heptane pool surfaces
The simultaneous solution of Eqn. (1) and Eqn. (2), by iteration, determines the critical velocity. The critical velocity, Vc, is the minimum steady-state velocity of the ventilation air moving toward a fire that is necessary to prevent backlayering, [5].
1/3
1C gp f
gHQV K KC ATρ
⎛ ⎞= ⎜ ⎟⎜ ⎟
⎝ ⎠ (1)
fp C
QTC AVρ
⎛ ⎞T= +⎜ ⎟⎜ ⎟
⎝ ⎠ (2)
Where: A - Area perpendicular to the flow [(m2)] Cp - Specific heat of air [(kJ/kg K)] g - Acceleration caused by gravity [(m/sec2)] H - Height of duct or tunnel at the fire site [(m)] K1 - 0.606 Kg - Grade factor (see Fig. 6) Q - Heat fire is adding directly to air at the fire site [(MW)] T - Temperature of the approach air [(K)] Tf - Average temperature of the fire site gases [(K)] Vc - Critical velocity [(m/sec)] ρ - Average density of the upstream air [(kg/m3)]
Figure 6. Grade factor for determining critical velocity
For large tunnel fires critical velocity can be taken as dependent of the HRR (Fig. 7).
Figure 7. Critical velocities as function of total HRR according to four different relations
12 | Safety Engineering

D. Zigar, D. Jovanović, M. Zdravković, Vol 1, No1 (2011) 11-16
13 | Safety Engineering
Fire Data for Typical Vehicles, according NFPA 502 Standard for Road Tunnels, Bridges and Other Limited- Access Highways are shown in the Table 1, [5].
Table 1. Fire Data for Typical Vehicles
Type of vehicle HRR (MW) Car 5-10
Multiple passenger cars (2-4 vehicles) 10-20
Bus 20-30 Heavy goods truck 70-200
Tanker 200-300
(e) Even a light spray from sprinklers can catch motorists unaware and can exceed that which windshield wipers could clear. Sprinkler discharge can also cause the roadway to become dangerously slippery. (f)Water that sprays from the ceiling of a subaqueous tunnel suggests tunnel failure and can induce panic in motorists. (g) The use of sprinklers can cause the delamination of the smoke layer and induce turbulence and mixing of the air and smoke, thus threatening the safety of motorists in the tunnel. (h) Periodic testing of a fire sprinkler system to determine its state of readiness is impractical and costly.
In Figure 8 the five fire temperature curves are presented graphically (the first two hours), [2].
NUMERICAL MODEL For the calculation of temperature fields and smoke concentration fields formed in case of fire within the tunnel space, the CFD software package NIST Fire Dynamics Simulator version 5 (FDS5) was used. For the calculation of flow and temperature fields of the air formed within the tunnel, k-ε turbulent model was used. Because of certain identical segments of the tunnel and the high length of the entire tunnel (Fig 9), in simulation used segment he was dimension: 600m(segment 60m) x 11.7m x 7.1m (lenght, wide, high, respectivelly). The FDS5 domain was divided into cells of dimension 0.15 m × 0.15 m × 0.15 m. The tunnel is built at grade in concrete. The fire source in the simulation was represented by burning of a flammable liquid in a pool with dimensions 5 x 5 m. The maximum heat release rate per unit area (HRRPUA) of the fire was 4000 kW and the total heat release rate (HRR) was 100 MW. The initial air temperature in the whole tunnel was set to 20 °C. This calculation determined that the ventilation of each tunnel segment is to be carried out by 2×2 pairs of regularly arranged jet fans and three parallel lines of sprinklers K-11 type. Distance between sprinklers is 3.05 m, according NFPA 13 Standard, [6]. The maximum volumetric flow of fresh air through these jet fans should be 17.1 m3/s and 34.2 m3/s.
Figure 8. Specific temperature curves of hydrocarbon fires in tunnels
In Japan and Australia water extinguishment systems are widely used in tunnels. In Europe, however, there has been a reluctance to use sprinkler in tunnels. According NFPA 502 Standard the major concerns expressed by tunnel authorities regarding fire sprinkler use and effectiveness include the following, [5]: (a) Typical fires usually occur under vehicles or inside passenger or engine compartments that are designed to be waterproof from above; therefore, overhead sprinklers have no extinguishing effect. (b) With any delay between ignition and sprinkler activation, a thin water spray on a very hot fire produces large quantities of superheated steam without suppressing the fire. Such steam has the potential to be more damaging than smoke.
(c) Tunnels are long and narrow, often sloped laterally and longitudinally, usually ventilated, and never subdivided, so heat normally is not localized over a fire. (d) Because of stratification of the hot gases plume along the tunnel ceiling, a number of activated sprinklers are unlikely to be located over the fire. A large number ofactivated sprinklers are likely to be located at a distance from the fire scene, producing a cooling effect that tends to draw the stratified layer of smoke down toward the roadway level.
Figure 9. The computational domain for the tunnel fire simulations

SAFETY ENGINEERING - INŽENJERSTVO ZAŠTITE
RESULTS OF CALCULATIONS Spread of smoke in a tunnel
a) Natural ventilation
b) Forced ventilation (jet fan 17.1 m3/s)- backlayering
c) Forced ventilation (jet fan 34.2 m3/s)
Figure 10. Spread of smoke in a tunnel
a) Without sprinklers activation
b) Sprinklers activated
Figure 11. Spread of smoke in a tunnel without and with activated sprinklers
Temperature schedule
a) Natural ventilation
b) Forced ventilation (jet fan 17.1 m3/s)- backlayering
14 | Safety Engineering

D. Zigar, D. Jovanović, M. Zdravković, Vol 1, No1 (2011) 11-16
c) Forced ventilation (jet fan 34.2 m3/s)
Figure 12. Temperature schedule along the centreline vertical plane
Figure 13. Temperature schedule along the centreline vertical plane with activated sprinklers
Sprinklers activation
Sprinklers position
a) Sprinklers activation: 20 sec. since ignition
b) Sprinklers activation: 30 sec. since ignition
c) Sprinklers activation: 40 sec. since ignition
Figure 14. Splinklers position and activation
15 | Safety Engineering

SAFETY ENGINEERING - INŽENJERSTVO ZAŠTITE
CONCLUSION In the event of a fire in an tunnel with natural ventilation (Fig. 10a), due to difference in densities, hot combustion products rise above the fire and entrain the surrounding cold air forming a plume. The rising plume reaches the ceiling and forms two smoke streams flowing in opposite directions along the ceiling. In tunnels with longitudinal ventilation systems (Fig. 10b and Fig. 10c), the symmetry of the rising plume and the ceiling smoke streams is broken. The rising plume bends and the length of the ceiling layer flowing against the ventilation current is reduced. The reversal of the flow of the plume is referred to as backlayering (Fig. 10b). If ventilation system operates only half at the maximum flow rate designed for the ventilation of the tunnel (17.1 m3/s) come to a backlayering effect. If ventilation system operates only at the maximum flow rate designed for the ventilation of the tunnel (Fig .10c), no wil be backlayering effect. In fire simulation with sprinklers, sprinklers activation come to destroying the smoke stratification (Fig. 11b) and there by decreasing the visibility, spreading liquid fuel over a larger area and there by spreading the fire, the risk for explosion, the production of steam affecting the people inside the tunnel. The maximum predicted gas temperature near the ceiling was just below 1000 °C (Fig. 12), in simulations with activated sprinklers 925 °C (Fig. 13). Also, the sprinkler system was not able to reduce temperature directly above the fire in the unshielded simulation. Apparently, sprinkler droplets are too light to penetrate the fire plume and are simply swept away. Simulation results suggested that the longitudinal ventilation system was very effective for blowing all smoke and hot gases in the downstream direction, which could be generally deemed empty, so immediately creating upstream the fire a safe route for evacuation and rescue.
REFERENCES [1] A. Kashef, N. Bénichou, G. Lougheed: “Numerical
modelling and behaviour of smoke produced from fires in the Ville-Marie and L.-H.-La ontaine Tunnels”, literature review, NRCC Report IRC-RR-141, 2003.
[2] D. Lacroix, A. Haack: “PIARC Design Criteria for Resistance to Fire for Road Tunnel Structures”, In Joint Issue ITA/PIARC of Route-Roads on Fire Safety in Tunnels, 2004.
[3] K. McGrattan, S.Hostikka, J. Floyd, H. Baum, R. Rhem: “Fire Dynamics Simulator (Version 5) Technical reference guide”, National Institute of Standards and Technology, 2007, Washington.
[4] M. Banjac, B.Nikolić: “Simulation of a tunnel fire and optimization of the ventilation system with the use of numerical fluid dynamics”, 11th International conference on fire and explosion protection, Novi Sad, 2008, pp. 44-50.
[5] NFPA 502: “Standard for Road Tunnels, Bridges, and other Limited Access Highways”, 2004 ed., National Fire Protection Association, 2004.
[6] NFPA 13: “Standard for The Installation of Sprinkler Systems”, 1999 ed., National Fire Protection Association, 1999.
BIOGRAPHY of the first author Darko Zigar was born on April 16, 1973. in Pancevo, Serbia. He received B.Sc. degree in Environmental Protection and M.Sc. degree in Occupational Safety in 2002 and 2007 respectively, from University of Niš, Serbia. He has been with the Faculty of Occupational Safety, University of Niš, since 2008., where he is working as a researcher / assistant lecturer. His areas of expertise include numerical fire simulations, as well as investigations of possible adverse effects of electromagnetic field irradiation from mobile phones and wireless systems.
16 | Safety Engineering

UDC 331.45 : 531.717.5 : 519.816 Review article
Paper is presented at the "International Conference Safety of Technical Systems in Living and Working Environment", Faculty of Occupational Safety in Niš, October 2011, Niš.
17 | Safety Engineering
GORAN JANAĆKOVIĆ1
SUZANA SAVIĆ2
MIOMIR STANKOVIĆ3
University of Niš, Faculty of Occupational Safety in Niš
[email protected] [email protected]
MULTI-CRITERIA DECISION ANALYSIS IN OCCUPATIONAL SAFETY MANAGEMENT SYSTEMS Abstract: Increasing the effectiveness of occupational safety increases the safety of an organization as its important performance. Safety performance indicators measure changes in the level of safety (related to accident prevention, preparedness and response) over time, which result from the actions taken to reduce appropriate risks. This paper presents the characteristics of basic types of safety indicators, the structure of safety factors, performances and indicators, as well as the multi-criteria decision analysis process and methods in safety management systems.
Key words: occupational safety, performances, indicators, multi-criteria decision making.
INTRODUCTION "The complexity of modern systems stems from the combination and use of various resources and the characteristics of the dynamic, turbulent environment in which they exist. Resources, internal and external environment interact to each other, and it defines system performances" [1]. The term includes a set of performance indicators to quantitatively or qualitatively describe the quality of a system. Indicators of health and safety have been developed and explored along with the raising awareness of the need for continuous improvement of quality of life. This includes health and safety at work and the importance of indicators of social responsibility for improving the economic indicators of the organization. Two different types of safety indicators: activity indicators (indirect or lagging indicators) and outcome indicators (direct or leading indicators) have been analyzed in this paper. Furthermore, it describes safety analysis - accident investigation and predictive assessment – and the structure of safety factors, performances and indicators. Multi-criteria decision analysis (MCDA) methods that can be used in the occupational safety management systems, which are based on occupational safety indicators, have been presented at the end of the paper. SAFETY MANAGEMENT SYSTEMS IN ORGANIZATIONS Safety management systems are integrated mechanisms in organisations designed to control the risks that can affect workers’ health and safety, and at the same time to ensure that the firm can easily comply with the relevant legislation [2]. They are parts of general organizational management systems that include organisational structure, responsibilities, practices, procedures, processes, and resources for determining and implementing an accident prevention policy; they
also include data on organisation and personnel, identification and evaluation of hazards and risks, operational control, management of changes, planning for emergency situations, monitoring performance, audit and review [3]. A good safety management system is fully integrated into an organization, and it defines policies, strategies and procedures that provide internal consistency and management. Developing the effective safety management system means creation of awareness, understanding, motivation and commitment among all the employees in an organization [4]. Achieved safety performance are conditioned by the effects of internal and external factors that can be objective or subjective. Objective factors are: the social (and economic and market system), technical (type of production, technical progress, the characteristics of engineering and technology), natural (climate), dispositive (innovation, entrepreneurship, quality management). Subjective factors are the factors of organizational nature and everything that is reflected in the performance characteristics of employees and the organization as a whole [1]. As it is described in [5], there are some key aspects of a good occupational health and safety management system, which can reduce workplace accidents in a sustainable manner: Development of a Safety Policy; Participation; Training and development of employee competences; Communication and transfer of information about the workplace, possible risks and preventive measures; Planning; and Control and review of activities carried out within the organisation. To achieve the best performance, safety must be integrated into all the organisation’s decisions and actions. Integration on the level of organization is the coordination of processes that are defined in the context of the primary safety activities on the basis that removes organizational, procedural and informational barriers for efficient flow of materials and data

SAFETY ENGINEERING - INŽENJERSTVO ZAŠTITE
exchange between different organizational units responsible for safety. It allows formulation of strategies, safety processes, information systems, technology and data within the boundaries of the organization in order to provide adequate safety level and as a consequence achievement of advantages over the competition [6]. Safety management system has a positive effect on competitiveness performance. It requires the formula-tion of working procedures, instructions, and planning and control of the work; the higher productivity, as a consequence of the improvement in quality and reduc-tion in costs caused by the accidents; the higher cus-tomer satisfaction and better reputation of organization, since occupational safety is particularly important to society; higher organizational degree of innovation, due to the technological and organizational innovations de-rived from the improvements in safety [5]. The relationship between safety and competitiveness at the level of the organization is presented in Fig. 1 [7].
Figure 1. The effects of safety at organizational level [7] Specialist knowledge and motivated employees are all assets that can provide organizations with a specific competitive advantage long periods of time. These assets are strongly affected by occupational accident rates and working conditions. SAFETY PERFORMANCE AND INDICATORS The concept of health and safety performance includes a set of indicators (indicators) that quantitatively or qualitatively describe the specific effects, contributions, and the results that are achieved in the safety system. Safety indicators are approximate measures for items identified as important in the underlying models of safety [3]. Safety performance indicators measure the changes in the level of safety (related to accident prevention, preparedness and response) over time, as the result of actions taken to reduce appropriate risks [3]. Safety performance indicators system provides a global view of safety status in a plant or an organization. It can be used in conjunction with inspection and evaluation activities carried out for the regulatory control. Safety indicators evaluation results can be used as an input for inspections or audits planning [8].
Findings from others activities give information for safety indicators interpretation, and safety indicators system is useful to evaluate efficiency of regulatory strategies. A set of safety performance indicators is an assembly of direct and indirect measures of the organizational safety. Process accidents are prevented by managing a safety performance indicator (SPI) program that consists of four different phases: identifying, measuring, analysing, and adjusting key process activities or indicators. Safety life cycle is an engineering process designed to achieve a risk-based level of safety with performance criteria that allow versatile technologies and optimal design solutions [9]. Organization for Economic Co-operation and Development (OECD) defines two classes of indicators: activities indicators and outcome indicators [3]. Activities indicators are means for measuring actions or conditions which, within the context accident prevention, preparedness and response, should maintain or lead to improvements in safety (e.g., reduction in risk, improvements in safety management and safety culture, mitigation of effects in event of an accident). Outcome indicators are used for measuring the results, effects or consequences of activities carried out in the context of a programme related to accident prevention, preparedness and response. Safety indicator project [10] also defines two types of indicators: direct indicators and indirect indicators. Direct (or outcome) indicators utilize different types of experience data. Indicators that can give early warnings are known as indirect (or predictive) indicators that are measures of performance of the functional units within an organization, such as operation, maintenance, training, and engineering support [10]. These indicators can be used to evaluate safety by assessing the performance level and the performance trend. Hopkins [11] discusses two dimensions of safety: personal safety versus process safety, and leading versus lagging indicators. Personal safety is about avoiding workplace incidents and workplace injuries of employees; it does not represent management of process hazards. According to that way of thinking, there are two different types of indicators: leading and lagging indicators. Lagging or outcome indicators are a measure of the undesired outcomes, such as injuries, accidents, near misses, number of control deviations that exceed process limits, releases of chemicals, procedures not followed correctly, equipment failures, high level alarms, equipment deficiencies, etc. These indicators need to be monitored but they will not give adequate forewarning to prevent accidents. Leading or activity indicators (also known as input indicators) are measures that determine the quality of activities that prevent outcomes. Leading indicators are selected to provide an early warning just in time to prevent process accidents. They include training, audits, and inspections, mechanical integrity checks,
18 | Safety Engineering

G. Janaćković, S. Savić, M. Stanković, Vol 1, No1 (2011) 17-22
timely maintenance, use of check lists, emergency procedures that are tested on regular basis, risk assessments made and related to layers of protection analysis, and measurements of leadership and workforce attitudes. According to [12], there are three indicator types, as presented in Tab. 1. The size of the set can be limited to get the required information using the smaller possible number of indicators. Indicators have to be predictive and sensitive. Considering the consequences produced by degradations at organizational level, indirect indicators can be included in order to evaluate those aspects.
Table 1. Description of indicator types according to different systems of classification in the HSE guide [12]
Classification of indicators Indicator Type
Definition Examples Input/ outcome
Measures of safety activity Lead Lead
Failures revealed by safety activity Lead Lead Lag
Failures in use Lag Lag Lag
The dimensions in characterising safety indicators could relate to different final outcomes such as process safety or occupational safety. Indicators could also address: technical safety features being in place and their performance; nature and characteristics of the hazards; formal safety organization systems, which are in place and how they perform; informal safety issues; communication and co-operation issues as discussed in [3]; absolute values or trends (changes of performance over time); economic consequences and probability for different outcomes. The first two areas can be the scope of technically oriented audits, and the third is concerned with organisational audits. THE STRUCTURE OF SAFETY FACTORS, PERFORMANCES AND INDICATORS
Analysis of the problem of safety at work can be done on the basis of empirical data in terms of searching for the causes of accidents, or on the basis of speculation and retrospectives. According to [13] the first perspective is related to the development of the search for causes of accidents, moving from technical, to human, and further to organizational causes, i.e. causal chain. The second perspective is based on a predictive and a retrospective view. It makes a big difference whether we try to predict the possibility of having a major accident “tomorrow”, including all possible causes, or if we only try to establish the causes after-the-event. Based on these two presented perspectives, the technical-human-organizational, and the predictive-versus-retrospective, we establish a conceptual model in order to structure
and illustrate the previous research. This simplified model is shown in Fig. 2. The technical–human–organizational perspective is illustrated horizontally and the retrospective-versus-predictive perspective is illustrated vertically. For the prediction of risk, as for accident investigation, we can talk about a development from technical, to human, and even to organizational causes. This does not imply that all features of risk assessment can be classified according to technical–human–organizational scheme.
Figure 2. Accident investigation versus predictive assessment
[14] Depending on the application situation the demands on safety indicators will vary considerably. One approach is therefore to start with the purpose of the indicators and the way they will be used. Fig. 3 illustrates each of the safety factors which are considered important by the key decision makers. The senior management team is hiring quality personnel, providing safety orientation, promoting safety through top management commitment, and developing a formal learning system. They were critical to improving an organizational safety performance. The safety, health and environmental team can identify that individual empowerment, responsibility, and systems for anonymous reporting and feedback are essential to improve organizational and individual safety performance. The items elicited in the expert elicitation sessions thus represent the initial safety factor structure, as presented in Fig. 3.
Figure 3. Safety factors structure [11]
Before defining the set of performance indicators, it was necessary to establish a framework to define the parameters and the associated indicators in order to assure that everything having influence on the organi-zational safety is included. After that, preliminary indicators were proposed in each area. In this stage all adequate indicators should be included. A screening process is necessary for all proposed indicators [8]. Based on the research presented in [3,13,15 and 16], we have defined the structure of safety factors, performances and indicators as shown in Tab. 2. Of course, this structure is neither complete nor final.
19 | Safety Engineering

SAFETY ENGINEERING - INŽENJERSTVO ZAŠTITE
Performances and indicators for each group of factors are selected according to specific circumstances. The selection of indicators depends on the method of analysis of problems related to health and safety (the technical-human-organizational and the predictive-versus-retrospective).
Table 2. Classification of safety factors and safety performance indicators (based on [3, 13, 15, 16])
Factors Performances Indicators
T
echn
ical
Functionality Reliability Flexibility Maintenance Costs
Level of protection number Number of control deviations that exceed process limits Number of failures Number of accidents Failure and repair intensity Mean time between failures Mean time to repair Availability Maintenance and infrastructure cost
H
uman
Knowledge Competence Leadership ability Risk-taking and problem solving capabilities Education Experience
Creating results by using knowledge Employees’ skills index
Haring and reporting knowledge Employees’ cooperation rate in teams Succession rate of training programs Success likelihood index Number of errors and omissions Absenteeism rate Injuries rate
O
rgan
izat
iona
l
Training Procedures, instructions Job safety analysis (JSA) Planning Coordination Control Design Preventive maintenance program
Proportion of process technicians having formal system training Average number of years of experience in total for relevant personnel Proportion of relevant personnel having received JSA training Number of controls of JSA preparation and application Number of hours inspection of accidents Efficiency in management of safety resources
E
nvir
onm
enta
l
Legislation Standardisation Protection Technologies Social Environmental Economic Environment Competitive Environment Perceptions and values of stakeholders
Level of application of legislation Number of implemented standards Level of social responsibility Level of technology protection Number of available databases on accidents Number of available funds Degree of innovation Degree of networking
MCDA METHODS IN SAFETY MANAGEMENT SYSTEMS Multi-criteria decision analysis (MCDA) methods have become increasingly popular in decision-making for safety management systems because of the multi-dimensionality of the goal and the complexity of socio-economic and technical systems [17]. MCDA is an integrated evaluation. Compared to single criteria approach, the distinctive advantage of MCDA methods is to employ multi-criteria or attributes to obtain an integrated DM result. Generally, the MCDA problem for safety management decision making involves m alternatives evaluated on n criteria. The grouped decision matrix can be expressed as follows:
1 2
1 2
n
n
criteria C C Cweights w w w
alternatives ================
L
L
(1) 1 11 12 1
2 21 22 2
1 2
n
n
m m m mn m x n
A x x xA x x x
X
A x x x
⎛ ⎞⎜ ⎟⎜ ⎟=⎜ ⎟⎜ ⎟⎝ ⎠
L
L
M M M M M
L
where xij is the value of j-th criteria with respect to the i-th alternative, wj is the weight of j-th criterion, n is the number of criteria and m is the number of alternatives. Based on the Eq. (1), corresponding decision making process can be described by means of algorithm presented in Fig. 4. It includes four main stages: formulation of alternatives and criteria selection, criteria weighting, evaluation, and final aggregation. Measuring effectiveness of the safety management systems is a problem. Developing evaluation criteria and methods that reliably measure effectiveness and efficiency is a prerequisite for selecting the best alternative, informing design-makers on performances of the alternatives and monitoring impacts on the social environment. The development and selection of criteria require parameters related to the reliability, appropriateness, practicality and limitations of measurement. These indexes are restricted and/or impacted each other. For example, the number of technical and societal possibilities are wanted to increase, but sometimes are blocked by economic and political interests [18]. Also, the advanced system may reduce the number of accidents, but excessive cost is needed to invest and/or maintain the system meanwhile. So the decision-maker is difficult to select the optimal system from options well. However, the weight values of evaluation indexes influence the evaluation results. Different weight values lead to different evaluation results. There are two methods: the equal weights and the rank-order weights.
20 | Safety Engineering

G. Janaćković, S. Savić, M. Stanković, Vol 1, No1 (2011) 17-22
Figure 4. MCDA process in safety management systems decision-making (based on [18])
There are also subjective and objective weighting methods (Tab.3). Subjective weighting methods such as pair-wise comparison were the most used methods in safety decision making. The objective weighting method elicits the criteria weights using the measurement data and information and reflects the difference degree. After determining the criteria weights it is necessary to determine the preference orders of alternative so that MCAD methods are employed to get the ranking order in Eq. (1). MCDA methods are divided into three categories, as presented in Table 4. Outranking methods allow incomparability between alternatives. This characteristic is important in situations where some alternatives cannot be compared to each other. The decision maker selects the best alternative based on the ranking orders after the calculation in a selected MCDA method. The application of various MCDA methods of calculation may give different preference ranking order.
Table 3. Weighting methods in MCDA decision making [18]
Categories Weighting methods Subjective weighting
Simple multiple-attribute rating technique (SMART), SMARTER, Swing, Trade-off, SIMOS, Consistent matrix analysis, AHP, Least-square method, Delphi method, PATTERN, Eigenvector method, Pair-wise comparison
Objective weighting
Least mean square (LMS) method, Minmax deviation method, Entropy method Principal component analysis, Multiple correlation coefficient, TOPSIS method, Variation coefficient, Vertical and horizontal method, Multi-objective optimization method
Combination weighting
Multiplication synthesis
Additive synthesis (Optimal weighting based on relational coefficient of gradation, Optimal weighting based on sum of squares, Optimal weighting based on minimum bias)
Table 4. MCDA methods [18]
Categories Weighting methods Elementary Dominance, Maximin, Maximax,
Conjunctive, Disjunctive, Lexicographic, Elimination by aspects, Linear assignment, Weighted additive, Weighted product
Unique synthesizing criteria
Analytical hierarchy process (AHP), TOPSIS, SMART, Grey relational analysis, Data envelopment analysis, Multi-attribute value theory (MAVT), Multi-attribute utility theory (MAUT), Utility theory additive (UTA), Fuzzy weighted sum, Fuzzy maximum
Outranking ELECTRE (I, IS, II, III, IV, TRI), PROMETHEE (I, II), ORESTRE
Methods used to aggregate the preference orders are called aggregation methods, and they are divided into two categories: voting method and mathematical aggregation method. General approach to aggregate alternatives’ preferences is the voting methods. The winning alternative in voting methods depends on which voting rule is used. Generally, Borda rule and Copeland rule are the most common voting rules. The mathematical aggregation methods are classified to two sub-categories, ‘‘hard aggregation method’’ and ‘‘soft aggregation method’’ based on including the decision-makers. CONCLUSION Managing occupational risk allows organizations to maintain and develop intellectual capital, which is fundamental for the development of the organization. Safety management system consists of a safety policy (principles and the responsibilities of all organization members), that encourage employees’ participation, training, continuous communication and collaboration, planning of the activities and adequate control of the activities. It has positive effect on: safety performance - by reducing the accident rate, and improving working conditions; and competitiveness - due to its positive
21 | Safety Engineering

SAFETY ENGINEERING - INŽENJERSTVO ZAŠTITE
influence on the organizational image, productivity, reputation and innovation.
[15] K. Øien: “A framework for the establishment of organizational risk indicators”, Realibility Engineering and System Safety, 74 (2001), pp. 147-167. When the research on developing indicators or metrics for
major hazards started, the focus was on direct or lagging indicators (after-the-event type of indicators). This approach counts the number of accidents or incidents or near misses, however, these indicators are not very useful as pre-warnings or early warnings. For early warnings, one needs to analyse causes of dangerous events and the condition of the factors that leads to accidents. This is achieved by indirect or proactive indicators (leading indicators) that provide performance feedback before an accident or incident occurs.
[16] F. Bozbura et al.: “Prioritization of human capital measurement indicators using fuzzy AHP”, Expert Systems with Applications, 32 (2007), pp. 1100-1112.
[17] G. Janaćković, S. Savić, M. Stanković: “Safety Performance Indicators in Organizational Safety Management Systems“, In Proc. of the 2nd Int. Conf. Life Cycle Engineering and Management ICDQM-2011, Belgrade, Serbia, pp. 131-139.
[18] L. Ustinovichius et al.: “Application of a quantitative multiple criteria decision making (MCDM-1) approach to the analysis of investments in construction“, Control and Cybernetics 2007;36, pp.251–68.
Defining safety performances and indicators, according to the specific organization, is the basis for application of multi-criteria decision-making in the safety management system.
ACKNOWLEDGEMENT The research presented in this paper was partially supported by Serbian Ministry of Education and Science (project III42006).
REFERENCES BIOGRAPHIES [1] B. Krstić, V. Sekulić: Upravljanje performansama
preduzeća, Ekonomski fakultet, Niš, 2007. Goran Janaćković received his BSc and MSc degrees in CS and CE from the Faculty of Electronic Engineering, University of Niš, in 2000 and 2004, respectively. He is currently working on his PhD thesis at the Faculty of Occupational Safety, University of Niš.
His research interests are systems engineering, information systems in safety, information and communication networks, multi-criteria decision making and optimization, collaborative web technologies and knowledge management. Suzana Savić received her BSc degree in Automatics from the Faculty of Electronic Engineering. She obtained her MSc as well as PhD in Occupational Safety from the Faculty of Occupational Safety. She works as a full professor at the Faculty of Occupational Safety, University of Niš. Her research interests are systems and risk analysis and management, systems engineering and multi-criteria decision making.
Miomir Stanković graduated from the Faculty of Electronic Engineering in 1975. He received his PhD degree from the Faculty of Electronic Engineering in 1979. He works as a full professor at the Faculty of Occupational Safety, University of Niš. His research interests are: integrated and discrete transformations, neural networks, signal processing, system risk analysis and system integration. He has published about 130 scientific papers in the country and abroad, 31 of which are in Kobson database.
[2] J. Santos-Reyes, A. Beard: “Assessing safety management systems”, Journal of Loss Prevention in the Process Industries, 15, 2002, pp. 77–95.
[3] OECD (Organisation for Economic Co-operation and Development): “Guidance on safety performance indicators”, OECD Environment, Health and Safety Publications, Series on Chemical Accidents 11, 2003.
[4] S. Guastello: “Do we really know how well our occupational accident prevention programs work?”, Safety Science 16, 1993, pp. 445–463.
[5] B. Fernandez-Muniz et al.: “Relation between occupational safety management and firm performance”, Safety Science, Volume 47, Issue 7, 2009, pp. 980-991.
[6] G. Janaćković, S. Savić, M. Stanković: “Životni ciklus zaštite i upravljanje znanjem“, Zbornik radova konferencije “Elektronsko učenje na putu ka društvu znanja“, Univerzitet Metropolitan, Beograd, 2010, 89-94.
[7] H. Roland, B. Moriarty: System Safety Engineering and Management, John Wiley & Sons, 1990.
[8] P.Vidal: “Safety performance indicators program”, Technical Meeting on NPP Safety Performance Indicators for Use by the Regulatory Organizations, Viena, Austria, 2003.
[9] G. Janaćković, S. Savić, M. Stanković: “Safety Lifecycle and risk assessment”, In Proc. of the 13th International Conference Dependability and Quality Management ICDQM-2010, Belgrade, Serbia, pp. 255-261.
[10] J. Holmberg et al.: “Safety evaluation by living probabilistic safety assessment and safety indicators”, In: TemaNord 1994:614, The Nordic Council of Ministers, Copenhagen, Denmark, 1994.
[11] A. Hopkins: “Thinking about process safety indicators”, Safety Science 47, 2009, pp. 460–465.
[12] HSE: “Developing process safety indicators: a step-by-step guide for chemical and major hazard industries”, UK Health and Safety Executive, 2006.
[13] K. Øien, et. al.: “Building Safety Indicators. Part 1-theoretical foundation”, Safety Science 49 (2), 2010, pp. 148–161.
[14] K. Øien: “Risk Control of Offshore Installations: A Framework for the Establishment of Risk Indicators”, PhD thesis, NTNU, Trondheim, Norway, 2001.
22 | Safety Engineering

UDC 303.211:614.256 Original article
Paper is presented at the "International Conference Safety of Technical Systems in Living and Working Environment", Faculty of Occupational Safety in Niš, October 2011, Niš.
23 | Safety Engineering
MILAN PROTIĆ1
DRAGAN MITIĆ2
VELIMIR STEFANOVIĆ3
1University of Niš, Faculty of Occupational Safety
2 University of Niš, Faculty of Occupational Safety
3 University of Niš, Faculty of Mechanical Engineering
2 [email protected] [email protected]
WOOD PELLETS PRODUCTION TECHNOLOGY Abstract: Increasing environmental concerns, particularly ones concerning the thermal utilization of fossil fuels, have significantly stimulated worldwide R&D work on mitigation of greenhouse gases. Biomass can be regarding as one the most promising “environmental friendly” alternative to fossil fuels. However, handling as well as direct combustion of biomass is restricted due to intrinsic properties of this kind of fuel. Pelleting technology offers possibility of lessening these difficulties. In following paper foundational operations in pelleting process line are described based on the theoretical work and experimental experience of authors.
Key words: pellets, wood pellets, pelleting technology INTRODUCTION
Worldwide production of terrestrial biomass has been estimated to be on the order of 200 × 1012 kg annually, which is approximately five times the energy content of the total worldwide crude oil consumption (via heat of combustion analysis) [1]. Despite these figures wide-spread usage of biomass in developed countries is still insufficient. This could be partly explained by signifi-cant investment costs associated with plants for thermal utilization of biomass and partly due to inherent draw-backs of biomass - heterogeneity, low energy density and high moisture content. The latter problems can be overcome by densification technologies i.e. through production of pellets and briquettes with consistent quality (high energy density, low moisture content and homogeneous size and shape). Although the production of pellets and briquettes requires additional energy input, resulting in increased fuel cost, worldwide pellet market (especially EU) has trend of persistent rise. This trend can be easily recognized locally with numerous new pelleting facilities being commissioned every year in Serbia. Exactly that fact motivated authors of this article to transfer some of their field experience and throw the light on essential steps in pellets production technology.
RAW MATERIAL FOR PELLETS PRODUCTION
Almost any kind of biomass can be regarded as potential raw material for pellet production. However, only pellets produced from woody biomass will be considered in this paper. It is worth noting that most of the pelleting plants operating around the world use wood as a dominant feedstock for pellets production. Woody biomass is made of three basic components with many trace materials. These are structural natural organic polymers: cellulose, hemicelluloses, and lignin. The most important constituent for pelleting process is lignin. It can be regarded as natural binding agent which keeps the woody particles inside the pellet together. Consequently, the higher the lignin content in
wood the more durable pellets are. Woody feedstock can be distinguished in two broad categories: softwood and hardwood. Typically these two kinds of wood differ in heating value, ash and lignin content. Production of pellets from just one raw material is rather difficult, thereby the producers often use various blends/mixtures of wood species. The best results in pellets production can be achieved with raw material originating exclusively from wood stem. These pellets are of premium quality (lowest ash content, highest mechanical durability etc.) and conforms to EN 14961 standard “A1 class pellets”. Production of this kind of pellets is payable only if raw material is readily available as sawdust. If it comes in any other form, production can be regarded as unprofitable. Surprisingly, in Serbia, as a result of insufficiently developed wood processing industry, most of the pellet plants use the wood logs. This can be explained by their unrealistically low price, but as the market progress and producers start to compete for raw material wood price will rise.
PELLETS PRODUCTION
It is particularly noteworthy that process steps in actual pelleting facility could differ from what is presented here. Main reasons for this are the type and moisture content of raw material. However, any pelleting plant consists of following process steps: • Pre-treatment of raw material • Pelletization • Post-treatment of produced pellets
Pre-treatment of raw material
Type of the pre-treatment primarily depends on raw material dimensional characteristics. Simply put, the greater the dimensions of input material the greater the investment and operational costs of pre-treatment. If sawdust is to be used then pre-treatment of raw material is not needed. Thereby, this kind of raw material can be regarded as the most favorable. Due to deficiency of sawdust, especially in Serbia, many
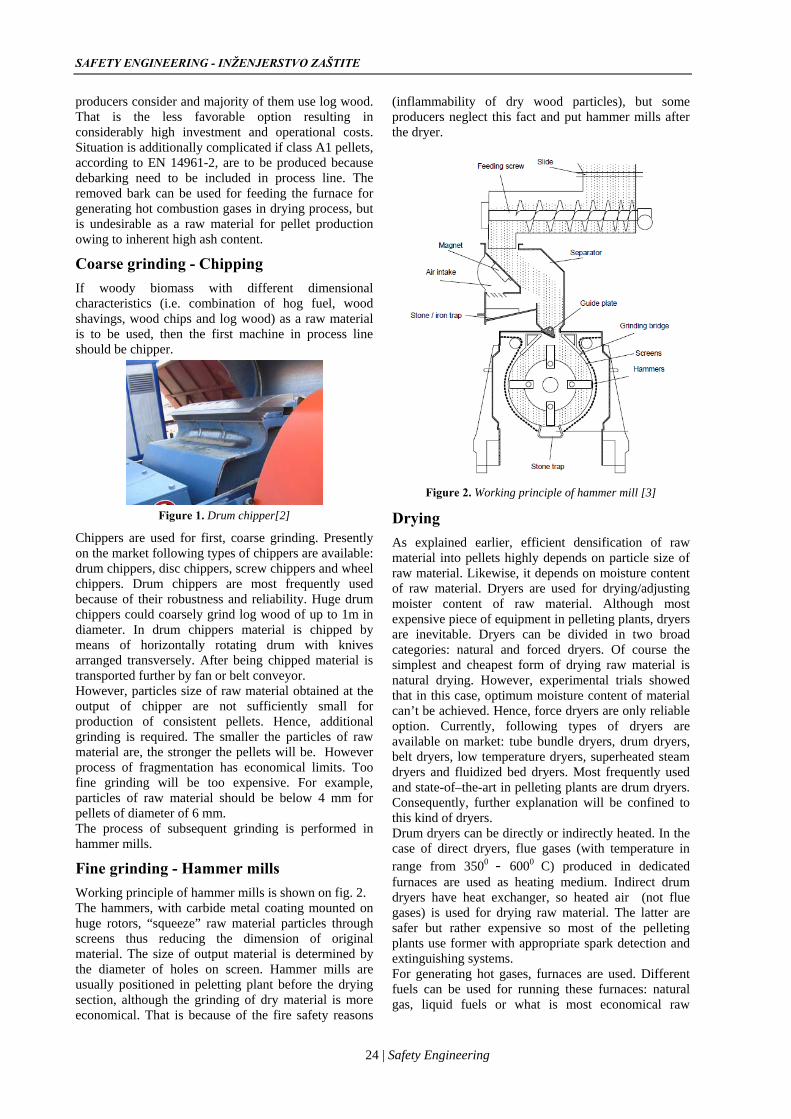
SAFETY ENGINEERING - INŽENJERSTVO ZAŠTITE
producers consider and majority of them use log wood. That is the less favorable option resulting in considerably high investment and operational costs. Situation is additionally complicated if class A1 pellets, according to EN 14961-2, are to be produced because debarking need to be included in process line. The removed bark can be used for feeding the furnace for generating hot combustion gases in drying process, but is undesirable as a raw material for pellet production owing to inherent high ash content.
Coarse grinding - Chipping
If woody biomass with different dimensional characteristics (i.e. combination of hog fuel, wood shavings, wood chips and log wood) as a raw material is to be used, then the first machine in process line should be chipper.
Figure 1. Drum chipper[2]
Chippers are used for first, coarse grinding. Presently on the market following types of chippers are available: drum chippers, disc chippers, screw chippers and wheel chippers. Drum chippers are most frequently used because of their robustness and reliability. Huge drum chippers could coarsely grind log wood of up to 1m in diameter. In drum chippers material is chipped by means of horizontally rotating drum with knives arranged transversely. After being chipped material is transported further by fan or belt conveyor. However, particles size of raw material obtained at the output of chipper are not sufficiently small for production of consistent pellets. Hence, additional grinding is required. The smaller the particles of raw material are, the stronger the pellets will be. However process of fragmentation has economical limits. Too fine grinding will be too expensive. For example, particles of raw material should be below 4 mm for pellets of diameter of 6 mm. The process of subsequent grinding is performed in hammer mills.
Fine grinding - Hammer mills
Working principle of hammer mills is shown on fig. 2. The hammers, with carbide metal coating mounted on huge rotors, “squeeze” raw material particles through screens thus reducing the dimension of original material. The size of output material is determined by the diameter of holes on screen. Hammer mills are usually positioned in peletting plant before the drying section, although the grinding of dry material is more economical. That is because of the fire safety reasons
(inflammability of dry wood particles), but some producers neglect this fact and put hammer mills after the dryer.
Figure 2. Working principle of hammer mill [3]
Drying
As explained earlier, efficient densification of raw material into pellets highly depends on particle size of raw material. Likewise, it depends on moisture content of raw material. Dryers are used for drying/adjusting moister content of raw material. Although most expensive piece of equipment in pelleting plants, dryers are inevitable. Dryers can be divided in two broad categories: natural and forced dryers. Of course the simplest and cheapest form of drying raw material is natural drying. However, experimental trials showed that in this case, optimum moisture content of material can’t be achieved. Hence, force dryers are only reliable option. Currently, following types of dryers are available on market: tube bundle dryers, drum dryers, belt dryers, low temperature dryers, superheated steam dryers and fluidized bed dryers. Most frequently used and state-of–the-art in pelleting plants are drum dryers. Consequently, further explanation will be confined to this kind of dryers. Drum dryers can be directly or indirectly heated. In the case of direct dryers, flue gases (with temperature in range from 3500 - 6000 C) produced in dedicated furnaces are used as heating medium. Indirect drum dryers have heat exchanger, so heated air (not flue gases) is used for drying raw material. The latter are safer but rather expensive so most of the pelleting plants use former with appropriate spark detection and extinguishing systems. For generating hot gases, furnaces are used. Different fuels can be used for running these furnaces: natural gas, liquid fuels or what is most economical raw
24 | Safety Engineering

M. Protić, D. Mitić, V. Stefanović, Vol 1, No1 (2011) 23-26
material for producing pellets (hog fuel, wood chips, shavings, sawdust). Some furnaces are designed to work even with moist feedstock but this is more exception than rule because in most cases efficiency reduces rapidly when dryers work with wet material.
Figure 3. Cross section of a drum dryer with three passes [4]
Operating principle of three pass drum dryer is shown on figure 3. Drum dryers are of cylindrical shape with multitude of inner flights which are combined in order to lift and shower raw material evenly through the hot air stream while drum rotates. Raw material is drawn in dryer by virtue of negative pressure created by fen on the other end of dryer. Most of the moisture from raw material evaporates in the first pass (in first contact between raw material and stream of hot gases), but two additional passes are usually needed in order to adjust the moisture to required value. Cyclones, positioned at the end of drying section are used for separation of dried material from hot gaseous stream. Dried material is then conveyed to silos for moisture equalization. Process of raw material moisture balancing lasts usually 10 - 24h. This interim storage of raw material also adds to more flexible work of whole plant since it decouples process of drying and pelleting. Part of the dried material from silos goes to furnace for drying new batches of wet feedstock while the other part continues its way in process. Before the process of pelleting, particles of dried raw material need to be balanced in size. Separation of fractions and further size reduction is performed in oscillating screens. Particles of dried raw material which suffice dimensional requirements are transported to silos of prepared material. From silos material goes to conditioner. Conditioner is used for adding thin film of water on wood particles in order to alleviate process of binding which is conducted in pelleting machines. Process usually raises the moisture content of raw material for 2 wt% (w.b.). There were some experimental trials, documented in [5], on the use of steam explosion reactors in conditioning. Idea is in flash decompression of material after it has been kept on high temperature and pressure. Proposed procedure significantly increases the mechanical durability of produced pellets. However, because of costs being too high, process didn’t become the reality in commercial plants. Pelleting process comes after the processes of grinding, drying, dimensional balancing and conditioning.
Pelleting process
Wood and biofuel pelleting technology emerged from fodder pelleting. Technology was actually slightly modified in order to enable densification of material
with different features. Currently, two distinctive procedures and consequently milling machines are used for producing pellets: ring and flat die pellet mills. More common are mills with ring dies. Main elements of pelleting machines, regardless the operating principle, are die and rollers. Pelleting mills with ring die (figure 4) consist of rotating ring die that rotates around the fixed rollers. The incoming raw material is “trapped” in space between roller and die and pressed through die holes (channel).
Figure 4. Designs and operating principles of pellet
mills-Ring die pellet mill [6]
In the case of flat die pellet mills, rollers rotate around own axis and around the flat die axis as well (figure 5). Flat die is in horizontal position and material is introduced from above.
Figure 5. Designs and operating principles of pellet
mills-Flat die pellet mill [6] Even distribution of raw material in the space between die and rollers is essential in order to get the pellets of proper quality. Produced pellets leave the pelleting mill as infinite string, so special knives positioned on the perimeter of pellet mill lid are needed in order to cut this string into pieces of acceptable length (usually less than 40 mm). Pelleting mills differentiate according to: press ratio, quantity of die holes (channels) and the inside area of channels [6]. Press ratio represents the ratio between the diameter and length of hole and it highly depends on type of raw material used. In the case of woody biomass it is in the range of 1:3 to 1:5.
Post treatment - Cooling
Temperature of pellets leaving the pellet mill is usually in the range of 80-1300C. Products with such high temperature are not appropriate for further handling (i.e. packing). That is the reason why cooling stage is
25 | Safety Engineering

SAFETY ENGINEERING - INŽENJERSTVO ZAŠTITE
essential. In addition, cooling process improves mechanical durability and reduces moisture content of produced pellets by some 2 wt% (w.b.). Pellets are usually transported from pelleting machine to cooler via bucket elevator.
Figure 6. Countercurrent pellet cooler [7]
Coolers with counter flow of pellets and cooling medium are most common. In this arrangement dry cold air enters the cooler at the bottom side, while the pellets enter the cooler from the opposite, top side. Cold air collects the heat and moisture released from pellets and leaves the cooler. On opposite, pellets cool down and continue their way to packaging section.
Pellets handling
There are few handling options for produced pellets. The straightforward option is to transport pellets internally to silos of finished commodities and then unload pellets to specially designed trucks (figure 7). However, this kind of pellet delivery exists only in countries with developed pellet market and significant number of household users (for example in Scandinavia, Germany, Austria). The other option is bag packaging. Pellets can be packed in smaller bags (10 – 25 kg) or in big “Jumbo” reusable bags containing 1 - 1.5 m3 of pellets.
Figure 7. Simultaneous pellets loading of pneumatic truck from silo and loading of loose pellets to the tractor trailer [8]
The former are used in households while the latter are intended for industrial customers. Producers usually pack small bags on pallets and then wrap the whole package with plastic foil. It is very important to provide good sealing of bags since pellets
are highly hygroscopic and are prone to disintegration in the presence of water.
CONCLUSION
Densification technologies provide practical options for overcoming some of the inherent drawbacks of biomass (moisture content and low energy density being the most important). Pelleting can be regarding as one of the well established densification procedure, gaining increasing popularity and acceptance in recent years. This is primarily due to pellets dimensions (appropriate for automatic feeding), durability and consistent and standardized quality. In this paper fundamental process steps in producing wood pellets were described. However, it is noteworthy that actual process can differ from ones depicted in this article, since it highly depends on kind of the raw material to be used, planned investment and available land for plant set up.
REFERENCES [1] Himmel, M. (ed.): “Biomass recalcitrance –
deconstructing the plant cell wall for bioenergy”, Blackwell Publishing, 2008, London
[2] http://www.bruks.com [3] Van Loo S., Koppejan J.(ed): “The handbook of
biomass combustion and co-firing, Earthscan, 2008. [4] http://www.andritz.com [5] Geisslhofer, A. et al.: “Holzpellets in Europa, Berichte
aus Energie- und Umweltforschung“, Bundesministerium für Verkehr, Innovation und Technologie Vienna, 2000
[6] Kaltscmitt, M: “Energie aus Biomasse: Grundlagen, Techniken und Verfahren”, Springer, 2009
[7] http://www.buhlergroup.com
[8] http://www.pelletime.fi/project/publications/material/raportti_logistiikka.pdf
ACKNOWLEDGEMENTS
This paper is part of the Project: “Research and development of energy and environmentally highly efficient polygeneration systems based on renewable energy sources”, project number III 42006 funded by Serbian Ministry of Education and Science.
BIOGRAPHY of the first author
Milan Protic was born in Nis, Serbia, in 1979. He received the diploma in Mechanical engineering and Mphil degree in Environmental engineering from the Faculty of Mechanical Engineering and Faculty of Occupational Safety, University of Nis, respectively. His research interests covers diverse renewable energy systems with particular focus on biomass densification and combustion technologies. He got CEI award “From Research to Enterprise” and participated in several internationally and nationally funded research project. One of the recent projects was Technological Project for Pelleting Plant – Forest enterprises d.o.o. in Pukovac, Serbia with capacity of 4 t/h. He presently works as teaching assistant at the University of Nis, Faculty of Occupational Safety.
26 | Safety Engineering

UDC 303.211:614.256 Original article
Paper is presented at the "International Conference Safety of Technical Systems in Living and Working Environment", Faculty of Occupational Safety in Niš, October 2011, Niš.
27 | Safety Engineering
TOMÁŠ CHREBET1 KAROL BALOG2
JOZEF MARTINKA3 IVAN HRUŠOVSKÝ4
1,2,3,4Slovak University of Technology
in Bratislava, Faculty of Materials science and Technology in Trnava,
Institute of Safety and Environmental Engineering
[email protected] 3 [email protected] [email protected]
MONITORING OF THE CELLULOSE PYROLYSIS IN A MODIFIED ELECTRICALLY HEATED HOT AIR FURNACE Abstract: This paper deals with monitoring of the thermal decomposition of pure cellulose in a modified electrically heated hot air furnace, which allows simultaneous measure of weight loss, released gases (CO, CO2, CxHy, H2, NO, NO2 and O2) at a given temperature or a selected heating rate and the selected airflow speed. The measurements were made under isothermal conditions in the temperature range 230-340 ° C and air flow at speeds 30, 20, 10, 0 mm.s-1.
Key words: thermal decomposition, cellulosic materials, evolved gases
INTRODUCTION
Cellulose, one of the most widely used natural polymers on earth, consists of repeated elements of cellobiose. Cellulose is a linear polymer of β-d-glucose in the pyranose form, linked together by 1,4-glycosidic bonds [1, 2]. Cellulose is a major component of wood, and it is released duringcombustion of the majority of flammable gases [3]. Therefore, we focused on the reaction of cellulose during thermal decomposition. When cellulose is heated in the temperature range 120 - 350 ° C, there are at least three primary reactions: thermo-oxidation, dehydration and depolymerization associated with glycosane formation. The parallel course of these reactions significantly affects the results of the process. Thermo-oxidation and dehydration are controlled by diffusion processes taking place mainly in the proportions of amorphous polysaccharides. At the same time, short chains are formed with depolymerization [4]. Fig. 1 shows the degradation scheme and various processes involved in pyrolysis and combustion of cellulose.
Figure 1. Scheme of cellulose degradation and the processes
involved in pyrolysis and combustion of cellulose [5]
During thermal straining of different materials, there is exo and endothermic processes associated with weight change, which are characteristic for the tested material. For monitoring these changes, various thermo-analytical methods can be used (thermogravimetry, derivation thermogravimetry, differential thermal analysis, differential scanning calorimetry). During heat straining, there is a development of gaseous
degradation, which can be continuously collected and evaluated [6, 7]. The disadvantage of simple thermo-analytical methods is possibility to monitor only one physical properties using one sample. With the simultaneous method, we can explore more physical properties simultaneously during one measurement using one sample. We modify the electrically heated hot air furnace in order to perform simultaneous measurement of weight loss, mass lose rate and concentration of released gases (CO, CO2, CxHy, H2, NO, NO2, O2) at a given temperature or a selected rate of heating and the selected airflow speed. DESCRIPTION OF TEST EQUIPMENT
degradation products depending on the temperature of
Figure 2. Test equipment
The basis of test heated hot-air equipment is electricallyfurnace according to ISO 871 (the Setchkin furnace) (1). A sample is put in a steel sieve, in order to better monitor the air flow effect in the furnace. Two thermocouples are also placed in the furnace (2), one is about two centimeters above the sample and the second approximately centimeter below the sample. Air is forced to the furnace with air pump; the flow is regulated by flow meter (3). Under the furnace, there is weight (KERN PLT 450-3M) (4). The sieve with the sample in the furnace is linked with weight using a glass rod (5), which is on both sides flat extended for
10
2
5

SAFETY ENGINEERING - INŽENJERSTVO ZAŠTITE
stability. Above the opening of the flow decomposition products there is a sampling probe (6) of gas analyzer (TESTO 350XL) (7); this analyzer can monitor O2, CO, CO2, CxHy, H2, NO, NO2 and temperature at the sampling place. Thermocouples, weight and gas analyzer are connected via RS 232 to N-port (8) and it is connected to a computer (9).
Sample preparation, experiment and recorded values
The sample of pure cellulose was filter paper with density 100g/m-2, which was cut into squares of approximately 15mm, and the loading of 2g. The sample was evenly distributed in the sample holder (strainer). When dynamic changing of temperature has been applied, the heating rate was 5 °C/min-1. In isothermal condition, the furnace has been left tempered during 30 minutes on set temperature, then the sample was inserted into the furnace and the measurement starts. Data from the weight, thermocouples and gas analyzers were recorded every 5 seconds. Samples in which change was not observed were left for three hours in the furnace. The course of the experiment
By the initial non-isothermal (dynamic) method, we get an overview of the overall thermal behavior of explored sample for the entire temperature range. However, it is not possible to observe self heating processes, the impact of external factors on this process or to determine critical conditions. For the monitoring of burning, self heating and flameless combustion processes, isothermal conditions are considered to be suitable. Therefore, we focused on finding the lowest temperature at which pyrolysis can be observed at different speeds of air flow around the sample.
Figure 3. TG / DTG record, 2 grams sampe of pure cellulose, heating rate 5°C.min-1 using sieve and velocity of airflow 25 mm.s-1
Figure 4. Dependence of released gases from temperature, 2 grams sampe of pure cellulose, heating rate 5°C.min-1 using sieve and velocity of airflow 25 mm.s-1
For overall mapping of processes at different temperatures, we chose the highest temperature of 20 °C above the temperature at which the maximum mass lose rate was observed during dynamically changing temperature (Fig. 3, 4), i.e. 340 ° C, and further temperature have been 10 ° C lower than the previous one. We also monitor the impact of air flow velocity into the reaction zone, we choose airflow speed: 30, 20, 10, 0 mm/s-1 converted to the appropriate temperature according to the relationship mentioned in the standard [8]. Measurements taken under isothermal conditions enabled us to calculate the activation energy of initiation and propagation phase of degradation of pure cellulose sample by Arrheniens equation (1):
RT
E
eZk−
⋅= (1) where Z is the frequency factor, E is the activation energy, R is the gas constant and T is absolute temperature. RESULTS OF EXPERIMENTS With regard to the large amount of measured results, we would like to mention the example graph for pure cellulose at temperature of 340 ° C and airflow velocity 30 mm/s-1. The graphs are displayed from the top, the time dependence of oxygen concentration in % and average temperature (average temperature between the thermocouple located above the sample and below the sample) in °C, time dependence of hydrogen and hydrocarbon concentration in ppm (parts per million), time dependency of carbon monoxide and carbon dioxide in ppm, the time dependence of the proportion CO2, CO, H2, CxHy, and time dependency of TG / DTG with marked times of decomposition stages. To draw graphs, we used a trend line in the originlab program marked as Smoothing, method of rendering Savitzky-Golay, polynomial order 1.
28 | Safety Engineering

T. Chrebet, K. Balog, J. Martinka, I. Hrušovský, Vol 1, No1 (2011) 27-33
Criteria for evaluation: • Time to mass loss rate 0,0004 g.s-1 in the second stage of
decomposition (this value was determined as the lowest mass lose rate which is followed by decomposition of the sample) (Fig. 5 Position 1)
• Duration of pyrolysis (time interval from the mass lose rate 0,0004 g.s-1 to the end of the second phase of decomposition, we did not counting the glowing interval) (Fig. 5 Position 2)
• Time to Bamford critery (mass lose rate of 0,005 g.s-1, which are conditions for the ignition) (Fig. 5 Position 3)
• Concentration of CO, CO2 and the ratio of CO/CO2 when was Bamford critery achieved (Fig. 5 Position 4, 5)
• Time to maximum concentration of CO (Fig. 5 Position 6)
• Time to maximum concentration of CO2 (Fig. 5 Position 7)
• With regard to that there were problems with the initial concentration of CxHy , and concentration of H2 is count from measured values of CxHy we did not deal with these gases any more in the graph on fig. 5 are shown only for illustration.
Figure 5. Time dependence at 340 ° C and a airflow velocity of 30 mm.s-1.Graphs are showing from the top: the time dependence of oxygen concentration in % and average temperature in ° C oven, the time dependence of hydrogen
and hydrocarbon concentration in ppm, time dependency of carbon monoxide and carbon dioxide in ppm, the time dependence of the proportion of CO2, CO, H2, CxHy and time dependence of weight loss in g and mass loss rate in g.s-1.
Figure 6. Time to achieve mass loss rate of 0,0004 g.s-1 in
dependence on temperature and airflow velocity
Figure 7. Duration of pyrolysis in dependence on
temperature and airflow velocity
Figure 8. Time to achieve mass loss rate of 0,005 g.s-1 in
dependence on temperature and airflow velocity
29 | Safety Engineering

SAFETY ENGINEERING - INŽENJERSTVO ZAŠTITE
Figure 9. Concentration of CO at mass loss rate 0,005 g.s-1
in dependence on temperature and airflow velocity Figure 12. Time to achieve maximal concentration of CO in
dependence on temperature and airflow velocity
Figure 10. Concentration of CO2 at mass loss rate 0,005 g.s-1 in dependence on temperature and airflow velocity
Figure 13. Time to achieve maximal concentration of CO2 in dependence on temperature and airflow velocity
Figure 11. Proportion of CO/CO2 at mass loss rate 0,005 g.s-
1 in dependence on temperature and airflow velocity
Table 1. Time to achieve mass loss rate of 0,0004 g.s-1 depending on temperature and airflow velocity
Time [s] to achieve mass loss rate of 0,0004 g.s-1 Temperature [°C]
Air flow velocity [mm.s-1] 240 250 260 270 280 290 300 310 320 330 340 30 7180 5790 2520 895 895 655 370 270 215 170 132 20 X X 2665 1715 765 520 365 235 180 145 146 10 X X X 2350 1295 605 515 445 210 210 144 0 X X X 4285 2010 1105 550 540 220 245 166
30 | Safety Engineering

T. Chrebet, K. Balog, J. Martinka, I. Hrušovský, Vol 1, No1 (2011) 27-33
Table 2. Duration of pyrolysis in dependence on temperature and airflow velocity
Duration of pyrolysis [s] Temperature [°C]
Air flow velocity [mm.s-1] 240 250 260 270 280 290 300 310 320 330 340 30 540 510 350 380 375 630 410 360 345 305 274 20 X X 750 445 410 455 420 270 325 305 310 10 X X X 460 450 450 645 725 380 345 350 0 X X X 470 495 525 560 510 450 430 362
Table 3. Time to achieve mass loss rate of 0,005 g.s-1 in dependence on temperature and airflow velocity
Time [s] to achieve mass loss rate of 0,005 g.s-1 Temperature [°C]
Air flow velocity [mm.s-1] 240 250 260 270 280 290 300 310 320 330 340 30 7415 6020 2690 1105 1105 895 630 480 395 325 252 20 X X X 1950 1015 775 615 435 345 285 284 10 X X X X 1590 880 800 700 405 385 304 0 X X X X X X X 825 455 475 310
Table 4. Concentration of CO at mass loss rate 0,005 g.s-1 in dependence on temperature and airflow velocity
Concentration of CO [ppm] at mass loss rate 0,005 g.s-1 Temperature [°C]
Air flow velocity [mm.s-1] 240 250 260 270 280 300 310 320 330 340 30 1134,57 981,762 482,095 453,905 453,905 327,333 238,047 342,429 333,429 175,524 20 X X X 619,476 600 307,714 249,952 162,476 292,19 190,333 10 X X X X 378,667 267,238 304,714 153,905 158,619 75,5714 0 X X X X X X 286,667 169 159 127,095
Table 5. Concentration of CO2 at mass loss rate 0,005 g.s-1 in dependence on temperature and airflow velocity
Concentration of CO2 [ppm] at mass loss rate 0,005 g.s-1 Temperature [°C]
Air flow velocity [mm.s-1] 240 250 260 270 280 300 310 320 330 340 30 3309,52 3214,29 2242,86 2414,29 2414,29 2380,95 1433,33 1814,29 1214,29 1447,62 20 X X X 2342,86 2680,95 2404,76 1790,48 1580,95 1519,05 1514,29 10 X X X X 2357,14 2395,24 2419,05 1804,76 990,476 1504,76 0 X X X X X X 2023,81 1938,1 1761,9 1685,71
Table 6. Proportion of CO/CO2 at mass loss rate 0,005 g.s-1 in dependence on temperature and airflow velocity
Proportion of CO/CO2 at mass loss rate 0,005 g.s-1 Temperature [°C]
Air flow velocity [mm.s-1] 240 250 260 270 280 300 310 320 330 340
30 0,34282 0,30544 0,21495 0,18801 0,18801 0,13748 0,16608 0,18874 0,27459 0,12125 20 X X X 0,26441 0,2238 0,12796 0,1396 0,10277 0,19235 0,12569 10 X X X X 0,16065 0,11157 0,12596 0,08528 0,16014 0,05022 0 X X X X X X 0,14165 0,0872 0,09024 0,0754
Table 7. Time to achieve maximal concentration of CO in dependence on temperature and airflow velocity Time [s] to achieve maximal concentration of CO
Temperature [°C] Air flow velocity [mm.s-1] 240 250 260 270 280 300 310 320 330 340 30 7525 6130 2830 1305 1305 795 675 570 490 392 20 X X 3020 2140 1165 755 610 510 440 422 10 X X X 2790 1715 960 900 585 560 442 0 X X X 4695 2475 1010 975 650 625 484 Table 8. Maximal concentration of CO in dependence on temperature and airflow velocity
Maximal concentration of CO[ppm] Temperature [°C]
Air flow velocity [mm.s-1] 240 250 260 270 280 300 310 320 330 340 30 1784,86 1619,29 1118,81 1991,95 1991,95 2175,38 1423,67 2000,1 2304,86 2234,71 20 X X 955,905 1093,52 1582,57 1511,86 1414,19 1595,67 1973,05 1668,19 10 X X X 553,286 771,333 1118,43 1274,43 1189 1154,24 566,143 0 X X X 140,762 373,905 576,143 577,524 616,381 565,19 613,286
31 | Safety Engineering
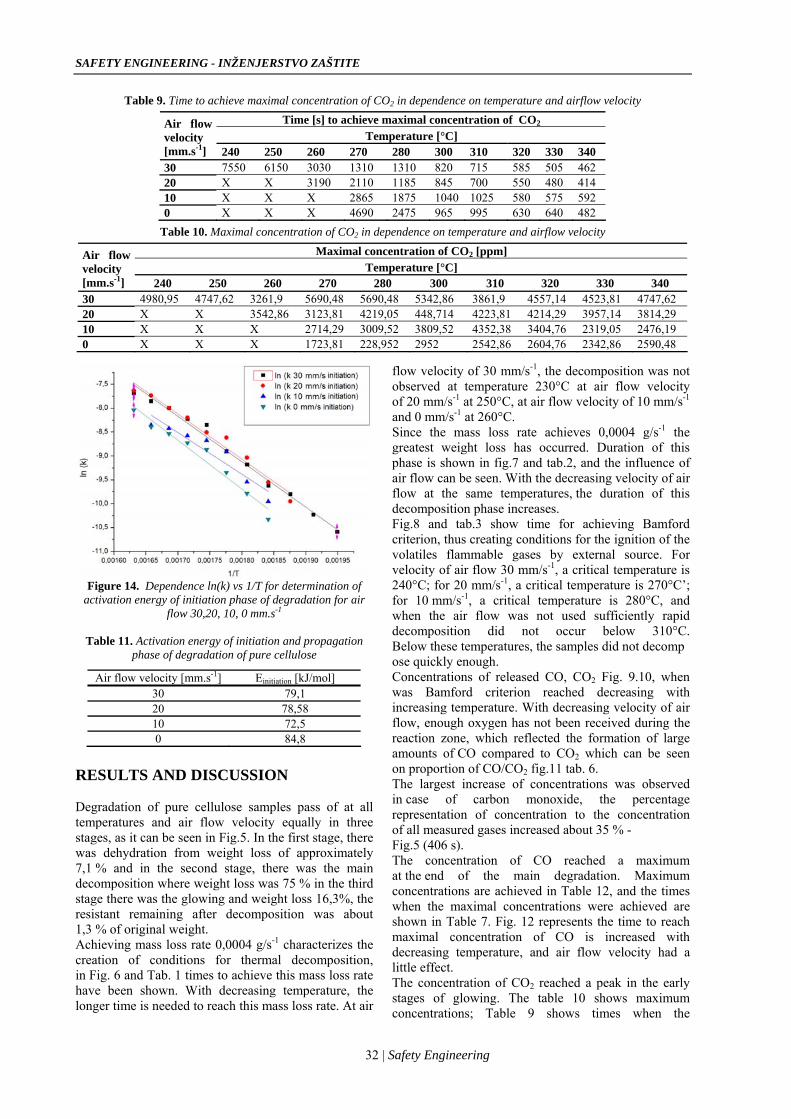
SAFETY ENGINEERING - INŽENJERSTVO ZAŠTITE
Table 9. Time to achieve maximal concentration of CO2 in dependence on temperature and airflow velocity Time [s] to achieve maximal concentration of CO2
Temperature [°C] Air flow velocity [mm.s-1] 240 250 260 270 280 300 310 320 330 340 30 7550 6150 3030 1310 1310 820 715 585 505 462 20 X X 3190 2110 1185 845 700 550 480 414 10 X X X 2865 1875 1040 1025 580 575 592 0 X X X 4690 2475 965 995 630 640 482
Table 10. Maximal concentration of CO2 in dependence on temperature and airflow velocity Maximal concentration of CO2 [ppm]
Temperature [°C] Air flow velocity [mm.s-1] 240 250 260 270 280 300 310 320 330 340 30 4980,95 4747,62 3261,9 5690,48 5690,48 5342,86 3861,9 4557,14 4523,81 4747,62 20 X X 3542,86 3123,81 4219,05 448,714 4223,81 4214,29 3957,14 3814,29 10 X X X 2714,29 3009,52 3809,52 4352,38 3404,76 2319,05 2476,19 0 X X X 1723,81 228,952 2952 2542,86 2604,76 2342,86 2590,48
32 | Safety Engineering
Figure 14. Dependence ln(k) vs 1/T for determination of activation energy of initiation phase of degradation for air
flow 30,20, 10, 0 mm.s-1
Table 11. Activation energy of initiation and propagation phase of degradation of pure cellulose
Air flow velocity [mm.s-1] Einitiation [kJ/mol] 30 79,1 20 78,58 10 72,5 0 84,8
RESULTS AND DISCUSSION Degradation of pure cellulose samples pass of at all temperatures and air flow velocity equally in three stages, as it can be seen in Fig.5. In the first stage, there was dehydration from weight loss of approximately 7,1 % and in the second stage, there was the main decomposition where weight loss was 75 % in the third stage there was the glowing and weight loss 16,3%, the resistant remaining after decomposition was about 1,3 % of original weight. Achieving mass loss rate 0,0004 g/s-1 characterizes the creation of conditions for thermal decomposition, in Fig. 6 and Tab. 1 times to achieve this mass loss rate have been shown. With decreasing temperature, the longer time is needed to reach this mass loss rate. At air
flow velocity of 30 mm/s-1, the decomposition was not observed at temperature 230°C at air flow velocity of 20 mm/s-1 at 250°C, at air flow velocity of 10 mm/s-1 and 0 mm/s-1 at 260°C. Since the mass loss rate achieves 0,0004 g/s-1 the greatest weight loss has occurred. Duration of this phase is shown in fig.7 and tab.2, and the influence of air flow can be seen. With the decreasing velocity of air flow at the same temperatures, the duration of this decomposition phase increases. Fig.8 and tab.3 show time for achieving Bamford criterion, thus creating conditions for the ignition of the volatiles flammable gases by external source. For velocity of air flow 30 mm/s-1, a critical temperature is 240°C; for 20 mm/s-1, a critical temperature is 270°C’; for 10 mm/s-1, a critical temperature is 280°C, and when the air flow was not used sufficiently rapid decomposition did not occur below 310°C. Below these temperatures, the samples did not decompose quickly enough. Concentrations of released CO, CO2 Fig. 9.10, when was Bamford criterion reached decreasing with increasing temperature. With decreasing velocity of air flow, enough oxygen has not been received during the reaction zone, which reflected the formation of large amounts of CO compared to CO2 which can be seen on proportion of CO/CO2 fig.11 tab. 6. The largest increase of concentrations was observed in case of carbon monoxide, the percentage representation of concentration to the concentration of all measured gases increased about 35 % -Fig.5 (406 s). The concentration of CO reached a maximum at the end of the main degradation. Maximum concentrations are achieved in Table 12, and the times when the maximal concentrations were achieved are shown in Table 7. Fig. 12 represents the time to reach maximal concentration of CO is increased with decreasing temperature, and air flow velocity had a little effect. The concentration of CO2 reached a peak in the early stages of glowing. The table 10 shows maximum concentrations; Table 9 shows times when the

T. Chrebet, K. Balog, J. Martinka, I. Hrušovský, Vol 1, No1 (2011) 27-33
maximum concentrations were achieved. Fig.13 shows the time of peak concentration of CO2 with increasing temperature decreasing and air-flow had as well as with CO, only a minor impact. CONCLUSION We made measurements in which we monitored the impact of temperature and velocity of air flow around the sample to pure cellulose degradation. At dynamically changing temperature, we found that the highest weight loss occurred at the temperature range between 280°C and 340°C, which coincides well with the TG record of pure cellulose made by standard method. In isothermal conditions, we found that the velocity of airflow 30 mm/s-1 created conditions for ignition even at 240°C but only after 7415 seconds. With decreasing velocity of the airflow, the temperature is rising. A modified furnace can be used for detailed exploration of the degradation processes of other materials. REFERENCES [1] Suuberg E. M.: Behavior of Charring Materials in
Simulated Fire Environments NIST, 1994 dostupné na: http://fire.nist.gov/bfrlpubs/fire94/PDF/f94009.pdf
[2] Kačík, F., Kačíková, D., Jablonský, M., Katuščák, S.: Cellulose degradation in newsprint paper ageing, Polymer Degradation and Stability 94 (2009) 1509–1514 dostupné na: www.sciencedirect.com
[3] Shaw, J.,R.: Fire-retardant and flame-resistant treatments of cellulosic materials, Fire Protection Haandbook, National Fire Protection Association, Quincy, 2003, str. 8-47, ISBN: 0-87765-474-3
[4] Kačík, F., Marková, I. Thermal decomposition of main wood components: part II: cellulose In: Wood, roč. 55, 2000, č.6, ISSN 0012-6144
[5] Butt, D. Thermochemical processing of agroforestry biomass for furans, phenols, cellulose and essential oils.
Rural Industries Research and Development Corporation. Publication, 2006, No. 06/121, 169 p. ISBN 1-74151-384-7
[6] Růžička M.,Bursíková P.,Dvořák O., Using STA/MS technique in detection of plastics thermal degradation products, Požární ochrana 2008, Sborník přednášek, ISBN 978-80-7385-040-1
[7] Thermal analysis – theory, accesible in: http://www.vscht.cz/met/stranky/vyuka/labcv/labor/fm_termicka_analyza/teorie.htm
[8] ISO 871: 2010 Plastics – Determination of ignition temperature using a hot-air furnace
ACKNOWLEDGEMENTS This paper is part of the Project: Center for research and application progresive methods in treatment process of metallic and nonmetallic materials, ITMS 26220120048, project implementation: 01/2010 - 12/2011. BIBLIOGRAPHY of the first author Tomáš Chrebet was born in Bojnice, Slovakia, in 1984. He received the diploma in Non-metalic materials and the PhD. degree in Integrated Safety from the Slovak University of Technology, Faculty of Materials Science and Technology in Trnava. His main areas of research include mass loss rate, ignitability and flamability etc. He is currently working as a research worker at Institute of Safety and Environmental Engineering, Faculty of Materials Science and Technology in Trnava.
33 | Safety Engineering

UDC 57.087.1:004:004.651 Review article
Paper is presented at the "International Conference Safety of Technical Systems in Living and Working Environment", Faculty of Occupational Safety in Niš, October 2011, Niš.
35 | Safety Engineering
MILJENKO VRBANEC1
FRANJO MAGUŠIĆ2
1Ministry of Interior of the Republic
of Croatia, Police Department međimurska, Čakovec
2 Ministry of Interior of the Republic of Croatia, Police Academy, Police
College, Zagreb
1 [email protected] [email protected]
APPLICATION OF BIOMETRIC SYSTEMS IN SAFETY Abstract: Development of civil society has created distinctive forms of public security and safety. Worldwide, there is a wide range of biometric systems, which today often come across as a modern approach to increasing public and workplace safety culture and process safety. The paper explains the basic criteria for the differentiation and classification, and the main special features of conventional and multimodal biometric systems, the possibility of comparison of biometric characteristics, the characteristics of alternative multimodal biometric models, building a database of biometric and possible errors, the possibility of stealing and misuse of biometric data. We will stress the police practice in the application of biometric systems.
Key words: conventional biometric systems, multimodal biometric systems, databases, biometric errors, misuse of biometric data.
INTRODUCTION Depending on the strategy and mission, there are various forms of safety and protection. For the purposes of this paper, we will get an insight into increased safety of critical infrastructure, "Business intelligence" and "Counterintelligence Business" integrated corporate security and private security using biometric systems. Because of the new strategy of terrorism and modern forms of information gathering and data, there are more biometric system which appear as a safer alternative in public safety and protection. Corporate companies develop corporate safety while security managers often manage the business processes of corporate security. Private security jobs can be performed in and around the perimeter of protected object space and around the protected person, within the perimeter security measures and protection as well as VIP (Very Important Person) persons, including public areas. Information Security of the archive of biometric systems is significant, and may be exposed to various security threats and dangers that may threaten its segments and sometimes the entire system. Constitution and international law protect all forms of trade secrets by criminal sanctions. Security and protection management can operate with different biometric systems and methods with and without the cooperation of people from a distance. Biometrics can be defined as a model to identify people based on physical and physiological characteristics or behavioral characteristics, and refers to something that a person has or what a person knows to carry out personal identification. Some authors give a more general definition trying to explain how to deal with biometric identification of individuals according to
their biological characteristics and behavioral characteristics. It is a sort of a methodology for solving the identification of the above criteria. In the very beginning of the performance and use of biometric systems, priority was given to physical characteristics in relation to behavioral characteristics. It was generally believed that the physical characteristics, in relation to behavioral, have "visibility". According to this view, it was assumed that the physical characteristics are more reliable than behavioral, since they tend to minor differences of variability within the groups and classes, rather than having the behavioral characteristics. Each biometric system has specific implementations that depends on the application of the methods used. The rapid development of technology has increased the need for reliable methods of identification in the field of forensic criminology. The biometric methods are used in the preparation of identification documents, authorizing the entry and movement of the perimeter of the vulnerable areas and facilities, and in recent times, more and more for identification of persons. Biometric identification is based on the physical and physiological characteristics and peculiarities of behavior of certain persons, on identification patterns and recognition of biometric characteristics.
CONVENTIONAL BIOMETRIC SYSTEMS
Conventional systems use only one biometric method. Although cheaper and easier, these systems are susceptible to errors in identification, because in large populations some biometric characteristics are not unique for everybody. For example, two people can have very similar face. Conventional biometric systems use different measures of the same biometric features, thus trying to improve the performance of biometric

SAFETY ENGINEERING - INŽENJERSTVO ZAŠTITE
systems. A biometric system is essentially a system for recognizing patterns which use the unique identification to determine the authenticity of some physical and physiological and behavioral characteristics of individuals. System identification can be based either on a single biometric characteristic (one shot), which is a unimodal biometric model, or more biometric characteristics ( more shots of biometric features) which is a multi-modal biometric model. Characteristics that should satisfy conventional biometric systems actually refer to only one condition and that is the possibility (impossibility) of fraud of identification systems. In this group of biometric characteristics we may include: fingerprint, iris, retina of the eye, and DNK. What is common for listed characteristic is high durability, permanence and universality, but also a relatively long time required for data processing. Quality conventional biometric system can be improved by using the traditional biometric features. These characteristics have certain qualities about people, but using these features is not possible to distinguish with absolute certainty the person. These are height, weight, gender, hair color and similar. By combining traditional biometric features with conventional biometric system, we get a multimodal biometric system that has characteristics of "strong" biometric features and the speed of traditional biometric features. Disadvantages of conventional biometric systems in relation to multimodal biometric systems are very obvious. The most obvious difference can be seen in the level of application of these systems. Conventional biometric systems can be applied to a "degree" of protection regardless of whether it was a strong, high and low biometric characteristic. Unlike conventional multimodal biometric systems, biometric systems cover the whole range of levels of "strength" which makes them more acceptable in the identification.
MULTIMODAL BIOMETRIC SYSTEMS Multimodal systems use two or more biometric methods of identification [1]. Each method uses the algorithm to calculate the degree of matching identity. The resulting levels are adjusted and the final decision is made. A number of the methods used mean greater accuracy, but higher cost. There is no simple way of selecting a biometric method that will be used in a multimodal system. The methods depend on its use, but in most cases, the best results are achieved with a combination of biometric methods of large and medium accuracy. Disadvantages of multi-modal systems are expensive and compatibility. There is no single standard that would allow easy connection of biometric method, which further increases the cost because of the need to explore and fine-tuning of the system [2]. Multimodal biometrics means combining all of the previously mentioned biometric methods. If the practice uses a larger number of previously listed methods, you can build a secure IT system. In practice,
it is a combination of physical characteristics and behaviors that include biometrics verification and identification. In practice they are used in the border police at border crossings to control entry or exit of persons, in the parameter protection to control access to any space, civilian and police identification, network security. Multimodal biometrics is used to support the standard procedures for verifying the identity or if the original documents and records are not possible to obtain sufficient data to describe a person (Figure 1).
Figure 1. An example of multimodal biometrics in
the customs control [3] Recommended is combination of standard security mechanisms and biometric in order to prevent misuse. One example is a fake template fingerprints. If you use only one technique, such as fingerprint matching, it is possible a situation in which a third person has a false fingerprint that performs authentication on behalf of a person, which is questionable safety and security functions. It is evident that unlike conventional biometric system here at their disposal are three more biometric characteristics. As used in this system with biometric features, which are difficult to cheat ,there can also be used biometric characteristics that have some other characteristics which are acceptable according to the manner of collection, costs and capabilities of their storage in databases. BIOMETRIC SYSTEM HISTORY
This process can be divided into several phases shown in Figure 2. Each biometric system has its own peculiarities of implementation depending on the application of the methods used. There are general features common to all systems. For the user, the first encounter with the system means biometric enrollment – registartion of his registration of biometric data and entry into the database.
Figure 2. Biometric enrollment [4]
36 | Safety Engineering

M. Vrbanec, F. Magušić, Vol 1, No1 (2011) 35-43
According to M. Bači [5], it is desirable to delete biometric data, because it is not advisable that they be be stored in the biometric records, since the identity of the user may be endangered. Each system deletion of biometric data should be carefully planned according to the strategy and goals of biometric systems. Biometric passports are widely used in the world and the European Union. Deletion of records is governed by a general or special regulations. In the case of the external borders of the EU, we will analyze a video surveillance system and deletion of their archives (registers) which are defined in the Catalogue of the EU Schengen external border control. In the Republic of Slovenia, the border police on the basis of the Law on State Border [6] [7] may be in the area of border crossings and other areas along the border, to enable the provision of state border control to install the photography and recording devices. At the border crossing, a person must be warned about the camera and recording devices, according to the Law on Personal Data Protection ZVOP-1-UPB1 [8]. Archive clips and recorded data will be destroyed within one year unless the information is not required in criminal proceedings or proceedings concerning the offense. The Director General of Police issued a technical guidance on the use of video surveillance systems for the protection and supervision of police facilities, premises and surrounding facilities, since 1 January 2008. The instructions included the installation and the use of video surveillance in safety and control of police buildings, spaces and space around the buildings, recording the process of command, control, views and visions, logistics management systems, monitoring the implementation of this guide and how to access the individual images. Instructions are available on the intranet of the police of the Republic of Slovenia. In Croatia, under the Law on State Border Protection [9], the border police has been authorized to supervise the state border for the purpose of searching, finding and determining the identity of the offender and the crime, do photography, imaging and video surveillance, and apply other technical aids. These devices can be automatic. Devices placed on the border crossings must be visible and people in such areas must be warned of such devices. When the border crossing record personal information, it is necessary to destroy such recordings within one year, unless they are required to prosecute perpetrators of an offense. In the Republic of Serbia, Border Police is authorized to apply effective border safety activities, under the Law on State Border Protection [10], and to collect personal data and use this data in the records. The collection can be done by applying technical and other means. Technical and other means can be automatic, when used for photography, filming and video surveillance. At border crossings, equipment must be placed at a visible position with a visible warning sign. The archives of recordings of personal data collected by these devices and equipment are destroyed after five
years, from the day of recording, unless they are required for criminal and misdemeanor proceedings. In the Republic of Bosnia and Herzegovina, under the Law on Border Control [11] Border Police is authorized to take photographs, to record and use video surveillance, and apply other technical aids during the border control, with the aim of searching, finding or determining the identity of the perpetrators of crimes and offenses. Devices placed on the border crossings must be visible and people must be warned of such devices. If you are using the devices and other technological aids to capture personal data, archive recordings of these data must be destroyed within one year from the date of recording, unless it is necessary to prosecute perpetrators of an offense. The data collected during the reading of documents border are used in the form of records [12]. Also, it is allowed to collect, store and process other kind of data: fingerprints, palm prints and information about other physical identification marks, if they exist. These data records are kept for five years after entry into the records. Modern identification documents contain biometric characteristics that the police use in criminal forensics to identify a person [2]. In the archives of the biometric systems, biometric features distinguish the following: • physical and physiological characteristics: face,
fingerprint, iris, retina of the eye, facial thermogram, body and hands, ears, DNK and
• behavioral characteristics: walk, smell, voice and signature.
In the very beginning of execution and use of biometric systems, priority was given to physical and physio-logical characteristics in comparison to behavioral characteristics. It was generally believed that physical and physiological characteristics in relation to behavioral have the "visibility. Physical and physiological characteristics are more reliable from behavioral since they differ within the groups. Today, there are a dozen biometric technologies that are being used or will be used soon [13].
PHYSICAL-PHYSIOLOGICAL CHARACTERISTICS
Face recognition Face recognition is the most natural way of identification among the people. Nowadays, it is used as a method of biometric authentication, where the computer compares the user's current face image with the face stored in the register. There are two-dimensional and three-dimensional algorithms to compare faces. Among the two-dimensional, the most famous algorithms are the algorithms of the face and facial metrics, used to solve the problems of face recognition. The algorithm -eigenface (possible faces of human beings) -compares the characteristic of facial feature with already existing images of human faces, usually with 100 to 150 faces. For each eigenface the degree of
37 | Safety Engineering

SAFETY ENGINEERING - INŽENJERSTVO ZAŠTITE
overlap with the user's face is calculated then the matrix of matching degrees stored as a user template that takes up very little disk space. The algorithm of facial metric analyzes the positions and relative distances between parts of the user's face (nose, mouth and eyes), and the information about them is written in the template. Two-dimensional algorithms can be easily fooled by a false image. The quality of recognition depends on the angle of light which falls on the face of the user and the change of the viewing angle of the camera. The problem is the change of face caused by aging, different hairstyles, makeup, facial expression and wearing glasses. Three-dimensional algorithms analyze and store 3D features and size of the parts of the face (Figure 3).
Figure 3. Biometric face recognition pattern [3]
This method avoids the problems that characterize the properties of two-dimensional methods, since three-dimensional model does not depend on facial expression, makeup or rotation of the head. A 3D method is so accurate that it can analyze the iris scan. Algorithms used to compare faces are faster than those for the comparison of the iris, and cameras for the retrieval of facial images are easier to handle. Fingerprint Fingerprint is the oldest and the most popular method of authentication. As a method for secure identification, it was known in ancient China, and since 1896 it has been used for criminal identification. Therefore, the identification of fingerprints has been inconvenient to users for a long period of time. Since this method became more popular, it also became more accepted. Fingerprint reader ca be found everywhere, and they can even be installed on PCs. From the loaded images of prints, samples can be extracted by various methods. The method detailed analysis explains the relative positions of individual characteristics such as fingerprint ridge endings, bifurcations (places where two lines merge into one), points (a very short line) and the places where two lines intersect (Figure 4).
Figure 4. Fingerprint and corresponding characteristics [2] The method of analyzing details has recently become very popular, but its main drawback is that it does not take into account the entire structure of the fingerprint, but only the position and direction of the characteristic points. These problems tend to improve the method of correlation, where one seeks to compare the entire sample prints. However, the method of correlation has a major drawback – it is overdependence on the position and rotation of the finger. The template obtained by this method is 2-3 times higher than the previously mentioned methods. Fingerprint has great potential to identify individuals. It is characterized by speed and accuracy and is suitable for rapid identification process in real time, this advantage is recognized by police practice for fast criminal processing. Reader prints available in the market are very cheap, but usually have no possibility of hardware fingerprint comparison. Iris The iris is the colored part of the eye surrounding the pupil. It consists of a network of radial lines (Figure 5) that is unique, the time fixed for each person and does not depend on the genetic parameters.
Figure 5. The appearance of the iris of two different
people [4] Reliable automatic identification of persons has long been an elusive goal. As with all pattern recognition, a key issue is the relationship between class and within-class variability: objects can be reliably classified only if the variability between different instances of the same class is less than the variability between different classes [14]. For example, in face recognition, difficulties arise from the fact that the face is a changing organ displaying a variety of expressions, as
38 | Safety Engineering

M. Vrbanec, F. Magušić, Vol 1, No1 (2011) 35-43
well as being a 3D object whose image depends on the viewing angle, position, lighting, equipment used, and age. Studies have shown that faces painted in a range of at least one year have errors, even the best current algorithms the 43% to 50% of errors. In contrast to this intra-class, variability between classes is limited because different faces possess the same basic set of features, in the same canonical geometry. For all these reasons, iris patterns become interesting as an alternative approach to the reliable recognition of persons when the picture is taken at distances of less then one meter and are more reliable especially when there is a need to search very large databases without the need for solving a large number of false matches. Although small in size (11 mm), and sometimes problematic to image, the iris has the great mathematical advantage that is pattern variability among different persons. As an additional benefit, because the inner part of the iris of the eye, it is well protected from the environment and stable over time. As a planar object its image is relatively insensitive to angle of illumination, a change in viewing angle cause only affine transformations; not even related to the deformation pattern caused by papillary dilation that is readily reversible. Finally, the ease of localizing eyes in faces, and the distinctive annular shape of the iris, facilitate reliable and precise isolation of this feature and the creation of a size-invariant representation. The iris begins to form around the third month of pregnancy. The structures and patterns that give it identity is formed by the eighth month, although pigment accretion can continue up to one year after birth. Its complex structure contains many different features such as arching ligaments, furrows, tops, rings, shells, freckles and so on. Iris color is determined mainly by the density of melanin pigment [15] in the front of her coat, and blue irises resulting from an absence of pigment: long wavelengths of light penetrate and are absorbed by the pigment epithelium, while shorter wavelengths are reflected and scattered are more reliable from the iris stroma. The pattern of the iris is taken by monochrome camera hidden behind the mirror. Respondent in the mirror looks at a reflection of their own eye, and so allows the camera to grab an image of the iris. The camera automatically focuses and, if necessary, includes additional light. The resulting image is processed in a way that extracts the iris from the pupil and the rest of the eye. As width of the iris is not constant because it changes depending on the light or the radius of the pupil final image should be transformed before analysis. From this picture a special algorithm encodes the features and gets IrisCode record that occupies 512 KB. Such records are quickly and easily compared using the Hamming distance. The computer can compare millions of records in seconds and iris identification is therefore highly suitable. Because of its unique characteristics, iris is extremely difficult to forge, and due to rapid decomposition after death, using someone else's iris is nearly impossible.
Retina of the eye The retina is a thin tissue of nerve cells and is located in the back of the eye (Figure 6). It is unique for each person in a network of blood capillaries which are steeped. It does not change throughout life, except in the case of glaucoma and diabetes. Retinal image is obtained by directing an infrared laser light into the interior of the eye. The reflected light contains information about the position of the capillaries.
Figure 6. Retina of the eye [4]
The size of the form is 96 kB, the data are discriminatory and can be used for identification. Negative aspect of this method is its aversion, since it requires the penetration of laser light around the person against whom is done testing for identification. A trained operator to manage these complex systems is often needed. Facial thermogram Thermogram of the face is a new and promising biometric method that has not been used in an appropriate manner. The face of every human being is pervaded by an extensive network of blood vessels. The network is unique for every person, even for twins. The heat spreading can be read using infrared camera (Figure 7). The uniqueness of the obtained sample is large, and unlike in the methods of facial recognition, the image can be sampled regardless of the surrounding lighting. Its advantage is the fact that a respondent is required only to look at the camera.
Figure 7. Facial thermogram [4]
Recognition works regardless of age, facial expression and aesthetic modifications. Due to high accuracy and speed, the method is suitable for identification. The reason it has not been used is the cost of necessary equipment and infrared cameras.
39 | Safety Engineering

SAFETY ENGINEERING - INŽENJERSTVO ZAŠTITE
Thermograms of hand and body Thermograms of hand and body have very similar features to facial thermogram (Figure 8 and 9). The images obtained by infrared camera describe the positions of blood vessels and veins that are unique to each person. Unlike facial thermogram, research method of thermogram hand and the body is still in its initial phase. Subcutaneous blood vessels on the human face and body products have the unique features, while the heat which penetrates through the tissue radiates out from the skin.
Figure 8. Palm thermogram hand and body [4]
Thermogram of face and body can be obtained from recording of the face and body by an infrared camera. It is believed that the thermogram of the face and body is unique for each person. Thermograms of the face and body are stable single biometric characteristic as they can be changed only by the surgery. There is the influence of ambient temperature, alcohol, drugs and medicines on thermogram image of the face and body. The disadvantage of this method is the price of infrared cameras, and thus obtained pictures take up a lot of spaces; therefore, this method is not suitable for large databases. Thermogram face and body gives us the possibility of classification, recognition and identification of faces and body parts (Figure 9).
Figure 9. Comparative facial thermogram [4]
It can be used in medicine to detect certain diseases. It is used in situations when you need to make a rapid identification, extracting the desired person from the group. Identification can be performed under various lighting conditions, including in the dark. This method allows the detection without the cooperation of people and shooting from a distance.
Ear Embossed ear shape and structure of crispy tissue on the surface of the ear are different among individuals (Fig. 10). Ear is not expected to have features unique to each person. Approaches to identify the ear based on the overlapping of the vectors of length of the convex points on the surface are more reliable from site boundary signs on the ear.
Figure 11. Biometric characteristics of the ear [4]
This method belongs to a group of intrusive techniques. Although this method gives promising results, we need additional research to answer the question: • can ear feature extraction can be done on different
conditions but with satisfactory reliability? • If an ear is covered with hair, this method is
inapplicable. It is necessary to find an answer: whether it is it possible to achieve a partial identification, and whether the use of thermogram can solve the problem.
DNA
DNA is a unique one-dimensional label for a person's individuality, used in forensics and identification (Figure 12). Most human DNA is identical for the entire human population, and only a relatively small number of specific locations on DNA presents individual variations.
Figure 12. Biometric characteristics of the
DNA sample [2]
These variations are represented either in the number of repetitions of basic block flow or less dysfunctional disorders of primary flow. The processes involved in the identification based on DNA determine whether two DNA samples derive from the same or different individuals.
BEHAVIOURAL CHARACTERISTICS From the behavioral characteristics we have chosen: the dynamics of walking and voice.
40 | Safety Engineering

M. Vrbanec, F. Magušić, Vol 1, No1 (2011) 35-43
Dynamic of walking Human walking is a complex spatio-temporal behavior of biometrics. Its characteristic is that it is unique to each individual, but its distinctive characteristics make it possible to verify the identity according to the character, situation in which a person can be found and personal health. Walk is not fixed, especially in long periods of time, since people get tired. The sample is obtained from video recording made by a video camera (Figure 13).
Figure 13. Display angle under which a person avoids
obstacles [3]
All the checks of dynamics of walking are based on the personalities of several different movements of each joint when performing certain actions. Walk is a complex spatiotemporal behavior of biometrics. It is not unique to each individual, but it is sufficiently distinctive to enable authentication. Walk is a biometric characteristic of the behavior and must remain immutable, especially over a long period of time. Characteristics of walking are derived from analyzing video material (it is necessary to record a person walking). Inspection is based on a typical journey of a sequence of images used by people walking, and the verification is based on the characterization of several different movements of each articulated joint. Voice Characteristics of the human voice are completely determined by vocal tract, mouth, nasal cavity and other mechanisms for creating the voice of the human body (Figure 14). Since these characteristics are not sufficiently unique, they are not expected to enable identification of individuals from a large database of identity.
Figure 14. Digitized voice sample [16]
The aim of identification is to determine the voice of the speaker, comparing a stored pattern with the current pattern. It relies on the characteristics of the voice, not the pronunciation of individual words. Vocal characteristics depend on the structure of the vocal cords, throat and mouth, but also acquired characteristics (tempo and style of speech). To be able to do the comparison, it is necessary to identify "undeniable" voice (the voice of strangers) and compare it with the spoken voice. BUILDING ALTERNATIVE MULTIMODAL BIOMETRIC MODELS
Each biometric system has four main modules, namely: • sensor module which is responsible for the
exclusion of features from raw data, • feature extraction module whose task is to extract
data from the a set of characteristics that best represent the characteristics of the raw data,
• module that provides a comparison of classification and comparison of secreted along with the feature templates and
• decision module whose task is to identify the information or the person.
According to the targeted needs of a biometric system and the BM (biometric) coefficients [5] [16], our practice is to order ITS multimodal biometric models. SAFETY OF BIOMETRIC SYSTEMS
An information security management system is accompanied by the standard ISO / IEC 27001:2005, and ISO / IEC 27001:2005, which describes the implementation of certain measures of the previous standards and the ISO / IEC 27005: 2008 which describes the risk assessment in the field of information security. Corporate companies develop a corporate security for the achievement of the company's success. Private [17] [18] and corporate security will be adjusted to control risks in the company by the international standard ISO 31000: 2009 (Risk Management Guidelines on principles and implementation of risk management). By K. Antoliš [19] a special hazard may be information security of wireless network transmission of biometric information and data. As it is the case with many technologies that have recently experienced strong growth and achieved interesting advances, there are some effects that provoked some criticism, fear and concern for the personal health in public, regarding biometry. According to the research by M. Vrbanac [20], biometrics can be associated with serious violations of justice, if the infatuation possibilities of new technology, hence the minimum extent of information security and civil control. In practice, we can see that:
41 | Safety Engineering

SAFETY ENGINEERING - INŽENJERSTVO ZAŠTITE
• DNA can be found at the crime scene, • other people identities can be connected with their
biometric characteristics, under false pretenses without inducing doubt
• biometric data archive can be used for criminal acts.
Identity theft Questions about identity theft through biometrics use have not yet been resolved. If a credit card number is stolen from an individual, this can cause many problems. In case when this person has a scan of the iris of the eye stolen, and it is used by an unknown person to "identify" as someone who is not (change of identity), then the damage done may be irreparable. It is often the case that the amount of biometric technology used in the public are without the adequate security and protection measures that would protect the collected personal information about individuals. It should be noted also that the biometric solutions for identity theft is as good as the information in a database that is used to verify identity. The problems of obtaining accurate and useful initial information confirmed by the current troubles with the so-called "No Fly List" U.S. Dept. of Homeland Security. Specifically, the assumption is that after the correct storage of the initial information, any future computer error or vandalism (hacking) prevent the biometrics of 100% resistance to identity theft.
Privacy Although biometrics is often given as a tool in order to fight crime, privacy rights defenders say fears that biometrics could be used for a denial of personal liberty and law abiding citizens. The development of a number of new technologies in addition of biometrics such as digital video, infrared, X-ray, wireless technology, GPS, image scanning, voice recognition, DNA and monitoring of brain waves - are provided by government agencies a host of new ways to "search" individuals and collect endless archives database of information about law abiding citizens.
Sociological questions As time progresses and technology advances, there are more and more private companies and public services that use biometrics for safe and accurate identification. However, this progress generates many questions in the society where great number of people may not be familiar with the procedure itself. Here are some ethical issues that the society assigns to biometrics: • Integrity of the body. Some believe that this
technology could cause body injury to an individual, when tools and methods that are not healthy for humans are used. For example, scanning, the use of the thermogram, etc.
• Privacy of personal information. There are concerns whether our personal information taken through biometric methods will be abused,
tampered with, sold to interest groups, stolen and made public, unauthorized reallocated or in copied from biometric database. Also, data collected using biometrics can be used in an unauthorized manner without the consent of the individual.
As safety culture becomes more and more familiar with the procedures in biometrics and its widespread usage, these issues will become increasingly apparent. The design technology used at border crossings that have electronic readers can read the chip in the card and thus confirm the information present in the card and the passport. This procedure allows the increased efficiency and accuracy of identification of people at border crossings. The example is a system called CANPAS currently used at several major airports in the United States. For this purpose, special units have been placed at the airports and they are used for taking digital photographs of the human eye, for the purpose of identification. Some biometric techniques can be forged by a copy: • rubber fingerprints in latex, • modified recording of a voice of a person, • mask or facial photographs and • contact lens or photography of an iris.
CONCLUSION Modern computer systems are being overwhelmingly used, but the special attention should be paid to the use of biometric system. In the area of safety and protection, they can be found in the perimeters of critical infrastructure, business intelligence and business counterintelligence, integral corporate security, private security, insurance, public performances, events and gatherings, the surveillance of public areas, the use of archives for telecommunications providers, monitoring traffic roads and other needs. Biometric characteristics can be documented by conventional and multimodal biometric systems. Conventional systems use a single biometric method while multi-modal systems use two or more biometric methods. Archives of biometric information and data require special security and competencies regarding archiving (recording) and deleting. The period of data storage and the user guides should be designed for all users; people privacy should be maintained and the abuse of biometric characteristics should be prevented. The following physical and physiological biometric features were selected: identification of the face, fingerprint, iris, retina of the eye, facial thermogram, palm and body thermogram, ear, and DNA. For each feature, we tried to discuss economic viability, development, implementation in the biometric systems, reliability, the consent of the person, and for some of them, even the size of the memory (in kB). The behavioral characteristics that have been explained are walk dynamic and voice with its features.
42 | Safety Engineering

M. Vrbanec, F. Magušić, Vol 1, No1 (2011) 35-43
[10] Zakon o zaštiti državne granice, Sl. Glasnik 97/08, Beograd: JP Službeni glasnik
The applicability of biometric information and data does not depend on the alternative platforms of multimodal biometric models. [11] Zakon o graničnoj kontroli, Sl. Glasnik 53/09,
Sarajevo: JP NIO Službeni list BiH Information security develops information security management using recognizable and binding international standards. Nowadays, it is extremely important to emphasize the wireless network security in the transmission of biometric information and data.
[12] Zakon o graničnoj kontroli, Sl. Glasnik 54/10, Sarajevo: JP NIO Službeni list BiH
[13] I. Vasiljević: Biometrija- Seminar, MUP RH, 2007, Zagreb
[14] M. Bača: Odabrane teme iz biometrije, poglavlje 4, FOI, 2005, Varaždin Society, project management and each individual
should develop and comply with IT security culture and develop transparent measures of surveillance equipment, biometric devices and systems that do not make the detrimental consequences on the health of our citizens and employees in public and private sectors.
[15] Identification in Networked Society, Kluwer Academic Publishers Jan, A., Bolle, R., Pankanti,S., „Biometrics“, Kluwer Academic Publisher, 1999.
[16] L. Gyergyek, i dr: Uvod u raspoznavanje uzoraka, Tehnička knjiga , 1988, Zagreb
[17] Nemet,Charles P. Private security & public safety/ Charles Nemeth, K.C.Poulin-1. st ed. P.cm., Pearson Education,Inc.Upper Saddle River, New Jersey 07458
REFERENCES
[18] http://www.coess.org/pdf/final-study.PDF (26.06.2011.)
[1] Cert.Carnet: Biometrija, CCert-Pubdoc-2006-09-167 [2] Arhiva Ministarstva unutarnjih poslova Republike
Hrvatske, 2004-2008, Zagreb [19] K. Antoliš, Simona. Strmečki, F. Magušić: Informacijska sigurnost i inteligentni transportni sustavi, Suvremeni promet, Vol.28 N˚ 5, 2008, pp. 353-355
[3] B. Pavišić, D. Modly, P. Veić: Kriminalistika ( Knjiga I), Golden marketing-Tehnička knjiga, 2006, Zagreb
[4] L. Nimac: Pregled biometrijskih metoda identifikacije- Seminar, MUP RH, 2004, Zagreb
[20] M. Vrbanec: Izgradnja biometrijskog kriminalističko identifikacijskog modela, Magistarski rad, FOI, 2008, Varaždin
[5] Miroslav. Bača, Marko. Antonić, Franjo. Magušić: Upgrading Existing Biometric Security Systems by Implementing the Concept of Cancelable Biometrics, 19thCentral Europen Conference on Information and Intelligent Systems, September 24-26, 2008, Varaždin, Croatia, pp. 421-425
BIOGRAPHY of the first author Miljenko Vrbanec was born 1970. in Čakovec, Croatia. He got his Master's degree from Faculty of Organisation and Informatics in Varaždin in the field of social sciences information sciences, and received Master of Science degree of from University of Zagreb. His main research interests include biometric indentification models and application biometric system to security procedures. He works as chief of police station of the Croatian Ministry of interior.
[6] Zakon o nadzoru državne meje, Uradni list RS št. 60/2007. i 35/2010, oznaka zakona ZNDM-2-UPB-1, Ljubljana: Uradni list RS, 2007, 2010.
[7] Pravilnik o izvajanju Zakon o nadzoru državne meje, Uradni list RS št. 116/2007, Ljubljana: Uradni list RS, 2007.
[8] Zakon o vartsvu osebnih podatkov ZVOP-1-UPB1, Uradni list RS št. 94/2007, Ljubljana: Uradni list RS, 2007.
[9] Zakon o nadzoru državne granice, NN 173/04, 141/06, 08/07, 146/08, Zagreb: Narodne novine
43 | Safety Engineering

UDC 303.211 : 614.256 Pregledni rad
IVAN KRSTIĆ1
DEJAN KRSTIĆ2 ANA KUSALO3
1,2Univerzitet u Nišu,
Fakultet zaštite na radu u Nišu 3Institut za kvalitet radne i životne
sredine "1.maj" a.d. Niš
[email protected] [email protected]
ANALIZA POKAZATELJA ZA PROCENU PROFESIONALNOG RIZIKA Abstract: Since the Law on Occupational Safety and Health has been imposed in Serbia, there were certain efforts to achieve compliance of Serbian legislation with EU regulations in this important area. Lack of compliance is particularly noticeable considering the fact that there is no common methodology for professional risk assessment. This paper deals with analyses of indicators for professional risk assessment based on standards, procedures, directives and other legislative documents in the area of occupational safety and health. One standardized methodology for occupational risk assessment would allow simplified survey of the status of occupational safety practice, as well as systematic review of obtained data. Applying common methodology would increase quality of occupational risk management.
Key words: indicators for risk assessment, occupational risk. UVOD Cilj procene profesionalnog rizika je utvrđivanje kritičnih mesta i postupaka, odnosno stanja i procesa u kojima može doći do ugrožavanja bezbednosti i zdravlja radnika na radnom mestu i u radnoj okolini, kao i preduzimanje odgovarajućih mera za njihovo eliminisanje ili smanjenje na prihvatljiv nivo. U praksi su prisutni različiti pristupi i metodologije u proceni profesionalnog rizika, što zavisi od cilja i namene procene rizika, kao i kvantitativnih i kvalitativnih pokazatelja uslova radne sredine. Takođe, nedostatak preciznog definisanja postupka i procedura, kao i kriterijuma i pokazatelja za procenu profesionalnog rizika dovodi do toga da svaki poslodavac ili pravno lice koje vrši procenu rizika, na svoj način definiše postupak i kriterijume procene, što dovodi do nepreglednosti dobijenih rezultata, kao i otežane kontrole kvaliteta procene.
RIZIK RADNE SREDINE Rizik radne sredine (R) se najčešće definiše kao proizvod verovatnoće nastanka rizičnog događaja (Prd) i težine njegove posledice (Cp):
R=Prd⋅Cp (1) Težina posledice zavisi od vrste opasnosti i/ili štetnosti koje mogu da izazovu povredu na radu, profesionalno oboljenje ili bolest u vezi s radom, a verovatnoća nastanka rizičnog događaja od ekspozicije opasnostima i/ili štetnostima i stanja ranga radne sredine, odnosno stanja sistema zaštite, slika 1. Imajući u vidu da svaki element radne sredine, pod određenim uslovima, podrazumeva rizik, u sistemu radne sredine potencijalno postoji veliki broj faktora rizika. Rizik sistema radne sredine treba analizirati posmatrajući elemente tehnološkog sistema. Pri funkcionisanju tehnoloških sistema radnici su izloženi različitim uticajima i delovanjima koja su
posledica tehnoloških procesa i operacija u njima. Takođe, obzirom da je praktično nemoguće eliminisati pojavu opasnosti i/ili štetnosti, izgraditi bezotkazna i savršeno ergonomična sredstva rada, potrebno je izabrati takvu organizaciju tehnološkog procesa koja uvažava uslove radne sredine, inicijalne faktore rizika, sadrži mere, postupke i sredstva za blagovremeno eliminisanje i/ili smanjenje neželjenih događaja.
Slika 1. Rizik radne sredine
U tom smislu, potrebno je, uz zadovoljavanje zakonske regulative, izvršiti istraživanja zasnovana na prikupljanju informacija o radnim mestima, direktnim uvidom u stanje, merenjima i ispitivanjima faktora radne sredine. Na taj način se formira adekvatan osnov za procenu profesionalnog rizika. Ovako izvršena procena je osnova kvalitetnog upravljanja profesionalnim rizikom i omogućava ostvarivanje ciljeva sistema (optimalnih radnih uslova), kako u uslovima iniciranja rizičnih događaja (prekidanjem uzročnog lanca događaja), tako i u uslovima njihove realizacije (preduzimanjem odgovarajućih korektivnih akcija). Upravljanje profesionalnim rizikom ne znači eliminaciju rizika, već svođenje rizika sistema na prihvatljiv nivo. Ukoliko je rizik sistema radne sredine prihvatljiv, radna sredina se smatra bezbednom, tj. sredina koja u određenim uslovima funkcionisanja
45 | Inženjerstvo zaštite
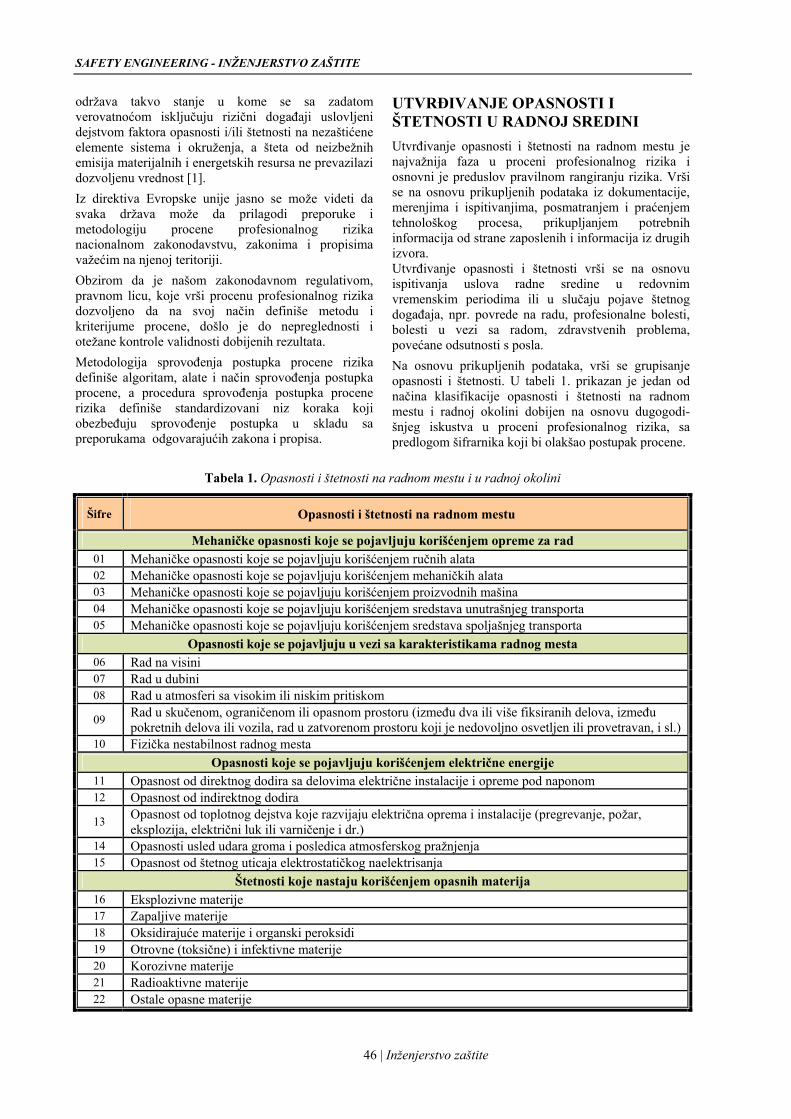
SAFETY ENGINEERING - INŽENJERSTVO ZAŠTITE
održava takvo stanje u kome se sa zadatom verovatnoćom isključuju rizični događaji uslovljeni dejstvom faktora opasnosti i/ili štetnosti na nezaštićene elemente sistema i okruženja, a šteta od neizbežnih emisija materijalnih i energetskih resursa ne prevazilazi dozvoljenu vrednost [1]. Iz direktiva Evropske unije jasno se može videti da svaka država može da prilagodi preporuke i metodologiju procene profesionalnog rizika nacionalnom zakonodavstvu, zakonima i propisima važećim na njenoj teritoriji. Obzirom da je našom zakonodavnom regulativom, pravnom licu, koje vrši procenu profesionalnog rizika dozvoljeno da na svoj način definiše metodu i kriterijume procene, došlo je do nepreglednosti i otežane kontrole validnosti dobijenih rezultata. Metodologija sprovođenja postupka procene rizika definiše algoritam, alate i način sprovođenja postupka procene, a procedura sprovođenja postupka procene rizika definiše standardizovani niz koraka koji obezbeđuju sprovođenje postupka u skladu sa preporukama odgovarajućih zakona i propisa.
UTVRĐIVANJE OPASNOSTI I ŠTETNOSTI U RADNOJ SREDINI Utvrđivanje opasnosti i štetnosti na radnom mestu je najvažnija faza u proceni profesionalnog rizika i osnovni je preduslov pravilnom rangiranju rizika. Vrši se na osnovu prikupljenih podataka iz dokumentacije, merenjima i ispitivanjima, posmatranjem i praćenjem tehnološkog procesa, prikupljanjem potrebnih informacija od strane zaposlenih i informacija iz drugih izvora. Utvrđivanje opasnosti i štetnosti vrši se na osnovu ispitivanja uslova radne sredine u redovnim vremenskim periodima ili u slučaju pojave štetnog događaja, npr. povrede na radu, profesionalne bolesti, bolesti u vezi sa radom, zdravstvenih problema, povećane odsutnosti s posla. Na osnovu prikupljenih podataka, vrši se grupisanje opasnosti i štetnosti. U tabeli 1. prikazan je jedan od načina klasifikacije opasnosti i štetnosti na radnom mestu i radnoj okolini dobijen na osnovu dugogodi-šnjeg iskustva u proceni profesionalnog rizika, sa predlogom šifrarnika koji bi olakšao postupak procene.
Tabela 1. Opasnosti i štetnosti na radnom mestu i u radnoj okolini
Šifre Opasnosti i štetnosti na radnom mestu
Mehaničke opasnosti koje se pojavljuju korišćenjem opreme za rad 01 Mehaničke opasnosti koje se pojavljuju korišćenjem ručnih alata 02 Mehaničke opasnosti koje se pojavljuju korišćenjem mehaničkih alata 03 Mehaničke opasnosti koje se pojavljuju korišćenjem proizvodnih mašina 04 Mehaničke opasnosti koje se pojavljuju korišćenjem sredstava unutrašnjeg transporta 05 Mehaničke opasnosti koje se pojavljuju korišćenjem sredstava spoljašnjeg transporta
Opasnosti koje se pojavljuju u vezi sa karakteristikama radnog mesta 06 Rad na visini 07 Rad u dubini 08 Rad u atmosferi sa visokim ili niskim pritiskom
09 Rad u skučenom, ograničenom ili opasnom prostoru (između dva ili više fiksiranih delova, između pokretnih delova ili vozila, rad u zatvorenom prostoru koji je nedovoljno osvetljen ili provetravan, i sl.)
10 Fizička nestabilnost radnog mesta Opasnosti koje se pojavljuju korišćenjem električne energije
11 Opasnost od direktnog dodira sa delovima električne instalacije i opreme pod naponom 12 Opasnost od indirektnog dodira
13 Opasnost od toplotnog dejstva koje razvijaju električna oprema i instalacije (pregrevanje, požar, eksplozija, električni luk ili varničenje i dr.)
14 Opasnosti usled udara groma i posledica atmosferskog pražnjenja 15 Opasnost od štetnog uticaja elektrostatičkog naelektrisanja
Štetnosti koje nastaju korišćenjem opasnih materija 16 Eksplozivne materije 17 Zapaljive materije 18 Oksidirajuće materije i organski peroksidi 19 Otrovne (toksične) i infektivne materije 20 Korozivne materije 21 Radioaktivne materije 22 Ostale opasne materije
46 | Inženjerstvo zaštite

I. Krstić, D. Krstić. A. Kusalo, Vol 1, No1 (2011) 45-58
Hemijske štetnosti, prašina i dimovi 23 Hemijske štetnosti 24 Prašina 25 Dimovi
Biološke štetnosti 26 Bakterije 27 Gljivice 28 Paraziti 29 Virusi 30 Druge biološke štetnosti
Fizičke štetnosti (buka) 31 Buka
Fizičke štetnosti (vibracije) 32 Vibracije celog tela 33 Vibracije šaka-ruka
Fizičke štetnosti (elektromagnetno zračenje) 34 Jonizujuće zračenje 35 Nejonizujuće zračenje
Fizičke štetnosti (štetni uticaj osvetljenosti) 36 Nedovoljna osvetljenost 37 Prevelika osvetljenost
Fizičke štetnosti (štetni uticaj mikroklime) 38 Visoka ili niska temperatura 39 Visoka ili niska vlažnost 40 Velika brzina strujanja vazduha
Štetni klimatski uticaji 41 Rad na otvorenom
Štetnosti koje proističu iz fizičkih opterećenja 42 Nefiziološki položaj tela - dugotrajno stajanje 43 Nefiziološki položaj tela - dugotrajno sedenje 44 Nefiziološki položaj tela - čučanje i klečanje 45 Nefiziološki položaj tela - saginjanje 46 Napori ili telesna naprezanja - ručno prenošenje tereta 47 Napori ili telesna naprezanja - guranje i vučenje tereta 48 Napori ili telesna naprezanja - penjanje i silaženje 49 Napori ili telesna naprezanja - dugotrajne povećane telesne aktivnosti i sl.
Štetnosti koje proističu iz psihofizioloških opterećenja 50 Režim rada u smenama 51 Psihomotorno opterećenje 52 Psihosenzorno opterećenje 53 Monotonija 54 Emocionalno opterećenje 55 Intelektualno (mentalno) opterećenje
Ostale opasnosti i/ili štetnosti 56 Štetnosti koje prouzrokuju druga lica (nasilje prema šalterskim radnicima, obezbeđenju i sl.) 57 Rad sa strankama i novcem 58 Rad sa životinjama 59 Rad sa vatrenim oružjem 60 Ostale opasnosti i/ili štetnosti
47 | Inženjerstvo zaštite

SAFETY ENGINEERING - INŽENJERSTVO ZAŠTITE
Mehaničke opasnosti koje se pojavljuju korišćenjem opreme za rad Prema Zakonu o bezbednosti i zdravlju na radu, oprema za rad obuhvata mašine, uređaje, postrojenja, instalacije, alat i slično, koja se koristi u tehnološkom procesu. Mehaničke opasnosti koje se javljuju korišćenjem ručnih alata (lopate, sekire, noževi, ključevi, poluge, testere, dleta, čekići i sl.) javljaju se zbog karakteristika
operacija, pogrešne upotrebe, nepravilnog održavanja i lošeg skladištenja. Mehaničke opasnosti koje se pojavljuju korišćenjem opreme za rad, a potiču od dejstva mehaničkih alata, proizvodnih mašina, uređaja i njihovih sastavnih elemenata koji se pokreću ili miruju (zupčanici, kaiševi, razne poluge, alati, prenosni lanci i dr.), a uzrok su njihovog linearnog i rotacionog kretanja. Na slici 3. prikazane su najčešće mehaničke opasnosti koje se javljaju pri radu sa opremom za rad.
rezanje nagnječenje odsecanje odsecanje zahvatanje
Slika 3. Primeri mehaničkih opasnosti pri radu sa opremom za rad
Posebnu pažnju treba posvetiti analizi mehaničkih opasnosti koje se javljaju kod prevoznih sredstava industrijskog i javnog transporta. Tehnološka povezanost industrijskog transporta i javnog transporta je u tome što veliki deo funkcije javnog transporta se ostvaruje spoljnim industrijskim transportom. Industrijski transport se deli na: • unutrašnji i • spoljašnji transport. Sredstva unutrašnjeg transporta obuhvataju mašine za premeštanje tereta unutar tehnološkog sistema i objekata na manjim rastojanjima, kao što su: dizalice (male ručne dizalice, čekrci, mosne dizalice - kranovi, lučke dizalice, portalne dizalice, železničke dizalice i dr.), podizači (vertikalni i kosi, nepokretni - liftovi i pokretni - viljuškari), tranporteri, elevatori, konvejeri. Sredstva spoljašnjeg transporta obuhvataju prevozna sredstva drumskog, železničkog, vodenog i vazdušnog saobraćaja, kojima se vrši priprema robe za transport (uključujući i pakovanje); skladištenje robe; prenos robe do transportnih sredstava; utovar robe u prevozna sredstva; prevoz robe do mesta gde se nalazi primalac; pretovar robe; prenos robe do skladišta i skidanje ambalaže u koju je roba bila pakovana. Globalno posmatrano, mehaničke opasnosti koje se mogu javiti kod ovih prevoznih sredstava su izloženost mehaničkom udaru, izloženost zatvaranju, poklapanju, nemogućnost ili ograničenost pravovremenog uklanjanja sa mesta rada i drugo. Ostale opasnosti se odnose, u zavisnosti od transportnog sredstva i operacije koje se rade sa njima, na napred navedene mehaničke opasnosti koje se javljaju pri radu sa proizvodnim mašinama i uređajima.
Opasnosti koje se pojavljuju u vezi sa karakteristikama radnog mesta Prema Pravilniku o zaštiti na radu pri izvođenju građevinskih radova [3], pod radom na visini, smatra se rad koji radnik obavlja koristeći oslonce na visini 3,0 m i više od čvrste podloge pri čemu radni prostor nije zaštićen od pada sa visine. Čvrstom podlogom smatra se podloga čije su deformacije pod opterećenjem koje se na nju prenosi u procesu rada zanemarljivih veličina i nemaju značaja za stabilnost na nju oslonjenih konstrukcija ili uređaja. Razliku u visini između tačke s koje je moguć pad (radno mesto ili površina za kretanje) i sledećeg nižeg nivoa koji je dovoljno širok i izdržljiv da zaustavi pad, nazivamo visinom pada. Pad kroz površinu koja ne može podneti opterećenje, pad ili potapanje u tečnost takođe se naziva pad s visine, slika 4.
Slika 4. Definicija visine pada H = vertikalna razlika u
visini između radnog mesta ili zone opasnosti od pada (A) i tačke udara (F)
Radno mesto na visini nije isključivo definisano visinom mogućeg pada. Posebna pažnja je takođe potrebna u radnoj okolini, gde se radnici mogu povrediti zbog pada u otvore i rupe u podu, zbog propadanja podova, plafona i krovova, odnosno gde
48 | Inženjerstvo zaštite

I. Krstić, D. Krstić. A. Kusalo, Vol 1, No1 (2011) 45-58
mogu upasti u različite materijale ili u vodu. To se može dogoditi pri izvođenju radova u i oko postrojenja za pročišćavanje otpadnih voda, silosima, blizini ili oko vodenih površina i slično. Rad na dubini obuhvata: • rad ispod površine vode (rad u kesonima i rad u
ronilačkim odelima), • rad ispod površine zemlje (rad u podzemnim
kopovima rudnika, rad u pećinama i drugim prirodnim šupljinama).
Rad u uslovima povišenog barometarskog pritiska obavljaju ronioci i radnici u kesonima ispod površine vode kao i medicinsko osoblje u hiperbaričnim komorama. Izloženost sniženom atmosferskom pritisku postoji kod radnika koji rade na velikim nadmorskim visinama, kod planinara i alpinista, kod pilota (u slučaju pada barometarskog pritiska u kabini sa normalnih na subatmosferske vrednosti - hipobarična dekompresija), kao i kod ronilaca i radnika u kesonima (nagli prelaz ili izranjanje sa povišenog na normalan atmosferski pritisak - hiperbarična dekompresija) [4]. Rad u skučenom, ograničenom ili opasnom prostoru se odnosi na rad između fiksiranih delova, između pokretnih delova ili vozila, rad u zatvorenom prostoru koji je nedovoljno osvetljen ili provetravan i slično. Fizička nestabilnost radnog mesta, tj. mogućnost klizanja ili spoticanja (mokre ili klizave površine) je česta opasnost koja se javlja kao posledica karakteristika radnog mesta, odnosno materijala i opreme za rad koje se koriste u tehnološkom procesu. Opasnosti koje se javljuju korišćenjem električne energije Direktni dodir s delovima pod naponom se javlja u slučaju ako su: nepropisno položeni „goli“ vodovi, nepropisno izvedeni prekidači, sklopke i ostali elemenati, kada delovi koji su pod naponom nisu zaštićeni, odnosno, kada je zaštita nesavesnim postupkom uklonjena, nezaključani razvodni ormari, radovi na vodovima i instalacijama pod naponom koji nisu prethodno isključeni. Opasnost od direktnog dodira delova pod naponom nastaje u slučajevima nepravilnog organizovanja i izvođenja radova, kao i neadekvatne ili nepotpune zaštite. Indirektan dodir može uzrokovati električni uređaj ili njegov metalni deo koji dodiruje čovek, a koji je zbog oštećene ili neispravne izolacije dospeo na povišeni potencijal u odnosu na potencijal zemlje. Indirektan dodir s delovima pod naponom javlja se usled grešaka pri izvođenju i održavanju elektroinstalacija ili kao posledica kvara na izolaciji električnih uređaja pri čemu se opasni napon dodira javlja i na provodljivim delovima opreme za rad koji ne pripadaju stalnom strujnom kolu. To će se dogoditi ako takvi električni uređaji ili njihovi delovi koji nisu na adekvatan način zaštićeni od opasnog napona dodira, jer će čovek svojim telom zatvoriti strujno kolo.
Opasnost od toplotnog dejstva koje razvijaju električna oprema i instalacije (pregrevanje, požar, eksplozija, električni luk ili varničenje i dr.) javlja se pri njihovom korišćenju i u slučaju preopterećenja i kvarova, kada dolazi do pojave oslobađanja toplote što prouzrokuje povećanje temperature na delovima opreme. Električne iskre, električni luk i ugrejani delovi električnih instalacija i opreme predstavljaju moguće izvore paljenja. Električne iskre se ne formiraju samo pod specifičnim uslovima, kao što je kratki spoj, već i tokom uobičajenog rada pojedinih električnih uređaja. Svi uređaji s prekidačima proizvode iskre različite jačine pri uobičajenom korišćenju. Opasnost od štetnog uticaja elektrostatičkog naelektrisanja javlja se u tehnološkim procesima gde postoji mogućnost generisanja i nagomilavanja jedne vrste naelektrisanja usled elektrostatičke indukcije, jonizacije, kontakta metala sa različitim elektrodnim potencijalima i drugih elektrohemijskih efekata. Najveću opasnost predstavlja pražnjenje statičkog naelektrisanja u zonama opasnosti od smeša zapaljivih tečnosti, gasova, prašina i eksploziva sa vazduhom. Nagomilavanje statičkog naelektrisanja dovodi do pojave električnog polja koje, u zavisnosti od intenziteta, može nepovoljno da utiče na čoveka ili vrši ometanje tehnološkog procesa, ugrožavanje i kvar elektronskih komponenti i opreme, oštećenje opreme, ubrzavanje korozije uređaja i cevovoda i izazivanje požara i eksplozije. Opasnosti od atmosferskog pražnjenja manifestuju se kao direktni udar groma i sekundarno dejstvo koje dovodi do pojave visokog potencijala na provodnim elementima. Posledice direktnog udara groma u objekte mogu biti velike zbog veoma visokih intenziteta struja koje prolaze kroz predmet udara, usled čega se oslobađa toplota manifestovana visokim temperatura na mestu udara. Opasnost od sekundarnog dejstva se ispoljava u vidu oštećenja elektronskih uređaja i opeme, kao i opasnosti nastanka požara i eksplozija u prostorima sa zapaljivim materijama i eksplozivnom atmosferom. Opasnost od pražnjenja atmosferskog elektriciteta zavisi od geografskog položaja, lokacije u odnosu na okolne objekte, vrste materijala od kog je objekat izrađen, sadržaja objekta u pogledu zapaljivih i eksplozivnih materija, kao i od stanja projektovane i izvedene gromobranske instalacije, njene ispravnosti, ispitivanja i održavanja itd. Osnovni pravilnici kojima je uređena ova problematika su: Pravilnik o tehničkim normativima za električne instalacije niskog napona [5]; Pravilnik o tehničkim normativima za zaštitu objekta od atmosferskog pražnjenja [6]; Pravilnik o tehničkim propisima o gromobranima [7], kao i SRPS i IEC standardi iz oblasti elektrotehnike.
49 | Inženjerstvo zaštite

SAFETY ENGINEERING - INŽENJERSTVO ZAŠTITE
Štetnosti koje nastaju korišćenjem opasnih materija Opasne materije su one materije koje pri proizvodnji, transportu, rukovanju i korišćenju mogu da predstavljaju opasnost u pogledu ugrožavanja zdravlja ljudi, materijalnih i prirodnih dobara. Opasne materije imaju bar jedno od svojstava koje ih čine opasnim, a to su: eksplozivnost, zapaljivost, sklonost ka oksidaciji, sklonost ka koroziji, otrovnost, infektivnost, radioaktivnost, kancerogenost i dr. U skladu s tim, može se izvršiti klasifikacija, koja može poslužiti za identifikaciju štetnosti koje nastaju korišćenjem opasnih materija: • eksplozivne materije su hemijska jedinjenja ili
mehaničke smeše hemijskih jedinjenja u čvrstom ili tečnom stanju, koje u sebi sadrže neophodne elemente za proticanje hemijske reakcije, praćene oslobađanjem toplote i gasnih produkata;
• zapaljive materije (zapaljive tečnosti i zapaljive čvrste materije) su one materije koje pod normalnim uslovima mogu da se zapale i nakon toga nastave da samostalno gore sve do svog potpunog sagorevanja;
• oksidirajuće materije u dodiru sa drugim materijama se razlažu i pri tom mogu prouzrokovati požar (hloridi, perflorati, vodeni rastvor vodonik - superoksida, peroksidi alkalnih metala i njihove smeše) i organski peroksidi (organske materije sa višim stepenom oksidacije koje mogu da izazovu štetne posledice po zdravlje i život ljudi ili oštećenje materijalnih dobara. Veliki broj organskih peroksida je osetljiv na povećane temperature i udare, pri čemu mogu eksplodirati;
• otrovne - toksične (materije sintetičkog, biološkog ili prirodnog porekla i preparati proizvedeni od tih materija koji uneseni u organizam ili u dodiru sa organizmom mogu ugroziti život ili zdravlje ljudi ili štetno delovati na životnu sredinu) i infektivne materije (materije koje šire neprijatan miris ili sadrže mikroorganizme ili njihove toksine za koje se zna da mogu izazvati zarazna oboljenja kod ljudi i životinja - sveža usoljena ili neusoljena koža, otpaci od proizvodnje tutkala, iznutrice, žlezde, fekalije, mokraća, gnojivo i dr.).
• radioaktivne materije su materije čija specifična aktivnost prelazi 74 bekerela (0,02 mikrokirija) po gramu;
• korozivne materije čine materije koje u dodiru sa drugim materijama i živim organizmima izazivaju njihovo oštećenje ili uništenje (sumporna, azotna kiselina, mravlja kiselina, brom, natrijum hloroksidi, hidroksidi, homogeni elementi). Korozivne materije u dodiru sa ljudskom kožom izazivaju teška oštećenja kože, očiju, disajnih puteva i probavnih organa. Delovanjem na druge materije mogu izdvajati toplotu, otrovne gasove i pare što može dovesti do požara i eksplozija;
• ostale opasne materije su materije koje se ne mogu svrstati u prethodne klase (azbest, suvi led,
magnetni materijali i sl.). Opasnim materijama smatraju se i sirovine od kojih se proizvode opasne materije i otpaci, ako imaju osobine tih materijala.
Prevetivne mere prilikom transporta proizvoda su regulisane Zakonom o prevozu opasnih materija [8], "Sl. list SFRJ", br. 27/90 i 45/90 -ispr. i "Sl. list SRJ", br.24/94, 28/96, 21/99, 44/99- dr. zakon i 68/2002, a definisane su u zavisnosti od klase opasnih materije, odnosno vrste saobraćaja (drumski - ADR, železnički - RID, rečni - ADN, pomorski - IMDG, vazdušni – ICAO).
Hemijske štetnosti, prašina i dimovi Ispitivanja hemijskih štetnosti vrše se na radnom mestu i u radnoj okolini gde se u tehnološkim procesima pojavljuju hemijske štetnosti. Ispitivanja se vrše uzimanjem najmanje jednog uzorka na radnom mestu najbližem izvoru štetnosti [9]. Ako je utvrđena koncentracija hemijskih štetnosti na radnom mestu najbližem izvoru štetnosti iznad dozvoljenih koncentracija, ispitivanje hemijskih štetnosti vrši se uzimanjem najmanje jednog uzorka i na ostalim radnim mestima na kojima se opravdano očekuju te štetnosti. Na radnim mestima na kojima je u postupku ispitivanja utvrđena koncentracija hemijskih štetnosti iznad dozvoljenih koncentracija, vrši se kontinualno ispitivanje radi procene rizika i preduzimanja mera za smanjenje štetnosti i zaštitu zdravlja zaposlenih. Prema Pravilniku o preventivnim merama za bezbedan i zdrav rad pri izlaganju hemijskim materijama [9] definiše se granična vrednost izloženosti na radnom mestu (GVI). Ona predstavlja prosečnu koncentraciju opasne hemijske materije u vazduhu na radnom mestu u zoni disanja zaposlenog, pri normalnim mikroklimatskim uslovima rada i uz lakši fizički rad. Određuje se za određeni vremenski period, u odnosu na naznačeni referentni period, za koju se smatra da nije štetna po zdravlje zaposlenog, ako zaposleni radi pri koncentraciji opasne hemijske materije koja je niža ili jednaka graničnoj vrednosti opasne hemijske materije, osam sati dnevno, a izražena u mg/m3 ili ml/m3 [ppm]. Granična vrednost izloženosti definiše se za osmočasovnu izloženost. Granična vrednost za pare i gasove definisana je za temperaturu od 20°C i pritisak od 1,013⋅105 Pa. Kratkotrajna granična vrednost izloženosti (KGVI) je ona koncentracija opasne hemijske materije kojoj zaposleni može biti izložen bez opasnosti po oštećenje zdravlja kraći vremenski period. Izloženost takvoj koncentraciji opasne hemijske materije može trajati najviše 15 minuta i ne sme se ponoviti više od četiri puta tokom radnog vremena. Između dva perioda izloženosti takvoj koncentraciji mora proći najmanje 60 minuta. Vrednosti kratkotrajne izloženosti izražavaju se u mg/m3 ili ml/m3 [ppm]. Granična vrednost izloženosti prašini data je kao ukupna prašina.
50 | Inženjerstvo zaštite

I. Krstić, D. Krstić. A. Kusalo, Vol 1, No1 (2011) 45-58
Pri određivanju hemijskih štetnosti utvrđuju se i sledeće kategorije: • kanc. kat. 1 - hemijske materije za koje je dokazano
da su kancerogene za čoveka; • kanc. kat. 2 - hemijske materije koje su verovatno
kancerogene za čoveka; • kanc. kat. 3 - hemijske materije za koje je moguće
kancerogeno dejstvo na čoveka. • mut. kat. 1 - hemijske materije za koje se zna da
imaju mutageno dejstvo na čoveka. • mut. kat. 2 - hemijske materije koje verovatno
imaju mutageno dejstvo na čoveka. • mut. kat. 3 - hemijske materije za koje je moguće
mutageno dejstvo na čoveka. • repr. kat. 1 - hemijske materije za koje se zna da
smanjuju reproduktivnu sposobnost kod ljudi i/ili materije za koje se zna da deluju toksično u procesu rasta i razvoja kod ljudi;
• repr. kat. 2 - hemijske materije koje verovatno smanjuju reproduktivnu sposobnost kod ljudi i/ili materije koje verovatno deluju toksično u procesu rasta i razvoja kod ljudi;
• repr. kat. 3 - hemijske materije za koje se pretpostavlja da mogu smanjiti reproduktivnu sposobnost kod ljudi i/ili materije za koje se pretpostavlja da mogu da deluju toksično u procesu rasta i razvoja kod ljudi.
Biološke štetnosti Osnovne smernice za procenu rizika od bioloških štetnosti kao i mere za sprečavanje i smanjenje rizika regulisane su Direktivom 2000/54 EC Evropske unije o zaštiti radnika od rizika pri izloženosti biološkim agensima na radu [10]. Pojam „biološke štetnosti“ u ovoj direktivi odnosi se na: • biološke agense - mikroorganizme, uključujući i
one koji su genetski modifikovani, ćelijske kulture i humane endoparazite koji su sposobni da izazovu infekciju, alergijske reakcije ili toksične efekte;
• mikroorganizme - ćelijske ili nećelijske mikrobiološke entitete sposobne za razmnožavanje ili za prenošenje genetskog materijala;
• kulture ćelija - ćelije, poreklom iz multićelijskih organizama, uzgajane in vitro.
Biološki agensi se svrstavaju u četiri rizične grupe, s obzirom na njihov nivo rizika od bolesti koje mogu izazvati kod ljudi: • rizična grupa 1 - biološki agens za kojeg nije
verovatno da će uzrokovati bolest kod ljudi; • rizična grupa 2 - biološki agens koji može
uzrokovati bolest kod ljudi i mogao bi biti opasan po radnike, ali nije verovatno da će se raširiti u okolinu; obično je na raspolaganju delotvorna profilaksa ili lečenje;
• rizična grupa 3 - biološki agens koji može uzrokovati tešku bolest kod ljudi i predstavlja ozbiljnu opasnost za radnike; može predstavljati
rizik za širenje u okolinu, ali obično je na raspolaganju delotvorna profilaksa ili lečenje;
• rizična grupa 4 - biološki agens koji uzrokuje tešku bolest kod ljudi i predstavlja ozbiljnu opasnost za radnike; može predstavljati veliki rizik za širenje u okolinu, a obično na raspolaganju nema delotvorne profilakse ili lečenja.
Identifikacija bioloških štetnosti u radnoj sredini vrši se mikrobiološkom obradom materijala uzetog sa radnih površina (razni brisevi), sirovina, poluproizvoda i gotovih proizvoda. Uzimanje uzoraka vazduha iz radne sredine vrši se izlaganjem otvorenih hranljivih podloga vazduhu radne prostorije tokom određenog vremena ili propuštanjem određene količine vazduha preko specijalnih aparata na hranljive podloge. Mnoge patogene bakterije prisutne su u niskim koncentracijama pa je njihova detekcija teška. Stoga se koriste indikatorske bakterije za detekciju verovatne prisutnosti patogenih bakterija. Koliformne bakterije su uz fekalne streptokoke najpodobnija grupa indikatorskih bakterija za ocenu kvaliteta vazduha radne sredine. Fekalne streptokoke su grupa crevnih bakterija. Široko su rasprostranjena, a nalaze se u fekalijama čoveka i mnogih drugih kičmenjaka. Broj fekalnih streptokoka po pravilu raste s porastom broja ukupnih koliformnih bakterija. U slučaju da ukupne koliformne bakterije nisu dokazane u uzorku, a fekalne streptokoke jesu, to je pouzdan znak da se radi o fekalnom zagađenju vazduha (slika 5.).
Slika 5. Hranljive podloge sa razvijenim fekalnim streptokokama i koliformnim bakterijama
Standardi koji se najčešće koriste za uzorkovanje bioloških štetnosti u radnoj atmosferi su: ISP/MYC/AC-01 [11], ISP/MYC/AC-03 [12] i NIOSH 0800 [13], a za ocenu kvaliteta radne sredine PN-89/ Z 0411/02 i 03 [14] i European Community Directive 2000/54/EC [15].
51 | Inženjerstvo zaštite

SAFETY ENGINEERING - INŽENJERSTVO ZAŠTITE
Fizičke štetnosti (buka) Pod bukom u radnoj sredini podrazumeva se svaki zvuk stvoren radom mašine, aparata ili uređaja u proizvodnji. Na radnom mestu može da vlada i buka koja potiče iz okoline, pa se zbog toga pri analizi njenog štetnog dejstva uzimaju tri tipa buke: • buka koju pravi oprema za rad ili uređaj kojim
radnik neposredno rukuje, ili ga opslužuje; • buka koju pravi oprema za rad ili uređaj kojim
radnik ne rukuje niti ga opslužuje; • buka koju stvaraju neproizvodni izvori (uređaji za
ventilaciju i klimatizaciju, saobraćaj, drugi tehnološki proces i dr.).
U različitim tehnološkim sistemima, kao posledica tehnološkog procesa, jaka buka dovodi, pri dužem radu, do ozbiljnih oštećenja. Tekstilna industrija se odlikuje konstantnom bukom, metalna industrija je izvor najjače buke, hemijska industrija ima u nekim pogonima buku izrazito štetnog dejstva (sita i mešalice) i dr. Merodavni nivo buke na određenom radnom mestu u radnim prostorijama ne sme prelaziti dopuštene vrednosti predviđene Pravilnikom o merama i normativima zaštite na radu od buke u radnim prostorijama [16]. Dopušteni nivo buke na radnom mestu s obzirom na vrstu delatnosti dat je u tabeli 2.
Tabela 2. Dopušteni nivo buke na radnom mestu s obzirom na vrstu delatnosti
Nivo buke u dB(A) R
b VRSTA DELATNOSTI a b v
1. Fizički rad bez zahteva za mentalnim naprezanjem i zapažanjem okoline sluhom 85 85 80
2.
Fizički rad usmeren na tačnost i koncentraciju; povremeno praćenje i kontrola okoline sluhom; upravljanje transportnim sredstvima
80 75 70
Rad koji se obavlja pod čestim govornim komandama i akustičnim signalima Rad koji zahteva stalno praćenje okoline sluhom 3.
Rad pretežno mentalnog karaktera, ali rutinski
75 70 60
4. Rad pretežno mentalnog karaktera koji zahteva koncentraciju, ali rutinski 70 65 55
Mentalni rad usmeren na kontrolu rada grupe ljudi koja obavlja pretežno fizički rad
5. Rad koji zahteva koncentraciju ili neposredno komuniciranje govorom i telefonom
- 60 50
Mentalni rad usmren na kontrolu rada grupe ljudi koja obavlja pretežno mentalni rad Rad koji zahteva koncentraciju, neposredno komuniciranje govorom i telefonom 6.
Rad isključivo vezan za razgovore preko komunikacionih sredstava
- 55 45
7.
Mentalni rad koji zahteva veliku koncentraciju, isključivanje iz okoline, preciznu psihomotoriku ili komuniciranje sa grupom ljudi
- - 40
8. Mentalni rad, kao izrada koncepcija, rad vezan za veliku odgovornost, komuniciranje radi dogovora sa grupom ljudi
- - 35
9. Koncertne i pozorišne sale - - 30
U cilju ocene karaktera buke i planiranja mera za smanjenje nivoa buke, pored merenja ukupnog nivoa buke, vrši se i frekvencijska analiza nivoa. Rezultat frekvencijske analize buke je spektar buke, koji prikazuje komponente buke u najčešće tercnim standardizovanim opsezima, slika 6. Na osnovu dobijenog spektra može se odrediti tonalnost buke i karakteristike koje treba da ispuni sistem. Takođe, moguće je identifikovati određene komponente mašinskog sistema koji generiše najveći nivo buke [17].
6.30 8 16 31.50 63 125 250 500 1000 2000 4000 8000 16000 A L60
70
80
90
100
110
120
dB
HzLLeq
Slika 6. Frekvencijska tercna analiza nivoa buke
Na radnim mestima na kojima se merenjem i ocenjivanjem utvrdi da buka prelazi dozvoljeni nivo buke vrši se oktavna analiza, slika 7. Za normiranje štetnosti delovanja buke na osnovu oktavne analize koriste se N-krive.
0
20
40
60
80
100
120
Izm. nivoN-80
Izm. nivo 103.4 104 104.1 102.5 105.2 109.1 107 103.8 114
N-80 98.7 91.6 86.4 82.7 80 77.7 75.9 74.4 85
63 125 250 500 1k 2k 4k 8k A
L [dB]
f [H
Slika 7. Frekvencijska oktavna analiza nivoa buke i komparacija sa N-krivom koja odgovara dozvoljenom
nivou buke za neometano obavljanje delatnosti i za zaštitu od oštećenja sluha
Praćenjem nivoa dnevne izloženosti buci, kao i iskustvom u merenjima i ispitivanjima, za normiranje rizika može koristiti tabela 3.
Tabela 3. Skala normiranja rizika izloženosti buci Nivo dnevne izloženosti buci
LEX,8h [dB(A)] Nivo rizika
LEX,8h≤80 bez rizika 80< LEX,8h≤85 umereni rizik 85< LEX,8h<87 povećan rizik
LEX,8h≥87 neprihvatljiv rizik
52 | Inženjerstvo zaštite

I. Krstić, D. Krstić. A. Kusalo, Vol 1, No1 (2011) 45-58
Fizičke štetnosti (vibracije) Vibracije su oscilatorna kretanja mehaničkih sistema, kod kojih su pomeranja tačaka sistema mala u poređenju sa dimenzijama sistema, a period oscilovanja znatno manji od vremena u kome se kretanje posmatra. Vibracije su rezultat dinamičkih sila kod mašina i alata koji imaju pokretne delove, kao i kod delova i elemenata za povezivanje mašina i alata. Proučavaju se dve komponente vibracija i to: prva komponenta koja predstavlja korisna vibraciona kretanja koja se koriste za obavljanje mehaničke operacije jedne mašine ili tehnološkog procesa i druga komponenta, a to su štetna vibraciona kretanja, gde različiti delovi mašina mogu da vibriraju različitim amplitudama i frekvencijama, pa je to često uzrok nastajanja profesionalnih oboljenja radnika koji rukuju mašinom ili alatom. Radnik u radnoj okolini je aktivan činilac sistema čovek-mašina, pa je često izložen prinudnim vibracijama. Izloženost vibracijama na čoveka može uticati na različite načine, od običnih smetnji do smanjenja radnog učinka, opasnosti po zdravlje, pa i do pojave profesionalnih oboljenja [17]. Prema načinu delovanja na ljudsko telo, vibracije se mogu podeliti na (slika 8): • opšte ili vibracije celog tela (whole-body
vibration) koje deluju na ljudsko telo kao celinu kada se čovek nalazi u okruženju mašine koja vibrira, a mogu da se prenose na celo telo, obično kroz mesto kontakta, odnosno strukturu oslonca (industrijske platforme ili sedišta vozila);
• lokalne ili vibracije šaka-ruka (hand-arm vibration) koje deluju na pojedine delove tela koji su u neposrednom kontaktu sa vibrirajućim sistemom - najčešće na dlanove i prste, a od mesta ulaska vibracije se rasprostiru na sve strane u vidu talasnog kretanja izazivajući naizmenično skupljanje i rastezanje tkiva.
Slika 8. Tipovi vibracija: vibracije celog tela (levo) i vibracije šaka-ruka (desno)
U zavisnosti od lokalizacije dejstva vibracija, razlikuju se i dva osnovna klinička oblika oboljenja: vibraciona bolest nastala pod dejstvom opštih ili lokalnih vibracija. Prenošenje vibracija na celo telo zavisi od pozicije tela. Efekti vibracija su zato kompleksni. Vibracije izazivaju kretanja i sile u ljudskom telu koje mogu izazvati neudobnost, imati nepovoljni uticaj na karakteristike, pogoršati već postojeće povrede u leđima i predstavljati rizik za bezbednost i zdravlje [18].
Usvajanjem direktive 2002/44/EC postavljeni su minimalni zahtevi za kontrolu rizika na radnim mestima koja su izložena negativnom dejtvu vibracija. Direktivom su definisane granične vrednosti dnevne izloženosti vibracijama, kao i akcione vrednosti dnevne izloženosti vibracijama kojima radnik ne bi smeo da bude izložen (tabela 4.). Pored toga, direktivom su postavljeni zahtevi poslodavcima za eliminisanje rizika ili smanjenje na najmanju moguću meru.
Tabela 4. Dozvoljene vrednosti dnevne
izloženosti vibracijama Šaka -
ruka Celo telo
Granične vrednosti dnevne izloženosti 5m/s2 1.15m/s2
(VDV=21m/s1.75) Akcione vrednosti dnevne izloženosti 5m/s2 0.5m/s2
(VDV=9.1m/s1.75) Na osnovu dozvoljenih vrednosti dnevne izloženosti vibracijama mogu se formulisati tri zone za procenu rizika od negativnog dejstva vibracija. Pored tabelarnog prikaza vrednosti ubrzanja vibracija po zonama (tabela 5.), zone su grafički prikazane na slici 9.
Slika 9. Zone za procenu rizika usled dejstva vibracija
Tabela 5. Zone za procenu rizika
Šaka - ruka Celo telo
Zona alarma >5m/s2 >1.15m/s2
(>21m/s1.75)
Zona upozorenja 2.5 ÷ 5m/s2
0.5÷1.15 m/s2 (9.1÷21 m/s1.75)
Zona tolerancije 0÷2.5 m/s2
0÷0.5 m/s2 (0÷9.1 m/s1.75)
Poređenjem ponderisanih vrednosti ubrzanja vibracijama sa dozvoljenim vrednostima može se utvrditi kojoj zoni pripada posmatrana izloženost vibracija i na osnovu toga proceniti rizik oštećenja tkiva i organa ljudskog tela usled dugotrajnog izlaganja vibracijama mašine, opreme ili alata sa kojom radnik rukuje i koja generiše vibracije.
53 | Inženjerstvo zaštite

SAFETY ENGINEERING - INŽENJERSTVO ZAŠTITE
Fizičke štetnosti (zračenje)
Pod pojmom elektromagnetno zračenje smatra se elektromagnetni talas u prostiranju (propagaciji) ili prostiranje više elektromagnetnih talasa. Elektroma-gnetni talas može biti proizvoljne frekvence, pa prema tome i energija elektromagnetnog kvanta pridruženog ovakvom elektromagnetnom zračenju može biti u širokom opsegu (frekvenca od 3⋅1020 Hz do 3 Hz), (talasnih dužina od 1⋅1015 m do 1⋅106 m), (energija kvanta od 1⋅10-13 J do 1⋅10-32 J), slika 10. Energija je najbitnija karakteristika koja definiše uticaj na sredinu kroz koju se prostire elektromagnetno zračenje [19].
Slika 10. Elektromagnetni spektar
Elektromagnetna (EM) zračenja se prema svom primarnom dejstvu na materijalnu sredinu dele na jonizujuća i nejonizujuća. Jonizujuća elektromagnetna zračenja imaju energiju kvanta dovoljnu da izvrše jonizaciju atoma ili molekula (12,4eV), dok energija kvanta dela nejonizujućeg zračenja nije bila dovoljna da se izvrši jonizacija. Opšte prihvaćena granica jonizacije je na talasnim dužinama oko 100nm u ultraljubičastom (UV) području. Frekvencijski opseg EM talasa koji se danas tehnički koristi je od 0Hz do frekvencija reda THz. Jonizujuća elektromagnetna zračenja se u radnoj okolini javljaju: pri korišćenju izotopa kao obeleživača (hemijska industrija, metalurgija), kod primene radioizotopa u kontroli procesa proizvodnje, biološkog zračenja u prehrambenoj industriji i u industriji lekova i medicini. Izvori nejonizujućeg elektromagnetnog zagađenja se sa prema učestanosti dele na: • UV izvore (ultraljubičaste izvore, talasne dužine od
100 do 400nm, sunce, UV lampe) koji se nalaze na samoj granici sa jonizujućim zračenjima i mogu imati jonizujuće dejstvo;
• izvore vidljive svetlosti (prirodne i veštačke kao svetiljke sa užarenim volframovim vlaknom, fluorescentna svetiljka, živina svetiljka, natrijumska svetiljka, halogene svetiljke i dr.);
• IC izvore (infracrvene ili izvore toplotnog zračenja) • visokofrekventne izvore (antene radio i televizi-
jskih stanica, primopredajne antene mikrotalasnih linkova, bazne stanice mobilne telefonije, wireless uređaja, mobilni telefoni, mikrotalasne izvore i dr.);
• niskofrekventne izvore ili izvore industrijske učestanosti (elektromagnetna postrojenja, transfo-rmatore, dalekovode, distributivnu električnu mrežu, kao i kućne električne uređaje);
• izvore statičkih i stacionarnih električnih i magnetnih polja (električna polja kondezatora, elektrostatičkih sistema u industiji, statička polja prirodnih i veštačkih magneta).
Slika 11. Raspodela električnog polja u čoveku i
indukovane gustine struje ispod dalekovoda
Prvi korak u proceni mogućih uticaja elektromagnetnih polja na žive organizme, a samim tim i na čoveka u radnoj sredini, je merenje i analiza elektromagnetnog zračenja. Potencijalno štetno dejstvo elektromagnetnih talasa zahteva da se vrši kontrola intenziteta zračenja na mestima gde se smatra da mogu da se pojave ova polja. Pri merenju UV zračenja vrši se merenje intenziteta (iradijance, I [W/m2]) i gustine energije zračenja (radiant exposure, Ф[Ј/m2]). Granične vrednosti su određene preporukom INCNIRP [20] i standardom ISO 17166 [21]. Istraživanja bioloških efekata je dovelo do razvoja standarda i propisa u ovoj oblasti koji služe za normiranje dozvoljenih vrednosti za električno (Е) i magnetnog (H) polja i površinske gustine zračenja (S). Nacionalno zakonodavstvo je ovu oblast pravno regulisalo: Zakonom o zaštiti od nejonizujućih zračenja [22], Pravilnikom o granicama izlaganja nejonizujućim zračenjima [23] i standardom SRPS EN 50413 [24]. Značajno je izvršiti pravilno merenje elektromagnetnih polja [25], s obzirom da su ovo veličine koje se u zavisnosti od vrste izvora menjaju, pa je pored snage i intenziteta potrebno znati i raspodelu po frekvenci. Merenje vrše akreditovane organizacije, a procenu rizika iz ove oblasti treba da vrše samo stručnjaci koji se bave ovom problematikom. Izuzetno je značajno pravilno odrediti ekspozicione uslove (mesto i dužinu izloženosti). Kod procene izloženosti zaposlenih koji intenzivno koriste mobilne telefone i druge komunikacione uređaje u opsegu visokih frekvenci neophodno je sagledati, izmeriti ili izračunati veličinu SAR (Specific Absorbtion Rate), specifičnu apsorpciju ili specifičnu količinu apsorbovane energije.
2 2 ddp
m m
P E J TSAR cm t
σ= = = =
ρ ρ σ (2)
gde je P snaga aporbovane količine toplote, m masa tela ili dela tela (glava), E jačina električnog polja unutar objekta, ρm zapreminska gustina, J gustina indukovanih struja, σ električna provodnost tkiva, cp toplotni kapacitet tkiva, dT promena temperature tela. Normiranje ove veličine se vrši za celo telo ili samo za pojedine delove tela ili organe (glava, koža). Značajno je ukazati da biološki efekti zavise od frekvencije talasa koji dolazi do osobe koja je izložena i da apsorpcija energije na površinskim delovima kože raste sa povećanjem frekvencije incidentnog EM talasa.
54 | Inženjerstvo zaštite

I. Krstić, D. Krstić. A. Kusalo, Vol 1, No1 (2011) 45-58
Fizičke štetnosti (štetni uticaj osvetljenosti) Svetlo, posredstvom oka, vidnom centru mozga ne daje samo informacije, već utiče i na regulacione organe vegetativnog nervnog sistema, koji upravljaju celokupnom razmenom materija u ljudskom organizmu i njegovim telesnim funkcijama. Zato se može reći kako kvalitetno svetlo ne olakšava samo gledanje i percepciju, već podiže volju za radom, ostvaruje vizuelni osećaj u prostoriji, a isto tako i poboljšava koncentraciju i sprečava prevremeni umor. Iz tih razloga proizilaze osnovni zahtevi koje osvetljenost (dnevna svetlost ili veštački sistem osvetljenosti) mora ispunjavati, a to su: da omogući dobre vidne uslove, potrebne za uspešno i bezbedno izvršavanje radnih zadataka; da u okviru kompleksnog oblikovanja prostora čoveku omogući takvu okolinu koja doprinosi dobrom fizičkom i psihološkom osećaju; da spreči nezgode i nesreće na radnom mestu.
opšta osvetljenost
lokalna i opšta osvetljenost
opšta lokalizovana osvetljenost
Slika 12. Sistemi osvetljenosti
Nepovoljna i nedovoljna osvetljenost stvara uslove za nastajanje nesrećnog slučaja; sličan efekat izaziva nepravilna jaka osvetljenost. Isto tako, vremenski neravnomerna osvetljenost može da prouzrokuje pojavu stroboskopskog efekta, što dovodi do subjektivne optičke varke. Čoveku se čini da se predmeti obasjani takvom svetlošću okreću brže ili sporije, odnosno da stoje iako se okreću. Loša osvetljenost posredno utiče na povećanje psihičkog i fizičkog zamora zaposlenih, smanjuje njihovu opreznost, smanjuje preciznost rada, povećava broj grešaka pri radu, smanjuje produktivnost itd. Slaba osvetljenost takođe može da prouzrokuje prekid celokupnog radnog procesa čija je značajna komponenta dobra vidljivost. Utvrđivanje faktora kvaliteta osvetljenosti, kao posledičnog stanja dnevnog i električnog osvetljenja u skladu sa SRPS U.C9.100/62 [26], podrazumeva određivanje pre svega nivoa i ravnomernosti osvetljenja na radnom mestu i u radnoj okolini i ocenu poređenjem
sa dozvoljenim vrednostima u zavisnosti od vidnog zahteva i vrste delatnosti. Za ocenu kvaliteta osvetljenosti radnog mesta i radnih prostorija u radnoj okolini potrebno je odrediti: • srednju osvetljenost od opšteg osvetljenja; • maksimalnu osvetljenost od opšteg osvetljenja; • minimalnu osvetljenost od opšteg osvetljenja; • osvetljenost radnog mesta; • ravnomernost osvetljenja; • kontrast. Osim navedenog standarda za utvrđivanje kvaliteta osvetljenosti koristi se i međunarodni standard EN 12464 [27].
Fizičke štetnosti (štetni uticaj mikroklime) Mikroklimatski parametri (temperatura, vlažnost i brzina strujanja vazduha) u značajnoj meri utiču na aktivnost radnika. Tako, rad u uslovima visoke temperature vodi teškim poremećajima (krvotok, varenje, metabolizam minerala, funkcije CNS-a sa simptomima umora, diskoordinacija pokreta i sl.) i iscrpljenosti. Takođe i rad pri niskim temperaturama izaziva poremećaje organizma i pad učinka. Ispitivanja mikroklimatskih parametara vrši se na radnim mestima u radnoj okolini u kojoj se obavlja proces rada, odnosno u kojoj se zaposleni kreću, ili zadržavaju duže od dva sata u toku radne smene. Vrše se u letnjem periodu, kad je spoljna temperatura iznad 15oC, i zimskom periodu kada je spoljna temperatura ispod 5oC. Ispitivanja mikroklime se ne vrše u prostorijama u kojima tehnološki postupak uslovljava određene klimatske uslove. Ispitivanja mikroklime vrše se u skladu sa Pravilnikom o preventivnim merama za bezbedan i zdrav rad na radnom mestu [28], tehničkim propisima, standardima i preporukama. Standardi koji se tom prilikom koriste zavise od kriterijuma ocenjivanja, i to: • za toplotni komfor PMV i PPD: ISO 7730 [29]; • za velika toplotna optrećenja WBGT: ISO 7243 [30]; • za rad po hladnoći: ISO 11079, ISO 9920 [31, 32].
Štetni klimatski uticaji U tehnološkim procesima različitih grana privrede (dobijanje i prerada nafte, rad na površinskim kopovima, građevini, rad na separaciji peska i sl.) zaposleni rade na otvorenom i tom prilikom mogu biti izloženi manje ili više štetnim klimatskim uslovima. Pod klimom jednog kraja odnosno predela pozdra-zumeva se skup prosečnih vrednosti fizičkih faktora (temperatura, vlažnost, kretanje vazduha, toplotno zračenje, insolacija (količina energije koju prima Zemlja sa sunčevim zracima), barometarski pritisak i atmosferske padavine) u toku određenog vremena. Osim navedenih faktora, od značaja za procenu rizika od štetnih klimatskih uticaja su: • izolaciona svojstva odeće - svojstvo odeće koje
omogućava isparavanje znoja sa površine kože;
55 | Inženjerstvo zaštite
SAFETY ENGINEERING - INŽENJERSTVO ZAŠTITE
• metabolička toplota - toplota koja je glavni "nusproizvod" metabolizma našeg organizma; što je veći fizički rad veća je proizvodnja toplote.
Pri razmatranja uticaja tople i hladne sredine na organizam treba imati u vidu da u termoregulaciji učestvuje ceo organizam - svi sistemi, organi i ćelije, iz čega proističe značaj termičkog komfora za očuvanje zdravlja i radne sposobnosti. Za sve radnike koji su izloženi visokim temperaturama pri radu na otvorenom kažemo da su pod toplotnim stresom. Za normiranje rizika pri ovakvim uslovima, upotrebljava se tzv. indeks vlažne globus temperature - IVGT (engl. WBGT - wet bulb global temperature), detaljnije je opisan u standardu toplotnog stresa ISO 7243 [30]. Procenu rizika u uslovima rada na otvorenom pri niskim temperaturama najpreciznije možemo odrediti pomoću tzv. Wind chill indeksa, a detaljnije je opisan u standardu ISO 11079 [31]. Wind chill indeks je temperatura koju ljudi i životinje „osećaju“ kada se nalaze na otvorenom, pri temperaturi od 10°C i nižoj i brzini vetra većoj od 4,2 km/h. Štetnosti koje proističu iz fizičkih opterećenja Prilikom identifkacije štetnosti koje proističu iz fizičkih opterećenja treba obratiti pažnju na starosnu dob, način života i radna opterećenja radnika. Rizični faktori pri radu su dizanje i nošenje tereta, nepravilan položaj tela i vibracije. Ručno rukovanje teretom može biti podizanje, držanje, prenošenje, povlačenje ili guranje, kao na primer postavljanje građevinskog kamena, utovar mašina, istovar paketa, držanje prenosne brusilice, postavljanje skela, premeštanje pacijenta. Svaki položaj tela koji značajno od uobičajenog i udobnog držanja smatra se nefiziološkim kao na primer saginjanje prema napred, okretanje ili bočno saginjanje gornjeg dela tela, teret odmaknut od tela ili iznad visine ramena, klečeći ili čučeći položaj. Ukoliko je teret glomazan, nepravilnog oblika, nestabilan, vruć, hladan, oštrih ivica ili pak glatkih površina onda je rukovanje teretom dodatno otežano. Ukoliko su uslovi rada takvi da je skučen prostor za kretanje, ili su prostorije male visine, neravnog, mekanog ili klizavog poda, loše osvetljenosti, onda je rukovanje teretom takođe dodatno otežano ovakvim uslovima rada. Radnici u tim slučajevima mogu imati pritužbe koje se tiču bolova u leđima i zglobovima, povećanim umorom. Takođe se mora obratiti pažnja kada ručno rukovanje teretom izvode mladi radnici, stariji radnici ili trudnice. Faktore koje treba uzeti u obzir za procenu rizika prilikom ručnog prenošenja tereta su: • karakteristike tereta (težina, oblik, dimenzije i dr.); • pritisci kojima je izložen radnik (kretanje i držanje
tela, udaljenost tereta od tela radnika, horizontalno i/ili vertikalno rastojanje na kojem se premešta teret, intenzitet, učestalost i trajanje fizičkih
napora, upotreba sredstava lične zaštite na radu, tempo rada, vreme odmora);
• karakteristike radne okoline (temperatura, vlažnost i brzina strujanja vazduha, osvetljenost, vrsta podne površine i dr.).
Fizički napor se karakteriše i položajem tela pri radu. Izbor položaja tela pri radu vrši se na osnovu fizičko organizaciono - tehničkih zahteva. Na radnom mestu mogu se zauzimati sledeći položaji: ležeći (na leđa, na bok i na trbuh); poluležeći; čučeći; sedeći (nisko i normalno sedenje); polustojeći i klečeći; stojeći. Postoji velika varijabilnost položaja koji se koriste pri različitim poslovima, kao i varijabilnost položaja koje zauzimaju radnici pri izvršavanju istih zadataka, pri čemu je najveća različitost primećena u položaju ručnog zgloba. Optimalan radni položaj je onaj položaj u kome su delovi tela poravnati vertikalno, a centar gravitacije prolazi kroz sve ose zglobova. Sile pritiska delova tela u optimalnom položaju raspoređene su ravnomerno oko nosećih površina, tako da nema prekomernog pritiska na ligamente i mišiće. Neudoban radni položaj podrazumeva rad u položaju koji odstupa od optimalnog. Rad u neudobnim položajima može biti bolan, kada pokreti dovode do izduženja tkiva iznad normalnog obima pokreta, uzrokujući mikrooštećenje ili istezanje tkiva, Bitno fizičko opterećenje je i spoljašna sila, odnosno opterećenja/naprezanja primenjena na neku površinu tela tokom radnih aktivnosti, kao što su podizanje, guranje ili držanje predmeta. Štetnosti koje proističu iz psihofizioloških opterećenja Štetnosti koje stvaraju kao posledica psihofiziološkog opterećenja na radu mogu se javiti zbog: poremećaja međuljudskih odnosa, neadekvatne organizacije rada - kako samog radnog procesa, tako i radnog vremena (rad u smenama, rad noću, prekovremeni rad, skraćeno radno vreme, pripravnost, ritam i režim rada i sl.), subjektivnog odnosa prema radu i konstitucije ličnosti, odgovornosti (u primanju i prenošenju informacija, korišćenju odgovarajućeg znanja i sposobnosti, rukovođenju, u pravilima ponašanja, za kvalitet rada i dr.), karaktera rada (brze izmene radnih procedura, intenzitet u radu, prostorna uslovljenost radnog mesta, nošenje oružja, jednoličnost radnih operacija, zavisnost od drugih izvršilaca), odnosa sa drugim licima (radne grupe, stranke, rad sa novcem, rizične grupe, nasilnički napadi) i ličnosti učesnika u radu (psihosenzorskih, psihomotornih, intelektualnih, emocionalnih i psihosocijalnih).Psihofiziološka opterećenja kod zaposlenog najčešće prouzrokuju stres koji u najvećoj meri utiče na mentalno zdravlje, a može da izazove i druge zdravstvene tegobe psihosomatske prirode. Pored stresa, u ovakvim situacijama javljaju se i druge promene u raspoloženju koje izazivaju stanje depresije, osećaj monotonije i slično.
56 | Inženjerstvo zaštite

I. Krstić, D. Krstić. A. Kusalo, Vol 1, No1 (2011) 45-58
Do poremećaja međuljudskih odnosa dolazi usled konflikta, sukoba između pojedinaca ili grupa (formalnih i neformalnih), koje se pri radu stvaraju ciljano ili spontano. Konfliktne situacije mogu nastati u odnosima po vertikali, između nadređenih i podređenih (rukovodilaca i radnika), i u odnosima po horizontali, kada se sukobi javljaju u grupi. Stvaranju konfliktnih situacija često doprinose frustrirajući uslovi u radnoj sredini ili u organizaciji rada, a nekada i zbog reakcije pojedinaca koji ispoljavaju određeno devijantno ponašanje. Krajem prošlog veka ispoljio se poseban oblik ponašanja u profesionalnim komunikacijama pod nazivom mobing koji je zbog ozbiljnosti posledica koje nastaju, u mnogim državama pravno regulisan kako bi se obezbedila zaštita od raznih oblika narušavanja, pre svega, psihofiziološkog integriteta. Prekomerno zalaganje, kao "sagorevanje" na poslu uglavnom dovodi do frustracija i poremećaja psihofiziološke ravnoteže. Međutim, ne znači da u svim slučajevima u ovakvim uslovima dolazi i do narušavanja psihofiziološkog integriteta. Da li će kod određene osobe doći do ugrožavanja psihofiziološkog integriteta, i u kojoj meri, zavisi i od intenziteta štetnosti i izloženosti njenom uticaju, kao i od psihofiziološke integracije ličnosti. Poremećaji psihofiziološkog integriteta mogu se ispoljiti u manjoj meri kao neki od oblika neuroza koji ne zahteva medicinsku intervenciju, ali utiče na ponašanje na radnom mestu. Međutim, oni se mogu javiti i kao vrlo ozbiljni emocionalni poremećaji (neurotski, psihofiziološki poremećaji i psihoze) koji zahtevaju medicinsku pomoć radi uspostavljanja mentalnog zdravlja i psihičke ravnoteže. Jedna od klasifikacija štetnosti koje proističu iz psihofizioloških opterećenja je: • režim rada u smenama; • psihomotorno opterećenje; • psihosenzorno opterećenje; • monotonija; • emocionalno opterećenje; • intelektualno (mentalno) opterećenje. Za razliku od većine drugih štetnosti koje se mogu naći u radnoj sredini i za koje su utvrđene dozvoljene vrednosti, standardi ili preporuke, za psihofiziološke štetnosti univerzalne norme ne postoje. To znači da se procena psihofiziološkog opterećenja zasniva na praktičnom iskustvu procenjivača. Zbog toga se od njih zahteva dobro poznavanje uslova, zahteva i mogućih opterećenja na radu. Procena rizika vrši se posebno za svaki elemenat psihofiziološkog opterećenja, koga čine: hronobiološko opterećenje pri radu u smenama, psihomotorno opterećenje, psihosenzorno opterećenje, monotonija i dinamika radne aktivnosti, emocionalno i intelektualno opterećenje. Svaki elemenat psihofiziološkog opterećenja rangira se na ordinalnoj skali u 4 nivoa Sx po rastućem redosledu intenziteta.
FORMIRANJE MATRICE RIZIKA Obzirom da je za određivanje nivoa rizika bitan kumulativni efekat dejstva opasnosti i/ili štetnosti od značaja je formiranje matrica rizika na osnovu ravni rizika. Ravan rizika je određena koordinatnim osama verovatnoće i posledica rizičnog događaja, slika 4.4. Na osnovu izraza 4.1. u ravni rizika su određene krive iste vrednosti rizika - izo-linije rizika. Takođe je predstavljena i izo-linija prihvatljivog rizika.
Slika 4.4. Ravan rizika Rang rizika radnog mesta određen je najvišim rangom rizika od pojedine opasnosti, odnosno štetnosti. Radna mesta sa rangovima rizika I i II smatraju se radnim mestima sa prihvatljivim rizikom. Radna mesta sa povećanim rizikom su radna mesta sa rangovima rizika III, IV i V.
ZAKLJUČAK Adekvatna analiza kriterijuma i pokazatelja za procenu profesionalnog rizika, bazirana na standardima, pravilnicima, direktivama i drugoj zakonodavnoj regulativi u oblasti bezbednosti i zdravlja na radu, jedan je od osnovnih preduslova kvalitetnom upravljanju rizikom radne sredine.
LITERATURA [1] S. Savić, M. Stanković, Teorija sistema i rizika, Fakultet
zaštite na radu u Nišu, Univerzitet u Nišu, 2010. [2] I. Krstić, Modeli za sistemsku analizu rizika tehnoloških
sistema, Doktorska disertacija, Univerzitet u Nišu, Fakultet zaštite na radu u Nišu, Niš, 2010.
[3] Pravilnik o zaštiti na radu pri izvodenju građevinskih radova, „Sl. glasnik RS“ br.53/97, 1998.
[4] S. Borjanović, Metod za procenu rizika na radnom mestu i u radnoj okolini, Institut za medicinu rada Srbije “Dr Dragomir Karajović”, Beograd, 2008.
[5] Pravilnik o tehničkim normativima za električne instalacije niskog napona („Službeni list SFRJ“ br. 53/88 i 54/88 i „Službeni list SRJ“ br. 28/95)
[6] Pravilnik o tehničkim normativima za zaštitu objekta od atmosferskog pražnjenja ("Službeni list SRJ", br. 11/96)
[7] Pravilnik o tehničkim propisima o gromobranima ("Službeni list SFRJ", br. 13/68)
[8] Zakon o prevozu opasnih materija, "Sl. list SFRJ", br. 27/90 i 45/90 -ispr. i "Sl. list SRJ", br.24/94, 28/96, 21/99, 44/99- dr. zakon i 68/2002
57 | Inženjerstvo zaštite

SAFETY ENGINEERING - INŽENJERSTVO ZAŠTITE
BIOGRAFIJE AUTORA [9] Pravilnik o preventivnim merama za bezbedan i zdrav rad pri izlaganju hemijskim materijama, „Sl. glasnik RS“ br. 101/05
58 | Inženjerstvo zaštite
[10] Direktiva 2000/54 EC, Evropske unije o zaštiti radnika od rizika pri izloženosti biološkim agensima na radu
[11] ISP/MYC/AC-01 - Qualite microbiologique dans les batiments a bureaux equipes de conditionnement d'air: enquete microbiologique standardisee de base
[12] ISP/MYC/AC-03 - Qualite microbiologique dans les batiments a bureaux equipes de conditionnement d'air: la charge bacterienne totale de l'air
[13] NIOSH 0800 - Bioaerosol sampling [14] Polish standard PN-89/ Z 0411/02 i 03 (evaluation of
microbiological air pollution) [15] European Community Directive 2000/54/EC
(biological agens at work)
Krstić M. Ivan je rođen u Nišu, 1972. godine. Doktorirao je na Univerzitetu u Nišu, Fakultetu zaštite na radu, iz oblasti inženjerstva zaštite radne i životne sredine. Vodeći je pro-verivač sistema upravljanja zašti-tom zdravlja i bezbednošću na radu prema BS OHSAS 18001. Zaposlen je na Fakultetu zaštite na radu na radnom mestu docenta za užu oblast Bezbednost i rizik sistema. Dejan D. Krstić je rođen u Nišu, 1969. godine. Doktorirao je na Univerzitetu u Nišu, Fakultetu zaštite na radu, iz oblasti inženjerstva zaštite radne i životne sredine. Vodeći je proverivač sistema upravljanja zaštitom zdravlja i bezbednošću na radu prema BS OHSAS 18001. Zaposlen je na Fakultetu zaštite na radu na radnom mestu docenta za užu oblast Energetski procesi i zaštita.
[16] Pravilnik o merama i normativima zaštite na radu od buke u radnim prostorijama, („Sl. list SFRJ“ br. 21/1992)
[17] D. Cvetković, M. Praščević, Buka i vibracije, Univerzitet u Nišu, Fakultet zaštite na radu u Nišu, Niš, 2005.
[18] M. Praščević, D. Mihajlov, Postupak za procenu rizika u radnoj okolini usled dejstva vibracija, Upravljanje vanrednim situacijama, Univerzitet u Nišu, Fakultet zaštite na radu u Nišu, Niš, 2007.
[19] D. Petković, D. Krstić, V. Stanković, “The Effect Of Electric Field On Humans In The Immediate Vicinity Of 110 kV Power Lines”, FACTA UNIVERSITATIS, Series: Working and Living Environmental Protection Vol. 3, No 1, 2006.
Ana Đ. Kusalo je rođena u Nišu, 1972. godine. U fazi je odbrane magistarske teze na Univerzitetu u Nišu, Fakultetu zaštite na radu, iz oblasti Bezbednosti i rizika sistema. Oblast naučnog i stručnog interesovanja je upravljanje profesionalnim rizikom. Zaposlena je u Institutu za kvalitet radne i životne sredine "1.maj" a.d. Niš.
[20] ICNIRP Guidelines 2004, Guidelines On Limits of Exposure to Ultraviolet Radiation of Wavelengths Between 180 nm and 400 nm (incoherent optical radiation)
[21] ISO 17166:1999/CIE S007-1998, Erythema Reference Action Spectrum and Standard Erythema Dose
[22] Zakon o zaštiti od nejonizujućih zračenja (Službeni glasnik 36/09)
[23] Pravilnik o granicama izlaganja nejonizujućim zračenjima (“Službeni glasnik RS” 104/09, br.110-00-58/2009-05)
ANALYSES OF INDICATORS FOR OCCUPATIONAL RISK ASSESSMENT [24] Pravilnik o granicama izlaganja nejonizujućim
zračenjima SRPS EN 50413:2010 Osnovni standard za procedure merenja i izračunavanja izlaganja ljudi električnim, magnetskim i elektromagnetskim poljima (od 0Hz do 300GHz).
Abstrakt: U predhodnom periodu od donošenja Zakona o bezbednosti i zdravlju na radu, došlo je do usklađivanja zakonodavne regulative u ovoj oblasti u Srbiji, sa Evropskom unijom. Neusaglašenost je u tome što ne postoji jedinstvena metodologija za procenu profesionalnog rizika. U radu su analizirani pokazatelji za procenu profesionalnog rizika koji se zasnivaju na standardima, pravilnicima, direktivama i drugoj zakonodavnoj regulativi u oblasti bezbednosti i zdravlja na radu. Jedinstveni metodološki postupak procene profesionalnog rizika bi omogućio jednostavan uvid u stanje zaštite na radu i sistematičan pregled dobijenih rezultata, a samim tim i kvalitetnije upravljanje profesionalnm rizikom.
[25] ECC Recommendation (02)04, Measuring non-ionising electromagnetic radiation (9 kHz – 300 GHz)
[26] SRPS U.C9.100/62, Dnevno i električno osvetljenje prostorija u zgradama
[27] EN 12464, Light and lighting - Lighting of work places [28] Pravilnik o preventivnim merama za bezbedan i zdrav rad
na radnom mestu („Službeni glasnik RS”, br. 21/09) [29] ISO 7730, Ergonomics of the thermal environments –
Analytic determination and interpretation of thermal comfort using calculation of the PMV and PPD indices and local thermal comfort criteria
[30] ISO 7243, Hot environments - Estimation of the heat stress on working man, based on the WBGT-index (wet bulb globe temperature)
Ključne reči: pokazatelji, profesionalni rizik.
[31] ISO 11079, Evaluation of cold environments - Determination of reqired clothing insulation (IREQ
[32] ISO 9920, Estimation of the thermal insulation and evaporative resistance of a clothing esemble
Book review Prikaz knjiga
BOOK REVIEW / PRIKAZ KNJIGE
BEZBEDNOST RADNE I ŽIVOTNE SREDINE, VANREDNE SITUACIJE I OBRAZOVANJE
Vesna Nikolić, Nenad Živković
Istorijski posmatrano, vanredne situacije su uvek pratile i obeležavale različita razdoblja u razvoju čovečanstva. One čine integralni deo prošlosti, sadašnjosti i budućnosti. Sadašnji trenutak uslovljava da naše razmišljanje o budućnosti posmatramo u tesnoj vezi sa obrazovanjem kao ključnim instrumentom za aktiviranje i usmeravanje ljudskog potencijala ka ostvarivanju bezbednosti u radnoj i životnoj sredini. Talas rizika različite prirode i karaktera koji je zahvatio savremenu civilizaciju dajući joj svojevrsno obeležje ''društva rizika'', podrazumeva permanentan rad na obrazovanju s ciljem pripremanja i osposobljavanja različitih subjekata za odgovarajuće ponašanje i odgovor u slučaju vanrednih situacija. U monografiji pod naslovom ''Bezbednost radne i životne sredine, vanredne situacije i obrazovanje'' predstavljeni su rezultati višegodišnjeg rada autora prof.dr Vesne Nikolić i prof.dr Nenada Živkovića na realizaciji niza naučno-istraživačkih projekata koji su finansirani od strane Ministarstva za nauku i tehnološki razvoj i Ministarstva za zaštitu životne sredine Republike Srbije. Otuda, sadržaj ove studije, dobrim delom, čine objavljeni radovi koji su nastali zanimanjem autora za različite segmente ove problematike. Istovremeno, monografija predstavlja teorijsku platformu za didaktičko-metodički priručnik u ovoj oblasti koji najavljuje autorka monografije. Bezbednost u radnoj i životnoj sredini i uspešnost odgovora na vanredne situacije zahteva permanentnu, naizmeničnu praksu obrazovanja, obučavanja i treninga. U osnovi svih ovih procesa su promene koje se nameću okruženju, ili odgovor na promene i nove zahteve okruženja. Obrazovanje dovodi do promena u
znanju, obučavanje do promena u veštinama, lični razvoj do promena u stavovima i vrednostima. U suočavanju sa savremenim bezbednosnim rizicima i izazovima, obrazovanje se, u studiji, posmatra kao nezamenljivo dobro u trajnom procesu poboljšanja znanja i umeća, ali i kao svojevrstan način ostvarenja kako ličnog tako i održivog društvenog razvoja. Paradigma bezbednosti traži kontinuirano učenje, inoviranje znanja, razvoj sposobnosti i kompetencija kako pojedinaca, organizacija tako i društva u celini. Posmatrano iz diskursa bezbednosti i održivog razvoja u studiji se jasno oblikuje vizura doživotnog učenja kao osnove opstanka i napredovanja u 21. veku, ali i kao neophodne konstituente procesa koji vodi ka društvu znanja. U prvom delu studije istraživačka interesovanja autora za probleme bezbednosti u radnoj i životnoj sredini kreću od određivanja i definisanja osnovnih pojmova i termina koji se koriste u ovoj oblasti. Obzirom da u toku eksponancijalno rastućih proizvodnih snaga i permanentne modernizacije dolazi do mnoštva rizika različite prirode i karaktera, problemi bezbednosti se posmatraju u tesnoj vezi sa rizicima u radnoj i životnoj sredini čija raznovrsnost, po autorima, implicira svojevrsno širenje istraživačkog polja bezbednosti. Tokom poslednjih decenija, problem integralne bezbednosti pretvorio se u jedan od najznačajnijih problema socijalnog razvoja i postao osnova shvatanja da koncepcija progresa ustupa mesto koncepciji bezbednosti. Bezbednost se promišlja kao suštinska potreba, vrednost i interes svakog pojedinca i čovečanstva u celini koji je u tesnoj vezi sa uslovima opstanka i održivog razvoja u budućnosti. Ono što, u drugom poglavlju, fokusira istraživačku pažnju autora jeste činjenica da potrebu i mogućnost upravljanja rizicima treba razmatrati i u kontekstu teorije o katastrofama u ljudskom društvu, zapravo u kontekstu takvih situacija čija je diferentia specifica vanredni uslovi, masovna nesreća, ogromne ljudske žrtve, gubitak materijalnih dobara, degradacija i destrukcija prirode. Polazeći od pojmovnog određenja vanrednih situacija, komparativnih analiza i distinkcija srodnih/sličnih pojmova (katastrofa, kriza, udesa i dr.), podele i klasifikacije vanrednih situacija, određivanja faza i stadijuma njihovog razvoja, promišljanja društvenog konteksta te međunarodnih direktiva, sporazuma i inicijativa (SEVESO, APELL, SEECAP, DPPI i dr.) i aktuelne nacionalne zakonske regulative u ovoj oblasti, autori dolaze do trećeg dela rada u kome su posebno elaborirani osnovni teorijski i metodološki problemi upravljanja (u) vanrednim situacijama. Posmatrajući sistem upravljanja vanrednim situacijama kao specifičan sistem složenih karakteristika, autori oblikuju koncepciju sistema za upravljanje vanrednim situacijama, pri čemu su posebno posmatrani pojedini subjekti/činioci ovog sistema u međunarodnim (OCHA, INSARAG, EADRCC, CMEP SEE i dr.) i nacionalnim okvirima (ministarstva, službe, sektori, mediji i dr.).
59 | Inženjerstvo zaštite
Vol 1, No1 (2011)
60 | Inženjerstvo zaštite
Svakako, sistemi upravljanja vanrednim situacijama reflektuju društvene i ekonomske uslove i okvire unutar kojih funkcionišu. Otuda su varijacije između sistema različitih država realne i očekivane. Uslovljene su specifičnostima ugrožavanja državne teritorije, klimatskim prilikama, prirodnim pojavama, karakte-ristikama tla i dr. ali i ekonomskim razvojem, pravnim sistemom, upravnom tradicijom, političko-teritorijalnom organizacijom, društvenim uređenjem i drugim subjektivnim i objektivnim mogućnostima i potrebama. Međutim, osnovna intencija, koja ima paradigmatičan značaj, odnosi se na preventivne mere i aktivnosti i to kako u sistemu integralne bezbednosti tako i u sistemu upravljanja vanrednim situacijama među kojima obrazovanje ima ulogu strateškog značaja. Preobražaj tradicionalne funkcije upravljanja vanrednim situacijama u savremenu ulogu javnog upravljanja vezanu za celokupni život zajednice, podrazumeva znanja, veštine i sposobnosti koje su u funkciji realizacije novih ciljeva i zadataka u ovoj oblasti. Obzirom na međusobnu povezanost rizika i opasnosti u radnoj i životnoj sredini te otuda uslovljenost i povezanost sistema zaštite na radu, zaštite od požara i zaštite životne sredine, u četvrtom poglavlju studije V. Nikolić polazi od potrebe kako pojedinačnog (uvažavajući specifičnosti problematike ovih sistema) tako i integralnog pristupa obrazovnoj problematici u ovoj oblasti. Zapravo, autorka razmatra i koncepcijski oblikuje obrazovanje za bezbednost i zdravlje na radu, obrazovanje za zaštitu od požara i obrazovanje za zaštitu životne sredine posmatrajući ih kao područja i konstituente jedinstvene koncepcije obrazovanja za bezbednost radne i životne sredine, i to u kontekstu širih promena i preobražaja našeg društva, a posebno reforme sistema obrazovanja. Ukazano je na kompleksnost i otvorenost sistema zaštite radne i životne sredine i potrebu sistemskog pristupa promišljanju i realizaciji obrazovanja (formalnog i neformalnog) u ovoj oblasti. Razmatrajući osnovne karakteristike okruženja u kome se obrazovanje za bezbednost radne i životne sredine odvijalo u prošlosti i odvija u sadašnjosti, na osnovu i uz pomoć ideja, shvatanja i preporuka koje do nas dopiru iz Evrope i sveta, u studiji se ukazuje na osnovne karakteristike razvoja ovog obrazovanja u narednom periodu. Pri tom proces reforme sistema obrazovanja posmatran je sa aspekta promena koje treba da dovedu do modernizacije i podizanja opšteg standarda bezbednosti radne i životne sredine i ostvarivanja strategije održivog razvoja. Obzirom da je pravo na obrazovanje, kao osnovno ljudsko pravo, ugroženo u vanrednim situacijama V. Nikolić posebnu pažnju posvećuje razmatranju i promišljanju obrazovanja u vanrednim situacijama s osvrtom na period oporavka i rekonstrukcije. U tom kontekstu autorka se oslanja na preporuke i strategiju UNESCO-a te obrazovanje elaborira kao četvrti potporni stub humanitarnih aktivnosti u vanrednim situacijama.
U tesnoj vezi sa problemima obrazovanja, V. Nikolić posmatra organizaciono učenje koje, zapravo, rezultira promenama odgovora organizacije kao celine na stalne bezbednosne izazove, promene i zahteve okruženja. Pored toga i sam proces upravljanja vanrednim situacijama podrazumeva planiranje, jasno definisanu strukturu i organizovanost države, lokalne samouprave, dobrovoljnih društava, organizacija javnog i privatnog sektora da zajedničkim snagama sveobuhvatno i koordinisano odgovore na širok spektar potreba u vanrednim situacijama. Polazeći od toga, u poslednjem delu rada, umesto zaključka, promovišu se savremeni pristupi i trendovi u razvoju ljudskih resursa, formiranju ''organizacija koje uče'' i primeni koncepta upravljanja znanjem u ovoj oblasti. Način upravljanja ljudskim resursima, u značajnoj meri, može uticati kako na efikasnost organizacije kao celine tako i na sposobnost pojedinaca/personala da ostvari definisane organizacione ciljeve kada je u pitanju bezbednost ili, pak, nastala vanredna situacija. Upravljanje, ali, po mišljenju autorke, pre svega razvoj ljudskih resursa «determiniše» radnu i poslovnu efikasnost i dugoročnu stabilnost ljudskih resursa, što je od posebne važnosti kada je u pitanju nepredvidljivost vanrednih situacija i specifičnost odgovora na njih. Takav razvoj se posmatra u kontekstu organizacije koja se permanentno menja, transformiše, koja je inovativno otvorena, vrhunski fleksibilna, koja vrednuje komunikaciju, saradnju, poverenje; u kojoj se se sam proces učenja ne odigrava ni slučajno, ni privremeno, već je reč o centralnoj i trajnoj aktivnosti svih njenih članova. Kompleksnost bezbednosnih pitanja podrazumeva razvoj sistemskog mišljenja, lično ovladavanje (stručnost, kompetencije, razmenu znanja), razvoj novih mentalnih modela (prevazilaženje rigidnih, tradicionalnih stavova), izgradnju zajedničke vizije, timski rad i permanentno učenje. S tim u vezi, andragoški pogledi iznešeni u četvrtom i petom delu studije u punoj meri podržavaju aktuelne tendencije 21. veka o važnosti unapređivanja organizacionih kompetencija za bezbednost radne i životne sredine, ali i o važnosti sveukupne saznajne i afektivne motivacije svakog pojedinca u ovoj oblasti. U savremenoj literaturi malo je radova koji se multidisciplinarno bave problematikom bezbednosti i vanrednih situacija sa aspekta upravljanja i razvoja ljudskih resursa u ovoj oblasti. Otuda naučno-istraživački rezultati prezentovani u ovoj monografiji predstavljaju izuzetan i originalan doprinos koji se višestruko reflektuje na osnovne elemente i aspekte daljeg koncipiranja i utemeljenja postojeće teorije i prakse zaštite radne i životne sredine, upravljanja vanrednim situacijama i obrazovanja u ovoj oblasti. Monografijom Bezbednost radne i životne sredine, vanredne situacije i obrazovanje, koju preporučujemo pažnji čitalaca, autori su učinili značajan korak u tom pravcu.
Prof. dr. Mirko Markič Fakultet za menadžment, Koper, Slovenija

Book review Prikaz knjiga
BOOK REVIEW / PRIKAZ KNJIGE
ULOGA I ZNAČAJ LICA ZA BEZBEDNOST I ZDRAVLJE NA RADU U PRIVREDNIM DRUŠTVIMA U REPUBLICI SRBIJI
Snežana Živković
U Uvodu se definiše predmet istraživanja – bezbednost i zdravlje na radu kao pretpostavka uspeha poslovne or-ganizacije i izvor zadovoljstva zaposlenih, a zatim se naglašava važnost sistemskog pristupa za njegovo pro-učavanje. Prikazane su određene međunarodne definici-je kako bi se preciznije odredio pojam predmeta pro-učavanja pri čemu se naglašava važnost nacionalnih za-konskih definicija kao i međunarodne standardizacije. Poglavlje Sistem bezbednosti i zdravlja u Republici Srbiji i započinje prikazom regulatornog okvira te se naglašavaju pojedini aspekti sistema bezbednosti i zdravlja najpre u Ustavu Republike Srbije, a zatim u Zakonu o bezbednosti i zdravlju na radu, Zakonu o ra-du, Zakonu o zdravstvenoj zaštiti, Zakonu o penzij-skom i invalidskom osiguranju, Zakonu o zdravstve-nom osiguranju, Krivičnom zakoniku, Zakonu o priv-rednim društvima, Zakonu o privatnim preduzetnicima, te u nizu podzakonskih akata. Nakon analize načina na koji su regulisani najvažniji sastavni delovi efikasne zaštite zdravlja i bezbednosti na radu, u nacionalnom zakonodavstvu, autor prikazuje menadžment kvalite-tom kao alat za upravljanje rizikom. Zahtevi standarda ISO 9001:2000 u savremenoj organizaciji nalažu potre-bu da se najpre dokumentuju zahtevi, zatim se imple-mentira dokumentacija sistema kvaliteta i nakon toga se ostvaruje i prati implementacija sistema kvaliteta u svakodnevnom radu. Sistem upravljanja zaštite zdravlja i bezbednosti na radu OHSAS 18001 uključuje: organi-zacijsku strukturu i odgovornost, planiranje, upravlja-nje procesom rada, provere i preispitivanje politike OHSAS te preduzimanje korektivnih mera u organiza-ciji. Autor daje vrlo zanimljiv tabelarni prikaz procedu-ra za uspostavljanje sistema menadžmenta prema stan-dardima serije ISO 18000, u odnosu na potpuno kom-
patibilan sistem kvaliteta koji je sertifikovan po stan-dardima JUS BSI 18001:2005. Na kraju poglavlja daje se ocena odgovornosti menadžmenta za čitav sistem bezbednosti i zaštite na radu te pregled aktuelnih istra-živanja ove tematike. Metodologija istraživanja. Polazeći od pretpostavke da ne postoje aktualna saznanja o stanju rada osoba za bezbednost i zdravlje na radu u privrednim društvima u Srbiji, u skladu sa obavezama iz Zakona o bezbednosti i zdravlju na radu, autor definiše cilj i hipoteze svog istraživanja, bira metode, uzorak i formira istraživački tim. Istraživanje je sprovedeno u intervalu od novembra 2010. godine do 15. januara 2011. godine. Rezultati istraživanja. Rezultati istraživanja nisu nabro-jani kao poseban deo knjige, ali su podeljeni u devet poglavlja i obuhvataju najveći deo teksta. Važnost predmeta koji se obrađuje u delu: Problemati-ka zaštite na radu, zdravlja i bezbednosti izuzetno je aktuelna u savremenim poslovnim organizacijama, a po sveobuhvatnosti i važnosti nadilazi poslovnu sferu te zadire u sve aspekte savremenog društvenog života i ljudske zajednice. Autor je prepozno najvažnije ele-mente bezbednosti i zaštite na radu te ih je obrazložio u uvodnim poglavljima, a u samom istraživanju obliko-van je relevantan set pitanja za prikupljanje kompetent-nih odgovora. Ova je knjiga posvećena proučavanju bezbednosti i zaštite na radu u savremenim poslovnim organizacija-ma u Republici Srbiji. Sam izbor predmeta istraživanja pokazuje originalnost jer u stručnoj javnosti nedostaju dela s tematikom bezbednosti i zaštite na radu na naci-onalnom nivou, a posmatrano kroz prizmu sistemskog pristupa. Takođe, integralan pristup važnosti odabranog problema na tri nivoa: individualnom, organizacijskom (korporativnom) i opštem društvenoj svakako je savre-men i inovativan. Osim po originalnom pristupu, obra-da središnjeg problema sprovedena je izvornim istraži-vanjem koje je izvedeno korektno, poštujući sve princi-pe temeljitog naučnog pristupa: od odabira uzorka do primene analitičkog postupka. Naučne hipoteze u ovom radu postavljene su logično i autoritativno, dileme izra-žene u njima jesu relevantne i podsticajne za istraživa-nje, a obrada rezultata je sistemska i besprekorna. Re-zultati istraživanja su originalan doprinos razvoju druš-tvenih nauka u polju bezbednosti, ali zadiru i u podru-čje menadžmenta, organizacije i upravljanja. Sadržaj rukopisa logično je raspoređen po poglavljima, stil je jasan i razumljiv, način pisanja dostupan krugu stručnih čitaoca. Ova knjiga je nova i preko potrebna, najpre široj stručnoj javnosti, zainteresovanoj za proučavanje raz-voja bezbednosti i zaštite na radu, a, zatim svima koji se bave menadžmentom u poslovnim i neposlovnim organizacijama.
Prof. dr. Marjan Cingula Ekonomski fakultet, Sveučilište u Zagrebu
61 | Inženjerstvo zaštite

Review of technical solution Prikaz tehničkog rešenja
REVIEW OF TECHNICAL SOLUTION PRIKAZ TEHNIČKOG REŠENJA
UpOl - SOFTVERSKI SISTEM ZA EVIDENTIRANJE OTPADA U LOKALNIM ZAJEDNICAMA Autori: Miomir Stanković, Suzana Savić, Žarko Janković, Goran Janaćković, Dejan Krstić, Ivan Krstić, Srđan Glišović
Kategorija tehničkog rešenja: M85, Softver
Rezultati su verifikovani od strane: Fakulteta zaštite na radu u Nišu, Gramont inženjering Niš
Oblast na koju se tehničko rešenje odnosi: Inženjerstvo zaštite radne i životne sredine Zadatak sistema je da omogući prikupljanje podataka na lokalnom nivou od kompanija koje predstavljaju izvore otpada, kompanija koje se bave prikupljanjem otpada, kompanija koje obrađuju otpad i institucija zaduženih za upravljanje otpadom na regionalnom nivou. Podacima u okviru centralne baze, korisnik pristupa posredstvom interfejsa. Nije poguće neposredno pristupanje podacima iz baze već interfejs omogućava da se podaci koje unese korisnik u procesu interakcije sa sistemom prilagode, odnosno transformišu u onaj oblik koji prihvati sam sistem. Pri tome na osnovu pristupnih privilegija, koje kontroliše poseban deo sistema zadužen za upravljanje korisnicima, omogućava se pristup podacima određenog nivoa detalja.
Suština tehničkog rešenja
U okviru tehničkog rešenja kreirana je web aplikacija za prikupljanje podataka o firma koje učestvuju u upravljanju otpadom, u cilju formiranja baze podataka na nivou organizacije, odnosno na nivou lokalne zajednice. Pomenuta baza podataka sadrži podatke o firmama koje generišu, prikupljaju i prerađuju otpad. Baza je projektovana za interaktivan rad. Dinamička izmena podataka je omogućena korisniku, radi komfornijeg unosa podataka. Razvijena je posebna web aplikacija, koja može da funkcioniše pod Windows ili Linux operativnim sistemom. Razvijena je za potrebe upravljanja otpadom, prikupljanje podataka i obradu podataka na nivou lokalne zajednice, okruga ili regiona. Jezgro sistema definiše web server, koji funkcioniše kao sistem za transformisanje i distribuiranje ulaznih i izlaznih tokova podataka. Pristupanje informacijama i izvorima podataka je obezbeđeno putem baze podataka za lociranje resursa i specijalnog sistema za izvršavanje upita.
Detaljan opis tehničkog rešenja Na slici 1 predstavljena je opšta struktura predloženog sistema. Sistem sadrži jednu centralnu bazu podataka u okviru koje se čuvaju neophodni podaci o otpadu.
Upravljanjekorisnicima
Generatorizvestaja
Statistickaanaliza
Centralna baza podataka Interfejs
Korisnik
Slika 1. Arhitektura sistema za evidentiranje otpada
Klijent koristi web pregledač (Internet Explorer, Firefox, Opera, Chrome, ...) i pristupa sistemu pomoću modula za proveru autentičnosti. Korisnički interfejs implementira lokalnu ili regionalnu funkcionalnost. Komunikacija između klijenata, centralne baze podataka, eksperata i dodatnih alata ostvaruje se pomoću Internet komunikacionih protokola (TCP/IP). Rešenje je veoma jednostavno modifikovati za potrebe korišćenja na mobilnim telefonima i sličnim prenosnim uređajima. Podacima u okviru centralne baze, kao i svim funkcijama koje mu stoje na raspolaganju, korisnik pristupa posredstvom interfejsa. Nije moguće neposredno pristupanje podacima iz baze, već interfejs omogućava da se podaci koje unese korisnik u procesu interakcije sa sitemom prilagode, odnosno transformišu u onaj oblik koji prihvata sam sistem. Pri tome, na osnovu pristupnih privilegija, koje kontroliše poseban deo sistema zadužen za upravljanje korisnicima, omogućava se pristup podacima određenog nivoa detalja. Samim korisnicima je omogućeno da dobiju odgovarajuće zbirne rezultate vezane za njihovu oblast interesovanja. Izveštaji se kreiraju u delu sistema koji je namenjen generisanju izveštaja. Takođe, obavlja se i odgovarajuća statistička analiza podataka, čiji su rezultati dostupni korisnicima putem interfejsa. Neposredan pristup centralnoj bazi podataka nije dozvoljen. Razvoj sistema za upravljanje otpadom zasniva se na preporuci EU broj 2150/2002, koja je vezana za obradu podataka o otpadu, a koja uvodi nove elemente u proces upravljanja otpadom. Definiše se period prikupljanja podataka, a unose podaci o organizaciji, o aktivnosti organizacije, podaci vezani za tip otpada, odnosno postupak obrade otpada. Za funkcionisanje ovakvog sistema veoma je važan period prikupljanja, odnosno unosa, odgovarajućih podataka, koji može biti korisnički definisan, ili je određen na osnovu pravne regulative koja obavezuje korisnike ovakvog sistema da redovno izveštavaju o količini generisanog otpada.
63 | Inženjerstvo zaštite
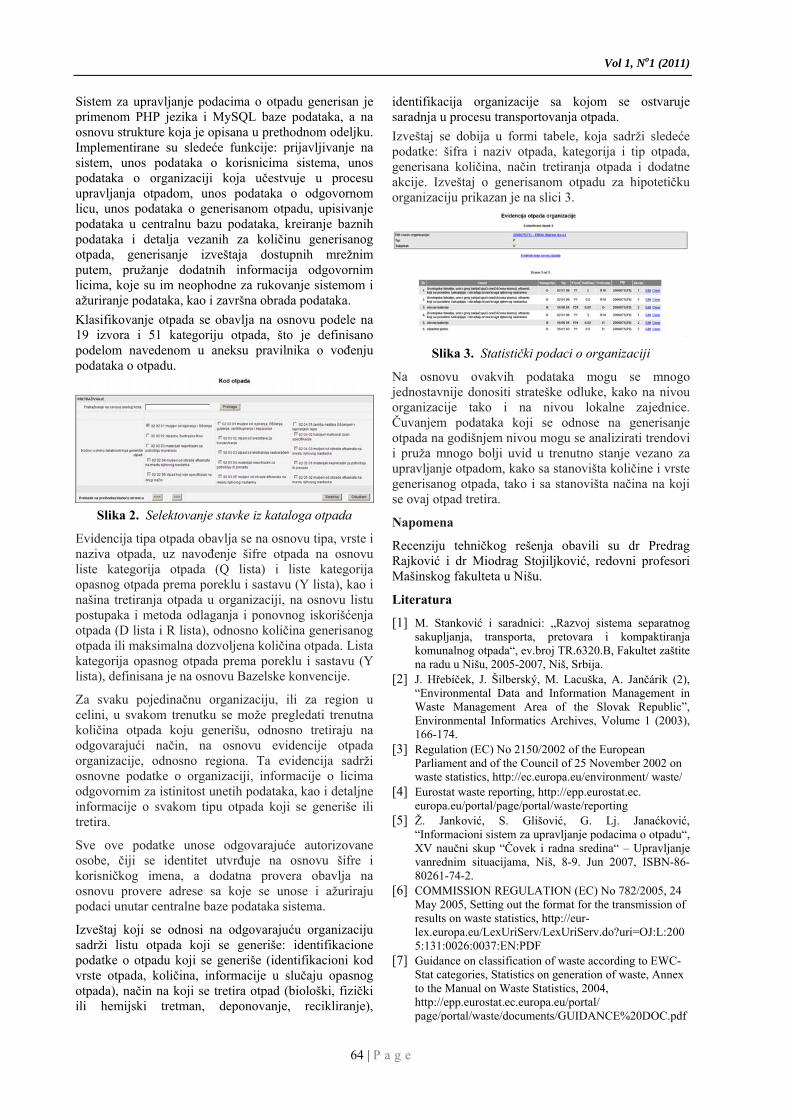
Vol 1, No1 (2011)
Sistem za upravljanje podacima o otpadu generisan je primenom PHP jezika i MySQL baze podataka, a na osnovu strukture koja je opisana u prethodnom odeljku. Implementirane su sledeće funkcije: prijavljivanje na sistem, unos podataka o korisnicima sistema, unos podataka o organizaciji koja učestvuje u procesu upravljanja otpadom, unos podataka o odgovornom licu, unos podataka o generisanom otpadu, upisivanje podataka u centralnu bazu podataka, kreiranje baznih podataka i detalja vezanih za količinu generisanog otpada, generisanje izveštaja dostupnih mrežnim putem, pružanje dodatnih informacija odgovornim licima, koje su im neophodne za rukovanje sistemom i ažuriranje podataka, kao i završna obrada podataka. Klasifikovanje otpada se obavlja na osnovu podele na 19 izvora i 51 kategoriju otpada, što je definisano podelom navedenom u aneksu pravilnika o vođenju podataka o otpadu.
Slika 2. Selektovanje stavke iz kataloga otpada
Evidencija tipa otpada obavlja se na osnovu tipa, vrste i naziva otpada, uz navođenje šifre otpada na osnovu liste kategorija otpada (Q lista) i liste kategorija opasnog otpada prema poreklu i sastavu (Y lista), kao i našina tretiranja otpada u organizaciji, na osnovu listu postupaka i metoda odlaganja i ponovnog iskorišćenja otpada (D lista i R lista), odnosno količina generisanog otpada ili maksimalna dozvoljena količina otpada. Lista kategorija opasnog otpada prema poreklu i sastavu (Y lista), definisana je na osnovu Bazelske konvencije.
Za svaku pojedinačnu organizaciju, ili za region u celini, u svakom trenutku se može pregledati trenutna količina otpada koju generišu, odnosno tretiraju na odgovarajući način, na osnovu evidencije otpada organizacije, odnosno regiona. Ta evidencija sadrži osnovne podatke o organizaciji, informacije o licima odgovornim za istinitost unetih podataka, kao i detaljne informacije o svakom tipu otpada koji se generiše ili tretira.
Sve ove podatke unose odgovarajuće autorizovane osobe, čiji se identitet utvrđuje na osnovu šifre i korisničkog imena, a dodatna provera obavlja na osnovu provere adrese sa koje se unose i ažuriraju podaci unutar centralne baze podataka sistema.
Izveštaj koji se odnosi na odgovarajuću organizaciju sadrži listu otpada koji se generiše: identifikacione podatke o otpadu koji se generiše (identifikacioni kod vrste otpada, količina, informacije u slučaju opasnog otpada), način na koji se tretira otpad (biološki, fizički ili hemijski tretman, deponovanje, recikliranje),
identifikacija organizacije sa kojom se ostvaruje saradnja u procesu transportovanja otpada. Izveštaj se dobija u formi tabele, koja sadrži sledeće podatke: šifra i naziv otpada, kategorija i tip otpada, generisana količina, način tretiranja otpada i dodatne akcije. Izveštaj o generisanom otpadu za hipotetičku organizaciju prikazan je na slici 3.
Slika 3. Statistički podaci o organizaciji
Na osnovu ovakvih podataka mogu se mnogo jednostavnije donositi strateške odluke, kako na nivou organizacije tako i na nivou lokalne zajednice. Čuvanjem podataka koji se odnose na generisanje otpada na godišnjem nivou mogu se analizirati trendovi i pruža mnogo bolji uvid u trenutno stanje vezano za upravljanje otpadom, kako sa stanovišta količine i vrste generisanog otpada, tako i sa stanovišta načina na koji se ovaj otpad tretira.
Napomena
Recenziju tehničkog rešenja obavili su dr Predrag Rajković i dr Miodrag Stojiljković, redovni profesori Mašinskog fakulteta u Nišu.
Literatura
[1] M. Stanković i saradnici: „Razvoj sistema separatnog sakupljanja, transporta, pretovara i kompaktiranja komunalnog otpada“, ev.broj TR.6320.B, Fakultet zaštite na radu u Nišu, 2005-2007, Niš, Srbija.
[2] J. Hřebíček, J. Šilberský, M. Lacuška, A. Jančárik (2), “Environmental Data and Information Management in Waste Management Area of the Slovak Republic”, Environmental Informatics Archives, Volume 1 (2003), 166-174.
[3] Regulation (EC) No 2150/2002 of the European Parliament and of the Council of 25 November 2002 on waste statistics, http://ec.europa.eu/environment/ waste/
[4] Eurostat waste reporting, http://epp.eurostat.ec. europa.eu/portal/page/portal/waste/reporting
[5] Ž. Janković, S. Glišović, G. Lj. Janaćković, “Informacioni sistem za upravljanje podacima o otpadu“, XV naučni skup “Čovek i radna sredina“ – Upravljanje vanrednim situacijama, Niš, 8-9. Jun 2007, ISBN-86-80261-74-2.
[6] COMMISSION REGULATION (EC) No 782/2005, 24 May 2005, Setting out the format for the transmission of results on waste statistics, http://eur-lex.europa.eu/LexUriServ/LexUriServ.do?uri=OJ:L:2005:131:0026:0037:EN:PDF
[7] Guidance on classification of waste according to EWC-Stat categories, Statistics on generation of waste, Annex to the Manual on Waste Statistics, 2004, http://epp.eurostat.ec.europa.eu/portal/ page/portal/waste/documents/GUIDANCE%20DOC.pdf
64 | P a g e


ALEKSANDAR INŽENJERING D.O.O. Novi Sad, Srbija
Prodaja i servis mernih instrumenata http://www.merniinstrumenti.com
Instrumenti za merenje električnih veličina
Merenje električnih veličina se vrši na svim instalacijama u velikim industrijama, malim pogonima ili stambenim objektima. Na osnovu rezultata dobijenih testiranjem moguće je napraviti preciznu evaluaciju električnih procesa. Informacije o struji, voltaži, otporu i energiji su dragoceni za adekvatno postavljanje električnih instalacija i njihovo puštanje u rad. Aparati za merenje električnih veličina su: * Multimetri * Miliommetri * Procesni kalibratori * Analizatori snage i energije * Analizatori kvaliteta napona * Instrumenti za ispitivanje električnih instalacija * Merila otpora izolacije * Merila otpora uzemljenja * Detektori napona * Tragači kablova * Strujna klešta * Izvori napajanja
Nemačka kompanija Gossen Metrawatt, koju na našem tržištu zastupa "Aleksandar Inženjering", drži lidersku poziciju u proizvodnji instrumenata za merenje i testiranje električnih veličina. Kreirajući aparate prema potrebama klijenata i kriterijumima visokih tehnoloških dostignuća, stvorili su sistemska rešenja za budućnost.
DIGITALNI MULTIMETRI
Metrahit a-serije, Metrahit e-serije, Metrahit s-serije, Analogni multimetri
MILIOMMETRI
Procesni kalibratori
Analizatori snage i energije
Strujna klešta
Instrumenti za ispitivanje električnih instalacija
Profitest 0100S-II+
Merila otpora izolacije
Merila otpora uzemljenja
GEOHM 5, GEOHM C
Kontakt Srbija, Novi Sad, Bem Lilike 2a Tel: 021/547-364, Fax: 021/65-46-297, Mob: 063/532-433

INSTRUCTIONS FOR AUTHORS
SAFETY ENGINEERING Journal publishes original scientific, technical and review papers in the field of occupational safety engineering, environmental safety and fire protection, as follows: • an original scientific article (a paper which presents
previously unpublished of personal research results by scientific method);
• review article (a paper which contains original, detailed and critical review of the research problem or the field in which the author has made a certain contribution, recognized on the basis of self-citations);
• preceding or short communications (original scientific full paper, but shorter and preliminary in character);
• scientific criticism or controversy (debate on a specific scientific topic based solely on scientific arguments) and reviews;
• professional paper (paper which provides useful experiences for improvement of professional practice, not necessarily based on scientific method);
• informative paper (editorial, comment, etc.). • review (books, computer programs, case studies, scientific
events, preceding or short communications, current topics, meta-analysis, other contributions and similar).
Papers are printed in Serbian and English, and published in both hard copy and electronic format on the website of the Faculty of Occupational Safety, University of Niš. SAFETY ENGINEERING Journal is published quarterly. Journal subject areas are: • Occupational Safety Engineering • Environmental Safety Engineering • Fire Protection Engineering • Legal, economic, sociological, psychological,
organizational, educational and linguistic aspects in safety engineering.
All papers published in the journal are subjected to peer review by the members of the Editorial Board who determine the order of their publication. Comments and suggestions of the editors and reviewers are submitted to the author for final revision. Manuscripts should be submitted in written and electronic form. The lenght of the manuscript is limited to eight A4 two-column pages. Template for papers can be found on the journal website:
www.znrfak.ni.ac.rs/safetyengineering
The papers made according to the template should be submitted to the following address: SAFETY ENGINEERING Journal Čarnojevića 10 a, 18000 Niš, Serbia or [email protected] If you have further questions, please contact us on +381 18 529 850
UPUTSTVO ZA AUTORE Časopis SAFETY ENGINEERING objavljuje originalne naučne, stručne i pregledne radove iz oblasti inženjerstva zaštite na radu, zaštite životne sredine i zaštite od požara, i to: • originalan naučni rad (rad u kome se iznose prethodno
neobjavljivani rezultati sopstvenih istraživanja naučnim metodom);
• pregledni rad (rad koji sadrži originalan, detaljan i kritički prikaz istraživačkog problema ili područja u kome je autor ostvario određeni doprinos, vidljiv na osnovu autocitata);
• kratko ili prethodno saopštenje (originalni naučni rad punog formata, ali manjeg obima ili preliminarnog karaktera);
• naučna kritika, odnosno polemika (rasprava na određenu naučnu temu zasnovana isključivo na naučnoj argumentaciji) i osvrti;
• stručni rad (prilog u kome se nude iskustva korisna za unapređenje profesionalne prakse, ali koja nisu nužno zasnovana na naučnom metodu);
• informativni prilog (uvodnik, komentar i sl.); • prikaz (knjige, računarskog programa, slučaja, naučnog
događaja, prethodna ili kratka saopštenja, aktuelne teme, meta-analize, drugi prilozi i slično).
Radovi se štampaju na srpskom i engleskom jeziku, a objavljuju se u pisanom i elektronskom formatu na sajtu Fakulteta zaštite na radu Univerziteta u Nišu. Časopis SAFETY ENGINEERING izlazi četiri puta godišnje.
Tematske oblasti časopisa su: • Inženjerstvo zaštite na radu; • Inženjerstvo zaštite životne sredine; • Inženjerstvo zaštite od požara; • Pravni, ekonomski, sociološki, psihološki, organizacioni,
obrazovni i lingvistički aspekti u inženjerstvu zaštite.
Svi radovi koji se objavljuju u časopis podležu recenziji od strane Uređivačkog odbora koji određuje i redosled njihovog štampanja. Primedbe i sugestije urednika i recenzenata dostavljaju se autoru radi konačnog oblikovanja. Radovi se predaju u pisanom i elektronskom obliku. Obim rukopisa je ograničen na osam dvokolonskih stranica formata A4. Templejt za pisanje radova se nalazi na sajtu časopisa:
www.znrfak.ni.ac.rs/safetyengineering
Radove pripremljene prema uputstvu za štampanje slati na adresu: Časopis Safety Engeenering Čarnojevića 10 a, 18000 Niš ili elektronskim putem na e-mail adresu:
Za sva dodatna pitanja obratiti se na telefon: 018/529-850

CIP - Каталогизација у публикацији Народна библиотека Србије, Београд 331.45/46 SAFETY ENGINEERING : Safety of Technical Systems : Journal for Scientiest and Engineers = Inženjerstvo zaštite : bezbednost tehničkih sistema : naučno stručni časopis / glavni urednik Dejan Krstić. - 2011, no. 1 (oct.)- . - Niš : Faculty of Occupational Safety in Niš. Center for Technical systems Safety, 2011- (Niš : M KOPS Centar). - 30 cm Tromesečno ISSN 2217-7124 = Safety Engineering (Niš) COBISS.SR-ID 187159820