World Customs Journal
167
World Customs Journal March 2020 Volume 14, Number 1 ISSN: 1834-6707 (Print) 1834-6715 (Online)
-
Upload
khangminh22 -
Category
Documents
-
view
3 -
download
0
Transcript of World Customs Journal
World C
ustoms Journal
Volume 14, N
umber 1
World Customs Journal
March 2020 Volume 14, Number 1
ISSN: 1834-6707 (Print) 1834-6715 (Online)
World Customs Journal
March 2020
Volume 14, Number 1
International Network of Customs UniversitiesInternational Network of Customs UniversitiesInternational Network of Customs Universities
World Customs JournalPublished by the Centre for Customs and Excise Studies (CCES), Charles Sturt University, Australia, and the Institute of Customs and International Trade Law (ICTL), University of Muenster, Germany, in association with the International Network of Customs Universities (INCU) and the World Customs Organization (WCO).
The World Customs Journal is a peer-reviewed journal that provides a forum for customs professionals, academics, industry researchers and research students to contribute items of interest and share research and experiences to enhance its readers’ understanding of all aspects of the roles and responsibilities of Customs. The Journal is published twice a year. The website is at: http://worldcustomsjournal.org
Guidelines for Contributors are included at the end of each issue. More detailed guidance about style is available on the Journal’s website.
Correspondence and all items submitted for publication should be sent in Microsoft Word or RTF, as email attachments, to the Editor-in-Chief: [email protected]
ISSN: 1834-6707 (Print) 1834-6715 (Online)
Volume 14, Number 1
Published March 2020
© 2020 CCES, Charles Sturt University, Australia and ICTL, University of Münster, Germany
INCU (www.incu.org) is an international not-for-profit association that aims to raise the academic standing of the customs profession through the development and promotion of educational programs, providing academic and applied research, and intellectual input to strategic decision-making.
Copyright. All rights reserved. Permission to use the content of the World Customs Journal must be obtained from the copyright owner. Please apply to the Editor-in-Chief.
Disclaimer. The views expressed in the World Customs Journal are those of individual contributors and are not necessarily those of the Editorial Board, INCU, the WCO or its individual membership, or the publishers.

Volume 14, Number 1 i
World Customs Journal
ContentsEditorial ..................................................................................................................................................iii
SECTION 1 – ACADEMIC CONTRIBUTIONS .............................................................................. 1The extent of the illicit cigarette market in Australia: using publicly available data in a ‘top‑down’ approach to estimation
Rob Preece and Alain Neher ............................................................................................................. 3The role and importance of customs representation to the customs control system in the Republic of Bulgaria
Momchil Antov ................................................................................................................................ 17Collaborative border management
Chappell Lawson and Alan Bersin .................................................................................................. 31Applying ‘mirror statistics’ in cross‑border trade administration: case of general department of Vietnam customs
Phan Thi Thu Hien and Nguyen Viet Hung ..................................................................................... 41Enhancing customs control in Cambodia through risk management policy
Hong Sreya ...................................................................................................................................... 55Tariff barriers and non‑tariff barriers: appraising Colombia’s protectionism
Jose Jaime Baena Rojas and Abraham Allec Londoño Pineda ...................................................... 71Lines, flows and transnational crime: toward a revised approach to countering the underworld of globalization
Alan Bersin and Lars Karlsson ....................................................................................................... 95The World Trade Organization and World Customs Organization key conventions and agreements (TFA, HSC, RKC): membership trends and opportunities
Carsten Weerth .............................................................................................................................. 107Implementing blockchain technology in the customs environment to support the SAFE Framework of Standards
Huseyin Yaren ................................................................................................................................ 127Advertising, marketing and promotional (AMP) expenses in customs valuation
Mrudula Dixit ................................................................................................................................ 139
SECTION 2 – SPECIAL REPORT ................................................................................................. 151WCO Announcement: 2022 Edition of the Harmonized System
SECTION 3 – REFERENCE MATERIAL .................................................................................... 155Guidelines for Contributors ................................................................................................................ 157Editorial Board .................................................................................................................................... 158
ii Volume 14, Number 1
International Network of Customs Universities
Volume 14, Number 1 iii
World Customs Journal
EditorialIn past editions of the Journal I have criticised governments for failing to provide the international trading community with the regulatory clarity and certainty required for prudent commercial decision-making. In stark contrast, it is pleasing to see the World Customs Organization (WCO) publishing the next iteration of the Harmonized System (HS) nomenclature two years prior to its implementation on 1 January 2022, giving traders and regulators alike ample opportunity to prepare for its introduction.
The regular updating of the HS to maintain its relevance in a continually changing world is no mean feat, and its importance to global trade should not be underestimated—it has arguably been one of the most significant contributors to international trade facilitation since its introduction over 30 years ago. We are therefore pleased to present the WCO’s announcement of HS 2022 as this edition’s Special Report, in which it highlights amendments to the nomenclature that address
environmental and social issues of increasing global concern.
The role played by Customs in addressing such issues was reinforced on International Customs Day, which is celebrated on 26 January each year, at which time the WCO announces a specific theme for its member administrations. This year the Secretary General, Dr Kunio Mikuriya, chose a particularly apposite theme, ‘Customs fostering Sustainability for People, Prosperity and the Planet’.
The chosen theme acknowledges the significant but generally unrecognised contribution to a sustainable future that Customs makes through its diverse range of social, economic, health and environmental responsibilities that underpin its critical role in policing international trade that may be harmful to the planet. This includes the enforcement of laws relating to endangered species of wild flora and fauna, ozone depleting substances, hazardous waste, hazardous chemicals and pesticides, persistent organic pollutants and biotechnology that may adversely affect biological diversity, to name a few.
Customs administrations around the world should be encouraged to use this year’s theme as a catalyst to raise the profile of the important role they play in protecting our planet for future generations. The Editorial Board would certainly welcome the publication of papers that address these important issues in future editions of the Journal.
Professor David Widdowson AM Editor-in-Chief

iv Volume 14, Number 1
International Network of Customs Universities

Section 1
Academic Contributions
SECTION 1 – ACADEMIC CONTRIBUTIONS

2 Volume 14, Number 1
International Network of Customs Universities
Volume 14, Number 1 3
World Customs Journal
The extent of the illicit cigarette market in Australia: using publicly available data in a
‘top‑down’ approach to estimationRob Preece and Alain Neher
Abstract
There have been several recent attempts to estimate the size of the Australian illicit tobacco market. The two most recent studies have provided significantly different results, with the Australian Taxation Office (ATO) arriving at an estimate of 5 per cent as the extent of the illicit component of the market, while a tobacco industry–funded approximation conducted by KPMG has suggested this figure to be 14.1 per cent. This paper investigates whether a new methodology for undertaking such an estimate could produce more accurate results and examines publicly available information to explore if there are datasets that could help determine which estimate of the illicit market may be more accurate. The resulting ‘top-down’ approach identifies an estimate lying between the ATO and KPMG estimates, although it is limited to the illicit cigarette market in Australia. Implications of the results are discussed, and suggestions for further research are presented.
1. IntroductionAustralia can be described as being innovative in its desire to reduce tobacco consumption levels and thus reduce exposure to non-communicable diseases that are associated with smoking (Preece, 2019). Through unique initiatives such as the ‘plain packaging’ of tobacco products1, the acceleration of excise taxation rates from 20102, and the linking of excise tax rate increases to affordability rather than inflation3, Australia has cut smoking prevalence4 to 13.8 per cent when last measured by the Australian Bureau of Statistics (ABS) in 2017/18, down from 27.7 per cent in 1990 (ABS, 2015; ABS, 2019a).
Due to these initiatives, there is a growing general interest in how such measures affect the nature and size of the illicit tobacco market. For this paper, the illicit tobacco market will be defined as being those tobacco products, namely cigarettes and loose leaf tobacco, on which duties and taxes are lawfully required to be paid but which enter the market without such payment.5 This definition seeks to avoid certain complexities that can be created by trying to further differentiate tax-evaded products as being either branded or unbranded, designated for Australian consumption or designated for foreign consumption, or as counterfeit or genuine, as is found in industry-funded studies (KPMG, 2019).
There have been several measurements made of the Australian illicit tobacco market during the past 10 years that are both different in their methodologies and significantly different in their estimates. Preece (2019) identifies three such studies, the earliest being that reported by the Department of Health (DOH)6, and, more recently and regularly, the ATO (2019b) and KPMG (2019). These illicit tobacco market estimates are summarised below in Table 1, which also identifies the methodology used.

4 Volume 14, Number 1
International Network of Customs Universities
Table 1: Summary of recent studies of the Australian illicit tobacco market
Author Period covered Methodology Estimate of illicit market share
DOH 2013 National Drug Household Survey 3.4%
KPMG 2013 Empty Pack Survey 13.5%
KPMG 2014 Empty Pack Survey 14.7%
KPMG 2015 Empty Pack Survey 14.4%
ATO 2015–16‘Supply side/bottom up’– analysis of distribution channels of import, bonded warehouse, domestic grown
5.6%(5.5% revised)
KPMG 2016 Empty Pack Survey 14.3%
DOH 2016 National Drug Household Survey 3.8%
ATO 2016–17‘Supply side/bottom up’– analysis of distribution channels of import, bonded warehouse, domestic grown
5.0%
KPMG 2017 Empty Pack Survey 15.0%
KPMG 2018 Empty Pack Survey 14.1%
ATO 2017–18‘Supply side/bottom up’– analysis of distribution channels of import, bonded warehouse, domestic grown
5.0%
Source: Authors.
Volume 14, Number 1 5
World Customs Journal
The ATO has used a ‘bottom up’ methodology which has analysed each of the ‘supply channels’ for tobacco entering the market (ATO, 2019a). These supply channels include illegally grown domestic tobacco7; imports of tobacco in cargo and mail; and imports ex-bonded warehouses8. The ATO’s methodology does not include imports by passengers of tobacco under its duty free allowance (ATO, 2019a).
The ATO has access to a range of data not available publicly, such as seizures not reported publicly, compliance results from business checks and audit activity, as well as intelligence relating to anti-illicit tobacco enforcement operations. While details of the actual methodology used to extrapolate the data into estimates are not published beyond the outline, the methodology has been subject to scrutiny by an independent panel of tax experts established in 2013 to determine whether proposed methodologies can be relied upon to produce a significantly robust gap estimate (ATO, 2019a).
Under this approach, the ATO (2019b) has published as its estimates of the extent of illicit tobacco:
• 2015/16 – 5.5%
• 2016/17 – 5.0%
• 2017/18 – 5.0%.
For the same period, and going back to 2013, the accounting firm KPMG has used a tobacco industry-funded ‘empty pack survey’ (EPS) methodology to analyse data collected from discarded tobacco packaging, as well as from industry sales and consumer surveys, to make its estimates. With these estimates ranging from 14.1 per cent to 15.0 per cent (KPMG, 2019) during the same period the ATO has been studying the illicit market, KPMG has been consistently about three times higher in its estimates than the ATO.
There has been some criticism of the approach undertaken in the KPMG findings, largely in terms of bias in sampling, such as collection of ‘foreign looking packaging’ in areas ‘frequented by foreign students’ (Preece, 2019, p. 30). Another question relates to how the tobacco companies who receive the packaging of their products from the EPS determine whether any package is properly tax paid or not properly tax paid.
Given these questions over the KPMG reporting and the size of the difference between both ATO’s and KPMG’s approaches, there is clearly value in investigating other sources of data and the use of a new methodology.
2. Methodology development and application
2.1. Tobacco tax gap estimates by Her Majesty’s Revenue & Customs (HMRC)
As a starting point, the study looked for, and located, what may be a more suitable methodology to adopt for the Australian tobacco market. The HMRC agency of the United Kingdom (UK) has been measuring and publishing its estimated ‘tax gap’ for tobacco products since 2013. HMRC (2017) uses a top-down approach, quite different from that used by both the ATO and KPMG; one in which total consumption of tobacco is established, then lawful clearances of tobacco are identified and deducted from total consumption.
For HMRC, total consumption is sourced from the Office of National Statistics’ (ONS) Opinions and Lifestyle Survey and is adjusted upwards to account for under-reporting of smoking levels by participants. Lawful clearance details are then sourced internally as HMRC is the agency charged with tobacco duty and tax collections, as well as estimating lawful cross border shopping and duty free sales (HMRC, 2017).
6 Volume 14, Number 1
International Network of Customs Universities
2.2 Australian top‑down approach to estimation
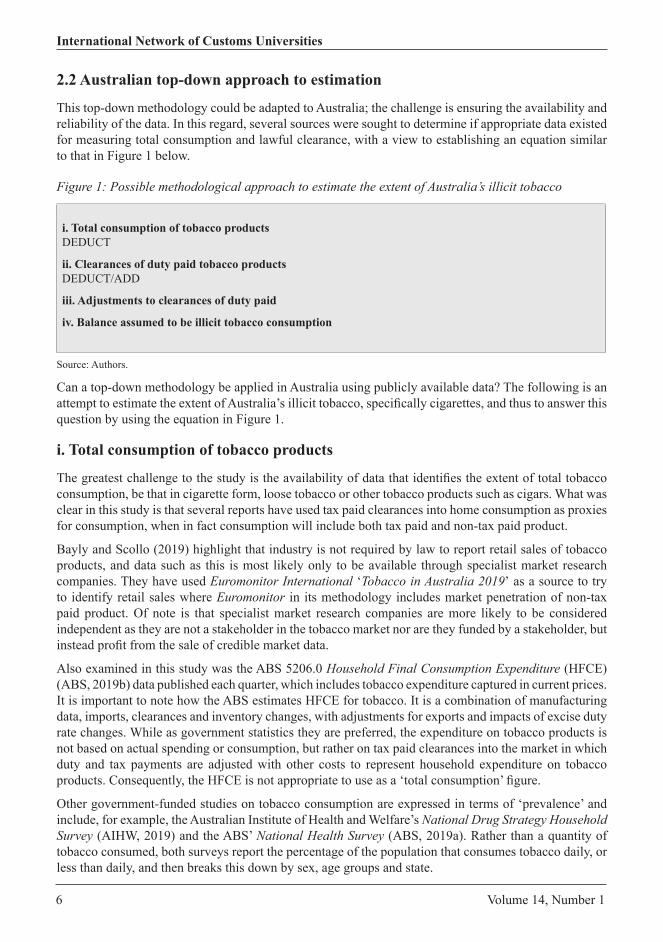
This top-down methodology could be adapted to Australia; the challenge is ensuring the availability and reliability of the data. In this regard, several sources were sought to determine if appropriate data existed for measuring total consumption and lawful clearance, with a view to establishing an equation similar to that in Figure 1 below.
Figure 1: Possible methodological approach to estimate the extent of Australia’s illicit tobacco
i. Total consumption of tobacco products DEDUCT
ii. Clearances of duty paid tobacco products DEDUCT/ADD
iii. Adjustments to clearances of duty paid
iv. Balance assumed to be illicit tobacco consumption
Source: Authors.
Can a top-down methodology be applied in Australia using publicly available data? The following is an attempt to estimate the extent of Australia’s illicit tobacco, specifically cigarettes, and thus to answer this question by using the equation in Figure 1.
i. Total consumption of tobacco products
The greatest challenge to the study is the availability of data that identifies the extent of total tobacco consumption, be that in cigarette form, loose tobacco or other tobacco products such as cigars. What was clear in this study is that several reports have used tax paid clearances into home consumption as proxies for consumption, when in fact consumption will include both tax paid and non-tax paid product.
Bayly and Scollo (2019) highlight that industry is not required by law to report retail sales of tobacco products, and data such as this is most likely only to be available through specialist market research companies. They have used Euromonitor International ‘Tobacco in Australia 2019’ as a source to try to identify retail sales where Euromonitor in its methodology includes market penetration of non-tax paid product. Of note is that specialist market research companies are more likely to be considered independent as they are not a stakeholder in the tobacco market nor are they funded by a stakeholder, but instead profit from the sale of credible market data.
Also examined in this study was the ABS 5206.0 Household Final Consumption Expenditure (HFCE) (ABS, 2019b) data published each quarter, which includes tobacco expenditure captured in current prices. It is important to note how the ABS estimates HFCE for tobacco. It is a combination of manufacturing data, imports, clearances and inventory changes, with adjustments for exports and impacts of excise duty rate changes. While as government statistics they are preferred, the expenditure on tobacco products is not based on actual spending or consumption, but rather on tax paid clearances into the market in which duty and tax payments are adjusted with other costs to represent household expenditure on tobacco products. Consequently, the HFCE is not appropriate to use as a ‘total consumption’ figure.
Other government-funded studies on tobacco consumption are expressed in terms of ‘prevalence’ and include, for example, the Australian Institute of Health and Welfare’s National Drug Strategy Household Survey (AIHW, 2019) and the ABS’ National Health Survey (ABS, 2019a). Rather than a quantity of tobacco consumed, both surveys report the percentage of the population that consumes tobacco daily, or less than daily, and then breaks this down by sex, age groups and state.

Volume 14, Number 1 7
World Customs Journal
The National Health Survey, however, does include some additional data of interest, namely the average number of cigarettes consumed per day by smokers over the age of 15, in both the ‘daily’ and ‘non-daily’ categories. This is additional information from the 2014/15 survey and allows for the design of Table 2 to capture this additional data to try to estimate a total consumption figure.
Table 2: Smoking prevalence to estimate actual consumption of cigarettes in 2018
Smokers >15 years of age Average cigarettes consumed per day Total (x 365 days per annum)
2,584,400 (daily) 12.3 11,602,663,800
266,500 (non-daily) 1.3 126,454,250
11,729,118,050
Source: Authors, ABS National Health Survey 2017/18 (ABS, 2019a).
While insightful, Table 2 is not representative of total tobacco consumption as it lacks data on youth smoking (below 15 years of age) and, as highlighted by the ABS, data may be impacted by under-reporting of consumption, particularly by those under 18 years of age who had other family members present during survey questioning (ABS, 2019a). Further, it should be noted that there is no data on other tobacco products and as such it is not clear whether ‘cigarette’ includes those rolled by the consumer from loose leaf tobacco.
As a result, the study returned to the Euromonitor International ‘Tobacco in Australia 2019’ report and examined the methodology used by Euromonitor to compile its market data and the approach taken to establish a total consumption quantity. Euromonitor’s website9 outlines its methodology of market analysis, which includes the following steps:
• Desk research of publicly available sources
• Trade survey that involves discussions of ‘data and dynamics’ with local industry
• Store visits to check products, prices, and promotions
• Data validation by way of audit and cross-referencing of data
• Data substantiated for release with explanations.
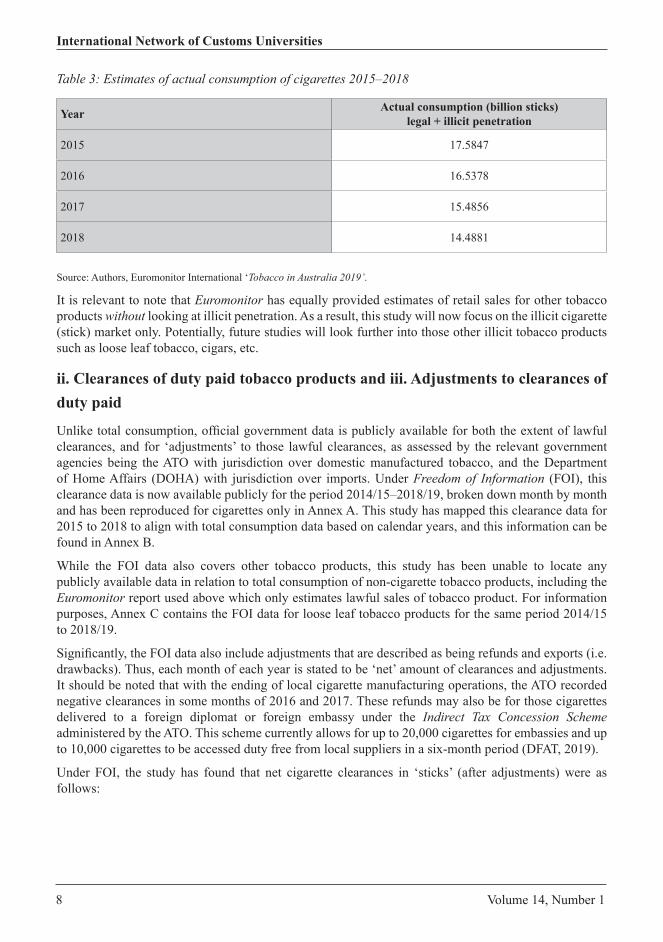
Within the datasets published in the 2019 report for Australia, Euromonitor has also included a figure titled ‘actual consumption’, being a combination of ‘legal sales’ and ‘illegal market penetration’ in which that illicit level of sales is expressed as a percentage of retail sales. The percentage of illicit sales in relation to retail has been determined by analysis of ‘official statistics, trade associations and trade interviews’ undertaken at wholesale and retail levels, and across the different retail channels. By applying ‘actual consumption’ from Euromonitor, Table 3 below may, in fact, be the most accurate publicly accessible and independent estimate of the total consumption of cigarettes.
8 Volume 14, Number 1
International Network of Customs Universities
Table 3: Estimates of actual consumption of cigarettes 2015–2018
Year Actual consumption (billion sticks) legal + illicit penetration
2015 17.5847
2016 16.5378
2017 15.4856
2018 14.4881
Source: Authors, Euromonitor International ‘Tobacco in Australia 2019’.
It is relevant to note that Euromonitor has equally provided estimates of retail sales for other tobacco products without looking at illicit penetration. As a result, this study will now focus on the illicit cigarette (stick) market only. Potentially, future studies will look further into those other illicit tobacco products such as loose leaf tobacco, cigars, etc.
ii. Clearances of duty paid tobacco products and iii. Adjustments to clearances of duty paid
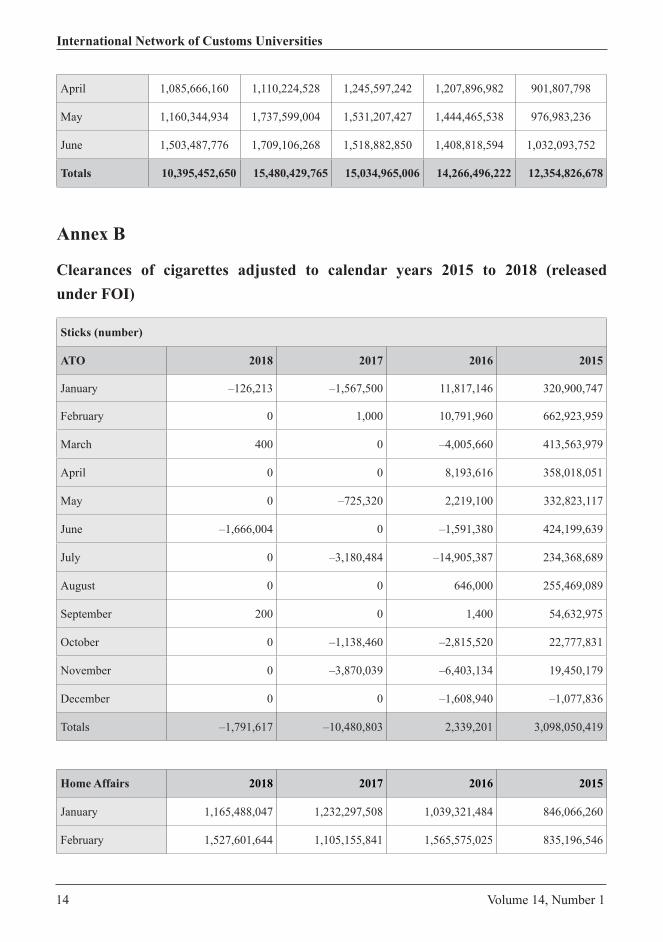
Unlike total consumption, official government data is publicly available for both the extent of lawful clearances, and for ‘adjustments’ to those lawful clearances, as assessed by the relevant government agencies being the ATO with jurisdiction over domestic manufactured tobacco, and the Department of Home Affairs (DOHA) with jurisdiction over imports. Under Freedom of Information (FOI), this clearance data is now available publicly for the period 2014/15–2018/19, broken down month by month and has been reproduced for cigarettes only in Annex A. This study has mapped this clearance data for 2015 to 2018 to align with total consumption data based on calendar years, and this information can be found in Annex B.
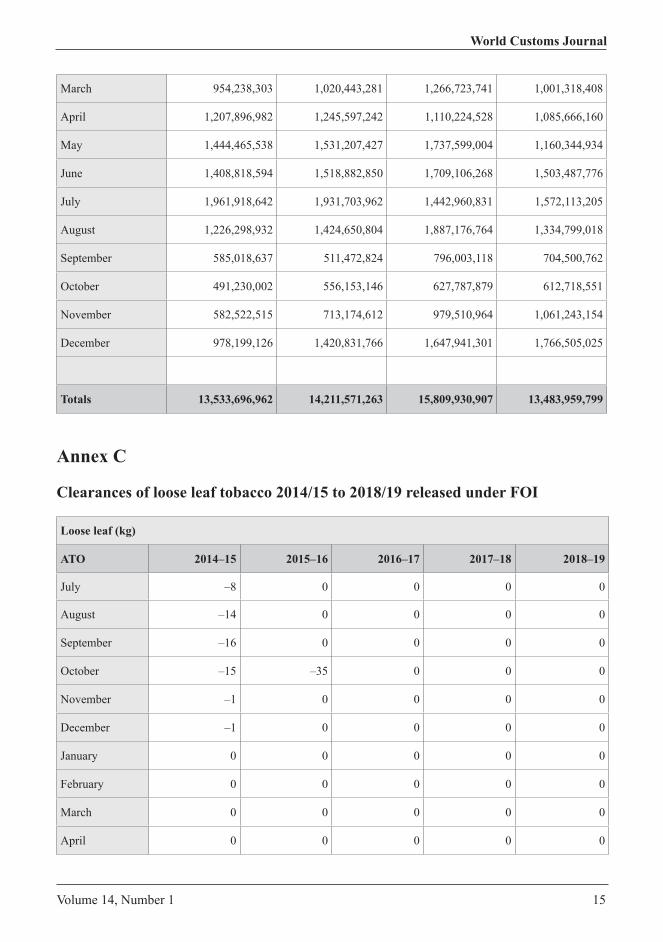
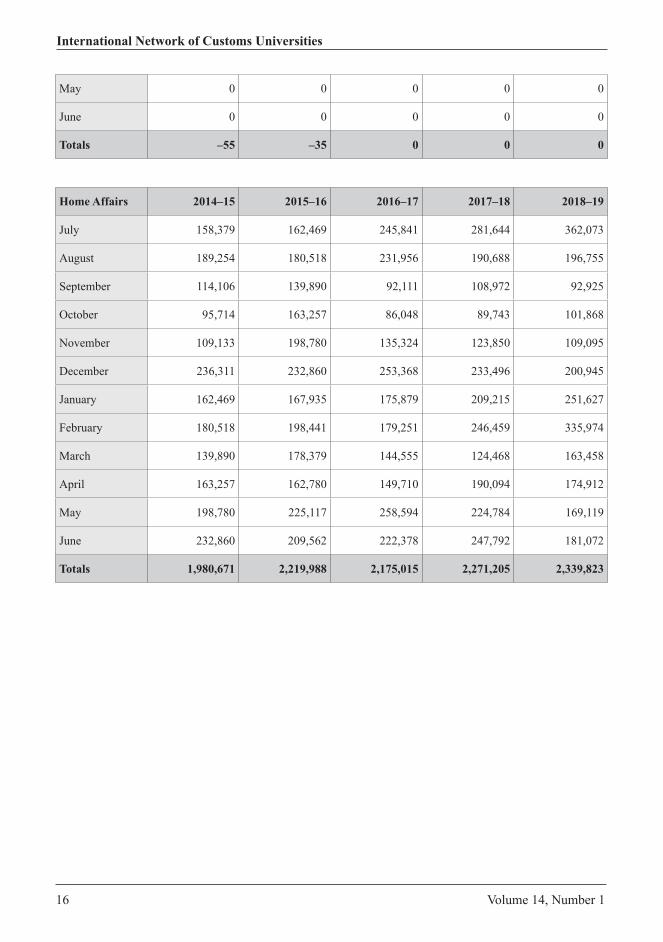
While the FOI data also covers other tobacco products, this study has been unable to locate any publicly available data in relation to total consumption of non-cigarette tobacco products, including the Euromonitor report used above which only estimates lawful sales of tobacco product. For information purposes, Annex C contains the FOI data for loose leaf tobacco products for the same period 2014/15 to 2018/19.
Significantly, the FOI data also include adjustments that are described as being refunds and exports (i.e. drawbacks). Thus, each month of each year is stated to be ‘net’ amount of clearances and adjustments. It should be noted that with the ending of local cigarette manufacturing operations, the ATO recorded negative clearances in some months of 2016 and 2017. These refunds may also be for those cigarettes delivered to a foreign diplomat or foreign embassy under the Indirect Tax Concession Scheme administered by the ATO. This scheme currently allows for up to 20,000 cigarettes for embassies and up to 10,000 cigarettes to be accessed duty free from local suppliers in a six-month period (DFAT, 2019).
Under FOI, the study has found that net cigarette clearances in ‘sticks’ (after adjustments) were as follows:
Volume 14, Number 1 9
World Customs Journal
• 2015 – 16,582,010,218
• 2016 – 15,812,270,108
• 2017 – 14,201,090,460
• 2018 – 13,531,905,345.
FOI data also include adjusted clearances for ‘loose leaf tobacco’ during this same period and will be used for future studies on the illicit market for such products. For information, this data can be found in Annex C.
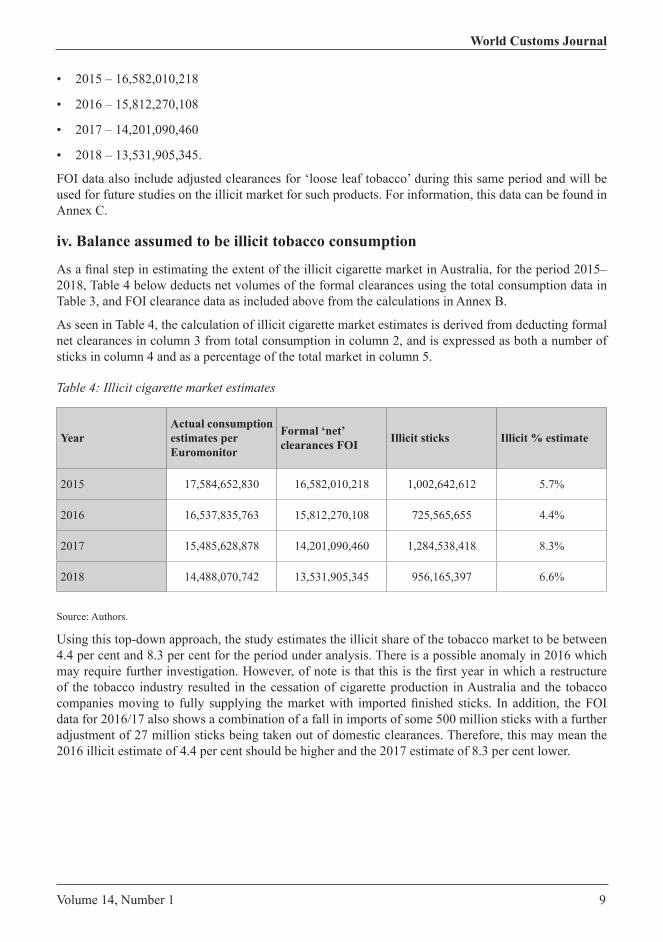
iv. Balance assumed to be illicit tobacco consumption
As a final step in estimating the extent of the illicit cigarette market in Australia, for the period 2015–2018, Table 4 below deducts net volumes of the formal clearances using the total consumption data in Table 3, and FOI clearance data as included above from the calculations in Annex B.
As seen in Table 4, the calculation of illicit cigarette market estimates is derived from deducting formal net clearances in column 3 from total consumption in column 2, and is expressed as both a number of sticks in column 4 and as a percentage of the total market in column 5.
Table 4: Illicit cigarette market estimates
YearActual consumption estimates per Euromonitor
Formal ‘net’ clearances FOI Illicit sticks Illicit % estimate
2015 17,584,652,830 16,582,010,218 1,002,642,612 5.7%
2016 16,537,835,763 15,812,270,108 725,565,655 4.4%
2017 15,485,628,878 14,201,090,460 1,284,538,418 8.3%
2018 14,488,070,742 13,531,905,345 956,165,397 6.6%
Source: Authors.
Using this top-down approach, the study estimates the illicit share of the tobacco market to be between 4.4 per cent and 8.3 per cent for the period under analysis. There is a possible anomaly in 2016 which may require further investigation. However, of note is that this is the first year in which a restructure of the tobacco industry resulted in the cessation of cigarette production in Australia and the tobacco companies moving to fully supplying the market with imported finished sticks. In addition, the FOI data for 2016/17 also shows a combination of a fall in imports of some 500 million sticks with a further adjustment of 27 million sticks being taken out of domestic clearances. Therefore, this may mean the 2016 illicit estimate of 4.4 per cent should be higher and the 2017 estimate of 8.3 per cent lower.

10 Volume 14, Number 1
International Network of Customs Universities
3. How do the study’s illicit cigarette market estimates compare with other studies?Excluding 2016 at this point, this study places the estimate of the illicit tobacco market in between the other studies conducted in Australia as set out in Table 1 above. Considering the cigarette market only, which is about 83.6 per cent (value of sales) of the tobacco market (Scollo & Bayly, 2019a), this study puts the illicit tobacco market share substantially lower than that published by KPMG during the period and closer to the ATO’s estimates. This is also consistent with Gallagher, Evans-Reeves, Hatchard and Gilmore (2019), who state that it is common for industry-funded studies to estimate a higher market share for illicit products. They have also questioned both the Empty Pack Survey and Consumer Survey methodologies that were used as the basis for much of the KPMG report.
Looking at an illicit cigarette market of currently 6.6 per cent in Australia, the study firstly looked regionally at illicit tobacco market estimates. Sou and Preece (2013), studying the illicit trade in tobacco across South East Asia, compared certain government tobacco tax receipts with Euromonitor data published in 2012. They found that of the ten ASEAN10 member countries of South East Asia, Singapore was at the lower end in terms of an illicit market at 5 per cent, through to Malaysia at 36 per cent, with the range of the illicit market at the regional level being somewhere between 7 per cent and 11 per cent.
Although these regional figures are dated three years before the data in this study, they are not too distant from what has been estimated for Australia. The Australian figure is then slightly below the global picture published by the World Health Organization (WHO), which states that globally ‘one in 10 cigarette and tobacco products consumed is illicit’, in other words, 10 per cent (WHO, 2019). This figure is actually an increase from a global figure of 9 per cent in 2013 (WHO, 2014).
4. Limitations and conclusionAs to some extent all research suffers from limitations, this study identifies the following limitations. The illicit tobacco trade by its nature is secretive and, therefore, inherently difficult to quantify with certainty. Following the aim to explore a new methodology to measure the Australian illicit tobacco market, this study, in the first instance, did not conduct empirical research in attempting to estimate the size of the illicit cigarette/tobacco market. Rather it sought to rely on information that is publicly available and accessible. In this regard, there is an over-reliance on the methodology used by Euromonitor in its estimation of the total consumption of cigarettes which itself includes an attempt to quantify illicit cigarette penetration. Additionally, available data on the estimation of the total consumption of tobacco products is limited to cigarettes.
Notwithstanding, these limitations must be weighed against the potential of the elaborated methodological approach and the new estimate of the illicit cigarette market complementing existing approximations. The research confirms that once credible data is available on both total cigarette and tobacco consumption, a top-down approach may be a suitable option to consider in measuring the extent of the illicit tobacco problem in Australia. By using the currently available data, the study further suggests that the size of the Australian illicit tobacco market lies in between the findings of the ATO and KPMG, potentially closer to the estimate of the ATO than that of KPMG.
In conclusion, the study highlights the needs for further research into estimating total tobacco consumption, for example, through surveys similar to those used in the UK which also allow for under-reporting effects. Likewise, such research into consumption should also include the breakdown of that consumption into the differing categories of product, as the illicit market share estimates of this study may change once loose leaf tobacco and other products are included.
Volume 14, Number 1 11
World Customs Journal
References
Australian Bureau of Statistics. (ABS). (2015). National Health Survey: First Results 2014–15. Catalogue 4364.0.55.001, Canberra.
Australian Bureau of Statistics (ABS). (2019a). National Health Survey: First Results 2017/18. Catalogue 4364.0.55.001, Canberra.
Australian Bureau of Statistics (ABS). (2019b). Household final consumption expenditure, retrieved 19 January 2020 from https://www.abs.gov.au/AUSSTATS/[email protected]/DetailsPage/5206.0Sep%202019?OpenDocument.
Australian Department of Foreign Affairs & Trade (DFAT). (2019). Protocol Guidelines: 6.2 Indirect Tax Concession Scheme. Retrieved from https://dfat.gov.au/about-us/publications/corporate/protocol-guidelines/Pages/6-2-indirect-tax-concession-scheme.aspx
Australian Department of Treasury. (2018). Response to FOI Request 2350 Net clearances of all tobacco products including cigarettes and loose leaf tobacco from the Australian Taxation Office and the Department of Home Affairs for the period January 2017 – December 2017. Retrieved from https://treasury.gov.au/sites/default/files/2019-03/FOI_2350-document-1.pdf
Australian Institute of Health & Welfare (AIHW). (2019). Fact sheet: Tobacco. Retrieved from https://www.aihw.gov.au/getmedia/d9f46b83-cc55-4c77-873f-4d2b802715cc/AODTSFactsheet_tobacco.pdf.aspx
Australian Taxation Office (ATO). 2019a, Tobacco tax gap, retrieved 19 January 2020 from https://www.ato.gov.au/About-ATO/Research-and-statistics/In-detail/Tax-gap/Tobacco-tax-gap/.
Australian Taxation Office (ATO). (2019b). Tobacco tax gap. Retrieved from https://www.ato.gov.au/About-ATO/Research-and-statistics/In-detail/Tax-gap/Tobacco-tax-gap/?page=3#Trends_and_latest_findings
Bayly, M., & Scollo M. (2019). 2.4 Expenditure on tobacco products. In M. M. Scollo & M. H. Winstanley (eds), Tobacco in Australia: Facts and issues. Melbourne, Cancer Council Victoria. Retrieved from http://www.tobaccoinaustralia.org.au/chapter-2-consumption/2-4-expenditure-on-tobacco-products
Cancer Council of Victoria. (2014). Analysis of KPMG LLP report on use of illicit tobacco in Australia (Unpublished). Retrieved from http://www.cancervic.org.au/downloads/mini_sites/Plain-facts/analysis-kpmg-llp-report-illicit-tobacco-aust-2013.pdf
Euromonitor International. (2019). Tobacco in Australia (Unpublished).Gallagher, A. W. A., Evans-Reeves, K. A., Hatchard, J. L., & Gilmore, A. B. (2019) Tobacco industry
data on illicit tobacco trade: A systematic review of existing assessments. Tobacco Control, 28, 334–345.
HM Revenue & Customs (HMRC). (2017). Measuring tax gaps 2017 edition: tobacco tax gap estimates for 2016–17. London, HM Revenue & Customs Corporate Communications.
KPMG. (2019). Illicit tobacco in Australia: 2018 full year report. Retrieved from https://www.medianet.com.au/releases/176600/
Preece, R. (2019). Addressing the illicit flow of tobacco products in Australia. In S. Dutta (ed), Confronting illicit tobacco trade: A global review of country experiences. World Bank Group. Retrieved from http://documents.worldbank.org/curated/en/677451548260528135/pdf/133959-REPL-PUBLIC-6-2-2019-19-59-24-WBGTobaccoIllicitTradeFINALvweb.pdf
Sou, G., & Preece, R. (2013). Reducing the illicit trade in tobacco products in the ASEAN Region: A review of the Protocol to Eliminate Illicit Trade in Tobacco Products. World Customs Journal, 7, 65–91.
12 Volume 14, Number 1
International Network of Customs Universities
Scollo, M. M., & Bayly, M. (2019a). 2.5 Industry sales figures as estimates for consumption. In M. M. Scollo & M. H. Winstanley (eds), Tobacco in Australia: Facts and issues. Melbourne, Cancer Council Victoria, retrieved from http://www.tobaccoinaustralia.org.au/chapter-2-consumption/2-5-industry-sales-figures-as-estimates-for-consum
World Health Organization (WHO). (2019). Tobacco. Retrieved from https://www.who.int/news-room/fact-sheets/detail/tobacco
World Health Organization (WHO). (2014). Illicit trade in tobacco: A summary of the evidence and country responses. Retrieved from https://www.who.int/tobacco/economics/illicittrade.pdf
Notes1 Tobacco Plain Packaging Act 2011 (and Regulations).2 See Excise Tariff Amendment Bill 2010, Excise Tariff Amendment Bill 2014.3 Excise tax rate increases since 2014 are based on Average Weekly Ordinary Times Earnings (AWOTE) and not the
Consumer Price Index (CPI).4 Smoking prevalence is the percentage of adults who smoke daily.5 Item 5.2 of the Schedule to the Excise Tariff Act 19216 As supplied in the FCTC (Framework Convention on Tobacco Control) Questionnaire to the World Health Organization
(WHO) for 2013 and 2016 by DOH, see Australian Institute of Health and Welfare (2017). National Drug Strategy Household Survey detailed report 2016. Drug statistics series no. 31. Cat. No. PHE 214. Canberra: AIHW. Available at: https://www.aihw.gov.au/reports/illicit-use-of-drugs/2016-ndshsdetailed.
7 No excise licences are currently on issue to grow or manufacture tobacco and as such all domestically grown tobacco is considered illegal.
8 Until 30 June 2020 after which time there will no longer be any duty suspended tobacco held in bonded warehouses following the cessation of that facility from 1 July 2019.
9 https://www.euromonitor.com/tobacco-in-australia/report.10 The Association of Southeast Asian Nations (ASEAN) comprises Brunei Darussalam, Cambodia, Indonesia, Laos People’s
Democratic Republic, Malaysia, Myanmar, Philippines, Singapore, Thailand and Vietnam.
Dr Rob PreeceRob is an Associate Professor with the Centre for Customs and Excise Studies (CCES), Charles Sturt University and is based in Canberra, Australia. He is the Convener of CCES’s postgraduate Excise Studies program and a Visiting Fellow at the Shanghai Customs College. Rob also undertakes capacity building, vocational training, policy development, and research on behalf of governments, private sector and academic partners. He holds a PhD with his thesis being in the area of excise tax policy development.
Dr Alain NeherAlain is an academic in the School of Management and Marketing at Charles Sturt University. He graduated from the University of Applied Sciences in Business Administration Zurich before completing two masters at the Lucerne University of Applied Sciences and Arts and a doctorate from Charles Sturt University. Alain has more than 25 years of work experience including management roles in private and public organisations as well as a not-for-profit organisation operating in a multinational environment. For numerous years he worked as a senior excise tax expert and vocational trainer at the General Directorate of Swiss Customs.

Volume 14, Number 1 13
World Customs Journal
Annex AClearances of cigarettes 2014/15 to 2018/19 released under FOI
Sticks (number)
ATO 2014–15 2015–16 2016–17 2017–18 2018–19
July 901,890,333 234,368,689 –14,905,387 –3,180,484 0
August 880,756,867 255,469,089 646,000 0 0
September 509,153,983 54,632,975 1,400 0 200
October 284,286,596 22,777,831 –2,815,520 –1,138,460 0
November 417,417,640 19,450,179 –6,403,134 –3,870,039 0
December 931,323,118 –1,077,836 –1,608,940 0 0
January 320,900,747 11,817,146 –1,567,500 –126,213 0
February 662,923,959 10,791,960 1,000 0 100
March 413,563,979 –4,005,660 0 400 0
April 358,018,051 8,193,616 0 0 2,000
May 332,823,117 2,219,100 –725,320 0 0
June 424,199,639 –1,591,380 0 –1,666,004 0
Totals 6,437,258,029 613,045,709 –27,377,401 –9,980,800 2,300
Home Affairs 2014–15 2015–16 2016–17 2017–18 2018–19
July 630,166,860 1,572,113,205 1,442,960,831 1,931,703,962 1,961,918,642
August 625,962,770 1,334,799,018 1,887,176,764 1,424,650,804 1,226,298,932
September 555,559,142 704,500,762 796,003,118 511,472,824 585,018,637
October 492,003,987 612,718,551 627,787,879 556,153,146 491,230,002
November 629,465,723 1,061,243,154 979,510,964 713,174,612 582,522,515
December 1,030,214,084 1,766,505,025 1,647,941,301 1,420,831,766 978,199,126
January 846,066,260 1,039,321,484 1,232,297,508 1,165,488,047 994,618,767
February 835,196,546 1,565,575,025 1,105,155,841 1,527,601,644 1,614,552,619
March 1,001,318,408 1,266,723,741 1,020,443,281 954,238,303 1,009,582,652
14 Volume 14, Number 1
International Network of Customs Universities
April 1,085,666,160 1,110,224,528 1,245,597,242 1,207,896,982 901,807,798
May 1,160,344,934 1,737,599,004 1,531,207,427 1,444,465,538 976,983,236
June 1,503,487,776 1,709,106,268 1,518,882,850 1,408,818,594 1,032,093,752
Totals 10,395,452,650 15,480,429,765 15,034,965,006 14,266,496,222 12,354,826,678
Annex B
Clearances of cigarettes adjusted to calendar years 2015 to 2018 (released under FOI)
Sticks (number)
ATO 2018 2017 2016 2015
January –126,213 –1,567,500 11,817,146 320,900,747
February 0 1,000 10,791,960 662,923,959
March 400 0 –4,005,660 413,563,979
April 0 0 8,193,616 358,018,051
May 0 –725,320 2,219,100 332,823,117
June –1,666,004 0 –1,591,380 424,199,639
July 0 –3,180,484 –14,905,387 234,368,689
August 0 0 646,000 255,469,089
September 200 0 1,400 54,632,975
October 0 –1,138,460 –2,815,520 22,777,831
November 0 –3,870,039 –6,403,134 19,450,179
December 0 0 –1,608,940 –1,077,836
Totals –1,791,617 –10,480,803 2,339,201 3,098,050,419
Home Affairs 2018 2017 2016 2015
January 1,165,488,047 1,232,297,508 1,039,321,484 846,066,260
February 1,527,601,644 1,105,155,841 1,565,575,025 835,196,546
Volume 14, Number 1 15
World Customs Journal
March 954,238,303 1,020,443,281 1,266,723,741 1,001,318,408
April 1,207,896,982 1,245,597,242 1,110,224,528 1,085,666,160
May 1,444,465,538 1,531,207,427 1,737,599,004 1,160,344,934
June 1,408,818,594 1,518,882,850 1,709,106,268 1,503,487,776
July 1,961,918,642 1,931,703,962 1,442,960,831 1,572,113,205
August 1,226,298,932 1,424,650,804 1,887,176,764 1,334,799,018
September 585,018,637 511,472,824 796,003,118 704,500,762
October 491,230,002 556,153,146 627,787,879 612,718,551
November 582,522,515 713,174,612 979,510,964 1,061,243,154
December 978,199,126 1,420,831,766 1,647,941,301 1,766,505,025
Totals 13,533,696,962 14,211,571,263 15,809,930,907 13,483,959,799
Annex C
Clearances of loose leaf tobacco 2014/15 to 2018/19 released under FOI
Loose leaf (kg)
ATO 2014–15 2015–16 2016–17 2017–18 2018–19
July –8 0 0 0 0
August –14 0 0 0 0
September –16 0 0 0 0
October –15 –35 0 0 0
November –1 0 0 0 0
December –1 0 0 0 0
January 0 0 0 0 0
February 0 0 0 0 0
March 0 0 0 0 0
April 0 0 0 0 0
16 Volume 14, Number 1
International Network of Customs Universities
May 0 0 0 0 0
June 0 0 0 0 0
Totals –55 –35 0 0 0
Home Affairs 2014–15 2015–16 2016–17 2017–18 2018–19
July 158,379 162,469 245,841 281,644 362,073
August 189,254 180,518 231,956 190,688 196,755
September 114,106 139,890 92,111 108,972 92,925
October 95,714 163,257 86,048 89,743 101,868
November 109,133 198,780 135,324 123,850 109,095
December 236,311 232,860 253,368 233,496 200,945
January 162,469 167,935 175,879 209,215 251,627
February 180,518 198,441 179,251 246,459 335,974
March 139,890 178,379 144,555 124,468 163,458
April 163,257 162,780 149,710 190,094 174,912
May 198,780 225,117 258,594 224,784 169,119
June 232,860 209,562 222,378 247,792 181,072
Totals 1,980,671 2,219,988 2,175,015 2,271,205 2,339,823
Volume 14, Number 1 17
World Customs Journal
The role and importance of customs representation to the customs control system in
the Republic of BulgariaMomchil Antov
Abstract
The complex nature of foreign trade operations and related customs formalities are some of the prerequisites giving rise to the need for customs representation to form part of the customs process. Such representation is a necessary part of international supply chains, as the requisite professional knowledge in the sphere of customs compliance serves to protect the interests of both the economic operators involved and the state represented by the customs administration. The services provided by the customs representatives facilitate the smooth passage of the consignments through the relevant customs formalities, lead to a reduction in the time for customs clearance and, through consultation, lead to increasing the wellbeing of the economic operators who trust them. At the same time, customs administrations generally have a trustworthy and predictable partner: the customs representative who understands the customs formalities and actively assists in fulfilling the tasks and objectives assigned to them. In the context of the Republic of Bulgaria, customs representatives play an important role in customs procedures and participate in a substantial part of import, export and transit operations.
1. IntroductionThe complex nature of foreign trade operations and related customs formalities are some of the main prerequisites giving rise to the need for customs representation to form part of the customs process. Traders cannot and need not know in detail the customs legislation and technological specifics of control on the goods imported or exported by them, especially if trading with third countries is not their main activity. At the same time, a good knowledge of customs procedures is important for conform with the law and derive maximum economic benefit from each foreign trade transaction by reducing or saving customs duties, shortening the time limits for customs clearance of goods and minimising the costs associated with the delivery of goods. Customs representatives are therefore a necessary part of international retail chains as their professional knowledge of customs control can help to protect the interests of both the economic operators involved and the state represented by the customs administration.
The object of this article is the status of customs representatives as part of the customs processes and especially its manifestation in the Republic of Bulgaria; the subject is the role and importance of customs representation to the customs control system; and the purpose is to characterise the features of customs representation and to identify its place in the different customs processes (import, export, transit) in the Republic of Bulgaria, outlining also some of its main benefits.
18 Volume 14, Number 1
International Network of Customs Universities
In order to achieve this goal, the author:
• draws out the main features of customs representation as an independent activity
• presents the historical development of customs representation in the Republic of Bulgaria
• analyses the activities of customs representatives in the Republic of Bulgaria by individual customs procedures: import, export and transit of goods.
2. Customs representationRepresentation, as a process, is part of civil law and is associated with the implementation of pre‑arranged actions between two persons, in which one of them represents the other before a third party. The representative may act in their own name (indirectly) or on behalf of the client (directly), but always on account of and in favour of the latter. In this regard, customs representation should be defined as a ‘purposeful activity in which one person (represented importer or exporter) is represented by another person (a representative) in their dealings with the customs control authorities’.
From a normative point of view, this type of representation is legally regulated in Article 5, Item 6 of the Union Customs Code (UCC)1, promulgated in 2013, where a customs representative is defined as ‘any person appointed by another person to carry out the acts and formalities required under the customs legislation in his or her dealings with customs authorities’.
In the national customs legislation in force in the Republic of Bulgaria, customs representation is defined in Article 18, Paragraph 1 of the Customs Act (Customs Act, 1998), according to which ‘any person may be represented before the customs authorities for performing the actions and formalities laid down herein and in the statutory instruments for the implementation of this act’.
The common European and national customs legislation applicable in the Republic of Bulgaria does not impose significant restrictions on the conditions that persons who are representatives in a given customs procedure have to meet. Article 18, Paragraph 2 of the UCC provides that the representative shall be ‘a person established within the customs territory of the Union’, except in cases expressly specified2. However, taking into account that representation expresses its essence through human activities, it could be stated that individuals appointed to act as customs representatives should at least have legal capacity3.
Globally, customs representation is developing and manifesting itself in a number of forms, but the prevailing practice is to carry it out in two ways: by a person specialised or approved by the respective customs administration (customs representative or customs agent) or by any other person, who has and can prove their representative authority in a specific customs procedure (proxy). ‘Proxies’ may also include the trader’s employees (e.g. from a specialised department in their enterprise), the carrier of the goods, or a close person or an acquaintance who the importer or exporter is inclined to trust (Bozhinova & Tomeva, 2010, p. 150).
There are more commonalities than differences between the two entities of customs representation thus outlined. Importantly, both entities are admitted to a specific customs procedure by explicit authorisation by the represented client and their representative power extends within the authorisation itself. Their powers may be specified in terms of type of activity (e.g. import, export, transit, administrative, expert), specific customs regime, specific consignment, or duration and/or territorial validity of the representative power. Generally, customs legislation does not envisage different procedures for representatives compared to those that would be applied to the holder of the respective foreign trade operation—an object of customs control. Practically, this means that their rights and obligations in a customs procedure are the same and that they stem from the legal framework for carrying out the relevant procedure.

Volume 14, Number 1 19
World Customs Journal
The customs representative shall draw up the customs declaration, present the goods and all necessary documents for verification and, if necessary, secure the customs duties in accordance with the provisions in force.
The differences between customs proxies and customs representatives (agents) are mainly shown in the way their activities are organised. The activities of customs representatives are professional, as they set up specialised enterprises through which they provide various services to their clients. Customs proxies do not have to meet such requirements and they usually lack substantial professional competence in customs matters. This circumstance often makes it necessary for customs proxies to use the services of customs representatives for consultations and document handling in relation to certain customs procedures, which they subsequently carry out on their own before the control authorities.
Although in the EU, member states customs representation is an unregulated profession, in many countries, such as the USA, Canada, Australia, New Zealand, China and Turkey, it is still a profession requiring licensing (a license is required to carry out the activity).
On the one hand, this means that in these countries there are restrictions on the choice of persons who can assist the economic operators in the customs clearance of the goods they trade in. On the other hand, prerequisites are created for building sound relations between the customs control authorities and their clients, which benefits all parties involved in the customs process.
Customs representation also brings certain benefits to the customs administration. The customs control legal framework is made up of legislative Acts at international, regional and national levels. Knowing it well is a challenge, but it is a prerequisite for carrying out foreign trade transactions and operations.
Taking into account the specialised focus of the actions of customs representatives and their practical experience in customs procedures, it is assumed that customs administrations generally consider them as reliable and trustworthy partners. Proper document handling for a specific customs procedure is a prerequisite for quickly and professionally completing the process. This creates conditions for avoiding conflicts and disputes, the smooth passing of international traffic of goods through customs clearance and ensuring conformity with the law.
As in all relationships with the interested parties, customs should also have regular, constructive communication with customs representatives, as they are often the first line of contact between customs and traders. Besides preparing documents and submitting them in writing or electronically, and calculating and often the paying duties, taxes and charges, customs representatives play an important role in facilitating the communication between the customs and other public authorities and the importers/exporters. Standards 8.5 and 1.3 of the Revised Kyoto Convention contain specific provisions for customs administrations to specify and maintain consultative relationships with the trade, and to provide for third parties, such as customs representatives, to participate in their formal consultations with trade (World Customs Organization, 2018, p. 35).
In order for a customs representation to be established, it should be distinguished as a legal fact. To this end, the client delegates power of representation through authorisation to a person of their choice (natural or legal). Authorisation is seen as a basic and irreversible condition for a person to be admitted to a customs procedure as a representative of a particular economic operator (exporter or importer). In this way, the client expresses their will and consent as to who shall represent him before the control authorities regarding the customs clearance of the goods they trade in.
According to Article 18 of the UCC, customs representation can be4:
• direct, when the representative takes action in the name of and on behalf of another person, or
• indirect, when the representative takes action in their own name but on behalf of another person and subsequently settles his or her relationships with that person.

20 Volume 14, Number 1
International Network of Customs Universities
Direct representation is most commonly used as the customs representative does not bear any risks related to the activity of the represented person. Indirect representation is less common and is mainly used where customs representatives have organised their activity well and who enjoy a high level of trust as regards their clients.
Representation, including customs representation, is an activity turned into a business for the purpose of obtaining an economic benefit (profit). This leads to the conclusion that it is a systematically practised profession (Bachvarova, 2006, p. 202). In addition to the activities directly related to the representation of the client before the third party, a customs representative may also act as a trade intermediary. This embodiment is economically justified when they provide ancillary services to their client, such as:
• finding clients for the goods they import or export
• assisting in securing the necessary transport (freight forwarding)
• taking out insurance in their capacity of an insurance agent.
In these cases, the payment for the ancillary services is in the form of a commission. There must be equality in the interests of the client and their customs representative, and the latter cannot derive a benefit to the detriment of the former.
As already stated, the customs legislation in force in the EU enables economic operators to choose whether to represent themselves before the customs authorities on their own or to use the services of customs representatives. In most cases, their decision depends on:
• the complexity of foreign trade operations
• the available knowledge and experience in that field
• the time required for the customs clearance of the goods
• the aggregate cost related to the customs clearance of the goods
• the possibility of simultaneous access to additional services (insurance, freight forwarding, cargo handling, bank guarantees, obtaining specific documents from competent authorities, assistance in applying for import quotas, etc.).
In case difficulties arise in the customs clearance of a foreign trade operation, economic operators usually seek assistance from customs representatives. In order to choose the right representative, who will maximally meet the specific requirements and expectations of a given economic operator, they should search for information from the branch organisations5, partners and friends, as well as meet with different customs representatives. The information sought should answer at least the following questions:
1. How long has the customs representative been in the business (what experience do they have)?
2. In which area did they specialise (import, export, transit, special procedures, excise duties, Intrastat)?
3. What additional services do they provide (insurance, freight forwarding, warehousing, bank guarantee, etc.)?
4. Are they inclined to explain in detail the procedures they perform (it is important so that the client understands properly the customs process)?
5. Do they have customer references or any recognition in the field?
6. How do they guarantee to exercise promptly and correctly their representative powers?
7. What is the total cost of the service offered?
Volume 14, Number 1 21
World Customs Journal
This choice is not always easy and the price that will eventually be paid to the customs representative should not be the leading criterion. Practice has proven that good consultation and consistent process management yield better results. At the same time, it should be considered that certain responsibilities are also transferred to the customs representatives, which economic operators can claim under the contracts concluded with them (Grainger, 2016, p. 25).
3. Development of customs representation in the Republic of BulgariaFrom an historical perspective, the status of the customs representative was established in the Republic of Bulgaria in the early 20th century. During this period, the country opened to international trade, which, also due to the country’s good geographical location, began to develop rapidly (Mladenov, 2000, p. 11). The Customs Act, which came into force in 1906, was the first to introduce the legal regulation of the activities of ‘customs commissioners’. It provided that they could act on behalf of their clients by interceding in writing and verbally with the customs and other administrative institutions in cases concerning the correct application of the customs legislation. Persons entitled to such intermediation had to fulfill requirements related to their professional knowledge, social status, and personal moral and ethical qualities.
In the years before the Second World War, the customs legislation of the Republic of Bulgaria was changed and improved many times so that it could better meet the needs of business and the state. At the same time, the texts referring to the activities of customs representatives were changed and supplemented, extending their powers as well as their responsibilities.
In 1948, in accordance with the changes occurring in the political and socio–economic life of the country, a new Customs Act was adopted, which significantly restricted and narrowed the possibilities for carrying out foreign trade activities. There were no provisions in its texts governing the functioning of customs representatives, which practically terminated their existence as legal entities.
The post‑1989 democratic changes in the country led to the economy’s orientation towards the principles of the free market, and the participation of local businesses in international trade was revived. Despite the new Customs Act adopted in 1990 to meet the newly created conditions for trade, the status of customs representative was not restored. Only in 1999, with a view to applying for and launching EU accession negotiations, Bulgaria’s customs legislation was unified with that of the European Community and customs representation was restored. A licensing regime was introduced, and those wishing to work as customs representatives had to meet certain requirements related primarily to their professional background and experience. The competent authorities to issue licences for customs agents were the Ministry of Finance along with the national customs administration of Bulgaria, the latter exercising direct control over their activity. During the years in which this licensing regime was in operation, more than 250 licences for customs agents of Bulgarian natural and legal persons were issued.
On 1 January 2007, Bulgaria became a full EU member state and from that moment on it applied directly the common customs regulations applicable throughout the community. The changes that occurred in trading with the other EU member states and the structural reforms carried out at the Customs Agency had an impact on the territorial scope and number of customs offices in the country. These changes, in turn, affected the business of the economic operators and hence the number of customs agents in the country.
At the beginning of 2013, the customs representation regime in the European Union was liberalised and the prior approval of persons wishing to develop professionally in this field was no longer required. This, on the one hand, reduces the administrative burden in the sector, but on the other hand implies the admission of insufficiently prepared persons to the customs processes. In practice, the market for

22 Volume 14, Number 1
International Network of Customs Universities
such services is expected to regulate which customs representatives can serve the foreign trade activity of the economic operators in EU member states. Ideally, customs brokers should have experience not only in the sphere of customs but also in facilitating international trade, supply chains, financing and financial operations, security issues and compliance with the requirements of import and export of goods (Gwardzińska, 2014, p. 68).
In recent years, there have been global changes in our society towards its informatisation. These changes have a significant impact on the ways, means and methods that are applicable in administering the processes related to international trade. From a technological point of view, many of the customs representation activities have already been transferred to a new electronic environment. This in turn creates new types of relationships, both between customs representatives and their clients, and between customs representatives and the respective third parties and institutions before which they exercise their powers.
At present customs authorisation in Bulgaria is implemented through the specially designed electronic Customs Agency’s Identification and Access Management System (BCA IAM). In order to start the authorisation process, it is also necessary for the economic operator (client) and the person acting as customs representative to be registered in this system. An additional prerequisite for working well with BCA IAM is that both parties need to have valid Qualified Electronic Signatures (QES) and valid EORI numbers6.
The customs representation authorisation process involves the following players:
• Authorising person: this is a person already registered in the BCA IAM, who delegates some of their business profiles to another registered person
• Authorised person: this is a person already registered with the BCA IAM, who receives some of the business profiles of another registered person.
Authorisation is always initiated by the authorising person and is called an authorisation request, which the authorised person can accept or reject.
4. Customs representation in the Republic of BulgariaUnder the current market conditions, customs representation in the Republic of Bulgaria develops mainly with regard to the importation, exportation and transit of goods from and to third countries. Individual customs representatives also provide services to their clients with regard to excise duty on goods, as well as intra–community trade between the member states of the European Union.
Customs procedures for introducing and importing goods are important for the overall customs control process, since all its functions are manifested in them. It is not just about raising funds for the national and EU budgets, but also about protecting the economic and personal interests of the Union’s businesses and population. The strict adherence of customs representatives to these procedures is a prerequisite for the proper and effective customs clearance of the foreign trade transactions they are entrusted with by their clients. Import procedures are applied in a certain logical sequence and customs representatives’ familiarity with the procedures serves to certify their professional competences and skills. Ignoring any of them may lead to damaging the client’s interests, which consequently may also affect the customs representatives themselves.
Although most of the foreign trade of the Republic of Bulgaria is with other EU member states, the country is also open to other trading partners. This is evidenced by the diversity and number of customs regimes used under which the goods imported from third countries and their value are placed. The data presented in Table 1 illustrate this diversity, outlining the place and importance of customs representation in the country.
Volume 14, Number 1 23
World Customs Journal
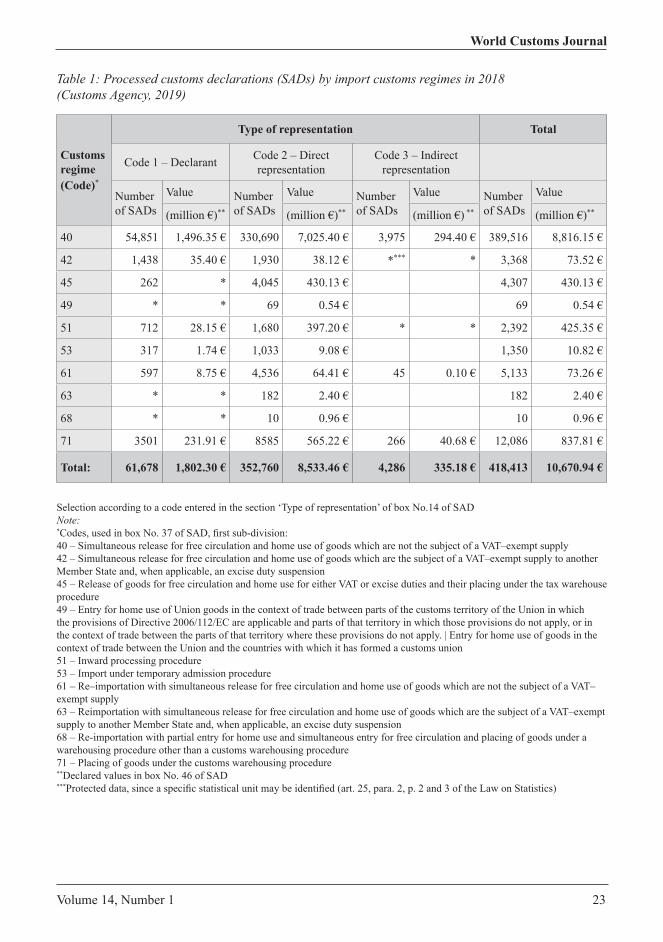
Table 1: Processed customs declarations (SADs) by import customs regimes in 2018 (Customs Agency, 2019)
Customs regime (Code)*
Type of representation Total
Code 1 – Declarant Code 2 – Direct representation
Code 3 – Indirect representation
Number of SADs
Value Number of SADs
Value Number of SADs
Value Number of SADs
Value
(million €)** (million €)** (million €) ** (million €)**
40 54,851 1,496.35 € 330,690 7,025.40 € 3,975 294.40 € 389,516 8,816.15 €
42 1,438 35.40 € 1,930 38.12 € **** * 3,368 73.52 €
45 262 * 4,045 430.13 € 4,307 430.13 €
49 * * 69 0.54 € 69 0.54 €
51 712 28.15 € 1,680 397.20 € * * 2,392 425.35 €
53 317 1.74 € 1,033 9.08 € 1,350 10.82 €
61 597 8.75 € 4,536 64.41 € 45 0.10 € 5,133 73.26 €
63 * * 182 2.40 € 182 2.40 €
68 * * 10 0.96 € 10 0.96 €
71 3501 231.91 € 8585 565.22 € 266 40.68 € 12,086 837.81 €
Total: 61,678 1,802.30 € 352,760 8,533.46 € 4,286 335.18 € 418,413 10,670.94 €
Selection according to a code entered in the section ‘Type of representation’ of box No.14 of SADNote:*Codes, used in box No. 37 of SAD, first sub-division:40 – Simultaneous release for free circulation and home use of goods which are not the subject of a VAT–exempt supply42 – Simultaneous release for free circulation and home use of goods which are the subject of a VAT–exempt supply to another Member State and, when applicable, an excise duty suspension45 – Release of goods for free circulation and home use for either VAT or excise duties and their placing under the tax warehouse procedure49 – Entry for home use of Union goods in the context of trade between parts of the customs territory of the Union in which the provisions of Directive 2006/112/EC are applicable and parts of that territory in which those provisions do not apply, or in the context of trade between the parts of that territory where these provisions do not apply. | Entry for home use of goods in the context of trade between the Union and the countries with which it has formed a customs union51 – Inward processing procedure53 – Import under temporary admission procedure61 – Re–importation with simultaneous release for free circulation and home use of goods which are not the subject of a VAT–exempt supply63 – Reimportation with simultaneous release for free circulation and home use of goods which are the subject of a VAT–exempt supply to another Member State and, when applicable, an excise duty suspension68 – Re-importation with partial entry for home use and simultaneous entry for free circulation and placing of goods under a warehousing procedure other than a customs warehousing procedure71 – Placing of goods under the customs warehousing procedure**Declared values in box No. 46 of SAD***Protected data, since a specific statistical unit may be identified (art. 25, para. 2, p. 2 and 3 of the Law on Statistics)
24 Volume 14, Number 1
International Network of Customs Universities
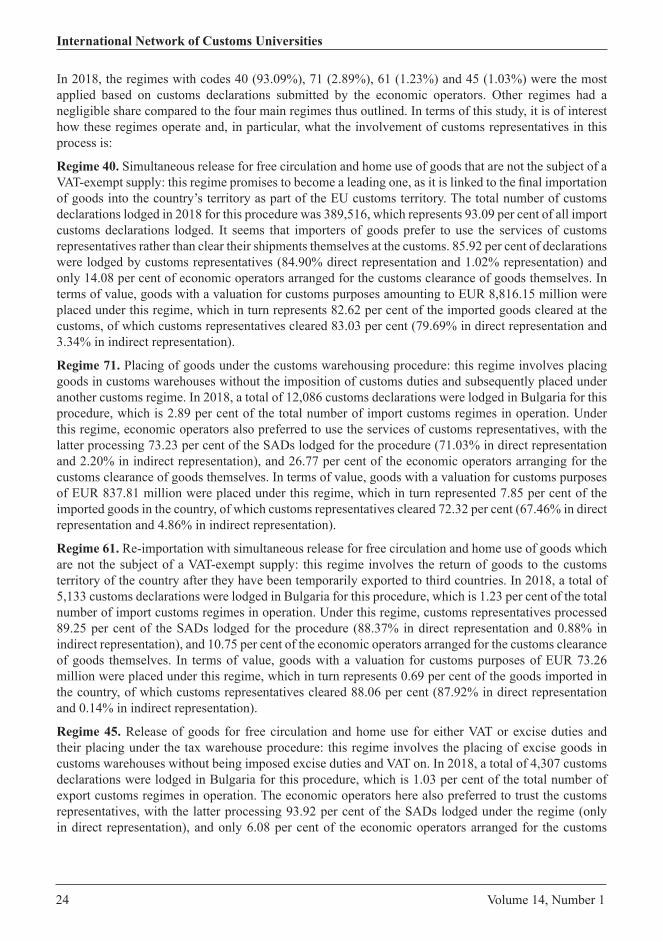
In 2018, the regimes with codes 40 (93.09%), 71 (2.89%), 61 (1.23%) and 45 (1.03%) were the most applied based on customs declarations submitted by the economic operators. Other regimes had a negligible share compared to the four main regimes thus outlined. In terms of this study, it is of interest how these regimes operate and, in particular, what the involvement of customs representatives in this process is:
Regime 40. Simultaneous release for free circulation and home use of goods that are not the subject of a VAT-exempt supply: this regime promises to become a leading one, as it is linked to the final importation of goods into the country’s territory as part of the EU customs territory. The total number of customs declarations lodged in 2018 for this procedure was 389,516, which represents 93.09 per cent of all import customs declarations lodged. It seems that importers of goods prefer to use the services of customs representatives rather than clear their shipments themselves at the customs. 85.92 per cent of declarations were lodged by customs representatives (84.90% direct representation and 1.02% representation) and only 14.08 per cent of economic operators arranged for the customs clearance of goods themselves. In terms of value, goods with a valuation for customs purposes amounting to EUR 8,816.15 million were placed under this regime, which in turn represents 82.62 per cent of the imported goods cleared at the customs, of which customs representatives cleared 83.03 per cent (79.69% in direct representation and 3.34% in indirect representation).
Regime 71. Placing of goods under the customs warehousing procedure: this regime involves placing goods in customs warehouses without the imposition of customs duties and subsequently placed under another customs regime. In 2018, a total of 12,086 customs declarations were lodged in Bulgaria for this procedure, which is 2.89 per cent of the total number of import customs regimes in operation. Under this regime, economic operators also preferred to use the services of customs representatives, with the latter processing 73.23 per cent of the SADs lodged for the procedure (71.03% in direct representation and 2.20% in indirect representation), and 26.77 per cent of the economic operators arranging for the customs clearance of goods themselves. In terms of value, goods with a valuation for customs purposes of EUR 837.81 million were placed under this regime, which in turn represented 7.85 per cent of the imported goods in the country, of which customs representatives cleared 72.32 per cent (67.46% in direct representation and 4.86% in indirect representation).
Regime 61. Re‑importation with simultaneous release for free circulation and home use of goods which are not the subject of a VAT-exempt supply: this regime involves the return of goods to the customs territory of the country after they have been temporarily exported to third countries. In 2018, a total of 5,133 customs declarations were lodged in Bulgaria for this procedure, which is 1.23 per cent of the total number of import customs regimes in operation. Under this regime, customs representatives processed 89.25 per cent of the SADs lodged for the procedure (88.37% in direct representation and 0.88% in indirect representation), and 10.75 per cent of the economic operators arranged for the customs clearance of goods themselves. In terms of value, goods with a valuation for customs purposes of EUR 73.26 million were placed under this regime, which in turn represents 0.69 per cent of the goods imported in the country, of which customs representatives cleared 88.06 per cent (87.92% in direct representation and 0.14% in indirect representation).
Regime 45. Release of goods for free circulation and home use for either VAT or excise duties and their placing under the tax warehouse procedure: this regime involves the placing of excise goods in customs warehouses without being imposed excise duties and VAT on. In 2018, a total of 4,307 customs declarations were lodged in Bulgaria for this procedure, which is 1.03 per cent of the total number of export customs regimes in operation. The economic operators here also preferred to trust the customs representatives, with the latter processing 93.92 per cent of the SADs lodged under the regime (only in direct representation), and only 6.08 per cent of the economic operators arranged for the customs
Volume 14, Number 1 25
World Customs Journal
clearance of goods themselves. In terms of value, goods with a valuation for customs purposes amounting to EUR 430.13 million were placed under this regime, which in turn represents 4.03 per cent of the goods imported in the country.
The data presented above show that customs representatives play an important role in import operations carried out in the territory of the Republic of Bulgaria. Of the total 418,413 customs declarations lodged in 2018 on importation of goods, customs representatives processed 85.33 per cent (84.31% in direct representation and 1.02% in indirect representation) and only 14.67 per cent of the economic operators chose to clear their imports to the customs administration themselves. In terms of value, goods from third countries with a valuation for customs purposes amounting to EUR 10,670.94 million were imported into the country, with customs representatives clearing 83.11 per cent of these goods (79.97% in direct representation and 3.14% in indirect representation). In terms of this analysis, it should be noted that in 2018 some import customs regimes remained unused in Bulgaria7. This can be defined both as a consequence of their specifics and as lack of interest in applying these regimes by the economic operators.
The customs procedures applied in the EU for the exportation of goods can be classified as benign, which is a consequence of the Union’s liberal policy on foreign trade regimes. At the same time, a number of mechanisms are used to control this process to protect the internal market from unwanted or fictitious exports of goods. The customs procedures for the exportation of goods are an element of the EU foreign trade policy and knowing them well and applying them properly enables customs representatives to actively assist their clients in expanding their market positions in third countries.
The dynamism of export operations gives rise to various difficulties for exporters, some of which are related to their customs clearance. Along with their commitment to undertake this clearance, customs representatives can also take on the role of foreign trade advisers to their clients. The knowledge they have of international retail chains and of the transportation, insurance and financial risks involved in building them can significantly assist economic operators in optimising their foreign trade activities. They can advise exporters on the specifics of the respective foreign trade operation and thus help them to achieve more favourable economic terms in carrying it out. Besides, customs representatives can also offer their clients ancillary services, such as securing transportation for their goods, taking out cargo insurance for the duration of its transportation and providing a guarantee for re‑exporting non‑union goods. The basic and ancillary services offered by the customs representatives provides everything the importers need for the successful implementation of their foreign trade marketing strategies.
The Republic of Bulgaria is an export‑oriented country, maintaining foreign trade relations with the other EU member states and with third countries. Bulgarian exporters can apply flexible export strategies, which is evidenced by their use of all normatively stipulated export customs regimes. The data presented in Table 2 confirm this, outlining the place and importance of customs representation in the country in the context of export customs procedures.
26 Volume 14, Number 1
International Network of Customs Universities
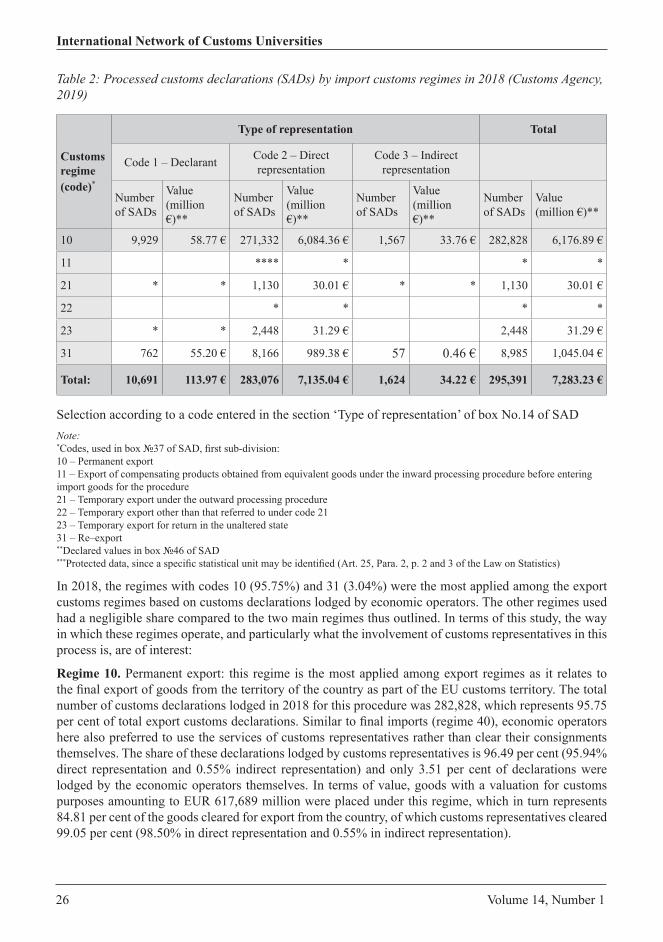
Table 2: Processed customs declarations (SADs) by import customs regimes in 2018 (Customs Agency, 2019)
Customs regime (code)*
Type of representation Total
Code 1 – Declarant Code 2 – Direct representation
Code 3 – Indirect representation
Number of SADs
Value (million €)**
Number of SADs
Value (million €)**
Number of SADs
Value(million €)**
Number of SADs
Value (million €)**
10 9,929 58.77 € 271,332 6,084.36 € 1,567 33.76 € 282,828 6,176.89 €
11 **** * * *
21 * * 1,130 30.01 € * * 1,130 30.01 €
22 * * * *
23 * * 2,448 31.29 € 2,448 31.29 €
31 762 55.20 € 8,166 989.38 € 57 0.46 € 8,985 1,045.04 €
Total: 10,691 113.97 € 283,076 7,135.04 € 1,624 34.22 € 295,391 7,283.23 €
Selection according to a code entered in the section ‘Type of representation’ of box No.14 of SADNote:*Codes, used in box 37 of SAD, first sub-division:10 – Permanent export11 – Export of compensating products obtained from equivalent goods under the inward processing procedure before entering import goods for the procedure21 – Temporary export under the outward processing procedure22 – Temporary export other than that referred to under code 2123 – Temporary export for return in the unaltered state31 – Re–export**Declared values in box 46 of SAD***Protected data, since a specific statistical unit may be identified (Art. 25, Para. 2, p. 2 and 3 of the Law on Statistics)
In 2018, the regimes with codes 10 (95.75%) and 31 (3.04%) were the most applied among the export customs regimes based on customs declarations lodged by economic operators. The other regimes used had a negligible share compared to the two main regimes thus outlined. In terms of this study, the way in which these regimes operate, and particularly what the involvement of customs representatives in this process is, are of interest:
Regime 10. Permanent export: this regime is the most applied among export regimes as it relates to the final export of goods from the territory of the country as part of the EU customs territory. The total number of customs declarations lodged in 2018 for this procedure was 282,828, which represents 95.75 per cent of total export customs declarations. Similar to final imports (regime 40), economic operators here also preferred to use the services of customs representatives rather than clear their consignments themselves. The share of these declarations lodged by customs representatives is 96.49 per cent (95.94% direct representation and 0.55% indirect representation) and only 3.51 per cent of declarations were lodged by the economic operators themselves. In terms of value, goods with a valuation for customs purposes amounting to EUR 617,689 million were placed under this regime, which in turn represents 84.81 per cent of the goods cleared for export from the country, of which customs representatives cleared 99.05 per cent (98.50% in direct representation and 0.55% in indirect representation).
Volume 14, Number 1 27
World Customs Journal
Regime 31. Re-export: this regime is linked to the final taking out of non–Union goods outside the EU customs territory after being placed under a special regime in that territory. The total number of customs declarations submitted in 2018 for this procedure was 8,985, which represents 3.04 per cent of all export customs declarations throughout the year. Following the trend developed so far, under this regime economic operators preferred to use the services of customs representatives rather than clear their own consignments. The share of these exports cleared by customs representatives is 91.51 per cent (90.88% direct representation and 0.63% indirect representation) and only 8.49 per cent of declarations were lodged by the economic operators themselves. In terms of value, goods with a valuation for customs purposes of EUR 1,045.04 million were placed under this regime, which in turn represented 14.35 per cent of the cleared goods for export from the country, of which customs representatives cleared 94.71 per cent of these goods (94.67% in direct representation and 0.04% in indirect representation).
The data presented above are similar to the state of customs representation in the Republic of Bulgaria when importing goods, thus leading to the generalisation that customs representatives also play a key role in the export operations carried out in the country’s territory. Of the total 259,391 customs declarations submitted for export of goods in 2018, customs representatives processed 96.38 per cent (95.83% in direct representation and 0.55% in indirect representation) and only 3.62 per cent of declarations were lodged by the economic operators themselves. In terms of value, goods to third countries with a valuation for customs purposes amounting to EUR 7,283.23 million were exported, and 98.43 per cent of those goods were cleared by customs representatives (97.96% in direct representation and 0.47% in indirect representation).
The transit of goods has its own specific features and effects on the activities of customs representatives. The presence of a risk of diverting the goods from a regime is a possible hypothesis in which responsibility can be borne by both the holder of the procedure and their representative when they are also the responsible person (guarantor) for this transit. However, the proper organisation and application of the transit regime is a challenge for the declarant as they need to be well acquainted with both the nature of the foreign trade transactions they are processing, and the customs formalities involved. These specifics allow customs representatives to assist their clients also as persons responsible for the transit by taking on their behalf the comprehensive guarantee required by the customs authorities (100% of potential customs duties and other public receivables that may become due for the goods in transit).
The transit regime can be started both by a customs declaration (SAD) and by an international guarantee document, such as the TIR and ATA Carnets. By its nature, it can be defined as ancillary as it usually precedes an import customs procedure or ends a special one through re‑export. Direct transit is the only independently applied procedure, where after entering the customs territory of the Union goods are transported to the customs office of exit where they leave that territory (e.g. goods from a third country that are shipped to another third country but are transported across the territory of an EU member state). In terms of customs representation, it is important to take into account the status of the customs office where the customs representatives serve their client, since this also determines their actions:
• Customs office of departure, from which the goods leave, and the transit operation is started: here the customs representatives can start the transit and assume the role of a responsible person in cases where SAD is used.
• Transit customs office, through which goods only pass: here the role of customs representatives is limited, as the processing of a transit operation that has started is of the exclusive competence of the customs authorities.
• Customs office of destination, where the goods arrive and the procedure ends: customs representatives prepare the documents for presenting the goods to the customs authorities and assist their clients in placing the goods under an import customs procedure.
28 Volume 14, Number 1
International Network of Customs Universities
Due to the lack of information in the transit documents (customs declarations or international guarantee documents) about the presence of customs representation, it is not possible to accurately measure its place in the transit processes. However, given the nature of transit as a regime and its features discussed above, it can be said that customs representatives also play an important role here and are a key factor in starting and completing the transit. This is due to the import and export data presented above and the fact that transit as a regime serves these processes at their beginning or end. This leads to the conclusion that, from a spatial, technological and logical point of view, the involvement of customs representatives in the transit of goods is justified, as well.
5. ConclusionIn conclusion, it can be summarised that customs representation in the Republic of Bulgaria is essential for achieving efficiency in relation to foreign trade with third countries. This applies both to the economic operators themselves and to the customs administration in its capacity as a controlling authority. The services provided by customs representatives facilitate the smooth passage of the consignments through the relevant customs formalities, lead to a reduction in the time for customs clearance and, through consultation, lead to increasing the wellbeing of the economic operators who trust them. At the same time, customs administrations have a relatively trustworthy and predictable partner in the customs representatives who know the customs formalities and actively assist in fulfilling the tasks and objectives assigned to it.
The data analysed in this article clearly show that customs representatives in the Republic of Bulgaria play an important role in customs procedures and participate in a substantial part of the import, export and transit operations in the country. In 2018, customs representatives processed 85.33 per cent of import declarations, which in terms of value represents 83.11 per cent of the total imports from third countries (EUR 8,868.62 million). In the same year, they processed 96.38 per cent of export declarations, which in terms of value represents 98.43 per cent of the total exports to third countries (EUR 7 168.88 million). The conclusion is that economic operators in the Republic of Bulgaria prefer to rely on customs representatives in their dealings with the customs authorities.
The transition to an information society is strongly reflected in the activities of all those involved in international trade. This, in practice, predetermines the need for the establishment and development of specialised information systems to mediate the activities of customs representatives in relation to their involvement in foreign trade operations. The knowledge of specialised software applications available in the market in the country and the free online data resources provided by the Directorate General Taxation and Customs Union (DG TAXUD) are an important prerequisite for the proper organisation of their activities. At the same time, their contacts with the control authorities in the new electronic environment have their own requirements for aligning with the type and format of the transferred data. The features of customs representation in an information environment thus outlined contribute to it being more efficient and, hence, to better protecting the interests of their clients.
Volume 14, Number 1 29
World Customs Journal
References
Bachvarova, M. (2006). Predstavitelstvo i posrednichestvo v targovskite otnosheniya (Vol. 78). Varna: Yearbook. University of Economics – Varna.
Bozhinova, M., & Tomeva, M. (2010). Targovsko i mitnichesko predstavitelstvo. Uchebno posobie za distantsionno obuchenie. Svishtov: D. A. Tsenov Academic Publishing House – Svishtov.
Customs Act, State Gazette n. 15 (06 02 1998 r.).Customs Agency. (2019). Request for access to public information No. 32–38767/06022019 to the
Customs Agency. Sofia: Customs Agency.Grainger, A. (2016). Customs management in multinational companies. World Customs Journal, 10(2),
27.Gwardzińska, E. (2014). The role of customs brokers in facilitating international trade. World Customs
Journal, 8(1), 68.Mladenov, P. (2000). Mitnichesko predstavitelstvo i agentirane. Sofia: CIELA.Regulation (EU) No 952/2013 of the European Parliament and of the Council of 9 October 2013 laying
down the Union Customs Code, ОJ L 269 (10 10, 2013).World Customs Organization. (2018). WCO Customs Brokers Guidelines. Brussels: WCO
Notes1 (Regulation (EU) No 952/2013 of the European Parliament and of the Council of 9 October 2013 laying down the Union
Customs Code, 2013)2 This condition is not required for persons who make declaration for transit or temporary admission regimes or declare goods
in rare cases and if the customs authorities consider declaring admissible.3 Legal capacity means the ability of a legal entity, through personal actions, to acquire or lose specific rights and to assume
specific responsibilities. The law also links legal capacity with the possibility to conclude deals.4 (Regulation (EU) No 952/2013 of the European Parliament and of the Council of 9 October 2013 laying down the Union
Customs Code, 2013)5 Two such organisations operate in the Republic of Bulgaria – National Organization of Customs Agents and the Bulgarian
Union for Customs and Foreign Trade Services.6 EORI number – Economic Operators Registration and Identification number (valid only to the customs information systems
in the EU member states).7 In 2018 no submitted declarations were registered for the following import customs regimes: 01 – Free circulation of goods simultaneously redispatched in the context of trade between parts of the customs territory
of the Union in which the provisions of Directive 2006/112/EC are applicable and parts of that territory in which these provisions do not apply, or in the context of trade between the parts of that territory where these provisions do not apply
07 – Free circulation with simultaneous placing of goods under a warehousing procedure other than a customs warehousing procedure
43 – Simultaneous release for free circulation and home use of goods subject to specific measures connected with the collection of an amount during the transitional period following the accession of new member states
48 – Entry for home use with simultaneous release for free circulation of replacement goods under the customs outward processing procedure prior to the export of the temporary export goods
54 – Inward processing in another member state (without their being released for free circulation in that Member State) 76 – Placing of goods under the customs warehousing procedure in order to obtain payment of special export refunds prior
to exportation 77 – Manufacturing of goods under supervision by the customs authorities and under customs control (within the meaning
of Article 5(27) of the Code prior to exportation and payment of export refunds 78 – Entry of goods for a free zone
30 Volume 14, Number 1
International Network of Customs Universities
Momchil AntovAssoc Prof PhD Momchil Antov is a lecturer at the Department of Control and Analysis of Economic Activities, at DA Tsenov Academy of Economics – Svishtov, Bulgaria. He has published over 30 conference and journal papers in his country and abroad. He delivers lectures on subjects related to customs and financial control and has practical experience in customs representation. He is a Chairman of the National Organization of Customs Agents (NOCA) in Bulgaria and contact person with the International Network of Customs Universities (INCU) for DA Tsenov Academy of Economics – Svishtov, Bulgaria.
Volume 14, Number 1 31
World Customs Journal
Collaborative border managementChappell Lawson and Alan Bersin
Abstract
This article challenges the conventional approach to border management, which despite many innovations in recent decades still involves unilateral efforts to protect territorial boundaries. A better alternative for neighbouring country-dyads, wherever the prospect of war has become implausible, is collaborative border management. This approach involves extensive, deep collaboration to facilitate legitimate trade and travel through authorized ports of entry, combat transnational criminal activity, and manage cross-border ecological resources.
IntroductionBorders are a defining element of the modern nation-state system. They serve to separate politico-legal regimes and allow countries, at least in theory, to control what moves in and out of their jurisdictions. Governments tenaciously defend these lines in the name of sovereignty, even when they have friendly relations with their neighbours. But in the 21st century, this ‘hold the line’ approach to borders has a number of drawbacks. Inspections at the border impose costs on legitimate travel and commerce, often without clear benefits to public safety. Lack of coordination with neighbours creates gaps that transnational criminal organisations and terrorists can exploit. Unilateral thinking also impedes intelligent management of critical infrastructures (such as pipelines or electricity grids) and natural resources (such as water systems and habitats) that span borders. In short, 19th and 20th century notions of sovereignty clash jarringly with the imperatives of globalised commerce, international law enforcement, critical infrastructure protection, and modern environmental management.
Most policymakers seem aware of these issues at an abstract level. For instance, rhetoric on border management sometimes acknowledges the value of working with foreign governments, ‘pushing out the border’, or creating a ‘security perimeter’. High-level declarations between the United States and both Mexico and Canada, in particular, have indicated a willingness to explore much deeper cooperation in North America (White House, 2010, 2011; see also Longo, 2016). But even the most forward-leaning policies still fall short of a coherent alternative approach to borders.
In this article, we assume that political boundaries will (and should) remain defining features of the global landscape but argue that they can be much better administered. Specifically, I outline how governments can move away from a unilateral, ad hoc and defensive posture to borders, towards a more systematic, proactive and cooperative approach. I call this approach collaborative border management (CBM).
The next section of this article sketches how border management has evolved, highlighting the changes over the last 20 years that have rendered sovereignty-based approaches obsolete in much of the world. The third section focuses on operations at legal crossing points (known as ports of entry, or POEs). The fourth section addresses infrastructure planning, including ports of entry, the roads and bridges leading into them, as well as electricity and pipeline networks. The fifth section addresses operations between the POEs, as well as law enforcement cooperation among investigative agencies. The sixth section addresses natural resource management. The final section identifies barriers to the adoption of CBM and suggests ways in which they could be overcome.
32 Volume 14, Number 1
International Network of Customs Universities
The evolution of border managementBefore the 19th century, border management was rarely focused on defending physical frontiers. Some borders were fortified—as evidenced by Roman limes, the Great Wall of China, The Pale in Ireland, and so forth—but these were exceptions rather than the rule; most fortification was limited to certain areas within countries (such as walled cities). Even when boundaries were clearly demarcated, governments generally focused on asserting state control over specific transportation nodes (major roads, bridges or ports) that represented opportunities to collect revenue without much attention to entry or exit at other locations. For instance, one of the oldest federal agencies in the United States, now called the Office of Field Operations within US Customs and Border Protection, was created to collect duties on imported goods arriving at major American ports (CBP, 2014); another ancient agency, the Revenue–Marine (now called the US Coast Guard), was created one year later to prevent smuggling of dutiable items along the coast near these ports (Evans, 1949).
In the late 19th and 20th centuries, governments in Europe and some other regions increasingly embraced the notion of stopping people and things at the jurisdictional line of the border. One event exemplifying this trend was the invention of barbed wire in 1874 in the American West and its spread worldwide after the Boer War at the turn of the century (Krell, 2002; McCallum & McCallum, 1965). Border management thus became a question of how many enforcement resources governments were willing to deploy at their physical frontiers. Where borders remained unpoliced, it was normally only because states lacked the capacity to do so—or, because of their economic policies, the inclination (Gavrilis, 2010, 2017). Defending a line unilaterally became the default posture (Bersin, 2012).
The conventional approach to borders represents the triumph of this mentality over the mutual gain that results from collaborative management of borders. Virtually all countries have an interest in preventing transnational criminal organisations from operating with impunity, processing safe travellers and goods as efficiently as possible, using the maximum available information and most up-to-date techniques to determine which people or shipments pose a threat to public safety, swift and safe repatriation of those who cross the border illegally, and keeping their agents safe from assaults from the other side of the border (see Longo, 2018). But these outcomes cannot be fully realised when countries focus their resources on unilaterally defending a physical line and fail to coordinate with their counterparts on the other side of that line.
At the POEsIn the traditional view of border management, governments operate POEs, more or less independently, on opposite sides of a border. Each government follows its own policies—search procedures, emergency protocols, information and duty collection, risk management strategies, staffing levels, and perhaps even hours of operation—with little in the way of communication between officials on opposite sides of the border. In the extreme case, lack of coordination defeats the purpose of having a POE in the first place: people or shipments could theoretically pass through one side’s portal but be denied entry at the other. In a less extreme case, POEs are misaligned, causing constant traffic flow problems.
Even in less extreme cases, lack of coordination leads to duplication of effort and imposes unnecessary costs on legitimate shippers and travellers. At a land border, exit from Country A equals entry into Country B. However, people crossing the border normally have to interact with two separate groups of authorities (one from each country). The costs of this exercise in redundancy could be eliminated entirely through single-entry processing, in which whatever one government did was automatically counted by the other government; costs could be greatly reduced if governments agreed on what customs officials in each country were supposed to be doing and on how they were supposed to be doing it.

Volume 14, Number 1 33
World Customs Journal
Figure 1 illustrates the ways in which governments can improve cooperation in managing POEs, both in terms of greater information sharing (the vertical axis) and increasingly joint operations (the horizontal axis). In the lower left corner, there is no coordination: each side is focused on what comes into its country and generally gives little thought to what goes out. There is no communication between officials on one side and their counterparts on the other; no common procedure for handling an incident at a POE (e.g. an overturned truck or a chemical spill); no notification if a potential felon might be headed into the other country; and no sharing of knowledge about techniques used by smugglers in the area.
Figure 1: CBM at ports of entry
In the upper right-hand corner, by contrast, there is single-entry processing by cross-deputised officers: each crossing is recorded once for the benefit of both governments. A slightly less ambitious version of this approach would be to co-locate officers from the two countries in a single building, with a divider or line on the floor indicating the international boundary; in this scenario, each country would still maintain its own officers at the port at all times, but they would work literally a few feet from each other.
In between these two scenarios lie many less ambitious but still meaningful measures. In terms of information-sharing, for instance, one approach would be for officials on both sides of the border to receive the same information about travellers and shipments on their screens at the same time, with real-time communication between the two sides, even though they sat in separate buildings and processed the information independently. Customs officers could also meet regularly to share information, develop response protocols, plan coordinated inspection operations, and jointly assess potential threats (as in the case of the Port Security Committees along the US–Mexico border and the Port Operations Committees on the US–Canada border). Training and equipment purchases could also be done jointly to ensure that officers on both sides had similar levels of professional preparation and used interoperable systems. Two mundane examples that have come up in North America concern training of canines—who are strikingly effective in detecting a wide variety of contraband—in a single facility that serves more than one country and reciprocal use of firearms training ranges.
CBM also involves a similar approach to risk management. Segmenting flows of goods and people by the potential danger they pose lies at the heart of customs operations. With the possible exception of the Triborder Region between Paraguay, Argentina and Brazil at some times, legitimate trade and travel dwarf smuggling almost everywhere. At the supposedly crime-ridden US–Mexico border, for instance, 97 per cent of people and 99 per cent of shipments are fully compliant with all laws and regulations1, and most of the ‘non-compliant’ entries involve minor infractions (e.g. driving across the border without remembering that there is an orange in the glove compartment of the car or inadvertently listing the wrong number of ball bearings per container on a customs declaration form). Identifying true threats to public safety is akin to searching for a needle in a haystack (Stodder, 2020; Lawson, 2020).

34 Volume 14, Number 1
International Network of Customs Universities
In this environment, adopting a uniform screening policy—in which every single person, vehicle and container is subjected to the same sort of inspection—would impose very high costs. The alternative ‘risk management’ approach, which has been adopted almost everywhere for cargo and in most places for people, consists of two separate strategies.
The first consists of blowing some of the hay off the haystack—that is, taking out of the mix those shipments and travellers who pose very little risk (e.g. the executive from a large software company who drives from Seattle to Vancouver each Tuesday, or a shipment of pharmaceuticals from one subsidiary of a company to another subsidiary of the same company that occurs on the same schedule each month). The principal manifestations of this strategy are vetted shipper programs (such as the American Customs-Trade Partnership against Terrorism, or C-TPAT), in which businesses secure their own supply chains (as verified by customs officers through occasional inspections) in exchange for expedited processing, and trusted traveller programs (such as Global Entry), in which individuals voluntarily provide information about themselves in exchange for not having to pass through normal customs screening most of the time. With the exception of occasional random inspections designed to ‘keep the honest honest’, law enforcement officers at the border can then devote their attention to risky or unknown shipments and travellers. Because a relatively small number of unique individuals and shippers account for a sizeable portion of all entries, trusted traveller and shipper programs can blow a great deal of hay off the stack (see Lawson, 2020).
The second strategy consists of getting better at finding the needle in the pile of remaining hay, something known in law enforcement parlance as ‘targeting’. Targeting ranges from the obvious (following up on alerts from investigative agencies about specific shipments) to the primitive (knowing that smugglers favour white vans) to the extremely sophisticated (e.g. complex network analyses aimed at identifying previously unknown members of terrorist organisations).
In CBM, these efforts would be undertaken jointly. Membership in vetted traveller and shipper programs would be reciprocal (as is the case with the United States’ Global Entry program and similar initiatives in other countries); supply chains would be jointly verified by both governments; and candidates for trusted traveller or shipper programs would be checked against law enforcement databases in both countries. At the other end of the risk spectrum, both countries would develop shared ‘watchlists’ or ‘blacklists’ for suspected criminals or terrorists entering either country from a third country. Cargo would be targeted for compliance by looking at trends and link analyses from previous seizures in both countries. Finally, targeting algorithms would be jointly developed based on information about criminal organisations collected by law enforcement agencies in both countries.
Into the POEsThe discussion so far has focused on POE operations, but CBM would also encompass binational planning for POEs, as well as the roads and bridges leading into them. Although the proverbial ‘port to nowhere’ (in which one country tries to establish a border crossing before the other has completed construction) is a rarity, mismatches in infrastructure investments leading into crossing points is rather common—for instance, when a multilane highway leading to a brand-new POE outfitted with modern technology dumps traffic into a potholed, two-lane road on the other side of the border or to a stoplight that immediately backs traffic up into the other country’s inspection areas. In such cases, a marginal dollar of capital investment would be much better spent on the side where resources infrastructure or personnel were lacking than in one’s own country. It was this realisation that prompted Canadian authorities to offer to pay the bulk of construction costs on both sides of a new bridge in the Detroit–Windsor area (see Battagello, 2013).
In an ideal world, partner countries would have a shared set of infrastructure priorities developed through some rational analysis of costs and benefits. This plan would be accompanied by a binational process

Volume 14, Number 1 35
World Customs Journal
to ensure that POEs received all appropriate permits in a reasonable time frame. Finally, each project would be designed and managed by a binational group and (conceivably) built by binational work teams to ensure that construction proceeded at the same pace on both sides of the border.
Cross-border infrastructure includes pipelines and electricity grids. The unification of electricity grids represents an extraordinary mutual benefit for neighbouring countries because it permits load-sharing, thus increasing overall grid reliability. The gain is similar for gas pipelines, with the corollary advantage of back-stopping gas pipeline networks that terminate in a seaport on one side of the border but not on the other.
Between the POEsIn general, transit across stretches of a land border between authorised ports of entry is illegal. The law enforcement response is therefore conceptually straightforward: stop everyone and everything from going in or out. But law enforcement between the ports of entry can be extremely difficult in practice, particularly when there are vast swathes of territory to patrol. The challenge, therefore, is to use resources in the most effective way possible by coordinating activities on both sides of the border.
CBM means that both sides do not need to patrol every piece of territory; each government can take a different stretch, with either a rapid response capability on the other side or reciprocal ‘hot pursuit’ authority. Where hot pursuit authority is not politically feasible, simultaneous operations on each side of the border can prevent criminal organisations from fleeing across the border when confronted with a significant presence on one side or openly staging operations. Another option would be joint patrols. On the Great Lakes, for instance, US and Canadian officers staff the same boats, with command shifting from one member of the binational team to another as their boat crosses the invisible maritime boundary. (This program is called “Shiprider”.) Whatever formula is used for any specific piece of the border, CBM also entails binational operational and strategic planning across the whole frontier. (See Figure 2.)
An example from North America illustrates the benefits of coordination. On the Mexican side of the US southwest border, there is no counterpart to the US Border Patrol. Individual Border Patrol station chiefs try to make ad hoc arrangements with whichever Mexican agencies or individuals seem most trustworthy and competent in their zone—local police, state police, federal police, the military or some other entity. In practice, there is often no partner on the other side of the border, and even when there is, communication equipment is not interoperable. Where coordinated operations have been conducted between the Border Patrol and vetted units of the Mexican federal police, the results have been impressive: attacks on Border Patrol personnel from the Mexican side have dropped precipitously, migrant safety has been enhanced while overall crossings have diminished, and cartel activities have been seriously disrupted.
Behind the POEsIn the traditional approach to borders, governments focus on what comes into their territory, considering what goes out only passingly if at all. But what goes out often comes back in, in some form or another. At the US–Mexican border, for instance, illegal drugs tend to flow northward while guns and billions of dollars in bulk cash are smuggled south. Because northbound and southbound flows are controlled by the same criminal organisations, which require both streams of contraband to operate, it makes little sense for law enforcement agencies to focus exclusively on one side; rather, both governments should work together to target the weakest links in the entire chain. Governments will be far more effective if they think in terms of illegal smuggling networks and supply chains, as criminal organizations do, rather than in terms of particular ‘entries’. Figure 2 summarises these sorts of options for closer collaboration between the POEs and with respect to investigations.
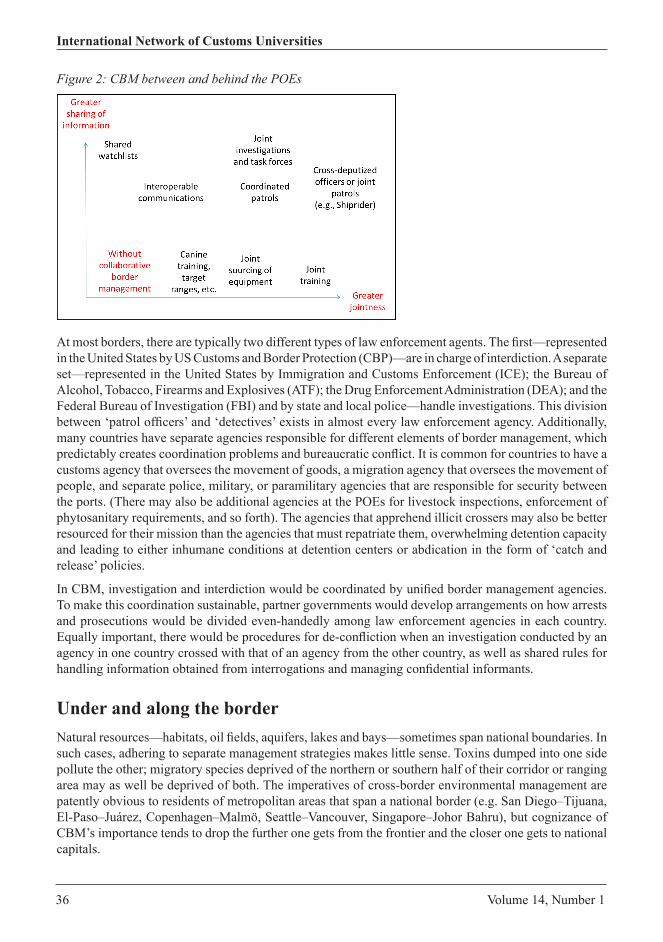
36 Volume 14, Number 1
International Network of Customs Universities
Figure 2: CBM between and behind the POEs
At most borders, there are typically two different types of law enforcement agents. The first—represented in the United States by US Customs and Border Protection (CBP)—are in charge of interdiction. A separate set—represented in the United States by Immigration and Customs Enforcement (ICE); the Bureau of Alcohol, Tobacco, Firearms and Explosives (ATF); the Drug Enforcement Administration (DEA); and the Federal Bureau of Investigation (FBI) and by state and local police—handle investigations. This division between ‘patrol officers’ and ‘detectives’ exists in almost every law enforcement agency. Additionally, many countries have separate agencies responsible for different elements of border management, which predictably creates coordination problems and bureaucratic conflict. It is common for countries to have a customs agency that oversees the movement of goods, a migration agency that oversees the movement of people, and separate police, military, or paramilitary agencies that are responsible for security between the ports. (There may also be additional agencies at the POEs for livestock inspections, enforcement of phytosanitary requirements, and so forth). The agencies that apprehend illicit crossers may also be better resourced for their mission than the agencies that must repatriate them, overwhelming detention capacity and leading to either inhumane conditions at detention centers or abdication in the form of ‘catch and release’ policies.
In CBM, investigation and interdiction would be coordinated by unified border management agencies. To make this coordination sustainable, partner governments would develop arrangements on how arrests and prosecutions would be divided even-handedly among law enforcement agencies in each country. Equally important, there would be procedures for de-confliction when an investigation conducted by an agency in one country crossed with that of an agency from the other country, as well as shared rules for handling information obtained from interrogations and managing confidential informants.
Under and along the borderNatural resources—habitats, oil fields, aquifers, lakes and bays—sometimes span national boundaries. In such cases, adhering to separate management strategies makes little sense. Toxins dumped into one side pollute the other; migratory species deprived of the northern or southern half of their corridor or ranging area may as well be deprived of both. The imperatives of cross-border environmental management are patently obvious to residents of metropolitan areas that span a national border (e.g. San Diego–Tijuana, El-Paso–Juárez, Copenhagen–Malmö, Seattle–Vancouver, Singapore–Johor Bahru), but cognizance of CBM’s importance tends to drop the further one gets from the frontier and the closer one gets to national capitals.
Volume 14, Number 1 37
World Customs Journal
Nowhere is the challenge of cross-border resource management more pronounced than with surface water. The consensus environmental policy prescription for riverine-lacustrine systems today is ‘integrated watershed management’ (or ‘comprehensive watershed management’)—that is, considering the health of an entire system, from water generation upstream to water use downstream, and addressing the quality as well as the volume of water in the system (Wang et al., 2016; Blomquist & Schlager, 2005; Bonnell & Koontz, 2007; Kerr, 2007). This perspective is motivated by the fact that human activities at one point in such a system—upstream deforestation, changes in snowmelt patterns, water generation projects, dam construction, seepage of chemicals, release of invasive species, etc.—have effects at other points. International boundaries notoriously complicate comprehensive watershed management. Most obviously, upstream countries frequently extract water to the detriment of downstream countries and the river system. A ‘race to the bottom’ on water quality is also likely wherever rivers from both countries flow into a shared body or where rivers are themselves the border; there is little point in adhering to strict environmental standards if the other side is polluting. In the case of common pool resources like cross-border aquifers or fish stocks, both sides may rush to grab as much as possible before it is all gone. Perhaps the most remarkable case is the Caspian Lake, the world’s largest body of fresh water, where caviar-bearing sturgeon populations have collapsed over the last two decades. Intelligent binational stewardship, by contrast, would preserve a shared resource.
One entity that illustrates the promise of CMB is the International Boundary and Water Commission (IBWC) between the United States and Mexico. A product of the 1944 Water Treaty, the IBWC manages the flow of water from the Rio Grande/Rio Bravo and Colorado River systems. Although officially bilateral (each member belongs to either the US or the Mexican side), in practice the IBWC operates as a truly binational entity (in which members from both countries all work together as a coherent group). With the US Commissioners reporting to the Assistant Secretary of State for Western Hemisphere (and a similar arrangement on the Mexican side), the IBWC is highly insulated from electoral politics, an essential ingredient to its success as a technical body.
Over the last seven decades, the Water Treaty has been updated through a process of ‘Minutes’, or minor amendments, which are typically developed by the IBWC and then approved by both countries through the administrative branch. The cumulative effect of this process—there were 324 Minutes as of November 2019—has been to allow the IBWC to take up the challenge of water management more effectively. Unfortunately, many issues still lie outside the IBWC’s mandate, such as aspects of water quality, ill-conceived policies on water use at the state level in the US and deforestation upstream. A more robust binational water authority would be better able to address the challenges of water management in this fundamentally arid region of the world with growing demands on freshwater supplies. But the IBWC represents a remarkable improvement over the status quo in most parts of the world, where whatever frameworks that have been developed remain inadequate to the task of protecting common-pool resources.
Getting there from hereDespite its manifest benefits, there are a number of potential challenges to CBM. The most obvious and important concerns areas where the threat of war between neighbouring states remains real: parts of the former Soviet Union, Pakistan–India, Israel’s borders with Lebanon and Syria, and China’s borders with most of its neighbours. In such circumstances, military preparation and intelligence collection will dominate other objectives, with logical consequences for trade, travel and law enforcement cooperation. But even when war remains a possibility, CBM may still be partially applicable. For instance, despite a longstanding history of military conflict, Ottoman and Greek officers regularly collaborated against bandits operating along their border in the 19th century (Gavrilis, 2008, 2010). In fact, elements of CBM can be used as confidence-building measures to help resolve interstate conflict, as with elements of the Brasilia Accords between Ecuador and Peru (St John, 1999, pp. 43–49). CBM mechanisms may also
38 Volume 14, Number 1
International Network of Customs Universities
be the only approach that can rescue some of the world’s largest lakes and river systems, even if the nations that border the Caspian, the Jordan River, the Dead Sea, and so forth are unable to sustain deeper collaboration on other issues.
Another hindrance to CBM concerns state capacity. For neighbours to derive much benefit from cooperation, they must both be able to provide basic policing and administrative services (issuing identification cards, processing forms, etc.). When ‘border control’ consists of a ten-year-old boy holding a frayed rope across a dirt road, it is tempting to conclude that not much can be done. But state capacity does not have to match developed-world standards to be effective; it simply needs to match the challenges governments face on the ground. For instance, the Commission of Coordination between the Tunisian and Algerian armed forces recently established 20 joint military checkpoints along their frontier as part of a coordinated effort to combat insurgents operating across the border—an effort that has proven effective against lightly armed and scattered guerrilla forces (Smadhi, 2013).
State capacity can also be built collaboratively. One crucial insight from CBM is the fact that an additional dollar allocated by one country might be more efficiently invested on other side of the border. For instance, the United States currently has close to 20,000 Border Patrol agents on its side of the US–Mexican border. By contrast, Mexico has virtually no law enforcement presence between the ports of entry along the same 1,951-mile stretch of territory. The result is that Border Patrol agents have no one to call when the smugglers they are chasing flee back into Mexico or miscreants pelt them with rocks from the Mexican side. This situation changed dramatically in 2010, when the Mexican government sent 300 vetted members of the Mexican Federal police to participate in joint operations with the Border Patrol at one section of the Arizona–Sonora frontier. Unfortunately, vetted units of the Federal Police are in short supply, and joint operations dropped off. Meanwhile, the US Congress voted to increase the size of the Border Patrol. Helping the Mexican government to establish a dedicated, professional law enforcement presence in the Sonoran Desert would be a better investment of US government funds.
A final objection concerns lack of shared interests between neighbouring countries. Most countries want trade with their neighbours, but not all. Likewise, most governments want to prevent smuggling, but in some governments, officials control the smuggling networks. Fortunately, as in cases where state capacity is thin, the policies outlined here can be adopted piecemeal; there may be room for deep cooperation on some issues, even in places where conditions might not at first appear auspicious.
CBM challenges governments’ notions of sovereignty and often elicits reflexive nationalist reactions. But such bureaucratic and emotional responses must be tempered by 21st-century realities and, above all, by the prospect of mutual advantage. Citizens benefit from trade, and cooperation at the border facilitates legitimate commerce. Governments promise to control crime, and joint law enforcement efforts enhance public safety. Binational resources that are worth preserving must be managed binationally. CBM may feel uncomfortable or revolutionary, but it is simply common sense.
AcknowledgementsWe are grateful to Andrew Selee for comments on earlier versions of this manuscript, as well as to members of MIT’s Security Studies Programs for their reactions to a presentation that summarised the main ideas in this article.
Volume 14, Number 1 39
World Customs Journal
References
Battagello, D. (2013). Canada to start buying property in Delray for DRIC bridge. Windsor Star. May 22. Retrieved from https://windsorstar.com/news/local-news/canadian-funds-allocated-to-start-buying-property-in-delray-for-dric-bridge
Bersin, A (2012). Lines and Flows: The Beginning and End of Borders. Brooklyn Journal of International Law, 37, 389–406.
Blomquist, W., & Schlager. E. (2005). Political pitfalls of integrated watershed management. Society & Natural Resources: An International Journal, 18, 101–117.
Bonnell, S. E., & Koontz, T. M. (2007). Stumbling forward: the organizational challenges of building and sustaining collaborative watershed management. Society & Natural Resources: An International Journal, 20, 153–167.
CBP (U.S. Customs and Border Protection). (2014). 1789: First Congress provides for customs administration. Retrieved from https://www.cbp.gov/about/history/1789-first-congress-provides-customs-administration
Evans, S. H. (1949). The United States Coast Guard 1790–1915: a definitive history. Annapolis, MD: Naval Institute Press.
Gavrilis, G. (2017). Central Asia’s borders: twenty-five years on., Bishkek Project. Retrieved from https://bishkekproject.com/memos/20
Gavrilis, G. (2010). The dynamics of interstate boundaries. Cambridge University Press.Gavrilis, G. (2008). Conflict along the Greek-Ottoman Border. In I. W. Zartman, Understanding life in
the borderlands. University of Georgia Press.Kerr J. (2007). Watershed management: lessons from common property theory. International Journal of
the Commons, 1, 89–110.Krell, A. (2002). The devil’s rope. A cultural history of barbed wire. London: Reaktion Books.McCallum, H. D., & McCallum, F. T. (1965). The wire that fenced the West. Norman: University of
Oklahoma Press.Lawson, C. (2020). The trusted and the targeted: Segmenting flows by risk. In C. Lawson, A. Bersin,
and J. Kayyem, eds. Beyond 9/11: Homeland Security for the 21st Century. Cambridge: MIT Press.Longo, M. B. (2016). A ‘21st century border’? Cooperative border controls in the US and EU after 9/11.
Journal of Borderlands Studies, 31(2), 187–202.Longo, M. B. (2018). The politics of borders: sovereignty, security, and the citizen after 9/11. Cambridge:
Cambridge University Press.Smadhi, A. (2013). Tunisia continues anti-militant operations along Algerian border. Tunisia live.
Retrieved from http://www.tunisia-live.net/2013/06/10/tunisia-continues-anti-militant-operations-near-algerian-border/#sthash.eHEZ09CR.dpuf
St John, R. B. (1999). The Ecuador–Peru boundary dispute: The road to settlement. Boundary and Territory Briefing, 3 (1). Retrieved from https://books.google.com/books?id=E9CyhGb66zQC&pg=PA43&lpg=PA43&dq=1998+Brasilia+Accords+national+park&source=bl&ots=WDHDbIDlyo&sig=ACfU3U3MGoQyB-ivCZnN85AlAYeFN9RlIQ&hl=en&sa=X&ved=2ahUKEwis4ODNxojmAhUriOAKHYEcD1EQ6AEwAXoECAoQAQ#v=onepage&q=1998%20Brasilia%20Accords%20national%20park&f=false
Stodder, S. (2020). Rethinking borders: Securing the flow of travel and commerce in the 21st Century. In C. Lawson, A. Bersin, and J. Kayyem, eds. Beyond 9/11: Homeland Security for the 21st Century. Cambridge: MIT Press.
40 Volume 14, Number 1
International Network of Customs Universities
Wang, G., Mang, S., Cai, H., Liu, S., Zhang, Z., Want, L., & Innes, J. L. (2016). Integrated watershed management: evolution, development and emerging trends. Journal of Forest Resources, 27(5), 967–994.
White House. (2010). Declaration by the Government of The United States of America and the Government of the United Mexican States Concerning Twenty-First Century Border Management. Retrieved from https://obamawhitehouse.archives.gov/the-press-office/declaration-government-united-states-america-and-government-united-mexican-states-c
White House. (2011). Declaration by President Obama and Prime Minister Harper of Canada. Beyond the Border: A Shared Vision for Perimeter Security and Economic Competitiveness. Retrieved from https://obamawhitehouse.archives.gov/the-press-office/2011/02/04/declaration-president-obama-and-prime-minister-harper-canada-beyond-bord
Notes1 These estimates are based on findings from random secondary inspections in the United States by US Customs and Border
Protection officers, in which a portion of entries that have no ‘flags’ and would otherwise go unexamined are selected at random for closer scrutiny.
Chappell LawsonChappell Lawson is an Associate Professor of Political Science at MIT. Professor Lawson’s recent work has focused on Mexican politics and homeland security policy. From September 2009 through February 2011, Professor Lawson was on leave from MIT as a political appointee in the Obama Administration, serving as Executive Director and Senior Advisor to the Commissioner of U.S. Customs and Border Protection. Before joining the MIT faculty, he served briefly as a Director of Inter-American Affairs on the National Security Council staff during the Clinton Administration.
Alan BersinAlan Bersin served as Assistant Secretary for Policy & International Affairs and Chief Diplomatic Officer in the U.S. Department of Homeland Security (DHS). Between 2012 and 2015, Bersin served as Vice President of INTERPOL for the Americas Region and as a member of the INTERPOL Executive Committee. From 2010 to 2012, Bersin served as Commissioner of U.S. Customs and Border Protection. He is the inaugural Fellow at the Belfer Center for Science and International Affairs at the Harvard Kennedy School, a policy consultant at the international law firm Covington & Burling, and a Principal at the strategic advisory firm BorderWorks.
Volume 14, Number 1 41
World Customs Journal
Applying ‘mirror statistics’ in cross-border trade administration: case of general
department of Vietnam customsPhan Thi Thu Hien and Nguyen Viet Hung
Abstract
International merchandise trade statistics plays a substantial role in governing cross-border trade in goods at both global and national levels. In relation to one flow of goods crossing borders, there are two trade data compilations—in the exporting and importing countries—which are to be made in compliance with various regulations and standards. This paper analyses Vietnam’s mirror statistics, focusing on the significant disparities of cross-border trade statistics in 2013–2016 between Vietnam—the reporting country—and its trade partners. The paper investigates the major reasons for the large discrepancies between Vietnam and its partners in cross-border trade documentation and suggest an operational model of mirror statistics to support cross-border trade administration by Vietnam Customs in future years. Cross-border statistics were collected from the General Department of Vietnam Customs and from the United Nations (UN) Comtrade database.
1. IntroductionGlobally, mirror statistics have been used as a tool to assess the quality of cross-border trade statistics and the enforcement capacity of trade policies and regulations of one country with their trading partners. There are normally disparities in the trade statistics of a pair of countries as there are numerous modes of trade statistics compilation and technical practices, such as commodity classification, rules of origin, value of exported and imported goods, compiling time, foreign trade exchange rates and terms of delivery. Mirror statistics help to investigate illegal trade, commercial fraud and weak enforcement capacity of national customs authorities. This is more challenging in the context of trade liberalisation and globalisation due to increasing cross-border trade flows with a huge variety of country partners and commodities; modes of transactions and transportation; supply chains stakeholders; laws and regulations; and technologies.
Significantly, we have seen discrepancies in cross-border merchandise trade data between Vietnam and China, with a peak of nearly 30 billion US dollars in 2014. In 2015, the reports of bilateral trade total value and trade balance by the National Bureau Statistics of China were 83.636 billion and 43.830 billion US dollars, which is much higher than the 58.773 billion and 28.963 billion US dollars reported by the General Statistics Office of Vietnam (National Bureau Statistics of China, 2015; General Statistics Office of Vietnam, 2015).
This research fundamentally applies mirror statistics, with many statistical standards and practices of internationals organisations like the United Nations (UN), World Trade Organization (WTO), World Customs Organization (WCO), and the General Department of Vietnam Customs, in order to answer two questions:
42 Volume 14, Number 1
International Network of Customs Universities
(1) What are the main reasons for statistical discrepancies in the cross-border trade data of Vietnam during 2010–2016?
(2) How can an operational model of mirror statistics be developed to support the cross-border trade administration of Vietnam?
Our paper is organised as follows: section 2 presents a theoretical explanation of mirror statistics in cross-border trade administration; section 3 describes the data and the methodology of mirror statistics; section 4 reports and discusses results of the mirror statistics analysis in Vietnam’s exports and imports; and section 5 concludes and delivers recommendations to apply mirror statistics in Vietnam’s cross-border administration.
2. Literature reviewInternational merchandise trade statistics: concepts and definitions 2010 (UNDESA, 2011) has provided a comprehensive overview of methodologies for cross-border trade statistics. Cross-border trade statistics for international trade transactions vary according to factors such as countries, commodities classifications, and trade value in exports and imports. Commonly, the country of origin and the last destination and are compiled as the exporting and importing partner of the reporting country. Free on Board (FOB) and Costs, Insurance and Freight (CIF) values are used for recording trade values in exports from and imports into the reporting country.
2.1 Bilateral merchandise trade statistics and CIF–FOB ratios
Bilateral merchandise trade statistics is concerned with records from both countries but there is only one flow of trade. In principle, the value of exports and imports is at FOB and CIF prices respectively, and the CIF–FOB discrepancy reflects the shipping and insurance costs from the export country to the importing country.
There are CIF–FOB differences because export value is mostly reported on an FOB basis, while import value is on a CIF basis. The CIF–FOB differences result in a higher import value than export value. The International Monetary Fund (IMF) estimates that, on average, the CIF price is greater than the FOB price by 10 per cent. However, the CIF–FOB ratio becomes greater as the distance between trade parties increases and the weight of the traded goods becomes heavier (Pomfret & Sourdin, 2009). Similarly, research about CIF–FOB ratios of CEPII (Center d’Etudes Prospectives et d’ informations Internationales) covering more than 200 countries and 5000 products between 1994 and 2007 reveals that there is a stable gap of 10 per cent in terms of value of trade for exports, and of 5 per cent for imports. Normally, the means that the CIF–FOB ratios are in the range of 1.05 to 1.1 (Gaulier & Zignago, 2010).
Gehlhar (1996) indicated that the CIF–FOB ratio in bilateral trade substantially depends on sectors and the nature of trading commodities; in particular, for manufacturers with a wide range of commodities, there is considerable difference between those with a high unit value, such as precious stones, metals and jewellery, and products with a low unit value, such as toys and sporting goods.
2.2 Mirrors statistics study and cross-border trade administration
(Hamanaka, 2013) explained the general view on the accuracy of data collected by customs offices that import data are more reliable than export data because governments are more serious about recording imported goods for the purposes of tariff revenue collection, taxes and other regulatory controls. This also indicates that discrepancies from mirror statistics comparison is caused by various trade data miscomputations and misclassifications, such as transaction directions, commodity codes, origin of imports and under-reported value of imported goods.

Volume 14, Number 1 43
World Customs Journal
Various factors can lead to discrepancies in mirror statistics (Yeats, 1995; Makhoul & Otterstrom, 1998; Ferrantino & Wang, 2007; Eurostat 2009). These studies mainly focus on both misclassifications associated with commodities and the direction of trade and statistical practices and performance of customs officers (of either the exporting or importing country). A short description of these findings is presented below.
In terms of international trade transactions, the goods transition starts from the exporting country and concludes with the destination in the importing country. Costs of importation include not only value of the trading goods but also freight, insurance and other cross-border charges. This leads to a discrepancy among the trade statistics of one reporting country with their partners, which explains why the value of the CIF–FOB ratio ranges from 1.05 to 1.1 (as mentioned above).
Exchange rates used for trade statistics is a periodical average value, which differs from the rates at the time of trading and reporting in both the reporting country and their partners. This contributes to the disparity in trade statistics of two trading partners whose bilateral trade is substantially high.
The difference in time of reporting can be a cause of discrepancy in some instances when the transaction occurs in different periods of statistical compilation in two related countries.
In terms of international transportation for re-exports and transhipments, the information about the country of origin and last destination are usually misreported and compiled in the customs database of the trading countries. This leads to a significant gap in bilateral trade statistics because there are many rules and understandings about the country of origin and destination in global trade (Hamanaka, 2013).
It is much more complicated when a country completes sales of goods with members of an economic-integrated region such as the European Union (EU). For example, if goods originating from Vietnam pass through the port of Rotterdam, Netherlands, before reaching their final destination (Germany), the origin country (Vietnam) may record goods as exports to either the Netherlands or Germany. Where there is such a discrepancy, it is difficult to determine which country’s customs office has the correct records.
The Rotterdam effect is used to illustrate trade map and statistics scenarios among the relevant countries as below.
In some situations, that goods are recorded as exports but returned to the exporting country for any reason will not be recorded by the intended importing country but may continue to be recorded in the export statistics of the exporting country.
Figure 1: Rotterdam effect in international merchandise statistics
44 Volume 14, Number 1
International Network of Customs Universities
Hamanaka (2013) analysed a variety of commercial frauds and misdeclarations about the transacted value, HS codes, origin, transportation and transaction chains in order to take advantage of duty free arrangements; duty reductions or duty drawback schemes. For instance, almost all countries apply GATT Article 7 (the WTO valuation agreement) for determining customs value, but traders may manipulate values to benefit from unfair market competition and duty exemption.
Mirror statistics is widely developed in many countries to enhance the quality of trade statistics compilation and the effectiveness of cross-border trade administration by taking advantage of data-driven border control methods, advanced informatics technologies and international cooperation between customs administrations. This is strongly facilitated and promoted by many international organisations, such as the World Bank, IMF, WTO and WCO (Roger-Claver Victorien Gnogoue, 2017).
3. Data and research methodologyIn this paper, Vietnam is selected as the reporting country for both exports and imports. Vietnam’s customs data is collected from the international merchandise trade database of the General Department of Vietnam Customs, while the data of Vietnam’s trade partners is collected from the Comtrade database.
This study uses basic statistical technique to explain mirror statistics and causal factors of unreasonable disparities in the bilateral trade data of Vietnam. This is based on the hypothesis that mirror statistics indicate the normal ratio of CIF-imported value and FOB-exported value in a range from 1.05 to 1.1. This ratio may be differentiated by trade costs and international transport routes between Vietnam and its partners. Otherwise, it reflects the weak performance of the national customs administration in cross-border trade management and statistics.
4. Analysis of mirror statistics for Vietnam, 2013–2016
4.1 Vietnam’s international merchandise trade, 2013–2016
In the slowdown of the world economy, Vietnam was facing many difficulties and challenges to achieve the growth of GDP at 6.21 per cent and international trade in merchandise goods of nearly $310 billion US dollars in 2016. It was a remarkable year for Vietnam’s international merchandise trade, with a trade surplus of $1.78 billion, compared to $3.54 billion deficit of 2015 (General Department of Vietnam Customs, 2016).
Vietnam has a wide variety of major export commodities with high comparative advantages in the world market, such as textile and garments, computers, fishery products and footwear. Vietnam is also an important importing partners of many leading economies in the world and region, such as China, EU, USA and ASEAN.
In general, Vietnam’s trade in goods has increased around four times from 85 billion US dollars since Vietnam became a WTO member in 2007. Numerous markets in the world have reached trade records over 1 billion US dollars, including the top 28 export partners and 22 import partners. In 2016, China continued to be the largest supplier with total value of about 50 billion US dollars, which accounted for 28.2 per cent of total imports. The USA, on the other hand, has been the biggest export market of Vietnam, reaching over 38 billion US dollars and 21.8 per cent of total exports in 2016.
4.2 Analyses of mirror statistics in Vietnam’s international merchandise trade
4.2.1 Mirror statistics analysis: Vietnam as the reporting country of exports
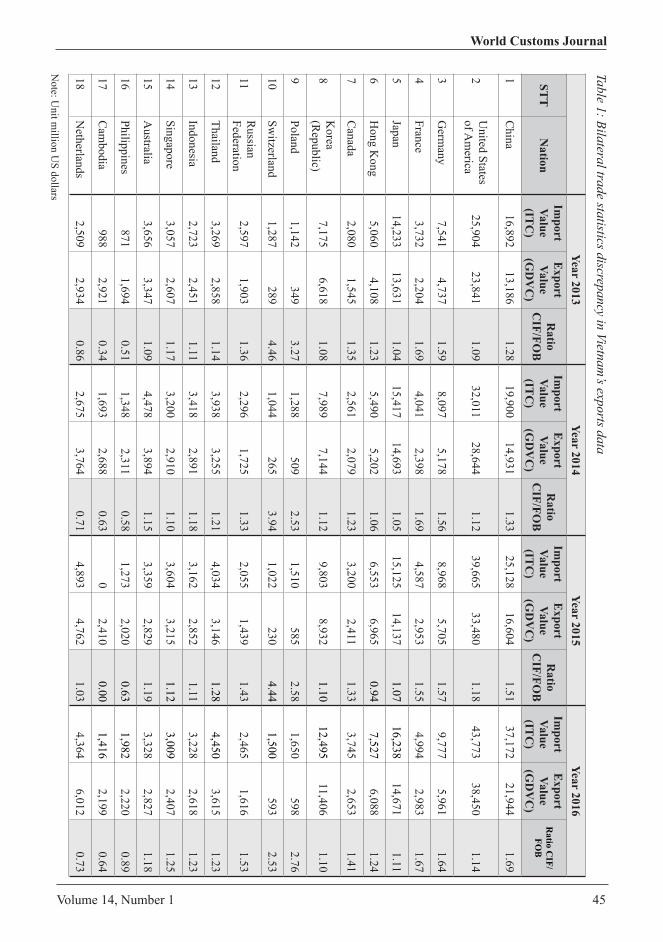
Volume 14, Number 1 45
World Customs Journal Table 1: Bilateral trade statistics discrepancy in Vietnam
’s exports data
Year 2013Year 2014
Year 2015Year 2016
STT
Nation
Import
Value (IT
C)
Export
Value (G
DV
C)
Ratio
CIF/FO
B
Import
Value (IT
C)
Export
Value (G
DV
C)
Ratio
CIF/FO
B
Import
Value (IT
C)
Export
Value (G
DV
C)
Ratio
CIF/FO
B
Import
Value (IT
C)
Export
Value (G
DV
C)
Ratio C
IF/FO
B
1C
hina16,892
13,1861.28
19,90014,931
1.3325,128
16,6041.51
37,172 21,944
1.69
2U
nited States of A
merica
25,90423,841
1.0932,011
28,6441.12
39,66533,480
1.18 43,773
38,4501.14
3G
ermany
7,5414,737
1.598,097
5,1781.56
8,9685,705
1.57 9,777
5,9611.64
4France
3,7322,204
1.694,041
2,3981.69
4,5872,953
1.55 4,994
2,9831.67
5Japan
14,23313,631
1.0415,417
14,6931.05
15,12514,137
1.07 16,238
14,6711.11
6H
ong Kong
5,0604,108
1.235,490
5,2021.06
6,5536,965
0.94 7,527
6,0881.24
7C
anada2,080
1,5451.35
2,5612,079
1.233,200
2,4111.33
3,745 2,653
1.41
8K
orea (R
epublic)7,175
6,6181.08
7,9897,144
1.129,803
8,9321.10
12,495 11,406
1.10
9Poland
1,142349
3.271,288
5092.53
1,510585
2.58 1,650
5982.76
10Sw
itzerland1,287
2894.46
1,044265
3.941,022
2304.44
1,500 593
2.53
11R
ussian Federation
2,5971,903
1.362,296
1,7251.33
2,0551,439
1.43 2,465
1,6161.53
12Thailand
3,2692,858
1.143,938
3,2551.21
4,0343,146
1.28 4,450
3,6151.23
13Indonesia
2,7232,451
1.113,418
2,8911.18
3,1622,852
1.11 3,228
2,6181.23
14Singapore
3,0572,607
1.173,200
2,9101.10
3,6043,215
1.12 3,009
2,4071.25
15A
ustralia3,656
3,3471.09
4,4783,894
1.153,359
2,8291.19
3,328 2,827
1.18
16Philippines
8711,694
0.511,348
2,3110.58
1,2732,020
0.63 1,982
2,2200.89
17C
ambodia
9882,921
0.341,693
2,6880.63
02,410
0.00 1,416
2,1990.64
18N
etherlands2,509
2,9340.86
2,6753,764
0.714,893
4,7621.03
4,364 6,012
0.73
Note: U
nit million U
S dollars
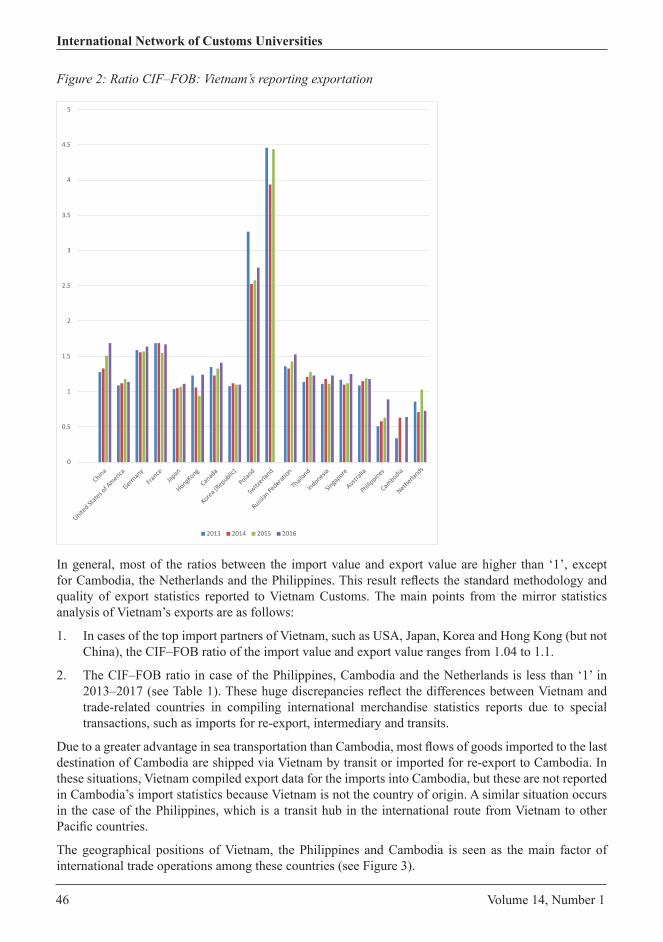
46 Volume 14, Number 1
International Network of Customs Universities
Figure 2: Ratio CIF–FOB: Vietnam’s reporting exportation
0
0.5
1
1.5
2
2.5
3
3.5
4
4.5
5
China
United St
ates o
f Americ
a
German
yFra
nceJap
an
HongKong
Canad
a
Korea (Republic)
Poland
Switz
erland
Russian
Federa
tion
Thail
and
Indonesia
Singa
pore
Australi
a
Philippines
Cambodia
Net
2013 2014 2015 2016
herlands
In general, most of the ratios between the import value and export value are higher than ‘1’, except for Cambodia, the Netherlands and the Philippines. This result reflects the standard methodology and quality of export statistics reported to Vietnam Customs. The main points from the mirror statistics analysis of Vietnam’s exports are as follows:
1. In cases of the top import partners of Vietnam, such as USA, Japan, Korea and Hong Kong (but not China), the CIF–FOB ratio of the import value and export value ranges from 1.04 to 1.1.
2. The CIF–FOB ratio in case of the Philippines, Cambodia and the Netherlands is less than ‘1’ in 2013–2017 (see Table 1). These huge discrepancies reflect the differences between Vietnam and trade-related countries in compiling international merchandise statistics reports due to special transactions, such as imports for re-export, intermediary and transits.
Due to a greater advantage in sea transportation than Cambodia, most flows of goods imported to the last destination of Cambodia are shipped via Vietnam by transit or imported for re-export to Cambodia. In these situations, Vietnam compiled export data for the imports into Cambodia, but these are not reported in Cambodia’s import statistics because Vietnam is not the country of origin. A similar situation occurs in the case of the Philippines, which is a transit hub in the international route from Vietnam to other Pacific countries.
The geographical positions of Vietnam, the Philippines and Cambodia is seen as the main factor of international trade operations among these countries (see Figure 3).
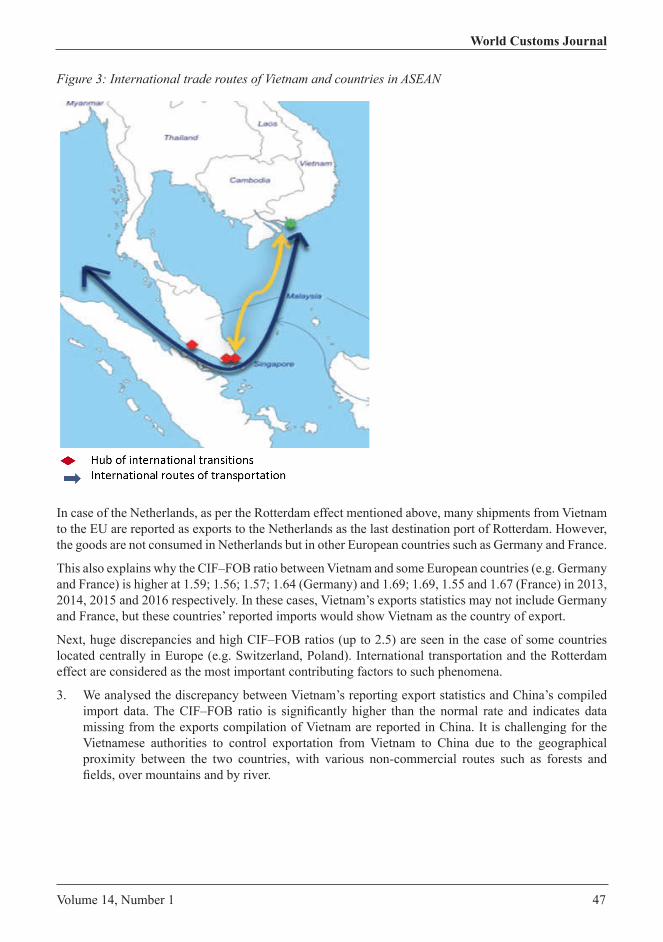
Volume 14, Number 1 47
World Customs Journal
Figure 3: International trade routes of Vietnam and countries in ASEAN
Hub of international transitions International routes of transportation
In case of the Netherlands, as per the Rotterdam effect mentioned above, many shipments from Vietnam to the EU are reported as exports to the Netherlands as the last destination port of Rotterdam. However, the goods are not consumed in Netherlands but in other European countries such as Germany and France.
This also explains why the CIF–FOB ratio between Vietnam and some European countries (e.g. Germany and France) is higher at 1.59; 1.56; 1.57; 1.64 (Germany) and 1.69; 1.69, 1.55 and 1.67 (France) in 2013, 2014, 2015 and 2016 respectively. In these cases, Vietnam’s exports statistics may not include Germany and France, but these countries’ reported imports would show Vietnam as the country of export.
Next, huge discrepancies and high CIF–FOB ratios (up to 2.5) are seen in the case of some countries located centrally in Europe (e.g. Switzerland, Poland). International transportation and the Rotterdam effect are considered as the most important contributing factors to such phenomena.
3. We analysed the discrepancy between Vietnam’s reporting export statistics and China’s compiled import data. The CIF–FOB ratio is significantly higher than the normal rate and indicates data missing from the exports compilation of Vietnam are reported in China. It is challenging for the Vietnamese authorities to control exportation from Vietnam to China due to the geographical proximity between the two countries, with various non-commercial routes such as forests and fields, over mountains and by river.
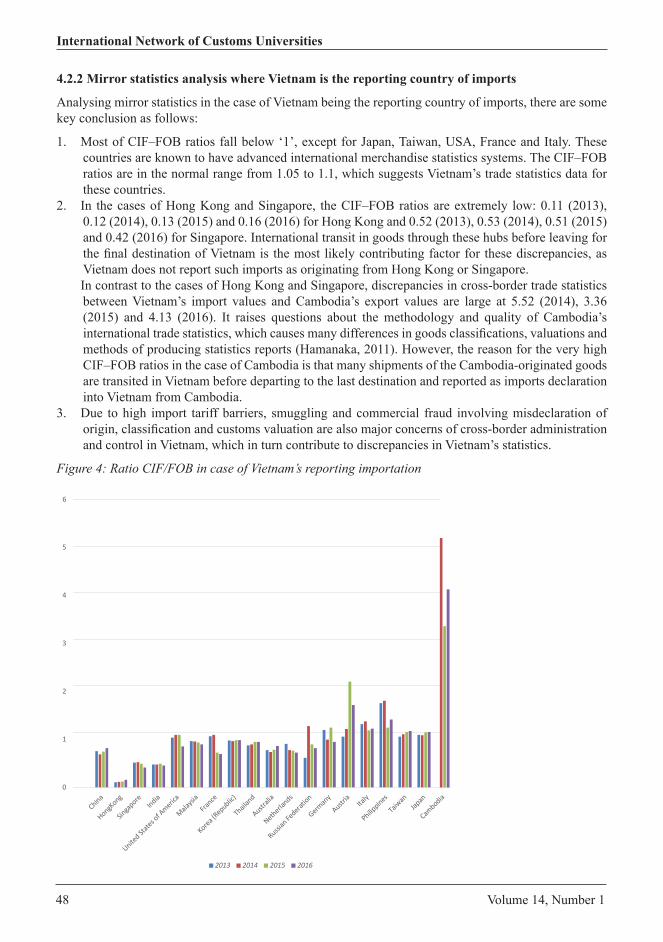
48 Volume 14, Number 1
International Network of Customs Universities
4.2.2 Mirror statistics analysis where Vietnam is the reporting country of imports
Analysing mirror statistics in the case of Vietnam being the reporting country of imports, there are some key conclusion as follows:
1. Most of CIF–FOB ratios fall below ‘1’, except for Japan, Taiwan, USA, France and Italy. These countries are known to have advanced international merchandise statistics systems. The CIF–FOB ratios are in the normal range from 1.05 to 1.1, which suggests Vietnam’s trade statistics data for these countries.
2. In the cases of Hong Kong and Singapore, the CIF–FOB ratios are extremely low: 0.11 (2013), 0.12 (2014), 0.13 (2015) and 0.16 (2016) for Hong Kong and 0.52 (2013), 0.53 (2014), 0.51 (2015) and 0.42 (2016) for Singapore. International transit in goods through these hubs before leaving for the final destination of Vietnam is the most likely contributing factor for these discrepancies, as Vietnam does not report such imports as originating from Hong Kong or Singapore.
In contrast to the cases of Hong Kong and Singapore, discrepancies in cross-border trade statistics between Vietnam’s import values and Cambodia’s export values are large at 5.52 (2014), 3.36 (2015) and 4.13 (2016). It raises questions about the methodology and quality of Cambodia’s international trade statistics, which causes many differences in goods classifications, valuations and methods of producing statistics reports (Hamanaka, 2011). However, the reason for the very high CIF–FOB ratios in the case of Cambodia is that many shipments of the Cambodia-originated goods are transited in Vietnam before departing to the last destination and reported as imports declaration into Vietnam from Cambodia.
3. Due to high import tariff barriers, smuggling and commercial fraud involving misdeclaration of origin, classification and customs valuation are also major concerns of cross-border administration and control in Vietnam, which in turn contribute to discrepancies in Vietnam’s statistics.
Figure 4: Ratio CIF/FOB in case of Vietnam’s reporting importation
0
1
2
3
4
5
6
China
HongKong
Singa
poreIndia
United St
ates o
f Americ
a
Malaysi
aFra
nce
Korea (Republic)
Thail
and
Australi
a
Netherlands
Russian
Federa
tion
German
y
Austria
Italy
Philippines
Taiw
anJap
an
Cambodia
2013 2014 2015 2016
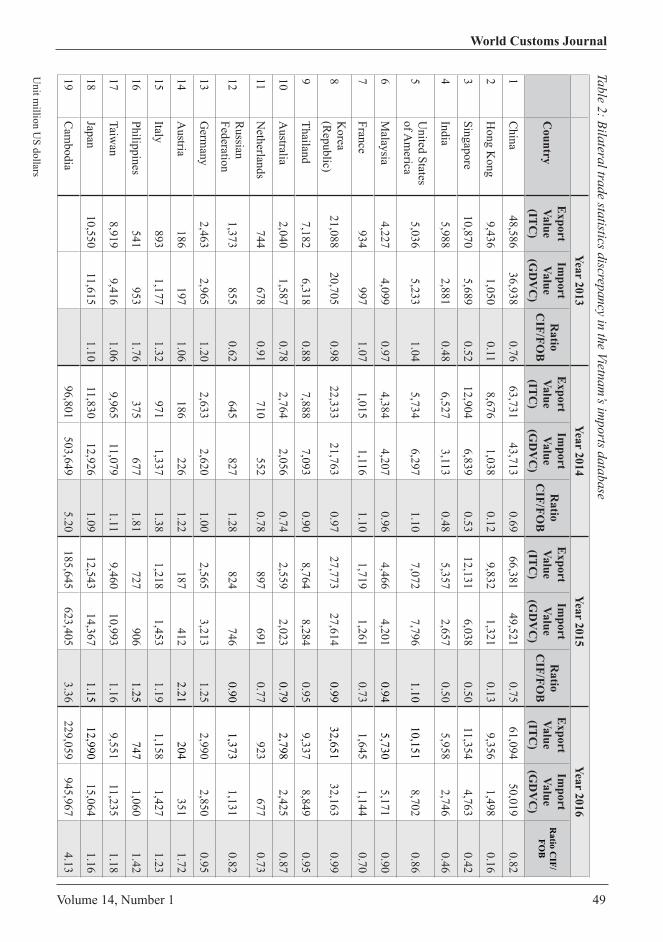
Volume 14, Number 1 49
World Customs Journal Table 2: Bilateral trade statistics discrepancy in the Vietnam
’s imports database
Unit m
illion US dollars
Year 2013Year 2014
Year 2015Year 2016
Country
Export
Value (IT
C)
Import
Value (G
DV
C)
Ratio
CIF/FO
B
Export
Value (IT
C)
Import
Value (G
DV
C)
Ratio
CIF/FO
B
Export
Value (IT
C)
Import
Value (G
DV
C)
Ratio
CIF/FO
B
Export
Value (IT
C)
Import
Value (G
DV
C)
Ratio C
IF/FO
B
1C
hina48,586
36,9380.76
63,73143,713
0.6966,381
49,5210.75
61,09450,019
0.82
2H
ong Kong
9,4361,050
0.118,676
1,0380.12
9,8321,321
0.139,356
1,4980.16
3Singapore
10,8705,689
0.5212,904
6,8390.53
12,1316,038
0.5011,354
4,7630.42
4India
5,9882,881
0.486,527
3,1130.48
5,3572,657
0.505,958
2,7460.46
5U
nited States of A
merica
5,0365,233
1.045,734
6,2971.10
7,0727,796
1.1010,151
8,7020.86
6M
alaysia4,227
4,0990.97
4,3844,207
0.964,466
4,2010.94
5,7305,171
0.90
7France
934997
1.071,015
1,1161.10
1,7191,261
0.731,645
1,1440.70
8K
orea (R
epublic)21,088
20,7050.98
22,33321,763
0.9727,773
27,6140.99
32,65132,163
0.99
9Thailand
7,1826,318
0.887,888
7,0930.90
8,7648,284
0.959,337
8,8490.95
10A
ustralia2,040
1,5870.78
2,7642,056
0.742,559
2,0230.79
2,7982,425
0.87
11N
etherlands744
6780.91
710552
0.78897
6910.77
923677
0.73
12R
ussian Federation
1,373855
0.62645
8271.28
824746
0.901,373
1,1310.82
13G
ermany
2,4632,965
1.202,633
2,6201.00
2,5653,213
1.252,990
2,8500.95
14A
ustria186
1971.06
186226
1.22187
4122.21
204351
1.72
15Italy
8931,177
1.32971
1,3371.38
1,2181,453
1.191,158
1,4271.23
16Philippines
541953
1.76375
6771.81
727906
1.25747
1,0601.42
17Taiw
an8,919
9,4161.06
9,96511,079
1.119,460
10,9931.16
9,55111,235
1.18
18Japan
10,55011,615
1.1011,830
12,9261.09
12,54314,367
1.1512,990
15,0641.16
19C
ambodia
96,801503,649
5.20185,645
623,4053.36
229,059945,967
4.13
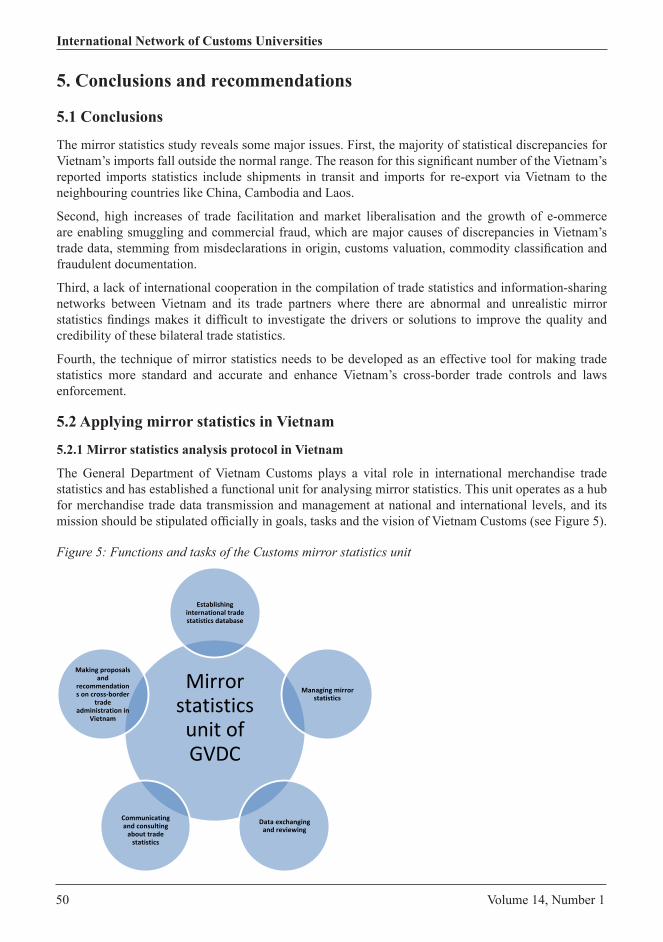
50 Volume 14, Number 1
International Network of Customs Universities
5. Conclusions and recommendations
5.1 Conclusions
The mirror statistics study reveals some major issues. First, the majority of statistical discrepancies for Vietnam’s imports fall outside the normal range. The reason for this significant number of the Vietnam’s reported imports statistics include shipments in transit and imports for re-export via Vietnam to the neighbouring countries like China, Cambodia and Laos.
Second, high increases of trade facilitation and market liberalisation and the growth of e-ommerce are enabling smuggling and commercial fraud, which are major causes of discrepancies in Vietnam’s trade data, stemming from misdeclarations in origin, customs valuation, commodity classification and fraudulent documentation.
Third, a lack of international cooperation in the compilation of trade statistics and information-sharing networks between Vietnam and its trade partners where there are abnormal and unrealistic mirror statistics findings makes it difficult to investigate the drivers or solutions to improve the quality and credibility of these bilateral trade statistics.
Fourth, the technique of mirror statistics needs to be developed as an effective tool for making trade statistics more standard and accurate and enhance Vietnam’s cross-border trade controls and laws enforcement.
5.2 Applying mirror statistics in Vietnam
5.2.1 Mirror statistics analysis protocol in Vietnam
The General Department of Vietnam Customs plays a vital role in international merchandise trade statistics and has established a functional unit for analysing mirror statistics. This unit operates as a hub for merchandise trade data transmission and management at national and international levels, and its mission should be stipulated officially in goals, tasks and the vision of Vietnam Customs (see Figure 5).
Figure 5: Functions and tasks of the Customs mirror statistics unit
Establishing international trade statistics database
Mirror statistics unit of GVDC
Managing mirror statistics
Data exchanging and reviewing
Communicating and consulting
about trade statistics
Making proposals and
recommendations on cross-border
trade administration in
Vietnam
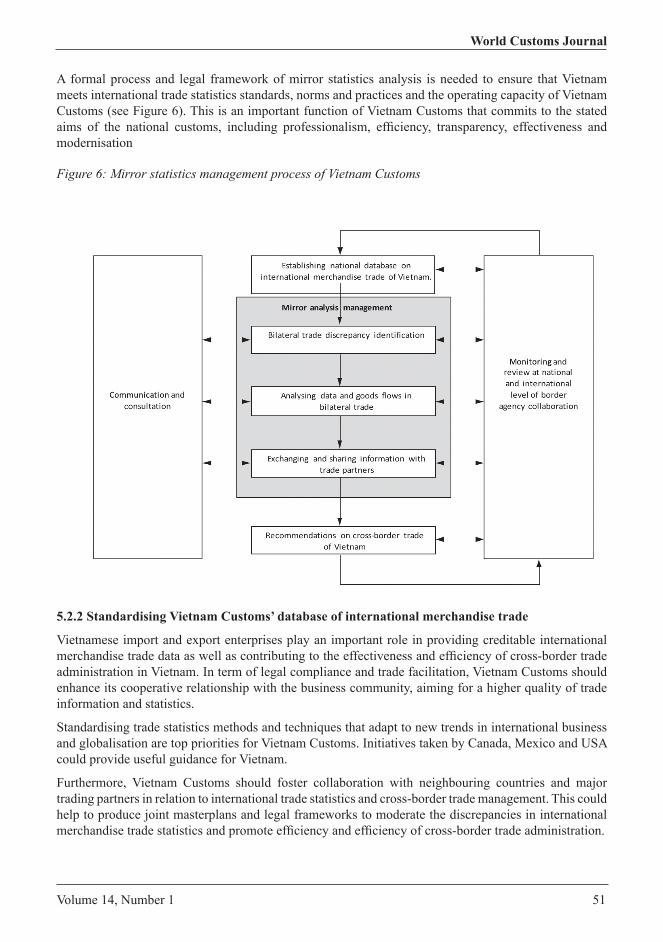
Volume 14, Number 1 51
World Customs Journal
A formal process and legal framework of mirror statistics analysis is needed to ensure that Vietnam meets international trade statistics standards, norms and practices and the operating capacity of Vietnam Customs (see Figure 6). This is an important function of Vietnam Customs that commits to the stated aims of the national customs, including professionalism, efficiency, transparency, effectiveness and modernisation
Figure 6: Mirror statistics management process of Vietnam Customs
5.2.2 Standardising Vietnam Customs’ database of international merchandise trade
Vietnamese import and export enterprises play an important role in providing creditable international merchandise trade data as well as contributing to the effectiveness and efficiency of cross-border trade administration in Vietnam. In term of legal compliance and trade facilitation, Vietnam Customs should enhance its cooperative relationship with the business community, aiming for a higher quality of trade information and statistics.
Standardising trade statistics methods and techniques that adapt to new trends in international business and globalisation are top priorities for Vietnam Customs. Initiatives taken by Canada, Mexico and USA could provide useful guidance for Vietnam.
Furthermore, Vietnam Customs should foster collaboration with neighbouring countries and major trading partners in relation to international trade statistics and cross-border trade management. This could help to produce joint masterplans and legal frameworks to moderate the discrepancies in international merchandise trade statistics and promote efficiency and efficiency of cross-border trade administration.

52 Volume 14, Number 1
International Network of Customs Universities
References
EIA see Environmental Investigation AgencyEnvironmental Investigation Agency (EIA). (2011). Crossroads: The illicit timber trade between
Laos and Vietnam. London. Retrieved from https://eia-international.org/wp-content/uploads/EIA-Crossroads-report-FINAL-low.pdf
Eurostat. (2009). MEDSTAT II: Asymmetry in Foreign Trade Statistics in Mediterranean Partner Countries. Eurostat Methodologies and Working Papers. Retrieved from http://unstats.un.org/unsd/ trade/Attachment158.aspx
Eurostat. (2009). MEDSTAT II: Asymmetry in Foreign Trade Statistics in Mediterranean Partner Countries. Eurostat Methodologies and Working Papers. Retrieved from http://unstats.un.org/unsd/ tradekb/Attachment158.aspx
Ferrantino, M., & Wang, Z. (2008). Accounting for discrepancies in bilateral trade: the case of China, Hong Kong, and the United States. China Economic Review, 19, 502–520.
Gaulier, G., & Zignago, S. (2010). BACI: International trade database at the product-level –The 1994–2007. CEPII Working Paper No. 2010–23, France. Retrieved from https://mpra.ub.uni-muenchen.de/36348/
Gehlhar, M. J. (1996). Reconciling bilateral trade data for use in GTAP. GTAP Technical Paper No.10, 1996.
General Department of Vietnam Customs (2015). Report on exports and imports of Vietnam in 2015.Goetzl, A. (2005). Why don’t trade numbers add up. ITTO Tropical Forest Update, pp. 8–10, 15 January.Hamanaka, S. (2013). Revealing informal trade by the mirror trade statistics comparison: the case of
Lao PDR and Cambodia. WCO WB Conference Paper, 2013.Hamanaka, S. (2011). Quality of the trade statistics of the Lao PDR: incompatibility with international
standards and inaccuracies due to smuggling. South East Asia Research, 19(3), 595–633.International Chamber of Commerce, ICC Product No. 560E, 2000 Edition, ICC Publishing HouseInternational Chamber of Commerce, ICC Product No. 715E, 2010 Edition, ICC Publishing HouseInternational Trade Center (ITC), Reliability of Trade Statistics, 2003.Javorsek, M. (2016). Asymmetries in international merchandise trade statistics: A case study of selected
countries in Asia and the Pacific, Working Paper, 2016.Makhoul, B., & Otterstrom, S. (1998). Exploring the accuracy of international trade statistics. Applied
Economics, 30, 1603–1616.Pomfret, R., & Sourdin, P. (2009). Have Asian trade agreements reduced trade costs. Journal Asian
Economics, 20, 255–268.UNDESA. (2011). International merchandise trade statistics: concepts and definitions 2010. UN.Makhoul, B., & Otterstrom, S. (1998). Exploring the accuracy of international trade statistics. Applied
Economics, 30, 1603–1616.Phan, T. T. H., Chan, S. W., & Chizhikov, S. (2016). Trafficking and illicit trade – Case Costa Rica,
Vietnam and Russia. PICARD Conference Manila, the Philippines.Pomfret, R., & Sourdin, P. (2009). Have Asian trade agreements reduced trade costs, Journal Asian
Economics, 20, 255–268.Roger-Claver Victorien Gnogoue, Mirror analysis, a risk analysis support tool for Customs administrations,
WCO News No.82, Feb.2017.
Volume 14, Number 1 53
World Customs Journal
Saunders, J. (2014). Trade in illegal timber: the response in Vietnam. A Chatham House Assessment. Chatham House – The Royal Institute of International Affairs. Retrieved from https://www.chathamhouse.org/sites/files/chathamhouse/field/field_document/20141210IllegalTimberVietnamSaunders.pdf
United Nations (UN). (1998). International merchandise trade statistics: concepts and definitions. Studies in Methods Series M, No. 52, Rev. 2., UN, New York.
Yeats, A. (1995). Are partner-country statistics useful for estimating ‘missing’ trade data? Policy Research working Paper 1501. Washington, DC: World Bank.
Phan Thi Thu HienDr Thi Thu Hien Phan is a lecturer of international business at the Vietnam Foreign Trade University. She had worked as a specialist in international business in the automobile industry in Vietnam before her academic career. In 2012, she defended successfully the PhD dissertation on the issue of establishing an efficient linkage between trade and industry policies for the industrialisation and global participation of Vietnam. She is known as an expert on international trade transactions and customs affairs not only lecturing at her University but also training and supervising Vietnam’s business community and customs officers. She is an active researcher about cross-border trade in Vietnam with several projects including illicit trade, informal trade and customs in Vietnam; trade costs of Vietnamese enterprises; timber value chains in Vietnam, so forth. Now she is an associate researcher of Cross-border Research Association in Switzerland – focusing on a study on global trade facilitation and supply chain security.
Nguyen Viet HungNguyen Viet Hung is Vietnamese, head of division and General Department of Viet Nam Customs (GDVC), having 24 years of service in customs. His main responsibility is to compile the Vietnam’s trade-in-goods statistics (from collection to dissemination) with depth knowledge in customs revenue statistics. Mr. Nguyen Viet Hung is experienced in customs and trade related matters (customs/trade procedures, HS/AHTN tariff classification, custom valuation, rule of origin, FTAs, ..). His current interests are inclusive of Big data, Data analysis and BI. He participated in ASEAN, APEC and UNSD activities (trade statistics, mirror statistics, AHTN review, trade data exchange, TiVA). Currently, he is members of the ASEAN Working Group on International Merchandise Trade Statistics (WGIMTS) and WCO Virtual Working Group on Future of Customs. Mr. Nguyen Viet Hung held Master of Public Finance by the National Graduate Institute for Policy Studies (GRIPS) in Tokyo-Japan with full scholarship from Japan Government and WCO; Bachelor of Economics (major in statistics) of Hanoi National Economics University (NEU) and received certificates from offline and online training workshops/courses offered by UNCTAD, UNSD, WTO, WCO, EDX, Coursera. His languages: Vietnamese (native), English (command), French (basic) and German (basic). He is proficient in MS office tools.
This paper was written by the ‘Trade facilitation and supply chain security’ research team, sponsored by Foreign Trade University of Vietnam.

54 Volume 14, Number 1
International Network of Customs Universities
Volume 14, Number 1 55
World Customs Journal
Enhancing customs control in Cambodia through risk management policy
Hong Sreya
Abstract
International agreements and the strategy of the Royal Government of Cambodia emphasise strengthening trade facilitation and customs control through risk management policies. The General Department of Customs and Excise of Cambodia has made significant progress in managing risks associated with revenue fraud and prohibited goods, and has restricted smuggling while facilitating legitimate trade through its reform and modernisation efforts. This research explores policy options to strengthen technology systems and the capacity of customs officials to manage risks.
1. IntroductionOn International Customs Day 2019, the World Customs Organization (WCO) (2019) highlighted the importance of fast and efficient global trade, movement of people and transportation of goods through the slogan ‘SMART borders for seamless Trade, Travel, and Transport’. With globalisation, international trade has increased significantly and is expected to continue to rise. In most developing countries, Customs has three major roles: collecting revenue from imported and exported goods, providing border security and facilitating trade. Therefore, key objectives are preventing revenue loss and providing border security while allowing goods to flow across borders with less delay. However, achieving a balance between control and trade facilitation can be seen as a ‘zero-sum’ game in Cambodia and elsewhere. To reach the optimal level of both, the effective application of risk management policies is needed (Widdowson, 2005).
Customs around the world have modernised and reformed their administrations through all areas so that they can respond to the challenges. The General Department of Customs and Excise of Cambodia (GDCE) is the leading agency at the Cambodian border, operationally responsible for ensuring that international trade is compliant with national laws and international agreements (Royal Government of Cambodia, 2007). The GDCE (2015) has been working towards achieving a robust risk management system that meets international standards and best practice through its Strategy and Work Programs on Reform and Modernisation. However, challenges regarding information technology (IT) and human capacity remain.
This paper first outlines the international and national legal frameworks regarding risk management policies and poses research questions. It then presents the methodology for the research investigation before identifying gaps in the current practices in Cambodia. Next, it summarises the key findings to the research questions and proposes an ‘improvement’ package that consists of a collection of actions that fits the context of Cambodia Customs. Finally, it analyses options against the status quo and recommends the next steps that the GDCE should take based on the results of the analysis.

56 Volume 14, Number 1
International Network of Customs Universities
1.1 Definition
‘Customs risk’ refers to the risk of noncompliance with customs legislation (WCO, 2010). WCO (2008)1 defined ‘customs risk management’ (CRM) as the system of managing customs policies, procedures and practices through having the necessary information and intelligence in order to identify, analyse, monitor and address risks of imported consignments (WCO, 2008). This process is set out in Figure 1.
Figure 1: Standard customs risk management process (WCO, 2008)
1.2 Types of customs risks
There are many types of risks that Customs around the world need to manage, including risks of revenue fraud, public health and environmental harms, illegal importation of prohibited and restricted goods, and fair economic competition. These are set out in Table 1.
Table 1: Type of risks facing Customs (Zivkovic & Sutevski, 2018, p. 9)
Revenue collection
Public health
Environmental protection
Fighting against
terrorism
Fair competition
Non-declared goods
Proper tariff classification
Proper valuation
Proper country of origin
Trade policy measures
Proper customs procedures
Intellectual property rights
Trade agreements compliance
Money laundering
Environmental crime
Smuggling
Drugs and precursors
Weapons of mass destruction
Firearms
CITES

Volume 14, Number 1 57
World Customs Journal
Nuclear and radioactive materials
High customs duty goods
1.3 Background
1.3.1 International framework
The guidelines in Chapter 6 of the Revised Kyoto Convention on Customs Control state that Customs should use risk analysis to identify high-risk goods for further examination and use risk management systems for customs control (WCO, 2008). Moreover, Standard 4 of the WCO SAFE Framework of Standards (FoS) states that ‘Customs should establish risk-management systems to identify potentially high-risk cargo and/or transport conveyances and automate that system’ (WCO, 2010, p. 13).
Risk management systems allow Customs to limit intrusive customs inspections, aligning with trade facilitation agreements (World Trade Organization, 2014). Due to a significant growth of international trade in the 21st century, the identification and mitigation of risks at the operational level and the application of risk management beyond the operation level are among the key building blocks for the new strategic direction (WCO, 2008).
1.3.2 National legal framework
The Royal Government of Cambodia (RGC) (2018) commits, in its Rectangular Strategy Phase IV, to strengthen trade facilitation by reducing cross-border control mechanisms and other unnecessary formalities that delay the flow of goods. The RGC (2018) also aims to prevent and suppress illegal activities, including smuggling, money laundering and illegal drugs trafficking and emphasises (RGC, 2019) medium-term revenue mobilisation during 2019–2023. The GDCE is responsible for mobilising revenue from importation and exportation of goods while protecting the border (RGC, 2007). These objectives and the associated primary responsibilities require the GDCE to have robust systems in place to effectively and efficiently control the importation, exportation, and transit of consignments with the least possible time and cost.
The RGC (2006) adopted a risk management policy under Sub-decree No. 21, The facilitation of trade through risk management. Article 5 of the sub-decree states that the GDCE is responsible for inspecting goods at the borders and checkpoints, while Article 15 states that inspections need to be based on risk-operative procedures. This means that the physical inspection of goods will be conducted only for those goods that are identified as high risk. The framework underlies the rationale of why the GDCE needs to have effective risk management policies. The RGC has established a Risk Management Unit (RMU) in the GDCE as it is an implementing agency (RGC, 2013). The RMU is under the Department of Customs Audit of the GDCE.
1.4 Research methodology and scope
The research draws upon academic studies of CRM practices, published and internal government reports, and the guidelines and standards of international organisations. Data are drawn from international standards and guidelines, the RGC’s documents, and the GDCE’s published documents and reports. Gap analysis is conducted on two main aspects: information technology (IT) and human resource management and capacity.
There are two important aspects to note in the scope of the research. First, it focuses on the risks associated with the importation of goods. Second, the research only focuses on policy aspects regarding IT system and human resources capacity and management.
58 Volume 14, Number 1
International Network of Customs Universities
2. Current policy analysis
2.1 Information technology
This section assesses the capability of the GDCE to use IT for effective implementation of CRM policies based on the SAFE FoS of the WCO (‘the standard’).
2.1.1 Submission of data
The standard states that importers should lodge an electronic cargo declaration to Customs before the arrival of goods.
With the support from the World Bank, the GDCE implemented the Automated System for Customs Data (ASYCUDA) in 2006 so that it could provide electronic submission of customs declarations to improve the business environment in Cambodia (World Bank, 2012). ASYCUDA has now been installed at all customs branches and offices in Cambodia. The ongoing development of ASYCUDA has contributed to enhancing the logistics performance in Cambodia by improving the rank from 129th in 2010 to 73th in 2016 (World Bank, 2016).
Gap analysis: The GDCE has successfully conformed to the standard regarding submission of customs declarations electronically. Since ASYCUDA covers all customs transactions, the GDCE can easily monitor and control trade data in Cambodia. However, the GDCE still faces challenges to receive electronic shipping information before the goods arrive. Therefore, unnecessary time and cost may occur.
2.1.2 Risk management systems
The standard states that Customs should use IT for effective implementation of risk management systems as IT supports faster analysis of selectivity criteria:
1. A national database for Customs to store all important information of all trading consignments and risk profiles can easily be updated and shared internally.
2. The database can be used as the basis for targeting, profiling and identifying risks through the selectivity module of automated clearance system.
So far, 28 risk indicators and nine selectivity criteria have been added to ASYCUDA. The list of prohibited and restricted goods has also added to ASYCUDA (RGC, 2007). The system assesses customs declarations, which are known as single administration declarations (SAD), according to its risk profile, then allocates them to one of four lanes (Ministry of Economy and Finance, 2007) as Figure 2 illustrates.
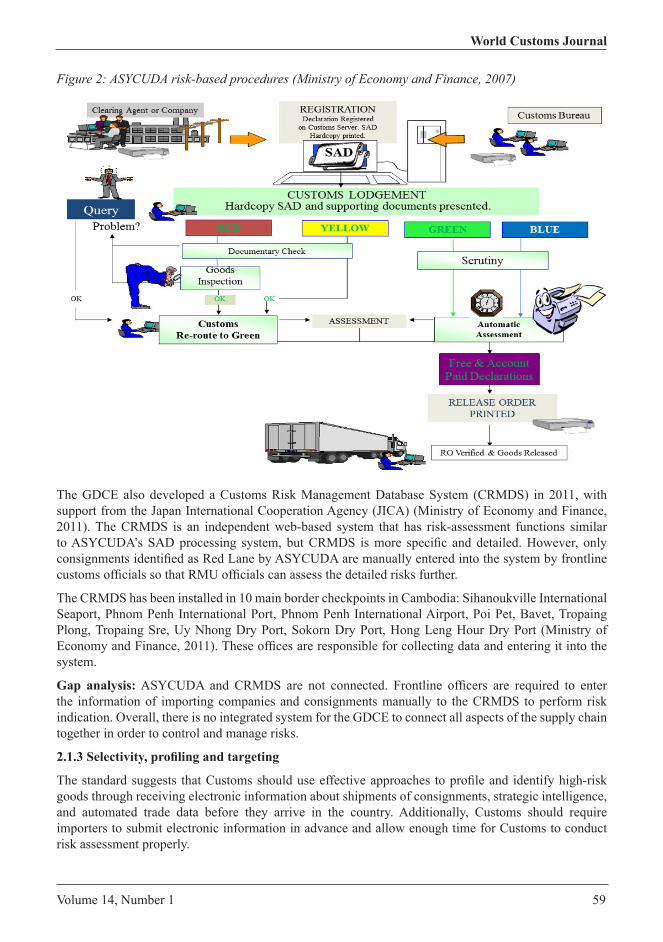
Volume 14, Number 1 59
World Customs Journal
Figure 2: ASYCUDA risk-based procedures (Ministry of Economy and Finance, 2007)
The GDCE also developed a Customs Risk Management Database System (CRMDS) in 2011, with support from the Japan International Cooperation Agency (JICA) (Ministry of Economy and Finance, 2011). The CRMDS is an independent web-based system that has risk-assessment functions similar to ASYCUDA’s SAD processing system, but CRMDS is more specific and detailed. However, only consignments identified as Red Lane by ASYCUDA are manually entered into the system by frontline customs officials so that RMU officials can assess the detailed risks further.
The CRMDS has been installed in 10 main border checkpoints in Cambodia: Sihanoukville International Seaport, Phnom Penh International Port, Phnom Penh International Airport, Poi Pet, Bavet, Tropaing Plong, Tropaing Sre, Uy Nhong Dry Port, Sokorn Dry Port, Hong Leng Hour Dry Port (Ministry of Economy and Finance, 2011). These offices are responsible for collecting data and entering it into the system.
Gap analysis: ASYCUDA and CRMDS are not connected. Frontline officers are required to enter the information of importing companies and consignments manually to the CRMDS to perform risk indication. Overall, there is no integrated system for the GDCE to connect all aspects of the supply chain together in order to control and manage risks.
2.1.3 Selectivity, profiling and targeting
The standard suggests that Customs should use effective approaches to profile and identify high-risk goods through receiving electronic information about shipments of consignments, strategic intelligence, and automated trade data before they arrive in the country. Additionally, Customs should require importers to submit electronic information in advance and allow enough time for Customs to conduct risk assessment properly.
60 Volume 14, Number 1
International Network of Customs Universities
The GDCE currently receives information on cargo shipping documents in hard copies, sometimes as soon as the shipment arrives (The PM Group, 2015). Customs officials identify high-risk goods based on its profile and selectivity criteria indicated by ASYCUDA’s SAD processing, and the CRMDS identifies the level of high-risk consignments in detailed. The GDCE is the leading agency to implement the national single window, which allows all traders to submit shipping documents of consignments electronically in advance to save time and cost of doing business in Cambodia (GDCE, 2015).
In 2016, the Royal Government of Cambodia officially joined the UNODC-WCO Container Control Programme (CCP) with other 54 member states to enhance security in the international containerized supply chain. As a result, Container Control Unit (CCU) and Air Cargo Control Unit (ACCU) have been inaugurated in Sihanoukville International Port and Phnom Penh International Airport respectively. CCU and ACCU officers are trained and equipped with risk analysis and identification skills and they are responsible for profiling and targeting high-risk consignments at the frontline using equipment and tools available to the units.
Gap analysis: Effective and successful selection of high-risk goods depends significantly on pre-arrival information (Zivkovic & Sutevski, 2018). With the importance of trade facilitation, customs officials at RMU, CCU and ACCU cannot take sufficient time to assess the risk associated with the goods to identify the high-risk consignments. Moreover, the CRMDS does not allow frontline officials to create emerging risk profile with the combination of potential risk indicators or suspicion even though they are the operators who meets consignment directly.
2.1.4 Modern technology in inspection equipment
The standard recommends that Customs should install non-intrusive inspection and radiation detection technology equipment for conducting inspection following risk assessment.
The GDCE has installed scanning machines at the main customs checkpoints: Phnom Penh and Sihanoukville International Port, Bavet office, Poi Pet Office and Phnom Penh International Airport (GDCE, 2015). The GDCE has also installed radiation detection equipment at Phnom Penh International Port, Sihanoukville International Seaport, Siem Reap and Phnom Penh International Airport, with support from the United States Department of Energy’s Office of the Second Line of Defence under Megaports Initiative Programme.22
Gap analysis: The scanning machines have not yet been installed at all border checkpoints yet. This means that some checkpoints still need to conduct intrusive physical inspections, which take longer and it is harder to detect concealed illegal items.
2.1.5 Intelligence exchange for high-risk consignments
The standard suggests Customs should adopt Customs-to-Customs electronic messages to exchange data for high-risk consignments to assist in assessing risks. These messages include arrival notification and inspection results. The provisions to enable Customs to send information to Customs in country and other countries for the purpose of targeting high-risk goods should be developed.
The GDCE has used the Customs Enforcement Network Communication Platform (CENcomm) by WCO (2008) as it is an online platform that allows customs officials in risk management areas to communicate and share intelligence. Currently, customs officials in the department of suppression and prevention, RMU, container control unit (CCU), and air cargo control unit (ACCU) can get a username and access the platform (GDCE, 2015). It provides:
• real-time intelligence exchange
• seizure record details
• reports on control or inspection action taken by customs of other countries.
Volume 14, Number 1 61
World Customs Journal
Furthermore, department of suppression and prevention is a part of WCO’s Regional Intelligence Liaison Offices in which intelligence is shared regularly among members.
Gap analysis: There is not yet a formal electronic system within the organisation for sharing real-time data among relevant departments and offices. Intelligence is a key factor for frontline officers to effectually detent and seize high-risk consignments. IT systems to support real-time data exchange is an important component for a smart risk management system (Zivkovic & Sutevski, 2018).
2.2 Human resource management and capacity
This section assesses the human resource management and capacity of the GDCE based on the Risk Management Compendium of the WCO (2010).
2.2.1 Human resource management
The standard recommends that work in RMU should be assigned based on an official’s skills, experience and capability related to risk analysis and relevant functions. Unfortunately, there is currently no monitoring and evaluation process to assess an RMU official’s competencies in risk management skills.
Gap analysis: Having specialists in any specific field is key for the organisation to achieve the best outcome. RMU officials should have competent skills related to analysing and identifying risks. Without these qualities, the outcome cannot reach its best yet.
2.2.2 Human resources capacity
The standard states that training should be regularly provided to officials in RMU to ensure that they are capable and knowledgeable in applying all areas of risk management policy. Moreover, all customs officials in Customs need to understand and be able to apply the concepts and functions of risk management and its role in the customs clearance process.
National training and training abroad by development partners is provided for the officials in the RMU (GDCE, 2015). However, no introductory training related to the risk management system to frontline customs officials is provided. RMU officials receive training with assistance from development partners, but there is an insufficient number of in-house instructors to conduct continuous internal training.
Gap analysis: Without all customs officials, particularly frontline officials, having risk management knowledge it is hard for the risk analysts to perform their work, as customs officials do not correspond in a required by RMU officials. USAID (2018) points out that risk analysts’ capacity is important, and so is the capacity building of all customs officials across the organisation, which is necessary for the risk analysts to perform risk assessment effectively and efficiently.
3. Key findings of alternative approaches
3.1 Information technology
An integrated customs risk management system has been used by several countries to ensure effective and efficient customs control. For example, New Zealand Customs and Ministry for Primary Industries (MPI) established the Joint Border Management System (JBMS) in 2016 to integrate business intelligence, data mining, and trade single window to improve the CRM capabilities (New Zealand Customs, 2017). Furthermore, Ukrainian Customs has successfully integrated their Automated Risk Analysis and Management System (ARAMS) into a customs database system and other developed systems (Komarov, 2017). When submitting customs declarations into the customs data system, those
62 Volume 14, Number 1
International Network of Customs Universities
goods are automatically assessed by the ARAMS. As a result, in 2014, Ukrainian Customs conducted further rigorous examination and control of only 4.1 per cent of total customs declarations and was able to facilitate 95.9 per cent of consignments that had low-risk profiles.
Electronic advance cargo information (ACI) has been found to be an effective policy that allows Customs to perform advanced risk assessment. ACI refers to the dataset of information that is necessary for Customs to profile and identify high-risk consignments before they arrive in each country (WCO, 2010). SAFE FoS of the WCO (2010) seeks to harmonise the ACI for arrival, transit and departure of consignments and advises Customs to implement an electronic ACI program. Incorporating ACI into the current CRM system enables Customs to increase their control over territory and supply chains and decreases risks. In addition, ACI enables Customs to have more time to scrutinise shipments in order to take the right action. Notably, setting up ACI is costly for Customs, other relevant agencies and business.
For example, in 1991, Japan Customs implemented the electronic ACI and pre-arrival examination, which aims to process customs procedures before the arrival of goods (WTO, 2010). In 2010, the percentage of traders who used this was 36 per cent for sea cargos, and 52 per cent for air cargos. This policy has allowed Japan Customs to provide trade facilitation for low-risk consignments and focus more on high-risk shipments. According to a time-release study conducted by the Ministry of Finance of Japan (2009), the clearance time was reduced to 48 per cent for goods shipping through sea and 95 per cent for goods shipping through air. The WTO (2010) also states that the implementation of a pre-arrival examination does not require a high cost as customs administrations can use their existing facilities combined with changes to their legislation.
Moreover, USAID (2018) recommends each Customs to implement the Cargo Targeting System (CTS) developed by the WCO (2018) as it is a system provided to its members with best practice for assessing and managing customs risks. The function of the system is to profile risk from all manifests and imported shipment data submitted by traders and to provide transactions for customs officials to review. The system is also easily integrated with other systems. The implementation of CTS needs to comply with the national laws and legislation of each country.
The guidelines in SAFE FoS of the WCO (2010) suggest that members establish a customs intelligence system to manage and share intelligence with others. The South-East European Law Enforcement Center has adopted the South-East European Messaging System (SEMS) as a tool for exchanging data among customs administrations of participating countries (Zivkovic & Sutevski, 2018). The SEMS allows each law enforcement agency to securely and accurately exchange real-time data. In addition, the system can be used to collect data for risk assessment, profiling and targeting. The systems play an important role to support CRM functions. The European Union and China also set out EU-China Smart and Secure Trade Lanes to exchange customs data.
For managing risks related to passengers leaving or entering the country by air, New Zealand Customs launched the SmartGate automated passenger processing system at Auckland International Airport in 2009, and Wellington and Christchurch international airports in 2010 (New Zealand Customs, 2017). SmartGate is a technology that uses electronic information and facial recognition against passport photos to perform customs and immigration control and verification. This system is effective and efficient as it allows customs officers to focus on high-risk travellers. Until 2015, approximately 3.9 million passengers air had gone through the SmartGate and the figure was equal to 36 per cent of the overall air passengers. New Zealand Customs is working to expand SmartGate to more airports and increase the eligibility to more nations in order to reduce manual border clearance.
Volume 14, Number 1 63
World Customs Journal
3.2 Human resources
Technology systems can produce results if staff know how to use the systems. Komarov (2017) warns that automated risk management systems are only able to analyse information electronically. However, customs officials in the RMU are responsible for adding, reviewing or editing indicators of risk, combinations and value into the risk profiles to ensure effective selectivity. For instance, in Ukraine Customs, the organisation allocated IT specialists in both the IT and risk analysis departments to raise the efficiency and capacity of the risk assessment process.
Human resources management is also an important factor to bring the best outcomes in managing risks. Laporte (2011) recommends Customs to adopt a modern human resources management in which the recruitment of CRM staff should be based on clearly defined job descriptions and assigned to work on a long-term basis. For example, Angola Customs has used an annual appraisal system to verify and rearrange staff to job descriptions based on their skills (Wulf, 2005). This allows Angola Customs to allocate staff in the area they have expertise in and identify who should be promoted.
There should be a clear process of determining how Customs should manage their human resources effectively. Wulf (2005) advises Customs to manage human resources by dividing the process into five stages. The first stage is to identify desired staff profile. For risk management, staff need to have expertise in IT, as modern risk assessment is based on intelligence-gathering techniques and be able to conduct risk analysis and post-clearance audits on the business. The second stage is to establish recruitment processes to find the needed skills, including analysis and technology skills. An interview should also be conducted to assess the ability of each individual. The third stage is to provide training to enhance their knowledge and skills. The fourth stage is to offer incentives for good performers so that they are motivated to work hard and improve themselves. The final stage is to conduct an evaluation to identify weaknesses and poor performers, and to find ways of improving their capabilities.
4. Policy analysis and recommendations
4.1 Policy options
Action 1: Integrated CRMDS with e-Customs
The GDCE should streamline CRMDS with all current technology systems of e-Customs for RMU to effectively improve the selectivity and cover all information of consignments. When CRMDS is connected to the ASYCUDA and the national single window, all shipping transactions will be automatically recorded to the CRMDS, and customs officials will not need to manually record data. After that, the integrated risk management system should be available to all customs and excise branches and offices. All frontline officials who clear goods for traders can identify the high-risk consignments by relying on the new integrated risk management system.
Action 2: Electronic advance cargo information
After establishing the integrated risk management system, the GDCE can introduce electronic advance cargo information. This requires importers to submit all shipping documents two days before the goods arrive the port. The 48-hour duration will allow the customs officials to profile and assess the risk of the consignments before the goods arrive. If there is any identification of high-risk consignments, those goods will be scrutinised and inspected physically.
64 Volume 14, Number 1
International Network of Customs Universities
Action 3: Capability-based staff system for RMU
The staff at RMU should be allocated and evaluated based on the three main competencies: technical skills, risk assessment skills and analytical skills. The officials who are based in that unit should have those competencies in order to obtain the best outcome from the integrated risk management system. Accordingly, the allocation and recruitment process into the RMU should also be based on competency in those skills.
Action 4: Ongoing and in-depth training for RMU officials
Having allocated sufficient capable people to the RMU, GDCE should conduct in-depth training to those officials every six months to keep knowledge and skills up to date. This could enable them to keep up with the trends in order to manage risk effectively. The GDCE can request support from the WCO and other development partners to provide experts for regular training twice per year and seek support to send officials for overseas training in order to learn from practical experience from a more developed country.
Action 5: Induction training for all customs officials at the border checkpoints
Induction training should be provided to all customs officials at the border checkpoints. The training should provide frontline customs officials with an understanding of customs risk management and effective use of the systems. It may be organised annually, and officials at RMU could be the trainers. The training should provide key concepts for customs officials to use the integrated risk management system successfully. The training would also provide opportunities for frontline customs officials to ask questions if they do not understand how to use the system.
4.2 Associated program logic and outcome analysis
The program logic framework below (Figure 3) illustrates the model of the recommended policy. The five actions are designed to improve IT and human resources. Implementing these actions can lead to outputs of having sophisticated risk management systems and competent and skilful customs officials in the GDCE. Having these outputs enables the RMU and frontline officials to conduct more effective risk assessment. This immediate outcome assumes that the RMU can receive all the information of trade and cooperate with frontline officials smoothly. Better risk assessment could lead the GDCE to make more seizures, collect more revenue, and reduce clearance time and cost. All of these can contribute to the seamless flow of trade and effective and economic growth in Cambodia.
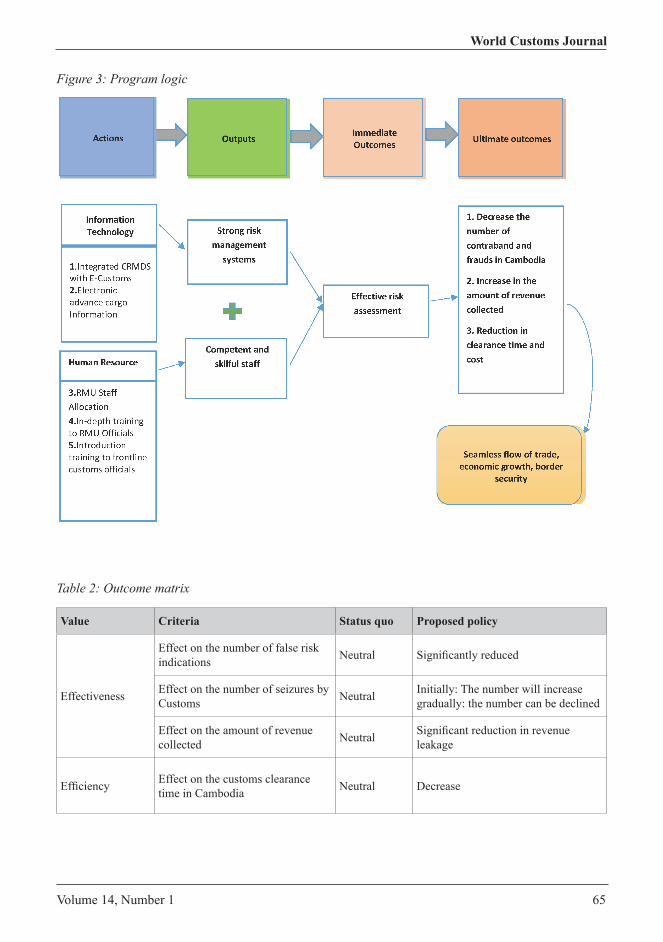
Volume 14, Number 1 65
World Customs Journal
Figure 3: Program logic
Table 2: Outcome matrix
Value Criteria Status quo Proposed policy
Effectiveness
Effect on the number of false risk indications Neutral Significantly reduced
Effect on the number of seizures by Customs Neutral Initially: The number will increase
gradually: the number can be declined
Effect on the amount of revenue collected Neutral Significant reduction in revenue
leakage
Efficiency Effect on the customs clearance time in Cambodia Neutral Decrease
66 Volume 14, Number 1
International Network of Customs Universities
4.3 Recommendations
Based on the results from the findings and option analysis, the paper recommends that the GDCE implements the proposed policy after the national single window is fully established.
The GDCE can start to streamline e-Customs operations with CRMDS and make it an integrated risk management system to be installed in the main border checkpoints of the GDCE. Then, it can continue to expand until it covers all customs offices. The system should enable frontline customs officers to add risk profile or contribute risk indicators they have into the system for effective risk assessment.
Simultaneously, the GDCE can include the RMU staff reform initiative in the next recruitment process. After adequate human resources are in the team, the GDCE can start to seek support for conducting in-depth training for RMU officials. When the RMU officials are fully equipped, the RMU officials could become the trainers to conduct introduction risk management training to the frontline officials.
Once the system functions effectively, GDCE could introduce electronic advance cargo information, which can boost both customs control and trade facilitation. GDCE could commence implementation at the main checkpoints first such as the Sihanoukville International Seaport and Phnom Penh International Airport. Once the initiative has proved successful, GDCE could expand it to other offices throughout the country.
5. ConclusionThe increasing complexity of global trade creates challenges for Customs who require sophisticated risk management policies to strengthen control and improve trade facilitation. Risk management policies need to cover various areas in order to ensure that the importation of goods is compliant with all national legislation and international agreements. Technology and human resources play key roles and the GDCE needs to focus on these, based on the assessment from the WCO.
The GDCE has made progress in implementing an effective risk management policy, having adopted a risk management system and established the RMU as guided by international standards. Several gaps of the GDCE’s technology practices and human resources factors still remain. Based on the key findings from international guidelines, practices and literature, this paper proposes a reform program of the customs risk management systems to tighten those gaps. The program consists of five actions: an integrated risk management system, electronic advance cargo information, capability-based staff system for the RMU, in-depth training to RMU officials, and introductory training for frontline customs officials. The proposed policy is likely to have a significant positive effect on GDCE. It is proposed that the next steps that GDCE should take are:
1. Streamlining e-customs operations with CRMDS, commencing with the main border checkpoints and then expanding to other border checkpoints while, simultaneously, introducing a RMU staff allocation recruitment process and focusing on building the capacity of RMU officials to become the trainers for new officials and frontline customs officials.
2. Introduce electronic advance cargo information once the integrated system is fully operational.
Volume 14, Number 1 67
World Customs Journal
ReferencesAfanasieva , V., Ivanov, L., & Yanushkevych, D. (2017). Modern Approaches to Risk Management and
Their Use in Customs. Path of Science, 3(4), 6.1-6.14. doi:http://dx.doi.org/10.22178/pos.21-6Bardach, E., & Patashnik, E. M. (2016). The Eightfold path. In E. Bardach, & E. Patashnik, A practical
guide for policy analysis; the eightfold path to more effective problem solving (5th ed., pp. 01–82). CQ Press/SAGE.
Davaa , T., & Namsrai, B. (2015). Ways to modernise customs risk management in Mongolia. World Customs Journal, 9(2), 24–37.
Drobot , E., & Klevleeva, A. (2016). Risk management in customs control. Russian Presidential Academy of National Economy and Public Administration. Retrieved from https://mpra.ub.uni-muenchen.de/71677/
General Department of Customs and Excise of Cambodia. (2013). Time Release Study in Cambodia. General Department of Customs and Excise of Cambodia. Retrieved from http://www.customs.gov.kh/wp-content/uploads/2015/10/TRS-Report-Cambodia-revision-28-11-2014.pdf
General Department of Customs and Excise of Cambodia. (2015). Handbook on Customs Clearance. General Department of Customs and Excise of Cambodia. Retrieved from http://www.customs.gov.kh/wp-content/uploads/2015/10/Handbook-on-Customs-Clearance-EN-Final.pdf
General Department of Customs and Excise of Cambodia. (2015). Strategy and Work Programs on Reform and Modernization of the General Department of Customs and Excise of Cambodia. Phnom Penh: General Department of Customs and Excise of Cambodia. Retrieved from http://www.customs.gov.kh/wp-content/uploads/2015/10/Strategy-and-Work-Programs-on-Reform-and-Modernization-2014-2018.pdf
General Department of Customs and Excise of Cambodia. (2016). Annual Internal Report.General Department of Customs and Excise of Cambodia. (2018). Process Diagram of ASYCUDA
risk-based procedures. General Department of Customs and Excise of Cambodia. Retrieved from http://www.customs.gov.kh
Geourjon, A. M., & Laporte, B. (2005). Risk Management for Targeting Customs Controls in developing countries: A Risky Venture for Revenue Performance. Public Administration and Development(25), 105-113. doi:10.1002/pad.336
Inter-American Development Bank. (2010). Risk Management for Cargo and Passengers. Integration and Trade Sector of Inter-American Development Bank. Retrieved from https://webimages.iadb.org/publications/english/document/Risk-Management-for-Cargo-and-Passengers-A-Knowledge-and-Capacity-Product.pdf
International Organization for Standardization. (2009). Risk Managment: Principles and Guidelines. Geneva: ISO. Retrieved from https://shop.standards.govt.nz/catalog/31000:2009(AS%7CNZS%20ISO)/scope
Komarov, O. (2017). Customs Control and Risk Managment System on the Example of The Ukrainian Customs. Customs Scientific Journal, 6(2), 85-96. Retrieved from https://scholar.google.co.nz/scholar?hl=en&as_sdt=0%2C5&as_vis=1&q=risk+managment+customs&btnG=
Laporte, B. (2011). Risk management systems: using data mining in developing countries’ customs administrations. World Customs Journal, 5(1), 17-28. Retrieved from http://www.akmal.gov.my/files/periodic/wco/WCJ_Volume_5_Number_1.pdf#page=23
Larbi, G. (2013). Overview of Public Sector Management Reform. United Nations Research Institute for Social development. Retrieved from http://siteresources.worldbank.org/INTROADSHIGHWAYS/Resources/338993-1115316483571/3-public_sector_mgmnt_reform.pdff
68 Volume 14, Number 1
International Network of Customs Universities
Ministry of Economy and Finance. (2007). No. 1447 MEF.BK Prakas on Provision and Procedures of Customs Declaration. Royal Government of Cambodia. Retrieved from http://www.customs.gov.kh/wp-content/uploads/2015/10/Customs-Law-and-Regulations-EN-GDCE.pdf
Ministry of Economy and Finance. (2011). Letter No. 009 MEF Decision on Establishment and Functioning of Customs Risk Management Database System (CRMDS). Retrieved from http://www.customs.gov.kh/wp-content/uploads/2015/10/Customs-Law-and-Regulations-EN-GDCE.pdf
Ministry of Economy and Finance. (2011). MEF Decision No. 009 dated 31 August 2011 on the implementation of Customs Risk Management Database System - CRMDS. Ministry of Economy and Finance.
Ministry of Finance of Japan. (2009). 9th Time Release Study. Ministry of Finance of Japan.New Zealand Customs. (2017). Annual Report. New Zealand Customs. Retrieved from https://www.
customs.govt.nz/globalassets/documents/corporate-documents/nzcs-annual-report-2016-2017.pdfRoyal Government of Cambodia. (2006). Sub-Decree No.21 on The Facilitation of Trade Through Risk
Management. Phnom Penh: The Royal Government of Cambodia.Royal Government of Cambodia. (2007). The Enforcement of The List of Prohibited and Restricted
Goods. Phnom Penh: The Royal Government of Cambodia. Retrieved from http://www.customs.gov.kh/wp-content/uploads/2015/05/Anukrit-209-on-Enforcement-of-the-List-of-Prohibited-and-Restricted-Goods.pdf
Royal Government of Cambodia. (2013). Sub-decree of the Royal Government of Cambodia No 488 Dated 16 October 2013. Phnom Penh: Royal Government of Cambodia.
Royal Government of Cambodia. (2018). Rectangular Strategy Phase IV. The Royal Government of Cambodia. Retrieved from http://cnv.org.kh/wp-content/uploads/2012/10/Rectangular-Strategy-Phase-IV-of-the-Royal-Government-of-Cambodia-of-the-Sixth-Legislature-of-the-National-Assembly-2018-2023.pdf
Royal Government of Cambodia. (2019). Medium-term revenue mobilization. Phnom Penh: Royal Government of Cambodia.
Second Line of Defense Office of U.S. Department of Energy and the Secretariat of the National Counter Terrorism Committee of the Royal Government of Cambodia. (2013). Second Line of Defense (SLD) Megaports Initiative Program Joint Transition Plan (JTP). Sihanoukville.
Seng, S. (2014). The facilitation of trade in Cambodia: challenges and possible solutions. World Customs Journal, 113-128. Retrieved from http://worldcustomsjournal.org/Archives/Volume%208%2C%20Number%201%20(Mar%202014)/11%20Seng.pdf
Steering Committee of the Public Financial Management Reform. (2015). Report of the Evaluation on The Public Financial Management System of Cambodia. Retrieved from http://gs.mef.gov.kh/contents/uploads/2016/08/PEFA_report.pdf
The PM Group. (2015). Blueprint for Cambodia National Single Window. Phnom Penh: Cambodia Customs. Retrieved from http://www.customs.gov.kh/wp-content/uploads/2015/10/6.-Blueprint-for-CNSW-Final-for-printing.pdf
The PM Group Team. (2015). A Blueprint for Cambodia National Single Window. Retrieved from http://www.customs.gov.kh/wp-content/uploads/2015/10/6.-Blueprint-for-CNSW-Final-for-printing.pdf
Thiel, S. V. (2014). Chapter 9: Desk Research. In S. V. Thiel, Research Methods in Public Administration and Public Management : An Introduction (pp. 102–117). Routledge.
USAID. (2018). Customs Modernization Handbook: Applying Risk Management In The Cargo Processing Environment. The United States Agency for International Development (USAID). Retrieved from https://www.nathaninc.com/wp-content/uploads/2018/08/USAID-Customs-Modernization-Handbook-Applying-Risk-Management-July-2018.pdf
Volume 14, Number 1 69
World Customs Journal
WCO Asia Pacific Regional Office for Capacity Building. (2018). ROCB A/P E-Newsletter NO.61. Bangkok: WCO Asia Pacific Regional Office for Capacity Building.
Widdowson, D. (2005). Managing Risk in the Customs Context. In L. D. Wulf , & J. B. Sokol , Customs Modernisation Handbook (pp. 91-100). Washington: World Bank. Retrieved from https://elibrary.worldbank.org/doi/pdf/10.1596/0-8213-5751-4?download=true
World Bank. (2005). Customs Modernisation Handbook. World Bank. Retrieved from https://siteresources.worldbank.org/INTEXPCOMNET/Resources/Customs_Modernization_Handbook.pdf
World Bank. (2016). Logistics Performance Index. World Bank. Retrieved from https://lpi.worldbank.org/international/global/2016
World Customs Organization. (2003). Customs Capacity Building Strategy. World Customs Organization. Retrieved from http://www.wcoomd.org/-/media/wco/public/global/pdf/topics/capacity-building/overview/cap-buil-strat.pdf?la=en
World Customs Organization. (2008). Chapter 6: Customs Control. In W. C. Organization, International Convention on the Simplification and Harmonization of Customs Procedures (pp. 24-26). World Customs Organization. Retrieved from http://www.wcoomd.org/-/media/wco/public/global/pdf/topics/facilitation/instruments-and-tools/conventions/kyoto-convention/revised-kyoto-convention/body_gen-annex-and-specific-annexes.pdf?la=en
World Customs Organization. (2008). Customs Enforcement Network Communication Platform (CENcomm). World Customs Organization. Retrieved from http://www.wcoomd.org/en/topics/enforcement-and-compliance/instruments-and-tools/cen-suite/cencomm.aspx
World Customs Organization. (2008). Customs in the 21st Century. World Customs Organization. Retrieved from http://www.wcoomd.org/~/media/wco/public/global/pdf/topics/key-issues/customs-in-the-21st-century/annexes/annex_ii_en.pdf?la=en
World Customs Organization. (2010). WCO Customs Risk Management Compedium (Vol. 1). Brussels: World Customs Organization. Retrieved from http://www.wcoomd.org/-/media/wco/public/global/pdf/topics/enforcement-and-compliance/activities-and-programmes/risk-management-and-intelligence/risk-management-compendium-common-part.pdf?db=web
World Customs Organization. (2010). WCO Risk Management Compendium Volume 2. Brussel: World Customs Organization.
World Customs Organization. (2010). WCO SAFE Framework of Standards. World Customs Organization. Retrieved from http://www.wcoomd.org/-/media/wco/public/global/pdf/topics/facilitation/instruments-and-tools/tools/safe-package/safe-framework-of-standards.pdf?la=en
World Customs Organization. (2018). Advance Cargo Information (ACI): Implementation Guidance. World Customs Organization. Retrieved from http://www.wcoomd.org/-/media/wco/public/global/pdf/topics/facilitation/instruments-and-tools/tools/safe-package/aci_implementation-guidance.pdf?la=en
World Customs Organization. (2018). WCO Cargo Targeting System. World Customs Organization. Retrieved from http://www.wcoomd.org/-/media/wco/public/global/pdf/topics/wto-atf/information-sheets/cts-wto-overview.pdf?la=en
World Customs Organization. (2019, January 26). International Customs Day 2019. Retrieved from World Customs Organization: http://www.wcoomd.org/en/about-us/international-customs-day/icd-2019.aspx
World Trade Organization. (2014). Protocol Amending the Marrakesh Agreement Establishing the World Trade Organization. Bali: World Trade Organization. Retrieved from https://www.wto.org/english/thewto_e/minist_e/mc9_e/balipackage_e.htm#trade_facilitation
70 Volume 14, Number 1
International Network of Customs Universities
World Trade Organization. (2010). Trade Facilitation Implementation of Pre-arrival Examination: A case study of Japan. World Trade Organization.
Wulf, L. D. (2005). Human Resources and Organisational Issues in Customs. In L. D. Wulf, & J. B. Sokol , Customs Modernisation Handbook (pp. 31-50). Washington: The World Bank. Retrieved from https://elibrary.worldbank.org/doi/pdf/10.1596/0-8213-5751-4?download=true
Zhu, G. (2008). Presentation on Risk Management at the 13th WCO Asia-pacific Regional Heads of Customs Administrations Conference. Retrieved from China Customs: http://english.customs.gov.cn/topic/html/info226556.htm
Zivkovic, A., & Sutevski, D. (2018). Facilitating Trade: Improving Customs Risk Management Systems In the OIC Member States. The COMCEC Coordination Office. Retrieved from http://ebook.comcec.org/Kutuphane/Icerik/Yayinlar/Analitik_Calismalar/Ticaret/Toplanti11rev2/files/assets/common/downloads/publication.pdf
Notes1 Standard 6.3 of the Revised Kyoto Convention (RKC)2 (Second Line of Defense Office of U.S. Department of Energy and the Secretariat of the National Counter Terrorism
Committee of the Royal Government of Cambodia, 2013).
Hong SreyaAfter passing the customs entrance exam, Sreya was assigned to work at a small customs border checkpoint in Cambodia. Regardless of her work condition, she took that as a good opportunity to experience all aspects of customs procedures and seek out for training and workshop in-country and abroad. After showcasing her potential, Sreya was then assigned to work at the Container Control, Unit which was established under the framework of UNODC-WCO Container Control Programme, and simultaneously, she was also transferred to work at Customs and Excise Branch of Sihanoukville International Port, which is the biggest seaport in Cambodia. Sreya was awarded a New Zealand scholarship and holds a Master degree in Public Policy from Victoria University of Wellington in New Zealand.
Volume 14, Number 1 71
World Customs Journal
Tariff barriers and non-tariff barriers: appraising Colombia’s protectionismJose Jaime Baena Rojas and Abraham Allec Londoño Pineda
Abstract
Tariff barriers (TBs) are regulated under the provisions of the General Agreement on Tariffs and Trade (GATT), such as the most-favoured-nation treatment article, which establishes that trade concessions granted to one member are applied immediately and without conditions to all other members. Likewise, the schedule of concessions on goods, which indicates that all trade concessions made by members must be reported under the legal agreement’s ‘bound’ rates. Then, if one World Trade Organization (WTO) member raises applied tariffs above their bound level, any WTO member can sue the country for this action. However, on the other hand, the non-tariff barriers (NTBs) are more complex to regulate due to a state’s ability to adopt many different new measures, which makes the measures hard to identify as barriers. Furthermore, the opacity of many NTBs also makes enforcement of regulations a complicated international endeavour. Thus, the international trading system assumes that there will be essential challenges and seeks to develop explicit provisions for this kind of protectionism. This paper, which is based on the findings of a comprehensive review of Colombia’s situation, provides a general explanation of TBs and NTBs as protectionist measures within the foreign trade of this Latin American country. In doing so, the research identifies the TBs and NTBs currently adopted, the effects of these barriers on this economy, and the sectors that are meaningfully affected by these measures.
1. IntroductionAccording to Bussière, Pérez-Barreiro, Straub and Taglioni (2011), recent trends in the implementation of protectionist policies among countries and their possible implications for economic growth are an essential issue in the study of international trade. Until recently, the increases in real protectionist measures to restrict trade have been moderated thanks, in part, to the WTO, which has been able to contain trade restrictions and protectionism. This is possible because the WTO’s member states believe in the functioning of the current legal framework, regulated by the provisions of the GATT because all members of the WTO seem to trust the multilateral trading system.
The recession of 2008–2009 (the vestiges of which can still be seen in the commercial tensions between some countries), resulted in economic uncertainty and induced many countries to implement protectionist measures, such as TBs and NTBs (Baena, Montoya & Torres, 2017).
Nevertheless, the current international trading system has been able to sustain this wave of protectionism, in part due to the effective regulation of the GATT against various unjustified protectionist policies. It should be noted that this legal system has managed to control trade protectionism, especially TBs, since the issue of tariffs was addressed as a central issue in all the rounds of the GATT and the provisions of the
72 Volume 14, Number 1
International Network of Customs Universities
GATT (both Article I General most-favoured-nation treatment and Article II Schedules of concessions) are a series of specific conditions for the implementation of TBs by the countries within the multilateral trading system (Baena & Fernández, 2016; Baena, 2018; Vanegas & Baena, 2019).
Article I states that any trade concession made by a member country of the WTO must be extended to any other member, which is usually understood as the most-favoured-nation (MFN) tariff. However, Article II states that member countries must report the maximum rates for each product, or line of product, in what is usually understood as a consolidated tariff. From the above it can be added that non-compliance with these two articles may lead to any multilateral trading system member being able to hold consultations and subsequently bring an official complaint before the dispute settlement body (DSB) of the WTO (Cardona, 2017).
Likewise, at the international level there are several regulatory variables within the multilateral trading system that influence the determination of the TBs of a state, which can go beyond traditional economic explanations associated with the minimum standard that domestic producers must meet in relation to foreign competition in terms of price, quality and other related aspects (Miravete, 2003; Marette & Beghin, 2010). There is also the additional variable that the classic perspective that protectionism is usually valid when infant industries, which arise in the national market, require a series of specific commercial policies by the state to allow them to develop their competitiveness against other industries of foreign origin that have more experience (Melitz, 2005; Lewis, 2014).
It is important to add that the concept of competitiveness depends on the role of the governments and their states, as they can develop trade policies enabling a series of favourable conditions associated with infrastructure, human and financial resources, and scientific and technological developments. Moreover, these policies must encourage innovation, protection of intellectual property, markets, investment, tax burdens and sustainability which can ultimately guarantee the constant improvement of the productive fabric of its different sectors and productive organisations (Pagell & Halperin, 1998; Porter & Stern, 2001; Londoño, 2015; Serna, Londoño & Vélez, 2016; Londoño & Baena, 2017).
Protectionism can be seen as a trade policy response that attempts to correct deficiencies in terms of competitiveness. Thus, there seems to be a relationship between the imposition of both TBs and NTBs by a government when there are inconveniences that hinder certain economic sectors from developing fully against foreign competition. Therefore, the primary purpose of the adoption of interventionist measures is to protect the national industry in an attempt to promote the long-term specialisation and productivity of sectors that are inefficient at the production level in order to encourage exports (Kaneda, 2003; Junguito, 2010).
In this sense, the primary objective of this paper is to characterise the current behaviour in Colombia’s protectionism derived from TBs and NTBs, the affected goods, and the most common protection mechanisms. Section 2 presents the review of the literature with particular emphasis on the role of protectionism in the international trade; section 3 outlines the methodology to be used for the development of this research; section 4 analyses the results; and section 5 presents the conclusions and main implications of this research.
2. Review of the literature
2.1 The role of protectionism in international trade
From the mercantilism of the 16th century to the present, the theories of international trade have kept alive the debate between free trade and trade protectionism. Such theories have repeatedly exposed the benefits that each of the two approaches can bring to international trade. It is for this reason that this whole debate is not static, given that recent world economic history has shown that countries that have

Volume 14, Number 1 73
World Customs Journal
adopted one of the two options, or a combination of both in different periods, have shown different results for the development of industry sectors. Trade policy alone is not enough to maintain a specific economic position, and unless trade is fairer and more equitable for all countries, the debate on free trade and protectionism will continue to fill pages in the specialised literature as well as in academic and political circles (Pereyra, 2015).
Steinberg (2006) claims that for all states, their governments are responsible for designing trade policy and choosing their measures for boosting economic development, taking into account many different factors, often including national security. Either way, there is no doubt these factors are related to the strategic interaction model in which interest groups put pressure on social systems and government. Then protectionism is just a political action related to the business associations and industry sectors which seek shelter from the state when they are not competitive abroad.
Currently, the debate behind trade protectionism is a sensitive issue for many governments owing to the economic consequences of political decisions. For instance, the Great Depression and the ensuing collapse of world trade, in the 1930s, and the global spread of nationalistic movements seem related to the Smoot-Hawley Tariff Act in which customs duties for many different products were increased regardless of the interests of consumers. Then, US imports fell sharply and other countries retaliated by increasing tariffs on American goods, leading to US exports contracting as well. All this unleashed an unprecedented trade war, and although Smoot-Hawley was hardly responsible for the Great Depression, it contributed to a decline in world trade that lasted decades (Irwin, 2017).
Merrills (2005) adds that when World War II ended, states were forced to consider the new shape of the post-war world and that is why the first priority was international peace and security, which led to the creation of the United Nations. Nevertheless, not far behind came financial and economic issues, including international trade, which also had an institutional implication. On this basis, the 1930s has been usually recognised as an anarchic period in every sense. To avoid repeating this complex scenario many governments of the post-war era resolved to establish arrangements that would reflect the realities of economic interdependence through new institutions. The International Monetary Fund (IMF), The World Bank, the GATT and the WTO, decades later, have provided the framework for international economic relations in the post-war period. These have been supplemented by numerous subsequent instruments and organisations, including regional arrangements, set up for particular purposes usually related to trade liberalisation.
Clearly, the net result of the war was a sharp decline in international trade flows and loss of welfare. However, from this mistake governments finally understood that international trade needs to be supported by effective multilateral institutions that can make the world a more orderly place. The common responsibility from full members is to strengthen the WTO, which still is not a perfect instrument. That is why it would appear appropriate to address its deficiencies since the international trading system must be careful not to repeat the mistakes of the past; then the primary goal should be to make the organisation better reflect the countries’ aspirations and avoid any protectionism escalation and subsequent trade isolation. Indeed, it is important to say that some of the WTO’s greatest imperfections, like its slow pace of negotiations, stem from its most positive attributes because this is precisely a democratic institution, based on consensus and political will (Gupta, 2006).
Hence, during a period of economic crisis, protectionist trade policies are commonly employed by governments as short-term instruments to tackle falling growth rates and rising unemployment. This protectionism is held despite the position from the multilateral trading system led by the WTO, which advocates avoiding unjustified protectionist measures that affect free trade. However, an economic crisis produces uncertainty regarding the actions of other countries, which in turn encourages defection in the form of discriminatory trade policy. Then, each country has a dominant strategy to implement protectionism during an economic crisis. Historical evidence demonstrates that, just like during the Great Depression, countries revert to protectionist policies as a reaction to pressures from sectors harmed
74 Volume 14, Number 1
International Network of Customs Universities
by such a crisis. In any case, the current era of globalisation is distinguishable from earlier periods by the presence of an extensive network of international institutions that serve as conveyors of information that help to guarantee free trade liberalisation (Baccini, Kim & Pammolli, 2010).
Either way, there are important issues within trade protectionism related to infant industries. In other words, protectionism is usually justified when some enterprises are starting their productive activities and but are not competitive with more established enterprises. The protection of infant industries still seems to generate a deep debate in which some initiatives that assume exceptions to the rules of the multilateral trading system are subject to disagreement. Thus, this is the reason why developing countries use TBs and NTBs more actively as a commercial policy for the promotion of infant industries. It is worth bearing in mind that, in the past, the most developed countries used this type of state aid not only during their industrialisation process but even when their economies were in recovery processes after some global crises, while the developing countries of today have not used this type of aid in the same proportion, which undoubtedly has generated a structural gap (Chang, 2003).
According to MacCharles (2013), protectionism is not necessarily the solution for increasing competitiveness in countries; in fact, this trade policy can be problematic for manufacturers in countries where domestic markets are too small for efficient support from government compared to a highly specialised producer abroad. In this sense, it is producers in smaller nations and newly industrialising countries whose potential for improved competitiveness is harmed the most by increased protectionism as this can create dependency for these new enterprises. Therefore, excessive interventionism may result in declining production capacity in smaller countries, which further adds to their cost and employment problems.
Empirical evidence demonstrates that higher TBs covered under trade protectionism will have a severe significant indirect impact through industrial forward (distribution) and backward (supply) linkages. An example is in transport, where value chains are longer and more complex, causing greater economic losses for tariff-imposing countries than to exporting countries (Kang & Dagli, 2018).
Likewise, according to Millet and García-Durán (2009), a protectionist measure in one country usually provokes retaliation by other governments, which can lead to the loss of confidence in the freeing of trade, bringing serious difficulties for all international trade in an action–reaction effect. This ends up curbing imports, leading to an increase in product prices and a reduction in employment in addition to affecting other indicators, leading to possible crises. These are some of the fundamental reasons why the WTO advocates the reduction of trade barriers through negotiation among all its member countries.
Broadly speaking, it is fair to say that protectionism, in the short term, can support some uncompetitive industries. However, the evidence shows that those countries that increase import tariffs do not necessarily increase, long term, their economic growth rate or their competitiveness (Schularick & Solomou, 2011).
Table 1 sets out the various non-tariff protectionist measures that are used in international trade.
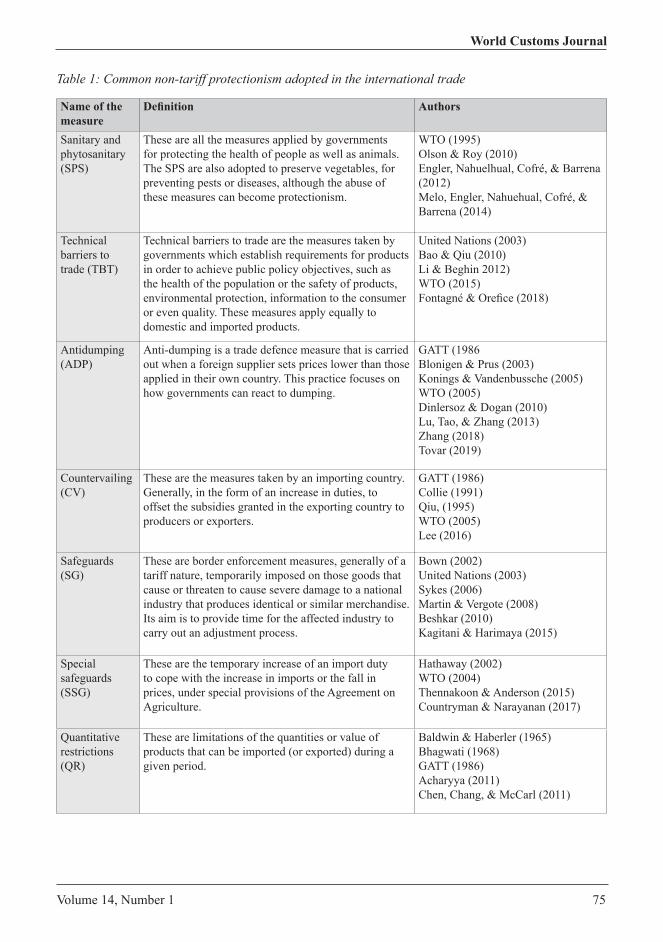
Volume 14, Number 1 75
World Customs Journal
Table 1: Common non-tariff protectionism adopted in the international trade
Name of the measure
Definition Authors
Sanitary and phytosanitary (SPS)
These are all the measures applied by governments for protecting the health of people as well as animals. The SPS are also adopted to preserve vegetables, for preventing pests or diseases, although the abuse of these measures can become protectionism.
WTO (1995)Olson & Roy (2010)Engler, Nahuelhual, Cofré, & Barrena (2012)Melo, Engler, Nahuehual, Cofré, & Barrena (2014)
Technical barriers to trade (TBT)
Technical barriers to trade are the measures taken by governments which establish requirements for products in order to achieve public policy objectives, such as the health of the population or the safety of products, environmental protection, information to the consumer or even quality. These measures apply equally to domestic and imported products.
United Nations (2003)Bao & Qiu (2010)Li & Beghin 2012)WTO (2015)Fontagné & Orefice (2018)
Antidumping (ADP)
Anti-dumping is a trade defence measure that is carried out when a foreign supplier sets prices lower than those applied in their own country. This practice focuses on how governments can react to dumping.
GATT (1986Blonigen & Prus (2003)Konings & Vandenbussche (2005)WTO (2005)Dinlersoz & Dogan (2010)Lu, Tao, & Zhang (2013)Zhang (2018)Tovar (2019)
Countervailing (CV)
These are the measures taken by an importing country. Generally, in the form of an increase in duties, to offset the subsidies granted in the exporting country to producers or exporters.
GATT (1986)Collie (1991)Qiu, (1995)WTO (2005)Lee (2016)
Safeguards (SG)
These are border enforcement measures, generally of a tariff nature, temporarily imposed on those goods that cause or threaten to cause severe damage to a national industry that produces identical or similar merchandise. Its aim is to provide time for the affected industry to carry out an adjustment process.
Bown (2002)United Nations (2003)Sykes (2006)Martin & Vergote (2008)Beshkar (2010)Kagitani & Harimaya (2015)
Special safeguards (SSG)
These are the temporary increase of an import duty to cope with the increase in imports or the fall in prices, under special provisions of the Agreement on Agriculture.
Hathaway (2002)WTO (2004)Thennakoon & Anderson (2015)Countryman & Narayanan (2017)
Quantitative restrictions (QR)
These are limitations of the quantities or value of products that can be imported (or exported) during a given period.
Baldwin & Haberler (1965)Bhagwati (1968)GATT (1986)Acharyya (2011)Chen, Chang, & McCarl (2011)
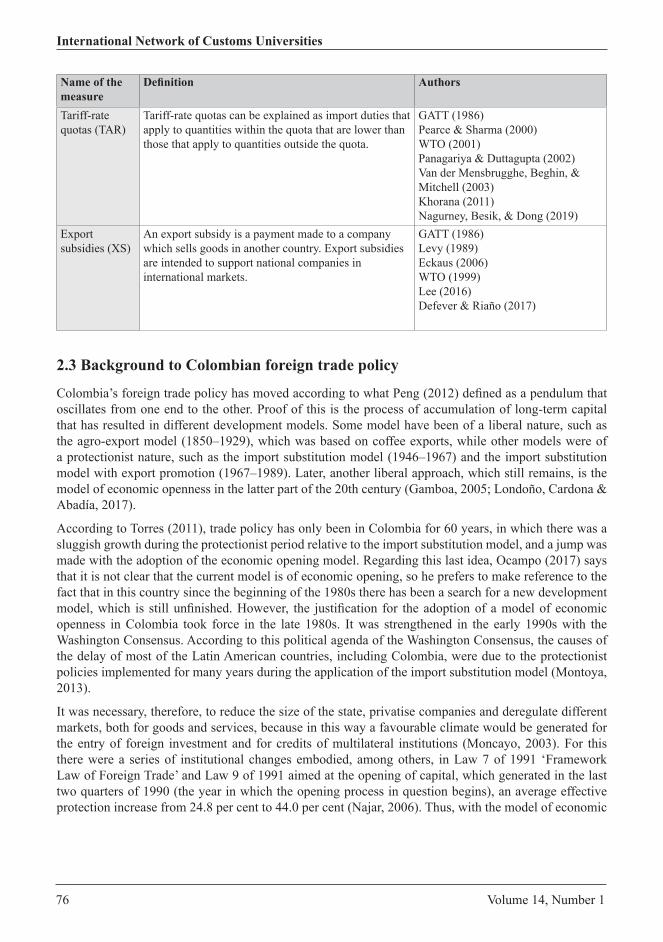
76 Volume 14, Number 1
International Network of Customs Universities
Name of the measure
Definition Authors
Tariff-rate quotas (TAR)
Tariff-rate quotas can be explained as import duties that apply to quantities within the quota that are lower than those that apply to quantities outside the quota.
GATT (1986)Pearce & Sharma (2000)WTO (2001)Panagariya & Duttagupta (2002)Van der Mensbrugghe, Beghin, & Mitchell (2003)Khorana (2011)Nagurney, Besik, & Dong (2019)
Export subsidies (XS)
An export subsidy is a payment made to a company which sells goods in another country. Export subsidies are intended to support national companies in international markets.
GATT (1986)Levy (1989)Eckaus (2006)WTO (1999)Lee (2016)Defever & Riaño (2017)
2.3 Background to Colombian foreign trade policy
Colombia’s foreign trade policy has moved according to what Peng (2012) defined as a pendulum that oscillates from one end to the other. Proof of this is the process of accumulation of long-term capital that has resulted in different development models. Some model have been of a liberal nature, such as the agro-export model (1850–1929), which was based on coffee exports, while other models were of a protectionist nature, such as the import substitution model (1946–1967) and the import substitution model with export promotion (1967–1989). Later, another liberal approach, which still remains, is the model of economic openness in the latter part of the 20th century (Gamboa, 2005; Londoño, Cardona & Abadía, 2017).
According to Torres (2011), trade policy has only been in Colombia for 60 years, in which there was a sluggish growth during the protectionist period relative to the import substitution model, and a jump was made with the adoption of the economic opening model. Regarding this last idea, Ocampo (2017) says that it is not clear that the current model is of economic opening, so he prefers to make reference to the fact that in this country since the beginning of the 1980s there has been a search for a new development model, which is still unfinished. However, the justification for the adoption of a model of economic openness in Colombia took force in the late 1980s. It was strengthened in the early 1990s with the Washington Consensus. According to this political agenda of the Washington Consensus, the causes of the delay of most of the Latin American countries, including Colombia, were due to the protectionist policies implemented for many years during the application of the import substitution model (Montoya, 2013).
It was necessary, therefore, to reduce the size of the state, privatise companies and deregulate different markets, both for goods and services, because in this way a favourable climate would be generated for the entry of foreign investment and for credits of multilateral institutions (Moncayo, 2003). For this there were a series of institutional changes embodied, among others, in Law 7 of 1991 ‘Framework Law of Foreign Trade’ and Law 9 of 1991 aimed at the opening of capital, which generated in the last two quarters of 1990 (the year in which the opening process in question begins), an average effective protection increase from 24.8 per cent to 44.0 per cent (Najar, 2006). Thus, with the model of economic
Volume 14, Number 1 77
World Customs Journal
openness, the objectives of Colombian trade policy ceased to be the justification of the structure of protection and incentives offered to non-traditional exports and began to be the promotion of integration into the economy worldwide and production diversification (WTO, 2006; Gallardo-Sánchez & Vallejo-Zamudio, 2019).
To achieve the first of the objectives, Colombia oriented its internationalisation strategy towards international trade (Montoya, 2011). For example, one of the historical milestones that reinforces this approach is the entry of this country in 1995 to the WTO (Baena & Fernández, 2016; Baena, 2019). As of this moment, Colombia adopted different principles of economic liberalism, such as the free market and the removal of barriers to the free flow of capital (Vargas-Alzate, Sosa & Rodriguez-Ríos, 2012). In this regard, it should be emphasised that Colombian foreign policy, in the first phase of its entry into the WTO, was oriented to strengthen its relations with governments of similar tendencies (ideologically close) such as the United States of America. This is evident in the governments of Andrés Pastrana (1998–2002) (Cardona, 2001) and also in the two governments of Alvaro Úribe (2002–2006 and 2006–2010) (Vargas-Alzate, Sosa & Rodriguez-Ríos, 2012).
During the term of the last two governments the increase in negotiations of various free trade agreements has been remarkable, which is consistent with the evolution of the WTO-led multilateral trading system, where the proliferation of trade agreements is increasingly common (Londoño, Cardona & Abadía, 2017). On the other hand, in a second phase of the process of integration of Columbia into the WTO, which covers the two governments of Juan Manuel Santos (2010–2014 and 2014–2018), most of the agreements that entered into force had been negotiated by the governments of Alvaro Uribe, as were the agreements with the United States and Canada (WTO, 2019b), in addition to the signing of treaties with ideologically close countries and regions (Vargas-Alzate, Sosa & Rodriguez-Ríos, 2012), as evidenced by trade agreements with Costa Rica and the Pacific Alliance (WTO, 2019b).
Regarding the second objective, that of product diversification, the results of some studies indicate that trade diversification in Colombia is relatively limited and seems to follow a pattern according to which exports are diversified mainly through increases in the number of products instead of the number of partners (Argüello, 2017), which in some way evidences a commercial dependence with the United States. In addition, foreign trade policy in the last two decades has also been based on the strong dependence on mining raw material to the detriment of industrial products that generate greater added value (Baena, 2019). Thus, it is necessary to adopt effective policies and measures that diversify the country’s exports.
Also according to García, López, Montes and Esguerra (2014), in 20 years of economic opening, tariffs as an instrument of protection have been reduced considerably, although the number of tariff lines has increased, which are also linked with the changes presented in the harmonised system of tariffs. Figure 1 shows the decrees that have modified or generated updates in the harmonised system for import tariff barriers in Colombia.

78 Volume 14, Number 1
International Network of Customs Universities
Figure 1: Harmonised systems in Colombia for tariff barriers in importsRegulation
Decree 255 of 1992
Decree 2317 of 1995
Decree 4341 of 2004
Decree 4589 of 2006
Decree 4927 of 2011
Decree 2153 of 2016
Name Modifications Total
1Decree 193 of 1993
3
9
61
34
15
Decrees 1744 of 2016, 1744 of 2016, 1246 of 2016, 1288 of 2016, 588 of 2016 , 459 of 2016, 343 of 2016, 1786 of 2017, 1563 of 2017, 1343 of 2017, 1280 of 2017, 1116 of 2017, 519 of 2017, 1027 of 2018 and 858 of 2018.
Decrees 2917 of 2011, 2916 of 2011, 2658 of 2011, 2052 of 2011, 2050 of 2011, 2051 of 2011, 2049 of 2011, 1750 of 2011, 1571 of 2011, 1414 of 2011, 511 of 2011, 492 of 2011, 2021 of 2012, 1702 of 2012, 1703 of 2012, 1573 of 2012, 2909 of 2013, 1755 of 2013, 444 of 2013, 074 of 2013, 2529 of 2014, 2432 of 2014, 2340 of 2014, 1498 of 2014, 555 of 2014, 456 of 2014, 332 of 2014, 2180 of 2015, 2230 of 2015, 1625 of 2015, 1704 of 2015, 1498 of 2015, 275 of 2015, and 154 of 2015.
Decrees 4423 of 2006, 4410 of 2006, 295 of 2006, 2880 of 2006,2222 of 2006 , 2735 of 2006, 2685 of 2006, 3000 of 2006, 3688 of2006, 476 of 2007, 4672 of 2007, 4670 of 2007, 4832 of 2007, 2040of 2007, 2760 of 2007, 3838 of 2007, 3484 of 2007, 160 of 2007,1035 of 2007, 1037 of 2007, 2039 of 2007, 4838 of 2008, 4500 of2008, 4300 of 2008, 4226 of 2008, 3515 of 2008, 3430 of 2008, 3434of 2008, 3272 of 2008, 3271 of 2008, 3260 of 2008 , 3169 of 2008,3142 of 2008, 3143 of 2008, 2987 of 2008, 2988 of 2008, 2959 of2008, 2565 of 2008, 1513 of 2008, 1531 of 2008, 1500 of 2008, 1205of 2008, 500 of 2008, 4978 of 2009, 4464 of 2009, 4135 of 2009,4098 de 2009, 3967 of 2009, 3969 of 2009, 961 of 2009, 370 of2009, 4662 of 2011, 4390 of 2010, 4114 of 2010, 4115 of 2010, 2906of 2010, 2439 of 2010, 319 of 2010, 322 of 2010, 314 of 2010, and240 of 2010.
Decrees 830 of 2005, 1000 of 2005, 1139 of 2005, 2273 of 2005, 4570 of 2005,1142 of 2005, 942 of 2006, 941 of 2006, and 0727 of 2006.
Decrees 2650 of 1999, 2394 of 2002 and 580 of 2003
Colombian Harmonised System
Source: Own elaboration based on MINCIT (2019).
Similarly, according to the World Bank (2019), since Colombia entered the WTO in 1995, there has been a decrease in MFN tariff: the average rate for this in 2019 was 13.67 per cent and for 2017 it was 8.81 per cent. This period refers to the first government and the beginning of the second term of Juan Manuel Santos, where there was an increase in the negotiation and conclusion of trade agreements (Vargas-Alzate, Sosa, & Rodriguez-Ríos, 2012). At the same time, the consolidated rate, taken as a simple average, has increased slightly since the country’s entry into the WTO in 1995. Then it was 41.91 per cent and for 2016 it was 42.77 per cent (World Bank, 2019a). This indicates that leeway or average room for manoeuvre has increased since joining the WTO.
In this sense, as highlighted by Gallardo-Sánchez and Vallejo-Zamudio (2019) and also the World Bank (2019b), it is noted that tariffs as an instrument of protection have decreased in Colombia, although it is no less true that the protectionism associated with the implementation of non-tariff measures such as those described in Table 1 have increased between 1991 and 2015. Tariff items with non-tariff measures went from 27 per cent to 78 per cent, which is consistent with a worldwide trend towards non-tariff protectionism. Even under the implementation of an economic opening model, there is a decrease in tariff barriers and a consequent increase in non-tariff barriers (Baena, 2018; WTO, 2019a) and evidence of the possibility of the implementation of other unconventional modes of protectionism such as support for the export of goods, as is precisely reflected in Decree 2153 of 2016 (MinCit, 2016; Baena, 2019).
Volume 14, Number 1 79
World Customs Journal
In most years between 1970 and 2018 Columbia has had a negative trade balance; in fact, 35 out of 49 years Columbia has been in deficit (Gallardo-Sánchez & Vallejo-Zamudio, 2019). It is therefore necessary to highlight that in the long term a deficit trade balance requires financing that, if left unattended, can constitute debts that jeopardise the financial sustainability of future governments. Due to all the above, Colombia needs to diversify and increase exports, and this situation requires immediate attention. However, without wanting to assume an anachronistic mercantilist position of the trade surplus stopping its imports abruptly, as the United States government maintains; because this is a perspective that supports, for instance, the recent trade war between the United States and China where it is assumed is that all trade deficits are not convenient (Rosales, 2019).
It should be noted that rather than placing the Colombian trade balance in surplus, what is required is to generate improvements in terms of trade. For this, it is also necessary to improve the commercial policy that enables the country to generate specialisations of its production that contribute added value and diversify export sectors and markets, thus reducing dependence on exports from the energy mining sector and, in particular, the impact generated by the decline in international oil prices (Toro, Garavito, López & Montes, 2015).
3. MethodologyThe review of the literature presented some reflections on the dynamics of trade protectionism, especially those related to the implementation of TBs (MFN tariffs and bound tariffs) in addition to analysing the incidence of NTBs, which are the most common type of protectionism. Thus, databases, such as Scopus, Web of Science (WOS) and others, were used to identify scientific publications on this research topic.
This paper seeks to carry out a descriptive study that does not intend to build laws or general theories, but from a general or panoramic view seeks to discover new aspects of a studied phenomenon (Ruíz, 2012; Nayar & Stanley, 2015). A descriptive study is based on a stronger knowledge base than the exploratory ones, since the problem is based on a previously established and known knowledge base, but if it is necessary to generate some hypothesis about the described variables, a complete description is required and, of course, a statement of the problem in question (Jiménez, 1998).
According to García (2004), the present descriptive study is a cross-sectional study as the phenomenon is analysed at a point in time, which for the purposes of this study will be the year 2019 because it is the year in which the most up-to-date data on tariff and non-tariff barriers in Colombia can be found. Likewise, the study is complemented with a longitudinal one, in which the evolution of the variables analysed over a period of time is presented. In the latter case, the start period is the year 1995, since that is when Colombia entered the WTO. The final time period is determined by access to the most recent data possible.
The descriptive studies include a series of phases, among which the definition of the objectives of the study, the variables to be analysed and the selection of the sources of information that will serve as support for the analysis of the information are highlighted (García, 2004). The objects of study, the variables to be analysed and the sources of information of this work are shown in Table 2.

80 Volume 14, Number 1
International Network of Customs Universities
Table 2: Study objects, variables to analyse and sources of information
Objects of study
Variables to analyse Information sources
Commercial opening and fiscal imbalances
Average and discrimination of tax revenues in Colombia (2019)
Dian (2019)World Bank (2019)García et al. (2014)y Gallardo-Sánchez & Vallejo-Zamudio (2019)Sarmiento (2002)Espitia et al. (2017)Clavijo, Alejandro & Vera (2013)OECD (2019, 2019 a)
Declining trend of bound tariffs since its inception to the WTO in 1995
Tariff rate MNF, simple mean, all products % (2019)Tariff rate MNF, simple mean, all products % (1995–2017)Bound rate, simple mean, all products (%) – Colombia (2019)Bound rate, simple mean, all products (%) – Colombia (1995–2017)Tariff protectionism Leeway within the sectors in Colombia (2019)
WTO (2019a)World Bank (2019)World Bank (2019a)
Decrease of tariffs and increase of tariff barriers
Non-Tariff protectionism in Colombia compared to other countries in the region
WTO (2019a)Global Trade Alert (2019)Yalcin, Felbermayr, & Kinzius (2017)Dean, Feinberg, Signoret, & Ludema (2008).
Source: Own elaboration based on García (2004), Nayar & Stanley (2015).
In this investigation, these issues are synthesised to generate a deeper explanation of the effects that the tariff and non-tariff measures currently adopted in this economy generate in their commercial dynamics, based on information from the DIAN, the OECD, the World Bank and the WTO and the bibliographic sources used in the literature review (section 2).
4. Results and discussionsIn 2019, as illustrated in Figure 2, the most significant proportion of taxes collected in Colombia were internal (84.34%). Regarding external taxes, these represent only 15.44 per cent of total taxes and, of these, 76.69 per cent are value-added taxes (VAT) and the remaining 23.41 per cent are tariffs, which indicates that tariffs represent only 3.61 per cent of total taxes.

Volume 14, Number 1 81
World Customs Journal
Figure 2: Overall tax revenue in Colombia (millions of US dollars)
$55,
999
$47,
342
$8,6
46
$11
100.00% 84.54% 15.44% 0.02%
Total taxes Internal External Others
$6,6
22
$2,0
24
76.59% 23.41%
VAT Tariffs
Source: Own elaboration based on DIAN (2019).
This is consistent with García et al. (2014) and Gallardo-Sánchez and Vallejo-Zamudio (2019), who found that tariffs as an instrument of protection has decreased in Colombia. Also, since Colombia entered the WTO, the applied tariff rate (simple average) has decreased from a value of 13.81 per cent in 1995 to 5 per cent in 2017 (See Figure 3).
Figure 3: Tariff rate, applied, simple mean, all products %
13.8
12.2
12.4
12.4
12.5 12.8
12.8
12.8
12.8
11.7
11.9
11.2
10.8
10.8
10.7 11
.3
6.8
5.5 5.7
5.2
5.0
5.0
0.0
2.0
4.0
6.0
8.0
10.0
12.0
14.0
16.0
1995
1996
1997
1998
1999
2000
2001
2002
2003
2004
2005
2006
2007
2008
2009
2010
2011
2012
2013
2014
2015
2016
Percen
tages
Years
Source: Own elaboration based on the World Bank (2019b).
Sarmiento (2002) affirms that internal taxes have been growing, especially indirect taxes such as VAT, which has increased both in its taxable base and in its general rate since the implementation of the economic opening model, which has also influenced a series of continuous tax reforms that aim to mitigate fiscal imbalance. Although society demands the application of a structural or long-term reform that provides for the much sought-after fiscal balance, such is the case of the academy (Espitia, y otros, 2017), as well as from international organisations such as the OECD, which suggest the increase in tax
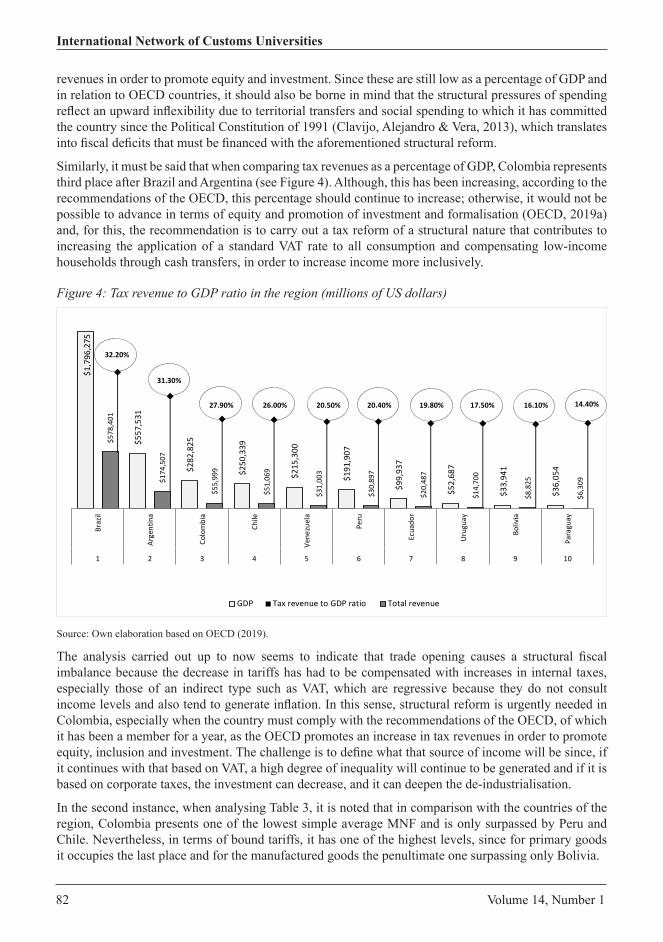
82 Volume 14, Number 1
International Network of Customs Universities
revenues in order to promote equity and investment. Since these are still low as a percentage of GDP and in relation to OECD countries, it should also be borne in mind that the structural pressures of spending reflect an upward inflexibility due to territorial transfers and social spending to which it has committed the country since the Political Constitution of 1991 (Clavijo, Alejandro & Vera, 2013), which translates into fiscal deficits that must be financed with the aforementioned structural reform.
Similarly, it must be said that when comparing tax revenues as a percentage of GDP, Colombia represents third place after Brazil and Argentina (see Figure 4). Although, this has been increasing, according to the recommendations of the OECD, this percentage should continue to increase; otherwise, it would not be possible to advance in terms of equity and promotion of investment and formalisation (OECD, 2019a) and, for this, the recommendation is to carry out a tax reform of a structural nature that contributes to increasing the application of a standard VAT rate to all consumption and compensating low-income households through cash transfers, in order to increase income more inclusively.
Figure 4: Tax revenue to GDP ratio in the region (millions of US dollars)
$1,7
96,2
75
$557
,531
$282
,825
$250
,339
$215
,300
$191
,907
$99,
937
$52,
687
$33,
941
$36,
054
32.20%
31.30%
27.90% 26.00% 20.50% 20.40% 19.80% 17.50% 16.10% 14.40%
$578
,401
$174
,507
$55,
999
$51,
069
$31,
003
$30,
897
$20,
487
$14,
700
$8,8
25
$6,3
09
Braz
il
Arge
ntin
a
Colo
mbi
a
Chile
Vene
zuel
a
Peru
Ecua
dor
Uru
guay
Boliv
ia
Para
guay
1 2 3 4 5 6 7 8 9 10
GDP Tax revenue to GDP ratio Total revenue
Source: Own elaboration based on OECD (2019).
The analysis carried out up to now seems to indicate that trade opening causes a structural fiscal imbalance because the decrease in tariffs has had to be compensated with increases in internal taxes, especially those of an indirect type such as VAT, which are regressive because they do not consult income levels and also tend to generate inflation. In this sense, structural reform is urgently needed in Colombia, especially when the country must comply with the recommendations of the OECD, of which it has been a member for a year, as the OECD promotes an increase in tax revenues in order to promote equity, inclusion and investment. The challenge is to define what that source of income will be since, if it continues with that based on VAT, a high degree of inequality will continue to be generated and if it is based on corporate taxes, the investment can decrease, and it can deepen the de-industrialisation.
In the second instance, when analysing Table 3, it is noted that in comparison with the countries of the region, Colombia presents one of the lowest simple average MNF and is only surpassed by Peru and Chile. Nevertheless, in terms of bound tariffs, it has one of the highest levels, since for primary goods it occupies the last place and for the manufactured goods the penultimate one surpassing only Bolivia.
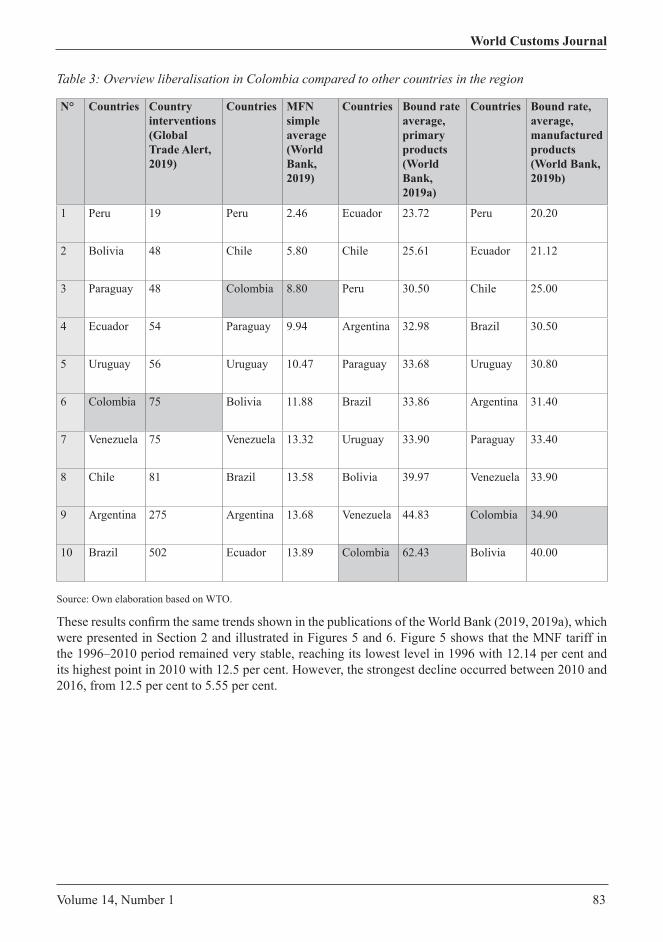
Volume 14, Number 1 83
World Customs Journal
Table 3: Overview liberalisation in Colombia compared to other countries in the region
N° Countries Country interventions(Global Trade Alert, 2019)
Countries MFN simple average(World Bank, 2019)
Countries Bound rate average, primary products(World Bank, 2019a)
Countries Bound rate, average, manufactured products(World Bank, 2019b)
1 Peru 19 Peru 2.46 Ecuador 23.72 Peru 20.20
2 Bolivia 48 Chile 5.80 Chile 25.61 Ecuador 21.12
3 Paraguay 48 Colombia 8.80 Peru 30.50 Chile 25.00
4 Ecuador 54 Paraguay 9.94 Argentina 32.98 Brazil 30.50
5 Uruguay 56 Uruguay 10.47 Paraguay 33.68 Uruguay 30.80
6 Colombia 75 Bolivia 11.88 Brazil 33.86 Argentina 31.40
7 Venezuela 75 Venezuela 13.32 Uruguay 33.90 Paraguay 33.40
8 Chile 81 Brazil 13.58 Bolivia 39.97 Venezuela 33.90
9 Argentina 275 Argentina 13.68 Venezuela 44.83 Colombia 34.90
10 Brazil 502 Ecuador 13.89 Colombia 62.43 Bolivia 40.00
Source: Own elaboration based on WTO.
These results confirm the same trends shown in the publications of the World Bank (2019, 2019a), which were presented in Section 2 and illustrated in Figures 5 and 6. Figure 5 shows that the MNF tariff in the 1996–2010 period remained very stable, reaching its lowest level in 1996 with 12.14 per cent and its highest point in 2010 with 12.5 per cent. However, the strongest decline occurred between 2010 and 2016, from 12.5 per cent to 5.55 per cent.
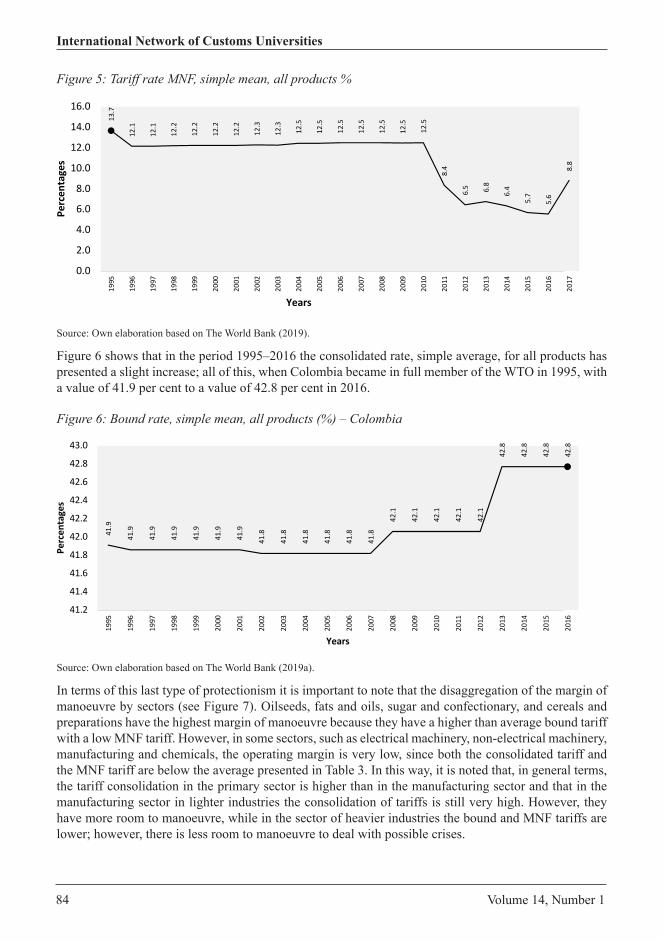
84 Volume 14, Number 1
International Network of Customs Universities
Figure 5: Tariff rate MNF, simple mean, all products %
13.7
12.1
12.1
12.2
12.2
12.2
12.2
12.3
12.3
12.5
12.5
12.5
12.5
12.5
12.5
12.5
8.4
6.5 6.8
6.4
5.7
5.6
8.8
0.0
2.0
4.0
6.0
8.0
10.0
12.0
14.0
16.019
95
1996
1997
1998
1999
2000
2001
2002
2003
2004
2005
2006
2007
2008
2009
2010
2011
2012
2013
2014
2015
2016
2017
Percen
tages
Years
Source: Own elaboration based on The World Bank (2019).
Figure 6 shows that in the period 1995–2016 the consolidated rate, simple average, for all products has presented a slight increase; all of this, when Colombia became in full member of the WTO in 1995, with a value of 41.9 per cent to a value of 42.8 per cent in 2016.
Figure 6: Bound rate, simple mean, all products (%) – Colombia
41.9
41.9
41.9
41.9
41.9
41.9
41.9
41.8
41.8
41.8
41.8
41.8
41.8
42.1
42.1
42.1
42.1
42.1
42.8
42.8
42.8
42.8
41.2
41.4
41.6
41.8
42.0
42.2
42.4
42.6
42.8
43.0
1995
1996
1997
1998
1999
2000
2001
2002
2003
2004
2005
2006
2007
2008
2009
2010
2011
2012
2013
2014
2015
2016
Percen
tages
Years
Source: Own elaboration based on The World Bank (2019a).
In terms of this last type of protectionism it is important to note that the disaggregation of the margin of manoeuvre by sectors (see Figure 7). Oilseeds, fats and oils, sugar and confectionary, and cereals and preparations have the highest margin of manoeuvre because they have a higher than average bound tariff with a low MNF tariff. However, in some sectors, such as electrical machinery, non-electrical machinery, manufacturing and chemicals, the operating margin is very low, since both the consolidated tariff and the MNF tariff are below the average presented in Table 3. In this way, it is noted that, in general terms, the tariff consolidation in the primary sector is higher than in the manufacturing sector and that in the manufacturing sector in lighter industries the consolidation of tariffs is still very high. However, they have more room to manoeuvre, while in the sector of heavier industries the bound and MNF tariffs are lower; however, there is less room to manoeuvre to deal with possible crises.

Volume 14, Number 1 85
World Customs Journal
Figure 7: Tariff protectionism leeway or average room within the sectors in Colombia62
.75
8.82 14
.86
10.5
6 21.0
2
14.1
6
9.07
5.00 13
.67
12.7
8
15.0
0
14.2
5
6.12 9.09
2.88 5.45
2.71 4.95
2.25 6.
64
1.85 3.40
73.9
5
122.
76
92.9
5
96.1
9
76.3
5
77.9
0
67.8
0
70.8
0
59.0
7
57.2
2
25.0
0
23.2
3
29.4
7
26.2
9
32.1
2
29.5
5
32.2
7
29.9
9
32.6
7
26.5
3
31.1
6
24.0
9
136.
70
131.
58
107.
81
106.
75
97.3
7
92.0
6
76.8
7
75.8
0
72.7
4
70.0
0
40.0
0
37.4
8
35.5
9
35.3
8
35.0
0
35.0
0
34.9
8
34.9
4
34.9
2
33.1
7
33.0
1
27.4
9
0.00
20.00
40.00
60.00
80.00
100.00
120.00
140.00
160.00Da
iry p
rodu
cts
Oils
eeds
, fat
s & o
ils
Cere
als &
pre
para
tions
Suga
rs a
nd c
onfe
ctio
nery
Anim
al p
rodu
cts
Beve
rage
s &
toba
cco
Oth
er a
gric
ultu
ral p
rodu
cts
Cott
on
Frui
t, ve
geta
bles
, pla
nts
Coffe
e, te
a
Clot
hing
Fish
& fi
sh p
rodu
cts
Text
iles
Tran
spor
t equ
ipm
ent
Petr
oleu
m
Woo
d, p
aper
, etc
,
Min
eral
s & m
etal
s
Leat
her,
foot
wea
r, et
c,
Chem
ical
s
Man
ufac
ture
s n,e
,p,
Non
-ele
ctric
al m
achi
nery
Elec
tric
al m
achi
nery
% MFN Tariff % Leeway % Bound Tariff
Source: Own elaboration based on WTO (2019).
The above tables show that since entering the WTO, Colombia has developed different protectionist policies at the sector level, especially in the agricultural and light industry sectors, as reflected in its bound tariffs. These protectionist measures were adopted in an attempt to protect these sectors that had not yet fully developed or not yet reached their expected growth levels.
However, a remarkable deindustrialisation of the country has occurred. This is explained in part by the signing of many different trade agreements despite the problems of competitiveness in specific industries. Furthermore, the significant dependence that the state has reached, in extractive terms, about some minerals and hydrocarbons has affected Colombia’s productive diversification (Echavarría & Villamizar, 2006; López, 2010; Baena, 2019).
Thus, it can be assumed that in Colombia, the WTO tenets are not fulfilled because as a country participates in the multilateral trading system as an active member of the WTO, bound tariffs should decrease over time, including for products of the agricultural sector (Bejarano, 1998). This seems to generate evidence in favour of the hypothesis that this non-reduction is due to the deindustrialisation phenomenon (Baena, 2019), which affects more sensitive industries in the generation of employment such as light industries. Likewise, the higher average rate of bound tariff for the primary sector indicates that these margins are necessary to protect the less competitive sectors or those most exposed to the phenomenon of openness, as is the case with the agricultural sector.
In the third instance, when analysing Table 4, Colombia occupies an intermediate position in the region in terms of the application of tariff barriers, which is consistent with that presented in Table 2, on interventions, where it also occupies an intermediate position with 75 interventions. (Global Trade Alert, 2019).
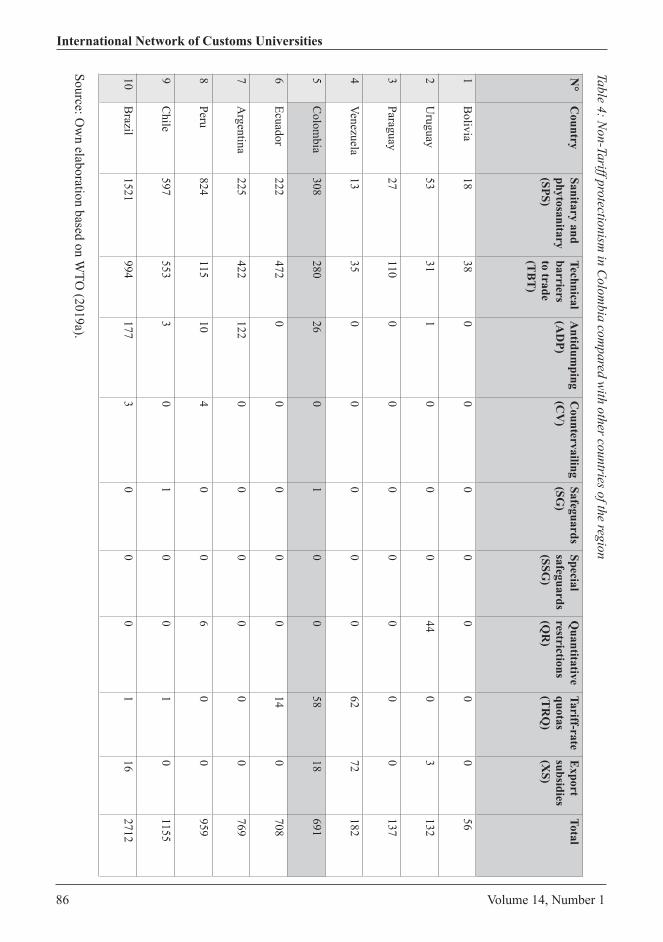
86 Volume 14, Number 1
International Network of Customs UniversitiesTable 4: N
on-Tariff protectionism in C
olombia com
pared with other countries of the region
N°
Country
Sanitary and phytosanitary(SPS)
Technical barriers to trade (T
BT
)
Antidum
ping(A
DP)
Countervailing
(CV
)Safeguards(SG
)Special safeguards(SSG
)
Quantitative
restrictions(Q
R)
Tariff-rate quotas (T
RQ
)
Export
subsidies(X
S)
Total
1B
olivia18
380
00
00
00
56
2U
ruguay53
311
00
044
03
132
3Paraguay
27110
00
00
00
0137
4Venezuela
1335
00
00
062
72182
5C
olombia
308280
260
10
058
18691
6Ecuador
222472
00
00
014
0708
7A
rgentina225
422122
00
00
00
769
8Peru
824115
104
00
60
0959
9C
hile597
5533
01
00
10
1155
10B
razil1521
994177
30
00
116
2712
Source: Ow
n elaboration based on WTO
(2019a).
Volume 14, Number 1 87
World Customs Journal
Although the country occupies first position in the region in terms of quantitative restrictions and export subsidies, these only represent 6.6 per cent and 0.43 per cent respectively of the total non-tariff measures in the country. In this regard, the measures that represent the most in terms of total tariff measures are sanitary and phytosanitary measures and technical obstacles, with 44.6 per cent and 40.5 per cent, respectively.
5. ConclusionIn this descriptive study, a general analysis of the protection and behaviour of Colombian foreign trade was carried out. It was also possible to delve deeper into three essential items regarding how the Colombian economy is integrated into international markets: commercial opening and fiscal imbalances; the trend of bound tariffs from the entry to WTO; and the decrease of tariffs and increase of tariff barriers as a result of the implementation of models of economic openness.
In Colombia, it appears that the entry into the multilateral trading system and the WTO did not necessarily result in lower bound tariffs, because Colombia has remarkable problems regarding deindustrialisation, which affects more sensitive industries in the generation of employment such as light industries. Indeed, the higher average rate of bound tariff for the primary sector indicates that these margins are necessary to protect weak populations or those more exposed to the phenomenon of openness such as farmers and certain specific industries.
Also, with regards to the first objective, the evidence seems to confirm the hypothesis that commercial opening causes a structural fiscal imbalance because the decrease in tariffs has had to be compensated with increases in internal taxes, especially indirect taxes, as happened with the VAT for example.
With regard to the economic opening model, it is necessary to add that the liberalisation of Colombian foreign trade has been very singular—considering its market competitiveness and the dynamic of globalisation, which has led to a fragmented liberalisation in only some sectors. For instance, in the agricultural sector and light industry, tariff protectionism remained quite high, as happens with the bound tariffs that were reported before the WTO, whose purpose was to provide room to manoeuvre against potential crises and risks in such sectors when opening trade to imports. However, this has been undermined by the signing of trade agreements as these almost completely liberalise foreign trade for the vast majority of products from new trading partners. This increasingly influences Colombia’s deindustrialisation, on the one hand, given the outstanding competitiveness of its trading partners and, on the other hand, given its lack of diversification and dependency on oil and mining.
Finally, it should be noted that this work went beyond mere exploration and, by focusing on a deeper description of phenomena of economic integration that affect the Colombian economy, it sought to generate a series of hypotheses that support the need for further work, which should be oriented to the verification of the hypotheses derived from the descriptive analysis performed in this work. For this, it would be ideal to use quantitative methods, to verify the hypotheses presented here about the behaviour of Colombian foreign trade and the levels of protectionism of this South American country.

88 Volume 14, Number 1
International Network of Customs Universities
References
Acharyya, R. (2011). A note on quantitative trade restrictions, income effects and wage inequality. Economic Modelling, 28(6), 2628–2633.
Argüello, R. (2017). Trade diversification in Colombia, 1991-2011. Cuadernos de Economía, 36(71), 345–378.
Baccini, L., Kim, S., & Pammolli, F. (2010). Globalization and economic crisis: does information really matter? In T. Lagoarde-Segot, After the crisis: rethinking finance (pp. 101–124). Nueva York: Nova Science Publishers Incorporated.
Baena, J. (2018). Barreras arancelarias y no arancelarias como restricciones al comercio internacional. Revista Venezolana de Gerencia, 23(83), 543–562.
Baena, J. (2019). La política de comercio exterior y las exportaciones colombianas. Revista de Economía Institucional, 21(41), 51–70.
Baena, J. (2019). Proteccionismo inverso y política comercial dentro del sistema multilateral de comercio: el caso de las restricciones a la exportación. Estudos internacionais, 7(3), 28–50.
Baena, J., & Fernández, X. (2016). Aproximaciones a la inserción de Colombia en el sistema multilateral de comercio en 1995–2015. Análisis Político, 29(87), 114–131.
Baena, J., Montoya, A., & Torres, D. (2017). La crisis económica mundial ¿La proliferación del proteccionismo como una causa-efecto? En-Contexto, 5(6), 185–207.
Baldwin, R., & Haberler, G. (1965). Trade, growth, and the balance of payments: essays in honor of Gottfried Haberler. Chicago: Rand McNally.
Bao, X., & Qiu, L. (2010). Do technical barriers to trade promote or restrict trade? Evidence from China. Asia-Pacific Journal of Accounting & Economics, 17, 253–280.
Bejarano, J. (1998). Economía de la agricultura. Bogotá: IICA Fonade.Beshkar, M. (2010). Trade skirmishes safeguards: a theory of the WTO dispute settlement process.
Journal of International Economics, 82(1), 35–48.Bhagwati, J. (1968). More on the equivalence of tariffs and quotas. The American Economic Review,
58(1), 142–146.Blonigen, B., & Prusa, T. (2003). Antidumping. In K. Choi, & J. Harrigan, Handbook of international
trade (pp. 251–284). Oxford: Blackwell Publishing.Bown, C. (2002). Why are safeguards under the WTO so unpopular? World Trade Review, 47–62.Bussière, M., Pérez-Barreiro, E., Straub, R., & Taglioni, D. (2011). Protectionist responses to the crisis:
global trends and implications. World Economy, 34(5), 826–852.Cardona, D. (2001). La política exterior de la Administración Pastrana (1998–2002). Hacia una
evaluación preliminar. Colombia Internacional, 53(1), 53–74.Cardona, G. (2017). Comercio Mundial tendencias y estructur. Medellín: Editorial CEIPA.Chang, H. (2003). Kicking away the ladder: infant industry promotion in historical perspective. Oxford
Development Studies, 31(1), 21–32.Chen, C.–C., Chang, C.–C., & McCarl, B. A. (2011). The equivalence of tariffs and quotas under a tariff–
rate quota system: a case study of rice. Canadian Journal of Agricultural Economics, 59(4), 573–587.Clavijo, S., Alejandro, V., & Vera, N. (2013). Estructura Fiscal de Colombia y Ajustes Requeridos 2012–
2020. Bogotá: Anif- Fedesarrollo.Collie, D. (1991). Export subsidies and countervailing tariffs. Journal of International Economics, 31(3–
4), 309–323.

Volume 14, Number 1 89
World Customs Journal
Countryman, A., & Narayanan, B. (2017). Price volatility, tariff structure and the special safeguard mechanism. Economic Modelling, 64, 399–408.
Dean, J., Feinberg, R., Signoret, J., & Ludema, R. (2008). Estimating the price effects of non-tariff barriers. Contributions in Economic Analysis & Policy, 9(1), 1–38.
Defever, F., & Riaño, A. (2017). Subsidies with export share requirements in China. Journal of Development Economics, 126, 33–51.
DIAN. (2019). Statistics of the taxes administered by the DIAN. Retrieved from https://www.dian.gov.co/dian/cifras/Paginas/EstadisticasRecaudo.aspx
Dinlersoz, E., & Dogan, C. (2010). Tariffs versus anti-dumping duties. International Review of Economics & Finance, 19(3), 436–451.
Echavarría, J., & Villamizar, M. (2006). El proceso colombiano de desindustrialización. Retrieved from https://www.banrep.gov.co/es/el-proceso-colombiano-desindustrializacion
Eckaus, R. (2006). China’s exports, subsidies to state-owned enterprises and the WTO. China Economic Review, 17, 1–13.
Engler, A., Nahuelhual, L., Cofré, G., & Barrena, J. (2012). How far from harmonization are sanitary, phytosanitary and quality-related standards? An exporter’s perception approach. Food Policy, 37(2), 162–170.
Espitia, J., Ferrari, C., Hernández, G., Hernández, I., Gónzalez, J., Reyes, L., . . . Zafra, G. (2017). Sobre la reforma tributaria estructural que se requiere en Colombia reflexiones y propuestas. Revista de Economía Institucional, 19(36), 149–174.
Fontagné, L., & Orefice, G. (2018). Let’s try next door: technical barriers to trade and multi-destination firms. European Economic Review, 101, 643–663.
Gallardo-Sánchez, C., & Vallejo-Zamudio, L. (2019). Política comercial y evolución del sector externo en Colombia 1970–2016. Apuntes del Cenes, 38(67), 123–155.
Gamboa, N. (2005). La economía colombiana. Del modelo de protección al modelo de apertura. Medellín: Universidad de Medellín.
García, J. (2004). Estudios Descriptivos. Nure Investigación, 7(1), 1–3.García, J., López, D., Montes, E., & Esguerra, P. (2014). Una visión general de la política comercial
colombiana entre 1950 y 2012. Borradores de Economía, 817, 1–68.GATT. (1986). The text of the General Agreement on Tariffs and Trade. Retrieved from https://www.wto.
org/english/docs_e/legal_e/gatt47.pdfGlobal Trade Alert. (2019). Global dynamics. Retrieved from https://www.globaltradealert.org/global_
dynamics/area_all/year-to_2018Gupta, K. (2006). A study of World Trade Organisation. New Delhi: Atlantic Publishers and Distributors.Hathaway, D. (2002). A special agricultural safeguard (SAS): buttressing the market access reforms of
developing countries. In FAO, Food and Agriculture Organization. Rome: FAO.Irwin, D. (2017). Peddling protectionism Smoot-Hawley and the Great Depression. New Jersey:
Princeton University Press.Jiménez, R. (1998). Metodología de la Investigación. Elementos básicos para la investigación clínica. La
Habana: Editorial Ciencias Médicas.Junguito, A. (2010). Tariff history lessons from the European periphery. Protection intensity and the
infant industry argument in Spain and Italy 1870–1930. Historical Social Research, 35(1), 340–362.Kagitani, K., & Harimaya, K. (2015). Safeguards and voluntary export restraints under the World Trade
Organization: the case of Japan’s vegetable trade. Japan and the World Economy, 36, 29–41.

90 Volume 14, Number 1
International Network of Customs Universities
Kaneda, M. (2003). Policy designs in a dynamic model of infant industry protection. Journal of Development Economics, 72(1), 91–115.
Kang, J., & Dagli, S. (2018). Tariff barriers and industrial spillover effects. Journal of Korea Trade, 22(3), 228–246.
Khorana, S. (2011). Tariff rate quotas: a market access barrier for developing countries products? The case of Switzerland. Retrieved from https://www.researchgate.net/publication/228777194_Tariff_Rate_Quotas_A_Market_Access_Barrier_for_Developing_Countries_Products_The_Case_of_Switzerland
Konings, J., & Vandenbussche, H. (2005). Antidumping protection and markups of domestic firms. Journal of International Economics, 65(1), 151–165.
Lee, G. (2016). Subsidies and countervailing duties. In K. Bagwell, & R. W. Staiger, Handbook of commercial policy (pp. 161–2010). Elsevier.
Levy, S. (1989). Export subsidies and the balance of trade. Journal of Development Economics, 31(1), 99–121.
Lewis, J. (2014). Industrial policy, politics and competition: Assessing the post-crisis wind power industry. Business and Politics, 16(4), 511–547.
Li, Y., & Beghin, J. C. (2012). A meta-analysis of estimates of the impact of technical barriers to trade. Journal of Policy Modeling, 34(3), 497–511.
Londoño, A. (2015) El enfoque de gobernanza en la evaluación del desarrollo sostenible a escala local (caso del departamento de Antioquia, Colombia). Revista Mexicana de Ciencias Agrícolas, 1(1), 257-263.
Londoño, A., & Baena, J. (2017) Análisis de la relación entre los subsidios al sector energético y algunas variables vinculantes en el desarrollo sostenible en México en el periodo 2004-2010. Gestión y política pública, 26(2), 491-526.
Londoño, J., Cardona, G., & Abadía, J. (2017). Los Acuerdos Comerciales Regionales y el Regionalismo Abierto: posibles efectos de desviación de comercio o erosión de preferencias. En Contexto, 5(6), 137–162.
López, L. (2010). Transformación productiva de la industria en Colombia y sus regiones después de la apertura económica. Cuadernos de Economía, 29(53), 239–286.
MacCharles, D. (2013). Trade among multinationals: intra-industry trade and national competitiveness. New York: Routledge Taylor and Francis Group.
Marette, S., & Beghin, J. (2010). Are standards always protectionist? Review of International Economics, 18(1), 179–192.
Martin, A., & Vergote, W. (2008). On the role of retaliation in trade agreements. Journal of International Economics, 76, 61–77.
Melitz, M. (2005). When and how should infant industries be protected? Journal of International Economics, 66(1), 177–196.
Melo, O., Engler, A., Nahuehual, L., Cofré, G., & Barrena, J. (2014). Do sanitary, phytosanitary, and quality-related standards affect international trade? Evidence from Chilean fruit exports. World Development, 54, 350–359.
Merrills, J. (2005). International dispute settlement. New York: Cambridge University Press.Millet, M., & García-Durán, P. (2009). ¿Vuelve el proteccionismo? ICE: Revista de Economía, 1(870),
73–87.MinCit. (2016). Decreto 2153 de 2016 – Arancel de Aduanas. Retrieved from http://www.mincit.gov.co/
getattachment/7d5829b5-a7f3-4fb1-94d2-b648faac81b1/Decreto-2153-quot;Por-la-cual-se-adopta-el-Arancel.aspx

Volume 14, Number 1 91
World Customs Journal
MINCIT. (2019). Normatividad – Decretos. Retrieved from http://www.mincit.gov.co/normatividad/decretos
Miravete, E. (2003). Time-consistent protection with learning by doing. European Economic Review, 47(5), 761–790.
Moncayo, E. (2003). Resultados de las reformas del consenso de Washington en los países andinos: estabilización incompleta, profundización de los desequilibrios sociales y crecimiento precario. Economía y Desarrollo, 2(1), 73–95.
Montoya, C. (2011). Colombia y su inserción a la economía mundial. Revista Ecos de Economía, 15(32), 172–193.
Montoya, J. (2013). The Colombian urban system in the face of globalization: economic restructuring and regional change. Cuadernos de Vivienda y Urbanismo, 6(12), 302–320.
Nagurney, A., Besik, D., & Dong, J. (2019). Tariffs and quotas in world trade: a unified variational inequality framework. European Journal of Operational Research, 275, 347–360.
Najar, A. S. (2006). Apertura económica en colombia y el sector externo (1990–2004). Apuntes del Cenes, 77–98.
Nayar, S., & Stanley, M. (2015). Qualitatives Research Methodologies for Occupational Sciences and Therapy. New York and London: Routledge-Taylor and Francis.
Ocampo, J. (2017). Historia económica de Colombia. Ciudad de México: Fondo de Cultura Económica.OECD. (2019). Tax revenue. Retrieved from https://data.oecd.org/tax/tax-revenue.htmOECD. (2019a). Nota de la OCDE sobre la ley de financiamiento en Colombia. Retrieved from http://
www.oecd.org/economy/surveys/OCDE_nota_sobre_la_ley_de_financiamiento_en_Colombia.pdfOlson, L., & Roy, S. (2010). Dynamic sanitary and phytosanitary trade policy. Journal of Environmental
Economics and Management, 60(1), 21–30.Pagell, R., & Halperin, M. (1998). International business information: how to find it, how to use it.
Phoenix: Oryx Press.Panagariya, A., & Duttagupta, R. (2002). Politics of free trade areas: tariffs versus quotas. Journal of
International Economics, 58, 413–427.Pearce, R., & Sharma, R. (2000). Market Access II: tariff rate quotas. Retrieved from http://www.fao.
org/3/x7353e/X7353e03.htmPeng, M. (2012). The global strategy of emerging multinationals from China. Global Strategy Journal,
2(2), 97–107.Pereyra, D. (2015). Librecambio vs. Proteccionismo: un debate desde la teoría del comercio internacional.
Rihumso: Revista de Investigación del Departamento de Humanidades y Ciencias Sociales, 1(7), 65–88.
Porter, M., & Stern, S. (2001). Innovation: location matters. MIT Sloan Management Review, 42(4), 28–36.
Qiu, L. (1995). Why can’t countervailing duties deter export subsidization? Journal of International Economics, 39(3), 249–272.
Rosales, O. (2019). El conflicto US–China: nueva fase de la globalización. Estudios Internacionales, (192), 97–126.
Ruíz, J. I. (2012). Teoría y Práctica de la Investigación Cualitativa. Bilbao: Universidad de Deusto.Serna, C., Londoño, A. & Vélez, O. (2016). Subnational governance model from the integration of
online media and social networks: The case of Medellin City, Colombia. In Handbook of Research on Sub-National Governance and Development. Sub-national governance and development.

92 Volume 14, Number 1
International Network of Customs Universities
Sarmiento, E. (2002). El modelo propio: teorías económicas e instrumentos. Bogotá: Editorial Norma.Schularick, M., & Solomou, S. (2011). Tariffs and economic growth in the first era of globalization.
Journal of Economic Growth, 16(1), 33–70.Steinberg, F. (2006). La economía política del proteccionismo. Cuadernos de Economía, 26, 65–95.Sykes, A. (2006). The WTO Agreement on Safeguards. Oxford: Oxford University Press.Thennakoon, J., & Anderson, K. (2015). Could the proposed WTO Special Safeguard Mechanism protect
farmers from low international prices? Food Policy, 50, 106–113.Toro, J., Garavito, A., López, d., & Montes, E. (2015). El choque petrolero y sus implicaciones en la
economía colombiana. Borradores de Economía, (906).Torres, D. (2011). Sesenta años de la política comercial en Colombia. Del letargo de la protección al
saldo al vacío de la apertura. Bogotá: Editorial jorge Tadeo Lozano.Tovar, P. (2019). Preferential and multilateral liberalization: evidence from Latin America’s use of tariffs,
antidumping and safeguards. Journal of Development Economics, 141, 1–19.United Nations. (2003). United Nations Conference on Trade and Development. New York: United
Nations.Van der Mensbrugghe, D., Beghin, J., & Mitchell, D. (2003). Modeling tariff rate quotas in a global
context: the case of sugar markets in OECD countries. Retrieved from https://lib.dr.iastate.edu/card_workingpapers/368/
Vanegas, J., & Baena, J. (2019). Virtual protectionism: overview of MFN tariffs and bound tariffs in South America. Journal of International Studies, 12(4), 63–78.
Vargas-Alzate, L., Sosa, S., & Rodriguez-Ríos, J. D. (2012). El comercio como plataforma de la política exterior colombiana en la administración de Juan Manuel Santos. Colombia Internacional, 76(1), 259–292.
World Bank. (2019). MFN simple average by country all products from world – WITS World Integrated Trade Solution. Retrieved from https://wits.worldbank.org/CountryProfile/en/country/by-country/startyear/LTST/endyear/LTST/tradeFlow/Import/indicator/MFN-SMPL-AVRG/partner/WLD/product/Total
World Bank. (2019a). Bound rate, simple mean, all products (%) – Colombia. Retrieved from https://data.worldbank.org/indicator/TM.TAX.MRCH.BR.ZS?locations=CO
World Bank. (2019a). Bound rate, simple mean, primary products (%). Retrieved from https://data.worldbank.org/indicator/TM.TAX.TCOM.BR.ZS
World Bank. (2019b). Bound rate, simple mean, manufactured products. Retrieved from https://data.worldbank.org/indicator/TM.TAX.MANF.BR.ZS
WTO. (1995). Agreement on the Application of Sanitary and Phytosanitary Measures. Retrieved from http://www.wto.org: http://www.wto.org/english/docs_e/legal_e/15sps_01_e.htm
WTO. (1999). The legal texts the results of the Uruguay round of multilateral trade negotiations. New York: Cambridge University Press.
WTO. (2001). Market access: tariffs and tariff quotas. Retrieved from https://www.wto.org/english/tratop_e/agric_e/negs_bkgrnd06_access_e.htm
WTO. (2004). Market access: special agricultural safeguards (SSGs). Retrieved from https://www.wto.org/english/tratop_e/agric_e/negs_bkgrnd11_ssg_e.htm
WTO. (2005). The Doha agenda. Retrieved from https://www.wto.org/english/thewto_e/whatis_e/tif_e/doha1_e.htm
WTO. (2006). Examen de las políticas comerciales, informe de la Secretaría. Bogotá: WTO.WTO. (2015). Technical barriers to trade. WTO.
Volume 14, Number 1 93
World Customs Journal
WTO. (2019). International trade and market access data. Retrieved from https://www.wto.org/english/res_e/statis_e/statis_bis_e.htm?solution=WTO&path=/Dashboards/MAPS&file=Tariff.wcdf&bookmarkState=%7b%22impl%22:%22client%22,%22params%22:%7b%22langParam%22:%22en%22%7d%7d
WTO. (2019a). I-TIP Goods: Integrated analysis and retrieval of notified non-tariff measures. Retrieved from http://i-tip.wto.org/goods/Forms/MemberView.aspx?mode=modify&action=search
WTO. (2019b). Regional trade agreements data base. Retrieved from http://rtais.wto.org/UI/PublicSearchByMemberResult.aspx?membercode=170
Yalcin, E., Felbermayr, G., & Kinzius, L. (2017). Hidden protectionism: non-tariff barriers and implications for international trade. Retrieved from https://www.ifo.de/DocDL/ifo_Forschungsberichte_91_2017_Yalcin_etal_Protectionism.pdf
Zhang, H. (2018). Political connections and antidumping investigations: evidence from China. China Economics Review, 50, 34–41.
Jose Jaime Baena-RojasJose Jaime Baena is PhD in Law and Political Science from Universidad de Barcelona (Spain); holds a MSc. in Internationalisation from the same university and a Sp. In International Trade from EUDE Business School (Spain), graduated in political science from Universidad Nacional de Colombia and graduated in International Business from Institución Universitaria Esumer (Colombia). He is full time professor at CEIPA Business School (Colombia), and researcher at Organization and Management (ORYGEN) Group of the same university. His research field is focused in international trade, ICT, international businesses, with several articles in these topics.
ORCID: 0000-0002-0915-4087.
Abraham Allec Londoño-PinedaAbraham Allec Londoño Pineda is PhD Sustainable Development from Universidad de Universidad de Manizales (Colombia); holds a MSc. in Business Administration from the Universidad de Medellín, graduated Economics from Universidad Nacional de Colombia. He is full time professor at Universidad de Medellín (Colombia), Editor in Chief of the journal Semestre Económico and and researcher at Business and International Relations Group of the same university. His research field is focused in international trade, international businesses, and sustainable development with several articles in these topics.
ORCID: 0000-0002-2419-0211.

94 Volume 14, Number 1
International Network of Customs Universities

Volume 14, Number 1 95
World Customs Journal
Lines, flows and transnational crime: toward a revised approach to countering the underworld
of globalisation1
Alan Bersin and Lars Karlsson
Abstract
This article proposes a paradigm shift in the means and methods of combating transnational criminal activity. It contends that global illicit flows, engineered by organised crime on a massive scale, alongside lawful trade and travel, represent a principal challenge to public safety and civic order. It proposes further that the Westphalian territorial state system, with its complement of multilateral regulatory and law enforcement organisations, is not equipped to meet the challenge effectively. The article advances a series of propositions in support of developing a revised approach to confronting transnational criminal activity.
1. IntroductionIn this article, we develop a new framework for combating transnational criminal activity.
We argue that global illicit flows, perpetrated by organised crime, in the interstices of lawful trade and travel, embody a critical and debilitating non-state security threat in today’s world, one that the Westphalian international system of sovereign states remains ill-equipped to confront.
Accordingly, we seek to generate a wider discussion in the field regarding a revised approach to this threat that is situated within a global framework of collaborative law enforcement that incorporates, in appropriate fashion, certain military and counter-terrorist strategies.
The propositions we advance in support of a revised approach to countering transnational crime and its globalised web-enabled criminals include:
(a) terrorism is one species of transnational crime
(b) the criminal justice model of arrest, prosecution, conviction and incarceration is a partial and insufficient response to transnational crime
(c) national security and law enforcement functions should be viewed analytically as a ‘public security’ continuum rather than disciplines separated by bright lines
(d) countering transnational criminal organisations effectively may require the development of a hybrid law enforcement/military capacity and new strategic and tactical doctrines, including safeguards against abuse, to govern its deployment
(e) joint border management within and between nations, coordinated with the private sector, is required and inter-agency cooperation and multilateral institutions must be strengthened in accordance with new international norms
96 Volume 14, Number 1
International Network of Customs Universities
(f) North America, a region construed as extending from Colombia to the Arctic and from Bermuda to Hawaii, could develop in the future, together with the European Union, as an initial site for a model pilot of the new approach.
2. A new border paradigm: Westphalian lines and global flowsBorders traditionally have been viewed as lines in the sand (and on a map) demarcating the edges of sovereign states (or empires) according to the Westphalian system dating from the 17th century. The Peace of Westphalia in 1648 is generally considered as the start of the modern territorial state system.
The Westphalia treaties concluded the Thirty Years War in Europe and set in motion a system whereby sovereign states began to co-exist alongside longstanding imperial regimes. This new system established principles such as mutual respect for national border boundaries and the territorial integrity of states, acknowledgment of the plenary authority exercised by a sovereign within its jurisdiction, covenants not to interfere in other states’ internal affairs, and the legal equality of states within the international system. As European influence spread globally, so too did this territorial and horizontal concept of sovereignty and the prerogatives that attach to it.
Today, sovereignty asserts itself aggressively at states’ borderline boundaries by determining who and what may enter or exit the geographic space and when, and the conditions under which, they may do so (Bersin, 2012). This exercise of sovereignty at national borders has long been a means for governments to assert and maintain internal political control. At the same time, to generate revenue, states levy customs and travel fees on the cross-border movement of people and goods. Borders today therefore should be conceived of both as lines marking sovereignty and as entry/exit points of flow.2 This new understanding of borders as lines and flows challenges the Westphalian conception of borders as ‘hard’ boundaries around the territories of sovereign states. In other words, borders must be managed as flows and interdependent networks rather than solely as jurisdictional lines to be endlessly fortified.
To be clear, we are not suggesting that sovereign borders have become irrelevant or unimportant. But because of accelerating technological innovation, time and space have been dramatically compressed such that global flows today are non-stop, and in many cases, instantaneous.
Globalisation is the cumulative effect of these trends: a 24/7/365 movement of capital, labour, cargo, people, goods, services, ideas, images, data and electrons continuously around the world.
These flows today are directed by actors independent of states. Often, they are the decisions of multinational corporations, transnational criminal organisations, and other non-state actors.
For this reason, they sometimes are referred to as ‘borderless’ or ‘stateless’ (Givens, Busch & Bersin, 2018). Nonetheless, they continue to flow toward and over Westphalian border lines, have their principal effects within states, and are regulated by the governments operating there. This presents us with a palpable collision of two historic trends: the sovereign power to regulate cross-border flows remains exclusively national, while the flows themselves—lawful and illicit alike—increasingly are transnational. Both trends accelerated mightily after World War II with the post-colonial rush to nationhood that has created 193 sets of separate sovereign borders and the technological innovation that has multiplied exponentially the volume and speed of movement that makes for the so-called borderless world.
The under-development of effective international cyber governance has made the collision between Westphalian border lines and global flows inevitable and has exacerbated its impact (Kaplan, 2016).
As the process of globalisation expands, the concept of ‘borderless’ is enlarged to encompass the unprecedented flows of all kinds that cross-national border lines continuously, often instantaneously. These include the multiple categories of virtual flows across cyberspace.
Volume 14, Number 1 97
World Customs Journal
Borders in a globalised and digital world, then, are most usefully conceived as incorporating flows toward and across lines marking national sovereignty. This new border paradigm, linking jurisdictional lines to global flows, includes the unlawful flows that trade on the dark web and comprise the underworld of globalisation (Shelley, 2018).
3. The underworld of globalisation: transnational criminal organisationsGlobalisation includes illicit flows on a massive scale. The transnational criminal organisations (TCO) generating the bulk of them comprise gigantic business conglomerates that are shadow reflections of multilateral corporations like Shell, Huawei, Gazprom, Samsung and Google. These illicit enterprises use modern institutions and means, including cyber space and cryptocurrencies (Corcoran, 2018), along with the contemporary international banking system. But they often also capitalise on ancient smuggling routes like The Silk Road. The United States National Security Council estimates (roughly):
• $1.3 trillion to $3.3 trillion is involved in money laundering perpetrated by transnational criminal enterprises
• $750 billion to $1 trillion in narcotics trafficking
• $170 billion to $320 billion in illicit firearms trafficking
• $21 billion in human trafficking
• $500 billion in counterfeit and pirated goods
• $20 to $40 billion in environmental crimes including illegal wildlife trade
• $10 to $12 billion in fraudulent credit card transactions.
The total proceeds of transnational organised crime are estimated at $6.2 trillion or about 10 per cent of the gross global product. This amount approaches the total 2017 gross domestic product (GDP) of all the countries in Africa ($2.9 trillion) and South America ($3.99 trillion) combined. Bribery of corrupt officials is estimated to involve up to $1 trillion.3
These illicit economies exercise enormous concentrated power. In the period since the end of the Cold War—one of transition to a new series of geopolitical rivalries and relationships—transnational criminal activity has increased significantly, and the non-state organisations involved have grown correspondingly in power and influence. At the same time, as observers have noted, by dispersing power and capacity so broadly, globalisation will continue to weaken the state, relatively speaking, and the monopoly of violence and legitimacy on which sovereign control has been premised for centuries (Scowcroft, 2011). The unlawful economies of TCOs and the criminal activities that sustain them remain, we submit, in the circumstances of this vacuum, a grave contemporary challenge to public security and civic order.
TCOs function in the seams between the boundaries of states. In the context of globalisation, they operate successfully, and largely with impunity, within these gaps between national law enforcement jurisdictions (Antonopoulos, 2016). These are the dark places where organised crime thrives. The growing proliferation of the internet of money4—through blockchain and other digital technologies—and the encryption of communication devices further shroud criminal transactions and the individuals and organisations who engage in them.
The global Westphalian framework of national sovereignty established in the 17th century is less and less suited to deal with the magnitude and methods of transnational crime operating today. The international

98 Volume 14, Number 1
International Network of Customs Universities
community is unable to manage and regulate the massive contemporary volume of unlawful flows in accordance with the traditional lines of national borders and the sovereign power of states exercised independently. Non-state actors—including multinational corporations and transnational criminal organisations—often operate entirely beyond the reach of government.5 The TCOs, functioning in the shadowy netherworld of globalisation, in short, outstrip the capacity of both national and international law enforcement agencies and organisations to control that dangerous space. Governments cannot successfully fight cross-border crime from behind national borders that transnational criminals do not recognise or often ever physically cross (US National Security Council, 2011). Ports of entry into countries managed by individual states are the last line of defence against dangerous people and dangerous things; not the first line they traditionally have been considered. There is a demonstrable need to develop a revised approach that addresses the resulting vulnerabilities in the contemporary international system of law enforcement.
3.1 The contours of a new counter-network approach: terrorism is one species of transnational crime
The principal motivation for conducting terrorist activity is to create political change while organised crime is pursued primarily for illicit economic gain. For analytic purposes in the context of border management and security, however, their similarities transcend their differences and suggest they be viewed as distinctive types of illicit transnational criminal activities. Terrorism from this perspective constitutes one species of transnational crime along with human trafficking and migrant smuggling, narcotics production and distribution, firearms trafficking, and the piracy of intellectual property, among many other staples of illicit market activity.
Crime and terror groups employ similar means and methods, albeit for their different purposes.
Criminal organisations use narco-terror tactics of violence to intimidate local populations and government officials. Similarly, jihadist terrorists engage in criminal activities designed to generate revenue as Hezbollah has done with money laundering in the tri-border zone of Argentina, Paraguay and Brazil and elsewhere, as al-Qaeda did in mediating the blood diamond trade in Charles Taylor’s Liberia, and as D’aesh more recently has done with the theft of oil in Iraq. Occasionally, the nexus has been even closer where groups, seeking to replace existing state authority, at the same time are engaging routinely in organised criminal activity. The FARC in Colombia and the Sendero Luminoso in Peru are prime illustrations of this phenomenon as was the maritime piracy of the al-Shabaab terrorist group in Somalia.
To characterise terrorism as a sub-species of transnational crime is not to minimise the problem but rather to place it in context and into perspective. There are several reasons to reconceptualise terrorism in this way. First, the harm done by terrorism is random and terrifying to be sure, but results in far fewer fatalities and concrete loss than numerous other threats and factors of risk. Second, the terror threat continues to evolve but the sources of jihad generating it—whether al-Qaeda or D’aesh—have been substantially weakened by the national military and intelligence campaigns waged against them. A third compelling reason to treat terrorism as a sub-species of transnational criminal activity is that such characterisation would facilitate incorporating the military and intelligence community’s approach to countering terrorism into policing/investigative strategy aimed at combating transnational crime. Certain of these tools, techniques, means and methods, are relevant to the broader TCO challenge and have proven reasonably effective in the counter-terror context.6
Volume 14, Number 1 99
World Customs Journal
3.2 The blurred boundaries of public security: internal security and national defence; international affairs and domestic affairs; and national security, border security and law enforcement
States remain the building blocks of geopolitical calculation and activity in the contemporary world. However, transnational factors increasingly dominate what matters in the internal as well as external security theatre. Homeland or internal security has become inherently transnational. There is hardly anything—human-made or natural7—that adversely affects the homeland of states today, which does not now have a cause or effect that is generated abroad from outside their border lines. This has led to the so-called ‘pushing out’ of borders.
The US Government and other governments regularly place civilian law enforcement officers and military personnel abroad to protect the homeland against threats of terrorism, pandemic disease and cyberspace intrusion (Nixon, 2014). The central mission of police attachés from the departments of Justice and Homeland Security stationed abroad, for example, is to prevent the import of crime and to intercept security threats at their point of foreign origin before they cross into the US and become a domestic threat. This is accomplished by the attaché network through capacity building, information sharing and, occasionally, operational coordination with host country partners (Nixon, 2014). This ‘externalisation of borders’ (Danelo, 2018) is breaking down old dichotomies and definitions by which policy makers and analysts in the past drew distinctions with a difference. A complete distinction between ‘national security’ and ‘homeland security’, for example, is increasingly questioned and the same appears to be true regarding ‘foreign affairs’ (Zelikow, 2003) and ‘domestic affairs’. Homeland security–centric activities abroad similarly blur traditional bright line boundaries between ‘national security’ and ‘law enforcement’ on the one hand and ‘law enforcement’ and ‘border security’ on the other (Adreas, 2003). The subject matter and objectives of these missions more frequently overlap and may more usefully be considered going forward as falling within the broader rubric of public security. This type of adjustment in nomenclature is a leading indicator of a paradigm shift (Kuhn, 1962) or dramatic transformation in existing conventional wisdom.
3.3 Integrated counter-transnational crime righting is required
Divided and fragmented management of borders is an anachronistic artifact of the Westphalian system. What is required, internally, is a whole-of-government strategy that utilises and applies five dimensions of official power: intelligence collection and analysis; military capacity; law enforcement response; financial sanction; and diplomatic partnership with foreign government authorities (US National Security Council, 2011).
The military approach to identifying and defeating networks through counter-networks may have much to commend itself to law enforcement (McChrystal, 2011). The separation between military and domestic law enforcement exists because there are dramatic philosophical and cultural differences between these institutions in both the conception and execution of their core missions. The police officer acts to maintain law and order through the arrest of offenders as required, while the soldier defends the nation, when necessary, through the killing of enemies. Accordingly, policy makers should not underestimate the legal, policy and moral challenges to accomplishing the necessary, reasoned reconciliation of these differences.
In order to accomplish a synthesis between law-enforcement capacity and certain aspects of a military/intelligence community approach, policy makers must understand and accept the proposition that terrorism is one variant of transnational crime.8 This activity, whether for terrorist or mercenary aims

100 Volume 14, Number 1
International Network of Customs Universities
and objectives, or both, is conducted by non-state actors who operate in the spaces, not only between states, but also in the seams between their domestic national security and defence, and law enforcement establishments, and their respective ‘stove-piped’ authorities and operations.
The growing ties between various terrorist organisations and TCOs highlight the substantial threat embodied in the crime–terror nexus. The logic of their growing affiliation, based on revenue generation, appears self-evident (Fedetov, 2019). Moreover, we also see an increasing identity of interest between certain state actors in the intelligence realm, seeking to exploit the accessibility and relative anonymity of TCOs, including terrorist organisations, to achieve their geopolitical aims.9 This growing adverse hybrid and asymmetric threat appears to require that a similar hybrid counter mission be developed between and among law enforcement, intelligence and military communities. This effort, in turn, would require the elaboration of strategic doctrine and the creation of a blended public security force that can deliver law enforcement approaches tailored to counter-TCO operations. This mixed force of warrior/lawmen and women would resemble Joint Interagency Task Force-South (JIATF-S) led by the United States Coast Guard (USCG), but with considerably amplified and appropriately constrained authorities, mission space, training and resources.10 Like the Coast Guard and JIATF-S, in their current counter-narcotics mission, this force would operate exclusively abroad in the kinetic enforcement dimension of its hybrid function; it would respect the requirements of posse comitatus, which limits authorised use of the military in domestic affairs to extreme emergency circumstances.
We must, in short, reconcile the legal, methodological, operational and cultural approaches of police officers, security agents and soldiers and do so within the parameters of an accountable and satisfactory rule of law.
11 The political and legal conundrums that have accompanied the US incarceration of prisoners of war at Guantanamo, and the efforts to try some of them in federal criminal court, demonstrate the degree of difficulty to be encountered as we attempt to place new round policy pegs into old square holes and vice-versa in order to supplement an outdated Westphalian regulatory and enforcement system.
3.4 Beyond the criminal justice model: disruption, prevention and protection
The law enforcement paradigm—the criminal justice model—has sought to adapt proactively to the phenomenon of TCOs through the utilisation of conspiracy doctrines and racketeering statutes such as RICO in the US—and in Europe. However, these tools by themselves can be unwieldy and are geared principally to imprison the individuals who operate and run organised criminal organisations. The criminal justice model is focused on proving past conduct in a court of law through the rules of evidence. Developing a case (usually over several years) presumes, in fact depends upon, the continuation of criminal activity so that enough evidence can be amassed and presented to a jury at trial.
This is antithetical to a disruption model, the objective of which, systematically and continuously, is to degrade and dismantle TCO operations (Bersin & Lawson, forthcoming). The strategy must employ but acknowledge forthrightly the limitations of the decapitation strategy.12 A decapitation approach, which seeks to arrest, prosecute and incarcerate the heads of organised crime can only succeed as part of a larger, more comprehensive approach that involves attacking all vulnerabilities of the transnational criminal organisation. As a single tool, decapitation is destined to fail. When a mob boss is taken down, he inevitably is a sorry sight, deflated in dejection because as Sebastian Rotella pointed out (fictionally) in Triple Crossing (Rotella, 2011), the power has already passed out of the former chieftain to those who succeed him. Because the revenue stream remains intact, the criminal incentive to sustain operations and maintain continuity is pronounced.
To defeat a TCO, its business model must be compromised and then broken through disruption and dismantlement. This effort must encompass both the production and distribution of TCO products as
Volume 14, Number 1 101
World Customs Journal
well as interdiction and seizure of their personnel and monetary proceeds and systematic disruption of their communication networks. Nothing short of a unified strategy of persistent erosion against the TCO business core will suffice. Currently, this rarely occurs.
We urge, therefore, an organised and focused discussion, among governmental authorities, scholars and practitioners, to reconceptualise the law enforcement/homeland security mission to combat transnational organised criminal activity. The law enforcement and national security activities of homeland security should be reframed in terms of protecting public and citizen security through safeguarding global supply chains and international travel zones. The reformulated model would set forth an internal security agency’s enforcement method which eschews exclusive reliance on the traditional criminal justice system for arrest, prosecution, conviction and incarceration. Instead it would seek to counter the underworld of globalisation by focusing on the disruption and degrading of criminal operations and the dismantling of TCOs. The ‘disruptive’ approach combines the analysis and exploitation of data geared to suspicious activities of TCO networks with interference, interdiction and investigation. Its goal is to identify the ‘pressure points’ in a targeted criminal ecosystem and then design and execute on the best law enforcement and crimefighting counter measures.
The new approach would rely on a variety of tools and sanctions in addition to traditional criminal justice system techniques and penalties.
3.5 Multilateral organisations—public and private—must be strengthened for purposes both of enhanced data sharing and coordinated operations
Our approach to protecting globalisation (see Pezzulo, 2014), with its extensive global supply chains and burgeoning international travel zones, requires significantly enhanced collaboration among public safety, state security, and police agencies at the international and national levels and between the private and public sectors. The operational weakness of multilateral organisations—from the United Nations to Interpol and the World Customs Organization (WCO), International Maritime Organization (IMO) and International Civil Aviation Organization (ICAO—in the face of transnational threats is palpable. The current situation reflects the stubborn resistance of Westphalian national politics to change and the inability of states to relinquish voluntarily even a small portion of their sovereign power. Only Europol, in the context of the European Union (EU) and the ‘shared sovereignty’ its member states have implemented partially, has taken significant steps in the direction we advocate here. Europol genuinely facilitates cooperation and coordination among police and border management agencies within the EU. Nonetheless, even here, there are substantial limitations in terms both of geographic reach and investigative focus.
As a consequence, information and intelligence sharing and operational coordination between national authorities and transnational law enforcement agencies, and with the private sector, remains woefully deficient. The result is that the global criminality of TCOs, unlike that of terrorist organisations, remains barely challenged today by the international community.
This dire diagnosis requires a radical prescription. The post-WWII approach to tailoring multilateral action in (virtually complete) deference to national sovereignty has run its course (Dasgupta, 2018). We need bold new thinking and the enunciation of transnational principles to govern a precise reengineering of strategy and doctrine. These in turn could lead to new theories of action that could elaborate revised tactics and strategies, devise strong modern mechanisms of collaboration, and develop a politically viable way forward. In sum, we need to create a global counter-TCO network that connects, in a much more seamless fashion, national systems to multinational organisations. The resulting network must address existing gaps in intelligence collection, analysis, and dissemination; operational coordination; regulation of both financial and cargo flows; and cross-border movements of people, both regular and irregular. Over time it must devise a satisfactory approach to the current anarchy in cyber space alluded to previously.
102 Volume 14, Number 1
International Network of Customs Universities
It is expected that in the interim, individual states will exercise sovereign power to protect their territorial integrity and security and the safety of their citizens. We explicitly acknowledge their right to do so. However, at the same time, we assert our view that no single government will ever fight effectively against transnational organised crime or transnational criminal activity on its own without the assistance of a multilateral counter-network, including a workable alliance with the private sector. To build and oversee this network and improve upon the positive development exemplified (albeit imperfectly) by Europol, will require:
(a) new international standards to govern the intelligence exchange, data sharing and operational coordination required to implement substantially enhanced national and international collaboration
(b) a new international body (perhaps a renovated Interpol) authorised and equipped to coordinate actionable responses for existing institutions that cannot perform them at a sufficient level of effectiveness
(c) global databases composing an international ‘data mart’ regarding the movement of both people and goods to provide a new world-wide intelligence network that could both light up the dark web and expedite the flow of lawful trade and travel13
(d) the design and development of new transnational protocols (e.g. a Global Authorized Economic Operator (AEO) 2.0 Framework for Public Private Partnership14) that articulate specific obligations of private and public sector participants in explicit new partnership accords.
3.6 North America: creating a model of the revised approach
The approach proposed here to understand borders and the transnational essence of contemporary homeland security and law enforcement in a global and digital age has special implications for Mexico and Canada and the North American continent that they share with the United States. Geographic proximity through the sharing of land borders—1900 miles with Mexico and 5400 with Canada—results in a unique relationship of these countries to the defence of the United State homeland. Following wars fought in the nineteenth century by the United States with each of its neighbours, North America has been blessed with the longest demilitarised borders in the world. These facts have created a special relationship between the United States and its neighbours, Canada and Mexico, that is neither international in a traditional sense nor domestic in light of the separate sovereignties involved15; instead, in a phrase coined by Bayless Manning in the 1970s, the relationship is more fittingly characterised as ‘intermestic’ (Manning, 1977).
For this reason, in the United States context, the Department of Homeland Security will continue to play a crucial role in policy formulation and operational coordination with national security and law enforcement authorities in both Canada and Mexico (and increasingly in Central America and the Caribbean). The growth in shared production platforms operating across common borders and increasingly shared critical infrastructure will further highlight this role. Flows north and south in the region are in the process of becoming functionally more relevant than the border boundary lines running east and west between them. The likelihood over time is that continental ‘perimeter security’ eventually, as in the European Union, will overshadow internal cross-border concerns. First, cyber-security regimes to ward off borderless cyber intrusions will require this adjustment just as the polar threat from Soviet ICBMs in the 1950s necessitated the formation of the North American Aerospace Defense Command (NORAD) (DeGering, 2016).
Second, the imperative for perimeter protection will become more pronounced as the economic competitiveness of North America becomes more critical to US prosperity (Tooze, 2019).
Volume 14, Number 1 103
World Customs Journal
The region comprises a half billion people, economies that together generate almost 30 per cent of global goods and services, and shared production with robust trade flows of more than 1.3 trillion dollars annually. The ‘homeland security enterprise’ will have much to do with the management of this promising future and could produce a model for expediting secure global flows of lawful trade and travel while at the same time countering transnational organised crime much more effectively.
4. ConclusionTechnology and globalisation have brought the world to a turning point. The inadequacies of Westphalian governance and the limitations of conventional wisdom and traditional process have become painfully evident in the increasing inability of governments to satisfactorily control transnational criminal activity. The advent and rapid expansion of web-enabled criminality has highlighted this global vulnerability. Westphalian governance increasingly is outdated because cyberspace and its savvy, networked criminals and TCOs supersede or ignore physical border lines and boundaries altogether.
We have proposed in this article, therefore, a broad-based international effort to develop a revised approach to counter the underworld of globalisation. We do not purport to have solved the problem but rather have sought to identify it and spur a reconsideration of the status quo that is long overdue. Initial international consultations to this end, starting with the observations and propositions we advance here, could usefully begin within and between the European Union and the North American Region led by the United States, Mexico and Canada. It is an era of dramatic transition and a time for innovative reinvention. As the English historian, A.J.P. Taylor reminded us, history can be brutally unkind when a turning point is reached and the world does not turn (Taylor, 1945).
References
Andreas, P. (2003). Redrawing the line: borders and security in the twenty-first century. International Security, 28(2), 78–111.
Antonopoulos, A. A. (2016). The internet of money. Merkle Bloom, LLC.Arango, T., Bogel-Burroughs, N., & Benner, K. (2019). Minutes before El Paso killing, hate-filled
manifesto appears online. New York Times, August 4, 2019.Bersin, A., & Lawson, C. (Forthcoming). Homeland security and transnational crime. Beyond 9/11:
Homeland Security for the 21st Century. MIT Press (Publication forthcoming).Bersin, A. (2012). Lines and flows: the beginning and end of borders. Brooklyn Journal of International
Law, 37(2), 389–406. [Originally presented at the Ira M Belfer Lecture, Brooklyn Law School, 6 October 201; republished in World Customs Journal, 6(1)].
Bonner, R. (2010). The new cocaine cowboys. Foreign Affairs, July/August 2010 at p. 4.Bonner, R. (2012). The Kingpin Strategy: did it work and is it still relevant. Retrieved from https://
deamuseum.org/lecture-series/kingpin-strategy-did-it-work-and-is-it-still-relevant/Cai, W., & Landon, S. (2019). Attacks by white extremists are growing. So are their connections.
New York Times, April 3, 2019.Corcoran, K. (2018). Law enforcement has a massive problem with these 3 cryptocurrencies. Business
Insider Singapore, February 27.Danelo, D. (2018). For protection or profit? Free trade, human smuggling and international border
management. The Global Initiative against Transnational Organized Crime, March 2018. Retrieved from https://globalinitiative.net/wp-content/uploads/2018/03/For-Protection-or-Profit-Intl-Border-Management-March-2018-web.pdf
104 Volume 14, Number 1
International Network of Customs Universities
Dasgupta, R. (2018). The demise of the nation state. The Guardian, 5 April 2018. Retrieved from https://www.theguardian.com/news/2018/apr/05
DeGering, R. (2016). What is NORAD’s role in military cyber attack warning?. Homeland Security Affairs, 12, Essay 5. Retrieved from https://www.hsaj.org/articles/10648
Givens, A. D., Busch, N. E., & Bersin, A. D. (2018). Going global: the international dimensions of US homeland security policy. Journal of Strategic Security, 11(3), 1–34. DOI: https://doi.org/10.5038/1944-0472.11.3.1689. Retrieved from https://scholarcommons.usf.edu/jss/vol11/iss3/2
Hatch, P. J. (2013). Maritime governance as an instrument of national security: a new perspective for DHS and the US Coast Guard. American Foreign Policy Interests, 35, 82–92.
Kaplan, F. (2016). Dark territory: the secret history of cyber war. New York: Simon and Schuster.Kuhn, T. S. (1962). The structure of scientific revolutions. 2nd edn. Chicago: University of Chicago
Press.Manning, B. (1977). The Congress, The Executive and Intermestic Affairs: three proposals. Foreign
Affairs 55, 306–309. Retrieved from https://www.foreignaffairs.com/articles/1977-01-01/congress-executive-and-intermestic-affairs-three-proposals
McChrystal, S. (2011). It takes a network: the new front line of modern warfare. Foreign Policy. 21 February. Retrieved from https://foreignpolicy.com/2011/02/21/it-takes-a-network/
McLay, J. M. (2015). Joint interagency task forces; the right model to combat transnational organized crime?. Naval War College (U. S.), Joint Military Operations Department, May 18, 2015, Defense Technical Information Center (DTIC): https://www.dtic.mil/UTIC/
National Institute of Justice. (2018). Domestic radicalization research yields possible keys to identifying extremists on the path to terrorism. Retrieved from https://nij.ojp.gov/topics/articles/domestic-radicalization-research-yields-possible-keys-identifying-extremists-path
Nixon, R. (2017). Homeland Security goes abroad. Not everyone is grateful. New York Times, December 26, 2017
Pezzullo, M. (2014). Sovereignty in an age of global interdependency: the role of borders. Speech made to the Australian Strategic Policy Institute, 19 December 2014. Retrieved from https://www.homeaffairs.gov.au/news-subsite/Pages/Speeches/australian-strategic-policy-institute-19-nov-2014.aspx
Rabusa, A., Schnaubelt, C. M., Chalk, P., Farah, D., Midgette, G., & Shatz, H. J. (2017). Counternetwork: Countering the expansion of transnational criminal networks. Santa Monica, CA: RAND Corporation. Retrieved from https://www.rand.org/pubs/research_reports/RR1481.html
Rotella, S. (2011). Triple crossing: a novel. New York, Mulholland Books/Little, Brown and Co.Scowcroft, B. (2011). Globalization erodes [the] power of individual countries. Address to National
Press Club, Washington DC, June 14, 2011.Shelley, L. I. (1995). Transnational organized crime: an imminent threat to the nation-state?. Journal of
International Affairs, 48(2), 463–389.Shelley, L. (2018). Dark commerce: how a new illicit economy is threatening our future. Princeton:
Princeton University Press.Taylor, A. J. P. (1945). The course of German history. London: Hamish Hamilton.Tooze, A. (2019). Is this the end of the American century?. London Review of Books, 41, 3–7 https://
www.lrb.co.uk/ v41/n07/adam-tooze/is-this-the-end-of-the-american-centuryUnited Nations Office on Drugs and Crime. (2010). The globalization of crime: a transnational
organized crime threat assessment. Retrieved from https://www.unodc.org/res/cld/bibliography/the-globalization-of-crime-a-transnational-organized-crime-threat-assessment_html/TOCTA_Report_2010_low_res.pdf
Volume 14, Number 1 105
World Customs Journal
United Nations Office on Drugs and Crime. (2011). Estimating illicit financial flows resulting from drug trafficking and other transnational organized crimes: research report. Retrieved from www.unodc.org/documents/data_and_analysis/studies/illicit_financial_ flows_2011_web.pdf
United Nations Office on Drugs and Crime. (2019). International cooperation. Retrieved from https://www.unodc.org/unodc/en/organized-crime/international-cooperation.html
US Department of Defense. (2014). DOD helps fight Ebola in Liberia and West Africa. Retrieved from https://archive.defense.gov/home/features/2014/1014_ebola/
US National Security Council. (2011). Transnational organized crime (TOC).US National Security Council. (2011), Strategy to combat transnational organized crime. Retrieved
from https://obamawhitehouse.archives.gov/sites/default/files/Strategy_to_Combat_Transnational_Organized_Crime_July_2011.pdf
Zelikow, P. (2003). The transformation of national security. The National Interest. Retrieved from https://nationalinterest.org/article/the-transformation-of-national-security-491
Notes1 This article was first presented and discussed in different form as a White Paper during the second International Summit
on Borders, 19–20 June 2018. The article first appeared in the Journal of Homeland Security Affairs: Bersin, Alan and Lars Karlsson. ‘Lines, Flows, and Transnational Crime: Toward a Revised Approach to Countering the Underworld of Globalization’ Homeland Security Affairs 15, Article 6 (December 2019). https://www.hsaj.org/articles/15514
2 This section of the article is drawn from Givens, Busch and Bersin (2018, pp. 1–34).3 US National Security Council (2011). Transnational criminal activities remain so opaque and non-transparent that estimates
of their proceeds remain no more than educated guesses subject to wide disparity. In contrast to the US National Security Council, the United Nations Office on Drugs and Crime estimates TCO proceeds far less at $870 billion, or 1.5% of the gross global product. See also United Nations Office on Drugs and Crime, 2011.
4 Legal non-state actors span multiple sovereignties acknowledging, if not quite accepting, the authority of each government they touch. Terror and crime syndicates, on the other hand, reject all jurisdiction and engage national governments only to penetrate and corrupt them or to replace them.
5 Legal non-state actors span multiple sovereignties acknowledging, if not quite accepting, the authority of each government they touch. Terror and crime syndicates, on the other hand, reject all jurisdiction and engage national governments only to penetrate and corrupt them or to replace them.
6 The dramatically enhanced post 9/11 information sharing between the FBI and CIA in the United States and the post Charlie Hebdo exchange of watchlists between European and U.S. intelligence and law enforcement agencies are cases in point. The relative success achieved in shutting down terrorist financial networks offers a further striking illustration.
7 Even domestic radicalization itself appears to constitute only a partial exception (National Institute of Justice, 2018). This includes homegrown violent extremism. The manifesto of the alleged gunman in the August 2019 mass shooting in El Paso, Texas, drew inspiration from the attacks the previous March on two mosques in Christchurch, New Zealand (Cai and S Landon, 2019). See also Arango, Bogel-Burroughs and Benner (2019).
8 Some observers are wary of blurring the line between international terrorism, as a form of asymmetrical warfare by non-state actors, on the one hand, and a TCO engaged in cross-border criminal activity on the other, for fear that sovereignty concerns could lessen, not increase nation-state cooperation; others contend that mixing national security and law enforcement tools would confuse existing channels of operation and threaten traditional civil liberties. While each of these points of view is not unreasonable, both, we believe, have been overtaken by contemporary events and circumstances.
9 A separate but related threat arises when transnational criminals are also government officials, usually in weak or failed states (e.g. Manuel Noriega in Panama during the 1980’s).
10 Joint Inter-Agency Task Force—South (JIATF-S), led by the USCG, offers a partial illustration, as stated in the text, of what might be extended internationally to accomplish this aim. See McLay (2015) and Hatch (2013).
11 Although this synthesis of effort almost never occurs, it is eminently feasible. US Attorney for the Southern District of New York Preet Bharara observed on the successful capture and prosecution of Abdul Kadir Warsawme, a go-between operative for Al Qaeda and Al-Shabaab: “[H]is lengthy interrogation for intelligence purposes, followed by his thorough questioning by law enforcement agents was an intelligence watershed…a seamless orchestration by our military intelligence, and law enforcement agencies that significantly furthered our ability to find, fight and apprehend those who wish to do us harm.” See Rabusa, Schnaubelt, Chalk, Farah, Midgette, & Shatz (2017).

106 Volume 14, Number 1
International Network of Customs Universities
12 Decapitation strategy is sometimes confused with the Kingpin Strategy. See Bonner (2010).13 This would suggest abandonment of traditional separate national customs and immigration declarations and their
replacement with transparent information about all flows verified (eventually) through block chain protocols and data cloud solutions.
14 The Authorized Economic Operator (AEO) Program was established in The SAFE Framework 2005 by the World Customs Organization — following Al-Quaeda’s 9/11 attack on the United States — as a ‘trusted trader program’ to balance heightened security requirements with a continuing intensified global need for trade facilitation. It provided for the security vetting of trading and logistical companies and for expedited customs clearance for those who qualified. The SAFE Framework and the AEO chapter has been updated several times. The call for an ‘AEO 2.0’ seeks a larger updating and modernization of the program than previously discussed, shaping a new AEO paradigm to take account of the changing environment and challenges in global trade.
15 This is to be contrasted with the alternative mode of ‘shared sovereignty’ that drives (and now complicates) the ‘Schengen’ and ‘EuroZone’ models employed in the European Union.
Alan BersinAlan Bersin served as Commissioner of U.S. Customs and Border Protection, and as Assistant Secretary of International Affairs and Chief Diplomatic Officer at the United States Department of Homeland Security. He is a Senior Advisor at the global law firm of Covington & Burling; an Inaugural Senior Fellow in the Homeland Security Project at the Belfer Center at the Harvard Kennedy School of Government; a Global Fellow at the Woodrow Wilson Center for International Scholars in Washington D.C.; and the Inaugural North America Fellow at the Canada Institute and the Mexico Institute (Wilson Center).
Lars KarlssonLars Karlsson is President of KGH Border Services providing consulting services to governments world-wide. He has served as the Director for Capacity Building at the World Customs Organization and as Director General of Swedish Customs. He was the architect of the world’s first Authorized Economic Operator (AEO) program and has served as a Senior Advisor to the EU and the UK on Brexit.
Volume 14, Number 1 107
World Customs Journal
The World Trade Organization and World Customs Organization key conventions and agreements (TFA, HSC, RKC): membership
trends and opportunitiesCarsten Weerth
Abstract
The World Trade Organization (WTO) has 164 member states and its Trade Facilitation Agreement (WTO TFA) currently has 149 signatories. The World Customs Organization (WCO) has 183 member states and its most successful legal instrument—the Harmonized System Convention (HSC)—has 158 signatories, while its legal instrument for trade facilitation—the Revised Kyoto Convention (RKC)—has 120 signatories.
This paper investigates which countries have signed which agreements and examines opportunities for future membership. It calls for WTO and WCO initiatives to attract new members to both organisations and their agreements.
1. IntroductionThe World Trade Organization (WTO) and its current Trade Facilitation Agreement (WTO TFA) have similar aims as the World Customs Organization (WCO), its Revised Kyoto Convention (RKC) and its Harmonized System Convention (HSC) regarding trade facilitation and making global trade more simple, easy and accessible.
It is advisable that trading nations all apply the same rules, which is also in the best interest of all traders and authorities that are applying data generated by the customs authorities. This paper investigates which countries have signed which agreements, current trends in membership development and future membership opportunities.
2. Agreements and conventionsThe five agreements and conventions concerned are the:
• WTO agreement of 1995
• WTO TFA of 2013
• Customs Co-operation Council (since 1994 named WCO) agreement of 10 December 1950
• Harmonized Commodity Description and Coding System (Harmonized System Convention, Brussels 14 June 1983; HSC) for the customs classification of goods
• International Convention on simplification and harmonization of Customs procedures (so-called Revised Kyoto Convention; RKC) of 26 June 1999, which entered into force in 2006.

108 Volume 14, Number 1
International Network of Customs Universities
The WTO has had 164 member states since 2016 (WTO, 2020a) and the WCO has had 183 contracting states since 2019 (WCO, 2019j).
The HSC for the customs classification of goods into the tariff scheme of the HSC nomenclature (also tariff classification) has resulted in the worldwide annealing of tariff nomenclatures since its first usage in 1988. It is in use in 211 countries and economic regions of the world (WCO, 2019d) and more than 98 per cent of all transborder trade is statistically and economically classified by help of the HSC nomenclature (Weerth, 2017a; Wind, 2007; WCO, 2019c). The customs classification of goods is complex and depends on numerous rules, in particular on the terms of 1,222 HS-headings and 380 notes according to General Rule 1 (GR 1), 5,387 HS-subheadings (6-digit code) and 9,528 subheadings (8-digit code) and 56 subheading-notes (within the EU) (Weerth, 2017a) according to GR 6 (Weerth, 2008a).
The HSC is the most successful legally binding instrument of the WCO (Weerth, 2016a, 2017a). The HSC membership rises continuously (Weerth, 2008b, 2009b, 2011, 2012, 2014, 2016, 2017a, 2017b) and in June 2019, 158 countries were contracting parties (WCO, 2019b).
The RKC was signed in 2006 and currently has 120 signatory states (WCO, 2019c).
The TFA was signed in 2013 and entered into force in February 2017. As at February 2020, the TFA has been ratified by 149 of the 164 WTO member states (WTO, 2020b). It is a WTO tool that aims at trade facilitation but is a collection of many known ingredients of the WCO RKC (Wolffgang & Kafeero, 2014).
3. Examination of WTO/TFA and WCO/HSC/RKC membershipThis study investigates published data from the WCO (WCO, 2019a–2019d, 2019j, 2020a–2020d) and WTO (WTO, 2020a–2020b) websites regarding WTO/WCO/HSC membership, the RKC ratifications and the ratifications of WTO member states regarding the TFA. Data from the United Nations (UN), United Nations Educational, Scientific and Cultural Organization (UNESCO) and World Health Organization (WHO) are also considered (UN, 2020; UNESCO, 2020; WHO, 2020). This topic has not been subject to regular published research as a whole before. Scattered data has been published before considering the WCO membership development (Weerth, 2016, 2017b) and the HSC development (Weerth, 2017a).
Appendix 1 lists 200 states and their WTO, WTO TFA, WCO, HSC and RKC status.
One hundred countries have signed and implemented all five agreements (among them the then 28 EU member states and the EU itself) (refer Appendix 1).
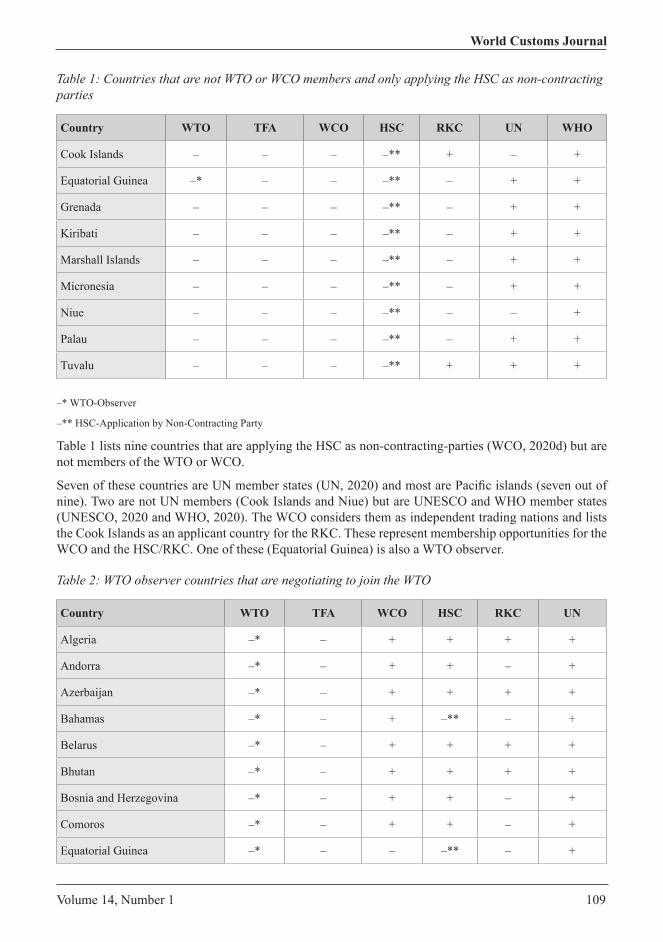
Volume 14, Number 1 109
World Customs Journal
Table 1: Countries that are not WTO or WCO members and only applying the HSC as non-contracting parties
Country WTO TFA WCO HSC RKC UN WHO
Cook Islands – – – –** + – +
Equatorial Guinea –* – – –** – + +
Grenada – – – –** – + +
Kiribati – – – –** – + +
Marshall Islands – – – –** – + +
Micronesia – – – –** – + +
Niue – – – –** – – +
Palau – – – –** – + +
Tuvalu – – – –** + + +
–* WTO-Observer
–** HSC-Application by Non-Contracting Party
Table 1 lists nine countries that are applying the HSC as non-contracting-parties (WCO, 2020d) but are not members of the WTO or WCO.
Seven of these countries are UN member states (UN, 2020) and most are Pacific islands (seven out of nine). Two are not UN members (Cook Islands and Niue) but are UNESCO and WHO member states (UNESCO, 2020 and WHO, 2020). The WCO considers them as independent trading nations and lists the Cook Islands as an applicant country for the RKC. These represent membership opportunities for the WCO and the HSC/RKC. One of these (Equatorial Guinea) is also a WTO observer.
Table 2: WTO observer countries that are negotiating to join the WTO
Country WTO TFA WCO HSC RKC UN
Algeria –* – + + + +
Andorra –* – + + – +
Azerbaijan –* – + + + +
Bahamas –* – + –** – +
Belarus –* – + + + +
Bhutan –* – + + + +
Bosnia and Herzegovina –* – + + – +
Comoros –* – + + – +
Equatorial Guinea –* – – –** – +
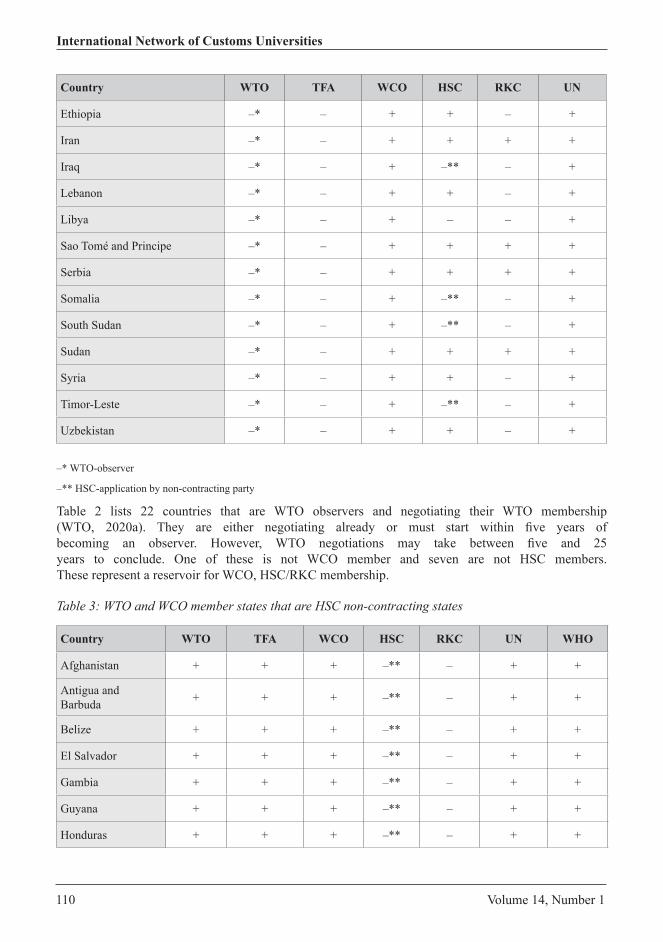
110 Volume 14, Number 1
International Network of Customs Universities
Country WTO TFA WCO HSC RKC UN
Ethiopia –* – + + – +
Iran –* – + + + +
Iraq –* – + –** – +
Lebanon –* – + + – +
Libya –* – + – – +
Sao Tomé and Principe –* – + + + +
Serbia –* – + + + +
Somalia –* – + –** – +
South Sudan –* – + –** – +
Sudan –* – + + + +
Syria –* – + + – +
Timor-Leste –* – + –** – +
Uzbekistan –* – + + – +
–* WTO-observer
–** HSC-application by non-contracting party
Table 2 lists 22 countries that are WTO observers and negotiating their WTO membership (WTO, 2020a). They are either negotiating already or must start within five years of becoming an observer. However, WTO negotiations may take between five and 25 years to conclude. One of these is not WCO member and seven are not HSC members. These represent a reservoir for WCO, HSC/RKC membership.
Table 3: WTO and WCO member states that are HSC non-contracting states
Country WTO TFA WCO HSC RKC UN WHO
Afghanistan + + + –** – + +
Antigua and Barbuda + + + –** – + +
Belize + + + –** – + +
El Salvador + + + –** – + +
Gambia + + + –** – + +
Guyana + + + –** – + +
Honduras + + + –** – + +
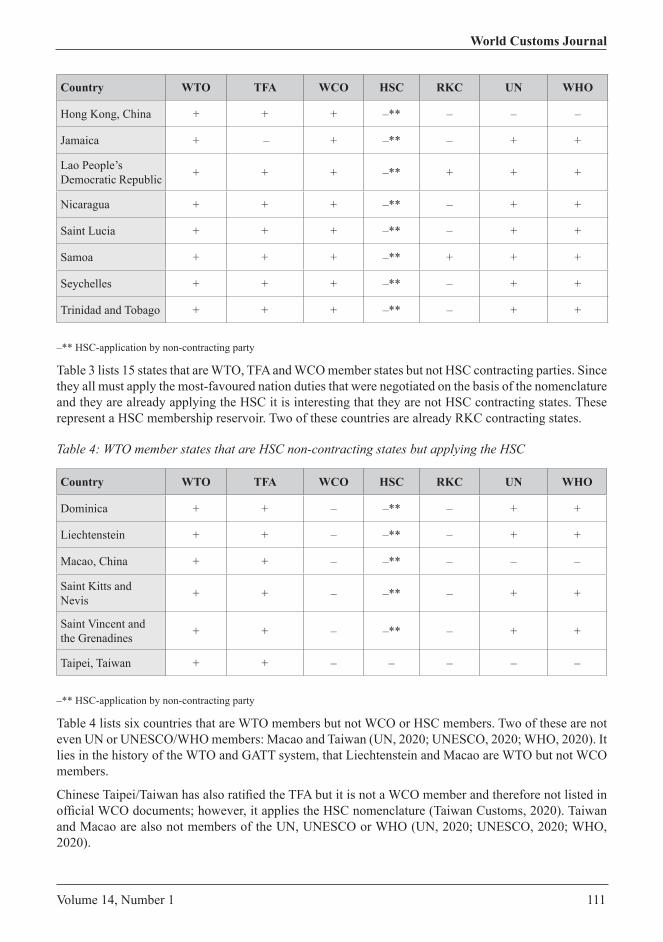
Volume 14, Number 1 111
World Customs Journal
Country WTO TFA WCO HSC RKC UN WHO
Hong Kong, China + + + –** – – –
Jamaica + – + –** – + +
Lao People’s Democratic Republic + + + –** + + +
Nicaragua + + + –** – + +
Saint Lucia + + + –** – + +
Samoa + + + –** + + +
Seychelles + + + –** – + +
Trinidad and Tobago + + + –** – + +
–** HSC-application by non-contracting party
Table 3 lists 15 states that are WTO, TFA and WCO member states but not HSC contracting parties. Since they all must apply the most-favoured nation duties that were negotiated on the basis of the nomenclature and they are already applying the HSC it is interesting that they are not HSC contracting states. These represent a HSC membership reservoir. Two of these countries are already RKC contracting states.
Table 4: WTO member states that are HSC non-contracting states but applying the HSC
Country WTO TFA WCO HSC RKC UN WHO
Dominica + + – –** – + +
Liechtenstein + + – –** – + +
Macao, China + + – –** – – –
Saint Kitts and Nevis + + – –** – + +
Saint Vincent and the Grenadines + + – –** – + +
Taipei, Taiwan + + – – – – –
–** HSC-application by non-contracting party
Table 4 lists six countries that are WTO members but not WCO or HSC members. Two of these are not even UN or UNESCO/WHO members: Macao and Taiwan (UN, 2020; UNESCO, 2020; WHO, 2020). It lies in the history of the WTO and GATT system, that Liechtenstein and Macao are WTO but not WCO members.
Chinese Taipei/Taiwan has also ratified the TFA but it is not a WCO member and therefore not listed in official WCO documents; however, it applies the HSC nomenclature (Taiwan Customs, 2020). Taiwan and Macao are also not members of the UN, UNESCO or WHO (UN, 2020; UNESCO, 2020; WHO, 2020).

112 Volume 14, Number 1
International Network of Customs Universities
Table 5: Countries that are WTO and/or WCO member states but are not applying the HSC/RKC
Country WTO TFA WCO HSC RKC UN UNESCO WHO
Kosovo – – + – – – – –
Myanmar + + + – – + – +
Both Kosovo and Myanmar are said to not apply the HSC.
Table 6: 40 countries in WCO-regions that are applying the HSC but are non-HSC-members
Country WCO HSC WCO-Region LDC
Antigua and Barbuda + –** Americas, Caribbean –
Bahamas + –** Americas, Caribbean –
Barbados + –** Americas, Caribbean –
Belize + –** Americas, Caribbean –
Bermuda + –** Americas, Caribbean –
Cook Islands – –** Far East/South East –
Curacao + –** Americas, Caribbean –
Dominica – –** Americas, Caribbean –
El Salvador + –** Americas, Caribbean –
Equatorial Guinea – –** Africa –
Grenada – –** Americas, Caribbean –
Guyana + –** Americas, Caribbean –
Honduras + –** Americas, Caribbean –
Hong Kong, China + –** Far East/South East –
Iraq + –** Africa –
Jamaica + –** Americas, Caribbean –
Kiribati – –** Far East/South East +
Lao People’s Democratic Republic + –** Far East/South East +
Liechtenstein – –** Europe –
Macao, China – –** Far East/South East –
Marshall Islands – –** Far East/South East –
Micronesia – –** Far East/South East –
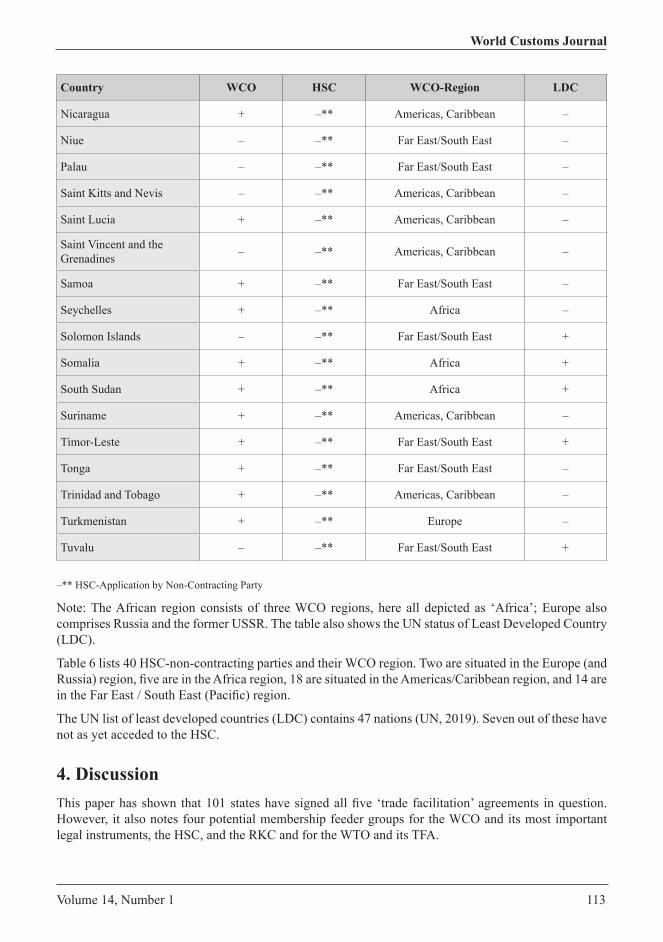
Volume 14, Number 1 113
World Customs Journal
Country WCO HSC WCO-Region LDC
Nicaragua + –** Americas, Caribbean –
Niue – –** Far East/South East –
Palau – –** Far East/South East –
Saint Kitts and Nevis – –** Americas, Caribbean –
Saint Lucia + –** Americas, Caribbean –
Saint Vincent and the Grenadines – –** Americas, Caribbean –
Samoa + –** Far East/South East –
Seychelles + –** Africa –
Solomon Islands – –** Far East/South East +
Somalia + –** Africa +
South Sudan + –** Africa +
Suriname + –** Americas, Caribbean –
Timor-Leste + –** Far East/South East +
Tonga + –** Far East/South East –
Trinidad and Tobago + –** Americas, Caribbean –
Turkmenistan + –** Europe –
Tuvalu – –** Far East/South East +
–** HSC-Application by Non-Contracting Party
Note: The African region consists of three WCO regions, here all depicted as ‘Africa’; Europe also comprises Russia and the former USSR. The table also shows the UN status of Least Developed Country (LDC).
Table 6 lists 40 HSC-non-contracting parties and their WCO region. Two are situated in the Europe (and Russia) region, five are in the Africa region, 18 are situated in the Americas/Caribbean region, and 14 are in the Far East / South East (Pacific) region.
The UN list of least developed countries (LDC) contains 47 nations (UN, 2019). Seven out of these have not as yet acceded to the HSC.
4. DiscussionThis paper has shown that 101 states have signed all five ‘trade facilitation’ agreements in question. However, it also notes four potential membership feeder groups for the WCO and its most important legal instruments, the HSC, and the RKC and for the WTO and its TFA.
114 Volume 14, Number 1
International Network of Customs Universities
Some groups can be distinguished that may have similar reasons for their reluctance to access WCO instruments:
• Nine countries that are applying the HSC as non-contracting-parties (WCO, 2019b) but are not members of the WTO or the WCO are listed in Table 1. These are mostly small developing countries in the Pacific area. The reasons are likely to be unawareness; unconcern; or fear of the many obligations, which of course can be exempted due to special conditions for developing countries.
• Twenty-two countries that are WTO observers and negotiating their WTO membership (WTO, 2020a) are listed in Table 2. They are either already negotiating or must do so within five years of becoming an observer. The reasons are likely to be unawareness; unconcern; or fear of the many obligations, which of course can be exempted due to special conditions for developing countries. HSC membership should be on the route to WTO accession and WTO and WCO could better cooperate in order to bring them into the world trading order (here the WCO and its HSC). Furthermore, the HSC accession is facilitated quickly, and it should be done in order to be updated to global customs rules.
• Fifteen WCO members that are not HSC contracting states (of which two are RKC signatory states) are listed in Table 3. They should know the benefits of HSC membership but are possibly wary of the obligations, although there are special conditions for developing countries.
• Table 4 lists six countries that have always been WTO but not WCO members, with this situation not seeming to have harmed them yet. Two of these countries—Macao and Taiwan—are not UN members (UN, 2020). It lies in the history of the WTO and GATT system, that Liechtenstein, Macao and Taiwan are WTO but not WCO members. Taiwan is applying the HSC in contrast to the WCO data (Taiwan Customs, 2020). The WCO data (HSC data) should therefore be updated. Two countries are listed in Table 5 that are ether WTO and/or WCO members but not applying the HSC/RKC: Kosovo and Myanmar. One is not accepted widely yet and an emerging state (Kosovo) and the other is a LDC with many other problems (Myanmar).
• Forty nations that are applying the HSC as non-member states and their WCO regions are listed in Table 6. Eighteen countries are situated in the Americas/Caribbean region and 14 are situated in the Far East/South East (Pacific) region. Seven of these belong to the LDC list of the UN. While the WCO has shown a strong commitment to the African regions regarding HSC implementation it should also engage in the Americas/Caribbean and Far East/South East (Pacific) regions since there is a large WCO/HSC membership potential.
The WCO has an open approach regarding countries and economic regions that are not widely accepted as an independent state or non-UN member states: the WCO has accepted Kosovo and Palestine as member states and also lists the Cook Islands and Niue, which are all not UN member states (UN, 2020). However, the latter two countries are members of UNESCO (UNESCO, 2020) and WHO (WHO, 2020).
But why, in 2020, are these countries not also WCO/HSC/RKC members? The WCO community should reach out to the hesitating states in order to accommodate a membership. And it is doing so actively already.
The WCO has commenced a joined program with the European Union to strengthen the HSC in Africa (WCO, 2019g). At the point of its implementation in February 2019, 49 out of 54 African states had signed the HSC (WCO, 2019g) and therefore this program was also directed at reaching out to the last five nations for HSC membership. The WCO is sending expert teams and trainers at the request of the WCO member states and it is also preparing the accession of new countries to the HSC: the latest cases were the Gambia (WCO, 2019e), the Seychelles (WCO 2019f) and Somalia (WCO, 2019i), out of which the Gambia joined the HSC in June 2019 as the 158th contracting state (WCO, 2019h).
Volume 14, Number 1 115
World Customs Journal
The WCO has issued a fact sheet on the introduction of a binding advance ruling system for tariff classification to support the HSC (WCO, 2014a, 2014b), as the WCO is also contributing to the implementation of the WTO TFA (WCO, 2014d, 2014e, 2016).
However, developed contracting parties (of the WCO) are asked to assist developing countries, according to article 5 HSC, with technical (and financial) support on issues of the application of the HSC and its nomenclature when this help is required and asked for. WCO outreach to all developing countries that are WCO members regarding accession to the HSC should be a priority. This can be supported by the HSC council and WCO developed nations.
Furthermore, introduction at the TFA will also supported by the WCO (WCO, 2014d, 2014e, 2016).
Currently, the WCO is actively supporting LDCs in particular, for example through the WCO Mercator program (WCO, 2014c). This support is also delivered with the help of the HMRC-WCO-UNCTAD Trade Facilitation Agreement Capacity Building Programme, which helps LDCs to implement the TFA (WCO, 2014d).
It is in the best interest of all trading nations, authorities and traders that they are all working according to the same rules. This can, must and should be achieved together.
5. Conclusion1. Membership of WTO, WTO TFA, WCO, HSC and RKC
In February 2020 there were 164 WTO member states (WTO, 2020a), of which 149 had ratified the WTO TFA (WTO, 2020b). In February 2020 there were 183 WCO member states (WCO, 2019a, WCO, 2019j), of which 158 were contracting parties to the HSC (WCO, 2019b).
Furthermore, there were 40 non-contracting parties that were applying the HSC (WCO, 2019b). In January 2020 there were 120 ratifying states to the RKC (WCO, 2019c) ( Annex 1). The UN currently has 193 member states (UN, 2020).
2. Comparison of the membership status
All in all, 200 states and economic regions were compared (Annex 1) and 101 of these countries have signed and implemented all five agreements.
There is still a large membership reservoir for WTO, WTO TFA, WCO, HSC and RKC membership (Tables 1–5):
• Nine countries that are applying the HSC as non-contracting-parties (WCO, 2019b) but are neither members of the WTO or the WCO are listed in Table 1.
• Twenty-two countries that are WTO observers and are negotiating their WTO membership (WTO, 2020a) are listed in Table 2. These countries must apply the HSC, although one is not a WCO member. Seven are applying the HSC without being a contracting state.
• Fifteen WCO members that are not HSC contracting states (but some are RKC signatory states) are listed in Table 3.
• Six countries that have always been WTO but not WCO members are listed in Table 4.
• Three countries that are either WTO and/or WCO members but are not applying the HSC/RKC are listed in Table 5.
116 Volume 14, Number 1
International Network of Customs Universities
3. WCO initiative (outreach campaign)
The WCO should actively lobby its member states to accede to the HSC and RKC, and it is currently doing so actively and successfully in Africa (WCO, 2019g). Such programs should also reach out to other regions, such as the Caribbean, Pacific and Asia (Far East/South East) areas, in order to reach all WCO member states.
The WCO should also encourage non-WCO members that are applying the HSC to become WCO and HSC/RKC members.
Many WCO programs concerning capacity building are sponsored by the EU, the UK or Japan, and involve continuous and sustainable commitment. Recognising the membership potential in the Americas and the Far East/South East it must be questioned whether other stakeholders should also contribute to the quest for an increased adoption of the WTO/WCO instruments, namely the US and China/Russia.
4. WTO initiative (outreach campaign)
The WTO is actively cooperating on various issues with the WCO, such as trade facilitation and the introduction of the TFA, market access, the Information Technology Agreement (ITA), customs valuation and rules of origin (WTO, 2020c).
The WTO should also actively lobby its member states to accede to the WCO, HSC and RKC.
References
Taiwan Customs. (2020). Customs tariff database. Retrieved from https://www.roc-taiwan.org/ca_en/post/8512.html and https://eweb.customs.gov.tw/
WCO. (2014a). Advance rulings, fact sheet, March 2014. Retrieved from http://www.wcoomd.org/-/media/wco/public/global/pdf/topicswto-atf/information-sheets/wto-info-sheet-wco-eac-aeo-program.pdf?la=en
WCO. (2014b). Implementing advance rulings in Liberia, fact sheet. Retrieved from http://www.wcoomd.org/-/media/wco/public/global/pdf/topics/wto-atf/information-sheets/advance-tariff-rulings-in-liberia-final-en-_-0611.pdf?la=en
WCO. (2014c). World Customs Organization supports LLDCs, fact sheet. Retrieved from http://www.wcoomd.org/-/media/wco/public/global/pdf/ topics/wto-atf/information-sheets/wco-for-lldcs.pdf?la=en
WCO. (2014d). HMRC-WCO-UNCTAD Programme. Retrieved from http://www.wco omd.org/en/topics/capacity-building/activities-and-programmes/cooperation-programmes/hmrc-wco-unctad-programme.aspx
WCO. (2014e). WTO Trade Facilitation Agreement and the Mercator Programme. The WCO’s role. Retrieved from http://www.wcoomd.org/en/topics/wco-implementing-the-wto-at/~/media/EACB364B21 A64865A86733D5AC642F51.ashx
WCO. (2016). How the WCO can support the implementation of the WTO TF Agreement, fact sheet. Retrieved from http://www.wcoomd.org/-/media/wco/public/ global/pdf/topics/wto-atf/information-sheets/wco-support-tfa-en.pdf?db=web
WCO. (2019a). Position as regards ratifications and accessions (as of 30 June 2019), Convention establishing a Customs Co-Operation Council. Retrieved from http://www.wcoomd.org/-/media/wco/public/global/pdf/about-us/legal-instruments/conventions-and-agreements/conventions/sg0205e1.pdf?la=en
Volume 14, Number 1 117
World Customs Journal
WCO. (2019b). Position of contracting parties to the Harmonized System Convention and non-contracting party administrations, as of 9 October 2019. Retrieved from http://www.wcoomd.org/-/media/wco/public/global/pdf/topics/nomenclature/overview/ hs-contracting-parties/positions-of-cp/situation_hs.pdf?db=web
WCO. (2019c). Position as regards ratifications and accessions (as of 19 September 2019), International Convention on the simplification and harmonization of Customs procedures (as amended) (Revised Kyoto Convention). Retrieved from http://www.wcoomd.org/-/media/-wco/public/global/pdf/about-us/legal-instruments/ conventions-and-agreements/revised-kyoto/pg0296ea.pdf?la=en
WCO. (2019d). List of 211 countries, territories, or customs or economic regions applying the Harmonized System as of 4 July 2019. Retrieved from http://www.wcoomd.org/~/media/wco/public/global/pdf/topics/nomenclature/ overview/hs-contracting-parties/list-of-countries/-countries_applying_hs.pdf?db=web
WCO. (2019e). Gambia gears up to accede to the Harmonized System Convention. Retrieved from http://www.wcoomd.org/en/media/newsroom/2019/april/gambia-gears-up-to-accede-to-the-harmonized-system-convention.aspx
WCO. (2019f). Seychelles puts a new perspective on its tariff-related work. Retrieved from http://www.wcoomd.org/en/media/newsroom/2019/june/seychelles-puts-a-new-perspective-on-its-tariff-related-work.aspx
WCO. (2019g). Launch of the EU-WCO Programme for Harmonized System in Africa. Retrieved from http://www.wcoomd.org/en/media/newsroom/2019/march/launch-of-the-eu-wco-programme-for-harmonized-system-in-africa.aspx
WCO. (2019h). Gambia becomes 158th contracting party to the Harmonized System Convention. Retrieved from http://www.wcoomd.org/en/media/newsroom/2019/ july/gambia-becomes-158th-contracting-party-to-the-harmonized-system-convention.aspx
WCO. (2019i). Support for Somalia to implement the Harmonized System. Retrieved from http://www.wcoomd.org/en/media/newsroom/2019/september/support-for-somalia-to-implement-the-harmonized-system.aspx
WCO. (2019j). List of members with membership date. Retrieved from http://www.wcoomd.org/-/media/wco/public/global/pdf/about-us/wco-members/list-of-members-with-membership-date.pdf?db=web
WCO. (2020a). About us à Legal instruments. Retrieved from http://www.wcoomd.org/ home_about_us_conventionslist.htm
WCO. (2020b). Harmonized System – general information. Retrieved from http://www. wcoomd.org/en/topics/nomenclature/overview.aspx
WCO. (2020c). WCO members à membership. Retrieved from http://www.wcoomd.org/ en/about-us/wco-members/membership.aspx
WCO. (2020d). Press releases on accessions to the WCO and its legal instruments. Retrieved from http://www.wcoomd.org/en/media.aspx
Weerth, C. (2008a). Basic principles of customs classifications under the Harmonized System. Global Trade and Customs Journal, 3(2), 61–67.
Weerth, C. (2008b). Harmonized System in developing countries. Global Trade and Customs Journal, 3(11/12), 379–382.
Weerth, C. (2009a). A short history of the World Customs Organization. Global Trade and Customs Journal, 4(7), 267–269.
Weerth, C. (2009b). New countries are applying the Harmonized System Convention: update 2009. Global Trade and Customs Journal, 4(9), 301.
118 Volume 14, Number 1
International Network of Customs Universities
Weerth, C. (2011). New countries are applying the Harmonized System Convention: update 2011 (as of 21 June 2011). Global Trade and Customs Journal, 6(9), 455.
Weerth, C. (2012). New countries are applying the Harmonized System Convention: update 2012. Global Trade and Customs Journal, 7(11/12), 510.
Weerth, C. (2014). New countries are applying the Harmonized System Convention: update 2014. Global Trade and Customs Journal, 9(9), 440–442.
Weerth, C. (2016). Recent developments in the World Customs Organization. In M. Bungenberg, C. Herrmann, M. Krajewski, & J. P. Terhechte, J. P. (Eds.), European Yearbook of International Economic Law (EYIEL), Chapter 34, pp. 787–799.
Weerth, C. (2017a). Globally uniform Harmonized System nomenclature? Waivers for developing countries and membership development: situation 2017. Customs Scientific Journal, 7(1), 50–62.
Weerth, C. (2107b). The World Customs Organization – a history of 65 years of growth and its legal milestones. Customs Scientific Journal, 7(2), 17–22.
Weerth, C. (2019a). Implementation of the Harmonized System (HS): Gambia to accede the HS convention, Researchgate, May 2019, DOI: 10.13140/RG.2.2.14945.35681.
Weerth, C. (2019b). Implementation of the Harmonized System (HS): Seychelles to accede the HS convention, Researchgate, June 2019, DOI: 10.13140/RG.2.2.10265.26725.
WHO. (2020). Alphabetical list of member states. Retrieved from https://www.who.int/choice/demography/by_country/en/
Wind, I. (2007). HS 2007: What’s it all about? Global Trade and Customs Journal, 2, 79–86.Wolffgang, H.-M., & Kafeero, E. (2014). Old wine in new skins: analysis of the Trade Facilitation
Agreement vis-à-vis the Revised Kyoto Convention. World Customs Journal, 8(2), 27–38.WTO. (2020a). List of WTO members and WTO observers. Retrieved from https://www.wto.org/english/
thewto_e/whatis_e/tif_e/org6_e.htmWTO. (2020b). The trade facilitation facility, ratifications and notifications. Retrieved from http://www.
tfafacility.org/ratificationsWTO. (2020c). The WTO and the World Customs Organization. Retrieved from https://www.wto.org/
english/thewto_e/coher_e/wto_wco_e.htmUN. (2019). List of least developed countries (as of December 2018), 2019. Retrieved from https://www.
un.org/development/desa/dpad/wp-content/uploads/sites/45/publication/ ldc_list.pdfUN. (2020). UN member states. Retrieved from https://www.un.org/en/member-states/UNESCO. (2020). Member states list. Retrieved from https://en.unesco.org/countries/
Carsten WeerthDr Weerth BSc (Glasgow) LLM MA, PhD, is a legal expert in European customs law and works with the German Customs and Excise Service in Bremen. He is a frequent contributor to the scientific journals AW-Prax (Zeitschrift für Außenwirtschaft in Recht und Praxis), ZfZ (Zeitschrift für Zölle und Verbrauchsteuern), GTCJ (Global Trade and Customs Journal), WCJ (World Customs Journal) and CSJ (Customs Scientific Journal), author of more than 10 books on European customs law, co-author of three legal comments on European customs law and EU law and lecturer of Law and Management at the FOM University of Applied Sciences in Economics and Management.

Volume 14, Number 1 119
World Customs Journal
Appendix 1
Table 1: WTO/TFA/WCO/HSC/RKC membership and contracting parties in 2020
Country WTO TFA WCO HSC RKC
Afghanistan + + + –** –
Albania + + + + +
Algeria –* – + + +
Andorra –* – + + –
Angola + + + + +
Antigua and Barbuda + + + –** –
Argentina + + + + +
Armenia + + + + +
Australia + + + + +
Austria + + + + +
Azerbaijan –* – + + +
Bahamas –* – + –** –
Bahrain + + + + +
Bangladesh + + + + +
Barbados – – + –** –
Belarus –* – + + +
Belgium + + + + +
Belize + + + –** –
Benin + + + + +
Bermuda – – + –** –
Bhutan –* – + + +
Bolivia + + + + –
Bosnia and Herzegovina –* – + + –
Botswana + + + + +
Brazil + + + + +
Brunei Darussalam + + + + –
Bulgaria + + + + +
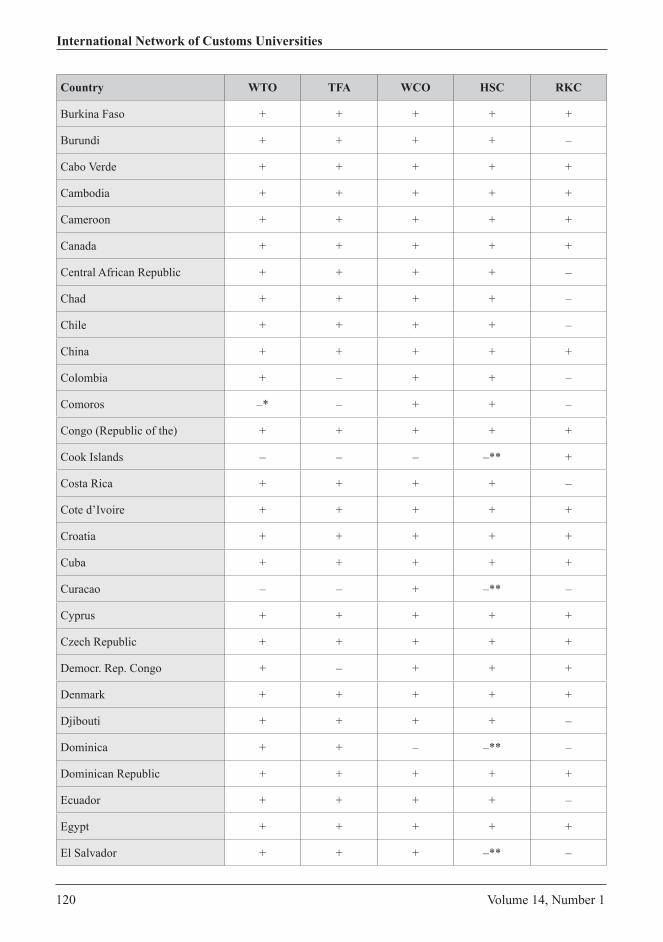
120 Volume 14, Number 1
International Network of Customs Universities
Country WTO TFA WCO HSC RKC
Burkina Faso + + + + +
Burundi + + + + –
Cabo Verde + + + + +
Cambodia + + + + +
Cameroon + + + + +
Canada + + + + +
Central African Republic + + + + –
Chad + + + + –
Chile + + + + –
China + + + + +
Colombia + – + + –
Comoros –* – + + –
Congo (Republic of the) + + + + +
Cook Islands – – – –** +
Costa Rica + + + + –
Cote d’Ivoire + + + + +
Croatia + + + + +
Cuba + + + + +
Curacao – – + –** –
Cyprus + + + + +
Czech Republic + + + + +
Democr. Rep. Congo + – + + +
Denmark + + + + +
Djibouti + + + + –
Dominica + + – –** –
Dominican Republic + + + + +
Ecuador + + + + –
Egypt + + + + +
El Salvador + + + –** –

Volume 14, Number 1 121
World Customs Journal
Country WTO TFA WCO HSC RKC
Estonia + + + + +
Eswatini (formerly Swaziland) + + + + +
Equatorial Guinea –* – – –** –
Ethiopia –* – + + –
European Union + + + + +
Fiji + + + + +
Finland + + + + +
France + + + + +
Gabon + + + + +
Gambia + + + + –
Georgia + + + + +
Germany + + + + +
Ghana + + + + +
Greece + + + + +
Grenada – – – –** –
Guatemala + + + + –
Guinea + + + + –
Guinea-Bissau + – + + –
Guyana + + + –** –
Haiti + – + + –
Honduras + + + –** –
Hong Kong, China + + + –** –
Hungary + + + + +
Iceland + + + + +
India + + + + +
Indonesia + + + + +
Iran –* – + + +
Iraq –* – + –** –
Ireland + + + + +
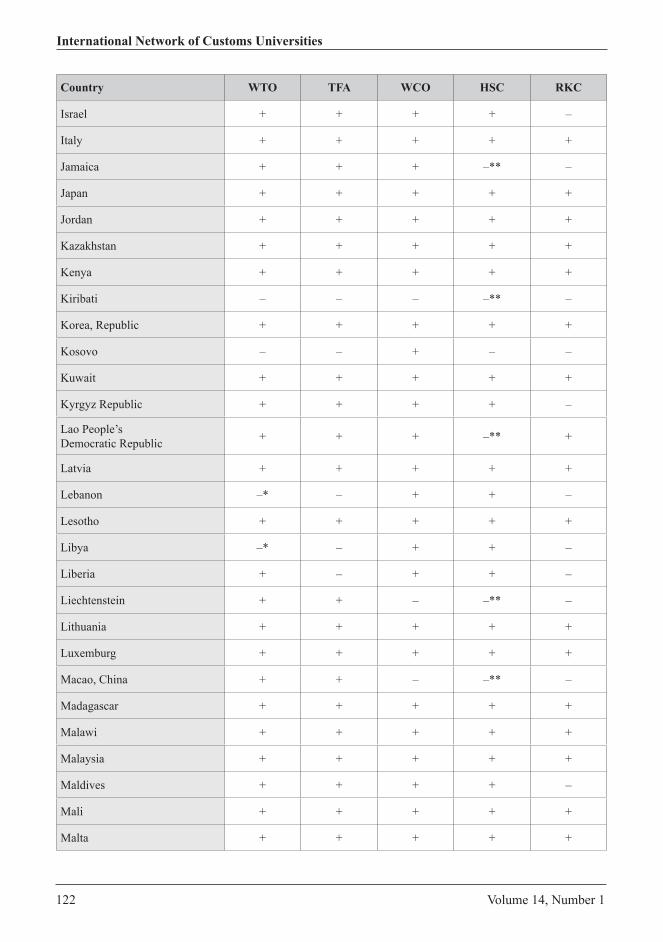
122 Volume 14, Number 1
International Network of Customs Universities
Country WTO TFA WCO HSC RKC
Israel + + + + –
Italy + + + + +
Jamaica + + + –** –
Japan + + + + +
Jordan + + + + +
Kazakhstan + + + + +
Kenya + + + + +
Kiribati – – – –** –
Korea, Republic + + + + +
Kosovo – – + – –
Kuwait + + + + +
Kyrgyz Republic + + + + –
Lao People’s Democratic Republic + + + –** +
Latvia + + + + +
Lebanon –* – + + –
Lesotho + + + + +
Libya –* – + + –
Liberia + – + + –
Liechtenstein + + – –** –
Lithuania + + + + +
Luxemburg + + + + +
Macao, China + + – –** –
Madagascar + + + + +
Malawi + + + + +
Malaysia + + + + +
Maldives + + + + –
Mali + + + + +
Malta + + + + +
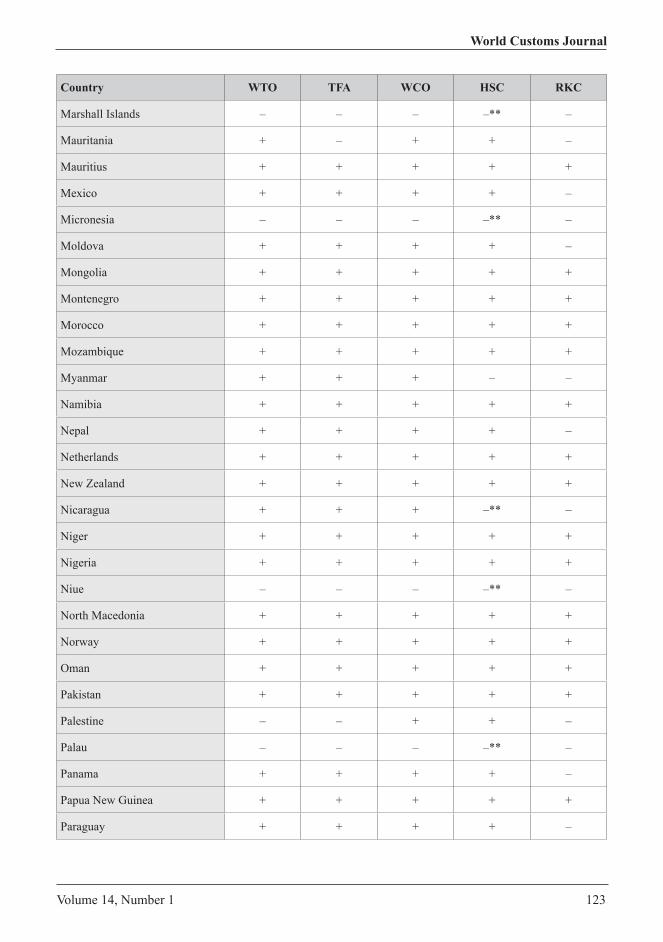
Volume 14, Number 1 123
World Customs Journal
Country WTO TFA WCO HSC RKC
Marshall Islands – – – –** –
Mauritania + – + + –
Mauritius + + + + +
Mexico + + + + –
Micronesia – – – –** –
Moldova + + + + –
Mongolia + + + + +
Montenegro + + + + +
Morocco + + + + +
Mozambique + + + + +
Myanmar + + + – –
Namibia + + + + +
Nepal + + + + –
Netherlands + + + + +
New Zealand + + + + +
Nicaragua + + + –** –
Niger + + + + +
Nigeria + + + + +
Niue – – – –** –
North Macedonia + + + + +
Norway + + + + +
Oman + + + + +
Pakistan + + + + +
Palestine – – + + –
Palau – – – –** –
Panama + + + + –
Papua New Guinea + + + + +
Paraguay + + + + –
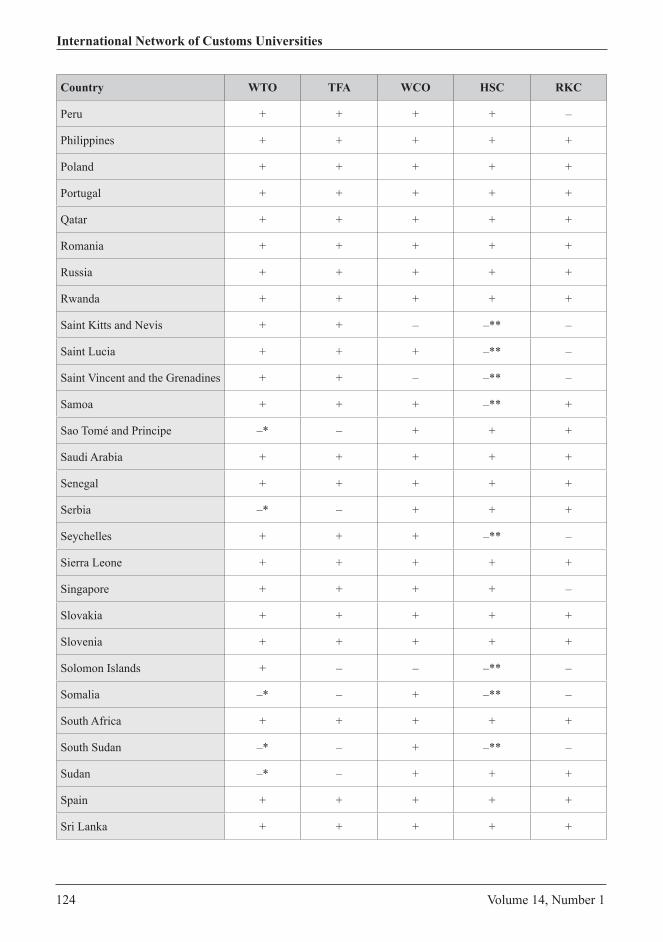
124 Volume 14, Number 1
International Network of Customs Universities
Country WTO TFA WCO HSC RKC
Peru + + + + –
Philippines + + + + +
Poland + + + + +
Portugal + + + + +
Qatar + + + + +
Romania + + + + +
Russia + + + + +
Rwanda + + + + +
Saint Kitts and Nevis + + – –** –
Saint Lucia + + + –** –
Saint Vincent and the Grenadines + + – –** –
Samoa + + + –** +
Sao Tomé and Principe –* – + + +
Saudi Arabia + + + + +
Senegal + + + + +
Serbia –* – + + +
Seychelles + + + –** –
Sierra Leone + + + + +
Singapore + + + + –
Slovakia + + + + +
Slovenia + + + + +
Solomon Islands + – – –** –
Somalia –* – + –** –
South Africa + + + + +
South Sudan –* – + –** –
Sudan –* – + + +
Spain + + + + +
Sri Lanka + + + + +
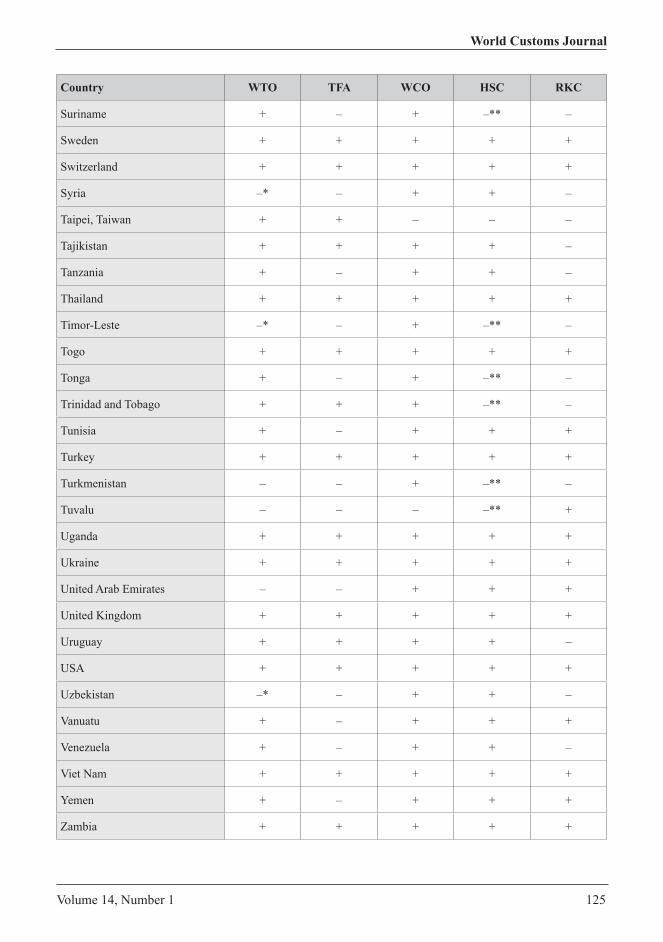
Volume 14, Number 1 125
World Customs Journal
Country WTO TFA WCO HSC RKC
Suriname + – + –** –
Sweden + + + + +
Switzerland + + + + +
Syria –* – + + –
Taipei, Taiwan + + – – –
Tajikistan + + + + –
Tanzania + – + + –
Thailand + + + + +
Timor-Leste –* – + –** –
Togo + + + + +
Tonga + – + –** –
Trinidad and Tobago + + + –** –
Tunisia + – + + +
Turkey + + + + +
Turkmenistan – – + –** –
Tuvalu – – – –** +
Uganda + + + + +
Ukraine + + + + +
United Arab Emirates – – + + +
United Kingdom + + + + +
Uruguay + + + + –
USA + + + + +
Uzbekistan –* – + + –
Vanuatu + – + + +
Venezuela + – + + –
Viet Nam + + + + +
Yemen + – + + +
Zambia + + + + +
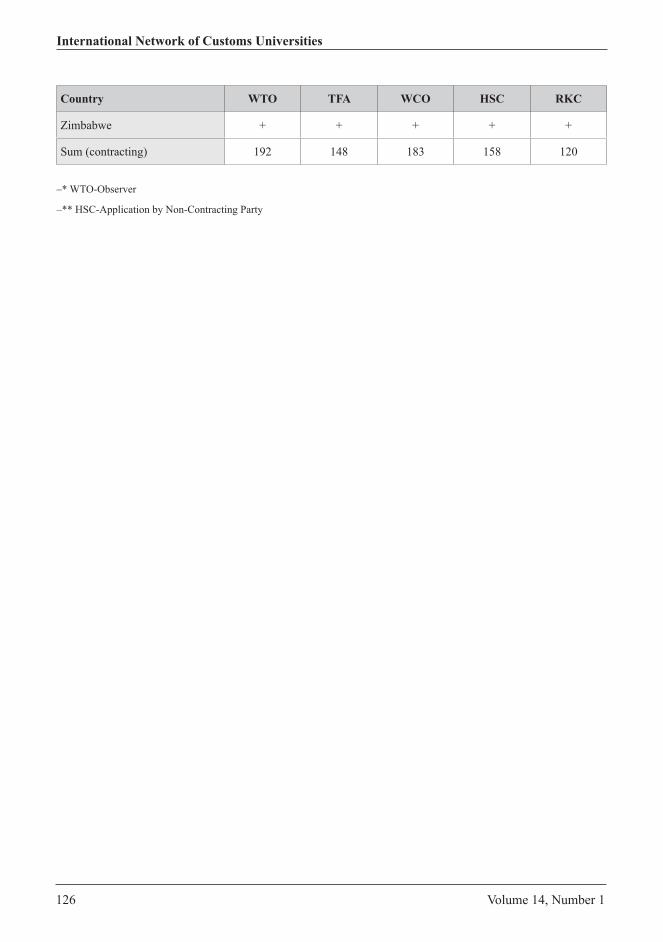
126 Volume 14, Number 1
International Network of Customs Universities
Country WTO TFA WCO HSC RKC
Zimbabwe + + + + +
Sum (contracting) 192 148 183 158 120
–* WTO-Observer
–** HSC-Application by Non-Contracting Party
Volume 14, Number 1 127
World Customs Journal
Implementing blockchain technology in the customs environment to support the SAFE
Framework of StandardsHuseyin Yaren
Abstract
This paper focuses on how blockchain technology’s features can revolutionise supply chain structures and the customs environment which is a vital part of today’s supply chains. In order to that, we firstly summarise blockchain technology and its features, then use the objectives and principles of the SAFE Framework of Standards as a basis to show this revolutionary effect.
1. IntroductionAs blockchain technology offers traceability, transparency and, as a result of these, trust among users, both governments and companies look for ways to cultivate the benefits of this technology. Successful implementation by both governments and companies encourages others to take advantage of this phenomenon. Supply chain management and customs transactions—which are vital parts of today’s supply chain structures—are two of the fields that blockchain technology has already started to revolutionise.
This paper aims to show how implementing blockchain technology in supply chain management and the customs environment can be beneficial for governments, Customs and the private sector by using the objectives and principles of the SAFE Framework of Standards as a basis.
2. Understanding blockchain technologyFor any paper written about blockchain, it is inevitable to cite its developer, Nakamoto (2008, p. 1) who started the blockchain discussion with these sentences:
In this paper, we propose a solution to the double-spending problem using a peer – to-peer distributed timestamp server to generate computational proof of the chronological order of transactions.
Following on from Nakamoto, blockchain began to be studied and applied in several fields, and many other explanations being proposed. Clark and Burstall (2018, p. 531) summarised blockchain in the following way:
Blockchain technology can be defined as an open ledger of information that is distributed and verified across a peer-to-peer network, rather than through one central server.
…As no single person, institution or company hosts or controls the information, the storing of the information on the blockchain is perceived as (nearly) unhackable.
In a note prepared by the WU Global Tax Policy Center at the Institute for Austrian and International Tax Law of the Vienna University of Business and Economics (WU GPTC, 2017, p. 2) it is stated that:
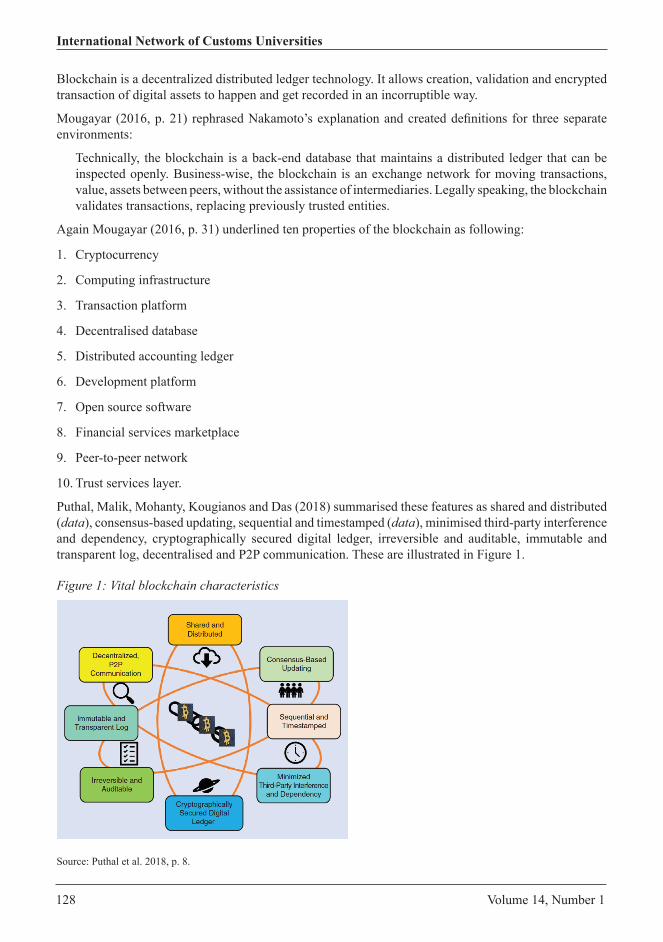
128 Volume 14, Number 1
International Network of Customs Universities
Blockchain is a decentralized distributed ledger technology. It allows creation, validation and encrypted transaction of digital assets to happen and get recorded in an incorruptible way.
Mougayar (2016, p. 21) rephrased Nakamoto’s explanation and created definitions for three separate environments:
Technically, the blockchain is a back-end database that maintains a distributed ledger that can be inspected openly. Business-wise, the blockchain is an exchange network for moving transactions, value, assets between peers, without the assistance of intermediaries. Legally speaking, the blockchain validates transactions, replacing previously trusted entities.
Again Mougayar (2016, p. 31) underlined ten properties of the blockchain as following:
1. Cryptocurrency
2. Computing infrastructure
3. Transaction platform
4. Decentralised database
5. Distributed accounting ledger
6. Development platform
7. Open source software
8. Financial services marketplace
9. Peer-to-peer network
10. Trust services layer.
Puthal, Malik, Mohanty, Kougianos and Das (2018) summarised these features as shared and distributed (data), consensus-based updating, sequential and timestamped (data), minimised third-party interference and dependency, cryptographically secured digital ledger, irreversible and auditable, immutable and transparent log, decentralised and P2P communication. These are illustrated in Figure 1.
Figure 1: Vital blockchain characteristics
Source: Puthal et al. 2018, p. 8.

Volume 14, Number 1 129
World Customs Journal
As understood from Nakamoto and other authors; we can summarise the blockchain as follows: Blockchain is a transaction platform, working in a peer-to-peer network—which eliminates the need for a trusted third party—that allows users to create and share data that has a timestamp and unique cryptographic signature. As a result of the creation and validation process, the data created in blockchain is nearly unhackable (Nakamoto, 2008; Clark and Burstall, 2018; WU GPTC, 2017; Mougayar, 2016; Puthal et al. 2018)
3. Benefits of applying blockchain technology to supply chain managementAs mentioned above, blockchain technology has several unique features that make it applicable to different types of industries, of which supply chain management is just one.
Rudenko and Borisov (2006, p. 123) defined supply chain as:
a network of suppliers, manufacturing plants, warehouses and distribution channels that perform the functions of raw material procurement, transformation of these materials into finished products and the distribution of these products to customers.
The authors added that supply chain management flows can be divided into three main flows: product, information and financial flows (p. 124).
When the features of blockchain and the characteristics of supply chains are considered together, it is easy to conclude that blockchain will support supply chains from several angles.
In supply chain management, it is vital to know exactly what is done when, and by whom. Blockchain’s timestamping feature perfectly fits that demand. Mougayar (2016, p. 45) explained that:
Timestamping is an irrefutable and immutable action once recorded on a blockchain, so it is useful when seeking the truth.
Bettín-Díaz, Rojas and Mejía-Moncayo (2018, p.22) underlined the importance of blockchain’s transparency, lack of need for an intermediary, decentralised network and traceability features, which can be directly beneficial to the supply chain environment.
Tse et al. (2018, p. 1359) summarised the suitability of blockchain technology in the food supply chain in the following way:
…Once unsafe operating incidents happen, the mistakes or errors coming from any part of the supply chain can be found easily…
According to The Organisation for Economic Co-operation and Development (OECD) (2018), blockchain technology can make supply chains more transparent, which will help both companies and consumers to identify risk and prevent them, and can provide opportunities to small – and medium-sized enterprises to have greater integration in supply chains.
Pugliatti and Gain (2018) mentioned that blockchain can establish data integrity from producers to the end point of the supply chain because the information is generated by its creator. Also, as the information will not have to be reproduced and submitted manually to agents in the supply chain, the whole process will be simplified. Accepting the blockchain records as the single source of truth will increase security. It is considered that, as time goes by, blockchain will accumulate data that will enable border authorities to increase their risk management capacity.
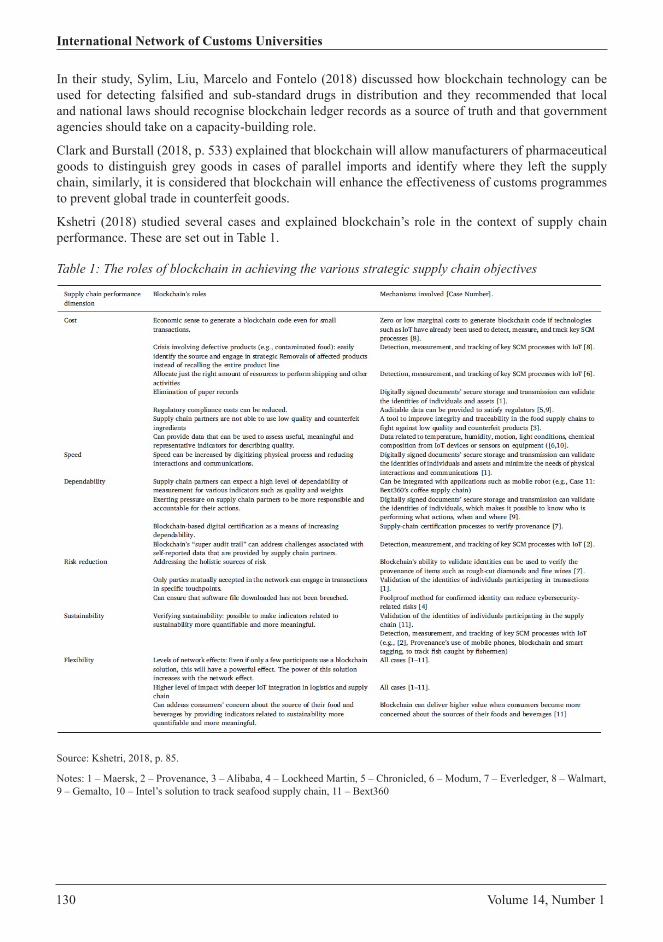
130 Volume 14, Number 1
International Network of Customs Universities
In their study, Sylim, Liu, Marcelo and Fontelo (2018) discussed how blockchain technology can be used for detecting falsified and sub-standard drugs in distribution and they recommended that local and national laws should recognise blockchain ledger records as a source of truth and that government agencies should take on a capacity-building role.
Clark and Burstall (2018, p. 533) explained that blockchain will allow manufacturers of pharmaceutical goods to distinguish grey goods in cases of parallel imports and identify where they left the supply chain, similarly, it is considered that blockchain will enhance the effectiveness of customs programmes to prevent global trade in counterfeit goods.
Kshetri (2018) studied several cases and explained blockchain’s role in the context of supply chain performance. These are set out in Table 1.
Table 1: The roles of blockchain in achieving the various strategic supply chain objectives
Source: Kshetri, 2018, p. 85.
Notes: 1 – Maersk, 2 – Provenance, 3 – Alibaba, 4 – Lockheed Martin, 5 – Chronicled, 6 – Modum, 7 – Everledger, 8 – Walmart, 9 – Gemalto, 10 – Intel’s solution to track seafood supply chain, 11 – Bext360

Volume 14, Number 1 131
World Customs Journal
To summarise: blockchain’s features make this technology very useful in supply chain management because it provides a transaction platform with shared, distributed, sequential and timestamped data that can be updated only by consensus between the nodes of the system. This reveals immutable, irreversible, unalterable data that provides higher transparency, traceability and, as a result of these, higher auditability. Also, it reduces costs and risks while increasing speed, dependability, sustainability and flexibility (Mougayar, 2016; Puthal et al., 2018; Bettín-Díaz, Rojas & Mejía-Moncayo, 2018; Kshetri, 2018).
4. Impact of blockchain technology on the customs environmentSeveral studies illustrate the current situation of basic export–import transactions and the possible new face of these transactions with the implementation of blockchain technology, including Godbole (n. d.) and White (2018).
White (2018) states that using an open platform will be beneficial in terms of creating a shipping information pipeline and paperless trade. He also notes that the current situation is complex, manual, time-consuming and paper-based, which results in ‘blind spots’ in the supply chain, and the clearance process becomes subject to fraud. By contrast, blockchain applied to the future customs environment depends on a single source of truth with verifiable and immutable digital documents, which leads to better risk assessment and lower administrative costs. In addition to that, White (2018) visualised the difference of current and blockchain implemented situations as illustrated in Figure 2.
Figure 2: The case for a better way
Source: White, 2018.
Godbole (n.d.) noted that just one avocado shipment from Mombasa to Rotterdam includes 30 actors, 100 people and 200 information changes (p. 9). As a solution to this complexity, Godbole referenced the IBM and Maersk Global Trade Digitization Platform, which enables the actors in international trade such as ports and terminals, shipping lines, customs authorities, freight forwarders/3PL and intermodal transport shippers to both contribute to and benefit from the platform. Godbole visualised how the entire supply chain ecosystem shares a single trusted view of shipping events and documentation filings with this platform, as set out in Figure 3.
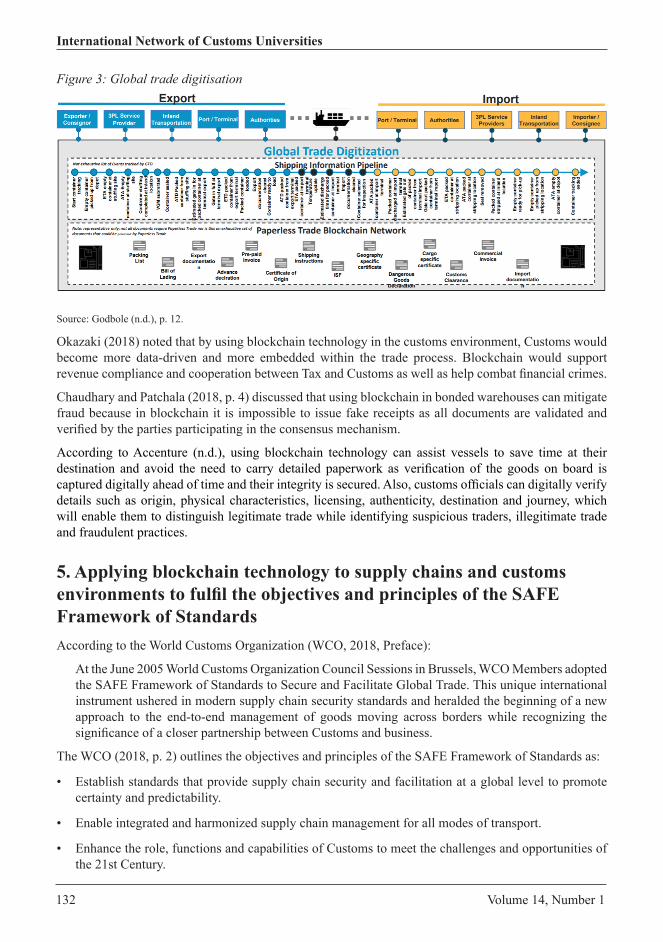
132 Volume 14, Number 1
International Network of Customs Universities
Figure 3: Global trade digitisation
Source: Godbole (n.d.), p. 12.
Okazaki (2018) noted that by using blockchain technology in the customs environment, Customs would become more data-driven and more embedded within the trade process. Blockchain would support revenue compliance and cooperation between Tax and Customs as well as help combat financial crimes.
Chaudhary and Patchala (2018, p. 4) discussed that using blockchain in bonded warehouses can mitigate fraud because in blockchain it is impossible to issue fake receipts as all documents are validated and verified by the parties participating in the consensus mechanism.
According to Accenture (n.d.), using blockchain technology can assist vessels to save time at their destination and avoid the need to carry detailed paperwork as verification of the goods on board is captured digitally ahead of time and their integrity is secured. Also, customs officials can digitally verify details such as origin, physical characteristics, licensing, authenticity, destination and journey, which will enable them to distinguish legitimate trade while identifying suspicious traders, illegitimate trade and fraudulent practices.
5. Applying blockchain technology to supply chains and customs environments to fulfil the objectives and principles of the SAFE Framework of StandardsAccording to the World Customs Organization (WCO, 2018, Preface):
At the June 2005 World Customs Organization Council Sessions in Brussels, WCO Members adopted the SAFE Framework of Standards to Secure and Facilitate Global Trade. This unique international instrument ushered in modern supply chain security standards and heralded the beginning of a new approach to the end-to-end management of goods moving across borders while recognizing the significance of a closer partnership between Customs and business.
The WCO (2018, p. 2) outlines the objectives and principles of the SAFE Framework of Standards as:
• Establish standards that provide supply chain security and facilitation at a global level to promote certainty and predictability.
• Enable integrated and harmonized supply chain management for all modes of transport.
• Enhance the role, functions and capabilities of Customs to meet the challenges and opportunities of the 21st Century.

Volume 14, Number 1 133
World Customs Journal
• Strengthen co-operation between Customs administrations to improve their capability to detect high-risk consignments.
• Strengthen co-operation between Customs administrations, for example through exchange of information, mutual recognition of controls, mutual recognition of Authorized Economic Operators (AEOs), and mutual administrative assistance.
• Strengthen co-operation between Customs administrations and other Government agencies involved in international trade and security such as through Single Window.
• Strengthen Customs/Business co-operation.
• Promote the seamless movement of goods through secure international trade supply chains.
The benefits of using blockchain technology in customs transactions can be summarised as follows: blockchain can be considered as an information pipeline with a single source of truth that is verifiable and immutable, and provides an opportunity for paperless trade, better risk assessment, lower administrative cost, real-time tracking and transparency for customs clearance. As a result of these attributes, blockchain can help mitigate fraud, improve compliance with regulations and documentation, and enable customs officials to distinguish legitimate and illegitimate trade and fraudulent practices (Godbole n.d., White, 2018, FICCI and Deloitte, 2018, Okazaki, 2018, Chaudhary & Patchala, 2018, Accenture, n.d.).
In the following section the features and benefits of blockchain and corresponding objectives and principles of the SAFE Framework of Standards will be discussed.
Establish standards that provide supply chain security and facilitation at a global level to promote certainty and predictability
Rudenko and Borisov (2006, p. 124) stated that supply chains consist of three flows: the product, information and finance flows. With regard to this, supply chain security can also be considered as security of the product flow, security of information flow and security of finances flow.
In terms of product flow security, Loop (2016) emphasised stolen merchandise recovery and theft protection:
Stolen merchandise recovery: When a consumer completes a transaction, the authenticity of the product purchased can be automatically verified and activated in the system. So if an item were to be stolen, it can be traced via any subsequent transaction, which is automatically recorded in the blockchain.
…
Theft protection: Blockchain-based platforms can solve the counterfeiting issue around goods that are notoriously difficult to trace, such as pharmaceuticals, luxury goods, electronics and diamonds.
In terms of information flow security, Clark and Burstall (2018, p. 531) noted that
Distributed ledgers are inherently harder to attack because, instead of a single database, there are multiple shared copies of the same database. As no single person, institution or company hosts or controls the information, the storing of the information on the blockchain is perceived as (nearly) unhackable.
Finally, in terms of finances flow security, FICCI and Deloitte (2018, p. 17) stated:
134 Volume 14, Number 1
International Network of Customs Universities
A Blockchain based Customs Duty payment processing will enable real-time tracking and transparency of the processing of customs clearance to all the relevant stakeholders viz. Customs department, importer, clearing house agent and bank. The solution will help the Customs department better manage space and cash cycle.
Also, in the long run, cryptocurrency can be an aid to the deficiencies of the current system.
As the security in product, information and finances flows are improved, that will boost the certainty and predictability for customs and other stakeholders in the supply chain.
Enable integrated and harmonised supply chain management for all modes of transport
Weernink, Engh, Francisconi and Thorborg (2017) stated that blockchain can add value to the port by trust, security, visibility, network expansion and integration of supply chain flows.
Enhance the role, functions and capabilities of Customs to meet the challenges and opportunities of the 21 century
When it was first developed, the internet phenomenon passed through the same steps as blockchain: at first, only a small group of people was able to use it, then its use was expanded until now a life without the internet is hard to imagine. This will be the same for blockchain technology too. As it is implemented by governments and the private sector, the acceptance of this technology will revolutionise many aspects of life. In terms of challenges and opportunities of the 21st century, Okazaki (2018) noted that with using blockchain technology in the customs environment, Customs would become more data-driven and would be more embedded within the trade process.
Strengthen co-operation between customs administrations to improve their capability to detect high-risk consignments
Implementing blockchain technology in the customs environment will help governments and Customs to cope with risk in a better way. According to Pugliatti and Gain (2018), ‘Accepting the blockchain records as the single source of truth will increase security. As time goes by, blockchain will accumulate data which will enable border authorities to increase their risk management capacity.’
Also, White (2018) noted that blockchain being applied to future customs environments depends on the single source of truth with verifiable and immutable digital documents, which leads to better risk assessment and lower administrative costs.
Strengthen co-operation between Customs administrations, for example through exchange of information, mutual recognition of controls, mutual recognition of Authorized Economic Operators (AEOs), and mutual administrative assistance
There are two things to consider in relation to the benefits of blockchain to AEOs: those AEOs who use blockchain will be better placed to present their record of compliance with Customs requirements, as Customs use the same technology, and it will be easier for customs administrations to evaluate mutual recognition of AEO status.
Strengthen co-operation between Customs administrations and other government agencies involved in international trade and security such as through single window
There are different terms and definitions for the single window environment, with the United Nations Economic Commission for Europe (UNECE) (2003) defining the concept as follows:
The single window environment aims to expedite and simplify information flows between trade and government and bring meaningful gains to all parties involved in cross border trade. In a theoretical sense, a Single Window can be described as ‘a system that allows traders to lodge information with a single body to fulfill all import – or export – related regulatory requirements.
Volume 14, Number 1 135
World Customs Journal
When the definition of a single window environment and the features of blockchain are considered together, it can be seen that there are several overlaps. It is evident that as a transaction platform with shared, distributed, sequential and timestamped data (Mougayar, 2016; Puthal et al., 2018), blockchain technology fits like a glove in the single window environment.
Furthermore, Canham and Kerstens (2018, p. 7) indicated that:
…take agricultural licenses. These are usually granted by the Ministry of Agriculture and controlled by health authorities or veterinarians at points of entry. The corresponding import declaration is supervised by customs, and its approval might require write-off of the permitted quantity specified by the certificate. When stored on a blockchain, this provides an integral view of usage and allows for accurate write-off and avoids double usage.
Also, Okazaki (2018, p. 17) noted that:
… By using a common distributed technical platform, they (Customs and other border agencies) could leverage the power of blockchain technology to open up new possibilities to share information and resources, particularly in a Single Window environment and for cross-border data exchange purposes.
Strengthen Customs/business co-operation
It will be easier for AEOs to share required information with customs and again it will be easier for governments to mutually recognise each other’s companies’ AEO status.
There have been several successful implementations of blockchain technology in the customs environment, with the co-operation of both government and business. Korea is one of the success stories. According to Samsung (2018), on 14 September 2018, Samsung SDS signed an agreement with the Korea Customs Service and 48 relevant government offices and companies to establish the blockchain-based export customs logistics service business. According to the agreement, this service will allow export-related organisations and companies to share documents from customs declaration of exported goods to the final delivery process.
Promote the seamless movement of goods through secure international trade supply chains
Implementing blockchain technology will revolutionise supply chains and the customs environment, which is a vital part of today’s supply chain.
As another success story, Singapore eliminated almost 80 per cent of the data entrance requirement in transport documents, which will lead to the seamless movement of goods. Munakata (2018) noted that the consortium, including global management consultancy Accenture, Singaporean ocean carrier APL and a European customs organisation, tested a blockchain solution to digitise transport documents. The system slashed data entry requirements when issuing documents such as bills of lading, which include information such as vessel names and cargo amounts, by up to 80 per cent.
6. ConclusionBlockchain technology has several unique features, including being timestamped, being nearly unhackable, and its traceability, transparency and auditability. These features have already started revolutionising both governmental and private sector transactions; being stakeholders of today’s supply chains, governments, Customs and business have already started cultivating the benefits of this technology.

136 Volume 14, Number 1
International Network of Customs Universities
Some examples include US Customs and Border Protection’s intention to apply blockchain technology to NAFTA and CAFTA certificates of origin (KPMG, 2018), Korea’s initiatives (Samsung, 2018), Netherlands’ Dutch Blockchain Coalition (DBC, 2018) and the Networked Trade Platform of Singapore (Singapore Customs, 2018).
With the aid of the features of blockchain, it will be easier for governments, Customs and business to boost certainty and predictability in global supply chains, strengthen Customs/business co-operation, meet the challenges and opportunities of the 21st century and strengthen co-operation between customs administrations. It will also strengthen co-operation between customs administrations and other government agencies involved in international trade and security, such as through single window. Finally, it will be easier for all stakeholders of international trade to promote the seamless movement of goods through secure international trade supply chains.
References
Accenture. (n.d.). Bridging borders with blockchain transforming global trade and travel. Retrieved from https://www.accenture.com/gb-en/insight-blockchain-at-the-borders
Bettín-Díaz R., Rojas A.E., & Mejía-Moncayo C. (2018). Methodological approach to the definition of a blockchain system for the food industry supply chain traceability. In: O. Gervasi, B. Murgante, S. Misra, E. Stankova, C. M. Torre, A Rocha, D. Taniar, B. O. Apduhan, E. Tarantino & Y. Ryu. (eds). Computational Science and Its Applications – ICCSA 2018. Part 2. 18th International Conference, Melbourne, Australia, 2–5 July 2018. Retrieved from https://link.springer.com/chapter/10.1007/978-3-319-95165-2_2
Canham, J., & Kerstens, J. (2018). Blockchain: mapping new trade routes to trust. Accenture Consulting. Retrieved from https://www.accenture.com/t00010101T000000Z__w__/gb-en/_acnmedia/PDF-79/accenture-blockchain-mapping-trade-routes-to-trust.pdf
Chaudhary, P., & Patchala, S. (2018). Simplifying and securing cross border eCommerce: the case for blockchain in bonded warehouses. TATA Consultancy Services (White Paper) Retrieved from https://www.tcs.com/content/dam/tcs/pdf/Industries/travel-and-hospitality/insights/Blockchain-in-Bonded-Warehouses.pdf
Clark, B., & Burstall, R. (2018). Blockchain, IP and the pharma industry—how distributed ledger technologies can help secure the pharma supply chain. Journal of Intellectual Property Law & Practice, 13(7), 531–533. doi:10.1093/jiplp/jpy069
Dutch Blockchain Coalition. (2018). Dutch Blockchain Coalition. Retrieved from https://dutchblockchaincoalition.org
Federation of Indian Chambers of Commerce & Industry; Deloitte. (2018). Blockchain in public sector, transforming government services through exponential technologies. Retrieved From https://www2.deloitte.com/content/dam/Deloitte/in/Documents/public-sector/in-ps-blockchain-noexp.pdf
Godbole, S. (n.d.). How blockchain can transform global trade supply chains. IBM Academy of Technology. Retrieved from https://www.unescap.org/sites/default/files/3_IBM%20Blockchain.pdf
KPMG. (2018). United States: CBP blockchain testing for ‘certificate of origin’ verification (20 August). Retrieved from https://home.kpmg.com/xx/en/home/insights/2018/08/tnf-united-states-cbp-blockchain-testing-for-certificate-of-origin-verification.html
Kshetri, N. (2018). 1 blockchain’s roles in meeting key supply chain management objectives. International Journal of Information Management, 39, 80–89. doi:10.1016/j.ijinfomgt.2017.12.005
Loop, P. (2016, January 13). Blockchain: the next evolution of supply chains. Industry Week. Retrieved from https://www.industryweek.com/supply-chain/blockchain-next-evolution-supply-chains
https://www2.deloitte.com/content/dam/Deloitte/in/Documents/public-sector/in-ps-blockchain-noexp.pdf
Volume 14, Number 1 137
World Customs Journal
Mougayar, W. (2016). Foreword: Buterin, V. The business blockchain: promise, practice, and application of the next internet technology. Hoboken, New Jersey: John Wiley & Sons. Retrieved from http://ebookcentral.proquest.com/lib/
Munakata, A. (2018). Global trade taps blockchain to unclog bottlenecks. Nikkei Asian Review. Retrieved from https://asia.nikkei.com/Spotlight/Bitcoin-evolution/Global-trade-taps-blockchain-to-unclog-bottlenecks
Nakamoto, S. (2008). Bitcoin: A peer-to-peer electronic cash system. Retrieved from https://bitcoin.org/bitcoin.pdf
Okazaki, Y. (2018). Unveiling the potential of blockchain for Customs. WCO Research Paper No. 45 Retrieved from http://www.wcoomd.org/-/media/wco/public/global/pdf/topics/research/research-paper-series/45_yotaro_okazaki_unveiling_the_potential_of_blockchain_for_customs.pdf?la=fi
Pugliatti, L., & Gain, B. (2018). Can blockchain revolutionize trade? World Bank Blogs. Retrieved from http://blogs.worldbank.org/trade/can-blockchain-revolutionize-trade
Puthal, D., Malik, N., Mohanty, S., Kougianos, E., & Das, G. (2018). Everything you wanted to know about the blockchain: its promise, components, processes, and problems. Ieee Consumer Electronics Magazine, 7(4), 6–14. doi:10.1109/MCE.2018.281.6299
Rudenko, D., & Borisovs, A. (2006). Agents in supply chain management: an overview. IT and Management Science, 28, 123–133. ISSN 1407-7493
Samsung. (2018). Samsung SDS to be world’s first to apply blockchain tech to export customs logistics service. Samsungsds.com. Retrieved from https://www.samsungsds.com/global/en/about/news/blockchain-tech-for-customs-logistics-service.html
Singapore Customs. (2018). Singapore launches the Networked Trade Platform to digitalise and streamline end-to-end trade processes. Media Release. Retrieved from https://www.customs.gov.sg/-/media/cus/files/media-releases/2018/for-website-media-release-_-networked-trade-platform.pdf
Sylim, P., Liu, F., Marcelo, A., & Fontelo, P. (2018). Blockchain technology for detecting falsified and substandard drugs in distribution: pharmaceutical supply chain intervention. JMIR Research Protocols, 7(9), e10163. doi:10.2196/10163
The Organisation for Economic Co-operation and Development (OECD). (2018). OECD blockchain primer. Retrieved from https://www.oecd.org/finance/OECD-Blockchain-Primer.pdf
Tse, D., Zhang, B., Yang, Y., Cheng, C., & Mu, H. (2017). Blockchain application in food supply information security. 2017 IEEE International Conference on Industrial Engineering and Engineering Management IEEM 2017, pp. 1357–1361. doi:10.1109/IEEM.2017.829.0114
United Nations Economic Commission for Europe (UNECE). (2003). The single window concept. United Nations. Retrieved from http://unpan1.un.org/intradoc/groups/public/documents/UNECE/UNPAN019892.pdf
Weernink, M. O., Engh, W. V. D., Francisconi, M., & Thorborg F. (2017). The blockchain potential for port logistics. Retrieved from http://smart-port.nl/wp-content/uploads/2017/06/Bijlage-6_White-Paper-Blockchain.pdf
White, M. (2018). Digitizing the global trade with Maersk and IBM. IBM. Retrieved from https://www.ibm.com/blogs/blockchain/2018/01/digitizing-global-trade-maersk-ibm/
World Customs Organization (WCO). (2018). WCO SAFE Framework of standards to secure and facilitate global trade (the SAFE Framework). WCO, Brussels. Retrieved from http://www.wcoomd.org/-/media/wco/public/global/pdf/topics/facilitation/instruments-and-tools/tools/safe-package/safe-framework-of-standards.pdf?la=en
138 Volume 14, Number 1
International Network of Customs Universities
WU GTPC (2017). Blockchain 101 for governments. A note prepared for the Committee of Experts on International Cooperation in Tax Matters Fifteenth session 17–20 October 2017, Geneva. Prepared by the WU Global Tax Policy Center (WU GTPC) at the Institute for Austrian and International Tax Law of Vienna University of Business and Economics. Retrieved From http://www.un.org/esa/ffd/wp-content/uploads/2017/10/15STM_Blockchain-101.pdf
Huseyin YarenHuseyin is a Trade Investigator at Turkish Republic Ministry of Trade. He graduated from the Ankara University Faculty of Political Science Public Finance in 2007 and completed an MBA with Supply Chain Concentration at the Claremont Graduate University, The Peter F. Drucker and Masatoshi Ito Graduate School of Management in 2018.
Volume 14, Number 1 139
World Customs Journal
Advertising, marketing and promotional (AMP) expenses in customs valuation
Mrudula Dixit
Abstract
Customs duties are an important aspect of international trade and compliance is mandatory for all companies and organisations engaged in overseas business. These customs duties generate revenue to the importing state and no link is needed between the two parties of different countries for the importing state to levy duty. Primarily, General Agreement on Tariffs and Trade (GATT) Article VII and Customs Valuation Rules, 2007, govern customs valuation in India and lay down the standards regarding transaction value, related party transactions and ‘price paid or actually payable’. Each of these authorities will be explained in this paper, along with recent rulings of Customs Excise and Service Tax Appellate Tribunal (CESTAT) and a comparative analysis of India with customs valuation in other jurisdictions, such as USA, Canada and the European Union. The objective of this paper is to establish whether advertising, marketing and promotional expenses should be included in the ‘price actually paid of payable’ of the goods or services imported. The considerations affecting this analysis are twofold: the extent of the term, ‘post-importation expenses’ and the nature of ‘buyer’s own account’. Further, the researcher will study the observations of the Technical Committee on Customs Valuation. Even though various technical terminologies are involved in the study of this issue, the finer nuances will be delineated carefully throughout the paper.
1. IntroductionSince the advent of international trade, customs valuation has been a pivotal subject matter for both developed and developing countries and has been used to calculate import duties on an ad valorem basis. An ad valorem duty rate is expressed as a percentage of the value of imported goods (Rosenow & Shea, 2010). Additionally, authorities use the Custom Valuation Rules (CVR) to calculate taxes such as value added tax (VAT), excise and sales tax on the imported goods (Rosenow & Shea, 2010, p. 3). It may also be used to determine rules of origin1 and trade statistics.
Customs valuation underwent a transformation after the 1979 GATT Valuation Code, which was further substantiated in the 1994 Agreement on Article VII. Hence, before 1979, there was much uncertainty about the calculation of duty on imported products worldwide. Primarily, two main concepts were followed: the notional concept and the positive concept. The notional concept was based on the Brussels Definition of Value (BDV). Here, the ‘normal price’ was:
the price which [the imported goods] would fetch at the time when the duty becomes payable on a sale in the open market between buyer and seller independent of each other. (World Trade Organization, 2019).
140 Volume 14, Number 1
International Network of Customs Universities
The positive concept focused more on the ‘actual value’—the actual price paid for the goods during the transaction and disregarded the ‘notional’ price, which may be paid under ideal competitive conditions
(WTO, 2019). To understand the cases explained in the latter half of the paper, the following Agreement, Rules and terms need to be understood.
2. Agreement on Implementation of Article VII of the General Agreement on Tariffs and Trade, 1994The general introductory Commentary to Article VII of GATT, which forms a part of the Agreement on Implementation of GATT (WTO, 1994, p. 1) (the ‘Agreement’) states that:
The primary basis for customs value under this Agreement is ‘transaction value’ as defined in Article 1. Article 1 is to be read together with Article 8 which provides, inter alia, for adjustments to the price actually paid or payable in cases where certain specific elements which are considered to form a part of the value for customs purposes are incurred by the buyer but are not included in the price actually paid or payable for the imported goods.
This above statement is further substantiated by the preamble, which recognises that the basis for valuation of goods for customs should, to the greatest extent possible, be the transaction value of the goods being valued. Article 1(1) of the Agreement equates ‘transaction value’ with the ‘price actually paid or payable’ when the goods are sold by the exporting country to the country of importation. It lists four conditions that, if not satisfied, will lead to the rejection of the transaction value and can invite further loading onto the original transaction value. The Notes to Articles defines ‘price actually paid or payable’ as the total price to be paid by the buyer to the seller, either directly or indirectly.
Note to Article 1(1) of the Agreement states that indirect payment, such as the settlement of the seller’s debt by the buyer, will also be considered in the transaction value. Further, the Note to Article 1 clarifies that activities undertaken by the buyer on their own account, even though it may benefit the seller, will not be considered an indirect payment and will not be added to the transaction value. Moreover, conditions in the agreement between the parties relating to marketing of the imported goods will not result in the rejection of the transaction value. It has been made clear, by virtue of Note to Article 1(1)(b), that if the buyer undertakes marketing expenses on their own account, even though pursuant to an agreement with the seller, it will not be included in the customs value.
Another pivotal aspect of Article 1 is its interpretation of ‘related parties’ and their impact on the transaction value. One of the provisos mentioned in Article 1(1) states that the buyer and seller must not be ‘related parties’ and if they are, as per Article 1(1)(d), the transaction value will be acceptable under the provisions of Article 1(2). Article 1(2)(a) makes it clear that, even though the parties (buyer and seller) are related, this fact in itself would not be the grounds for rejecting the transaction value. In such a situation, the sale shall be examined, and the transaction value will be accepted if the relationship did not influence the price. In other words, the transaction was carried out at an ‘arm’s length’. This Article makes a reference to Article 15(4) of the Agreement, which defines related parties. For the purposes of this paper, related parties will be interpreted in the light of Article 15(4)(e) as ‘one of them directly or indirectly controls the other’.
Volume 14, Number 1 141
World Customs Journal
3. Customs Valuation Rules, 2007 (India)To say that the Indian Customs Valuation (Determination of Value of Imported Goods) Rules (CVR) draws considerably from the GATT Agreement would be an understatement. CVR, 2007 is almost verbatim of the Agreement with only a few variations, one of which is crucial to our analysis and will be discussed later. Rule 2(1)(g) of CVR redirects the definition of transaction value to Section 14(1) of the Customs Act, 1962 (India) which defines it as ‘the value at which like or identical goods are sold in the course of international trade through a transaction between unrelated buyer and seller’. This is subject to Rule 3 of CVR, which deals with determination of methods of valuation. This paper is concerned with the following provisions:
1. Rule 10(1)(e): Rule 10 lays down the adjustments by virtue of any direct/indirect payments made by the buyer to the seller but those not included in the ‘price actually paid or payable’. 10(1)(e) provides:
All other payments actually made or to be made as a condition of sale of the imported goods, by the buyer to the seller, or by the buyer to a third party to satisfy an obligation of the seller to the extent that such payments are included in the price actually paid or payable.
Rule 10 is based on Article 8 of the GATT Valuation Code. However, the text of Rule 10(1)(e) of CVR, 2007 is conspicuously absent from the GATT Code. It is only mentioned in Annex III of the Agreement to further clarify the meaning of ‘price actually paid or payable’, but this general statement is subject to the particular rules. The concept of ‘condition of sale’ in this context (i.e. expressly for determination of value) does not form a part of the international agreement but is rather a product of national policy.
2. Rule 3(2)(b): This rule corresponds to Article 1.1(b) of the GATT Valuation Code. These provisions are similar and state that in absence of any condition of sale, the transaction value will be accepted. Further, the interpretative note to Rule 3(2)(b) makes it clear that if the buyer takes up on their own account activities relating to marketing of goods, those activities will not be a part of the value of the imported goods. This Note, as explained above, is the same as the interpretative note to Article 1(1)(b) of the Agreement.
Apart from this, similar to the GATT Agreement, Rule 2(2)(v) defines ‘related parties’. The Customs Valuation Rules are used extensively for international trade and they monitor transactions so as to avoid misuse and arrive at the right transaction value.
4. Advertising, marketing and promotional expensesAdvertising, marketing and promotional (AMP) expenses are a novel phenomenon in this era of international trade between multinational companies. As a trend, related enterprises, such as the national subsidiary of a global brand and the global brand itself, have a distribution agreement that lays down the terms of marketing deliverables and promotional costs that obligate the buyer (subsidiary) to comply with the same. The common example for this will be: Company A is a worldwide manufacturer and seller of high-end clothes and suits. Company ‘A India Ltd’ is a subsidiary of Company A, which sells A’s product in India. Company A and Company ‘A India Ltd’ may often enter into a distribution agreement by which the Indian subsidiary imports goods of the worldwide brand into the country. They are related parties and the agreement between them may also specify a sum that ought to be incurred by the subsidiary for the marketing of the product in India. Marketing expenses thus can be of two broad types:

142 Volume 14, Number 1
International Network of Customs Universities
1. The global parent company obligates the national subsidiary, through an agreement to spend a particular percentage of the total import value on AMP.
2. The global parent company requires the national subsidiary to contribute to a certain amount of the worldwide promotional expenses undertaken by the parent. This kind of agreement between the two parties is not related to importation of goods and is independent of importation and trade between the parties.
Moreover, the buyer may decide to spend on advertising on its own accord or, as seen above, be prompted by the seller. The buyer may pay the seller or a third party provider for those expenses (Neville Jr., 2016). As this paper centres around the ambit of this particular term, it will be explained in detail through various case laws.
5. Analysis of authoritiesThe introduction summarises the researcher’s attempt to consolidate the various rules and regulations affecting customs valuation and linking the same to advertising expenses. The law regarding the current position is vague and often misrepresented. The main issue is:
Whether marketing and advertising expenses can be included in the ‘transaction value’ for the purposes of customs valuation.
This is sought to be studied through the following legislative pronouncements:
5.1 India
The controversy regarding the above issue centred around the decision of the Delhi Bench of Customs, Excise and Service Tax Appellate Tribunal in the case of Reebok India Ltd. v CC, Patparganj (2018 VIL 49 CESTAT DEL CU), which was delivered on 12 January 2018 by Dr Satish Chandra and V Padmanabhan. The tribunal was tasked with interpreting a distribution agreement between Reebok International Limited (RIL, England) and Reebok India Limited (subsidiary of RIL, England). The facts of the case are set out below.
The appellant in the case was Reebok India Ltd., a subsidiary of RIL, England. Both parties had entered into a distribution agreement in 1995. As the parties were ‘related’ within the meaning of Rule 2(2)(v) of CVR, 2007, they made an application to the Special Valuation Branch to accept the ‘transaction value’ of their imports. On basis of this application, the Directorate of Revenue Intelligence (DRI) investigated the allegation that the transaction value did not include certain costs pertaining to advertising, marketing and promotion of the goods (para 2). The terms of the distribution agreement between the parties, brought into question by DRI were:
Distributor agrees to spend on advertising and promotions, a sum not less than six percent (6%) of its total net invoiced sales of products. As a guideline, at least half of the expenditure shall be in the form of media (print, radio and/or television) advertising. Details of such expenditure shall be reported quarterly to Reebok and are subject to annual verification by independent audit. (para 7)
It was argued by the DRI that this clause of the distribution agreement was a condition of sale for imports by the appellant. The appellant thus had an obligation to spend the requisite amount on AMP (para 5). Hence, the DRI invoked Rule 10(1)(e) of CVR, 2007. It stated that the 6 per cent was a condition of sale and it conferred an obligation on the buyer, hence making it a part of the ‘price actually paid or payable’. On the other hand, the appellant relied on the Interpretative Note to Rule 3(2)(b), which explained that activities undertaken on the buyers own account will not be included in the price paid or
Volume 14, Number 1 143
World Customs Journal
payable. The Note had also made an explicit reference to how marketing costs should not be included in the transaction value (para 4.ii). The appellant also claimed that AMP expenses are, by their very nature, post-importation expenses and so should not be loaded onto the import amount (para 4.v). The tribunal concluded that RIL, England is the owner of the brand name Reebok and was controlling every aspect of the advertising to be undertaken by its subsidiary (appellant). The tribunal stated:
Therefore, from these agreements it is evident that such appellant is carrying on such brand promotion on behalf of RIL, England and such expenses were made on their behalf. Hence, we conclude that advertising and promotional expenses have been incurred as a condition of sale and on behalf of the seller and may be considered as satisfying the obligation of the seller. (para 8)
It is interesting to note that the same judges of the Delhi Bench of CESTAT delivered a contradictory judgment on 2 April 2018 in the case of Giorgio Armani India Pvt. Ltd. v. New Delhi 2018 VIL 248 CESTAT DEL CU. As in the previous case, the appellant is an Indian subsidiary of a global parent brand engaged in high-end fashion retail. Hence, they too are ‘related parties’ and, because of this, the appellant made an application to the Special Valuation Branch for appraisal and acceptance of the transaction value of imports. The original authority decided, vide his order to load additional amounts onto the transaction value, including an annual franchise fee of five per cent of value of net purchases, two per cent for institutional advertising and promotional campaign and three per cent on account of advertising expenses required to be undertaken by the appellant as per the terms if the distribution agreement (para 1). For the purposes of analysing the AMP, the last two additions will be considered:
First, the appellant had submitted in the tribunal that the two per cent required to be undertaken was merely a part of worldwide advertising and not related to the actual importation of goods (para 3.b). It is a common presumption that there must be some nexus between the import of goods and the amount spent on advertising. If there is no connection between the two, it cannot be said that the transaction value should be loaded with an unrelated amount. Ironically, the earlier Reebok India Ltd. decision made a reference to such kind of agreements where the appellant (subsidiary of parent) is required to contribute a certain amount to worldwide advertising. It referred to the judgment of Samsonite South Asia Pvt. Ltd. v. Commr. Of Customs 2015 (327) ELT- 528 Tribunal-Mumbai and agreed that, when the expenses charged to the account of the subsidiary (in this case, the appellant) are merely a share of the global expenditure, it will cease to have a connection with the import and thus will not be loaded onto the transaction value (Reebok India Ltd., para 10). The judgment of the Samsonite case reads:
There is no nexus between the imports made by the appellants and the expenditure shared by the appellants for the global advertising campaign. We also find that the sharing of cost towards advertising expenses is not a condition of sale for the import of goods. (para 6.1)
The facts of this case were similar to Reebok India Ltd. and Giorgio Armani India Pvt. Ltd. The appellant (Samsonite India) was a subsidiary of the global parent company and, through an agreement, was engaged in contributing to a global advertising campaign for 2008 (para 2). Hence, the tribunal was quick to separate the actual importation from an unrelated amount.
Second, the tribunal in Giorgio Armani India went against its judgment delivered in Reebok India with regards to the three per cent AMP expenses of the total import cost to be undertaken by the buyer in pursuance of an agreement. In this case, the tribunal held that the stipulated three per cent amount for advertising was not a condition of sale. It was of the view that the appellant is not fulfilling any obligation by the seller by incurring three per cent of the import value on AMP expenses (para 10). This judgment delivered by the same technical member of the Delhi Bench of CESTAT, Mr V Padmanabhan is in stark contrast to his decision in the Reebok India case.
144 Volume 14, Number 1
International Network of Customs Universities
It is helpful to look at a complementary case that helps provide a comprehensive view on the matter. The appellant subsidiary, Richemont India Pvt Ltd (Customs – Case No. 50868/2015) had imported watches from Richemont Dubai (the parent company) through a distribution agreement between the two related parties. The commissioner, however, stated that the goods were priced at a lesser amount than other identical goods exported by Richemont Dubai to unrelated buyers. Therefore, the Commissioner only relied on Rule 4 of CVR, 20072 and made no reference to Rule 10. But, during the hearing of the appeal, DRI relied on Rule 10 to bring in the costs of AMP expenses and royalty payments onto the transaction value. The appellant contended that AMP expenses were post-importation expenses and hence cannot be added to the price actually paid or payable. In its decision, the tribunal held that there was no need to go into the question of whether AMP expenses should be included in the assessable value of the goods imported. Hence, the question of law remained unanswered.
5.2 United States of America
The question being investigated has baffled numerous other jurisdictions, including the Customs Authority of the United States of America. US Customs and Border Protection is the ruling authority on matters relating to transaction value of imports (US Customs and Border Protection, 2016). A few of the relevant cases are described below.
CROSS Ruling HQ 544638 (Seagrams Case, 1991): In this case, a seller was a manufacturer of Polish vodka who had entered into an agreement with Seagrams (the importer) in 1988. The agreement, in paragraph 12(b) required Seagram to develop and execute a marketing plan for the imported vodka (p. 2, para 3). The agreement required that the Seagrams and the exporter each make minimum payments for brand marketing purposes each calendar year. Brand marketing included advertising, merchandising, promotion, market research, public relations, testing and similar brand-building activities. The amount to be spent on AMP expenses depended on the volume of product imported into the US (p. 2, para 4). The question that arose was whether these expenses should be included in the price actually paid or payable (p. 3). The counsel for the importer argued that the payments for advertising indirectly benefited the buyer and hence they could not be loaded onto the assessable value. Moreover, it was contended that the brand marketing expenditure had no relation to the production and export of vodka and hence could not be said to made exclusively for the imported merchandise. The court to resolve the issue relied on Title XIX of the United States legislation (p. 4), particularly Section 153.103(a)(2). The text is:
Activities such as advertising, undertaken by the buyer on his own account, other than those for which an adjustment is provided in § 152.103(b), will not be considered an indirect payment to the seller though they may benefit the seller. The costs of those activities will not be added to the price actually paid or payable in determining the customs value of the imported merchandise.
It concluded that the advertising expenses will not be considered an indirect payment to the seller even though it may benefit the seller and thus will not be added to the transaction value of imported vodka (p. 5). However, this case can be distinguished on the simple fact that the parties in the transaction were unrelated.
CROSS Ruling HQ H038381 (November 2014): In this case, the buyer and seller are related parties: the seller and the importer sell merchandise under the same trademarked name. Both these parties contracted a service agreement that governs their relationship independent of import–exports. They also have a distribution agreement that sets out the terms of import. Article 8 of the distribution agreement relates to marketing and advertising and Article 8.1 states that the importer will ‘actively and continuously promote’ the products in its territory. Moreover, Article 8.2 specifies that the importer has an ‘obligation to use any publicity tools provided by the Seller and such tools must be used according to the seller’s instructions’. While deciding this matter, HQ said:

Volume 14, Number 1 145
World Customs Journal
Based on the language of the agreements between the parties, the Importer does not have an option regarding advertising and marketing. The Importer must “use any publicity tools that may be provided to it by the Company” as the Seller directs. Therefore, the portion of the service fee related to advertising and marketing, prorated to account for only the imported merchandise, would be considered part of the price actually paid or payable.
This judgment can be criticised on two grounds. First, though HQmade a reference to Title 19 152.103(a)(2), they failed to take into consideration its essence. It states explicitly that even though advertising may benefit the seller, it will not be considered an ‘indirect payment’. Perhaps what differentiates this clause is that that there is no reference made to ‘agreement of advertising’ between the parties. However, it should be clarified that the presence of marketing agreements between related parties will not lead to rejection of the transaction value according to Note to Article 1(1)(b), paragraph 2 of GATT Agreement on Article VII.
Second, it can be argued that the service agreement as a whole, and the distribution agreement concerning AMP expenses, between the parties could have existed independently of the importation of goods. Hence, even though the court only loaded AMP charges on the amount of goods imported, the intention behind sharing advertising costs had no nexus with importation and was rather a separate agreement governing the relationship between a parent and a subsidiary. Thus, even the stance in USA regarding this issue is ambiguous.
5.3 Canada
The government of Canada, as a common practice, issues ‘D Memos’ which reflect the stance of the country on a particular matter. With regard to the matter at hand, the Canadian Border Services Agency (CBSA) published Memorandum D13-4-13 on 31 March 2015 on Post-Importation Payment or Fees (Subsequent Proceeds). Appendix B relates to ‘Marketing and Promotional Fees’ which may not be added to the price actually paid or payable. As a reiteration of the general rule, it states that the costs of marketing activities shall not be added to the price paid or payable. However, when already included in the price paid or payable, such costs cannot be deducted. The memo states that the purchaser/importer has to substantiate the receipt of justified services relevant to the payments. Simply put, Canada agrees that when the expenses accrue to a buyer by virtue of a contract between the parties or otherwise and it relates specifically back to the goods imported, AMP expenses will not be included in the dutiable value. To better understand the importance of this clause:
If the marketing fee charged cannot be related to the specific product(s), which are imported and sold in Canada, then the fees cannot be identified as legitimate services the Canadian subsidiary received. Accordingly, this type of marketing or promotional fees would be found to be an addition to the price paid or payable.
However, this is where Canada errs. If the marketing expenses are not related to the imported goods, then the question of customs valuation should not arise in the first place. The very definition of ‘price actually paid or payable’ presumes that payments made to the seller cannot be ‘free-floating’ or unrelated to the imported goods. The payments must be tied back in some way to those imported products. In the case of Canada, they will make the payments dutiable even there is no ties to the import, thus contradicting the nature of price actually paid or payable (Neville Jr, 2016).

146 Volume 14, Number 1
International Network of Customs Universities
5.4 European Union
It can be argued that the European Union perhaps takes the best interpretation of marketing expenses and their addition to the price actually paid or payable. Commission Regulation (EEC) No. 2454/93 in Article 149 states:
(1) For the purposes of Article 29 (3) (b) of the Code, the term ‘marketing activities’ means all activities relating to advertising and promoting the sale of the goods in question and all activities relating to warranties or guarantees in respect of them.
(2) Such activities undertaken by the buyer shall be regarded as having been undertaken on his own account even if they are performed in pursuance of an obligation on the buyer following an agreement with the seller.
This Code was amended by Commission Implementing Regulation 2015/2447 and the Implementing Act of UCC, in its Article 129, states that marketing activities ‘undertaken by the buyer or an undertaking relating to the buyer’ shall not be an indirect payment. Thus, the 1993 regulation clearly provides for the contingency where AMP expenses are to be incurred by the buyer based on an agreement with the seller. It clearly states that a ‘buyer’s own account’ will also include costs spent in pursuance of an ‘obligation’. Consequently, such costs will not load onto the transaction value of the goods imported. The 2015 Implementing Act merely compiled the two subsections into one term, ‘undertaking relating to the buyer’, which clearly establishes that irrespective of an agreement between the parties or obligation on the buyer, the AMP expenses are outside the purview of customs valuation.
6. Interpretation and appraisalConsidering the stance of various jurisdictions on this matter, it is evident that further clarification, discussion and discourse is required. The researcher will now evaluate the information gathered to suit the Indian approach. It is argued that AMP expenses must not be included in the ‘price actually paid or payable’, as it is against the generally accepted position of law. It is necessary to rely on the points set out below.
6.1 Post-importation expenses
Post-importation expenses are known as ‘subsequent proceeds’. To define this simply, it means those expenses incurred by the buyer after the importation of goods or services. Hence, a simple interpretation concludes that such expenses must not be added to the price actually paid or payable since it has no relation to the importation of goods because the costs occur in the future. However, there are many more considerations to study. The Supreme Court, in the case of CC, Ahmedabad v. M/S Essar Steel Ltd 2015 (319) ELT 202 (SC) held that a cursory reading of Section 14 of the Customs Act, 19623 makes it evident that post-importation expenses find no place in the transaction value and should not be loaded. It reads:
A cursory reading of the Section makes it clear that customs duty is chargeable on goods by reference to their value at a price at which such goods or like goods are ordinarily sold or offered for sale at the time and place of importation in the course of international trade. This would mean that any amount that is referable to the imported goods post-importation has necessarily to be excluded. (para 7)

Volume 14, Number 1 147
World Customs Journal
It is clear that in cases where the AMP expenses to be incurred are tied to the importation, these are to be borne after the importation of goods. Any percentage specified for advertising and marketing by the agreement between the buyer and seller should not be loaded onto the transaction value. There are numerous other cases that settle the issue on post-importation expenses. The Supreme Court in Commissioner of Customs (Port), Kolkata vs. J K Corporation Ltd (2007) 9 SCC 401 noted that any amount paid for post-importation service or activity would not be loaded onto the assessable value of the imported goods so as to allow the DRI to levy customs duty (para 5). The position is so clear in the Indian legislation that it would be against the interests of justice to levy customs on post-importation charges.
6.2 Buyer’s own account
If this term is interpreted in plain English, a buyer’s own account either means for the buyer’s own interest or by the buyer’s own efforts (Neville Jr, 2016). It is contended by the researcher that the ‘buyer’s own account’ and ‘condition of sale’ must not be treated as mutually exclusive terms. In many of the cases discussed above, the tribunals or authorities make this fallacy in their judgment. It is assumed that when the buyer undertakes AMP expenses in pursuance of an agreement, it ceases to be on the ‘buyer’s own account’. However, it can be both. Even though the obligation emanates from an agreement, the buyer uses their own efforts to further advertising. Where the tools for advertising are provided by the seller, the benefit of such marketing accrues to both seller and buyer as the demand for their products/services increases. The 1985 Case Study 3.1 of Technical Committee on Customs Valuation (TCCV) notes that is a common commercial practice for buyers to advertise their products (even through an agreement with seller) to augment their business. Many have erred in interpreting ‘buyer’s own account’ to mean by the buyer’s own initiative and requiring a voluntary payment of their own accord by the buyer/importer. However, that is a misinterpretation of language. If one reads the French and Spanish4 text of the agreement, the true sense of the term becomes more evident as there, ‘buyer’s own account’ is connoted in a wider sense.
Further, as explained through examples, especially the GATT Agreement, the explanatory Note to Article 1(1)(a) in the Agreement disregards the aspect of advertising benefitting the seller. It states that, irrespective of the benefit to the seller, AMP expenses will be interpreted as on the buyer’s own account and outside the scope of price actually paid or payable. The 1990 Commentary 16.1 of the TCCV, which talks about ‘Activities undertaken by the buyer on his own account after purchase of goods but before importation’, further strengthens this point. It clarifies the position relating to AMP expenses undertaken by the buyer after purchase but before importation. Even when the advertising has been done before actual importation but after the goods have been sold to buyer through agreement, they still will not be counted for the purposes of customs valuation. This clearly indicates the intention of the international agreement to keep AMP expenses away from transaction value calculations.

148 Volume 14, Number 1
International Network of Customs Universities
7. ConclusionIt can be concluded that the GATT Agreement, Rules framed and legislations passed by countries in pursuance of the Agreement and opinions of the TCCV all point in one direction: AMP expenses are not to be regarded as a part of the price actually paid or payable and the transaction value is to be accepted without consideration of the costs incurred by the buyer on marketing. However, there is no doubt that the tribunal pronouncements in India and elsewher have yielded a different view. A look at the contradictory judgments of Reebok India and Giorgio Armani given by the Delhi CESTAT is a fine example of the confusing nature of AMP expenses. Hence, the following points must be reinforced:
• The interpretive Note to Article 1(1)(b) of the GATT Agreement, 1994, as explained above, makes it clear that marketing expenses should not be included in the assessable value even when they emanate from an agreement with the seller. This express provision thus removes doubts regarding whether advertising undertaken by the buyer through agreement is a condition of sale or merely on the ‘buyer’s own account’.
• The 1993 Union Customs Code enforced in the jurisdiction of European Union provides a true and accurate interpretation of ‘buyer’s own account’. It is clearly stated in Article 149 that promotional activities undertaken by the buyer even because of an obligation in an agreement will still be considered to be on the buyer’s own account.
• When it comes to worldwide promotional expenses and the buyer having to contribute a certain percentage for the same, it is emphasised that where there is no nexus between the actual importation of goods and advertisement of a brand, customs duties cannot be levied. In the absence of a connection, customs valuation in itself does not apply. Many times, related parties (parent and subsidiaries) have separate agreements: one that governs importation and the other which lays down the terms of their relationship. Hence, they cannot be read together and an unnecessary link cannot be drawn. The American view is also consistent with this. In paragraph 652 of VWP of America v. United States, 163 F. Supp. 2d 645, it was stated that ‘whether a certain payment invokes liability for customs duties depends upon its relevance to the actual importation’. In CROSS Ruling HQ 545663, the US CBP has further remarked on this issue that there is a presumption that all payments made by the buyer will be included in the price actually paid or payable, but this presumption can be rebutted if the payments are unrelated. For this the Headquarters relied on the cases of Chrysler Corporation v. United States, Slip Op. 93-186 (Ct. Int’l Trade, 22 September 1993) and Generra Sportswear, 8 CAFC 132, 905 F. 2d 377 (1990) to declare that independent and unrelated costs of buyer should be kept away from assessable value.
Hence, with regards to the above submissions, it is clear that advertising costs are not to be included in the transaction value. Further, it is recommended that clarifications be provided by the Central Board of Indirect Taxes and Customs (CBIC) in this regard. CBIC is urged to carefully appraise this situation as it has considerable impact on revenue collection and international trade.

Volume 14, Number 1 149
World Customs Journal
8. References
Canadian Border Services Agency 2015, Memorandum D13-4-13: Post-Importation Payment or Fees (Subsequent Proceeds) of 31 March 2015. Retrieved from https://www.cbsa-asfc.gc.ca/publications/dm-md/d13/d13-4-13-eng.pdf
CROSS ruling HQ 544638 dated July 1, 1991. Retrieved from https://rulings.cbp.gov/ruling/544638CROSS ruling HQ H038381 dated Nov 17, 2014. Retrieved from https://rulings.cbp.gov/ruling/H038381Customs Valuation (Determination of Value of Imported Goods) Rules, 2007.European Economic Community 1993, Commission Regulation (EEC) No. 2454/93 of 2nd July, 1993.
Retrieved from https://eur-lex.europa.eu/legal-content/EN/TXT/HTML/?uri=CELEX:01993R2454-20150501&from=en
European Union. (2015). Commission Implementing Regulation (EU) 2015/2447 of 24 November, 2015. Retrieved from https://eur-lex.europa.eu/legal-content/EN/TXT/PDF/?uri=CELEX:02015R2447-20180421&from=EN
Indian Customs Act, 1962.Neville Jr. M. K. (2016). Some observations on the Customs Valuation Law status on Advertising,
Marketing and Promotion Payments. ITC Trade Law, April. Retrieved from http://www.itctradelaw.com/articles/advertising-marketing-promotion.html
Sinen, M. I. (2010). European Community customs duties: a significant trading consideration for US companies. William Mitchell Law Review, 18(2), 402.
Rosenow, S., & O’Shea, B. (2010). A handbook on WTO Customs Valuation Agreement. Cambridge University Press & WTO: London.
Technical Committee on Customs Valuation 1985, 9th Session Case Study 3.1 of TCCV – Conditions and restrictions on Article 1’ of 8 March 1985. Retrieved from http://www.wcoomd.org/~/media/wco/public/global/pdf/topics/valuation/resources/historical-documents/tccv-30/VT0748E
Technical Committee on Customs Valuation 1990, 20th Session – Commentary 16.1: Activities undertaken by buyer on his own account after purchase of goods but before importation of 12 October 1990.
United States of America, Title 19 CFR § 152.US Customs and Border Protection. (2016). About CBP. Retrieved from https://www.cbp.gov/aboutWorld Trade Organization (WTO). (n.d.) Technical information on customs valuation. Retrieved from
https://www.wto.org/english/tratop_e/cusval_e/cusval_info_e.htmWorld Trade Organization (WTO). (1994). Agreement on Implementation of Article VII of the General
Agreement on Tariffs and Trade of 1994. Retrieved from https://www.wto.org/English/docs_e/legal_e/20-val.pdf

150 Volume 14, Number 1
International Network of Customs Universities
Notes1 Rules of origin denote an agreement between two or more countries where they allow imports free of duty if 50% or more of
the customs value of import is carried out through operations indigenous to the particular country. For example, the foreign trade agreement (FTA) between India and Malaysia has provisions relating to rules of origin.
2 Rule 4 of the Customs Valuation Rules, 2007 provide for ‘Transaction value of identical goods’.3 The CVR, 2007 is derived from Section 14 of the Customs Act, 1962.4 The French Text of the Agreement on Article VII of GATT reads as ‘Accord sur la mise en œuvre de l’article VII de
l’Accord général sur les tarifs douaniers et le commerce de 1994’ and the Spanish text reads as ‘Acuerdo relativo a la Aplicación del artículo vii del Acuerdo general sobre aranceles aduaneros y comercio de 1994’.
Mrudula DixitMrudula Dixit is a Fourth Year Law Student at Symbiosis Law School, Pune. She has interned at reputed law firms including Lakshmikumaran and Sridharan Attorneys as well as Khaitan & Company. She is interested in International Trade Law and Customs Litigation and plans to pursue it further.
Case law
CC, Ahmedabad v. M/S Essar Steel Ltd 2015 (319) ELT 202 (SC).Chrysler Corporation v. United States, Slip Op. 93-186 (Ct. Int’l Trade, 22 September 1993).Commissioner of Customs (Port), Kolkata vs. J K Corporation Ltd., (2007) 9 SCC 401.CROSS ruling HQ 545663. Retrieved from https://rulings.cbp.gov/ruling/545663Generra Sportswear, 8 CAFC 132, 905 F. 2d 377 (1990).Giorgio Armani India Pvt. Ltd. v. New Delhi, 2018 VIL 248 CESTAT DEL CU.Reebok India Ltd. v. CC, Patparganj, 2018 VIL 49 CESTAT DEL CU.Samsonite South Asia Pvt. Ltd. v. Commr. Of Customs, 2015 (327) ELT- 528 Tribunal-Mumbai.Richemont India Pvt Ltd. case (Customs – Case No. 50868/2015).VWP of America v. United States, 163 F. Supp. 2d 645 (CIT 2001).

Section 2
Special Report
SECTION 2 – SPECIAL REPORT
152 Volume 14, Number 1
International Network of Customs Universities

Volume 14, Number 1 153
World Customs Journal
WCO Announcement: 2022 Edition of the Harmonized System
On 8 January 2020 the WCO made the following announcement regarding the acceptance of the 2022 edition of the Harmonized System:
‘HS 2022, which is the seventh edition of the Harmonized System (HS) nomenclature used for the uniform classification of goods traded internationally all over the world, has been accepted by the all Contracting Parties to the Harmonized System Convention. It shall come into force on 1 January 2022.
The HS serves as the basis for Customs tariffs and for the compilation of international trade statistics in 211 economies (of which 158 are Contracting Parties to the HS Convention). The new HS2022 edition makes some major changes to the Harmonized System with a total of 351 sets of amendments covering a wide range of goods moving across borders. Here are some of the highlights:
Adaption to current trade through the recognition of new product streams and addressing environmental and social issues of global concern are the major features of the HS 2022 amendments.
Visibility will be introduced to a number of high profile product streams in the 2022 Edition to recognise the changing trade patterns. Electrical and electronic waste, commonly referred to as e-waste, is one example of a product class which presents significant policy concerns as well as a high value of trade, hence HS 2022 includes specific provisions for its classification to assist countries in their work under the Basel Convention. New provisions for novel tobacco and nicotine based products resulted from the difficulties of the classification of these products, lack of visibility in trade statistics and the very high monetary value of this trade. Unmanned aerial vehicles (UAVs), commonly referred to as drones, also gain their own specific provisions to simplify the classification of these aircraft. Smartphones will gain their own subheading and Note, which will also clarify and confirm the current heading classification of these multifunctional devices.
Major reconfigurations have been undertaken for the subheadings of heading 70.19 for glass fibres and articles thereof and for heading 84.62 for metal forming machinery. These changes recognize that the current subheadings do not adequately represent the technological advances in these sectors, leaving a lack of trade statistics important to the industries and potential classification difficulties.
One area which is a focus for the future is the classification of multi-purpose intermediate assemblies. However, one very important example of such a product has already been addressed in HS 2022. Flat panel display modules will be classified as a product in their own right which will simplify classification of these modules by removing the need to identify final use. Health and safety has also featured in the changes. The recognition of the dangers of delays in the deployment of tools for the rapid diagnosis of infectious diseases in outbreaks has led to changes to the provisions for such diagnostic kits to simplify classification. New provisions for placebos and clinical trial kits for medical research to enable classification without information on the ingredients in a placebos will assist in facilitating cross-border medical research. Cell cultures and cell therapy are among the product classes that have gained new and specific provisions. On a human security level, a number of new provisions specifically provide for various dual use items. These range from toxins to laboratory equipment.
Protection of society and the fight against terrorism are increasingly important roles for Customs. Many new subheadings have been created for dual use goods that could be diverted for unauthorized use, such as radioactive materials and biological safety cabinets, as well as for items required for the construction of improvised explosive devices, such as detonators.
Goods specifically controlled under various Conventions have also been updated. The HS 2022 Edition introduces new subheadings for specific chemicals controlled under the Chemical Weapons Convention

154 Volume 14, Number 1
International Network of Customs Universities
(CWC), for certain hazardous chemicals controlled under the Rotterdam Convention and for certain persistent organic pollutants (POPs) controlled under the Stockholm Convention. Furthermore, at the request of the International Narcotics Control Board (INCB), new subheadings have been introduced for the monitoring and control of fentanyls and their derivatives as well as two fentanyl precursors. Major changes, including new heading Note 4 to Section VI and new heading 38.27, have been introduced for gases controlled under the Kigali Amendment of the Montreal Protocol.
The changes are not confined to creating new specific provisions for various goods. The amendments also include clarification of texts to ensure uniform application of the nomenclature. For example, there are changes for the clarification and alignment between French and English of the appropriate way to measure wood in the rough for the purposes of subheadings under heading 44.03.
Given the wide scope of the changes, there are many important changes not mentioned in this short introduction. All interested parties are encourage to read the Recommendation carefully (to be published soon).
ImplementationWhile January 2022 may seem far off, a lot of work needs to be done at WCO, national and regional levels for the timely implementation of the new HS edition. The WCO is currently working on the development of requisite correlation tables between the current 2017 and the new edition of the HS, and on updating the HS publications, such as the Explanatory Notes, the Classification Opinions, the Alphabetical Index and the HS online database.
Customs administrations and regional economic communities have a huge task to ensure timely implementation of the 2022 HS Edition, as required by the HS Convention. They are therefore encouraged to begin the process of preparing for the implementation of HS 2022 in their national Customs tariff or statistical nomenclatures. The WCO will step up its capacity building efforts to assist Members with their implementation.’
Note: the WCO has now published the amendments to HS 2022 on its website.
Section 3
Reference Material
SECTION 3 – REFERENCE MATERIAL

156 Volume 14, Number 1
International Network of Customs Universities

Volume 14, Number 1 157
World Customs Journal
Guidelines for ContributorsThe World Customs Journal invites authors to submit papers that relate to all aspects of customs activity, for example, law, policy, economics, administration, information and communications technologies. The Journal has a multi-dimensional focus on customs issues and the following broad categories should be used as a guide.
Research and theoryThe suggested length for articles about research and theory is approximately 5,000 words per article. Longer items will be accepted, however, publication of items of 10,000 or more words may be spread over more than one issue of the Journal.
Original research and theoretical papers submitted will be reviewed using a ‘double blind’ or ‘masked’ process, that is, the identity of author/s and reviewer/s will not be made known to each other. This process may result in delays in publication, especially where modifications to papers are suggested to the author/s by the reviewer/s. Authors submitting original items that relate to research and theory are asked to include the following details separately from the body of the article:
• title of the paper• names, positions, organisations, and contact details of each author• bionotes (no more than 100 words for each author) together with a recent, high resolution, colour photograph
for possible publication in the Journal• an abstract of no more than 100 words for papers up to 5,000 words, or for longer papers, a summary of up to
600 words depending on the length and complexity of the paper.
Please note that previously refereed papers will not be refereed by the World Customs Journal.
Practical applications, including case studies, issues and solutionsThese items are generally between 2,000 and 5,000 words per article. Authors of these items are asked to include bionotes (no more than 100 words for each author) together with a recent, high resolution, colour photograph for possible publication in the Journal. The Editorial Board will review articles that relate to practical applications.
Reviews of books, publications, systems and practicesThe suggested length is between 350 and 800 words per review. The Editorial Board will review these items submitted for publication.
Papers published elsewhereAuthors of papers previously published should provide full citations of the publication/s in which their paper/s appeared. Where appropriate, authors are asked to obtain permission from the previous publishers to re-publish these items in the World Customs Journal, which will acknowledge the source/s. Copies of permissions obtained should accompany the article submitted for publication in the World Customs Journal.
Authors intending to offer their papers for publication elsewhere—in English and/or another language—are asked to advise the Editor-in-Chief of the names of those publications.
Where necessary and appropriate, and to ensure consistency in style, the editors will make any necessary changes in items submitted and accepted for publication, except where those items have been refereed and published elsewhere. Guidance on the editors’ approach to style and referencing is available on the Journal’s website.
Letters to the EditorWe invite Letters to the Editor that address items previously published in the Journal as well as topics related to all aspects of customs activity. Authors of letters are asked to include their name and address (or a pseudonym) for publication in the Journal. As well, authors are asked to provide full contact details so that, should the need arise, the Editor-in-Chief can contact them.
All items should be submitted in Microsoft Word or RTF, as email attachments, to the Editor-in-Chief: [email protected]
158 Volume 14, Number 1
International Network of Customs Universities
Editorial BoardProfessor David Widdowson AM
Charles Sturt University, Australia Editor-in-Chief
Professor David Widdowson is Chief Executive Officer of the Centre for Customs and Excise Studies at Charles Sturt University, Australia. He is President of the International Network of Customs Universities, a member of the WCO’s PICARD Advisory Group and Scientific Board, and a founding director of the Trusted Trade Alliance. David holds a PhD in Public Sector Management and has over 40 years’ experience in international trade regulation, including 21 years with the Australian Customs Service. In 2019 he was appointed as a Member of the Order of Australia for significant service to higher education in the field of international trade and customs.
Professor Hans-Michael WolffgangUniversity of Münster, Germany
Professor Dr Hans-Michael Wolffgang is Professor of International Trade and Tax Law and Head of the Department of Customs and Excise which forms part of the Institute of Tax Law at the University of Münster, Germany. He is director of the Münster Masters studies in Customs, Taxation and International Trade Law and has written extensively on international trade law, customs law and export controls in Europe.
Dr Andrew GraingerTrade Facilitation Consulting Ltd, United Kingdom
Dr Andrew Grainger is trade facilitation practitioner, academic and educator with over 20 years of experience. As the Director of Trade Facilitation Consulting Ltd, he is regularly contracted by government agencies, companies and international organisations around the world. He is also an Honorary Associate Professor at the University of Nottingham and collaborates with other leading universities and research institutes, too. In previous roles, Andrew was the Deputy Director for Trade Procedures at SITPRO, the UK’s former trade facilitation agency, and Secretary for EUROPRO, the umbrella body for European trade facilitation organisations. His PhD thesis in Supply Chain Management and Trade Facilitation was awarded the prestigious Palgrave Macmillan Prize for best PhD in Maritime Economics and Logistics 2005–2008. He has authored many papers within the subject of trade and customs procedures and is a member of the International Network of Customs Universities’ (INCU) executive committee.
Volume 14, Number 1 159
World Customs Journal
Professor Aydin AliyevState Customs Committee, Republic of Azerbaijan
Professor Aydin Aliyev is a Colonel General of Customs Service (Rtd) and former Chairman of the State Customs Committee of the Republic of Azerbaijan. He is a graduate in Law from Azerbaijan State University, and author of educational and scientific articles and books on customs matters which have been published in several countries. His contributions to the development of customs administrations and for strengthening customs cooperation have been recognised by the World Customs Organization, the Federal Customs Service of the Russian Federation, the Republic of Hungary and by customs administrations of several other countries. In 2010, Prof. Aliyev was awarded the title of ‘Honoured Lawyer of the Republic of Azerbaijan’ by Presidential Decree. In 2014, he was admitted as an Honorary Fellow of the International Network of Customs Universities for his contribution to raising the academic standing of the customs profession.
Professor Enrique BarreiraBRSV, Buenos Aires, Republic of Argentina
Professor Enrique Barreira is a founding partner of BRSV Attorneys at Law in Buenos Aires, Argentina. He was one of the drafters of the Argentine Customs Code. He has also been a professor of Customs Tax Law, Customs Regimes, and Anti-dumping and Subsidies in the Graduate Program at the School of Law, University of Buenos Aires since 1993, and is a founding member of the International Customs Law Academy. Professor Barreira has been the Argentine arbitrator to the Mercosur in various disputes.
Dr Juha HintsaCross-border Research Association and Hautes Etudes Commerciales (HEC), University of Lausanne, Switzerland
Dr Juha Hintsa is a Senior Researcher in global supply chain security management. He is one of the founding partners of the Global Customs Research Network, and the founder of the Cross-border Research Association (CBRA) in Lausanne, where he undertakes research into various aspects of supply chain security management in close collaboration with several multinational corporations. Juha’s PhD thesis was on ‘Post-2001 supply chain security: impacts on the private sector’.
Dr Santiago Ibáñez MarsillaPublic Finance Law and Taxation Department, University of Valencia.
Dr Santiago Ibáñez Marsilla is Principal Advisor, Spain, for Trusted Trade Alliance. His area of expertise is customs law and is currently the Jean Monnet Chair, EU Customs Law, which is awarded by the European Commission. In 2017- 2018 he was the senior expert at the mid-term evaluation of TAXUD’s Customs 2020 program. EuropeAid, USAID and Europäische Rechtsakademie (ERA) are among the institutions that have relied upon his customs law expertise. Santiago is used to working in international environments and has trained, taught or delivered presentations in 23 countries, and has authored more than 60 publications.

160 Volume 14, Number 1
International Network of Customs Universities
Principal Editor
Dr Pam FaulksCharles Sturt University, Australia
Dr Pam Faulks is an editor with the Centre for Customs & Excise Studies (CCES), Charles Sturt University. She is an accredited editor with the Institute of Professional Editors (IPEd) and has tertiary qualifications and extensive experience in editing, communications, tourism and education.