VCPPARC ISI 15(2011-12)
7
Middle-East Journal of Scientific Research 9 (6): 711-717, 2011 ISSN 1990-9233 © IDOSI Publications, 2011 Corresponding Author: K.A. Al-Gaadi, Department of Agricultural Engineering, Precision Agriculture Research Chair, College of Food and Agriculture Sciences, King Saud University, P.O. Box 2460, Riyadh 11451, Saudi Arabia, E-mail: [email protected], Tel: +966(1) 4678396. 711 Assessment of Temporal Land Cover Changes in Saudi Arabia Using Remotely Sensed Data K.A. Al-Gaadi, M.S. Samdani and V.C. Patil 1 2 2 Department of Agricultural Engineering, Precision Agriculture Research Chair, 1 College of Food and Agriculture Sciences, King Saud University, Riyadh, Saudi Arabia Precision Agriculture Research Chair, College of Food and Agriculture Sciences, 2 King Saud University, Riyadh, Saudi Arabia Abstract: The natural vegetation in desert environments is a precious resource. Space imagery can be very useful in monitoring the vegetation in a large country like Saudi Arabia. The goal of the study was to assess the temporal land cover changes from 1990 to 2006 and in-season changes in vegetation during the years 2000 and 2006, in Dirab region of Saudi Arabia. Landsat TM and ETM+ images were used for the study. Normalized Difference Vegetation Index (NDVI) supported by GIS (ArcMap) was employed to detect the land cover and vegetation changes. Results revealed significant changes in land cover and vegetation of the region during the study period. The mean NDVI values of the region ranged from 0.091728 during September 2000 to 0.462475 during January 2006. Similarly, the maximum NDVI of the region increased from +0.373933 in September 2000 to +0.995817 in January 2006. The in-season variations observed in vegetation of the region were mainly due to changes in agricultural crop cover. Such studies on temporal analysis of land cover changes can help in monitoring the pattern of land cover changes and in planning for attaining sustainability of land use pattern. The results could be integrated with socio-economic information to develop strategies for efficient utilization of available natural resources in the region. Key words: Land Cover mapping % In-season vegetation changes % Landsat imagery % NDVI % Temporal changes INTRODUCTION manner [6]. Studies on land cover changes have assumed The natural vegetation is of crucial importance to the Temporal landsat images are very useful for stability of the fragile desert ecosystem of Saudi Arabia. assessing land use land cover changes and changes in Periodic monitoring of temporal land cover changes in vegetation [6-8]. The landsat imagery with coarse such environments would help in effective management resolution are more effective in land cover mapping of of the scarce natural resources. The expansions of larger areas [9] and can be used to provide a more urbanization, lack of planning and socio-economic factors meaningful linkage between surface energy fluxes and determine land use and land cover changes [1]. The remotely sensed observations across multiple years [10]. human activity and the environment are the interactive Bagour et al. [11] used NDVI and PCA techniques to components, which affect land use and land cover analyze AVHRR data for change detection of the changes [2]. Land degradation due to urbanization can be vegetation cover in northeastern part of Saudi Arabia observed using remotely sensed data [3] at local, regional due to the Gulf war. Kelarestaghi, et al. [12] performed and global scales [4,5]. Recent developments in remote NDVI, PCA, tassel cap transformation and data fusion sensing coupled with availability of multi-temporal on Landsat ETM+ data for land use change detection. satellite images have provided a better opportunity to Time series data from Landsat images offer several study and understand land cover changes in an effective unique advantages, such as coverage of larger area, greater importance in an era of rapid urbanization [7].
Transcript of VCPPARC ISI 15(2011-12)

Middle-East Journal of Scientific Research 9 (6): 711-717, 2011ISSN 1990-9233© IDOSI Publications, 2011
Corresponding Author: K.A. Al-Gaadi, Department of Agricultural Engineering, Precision Agriculture Research Chair,College of Food and Agriculture Sciences, King Saud University, P.O. Box 2460,Riyadh 11451, Saudi Arabia, E-mail: [email protected], Tel: +966(1) 4678396.
711
Assessment of Temporal Land Cover Changes in Saudi Arabia Using Remotely Sensed Data
K.A. Al-Gaadi, M.S. Samdani and V.C. Patil1 2 2
Department of Agricultural Engineering, Precision Agriculture Research Chair,1
College of Food and Agriculture Sciences, King Saud University, Riyadh, Saudi ArabiaPrecision Agriculture Research Chair, College of Food and Agriculture Sciences,2
King Saud University, Riyadh, Saudi Arabia
Abstract: The natural vegetation in desert environments is a precious resource. Space imagery can be veryuseful in monitoring the vegetation in a large country like Saudi Arabia. The goal of the study was to assessthe temporal land cover changes from 1990 to 2006 and in-season changes in vegetation during the years 2000and 2006, in Dirab region of Saudi Arabia. Landsat TM and ETM+ images were used for the study. NormalizedDifference Vegetation Index (NDVI) supported by GIS (ArcMap) was employed to detect the land cover andvegetation changes. Results revealed significant changes in land cover and vegetation of the region during thestudy period. The mean NDVI values of the region ranged from 0.091728 during September 2000 to 0.462475during January 2006. Similarly, the maximum NDVI of the region increased from +0.373933 in September 2000to +0.995817 in January 2006. The in-season variations observed in vegetation of the region were mainly dueto changes in agricultural crop cover. Such studies on temporal analysis of land cover changes can help inmonitoring the pattern of land cover changes and in planning for attaining sustainability of land use pattern.The results could be integrated with socio-economic information to develop strategies for efficient utilizationof available natural resources in the region.
Key words:Land Cover mapping % In-season vegetation changes % Landsat imagery % NDVI % Temporalchanges
INTRODUCTION manner [6]. Studies on land cover changes have assumed
The natural vegetation is of crucial importance to the Temporal landsat images are very useful forstability of the fragile desert ecosystem of Saudi Arabia. assessing land use land cover changes and changes inPeriodic monitoring of temporal land cover changes in vegetation [6-8]. The landsat imagery with coarsesuch environments would help in effective management resolution are more effective in land cover mapping ofof the scarce natural resources. The expansions of larger areas [9] and can be used to provide a moreurbanization, lack of planning and socio-economic factors meaningful linkage between surface energy fluxes anddetermine land use and land cover changes [1]. The remotely sensed observations across multiple years [10].human activity and the environment are the interactive Bagour et al. [11] used NDVI and PCA techniques tocomponents, which affect land use and land cover analyze AVHRR data for change detection of thechanges [2]. Land degradation due to urbanization can be vegetation cover in northeastern part of Saudi Arabiaobserved using remotely sensed data [3] at local, regional due to the Gulf war. Kelarestaghi, et al. [12] performedand global scales [4,5]. Recent developments in remote NDVI, PCA, tassel cap transformation and data fusionsensing coupled with availability of multi-temporal on Landsat ETM+ data for land use change detection.satellite images have provided a better opportunity to Time series data from Landsat images offer severalstudy and understand land cover changes in an effective unique advantages, such as coverage of larger area,
greater importance in an era of rapid urbanization [7].
Middle-East J. Sci. Res., 9 (6): 711-717, 2011
712
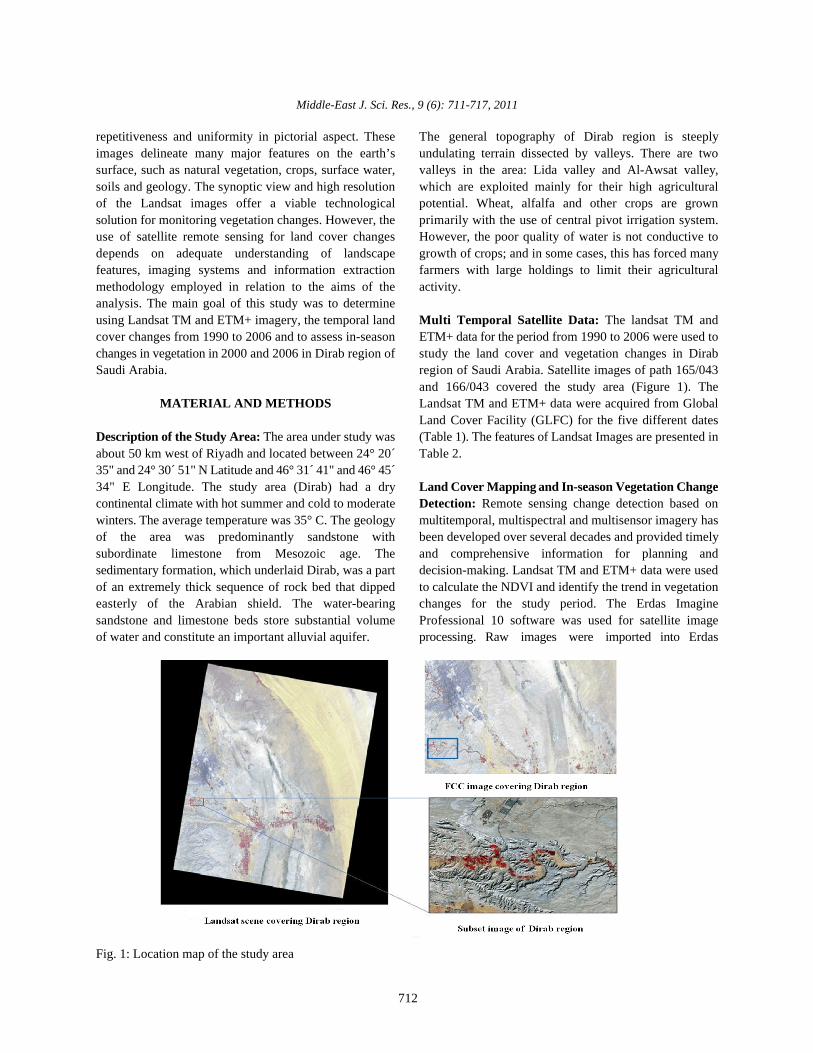
repetitiveness and uniformity in pictorial aspect. These The general topography of Dirab region is steeplyimages delineate many major features on the earth’s undulating terrain dissected by valleys. There are twosurface, such as natural vegetation, crops, surface water, valleys in the area: Lida valley and Al-Awsat valley,soils and geology. The synoptic view and high resolution which are exploited mainly for their high agriculturalof the Landsat images offer a viable technological potential. Wheat, alfalfa and other crops are grownsolution for monitoring vegetation changes. However, the primarily with the use of central pivot irrigation system.use of satellite remote sensing for land cover changes However, the poor quality of water is not conductive todepends on adequate understanding of landscape growth of crops; and in some cases, this has forced manyfeatures, imaging systems and information extraction farmers with large holdings to limit their agriculturalmethodology employed in relation to the aims of the activity. analysis. The main goal of this study was to determineusing Landsat TM and ETM+ imagery, the temporal land Multi Temporal Satellite Data: The landsat TM andcover changes from 1990 to 2006 and to assess in-season ETM+ data for the period from 1990 to 2006 were used tochanges in vegetation in 2000 and 2006 in Dirab region of study the land cover and vegetation changes in DirabSaudi Arabia. region of Saudi Arabia. Satellite images of path 165/043
MATERIAL AND METHODS Landsat TM and ETM+ data were acquired from Global
Description of the Study Area: The area under study was (Table 1). The features of Landsat Images are presented inabout 50 km west of Riyadh and located between 24° 20´ Table 2.35" and 24° 30´ 51" N Latitude and 46° 31´ 41" and 46° 45´34" E Longitude. The study area (Dirab) had a dry Land Cover Mapping and In-season Vegetation Changecontinental climate with hot summer and cold to moderate Detection: Remote sensing change detection based onwinters. The average temperature was 35° C. The geology multitemporal, multispectral and multisensor imagery hasof the area was predominantly sandstone with been developed over several decades and provided timelysubordinate limestone from Mesozoic age. The and comprehensive information for planning andsedimentary formation, which underlaid Dirab, was a part decision-making. Landsat TM and ETM+ data were usedof an extremely thick sequence of rock bed that dipped to calculate the NDVI and identify the trend in vegetationeasterly of the Arabian shield. The water-bearing changes for the study period. The Erdas Imaginesandstone and limestone beds store substantial volume Professional 10 software was used for satellite imageof water and constitute an important alluvial aquifer. processing. Raw images were imported into Erdas
and 166/043 covered the study area (Figure 1). The
Land Cover Facility (GLFC) for the five different dates
Fig. 1: Location map of the study area

Middle-East J. Sci. Res., 9 (6): 711-717, 2011
713
Table 1: Details of data obtained from archive of the Global Land Cover
Facility
S.N. ID WRS:P/R Acquisition date Data Set Source
1 203-839 166.043 07/09/1990 TM USGS
2 212-570 166.043 02/09/2000 ETM+ USGS
3 212-509 165.043 16/12/2000 ETM+ USGS
4 219-178 166.043 22/01/2006 ETM+ USGS
5 219-121 165.043 04/03/2006 ETM+ USGS
Table 2: The specifications of Landsat data
Spatial Spectral
Resolution (m) Resolution (µm)
Spectral Bands ------------------------- ------------------------------
Band TM ETM+ TM ETM+
1. Blue 30 30 0.45 - 0.52 0.45 - 0.52
2. Green 30 30 0.52 - 0.60 0.53 - 0.61
3. Red 30 30 0.63 - 0.69 0.63 - 0.69
4. Near IR 30 30 0.76 - 0.90 0.78 - 0.90
5. Middle IR 30 30 1.55 - 1.75 1.55 - 1.75
6. Thermal IR 120 60 10.4 - 12.5 10.4 - 12.5
7. Middle IR 30 30 2.08 - 2.35 2.09 - 2.35
8. Panchromatic - 15 - 0.52 - 0.90
software and subset images of Dirab region (study area)were generated from two different Landsat scenes (Fig. 1).After subsetting of the study area with reference togeographic co-ordinates, digital numbers (DN) wereconverted to Normalized Difference Vegetation Index(NDVI) values. Normalized Difference Vegetation Index(NDVI) values were derived using the following formulaof Rouse et al. [13]: C NDVI = NIR-R / NIR+R
Where, NIR is reflectance in Near Infrared bandand R is reflectance in red band. The wavebandsrepresenting near-infrared and visible-red region wereextracted from each Landsat dataset to calculate theNormalized Difference Vegetation Index (NDVI) values.The Principal Component Analysis (PCA) was used toreduce noise, multiband correlation and compressinformation in bands [14-21]. All the digital numbers (DN)of image pixels were exported into Excel to obtain actualvalues of NDVI using statistical equations. The NDVImaps of the study area were prepared using ArcMapsoftware (Figures 2-6). These NDVI values and maps wereused to detect the changes in vegetation over the studyperiod.
Fig. 2: NDVI map of Dirab region (07/09/1990)
Fig. 3: NDVI map of Dirab region (02/09/2000)

Middle-East J. Sci. Res., 9 (6): 711-717, 2011
714
Fig. 4: NDVI map of Dirab region (16/12/2000)
Fig. 5: NDVI map of Dirab region ( 22/01/2006)
Fig. 6: NDVI map of Dirab region (04/03/2006)
RESULTS AND DISCUSSION indicate more “green” cover type [15] and increase
Because of sparse vegetation, it is always maps of the study area from 1990 to 2006 and fiveintrinsically difficult to analyze vegetation cover in NDVI classes are presented in Figures 2-6. The dataarid regions using remote sensing data. NDVI values revealed significant changes in vegetation, vigor andgenerally range from -1.0 to +1.0, where negative values density in response to biophysical conditionsrepresent clouds, snow, water and other non- including soil type, nature of vegetation, weather andvegetated surface and positive values represent anthropological factors. The mean NDVI values (Table 3vegetated surfaces. The NDVI values increase as the and Figure 7) ranged from 0.091728 (September 2000) toquantity of green biomass increases. Higher NDVI values 0.462475 (January 2006).
in biomass per unit area, and vice versa. The NDVI

NDVI
165.33
624.15
1016.55
417.6
603.18
0
200
400
600
800
1000
1200
7/9/1990 2/9/2000 16/12/2000 22/01/2006 4/3/2006
Middle-East J. Sci. Res., 9 (6): 711-717, 2011
715
Fig. 7: Temporal changes in NDVI values
Fig. 8: Area under healthy biomass based on NDVIvalues (Class-I and II)
This indicates that the vegetation in the study areahad a higher active biomass during January 2006 thanduring any other period. The in-season maximum NDVIvalues, during the year 2000, increased from 0.373933during September to +0.850776 during December. Thesowing of wheat crop in the region is generally performedduring the months of October and November. As a resultthere was an increase in the maximum NDVI values duringDecember. During the year 2006, the in-season maximumNDVI values decreased from 0.995817 during January to0.645446 during March. This decrease is attributed to theharvest of the predominantly grown alfalfa crop whichtook place between January and March 2006. The resultsalso indicated that the period of maximum vegetationin the region was in January. For the years from 1990 to2006 the maximum NDVI values were observed togradually increase from 0.373933 in September to 0.850776in December and ultimately reach the highest NDVI valueof 0.995817 in January and decreased thereafter to
Table 3: The temporal variation in NDVI values from 1990-2006Date Min. NDVI Max. NDVI Mean NDVI07/09/1990 -0.247312 0.572008 0.16234802/09/2000 -0.190476 0.373933 0.09172816/12/2000 -0.571429 0.850776 0.13967322/01/2006 -0.0708661 0.995817 0.46247504/03/2006 -0.292035 0.645446 0.176705
0.645446 during March. The temporal changes in the areaunder healthy biomass based on NDVI values from ClassI and II are presented in Figure 8.
The largest area under healthy biomass of 1016.55 hawas observed during December 2000, however, thesmallest area of 165.33 ha was observed during September1990. The temporal NDVI changes clearly depicted thenature of seasonal variation in the vegetation of theregion due to anthropological factors. The major activityin the area that influenced the changes in vegetation wasthe agricultural activity. The sowing season generallystarted during October and November and hence therewas a gradual build up of the biomass and consequentincrease in NDVI values due to growth and developmentof agricultural crops until wheat crop is harvested inMarch and April. However, fluctuations in the vegetationof the area were due to cultivation of alfalfa, which is amulti-cut crop generally harvested at an interval of 60days. Bagour et al. [11] concluded that imagery ofAugust month was not ideal for measuring vegetation innorth eastern part of Saudi Arabia, because thevegetation was at a seasonally low level and there waslittle vegetation in the desert study area. The study area(Dirab region) was also a desert ecosystem and the onlyvegetation observed was the biomass of agriculturalcrops grown in the region under center pivot irrigationsystems.

Middle-East J. Sci. Res., 9 (6): 711-717, 2011
716
CONCLUSION 8. Baboo, S.S. and M.R. Devi, 2010. Integrations of
The present study analyzed the land cover changes Cover Change Detection of Coimbatore District. Int.in Dirab region of Saudi Arabia using multi temporal TM J. Comp. Sci. Eng., 2(9): 3085-3088.and ETM+ data from 1990 to 2006. NDVI maps created for 9. Pirasteh, S., S.A.Ali and H.J. Hussain, 2005.comparing temporal land cover changes indicated Greenrey (Green Space) Percentage Estimation Usingsignificant changes in vegetation of the region. The mean Band Ratio, NDVI From Landsat Enhanced ThematicNDVI values ranged from 0.373933 (September 2000) to Mapper (ETM)-2002 & An Application Of0.995817 (January 2006). The area under healthy biomass Geographic Information System (GIS) Techniques,in the region ranged from 165.33 ha in September 1990 to Dezful-Andimeshk, Khuzestan South-West Iran. 8th1016.55 ha in December 2000. The use of Landsat imagery annual international conference, New Delhi, India.and NDVI mapping were found to be quite useful in 10. Malika, B., A.D. Dale, F.F. Lynn and H.Y. Michael,assessing temporal land cover changes. 2010. Monitoring Vegetation Phenological Cycles in
ACKNOWLEDGEMENT Using a Ground-Based NDVI System: A Potential
This project was supported by King Saud University, Remote Sens., 2: 990-1013.Deanship of Scientific Research, College of Food and 11. Bagour, M.H., S. Al-Mahlafe, A. Jacob and A. Fahsi,Agriculture Sciences, Research center. 2006. Change detection of the vegetation cover
REFERENCES Radiometer (AVHRR) data. Res. J. Agric. Biol. Sci.,
1. Manonmani, I.K., 2010. Spatio Temporal Analysis of 12. Kelarestaghi, A., H.Ahmadi, M. Jafari and J. Ghodosi,Land Use in Fringe Area using GIS a Case Study of 2006. Land use changes detection and spatialMadurai City, Tamil Nadu. Int. J. Geomatics Geosci., distribution using digital and satellite data, case1(2): 264-270. study: Farim Drainage Basin, northern of Iran. J.
2. Prakasam, C., 2010. Land use and land cover change Biaban, 11(2): 33-47.detection through remote sensing approach:A case 13. Rouse, J.W., R.H. Haas, J.A. Schell and J.A. Deering,study of Kodaikanal taluk, Tamil Nadu. Int. J. 1974. Monitoring vegetation systems in the GreatGeomatics Geosci., 1(2): 150-158. Plains with ERTS. Proceedings of the Third Earth
3. Srivastava, S.K. and R.D. Gupta, 2003. Monitoring of Resources Technology Satellite-1Symposium,Changes in Land Use/ Land Cover using Multi- NASA, Greenbelt, MD, pp: 301-317.sensor Satellite Data, 6th International Conference on 14. Jensen, J.R., 2005. Introductory digital ImageGIS/GPS/RS: Map India, pp: 28-31. Processing: a remote sensing perspective 3rd Ed
4. Csaplovics, E., 1998. High Resolution space imagery Prentice Hall Series in Geographic Information Sci.,for regional environmental monitoring-status quo and ISBN 0-13-145361-0.future trends. Int. Arch. Photogramm. Remote Sens., 15. Deering, D.W., J.W. Rouse, R.H. Haas and J.S. Schell,32(7): 211-216. 1975. Measuring forage production of grazing units
5. Foody, G.M., 2002. Status of Land Cover from Landsat MSS data. Proc. Tenth InternationalClassification Accuracy Assessment. Remote Sens. Symposium on Remote Sensing of the Environment,Environ. 80: 185-201. Ann Arbor, MI, pp: 1169-1178.
6. Diallo, O. and A. Diouf, 1991. AVHRR monitoring of 16. Eastman, J.R., 2006. IDRISI Andes Guide to GIS andsavanna primary production in Senegal, West Africa: Image Processing, Worcester, USA: Clark Labs.1987-1988. Int. J. Remote Sens., 12(6): 1259-1279. 17. Fenglei, F., W. Yunpeng and W. Zhishi, 2007.
7. Alhammadi, M.S. and E.P. Glenn, 2008. Temporal and spatial change detecting (1998-2003)Detecting date palm trees health and vegetation and predicting of land use and land cover in Coregreenness change on the eastern coast of the United corridor of Pearl River Delta (China) by usingArab Emirates using SAVI. Int. J. Remote Sens., TM and ETM+ images. Environ. Monit. Assess.,29(6): 1745-1765. 137(1-3): 127-147.
Remote Sensing and GIS to Land Use and Land
Two Different. Semi-Arid Environmental Settings
Approach to Improve Satellite Data Interpretation.
based upon Advanced very High Resolution
2(6): 341-348.

Middle-East J. Sci. Res., 9 (6): 711-717, 2011
717
18. Ricotta, C. and G.C.F. Avena, 1999. The influence of 20. Soffianian, A., M. Ahmadi Nadoushan, L. Yaghmaeiprincipal component analysis on the spatial structure and S. Falahatkar, 2010. Mapping and Analyzingof multispectral dataset, Int. J. Remote Sens., Urban Expansion Using Remotely Sensed Imagery in20(17): 3367-3376. Isfahan, Iran.World Appl. Sci. J., 9(12): 1370-1378.
19. Rigina, O. and M.S. Rasmusen, 2003. 21. Taghizadeh Mehrjardi, R., S. Mahmoodi, M. TazeUsing trend line and principal component and E. Sahebjalal. 2008. Accuracy Assessment ofanalysis to study vegetation changes in Senegal Soil Salinity Map in Yazd-Ardakan Plain, Central Iran,1986 -1999 from AVHRR 8km data Danish. J. Geogr., Based on Landsat ETM+ Imagery. Am. Euras. J.103(1): 31-42. Agric. Environ. Sci., 3(5): 708-712.