
Validating transmission line impedances using known event data
Upload
independentCategory
view
3download
0
Information and Software Technology 57 (2015) 405–429
Contents lists available at ScienceDirect
Information and Software Technology
journal homepage: www.elsevier .com/locate / infsof
Validating a model-driven software architecture evaluationand improvement method: A family of experiments
http://dx.doi.org/10.1016/j.infsof.2014.05.0180950-5849/� 2014 Elsevier B.V. All rights reserved.
⇑ Corresponding author. Tel.: +34 659024445.E-mail address: [email protected] (J. Gonzalez-Huerta).
Javier Gonzalez-Huerta a,⇑, Emilio Insfran a, Silvia Abrahão a, Giuseppe Scanniello b
a Department of Information Systems and Computation, Universitat Politècnica de València, Valencia, Spainb DiMIE, Università della Basilicata, Potenza, Italy
a r t i c l e i n f o
Article history:Received 17 October 2013Received in revised form 22 May 2014Accepted 23 May 2014Available online 2 June 2014
Keywords:Software architecturesSoftware architecture evaluation methodsQuality attributesATAMFamily of experimentsMeta-analysis
a b s t r a c t
Context: Software architectures should be evaluated during the early stages of software development inorder to verify whether the non-functional requirements (NFRs) of the product can be fulfilled. Thisactivity is even more crucial in software product line (SPL) development, since it is also necessary toidentify whether the NFRs of a particular product can be achieved by exercising the variationmechanisms provided by the product line architecture or whether additional transformations arerequired. These issues have motivated us to propose QuaDAI, a method for the derivation, evaluationand improvement of software architectures in model-driven SPL development.Objective: We present in this paper the results of a family of four experiments carried out to empiricallyvalidate the evaluation and improvement strategy of QuaDAI.Method: The family of experiments was carried out by 92 participants: Computer Science Master’s andundergraduate students from Spain and Italy. The goal was to compare the effectiveness, efficiency,perceived ease of use, perceived usefulness and intention to use with regard to participants using theevaluation and improvement strategy of QuaDAI as opposed to the Architecture Tradeoff AnalysisMethod (ATAM).Results: The main result was that the participants produced their best results when applying QuaDAI, sig-nifying that the participants obtained architectures with better values for the NFRs faster, and that theyfound the method easier to use, more useful and more likely to be used. The results of the meta-analysiscarried out to aggregate the results obtained in the individual experiments also confirmed these results.Conclusions: The results support the hypothesis that QuaDAI would achieve better results than ATAM inthe experiments and that QuaDAI can be considered as a promising approach with which to performarchitectural evaluations that occur after the product architecture derivation in model-driven SPLdevelopment processes when carried out by novice software evaluators.
� 2014 Elsevier B.V. All rights reserved.
1. Introduction
Software architectures are a means to preclude or permit theachievement of the non-functional requirements (NFRs) of a soft-ware system. In software product line (SPL) development, in whicha set of software intensive systems sharing a common managed setof features are developed from a common set of core assets, theproduct line architecture should contain variation mechanismsthat help to achieve a set of permitted variations, includingfunctional, structural and quality concerns [23]. The product archi-tecture is derived from the product line architecture by exercising
its built-in architectural variation mechanisms, which supportboth the functional and NFRs for a specific product.
Once it has been derived, the product architecture should beevaluated to assess the achievement of the product’s specificrequirements. When the required levels of quality attributesfor a specific product fall outside the original specification ofthe SPL (and cannot be attained by using product line variationmechanisms), certain architectural transformations should beapplied to the product architecture to ensure that these NFRsare met [15].
Various studies concerned with the derivation (e.g., [14,61])and/or evaluation of software architectures from several points ofview (e.g., [64,36,69,65]) have been proposed in literature. Afterreviewing these studies, we have observed that:

406 J. Gonzalez-Huerta et al. / Information and Software Technology 57 (2015) 405–429
(a) There is a lack of systematic methods that model the impactbetween architectural design decisions and quality attri-butes to support the integrated derivation, evaluation andquality enhancement of software architectures.
(b) In the software architecture field, there is a lack of empiricalevidences regarding the advantages of tools and methods[9]. Software architecture researchers must follow a two-pronged strategy: develop new techniques, methods or toolswith which to improve on current practices, and performsystematic, rigorous assessments of existing and new tech-niques by following the empirical paradigm [31].
We have addressed the first issue by proposing the Quality-Driven Architecture Derivation and Improvement (QuaDAI) methodin previous studies [39,40]. QuaDAI is a model-driven approachto ensure the desired quality attribute levels for a product byapplying architectural transformations to a product architecturederived from a product line architecture.
With regard to the second issue, in previous works, we havepresented a first controlled experiment [40] and a replication study[41] as an initial step in the empirical validation of the QuaDAIstrategy for the evaluation and improvement of product architec-tures that consist on the evaluation and transformation activities.The objective of these experiments was to compare the effective-ness, efficiency, perceived ease of use, perceived usefulness andintention to use with regard to participants using the productevaluation and transformation activities of QuaDAI (from now onQuaDAI) as opposed to the Architecture Tradeoff Analysis Method(ATAM) [50], a well-known and widely-used software architectureevaluation method. The results of the first experiment (conductedwith undergraduate students) showed that QuaDAI was found tobe more efficient and was perceived as easier to use than ATAM.However, although QuaDAI performed better than ATAM, we couldnot confirm the other variables, as the differences between bothmethods were not statistically significant. In the replicationstudy, QuaDAI also performed better than ATAM, but as opposedto the original study, all the variables proved to be statisticallysignificant.
Two further replications were therefore conducted in order toprovide more evidence about the validity of these results. Theseexperiments were conducted with Computer Science Master’sand undergraduate students from the Universitat Politècnica deValència (UPV) in Spain and with Information Science undergradu-ate students from the Università degli Studi della Basilicata in Italy.All the experiments conducted form a family1 of controlled exper-iments. The objective of this paper is, therefore, to report the resultsof a family of four controlled experiments with the aim of empiri-cally validating the effectiveness, efficiency, perceived ease of use,perceived usefulness and intention to use with regard to participantsusing QuaDAI as opposed to ATAM. We have also carried out a meta-analysis in order to aggregate the results obtained in the individualexperiments to provide more general conclusions.
This paper is organized as follows. Firstly, related works on theempirical validation of software architecture evaluation methodsare discussed in Section 2. The architecture evaluation methodsthat were evaluated in the family of experiments (QuaDAI andATAM) are introduced in Section 3. The family of experiments isdescribed in Section 4. The details of the individual design of eachexperiment are provided in Section 5. The results of each experi-ment are reported and analyzed in Section 6. The results of thefamily of experiments are summarized in Section 7, together withthose of the meta-analysis. Threats that might affect the validity of
1 The concept of replication is extended to the ‘‘family of experiments’’ reported byBasili et al. [12].A family is composed of multiple similar experiments that pursue thesame goal to build the knowledge needed to extract significant conclusions [1].
our results are discussed in Section 8. Finally, our conclusions andfinal remarks are presented in Section 9.
2. Related work
The increasing size and complexity of software systems, alongwith the demand for high-quality systems, has driven theincreased interest in the software architecture sub-discipline ofsoftware engineering [2]. In this context, several methods and toolswith which to support the different activities in the architecturedesign and evaluation processes have been proposed [9]. However,little attention has been paid in this field to the empirical valida-tion of the methods and tools proposed. Instead, in general, theempirical studies in this field are focused on establishing taxono-mies for classifying the methods or assessing specific aspects of agiven evaluation method. In this section, we discuss related worksthat report on comparisons of architecture evaluation methods andempirical studies that assess various aspects of the architecturalevaluation process.
2.1. Classification frameworks for comparing software architectureevaluation methods
Several studies comparing or establishing frameworks withwhich to compare software architecture evaluation methods haverecently been reported in literature. The first literature review byAli Babar et al. [2] compared four scenario-based software archi-tecture evaluation methods: Scenario-Based Architecture Analysis(SAAM), the Architecture Level Modifiability Analysis (ALMA), thePerformance Assessment of Software Architecture (PASA) and theArchitecture Trade off Analysis Method (ATAM). In a subsequentwork, the same authors presented an extension of this comparisonin which they established a framework that could be used tocharacterize software architecture evaluation methods based ona literature review [3]. In this later study, the authors applied theirframework in order to compare eight evaluation methods (e.g.,SAAM, ATAM or ARID). In both studies, the authors followed afifteen criteria schema (e.g., the maturity stage, the particulardefinition behind the method, the process support, the method’sactivities). This framework was also evaluated in Ali Babar andKitchenham [4] through the use of a survey whose objective wasto analyze the suitability of the elements in the framework. Theresults of this survey supported the majority of the elements inthe framework, and only in a few of them (i.e., tool support,method activities and application domain) there were disagree-ments among the participants.
Roy and Graham [66] presented a survey in which theyreviewed thirty-seven software architecture evaluation methods.They also established a taxonomy for their classification based onthe development phase in which they are applied (i.e., early vs.late), the main analysis technique applied or the artifacts analyzed(i.e., scenario-based, mathematical models or metric-based), andtheir ability to deal with styles and patterns. The main conclusionswere: (i) it is difficult to be proficient in the use of architecturalevaluation methods; (ii) there is a lack of tools supporting themethods; and (iii) the majority of the methods (except SAAMand ATAM) have not been empirically validated.
Etxebarria and Sagardui [30] presented a framework based on aliterature review in order to classify sixteen software architectureevaluation approaches and techniques specifically defined for SPLdevelopment environments. This framework classifies softwarearchitecture evaluation approaches based on the evaluation time(i.e., design time vs. evolution time), the architecture being evalu-ated (product line architecture vs. product architecture) and thepurpose of the evaluation (e.g., evolution-related product line

J. Gonzalez-Huerta et al. / Information and Software Technology 57 (2015) 405–429 407
architecture evaluation, evaluation during derivation, synchroniza-tion-related evaluation).
Finally, Breivold et al. [16] presented a systematic literaturereview in which, among other topics, the authors covered the qual-ity evaluation of software architectures focusing on the evolutionaspects. They principally focused on assessing experience-based,scenario-based and metric-based evaluation methods that are ableto deal with evolvability. One of their conclusions was that thetechniques that support quality considerations help to identifykey quality attributes early in the software design phase. They alsoencouraged the definition of methods and tools with which todesign (and manage) software architectures for ultra-large-systems(e.g., SPL).
The comparisons mentioned above provide an analysis of thecharacteristics of the methods under analysis, which can help prac-titioners and researchers to attain a holistic view of the methodsavailable. However, they do not provide factual data as to whichmethod is most efficient, effective, easy to use or useful for a giventype of project or development scenario. The majority of theseworks report surveys that are based solely on subjective informa-tion and do not follow a predefined methodology. Our research,on the other hand, provides factual objective and subjectiveinformation collected by following a well-defined methodology.
2.2. Empirical studies assessing software architecture evaluation
Despite the fact that the interest in the software architecturefield has increased over the last few years, few experiments havebeen conducted to analyze different aspects of software architec-ture evaluation processes (e.g., [5,7,8,32,33,38,53]), or empiricalvalidations through case studies or experience reports (i.e.,[10,63,73]). A summary of each of these studies is presented belowin chronological order.
Golden et al. [38] reported on a controlled experiment analyz-ing the value of the different parts of a usability supporting archi-tectural patterns in the modification of a software architecturedesign. In this study the authors evaluated how the architecturalsolutions produced as a result of using a more complete specifica-tion of a pattern better support the usability needs. The studydemonstrates that the use of more complete specification of thepatterns increases the effectiveness and efficiency of usabilityevaluations.
Various empirical studies evaluating the influence of team size,organization and support as regards the communication among themembers of teams have been reported (i.e., [7,5,6]). Ali Babar andKitchenham [7] reported on a controlled experiment to analyzethe impact of group size on the outcome of a software architectureevaluation exercise. They analyzed how the group size affects boththe quality of scenario profiles and the participants’ satisfactionwith the process and outcomes. The principal result of this studywas that the size of the group affects the quality of the scenarioscreated. There were also disagreements as to the group size withwhich the subjects obtained scenarios with the best quality (i.e.,groups of five participants) and the group size with which the par-ticipants were most satisfied (i.e., groups of three participants).
Ali Babar et al. [5] presented an experiment comparing distrib-uted and face-to-face meetings within the software architectureevaluation process. The objective of this study was to assess theeffectiveness of the proposed groupware-supported process inthe development of high quality scenarios during the evaluationprocess. In a similar study, Ali Babar et al. [6] reported the resultsof an experiment assessing the use of LiveNet, a groupware toolthat can be used to support the software architecture evaluationprocess. The objective of the study was to analyze the perceivedease of use and usefulness of the tool after performing various col-laborative tasks. The results of the first experiment showed that
the quality of the scenario profiles developed by distributed teamsusing a groupware tool were significantly better than those devel-oped by face to face teams. The results of the second study showedthat the participants found the use of the groupware tool positivein distributed meetings.
Falessi et al. [32] reported the results of a controlled experimentand its replication [33] with the aim of analyzing the perceivedutility of the information associated with Architectural DesignDecisions Rationale Documentation (DDRD), an artifact with whichto document architectural design decisions. The participants wererequested to perform different activities (described using theDDRD Use Cases) and to then rank the categories of informationin DDRDs (e.g., issue, decision, status, constraints, related require-ments). The results showed that the perceived importance of thedifferent information categories in DDRDs depend on the activitythat the DDRD is helping to conduct [32], and that the DDRDshould contain only the information required to perform thatactivity [33].
Ali Babar [8] presented the assessment of the ArchitecturalLevel Security Analysis Framework (ALSAF), performed with a pilotstudy and a quasi-experiment. The goal of the study was to identifysecurity attributes and the security design patterns that are suit-able to attain these attributes based on a given list of security prop-erties. In this study, the control group only had access to thesoftware requirement specification (SRS), whereas the treatmentgroup had access to both the SRS and ALSAF. The results show thatthe participants using ALSAF obtained significantly better resultsas regards identifying security attributes and patterns, and alsothat they found ALSAF useful when performing these tasks.
Martens et al. [53] reported a series of three separated con-trolled experiments comparing the accuracy and required effortwhen applying different software architecture performance evalu-ation methods. The aim of the study was to compare three mono-lithic performance evaluation methods (i.e., SPE, CP and umlPSI)with the component based performance evaluation method(PCM). The results showed that, in terms of accuracy, PCM, SPEand CP produced similar results, and that umlPSI produced overestimations, whereas the application of PCM required more effort.
Although the intention of the aforementioned studies was togather empirical knowledge through experiments or quasi experi-ments, it will be observed that the majority of them are focused onspecific aspects of the architecture evaluation process or onassessing how a given treatment improves performance. There is,however, a lack of empirical validations of the methods and toolsbeing proposed, through a comparison with the existing body ofknowledge.
Finally, there are several works reporting experiences on theapplication of ATAM with different purposes (i.e., [10,63,73]).Reijonen et al. [63] presented an experience report describing theapplication of ATAM in eleven architecture evaluations in realindustrial projects. In this work, the authors provide a detaileddescription of the application steps, the schedule followed in theevaluations, the problems confronted during the evaluation andthe main benefits perceived by the stakeholders. Svahnberg andMartensson [73] reported their experiences in academic architec-tural evaluations in student projects. They applied a lightweightsoftware architecture evaluation method adapted from SAAMand ATAM. The architecture evaluations were applied both toassess the architectures of the projects developed by the studentsand to teach software architecture evaluation. Barbaci et al. [10]presented a case study in which a product line architecture inthe avionics domain was evaluated. These works contributetowards demonstrating the feasibility of ATAM; all of them high-light the importance of conducting software architectureevaluations, emphasize the importance of the utility tree (althoughReijonen et al. point out the difficulties found by the evaluators

408 J. Gonzalez-Huerta et al. / Information and Software Technology 57 (2015) 405–429
during its creation) and how critical the quality of scenarios is tothe success of the evaluation.
2.3. Discussion
The analysis of the aforementioned studies has allowed us toidentify some limitations in the empirical validation of softwarearchitecture evaluation methods, such as: (i) the low number ofempirical studies assessing the approaches being defined; (ii) thefact that the quantitative and qualitative comparisons with exist-ing methods has been neglected; and (iii) the fact that the majorityof the empirical studies tend to be isolated and not replicated.
The first limitation is in line with the findings of Ali Babar et al.[9], Falessi et al. [31] and Dyba et al. [29] in which the authorsclaim that the majority of the approaches being presented in thesoftware architecture field lack empirical validation. The few avail-able validations of the approaches being proposed are based on toyexamples, case studies or experience reports, as discussed byQureshi et al. [62], and few of them are validated through con-trolled experiments. Moreover, in this field we have found thatmost of the software architecture papers used incorrect terminol-ogy (e.g., they used the term experiment rather than experiencereport, as in the works of Niemela and Immonen [59] or Martesson[54]; or the term case study when documenting proof of conceptswithout methodical or data extraction descriptions [62]).
The second limitation concerns the lack of quantitative or qual-itative comparisons with existing methods. The proposed methodsand tools that are defined have not been compared with the exist-ing alternatives in the software architecture evaluation body ofknowledge. There are various frameworks (see Section 2.1) withwhich to classify software architecture evaluation methods; how-ever, there is a lack of empirical studies in which the authors ana-lyze how the methods perform as compared with similar ones.
The third limitation is in line with studies that have been per-formed in the Software Engineering field, such as that by Sjøberget al. [71]. This work claims that only 20 out of 113 controlledexperiments are replications. A replication is the repetition of anexperiment to confirm findings or to ensure accuracy. There aretwo types of replications: close replications, also known as strictreplications (i.e., replications that attempt to keep almost all theknown experimental conditions much the same or at least verysimilar), and differentiated replications (i.e., replications that intro-duce variations in essential aspects of the experimental conditions,such as executions of replications with different kinds of partici-pants) [52]. Both types of replications are necessary to achieve agreater validity of the results obtained from empirical studies.The problem of dealing with experimental replications has beenaddressed with the concept of the family of experiments. Althoughmany empirical studies have been applied in the software architec-ture evaluation field, few families of experiments have beenreported so far.
3. Software architecture evaluation methods
The two software architecture evaluation methods evaluated inour family of experiments are: the ATAM [50] and our proposalQuaDAI [40], both of which are introduced in the followingsubsections.
Both ATAM and QuaDAI can be classified as early architectureevaluation methods, capable of deal with multi-attributeevaluations, following the taxonomy of architectural evaluationmethods described by Roy and Graham [66]. Although ATAMwas initially defined to assess general purpose software architec-tures, it can be used in an SPL environment to assess both theproduct line architecture and the product architectures at
derivation time at various stages of SPL development (conceptual,before code, during development or after deployment) [23,56,67]taking into account multiple quality attributes, as is shown invarious experience reports (e.g., [10,63,67,73]). QuaDAI is,meanwhile, focused on the evaluation and improvement ofproduct architectures once they have been derived from theproduct line architecture.
We opted for ATAM as the baseline for the following reasons:
– It is a widely-used software architecture evaluation method[54].
– It has been widely applied and validated [66] in both industry(e.g., [63,10]) and academic environments (e.g., [73]).
– It is capable of addressing multiple attribute analysis [1].– It performs tradeoff analyses among quality attributes and
design decisions [50]. ATAM extend previous methods such asSAAM to cover the tradeoff among competing quality attributes[54].
– It is capable of reengineering the software architecture andemploys activities to extract architectural styles or design pat-terns [66] whereas other architectural evaluation methods(e.g. ARID) are focused on evaluating the suitability of a portionof the architecture to be used by the developers to completetheir tasks [22].
3.1. ATAM
The purpose of ATAM is to assess the consequences of architec-tural design decisions in the light of quality attributes [50]. ATAMassists in foreseeing how an attribute of interest can be affected byan architectural design decision. The quality attributes of interestare clarified by analyzing the stakeholder’s scenarios in terms ofstimuli and responses. Finally, ATAM helps to define which archi-tectural approaches may affect quality attributes of interest. ATAMmakes use of utility trees to translate the business drivers of a sys-tem into concrete quality attribute scenarios. Utility trees are ahierarchical structure in which the utility of a system is specifiedin terms of quality attributes which are further broken down intorequirements and scenarios.
The main goals of ATAM are to elicit and refine the architec-ture’s quality goals; to elicit and refine the architectural designdecisions and to evaluate the architectural design decisions inorder to determine whether they address the quality attributerequirements satisfactorily.
ATAM consists of nine steps that can be separated into fourgroups: (i) Presentation, which involves the presentation of themethod, the business drivers and the architecture being evaluated;(ii) Investigation and analysis, which involves the identification ofarchitectural approaches, the generation of the quality attributeutility tree and the analysis of the architectural approaches basedon the high-priority scenarios identified in the utility tree; (iii)Testing, which involves a brainstorming and prioritization of thescenarios elicited in the utility tree, the analysis of the architecturalapproaches taking into account the high priority scenarios of theutility tree and the definition of the approaches to be applied,the risks and non-risks, sensitivity points and tradeoff points;and (iv) Reporting, which involves presenting the results of ATAM.A summary of these phases and steps and the main generated arti-facts is shown in Fig. 1.
Finally, the outputs of ATAM are: (i) a prioritized statement ofquality attribute requirements; (ii) a mapping of approaches ontoquality attributes; (iii) a catalog of the architectural approachesidentified and used; (iv) risks and non-risks; (v) quality-attribute-specific analysis questions; and (vi) sensitivity pointsand tradeoff points [50].

Fig. 1. Summary of the ATAM phases and activities.
J. Gonzalez-Huerta et al. / Information and Software Technology 57 (2015) 405–429 409
3.2. QuaDAI
QuaDAI is a generic, integrated method for the derivation andimprovement of product architectures regardless the ArchitecturalDescription Language in which they are expressed or the domain. Itis based on an artifact (the multimodel [40]) that represents theSPL viewpoints and a process consisting of a set of activities con-ducted by model transformations. QuaDAI has been designed bytaking into account the weak points of existing architecture evalu-ation methods in order to improve their usability and effectiveness(e.g., the need for a highly experienced team: QuaDAI relies onknowledge reuse, which allows a less skilled evaluator to performarchitecture evaluations using the domain expert’s knowledge).
In QuaDAI, a multimodel permits the explicit representation ofrelationships among entities in different viewpoints. A multimodelis a set of interrelated models that represent the different view-points of a particular system. A viewpoint is an abstraction thatyields the specification of the whole system restricted to a partic-ular set of concerns, and it is created with a specific purpose inmind. In any given viewpoint it is possible to produce a model ofthe system that contains only the objects that are visible from thatviewpoint [11]. Such a model is known as a viewpoint model, orview of the system from that viewpoint. The multimodel permitsthe definition of relationships among model elements in thoseviewpoints, capturing the missing information that the separationof concerns could lead to.
The multimodel plays two different roles in SPL development:(i) in the domain engineering phase, during which the core assetbase is created, the multimodel explicitly represents the relation-ships among the different views; (ii) in the application engineeringphase, during which a final product is derived, the relationshipsdrive the different model transformation processes that constitutethe production plan [23] used to produce a product architecture.
The multimodel used to specify SPLs is composed of (at least)four interrelated viewpoints:
– The variability viewpoint, which expresses the commonalitiesand variability within the product line. Its main element is thefeature, which is a user-visible aspect or characteristic of asystem [23].
– The architectural viewpoint, which contains the architecturalvariability of the Product Line architecture that realizes theexternal variability of the SPL expressed in the variabilityviewpoint. This variability can be defined on the differentarchitectural viewpoints. It is expressed by means of the
Common Variability Language (CVL) [60], which is a genericlanguage for expressing variability on a modeling language. Itsmain element is the architectural variation point.
– The quality viewpoint, which includes a quality model for SPLdefined in [42]. This quality model extends the ISO/IEC 25000standard (SQuaRE) [47], thus providing the quality assuranceand evaluation activities in SPL development with support.The multimodel also permits the specification of the productline and the product specific NFRs as constraints defined overthe quality model, affecting characteristics, sub-characteristicsand quality attributes [42]. The NFRs can incorporate variabilityin terms of thresholds (i.e., the interval in which the productquality attribute levels can vary). The explicit representationof the NFRs in the multimodel provides a mechanism for theautomatic validation of NFR fulfillment once the softwareartifacts have been obtained [39].
– The transformation viewpoint, contains the explicit representa-tion of the design decisions made in the different model trans-formation processes that integrate the production plan for amodel-driven SPL. Alternatives appear in a model transforma-tion process when a set of constructs in the source modeladmits different representations in the target model. Theapplication of each alternative transformation could generatealternative target models that may have the same functionalitybut might differ in their quality attributes. In this work, wefocus on architectural patterns [18] and [28]. Architecturalpatterns specify the solutions to recurrent problems that occurin specific contexts [18]. They also specify how the system willdeal with one aspect of its functionality, impacting directly onthe quality attributes. Architectural patterns can be representedas architectural transformations as a means to ensure the qual-ity of the product architectures.
The QuaDAI process includes different activities in which themultimodel is used to drive the model transformation processesfor the derivation, evaluation and improvement of product archi-tectures in SPL development. The activity diagram of the processsupporting the approach is shown in Fig. 5(a). It consists of the fol-lowing activities:
– Product Architecture Derivation. The product architecture isderived from the product line architecture in the ProductArchitecture Derivation activity, taking as input the product linearchitecture, the quality, the variability and the architecturalviewpoints of the multimodel, and the product configuration

410 J. Gonzalez-Huerta et al. / Information and Software Technology 57 (2015) 405–429
containing both the product specific features and the product-specific NFRs selected by the application engineer (seeFig. 5(b)). In this activity, the decision as to which architecturalvariation points should be resolved in the product architectureis made by considering: (i) the composition relationshipsbetween features and architectural variation points; (ii) theimpact relationships between architectural variation pointsand NFRs; and (iii) the impact relationships between featuresand NFRs. The transformation generates the CVL resolutionmodel that is used to generate the first version of the candidatearchitecture, through a CVL transformation [39]. This activitycomprises the configuration of the product, the consistencychecking of the configuration, taking into account the variabilityand quality constraints but also the inter-viewpoint relation-ships. This validation, together with a consistency checking ofthe obtained models allows us to assure that the obtained prod-uct architecture is well-formed [39]. Once derived, the productarchitecture should be evaluated in order to analyze the attain-ment of non-functional requirements. The QuaDAI derivationactivity has been preliminary empirically validated throughtwo case studies [39].
The activities of the QuaDAI process are illustrated through theuse of a running example: a SPL from the automotive domain thatcomprises the safety critical embedded software systems responsi-ble for controlling a car. Fig. 3 shows the product architecturederived from the product line architecture (shown in Fig. 2) gener-ated by the Product Architecture Derivation for the automotiveexample when the application engineer selects only the anti-lock_brake_system feature and introduces the product specificNFRs, which come from the system’s requirements, demanding afault tolerance of the ABS greater than 99.5% and restricting theABS latency time to 5 ms.
– Product Architecture Evaluation. In the second model transfor-mation process, the Product Architecture Evaluation applies thesoftware measures described in the quality view of the multi-model to the product architecture in order to evaluate whetheror not it satisfies the desired NFRs. This evaluation actuallymeasures the degree of fulfillment of the NFRs defined duringthe configuration on the product architectural models [39].Thistransformation takes as input the product architecture derived,the product specific NFRs and the quality view of the multimod-el containing the metrics to be applied in order to measure theNFRs, generating as output an evaluation report (see Fig. 5(b)).The method relies on analyzing the derived product architec-tural models instead of relying on a set of predicted values,based on a previous measurement process of a sample of prod-ucts as in [64,36,69]. Those approaches could have scalability
Fig. 2. Excerpt of a produ
concerns, due to the exponential growth of the number of con-figurations as a function of the number of features and they alsofail on managing those products that refine or extend the NFRsof the product line with delta requirements specific for theproduct under development. Following the automotive examplethe evaluation for the architecture shown in Fig. 3 may concludethat the architecture meets the latency NFR but that the faulttolerance NFR is not achieved, and architectural transforma-tions may thus be required.
– Product Architecture Transformation. Finally, in those cases inwhich the non-functional requirements cannot be achieved byexercising the architectural variability mechanisms in the thirdactivity, the Product Architecture Transformation automaticallyapplies pattern-based architectural transformations to theproduct architecture. These architectural transformations canbe applied to different architectural viewpoints, depending onthe nature of the patterns being considered. The inputs of theProduct Architecture Transformation are the product architecture,the relative importance of the different NFRs and the transfor-mation view of the multimodel, containing the transformationsto be applied. It generates a product architecture as output in anattempt to cover the NFRs prioritized by the architect (seeFig. 5(b)). The architect introduces the relative importance ofeach NFR that the product must fulfill as normalized weightsranging from 0 to 1 as external parameters when executingthe transformation. The transformation process uses the rela-tive importance of each NFR and the impact relationshipsamong transformations and quality attributes to select thearchitectural transformation to be applied in order to improvethe architecture quality attribute levels. These architecturaltransformations may help achieving the NFRs. In the automo-tive example, if the architect selects both the latency and thefault tolerance as being of equal importance (i.e., with a weightof 0.5 for each one) the transformation process will select theTriple Modular Redundancy pattern (TMR). The architectureresulting from the application of the TMR pattern is shown inFig. 4.
The process iterates until the NFRs are achieved or when thearchitect detects that it is not possible to build the product withthe set of NFRs selected in the configuration (Fig. 5a(1)). Theevaluation process may result also in a renegotiation of the NFRswith the customer (Fig. 5a(2)). In this case, the product architec-ture should be re-evaluated to check the conformance with thenew NFRs. Finally, in some cases the architect should varysome architectural variation points to modify the candidateproduct architecture. For instance, in some cases the first candi-date architecture may imply the positive resolution of a set ofarchitectural variation points that may lead to a quality attribute
ct line architecture.

Fig. 3. Portion of the product architecture showing the ABS System.
Fig. 4. Product architecture after applying the TMR pattern.
J. Gonzalez-Huerta et al. / Information and Software Technology 57 (2015) 405–429 411
levels that are far above of a given NFR. Considering anothercombination of architectural variation points may also implythe fulfillment of that specific NFR but also other that werepreviously unfulfilled.
The multimodel and the use of model-driven principles duringthe QuaDAI process may help when dealing with large-scale prob-lems since: (i) it allows architects reorganizing alternative archi-tectural transformations in transformation groups [43] in thetransformation viewpoint of the multimodel so as to reduce thecomplexity of the tradeoff process that occurs in the domain engi-neering; (ii) automates the selection of the best alternative archi-tectural transformation to be applied given a set of competingNFRs in the product architecture transformation activity; (iii) auto-mates, through model transformations [39], the measurement pro-cess that determines whether the product architecture fulfills theNFRs reducing the complexity of the product architecture evalua-tion activity.
4. Overview of the family of experiments
In this section, we present the family of experiments con-ducted to empirically validate the evaluation and transformationactivities of QuaDAI. The methodology adopted is an extension ofthe five-steps proposed by Ciolkowski et al. [20], in which thefifth step, family data analysis, has been replaced with ‘‘familydata analysis and meta-analysis’’. Each experiment was designed
according to the experimental process proposed by Wohlinet al. [77].
4.1. Step 1: Experiment preparation
According to the Goal-Question Metric (GQM) paradigm [13],the goal of the family of experiments is to analyze the evaluationand transformation activities of QuaDAI and ATAM for the purposeof comparing them with respect to their effectiveness, efficiency,ease of use, usefulness and intention of use in order to obtain soft-ware architectures that meet a given set of quality requirementsfrom the viewpoint of novice software architecture evaluators inthe context of undergraduate and postgraduate students inComputer Science.
4.2. Step 2: Context definition
The context of the family of experiments is the quality evalua-tion of two software architectures carried out by novice evaluators.The context is defined by (i) the software architecture to be evalu-ated; (ii) the architectural evaluation method and (iii) the selectionof participants.
4.2.1. Software architecture evaluatedThe software architectures to be evaluated in the family of
experiments are two architectures from two domains: the software

Table 1Experimental objects details.
Software metrics
Architectural view NFRs Reliability Performance Architectural patterns
Object O1: ABS System Component & connector Reliability,performance
Failureprobability
Latency time Watchdog, homogenous redundancy, sanitycheck and triple redundancy [28]
Object O2: Savi application Deployment view Reliability,performance
Uptime Workload Load Balancer, symmetric cluster, asymmetriccluster, failover cluster [57]
412 J. Gonzalez-Huerta et al. / Information and Software Technology 57 (2015) 405–429
architecture of an Antilock Braking System (ABS System) from anautomotive control system SPL and the software architecture ofthe Savi application (http://goo.gl/1Q49O), which is a mobile appli-cation for emergency notifications.
The architecture of the ABS System, represented through itsComponent and Connector view [21] expressed in AADL [34], wasselected as experimental object O1,2 and the Savi architecture, rep-resented through the Deployment view, was selected as experimentalobject O2. We also selected a set of four architectural patterns thatcan be applied to improve the quality attribute levels of interestfor each of the software architectures from two pattern catalogues([28] for the automotive domain and [57] for the emergency man-agement domain). The corresponding selected patterns are intendedto improve the specific NFRs specified in each experimental object.Some of these architectural patterns may impact on several qualityattributes of interest, so as to force the subjects in performing trade-offs. The experimental tasks include the evaluation of these qualityattributes by means of two software metrics in each experimentalobject before and after applying the architecture evaluation meth-ods. Table 1 shows the details of the experimental objects used inthe individual experiments. The rationale behind the selection ofthese two architectures is to have different problems, in differentdomains and that deal with aspects represented in different archi-tectural viewpoints, so as to have an analysis that is not influencedby one specific domain or one specific architectural concern. In addi-tion, these two architectures are comparable in terms of size andcomplexity.
4.2.2. Architecture evaluation methods comparedIn this family of experiments we focus on the QuaDAI activities
that occur after obtaining the product architecture: the ProductArchitecture Evaluation and the Product Transformation activities.These activities deal with the evaluation and improvement ofproduct architectures, which are aligned with the main purposeof ATAM. Before its execution, the authors first performed thedomain expert role for the QuaDAI method, which includes (i)the selection of the architectural patterns for each domain; (ii)the selection of the quality attributes and the metrics that measureeach quality attribute; (iii) the execution of the tradeoff processbetween architectural patterns and quality attributes for theQuaDAI application and (iv) the storage of the tradeoff results inthe multimodel. These activities were carried by the authors sinceit was required for the subjects to have a full description of theproblem, and since we did not expect the subjects to have a deepknowledge on the domain to identify the metrics and architecturalpatterns and be able to perform this tradeoff.
The activities selected from the ATAM method to be included asexperimental tasks were the analysis of Analysis of ArchitecturalApproaches from the investigation and analysis phase, the ScenarioPrioritization and the second Analysis of Architectural Approachesfrom the testing phase. Before its execution, the authors first per-formed the architect role to identify the architectural approaches,
2 An excerpt of the description of the architecture is shown in Appendix A.1.1.
along with the first step performed by the evaluators: the genera-tion of the utility tree. These activities were carried by the authorssince, as for QuaDAI, it was required for the subjects to have a fulldescription of the problem, and since we did not expect the partic-ipants to have a deep knowledge on the domain to identify thearchitectural approaches by themselves from the scratch.
In order to have a fair comparison between both methods, weprovided the multimodel in the case of QuaDAI containing thearchitectural transformations and their impact on the NFRs andthe utility tree and the architectural approaches in the case ofATAM.
4.2.3. Participants selectionThe context of this family of experiments is the quality evalua-
tion of software architectures from the perspective of novice archi-tecture evaluators.
Although experienced architecture evaluators enhance thevalue of the evaluation [22], we focus on the profile of noviceevaluators since one of our goals is to provide a software archi-tecture evaluation method that will help less experiencedevaluators to perform architecture evaluation, by reusing thedomain expert’s knowledge. The following groups of participantswere therefore identified in order to facilitate the generalizationof results:
– Undergraduate students, all Computer Science students at theUniversitat Politècnica de València. These students attendedthe ‘‘Advanced Software Engineering’’ course from September2012 to January 2013, during which time they had 8 h of lec-tures on software architectures and architecture evaluation.
– Master’s students, enrolled on the Software Engineering Master’sdegree program at the Universitat Politècnica de València.These students attended the ‘‘Quality of Web Information Sys-tems’’ course from February 2013 to July 2013. One of the maintopics on this course is the quality assurance and control andincludes more than 8 h of theoretical content concerning soft-ware architectures and architecture evaluation.
– Undergraduate students, all Computer Science students at theUniversitat Politècnica de València. These students attendedthe ‘‘Software Quality’’ course from February 2013 to July2013. One of the main topics on this course is the quality assur-ance and control and also includes more than 8 h of theoreticalcontent concerning software architectures and architectureevaluation.
– Undergraduate students, all Computer Science students at theUniversità degli Studi della Basilicata. These students attendedthe ‘‘Software Engineering’’ course from March 2013 to June2013. One of the main topics on this course is modeling ofobject-oriented systems using the UML. The students had expe-rience in object-oriented programming and Web technology.
We have focused on the profile of final-year undergraduate andMaster’s students since it has been demonstrated that, undercertain conditions, there is no great difference between this type

3 All the materials are available for download at http://users.dsic.upv.es/~jagonz-alez/IST/family.html.
J. Gonzalez-Huerta et al. / Information and Software Technology 57 (2015) 405–429 413
of students and professionals [12]; [44], and that they can be con-sidered as the next generation of practitioners [51].
We did not establish a classification of participants based ontheir architecture evaluation experience, since neither the under-graduates nor the Master’s students had a previous backgroundin conducting architectural evaluations.
4.3. Step 3: Experimental tasks and material
The experimental tasks were structured to allow the compar-ison of both methods, starting with the software architecture tobe evaluated, a set of NFRs (which are documented in differentways depending on the method), and a set of patterns. Weselected a set of NFRs (reliability and performance) which arecritical in the automotive domain [17] and in the mobile applica-tions domain [35]. Depending on the method, each task wascomposed of the method activities that help to achieve itspurpose. After applying the method, the participants had to fillin a post-experimental questionnaire with subjective questionsregarding the method.
4.3.1. ATAM experimental tasksThe experimental tasks carried out by the participants when
applying ATAM included two measurement processes, the analysisof architectural approaches (both on the investigation and analysisand on the testing phase) and the scenario prioritization activitiesof ATAM (see Section 3.1). The system’s software architecture,the business goals, the architectural approaches to be consideredand the utility tree of the system were provided as input as a resultof the activities performed by the authors since they were part ofthe problem description (see Section 4.2.2). The experiment con-sisted of three experimental tasks, which in the case of ATAM werestructured as follows:
� The first experimental task consisted of a first measurement ofthe architecture to check the fulfillment of the NFRs describedin the utility tree. This helps the participants to understandwhether the architecture meets the NFRs. During this activity,the participants had first to examine the documentation ofthe metrics to be applied and then to calculate the metrics val-ues by introducing the values required in an excel file that auto-mate the metric calculation.� The second experimental task consisted of three ATAM activi-
ties: (i) the first analysis of architectural approaches, in whichthe participants had to analyze how the architecturalapproaches identified support the scenarios and attributes onthe utility tree; (ii) the prioritization of scenarios activity, inwhich the participants had to assign priorities to the utility treescenarios and; (iii) the second analysis of the architecturalapproaches, in which the participants had to select the architec-tural pattern to be applied.� Finally the third experimental task consisted of the final mea-
surement of the modified architecture after the application ofpatterns in order to check the fulfillment of the NFRs describedin the utility tree by following the same procedure than in thefirst measurement process.
4.3.2. QuaDAI experimental tasksThe experimental tasks carried out by the participants when
applying QuaDAI included two executions of the Product Architec-ture Evaluation activity and the Product Architecture Transformationactivity (see Section 3.2). The system’s software architecture, thesystem’s NFRs and the multimodel with the tradeoff among archi-tectural transformations and quality attributes were provided asinput as a result of the activities performed by the authors since,as in the case of the inputs of the ATAM method, it is part of the
problem description (see Section 4.2.2). The experiment consistedof three experimental tasks, which in the case of QuaDAI werestructured as follows:
� The first experimental task consisted of a first application of theQuaDAI’s Product Architecture Evaluation activity, in whichthe participants performed a first measurement of the architec-ture to check the fulfillment of the NFRs. During this activity,the participants had first to examine the documentationof the metrics to be applied and then to calculate the metricsvalues by introducing the values required in an excel file thatautomate the metric calculation.� The second experimental task consisted of the QuaDAI’s Archi-
tectural Transformation activity, in which the participants alsohad to introduce the relative importance of the NFRs as weightsranging from 0 to 1. These values were introduced by the partic-ipant in the excel file that contains the multimodel and thatreturns which pattern was selected based on that information.� Finally, the third experimental task consisted of a second appli-
cation of the QuaDAI’s Product Architecture Evaluation activity,in which the participants performed the final measurement ofthe modified architecture after the application of patterns inorder to check the fulfillment of the NFRs by following the sameprocedure than in the first measurement process.
The experimental tasks only comprised one iteration of themethod due to the need of defining a set of experimental tasks thatallow us to compare the final results of the process.
4.3.3. Experimental materialsThe experimental material3 was composed of a set of documents
required to support the experimental tasks and the training sessions,along with the post-experimental questionnaire.
The training materials included: (i) a set of slides containing theintroduction to software architectures, architectural patterns, andsoftware architecture evaluation; (ii) a set of slides describingthe QuaDAI method, with an example of its application which alsointroduced the use of the excel files which partially automate themetrics calculation; (iii) a set of slides describing the ATAMmethod, along with an example of its application.
The documents supporting the experimental tasks included:
– Four kinds of booklets which covered the four possible combi-nations of both evaluation methods and experimental objects(QuaDAI-O1, QuaDAI-O2, ATAM-O1, ATAM-O2). The purposeof these booklets was to (i) describe the experimental tasks tobe performed; (ii) describe the systems, the architecture of eachsystem and the NFRs to be fulfilled; and (iii) gather the datafrom each experimental task. An excerpt of the architecturaldescription contained on the booklet can be found in AppendixA.1.1.
– Two appendixes (O1 and O2) containing the description of thearchitectural pattern to be applied. The description of each pat-tern contains its name, the context in which the pattern can beapplied, the description of the problem to be solved, the patternstructure and the consequences in terms of benefits anddrawbacks. Two examples of these patterns can be found inAppendix A.1.3.
– Two appendixes (O1 and O2) containing the description of thesoftware metrics that measure the systems’ NFRs (Both forATAM and for QuaDAI). An example of these metrics can befound in Appendix A.1.4.

Fig. 5. Overview of the QuaDAI process.
414 J. Gonzalez-Huerta et al. / Information and Software Technology 57 (2015) 405–429
– Two appendixes (O1 and O2) containing the description of thearchitecture after the application of each pattern (Both forATAM and for QuaDAI). An example of the resulting architectureafter the application of a pattern is shown in Appendix A.1.5.
– Two Excel files (O1 and O2) which automate the calculations ofthe application of the different metrics (Both for ATAM and forQuaDAI). The complexity of the calculations required that thecalculations of each metric were partially automated. The par-ticipants had to fill in the data required by each metric (whichwas provided in the booklet) and they then obtained the finalresult, which they had to evaluate.
– Two appendixes containing a detailed explanation of each eval-uation method (QuaDAI and ATAM). The QuaDAI appendixincluded guideline to help the participants in the definition ofthe importance of the quality attributes.
– Two Excel files (O1 and O2) which included the selection ofalternative architecture transformations based on the qualityattributes’ relative importance selected by the participant, tobe used during the application of the QuaDAI method.
The post-experimental questionnaire contained a set of closed-questions that allowed the participants to express their opinionof the method’s ease of use, usefulness and their intention touse that method in the future. The closed questions included inthe questionnaire can be found in Appendix A.2. The order of thequestions in this questionnaire was shuffled in order to preventsystemic response bias, and the questions were formulated tobecome negative statements on the left-hand side so as to avoidmonotonous responses [45]. We also included two open ques-tions in order to obtain the participants’ feedback as regards thechanges that they would make to improve the methods and theirreasons for using a given method in the future.
4.4. Step 4: Individual experiments
The family of experiments is summarized in Fig. 6. The originalexperiment (UPV1) [40] was replicated [41] so as to obtain more
evidence for the results obtained in the experiment and to verifythe remaining issues. The second experiment (i.e., UPV2) wasdifferentiated internal replication of the original experiment per-formed in different settings and the third experiment (i.e., UPV3)as a differentiated internal replication of the second experiment(i.e., UPV2).
The fourth experiment (UNIBAS) was an external replication ofthe third experiment (i.e., UPV3) performed at the Università degliStudi della Basilicata in Italy so as to verify the findings obtained inthe three previous experiments and to avoid any author bias thatmay have been present in the previous studies.
4.5. Step 5: Family data analysis and meta-analysis
The results of each individual experiment were collected usingthe booklets and the questionnaire containing the closed-questions, and they were then analyzed. For testing the hypotheseswe applied parametric one-tailed t-tests for testing these variablesthat were normally distributed and the non-parametric MannWhitney test when the data was not normally distributed. For test-ing whether or not the data was normally distributed we appliedthe Shapiro-Wilk test since in each individual experiment the sam-ple size was less than 50 [24].
We also performed a meta-analysis, based on the Hunter-Schmidt method [46], based on the point biserial correlation r, inorder to aggregate the results, since the experimental conditionswere very similar for each experiment. This analysis, which isdetailed in Section 7.2, enabled us to obtain stronger results andto extract more general conclusions with regard to each individualexperiment.
5. Design of individual experiments
In this section, we describe the characteristics of each experi-ment in the family of experiments. To avoid redundancies, we onlydiscuss some clarifications of the original experiment with regard tothe information presented in the previous section and the differences

1st Experiment [41] 2nd Experiment [42] 3rd Experiment 4th ExperimentUPV1
28 Undergraduate Students
(Published at [41])
UPV2 16 Master’s Students
Differen�ated Internal Replica�on of UPV1
(Published at [42])
UPV3 36 Undergraduate Students
Differen�ated Internal Replica�on of UPV2
UNIBAS12 Undergraduate Students
Differen�ated External Replica�on of UPV3
Main factor: Method (QuaDAI vs. ATAM)Other factors: Experimental Objects (O1 and O2)Dependent variables: Effec�veness, Efficiency, Perceived Ease of Use, Perceived Usefulness and Inten�on to Use
Fig. 6. Overview of our family of experiments.
J. Gonzalez-Huerta et al. / Information and Software Technology 57 (2015) 405–429 415
between the experiments. We conclude the section by discussingissues related to the documentation used in the external replicationand the means of communication used by the experimenters.
5.1. The original experiment (UPV1)
5.1.1. PlanningContext of the experiment: we used both of the experimental
objects (O1 and O2) described in Section 4.2.1 and applied the soft-ware architecture evaluation methods described in Section 4.2.2.We selected 31 undergraduate students as participants.
Selection of variables: The independent variable of interest inthis family of experiments is the use of each architecture evalua-tion method with nominal values: ATAM and QuaDAI.
There are two objective dependent variables:
– Effectiveness of the method, which was calculated as a functionof the Euclidean Distances between the NFR values attained bythe architecture being evaluated by the participant and theoptimal set of values that it was possible to attain when select-ing the architectural pattern that best fits the NFRs for eachexperimental object.
– Efficiency, which is calculated as the ratio between the effective-ness and the total time spent on applying the evaluationmethod.
Effectiveness is calculated by applying formula (1) to normal-ized Euclidean distances, were p is the vector of NFRs’ values asobtained by the participant. The normalization is calculated byapplying formula (2) to the Euclidean distances, which is calculatedby applying formula (3) and returns a value ranging from 0 to 1.Formula (3), calculates the distance between two n-dimensionalvectors of NFRs values, p and q Normalization is required to avoidthe effects of the scales of the metrics that measure each NFR. Theoptimal function in formulas (1) and (2) returns the optimal valuesof the NFRs that can be achieved for a given experimental object.The Max function returns the maximal distance D observed for agiven experimental object. The values for effectiveness range from0 (i.e., the minimum possible effectiveness, when the distance D isthe maximum observed for all the participants) to 1 (i.e., the max-imum effectiveness, when the distance D is 0).
Effectiveness ðpÞ ¼ 1� NormðDðp; optimalðObjectÞÞ ð1Þ
NormðDðp;OptimalðObjectÞÞ ¼ Dðp;OptimalðObjectÞÞMaxðObjectÞ ð2Þ
Dðp; qÞ ¼
ffiffiffiffiffiffiffiffiffiffiffiffiffiffiffiffiffiffiffiffiffiffiffiffiffiffiffiXn
i¼1
ðpi � qiÞ2
vuut ð3Þ
For example, if the optimal values for a given experimentobject Oi are q = (0.5, 50) and a given participant obtains anarchitecture whose NFRs are p = (0.7,51) the Euclidean distance
D ¼ffiffiffiffiffiffiffiffiffiffiffiffiffiffiffiffiffiffiffiffiffiffiffiffiffiffiffiffiffiffiffiffiffiffiffiffiffiffiffiffiffiffiffiffiffiffiffiffiffiffiffiffiffiffið0:7� 0:5Þ2 þ ð51� 50Þ2
q¼ 1:02. If the maximum dis-
tance for this specific experimental object is 1.5;NormðDðp;OptimalðOiÞÞ ¼ 1:02=1:5 ¼ 0:68 and the participantseffectiveness is calculated as: EffectivenessðpÞ ¼ 1� 0:68 ¼ 0:32.
There are also three subjective dependent variables, which arebased on the Technology Acceptance Model (TAM) [27], sinceTAM is one of the most widely applied theoretical models whenanalyzing user acceptance and usage behavior of emerging infor-mation technologies, and has empirical support through valida-tions and replications [76]. The perceived efficacy [27] of themethod can be broken down into the following subjective depen-dent variables:
– Perceived Ease of Use, which refers to the degree to which eval-uators believe that learning and using a particular method willbe easy.
– Perceived Usefulness, which refers to the degree to which evalu-ators believe that using a specific method will increase their jobperformance within an organizational context.
– Intention to Use, which refers to the extent to which an evalu-ator intends to use a particular method. This last variable rep-resents a perceptual judgment of the method’s efficacy – thatis, whether it is cost-effective and is commonly used to predictthe likelihood of acceptance of a method in practice.
These three subjective variables were measured by using a Lik-ert scale questionnaire with a set of 13 closed-questions: 3 ques-tions for perceived ease of use (PEOU), 6 questions for perceivedusefulness (PU) and 4 for intention to use (ITU). The closed-ques-tions were formulated by using a 5-point Likert scale, using theopposing statement question format. In other words, each questioncontains two opposite statements representing the maximum andminimum possible values (5 and 1), where the value 3 is consid-ered to be a neutral perception. The aggregated value of each sub-jective variable was calculated as the arithmetical mean of theanswers to the questions associated with each subjective depen-dent variable.
Hypothesis formulation: We formulated the following nullhypotheses, which were formulated in a one-tailed manner, sincewe wanted to analyze the effect of the use of QuaDAI on the sub-jective variables.
Each null hypothesis and its alternative are presented asfollows:
– H10: There is no significant difference between the effectivenessof QuaDAI and ATAM / H1a: QuaDAI is significantly more effec-tive than ATAM.
– H20: There is no significant difference between the efficiency ofQuaDAI and ATAM / H2a: QuaDAI is significantly more efficientthan ATAM.
– H30: There is no significant difference between the perceivedease of use of evaluators applying QuaDAI and ATAM / H3a:QuaDAI is perceived as easier to use than ATAM.

Table 2Experimental design.
Groups (sample size = 4n participants)
G1 (n participants) G2 (n participants) G3 (n participants) G4 (n participants)
1st Session ATAM applied in O1 ATAM applied in O2 QuaDAI applied in O1 QuaDAI applied in O22nd Session QuaDAI applied in O2 QuaDAI applied in O1 ATAM applied in O2 ATAM applied in O1
416 J. Gonzalez-Huerta et al. / Information and Software Technology 57 (2015) 405–429
– H40: There is no significant difference between the perceivedusefulness of QuaDAI and ATAM / H4a: QuaDAI is perceived asmore useful than ATAM.
– H50: There is no significant difference between the intention touse of QuaDAI and ATAM / H5a: QuaDAI is perceived as morelikely to be used than ATAM.
Experimental design: The experiment was planned as a bal-anced within-participant design with a confounding effect, signify-ing that the same participants applied both methods with bothexperimental objects in a different order. We established fourgroups (each of which applied one method to one object) and theparticipants were randomly assigned to each group.
Table 2 shows the experimental design schema used in all theindividual experiments. The within participants experimentaldesign is intended to minimize the impact of learning effects onthe results, since none of the participants repeat any treatmentor experimental object during the execution. Other factors whichmay also have been present needed to be controlled, since theymight have influenced the results, i.e., the complexity of experi-mental objects. The comprehension of the architecture to be eval-uated, the NFRs, the metrics evaluating these NFRs and thearchitectural patterns may have affected the application of bothmethods. We attempted to alleviate the influence of this factorby selecting two representative software systems with softwarearchitectures, NFRs, software metrics and architectural patternsof a reasonable complexity. The complexity of the patterns andmetrics selected made them suitable for application in the timeslot available for the execution of the experiments.
Instrumentation: the documents presented in Section 4.3 wereused to support the experimental tasks (4 data gathering docu-ments, 4 appendices and 1 questionnaire and 3 Excel files) andthe training material (3 slide sets).
4 The control questions are included in the booklet (which is available at http://users.dsic.upv.es/~jagonzalez/IST/family.html) and should be answered by the par-ticipants after reading the pattern description for the questions regarding the patternsand before the first measurement for the questions regarding the metrics.
5.1.2. Operation and executionThis section describes the experimental operation, including the
preparation, the execution, the data recording and the datavalidation.
With regard to the operation of the experiment, the experimentwas planned to be conducted in three sessions (Table 3 shows thedetails for each day). On the first day, the participants were givencomplete training on the methods to be applied and also on thetasks to be performed in the execution of the experiment. On thesecond and third days, the participants were given an overviewof the training before applying one evaluation method to anexperimental object (O1 or O2). We established a slot of 90 minwith no time limit for any of the methods to be applied. However,we allowed the participants to continue the experiment eventhough these 90 min had passed in order to avoid a possible ceilingeffect [70].
With regard to the experiment execution, the experiment tookplace in a single room, and no interaction between participantswas allowed. The questions that arose during the session wereclarified by those conducting the experiment.
With regard to the data validation, we verified that one of theparticipants had not completed the 2nd session and that it wastherefore necessary to eliminate this data point. Since we had 30
participants distributed in four groups, it was necessary to discardtwo participants (who did not represent outliers, they were simplyselected randomly) in order to maintain the balanced design,shown in Table 2 (i.e., having exactly the same number of partici-pants in each group), consisting of a total of 28 participants, withseven samples in each group.
5.2. The second experiment (UPV2)
This experiment (first replication) was different to the originalexperiment in three aspects:
– Participant selection: The participants were 19 Master students.They attended the ‘‘Quality of Web Information Systems’’course, and whose profile is described in Section 4.2.3.
– One level of an NFR in the experimental object O2 was alsochanged since in this experimental object it was easier to findthe best solution (100% of the participants had selected the bestpattern when dealing with O2 in the original study) as com-pared to the experimental object O1 (only 71% of the partici-pants had selected the best pattern, regardless of the method).
– Control questions: We included a set of control questions4 inthe experimental material in order to analyze the comprehensionof the patterns and the metrics being applied. These questionshelped the participants to focus on understanding the patternsand metrics and allowed us to control their comprehension ofthe problem. These questions did not influence the experimentexecution and results; their purpose was solely to control thecomprehension of the patterns and metrics.
With regard to the preparation of the experiment, the experi-ment was also planned to be conducted by following the scheduleshown in Table 3. As in the original experiment, the experimenttook place in a single room and no interaction between partici-pants was allowed. With regard to the data validation, in orderto maintain a balanced design, it was necessary to discard the datafrom three participants (who did not represent outliers, they weresimply selected randomly), consisting of a total of 16 participants –4 samples in each group.
5.3. The third experiment (UPV3)
This third experiment (second replication) was a replication ofUPV2. The difference between this experiment and UPV2 was theparticipants selected. The participants were 40 undergraduate stu-dents. They attended the ‘‘Software Quality’’ course, and whoseprofile is described in Section 4.2.3.
The preparation and execution of the experiment were thesame as those for UPV2 since the same three day planning was fol-lowed. With regard to the data validation, we verified that threeparticipants had not completed the 2nd session and that it wastherefore necessary to eliminate their first exercise. Since we had

Table 3Schedule of the first experiment.
1st Session (120 min) Training on software architecture evaluation using ATAM and QuaDAI
2nd Session (120 min) Software architecture evaluation using ATAM and QuaDAI (short training)QuaDAI in O1 QuaDAI in O2 ATAM in O1 ATAM in O2QuaDAI Questionnaire ATAM Questionnaire
3rd Session (120 min) Software architecture evaluation using ATAM and QuaDAI (short training)ATAM in O2 ATAM in O1 QuaDAI in O2 QuaDAI in O1ATAM Questionnaire QuaDAI Questionnaire
J. Gonzalez-Huerta et al. / Information and Software Technology 57 (2015) 405–429 417
37 participants distributed in four groups, it was necessary to dis-card one additional participant (who did not represent an outlier,and was simply selected randomly) so as to maintain the samenumber of samples per group, consisting of a total of 36 partici-pants, with nine samples in each group.
5.4. The fourth experiment (UNIBAS)
The fourth experiment (third replication in our family of exper-iments) is an external replication of UPV3. UNIBAS was differentfrom UPV3 in three respects:
– Participants Selection: The participants were 12 third-yearComputer Science undergraduate students. They attended a‘‘Software Engineering’’ course.
– Experimental Tasks: we also included a third NFR and a newsoftware metric to be applied in order to make the tradeoffmore complex and less obvious. This also included a new NFRin the calculation of the effectiveness, following the expressionsdescribed in Section 5.1.1.
– Experimental Material: The material was translated fromSpanish into English, which was the language in which thereplication was conducted. English was not the mother tongueof the participants. This may have led to construct and externalvalidity threats because of the participants’ familiarity with theEnglish language. However, all of the participants had to pass anEnglish language exam to be enrolled in the second year of theirBachelor program, and the participants’ knowledge of Englishwas therefore almost homogenous, thus mitigating the possiblethreats mentioned above. For the first time, the participantsused the electronic version of the material rather than printedversions of the documents.
The preparation and execution of the experiment wereslightly different to those of the other experiments. A few daysbefore the experiment sessions, the participants attended threetraining sessions (180 min in total). In the first session(60 min), software architecture evaluation concepts were pre-sented, while ATAM and QuaDAI were introduced in the lattertwo training sessions, respectively. In order to better explainthe software architecture evaluation approaches that are theobject of our study, two running examples were presented tothe participants in these latter two sessions, which lasted about60 min each. It is worth mentioning that the experimentalschema used was the same as that used in the other experi-ments (see Table 3).
5.5. Documentation and communication
Issues such as documentation [72] and communicationbetween experimenters [75] may influence the success of a repli-cation. Deficiencies in documentation and laboratory packagesare one of the biggest sources of problems, and make it difficultto use replication to advance knowledge. As a possible solution,
the authors propose better laboratory packages and the use ofknowledge sharing mechanisms.
With regard to the documentation, the experimenters in thethree original experiments translated all the material initiallywritten in Spanish into English. This material included the post-experimental questionnaire, all the annexes documenting thepatterns, the metrics, the software architectures resulting fromthe application of patterns, and the excel spreadsheets automatiz-ing the application of each metric. We also included a set of slidesin the training material so as to explain the execution procedure.
In the document, we also discussed the rationale behind thedesign choices made in the original experiment, highlighting allthe information that was useful to reproduce the experimentalconditions. The experimenter involved in the external replicationswas also provided with previous publications concerning the origi-nal experiment [40,41]. The groups of experimenters additionallyexchanged the training material in order to reproduce the sameexperimental setting as used in UPV1, UPV2 and UPV3. Althoughdocumentation is a key factor in being able to carry out areplication, communication among experimenters is even moreimportant [75].
The interactions between the groups of experimenters weremainly by e-mail, and instant messaging tools were also occasion-ally used. The exchange of documentation was performed by usingfile sharing tools in the cloud.
6. Analysis of the results
In this section, we discuss the results of each individual exper-iment by quantitatively analyzing the data according to thehypotheses stated. All the results presented were obtained byusing the SPSS v20.
In this analysis, we used descriptive statistics, boxplots andstatistical tests in order to analyze the data collected from eachindividual experiment. In particular, since the sample size was lessthan 50, it was necessary to apply the Shapiro-Wilk test to checkwhether the data was normally distributed. The Shapiro-Wilk testallowed us to select the tests to be applied in order to check thehypotheses. When the data was normally distributed (Shapiro-Wilk p-value P0.05) we applied the parametric one tailed t-testfor independent samples [48]. However, when the data could notbe assumed to be normally distributed, we applied the non-parametric Mann-Whitney test [24]. The subjective variables wereanalyzed separately for each method, by comparing whether themean of the responses to the questions related to a variablewere significantly greater than the Likert neutral value. In our case,the ordinal scales ranged from 0 to 5 and the neutral value corre-sponded to 3.
We applied these tests because they are a set of robust, sensi-tive and accepted statistical tests that are widely applied in theSoftware Engineering community [55]. As is usual, in all the testswe decided to accept a probability of 5% of committing a Type-I-Error [77], i.e., rejecting the null hypothesis when it is actually true.Table 4 shows a summary of the overall results of the architecture

Table 4Summary of the family results.
UPV1 (N = 56) UPV2 (N = 32) UPV3 (N = 72) UNIBAS (N = 24)
Mean SD Mean SD Mean SD Mean SD
Effectiveness QuaDAI 0.684 0.361 0.797 0.209 0.708 0.351 0.631 0.277ATAM 0.626 0.388 0.461 0.448 0.462 0.404 0.297 0.285
Efficiency QuaDAI 0.029 0.013 0.023 0.007 0.025 0.015 0.011 0.006ATAM 0.019 0.018 0.014 0.015 0.015 0.014 0.006 0.007
Duration QuaDAI 25.36 7.258 34.63 7.974 30.11 8.671 69.83 23.486ATAM 31.11 9.154 39.19 11.356 33.03 9.032 73.17 29.735
Perceived Ease of Use QuaDAI 3.98 0.876 4.312 0.714 3.59 0.659 2.667 1.054ATAM 3.50 0.816 4.020 0.714 3.59 0.658 2.444 0.729
Perceived Usefulness QuaDAI 3.804 0.832 4.167 0.860 4.07 0.498 3.569 0.329ATAM 3.723 0.730 3.927 0.672 3.85 0.528 3.458 0.342
Intention to Use QuaDAI 3.654 0.698 4.063 0.710 3.935 0.631 3.458 0.673ATAM 3.547 0.844 3.906 0.831 3.740 0.638 3.417 0.685
5 We did not provide specific treatment to the outliers; they are only evident forthe efficiency variable since those two participants finished the experimental tasks inless time than the rest.
418 J. Gonzalez-Huerta et al. / Information and Software Technology 57 (2015) 405–429
evaluations performed in each individual experiment. Mean andstandard deviations have also been used as descriptive statisticsfor the qualitative subjective variables PEOU, PU and ITU. Eventhough we did not further analyze Duration we included the vari-able in this summary so as to give a first idea of the complexityof the experimental tasks. In the UNIBAS experiment, durationwas higher since we included a third NFR that make the processless obvious and probably due to the participant’s former level ofexperience.
The five-point Likert scale ranging from 1 to 5 adopted for themeasurement of the subjective variables has also been consideredas an interval scale [19]. The cells highlighted in bold type inTable 4 show the best values for each of the statistics. The overallresults have allowed us to interpret that the participants achievedtheir best performance with QuaDAI in almost all the statisticsunder analysis.
The following subsections detail the analysis of each dependentvariable (Effectiveness, Efficiency, Perceived Ease of Use, PerceivedUsefulness and Intention to Use) and the hypotheses testing.
6.1. Effectiveness
Fig. 7 shows the boxplots for the effectiveness variable per par-ticipant and per method for each experiment in our family. Theseboxplots show that QuaDAI was relatively more effective thanATAM when evaluating the architectures in each experimentalobject. Probably this can be explained by the reuse of the knowl-edge stored in the multimodel. It was easier for the participantsto interpret the NFRs and prioritize the quality attributes so as toobtain the correct pattern to be applied rather than the subjectiveevaluation of the patterns with regard to the scenarios on theutility tree.
We checked the statistical significance of these tests by per-forming the Mann-Whitney non-parametric test so as to verifyH1 in UPV1, UPV2 and UPV3, since the Shapiro-Wilk test resultsevidenced that they were not normally distributed (p-value = 0.000both for QuaDAI and ATAM in UPV1, p-value = 0.000 for QuaDAIand p-value = 0.001 for ATAM in UPV2 and finally, p-value = 0.000both for QuaDAI and ATAM in UPV3). The 1-tailed t-test wasthen used for the verification of H1 in UNIBAS since it wasnormally distributed. The p-values obtained for these tests were0.906 for UPV1, 0.036 for UPV2, 0.003 for UPV3 and 0.008 forUNIBAS. These results therefore support the rejection of thenull hypothesis H10 in experiments UPV2, UPV3 and UNIBAS(p-value <0.05) and the acceptance of its alternative hypothesis,signifying that the effectiveness of the participants when applyingQuaDAI was significantly greater than their effectiveness whenapplying ATAM.
6.2. Efficiency
Fig. 8 shows the boxplots for the efficiency variable per partic-ipant and per method for each experiment.5 These boxplots showthat QuaDAI was relatively more efficient than ATAM when evaluat-ing the architectures in each experimental object. This can be due tothe effectiveness of the participants (the efficiency variable was cal-culated as effectiveness/duration) but also because they performedfaster, since the selection of the architectural pattern was automatedonce they established the priority of the quality attributes.
We checked the statistical significance of these results by per-forming the Mann-Whitney non-parametric test so as to verifyH2 in UPV2, UPV3 and UNIBAS, since the Shapiro-Wilk test evi-denced that they were not normally distributed (p-value = 0.016for ATAM in UPV2, p-value = 0.000 for ATAM in UPV3 and finally,p-value = 0.001for ATAM in UNIBAS). The 1-tailed t-test was thenused for the verification of H2 in UPV1 since it was normally dis-tributed. The p-values obtained for these tests were 0.030 forUPV1, 0.043 for UPV2, 0.06 for UPV3 and finally 0.045 for UNIBAS.These results therefore support the rejection of the null hypothesisH20 in all the experiments (p-value <0.05) and the acceptance of itsalternative hypothesis, signifying that the efficiency of the partici-pants when applying QuaDAI was significantly greater than theirefficiency when applying ATAM.
6.3. Perceived ease of use
Fig. 9 shows the density-plots for PEOU per method for eachexperiment. The mean of each population is shown with two ver-tical lines in each density-plot. These density-plots show that, withthe exception of UPV3 in which the participants perceived bothmethods to be equally easy to use, the participants perceived Qua-DAI to be easier to use than ATAM. This can be owing to the factthat the participants perceived as easier to decide the priority ofthe quality attributes once they had finished the measurementprocess rather than evaluating the different patterns and howthese patterns support the scenarios. This was confirmed by theparticipants in their response to the open questions of the ques-tionnaire: ‘‘I find a simple and intuitive way to evaluate. The use ofthe spreadsheet facilitates the process’’, ‘‘It is a method easy to learnand apply’’.
We checked the statistical significance of these results by per-forming the one sample Wilcoxon test with a test value equal to3 for each method separately so as to verify H3 for UPV1/QuaDAI,

Fig. 7. Effectiveness variable boxplots.
Fig. 8. Efficiency variable boxplots.
Fig. 9. Perceived ease of use variable density-plots.
J. Gonzalez-Huerta et al. / Information and Software Technology 57 (2015) 405–429 419
UPV1/ATAM, UPV2/QuaDAI and UPV3/ATAM, since the Shapiro-Wilk test evidenced that they were not normally distributed(p-value = 0.014 for UPV1/QuaDAI, p-value = 0.027 for UPV1/ATAM,p-value = 0.026 for UPV2/QuaDAI and finally p-value = 0.046 forUPV3/ATAM). The two-tailed t-test with a test value equal to 3(the Likert scale’s neutral value) was then used to verify H3 forUPV2/ATAM, UPV3/QuaDAI, UNIBAS/QuaDAI and finally forUNIBAS/ATAM, since they were normally distributed. The p-values
obtained for these tests were 0.000 for UPV1/QuaDAI, 0.003 forUPV1/ATAM, 0.001 for UPV2/QuaDAI, 0.000 for UPV2/ATAM,0.000 for UPV3/QuaDAI, 0.000 for UPV3/ATAM, 0.297 for UNIBAS/QuaDAI and 0.023 for UNIBAS/ATAM. These results thereforesupport the rejection of the null hypothesis H30 in UPV1, UPV2,UPV3 (p-value <0.05) and the acceptance of its alternativehypothesis, signifying that the participants perceived QuaDAI tobe easier to use than ATAM.

Fig. 10. Perceived usefulness variable density-plots.
420 J. Gonzalez-Huerta et al. / Information and Software Technology 57 (2015) 405–429
6.4. Perceived usefulness
Fig. 10 shows the density-plots for PU per method for eachexperiment. The mean of each population is shown with two ver-tical lines in each density-plot. These density-plots show that theparticipants perceived QuaDAI to be more useful than ATAM. Thiscan be owing to the fact that the participants perceived they per-ceived as more useful the use of a tool (the spreadsheet) that helpsthem to take the decision. Since they are novice architecture eval-uators, it seems more useful for them to use a method that allowsreusing the domain expert’s knowledge.
We checked the statistical significance of these results by per-forming the one sample Wilcoxon test with a test value equal to3 for each method separately so as to verify H4 for UPV1/QuaDAI,UPV3/QuaDAI, and UNIBAS/QuaDAI, since the Shapiro-Wilk testevidenced that they were not normally distributed (p-value = 0.001for UPV1/QuaDAI, p-value = 0.008 for UPV3/QuaDAI and finallyp-value = 0.005 for UNIBAS/QuaDAI). The two-tailed t-test with atest value equal to 3 (the Likert scale’s neutral value) was thenused to verify H4 for UPV1/ATAM, UPV2/QuaDAI, UPV2/ATAM,UPV3/ATAM, and UNIBAS/ATAM, since they were normally distrib-uted. The p-values obtained for these tests were 0.000 for UPV1/QuaDAI, 0.000 for UPV1/ATAM, 0.001 for UPV2/QuaDAI, 0.001 forUPV2/ATAM, 0.001 for UPV3/QuaDAI, 0.000 for UPV3/ATAM,
Fig. 11. Intention to use v
0.002 for UNIBAS/QuaDAI and 0.001 for UNIBAS/ATAM. Theseresults therefore support the rejection of the null hypothesis H40
in each experiment (p-value <0.05) and the acceptance of itsalternative hypothesis, signifying that the participants perceivedQuaDAI to be more useful than ATAM.
6.5. Intention to use
Fig. 11 shows the density-plots for the ITU per method for eachexperiment. The mean of each population is shown with two ver-tical lines in each density plot. These density-plots show that theparticipants perceived QuaDAI to be more likely to be used thanATAM. This can be owing to the fact that since they are novicearchitecture evaluators, they perceive that the method providesthem mechanisms with which to carry out software evaluationsin a model-driven context. This was confirmed by the participantsin their response to the open questions of the questionnaire:‘‘I have the intention of using this method for the evaluation ofarchitectures since incorporates the mechanisms to detect theimprovements to be made in software architectures’’, ‘‘I will use itsince allows prioritizing different characteristics and take the decisionbased on this prioritization’’.
We checked the statistical significance of these tests by per-forming the one sample Wilcoxon test with a test value equal to
ariable density-plots.
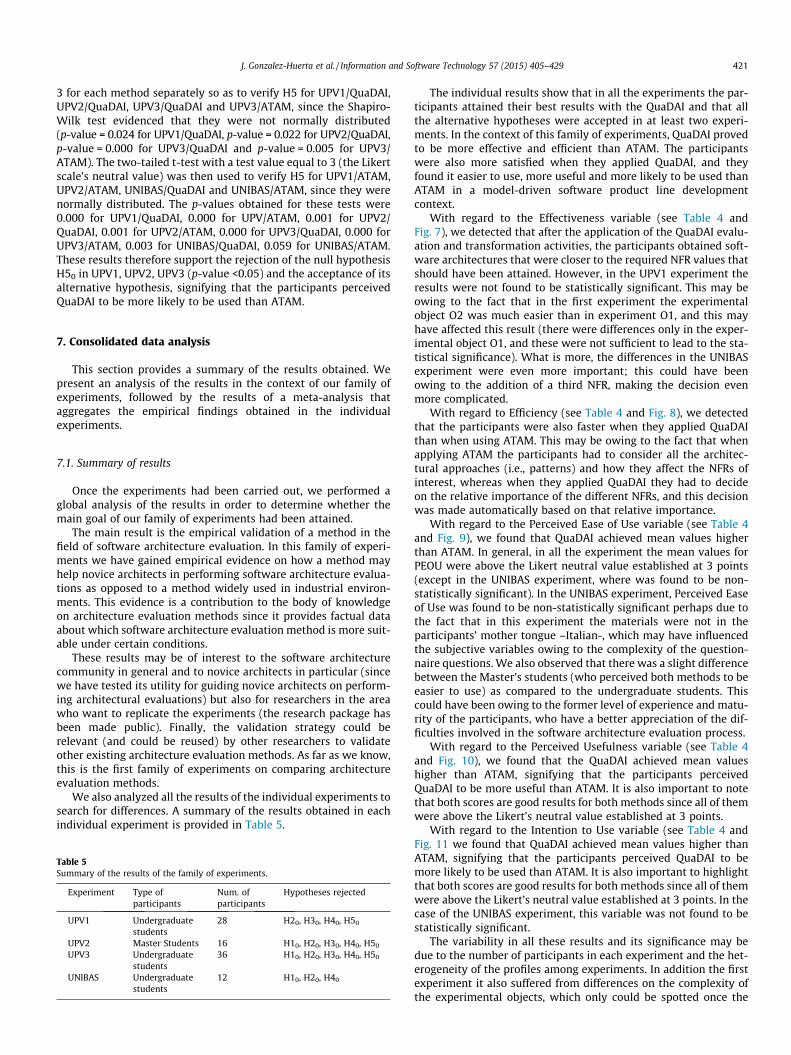
J. Gonzalez-Huerta et al. / Information and Software Technology 57 (2015) 405–429 421
3 for each method separately so as to verify H5 for UPV1/QuaDAI,UPV2/QuaDAI, UPV3/QuaDAI and UPV3/ATAM, since the Shapiro-Wilk test evidenced that they were not normally distributed(p-value = 0.024 for UPV1/QuaDAI, p-value = 0.022 for UPV2/QuaDAI,p-value = 0.000 for UPV3/QuaDAI and p-value = 0.005 for UPV3/ATAM). The two-tailed t-test with a test value equal to 3 (the Likertscale’s neutral value) was then used to verify H5 for UPV1/ATAM,UPV2/ATAM, UNIBAS/QuaDAI and UNIBAS/ATAM, since they werenormally distributed. The p-values obtained for these tests were0.000 for UPV1/QuaDAI, 0.000 for UPV/ATAM, 0.001 for UPV2/QuaDAI, 0.001 for UPV2/ATAM, 0.000 for UPV3/QuaDAI, 0.000 forUPV3/ATAM, 0.003 for UNIBAS/QuaDAI, 0.059 for UNIBAS/ATAM.These results therefore support the rejection of the null hypothesisH50 in UPV1, UPV2, UPV3 (p-value <0.05) and the acceptance of itsalternative hypothesis, signifying that the participants perceivedQuaDAI to be more likely to be used than ATAM.
7. Consolidated data analysis
This section provides a summary of the results obtained. Wepresent an analysis of the results in the context of our family ofexperiments, followed by the results of a meta-analysis thataggregates the empirical findings obtained in the individualexperiments.
7.1. Summary of results
Once the experiments had been carried out, we performed aglobal analysis of the results in order to determine whether themain goal of our family of experiments had been attained.
The main result is the empirical validation of a method in thefield of software architecture evaluation. In this family of experi-ments we have gained empirical evidence on how a method mayhelp novice architects in performing software architecture evalua-tions as opposed to a method widely used in industrial environ-ments. This evidence is a contribution to the body of knowledgeon architecture evaluation methods since it provides factual dataabout which software architecture evaluation method is more suit-able under certain conditions.
These results may be of interest to the software architecturecommunity in general and to novice architects in particular (sincewe have tested its utility for guiding novice architects on perform-ing architectural evaluations) but also for researchers in the areawho want to replicate the experiments (the research package hasbeen made public). Finally, the validation strategy could berelevant (and could be reused) by other researchers to validateother existing architecture evaluation methods. As far as we know,this is the first family of experiments on comparing architectureevaluation methods.
We also analyzed all the results of the individual experiments tosearch for differences. A summary of the results obtained in eachindividual experiment is provided in Table 5.
Table 5Summary of the results of the family of experiments.
Experiment Type ofparticipants
Num. ofparticipants
Hypotheses rejected
UPV1 Undergraduatestudents
28 H20, H30, H40, H50
UPV2 Master Students 16 H10, H20, H30, H40, H50
UPV3 Undergraduatestudents
36 H10, H20, H30, H40, H50
UNIBAS Undergraduatestudents
12 H10, H20, H40
The individual results show that in all the experiments the par-ticipants attained their best results with the QuaDAI and that allthe alternative hypotheses were accepted in at least two experi-ments. In the context of this family of experiments, QuaDAI provedto be more effective and efficient than ATAM. The participantswere also more satisfied when they applied QuaDAI, and theyfound it easier to use, more useful and more likely to be used thanATAM in a model-driven software product line developmentcontext.
With regard to the Effectiveness variable (see Table 4 andFig. 7), we detected that after the application of the QuaDAI evalu-ation and transformation activities, the participants obtained soft-ware architectures that were closer to the required NFR values thatshould have been attained. However, in the UPV1 experiment theresults were not found to be statistically significant. This may beowing to the fact that in the first experiment the experimentalobject O2 was much easier than in experiment O1, and this mayhave affected this result (there were differences only in the exper-imental object O1, and these were not sufficient to lead to the sta-tistical significance). What is more, the differences in the UNIBASexperiment were even more important; this could have beenowing to the addition of a third NFR, making the decision evenmore complicated.
With regard to Efficiency (see Table 4 and Fig. 8), we detectedthat the participants were also faster when they applied QuaDAIthan when using ATAM. This may be owing to the fact that whenapplying ATAM the participants had to consider all the architec-tural approaches (i.e., patterns) and how they affect the NFRs ofinterest, whereas when they applied QuaDAI they had to decideon the relative importance of the different NFRs, and this decisionwas made automatically based on that relative importance.
With regard to the Perceived Ease of Use variable (see Table 4and Fig. 9), we found that QuaDAI achieved mean values higherthan ATAM. In general, in all the experiment the mean values forPEOU were above the Likert neutral value established at 3 points(except in the UNIBAS experiment, where was found to be non-statistically significant). In the UNIBAS experiment, Perceived Easeof Use was found to be non-statistically significant perhaps due tothe fact that in this experiment the materials were not in theparticipants’ mother tongue –Italian-, which may have influencedthe subjective variables owing to the complexity of the question-naire questions. We also observed that there was a slight differencebetween the Master’s students (who perceived both methods to beeasier to use) as compared to the undergraduate students. Thiscould have been owing to the former level of experience and matu-rity of the participants, who have a better appreciation of the dif-ficulties involved in the software architecture evaluation process.
With regard to the Perceived Usefulness variable (see Table 4and Fig. 10), we found that the QuaDAI achieved mean valueshigher than ATAM, signifying that the participants perceivedQuaDAI to be more useful than ATAM. It is also important to notethat both scores are good results for both methods since all of themwere above the Likert’s neutral value established at 3 points.
With regard to the Intention to Use variable (see Table 4 andFig. 11 we found that QuaDAI achieved mean values higher thanATAM, signifying that the participants perceived QuaDAI to bemore likely to be used than ATAM. It is also important to highlightthat both scores are good results for both methods since all of themwere above the Likert’s neutral value established at 3 points. In thecase of the UNIBAS experiment, this variable was not found to bestatistically significant.
The variability in all these results and its significance may bedue to the number of participants in each experiment and the het-erogeneity of the profiles among experiments. In addition the firstexperiment it also suffered from differences on the complexity ofthe experimental objects, which only could be spotted once the

422 J. Gonzalez-Huerta et al. / Information and Software Technology 57 (2015) 405–429
experiments had been carried out. In the future, and once we havea stable experiment definition, we plan to execute new replicationnot only with bigger groups but also with more experienced partic-ipants, in order to analyze the impact that the profile could have onthe results.
In summary, the results support the hypothesis that QuaDAIwould perform better than ATAM in the specified context forwhich had been designed which is the evaluation of productarchitectures that occur after the product architecture derivationin model-driven SPL development context. According to thepreviously discussed results, we can conclude that QuaDAI canbe considered as a promising approach with which to performproduct architecture evaluations in model-driven SPL developmentprocesses after the architecture derivation. Feedback on how toimprove the approach was also obtained (e.g., the difficulties thatsome participants had when assigning the relative importance tothe set of NFRs or the possible reuse of the measurement resultsto select from among architectural transformations). Running afamily of experiments (including replications) rather than a singleexperiment provided us with more evidence of the externalvalidity, and thus the generalization of the study results. Eachreplication provided further evidence of the confirmation of thehypothesis. We can thus conclude that the general goal of theempirical validation has been achieved.
7.2. Meta-analysis
Although several statistical methods have been proposed forthe aggregation and interpretation of the results that wereobtained from interrelated experiments (e.g., [37,46,58,68]), weused meta-analysis since it allowed us to extract more general con-clusions. Meta-analysis consists of a set of statistical techniqueswith which to combine the effect sizes of each experiment so asto obtain a global effect of a factor. The estimation of effect sizescan be used after the comparison of the different studies to evalu-ate the average impact across studies of an independent variableon the dependent variable. Since measures may originate fromdifferent settings and may be non-homogeneous, a standardizedmeasure should be obtained for each experiment: these measuresmust be combined to estimate the global effect size of a factor. Inour study, we considered that the architectural evaluation methodwas the main factor in the family of experiments.
The meta-analysis was performed by using the Meta53 [68] andapplying the Hunter-Schmidt method [46]. Since all the variablesunder study had at least one experiment in which the data wasnot normally distributed we used the point biserial correlation r.Correlations are the best-known effect sizes, and they describethe direction and strength of the relationships between two vari-ables within a range of �1.0 and 1.0 [68]. The point biserial corre-lation r for each experiment can be calculated by applying theformula (4) [58], where Z is the quartile (z-score) of the p-valueobtained by the Mann-Whitney/Wilcoxon tests and N is the sample
Table 6Effect sizes and homogeneity test results.
Variable N Global effect size (weighted mean �r) Significa
Effectiveness 184 Medium (0.27197) Yes (p <Efficiency 184 Medium (0.32346) Yes (p <PEOU QuaDAI 92 Large (0.70681) Yes (p <
ATAM 92 Large (0.55076) Yes (p <PU QuaDAI 92 Large (1.00000) Yes (p <
ATAM 92 Large (0.98694) Yes (p <ITU QuaDAI 92 Large (0.93938) Yes (p <
ATAM 92 Large (0.87296) Yes (p <
size in each case. Since we have different population sizes acrossthe studies, the best way in which to estimate the effect size forthe family of experiments is to calculate the correlation �r weightedby the number of participants in each study [46]. This metricassigns more weight to the large N studies and is calculated usingformula (5) [46]. For studies in the Software Engineering field, theeffect size calculated using point-biserial r correlation is rated asfollows: small (0–0.193), medium (0.194–0.456), or large (above0.456) [49]. The Hunter-Schmidt Method also allows a chi-squaresignificance test of homogeneity across the studies to be per-formed. This test is calculated by applying formula (6) [46]. Theresult of homogeneity test is the chi-square with k-1 degrees offreedom, for a family of k experiments, and where the weightedvariance across studies S2
r is calculated by applying formula (7)[46]. If the chi-square is not significant, this means that there isstrong evidence that there is no true variation across studies, butif it is significant, then the variation may still be negligible in mag-nitude [46].
r ¼
ffiffiffiffiffiZ2
N
sð4Þ
�r ¼P
ri � NiPNi
ð5Þ
v2k�1 ¼
PNi
ð1� �r2Þ2� S2
r ð6Þ
S2r ¼
PðNiðri � �rÞ2ÞP
Nið7Þ
Table 6 summarizes the results of the meta-analysis. The overalleffect of each variable is reported with the weighted mean �r, itssignificance, and the homogeneity of the studies with regard tothat effect. In each case, the significance of this effect size wasstrongly significant, and the population was found to be homoge-neous for the Effectiveness and Efficiency variables and for thePerceived Usefulness of QuaDAI, and heterogeneous for theremaining variables (i.e., Perceived Ease of Use, ATAM’s PerceivedUsefulness and for Intention to Use). The effect size obtained wasmedium for Effectiveness and Efficiency, and large for the subjec-tive dependent variables (i.e., Perceived Ease of Use, Perceived Use-fulness and Intention to Use). This was probably as a result of thenumber of experiments used in the data meta-analysis.
The results of the cluster analysis, in which the effect size ofeach individual experiment is also analyzed, are shown in Table 7.For each experiment, this table reports the population effect sizethrough the unweighted mean r after applying Mullen andRosenthal’s cluster analysis method [58]. This effect has also beenclassified as Small (S), Medium (M) and Large (L) following thesame classification [49] for effect sizes as those applied to theweighted effect size in Table 6.
nce Test of homogeneity
Chi-square Degrees of freedom Result (p-value)
0.001) 6.7648 3 Homogeneous (p = 0.080)0.001) 0.4693 3 Homogeneous (p = 0.926)0.001) 47.0646 3 Heterogeneous (p < 0.001)0.001) 51.4611 3 Heterogeneous (p < 0.001)0.001) 3.5851 3 Homogeneous (p = 0.310)0.001) 27.6145 3 Heterogeneous (p < 0.001)0.001) 36.8937 3 Heterogeneous (p < 0.001)0.001) 17.4899 3 Heterogeneous (p < 0.001)

Table 7Individual experiments effect sizes.
Experiment Effectiveness Efficiency PEOU PU ITU
QuaDAI ATAM QuaDAI ATAM QuaDAI ATAM
UPV1 S (0.0146) M (0.2684) L (0.9622) M (0.4374) L (1.0000) L (0.8079) L (0.8880) L (0.7684)UPV2 M (0.3678) M (0.3585) L (1.0000) L (1.0000) L (1.0000) L (0.8011) L (1.0000) L (0.8273)UPV3 M (0.3502) M (0.3230) L (0.6584) L (0.8495) L (1.0000) L (1.0000) L (1.0000) L (1.0000)UNBAS L (0.5098) M (0.4069) S (�0.1348) S (�0.6799) L (1.0000) L (1.0000) L (0.7965) L (0.7967)
J. Gonzalez-Huerta et al. / Information and Software Technology 57 (2015) 405–429 423
Despite the fact that the first experiment contributed to theoverall results of the meta-analysis to a lesser extent, these resultshave a significant positive effect, and we can thus reject the nullhypotheses which were formulated for each dependent variable(i.e., ‘‘there are no significant differences between QuaDAI andATAM’’). The meta-analysis therefore strengthens all the alterna-tive hypotheses, providing promising results as regards QuaDAI’sperformance.
8. Threats to the validity
In this section, we explain the main issues that may have threa-tened the validity of the experiments, by considering the four typesof threats proposed in [25].
8.1. Internal validity
The threats to internal validity are relevant in those studies thatattempt to establish causal relationship. In our case, the mainthreats to the internal validity of the family of experiments were:Learning effect, participants’ experience, information exchangeamong participants, author’s bias, author influence, order ofmethods in the training sessions and the understandability of thedocuments.
The learning effect was alleviated by defining two experimentalobjects, ensuring that each participant applied each method in adifferent experimental object and considering all the possible com-binations of both the method order and the experimental objectsby following a within participants experiment design which isintended to minimize the impact of learning effects.
There were no differences in the participants’ experience sincenone of them had any experience in architecture evaluations. Weconfirmed this by asking the participants about their previousexperience with architecture evaluation methods. This was therationale behind providing the training sessions on both methodsin each experiment since it was our intention to balance the partic-ipants’ knowledge of architecture evaluation methods according tothe novice evaluator profile. The participants were also providedwith an introduction to the tasks and the problems they wouldhave to solve via training sessions.
The information exchange was minimized by, on the one handusing different experimental objects, and on the other hand bymonitoring the participants while they performed the tasks. How-ever, since the experiment was designed to take place on morethan one day, the participants might have been able to exchangeinformation during the time between the sessions. In order to alle-viate this situation the participants were asked to return the mate-rial at the end of each session.
The author’s bias may have influenced the results in the Spanishexperiments (i.e., UPV1, UPV2 and UPV3) since the trainingsessions were conducted by one author of the method. In theseexperiments, the author’s influence was alleviated by not disclos-ing the authorship of the QuaDAI method to the participants.However, in the UNIBAS experiment this threat was alleviated
since both the training session and the experiment were conductedby an external researcher. In addition the authors may also haveinfluenced the results of the studies since the first activities of bothmethods were carried out by them resulting on the artifacts to beused by the participants on their experimental tasks. However thisbias is mitigated since in both cases the set of artifacts wereleveled, and, for each experimental object, contained in essencethe same information for both methods. Finally, the authors mayhave also influenced the results through the addition of themeasurement processes to the ATAM experimental tasks. Thesemeasurement processes help the subjects identifying the whetherthe architecture meets the NFRs or not. It is probable that the sub-jects will take more time if they apply ATAM without applyingthese measurement tasks. We will investigate this issue in futureexperimentations.
We attempted to alleviate the understandability by writing theexperimental materials for the first three experiments (i.e., UPV1,UPV2 and UPV3) in the participants’ mother tongue. However, inthe UNIBAS experiment the experimental material was in Englishrather than in the participants’ mother tongue (Italian), and thismay have influenced the final results of this replication. Finally,we cleared up any misunderstandings about the experimentalmaterials that appeared during the experimental sessions in allthe experiments in the family.
8.2. External validity
This refers to the approximate truth of conclusions involvinggeneralizations within different contexts. The main threat to exter-nal validity is the representativeness of the results. The representa-tiveness of the results might be affected by the evaluation design,the participant context selected and the size and complexity of thetasks.
We believe that the results obtained are applicable to SPLs eventhough the context at the experiments was not specific for SPLdevelopment (this study is focused on validating a subset ofQUADAI that provide activities for evaluating and improvingsoftware architectures that can (or not) be obtained as a result ofa derivation activity in a SPL environment). However, the strategyand the mechanisms provided by QuaDAI to express and validateNFRs make this method suitable to model-driven SPL development.
The evaluation design might have had an impact on the gener-alization of the results owing to the kind of architectural modelsand quality attributes to be evaluated. We attempted to alleviatethis by selecting two architectures with the same size and com-plexity from two different domains (i.e., the automotive andmobile applications domains). The architectural models represent-ing the architectural views under study (the Component andConnector view for O1 and the Deployment view for O2) had a similarnumber of entities (8 vs 6). With regard to the NFRs, we attemptedto select two different and representative NFRs (related to reliabil-ity and performance) and their associated metrics, that had alsothe same complexity (for each experimental object one of themetrics was linear and the second was logarithmic/exponential).

424 J. Gonzalez-Huerta et al. / Information and Software Technology 57 (2015) 405–429
With regard to the architectural patterns, the domain expertsselected four different patterns for each experimental object withthe intention of improving the NFRs of interest.
With regard to the participant’s experience, the experimentswere conducted with students with no previous experience inarchitectural evaluations, and who received only limited trainingin the evaluation methods. However, since they were final yearstudents they can be considered as novice users of architecturalevaluation methods, and the next generation of practitioners[51]. The results could thus be considered to be representative ofnovice evaluators. As further work, we intend to conduct moreexperiments involving participants with different participantprofiles (e.g., practitioners or students with a higher level ofknowledge and skills in architecture evaluation) and differentexperimental objects in order to improve the representativenessof our results. In addition, more external replications should beconducted by other experimental conductors to reinforce theresults of the UNIBAS external replication.
The size and complexity of the tasks might have also affectedthe external validity. We decided to use relatively small tasks thatwould be applied in few representative architectural models sincea controlled experiment requires participants to complete theassigned tasks in a limited amount of time. In addition, the exper-iments were designed for executing just one iteration of the exper-imental tasks and thus the results are valid only in this context.The scalability of the method in medium and large scale problemsshould be studied in new studies.
8.3. Construct validity
The construct validity of the family of experiments may havebeen influenced by both the measures that were applied duringthe quantitative analysis and the reliability of the questionnaire.We attempted to alleviate this threat by using measures that arecommonly applied in architecture evaluation and optimizationtechniques. In particular, the Effectiveness was measured usingthe Euclidean distance, which has commonly been used to measurethe goodness of a solution with regard to a set of opposed NFRswith different purposes (e.g., [26,74]). The subjective variablesare based on the Technology Acceptance Method (TAM), a well-known and empirically validated model for the evaluation ofinformation technologies [27].
The reliability of the questionnaire was tested by applying theCronbach test. Table 8 shows the Cronbach’s alphas obtained foreach set of the closed-questions intended to measure the threesubjective dependent variables (i.e., PEOU, PU, and ITU). Exceptin UNIBAS, all the values obtained for PU and ITU were higher thanthe acceptable minimum threshold (a = 0.70) [55]. This can beexplained by the fact that in UPV1, UPV2 and UPV3 the materialswere in Spanish, the participants’ mother tongue, whereas in theUNIBAS experiment the materials were in English, and this differ-ence may have had more influence in the case of the questionnaire.
8.4. Conclusion validity
The main threats to the conclusion validity of the family ofexperiments were the data collection and the validity of the
Table 8Cronbach’s alphas for the questionnaires’ reliability.
Dependent variable UPV1 UPV2
Perceived ease of use Acceptable (0.824) Acceptable (0Perceived usefulness Acceptable (0.870) Acceptable (0Intention to use Acceptable (0.831) Acceptable (0
statistical tests applied. With regard to the data collection, weapplied the same procedure to each individual experiment whenextracting the data, and ensured that each dependent variablewas calculated by applying the same formula. With regard to thevalidity of the statistical tests applied, we alleviated this threatby applying a set of commonly accepted tests employed in theempirical SE community [55].
9. Conclusions and further work
The lack of integrated methods to support the derivation,evaluation, and quality improvement of software architecturesmotivated us, in a previous work, to propose the Quality-DrivenArchitecture Derivation and Improvement (QuaDAI) [40], amodel-driven approach with which to derive, evaluate and eventu-ally transform software architectures in an SPL environment.
In this paper, we have reported the results of a family of exper-iments aimed at evaluating participants’ effectiveness, efficiency,perceived ease of use, perceived usefulness and intention to usewith regard to the use of QuaDAI as opposed to a widely-usedindustrial architectural evaluation method: the ArchitectureTradeoff Analysis Method (ATAM).
The results of the quantitative analysis showed that, under theconditions described above, QuaDAI was more effective and effi-cient than ATAM (although in the first experiment the differencesin the participant’s effectiveness did not prove to be statically sig-nificant, perhaps owing to the difference in difficulty between theexperimental objects in that experiment). In addition, with regardto the evaluators’ perceptions, the participants perceived QuaDAIto be easier to use, more useful and more likely to be used thanATAM (although again in the fourth experiment the differencesin the perceived ease of use and intention to use were not foundto be statistically significant, and this was perhaps influenced bythe fact that in the last replication the materials were not in theparticipants’ mother tongue, which may have influenced the sub-jective variables owing to the complexity of the questionnairequestions). The results were supported by a meta-analysis thatwas performed in order to aggregate the empirical findings fromeach individual experiment. The results of the meta-analysis allowus to conclude that there is a significant positive effect on all thevariables under study associated with the use of QuaDAI as anarchitecture evaluation method for evaluating the derived productarchitecture.
From a research perspective, the application of the method dur-ing the experimental sessions has taught us that there were severalpoints in which QuaDAI could be improved (e.g., the mechanismused to assign the relative importance to the set of NFRs or reusethe results from the measurement process to select architecturaltransformations). To the best of our knowledge, this is the firstempirical study to provide evidence of the usefulness of a softwarearchitecture evaluation method for a model-driven software devel-opment process. In our family of experiments what we did a firstvalidation of the method to obtain some feedback and to analyzeourselves how the participants performed. We agree that studentsmay not be as helpful as working with practitioners. However wewere running the initial validation of the method. Now when wehave a first version of the method, and when we have a tool for
UPV3 UNIBAS
.890) Acceptable (0.738) Acceptable (0.748)
.898) Acceptable (0.758) Non-Acceptable (0.011)
.814) Acceptable (0.731) Non-Acceptable (0.666)
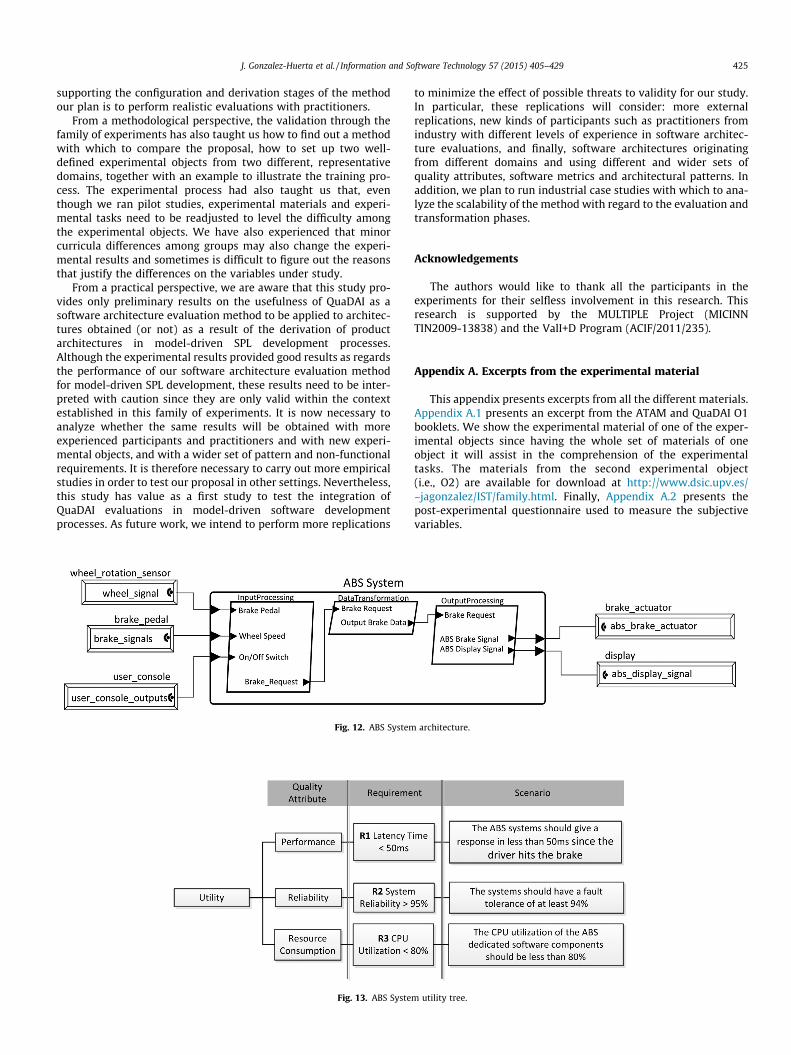
J. Gonzalez-Huerta et al. / Information and Software Technology 57 (2015) 405–429 425
supporting the configuration and derivation stages of the methodour plan is to perform realistic evaluations with practitioners.
From a methodological perspective, the validation through thefamily of experiments has also taught us how to find out a methodwith which to compare the proposal, how to set up two well-defined experimental objects from two different, representativedomains, together with an example to illustrate the training pro-cess. The experimental process had also taught us that, eventhough we ran pilot studies, experimental materials and experi-mental tasks need to be readjusted to level the difficulty amongthe experimental objects. We have also experienced that minorcurricula differences among groups may also change the experi-mental results and sometimes is difficult to figure out the reasonsthat justify the differences on the variables under study.
From a practical perspective, we are aware that this study pro-vides only preliminary results on the usefulness of QuaDAI as asoftware architecture evaluation method to be applied to architec-tures obtained (or not) as a result of the derivation of productarchitectures in model-driven SPL development processes.Although the experimental results provided good results as regardsthe performance of our software architecture evaluation methodfor model-driven SPL development, these results need to be inter-preted with caution since they are only valid within the contextestablished in this family of experiments. It is now necessary toanalyze whether the same results will be obtained with moreexperienced participants and practitioners and with new experi-mental objects, and with a wider set of pattern and non-functionalrequirements. It is therefore necessary to carry out more empiricalstudies in order to test our proposal in other settings. Nevertheless,this study has value as a first study to test the integration ofQuaDAI evaluations in model-driven software developmentprocesses. As future work, we intend to perform more replications
Fig. 12. ABS System
Fig. 13. ABS Syste
to minimize the effect of possible threats to validity for our study.In particular, these replications will consider: more externalreplications, new kinds of participants such as practitioners fromindustry with different levels of experience in software architec-ture evaluations, and finally, software architectures originatingfrom different domains and using different and wider sets ofquality attributes, software metrics and architectural patterns. Inaddition, we plan to run industrial case studies with which to ana-lyze the scalability of the method with regard to the evaluation andtransformation phases.
Acknowledgements
The authors would like to thank all the participants in theexperiments for their selfless involvement in this research. Thisresearch is supported by the MULTIPLE Project (MICINNTIN2009-13838) and the ValI+D Program (ACIF/2011/235).
Appendix A. Excerpts from the experimental material
This appendix presents excerpts from all the different materials.Appendix A.1 presents an excerpt from the ATAM and QuaDAI O1booklets. We show the experimental material of one of the exper-imental objects since having the whole set of materials of oneobject it will assist in the comprehension of the experimentaltasks. The materials from the second experimental object(i.e., O2) are available for download at http://www.dsic.upv.es/~jagonzalez/IST/family.html. Finally, Appendix A.2 presents thepost-experimental questionnaire used to measure the subjectivevariables.
architecture.
m utility tree.

Fig. 14. Triple modular redundancy pattern structure.
Fig. 15. Watchdog pattern structure.
Fig. 16. Resulting architecture after the application of the triple modular redundancy pattern.
426 J. Gonzalez-Huerta et al. / Information and Software Technology 57 (2015) 405–429

Table 9Closed-questions evaluating each subjective dependent variable.
Question Positive statement (5 Points) Negative statement (1 Point)
PEOU-1 The architecture evaluation method is simple and easy to follow The architecture evaluation method is complex and difficult to followPEOU-2 In general, the software architecture method is easy to understand In general, the software architecture method is difficult to understandPEOU-3 The software architecture method is easy to learn The software architecture method is difficult to learnPU-1 I believe that this method would reduce the time and effort required for the
evaluation of software architectureI believe that this method would increase the time and effort required for theevaluation of software architecture
PU-2 In general, the software architecture method is useful In general, the software architecture method is uselessPU-3 I believe that this software architecture evaluation method is useful as
regards obtaining architectures that fulfill the quality requirementsI believe that this software architecture evaluation method is useless asregards obtaining architectures that fulfill the quality requirements
PU-4 I believe that this method incorporates the mechanisms required to detectthe improvements to be made to software architectures
I believe that this method lacks the mechanisms required to detect theimprovements to be made to software architectures
PU-5 In general, I believe that this method efficiently supports the softwarearchitecture evaluation
In general, I believe that this method does not efficiently support thesoftware architecture evaluation
PU-6 The use of this method will improve my performance when evaluatingsoftware architectures
The use of this method will not improve my performance when evaluatingsoftware architectures
ITU-1 If I need to use a software architecture method in the future, I believe that Iwill consider this method
If I need to use a software architecture method in the future, I do not believethat I will consider this method
ITU-2 I believe that it would be easy to become skilled in using this method I believe that It would be difficult to become skilled in using this methodITU-3 I intend to use this method in the future I have NO intention of using this method in the futureITU-4 I would not recommend using this software architecture evaluation method I would not recommend using this software architecture evaluation method
J. Gonzalez-Huerta et al. / Information and Software Technology 57 (2015) 405–429 427
A.1. Examples of software architecture, patterns and metrics
A.1.1. Software architecture to be evaluatedThe first software architecture to be evaluated is from an Anti-
lock Braking System (ABS). The goal of the ABS Systems is to con-trol the brake actuators of a car. The system monitors the brakepedal sensor and activates the brake actuator as soon as the driverpresses the brake pedal. In addition, so as to prevent wheel slip-page when the brake actuator is activated, the system monitorsfour wheel rotation sensors, one on each wheel. Each sensor sendssignals while the wheel is rotating. If the system detects wheelslippage, the brake actuator will be deactivated, and it will be acti-vated again after a short period of time.
A.1.3. Architectural patterns
Pattern Triple modular redundancy pattern [28]
Context The Triple Modular Redundancy Pattern (TMR, for swhich there is no fail-safe state. The TMR pattern hThe computational results or resulting actuation signof-three majority wins policy is invoked
Problem The problem addressed by the Triple Modular ReduRedundancy Pattern—that is, to provide protection awhen a fault is detected, the input data should not boutput response
Patternstructure
The pattern has a replicated structure consisting ofchannel contains a set of objects that process incomicross-check each other at strategic points. Rather, tonly the final resulting outputs are compared. The cochannels producing the correct results win
Consequences The Triple Modular Redundancy Pattern can only dedefinition any systematic fault in one channel mustparallel, the source data is also replicated in each chais discarded, and the other channels’ output is used, sthat the output be re-calculated. This pattern addsthe general case. TMR has a rather high recurring creplicated. The TMR pattern is common in applicatiadditional cost involved in replicating the channels
Fig. 12 shows the (ABS) system architecture. The input sensorsare on the left. We can see the processing and control softwarecomponents inside the ABS System, and the actuators are on theright. In this case, apart from the sensors and actuators, the drivingconsole has also been considered. The driving console includes theswitches used to activate or deactivate the different systems andthe signals that indicate to the user that the ABS has beenactivated.
A.1.2. ATAM utility treeSee Fig. 13.
hort) is used to enhance reliability and safety in situations inas an odd number of channels (three) which operate in parallel.als are compared, and if there is a disagreement, then a two-out-
ndancy Pattern is the same as that of the Homogeneousgainst random faults (failures) with the additional constraint thate lost, nor should additional time be required to provide a correct
three channels operating in parallel, as shown in Fig. 14. Eachng data in a series of transformational steps. The channels do nothe three channels in the set operate completely in parallel, andmparator implements a winner-take-all policy such that the two
tect random faults. Since the channels are homogeneous, then bybe present in both of the others. Because the channels execute innnel. In the case of an error, only the erroneous channel’s outputo the failure does not result in the loss of data, nor does it require
to the computation time, thus affecting the system’s behavior inost because the hardware and software in the channels must beons in which reliability needs are very high and worth the

Pattern Watchdog pattern [28]
Context The watchdog pattern is a lightweight pattern that provides minimal coverage against faults. The watchdog patternmerely checks that the internal computational processing is proceeding as expected. This means that its coverage isminimal, and a broad set of faults will not be detected
Problem Real-time systems are those that are predictably timely. In the most common (albeit simplified) view, thecomputations have a deadline by which they must be applied. If the computation occurs after that deadline, the resultmay either be erroneous or irrelevant. If the output appears too late, then the system cannot be controlled; the systemis said to be in an unstable region
Patternstructure
The structure of the watchdog pattern is shown in Fig. 15, in which we can see its simplicity. The Actuator Channeloperates pretty much independently of the watchdog, sending a liveness message to the watchdog every so often.This is called stroking the watchdog. The watchdog uses the timeliness of the stroking to determine whether a faulthas occurred. Most watchdogs check only that a stroke occurs in a particular period of time and do not pay attentionto what happens if the stroke occurs too quickly. Some watchdogs check that the stroke occurs neither too quickly nortoo slowly
Consequences The Watchdog Pattern is a very lightweight pattern that is rarely used alone in safety-critical systems. It is best atidentifying timebase faults, particularly when an independent timebase drives the Watchdog. It can also be used todetect a deadlock in the actuation channel.Since its coverage it so minimal, its effect on the reliability is weak, and it istherefore rarely used alone
428 J. Gonzalez-Huerta et al. / Information and Software Technology 57 (2015) 405–429
A.1.4. Metrics
Metric Latency time
Description The latency time is defined as the time that has elapsed between receiving an input event and the generation of theoutput by the system.
Calculation For its calculation we should consider the flows of data and events that follow the reception of an input event in asensor until the actuator state is changed. We shall consider only the latency time in the best case.Latency time ¼
PComponents in flowLatency timeðComponentÞ
Interpretation The latency time gives a positive value as a result. The lower the value is, the better the latency time of the system. Itcan be measured using different time units (e.g., ms, sec)
A.1.5. Resulting architecture after the application of patternsSee Fig. 16.
A.2. Subjective variables evaluation questionnaire
See Table 9.
References
[1] S. Abrahão, C. Gravino, E. Insfrán, G. Scanniello, G. Tortora, Assessing theeffectiveness of sequence diagrams in the comprehension of functionalrequirements: results from a family of five experiments, IEEE Trans. SoftwareEng. 39 (3) (2013) 327–342.
[2] M. Ali-Babar, I. Gordon, Comparison of Scenario-based Software ArchitectureEvaluation Methods, in: 11th Asia-Pacific Software Engineering Conference,Bussan, Korea, 2004, pp. 600–607.
[3] M. Ali-Babar, L. Zhu, R. Jeffery, A Framework for Classifying and ComparingSoftware Architecture Evaluation Methods, in: 15th Australian SoftwareEngineering Conference, Melbourne, Australia, 2004, pp. 13–16.
[4] M. Ali-Babar, B. Kitchenham, Assessment of a Framework for ComparingSoftware Architecture Analysis Methods, in: 11th International Conference onEvaluation and Assessment in Software Engineering, Keele, England, 2007,pp. 12–20.
[5] M. Ali-Babar, B. Kitchenham, R. Jeffery, Comparing distributed and face-to-facemeetings for software architecture evaluation: a controlled experiment, Empir.Softw. Eng. 13 (1) (2007) 39–62.
[6] M. Ali-Babar, D. Winkler, S. Biffl, Evaluating the Usefulness and Ease of use of aGroupware Tool for the Software Architecture Evaluation Process, in: 1stInternational Symposium on Empirical Software Engineering andMeasurement, Madrid, Spain, 2007, pp. 430–439.
[7] M. Ali-Babar, B. Kitchenham, The Impact of Group Size on SoftwareArchitecture Evaluation. A controlled experiment, in: 1st Internationalsymposium on Empirical Software Engineering and Measurement, Madrid,Spain, 2007, pp. 420–429.
[8] M. Ali-Babar, Assessment of a Framework for Designing and EvaluatingSecurity Sensitive Architecture, in: 12th International Conference onEvaluation and Assessment in Software Engineering, Bari, Italy, 2008.
[9] M. Ali-Babar, P. Lago, A. Van Deursen, Empirical research in softwarearchitecture: opportunities, challenges, and approaches, Empir. Softw. Eng.16 (5) (2011) 539–543 (October 2011).
[10] M. Barbacci, P. Clements, A. Lattanze, L. Northrop, W. Wood, Using theArchitecture Tradeoff Analysis Method (ATAM) to Evaluate the SoftwareArchitecture for a Product Line of Avionics Systems: A Case Study. Tech. ReportCMU/SEI-2003-TN-012, Software Engineering Institute, Carnegie MellonUniversity, 2003.
[11] E.J. Barkmeyer, A.B. Feeney, P. Denno, D.W. Flater, D.E. Libes, M.P. Steves,E.K. Wallace, Concepts for Automating Systems Integration, NISTIR 6928,National Institute of Standards and Technology, U.S. Dept. of Commerce,2003.
[12] V.R. Basili, F. Shull, F. Lanubile, Building knowledge through families ofexperiments, IEEE Trans. Software Eng. 25 (4) (1999) 456–473.
[13] V.R. Basili, H.D. Rombach, The TAME project: towards improvement-orientedsoftware environments, IEEE Trans. Software Eng. 14 (6) (1998) 758–773.
[14] G. Botterweck, L. O’Brien, S. Thiel, Model-driven Derivation of ProductArchitectures, in: 22th International Conference on Automated SoftwareEngineering, New York, USA, 2007, pp. 469–472.
[15] J. Bosch, Design and Use of Software Architectures, Adopting and EvolvingProduct-Line Approach, Addison-Wesley, Harlow, 2000.
[16] H.P. Breivold, I. Crnkovic, M. Larsson, A systematic review on softwarearchitecture evolution research, Inf. Softw. Technol. 54 (1) (2012) 16–40.
[17] M. Broy, Challenges in Automotive Software Engineering, in: 28thInternational Conference on Software Engineering New York, USA, 2006, pp.33–42.
[18] F. Buschmann, R. Meunier, H. Rohnert, P. Sommerlad, M. Stal, Pattern-orientedSoftware Architecture, vol. 1: A System of Patterns, Wiley, 1996.
[19] J. Carifio, R.J. Perla, Ten common misunderstandings, misconceptions,persistent myths and urban legends about Likert scales and Likert responseformats and their antidotes, J. Social Sci. 3 (3) (2007) 106–116.
[20] M. Ciolkowski, F. Shull, S. Biffl, A Family of Experiments to Investigate theInfluence of Context on the Effect of Inspection Techniques, in: 6thInternational Conference on Empirical Assessment in Software Engineering,2002, pp. 48–60.
[21] P. Clements, F. Bachmann, L. Bass, D. Garlan, J. Ivers, R. Little, P. Merson, R.Nord, J. Stafford, Documenting Software Architectures, Views and Beyond,Addison-Wesley, Boston, USA, 2011.
[22] P. Clements, R. Kazman, M. Klein, Evaluating Software Architecture, Methodsand Case Studies, Addison-Wesley, Boston, USA, 2002.

J. Gonzalez-Huerta et al. / Information and Software Technology 57 (2015) 405–429 429
[23] P. Clements, L. Northrop, Software Product Lines: Practices and Patterns,Addison-Wesley, Boston, 2007.
[24] W.J. Conover, Practical Nonparametric Statistics, third ed., Wiley, 1998.[25] T. Cook, D. Campbell, Quasi-Experimentation: Design and Analysis Issues for
Field Settings, Houghton Mifflin Company, Boston, 1979.[26] J. Datorro, Convex Optimization and Euclidean Distance Geometry, Meboo
Publishing, 2005.[27] F.D. Davis, Perceived usefulness, perceived ease of use and user acceptance of
information technology, MIS Quart. 13 (3) (1989) 319–340.[28] B.P. Douglass, Real-time Design Patterns: Robust Scalable Architecture for
Real-time Systems, Addison-Wesley, Boston, 2002.[29] T. Dyba, B. Kitchenham, M. Jorgensen, Evidence-based software engineering
for practitioners, IEEE Softw. 22 (1) (2005) 58–65.[30] L. Etxeberria, G. Sagardui, Product line Architecture: New Issues for Evaluation,
in: 9th International Conference on Software Product Lines, LNCS 3714,Springer, 2005, pp. 174–185.
[31] D. Falessi, M. Ali-Babar, G. Cantone, P. Kruchten, Applying empirical softwareengineering to software architecture: challenges and lessons learned, Empir.Softw. Eng. 15 (3) (2010) 250–276.
[32] D. Falessi, G. Cantone, P. Kruchten, Value-based Design Decision RationaleDocumentation: Principles and Empirical Feasibility Study, in: 7th WorkingIEEE/IFIP Conference on Software Architecture, Vancouver, Canada, 2008,pp. 189–198.
[33] D. Falessi, R. Capilla, G. Cantone, A Value-based Approach for DocumentingDesign Decisions Rationale: A Replicated Experiment, in: 3rd InternationalWorkshop on Sharing and Reusing Architectural Knowledge, Leipzig, Germany,2008, pp. 63–69.
[34] P.H. Feiler, D.P. Gluch, J. Hudak, The Architecture Analysis & Design Language(AADL): An Introduction. Tech. Report CMU/SEI-2006-TN-011. SoftwareEngineering Institute, Carnegie Mellon University, 2006.
[35] J. Flinn, S.Y. Park, M. Satyanarayanan, Balancing Performance, Energy, andQuality in Pervasive Computing, in: 22th International Conference onDistributed Computing Systems, Vienna, Austria, 2002, pp. 217–226.
[36] C. Ghezzi, A.M. Sharifloo, Model-based verification of quantitative non-functional properties for software product lines, Inf. Softw. Technol. 55 (3)(2013) 508–524.
[37] G.V. Glass, B. Mcgaw, M.L. Smith, Meta-analysis in Social Research, SagePublications, 1981.
[38] E. Golden, B.E. John, L. Bass, The Value of A Usability-supporting ArchitecturalPattern in Software Architecture Design: A Controlled Experiment, in: 27thInternational Conference on Software Engineering, St. Louis, Missouri, USA,2005, pp. 460–469.
[39] J. Gonzalez-Huerta, Derivación Evaluación y Mejora de la Calidad deArquitecturas Software en el Desarrollo de Líneas de Producto SoftwareDirigido por Modelos. PhD Thesis, Departamento de Sistemas Informáticos yComputación, Universitat Politècnica de València, 2014, <http://hdl.handle.net/10251/36448>.
[40] J. Gonzalez-Huerta, E. Insfrán, S. Abrahão, Defining and Validating aMultimodel Approach for Product Architecture Derivation and Improvement,in: 16th International Conference on Model Driven Engineering Languages andSystems, Miami, USA, 2013, pp. 388–404.
[41] J. Gonzalez-Huerta, E. Insfrán, S. Abrahão, On the Effectiveness, Efficiency andPerceived Utility of Architecture Evaluation Methods: A Replication Study, in:18th National Conference in Software Engineering and Databases, Madrid,Spain, 2013, pp. 427–440.
[42] J. Gonzalez-Huerta, E. Insfrán, S. Abrahão, J.D. McGregor, Non-FunctionalRequirements in Model-driven Software Product Line Engineering, in: 4thInternational Workshop on Non-functional System Properties in DomainSpecific Modeling Languages, Insbruck, Austria, 2012, pp. 63–78.
[43] J. Gonzalez-Huerta, E. Insfrán, S. Abrahão, J.D. McGregor, ArchitectureDerivation in Product Line Development through Model Transformations, in:22th International Conference on Information Systems Development, Seville,Spain, 2013.
[44] M. Höst, B. Regnell, C. Wohlin, Using Students as Subjects – A ComparativeStudy of Students and Professionals in Lead-time Impact Assessment, in: 4thConference on Empirical Assessment and Evaluation in Software Engineering,2000, pp. 201–214.
[45] P.J. Hu, P.Y.K. Chau, Examining the technology acceptance model usingphysician acceptance of telemedicine technology, Manage. Inform. Syst. 16(2) (1999) 91–113.
[46] J.E. Hunter, F.L. Schmidt, G.B. Jackson, Meta-analysis: Cumulating ResearchFindings Across Studies, Sage Publications, 1982.
[47] ISO/IEC 25000:2005, Software Engineering, Software Product QualityRequirements and Evaluation SQuaRE, 2005.
[48] N. Juristo, A.M. Moreno, Basics of Software Engineering Experimentation,Kluwer Academic Publishers, 2001.
[49] V. Kampenes, T. Dybå, J.E. Hannay, D.I.K. Sjøberg, A Systematic Review ofEffect Size in Software Engineering Experiments, Information andSoftware Technology, vol. 49, issue 11–12 (November 2007), 2007,pp. 1073–1086.
[50] R. Kazman, M. Klein, P. Clements, ATAM: A Method for ArchitectureEvaluation, Tech. Report CMU/SEI-2000-TR-004, ADA382629, SoftwareEngineering Institute, Carnegie Mellon University, 2000.
[51] B.A. Kitchenham, S.L. Pfleeger, D.C. Hoaglin, J. Rosenber, Preliminary guidelinesfor empirical research in software engineering, IEEE Trans. Software Eng. 28(8) (2002) 721–734.
[52] R.M. Lindsay, A.S.C. Ehrenberg, The Design of Replicated Studies, The AmericanStatistician, vol. 47, 1993, pp. 217-228.
[53] A. Martens, H. Koziolek, L. Prechelt, R. Reussner, From Monolithic toComponent-based Performance Evaluation of Software Architectures: ASeries of Experiments Analyzing Accuracy and Effort, Empirical SoftwareEngineering, vol. 16, issue 5 (October 2011), 2011, pp. 587–622.
[54] F. Martensson, Software Architecture Quality Evaluation. Approaches in anIndustrial Context. Ph.D. Thesis, Blekinge Institute of Technology, Karlskrona,Sweden, 2006.
[55] K. Maxwell, Applied Statistics for Software Managers, Software QualityInstitute Series, Prentice Hall, 2002.
[56] J.D. McGregor, Testing a Software Product Line. Revised Lectures of 2ndPernambuco Summer School on Software Engineering, Pernambuco, Brazil,2010, pp. 104–140.
[57] Microsoft MSDN, Performance and Reliability Patterns, Version 1.1.0, 2003,<http://msdn.microsoft.com/en-us/library/ff648802.aspx> (accessed 07/2013).
[58] B. Mullen, R. Rosenthal, Basic Meta-analysis: Procedures and Programs. L.Earlbaum Associates, 1985.
[59] E. Niemelä, A. Immonen, Capturing Quality Requirements of Product FamilyArchitecture. Information and Software Technology, vol. 49, issue 11–12(November 2007), 2007, pp. 1107–1120, doi:10.1016/j.infsof.2006.11.003.
[60] Object Management Group, Common Variability Language (CVL), OMGRevised Submission, 2012.
[61] D. Perovich, P.O. Rossel, M.C. Bastarrica, Feature Model to ProductArchitectures: Applying MDE to Software Product Lines, in: IEEE/IFIP &European Conference on Software Architecture, Helsinki, Finland, 2009, pp.201–210.
[62] N. Qureshi, M. Usman, N. Ikram, Evidence in Software Architecture, a SystematicLiterature Review, in: 17th International Conference on Evaluation andAssessment in Software Engineering, Porto de Galinhas, Brazil, 2013, pp. 97–106.
[63] V. Reijonen, J. Koskinen, I. Haikala, Experiences from Scenario-basedArchitecture Evaluations with ATAM, in: 4th European Conference onSoftware Architecture, Copenhagen, Denmark, 2010, pp. 214–229.
[64] A. von Rhein, S. Apel, C. Kästner, The PLA Model: on the Combination ofProduct-line Analyses, in: 7th International Workshop on VariabilityModelling of Software-intensive Systems, Pisa, Italy, 2013.
[65] F. Roos-Frantz, D. Benavides, A. Ruiz-Cortés, A. Heuer, K. Lauenroth, Quality-aware analysis in product line engineering with the orthogonal variabilitymodel, Software Qual. J. 20 (3–4) (2011) 519–565, http://dx.doi.org/10.1007/s11219-011-9156-5.
[66] B. Roy, T.C.N. Graham, Methods for Evaluating Software Architecture: ASurvey, School of Computing, Technical Report 2008-545, Queen’s University,2008, <http://citeseerx.ist.psu.edu/viewdoc/download?rep=rep1&type=pdf&doi=10.1.1.211.8188> (accessed 05/2014).
[67] D. Ryu, D. Lee, J. Baik, Designing an Architecture of SNS Platform by Applying aProduct Line Engineering Approach, in: 11th International Conference onComputer and Information Science, Shanghai, China, 2012, pp. 559–564.
[68] R. Schwarzer, Meta-analysis Programs, 1987, <http://userpage.fu-berlin.de/~health/meta_e.htm> (accessed 09/2013).
[69] N. Siegmund, M. Rosenmuller, C. Kästner, P.G. Giarrusso, S. Apel, S.S.Kolesnikov, Scalable Prediction of Non-functional Properties in SoftwareProduct Lines, in: 15th International Software Product Line Conference,Munich, Germany, 2011, pp. 160–169.
[70] D.I.K. Sjøberg, B. Anda, E. Arisholm, T. Dybå, M. Jørgensen, A. Karahasanovic, M.Vokác, Challenges and Recommendations when Increasing the Realism ofControlled Software Engineering Experiments, Empirical Methods and Studiesin Software Engineering Experiences from ESERNET 2001-2003, LNCS 2765,2003, pp. 24–38.
[71] D.I.K. Sjøberg, J.E. Hannay, O. Hansen, V.B. Kampenes, A. Karahasanovic, N.Liborg, A.C. Rekdal, A survey of controlled experiments in SoftwareEngineering, IEEE Trans. Software Eng. 31 (9) (2005) 733–753.
[72] F. Shull, M.G. Mendoncça, V. Basili, J. Carver, J.C. Maldonado, S. Fabbri, G.H.Travasos, M.C. Ferreira, Knowledge-sharing Issues in Experimental SoftwareEngineering, Empirical Software Engineering, vol. 9 (January–February 2004),2004, pp. 111–137, doi:10.1023/B:EMSE.0000013516.80487.33.
[73] M. Svahnberg, F. Martensson, Six years of evaluating software architectures instudent projects, J. Syst. Softw. 80 (11) (2007) 1893–1901.
[74] L. Taher, H.E. Khatib, R. Basha, A Framework and QoS Matchmaking Algorithmfor Dynamic Web Services Selection, in: 2nd International Conference onInnovations in Information Technology, Dubai, UAE, 2005, pp. 1–10.
[75] S. Vegas, N. Juristo, A. Moreno, M. Solari, P. Letelier, Analysis of the Influence ofCommunication between Researchers on Experiment Replication, in:Proceedings of the 2006 ACM/IEEE International Symposium on EmpiricalSoftware Engineering, New York, New York, USA, 2006, pp. 28–37,doi:10.1145/1159733.1159741.
[76] V. Venkatesh, Determinants of perceived ease of use: integrating controlintrinsic motivations, and emotion into the Technology Acceptance Model,Inform. Syst. Res. 11 (4) (2000) 342–365.
[77] C. Wohlin, P. Runeson, M. Höst, M.C. Ohlsson, B. Regnell, A. Andwesslen,Experimentation in Software Engineering – An Introduction, Kluwer, 2000.
Copyright © 2022 FDOKUMEN