Unvertainty in measurement power point
25
TOPIC 11 : TOPIC 11 : Measurement and data Measurement and data processing processing 1.1.1Describe and give examples of random uncertainties and systematic errors 1.1.2Distinguish between precision and accuracy Learning Outcomes: At the end of the lesson the students should be able to:
Transcript of Unvertainty in measurement power point
TOPIC 11 : TOPIC 11 : Measurement and data Measurement and data
processingprocessing
1.1.1Describe and give examples of random uncertainties and systematic errors1.1.2Distinguish between precision and accuracy
Learning Outcomes:At the end of the lesson the students should be able to:
1.1.4State random uncertainty as an uncertainty range (±)
1.1.5State the results of calculation to the
appropriate number of significant figures
1.1.3Describe how the effects of random uncertainties may be reduced
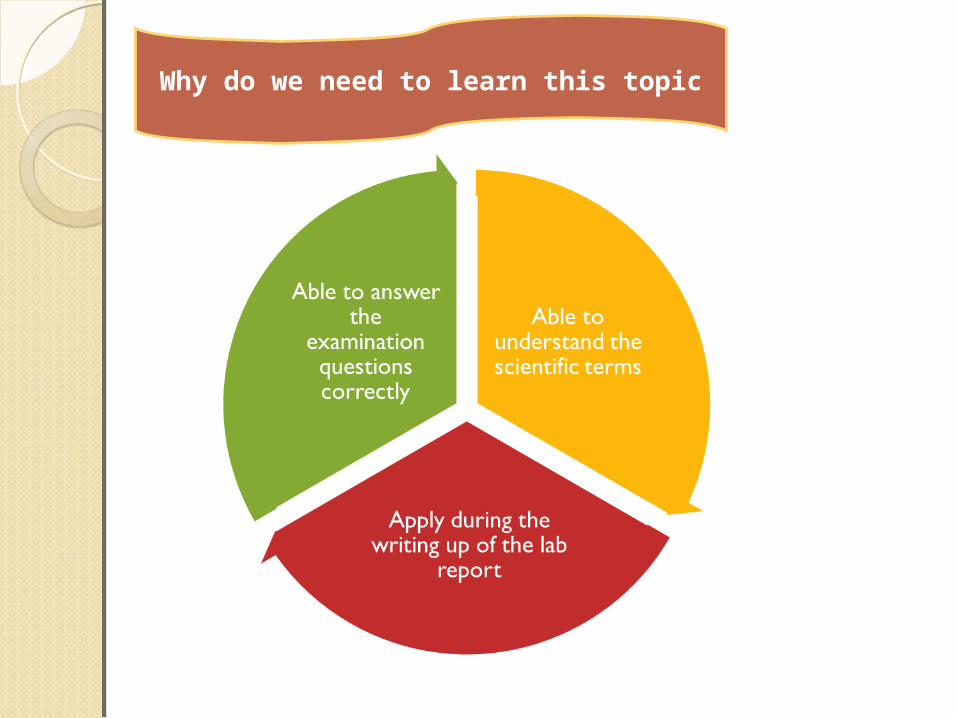
Why do we need to learn this topic
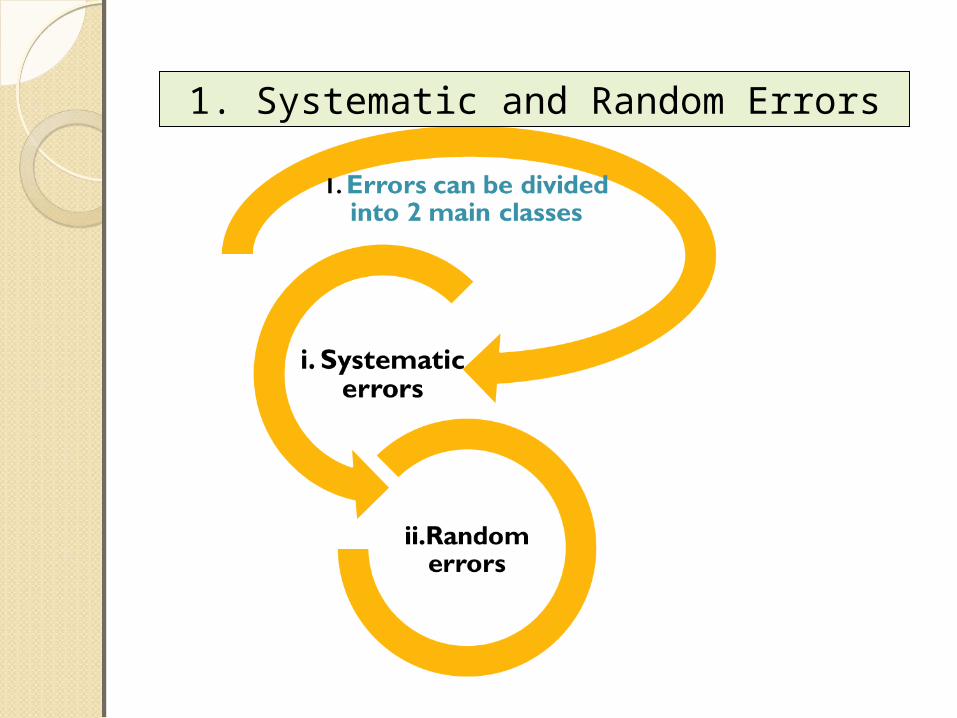
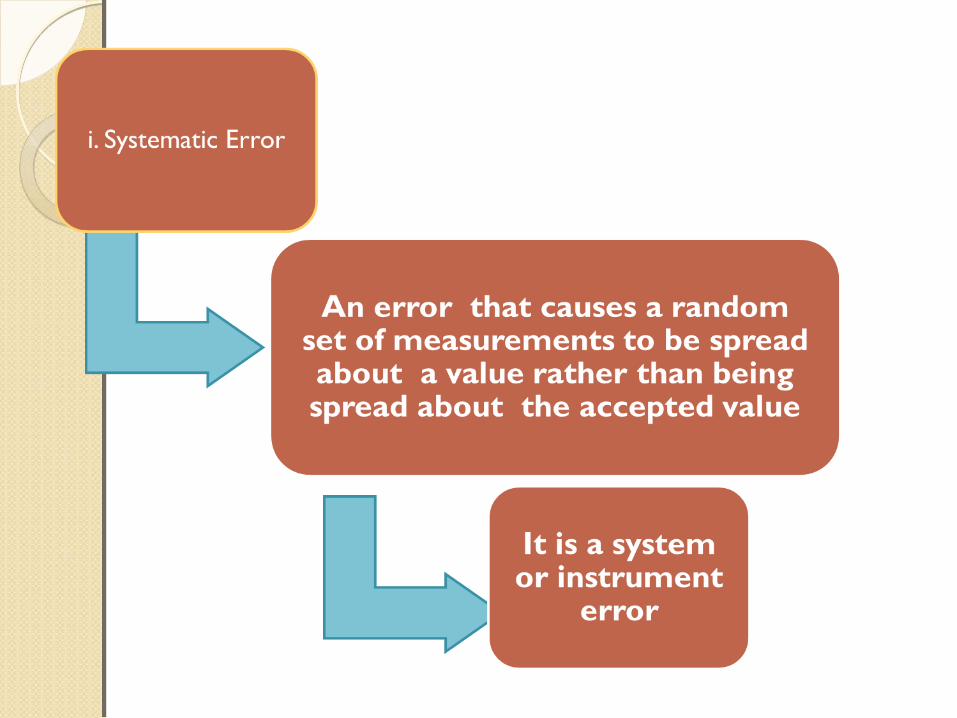
1. Systematic and Random Errors
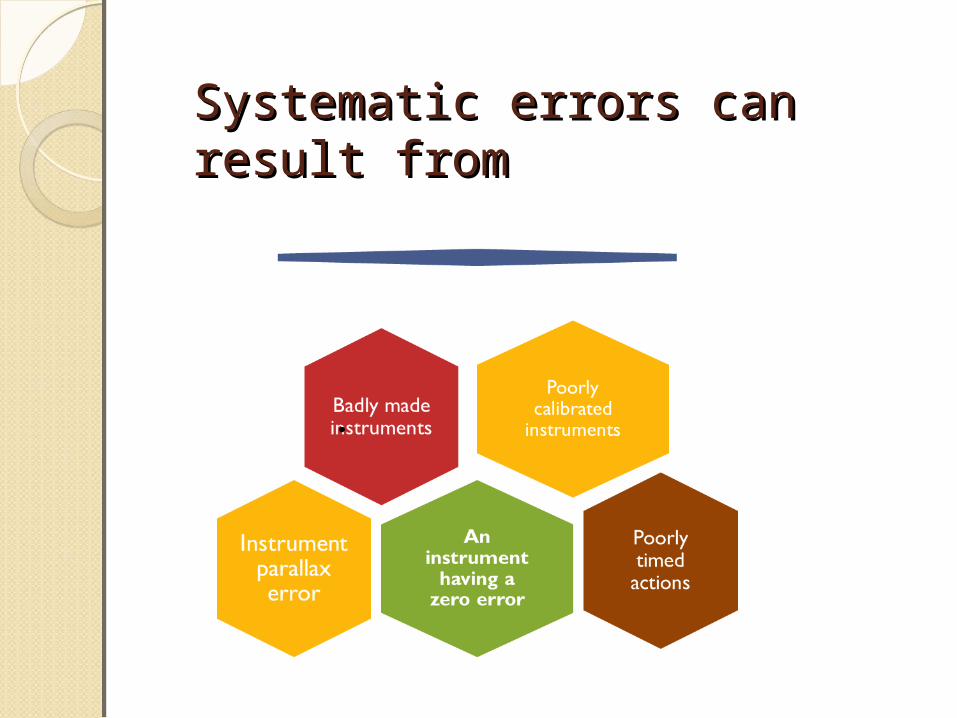
Systematic errors can Systematic errors can result fromresult from
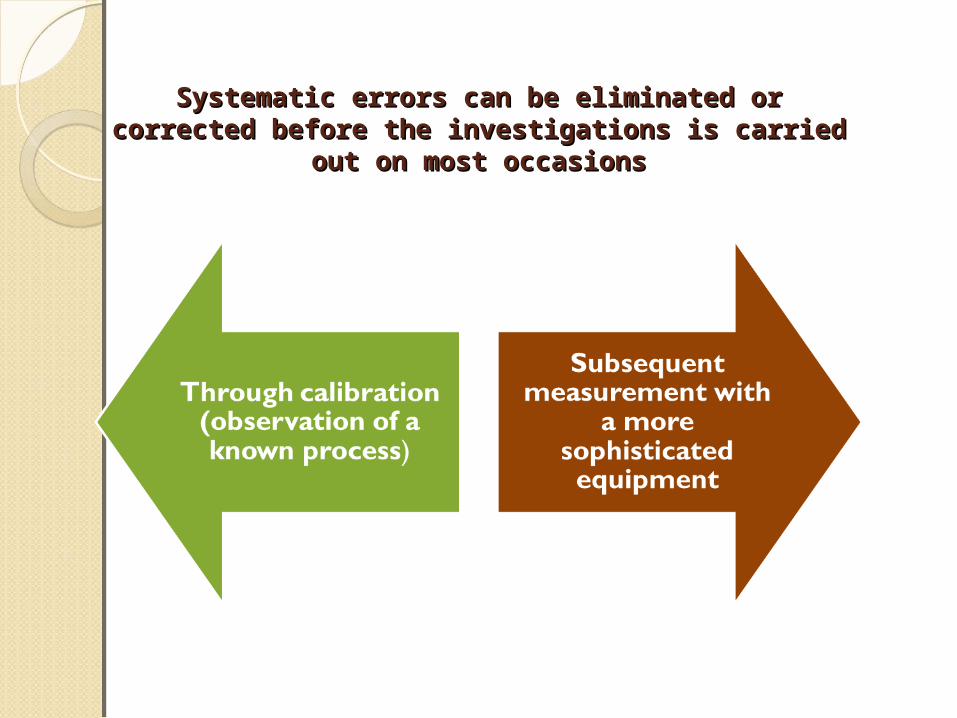
Systematic errors can be eliminated or Systematic errors can be eliminated or corrected before the investigations is carried corrected before the investigations is carried
out on most occasionsout on most occasions
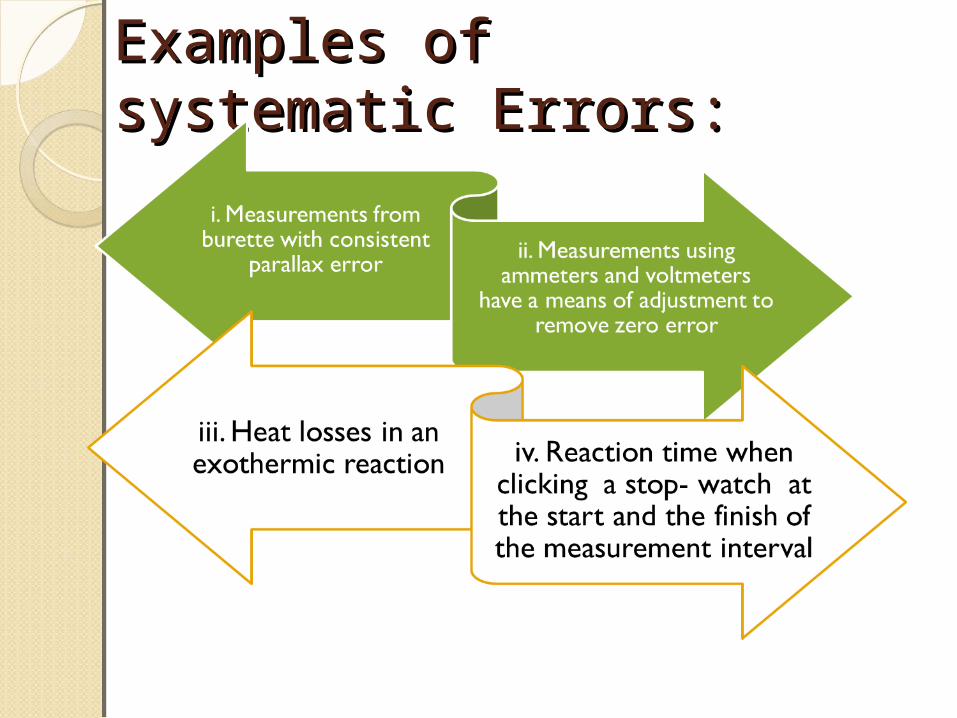
Examples of Examples of systematic Errors:systematic Errors:
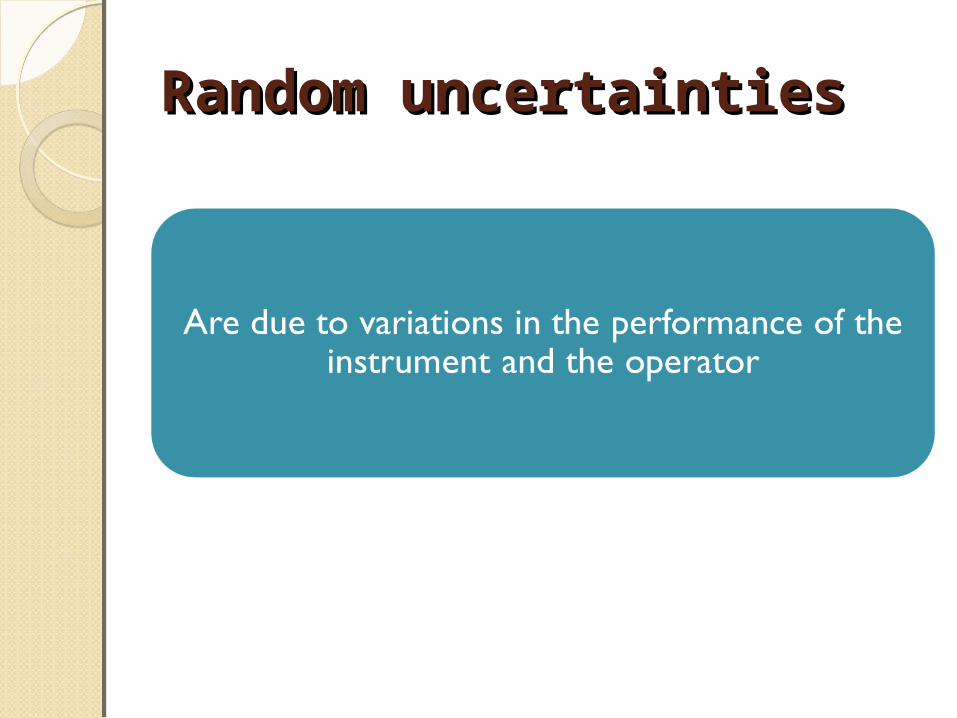
Random uncertaintiesRandom uncertainties
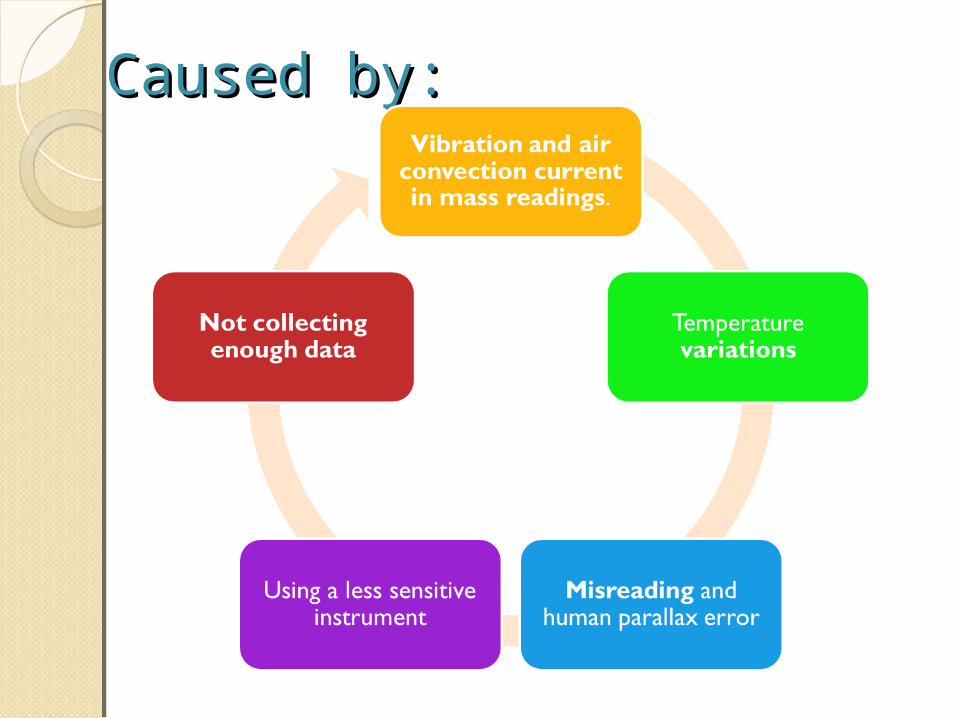
Caused by:Caused by:
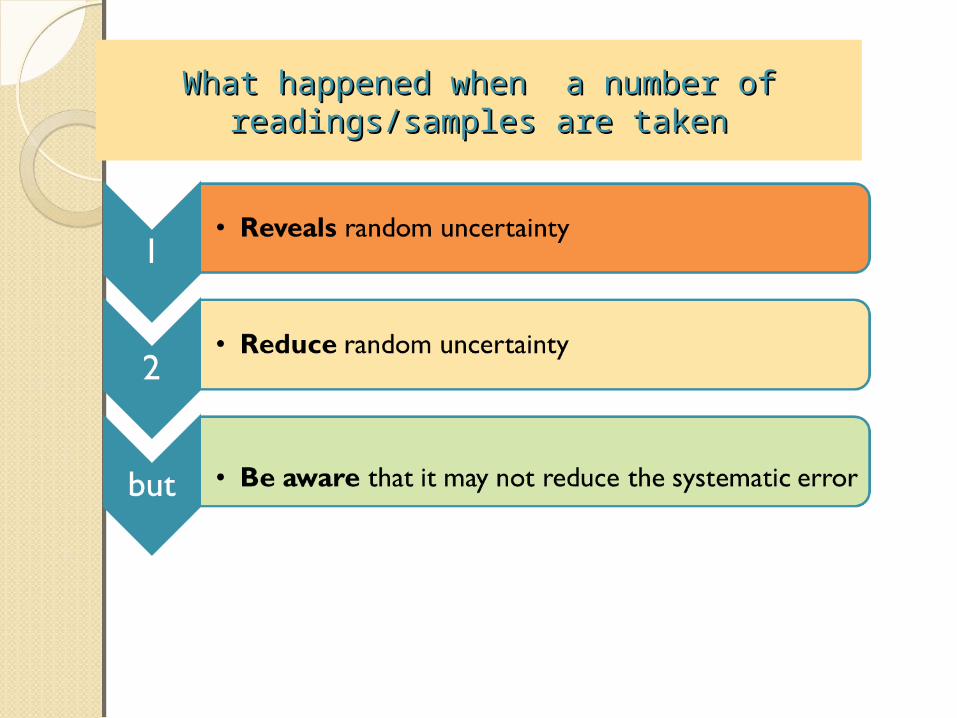
What happened when a number of What happened when a number of readings/samples are takenreadings/samples are taken
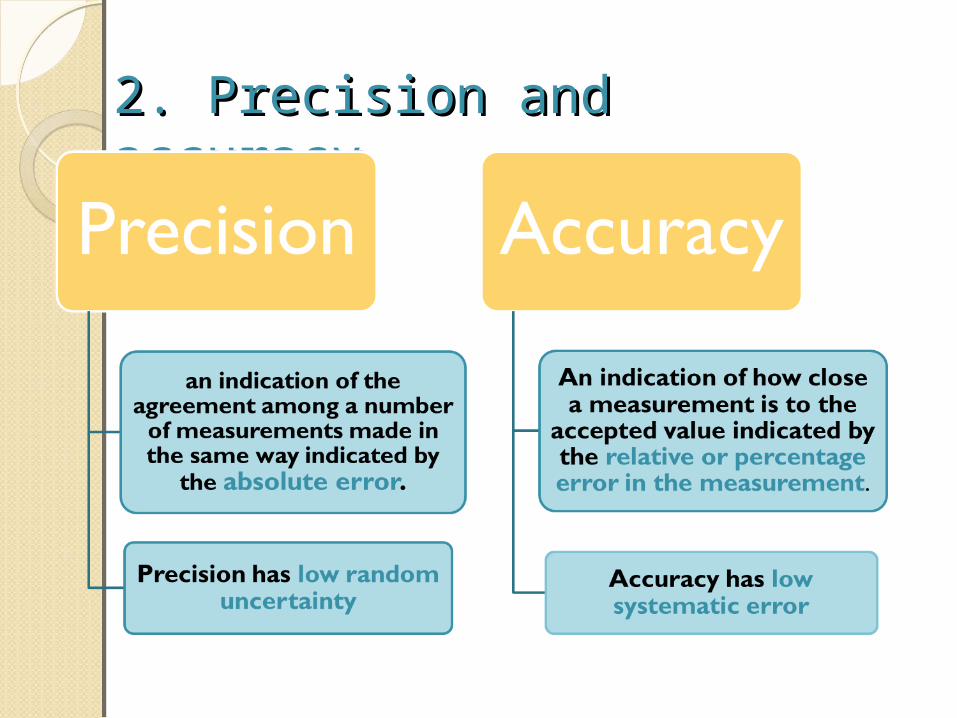
2. Precision and 2. Precision and accuracyaccuracy
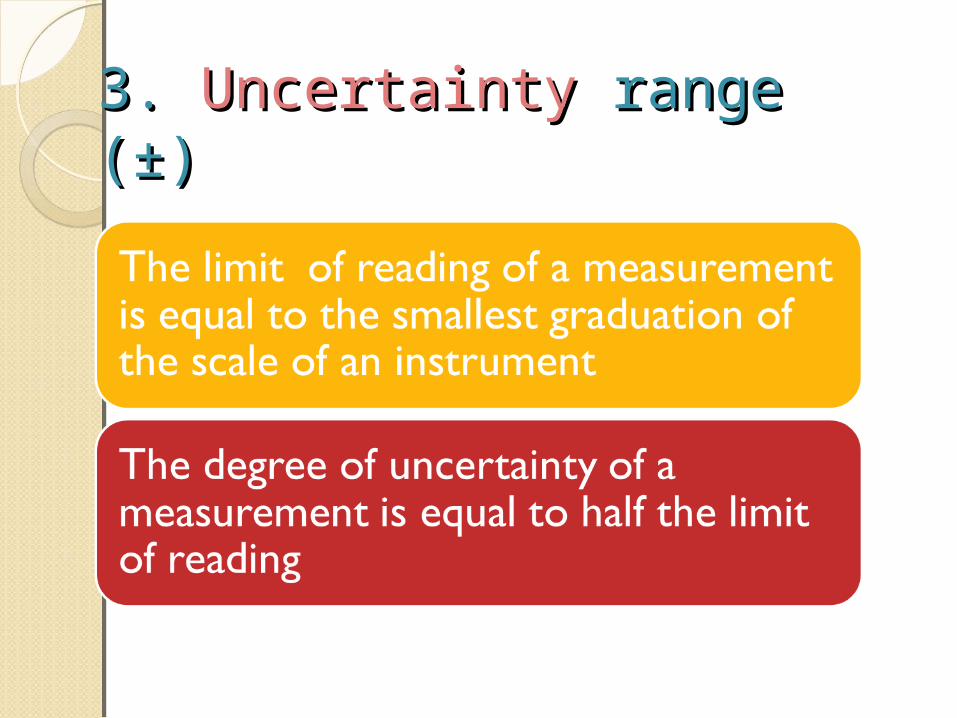
3. 3. UncertaintyUncertainty range range (±)(±)
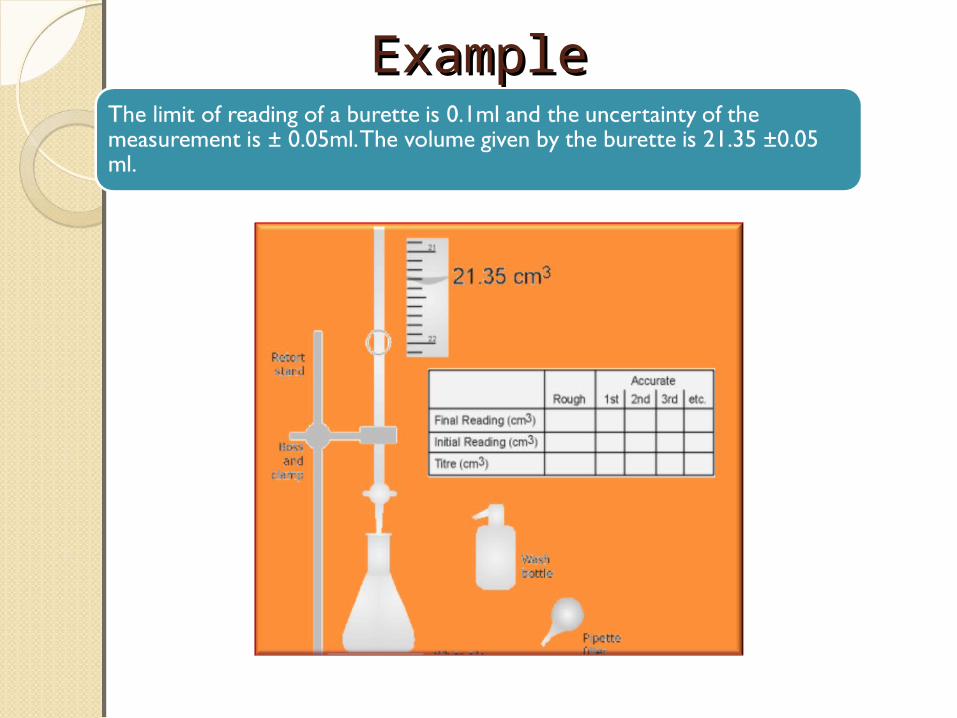
ExampleExample
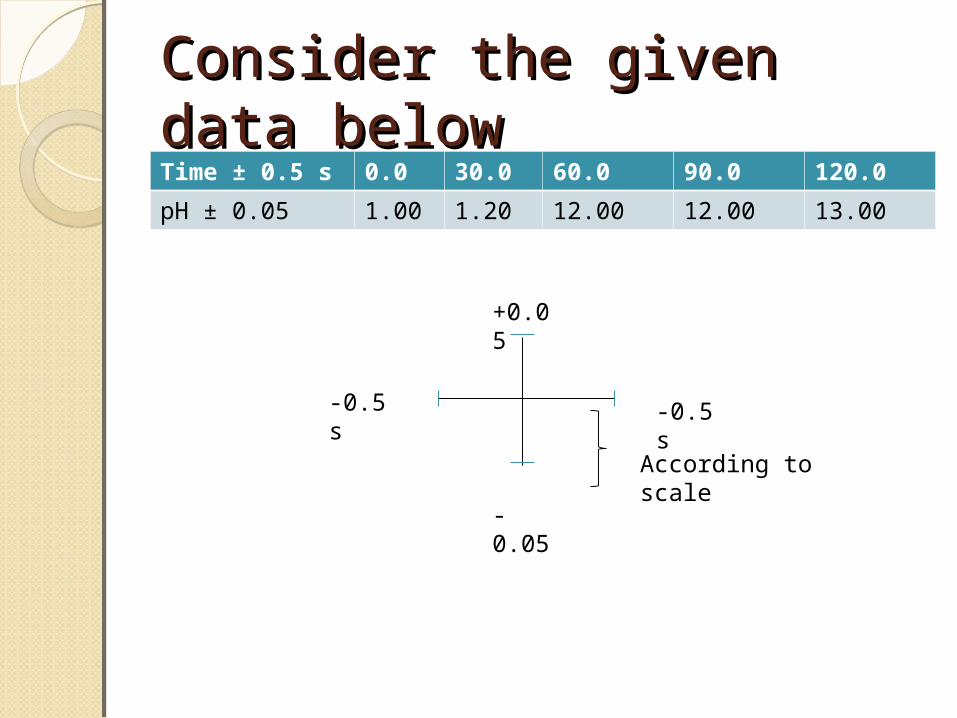
Consider the given Consider the given data belowdata belowTime ± 0.5 s 0.0 30.0 60.0 90.0 120.0pH ± 0.05 1.00 1.20 12.00 12.00 13.00
+0.05
-0.05
-0.5 s
-0.5 s
According to scale
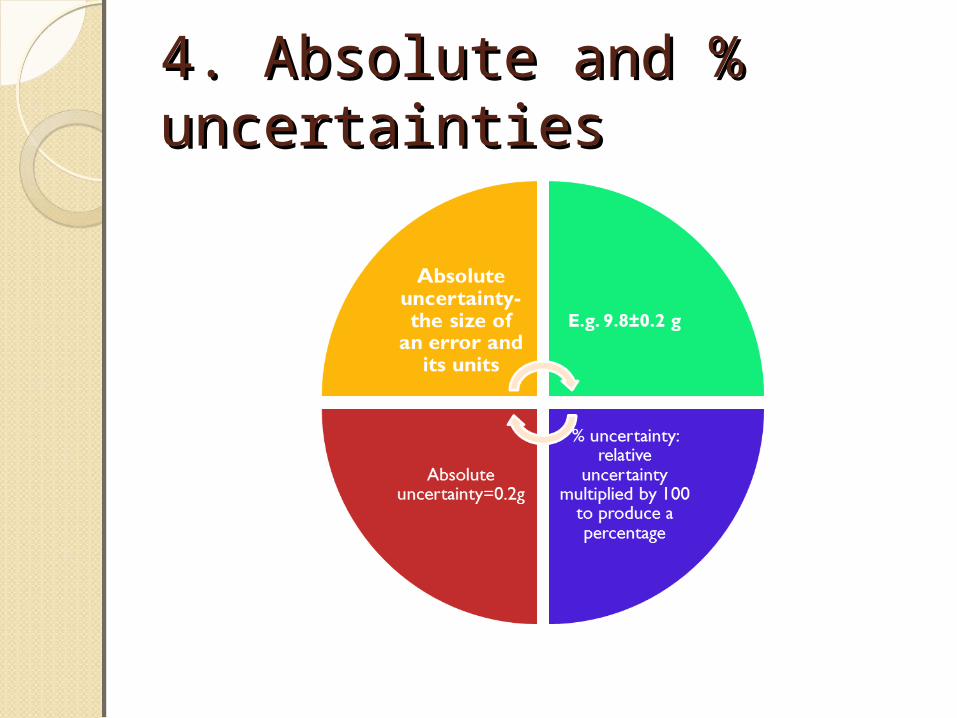
4. Absolute and % 4. Absolute and % uncertaintiesuncertainties
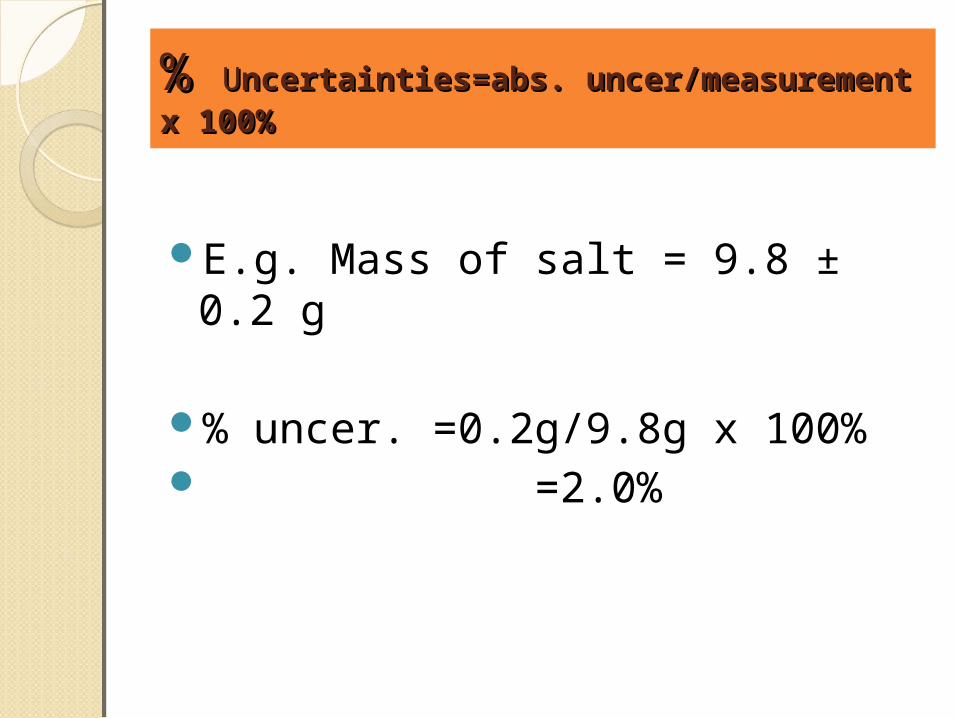
% % UUncertainties=abs. uncer/measurement ncertainties=abs. uncer/measurement x 100%x 100%
E.g. Mass of salt = 9.8 ± 0.2 g
% uncer. =0.2g/9.8g x 100% =2.0%
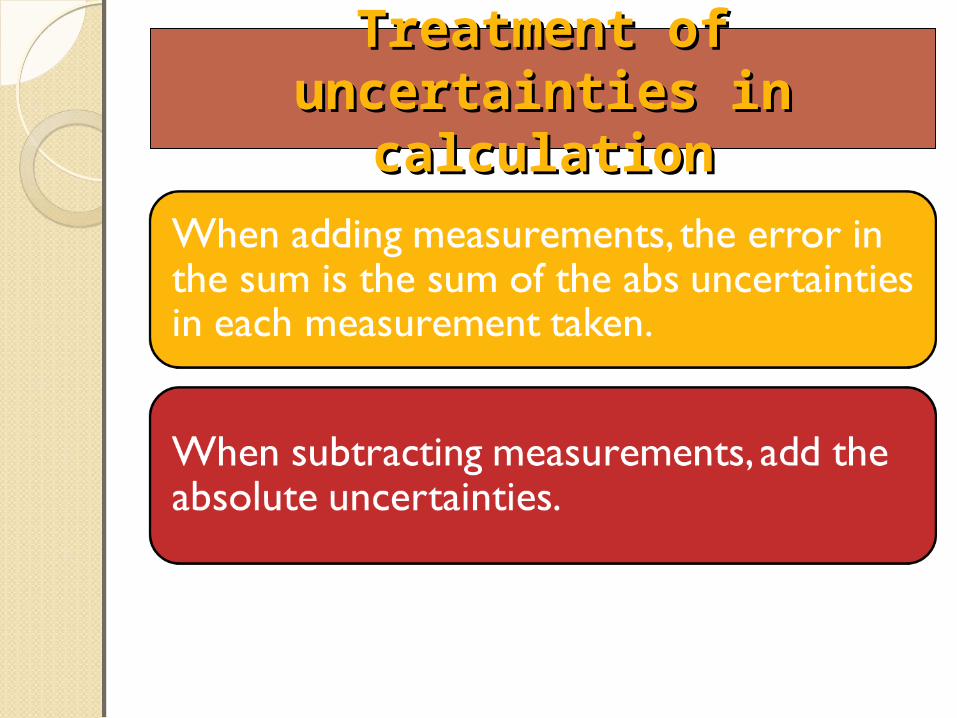
Treatment of Treatment of uncertainties in uncertainties in
calculationcalculation
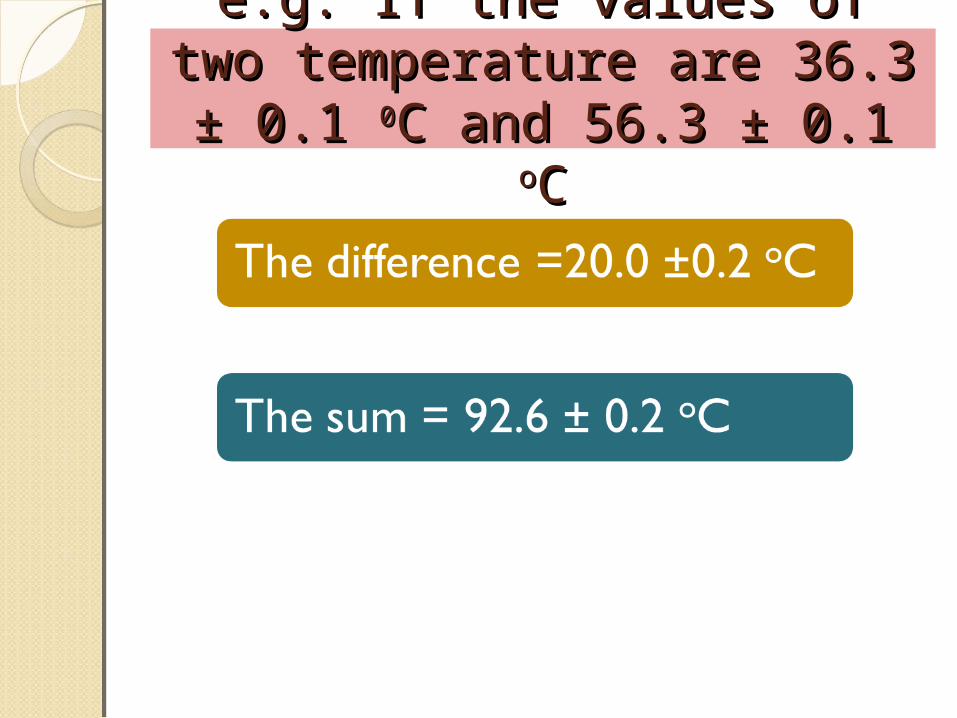
e.g. If the values of e.g. If the values of two temperature are 36.3 two temperature are 36.3 ± 0.1 ± 0.1 00C and 56.3 ± 0.1 C and 56.3 ± 0.1
ooCC
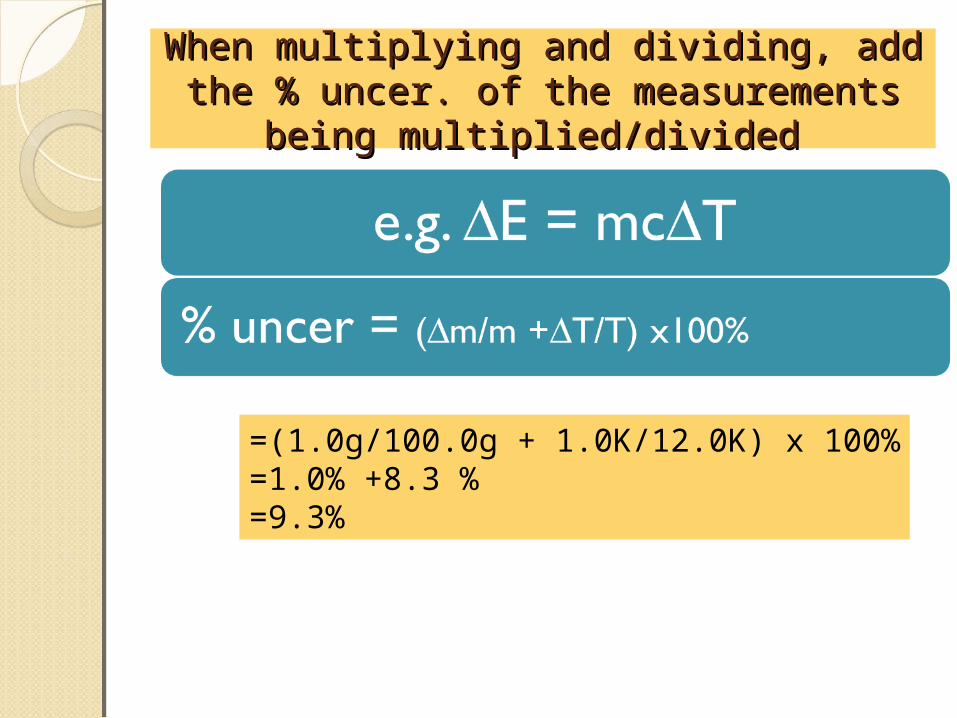
When multiplying and dividing, add When multiplying and dividing, add the % uncer. of the measurements the % uncer. of the measurements
being multiplied/divided being multiplied/divided
=(1.0g/100.0g + 1.0K/12.0K) x 100%=1.0% +8.3 %=9.3%
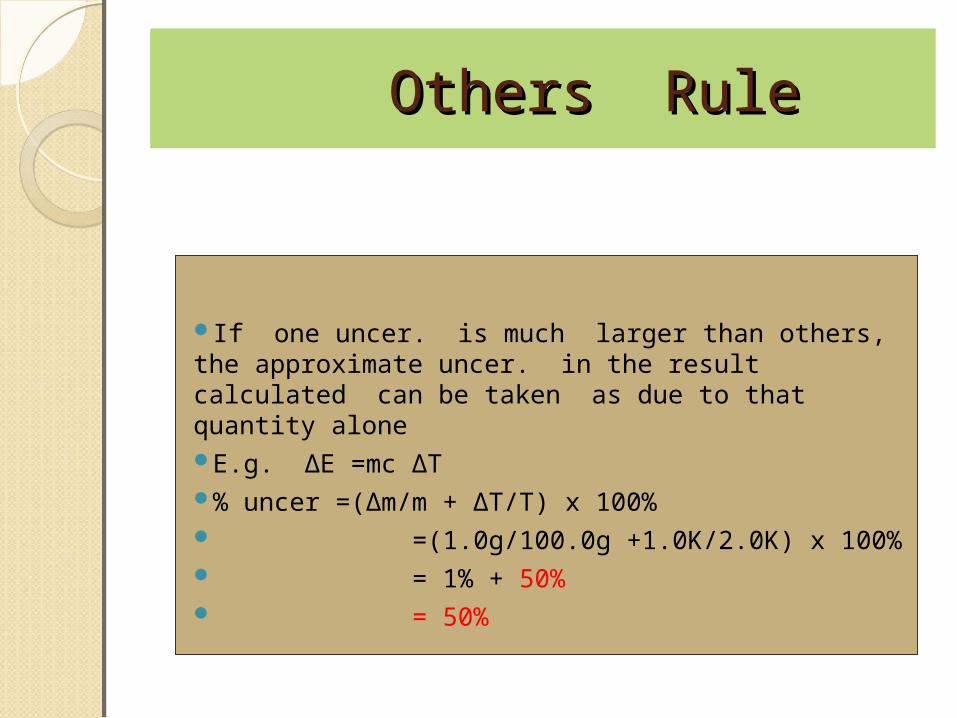
If one uncer. is much larger than others, the approximate uncer. in the result calculated can be taken as due to that quantity aloneE.g. ∆E =mc ∆T% uncer =(∆m/m + ∆T/T) x 100% =(1.0g/100.0g +1.0K/2.0K) x 100% = 1% + 50% = 50%
Others RuleOthers Rule
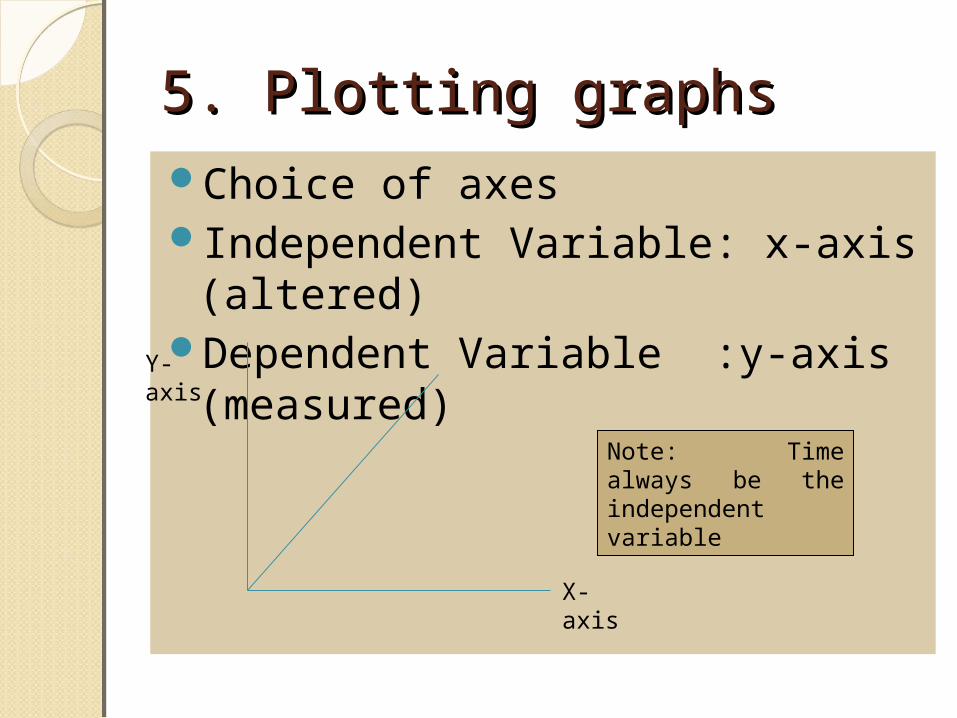
5. Plotting graphs5. Plotting graphsChoice of axesIndependent Variable: x-axis (altered)
Dependent Variable :y-axis (measured)
Y-axis
X-axis
Note: Time always be the independent variable
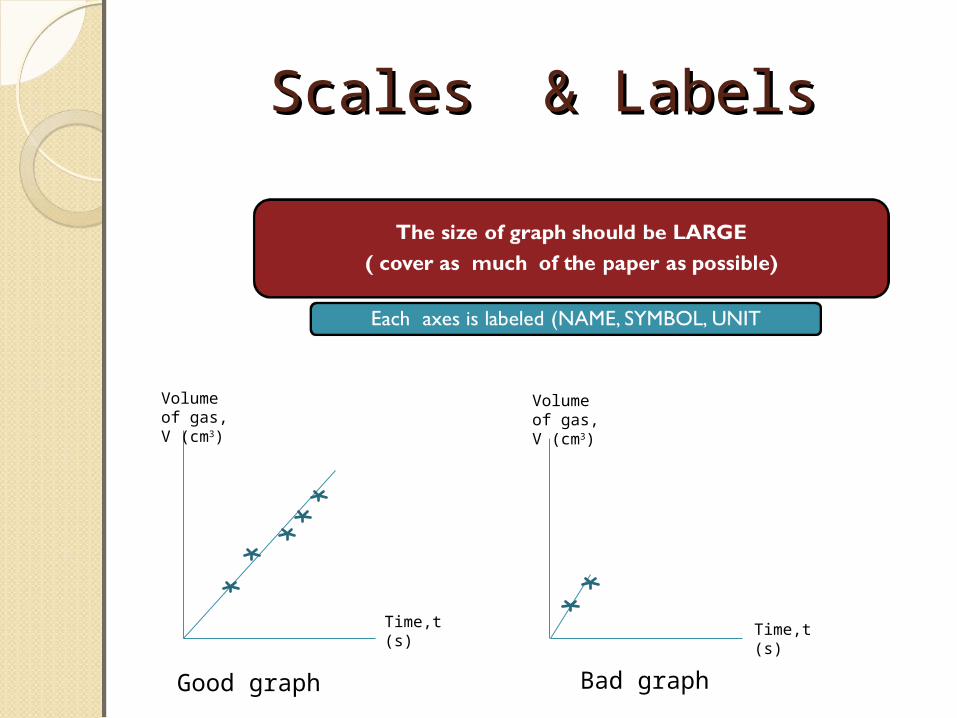
Scales & LabelsScales & Labels
Volume of gas, V (cm3)
Time,t (s)
Volume of gas, V (cm3)
Time,t (s)
Good graph Bad graph
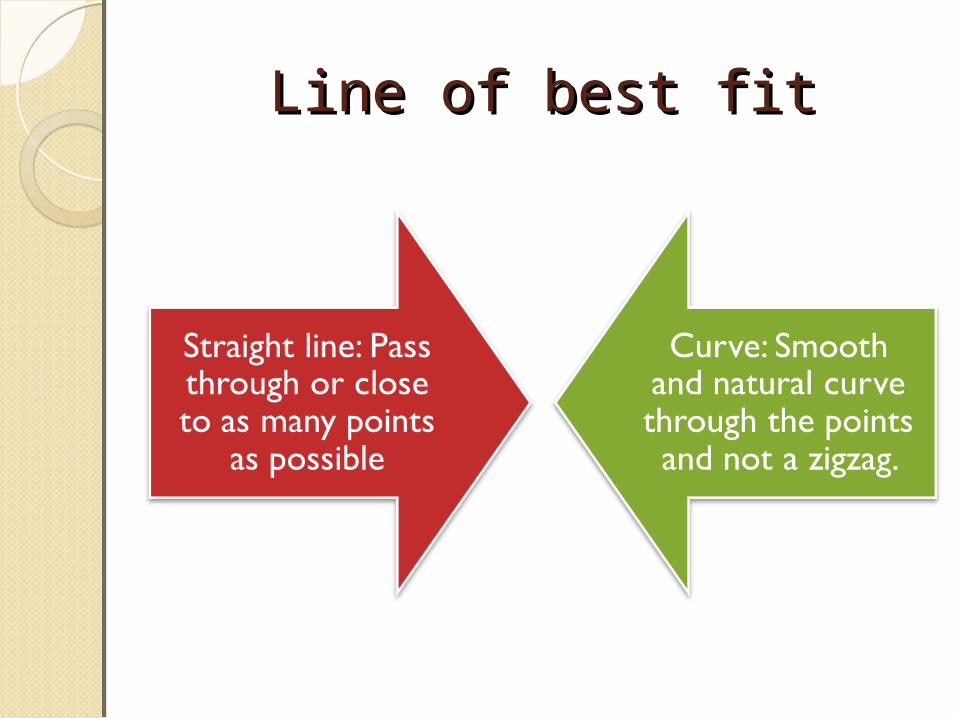
Line of best fitLine of best fit

Straight line and Curve Straight line and Curve GraphGraph
Include obvious data errors on the graph but Omit them when drawing the line. Such an omitted point is
called an “outlier”
Volume of gas, V (cm3)
Volume of gas, V (cm3)
Time,t (s)
Time,t (s)