SICAM Power Quality and Measurement - Siemens
28
siemens.de/powerquality siemens.com/powerquality SICAM Power Quality and Measurement Catalog ⋅ Edition 6
-
Upload
khangminh22 -
Category
Documents
-
view
4 -
download
0
Transcript of SICAM Power Quality and Measurement - Siemens

siemens.de/powerquality
siemens.com/powerquality
SICAM Power Quality and Measurement Catalog ⋅ Edition 6

SICAM Power Quality and Measurement ⋅ Catalog ⋅ Edition 6.02
www.siemens.com/powerquality
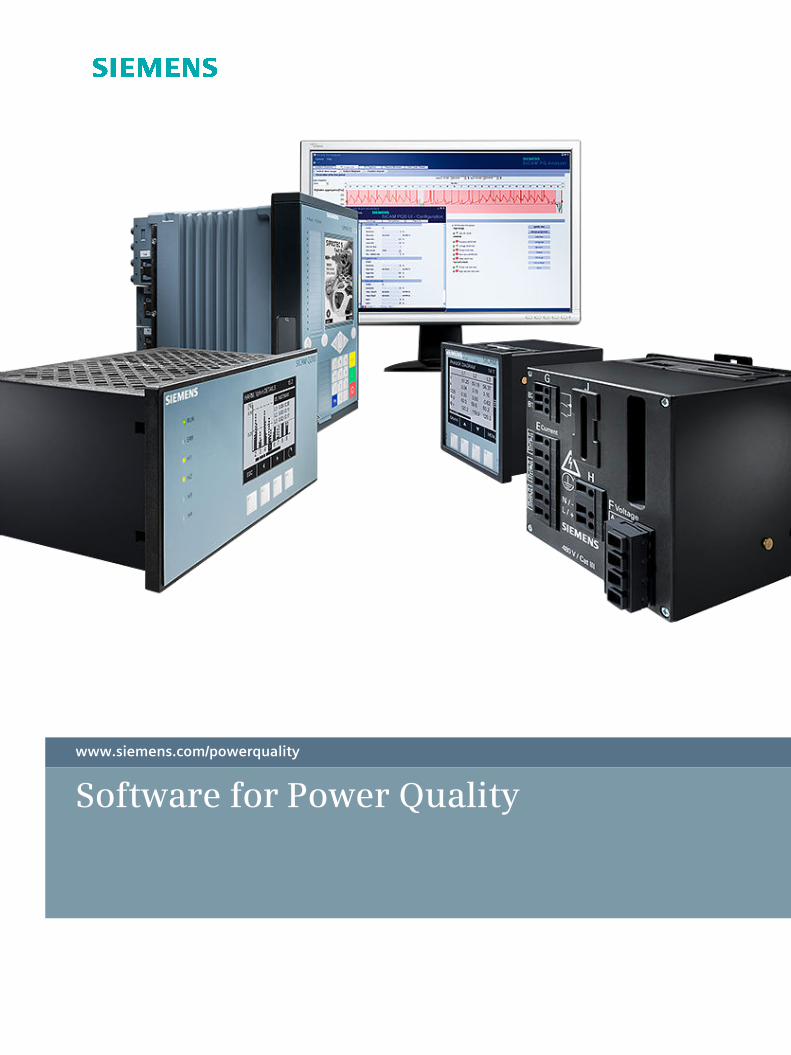
Software for Power Quality
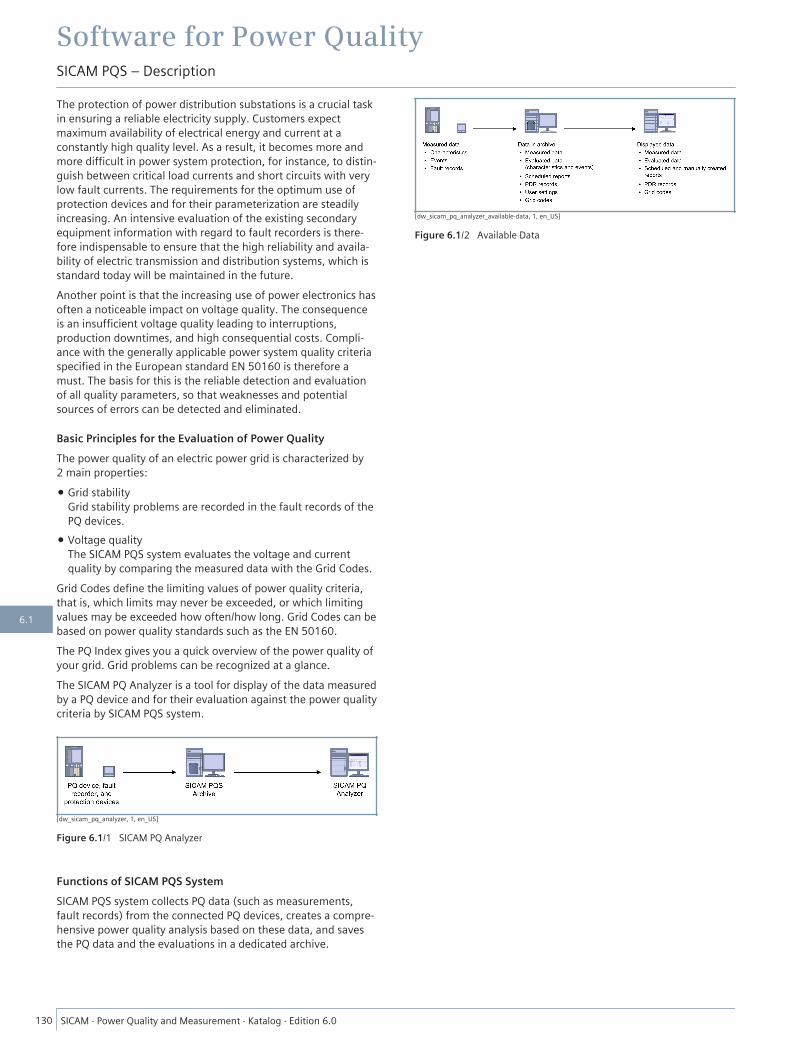
The protection of power distribution substations is a crucial taskin ensuring a reliable electricity supply. Customers expectmaximum availability of electrical energy and current at aconstantly high quality level. As a result, it becomes more andmore difficult in power system protection, for instance, to distin-guish between critical load currents and short circuits with verylow fault currents. The requirements for the optimum use ofprotection devices and for their parameterization are steadilyincreasing. An intensive evaluation of the existing secondaryequipment information with regard to fault recorders is there-fore indispensable to ensure that the high reliability and availa-bility of electric transmission and distribution systems, which isstandard today will be maintained in the future.Another point is that the increasing use of power electronics hasoften a noticeable impact on voltage quality. The consequenceis an insufficient voltage quality leading to interruptions,production downtimes, and high consequential costs. Compli-ance with the generally applicable power system quality criteriaspecified in the European standard EN 50160 is therefore amust. The basis for this is the reliable detection and evaluationof all quality parameters, so that weaknesses and potentialsources of errors can be detected and eliminated.
Basic Principles for the Evaluation of Power QualityThe power quality of an electric power grid is characterized by2 main properties:
• Grid stabilityGrid stability problems are recorded in the fault records of thePQ devices.
• Voltage qualityThe SICAM PQS system evaluates the voltage and currentquality by comparing the measured data with the Grid Codes.
Grid Codes define the limiting values of power quality criteria,that is, which limits may never be exceeded, or which limitingvalues may be exceeded how often/how long. Grid Codes can bebased on power quality standards such as the EN 50160.The PQ Index gives you a quick overview of the power quality ofyour grid. Grid problems can be recognized at a glance.The SICAM PQ Analyzer is a tool for display of the data measuredby a PQ device and for their evaluation against the power qualitycriteria by SICAM PQS system.
[dw_sicam_pq_analyzer, 1, en_US]
Figure 6.1/1 SICAM PQ Analyzer
Functions of SICAM PQS SystemSICAM PQS system collects PQ data (such as measurements,fault records) from the connected PQ devices, creates a compre-hensive power quality analysis based on these data, and savesthe PQ data and the evaluations in a dedicated archive.
[dw_sicam_pq_analyzer_available-data, 1, en_US]
Figure 6.1/2 Available Data
Software for Power QualitySICAM PQS – Description
130 SICAM ⋅ Power Quality and Measurement ⋅ Katalog ⋅ Edition 6.0
6.1
Description Variants Order No.1 2 3 4 5 6 7 8 9 10 11 12 13 14 15 16
Bundles (base package including a communication application) 7 K E 9 0 0 0 - 1 □ A 1 0 - 8 □ A 0▲ ▲ ▲
Version 8.0 │ 8 │Supports up to 4 devices │ │
SICAM PQS incl. SICAM Q80 R BSICAM PQS incl. SIMEAS R R CSICAM PQS incl. IEC 61850 (monitoring direc-tion)
R D
Supports up to 15 devices │ │SICAM PQS incl. SICAM Q80 M BSICAM PQS incl. SIMEAS R M CSICAM PQS incl. IEC 61850 (monitoring direc-tion)
M D
Supports up to 180 devices │ │SICAM PQS incl. SICAM Q80 A BSICAM PQS incl. SIMEAS R A CSICAM PQS incl. IEC 61850 (monitoring direc-tion)
A D
Additional V8.05 order for special use C 5 3 2 0 7 - A 4 0 4 - D 4 4 8 - 2DVD with V8.05 software, latest versionreleased for Windows XP, SICAM Station UnitV2.20, Windows Server 2003 R2 and the useof Profibus FMS; requirement: License/dongleorder with MLFBs 6MD90..-…..-8..0 / 7KE90..-…..-8..0
Upgrades 6 M D 9 0 0 □ - 0 □ A □ □ - 8 A A 0Functional upgrades with respect to the supported number of devices ▲ ▲ ▲ ▲"Full Server" - runtime (up to 15 devices/2000 master information objects)
Prerequisite: 7KE9000-1RA10-8AA0 4 R 1 0
"Full Server" - runtime (up to 180 devices) Prerequisite: 7KE9000-1MA10-8AA0 4 M 1 0Version upgrade SICAM PAS/PQS upgrade to V8.0x SPx (the 1st
order must be referenced in the order)3 A 0 0
Options & Add-onsMaster protocols Power Quality 7 K E 9 0 0 0 - 0 C B 1 □ - 8 A A 0
SIMEAS R master 1SICAM Q80 Master 2
Master protocols Power Automation (monitoring direction) 6 M D 9 0 0 0 - 0 C □ 1 0 - 8 A A 0IEC 60870-5-103 master (monitoring direc-tion)
B
IEC 61850 client (monitoring direction) EPower Quality applications 7 K E 9 0 0 0 - 0 B A 6 □ - 8 A A 0
Automatic Comtrade import 0Automatic Comtrade export 1Automatic PQDif import 2Automatic PQDif export 3Automatic report export 4Automatic fault location 5Message (e-mail, SMS) 6Automatic GridCode evaluation 7Scheduled PQ reports 8
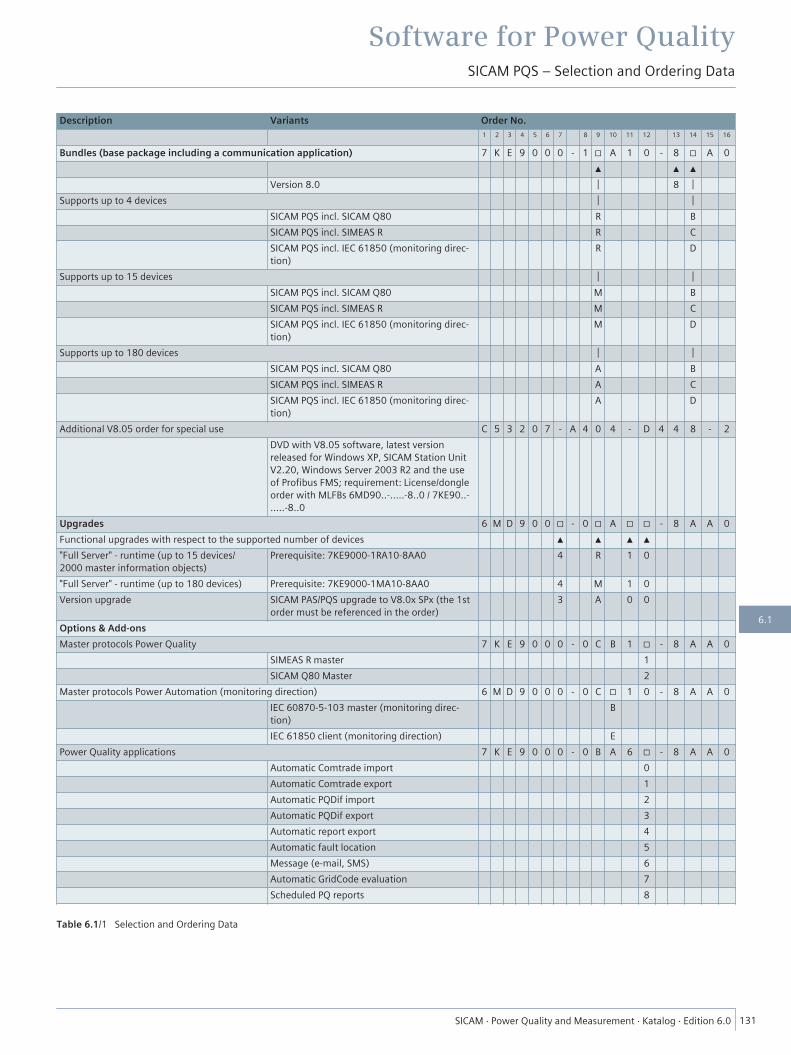
Table 6.1/1 Selection and Ordering Data
Software for Power QualitySICAM PQS – Selection and Ordering Data
SICAM ⋅ Power Quality and Measurement ⋅ Katalog ⋅ Edition 6.0 131
6.1
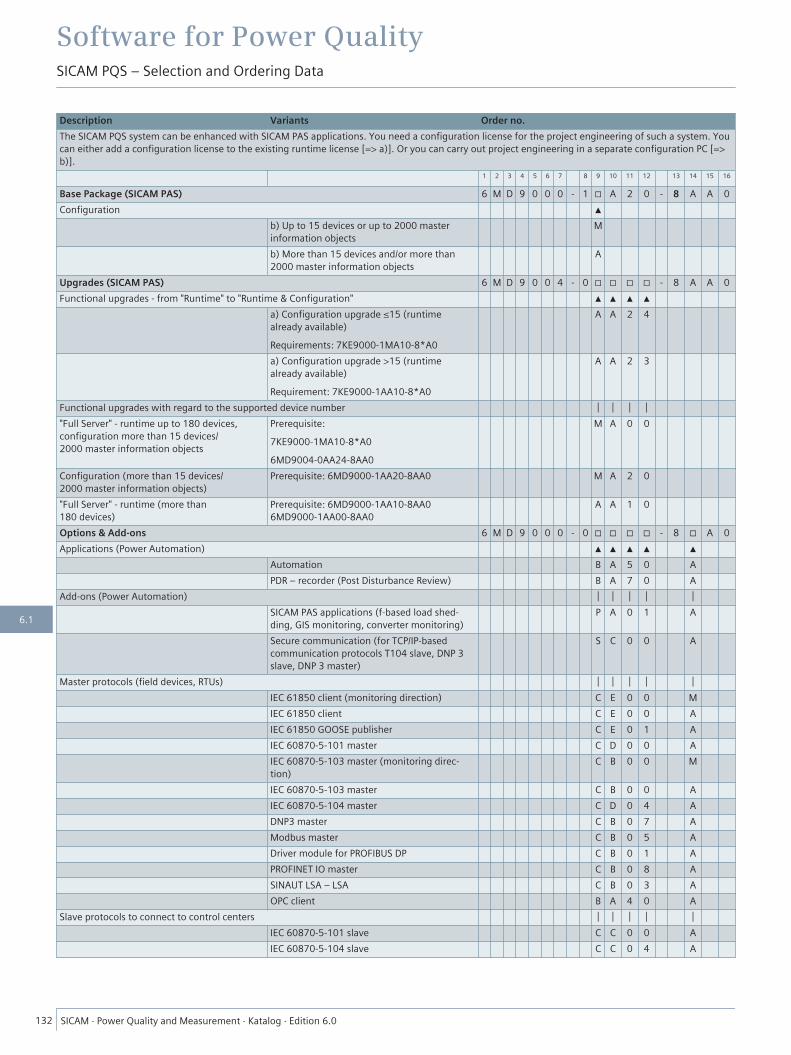
Description Variants Order no.The SICAM PQS system can be enhanced with SICAM PAS applications. You need a configuration license for the project engineering of such a system. Youcan either add a configuration license to the existing runtime license [=> a)]. Or you can carry out project engineering in a separate configuration PC [=>b)].
1 2 3 4 5 6 7 8 9 10 11 12 13 14 15 16
Base Package (SICAM PAS) 6 M D 9 0 0 0 - 1 □ A 2 0 - 8 A A 0Configuration ▲
b) Up to 15 devices or up to 2000 masterinformation objects
M
b) More than 15 devices and/or more than2000 master information objects
A
Upgrades (SICAM PAS) 6 M D 9 0 0 4 - 0 □ □ □ □ - 8 A A 0Functional upgrades - from "Runtime" to "Runtime & Configuration" ▲ ▲ ▲ ▲
a) Configuration upgrade ≤15 (runtimealready available)Requirements: 7KE9000-1MA10-8*A0
A A 2 4
a) Configuration upgrade >15 (runtimealready available)Requirement: 7KE9000-1AA10-8*A0
A A 2 3
Functional upgrades with regard to the supported device number │ │ │ │"Full Server" - runtime up to 180 devices,configuration more than 15 devices/2000 master information objects
Prerequisite:7KE9000-1MA10-8*A06MD9004-0AA24-8AA0
M A 0 0
Configuration (more than 15 devices/2000 master information objects)
Prerequisite: 6MD9000-1AA20-8AA0 M A 2 0
"Full Server" - runtime (more than180 devices)
Prerequisite: 6MD9000-1AA10-8AA06MD9000-1AA00-8AA0
A A 1 0
Options & Add-ons 6 M D 9 0 0 0 - 0 □ □ □ □ - 8 □ A 0Applications (Power Automation) ▲ ▲ ▲ ▲ ▲
Automation B A 5 0 APDR – recorder (Post Disturbance Review) B A 7 0 A
Add-ons (Power Automation) │ │ │ │ │SICAM PAS applications (f-based load shed-ding, GIS monitoring, converter monitoring)
P A 0 1 A
Secure communication (for TCP/IP-basedcommunication protocols T104 slave, DNP 3slave, DNP 3 master)
S C 0 0 A
Master protocols (field devices, RTUs) │ │ │ │ │IEC 61850 client (monitoring direction) C E 0 0 MIEC 61850 client C E 0 0 AIEC 61850 GOOSE publisher C E 0 1 AIEC 60870-5-101 master C D 0 0 AIEC 60870-5-103 master (monitoring direc-tion)
C B 0 0 M
IEC 60870-5-103 master C B 0 0 AIEC 60870-5-104 master C D 0 4 ADNP3 master C B 0 7 AModbus master C B 0 5 ADriver module for PROFIBUS DP C B 0 1 APROFINET IO master C B 0 8 ASINAUT LSA – LSA C B 0 3 AOPC client B A 4 0 A
Slave protocols to connect to control centers │ │ │ │ │IEC 60870-5-101 slave C C 0 0 AIEC 60870-5-104 slave C C 0 4 A
Software for Power QualitySICAM PQS – Selection and Ordering Data
132 SICAM ⋅ Power Quality and Measurement ⋅ Katalog ⋅ Edition 6.0
6.1
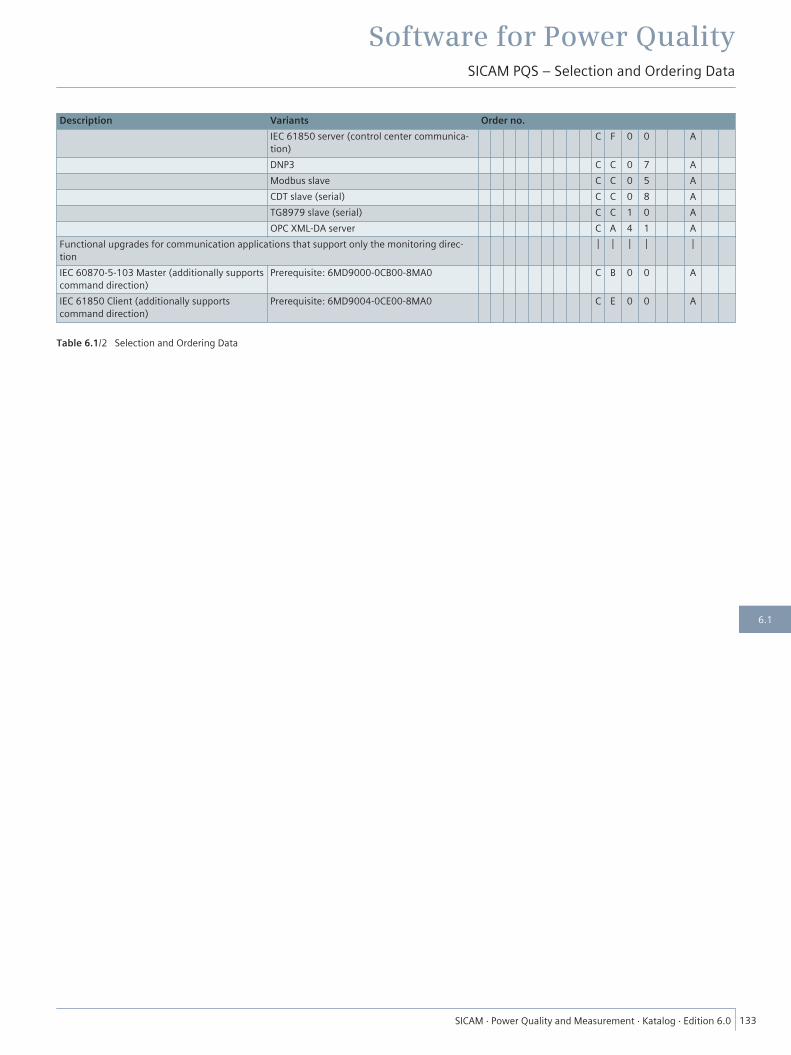
Description Variants Order no.IEC 61850 server (control center communica-tion)
C F 0 0 A
DNP3 C C 0 7 AModbus slave C C 0 5 ACDT slave (serial) C C 0 8 ATG8979 slave (serial) C C 1 0 AOPC XML-DA server C A 4 1 A
Functional upgrades for communication applications that support only the monitoring direc-tion
│ │ │ │ │
IEC 60870-5-103 Master (additionally supportscommand direction)
Prerequisite: 6MD9000-0CB00-8MA0 C B 0 0 A
IEC 61850 Client (additionally supportscommand direction)
Prerequisite: 6MD9004-0CE00-8MA0 C E 0 0 A
Table 6.1/2 Selection and Ordering Data
Software for Power QualitySICAM PQS – Selection and Ordering Data
SICAM ⋅ Power Quality and Measurement ⋅ Katalog ⋅ Edition 6.0 133
6.1
DescriptionSICAM PQ Analyzer provides comprehensive evaluation optionsfor archived PQ measured data and fault records. In addition toclearly structured fault-record analysis, the fault locator facili-tates and accelerates the elimination of faults in the powernetwork. PQ Violation Reports provide a quick and comprehen-sive overview of limiting-value violations. Scheduled reportsprovide an overview of the development of measured data overselectable time ranges. Using a calendar tool, that is available inall views, you can quickly and easily select any time range overwhich data is to be displayed in a diagram. The calculated PQindex delivers concise information on the quality of yournetwork.
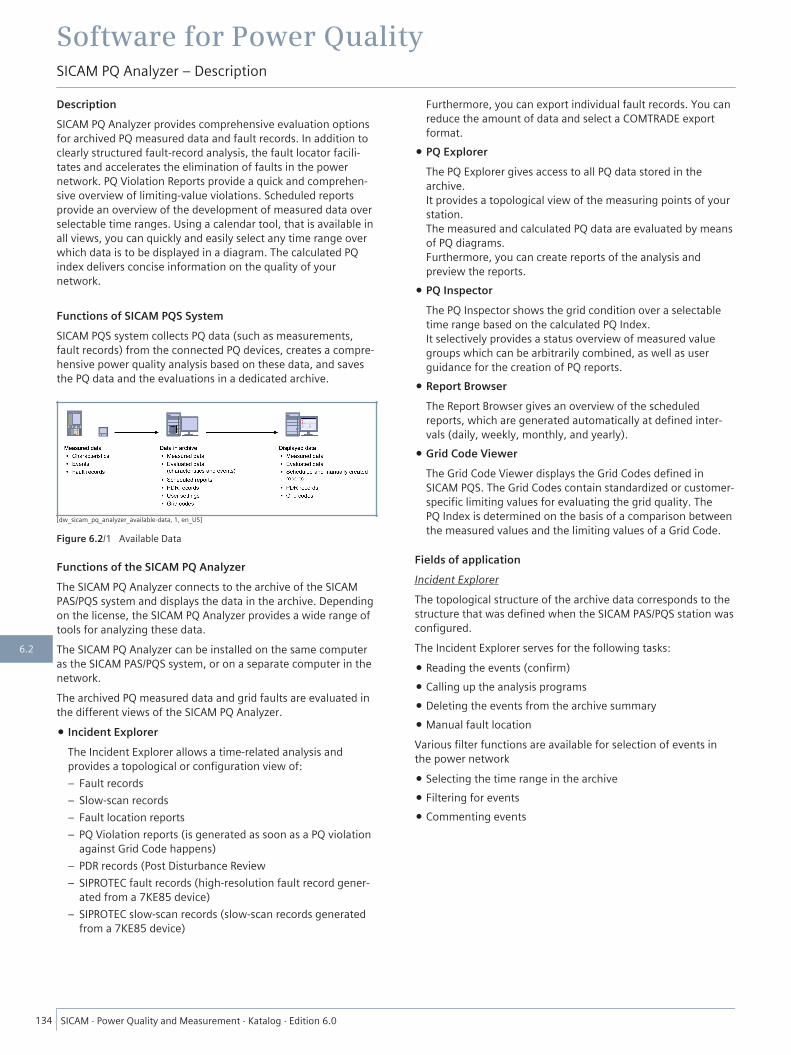
Functions of SICAM PQS SystemSICAM PQS system collects PQ data (such as measurements,fault records) from the connected PQ devices, creates a compre-hensive power quality analysis based on these data, and savesthe PQ data and the evaluations in a dedicated archive.
[dw_sicam_pq_analyzer_available-data, 1, en_US]
Figure 6.2/1 Available Data
Functions of the SICAM PQ AnalyzerThe SICAM PQ Analyzer connects to the archive of the SICAMPAS/PQS system and displays the data in the archive. Dependingon the license, the SICAM PQ Analyzer provides a wide range oftools for analyzing these data.The SICAM PQ Analyzer can be installed on the same computeras the SICAM PAS/PQS system, or on a separate computer in thenetwork.The archived PQ measured data and grid faults are evaluated inthe different views of the SICAM PQ Analyzer.
• Incident ExplorerThe Incident Explorer allows a time-related analysis andprovides a topological or configuration view of:– Fault records– Slow-scan records– Fault location reports– PQ Violation reports (is generated as soon as a PQ violation
against Grid Code happens)– PDR records (Post Disturbance Review– SIPROTEC fault records (high-resolution fault record gener-
ated from a 7KE85 device)– SIPROTEC slow-scan records (slow-scan records generated
from a 7KE85 device)
Furthermore, you can export individual fault records. You canreduce the amount of data and select a COMTRADE exportformat.
• PQ ExplorerThe PQ Explorer gives access to all PQ data stored in thearchive.It provides a topological view of the measuring points of yourstation.The measured and calculated PQ data are evaluated by meansof PQ diagrams.Furthermore, you can create reports of the analysis andpreview the reports.
• PQ InspectorThe PQ Inspector shows the grid condition over a selectabletime range based on the calculated PQ Index.It selectively provides a status overview of measured valuegroups which can be arbitrarily combined, as well as userguidance for the creation of PQ reports.
• Report BrowserThe Report Browser gives an overview of the scheduledreports, which are generated automatically at defined inter-vals (daily, weekly, monthly, and yearly).
• Grid Code ViewerThe Grid Code Viewer displays the Grid Codes defined inSICAM PQS. The Grid Codes contain standardized or customer-specific limiting values for evaluating the grid quality. ThePQ Index is determined on the basis of a comparison betweenthe measured values and the limiting values of a Grid Code.
Fields of applicationIncident ExplorerThe topological structure of the archive data corresponds to thestructure that was defined when the SICAM PAS/PQS station wasconfigured.The Incident Explorer serves for the following tasks:
• Reading the events (confirm)• Calling up the analysis programs• Deleting the events from the archive summary• Manual fault locationVarious filter functions are available for selection of events inthe power network
• Selecting the time range in the archive• Filtering for events• Commenting events
Software for Power QualitySICAM PQ Analyzer – Description
134 SICAM ⋅ Power Quality and Measurement ⋅ Katalog ⋅ Edition 6.0
6.2
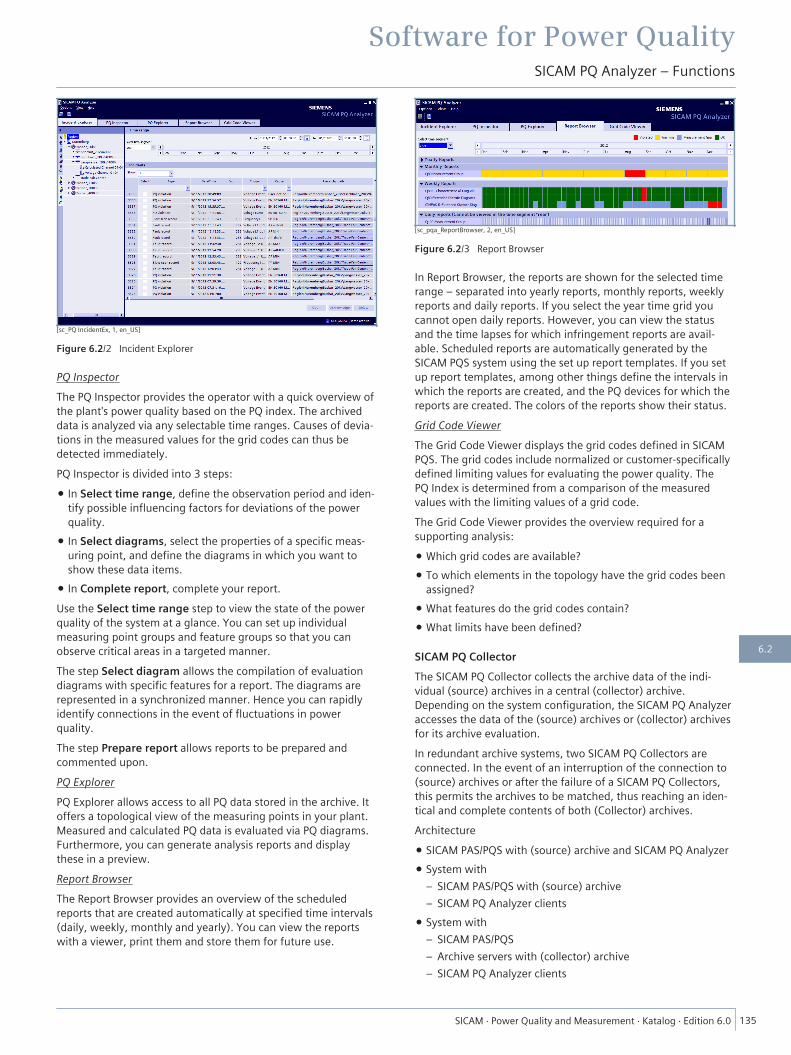
[sc_PQ IncidentEx, 1, en_US]
Figure 6.2/2 Incident Explorer
PQ InspectorThe PQ Inspector provides the operator with a quick overview ofthe plant's power quality based on the PQ index. The archiveddata is analyzed via any selectable time ranges. Causes of devia-tions in the measured values for the grid codes can thus bedetected immediately.PQ Inspector is divided into 3 steps:
• In Select time range, define the observation period and iden-tify possible influencing factors for deviations of the powerquality.
• In Select diagrams, select the properties of a specific meas-uring point, and define the diagrams in which you want toshow these data items.
• In Complete report, complete your report.Use the Select time range step to view the state of the powerquality of the system at a glance. You can set up individualmeasuring point groups and feature groups so that you canobserve critical areas in a targeted manner.The step Select diagram allows the compilation of evaluationdiagrams with specific features for a report. The diagrams arerepresented in a synchronized manner. Hence you can rapidlyidentify connections in the event of fluctuations in powerquality.The step Prepare report allows reports to be prepared andcommented upon.PQ ExplorerPQ Explorer allows access to all PQ data stored in the archive. Itoffers a topological view of the measuring points in your plant.Measured and calculated PQ data is evaluated via PQ diagrams.Furthermore, you can generate analysis reports and displaythese in a preview.Report BrowserThe Report Browser provides an overview of the scheduledreports that are created automatically at specified time intervals(daily, weekly, monthly and yearly). You can view the reportswith a viewer, print them and store them for future use.
[sc_pqa_ReportBrowser, 2, en_US]
Figure 6.2/3 Report Browser
In Report Browser, the reports are shown for the selected timerange – separated into yearly reports, monthly reports, weeklyreports and daily reports. If you select the year time grid youcannot open daily reports. However, you can view the statusand the time lapses for which infringement reports are avail-able. Scheduled reports are automatically generated by theSICAM PQS system using the set up report templates. If you setup report templates, among other things define the intervals inwhich the reports are created, and the PQ devices for which thereports are created. The colors of the reports show their status.Grid Code ViewerThe Grid Code Viewer displays the grid codes defined in SICAMPQS. The grid codes include normalized or customer-specificallydefined limiting values for evaluating the power quality. ThePQ Index is determined from a comparison of the measuredvalues with the limiting values of a grid code.The Grid Code Viewer provides the overview required for asupporting analysis:
• Which grid codes are available?• To which elements in the topology have the grid codes been
assigned?• What features do the grid codes contain?• What limits have been defined?
SICAM PQ CollectorThe SICAM PQ Collector collects the archive data of the indi-vidual (source) archives in a central (collector) archive.Depending on the system configuration, the SICAM PQ Analyzeraccesses the data of the (source) archives or (collector) archivesfor its archive evaluation.In redundant archive systems, two SICAM PQ Collectors areconnected. In the event of an interruption of the connection to(source) archives or after the failure of a SICAM PQ Collectors,this permits the archives to be matched, thus reaching an iden-tical and complete contents of both (Collector) archives.Architecture
• SICAM PAS/PQS with (source) archive and SICAM PQ Analyzer• System with
– SICAM PAS/PQS with (source) archive– SICAM PQ Analyzer clients
• System with– SICAM PAS/PQS– Archive servers with (collector) archive– SICAM PQ Analyzer clients
Software for Power QualitySICAM PQ Analyzer – Functions
SICAM ⋅ Power Quality and Measurement ⋅ Katalog ⋅ Edition 6.0 135
6.2
The number of components which can be used in a systemdepends on the individual license.(Source) archiveSICAM PAS/PQS collects the PQ measured data and fault recordsfrom the connected devices and stores them in its local (source)archive. This archive data can be directly evaluated by one ormore SICAM PQ Analyzer(s).(Collector) archiveIn distributed systems with one or several SICAM PAS/PQS, thedata of the (source) archives is collected by the SICAM PQAnalyzer collector and stored in a central (Collector) archive onan archive computer. This archive data is evaluated by one ormore SICAM PQ Analyzer(s).
Software for Power QualitySICAM PQ Analyzer – Functions
136 SICAM ⋅ Power Quality and Measurement ⋅ Katalog ⋅ Edition 6.0
6.2
One of the following operating systems is required:
• Windows Embedded 7 (SICAM Station Unit V2.40, 32-bit)• Windows Server 2012 R2 Standard (64-bit)• Windows 8.1 Professional (64-bit)• Windows 10 Professional (64-bit)Computer equipped with:
• Processor:– Minimum: Intel Core 2 Duo 1.6 GHz– Recommended: Quad Core CPU 3 GHz
• Primary storage capacity:– Minimum: 2 GB– Recommended: 4 GB
• Hard disk capacity:– Minimum: 4 GB– (Collector) archive: > 100 GB
• Graphics card:– Minimum: 1600 x 1200– Recommended: 1920 x 1080
• Monitor suitable for graphics card• DVD drive• Keyboard• Mouse• Network interface• USB portSICAM PQ Analyzer is released for computers with multi-coreprocessors. Computers with multi-processor main boards aresupported when working in single-processor mode.
Software for Power QualitySICAM PQ Analyzer – Software and Hardware Requirements
SICAM ⋅ Power Quality and Measurement ⋅ Katalog ⋅ Edition 6.0 137
6.2
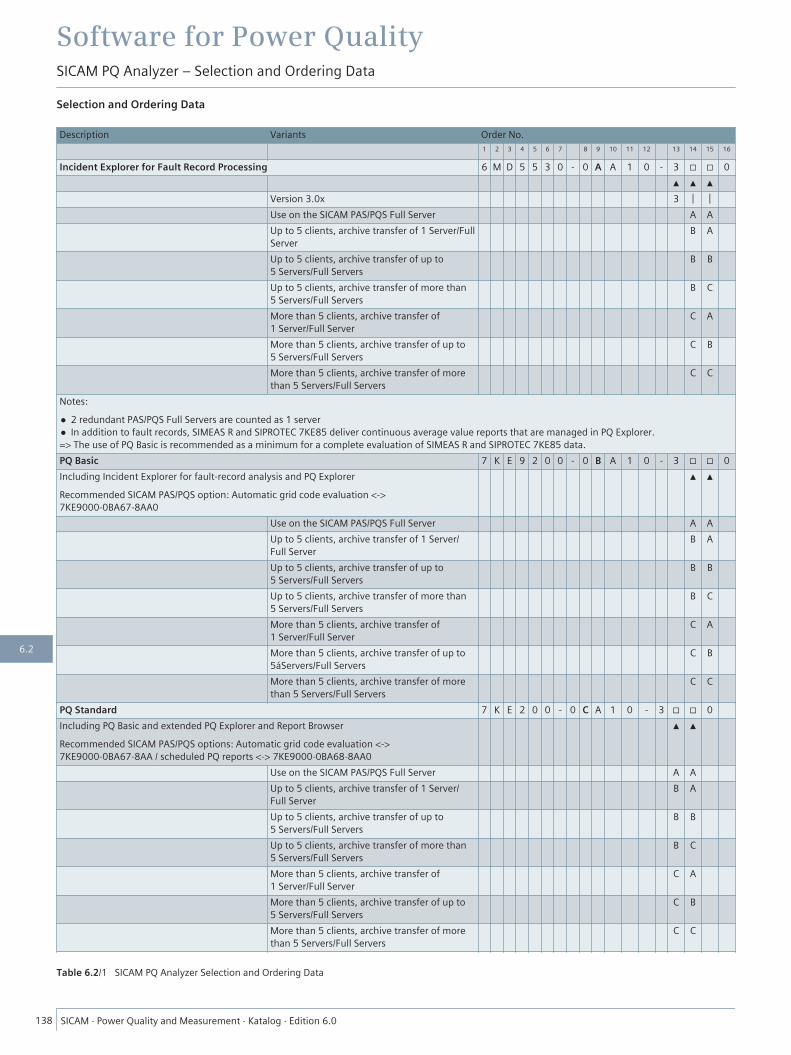
Selection and Ordering Data
Description Variants Order No.1 2 3 4 5 6 7 8 9 10 11 12 13 14 15 16
Incident Explorer for Fault Record Processing 6 M D 5 5 3 0 - 0 A A 1 0 - 3 □ □ 0▲ ▲ ▲
Version 3.0x 3 │ │Use on the SICAM PAS/PQS Full Server A AUp to 5 clients, archive transfer of 1 Server/FullServer
B A
Up to 5 clients, archive transfer of up to5 Servers/Full Servers
B B
Up to 5 clients, archive transfer of more than5 Servers/Full Servers
B C
More than 5 clients, archive transfer of1 Server/Full Server
C A
More than 5 clients, archive transfer of up to5 Servers/Full Servers
C B
More than 5 clients, archive transfer of morethan 5 Servers/Full Servers
C C
Notes:
• 2 redundant PAS/PQS Full Servers are counted as 1 server• In addition to fault records, SIMEAS R and SIPROTEC 7KE85 deliver continuous average value reports that are managed in PQ Explorer.=> The use of PQ Basic is recommended as a minimum for a complete evaluation of SIMEAS R and SIPROTEC 7KE85 data.PQ Basic 7 K E 9 2 0 0 - 0 B A 1 0 - 3 □ □ 0Including Incident Explorer for fault-record analysis and PQ ExplorerRecommended SICAM PAS/PQS option: Automatic grid code evaluation <->7KE9000-0BA67-8AA0
▲ ▲
Use on the SICAM PAS/PQS Full Server A AUp to 5 clients, archive transfer of 1 Server/Full Server
B A
Up to 5 clients, archive transfer of up to5 Servers/Full Servers
B B
Up to 5 clients, archive transfer of more than5 Servers/Full Servers
B C
More than 5 clients, archive transfer of1 Server/Full Server
C A
More than 5 clients, archive transfer of up to5áServers/Full Servers
C B
More than 5 clients, archive transfer of morethan 5 Servers/Full Servers
C C
PQ Standard 7 K E 2 0 0 - 0 C A 1 0 - 3 □ □ 0Including PQ Basic and extended PQ Explorer and Report BrowserRecommended SICAM PAS/PQS options: Automatic grid code evaluation <->7KE9000-0BA67-8AA / scheduled PQ reports <-> 7KE9000-0BA68-8AA0
▲ ▲
Use on the SICAM PAS/PQS Full Server A AUp to 5 clients, archive transfer of 1 Server/Full Server
B A
Up to 5 clients, archive transfer of up to5 Servers/Full Servers
B B
Up to 5 clients, archive transfer of more than5 Servers/Full Servers
B C
More than 5 clients, archive transfer of1 Server/Full Server
C A
More than 5 clients, archive transfer of up to5 Servers/Full Servers
C B
More than 5 clients, archive transfer of morethan 5 Servers/Full Servers
C C
Table 6.2/1 SICAM PQ Analyzer Selection and Ordering Data
Software for Power QualitySICAM PQ Analyzer – Selection and Ordering Data
138 SICAM ⋅ Power Quality and Measurement ⋅ Katalog ⋅ Edition 6.0
6.2
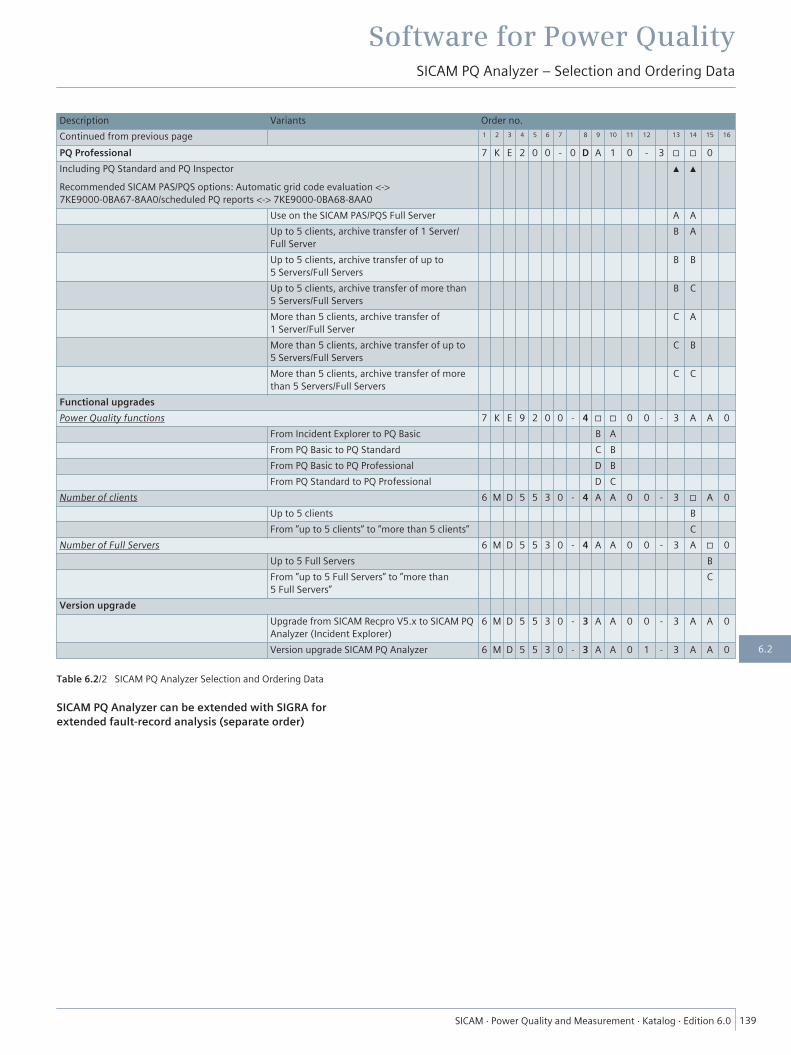
Description Variants Order no.Continued from previous page 1 2 3 4 5 6 7 8 9 10 11 12 13 14 15 16
PQ Professional 7 K E 2 0 0 - 0 D A 1 0 - 3 □ □ 0Including PQ Standard and PQ InspectorRecommended SICAM PAS/PQS options: Automatic grid code evaluation <->7KE9000-0BA67-8AA0/scheduled PQ reports <-> 7KE9000-0BA68-8AA0
▲ ▲
Use on the SICAM PAS/PQS Full Server A AUp to 5 clients, archive transfer of 1 Server/Full Server
B A
Up to 5 clients, archive transfer of up to5 Servers/Full Servers
B B
Up to 5 clients, archive transfer of more than5 Servers/Full Servers
B C
More than 5 clients, archive transfer of1 Server/Full Server
C A
More than 5 clients, archive transfer of up to5 Servers/Full Servers
C B
More than 5 clients, archive transfer of morethan 5 Servers/Full Servers
C C
Functional upgradesPower Quality functions 7 K E 9 2 0 0 - 4 □ □ 0 0 - 3 A A 0
From Incident Explorer to PQ Basic B AFrom PQ Basic to PQ Standard C BFrom PQ Basic to PQ Professional D BFrom PQ Standard to PQ Professional D C
Number of clients 6 M D 5 5 3 0 - 4 A A 0 0 - 3 □ A 0Up to 5 clients BFrom ”up to 5 clients” to ”more than 5 clients” C
Number of Full Servers 6 M D 5 5 3 0 - 4 A A 0 0 - 3 A □ 0Up to 5 Full Servers BFrom ”up to 5 Full Servers” to ”more than5 Full Servers”
C
Version upgradeUpgrade from SICAM Recpro V5.x to SICAM PQAnalyzer (Incident Explorer)
6 M D 5 5 3 0 - 3 A A 0 0 - 3 A A 0
Version upgrade SICAM PQ Analyzer 6 M D 5 5 3 0 - 3 A A 0 1 - 3 A A 0
Table 6.2/2 SICAM PQ Analyzer Selection and Ordering Data
SICAM PQ Analyzer can be extended with SIGRA forextended fault-record analysis (separate order)
Software for Power QualitySICAM PQ Analyzer – Selection and Ordering Data
SICAM ⋅ Power Quality and Measurement ⋅ Katalog ⋅ Edition 6.0 139
6.2
SIGUARD PDP (Phasor Data Processing) is a software for moni-toring the status of power transmission in widespread power-supply systems. It detects and displays early the approach tocritical states (frequency stability, voltage stability, transmissionstability, and power swing). At any time you can define andchange the threshold at which a critical state is reached andrequires intervention. In addition, SIGUARD PDP supports you inthe analysis of the power-supply system.SIGUARD PDP works together with PMUs (Phasor MeasurementUnits). These measuring devices are installed in the power distri-bution systems and connected to the current and voltage trans-formers. The time of the PMUs must be synchronized via GPSwith an accuracy of < 5 μs. This enables the PMUs to acquire themeasured values with magnitude and phase as phasors (indi-cator values) with high precision and to transmit them via thecommunication interface. Using SIGUARD PDP, you can collectand evaluate these time-synchronized measured values fromlocally widespread measuring points.Possible causes of critical states in energy networks:
• The increasing boundary-crossing electricity trading, forexample, puts in Europe new requirements on the tie linesbetween the control zones. From 1975 to 2008, the transferof energy via tie lines in the European power grid rose byalmost 6 times (source: Statistical yearbook of ENTSO-E 2008)
• The transfer distances between generation and consumersincrease due to the increasing infeed from wind power plantsand the planned disconnection of existing power plants.
• More frequently occurring thunderstorms and hurricanes canput vital lines out of operation, thus exposing the remainingnetwork briefly to higher loads.
Consequently, network operation is closer to the stability limit,which results in new power flows to which the control centeroperators are not used. This is where SIGUARD PDP (Phasor DataProcessor) starts. This system for network monitoring usingsynchrophasors helps with fast appraisal of the current situa-tion. Power swings and transients are indicated without delay tohelp the control center personnel find the causes and take coun-termeasures.
Benefits• As a fast monitoring system, SIGUARD PDP captures the
events and trends in networks with fluctuating power flow orheavily stressed lines, that are not or only too late detected byconventional systems.
• An extensive location of the cause can be carried out after afailure.
• Investment decisions for new equipment can be made onthe basis of well founded dynamic measurements.
• Protection settings can be checked and improved on thebasis of the measured dynamic operations.
Applications• Analysis of the power flows in the system• Observing power swings• Assessment of power-swing attenuation• Monitoring the loading schedule of transfer routes• Island-state detection
• Reverse event analysis• Alarm generated at limiting-value violation, with alarm list
and color change in the geographic overview image• Display of the power-system status as characteristic key value
for system stability• Phase-angle display• Event-controlled archiving• Automatic failure detection• High-precision frequency calculation• E-mail notification• Deriving actions from phase-angle measurements (Wide Area
Control)
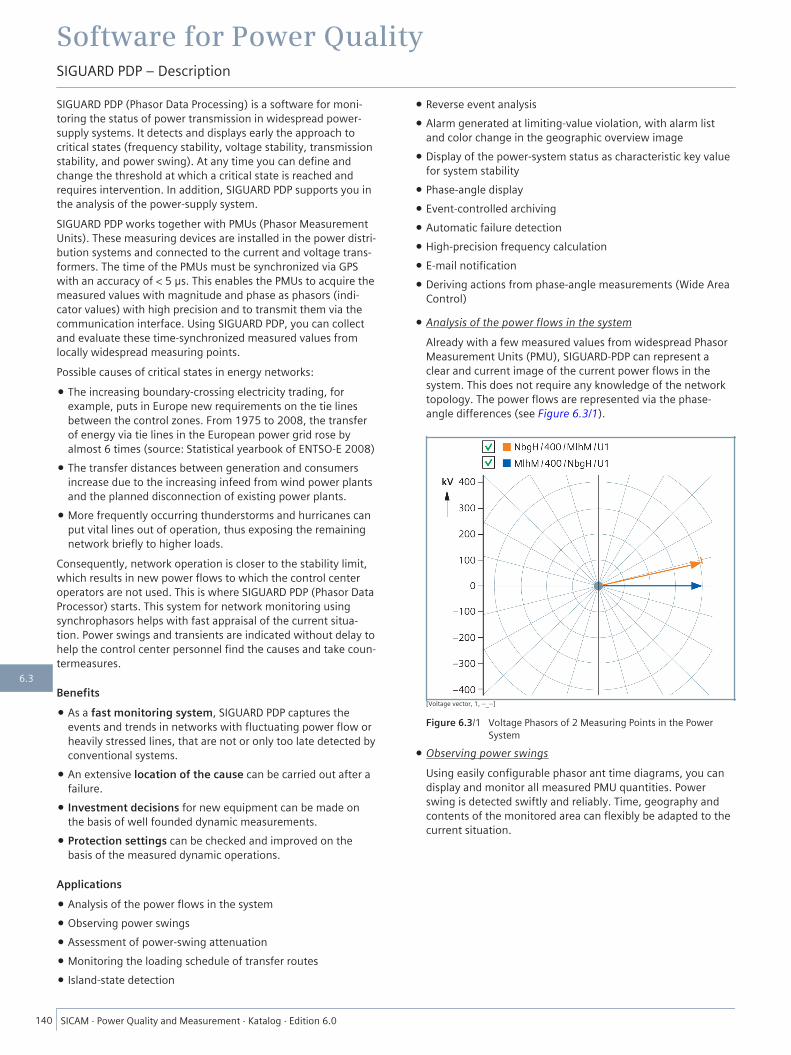
• Analysis of the power flows in the systemAlready with a few measured values from widespread PhasorMeasurement Units (PMU), SIGUARD-PDP can represent aclear and current image of the current power flows in thesystem. This does not require any knowledge of the networktopology. The power flows are represented via the phase-angle differences (see Figure 6.3/1).
[Voltage vector, 1, --_--]
Figure 6.3/1 Voltage Phasors of 2 Measuring Points in the PowerSystem
• Observing power swingsUsing easily configurable phasor ant time diagrams, you candisplay and monitor all measured PMU quantities. Powerswing is detected swiftly and reliably. Time, geography andcontents of the monitored area can flexibly be adapted to thecurrent situation.
Software for Power QualitySIGUARD PDP – Description
140 SICAM ⋅ Power Quality and Measurement ⋅ Katalog ⋅ Edition 6.0
6.3
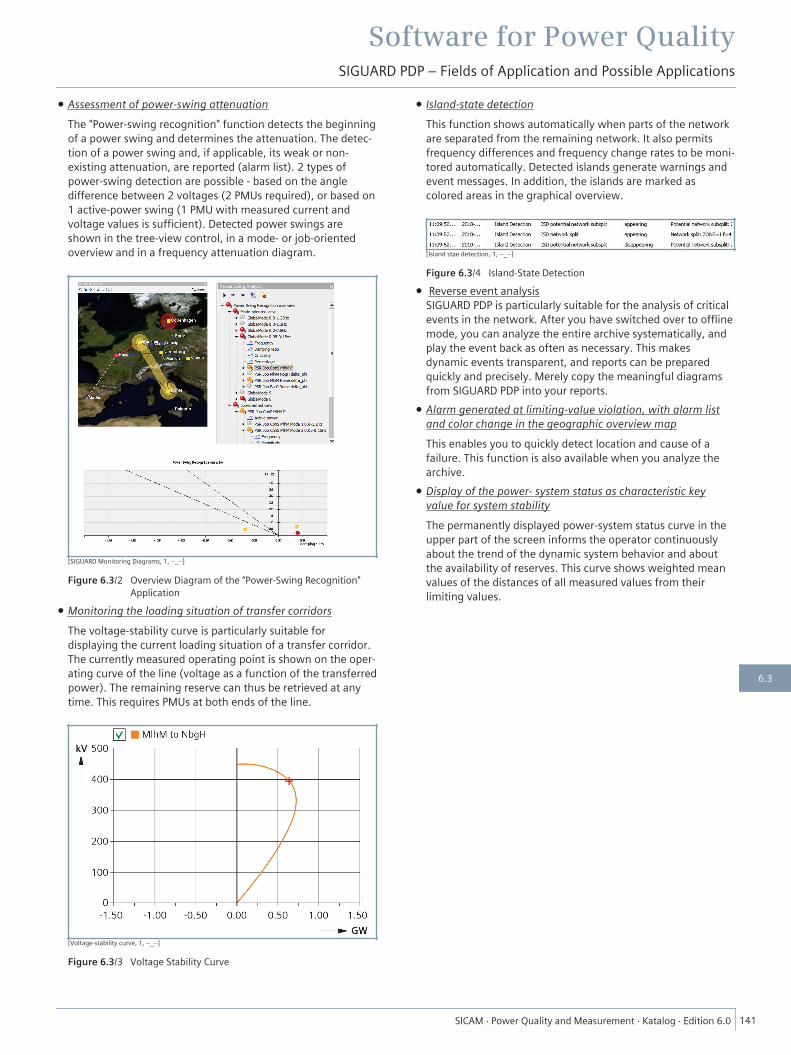
• Assessment of power-swing attenuationThe "Power-swing recognition" function detects the beginningof a power swing and determines the attenuation. The detec-tion of a power swing and, if applicable, its weak or non-existing attenuation, are reported (alarm list). 2 types ofpower-swing detection are possible - based on the angledifference between 2 voltages (2 PMUs required), or based on1 active-power swing (1 PMU with measured current andvoltage values is sufficient). Detected power swings areshown in the tree-view control, in a mode- or job-orientedoverview and in a frequency attenuation diagram.
[SIGUARD Monitoring Diagrams, 1, --_--]
Figure 6.3/2 Overview Diagram of the “Power-Swing Recognition"Application
• Monitoring the loading situation of transfer corridorsThe voltage-stability curve is particularly suitable fordisplaying the current loading situation of a transfer corridor.The currently measured operating point is shown on the oper-ating curve of the line (voltage as a function of the transferredpower). The remaining reserve can thus be retrieved at anytime. This requires PMUs at both ends of the line.
[Voltage-stability curve, 1, --_--]
Figure 6.3/3 Voltage Stability Curve
• Island-state detectionThis function shows automatically when parts of the networkare separated from the remaining network. It also permitsfrequency differences and frequency change rates to be moni-tored automatically. Detected islands generate warnings andevent messages. In addition, the islands are marked ascolored areas in the graphical overview.
[Island stae detection, 1, --_--]
Figure 6.3/4 Island-State Detection
• Reverse event analysisSIGUARD PDP is particularly suitable for the analysis of criticalevents in the network. After you have switched over to offlinemode, you can analyze the entire archive systematically, andplay the event back as often as necessary. This makesdynamic events transparent, and reports can be preparedquickly and precisely. Merely copy the meaningful diagramsfrom SIGUARD PDP into your reports.
• Alarm generated at limiting-value violation, with alarm listand color change in the geographic overview mapThis enables you to quickly detect location and cause of afailure. This function is also available when you analyze thearchive.
• Display of the power- system status as characteristic keyvalue for system stabilityThe permanently displayed power-system status curve in theupper part of the screen informs the operator continuouslyabout the trend of the dynamic system behavior and aboutthe availability of reserves. This curve shows weighted meanvalues of the distances of all measured values from theirlimiting values.
Software for Power QualitySIGUARD PDP – Fields of Application and Possible Applications
SICAM ⋅ Power Quality and Measurement ⋅ Katalog ⋅ Edition 6.0 141
6.3
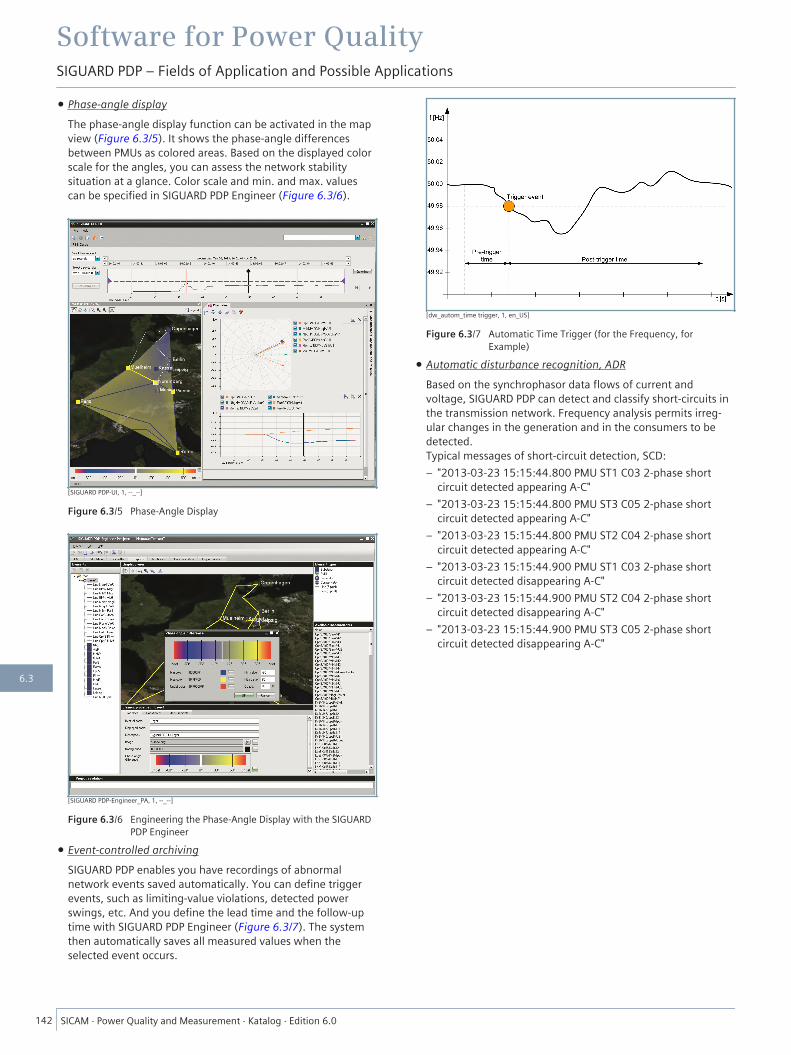
• Phase-angle displayThe phase-angle display function can be activated in the mapview (Figure 6.3/5). It shows the phase-angle differencesbetween PMUs as colored areas. Based on the displayed colorscale for the angles, you can assess the network stabilitysituation at a glance. Color scale and min. and max. valuescan be specified in SIGUARD PDP Engineer (Figure 6.3/6).
[SIGUARD PDP-UI, 1, --_--]
Figure 6.3/5 Phase-Angle Display
[SIGUARD PDP-Engineer_PA, 1, --_--]
Figure 6.3/6 Engineering the Phase-Angle Display with the SIGUARDPDP Engineer
• Event-controlled archivingSIGUARD PDP enables you have recordings of abnormalnetwork events saved automatically. You can define triggerevents, such as limiting-value violations, detected powerswings, etc. And you define the lead time and the follow-uptime with SIGUARD PDP Engineer (Figure 6.3/7). The systemthen automatically saves all measured values when theselected event occurs.
[dw_autom_time trigger, 1, en_US]
Figure 6.3/7 Automatic Time Trigger (for the Frequency, forExample)
• Automatic disturbance recognition, ADRBased on the synchrophasor data flows of current andvoltage, SIGUARD PDP can detect and classify short-circuits inthe transmission network. Frequency analysis permits irreg-ular changes in the generation and in the consumers to bedetected.Typical messages of short-circuit detection, SCD:– "2013-03-23 15:15:44.800 PMU ST1 C03 2-phase short
circuit detected appearing A-C"– "2013-03-23 15:15:44.800 PMU ST3 C05 2-phase short
circuit detected appearing A-C"– "2013-03-23 15:15:44.800 PMU ST2 C04 2-phase short
circuit detected appearing A-C"– "2013-03-23 15:15:44.900 PMU ST1 C03 2-phase short
circuit detected disappearing A-C"– "2013-03-23 15:15:44.900 PMU ST2 C04 2-phase short
circuit detected disappearing A-C"– "2013-03-23 15:15:44.900 PMU ST3 C05 2-phase short
circuit detected disappearing A-C"
Software for Power QualitySIGUARD PDP – Fields of Application and Possible Applications
142 SICAM ⋅ Power Quality and Measurement ⋅ Katalog ⋅ Edition 6.0
6.3
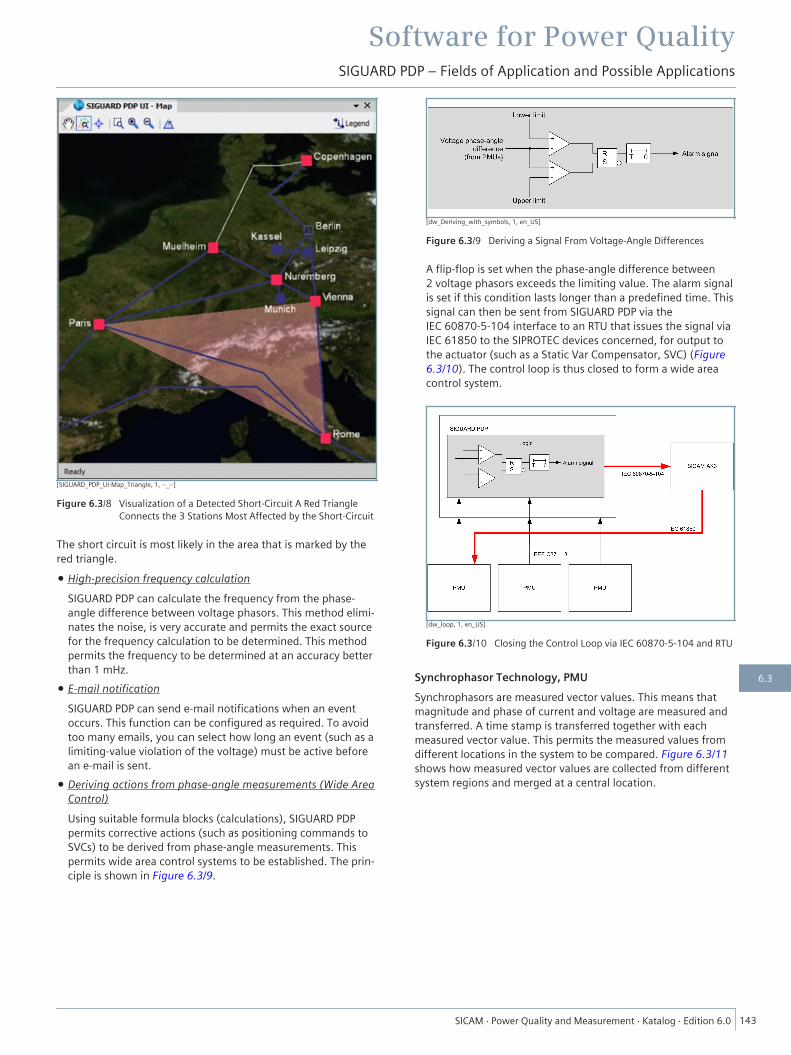
[SIGUARD_PDP_UI-Map_Triangle, 1, --_--]
Figure 6.3/8 Visualization of a Detected Short-Circuit A Red TriangleConnects the 3 Stations Most Affected by the Short-Circuit
The short circuit is most likely in the area that is marked by thered triangle.
• High-precision frequency calculationSIGUARD PDP can calculate the frequency from the phase-angle difference between voltage phasors. This method elimi-nates the noise, is very accurate and permits the exact sourcefor the frequency calculation to be determined. This methodpermits the frequency to be determined at an accuracy betterthan 1 mHz.
• E-mail notificationSIGUARD PDP can send e-mail notifications when an eventoccurs. This function can be configured as required. To avoidtoo many emails, you can select how long an event (such as alimiting-value violation of the voltage) must be active beforean e-mail is sent.
• Deriving actions from phase-angle measurements (Wide AreaControl)Using suitable formula blocks (calculations), SIGUARD PDPpermits corrective actions (such as positioning commands toSVCs) to be derived from phase-angle measurements. Thispermits wide area control systems to be established. The prin-ciple is shown in Figure 6.3/9.
[dw_Deriving_with_symbols, 1, en_US]
Figure 6.3/9 Deriving a Signal From Voltage-Angle Differences
A flip-flop is set when the phase-angle difference between2 voltage phasors exceeds the limiting value. The alarm signalis set if this condition lasts longer than a predefined time. Thissignal can then be sent from SIGUARD PDP via theIEC 60870-5-104 interface to an RTU that issues the signal viaIEC 61850 to the SIPROTEC devices concerned, for output tothe actuator (such as a Static Var Compensator, SVC) (Figure6.3/10). The control loop is thus closed to form a wide areacontrol system.
[dw_loop, 1, en_US]
Figure 6.3/10 Closing the Control Loop via IEC 60870-5-104 and RTU
Synchrophasor Technology, PMUSynchrophasors are measured vector values. This means thatmagnitude and phase of current and voltage are measured andtransferred. A time stamp is transferred together with eachmeasured vector value. This permits the measured values fromdifferent locations in the system to be compared. Figure 6.3/11shows how measured vector values are collected from differentsystem regions and merged at a central location.
Software for Power QualitySIGUARD PDP – Fields of Application and Possible Applications
SICAM ⋅ Power Quality and Measurement ⋅ Katalog ⋅ Edition 6.0 143
6.3

[Prinzip, 1, --_--]
Figure 6.3/11 Principle of Geographically Distributed Measured Values
The information gained from the synchrophasors is only useful iftime stamping is extremely accurate. The PMUs are thereforeequipped with a GPS-controlled time synchronization.
Measured values from substationautomation technology or remoteterminal unit
Synchrophasor from a PMU
Slow update cycle (typically onceevery 5 seconds, for example)
Continuous updating (measuredvalue-stream), typically 10 valuesper second (reporting rate), forexample
Measured values without timestamp
Each measured value with aprecise time stamp
RMS values without phase angle Current and voltage are suppliedas phasor value with amplitudeand phase
Table 6.3/1 Significant Differences from the "Conventional" MeasuringPoints (Substation Automation Technology, RTU)
With these features, the synchrophasors permit a dynamic viewin real time on power swings and other phenomena in networkoperation.Phase Measurement Units (PMUs)A phasor measuring unit (PMU, Figure 6.3/12) is a measuringdevice that measures and transfers synchrophasors. It alsocaptures frequency and frequency changes (df/dt). A PMU canbe a stand-alone unit or be integrated into a protection deviceor a fault recorder. Siemens offers the SIPROTEC 5-PMU here.The SIPROTEC 5-PMU (available in the SIPROTEC 6MD85 baycontroller, for example) satisfies the IEEE C37.118-2011standard that specifies the communication protocol of thesynchrophasors and the requirements for the dynamic responseof the PMU.
[SIP5_GD_W3, 1, --_--]
Figure 6.3/12 SIPROTEC 5 - PMU
Software for Power QualitySIGUARD PDP – Synchrophasor Technology, PMU
144 SICAM ⋅ Power Quality and Measurement ⋅ Katalog ⋅ Edition 6.0
6.3
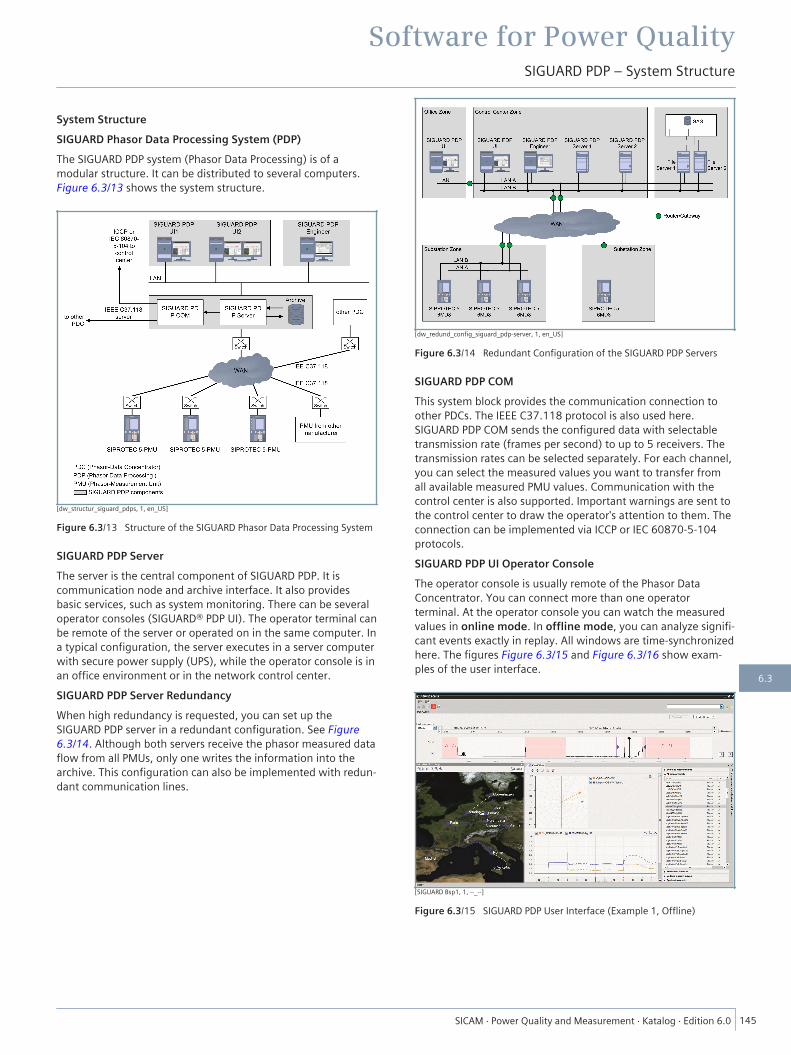
System StructureSIGUARD Phasor Data Processing System (PDP)The SIGUARD PDP system (Phasor Data Processing) is of amodular structure. It can be distributed to several computers.Figure 6.3/13 shows the system structure.
[dw_structur_siguard_pdps, 1, en_US]
Figure 6.3/13 Structure of the SIGUARD Phasor Data Processing System
SIGUARD PDP ServerThe server is the central component of SIGUARD PDP. It iscommunication node and archive interface. It also providesbasic services, such as system monitoring. There can be severaloperator consoles (SIGUARD® PDP UI). The operator terminal canbe remote of the server or operated on in the same computer. Ina typical configuration, the server executes in a server computerwith secure power supply (UPS), while the operator console is inan office environment or in the network control center.SIGUARD PDP Server RedundancyWhen high redundancy is requested, you can set up theSIGUARD PDP server in a redundant configuration. See Figure6.3/14. Although both servers receive the phasor measured dataflow from all PMUs, only one writes the information into thearchive. This configuration can also be implemented with redun-dant communication lines.
[dw_redund_config_siguard_pdp-server, 1, en_US]
Figure 6.3/14 Redundant Configuration of the SIGUARD PDP Servers
SIGUARD PDP COMThis system block provides the communication connection toother PDCs. The IEEE C37.118 protocol is also used here.SIGUARD PDP COM sends the configured data with selectabletransmission rate (frames per second) to up to 5 receivers. Thetransmission rates can be selected separately. For each channel,you can select the measured values you want to transfer fromall available measured PMU values. Communication with thecontrol center is also supported. Important warnings are sent tothe control center to draw the operator's attention to them. Theconnection can be implemented via ICCP or IEC 60870-5-104protocols.SIGUARD PDP UI Operator ConsoleThe operator console is usually remote of the Phasor DataConcentrator. You can connect more than one operatorterminal. At the operator console you can watch the measuredvalues in online mode. In offline mode, you can analyze signifi-cant events exactly in replay. All windows are time-synchronizedhere. The figures Figure 6.3/15 and Figure 6.3/16 show exam-ples of the user interface.
[SIGUARD Bsp1, 1, --_--]
Figure 6.3/15 SIGUARD PDP User Interface (Example 1, Offline)
Software for Power QualitySIGUARD PDP – System Structure
SICAM ⋅ Power Quality and Measurement ⋅ Katalog ⋅ Edition 6.0 145
6.3
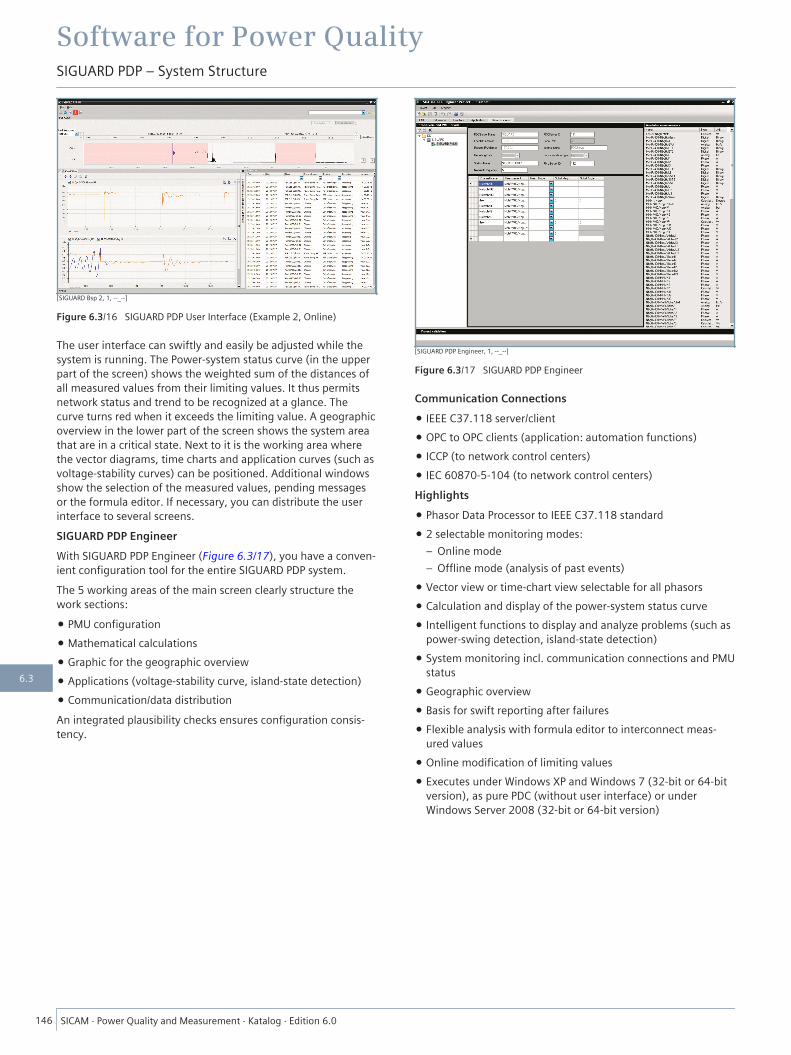
[SIGUARD Bsp 2, 1, --_--]
Figure 6.3/16 SIGUARD PDP User Interface (Example 2, Online)
The user interface can swiftly and easily be adjusted while thesystem is running. The Power-system status curve (in the upperpart of the screen) shows the weighted sum of the distances ofall measured values from their limiting values. It thus permitsnetwork status and trend to be recognized at a glance. Thecurve turns red when it exceeds the limiting value. A geographicoverview in the lower part of the screen shows the system areathat are in a critical state. Next to it is the working area wherethe vector diagrams, time charts and application curves (such asvoltage-stability curves) can be positioned. Additional windowsshow the selection of the measured values, pending messagesor the formula editor. If necessary, you can distribute the userinterface to several screens.SIGUARD PDP EngineerWith SIGUARD PDP Engineer (Figure 6.3/17), you have a conven-ient configuration tool for the entire SIGUARD PDP system.The 5 working areas of the main screen clearly structure thework sections:
• PMU configuration• Mathematical calculations• Graphic for the geographic overview• Applications (voltage-stability curve, island-state detection)• Communication/data distributionAn integrated plausibility checks ensures configuration consis-tency.
[SIGUARD PDP Engineer, 1, --_--]
Figure 6.3/17 SIGUARD PDP Engineer
Communication Connections• IEEE C37.118 server/client• OPC to OPC clients (application: automation functions)• ICCP (to network control centers)• IEC 60870-5-104 (to network control centers)Highlights• Phasor Data Processor to IEEE C37.118 standard• 2 selectable monitoring modes:
– Online mode– Offline mode (analysis of past events)
• Vector view or time-chart view selectable for all phasors• Calculation and display of the power-system status curve• Intelligent functions to display and analyze problems (such as
power-swing detection, island-state detection)• System monitoring incl. communication connections and PMU
status• Geographic overview• Basis for swift reporting after failures• Flexible analysis with formula editor to interconnect meas-
ured values• Online modification of limiting values• Executes under Windows XP and Windows 7 (32-bit or 64-bit
version), as pure PDC (without user interface) or underWindows Server 2008 (32-bit or 64-bit version)
Software for Power QualitySIGUARD PDP – System Structure
146 SICAM ⋅ Power Quality and Measurement ⋅ Katalog ⋅ Edition 6.0
6.3
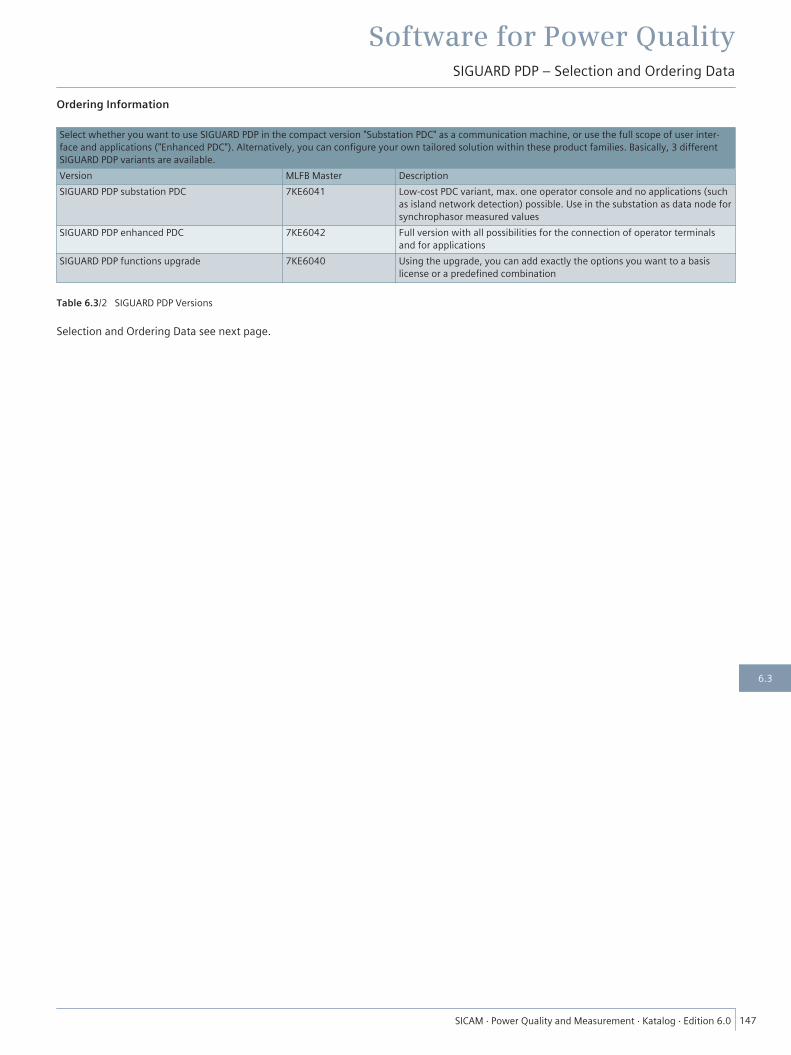
Ordering Information
Select whether you want to use SIGUARD PDP in the compact version "Substation PDC" as a communication machine, or use the full scope of user inter-face and applications ("Enhanced PDC"). Alternatively, you can configure your own tailored solution within these product families. Basically, 3 differentSIGUARD PDP variants are available.Version MLFB Master DescriptionSIGUARD PDP substation PDC 7KE6041 Low-cost PDC variant, max. one operator console and no applications (such
as island network detection) possible. Use in the substation as data node forsynchrophasor measured values
SIGUARD PDP enhanced PDC 7KE6042 Full version with all possibilities for the connection of operator terminalsand for applications
SIGUARD PDP functions upgrade 7KE6040 Using the upgrade, you can add exactly the options you want to a basislicense or a predefined combination
Table 6.3/2 SIGUARD PDP Versions
Selection and Ordering Data see next page.
Software for Power QualitySIGUARD PDP – Selection and Ordering Data
SICAM ⋅ Power Quality and Measurement ⋅ Katalog ⋅ Edition 6.0 147
6.3
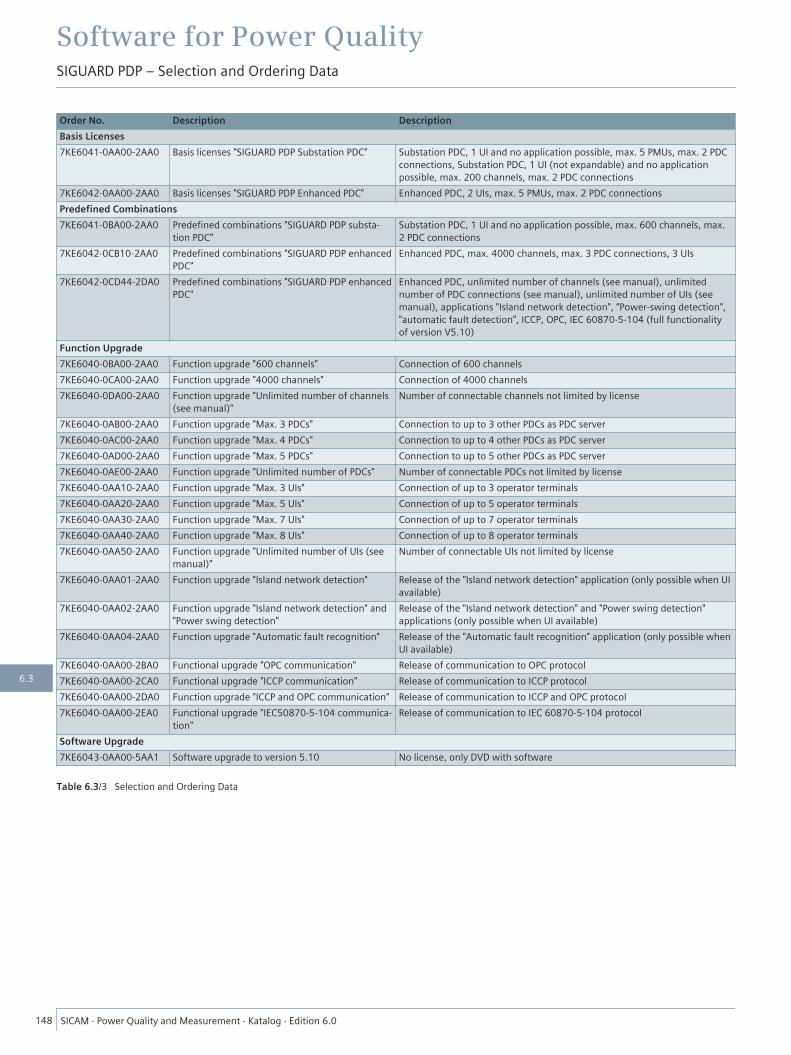
Order No. Description DescriptionBasis Licenses7KE6041-0AA00-2AA0 Basis licenses "SIGUARD PDP Substation PDC" Substation PDC, 1 UI and no application possible, max. 5 PMUs, max. 2 PDC
connections, Substation PDC, 1 UI (not expandable) and no applicationpossible, max. 200 channels, max. 2 PDC connections
7KE6042-0AA00-2AA0 Basis licenses "SIGUARD PDP Enhanced PDC" Enhanced PDC, 2 UIs, max. 5 PMUs, max. 2 PDC connectionsPredefined Combinations7KE6041-0BA00-2AA0 Predefined combinations "SIGUARD PDP substa-
tion PDC"Substation PDC, 1 UI and no application possible, max. 600 channels, max.2 PDC connections
7KE6042-0CB10-2AA0 Predefined combinations "SIGUARD PDP enhancedPDC"
Enhanced PDC, max. 4000 channels, max. 3 PDC connections, 3 UIs
7KE6042-0CD44-2DA0 Predefined combinations "SIGUARD PDP enhancedPDC"
Enhanced PDC, unlimited number of channels (see manual), unlimitednumber of PDC connections (see manual), unlimited number of UIs (seemanual), applications "Island network detection", “Power-swing detection","automatic fault detection", ICCP, OPC, IEC 60870-5-104 (full functionalityof version V5.10)
Function Upgrade7KE6040-0BA00-2AA0 Function upgrade "600 channels" Connection of 600 channels7KE6040-0CA00-2AA0 Function upgrade "4000 channels" Connection of 4000 channels7KE6040-0DA00-2AA0 Function upgrade "Unlimited number of channels
(see manual)"Number of connectable channels not limited by license
7KE6040-0AB00-2AA0 Function upgrade "Max. 3 PDCs" Connection to up to 3 other PDCs as PDC server7KE6040-0AC00-2AA0 Function upgrade "Max. 4 PDCs" Connection to up to 4 other PDCs as PDC server7KE6040-0AD00-2AA0 Function upgrade "Max. 5 PDCs" Connection to up to 5 other PDCs as PDC server7KE6040-0AE00-2AA0 Function upgrade "Unlimited number of PDCs" Number of connectable PDCs not limited by license7KE6040-0AA10-2AA0 Function upgrade "Max. 3 UIs" Connection of up to 3 operator terminals7KE6040-0AA20-2AA0 Function upgrade "Max. 5 UIs" Connection of up to 5 operator terminals7KE6040-0AA30-2AA0 Function upgrade "Max. 7 UIs" Connection of up to 7 operator terminals7KE6040-0AA40-2AA0 Function upgrade "Max. 8 UIs" Connection of up to 8 operator terminals7KE6040-0AA50-2AA0 Function upgrade "Unlimited number of UIs (see
manual)"Number of connectable UIs not limited by license
7KE6040-0AA01-2AA0 Function upgrade "Island network detection" Release of the "Island network detection" application (only possible when UIavailable)
7KE6040-0AA02-2AA0 Function upgrade "Island network detection" and"Power swing detection"
Release of the "Island network detection" and "Power swing detection"applications (only possible when UI available)
7KE6040-0AA04-2AA0 Function upgrade "Automatic fault recognition" Release of the "Automatic fault recognition" application (only possible whenUI available)
7KE6040-0AA00-2BA0 Functional upgrade "OPC communication" Release of communication to OPC protocol7KE6040-0AA00-2CA0 Functional upgrade "ICCP communication" Release of communication to ICCP protocol7KE6040-0AA00-2DA0 Function upgrade "ICCP and OPC communication“ Release of communication to ICCP and OPC protocol7KE6040-0AA00-2EA0 Functional upgrade "IEC50870-5-104 communica-
tion"Release of communication to IEC 60870-5-104 protocol
Software Upgrade7KE6043-0AA00-5AA1 Software upgrade to version 5.10 No license, only DVD with software
Table 6.3/3 Selection and Ordering Data
Software for Power QualitySIGUARD PDP – Selection and Ordering Data
148 SICAM ⋅ Power Quality and Measurement ⋅ Katalog ⋅ Edition 6.0
6.3
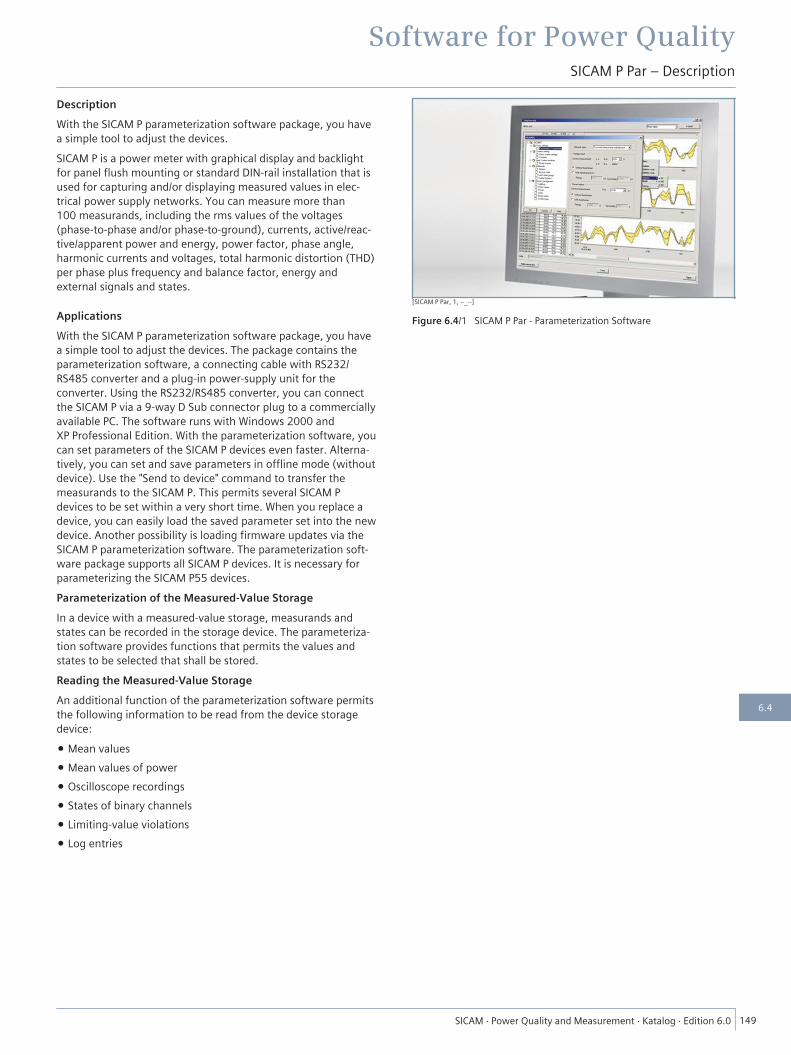
DescriptionWith the SICAM P parameterization software package, you havea simple tool to adjust the devices.SICAM P is a power meter with graphical display and backlightfor panel flush mounting or standard DIN-rail installation that isused for capturing and/or displaying measured values in elec-trical power supply networks. You can measure more than100 measurands, including the rms values of the voltages(phase-to-phase and/or phase-to-ground), currents, active/reac-tive/apparent power and energy, power factor, phase angle,harmonic currents and voltages, total harmonic distortion (THD)per phase plus frequency and balance factor, energy andexternal signals and states.
ApplicationsWith the SICAM P parameterization software package, you havea simple tool to adjust the devices. The package contains theparameterization software, a connecting cable with RS232/RS485 converter and a plug-in power-supply unit for theconverter. Using the RS232/RS485 converter, you can connectthe SICAM P via a 9-way D Sub connector plug to a commerciallyavailable PC. The software runs with Windows 2000 andXP Professional Edition. With the parameterization software, youcan set parameters of the SICAM P devices even faster. Alterna-tively, you can set and save parameters in offline mode (withoutdevice). Use the "Send to device" command to transfer themeasurands to the SICAM P. This permits several SICAM Pdevices to be set within a very short time. When you replace adevice, you can easily load the saved parameter set into the newdevice. Another possibility is loading firmware updates via theSICAM P parameterization software. The parameterization soft-ware package supports all SICAM P devices. It is necessary forparameterizing the SICAM P55 devices.Parameterization of the Measured-Value StorageIn a device with a measured-value storage, measurands andstates can be recorded in the storage device. The parameteriza-tion software provides functions that permits the values andstates to be selected that shall be stored.Reading the Measured-Value StorageAn additional function of the parameterization software permitsthe following information to be read from the device storagedevice:
• Mean values• Mean values of power• Oscilloscope recordings• States of binary channels• Limiting-value violations• Log entries
[SICAM P Par, 1, --_--]
Figure 6.4/1 SICAM P Par - Parameterization Software
Software for Power QualitySICAM P Par – Description
SICAM ⋅ Power Quality and Measurement ⋅ Katalog ⋅ Edition 6.0 149
6.4
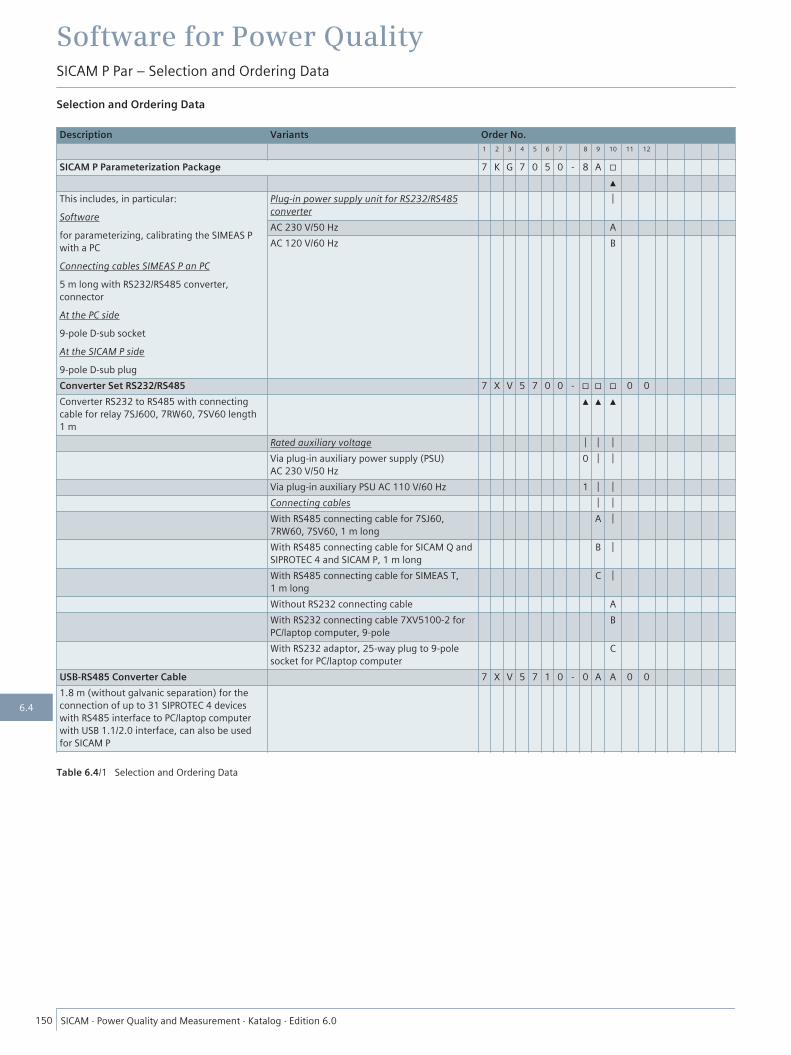
Selection and Ordering Data
Description Variants Order No.1 2 3 4 5 6 7 8 9 10 11 12
SICAM P Parameterization Package 7 K G 7 0 5 0 - 8 A □▲
This includes, in particular:Softwarefor parameterizing, calibrating the SIMEAS Pwith a PCConnecting cables SIMEAS P an PC5 m long with RS232/RS485 converter,connectorAt the PC side9-pole D-sub socketAt the SICAM P side9-pole D-sub plug
Plug-in power supply unit for RS232/RS485converter
│
AC 230 V/50 Hz AAC 120 V/60 Hz B
Converter Set RS232/RS485 7 X V 5 7 0 0 - □ □ □ 0 0Converter RS232 to RS485 with connectingcable for relay 7SJ600, 7RW60, 7SV60 length1 m
▲ ▲ ▲
Rated auxiliary voltage │ │ │Via plug-in auxiliary power supply (PSU)AC 230 V/50 Hz
0 │ │
Via plug-in auxiliary PSU AC 110 V/60 Hz 1 │ │Connecting cables │ │With RS485 connecting cable for 7SJ60,7RW60, 7SV60, 1 m long
A │
With RS485 connecting cable for SICAM Q andSIPROTEC 4 and SICAM P, 1 m long
B │
With RS485 connecting cable for SIMEAS T,1 m long
C │
Without RS232 connecting cable AWith RS232 connecting cable 7XV5100-2 forPC/laptop computer, 9-pole
B
With RS232 adaptor, 25-way plug to 9-polesocket for PC/laptop computer
C
USB-RS485 Converter Cable 7 X V 5 7 1 0 - 0 A A 0 01.8 m (without galvanic separation) for theconnection of up to 31 SIPROTEC 4 deviceswith RS485 interface to PC/laptop computerwith USB 1.1/2.0 interface, can also be usedfor SICAM P
Table 6.4/1 Selection and Ordering Data
Software for Power QualitySICAM P Par – Selection and Ordering Data
150 SICAM ⋅ Power Quality and Measurement ⋅ Katalog ⋅ Edition 6.0
6.4

CE conformityThis product complies with the directive of the Council of the European Communitieson harmonization of the laws of the Mem-ber States relating to electromagnetic
compatibility (EMC Directive 2014/30/EU) and concerning electrical equipment for use within specified voltage limits (Low Voltage Directive 2014/35/EU).
This conformity has been proved by tests performed accord-ing to the Council Directive in accordance with the generic standard EN 61000-6-5 (for EMC directive) and with theproduct standard EN 62586-1 (for Low Voltage Directive) by Siemens AG.
The device is designed and manufactured for application in an industrial environment.
The product conforms with the international standards of EN 62586 and the German standard VDE 0415.
Disclaimer for liabilityThis document has been subjected to rigorous technicalreview before being published. It is revised at regular inter-vals, and any modifications and amendments are includedin the subsequent issues. The content of this document hasbeen compiled for information purposes only.Although Siemens AG has made best efforts to keep thedocument as precise and up-to-date as possible, Siemens AGshall not assume any liability for defects and damage whichresult through use of the information contained herein.
This content does not form part of a contract or of businessrelations; nor does it change these. All obligationsof Siemens AG are stated in the relevant contractualagreements.
Siemens AG reserves the right to revise this document fromtime to time.
Document version: 06
Release status: 05.2017
CopyrightSiemens AG 2017. All rights reserved.The disclosure, duplication, distribution and editing of thisdocument, or utilization and communication of the contentare not permitted, unless authorized in writing. All rights,including rights created by patent grant or registration of autility model or a design, are reserved.
Registered trademarksSIPROTEC ® , DIGSI ® , SIGUARD ® , SIMEAS ® und SICAM ® are registered trademarks of Siemens AG. Any unauthorized use is illegal. All other designations in this document can betrademarks whose use by third parties for their own pur-poses can infringe the rights of the owner.
All rights reserved.If not stated otherwise on the individual pages of thiscatalog, we reserve the right to include modifications,especially regarding the stated values, dimensions andweights. Drawings are not binding.
All product designations used are trademarks or productnames of Siemens AG or other suppliers.If not stated otherwise, all dimensions in this catalogare given in mm.
AppendixLegal Notice
SICAM Power Quality and Measurement ⋅ Catalog ⋅ Edition 6.0
PublishedSiemens AG 2017
Energy Management DivisionDigital GridAutomation ProductsHumboldtstr. 5990459 Nuremberg, Germany
www.siemens.com/powerquality
For more information,please contact ourCustomer Support Center.Tel.: +49 180 524 7000Fax: +49 180 524 2471(Charges demending on provider)E-Mail: [email protected]
Article No. EMDG-C10026-01-7600 Printed in Germany Dispo 06200 KG 05170.7
© 2017 Siemens. Subject to changes and errors.The information given in this document only containsgeneral descriptions and/or performance features whichmay not always specifically reflect those described, orwhich may undergo modification in the course of furtherdevelopment of the products. The requested performancefeatures are binding only when they are expressly agreedupon in the concluded contract.
For all products using security features of OpenSSLthe following shall apply:This product includes software developed by the OpenSSL Project for use in the OpenSSL Toolkit. (http://www.openssl.org/ )This product includes cryptographic software written by Eric Young ([email protected] )This product includes software written by Tim Hudson ([email protected]) This product includes software developed by Bodo Moeller.

CE conformityThis product complies with the directive of the Council of the European Communitieson harmonization of the laws of the Mem-ber States relating to electromagnetic
compatibility (EMC Directive 2014/30/EU) and concerning electrical equipment for use within specified voltage limits (Low Voltage Directive 2014/35/EU).
This conformity has been proved by tests performed accord-ing to the Council Directive in accordance with the generic standard EN 61000-6-5 (for EMC directive) and with theproduct standard EN 62586-1 (for Low Voltage Directive) by Siemens AG.
The device is designed and manufactured for application in an industrial environment.
The product conforms with the international standards of EN 62586 and the German standard VDE 0415.
Disclaimer for liabilityThis document has been subjected to rigorous technicalreview before being published. It is revised at regular inter-vals, and any modifications and amendments are includedin the subsequent issues. The content of this document hasbeen compiled for information purposes only.Although Siemens AG has made best efforts to keep thedocument as precise and up-to-date as possible, Siemens AGshall not assume any liability for defects and damage whichresult through use of the information contained herein.
This content does not form part of a contract or of businessrelations; nor does it change these. All obligationsof Siemens AG are stated in the relevant contractualagreements.
Siemens AG reserves the right to revise this document fromtime to time.
Document version: 06
Release status: 05.2017
CopyrightSiemens AG 2017. All rights reserved.The disclosure, duplication, distribution and editing of thisdocument, or utilization and communication of the contentare not permitted, unless authorized in writing. All rights,including rights created by patent grant or registration of autility model or a design, are reserved.
Registered trademarksSIPROTEC ® , DIGSI ® , SIGUARD ® , SIMEAS ® und SICAM ® are registered trademarks of Siemens AG. Any unauthorized use is illegal. All other designations in this document can betrademarks whose use by third parties for their own pur-poses can infringe the rights of the owner.
All rights reserved.If not stated otherwise on the individual pages of thiscatalog, we reserve the right to include modifications,especially regarding the stated values, dimensions andweights. Drawings are not binding.
All product designations used are trademarks or productnames of Siemens AG or other suppliers.If not stated otherwise, all dimensions in this catalogare given in mm.
AppendixLegal Notice
SICAM Power Quality and Measurement ⋅ Catalog ⋅ Edition 6.0

PublishedSiemens AG 2017
Energy Management DivisionDigital GridAutomation ProductsHumboldtstr. 5990459 Nuremberg, Germany
www.siemens.com/powerquality
For more information,please contact ourCustomer Support Center.Tel.: +49 180 524 7000Fax: +49 180 524 2471(Charges demending on provider)E-Mail: [email protected]
Article No. EMDG-C10026-01-7600 Printed in Germany Dispo 06200 KG 05170.7
© 2017 Siemens. Subject to changes and errors.The information given in this document only containsgeneral descriptions and/or performance features whichmay not always specifically reflect those described, orwhich may undergo modification in the course of furtherdevelopment of the products. The requested performancefeatures are binding only when they are expressly agreedupon in the concluded contract.
For all products using security features of OpenSSLthe following shall apply:This product includes software developed by the OpenSSL Project for use in the OpenSSL Toolkit. (http://www.openssl.org/ )This product includes cryptographic software written by Eric Young ([email protected] )This product includes software written by Tim Hudson ([email protected]) This product includes software developed by Bodo Moeller.