Siemens Report
214
Siemens Report FOR FISCAL 2021
-
Upload
khangminh22 -
Category
Documents
-
view
2 -
download
0
Transcript of Siemens Report
Siemens ReportFOR FISCAL 2021
Table of contents
Combined Management Report
Consolidated Financial Statements
Responsibility Statement (Siemens Group)
Independent Auditor’s Report (Siemens Group)
Annual Financial Statements
Responsibility Statement (Siemens AG)
Independent Auditor’s Report (Siemens AG)
Five-Year Summary
Compensation Report (including Auditor's Report)
Report of the Supervisory Board
Corporate Governance Statement
Notes and forward-looking statements

Combined Management Report
FOR FISCAL 2021

Table of contents
Combined Management Report
3
4
7
16
19
20
23
25
35
37
1.
2.
3.
4.
5.
6.
7.
8.
9.
10.
Organization of the Siemens Group and basis of presentation
Financial performance system
Segment information
Results of operations
Net assets position
Financial position
Overall assessment of the economic position
Report on expected developments and associated material opportunities and risks
Siemens AG
Takeover-relevant information

Combined Management Report
3
1. Organization of the Siemens Group and basis of presentation
Siemens is a technology group that is active in nearly all countries of the world, focusing on the areas of automation and digitalization in the process and manufacturing industries, intelligent infrastructure for buildings and distributed energy systems, smart mobility solutions for rail and road and medical technology and digital healthcare services.
Siemens comprises Siemens Aktiengesellschaft (Siemens AG), a stock corporation under the Federal laws of Germany, as the parent company, and its subsidiaries. Our Company is incorporated in Germany, with our corporate headquarters situated in Munich. As of September 30, 2021, Siemens had around 303,000 employees.
As of September 30, 2021, Siemens has the following reportable segments: Digital Industries, Smart Infrastructure, Mobility and Siemens Healthineers, which together form our “Industrial Business” and Siemens Financial Services (SFS), which supports the activities of our industrial businesses and also conducts its own business with external customers. Furthermore, we report results for Portfolio Companies, which comprises businesses that are managed separately to improve their performance.
Our reportable segments and Portfolio Companies may do business with each other, leading to corresponding orders and revenue. Such orders and revenue are eliminated on the Group level.
Non-financial matters of the Group and Siemens AG
Siemens has policies for environmental, employee and social matters, for the respect of human rights, and anti-corruption and bribery matters, among others. Our business model is described in chapters 1 and 3 of this Combined Management Report. Reportable information that is necessary for an understanding of the development, performance, position and the impact of our activities on these matters is included in this Combined Management Report, in particular in chapters 3 through 7. Forward-looking information, including risk disclosures, is presented in chapter 8. Chapter 9 includes additional information that is required to be reported in the Combined Management Report related to the parent company Siemens AG. As supplementary information, amounts reported in the Consolidated Financial Statements and the Annual Financial Statements of Siemens AG related to such non-financial matters, and additional explanations thereto, are included in Notes to Consolidated Financial Statements for fiscal 2021, Notes 17, 18, 22, 26 and 27, and in the Notes to the Annual Financial Statements for fiscal 2021, Notes 16, 17, 20, 21 and 25. In order to inform the users of the financial reports in a focused manner, these disclosures are not subject to a specific non-financial framework – in contrast to the disclosures in our separate “Sustainability Report 2021” document, which are based on the standards developed by the Global Reporting Initiative (GRI). Said document also includes detailed information on DEGREE, Siemens’ new sustainability framework which was introduced during fiscal 2021. With DEGREE, Siemens intends to manage and track its progress on selected ambitions in the environmental, social and governance areas.

Combined Management Report
4
2. Financial performance system
2.1 OverviewThe Siemens Financial Framework includes targets that we aim to achieve over a cycle of three to five years. During fiscal 2021, we modified this framework. The resulting changes became effective starting with fiscal 2022.
2.2 Revenue growthIn the Siemens Financial Framework, up to and including fiscal 2021, we aimed to achieve a revenue growth range of 4% to 5% per year on a comparable basis.
Our primary measure for managing and controlling our revenue growth is comparable growth, because it shows the development in our business net of currency translation effects, which arise from the external environment outside of our control, and portfolio effects, which involve business activities which are either new to or no longer a part of the respective business.
Currency translation effects are the difference between revenue for the current period calculated using the exchange rates of the current period and revenue for the current period calculated using the exchange rates of the comparison period. For calculating the percentage change year-over-year, this absolute difference is divided by revenue for the comparison period. A portfolio effect arises in the case of an acquisition or a disposition and is calculated as the change year-over-year in revenue related to the transaction. For calculating the percentage change, this absolute change is divided by revenue for the comparison period. Any portfolio effect is excluded for the 12 months following the relevant transaction after which both current and past reporting periods fully reflect the portfolio change. For orders, we apply the same calculations for currency translation and portfolio effects as described above.
Under the modified framework, we aim to achieve comparable revenue growth in the range of 5% to 7% per year over a cycle of three to five years.
2.3 Profitability and capital efficiencyWithin the Siemens Financial Framework, we aim to achieve margins that are comparable to those of our relevant competitors. Therefore, we have defined profit margin ranges for our industrial businesses which also consider the profit margins of their respective relevant competitors. Profit margin is defined as profit of the respective business divided by its revenue.
For our industrial businesses, in fiscal 2021 profit represented EBITA adjusted for operating financial income (expenses), net, and amortization of intangible assets not acquired in business combinations (Adjusted EBITA).
The margin ranges for our industrial businesses were as follows:
Margin ranges until fiscal 2021
Margin range
Digital Industries 17 - 23%
Smart Infrastructure 10 - 15%
Mobility 9 - 12%
Siemens Healthineers 17 - 21%
Industrial Business 11 - 15%
Siemens Financial Services (ROE after tax) 17 - 22%
Beginning with fiscal 2022, the profit definition no longer adjusts EBITA for operating financial income (expenses), net to present a more transparent view on operating earnings. Operating financial income, net for Industrial Business was €23 million in fiscal 2021, without a change to the reported margin.
The margin ranges were set as follows:
Margin ranges from fiscal 2022
Margin range
Digital Industries 17 - 23%
Smart Infrastructure 11 - 16%
Mobility 10 - 13%
Siemens Healthineers 17 - 21%
Siemens Financial Services (ROE after tax) 15 - 20%
For Siemens Healthineers, we present the margin range we expect as that company’s majority shareholder.
In line with common practice in the financial services business, our financial indicator for measuring capital efficiency at Siemens Financial Services is return on equity after tax, or ROE after tax. ROE is defined as Siemens Financial Services’ profit after tax, divided by its average allocated equity.
For purposes of managing and controlling profit and profitability at the Group level, we use net income as our primary measure. This measure is the primary driver of basic earnings per share from net income (EPS).

Combined Management Report
5
Beginning with fiscal 2022, we will in addition report EPS before purchase price allocation accounting (EPS pre PPA) to increase transparency regarding our operating performance. EPS pre PPA is defined as basic earnings per share from net income adjusted for amortization of intangible assets acquired in business combinations and related income taxes. Like for EPS, EPS pre PPA includes the amounts attributable to shareholders of Siemens AG. We aim to achieve high-single-digit annual growth in EPS pre PPA over a cycle of three to five years. EPS pre PPA for fiscal 2021 was €8.32.
We seek to work profitably and as efficiently as possible with the capital provided by our shareholders and lenders. For purposes of managing and controlling our capital efficiency, we use return on capital employed, or ROCE, as our primary measure in our Siemens Financial Framework.
Beginning with fiscal 2022, ROCE excludes defined acquisition-related effects for Varian Medical Systems, Inc. (Varian), which was acquired by Siemens Healthineers in fiscal 2021, to further increase the transparency on our operating performance. Our goal is to achieve a ROCE within a range of 15% to 20% over a cycle of three to five years.
2.4 Capital structureSustainable revenue and profit development is supported by a healthy capital structure. Accordingly, a key consideration within the Siemens Financial Framework is to maintain ready access to the capital markets through various debt products and preserve our ability to repay and service our debt obligations over time. Our primary measure for managing and controlling our capital structure is the ratio of Industrial net debt to EBITDA (continuing operations). This financial measure indicates the approximate amount of time in years that would be needed to cover Industrial net debt through income from continuing operations, without taking into account interest, taxes, depreciation and amortization. In fiscal 2021, we aimed to achieve a ratio of up to 1.0. Beginning with fiscal 2022, this ratio was raised to up to 1.5.
2.5 Liquidity and dividendWe intend to continue providing an attractive return to our shareholders under the Siemens Financial Framework. Beginning with fiscal 2022, this includes striving for a dividend per share that exceeds the amount of the preceding year, or that at least matches the prior-year-level.
As in the past, we intend to fund the dividend payout from Free cash flow. To provide an assessment of our ability to generate cash, and ultimately to pay dividends, in fiscal 2021 we used the cash conversion rate of Industrial Business, defined as the ratio of Free cash flow from Industrial Business to Adjusted EBITA Industrial Business. Because growth requires investments, we aimed to achieve a cash conversion rate of 1 minus the annual comparable revenue growth rate of Industrial Business.
Beginning with fiscal 2022, we use the cash conversion rate for the Siemens Group to reinforce our commitment to cash generation on a Group level. It is defined as the ratio of Free cash flow (continuing and discontinued operations) to Net income. We aim to achieve a cash conversion rate of 1 minus the annual comparable revenue growth rate for the Group over a cycle of three to five years.
At the Annual Shareholders’ Meeting, the Managing Board, in agreement with the Supervisory Board, will submit the following proposal to allocate the unappropriated net income of Siemens AG for fiscal 2021: to distribute a dividend of €4.00 on each share of no par value entitled to the dividend for fiscal 2021 existing at the date of the Annual Shareholders’ Meeting; the remaining amount is to be carried forward. Payment of the proposed dividend is contingent upon approval by Siemens shareholders at the Annual Shareholders’ Meeting on February 10, 2022. The prior-year dividend was €3.50 per share.
2.6 Calculation of return on capital employed Calculation of ROCE
Fiscal year
(in millions of €) 2021 2020
Net income 6,697 4,200
Less: Other interest expenses/income, net1 (769) (692)
Plus: SFS Other interest expenses/income 842 806
Plus: Net interest expenses related to provisions for pensions and similar obligations 53 66
Less: Interest adjustments (discontinued operations) (11) 100
Less: Taxes on interest adjustments (tax rate (flat) 30%) (34) (84)
(I) Income before interest after tax 6,778 4,397
(II) Average capital employed 51,723 56,190
(I) / (II) ROCE 13.1% 7.8%¹ Item Other interest expenses/income, net primarily consists of interest relating to corporate debt, and related hedging activities, as well as interest income on corporate assets.
Combined Management Report
6
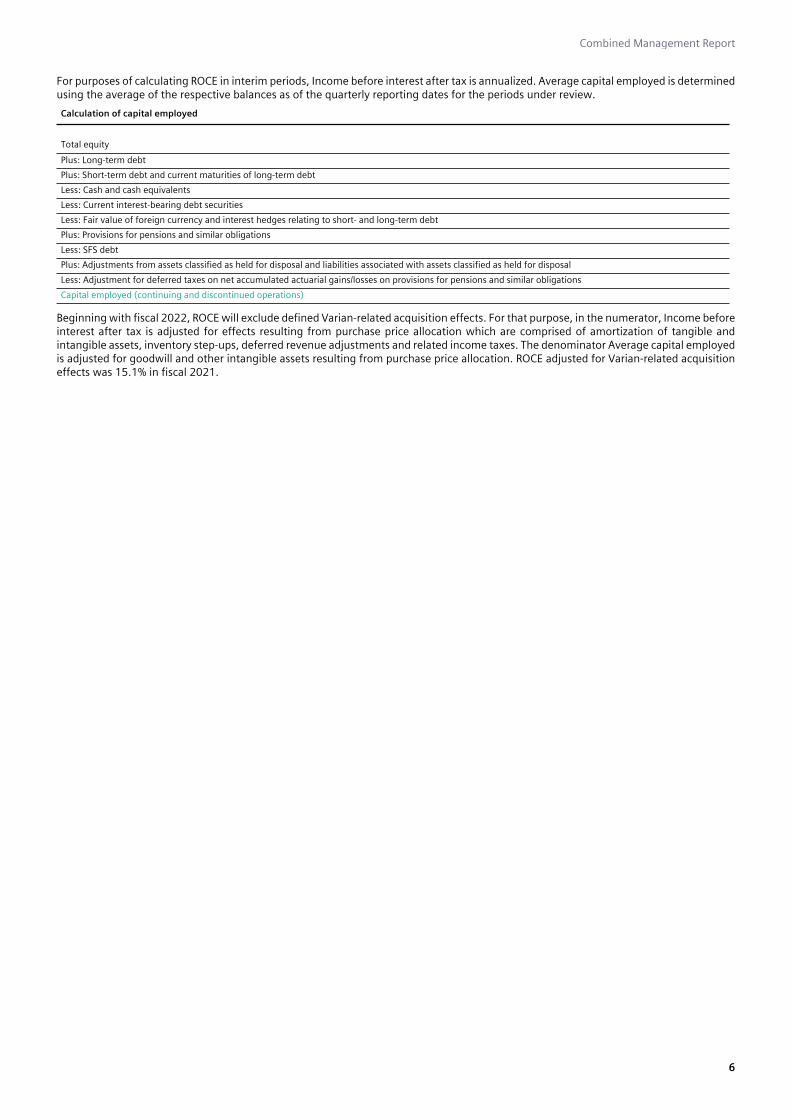
For purposes of calculating ROCE in interim periods, Income before interest after tax is annualized. Average capital employed is determined using the average of the respective balances as of the quarterly reporting dates for the periods under review.
Calculation of capital employed
Total equity
Plus: Long-term debt
Plus: Short-term debt and current maturities of long-term debt
Less: Cash and cash equivalents
Less: Current interest-bearing debt securities
Less: Fair value of foreign currency and interest hedges relating to short- and long-term debt
Plus: Provisions for pensions and similar obligations
Less: SFS debt
Plus: Adjustments from assets classified as held for disposal and liabilities associated with assets classified as held for disposal
Less: Adjustment for deferred taxes on net accumulated actuarial gains/losses on provisions for pensions and similar obligations
Capital employed (continuing and discontinued operations)
Beginning with fiscal 2022, ROCE will exclude defined Varian-related acquisition effects. For that purpose, in the numerator, Income before interest after tax is adjusted for effects resulting from purchase price allocation which are comprised of amortization of tangible and intangible assets, inventory step-ups, deferred revenue adjustments and related income taxes. The denominator Average capital employed is adjusted for goodwill and other intangible assets resulting from purchase price allocation. ROCE adjusted for Varian-related acquisition effects was 15.1% in fiscal 2021.
Combined Management Report
7
3. Segment information
3.1 Overall economic conditionsThe global economic development in fiscal 2021 was still dominated by the coronavirus pandemic (COVID-19) and its many repercussions. After the recession in calendar 2020, in which global gross domestic product (GDP) contracted by 3.4%, calendar 2021 is expected to show a very strong rebound with global GDP increasing by 5.5%.
Global economic activity expanded at very high rates in the third quarter of calendar 2020 after the first wave of COVID-19 ebbed. Subsequent infection waves in winter months caused fears of a new global recession. But economic activity had already adapted to the pandemic and was supported by massive stimulus programs, especially in Europe and the U.S. Globally, governments allocated nearly USD 11 trillion in stimulus programs and more than USD 6 trillion in liquidity support to businesses and households in response to the pandemic. Central banks gave support with expansionary measures, in particular new quantitative easing programs, while short-term interest rates were at or near zero. Accordingly, the global economy continued to expand also in the fourth quarter of calendar 2020 and the first quarter of calendar 2021, despite renewed outbreaks and lockdowns. In December 2020, the first countries approved new COVID-19 vaccines, which were developed in a very short time and which are of paramount importance in order to solve the health crisis and economic challenges.
However, momentum again weakened in the first half of calendar 2021, due to increasing infections in many countries. The new Delta variant was more contagious than previous virus strains. Vaccine roll-out could not keep up with the spread of this new variant, especially in emerging countries. In addition, supply disruptions, which were both caused and magnified by the pandemic, impaired the recovery. Bottlenecks had impacts across the value chains from raw materials to high tech goods, especially semiconductors, and were exemplified by extraordinary disruptions in global logistics systems. In addition, many companies were surprised by the strong recovery and high demand for goods which often exceeded their production plans and short-term capacity. The extraordinarily high demand for goods was caused by consumers with high excess savings and limited spending alternatives as many service offerings were still not available (“services-to-products shift”). Limited supply, logistics bottlenecks and record high consumer demand for goods caused substantial increases of producer prices for many products, which partly translated to an increase of general inflation. In addition, energy prices increased, and base effects from reduced 2020 price levels as well as temporary effects (e.g. provisional changes in taxation) contributed to the elevated rate of inflation.
The Chinese economy – with the world’s largest manufacturing sector – benefited particularly from the high global demand for goods and is expected to grow by 8.2% in calendar 2021. However, tensions in the property sector and energy shortages weighed on economic activity in the second half of calendar 2021.
Overall, the other major economies have experienced very strong economic rebounds and GDP is expected to grow strongly in calendar 2021: European Union (EU) 5.0%, U.S. 5.4%, Japan 2.3%, India 7.7%. For advanced countries in aggregate, calendar 2021 GDP is expected to expand by 4.9%. For emerging markets, the increase in calendar 2021 GDP is estimated at 6.4%.
The partly estimated figures presented here for GDP are based on an IHS Markit report dated October 15, 2021.
3.2 Digital IndustriesDigital Industries offers a comprehensive product portfolio and system solutions for automation used in discrete and process industries; these offerings include automation systems and software for factories, numerical control systems, motors, drives and inverters and integrated automation systems for machine tools and production machines. Digital Industries also provides process control systems, machine-to-machine communication products, sensors (for measuring pressure, temperature, level, flow rate, distance or shape) and radio frequency identification systems. Furthermore, Digital Industries offers production and product lifecycle management (PLM) software, and software for simulation and testing of mechatronic systems. These leading software offerings are integrated with an electronic design automation (EDA) software portfolio, and the open, cloud-based industrial internet of things (IIoT) operating system MindSphere, which connects machines and physical infrastructure to the digital world. All these software offerings are complemented by the Mendix cloud-native low-code application development platform, which allows customers to significantly reduce app development times through visual representation of underlying code. Digital Industries also provides customers with lifecycle and data-driven services. During the first quarter of fiscal 2021, Digital Industries’ stake in Bentley Systems, Inc. (Bentley) was transferred to Siemens Pension-Trust e.V. In August 2021, Digital Industries closed the acquisition of Supplyframe, Inc. (Supplyframe), a marketplace for the global electronics value chain, to significantly strengthen and accelerate growth of its offerings in digital marketplaces. For further information on the acquisition see Note 3 in Notes to Consolidated Financial Statements for fiscal 2021.
Taken together, Digital Industries’ offerings enable customers to optimize entire value chains from product design and development through production and post-sale services. With its advanced software solutions in particular, Digital Industries supports customers in their evolution towards the “Digital Enterprise,” resulting in increased flexibility and efficiency of production processes and reduced time to market for new products. The most important markets include the automotive industry, the machine building industry, the pharmaceutical and chemicals industry, the food and beverage industry and the electronics and semiconductor industry. Digital Industries serves its customers through a common regional sales organization spanning all its businesses, using various sales channels depending on the type of customer and industry and also enhancing customer choice across all channels. Changes in customer demand, especially for standard products, are driven strongly by macroeconomic cycles, and can lead to significant short-term fluctuation in Digital Industries’ profitability. Volume from large contracts in the software business, particularly for EDA, may also result in strong fluctuations in quarterly volume and profitability. Starting in fiscal 2022, Digital Industries intends to transition parts of its software business, particularly PLM, from largely upfront revenue recognition towards Software as a Service (SaaS), which yields more predictable recurring revenue and offers growth opportunities by opening access to new customers, especially small and medium-sized companies seeking to reduce costs associated with owning complex IT infrastructure. During the transition, Digital Industries expects impacts on revenue growth rates and profit margin development in the software business. Competition with Digital Industries’ business activities comes primarily from multinational corporations that offer a relatively broad portfolio and from smaller companies active only in certain geographic or product markets.

Combined Management Report
8
Digital Industries sees three trends influencing its business and providing long-term growth opportunities. Producers of investment goods in today’s increasingly digital environment must modernize their production capacity, particularly to increase production flexibility and reduce time to market. This environment also spurs producers to complement their core products with vertical solutions and service offerings, which their customers either need or want in order to take full advantage of the investment goods. Finally, there is a trend from globalization to regionalization, to support local economic development or to better adapt solutions to local needs. This is increasingly accompanied by more differentiated regulatory requirements.
Research & Development (R&D) activities at Digital Industries are aimed at providing its customers with solutions that allow them to exploit the potential of data in their businesses and to combine the real and the digital worlds. Digital Industries is developing and integrating technologies such as artificial intelligence (AI), edge computing, cloud technologies, additive manufacturing and industrial 5G wireless technology. For example, Digital Industries cooperated with Schaeffler Group by combining its IIoT platform Sidrive IQ, which augments drive systems with AI-based analytics and digital content, with Schaeffler’s products and services in the area of designing, manufacturing, and servicing bearings. Digital Industries introduced a new Industrial Edge Management system with which users can remotely monitor the status of every connected device and remotely install edge apps and software functions on distributed edge devices. Also in fiscal 2021, Digital Industries announced a cooperation with Google Cloud which aims at the integration of factory automation systems from Digital Industries with Google’s data cloud, AI and machine learning technologies. In the field of additive manufacturing, Digital Industries worked with EOS and DyeMansion to present the first virtual additive manufacturing reference factory for selective laser sintering and industrial post-processing. During the 2021 Hanover Fair, Digital Industries demonstrated its first industrial 5G router and set up a private 5G campus network with a focus on industrial use cases such as automated guided vehicles, augmented reality, and autonomous mobile robots. Major investments of Digital Industries in fiscal 2021 relate to its own factory automation, motion control and process automation businesses, to further automate and digitalize facilities particularly in Germany, China and the Czech Republic.
Fiscal year % Change
(in millions of €) 2021 2020 Actual Comp.
Orders 18,427 15,896 16% 18%
Revenue 16,514 14,997 10% 13%
therein: software business 4,290 4,144 4% 7%
Adjusted EBITA 3,362 3,252 3%
Adjusted EBITA margin 20.4% 21.7%
Significant order growth for Digital Industries was driven by the automation businesses, particularly factory automation and motion control, on a recovery of their most important customer industries such as the automotive and machine building industries, which a year earlier were strongly impacted by effects related to COVID-19. Orders in the software business came in lower compared to fiscal 2020, which included a sharply higher volume from large orders, most notably in the EDA business. Revenue rose in all businesses, including significant growth contributions from the factory automation and motion control businesses and successful mitigation of supply chain risks primarily associated with electronics components. On a geographic basis, order and revenue were up in all regions with growth mainly driven by the region Asia, Australia, due primarily to substantial increases in China, and the region comprising Europe, Commonwealth of Independent States (C.I.S.), Africa, Middle East, including a strong growth contribution from Germany. Adjusted EBITA rose moderately even though the prior fiscal year included a €767 million positive effect related to Digital Industries’ former stake in Bentley. The effect resulted mainly from revaluation of the stake following Bentley’s public listing. Excluding this effect, Adjusted EBITA rose on double-digit increases in all businesses and improved profitability compared to the prior fiscal year, with the strongest growth contributions coming from the factory automation and motion control businesses. Adjusted EBITA improved also from successful execution of the cost structure improvement program in prior periods, which strengthened current profitability. Furthermore, severance charges, which resulted primarily from the ongoing program, fell substantially to €114 million from €210 million in the prior year. During the first half of fiscal 2021, Adjusted EBITA development benefited from expense reductions year-over-year related to COVID-19 restrictions, such as lower travel and marketing expenses. Digital Industries’ order backlog was €7 billion at the end of the fiscal year, of which €6 billion are expected to be converted into revenue in fiscal 2022.
In fiscal 2021 the market environment for Digital Industries improved strongly as global manufacturing production recovered throughout the fiscal year from burdens related to COVID-19, which were most noticeable in the second and third quarter a year earlier. The rebound was faster and stronger than assumed and led to constraints in global value chains over the course of the fiscal year. The main driver of the upswing was China where the growth dynamic was extremely strong in the first half of the fiscal year. Other countries followed with a delay of around three to six months, but their recovery was less pronounced than in China resulting in moderate growth in the regions Americas and Europe, C.I.S., Africa, Middle East. Discrete industries recovered particularly quickly and strongly, benefiting in part from restocking effects, while recovery in the more project-related process industries was delayed. The automotive industry started strongly into fiscal 2021, but the recovery was held back by supply chain constraints which impacted production especially in the second half of the fiscal year. This led to slowing or even limited contraction of production during the last months of the fiscal year. The machine building industry also recovered faster than expected, with the recovery starting in China and benefiting from demand for general investment goods. This development was evident in demand for automation equipment which in addition benefited from the trend towards digitalization and from stock-building effects to mitigate risks from supply chain constraints. The pharmaceutical and the chemicals industries expanded during the entire fiscal year. While the pharmaceuticals industry benefited from COVID-19 vaccine demand among other factors, the chemicals industry steadily improved in line with the overall economic recovery. The development in the food and beverage industry followed a similar pattern and grew steadily throughout the fiscal year. Global production of electronics and semiconductors was not held back by effects related to COVID-19, and experienced strong growth during fiscal 2021. However, market shifts within the semiconductor industry led to global shortages of semiconductors for certain customer segments that grew worse through the fiscal year and increasingly affected the automotive and machine building industries. In addition, supply constraints for plastics, metals and freight delivery impacted Digital Industries’ market environment. Price increases affected all markets and were stronger than usually experienced during periods of economic rebound. While prices started to surge in the first quarter of fiscal 2021 mainly in the raw material sector (e. g. copper), they spread further to intermediate goods and to all markets, including electrical equipment, in the following

Combined Management Report
9
quarters. Digital Industries expects its primary markets, as described above, to show clear growth in fiscal 2022, with somewhat diminished momentum compared to fiscal 2021 and more geographic balance among the three reporting regions.
3.3 Smart InfrastructureSmart Infrastructure offers products, systems, solutions, services and software to support a sustainable transition in energy generation sources, from fossil to renewable and a transition to smarter, more sustainable buildings and communities. This versatile portfolio is structured into three businesses: buildings, electrification and electrical products. The buildings business addresses the needs of operators, owners, occupants and users of buildings. It spans integrated building management systems and software; heating, ventilation and air conditioning (HVAC) controls; fire safety and security products and systems; and solutions and services such as energy and performance services. The electrification business makes grids more resilient, flexible and efficient. Its offerings cover grid simulation, operation and control software; substation automation and protection; medium-voltage primary and secondary switchgear (including SF6-free medium-voltage switchgear); and low-voltage switchboards and eMobility charging infrastructure. The electrical products business supplies electrification and buildings. Its offerings include low-voltage switching, measuring and control equipment; low-voltage distribution systems and switchgear; and circuit breakers, contactors and switching for medium-voltage. In fiscal 2021, Smart Infrastructure acquired C&S Electric Limited (C&S Electric), India, a provider of electrical and electronic equipment for infrastructure, power generation, transmission and distribution to strengthen its position in India as a supplier of low-voltage power distribution and electrical installation technology.
Smart Infrastructure’s customer base is diverse. It encompasses infrastructure developers, construction companies and contractors; owners, operators and tenants of both public and commercial buildings including hospitals, campuses, airports and data centers; companies in heavy industries such as oil and gas, mining and chemicals; companies in discrete manufacturing industries such as automotive and machine building; and utilities and power grid network operators (transmission and distribution). Smart Infrastructure serves its customers through a broad range of channels, including its global sales organization, distributors and partners such as panel builders, original equipment manufacturers (OEM) and value-added resellers and installers, all complemented by direct sales such as through the branch offices of its regional solutions and services units worldwide and e-commerce channels. Smart Infrastructure’s principal competitors consist mainly of large multinational companies and smaller manufacturers in emerging countries. Its solutions and services business also competes with local players such as system integrators and facility management firms. Smart Infrastructure’s businesses are impacted by changes in the overall economic environment to varying degrees, depending on customer segment. While customer demand in discrete manufacturing industries changes quickly and strongly with macroeconomic cycles, it reacts more slowly in infrastructure, construction, heavy industries and the utilities sector. The building solutions business in particular is affected by economic cycles in the non-residential building construction markets with a time lag of two to four quarters. Overall, Smart Infrastructure has developed a balanced and resilient business mix with its diversified regional and vertical markets; its range of products, systems, solutions and services; and its participation in both long- and short-cycle markets. To further strengthen the resilience of its portfolio, Smart Infrastructure aims at increasing the share of service revenue and beginning with fiscal 2022 will report revenue generated from service activities.
Smart Infrastructure benefits from a number of favorable trends. These include urbanization, demographic change, climate change, and digitalization. Urbanization and demographic change drive a need for smarter and more human-centric buildings. Climate change drives the need for decarbonization. This results in an increasing demand for flexible and resilient energy infrastructures and rapid growth in electric mobility. Digitalization is an enabler for such changes in both buildings and grids, making it possible to develop smarter buildings and manage electricity distribution with a higher share of renewables. The markets served are experiencing shifts that present opportunities where building technologies and electrification meet.
Smart Infrastructure’s R&D activities focus on sustainable and decarbonized infrastructures in electrification, distribution grids and buildings. It develops digital offerings for the energy market such as for integrating renewable energy into conventional grids. Furthermore, R&D efforts strengthen Smart Infrastructure’s capabilities to create comfortable, safe and energy-efficient buildings and infrastructures that support increased efficiency for occupants, equipment and the use of building space. Smart Infrastructure is expanding its digital offerings such as cloud solutions using field data from controllers and IoT devices. Furthermore, it develops technologies for environmentally friendly and increasingly renewable-based energy systems, ranging from photovoltaic and battery storage inverters to charging solutions for e-mobility. In this regard, data from field devices is the basis for intelligent grid control and protection, providing grid stability and flexibility and continuously matching energy supply and demand while protecting grid assets. For electrical distribution systems and industrial plants, Smart Infrastructure continuously drives digitalization of its switching and control products with built-in intelligence, connectivity to the cloud, and increasingly remote diagnostics and edge computing capability. Its digital twins of products, building systems or grids deliver customer value from online configuration and parametrization, to operation, to maintenance planning. Smart Infrastructure also develops data-driven applications and digital services. To a large extent, its capital expenditures relate to the products businesses. Main investment areas are replacement of fixed assets and further digitalization of factories and technical equipment, with a strong focus on innovation.
Fiscal year % Change
(in millions of €) 2021 2020 Actual Comp.
Orders 16,071 14,734 9% 12%
Revenue 15,015 14,323 5% 8%
therein: products business 5,769 5,182 11% 15%
Adjusted EBITA 1,743 1,302 34%
Adjusted EBITA margin 11.6% 9.1%
Orders at Smart Infrastructure rose in all businesses on broad-based improvements in its main customer markets. The strongest growth contributions came from the products business, which saw a clear recovery in demand from industrial customers, and from the systems business, which won a number of significant contracts including orders from semiconductor manufacturers in the U.S. Orders in the solutions and services business grew slightly as the business saw first signs of recovery in relevant markets towards the end of the fiscal year. Revenue growth also was driven mainly by the products business and the systems business, while a slight decline in the solutions
Combined Management Report
10
and services business was due to negative currency translation effects. Despite more challenging supply conditions, Smart Infrastructure maintained its delivery capacity by successfully avoiding major supply chain disruptions. On a geographic basis, orders and revenue were up in all regions, with double-digit volume growth in the region Asia, Australia including a particularly strong contribution from China. Volume growth in the Americas included strong demand from residential markets in the U.S. Overall, growth in this region was sharply impacted by negative currency translation effects, which eased towards the end of the fiscal year. Adjusted EBITA and profitability rose in all businesses, with the strongest growth contributions coming from the products business and the systems business on higher revenue and increased capacity utilization. Adjusted EBITA overall rose also due to cost savings related to prior execution of Smart Infrastructure’s competitiveness program, while severance associated with the program fell sharply, to €47 million from €195 million a year earlier. Particularly during the first half of fiscal 2021, Adjusted EBITA development benefited from expense reductions year-over-year related to COVID-19 restrictions. These effects were only partly offset by negative currency effects. For comparison, Adjusted EBITA in fiscal 2020 benefited from a €159 million gain from the sale of a business. Smart Infrastructure’s order backlog was €11 billion at the end of the fiscal year, of which €7 billion are expected to be converted into revenue in fiscal 2022.
Overall, markets served by Smart Infrastructure grew moderately in fiscal 2021, experiencing a recovery from COVID-19-related effects that had a strong impact on most customer industries a year earlier. Industrial markets developed well, with strong growth in the machine building and pharmaceutical industries, followed by the automotive, food and beverage, oil and gas and chemicals industries. Grid markets grew clearly as utilities continued to prioritize investments in making legacy networks more automated, intelligent, flexible and reliable. Ongoing strong demand for remote working and cloud services resulted in strong growth in the data center market. Conditions in non-residential construction markets were challenging, while residential construction markets, in which Smart Infrastructure has a significantly lower exposure, grew strongly. On a geographic basis, market growth in fiscal 2021 was mainly driven by the region Asia, Australia, which recovered earlier from impacts related to COVID-19, while market volume in the Americas declined. Smart Infrastructure also experienced a number of supply chain constraints, especially in the areas of base metals (copper, aluminum, steel), plastics, semiconductors and transportation services. Whereas the management of these constraints required additional effort, Smart Infrastructure’s supply chains have proven to be resilient, so that major interruptions could be avoided and delivery ability was maintained. In fiscal 2022, markets served by Smart Infrastructure are expected to grow slightly faster than in fiscal 2021. Demand from the pharmaceutical industry, data centers and utilities are expected to be main growth drivers, while growth rates of the non-residential construction markets are expected to come in below the average growth of markets served by Smart Infrastructure. On a geographic basis, Asia, Australia is expected to continue to be the fastest-growing region. Growth in the region Europe, C.I.S., Africa, Middle East is expected to accelerate and markets in the region Americas are expected to return to growth.
3.4 MobilityMobility combines all Siemens businesses in the area of passenger and freight transportation. Within its rolling stock business, its offerings encompass trains for urban and regional transport such as vehicles for metro systems, trams and light rail, and commuter trains as well as trains and passenger coaches for intercity and long-distance services, such as high-speed rail. Rolling stock offerings furthermore include locomotives for freight or passenger transport and solutions for automated transportation such as automated people movers. Offerings in its rail infrastructure business include products and solutions for rail automation, such as automatic train control systems, interlocking, operations control and telematic systems, digital station solutions and railway communication systems, signaling on-board and crossing products and yard and depot solutions; for electrification such as AC and DC traction power supply, contact lines and network control; and intermodal solutions, such as platforms for fleet management, route planning, ticketing and payments solutions and data analytics. With its service business, Mobility provides customer services for rolling stock and rail infrastructure throughout the entire lifecycle, such as maintenance and digital services. In its turnkey business, it bundles consulting, planning, financing, construction, service and operation of completed mobility systems. Its intelligent traffic systems business provides solutions for traffic management such as autonomous driving, eHighway systems and tolling solutions. During fiscal 2021, Mobility carved out the intelligent traffic systems business to form a separately managed entity, which operates under the brand name Yunex Traffic.
Mobility sells its products, systems and solutions through its worldwide network of sales units. The principal customers of Mobility are public and state-owned companies in the transportation and logistics sectors, so its markets are driven primarily by public spending. Customers usually have multi-year planning and implementation horizons, and their contract tenders therefore tend to be independent of short-term economic trends. Large contracts in the rolling stock and the rail infrastructure business are often awarded together with service contracts, which start to generate revenue only after the respective products and solutions have been put in operation, which can be a number of years after the contract award. Mobility’s principal competitors are multinational companies. Consolidation among Mobility’s competitors is continuing: In January 2021, Alstom SA of France announced the closing of the acquisition of Bombardier Transportation. In August 2021, Hitachi Ltd., Japan, announced an agreement of Hitachi Rail to acquire the Ground Transportation Systems business of Thales. Market consolidation may lead to increased competitive pressure within the rail supply industry and also to fewer sourcing options for rail customers.
The main trends driving Mobility’s markets are urbanization and the need to reduce emissions, particularly from transportation. Increasing populations in urban centers need daily mobility that is simpler, faster, and more flexible, reliable and affordable. At the same time, cities and national economies face the challenge of cutting CO2 and noise emissions and reducing space requirements and costs of transportation. The pressure on mobility providers to meet all these needs is expected to rise continuously. Furthermore, improving availability, connectivity, and sustainability of rail infrastructures increasingly requires digital solutions, which provide growth opportunities. While a significant drop in ridership driven by COVID-19 has strongly impacted mobility operators, overall trends towards urbanization and decarbonization persist unchanged and recovery programs in many countries have been allocating significant funds to rail and public transport operators to address these trends.
Mobility’s R&D strategy is focused on making trains and infrastructures more intelligent, thereby increasing its customers’ return on investment, improving the passenger experience, and guaranteeing availability. Decarbonization and seamlessly connected (e-)mobility are also key factors for the future of transportation. Mobility’s major R&D areas include the development of efficient vehicle platforms with optimized lifecycle cost and maximum customization flexibility; eco-friendly, alternative power supplies for trains (batteries, hydrogen, dual mode) and trucks (eHighway); digital services for railways via its Railigent application suite; “signaling in the cloud,” a new system architecture for rail infrastructure and IoT/cloud-based technologies; solutions for more automated and autonomous driving for rail and road; innovative brake monitoring systems for freight trains; and digital technologies and IoT solutions including cyber security,

Combined Management Report
11
connectivity, simulation and digital twin, data analytics and AI, additive manufacturing and software systems and processes. Mobility’s investments focus mainly on maintaining or enhancing its production facilities, on meeting project demands and enhancing its depot services.
Fiscal year % Change
(in millions of €) 2021 2020 Actual Comp.
Orders 12,696 9,169 38% 41%
Revenue 9,232 9,052 2% 3%
therein: service business 1,416 1,392 2% 3%
Adjusted EBITA 857 822 4%
Adjusted EBITA margin 9.3% 9.1%
Orders grew on sharply higher volume from large orders, which Mobility won across the three reporting regions, highlighted by a €2.8 billion order for trainsets including dual powered and hybrid battery vehicles and associated services in the U.S., Mobility’s largest-ever order in the Americas. Large contract wins in the region Europe, C.I.S., Africa, Middle East included an order for passenger coaches in the Czech Republic, an order for regional trains in Austria and an order for light rail vehicles in Germany, each worth €0.4 billion, and in the region Asia, Australia a €0.2 billion order for a signaling system in Taiwan. Revenue growth was driven by the rail infrastructure business, including significant growth in its mainline activities. On a geographic basis, revenue rose in the Americas due particularly to a significant growth contribution from the U.S., and in the region Europa, C.I.S., Africa, Middle East, including clear growth in Germany. These increases were only partly offset by lower revenue in the region Asia, Australia. Adjusted EBITA rose in the majority of the businesses, most strongly in the rail infrastructure business. For Mobility overall, impacts related to COVID-19, such as measures in the rolling stock business to safeguard employee health in manufacturing facilities, held back revenue and Adjusted EBITA growth, albeit to a lesser extent than a year earlier. Severance charges were €22 million, compared to €20 million a year earlier. Mobility’s order backlog reached €36 billion at the end of the fiscal year, of which €9 billion are expected to be converted into revenue in fiscal 2022.
Markets served by Mobility grew moderately in fiscal 2021 as they partly recovered from impacts related to COVID-19. The market for rolling stock saw large orders across all segments, especially for high-speed trains, commuter trains and locomotives. The rail infrastructure market has seen growth both in urban and mainline segments due to the renewal and extension of mainline tracks and the ongoing trend towards automatic train protection (ATP), including communications-based train control (CBTC) and European train control system (ETCS) technologies. Service demand partly recovered from prior-year impacts related to COVID-19, due to growing installed bases which drove a corresponding increase in the spare parts and maintenance market. On a geographic basis, market development in Europe continued to be characterized by awards of mid-size to large orders, particularly in Germany, Denmark and in Switzerland. While demand in the Middle East rose, demand in Africa was held back by ongoing uncertainties related to budget constraints and political climates. In the Americas region, investment activities were driven by demand for urban and mainline transport, especially in the U.S. and Canada. Within the Asia, Australia region, markets saw ongoing rail investments, particularly in China. For fiscal 2022, markets served by Mobility are expected to further recover from impacts related to COVID-19 and to grow clearly, partly benefiting from fiscal stimulus and investment programs. Mobility anticipates that rail operators in Europe, particularly in Germany and in the U.K., will continue making significant investments and that customers in the Middle East and Africa will tender large turnkey systems, especially for additional rail lines in Egypt and Saudi Arabia. Markets in the Americas region are expected to remain strong, especially due to ongoing investments in urban and mainline transport and large investment programs dedicated to transportation and enhancements of existing infrastructure in the U.S. In China, investments in high-speed trains, urban transport, freight logistics and rail infrastructure are expected to continue to drive growth. In India, privatization is expected to drive infrastructure enhancements and upgrades and to lead to strong market growth through investments in mainline (high-speed, freight infrastructure, additional rolling stock), urban metro and rail electrification with ambitious electrification targets for the broad-gauge network. Despite an adverse short-term impact from COVID-19, rail transport and intermodal mobility solutions are expected to remain a high priority as urbanization continues to progress around the world. In emerging countries, rising incomes are expected to result in greater demand for public transport solutions.
In October 2021, Mobility closed the acquisition of SQCAP B.V. (Sqills), Netherlands, a provider of cloud-based inventory management, reservation, and ticketing software for public transport operators to enhance its offerings that increase the availability, capacity and utilization of public transportation. The purchase price is €537 million paid in cash plus a contingent consideration recognized at the acquisition date at its maximum amount of €79 million. For further information see Note 34 in Notes to Consolidated Financial Statements for fiscal 2021.
3.5 Siemens HealthineersSiemens is majority shareholder in the publicly listed Siemens Healthineers AG, Germany (Siemens Healthineers). Siemens Healthineers is a global provider of healthcare solutions and services. It develops, manufactures, and sells a diverse range of innovative diagnostic and therapeutic products and services to healthcare providers. In addition, it also provides clinical consulting services, complemented by extensive training and service offerings. This comprehensive portfolio supports customers all along the care continuum, from prevention and early detection to diagnosis, treatment, and follow-up care. The customer spectrum ranges from public and private healthcare providers, including hospitals and hospital systems, public and private clinics and laboratories, universities, physicians/physician groups, public health agencies, state-run and private health insurers, to pharmaceutical companies and clinical research institutes. The imaging business provides imaging products, services and solutions. Its most important products are equipment for magnetic resonance, computed tomography, X-ray systems, molecular imaging, and ultrasound. The diagnostics business offers in-vitro diagnostic products and services to healthcare providers in laboratory, molecular and point-of-care diagnostics. The portfolio of the advanced therapies business consists of highly integrated products, solutions and services across multiple clinical fields that are designed to support image-guided minimally invasive treatments, in areas such as cardiology, interventional radiology and surgery. On April 15, 2021, Siemens acquired Varian, which is active in the field of cancer care, with solutions especially in radiation oncology and related digital solutions and applications. Varian thus offers a good complement to Siemens Healthineers’ businesses in medical imaging, laboratory diagnostics and interventional procedures. The purchase price paid in cash amounted to USD 16.4 billion (€13.9 billion as of the acquisition date). To partially finance this acquisition, Siemens Healthineers carried out a capital increase during fiscal 2021 without the participation of Siemens, consequently

Combined Management Report
12
reducing Siemens’ stake in Siemens Healthineers from about 79% to slightly over 75%. Competition in the imaging, Varian and advanced therapies businesses consists mainly of a small number of large multinational companies, while the diagnostics market is fragmented with a variety of global players that compete with each other across market segments and also with several regional players and specialized companies in niche technologies. The business activities of Siemens Healthineers are to a certain extent resilient to short-term economic trends because large portions of its revenue stem from recurring business. They are, however, directly and indirectly dependent on trends in healthcare markets and on developments in health policy, and geopolitical developments around the world.
The addressable markets of Siemens Healthineers are shaped by four major trends. The first is demographic, in particular the growing and aging global population. This trend poses major challenges for global healthcare systems and, at the same time, offers opportunities for players in the healthcare industry as the demand for cost-efficient healthcare solutions continues to intensify. The second trend is economic development in emerging countries, which opens up improved access to healthcare for many people. Significant investment in the expansion of private and public healthcare systems will persist, driving overall demand for healthcare products and services and hence market growth. The third trend is the increase in chronic diseases as a consequence of an aging population and environmental and lifestyle-related changes. This trend results in far more patients with multiple morbidities, putting further pressure on healthcare systems and leading to higher costs; it also increases the need for new, more timely ways to detect and treat diseases. The fourth global trend, the transformation of healthcare providers, results from a combination of societal and market forces that are driving healthcare providers to operate and organize their businesses differently. Increasing cost pressure on the healthcare sector is prompting the introduction of new remuneration models for healthcare services, such as value-based rather than treatment-based reimbursement. Digitalization and artificial intelligence are thereby likely to be key enablers for healthcare providers as they increasingly focus on enhancing the overall patient experience, with better outcomes and overall reduction in cost of care. This development is driven partly by society’s increasing resistance to healthcare costs, payers’ increasing professionalization, burdens from chronic disease, rapid scientific progress and staff shortages. As a result of these factors, healthcare providers are consolidating into networked structures, resulting in larger clinic and laboratory chains, often operating internationally, which act increasingly like large corporations. Applying this industrial logic to the healthcare market can lead to systematic improvements in quality, while at the same time reducing costs.
R&D activities at Siemens Healthineers are aimed at delivering innovative, sustainable solutions to its customers while safeguarding and improving its competitiveness. Particularly in the field of digitalization and artificial intelligence, it has further expanded its activities and has 67 products and applications on the market that are designed to further improve its customers’ productivity, while enabling clinical decisions to be more precise and tailored to the individual patient. Furthermore, Siemens Healthineers is continuously expanding its portfolio of digital services to support customers in their transition to value-based care. The teamplay digital health platform brings together data, applications and services to make better decisions for patients in an efficient way. In addition, in fiscal 2021 Siemens Healthineers extended its portfolio in the field of cancer care with the Varian acquisition. The combined company pursues an intelligent cancer care strategy, harnessing advanced technologies such as AI and data analytics to improve cancer treatment and expand global access to cancer care. In addition to continually updating its portfolio, Siemens Healthineers also improves existing products and solutions. Siemens Healthineers focuses its investments mainly on enhancing competitiveness and innovation. The main capital expenditures were for spending for factories to expand manufacturing and technical capabilities, in particular in China and the U.S., and for additions to intangible assets, including capitalized development expenses within the Atellica Solution and Central Lab product lines.
Fiscal year % Change
(in millions of €) 2021 2020 Actual Comp.
Orders 20,320 16,163 26% 18%
Revenue 17,997 14,460 24% 19%
Adjusted EBITA 2,847 2,184 30%
Adjusted EBITA margin 15.8% 15.1%
In fiscal 2021, Siemens Healthineers recorded double-digit growth both in orders and revenue, with both metrics developing similarly. While all businesses contributed to growth, the increases were highest in the diagnostics and imaging businesses. On a geographic basis, growth was particularly strong in the region Europe, C.I.S. Africa, Middle East. The reporting regions Asia, Australia and Americas also saw double-digit increases, the latter one despite significant currency translation effects. Portfolio effects primarily following the acquisition of Varian added twelve percentage points to order growth and nine percentage points to revenue growth. Adjusted EBITA was substantially higher year-over-year, due primarily to strong earnings development in the diagnostics business that was driven by high demand for rapid coronavirus antigen tests. The imaging business again posted strong earnings, which were higher than in the prior year. Varian delivered a positive contribution to earnings on an operating basis. In contrast, Adjusted EBITA in the advanced therapies business was lower year-over-year. Adjusted EBITA included subsequent measurement effects from purchase price allocation related to the Varian acquisition totaling €0.1 billion and expenses totaling €0.1 billion related to the closing of the Varian transaction and its ongoing integration. Profitability was also burdened by negative currency effects. Severance charges were €68 million in fiscal 2021 and €65 million in fiscal 2020. The order backlog for Siemens Healthineers was €27 billion at the end of the fiscal year, of which €9 billion are expected to be converted into revenue in fiscal 2022.
In general, the markets addressed by Siemens Healthineers showed significant growth in fiscal 2021. Nearly two years after the first case of COVID-19 was identified, the virus continues to impact health systems worldwide. Competition among the leading healthcare companies remained at elevated high levels. While the long-term market trends generally remained intact, the COVID-19 pandemic did reinforce some of these trends and has, for example, raised the already increasing cost pressure on health systems and customers to unprecedented levels. Especially in countries with severe COVID-19 outbreaks such as the U.S., India, and Brazil, a significant impact on healthcare economics was apparent in the form of additional cost increases combined with simultaneous revenue losses for hospitals. Staff shortages became more acute, leading to significant care disruptions at many hospitals and overburdening healthcare systems. The pandemic served to drive efforts toward innovation and digital transformation in healthcare. From a regional perspective, China is one of the biggest markets for medical technology and a major incremental growth driver. In the course of the last fiscal year, China’s healthcare market recovered almost fully from effects related to the coronavirus pandemic during the fiscal year. In the region Europe, C.I.S., Africa, Middle East, public investment programs as well as a rise in COVID-19-related demand helped drive a market rise in several countries. The private market also began to recover. In the U.S., business began to return to normal as progress was made in the vaccination campaign.

Combined Management Report
13
Markets addressed by the imaging business grew significantly, mainly due to large COVID 19-driven demand for computer tomography systems and initial signs of normalization in all other modalities. For the Imaging market, it is expected that a normalization of growth to pre-COVID-19 levels will occur in fiscal year 2022. In the diagnostics business, the markets for point-of-care tests for patient monitoring and for lab tests increased in fiscal 2021. On the one hand, the backlog of purchasing decisions and capital expenditure by laboratories and hospitals from the previous year dissipated while, on the other, demand for certain diagnostic reagents, particularly tests for routine care, increased. The markets for combating the COVID-19 pandemic posted sharp growth. Vaccination rates in the population and further COVID-19 implications such as future waves and testing guidelines are key factors for determining expected growth in the market for the diagnostics business. Siemens Healthineers expects demand for tests for acute infection with SARS-CoV-2 to decrease sharply. In the Varian business, growth was driven primarily by new and replacement business. In markets such as the U.S. and Western Europe, product innovations led to higher customer investment. The market for Varian is expected to continue to grow throughout fiscal 2022. The recovery in the advanced therapies markets was made possible through a combination of a resumption in elective surgical procedures and the gradual return of patients. The expectation is that the slight market recovery already seen in fiscal 2021 will continue on a broad basis in fiscal 2022.
3.6 Siemens Financial Services Siemens Financial Services provides financing solutions for Siemens’ customers as well as other companies in the form of debt and equity investments. Based on its comprehensive financing know-how and specialist technology expertise in the areas of Siemens businesses, SFS supports its customers’ investments with leasing, lending and working capital financing solutions as well as equipment, project and structured financing. In addition, SFS supports Siemens’ industrial businesses via a joint go-to-market that includes SFS’s risk management expertise, such as to assess the risk profiles of projects or business models. Furthermore, SFS collaborates with the industrial businesses to co-develop new digital business models. Recent examples include energy as a service or pay-per-use and pay-for-outcome options that give customers more financial flexibility.
Fiscal year
(in millions of €) 2021 2020
Earnings before taxes (EBT) 512 345
therein: equity business 49 82
ROE (after taxes) 15.4% 11.7%
Sep 30, Sep 30,
(in millions of €) 2021 2020
Total assets 30,384 28,946
A high earnings contribution from the debt business resulted in a sharp increase in Earnings before taxes and was also the main factor for the increase of the ROE. The improvement was due mainly to sharply lower expenses for credit risk provisions compared to fiscal 2020, when results were significantly influenced by effects related to COVID-19. However, results from the equity business were affected by high ongoing uncertainty in the macroeconomic environment. Additionally, sales of investments in the previous fiscal year lifted profit for that period. This led also, along with seasonal effects on offshore wind-farm projects, to a lower share of profit from investments accounted for using the equity method in fiscal 2021. For comparison, results in the equity business in fiscal 2020 included a loss of €98 million from an impairment of an equity investment in the U.S.
The increase in total assets since the end of fiscal 2020 was due to growth in the debt business and positive currency translation effects.
Net cash from operations (defined as the sum of cash flows from operating and investing activities) amounted to €105 million compared to €(284) million in fiscal 2020. In fiscal 2021 and fiscal 2020, net cash from operations comprised Free cash flow of €820 million and €611 million, respectively, and remaining cash flows from investing activities, including from change in receivables from financing activities, of €(715) million and €(895) million, respectively.
SFS is de-risking its business profile by reducing exposure in connection with energy-related equity investments as a consequence of the spin-off of Siemens Energy. This has the additional benefit of more tightly focusing SFS’s business scope and capital allocation on areas of intense domain know-how closely aligned with Siemens’ customers and markets, particularly for Digital Industries, Smart Infrastructure and Mobility. Accordingly, SFS is influenced by the business development of the markets served by our industrial businesses, among other factors, including effects related to COVID-19. In addition to its high level of diversification across industries, SFS has a strong regional footprint in investment-grade countries, with the highest share in the U.S. SFS intends to maintain a highly diversified portfolio across regions, while participating in the strong economic development of selected Asian markets.
3.7 Portfolio CompaniesPortfolio Companies comprise businesses which deliver a broad range of customized and application-specific products, software, solutions, systems and services for different industries including oil and gas, chemical, mining, cement, logistics, energy, marine, water and fiber. Unrealized potential within these businesses requires adjustment in their approach using defined measures including internal re-organization, digitalization, cost improvements, and optimizing procurement, production and service activities. After achieving certain threshold performance targets, businesses may be transferred to one of Siemens industrial businesses, combined with an external business from the same industry, sold or placed into an external private equity partnership.
In March 2021 Siemens sold Flender GmbH, Germany, (Flender) to Carlyle Group Inc., U.S. During the first quarter of fiscal 2021 the businesses of Flender (previously reported in Portfolio Companies) were classified as held for disposal and discontinued operations. Prior-period amounts are presented on a comparable basis. For further information see Note 3 in Notes to Consolidated Financial Statements for fiscal 2021.
Combined Management Report
14
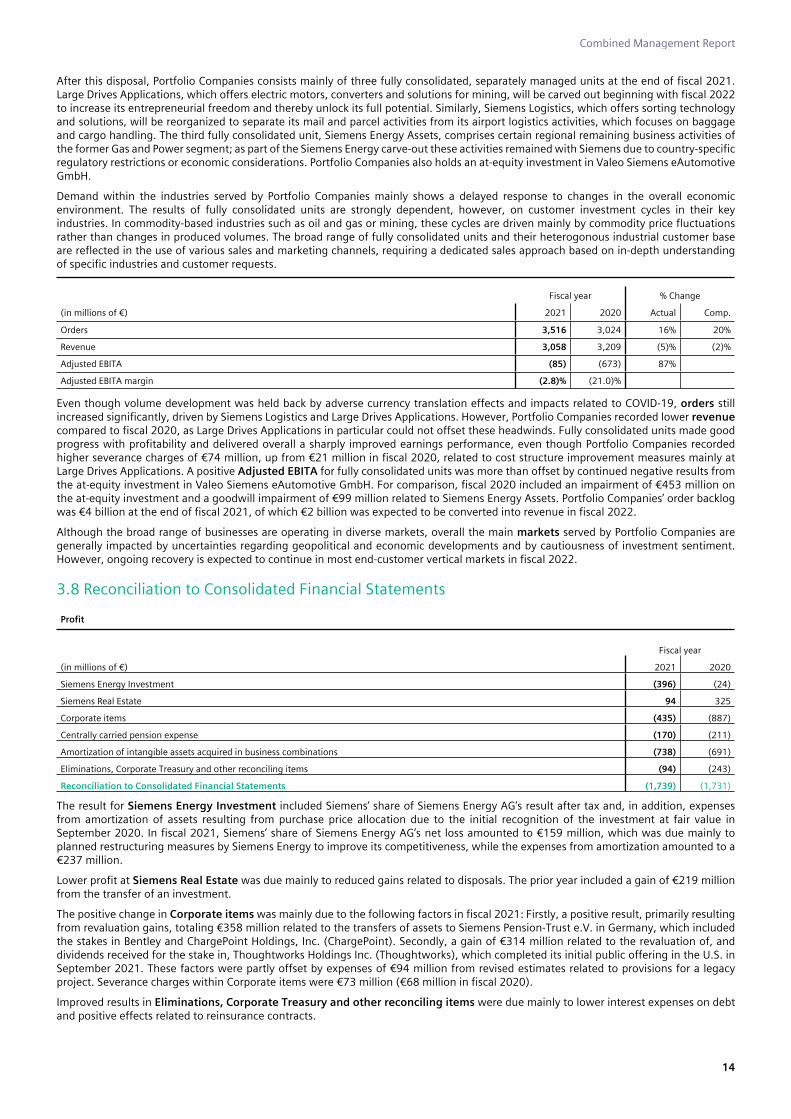
After this disposal, Portfolio Companies consists mainly of three fully consolidated, separately managed units at the end of fiscal 2021. Large Drives Applications, which offers electric motors, converters and solutions for mining, will be carved out beginning with fiscal 2022 to increase its entrepreneurial freedom and thereby unlock its full potential. Similarly, Siemens Logistics, which offers sorting technology and solutions, will be reorganized to separate its mail and parcel activities from its airport logistics activities, which focuses on baggage and cargo handling. The third fully consolidated unit, Siemens Energy Assets, comprises certain regional remaining business activities of the former Gas and Power segment; as part of the Siemens Energy carve-out these activities remained with Siemens due to country-specific regulatory restrictions or economic considerations. Portfolio Companies also holds an at-equity investment in Valeo Siemens eAutomotive GmbH.
Demand within the industries served by Portfolio Companies mainly shows a delayed response to changes in the overall economic environment. The results of fully consolidated units are strongly dependent, however, on customer investment cycles in their key industries. In commodity-based industries such as oil and gas or mining, these cycles are driven mainly by commodity price fluctuations rather than changes in produced volumes. The broad range of fully consolidated units and their heterogonous industrial customer base are reflected in the use of various sales and marketing channels, requiring a dedicated sales approach based on in-depth understanding of specific industries and customer requests.
Fiscal year % Change
(in millions of €) 2021 2020 Actual Comp.
Orders 3,516 3,024 16% 20%
Revenue 3,058 3,209 (5)% (2)%
Adjusted EBITA (85) (673) 87%
Adjusted EBITA margin (2.8)% (21.0)%
Even though volume development was held back by adverse currency translation effects and impacts related to COVID-19, orders still increased significantly, driven by Siemens Logistics and Large Drives Applications. However, Portfolio Companies recorded lower revenue compared to fiscal 2020, as Large Drives Applications in particular could not offset these headwinds. Fully consolidated units made good progress with profitability and delivered overall a sharply improved earnings performance, even though Portfolio Companies recorded higher severance charges of €74 million, up from €21 million in fiscal 2020, related to cost structure improvement measures mainly at Large Drives Applications. A positive Adjusted EBITA for fully consolidated units was more than offset by continued negative results from the at-equity investment in Valeo Siemens eAutomotive GmbH. For comparison, fiscal 2020 included an impairment of €453 million on the at-equity investment and a goodwill impairment of €99 million related to Siemens Energy Assets. Portfolio Companies’ order backlog was €4 billion at the end of fiscal 2021, of which €2 billion was expected to be converted into revenue in fiscal 2022.
Although the broad range of businesses are operating in diverse markets, overall the main markets served by Portfolio Companies are generally impacted by uncertainties regarding geopolitical and economic developments and by cautiousness of investment sentiment. However, ongoing recovery is expected to continue in most end-customer vertical markets in fiscal 2022.
3.8 Reconciliation to Consolidated Financial Statements
Profit
Fiscal year
(in millions of €) 2021 2020
Siemens Energy Investment (396) (24)
Siemens Real Estate 94 325
Corporate items (435) (887)
Centrally carried pension expense (170) (211)
Amortization of intangible assets acquired in business combinations (738) (691)
Eliminations, Corporate Treasury and other reconciling items (94) (243)
Reconciliation to Consolidated Financial Statements (1,739) (1,731)
The result for Siemens Energy Investment included Siemens’ share of Siemens Energy AG’s result after tax and, in addition, expenses from amortization of assets resulting from purchase price allocation due to the initial recognition of the investment at fair value in September 2020. In fiscal 2021, Siemens’ share of Siemens Energy AG’s net loss amounted to €159 million, which was due mainly to planned restructuring measures by Siemens Energy to improve its competitiveness, while the expenses from amortization amounted to a €237 million.
Lower profit at Siemens Real Estate was due mainly to reduced gains related to disposals. The prior year included a gain of €219 million from the transfer of an investment.
The positive change in Corporate items was mainly due to the following factors in fiscal 2021: Firstly, a positive result, primarily resulting from revaluation gains, totaling €358 million related to the transfers of assets to Siemens Pension-Trust e.V. in Germany, which included the stakes in Bentley and ChargePoint Holdings, Inc. (ChargePoint). Secondly, a gain of €314 million related to the revaluation of, and dividends received for the stake in, Thoughtworks Holdings Inc. (Thoughtworks), which completed its initial public offering in the U.S. in September 2021. These factors were partly offset by expenses of €94 million from revised estimates related to provisions for a legacy project. Severance charges within Corporate items were €73 million (€68 million in fiscal 2020).
Improved results in Eliminations, Corporate Treasury and other reconciling items were due mainly to lower interest expenses on debt and positive effects related to reinsurance contracts.

Combined Management Report
15
Beginning with fiscal 2022, governance costs and Siemens brand fees, previously included in Corporate items, will be included within the new item Governance; results related to Technology and Next47, also previously included in Corporate items, will be disclosed under the new item Innovation. Other components of corporate items, including the businesses Advanta and Global Business Solution, will be transferred to the item Financing, eliminations and other items (formerly Eliminations, Corporate Treasury and other reconciling items). In line with the change to a new profit definition, this item will also include operating financial income (expenses), net. As a result of the changes described above, Corporate items will be retired as a disclosure line item. If this new reporting structure had already existed in fiscal 2021, the items Innovation; Governance; and Financing, eliminations and other items would have recorded €(207) million, €(751) million and €452 million in profit, respectively.

Combined Management Report
16
4. Results of operations
4.1 Orders and revenue by regionCurrency translation effects took three percentage points each from order and revenue growth, respectively. Portfolio transactions, in particular the acquisition of Varian by Siemens Healthineers, added five percentage points to order and four percentage points to revenue growth year-over-year. The resulting ratio of orders to revenue (book-to-bill) for Siemens in fiscal 2021 was 1.15. The order backlog was €85 billion as of September 30, 2021.
Orders (location of customer)
Fiscal year % Change
(in millions of €) 2021 2020 Actual Comp.
Europe, C.I.S., Africa, Middle East 34,311 27,778 24% 20%
therein: Germany 12,118 10,646 14% 9%
Americas 20,474 16,780 22% 24%
therein: U.S. 17,555 14,212 24% 26%
Asia, Australia 16,589 13,473 23% 20%
therein: China 9,029 7,094 27% 23%
Siemens (continuing operations) 71,374 58,030 23% 21%
therein: emerging markets1 19,208 15,234 26% 25%
¹ As defined by the International Monetary Fund.
Orders related to external customers were up substantially year-over-year on double-digit growth in all four industrial businesses, reflecting a very strong rebound in economic activity even though the economic environment was still strongly impacted by COVID-19. Orders in Mobility increased sharply on a higher volume from large orders which included a €2.8. billion order for trainsets including dual powered and hybrid battery vehicles and associated services in the U.S., its largest-ever order in the Americas. Siemens Healthineers, Digital Industries and Smart Infrastructure also posted double-digit order growth year-over-year. The broad-based increase in emerging markets was driven by China and, to a lesser degree, India.
In the Europe, C.I.S., Africa, Middle East region, order intake was up substantially year-over-year with increases in all four industrial businesses. Sharp order growth in Siemens Healthineers included high volume from rapid coronavirus antigen tests. Digital Industries and Smart Infrastructure also recorded double-digit growth, while orders in Mobility were up clearly year-over year. In Germany, order intake in Siemens Healthineers almost doubled due mainly to the high volume from rapid coronavirus antigens tests. Digital Industries and Smart Infrastructure posted double-digit growth, while Mobility posted a substantial decline due to a lower volume from large orders which in fiscal 2020 had included a €1.1 billion order for high-speed trains.
Order growth in the Americas and in the U.S. was due mainly to a higher volume from large orders in Mobility, particularly including the large order in the U.S. mentioned above. Overall, order intake both in the region and in the U.S. was subject to significantly negative currency translation effects, partly offset by portfolio effects which related primarily to the acquisition of Varian.
In the Asia, Australia region, orders overall rose substantially due to double-digit increases in all four industrial businesses, with the highest contributions from Siemens Healthineers and Digital Industries. The pattern of order development in China was largely the same as for the region.
Revenue (location of customer)
Fiscal year % Change
(in millions of €) 2021 2020 Actual Comp.
Europe, C.I.S., Africa, Middle East 31,138 27,252 14% 12%
therein: Germany 11,249 9,373 20% 16%
Americas 16,312 15,218 7% 10%
therein: U.S. 13,521 12,761 6% 9%
Asia, Australia 14,815 12,784 16% 13%
therein: China 8,232 6,594 25% 21%
Siemens (continuing operations) 62,265 55,254 13% 11%
therein: emerging markets¹ 17,651 15,323 15% 15%
¹ As defined by the International Monetary Fund.
Revenue related to external customers went up significantly year-over-year, led by double-digit growth in Siemens Healthineers and Digital Industries. Smart Infrastructure recorded a clear increase, while Mobility posted slightly higher revenue year-over-year. The revenue increase in emerging markets was driven by substantially higher demand in China and, to a lesser degree, India.
Revenue in Europe, C.I.S., Africa, Middle East increased significantly on growth in all four industrial businesses. Within the region, Germany showed sharp growth particularly due to Siemens Healthineers which doubled its revenue in the country through sales of rapid coronavirus antigen tests. The other industrial businesses posted sizeable increases in Germany.

Combined Management Report
17
In the Americas, revenue was up in all four industrial businesses, led by Siemens Healthineers. As with orders, revenue was subject to significantly negative currency translation effects, partly offset by portfolio effects related primarily to the acquisition of Varian. The pattern of revenue growth in the U.S. was largely the same as for the region.
In Asia, Australia, Digital Industries, Siemens Healthineers and Smart Infrastructure all posted double-digit growth, while Mobility reported a decline. Growth in the region was primarily due to increases in China and India.
4.2 Income
Fiscal year
(in millions of €, earnings per share in €) 2021 2020 % Change
Digital Industries 3,362 3,252 3%
Smart Infrastructure 1,743 1,302 34%
Mobility 857 822 4%
Siemens Healthineers 2,847 2,184 30%
Industrial Business 8,808 7,560 17%
Adjusted EBITA margin Industrial Business 15.0% 14.3%
Siemens Financial Services 512 345 48%
Portfolio Companies (85) (673) 87%
Reconciliation to Consolidated Financial Statements (1,739) (1,731) 0%
Income from continuing operations before income taxes 7,496 5,502 36%
Income tax expenses (1,861) (1,346) (38)%
Income from continuing operations 5,636 4,156 36%
Income from discontinued operations, net of income taxes 1,062 44 >200%
Net income 6,697 4,200 59%
Basic earnings per share 7.68 5.00 54%
ROCE 13.1% 7.8%
As a result of the developments described above, Income from continuing operations before income taxes increased 36%. Severance charges for continuing operations were €410 million, of which €251 million were in Industrial Business. In fiscal 2020, severance charges for continuing operations were €589 million, of which €490 million were in Industrial Business.
The tax rate in fiscal 2021 was 25%, close to the 24% rate in fiscal 2020, benefiting from reversal of income tax provisions and largely tax-free gains resulting from the transfers of assets to Siemens Pension-Trust e.V. mentioned above. These benefits were partly offset by losses related to equity investments which were not tax-deductible. As a result, the increase in Income from continuing operations was 36%.
Income from discontinued operations, net of income taxes in fiscal 2021 included a gain of €0.9 billion from the sale of Flender and also benefited from reversal of income tax provisions. The prior year included a pretax gain of €0.9 billion, net of related expenses, from the spin-off of Siemens Energy AG (Siemens Energy), as well as a positive contribution from Flender. These positive factors were largely offset, however, by losses at the former operating businesses Gas and Power and Siemens Gamesa Renewable Energy (now part of Siemens Energy) and €0.3 billion in income tax expenses mainly related to the carve-out of Siemens Energy.
The increase in basic earnings per share reflects an increase of Net income attributable to Shareholders of Siemens AG, which was €6,161 million in fiscal 2021 compared to €4,030 million in fiscal 2020, combined with a lower number of weighted average shares outstanding.
As expected, ROCE improved year-over-year, but was below the target range set in our Siemens Financial Framework. The increase year-over-year was due both to sharply higher income before interest after tax and to clearly lower average capital employed following the spin-off of Siemens Energy at the end of fiscal 2020.
4.3 Research and developmentIn fiscal 2021, we reported research and development expenses of €4.9 billion, compared to €4.6 billion in fiscal 2020. The resulting R&D intensity, defined as the ratio of R&D expenses and revenue, was 7.8% (fiscal 2020: 8.3%). Additions to capitalized development expenses amounted to €0.3 billion in fiscal 2021, compared to €0.4 billion in fiscal 2020. As of September 30, 2021 and 2020, Siemens held approximately 43,400 and 40,900 respectively, granted patents worldwide in its continuing operations. On average, we had 42,500 R&D employees in fiscal 2021.
Our research and development activities are ultimately geared to developing innovative, sustainable solutions for our customers – and the Siemens businesses – while also strengthening our own competitiveness. Joint implementation by the operating units and Technology, our central R&D department, ensures that research activities and business strategies are closely aligned with one another, and that all units benefit equally and quickly from technological developments. As in previous years, we focused on the following technologies: additive manufacturing, autonomous robotics, blockchain applications, connected (e-)mobility, connectivity and edge devices, cyber security, data analytics and artificial intelligence, distributed energy systems, energy storage, future of automation, materials, power electronics, simulation and digital twin, and software systems and processes.
We advance certain of these technologies also through our open innovation concept. We are working closely with scholars from leading universities and research institutions, not only under bilateral cooperation agreements but also in publicly funded collective projects. Our focus here is on our strategic research partners, and especially the eight Centers of Knowledge Interchange that we maintain at leading universities worldwide.

Combined Management Report
18
Siemens’ global venture capital unit, Next47, provides capital to help start-ups expand and scale. It serves as the creator of next-generation businesses for Siemens by building, buying and partnering with innovative companies at any stage. Next47 is focused on anticipating how emerging technologies will influence our end markets. This foreknowledge enables Siemens and our customers to grow and thrive in the age of digitalization.

Combined Management Report
19
5. Net assets positionSep 30,
(in millions of €) 2021 2020 % Change
Cash and cash equivalents 9,545 14,041 (32)%
Trade and other receivables 15,518 14,074 10%
Other current financial assets 7,985 8,382 (5)%
Contract assets 6,688 5,545 21%
Inventories 8,836 7,795 13%
Current income tax assets 1,795 1,523 18%
Other current assets 1,751 1,271 38%
Assets classified as held for disposal 223 338 (34)%
Total current assets 52,340 52,968 (1)%
Goodwill 29,729 20,449 45%
Other intangible assets 10,964 4,838 127%
Property, plant and equipment 11,023 10,250 8%
Investments accounted for using the equity method 7,539 7,862 (4)%
Other financial assets 22,964 22,771 1%
Deferred tax assets 2,865 2,988 (4)%
Other assets 2,183 1,769 23%
Total non-current assets 87,267 70,928 23%
Total assets 139,608 123,897 13%
Our total assets at the end of fiscal 2021 were influenced by positive currency translation effects of €2.3 billion (mainly goodwill), primarily involving the U.S. dollar.
In fiscal 2021, the acquisition of Varian was the major factor related to the increase of Siemens’ assets, mainly goodwill, other intangible assets, inventories, property, plant and equipment, and trade and other receivables. The increase of the latter was driven also by higher business volume, primarily at Siemens Healthineers. Goodwill increased also due to the acquisition of Supplyframe. These increases were partly offset by the sale of Flender, among other factors. This applies mainly to inventories, trade and other receivables, and property, plant and equipment. For further information see Note 3 in Notes to Consolidated Financial Statements for fiscal 2021.
The increase in other financial assets was driven mainly by increased equity investments as well as higher receivables from finance leases and higher loans receivable at SFS. The increase of the latter two was mainly due to new business and – in case of loans receivable – also to a reassessment of the expected repayment dates. Set against these factors was a decrease resulting mainly from contributions of assets to Siemens Pension-Trust e.V., including the stake in Bentley.
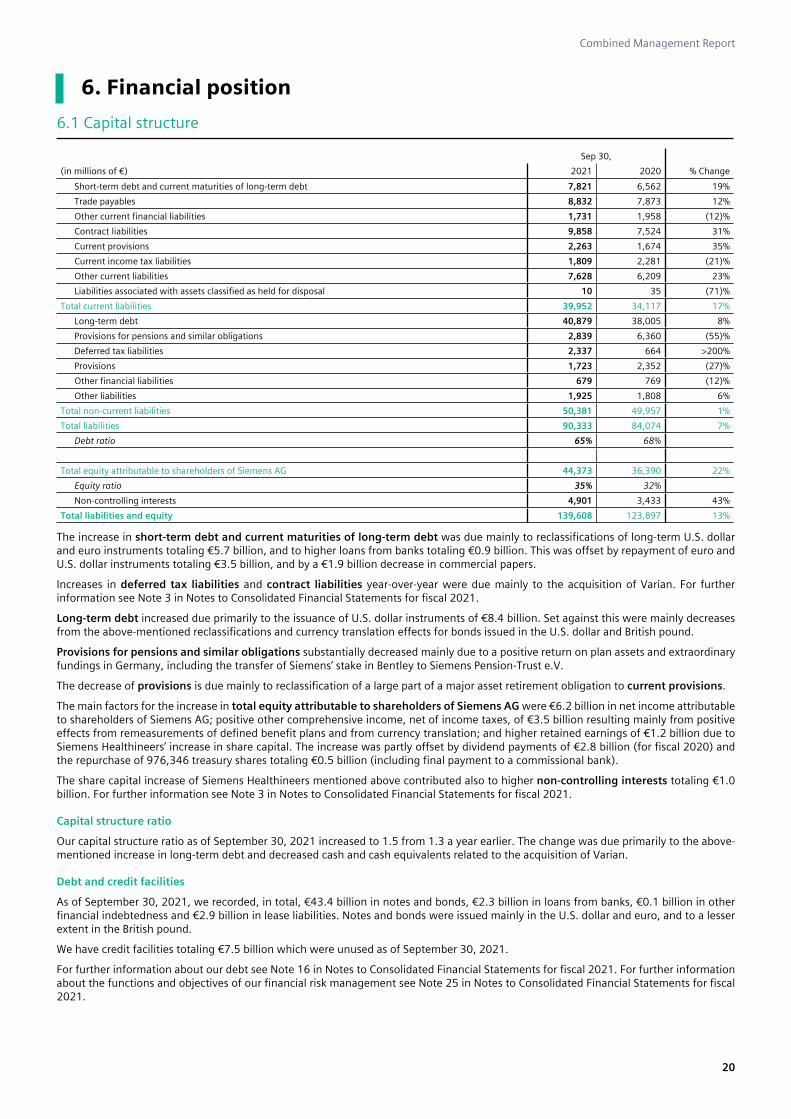
Combined Management Report
20
6. Financial position
6.1 Capital structure
Sep 30,
(in millions of €) 2021 2020 % Change
Short-term debt and current maturities of long-term debt 7,821 6,562 19%
Trade payables 8,832 7,873 12%
Other current financial liabilities 1,731 1,958 (12)%
Contract liabilities 9,858 7,524 31%
Current provisions 2,263 1,674 35%
Current income tax liabilities 1,809 2,281 (21)%
Other current liabilities 7,628 6,209 23%
Liabilities associated with assets classified as held for disposal 10 35 (71)%
Total current liabilities 39,952 34,117 17%
Long-term debt 40,879 38,005 8%
Provisions for pensions and similar obligations 2,839 6,360 (55)%
Deferred tax liabilities 2,337 664 >200%
Provisions 1,723 2,352 (27)%
Other financial liabilities 679 769 (12)%
Other liabilities 1,925 1,808 6%
Total non-current liabilities 50,381 49,957 1%
Total liabilities 90,333 84,074 7%
Debt ratio 65% 68%
Total equity attributable to shareholders of Siemens AG 44,373 36,390 22%
Equity ratio 35% 32%
Non-controlling interests 4,901 3,433 43%
Total liabilities and equity 139,608 123,897 13%
The increase in short-term debt and current maturities of long-term debt was due mainly to reclassifications of long-term U.S. dollar and euro instruments totaling €5.7 billion, and to higher loans from banks totaling €0.9 billion. This was offset by repayment of euro and U.S. dollar instruments totaling €3.5 billion, and by a €1.9 billion decrease in commercial papers.
Increases in deferred tax liabilities and contract liabilities year-over-year were due mainly to the acquisition of Varian. For further information see Note 3 in Notes to Consolidated Financial Statements for fiscal 2021.
Long-term debt increased due primarily to the issuance of U.S. dollar instruments of €8.4 billion. Set against this were mainly decreases from the above-mentioned reclassifications and currency translation effects for bonds issued in the U.S. dollar and British pound.
Provisions for pensions and similar obligations substantially decreased mainly due to a positive return on plan assets and extraordinary fundings in Germany, including the transfer of Siemens’ stake in Bentley to Siemens Pension-Trust e.V.
The decrease of provisions is due mainly to reclassification of a large part of a major asset retirement obligation to current provisions.
The main factors for the increase in total equity attributable to shareholders of Siemens AG were €6.2 billion in net income attributable to shareholders of Siemens AG; positive other comprehensive income, net of income taxes, of €3.5 billion resulting mainly from positive effects from remeasurements of defined benefit plans and from currency translation; and higher retained earnings of €1.2 billion due to Siemens Healthineers’ increase in share capital. The increase was partly offset by dividend payments of €2.8 billion (for fiscal 2020) and the repurchase of 976,346 treasury shares totaling €0.5 billion (including final payment to a commissional bank).
The share capital increase of Siemens Healthineers mentioned above contributed also to higher non-controlling interests totaling €1.0 billion. For further information see Note 3 in Notes to Consolidated Financial Statements for fiscal 2021.
Capital structure ratio
Our capital structure ratio as of September 30, 2021 increased to 1.5 from 1.3 a year earlier. The change was due primarily to the above-mentioned increase in long-term debt and decreased cash and cash equivalents related to the acquisition of Varian.
Debt and credit facilities
As of September 30, 2021, we recorded, in total, €43.4 billion in notes and bonds, €2.3 billion in loans from banks, €0.1 billion in other financial indebtedness and €2.9 billion in lease liabilities. Notes and bonds were issued mainly in the U.S. dollar and euro, and to a lesser extent in the British pound.
We have credit facilities totaling €7.5 billion which were unused as of September 30, 2021.
For further information about our debt see Note 16 in Notes to Consolidated Financial Statements for fiscal 2021. For further information about the functions and objectives of our financial risk management see Note 25 in Notes to Consolidated Financial Statements for fiscal 2021.

Combined Management Report
21
Off-balance-sheet commitments
As of September 30, 2021, the undiscounted amount of maximum potential future payments related primarily to credit and performance guarantees amounted to €15.6 billion. This included primarily Siemens’ obligations from performance and credit guarantees in connection with the Siemens Energy business, for which Siemens has reimbursement rights towards Siemens Energy.
In addition to these commitments, there are contingent liabilities of €0.5 billion which mainly result from other guarantees, legal proceedings and from joint and several liabilities of consortia. Other guarantees include €0.2 billion in connection with the Siemens Energy business, for which Siemens has reimbursement rights towards Siemens Energy.
Irrevocable loan commitments amounted to €3.9 billion. A considerable portion of these commitments resulted from asset-based lending transactions, meaning that the respective loans can be drawn only after the borrower has provided sufficient collateral.
For further information about our commitments and contingencies see Note 21 in Notes to Consolidated Financial Statements for fiscal 2021.
Share buyback
The share buyback announced in November 2018 was completed on September 24, 2021 with a total volume of €3 billion. On June 24, 2021, Siemens announced that it intends to launch a new five-year share buyback program of up to €3 billion, beginning in fiscal 2022.
6.2 Cash flows
Fiscal year(in millions of €) 2021
Cash flows from operating activities
Net income 6,697
Change in operating net working capital (187)
Other reconciling items to cash flows from operating activities - continuing operations 3,599
Cash flows from operating activities - continuing operations 10,109
Cash flows from operating activities - discontinued operations (113)
Cash flows from operating activities - continuing and discontinued operations 9,996
Cash flows from investing activities
Additions to intangible assets and property, plant and equipment (1,730)
Acquisitions of businesses, net of cash acquired (14,391)
Purchase of investments and financial assets for investment purposes (1,523)
Change in receivables from financing activities of SFS (631)
Other disposals of assets 1,084
Cash flows from investing activities - continuing operations (17,192)
Cash flows from investing activities - discontinued operations 1,698
Cash flows from investing activities - continuing and discontinued operations (15,494)
Cash flows from financing activities
Purchase of treasury shares (547)
Re-issuance of treasury shares and other transactions with owners 2,055
Issuance of long-term debt 8,316
Repayment of long-term debt (including current maturities of long-term debt) (4,294)
Change in short-term debt and other financing activities (952)
Interest paid (704)
Dividends paid to shareholders of Siemens AG (2,804)
Dividends attributable to non-controlling interests (285)
Cash flows from financing activities - continuing operations 785
Cash flows from financing activities - discontinued operations −
Cash flows from financing activities - continuing and discontinued operations 785
Led by Digital Industries, all industrial businesses delivered strong conversion of their Adjusted EBITA to Cash flows from operating activities, including only minor cash flows from changes in operating net working capital in all industrial businesses.
Cash outflows from acquisitions of businesses, net of cash acquired, were due mainly to the acquisitions of Varian by Siemens Healthineers for €13.4 billion and Supplyframe by Digital Industries for €0.6 billion.
Cash outflows for purchase of investments and financial assets for investment purposes primarily included additions of assets eligible as central bank collateral and payments for debt or equity investments related to certain businesses or projects, including the acquisition of an equity stake in Thoughtworks for €0.3 billion.
Cash outflows from change in receivables from financing activities of SFS related mainly to SFS’ debt business.
Cash inflows from other disposals of assets mainly included disposals of assets eligible as central bank collateral.
Cash outflows for purchase of treasury shares included a final payment of €0.4 billion to the commissioned bank, which was due with completion of the share buyback program 2018-2021.
Cash inflows from the re-issuance of treasury shares and other transactions with owners mainly included proceeds of €2.3 billion related to Siemens Healthineers AG’s issuance of 53 million new shares to institutional investors.
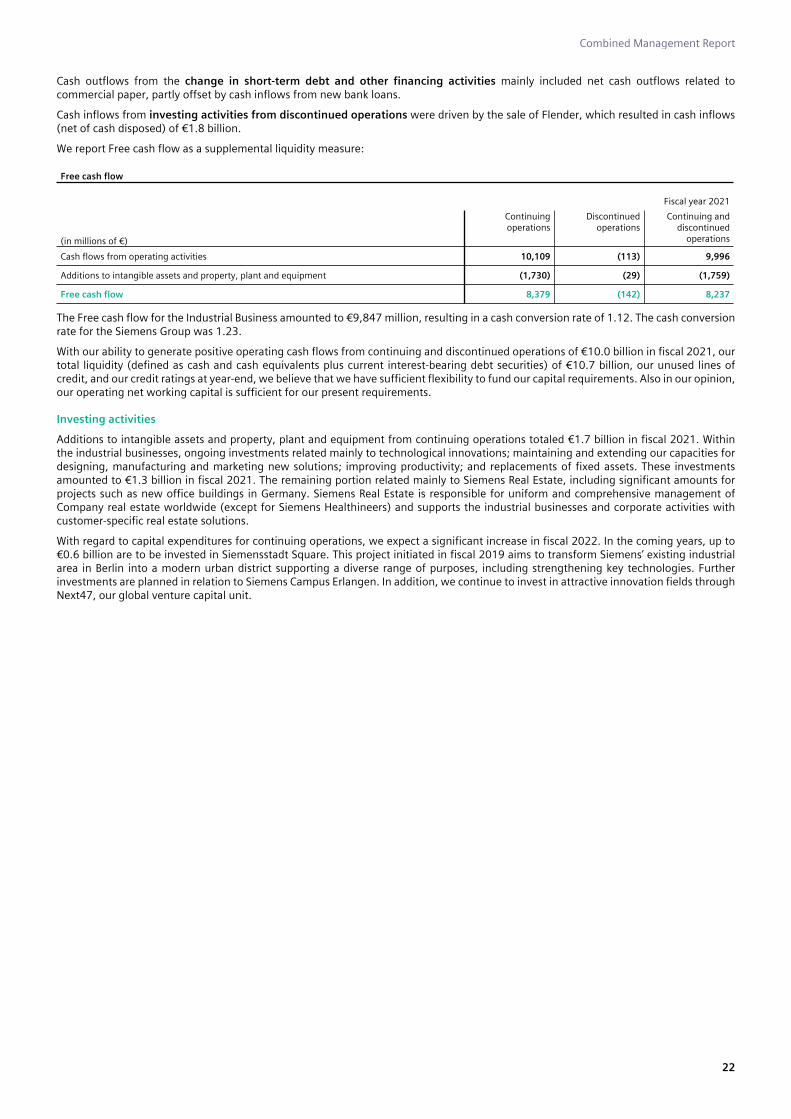
Combined Management Report
22
Cash outflows from the change in short-term debt and other financing activities mainly included net cash outflows related to commercial paper, partly offset by cash inflows from new bank loans.
Cash inflows from investing activities from discontinued operations were driven by the sale of Flender, which resulted in cash inflows (net of cash disposed) of €1.8 billion.
We report Free cash flow as a supplemental liquidity measure:
Free cash flow
Fiscal year 2021
(in millions of €)
Continuing operations
Discontinuedoperations
Continuing and discontinued
operations
Cash flows from operating activities 10,109 (113) 9,996
Additions to intangible assets and property, plant and equipment (1,730) (29) (1,759)
Free cash flow 8,379 (142) 8,237
The Free cash flow for the Industrial Business amounted to €9,847 million, resulting in a cash conversion rate of 1.12. The cash conversion rate for the Siemens Group was 1.23.
With our ability to generate positive operating cash flows from continuing and discontinued operations of €10.0 billion in fiscal 2021, our total liquidity (defined as cash and cash equivalents plus current interest-bearing debt securities) of €10.7 billion, our unused lines of credit, and our credit ratings at year-end, we believe that we have sufficient flexibility to fund our capital requirements. Also in our opinion, our operating net working capital is sufficient for our present requirements.
Investing activities
Additions to intangible assets and property, plant and equipment from continuing operations totaled €1.7 billion in fiscal 2021. Within the industrial businesses, ongoing investments related mainly to technological innovations; maintaining and extending our capacities for designing, manufacturing and marketing new solutions; improving productivity; and replacements of fixed assets. These investments amounted to €1.3 billion in fiscal 2021. The remaining portion related mainly to Siemens Real Estate, including significant amounts for projects such as new office buildings in Germany. Siemens Real Estate is responsible for uniform and comprehensive management of Company real estate worldwide (except for Siemens Healthineers) and supports the industrial businesses and corporate activities with customer-specific real estate solutions.
With regard to capital expenditures for continuing operations, we expect a significant increase in fiscal 2022. In the coming years, up to €0.6 billion are to be invested in Siemensstadt Square. This project initiated in fiscal 2019 aims to transform Siemens’ existing industrial area in Berlin into a modern urban district supporting a diverse range of purposes, including strengthening key technologies. Further investments are planned in relation to Siemens Campus Erlangen. In addition, we continue to invest in attractive innovation fields through Next47, our global venture capital unit.
Combined Management Report
23
7. Overall assessment of the economic positionSiemens successfully executed on its strategy as a focused technology company in fiscal 2021, following the spin-off and public listing of Siemens Energy in September 2020. All our industrial businesses are addressing highly attractive markets in industrial automation, infrastructure, transportation and healthcare. With our offerings we are taking advantage of growth trends such as digitalization and decarbonization, for example by helping our customers to combine the real and the digital worlds. With the financial framework that we presented in June 2021, we have set ambitious new targets: we aim to further accelerate our profitable growth while placing an even greater emphasis on free cash flow.
In fiscal 2021, Siemens made further progress in sharpening its business focus by divesting activities such as the Flender business on one side, while on the other side strengthening our industrial businesses with a number of significant acquisitions. Important examples are: in the second quarter of fiscal 2021, the acquisition of C&S Electric, a provider of electrical and electronic equipment for infrastructure, power generation, transmission and distribution in India, to strengthen Smart Infrastructure’s position in that country as a supplier of low-voltage power distribution and electrical installation technology; in the third quarter of fiscal 2021, the acquisition of Varian, a global leader in the field of cancer care, with solutions especially in radiation oncology and related digital solutions and applications, which provides a good complement to Siemens Healthineers’ activities in medical imaging, laboratory diagnostics and interventional procedures; in the fourth quarter of fiscal 2021, the acquisition of Supplyframe, a marketplace for the global electronics value chain, with which Digital Industries intends to significantly strengthen digital marketing and accelerate sales of its offerings to small and medium-sized companies. At the beginning of the first quarter of fiscal 2022, Mobility closed the acquisition of Sqills, a provider of cloud-based inventory management, reservation, and ticketing software for public transport operators, which enhances Mobility’s existing offerings for increasing the availability, capacity and utilization of public transportation.
Following the deep recession during fiscal 2020, many of Siemens’ key customer industries including automotive, machine building, pharmaceuticals, chemicals, electronics, and cloud services recovered or continued to grow during fiscal 2021. Although COVID-19 led to a significant drop in public transit ridership, recovery programs in many countries have been allocating significant funds to transport providers, resulting in strong order development. During the fiscal year, Siemens succeeded in maintaining its supply chains and delivery capacity and continued to be a reliable partner for its customers, despite more challenging supply condition. These developments were reflected in our strong financial performance for fiscal 2021. We raised our outlook during the fiscal year, most recently after the third quarter, and reached or exceeded all the targets set for our primary measures for fiscal 2021. We achieved revenue growth of 11.5% net of currency translation and portfolio effects and delivered net income of €6.7 billion. Return on capital employed (ROCE) was double-digit at 13.1% and our capital structure ratio came in at 1.5.
Orders rose 23% year-over-year to €71.4 billion, for a book-to-bill ratio of 1.15, thus fulfilling our expectation of a ratio above 1. All our four industrial businesses increased orders year-over-year. Mobility achieved the highest growth rate due to a sharply higher volume from large orders, including its largest ever order in the Americas, worth €2.8 billion, for trainsets and associated services. Substantial order growth at Siemens Healthineers included new volume from the acquisition of Varian. Significant order growth at Digital Industries was driven mainly by its factory automation and motion control businesses, while orders at Smart Infrastructure increased clearly on growth in all its businesses, with the strongest contributions coming from the products business and the systems business.
Revenue was also higher in all our industrial businesses, rising to €62.3 billion, a 13% increase year-over-year. The strongest increases came from Siemens Healthineers and Digital Industries, which both posted double-digit growth. Revenue growth at Siemens Healthineers included all businesses with the highest increases coming from the diagnostics and imaging businesses. Revenue development at Digital Industries also included increases in all its businesses led by factory automation and motion control. Revenue growth at Smart Infrastructure was driven by its products business and its systems business. Revenue at Mobility rose slightly, as parts of its businesses continued to be impacted by restrictions related to COVID-19. Excluding currency translation and portfolio effects, revenue for Siemens grew 11.5%. We thus exceeded our forecast given in our Annual Report 2020, which was to achieve moderate comparable revenue growth and we met our raised guidance given after the third quarter of fiscal 2021, which was to achieve comparable revenue growth of 11% to 12%.
Adjusted EBITA Industrial Business rose 17% to €8.8 billion on growth in all industrial businesses, led by Siemens Healthineers on strong earnings development in its diagnostics business driven by strong demand for rapid coronavirus antigen tests and by Smart Infrastructure on increases in all its businesses. Adjusted EBITA at Digital Industries rose moderately even though prior-year results benefited from a €0.8 billion positive effect related mainly to a revaluation of the stake in Bentley. Adjusted EBITA at Mobility also rose moderately, driven by its rail infrastructure business.
Adjusted EBITA margin Industrial Business rose to 15.0%, up from 14.3% a year earlier. With Adjusted EBITA margins of 11.6%, 15.8% and 9.3%, respectively, Smart Infrastructure, Siemens Healthineers and Mobility improved their Adjusted EBITA margins year-over-year. The Adjusted EBITA margin of 20.4% at Digital Industries came in below the prior-year level of 21.7%, which included the above-mentioned substantial positive effect related to Bentley, which added 5.1 percentage points to Digital Industries’ Adjusted EBITA margin.
Siemens Financial Services sharply increased earnings before taxes due to lower expenses for credit risk provisions year-over-year, resulting in a return on equity after tax of 15.4%. In addition, results outside Industrial Business in fiscal 2021 benefited from a €0.3 billion revaluation gain and gains related to transfers of assets to Siemens Pension Trust e.V. in Germany were higher in the current period. A €0.4 billion loss related to Siemens Energy Investment was due mainly to Siemens Energy’s execution of planned restructuring measures to improve its competitiveness and expenses from amortization of assets resulting from purchase price allocation. For comparison, results outside Industrial Business a year earlier included an impairment of €0.5 billion on our equity investment stake in Valeo Siemens eAutomotive GmbH.
Net income in fiscal 2021 rose 59% to €6.7 billion, and basic EPS from net income increased 54% to €7.68. We thus exceeded the forecast given in our Annual Report 2020, which was for a moderate increase in net income, and also exceeded our raised forecast after the third quarter, which was for net income in the range of €6.1 billion to €6.4 billion. This improvement was due mainly to the aforementioned significantly higher Adjusted EBITA Industrial Business and the lower loss outside Industrial Business. In addition, discontinued operations, largely related to the sale of Flender, contributed income of €1.1 billion in fiscal 2021.

Combined Management Report
24
ROCE for fiscal 2021 rose to 13.1%, up from 7.8% in fiscal 2020. This increase was due to a combination of sharply higher net income and clearly lower average capital employed year-over-year. We thus exceeded our forecast for ROCE given in our Annual Report 2020, which was for ROCE to remain in the single-digit range in fiscal 2021.
We evaluate our capital structure using the ratio of Industrial net debt to EBITDA. Due primarily to an increase in net debt year-over-year, this ratio rose to 1.5, compared to 1.3 in fiscal 2020. We thus achieved our forecast given in our Annual Report 2020, which was for a ratio above 1.0 in fiscal 2021.
Free cash flow from continuing and discontinued operations for fiscal 2021 increased 29% year-over-year to €8.2 billion, reaching a new high.
We intend to continue providing an attractive shareholder return. The Siemens Managing Board, in agreement with the Supervisory Board, proposes a dividend of €4.00 per share, up from €3.50 per share a year earlier.
Combined Management Report
25
8. Report on expected developments and associated materialopportunities and risks
8.1 Report on expected developments
8.1.1 Worldwide economy
After the deepest recession and the fastest rebound in decades, in calendar 2020 and calendar 2021, respectively, the global economic recovery is expected to continue with slowing momentum in fiscal 2022. Global gross domestic product (GDP) is expected to expand by 4.3% in calendar 2022. The outlook is still subject to a high level of uncertainty. The biggest source of concern remains COVID-19. New variants could emerge before widespread vaccination is reached globally, or they could escape existing immunity, while vaccine effectiveness might fade more quickly than expected.
However, in our baseline forecast we assume the impact of the Delta variant will recede further, vaccination rates will continue to rise, especially in developing countries, and the global economy gradually will return to normal. The service sector will reopen further, and consumer spending for services will recover, which will contribute significantly to the global recovery. This is supported by consumers still having substantial pent-up savings which will continue to fuel consumer demand. In addition, companies in general have low levels of inventory and will seek to re-stock, adding to demand, even if consumer spending should slow. Also, many companies might want to have structurally higher inventory levels to improve supply chain resilience, as supply chains were often stressed during the pandemic. However, we expect supply shortages to continue in the first half of calendar 2022.
Besides a potential re-emergence of the pandemic, further risks exist for fiscal 2022. Supply bottlenecks might last longer and restrain the recovery. While we expect price pressures to subside for the most part in fiscal 2022 in our baseline outlook, persistent supply bottlenecks or further energy price increases could fuel inflation and inflation expectations, and thus prompt a faster-than-anticipated monetary tightening. This could reverberate in financial markets and weigh on investment spending. Risks for financial markets could also emerge from other sources, e.g. an escalation of the U.S.-China trade and technology conflict, high corporate or government debt levels or China’s property sector which could undergo a substantial correction after a period of over-investment.
The necessary adjustments in the Chinese property sector, a high ratio of debt to GDP and worsening business conditions will limit China’s GDP growth in calendar 2022 to 5.7%. The European Union economy is expected to expand by 4.0% in calendar 2022, still supported by catch-up effects and announced stimulus programs becoming effective. In the U.S., GDP is expected to expand by 4.3%, where government spending has a negative effect on GDP growth, as it is reduced from calendar 2021 on, implying a negative fiscal impulse. An important pre-requisite is preventing federal limits on borrowing (the debt ceiling) from disrupting government operations and spending programs.
Global fixed investments are expected to expand by 4.4% in calendar 2022, after already growing by 6.4% in calendar 2021. Important customer industries for Siemens are participating in the global recovery (e.g. electronics, pharma, materials, chemicals). Yet persistent supply bottlenecks have the potential to significantly derail this recovery, such as in the automotive sector due to semiconductor shortages. The infrastructure sector (particularly public transport and electricity grids) will benefit from various green stimulus programs.
Overall, the market environment for Siemens is expected to remain favorable in fiscal 2022, but with some deceleration compared to fiscal 2021. Risks for the outlook are still substantial.
The forecasts presented here for GDP and fixed investments are based on a report from IHS Markit dated October 15, 2021.
8.1.2 Siemens Group
We are basing our outlook for fiscal 2022 on the above-mentioned expectations and assumptions regarding the overall economic situation, including continuing healthy growth in global GDP albeit with slowing momentum, and also on the specific market conditions we expect for our respective industrial businesses, as described in chapter 3 Segment information. Furthermore, we assume that the challenges to our businesses from COVID-19 will ease during fiscal 2022. Although we also expect supply chain constraints to recede somewhat during fiscal 2022, we expect continued impacts from higher prices for raw materials and components and from wage increases, which we intend to mitigate by adjusting prices for our own products, solutions and services.
We are exposed to currency translation effects, mainly involving the U.S. dollar, the British pound and currencies of emerging markets, particularly the Chinese yuan. While we expect volatility in global currency markets to continue in fiscal 2022, we have improved our natural hedge on a global basis through geographic distribution of our production facilities in the past. Nevertheless, Siemens is still a net exporter from the Eurozone to the rest of the world, so a weak euro is principally favorable for our business and a strong euro is principally unfavorable. In addition to the natural hedging strategy just mentioned, we also hedge currency risk in our export business using derivative financial instruments. We expect these steps to help us limit effects on income related to currency in fiscal 2022. Based on currency exchange rates as of the beginning of November 2021, we do not expect significant currency effects on nominal growth rates in volume and profit for our businesses in fiscal 2022.
This outlook excludes burdens from legal and regulatory matters.
Segments
We expect our industrial businesses to continue their profitable growth.
Digital Industries expects for fiscal 2022 to achieve comparable revenue growth of 5% to 8%. The profit margin is expected to be 19% to 21%, including known headwinds of up to two percentage points associated with the strategic transition to software as a service (SaaS) in parts of its large software business.
Smart Infrastructure expects for fiscal 2022 comparable revenue growth of 5% to 8%. The profit margin is expected to be 12% to 13%.
Mobility expects for fiscal 2022 comparable revenue growth of 5% to 8%. The profit margin is expected to be 10.0% to 10.5%.

Combined Management Report
26
Siemens Healthineers expects to achieve comparable revenue growth in the range of 0% to 2% in fiscal 2022. The profit margin, which was 15.8% in fiscal 2021, is expected to continue to improve.
Siemens Financial Services expects to further improve Earnings before taxes year-over-year. Return on equity (ROE) (after tax) is expected to reach the lower half of the new target range of 15% to 20%.
Revenue growth
For comparable revenue, net of currency translation and portfolio effects, we expect the Siemens Group to achieve mid-single-digit growth. Furthermore, we anticipate that orders in fiscal 2022 will exceed revenue for a book-to-bill ratio above 1.
As of September 30, 2021, our order backlog totaled €85 billion, and we expect conversion from the backlog to strongly support revenue growth in fiscal 2022 with approximately €34 billion of past orders converted to current revenue. For expected conversion of order backlog to revenue for our respective segments, see chapter 3 Segment information.
Profitability
We assume that rigorous execution of our portfolio optimization strategy in fiscal 2022 will contribute similarly as in fiscal 2021, when we generated €1.5 billion in net income from the sale of our Flender business, divestment of our stakes in Bentley and ChargePoint, Inc., and revaluation of our stake in Thoughtworks. In October 2021, Siemens already recognized a €0.3 billion pretax gain (€0.2 billion after tax) related to its investment in Fluence Energy, LLC (Fluence).
We expect our fully consolidated units within Portfolio Companies to reach profit margins above 5%, while results from the equity investment are expected to be volatile and negative.
In addition, results for Siemens Energy Investment, which includes Siemens’ share of Siemens Energy AG’s profit after tax, amounting to a negative €0.2 billion in fiscal 2021, is expected to improve; amortization of assets resulting from purchase price allocation due to the initial recognition of the investment at fair value in September 2020, which are also included in Siemens Energy Investment, are expected to decline to €0.1 billion in fiscal 2022, from €0.2 billion in fiscal 2021. We anticipate that Siemens Real Estate will continue with real estate disposals depending on market conditions, at a similar level as in fiscal 2021. Results for Innovation also are expected on the prior-year level, which was a negative €0.2 billion. Results related to Governance, were a negative €0.8 billion in fiscal 2021; we expect a substantial improvement in fiscal 2022, to a negative €0.5 billion. Centrally carried pension expense are expected to be on prior-year level, which was a negative €0.2 billion. Amortization of intangible assets acquired in business combinations, which was €0.7 billion in fiscal 2021, is expected at €0.9 billion due mainly to the acquisition of Varian in April 2021. Financing, eliminations and other items, which were a positive €0.5 billion in fiscal 2021, are expected to include substantial parts of gains from revaluation and from divestments in fiscal 2022, resulting from our portfolio optimization strategy, among them the above-mentioned gain related to Fluence.
We anticipate our tax rate for fiscal 2022 to be in the range of 25% to 29%, depending strongly on portfolio-related gains, compared to 25% in fiscal 2021. This assumption does not take into consideration possible impacts from potential major tax reforms. We do not expect material influence on financial results from discontinued operations in fiscal 2022.
Our forecast for net income takes into account a number of additional factors. We assume solid project execution to continue in fiscal 2022. We plan to increase the ratio of R&D expenses to revenue, which was 7.8% in fiscal 2021, to approximately 8% with a strong focus on software and digital technologies. Severance charges, which were €0.4 billion in fiscal 2021, are expected at €0.2 billion in fiscal 2022.
Given the above-mentioned assumptions, we expect profitable growth of our industrial businesses to drive an increase in net income and EPS pre PPA to a range of €8.70 to €9.10, up from €8.32 in fiscal 2021.
Capital efficiency
For fiscal 2022, we expect ROCE adjusted for defined Varian-related acquisition effects, which was 15.1% in fiscal 2021, to improve in our target range of 15% to 20%.
Capital structure
For our capital structure, defined as the ratio of industrial net debt to EBITDA (continuing operations), we expect in fiscal 2022 to achieve a ratio below the prior-year figure of 1.5. We assume that our targeted cash conversion rate of 1 minus the annual comparable revenue growth rate of the Group over a cycle of three to five years will support the achievement of the capital structure target in fiscal 2022.
8.1.3 Overall assessment
Our outlook for fiscal 2022 is based on continuing healthy growth in global GDP, albeit with slowing momentum, and our expectation that the challenges to our businesses from COVID-19 and supply chain constraints will ease during fiscal 2022. With these conditions and given our very strong fiscal year 2021, we expect our industrial businesses to continue their profitable growth.
For the Siemens Group we expect mid-single-digit comparable revenue growth, net of currency translation and portfolio effects, and a book-to-bill ratio above 1.
We expect profitable growth of our industrial businesses to drive an increase in EPS pre PPA to a range of €8.70 to €9.10, up from €8.32 in fiscal 2021. We assume that rigorous execution of our portfolio optimization strategy will contribute similarly as in fiscal 2021, when we generated €1.5 billion in net income from the sale of our Flender business, divestment of our stakes in Bentley and ChargePoint, and revaluation of our stake in Thoughtworks.
This outlook excludes burdens from legal and regulatory matters.
Overall, the actual development for Siemens and its segments may vary, positively or negatively, from our outlook due to the risks and opportunities described below or if our expectations and assumptions do not materialize.
Combined Management Report
27
8.2 Risk management
8.2.1 Basic principles of risk management
Our risk management policy stems from a philosophy of pursuing sustainable growth and creating economic value while managing appropriate risks and opportunities and avoiding inappropriate risks. As risk management is an integral part of how we plan and execute our business strategies, our risk management policy is set by the Managing Board. Our organizational and accountability structure requires each of the respective managements of our organizational units to implement risk management programs that are tailored to their specific industries and responsibilities, while being consistent with the overall policy.
8.2.2 Enterprise risk management process
We have implemented and coordinated a set of risk management and control systems which support us in the early recognition of developments that could jeopardize the continuity of our business. The most important of these systems include our enterprise-wide processes for strategic planning and management reporting. Strategic planning is intended to support us in considering potential risks and opportunities well in advance of major business decisions, while management reporting is intended to enable us to monitor such risks more closely as our business progresses. Our internal auditors regularly review the adequacy and effectiveness of our risk management. Accordingly, if deficits are detected, it is possible to adopt appropriate measures for their elimination. This coordination of processes and procedures is intended to help ensure that the Managing Board and the Supervisory Board are fully informed about significant risks in a timely manner.
Risk management at Siemens builds on a comprehensive, interactive and management-oriented Enterprise Risk Management (ERM) approach that is integrated into the organization and that addresses both risks and opportunities. Our ERM approach is based on the globally accepted COSO Standard (Committee of Sponsoring Organizations of the Treadway Commission) Enterprise Risk Management – Integrating with Strategy and Performance (2017) and the ISO (International Organization for Standardization) Standard 31000 (2018) and is adapted to Siemens requirements. The frameworks connect the ERM process with our financial reporting process and our internal control system. They consider a company’s strategy, the efficiency and effectiveness of its business operations, the reliability of its financial reporting and compliance with relevant laws and regulations to be equally important.
Our ERM process aims for early identification and evaluation of, and response regarding, risks and opportunities that could materially affect the achievement of our strategic, operational, financial and compliance objectives. The time horizon is typically three years, and we take a net risk approach, addressing risks and opportunities remaining after the execution of existing and effective measures and controls. If risks have already been considered in plans, budgets, forecasts or the consolidated financial statements (e.g. as a provision or risk contingency), they are supposed to be incorporated with their financial impact in the entity’s business objectives. As a consequence, only additional risks arising from the same subject (e.g. deviations from business objectives, different impact perspectives) should be considered. In order to provide a comprehensive view of our business activities, risks and opportunities are identified in a structured way combining elements of both top-down and bottom-up approaches. Reporting generally follows a quarterly cycle; we complement this periodic reporting with an ad-hoc reporting process that aims to escalate critical issues in a timely manner. Relevant risks and opportunities are evaluated in terms of impact and likelihood, considering different impact perspectives, including business objectives, reputation and regulatory requirements. The bottom-up identification and prioritization process is supplemented by workshops with the respective managements of our organizational units. The top-down element ensures that potential new risks and opportunities are discussed at different management levels and are included in the subsequent reporting process, if found to be relevant. Reported risks and opportunities are analyzed regarding potential cumulative effects and are aggregated within and for each of the organizational units mentioned above.
Responsibilities are assigned for all relevant risks and opportunities, with the hierarchical level of responsibility depending on the significance of the respective risk or opportunity. In a first step, assuming responsibility for a specific risk or opportunity involves choosing one of our general response strategies. Our general response strategies with respect to risks are avoidance, transfer, reduction or acceptance of the relevant risk. Our general response strategy with respect to opportunities is to “seize” the relevant opportunity. In a second step, responsibility for a risk or opportunity also involves the development, initiation and monitoring of appropriate response measures corresponding to the chosen response strategy. These response measures have to be specifically tailored to allow for effective risk management. Accordingly, we have developed a variety of response measures with different characteristics. For example, we mitigate the risk of fluctuations in currency and interest rates by engaging in hedging activities. Regarding our projects, systematic and comprehensive project management with standardized project milestones, including provisional acceptances during project execution and complemented by clearly defined approval processes, assists us in identifying and responding to project risks at an early stage, even before the bidding phase. Furthermore, we maintain appropriate insurance levels for potential cases of damage and liability risks in order to reduce our exposure to such risks and to avoid or minimize potential losses. Among others, we address the risk of fluctuation in economic activity and customer demand by closely monitoring macroeconomic conditions and developments in relevant industries, and by adjusting capacity and implementing cost-reduction measures in a timely and consistent manner if they are deemed necessary. Worldwide there are risks from the transmission of infectious agents from animals to humans, from humans to humans and in other ways. Epidemic, pandemic or other infectious developments such as bioterrorism to cause high disease rates in countries, regions or continents. We constantly check information from the World Health Organization (WHO), the - Centers for Disease Control and Prevention in the U.S. and Europe, the Robert Koch Institute in Germany and other institutions in order to be able to identify early epidemic or pandemic risks and determine and initiate related mitigation actions as early as possible.
8.2.3 Risk management organization and responsibilities
To oversee the ERM process and to further drive the integration and harmonization of existing control activities to align with legal and operational requirements, the Managing Board established a Risk Management and Internal Control Organization, led by the Head of Assurance. In order to allow for a meaningful discussion of risk at the Siemens Group level, this organization aggregates individual risks and opportunities of similar cause-and-effect nature into broader risk and opportunity themes. This aggregation naturally results in a mixture of risks, including those with a primarily qualitative assessment and those with a primarily quantitative risk assessment. Accordingly, we do not adopt a purely quantitative assessment of risk and opportunity themes. Thematic risk and opportunity assessments
Combined Management Report
28
as well as our risk-bearing capacity then form the basis for the evaluation of the company-wide risk and opportunity situation during the quarterly board meetings. The Head of Assurance assists the Managing Board with the operation and oversight of the risk and internal control system and reporting to the Audit Committee of the Supervisory Board.
8.3 RisksBelow we describe the risks that could have a material adverse effect on our business situation, financial condition (including effects on assets, liabilities and cash flows), results of operations and reputation. The order in which the risks are presented in each of the four categories reflects the currently estimated relative exposure for Siemens associated with these risks and thus provides an indication of the risks’ current importance to us. Additional risks not known to us or that we currently consider immaterial may also negatively impact our business objectives and operations. Unless otherwise stated, the risks described below relate to all our organizational units.
8.3.1 Strategic risks
Economic, political and geopolitical conditions: We see significant uncertainties regarding the global economic outlook. In particular, a renewed intensity of the COVID-19 pandemic could stall the recovery achieved to date, and even lead to a new recession, for example if current vaccines are less effective with new variants, leading to the return of contact restrictions or lockdowns. There is also great uncertainty about the long-term consequences of the pandemic for important Siemens customer industries, such as aerospace and non-residential construction. Moreover, during the COVID-19 pandemic significant macroeconomic challenges have not been defused and in some cases, they have intensified. A renewed escalation of the trade conflict between the U.S. and China and an intensified de-coupling would significantly worsen global growth prospects. Adverse effects on confidence and investment activity would severely hit Siemens’ business. Increasing trade barriers, protectionism, sanctions and in particular technical regulations would negatively impact production costs and productivity along our many value chains, as well as significantly impede or even hinder access to sales markets. A significant risk to our sales potential and cost structure is coming from mounting supply chain bottlenecks, due to growing lack of availability of intermediate goods, in particular electronic components. Bottlenecks in energy supply on the one hand and in access to raw materials on the other would substantially reduce industrial production potential. The escalating possibility of major defaults in the Chinese property sector, with potential spillover effects into the entire real estate market and financial markets, would significantly impact growth prospects of one of our core geographic markets and might have reverberations even on the global financial system and the world economy. A substantial increase in inflation rates could lead to serious distortions in global currency, capital, and foreign exchange markets, if central banks initiate the tightening cycle too fast and too aggressively. Highly indebted (emerging and industrialized) countries could suffer from increasing financing costs and a loss of investor confidence. Additional threats to the outlook could arise as well, ranging from market pressure to intensify austerity measures to declining confidence in individual currency markets. Additionally, a strong increase of raw material and intermediate goods prices would negatively impact Siemens’s cost structure. Other significant risks could arise from geopolitical tensions (particularly in the Near and Middle East, Hong Kong and Taiwan), the European Union's relations with Russia, the economic vulnerability of several emerging markets (including Argentina, Turkey, Venezuela) and political upheavals. We are dependent on the economic development of certain industries; a continuation or even an intensification of the cyclical and structural headwinds in core customer industries, e.g., automotive or construction, would have adverse impact on our business prospects. Further business risk would result from an abrupt weakening of Chinese economic growth. A terrorist mega-attack or a significant cybercrime incident, or a series of such attacks or incidents in major economies, could depress economic activity globally and undermine consumer and business confidence. Additionally, the highly interconnected global economy remains vulnerable to natural disasters or further pandemics.
In general, due to long-cycle businesses in our organizational units and the importance of long-term contracts for Siemens, there is usually a time lag between changes in macroeconomic conditions and their impact on our financial results. In contrast, short-cycle business activities react quickly to volatility in market demand. If the moderate growth of certain markets stalls again and if we are not successful in adapting our production and cost structure to subsequent changes in conditions in the markets in which we operate, there can be no assurance that we will not experience adverse effects. For example, our customers may modify, delay or cancel plans to purchase our products, solutions and services, or fail to follow through on purchases or contracts already executed. Furthermore, the prices for our products, solutions and services may decline to a greater extent than we currently anticipate. In addition, it may become more difficult for our customers to obtain financing. Contracted payment terms, especially regarding the level of advance payments by our customers relating to long-term projects, may become less favorable, which could negatively impact our financial condition. Siemens’ global setup with operations in almost all relevant economies, our wide range of offerings with varied exposures to business cycles, and our balanced mix of business models (e.g. equipment, components, systems, software, services and solutions) help us to absorb impacts from adverse developments in any single market.
Disruptive technologies: The markets in which our businesses operate experience rapid and significant changes due to the introduction of innovative and disruptive technologies. In the fields of digitalization (e.g. IoT, artificial intelligence, cloud computing, Industry 4.0), there are risks associated with new competitors, substitutions of existing products/solutions/services, new business models (e.g. in terms of pricing, financing, extended scopes for project business or subscription models in the software business) and finally the risk that our competitors may have more advanced time-to-market strategies and introduce their disruptive products and solutions faster than Siemens. Our operating results depend to a significant extent on our technological leadership, our ability to anticipate and adapt to changes in our markets and to optimize our cost base accordingly. Introducing new products and technologies requires a significant commitment to research and development, which in return requires expenditure of considerable financial resources that may not always result in success. Our results of operations may suffer if we invest in technologies that do not operate or may not be integrated as expected, or that are not accepted in the marketplace as anticipated, or if our products, solutions or systems are not introduced to the market in a timely manner, particularly compared to our competitors, or even become obsolete. We constantly apply for new patents and actively manage our intellectual property portfolio to secure our technological position. However, our patents and other intellectual property may not prevent competitors from independently developing or selling products and services that are similar to ours.
Competitive environment: The worldwide markets for our products, solutions and services are highly competitive in terms of pricing, product and service quality, product development and introduction time, customer service, financing terms and shifts in market demands. We face strong, established competitors as well as rising competitors from emerging markets and new industries, which may have a better cost structure. Some industries in which we operate are undergoing consolidation, which may result in stronger competition, a change in our relative market position, an increase in inventory of finished or work-in-progress goods, or unexpected price erosion. Furthermore,

Combined Management Report
29
there is a risk that critical suppliers are taken over by competitors and a risk that competitors are increasingly offering services to our installed base. We address these risks with various measures, for example benchmarking, strategic initiatives, sales push initiatives, executing productivity measures and target cost projects, rightsizing of our footprint, outsourcings, mergers and joint ventures and optimizing our product and service portfolio. We continuously monitor and analyze competitive, market and industry information in order to be able to anticipate unfavorable changes in the competitive environment rather than merely reacting to such changes.
COVID-19 pandemic (COVID-19): The COVID-19 situation may worsen, as the number of new infections is rising again in many countries. At the same time, the number of cases and the severe course of the disease will develop very differently depending on the respective vaccination rate in the countries. The impact of the pandemic therefore varies considerably between regions and customer sectors. Governments and other local authorities are working to contain the spread of infection by implementing various countermeasures such as contact restrictions, adherence to minimum hygienic standards, wearing of respiratory masks, vaccine mandates, and vaccination and testing services to avoid widespread curfews and restrictions on the opening of certain sectors of the economy. Depending on epidemiological trends and political pressure, governments are expected to relax existing restrictions and avoid new ones to reduce the associated economic harm. The extent and duration of the individual impacts on our business are difficult to predict. For example, if containment measures are initiated at short notice or last an unpredictably long time, our business may be significantly impacted in ways that exceed current expectations and go beyond mitigation measures already in place. We could face unexpected closures of sites, factories or office buildings of our suppliers, customers or our own operations, which would affect our ability to produce or deliver our products, solutions and services. The most material uncertainties of the COVID-19 crisis are its continued duration, including for example potential further waves of infection, mutations of the virus and the evolution of global vaccination progress, and the economic costs of restrictions. Since the second quarter of fiscal 2020, we have felt the impact in our businesses, both our short-cycle businesses and project businesses, as, for example, customers cancelled orders or postponed investments, we were exposed to increased default risk, and our supply chain experienced difficulties in certain areas. Now we are seeing a recovery in many business sectors, and travel is also becoming easier. The longer the restrictive measures such as curfews last, the deeper the resulting recession will be. Possible consequences include an unchecked increase of public and private debt which hampers the post-crisis recovery, serious disruptions in the financial system and insolvencies among Siemens customers and suppliers. In the long term, a reversal of globalization could reduce potential future growth. Various task forces and crisis teams have been set up in all areas of Siemens to carefully monitor and mitigate the various impacts of COVID-19, with a focus on the health and safety of our employees through operational vaccination offers, testing concepts and making treatment offers available, and on business continuity. At the Group level, an executive-level crisis team at Group headquarters has worked out overarching decisions and coordinated the flow of information through the different levels of the organization, while empowering responsible management in each business and country to take appropriate action according to national and regional guidelines.
Increasing sustainability focus: The increasing environmental, social and governance (ESG) requirements from governments and customers as well as financing restrictions from governments, customer demands and financing restrictions for greenhouse gas emitting technologies could result in additional costs. Additionally, business involvement in sensitive environmental, social or governance activities might be negatively perceived and trigger adverse media attention. This could lead to reputational damage and have an impact on achieving our business goals. In fiscal 2021 we introduced a binding ESG risk framework and with it an optimized due diligence process. This supports Siemens businesses with due diligence in the customer-oriented environment with a view to possible environmental and social risks as well as related human rights and reputational risks.
Portfolio measures, at-equity investments, other investments and strategic alliances: Our strategy includes divesting our activities in some business areas and strengthening others through portfolio measures, including mergers and acquisitions. With respect to divestments, we may not be able to divest some of our activities as planned, and the divestitures we do carry out could have a negative impact on our business situation, financial condition, results of operations and reputation. Mergers and acquisitions are inherently risky because of difficulties that may arise when integrating people, operations, technologies and products. There can be no assurance that any of the businesses we acquire can be integrated successfully and in a timely manner as originally planned, or that they will perform as anticipated once integrated. In addition, we may incur significant acquisition, administrative, tax and other expenditures in connection with these transactions, including costs related to integration of acquired businesses. Furthermore, portfolio measures may result in additional financing needs and adversely affect our capital structure. Acquisitions can lead to substantial additions to intangible assets, including goodwill, in our statements of financial position. If we were to encounter continuing adverse business developments or if we were otherwise to perform worse than expected at acquisition activities, then these intangible assets, including goodwill, might have to be impaired, which could adversely affect our business situation, financial condition and results of operations. Our investment portfolio includes investments held for purposes other than trading and other investments. Any factors negatively influencing the financial condition and results of operations of our at-equity investments and other investments could have an adverse effect on our equity pick-up related to these investments or may result in a related write-off. In addition, our business situation, financial condition and results of operations could also be adversely affected in connection with loans, guarantees or non-compliance with financial covenants related to these investments. Furthermore, such investments are inherently risky as we may not be able to sufficiently influence corporate governance processes or business decisions taken by our at-equity investments, other investments and strategic alliances, which may have a negative effect on our business and especially on our reputation. In addition, joint ventures bear the risk of difficulties that may arise when integrating people, operations, technologies and products. Strategic alliances may also pose risks for us because we compete in some business areas with companies with which we have strategic alliances. Besides other measures, we handle these risks with standardized processes as well as dedicated roles and responsibilities in the areas of mergers, acquisitions, divestments and carve-outs. This includes the systematic treatment of all contractual obligations and post-closing claims.
8.3.2 Operational risks
Cyber/Information security: Digital technologies are deeply integrated into our business portfolio. Further integration of information technology into products and services in conjunction with changing business strategies (such as outsourcing, globally distributed development, a lesser degree of sole production) are leading to an increasingly distributed supply chain, making efficient controls difficult. The fact of a large number of suppliers requires a significant effort for the initial and regular verification of the effective implementation of cybersecurity requirements by suppliers. Siemens business entities might lose market access if their products, solutions and services do not comply with increased regulations and legal requirements for cybersecurity in their respective countries. We observe a global increase

Combined Management Report
30
of cybersecurity threats and higher levels of professionalism in computer crime, which pose a risk to the security of products, systems and networks and the confidentiality, availability and integrity of data. According to various external data sources, this trend has accelerated during the COVID-19 pandemic. Especially the number of phishing attacks as well as the number of malicious websites have increased significantly. Moreover, the information technology market is concentrated among a small number of information technology and software vendors, which could lead to dependence on a single provider. There can be no assurance that the measures aimed at protecting our intellectual property and portfolio will address these threats under all circumstances. There is a risk that confidential information (data privacy) may be stolen or that the integrity of our portfolio may be compromised, e.g. by attacks on our networks, social engineering, data manipulations in critical applications and a loss of critical resources, resulting in financial damages. Cybersecurity covers the IT of our entire enterprise including office IT, systems and applications, special purpose networks, and our operating environments such as manufacturing and research and development (R&D). Like other large multinational companies, we face active cyber threats from sophisticated adversaries that are supported by organized crime and nation-states engaged in economic espionage or even sabotage. We strive to mitigate these risks by employing a number of measures, including employee training, considering new models of flexible working environments, and comprehensive monitoring of our networks and systems through cyber defense with an artificial intelligence solution to identify attacks faster and prevent damage to society and especially to critical infrastructures, our customers, our partners and Siemens overall. We initiated the industrial “Charter of Trust,” signed by a growing group of global companies, which sets out principles for building trust in digital technologies and creating a more secure digital world. Nonetheless, our systems, products, solutions and services, as well as those of our service providers, remain potentially vulnerable to attacks. Such attacks could potentially lead to the publication, manipulation or leakage of information such as through industrial espionage. They could also result in deliberate improper use of our systems, vulnerable products, production downtimes and supply shortages, with potential adverse effects on our reputation, our competitiveness and results of operations. For increased protection of Siemens and reduction of a potential financial impact caused by cyber incidents, the risk transfer possibilities have been evaluated. As a result of an international insurance tender, the currently insurable cybersecurity risks have been to a partial extent transferred to a consortium of insurance companies.
Supply chain management: The financial performance of our operating units depends on reliable and effective supply chain management for components, sub-assemblies and materials. Capacity constraints and supply shortages resulting from ineffective supply chain management may lead to production bottlenecks, delivery delays, quality issues and additional costs. We also rely on third parties to supply us with parts, components and services. Using third parties to manufacture, assemble and test our products may reduce our control over manufacturing yields, quality assurance, product delivery schedules and costs. Although we work closely with our suppliers to avoid supply-related problems, there can be no assurance that we will not encounter supply problems in the future, especially if we use single-source suppliers for critical components. Shortages and delays could materially harm our businesses. Unanticipated increases in the price of components or raw materials due to market shortages or other reasons could also adversely affect performance. Furthermore, we may be exposed to the risk of delays and interruptions in the supply chain as a consequence of catastrophic events (including pandemics), cyber incidents or suppliers’ financial difficulties, particularly if we are unable to identify alternative sources of supply or means of transportation in a timely manner or at all. Besides other measures, we mitigate price fluctuation in global raw material markets with various hedging instruments.
Internal programs and initiatives: We are in a continuous process of operational optimization and constantly engage in cost-reduction initiatives, including ongoing capacity adjustment measures and structural initiatives. Consolidation of business activities and manufacturing facilities, outsourcings, joint ventures and the streamlining of product portfolios are all part of these cost-reduction efforts. These measures may not be implemented as planned, may turn out to be less effective than anticipated, may become effective later than estimated or may not become effective at all. Any future contribution of these measures to our profitability will be influenced by the actual savings achieved and by our ability to sustain them. In case of restructuring and outsourcing activities, there could be delays in product deliveries or we might even experience delivery failures. Furthermore, delays in critical R&D projects could lead to negative impacts in running projects. We constantly control and monitor the progress of these projects and initiatives using standardized controlling and milestone tracking approaches.
Project-related risks: A number of our segments conduct activities under long-term contracts that are awarded on a competitive bidding basis. Such contracts typically arise at Mobility and in various activities of Smart Infrastructure or Portfolio Companies. Some of these contracts are inherently risky because we may assume substantially all of the risks associated with completing a project and meeting post-completion warranty obligations. For example, we may face the risk that we must satisfy technical requirements of a project even though we have not gained experience with those requirements before winning the project. The profit margins realized on fixed-priced contracts may vary from original estimates as a result of changes in costs and productivity over a contract’s term. We sometimes bear the risk of unanticipated project modifications, shortage of key personnel, quality problems, financial difficulties of our customers and/or significant partners, cost overruns or contractual penalties caused by unexpected technological problems, unexpected developments at the project sites, unforeseen changes or difficulties in the regulatory or political environment, performance problems with our suppliers, subcontractors and consortium partners or other logistical difficulties. Some of our multi-year contracts also contain demanding installation and maintenance requirements in addition to other performance criteria relating to timing, unit cost and compliance with government regulations, which, if not satisfied, could subject us to substantial contractual penalties, damages, non-payment and contract termination. There can be no assurance that contracts and projects, in particular those with long-term duration and fixed-priced calculation, can be completed profitably. To tackle those risks, we established a global project management organization to systematically improve the technical and commercial capabilities of our project management personnel. For very complex projects we conduct dedicated risk assessments in very early stages of the sales phase before we decide to hand over a binding offer to our customers.
Shortage of skilled personnel: Competition for diverse and highly qualified personnel (e.g. specialists, experts, digital talent) remains intense in the industries and regions in which our businesses operate. We have ongoing demand for highly skilled employees and a need to enhance diversity, inclusion and sense of belonging in our workforce. Our future success depends in part on our continued ability to identify, assess and hire engineers, digital talent and other qualified personnel. We must also integrate, develop and retain them after they join us, which appears especially relevant in times of a new, increasingly virtual working environment. We address these topics for example by strengthening the capabilities and skills of our talent acquisition teams and a strategy of proactive search for people with the required capabilities in our respective industries and markets. Technology and digitalization help us to be more effective in attracting and selecting diverse talent. Furthermore, we have a focus on diversity and structured succession planning.

Combined Management Report
31
8.3.3 Financial risks
Risks from pension obligations: The provisions for pensions and similar obligations may be affected by changes in actuarial assumptions, including the discount rate, as well as by movements in financial markets or a change in the mix of assets in our investment portfolio. Additionally, they are subject to legal risks with regard to plan design among other factors. A significant increase in the underfunding may have a negative effect on our capital structure and rating, and thus may tighten refinancing options and increase costs. In order to comply with local pension regulations in selected foreign countries, we may face an economic risk of increasing cash outflows due to change in funding level according to local regulations of our pension plans in these countries or to changes in the regulations themselves.
Audits by tax authorities and changes in tax regulations: We operate in nearly all countries of the world and therefore are subject to many different tax regulations. Changes in tax laws in any of these jurisdictions could result in higher tax expenses and increased tax payments. Furthermore, legislative changes could impact our tax receivables and liabilities as well as deferred tax assets and deferred tax liabilities. In addition, the uncertain legal environment in some regions could limit our ability to enforce our rights. As a globally operating organization, we conduct business in countries subject to complex tax rules, which may be interpreted in different ways. Future interpretations or developments of tax regimes may affect our business situation, financial condition and results of operations. We are regularly audited by tax authorities in various jurisdictions and we continuously identify and assess relevant risks.
Market price risks: We are exposed to fluctuations in exchange rates, especially between the U.S. dollar and the euro, because a high percentage of our business volume is conducted as exports from Europe to areas using the U.S. dollar. In addition, we are exposed to effects involving the currencies of emerging markets, in particular the Chinese yuan. Appreciable changes in euro exchange rates could materially change our competitive position. We are also exposed to fluctuations in interest rates. Even hedging activities to mitigate such risks may result in a reverse effect. Fluctuations in exchange or interest rates, negative developments in the financial markets and changes in central bank policies could therefore negatively impact our financial results.
Liquidity and financing risks: Our treasury and financing activities could face adverse deposit and/or financing conditions from negative developments related to financial markets, such as limited availability of funds and hedging instruments, an updated evaluation of our solvency, particularly from rating agencies, negative interest rates, and impacts arising from more restrictive regulation of the financial sector, central bank policy, or the usage of financial instruments. Widening credit spreads due to uncertainty and risk aversion in the financial markets might lead to adverse changes in the market values of our financial assets, in particular our derivative financial instruments.
Credit risks: We provide our customers with various forms of direct and indirect financing of orders and projects, including guarantees. Siemens Financial Services in particular bears credit risks due to such financing activities if, for example, customers do not meet obligations arising from these financing arrangements, meet them only partially, or meet them late.
For further information on post-employment benefits, derivative financial instruments, hedging activities, financial risk management and related measures, see Notes 17, 24 and 25 in Notes to Consolidated Financial Statements for fiscal 2021.
8.3.4 Compliance risks
Current and future investigations regarding allegations of corruption, of antitrust violations and of other violations of law: Proceedings against us or our business partners regarding allegations of corruption, of antitrust violations and of other violations of law may lead to fines as well as penalties, sanctions, injunctions against future conduct, profit disgorgements, disqualifications from directly and indirectly engaging in certain types of business, the loss of business licenses or permits, other restrictions and legal consequences as well as negative public media coverage. Accordingly, we may, among other things, be required to comply with potential obligations and liabilities arising in connection with such investigations and proceedings, including potential tax penalties. Moreover, any findings related to public corruption that are not covered by the 2008 and 2009 corruption charge settlements, which we concluded with U.S. and German authorities, may endanger our business with government agencies and intergovernmental and supranational organizations. Monitors could again be appointed to review future business practices and we may otherwise be required to further modify our business practices and our compliance program.
In its global business, Siemens does part of its business with state-owned enterprises and governments. We also participate in a number of projects funded by government agencies and intergovernmental and supranational organizations, such as multilateral development banks. Ongoing or potential future investigations into allegations of corruption, antitrust violations or other violations of law could as well impair relationships with such parties or could result in our exclusion from public contracts. Such investigations may also adversely affect existing private business relationships and our ability to pursue potentially important strategic projects and transactions, such as strategic alliances, joint ventures or other business alliances, or could result in the cancellation of certain of our existing contracts. Moreover, third parties, including our competitors, could initiate significant litigation.
In addition, future developments in ongoing and potential future investigations, such as responding to the requests of governmental authorities and cooperating with them, could divert management’s attention and resources from other issues facing our business. Furthermore, we might be exposed to compliance risks in connection with recently acquired operations that are in the ongoing process of integration.
Along with other measures, Siemens has established a global compliance organization that conducts among others compliance risk mitigation processes such as Compliance Risk Assessments or initiates internal audit activities performed by the internal assurance department.
Changes of regulations, laws and policies: As a diversified company with global businesses we are exposed to various product- and country-related regulations, laws and policies influencing our business activities and processes. According to observations and analysis, there is an increasing risk that existing technical regulations in target markets will suddenly change, or new ones will be set in force, which determine market access criteria that our products do not meet. The affected products would lose marketability in this market. The way of resolving the risk of a sales-stop depends on the case of how to correct the non-conformity. In case the product can technically stay as is, while it has to undergo new and additional conformity assessment and certification, there will be considerable effort and cost to carry out the needed testing and certification procedures. In a worse case, the affected product will need re-engineering or re-design to meet the requirements of the changed or new technical regulation even before it can become re-assessed and certified for market approval.
Combined Management Report
32
The latter case will cause significant extra effort and cost to do the needed product changes and to maintain the country-specific product variant as an additional derivate item in the portfolio. In the worst case, if the two aforementioned ways of maintaining the product’s marketability prove to be not feasible, sale of the affected product in the market has to be stopped. We monitor the political and regulatory landscape in all our key markets to anticipate potential problem areas, with the aim of quickly adjusting our business activities and processes to changed conditions. However, any changes in regulations, laws and policies could adversely affect our business activities and processes as well as our financial condition and results of operations.
Protectionism (including tariffs/trade war): Protectionist trade policies, de-coupling and changes in the political and regulatory environment in the markets in which we operate, such as import and export controls, tariffs and other trade barriers including debarment from certain markets and price or exchange controls, could affect our business in national markets and could impact our business situation, financial position and results of operations; and may expose us to penalties, other sanctions and reputational damage. In addition, the uncertainty of the legal environment in some regions could limit our ability to enforce our rights and subject us to increasing costs related to appropriate compliance programs.
Geopolitical uncertainties including sanctions and export control: As a globally operating organization, we conduct business with customers in countries which are subject to export control regulations, embargoes, economic sanctions, debarment policies or other forms of trade restrictions (hereafter referred to as “sanctions”) imposed by the U.S., the EU, China or other countries or organizations. New or expanded sanctions in countries in which we do business may result in a curtailment of our existing business in such countries or indirectly in other countries. We are also aware of policies of national authorities and institutional investors, such as pension funds or insurance companies, requiring divestment of interests in and prohibiting investment in and transactions with entities doing business with countries identified by the U.S. Department of State as state sponsors of terrorism. As a result, it is possible that such policies may result in our being unable to gain or retain certain investors or customers. In addition, the termination of our activities in sanctioned countries may expose us to customer claims and other actions. Our reputation could also suffer due to our activities with counterparties in or affiliated with these countries.
Environmental, health & safety and other governmental regulations: Some of the industries in which we operate are highly regulated. Current and future environmental, health and safety and other governmental regulations or changes thereto may require us to change the way we run our operations and could result in significant increases in our operating or production costs. Furthermore, we see the risk of potential environmental and health and safety incidents as well as potential non-compliance with environmental and health and safety regulations affecting Siemens and our contractors or sub-suppliers, resulting for example in serious injuries, business interruptions, penalties, loss of reputation and internal or external investigations.
In addition, while we have procedures in place to ensure compliance with applicable governmental regulations in the conduct of our business operations, it cannot be excluded that violations of applicable governmental regulations may be caused either by us or by third parties that we contract with, including suppliers or service providers whose activities may be attributed to us. Any such violations particularly expose us to the risk of liability, penalties, fines, reputational damage or loss of licenses or permits that are important to our business operations. In particular, we could also face liability for damage or remediation for environmental contamination at the facilities we design or operate. With regard to certain environmental risks, we maintain liability insurance at levels that our management believes are appropriate and consistent with industry practice. We may incur environmental losses beyond the limits, or outside the coverage, of such insurance, and such losses may have an adverse effect on our business situation, financial condition and results of operations.
Current or future litigation and legal and regulatory proceedings: Siemens is and potentially will be involved in numerous legal disputes and proceedings in various jurisdictions. These legal disputes and proceedings could result, in particular, in Siemens being subject to payment of damages and punitive damages, equitable remedies or sanctions, fines or disgorgement of profit. In individual cases this may also lead to formal or informal exclusion from tenders or the revocation or loss of business licenses or permits. Asserted claims are generally subject to interest rates. Some of these legal disputes and proceedings could result in adverse decisions for Siemens or decisions, assessments or requirements of regulatory authorities could deviate from our expectations, which may have material effects on our business activities as well as our financial position, results of operations and cash flows. Siemens maintains liability insurance for certain legal risks at levels our management believes are appropriate and consistent with industry practice. The insurance policy, however, does not protect Siemens against reputational damage. Moreover, Siemens may incur losses relating to legal proceedings beyond the limits, or outside the coverage, of such insurance or exceeding any provisions made for losses related to legal proceedings. Finally, there can be no assurance that Siemens will be able to maintain adequate insurance coverage on commercially reasonable terms in the future.
For additional information with respect to specific proceedings, see Note 22 in Notes to Consolidated Financial Statements for fiscal 2021.
8.3.5 Assessment of the overall risk situation
The most significant challenges have been mentioned first in each of the four risk categories: strategic, operational, financial and compliance.
While our assessments of individual risks have changed during fiscal 2021 due to developments in the external environment, changes in our business portfolio, effects of our own mitigation measures and the revision of our risk assessment, the overall risk situation for Siemens did not change significantly as compared to the prior year. We currently see the operational risk cyber/information security as the most significant challenge for us followed by the strategic risk arising from economic, political and geopolitical conditions.
At present, no risks have been identified that either individually or in combination could endanger our ability to continue as a going concern.
8.4 OpportunitiesWithin our ERM we regularly identify, evaluate and respond to opportunities that present themselves in our various fields of activity. Below we describe our most significant opportunities. Unless otherwise stated, the opportunities described relate to all organizational units. The order in which the opportunities are presented reflects the currently estimated relative exposure for Siemens associated with these opportunities and thus provides an indication of the opportunities’ current importance to us. The described opportunities are not
Combined Management Report
33
necessarily the only ones we encounter. In addition, our assessment of opportunities is subject to change because the Company, our markets and technologies are constantly advancing. It is also possible that opportunities we see today will never materialize.
Favorable political and regulatory environment (including sustainability): We see opportunities from potential improvement in the geopolitical policy environment, which could quickly restore a more positive industrial investment sentiment that supports the growth of our markets. In addition, government initiatives and subsidies (including tax reforms, recovery plans among others) may lead to more government spending (e.g. infrastructure, healthcare or digitalization investments) and ultimately result in an opportunity for us to participate in ways that increase our revenue and profit. By enabling our customers to lower their GHG (Greenhouse Gas) emissions across our portfolio and by reducing CO2 emission in our own operation, Siemens strives to support the trend towards a low-carbon economy. Siemens also welcomes and supports from an opportunity perspective, recent legislative and governmental accelerate to mitigate climate change worldwide, especially in Europe through e.g. the Green Deal or Sustainable Finance Initiative.
Mergers, acquisitions, equity investments, partnerships, divestments and streamlining our portfolio: We constantly monitor our current and potential markets to identify opportunities for strategic mergers, acquisitions, equity investments and partnerships, which may complement our organic growth. Such activities may help us to strengthen our position in our existing markets, provide access to new or underserved markets, or complement our technological portfolio in strategic areas. Opportunities might also arise when portfolio optimization measures generate gains, which enable us to further pursue our other strategies for growth and profitability.
Value creation through innovation: We drive innovation by investing significantly in R&D in order to develop sustainable solutions for our customers while also strengthening our own competitiveness. Being an innovative company and constantly inventing new technologies that we expect will meet future demands arising from the megatrends of demographic change, urbanization, climate change and globalization is one of our core purposes. We are granted thousands of new patents every year and continuously develop new concepts and convincing new digital and data-driven business models. This helps us create the next generation of ground-breaking innovations in such fields as digitalization, artificial intelligence, autonomous machines and edge computing. Across our operating units, we are profiting from our strength in the “Digital Enterprise.” Foremost, our cloud-based MindSphere platform enhances the availability of our customers’ digital products and systems and improves their productivity and efficiency. We offer edge computing apps along with MindSphere in individual facilities, so that customers can connect all their facilities to create an integrated data network. We see also significant opportunities to generate additional volume and profit from innovative digital products, services and solutions, including cyber security and applications for optimized energy consumption. We see growth opportunities in opening up access to new markets and customers through new marketing and sales strategies, which we implement in our operating units. Our position along the value chains of automation and digitalization allows us to further increase market penetration. Along these value chains, we have identified several concrete growth fields in which we see our greatest long-term potential. Hence, we are combining and developing our resources and capabilities for these growth fields.
Turning COVID-19 challenges into opportunities: The participation in governmental COVID-19 recovery programs such as the European Union’s “Next Generation EU" recovery plan is an opportunity for Siemens. There is also the chance to strengthen our customer relationship through additional market offerings that specifically address use cases related directly to the COVID-19 pandemic. Potential growth areas might arise through the optimization program "new normal" with, for example, more working flexibility for our employees.
Optimization of organization and processes: On the one hand, we leverage ideas to drive further improvements in our processes and cost structure, such as common computing architecture for image processing or optimizing factory capacities for shorter lead times. On the other hand, we see an opportunity of further penetrating markets by ramping up local business excellence (e.g. engineering) and increasing local sourcing and local manufacturing.
Assessment of the overall opportunities situation: The most significant opportunity for Siemens is favorable political and regulatory environment (including sustainability) as described above.
While our assessments of individual opportunities have changed during fiscal 2021 due to developments in the external environment, changes in our business portfolio, our endeavors to profit from them and revision of our strategic plans, the overall opportunity situation for Siemens did not change significantly as compared to the prior year.
8.5 Significant characteristics of the accounting-related internal control and risk management systemThe overarching objective of our accounting-related internal control and risk management system is to ensure that financial reporting is conducted in a proper manner, such that the Consolidated Financial Statements and the Combined Management Report of Siemens Group as well as the Annual Financial Statements of Siemens AG as the parent company are prepared in accordance with all relevant regulations.
Our ERM approach is based on the globally accepted COSO Standard (Committee of Sponsoring Organizations of the Treadway Commission) Enterprise Risk Management – Integrating with Strategy and Performance (2017) and the ISO (International Organization for Standardization) Standard 31000 (2018) and is adapted to Siemens requirements. The frameworks connect the ERM process with our financial reporting process and our internal control system. They consider a company’s strategy, the efficiency and effectiveness of its business operations, the reliability of its financial reporting and compliance with relevant laws and regulations to be equally important. Our accounting-related internal control system is based on the internationally recognized Internal Control – Integrated Framework (2013) also developed by COSO. The two systems are complementary.
At the end of each fiscal year, our management performs an evaluation of the effectiveness of the implemented control system, both in design and operating effectiveness. We have a standardized procedure under which necessary controls are defined, documented in accordance with uniform standards, and tested regularly for their effectiveness. Nevertheless, there are inherent limitations on the effectiveness of any control system, and no system, including one determined to be effective, may prevent or detect all misstatements.
Our Consolidated Financial Statements are prepared on the basis of a centrally issued conceptual framework which primarily consists of uniform Financial Reporting Guidelines and a chart of accounts. For Siemens AG and other companies within the Siemens Group required to prepare financial statements in accordance with German Commercial Code, this conceptual framework is complemented by mandatory regulations specific to the German Commercial Code. The need for adjustments in the conceptual framework due to regulatory changes
Combined Management Report
34
is analyzed on an ongoing basis. Accounting departments are informed quarterly about current topics and deadlines from an accounting and closing process perspective.
The base data used in preparing our financial statements consists of the closing data reported by the operations of Siemens AG and its subsidiaries. The preparation of the closing data of most of our entities is supported by an internal shared services organization. Furthermore, other accounting activities, such as governance and monitoring activities, are usually bundled on a regional level. In particular cases, such as valuations relating to post-employment benefits, we use external experts. The reported closing data is used to prepare the financial statements in the consolidation system. The steps necessary to prepare the financial statements are subject to both manual and automated controls.
Qualification of employees involved in the accounting process is ensured through appropriate selection processes and training. As a fundamental principle, based on materiality considerations, the “four eyes” principle applies, and specific procedures must be adhered to for data authorization. Additional control mechanisms include target-performance comparisons and analyses of the composition of and changes in individual line items, both in the closing data submitted by reporting units and in the Consolidated Financial Statements. In line with our information security requirements, accounting-related IT systems contain defined access rules protecting them from unauthorized access. The manual and system-based control mechanisms referred to above generally also apply when reconciling the International Financial Reporting Standards (IFRS) closing data to the Annual Financial Statements of Siemens AG.
On a quarterly basis, we execute an internal certification process. Management at different levels of our organization, supported by confirmations by managements of entities under their responsibility, confirms the accuracy of the financial data that has been reported to Siemens’ corporate headquarters and reports on the effectiveness of the related control systems.
Siemens Healthineers is subject to our Group-wide principles for the accounting-related internal control and risk management system and is responsible for adhering to those principles. The management of Siemens Healthineers provides periodic signoffs to the Managing Board of Siemens AG, certifying the effectiveness of its accounting-related internal control system as well as the completeness, accuracy, and reliability of the financial data reported to us.
After the acquisition of Varian, Siemens Healthineers has commenced to integrate the former Varian entities into our accounting-related internal control and risk management system. The integration efforts for the accounting-related internal control system will continue in fiscal 2022.
Our internal audit function systematically evaluates our financial reporting integrity, the effectiveness of the control system and the risk management system, and adherence to our compliance policies. Siemens Healthineers has its own internal audit department and annual audit plan. Topics from the annual audit plan of Siemens Healthineers that are also relevant for our Managing Board and Audit Committee must be mandated first by Siemens Healthineers’ Managing Board and Audit Committee and subsequently by our Managing Board and Audit Committee. The audit procedures for these topics will be generally executed by joint teams including members of our and Siemens Healthineers’ internal audit functions, thus respecting the interests of both Siemens AG and Siemens Healthineers. In addition, the Audit Committee is integrated into our control system. In particular, it oversees the accounting and accounting process and the effectiveness of the internal control system, the risk management system and the internal audit system. Moreover, we have rules for accounting-related complaints.

Combined Management Report
35
9. Siemens AGThe Annual Financial Statements of Siemens AG have been prepared in accordance with the regulations set forth in the German Commercial Code (Handelsgesetzbuch) and the German Stock Corporation Act (Aktiengesetz).
In fiscal 2021, results for Siemens AG arise mainly from the business activities of Digital Industries and Smart Infrastructure and are influenced significantly by the results of subsidiaries and investments we own either directly or indirectly. The business development of Siemens AG is fundamentally subject to the same risks and opportunities as the Siemens Group. Therefore, the foregoing explanations for the Siemens Group apply also for Siemens AG.
The Supervisory Board and the Managing Board propose from the unappropriated net income of Siemens AG for the fiscal year ended September 30, 2021, amounting to €3,400 million to distribute a dividend of €4.00 per share of no par value entitled to the dividend. The proposed dividend represents a total payout of €3.2 billion based on the estimated number of shares entitled to dividend at the date of the Annual Shareholders’ Meeting. Based on Net income of Siemens group attributable to shareholders of Siemens AG of €6.2 billion for fiscal 2021, the dividend payout percentage is 52%. We intend to continue providing an attractive return to our shareholders. This includes striving for a dividend per share that exceeds the amount of the preceding year, or that at least matches the prior-year-level. For fiscal 2022, we expect that net income of Siemens AG will be sufficient to fund the distribution of a corresponding dividend.
As of September 30, 2021, the number of employees was 49.100.
9.1 Results of operationsStatement of Income of Siemens AG in accordance with German Commercial Code (condensed)
Fiscal year % Change
(in millions of €) 2021 2020
Revenue 15,094 16,389 (8)%
Cost of Sales (10,960) (12,032) 9%
Gross profit 4,135 4,357 (5)%
as percentage of revenue 27% 27%
Research and development expenses (1,570) (1,677) 6%
Selling and general administrative expenses (2,999) (3,490) 14%
Other operating income (expenses), net (196) (555) 65%Financial income, net
thereof Income from investments, net 5,303 (prior year 8,078) 5,797 6,557 (12)%
Income from business activity 5,166 5,192 0%
Income taxes (20) 78 n/a
Net income 5,147 5,270 (2)%
Profit carried forward 171 141 22%
Allocation to other retained earnings (1,918) (2,436) 21%
Unappropriated net income 3,400 2,975 14%
The decrease of revenue and cost of sales was due mainly to the business activities of Gas and Power which, effective with the beginning of calendar year 2020, were transferred to Siemens Energy Global GmbH & Co. KG in preparation of the Siemens Energy spin-off completed in September 2020.
On a geographical basis, 76% of revenue was generated in the Europe, C.I.S., Africa, Middle East region, 17% in the Asia, Australia region and 7% in the Americas region. Exports from Germany accounted for 54% of overall revenue. In fiscal 2021, orders for Siemens AG amounted to €15.7 billion.
Research and development expenses and selling and general administrative expenses decreased due mainly to the above-mentioned transfer of the business activities of Gas and Power.
The R&D intensity (R&D as a percentage of revenue) was 10%, on the same level as fiscal 2020. The research and development activities of Siemens AG are fundamentally the same as for its corresponding business activities within the Siemens Group. Research and development expenses in both periods related mainly to Digital Industries. On an average basis, we employed 7,000 people in R&D in fiscal 2021.
The change in other operating income (expenses), net, was mainly due to higher expenses in fiscal 2020, which included expenses related to the valuation of an investment as well as expenses related to the spin-off of Siemens Energy.
The decrease in financial income, net was due primarily to lower income from investments, net, partly offset by a positive change in other financial income (expenses), net. The primary factors in lower income from investments, net were the following: a profit transfer agreement with Siemens Beteiligungen Inland GmbH, Germany, which reduced income by €0.9 billion; a decline in income from the investment in Siemens Holdings plc, Ltd., United Kingdom, of €0.7 billion; and a decrease of €0.5 billion in income from Siemens Ltd, China. Furthermore, fiscal 2020 included a gain of €2.1 billion from the disposal of Siemens Limited, India, which was partly offset by an impairment of €1.3 billion on the stake in Siemens Energy AG. In contrast, a gain of €0.9 billion from the sale of Flender GmbH, Germany in fiscal 2021 was recorded in income from investments, net. The positive change in other financial income (expenses), net included an increase in gains from non-current securities by €0.5 billion and a reduction of expenses by €0.4 billion from impairments of loan receivables related to an investment. Higher gains from non-current securities were driven by a transfer of investment funds and corresponding realization of hidden reserves as mentioned below.

Combined Management Report
36
9.2 Net assets and financial position Statement of Financial Position of Siemens AG in accordance with German Commercial Code (condensed)
Sep. 30, % Change
(in millions of €) 2021 2020
Assets
Non-current assets
Intangible and tangible assets 1,068 1,122 (5)%
Financial assets 74,852 74,877 0%
75,920 75,999 0%
Current assets
Inventories, receivables and other assets 21,792 16,937 29%
Cash and cash equivalents, other securities 2,297 8,786 (74)%
24,089 25,724 (6)%
Prepaid expenses 184 133 39%
Deferred tax assets 1,243 1,034 20%
Active difference resulting from offsetting 51 85 (41)%
Total assets 101,487 102,975 (1)%
Liabilities and equity
Equity 21,216 18,917 12%
Special reserve with an equity portion 541 619 (13)%
Provisions
Provisions for pensions and similar commitments 12,372 11,700 6%
Provisions for taxes and other provisions 4,220 4,323 (2)%
16,592 16,023 4%
Liabilities
Liabilities to banks 501 98 >200%
Trade payables, liabilities to affiliated companies and other liabilities 62,389 67,047 (7)%
62,890 67,145 (6)%
Deferred income 249 271 (8)%
Total liabilities and equity 101,487 102,975 (1)%
During fiscal 2021 Siemens contributed supplemental fundings to Siemens Pension-Trust e.V. and took measures under company law to simplify the investment structure of pension assets, which for the most part had overall no impact on the carrying amount of the financial assets as of September 2021 compared to the prior year. The supplemental fundings included stakes in Bentley Systems, Inc. in the amount of €1.0 billion and in ChargePoint Holdings, Inc. in the amount of €0.3 billion, as well as zero-coupon receiver swaps in the amount of €0.3 billion. The measures to simplify the investment structure included a transfer of investment funds at fair value of €4.8 billion (including realization of hidden reserves) to shares in affiliated companies, which led to a disposal of securities with a carrying amount of €4.1 billion in the fixed assets register. In addition to these transactions Siemens recorded the disposal of Flender GmbH in the fixed assets register, at a carrying amount of €1.0 billion.
The change in cash and cash equivalents, other securities related to the liquidity management of the Corporate Treasury of Siemens AG, which was focused not solely on the business activities of Siemens AG. The liquidity management is based on the financing policy of the Siemens Group, which is aimed towards a balanced financing portfolio, a diversified maturity profile and a comfortable liquidity cushion. Intra-group financing activities drove both an increase in receivables from affiliated companies, which resulted in higher inventories, receivables and other assets, and lower liabilities to affiliated companies, which was the main reason for the reduction of trade payables, liabilities to affiliated companies and other liabilities.
The increase in provisions for pensions and similar commitments was mainly due to recording of current service and interest costs and to lower discount rates partly offset by payments for pensions and similar commitments.
The increase in equity was attributable to net income for the year of €5.1 billion and the transfer of €0.5 billion in treasury shares to employees in connection with our share-based payments programs. These factors were partly offset by dividends paid in fiscal 2021 (for fiscal 2020) of €2.8 billion and share buybacks during the year amounting to €0.5 billion (including a €0.4 billion final payment to the commissioned bank). The equity ratio as of September 30, 2021 increased to 21%, from 18% a fiscal year earlier. For the disclosures in accordance with Section 160 para. 1 no. 2 of the German Stock Corporation Act about treasury shares, refer to Note 15 of our Notes to Annual Financial Statements for fiscal 2021.
9.3 Corporate Governance statementThe Corporate Governance statement pursuant to Sections 289f and 315d of the German Commercial Code is publicly available on the company’s website at siemens.de/corporate-governance.

Combined Management Report
37
10. Takeover-relevant information (pursuant to Sections 289aand 315a of the German Commercial Code) andexplanatory report
10.1 Composition of common stockAs of September 30, 2021, the Company’s common stock totaled €2.550 billion. The capital stock is divided into 850 million registered shares of no par value (Siemens shares). The shares are fully paid in. All shares confer the same rights and obligations. The shareholders’ rights and obligations are governed in detail by the provisions of the German Stock Corporation Act, in particular by Sections 12, 53a et seq., 118 et seq. and 186 of the German Stock Corporation Act.
10.2 Restrictions on voting rights or transfer of sharesAt the Shareholders’ Meeting, each share of stock has one vote and accounts for the shareholder’s proportionate share in the Company’s net income. An exception to this rule applies with regard to treasury shares held by the Company, which do not entitle the Company to any rights. Under Section 136 of the German Stock Corporation Act the voting right of the affected shares is excluded by law.
Siemens shares issued to employees worldwide under the employee share programs implemented since the beginning of fiscal 2009, in particular the Share Matching Plan, are freely transferable unless applicable local laws provide otherwise. Under the rules of the Share Matching Plan, however, in order to receive one matching share free of charge for each three shares purchased, participants are required to hold the shares purchased by them for a vesting period of several years, during which the participants must be continuously employed by Siemens AG or any of its affiliated companies. The right to receive matching shares is forfeited if the purchased shares are sold, transferred, hedged on, pledged or hypothecated in any way during the relevant vesting period.
The von Siemens-Vermögensverwaltung GmbH (vSV) has, on a sustained basis, powers of attorney allowing it to exercise the voting rights for 10,716,740 shares (as of September 30, 2021) on behalf of members of the Siemens family. These shares are part of the total number of shares held by the family’s members. The powers of attorney are based on an agreement between the vSV and, among others, members of the Siemens family. The shares are voted together by vSV, taking into account the suggestions of a family partnership established by the family’s members or of one of this partnership’s governing bodies.
10.3 Legislation and provisions of the Articles of Association applicable to the appointment and removal of members of the Managing Board and governing amendment to the Articles of AssociationThe appointment and removal of members of the Managing Board are subject to the provisions of Sections 84 and 85 of the German Stock Corporation Act and Section 31 of the German Codetermination Act (Mitbestimmungsgesetz). According to Section 8 para. 1 of the Articles of Association, the Managing Board is comprised of several members, the number of which is determined by the Supervisory Board.
According to Section 179 of the German Stock Corporation Act, any amendment to the Articles of Association requires a resolution of the Shareholders’ Meeting. The authority to adopt purely formal amendments to the Articles of Association was transferred to the Supervisory Board under Section 13 para. 2 of the Articles of Association. In addition, by resolutions adopted during past Shareholders’ Meetings, the Supervisory Board has been authorized to amend Section 4 of the Articles of Association in accordance with the utilization of the Authorized and Conditional Capitals, and after expiration of the then-applicable authorization and utilization period.
Resolutions of the Shareholders’ Meeting require a simple majority vote, unless a greater majority is required by law (Section 23 para. 2 of the Articles of Association). Pursuant to Section 179 para. 2 of the German Stock Corporation Act, amendments to the Articles of Association require a majority of at least three-quarters of the capital stock represented at the time of the casting of the votes, unless another capital majority is prescribed by the Articles of Association.
10.4 Powers of the Managing Board to issue and repurchase sharesThe Managing Board is authorized to increase, with the approval of the Supervisory Board, the capital stock until February 2, 2026 by up to €90 million through the issuance of up to 30 million Siemens shares against contributions in cash (Authorized Capital 2021). Subscription rights of existing shareholders are excluded. The new shares shall be offered exclusively to employees of the Company and any of its affiliated companies. To the extent permitted by law, such employee shares may also be issued in such a manner that the contribution to be paid on such shares is covered by that part of the annual net income which the Managing Board and the Supervisory Board may allocate to other retained earnings under Section 58 para. 2 of the German Stock Corporation Act.
Furthermore, the Managing Board is authorized to increase, with the approval of the Supervisory Board, the capital stock until January 29, 2024 by up to €510 million through the issuance of up to 170 million Siemens shares against cash contributions and/or contributions in kind (Authorized Capital 2019).
As of September 30, 2021, the total unissued authorized capital of Siemens AG therefore consisted of €600 million nominal that may be used, in installments with varying terms, by issuance of up to 200 million Siemens shares.
By resolutions of the Shareholders’ Meetings on January 30, 2019 and February 5, 2020, the Managing Board is authorized to issue bonds with conversion, exchange or option rights or with warrants attached, or a combination of these instruments, entitling the holders to subscribe to up to 80 million and up to 60 million Siemens shares, respectively. Based on these two authorizations, the Company or its affiliated companies may issue bonds until January 29, 2024 and February 4, 2025, respectively, each in an aggregate principal amount of up to €15 billion. In order to grant shares of stock to holders/creditors of such convertible bonds or warrant bonds, the capital stock was conditionally increased by resolutions of the Shareholders’ Meetings in 2019 and 2020, by up to 80 million and up to 60 million Siemens

Combined Management Report
38
shares, respectively (Conditional Capitals 2019 and 2020), i.e. in total by up to €420 million through the issuance of up to 140 million Siemens shares.
The new shares under Authorized Capital 2019 and the aforementioned bonds are to be issued against cash or non-cash contributions. They are, as a matter of principle, to be offered to shareholders for subscription. The Managing Board is authorized to exclude, with the approval of the Supervisory Board, subscription rights of shareholders in the event of capital increases against contributions in kind. In the event of capital increases against contributions in cash, the Managing Board is authorized to exclude shareholders’ subscription rights with the approval of the Supervisory Board in the following cases:
• The issue price of the new shares/bonds is not significantly lower than the stock market price of the Siemens shares already listed or the theoretical market price of the bonds computed in accordance with generally accepted actuarial methods (exclusion of subscription rights, limited to 10% of the capital stock, in accordance with or by mutatis mutandis application of Section 186 para. 3 sentence 4 German Stock Corporation Act).
• The exclusion is necessary with regard to fractional amounts resulting from the subscription ratio.
• The exclusion is used to grant holders of conversion or option rights or conversion or option obligations on Siemens shares a compensation for the effects of dilution.
The new shares issued or to be issued in exchange for contributions in cash and in kind and with shareholders’ subscription rights excluded, may in certain cases be subject to further restrictions. The details of those restrictions are described in the relevant authorization. In addition, the Managing Board has issued the commitment not to increase the capital stock from the Authorized Capital 2019 and the Conditional Capitals 2019 and 2020 by a total of more than 10% of the capital stock existing at the time of the Shareholders’ Meeting on February 5, 2020, to the extent that capital increases with shareholders’ subscription rights excluded are made from the Authorized Capital 2019 against contributions in cash or in kind or to service convertible bonds and/or warrant bonds issued under the authorizations approved on January 30, 2019 or February 5, 2020 with shareholders’ subscription rights excluded. This commitment ends no later than February 4, 2025.
The Company may not repurchase its own shares unless so authorized by a resolution duly adopted by the shareholders at a general meeting or in other very limited circumstances set forth in the German Stock Corporation Act. On February 5, 2020, the Shareholders’ Meeting authorized the Company to acquire until February 4, 2025 up to 10% of its capital stock existing at the date of adopting the resolution or – if this value is lower – as of the date on which the authorization is exercised. The aggregate of shares of stock of Siemens AG repurchased under this authorization and any other Siemens shares previously acquired and still held in treasury by the Company or attributable to the Company pursuant to Sections 71d and 71e of the German Stock Corporation Act may at no time exceed 10% of the then existing capital stock. Any repurchase of Siemens shares shall be accomplished at the discretion of the Managing Board either (1) by acquisition over the stock exchange, (2) through a public share repurchase offer or (3) through a public offer to swap Siemens shares for shares in a listed company within the meaning of Section 3 para. 2 German Stock Corporation Act. The Managing Board is additionally authorized to complete the repurchase of Siemens shares in accordance with the authorization described above by using certain derivatives (put and call options, forward purchases and any combination of these derivatives). In exercising this authorization, all stock repurchases based on the derivatives are limited to a maximum volume of 5% of Siemens' capital stock existing at the date of adopting the resolution at the Shareholders’ Meeting. A derivative’s term of maturity may not, in any case, exceed 18 months and must be chosen in such a way that the repurchase of Siemens shares upon exercise of the derivative will take place no later than February 4, 2025.
In addition to selling them over the stock exchange or through a public sales offer to all shareholders, the Managing Board is authorized by resolution of the Shareholders’ Meeting on February 5, 2020 to also use Siemens shares repurchased on the basis of this or any previously given authorization for every permissible purpose, in particular as follows: Such Siemens shares may be
• retired;
• used in connection with share-based compensation programs and/or employee share programs of the Company or any of its affiliated companies and issued to individuals currently or formerly employed by the Company or any of its affiliated companies as well as to board members of any of the Company’s affiliated companies;
• offered and transferred, with the approval of the Supervisory Board, to third parties against non-cash contributions;
• sold by the Managing Board, with the approval of the Supervisory Board, against payment in cash if the price at which such Siemens shares are sold is not significantly lower than the market price of Siemens stock (exclusion of subscription rights, limited to 10% of the capital stock, by mutatis mutandis application of Section 186 para. 3 sentence 4 German Stock Corporation Act); or
• used to service or secure obligations or rights to acquire Siemens shares arising particularly from or in connection with convertible bonds or warrant bonds of the Company or its affiliated companies. Moreover, the Managing Board is authorized to exclude subscription rights in order to grant holders/creditors of conversion or option rights or respective conversion or option obligations on Siemens shares subscription rights as compensation against effects of dilution to the extent to which they would be entitled after exercise of such rights or fulfillment of such obligations, and to use Siemens shares to service such subscription rights.
Furthermore, the Supervisory Board is authorized to use shares acquired on the basis of this or any previously given authorization to meet obligations or rights to acquire Siemens shares that were or will be agreed with members of the Managing Board within the framework of rules governing Managing Board compensation.
In November 2018, the Company announced that it would carry out a share buyback of up to €3 billion in volume until November 15, 2021 at the latest. The buyback commenced on December 3, 2018 and terminated on September 24, 2021. Using the authorizations given by the Annual Shareholders’ Meetings on January 27, 2015 and February 5, 2020, Siemens repurchased 29.4 million shares by September 30, 2021 under this share buyback. This buyback had the exclusive purposes of retirement, of issuing shares to employees, board members of affiliated companies and members of the Managing Board of Siemens AG, and of servicing/securing the obligations or rights to acquire Siemens shares arising particularly from or in connection with convertible bonds and warrant bonds. On June 24, 2021, Siemens announced that it intends to launch a new five-year share buyback program of up to €3 billion, beginning in fiscal 2022.
As of September 30, 2021, the Company held 47,644,581 shares of stock in treasury.

Combined Management Report
39
For details on the authorizations referred to above, especially with the restrictions to exclude subscription rights and the terms to include shares when calculating such restrictions, please refer to the relevant resolution and to Section 4 of the Articles of Association.
10.5 Significant agreements which take effect, alter or terminate upon a change of control of the Company following a takeover bidAs of September 30, 2021, Siemens AG maintained lines of credit in the amount of € 7.45 billion.
In March 2021, Siemens AG entered into a bilateral loan agreement, which has been drawn in the full amount of € 500 million.
In addition, in March 2020 and in June 2019 respectively, a consolidated subsidiary as borrower and Siemens AG as guarantor entered into a bilateral loan agreement, each of which has been drawn in the full amount of US$ 500 million. In February 2021, a consolidated subsidiary as borrower entered into two bilateral loan agreements in the total amount of US$ 500 million; both loan agreements have been guaranteed by Siemens AG and have been fully drawn.
The lines of credit, and the relevant loan agreements mentioned above provide their respective lenders with a right of termination in the event that (1) Siemens AG becomes a subsidiary of another company or (2) a person or a group of persons acting in concert acquires effective control over Siemens AG by being able to exercise decisive influence over its activities (Art. 3(2) of Council Regulation (EC) 139 / 2004).
Framework agreements concluded by Siemens AG under International Swaps and Derivatives Association Inc. documentation (ISDA Agreements) grant each counterparty a right of termination, including in certain cases of (i) a transformation (for example mergers and changes of form), (ii) an asset transfer or (iii) acquisition of ownership interests that enables the acquirer to exercise control over Siemens AG or its controlling bodies. Partially this right of termination exists only, if (1) the resulting entity fails to simultaneously assume Siemens AG’s obligations under the ISDA Agreements or (2) the resulting entity’s creditworthiness is materially weaker than Siemens AG’s immediately prior to such event. Generally, ISDA Agreements are designed such that upon termination all outstanding payment claims documented under them are to be netted.
10.6 Compensation agreements with members of the Managing Board or employees in the event of a takeover bidThe contracts with the members of the Managing Board previously contained the right of the member to terminate his or her contract with the Company for good cause in the event of a change of control that results in a substantial change in the position of a Managing Board member (for example, due to a change in corporate strategy or a change in the Managing Board member’s duties and responsibilities). A change of control exists if one or several shareholders acting jointly or in concert acquire a majority of the voting rights in Siemens AG and exercise a controlling influence, or if Siemens AG becomes a dependent enterprise as a result of entering into an intercompany agreement within the meaning of Section 291 of the German Stock Corporation Act, or if Siemens AG is to be merged into an existing corporation or other entity. If this right of termination is exercised, the Managing Board member is entitled to a severance payment in the amount of no more than two years’ compensation. The calculation of the annual compensation includes not only the base compensation and the target amount for the bonus, but also the target amount for the stock awards, in each case based on the most recent completed fiscal year prior to termination of the contract. The stock-based compensation components for which a firm commitment already exists will remain unaffected. Additionally, the severance payments cover non-monetary benefits by including an amount of 5% of the total severance amount. Severance payments will be reduced by 10% as a lump-sum allowance for discounted values and for income earned elsewhere. However, this reduction will apply only to the portion of the severance payment that was calculated without taking account of the first six months of the remaining term of the Managing Board member’s contract. There is no entitlement to a severance payment if the Managing Board member receives benefits from third parties in connection with a change of control. A right to terminate the contract does not exist if the change of control occurs within a period of twelve months prior to a Managing Board member’s retirement.
On September 18, 2019, the Supervisory Board of Siemens AG resolved that the contracts with members of the Managing Board should not contain such right of termination in the future. This has already been taken into account in the case of contract extensions and in the case of new contracts with the newly appointed members of the Managing Board as of October 1, 2020.
10.7 Other takeover-relevant informationWe are not aware of, nor have we during the last fiscal year been notified of, any shareholder directly or indirectly holding 10% or more of the voting rights. There are no Siemens shares with special rights conferring powers of control. Shares of stock issued by Siemens AG to employees under its employee share program and/or as share-based compensation are transferred to the employees. The beneficiary employees who hold shares of employee stock may exercise their control rights in the same way as any other shareholder in accordance with applicable laws and the Articles of Association.

Consolidated Financial Statements*
FOR FISCAL 2021
* This document is an English language translation of the decisive German version and is not provided in the European Single Electronic Format (ESEF). The legally required rendering in ESEF-format is filed in German language with the operator of the German Federal Gazette and published in the German Federal Gazette.

Table of contents
Consolidated Financial Statements
3
3
4
5
6
7
1.
2.
3.
4.
5.
6.
Consolidated Statements of Income
Consolidated Statements of Comprehensive Income
Consolidated Statements of Financial Position
Consolidated Statements of Cash Flows
Consolidated Statements of Changes in Equity
Notes to Consolidated Financial Statements
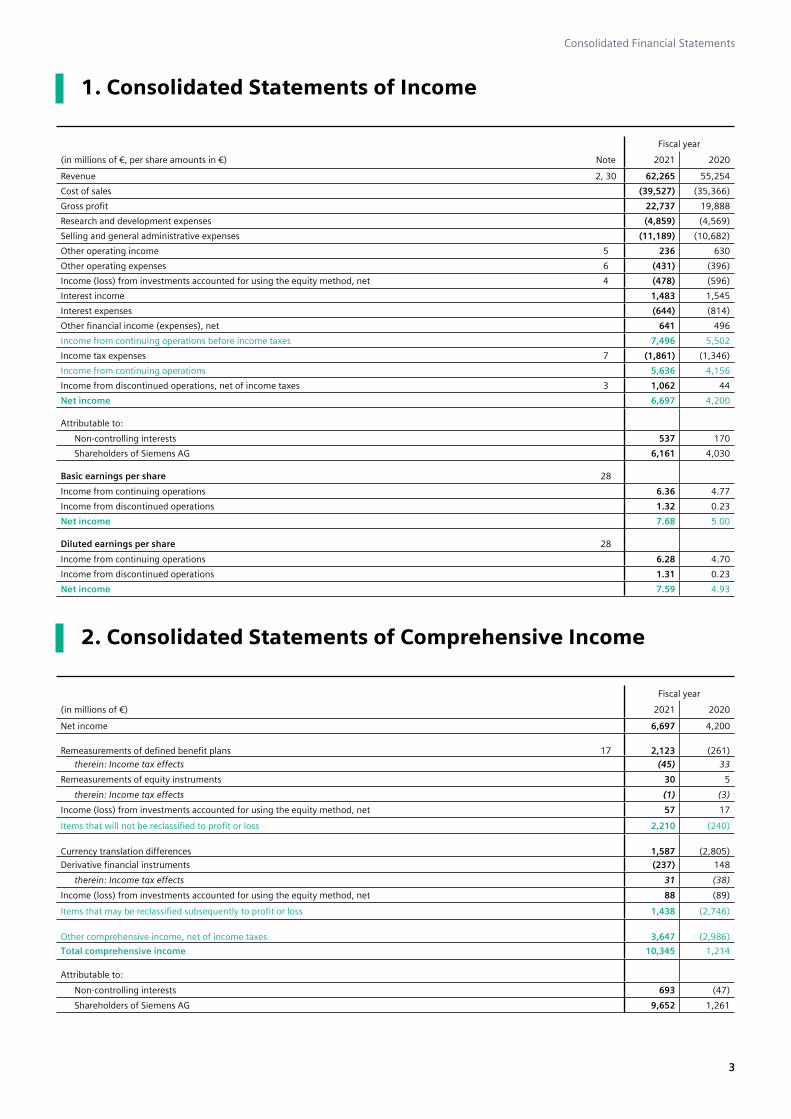
Consolidated Financial Statements
3
1. Consolidated Statements of Income
Fiscal year
(in millions of €, per share amounts in €) Note 2021 2020
Revenue 2, 30 62,265 55,254
Cost of sales (39,527) (35,366)
Gross profit 22,737 19,888
Research and development expenses (4,859) (4,569)
Selling and general administrative expenses (11,189) (10,682)
Other operating income 5 236 630
Other operating expenses 6 (431) (396)
Income (loss) from investments accounted for using the equity method, net 4 (478) (596)
Interest income 1,483 1,545
Interest expenses (644) (814)
Other financial income (expenses), net 641 496
Income from continuing operations before income taxes 7,496 5,502
Income tax expenses 7 (1,861) (1,346)
Income from continuing operations 5,636 4,156
Income from discontinued operations, net of income taxes 3 1,062 44
Net income 6,697 4,200
Attributable to:
Non-controlling interests 537 170
Shareholders of Siemens AG 6,161 4,030
Basic earnings per share 28
Income from continuing operations 6.36 4.77
Income from discontinued operations 1.32 0.23
Net income 7.68 5.00
Diluted earnings per share 28
Income from continuing operations 6.28 4.70
Income from discontinued operations 1.31 0.23
Net income 7.59 4.93
2. Consolidated Statements of Comprehensive Income
Fiscal year
(in millions of €) 2021 2020
Net income 6,697 4,200
Remeasurements of defined benefit plans 17 2,123 (261)
therein: Income tax effects (45) 33
Remeasurements of equity instruments 30 5
therein: Income tax effects (1) (3)
Income (loss) from investments accounted for using the equity method, net 57 17
Items that will not be reclassified to profit or loss 2,210 (240)
Currency translation differences 1,587 (2,805)
Derivative financial instruments (237) 148
therein: Income tax effects 31 (38)
Income (loss) from investments accounted for using the equity method, net 88 (89)
Items that may be reclassified subsequently to profit or loss 1,438 (2,746)
Other comprehensive income, net of income taxes 3,647 (2,986)
Total comprehensive income 10,345 1,214
Attributable to:
Non-controlling interests 693 (47)
Shareholders of Siemens AG 9,652 1,261
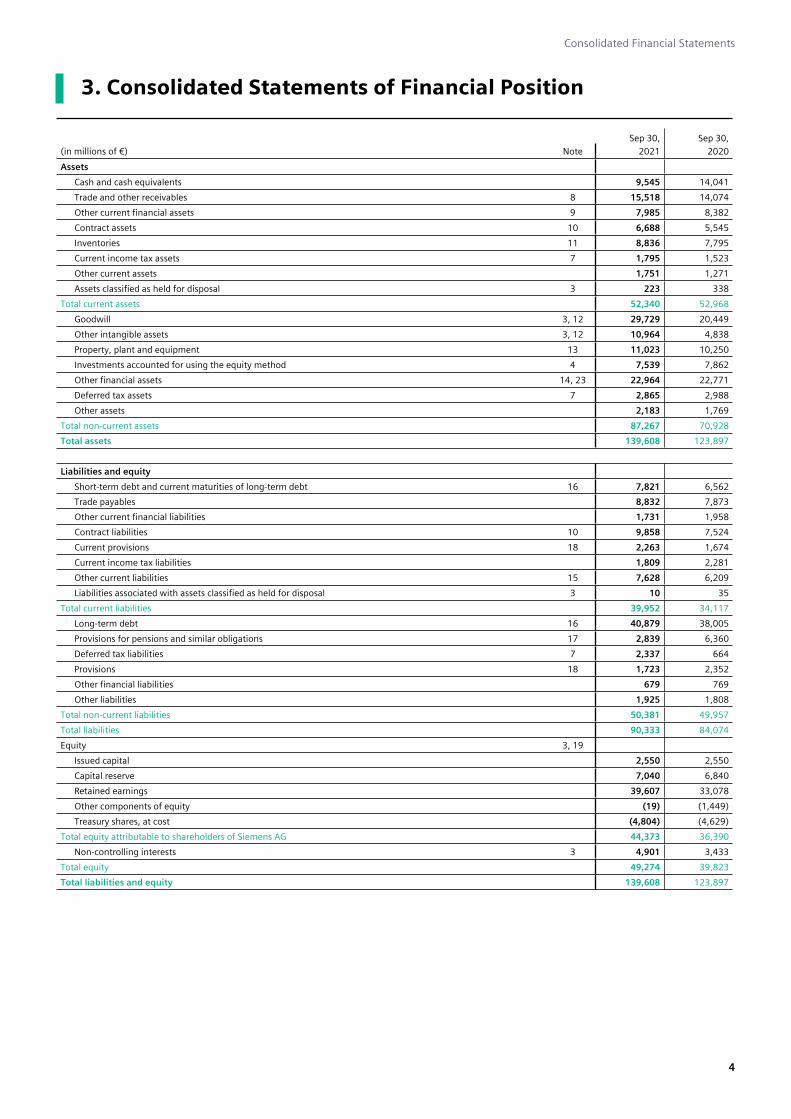
Consolidated Financial Statements
4
3. Consolidated Statements of Financial Position
Sep 30, Sep 30,
(in millions of €) Note 2021 2020
Assets
Cash and cash equivalents 9,545 14,041
Trade and other receivables 8 15,518 14,074
Other current financial assets 9 7,985 8,382
Contract assets 10 6,688 5,545
Inventories 11 8,836 7,795
Current income tax assets 7 1,795 1,523
Other current assets 1,751 1,271
Assets classified as held for disposal 3 223 338
Total current assets 52,340 52,968
Goodwill 3, 12 29,729 20,449
Other intangible assets 3, 12 10,964 4,838
Property, plant and equipment 13 11,023 10,250
Investments accounted for using the equity method 4 7,539 7,862
Other financial assets 14, 23 22,964 22,771
Deferred tax assets 7 2,865 2,988
Other assets 2,183 1,769
Total non-current assets 87,267 70,928
Total assets 139,608 123,897
Liabilities and equity
Short-term debt and current maturities of long-term debt 16 7,821 6,562
Trade payables 8,832 7,873
Other current financial liabilities 1,731 1,958
Contract liabilities 10 9,858 7,524
Current provisions 18 2,263 1,674
Current income tax liabilities 1,809 2,281
Other current liabilities 15 7,628 6,209
Liabilities associated with assets classified as held for disposal 3 10 35
Total current liabilities 39,952 34,117
Long-term debt 16 40,879 38,005
Provisions for pensions and similar obligations 17 2,839 6,360
Deferred tax liabilities 7 2,337 664
Provisions 18 1,723 2,352
Other financial liabilities 679 769
Other liabilities 1,925 1,808
Total non-current liabilities 50,381 49,957
Total liabilities 90,333 84,074
Equity 3, 19
Issued capital 2,550 2,550
Capital reserve 7,040 6,840
Retained earnings 39,607 33,078
Other components of equity (19) (1,449)
Treasury shares, at cost (4,804) (4,629)
Total equity attributable to shareholders of Siemens AG 44,373 36,390
Non-controlling interests 3 4,901 3,433
Total equity 49,274 39,823
Total liabilities and equity 139,608 123,897

Consolidated Financial Statements
5
4. Consolidated Statements of Cash Flows
Fiscal year
(in millions of €) 2021 2020
Cash flows from operating activities
Net income 6,697 4,200
Adjustments to reconcile net income to cash flows from operating activities - continuing operations
Income from discontinued operations, net of income taxes (1,062) (44)
Amortization, depreciation and impairments 3,075 3,098
Income tax expenses 1,861 1,346
Interest (income) expenses, net (839) (731)
(Income) loss related to investing activities (243) (644)
Other non-cash (income) expenses 586 373
Change in operating net working capital from
Contract assets (934) (723)
Inventories (444) (414)
Trade and other receivables (1,227) 214
Trade payables 1,286 67
Contract liabilities 1,132 418
Additions to assets leased to others in operating leases (463) (500)
Change in other assets and liabilities 1,403 1,183
Income taxes paid (2,324) (1,632)
Dividends received 238 293
Interest received 1,369 1,347
Cash flows from operating activities - continuing operations 10,109 7,851
Cash flows from operating activities - discontinued operations (113) 1,012
Cash flows from operating activities - continuing and discontinued operations 9,996 8,862
Cash flows from investing activities
Additions to intangible assets and property, plant and equipment (1,730) (1,498)
Acquisitions of businesses, net of cash acquired (14,391) (1,727)
Purchase of investments and financial assets for investment purposes (1,523) (1,269)
Change in receivables from financing activities (631) (994)
Disposal of intangibles and property, plant and equipment 98 47
Disposal of businesses, net of cash disposed 2 218
Disposal of investments and financial assets for investment purposes 985 1,174
Cash flows from investing activities - continuing operations (17,192) (4,050)
Cash flows from investing activities - discontinued operations 1,698 (1,134)
Cash flows from investing activities - continuing and discontinued operations (15,494) (5,184)
Cash flows from financing activities
Purchase of treasury shares (547) (1,517)
Re-issuance of treasury shares and other transactions with owners 2,055 2,624
Issuance of long-term debt 8,316 10,255
Repayment of long-term debt (including current maturities of long-term debt) (4,294) (4,472)
Change in short-term debt and other financing activities (952) 1,592
Interest paid (704) (833)
Dividends paid to shareholders of Siemens AG (2,804) (3,174)
Dividends attributable to non-controlling interests (285) (208)
Cash flows from financing activities - continuing operations 785 4,267
Cash flows from financing activities - discontinued operations − (1,095)
Cash flows from financing activities - continuing and discontinued operations 785 3,172
Effect of deconsolidation of Siemens Energy on cash and cash equivalents − (4,663)
Effect of changes in exchange rates on cash and cash equivalents 204 (525)
Change in cash and cash equivalents (4,509) 1,663
Cash and cash equivalents at beginning of period 14,054 12,391
Cash and cash equivalents at end of period 9,545 14,054
Less: Cash and cash equivalents of assets classified as held for disposal and discontinued operationsat end of period − 13
Cash and cash equivalents at end of period (Consolidated Statements of Financial Position) 9,545 14,041
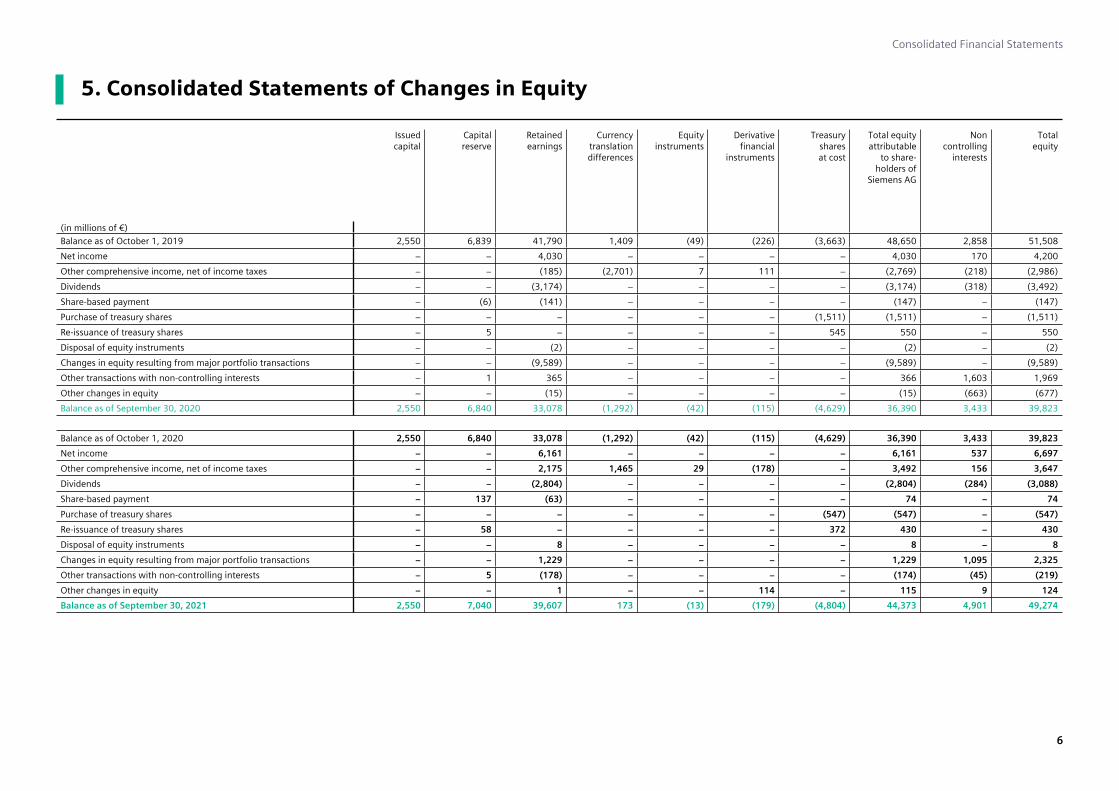
Consolidated Financial Statements
6
5. Consolidated Statements of Changes in Equity
Issuedcapital
Capitalreserve
Retainedearnings
Currencytranslationdifferences
Equity instruments
Derivativefinancial
instruments
Treasurysharesat cost
Total equityattributable
to share-holders of
Siemens AG
Non controlling
interests
Totalequity
(in millions of €)
Balance as of October 1, 2019 2,550 6,839 41,790 1,409 (49) (226) (3,663) 48,650 2,858 51,508
Net income − − 4,030 − − − − 4,030 170 4,200
Other comprehensive income, net of income taxes − − (185) (2,701) 7 111 − (2,769) (218) (2,986)
Dividends − − (3,174) − − − − (3,174) (318) (3,492)
Share-based payment − (6) (141) − − − − (147) − (147)
Purchase of treasury shares − − − − − − (1,511) (1,511) − (1,511)
Re-issuance of treasury shares − 5 − − − − 545 550 − 550
Disposal of equity instruments − − (2) − − − − (2) − (2)
Changes in equity resulting from major portfolio transactions − − (9,589) − − − − (9,589) − (9,589)
Other transactions with non-controlling interests − 1 365 − − − − 366 1,603 1,969
Other changes in equity − − (15) − − − − (15) (663) (677)
Balance as of September 30, 2020 2,550 6,840 33,078 (1,292) (42) (115) (4,629) 36,390 3,433 39,823
Balance as of October 1, 2020 2,550 6,840 33,078 (1,292) (42) (115) (4,629) 36,390 3,433 39,823
Net income − − 6,161 − − − − 6,161 537 6,697
Other comprehensive income, net of income taxes − − 2,175 1,465 29 (178) − 3,492 156 3,647
Dividends − − (2,804) − − − − (2,804) (284) (3,088)
Share-based payment − 137 (63) − − − − 74 − 74
Purchase of treasury shares − − − − − − (547) (547) − (547)
Re-issuance of treasury shares − 58 − − − − 372 430 − 430
Disposal of equity instruments − − 8 − − − − 8 − 8
Changes in equity resulting from major portfolio transactions − − 1,229 − − − − 1,229 1,095 2,325
Other transactions with non-controlling interests − 5 (178) − − − − (174) (45) (219)
Other changes in equity − − 1 − − 114 − 115 9 124
Balance as of September 30, 2021 2,550 7,040 39,607 173 (13) (179) (4,804) 44,373 4,901 49,274

Consolidated Financial Statements
7
6. Notes to Consolidated Financial Statements
NOTE 1 Basis of presentationThe accompanying Consolidated Financial Statements present the operations of Siemens Aktiengesellschaft with registered offices in Berlin (registry number HRB 12300) and Munich (registry number HRB 6684), Germany, and its subsidiaries (the Company or Siemens). They have been prepared in accordance with International Financial Reporting Standards (IFRS), as adopted by the European Union as well as with the additional requirements set forth in Section 315e (1) of the German Commercial Code (HGB). The financial statements are in accordance with IFRS as issued by the International Accounting Standards Board (IASB). The Consolidated Financial Statements were authorized for issue by the Managing Board on November 30, 2021. Siemens prepares and reports its Consolidated Financial Statements in euros (€). Due to rounding, numbers presented may not add up precisely to totals provided. Siemens is a German based multinational focused technology company.
NOTE 2 Material accounting policies and critical accounting estimatesCertain of these accounting policies require critical accounting estimates that involve complex and subjective judgments and the use of assumptions, some of which may be for matters that are inherently uncertain and susceptible to change. Such critical accounting estimates could change from period to period and have a material impact on the Company’s results of operations, financial positions and cash flows. Critical accounting estimates could also involve estimates where Siemens reasonably could have used a different estimate in the current accounting period. Siemens cautions that future events often vary from forecasts and that estimates routinely require adjustment.
COVID-19 – Impacts of the pandemic coronavirus spread on Siemens’ Consolidated Financial Statements are contingent on the further evolution of virus variants, the progress of worldwide vaccinations and the vaccines’ effectiveness. Potential impacts may also result from increasingly phased out financial and non-financial measures originally taken by governments and organizations globally. Related impacts could influence fair value and carrying amounts of assets and liabilities, amount and timing of results of operations and cash flows. Effects vary considerably by region and customer industries. Siemens based its estimates and assumptions on existing knowledge and best information available. We expect that related effects on Siemens’ Consolidated Financial Statements will not reach a substantial degree.
Basis of consolidation – The Consolidated Financial Statements include the accounts of Siemens AG and its subsidiaries over which the Company has control. Siemens controls an investee if it has power over the investee. In addition, Siemens is exposed to, or has rights to, variable returns from the involvement with the investee and Siemens is able to use its power over the investee to affect the amount of Siemens’ return.
Business combinations – Cost of an acquisition is measured at the fair value of the assets given and liabilities incurred or assumed at the date of exchange. Identifiable assets acquired and liabilities assumed in a business combination (including contingent liabilities) are initially measured at their fair values at the acquisition date, irrespective of the extent of any non-controlling interest. Non-controlling interests are measured at the proportional fair value of assets acquired and liabilities assumed (partial goodwill method). If there is no loss of control, transactions with non-controlling interests are accounted for as equity transactions not affecting net income. At the date control is lost, any retained equity interests are remeasured to fair value. In case of a written put option on non-controlling interests the Company assesses whether the prerequisites for the transfer of present ownership interest are fulfilled at the balance sheet date. If the Company is not the beneficial owner of the shares underlying the put option, the exercise of the put option will be assumed at each balance sheet date and treated as equity transaction between shareholders with the recognition of a purchase liability at the respective exercise price. The non-controlling interests participate in profits and losses during the reporting period.
Associates and joint ventures – Associates are companies over which Siemens has the ability to exercise significant influence over operating and financial policies (generally through direct or indirect ownership of 20% to 50% of the voting rights). Joint ventures are entities over which Siemens and one or more parties have joint control. Joint control requires unanimous consent of the parties sharing control in decision making on relevant activities.
Associates and joint ventures are recorded in the Consolidated Financial Statements using the equity method and are initially recognized at cost. If the investment was retained in a transaction in which Siemens lost control of a subsidiary, the fair value of the investment represents the cost on initial recognition. Siemens’ share of its associate’s or joint venture’s post-acquisition profits or losses is recognized in the Consolidated Statements of Income, and its share of post-acquisition changes in equity that have not been recognized in the associate’s or joint venture’s profit or loss is recognized directly in equity. The cumulative post-acquisition changes also include effects from fair value adjustments and are adjusted against the carrying amount of the investment. When Siemens’ share of losses in an associate or joint venture equals or exceeds its interest in the investment, Siemens does not recognize further losses, unless it incurs obligations or makes payments on behalf of the associate or joint venture. The interest in an associate or joint venture is the carrying amount of the investment together with any long term interests that, in substance, form part of Siemens’ net investment in the associate or joint venture.
Siemens reviews associates and joint ventures for impairment whenever there is objective evidence that its investment is impaired, for example a significant or prolonged decline in the fair value of the investment below its cost. This includes the use of estimates and assumptions also related to observable valuation inputs that tend to be uncertain.
Foreign currency translation – Assets and liabilities of foreign subsidiaries, where the functional currency is other than the euro, are translated using the spot exchange rate at the end of the reporting period, while the Consolidated Statements of Income are translated using average exchange rates during the period. Differences arising from such translations are recognized within equity and reclassified to net income when the gain or loss on disposal of the foreign subsidiary is recognized. The Consolidated Statements of Cash Flows are translated at average exchange rates during the period, whereas cash and cash equivalents are translated at the spot exchange rate at the end of the reporting period.
Foreign currency transaction – Transactions that are denominated in a currency other than the functional currency of an entity, are recorded at that functional currency applying the spot exchange rate at the date when the underlying transactions are initially recognized. At the end of the reporting period, foreign currency-denominated monetary assets and liabilities are revalued to functional currency applying the spot exchange rate prevailing at that date. Gains and losses arising from these foreign currency revaluations are recognized

Consolidated Financial Statements
8
in net income. Those foreign currency-denominated transactions which are classified as non-monetary are remeasured using the historical spot exchange rate.
Revenue recognition – Siemens recognizes revenue when, or as control over distinct goods or services is transferred to the customer; i.e. when the customer is able to direct the use of the transferred goods or services and obtains substantially all of the remaining benefits, provided a contract with enforceable rights and obligations exists and amongst others collectability of consideration is probable taking our customer’s creditworthiness into account. Revenue is the transaction price Siemens expects to be entitled to. Variable consideration is included in the transaction price if it is highly probable that a significant reversal of revenue will not occur once associated uncertainties are resolved. The amount of variable consideration is calculated by either using the expected value or the most likely amount depending on which is expected to better predict the amount of variable consideration. Consideration is adjusted for the time value of money if the period between the transfer of goods or services and the receipt of payment exceeds twelve months and there is a significant financing benefit either to the customer or Siemens. If a contract contains more than one distinct good or service, the transaction price is allocated to each performance obligation based on relative stand-alone selling prices. If stand-alone selling prices are not observable, the Company reasonably estimates those. Revenue is recognized for each performance obligation either at a point in time or over time.
Sales from construction-type contracts: Revenues are recognized over time under the percentage-of-completion method, based on the percentage of costs incurred to date compared to total estimated costs. An expected loss on the contract is recognized as an expense immediately. Payment terms are usually 30 days from the date of invoice issued according to the contractual terms.
The percentage-of-completion method places considerable importance on accurate estimates of the extent of progress towards completion and may involve estimates on the scope of deliveries and services required to fulfill the contractually defined obligations. These significant estimates include total estimated costs, total estimated revenues, contract risks, including technical, political and regulatory risks, risks from supply chain constraints and other judgments. Under the percentage-of-completion method, changes in estimates may lead to an increase or decrease of revenue. In addition, Siemens needs to assess whether the contract is expected to continue or whether it is terminated. In determining whether the continuation or termination of a contract is expected to be the most likely scenario, all relevant facts and circumstances relating to the contract are considered on an individual basis.
Revenues from services: Revenues are recognized over time on a straight-line basis or, if the performance pattern is other than straight-line, as services are provided, i.e. under the percentage-of-completion method as described above. Payment terms are usually 30 days from the date of invoice issued according to the contractual terms.
Sale of goods: Revenues are recognized at a point in time when control of the goods passes to the buyer, usually upon delivery of the goods. Invoices are issued at that point in time and are usually payable within 30 days. For licensing transactions granting the customer a right to use Siemens’ intellectual property, payment terms are usually 30 days from the date of invoice issued according to the contractual terms.
Income from royalties: Royalties are recognized on an accrual basis in accordance with the substance of the relevant agreement.
Income from interest – Interest is recognized using the effective interest method.
Functional costs – In general, operating expenses by types are assigned to the functions following the functional area of the corresponding profit and cost centers. Amortization, depreciation and impairment of intangible assets and property, plant and equipment are included in functional costs depending on the use of the assets.
Product-related expenses – Provisions for estimated costs related to product warranties are recorded in line item Cost of sales at the time the related sale is recognized.
Research and development costs – Costs of research activities are expensed as incurred. Costs of development activities are capitalized when the recognition criteria in IAS 38 are met. Capitalized development costs are stated at cost less accumulated amortization and impairment losses with an amortization period of generally three to ten years.
Earnings per share – Basic earnings per share are computed by dividing income from continuing operations, income from discontinued operations and net income, all attributable to ordinary shareholders of Siemens AG by the weighted average number of shares outstanding during the year. Diluted earnings per share are calculated by assuming conversion or exercise of all potentially dilutive securities and share-based payment plans.
Goodwill – Goodwill is not amortized, instead, goodwill is tested for impairment annually, as well as whenever there are events or changes in circumstances (triggering events) which suggest that the carrying amount may not be recoverable. Goodwill is carried at cost less accumulated impairment losses. The goodwill impairment test is performed at the level of a cash-generating unit or a group of cash-generating units, generally represented by a segment. Siemens Healthineers is tested one level below the segment. This is the lowest level at which goodwill is monitored for internal management purposes.
For the purpose of impairment testing, goodwill acquired in a business combination is allocated to the cash-generating unit or the group of cash-generating units that is expected to benefit from the synergies of the business combination. If the carrying amount of the cash-generating unit or the group of cash-generating units, to which the goodwill is allocated, exceeds its recoverable amount, an impairment loss on goodwill allocated to that (group of) cash-generating unit(s) is recognized. The recoverable amount is the higher of the cash-generating unit’s or the group of cash-generating units’ fair value less costs to sell and its value in use. If either of these values exceeds the carrying amount, it is not always necessary to determine both values. These values are generally determined based on discounted cash flow calculations. Impairment losses on goodwill are not reversed in future periods.
The determination of the recoverable amount of a cash-generating unit or a group of cash-generating units to which goodwill is allocated involves the use of estimates by management. The outcome predicted by these estimates is influenced e.g. by the successful integration of acquired entities, volatility of capital markets, interest rate developments, foreign exchange rate fluctuations and the outlook on economic trends. In determining recoverable amounts, discounted cash flow calculations generally use five-year projections (in exceptional cases up to ten years) that are based on financial forecasts. Cash flow projections take into account past experience and represent management’s best estimate about future developments. Cash flows after the planning period are extrapolated using individual growth rates. Key assumptions on which management has based its determination of fair value less costs to sell and value in use include

Consolidated Financial Statements
9
estimated growth rates and weighted average cost of capital. These estimates, including the methodology used, can have a material impact on the respective values and ultimately the amount of any goodwill impairment.
Other intangible assets – The Company amortizes intangible assets with finite useful lives on a straight-line basis over their respective estimated useful lives. Estimated useful lives for patents, licenses and other similar rights generally range from three to five years, except for intangible assets with finite useful lives acquired in business combinations. Intangible assets acquired in business combinations primarily consist of customer relationships and trademarks as well as technology. Useful lives in specific acquisitions ranged from four to 30 years for customer relationships and trademarks (in fiscal 2020 four to 20 years) and for technology from five to 22 years (in fiscal 2020 five to 18 years).
Property, plant and equipment – Property, plant and equipment, is valued at cost less accumulated depreciation and impairment losses. Depreciation expense is recognized using the straight-line method. The following useful lives are assumed:
Factory and office buildings 20 to 50 years
Other buildings 5 to 10 years
Technical machinery & equipment generally 10 years
Office & other equipment generally 5 years
Equipment leased to others generally 3 to 7 years
Impairment of property, plant and equipment and other intangible assets – The Company reviews property, plant and equipment and other intangible assets for impairment whenever events or changes in circumstances indicate that the carrying amount of an asset may not be recoverable. In addition, intangible assets not yet available for use are subject to an annual impairment test. Impairment testing of property, plant and equipment and other intangible assets involves the use of estimates in determining the assets’ recoverable amount, which can have a material impact on the respective values and ultimately the amount of any impairment.
Leases – A contract is or contains a lease if the contract conveys the right to control the use of an identified asset for a period of time in exchange for consideration. Further information on leases can be found in Notes 8, 13 and 16.
Lessor – Leases are classified as either finance or operating leases, determined based on whether substantially all the risks and rewards incidental to ownership of an underlying asset are transferred. If this is the case, the lease is classified as a finance lease; if not, it is an operating lease. Receivables from finance leases are recognized at an amount equal to the net investment in the lease. The assets underlying the operating leases are presented in Property, plant and equipment and depreciated on a straight-line basis over their useful lives or to their estimated residual value. Operating lease income is recognized on a straight-line basis over the lease term.
Lessee – Siemens recognizes right-of-use assets and lease liabilities for leases with a term of more than twelve months if the underlying asset is not of low value. Payments for short-term and low-value leases are expensed over the lease term. Extension options are included in the lease term if their exercise is reasonably certain. Right-of-use assets are measured at cost less accumulated depreciation and impairment losses adjusted for any remeasurements. Right-of-use assets are depreciated under the straight-line method over the shorter of the lease term and the useful life of the underlying assets. Lease liabilities are measured at the present value of the lease payments due over the lease term, generally discounted using the incremental borrowing rate. Lease liabilities are subsequently measured at amortized cost using the effective interest method. They are remeasured in case of modifications or reassessments of the lease.
Discontinued operations and non-current assets held for disposal – Discontinued operations are reported when a component of an entity is classified as held for disposal or has been disposed of, if the component represents a separate major line of business or geographical area of operations and is part of a single coordinated plan to disposal. A non-current asset or a disposal group is held for disposal if its carrying amount will be recovered principally through a sale transaction or through a distribution to owners rather than through continuing use. In the Consolidated Statements of Income and of Cash Flows, discontinued operations is reported separately from continuing operations; prior periods are presented on a comparable basis. The disclosures in the Notes to the Consolidated Financial Statements outside Note 3 relate to continuing operations or assets and liabilities not held for disposal. The determination of the fair value less costs to sell includes the use of estimates and assumptions that tend to be uncertain.
Income taxes – Tax positions are calculated taking into consideration the respective local tax laws, relevant court decisions and applicable tax authorities’ views. Tax regulations can be complex and possibly subject to different interpretations of tax payers and local tax authorities. Different interpretations of existing or new tax laws as a result of tax reforms or other tax legislative procedures may result in additional tax payments for prior years and are taken into account based on management’s considerations. Under the liability method, deferred tax assets and liabilities are recognized for expected tax consequences of future periods attributable to differences between the financial statement carrying amounts of assets and liabilities and their respective tax bases. Deferred tax assets are recognized if sufficient future taxable profit is available, including income from forecasted operating earnings, the reversal of existing taxable temporary differences and available tax planning opportunities that Siemens would execute. As of each period-end, Siemens evaluates the recoverability of deferred tax assets, based on taxable income of past periods and projected future taxable profits. As future developments are uncertain and partly beyond Siemens’s control, assumptions are necessary to estimate future taxable profits as well as the period in which deferred tax assets will recover. Estimates are revised in the period in which there is sufficient evidence to revise the assumption.
Contract assets, contract liabilities, receivables – When either party to a contract with customers has performed, Siemens presents a contract asset, a contract liability or a receivable depending on the relationship between Siemens’ performance and the customer’s payment. Contract assets and liabilities are presented as current since incurred in the normal operating cycle. Receivables are recognized when the right to consideration becomes unconditional. Valuation allowances for credit risks are made for contract assets and receivables in accordance with the accounting policy for financial assets measured at amortized cost.
Inventories – Inventories are valued at the lower of acquisition or production costs and net realizable value, costs being generally determined based on an average or first-in, first-out method. Determining net realizable value of inventories involves accounting estimates for quantity, technical and price risks.
Defined benefit plans – Siemens measures the entitlements by applying the projected unit credit method. The approach reflects an actuarially calculated net present value of the future benefit entitlement for services already rendered. In determining the net present value of the future benefit entitlement for service already rendered (Defined Benefit Obligation (DBO)), the expected rates of future salary

Consolidated Financial Statements
10
increases and expected rates of future pension progression are considered. The assumptions used for the calculation of the DBO as of the period-end of the preceding fiscal year are used to determine the calculation of service cost and interest income and expense of the following year. Significant plans apply individual spot rates from full discount rate curves to determine service cost and interest expense. The net interest income or expense for the fiscal year will be based on the discount rate for the respective year multiplied by the net defined benefit liability (asset) at the preceding fiscal year’s period-end date.
Service cost, past service cost and settlement gains (losses) for pensions and similar obligations as well as administration costs unrelated to the management of plan assets are allocated among functional costs. Past service cost and settlement gains (losses) are recognized immediately in profit or loss. For unfunded plans, the amount in line item Provisions for pensions and similar obligations equals the DBO. For funded plans, Siemens offsets the fair value of the plan assets with the DBO. Siemens recognizes the net amount, after adjustments for effects relating to any asset ceiling.
Remeasurements comprise actuarial gains and losses as well as the difference between the return on plan assets and the amounts included in net interest on the net defined benefit liability (asset). They are recognized in Other comprehensive income, net of income taxes.
Actuarial valuations rely on key assumptions including discount rates, expected compensation increases, rate of pension progression and mortality rates. Discount rates used are determined by reference to yields on high-quality corporate bonds of appropriate duration and currency at the end of the reporting period. In case such yields are not available, discount rates are based on government bonds yields. Due to changing market, economic and social conditions, the underlying key assumptions may differ from actual developments.
Entitlements resulting from plans based on asset returns from underlying assets are generally measured at the fair value of the underlying assets at period-end. If the performance of the underlying assets is lower than a guaranteed return, the DBO is measured by projecting forward the contributions at the guaranteed fixed return and discounting back to a present value.
Provisions – A provision is recognized in the Statement of Financial Position when it is probable that the Company has a present legal or constructive obligation as a result of a past event and it is probable that an outflow of economic benefits will be required to settle the obligation and a reliable estimate can be made of the amount of the obligation. If the effect is material, provisions are recognized at present value by discounting the expected future cash flows at a pretax rate that reflects current market assessments of the time value of money. When a contract becomes onerous, the present obligation under the contract is recognized as a provision.
Significant estimates are involved in the determination of provisions related to onerous contracts, warranty costs, asset retirement obligations, legal and regulatory proceedings as well as governmental investigations (Legal Proceedings). Siemens records a provision for onerous contracts with customers when current estimates of total estimated costs exceed estimated revenue. Onerous contracts with customers are identified by monitoring the progress of the project and updating the estimates which requires significant judgment relating to achieving certain performance standards as well as estimates involving warranty costs and estimates regarding project delays including the assessment of responsibility splits between the contract partners for these delays.
Legal Proceedings often involve complex legal issues and are subject to substantial uncertainties. Accordingly, considerable judgment is part of determining whether it is probable that there is a present obligation as a result of a past event at the end of the reporting period, whether it is probable that such a Legal Proceeding will result in an outflow of resources and whether the amount of the obligation can be reliably estimated. Internal and external counsels are generally part of the determination process. Due to new developments, it may be necessary, to record a provision for an ongoing Legal Proceeding or to adjust the amount of a previously recognized provision. Upon resolution of a Legal Proceeding, Siemens may incur charges in excess of the recorded provisions for such matters. The outcome of Legal Proceedings may have a material effect on Siemens’ financial position, its results of operations and/or its cash flows.
Termination benefits – Termination benefits are provided as a result of an entity’s offer made in order to encourage voluntary redundancy before the regular retirement date or from an entity’s decision to terminate the employment. Termination benefits in accordance with IAS 19, Employee Benefits, are recognized as a liability and an expense when the entity can no longer withdraw the offer of those benefits.
Financial instruments – A financial instrument is any contract that gives rise to a financial asset of one entity and a financial liability or equity instrument of another entity. Based on their contractual cash flow characteristics and the business model they are held in, financial instruments are classified as financial assets and financial liabilities measured at cost or amortized cost, measured at fair value, loan commitments, contract assets and receivables from finance leases. Regular way purchases or sales of financial assets are accounted for at the trade date. Initially, financial instruments are recognized at fair value and net of transaction costs, if not categorized at FVTPL. Subsequently, financial assets and liabilities are measured according to the category to which they are assigned to:
Financial assets measured at fair value through profit and loss (FVTPL): a) mandatorily measured at FVTPL: Debt financial assets are measured at FVTPL if the business model they are held in is not a hold-to-collect or a hold-and-sell business model, or if their contractual cash flows do not represent solely payments of principal and interest. Equity instruments are measured at FVTPL unless the FVOCI-option is elected. b) Financial assets designated as measured at FVTPL are irrevocably designated at initial recognition if the designation significantly reduces accounting mismatches that would otherwise arise if assets and liabilities as well as recognizing gains (losses) were measured on different bases.
Financial assets measured at fair value through other comprehensive income (FVOCI): are equity instruments for which Siemens irrevocably elects to present subsequent fair value changes in OCI at initial recognition of the instrument. Unrealized gains and losses, net of deferred income tax expenses, as well as gains and losses on the subsequent sale of the instruments are recognized in line item Other comprehensive income, net of income taxes.
Financial assets measured at amortized cost: Loans, receivables and other debt instruments held in a hold-to-collect business model with contractual cash flows that represent solely payments of principal and interest are measured at amortized cost using the effective interest method less valuation allowances for expected credit losses.
Valuation allowances are set up for expected credit losses, representing a forward-looking estimate of future credit losses involving significant judgment. Expected credit loss is the gross carrying amount less collateral, multiplied by the probability of default and a factor reflecting the loss in the event of default. Valuation allowances are not recognized when the gross carrying amount is sufficiently collateralized. Probabilities of default are mainly derived from internal rating grades. A simplified approach is used to assess expected credit losses from trade receivables, lease receivables and contract assets by applying their lifetime expected credit losses. The valuation
Consolidated Financial Statements
11
allowance for loans and other long-term debt instruments primarily held at Financial Services (SFS) is measured according to a three-stage impairment approach:
Stage 1: At inception, twelve-month expected credit losses are recognized based on a twelve months probability of default.
Stage 2: If the credit risk of a financial asset increases significantly without being credit-impaired, lifetime expected credit losses are recognized based on a lifetime probability of default. A significant increase in credit risk is determined for each individual financial instrument using internal credit ratings. A rating deterioration does not trigger a transfer into Stage 2, if the credit rating remains within the investment grade range. More than 30 days past due payments will not be transferred into Stage 2, if the delay is not credit-risk-related.
Stage 3: If the financial asset is credit-impaired, valuation allowances equal lifetime expected credit losses. A financial asset is considered credit-impaired when there is observable information about significant financial difficulties and a high vulnerability to default, however, the definition of default is not yet met. Impairment triggers include liquidity problems, a request for debt restructuring or a breach of contract. A credit-risk driven contractual modification always results in a credit-impaired financial asset.
Financial assets are written off as uncollectible if recovery appears unlikely. Generally, if the limitation period expired, when a debtor’s sworn statement of affairs is received, or when the receivable is not pursued due to its minor value. Receivables are written off when bankruptcy proceedings close.
A financial asset is derecognized when the rights to cash flows expire or the financial asset is transferred to another party. Significant modifications of contractual terms of a financial asset measured at amortized cost result in derecognition and recognition of a new financial asset; for insignificant modifications, the carrying amount of the financial asset is adjusted without derecognition.
Cash and cash equivalents – The Company considers all highly liquid investments with less than three months maturity from the date of acquisition to be cash equivalents. Cash and cash equivalents are measured at cost.
Loan Commitments – Expected credit losses for irrevocable loan commitments are determined using the three-stage impairment approach for financial assets measured at amortized cost and recognized as a liability.
Financial liabilities – except for derivative financial instruments, Siemens measures financial liabilities at amortized cost using the effective interest method.
Derivative financial instruments – Derivative financial instruments, such as foreign currency exchange contracts and interest rate swap contracts are measured at fair value unless they are designated as hedging instruments, for which hedge accounting is applied. Changes in the fair value of derivative financial instruments are recognized either in net income or, in the case of a cash flow hedge, in line item Other comprehensive income, net of income taxes (applicable deferred income tax). Certain derivative instruments embedded in host contracts are also accounted for separately as derivatives.
Fair value hedges: The carrying amount of the hedged item is adjusted by the gain or loss attributable to the hedged risk. Where an unrecognized firm commitment is designated as hedged item, the subsequent cumulative change in its fair value is recognized as a separate financial asset or liability with corresponding gain or loss recognized in net income. For hedged items carried at amortized cost, the adjustment is amortized until maturity of the hedged item. For hedged firm commitments the initial carrying amount of the assets or liabilities that result from meeting the firm commitments are adjusted to include the cumulative changes in the fair value that were previously recognized as separate financial assets or liabilities.
Cash flow hedges: The effective portion of changes in the fair value of derivative instruments designated as cash flow hedges are recognized in line item Other comprehensive income, net of income taxes, and any ineffective portion is recognized immediately in net income. Amounts accumulated in equity are reclassified into net income in the same periods in which the hedged item affects net income.
Share-based payment – Share-based payment awards at Siemens are predominately designed as equity-settled. Fair value is measured at grant date and is expensed over the vesting period. Fair value is determined as the market price of the underlying shares, considering dividends during the vesting period the grantees are not entitled to as well as market conditions and non-vesting conditions, if applicable. Plans granting the rights to receive subsidiary shares constitute own shares and, accordingly, are accounted as equity-settled.
Prior-year information – The presentation of certain prior-year information has been reclassified to conform to the current year presentation.
NOTE 3 Acquisitions, dispositions and discontinued operations
Acquisitions
On April 15, 2021, Siemens completed the acquisition of all shares in Varian Medical Systems, Inc., USA (Varian). Varian is active in the field of cancer care, with solutions especially in radiation oncology and related digital solutions and applications. The acquired business is integrated into Siemens Healthineers. Varian thus offers a good complement to Siemens Healthineers’ businesses in medical imaging, laboratory diagnostics and interventional procedures. The purchase price paid in cash amounted to US$16.4 billion (€13.9 billion as of the acquisition date). The preliminary purchase price allocation as of the acquisition date resulted in the following assets and liabilities: Cash and cash equivalents €0.6 billion, Trade and other receivables €0.6 billion, Inventories €0.8 billion, various other current assets €0.4 billion, Goodwill €8.0 billion, Other intangible assets €6.3 billion, Property, plant and equipment €0.5 billion, miscellaneous assets €0.2 billion, Trade payables €0.2 billion, Contract liabilities €0.7 billion, Current income tax liabilities €0.2 billion, Other current liabilities €0.3 billion, Deferred tax liabilities €1.6 billion and miscellaneous liabilities €0.5 billion. Resulting intangible assets mainly relate to technologies for oncology solutions, customer relationships, and the acquired order backlog. As of the acquisition date, goodwill was allocated to the groups of cash-generating units Varian €7.5 billion and Imaging €0.5 billion in accordance with the expected synergies. Goodwill relates to inseparable intangible assets such as synergy effects and employee know-how. Synergies from the acquisition are mainly expected from broader regional coverage of the sales network, cross-selling opportunities into our existing customer base and from expanded integrated service offerings (e.g. “Oncology-as-a-Service” program) and value partnerships, and joint product innovation. In addition, the business combination is expected to generate cost synergies in the administrative field and in procurement
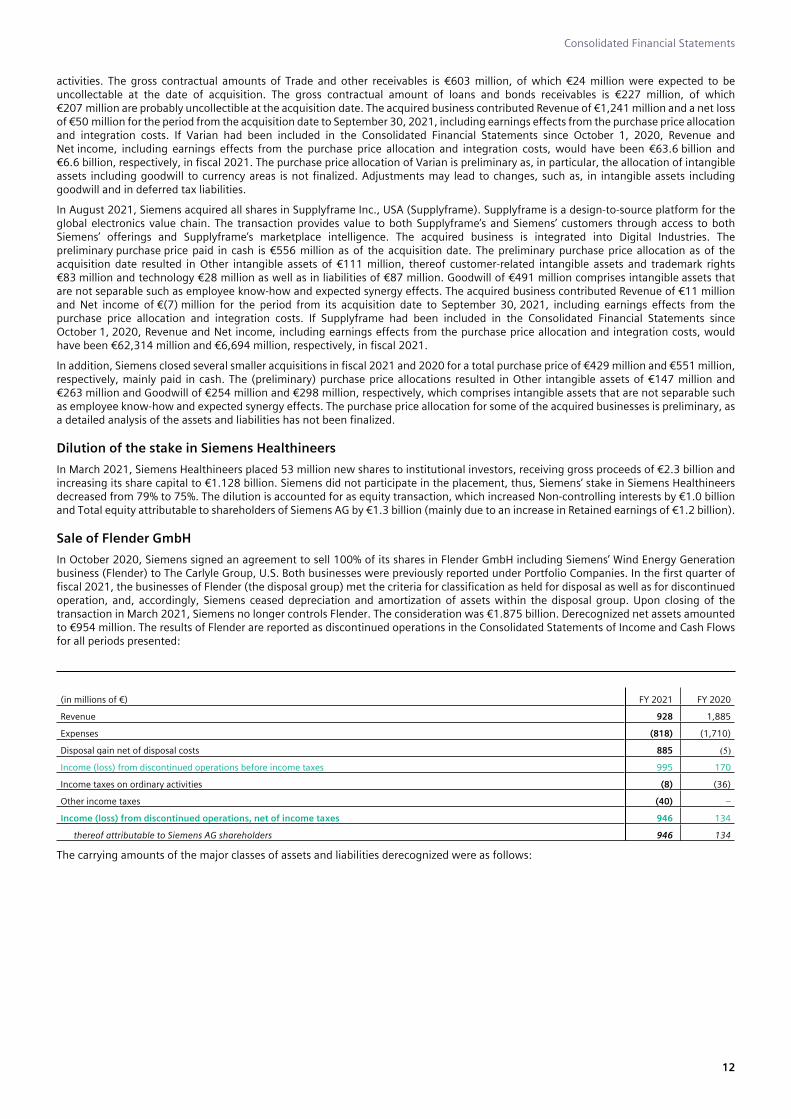
Consolidated Financial Statements
12
activities. The gross contractual amounts of Trade and other receivables is €603 million, of which €24 million were expected to be uncollectable at the date of acquisition. The gross contractual amount of loans and bonds receivables is €227 million, of which €207 million are probably uncollectible at the acquisition date. The acquired business contributed Revenue of €1,241 million and a net loss of €50 million for the period from the acquisition date to September 30, 2021, including earnings effects from the purchase price allocation and integration costs. If Varian had been included in the Consolidated Financial Statements since October 1, 2020, Revenue and Net income, including earnings effects from the purchase price allocation and integration costs, would have been €63.6 billion and €6.6 billion, respectively, in fiscal 2021. The purchase price allocation of Varian is preliminary as, in particular, the allocation of intangible assets including goodwill to currency areas is not finalized. Adjustments may lead to changes, such as, in intangible assets including goodwill and in deferred tax liabilities.
In August 2021, Siemens acquired all shares in Supplyframe Inc., USA (Supplyframe). Supplyframe is a design-to-source platform for the global electronics value chain. The transaction provides value to both Supplyframe’s and Siemens’ customers through access to both Siemens’ offerings and Supplyframe’s marketplace intelligence. The acquired business is integrated into Digital Industries. The preliminary purchase price paid in cash is €556 million as of the acquisition date. The preliminary purchase price allocation as of the acquisition date resulted in Other intangible assets of €111 million, thereof customer-related intangible assets and trademark rights €83 million and technology €28 million as well as in liabilities of €87 million. Goodwill of €491 million comprises intangible assets that are not separable such as employee know-how and expected synergy effects. The acquired business contributed Revenue of €11 million and Net income of €(7) million for the period from its acquisition date to September 30, 2021, including earnings effects from the purchase price allocation and integration costs. If Supplyframe had been included in the Consolidated Financial Statements since October 1, 2020, Revenue and Net income, including earnings effects from the purchase price allocation and integration costs, would have been €62,314 million and €6,694 million, respectively, in fiscal 2021.
In addition, Siemens closed several smaller acquisitions in fiscal 2021 and 2020 for a total purchase price of €429 million and €551 million, respectively, mainly paid in cash. The (preliminary) purchase price allocations resulted in Other intangible assets of €147 million and €263 million and Goodwill of €254 million and €298 million, respectively, which comprises intangible assets that are not separable such as employee know-how and expected synergy effects. The purchase price allocation for some of the acquired businesses is preliminary, as a detailed analysis of the assets and liabilities has not been finalized.
Dilution of the stake in Siemens Healthineers
In March 2021, Siemens Healthineers placed 53 million new shares to institutional investors, receiving gross proceeds of €2.3 billion and increasing its share capital to €1.128 billion. Siemens did not participate in the placement, thus, Siemens’ stake in Siemens Healthineers decreased from 79% to 75%. The dilution is accounted for as equity transaction, which increased Non-controlling interests by €1.0 billion and Total equity attributable to shareholders of Siemens AG by €1.3 billion (mainly due to an increase in Retained earnings of €1.2 billion).
Sale of Flender GmbH
In October 2020, Siemens signed an agreement to sell 100% of its shares in Flender GmbH including Siemens’ Wind Energy Generation business (Flender) to The Carlyle Group, U.S. Both businesses were previously reported under Portfolio Companies. In the first quarter of fiscal 2021, the businesses of Flender (the disposal group) met the criteria for classification as held for disposal as well as for discontinued operation, and, accordingly, Siemens ceased depreciation and amortization of assets within the disposal group. Upon closing of the transaction in March 2021, Siemens no longer controls Flender. The consideration was €1.875 billion. Derecognized net assets amounted to €954 million. The results of Flender are reported as discontinued operations in the Consolidated Statements of Income and Cash Flows for all periods presented:
(in millions of €) FY 2021 FY 2020
Revenue 928 1,885
Expenses (818) (1,710)
Disposal gain net of disposal costs 885 (5)
Income (loss) from discontinued operations before income taxes 995 170
Income taxes on ordinary activities (8) (36)
Other income taxes (40) −
Income (loss) from discontinued operations, net of income taxes 946 134
thereof attributable to Siemens AG shareholders 946 134
The carrying amounts of the major classes of assets and liabilities derecognized were as follows:

Consolidated Financial Statements
13
(in millions of €) Mar 10, 2021
Cash and cash equivalents 95
Trade and other receivables 510
Other current financial assets 143
Inventories 540
Goodwill 123
Property, plant and equipment 359
Miscellaneous current and non-current assets 92
Assets classified as held for disposal 1,862
Trade payables 355
Other current financial liabilities 193
Miscellaneous current liabilities 244
Miscellaneous non-current liabilities 116
Liabilities associated with assets classified as held for disposal 907
Spin-off Siemens Energy AG in fiscal 2020
Income from discontinued operations, net of income taxes includes €119 million from Siemens Energy AG in fiscal 2021, which are mainly attributable to the reversal of income tax provisions.
NOTE 4 Interests in other entities Investments accounted for using the equity method
Fiscal year
(in millions of €) 2021 2020
Share of profit (loss), net (514) (114)
Gains (losses) on sales, net 57 108
Impairment and reversals of impairment (21) (590)
Income (loss) from investments accounted for using the equity method, net (478) (596)
In fiscal 2021, share of profit (loss) from investments accounted for using the equity method includes a loss of €396 million (loss of €24 million in fiscal 2020) from Siemens Energy AG. In fiscal 2021, the loss includes Siemens’ share of Siemens Energy AG’s net losses of €(159) million as well as effects from fair value adjustments at initial recognition of €(237) million.
Below summarized financial information of Siemens Energy AG are disclosed at a 100 per cent basis. They are adjusted to align with Siemens’ accounting policies and to incorporate effects from fair value adjustments at initial recognition. These adjustments were preliminary in fiscal 2020 and have been finalized in fiscal 2021.
Siemens Energy AGregistered in Munich, Germany
(in millions of €) Sep 30, 2021 Sep 30, 2020
Ownership interest 35.1% 35.1%
Current assets 23,397 23,136
Non-current assets excluding goodwill 16,874 18,792
Current liabilities 22,602 21,669
Non-current liabilities 7,514 8,080
Net Assets 10,155 12,179
attributable to shareholders of Siemens Energy AG 9,525 11,731
Siemens interest in the net assets of Siemens Energy AG at fiscal year-end 3,343 4,118
Consolidation adjustments (including goodwill) 3,009 2,527
Carrying amount of Siemens Energy AG at end of fiscal year 6,352 6,645
Fiscal year 2021 Fiscal year 2020
Revenue 28,482 27,457
Income (loss) from continuing operations, net of income taxes (1,236) (1,873)
Other comprehensive income, net of income taxes 369 (1,120)
Total comprehensive income (loss), net of income taxes (867) (2,993)
attributable to shareholders of Siemens Energy AG (793) (2,630)
Total comprehensive income, net of income taxes, attributable to Siemens (2020: since initial recognition on Sep. 25) (278) (24)

Consolidated Financial Statements
14
Siemens Energy AG is globally active in the transmission and generation of electrical power and is publicly listed. The market capitalization of Siemens Energy is €16.6 billion and €16.5 billion, respectively, as of September 30, 2021 and 2020.
Subsidiary with material non-controlling interests
Summarized financial information, in accordance with IFRS and before inter-company eliminations, is presented below.
Siemens Healthineers AGregistered in Munich, Germany
(in millions of €) Sep 30, 2021 Sep 30, 2020
Ownership interests held by non-controlling interests 25% 21%
Accumulated non-controlling interests 4,031 2,623
Current assets 10,824 10,268
Non-current assets 31,338 14,827
Current liabilities 10,065 7,289
Non-current liabilities 15,758 5,294
Fiscal year 2021 Fiscal year 2020
Net income attributable to non-controlling interests 409 241
Dividends paid to non-controlling interests 192 132
Revenue 17.997 14,460
Income (loss) from continuing operations, net of income taxes 1.746 1,423
Other comprehensive income, net of income taxes 700 (598)
Total comprehensive income, net of income taxes 2.446 825
Total cash flows 632 (233)
NOTE 5 Other operating income In fiscal 2021 and 2020, Other operating income mainly includes gains on sales of property, plant and equipment of €73 million and €308 million, respectively, as well as insurance related income. Fiscal 2020 included gains on the sales of businesses of €177 million.
NOTE 6 Other operating expenses Other operating expenses in fiscal 2021 and 2020 include losses on the sale of businesses as well as effects from insurance, personnel, legal and regulatory matters.
NOTE 7 Income taxesIncome tax expenses (benefits) consist of the following:
Fiscal year
(in millions of €) 2021 2020
Current taxes 1,650 1,563
Deferred taxes 211 (217)
Income tax expenses 1,861 1,346
Current income tax expenses in fiscal 2021 and 2020 include adjustments recognized for current taxes of prior years in the amount of €(359) million and €(64) million, respectively. The deferred tax expenses (benefits) in fiscal 2021 and 2020 include tax effects of the origination and reversal of temporary differences of €94 million and €(289) million, respectively.
In Germany, the calculation of current taxes is based on a combined tax rate of 31%, consisting of a corporate tax rate of 15%, a solidarity surcharge thereon of 5.5% and an average trade tax rate of 15%. For foreign subsidiaries, current taxes are calculated based on the local tax law and applicable tax rates in the individual foreign countries. Deferred tax assets and liabilities in Germany and abroad are measured at the tax rates that are expected to apply to the period when the asset is realized or the liability is settled.

Consolidated Financial Statements
15
Current and deferred income tax expenses differ from the amounts computed by applying a combined statutory German income tax rate of 31% as follows:
Fiscal year
(in millions of €) 2021 2020
Expected income tax expenses 2,324 1,705
Increase (decrease) in income taxes resulting from:
Non-deductible expenses 607 655
Tax-free income (386) (377)
Taxes for prior years (398) (56)
Change in realizability of deferred tax assets and tax credits 100 (75)
Change in tax rates 54 7
Foreign tax rate differential (496) (437)
Tax effect of investments accounted for using the equity method 147 33
Other, net (primarily German trade tax differentials) (91) (109)
Actual income tax expenses 1,861 1,346
Deferred income tax assets and (liabilities) on a net basis are summarized as follows:
Sep 30,
(in millions of €) 2021 2020
Deferred taxes due to temporary differences
Intangible assets (2,931) (1,302)
Pensions and similar obligations 2,724 2,921
Current assets and liabilities 437 362
Non-current assets and liabilities (600) (417)
Tax loss carryforwards and tax credits 898 760
Total deferred taxes, net 527 2,324
Deferred tax balances and expenses (benefits) developed as follows in fiscal 2021 and 2020:
Fiscal year
(in millions of €) 2021 2020
Balance at beginning of fiscal year of deferred tax (assets) liabilities (2,324) (1,869)
Income taxes presented in the Consolidated Statements of Income 211 (217)
Changes in items of the Consolidated Statements of Comprehensive Income 15 8
Additions from acquisitions not impacting net income 1,620 61
Changes due to Siemens Energy - (301)
Other (49) (6)
Balance at end of fiscal year of deferred tax (assets) liabilities (527) (2,324)
Deferred tax assets have not been recognized with respect of the following items (gross amounts):
Sep 30,
(in millions of €) 2021 2020
Deductible temporary differences 194 192
Tax loss carryforwards 2,280 2,172
2,474 2,364
The amount of €2,280 million for tax loss carryforwards for which no deferred tax asset has been recognized does include material loss carryforwards for local taxes only.
As of September 30, 2021 and 2020, €82 million and €221 million respectively, expire over the periods to 2029.
Siemens has not recognized deferred tax liabilities for income taxes or foreign withholding taxes on the cumulative earnings of subsidiaries of €31,628 million and €25,003 million, respectively in fiscal 2021 and 2020, because the earnings are intended to be permanently reinvested in the subsidiaries.

Consolidated Financial Statements
16
Including items charged or credited directly to equity and the expenses (benefits) from continuing and discontinued operations, the income tax expenses (benefits) consist of the following:
Fiscal year
(in millions of €) 2021 2020
Continuing operations 1,861 1,346
Discontinued operations (116) 435
Income and expenses recognized directly in equity (55) (588)
1,690 1,192
An uncertain tax regulation arising from a foreign tax reform may result in potential future tax payments amounting to a middle three-digit million euro range. Due to the low probability and the character of a contingent liability, no tax liability was recognized.
NOTE 8 Trade and other receivables
Sep 30,
(in millions of €) 2021 2020
Trade receivables from the sale of goods and services 13,267 12,071
Receivables from finance leases 2,250 2,003
15,518 14,074
In fiscal 2021 and 2020, the long-term portion of receivables from finance leases is reported in Other financial assets amounting to €4,700 million and €4,245 million, respectively.
Future minimum lease payments to be received are as follows:
Sep 30,
(in millions of €) 2021 2020
Within one year 2,711 2,441
After one year but not more than two years 1,911 1,685
After two years but not more than three years 1,284 1,156
After three years but not more than four years 807 732
After four years but not more than five years 452 422
More than five years 748 717
7,914 7,153
Future minimum lease payments reconcile to the net investment in the lease as follows:
Sep 30,
(in millions of €) 2021 2020
Future minimum lease payments 7,914 7,153
Less: Unearned finance income relating to future minimum lease payments (867) (778)
Present value of future minimum lease payments 7,047 6,375
Plus present value of unguaranteed residual value 115 100
Net investment in the lease 7,162 6,475
Investments in finance leases primarily relate to industrial machinery, medical equipment, transportation systems, equipment for information technology and office machines.
In fiscal 2021 and 2020, finance income on the net investment in the lease is €412 million and €398 million.
NOTE 9 Other current financial assets
Sep 30,
(in millions of €) 2021 2020
Loans receivable 5,085 4,904
Interest-bearing debt securities 1,132 1,256
Derivative financial instruments 398 798
Other 1,370 1,424
7,985 8,382

Consolidated Financial Statements
17
NOTE 10 Contract assets and liabilities As of September 30, 2021 and 2020, amounts expected to be settled after twelve months are €1,319 million and €960 million for contract assets and €1,824 million and €1,112 million for contract liabilities, respectively. In fiscal 2021, contract assets and liabilities increased by €141 million and €724 million, respectively, due to business combinations (mainly Varian). In fiscal 2021 and 2020, revenue includes €4,966 million and €4,616 million, respectively, which was included in contract liabilities at the beginning of the fiscal year.
NOTE 11 Inventories
Sep 30,
(in millions of €) 2021 2020
Raw materials and supplies 1,974 1,796
Work in progress 3,421 3,043
Finished goods and products held for resale 2,825 2,355
Advances to suppliers 616 600
8,836 7,795
Cost of sales includes inventories recognized as expense amounting to €39,227 million and €35,017 million, respectively, in fiscal 2021 and 2020. Compared to prior year, write-downs increased by €61 million as of September 30, 2021. As of September 30, 2020, write-downs decreased by €18 million compared to FY 2019.
NOTE 12 Goodwill
Fiscal year
(in millions of €) 2021 2020
Cost
Balance at begin of fiscal year 22,115 32,098
Translation differences and other 657 (1,642)
Acquisitions and purchase accounting adjustments 8,768 1,247
Dispositions and reclassifications to assets classified as held for disposal (123) (9,588)
Balance at fiscal year-end 31,417 22,115
Accumulated impairment losses and other changes
Balance at begin of fiscal year 1,666 1,938
Translation differences and other 22 (100)
Impairment losses recognized during the period − 99
Dispositions and reclassifications to assets classified as held for disposal − (271)
Balance at fiscal year-end 1,688 1,666
Carrying amount
Balance at begin of fiscal year 20,449 30,160
Balance at fiscal year-end 29,729 20,449
Siemens performs the mandatory annual impairment test in the three months ended September 30. Key assumptions on which Siemens based its determinations of the fair value less costs to sell for the cash-generating units or groups of cash-generating units include terminal value growth rates up to 1.7% in fiscal 2021 and fiscal 2020, respectively and after-tax discount rates of 5.5% to 12.0% in fiscal 2021 and 5.5% to 12.5% in fiscal 2020.
To estimate the fair value less costs to sell of the cash-generating units or groups of cash-generating units, cash flows were projected for the next five years (in exceptional cases up to ten years) based on past experience, actual operating results and management’s best estimate about future developments as well as market assumptions. The determined fair value of the cash-generating units or groups of cash-generating units is assigned to level 3 of the fair value hierarchy.
The fair value less costs to sell is mainly driven by the terminal value, which is particularly sensitive to changes in the assumptions on the terminal value growth rate and discount rate. Both assumptions are determined individually for each cash-generating unit or group of cash-generating units. Discount rates are based on the weighted average cost of capital (WACC). Siemens Financial Services’ discount rate represents its specific cost of equity. The discount rates are calculated based on a risk-free rate of interest and a market risk premium. In addition, the discount rates reflect the current market assessment of the risks specific to each cash-generating unit or group of cash-generating units by taking into account specific peer group information on beta factors, leverage and cost of debt as well as country specific premiums. The parameters for calculating the discount rates are based on external sources of information. The peer group is subject to an annual review and adjusted, if necessary. Terminal value growth rates take into consideration external macroeconomic sources of data and industry specific trends.

Consolidated Financial Statements
18
The following table presents key assumptions used to determine fair value less costs to sell for impairment test purposes for the groups of cash-generating units to which a significant amount of goodwill is allocated:
Sep 30, 2021
(in millions of €) Goodwill
Terminal value growth
rateAfter-tax
discount rate
Varian of Siemens Healthineers 7,692 1.7% 7.8%
Digital Industries 7,417 1.7% 8.5%
Imaging of Siemens Healthineers 6,525 1.7% 7.5%
Revenue figures in the detailed forecast planning period of the groups of cash-generating units to which a significant amount of goodwill is allocated are based on average revenue growth rates (excluding portfolio effects) of between 7.3% and 9.3% (3.1% and 6.1% in fiscal 2020).
Sep 30, 2020
(in millions of €) Goodwill
Terminal value growth
rateAfter-tax
discount rate
Digital Industries 6,732 1.7% 8.5%
Imaging of Siemens Healthineers 5,827 1.7% 7.0%
Smart Infrastructure 2,114 1.5% 7.5%
The sensitivity analysis for the groups of cash-generating units to which a significant amount of goodwill is allocated was based on a reduction in after-tax future cash flows by 10% or an increase in after-tax discount rates by one percentage point or a reduction in the terminal value growth rate by one percentage point. Siemens concluded that no impairment loss would need to be recognized on goodwill in any of these groups of cash-generating units.
NOTE 13 Other intangible assets and property, plant and equipment
Additions
(in millions of €)
Grosscarrying amount
10/01/2020
Translation differences
Additions through business
combi-nations
Reclassi-fications
Retire- ments¹
Gross carrying amount
09/30/2021
Accumu- lated depre- ciation/am-
ortization and impair-
ment
Carrying amount
09/30/2021
Deprecia- tion/amorti-
zation and impairment
in fiscal 2021
Internally generated technology 3,456 22 − 277 − (51) 3,704 (1,910) 1,794 (208)
Acquired technology including patents, licenses and similar rights 4,631 138 2,576 43 − (243) 7,144 (3,158) 3,987 (458)
Customer relationships and trademarks 5,037 176 3,978 − − (1,051) 8,139 (2,956) 5,184 (338)
Other intangible assets 13,124 335 6,553 319 − (1,345) 18,987 (8,023) 10,964 (1,004)
Land and buildings 8,656 126 349 756 195 (629) 9,454 (4,029) 5,425 (707)
Technical machinery and equipment 5,120 86 73 136 142 (732) 4,826 (3,405) 1,421 (270)
Office and other equipment 5,249 75 85 511 81 (595) 5,406 (4,164) 1,242 (582)
Equipment leased to others 3,682 76 14 626 1 (538) 3,860 (1,979) 1,882 (511)
Advances to suppliers andconstruction in progress 736 16 47 711 (420) (35) 1,055 (1) 1,053 −
Property, plant and equipment 23,443 379 568 2,739 − (2,529) 24,601 (13,578) 11,023 (2,071)
1 Includes assets reclassified to Assets classified as held for disposal and dispositions of those entities.
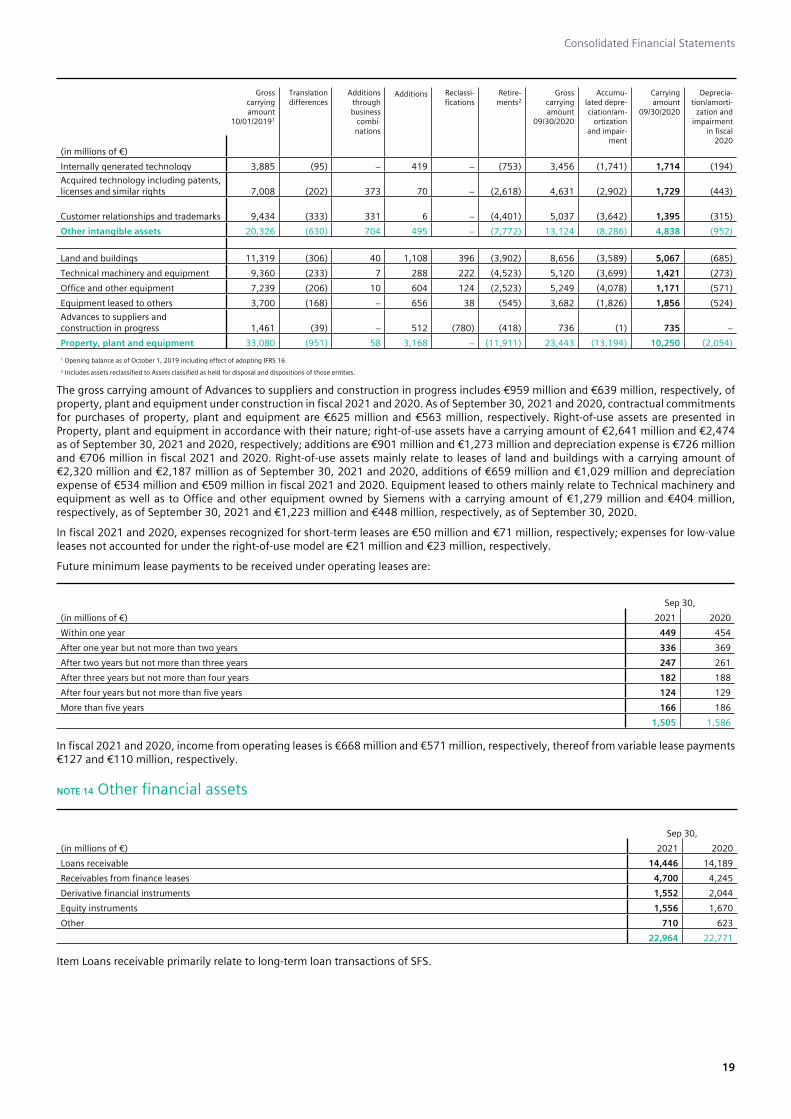
Consolidated Financial Statements
19
Additions
(in millions of €)
Gross carrying amount
10/01/20191
Translation differences
Additions through business
combi- nations
Reclassi- fications
Retire- ments2
Gross carrying amount
09/30/2020
Accumu- lated depre- ciation/am-
ortization and impair-
ment
Carrying amount
09/30/2020
Deprecia- tion/amorti-
zation and impairment
in fiscal 2020
Internally generated technology 3,885 (95) − 419 − (753) 3,456 (1,741) 1,714 (194)
Acquired technology including patents, licenses and similar rights 7,008 (202) 373 70 − (2,618) 4,631 (2,902) 1,729 (443)
Customer relationships and trademarks 9,434 (333) 331 6 − (4,401) 5,037 (3,642) 1,395 (315)
Other intangible assets 20,326 (630) 704 495 − (7,772) 13,124 (8,286) 4,838 (952)
Land and buildings 11,319 (306) 40 1,108 396 (3,902) 8,656 (3,589) 5,067 (685)
Technical machinery and equipment 9,360 (233) 7 288 222 (4,523) 5,120 (3,699) 1,421 (273)
Office and other equipment 7,239 (206) 10 604 124 (2,523) 5,249 (4,078) 1,171 (571)
Equipment leased to others 3,700 (168) − 656 38 (545) 3,682 (1,826) 1,856 (524)
Advances to suppliers and construction in progress 1,461 (39) − 512 (780) (418) 736 (1) 735 −
Property, plant and equipment 33,080 (951) 58 3,168 − (11,911) 23,443 (13,194) 10,250 (2,054)
1 Opening balance as of October 1, 2019 including effect of adopting IFRS 16
2 Includes assets reclassified to Assets classified as held for disposal and dispositions of those entities.
The gross carrying amount of Advances to suppliers and construction in progress includes €959 million and €639 million, respectively, of property, plant and equipment under construction in fiscal 2021 and 2020. As of September 30, 2021 and 2020, contractual commitments for purchases of property, plant and equipment are €625 million and €563 million, respectively. Right-of-use assets are presented in Property, plant and equipment in accordance with their nature; right-of-use assets have a carrying amount of €2,641 million and €2,474 as of September 30, 2021 and 2020, respectively; additions are €901 million and €1,273 million and depreciation expense is €726 million and €706 million in fiscal 2021 and 2020. Right-of-use assets mainly relate to leases of land and buildings with a carrying amount of €2,320 million and €2,187 million as of September 30, 2021 and 2020, additions of €659 million and €1,029 million and depreciation expense of €534 million and €509 million in fiscal 2021 and 2020. Equipment leased to others mainly relate to Technical machinery and equipment as well as to Office and other equipment owned by Siemens with a carrying amount of €1,279 million and €404 million, respectively, as of September 30, 2021 and €1,223 million and €448 million, respectively, as of September 30, 2020.
In fiscal 2021 and 2020, expenses recognized for short-term leases are €50 million and €71 million, respectively; expenses for low-value leases not accounted for under the right-of-use model are €21 million and €23 million, respectively.
Future minimum lease payments to be received under operating leases are:
Sep 30,
(in millions of €) 2021 2020
Within one year 449 454
After one year but not more than two years 336 369
After two years but not more than three years 247 261
After three years but not more than four years 182 188
After four years but not more than five years 124 129
More than five years 166 186
1,505 1,586
In fiscal 2021 and 2020, income from operating leases is €668 million and €571 million, respectively, thereof from variable lease payments €127 and €110 million, respectively.
NOTE 14 Other financial assets
Sep 30,
(in millions of €) 2021 2020
Loans receivable 14,446 14,189
Receivables from finance leases 4,700 4,245
Derivative financial instruments 1,552 2,044
Equity instruments 1,556 1,670
Other 710 623
22,964 22,771
Item Loans receivable primarily relate to long-term loan transactions of SFS.

Consolidated Financial Statements
20
NOTE 15 Other current liabilities
Sep 30,
(in millions of €) 2021 2020
Liabilities to personnel 5,375 4,304
Deferred Income 96 108
Accruals for pending invoices 541 518
Other 1,616 1,280
7,628 6,209
Other includes miscellaneous tax liabilities of €742 million and €576 million, respectively, in fiscal 2021 and 2020.
NOTE 16 Debt
Current debt Non-current debt
Sep 30, Sep 30, Sep 30, Sep 30,(in millions of €) 2021 2020 2021 2020
Notes and bonds 5,867 3,537 37,505 34,728
Loans from banks 1,183 321 1,100 1,076
Other financial indebtedness 70 2,021 46 55
Lease liabilities 701 683 2,228 2,146
Total debt 7,821 6,562 40,879 38,005
In fiscal 2021 and 2020, Siemens recognized interest expenses on lease liabilities of €43 million and €39 million and expenses relating to variable lease payments not included in the measurement of lease liabilities of €64 million and €100 million, respectively. In fiscal 2021 and 2020, cash flows to which Siemens is potentially exposed and which are not reflected in the measurement of lease liabilities relate primarily to lease contracts entered into, however which have not yet commenced as well as to extension options whose exercise is not yet reasonably certain totaling €2.9 billion and €2.6 billion, respectively, and, in addition, to variable lease payments mainly relating to incidental and operating costs for buildings leased by Siemens, for which no significant fluctuations are expected in the future.
Changes in liabilities arising from financing activities
Cash flows Non-cash changes
(in millions of €) 10/01/2020
(Acquisi-tions)/Dis-positions
Foreign currency
translationFair value
changes
Reclassifi-cations and
other changes 09/30/2021
Non-current notes and bonds 34,728 8,316 − 461 (242) (5,758) 37,505
Current notes and bonds 3,537 (3,511) − 110 5 5,726 5,867
Loans from banks (current and non-current) 1,397 839 67 22 − (42) 2,282
Other financial indebtness (current and non-current) 2,076 (1,957) − (9) − 6 116
Lease liabilities (current and non-current) 2,829 (745) 92 26 − 726 2,929
Total debt 44,567 2,941 159 610 (236) 659 48,700
In addition, other financing activities resulted in €130 million cash flows in fiscal 2021.
Cash flows Non-cash changes
(in millions of €) 10/01/2019
(Acquisi-tions)/Dis-positions
Foreign currency
translationFair value
changes
Reclassifi-cations and
other changes 09/30/2020
Non-current notes and bonds 29,176 10,256 − (1,276) 120 (3,549) 34,728
Current notes and bonds 4,029 (3,959) − (46) 4 3,509 3,537
Loans from banks (current and non-current) 2,262 891 (1,387) (225) − (144) 1,397
Other financial indebtness (current and non-current) 875 1,388 (1) (209) − 24 2,076
Lease liabilities (current and non-current) 3,233 (911) (735) (108) − 1,351 2,829
Total debt 39,576 7,664 (2,123) (1,865) 124 1,191 44,567
In addition, other financing activities resulted in €(99) million cash flows in fiscal 2020.
Credit facilities
As of September 30, 2021 and 2020, Siemens has €7.45 billion and €22.95 billion lines of credit, thereof unused €7.45 billion and €22.95 billion, respectively. In fiscal 2021, the unused €7.0 billion syndicated credit facility maturing in 2025 was extended to mature in 2026

Consolidated Financial Statements
21
with no extension option remaining. The €3.0 billion unused syndicated credit facility matured in December 2020. The €12.5 billion unused syndicated bridge facility to secure Siemens Healthineers AG’s financing of the acquisition of Varian Medical Systems, Inc. was cancelled by Siemens in March 2021. In September 2021, the unused €450 million revolving bilateral credit facility was extended to September 2022. The facilities are for general corporate purposes.

Consolidated Financial Statements
22
Notes and bonds
Sep 30, 2021 Sep 30, 2020
Currency Carrying Currency Carrying
Notional amount amount in Notional amount amount in
(interest/issued/maturity) (in millions) millions of € 1 (in millions) millions of € 1
2.75%/2012/September 2025/GBP fixed-rate instruments £ 350 406 £ 350 383
3.75%/2012/September 2042/GBP fixed-rate instruments £ 650 743 £ 650 700
1.75%/2013/March 2021/EUR fixed-rate instruments − − − € 1,250 1,254
2.875%/2013/March 2028/EUR fixed-rate instruments € 1,000 998 € 1,000 998
3.5%/2013/March 2028/US$ fixed-rate instruments US$ 100 85 US$ 100 84
2014/September 2021/US$ floating-rate instruments − − − US$ 400 342
0.375%/2018/September 2023/EUR fixed-rate instruments € 1,000 999 € 1,000 998
1.0%/2018/September 2027/EUR fixed-rate instruments € 750 747 € 750 746
1.375%/2018/September 2030/EUR fixed-rate instruments € 1,000 994 € 1,000 994
0.3%/2019/February 2024/EUR fixed-rate instruments € 750 759 € 750 764
0.9%/2019/February 2028/EUR fixed-rate instruments € 650 673 € 650 690
1.25%/2019/February 2031/EUR fixed-rate instruments € 800 846 € 800 882
1.75%/2019/February 2039/EUR fixed-rate instruments € 800 884 € 800 963
0.0%/2019/September 2021/EUR fixed-rate instruments − − − € 1,000 1,002
0.0%/2019/September 2024/EUR fixed-rate instruments € 500 503 € 500 503
0.125%/2019/September 2029/EUR fixed-rate instruments € 1,000 994 € 1,000 993
0.5%/2019/September 2034/EUR fixed-rate instruments € 1,000 991 € 1,000 991
3m EURIBOR+0.7%/2019/December 2021/EUR floating-rate instrument € 1,250 1,251 € 1,250 1,256
0.0%/2020/February 2023/EUR fixed-rate instruments € 1,250 1,252 € 1,250 1,253
0.0%/2020/February 2026/EUR fixed-rate instruments € 1,000 998 € 1,000 997
0.25%/2020/February 2029/EUR fixed-rate instruments € 1,000 997 € 1,000 996
0.5%/2020/February 2032/EUR fixed-rate instruments € 750 748 € 750 747
1.0%/2020/February 2025/GBP fixed-rate instruments £ 850 985 £ 850 929
0.125%/2020/June 2022/EUR fixed-rate instruments € 1,500 1,498 € 1,500 1,496
0.25%/2020/June 2024/EUR fixed-rate instruments € 1,000 998 € 1,000 997
0.375%/2020/June 2026/EUR fixed-rate instruments € 1,000 998 € 1,000 998
0.875%/2020/June 2023/GBP fixed-rate instruments £ 450 522 £ 450 491
Total Debt Issuance Program 20,867 23,449
6.125%/2006/August 2026/US$ fixed-rate instruments US$ 1,750 1,697 US$ 1,750 1,718
2.9%/2015/May 2022/US$-fixed-rate-instruments US$ 1,750 1,511 US$ 1,750 1,493
3.25%/2015/May 2025/US$ fixed-rate-instruments US$ 1,500 1,369 US$ 1,500 1,401
4.4%/2015/May 2045/US$ fixed-rate-instruments US$ 1,750 1,493 US$ 1,750 1,476
1.7%/2016/September 2021/US$-fixed-rate-instruments − − − US$ 1,100 939
2.0%/2016/September 2023/US$-fixed-rate-instruments US$ 750 646 US$ 750 638
2.35%/2016/October 2026/US$-fixed-rate-instruments US$ 1,700 1,463 US$ 1,700 1,446
3.3%/2016/September 2046/US$-fixed-rate-instruments US$ 1,000 856 US$ 1,000 846
2.7%/2017/March 2022/US$ fixed-rate-instruments US$ 1,000 873 US$ 1,000 884
US$ 3m LIBOR+0.61%/2017/March 2022/US$ floating-rate instruments US$ 850 734 US$ 850 725
3.125%/2017/March 2024/US$ fixed-rate-instruments US$ 1,000 902 US$ 1,000 915
3.4%/2017/March 2027/US$ fixed-rate-instruments US$ 1,250 1,077 US$ 1,250 1,064
4.2%/2017/March 2047/US fixed-rate-instruments US$ 1,500 1,283 US$ 1,500 1,269
0.4%/2021/March 2023/US$ fixed-rate-instruments US$ 1,250 1,078 − − −
Compounded SOFR+0.43%/2021/March 2024/US$ floating-rate instruments US$ 1,000 862 − − −
0.65%/2021/March 2024/US$ fixed-rate-instruments US$ 1,500 1,293 − − −
1.2%/2021/March 2026/US$ fixed-rate-instruments US$ 1,750 1,505 − − −
1.7%/2021/March 2028/US$ fixed-rate-instruments US$ 1,250 1,074 − − −
2.15%/2021/March 2031/US$ fixed-rate-instruments US$ 1,750 1,503 − − −
2.875%/2021/March 2041/US$ fixed-rate-instruments US$ 1,500 1,284 − − −
Total US$ Bonds 22,505 14,816
Total 43,372 38,265
1 Includes adjustments for fair value hedge accounting.

Consolidated Financial Statements
23
Debt Issuance Program – The Company has a program for the issuance of debt instruments in place under which, as of September 30, 2021, up to €30.0 billion of instruments can be issued (€25.0 billion as of September 30, 2020). As of September 30, 2021, €20.8 billion in notional amounts were issued and are outstanding (€23.2 billion as of September 30, 2020). In March 2021 the 1.75% €1.25 billion fixed-rate instrument was redeemed at face value. In September 2021, the US$ 400 million floating rate instruments were redeemed at face value. In September 2021 the 0.0% €1.0 billion fixed-rate instrument was redeemed at face value.
US$ Bonds – In September 2021, the 1.7% US$1.1 billion fixed-rate instruments were redeemed at face value. In March 2021, Siemens issued instruments totaling US$10.0 billion (€8.6 billion at September 30, 2021) in seven tranches.
Assignable and term loans
As of September 30, 2021 and 2020, five respectively two bilateral term loan facilities are outstanding (in aggregate € 1.8 billion and €0.85 billion). In fiscal 2021 three bilateral term loan facilities were newly signed: one bilateral €500 million term loan facility maturing in March 2022 with a one-year extension option; one bilateral US$150 million term loan facility (€130 million) maturing in February 2022 with a one-year extension option and one bilateral US$350 million term loan facility (€302 million) maturing in February 2022 with a one-year extension option. One existing bilateral US$500 million term loan facility (€432 million) has a maturity until March 2024 with a one-year extension option remaining and the second existing bilateral US$500 million term loan facility (€432 million) has a maturity until June 2024.
Commercial paper program
Siemens has a US$9.0 billion (€7.8 billion and €7.7 billion as of September 30, 2021 and 2020) commercial paper program in place including US$ extendible notes capabilities as of September 30, 2021 and 2020. As of September 30, 2021 and 2020, US$15 million (€13 million) and US$2.3 billion (€2.0 billion), respectively, were outstanding. Siemens’ commercial papers have a maturity of generally less than 90 days. Interest rates ranged from 0.05% to 0.21% in fiscal 2021 and from 0.06% to 1.98% in fiscal 2020.
NOTE 17 Post-employment benefits
Defined benefit plans
The defined benefit plans open to new entrants are based predominantly on contributions made by the Company. Only to a certain extent, those plans are affected by longevity, inflation and compensation increases and take into account country specific differences. The Company’s major plans are funded with assets in segregated entities. In accordance with local laws these plans are managed in the interest of the beneficiaries by way of contractual trust agreements with each separate legal entity. The defined benefit plans cover 442,000 participants, including 178,000 actives, 84,000 deferreds with vested benefits and 180,000 retirees and surviving dependents.
Germany
In Germany, pension benefits are provided through the following plans: BSAV (Beitragsorientierte Siemens Altersversorgung), frozen legacy plans as well as deferred compensation plans. The majority of active employees participate in the BSAV. Those benefits are predominantly based on notional contributions and the return on the corresponding assets of this plan, subject to a minimum return guaranteed by the employer. At inception of the BSAV, benefits provided under the frozen legacy plans were modified to substantially eliminate the effects of compensation increases. However, the frozen plans still expose Siemens to investment risk, interest rate risk and longevity risk. The pension plans are funded via contractual trust arrangements (CTA). In Germany no legal or regulatory minimum funding requirements apply.
U.S.
In the US, the Siemens Pension Plans are sponsored, which for the most part have been frozen to new entrants and to future benefit accruals, except for interest credits on cash balance accounts. Siemens has appointed the Investment Committee as the named fiduciary for the management of the assets of the Plans. The Plans’ assets are held in Master Trusts and the trustees of the Master Trusts are responsible for the administration of the assets of the trust, taking directions from the Investment Committee. The Plans are subject to the funding requirements under the Employee Retirement Income Security Act of 1974 as amended (ERISA). There is a regulatory requirement to maintain a minimum funding level of 80% in the defined benefit plans in order to avoid benefit restrictions. At their discretion, sponsoring employers may contribute in excess of this regulatory requirement. Annual contributions are calculated by independent actuaries.
U.K.
Pension benefits are mainly offered through the Siemens Benefit Scheme for which, until the start of retirement, an inflation increase of the majority of accrued benefits is mandatory. The required funding is determined by a funding valuation carried out every third year based on legal requirements. Due to deviating guidelines for the determination of the discount rates, the technical funding deficit is usually larger than the IFRS funding deficit. To reduce the deficit Siemens entered into an agreement with the trustees to provide annual payments of £31 (€35) million until fiscal 2033. The agreement also provides for a cumulative advance payment by Siemens AG compensating the remaining annual payments at the date of early termination of the agreement due to cancellation or insolvency.
Switzerland
Following the Swiss law of occupational benefits (BVG) each employer has to grant post-employment benefits for qualifying employees. Accordingly, Siemens in Switzerland sponsors several cash balance plans. These plans are administered by external foundations. The board of the main foundation is composed of equally many employer and employee representatives. The board of the foundation is responsible for investment policy and asset management, as well as for any changes in the plan rules and the determination of contributions to finance the benefits. The Company is required to make total contributions at least as high as the sum of the employee contributions set out in the

Consolidated Financial Statements
24
plan rules. In case of an underfunded plan the Company together with the employees may be asked to pay supplementary contributions according to a well-defined framework of recovery measures.
Development of the defined benefit plans1
Defined benefit obligation
(DBO)2
Fair value of plan assets
Effects of asset ceiling
Net defined benefit balance
(I) (II) (III) (I – II + III)
Fiscal year Fiscal year Fiscal year Fiscal year
(in millions of €) 2021 2020 2021 2020 2021 2020 2021 2020
Balance at begin of fiscal year 35,777 40,317 29,970 31,307 11 33 5,819 9,042
Current service cost 485 595 − − − − 485 595
Interest expenses 299 406 − − − 2 299 407
Interest income − − 254 333 − − (254) (333)
Other3 (4) (31) (13) (20) − − 9 (11)Components of defined benefit costs recognized in the Consolidated Statements of income 780 970 241 313 − 2 540 658Return on plan assets excluding amounts included in net interest income and net interest expenses − − 2,243 (74) − − (2,243) 74
Actuarial (gains) losses 75 303 − − − − 75 303
Effects of asset ceiling − − − − 4 (18) 4 (18)Remeasurements recognized in the Consolidated Statements of Comprehensive Income 75 303 2,243 (74) 4 (18) (2,165) 358
Employer contributions − − 2,041 2,898 − − (2,041) (2,898)
Plan participants’ contributions 102 142 102 142 − − − −
Benefits paid (1,759) (1,828) (1,638) (1,685) − − (121) (143)
Settlement payments − (3) − (2) − − − (1)
Business combinations, disposals and other 195 (3,489) 195 (2,394) − (2) 1 (1,097)
Foreign currency translation effects 371 (634) 388 (535) 1 (2) (17) (101)
Other reconciling items (1,091) (5,812) 1,089 (1,576) 1 (4) (2,179) (4,240)
Balance at fiscal year-end 35,542 35,777 33,543 29,970 16 11 2,015 5,819
Germany 21,697 22,223 19,929 17,161 − − 1,768 5,062
U.S. 2,795 2,958 2,648 2,617 − − 147 341
U.K. 6,005 5,637 6,339 6,000 8 8 (325) (356)
CH 3,402 3,328 3,702 3,355 − − (300) (27)
Other countries 1,643 1,632 925 838 8 4 726 798
Total 35,542 35,777 33,543 29,970 16 11 2,015 5,819
thereof provisions for pensions and similar obligations 2,839 6,360
thereof net defined benefit assets (presented in Other assets) 825 541
1 Discloses figures including Flender and Siemens Energy AG. Accordingly, it comprises the total of continuing and discontinuing operations.2 Total Defined benefit obligation (DBO) includes other post-employment benefits of €345 million and €393 million in fiscal 2021 and 2020 respectively, which primarily consist of transition payments to German employees after
retirement as well as post-employment health care and life insurance benefits to employees in the U.S. and India. 3 Includes past service benefits/costs, settlement gains/losses and administration costs related to liabilities.
Line item Business combinations, disposals and other includes the acquisition of Varian in fiscal 2021: DBO €303 million, Fair value of plan assets €271 million.
Employer contributions in fiscal 2021 include fundings in Germany of €1,887 million, thereof a contribution of a stake in Bentley Systems, Inc. amounting to €1,146 million, the contribution of various zero-coupon receiver swaps at total value of €368 million and the contribution of a stake in an equity instrument in the amount of €270 million. In fiscal 2020, Employer contributions include fundings in Germany of €2,730 million, including the contribution of a 9.9% interest in Siemens Energy AG of €1,881 million and real estate contributions from Siemens Real Estate.
Net interest expenses relating to provisions for pensions and similar obligations amount to €53 million and €66 million, respectively, in fiscal 2021 and 2020. The DBO is attributable to actives 29% and 28%, to deferreds with vested benefits 15% and 14% and to retirees and surviving dependents 57% and 57%, respectively, in fiscal 2021 and 2020.
The DBO remeasurements comprise actuarial (gains) and losses resulting from:
Fiscal year
(in millions of €) 2021 2020
Changes in demographic assumptions (224) (3)
Changes in financial assumptions (156) 402
Experience (gains) losses 455 (97)
Total 75 303

Consolidated Financial Statements
25
Actuarial assumptions
The weighted-average discount rate used for the actuarial valuation of the DBO was as follows:
Sep 30,
2021 2020
Discount rate 1.3% 1.1%
EUR 0.9% 0.8%
USD 2.8% 2.5%
GBP 1.9% 1.6%
CHF 0.3% 0.2%
The discount rate was derived from high-quality corporate bonds with an issuing volume of more than 100 million units in the respective currency zones, which have been awarded an AA rating (or equivalent) by at least one of the three rating agencies Moody’s Investors Service, S&P Global Ratings or Fitch Ratings.
Applied mortality tables are:
Germany Siemens specific tables (Siemens Bio 2017/2021), (in fiscal 2020 Siemens Bio 2017/2020)
U.S. Pri-2012 with generational projection from the US Social Security Administration’s Long Range Demographic Assumptions
U.K.SAPS S3 (Standard mortality tables for Self Administered Pension Schemes with allowance for future mortality improvements), (in fiscal 2020 SAPS S2)
CH BVG 2020 G (in fiscal 2020 BVG 2015 G)
The mortality tables used in Germany (Siemens Bio 2017/2021) are mainly derived from data of the German Siemens population and to a lesser extent from data of the Federal Statistical Office in Germany by applying formulas in accordance with recognized actuarial standards.
The rates of compensation increase and pension progression for countries with significant effects are shown in the following table. Inflation effects, if applicable, are included in the assumptions below.
Sep 30,
2021 2020
Compensation increase
U.K. 3.0% 2.6%
CH 1.4% 1.4%
Pension progression
Germany 1.5% 1.5%
U.K. 3.1% 2.7%
Sensitivity analysis
A one-half-percentage-point change of the above assumptions would result in the following increase (decrease) of the DBO:
Effect on DBO due to a one-half percentage-pointincrease decrease increase decrease
Sep 30,
(in millions of €) 2021 2020
Discount rate (2,045) 2,259 (2,134) 2,412
Rate of compensation increase 95 (89) 95 (90)
Rate of pension progression 1,559 (1,386) 1,689 (1,367)
The DBO effect of a 10% reduction in mortality rates for all beneficiaries would be an increase of €1,196 million and €1,285 million, respectively, as of September 30, 2021 and 2020.
As in prior years, sensitivity determinations apply the same methodology as applied for the determination of the post-employment benefit obligation. Sensitivities reflect changes in the DBO solely for the assumption changed.
Asset Liability Matching Strategies
As a significant risk, the Company considers a decline in the plans’ funded status due to adverse developments of plan assets and/or defined benefit obligations resulting from changing parameters. Accordingly, Siemens implemented a risk management concept aligned with the defined benefit obligations (Asset Liability Matching). Risk management is based on a worldwide defined risk threshold (Value at Risk). The concept, the Value at Risk and the asset development including the investment strategy are monitored and adjusted on an ongoing basis under consultation of senior external experts. Independent asset managers are selected based on quantitative and qualitative analyses, which include their performance and risk evaluation. Derivatives are used to reduce risks as part of risk management.

Consolidated Financial Statements
26
Disaggregation of plan assets
Sep 30,
(in millions of €) 2021 2020
Equity securities 5,773 5,166
Fixed income securities 13,811 13,166
Government bonds 3,782 3,583
Corporate bonds 10,030 9,583
Alternative investments 4,627 4,078
Multi strategy funds 4,288 3,154
Derivatives 1,510 750
Cash and cash equivalents 547 813
Insurance contracts 2,690 2,565
Other assets 297 277
Total 33,543 29,970
Virtually all equity securities have quoted prices in active markets. The fair value of fixed income securities is based on prices provided by price service agencies. The fixed income securities are traded in active markets and almost all fixed income securities are investment grade. Alternative investments include hedge funds, private equity and real estate investments, thereof real estate used by the Company with a fair value of €530 million and €527 million, respectively, as of September 30, 2021 and 2020. Multi strategy funds mainly comprise absolute return funds and diversified growth funds that invest in various asset classes within a single fund and aim to stabilize return and reduce volatility. Derivatives predominantly consist of financial instruments for hedging interest rate risk and inflation risk.
Future cash flows
Employer contributions expected to be paid to defined benefit plans in fiscal 2022 are €212 million. Over the next ten fiscal years, average annual benefit payments of €1,754 million and €1,730 million, respectively, are expected as of September 30, 2021 and 2020. The weighted average duration of the DBO for Siemens defined benefit plans was 12 and 13 years, respectively, as of September 30, 2021 and 2020.
Defined contribution plans and state plans
Amounts recognized as expenses for defined contribution plans are €484 million and €710 million in fiscal 2021 and 2020, respectively. Contributions to state plans amount to €1,449 million and €1,844 million in fiscal 2021 and 2020. Amounts are based on continuing and discontinued operations.
NOTE 18 Provisions
(in millions of €) Warranties
Order related
losses and risks
Asset retirement obligations Other Total
Balance as of October 1, 2020 1,574 380 702 1,369 4,026
thereof: non-current 581 183 690 898 2,352
Additions 633 134 3 424 1,195
Usage (375) (98) (100) (199) (773)
Reversals (246) (68) (8) (164) (486)
Translation differences 12 4 1 7 24
Accretion expense and effect of changes in discount rates − − (24) − (24)
Other changes including reclassifications to held for disposal and disposition of those entities (93) (2) 3 115 23
Balance as of September 30, 2021 1,505 351 577 1,552 3,985
thereof: non-current 539 138 199 847 1,723
The majority of the Company’s provisions are generally expected to result in cash outflows during the next five years.
Warranties mainly relate to products sold. Order related losses and risks are provided for anticipated losses and risks on uncompleted construction, sales and leasing contracts.
The Company is subject to asset retirement obligations related to certain items of property, plant and equipment. Such asset retirement obligations are primarily attributable to environmental clean-up costs (disclosed in Corporate items of the Segment information) and to costs primarily associated with the removal of leasehold improvements at the end of the lease term.
Environmental clean-up costs relate to remediation and environmental protection liabilities which have been accrued based on the estimated costs of decommissioning the site for the production of uranium and mixed-oxide fuel elements in Hanau, Germany (Hanau facilities), as well as for a nuclear research and service center in Karlstein, Germany (Karlstein facilities). In May 2021, Siemens AG and the Federal Republic of Germany entered into a public-law contract based on which the obligation of final disposal of nuclear waste is transferred to the Federal Republic of Germany for a payment of €360 million. The contract and therefore the payment is subject to the approval of the EU commission under state-aid rules. Estimation uncertainties still relate to assumptions made to measure the obligations that remain with Siemens AG, with regard to conditioning and packaging of nuclear waste, as well as intermediate storage and transport to the final storage facility “Schacht Konrad” or a logistics depot until year-end 2032. As of September 30, 2021 and 2020, the provisions total €507 million and €638 million, respectively. The decrease results primarily from the reversal of advance payments to the federal
Consolidated Financial Statements
27
government in the amount of €95 million which were capitalized and included in the carrying amount of the provision as well as from interest rate adjustments.
Other includes provisions for life and industrial business reinsurance contracts (liability, property, construction) in connection with the Siemens Energy business of €487 million and €499 million as of September 30, 2021 and 2020; thereof life €248 million and €262 million and industrial business €239 million and €237 million, respectively, as of September 30, 2021 and 2020. The provisions are for incurred and reported insurance losses as well as for incurred, hence, not yet reported insurance losses as of fiscal year-end. The provision is determined using actuarial standard valuation methodologies, which are parameterized based on historical loss data. Life reinsurance contracts have an average term of 20 years, whereas the cash outflows for the industrial business reinsurance contracts are expected within the next five years. Other also includes provisions for Legal Proceedings, as far as the risks that are subject to such Legal Proceedings are not already covered by project accounting. Provisions for Legal Proceedings amounted to €251 million and €248 million as of September 30, 2021 and 2020, respectively. Furthermore, Other includes provision for indemnifications in connection with dispositions of businesses of €96 million and €87 million as of September 30, 2021 and 2020. Such indemnifications may protect the buyer from potential tax, legal and other risks in conjunction with the purchased business.
NOTE 19 EquitySiemens’ issued capital is divided into 850 million registered shares with no par value and a notional value of €3.00 per share as of September 30, 2021 and 2020, respectively. The shares are paid in full. At the Shareholders’ Meeting, each share has one vote and accounts for the shareholders’ proportionate share in the Company’s net income. All shares confer the same rights and obligations.
In fiscal 2021 and 2020, Siemens repurchased 976,346 shares and 19,071,746 shares, respectively. In fiscal 2021 and 2020, Siemens transferred 4,022,053 and 5,613,506 treasury shares, respectively. As of September 30, 2021 and 2020, the Company has treasury shares of 47,644,581 and 50,690,288 respectively.
Share based payment expenses increased Capital reserve by €294 million and €295 million (including non-controlling interests), respectively, in fiscal 2021 and 2020. In connection with the settlement of share based payment awards Siemens treasury shares (at cost) were transferred to employees of €226 million in fiscal 2021 and €310 million in fiscal 2020 which decreased Capital reserve and Retained earnings by €165 million and €61 million, respectively in 2021 and by €218 million and €92 million in fiscal 2020.
As of September 30, 2021 and 2020, total authorized capital of Siemens AG is €600 million nominal issuable in installments based on various time-limited authorizations, by issuance of up to 200 million registered shares of no par value. Siemens AG’s conditional capital is €420.6 million or 140.2 million shares as of September 30, 2021 and 2020. Primarily, it can be used to serve convertible bonds or warrants under warrant bonds that could or can be issued based on various time-limited authorizations approved by the respective Shareholders’ Meeting.
Dividends paid per share were €3.50 and €3.90, respectively, in fiscal 2021 and 2020. The Managing Board and the Supervisory Board propose to distribute a dividend of €4.00 per share to holders entitled to dividends, in total representing approximately €3.2 billion in expected payments. Payment of the proposed dividend is contingent upon approval at the Shareholders’ Meeting on February 10, 2022.
In November 2018, Siemens announced a share-buyback program of up to €3 billion. The program ceased in September 2021. On June 24, 2021, Siemens announced that it intends to launch a new five-year share buyback program of up to €3 billion, beginning in fiscal 2022.
NOTE 20 Additional capital disclosuresA key consideration of our capital structure management is to maintain ready access to capital markets through various debt instruments and to sustain our ability to repay and service our debt obligations over time. In order to achieve this, Siemens intended to maintain an Industrial net debt divided by EBITDA (continued operations) ratio of up to 1.0 as of September 30, 2021 and 2020, respectively. In line with our updated Financial Framework we target an Industrial net debt divided by EBITDA (continuing operations) ratio of up to 1.5 for fiscal 2022 and beyond. The ratio indicates the approximate number of years that would be needed to cover the Industrial net debt through Income from continuing operations, excluding interest, other financial income (expenses), taxes, depreciation, amortization and impairments. The fiscal 2020 ratio is disclosed as computed in the prior year, it is disclosed before retrospective classification of discontinued operation.

Consolidated Financial Statements
28
Sep 30,
(in millions of €) 2021 2020
Short-term debt and current maturities of long-term debt 7,821 6,562
Plus: Long-term debt 40,879 38,005
Less: Cash and cash equivalents (9,545) (14,041)
Less: Current interest bearing debt securities (1,132) (1,256)
Less: Fair value of foreign currency and interest hedges relating to short- and long-term debt1 (1,012) (777)
Net debt 37,010 28,492
Less: Siemens Financial Services debt2 (26,519) (25,267)
Plus: Provisions for pensions and similar obligations 2,839 6,360
Plus: Credit guarantees 530 604
Industrial net debt 13,861 10,189
Income from continuing operations before income taxes 7,496 5,672
Plus/Less: Interest income, interest expenses and other financial income (expenses), net (1,480) (1,228)
Plus: Amortization, depreciation and impairments 3,075 3,157
EBITDA 9,091 7,601
Industrial net debt/EBITDA 1.5 1.3
1 Debt is generally reported with a value representing approximately the amount to be repaid. Accordingly, debt in a hedging relationship is adjusted for fair values of interest hedges as well as for foreign currency hedge effects; the latter commencing with financing the acquisition of Varian Medical Systems, Inc. in fiscal 2021. Siemens deducts resulting changes in fair value, to derive an amount of debt that approximates the amount that will be repaid.
2 The adjustment considers that both Moody’s and S&P view Siemens Financial Services as a captive finance company. These rating agencies generally recognize and accept higher levels of debt attributable to captive finance subsidiaries in determining credit ratings. Following this concept, Siemens excludes Siemens Financial Services debt.
The SFS business is capital intensive and operates with a larger amount of debt to finance its operations compared to the industrial business.
Sep 30, Sep 30,
(in millions of €) 2021 2020
Allocated equity 2,774 2,672
Siemens Financial Services debt 26,519 25,267
Debt to equity ratio 9.56 9.46
Equity allocated to SFS differs from the carrying amount of equity as it is mainly allocated based on the risks of the underlying business. Siemens’ current corporate credit ratings are:
Sep 30, 2021 Sep 30, 2020Moody'sInvestors Service
S&P Global Ratings
Moody'sInvestors Service
S&P Global Ratings
Long-term debt A1 A+ A1 A+
Short-term debt P-1 A-1+ P-1 A-1+
NOTE 21 Commitments and contingenciesThe following table presents the undiscounted amount of maximum potential future payments for major groups of guarantees:
Sep 30, Sep 30,
(in millions of €) 2021 2020
Credit guarantees 530 604
Performance guarantees 15,116 27,917
15,646 28,521
Item Credit guarantees covers the financial obligations of third parties generally in cases where Siemens is the vendor and (or) contractual partner or Siemens is liable for obligations of associated companies accounted for using the equity method. Additionally, credit guarantees are issued in the course of the SFS business. Credit guarantees generally provide that in the event of default or non-payment by the primary debtor, Siemens will be required to settle such financial obligations. The maximum amount of these guarantees is equal to the outstanding balance of the credit or, in case a credit line is subject to variable utilization, the nominal amount of the credit line. These guarantees have typically residual terms of up to four years. The Company held collateral mainly through inventories and trade receivables. As of September 30, 2021 and 2020, Credit guarantees include €124 million and €271 million for which Siemens holds reimbursement rights towards Siemens Energy. Siemens accrued €3 million and €18 million relating to credit guarantees as of September 30, 2021 and 2020, respectively.
Furthermore, Siemens issues performance guarantees, which mainly include performance bonds. In the event of non-fulfillment of contractual obligations by the primary obligor, Siemens will be required to pay up to an agreed-upon maximum amount. These agreements typically have terms of up to ten years. As of September 30, 2021 and 2020, Performance guarantees include €14,508 million and €27,425

Consolidated Financial Statements
29
million for which Siemens holds reimbursement rights towards Siemens Energy; the related contract liability amount for parent company guarantees is generally reduced using the straight-line method over the planned term of the underlying delivery or service agreement. As of September 30, 2021 and 2020, the Company accrued €51 million and €1 million, respectively, relating to performance guarantees.
As of September 30, 2021 and 2020, in addition to guarantees disclosed in the table above, there are contingent liabilities of €475 million and €405 million which mainly result from other guarantees, legal proceedings and from joint and several liabilities of consortia, in particular from the construction of a power plant in Finland. Other guarantees include €189 million and €261 million for which Siemens holds reimbursement rights towards Siemens Energy.
NOTE 22 Legal proceedings
Proceedings out of or in connection with alleged compliance violations
As previously reported, in July 2008, Hellenic Telecommunications Organization S.A. (OTE) filed a lawsuit against Siemens AG with the district court of Munich, Germany, seeking to compel Siemens AG to disclose the outcome of its internal investigations with respect to OTE. OTE seeks to obtain information with respect to allegations of undue influence and/or acts of bribery in connection with contracts concluded between Siemens AG and OTE from calendar year 1992 to 2006. At the end of July 2010, OTE expanded its claim and requested payment of damages by Siemens AG of at least €57 million to OTE for alleged bribery payments to OTE employees. In October 2014, OTE increased its damage claim to the amount of at least €68 million. Siemens AG continues to defend itself against the expanded claim.
As previously reported, in May 2014, the Public Affairs Office (Ministério Público) São Paulo initiated a lawsuit against Siemens Ltda. as well as other companies and several individuals claiming, inter alia, damages in an amount of BRL2.5 billion (approximately €399 million as of September 2021) plus adjustments for inflation and related interest in relation to train refurbishment contracts entered into between 2008 and 2011. In January 2015, the district court of São Paulo admitted a lawsuit of the State of São Paulo and two customers against Siemens Ltda., Siemens AG and other companies and individuals claiming damages in an unspecified amount. In March 2015, the district court of São Paulo admitted a lawsuit of the Public Affairs Office (Ministério Público) São Paulo against Siemens Ltda. and other companies claiming, inter alia, damages in an amount of BRL487 million (approximately €78 million as of September 2021) plus adjustments for inflation and related interest in relation to train maintenance contracts entered into in 2000 and 2002. In September 2015, the district court of São Paulo admitted another lawsuit of the Public Affairs Office (Ministério Público) São Paulo against Siemens Ltda. and other companies claiming, inter alia, damages in an amount of BRL918 million (approximately €147 million as of September 2021) plus adjustments for inflation and related interest in relation to train maintenance contracts entered into in 2006 and 2007. Siemens is defending itself against these actions. It cannot be excluded that further significant damage claims will be brought by customers or the state against Siemens.
As previously reported, in June 2015, Siemens Ltda. appealed to the Supreme Court against a decision of a previous court to suspend Siemens Ltda. from participating in public tenders and signing contracts with public administrations in Brazil for a five year term based on alleged irregularities in calendar year 1999 and 2004 in public tenders with the Brazilian Postal authority. In June 2018, the court accepted Siemens’ appeal and declared the earlier instance decision as void. In June 2021, the court referred the case back to the court of first instance. In February 2018, the Ministério Público in Brasilia filed a lawsuit based on the same set of facts, mainly claiming the exclusion of Siemens Ltda. from public tenders for a ten year term. Siemens Ltda. is defending itself against the lawsuit. Siemens Ltda. is currently not excluded from participating in public tenders.
Siemens is involved in numerous Legal Proceedings in various jurisdictions. These Legal Proceedings could result, in particular, in Siemens being subject to payment of damages and punitive damages, equitable remedies or sanctions, fines or disgorgement of profit. In individual cases this may also lead to formal or informal exclusion from tenders or the revocation or loss of business licenses or permits. In addition, further Legal Proceedings may be commenced or the scope of pending Legal Proceedings may be extended. Asserted claims are generally subject to interest rates.
Some of these Legal Proceedings could result in adverse decisions for Siemens, which may have material effects on its business activities as well as its financial position, results of operations and cash flows.
For Legal Proceedings information required under IAS 37, Provisions, Contingent Liabilities and Contingent Assets is not disclosed if the Company concludes that disclosure can be expected to seriously prejudice the outcome of the matter.

Consolidated Financial Statements
30
NOTE 23 Additional disclosures on financial instrumentsThe following table discloses the carrying amounts of each category of financial assets and financial liabilities:
Sep 30,
(in millions of €) 2021 2020
Loans, receivables and other debt instruments measured at amortized cost1 42,436 40,304
Cash and cash equivalents 9,545 14,041
Derivatives designated in a hedge accounting relationship 852 790
Financial assets mandatorily measured at FVTPL2 2,305 3,422
Financial assets designated as measured at FVTPL3 198 220
Equity instruments measured at FVOCI1 675 491
Financial assets 56,012 59,268
Financial liabilities measured at amortized cost4 59,172 54,189
Derivatives not designated in a hedge accounting relationship5 505 765
Derivatives designated in a hedge accounting relationship 5 263 213
Financial liabilities 59,941 55,167¹ Reported in the following line items of the Statements of Financial Position as of September 30, 2021 and 2020, respectively: Trade and other receivables, Other current financial assets and Other financial assets, except for separately disclosed €1,824 million and €1,843 million equity instruments in Other financial assets (thereof €675 million and €491 million at FVOCI), €198 million and €220 million financial assets designated as measured at FVTPL and €1,950 million and €2,842 million derivative financial instruments (thereof in Other financial assets €1,552 million and €2,044 million) as well as €58 million and €18 million debt instruments measured at FVTPL in Other financial assets. Includes €13,267 million and €12,071 million trade receivables from the sale of goods and services, thereof €663 million and €694 million with a term of more than twelve months as of September 30, 2021 and 2020.² Reported in line items Other current financial assets and Other financial assets. ³ Reported in Other financial assets.⁴ Reported in the following line items of the Statements of Financial Position: Short-term debt and current maturities of long-term debt, Trade payables, Other current financial liabilities, Long-term debt and Other financial liabilities, except for separately disclosed derivative financial instruments of €769 million and €978 million as of September 30, 2021 and 2020, respectively. ⁵ Reported in line items Other current financial liabilities and Other financial liabilities.
Cash and cash equivalents include €190 million and €126 million as of September 30, 2021 and 2020, respectively, which are not available for use by Siemens mainly due to minimum reserve requirements with banks. As of September 30, 2021 and 2020, the carrying amount of financial assets Siemens pledged as collateral is €156 million and €115 million, respectively.
The following table presents the fair values and carrying amounts of financial assets and financial liabilities measured at cost or amortized cost for which the carrying amounts do not approximate fair value:
Sep 30, 2021 Sep 30, 2020
Carrying Carrying
(in millions of €) Fair value amount Fair value amount
Notes and bonds 45,594 43,373 40,868 38,264
Loans from banks and other financial indebtedness 2,400 2,398 3,483 3,473
Fixed-rate and variable-rate receivables with a remaining term of more than twelve months, including receivables from finance leases, are evaluated by the Company based on parameters such as interest rates, specific country risk factors, individual creditworthiness of the customer, and the risk characteristics of the financed project. Based on this evaluation, allowances for these receivables are recognized.
The fair value of notes and bonds is based on prices provided by price service agencies at the period-end date (Level 2). The fair value of loans from banks and other financial indebtedness as well as other non-current financial liabilities are estimated by discounting future cash flows using rates currently available for debt of similar terms and remaining maturities (Level 2).
The following table allocates financial assets and financial liabilities measured at fair value to the three levels of the fair value hierarchy:
Sep 30, 2021
(in millions of €) Level 1 Level 2 Level 3 Total
Financial assets measured at fair value 917 2,030 1,085 4,031
Equity instruments measured at FVTPL 718 77 354 1,149
Equity instruments measured at FVOCI − 1 674 675
Debt instruments measured at FVTPL 198 1 57 256
Derivative financial instruments − 1,950 − 1,950
Not designated in a hedge accounting relationship (including embedded derivatives) − 1,098 − 1,098
In connection with fair value hedges − 307 − 307
In connection with cash flow hedges − 545 − 545
Financial liabilities measured at fair value – Derivative financial instruments − 769 − 769
Not designated in a hedge accounting relationship (including embedded derivatives) − 505 − 505
In connection with cash flow hedges − 263 − 263

Consolidated Financial Statements
31
Sep 30, 2020
(in millions of €) Level 1 Level 2 Level 3 Total
Financial assets measured at fair value 1,288 3,023 612 4,923
Equity instruments measured at FVTPL 1,067 77 209 1,353
Equity instruments measured at FVOCI 1 104 385 491
Debt instruments measured at FVTPL 220 − 18 238
Derivative financial instruments − 2,842 − 2,842
Not designated in a hedge accounting relationship (including embedded derivatives) − 2,052 − 2,052
In connection with fair value hedges − 554 − 554
In connection with cash flow hedges − 236 − 236
Financial liabilities measured at fair value – Derivative financial instruments − 978 − 978
Not designated in a hedge accounting relationship (including embedded derivatives) − 765 − 765
In connection with cash flow hedges − 213 − 213
Fair value of equity instruments quoted in an active market is based on price quotations at period-end date. Fair value of debt instruments, is either based on prices provided by price service agencies or is estimated by discounting future cash flows using current market interest rates.
Fair values of derivative financial instruments are determined in accordance with the specific type of instrument. Fair values of derivative interest rate contracts are estimated by discounting expected future cash flows using current market interest rates and yield curves over the remaining term of the instrument. Interest rate futures are valued based on quoted market prices, if available. Fair values of foreign currency derivatives are based on forward exchange rates. Options are generally valued based on quoted market prices or based on option pricing models. No compensating effects from underlying transactions (e.g. firm commitments and forecast transactions) are considered.
The Company limits default risks resulting from derivative financial instruments by generally transacting with financial institutions with a minimum credit rating of investment grade. Based on Siemens’ net risk exposure towards the counterparty, the resulting credit risk is taken into account via a credit valuation adjustment.
In fiscal 2021, Siemens Advanta acquired equity stakes for €279 million in cash (Thoughtworks). The financial asset is mandatorily measured at fair value through profit and loss (FVTPL). The company went public in September 2021 resulting in a gain from fair value measurement including foreign currency effects of €289 million at Siemens disclosed in Corporate items of segment information and presented in Other financial income (expenses), net.
As of September 30, 2021 and 2020, Level 3 financial assets include venture capital investments of €515 million and €386 million (Next47 investments). In fiscal 2021 and 2020, new level 3 investments and purchases amounted to €522 million and €249 million, respectively. Sales of Level 3 financial assets amounted to €305 million and €327 million, respectively, in fiscal 2021 and 2020.
In fiscal 2021, a Level 3 equity investment mandatorily measured at FVTPL was merged with a public holding company in exchange for shares in the new entity, ChargePoint. The transaction resulted in a gain of €220 million derived from now available Level 1 quoted prices. The gain is disclosed in Other financial income (expenses), net and in Next47 of Corporate items. Subsequently, the investment was contributed to the Siemens Pension-Trust e.V. at fair value of €270 million.
Net gains (losses) resulting from financial instruments are:
Fiscal year
(in millions of €) 2021 2020
Cash and cash equivalents (17) (168)
Loans, receivables and other debt instruments measured at amortized cost 74 (526)
Financial liabilities measured at amortized cost 22 1,291
Financial assets and financial liabilities at FVTPL 1,020 552
Amounts include foreign currency gains (losses) from recognizing and measuring financial assets and liabilities. Net gains (losses) on financial assets and liabilities measured at FVTPL resulted from those mandatorily measured at FVTPL and comprise fair value changes of derivative financial instruments for which hedge accounting is not applied including interest income (expense), as well as dividends from and fair value changes of equity instruments measured at FVTPL.
Interest income (expense) includes interest from financial assets and financial liabilities not at fair value through profit or loss:
Fiscal year
(in millions of €) 2021 2020
Total interest income on financial assets 1,434 1,503
Total interest expenses on financial liabilities (672) (702)
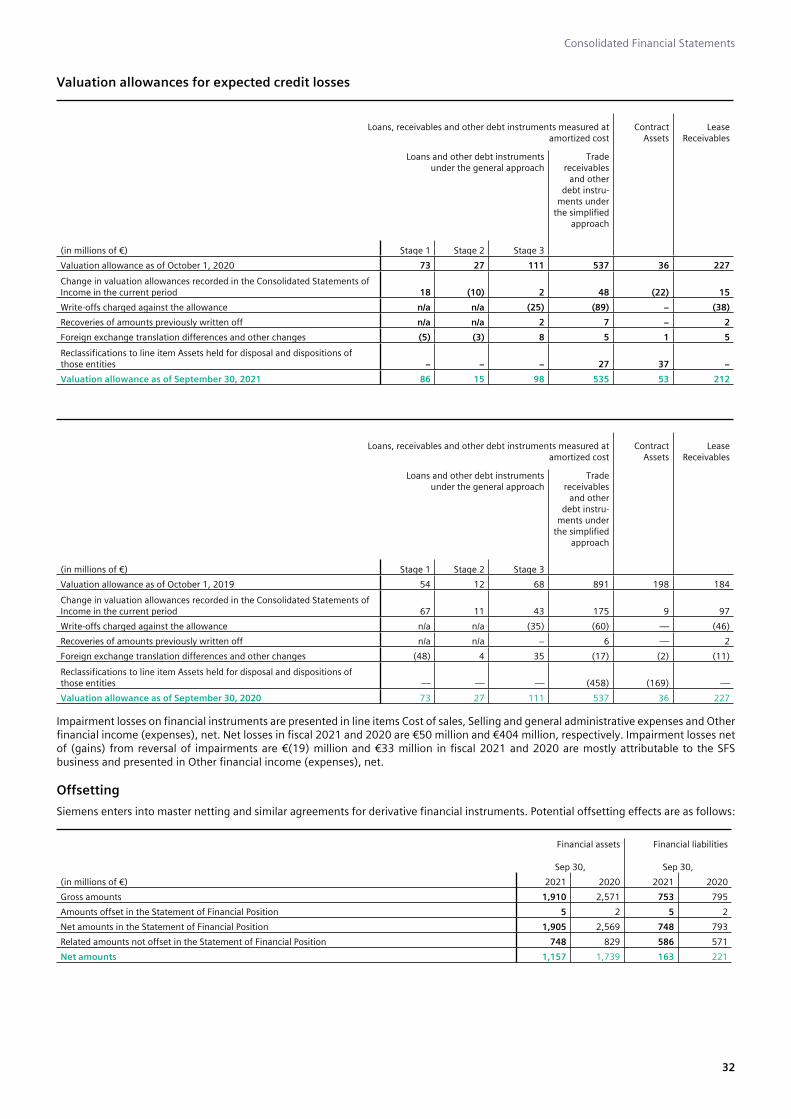
Consolidated Financial Statements
32
Valuation allowances for expected credit losses
Loans, receivables and other debt instruments measured at amortized cost
Contract Assets
Lease Receivables
Loans and other debt instruments under the general approach
(in millions of €) Stage 1 Stage 2 Stage 3
Trade receivables
and other debt instru-
ments under the simplified
approach
Valuation allowance as of October 1, 2020 73 27 111 537 36 227
Change in valuation allowances recorded in the Consolidated Statements of Income in the current period 18 (10) 2 48 (22) 15
Write-offs charged against the allowance n/a n/a (25) (89) − (38)
Recoveries of amounts previously written off n/a n/a 2 7 − 2
Foreign exchange translation differences and other changes (5) (3) 8 5 1 5
Reclassifications to line item Assets held for disposal and dispositions of those entities − − − 27 37 −
Valuation allowance as of September 30, 2021 86 15 98 535 53 212
Loans, receivables and other debt instruments measured at amortized cost
Contract Assets
Lease Receivables
Loans and other debt instruments under the general approach
Trade receivables
and other debt instru-
ments under the simplified
approach
(in millions of €) Stage 1 Stage 2 Stage 3
Valuation allowance as of October 1, 2019 54 12 68 891 198 184
Change in valuation allowances recorded in the Consolidated Statements of Income in the current period 67 11 43 175 9 97
Write-offs charged against the allowance n/a n/a (35) (60) — (46)
Recoveries of amounts previously written off n/a n/a − 6 — 2
Foreign exchange translation differences and other changes (48) 4 35 (17) (2) (11)
Reclassifications to line item Assets held for disposal and dispositions of those entities — — — (458) (169) —
Valuation allowance as of September 30, 2020 73 27 111 537 36 227
Impairment losses on financial instruments are presented in line items Cost of sales, Selling and general administrative expenses and Other financial income (expenses), net. Net losses in fiscal 2021 and 2020 are €50 million and €404 million, respectively. Impairment losses net of (gains) from reversal of impairments are €(19) million and €33 million in fiscal 2021 and 2020 are mostly attributable to the SFS business and presented in Other financial income (expenses), net.
Offsetting
Siemens enters into master netting and similar agreements for derivative financial instruments. Potential offsetting effects are as follows:
Financial assets Financial liabilities
Sep 30, Sep 30,
(in millions of €) 2021 2020 2021 2020
Gross amounts 1,910 2,571 753 795
Amounts offset in the Statement of Financial Position 5 2 5 2
Net amounts in the Statement of Financial Position 1,905 2,569 748 793
Related amounts not offset in the Statement of Financial Position 748 829 586 571
Net amounts 1,157 1,739 163 221

Consolidated Financial Statements
33
NOTE 24 Derivative financial instruments and hedging activitiesTo hedge foreign currency exchange and interest rate risks, derivatives are contracted to achieve a 1:1 hedge ratio so that the main characteristics match the underlying hedged items (e.g. nominal amount, maturity) in a critical term match, which ensures an economic relationship between hedging instruments and hedged items suitable for hedge accounting. The nominal amounts of hedging instruments by maturity are:
Sep 30, 2021 Sep 30, 2020
(in millions of €)Up to 12 months
More than 12 months
Up to 12 months
More than 12 months
Foreign currency exchange contracts 3,605 14,676 10,739 4,435
Interest rate swaps 873 5,752 450 7,110
therein: included in cash flow hedges 13 605 − 598
therein: included in fair value hedges 859 5,147 450 6,512
Fair values of each type of derivative financial instruments reported as financial assets or financial liabilities in line items Other current financial assets (liabilities) or Other financial assets (liabilities) are:
Sep 30, 2021 Sep 30, 2020
(in millions of €) Asset Liability Asset Liability
Foreign currency exchange contracts 893 569 933 617
therein: included in cash flow hedges 544 231 231 106
Interest rate swaps and combined interest and currency swaps 987 155 1,835 328
therein: included in cash flow hedges − 31 − 107
therein: included in fair value hedges 307 − 554 −
Other (embedded derivatives, options, commodity swaps) 70 45 74 33
1,950 769 2,842 978
Other components of equity, net of income taxes, relating to cash flow hedges reconciles as follows:
Interest rate risk
Foreign currency risk
(in millions of €)
Cash flow hedge
reserve
Cash flow hedge
reserve
Cost of hedging reserve
Balance as of October 1, 2020 (59) 133 117
Hedging gains (losses) presented in OCI 36 (263) 97
Reclassification to net income 6 (12) (121)
Other − 114 −
Balance as of September 30, 2021 (17) (28) 93
thereof: discontinued hedge accounting (11) (3) −
Amounts reclassified to net income in connection with interest rate risk hedges and non-operative foreign currency hedges are presented in Other financial income (expenses), net. Reclassifications of foreign currency risk hedges with operative business purposes are presented as functional costs. Costs of hedging reserve is the forward element of forward contracts that are not designated as hedge accounting and which are amortized to interest expense on a straight-line basis as the hedged item is time-period related. In fiscal 2021, €114 million in Other relate to designated foreign currency swaps to hedge risks of the highly probable purchase price payment made for the Varian acquisition. The amount was removed from the cash flow hedge reserve and included in the initial cost of Varian.
Foreign currency exchange rate risk management
Derivative financial instruments not designated in a hedging relationship
The Company manages its risks associated with fluctuations in foreign currency denominated receivables, payables, debt, firm commitments and forecast transactions primarily through a Company-wide portfolio approach. Under this approach the Company-wide risks are aggregated centrally, and various derivative financial instruments, primarily foreign currency exchange contracts, foreign currency swaps and options, are utilized to minimize such risks. Such a strategy does not qualify for hedge accounting treatment. The Company also accounts for foreign currency derivatives, which are embedded in sale and purchase contracts.
Cash flow hedges
The Company’s operating units apply hedge accounting to certain significant forecast transactions and firm commitments denominated in foreign currencies. Particularly, the Company entered into foreign currency exchange contracts to reduce the risk of variability of future cash flows resulting from forecast sales and purchases as well as firm commitments. The risk mainly results from contracts denominated in US$ both from Siemens’ operating units entering into long-term contracts e.g. from the project business and from the standard product business. In fiscal 2021 and 2020, the risk is hedged against the euro at an average rate of 1.2808 €/US$ and 1.2013 €/US$ (forward purchases of US$), respectively and 1.2070 €/US$ and 1.1950 €/US$ (forward sales of US$). As of September 30, 2021 and 2020, the

Consolidated Financial Statements
34
hedging transactions have an average remaining maturity until 2026 and 2022 (forward purchases of US$) as well as 2022 and 2021 (forward sales of US$).
Included are Siemens’ foreign currency forward contracts, entered into in fiscal 2021, to hedge foreign currency risks relating to US$10 billion (€8.5 billion) bonds granted to Siemens Healthineers, through which a synthetic Euro financing structure is achieved. It factually, also turns interest into € with volume weighted average interest rates of currently about 0.3%.
Interest rate risk management
Derivative financial instruments not designated in a hedging relationship
Interest rate risk management relating to the Group, excluding SFS’ businesses, uses derivative financial instruments under a portfolio-based approach to manage interest risk actively relative to a benchmark. Interest rate management of the SFS and businesses remains to be managed separately, considering the term structure of SFS’ financial assets and liabilities on a portfolio basis. Neither approach qualifies for hedge accounting treatment. Net cash receipts and payments in connection with interest rate swap agreements are recorded as interest expense in Other financial income (expenses), net.
Cash flow hedges of floating-rate commercial papers
Siemens applies cash flow hedge accounting to a revolving portfolio of floating-rate commercial papers of nominal US$700 million. Siemens pays a fixed rate of interest and receives a variable rate of interest, offsetting future changes in interest payments of the underlying floating-rate commercial papers. Net cash receipts and payments are recorded as interest expenses. The Company had interest rate swap contracts to receive variable rates of interest of an average of 0.13% and 0.23% as of September 30, 2021 and 2020, respectively, and paid fixed rates of interest (average rate of 1.95% and 1.95%, as of September 30, 2021 and 2020, respectively).
Fair value hedges of fixed-rate debt obligations
Under interest rate swap agreements outstanding in fiscal 2021 and 2020, the Company agreed to pay a variable rate of interest multiplied by a notional principal amount, and to receive in return an amount equal to a specified fixed rate of interest multiplied by the same notional principal amount. These interest rate swap agreements offset future changes in interest rates designated as hedged risk on the fair value of the underlying fixed-rate debt obligations. As of September 30, 2021 and 2020, the carrying amounts of €6,305 million and €6,938 million, respectively, of fixed-rate debt obligations are designated in fair value hedges, including €304 million and €540 million cumulative fair value hedge adjustments. Unamortized fair value hedge adjustments of €181 million and €220 million as of September 30, 2021 and 2020, respectively, relate to no longer applied hedge accounting. The amounts are amortized over the remaining term of the underlying debt, maturing until 2042. Carrying amount adjustments to debt of €236 million and €(123) million, respectively, in fiscal 2021 and 2020 are included in Other financial income (expenses), net; the related swap agreements resulted in gains (losses) of €(243) million and €91 million, respectively, in fiscal 2021 and 2020. Net cash receipts and payments relating to such interest rate swap agreements are recorded as interest expenses.
The Company had interest rate swap contracts to pay variable rates of interest of an average of (0.14)% and (0.13)% as of September 30, 2021 and 2020, respectively and received fixed rates of interest (average rate of 1.50% and 1.49%, as of September 30, 2021 and 2020, respectively). The notional amount of indebtedness hedged as of September 30, 2021 and 2020 was €6,007 million and €6,423 million, respectively. This changed 15% and 18% of the Company’s underlying notes and bonds from fixed interest rates into variable interest rates as of September 30, 2021 and 2020, respectively. The notional amounts of these contracts mature at varying dates based on the maturity of the underlying hedged items. The net fair value of interest rate swap contracts (excluding accrued interest) used to hedge indebtedness as of September 30, 2021 and 2020 was €277 million and €520 million, respectively.
NOTE 25 Financial risk managementIncreasing market fluctuations may result in significant earnings and cash flow volatility risk for Siemens. The Company’s operating business as well as its investment and financing activities are affected particularly by changes in foreign exchange rates and interest rates. In order to optimize the allocation of financial resources across Siemens' segments and entities, as well as to achieve its aims, Siemens identifies, analyzes and manages the associated market risks. The Company seeks to manage and control these risks primarily through its regular operating and financing activities and uses derivative financial instruments when deemed appropriate.
In order to quantify market risks Siemens has implemented a system based on Value at Risk (VaR), which is also used for internal management of Corporate Treasury activities. The VaR figures are calculated based on historical volatilities and correlations of various risk factors, a ten day holding period, and a 99.5% confidence level.
Actual results that are included in the Consolidated Statements of Income or Consolidated Statements of Comprehensive Income may differ substantially from VaR figures due to fundamental conceptual differences. While the Consolidated Statements of Income and Consolidated Statements of Comprehensive Income are prepared in accordance with IFRS, the VaR figures are the output of a model with a purely financial perspective and represent the potential financial loss, which will not be exceeded within ten days with a probability of 99.5%. Although VaR is an important tool for measuring market risk, the assumptions on which the model is based give rise to some limitations including the following. A ten day holding period assumes that it is possible to dispose of the underlying positions within this period. This may not be valid during continuing periods of illiquid markets. A 99.5% confidence level means that there is a 0.5% statistical probability that losses could exceed the calculated VaR. The use of historical data as a basis for estimating the statistic behavior of the relevant markets and finally determining the possible range of the future outcomes on the basis of this statistic behavior may not always cover all possible scenarios, especially those of an exceptional nature.
Any market sensitive instruments, including equity and interest-bearing investments that our Company’s pension plans hold are not included in the following quantitative and qualitative disclosures.
Consolidated Financial Statements
35
Foreign currency exchange rate risk
Transaction risk
Each Siemens unit conducting businesses with international counterparties leading to future cash flows denominated in a currency other than its functional currency is exposed to risks from changes in foreign currency exchange rates. In the ordinary course of business, Siemens units are exposed to foreign currency exchange rate fluctuations, particularly between the U.S. dollar and the euro. Foreign currency exchange rate exposure is partly balanced by purchasing of goods, commodities and services in the respective currencies as well as production activities and other contributions along the value chain in the local markets.
Operating units are prohibited from borrowing or investing in foreign currencies on a speculative basis. Intercompany financing or investments of operating units are preferably carried out in their functional currency or on a hedged basis.
According to the Company policy, Siemens units are responsible for recording, assessing and monitoring their foreign currency transaction exposure. The net foreign currency position of Siemens units serves as a central performance measure and has to be hedged within a band of at least 75% but no more than 100%.
Generally, the operating units conclude their hedging activities internally with Corporate Treasury. By applying a cost-optimizing portfolio approach, Corporate Treasury itself hedges foreign currency exchange rate risks with external counterparties and limits them.
As of September 30, 2021 and 2020, the VaR relating to foreign currency exchange rates was €39 million and €90 million. This VaR was calculated under consideration of items of the Consolidated Statements of Financial Position in addition to firm commitments, which are denominated in foreign currencies, as well as foreign currency denominated cash flows from forecast transactions for the following twelve months. The decrease in the VaR resulted mainly from a lower net foreign currency position after hedging activities and a lower volatility between the U.S. dollar and the euro.
Translation risk
Many Siemens units are located outside the Eurozone. Because the financial reporting currency of Siemens is the euro, the financial statements of these subsidiaries are translated into euro for the preparation of the Consolidated Financial Statements. To consider the effects of foreign currency translation in the risk management, the general assumption is that investments in foreign-based operations are permanent and that reinvestment is continuous. Effects from foreign currency exchange rate fluctuations on the translation of net asset amounts into euro are reflected in the Company’s consolidated equity position.
Interest rate risk
Interest rate risk is the risk that the fair value or future cash flows of a financial instrument will fluctuate because of changes in market interest rates. This risk arises whenever interest terms of financial assets and liabilities are different. In order to manage the Company’s position with regard to interest rate risk, interest income and interest expenses, Corporate Treasury performs a comprehensive corporate interest rate risk management by using fixed or variable interest rates from bond issuances and derivative financial instruments when appropriate. The interest rate risk relating to the Group, excluding SFS’ business, is mitigated by managing interest rate risk within an integrated Asset Liability Management approach. The interest rate risk relating to SFS’ business is managed separately, considering the term structure of financial assets and liabilities. The Company’s interest rate risk results primarily from funding in the U.S. dollar, British pound and euro.
If there are no conflicting country-specific regulations, all Siemens operating units generally obtain any required financing through Corporate Treasury in the form of loans or intercompany clearing accounts. The same concept is adopted for deposits of cash generated by the units.
As of September 30, 2021 and 2020, the VaR relating to the interest rate was €529 million and €424 million. The increase was driven mainly by higher interest rate volatilities for the U.S. dollar and an increase in interest rate sensitivity for the U.S. dollar related to the US$10 billion instrument issued in March 2021.
Liquidity risk
Liquidity risk results from the Company’s inability to meet its financial liabilities. Siemens follows a deliberated financing policy that is aimed towards a balanced financing portfolio, a diversified maturity profile and a comfortable liquidity cushion. Siemens mitigates liquidity risk by the implementation of effective working capital and cash management, arranged credit facilities with highly rated financial institutions, via a debt issuance program and via a global multi-currency commercial paper program. Liquidity risk may also be mitigated by the Siemens Bank GmbH, which increases the flexibility of depositing cash or refinancing.
In addition, Siemens constantly monitors funding options available in the capital markets, as well as trends in the availability and costs of such funding, with a view to maintaining financial flexibility and limiting repayment risks.
The following table reflects our contractually fixed pay-offs for settlement, repayments and interest. The disclosed expected undiscounted net cash outflows from derivative financial liabilities are determined based on each particular settlement date of an instrument and based on the earliest date on which Siemens could be required to pay. Cash outflows for financial liabilities (including interest) without fixed amount or timing are based on the conditions existing at September 30, 2021.

Consolidated Financial Statements
36
Fiscal year
(in millions of €) 2022 20232024 to
20262027 and thereafter
Non-derivative financial liabilities
Notes and bonds 6,600 5,178 14,768 24,290
Loans from banks 1,217 176 914 16
Other financial indebtedness 70 6 36 4
Lease liabilities 731 556 971 921
Trade payables 8,776 25 30 1
Other financial liabilities 1,430 147 111 14
Derivative financial liabilities 429 143 213 72
Credit guarantees1 530 − − −
Irrevocable loan commitments2 3,408 312 165 2¹ Based on the maximum amounts Siemens could be required to settle in the event of default by the primary debtor.
² A considerable portion result from asset-based lending transactions meaning that the respective loans can only be drawn after sufficient collateral has been provided by the borrower.
Credit risk
Credit risk is defined as an unexpected loss in financial instruments if the contractual partner is failing to discharge its obligations in full and on time or if the value of collateral declines.
Siemens provides its customers with various forms of direct and indirect financing particularly in connection with large projects. Hence, credit risks are determined by the solvency of the debtors, the recoverability of the collaterals, the success of projects we invested in and the global economic development.
The effective monitoring and controlling of credit risk through credit evaluations and ratings is a core competency of our risk management system. In this context, Siemens has implemented a binding credit policy.
Siemens maintains a Credit Risk Intelligence Unit to which numerous operating units from the Siemens Group regularly transfer business partner data as a basis for a centralized internal rating and credit limit recommendation process. Due to the identification, quantification and active management of credit risks, this increases credit risk transparency.
Ratings and individually defined credit limits are based on generally accepted rating methodologies, with information obtained from customers, external rating agencies, data service providers and Siemens’ credit default experiences. Internal ratings consider appropriate forward-looking information relevant to the specific financial instrument like expected changes in the debtor’s financial position, ownership, management or operational risks, as well as broader forward-looking information, such as expected macroeconomic, industry-related and competitive developments. The ratings also consider a country-specific risk component derived from external country credit ratings. Ratings and credit limits for financial institutions as well as Siemens' public and private customers, which are determined by internal risk assessment specialists, are continuously updated and considered for investments in cash and cash equivalents and in determining the conditions under which direct or indirect financing will be offered to customers.
An exposure is considered defaulted if the debtor is unwilling or unable to pay its credit obligations. A range of internally defined events trigger a default rating, including the opening of bankruptcy proceedings, receivables being more than 90 days past due, or a default rating by an external rating agency.
To analyze and monitor credit risks, the Company applies various systems and processes. A main element is a central IT application that processes data from operating units together with rating and default information and calculates an estimate, which may be used as a basis for individual bad debt provisions. Additionally, qualitative information is considered to particularly incorporate the latest developments.
The carrying amount is the maximum exposure to a financial asset’s credit risk, without taking account of any collateral. Collateral reduces the valuation allowance to the extent it mitigates credit risk. Collateral needs to be specific, identifiable and legally enforceable to be taken into account. Those collaterals are mostly held in the portfolio of SFS.
As of September 30, 2021 and 2020, collateral of €748 million and €829 million, respectively, relate to financial assets measured at fair value. Those collaterals are provided in connection with netting agreements for derivatives providing protection from the risk of a counterparty’s insolvency. As of September 30, 2021 and 2020, collateral held for credit-impaired receivables from finance leases amounted to €90 million and €141 million, respectively. As of September 30, 2021 and 2020, collateral held for financial assets measured at amortized cost amounted to €3,328 million and €4,109 million, respectively, including €90 million and €141 million, respectively, for credit-impaired loans in SFS’ asset finance business. Those collaterals mainly comprised property, plant and equipment. Credit risks arising from irrevocable loan commitments are equal to the expected future pay-offs resulting from these commitments.

Consolidated Financial Statements
37
SFS’ external financing portfolio disaggregates into credit risk rating grades as of September 30, 2021 as follows (pre valuation allowances):
Loans and other debt instruments under the general
approach
Financial guarantees andloan commitments
(in millions of €) Stage 1 Stage 2 Stage 3 Stage 1 Stage 2 Stage 3
Lease Re-ceivables
Investment Grade Ratings 5,627 8 n/a 671 n/a n/a 2,068
Non-Investment Grade Ratings 13,456 657 360 2,684 39 91 4,704
Trade receivables of operating units are generally rated internally; as of September 30, 2021 and 2020, approximately 47% and 43%, respectively, have an investment grade rating and 53% and 57%, respectively, have a non-investment grade rating. Contract assets generally show similar risk characteristics as trade receivables in operating units.
Amounts above do not represent economic credit risk, since they consider neither collateral held nor valuation allowances already recognized.
Equity Price Risk
Siemens‘ investment portfolio consists of direct and indirect investments in publicly traded companies that are classified as long term investments. These investments are monitored based on their current market value, affected primarily by fluctuations on the volatile technology-related markets worldwide. As of September 30, 2021 and 2020, the market value of Siemens’ portfolio, which mainly consists of one investment in a publicly traded company, was €678 million and €1,055 million, respectively. As of September 30, 2021 and 2020, the VaR relating to the equity price was €105 million and €182 million.
NOTE 26 Share-based paymentShare-based payment awards may be settled in newly issued shares of capital stock of Siemens AG, in treasury shares or in cash. Share-based payment awards may forfeit if the employment of the beneficiary terminates prior to the expiration of the vesting period. In fiscal 2021 and 2020, expense from equity-settled awards on a continuing basis are €294 million and €295 million; cash-settled awards on a continuing basis resulted in gains (expenses) of €(8) million and €(26) million in fiscal 2021 and 2020. Included is expense of €127 million and €100 million in fiscal 2021 and 2020, respectively, resulting from various individually immaterial plans, of which €66 million and €45 million, respectively, stem from Siemens Healthineers plans. Siemens Healthineers plans are largely similar to Siemens’ plans, except for granting Siemens Healthineers AG shares.
Stock Awards
The Company grants stock awards to members of the Managing Board, members of the senior management and other eligible employees. Stock awards are subject to a restriction period of about four years and entitle the beneficiary to Siemens shares following the restriction period without payment of consideration.
Stock awards are tied to performance criteria. For stock awards granted in fiscal 2021 and 2020, 80% of the target amount is linked to the relative total shareholder return of Siemens compared to the total shareholder return of the MSCI World Industrials sector index (TSR-Target) during a four-year restriction period; the remaining 20% are linked to a Siemens internal sustainability target considering environmental, social and governance targets (ESG-Target). The annual target amount for stock awards up to and including tranche 2019 is linked to the share price performance of Siemens relative to the share price performance of five important competitors during the four-year restriction period. The target attainment for each individual performance criteria ranges between 0% and 200%. For awards granted since fiscal 2019 settlement is in shares only corresponding to the actual target attainment. Awards granted prior to fiscal 2019, target outperformances in excess of 100% are settled in cash. The vesting period is four years.
Commitments to members of the Managing Board
The Managing Board’s stock awards are based on criteria described above. Fair values are €12 million and €12 million, respectively, in fiscal 2021 and 2020, calculated by applying a valuation model. In fiscal 2021 and 2020, inputs to that model include an expected weighted volatility of Siemens shares of 24.30% and 21.58%, respectively, and a market price of €112.70 and €116.80 per Siemens share. Expected volatility was determined by reference to historic volatilities. The model applies a risk-free interest rate of up to (0.49)% and (0.24)% in fiscal 2021 and 2020, respectively, and an expected dividend yield of 3.10% in fiscal 2021 and 3.31% in fiscal 2020. Assumptions relating to correlations between the Siemens share price and the development of the MSCI index were derived from historic observations of share price and index changes.
Commitments to members of the senior management and other eligible employees
In fiscal 2021 and 2020, 1,975,492 and 2,688,334 equity-settled stock awards were granted relating to the TSR-Target with a fair value of €104 million and €132 million, respectively. In fiscal 2021 and 2020, 493,472 and 672,197 equity-settled stock awards were granted relating to the ESG-Target with a fair value of €48 million and €66 million, respectively.
The fair value of stock awards granted in fiscal 2021 and 2020 (TSR-related) was calculated applying a valuation model. In fiscal 2021 and 2020, inputs to that model include an expected weighted volatility of Siemens shares of 24.34% and 21.58%, respectively, and a market price of €112.36 and €116.02 per Siemens share. Expected volatility was determined by reference to historic volatilities. The model applies a risk-free interest rate of up to (0.49)% in fiscal 2021 and up to (0.26)% in fiscal 2020 and an expected dividend yield of 3.11% and 3.31% in fiscal 2021 and 2020, respectively. Assumptions relating to correlations between the Siemens share price and the development of the MSCI Index were derived from historic observations of share price and index changes. The fair value of the ESG component of €97.63 and

Consolidated Financial Statements
38
€98.02 per share in fiscal 2021 and 2020, respectively, was determined as the market price of Siemens shares less the present value of expected dividends during the vesting period.
Changes in stock awards:
Fiscal year
2021 2020
Non-vested, beginning of period 7,939,840 9,300,505
Granted 2,683,909 3,577,133
Vested and fulfilled (1,292,912) (1,846,312)
Adjustments due to vesting conditions other than market conditions (173,648) (374,733)
Forfeited (444,962) (412,903)
Settled (42,116) (2,303,850)
Non-vested, end of period 8,670,111 7,939,840
Share Matching Program and its underlying plans
In fiscal 2021, Siemens issued a new tranche under each of the plans of the Share Matching Program.
Share Matching Plan
Under the Share Matching Plan, senior managers may invest a specified part of their variable compensation in Siemens shares (investment shares). The shares are purchased at the market price at a predetermined date in the second quarter. Plan participants receive the right to one Siemens share without payment of consideration (matching share) for every three investment shares continuously held over a period of about three years (vesting period) provided the plan participant has been continuously employed by Siemens until the end of the vesting period.
Monthly Investment Plan
Under the Monthly Investment Plan employees other than senior managers may invest a specified part of their compensation in Siemens shares on a monthly basis over a period of twelve months. Shares are purchased at market price at a predetermined date once a month. If the Managing Board decides that shares acquired under the Monthly Investment Plan are transferred to the Share Matching Plan, plan participants will receive the right to matching shares under the same conditions applying to the Share Matching Plan described above with a vesting period of about two years. The Managing Board decided that shares acquired under the tranches issued in fiscal 2020 and 2019 are transferred to the Share Matching Plan as of February 2021 and February 2020, respectively.
Base Share Program
Under the Base Share Program employees of Siemens AG and participating domestic Siemens companies may invest a fixed amount of their compensation in Siemens shares, sponsored by Siemens. The shares are bought at market price at a predetermined date in the second quarter and grant the right to receive matching shares under the same conditions applying to the Share Matching Plan described above. The fair value of the Base Share Program amounted to €25 million and €33 million in fiscal 2021 and 2020, respectively.
Resulting Matching Shares
Fiscal year
2021 2020
Outstanding, beginning of period 1,509,046 1,785,913
Granted 654,483 874,793
Vested and fulfilled (624,480) (569,405)
Forfeited (80,385) (122,659)
Settled (69,648) (459,596)
Outstanding, end of period 1,389,016 1,509,046
The weighted average fair value of matching shares granted in fiscal 2021 and 2020 of €96.92 and €89.71 per share, respectively, was determined as the market price of Siemens shares less the present value of expected dividends; non-vesting conditions were taken into account.
Jubilee Share Program
For their 25th and 40th service anniversary eligible employees receive jubilee shares. There were 3.15 million and 3.29 million entitlements to jubilee shares outstanding as of September 30, 2021 and 2020, respectively.
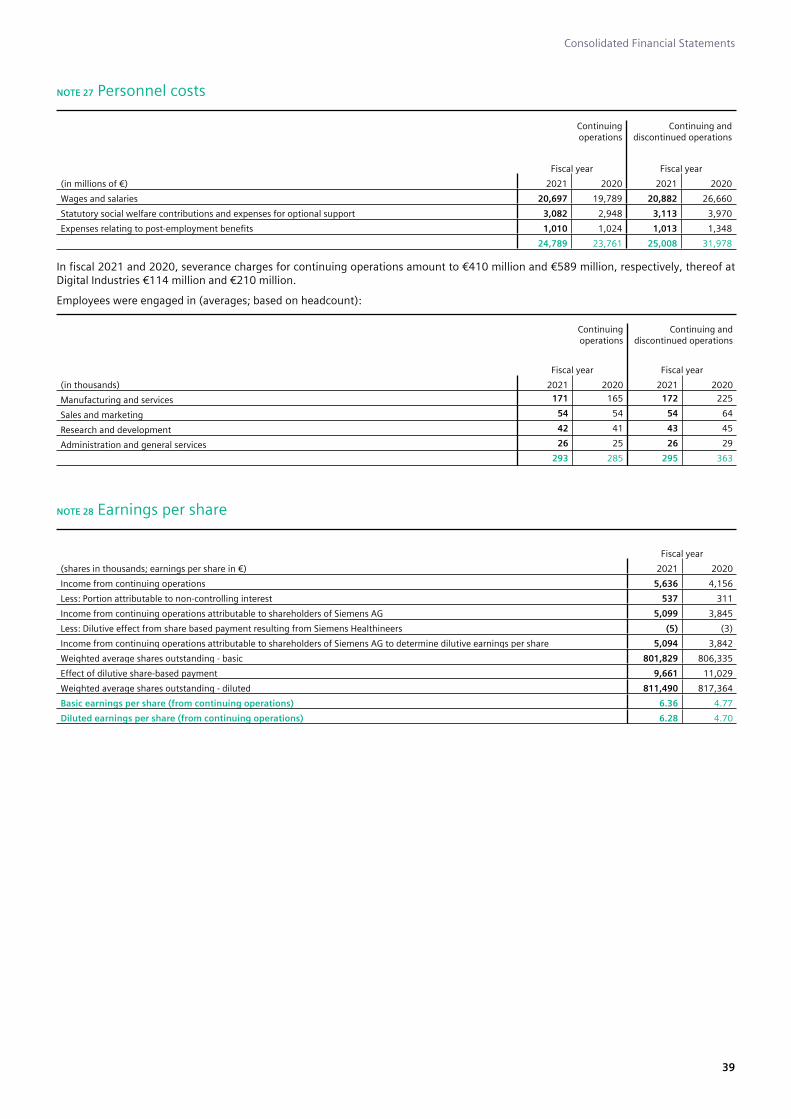
Consolidated Financial Statements
39
NOTE 27 Personnel costs
Continuing operations
Continuing and discontinued operations
Fiscal year Fiscal year
(in millions of €) 2021 2020 2021 2020
Wages and salaries 20,697 19,789 20,882 26,660
Statutory social welfare contributions and expenses for optional support 3,082 2,948 3,113 3,970
Expenses relating to post-employment benefits 1,010 1,024 1,013 1,348
24,789 23,761 25,008 31,978
In fiscal 2021 and 2020, severance charges for continuing operations amount to €410 million and €589 million, respectively, thereof at Digital Industries €114 million and €210 million.
Employees were engaged in (averages; based on headcount):
Continuing operations
Continuing and discontinued operations
Fiscal year Fiscal year
(in thousands) 2021 2020 2021 2020
Manufacturing and services 171 165 172 225
Sales and marketing 54 54 54 64
Research and development 42 41 43 45
Administration and general services 26 25 26 29
293 285 295 363
NOTE 28 Earnings per share
Fiscal year
(shares in thousands; earnings per share in €) 2021 2020
Income from continuing operations 5,636 4,156
Less: Portion attributable to non-controlling interest 537 311
Income from continuing operations attributable to shareholders of Siemens AG 5,099 3,845
Less: Dilutive effect from share based payment resulting from Siemens Healthineers (5) (3)
Income from continuing operations attributable to shareholders of Siemens AG to determine dilutive earnings per share 5,094 3,842
Weighted average shares outstanding - basic 801,829 806,335
Effect of dilutive share-based payment 9,661 11,029
Weighted average shares outstanding - diluted 811,490 817,364
Basic earnings per share (from continuing operations) 6.36 4.77
Diluted earnings per share (from continuing operations) 6.28 4.70
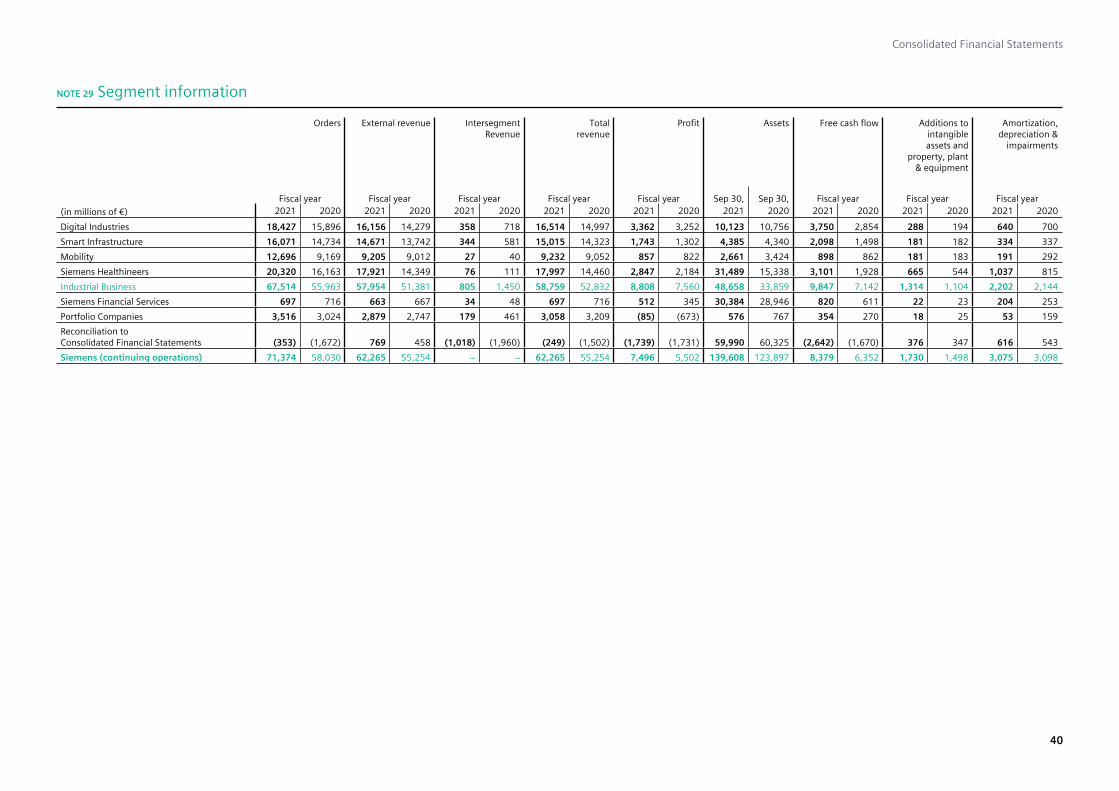
Consolidated Financial Statements
40
NOTE 29 Segment information
Orders External revenue IntersegmentRevenue
Total revenue
Profit Assets Free cash flow Additions tointangibleassets and
property, plant& equipment
Amortization,depreciation &
impairments
Fiscal year Fiscal year Fiscal year Fiscal year Fiscal year Sep 30, Sep 30, Fiscal year Fiscal year Fiscal year
(in millions of €) 2021 2020 2021 2020 2021 2020 2021 2020 2021 2020 2021 2020 2021 2020 2021 2020 2021 2020
Digital Industries 18,427 15,896 16,156 14,279 358 718 16,514 14,997 3,362 3,252 10,123 10,756 3,750 2,854 288 194 640 700
Smart Infrastructure 16,071 14,734 14,671 13,742 344 581 15,015 14,323 1,743 1,302 4,385 4,340 2,098 1,498 181 182 334 337
Mobility 12,696 9,169 9,205 9,012 27 40 9,232 9,052 857 822 2,661 3,424 898 862 181 183 191 292
Siemens Healthineers 20,320 16,163 17,921 14,349 76 111 17,997 14,460 2,847 2,184 31,489 15,338 3,101 1,928 665 544 1,037 815
Industrial Business 67,514 55,963 57,954 51,381 805 1,450 58,759 52,832 8,808 7,560 48,658 33,859 9,847 7,142 1,314 1,104 2,202 2,144
Siemens Financial Services 697 716 663 667 34 48 697 716 512 345 30,384 28,946 820 611 22 23 204 253
Portfolio Companies 3,516 3,024 2,879 2,747 179 461 3,058 3,209 (85) (673) 576 767 354 270 18 25 53 159
Reconciliation to Consolidated Financial Statements (353) (1,672) 769 458 (1,018) (1,960) (249) (1,502) (1,739) (1,731) 59,990 60,325 (2,642) (1,670) 376 347 616 543
Siemens (continuing operations) 71,374 58,030 62,265 55,254 − − 62,265 55,254 7,496 5,502 139,608 123,897 8,379 6,352 1,730 1,498 3,075 3,098

Consolidated Financial Statements
41
Description of reportable segments
Digital Industries, offers a comprehensive product portfolio and system solutions for automation used in discrete and process industries, complemented by product lifecycle and data-driven services,
Smart Infrastructure, offers products, systems, solutions, services and software to support a sustainable transition in energy generation sources, from fossil to renewable and a transition to smarter, more sustainable buildings and communities,
Mobility, combines all Siemens businesses in the area of passenger and freight transportation, including rail vehicles, rail automation systems, rail electrification systems, road traffic technology, digital solutions and related services,
Siemens Healthineers develops, manufactures, and sells a diverse range of innovative diagnostic and therapeutic products and services to healthcare providers,
Siemens Financial Services provides financing solutions to Siemens’ customers and other companies via debt and equity investments, offering leasing, lending and working capital financing solutions and equipment, project and structured financing.
Portfolio Companies (POC)
Portfolio Companies comprise businesses which deliver a broad range of customized and application-specific products, software, solutions, systems and services for various industries including oil and gas, chemical, mining, cement, logistics, energy, marine, water and fiber.
Reconciliation to Consolidated Financial Statements
Siemens Energy Investment – includes our investment in Siemens Energy accounted for using the equity method as well as a smaller investment in connection with Siemens Energy.
Siemens Real Estate (SRE) – manages the Group’s real estate business portfolio, operates the properties, and is responsible for building projects and the purchase and sale of real estate; excluded is the carved-out real estate of Siemens Healthineers; in fiscal 2020 Mobility was excluded as well.
Corporate items – includes corporate costs, such as group managing costs, basic research of Corporate Technology, Siemens Advanta, as well as corporate services and projects. Corporate items also include equity interests, activities generally intended for closure as well as activities remaining from divestments and discontinued operations.
Centrally carried pension expense – includes the Company’s pension related income (expense) not allocated to the segments, POC or Siemens Real Estate.
Eliminations, Corporate Treasury and other reconciling items – comprise consolidation of transactions within the segments, certain reconciliation and reclassification items as well as central financing activities. It also includes interest income and expense, such as, for example, interest not allocated to segments or POC (referred to as financing interest), interest related to central financing activities or resulting consolidation and reconciliation effects on interest.
Measurement – Segments
Accounting policies for Segment information are generally the same as those used for the Consolidated Financial Statements. Segment information is disclosed for continuing operations; prior year Assets are reclassified to conform to the current year presentation. For internal and segment reporting purposes intercompany lease transactions, however, are classified as operating leases by the lessor and are accounted for off-balance sheet by the lessee (except for intercompany leases with Siemens Healthineers as lessees). Intersegment transactions are based on market prices.
Revenue
Revenue includes revenue from contracts with customers and revenue from leasing activities. In fiscal 2021 and 2020, lease revenue is €1,050 million and €958 million, respectively. In fiscal 2021 and 2020, Digital industries recognized €4,290 million and €4,144 million revenue, respectively, from its software business, Smart Infrastructure recognized €5,769 million and €5,182 million in its products business. Revenues of Mobility are mainly derived from construction-type business.
Profit
Siemens’ Managing Board is responsible for assessing the performance of the segments (chief operating decision maker). The Company’s profitability measure of the segments except for SFS is earnings before financing interest, certain pension costs, income taxes and amortization expenses of intangible assets acquired in business combinations as determined by the chief operating decision maker (Profit). The major categories of items excluded from Profit are described below.
Financing interest, excluded from Profit, is any interest income or expense other than interest income related to receivables from customers, from cash allocated to the segments and interest expenses on payables to suppliers. Financing interest is excluded from Profit because decision-making regarding financing is typically made at the corporate level.
Decisions on essential pension items are made centrally. Accordingly, Profit primarily includes amounts related to service cost of pension plans only, while all other regularly recurring pension related costs are included in reconciliations in line item Centrally carried pension expense.
Amortization expenses of intangible assets acquired in business combinations are not part of Profit. Furthermore, income taxes are excluded from Profit since income tax is subject to legal structures, which typically do not correspond to the structure of the segments. The effect of certain litigation and compliance issues is excluded from Profit, if such items are not indicative of performance. This may also
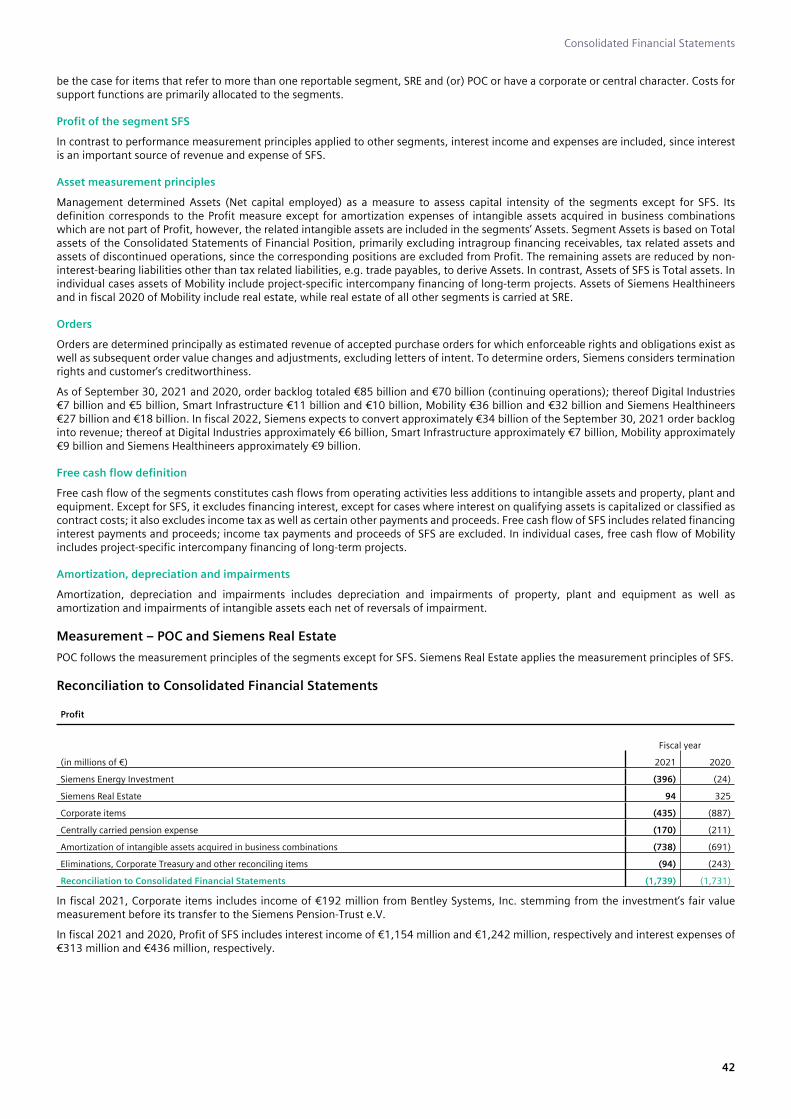
Consolidated Financial Statements
42
be the case for items that refer to more than one reportable segment, SRE and (or) POC or have a corporate or central character. Costs for support functions are primarily allocated to the segments.
Profit of the segment SFS
In contrast to performance measurement principles applied to other segments, interest income and expenses are included, since interest is an important source of revenue and expense of SFS.
Asset measurement principles
Management determined Assets (Net capital employed) as a measure to assess capital intensity of the segments except for SFS. Its definition corresponds to the Profit measure except for amortization expenses of intangible assets acquired in business combinations which are not part of Profit, however, the related intangible assets are included in the segments’ Assets. Segment Assets is based on Total assets of the Consolidated Statements of Financial Position, primarily excluding intragroup financing receivables, tax related assets and assets of discontinued operations, since the corresponding positions are excluded from Profit. The remaining assets are reduced by non-interest-bearing liabilities other than tax related liabilities, e.g. trade payables, to derive Assets. In contrast, Assets of SFS is Total assets. In individual cases assets of Mobility include project-specific intercompany financing of long-term projects. Assets of Siemens Healthineers and in fiscal 2020 of Mobility include real estate, while real estate of all other segments is carried at SRE.
Orders
Orders are determined principally as estimated revenue of accepted purchase orders for which enforceable rights and obligations exist as well as subsequent order value changes and adjustments, excluding letters of intent. To determine orders, Siemens considers termination rights and customer’s creditworthiness.
As of September 30, 2021 and 2020, order backlog totaled €85 billion and €70 billion (continuing operations); thereof Digital Industries €7 billion and €5 billion, Smart Infrastructure €11 billion and €10 billion, Mobility €36 billion and €32 billion and Siemens Healthineers €27 billion and €18 billion. In fiscal 2022, Siemens expects to convert approximately €34 billion of the September 30, 2021 order backlog into revenue; thereof at Digital Industries approximately €6 billion, Smart Infrastructure approximately €7 billion, Mobility approximately €9 billion and Siemens Healthineers approximately €9 billion.
Free cash flow definition
Free cash flow of the segments constitutes cash flows from operating activities less additions to intangible assets and property, plant and equipment. Except for SFS, it excludes financing interest, except for cases where interest on qualifying assets is capitalized or classified as contract costs; it also excludes income tax as well as certain other payments and proceeds. Free cash flow of SFS includes related financing interest payments and proceeds; income tax payments and proceeds of SFS are excluded. In individual cases, free cash flow of Mobility includes project-specific intercompany financing of long-term projects.
Amortization, depreciation and impairments
Amortization, depreciation and impairments includes depreciation and impairments of property, plant and equipment as well as amortization and impairments of intangible assets each net of reversals of impairment.
Measurement – POC and Siemens Real Estate
POC follows the measurement principles of the segments except for SFS. Siemens Real Estate applies the measurement principles of SFS.
Reconciliation to Consolidated Financial Statements
Profit
Fiscal year
(in millions of €) 2021 2020
Siemens Energy Investment (396) (24)
Siemens Real Estate 94 325
Corporate items (435) (887)
Centrally carried pension expense (170) (211)
Amortization of intangible assets acquired in business combinations (738) (691)
Eliminations, Corporate Treasury and other reconciling items (94) (243)
Reconciliation to Consolidated Financial Statements (1,739) (1,731)
In fiscal 2021, Corporate items includes income of €192 million from Bentley Systems, Inc. stemming from the investment’s fair value measurement before its transfer to the Siemens Pension-Trust e.V.
In fiscal 2021 and 2020, Profit of SFS includes interest income of €1,154 million and €1,242 million, respectively and interest expenses of €313 million and €436 million, respectively.

Consolidated Financial Statements
43
Assets
Sep 30, Sep 30,
(in millions of €) 2021 2020
Siemens Energy Investment 6,458 6,748
Assets Siemens Real Estate 4,535 3,898
Assets Corporate items and pensions 228 (608)
Asset-based adjustments:
Intragroup financing receivables 56,091 51,431
Tax-related assets 4,511 4,335
Liability-based adjustments 33,456 27,568
Eliminations, Corporate Treasury, other items (45,289) (33,049)
Reconciliation to Consolidated Financial Statements 59,990 60,325
NOTE 30 Information about geographies
Revenue by location of customers
Fiscal year
Revenue by location of companies
Fiscal year
Non-current assets
Sep 30,(in millions of €) 2021 2020 2021 2020 2021 2020
Europe, C.I.S., Africa, Middle East 31,138 27,252 32,066 28,563 23,724 17,624
Americas 16,312 15,218 16,426 15,061 22,409 14,410
Asia, Australia 14,815 12,784 13,773 11,630 5,582 3,504
Siemens 62,265 55,254 62,265 55,254 51,716 35,537
thereof Germany 11,249 9,373 13,226 11,227 7,061 6,995
thereof countries outside of Germany 51,016 45,881 49,039 44,027 44,655 28,543
therein U.S. 13,521 12,761 13,901 12,907 21,550 13,656
Non-current assets consist of property, plant and equipment, goodwill and other intangible assets.
NOTE 31 Related party transactions
Joint ventures and associates
Siemens has relationships with many joint ventures and associates in the ordinary course of business whereby Siemens buys and sells a wide variety of products and services generally on arm’s length terms. The transactions between continuing operations and joint ventures and associates were as follows:
Sales of goods and services and other income
Purchases of goods and services and other expenses
Receivables Liabilities
Fiscal year Fiscal year Sep 30, Sep 30, Sep 30, Sep 30,
(in millions of €) 2021 2020 2021 2020 2021 2020 2021 2020
Joint ventures 169 147 10 34 113 76 8 49
Associates 1,329 68 584 87 1,129 1,105 861 1,358
1,498 215 594 121 1,242 1,181 870 1,407
In fiscal 2021 and 2020, sales of goods and services and other income resulting from transactions between discontinued operations and joint ventures and associates amounted to €97 million and €391 million, respectively. Purchases of goods and services and other expenses resulting from transactions between discontinued operations and joint ventures and associates amounted to €1 million and €174 million, respectively.
As of September 30, 2021 and 2020, receivables to associates included reimbursement rights against Siemens Energy which were recognized correspondingly with obligations from customer contracts in connection with Siemens Energy activities legally remaining at Siemens. Liabilities to associates as of September 30, 2021 and 2020 were mainly due to trade receivables that also result from these activities and that have economically to be allocated to Siemens Energy.
As of September 30, 2021 and 2020, guarantees to joint ventures and associates amounted to €14,533 million and €27,505 million, respectively, thereof €14,159 million and €27,253 million, respectively, to associates. These guarantees included mainly obligations from performance and credit guarantees in connection with the Siemens Energy business. For these guarantees, Siemens has reimbursement rights towards Siemens Energy.
As of September 30, 2021 and 2020, loans given to joint ventures and associates amounted to €1,138 million and €900 million, therein €1,122 million and €881 million related to joint ventures, respectively. The related book values amounted to €28 million and €26 million, therein €25 million and €20 million related to joint ventures, respectively. Valuation adjustments recognized in fiscal 2021 and 2020 reduced book values of loans related to joint ventures by €242 million and €744 million, respectively.
As of September 30, 2021 and 2020, the Company had commitments to make capital contributions to joint ventures and associates of €72 million and €62 million, therein €65 million and €51 million related to joint ventures, respectively.

Consolidated Financial Statements
44
As of September 30, 2021 and 2020, there were loan commitments to joint ventures amounting to €222 million and €299 million, respectively.
Pension entities
For information regarding the funding of our post-employment benefit plans see Note 17.
Related individuals
In fiscal 2021 and 2020, members of the Managing Board ‒ including members who left during fiscal 2021 ‒ received cash compensation of €21.4 million and €15.3 million. The fair value of share-based compensation amounted to €11.6 million and €11.3 million for 202,139 and 203,460 stock awards, respectively, granted in fiscal 2021 and 2020. In fiscal 2021 and 2020, the Company granted contributions under the BSAV to members of the Managing Board totaling €3.0 million and €4.5 million, respectively.
Therefore, in fiscal 2021 and 2020, compensation and benefits, attributable to members of the Managing Board amounted to €36.0 million and €31.0 million in total, respectively.
In fiscal 2021 and 2020, expense related to share-based compensation amounted to €7.6 million and €17.7 million, respectively, including expenses related to the additional cash payment compensation due to the spin-off of Siemens Energy.
Former members of the Managing Board and their surviving dependents received emoluments within the meaning ofSection 314 para. 1 No. 6 b of the German Commercial Code totaling €30.1 million and €16.0 million in fiscal 2021 and 2020, respectively.
The defined benefit obligation (DBO) of all pension commitments to former members of the Managing Board and their surviving dependents as of September 30, 2021 and 2020 amounted to €192.0 million and €176.5 million, respectively.
Compensation attributable to members of the Supervisory Board comprised in fiscal 2021 and 2020 base compensation and additional compensation for committee work and amounted to €5.2 and €5.3 million (including meeting fees), respectively.
In fiscal 2021 and 2020, no other major transactions took place between the Company and the members of the Managing Board and the Supervisory Board.
Some of our board members hold, or in the last year have held, positions of significant responsibility with other entities. We have relationships with almost all of these entities in the ordinary course of our business whereby we buy and sell a wide variety of products and services on arm’s length terms.
NOTE 32 Principal accountant fees and services Fees related to professional services rendered by the Company’s principal accountant, EY, for fiscal 2021 and 2020 are:
Fiscal year
(in millions of €) 2021 2020
Audit services 37.6 58.1
Other attestation services 3.9 10.4
Tax services − 0.1
41.6 68.6
In fiscal 2021 and 2020, 43% and 44%, respectively, of the total fees related to Ernst & Young GmbH Wirtschaftsprüfungsgesellschaft, Germany.
Audit Services relate primarily to services provided by EY for auditing Siemens’ Consolidated Financial Statements, for auditing financial statements of Siemens AG and its subsidiaries, for reviews of interim financial statements being integrated into the audit, for project-accompanying IT audits, for audit services in connection with the implementation of new accounting standards as well as for audits of the internal control system at service companies. Other Attestation Services include primarily audits of financial statements as well as other attestation services in connection with M&A activities, audits of employee benefit plans, attestation services related to the sustainability reporting, comfort letters and other attestation services required under regulatory requirements, contractually agreed or requested on a voluntary basis.
NOTE 33 Corporate governanceThe Managing and Supervisory Boards of Siemens Aktiengesellschaft and of Siemens Healthineers AG, a publicly listed subsidiary of Siemens, provided the declarations required under Section 161 of the German Stock Corporation Act (AktG) on October 1, 2021 and September 30, 2021. The declarations are available on the company’s websites at siemens.com/gcg-code and at corporate.siemens-healthineers.com/investor-relations/corporate-governance.
NOTE 34 Subsequent eventsIn October 2021, Siemens recognized a pre-tax gain of €291 million related to Siemens’ investment in Fluence Energy, LLC, Delaware, U.S. (Fluence), an investment accounted for using the equity method, which is active in energy storage products and services and digital applications for renewables and storage. Fluence issued new equity to a newly formed parent holding company, Fluence Energy, Inc., a Delaware corporation, which in turn issued shares of stock through an initial public offering. The transaction diluted Siemens’ share in Fluence to 34%.
In October 2021, Siemens acquired the Netherlands based company SQCAP B.V. (Sqills), a provider in the provision of cloud-based inventory management, reservation, and ticketing software to public transport operators around the world. The acquired business will be integrated into Mobility. The purchase price is €537 million paid in cash plus contingent consideration recognized at the acquisition date
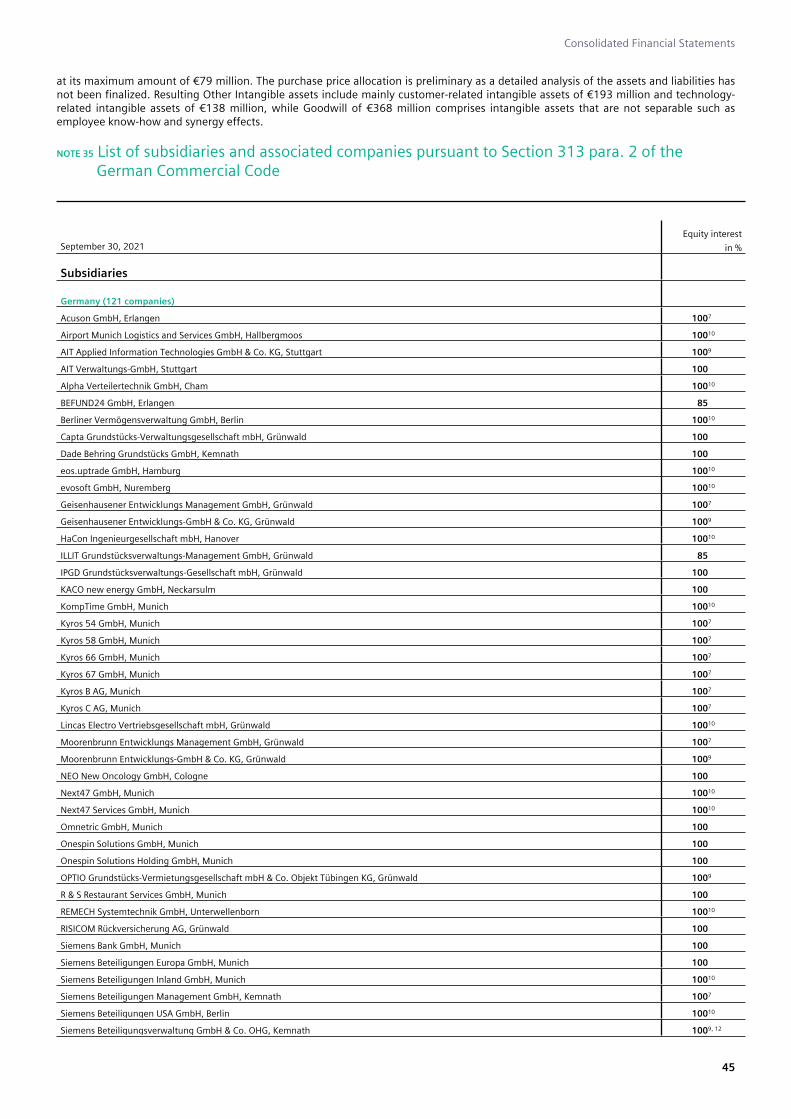
Consolidated Financial Statements
45
at its maximum amount of €79 million. The purchase price allocation is preliminary as a detailed analysis of the assets and liabilities has not been finalized. Resulting Other Intangible assets include mainly customer-related intangible assets of €193 million and technology-related intangible assets of €138 million, while Goodwill of €368 million comprises intangible assets that are not separable such as employee know-how and synergy effects.
NOTE 35 List of subsidiaries and associated companies pursuant to Section 313 para. 2 of the German Commercial Code
Equity interest September 30, 2021 in %
Subsidiaries
Germany (121 companies)
Acuson GmbH, Erlangen 1007
Airport Munich Logistics and Services GmbH, Hallbergmoos 10010
AIT Applied Information Technologies GmbH & Co. KG, Stuttgart 1009
AIT Verwaltungs-GmbH, Stuttgart 100
Alpha Verteilertechnik GmbH, Cham 10010
BEFUND24 GmbH, Erlangen 85
Berliner Vermögensverwaltung GmbH, Berlin 10010
Capta Grundstücks-Verwaltungsgesellschaft mbH, Grünwald 100
Dade Behring Grundstücks GmbH, Kemnath 100
eos.uptrade GmbH, Hamburg 10010
evosoft GmbH, Nuremberg 10010
Geisenhausener Entwicklungs Management GmbH, Grünwald 1007
Geisenhausener Entwicklungs-GmbH & Co. KG, Grünwald 1009
HaCon Ingenieurgesellschaft mbH, Hanover 10010
ILLIT Grundstücksverwaltungs-Management GmbH, Grünwald 85
IPGD Grundstücksverwaltungs-Gesellschaft mbH, Grünwald 100
KACO new energy GmbH, Neckarsulm 100
KompTime GmbH, Munich 10010
Kyros 54 GmbH, Munich 1007
Kyros 58 GmbH, Munich 1007
Kyros 66 GmbH, Munich 1007
Kyros 67 GmbH, Munich 1007
Kyros B AG, Munich 1007
Kyros C AG, Munich 1007
Lincas Electro Vertriebsgesellschaft mbH, Grünwald 10010
Moorenbrunn Entwicklungs Management GmbH, Grünwald 1007
Moorenbrunn Entwicklungs-GmbH & Co. KG, Grünwald 1009
NEO New Oncology GmbH, Cologne 100
Next47 GmbH, Munich 10010
Next47 Services GmbH, Munich 10010
Omnetric GmbH, Munich 100
Onespin Solutions GmbH, Munich 100
Onespin Solutions Holding GmbH, Munich 100
OPTIO Grundstücks-Vermietungsgesellschaft mbH & Co. Objekt Tübingen KG, Grünwald 1009
R & S Restaurant Services GmbH, Munich 100
REMECH Systemtechnik GmbH, Unterwellenborn 10010
RISICOM Rückversicherung AG, Grünwald 100
Siemens Bank GmbH, Munich 100
Siemens Beteiligungen Europa GmbH, Munich 100
Siemens Beteiligungen Inland GmbH, Munich 10010
Siemens Beteiligungen Management GmbH, Kemnath 1007
Siemens Beteiligungen USA GmbH, Berlin 10010
Siemens Beteiligungsverwaltung GmbH & Co. OHG, Kemnath 1009, 12
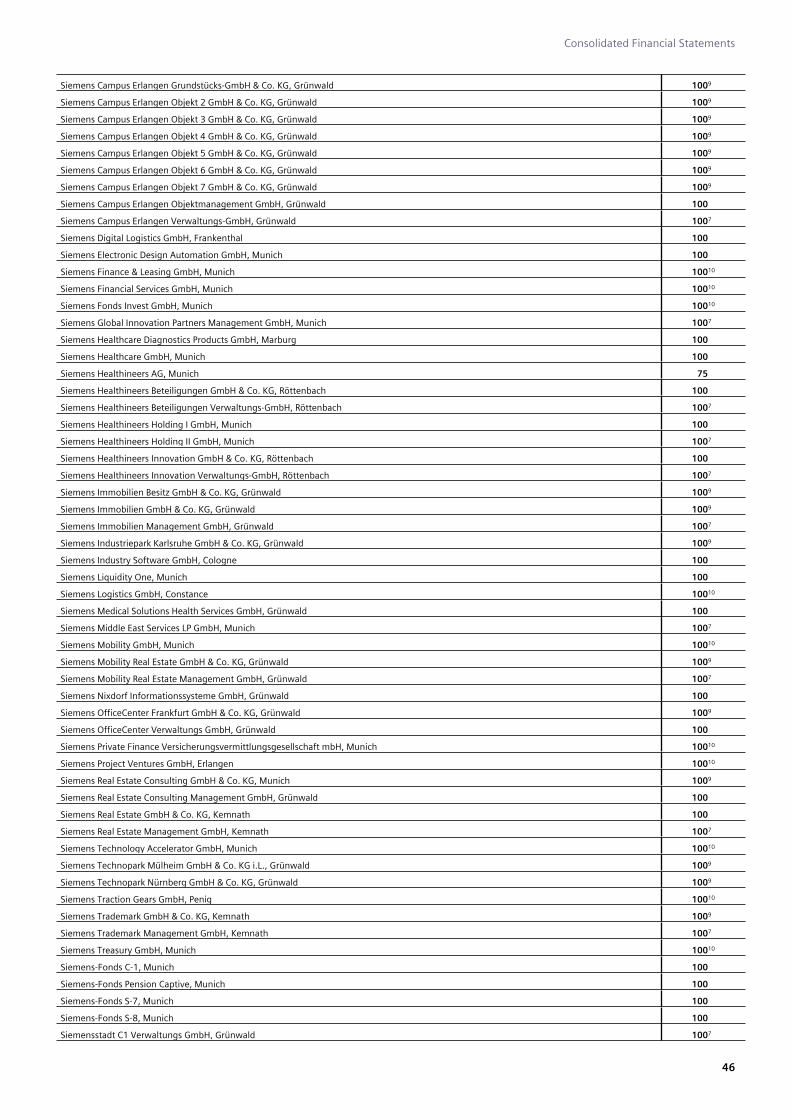
Consolidated Financial Statements
46
Siemens Campus Erlangen Grundstücks-GmbH & Co. KG, Grünwald 1009
Siemens Campus Erlangen Objekt 2 GmbH & Co. KG, Grünwald 1009
Siemens Campus Erlangen Objekt 3 GmbH & Co. KG, Grünwald 1009
Siemens Campus Erlangen Objekt 4 GmbH & Co. KG, Grünwald 1009
Siemens Campus Erlangen Objekt 5 GmbH & Co. KG, Grünwald 1009
Siemens Campus Erlangen Objekt 6 GmbH & Co. KG, Grünwald 1009
Siemens Campus Erlangen Objekt 7 GmbH & Co. KG, Grünwald 1009
Siemens Campus Erlangen Objektmanagement GmbH, Grünwald 100
Siemens Campus Erlangen Verwaltungs-GmbH, Grünwald 1007
Siemens Digital Logistics GmbH, Frankenthal 100
Siemens Electronic Design Automation GmbH, Munich 100
Siemens Finance & Leasing GmbH, Munich 10010
Siemens Financial Services GmbH, Munich 10010
Siemens Fonds Invest GmbH, Munich 10010
Siemens Global Innovation Partners Management GmbH, Munich 1007
Siemens Healthcare Diagnostics Products GmbH, Marburg 100
Siemens Healthcare GmbH, Munich 100
Siemens Healthineers AG, Munich 75
Siemens Healthineers Beteiligungen GmbH & Co. KG, Röttenbach 100
Siemens Healthineers Beteiligungen Verwaltungs-GmbH, Röttenbach 1007
Siemens Healthineers Holding I GmbH, Munich 100
Siemens Healthineers Holding II GmbH, Munich 1007
Siemens Healthineers Innovation GmbH & Co. KG, Röttenbach 100
Siemens Healthineers Innovation Verwaltungs-GmbH, Röttenbach 1007
Siemens Immobilien Besitz GmbH & Co. KG, Grünwald 1009
Siemens Immobilien GmbH & Co. KG, Grünwald 1009
Siemens Immobilien Management GmbH, Grünwald 1007
Siemens Industriepark Karlsruhe GmbH & Co. KG, Grünwald 1009
Siemens Industry Software GmbH, Cologne 100
Siemens Liquidity One, Munich 100
Siemens Logistics GmbH, Constance 10010
Siemens Medical Solutions Health Services GmbH, Grünwald 100
Siemens Middle East Services LP GmbH, Munich 1007
Siemens Mobility GmbH, Munich 10010
Siemens Mobility Real Estate GmbH & Co. KG, Grünwald 1009
Siemens Mobility Real Estate Management GmbH, Grünwald 1007
Siemens Nixdorf Informationssysteme GmbH, Grünwald 100
Siemens OfficeCenter Frankfurt GmbH & Co. KG, Grünwald 1009
Siemens OfficeCenter Verwaltungs GmbH, Grünwald 100
Siemens Private Finance Versicherungsvermittlungsgesellschaft mbH, Munich 10010
Siemens Project Ventures GmbH, Erlangen 10010
Siemens Real Estate Consulting GmbH & Co. KG, Munich 1009
Siemens Real Estate Consulting Management GmbH, Grünwald 100
Siemens Real Estate GmbH & Co. KG, Kemnath 100
Siemens Real Estate Management GmbH, Kemnath 1007
Siemens Technology Accelerator GmbH, Munich 10010
Siemens Technopark Mülheim GmbH & Co. KG i.L., Grünwald 1009
Siemens Technopark Nürnberg GmbH & Co. KG, Grünwald 1009
Siemens Traction Gears GmbH, Penig 10010
Siemens Trademark GmbH & Co. KG, Kemnath 1009
Siemens Trademark Management GmbH, Kemnath 1007
Siemens Treasury GmbH, Munich 10010
Siemens-Fonds C-1, Munich 100
Siemens-Fonds Pension Captive, Munich 100
Siemens-Fonds S-7, Munich 100
Siemens-Fonds S-8, Munich 100
Siemensstadt C1 Verwaltungs GmbH, Grünwald 1007

Consolidated Financial Statements
47
Siemensstadt CX Verwaltungs GmbH, Grünwald 1007
Siemensstadt Grundstücks-GmbH & Co. KG, Grünwald 1009
Siemensstadt Management GmbH, Grünwald 1007
Siemensstadt SPE Verwaltungs GmbH, Grünwald 1007
Siemensstadt SWHH Verwaltungs GmbH, Grünwald 1007
Siemensstadt VG Verwaltungs GmbH, Grünwald 1007
SILLIT Grundstücks-Verwaltungsgesellschaft mbH, Munich 100
SIMAR Ost Grundstücks-GmbH, Grünwald 10010
SYKATEC Systeme, Komponenten, Anwendungstechnologie GmbH, Erlangen 10010
timeseries germany GmbH, Munich 100
Varian Medical Systems Deutschland GmbH & Co. KG, Darmstadt 10013
Varian Medical Systems Haan GmbH, Haan 100
Varian Medical Systems München GmbH, Munich 100
Varian Medical Systems Particle Therapy GmbH & Co. KG, Troisdorf 10013
VMS Deutschland Holdings GmbH, Darmstadt 100
VMZ Berlin Betreibergesellschaft mbH, Berlin 100
VVK Versicherungsvermittlungs- und Verkehrskontor GmbH, Munich 10010
Weiss Spindeltechnologie GmbH, Maroldsweisach 100
Yunex GmbH, Munich 100
Zeleni Holding GmbH, Kemnath 100
Zeleni Real Estate GmbH & Co. KG, Kemnath 100
Europe, Commonwealth of Independent States (C.I.S.), Africa, Middle East (without Germany) (306 companies)
ESTEL Rail Automation SPA, Algiers / Algeria 51
Siemens Spa, Algiers / Algeria 100
Varian Medical Systems Algeria Spa., Hydra / Algeria 491
Siemens Industry Software Closed Joint-Stock Company, Yerevan / Armenia 100
ETM professional control GmbH, Eisenstadt / Austria 100
ITH icoserve technology for healthcare GmbH, Innsbruck / Austria 69
Omnetric GmbH, Vienna / Austria 100
Siemens Aktiengesellschaft Österreich, Vienna / Austria 100
Siemens Gebäudemanagement & -Services G.m.b.H., Vienna / Austria 100
Siemens Healthcare Diagnostics GmbH, Vienna / Austria 100
Siemens Industry Software GmbH, Linz / Austria 100
Siemens Konzernbeteiligungen GmbH, Vienna / Austria 100
Siemens Metals Technologies Vermögensverwaltungs GmbH, Vienna / Austria 100
Siemens Mobility Austria GmbH, Vienna / Austria 100
Siemens Personaldienstleistungen GmbH, Vienna / Austria 100
Steiermärkische Medizinarchiv GesmbH, Graz / Austria 52
Varian Medical Systems Gesellschaft mbH, Brunn am Gebirge / Austria 100
VVK Versicherungs-Vermittlungs- und Verkehrs-Kontor GmbH, Vienna / Austria 100
Yunex Traffic Austria GmbH, Vienna / Austria 100
Siemens W.L.L., Manama / Bahrain 51
Samtech SA, Angleur / Belgium 100
Siemens Healthcare NV, Beersel / Belgium 100
Siemens Industry Software NV, Leuven / Belgium 100
Siemens Mobility S.A. / N.V, Beersel / Belgium 100
Siemens S.A./N.V., Beersel / Belgium 100
Varian Medical Systems Belgium NV, Machelen / Belgium 100
Yunex S.A./N.V., Beersel / Belgium 100
Siemens d.o.o. Sarajevo - U Likvidaciji, Sarajevo / Bosnia and Herzegovina 100
Siemens Medicina d.o.o., Sarajevo / Bosnia and Herzegovina 100
Siemens EOOD, Sofia / Bulgaria 100
Siemens Healthcare EOOD, Sofia / Bulgaria 100
Siemens Mobility EOOD, Sofia / Bulgaria 100
Varinak Bulgaria EOOD, Sofia / Bulgaria 100
Siemens d.d., Zagreb / Croatia 100
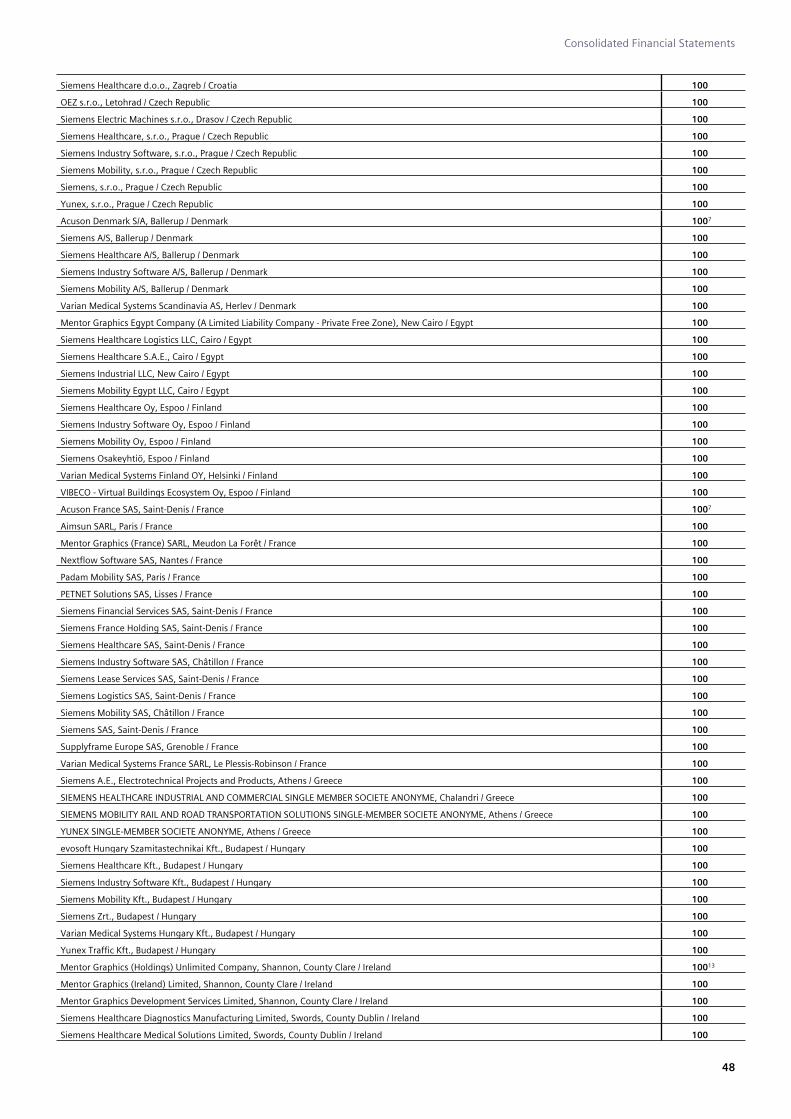
Consolidated Financial Statements
48
Siemens Healthcare d.o.o., Zagreb / Croatia 100
OEZ s.r.o., Letohrad / Czech Republic 100
Siemens Electric Machines s.r.o., Drasov / Czech Republic 100
Siemens Healthcare, s.r.o., Prague / Czech Republic 100
Siemens Industry Software, s.r.o., Prague / Czech Republic 100
Siemens Mobility, s.r.o., Prague / Czech Republic 100
Siemens, s.r.o., Prague / Czech Republic 100
Yunex, s.r.o., Prague / Czech Republic 100
Acuson Denmark S/A, Ballerup / Denmark 1007
Siemens A/S, Ballerup / Denmark 100
Siemens Healthcare A/S, Ballerup / Denmark 100
Siemens Industry Software A/S, Ballerup / Denmark 100
Siemens Mobility A/S, Ballerup / Denmark 100
Varian Medical Systems Scandinavia AS, Herlev / Denmark 100
Mentor Graphics Egypt Company (A Limited Liability Company - Private Free Zone), New Cairo / Egypt 100
Siemens Healthcare Logistics LLC, Cairo / Egypt 100
Siemens Healthcare S.A.E., Cairo / Egypt 100
Siemens Industrial LLC, New Cairo / Egypt 100
Siemens Mobility Egypt LLC, Cairo / Egypt 100
Siemens Healthcare Oy, Espoo / Finland 100
Siemens Industry Software Oy, Espoo / Finland 100
Siemens Mobility Oy, Espoo / Finland 100
Siemens Osakeyhtiö, Espoo / Finland 100
Varian Medical Systems Finland OY, Helsinki / Finland 100
VIBECO - Virtual Buildings Ecosystem Oy, Espoo / Finland 100
Acuson France SAS, Saint-Denis / France 1007
Aimsun SARL, Paris / France 100
Mentor Graphics (France) SARL, Meudon La Forêt / France 100
Nextflow Software SAS, Nantes / France 100
Padam Mobility SAS, Paris / France 100
PETNET Solutions SAS, Lisses / France 100
Siemens Financial Services SAS, Saint-Denis / France 100
Siemens France Holding SAS, Saint-Denis / France 100
Siemens Healthcare SAS, Saint-Denis / France 100
Siemens Industry Software SAS, Châtillon / France 100
Siemens Lease Services SAS, Saint-Denis / France 100
Siemens Logistics SAS, Saint-Denis / France 100
Siemens Mobility SAS, Châtillon / France 100
Siemens SAS, Saint-Denis / France 100
Supplyframe Europe SAS, Grenoble / France 100
Varian Medical Systems France SARL, Le Plessis-Robinson / France 100
Siemens A.E., Electrotechnical Projects and Products, Athens / Greece 100
SIEMENS HEALTHCARE INDUSTRIAL AND COMMERCIAL SINGLE MEMBER SOCIETE ANONYME, Chalandri / Greece 100
SIEMENS MOBILITY RAIL AND ROAD TRANSPORTATION SOLUTIONS SINGLE-MEMBER SOCIETE ANONYME, Athens / Greece 100
YUNEX SINGLE-MEMBER SOCIETE ANONYME, Athens / Greece 100
evosoft Hungary Szamitastechnikai Kft., Budapest / Hungary 100
Siemens Healthcare Kft., Budapest / Hungary 100
Siemens Industry Software Kft., Budapest / Hungary 100
Siemens Mobility Kft., Budapest / Hungary 100
Siemens Zrt., Budapest / Hungary 100
Varian Medical Systems Hungary Kft., Budapest / Hungary 100
Yunex Traffic Kft., Budapest / Hungary 100
Mentor Graphics (Holdings) Unlimited Company, Shannon, County Clare / Ireland 10013
Mentor Graphics (Ireland) Limited, Shannon, County Clare / Ireland 100
Mentor Graphics Development Services Limited, Shannon, County Clare / Ireland 100
Siemens Healthcare Diagnostics Manufacturing Limited, Swords, County Dublin / Ireland 100
Siemens Healthcare Medical Solutions Limited, Swords, County Dublin / Ireland 100
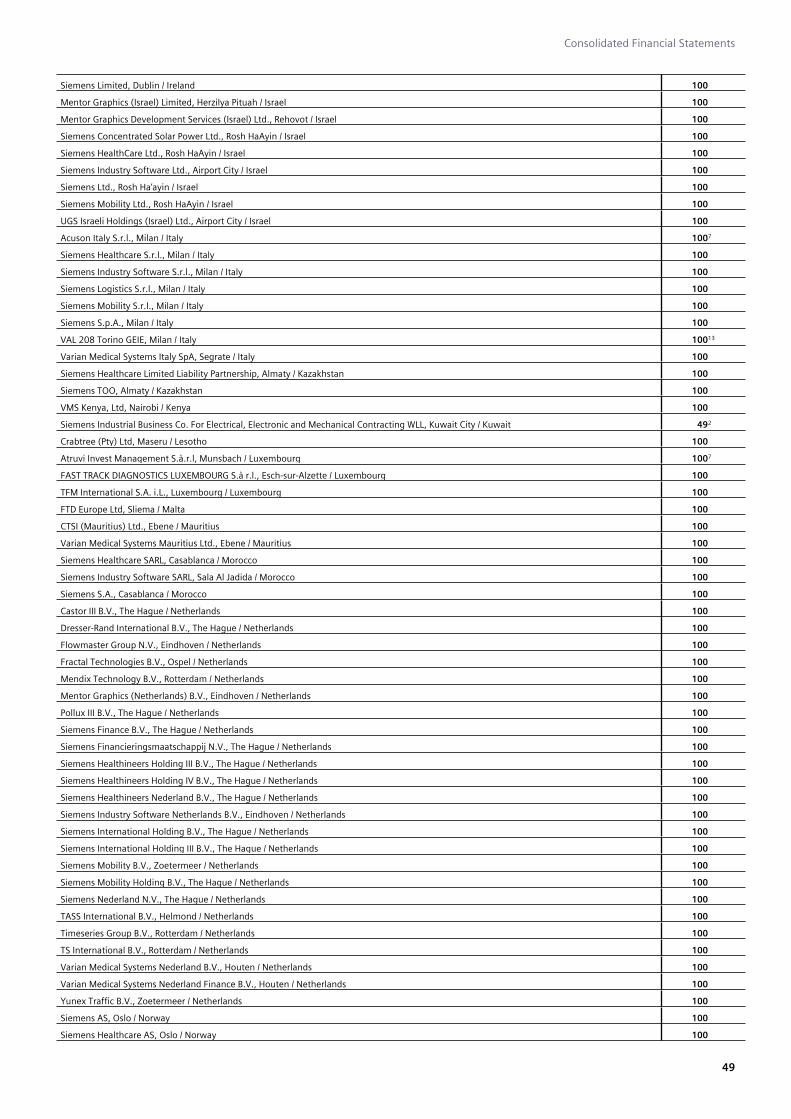
Consolidated Financial Statements
49
Siemens Limited, Dublin / Ireland 100
Mentor Graphics (Israel) Limited, Herzilya Pituah / Israel 100
Mentor Graphics Development Services (Israel) Ltd., Rehovot / Israel 100
Siemens Concentrated Solar Power Ltd., Rosh HaAyin / Israel 100
Siemens HealthCare Ltd., Rosh HaAyin / Israel 100
Siemens Industry Software Ltd., Airport City / Israel 100
Siemens Ltd., Rosh Ha’ayin / Israel 100
Siemens Mobility Ltd., Rosh HaAyin / Israel 100
UGS Israeli Holdings (Israel) Ltd., Airport City / Israel 100
Acuson Italy S.r.l., Milan / Italy 1007
Siemens Healthcare S.r.l., Milan / Italy 100
Siemens Industry Software S.r.l., Milan / Italy 100
Siemens Logistics S.r.l., Milan / Italy 100
Siemens Mobility S.r.l., Milan / Italy 100
Siemens S.p.A., Milan / Italy 100
VAL 208 Torino GEIE, Milan / Italy 10013
Varian Medical Systems Italy SpA, Segrate / Italy 100
Siemens Healthcare Limited Liability Partnership, Almaty / Kazakhstan 100
Siemens TOO, Almaty / Kazakhstan 100
VMS Kenya, Ltd, Nairobi / Kenya 100
Siemens Industrial Business Co. For Electrical, Electronic and Mechanical Contracting WLL, Kuwait City / Kuwait 492
Crabtree (Pty) Ltd, Maseru / Lesotho 100
Atruvi Invest Management S.à.r.l, Munsbach / Luxembourg 1007
FAST TRACK DIAGNOSTICS LUXEMBOURG S.à r.l., Esch-sur-Alzette / Luxembourg 100
TFM International S.A. i.L., Luxembourg / Luxembourg 100
FTD Europe Ltd, Sliema / Malta 100
CTSI (Mauritius) Ltd., Ebene / Mauritius 100
Varian Medical Systems Mauritius Ltd., Ebene / Mauritius 100
Siemens Healthcare SARL, Casablanca / Morocco 100
Siemens Industry Software SARL, Sala Al Jadida / Morocco 100
Siemens S.A., Casablanca / Morocco 100
Castor III B.V., The Hague / Netherlands 100
Dresser-Rand International B.V., The Hague / Netherlands 100
Flowmaster Group N.V., Eindhoven / Netherlands 100
Fractal Technologies B.V., Ospel / Netherlands 100
Mendix Technology B.V., Rotterdam / Netherlands 100
Mentor Graphics (Netherlands) B.V., Eindhoven / Netherlands 100
Pollux III B.V., The Hague / Netherlands 100
Siemens Finance B.V., The Hague / Netherlands 100
Siemens Financieringsmaatschappij N.V., The Hague / Netherlands 100
Siemens Healthineers Holding III B.V., The Hague / Netherlands 100
Siemens Healthineers Holding IV B.V., The Hague / Netherlands 100
Siemens Healthineers Nederland B.V., The Hague / Netherlands 100
Siemens Industry Software Netherlands B.V., Eindhoven / Netherlands 100
Siemens International Holding B.V., The Hague / Netherlands 100
Siemens International Holding III B.V., The Hague / Netherlands 100
Siemens Mobility B.V., Zoetermeer / Netherlands 100
Siemens Mobility Holding B.V., The Hague / Netherlands 100
Siemens Nederland N.V., The Hague / Netherlands 100
TASS International B.V., Helmond / Netherlands 100
Timeseries Group B.V., Rotterdam / Netherlands 100
TS International B.V., Rotterdam / Netherlands 100
Varian Medical Systems Nederland B.V., Houten / Netherlands 100
Varian Medical Systems Nederland Finance B.V., Houten / Netherlands 100
Yunex Traffic B.V., Zoetermeer / Netherlands 100
Siemens AS, Oslo / Norway 100
Siemens Healthcare AS, Oslo / Norway 100
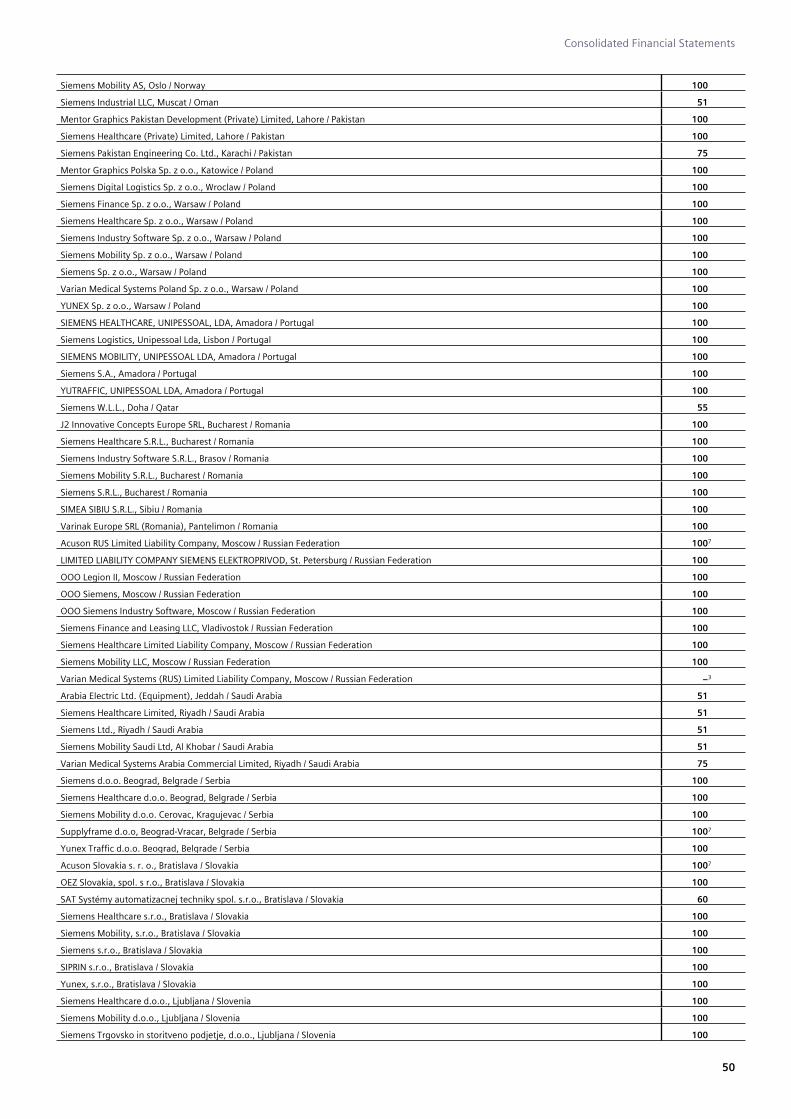
Consolidated Financial Statements
50
Siemens Mobility AS, Oslo / Norway 100
Siemens Industrial LLC, Muscat / Oman 51
Mentor Graphics Pakistan Development (Private) Limited, Lahore / Pakistan 100
Siemens Healthcare (Private) Limited, Lahore / Pakistan 100
Siemens Pakistan Engineering Co. Ltd., Karachi / Pakistan 75
Mentor Graphics Polska Sp. z o.o., Katowice / Poland 100
Siemens Digital Logistics Sp. z o.o., Wroclaw / Poland 100
Siemens Finance Sp. z o.o., Warsaw / Poland 100
Siemens Healthcare Sp. z o.o., Warsaw / Poland 100
Siemens Industry Software Sp. z o.o., Warsaw / Poland 100
Siemens Mobility Sp. z o.o., Warsaw / Poland 100
Siemens Sp. z o.o., Warsaw / Poland 100
Varian Medical Systems Poland Sp. z o.o., Warsaw / Poland 100
YUNEX Sp. z o.o., Warsaw / Poland 100
SIEMENS HEALTHCARE, UNIPESSOAL, LDA, Amadora / Portugal 100
Siemens Logistics, Unipessoal Lda, Lisbon / Portugal 100
SIEMENS MOBILITY, UNIPESSOAL LDA, Amadora / Portugal 100
Siemens S.A., Amadora / Portugal 100
YUTRAFFIC, UNIPESSOAL LDA, Amadora / Portugal 100
Siemens W.L.L., Doha / Qatar 55
J2 Innovative Concepts Europe SRL, Bucharest / Romania 100
Siemens Healthcare S.R.L., Bucharest / Romania 100
Siemens Industry Software S.R.L., Brasov / Romania 100
Siemens Mobility S.R.L., Bucharest / Romania 100
Siemens S.R.L., Bucharest / Romania 100
SIMEA SIBIU S.R.L., Sibiu / Romania 100
Varinak Europe SRL (Romania), Pantelimon / Romania 100
Acuson RUS Limited Liability Company, Moscow / Russian Federation 1007
LIMITED LIABILITY COMPANY SIEMENS ELEKTROPRIVOD, St. Petersburg / Russian Federation 100
OOO Legion II, Moscow / Russian Federation 100
OOO Siemens, Moscow / Russian Federation 100
OOO Siemens Industry Software, Moscow / Russian Federation 100
Siemens Finance and Leasing LLC, Vladivostok / Russian Federation 100
Siemens Healthcare Limited Liability Company, Moscow / Russian Federation 100
Siemens Mobility LLC, Moscow / Russian Federation 100
Varian Medical Systems (RUS) Limited Liability Company, Moscow / Russian Federation −3
Arabia Electric Ltd. (Equipment), Jeddah / Saudi Arabia 51
Siemens Healthcare Limited, Riyadh / Saudi Arabia 51
Siemens Ltd., Riyadh / Saudi Arabia 51
Siemens Mobility Saudi Ltd, Al Khobar / Saudi Arabia 51
Varian Medical Systems Arabia Commercial Limited, Riyadh / Saudi Arabia 75
Siemens d.o.o. Beograd, Belgrade / Serbia 100
Siemens Healthcare d.o.o. Beograd, Belgrade / Serbia 100
Siemens Mobility d.o.o. Cerovac, Kragujevac / Serbia 100
Supplyframe d.o.o, Beograd-Vracar, Belgrade / Serbia 1007
Yunex Traffic d.o.o. Beograd, Belgrade / Serbia 100
Acuson Slovakia s. r. o., Bratislava / Slovakia 1007
OEZ Slovakia, spol. s r.o., Bratislava / Slovakia 100
SAT Systémy automatizacnej techniky spol. s.r.o., Bratislava / Slovakia 60
Siemens Healthcare s.r.o., Bratislava / Slovakia 100
Siemens Mobility, s.r.o., Bratislava / Slovakia 100
Siemens s.r.o., Bratislava / Slovakia 100
SIPRIN s.r.o., Bratislava / Slovakia 100
Yunex, s.r.o., Bratislava / Slovakia 100
Siemens Healthcare d.o.o., Ljubljana / Slovenia 100
Siemens Mobility d.o.o., Ljubljana / Slovenia 100
Siemens Trgovsko in storitveno podjetje, d.o.o., Ljubljana / Slovenia 100
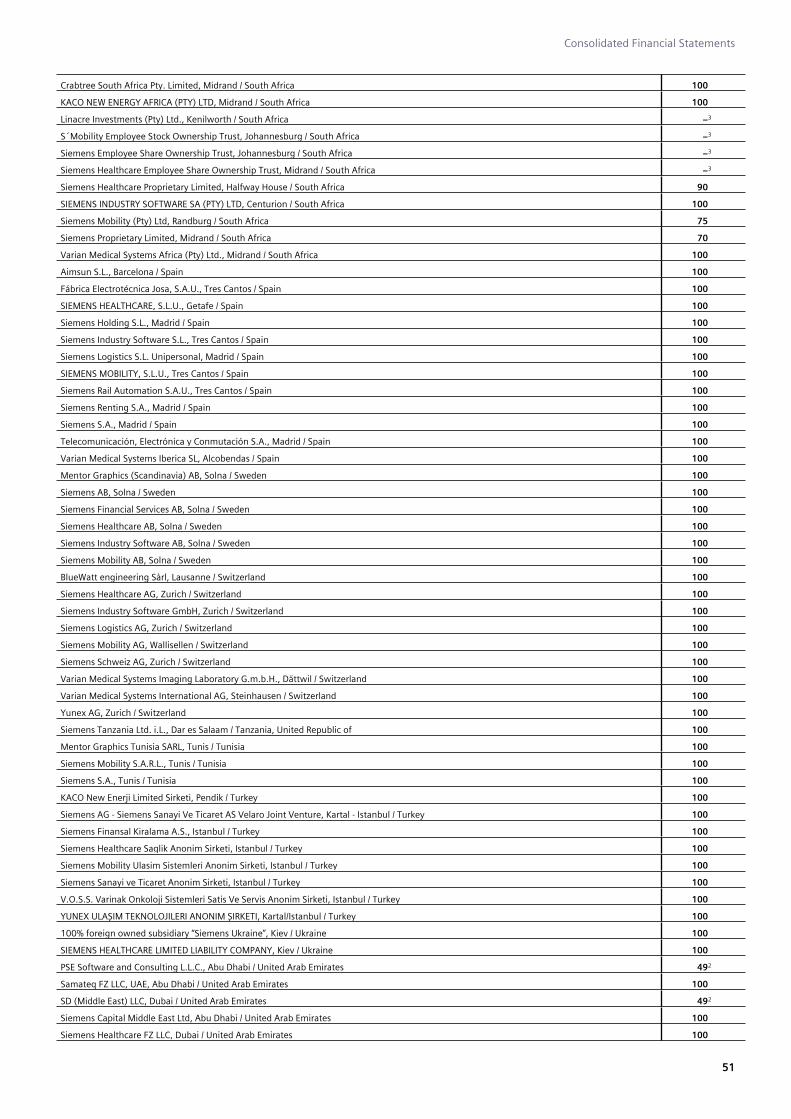
Consolidated Financial Statements
51
Crabtree South Africa Pty. Limited, Midrand / South Africa 100
KACO NEW ENERGY AFRICA (PTY) LTD, Midrand / South Africa 100
Linacre Investments (Pty) Ltd., Kenilworth / South Africa −3
S´Mobility Employee Stock Ownership Trust, Johannesburg / South Africa −3
Siemens Employee Share Ownership Trust, Johannesburg / South Africa −3
Siemens Healthcare Employee Share Ownership Trust, Midrand / South Africa −3
Siemens Healthcare Proprietary Limited, Halfway House / South Africa 90
SIEMENS INDUSTRY SOFTWARE SA (PTY) LTD, Centurion / South Africa 100
Siemens Mobility (Pty) Ltd, Randburg / South Africa 75
Siemens Proprietary Limited, Midrand / South Africa 70
Varian Medical Systems Africa (Pty) Ltd., Midrand / South Africa 100
Aimsun S.L., Barcelona / Spain 100
Fábrica Electrotécnica Josa, S.A.U., Tres Cantos / Spain 100
SIEMENS HEALTHCARE, S.L.U., Getafe / Spain 100
Siemens Holding S.L., Madrid / Spain 100
Siemens Industry Software S.L., Tres Cantos / Spain 100
Siemens Logistics S.L. Unipersonal, Madrid / Spain 100
SIEMENS MOBILITY, S.L.U., Tres Cantos / Spain 100
Siemens Rail Automation S.A.U., Tres Cantos / Spain 100
Siemens Renting S.A., Madrid / Spain 100
Siemens S.A., Madrid / Spain 100
Telecomunicación, Electrónica y Conmutación S.A., Madrid / Spain 100
Varian Medical Systems Iberica SL, Alcobendas / Spain 100
Mentor Graphics (Scandinavia) AB, Solna / Sweden 100
Siemens AB, Solna / Sweden 100
Siemens Financial Services AB, Solna / Sweden 100
Siemens Healthcare AB, Solna / Sweden 100
Siemens Industry Software AB, Solna / Sweden 100
Siemens Mobility AB, Solna / Sweden 100
BlueWatt engineering Sàrl, Lausanne / Switzerland 100
Siemens Healthcare AG, Zurich / Switzerland 100
Siemens Industry Software GmbH, Zurich / Switzerland 100
Siemens Logistics AG, Zurich / Switzerland 100
Siemens Mobility AG, Wallisellen / Switzerland 100
Siemens Schweiz AG, Zurich / Switzerland 100
Varian Medical Systems Imaging Laboratory G.m.b.H., Dättwil / Switzerland 100
Varian Medical Systems International AG, Steinhausen / Switzerland 100
Yunex AG, Zurich / Switzerland 100
Siemens Tanzania Ltd. i.L., Dar es Salaam / Tanzania, United Republic of 100
Mentor Graphics Tunisia SARL, Tunis / Tunisia 100
Siemens Mobility S.A.R.L., Tunis / Tunisia 100
Siemens S.A., Tunis / Tunisia 100
KACO New Enerji Limited Sirketi, Pendik / Turkey 100
Siemens AG - Siemens Sanayi Ve Ticaret AS Velaro Joint Venture, Kartal - Istanbul / Turkey 100
Siemens Finansal Kiralama A.S., Istanbul / Turkey 100
Siemens Healthcare Saglik Anonim Sirketi, Istanbul / Turkey 100
Siemens Mobility Ulasim Sistemleri Anonim Sirketi, Istanbul / Turkey 100
Siemens Sanayi ve Ticaret Anonim Sirketi, Istanbul / Turkey 100
V.O.S.S. Varinak Onkoloji Sistemleri Satis Ve Servis Anonim Sirketi, Istanbul / Turkey 100
YUNEX ULAŞIM TEKNOLOJILERI ANONIM ŞIRKETI, Kartal/Istanbul / Turkey 100
100% foreign owned subsidiary “Siemens Ukraine”, Kiev / Ukraine 100
SIEMENS HEALTHCARE LIMITED LIABILITY COMPANY, Kiev / Ukraine 100
PSE Software and Consulting L.L.C., Abu Dhabi / United Arab Emirates 492
Samateq FZ LLC, UAE, Abu Dhabi / United Arab Emirates 100
SD (Middle East) LLC, Dubai / United Arab Emirates 492
Siemens Capital Middle East Ltd, Abu Dhabi / United Arab Emirates 100
Siemens Healthcare FZ LLC, Dubai / United Arab Emirates 100

Consolidated Financial Statements
52
Siemens Healthcare L.L.C., Dubai / United Arab Emirates 492
Siemens Industrial LLC, Masdar City / United Arab Emirates 492
Siemens Middle East Limited, Masdar City / United Arab Emirates 100
SIEMENS MOBILITY LLC, Dubai / United Arab Emirates 492
Acuson United Kingdom Ltd., Frimley, Surrey / United Kingdom 1007
AIMSUN LIMITED, London / United Kingdom 100
ByteToken, Ltd, Edinburgh / United Kingdom 100
Data Sheet Archive Limited, London / United Kingdom 100
Electrium Sales Limited, Frimley, Surrey / United Kingdom 100
Flomerics Group Limited, Frimley, Surrey / United Kingdom 100
GyM Renewables Limited, Frimley, Surrey / United Kingdom 1007
Mendix Technology Limited, Frimley, Surrey / United Kingdom 100
Mentor Graphics (UK) Limited, Frimley, Surrey / United Kingdom 100
MRX Technologies Limited, Frimley, Surrey / United Kingdom 100
Next47 Fund 2018, L.P., Palo Alto, CA / United Kingdom 100
Next47 Fund 2019, L.P., Palo Alto, CA / United Kingdom 100
Next47 Fund 2020, L.P., Palo Alto, CA / United Kingdom 100
Next47 Fund 2021, L.P., Palo Alto, CA / United Kingdom 100
Next47 Fund 2022, L.P., Palo Alto, CA / United Kingdom 100
Project Ventures Rail Investments I Limited, Frimley, Surrey / United Kingdom 100
Samacsys Limited, London / United Kingdom 100
SBS Pension Funding (Scotland) Limited Partnership, Edinburgh / United Kingdom 573
Siemens Financial Services Holdings Ltd., Stoke Poges, Buckinghamshire / United Kingdom 100
Siemens Financial Services Ltd., Stoke Poges, Buckinghamshire / United Kingdom 100
Siemens Healthcare Diagnostics Ltd, Frimley, Surrey / United Kingdom 100
Siemens Healthcare Diagnostics Manufacturing Ltd, Frimley, Surrey / United Kingdom 100
Siemens Healthcare Diagnostics Products Ltd, Frimley, Surrey / United Kingdom 100
Siemens Healthcare Limited, Frimley, Surrey / United Kingdom 100
Siemens Holdings plc, Frimley, Surrey / United Kingdom 100
Siemens Industry Software Computational Dynamics Limited, Frimley, Surrey / United Kingdom 100
Siemens Industry Software Limited, Frimley, Surrey / United Kingdom 100
Siemens Logistics Limited, Frimley, Surrey / United Kingdom 100
Siemens Mobility Limited, London / United Kingdom 100
Siemens Pension Funding (General) Limited, Frimley, Surrey / United Kingdom 100
Siemens Pension Funding Limited, Frimley, Surrey / United Kingdom 100
Siemens plc, Frimley, Surrey / United Kingdom 100
Siemens Process Systems Engineering Limited, Frimley, Surrey / United Kingdom 100
Siemens Rail Automation Limited, London / United Kingdom 100
Siemens Rail Systems Project Holdings Limited, London / United Kingdom 100
The Preactor Group Limited, Frimley, Surrey / United Kingdom 100
UltraSoc Technologies Limited, Frimley, Surrey / United Kingdom 100
Varian Medical Systems UK Holdings Limited, Crawley, West Sussex / United Kingdom 100
Varian Medical Systems UK Limited, Crawley, West Sussex / United Kingdom 100
Yunex Limited, Poole, Dorset / United Kingdom 100
Americas (124 companies)
Siemens Healthcare S.A., Buenos Aires / Argentina 100
Siemens Industrial S.A., Buenos Aires / Argentina 100
Siemens IT Services S.A., Buenos Aires / Argentina 100
Siemens Mobility S.A., Munro / Argentina 100
Iriel Indústria e Cómercio de Sistemas Eléctricos Ltda., Canoas / Brazil 100
Siemens Healthcare Diagnósticos Ltda., São Paulo / Brazil 100
Siemens Industry Software Ltda., São Caetano do Sul / Brazil 100
Siemens Infraestrutura e Indústria Ltda., São Paulo / Brazil 100
Siemens Mobility Soluções de Mobilidade Ltda., São Paulo / Brazil 100
Siemens Participações Ltda., São Paulo / Brazil 100
Varian Medical Systems Brasil Ltda., São Paulo / Brazil 100

Consolidated Financial Statements
53
10125032 CANADA INC, Mississauga / Canada 100
10262595 Canada Inc., Mississauga / Canada 100
12241510 CANADA INC., Mississauga / Canada 100
Bytemark Canada Inc., Saint John / Canada 100
EPOCAL INC., Toronto / Canada 100
Mentor Graphics (Canada) ULC, Vancouver / Canada 10013
RAIL-TERM INC., Mississauga / Canada 100
RailTerm Systems Inc., Dorval / Canada 100
Siemens Canada Limited, Oakville / Canada 100
Siemens Financial Ltd., Oakville / Canada 100
Siemens Healthcare Limited, Oakville / Canada 100
Siemens Industry Software ULC, Vancouver / Canada 10013
Siemens Logistics Ltd., Oakville / Canada 100
SIEMENS MOBILITY LIMITED, Oakville / Canada 100
TimeSeries Canada Inc., Montreal / Canada 100
Varian Medical Systems Canada, Inc., Ottawa / Canada 100
Monarch Capital, Limited, Grand Cayman / Cayman Islands 100
Talent Choice Investment Limited, George Town / Cayman Islands 100
Nimbic Chile SpA, Las Condes / Chile 100
Siemens Healthcare Equipos Médicos Sociedad por Acciones, Santiago de Chile / Chile 100
Siemens Mobility SpA, Santiago de Chile / Chile 100
Siemens S.A., Santiago de Chile / Chile 100
J. Restrepo Equiphos S.A.S, Bogotá / Colombia 100
Siemens Healthcare S.A.S., Tenjo / Colombia 100
Siemens S.A., Tenjo / Colombia 100
YUNEX S.A.S., Bogotá / Colombia 100
Siemens Healthcare Diagnostics S.A., San José / Costa Rica 100
Siemens S.A., San José / Costa Rica 100
Siemens Mobility, S.R.L., Santo Domingo / Dominican Republic 100
Siemens S.A., Quito / Ecuador 100
Siemens-Healthcare Cia. Ltda., Quito / Ecuador 100
Siemens Healthcare, Sociedad Anonima, Antiguo Cuscatlán / El Salvador 100
Siemens S.A., Antiguo Cuscatlán / El Salvador 100
Siemens S.A., Guatemala / Guatemala 100
Grupo Siemens S.A. de C.V., Mexico City / Mexico 100
Indústria de Trabajos Eléctricos S.A. de C.V., Ciudad Juárez / Mexico 100
Siemens Healthcare Diagnostics, S. de R.L. de C.V., Mexico City / Mexico 100
Siemens Industry Software, S.A. de C.V., Mexico City / Mexico 100
Siemens Inmobiliaria S.A. de C.V., Mexico City / Mexico 100
Siemens Logistics S. de R.L. de C.V., Mexico City / Mexico 100
Siemens Mobility S. de R.L. de C.V., Mexico City / Mexico 100
SIEMENS SERVICIOS COMERCIALES SA DE CV, SOFOM, ENR, Mexico City / Mexico 100
Siemens, S.A. de C.V., Mexico City / Mexico 100
Siemens Large Drive Applications S.A., Panama City / Panama 1007
Siemens Healthcare S.A.C., Surquillo / Peru 100
Siemens Mobility S.A.C., Lima / Peru 100
Siemens S.A.C., Surquillo / Peru 100
Varian Medical Systems Puerto Rico, LLC, Guaynabo / Puerto Rico 100
Acuson, LLC, Wilmington, DE / United States 1007
Aimsun Inc., New York, NY / United States 100
Building Robotics Inc., Wilmington, DE / United States 100
Bytemark Inc., Dover, DE / United States 97
CD-adapco Battery Design LLC, Dover, DE / United States 100
Corindus, Inc., Wilmington, DE / United States 100
D3 Oncology Inc., Wilmington, DE / United States 100
Dedicated2Imaging LLC, Wilmington, DE / United States 80
ECG Acquisition, Inc., Wilmington, DE / United States 100
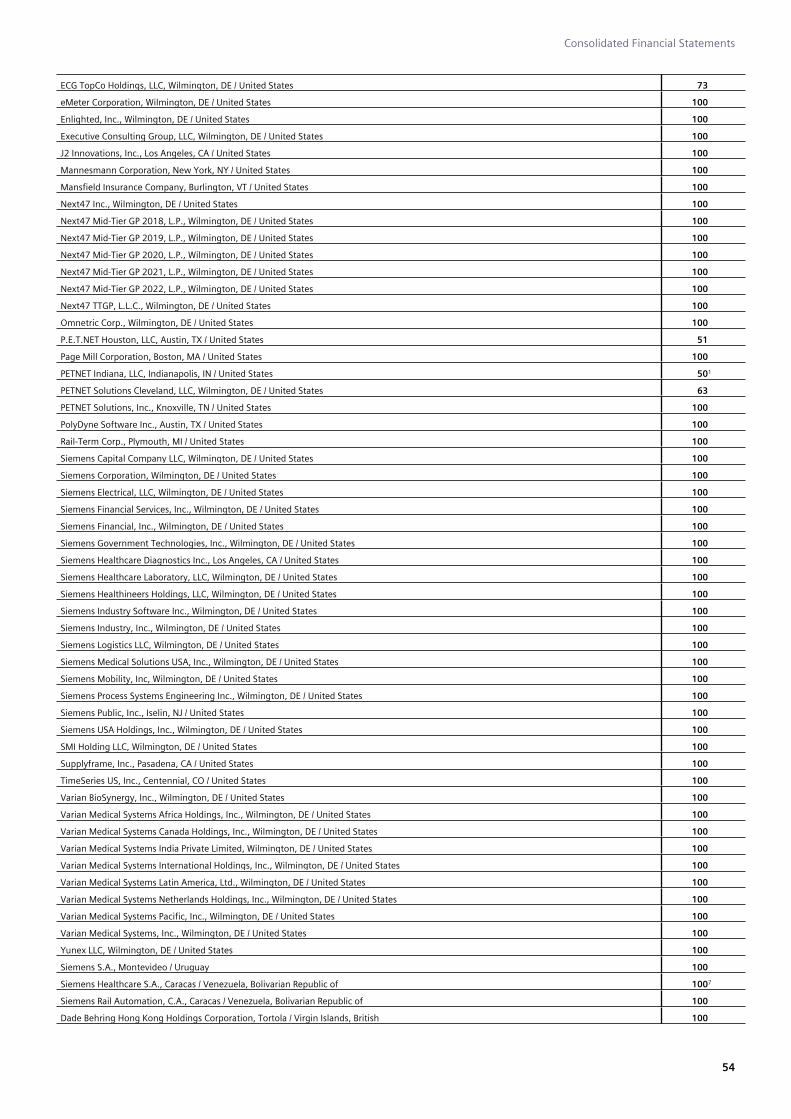
Consolidated Financial Statements
54
ECG TopCo Holdings, LLC, Wilmington, DE / United States 73
eMeter Corporation, Wilmington, DE / United States 100
Enlighted, Inc., Wilmington, DE / United States 100
Executive Consulting Group, LLC, Wilmington, DE / United States 100
J2 Innovations, Inc., Los Angeles, CA / United States 100
Mannesmann Corporation, New York, NY / United States 100
Mansfield Insurance Company, Burlington, VT / United States 100
Next47 Inc., Wilmington, DE / United States 100
Next47 Mid-Tier GP 2018, L.P., Wilmington, DE / United States 100
Next47 Mid-Tier GP 2019, L.P., Wilmington, DE / United States 100
Next47 Mid-Tier GP 2020, L.P., Wilmington, DE / United States 100
Next47 Mid-Tier GP 2021, L.P., Wilmington, DE / United States 100
Next47 Mid-Tier GP 2022, L.P., Wilmington, DE / United States 100
Next47 TTGP, L.L.C., Wilmington, DE / United States 100
Omnetric Corp., Wilmington, DE / United States 100
P.E.T.NET Houston, LLC, Austin, TX / United States 51
Page Mill Corporation, Boston, MA / United States 100
PETNET Indiana, LLC, Indianapolis, IN / United States 501
PETNET Solutions Cleveland, LLC, Wilmington, DE / United States 63
PETNET Solutions, Inc., Knoxville, TN / United States 100
PolyDyne Software Inc., Austin, TX / United States 100
Rail-Term Corp., Plymouth, MI / United States 100
Siemens Capital Company LLC, Wilmington, DE / United States 100
Siemens Corporation, Wilmington, DE / United States 100
Siemens Electrical, LLC, Wilmington, DE / United States 100
Siemens Financial Services, Inc., Wilmington, DE / United States 100
Siemens Financial, Inc., Wilmington, DE / United States 100
Siemens Government Technologies, Inc., Wilmington, DE / United States 100
Siemens Healthcare Diagnostics Inc., Los Angeles, CA / United States 100
Siemens Healthcare Laboratory, LLC, Wilmington, DE / United States 100
Siemens Healthineers Holdings, LLC, Wilmington, DE / United States 100
Siemens Industry Software Inc., Wilmington, DE / United States 100
Siemens Industry, Inc., Wilmington, DE / United States 100
Siemens Logistics LLC, Wilmington, DE / United States 100
Siemens Medical Solutions USA, Inc., Wilmington, DE / United States 100
Siemens Mobility, Inc, Wilmington, DE / United States 100
Siemens Process Systems Engineering Inc., Wilmington, DE / United States 100
Siemens Public, Inc., Iselin, NJ / United States 100
Siemens USA Holdings, Inc., Wilmington, DE / United States 100
SMI Holding LLC, Wilmington, DE / United States 100
Supplyframe, Inc., Pasadena, CA / United States 100
TimeSeries US, Inc., Centennial, CO / United States 100
Varian BioSynergy, Inc., Wilmington, DE / United States 100
Varian Medical Systems Africa Holdings, Inc., Wilmington, DE / United States 100
Varian Medical Systems Canada Holdings, Inc., Wilmington, DE / United States 100
Varian Medical Systems India Private Limited, Wilmington, DE / United States 100
Varian Medical Systems International Holdings, Inc., Wilmington, DE / United States 100
Varian Medical Systems Latin America, Ltd., Wilmington, DE / United States 100
Varian Medical Systems Netherlands Holdings, Inc., Wilmington, DE / United States 100
Varian Medical Systems Pacific, Inc., Wilmington, DE / United States 100
Varian Medical Systems, Inc., Wilmington, DE / United States 100
Yunex LLC, Wilmington, DE / United States 100
Siemens S.A., Montevideo / Uruguay 100
Siemens Healthcare S.A., Caracas / Venezuela, Bolivarian Republic of 1007
Siemens Rail Automation, C.A., Caracas / Venezuela, Bolivarian Republic of 100
Dade Behring Hong Kong Holdings Corporation, Tortola / Virgin Islands, British 100
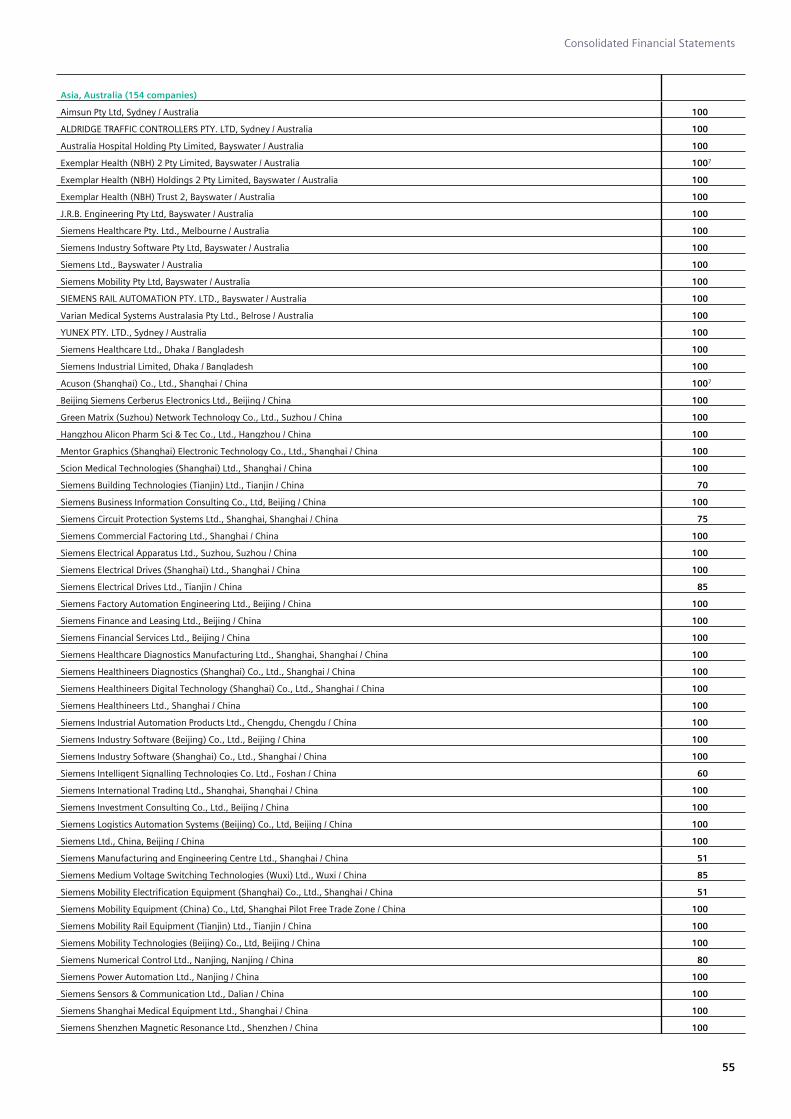
Consolidated Financial Statements
55
Asia, Australia (154 companies)
Aimsun Pty Ltd, Sydney / Australia 100
ALDRIDGE TRAFFIC CONTROLLERS PTY. LTD, Sydney / Australia 100
Australia Hospital Holding Pty Limited, Bayswater / Australia 100
Exemplar Health (NBH) 2 Pty Limited, Bayswater / Australia 1007
Exemplar Health (NBH) Holdings 2 Pty Limited, Bayswater / Australia 100
Exemplar Health (NBH) Trust 2, Bayswater / Australia 100
J.R.B. Engineering Pty Ltd, Bayswater / Australia 100
Siemens Healthcare Pty. Ltd., Melbourne / Australia 100
Siemens Industry Software Pty Ltd, Bayswater / Australia 100
Siemens Ltd., Bayswater / Australia 100
Siemens Mobility Pty Ltd, Bayswater / Australia 100
SIEMENS RAIL AUTOMATION PTY. LTD., Bayswater / Australia 100
Varian Medical Systems Australasia Pty Ltd., Belrose / Australia 100
YUNEX PTY. LTD., Sydney / Australia 100
Siemens Healthcare Ltd., Dhaka / Bangladesh 100
Siemens Industrial Limited, Dhaka / Bangladesh 100
Acuson (Shanghai) Co., Ltd., Shanghai / China 1007
Beijing Siemens Cerberus Electronics Ltd., Beijing / China 100
Green Matrix (Suzhou) Network Technology Co., Ltd., Suzhou / China 100
Hangzhou Alicon Pharm Sci & Tec Co., Ltd., Hangzhou / China 100
Mentor Graphics (Shanghai) Electronic Technology Co., Ltd., Shanghai / China 100
Scion Medical Technologies (Shanghai) Ltd., Shanghai / China 100
Siemens Building Technologies (Tianjin) Ltd., Tianjin / China 70
Siemens Business Information Consulting Co., Ltd, Beijing / China 100
Siemens Circuit Protection Systems Ltd., Shanghai, Shanghai / China 75
Siemens Commercial Factoring Ltd., Shanghai / China 100
Siemens Electrical Apparatus Ltd., Suzhou, Suzhou / China 100
Siemens Electrical Drives (Shanghai) Ltd., Shanghai / China 100
Siemens Electrical Drives Ltd., Tianjin / China 85
Siemens Factory Automation Engineering Ltd., Beijing / China 100
Siemens Finance and Leasing Ltd., Beijing / China 100
Siemens Financial Services Ltd., Beijing / China 100
Siemens Healthcare Diagnostics Manufacturing Ltd., Shanghai, Shanghai / China 100
Siemens Healthineers Diagnostics (Shanghai) Co., Ltd., Shanghai / China 100
Siemens Healthineers Digital Technology (Shanghai) Co., Ltd., Shanghai / China 100
Siemens Healthineers Ltd., Shanghai / China 100
Siemens Industrial Automation Products Ltd., Chengdu, Chengdu / China 100
Siemens Industry Software (Beijing) Co., Ltd., Beijing / China 100
Siemens Industry Software (Shanghai) Co., Ltd., Shanghai / China 100
Siemens Intelligent Signalling Technologies Co. Ltd., Foshan / China 60
Siemens International Trading Ltd., Shanghai, Shanghai / China 100
Siemens Investment Consulting Co., Ltd., Beijing / China 100
Siemens Logistics Automation Systems (Beijing) Co., Ltd, Beijing / China 100
Siemens Ltd., China, Beijing / China 100
Siemens Manufacturing and Engineering Centre Ltd., Shanghai / China 51
Siemens Medium Voltage Switching Technologies (Wuxi) Ltd., Wuxi / China 85
Siemens Mobility Electrification Equipment (Shanghai) Co., Ltd., Shanghai / China 51
Siemens Mobility Equipment (China) Co., Ltd, Shanghai Pilot Free Trade Zone / China 100
Siemens Mobility Rail Equipment (Tianjin) Ltd., Tianjin / China 100
Siemens Mobility Technologies (Beijing) Co., Ltd, Beijing / China 100
Siemens Numerical Control Ltd., Nanjing, Nanjing / China 80
Siemens Power Automation Ltd., Nanjing / China 100
Siemens Sensors & Communication Ltd., Dalian / China 100
Siemens Shanghai Medical Equipment Ltd., Shanghai / China 100
Siemens Shenzhen Magnetic Resonance Ltd., Shenzhen / China 100

Consolidated Financial Statements
56
Siemens Signalling Co., Ltd., Xi'an / China 70
Siemens Standard Motors Ltd., Yizheng / China 100
Siemens Switchgear Ltd., Shanghai, Shanghai / China 55
Siemens Technology Development Co., Ltd. of Beijing, Beijing / China 90
Siemens Venture Capital Co., Ltd., Beijing / China 100
Siemens Wiring Accessories Shandong Ltd., Zibo / China 100
Siemens X-Ray Vacuum Technology Ltd., Wuxi, Wuxi / China 100
Suzhou Ling Dong Zhen GE Network Technology Co., Ltd., Suzhou / China −3
Varian Medical Systems China Co., Ltd., Beijing / China 100
Varian Medical Systems Trading (Beijing) Co., Ltd., Beijing / China 100
Yutraffic Technologies (Beijing) Co., Ltd., Beijing / China 100
Scion Medical Limited, Hong Kong / Hong Kong 100
Siemens Healthcare Limited, Hong Kong / Hong Kong 100
Siemens Industry Software Limited, Hong Kong / Hong Kong 100
Siemens Limited, Hong Kong / Hong Kong 100
Siemens Logistics Limited, Hong Kong / Hong Kong 100
Siemens Mobility Limited, Hong Kong / Hong Kong 100
Supply Frame (Hong Kong) Limited, Hong Kong / Hong Kong 100
Vertice Investment Limited, Hong Kong / Hong Kong 100
YUTRAFFIC LTD., Hong Kong / Hong Kong 100
AIS Design Automation Private Limited, Bangalore / India 100
American Institute of Pathology and Laboratory Sciences Private Limited, Hyderabad / India 100
Artmed Healthcare Private Limited, Hyderabad / India 100
Bytemark India LLP, Bangalore / India 100
Bytemark Technology Solutions India Pvt Ltd, Bangalore / India 100
C&S Electric Limited, New Delhi / India 99
Cancer Treatment Services Hyderabad Private Limited, Hyderabad / India 100
Enlighted Energy Systems Pvt Ltd, Chennai / India 100
Flomerics India Private Limited, Mumbai / India 100
Mentor Graphics (India) Private Limited, New Delhi / India 100
Mentor Graphics (Sales and Services) Private Limited, New Delhi / India 100
PETNET Radiopharmaceutical Solutions Pvt. Ltd., Mumbai / India 100
Preactor Software India Private Limited, Bangalore / India 100
Siemens Factoring Private Limited, Navi Mumbai / India 100
Siemens Financial Services Private Limited, Mumbai / India 100
Siemens Healthcare Private Limited, Mumbai / India 100
Siemens Healthineers India LLP, Bangalore / India 100
SIEMENS HEALTHINEERS INDIA MANUFACTURING PRIVATE LIMITED, Mumbai / India 1007
Siemens Industry Software (India) Private Limited, New Delhi / India 100
Siemens Limited, Mumbai / India 51
Siemens Logistics India Private Limited, Navi Mumbai / India 100
Siemens Rail Automation Pvt. Ltd., Navi Mumbai / India 100
Siemens Technology and Services Private Limited, Navi Mumbai / India 100
Varian Medical Systems International (India) Private Limited, Mumbai / India 100
P.T. Siemens Indonesia, Jakarta / Indonesia 100
PT Siemens Healthineers Indonesia, Jakarta / Indonesia 100
PT Siemens Mobility Indonesia, Jakarta / Indonesia 100
Acrorad Co., Ltd., Okinawa / Japan 96
Avatar Integrated Systems Kabushiki Kaisha, Yokohama / Japan 100
OneSpin Solutions Japan K.K., Yokohama / Japan 100
Siemens Electronic Design Automation Japan K.K., Tokyo / Japan 100
Siemens Healthcare Diagnostics K.K., Tokyo / Japan 100
Siemens Healthcare K.K., Tokyo / Japan 100
Siemens K.K., Tokyo / Japan 100
Siemens PLM Software Computational Dynamics K.K., Yokohama / Japan 100
Varian Medical Systems K.K., Tokyo / Japan 100
Acuson Korea Ltd., Seongnam-si / Korea, Republic of 1007

Consolidated Financial Statements
57
Siemens Electronic Design Automation (Korea) LLC, Seoul / Korea, Republic of 100
Siemens Healthineers Ltd., Seoul / Korea, Republic of 100
Siemens Industry Software Ltd., Seoul / Korea, Republic of 100
Siemens Ltd. Seoul, Seoul / Korea, Republic of 100
Siemens Mobility Ltd., Seoul / Korea, Republic of 100
Siemens Process Systems Engineering Limited, Daejeon / Korea, Republic of 100
Varian Medical Systems Korea, Inc., Seoul / Korea, Republic of 100
Dresser-Rand Asia Pacific Sdn. Bhd., Kuala Lumpur / Malaysia 100
Siemens Healthcare Sdn. Bhd., Petaling Jaya / Malaysia 100
Siemens Industry Software Sdn. Bhd., George Town, Penang / Malaysia 100
Siemens Malaysia Sdn. Bhd., Petaling Jaya / Malaysia 100
Siemens Mobility Sdn. Bhd., Kuala Lumpur / Malaysia 100
Varian Medical Systems Malaysia Sdn Bhd, Kuala Lumpur / Malaysia 100
Siemens (N.Z.) Limited, Auckland / New Zealand 100
Siemens Healthcare Limited, Auckland / New Zealand 100
Siemens Healthcare Inc., Manila / Philippines 100
Siemens, Inc., Manila / Philippines 100
Varian Medical Systems Philippines, Inc., City of Pasig / Philippines 100
Acuson Singapore Pte. Ltd., Singapore / Singapore 1007
Aimsun Pte Ltd, Singapore / Singapore 100
Mentor Graphics Asia Pte Ltd, Singapore / Singapore 100
Siemens Healthcare Pte. Ltd., Singapore / Singapore 100
Siemens Industry Software Pte. Ltd., Singapore / Singapore 100
Siemens Logistics PTE. LTD., Singapore / Singapore 100
Siemens Mobility Pte. Ltd., Singapore / Singapore 100
Siemens Pte. Ltd., Singapore / Singapore 100
YUNEX PTE. LTD., Singapore / Singapore 100
Asiri A O I Cancer Centre (Private) Limited, Colombo / Sri Lanka 502
Fang Chi Health Management Co., Ltd, Taipei / Taiwan, Province of China 100
Hong Tai Health Management Co. Ltd., Taipei / Taiwan, Province of China 100
New Century Technology Co. Ltd., Taipei / Taiwan, Province of China 100
Siemens Healthcare Limited, Taipei / Taiwan, Province of China 100
Siemens Industry Software (TW) Co., Ltd., Taipei / Taiwan, Province of China 100
Siemens Limited, Taipei / Taiwan, Province of China 100
Varian Medical Systems Taiwan Co., Ltd., Taipei / Taiwan, Province of China 100
Siemens Healthcare Limited, Bangkok / Thailand 100
Siemens Limited, Bangkok / Thailand 100
Siemens Logistics Automation Systems Ltd., Bangkok / Thailand 100
Siemens Mobility Limited, Bangkok / Thailand 100
Siemens Healthcare Limited, Ho Chi Minh City / Viet Nam 100
Siemens Ltd., Ho Chi Minh City / Viet Nam 100
Varian Medical Systems Vietnam Co Ltd, Ho Chi Minh City / Viet Nam 100
Associated companies and joint ventures
Germany (24 companies)
Alchemist Accelerator Europe Fund I GmbH & Co. KG, Grünwald 418
ATS Projekt Grevenbroich GmbH, Schüttorf 258
BELLIS GmbH, Braunschweig 49
BentoNet GmbH, Baden-Baden 50
Caterva GmbH, Pullach i. Isartal 50
Curagita Holding GmbH, Heidelberg 30
DKS Dienstleistungsgesellschaft f. Kommunikationsanlagen des Stadt- und Regionalverkehrs mbH, Cologne 498
FEAG Fertigungscenter für Elektrische Anlagen GmbH, Erlangen 498
GuD Herne GmbH, Essen 50
IFTEC GmbH & Co. KG, Leipzig 50
INPRO Innovationsgesellschaft für fortgeschrittene Produktionssysteme in der Fahrzeugindustrie mbH, Berlin 338
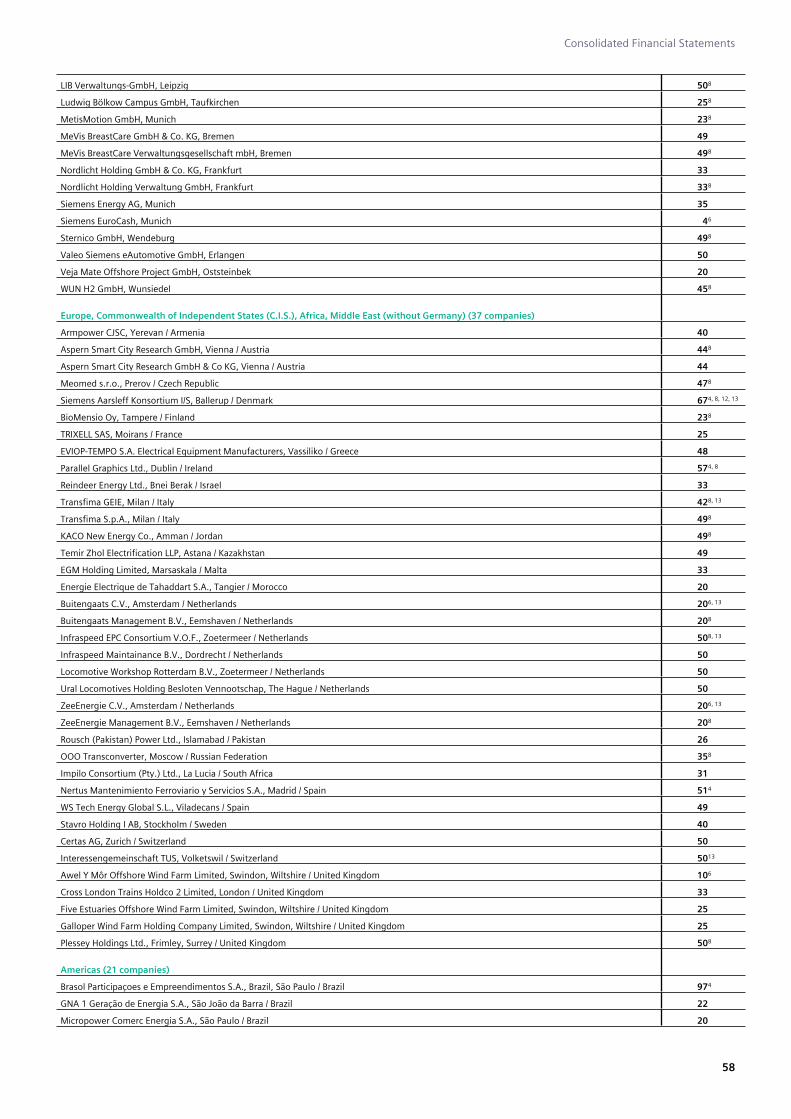
Consolidated Financial Statements
58
LIB Verwaltungs-GmbH, Leipzig 508
Ludwig Bölkow Campus GmbH, Taufkirchen 258
MetisMotion GmbH, Munich 238
MeVis BreastCare GmbH & Co. KG, Bremen 49
MeVis BreastCare Verwaltungsgesellschaft mbH, Bremen 498
Nordlicht Holding GmbH & Co. KG, Frankfurt 33
Nordlicht Holding Verwaltung GmbH, Frankfurt 338
Siemens Energy AG, Munich 35
Siemens EuroCash, Munich 46
Sternico GmbH, Wendeburg 498
Valeo Siemens eAutomotive GmbH, Erlangen 50
Veja Mate Offshore Project GmbH, Oststeinbek 20
WUN H2 GmbH, Wunsiedel 458
Europe, Commonwealth of Independent States (C.I.S.), Africa, Middle East (without Germany) (37 companies)
Armpower CJSC, Yerevan / Armenia 40
Aspern Smart City Research GmbH, Vienna / Austria 448
Aspern Smart City Research GmbH & Co KG, Vienna / Austria 44
Meomed s.r.o., Prerov / Czech Republic 478
Siemens Aarsleff Konsortium I/S, Ballerup / Denmark 674, 8, 12, 13
BioMensio Oy, Tampere / Finland 238
TRIXELL SAS, Moirans / France 25
EVIOP-TEMPO S.A. Electrical Equipment Manufacturers, Vassiliko / Greece 48
Parallel Graphics Ltd., Dublin / Ireland 574, 8
Reindeer Energy Ltd., Bnei Berak / Israel 33
Transfima GEIE, Milan / Italy 428, 13
Transfima S.p.A., Milan / Italy 498
KACO New Energy Co., Amman / Jordan 498
Temir Zhol Electrification LLP, Astana / Kazakhstan 49
EGM Holding Limited, Marsaskala / Malta 33
Energie Electrique de Tahaddart S.A., Tangier / Morocco 20
Buitengaats C.V., Amsterdam / Netherlands 206, 13
Buitengaats Management B.V., Eemshaven / Netherlands 208
Infraspeed EPC Consortium V.O.F., Zoetermeer / Netherlands 508, 13
Infraspeed Maintainance B.V., Dordrecht / Netherlands 50
Locomotive Workshop Rotterdam B.V., Zoetermeer / Netherlands 50
Ural Locomotives Holding Besloten Vennootschap, The Hague / Netherlands 50
ZeeEnergie C.V., Amsterdam / Netherlands 206, 13
ZeeEnergie Management B.V., Eemshaven / Netherlands 208
Rousch (Pakistan) Power Ltd., Islamabad / Pakistan 26
OOO Transconverter, Moscow / Russian Federation 358
Impilo Consortium (Pty.) Ltd., La Lucia / South Africa 31
Nertus Mantenimiento Ferroviario y Servicios S.A., Madrid / Spain 514
WS Tech Energy Global S.L., Viladecans / Spain 49
Stavro Holding I AB, Stockholm / Sweden 40
Certas AG, Zurich / Switzerland 50
Interessengemeinschaft TUS, Volketswil / Switzerland 5013
Awel Y Môr Offshore Wind Farm Limited, Swindon, Wiltshire / United Kingdom 106
Cross London Trains Holdco 2 Limited, London / United Kingdom 33
Five Estuaries Offshore Wind Farm Limited, Swindon, Wiltshire / United Kingdom 25
Galloper Wind Farm Holding Company Limited, Swindon, Wiltshire / United Kingdom 25
Plessey Holdings Ltd., Frimley, Surrey / United Kingdom 508
Americas (21 companies)
Brasol Participaçoes e Empreendimentos S.A., Brazil, São Paulo / Brazil 974
GNA 1 Geração de Energia S.A., São João da Barra / Brazil 22
Micropower Comerc Energia S.A., São Paulo / Brazil 20

Consolidated Financial Statements
59
MPC Serviços Energéticos 1A S.A, Navegantes / Brazil 48
MPC Serviços Energéticos 1B S.A., Cabo de Santo Agostinho / Brazil 48
UTE GNA II GERAÇÃO DE ENERGIA S.A., Rio de Janeiro / Brazil 22
Union Temporal Recaudo y Tecnologia, Santiago de Cali / Colombia 2013
Akuo Energy Dominicana, S.R.L, Santo Domingo / Dominican Republic 33
DELARO, S.A.P.I. DE C.V., Mexico City / Mexico 29
CEF-L Holding, LLC, Wilmington, DE / United States 27
DeepHow Corp., Princeton, NJ / United States 238
Fluence Energy, LLC, Wilmington, DE / United States 43
Hickory Run Holdings, LLC, Wilmington, DE / United States 206
MSS Energy Holdings, LLC, New York, NY / United States 20
Panda Stonewall Intermediate Holdings I, LLC, Wilmington, DE / United States 37
PhSiTh LLC, New Castle, DE / United States 33
PTG Holdings Company LLC, Dover, DE / United States 26
Rether networks, Inc., Berkeley, CA / United States 308
Software.co Technologies, Inc., Wilmington, DE / United States 24
USARAD Holdings, Inc., Fort Lauderdale, FL / United States 308
Wi-Tronix Group Inc., Dover, DE / United States 30
Asia, Australia (22 companies)
Exemplar Health (NBH) Partnership, Melbourne / Australia 50
Forest Wind Holdings Pty Limited, Sydney / Australia 50
Forest Wind Investment Company (1) Pty Limited, Sydney / Australia 50
PHM Technology Pty Ltd, Melbourne / Australia 378
DBEST (Beijing) Facility Technology Management Co., Ltd., Beijing / China 25
Guangzhou Suikai Smart Energy Co., Ltd., Guangzhou / China 35
Shanghai Electric Power Generation Equipment Co., Ltd., Shanghai / China 40
Siemens Traction Equipment Ltd., Zhuzhou, Zhuzhou / China 50
Smart Metering Solutions (Changsha) Co. Ltd., Changsha / China 49
TianJin ZongXi Traction Motor Ltd., Tianjin / China 50
TieKe Intelligent Signalling Railway Equipment Co., Ltd., Tianjin / China 49
Xi’An X-Ray Target Ltd., Xi'an / China 438
Zhenjiang Siemens Busbar Trunking Systems Co. Ltd., Yangzhong / China 50
Zhi Dao Railway Equipment Ltd., Taiyuan / China 50
Bangalore International Airport Ltd., Bangalore / India 20
HEALTH CONTINUUM PRIVATE LIMITED, Bangalore / India 308
Orange Sironj Wind Power Private Limited, New Delhi / India 46
Pune IT City Metro Rail Limited, Pune / India 26
P.T. Jawa Power, Jakarta / Indonesia 50
BE C&I Solutions Holding Pte. Ltd., Singapore / Singapore 24
Power Automation Pte. Ltd., Singapore / Singapore 49
SINGAPORE AQUACULTURE TECHNOLOGIES (SAT) PTE LTD, Singapore / Singapore 24
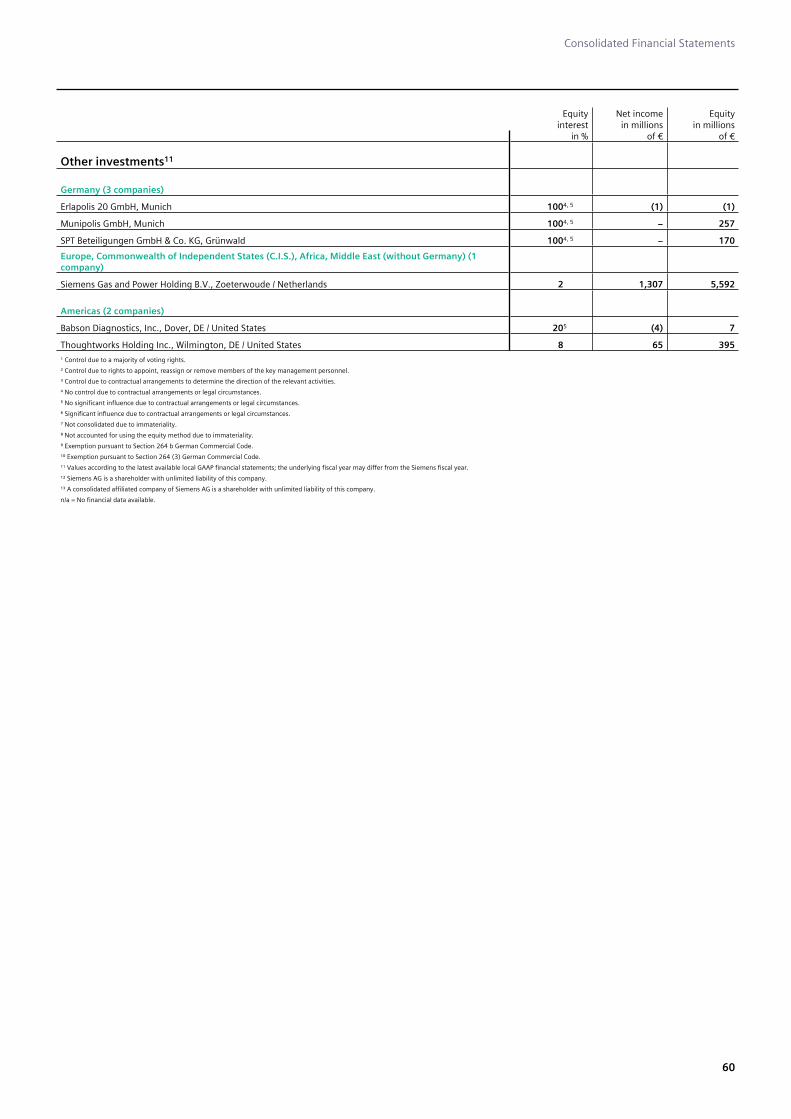
Consolidated Financial Statements
60
Equity Net income Equity interest in millions in millions
in % of € of €
Other investments11
Germany (3 companies)
Erlapolis 20 GmbH, Munich 1004, 5 (1) (1)
Munipolis GmbH, Munich 1004, 5 − 257
SPT Beteiligungen GmbH & Co. KG, Grünwald 1004, 5 − 170
Europe, Commonwealth of Independent States (C.I.S.), Africa, Middle East (without Germany) (1 company)
Siemens Gas and Power Holding B.V., Zoeterwoude / Netherlands 2 1,307 5,592
Americas (2 companies)
Babson Diagnostics, Inc., Dover, DE / United States 205 (4) 7
Thoughtworks Holding Inc., Wilmington, DE / United States 8 65 395
¹ Control due to a majority of voting rights.
² Control due to rights to appoint, reassign or remove members of the key management personnel.
³ Control due to contractual arrangements to determine the direction of the relevant activities.
⁴ No control due to contractual arrangements or legal circumstances.
⁵ No significant influence due to contractual arrangements or legal circumstances.
⁶ Significant influence due to contractual arrangements or legal circumstances.
⁷ Not consolidated due to immateriality.
⁸ Not accounted for using the equity method due to immateriality.
⁹ Exemption pursuant to Section 264 b German Commercial Code.
¹⁰ Exemption pursuant to Section 264 (3) German Commercial Code.
¹¹ Values according to the latest available local GAAP financial statements; the underlying fiscal year may differ from the Siemens fiscal year.
¹² Siemens AG is a shareholder with unlimited liability of this company.
¹³ A consolidated affiliated company of Siemens AG is a shareholder with unlimited liability of this company.
n/a = No financial data available.

Responsibility Statement TO THE CONSOLIDATED FINANCIAL STATEMENTS AND THE GROUP MANAGEMENT REPORT FOR FISCAL 2021

Responsibility Statement (Group)
2
To the best of our knowledge, and in accordance with the applicable reporting principles, the Consolidated Financial Statements give a true and fair view of the assets, liabilities, financial position and profit or loss of the Group, and the Group Management Report, which has been combined with the Management Report for Siemens Aktiengesellschaft, includes a fair review of the development and performance of the business and the position of the Group, together with a description of the material opportunities and risks associated with the expected development of the Group.
Munich, November 30, 2021
Siemens Aktiengesellschaft
The Managing Board
Dr. Roland Busch
Cedrik Neike Matthias Rebellius
Prof. Dr. Ralf P. Thomas Judith Wiese
Independent Auditor’s ReportTO THE CONSOLIDATED FINANCIAL STATEMENTS AND THE GROUP MANAGEMENT REPORT FOR FISCAL 2021
Independent Auditor’s Report (Group)
2
To Siemens Aktiengesellschaft, Berlin and Munich
Report on the audit of the consolidated financial statements and of the group management report
Opinions
We have audited the consolidated financial statements of Siemens Aktiengesellschaft, Berlin and Munich, and its subsidiaries (the Group), which comprise the consolidated statements of income and comprehensive income for the fiscal year from October 1, 2020 to September 30, 2021, the consolidated statements of financial position as of September 30, 2021, the consolidated statements of cash flows and changes in equity for the fiscal year from October 1, 2020 to September 30, 2021, and notes to the consolidated financial statements, including a summary of significant accounting policies. In addition, we have audited the group management report of Siemens Aktiengesellschaft, which is combined with the management report of Siemens Aktiengesellschaft, for the fiscal year from October 1, 2020 to September 30, 2021. In accordance with the German legal requirements, we have not audited the content of the Corporate Governance Statement which is published on the website stated in the combined management report.
In our opinion, on the basis of the knowledge obtained in the audit,
• the accompanying consolidated financial statements comply, in all material respects, with the International Financial Reporting Standards (IFRSs) as adopted by the European Union (EU), and the additional requirements of German commercial law pursuant to Sec. 315e (1) HGB [“Handelsgesetzbuch”: German Commercial Code] as well as with full IFRSs as issued by the International Accounting Standards Board (IASB), and, in compliance with these requirements, give a true and fair view of the assets, liabilities and financial position of the Group as of September 30, 2021 and of its financial performance for the fiscal year from October 1, 2020 to September 30, 2021, and
• the accompanying group management report as a whole provides an appropriate view of the Group’s position. In all material respects, this group management report is consistent with the consolidated financial statements, complies with German legal requirements and appropriately presents the opportunities and risks of future development. Our opinion on the group management report does not cover the content of the Corporate Governance Statement referred to above.
Pursuant to Sec. 322 (3) Sentence 1 HGB, we declare that our audit has not led to any reservations relating to the legal compliance of the consolidated financial statements and of the group management report.
Basis for the opinions
We conducted our audit of the consolidated financial statements and of the group management report in accordance with Sec. 317 HGB and the EU Audit Regulation (No 537/2014, referred to subsequently as “EU Audit Regulation”) and in compliance with German Generally Accepted Standards for Financial Statement Audits promulgated by the Institut der Wirtschaftsprüfer [Institute of Public Auditors in Germany] (IDW). In conducting the audit of the consolidated financial statements we also complied with International Standards on Auditing (ISA). Our responsibilities under those requirements, principles and standards are further described in the “Auditor’s responsibilities for the audit of the consolidated financial statements and of the group management report” section of our auditor’s report. We are independent of the group entities in accordance with the requirements of European law and German commercial and professional law, and we have fulfilled our other German professional responsibilities in accordance with these requirements. In addition, in accordance with Art. 10 (2) f) of the EU Audit Regulation, we declare that we have not provided non-audit services prohibited under Art. 5 (1) of the EU Audit Regulation. We believe that the audit evidence we have obtained is sufficient and appropriate to provide a basis for our opinions on the consolidated financial statements and on the group management report.
Key audit matters in the audit of the consolidated financial statements
Key audit matters are those matters that, in our professional judgment, were of most significance in our audit of the consolidated financial statements for the fiscal year from October 1, 2020 to September 30, 2021. These matters were addressed in the context of our audit of the consolidated financial statements as a whole, and in forming our opinion thereon; we do not provide a separate opinion on these matters.
Below, we describe what we consider to be the key audit matters:
Accounting for the acquisition of Varian
Reasons why the matter was determined to be a key audit matter: The acquisition of Varian Medical Systems, Inc., USA (Varian), was completed on April 15, 2021. Since then, Siemens AG indirectly holds all the shares in Varian via its subsidiary Siemens Healthineers AG. The acquisition was accounted for in accordance with IFRS 3, Business Combinations, on the basis of a preliminary purchase price allocation. To finance the acquisition, a further capital increase was carried out at the level of Siemens Healthineers AG in fiscal year 2021 by issuing new shares, resulting in an increase of non-controlling interests in the Siemens consolidated financial statements. Furthermore, the Group issued bonds denominated in US dollars to finance the transaction. To hedge foreign currency risks in connection with the acquisition and its financing, the Group entered into hedging transactions which were designated as hedging instruments in hedging relationships.
The accounting for the acquisition, including financing and hedging of foreign currency risks, was a key audit matter due to the estimation uncertainties and judgments involved in the preliminary purchase price allocation (particularly regarding the measurement of acquired intangible assets) and due to the overall significant impact on the assets, liabilities, financial position and financial performance of the Group, the complexity of the transaction and the associated significant risk of material misstatement.
Auditor’s response: Our audit procedures in relation to the preliminary purchase price allocation included the assessment of the consideration transferred by Siemens and an evaluation of the methodology applied by the external appraiser engaged by management with respect to the identification and valuation of the assets acquired and liabilities assumed in accordance with the requirements of IFRS
Independent Auditor’s Report (Group)
3
3. We assessed the suitability of the preliminary external appraisal as audit evidence, among other things, through inquiries of management as well as of the external appraiser. With the assistance of internal valuation specialists, we also analyzed whether the assumptions and estimates (particularly growth rates, cost of capital, royalty rates and remaining useful lives) used in determining the fair values of the identifiable assets acquired (particularly the acquired customer relationships and trade names as well as technologies) and liabilities assumed correspond to general and industry-specific market expectations. In addition, we used the expertise of internal industry specialists for the assessment of the recognition and valuation of identified intangible assets and liabilities assumed. Further, we reperformed the calculations in the valuation models and reconciled the expected future cash flows underlying the valuations with, inter alia, internal business plans. As part of our audit procedures, we also assessed the earnings effects in fiscal year 2021 resulting from the subsequent accounting for assets acquired and liabilities assumed, particularly taking into account the remaining useful lives of the acquired assets. As part of our audit of the accounting for the capital increase, we compared the change in equity with the underlying resolutions of the Managing Board and the Supervisory Board of Siemens Healthineers, the register entries as well as other contractual agreements with third parties. For the bonds issued, we compared the recognized amounts with the respective underlying contractual agreements. With regard to the accounting for hedging relationships we assessed whether the requirements for hedge accounting in accordance with IFRS 9, Financial Instruments, were satisfied based on the documentation prepared by management and the underlying contractual agreements. We also assessed the accounting for hedging relationships and reconciled the amounts with the respective line items in the consolidated statement of financial position, consolidated statement of income and consolidated statement of comprehensive income. In this context, we further assessed the methodology applied to determine the fair values of hedging instruments and the clerical accuracy of the respective calculations.
Furthermore, we assessed the application of uniform accounting policies, tax effects resulting from the acquisition and the accounting for the first-time consolidation of the Varian entities in the consolidation system. In addition, we assessed the acquisition-related disclosures (including financing and hedging) in the notes to the consolidated financial statements taking into account the respective IFRS requirements.
Our audit procedures did not lead to any reservations relating to the accounting for the acquisition of Varian.
Reference to related disclosures: With regard to the accounting and measurement policies applied in connection with the business combination, refer to Note 2 Material accounting policies and critical accounting estimates in the notes to the consolidated financial statements. An explanation of the transaction including the related financing and hedging transactions as well as disclosures on the preliminary purchase price allocation is included in Note 3 Acquisitions, dispositions and discontinued operations, Note 16 Debt and Note 24 Derivative financial instruments and hedging activities in the notes to the consolidated financial statements.
Revenue recognition on construction-type contracts
Reasons why the matter was determined to be a key audit matter: The Group conducts a significant portion of its business under construction-type contracts, particularly in the Mobility business. Revenue from long-term construction-type contracts is recognized in accordance with IFRS 15, Revenue from Contracts with Customers, generally over time under the percentage-of-completion method. We consider the accounting for construction-type contracts to be an area posing a significant risk of material misstatement (including the potential risk of management override of internal controls) and accordingly a key audit matter, because management’s assessments significantly impact the determination of the extent of progress towards completion. These assessments include, in particular, the scope of deliveries and services required to fulfill contractually defined obligations, total estimated contract costs, remaining costs to completion and total estimated contract revenues, as well as contract risks including technical, political, regulatory and legal risks. Revenues, total estimated contract costs and profit recognition may deviate significantly from original estimates based on new knowledge about cost overruns and changes in project scope over the term of a construction-type contract. The effects of the coronavirus pandemic (COVID-19) on the project business, such as delays in project execution or disruptions in supply chains as well as change in law clauses with regard to compensation for damages or contractual penalties for delays in delivery and their accounting treatment remained of key significance for our audit.
Auditor’s response: As part of our audit, we obtained an understanding of the Group’s internally established methods, processes and control mechanisms for project management in the bid and execution phase of construction-type contracts. In this regard, we assessed the design and operating effectiveness of the accounting-related internal controls in the project business by obtaining an understanding of business transactions specific to construction-type contracts, from the initiation of the transaction through presentation in the consolidated financial statements. We also tested controls addressing the timely assessment of changes in cost estimates and the timely and complete recognition of such changes in the project calculation.
As part of our substantive audit procedures, which particularly involved project reviews, we evaluated management’s estimates and assumptions based on a risk-based selection of a sample of contracts. Our sample primarily included projects that are subject to significant future uncertainties and risks, such as projects with complex safety/technical and regulatory requirements or projects with a large portion of materials and services to be provided by suppliers or consortium partners, fixed-price or turnkey projects, cross-border projects, projects in regions particularly affected by the COVID-19 pandemic and projects with changes in cost estimates, delays and/or low or negative margins. Our audit procedures included, among others, review of the contracts and their terms and conditions including contractually agreed partial deliveries and services, termination rights, penalties for delay and breach of contract, liquidated damages as well as joint and several liability. In order to evaluate whether revenues were recognized on an accrual basis for the selected projects, we analyzed revenues attributable to the fiscal year and corresponding cost of sales to be recognized in the statement of income considering the extent of progress towards completion and examined the accounting for the associated items in the statement of financial position. Considering the requirements of IFRS 15, we also assessed the accounting for contract amendments or contractually agreed options. We further performed inquiries of project management (both commercial and technical project managers) with respect to the development of the projects including the effects of COVID-19 on project execution, the reasons for deviations between planned and actual costs, the current estimated costs to complete the projects, and management’s assessments on probabilities that contract risks and claims from joint and several liability will materialize. To identify anomalies in the development of margins and other project KPIs, we also applied data analysis procedures. In designing our audit procedures, we also considered results from project audits conducted by the internal audit function. Furthermore, we obtained evidence from third parties for selected projects (e.g., project acceptance documentation, contractual terms and conditions, and lawyers’ confirmations regarding alleged breaches of contract and asserted claims).

Independent Auditor’s Report (Group)
4
Due to the large contract volume and risk profile, our audit procedures focused on large contracts for delivery of high-speed and commuter trains.
Our audit procedures did not lead to any reservations relating to revenue recognition on construction-type contracts.
Reference to related disclosures: With regard to the recognition and measurement policies applied in accounting for construction-type contracts, refer to Note 2 Material accounting policies and critical accounting estimates in the notes to the consolidated financial statements. With respect to contract assets and liabilities as well as provisions for order related losses and risks, refer to Note 10 Contract assets and liabilities, Note 18 Provisions and Note 21 Commitments and contingencies in the notes to the consolidated financial statements.
Provisions for proceedings out of or in connection with alleged compliance violations as well as provisions for asset retirement obligations
Reasons why the matter was determined to be a key audit matter: We considered the accounting for provisions for proceedings out of or in connection with alleged compliance violations, including allegations of corruption and antitrust violations, and for asset retirement obligations to be a key audit matter. These matters are subject to inherent uncertainties and require estimates that could have a significant impact on the recognition and measurement of the respective provision and, accordingly, on assets, liabilities and financial performance. The proceedings out of or in connection with alleged compliance violations are subject to uncertainties because they involve complex legal issues and accordingly, considerable management judgment, in particular when determining whether and in what amount a provision is required to account for the risks. The uncertainties and estimates with respect to asset retirement obligations pertain especially to the estimated costs for waste treatment and packaging for final storage, for interim storage as well as transport to the final nuclear waste storage facility.
Auditor’s response: During our audit of the financial reporting of proceedings out of or in connection with alleged compliance violations, we examined the processes implemented by Siemens for identifying, assessing and accounting for legal and regulatory proceedings. To determine what potentially significant pending legal proceedings or claims asserted are known and to assess management’s estimates of the expected cash outflows, our audit procedures included inquiring of management and other persons within the Group entrusted with these matters, obtaining written statements from in-house legal counsels with respect to the assessment of estimated cash outflows and their probability, obtaining confirmations from external legal advisors and evaluating internal statements concerning the accounting treatment in the consolidated financial statements. Furthermore, we examined legal consulting expense accounts for any indications of legal matters not yet considered.
We further considered alleged or substantiated non-compliance with legal provisions, official regulations and internal company policies (compliance violations) by inspecting internal and external statements on specific matters, obtaining written statements from external legal advisors, and by inquiring of the compliance organization. In this regard, among other procedures, we evaluated the conduct and results of internal investigations by inspecting internal reports and the measures taken to remediate identified weaknesses, and assessed on this basis whether management’s evaluation of any risks to be accounted for in the consolidated financial statements is plausible.
Based on the aforementioned uncertainties, our audit procedures with respect to asset retirement obligations focused on the remediation and environmental protection liabilities in connection with the decommissioning of the facilities in Hanau, Germany (Hanau facilities), as well as for the nuclear research and service center in Karlstein, Germany (Karlstein facilities). Our audit procedures included, among others, assessing the estimated costs for waste treatment and packaging for final storage, for interim storage as well as transport to the final nuclear waste storage facility, and the valuation methods used by drawing on the expertise of our valuation specialists. We evaluated management’s assessments, particularly regarding the accounting effects of the contractually agreed transfer of the nuclear waste disposal obligation to the Federal Republic of Germany, which is still subject to the approval of the EU commission under state-aid-rules, and the expected costs to fulfill the obligations remaining with Siemens through inquiries of persons entrusted with the matter and inspections of internal and external documents.
Furthermore, we evaluated the disclosures on proceedings out of or in connection with alleged compliance violations as well as on asset retirement obligations in the notes to the consolidated financial statements.
Our audit procedures did not lead to any reservations relating to the accounting for proceedings out of or in connection with alleged compliance violations as well as for asset retirement obligations.
Reference to related disclosures: With regard to the recognition and measurement policies applied in accounting for provisions, refer to Note 2 Material accounting policies and critical accounting estimates in the notes to the consolidated financial statements. With respect to proceedings out of or in connection with alleged compliance violations, refer to Note 22 Legal proceedings. With respect to the uncertainties and estimates relating to asset retirement obligations, refer to Note 18 Provisions of the notes to the consolidated financial statements.
Uncertain tax positions and deferred taxes
Reasons why the matter was determined to be a key audit matter: Siemens operates in numerous countries with different local tax legislation. The accounting for uncertain tax positions as well as deferred taxes requires management to exercise considerable judgment and make estimates and assumptions, and was therefore a key audit matter. In particular, this affects the measurement and completeness of uncertain tax positions, the recoverability of deferred tax assets, the measurement and completeness of deferred tax liabilities as well as management’s assessments regarding the tax implications of the COVID-19 pandemic.
Auditor’s response: With the assistance of internal tax specialists who have knowledge of relevant local tax law, we examined the processes installed by management for the identification, recognition and measurement of tax positions. In the course of our audit procedures relating to uncertain tax positions, we evaluated whether management’s assessment of the tax implications of significant business transactions or events in fiscal year 2021, which could result in uncertain tax positions or influence the measurement of existing uncertain tax positions, was in compliance with tax law. In particular, this includes the tax implications arising from the results of tax field audits, the acquisition or disposal of company shares, corporate (intragroup) restructuring activities and cross-border matters, such as the determination of transfer prices.
Independent Auditor’s Report (Group)
5
In order to assess measurement and completeness, we also obtained confirmations from external tax advisors. Further, we evaluated management’s assessments with respect to the prospects of success of appeal and tax court proceedings by inquiring of the employees of the Siemens tax department and by considering current tax case law.
In assessing the recoverability of deferred tax assets, we above all analyzed management’s assumptions with respect to tax planning strategies and projected future taxable income, also in view of the implications of the COVID-19 pandemic, and compared them to internal business plans. In the course of our audit procedures regarding deferred tax liabilities, we examined in particular the assumptions regarding reinvestment of subsidiaries’ retained profits for an indefinite period and assessed these taking into account dividend planning.
Our audit procedures did not lead to any reservations relating to the accounting for uncertain tax positions and deferred taxes.
Reference to related disclosures: With regard to the recognition and measurement policies applied in accounting for income taxes, refer to Note 2 Material accounting policies and critical accounting estimates in the notes to the consolidated financial statements. With respect to disclosures for deferred tax assets and liabilities, refer to Note 7 Income taxes in the notes to the consolidated financial statements.
Other information
The Supervisory Board is responsible for the Report of the Supervisory Board in the Annual Report 2021 within the meaning of ISA [DE] 720 (Revised). Management and the Supervisory Board are responsible for the declaration pursuant to Sec. 161 AktG [“Aktiengesetz”: German Stock Corporation Act] on the Corporate Governance Code, which is part of the Corporate Governance Statement, and for the Compensation Report. In all other respects, management is responsible for the other information. The other information comprises the Corporate Governance Statement referred to above. In addition, the other information comprises parts to be included in the Annual Report, of which we received a version prior to issuing this auditor’s report, in particular:
• the Responsibility Statement (to the Consolidated Financial Statements and the Group Management Report),
• the Responsibility Statement (to the Annual Financial Statements and the Management Report),
• the Five-Year Summary,
• the Compensation Report,
• the Report of the Supervisory Board,
• Notes and forward-looking statements,
but not the consolidated financial statements and the annual financial statements, not the disclosures of the combined management report whose content is audited and not our auditor’s reports thereon.
Our opinions on the consolidated financial statements and on the group management report do not cover the other information, and consequently we do not express an opinion or any other form of assurance conclusion thereon.
In connection with our audit, our responsibility is to read the other information and, in so doing, to consider whether the other information
• is materially inconsistent with the consolidated financial statements, with the group management report or our knowledge obtained in the audit, or
• otherwise appears to be materially misstated.
If, based on the work we have performed, we conclude that there is a material misstatement of this other information, we are required to report that fact. We have nothing to report in this regard.
Responsibilities of management and the Supervisory Board for the consolidated financial statements and the group management report
Management is responsible for the preparation of the consolidated financial statements that comply, in all material respects, with IFRSs as adopted by the EU and the additional requirements of German commercial law pursuant to Sec. 315e (1) HGB as well as with full IFRSs as issued by the IASB, and that the consolidated financial statements, in compliance with these requirements, give a true and fair view of the assets, liabilities, financial position and financial performance of the Group. In addition, management is responsible for such internal control as management has determined necessary to enable the preparation of consolidated financial statements that are free from material misstatement, whether due to fraud or error.
In preparing the consolidated financial statements, management is responsible for assessing the Group’s ability to continue as a going concern. It also has the responsibility for disclosing, as applicable, matters related to going concern. In addition, management is responsible for financial reporting based on the going concern basis of accounting, unless there is an intention to liquidate the Group or to cease operations, or there is no realistic alternative but to do so.
Furthermore, management is responsible for the preparation of the group management report that, as a whole, provides an appropriate view of the Group’s position and is, in all material respects, consistent with the consolidated financial statements, complies with German legal requirements and appropriately presents the opportunities and risks of future development. In addition, management is responsible for such arrangements and measures (systems) as management has considered necessary to enable the preparation of a group management report that is in accordance with the applicable German legal requirements, and to be able to provide sufficient appropriate evidence for the assertions in the group management report.
The Supervisory Board is responsible for overseeing the Group’s financial reporting process for the preparation of the consolidated financial statements and of the group management report.

Independent Auditor’s Report (Group)
6
Auditor’s responsibilities for the audit of the consolidated financial statements and of the group management report
Our objectives are to obtain reasonable assurance about whether the consolidated financial statements as a whole are free from material misstatement, whether due to fraud or error, and whether the group management report as a whole provides an appropriate view of the Group’s position and, in all material respects, is consistent with the consolidated financial statements and the knowledge obtained in the audit, complies with the German legal requirements and appropriately presents the opportunities and risks of future development, as well as to issue an auditor’s report that includes our opinions on the consolidated financial statements and on the group management report.
Reasonable assurance is a high level of assurance, but is not a guarantee that an audit conducted in accordance with Sec. 317 HGB and the EU Audit Regulation as well as in compliance with German Generally Accepted Standards for Financial Statement Audits promulgated by the IDW and in supplementary compliance with ISA will always detect a material misstatement. Misstatements can arise from fraud or error and are considered material if, individually or in the aggregate, they could reasonably be expected to influence the economic decisions of users taken on the basis of these consolidated financial statements and this group management report.
We exercise professional judgment and maintain professional skepticism throughout the audit. We also:
• Identify and assess the risks of material misstatement of the consolidated financial statements and of the group management report, whether due to fraud or error, design and perform audit procedures responsive to those risks, and obtain audit evidence that is sufficient and appropriate to provide a basis for our opinions. The risk of not detecting a material misstatement resulting from fraud is higher than for one resulting from error, as fraud may involve collusion, forgery, intentional omissions, misrepresentations, or the override of internal control.
• Obtain an understanding of internal control relevant to the audit of the consolidated financial statements and of arrangements and measures (systems) relevant to the audit of the group management report in order to design audit procedures that are appropriate in the circumstances, but not for the purpose of expressing an opinion on the effectiveness of these systems.
• Evaluate the appropriateness of accounting policies used by management and the reasonableness of estimates made by management and related disclosures.
• Conclude on the appropriateness of management’s use of the going concern basis of accounting and, based on the audit evidence obtained, whether a material uncertainty exists related to events or conditions that may cast significant doubt on the Group’s ability to continue as a going concern. If we conclude that a material uncertainty exists, we are required to draw attention in the auditor’s report to the related disclosures in the consolidated financial statements and in the group management report or, if such disclosures are inadequate, to modify our respective opinions. Our conclusions are based on the audit evidence obtained up to the date of our auditor’s report. However, future events or conditions may cause the Group to cease to be able to continue as a going concern.
• Evaluate the overall presentation, structure and content of the consolidated financial statements, including the disclosures, and whether the consolidated financial statements present the underlying transactions and events in a manner that the consolidated financial statements give a true and fair view of the assets, liabilities, financial position and financial performance of the Group in compliance with IFRSs as adopted by the EU and the additional requirements of German commercial law pursuant to Sec. 315e (1) HGB as well as with full IFRSs as issued by the IASB.
• Obtain sufficient appropriate audit evidence regarding the financial information of the entities or business activities within the Group to express opinions on the consolidated financial statements and on the group management report. We are responsible for the direction, supervision and performance of the group audit. We remain solely responsible for our opinions.
• Evaluate the consistency of the group management report with the consolidated financial statements, its conformity with German law, and the view of the Group’s position it provides.
• Perform audit procedures on the prospective information presented by management in the group management report. On the basis of sufficient appropriate audit evidence we evaluate, in particular, the significant assumptions used by management as a basis for the prospective information, and evaluate the proper derivation of the prospective information from these assumptions. We do not express a separate opinion on the prospective information and on the assumptions used as a basis. There is a substantial unavoidable risk that future events will differ materially from the prospective information.
We communicate with those charged with governance regarding, among other matters, the planned scope and timing of the audit and significant audit findings, including any significant deficiencies in internal control that we identify during our audit.
We also provide those charged with governance with a statement that we have complied with the relevant independence requirements, and communicate with them all relationships and other matters that may reasonably be thought to bear on our independence and where applicable, the related safeguards.
From the matters communicated with those charged with governance, we determine those matters that were of most significance in the audit of the consolidated financial statements of the current period and are therefore the key audit matters. We describe these matters in our auditor’s report unless law or regulation precludes public disclosure about the matter.
Other legal and regulatory requirements
Report on the assurance on the electronic rendering of the consolidated financial statements and the group management report prepared for publication purposes in accordance with Sec. 317 (3a) HGB
Opinion
We have performed assurance work in accordance with Sec. 317 (3a) HGB to obtain reasonable assurance about whether the rendering of the consolidated financial statements and the group management report (hereinafter the “ESEF documents”) contained in the file SIEMENS_2021.zip (SHA-256 checksum: c2fee878a23005add85c87b5f4a7cf3e7883b81d2626892870c12ff3d2a977f8) and prepared for publication purposes complies in all material respects with the requirements of Sec. 328 (1) HGB for the electronic reporting format (“ESEF

Independent Auditor’s Report (Group)
7
format”). In accordance with German legal requirements, this assurance work extends only to the conversion of the information contained in the consolidated financial statements and the group management report into the ESEF format and therefore relates neither to the information contained within these renderings nor to any other information contained in the file identified above.
In our opinion, the rendering of the consolidated financial statements and the group management report contained in the file identified above and prepared for publication purposes complies in all material respects with the requirements of Sec. 328 (1) HGB for the electronic reporting format. Beyond this assurance opinion and our audit opinions on the accompanying consolidated financial statements and the accompanying group management report for the fiscal year from October 1, 2020 to September 30, 2021 contained in the “Report on the audit of the consolidated financial statements and of the group management report” above, we do not express any assurance opinion on the information contained within these renderings or on the other information contained in the file identified above.
Basis for the opinion
We conducted our assurance work on the rendering, of the consolidated financial statements and the group management report contained in the file identified above in accordance with Sec. 317 (3a) HGB and the IDW Assurance Standard: Assurance on the Electronic Rendering of Financial Statements and Management Reports Prepared for Publication Purposes in Accordance with Sec. 317 (3a) HGB (IDW AsS 410) and the International Standard on Assurance Engagements 3000 (Revised). Our responsibility in accordance therewith is further described in the “Group auditor’s responsibilities for the assurance work on the ESEF documents” section. Our audit firm applies the IDW Standard on Quality Management 1: Requirements for Quality Management in the Audit Firm (IDW QS 1).
Responsibilities of management and the Supervisory Board for the ESEF documents
Management is responsible for the preparation of the ESEF documents including the electronic rendering of the consolidated financial statements and the group management report in accordance with Sec. 328 (1) Sentence 4 No. 1 HGB and for the tagging of the consolidated financial statements in accordance with Sec. 328 (1) Sentence 4 No. 2 HGB.
In addition, management is responsible for such internal control as it has determined necessary to enable the preparation of ESEF documents that are free from material intentional or unintentional non-compliance with the requirements of Sec. 328 (1) HGB for the electronic reporting format.
The Supervisory Board is responsible for overseeing the process for preparing the ESEF documents as part of the financial reporting process.
Group auditor’s responsibilities for the assurance work on the ESEF documents
Our objective is to obtain reasonable assurance about whether the ESEF documents are free from material intentional or unintentional non-compliance with the requirements of Sec. 328 (1) HGB. We exercise professional judgment and maintain professional skepticism throughout the assurance work. We also:
• Identify and assess the risks of material intentional or unintentional non-compliance with the requirements of Sec. 328 (1) HGB, design and perform assurance procedures responsive to those risks, and obtain assurance evidence that is sufficient and appropriate to provide a basis for our assurance opinion.
• Obtain an understanding of internal control relevant to the assurance on the ESEF documents in order to design assurance procedures that are appropriate in the circumstances, but not for the purpose of expressing an assurance opinion on the effectiveness of these controls.
• Evaluate the technical validity of the ESEF documents, i.e., whether the file containing the ESEF documents meets the requirements of Commission Delegated Regulation (EU) 2019/815, in the version in force at the date of the financial statements, on the technical specification for this file.
• Evaluate whether the ESEF documents enable an XHTML rendering with content equivalent to the audited consolidated financial statements and to the audited group management report.
• Evaluate whether the tagging of the ESEF documents with Inline XBRL technology (iXBRL) in accordance with the requirements of Arts. 4 and 6 of Commission Delegated Regulation (EU) 2019/815, in the version in force at the date of the financial statements, enables an appropriate and complete machine-readable XBRL copy of the XHTML rendering.
Further information pursuant to Art. 10 of the EU Audit Regulation
We were elected as group auditor by the Annual Shareholders’ Meeting on February 3, 2021. We were engaged by the Supervisory Board on February 3, 2021. We have been the group auditor of Siemens Aktiengesellschaft without interruption since the fiscal year from October 1, 2008 to September 30, 2009.
We declare that the opinions expressed in this auditor’s report are consistent with the additional report to the Audit Committee pursuant to Art. 11 of the EU Audit Regulation (long-form audit report).
Other matter – use of the auditor’s report
Our auditor’s report must always be read together with the audited consolidated financial statements and the audited group management report as well as the assured ESEF documents. The consolidated financial statements and the group management report converted to the ESEF format – including the versions to be published in the Bundesanzeiger [German Federal Gazette] – are merely electronic renderings of the audited consolidated financial statements and the audited group management report and do not take their place. In particular, the ESEF report and our assurance opinion contained therein are to be used solely together with the assured ESEF documents made available in electronic form.

Independent Auditor’s Report (Group)
8
German Public Auditor responsible for the engagementThe German Public Auditor responsible for the engagement is Katharina Breitsameter.
Munich, November 30, 2021
Ernst & Young GmbH
Wirtschaftsprüfungsgesellschaft
Breitsameter Dr. Gaenslen
Wirtschaftsprüferin Wirtschaftsprüfer
[German Public Auditor] [German Public Auditor]

Annual Financial Statements*
FOR FISCAL 2021
* This document is an English language translation of the decisive German version and is not provided in the European Single Electronic Format (ESEF). The legally required rendering in ESEF is filed in German language with the operator of the German Federal Gazette and published in the German Federal Gazette.

Table of contents
Annual Financial Statements
3
4
5
1.
2.
3.
Income Statement
Balance Sheet
Notes
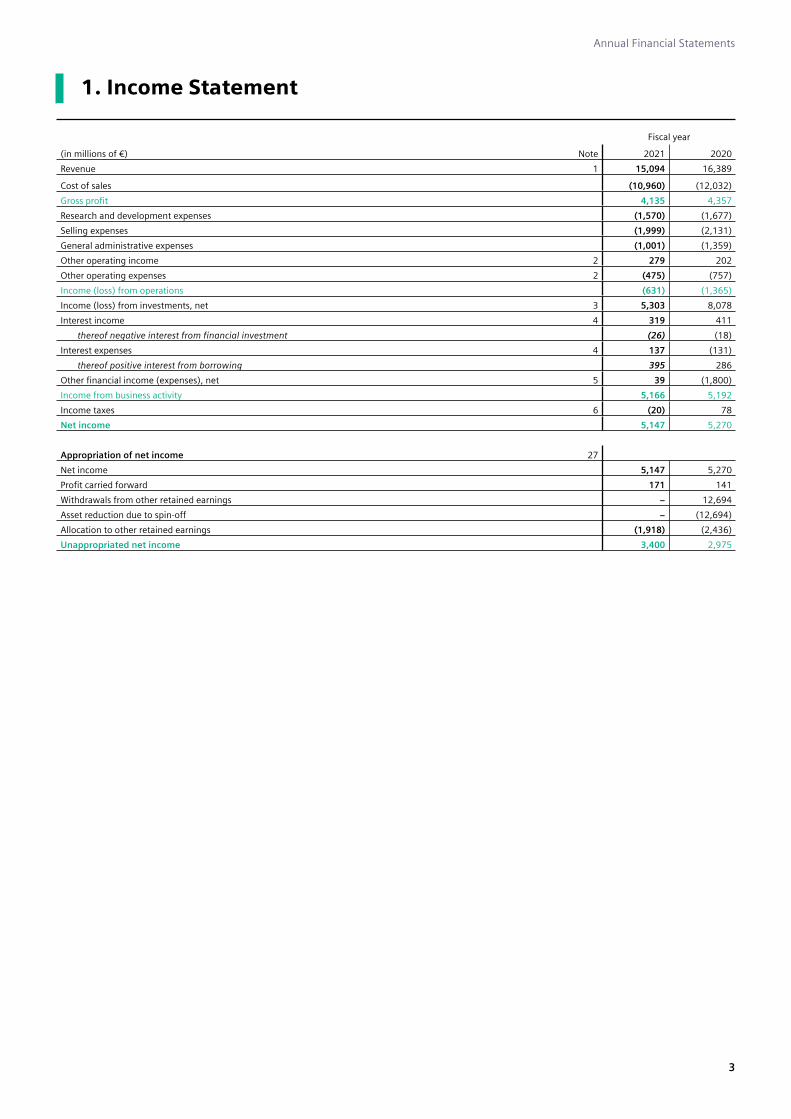
Annual Financial Statements
3
1. Income Statement
Fiscal year
(in millions of €) Note 2021 2020
Revenue 1 15,094 16,389
Cost of sales (10,960) (12,032)
Gross profit 4,135 4,357
Research and development expenses (1,570) (1,677)
Selling expenses (1,999) (2,131)
General administrative expenses (1,001) (1,359)
Other operating income 2 279 202
Other operating expenses 2 (475) (757)
Income (loss) from operations (631) (1,365)
Income (loss) from investments, net 3 5,303 8,078
Interest income 4 319 411
thereof negative interest from financial investment (26) (18)
Interest expenses 4 137 (131)
thereof positive interest from borrowing 395 286
Other financial income (expenses), net 5 39 (1,800)
Income from business activity 5,166 5,192
Income taxes 6 (20) 78
Net income 5,147 5,270
Appropriation of net income 27
Net income 5,147 5,270
Profit carried forward 171 141
Withdrawals from other retained earnings − 12,694
Asset reduction due to spin-off − (12,694)
Allocation to other retained earnings (1,918) (2,436)
Unappropriated net income 3,400 2,975

Annual Financial Statements
4
2. Balance Sheet
Sep. 30,
(in millions of €) Note 2021 2020
Assets
Non-current assets 10
Intangible assets 192 225
Property, plant and equipment 876 897
Financial assets 74,852 74,877
75,920 75,999
Current assets
Inventories 11 1,934 1,869
Advance payments received (986) (1,005)
949 863
Receivables and other assets 12
Trade receivables 1,696 1,442
Receivables from affiliated companies 17,564 12,694
Other receivables and other assets 1,583 1,937
20,844 16,074
Other Securities 215 435
Cash and cash equivalents 2,082 8,351
24,089 25,724
Prepaid expenses 184 133
Deferred tax assets 13 1,243 1,034
Active difference resulting from offsetting 14 51 85
Total assets 101,487 102,975
Shareholders´ equity and liabilities
Shareholders´ equity 15
Subscribed capital1 2,550 2,550
Treasury shares (143) (152)
Issued capital 2,407 2,398
Capital reserve 8,289 8,156
Other retained earnings 7,119 5,387
Unappropriated net income 3,400 2,975
21,216 18,917
Special reserve with an equity portion 541 619
Provisions
Provisions for pensions and similar commitments 16 12,372 11,700
Provisions for taxes 628 636
Other provisions 17 3,592 3,687
16,592 16,023
Liabilities 18
Liabilities to banks 501 98
Trade payables 2,111 1,777
Liabilities to affiliated companies 58,985 63,638
Other liabilities 1,293 1,632
62,890 67,145
Deferred income 249 271
Total shareholders´ equity and liabilities 101,487 102,975¹ Conditional Capital as of September 30, 2021 and 2020 amounted to €421 million and €421 million, respectively.
Annual Financial Statements
5
3. Notes to Annual Financial Statements
3.1 General DisclosuresSiemens AG has registered offices in Berlin and Munich, Germany. The Company is registered in the commercial register maintained by the local courts in Berlin Charlottenburg, Germany, under the entry number HRB 12300, and in Munich, Germany, under the entry number HRB 6684.
The Annual Financial Statements of Siemens AG have been prepared in accordance with the regulations set forth in the German Commercial Code (Handelsgesetzbuch, HGB) and the German Stock Corporation Act (Aktiengesetz, AktG). Amounts are presented in millions of euros (€ million). Due to rounding, numbers presented may not add up precisely to totals provided.
3.2 Accounting and Measurement PrinciplesRevenue are proceeds from selling and leasing products, providing services and granting licenses, including licensing contracts for the use of the Siemens trademark.
Negative interest from financial investments is presented as a deduction in interest income, and positive interest from borrowings as a deduction in interest expenses.
Intangible assets acquired for consideration are capitalized at acquisition costs and amortized on a straight-line basis over a maximum of five years or, if longer, the contractually agreed useful life. Items are amortized on a pro rata temporis basis in the year of acquisition. The capitalization option for internally generated intangible assets is not used.
Acquired goodwill is generally amortized systematically over the expected useful life of five to 15 years. The expected useful life is based on the expected use of the acquired businesses and is determined in particular by economic factors such as future growth and profit expectations, synergy effects and employee base.
Property, plant and equipment: The components of production costs are described in the context of the explanations for inventories. In general, property, plant and equipment is depreciated using the straight-line method. In certain cases, the declining balance method is applied, whereby a switch is made from the declining balance to the straight-line method as soon as the latter results in higher depreciation expense. Items are depreciated on a pro rata temporis basis in the year of acquisition. Low-value non-current assets that are subject to wear and tear, movable, and capable of being used independently, are expensed immediately or capitalized and fully depreciated in the year of acquisition.
Useful lives of property, plant and equipment
Factory and office buildings 20 to 50 years
Other buildings 5 to 10 years
Technical equipment and machines mostly 10 years
Other equipment, plant and office equipment 3 to 8 years
Equipment leased to others mostly 3 to 5 years
Special reserve with an equity portion includes reserves pursuant to Section 6b of the German Income Tax Act (Einkommensteuergesetz), recognized and transferred in fiscal years prior to the transition to regulations of the German Accounting Law Modernisation Act (Bilanzrechtsmodernisierungsgesetz).
Financial assets: Impairment losses are recognized if the decline in value is presumed to be other than temporary. This applies, if objective evidence, particularly events or changes in circumstances, indicate a significant or other than temporary decline in value. In case of an impairment in prior periods, a lower recognized value may not be maintained if the reasons for the impairment do no longer exist.
Inventories are measured at the lower of average acquisition or production costs and daily values. Production costs comprise, in addition to direct costs, an appropriate portion of production and material overheads and depreciation of property, plant and equipment. General administration expenses, expenses for social facilities, voluntary social costs and company pension scheme costs are not capitalized. Write-downs are recorded to cover inventory risks for reduced usability and technological obsolescence as well as in the context of loss-free valuation of unbilled contracts in construction-type and service businesses.
Allowances on receivables are determined on the basis of the probability of default and country risks.
Deferred tax assets for differences between valuations of balance sheet line items in accordance to commercial and tax law and tax loss carryforwards are recognized if a future tax benefit is expected. Deferred tax assets are netted with deferred tax liabilities. Recognized deferred tax assets and liabilities comprise temporary differences of assets, liabilities, and deferred items of entities forming part of the Siemens AG tax group and partnerships to the extent that the recovery or settlement of the carrying amount of assets, liabilities, or deferred items result in a deductible or taxable amount in the taxable profit (loss) of Siemens AG.
Offsetting of assets and of income and expenses: Siemens AG measures assets at fair value that are designated as being held exclusively to settle specified pension obligations and obligations for early retirement (“Altersteilzeit”) arrangements and which cannot be accessed by other creditors. Income and expenses relating to these designated assets are offset against the expenses arising from compounding the corresponding obligations and are reported within the line item Other financial income (expenses), net.
Pensions and similar commitments: Siemens AG measures its pension obligations using the settlement amount calculated with the actuarial projected unit credit method on the basis of biometric probabilities. The discount rate used corresponds to the average market interest rate for instruments with an assumed remaining maturity of 15 years as published by German Federal Reserve Bank (Deutsche Bundesbank).

Annual Financial Statements
6
Entitlements resulting from plans based on asset returns from underlying assets are generally measured at the fair value of the underlying assets at the balance sheet date. If the performance of the underlying assets is lower than a guaranteed return, the pension provision is measured by projecting forward the contributions at the guaranteed fixed return and discounting to a present value.
According to the Act on the Improvement of Company Pensions (Gesetz zur Verbesserung der betrieblichen Altersversorgung), Siemens AG is secondarily liable for pension benefits provided under an indirect pension funding vehicle (mittelbarer Durchführungsweg). Siemens AG recognizes the underfunding in the item Provisions for pensions and similar commitments as far as the respective assets of the pension fund or of the pension and support fund (Pensions- und Unterstützungskasse) do not cover the settlement amount of the respective pension obligations.
Other provisions are recognized in an appropriate and sufficient amount to cover individual obligations for all identifiable risks relating to liabilities of uncertain timing and amount and for anticipated losses on onerous contracts, taking account of price and cost increases expected to arise in the future. Provisions for agreed personnel restructuring measures were recognized for legal and constructive obligations. Significant provisions with a remaining term of more than one year are discounted using a discount rate which corresponds to the average market interest rate appropriate for the remaining term of the obligations, as calculated and published by Deutsche Bundesbank.
Foreign currency translation: Receivables, other current assets, securities, cash and cash equivalents, provisions and liabilities (excluding advance payments received on orders) as well as commitments and contingencies denominated in foreign currency are generally measured applying the mean spot exchange rate on the balance sheet date. Balance Sheet line items denominated in foreign currency which are part of a valuation unit used to hedge foreign currency risk are measured using the mean spot exchange rate on the transaction date. Non-current assets and inventories acquired in foreign currency are generally measured applying the mean spot exchange rate on the transaction date.
Guarantees and other commitments: Siemens AG issues parent company guarantees, i.e. guarantees to ensure performance obligations incurred from the delivery of goods or provision of services by affiliated and long-term investee companies or their parent companies. For measurement purposes, the contract amount of the secured delivery or service agreement is reduced using the straight-line method over the planned term of the delivery or service agreement, unless there are reasons for a different risk assessment and an increased liability amount (“risk-adequate liability amount”). Credit lines included in the guarantee obligations in the context of financing affiliated companies are recognized at their nominal amount.
Derivative financial instruments are used by Siemens AG almost exclusively for hedging purposes and - if the relevant conditions are met - are aggregated with the underlying hedged item into valuation units. When a valuation unit is created, changes in values or cash flows from the hedged item and hedging contract are compared. A provision is recognized only for a negative surplus from the ineffective part of the market value changes. The unrealized gains and losses from the effective part offset each other completely and are not recognized in the Balance Sheet or the Income Statement.
Classification of items in the annual financial statements: Siemens AG aggregates individual line items of the Income Statement and Balance Sheet if the individual line item is not material for providing a true and fair view of the Company’s financial position and if such an aggregation improves the clarity of the presentation. Siemens AG discloses these items separately in the notes.
The business and economic environment continues to be affected by the coronavirus pandemic (COVID-19). Due to the spread of the virus, it is difficult to predict the duration and extent of the resulting impact on Siemens AG's assets, provisions, liabilities and results. However, the Company does not anticipate that COVID-19-related effects will have a material impact on the financial statements.
3.3 Notes to the Income Statement
NOTE 1 Revenue
Revenue by lines of business
Fiscal year
(in millions of €) 2021
Digital Industry 8,176
Smart Infrastructure 4,832
Other revenue 2,086
Revenue 15,094
Revenue by region
Fiscal year
(in millions of €) 2021
Europe, C.I.S., Africa, Middle East 11,507
Americas 1,058
Asia, Australia 2,529
Revenue 15,094

Annual Financial Statements
7
NOTE 2 Other operating income and expensesOther operating income included income of €171 million from the release of a provision related to an investment and income from the release of the special reserve with an equity portion of €78 (2020: €49) million.
Other operating expenses included expenses of €191 million for an intragroup service contract and expenses of €109 million for the recognition of a provision related to guarantees and expected obligations from consortium contracts.
NOTE 3 Income (loss) from investments, net
Fiscal year
(in millions of €) 2021 2020
Income from investments 3,599 4,666
thereof from affiliated companies 3,534 4,655
Income from profit transfer agreements with affiliated companies 610 1,968
Expenses from loss transfers from affiliated companies (4) (6)
Impairments on investments (619) (1,646)
Reversals of impairments on investments 32 664
Gains from the disposal of investments 1,724 2,452
Losses from the disposal of investments (39) (21)
Income from investments, net 5,303 8,078
Income from investments included in particular profit distributions from Siemens Ltd., China, amounting to €1,331 million, from Siemens Holdings plc., United Kingdom, amounting to €698 million and from Siemens Healthineers AG, Germany, amounting to €534 million.
Income from profit transfer agreements with affiliated companies included profit transfers from Siemens Beteiligungen Inland GmbH, Germany, amounting to €307 million.
Gains from the disposal of investments included gains from the disposal of Flender GmbH, Germany, amounting to €875 million, of Kyros Beteiligungsverwaltung GmbH, Germany, amounting to €411 million and of BSAV Kapitalbeteiligungen und Vermögensverwaltungs Management GmbH, Germany, amounting to €301 million.
NOTE 4 Interest income and interest expensesInterest income presented in the income statement included interest income from affiliated companies of €209 (2020: €326) million. Interest expenses included interest income from borrowing from affiliated companies of €166 (2020: interest expenses from borrowing of €88) million.
Interest income from loans of non-current financial assets amounted to €79 (2020: €81) million.
NOTE 5 Other financial income (expenses), net
Fiscal year
(in millions of €) 2021 2020
Interest component of changes in the pension provisions that are not offset against designated plan assets (1,058) (815)
Financial income (expenses), (net) relating to the pension and personnel-related provisions that are offset against designated plan assets 11 (31)
Other financial income 1,424 218
Other financial expenses (206) (277)
Impairments and reversal of impairments of loans and securities of non-current and current assets (132) (895)
Other financial income (expenses), net 39 (1,800)
Financial income (expenses), net relating to the pension and personnel-related provisions that are offset against designated plan assets represented a net amount from offset income totaling €57 (2020: €18) million and expenses totaling €46 (2020: €50) million.
Other financial income resulted from gains from non-current securities, in fiscal 2021 primarily from the transfer of investment funds to SPT Beteiligungen GmbH & Co. KG, totaling €692 (2020: €186) million, the release of provisions for risks relating to derivative financial instruments totaling €213 (2020: expenses of €48) million, from derivative instruments related to interest rate hedging totaling €312 (2020: expenses of €10) million, and from derivative financial instruments related to foreign currency hedging amounting to €197 (2020: expenses of €176) million.
Other financial expenses included expenses from monetary balance sheet items denominated in foreign currencies totaling €186 (2020: income of €32) million. In addition, the position included expenses from compounding of other provisions amounting to €18 (2020: €33) million.
Impairments and reversal of impairments of loans and securities of non-current and current assets included an impairment of €149 million of a long-term loan related to an investment.

Annual Financial Statements
8
NOTE 6 Income taxes
Fiscal year
(in millions of €) 2021 2020
Income tax expenses (229) (126)
Deferred taxes 209 204
Income taxes (20) 78
Income tax expenses resulted primarily from foreign withholding taxes as well as from expenses for previous years from the completion of a tax audit. Tax income from the remedy of appeals filed had an offsetting effect.
Deferred taxes included income from the increase of deferred tax assets related to pension provisions.
NOTE 7 Other taxesOther taxes of €16 (2020: €16) million were included in functional costs.
NOTE 8 Impact of tax regulations on net incomeThe use of tax incentives had a positive effect on net income of €78 million.
NOTE 9 Income and expenses relating to prior periodsThe income statement of Siemens AG included expenses and income relating to prior periods of €253 million and €512 million, respectively. Expenses relating to prior periods included tax expenses related to the completion of a tax audit. Income relating to prior periods resulted mainly from the release of provisions as well as tax income, particularly related to the remedy of appeals filed.
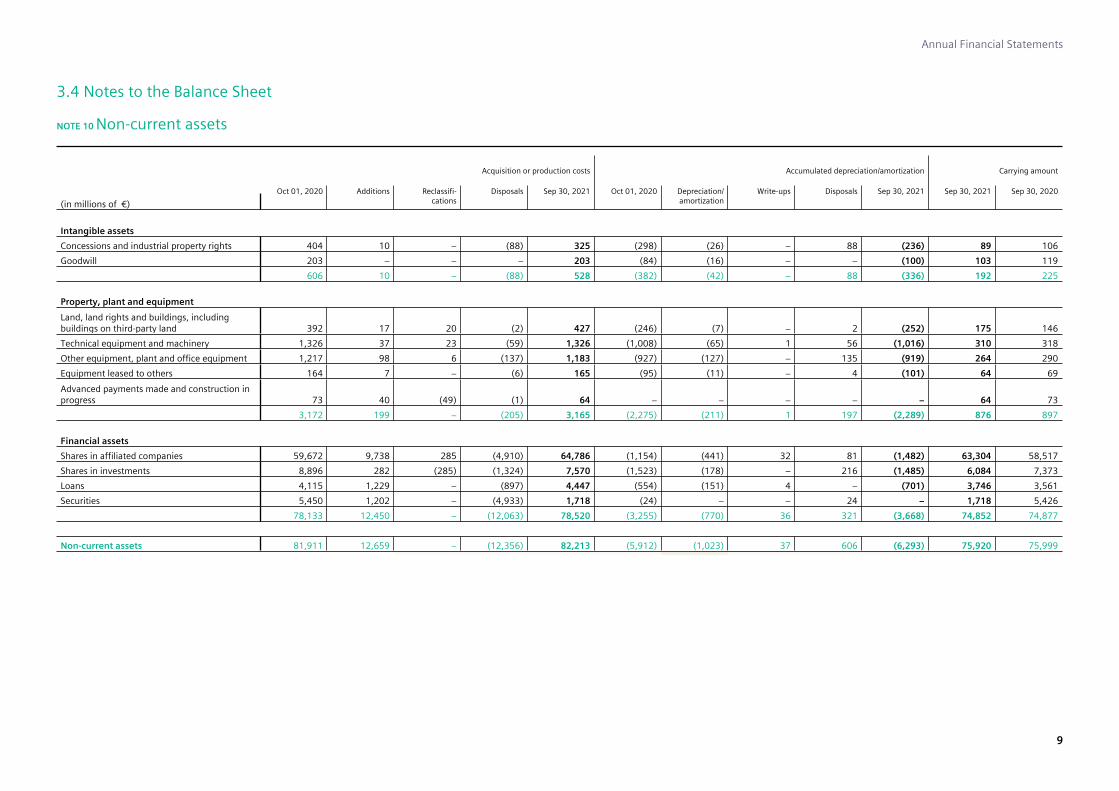
Annual Financial Statements
9
3.4 Notes to the Balance Sheet
NOTE 10 Non-current assets
Acquisition or production costs Accumulated depreciation/amortization Carrying amount
(in millions of €)
Oct 01, 2020 Additions Reclassifi-cations
Disposals Sep 30, 2021 Oct 01, 2020 Depreciation/amortization
Write-ups Disposals Sep 30, 2021 Sep 30, 2021 Sep 30, 2020
Intangible assets
Concessions and industrial property rights 404 10 − (88) 325 (298) (26) − 88 (236) 89 106
Goodwill 203 − − − 203 (84) (16) − − (100) 103 119
606 10 − (88) 528 (382) (42) − 88 (336) 192 225
Property, plant and equipment
Land, land rights and buildings, including buildings on third-party land 392 17 20 (2) 427 (246) (7) − 2 (252) 175 146
Technical equipment and machinery 1,326 37 23 (59) 1,326 (1,008) (65) 1 56 (1,016) 310 318
Other equipment, plant and office equipment 1,217 98 6 (137) 1,183 (927) (127) − 135 (919) 264 290
Equipment leased to others 164 7 − (6) 165 (95) (11) − 4 (101) 64 69
Advanced payments made and construction in progress 73 40 (49) (1) 64 − − − − − 64 73
3,172 199 − (205) 3,165 (2,275) (211) 1 197 (2,289) 876 897
Financial assets
Shares in affiliated companies 59,672 9,738 285 (4,910) 64,786 (1,154) (441) 32 81 (1,482) 63,304 58,517
Shares in investments 8,896 282 (285) (1,324) 7,570 (1,523) (178) − 216 (1,485) 6,084 7,373
Loans 4,115 1,229 − (897) 4,447 (554) (151) 4 − (701) 3,746 3,561
Securities 5,450 1,202 − (4,933) 1,718 (24) − − 24 − 1,718 5,426
78,133 12,450 − (12,063) 78,520 (3,255) (770) 36 321 (3,668) 74,852 74,877
Non-current assets 81,911 12,659 − (12,356) 82,213 (5,912) (1,023) 37 606 (6,293) 75,920 75,999
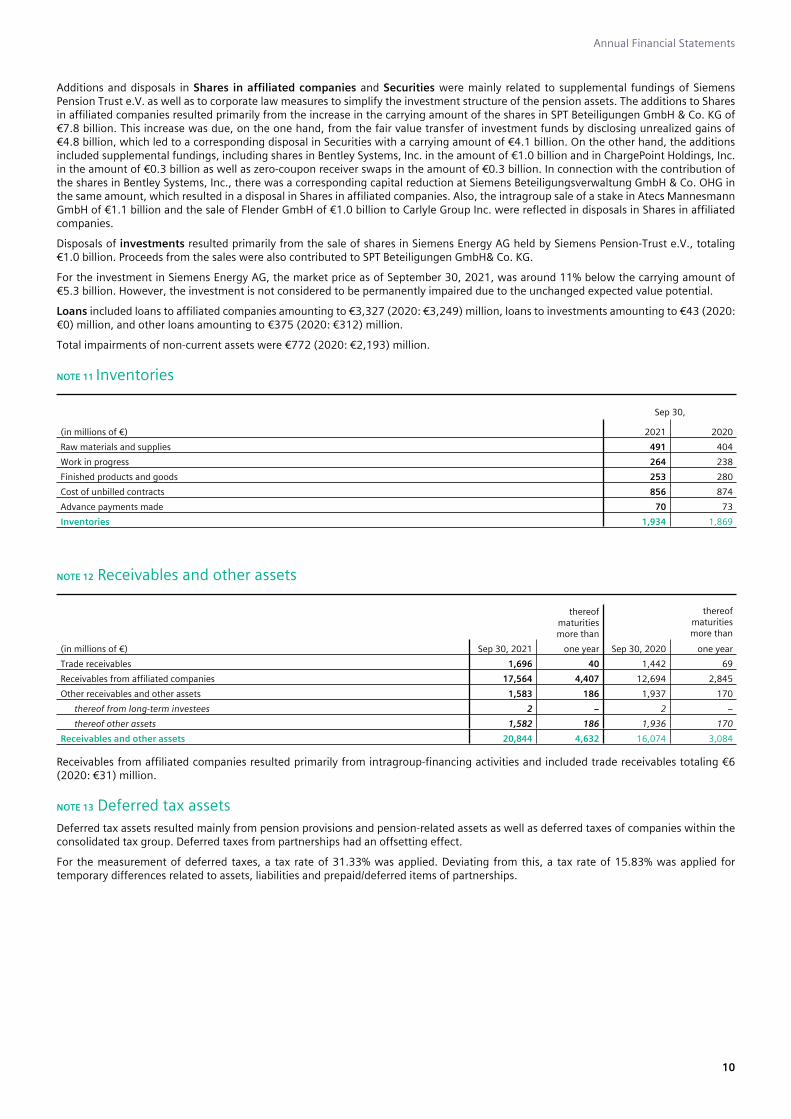
Annual Financial Statements
10
Additions and disposals in Shares in affiliated companies and Securities were mainly related to supplemental fundings of Siemens Pension Trust e.V. as well as to corporate law measures to simplify the investment structure of the pension assets. The additions to Shares in affiliated companies resulted primarily from the increase in the carrying amount of the shares in SPT Beteiligungen GmbH & Co. KG of €7.8 billion. This increase was due, on the one hand, from the fair value transfer of investment funds by disclosing unrealized gains of €4.8 billion, which led to a corresponding disposal in Securities with a carrying amount of €4.1 billion. On the other hand, the additions included supplemental fundings, including shares in Bentley Systems, Inc. in the amount of €1.0 billion and in ChargePoint Holdings, Inc. in the amount of €0.3 billion as well as zero-coupon receiver swaps in the amount of €0.3 billion. In connection with the contribution of the shares in Bentley Systems, Inc., there was a corresponding capital reduction at Siemens Beteiligungsverwaltung GmbH & Co. OHG in the same amount, which resulted in a disposal in Shares in affiliated companies. Also, the intragroup sale of a stake in Atecs Mannesmann GmbH of €1.1 billion and the sale of Flender GmbH of €1.0 billion to Carlyle Group Inc. were reflected in disposals in Shares in affiliated companies.
Disposals of investments resulted primarily from the sale of shares in Siemens Energy AG held by Siemens Pension-Trust e.V., totaling €1.0 billion. Proceeds from the sales were also contributed to SPT Beteiligungen GmbH& Co. KG.
For the investment in Siemens Energy AG, the market price as of September 30, 2021, was around 11% below the carrying amount of €5.3 billion. However, the investment is not considered to be permanently impaired due to the unchanged expected value potential.
Loans included loans to affiliated companies amounting to €3,327 (2020: €3,249) million, loans to investments amounting to €43 (2020: €0) million, and other loans amounting to €375 (2020: €312) million.
Total impairments of non-current assets were €772 (2020: €2,193) million.
NOTE 11 Inventories
Sep 30,
(in millions of €) 2021 2020
Raw materials and supplies 491 404
Work in progress 264 238
Finished products and goods 253 280
Cost of unbilled contracts 856 874
Advance payments made 70 73
Inventories 1,934 1,869
NOTE 12 Receivables and other assets
thereof maturitiesmore than
thereof maturitiesmore than
(in millions of €) Sep 30, 2021 one year Sep 30, 2020 one year
Trade receivables 1,696 40 1,442 69
Receivables from affiliated companies 17,564 4,407 12,694 2,845
Other receivables and other assets 1,583 186 1,937 170
thereof from long-term investees 2 − 2 −
thereof other assets 1,582 186 1,936 170
Receivables and other assets 20,844 4,632 16,074 3,084
Receivables from affiliated companies resulted primarily from intragroup-financing activities and included trade receivables totaling €6 (2020: €31) million.
NOTE 13 Deferred tax assetsDeferred tax assets resulted mainly from pension provisions and pension-related assets as well as deferred taxes of companies within the consolidated tax group. Deferred taxes from partnerships had an offsetting effect.
For the measurement of deferred taxes, a tax rate of 31.33% was applied. Deviating from this, a tax rate of 15.83% was applied for temporary differences related to assets, liabilities and prepaid/deferred items of partnerships.
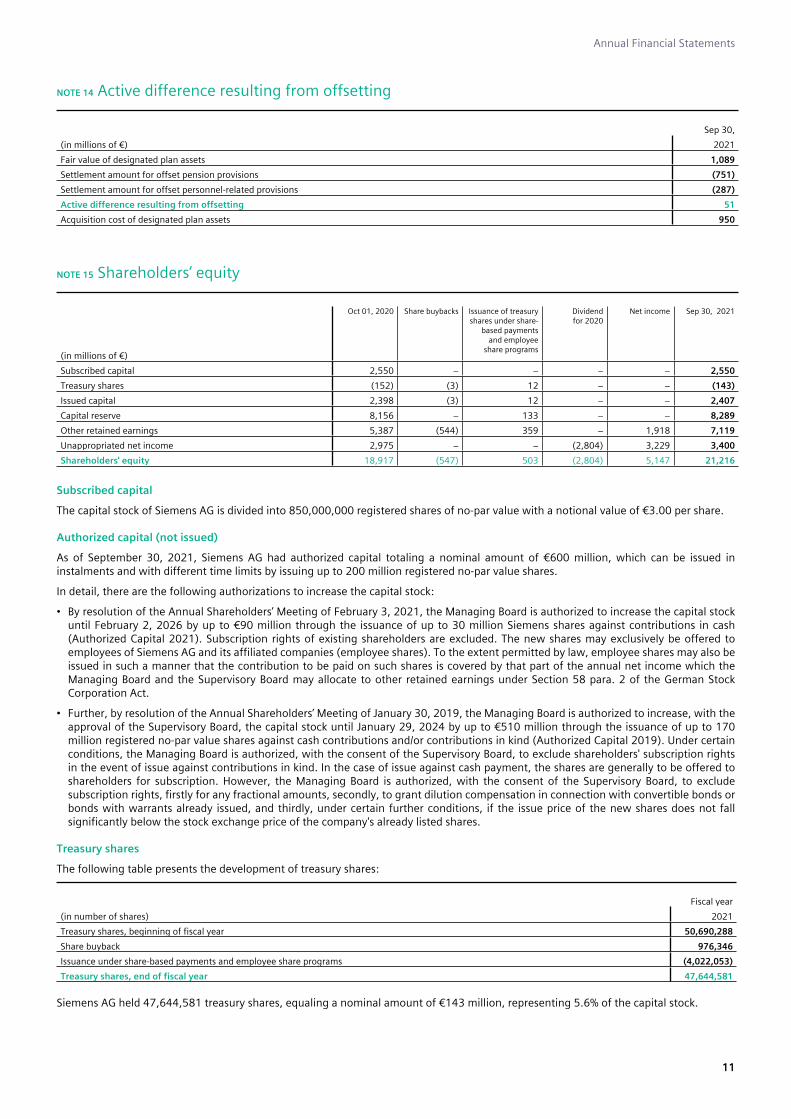
Annual Financial Statements
11
NOTE 14 Active difference resulting from offsetting
Sep 30,
(in millions of €) 2021
Fair value of designated plan assets 1,089
Settlement amount for offset pension provisions (751)
Settlement amount for offset personnel-related provisions (287)
Active difference resulting from offsetting 51
Acquisition cost of designated plan assets 950
NOTE 15 Shareholders’ equity
(in millions of €)
Oct 01, 2020 Share buybacks Issuance of treasury shares under share-
based payments and employee
share programs
Dividendfor 2020
Net income Sep 30, 2021
Subscribed capital 2,550 − − − − 2,550
Treasury shares (152) (3) 12 − − (143)
Issued capital 2,398 (3) 12 − − 2,407
Capital reserve 8,156 − 133 − − 8,289
Other retained earnings 5,387 (544) 359 − 1,918 7,119
Unappropriated net income 2,975 − − (2,804) 3,229 3,400
Shareholders' equity 18,917 (547) 503 (2,804) 5,147 21,216
Subscribed capital
The capital stock of Siemens AG is divided into 850,000,000 registered shares of no-par value with a notional value of €3.00 per share.
Authorized capital (not issued)
As of September 30, 2021, Siemens AG had authorized capital totaling a nominal amount of €600 million, which can be issued in instalments and with different time limits by issuing up to 200 million registered no-par value shares.
In detail, there are the following authorizations to increase the capital stock:
• By resolution of the Annual Shareholders’ Meeting of February 3, 2021, the Managing Board is authorized to increase the capital stock until February 2, 2026 by up to €90 million through the issuance of up to 30 million Siemens shares against contributions in cash (Authorized Capital 2021). Subscription rights of existing shareholders are excluded. The new shares may exclusively be offered to employees of Siemens AG and its affiliated companies (employee shares). To the extent permitted by law, employee shares may also be issued in such a manner that the contribution to be paid on such shares is covered by that part of the annual net income which the Managing Board and the Supervisory Board may allocate to other retained earnings under Section 58 para. 2 of the German Stock Corporation Act.
• Further, by resolution of the Annual Shareholders’ Meeting of January 30, 2019, the Managing Board is authorized to increase, with the approval of the Supervisory Board, the capital stock until January 29, 2024 by up to €510 million through the issuance of up to 170 million registered no-par value shares against cash contributions and/or contributions in kind (Authorized Capital 2019). Under certain conditions, the Managing Board is authorized, with the consent of the Supervisory Board, to exclude shareholders' subscription rights in the event of issue against contributions in kind. In the case of issue against cash payment, the shares are generally to be offered to shareholders for subscription. However, the Managing Board is authorized, with the consent of the Supervisory Board, to exclude subscription rights, firstly for any fractional amounts, secondly, to grant dilution compensation in connection with convertible bonds or bonds with warrants already issued, and thirdly, under certain further conditions, if the issue price of the new shares does not fall significantly below the stock exchange price of the company's already listed shares.
Treasury shares
The following table presents the development of treasury shares:
Fiscal year
(in number of shares) 2021
Treasury shares, beginning of fiscal year 50,690,288
Share buyback 976,346
Issuance under share-based payments and employee share programs (4,022,053)
Treasury shares, end of fiscal year 47,644,581
Siemens AG held 47,644,581 treasury shares, equaling a nominal amount of €143 million, representing 5.6% of the capital stock.

Annual Financial Statements
12
On September 24, 2021, the share buyback announced on November 8, 2018 with a volume of up to €3 billion was completed. The share buyback, which began on December 3, 2018, was executed in the reporting period based on the authorization granted by the Annual Shareholders’ Meeting on February 5, 2020. In addition to the dividend policy, the share buyback was intended to allow shareholders to continuously participate in the success of the company. In fiscal 2021, Siemens AG repurchased a total of 976,346 treasury shares under this share buyback program. This represented a nominal amount of €3 million or 0.1% of capital stock. In this reporting period, €137 million (excluding incidental transaction charges) were spent for this purpose; this represents a weighted average stock price of €140.22 per share. The purchases were made in the reporting period on 228 Xetra trading days and were carried out by a bank that had been commissioned by Siemens AG; the shares were purchased exclusively on the electronic trading platform of the Frankfurt Stock Exchange (Xetra). The average volume on these trading days was about 4,282 shares.
In addition, a final payment of €410 million was made to the executing bank in fiscal 2021, which led to weighted average acquisition costs of €100.42 per share in relation to the total share buyback from 2018 to 2021 of 29,385,132 shares with a buyback volume including the final payment of €2,951 million. The final payment was recognized in the balance sheet as a purchase price adjustment against other retained earnings.
On June 24, 2021, Siemens again announced a share buyback with a volume of up to €3 billion in the period from the beginning of fiscal 2022 to 2026. The share buyback, which began on November 15, 2021, will be executed based on the authorizations granted by the Annual Shareholders’ Meeting on February 5, 2021. In addition to the dividend policy, the share buyback is intended to allow shareholders to continuously participate in the success of the company.
The treasury shares purchased under the share buybacks may be used for purposes of retirement, distribution to employees, members of the executive bodies of companies affiliated with Siemens and members of the Managing Board, as well as the servicing of convertible bonds with attached warrants.
In fiscal 2021, Siemens AG re-issued in total 4,022,053 treasury shares under the exclusion of subscription rights in connection with share-based payments and employee share programs in the Group, equaling a nominal amount of €12 million and 0.5% of the capital stock. The Company received in total €203 million for 1,729,089 shares, re-issued against payment of a purchase price. Siemens AG received this amount for unrestricted use. All shares were sold as investment shares in connection with the share matching program to plan participants. In each case, the purchase price was determined on the basis of the closing rate in Xetra trading, determined on a monthly effective date. Therefore, in the reporting period, in total 1,199,097 shares related to the monthly investment plan at a weighted average share price of €130.61 per share, 158,769 shares related to the share matching plan at a weighted average share price of €134.02 per share, and 371,223 shares related to the base share program at a weighted average share price of €67.01 per share (after consideration of a 50% subsidy by the Company). The other shares re-issued during the reporting period can be primarily attributed to the servicing of stock awards granted in fiscal 2017 totaling 1,555,044 shares, to 624,480 matching shares under the share matching program for fiscal 2018, and to 113,440 jubilee shares.
Information on amounts subject to dividend payout restrictions
Fiscal Year(in millions of €) 2021
Amount representing the difference of the recognition of provisions and similar commitments based on average interest rates covering ten and seven years, respectivly 890
Amounts from the capitalization of deferred taxes 1,243
Amounts from the capitalization of assets at fair value 38
These amounts subject to dividend payout restrictions face other retained earnings in a sufficiently high amount. The unappropriated net income of €3,400 million is available for distribution.
Disclosures on shareholdings of Siemens AG
As of September 30, 2021, the following information on shareholdings subject to reporting requirements was available to the Company pursuant to Section 160 para 1 No. 8 German Stock Corporation Act (Aktiengesetz):
BlackRock, Inc., Wilmington, USA, notified us on April 14, 2021, that its percentage of voting rights (held either directly or indirectly) in Siemens AG amounted to 6.17% (52,408,410 voting rights) on April 9, 2021.
The State of Qatar, Doha, acting by and through the DIC Company Limited, notified us on May 10, 2012, that its percentage of voting rights (held either directly or indirectly) in Siemens AG exceeded the threshold of 3% of the voting rights in our Company on May 7, 2012 and amounted to 3.04% (27,758,338 voting rights) as per this date.
The Werner Siemens-Stiftung, Zug, Switzerland, notified us on January 21, 2008, that its percentage of voting rights (held either directly or indirectly) in Siemens AG exceeded the threshold of 3% of the voting rights in our Company on January 2, 2008 and amounted to 3.03% (27,739,285 voting rights) as per this date.
NOTE 16 Provisions for pensions and similar commitmentsIn Germany, Siemens AG provides pension benefits through the BSAV (Beitragsorientierte Siemens Altersversorgung), frozen legacy plans and deferred compensation plans. The majority of Siemens’ active employees participate in the BSAV. The benefits are predominantly based on nominal contributions by the Company and investment returns on assets designated to that plan, subject to a minimum return guaranteed by the Company. In connection with the implementation of the BSAV, benefits provided under the frozen legacy plans were modified to substantially eliminate the effects of compensation increases. Therefore, valuation assumptions for salary and pension increases including career trend are no longer significant for the pension obligation of Siemens AG. The pension benefits are funded via contractual trust arrangements (CTA). A portion of these trust assets also covers the pension obligations of other domestic subsidiaries.

Annual Financial Statements
13
Therefore, the assets do not meet the criteria for offsetting against the pension obligation and are presented as financial assets of Siemens AG.
The actuarial valuation of the settlement amount of €13,123 million as of September 30, 2021 was based, among others, on a discount rate of 1.98% and on a rate of pension progression of 1.50% per year, except for the BSAV and deferred compensation plans with 1.00% per year. The mortality tables used (Siemens Bio 2017/2021) are primarily based on data of the German Siemens population, using a set of formulas that corresponds to generally accepted actuarial standards.
NOTE 17 Other provisionsThe main amounts in other provisions were contributed by provisions related to personnel costs of €1,271 million, provisions for decontamination obligations of €496 million, and provisions for onerous contracts from derivative financial instruments amounting to €422 million.
In May 2021, Siemens AG and the Federal Republic of Germany entered into a public-law contract based on which the obligation of final disposal of nuclear waste is transferred to the Federal Republic of Germany for a payment of €360 million. The contract and therefore the payment is subject to the approval of the EU commission under state-aid rules. Estimation uncertainties still relate to assumptions made to measure the obligations that remain with Siemens AG, with regard to conditioning and packaging of nuclear waste, as well as intermediate storage and transport to the final storage facility “Schacht Konrad” or a logistics depot until year-end 2032.
NOTE 18 Liabilities
thereof maturities
thereof maturities
(in million of €)Sep 30,
2021up to 1
year1 year up to 5 years
more than 5 years
Sep 30, 2020
up to 1 year
1 year up to 5 years
more than 5 years
Liabilities to banks 501 501 − − 98 98 − −
Advance payments received − − − − − − − −
Trade payables 2,111 2,072 39 − 1,777 1,708 69 −
Liabilities to affiliated companies 58,985 52,047 5,270 1,669 63,638 51,802 8,674 3,163
Other liabilities 1,293 1,224 68 − 1,632 1,619 14 −
thereof to long-term investees 5 5 − − 1 1 − −
thereof miscellaneous liabilities 1,288 1,220 68 − 1,632 1,618 14 −
therein from taxes 50 50 − − 39 39 − −
therein for social security 209 209 − − 231 231 − −
Liabilities 62,890 55,844 5,377 1,669 67,145 55,226 8,756 3,163
Liabilities to affiliated companies resulted primarily from intragroup-financing activities.
3.5 Other disclosures
NOTE 19 Material expenses
Fiscal year
(in millions of €) 2021 2020
Expenses for raw materials, supplies and purchased merchandise (4,713) (5,299)
Costs of purchased services (3,009) (3,211)
Material expenses (7,722) (8,510)
NOTE 20 Personnel expenses
Fiscal year
(in millions of €) 2021 2020
Wages and salaries (4,584) (4,993)
Social security contributions and expenses for other employee benefits (657) (738)
Expenses for pensions (383) (437)
Personnel expenses (5,624) (6,168)
Personnel expenses did not include the expenses resulting from the compounding of the pension and personnel-related provisions, which are included in other financial income (expenses), net.

Annual Financial Statements
14
The breakdown of employees per function is as follows:
Fiscal year
2021
Production 27,100
Sales 8,300
Research and development 7,000
Administration and general functions 7,200
Employees 49,500
NOTE 21 Share-based paymentSiemens AG allows employees and members of the Managing Board to participate in share-based payment programs. For the purpose of servicing share-based payment programs Siemens AG also delivers Siemens shares, which have been granted by affiliated companies.
Stock Awards
Siemens AG grants stock awards to members of the Managing Board, members of the senior management and other eligible employees.
Stock awards to beneficiaries of Siemens AG are expensed as incurred over the vesting period and are measured at the intrinsic value (= share price of the Siemens stock) at the balance sheet date on a pro rata basis for the proportion of the vesting period expired considering the estimated target attainment at the balance sheet date.
The following table shows the changes in the stock awards held by beneficiaries of Siemens AG:
Fiscal year
(in number of shares) 2021
Non-vested, beginning of fiscal year 4,145,939
Granted 1,402,547
Vested and fulfilled (663,086)
Forfeited (227,627)
Settled (3,591)
Change in connection with the adjustment of the ESG target (90,280)
Organizational changes 114,516
Non-vested, end of fiscal year 4,678,418
The pro rata intrinsic value of all stock awards issued to beneficiaries of Siemens AG amounted to €288 million at the balance sheet date.
Share Matching Program
Plan participants receive the right to one Siemens share without payment (matching share) for every three investment shares continuously held over a vesting period.
Matching shares granted to beneficiaries of Siemens AG are expensed as incurred over the vesting period and are measured at the intrinsic value (= share price of the Siemens stock) at the balance sheet date on a pro rata basis for the proportion of the vesting period expired at the balance sheet date.
The following table shows the changes in the entitlements to matching shares of beneficiaries of Siemens AG:
Fiscal year
(in number of shares) 2021
Outstanding, beginning of fiscal year 744,034
Granted 314,473
Vested and fulfilled (268,767)
Forfeited (36,845)
Settled (20,289)
Organizational changes 4,975
Outstanding, end of fiscal year 737,581
The pro rata intrinsic value of all matching shares issued to beneficiaries of Siemens AG amounted to €64 million.

Annual Financial Statements
15
NOTE 22 Shares in investment fundsThe following shares in investment funds according to investment objects were held:
Sep 30, 2021
(in million of €)Carrying amount Market value
Deviation from carrying
amount
Mixed funds 2,157 2,383 226
Bond-based funds 331 331 −
Share-based funds 37 37 −
Money market funds 59 59 −
Shares in investment assets according to investment objects 2,583 2,809 226
Generally, shares in investment funds are accounted for securities held as non-current financial assets. Exceptions were those shares which represented plan assets and therefor were not accessible by all other creditors. These shares are held exclusively for the purpose of settling liabilities arising from post-employment obligations or comparable obligations with a long-term maturity, and are to be offset against such liabilities.
NOTE 23 Guarantees and other commitments
Sep 30,
(in millions of €) 2021
Obligations from guarantees 2,711
Warranty obligations 111,515
thereof relating to financing of affiliated companies 75,845
thereof relating to performance guarantees on behalf of affiliated companies 20,011
thereof Others 15,658
Guarantees and other commitments 114,226
Warranty obligations relating to financing of affiliated companies included guarantees towards banks for credit lines granted to affiliated companies.
Effective January 1, 2020, the Gas and Power business line was transferred to Siemens Energy Global GmbH & Co. KG in preparation for the spin-off of the Siemens Energy business, which occurred on September 25, 2020. The items Obligations from guarantees and Others included guarantees and other commitments for the benefit of companies of the Siemens Energy Group totaling €0.8 billion and €12.3 billion, respectively, with corresponding full reimbursement rights towards Siemens Energy Global GmbH & Co. KG. In addition, the position included indemnifications issued in connection with dispositions of businesses. Such indemnifications, if customary to the relevant transactions, may protect the buyer from potential tax, legal and other risks in conjunction with the purchased business.
Warranty obligations included obligations of Siemens AG towards affiliated companies totaling €414 million.
Siemens AG only enters into guarantees and other commitments after careful consideration of the risks concerned and in general only in relation to its own business activities or those of affiliated companies as well as to business activities of companies, if it holds an investment in them or their parent companies. Based on an ongoing risk evaluation of the arrangements entered into and taking into account all information available up to the date on which the Annual Financial Statements were issued for approval, Siemens AG concluded that the relevant primary debtors are able to fulfill the underlying obligations. For this reason, Siemens AG considered it not probable that it will be called upon in conjunction with any of the guarantees and commitments described above.
NOTE 24 Financial payment obligations under lease and rental arrangementsExpenses for lease and rental arrangements with third parties in which the economic ownership of the leased/rented asset was not attributable to Siemens AG and the relevant items were not recognized as assets by Siemens AG amounted to €195 million. Object of these contracts were mainly real estate and other non-current assets.
Payment obligations under lease and rental arrangements amounted to €1,155 million, of which €74 million resulted from transactions with affiliated companies. Payment obligations under lease and rental arrangements due within the next fiscal year amounted to €259 million.
NOTE 25 Other financial obligationsObligations for equity and debt contributions amounted to €379 million, of which €165 million related to associates.
Approximately €2.2 billion were outstanding as of September 30, 2021 from an outsourcing agreement with a maturity of several years.
Siemens AG has entered into a contract to pay its affiliated company Siemens Trademark GmbH & Co. KG, Germany, a running royalty for the use of the Siemens trademark rights. The fee is calculated by applying business-specific royalty rates to brand-related revenue. The contract has an indefinite duration. For fiscal 2021, the corresponding expenses amounted to €725 million. For fiscal 2022, the royalty is expected to be in the same magnitude.
In the course of its normal business operations, Siemens AG is involved in numerous legal and regulatory proceedings as well as governmental investigations (legal proceedings) in various jurisdictions. These legal proceedings could result in particular in the Company

Annual Financial Statements
16
being subject to payment of damages and punitive damages, equitable remedies or criminal or civil sanctions, fines or disgorgements of profit. In individual cases, this may also lead to formal or informal exclusion from tenders or the revocation or loss of business licenses or permits. In addition, further Legal Proceedings may be commenced or the scope of pending Legal Proceedings may be expanded. Some of these legal proceedings could result in adverse decisions for Siemens AG that may have material effects on its financial position, the results of its operations and/or its cash flows in the respective reporting period. In addition, Siemens is jointly and severally liable within consortia. As far as not recognized in the financial statements, Siemens AG did not expect any material negative effects on its financial position, the results of its operations and/or its cash flows at balance sheet date.
NOTE 26 Derivative financial instruments and valuation unitsAs a consequence of its global operating, investing and financing activities, Siemens AG is in particular exposed to risks resulting from changes in exchange rates and interest rates, managed in line with a proven risk management system in consideration of defined risk limits. As the parent company of the Siemens Group, Siemens AG has the central role within the group-wide management of financial market risks. To manage the risks resulting from changes in exchange rates and interest rates, Siemens uses primarily foreign currency forward contracts, interest rate swaps, combined interest and foreign currency swaps as well as interest rate options and interest rate futures. Thereby the operating units of Siemens AG are not allowed to enter into derivative financial instruments for speculative purposes. The contract partners of the Company for derivative financial instruments are banks, brokers and affiliated companies. The credit rating for banks and brokers is constantly monitored.
The following table presents the notional amounts and fair values of those existing derivative financial instruments that were not included in a valuation unit at the balance sheet date:
Sep 30, 2021
(in millions of €)Notionalamount Fair values
Interest rate hedging contracts
Interest rate swaps 5,325 24
Interest rate options 950 5
Existing derivative financial instruments 6,275 30
The notional amounts equal the contractual amounts of the individual derivative financial instrument which – irrespective of the nature of the concluded position (sale or purchase) – are presented on a gross basis (gross notional amounts).
Fair values of interest rate derivative financial instruments are determined by discounting expected future cash flows over the remaining term of the instrument using current market interest rates and yield curves. If option components are included, fair values are determined based on an option price model or quoted market prices.
The following table presents the carrying amounts, if existing, of derivative financial instruments not included in valuation units and the balance sheet line items in which these amounts were recognized.
Sep 30, 2021
(in millions of €) Other assetsOther
provisions Other liabilities
Interest rate hedging contracts
Interest rate swaps − (283) −
Interest rate options 1 − (10)
Derivative financial instruments requiring recognition 1 (283) (10)
Provided the relevant conditions are met, derivative financial instruments are aggregated with the underlying hedged item into valuation units. Using the freezing method, the hedging transactions are not recognized in the balance sheet. The effectiveness of the valuation unit is either ensured through risk management, or is demonstrated both prospectively and retrospectively based on appropriate methods used to demonstrate effectiveness (e.g. dollar offset method, regression method, sensitivity analysis). Valuation gains and losses from derivative financial instruments and hedged items are netted for each valuation unit. A provision for anticipated losses on onerous contracts is recognized for the respective valuation unit in the amount of an existing loss surplus. Profit surpluses are not recognized.
Valuation unit used to hedge the foreign currency risk
According to the Company policy, Siemens units are responsible for recording, assessing and monitoring their foreign currency transaction exposure. The net foreign currency position of the Siemens units serves as a central performance measure and has to be hedged within a band of at least 75% but no more than 100% with the Corporate Treasury of Siemens AG.
The remaining foreign currency risk after offsetting cash flows in the same currency is hedged by the Corporate Treasury of Siemens AG with external contract partners. The net foreign currency position (before hedging) of Siemens AG is combined with the offsetting foreign currency exchange contracts to a macro valuation unit. For this purpose, hedged items and hedging instruments are measured with the respective underlying discounted cash flows. For foreign currency derivative financial instruments, the determination is based on the changes in relevant forward exchange rates. The existing derivative currency hedging contracts are included in the valuation unit in their entirety and had maturity terms until the year 2041. The cash in- and outflows from the foreign currency exchange contracts, firm commitments and forecast transactions are disclosed on a net basis in the following table.
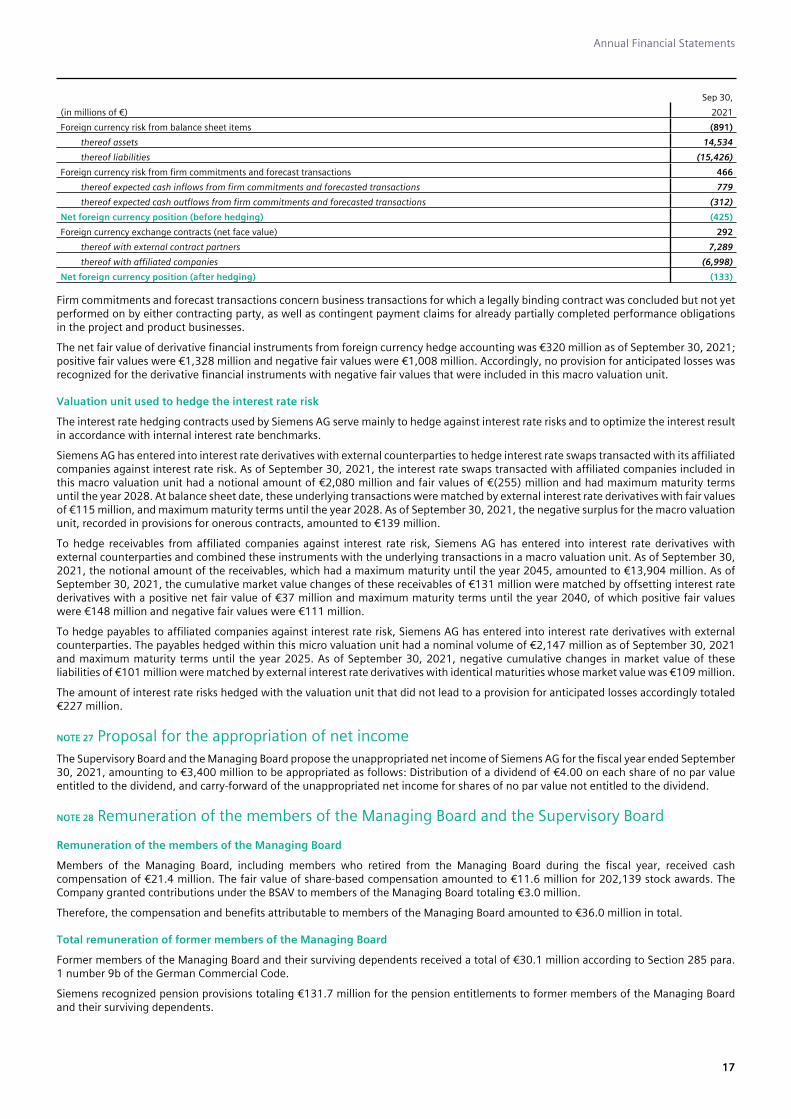
Annual Financial Statements
17
Sep 30,
(in millions of €) 2021
Foreign currency risk from balance sheet items (891)
thereof assets 14,534
thereof liabilities (15,426)
Foreign currency risk from firm commitments and forecast transactions 466
thereof expected cash inflows from firm commitments and forecasted transactions 779
thereof expected cash outflows from firm commitments and forecasted transactions (312)
Net foreign currency position (before hedging) (425)
Foreign currency exchange contracts (net face value) 292
thereof with external contract partners 7,289
thereof with affiliated companies (6,998)
Net foreign currency position (after hedging) (133)
Firm commitments and forecast transactions concern business transactions for which a legally binding contract was concluded but not yet performed on by either contracting party, as well as contingent payment claims for already partially completed performance obligations in the project and product businesses.
The net fair value of derivative financial instruments from foreign currency hedge accounting was €320 million as of September 30, 2021; positive fair values were €1,328 million and negative fair values were €1,008 million. Accordingly, no provision for anticipated losses was recognized for the derivative financial instruments with negative fair values that were included in this macro valuation unit.
Valuation unit used to hedge the interest rate risk
The interest rate hedging contracts used by Siemens AG serve mainly to hedge against interest rate risks and to optimize the interest result in accordance with internal interest rate benchmarks.
Siemens AG has entered into interest rate derivatives with external counterparties to hedge interest rate swaps transacted with its affiliated companies against interest rate risk. As of September 30, 2021, the interest rate swaps transacted with affiliated companies included in this macro valuation unit had a notional amount of €2,080 million and fair values of €(255) million and had maximum maturity terms until the year 2028. At balance sheet date, these underlying transactions were matched by external interest rate derivatives with fair values of €115 million, and maximum maturity terms until the year 2028. As of September 30, 2021, the negative surplus for the macro valuation unit, recorded in provisions for onerous contracts, amounted to €139 million.
To hedge receivables from affiliated companies against interest rate risk, Siemens AG has entered into interest rate derivatives with external counterparties and combined these instruments with the underlying transactions in a macro valuation unit. As of September 30, 2021, the notional amount of the receivables, which had a maximum maturity until the year 2045, amounted to €13,904 million. As of September 30, 2021, the cumulative market value changes of these receivables of €131 million were matched by offsetting interest rate derivatives with a positive net fair value of €37 million and maximum maturity terms until the year 2040, of which positive fair values were €148 million and negative fair values were €111 million.
To hedge payables to affiliated companies against interest rate risk, Siemens AG has entered into interest rate derivatives with external counterparties. The payables hedged within this micro valuation unit had a nominal volume of €2,147 million as of September 30, 2021 and maximum maturity terms until the year 2025. As of September 30, 2021, negative cumulative changes in market value of these liabilities of €101 million were matched by external interest rate derivatives with identical maturities whose market value was €109 million.
The amount of interest rate risks hedged with the valuation unit that did not lead to a provision for anticipated losses accordingly totaled €227 million.
NOTE 27 Proposal for the appropriation of net incomeThe Supervisory Board and the Managing Board propose the unappropriated net income of Siemens AG for the fiscal year ended September 30, 2021, amounting to €3,400 million to be appropriated as follows: Distribution of a dividend of €4.00 on each share of no par value entitled to the dividend, and carry-forward of the unappropriated net income for shares of no par value not entitled to the dividend.
NOTE 28 Remuneration of the members of the Managing Board and the Supervisory Board
Remuneration of the members of the Managing Board
Members of the Managing Board, including members who retired from the Managing Board during the fiscal year, received cash compensation of €21.4 million. The fair value of share-based compensation amounted to €11.6 million for 202,139 stock awards. The Company granted contributions under the BSAV to members of the Managing Board totaling €3.0 million.
Therefore, the compensation and benefits attributable to members of the Managing Board amounted to €36.0 million in total.
Total remuneration of former members of the Managing Board
Former members of the Managing Board and their surviving dependents received a total of €30.1 million according to Section 285 para. 1 number 9b of the German Commercial Code.
Siemens recognized pension provisions totaling €131.7 million for the pension entitlements to former members of the Managing Board and their surviving dependents.

Annual Financial Statements
18
Remuneration of the members of the Supervisory Board
Compensation attributable to members of the Supervisory Board comprises a base compensation and additional compensation for committee work and amounted to €5.2 million (including meeting fees).
NOTE 29 Declaration of Compliance with the German Corporate Governance CodeAs of October 1, 2021, the mandatory statement pursuant to Section 161 of the German Stock Corporation Act (AktG) has been issued by the Managing Board and the Supervisory Board and is permanently accessible on WWW.SIEMENS.DE/CORPORATE-GOVERNANCE.
NOTE 30 Members of the Managing Board and Supervisory Board
Members of the Managing Board and positions held by Managing Board members
In fiscal 2021, the Managing Board had the following members:
Members of the Supervisory Board and positions held by Supervisory Board members
In fiscal 2021, the Supervisory Board had the following members:
Memberships in supervisory boards whose establishment is required by law or in comparable domestic or foreign controlling bodies of business enterprises
Name Date of birth First appointed Term expiresExternal positions (as of September 30, 2021)
Group company positions (as of September 30, 2021)
Roland Busch (Dr. rer. nat.)
President and Chief Executive Officer (since February 3, 2021)
November 22, 1964
April 1, 2011 March 31, 2025 German positions:- Siemens Healthineers AG, Munich¹- Siemens Mobility GmbH, Munich (Chairman)
Klaus Helmrich
(until March 31, 2021)as of March 31, 2021
May 24, 1958 April 1, 2011 March 31, 2021 German positions:- EOS Holding AG, Krailling
Joe Kaeser
(President and Chief Executive Officer, member of the Managing Board until February 3, 2021)as of February 3, 2021
June 23, 1957 May 1, 2006 At the end of the 2021 Annual Shareholders’ Meeting
German positions:- Daimler AG, Stuttgart1
- Mercedes-Benz AG, Stuttgart- Siemens Energy AG, Munich (Chairman)¹- Siemens Energy Management GmbH, Munich (Chairman)Positions outside Germany:- NXP Semiconductors N.V., Netherlands¹
Positions outside Germany:- Siemens Ltd., India¹
Cedrik Neike March 7, 1973 April 1, 2017 May 31, 2025 German positions:- Evonik Industries AG, Essen¹Positions outside Germany:- Atos SE, France¹
Positions outside Germany:- Siemens Aktiengesellschaft Österreich, Austria (Chairman)- Siemens France Holding S.A., France
Matthias Rebellius January 2, 1965
October 1, 2020
September 30, 2025
German positions:- Siemens Energy AG, Munich¹- Siemens Energy Management GmbH, Munich
Positions outside Germany:- Arabia Electric Ltd., Saudi Arabia (Deputy Chairman)- Siemens Ltd., Australia- Siemens Ltd., India¹- Siemens Ltd., Saudi Arabia (Deputy Chairman)- Siemens Schweiz AG, Switzerland (Chairman)- Siemens W.L.L., Qatar
Ralf P. Thomas (Prof. Dr. rer. pol.)
March 7, 1961 September 18, 2013
September 17, 2023
German positions:- Siemens Energy AG, Munich¹- Siemens Energy Management GmbH, Munich
German positions:- Siemens Healthcare GmbH, Munich (Chairman)- Siemens Healthineers AG, Munich (Chairman)¹Positions outside Germany:- Siemens Proprietary Ltd., South Africa (Chairman)
Judith Wiese January 30, 1971
October 1, 2020
September 30, 2023
German positions:- European School of Management and Technology GmbH, Berlin
1 Publicly listed.
Name Occupation Date of birthMember since
Term expires1
Memberships in supervisory boards whose establishment is required by law or in comparable domestic or foreign controlling bodies of business enterprises (as of September 30, 2021)
Jim Hagemann Snabe
Chairman
Chairman of the Supervisory Board of Siemens AG and of the Board of Directors of A.P. Møller-Mærsk A/S
October 27, 1965
October 1, 2013
2025 German positions:- Allianz SE, Munich (Deputy Chairman)3
Positions outside Germany:- A.P. Møller-Mærsk A/S, Denmark (Chairman)3
- C3.ai, Inc., USA3
Birgit Steinborn2
First Deputy Chairwoman
Chairwoman of the Central Works Council of Siemens AG
March 26, 1960
January 24, 2008
2023
Werner Brandt Chairman of the Supervisory Board of January 3, January 31, 2023 German positions:

Annual Financial Statements
19
(Dr. rer. pol.)
Second Deputy Chairman (since February 3, 2021)
RWE AG and of ProSiebenSat.1 Media SE 1954 2018 - ProSiebenSat.1 Media SE, Munich (Chairman)3
- RWE AG, Essen (Chairman)3
Tobias Bäumler2
(since October 16, 2020)
Deputy Chairman of the Central Works Council and of the Combine Works Council of Siemens AG
October 10, 1979
October 16, 2020
2023
Michael Diekmann Chairman of the Supervisory Board of Allianz SE
December 23, 1954
January 24, 2008
2023 German positions:- Allianz SE, Munich (Chairman)3
- Fresenius Management SE, Bad Homburg- Fresenius SE & Co. KGaA, Bad Homburg (Deputy Chairman)3
Andrea Fehrmann2 (Dr. phil.)
Trade Union Secretary, IG Metall Regional Office for Bavaria
June 21, 1970
January 31, 2018
2023 German positions:- Siemens Energy AG, Munich3
- Siemens Energy Management GmbH, MunichBettina Haller2 Chairwoman of the Combine Works
Council of Siemens AGMarch 14, 1959
April 1, 2007
2023 German positions:- Siemens Mobility GmbH, Munich (Deputy Chairwoman)
Harald Kern2 Chairman of the Siemens Europe Committee
March 16, 1960
January 24, 2008
2023
Jürgen Kerner2 Chief Treasurer and Executive Member of the Managing Board of IG Metall
January 22, 1969
January 25, 2012
2023 German positions:- MAN Truck & Bus SE, Munich (Deputy Chairman)- Premium Aerotec GmbH, Augsburg (Deputy Chairman)- Siemens Energy AG, Munich3
- Siemens Energy Management GmbH, Munich- ThyssenKrupp AG, Essen (Deputy Chairman)3
- Traton SE, Munich3
Nicola Leibinger-Kammüller (Dr. phil.)
(until February 3, 2021)as of February 3, 2021
Chief Executive Officer (CEO) – President and Chairwoman of the Group Management of TRUMPF GmbH + Co. KG
December 15, 1959
January 24, 2008
2021 Positions outside Germany:- TRUMPF Schweiz AG, Switzerland4
Benoît Potier Chairman and Chief Executive Officer ofAir Liquide S.A.
September 3, 1957
January 31, 2018
2023 Positions outside Germany:- Air Liquide International S.A., France (Chairman and Chief Executive Officer)3,4
- Air Liquide International Corporation (ALIC), USA (Chairman)4
- American Air Liquide Holdings, Inc., USA4
- The Hydrogen Company S.A., France4
Hagen Reimer2 Trade Union Secretary of the Managing Board of IG Metall
April 26, 1967
January 30, 2019
2023 German positions:- Siemens Energy AG, Munich3
- Siemens Energy Management GmbH, MunichNorbert Reithofer (Dr.-Ing. Dr.-Ing. E.h.)
Chairman of the Supervisory Board of Bayerische Motoren Werke Aktiengesellschaft
May 29, 1956 January 27, 2015
2023 German positions:- Bayerische Motoren Werke Aktiengesellschaft, Munich (Chairman)3
- Henkel AG & Co. KGaA, Düsseldorf3,5 - Henkel Management AG, Düsseldorf
Kasper Rørsted
(since February 3, 2021)
Chief Executive Officer and Board Member of adidas AG3
February 24, 1962
February 3, 2021
2025 Positions outside Germany:- Member of the Board of Directors, Nestlé S.A., Switzerland3
Baroness Nemat Shafik (DBE, DPhil)
Director of the London School of Economics
August 13, 1962
January 31, 2018
2023
Nathalie von Siemens (Dr. phil.)
Member of supervisory boards July 14, 1971 January 27, 2015
2023 German positions:- Messer Group GmbH, Sulzbach- Siemens Healthcare GmbH, Munich- Siemens Healthineers AG, Munich3
- TÜV Süd AG, Munich Positions outside Germany:- EssilorLuxottica SA, France3
Michael Sigmund2 Chairman of the Committee of Spokespersons of the Siemens Group and Chairman of the Central Committee of Spokespersons of Siemens AG
September 13, 1957
March 1, 2014
2023
Dorothea Simon2 Chairwoman of the Central Works Council of Siemens Healthcare GmbH
August 3, 1969
October 1, 2017
2023 German positions:- Siemens Healthcare GmbH, Munich
Grazia Vittadini
(since February 3, 2021)
Airbus Special Advisor September 23, 1969
February 3, 2021
2025
Werner Wenning
(Second Deputy Chairman and member of the Supervisory Board until February 3, 2021)as of February 3, 2021
Member of the Supervisory Board October 21, 1946
January 23, 2013
2021
Matthias Zachert Chairman of the Board of Management of LANXESS AG3
November 8, 1967
January 31, 2018
2023
Gunnar Zukunft2 Deputy Chairman of the Central Works Council of Siemens Industry Software GmbH
June 21, 1965
January 31, 2018
2023 German positions:- Siemens Industry Software GmbH, Cologne
1 As a rule, the term of office ends at the conclusion of the (relevant) ordinary Annual Shareholders’ Meeting.2 Employee representative. 3 Publicly listed.4 Group company position.5 Shareholders’ Committee.
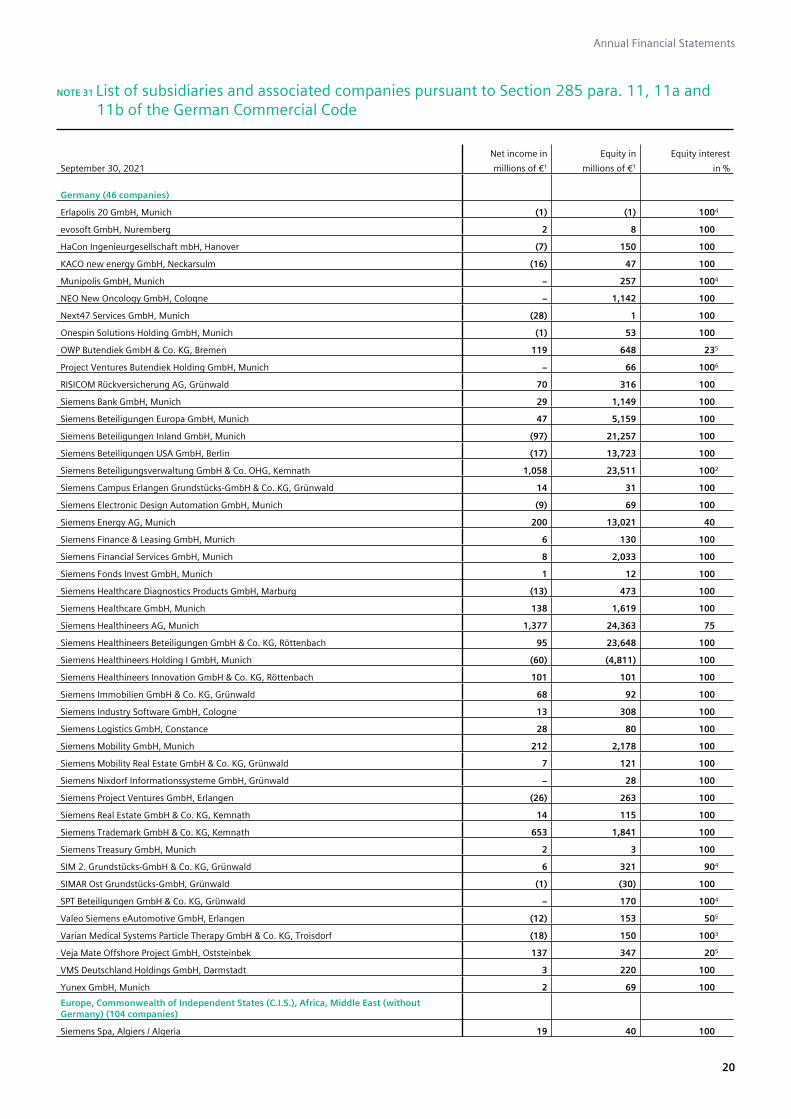
Annual Financial Statements
20
NOTE 31 List of subsidiaries and associated companies pursuant to Section 285 para. 11, 11a and 11b of the German Commercial Code
Net income in Equity in Equity interest
September 30, 2021 millions of €1 millions of €1 in %
Germany (46 companies)
Erlapolis 20 GmbH, Munich (1) (1) 1004
evosoft GmbH, Nuremberg 2 8 100
HaCon Ingenieurgesellschaft mbH, Hanover (7) 150 100
KACO new energy GmbH, Neckarsulm (16) 47 100
Munipolis GmbH, Munich − 257 1004
NEO New Oncology GmbH, Cologne − 1,142 100
Next47 Services GmbH, Munich (28) 1 100
Onespin Solutions Holding GmbH, Munich (1) 53 100
OWP Butendiek GmbH & Co. KG, Bremen 119 648 235
Project Ventures Butendiek Holding GmbH, Munich − 66 1006
RISICOM Rückversicherung AG, Grünwald 70 316 100
Siemens Bank GmbH, Munich 29 1,149 100
Siemens Beteiligungen Europa GmbH, Munich 47 5,159 100
Siemens Beteiligungen Inland GmbH, Munich (97) 21,257 100
Siemens Beteiligungen USA GmbH, Berlin (17) 13,723 100
Siemens Beteiligungsverwaltung GmbH & Co. OHG, Kemnath 1,058 23,511 1002
Siemens Campus Erlangen Grundstücks-GmbH & Co. KG, Grünwald 14 31 100
Siemens Electronic Design Automation GmbH, Munich (9) 69 100
Siemens Energy AG, Munich 200 13,021 40
Siemens Finance & Leasing GmbH, Munich 6 130 100
Siemens Financial Services GmbH, Munich 8 2,033 100
Siemens Fonds Invest GmbH, Munich 1 12 100
Siemens Healthcare Diagnostics Products GmbH, Marburg (13) 473 100
Siemens Healthcare GmbH, Munich 138 1,619 100
Siemens Healthineers AG, Munich 1,377 24,363 75
Siemens Healthineers Beteiligungen GmbH & Co. KG, Röttenbach 95 23,648 100
Siemens Healthineers Holding I GmbH, Munich (60) (4,811) 100
Siemens Healthineers Innovation GmbH & Co. KG, Röttenbach 101 101 100
Siemens Immobilien GmbH & Co. KG, Grünwald 68 92 100
Siemens Industry Software GmbH, Cologne 13 308 100
Siemens Logistics GmbH, Constance 28 80 100
Siemens Mobility GmbH, Munich 212 2,178 100
Siemens Mobility Real Estate GmbH & Co. KG, Grünwald 7 121 100
Siemens Nixdorf Informationssysteme GmbH, Grünwald − 28 100
Siemens Project Ventures GmbH, Erlangen (26) 263 100
Siemens Real Estate GmbH & Co. KG, Kemnath 14 115 100
Siemens Trademark GmbH & Co. KG, Kemnath 653 1,841 100
Siemens Treasury GmbH, Munich 2 3 100
SIM 2. Grundstücks-GmbH & Co. KG, Grünwald 6 321 904
SIMAR Ost Grundstücks-GmbH, Grünwald (1) (30) 100
SPT Beteiligungen GmbH & Co. KG, Grünwald − 170 1004
Valeo Siemens eAutomotive GmbH, Erlangen (12) 153 505
Varian Medical Systems Particle Therapy GmbH & Co. KG, Troisdorf (18) 150 1003
Veja Mate Offshore Project GmbH, Oststeinbek 137 347 205
VMS Deutschland Holdings GmbH, Darmstadt 3 220 100
Yunex GmbH, Munich 2 69 100
Europe, Commonwealth of Independent States (C.I.S.), Africa, Middle East (without Germany) (104 companies)
Siemens Spa, Algiers / Algeria 19 40 100
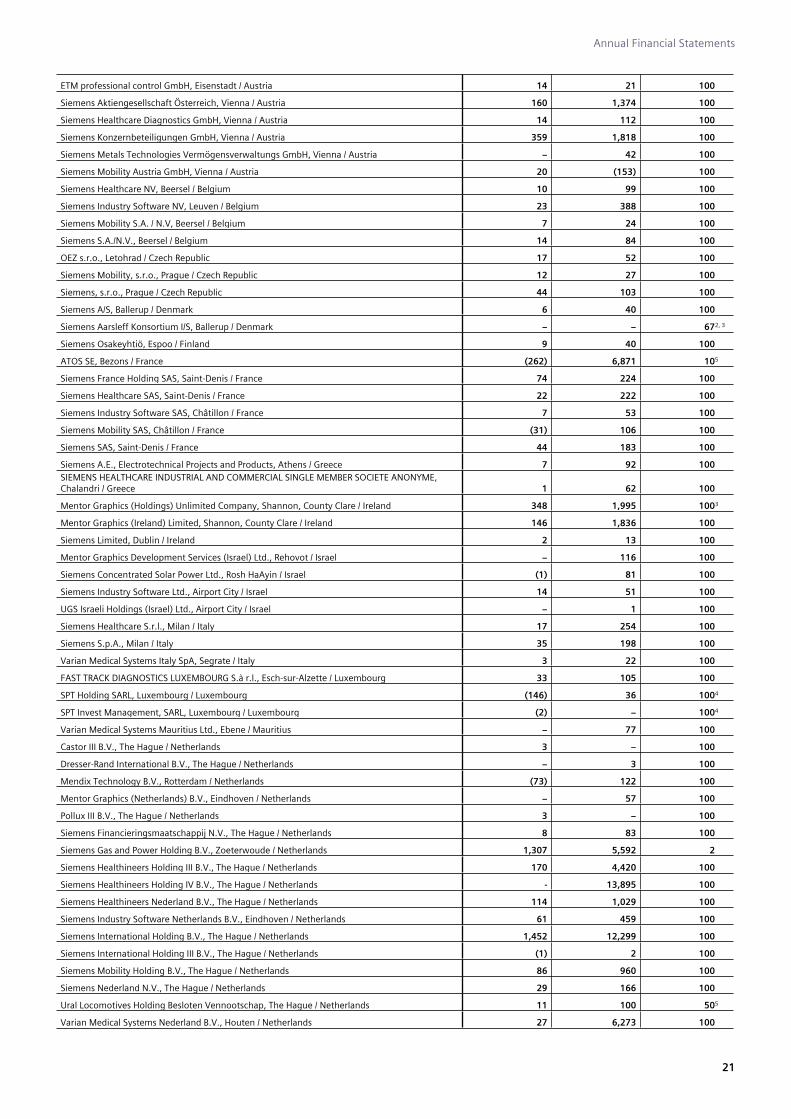
Annual Financial Statements
21
ETM professional control GmbH, Eisenstadt / Austria 14 21 100
Siemens Aktiengesellschaft Österreich, Vienna / Austria 160 1,374 100
Siemens Healthcare Diagnostics GmbH, Vienna / Austria 14 112 100
Siemens Konzernbeteiligungen GmbH, Vienna / Austria 359 1,818 100
Siemens Metals Technologies Vermögensverwaltungs GmbH, Vienna / Austria − 42 100
Siemens Mobility Austria GmbH, Vienna / Austria 20 (153) 100
Siemens Healthcare NV, Beersel / Belgium 10 99 100
Siemens Industry Software NV, Leuven / Belgium 23 388 100
Siemens Mobility S.A. / N.V, Beersel / Belgium 7 24 100
Siemens S.A./N.V., Beersel / Belgium 14 84 100
OEZ s.r.o., Letohrad / Czech Republic 17 52 100
Siemens Mobility, s.r.o., Prague / Czech Republic 12 27 100
Siemens, s.r.o., Prague / Czech Republic 44 103 100
Siemens A/S, Ballerup / Denmark 6 40 100
Siemens Aarsleff Konsortium I/S, Ballerup / Denmark − − 672, 3
Siemens Osakeyhtiö, Espoo / Finland 9 40 100
ATOS SE, Bezons / France (262) 6,871 105
Siemens France Holding SAS, Saint-Denis / France 74 224 100
Siemens Healthcare SAS, Saint-Denis / France 22 222 100
Siemens Industry Software SAS, Châtillon / France 7 53 100
Siemens Mobility SAS, Châtillon / France (31) 106 100
Siemens SAS, Saint-Denis / France 44 183 100
Siemens A.E., Electrotechnical Projects and Products, Athens / Greece 7 92 100SIEMENS HEALTHCARE INDUSTRIAL AND COMMERCIAL SINGLE MEMBER SOCIETE ANONYME, Chalandri / Greece 1 62 100
Mentor Graphics (Holdings) Unlimited Company, Shannon, County Clare / Ireland 348 1,995 1003
Mentor Graphics (Ireland) Limited, Shannon, County Clare / Ireland 146 1,836 100
Siemens Limited, Dublin / Ireland 2 13 100
Mentor Graphics Development Services (Israel) Ltd., Rehovot / Israel − 116 100
Siemens Concentrated Solar Power Ltd., Rosh HaAyin / Israel (1) 81 100
Siemens Industry Software Ltd., Airport City / Israel 14 51 100
UGS Israeli Holdings (Israel) Ltd., Airport City / Israel − 1 100
Siemens Healthcare S.r.l., Milan / Italy 17 254 100
Siemens S.p.A., Milan / Italy 35 198 100
Varian Medical Systems Italy SpA, Segrate / Italy 3 22 100
FAST TRACK DIAGNOSTICS LUXEMBOURG S.à r.l., Esch-sur-Alzette / Luxembourg 33 105 100
SPT Holding SARL, Luxembourg / Luxembourg (146) 36 1004
SPT Invest Management, SARL, Luxembourg / Luxembourg (2) − 1004
Varian Medical Systems Mauritius Ltd., Ebene / Mauritius − 77 100
Castor III B.V., The Hague / Netherlands 3 − 100
Dresser-Rand International B.V., The Hague / Netherlands − 3 100
Mendix Technology B.V., Rotterdam / Netherlands (73) 122 100
Mentor Graphics (Netherlands) B.V., Eindhoven / Netherlands − 57 100
Pollux III B.V., The Hague / Netherlands 3 − 100
Siemens Financieringsmaatschappij N.V., The Hague / Netherlands 8 83 100
Siemens Gas and Power Holding B.V., Zoeterwoude / Netherlands 1,307 5,592 2
Siemens Healthineers Holding III B.V., The Hague / Netherlands 170 4,420 100
Siemens Healthineers Holding IV B.V., The Hague / Netherlands - 13,895 100
Siemens Healthineers Nederland B.V., The Hague / Netherlands 114 1,029 100
Siemens Industry Software Netherlands B.V., Eindhoven / Netherlands 61 459 100
Siemens International Holding B.V., The Hague / Netherlands 1,452 12,299 100
Siemens International Holding III B.V., The Hague / Netherlands (1) 2 100
Siemens Mobility Holding B.V., The Hague / Netherlands 86 960 100
Siemens Nederland N.V., The Hague / Netherlands 29 166 100
Ural Locomotives Holding Besloten Vennootschap, The Hague / Netherlands 11 100 505
Varian Medical Systems Nederland B.V., Houten / Netherlands 27 6,273 100

Annual Financial Statements
22
SIEMENS HEALTHCARE, UNIPESSOAL, LDA, Amadora / Portugal 4 91 100
Siemens S.A., Amadora / Portugal 11 108 100
Siemens W.L.L., Doha / Qatar 11 25 55
LIMITED LIABILITY COMPANY SIEMENS ELEKTROPRIVOD, St. Petersburg / Russian Federation 5 25 100
OOO Legion II, Moscow / Russian Federation 3 74 100
OOO Siemens, Moscow / Russian Federation 20 51 100
Siemens Finance and Leasing LLC, Vladivostok / Russian Federation 50 115 100
Siemens Healthcare Limited Liability Company, Moscow / Russian Federation 19 14 100
Siemens Mobility LLC, Moscow / Russian Federation 16 25 100
Siemens Healthcare Limited, Riyadh / Saudi Arabia 20 40 51
Siemens Mobility d.o.o. Cerovac, Kragujevac / Serbia (9) 34 100
Siemens s.r.o., Bratislava / Slovakia 5 29 100
Siemens Proprietary Limited, Midrand / South Africa (12) 43 70
Fábrica Electrotécnica Josa, S.A.U., Tres Cantos / Spain 2 45 100
SIEMENS HEALTHCARE, S.L.U., Getafe / Spain 12 277 100
Siemens Holding S.L., Madrid / Spain 9 76 100
SIEMENS MOBILITY, S.L.U., Tres Cantos / Spain 1 65 100
Siemens Rail Automation S.A.U., Tres Cantos / Spain 27 639 100
Siemens S.A., Madrid / Spain 20 188 100
Siemens Financial Services AB, Solna / Sweden 26 214 100
Siemens Healthcare AG, Zurich / Switzerland 4 157 100
Siemens Industry Software GmbH, Zurich / Switzerland 7 142 100
Siemens Mobility AG, Wallisellen / Switzerland 29 110 100
Siemens Schweiz AG, Zurich / Switzerland 35 1,103 100
Varian Medical Systems International AG, Steinhausen / Switzerland 74 5,968 100
Siemens Healthcare Saglik Anonim Sirketi, Istanbul / Turkey 11 49 100
Siemens Sanayi ve Ticaret Anonim Sirketi, Istanbul / Turkey 35 93 100
Electrium Sales Limited, Frimley, Surrey / United Kingdom (6) 81 100
Galloper Wind Farm Holding Company Limited, Swindon, Wiltshire / United Kingdom 38 99 255
Next47 Fund 2018, L.P., Palo Alto, CA / United Kingdom − 92 100
Next47 Fund 2019, L.P., Palo Alto, CA / United Kingdom − 94 100
Next47 Fund 2020, L.P., Palo Alto, CA / United Kingdom − 124 100
Next47 Fund 2021, L.P., Palo Alto, CA / United Kingdom − 162 100
Project Ventures Rail Investments I Limited, Frimley, Surrey / United Kingdom 15 8 100
SBS Pension Funding (Scotland) Limited Partnership, Edinburgh / United Kingdom 15 591 57
Siemens Financial Services Holdings Ltd., Stoke Poges, Buckinghamshire / United Kingdom 23 137 100
Siemens Financial Services Ltd., Stoke Poges, Buckinghamshire / United Kingdom 41 341 100
Siemens Healthcare Diagnostics Manufacturing Ltd, Frimley, Surrey / United Kingdom 6 180 100
Siemens Healthcare Diagnostics Products Ltd, Frimley, Surrey / United Kingdom 3 170 100
Siemens Healthcare Limited, Frimley, Surrey / United Kingdom 34 (26) 100
Siemens Holdings plc, Frimley, Surrey / United Kingdom 577 1,214 100
Siemens Industry Software Computational Dynamics Limited, Frimley, Surrey / United Kingdom 2 378 100
Siemens Industry Software Limited, Frimley, Surrey / United Kingdom 18 101 100
Siemens Mobility Limited, London / United Kingdom 111 750 100
Siemens Pension Funding Limited, Frimley, Surrey / United Kingdom (2) 480 100
Siemens plc, Frimley, Surrey / United Kingdom 22 1,053 100
Siemens Process Systems Engineering Limited, Frimley, Surrey / United Kingdom (15) 105 100
Yunex Limited, Poole, Dorset / United Kingdom − 60 100
Americas (47 companies)
Siemens Industrial S.A., Buenos Aires / Argentina (1) 19 100
GNA 1 Geração de Energia S.A., São João da Barra / Brazil (11) 277 225
Siemens Healthcare Diagnósticos Ltda., São Paulo / Brazil 20 138 100
Siemens Infraestrutura e Indústria Ltda., São Paulo / Brazil 16 78 100
Siemens Participações Ltda., São Paulo / Brazil (12) 74 100
EPOCAL INC., Toronto / Canada 3 116 100

Annual Financial Statements
23
Siemens Canada Limited, Oakville / Canada 26 284 100
Siemens Financial Ltd., Oakville / Canada 13 463 100
Siemens Healthcare Limited, Oakville / Canada 3 77 100
Siemens S.A., Santiago de Chile / Chile 17 44 100
Siemens S.A., Tenjo / Colombia (2) 46 100
Grupo Siemens S.A. de C.V., Mexico City / Mexico 58 83 100
Siemens, S.A. de C.V., Mexico City / Mexico 6 111 100
Babson Diagnostics, Inc., Dover, DE / United States (4) 7 205
Bentley Systems, Incorporated, Wilmington, DE / United States 101 278 95, 7
CEF-L Holding, LLC, Wilmington, DE / United States 7 247 275
ChargePoint Holdings, Inc., Campbell, CA / United States n/a n/a 4
Corindus, Inc., Wilmington, DE / United States (46) 530 100
ECG Acquisition, Inc., Wilmington, DE / United States − 176 100
ECG TopCo Holdings, LLC, Wilmington, DE / United States (21) 129 73
eMeter Corporation, Wilmington, DE / United States (4) 98 100
Enlighted, Inc., Wilmington, DE / United States (15) 3 100
Fluence Energy, LLC, Wilmington, DE / United States (44) (18) 43
Hickory Run Holdings, LLC, Wilmington, DE / United States 4 275 205
Mannesmann Corporation, New York, NY / United States − 43 100
Panda Stonewall Intermediate Holdings I, LLC, Wilmington, DE / United States − − 375
PETNET Solutions, Inc., Knoxville, TN / United States 28 158 100
PolyDyne Software Inc., Austin, TX / United States 1 6 1005
Siemens Capital Company LLC, Wilmington, DE / United States (48) 1,497 100
Siemens Corporation, Wilmington, DE / United States 58 5,327 100
Siemens Financial Services, Inc., Wilmington, DE / United States 124 1,607 100
Siemens Government Technologies, Inc., Wilmington, DE / United States 5 422 100
Siemens Healthcare Diagnostics Inc., Los Angeles, CA / United States (14) 6,632 100
Siemens Healthineers Holdings, LLC, Wilmington, DE / United States - 13,895 100
Siemens Industry Software Inc., Wilmington, DE / United States 160 4,675 100
Siemens Industry, Inc., Wilmington, DE / United States 461 6,852 100
Siemens Medical Solutions USA, Inc., Wilmington, DE / United States 165 16,362 100
Siemens Mobility, Inc, Wilmington, DE / United States 70 938 100
Siemens Public, Inc., Iselin, NJ / United States 27 1,476 100
Siemens USA Holdings, Inc., Wilmington, DE / United States − 10,376 100
SMI Holding LLC, Wilmington, DE / United States (6) 7 100
Supplyframe, Inc., Pasadena, CA / United States (1) 60 100
Thoughtworks Holding Inc., Wilmington, DE / United States 65 395 85
Varian Medical Systems International Holdings, Inc., Wilmington, DE / United States 6,587 7,415 100
Varian Medical Systems Netherlands Holdings, Inc., Wilmington, DE / United States 214 423 100
Varian Medical Systems, Inc., Wilmington, DE / United States 246 8,620 100
Dade Behring Hong Kong Holdings Corporation, Tortola / Virgin Islands, British 94 33 100
Asia, Australia (53 companies)
Australia Hospital Holding Pty Limited, Bayswater / Australia 1 22 100
J.R.B. Engineering Pty Ltd, Bayswater / Australia − − 100
Siemens Ltd., Bayswater / Australia 12 102 100
Siemens Mobility Pty Ltd, Bayswater / Australia 22 159 100
Beijing Siemens Cerberus Electronics Ltd., Beijing / China 22 30 100
Mentor Graphics (Shanghai) Electronic Technology Co., Ltd., Shanghai / China 2 62 100
Shanghai Electric Power Generation Equipment Co., Ltd., Shanghai / China 10 507 405
Siemens Circuit Protection Systems Ltd., Shanghai, Shanghai / China 21 30 75
Siemens Electrical Apparatus Ltd., Suzhou, Suzhou / China 74 122 100
Siemens Electrical Drives (Shanghai) Ltd., Shanghai / China 32 40 100
Siemens Electrical Drives Ltd., Tianjin / China 63 134 85
Siemens Factory Automation Engineering Ltd., Beijing / China 25 29 100
Siemens Finance and Leasing Ltd., Beijing / China 23 132 100

Annual Financial Statements
24
Siemens Financial Services Ltd., Beijing / China 25 433 100
Siemens Healthcare Diagnostics Manufacturing Ltd., Shanghai, Shanghai / China (7) 77 100
Siemens Healthineers Diagnostics (Shanghai) Co., Ltd., Shanghai / China 41 333 100
Siemens Healthineers Ltd., Shanghai / China 96 182 100
Siemens Industrial Automation Products Ltd., Chengdu, Chengdu / China 162 192 100
Siemens Industry Software (Shanghai) Co., Ltd., Shanghai / China 39 81 100
Siemens International Trading Ltd., Shanghai, Shanghai / China 13 41 100
Siemens Ltd., China, Beijing / China 851 2,333 100
Siemens Medium Voltage Switching Technologies (Wuxi) Ltd., Wuxi / China 50 55 85
Siemens Mobility Equipment (China) Co., Ltd, Shanghai Pilot Free Trade Zone / China 17 93 100
Siemens Mobility Technologies (Beijing) Co., Ltd, Beijing / China 19 123 100
Siemens Numerical Control Ltd., Nanjing, Nanjing / China 73 89 80
Siemens Shanghai Medical Equipment Ltd., Shanghai / China 102 128 100
Siemens Shenzhen Magnetic Resonance Ltd., Shenzhen / China 60 99 100
Siemens Standard Motors Ltd., Yizheng / China 60 87 100
Siemens Switchgear Ltd., Shanghai, Shanghai / China 29 49 55
Siemens Wiring Accessories Shandong Ltd., Zibo / China 7 14 100
Zhenjiang Siemens Busbar Trunking Systems Co. Ltd., Yangzhong / China 21 33 505
Siemens Limited, Hong Kong / Hong Kong 9 24 100
Bangalore International Airport Ltd., Bangalore / India (64) 318 206
C&S Electric Limited, New Delhi / India (4) 248 99
Mentor Graphics (India) Private Limited, New Delhi / India 7 85 100
Siemens Financial Services Private Limited, Mumbai / India 8 69 100
Siemens Healthcare Private Limited, Mumbai / India 31 171 100
Siemens Limited, Mumbai / India 120 1,523 51
Siemens Technology and Services Private Limited, Navi Mumbai / India 28 65 100
P.T. Jawa Power, Jakarta / Indonesia 195 909 505
Siemens Healthcare Diagnostics K.K., Tokyo / Japan 7 207 100
Siemens Healthcare K.K., Tokyo / Japan 25 251 100
Siemens K.K., Tokyo / Japan 5 180 100
Varian Medical Systems K.K., Tokyo / Japan 10 77 100
Siemens Healthineers Ltd., Seoul / Korea, Republic of 27 100 100
Siemens Ltd. Seoul, Seoul / Korea, Republic of 13 126 100
Dresser-Rand Asia Pacific Sdn. Bhd., Kuala Lumpur / Malaysia − 6 100
Siemens Malaysia Sdn. Bhd., Petaling Jaya / Malaysia 6 86 100
Siemens, Inc., Manila / Philippines − 3 100
Siemens Pte. Ltd., Singapore / Singapore 39 92 100
Siemens Limited, Taipei / Taiwan, Province of China 13 44 100
Siemens Mobility Limited, Bangkok / Thailand 11 10 100
Siemens Ltd., Ho Chi Minh City / Viet Nam 1 25 100
¹ The values correspond to the annual financial statements after a possible profit transfer, for subsidiaries according to the IFRS closing.
² Siemens AG is a shareholder with unlimited liability of this company.
³ A consolidated affiliated company of Siemens AG is a shareholder with unlimited liability of this company.
⁴ Values from fiscal year October 01, 2019 - September 30, 2020
⁵ Values from fiscal year January 01, 2020 - December 31, 2020
⁶ Values from fiscal year April 01, 2020 - March 31, 2021
⁷ Therein are 2% held via an investment fund managed by Siemens Fonds Invest GmbH.
n/a = No financial data available.

Responsibility Statement TO THE ANNUAL FINANCIAL STATEMENTS AND THE MANAGEMENT REPORT FOR FISCAL 2021

Responsibility Statement (Siemens AG)
2
To the best of our knowledge, and in accordance with the applicable reporting principles, the Annual Financial Statements give a true and fair view of the assets, liabilities, financial position and profit or loss of the Company, and the Management Report for Siemens Aktiengesellschaft, which has been combined with the Group Management Report, includes a fair review of the development and performance of the business and the position of the Company, together with a description of the material opportunities and risks associated with the expected development of the Company.
Munich, November 30, 2021
Siemens Aktiengesellschaft
The Managing Board
Dr. Roland Busch
Cedrik Neike Matthias Rebellius
Prof. Dr. Ralf P. Thomas Judith Wiese

Independent Auditor’s Report TO THE ANNUAL FINANCIAL STATEMENTS AND THE MANAGEMENT REPORT FOR FISCAL 2021

Independent Auditor’s Report (Siemens AG)
2
To Siemens Aktiengesellschaft, Berlin and Munich
Report on the audit of the annual financial statements and of the management report
Opinions
We have audited the annual financial statements of Siemens Aktiengesellschaft, Berlin and Munich, (the Company) which comprise the income statement for the fiscal year from October 1, 2020 to September 30, 2021, the balance sheet as of September 30, 2021 and notes to the financial statements, including the recognition and measurement policies presented therein. In addition, we have audited the management report of Siemens Aktiengesellschaft, which is combined with the group management report, for the fiscal year from October 1, 2020 to September 30, 2021. In accordance with the German legal requirements, we have not audited the content of the Corporate Governance Statement which is published on the website stated in the combined management report.
In our opinion, on the basis of the knowledge obtained in the audit,
• the accompanying annual financial statements comply, in all material respects, with the requirements of German commercial law applicable to business corporations and give a true and fair view of the assets, liabilities and financial position of the Company as of September 30, 2021 and of its financial performance for the fiscal year from October 1, 2020 to September 30, 2021 in compliance with German legally required accounting principles, and
• the accompanying management report as a whole provides an appropriate view of the Company’s position. In all material respects, this management report is consistent with the annual financial statements, complies with German legal requirements and appropriately presents the opportunities and risks of future development. Our opinion on the management report does not cover the content of the Corporate Governance Statement referred to above.
Pursuant to Sec. 322 (3) Sentence 1 HGB, we declare that our audit has not led to any reservations relating to the legal compliance of the annual financial statements and of the management report.
Basis for the opinions
We conducted our audit of the annual financial statements and of the management report in accordance with Sec. 317 HGB and the EU Audit Regulation (No 537/2014, referred to subsequently as “EU Audit Regulation”) and in compliance with German Generally Accepted Standards for Financial Statement Audits promulgated by the Institut der Wirtschaftsprüfer [Institute of Public Auditors in Germany] (IDW). In conducting the audit of the annual financial statements we also complied with International Standards on Auditing (ISA). Our responsibilities under those requirements, principles and standards are further described in the “Auditor’s responsibilities for the audit of the annual financial statements and of the management report” section of our auditor’s report. We are independent of the Company in accordance with the requirements of European law and German commercial and professional law, and we have fulfilled our other German professional responsibilities in accordance with these requirements. In addition, in accordance with Art. 10 (2) f) of the EU Audit Regulation, we declare that we have not provided non-audit services prohibited under Art. 5 (1) of the EU Audit Regulation. We believe that the audit evidence we have obtained is sufficient and appropriate to provide a basis for our opinions on the annual financial statements and on the management report.
Key audit matters in the audit of the annual financial statements
Key audit matters are those matters that, in our professional judgment, were of most significance in our audit of the annual financial statements for the fiscal year from October 1, 2020 to September 30, 2021. These matters were addressed in the context of our audit of the annual financial statements as a whole, and in forming our opinion thereon; we do not provide a separate opinion on these matters.
Below, we describe what we consider to be the key audit matters:
Impairment of non-current financial assets
Reasons why the matter was determined to be a key audit matter: The impairment test of non-current financial assets was a key audit matter, as in particular shares in affiliated companies and investments entail a significant risk of material misstatement due to the materiality of these assets as well as the judgment involved in assessing whether there is objective evidence to indicate a lower net realizable value and permanent impairment. The valuations of non-current financial assets also depend to a large extent on the assessment of future cash inflows, particularly given the continuing effects of the COVID-19 pandemic, and the discount rate applied.
Auditor’s response: In assessing whether there was objective evidence to indicate a lower net realizable value and permanent impairment, we obtained an understanding of management’s evaluation and also obtained external evidence of ratings, stock market prices, analyst assessments and observable valuation inputs in this regard.
With regard to the net realizable values calculated by management and its assessment as to whether an impairment is expected to be permanent, we examined the underlying processes related to the planning of future cash flows as well as to the calculation of net realizable value. We assessed the underlying valuation models for the determination of net realizable value in terms of methodology and reperformed the calculations with the assistance of internal valuation specialists. We further obtained explanations from management regarding material value drivers of the planning, including the effects of the COVID-19 pandemic, and examined whether the budget planning reflects general and industry-specific market expectations.
Forecast accuracy was assessed on a sample basis using budget-to-actual comparisons of historically forecast data with the actual results, also considering the effects attributable to the COVID-19 pandemic. The parameters used to estimate net realizable value such as the estimated growth rates and the weighted average cost of capital rates were assessed by comparing them to publicly available market data. We also performed our own sensitivity analyses to assess the impairment risk in the case of a reasonably possible change in one of the significant assumptions.
Our audit procedures did not lead to any reservations relating to assessing the impairment of non-current financial assets.

Independent Auditor’s Report (Siemens AG)
3
Reference to related disclosures: With regard to the recognition and measurement policies applied for the impairment of non-current financial assets, refer to chapter 3.2 Accounting and Measurement Principles in the notes to the financial statements and with respect to write-downs and write-ups of non-current financial assets, refer to chapter 3.3 Notes to the Income Statement, Note 3 Income (loss) from investments, net as well as chapter 3.4 Notes to the Balance Sheet, Note 10 Non-current assets in the notes to the financial statements.
Other provisions
Reasons why the matter was determined to be a key audit matter: We considered the accounting for other provisions, especially for legal disputes, regulatory proceedings and governmental investigations (legal proceedings) resulting from or in connection with alleged compliance violations as well as for decontamination to be a key audit matter. These matters are subject to inherent uncertainties and require estimates that could have a significant impact on the recognition and measurement of the respective provision and, accordingly, on assets, liabilities and financial performance. Legal proceedings resulting from or in connection with alleged compliance violations are subject to uncertainties because they involve complex legal issues and accordingly, considerable management judgment, in particular when determining whether and in what amount a provision is required to account for the risks. The uncertainties and estimates with respect to provisions for decontamination pertain especially to the estimated costs for waste treatment and packaging for final storage, for interim storage as well as transport to the final nuclear waste storage facility.
Auditor’s response: During our audit of the financial reporting of legal proceedings resulting from or in connection with alleged compliance violations, we examined the processes implemented by Siemens for identifying, assessing and accounting for legal and regulatory proceedings. To determine what potentially significant pending legal proceedings or claims asserted also in connection with joint and several liability are known and to assess management’s estimates of the expected cash outflows, our audit procedures included inquiring of management and other persons within the Company entrusted with these matters, obtaining written statements from in-house legal counsels with respect to the assessment of estimated cash outflows and their probability, obtaining confirmations from external legal advisors and evaluating internal statements concerning the accounting treatment in the annual financial statements. Furthermore, we examined legal consulting expense accounts for any indications of legal matters not yet considered.
We further considered alleged or substantiated non-compliance with legal provisions, official regulations and internal company policies (compliance violations) by inspecting internal and external statements on specific matters, obtaining written statements from external legal advisors, and by inquiring of the compliance organization. In this regard, among other procedures, we evaluated the conduct and results of internal investigations by inspecting internal reports and the measures taken to remediate identified weaknesses, and assessed on this basis whether management’s evaluation of any risks to be accounted for in the annual financial statements is plausible.
Based on the aforementioned uncertainties, our audit procedures with respect to the provisions for decontamination focused on the remediation and environmental protection liabilities in connection with the decommissioning of the facilities in Hanau, Germany (Hanau facilities), as well as for the nuclear research and service center in Karlstein, Germany (Karlstein facilities). Our audit procedures included, among others, assessing the estimated costs for waste treatment and packaging for final storage, for interim storage as well as transport to the final nuclear waste storage facility, and the valuation methods used by drawing on the expertise of our valuation specialists. We evaluated management’s assessments particularly regarding the accounting effects of the contractually agreed transfer of the nuclear waste disposal obligation to the Federal Republic of Germany, which is still subject to the approval of the EU commission under state-aid rules, and the expected costs to fulfill the obligations remaining with Siemens through inquiries of persons entrusted with the matter and inspections of internal and external documents.
Furthermore, we evaluated the disclosures on provisions for decontamination in the notes to the financial statements.
Our audit procedures did not lead to any reservations relating to the accounting for other provisions.
Reference to related disclosures: With regard to the recognition and measurement policies applied in accounting for other provisions, refer to chapter 3.2 Accounting and Measurement Principles in the notes to the financial statements. With respect to the legal proceedings, regulatory proceedings and governmental investigations, refer to chapter 3.5 Other Disclosures, Note 25 Other financial obligations and with respect to the uncertainties and estimates relating to the provisions for decontamination, refer to chapter 3.4 Notes to the Balance Sheet, Note 17 Other provisions in the notes to the financial statements.
Uncertain tax positions and recoverability of deferred tax assets
Reasons why the matter was determined to be a key audit matter: The accounting for uncertain tax positions as well as deferred taxes requires management to exercise considerable judgment and make estimates and assumptions, and was therefore a key audit matter. In particular, this affects the measurement and completeness of uncertain tax positions, the recoverability of deferred tax assets as well as management’s assessments regarding the tax implications of the COVID-19 pandemic.
Auditor’s response: With the assistance of internal tax specialists who have knowledge of tax law, we examined the processes installed by management for the identification, recognition and measurement of tax positions. In the course of our audit procedures relating to uncertain tax positions, we evaluated whether management’s assessment of the tax implications of significant business transactions or events in fiscal year 2021, which could result in uncertain tax positions or influence the measurement of existing uncertain tax positions, was in compliance with tax law. In particular, this includes the tax implications arising from the results of tax field audits, the acquisition or disposal of company shares, corporate (intragroup) restructuring activities and cross-border matters, such as the determination of transfer prices. In order to assess measurement and completeness, we also obtained confirmations from external tax advisors. Further, we evaluated management’s assessments with respect to the prospects of success of appeal and tax court proceedings by inquiring of the employees of the Siemens tax department and by considering current tax case law.
In assessing the recoverability of deferred tax assets, we above all analyzed management’s assumptions with respect to tax planning strategies and projected future taxable income, also in view of the implications of the COVID-19 pandemic, and compared them to internal business plans.
Our audit procedures did not lead to any reservations relating to the accounting for uncertain tax positions and the assessment of the recoverability of deferred tax assets.

Independent Auditor’s Report (Siemens AG)
4
Reference to related disclosures: With regard to the recognition and measurement policies applied in accounting for income taxes, refer to chapter 3.2 Accounting and Measurement Principles and chapter 3.3 Notes to the Income Statement, Note 6 Income taxes and with respect to disclosures for deferred tax assets, refer to chapter 3.4 Notes to the Balance Sheet, Note 13 Deferred tax assets in the notes to the financial statements.
Other information
The Supervisory Board is responsible for the Report of the Supervisory Board in the Annual Report 2021 within the meaning of ISA [DE] 720 (Revised). Management and the Supervisory Board are responsible for the declaration pursuant to Sec. 161 AktG [“Aktiengesetz”: German Stock Corporation Act] on the Corporate Governance Code, which is part of the Corporate Governance Statement, and for the Compensation Report. In all other respects, management is responsible for the other information. The other information comprises the Corporate Governance Statement referred to above.
In addition, the other information comprises parts to be included in the Annual Report, of which we received a version prior to issuing this auditor’s report, in particular:
• the Responsibility Statement (to the annual financial statements and the management report),
• the Responsibility Statement (to the consolidated financial statements and the group management report),
• the Five-Year Summary,
• the Compensation Report,
• the Report of the Supervisory Board,
• Notes and forward-looking statements,
but not the consolidated financial statements and the annual financial statements, not the disclosures of the combined management report whose content is audited and not our auditor’s reports thereon.
Our opinions on the annual financial statements and on the management report do not cover the other information, and consequently we do not express an opinion or any other form of assurance conclusion thereon.
In connection with our audit, our responsibility is to read the other information, and, in so doing, to consider whether the other information
• is materially inconsistent with the annual financial statements, with the management report or our knowledge obtained in the audit, or
• otherwise appears to be materially misstated.
If, based on the work we have performed, we conclude that there is a material misstatement of this other information, we are required to report that fact. We have nothing to report in this regard.
Responsibilities of management and the Supervisory Board for the annual financial statements and the management report
Management is responsible for the preparation of the annual financial statements that comply, in all material respects, with the requirements of German commercial law applicable to business corporations, and that the annual financial statements give a true and fair view of the assets, liabilities, financial position and financial performance of the Company in compliance with German legally required accounting principles. In addition, management is responsible for such internal control as it, in accordance with German legally required accounting principles, has determined necessary to enable the preparation of annual financial statements that are free from material misstatement, whether due to fraud or error.
In preparing the annual financial statements, management is responsible for assessing the Company’s ability to continue as a going concern. It also has the responsibility for disclosing, as applicable, matters related to going concern. In addition, management is responsible for financial reporting based on the going concern basis of accounting, provided no actual or legal circumstances conflict therewith.
Furthermore, management is responsible for the preparation of the management report that as a whole provides an appropriate view of the Company’s position and is, in all material respects, consistent with the annual financial statements, complies with German legal requirements and appropriately presents the opportunities and risks of future development. In addition, management is responsible for such arrangements and measures (systems) as management has considered necessary to enable the preparation of a management report that is in accordance with the applicable German legal requirements, and to be able to provide sufficient appropriate evidence for the assertions in the management report.
The Supervisory Board is responsible for overseeing the Company’s financial reporting process for the preparation of the annual financial statements and of the management report.
Auditor’s responsibilities for the audit of the annual financial statements and of the management report
Our objectives are to obtain reasonable assurance about whether the annual financial statements as a whole are free from material misstatement, whether due to fraud or error, and whether the management report as a whole provides an appropriate view of the Company’s position and, in all material respects, is consistent with the annual financial statements and the knowledge obtained in the audit, complies with the German legal requirements and appropriately presents the opportunities and risks of future development, as well as to issue an auditor’s report that includes our opinions on the annual financial statements and on the management report.
Reasonable assurance is a high level of assurance, but is not a guarantee that an audit conducted in accordance with Sec. 317 HGB and the EU Audit Regulation as well as in compliance with German Generally Accepted Standards for Financial Statement Audits promulgated by the IDW and in supplementary compliance with ISA will always detect a material misstatement. Misstatements can arise from fraud or
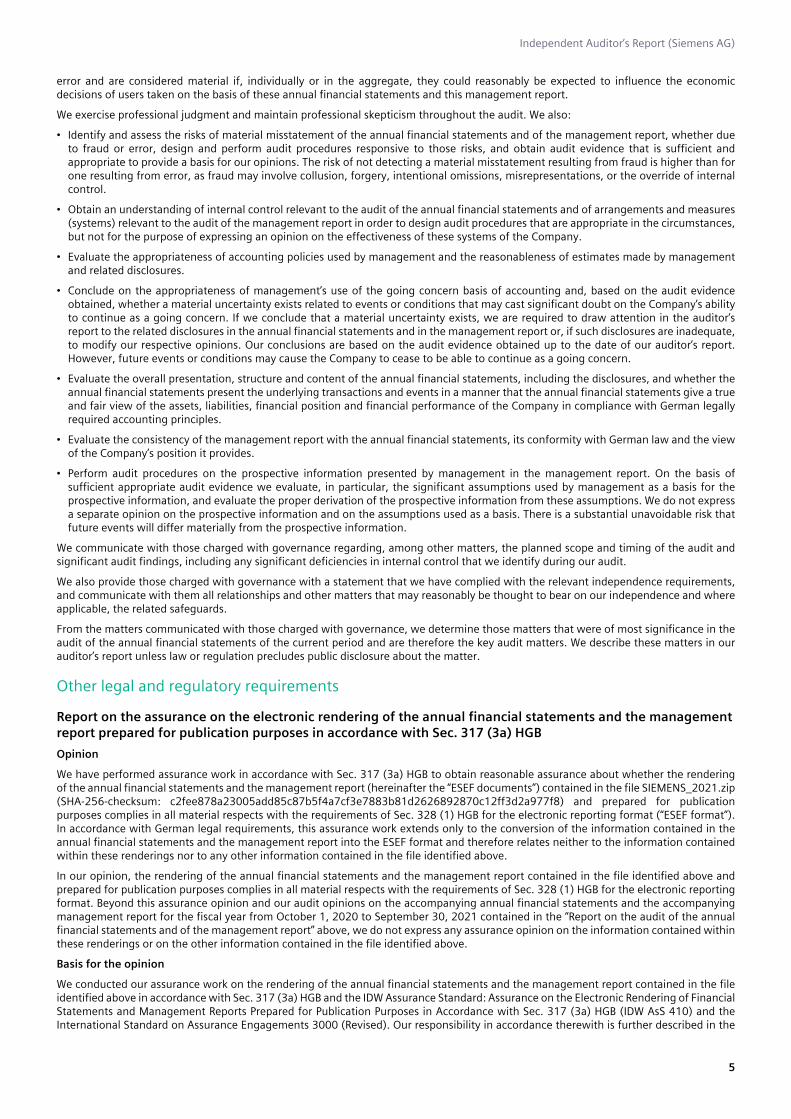
Independent Auditor’s Report (Siemens AG)
5
error and are considered material if, individually or in the aggregate, they could reasonably be expected to influence the economic decisions of users taken on the basis of these annual financial statements and this management report.
We exercise professional judgment and maintain professional skepticism throughout the audit. We also:
• Identify and assess the risks of material misstatement of the annual financial statements and of the management report, whether due to fraud or error, design and perform audit procedures responsive to those risks, and obtain audit evidence that is sufficient and appropriate to provide a basis for our opinions. The risk of not detecting a material misstatement resulting from fraud is higher than for one resulting from error, as fraud may involve collusion, forgery, intentional omissions, misrepresentations, or the override of internal control.
• Obtain an understanding of internal control relevant to the audit of the annual financial statements and of arrangements and measures (systems) relevant to the audit of the management report in order to design audit procedures that are appropriate in the circumstances, but not for the purpose of expressing an opinion on the effectiveness of these systems of the Company.
• Evaluate the appropriateness of accounting policies used by management and the reasonableness of estimates made by management and related disclosures.
• Conclude on the appropriateness of management’s use of the going concern basis of accounting and, based on the audit evidence obtained, whether a material uncertainty exists related to events or conditions that may cast significant doubt on the Company’s ability to continue as a going concern. If we conclude that a material uncertainty exists, we are required to draw attention in the auditor’s report to the related disclosures in the annual financial statements and in the management report or, if such disclosures are inadequate, to modify our respective opinions. Our conclusions are based on the audit evidence obtained up to the date of our auditor’s report. However, future events or conditions may cause the Company to cease to be able to continue as a going concern.
• Evaluate the overall presentation, structure and content of the annual financial statements, including the disclosures, and whether the annual financial statements present the underlying transactions and events in a manner that the annual financial statements give a true and fair view of the assets, liabilities, financial position and financial performance of the Company in compliance with German legally required accounting principles.
• Evaluate the consistency of the management report with the annual financial statements, its conformity with German law and the view of the Company’s position it provides.
• Perform audit procedures on the prospective information presented by management in the management report. On the basis of sufficient appropriate audit evidence we evaluate, in particular, the significant assumptions used by management as a basis for the prospective information, and evaluate the proper derivation of the prospective information from these assumptions. We do not express a separate opinion on the prospective information and on the assumptions used as a basis. There is a substantial unavoidable risk that future events will differ materially from the prospective information.
We communicate with those charged with governance regarding, among other matters, the planned scope and timing of the audit and significant audit findings, including any significant deficiencies in internal control that we identify during our audit.
We also provide those charged with governance with a statement that we have complied with the relevant independence requirements, and communicate with them all relationships and other matters that may reasonably be thought to bear on our independence and where applicable, the related safeguards.
From the matters communicated with those charged with governance, we determine those matters that were of most significance in the audit of the annual financial statements of the current period and are therefore the key audit matters. We describe these matters in our auditor’s report unless law or regulation precludes public disclosure about the matter.
Other legal and regulatory requirements
Report on the assurance on the electronic rendering of the annual financial statements and the management report prepared for publication purposes in accordance with Sec. 317 (3a) HGB
Opinion
We have performed assurance work in accordance with Sec. 317 (3a) HGB to obtain reasonable assurance about whether the rendering of the annual financial statements and the management report (hereinafter the “ESEF documents”) contained in the file SIEMENS_2021.zip (SHA-256-checksum: c2fee878a23005add85c87b5f4a7cf3e7883b81d2626892870c12ff3d2a977f8) and prepared for publication purposes complies in all material respects with the requirements of Sec. 328 (1) HGB for the electronic reporting format (“ESEF format”). In accordance with German legal requirements, this assurance work extends only to the conversion of the information contained in the annual financial statements and the management report into the ESEF format and therefore relates neither to the information contained within these renderings nor to any other information contained in the file identified above.
In our opinion, the rendering of the annual financial statements and the management report contained in the file identified above and prepared for publication purposes complies in all material respects with the requirements of Sec. 328 (1) HGB for the electronic reporting format. Beyond this assurance opinion and our audit opinions on the accompanying annual financial statements and the accompanying management report for the fiscal year from October 1, 2020 to September 30, 2021 contained in the “Report on the audit of the annual financial statements and of the management report” above, we do not express any assurance opinion on the information contained within these renderings or on the other information contained in the file identified above.
Basis for the opinion
We conducted our assurance work on the rendering of the annual financial statements and the management report contained in the file identified above in accordance with Sec. 317 (3a) HGB and the IDW Assurance Standard: Assurance on the Electronic Rendering of Financial Statements and Management Reports Prepared for Publication Purposes in Accordance with Sec. 317 (3a) HGB (IDW AsS 410) and the International Standard on Assurance Engagements 3000 (Revised). Our responsibility in accordance therewith is further described in the

Independent Auditor’s Report (Siemens AG)
6
“Auditor’s responsibilities for the assurance work on the ESEF documents” section. Our audit firm applies the IDW Standard on Quality Management 1: Requirements for Quality Management in the Audit Firm (IDW QS 1).
Responsibilities of management and the Supervisory Board for the ESEF documents
Management is responsible for the preparation of the ESEF documents including the electronic rendering of the annual financial statements and the management report in accordance with Sec. 328 (1) Sentence 4 No. 1 HGB.
In addition, management is responsible for such internal control as it has determined necessary to enable the preparation of ESEF documents that are free from material intentional or unintentional non-compliance with the requirements of Sec. 328 (1) HGB for the electronic reporting format.
The Supervisory Board is responsible for overseeing the process for preparing the ESEF documents as part of the financial reporting process.
Auditor’s responsibilities for the assurance work on the ESEF documents
Our objective is to obtain reasonable assurance about whether the ESEF documents are free from material intentional or unintentional non-compliance with the requirements of Sec. 328 (1) HGB. We exercise professional judgment and maintain professional skepticism throughout the assurance work. We also:
• Identify and assess the risks of material intentional or unintentional non-compliance with the requirements of Sec. 328 (1) HGB, design and perform assurance procedures responsive to those risks, and obtain assurance evidence that is sufficient and appropriate to provide a basis for our assurance opinion.
• Obtain an understanding of internal control relevant to the assurance on the ESEF documents in order to design assurance procedures that are appropriate in the circumstances, but not for the purpose of expressing an assurance opinion on the effectiveness of these controls.
• Evaluate the technical validity of the ESEF documents, i.e., whether the file containing the ESEF documents meets the requirements of Commission Delegated Regulation (EU) 2019/815, in the version in force at the date of the financial statements, on the technical specification for this file.
• Evaluate whether the ESEF documents enable an XHTML rendering with content equivalent to the audited annual financial statements and to the audited management report.
Further information pursuant to Art. 10 of the EU Audit Regulation
We were elected as auditor by the Annual Shareholders’ Meeting on February 3, 2021. We were engaged by the Supervisory Board on February 3, 2021. We have been the auditor of Siemens Aktiengesellschaft without interruption since the fiscal year from October 1, 2008 to September 30, 2009.
We declare that the opinions expressed in this auditor’s report are consistent with the additional report to the Audit Committee pursuant to Art. 11 of the EU Audit Regulation (long-form audit report).
In addition to the financial statement audit, we have provided to the Company or entities controlled by it the following services that are not disclosed in the annual financial statements or in the management report:
In addition to auditing the statutory financial statements of Siemens AG, we performed the statutory audit of Siemens’ consolidated financial statements, audits of financial statements of subsidiaries of Siemens AG, reviews of interim financial statements integrated in the audit, project-based IT audits, audit services in connection with the implementation of new accounting standards as well as service organization control engagements.
Audit-related services include primarily audits of financial statements as well as other attestation services in connection with M&A activities, attestation services related to the sustainability reporting, comfort letters and other attestation services required under regulatory requirements, contractually agreed or requested on a voluntary basis. Permitted tax services were rendered in connection with audit-related support for the analysis of the design of the tax compliance management system performed by Siemens.
Other matter – use of the auditor’s report
Our auditor’s report must always be read together with the audited annual financial statements and the audited management report as well as the assured ESEF documents. The annual financial statements and the management report converted to the ESEF format – including the versions to be published in the Bundesanzeiger [German Federal Gazette] – are merely electronic renderings of the audited annual financial statements and the audited management report and do not take their place. In particular, the ESEF report and our assurance opinion contained therein are to be used solely together with the assured ESEF documents made available in electronic form.

Independent Auditor’s Report (Siemens AG)
7
German Public Auditor responsible for the engagementThe German Public Auditor responsible for the engagement is Katharina Breitsameter.
Munich, November 30, 2021
Ernst & Young GmbH
Wirtschaftsprüfungsgesellschaft
Breitsameter Dr. Gaenslen
Wirtschaftsprüferin Wirtschaftsprüfer
[German Public Auditor] [German Public Auditor]

Five-Year Summary FOR THE FIVE YEARS UNTIL FISCAL 2021

Five-Year Summary
2
(in millions of €, except where otherwise stated)
Revenue and profit FY 2021 FY 2020 FY 2019 FY 2018 FY 2017
Revenue1 62,265 55,254 56,797 55,538 82,863
Gross profit1 22,737 19,888 21,381 20,535 25,043
Income from continuing operations1 5,636 4,156 5,063 5,084 6,041
Net income 6,697 4,200 5,648 6,120 6,094
Assets, liabilities and equity2
Sep 30, 2021
Sep 30, 2020
Sep 30, 2019
Sep 30, 2018
Sep 30, 2017
Current assets 52,340 52,968 70,370 64,556 60,750
Current liabilities 39,952 34,117 50,723 47,874 46,077
Debt 48,700 44,567 36,449 32,177 32,224
Long-term debt 40,879 38,005 30,414 27,120 26,777
Net debt 38,022 29,270 22,726 19,840 22,607
Provisions for pensions and similar obligations 2,839 6,360 9,896 7,684 9,582
Equity (including non-controlling interests) 49,274 39,823 50,984 48,046 44,619
as a percentage of total assets 35% 32% 34% 35% 33%
Total assets 139,608 123,897 150,248 138,915 136,111
Cash flows FY 2021 FY 2020 FY 2019 FY 2018 FY 2017
Cash flows from operating activities – continuing operations1 10,109 7,851 6,825 7,539 7,225
Amortization, depreciation and impairments1 3,075 3,098 2,222 2,131 3,211
Cash flows from investing activities – continuing operations1 (17,192) (4,050) (4,166) (3,288) (7,456)
Additions to intangible assets and property, plant and equipment1 (1,730) (1,498) (1,739) (1,820) (2,406)
Cash flows from financing activities – continuing operations1 785 4,267 (1,214) (2,376) (1,560)
Change in cash and cash equivalents (4,509) 1,663 1,325 2,677 (2,228)
Free cash flow – continuing and discontinued operations 8,237 6,404 5,845 5,824 4,769
Free cash flow – continuing operations1 8,379 6,352 5,086 5,719 4,819
EmployeesSep 30,
2021Sep 30,
2020Sep 30,
2019Sep 30,
2018Sep 30,
2017
Continuing operations (in thousands)1 303 285 287 288 377
Stock market information FY 2021 FY 2020 FY 2019 FY 2018 FY 2017
Basic earnings per share - continuing and discontinued operations €7.68 €5.00 €6.41 €7.12 €7.34
Basic earnings per share - continuing operations1 €6.36 €4.77 €5.82 €5.94 €7.27
Diluted earnings per share - continuing and discontinued operations €7.59 €4.93 €6.32 €7.01 €7.19
Diluted earnings per share - continuing operations1 €6.28 €4.70 €5.74 €5.84 €7.13
Dividend per share3 €4.00 €3.50 €3.90 €3.80 €3.70
¹ In FY 2020, Gas and Power and Siemens Gamesa Renewable Energy were classified as discontinued operations. Prior-period amounts beginning with FY 2018 are presented on a comparable basis. In FY 2021, Flender GmbH was classified as discontinued operation. Prior-period amounts beginning with FY 2019 are presented on a comparable basis.
² Beginning with September 30, 2018 under consideration of IFRS 9.
³ For FY 2021 to be proposed to the Annual Shareholders’ Meeting.

Compensation Report 2021

Compensation Report 2021
This Compensation Report provides an explanation and a clear and com
prehensible presentation of the compensation individually awarded
and due to the current and former members of the Managing Board and
the Super visory Board of Siemens AG for fiscal 2021 (October 1, 2020 to
September 30, 2021). The Report complies with the requirements of the
German Stock Corporation Act ( Aktiengesetz, AktG). Detailed information
regarding the compensation systems for members of the Managing Board
and the Supervisory Board of Siemens AG is available on the Siemens
Global Website WWW.SIEMENS.COM/CORPORATE-GOVERNANCE.
Due to rounding, numbers presented throughout this document may not
add up precisely to the totals provided and percentages may not precisely
reflect the absolute figures.
Siemens Aktiengesellschaft
Berlin and Munich

A. Fiscal 2021 in retrospect 4
B. Compensation of Managing Board members 6
B.1 The compensation system at a glance 6
B.2 Principles of the determination of compensation 9
B.2.1 Target compensation and compensation structure 9
B.2.2 Maximum compensation 11
B.2.3 Appropriateness of compensation 12
B.3 Variable compensation in fiscal 2021 12
B.3.1 Shortterm variable compensation (Bonus) 14
B.3.2 Longterm variable compensation (Stock Awards) 18
B.3.3 Malus and clawback regulations 25
B.4 Share Ownership Guidelines 26
B.5 Pension benefit commitment 26
B.6 Compensation awarded and due 27
B.6.1 Active Managing Board members in fiscal 2021 27
B.6.2 Former members of the Managing Board 30
B.7 Outlook for fiscal 2022 31
C. Compensation of Supervisory Board members 32
D. Comparative information on profit development and annual change in compensation 35
E. Other 38
Independent auditor’s report 39
Table of contents

FISCAL 2021 4
Compensation Report A. Fiscal 2021 in retrospect A. Fiscal 2021 in retrospect
The Managing Board and the Supervisory Board of
Siemens AG have decided to voluntarily implement
ahead of time the new legal requirements regarding the
issuance of the Compensation Report that are set out in
Section 162 of the German Stock Corporation Act. The
emphasis of the Report continues to be on providing
clear, transparent and comprehensive reporting. The
Managing Board and the Supervisory Board have also
decided to commission the independent auditor to con
duct a substantive audit of the Compensation Report,
over and above the requirement set out in Section 162
para. 3 sent. 1 and 2 of the German Stock Corporation Act.
What did the economic and political environment look like at the start of fiscal 2021?
In the fall of 2020, the outlook for the fiscal year ahead
was anything but stable. Due to the ongoing COVID19
pandemic, Siemens and its customers and partners
worldwide faced major challenges. In the U. S., the presi
dential election was imminent, and it wasn’t clear what
economic consequences the tense relations between the
U. S. and China would have. There were also structural
problems in Siemens’ key customer sectors such as ma
chine building – due to low capacity utilization – and in
the automobile industry, which is undergoing a dramatic
structural transformation. All these factors are having an
impact on Siemens’ business. In retrospect, we’ve experi
enced an exciting and a very challenging, but also a very
successful fiscal year. The employees of Siemens have
delivered a stellar performance in difficult times.
Changes in the Managing Board and the Compensation Committee
In fiscal 2021, there were also changes in the Managing
Board. Matthias Rebellius and Judith Wiese were ap
pointed full members of the Managing Board effective
October 1, 2020. Joe Kaeser left the Managing Board
effective the end of the Annual Shareholders’ Meeting on
February 3, 2021. Klaus Helmrich left the Managing
Board effective March 31, 2021. The Supervisory Board is
very grateful to both Mr. Kaeser and Mr. Helmrich for
their many years of successful work on behalf of Siemens
and for their extraordinary services to the Company.
Dr. Roland Busch was appointed President and CEO effec
tive the end of the 2021 Annual Shareholders’ Meeting.
He combines entrepreneurial farsightedness with a de
sire to optimally support customers in their digital and
sustainable transformation. The Company is driving this
transformation with technologies that add real value for
customers – technologies that will continue to be crucial
for Siemens in the future and of which Dr. Roland Busch
has a deep and broad understanding.
Following the scheduled departure of Werner Wenning,
the previous, longserving Chairman of the Compensa
tion Committee of the Supervisory Board of Siemens AG,
from the Supervisory Board and thereby also from the
Compensation Committee, the Compensation Commit
tee elected Michael Diekmann to serve as its new Chair
man effective February 4, 2021. The Compensation Com
mittee also acquired two new members: Harald Kern,
who joined the Committee in October 2020, succeeding
Robert Kensbock, who left the Supervisory Board
on September 25, 2020, the effective date of the
Siemens Energy spinoff, and Matthias Zachert, who
joined the Committee in February 2021.

FISCAL 2021 5
Compensation Report A. Fiscal 2021 in retrospect
How is the new strategy reflected in Managing Board compensation?
The Managing Board presented the new Company strat
egy for accelerated high value growth at Capital Market
Day on June 24, 2021: Siemens as a focused technology
company, active in highly attractive growth markets that
are the backbone of the global economy: industry, infra
structure, transportation and healthcare. The Super visory
Board is convinced that this strategy positions Siemens to
meet the challenges of the future. The Managing Board
compensation that has been determined by the Supervi
sory Board fosters the implementation of the Company’s
strategic targets by providing incentives for increasing
profit and capital efficiency and for cash generation.
Taking into account all the changes and the existing chal
lenges, the Compensation Committee of the Supervisory
Board intensively discussed the key performance indica
tors for variable compensation as well as the individual
targets for Managing Board members. As a result of its
decision to place the focus on the Managing Board’s over
all responsibility and crossbusiness collaboration, two
thirds of the shortterm variable compensation (Bonus)
of all Managing Board members were determined on the
basis of the same criteria. Strategic and sustainability
related aspects, which are measured on the basis of the
members’ individual areas of responsibility, are anchored
in the remaining third of shortterm variable compensa
tion, the “individual targets.”
Sustainability – strategic goal and an expression of
Siemens’ social responsibility – is also firmly anchored in
the longterm variable compensation of both the Manag
ing Board and the roughly 7,000 other Company manag
ers worldwide. At Capital Market Day in 2021, DEGREE, a
framework that addresses sustainability from every angle
and defines ambitious targets, was introduced. As a re
sult, the environment, society and good governance will
play a significantly stronger role. The key performance
indicators applied in longterm variable compensation are
part of this framework (CO2 emissions and digital learning
hours) and /or reflect the Company’s priorities (Net Pro
moter Score as an expression of customer satisfaction).
How did Siemens perform in fiscal 2021?
Despite the challenges and the economic and pandem
icrelated uncertainty, Siemens has achieved outstanding
results. For example, the Company succeeded in main
taining its supply chains and its delivery capacity during
the fiscal year and continued to be a reliable partner to its
customers. These developments were reflected in the
strong financial performance in fiscal 2021. Siemens
raised its outlook several times during the fiscal year,
most recently after the third quarter, and reached or ex
ceeded all the targets set for the primary measures for
fiscal 2021. Return on capital employed (ROCE) was in
doubledigits, and the capital structure ratio came in at
1.5. Basic EPS from net income increased 54 % to € 7.68. In
addition, free cash flow from continuing and discontin
ued operations for fiscal 2021 increased 29 % yearover
year to € 8.2 billion, reaching a new high. Revenue also
was higher at all industrial businesses, rising to € 62.3 bil
lion. Siemens achieved revenue growth of 11.5 % net of
currency translation and portfolio effects and delivered
net income of € 6.7 billion. Discontinued operations,
largely related to the sale of Flender, contributed income
of € 1.1 billion in fiscal 2021.
In line with the principle anchored in the compensation
system – namely, that exceptional performance should
be appropriately rewarded and that failure to achieve tar
gets should result in a perceptible reduction in compen
sation (the pay for performance principle) – the excellent
results of fiscal 2021 are reflected in the Managing
Board’s variable compensation, which takes into account
not only financial success but also environmental and
social aspects. As a result, the compensation of the Man
aging Board members is also oriented toward the inter
ests of the shareholders as well as the other stakeholders
of Siemens AG.

FISCAL 2021 6
Compensation Report B. Compensation of Managing Board members
B. Compensation of Managing Board members
B.1 The compensation system at a glance
The current compensation system for the members of
the Managing Board of Siemens AG has been in place
since fiscal 2020 and was endorsed by the Annual Share
holders’ Meeting on February 5, 2020, by a majority of
94.51 %.
The compensation of the Managing Board members con
sists of fixed and variable components. Fixed compensa
tion, which is not performancebased, comprises base
salary, fringe benefits and a pension benefit commit
ment. Shortterm variable compensation (Bonus) and
longterm variable compensation (Stock Awards) are per
formancebased compensation and thus variable.
The Share Ownership Guidelines are a further key com
ponent of the compensation system. They obligate Man
aging Board members to permanently hold Siemens
shares worth a defined multiple of their base salary and
to purchase additional shares in the event that the value
of their shares falls below the defined amount.
The Managing Board compensation system is also sup
plemented by commitments granted in connection with
the commencement and termination of appointments to
the Managing Board as well as any change in the regular
place of work.
The following table provides an overview of the compo
nents of the compensation system for Managing Board
members, the underlying goals (including the link to the
Company’s strategy) and the components’ concrete im
plementation in fiscal 2021.
FIXED COMPENSATION
Link to strategy Competitive compensation in order to obtain the best candidates worldwide to develop and execute the Company ’s strategy and manage its operations and in order to retain these individuals at the Company over the long term
Base salary Fringe benefits Pension benefit commitment
Implementation in compensation system
Contractually agreed fixed annual compensation based on a Managing Board member’s duties and related responsibilities and his or her experience
Payment in 12 monthly installments
Determination of a maximum amount relative to base salary, covering expenses incurred to the benefit of the Managing Board member
Includes inkind compensation and fringe benefits granted by the Company, for example:
– Provision of a company car – Insurance allowances – Costs of medical checkups
Annual contributions to the Siemens Defined Contribution Pension Plan (BSAV)
Newly appointed Managing Board members as of October 1, 2019: fixed cash amount for free disposal
Commitment at beginning of fiscal year
Credit to pension account (BSAV contribution) or payout (amount for free disposal) in January after the end of the fiscal year
Application in 2021
President and CEO: € 1,770,000 p. a.
Other Managing Board members: € 1,101,600 p. a.
In fiscal 2021, Managing Board members were entitled to fringe benefits equal to a maximum of 7.5 % of their base salary.
President and CEO: max. € 132,750
Other Managing Board members: max. € 82,620
BSAV contribution(credit in January 2022)
President and CEO: € 991,200
Other Managing Board members: € 616,896
Amount for free disposal (payment in January 2022)
Other Managing Board members: € 550,800

FISCAL 2021 7
Compensation Report B. Compensation of Managing Board members
VARIABLE COMPENSATION
Short-term variable compensation (Bonus)
Long-term variable compensation (Stock Awards)
Malus and clawback regulations
Link to strategy Provides incentives for strong annual financial and non-financial performance as the basis for long-term Company strategy and sustainable value creation.
Fosters long-term commitment and provides incentives for sustainable value creation in accordance with the interests of shareholders and for the achievement of strategic sus-tainability targets.
Aim to ensure sustainable Company development and avoid inappropriate risks.
Implementation in compensation system
Performanceoriented annual Bonus, paid in cash in the subsequent fiscal year
Performance range: 0 % to 200 %, using linear interpolation
Three equally weighted target dimensions:
– Siemens Group – Managing Board portfolio – Individual targets: two to four
equally weighted financial targets or focus topics
Consideration of extraordinary developments in justified, infrequent special cases possible
Performanceoriented plan settled by share transfer after the end of an approximately fouryear vesting period
Performance range: 0 % to 200 %, using linear interpolation
Two performance criteria: – 80 %: development of total
shareholder return (TSR) relative to an international sector index
• 12month reference and 36month performance period
• Outperformance relative to sector index – / + 20 percentage points
– 20 %: Siemensinternal ESG / Sustainability index with three equally weighted key performance indicators and annual interim targets
Payout cap: 300 % of target amount
In cases of severe breaches of duty or compliance and /or unethical behavior or in cases of grossly negligent or willful breaches of duty of care or in cases in which variable compensation components linked to the achievement of specific targets have been unduly paid out on the basis of incorrect data, the Supervisory Board can withhold or reclaim variable compensation.
Application in 2021
Bonus for fiscal 2021 Performance period: October 1,
2020, to September 30, 2021 Payout: February 2022 (at the latest) 33.34% earnings per share (EPS) 33.33 % return on capital
employed (ROCE) 33.33 % individual targets:
– Cash conversion rate (CCR) in the area of responsibility
– Growth (for Managing Board members with business responsibility and the President and CEO)
– One to three additional individual targets with focus topics from the Bonus topic catalogue
Target amounts (based on 100 % target achievement)
President and CEO: € 1,770,000 Other Managing Board members:
€ 1,101,600
2021 Stock Awards tranche Grant date: November 13, 2020 End of vesting period: in Novem
ber 2024 Performance criteria:
– 80 %: development of TSR relative to MSCI World Industrials index
– 20 %: ESG key performance indicators: CO2 emissions, digital learning hours and Net Promoter Score
Target amounts (based on 100 % target achievement)
President and CEO: € 2,390,000 CFO: € 1,544,000 Other Managing Board members:
€ 1,259,000
No application in fiscal 2021

FISCAL 2021 8
Compensation Report B. Compensation of Managing Board members
SHARE OWNERSHIP GUIDELINESOTHER BENEFITS MAXIMUM COMPENSATION
Link to strategy Are part of competitive compensation and help the Company obtain the best candidates worldwide for the Managing Board.
Caps Managing Board members’ compensation in order to avoid uncontrollably high payments and thus disproportionate costs and risks for the Company.
Foster an alignment of Managing Board and shareholder interests and provide additional incentives to sustainably increase Company value.
Implementation in compensation system
Commitments granted in connection with the commencement of Managing Board appointments:
– Compensation for the loss of benefits from a former employer
– Moving expenses due to a change of the regular place of work at the request of the Company
Commitments in connection with the termination of Managing Board appointments:
– Termination by mutual agreement and without serious cause
– Change of control (only for firsttime appointments and /or reappointments before November 2019)
Determined annually by the Supervisory Board
Equals the sum of maximum amounts that can possibly be paid out to each Managing Board member from all compensation components for the relevant fiscal year and is calculated as follows:
Base salary + maximum fringe benefits + BSAV contribution or amount
for free disposal + two times the Bonus
target amount + three times the Stock Awards
target amount
Obligates Managing Board members to permanently hold Siemens shares of an amount equal to a multiple of their base salary during their terms of office on the Managing Board
– President and CEO: 300% – Other Managing Board
members: 200% Fouryear buildup phase Verification date on second Friday
in March Relevant share price: average Xetra
opening price of the fourth quarter of the previous calendar year
Obligation to purchase additional shares if the value of the accumulated shareholding falls below the respective amounts to be verified due to fluctuations in the Siemens share price
Application in 2021
Compensation alloted to Judith Wiese for the loss of benefits granted by her former employer: € 1,469,124 (gross)
– 50 % in the form of Stock Awards additionally to the 2021 tranche in November 2020
– 50 % in cash in March 2021
Maximum compensation for each Managing Board member for fiscal 2021 determined in accordance with the compensation system
Final assessment of compliance with maximum compensation when the 2021 Stock Awards tranche is settled in fiscal 2025
Reporting in Compensation Report for fiscal 2025
Verification date: March 12, 2021 Relevant share price: € 111.13 Fulfilled by all the Managing Board
members obligated to provide verification
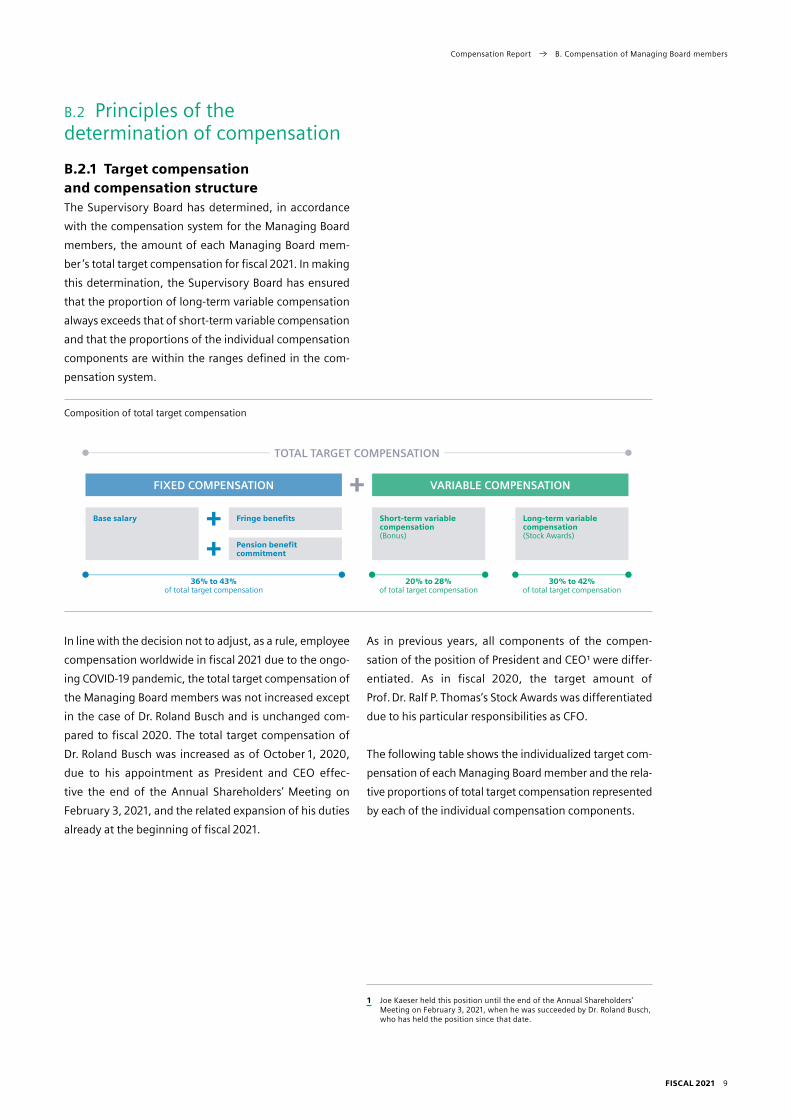
FISCAL 2021 9
Compensation Report B. Compensation of Managing Board members
B.2 Principles of the determination of compensation
B.2.1 Target compensation and compensation structureThe Supervisory Board has determined, in accordance
with the compensation system for the Managing Board
members, the amount of each Managing Board mem
ber ’s total target compensation for fiscal 2021. In making
this determination, the Supervisory Board has ensured
that the proportion of longterm variable compensation
always exceeds that of shortterm variable compensation
and that the proportions of the individual compensation
components are within the ranges defined in the com
pensation system.
Composition of total target compensation
TOTAL TARGET COMPENSATION
FIXED COMPENSATION VARIABLE COMPENSATION
Base salary Fringe benefits Short-term variable compensation (Bonus)
Long-term variable compensation (Stock Awards)
Pension benefit commitment
36 % to 43 %of total target compensation
20 % to 28 %of total target compensation
30 % to 42 %of total target compensation
In line with the decision not to adjust, as a rule, employee
compensation worldwide in fiscal 2021 due to the ongo
ing COVID19 pandemic, the total target compensation of
the Managing Board members was not increased except
in the case of Dr. Roland Busch and is unchanged com
pared to fiscal 2020. The total target compensation of
Dr. Roland Busch was increased as of October 1, 2020,
due to his appointment as President and CEO effec
tive the end of the Annual Shareholders’ Meeting on
February 3, 2021, and the related expansion of his duties
already at the beginning of fiscal 2021.
As in previous years, all components of the compen
sation of the position of President and CEO 1 were differ
entiated. As in fiscal 2020, the target amount of
Prof. Dr. Ralf P. Thomas’s Stock Awards was differentiated
due to his particular responsibilities as CFO.
The following table shows the individualized target com
pensation of each Managing Board member and the rela
tive proportions of total target compensation represented
by each of the individual compensation components.
1 Joe Kaeser held this position until the end of the Annual Shareholders’ Meeting on February 3, 2021, when he was succeeded by Dr. Roland Busch, who has held the position since that date.

FISCAL 2021 10
Compensation Report B. Compensation of Managing Board members
Target compensation fiscal 2021
Managing Board members in office on September 30, 2021
Dr. Roland Busch 1
President and CEO since Feb. 3, 2021
Cedrik Neike
Managing Board member since April 1, 2017
2021 2020 2021 2020
€ thousand in % of TTC € thousand in % of TTC € thousand in % of TTC € thousand in % of TTC
Fixed compensation
Base salary 1,770 25 % 1,352 27 % 1,102 26 % 1,102 26 %
+ Fringe benefits 2 133 2 % 101 2 % 83 2 % 83 2 %
+ BSAV contribution /amount for free disposal 3 991 14 % 617 12 % 617 15 % 617 15 %
= Total 2,894 41 % 2,071 42 % 1,801 43 % 1,801 43 %
Variable compensation
+ Short-term variable compensation
Bonus for fiscal 2021 1,770 25 % – – 1,102 26 % – –
Bonus for fiscal 2020 – – 1,277 26 % – – 1,102 26 %
+ Long-term variable compensation
2021 Stock Awards (vesting: 2020 – 2024) 2,390 34 % – – 1,259 30 % – –
2020 Stock Awards (vesting: 2019 – 2023) – – 1,594 32 % – – 1,259 30 %
= Total target compensation (TTC) 7,054 100 % 4,942 100 % 4,162 100 % 4,162 100 %
Matthias Rebellius
Managing Board member since Oct. 1, 2020
Prof. Dr. Ralf P. Thomas
Managing Board member since Sept. 18, 2013
2021 2020 2021 2020
€ thousand in % of TTC € thousand in % of TTC € thousand in % of TTC € thousand in % of TTC
Fixed compensation
Base salary 1,102 27 % – – 1,102 25 % 1,102 25 %
+ Fringe benefits 2 83 2 % – – 83 2 % 83 2 %
+ BSAV contribution /amount for free disposal 3 551 13 % – – 617 14 % 617 14 %
= Total 1,735 42 % – – 1,801 41 % 1,801 41 %
Variable compensation
+ Short-term variable compensation
Bonus for fiscal 2021 1,102 27 % – – 1,102 25 % – –
Bonus for fiscal 2020 – – – – – – 1,102 25 %
+ Long-term variable compensation
2021 Stock Awards (vesting: 2020 – 2024) 1,259 31 % – – 1,544 35 % – –
2020 Stock Awards (vesting: 2019 – 2023) – – – – – – 1,544 35 %
= Total target compensation (TTC) 4,096 100 % – – 4,447 100 % 4,447 100 %
Judith Wiese
Managing Board member since Oct. 1, 2020
2021 2020
€ thousand in % of TTC € thousand in % of TTC
Fixed compensation
Base salary 1,102 27 % – –
+ Fringe benefits 2 83 2 % – –
+ BSAV contribution /amount for free disposal 3 551 13 % – –
= Total 1,735 42 % – –
Variable compensation
+ Short-term variable compensation
Bonus for fiscal 2021 1,102 27 % – –
Bonus for fiscal 2020 – – – –
+ Long-term variable compensation
2021 Stock Awards (vesting: 2020 – 2024) 1,259 31 % – –
2020 Stock Awards (vesting: 2019 – 2023) – – – –
= Total target compensation (TTC) 4,096 100 % – –
1 Dr. Roland Busch was first appointed a full member of the Managing Board effective April 1, 2011. He served as Deputy CEO from October 1, 2019, until the end of the Annual Shareholders’ Meeting on February 3, 2021, when he succeeded Joe Kaeser as President and CEO.
2 For fiscal 2021, each Managing Board member was awarded fringe benefits equal to a maximum 7.5 % of his or her base salary. The target amount reported here is also equal to the maximum amount.
3 Matthias Rebellius and Judith Wiese are not included in the Siemens Defined Contribution Pension Plan (BSAV). Instead of BSAV contributions, they receive a fixed cash amount for free disposal.

FISCAL 2021 11
Compensation Report B. Compensation of Managing Board members
Target compensation fiscal 2021 (cont.)
Managing Board members who left during the fiscal year
Joe Kaeser 1
President and CEO until Feb. 3, 2021
Klaus Helmrich 2
Managing Board member until March 31, 2021
2021 2020 2021 2020
€ thousand in % of TTC € thousand in % of TTC € thousand in % of TTC € thousand in % of TTC
Fixed compensation
Base salary 755 26 % 2,205 26 % 551 26 % 1,102 26 %
+ Fringe benefits 3 57 2 % 165 2 % 41 2 % 83 2 %
+ BSAV contribution /amount for free disposal 423 15 % 1,235 15 % 308 15 % 617 15 %
= Total 1,234 43 % 3,605 43 % 901 43 % 1,801 43 %
Variable compensation
+ Short-term variable compensation
Bonus for fiscal 2021 755 26 % – – 551 26 % – –
Bonus for fiscal 2020 – – 2,205 26 % – – 1,102 26 %
+ Long-term variable compensation
2021 Stock Awards (vesting: 2020 – 2024) 861 30 % – – 630 30 % – –
2020 Stock Awards (vesting: 2019 – 2023) – – 2,516 30 % – – 1,259 30 %
= Total target compensation (TTC) 2,850 100 % 8,326 100 % 2,081 100 % 4,162 100 %
1 Prorated compensation for the period from October 1, 2020, up to and including February 3, 2021.2 Prorated compensation for the period from October 1, 2020, up to and including March 31, 2021.3 For fiscal 2021, each Managing Board member was awarded fringe benefits equal to a maximum 7.5 % of his or her base salary.
The target amount reported here is also equal to the maximum amount for the fiscal year on a prorated basis.
B.2.2 Maximum compensationThe maximum compensation of each Managing Board
member is determined annually by the Supervisory Board
in accordance with Section 87 a para. 1 sent. 2 No. 1 of the
German Stock Corporation Act. Maximum compensation
is equal to the total of the maximum amounts of all com
pensation components that can possibly be paid out to
each Managing Board member for the relevant fiscal
year. It is calculated by adding base salary, maximum
fringe benefits, the BSAV contribution (or the amount
for free disposal) as well as two times the Bonus target
amount and three times the Stock Awards target amount.
Twice the Bonus target amount and triple the Stock
Awards target amount also correspond to the respective
limits (individual caps) on the amount of variable com
pensation.
The following table shows the maximum compensation
of each Managing Board member as approved by the
Supervisory Board for fiscal 2021 in accordance with Sec
tion 87 a para. 1 sent. 2 No. 1 of the German Stock Corpo
ration Act.
Maximum compensation fiscal 2021
Managing Board members in office on September 30, 2021
Managing Board memberswho left during the fiscal year
(€ thousand)
Dr. Roland Busch
Cedrik Neike
Matthias Rebellius
Prof. Dr. Ralf P.
ThomasJudithWiese
Joe Kaeser
(until Feb. 3, 2021)
Klaus Helmrich
(until March 31, 2021)
Fixed compensation
Base salary 1,770 1,102 1,102 1,102 1,102 755 551
+ Fringe benefits (maximum amount) 133 83 83 83 83 57 41
+BSAV contribution /amount for free disposal 991 617 551 617 551 423 308
Variable compensation +
Bonus for fiscal 2021(two times target amount) 3,540 2,203 2,203 2,203 2,203 1,509 1,102
+
2021 Stock Awards vesting: 2020 – 2024 (three times target amount)1 7,170 3,777 3,777 4,632 3,777 2,583 1,889
= Maximum compensation 13,604 7,781 7,715 8,636 7,715 5,327 3,891
1 The value of the Siemens shares transferred after the expiration of the vesting period is capped at 300 % of the Stock Awards target amount. If this cap is exceeded, a corresponding number of Stock Awards is forfeited without refund or replacement.

FISCAL 2021 12
Compensation Report B. Compensation of Managing Board members
The base salary and the BSAV contribution (or the amount
for free disposal) are fixed amounts. In no case did the
fringe benefits awarded to a Managing Board member
exceed the maximum amount defined for fiscal 2021. The
Bonus cap was not reached in fiscal 2021.
Since the 2021 Stock Awards tranche is not due until No
vember 2024, compliance with the maximum limit of the
Stock Awards for fiscal 2021 can only be finally assessed
in November 2024, when the 2021 Stock Awards tranche
is settled. However, compliance with the maximum com
pensation for fiscal 2021 in accordance with Section 87 a
of the German Stock Corporation Act is already ensured
since the maximum compensation for fiscal 2021 will not
be exceeded even if the value of the Siemens shares
transferred equals 300 % of the Stock Awards target
amount (cap).
The final assessment of compliance with the maximum
compensation for fiscal 2021 will be included in the Com
pensation Report for fiscal 2025.
B.2.3 Appropriateness of compensationThe Supervisory Board conducted the annual review of
Managing Board compensation in order to determine
the latter ’s appropriateness and conformity with market
conditions. For this purpose, the Supervisory Board
assessed – with the assistance of an external and inde
pendent compensation consultant and in accordance
with the compensation system – the compensation’s
level and structure relative to the companies included in
the DAX 40, the German bluechip stock index, and rela
tive to the companies included in the STOXX Europe 50
( horizontal comparison). In the course of its review, the
Supervisory Board also assessed the development of
Managing Board compensation relative to the compen
sation of Senior Management and Siemens’ total work
force in Germany (vertical comparison). Senior Manage
ment comprises executive employees. The total
workforce comprises Senior Management as well as the
Siemens employees who are covered by collective bar
gaining agreements and those who are not. In addition
to a status quo analysis, the vertical comparison took into
account the development of compensation ratios over
time. Since Siemens Healthineers is a separately man
aged, publicly listed company, its workforce was not in
cluded in the vertical comparison.
The appropriateness review of Managing Board com
pensation for fiscal 2021 has shown that the Managing
Board compensation resulting from target achievement
in fiscal 2021 is appropriate.
B.3 Variable compensation in fiscal 2021
Variable compensation is tied to performance and
accounts for a significant proportion of the total compen
sation of Managing Board members. It consists of a short
term variable component (Bonus) and a longterm variable
component (Stock Awards).
The performance criteria and the key performance indi
cators used to measure performance for variable com
pensation in fiscal 2021 are derived from the Company’s
strategic goals and operational steering and are in line
with the current compensation system. As a rule, all the
performance criteria measure successful value creation
in all its different forms, as strategically envisioned.
In line with Siemens’ social responsibility, sustainability
is also included in the performance criteria.
The performance criteria relevant for fiscal 2021, the key
performance indicators, the focus topics and the ex
planations of how these foster the Company’s longterm
development are shown in the following table.

FISCAL 2021 13
Compensation Report B. Compensation of Managing Board members
Performance criteria of variable compensation and link to strategy
Performance criterion
Key performance indicator / focus topic Bonus
Stock Awards Link to strategy
FIN
AN
CIA
L TA
RG
ET
S
Profit Earnings per share (EPS) ✓
EPS reflects the net income attributable to the shareholders of Siemens AG and incentivizes the sustainable increase in profit – particularly by focusing on profitable growth. This key performance indicator provides a comprehensive perspective that encompasses all units of the Siemens Group.
Profitability / capital efficiency
Return on capital employed (ROCE) ✓
ROCE, which is the primary measure for managing capital efficiency at Group level, reflects our focus on profitable growth, the implementation of measures to sustainably increase competitiveness and stringent working capital management.
Liquidity Cash conversion rate (CCR) ✓
CCR measures the ability to convert profit into cash flow in order to finance growth and offer our shareholders an attractive, progressive dividend policy.
Growth Comparable revenue growth ✓
Further accelerating highvalue qualitative growth is a key element of Siemens’ strategy. As a focused technology company, Siemens wants to expand its position on all targeted markets and tap additional profitable markets.
Long-term value creation
Total shareholder return (TSR) ✓
TSR is a yardstick for measuring the achievement of Siemens’ strategic goal of sustainably increasing Company value. It indicates total value creation for shareholders in the form of increases in the Siemens share price and dividends paid.
NO
N-F
INA
NC
IAL,
QU
ALI
TATI
VE
TA
RG
ET
S
Execution of Company strategy
Diverse focus topics ✓
The individual targets for executing the Company strategy enable the Company to focus on specific factors that are aligned with its short and mediumterm targets and measures in order to ensure its longterm strategic development.
The focus topics in fiscal 2021 comprised business development, optimization /efficiency enhancement, the implementation of portfolio measures and the implementation of other strategic measures.
Sustainability
Diverse focus topics ✓
Succession planning – Thorough succession planning ensures sustainable Company development and fosters talents and young employees.
Innovation performance – Innovation is the basis of our success. The development and introduction of futureoriented technologies, products and services create opportunities for a sustainable and better future by, among other things, reducing emissions and waste and enhancing resource efficiency.
Employee satisfaction – Satisfied employees feel valued. They are motivated and resilient, tackle challenges gladly and thus make a major contribution to the Company ’s success.
Sustainability /diversity – Siemens honors its social responsibility by achieving ambitious sustainability targets and by fostering diversity, inclusion and equal opportunity.
Siemens-internal ESG / Sustainability index
✓
The Siemens-internal ESG / Sustainability index for the 2021 Stock Awards tranche includes:
CO2 emissions – Climate neutrality by 2030 in order to support the 1.5degree target and thus combat global warming.
Digital learning hours – Focus on learning in order to empower our people to remain resilient and relevant in a constantly changing environment.
Net Promoter Score – Strong customer relationships are the basis for sustainable development both for Siemens and for our customers.
The Supervisory Board aims to ensure that the targets
for variable compensation are demanding and ambitious.
If they are not reached, variable compensation can be
reduced to zero. If the targets are significantly exceeded,
target achievement is capped at 200 %.
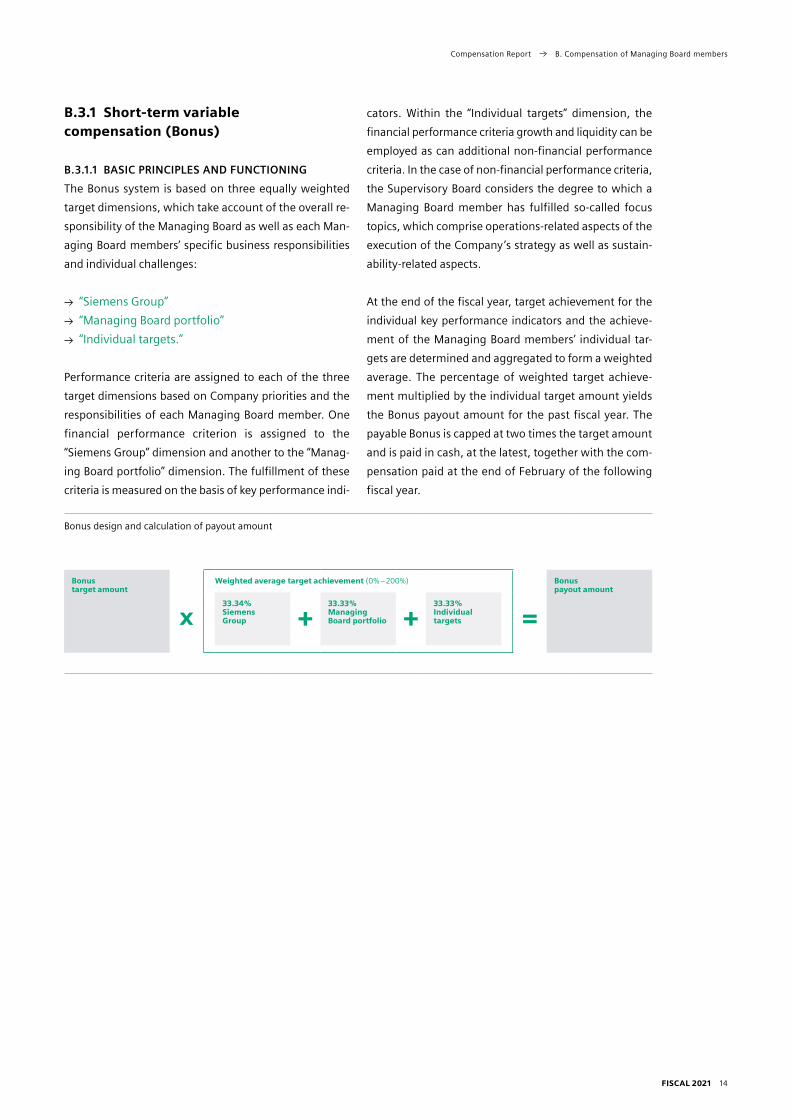
FISCAL 2021 14
Compensation Report B. Compensation of Managing Board members
B.3.1 Short-term variable compensation (Bonus)
B.3.1.1 BASIC PRINCIPLES AND FUNCTIONING
The Bonus system is based on three equally weighted
target dimensions, which take account of the overall re
sponsibility of the Managing Board as well as each Man
aging Board members’ specific business responsibilities
and individual challenges:
“Siemens Group”
“Managing Board portfolio”
“Individual targets.”
Performance criteria are assigned to each of the three
target dimensions based on Company priorities and the
responsibilities of each Managing Board member. One
financial performance criterion is assigned to the
“Siemens Group” dimension and another to the “Manag
ing Board portfolio” dimension. The fulfillment of these
criteria is measured on the basis of key performance indi
cators. Within the “Individual targets” dimension, the
financial performance criteria growth and liquidity can be
employed as can additional nonfinancial performance
criteria. In the case of nonfinancial performance criteria,
the Supervisory Board considers the degree to which a
Managing Board member has fulfilled socalled focus
topics, which comprise operationsrelated aspects of the
execution of the Company’s strategy as well as sustain
abilityrelated aspects.
At the end of the fiscal year, target achievement for the
individual key performance indicators and the achieve
ment of the Managing Board members’ individual tar
gets are determined and aggregated to form a weighted
average. The percentage of weighted target achieve
ment multiplied by the individual target amount yields
the Bonus payout amount for the past fiscal year. The
payable Bonus is capped at two times the target amount
and is paid in cash, at the latest, together with the com
pensation paid at the end of February of the following
fiscal year.
Bonus design and calculation of payout amount
Bonus target amount
Weighted average target achievement (0 % – 200 %) Bonuspayout amount
33.34 % Siemens Group
33.33 % Managing Board portfolio
33.33 % Individual targets
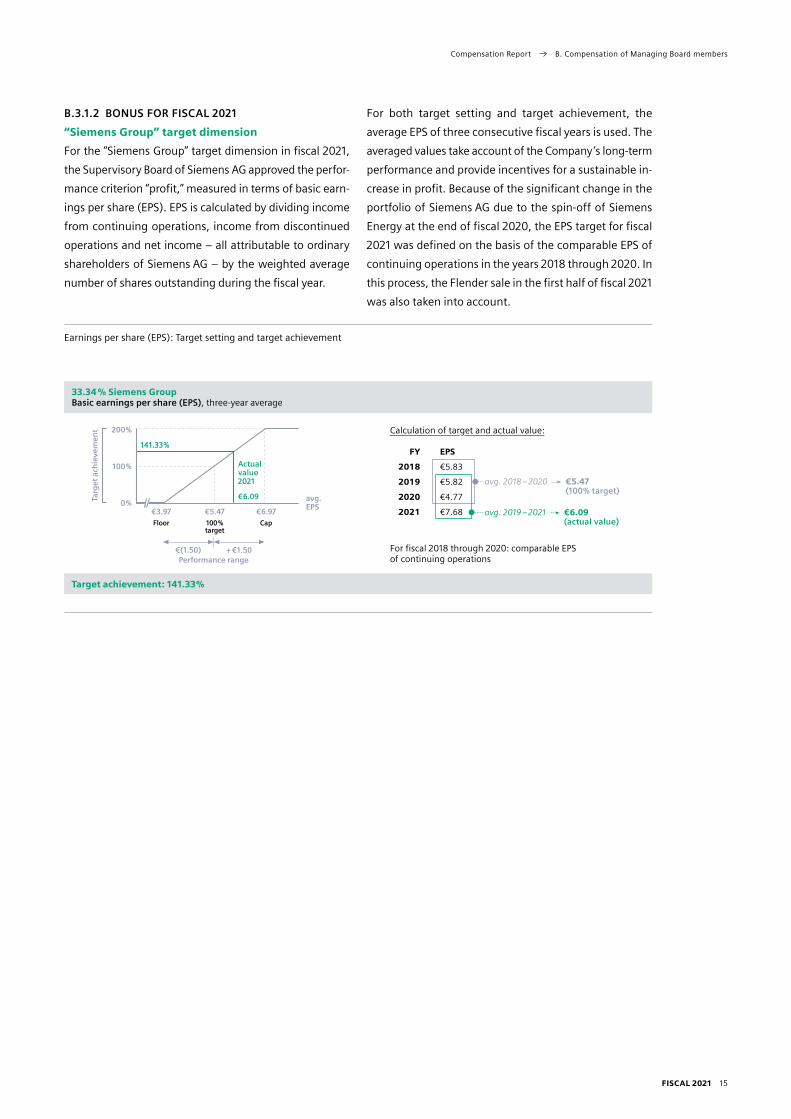
FISCAL 2021 15
Compensation Report B. Compensation of Managing Board members
B.3.1.2 BONUS FOR FISCAL 2021
“Siemens Group” target dimension
For the “Siemens Group” target dimension in fiscal 2021,
the Supervisory Board of Siemens AG approved the perfor
mance criterion “profit,” measured in terms of basic earn
ings per share (EPS). EPS is calculated by dividing income
from continuing operations, income from discontinued
operations and net income – all attributable to ordinary
shareholders of Siemens AG – by the weighted average
number of shares outstanding during the fiscal year.
For both target setting and target achievement, the
average EPS of three consecutive fiscal years is used. The
averaged values take account of the Company’s longterm
performance and provide incentives for a sustainable in
crease in profit. Because of the significant change in the
portfolio of Siemens AG due to the spinoff of Siemens
Energy at the end of fiscal 2020, the EPS target for fiscal
2021 was defined on the basis of the comparable EPS of
continuing operations in the years 2018 through 2020. In
this process, the Flender sale in the first half of fiscal 2021
was also taken into account.
Earnings per share (EPS): Target setting and target achievement
33.34 % Siemens GroupBasic earnings per share (EPS), threeyear average
Actual value 2021
200 %
100 %
0 %
141.33 %
€ 6.09 avg. EPS
€ 3.97Floor
€ 5.47100 % target
€ 6.97Cap
€ (1.50) + € 1.50Performance range
Targ
et a
chie
vem
ent
FY EPS
2018 € 5.83
2019 € 5.82
2020 € 4.77
2021 € 7.68
For fiscal 2018 through 2020: comparable EPS of continuing operations
Calculation of target and actual value:
avg. 2018 – 2020 € 5.47 (100 % target)
avg. 2019 – 2021 € 6.09 (actual value)
Target achievement: 141.33 %

FISCAL 2021 16
Compensation Report B. Compensation of Managing Board members
“Managing Board portfolio” target dimension
Because of the new structure of Siemens AG and the
changes in the assignment of Managing Board respon
sibilities as of October 1, 2020, target setting for the
Bonus for fiscal 2021 focused on the Managing Board’s
overall responsibility, crossbusiness collaboration and
Siemens’ strategic realignment. For this reason, the
Supervisory Board of Siemens AG established “profit
ability /capital efficiency” measured in terms of return on
capital employed (ROCE) as the performance criterion
for the “Managing Board portfolio” target dimension for
fiscal 2021 for all Managing Board members. ROCE is
defined as profit before interest and after tax divided by
average capital employed. The target amount for ROCE
is based on the budget plans. To focus on the operating
performance of Siemens AG, Varian and main effects
relating to the stake in Siemens Energy (profit “Siemens
Energy Investment” and asset “Siemens Energy Invest
ment”) were disregarded in target setting and in deter
mining ROCE target achievement.
Return on capital employed (ROCE): Target setting and target achievement
33.33 % Managing Board portfolio Return on capital employed (ROCE)
200 %
100 %
0 %
200.00 %
18.56 %ROCE
Actual value 2021
Targ
et a
chie
vem
ent
Performance range+ 3.0 ppts.(3.0) ppts.
8.54 % Floor
11.54 %100 % target
14.54 %Cap
Calculation:
ROCE (as reported)
Varian and Siemens Energyrelated effects
Actual ROCE value
13.10 %
+ 5.46 percentage points
18.56 %
Target achievement: 200.00 %
“Individual targets” target dimension
The “Individual targets” target dimension comprises two
to four equally weighted individual targets, achievement
of each of which may be between 0 % and 200 %.
When setting the targets for fiscal 2021, the Supervisory
Board took into account both the shared tasks and the
individual responsibilities of the Managing Board mem
bers. For this reason, the cash conversion rate (CCR) was
defined as a target for all Managing Board members. The
CCR reflects a company’s ability to convert profit into
available cash. For the President and CEO and the
Managing Board members with primarily functional
responsibility, the CCR target was defined on the basis of
Siemens’ Industrial Businesses (IB). The CCR IB is defined
as the ratio of free cash flow from IB to Adjusted EBITA IB.
For the Managing Board members with business respon
sibility for Digital Industries (DI) and Smart Infrastructure
(SI), the CCR targets are businessspecific and defined as
the ratio of free cash flow to Adjusted EBITA at each busi
ness. The target amounts for CCR were based on the
budget plans.
The other individual targets were defined on the basis of
the Managing Board members’ respective areas of re
sponsibility.

FISCAL 2021 17
Compensation Report B. Compensation of Managing Board members
Individual targets: Target setting and target achievement
33.33 % Individual targets2 to 4 individual targets, target achievement between 0 % and 200 % each
Calculation:
Average achievement of the equally weighted individual targets: CCR as reported, growth and /or further nonfinancial, qualitative individual targets
Cash conversion rate
Industrial Businesses Digital Industries Smart Infrastructure
200 %
100 %
0 %
134.00 %
1.12CCR
Actualvalue2021
(0.5) + 0.5Performance range
0.45 Floor
0.95 100 %target
1.45Cap
Targ
et a
chie
vem
ent
0.56 Floor
0.96 100 %target
1.36Cap
140.00 %
1.12CCR
(0.4) + 0.4Performance range
Targ
et a
chie
vem
ent 200 %
100 %
0 %
Actualvalue2021
160.00 %
1.20CCR
(0.4) + 0.4Performance range
Targ
et a
chie
vem
ent 200 %
100 %
0 %0.56 Floor
0.96 100 %target
1.36Cap
Actualvalue2021
Individual targets per Managing Board member
WeightingKey performance indicator / focus topic Target setting
Target achievement
Total target achievement
Dr. Roland Busch
25 % Cash conversion rate CCR IB 134.00 %
133.50 %75 %
Growth Expansion of the software and digital businesses
avg. 133.33 %Implementation of other strategic measures Further development of the strategy for the Mobility business
Succession planning Succession planning, taking into consideration Siemens’ diversity targets
Cedrik Neike
25 % Cash conversion rate CCR DI 140.00 %
132.50 %75 %
Growth Expansion of the software and digital businesses
avg. 130.00 %Implementation of other strategic measures
Further development of the strategy for Digital Industries and Advanta
Innovation performance Expansion und use of innovative IoT solution building blocks
Matthias Rebellius
25 % Cash conversion rate CCR SI 160.00 %
125.00 %75 %
Growth Expansion of the software and digital businesses
avg. 113.33 %Implementation of other strategic measures
Further development of the strategy for Smart Infrastructure and Supply Chain Management
Innovation performance Expansion and use of innovative IoT solution building blocks
Prof. Dr. Ralf P. Thomas
25 % Cash conversion rate CCR IB 134.00 %
131.00 %75 %
Implementation of portfolio measures
Implementation of portfolio measures and drive performance of Portfolio Companies
avg. 130.00 %Optimization /efficiency enhancement
Performance of Siemens Financial Services and optimization of finance organization
Implementation of other strategic measures Preserve rating and safeguard deleveraging
Judith Wiese
25 % Cash conversion rate CCR IB 134.00 %
126.00 %75 %
Business development Expansion of Global Business Services
avg. 123.33 %Employee satisfaction Strengthening employee responsibility and people development
Sustainability /diversity Implementation and realization of CO2 climate targets; succession planning, taking into consideration Siemens’ diversity targets
Managing Board members who left during the fiscal year
Joe Kaeser50 % Cash conversion rate CCR IB 134.00 %
122.00 %50 % Succession planning Successful transition to new CEO Dr. Roland Busch 110.00 %
Klaus Helmrich
33 % Cash conversion rate CCR IB 134.00 %
118.00 %67 %
Growth Optimization of the regional growth conceptavg. 110.00 %
Succession planning Successful transition of the Digital Industries business to Cedrik Neike
Target achievement: 118.00 % to 133.50 %
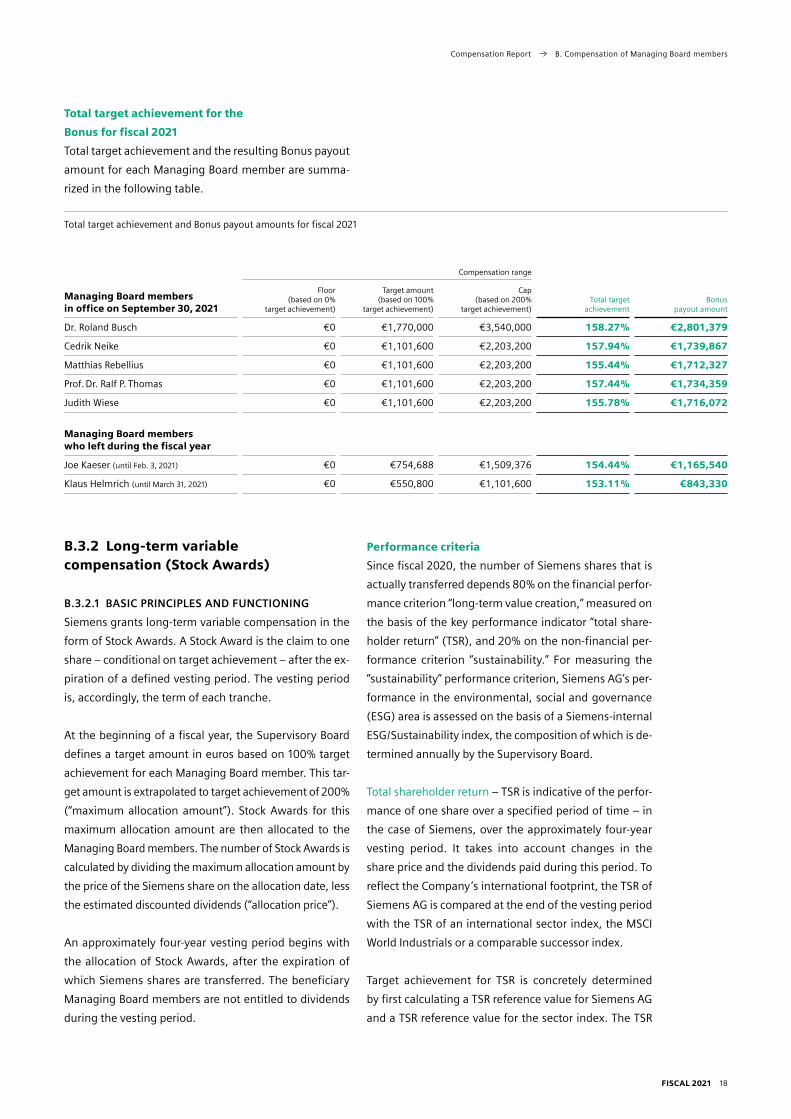
FISCAL 2021 18
Compensation Report B. Compensation of Managing Board members
Total target achievement for the
Bonus for fiscal 2021
Total target achievement and the resulting Bonus payout
amount for each Managing Board member are summa
rized in the following table.
Total target achievement and Bonus payout amounts for fiscal 2021
Compensation range
Managing Board members in office on September 30, 2021
Floor(based on 0 %
target achievement)
Target amount (based on 100 %
target achievement)
Cap (based on 200 %
target achievement)Total target
achievementBonus
payout amount
Dr. Roland Busch € 0 € 1,770,000 € 3,540,000 158.27 % € 2,801,379
Cedrik Neike € 0 € 1,101,600 € 2,203,200 157.94 % € 1,739,867
Matthias Rebellius € 0 € 1,101,600 € 2,203,200 155.44 % € 1,712,327
Prof. Dr. Ralf P. Thomas € 0 € 1,101,600 € 2,203,200 157.44 % € 1,734,359
Judith Wiese € 0 € 1,101,600 € 2,203,200 155.78 % € 1,716,072
Managing Board members who left during the fiscal year
Joe Kaeser (until Feb. 3, 2021) € 0 € 754,688 € 1,509,376 154.44 % € 1,165,540
Klaus Helmrich (until March 31, 2021) € 0 € 550,800 € 1,101,600 153.11 % € 843,330
B.3.2 Long-term variable compensation (Stock Awards)
B.3.2.1 BASIC PRINCIPLES AND FUNCTIONING
Siemens grants longterm variable compensation in the
form of Stock Awards. A Stock Award is the claim to one
share – conditional on target achievement – after the ex
piration of a defined vesting period. The vesting period
is, accordingly, the term of each tranche.
At the beginning of a fiscal year, the Supervisory Board
defines a target amount in euros based on 100 % target
achievement for each Managing Board member. This tar
get amount is extrapolated to target achievement of 200 %
(“maximum allocation amount”). Stock Awards for this
maximum allocation amount are then allocated to the
Managing Board members. The number of Stock Awards is
calculated by dividing the maximum allocation amount by
the price of the Siemens share on the allocation date, less
the estimated discounted dividends (“allocation price”).
An approximately fouryear vesting period begins with
the allocation of Stock Awards, after the expiration of
which Siemens shares are transferred. The beneficiary
Managing Board members are not entitled to dividends
during the vesting period.
Performance criteria
Since fiscal 2020, the number of Siemens shares that is
actually transferred depends 80 % on the financial perfor
mance criterion “longterm value creation,” measured on
the basis of the key performance indicator “total share
holder return” (TSR), and 20 % on the nonfinancial per
formance criterion “sustainability.” For measuring the
“sustainability” performance criterion, Siemens AG’s per
formance in the environmental, social and governance
(ESG) area is assessed on the basis of a Siemensinternal
ESG / Sustainability index, the composition of which is de
termined annually by the Supervisory Board.
Total shareholder return – TSR is indicative of the perfor
mance of one share over a specified period of time – in
the case of Siemens, over the approximately fouryear
vesting period. It takes into account changes in the
share price and the dividends paid during this period. To
reflect the Company’s international footprint, the TSR of
Siemens AG is compared at the end of the vesting period
with the TSR of an international sector index, the MSCI
World Industrials or a comparable successor index.
Target achievement for TSR is concretely determined
by first calculating a TSR reference value for Siemens AG
and a TSR reference value for the sector index. The TSR

FISCAL 2021 19
Compensation Report B. Compensation of Managing Board members
reference value is equal to the average of the endof
month values over the first 12 months of the vesting
period (reference period).
In order to determine at the end of the vesting period
how well the TSR of Siemens AG has performed rela
tive to the TSR of the sector index, the TSR perfor
mance value is calculated over the subsequent 36 months
(performance period). The TSR performance value is the
average of the endofmonth values during the perfor
mance period.
At the end of the vesting period, the change in Siemens’
TSR as well as that of the sector index is determined by
comparing the TSR reference values with the TSR perfor
mance values.
Calculation of TSR reference values and TSR performance values for Stock Awards
FYn FYn+1 FYn+4
NOV NOVOCT OCT
12 months 36 months
TSR reference values for MSCI World Industrials index Siemens AG
TSR performance values for MSCI World Industrials index Siemens AG
The following applies for the determination of target
achievement.
Calculation of TSR target achievement
Targ
et a
chie
vem
ent
200 %
100 %
0 %
Siemens compared to MSCI World Industrials index
Relative TSR
+ 20 ppts.(20) ppts.
If the change in the TSR of Siemens AG is at least 20 percentage points above that of the sector index, target achievement is 200 %.
If the change in the TSR of Siemens AG is equal to that of the sector index, target achievement is 100 %.
If the change in the TSR of Siemens AG is at least 20 percentage points below that of the sector index, target achievement is 0 %.
If the change in the TSR of Siemens AG is between 20 percentage points above and 20 percentage points below that of the sector index, target achievement is calculated using linear interpolation.
Environmental, social and governance – The Siemens
internal ESG / Sustainability index is based on three
equally weighted, structured and verifiable ESG key per
formance indicators. At the beginning of each tranche,
the Supervisory Board defines ambitious target values for
each of the ESG key performance indicators. Target mea
surement is based on defined interim targets for each
fiscal year. Target achievement for the Siemensinternal
ESG / Sustainability index is finally determined at the end
of the approximately fouryear vesting period on the
basis of the weighted average of the target achievement
values calculated for each of the key performance indi
cators.

FISCAL 2021 20
Compensation Report B. Compensation of Managing Board members
Determination of total target achievement
At the end of the approximately fouryear vesting period,
the Supervisory Board determines the degree of target
achievement. The target achievement range for TSR and for
the Siemensinternal ESG / Sustainability index is between
0 % and 200 %. If target achievement is less than 200 %, a
number of Siemens Stock Awards equivalent to the short
fall are forfeited without refund or replacement and a
correspondingly smaller number of shares is transferred.
The value of the Siemens shares transferred after the ex
piration of the vesting period is also capped at 300 % of
the target amount. If this cap is exceeded, a correspond
ing number of Stock Awards is forfeited without refund
or replacement.
The remaining number of Stock Awards is settled by the
transfer of Siemens shares to the relevant Managing
Board member.
Calculation of Siemens shares to be transferred (illustrative)
ESG (Weighting: 20 %)
TSR (Weighting: 80 %)
ESG
TSR
Maximum number of Stock Awards (based on 200% target achievement)
Number of Stock Awards based on target achievement
Adjustment to actual target achievement
120 %
110 % Xetra closing price of Siemens share on transfer date
Value of Stock Awards in euros (Cap: 300 %)
> 300 % of target amountNumber of Stock Awards based on target achievement is reduced by amount by which cap is exceeded
≤ 300 % of target amountNumber of Stock Awards based on target achievement = final number of Stock Awards
Final number of Stock Awards
Settlement by transfer of Siemens shares to Managing Board member

FISCAL 2021 21
Compensation Report B. Compensation of Managing Board members
B.3.2.2 ALLOCATION OF STOCK AWARDS
IN FISCAL 2021
The Supervisory Board approved the following perfor
mance criteria for the 2021 Stock Awards tranche:
“Longterm value creation,” measured in terms of the
development of the TSR of Siemens AG relative to the
international sector index MSCI World Industrials and
“Sustainability,” measured in terms of the Siemens
internal ESG / Sustainability index, which is based on
the following three equally weighted key performance
indicators:
ESG key performance indicators for 2021 Stock Awards tranche
CO2 emissions Digital learning hours per employee Net Promoter Score (NPS)
Amount of greenhouse gases emitted by the Company ’s business operations in tons of CO2 equivalent, excluding carbon offsets (for example, certificates).
The total number of digital learning hours completed in virtual trainerled training sessions, selfpaced learning, learning on the job, communitybased virtual learning and hybrid training sessions, divided by the total number of employees.
Customer intention to recommend us, measured on a scale of 1 (extremely unlikely) to 10 (extremely likely). NPS is defined as the number of promoters (%) minus the number of detractors (%).
The Supervisory Board set the allocation date for the
2021 Stock Awards tranche at November 13, 2020. The
time sequence of this tranche is as follows.
Time sequence for the 2021 Stock Awards tranche
OCT ’20 OCT ’21NOV ’20 NOV ’21 2022 2023 OCT ’24SEPT ’24 NOV ’24
Process sequence
Performance measurement
Allocation and four-year vesting period Transfer
TSR reference period
ESG performance measurement based on interim targets for each fiscal year
TSR performance period
The target amounts, the maximum allocation amounts,
the maximum number of Stock Awards allocated and
the fair value at allocation date in accordance with IFRS 2
Sharebased Payment are shown in the following table.
The allocation price applicable for the 2021 tranche was
€ 98.31.

FISCAL 2021 22
Compensation Report B. Compensation of Managing Board members
Information on the allocation of 2021 Stock Awards tranche
Based on 200 % target achievement
Target amount (based on 100 %
target achievement)Maximum
allocation amountMaximum number
of Stock AwardsFair value at
allocation date 1
Managing Board members in office on September 30, 2021
Total shareholder return (Weighting 80 %)
Siemensinternal ESG / Sustainability index
(Weighting 20 %)
Dr. Roland Busch € 2,390,000 € 4,780,000 38,897 9,724 € 2,795,114
Cedrik Neike € 1,259,000 € 2,518,000 20,490 5,123 € 1,472,460
Matthias Rebellius 2 € 1,259,000 € 2,518,000 20,490 5,122 € 1,472,362
Prof. Dr. Ralf P. Thomas € 1,544,000 € 3,088,000 25,129 6,282 € 1,805,745
Judith Wiese 3 € 1,259,000 € 2,518,000 20,490 5,123 € 1,472,460
Managing Board members who left during the fiscal year
Joe Kaeser (until Feb. 3, 2021) € 861,131 € 1,722,262 14,015 3,504 € 1,007,142
Klaus Helmrich (until March 31, 2021) € 629,500 € 1,259,000 10,245 2,561 € 736,181
1 The fair value on the allocation date is calculated for the TSR component on the basis of a valuation model and amounts to € 47.37. The fair value for the ESG component of € 97.96 is equal to the Xetra closing price of the Siemens share on the allocation date, less the discounted expected dividends. For the 2021 tranche, the allocation date in accordance with IFRS 2 was December 14, 2020 (the date of communication to the Managing Board members).
2 In addition to his position as a member of the Managing Board of Siemens AG, Matthias Rebellius is Chairman of the Board of Directors and CEO of Siemens Schweiz AG. The corresponding legal relationship is defined in a separate contract between Matthias Rebellius and Siemens Schweiz AG. The entire compensation he receives under the terms of his contract with Siemens Schweiz AG is deducted from his Managing Board compensation. Of the target amount reported here (based on 100 % target achievement), € 600,000 is attributable to Siemens Schweiz AG.
3 As compensation for the loss of benefits granted by her former employer, the Supervisory Board allotted to Judith Wiese onetime compensation of € 1,469,124 (gross) in fiscal 2021 – 50 % in cash and the remaining 50 % in the form of Stock Awards from the 2021 tranche. Accordingly, a further 14,944 Stock Awards from the 2021 tranche with a fair value of € 859,111 were allocated to Judith Wiese in November 2020, based on target achievement of 200 %.
Concrete target setting and the degree of target achieve
ment for the Siemensinternal ESG / Sustainability index
of the 2021 Stock Awards tranche will be published to
gether with the degree of target achievement for the
TSR in the Compensation Report for fiscal 2025, after the
expiration of the vesting period.
B.3.2.3 TRANSFER OF STOCK AWARDS
IN FISCAL 2021 (2017 TRANCHE)
The 2017 Stock Awards tranche became due and was
settled in fiscal 2021. The 2017 Stock Awards tranche de
pended on the performance of the Siemens share com
pared to the share performance of five relevant compet
itors during the approximately fouryear vesting period
from November 11, 2016, to November 12, 2020.
Overview of target achievement for the 2017 Stock Awards tranche
Performance of the Siemens share compared to the share performance of five relevant competitors
Reference price
Performance price
Reference price versus performance price
ABB CHF 23.26 CHF 21.33 (8.27) %
GE $26.40 $10.42 (60.54) %
MHI ¥4,607.00 ¥3,867.60 (16.05) %
Rockwell $159.09 $183.62 15.42 %
Schneider €65.55 €78.71 20.08 %
(9.87) % Δ = (2.16) percentage pointsSiemens AG €108.32 €95.29 (12.03) %
Target achievement: 89 %
Competitors (average)

FISCAL 2021 23
Compensation Report B. Compensation of Managing Board members
The following table provides a summary of the key pa
rameters of the 2017 Stock Awards tranche. In connection
with the due date and settlement of the Stock Awards for
fiscal 2017, the table also includes an additional cash pay
ment to the Managing Board members as a result of the
Siemens Energy spinoff. The spinoff of Siemens Energy
in fiscal 2020 led to adjustments in the stockbased com
pensation commitments agreed upon until the spinoff
date. At the time when the 2017 Stock Awards became
due, the Managing Board members – like all other eligi
ble employees – were, accordingly, entitled to receive an
additional cash payment based on the spinoff ratio of 2:1
and on the Siemens Energy share price of € 22.20 on the
date when their stockbased compensation commit
ments became due.
Information on the transfer of the 2017 Stock Awards tranche
Target amount(based on
100% target achievement)
Allocation price
Nov. 11, 2016
Number of Stock Awards 1
allocated
Target achievement
of share price performance
Number of Stock Awards 1
calculated
Value attransfer date
Nov. 13, 2020 2
Cash payment Siemens Energy
spinoff
Managing Board members in office on September 30, 2021
Dr. Roland Busch € 1,100,000 / € 91.32 = 12,046 x 89 % = 10,721 € 1,209,114 + € 119,003
Cedrik Neike (since April 1, 2017) 3 € 550,000 / € 91.32 = 6,023 x 89 % = 5,360 € 608,849 + € 59,836
Prof. Dr. Ralf P. Thomas € 1,100,000 / € 91.32 = 12,046 x 89 % = 10,721 € 1,209,114 + € 119,003
Managing Board members who left during the fiscal year
Joe Kaeser (until Feb. 3, 2021) € 2,200,000 / € 91.32 = 24,092 x 89 % = 21,442 € 2,418,229 + € 238,006
Klaus Helmrich (until March 31, 2021) € 1,100,000 / € 91.32 = 12,046 x 89 % = 10,721 € 1,209,114 + € 119,003
1 Cedrik Neike was appointed a full member of the Managing Board effective April 1, 2017. Due to his intrayear appointment, his Stock Awards target amount for fiscal 2017 was determined on a prorated basis and, instead of Stock Awards, a corresponding number of Phantom Stock Awards was allocated to him in accordance with plan requirements. In contrast to Stock Awards, these Phantom Stock Awards were settled after the end of the vesting period by cash payment rather than by share transfer. In addition to his position as a member of the Managing Board, Cedrik Neike served as Executive Chairman of the Board of Directors of Siemens Ltd. China from May 1, 2017, to March 31, 2019. Of the allocated number of Phantom Stock Awards reported here, 1,141 are attributable to the commitment by Siemens Ltd. China. Of the calculated number of Phantom Stock Awards reported here, 1,015 were awarded and paid by Siemens Ltd. China.
2 The Stock Awards settled by share transfer were valued at € 112.78, the German low price of the Siemens share on November 13, 2020.3 The amount reported for Cedrik Neike under “Value at transfer date” comprises the 4,345 Phantom Stock Awards allocated by Siemens AG that were valued
at € 113.72, the Xetra closing price of the Siemens share on November 12, 2020, in accordance with the plan requirements applicable to the Managing Board as well as the 1,015 Stock Awards allocated by Siemens Ltd. China that were valued at € 113.04, the Xetra closing price of the Siemens share on November 13, 2020, in accordance with the plan requirements applicable to Senior Management. For the calculation of the additional cash payment resulting from the Siemens Energy spinoff, the Xetra closing prices of the Siemens Energy share on November 12, 2020, of € 22.20 and on November 13, 2020, of € 22.87, respectively, were used in accordance with the relevant plan requirements.
In the course of transferring the 2017 Stock Awards
tranche, compliance with the maximum amounts of total
compensation for fiscal 2017 was also reviewed. The ap
plicable maximum amount was not exceeded in the case
of any active or former Managing Board member.

FISCAL 2021 24
Compensation Report B. Compensation of Managing Board members
B.3.2.4 CHANGES IN STOCK AWARDS
IN FISCAL 2021
The following overview shows the changes in the balance
of the Stock Awards held by Managing Board members in
fiscal 2021.
Changes in Stock Awards in fiscal 2021
During fiscal year
(Amounts in number of units) 1
Balance at beginning of fiscal 2021 Allocated Vested and settled Other changes 2
Balance at the end of fiscal 2021
Managing Board members in office on September 30, 2021
Dr. Roland Busch 83,308 48,621 10,721 1,325 119,883
Cedrik Neike 3 70,291 25,613 5,360 663 89,881
Matthias Rebellius – 25,612 – – 25,612
Prof. Dr. Ralf P. Thomas 88,967 31,411 10,721 1,325 108,332
Judith Wiese 4 – 40,557 – – 40,557
Managing Board members who left during the fiscal year
Joe Kaeser (until Feb. 3, 2021) 152,528 17,519 21,442 2,650 145,955
Klaus Helmrich (until March 31, 2021) 76,314 12,806 10,721 1,325 77,074
1 The settlement of Stock Awards from the 2018 tranche will be by share transfer up to a target achievement of 100 %, and above 100 % in cash. For this reason, the number of Stock Awards from the 2018 tranche, as set out in the table, is based on a target achievement of 100 %. Starting with the 2019 tranche, settlement of Stock Awards will be entirely by share transfer. For this reason, the number of Stock Awards, as set out in the table, is based on a target achievement of 200 %. At the end of the vesting period, a final number of Siemens shares to be transferred will be determined on the basis of actual target achievement and taking into account the Stock Awards cap.
2 The target achievement of the Stock Awards from the 2017 tranche, which were due and settled in fiscal 2021, was 89 %. As the Stock Awards from the 2017 tranche were allocated on the basis of 100 % target achievement, a number equivalent to this shortfall was forfeited without refund or replacement, in accordance with plan requirements.
3 In addition to his position as a member of the Managing Board, Cedrik Neike served as Executive Chairman of the Board of Directors of Siemens Ltd. China from May 1, 2017, to March 31, 2019. The reported figures include the Stock Awards allocated to Cedrik Neike by Siemens Ltd. China due to this position.
4 The reported figures also include the Stock Awards allocated to Judith Wiese in November 2020 as compensation for the loss of benefits granted by her former employer in addition to the regular allocation of Stock Awards from the 2021 tranche.
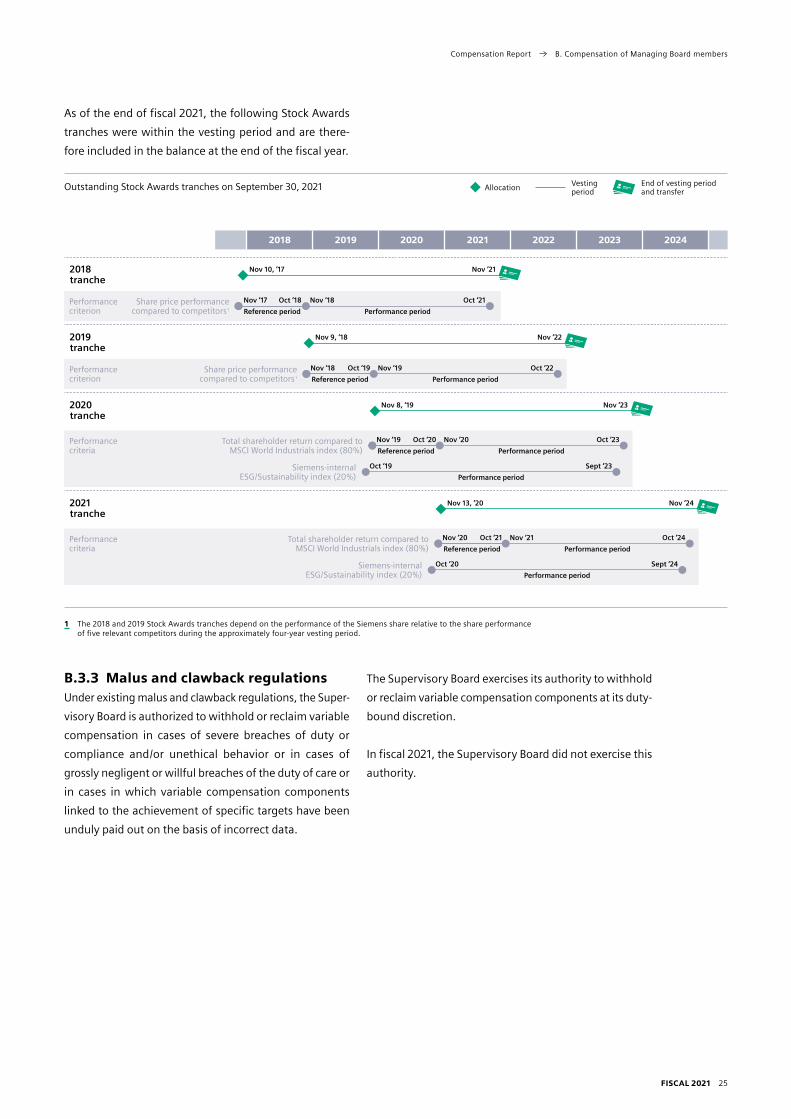
FISCAL 2021 25
Compensation Report B. Compensation of Managing Board members
As of the end of fiscal 2021, the following Stock Awards
tranches were within the vesting period and are there
fore included in the balance at the end of the fiscal year.
Outstanding Stock Awards tranches on September 30, 2021 Allocation Vesting period
End of vesting period and transfer
2018 2019 2020 2021 2022 2023 2024
2018tranche
Nov 10, ’17 Nov ’21
Performance criterion
Share price performance compared to competitors 1 Reference period
Nov ’17 Nov ’18Oct ’18 Oct ’21
Performance period
2019tranche
Nov 9, ’18 Nov ’22
Performance criterion
Share price performance compared to competitors 1 Reference period
Nov ’18 Nov ’19Oct ’19 Oct ’22
Performance period
2020tranche
Nov 8, ’19 Nov ’23
Performance criteria
Total shareholder return compared to MSCI World Industrials index (80 %) Reference period
Nov ’19 Nov ’20Oct ’20 Oct ’23
Performance period
Siemensinternal ESG / Sustainability index (20 %)
Oct ’19 Sept ’23
Performance period
2021tranche
Nov 13, ’20 Nov ’24
Performance criteria
Total shareholder return compared to MSCI World Industrials index (80 %) Reference period
Nov ’20 Nov ’21Oct ’21 Oct ’24
Performance period
Siemensinternal ESG / Sustainability index (20 %)
Oct ’20 Sept ’24
Performance period
1 The 2018 and 2019 Stock Awards tranches depend on the performance of the Siemens share relative to the share performance of five relevant competitors during the approximately fouryear vesting period.
B.3.3 Malus and clawback regulationsUnder existing malus and clawback regulations, the Super
visory Board is authorized to withhold or reclaim variable
compensation in cases of severe breaches of duty or
compliance and /or unethical behavior or in cases of
grossly negligent or willful breaches of the duty of care or
in cases in which variable compensation components
linked to the achievement of specific targets have been
unduly paid out on the basis of incorrect data.
The Supervisory Board exercises its authority to withhold
or reclaim variable compensation components at its duty
bound discretion.
In fiscal 2021, the Supervisory Board did not exercise this
authority.

FISCAL 2021 26
Compensation Report B. Compensation of Managing Board members
B.4 Share Ownership Guidelines
The deadlines by which the individual Managing Board
members must first verify compliance with the Share
Ownership Guidelines (SOG) vary from member to mem
ber, depending on when they were appointed to the
Managing Board. For Managing Board members in office
on September 30, 2021, the following table shows the
number of Siemens shares that each held in order to
comply with the SOG on March 12, 2021, the verification
date. It also shows the number of shares to be held
throughout the Managing Board members’ terms of of
fice with a view to future verification dates.
Obligations under the Share Ownership Guidelines
Required Verified
Managing Board members in office on September 30, 2021, and required to verify compliance on March 12, 2021
Percentage of base salary 1
Value in € 1
Number of shares 2
Percentage of base salary 1
Value in € 2
Number of shares 3
Dr. Roland Busch 4 200 % 2,446,325 22,013 268 % 3,280,002 29,515
Prof. Dr. Ralf P. Thomas 200 % 2,181,725 19,632 299 % 3,264,444 29,375
Total 4,628,050 41,645 6,544,446 58,890
1 The amount of the obligation is based on the average base salary during the four years prior to the respective verification dates.2 Based on the average Xetra opening price of € 111.13 for the fourth quarter of 2020 (October to December).3 As of March 12, 2021 (verification date).4 Dr. Roland Busch was appointed President and CEO only after the reference date relevant for the calculation of the SOG target.
As a result, the amount of his obligation on the verification date of March 12, 2021, was still 200 % of his relevant average base salary.
B.5 Pension benefit commitment
Most of the members of the Managing Board are in
cluded in the Siemens Defined Contribution Pension Plan
(BSAV). Newly appointed members of the Managing Board
can be awarded, instead of BSAV contributions, a fixed
cash amount for free disposal.
Contributions under the BSAV are credited to the individ
ual pension accounts in the January following each fiscal
year. Until pension payments begin, members’ pension
accounts are credited with an annual interest payment
(guaranteed interest) in January of each year. The inter
est rate is currently 0.90 %.
Information on the BSAV
Contributions 1 Service costs
according to IAS 19R
Defined benefit obligation for all pension commitments
excluding deferred compensation 2
(Amounts in €) 2021 2020 2021 2020 2021 2020
Managing Board members in office on September 30, 2021
Dr. Roland Busch 991,200 616,896 932,613 608,225 8,538,765 6,566,101
Cedrik Neike 616,896 616,896 594,468 621,266 4,069,811 2,938,080
Prof. Dr. Ralf P. Thomas 616,896 616,896 588,070 601,098 8,431,412 6,702,858
Total 2,224,992 1,850,688 2,115,151 1,830,589 21,039,988 16,207,039
Managing Board members who left during the fiscal year
Joe Kaeser (until Feb. 3, 2021) 422,625 1,234,800 0 1,219,888 13,028,557 15,592,209
Klaus Helmrich (until March 31, 2021) 308,448 616,896 294,170 611,168 7,397,589 7,026,562
Total 731,073 1,851,696 294,170 1,831,056 20,426,146 22,618,771
1 As in the previous year, a total of € 22,950 is attributable to the funding of personal pension benefit commitments earned prior to the transfer to the BSAV.2 Deferred compensation totals € 4,164,429 (2020: € 3,911,848), including € 3,741,588 for Joe Kaeser (2020: € 3,512,020), € 359,363 for Klaus Helmrich (2020: € 342,276)
and € 63,478 for Prof. Dr. Ralf P. Thomas (2020: € 57,552).

FISCAL 2021 27
Compensation Report B. Compensation of Managing Board members
Judith Wiese and Matthias Rebellius, who were newly
appointed to the Managing Board as of October 1, 2020,
are not included in the BSAV. Instead of BSAV contribu
tions, the Supervisory Board awarded them for fiscal 2021
a fixed cash amount of € 550,800 each for free disposal.
This amount will be paid in January 2022.
B.6 Compensation awarded and due
B.6.1 Active Managing Board members in fiscal 2021The following tables show the compensation awarded
and due to the active members of the Managing Board in
fiscal 2021 and fiscal 2020 in accordance with Sec
tion 162, para. 1, sent. 1 of the German Stock Corporation
Act. As a result, they include all the amounts actually paid
to individual Managing Board members in the reporting
period (“awarded compensation”) and /or all the compen
sation that is legally due but not yet received (“due com
pensation”).
The Bonus is reported under “Shortterm variable com
pensation” as “due compensation” since the underlying
services were fully rendered by the end of each period
(September 30). Therefore, the Bonus payout amounts
for the reporting year are reported, although payout only
occurs after the end of each reporting year, in order to
make reporting transparent and comprehensible and in
order to guarantee a connection between performance
and compensation in the reporting period.
Furthermore, in fiscal 2021 and 2020, the Stock Awards
from the 2017 and 2016 tranches allocated in fiscal 2017
and 2016, respectively, became due and were settled by
transfer of Siemens shares. The value of Siemens shares
at the time of transfer is reported under “Longterm vari
able compensation.”
In connection with the due date and settlement of the
Stock Awards for fiscal 2017, the table also includes the
additional cash payment to eligible Managing Board
members as a result of the Siemens Energy spinoff.
The spinoff of Siemens Energy in fiscal 2020 led to ad
justments in the stockbased compensation allocations
agreed upon until the spinoff date. At the time when
the 2017 Stock Awards became due, the Managing
Board members – like all other eligible employees –
were, accordingly, entitled to receive an additional
cash payment based on the spinoff ratio of 2:1 and on
the Siemens Energy share price of € 22.20 on the date
when their stockbased compensation allocations be
came due.
Compensation awarded and due in fiscal 2021
Payout latest in Feb ’22
Oct Nov Dec Jan Feb March April May June July Aug Sep
Base salary and fringe benefits
Amount for free disposalPayout in Jan ’22
Long-term variable compensation: 2017 Stock Awards tranche
Short-term variable compensation: Bonus for 2021
Compensation granted in connection with the commencement / termination of appointments
Monthly payout
2021 20222017
Settlement inNov ’20 plus cash payment relating to Siemens Energy spinoff
Fixed compensation
Variable compensation
Other
In addition to the amounts of compensation, Section 162
para. 1 sent. 2 No. 1 of the German Stock Corporation Act
requires disclosure of the relative proportion of total
compensation represented by all fixed and variable
compensation components. The relative proportions
reported here refer to the compensation components
“awarded” and “due” in the respective fiscal years in
accordance with Section 162 para. 1 sent. 1 of the German
Stock Corporation Act.
Although the service costs for Company pension plans
are not to be classified as awarded and due compensa
tion, they are also reported in the following table for pur
poses of transparency.

FISCAL 2021 28
Compensation Report B. Compensation of Managing Board members
Compensation awarded and due in accordance with Section 162 para. 1 sent 1 AktG –Active Managing Board members in fiscal 2021
Managing Board members in office on September 30, 2021
Dr. Roland Busch 1 President and CEO since Feb. 3, 2021
Cedrik Neike 2, 3
Managing Board member since April 1, 2017
2021 2020 2021 2020
€ thousand in % of TC € thousand in % of TC € thousand in % of TC € thousand in % of TC
Fixed compensation
Base salary 1,770 29 % 1,352 30 % 1,102 31 % 1,102 55 %
+ Fringe benefits 109 2 % 98 2 % 14 0 % 36 2 %
+ Amount for free disposal – – – – – – – –
= Total 1,879 31 % 1,450 33 % 1,116 32 % 1,138 56 %
Variable compensation
+ Short-term variable compensation
Bonus for fiscal 2021 2,801 47 % – – 1,740 49 % – –
Bonus for fiscal 2020 – – 899 20 % – – 879 44 %
+ Long-term variable compensation
2017 Stock Awards (vesting: 2016 – 2020) 1,209 20 % – – 609 17 % – –
2016 Stock Awards (vesting: 2015 – 2019) – – 2,092 47 % – – – –
Cash payment Siemens Energy spinoff 119 2 % – – 60 2 % – –
+ Other – – – – – – – –
= Total compensation (TC) (according to Section 162 AktG) 6,008 100 % 4,441 100 % 3,524 100 % 2,017 100 %
+ Service costs 933 – 608 – 594 – 621 –
= Total compensation (incl. service costs) 6,941 – 5,049 – 4,119 – 2,638 –
Matthias Rebellius 4
Managing Board member since Oct. 1, 2020
Prof. Dr. Ralf P. Thomas
Managing Board member since Sept. 18, 2013
2021 2020 2021 2020
€ thousand in % of TC € thousand in % of TC € thousand in % of TC € thousand in % of TC
Fixed compensation
Base salary 1,102 32 % – – 1,102 26 % 1,102 27 %
+ Fringe benefits 70 2 % – – 71 2 % 81 2 %
+ Amount for free disposal 551 16 % – – – – – –
= Total 1,723 50 % – – 1,172 28 % 1,183 29 %
Variable compensation
+ Short-term variable compensation
Bonus for fiscal 2021 1,712 50 % – – 1,734 41 % – –
Bonus for fiscal 2020 – – – – – – 812 20 %
+ Long-term variable compensation
2017 Stock Awards (vesting: 2016 – 2020) – – – – 1,209 29 % – –
2016 Stock Awards (vesting: 2015 – 2019) – – – – – – 2,092 51 %
Cash payment Siemens Energy spinoff – – – – 119 3 % – –
+ Other – – – – – – – –
= Total compensation (TC) (according to Section 162 AktG) 3,435 100 % – – 4,235 100 % 4,087 100 %
+ Service costs – – – – 588 – 601 –
= Total compensation (incl. service costs) 3,435 – – – 4,823 – 4,688 –
1 Dr. Roland Busch was first appointed a full member of the Managing Board effective April 1, 2011. He served as Deputy CEO from October 1, 2019, until the end of the Annual Shareholders’ Meeting on February 3, 2021, when he succeeded Joe Kaeser as President and CEO.
2 Cedrik Neike was appointed a full member of the Managing Board effective April 1, 2017. Due to his intrayear appointment, his Stock Awards target amount for fiscal 2017 was determined on a prorated basis and, instead of Stock Awards, a corresponding number of Phantom Stock Awards was allocated to him in accordance with plan requirements. In contrast to Stock Awards, these Phantom Stock Awards were settled after the expiration of the vesting period by cash payment rather than by share transfer.
3 In addition to his position as a member of the Managing Board, Cedrik Neike served as Executive Chairman of the Board of Directors of Siemens Ltd. China from May 1, 2017, to March 31, 2019. The amount reported under “2017 Stock Awards (vesting: 2016 – 2020)” includes the value of the Stock Awards allocated by Siemens Ltd. China. Likewise, a portion of the additional cash payment attributable to the Stock Awards allocated by Siemens Ltd. China is included under “Cash payment Siemens Energy spinoff.” For details, see “Transfer of Stock Awards in fiscal 2021 (2017 tranche).”
4 In addition to his position as a member of the Managing Board of Siemens AG, Matthias Rebellius is Chairman of the Board of Directors and CEO of Siemens Schweiz AG. The corresponding legal relationship is defined in a separate contract between Matthias Rebellius and Siemens Schweiz AG. The entire compensation he receives under the terms of his contract with Siemens Schweiz AG is deducted from his Managing Board compensation. Of the base salary and fringe benefits reported here, € 615,367 and € 29,579, respectively, were awarded and paid by Siemens Schweiz AG. Of the Bonus for fiscal 2021 reported here, € 859,802 (corresponding to CHF931,165 and converted into euros as of September 30, 2021) will be paid by Siemens Schweiz AG. Furthermore, employer contributions to pension plans paid by Siemens Schweiz AG are deducted from the amount for free disposal.
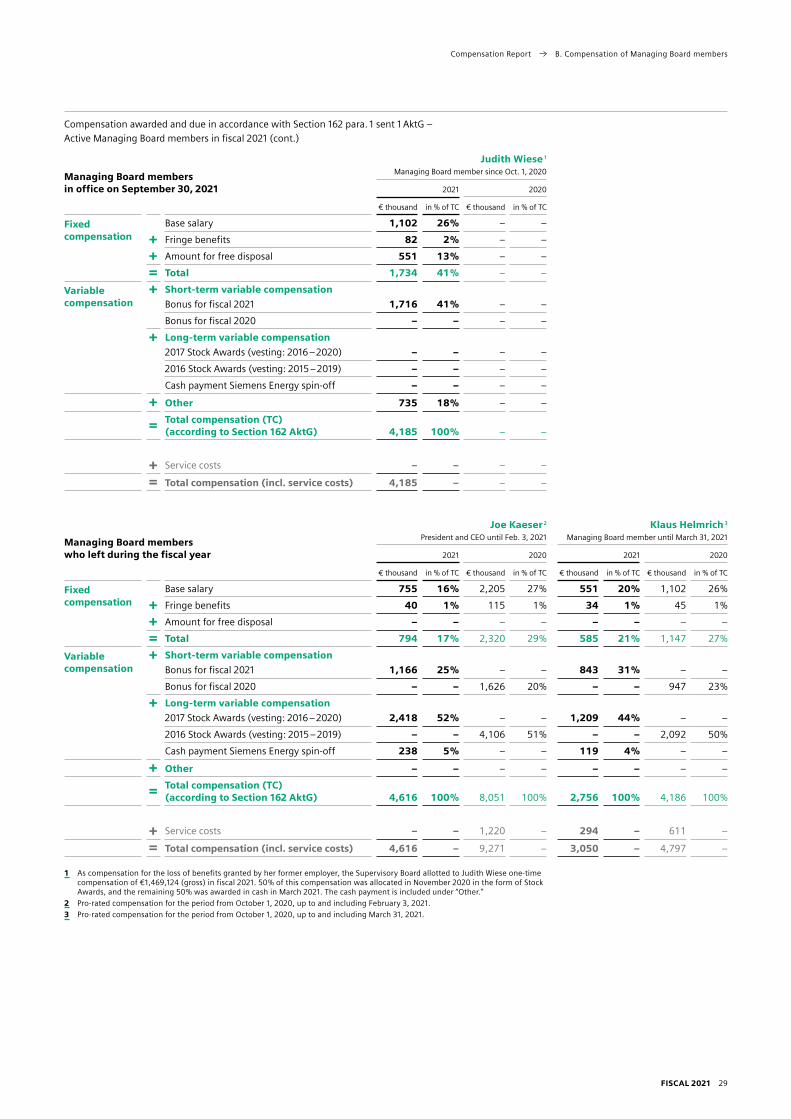
FISCAL 2021 29
Compensation Report B. Compensation of Managing Board members
Compensation awarded and due in accordance with Section 162 para. 1 sent 1 AktG –Active Managing Board members in fiscal 2021 (cont.)
Managing Board members in office on September 30, 2021
Judith Wiese 1 Managing Board member since Oct. 1, 2020
2021 2020
€ thousand in % of TC € thousand in % of TC
Fixed compensation
Base salary 1,102 26 % – –
+ Fringe benefits 82 2 % – –
+ Amount for free disposal 551 13 % – –
= Total 1,734 41 % – –
Variable compensation
+ Short-term variable compensation
Bonus for fiscal 2021 1,716 41 % – –
Bonus for fiscal 2020 – – – –
+ Long-term variable compensation
2017 Stock Awards (vesting: 2016 – 2020) – – – –
2016 Stock Awards (vesting: 2015 – 2019) – – – –
Cash payment Siemens Energy spinoff – – – –
+ Other 735 18 % – –
= Total compensation (TC) (according to Section 162 AktG) 4,185 100 % – –
+ Service costs – – – –
= Total compensation (incl. service costs) 4,185 – – –
Managing Board members who left during the fiscal year
Joe Kaeser 2
President and CEO until Feb. 3, 2021
Klaus Helmrich 3
Managing Board member until March 31, 2021
2021 2020 2021 2020
€ thousand in % of TC € thousand in % of TC € thousand in % of TC € thousand in % of TC
Fixed compensation
Base salary 755 16 % 2,205 27 % 551 20 % 1,102 26 %
+ Fringe benefits 40 1 % 115 1 % 34 1 % 45 1 %
+ Amount for free disposal – – – – – – – –
= Total 794 17 % 2,320 29 % 585 21 % 1,147 27 %
Variable compensation
+ Short-term variable compensation
Bonus for fiscal 2021 1,166 25 % – – 843 31 % – –
Bonus for fiscal 2020 – – 1,626 20 % – – 947 23 %
+ Long-term variable compensation
2017 Stock Awards (vesting: 2016 – 2020) 2,418 52 % – – 1,209 44 % – –
2016 Stock Awards (vesting: 2015 – 2019) – – 4,106 51 % – – 2,092 50 %
Cash payment Siemens Energy spinoff 238 5 % – – 119 4 % – –
+ Other – – – – – – – –
= Total compensation (TC) (according to Section 162 AktG) 4,616 100 % 8,051 100 % 2,756 100 % 4,186 100 %
+ Service costs – – 1,220 – 294 – 611 –
= Total compensation (incl. service costs) 4,616 – 9,271 – 3,050 – 4,797 –
1 As compensation for the loss of benefits granted by her former employer, the Supervisory Board allotted to Judith Wiese onetime compensation of € 1,469,124 (gross) in fiscal 2021. 50 % of this compensation was allocated in November 2020 in the form of Stock Awards, and the remaining 50 % was awarded in cash in March 2021. The cash payment is included under “Other.”
2 Prorated compensation for the period from October 1, 2020, up to and including February 3, 2021.3 Prorated compensation for the period from October 1, 2020, up to and including March 31, 2021.

FISCAL 2021 30
Compensation Report B. Compensation of Managing Board members
B.6.2 Former members of the Managing Board The following table shows the compensation awarded
and due to former members of the Managing Board in
fiscal 2021 in accordance with Section 162 para. 1 sent. 1
of the German Stock Corporation Act. In accordance with
Section 162 para. 5 of the German Stock Corporation Act,
the personal information of former Managing Board
members is no longer included if they left the Managing
Board before September 30, 2011.
Compensation awarded and due in accordance with Section 162 para. 1 sent 1 AktG – Former members of the Managing Board 1
(€ thousand)
Klaus Helmrich Managing Board member
until March 31, 2021
Joe Kaeser 4 President and CEO
until Feb. 3, 2021
Michael Sen 5 Managing Board member
until March 31, 2020
Lisa Davis Managing Board member
until Feb. 29, 2020
Fixed and variable compen sation
Fringe benefits 2 – – 21 106
Other – – 4,646 –
2017 Stock Awards (vesting: 2016 – 2020) 3 – – 1,247 1,328
Pensions Annuity 14 1,103 – –
Capital payment (partial or full) 571 3,085 – –
Janina Kugel Managing Board member
until Jan. 31, 2020
Prof. Dr. Siegfried Russwurm
Managing Board member until March 31, 2017
Prof. Dr. Hermann Requardt
Managing Board member until Jan. 31, 2015
Peter Löscher President and CEO until July 31, 2013
Fixed and variable compen sation
Fringe benefits 2 – – – –
Other – – – –
2017 Stock Awards (vesting: 2016 – 2020) 3 1,274 664 – –
Pensions Annuity – – 42 –
Capital payment (partial or full) – – – 588
1 The table includes only compensation that was awarded to former members after they left the Managing Board.2 Fringe benefits include inkind compensation and fringe benefits awarded by the Company such as the provision of a company car and insurance allowances.
In the case of Lisa Davis, they also include contractually agreed payments for tax adjustments.3 The amounts reported under “2017 Stock Awards (vesting: 2016 – 2020)” also include the additional cash payment relating to the settlement of the 2017 Stock Awards
tranche due to the Siemens Energy spinoff.4 Like other eligible employees of Siemens AG who were employed by the Company before September 30, 1983, Joe Kaeser was entitled to transition payments
in the first six months of his retirement equal to the difference between his last base salary and his pension entitlement under the Company pension plan. The transition payments that Joe Kaeser received in each month from March through August 2021 amounted to € 178,080 and are included under “Pensions: Annuity.”
5 Michael Sen’s appointment as a member of the Managing Board of Siemens AG was terminated by mutual agreement as of March 31, 2020, prior to the end of his contractual term of office. His employment relationship remained unaffected until the end of the day on March 31, 2021. The amount reported under “Other” contains the base salary of € 550,800 awarded to Michael Sen for the period from October 1, 2020, until the early termination of his employment contract on March 31, 2021, his prorated Bonus for fiscal 2021 of € 550,800 and a severance payment in the gross amount of € 3,544,427, which was due and payable on the termination date of March 31, 2021.

FISCAL 2021 31
Compensation Report B. Compensation of Managing Board members
B.7 Outlook for fiscal 2022
The following overview shows the maximum compen
sation and the performance criteria for variable compensa
tion for fiscal 2022, as approved by the Supervisory Board
of Siemens AG on September 23, 2021.
Outlook fiscal 2022
MAXIMUM COMPENSATION
VARIABLE COMPENSATION
Target dimension
Performance criterion
Key performance indicator Details
Bonusfiscal 2022
Siemens Group
Profit Basic earnings per share (EPS)
To strengthen the focus and connection between performance in the reporting year and target achievement, the actual value of the reporting year is used. The target value continues to be based on the average of the previous three fiscal years and thus on the concept of continuous improvement.
Beginning with fiscal 2022, EPS before purchase price allocation (EPS pre PPA) will be used in order to increase transparency regarding the operating performance of Siemens. EPS pre PPA is defined as basic earnings per share from net income adjusted for amortization of intangible assets acquired in business combinations and related income taxes. As for EPS, EPS pre PPA includes the amounts attributable to shareholders of Siemens AG.
This approach is aligned with external communications and the modified Financial Framework for the financial steering of the Company, presented at Capital Market Day 2021.
Managing Board portfolio
Profitability /capital efficiency
Return on capital employed (ROCE)
With return on capital employed (ROCE), we aim to focus on Siemens’ operating performance, analogously to fiscal 2021. Thus ROCE excludes defined Varian related acquisition effects and the main Siemens Energyrelated effects in order to further increase the transparency of Siemens’ operating performance.
Individual targets
Liquidity Cash conversion rate (CCR)
CCR, measured on the basis of: allin for Managing Board members with primarily functional responsibility the relevant business for Managing Board members with business responsibility
Growth Comparable revenue growth
Comparable revenue growth, measured on the basis of: Siemens for Managing Board members with primarily functional responsibility the relevant business for Managing Board members with business responsibility
Company strategy
Diverse focus topics
Business development; implementation of portfolio measures; optimization / efficiency enhancement; implementation of other strategic measures
Sustainability Diverse focus topics
Sucession planning; sustainability /diversity
2022 Stock Awards tranche
Longterm value creation
Total shareholder return (TSR)
Development of the TSR of Siemens AG relative to the international sector index MSCI World Industrials
Sustainability Siemens internal ESG/ Sustainability index
The Siemensinternal ESG / Sustainability index for the 2022 Stock Awards tranche is based on the following three equally weighted key performance indicators:
CO2 emissions Digital learning hours per employee Net Promoter Score
Dr. Roland Busch € 15,295,950
Cedrik Neike€ 7,781,316
Matthias Rebellius€ 7,715,220
Prof. Dr. Ralf P. Thomas€ 8,636,316
Judith Wiese€ 7,715,220

FISCAL 2021 32
Compensation Report C. Compensation of Supervisory Board members
C. Compensation of Supervisory Board members
The rules for Supervisory Board compensation for fiscal
2021 were approved by the Annual Shareholders’ Meeting
on January 28, 2014, and have been in effect since fiscal
2014. They are set out in Section 17 of the Articles of
Association of Siemens AG in the version applicable for
fiscal 2021. Supervisory Board compensation consists
entirely of fixed compensation; it reflects the responsibil
ities and scope of the work of the Supervisory Board
members. The Chairman and Deputy Chairs of the Super
visory Board as well as the chairs and members of the
Audit Committee, the Chairman’s Committee, the Com
pensation Committee, the Compliance Committee and
the Innovation and Finance Committee receive additional
compensation. The compensation authorized by the Arti
cles of Association for work in the Compliance Committee
was no longer paid in fiscal 2021 since the Compliance
Committee was reintegrated into the Audit Committee
and the duties of the Compliance Committee were trans
ferred to the Audit Committee effective October 1, 2020.
Under the rules for fiscal 2021, the members of the Super
visory Board receive an annual base compensation, and
the members of the Supervisory Board committees re
ceive additional compensation for their committee work.
Compensation of members of the Supervisory Board and its committees
Base compensation of Supervisory Board
Chairman€ 280,000
Deputy Chair€ 220,000
Member€ 140,000
Additional compensation for committee work
Audit Committee Chairman’s Committee Compensation Committee
Innovation and Finance Committee
Chair€ 160,000
Chair€ 120,000
Chair€ 100,000
Chair€ 80,000
Member € 80,000
Member € 80,000
Member € 60,000
Member € 40,000
Compensation for any work on the Chairman’s Commit
tee is deducted from compensation for work on the Com
pensation Committee.
If a Supervisory Board member is absent from any Super
visory Board meetings, onethird of the aggregate com
pensation due to that member is reduced by the percent
age of Supervisory Board meetings he or she does not
attend in relation to the total number of Supervisory
Board meetings held during the fiscal year. In the event
of changes in the composition of the Supervisory Board
or its committees, compensation is paid on a prorated
basis, rounding up to the next full month.
In addition, the members of the Supervisory Board re
ceive € 1,500 for each meeting of the Supervisory Board
and its committees they attend.
The members of the Supervisory Board are reimbursed
for outofpocket expenses incurred in connection with
their duties and for any valueadded tax to be paid on
their compensation. For the performance of his duties,
the Chairman of the Supervisory Board is also entitled to
an office with secretarial support and the use of a car
service. No loans or advances from the Company are pro
vided to members of the Supervisory Board.
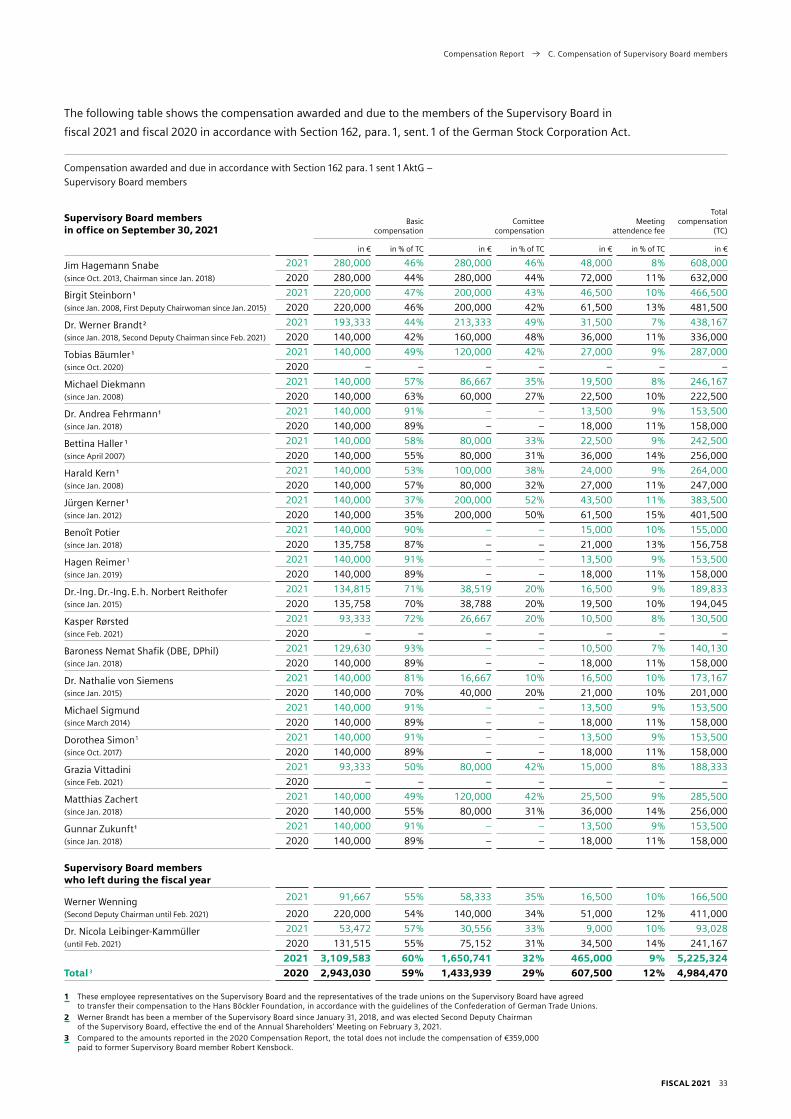
FISCAL 2021 33
Compensation Report C. Compensation of Supervisory Board members
The following table shows the compensation awarded and due to the members of the Supervisory Board in
fiscal 2021 and fiscal 2020 in accordance with Section 162, para. 1, sent. 1 of the German Stock Corporation Act.
Compensation awarded and due in accordance with Section 162 para. 1 sent 1 AktG –Supervisory Board members
Supervisory Board members in office on September 30, 2021
Basic compensation
Comittee compensation
Meeting attendence fee
Total compensation
(TC)
in € in % of TC in € in % of TC in € in % of TC in €
Jim Hagemann Snabe (since Oct. 2013, Chairman since Jan. 2018)
2021 280,000 46 % 280,000 46 % 48,000 8 % 608,000
2020 280,000 44 % 280,000 44 % 72,000 11 % 632,000
Birgit Steinborn 1
(since Jan. 2008, First Deputy Chairwoman since Jan. 2015)
2021 220,000 47 % 200,000 43 % 46,500 10 % 466,500
2020 220,000 46 % 200,000 42 % 61,500 13 % 481,500
Dr. Werner Brandt 2
(since Jan. 2018, Second Deputy Chairman since Feb. 2021)
2021 193,333 44 % 213,333 49 % 31,500 7 % 438,167
2020 140,000 42 % 160,000 48 % 36,000 11 % 336,000
Tobias Bäumler 1
(since Oct. 2020)
2021 140,000 49 % 120,000 42 % 27,000 9 % 287,000
2020 – – – – – – –
Michael Diekmann(since Jan. 2008)
2021 140,000 57 % 86,667 35 % 19,500 8 % 246,167
2020 140,000 63 % 60,000 27 % 22,500 10 % 222,500
Dr. Andrea Fehrmann 1
(since Jan. 2018)
2021 140,000 91 % – – 13,500 9 % 153,500
2020 140,000 89 % – – 18,000 11 % 158,000
Bettina Haller 1
(since April 2007)
2021 140,000 58 % 80,000 33 % 22,500 9 % 242,500
2020 140,000 55 % 80,000 31 % 36,000 14 % 256,000
Harald Kern 1
(since Jan. 2008)
2021 140,000 53 % 100,000 38 % 24,000 9 % 264,000
2020 140,000 57 % 80,000 32 % 27,000 11 % 247,000
Jürgen Kerner 1
(since Jan. 2012)
2021 140,000 37 % 200,000 52 % 43,500 11 % 383,500
2020 140,000 35 % 200,000 50 % 61,500 15 % 401,500
Benoît Potier(since Jan. 2018)
2021 140,000 90 % – – 15,000 10 % 155,000
2020 135,758 87 % – – 21,000 13 % 156,758
Hagen Reimer 1
(since Jan. 2019)
2021 140,000 91 % – – 13,500 9 % 153,500
2020 140,000 89 % – – 18,000 11 % 158,000
Dr.Ing. Dr.Ing. E. h. Norbert Reithofer(since Jan. 2015)
2021 134,815 71 % 38,519 20 % 16,500 9 % 189,833
2020 135,758 70 % 38,788 20 % 19,500 10 % 194,045
Kasper Rørsted(since Feb. 2021)
2021 93,333 72 % 26,667 20 % 10,500 8 % 130,500
2020 – – – – – – –
Baroness Nemat Shafik (DBE, DPhil)(since Jan. 2018)
2021 129,630 93 % – – 10,500 7 % 140,130
2020 140,000 89 % – – 18,000 11 % 158,000
Dr. Nathalie von Siemens(since Jan. 2015)
2021 140,000 81 % 16,667 10 % 16,500 10 % 173,167
2020 140,000 70 % 40,000 20 % 21,000 10 % 201,000
Michael Sigmund(since March 2014)
2021 140,000 91 % – – 13,500 9 % 153,500
2020 140,000 89 % – – 18,000 11 % 158,000
Dorothea Simon 1
(since Oct. 2017)
2021 140,000 91 % – – 13,500 9 % 153,500
2020 140,000 89 % – – 18,000 11 % 158,000
Grazia Vittadini(since Feb. 2021)
2021 93,333 50 % 80,000 42 % 15,000 8 % 188,333
2020 – – – – – – –
Matthias Zachert(since Jan. 2018)
2021 140,000 49 % 120,000 42 % 25,500 9 % 285,500
2020 140,000 55 % 80,000 31 % 36,000 14 % 256,000
Gunnar Zukunft 1
(since Jan. 2018)
2021 140,000 91 % – – 13,500 9 % 153,500
2020 140,000 89 % – – 18,000 11 % 158,000
Supervisory Board members who left during the fiscal year
Werner Wenning(Second Deputy Chairman until Feb. 2021)
2021 91,667 55 % 58,333 35 % 16,500 10 % 166,500
2020 220,000 54 % 140,000 34 % 51,000 12 % 411,000
Dr. Nicola LeibingerKammüller(until Feb. 2021)
2021 53,472 57 % 30,556 33 % 9,000 10 % 93,028
2020 131,515 55 % 75,152 31 % 34,500 14 % 241,167
Total 32021 3,109,583 60 % 1,650,741 32 % 465,000 9 % 5,225,324
2020 2,943,030 59 % 1,433,939 29 % 607,500 12 % 4,984,470
1 These employee representatives on the Supervisory Board and the representatives of the trade unions on the Supervisory Board have agreed to transfer their compensation to the Hans Böckler Foundation, in accordance with the guidelines of the Confederation of German Trade Unions.
2 Werner Brandt has been a member of the Supervisory Board since January 31, 2018, and was elected Second Deputy Chairman of the Supervisory Board, effective the end of the Annual Shareholders’ Meeting on February 3, 2021.
3 Compared to the amounts reported in the 2020 Compensation Report, the total does not include the compensation of €359,000 paid to former Supervisory Board member Robert Kensbock.
FISCAL 2021 34
Compensation Report C. Compensation of Supervisory Board members
Pursuant to Section 113 para. 3 of the German Stock Cor
poration Act in the version amended by the German Act
Implementing the Second Shareholders’ Rights Directive
(Gesetz zur Umsetzung der zweiten Aktionärsrechtericht-
linie, ARUG II), the annual shareholders’ meeting of a
listed company must resolve on compensation for the
members of the supervisory board at least every four
years. In accordance with Section 113 para. 3 of the Ger
man Stock Corporation Act, the Annual Shareholders’
Meeting on February 3, 2021, therefore adopted a resolu
tion regarding the compensation of Supervisory Board
members and voted to amend Section 17 of the Articles
of Association. The compensation system for Supervisory
Board members submitted to the Annual Shareholders’
Meeting and the proposed new version of Section 17 of
the Articles of Association were approved by a majority of
97.49 % of the valid votes cast. The provisions of the new
version of Section 17 of the Articles of Association, which
came into effect on October 1, 2021, replace the previous
provisions of the Articles of Association regarding Super
visory Board compensation as of that date. The compen
sation system approved by the Annual Shareholders’
Meeting as well as the Articles of Association are publicly
available on the Siemens Global Website at WWW.
SIEMENS.COM/CORPORATE-GOVERNANCE.

FISCAL 2021 35
Compensation Report D. Comparative information on profit development and annual change in compensation
D. Comparative information on profit development and annual change in compensation
The following table shows, in accordance with Sec
tion 162 para. 1 sent. 2 No. 2 of the German Stock Corpo
ration Act, Siemens’ profit development, the annual
change in the Managing Board and Supervisory Board
members’ compensation and the annual change in aver
age employee compensation on a fulltime equivalent
basis over the last five fiscal years.
Profit development is presented on the basis of the
Siemens Group’s key performance indicators revenue,
comparable revenue growth and earnings per share. The
latter is also one of the financial targets for the short
term variable compensation (Bonus) of the Managing
Board and thus has a significant influence on the amount
of the compensation of the Managing Board members. In
accordance with Section 275 para. 3 No. 16 of the German
Commercial Code (Handelsgesetzbuch, HGB), the devel
opment of the net income of Siemens AG is also shown.
The compensation awarded and due to the Managing
Board and Supervisory Board members in each fiscal year
is presented in accordance with Section 162 para. 1 sent. 1
of the German Stock Corporation Act.
The presentation of average employee compensation is
based on the size of the workforce, including trainees,
employed by Siemens in Germany. In fiscal 2021, this
workforce comprised on average 71,838 employees
(fulltime equivalent). By way of comparison, the
Siemens Group had about 241,000 employees and train
ees worldwide as of September 30, 2021. The figures
exclude the workforce of Siemens Healthineers, which
is not included in the presentation since it is a separately
managed, publicly listed company.
Average employee compensation comprises the person
nel costs for wages and salaries, fringe benefits, employer
contributions to social insurance and any shortterm
variable compensation components attributable to the
fiscal year. For compensation in connection with share
plans, the amounts received in the fiscal year are taken
into account. Therefore, employee compensation is also
equivalent, in principle, to awarded and due compensa
tion within the meaning of Section 162 para. 1 sent. 1 of
the German Stock Corporation Act and thus in line with
Managing Board and Supervisory Board compensation.
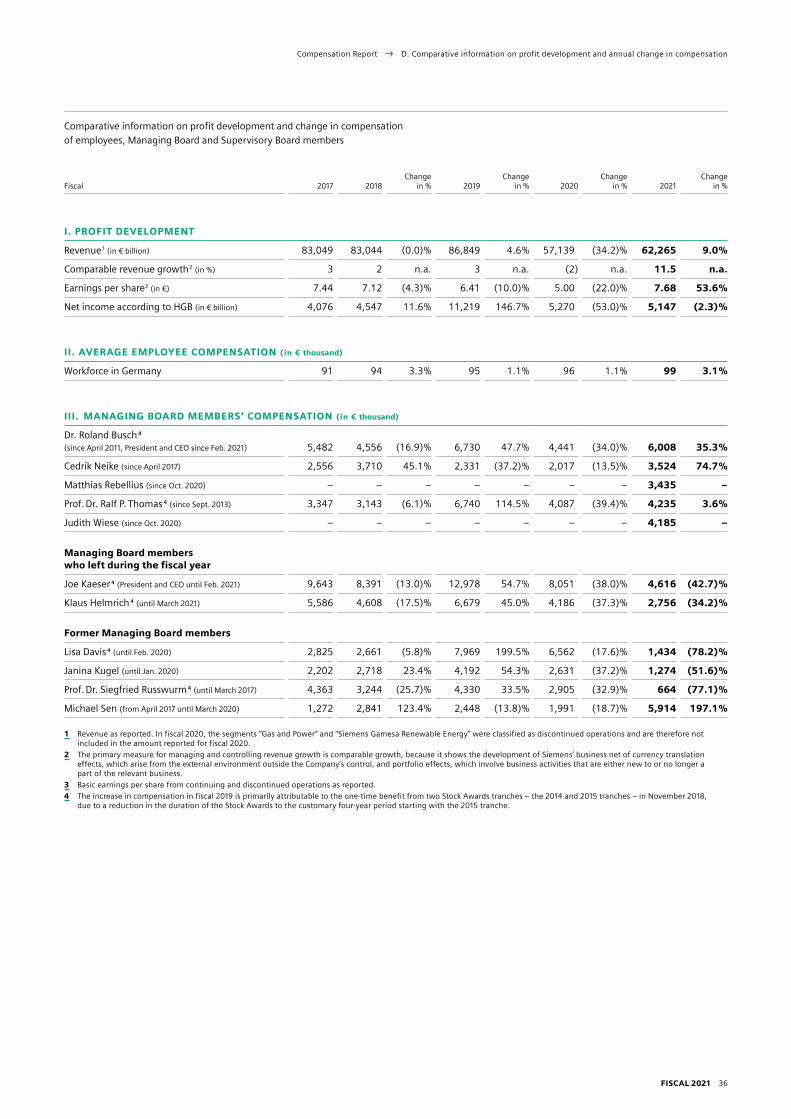
FISCAL 2021 36
Compensation Report D. Comparative information on profit development and annual change in compensation
Comparative information on profit development and change in compensation of employees, Managing Board and Supervisory Board members
Fiscal 2017 2018Change
in % 2019Change
in % 2020Change
in % 2021Change
in %
I. PROFIT DEVELOPMENT
Revenue 1 (in € billion) 83,049 83,044 (0.0) % 86,849 4.6 % 57,139 (34.2) % 62,265 9.0 %
Comparable revenue growth 2 (in %) 3 2 n.a. 3 n.a. (2) n.a. 11.5 n.a.
Earnings per share3 (in €) 7.44 7.12 (4.3) % 6.41 (10.0) % 5.00 (22.0) % 7.68 53.6 %
Net income according to HGB (in € billion) 4,076 4,547 11.6 % 11,219 146.7 % 5,270 (53.0) % 5,147 (2.3) %
II. AVERAGE EMPLOYEE COMPENSATION (in € thousand)
Workforce in Germany 91 94 3.3 % 95 1.1 % 96 1.1 % 99 3.1 %
III.
Dr. Roland Busch 4
(since April 2011, President and CEO since Feb. 2021) 5,482 4,556 (16.9) % 6,730 47.7 % 4,441 (34.0) % 6,008 35.3 %
Cedrik Neike (since April 2017) 2,556 3,710 45.1 % 2,331 (37.2) % 2,017 (13.5) % 3,524 74.7 %
Matthias Rebellius (since Oct. 2020) – – – – – – – 3,435 –
Prof. Dr. Ralf P. Thomas 4 (since Sept. 2013) 3,347 3,143 (6.1) % 6,740 114.5 % 4,087 (39.4) % 4,235 3.6 %
Judith Wiese (since Oct. 2020) – – – – – – – 4,185 –
Managing Board memberswho left during the fiscal year
Joe Kaeser 4 (President and CEO until Feb. 2021) 9,643 8,391 (13.0) % 12,978 54.7 % 8,051 (38.0) % 4,616 (42.7) %
Klaus Helmrich 4 (until March 2021) 5,586 4,608 (17.5) % 6,679 45.0 % 4,186 (37.3) % 2,756 (34.2) %
Former Managing Board members
Lisa Davis 4 (until Feb. 2020) 2,825 2,661 (5.8) % 7,969 199.5 % 6,562 (17.6) % 1,434 (78.2) %
Janina Kugel (until Jan. 2020) 2,202 2,718 23.4 % 4,192 54.3 % 2,631 (37.2) % 1,274 (51.6) %
Prof. Dr. Siegfried Russwurm 4 (until March 2017) 4,363 3,244 (25.7) % 4,330 33.5 % 2,905 (32.9) % 664 (77.1) %
Michael Sen (from April 2017 until March 2020) 1,272 2,841 123.4 % 2,448 (13.8) % 1,991 (18.7) % 5,914 197.1 %
1 Revenue as reported. In fiscal 2020, the segments “Gas and Power” and “Siemens Gamesa Renewable Energy” were classified as discontinued operations and are therefore not included in the amount reported for fiscal 2020.
2 The primary measure for managing and controlling revenue growth is comparable growth, because it shows the development of Siemens’ business net of currency translation effects, which arise from the external environment outside the Company’s control, and portfolio effects, which involve business activities that are either new to or no longer a part of the relevant business.
3 Basic earnings per share from continuing and discontinued operations as reported.4 The increase in compensation in fiscal 2019 is primarily attributable to the onetime benefit from two Stock Awards tranches – the 2014 and 2015 tranches – in November 2018,
due to a reduction in the duration of the Stock Awards to the customary fouryear period starting with the 2015 tranche.
MANAGING BOARD MEMBERS’ COMPENSATION (in € thousand)

FISCAL 2021 37
Compensation Report D. Comparative information on profit development and annual change in compensation
Comparative information on profit development and change in compensation of employees, Managing Board and Supervisory Board members (cont.)
Fiscal 2017 2018Change
in % 2019Change
in % 2020Change
in % 2021Change
in %
IV. SUPERVISORY BOARD MEMBERS’ COMPENSATION (in € thousand)
Jim Hagemann Snabe
(since Oct. 2013, Chairman since Jan. 2018) 279 536 92.0 % 613 14.3 % 632 3.2 % 608 (3.8) %
Birgit Steinborn 1
(since Jan. 2008, First Deputy Chairwoman since Jan. 2015) 468 477 1.9 % 471 (1.3) % 482 2.2 % 467 (3.1) %
Dr. Werner Brandt 2
(since Jan. 2018, Second Deputy Chairman since Feb. 2021) – 240 – 324 35.0 % 336 3.7 % 438 30.4 %
Tobias Bäumler 1 (since Oct. 2020) – – – – – – – 287 –
Michael Diekmann (since Jan. 2008) 204 217 6.1 % 215 (0.7) % 223 3.5 % 246 10.6 %
Dr. Andrea Fehrmann 1 (since Jan. 2018) – 113 – 149 32.4 % 158 6.0 % 154 (2.8) %
Bettina Haller 1 (since April 2007) 231 244 5.8 % 244 0.0 % 256 4.9 % 243 (5.3) %
Harald Kern 1 (since Jan. 2008) 229 244 6.5 % 240 (1.8) % 247 3.1 % 264 6.9 %
Jürgen Kerner 1 (since Jan. 2012) 381 394 3.5 % 391 (0.8) % 402 2.7 % 384 (4.5) %
Benoît Potier (since Jan. 2018) – 113 – 141 25.5 % 157 11.0 % 155 (1.1) %
Hagen Reimer 1 (since Jan. 2019) – – – 110 – 158 44.3 % 154 (2.8) %
Dr.Ing. Dr.Ing. E. h. Norbert Reithofer (since Jan. 2015) 188 189 0.6 % 182 (3.7) % 194 6.6 % 190 (2.2) %
Kasper Rørsted (since Feb. 2021) – – – – – – – 131 –
Baroness Nemat Shafik (DBE, DPhil) (since Jan. 2018) – 113 – 140 24.2 % 158 13.1 % 140 (11.3) %
Dr. Nathalie von Siemens (since Jan. 2015) 151 185 22.9 % 194 4.6 % 201 3.9 % 173 (13.8) %
Michael Sigmund (since March 2014) 151 152 1.0 % 149 (2.0) % 158 6.0 % 154 (2.8) %
Dorothea Simon 1 (since Oct. 2017) – 152 – 149 (2.0) % 158 6.0 % 154 (2.8) %
Grazia Vittadini (since Feb. 2021) – – – – – – – 188 –
Matthias Zachert (since Jan. 2018) – 177 – 244 37.9 % 256 4.9 % 286 11.5 %
Gunnar Zukunft 1 (since Jan. 2018) – 113 – 149 32.4 % 158 6.0 % 154 (2.8) %
Supervisory Board members who left during the fiscal year
Werner Wenning (Second Deputy Chairman until Feb. 2021) 402 404 0.4 % 398 (1.5) % 411 3.4 % 167 (59.5) %
Dr. Nicola LeibingerKammüller (until Feb. 2021) 243 249 2.5 % 246 (1.2) % 241 (1.8) % 93 (61.4) %
1 These employee representatives on the Supervisory Board and the representatives of the trade unions on the Supervisory Board have agreed to transfer their compensation to the Hans Böckler Foundation, in accordance with the guidelines of the Confederation of German Trade Unions.
2 Werner Brandt has been a member of the Supervisory Board since January 31, 2018, and was elected Second Deputy Chairman of the Supervisory Board, effective the end of the Annual Shareholders’ Meeting on February 3, 2021.
FISCAL 2021 38
Compensation Report E. Other E. Other
The Company provides a group insurance policy for
Supervisory and Managing Board members and certain
other employees of the Siemens Group. The policy is taken
out for one year at a time or renewed annually. It covers
the personal liability of the insured individuals in cases of
financial loss associated with their activities on behalf
of the Company. The insurance policy for fiscal 2021 in
cludes a deductible for the members of the Managing
Board that complies with the requirements of the Ger
man Stock Corporation Act.
For the Managing Board For the Supervisory Board
Dr. Roland Busch
President and Chief Executive Officer
of Siemens AG
Prof. Dr. Ralf P. Thomas
Chief Financial Officer
of Siemens AG
Jim Hagemann Snabe
Chairman of the Supervisory Board
of Siemens AG

FISCAL 2021 39
Compensation Report Independent auditor’s report Independent auditor’s report
To Siemens Aktiengesellschaft, Berlin and Munich
We have audited the attached Compensation Report of
Siemens Aktiengesellschaft, Berlin and Munich, prepared
to comply with Sec. 162 AktG [“Aktiengesetz”: German
Stock Corporation Act] for the fiscal year from October 1,
2020 to September 30, 2021 and the related disclosures.
We have not audited the content of disclosures regarding
appropriateness and marketability of the compensation
in chapter B.2.3 APPROPRIATENESS OF THE COMPENSATION that
is beyond the scope of Sec. 162 AktG.
Responsibilities of management and the Supervisory BoardManagement and the Supervisory Board of Siemens AG
are responsible for the preparation of the Compensation
Report and the related disclosures in compliance with the
requirements of Sec. 162 AktG. In addition, management
and the Supervisory Board are responsible for such inter
nal control as they determine is necessary to enable the
preparation of a Compensation Report and the related
disclosures that are free from material misstatement,
whether due to fraud or error.
Auditor’s responsibilityOur responsibility is to express an opinion on this Com
pensation Report and the related disclosures based on
our audit. We conducted our audit in compliance with
German Generally Accepted Standards for Financial State
ment Audits promulgated by the Institut der Wirtschafts
prüfer [Institute of Public Auditors in Germany] (IDW).
Those standards require that we comply with ethical re
quirements and plan and perform the audit to obtain
reasonable assurance about whether the Compensation
Report and the related disclosures are free from material
misstatement.
An audit involves performing audit procedures to obtain
audit evidence about the amounts in the Compensation
Report and the related disclosures. The audit procedures
selected depend on the auditor ’s judgment, including
the assessment of the risks of material misstatement of
the Compensation Report and the related disclosures,
whether due to fraud or error. In making those risk as
sessments, the auditor considers internal control relevant
to the preparation of the Compensation Report and the
related disclosures in order to plan and perform audit
procedures that are appropriate under the given circum
stances, but not for the purpose of expressing an opinion
on the effectiveness of the entity ’s internal control. An
audit also includes evaluating the accounting policies
used and the reasonableness of accounting estimates
made by management and the Supervisory Board, as
well as evaluating the overall presentation of the Com
pensation Report and the related disclosures.
We believe that the evidence we have obtained is suffi
cient and appropriate to provide a basis for our opinion.
OpinionIn our opinion, on the basis of the knowledge obtained in
the audit, the Compensation Report for the fiscal year
from October 1, 2020 to September 30, 2021 and the re
lated disclosures comply, in all material respects, with the
financial reporting provisions of Sec. 162 AktG. Our opin
ion on the Compensation Report does not cover the con
tent of the abovementioned disclosures in the Compen
sation Report that is beyond the scope of Sec. 162 AktG.
Other matter – formal audit of the Compensation ReportThe audit of the content of the Compensation Report de
scribed in this auditor ’s report comprises the formal audit
of the Compensation Report required by Sec. 162 (3) AktG
and the issue of a report on this audit. As we are issuing
an unqualified opinion on the audit of the content of the
Compensation Report, this also includes the opinion that
the disclosures pursuant to Sec. 162 (1) and (2) AktG are
made in the Compensation Report in all material respects.
FISCAL 2021 40
Compensation Report Independent auditor’s report
Limitation of liabilityThe “General Engagement Terms for Wirtschaftsprüfer
and Wirtschaftsprüfungsgesellschaften [German Public
Auditors and Public Audit Firms]” as issued by the IDW
on January 1, 2017, are applicable to this engagement
and also govern our responsibility and liability to third
parties in the context of this engagement ( WWW.DE.EY.
COM/GENERAL-ENGAGEMENT-TERMS).
Munich, December 2, 2021
Ernst & Young GmbH
Wirtschaftsprüfungsgesellschaft
Breitsameter Dr. Gaenslen
Wirtschaftsprüferin Wirtschaftsprüfer
[German Public Auditor] [German Public Auditor]

Report of the Supervisory Board
FISCAL 2021 2
Report of the Supervisory Board Report of the Supervisory Board
Berlin and Munich, December 2, 2021
Dear Shareholders,
Fiscal 2021 was Siemens AG’s first year as a newly posi-
tioned, focused technology company. It was also the
first year for the Company ’s new Managing Board
team. Together with his Managing Board colleagues,
Dr. Roland Busch pursued clear strategic objectives and
positioned Siemens’ operations for faster growth. As
planned, Dr. Busch succeeded Joe Kaeser as President
and CEO at the conclusion of the ordinary Annual Share-
holders’ Meeting on February 3, 2021.
This move – intensively promoted by the Supervisory
Board – successfully concluded Siemens’ strategic, struc-
tural and personnel realignment, which provided a
strong foundation for the outstanding achievements of
the Company’s roughly 300,000 employees in fiscal 2021.
Despite the uncertainties due to the ongoing COVID-19
pandemic, Siemens AG seized the opportunities provided
by the economic recovery and the accelerated drive to-
ward digitalization and sustainability that is transforming
its key markets. The broad-based growth and high profit-
ability achieved by the Company’s businesses are impres-
sive and speak for themselves. Siemens proved that sus-
tainable technologies designed to benefit society are
already a model for success.
In close dialogue with the Supervisory Board, the new
management team also succeeded in further accelerating
business and technological innovation. The extensive in-
troduction of Software-as-a-Service (SaaS) offerings by
Siemens’ industry software business is an excellent exam-
ple of this success. In addition, the Companywide DEGREE
program intensified the focus of all Siemens businesses
on ambitious sustainability targets – targets for environ-
mental and social sustainability and good governance –
even further.
In fiscal 2021, the Supervisory Board performed in full the
duties assigned to it by law, the Siemens Articles of Asso-
ciation and the Bylaws for the Supervisory Board. On the
basis of detailed written and oral reports provided by the
Managing Board, we monitored the Managing Board and
advised it on the management of the Company. In my
capacity as Chairman of the Supervisory Board, I regu-
larly exchanged information with the President and CEO
and the other Managing Board members. As a result, the
Supervisory Board was always kept up to date on pro-
jected business policies, Company planning – including
financial, investment and personnel planning – and the
Company’s profitability and business operations as well
as on the state of Siemens AG and the Siemens Group.
We were directly involved at an early stage in all deci-
sions of fundamental importance to the Company and
discussed these decisions with the Managing Board
intensively and in detail. To the extent that Supervisory
Board approval of the decisions and measures of Com-
pany management was required by law, the Siemens
Articles of Association or our Bylaws, the members of
the Supervisory Board – prepared in some cases by the
Supervisory Board’s committees – issued such approval
after intensive review and discussion. The relevant Man-
aging Board members informed us – within the limits of
the applicable legal framework – about critically impor-
tant measures and decisions at the Company ’s equity
investments.
A special focus of our activities in fiscal 2021 was the
Company’s further strategic development after the suc-
cessful spin-off and subsequent public listing of Siemens
Energy. At our meetings and in additional informational
sessions, we concerned ourselves intensively with the
goals and priorities of Siemens’ businesses and with the
Managing Board’s technology and personnel strategy.
In this connection, we focused our attention on innova-
tion, digitalization and the related opportunities for
growth. Together with the Managing Board, we dis-
cussed the markets, trends and growth fields. The sus-
tainability strategy of Siemens AG was another focus of
our work in fiscal 2021.

FISCAL 2021 3
Report of the Supervisory Board
Topics at the plenary meetings of the Supervisory BoardWe held a total of six regular plenary meetings and two
extraordinary meetings in fiscal 2021. Another extraordi-
nary meeting – the Supervisory Board’s constituent meet-
ing – was held immediately after the Annual Sharehold-
ers’ Meeting on February 3, 2021. We also made two
decisions using other customary means of communica-
tion. Topics of discussion at our regular plenary meetings
were revenue, profit and employment development at
Siemens AG and the Siemens Group as well as the Com-
pany’s financial position and the results of its operations.
In addition, we concerned ourselves, as occasion required,
with acquisition and divestment projects and with risks
to the Company. We received regular reports from the
Managing Board regarding the impact on Siemens of the
COVID-19 pandemic. In addition, we met regularly in
closed sessions without the Managing Board in atten-
dance. In these sessions, we dealt with agenda items that
concerned either the Managing Board itself or internal
Supervisory Board matters.
At an extraordinary meeting on October 29, 2020,
we approved the Managing Board’s decision to sell
Flender GmbH, a producer of mechanical and electrical
drive systems, to The Carlyle Group, U. S.
At our meeting on November 11, 2020, we discussed the
key financial figures for fiscal 2020 and approved the bud-
get for fiscal 2021. On a recommendation by the Compen-
sation Committee, we also defined the Managing Board
members’ compensation for fiscal 2020 on the basis of
calculated target achievement. An internal review con-
firmed the appropriateness of this compensation. We had
already defined the performance criteria for the Manag-
ing Board’s variable compensation for fiscal 2021 at our
meeting on September 22, 2020. On this basis and on the
recommendation of the Compensation Committee, we
made a decision on target setting for Managing Board
compensation for fiscal 2021 at our meeting on Novem-
ber 11, 2020. At this meeting, we also approved a Manag-
ing Board decision on financing measures.
On December 1, 2020, we discussed the financial state-
ments and the Combined Management Report for
Siemens AG and the Siemens Group as of September 30,
2020, the Annual Report for 2020 – including the Report
of the Supervisory Board, corporate governance reporting
and the Compensation Report – and the agenda for the
ordinary Annual Shareholders’ Meeting on February 3,
2021. On the recommendation of the Compensation
Committee, we also made a further decision regarding
the target setting for Managing Board compensation for
fiscal 2021. In addition, we concerned ourselves with the
annual reporting of the Chief Compliance Officer and the
Cybersecurity Officer.
At our meeting on February 2, 2021, the Managing Board
reported on the Company’s current business and finan-
cial position following the conclusion of the first quarter.
The regular terms of office of three shareholder represen-
tatives on the Supervisory Board, who had been reelected
early to five-year terms of office by the Annual Sharehold-
ers’ Meeting on January 26, 2016, ended at the Annual
Shareholders’ Meeting on February 3, 2021. Three share-
holder representatives on the Supervisory Board were
elected for new, four-year terms of office – that is, for the
electoral period 2021 to 2025 – by the Annual Sharehold-
ers’ Meeting on February 3, 2021. The constituent meet-
ing of the Supervisory Board took place immediately after
the Annual Shareholders’ Meeting on February 3, 2021.
At this Supervisory Board meeting, Jim Hagemann Snabe
was reelected Chairman of the Supervisory Board.
The Supervisory Board confirmed Birgit Steinborn in
her position as First Deputy Chairwoman and elected
Dr. Werner Brandt Second Deputy Chairman of the Super-
visory Board. The Supervisory Board also elected the
members of its committees.
In April 2021, the members of the Managing and Super-
visory Boards met several times in smaller groups of a few
participants each for strategy discussions (so-called multi-
lateral strategy sessions) in order to conduct detailed con-
sultations and discussions regarding topics of strategic
importance for Siemens AG.
At our meeting on May 7, 2021, the Managing Board
reported to us on the Company’s current business and
financial position following the conclusion of the second
quarter. As part of a strategic focus, we concerned our-
selves at this meeting – on the basis of the strategy dis-
cussions conducted in smaller groups with the Managing
Board in the previous weeks – comprehensively and
in detail with the strategic priorities of Siemens AG and
the strategic orientation of its businesses. The Managing

FISCAL 2021 4
Report of the Supervisory Board
Board reported to us in detail in particular on the digital
marketplace strategy of the Digital Industries Business
and the SaaS business model. We also discussed Manag-
ing Board compensation. Finally, we concerned ourselves
with the Company’s stake in Siemens Energy.
On May 16, 2021, we approved – in a decision using other
customary means of communication and on the recom-
mendation of the Innovation and Finance Committee –
the Managing Board’s decisions to acquire Supplyframe,
Inc., U.S., a marketplace for the global electronics value
chain. On May 21, 2021, we made another decision using
other customary means of communication to exercise
ownership rights in subsidiaries of Siemens AG in accor-
dance with Section 32 of the German Codetermination
Act (Mitbe stimmungsgesetz, MitbestG). At an extraordi-
nary Super visory Board meeting on June 22, 2021, the
Managing Board presented the reporting planned for
Capital Market Day on June 24, 2021. We approved the
Managing Board’s decision on the share buyback. On
July 28, 2021, we were informed about matters concern-
ing Siemens Healthineers.
At our meeting on August 4, 2021, the Managing Board
reported on the Company’s current business and finan-
cial position following the conclusion of the third quarter.
One focus of this meeting was the sustainability strategy
(DEGREE). We were informed about the current business
situation at Siemens Healthineers. We approved the Man-
aging Board’s decision to acquire SQCAP B. V. (Sqills),
Netherlands, a leading supplier of SaaS solutions for the
rail industry.
At our meeting on September 23, 2021, the Managing
Board reported on the state of the Company. One focus of
this meeting was the Company’s human resources strat-
egy – including talent and leadership development, suc-
cession planning for the Managing Board and diversity.
The Managing Board reported on the current situation at
the Portfolio Companies. We concerned ourselves with
the annual review of Managing Board compensation and –
after preparation by and on a recommendation of the
Compensation Committee – defined each Managing Board
member ’s individual target total compensation and max-
imum compensation as well as the performance criteria
for variable compensation for fiscal 2022. At this meeting,
we also discussed the Compensation Report for fiscal 2021
and made a decision regarding the engagement of an
auditor for the Compensation Report for fiscal 2021. In
addition, we dealt with matters relating to corporate gov-
ernance, in particular with the Declaration of Conformity
with the German Corporate Governance Code and with
the independence of the shareholder representatives on
the Supervisory Board. We approved amendments to the
Bylaws for the Managing Board, the Bylaws for the Super-
visory Board and the bylaws for the Chairman’s Commit-
tee, the Audit Committee and the Compensation Commit-
tee of the Supervisory Board. In addition, we amended
the objectives for the composition of the Supervisory
Board as well as the profile of skills and expertise and the
diversity concept for the Super visory Board. Finally, we
conducted a self-assessment of our activities.
Corporate Governance CodeAt our meeting on September 23, 2021, we approved a
Declaration of Conformity in accordance with Section 161
of the German Stock Corporation Act (Aktiengesetz,
AktG). Information on corporate governance is provided
in the Corporate Governance Statement, which is pub-
licly available on the Siemens Global Website at WWW.
SIEMENS.COM/CORPORATE-GOVERNANCE. The Company’s Dec-
laration of Conformity has been made permanently avail-
able to shareholders on the Siemens Global Website at
WWW.SIEMENS.COM/DECLARATIONOFCONFORMITY. The cur-
rent Declaration of Conformity is also available in the
Corporate Governance Statement.
Work in the Supervisory Board committeesIn fiscal 2021, the Supervisory Board had six standing
committees. These committees prepare proposals and
issues to be dealt with at the Supervisory Board’s plenary
meetings. Some of the Supervisory Board’s decision-mak-
ing powers have been delegated to these committees
within the permissible legal framework. The committee
chairpersons report to the Supervisory Board on their
committees’ work at the subsequent Board meeting.
A list of the members and a detailed explanation of the
tasks of the individual Supervisory Board committees are
set out in the Corporate Governance Statement.
The Chairman’s Committee met nine times. It also made
two decisions using other customary means of commu-
nication. In my capacity as Chairman of the Chairman’s
Committee, I discussed topics of major importance with
the other Committee members also between meetings.

FISCAL 2021 5
Report of the Supervisory Board
The Committee concerned itself, in particular, with per-
sonnel-related matters, succession planning for the com-
position of the Managing Board, corporate governance
issues and the acceptance by Managing Board members
of positions at other companies and institutions. Within
the limits of the applicable legal framework, the Chair-
man’s Committee was informed of and /or approved crit-
ically important, personnel-related measures at Siemens’
businesses and equity investments.
The Nominating Committee met once. It also made one
decision using other customary means of communica-
tion. The Nominating Committee gave in-depth consid-
eration to succession planning for the Supervisory Board
and prepared the Supervisory Board’s nominations of
shareholder representatives on the Supervisory Board for
election by the 2021 Annual Shareholders’ Meeting. The
Nominating Committee was supported in this connection
by an external consulting firm. In selecting the potential
candidates and in preparing a recommendation for the
Supervisory Board decision, the Nominating Committee
gave particular consideration to the objectives that the
Supervisory Board had previously approved for its com-
position, including the profile of required skills and
expertise and the diversity concept for the Supervisory
Board. With a view to the regular Supervisory Board elec-
tions scheduled for 2023, the Nominating Committee
defined the topics for its work over the next few years
and examined the regulatory framework conditions for
the Supervisory Board’s composition.
The Mediation Committee had no need to meet.
The Compensation Committee met four times. It also
made one decision using other customary means of com-
munication. The Compensation Committee prepared, in
particular, Supervisory Board decisions regarding the
definition of performance criteria and the targets for vari-
able compensation, the determination and review of the
appropriateness of Managing Board compensation and
the approval of the Compensation Report. In addition,
the Compensation Committee prepared the Supervisory
Board’s decision regarding the engagement of an auditor
for the Compensation Report for fiscal 2021.
The Innovation and Finance Committee met three
times. It also made one decision using other customary
means of communication. The Innovation and Finance
Committee’s work focused on its recommendation re-
garding the budget for fiscal 2021, the discussion of the
pension system and the preparation and approval of in-
vestment and divestment projects and /or financial mea-
sures. For example, the Innovation and Finance Commit-
tee prepared the Supervisory Board’s decision regarding
the acquisition of Supplyframe, Inc., U. S. It also con-
cerned itself with M & A action fields and with Next47, the
independent unit established by Siemens in 2016 to bun-
dle the Company’s venture capital activities in order to
foster disruptive ideas more intensively and expedite the
development of new technologies. Innovation and tech-
nology-related topics were a further focus. The Managing
Board reported to the Innovation and Finance Committee
regarding user-centered product design and experience
(UX). A guest speaker explained this topic from an exter-
nal perspective (outside-in). Within the limits of the ap-
plicable legal framework, the relevant Managing Board
members informed the Innovation and Finance Commit-
tee about critically important measures and decisions at
the Company’s equity investments.
The Audit Committee held six regular meetings. In the
presence of the independent auditors, of the President
and CEO, of the Deputy Chairman and of the Chief Finan-
cial Officer, the Audit Committee dealt with the financial
statements and the Combined Management Report for
Siemens AG and the Siemens Group. The Audit Commit-
tee discussed the Half-year Financial Report and the quar-
terly statements with the Managing Board and the inde-
pendent auditors. In the presence of the independent
auditors, it also discussed the report on the auditors’
review of the Company’s Half-year Consolidated Financial
Statements and of its Interim Group Management Re-
port. As part of the preparation and implementation of
the audit, the Audit Committee regularly exchanged
views with the independent auditors without the Manag-
ing Board in attendance. In addition, it met regularly in
closed sessions without the Managing Board and inde-
pendent auditors in attendance. The Audit Committee
recommended that the Supervisory Board propose to the
Annual Shareholders’ Meeting that Ernst & Young GmbH
Wirtschaftsprüfungsgesellschaft, Stuttgart, be elected
independent auditors for fiscal 2021. It awarded the audit

FISCAL 2021 6
Report of the Supervisory Board
contract for fiscal 2021 to the independent auditors, who
had been elected by the Annual Shareholders’ Meeting,
defined the Audit Committee’s focus areas and deter-
mined the auditors’ fee. The Audit Committee monitored
the selection, independence, qualification, rotation and
efficiency of the independent auditors as well as the ser-
vices they provided and concerned itself with the review
of the quality of the audit of the financial statements.
In fiscal 2021, against the backdrop of the Wirecard situ-
ation, the Audit Committee regularly discussed the role
of Ernst & Young GmbH Wirtschaftsprüfungsgesellschaft,
Stuttgart, as the independent auditors of Wirecard AG.
The Audit Committee questioned the independent audi-
tors regarding this matter and assessed the impact on
Siemens AG. No impediments were identified that would
preclude Ernst & Young GmbH Wirtschaftsprüfungs-
gesellschaft, Stuttgart, from being elected to serve as
independent auditors for fiscal 2022. The Audit Commit-
tee also dealt with the Company’s accounting and ac-
counting process, the effectiveness of its internal control
system, its risk management system and the effective-
ness, resources and findings of its internal audit as well
as with reports concerning potential and pending legal
disputes. In addition, the Audit Committee concerned
itself with compliance-related matters and, in particular,
with the Chief Compliance Officer ’s quarterly reports and
annual report. Due to the regular external rotation of
independent auditors at the conclusion of fiscal 2023
required in accordance with the current legal situation,
the Audit Committee’s work in fiscal 2021 also focused on
the preparation and implementation of a transparent and
non-discriminatory process for the selection of the inde-
pendent auditors for fiscal 2024. At its meeting on
August 3, 2021, the Audit Committee approved for this
purpose the introduction of a tendering process in accor-
dance with Article 16 of the EU audit regulation (Regula-
tion (EU) No. 537 / 2014 of the European Parliament and of
the Council of April 16, 2014, on specific requirements
regarding the statutory audit of public-interest entities
and repealing Commission Decision 2005 / 909 / EG,
“EU audit regulation”). The members of the Audit Commit-
tee participated as guests in the Innovation and Finance
Committee’s discussion of the budget for fiscal 2021.
The Supervisory Board members take part, on their own
responsibility, in the educational and training measures
necessary for the performance of their duties – measures
relating, for example, to changes in the legal framework
and new, groundbreaking technologies. The Company
supports them in this regard. Internal informational
events are offered when necessary to support targeted
training measures. Two internal training events for all
Supervisory Board members were held in fiscal 2021: one
event on April 14, 2021, concerning strategically relevant
technology-related topics, and another on July 19, 2021,
concerning Group finance.
New Supervisory Board members can meet with Manag-
ing Board members and other managers with specialist
responsibility to exchange views on current topics and
topics of fundamental importance and thus gain an
overview of Company-relevant matters (onboarding). In
fiscal 2021, a separate informational event was held for
the new Supervisory Board members on March 12, 2021,
in order to acquaint them, in particular, with the Compa-
ny’s business model and strategy and with the structures
of the Siemens Group. The new members of the Audit
Committee participated in discussions with the indepen-
dent auditors on April 14, 2021. On April 15, 2021, they
also took part in an introductory event regarding the
Audit Committee’s tasks and processes and the areas of
the Group relevant for the Audit Committee.
Disclosure of participation by individual Supervisory Board members in meetingsThe average rate of participation by members in the
meetings of the Supervisory Board and its committees
was 98 %. Due to the exceptional circumstances caused
by the COVID-19 pandemic, all meetings in fiscal 2021
were held either in a virtual format or as in-person meet-
ings in which virtual participation was possible. The par-
ticipation rate of individual members in the meetings of
the Supervisory Board and its committees is set out in the
following chart:

FISCAL 2021 7
Report of the Supervisory Board
Supervisory Board (plenary
meetings)Chairman’s Committee
Compensation Committee
Audit Committee
Innovation and Finance Committee
Nominating Committee
(Number of meetings / participation in %) No. in % No. in % No. in % No. in % No. in % No. in %
Jim Hagemann Snabe Chairman 9/9 100 9/9 100 4/4 100 6/6 100 3/3 100 1/1 100
Birgit Steinborn First Deputy Chairwoman 9/9 100 9/9 100 4/4 100 6/6 100 3/3 100
Werner Brandt (Dr. rer. pol.) Second Deputy Chairman 9/9 100 5/5 100 6/6 100 1/1 100
Tobias Bäumler 9/9 100 6/6 100 3/3 100
Michael Diekmann 9/9 100 4/4 100
Andrea Fehrmann (Dr. phil.) 9/9 100
Bettina Haller 9/9 100 6/6 100
Harald Kern 9/9 100 4/4 100 3/3 100
Jürgen Kerner 9/9 100 8/9 89 3/4 75 6/6 100 3/3 100
Nicola Leibinger-Kammüller (Dr. phil.) (until February 3, 2021) 3/4 75 3/3 100
Benoît Potier 9/9 100 1/1 100
Hagen Reimer 9/9 100
Norbert Reithofer (Dr. Ing. Dr. Ing. E. h.) 8/9 89 3/3 100
Kasper Rørsted (since February 3, 2021) 5/5 100 2/2 100
Baroness Nemat Shafik (DBE, DPhil) 7/9 78
Nathalie von Siemens (Dr. phil.) 9/9 100 1/1 100 1/1 100
Michael Sigmund 9/9 100
Dorothea Simon 9/9 100
Grazia Vittadini (since February 3, 2021) 5/5 100 3/3 100 2/2 100
Werner Wenning (until February 3, 2021) 4/4 100 4/4 100 2/2 100 1/1 100
Matthias Zachert 9/9 100 2/2 100 6/6 100
Gunnar Zukunft 9/9 100
98 97 96 100 100 100
Detailed discussion of the audit of the financial statementsThe independent auditors, Ernst & Young GmbH Wirt-
schaftsprüfungsgesellschaft, Stuttgart, audited the An-
nual Financial Statements of Siemens AG, the Consoli-
dated Financial Statements of the Siemens Group and the
Combined Management Report for Siemens AG and the
Siemens Group for fiscal 2021 and issued an unqualified
opinion for each. Ernst & Young GmbH Wirtschaftsprü-
fungsgesellschaft, Stuttgart, has served as the indepen-
dent auditors of Siemens AG and the Siemens Group
since fiscal 2009. Katharina Breitsameter has signed as
auditor since fiscal 2016 and as auditor responsible for
the audit since fiscal 2021. Dr. Philipp Gaenslen has
signed as auditor since fiscal 2021. The Annual Financial
Statements of Siemens AG and the Combined Manage-
ment Report for Siemens AG and the Siemens Group
were prepared in accordance with the requirements of
German law. The Consolidated Financial Statements of
the Siemens Group were prepared in accordance with
the International Financial Reporting Standards (IFRS) as
adopted by the EU and with the additional requirements
of German law set out in Section 315 e (1) of the German
Commercial Code (Handelsgesetzbuch, HGB). The Con-
solidated Financial Statements of the Siemens Group also
comply with the IFRS as issued by the International Ac-
counting Standards Board (IASB). The independent audi-
tors conducted their audit in accordance with Section 317
of the German Commercial Code and the EU Audit Regu-
lation and German generally accepted standards for the
audit of financial statements as promulgated by the Insti-
tut der Wirtschaftsprüfer (IDW) as well as in supplemen-
tary compliance with the International Standards on Au-
diting (ISA). The abovementioned documents as well as

FISCAL 2021 8
Report of the Supervisory Board
the Managing Board’s proposal for the appropriation of
net income were submitted to us by the Managing Board
in advance. The Audit Committee discussed the dividend
proposal in detail at its meeting on November 9, 2021. It
discussed the Annual Financial Statements of Siemens AG,
the Consolidated Financial Statements of the Siemens
Group and the Combined Management Report in detail
at its meeting on December 1, 2021. In this context, the
Audit Committee concerned itself, in particular, with the
key audit matters described in the independent auditors’
respective opinions, including the audit procedures im-
plemented. The Audit Committee’s review also covered
the non-financial information for Siemens AG and the
Siemens Group that is included in the Combined Man-
agement Report. The audit reports prepared by the inde-
pendent auditors were distributed to all members of the
Supervisory Board and comprehensively reviewed at the
Supervisory Board meeting on December 2, 2021, in the
presence of the independent auditors, who reported on
the scope, focal points and main findings of their audit,
addressing, in particular, key audit matters and the audit
procedures implemented. No major weaknesses in the
Company’s internal control or risk management systems
were reported. At this meeting, the Managing Board ex-
plained the financial statements of Siemens AG and the
Siemens Group as well as the Company’s risk manage-
ment system.
The Supervisory Board concurs with the results of the
audit. Following the definitive findings of the Audit Com-
mittee’s examination and our own examination, we have
no objections. The Managing Board prepared the Annual
Financial Statements of Siemens AG and the Consoli-
dated Financial Statements of the Siemens Group.
We approved the Annual Financial Statements and the
Consolidated Financial Statements. In view of our ap-
proval, the financial statements are accepted as submit-
ted. We endorsed the Managing Board’s proposal that
the net income available for distribution be used to pay
out a dividend of € 4.00 per share entitled to a dividend
and that the amount of net income attributable to shares
of stock not entitled to receive a dividend for fiscal 2021
be carried forward.
Changes in the composition of the Supervisory and Managing BoardsMatthias Rebellius and Judith Wiese have been full mem-
bers of the Managing Board since October 1, 2020.
Joe Kaeser left the Managing Board effective the end of
the Annual Shareholders’ Meeting on February 3, 2021.
Klaus Helmrich left the Managing Board effective
March 31, 2021. Joe Kaeser worked for Siemens for more
than 40 years. For seven years, he headed the Company
as President and CEO. Klaus Helmrich retired at the expi-
ration of his term of office after nine years on the Man-
aging Board and 35 years at the Company. The Super-
visory Board would like to thank both Mr. Kaeser and
Mr. Helmrich for their many years of successful work on
behalf of Siemens and their extraordinary services to the
Company. We would especially like to thank Joe Kaeser,
who shaped the Company as few others have done and
left behind a strong foundation for future generations.
Robert Kensbock left the Supervisory Board on Septem-
ber 25, 2020, the effective date of the spin-off of Siemens
Energy. In a decision of October 16, 2020, the Charlotten-
burg District Court appointed Tobias Bäumler to succeed
Mr. Kensbock as an employee representative on the
Supervisory Board for the remainder of Mr. Kensbock’s
term of office.
Dr. Nicola Leibinger-Kammüller and Werner Wenning left
the Supervisory Board at the end of the Annual Share-
holders’ Meeting on February 3, 2021, when their terms
of office as shareholder representatives on the Super-
visory Board expired. We thanked Dr. Nicola Leibinger-
Kammüller and Werner Wenning for their many years of
trust-based cooperation and for their professional com-
mitment and contribution to the Company’s success. We
are especially grateful to Mr. Wenning, who, as Second
Deputy Chairman of the Supervisory Board and Chairman
of the Compensation Committee, decisively shaped the
Supervisory Board’s work over a period of many years.
The Annual Shareholders’ Meeting reelected
Jim Hagemann Snabe, whose regular term of office also
expired at the end of the Annual Shareholders’ Meeting
on February 3, 2021, to a four-year term of office as
shareholder representative on the Supervisory Board,
FISCAL 2021 9
Report of the Supervisory Board
and the Supervisory Board reelected Mr. Snabe its Chair-
man. The Annual Shareholders’ Meeting on February 3,
2021, newly elected Kasper Rørsted and Grazia Vittadini
to four-year terms of office as shareholder representa-
tives on the Supervisory Board.
On behalf of the Supervisory Board, I would like to thank
the members of the Managing Board and all the employ-
ees and employee representatives of Siemens AG and of
all Group Companies for their outstanding commitment
and constructive cooperation in fiscal 2021.
For the Supervisory Board
Jim Hagemann Snabe
Chairman

Corporate Governance Statement
pursuant to Sections 289 f and 315 d of the German Commercial Code

2
Corporate Governance Statement
Corporate Governance Statement pursuant to Sections 289 f and 315 d of the German Commercial Code
In this Statement, the Managing Board and the Super
visory Board report as of November 8, 2021, on corporate
governance at the Company in fiscal 2021 (October 1,
2020, to September 30, 2021) pursuant to Sections 289 f
and 315 d of the German Commercial Code (Handels
gesetzbuch, HGB) and as prescribed in Principle 22 of the
German Corporate Governance Code (“Code”). Further
information regarding corporate governance – for exam
ple, the Bylaws for the Supervisory Board, the Bylaws
for the Managing Board, the bylaws for the Supervisory
Board committees and the Corporate Governance State
ments of the previous fiscal years – is also available
on the Siemens Global Website at WWW.SIEMENS.COM/
CORPORATE-GOVERNANCE.
1. Declaration of Conformity with the German Corporate Governance Code
The Managing Board and the Supervisory Board of
Siemens AG approved the following Declaration of Con
formity pursuant to Section 161 of the German Stock Cor
poration Act (Aktiengesetz, AktG) as of October 1, 2021:
“ Declaration of Conformity by the Managing Board and
the Supervisory Board of Siemens Aktiengesell schaft
with the German Corporate Governance Code pursu
ant to Section 161 of the German Stock Corporation Act
Since making its last Declaration of Conformity dated
February 4, 2021, Siemens AG has complied, and will
continue to comply, with all the recommendations of
the Government Commission on the German Corpo
rate Governance Code in the version of December 16,
2019 (‘Code’) published by the Federal Ministry of
Justice and Consumer Protection in the official section
of the Federal Gazette (Bundesanzeiger), with the fol
lowing exceptions:
Siemens AG does not comply with the recommen
dation in B.3. According to this recommendation,
the firsttime appointment of Managing Board
members shall be for a period of not more than
three years.
Siemens AG does not comply with the recommen
dations in C.4 and C.5. According to the recom
mendation in C.4, a Supervisory Board member
who is not a member of any Managing Board of a
listed company shall not accept more than five
Super visory Board mandates at nongroup listed
companies or comparable functions, with an ap
pointment as chair of the Supervisory Board being
counted twice. According to the recommendation
in C.5, members of the Managing Board of a listed
company shall not have, in aggregate, more than
two Supervisory Board mandates in nongroup
listed companies or comparable functions and shall
not accept the chairmanship of a Supervisory Board
in a nongroup listed company.
Siemens AG does not comply with the recommen
dation in C.10 sent. 1 variant 3. According to this
recommendation, the chair of the committee that
addresses Managing Board compensation shall
be independent from the company and the Man
aging Board.
Instead of regarding the recommended maximum pe
riod of the firsttime appointment of Managing Board
members and the recommended maximum number
of mandates for Managing Board and Supervisory
Board members as rigid upper limits, an assessment is
to be possible in each individual case. While the period
of the firsttime appointment of a Managing Board
member shall not, as a rule, exceed three years, an
assessment is to be possible in each individual case in
order to determine what period of appointment is
deemed appropriate within the legally permissible pe
riod. This assessment is to consider the individual
3
Corporate Governance Statement
qualifications and experience of the Managing Board
member to be appointed and, in particular, the quali
fications and experience that he or she has acquired
over many years in management positions within the
Siemens Group. With regard to the number of man
dates accepted by Managing Board and Supervisory
Board members, an assessment is also to be possible
in each individual case in order to determine if the
number of accepted mandates relevant within the
meaning of the Code is deemed appropriate. This as
sessment is to consider the expected personal work
load caused by the accepted mandates, which can
vary from mandate to mandate.
Following the regular departure of Werner Wenning,
the previous, longserving Chairman of the Compen
sation Committee of the Supervisory Board of
Siemens AG, from the Supervisory Board and thereby
also from the Compensation Committee, the Compen
sation Committee elected Michael Diekmann to serve
as its new Chairman, effective February 4, 2021.
Mr. Diekmann has been a member of the Supervisory
Board of Siemens AG since January 24, 2008, and is
therefore not regarded as independent in terms of the
Code’s independence indicators. In the view of the
Compensation Committee, however, Mr. Diekmann is
currently the most suitable candidate for the position
of Chairman because of his professional experience –
due, among other things, to his many years of work
on the Compensation Committee – and because his
election will help ensure continuity in the Commit
tee’s work.
Berlin and Munich, October 1, 2021
Siemens Aktiengesellschaft
The Managing Board The Supervisory Board ”
The current Declaration of Conformity and the Declara
tions of Conformity of the previous five years are avail
able on the Siemens Global Website at WWW.SIEMENS.
COM/DECLARATIONOFCONFORMITY.
2. Compensation Report / Compensation system
The current compensation system for the Managing
Board members pursuant to Section 87 a para. 1 and 2
sent. 1 of the German Stock Corporation Act, which was
endorsed by the Annual Shareholders’ Meeting on Febru
ary 2, 2020, and the decision of the Annual Shareholders’
Meeting on February 3, 2021, pursuant to Section 113
para. 3 of the German Stock Corporation Act regarding
the compensation of the Supervisory Board members are
publicly available on the Siemens Global Website at
WWW.SIEMENS.COM/CORPORATE-GOVERNANCE. The Compen
sation Report and the Independent Auditor ’s Report in
accordance with Section 162 of the German Stock Cor
poration Act are publicly available at the same Internet
address.
3. Information on corporate governance practices
Suggestions of the CodeSiemens AG voluntarily complies with the Code’s sugges
tions, with only the following exceptions:
According to the suggestion in A.5 of the Code, in the
case of a takeover event, the Managing Board should
convene an Extraordinary General Meeting at which
shareholders will discuss the takeover offer and may
decide on corporate actions. The convening of a share
holders’ meeting – even taking into account the short
ened time limits stipulated in the German Securities
Acquisition and Takeover Act (Wertpapiererwerbs und
Übernahmegesetz, WpÜG) – is an organizational chal
lenge for large publicly listed companies. It appears
doubtful whether the associated effort is justified also
in cases where no relevant decisions by the sharehold
ers’ meeting are intended. Therefore, extraordinary
shareholders’ meetings shall be convened only in appro
priate cases.
According to the suggestion in D.8 sent. 2, participation
by telephone or video conference in the meetings of the
Supervisory Board and its committees should not be the
rule. At Siemens AG, participation in meetings is, as a rule,
in person. Participation by telephone takes place only
in exceptional cases. Due to the special circumstances

4
Corporate Governance Statement
created by the COVID19 pandemic, several meetings of
the Supervisory Board and its committees in fiscal 2021
took place as virtual meetings or with the possibility of
participation in a virtual format.
Further corporate governance practices applied beyond
the applicable legal requirements are contained in our
Business Conduct Guidelines, which are publicly available
on the Siemens Global Website at WWW.SIEMENS.COM/
COMPLIANCE.
The Company’s values and Business Conduct GuidelinesIn the 174 years of its existence, our Company has built an
excellent reputation around the world. Technical perfor
mance, innovation, quality, reliability and international
engagement have made Siemens a leading company in
its areas of activity. It is top performance with the highest
ethics that has made Siemens strong. This is what the
Company will continue to stand for in the future.
The Business Conduct Guidelines provide the ethical and
legal framework within which we want to conduct our
activities and remain on course for success. They contain
the basic principles and rules for our conduct within our
Company and in relation to our external partners and the
general public. They set out how we meet our ethical and
legal responsibility as a Company and give expression to
our Company values: “Responsible” – “Excellent” – “Inno
vative.” Our Business Conduct Guidelines are publicly
available on the Siemens Global Website at WWW.
SIEMENS.COM/COMPLIANCE.
4. Description of the operation of the Managing Board and the Supervisory Board and of the composition and operation of their committees
Siemens AG is subject to German corporate law. There
fore, it has a twotier board structure, consisting of a
Managing Board and a Supervisory Board. The duties and
powers of the Managing Board and the Supervisory
Board as well as the regulations regarding their operation
and composition are defined primarily by the German
Stock Corporation Act, the Articles of Association of
Siemens AG and the bylaws for the Company’s governing
bodies. The Articles of Association of Siemens AG,
the Bylaws for the Managing Board, the Bylaws for
the Supervisory Board and the bylaws for the Super
visory Board’s most important committees are available
on the Siemens Global Website at WWW.SIEMENS.COM/
CORPORATE-GOVERNANCE.
Managing BoardIn fiscal 2021, the Managing Board of Siemens AG
comprised Dr. Roland Busch (President and CEO since
the conclusion of the ordinary Annual Shareholders’
Meeting on February 3, 2021, previously Deputy CEO),
Cedrik Neike, Matthias Rebellius, Prof. Dr. Ralf P. Thomas
and Judith Wiese as well as Klaus Helmrich (until
March 31, 2021) and Joe Kaeser (President and CEO until
the conclusion of the ordinary Annual Shareholders’
Meeting on February 3, 2021). Further information
regarding the Managing Board members and their mem
berships, which are to be disclosed pursuant to Sec
tion 285 No. 10 of the German Commercial Code, are set
out in Section 10 of this Corporate Governance State
ment. Information about the Managing Board members’
areas of responsibility and their curricula vitae are avail
able on the Siemens Global Website at WWW.SIEMENS.
COM/MANAGEMENT.
As the top management body, the Managing Board is
committed to serving the interests of the Company and
achieving sustainable growth in company value. The
members of the Managing Board are jointly responsible
for the entire management of the Company and decide
on basic issues of business policy and corporate strategy,
including Siemens’ sustainability strategy, as well as on
the Company’s annual and multiyear plans, unless spe
cific circumstances are taken into account for companies
that are separately managed and publicly listed them
selves (Siemens Healthineers). The Companywide DEGREE
program, which was approved by the Managing Board in
fiscal 2021, intensified the focus of all Siemens businesses
on ambitious sustainability targets – targets for environ
mental and social sustainability and good governance –
even further. More details on sustainability are available
on the Siemens Global Website at WWW.SIEMENS.COM/
SUSTAINABILITYINFORMATION.
The Managing Board prepares the Company’s Quarterly
Statements and Halfyear Financial Report, the Annual
Financial Statements of Siemens AG, the Consolidated
Financial Statements of the Siemens Group and the
5
Corporate Governance Statement
Combined Management Report of Siemens AG and the
Siemens Group. Together with the Supervisory Board,
the Managing Board prepares the Compensation Report.
The Managing Board has established an appropriate and
effective internal control system and risk management
system. It also ensures that the Company adheres to stat
utory requirements, official regulations and internal
Company policies and works to achieve compliance with
these provisions and policies within the Siemens Group.
The Managing Board has established a comprehensive
compliance management system. Protection is offered
to employees and third parties who provide informa
tion on unlawful behavior within the Company. Details
on the compliance management system are available
on the Siemens Global Website at WWW.SIEMENS.COM/
SUSTAINABILITYINFORMATION.
The Supervisory Board has issued Bylaws for the Manag
ing Board that contain the assignment of different port
folios and the rules for cooperation both within the Man
aging Board and between the Managing Board and the
Supervisory Board as well as rules for the socalled Equity
Investments. In accordance with these Bylaws, the Man
aging Board is divided into the portfolio of the President
and CEO and a variety of Managing Board portfolios. The
Managing Board members responsible for the individual
Managing Board portfolios are defined in a business as
signment plan that is determined by the Supervisory Board.
As the Managing Board member with responsibility for
the People & Organization portfolio, the Labor Director
(Arbeitsdirektor) is appointed in accordance with the re
quirements of Section 33 of the German Codetermina
tion Act (Mitbestimmungsgesetz, MitbestG). While the
firsttime appointment of Managing Board members is
not, as a rule, to exceed a period of three years, an assess
ment is to be made in each individual case in order to
determine what period of appointment is deemed appro
priate within the legally permissible period. This matter is
explained in greater detail in Section 1 of this Corporate
Governance Statement.
As a rule, the portfolio assigned to an individual member
is that member ’s own responsibility. Activities and trans
actions in a particular Managing Board portfolio that are
considered to be extraordinarily important for the Com
pany or associated with an extraordinary economic risk
require the prior consent of the full Managing Board. The
same applies to activities and transactions for which the
President and CEO or another member of the Managing
Board demands a prior decision by the Managing Board.
The President and CEO is responsible for the coordina
tion of all Managing Board portfolios. Further details
are available in the Bylaws for the Managing Board
on the Siemens Global Website at WWW.SIEMENS.COM/
BYLAWS-MANAGINGBOARD.
The Managing Board and the Supervisory Board cooper
ate closely for the benefit of the Company. The Managing
Board informs the Supervisory Board regularly, compre
hensively and without delay on all issues of importance
to the entire Company with regard to strategy, planning,
business development, financial position, results of oper
ations, compliance and entrepreneurial risks. At regular
intervals, the Managing Board also discusses the status
of strategy implementation with the Supervisory Board.
The members of the Managing Board are subject to a com
prehensive prohibition on competitive activity for the pe
riod of their employment at Siemens AG. They are commit
ted to serving the interest of the Company. When making
their decisions, they may not be guided by personal inter
ests, nor may they exploit for their own advantage busi
ness opportunities offered to the Company. Managing
Board members may engage in secondary activities – in
particular, supervisory board positions outside the Siemens
Group – only with the approval of the Chairman’s Commit
tee of the Supervisory Board. The Supervisory Board is re
sponsible for decisions regarding any adjustments to Man
aging Board compensation that are necessary in order to
take account of compensation for secondary activities.
Every Managing Board member is under an obligation to
disclose conflicts of interest without delay to the Chairman
or Chairwoman of the Supervisory Board and to inform the
other members of the Managing Board thereof.
EQUITY AND COMPENSATION COMMITTEE
OF THE MANAGING BOARD
In fiscal 2021, the Managing Board had one committee,
the Equity and Compensation Committee. The Equity
and Compensation Committee was dissolved effective
October 1, 2021. The duties assigned to it were trans
ferred back to the Managing Board at that time. The
Equity and Compensation Committee was responsible for
the duties assigned to it by a decision of the Managing
Board ‒ including, in particular, duties in connection with
capital measures and equitylinked financial instruments
relating to the compensation of all employees and man
agers of the Siemens Group except the members of the

6
Corporate Governance Statement
Managing Board and of Top Management and relating to
sharebased compensation components and employee
share plans. The Equity and Compensation Committee
comprised the President and CEO, the Managing Board
member with responsibility for the People & Organization
portfolio, the Managing Board member with responsibil
ity for the Controlling and Finance portfolio and – as of
October 1, 2020 – the Deputy CEO. As of September 30,
2021, its members were Dr. Roland Busch (Chairman),
Prof. Dr. Ralf P. Thomas and Judith Wiese.
Further details regarding the operation and composition
of the Managing Board and its committees are provided
in the Bylaws for the Managing Board, which are publicly
available on the Siemens Global Website at WWW.
SIEMENS.COM/BYLAWS-MANAGINGBOARD.
Supervisory BoardThe Supervisory Board of Siemens AG has 20 members.
As stipulated by the German Codetermination Act, half of
its members represent Company shareholders, and half
represent Company employees. The shareholder repre
sentatives on the Supervisory Board are elected at the
Annual Shareholders’ Meeting by a simple majority vote.
Elections to the Supervisory Board are conducted, as a
rule, on an individual basis. The employee representatives
on the Supervisory Board are elected in accordance with
the provisions of the German Codetermination Act. Fur
ther information regarding the Supervisory Board mem
bers and their memberships, which are to be disclosed
pursuant to Section 285 No. 10 of the German Commer
cial Code, are set out in Section 11 of this Corporate Gov
ernance Statement. The curricula vitae of the Supervisory
Board members are publicly available on the Siemens
Global Website at WWW.SIEMENS.COM/SUPERVISORY-BOARD
and updated annually.
The Supervisory Board oversees and advises the Manag
ing Board in its management of the Company’s business.
At regular intervals, the Supervisory Board discusses
business development, planning, strategy and strategy
implementation. It reviews the Annual Financial State
ments of Siemens AG, the Consolidated Financial State
ments of the Siemens Group, the Combined Manage
ment Report of Siemens AG and the Siemens Group, and
the proposal for the appropriation of net income. It ap
proves the Annual Financial Statements of Siemens AG as
well as the Consolidated Financial Statements of the
Siemens Group, based on the results of the preliminary
review conducted by the Audit Committee and taking
into account the reports of the independent auditors.
The Supervisory Board approves the Managing Board’s
proposal for the appropriation of net income and the Re
port of the Supervisory Board to the Annual Sharehold
ers’ Meeting. The Supervisory Board is jointly responsible
with the Managing Board for the preparation of the Com
pensation Report. In addition, the Company’s adherence
to statutory provisions, official regulations and internal
Company policies (compliance) are monitored by the
Supervisory Board and /or the Audit Committee. The Super
visory Board also appoints the members of the Managing
Board and determines each member ’s portfolios. The
Supervisory Board approves – on the basis of a proposal
by the Compensation Committee – the compensation
system for Managing Board members and defines their
concrete compensation in accordance with this system.
It sets the individual targets for the variable compensa
tion and the total compensation of each individual Man
aging Board member, reviews the appropriateness of to
tal compensation and regularly reviews the Managing
Board compensation system. Effective October 1, 2019,
the Supervisory Board adopted – on the basis of a pro
posal by the Compensation Committee – an adjusted
compensation system, which was approved by the An
nual Shareholders’ Meeting on February 5, 2020. Import
ant Managing Board decisions – such as those regarding
major acquisitions, divestments, fixed asset investments
or financial measures – require Supervisory Board ap
proval unless the Bylaws for the Supervisory Board spec
ify that such authority be delegated to the Innovation
and Finance Committee of the Supervisory Board.
Separate preparatory meetings of the shareholder repre
sentatives and of the employee representatives are held
regularly in order to prepare the Supervisory Board meet
ings. The Supervisory Board also meets regularly without
the Managing Board in attendance. Every Supervisory
Board member must disclose conflicts of interest to the
Supervisory Board. Information regarding conflicts of in
terest that may have arisen and their handling is provided
in the Report of the Supervisory Board. Special informa
tional (onboarding) events are held in order to familiarize
new Supervisory Board members with the Company’s
business model and the structures of the Siemens Group.
The Supervisory Board members take part, on their own
responsibility, in the educational and training measures
necessary for the performance of their duties – measures
relating, for example, to changes in the legal framework
7
Corporate Governance Statement
and new, groundbreaking technologies. The Company
supports them in this regard. Internal informational
events are offered when necessary to support targeted
training measures.
Details regarding the work of the Supervisory Board are
provided in the Report of the Supervisory Board, which
will be made publicly available for each previous fiscal
year on the Siemens Global Website.
SUPERVISORY BOARD COMMITTEES
In fiscal 2021, the Supervisory Board had six committees,
whose duties, responsibilities and procedures fulfill the
requirements of the German Stock Corporation Act and
the Code. The chairmen of these committees provide the
Supervisory Board with regular reports on their commit
tees’ activities.
The Chairman’s Committee makes proposals, in particu
lar, regarding the appointment and dismissal of Manag
ing Board members and is responsible for concluding,
amending, extending and terminating employment con
tracts with members of the Managing Board. When mak
ing recommendations for firsttime appointments, it
takes into account that the terms of these appointments
shall not, as a rule, exceed three years, whereby it is to be
determined in each individual case what period of ap
pointment is to be deemed appropriate within the legally
permissible period. In preparing recommendations re
garding the appointment of Managing Board members,
the Chairman’s Committee takes into account the candi
dates’ professional qualifications, international experi
ence and leadership qualities, the age limit specified for
Managing Board members and the longrange plans for
succession as well as diversity. It also takes into account
the targets for the proportion of women on the Manag
ing Board that have been defined by the Supervisory
Board and the diversity concept for the Managing Board
that has been approved by the Supervisory Board. The
Chairman’s Committee concerns itself with questions re
garding the Company’s corporate governance and pre
pares the resolutions to be approved by the Supervisory
Board regarding the Declaration of Conformity with the
Code ‒ including the explanation of deviations from the
Code ‒ and regarding corporate governance reporting
and the Report of the Supervisory Board to the Annual
Shareholders’ Meeting. It is responsible for approving the
Company’s related party transactions. Furthermore, the
Chairman’s Committee submits recommendations to the
Supervisory Board regarding the composition of the Super
visory Board committees and decides whether to approve
contracts and business transactions with Managing
Board members and parties related to them.
As of September 30, 2021, the Chairman’s Committee
comprised Jim Hagemann Snabe (Chairman), Dr. Werner
Brandt, Jürgen Kerner and Birgit Steinborn.
The Compensation Committee prepares, in particular,
the proposals for decisions by the Supervisory Board’s
plenary meetings regarding the system of Managing
Board compensation, including the implementation of
this system in Managing Board contracts, the definition
of the targets for variable Managing Board compensa
tion, the determination and review of the appropriate
ness of the total compensation of individual Managing
Board members and the annual Compensation Report.
As of September 30, 2021, the Compensation Committee
comprised Michael Diekmann (Chairman), Harald Kern,
Jürgen Kerner, Jim Hagemann Snabe, Birgit Steinborn
and Matthias Zachert.
The Audit Committee oversees, in particular, the ac
counting and the accounting process and conducts a
preliminary review of the Annual Financial Statements
of Siemens AG, the Consolidated Financial Statements of
the Siemens Group and the Combined Management
Report of Siemens AG and the Siemens Group (including
non financial measures). On the basis of the indepen
dent auditors’ report on their audit of the annual finan
cial statements, the Audit Committee makes, after its
preliminary review, recommendations regarding Super
visory Board approval of the Annual Financial Statements
of Siemens AG and the Consolidated Financial Statements
of the Siemens Group. The Audit Committee discusses
the Quarterly Statements and Halfyear Financial Report
with the Managing Board and the independent auditors
and deals with the auditors’ reports on the review of the
Halfyear Consolidated Financial Statements and Interim
Group Management Report. It also monitors the Compa
ny ’s adherence to statutory provisions, official regula
tions and internal Company policies (compliance). The
Chief Compliance Officer reports regularly to the Audit
Committee. The Audit Committee concerns itself with the
Company’s risk monitoring system and oversees the ap
propriateness and effectiveness of its internal control, risk
management and internal audit systems as well as the

8
Corporate Governance Statement
internal process for related party transactions. The Audit
Committee receives regular reports from the internal au
dit department. It prepares the Supervisory Board’s rec
ommendation to the Annual Shareholders’ Meeting con
cerning the election of the independent auditors and
submits the corresponding proposal to the Supervisory
Board. Prior to submitting this proposal, the Audit Com
mittee obtains a statement from the prospective indepen
dent auditors affirming that their independence is not in
question. It awards the audit contract to the independent
auditors elected by the Annual Shareholders’ Meeting and
monitors the independent audit of the financial state
ments as well as the auditors’ selection, independence,
qualification, rotation and efficiency and the services ren
dered by the auditors. The Audit Committee assesses the
quality of the audit of the financial statements on a regu
lar basis. Outside its meetings, the Supervisory Board is
also in regular communication with the independent au
ditors via the Chairman of the Audit Committee.
As of September 30, 2021, the Audit Committee com
prised Dr. Werner Brandt (Chairman), Tobias Bäumler,
Bettina Haller, Jürgen Kerner, Jim Hagemann Snabe,
Birgit Steinborn, Grazia Vittadini and Matthias Zachert.
The members of the Audit Committee are, as a group,
familiar with the sector in which the Company operates.
Pursuant to the German Stock Corporation Act, the Audit
Committee has had to include to date at least one Super
visory Board member with knowledge and experience in
the areas of accounting or the auditing of financial state
ments. Pursuant to the German Stock Corporation Act in
the version of the Financial Market Integrity Strengthen
ing Act (Finanzmarktintegritätsstärkungsgesetz, FISG),
the Supervisory Board must – after the conclusion of a
defined transition period – have at least one member
with knowledge and expertise in the area of accounting,
and at least one additional member with knowledge and
expertise in the auditing of financial statements. In the
person of Mr. Zachert, the Supervisory Board and the Au
dit Committee have at least one member with knowledge
and expertise in the area of accounting and in the person
of Dr. Brandt at least one additional member with knowl
edge and expertise in the auditing of financial statements.
Pursuant to the Code, the chair of the Audit Committee
shall have specialist knowledge and experience in the ap
plication of accounting principles and internal control
processes, be familiar with the auditing of financial state
ments and be independent. The Chairman of the Audit
Committee, Dr. Werner Brandt, fulfills these requirements.
The Nominating Committee is responsible for making rec
ommendations to the Supervisory Board on suitable can
didates for the election by the Annual Shareholders’ Meet
ing of shareholder representatives on the Super visory
Board. In preparing these recommendations, the objec
tives defined by the Supervisory Board for its composition
and the approved diversity concept ‒ in particular, inde
pendence and diversity ‒ are to be appropriately consid
ered, as are the proposed candidates’ required knowledge,
abilities and professional experience. Fulfillment of the
required profile of skills and expertise is also to be aimed
at. Attention shall be paid to an appropriate participation
of women and men in accordance with the legal require
ments relating to the gender quota as well as to ensuring
that the members of the Super visory Board are, as a group,
familiar with the sector in which the Company operates.
As of September 30, 2021, the Nominating Committee
comprised Jim Hagemann Snabe (Chairman), Dr. Werner
Brandt, Benoît Potier and Dr. Nathalie von Siemens.
The Mediation Committee submits proposals to the
Supervisory Board in the event that the Supervisory
Board cannot reach the twothirds majority required for
the appointment or dismissal of a Managing Board mem
ber on the first ballot.
As of September 30, 2021, the Mediation Committee
comprised Jim Hagemann Snabe (Chairman), Dr. Werner
Brandt, Jürgen Kerner and Birgit Steinborn.
Based on the Company’s overall strategy, the Innovation
and Finance Committee discusses, in particular, the
Company’s innovation focuses and prepares the Super
visory Board’s discussions and resolutions regarding ques
tions relating to the Company’s financial situation and
structure ‒ including annual planning (budget) ‒ as well
as the Company’s fixed asset investments and its finan
cial measures. In addition, the Innovation and Finance
Committee has been authorized by the Supervisory
Board to decide on the approval of transactions and mea
sures that require Supervisory Board approval and have a
value of between € 300 million and € 600 million.
As of September 30, 2021, the Innovation and Finance
Committee comprised Jim Hagemann Snabe (Chair
man), Tobias Bäumler, Harald Kern, Jürgen Kerner,
Dr.Ing. Dr.Ing. E. h. Norbert Reithofer, Kasper Rørsted,
Birgit Steinborn and Grazia Vittadini.

9
Corporate Governance Statement
Further details regarding the operation and composition
of the Supervisory Board and its committees are pro
vided in the Bylaws for the Supervisory Board and the
bylaws for its committees, which are publicly available
on the Siemens Global Website at WWW.SIEMENS.COM/
CORPORATE-GOVERNANCE.
SUPERVISORY BOARD SELF-ASSESSMENT
The Supervisory Board and its committees regularly con
duct reviews – either internally or with the involvement
of external consultants – in order to determine how effi
ciently they perform their duties. In fiscal 2021, the Super
visory Board conducted an internal selfassessment at its
meeting on September 23, 2021. The results of this as
sessment confirm that cooperation within the Super
visory Board and with the Managing Board is professional,
constructive and characterized by a high degree of trust
and openness. The results also confirm that meetings are
organized and conducted efficiently and that the partici
pants receive sufficient information. The review did not
reveal a need for any fundamental changes. Individual
suggestions for improvement are also discussed and im
plemented during the year.
5. Targets for the quota of women on the Managing Board and at the two management levels below the Managing Board; Information on Managing Board and Supervisory Board compliance with minimum gender quota requirements
At Siemens AG, the Supervisory Board has set a target for
the proportion of women on the Managing Board at a
minimum of 25 % until June 30, 2022. Pursuant to the Ger
man Stock Corporation Act in the version of the Second
Management Positions Act (Zweites Führungspositio nen
Gesetz, FüPoG II), the Managing Board must include at
least one woman and at least one man (minimum partic
ipation requirement). In fiscal 2021, Siemens AG already
complied with this requirement.
When filling managerial positions at the Company, the
Managing Board takes diversity into account and, in par
ticular, aims for an appropriate consideration of women
and internationality. In 2017, the Managing Board set the
target for the percentage of women at each of the two
management levels below the Managing Board at 20 %,
applicable in each case until June 30, 2022.
The composition of the Supervisory Board fulfilled the
legal requirements regarding the minimum gender quota
in the reporting period.
Statutory provisions on the equal participation of men
and women in management positions that may be appli
cable to Group Companies other than Siemens AG re
main unaffected.
6. Diversity concept for the Managing Board and longterm succession planning
In September 2018, the Supervisory Board approved the
following diversity concept for the composition of the
Managing Board:
“ The goal is to achieve a composition that is as diverse
as possible and comprises individuals who comple
ment one another in a Managing Board that provides
strong leadership as well as to ensure that, as a group,
the members of the Managing Board have all the
knowhow and skills that are considered essential in
view of Siemens’ activities.
When selecting members of the Managing Board, the
Supervisory Board pays close attention to candidates’
personal suitability, integrity, convincing leadership
qualities, international experience, expertise in their
prospective areas of responsibility, achievements to
date and knowledge of the Company as well as their
ability to adjust business models and processes in a
changing world. Diversity with respect to such charac
teristics as age and gender as well as professional and
educational background is an important selection cri
terion for appointments to Managing Board positions.
When selecting members of the Managing Board, the
Supervisory Board also gives special consideration to
the following factors:
In addition to the expertise and management and
leadership experience required for their specific
tasks, the Managing Board members shall have the
broadest possible range of knowledge and experi
ence and the widest possible educational and pro
fessional backgrounds.

10
Corporate Governance Statement
Taking the Company ’s international orientation
into account, the composition of the Managing
Board shall reflect internationality with respect to
different cultural backgrounds and international
experience (such as extensive professional experi
ence in foreign countries and responsibility for
business activities in foreign countries in areas that
are relevant for Siemens).
As a group, the Managing Board shall have experi
ence in the business areas that are important for
Siemens – in particular, in the industry, energy,
healthcare and infrastructure sectors.
As a group, the Managing Board shall have many
years of experience in technology (including infor
mation technology and digitalization), research
and development, procurement, manufacturing
and sales, finance, law (including compliance) and
human resources.
When selecting individuals for Managing Board po
sitions, the targets set by the Supervisory Board for
the proportion of women on the Managing Board
shall be taken into account. The Supervisory Board
has established as a target that – until June 30,
2022 – 25 % of the Managing Board positions are to
be held by women.
It is considered helpful if different age groups are
represented on the Managing Board. In accordance
with the recommendation of the Code, the Super
visory Board has defined an age limit for the mem
bers of the Managing Board. In keeping with this
limit, the members of the Managing Board are, as
a rule, to be not older than 63 years of age.
When making an appointment to a specific Manag
ing Board position, the decisive factor is always the
Company’s best interest, taking into consideration all
circumstances in the individual case.”
Implementation of the diversity concept for the Managing Board in fiscal 2021The diversity concept for the Managing Board is imple
mented as part of the process for making appointments
to the Managing Board. When selecting candidates and /
or making proposals for the appointment of Managing
Board members, the Supervisory Board and /or the Chair
man’s Committee of the Supervisory Board take into ac
count the requirements defined in the diversity concept
for the Managing Board.
In its current composition, the Managing Board fulfills all
the requirements of the diversity concept. The Managing
Board members have a broad range of knowledge, expe
rience and educational and professional backgrounds as
well as international experience. The Managing Board has
all the knowledge and experience that is considered es
sential in view of Siemens’ activities. As a group, the Man
aging Board has experience in the business areas that are
important for Siemens – in particular, in the industry, en
ergy, healthcare and infrastructure sectors – as well as
many years of experience in technology (including infor
mation technology and digitalization), research and devel
opment, procurement, manufacturing and sales, finance,
law (including compliance) and human resources.
In the summer of 2020, the Supervisory Board appointed
Judith Wiese and Matthias Rebellius to the Managing
Board as of October 1, 2020, taking into account the diver
sity concept and the Company’s best interest. In the
course of fiscal 2021, Joe Kaeser and Klaus Helmrich left
the Managing Board at the completion of their regular
terms of office. The target for June 30, 2022, continues
to apply. The appropriate consideration of women is a
key component of longterm succession planning for the
Managing Board. Different age groups are represented
on the Managing Board. No Managing Board member is
currently older than 63 years of age.
Long-term succession planning for the Managing BoardJointly with the Managing Board and with the support of
the Chairman’s Committee, the Supervisory Board conducts
longterm succession planning for the Managing Board. In
its longterm succession planning, the Supervisory Board
takes into account the target it has defined for the propor
tion of women on the Managing Board and the criteria set
out in the diversity concept it has approved for the Manag
ing Board’s composition as well as the requirements of the
German Stock Corporation Act, the Code and the Bylaws for
the Chairman’s Committee. Considering the concrete qual
ification requirements and the abovementioned criteria,
the Chairman’s Committee prepares an ideal profile, on the
basis of which it compiles a shortlist of the available candi
dates. Structured interviews are then conducted with these
candidates. After the interviews, a proposal is submitted to
the Super visory Board for approval. When developing the
profile of requirements and selecting candidates, the Super
visory Board and the Chairman’s Committee are supported,
if necessary, by external consultants.

11
Corporate Governance Statement
7. Objectives regarding the Supervisory Board’s composition as well as the profile of required skills and expertise and the diversity concept for the Supervisory Board
In September 2021, the Supervisory Board approved
changes to the objectives for its composition including
the profile of required skills and expertise and the diver
sity concept:
“ The composition of the Supervisory Board of
Siemens AG shall be such that the Supervisory Board’s
ability to effectively monitor and advise the Managing
Board is ensured. In this connection, mutually comple
mentary collaboration among members with a wide
range of personal and professional backgrounds and
diversity with regard to internationality, age and gen
der are considered helpful.
Profile of required skills and expertiseThe candidates proposed for election to the Super
visory Board shall have the knowledge, skills and ex
perience necessary to carry out the functions of a
Super visory Board member in a multinational com
pany oriented toward the capital markets and to safe
guard the reputation of Siemens in public. In particu
lar, care shall be taken with regard to the personality,
integrity, commitment and professionalism of the in
dividuals proposed for election.
The goal is to ensure that, in the Supervisory Board, as
a group, all the knowhow and experience is available
that is considered essential in view of Siemens’ activi
ties. This includes, for instance, knowledge and expe
rience in the areas of technology (including informa
tion technology and digitalization), procurement,
manufacturing and sales, finance, law (including
compliance) and human resources. In addition, the
members of the Supervisory Board shall collectively
have knowledge and experience in the business areas
that are important for Siemens, in particular, in the
areas of industry, energy, healthcare and infrastruc
ture. As a group, the members of the Supervisory
Board are to be familiar with the sector in which the
Company operates. In accordance with the German
Stock Corporation Act, at least one member of the
Supervisory Board must have knowledge and exper
tise in the area of accounting, and at least one addi
tional member of the Supervisory Board must have
knowledge and expertise in the area of financial state
ments. These two Supervisory Board members shall
be independent. At least one member of the Super
visory Board shall have specific knowledge and expe
rience in applying accounting principles and internal
control processes. This member shall, in addition, be
familiar with the auditing of financial statements and
independent. In particular, the Supervisory Board
shall also include members who have leadership expe
rience as senior executives or members of a super
visory board (or comparable body) at a major com
pany with international operations.
When a new member is to be appointed, a review shall
be performed to determine which of the areas of ex
pertise deemed desirable for the Supervisory Board
are to be strengthened.
InternationalityTaking the Company’s international orientation into
account, care shall be taken to ensure that the Super
visory Board has an adequate number of members
with extensive international experience. The goal is to
make sure that the present considerable share of Su
pervisory Board members with extensive international
experience is maintained.
DiversityWith regard to the composition of the Supervisory
Board, attention shall be paid to achieving sufficient
diversity. Not only is appropriate consideration to be
given to women. Diversity of cultural heritage and a
wide range of educational and professional back
grounds, experiences and ways of thinking are also to
be promoted. When considering possible candidates
for new elections or for filling Supervisory Board posi
tions that have become vacant, the Supervisory Board
shall give appropriate consideration to diversity at an
early stage in the selection process.
In accordance with the German Stock Corporation
Act, the Supervisory Board is composed of at least
30 % women and at least 30 % men. The Nominating
Committee shall continue to include at least one fe
male member.
12
Corporate Governance Statement
IndependenceThe Supervisory Board shall include what the share
holder representatives on the Supervisory Board con
sider to be an appropriate number of independent
shareholder representatives. More than half of the
shareholder representatives shall be independent of
the Company and its Managing Board. Substantial –
and not merely temporary – conflicts of interest are to
be avoided.
No more than two former members of the Managing
Board of Siemens AG shall belong to the Supervisory
Board.
The Supervisory Board members shall have sufficient
time to exercise their mandates with the necessary
regularity and diligence.
Limits on age and on length of membershipIn compliance with the age limit stipulated by the
Super visory Board in its Bylaws, only individuals who
are no older than 70 years of age shall, as a rule, be
nominated for election to the Supervisory Board.
Nominations shall take into account the regular limit
established by the Supervisory Board, which restricts
membership on the Supervisory Board to a maximum
of three full terms of office. It is considered helpful if
different age groups are represented on the Super
visory Board.”
Implementation of the objectives regarding the Supervisory Board’s composition as well as the profile of required skills and expertise and the diversity concept for the Supervisory Board in fiscal 2021; independent members of the Supervisory BoardWithin the framework of the selection process and the
nomination of candidates for the Supervisory Board, the
Supervisory Board as well as the Nominating Committee
of the Supervisory Board take into account the objectives
regarding the Supervisory Board’s composition and the
requirements defined in its diversity concept. The Super
visory Board and the Nominating Committee have re
cently taken the objectives – including the profile of re
quired skills and expertise and the diversity concept – into
consideration in the nominations of three shareholder
representatives to be elected by the Annual Shareholders’
Meeting in 2021. As an additional criterion, the Super
visory Board takes into account expertise in the area of
sustainability.
The Supervisory Board is of the opinion that, with its cur
rent composition, it meets the objectives for its composi
tion and fulfills the profile of required skills and expertise
as well as the diversity concept. The Supervisory Board
members have the specialist and personal qualifications
considered necessary. As a group, they are familiar with
the sector in which the Company operates and have the
knowledge, skills and experience essential for Siemens.
A considerable number of Supervisory Board members
are engaged in international activities and /or have many
years of international experience. Appropriate consider
ation has been given to diversity in the Supervisory Board.
In fiscal 2021, the Supervisory Board had seven female
members, of whom three are shareholder representatives
and four are employee representatives. As a result, 35 % of
the Supervisory Board members are women. Dr. Nathalie
von Siemens is a member of the Nominating Committee.
In the estimation of the shareholder representatives, the
Supervisory Board now has at least nine independent
shareholder representatives – namely, Dr. Werner Brandt,
Benoît Potier, Dr.Ing. Dr.Ing. E. h. Norbert Reithofer,
Kasper Rørsted, Baroness Nemat Shafik, Dr. Nathalie von
Siemens, Jim Hagemann Snabe, Grazia Vittadini and
Matthias Zachert – and thus an appropriate number of
members who are independent in the meaning of the
Code. The regulations establishing limits on age and re
stricting membership in the Supervisory Board to three
full terms of office are complied with.
8. Share transactions by members of the Managing and Supervisory Boards
Pursuant to Article 19 of EU Regulation No. 596 / 2014 of
the European Parliament and Council of April 16, 2014,
on market abuse (Market Abuse Regulation), members
of the Managing Board and the Supervisory Board are
legally required to disclose all transactions conducted on
their own account relating to the shares or debt instru
ments of Siemens AG or to the derivatives or financial
instruments linked thereto if the total value of such
transactions entered into by a board member or any
closely associated person in any calendar year reaches or
13
Corporate Governance Statement
exceeds € 20,000. All transactions reported to Siemens AG
in fiscal 2021 have been duly published and are available
on the Siemens Global Website at WWW.SIEMENS.COM/
DIRECTORS-DEALINGS.
9. Annual Shareholders’ Meeting and investor relations
Shareholders exercise their rights at the Annual Share
holders’ Meeting. An ordinary Annual Shareholders’
Meeting normally takes place within the first five months
of each fiscal year. The Annual Shareholders’ Meeting de
cides, among other things, on the appropriation of net
income, the ratification of the acts of the members of the
Managing and Supervisory Boards, and the appointment
of the independent auditors. Amendments to the Articles
of Association and measures that change the Company’s
capital stock are approved at the Annual Shareholders’
Meeting and implemented by the Managing Board. The
Managing Board facilitates shareholder participation in
this meeting through electronic communications – in
particular, via the Internet – and enables shareholders
who are unable to attend the meeting to vote by proxy.
Proxies can also be reached during the Annual Sharehold
ers’ Meeting. Furthermore, shareholders may exercise
their right to vote in writing or by means of electronic
communications (absentee voting). The Managing Board
may enable shareholders to participate in the Annual
Shareholders’ Meeting without the need to be present at
the venue and without a proxy and to exercise some or all
of their rights fully or partially by means of electronic
communications. The Company enables shareholders to
follow the entire Annual Shareholders’ Meeting via the
Internet. Shareholders may submit motions regarding
the proposals of the Managing and Supervisory Boards
and may contest decisions of the Annual Shareholders’
Meeting. Shareholders owning Siemens stock with an
aggregate notional value of € 100,000 or more may also
demand the judicial appointment of special auditors to
examine specific issues. The reports, documents and in
formation required by law for the Annual Shareholders’
Meeting, including the Annual Report, can be down
loaded from the Siemens Global Website. The same ap
plies to the agenda for the Annual Shareholders’ Meeting
and to any counterproposals or shareholders’ nomina
tions that may require disclosure. For the election of
shareholder representatives on the Supervisory Board, a
detailed curriculum vitae of every candidate is published.
In accordance with Section 1 para. 2 of the German Act
Concerning Measures Under the Law of Companies,
Cooperative Societies, Associations, Foundations and
Commonhold Property to Combat the Effects of the
COVID19 Pandemic (Gesetz über Maßnahmen im Gesell
schafts, Genossenschafts, Vereins, Stiftungs und
Wohnungs eigentumsrecht zur Bekämpfung der Aus
wirkungen der COVID19Pandemie, GesRuaCOVBekG)
of March 27, 2020 (Federal Law Gazette I No. 14 2020,
p. 570) whose application was extended until Decem
ber 31, 2021 by the Ordinance on the Extension of the
Measures Under the Law of Companies, Cooperative
Societies, Associations and Foundations to Combat the
Effects of the COVID19 Pandemic (Verordnung zur Ver
längerung von Maßnahmen im Gesellschafts, Genossen
schafts, Vereins und Stiftungsrecht zur Bekämpfung
der Auswirkungen der COVID19Pandemie, GesRGen
RCOVMVV) of October 20, 2020 (Federal Law Gazette I
No. 48 2020, p. 2258), the ordinary Shareholders’ Meet
ing on February 3, 2021, was conducted as a virtual
shareholders’ meeting without the physical presence of
shareholders or their proxies due to the special circum
stances created by the COVID19 pandemic.
As part of our investor relations activities, we inform our
investors comprehensively about developments within
the Company. For communication purposes, Siemens
makes extensive use of the Internet. We publish Quar
terly Statements, Halfyear Financial and Annual Reports,
earnings releases, ad hoc announcements, analyst pre
sentations, letters to shareholders and press releases as
well as the financial calendar for the current year, which
contains the publication dates of significant financial
communications and the date of the Annual Sharehold
ers’ Meeting, at WWW.SIEMENS.COM/INVESTORS. The Chair
man of the Supervisory Board regularly discusses Super
visoryBoardspecific topics with investors.
The Articles of Association of Siemens AG, the Bylaws for
the Supervisory Board, the bylaws for the most important
Supervisory Board committees, the Bylaws for the Man
aging Board, our Declarations of Conformity with the
Code and a variety of other corporategovernance related
documents are posted on the Siemens Global Website at
WWW.SIEMENS.COM/CORPORATE-GOVERNANCE.

14
Corporate Governance Statement
10. Members of the Managing Board and positions held by Managing Board members
In fiscal 2021, the Managing Board had the following members:
Name Date of birth First appointed Term expires
Memberships in supervisory boards whose establishment is required by law or in comparable domestic or foreign controlling bodies of business enterprises
External positions (as of September 30, 2021)
Group company positions (as of September 30, 2021)
Roland Busch(Dr. rer. nat.) President and Chief Executive Officer (since February 3, 2021)
November 22, 1964
April 1, 2011
March 31, 2025
German positions: Siemens Healthineers AG, Munich 1
Siemens Mobility GmbH, Munich (Chairman)
Klaus Helmrich (until March 31, 2021) as of March 31, 2021
May 24, 1958
April 1, 2011
March 31, 2021
German positions: EOS Holding AG, Krailling
Joe Kaeser (President and Chief Executive Officer, member of the Managing Board until February 3, 2021) as of February 3, 2021
June 23, 1957
May 1, 2006
At the end of the 2021 Annual Shareholders’ Meeting
German positions: Daimler AG, Stuttgart 1
MercedesBenz AG, Stuttgart Siemens Energy AG, Munich (Chairman) 1
Siemens Energy Management GmbH, Munich (Chairman)
Positions outside Germany: NXP Semiconductors N. V., Netherlands 1
Positions outside Germany: Siemens Ltd., India 1
Cedrik Neike March 7, 1973
April 1, 2017
May 31, 2025
German positions: Evonik Industries AG, Essen 1
Positions outside Germany: Atos SE, France 1
Positions outside Germany: Siemens Aktiengesellschaft Österreich, Austria (Chairman)
Siemens France Holding S. A., France
Matthias Rebellius January 2, 1965
October 1, 2020
September 30, 2025
German positions: Siemens Energy AG, Munich 1
Siemens Energy Management GmbH, Munich
Positions outside Germany: Arabia Electric Ltd., Saudi Arabia (Deputy Chairman)
Siemens Ltd., Australia Siemens Ltd., India 1
Siemens Ltd., Saudi Arabia (Deputy Chairman)
Siemens Schweiz AG, Switzerland (Chairman)
Siemens W. L. L., Qatar
Ralf P. Thomas(Prof. Dr. rer. pol.)
March 7, 1961
September 18, 2013
September 17, 2023
German positions: Siemens Energy AG, Munich 1
Siemens Energy Management GmbH, Munich
German positions: Siemens Healthcare GmbH, Munich (Chairman)
Siemens Healthineers AG, Munich (Chairman) 1
Positions outside Germany: Siemens Proprietary Ltd., South Africa (Chairman)
Judith Wiese January 30, 1971
October 1, 2020
September 30, 2023
German positions: European School of Management and Technology GmbH, Berlin
1 Publicly listed.

15
Corporate Governance Statement
Name Occupation Date of birth Member sinceTerm expires 1
Memberships in supervisory boards whose establishment is required by law or in comparable domestic or foreign controlling bodies of business enterprises (as of September 30, 2021)
Jim Hagemann SnabeChairman
Chairman of the Supervisory Board of Siemens AG and of the Board of Directors of A. P. MøllerMærsk A / S
October 27, 1965
October 1, 2013
2025 German positions: Allianz SE, Munich (Deputy Chairman) 3
Positions outside Germany: A. P. MøllerMærsk A / S, Denmark (Chairman) 3
C3.ai, Inc., USA 3
Birgit Steinborn 2
First Deputy Chairwoman
Chairwoman of the Central Works Council of Siemens AG
March 26, 1960
January 24, 2008
2023
Werner Brandt (Dr. rer. pol.)Second Deputy Chairman (since February 3, 2021)
Chairman of the Supervisory Board of RWE AG and of ProSiebenSat.1 Media SE
January 3, 1954
January 31, 2018
2023 German positions: ProSiebenSat.1 Media SE, Munich (Chairman) 3
RWE AG, Essen (Chairman) 3
Tobias Bäumler 2
(since October 16, 2020)
Deputy Chairman of the Central Works Council and of the Combine Works Council of Siemens AG
October 10, 1979
October 16, 2020
2023
Michael Diekmann Chairman of the Supervisory Board of Allianz SE
December 23, 1954
January 24, 2008
2023 German positions: Allianz SE, Munich (Chairman) 3
Fresenius Management SE, Bad Homburg
Fresenius SE & Co. KGaA, Bad Homburg (Deputy Chairman) 3
Andrea Fehrmann 2
(Dr. phil.)Trade Union Secretary, IG Metall Regional Office for Bavaria
June 21, 1970
January 31, 2018
2023 German positions: Siemens Energy AG, Munich 3
Siemens Energy Management GmbH, Munich
Bettina Haller 2 Chairwoman of the Combine Works Council of Siemens AG
March 14, 1959
April 1, 2007
2023 German positions: Siemens Mobility GmbH, Munich (Deputy Chairwoman)
Harald Kern 2 Chairman of the Siemens Europe Committee
March 16, 1960
January 24, 2008
2023
Jürgen Kerner 2 Chief Treasurer and Executive Member of the Managing Board of IG Metall
January 22, 1969
January 25, 2012
2023 German positions: MAN Truck & Bus SE, Munich (Deputy Chairman)
Premium Aerotec GmbH, Augsburg (Deputy Chairman)
Siemens Energy AG, Munich 3
Siemens Energy Management GmbH, Munich
Thyssenkrupp AG, Essen (Deputy Chairman) 3
Traton SE, Munich 3
Nicola Leibinger Kammüller (Dr. phil.)(until February 3, 2021) as of February 3, 2021
Chief Executive Officer (CEO) – President and Chairwoman of the Group Management of TRUMPF GmbH + Co. KG
December 15, 1959
January 24, 2008
2021 Positions outside Germany: TRUMPF Schweiz AG, Switzerland 4
Benoît Potier Chairman and Chief Executive Officer of Air Liquide S. A
September 3, 1957
January 31, 2018
2023 Positions outside Germany: Air Liquide International S. A., France (Chairman and Chief Executive Officer) 3, 4
Air Liquide International Corpo ration (ALIC), USA (Chairman) 4
American Air Liquide Holdings, Inc., USA 4
The Hydrogen Company S. A., France 4
1 As a rule, the term of office ends at the conclusion of the (relevant) ordinary Annual Shareholders’ Meeting.2 Employee representative.3 Publicly listed.4 Group company position.5 Shareholders’ Committee.
11. Members of the Supervisory Board and positions held by Supervisory Board members
In fiscal 2021, the Supervisory Board had the following members:

16
Corporate Governance Statement
Name Occupation Date of birth Member sinceTerm expires 1
Memberships in supervisory boards whose establishment is required by law or in comparable domestic or foreign controlling bodies of business enterprises (as of September 30, 2021)
Hagen Reimer 2 Trade Union Secretary of the Managing Board of IG Metall
April 26, 1967
January 30, 2019
2023 German positions: Siemens Energy AG, Munich 3
Siemens Energy Management GmbH, Munich
Norbert Reithofer (Dr.Ing. Dr.Ing. E. h.)
Chairman of the Supervisory Board of Bayerische Motoren Werke Aktiengesellschaft
May 29, 1956
January 27, 2015
2023 German positions: Bayerische Motoren Werke Aktiengesellschaft, Munich (Chairman) 3
Henkel AG & Co. KGaA, Düsseldorf 3, 5
Henkel Management AG, Düsseldorf
Kasper Rørsted (since February 3, 2021)
Chief Executive Officer and Board Member of adidas AG 3
February 24, 1962
February 3, 2021
2025 Positions outside Germany: Member of the Board of Directors, Nestlé S. A., Switzerland 3
Baroness Nemat Shafik(DBE, DPhil)
Director of the London School of Economics
August 13, 1962
January 31, 2018
2023
Nathalie von Siemens(Dr. phil.)
Member of supervisory boards July 14, 1971
January 27, 2015
2023 German positions: Messer Group GmbH, Sulzbach Siemens Healthcare GmbH, Munich Siemens Healthineers AG, Munich 3
TÜV Süd AG, MunichPositions outside Germany:
EssilorLuxottica SA, France 3
Michael Sigmund 2 Chairman of the Committee of Spokespersons of the Siemens Group and Chairman of the Central Committee of Spokespersons of Siemens AG
September 13, 1957
March 1, 2014
2023
Dorothea Simon 2 Chairwoman of the Central Works Council of Siemens Healthcare GmbH
August 3, 1969
October 1, 2017
2023 German positions: Siemens Healthcare GmbH, Munich
Grazia Vittadini(since February 3, 2021)
Airbus Special Advisor September 23, 1969
February 3, 2021
2025
Werner Wenning(Second Deputy Chairman and member of the Supervisory Board until February 3, 2021) as of February 3, 2021
Member of the Supervisory Board October 21, 1946
January 23, 2013
2021
Matthias Zachert Chairman of the Board of Management of LANXESS AG 3
November 8, 1967
January 31, 2018
2023
Gunnar Zukunft 2 Deputy Chairman of the Central Works Council of Siemens Industry Software GmbH
June 21, 1965
January 31, 2018
2023 German positions: Siemens Industry Software GmbH, Cologne
1 As a rule, the term of office ends at the conclusion of the (relevant) ordinary Annual Shareholders’ Meeting.2 Employee representative.3 Publicly listed.4 Group company position.5 Shareholders’ Committee.

Notes and forward-looking statements

Notes and forward-looking statements
2
This document contains statements related to our future business and financial performance and future events or developments involving Siemens that may constitute forward-looking statements. These statements may be identified by words such as “expect,” “look forward to,” “anticipate,” “intend,” “plan,” “believe,” “seek,” “estimate,” “will,” “project” or words of similar meaning. We may also make forward-looking statements in other reports, in prospectuses, in presentations, in material delivered to shareholders and in press releases. In addition, our representatives may from time to time make oral forward-looking statements. Such statements are based on the current expectations and certain assumptions of Siemens’ management, of which many are beyond Siemens’ control. These are subject to a number of risks, uncertainties and factors, including, but not limited to, those described in disclosures, in particular in the chapter Report on expected developments and associated material opportunities and risks in the Annual Report. Should one or more of these risks or uncertainties materialize, events of force majeure, such as pandemics, occur or should underlying expectations including future events occur at a later date or not at all or assumptions prove incorrect, actual results, performance or achievements of Siemens may (negatively or positively) vary materially from those described explicitly or implicitly in the relevant forward-looking statement. Siemens neither intends, nor assumes any obligation, to update or revise these forward-looking statements in light of developments which differ from those anticipated.
This document includes – in the applicable financial reporting framework not clearly defined – supplemental financial measures that are or may be alternative performance measures (non-GAAP-measures). These supplemental financial measures should not be viewed in isolation or as alternatives to measures of Siemens’ net assets and financial positions or results of operations as presented in accordance with the applicable financial reporting framework in its Consolidated Financial Statements. Other companies that report or describe similarly titled alternative performance measures may calculate them differently.
Due to rounding, numbers presented throughout this and other documents may not add up precisely to the totals provided and percentages may not precisely reflect the absolute figures.
This document is an English language translation of the German document. In case of discrepancies, the German language document is the sole authoritative and universally valid version.
For technical reasons, there may be differences between the accounting records appearing in this document and those published pursuant to legal requirements.
The Sustainability Report 2021 which reports on Sustainability and Citizenship at Siemens is available at: siemens.com/investor/en/