Nokia Siemens Networks
22
SON as CSP OPEX and CAPEX saving tool 22.11.2011 Dmitrijs Serdega / 2G/3G SON Nokia Siemens Networks
-
Upload
khangminh22 -
Category
Documents
-
view
0 -
download
0
Transcript of Nokia Siemens Networks

SON1 © Nokia Siemens Networks
SON as CSP OPEX and CAPEX saving tool
22.11.2011
Dmitrijs Serdega
/
2G/3G SON
Nokia Siemens Networks

SON2 © Nokia Siemens Networks
Agenda
/
Introduction to 2G/3G SON
SON Suite overview
Features
References
Roadmap
SON3 © Nokia Siemens Networks
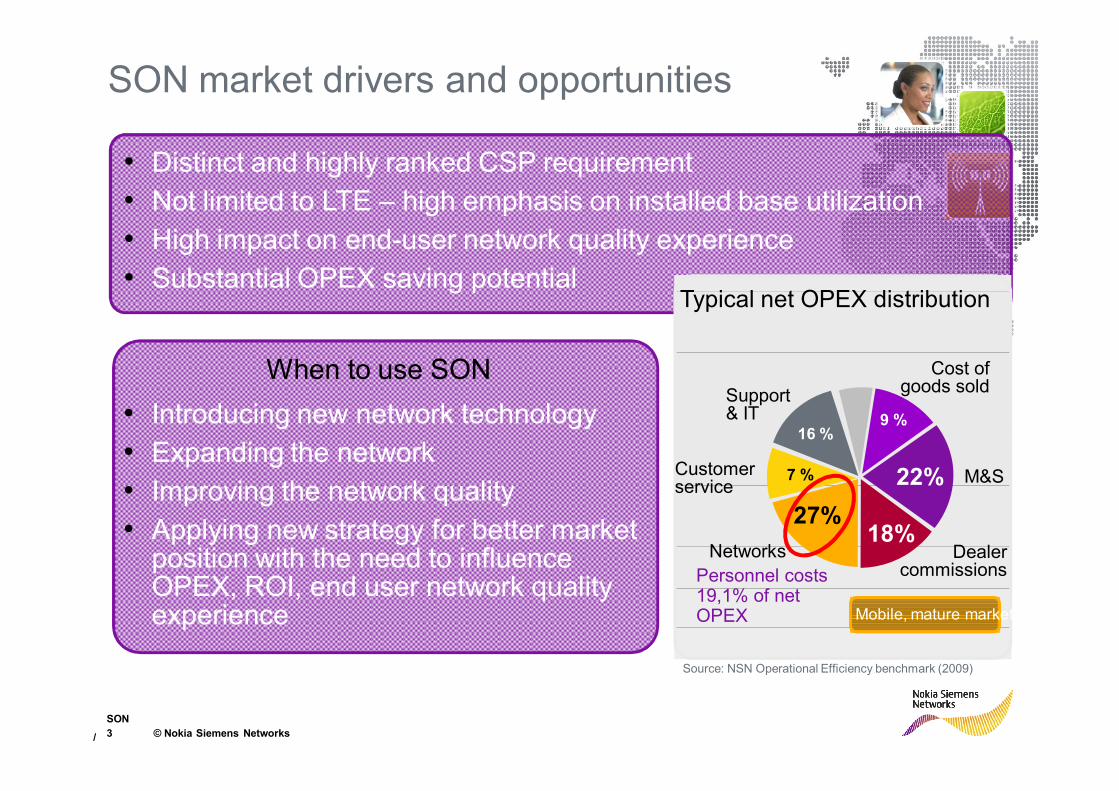
SON market drivers and opportunities
/
• Distinct and highly ranked CSP requirement• Not limited to LTE – high emphasis on installed base utilization• High impact on end-user network quality experience• Substantial OPEX saving potential
Source: NSN Operational Efficiency benchmark (2009)
M&S
Typical net OPEX distribution
Customerservice
Networks
Support& IT
Cost of goods sold
27%
7 %
16 %
Personnel costs 19,1% of net OPEX
18%
9 %
22%
Dealercommissions
Mobile, mature markets
• Introducing new network technology • Expanding the network • Improving the network quality • Applying new strategy for better market
position with the need to influence OPEX, ROI, end user network quality experience
When to use SON

SON4 © Nokia Siemens Networks
SON has key operational benefits
/
SelfQuality
Capacity
Coverage
Healing• Error self-detection
and mitigation• Reduced operator
effort• Faster maintenance • Reduced outage time
Optimization• Increased network quality
and performance• Parameter optimization• Reduced operational
effort
Configuration• Simplified installation
procedures - less prone to errors
• Faster roll-out• Fewer drive-tests• More flexibility in logistics
(no site specifics)• Reduced site planning
SON key objectivesSON key objectives-Reduce complexity and cost of network operations-Maintain and improve quality of the networks-Cost effective introduction of new technologies-Protect network investments

SON5 © Nokia Siemens Networks
Agenda
/
Introduction to 2G/3G SON
SON Suite overview
Features
References
Roadmap

SON6 © Nokia Siemens Networks
SON Suite Features
Self-healing
Self-optimization
Self-configuration
• SON Plug and Play• Automated Neighbor
Relations (ANR) Management• PRACH Management
• Automated Neighbor Relations (ANR) Management
• Energy Saving• Mobility Robustness
Optimization• Minimization of Drive Tests• Load Balancing
• Cell Outage Detection, Triggered Reset and Compensation
• Automatic interface alarm correlation
• SON Plug and Play• Automated Neighbor
Management
LTE WCDMA & GSM
• Automated Neighbor Management• Energy Saving • Interference Reduction• Load Balancing• Min. of Drive Tests• HO Perform. Optimization• Capacity and Coverage
Optimization
• Alarm Triggered Log Collection (WCDMA)
• Automatic OMS resiliency (WCDMA)
• OMS Overload Control (WCDMA)
MVI
MVI
MVI
MVI

SON7 © Nokia Siemens Networks
SON Suite = Fast Return On Investment
/
• Automated Neighbor Relations and SON Plug & Play accelerate rollout
• Network optimization cycle time reduced from 3 months to 7 days with Optimizer
Fast new technology rollout
ROI
• Proven NetAct automation and optimization increase staff efficiency by >10%
• Proven > 50% OPEX reduction in key radio network optimization tasks
• > 50% of cell overload eliminated with Load BalancingOPEX
Efficiency in operations and re-use of existing infrastructure
• Cell outage detection and compensation provide uninterrupted eNB performance. Adaptive ANR saves UE battery life. Mobility robustness and ANR minimizes the drop calls. Optimizer’s powerful real–time processes result in highest radio network performance.QUALITY
End-user quality experience

SON8 © Nokia Siemens Networks
SON Plug and Play
/
The steps of BTS Plug and Play process• Configuration pre-planning• BTS Auto connection• BTS Auto configuration
•Automates the BTS network integration •Downloads all needed data like SW upgrades and initial parameter configuration from NetAct and makes BTS up and running in minutes.
•This one-touch self-commissioning deployment is industry unique simplifying the network setup markedly.
GSM/WCDMA

SON9 © Nokia Siemens Networks
Automated Neighbor Relations (ANR)
/
The steps of ANR process• Measurement collection• Defining the creation/deletion criteria• Run optimization and activate the changes
• The ANR function for WCDMA automates and optimizes the adjacency optimization process •Support for Inter-System (2G-3G), MV adjacency •The decision about adjacency creation/deletion is based on real measurement information from the network•The automated neighbor relations removes a need for manual neighbor optimization, maintenance and subsequently errors from the process•NetAct Optimizer is used to perform the neighbor optimization
GSM/WCDMAMV Support

SON10 © Nokia Siemens Networks
Minimization of drive test by location based performance analysis
/
The steps of interference optimization process• Measurement collection via RNC Collector• Measurement processing and geo-location by TraceViewer•Optimization and visualization via Optimizer
•Accurate real-time location based analysis for network performance and traffic distribution • Partial replacement of drive test measurement OPEX saving
•Localization algorithm is based on network statistics collected from RNC•Geo location of drop calls•Drop call history analysis including drops reasons•Traffic localization (coming in later releases)•Traffic type distribution (coming in later releases)
•Solution consist of several products: RNC Collector, TraceViewer and Optimizer
WCDMAMV Support

SON11 © Nokia Siemens Networks
Power Saving Mode for BTS
/
The steps for Power Saving Mode for BTS process• Configuration of radio parameters and thresholds•>60 000 sites, 20% saving ~70 MUSD/year
•Cell shutdown during low load periods•It is ensured that the target layer has room for the calls before execution
•Cell is activated on need basis•The other layer cell load increases
•The shutdown and activation is possible for more than one frequency layer
GSM/WCDMA

SON12 © Nokia Siemens Networks
Agenda
/
Introduction to 2G/3G SON
SON Suite overview
Features
Key benefits and references

SON13 © Nokia Siemens Networks
Excelcomindo raises service quality in a multi-vendor network
/
Customer challenge• To reduce dropped calls in a popular tourist
area with challenging topology
• To improve service quality• To reduce churn in their customer base
Our solution• Analysis of the Evendor A network • Integration of the Nokia Siemens Network
NetAct™ Optimizer software with multi-vendor capabilities into the network infrastructure
Customer benefit• Improved KPI’s• Reduced dropped call rate• Reduced OPEX
“I would personally recommend the service using this efficient and effective tool to other operators if they asked me.”
Anton Perwira Putra, Network Optimization Manager, Central Area, Excelcomindo. Source: Success story
KPI After optimization
OSS Average DCR 36% relative improvement
TCH Drive test DCR
78% relative improvement
HO Success Rate -OSS
2.6% absolute improvement

SON14 © Nokia Siemens Networks Presentation / Author / 10.2008 Date
Optimizer Customer Experiences
• Fine tuned network• 5 days project
KPI Before After Gain %TCH DCR(3i) 0.53 0.44 16.80TCH DCR RF 0.25 0.21 14.29
DQ5-7 1.09 0.77 29.28
SDCCH DCR 3.32 2.02 39.23SDCCH DCR RF 0.33 0.26 22.85
HO drop ratio 0.26 0.20 23.49HO failure 2.61 2.26 13.43
Middle East

SON15 © Nokia Siemens Networks
Finding3.9% - Blocked Call rate during trial.Only 42% of BC are followed by redial. Half of redials fail again.0.7% of cells (10 worst cells) is responsible for 27% of blocked calls.Understanding80% of blocked calls are lost – do NOT generate revenue despite users’ readiness to pay.Limited effort: 0.7% cells correction (10 worst), leads to important improvement: 27% BC.ActionIdentify worst cells, verify them with worst Drop Call cells and worst data cells.Correct selected worst cells to capture revenue that users are ready to pay.1.28% (80%*40% out of 4%) does not generate revenue =>~ 5 mEur yearly loss.
67 (22%)
61 (20%)
Successful Calls
180( 58%)
User behavior after Blocked Call
7639 (96%)
308 (3.9%)
Blocked Calls7947 (100%) outgoing call attempts
Redial success
Redial failure
No attempt afterblocked call
247 (80%)
61 (20%)
Revenue savedby second attempt
Lost Revenue
C-1 Do little to get much

SON16 © Nokia Siemens Networks
Finding5.5% of Dropped Call rate identified during trial.50% of DC are followed by redial. Half of redials fail again.0.7% of cells (10 worst cells) is responsible for 32% of dropped calls.Understanding54% of dropped calls generate LESS revenue than users are ready to pay.23% of dropped calls generate additional revenue on connect fee, but against LOST of trust.Limited effort: 0.7% cells correction (10 worst), leads to important improvement: 32% BC.ActionIdentify worst cells, verify them with worst Block Call cells and worst data cells.Correct selected worst cells to capture revenue that users are ready to pay.
135 (27%)
Successful Calls
253( 50%)
User behavior after Dropped Call
8712 (94.5%)
504 (5.5%)
Dropped Calls
9219 (100%) successful callsin and out
Redial success
Redial failure
B-partyreactionassumed Lost
Revenue
137 (27%)
116 (23%)
No A-party attempt afterdropped call
B-partyredial success
B-partyredial failureor no redial
330(54%)
Additional Revenue
C-1 Do little to get much
116 (23%)
116 (23%)
Saved revenue byB-party redial
116 (23%)
SON17 © Nokia Siemens Networks MTS UA MQA trial Executive Summary / August 2009
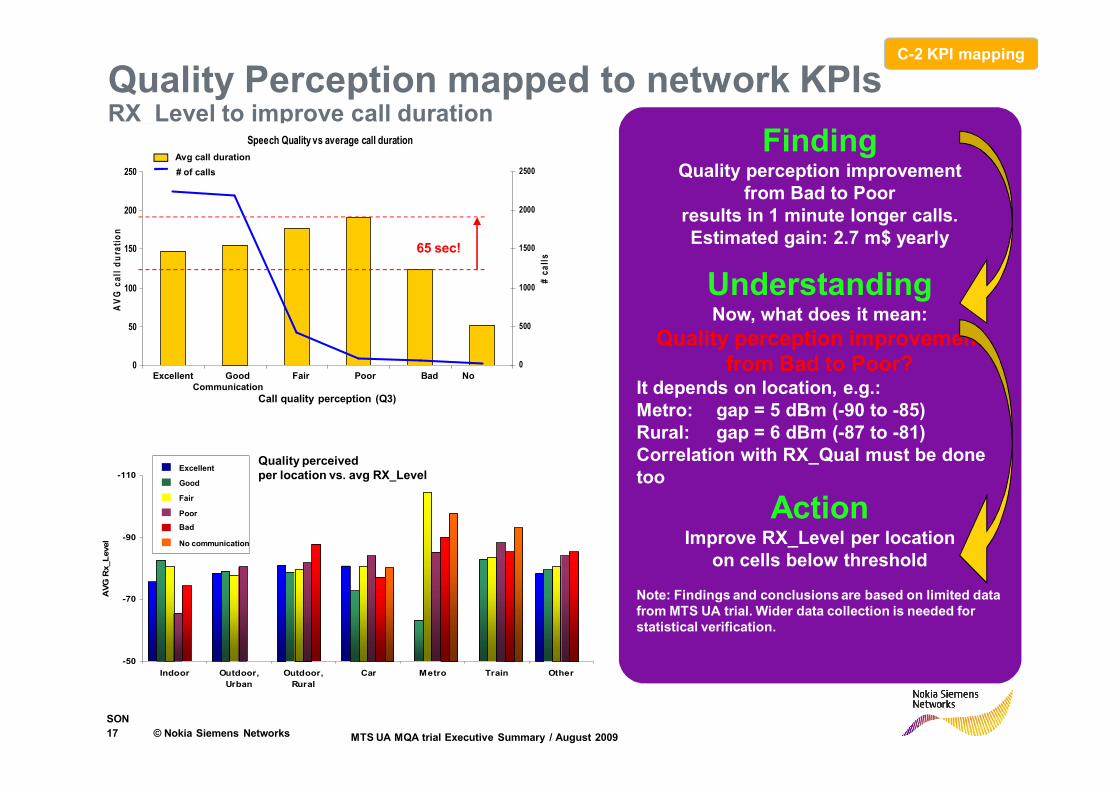
Quality Perception mapped to network KPIsRX_Level to improve call duration
Location and quality perceived vs AVG Rx_Level
-110
-90
-70
-50Indoor Outdoor,
UrbanOutdoor,
RuralCar Metro Train Other
AVG
Rx_
Leve
l
Excellent
Good
Fair
Poor
Bad
No Connection
FindingQuality perception improvement
from Bad to Poorresults in 1 minute longer calls.Estimated gain: 2.7 m$ yearly
UnderstandingNow, what does it mean:
Quality perception improvementfrom Bad to Poor?
It depends on location, e.g.:Metro: gap = 5 dBm (-90 to -85)Rural: gap = 6 dBm (-87 to -81)Correlation with RX_Qual must be done too
ActionImprove RX_Level per location
on cells below threshold
Note: Findings and conclusions are based on limited data from MTS UA trial. Wider data collection is needed for statistical verification.
Speech quality vs. average call duration
Quality perceivedper location vs. avg RX_LevelExcellent
Good
Fair
PoorBad
No communication
Speech Quality vs average call duration
0
50
100
150
200
250
Excellent Good Fair Poor Bad No ConnectionCall based quality (Q3)
AVG
cal
l dur
atio
n
0
500
1000
1500
2000
2500
# ca
lls
65 sec!
Call quality perception (Q3)
Excellent Good Fair Poor Bad No Communication
Avg call duration# of calls
C-2 KPI mapping

SON18 © Nokia Siemens Networks MTS UA MQA Trial Report / AWo / 17.07.2009
Где Вы находились?
Вне помещения, за городом
2.8%В машине
6.6% В метро1.3%
Вне помещения, в городе15.4%
В поезде0.2%
Другое0.8%
В помещении72.8%
В помещенииВне помещения, в городеВне помещения, за городомВ машинеВ метроВ поездеДругое
72.8% of the total calls have been performed in Indoor location by the users. Higher percentage of Indoor should be represented by Office.
Call Based Q2
QuestionnaireEnd-User Perception

SON19 © Nokia Siemens Networks
Customer Benefits. Fast Return On Investment
• Reduced OPEX– Automated optimization process– Less resources needed
• Increased Revenue – Improved service quality – reduced drop call rate– More served traffic and subscribers
• Optimized CAPEX– Efficient network capacity utilization– Better planning of network extensions
Results from 17 Optimizer cases
In average 10% improvement of UL RXQuality
In average 16% improvement for Drop Call Rate
In average 12% improvement of DL RXQuality

SON20 © Nokia Siemens Networks
Project Leader quote:NSN is a true forerunner in SON which combines various network elements and OSS NetActtools into coherent use for SON automation. The customer has shown great enthusiasm towards this solution foreseeing the big chances to minimize net provisioning costs achieving an optimized network at the same time.”
NSN LTE SON success in Russia
A wide scope of Nokia Siemens Networks LTE SON features were recently successfully tested by the leading Russian operator.
The tests were carried out in the all 3 key areas of SON automation:
Self-Configuration: Plug and Play and Automated Neighbor RelationsSelf-Healing: Cell Outage Detection and Cell Outage Triggered ResetSelf-Optimization: ANR Intra-Inter frequency

SON21 © Nokia Siemens Networks
NSN NetAct Optimizer ReferencesExamples of Cases
Excelcomindo, Indonesia: •Improved service quality in a multi-vendor network using NSN NetAct Optimizer
Shanghai Unicom, China•Improved network quality with NSN NetAct Optimizer
Smart, Philippines•GSM Optimization of Metro Manila area
Elisa, Finland•Extending coverage with cost-efficient WCDMA frequency re-farming
NetAct Optimizer / September 2010 / EJä
Over 100 Optimizer deliveries since 2004
Sample cases