![[Second Edition,.]](https://static.fdokumen.com/doc/165x107/6322fad1887d24588e04752c/second-edition.jpg)
SICAM Power Quality and Measurement Catalog Edition 6
152
siemens.de/powerquality siemens.com/powerquality SICAM Power Quality and Measurement Catalog ⋅ Edition 6
-
Upload
khangminh22 -
Category
Documents
-
view
4 -
download
0
Transcript of SICAM Power Quality and Measurement Catalog Edition 6

siemens.de/powerquality
siemens.com/powerquality
SICAM Power Quality and Measurement Catalog ⋅ Edition 6

SICAM Power Quality and Measurement ⋅ Catalog ⋅ Edition 6.02

SICAMPower Quality andMeasurement
Katalog ⋅ Edi t ion 6 .0
I n v a l i d :E d i t i o n 5
General
Product Overview - Devices and Applications
Power Quality Recorder
Power Quality
SICAM Q200
SICAM Q100
SICAM P855
Power Meters
SICAM P850
SICAM MMU
SICAM P50/P55
Digital Measuring Transducer
SICAM T
Fault Recorder
SIPROTEC 7KE85
Software for Power Quality
SICAM PQS
SICAM PQ Analyzer
SIGUARD PDP
SICAM P Par
1
1.1
2
2.1
2.2
2.3
2.4
3
3.1
3.2
3.3
4
4.1
5
5.1
6
6.1
6.2
6.3
6.4
The products and systems described in this catalog aremanufactured and sold according to a certified manage-ment system (acc. to ISO 9001, ISO 14001 and BSOHSAS 18001).
Content
SICAM ⋅ Power Quality and Measurement ⋅ Katalog ⋅ Edition 6.0 3

Device SICAM Q200 SICAM Q100Main function Power meter and PQ recorder Power meter and PQ recorderDisplay ■ ■Housing (width x height x depth in mm) 192 x 96 x 134.6 96 x 96 x 100Assembly Control panel DIN rail/control panelDegree of protection IP40 (standard), option: IP54 (with separate
seal between housing and switch panel)terminals: IP20 (behind switch panel)
IP40
Configuration and online view Web browser Web browser Data analysis and reporting
Web-browser visualization (with Sigraplugin) and file download in CSV-,
COMTRADE- or PQDiF format for reportingwith SICAM PAS/PQS, SIGRA, Excel or
SENTRON power manager
Web-browser visualization (with Sigraplugin) and file download in CSV-,
COMTRADE- or PQDiF format for reportingwith SICAM PAS/PQS, SIGRA, Excel or
SENTRON power manager
Basic measurands V, I, f, P, Q, S, energy,phase angle, cosφ ■ ■
Accuracy % (V/I/P) 0.1/0.1/0.2 0.2/0.2/0.5Adjustable limits ■ ■
HarmonicDetection 50th/63rd 1 50th/63rd 1to IEC 61000-4-7 ■ ■
Min, max, mean values ■ ■Power quality IEC 61000-4-30 Class A Class AEN 50160 power quality data ■ ■Flicker IEC 61000-4-15 ■ ■Fault recording (see device specification) ■ ■Load profile (15 min. mean values) ■ ■Tariffs ■ ■Recording transients 1 μs 100 μsIdentification of the fault origin 2 ■ ■2 to 9 kHz ■ –9 to 150 kHz ■ –Sampling frequency 40.96 kHz for fault recording, 1 MHz for
transient recording10.24 kHz (oversampling with 12.8 kHz for
fault recording)
Recorder
Measured values/mean, min, max values/PQdata (CSV and PQDIF), voltage events and
fault recordings, events, load profiles, tran-sient event, ripple-control signal
(COMTRADE)
Measured values/mean, min, max values/PQdata (CSV and PQDIF), voltage events and
fault recordings, events, load profiles, tran-sient event, ripple-control signal
(COMTRADE)Averaging time intervals 1 min, 10 min 30 s, 1 min, 10 min, 15 min, 1 h, 2 hRecording criterion (trigger) RMS level V/I, binary RMS level V/I, binaryLimit violation/notification ■ ■Mass storage unit 2 GB (expandable) 2 GB
(1) Harmonics up to 63rd are measured and shown in the Web browser. Harmonics up to 50th are transferred via IEC 61850 protocol(PQDIF).
(2) Measuring and calculating the harmonic active power/angle
GeneralProduct Overview - Devices and Applications
4 SICAM ⋅ Power Quality and Measurement ⋅ Katalog ⋅ Edition 6.0
1.1
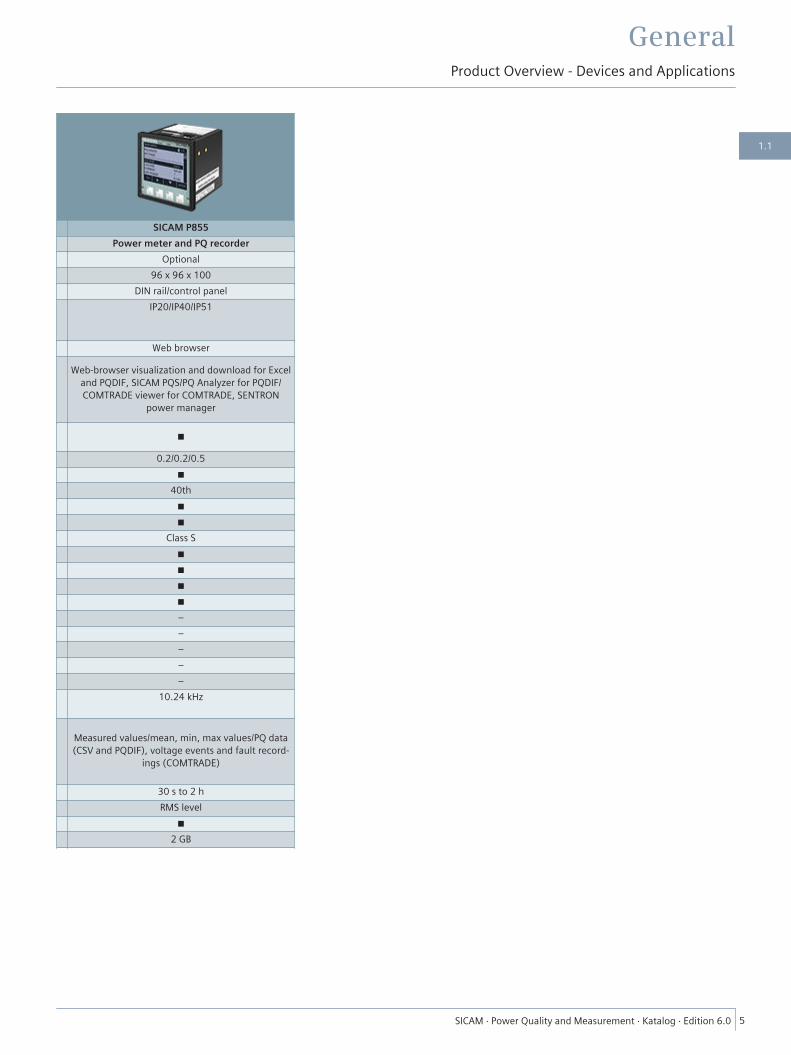
SICAM P855 Power meter and PQ recorder
Optional96 x 96 x 100
DIN rail/control panel
IP20/IP40/IP51
Web browser
Web-browser visualization and download for Exceland PQDIF, SICAM PQS/PQ Analyzer for PQDIF/COMTRADE viewer for COMTRADE, SENTRON
power manager
■
0.2/0.2/0.5■
40th■■
Class S■■■■–––––
10.24 kHz
Measured values/mean, min, max values/PQ data(CSV and PQDIF), voltage events and fault record-
ings (COMTRADE)
30 s to 2 hRMS level
■2 GB
GeneralProduct Overview - Devices and Applications
SICAM ⋅ Power Quality and Measurement ⋅ Katalog ⋅ Edition 6.0 5
1.1
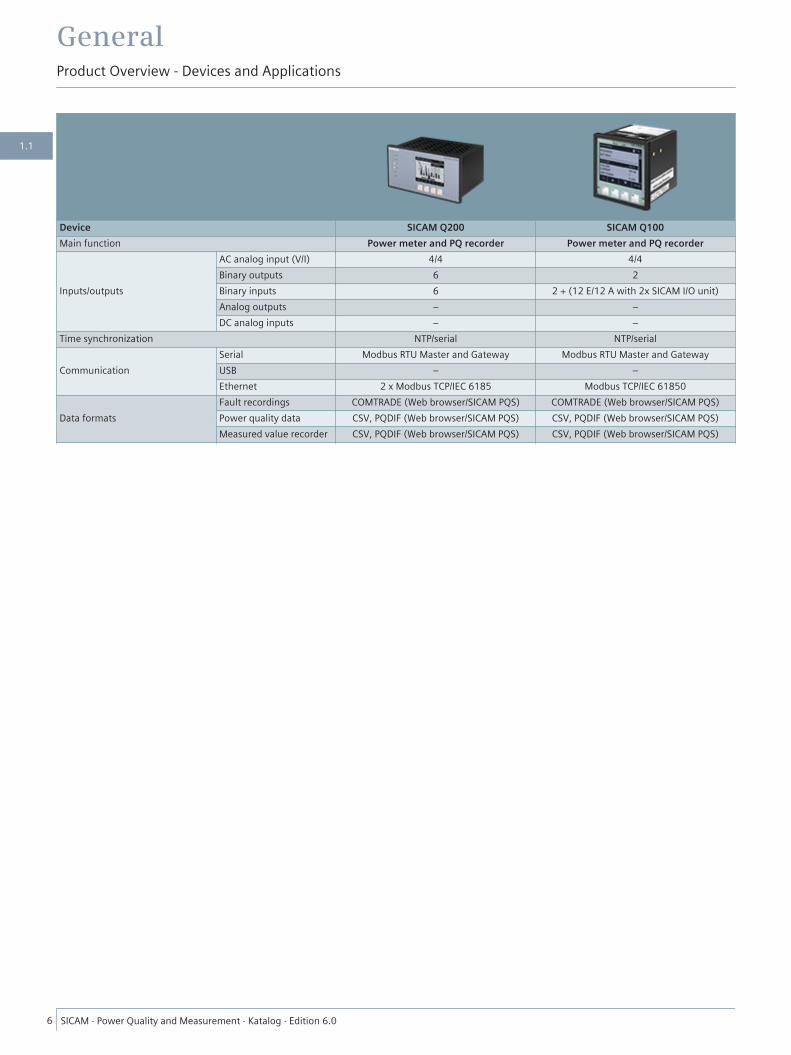
Device SICAM Q200 SICAM Q100Main function Power meter and PQ recorder Power meter and PQ recorder
Inputs/outputs
AC analog input (V/I) 4/4 4/4Binary outputs 6 2Binary inputs 6 2 + (12 E/12 A with 2x SICAM I/O unit)Analog outputs – –DC analog inputs – –
Time synchronization NTP/serial NTP/serial
CommunicationSerial Modbus RTU Master and Gateway Modbus RTU Master and GatewayUSB – –Ethernet 2 x Modbus TCP/IEC 6185 Modbus TCP/IEC 61850
Data formatsFault recordings COMTRADE (Web browser/SICAM PQS) COMTRADE (Web browser/SICAM PQS)Power quality data CSV, PQDIF (Web browser/SICAM PQS) CSV, PQDIF (Web browser/SICAM PQS)Measured value recorder CSV, PQDIF (Web browser/SICAM PQS) CSV, PQDIF (Web browser/SICAM PQS)
GeneralProduct Overview - Devices and Applications
6 SICAM ⋅ Power Quality and Measurement ⋅ Katalog ⋅ Edition 6.0
1.1
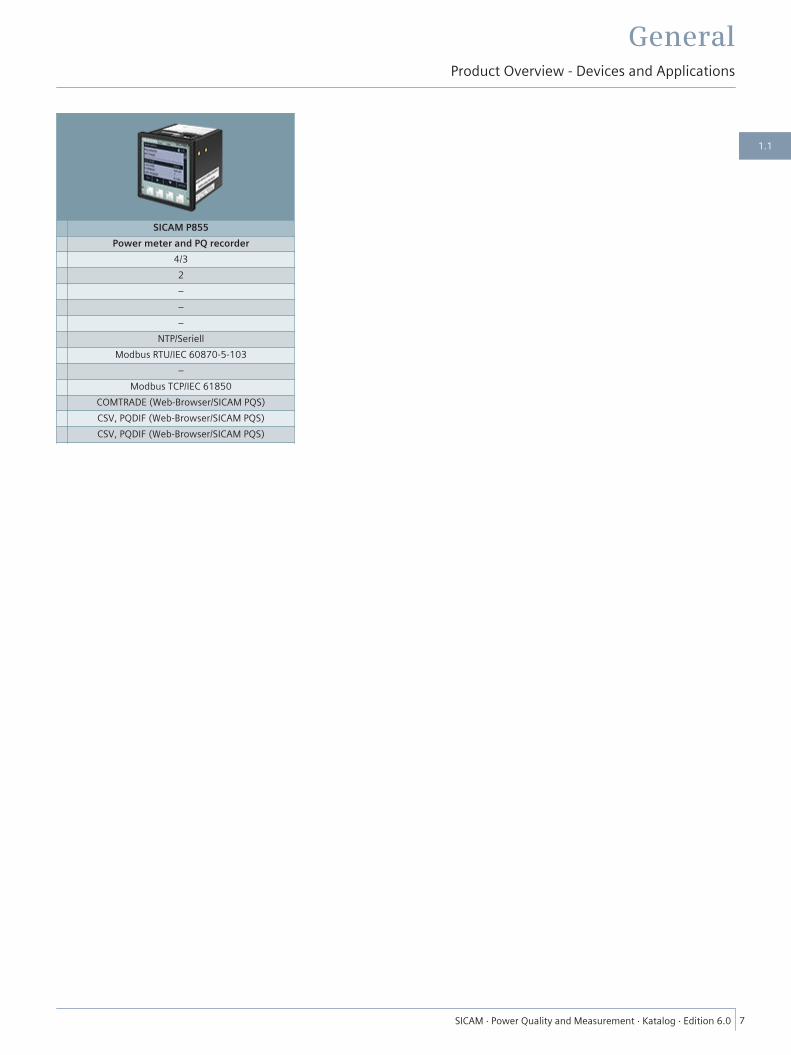
SICAM P855 Power meter and PQ recorder
4/32–––
NTP/SeriellModbus RTU/IEC 60870-5-103
–Modbus TCP/IEC 61850
COMTRADE (Web-Browser/SICAM PQS)CSV, PQDIF (Web-Browser/SICAM PQS)CSV, PQDIF (Web-Browser/SICAM PQS)
GeneralProduct Overview - Devices and Applications
SICAM ⋅ Power Quality and Measurement ⋅ Katalog ⋅ Edition 6.0 7
1.1
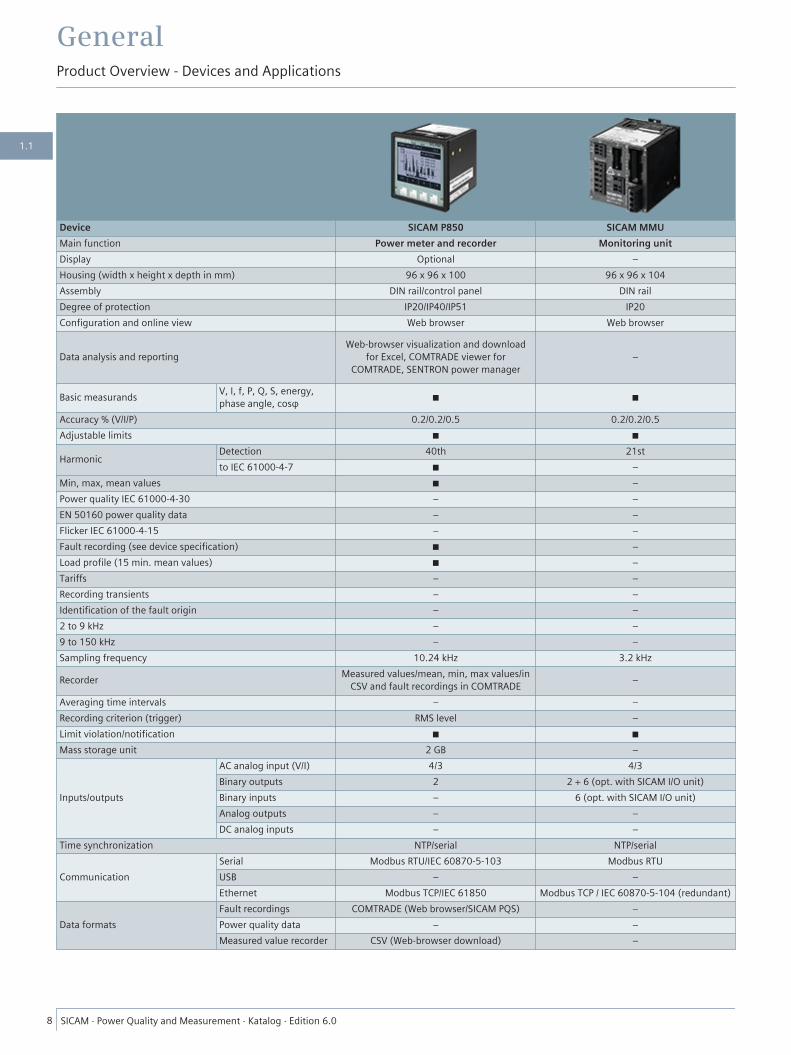
Device SICAM P850 SICAM MMUMain function Power meter and recorder Monitoring unitDisplay Optional –Housing (width x height x depth in mm) 96 x 96 x 100 96 x 96 x 104Assembly DIN rail/control panel DIN railDegree of protection IP20/IP40/IP51 IP20Configuration and online view Web browser Web browser Data analysis and reporting
Web-browser visualization and downloadfor Excel, COMTRADE viewer for
COMTRADE, SENTRON power manager–
Basic measurands V, I, f, P, Q, S, energy,phase angle, cosφ ■ ■
Accuracy % (V/I/P) 0.2/0.2/0.5 0.2/0.2/0.5Adjustable limits ■ ■
HarmonicDetection 40th 21stto IEC 61000-4-7 ■ –
Min, max, mean values ■ –Power quality IEC 61000-4-30 – –EN 50160 power quality data – –Flicker IEC 61000-4-15 – –Fault recording (see device specification) ■ –Load profile (15 min. mean values) ■ –Tariffs – –Recording transients – –Identification of the fault origin – –2 to 9 kHz – –9 to 150 kHz – –Sampling frequency 10.24 kHz 3.2 kHz
Recorder Measured values/mean, min, max values/inCSV and fault recordings in COMTRADE –
Averaging time intervals – –Recording criterion (trigger) RMS level –Limit violation/notification ■ ■Mass storage unit 2 GB –
Inputs/outputs
AC analog input (V/I) 4/3 4/3Binary outputs 2 2 + 6 (opt. with SICAM I/O unit)Binary inputs – 6 (opt. with SICAM I/O unit)Analog outputs – –DC analog inputs – –
Time synchronization NTP/serial NTP/serial
CommunicationSerial Modbus RTU/IEC 60870-5-103 Modbus RTUUSB – –Ethernet Modbus TCP/IEC 61850 Modbus TCP / IEC 60870-5-104 (redundant)
Data formatsFault recordings COMTRADE (Web browser/SICAM PQS) –Power quality data – –Measured value recorder CSV (Web-browser download) –
GeneralProduct Overview - Devices and Applications
8 SICAM ⋅ Power Quality and Measurement ⋅ Katalog ⋅ Edition 6.0
1.1

SICAM P50/P55 Power meter
Optional96 x 96 x 76.5
DIN rail/control panelIP20/IP41/IP65
SICAM P Manager
–
–
0.2/0.2/0.5■
21st–■–––■––––––
3.2 kHz
Mean value
––■
1 MB4/3
2 + 2 (opt.)2 (opt.)2 (opt.)2 (opt.)Serial
Modbus RTU/PROFIBUS/IEC 60870-5-103––
COMTRADE (SIMEAS P Manager)––
GeneralProduct Overview - Devices and Applications
SICAM ⋅ Power Quality and Measurement ⋅ Katalog ⋅ Edition 6.0 9
1.1

Device SICAM T SIPROTEC 7KE85Main function Measuring transducer Fault recorder opt. synchrophasors
and PQ recordersDisplay – OptionalHousing (width x height x depth in mm) 96 x 96 x 104 145 (445) x 268 x 229Assembly DIN rail Switch panel/mounting plateDegree of protection IP20 IP50/IP51Configuration and online view Web browser DIGSI 5Data analysis and reporting – DIGSI 5/SICAM PQS/SICAM PQ Analyzer
Basic measurands V, I, f, P, Q, S, energy,phase angle, cosφ ■ ■
Accuracy % (V/I/P) 0.2/0.2/0.5 0.1/ 0.1/0.3Adjustable limits ■ ■
HarmonicDetection – 50th 1to IEC 61000-4-7 – ■
Min, max, mean values – Mean valuesPower quality IEC 61000-4-30 – Class S 1EN 50160 power quality data – ■ 1Flicker IEC 61000-4-15 – ■Fault recording (see device specification) – ■Load profile (15 min. mean values) – –Tariffs – –Recording transients – 60 to 80 μsIdentification of the fault origin – –2 to 9 kHz – –9 to 150 kHz – –Sampling frequency 3.2 kHz Max. 16 kHz (1/2/4/8/16 adjustable)
Recorder – Fault recording/dynamic processes/contin-uous/sequence of events/PQ data
Averaging time intervals – 1 s to 900 sRecording criterion (trigger) – Level/gradients/GOOSE/manual/binary/logic
trigger/…Limit violation/notification ■ ■Mass storage unit – 16 GB
Inputs/outputs
AC analog input (V/I) 4/3 8 to 40Binary outputs 2 3 to 15 2Binary inputs – from 11 to 203 2 (8 + 3 + 192 with IO230)Analog outputs 4 (opt.) –DC analog inputs – 4 to 52 ± 20 mA, 8 – 32 ± 10 V
Time synchronization NTP/serial IRIG-B/DCF77/SNTP/IEEE 1588
CommunicationSerial Modbus RTU/IEC 60870-5-103 –USB – DIGSI 5Ethernet Modbus TCP/IEC 61850 DIGSI 5/IEC 61850/IEEE C37.118
Data formatsFault recordings – COMTRADE (DIGSI 5/SICAM PQS)Power quality data – PQDIF (SICAM PQS)Measured value recorder – –
(1) Harmonic (THD/TDD) to IEC 61000-4-7 in preparation(2) Flexible extension via inputs/outputs
GeneralProduct Overview - Devices and Applications
10 SICAM ⋅ Power Quality and Measurement ⋅ Katalog ⋅ Edition 6.0
1.1
www.siemens.com/powerquality
Power Quality Recorder
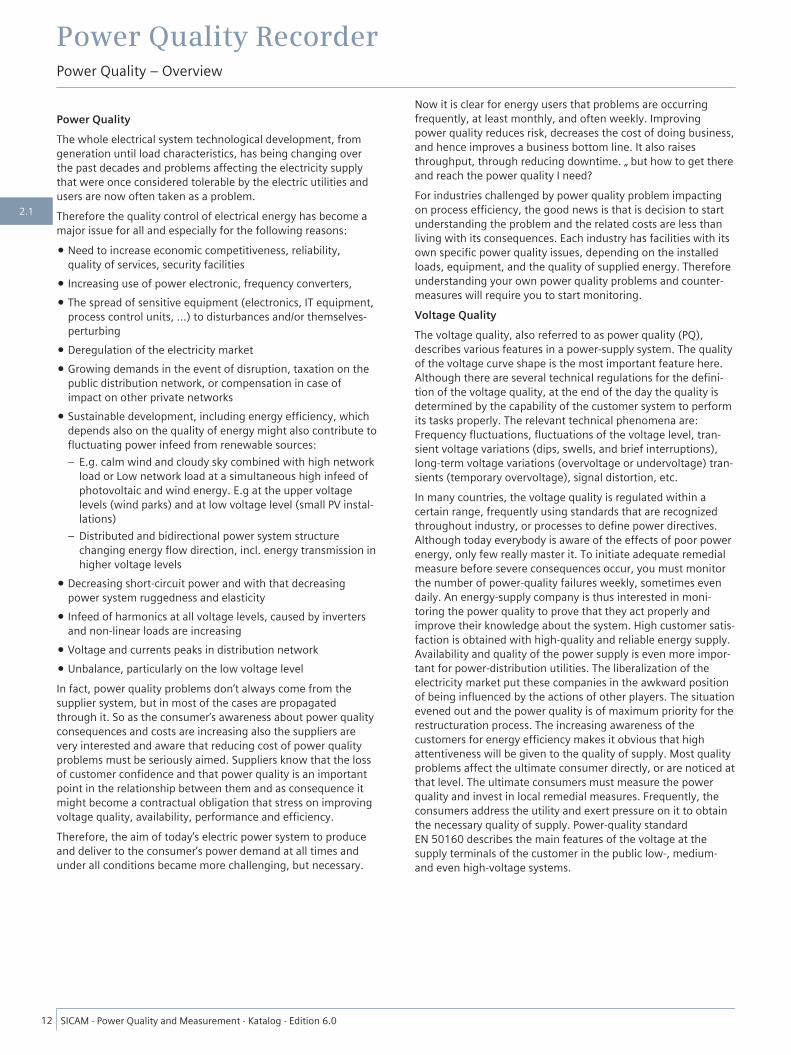
Power QualityThe whole electrical system technological development, fromgeneration until load characteristics, has being changing overthe past decades and problems affecting the electricity supplythat were once considered tolerable by the electric utilities andusers are now often taken as a problem.Therefore the quality control of electrical energy has become amajor issue for all and especially for the following reasons:
• Need to increase economic competitiveness, reliability,quality of services, security facilities
• Increasing use of power electronic, frequency converters,• The spread of sensitive equipment (electronics, IT equipment,
process control units, ...) to disturbances and/or themselves-perturbing
• Deregulation of the electricity market• Growing demands in the event of disruption, taxation on the
public distribution network, or compensation in case ofimpact on other private networks
• Sustainable development, including energy efficiency, whichdepends also on the quality of energy might also contribute tofluctuating power infeed from renewable sources:– E.g. calm wind and cloudy sky combined with high network
load or Low network load at a simultaneous high infeed ofphotovoltaic and wind energy. E.g at the upper voltagelevels (wind parks) and at low voltage level (small PV instal-lations)
– Distributed and bidirectional power system structurechanging energy flow direction, incl. energy transmission inhigher voltage levels
• Decreasing short-circuit power and with that decreasingpower system ruggedness and elasticity
• Infeed of harmonics at all voltage levels, caused by invertersand non-linear loads are increasing
• Voltage and currents peaks in distribution network• Unbalance, particularly on the low voltage levelIn fact, power quality problems don’t always come from thesupplier system, but in most of the cases are propagatedthrough it. So as the consumer’s awareness about power qualityconsequences and costs are increasing also the suppliers arevery interested and aware that reducing cost of power qualityproblems must be seriously aimed. Suppliers know that the lossof customer confidence and that power quality is an importantpoint in the relationship between them and as consequence itmight become a contractual obligation that stress on improvingvoltage quality, availability, performance and efficiency.Therefore, the aim of today’s electric power system to produceand deliver to the consumer’s power demand at all times andunder all conditions became more challenging, but necessary.
Now it is clear for energy users that problems are occurringfrequently, at least monthly, and often weekly. Improvingpower quality reduces risk, decreases the cost of doing business,and hence improves a business bottom line. It also raisesthroughput, through reducing downtime. „ but how to get thereand reach the power quality I need?For industries challenged by power quality problem impactingon process efficiency, the good news is that is decision to startunderstanding the problem and the related costs are less thanliving with its consequences. Each industry has facilities with itsown specific power quality issues, depending on the installedloads, equipment, and the quality of supplied energy. Thereforeunderstanding your own power quality problems and counter-measures will require you to start monitoring.Voltage QualityThe voltage quality, also referred to as power quality (PQ),describes various features in a power-supply system. The qualityof the voltage curve shape is the most important feature here.Although there are several technical regulations for the defini-tion of the voltage quality, at the end of the day the quality isdetermined by the capability of the customer system to performits tasks properly. The relevant technical phenomena are:Frequency fluctuations, fluctuations of the voltage level, tran-sient voltage variations (dips, swells, and brief interruptions),long-term voltage variations (overvoltage or undervoltage) tran-sients (temporary overvoltage), signal distortion, etc.In many countries, the voltage quality is regulated within acertain range, frequently using standards that are recognizedthroughout industry, or processes to define power directives.Although today everybody is aware of the effects of poor powerenergy, only few really master it. To initiate adequate remedialmeasure before severe consequences occur, you must monitorthe number of power-quality failures weekly, sometimes evendaily. An energy-supply company is thus interested in moni-toring the power quality to prove that they act properly andimprove their knowledge about the system. High customer satis-faction is obtained with high-quality and reliable energy supply.Availability and quality of the power supply is even more impor-tant for power-distribution utilities. The liberalization of theelectricity market put these companies in the awkward positionof being influenced by the actions of other players. The situationevened out and the power quality is of maximum priority for therestructuration process. The increasing awareness of thecustomers for energy efficiency makes it obvious that highattentiveness will be given to the quality of supply. Most qualityproblems affect the ultimate consumer directly, or are noticed atthat level. The ultimate consumers must measure the powerquality and invest in local remedial measures. Frequently, theconsumers address the utility and exert pressure on it to obtainthe necessary quality of supply. Power-quality standardEN 50160 describes the main features of the voltage at thesupply terminals of the customer in the public low-, medium-and even high-voltage systems.
Power Quality RecorderPower Quality – Overview
12 SICAM ⋅ Power Quality and Measurement ⋅ Katalog ⋅ Edition 6.0
2.1

[Areas of application, 1, en_US]
Figure 2.1/1 Fields of Application
Power Quality RecorderPower Quality – Overview
SICAM ⋅ Power Quality and Measurement ⋅ Katalog ⋅ Edition 6.0 13
2.1
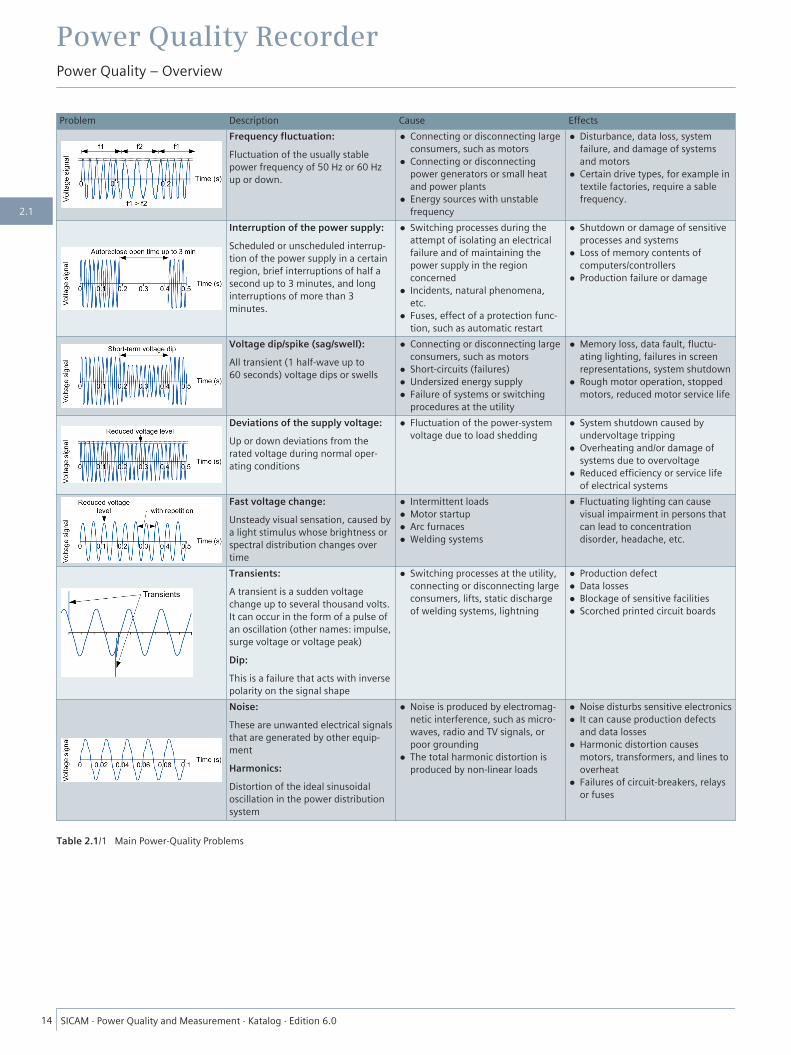
Problem Description Cause EffectsFrequency fluctuation:Fluctuation of the usually stablepower frequency of 50 Hz or 60 Hzup or down.
• Connecting or disconnecting largeconsumers, such as motors
• Connecting or disconnectingpower generators or small heatand power plants
• Energy sources with unstablefrequency
• Disturbance, data loss, systemfailure, and damage of systemsand motors
• Certain drive types, for example intextile factories, require a sablefrequency.
Interruption of the power supply:Scheduled or unscheduled interrup-tion of the power supply in a certainregion, brief interruptions of half asecond up to 3 minutes, and longinterruptions of more than 3minutes.
• Switching processes during theattempt of isolating an electricalfailure and of maintaining thepower supply in the regionconcerned
• Incidents, natural phenomena,etc.
• Fuses, effect of a protection func-tion, such as automatic restart
• Shutdown or damage of sensitiveprocesses and systems
• Loss of memory contents ofcomputers/controllers
• Production failure or damage
Voltage dip/spike (sag/swell):All transient (1 half-wave up to60 seconds) voltage dips or swells
• Connecting or disconnecting largeconsumers, such as motors
• Short-circuits (failures)• Undersized energy supply• Failure of systems or switching
procedures at the utility
• Memory loss, data fault, fluctu-ating lighting, failures in screenrepresentations, system shutdown
• Rough motor operation, stoppedmotors, reduced motor service life
Deviations of the supply voltage:Up or down deviations from therated voltage during normal oper-ating conditions
• Fluctuation of the power-systemvoltage due to load shedding
• System shutdown caused byundervoltage tripping
• Overheating and/or damage ofsystems due to overvoltage
• Reduced efficiency or service lifeof electrical systems
Fast voltage change:Unsteady visual sensation, caused bya light stimulus whose brightness orspectral distribution changes overtime
• Intermittent loads• Motor startup• Arc furnaces• Welding systems
• Fluctuating lighting can causevisual impairment in persons thatcan lead to concentrationdisorder, headache, etc.
Transients:A transient is a sudden voltagechange up to several thousand volts.It can occur in the form of a pulse ofan oscillation (other names: impulse,surge voltage or voltage peak)Dip:This is a failure that acts with inversepolarity on the signal shape
• Switching processes at the utility,connecting or disconnecting largeconsumers, lifts, static dischargeof welding systems, lightning
• Production defect• Data losses• Blockage of sensitive facilities• Scorched printed circuit boards
Noise:These are unwanted electrical signalsthat are generated by other equip-mentHarmonics:Distortion of the ideal sinusoidaloscillation in the power distributionsystem
• Noise is produced by electromag-netic interference, such as micro-waves, radio and TV signals, orpoor grounding
• The total harmonic distortion isproduced by non-linear loads
• Noise disturbs sensitive electronics• It can cause production defects
and data losses• Harmonic distortion causes
motors, transformers, and lines tooverheat
• Failures of circuit-breakers, relaysor fuses
Table 2.1/1 Main Power-Quality Problems
Power Quality RecorderPower Quality – Overview
14 SICAM ⋅ Power Quality and Measurement ⋅ Katalog ⋅ Edition 6.0
2.1
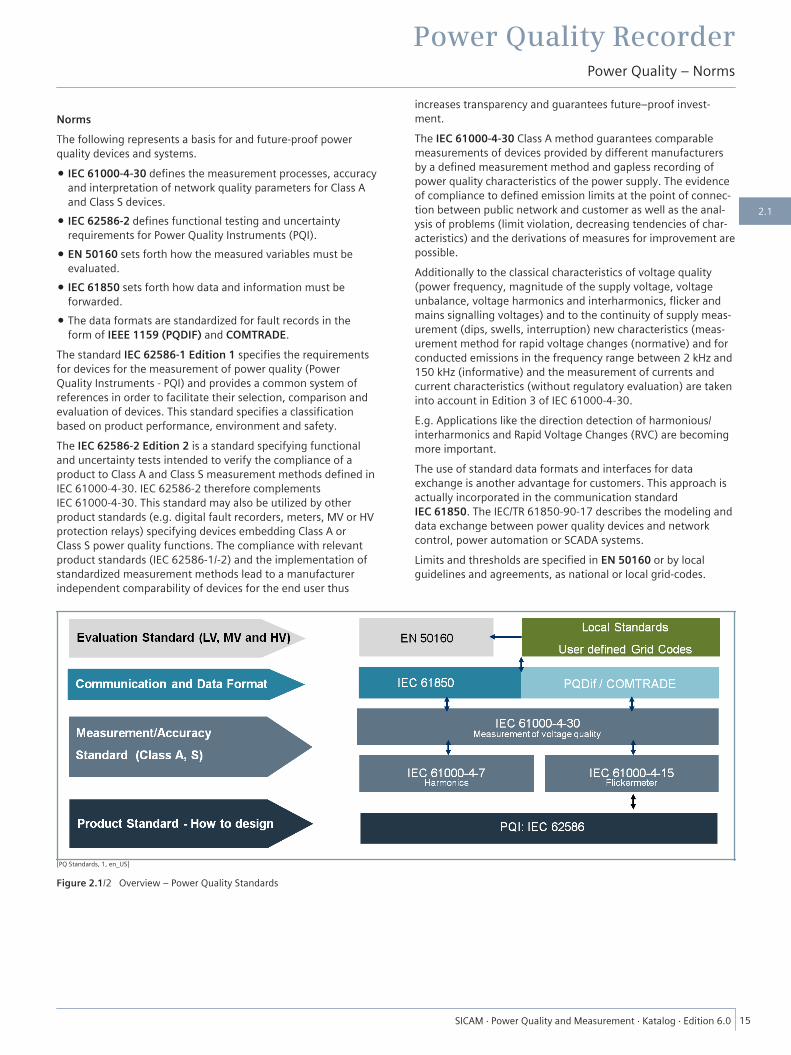
NormsThe following represents a basis for and future-proof powerquality devices and systems.
• IEC 61000-4-30 defines the measurement processes, accuracyand interpretation of network quality parameters for Class Aand Class S devices.
• IEC 62586-2 defines functional testing and uncertaintyrequirements for Power Quality Instruments (PQI).
• EN 50160 sets forth how the measured variables must beevaluated.
• IEC 61850 sets forth how data and information must beforwarded.
• The data formats are standardized for fault records in theform of IEEE 1159 (PQDIF) and COMTRADE.
The standard IEC 62586-1 Edition 1 specifies the requirementsfor devices for the measurement of power quality (PowerQuality Instruments - PQI) and provides a common system ofreferences in order to facilitate their selection, comparison andevaluation of devices. This standard specifies a classificationbased on product performance, environment and safety.The IEC 62586-2 Edition 2 is a standard specifying functionaland uncertainty tests intended to verify the compliance of aproduct to Class A and Class S measurement methods defined inIEC 61000-4-30. IEC 62586-2 therefore complementsIEC 61000-4-30. This standard may also be utilized by otherproduct standards (e.g. digital fault recorders, meters, MV or HVprotection relays) specifying devices embedding Class A orClass S power quality functions. The compliance with relevantproduct standards (IEC 62586-1/-2) and the implementation ofstandardized measurement methods lead to a manufacturerindependent comparability of devices for the end user thus
increases transparency and guarantees future–proof invest-ment.The IEC 61000-4-30 Class A method guarantees comparablemeasurements of devices provided by different manufacturersby a defined measurement method and gapless recording ofpower quality characteristics of the power supply. The evidenceof compliance to defined emission limits at the point of connec-tion between public network and customer as well as the anal-ysis of problems (limit violation, decreasing tendencies of char-acteristics) and the derivations of measures for improvement arepossible.Additionally to the classical characteristics of voltage quality(power frequency, magnitude of the supply voltage, voltageunbalance, voltage harmonics and interharmonics, flicker andmains signalling voltages) and to the continuity of supply meas-urement (dips, swells, interruption) new characteristics (meas-urement method for rapid voltage changes (normative) and forconducted emissions in the frequency range between 2 kHz and150 kHz (informative) and the measurement of currents andcurrent characteristics (without regulatory evaluation) are takeninto account in Edition 3 of IEC 61000-4-30.E.g. Applications like the direction detection of harmonious/interharmonics and Rapid Voltage Changes (RVC) are becomingmore important.The use of standard data formats and interfaces for dataexchange is another advantage for customers. This approach isactually incorporated in the communication standardIEC 61850. The IEC/TR 61850-90-17 describes the modeling anddata exchange between power quality devices and networkcontrol, power automation or SCADA systems.Limits and thresholds are specified in EN 50160 or by localguidelines and agreements, as national or local grid-codes.
[PQ Standards, 1, en_US]
Figure 2.1/2 Overview – Power Quality Standards
Power Quality RecorderPower Quality – Norms
SICAM ⋅ Power Quality and Measurement ⋅ Katalog ⋅ Edition 6.0 15
2.1

Measuring PointsPower-quality measurements are used to determine the supplyperformance by describing the quality of each interface in anelectrical energy-supply system and in the systems of the indi-vidual customers. Identification, definition, and profiling of themeasuring points for system-quality monitoring play a majorrole when planning a power-quality project. Since the power-distribution system is a dynamic system, the optimization of themeasuring points is based on the information gained in the dailyoperation. Although this can not necessarily prevent changes, itpermits taking more effective counter measures.
Identifying the Measuring PointsThe measuring points can be assigned and established forexample as in Figure 2.1/3 / Table 2.1/2. In addition to selectingthe measuring points, measuring the power quality requiresdefinition and selection of the assessment criteria at the indi-vidual measuring points. Monitoring the "power quality" is acombination of data acquisition techniques that are classified bypurpose and/or application.
[dw_pq_general, 1, en_US]
Figure 2.1/3 General Representation of the System Connections
Power Quality RecorderPower Quality – Measuring Points
16 SICAM ⋅ Power Quality and Measurement ⋅ Katalog ⋅ Edition 6.0
2.1
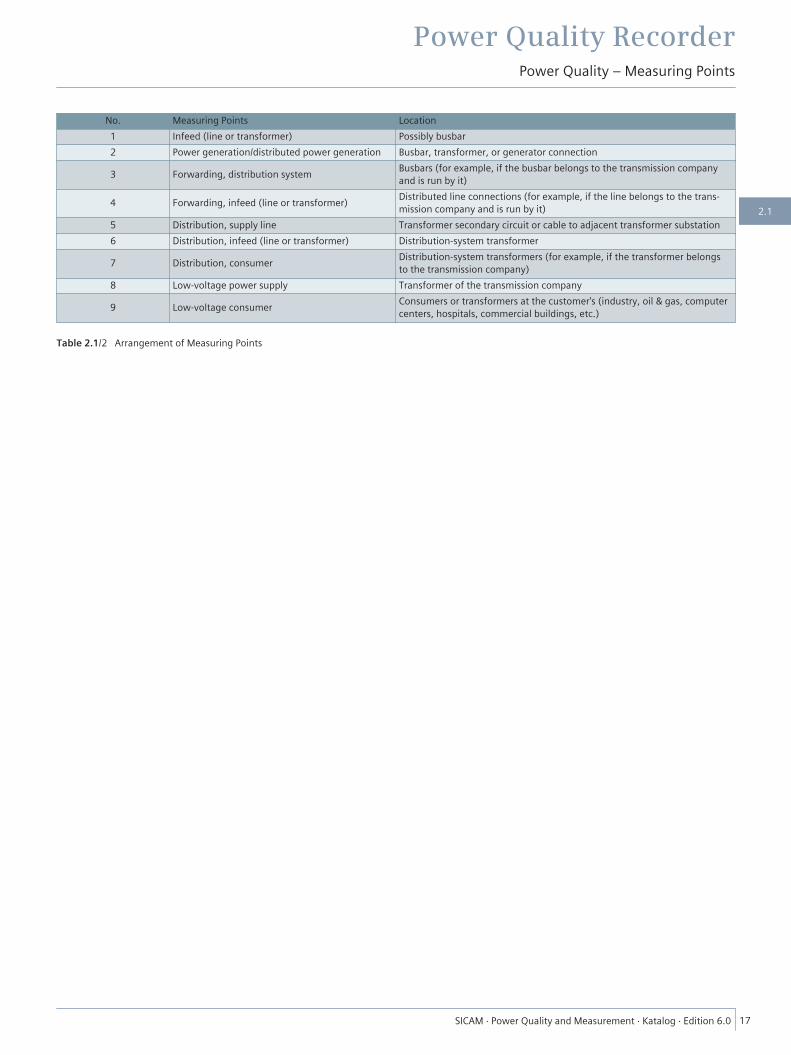
No. Measuring Points Location1 Infeed (line or transformer) Possibly busbar2 Power generation/distributed power generation Busbar, transformer, or generator connection
3 Forwarding, distribution system Busbars (for example, if the busbar belongs to the transmission companyand is run by it)
4 Forwarding, infeed (line or transformer) Distributed line connections (for example, if the line belongs to the trans-mission company and is run by it)
5 Distribution, supply line Transformer secondary circuit or cable to adjacent transformer substation6 Distribution, infeed (line or transformer) Distribution-system transformer
7 Distribution, consumer Distribution-system transformers (for example, if the transformer belongsto the transmission company)
8 Low-voltage power supply Transformer of the transmission company
9 Low-voltage consumer Consumers or transformers at the customer's (industry, oil & gas, computercenters, hospitals, commercial buildings, etc.)
Table 2.1/2 Arrangement of Measuring Points
Power Quality RecorderPower Quality – Measuring Points
SICAM ⋅ Power Quality and Measurement ⋅ Katalog ⋅ Edition 6.0 17
2.1
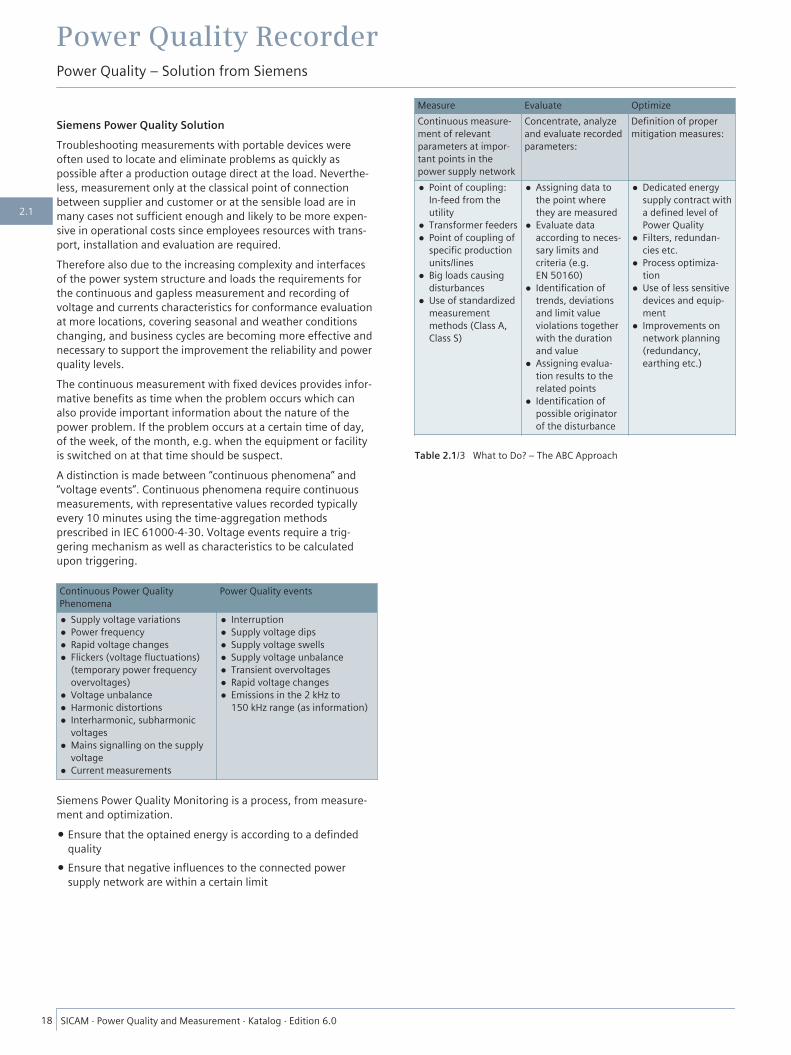
Siemens Power Quality SolutionTroubleshooting measurements with portable devices wereoften used to locate and eliminate problems as quickly aspossible after a production outage direct at the load. Neverthe-less, measurement only at the classical point of connectionbetween supplier and customer or at the sensible load are inmany cases not sufficient enough and likely to be more expen-sive in operational costs since employees resources with trans-port, installation and evaluation are required.Therefore also due to the increasing complexity and interfacesof the power system structure and loads the requirements forthe continuous and gapless measurement and recording ofvoltage and currents characteristics for conformance evaluationat more locations, covering seasonal and weather conditionschanging, and business cycles are becoming more effective andnecessary to support the improvement the reliability and powerquality levels.The continuous measurement with fixed devices provides infor-mative benefits as time when the problem occurs which canalso provide important information about the nature of thepower problem. If the problem occurs at a certain time of day,of the week, of the month, e.g. when the equipment or facilityis switched on at that time should be suspect.A distinction is made between “continuous phenomena” and“voltage events”. Continuous phenomena require continuousmeasurements, with representative values recorded typicallyevery 10 minutes using the time-aggregation methodsprescribed in IEC 61000-4-30. Voltage events require a trig-gering mechanism as well as characteristics to be calculatedupon triggering.
Continuous Power QualityPhenomena
Power Quality events
• Supply voltage variations• Power frequency• Rapid voltage changes• Flickers (voltage fluctuations)
(temporary power frequencyovervoltages)
• Voltage unbalance• Harmonic distortions• Interharmonic, subharmonic
voltages• Mains signalling on the supply
voltage• Current measurements
• Interruption• Supply voltage dips• Supply voltage swells• Supply voltage unbalance• Transient overvoltages• Rapid voltage changes• Emissions in the 2 kHz to
150 kHz range (as information)
Siemens Power Quality Monitoring is a process, from measure-ment and optimization.
• Ensure that the optained energy is according to a defindedquality
• Ensure that negative influences to the connected powersupply network are within a certain limit
Measure Evaluate OptimizeContinuous measure-ment of relevantparameters at impor-tant points in thepower supply network
Concentrate, analyzeand evaluate recordedparameters:
Definition of propermitigation measures:
• Point of coupling:In-feed from theutility
• Transformer feeders• Point of coupling of
specific productionunits/lines
• Big loads causingdisturbances
• Use of standardizedmeasurementmethods (Class A,Class S)
• Assigning data tothe point wherethey are measured
• Evaluate dataaccording to neces-sary limits andcriteria (e.g.EN 50160)
• Identification oftrends, deviationsand limit valueviolations togetherwith the durationand value
• Assigning evalua-tion results to therelated points
• Identification ofpossible originatorof the disturbance
• Dedicated energysupply contract witha defined level ofPower Quality
• Filters, redundan-cies etc.
• Process optimiza-tion
• Use of less sensitivedevices and equip-ment
• Improvements onnetwork planning(redundancy,earthing etc.)
Table 2.1/3 What to Do? – The ABC Approach
Power Quality RecorderPower Quality – Solution from Siemens
18 SICAM ⋅ Power Quality and Measurement ⋅ Katalog ⋅ Edition 6.0
2.1

BenefitsIncrease power availability, reliability and quality – 24/7running process
• To ensure system availability monitor, visualize and evaluateand document certain power quality parameters to supportthe identification of (potential) voltage disturbances outagesand losses is first and essential step to reduce or eliminate thecut down time-consuming processes and avoidance of lossesdue supply events
• Customer satisfaction since time schedule, quality problemscan be avoid
Accurate assessment for Power Utilities and Renewable Sources
• Power Quality monitoring becomes even more necessary andimportant as renewable power penetration level increasesquickly. There is a need to continue to monitor the effects ofemerging technologies so as to identify not only possibleproblems but also good experiences and opportunities of theirimplementation on the network while ensuring that adequatepower quality levels are maintained.
• Accurate assessment of the possible impacts of large andsmall grid-connected REGs on network performance is there-fore very important. Performing such analysis can allowpower utilities to become efficiently equipped to solve poten-tial operational issues caused by RES improving the deploy-ment and using effectively investments with sustainability.
• In case of clarification with customers and energy providersgapless documentation of power quality parameters areessential.
• Understanding the problems associated with power qualityvariations is the first step towards developing standards andthe optimum approach to solutions. These standards develop-ments must be taken into account for the measurement ofpower quality.
Improve Energy efficiency/CO2 reduction
• Monitoring power and power quality create transparency ofenergy flows that supports energy management systems toIdentify energy savings potentia
• Energy inefficiency causes high costs and environmentaldamage
• Efficient use of energy ISO 50001/EN 16247-1Increase Data transparency
• Power quality problems are one of the major causes ofunplanned downtime and malfunction and damage of equip-ment. Continuous monitoring, acquisition and documentationof parameters relevant to supply quality are necessary to iden-tify possible weak points and initiate appropriate measures toeliminate them.
• Tthe anticipation of potential problems and/or identificationof counter measures and avoid process failure and losses
• In case of clarification and claiming with energy providersgapless documentation of power quality parameters areessential.
Continuous power system monitoring and quality of supplyaccording to the standards
• Our power quality systems comply with international powerquality standards and support you with a professional powerquality system.
• The standard IEC 61000-4-30 defines measurement methodsfor each power quality parameter so that as Class A is guaran-teed that the measurements are reliable, reproducible and theresults comparable
• The standard IEC 62586-2 specifies functional tests and uncer-tainty requirements for Power Quality Instruments (PQI)whose functions include measuring, recording, and possiblymonitoring power quality parameters in power supplysystems, and whose measuring methods (Class A or Class S)are defined in IEC 61000-4-30.
• EN 50160 defines how these parametersc an be reported• IEC 61850 defines how the data and information can be trans-
mited• Interoperability is guaranteed by using standard interfaces
and standard protocols (IEC 61850, Modbus TCP) and dataformats (PQDIF, COMTRADE and CSV)
Power Quality RecorderPower Quality – Benefits
SICAM ⋅ Power Quality and Measurement ⋅ Katalog ⋅ Edition 6.0 19
2.1
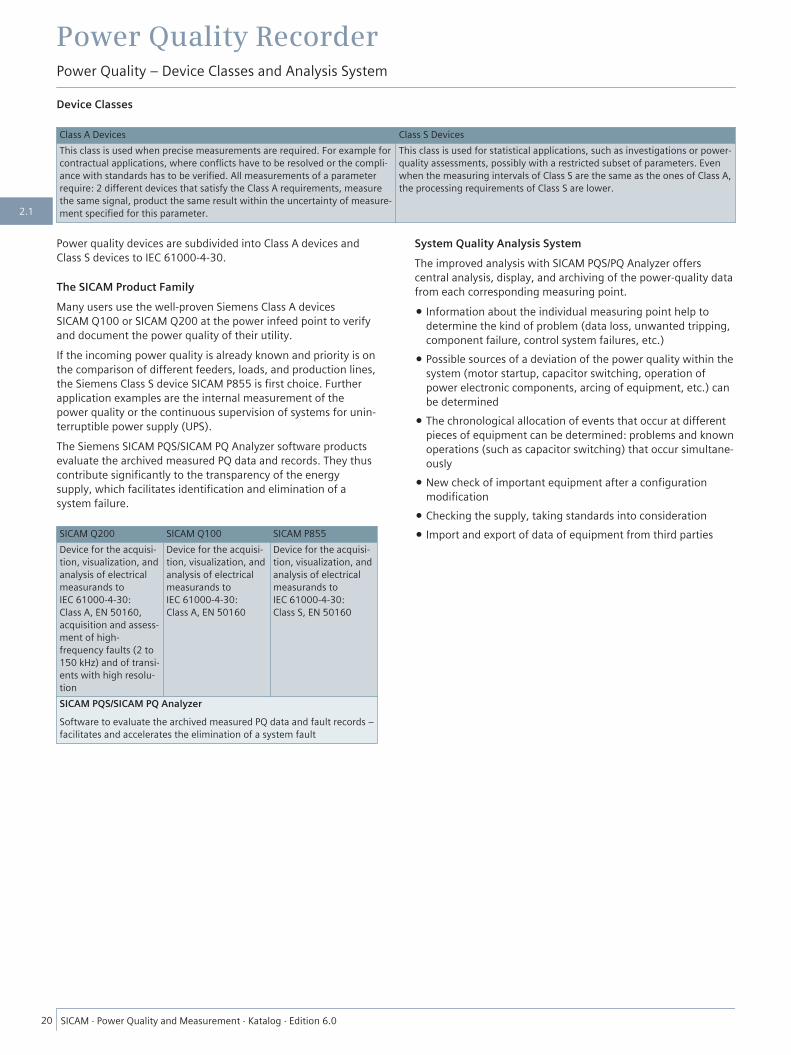
Device Classes
Class A Devices Class S DevicesThis class is used when precise measurements are required. For example forcontractual applications, where conflicts have to be resolved or the compli-ance with standards has to be verified. All measurements of a parameterrequire: 2 different devices that satisfy the Class A requirements, measurethe same signal, product the same result within the uncertainty of measure-ment specified for this parameter.
This class is used for statistical applications, such as investigations or power-quality assessments, possibly with a restricted subset of parameters. Evenwhen the measuring intervals of Class S are the same as the ones of Class A,the processing requirements of Class S are lower.
Power quality devices are subdivided into Class A devices andClass S devices to IEC 61000-4-30.
The SICAM Product FamilyMany users use the well-proven Siemens Class A devicesSICAM Q100 or SICAM Q200 at the power infeed point to verifyand document the power quality of their utility.If the incoming power quality is already known and priority is onthe comparison of different feeders, loads, and production lines,the Siemens Class S device SICAM P855 is first choice. Furtherapplication examples are the internal measurement of thepower quality or the continuous supervision of systems for unin-terruptible power supply (UPS).The Siemens SICAM PQS/SICAM PQ Analyzer software productsevaluate the archived measured PQ data and records. They thuscontribute significantly to the transparency of the energysupply, which facilitates identification and elimination of asystem failure.
SICAM Q200 SICAM Q100 SICAM P855Device for the acquisi-tion, visualization, andanalysis of electricalmeasurands toIEC 61000-4-30:Class A, EN 50160,acquisition and assess-ment of high-frequency faults (2 to150 kHz) and of transi-ents with high resolu-tion
Device for the acquisi-tion, visualization, andanalysis of electricalmeasurands toIEC 61000-4-30:Class A, EN 50160
Device for the acquisi-tion, visualization, andanalysis of electricalmeasurands toIEC 61000-4-30:Class S, EN 50160
SICAM PQS/SICAM PQ AnalyzerSoftware to evaluate the archived measured PQ data and fault records –facilitates and accelerates the elimination of a system fault
System Quality Analysis SystemThe improved analysis with SICAM PQS/PQ Analyzer offerscentral analysis, display, and archiving of the power-quality datafrom each corresponding measuring point.
• Information about the individual measuring point help todetermine the kind of problem (data loss, unwanted tripping,component failure, control system failures, etc.)
• Possible sources of a deviation of the power quality within thesystem (motor startup, capacitor switching, operation ofpower electronic components, arcing of equipment, etc.) canbe determined
• The chronological allocation of events that occur at differentpieces of equipment can be determined: problems and knownoperations (such as capacitor switching) that occur simultane-ously
• New check of important equipment after a configurationmodification
• Checking the supply, taking standards into consideration• Import and export of data of equipment from third parties
Power Quality RecorderPower Quality – Device Classes and Analysis System
20 SICAM ⋅ Power Quality and Measurement ⋅ Katalog ⋅ Edition 6.0
2.1

[SICAM PQS_PQ Analyzer, 1, en_US]
Figure 2.1/4 Fault Records and Power Quality Analysis System
Power Quality RecorderPower Quality – Device Classes and Analysis System
SICAM ⋅ Power Quality and Measurement ⋅ Katalog ⋅ Edition 6.0 21
2.1

[dw_appl_data_center, 1, en_US]
Figure 2.1/5 With Siemens You Have a Comprehensive System to Analyze the Quality of Supply of Current and Voltage in Data Centers and Industry
Quality of Power Supply in Data CentersFailures in the power supply of a data center cause expensivedomino effects in IT and telecommunication networks.To achieve an availability of your data centers in accordancewith the Six-Sigma specifications, and beyond, IT and telecom-munication providers are dependent on a stable and reliablepower supply. The stability of a system is determined by itsweakest element. Redundancy systems must provide an uninter-rupted constant power supply. If this is not the case, small prob-lems can have enormous consequences. An example: The poorprotection of their systems against transients and voltage dipscosts a telephone company yearly approximately 24 millionEuro.*Source: Leonardo Energy, www.leonardo-energy.org
Inadequate power quality can have far-reaching consequences:
• Costly customer demandsIT and telecommunication companies are expected to provideperfect performance. Each voltage interruption causes expen-sive claims and credits.
• Bad reputation
A loss of voltage can severely damage the reputation of acompany and lead to losing customers. Regaining confidenceis a lengthy and expensive process.
• Site-crossing standstillThe central data center of an IT company feeds data to manycomputers around the world. In the event of a standstill, datais globally not available. Turnover is lost, likewise the workingtime of the employees.
• Costs for expertsExternal specialists are frequently required to solve theproblem. This creates high unexpected costs.
• Expensive customer careThe costs of an individual customer call are insignificant. In atelephone company with wide geographic coverage,however, the related costs rise exponentially.
Power Quality RecorderPower Quality – Applications In Data Centers and Industry
22 SICAM ⋅ Power Quality and Measurement ⋅ Katalog ⋅ Edition 6.0
2.1

• New setup of the electrical systemA power event can require your electrical system to be rebuiltpartly or as a whole. Preventive measures are more cost-effec-tive than restoring!
• High repair costsRepairing damage on servers, switchgear, hubs, etc. is expen-sive. Replacing IT or telecommunication equipment canseverely burden the budget of a company – in particular, ifthe expenses are unscheduled.
Maximum availability is the crucial factor in the operation ofdata centers and telecommunication networks. Consequently,monitoring the power quality and controlling and measuring theelectrical energy is of utmost importance.Energy monitoring with SICAM Power Quality andMeasurement supports you in the best way of monitoringyour energy system.In your data center, too, Siemens provides higher operationalsafety and better planning possibilities. The Siemens SICAMsolution ensures a simple continuous monitoring of powersupply and voltage characteristic in each required monitoringinterval. All data and events, such as dips, swells, interruptions,harmonics or voltage fluctuation are reported, documented inreal time, and archived. A corresponding evaluation of themeasured data enables you to detect potential problems at anearly stage, initiate counter measures immediately, and avoidconsequential damage. You create safety for your data andprotect against data loss.Power-Quality Monitoring in data centers with Siemens – bene-fits
• Around the clock maximum current availability and voltagequality for less downtime
• Better data transparency to determine weak points and meas-ures for elimination
• Improved energy efficiency due to identification of potentialsavings
• Comprehensive documentation of all power-quality parame-ters to clarify any claims towards the power supplier
• Compliance with all relevant standards.
Optimum Power Supply in Industrial BusinessesMany companies underestimate the financial consequences of apoor quality of their electrical energy supply. Modern industrialproduction contains much electronic equipment and many auto-mation devices. Such equipment is not only sensitive to voltagefluctuation from the energy supply system, but can also be thecause of failures which it feeds back into the energy supplynetwork.Copper Development Association estimates that the expensesfor preventive measures in industry and commerce are less than5 % of the costs that are caused by inadequate power quality.Studies show that the average return of investment for damage-limiting measures is less than 2 years.Continuous acquisition and evaluation of power-quality-relevantmeasured data helps to detect and eliminate malfunctions at anearly stage.
Energy monitoring with SICAM Power Quality does exactly this –in 3 steps, for each business sector
• Defining measuring points in the electrical supply system:Here we distinguish between the transfer point of the localutility and important measuring points within the own indus-trial network.The goal is to ensure the quality of the energy obtained fromthe utility, and the supervision of the power quality in theindustrial network.
• Giving a precise statement of measuring devices using Class Adevices, such as SICAM Q100 and SICAM Q200, is preferredfor the measurement at a transfer point and for contractuallyagreed energy supply contracts. Class S devices are usuallyemployed for a continuous acquisition of the power qualityand/or for the identification of "disturbers" in the industrialnetwork. Siemens offers the multi-function measuring deviceSICAM P855 for this purpose.The combination of these devices thus permits a comprehen-sive surveillance of the energy network.
• The measured data is completely saved and evaluated in thedevices. This feature detects and documents information suchas harmonics, voltage fluctuation and flickers.
Energy availability, reliability and quality – at any time
• Continuous monitoring, acquisition and documentation of theparameters that are relevant to the quality of supply in orderto identify potential weak points and to initiate suitable meas-ures for their elimination.
• A complete documentation of all relevant parameters isnecessary to clarify claims against utilities.
More energy efficiency
• You obtain transparency of energy flow and can identifypotential savings.
• The PQ devices provide valuable information for energymanagement systems that satisfy ISO 50001/EN16247-1 andthe energy efficiency standard IEC 60364-8-1.
• Reduced power losses and aging of devices (part 8-1 of theIEC 60364-8-1 standard illustrates the large influence ofpower quality on energy efficiency)
Poor power quality causes a yearly damage of
• EUR 150 billion due to downtime in production and IT inEurope
• 10 % loss of turnover in some companies
Source: J. Manson, R. Targosz: European Power Quality Survey Report, Leonardo Energy
Power Quality RecorderPower Quality – Applications In Data Centers and Industry
SICAM ⋅ Power Quality and Measurement ⋅ Katalog ⋅ Edition 6.0 23
2.1
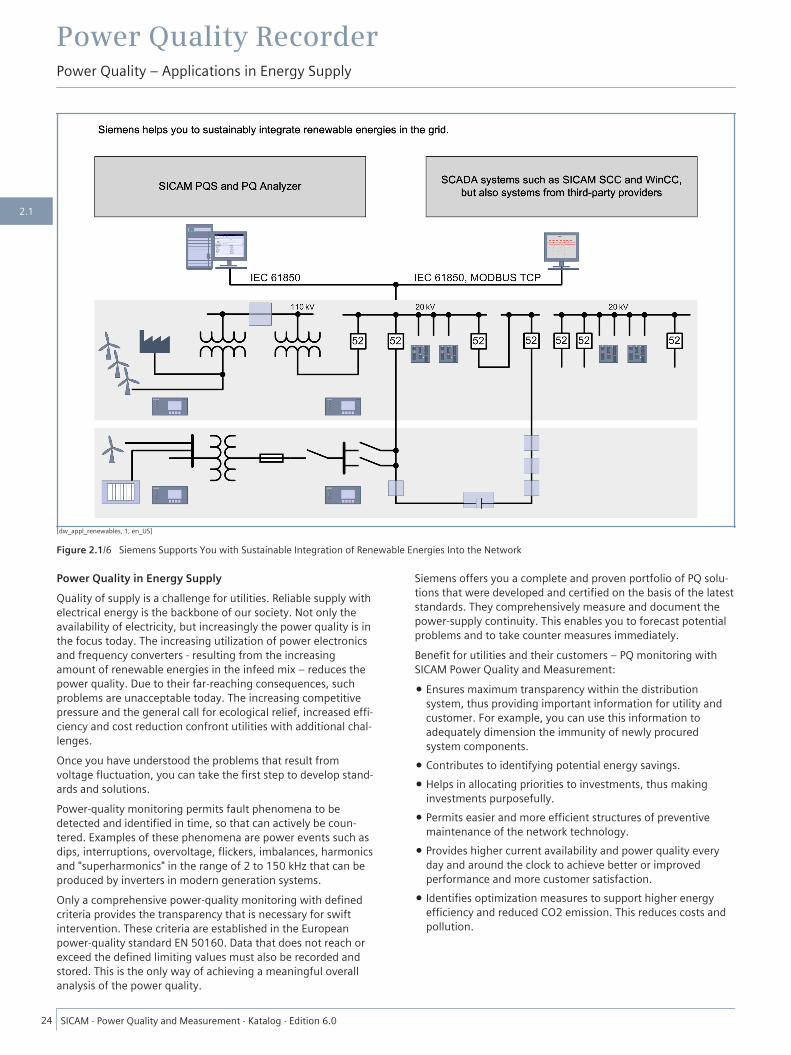
[dw_appl_renewables, 1, en_US]
Figure 2.1/6 Siemens Supports You with Sustainable Integration of Renewable Energies Into the Network
Power Quality in Energy SupplyQuality of supply is a challenge for utilities. Reliable supply withelectrical energy is the backbone of our society. Not only theavailability of electricity, but increasingly the power quality is inthe focus today. The increasing utilization of power electronicsand frequency converters - resulting from the increasingamount of renewable energies in the infeed mix – reduces thepower quality. Due to their far-reaching consequences, suchproblems are unacceptable today. The increasing competitivepressure and the general call for ecological relief, increased effi-ciency and cost reduction confront utilities with additional chal-lenges.Once you have understood the problems that result fromvoltage fluctuation, you can take the first step to develop stand-ards and solutions.Power-quality monitoring permits fault phenomena to bedetected and identified in time, so that can actively be coun-tered. Examples of these phenomena are power events such asdips, interruptions, overvoltage, flickers, imbalances, harmonicsand "superharmonics" in the range of 2 to 150 kHz that can beproduced by inverters in modern generation systems.Only a comprehensive power-quality monitoring with definedcriteria provides the transparency that is necessary for swiftintervention. These criteria are established in the Europeanpower-quality standard EN 50160. Data that does not reach orexceed the defined limiting values must also be recorded andstored. This is the only way of achieving a meaningful overallanalysis of the power quality.
Siemens offers you a complete and proven portfolio of PQ solu-tions that were developed and certified on the basis of the lateststandards. They comprehensively measure and document thepower-supply continuity. This enables you to forecast potentialproblems and to take counter measures immediately.Benefit for utilities and their customers – PQ monitoring withSICAM Power Quality and Measurement:
• Ensures maximum transparency within the distributionsystem, thus providing important information for utility andcustomer. For example, you can use this information toadequately dimension the immunity of newly procuredsystem components.
• Contributes to identifying potential energy savings.• Helps in allocating priorities to investments, thus making
investments purposefully.• Permits easier and more efficient structures of preventive
maintenance of the network technology.• Provides higher current availability and power quality every
day and around the clock to achieve better or improvedperformance and more customer satisfaction.
• Identifies optimization measures to support higher energyefficiency and reduced CO2 emission. This reduces costs andpollution.
Power Quality RecorderPower Quality – Applications in Energy Supply
24 SICAM ⋅ Power Quality and Measurement ⋅ Katalog ⋅ Edition 6.0
2.1

Quality of Supply and Renewable EnergiesThe world need the transition to a safer, more affordable andCO2-reduced energy system.The climatic and energy goals for the years 2020 and 2030, thatwere passed by the European Union, can only be achieved witha strong consolidation of renewable energies. However, thequality of the produced electrical energy is very important fortheir efficiency and reliability.Practice shows: Technologies like photovoltaic technology andwind power can have a negative effect on the quality of thegenerated energy. The number of inverter increases as the shareof renewable energy increase – and thus the number of high-frequency levels (2 to 150 kHz) in the electricity-supply system.The following phenomena and challenges are to be met:
• Voltage fluctuation (influenced by daytime or weather, forexample) can cause shutdown, reduced efficiency, andreduced service life of electrical systems. Such phenomenacan also show with flickering lighting.
• Harmonics caused by inverters can increase the risk of trans-formers and capacitor banks to overheat, which causes anoverload of the neutral phase and malfunctioning protectiveequipment.
• Transients and rapid voltage changes, caused by switchingactivities, for example, can cause hardware failures and datalosses and can destroy power supply units.
Meeting these challenges requires exact measurements first andforemost. The Siemens multifunction measuring devicesSICAM P855, SICAM Q100, and SICAM Q200 ensure comprehen-sive monitoring of all relevant parameters in the electricalenergy supply network. In accordance with the IEC 61000-4-30standard, all necessary power-quality parameters are measured,stored and evaluated continuously and completely.The Siemens SICAM PQS/SICAM PQ Analyzer software is avail-able for an efficient further processing of the measured data.The software automatically evaluates the archived measuredPQ data and records, and provides you with extensive informa-tion about the compliance with the "grid codes". This facilitatesidentification and elimination of a system fault, and generallycontributes to more transparency in energy supply.The use of standard communication protocols and data formats,such as IEC 61850, PQDIF, and COMTRADE, makes dataexchange easy. In addition, measured values and event informa-tion are completely available via Modbus TCP for SCADAsystems, such as WinCC.Power Quality-monitoring with Siemens: Your benefits
• Monitoring-relevant network parameter not only helps you inidentifying problems, it also informs you about the integra-tion of renewable energy into the network and the resultingeffects. You thus ensure the required quality of the electricalenergy supply within the scope of the necessary limits.
• The analysis the effect of the renewable energies has on theenergy supply prepares utilities for potential operational prob-lems. It contributes to improving the integration of the renew-
able energies and to structure investments as sustainably aspossible.
• Understanding the problems that result from the fluctuationof the power quality is the first step towards the definition of"grid codes" and the development of preventive measures.
Power Quality RecorderPower Quality – Applications in Energy Supply
SICAM ⋅ Power Quality and Measurement ⋅ Katalog ⋅ Edition 6.0 25
2.1

DescriptionOne of the most frequent causes of unplanned downtimes anddevice failures is the insufficient quality of the supplied electricalenergy. The acquisition and documentation of parameters rele-vant to supply quality is an important step to identify possibleweak points and initiate appropriate measures to eliminatethem.SICAM Q200 is a network analyzer for high-definition acquisitionand assessment of the power quality in electrical power supplysystems. It offers algorithms and functions for energy manage-ment applications. The device supports continuous acquisitionand analysis of all relevant parameters. These results help toidentify and implement quality programs to ensure the supplyquality. This increases the service life of the equipment while atthe same time reducing downtimes.
Device type Switch panelAuxiliary voltage AC/DC 100 to 230 VMemory 2 GB for approx. several months EN 50160 PQ
data (expandable)Inputs and outputcircuits
4x alternating voltage4x alternating currentUp to 6 binary inputs, 6 outputs, individuallyprogrammable
Operation anddisplay
Graphic display including operation via 4 func-tion keysIntegrated web server to interact with PC andHTML pages
Communication 2 x Ethernet (IEC 61850, Modbus TCP),Modbus gateway/master, integrated switch,SNMPv3Modbus RTU master and gateway function forRS485 devices
Time synchronization Via Ethernet: NTP client (Network TimeProtocol)Optical IRIG-B (planned)
Benefits• The early identification of supply quality problems allows for
time and cost savings due to comprehensive acquisition ofnetwork parameters
• High level of investment security through the use of stand-ards, for example, measuring methods in accordance with IEC61000-4-30 Class A Edition 3 – ensure manufacturer-inde-pendent comparable measured values, standard interfacesand protocols (IEC 61850, Modbus TCP) and data exchangeformats (PQDIF, Comtrade, and CSV) – and thus guaranteeinteroperability
• Versatile application areas thanks to the high measuring accu-racy and the wide measuring range for high-frequency noise(2 to 150 kHz and transients with 1 MHz)
FunctionsSICAM Q200 is a PQ device Class A acc. to IEC 62586-1/2 and IEC61000-4-30 Edition 3 beyond Class A and acquires, visualizes,analyzes and transmits alternating current characteristics suchas current, voltage, frequency, performance, harmonic, etc. Themeasured variables can be provided to a PC, an energy automa-tion/SCADA system and/or shown on a display using communi-
cation interfaces. In addition, the SICAM Q200 provides acombined recording and analysis function for measured valuesdirectly in the device. Long-term data and events can be trans-ferred to SICAM PQS/PQ Analyzer System via IEC 61850, andflexible analyses and reports (for example EN 50160) can begenerated.Measured Characteristics and Power Quality• Measurement compliant with IEC 61000-4-30 Class A
Edition 3, reporting and analyses compliant with EN 50160(CBEMA)
• True RMS of voltage and current with 8192 sampled values/10sampling cycles (sampling rate 40 kHz @50 Hz), voltage tran-sients with a sampling rate of 1 MHz
• Harmonics up to the 63rd harmonic• Measurement, visualization*, recording in PQDIF of frequen-
cies in the range of 2 kHz to 9 kHz (IEC 61000-4-7) and 9 kHzto 150 kHz (IEC 610000-4-30 (2015))
• Rapid voltage changes• Power of harmonics for harmonic direction detection• Active, reactive and apparent power and energy• Phase angles* in preparationEnergy Management• Load profile peaks and average values; time of use (TOU) with
4 tariffs• Complies with the following standards: IEC 62053-22 accu-
racy Class 0.2 S, ANSI C12.20 Class 0.2• ANSI C12.20 Electricity meter, accuracy Class 0.2• 4 Quadrant Power: received and delivered/inductive and
capacitive
[ph_SICAM_Q200, 1, --_--]
Figure 2.2/1 SICAM Q200
Power Quality RecorderSICAM Q200 – Description
26 SICAM ⋅ Power Quality and Measurement ⋅ Katalog ⋅ Edition 6.0
2.2

Data Export• CSV data, for example for further processing in MS Excel• PQDIF data compliant with IEEE 1159.3, for PQ recordings• COMTRADE data compliant with IEC 60255-24/IEEE Std
C37.111 for waveform recordsSpecial Features• PQ reporting according to EN 50160 and CBEMA directly over
HTML Web server• Multi web browser support (IE, Chrome, Firefox)• Evaluation of events directly in HTML via COMTRADE viewer/
SIGRA plug-in
ApplicationsSICAM Q200 is used in single-phase as well as in threewire andfour-wire systems (with neutral conductor) in power utilities,industries, data centers and in commerce.
[Areas of application, 1, en_US]
Figure 2.2/2 Fields of Application
Power Quality RecorderSICAM Q200 – Description
SICAM ⋅ Power Quality and Measurement ⋅ Katalog ⋅ Edition 6.0 27
2.2
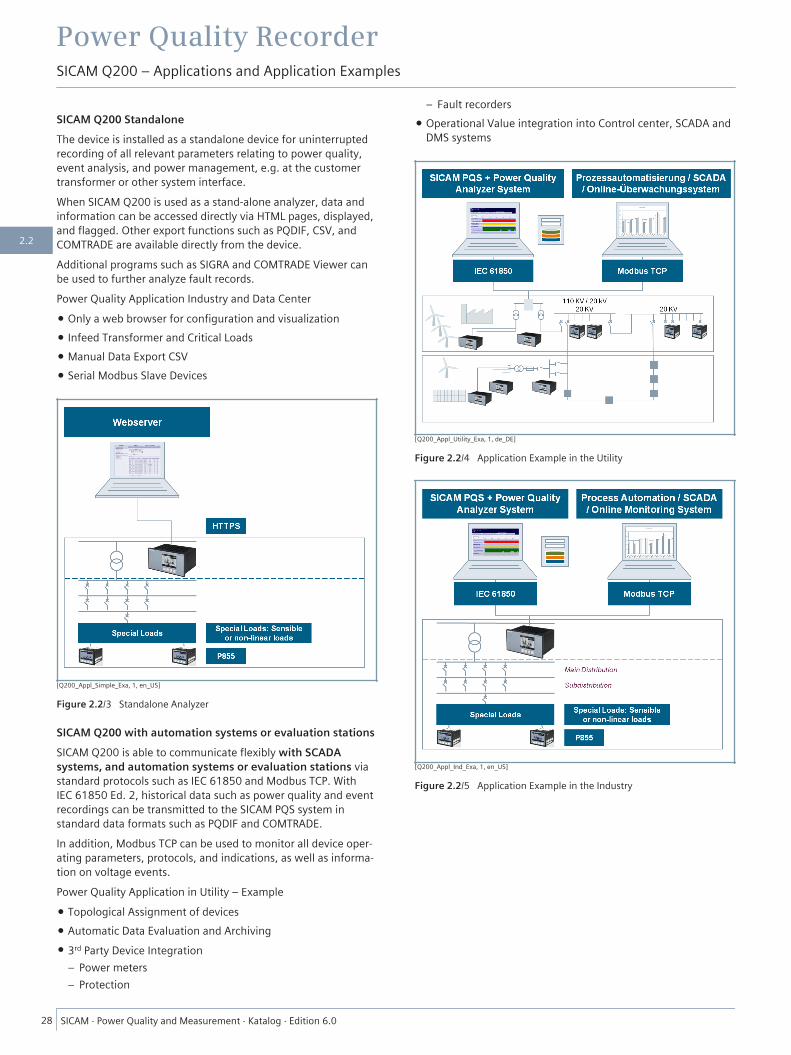
SICAM Q200 StandaloneThe device is installed as a standalone device for uninterruptedrecording of all relevant parameters relating to power quality,event analysis, and power management, e.g. at the customertransformer or other system interface.When SICAM Q200 is used as a stand-alone analyzer, data andinformation can be accessed directly via HTML pages, displayed,and flagged. Other export functions such as PQDIF, CSV, andCOMTRADE are available directly from the device.Additional programs such as SIGRA and COMTRADE Viewer canbe used to further analyze fault records.Power Quality Application Industry and Data Center
• Only a web browser for configuration and visualization• Infeed Transformer and Critical Loads• Manual Data Export CSV• Serial Modbus Slave Devices
[Q200_Appl_Simple_Exa, 1, en_US]
Figure 2.2/3 Standalone Analyzer
SICAM Q200 with automation systems or evaluation stationsSICAM Q200 is able to communicate flexibly with SCADAsystems, and automation systems or evaluation stations viastandard protocols such as IEC 61850 and Modbus TCP. WithIEC 61850 Ed. 2, historical data such as power quality and eventrecordings can be transmitted to the SICAM PQS system instandard data formats such as PQDIF and COMTRADE.In addition, Modbus TCP can be used to monitor all device oper-ating parameters, protocols, and indications, as well as informa-tion on voltage events.Power Quality Application in Utility – Example
• Topological Assignment of devices• Automatic Data Evaluation and Archiving• 3rd Party Device Integration
– Power meters– Protection
– Fault recorders• Operational Value integration into Control center, SCADA and
DMS systems
[Q200_Appl_Utility_Exa, 1, de_DE]
Figure 2.2/4 Application Example in the Utility
[Q200_Appl_Ind_Exa, 1, en_US]
Figure 2.2/5 Application Example in the Industry
Power Quality RecorderSICAM Q200 – Applications and Application Examples
28 SICAM ⋅ Power Quality and Measurement ⋅ Katalog ⋅ Edition 6.0
2.2

Communication Applications
SICAM Q200 is equipped with 2 Ethernet interfaces that permitring communication configurations.
[Q200_Appl_Parallel, 1, en_US]
Figure 2.2/6 Example: Parallel Power-Quality Evaluation and Operating-Value Processing
SICAM Q200 as Modbus gateway and masterSICAM Q200 uses the RS485 interface to implement the Modbusmaster and Modbus gateway functions.The gateway functionality permits a swift and easy integrationof other serial RS485 devices into the Modbus TCP or IEC 61850network.The Modbus master function permits data from up to 16 of theabove-mentioned devices to be monitored and displayed on thedisplay or via an HTML page.
[Q200_Appl_Modbus, 1, en_US]
Figure 2.2/7 Example: Modbus Master and Gateway
Power Quality RecorderSICAM Q200 – Applications and Application Examples
SICAM ⋅ Power Quality and Measurement ⋅ Katalog ⋅ Edition 6.0 29
2.2
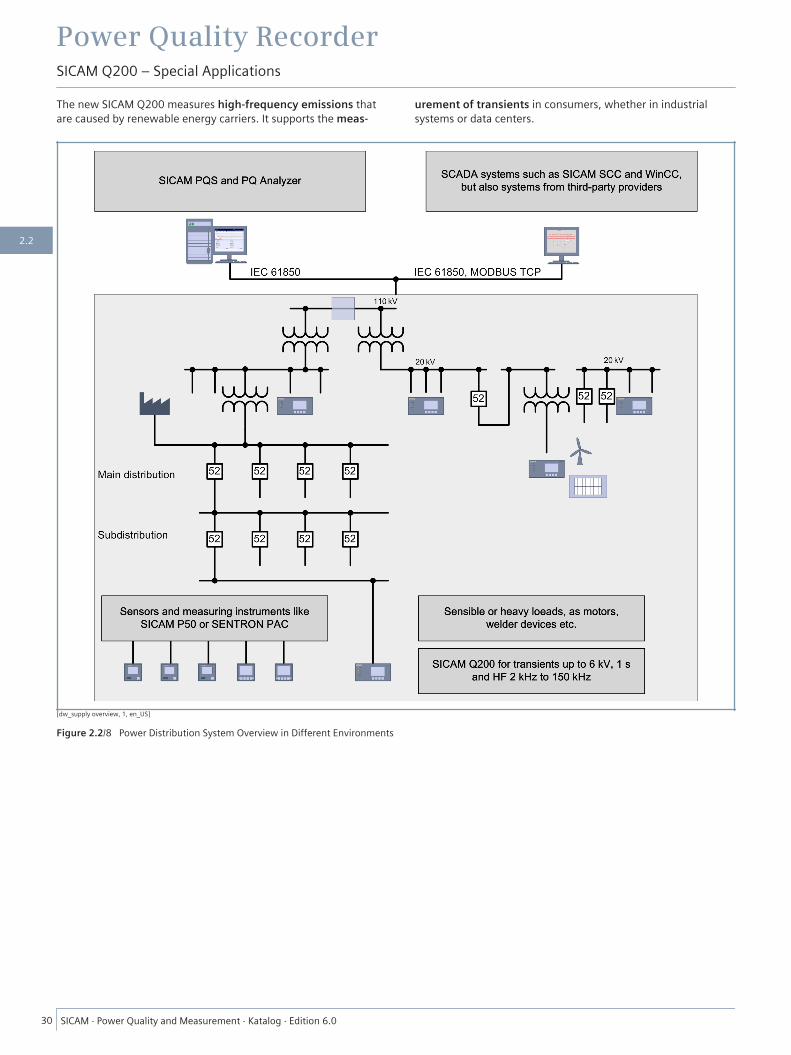
The new SICAM Q200 measures high-frequency emissions thatare caused by renewable energy carriers. It supports the meas-
urement of transients in consumers, whether in industrialsystems or data centers.
[dw_supply overview, 1, en_US]
Figure 2.2/8 Power Distribution System Overview in Different Environments
Power Quality RecorderSICAM Q200 – Special Applications
30 SICAM ⋅ Power Quality and Measurement ⋅ Katalog ⋅ Edition 6.0
2.2
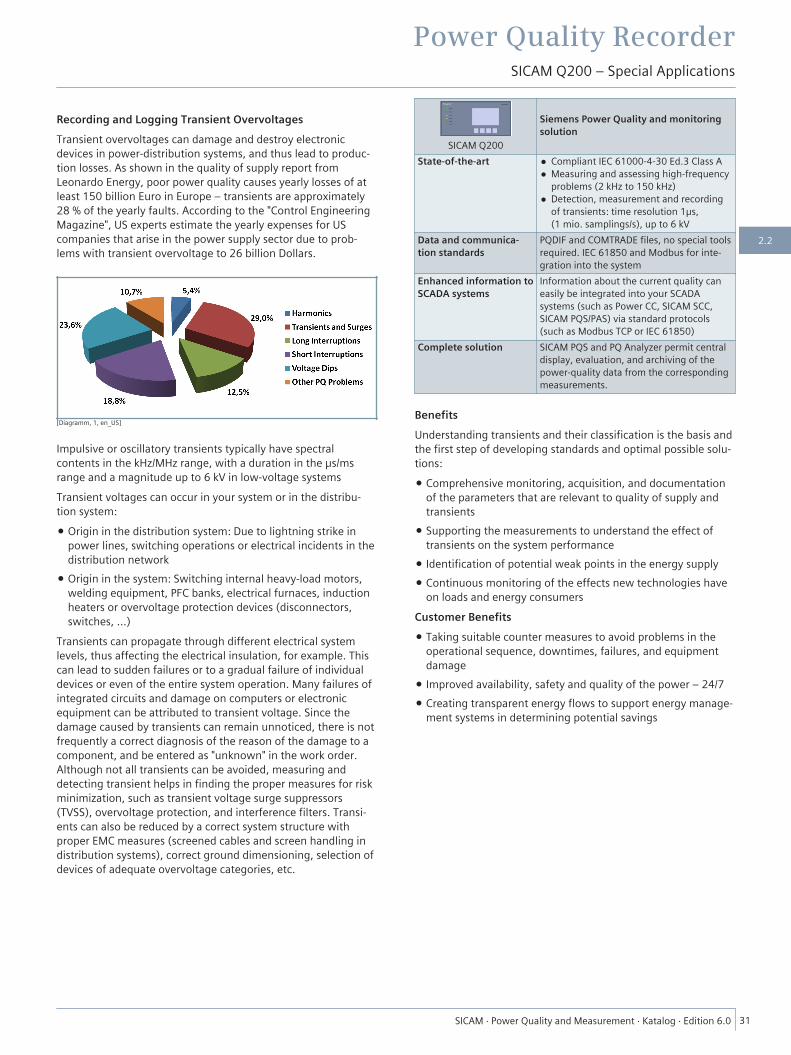
Recording and Logging Transient OvervoltagesTransient overvoltages can damage and destroy electronicdevices in power-distribution systems, and thus lead to produc-tion losses. As shown in the quality of supply report fromLeonardo Energy, poor power quality causes yearly losses of atleast 150 billion Euro in Europe – transients are approximately28 % of the yearly faults. According to the "Control EngineeringMagazine", US experts estimate the yearly expenses for UScompanies that arise in the power supply sector due to prob-lems with transient overvoltage to 26 billion Dollars.
[Diagramm, 1, en_US]
Impulsive or oscillatory transients typically have spectralcontents in the kHz/MHz range, with a duration in the µs/msrange and a magnitude up to 6 kV in low-voltage systemsTransient voltages can occur in your system or in the distribu-tion system:
• Origin in the distribution system: Due to lightning strike inpower lines, switching operations or electrical incidents in thedistribution network
• Origin in the system: Switching internal heavy-load motors,welding equipment, PFC banks, electrical furnaces, inductionheaters or overvoltage protection devices (disconnectors,switches, ...)
Transients can propagate through different electrical systemlevels, thus affecting the electrical insulation, for example. Thiscan lead to sudden failures or to a gradual failure of individualdevices or even of the entire system operation. Many failures ofintegrated circuits and damage on computers or electronicequipment can be attributed to transient voltage. Since thedamage caused by transients can remain unnoticed, there is notfrequently a correct diagnosis of the reason of the damage to acomponent, and be entered as "unknown" in the work order.Although not all transients can be avoided, measuring anddetecting transient helps in finding the proper measures for riskminimization, such as transient voltage surge suppressors(TVSS), overvoltage protection, and interference filters. Transi-ents can also be reduced by a correct system structure withproper EMC measures (screened cables and screen handling indistribution systems), correct ground dimensioning, selection ofdevices of adequate overvoltage categories, etc.
SICAM Q200
Siemens Power Quality and monitoringsolution
State-of-the-art • Compliant IEC 61000-4-30 Ed.3 Class A• Measuring and assessing high-frequency
problems (2 kHz to 150 kHz)• Detection, measurement and recording
of transients: time resolution 1µs,(1 mio. samplings/s), up to 6 kV
Data and communica-tion standards
PQDIF and COMTRADE files, no special toolsrequired. IEC 61850 and Modbus for inte-gration into the system
Enhanced information toSCADA systems
Information about the current quality caneasily be integrated into your SCADAsystems (such as Power CC, SICAM SCC,SICAM PQS/PAS) via standard protocols(such as Modbus TCP or IEC 61850)
Complete solution SICAM PQS and PQ Analyzer permit centraldisplay, evaluation, and archiving of thepower-quality data from the correspondingmeasurements.
BenefitsUnderstanding transients and their classification is the basis andthe first step of developing standards and optimal possible solu-tions:
• Comprehensive monitoring, acquisition, and documentationof the parameters that are relevant to quality of supply andtransients
• Supporting the measurements to understand the effect oftransients on the system performance
• Identification of potential weak points in the energy supply• Continuous monitoring of the effects new technologies have
on loads and energy consumersCustomer Benefits• Taking suitable counter measures to avoid problems in the
operational sequence, downtimes, failures, and equipmentdamage
• Improved availability, safety and quality of the power – 24/7• Creating transparent energy flows to support energy manage-
ment systems in determining potential savings
Power Quality RecorderSICAM Q200 – Special Applications
SICAM ⋅ Power Quality and Measurement ⋅ Katalog ⋅ Edition 6.0 31
2.2
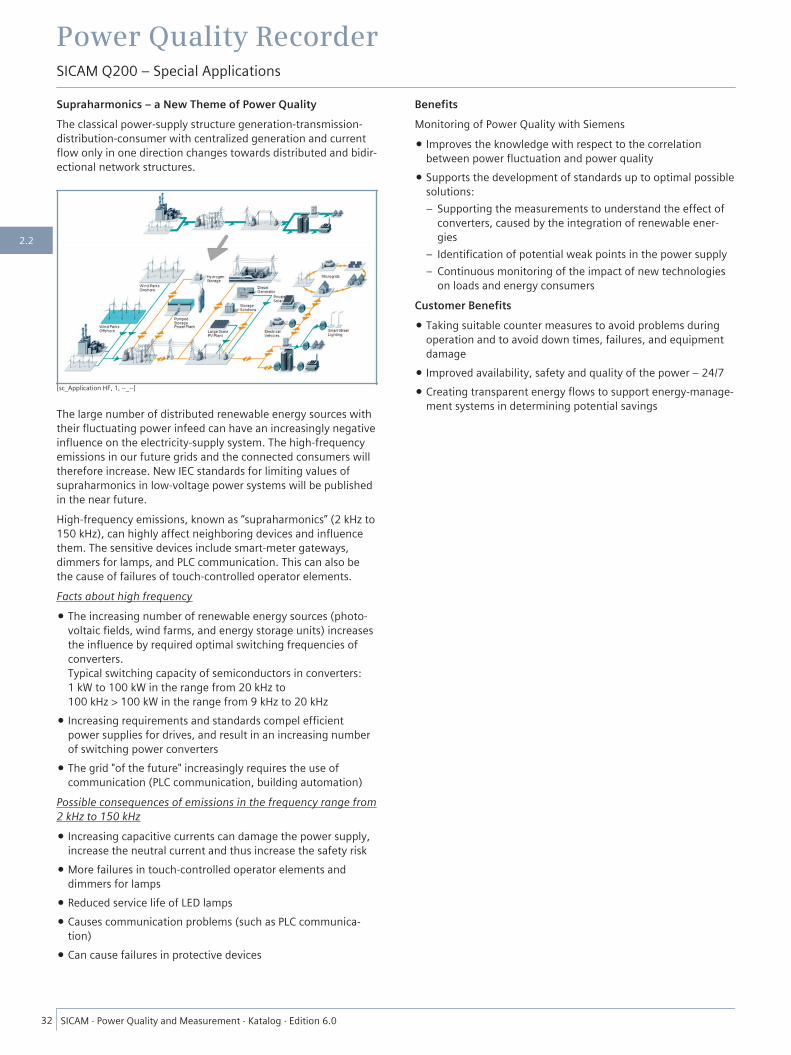
Supraharmonics – a New Theme of Power QualityThe classical power-supply structure generation-transmission-distribution-consumer with centralized generation and currentflow only in one direction changes towards distributed and bidir-ectional network structures.
[sc_Application HF, 1, --_--]
The large number of distributed renewable energy sources withtheir fluctuating power infeed can have an increasingly negativeinfluence on the electricity-supply system. The high-frequencyemissions in our future grids and the connected consumers willtherefore increase. New IEC standards for limiting values ofsupraharmonics in low-voltage power systems will be publishedin the near future.High-frequency emissions, known as “supraharmonics” (2 kHz to150 kHz), can highly affect neighboring devices and influencethem. The sensitive devices include smart-meter gateways,dimmers for lamps, and PLC communication. This can also bethe cause of failures of touch-controlled operator elements.Facts about high frequency
• The increasing number of renewable energy sources (photo-voltaic fields, wind farms, and energy storage units) increasesthe influence by required optimal switching frequencies ofconverters.Typical switching capacity of semiconductors in converters:1 kW to 100 kW in the range from 20 kHz to100 kHz > 100 kW in the range from 9 kHz to 20 kHz
• Increasing requirements and standards compel efficientpower supplies for drives, and result in an increasing numberof switching power converters
• The grid "of the future" increasingly requires the use ofcommunication (PLC communication, building automation)
Possible consequences of emissions in the frequency range from2 kHz to 150 kHz
• Increasing capacitive currents can damage the power supply,increase the neutral current and thus increase the safety risk
• More failures in touch-controlled operator elements anddimmers for lamps
• Reduced service life of LED lamps• Causes communication problems (such as PLC communica-
tion)• Can cause failures in protective devices
BenefitsMonitoring of Power Quality with Siemens
• Improves the knowledge with respect to the correlationbetween power fluctuation and power quality
• Supports the development of standards up to optimal possiblesolutions:– Supporting the measurements to understand the effect of
converters, caused by the integration of renewable ener-gies
– Identification of potential weak points in the power supply– Continuous monitoring of the impact of new technologies
on loads and energy consumersCustomer Benefits• Taking suitable counter measures to avoid problems during
operation and to avoid down times, failures, and equipmentdamage
• Improved availability, safety and quality of the power – 24/7• Creating transparent energy flows to support energy-manage-
ment systems in determining potential savings
Power Quality RecorderSICAM Q200 – Special Applications
32 SICAM ⋅ Power Quality and Measurement ⋅ Katalog ⋅ Edition 6.0
2.2

Device PropertiesAll devices consistently provide the following properties:
• Device type:– Power Monitoring Device and Power Quality Recorder, class
A, with measured-value recorders and exchangeable 2-GBmicroSD card
– Panel flush-mounting device with display for measuredvalues and parameterization
– Plastic case 192 mm/7.56 inch x 96 mm/3.78 inch x 134.6mm/5.3 inch (W x H x D)
– Web server for parameterization, visualization, and datamanagement
– Transmitting measured values using communication proto-cols
– Degree of protection:– Front: IP40 (standard)– Front: IP54 (with separate seal between housing and
switch panel)– Terminals: IP20 (behind switch panel)
• Input and output circuits:– 4 inputs for alternating voltage measurements– 4 inputs for alternating current measurements– Up to 2 binary modules; each binary module has:
– 3 binary inputs, for example, for synchronization pulsesof the load profile or external triggers
– 3 binary outputs (relay contacts)
• Measurement acc. to standard IEC 61000-4-30 Ed. 3, class A• Measured quantities:
– Voltage V– Current I– Phase angle ϕ– System frequency f (fundamental)– 10-s frequency– Active power P (accuracy class 0.2S; ANSI C12.20 current
class 2 and current class 10)– Reactive power Q– Apparent power S– Energy measured values W– Active power factor cos ϕ– Power factor PF– Voltage and current harmonics up to 63rd, voltage and
current interharmonics up to 49th, and voltage harmonicsin the range from 2 kHz to 9 kHz and from 9 kHz to 150 kHz
– THDS– Flicker acc. to IEC 61000-4-15
• Measurements for evaluation and supervision– Minimum/mean/maximum values– Event detection: voltage dips, voltage swells, voltage inter-
ruptions– Limit violations– Energy management (load profiles and tariffs)
– Rapid voltage change (RVC)
• Communication interfaces– Communication via Ethernet:
– Only Modbus TCP protocol (device version7KG9700-0BA0x-xAA0)
– Modbus TCP protocol and/or IEC 61850 server protocol(device version 7KG9700-0BA0x-xBA0)
– Serial communication via RS485– Protocol Modbus RTU slave– Protocol Modbus RTU master protocol and gateway func-
tion
• Data export– CSV data– PQDIF dataIEEE1159.3: PQDIF for PQ records (events, measure-ments, records)
– COMTRADE dataIEC 60255-24/IEEE Std C37.111: Measuring relaysand protection equipment – Part 24: Common format fortransient data exchange (COMTRADE for power systems)for fault records
• Internal Ethernet switch• Certificates
– CE certification– UL certification
CommunicationThe device has 2 Ethernet ports which can be used as 2 inde-pendent Ethernet interfaces (in different networks) or as 2 portsof the integrated Ethernet switch (in 1 network). Ethernetsupports the device parameterization, transmission of measuredvalues, metered values, load profiles, and indications/events andthe time synchronization with NTP. The supported Ethernetcommunication protocols are HTTP, IEC 61850, Modbus TCP,and SNMPv3.The RS485 interface (1 interface with 2 connectors) allowsModbus RTU master and Modbus RTU slave functionality.
SecurityTo ensure a high level of security (for example IT industry), theaccess to the device is password-protected.Further security features are:
• SNMPv3• Automatic logoff after a timeout of no action• Disabling of ports• Modbus TCP as read only
Time SynchronizationDuring operation, SICAM Q200 needs the date and time for alltime-relevant processes. This ensures that a common time basisexists when communicating with peripheral devices and enablestime stamping of the process data.
Power Quality RecorderSICAM Q200 – Properties and Functions
SICAM ⋅ Power Quality and Measurement ⋅ Katalog ⋅ Edition 6.0 33
2.2
The following types of time synchronization can be executed:
• External time synchronization via Ethernet NTP (preferred)• External time synchronization via fieldbus• Internal time synchronization via RTC (if external time
synchronization is not available)
Functionality of RecordersThe recorders can record measured values, events, and loadprofiles in parameterizable time intervals. The followingrecorder types are used:
• Measurement recorder:Recording of PQ measured quantities acc. to IEC 61000-4-30(for example, frequency and voltage magnitude) and non-PQmeasured quantities (for example, currents and power) aswell as parameterized periods, for example, 10-secondfrequency, voltage aggregation, current, and power, emis-sions 2 kHz to 9 kHz, and emissions 9 kHz to 150 kHz
• Trend recorder:Long-term recording and monitoring of the voltage-changehistory within a parameterized time period in programmabletolerance ranges; 1/2 cycle RMS values
• Sine recording:Recording of voltage and current sampled values with 40.96kHz (at 50 Hz, about 819 samples per cycle) using program-mable triggers
• Event recorder:Recording of 819 samples per period of voltage: voltageevents (acc. to IEC 61000-4-30: swells, dips, interruptions)
The device hosts a 2-GB micro SD card for storing the recorderdata.
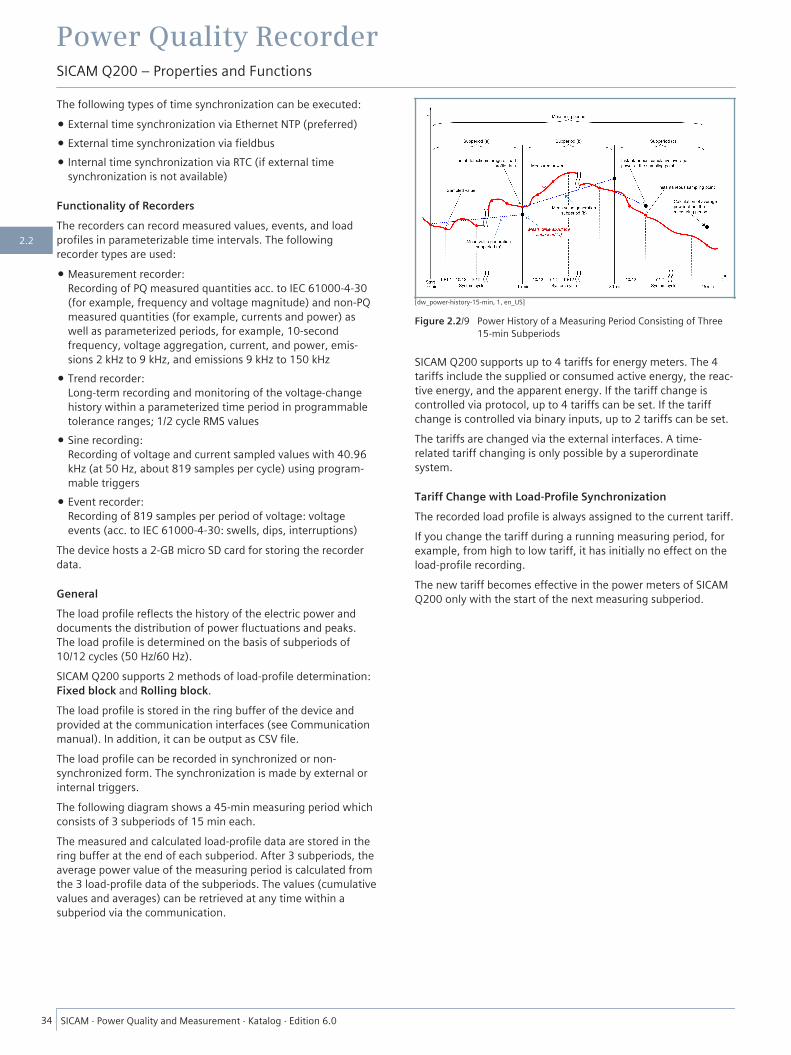
GeneralThe load profile reflects the history of the electric power anddocuments the distribution of power fluctuations and peaks.The load profile is determined on the basis of subperiods of10/12 cycles (50 Hz/60 Hz).SICAM Q200 supports 2 methods of load-profile determination:Fixed block and Rolling block.The load profile is stored in the ring buffer of the device andprovided at the communication interfaces (see Communicationmanual). In addition, it can be output as CSV file.The load profile can be recorded in synchronized or non-synchronized form. The synchronization is made by external orinternal triggers.The following diagram shows a 45-min measuring period whichconsists of 3 subperiods of 15 min each.The measured and calculated load-profile data are stored in thering buffer at the end of each subperiod. After 3 subperiods, theaverage power value of the measuring period is calculated fromthe 3 load-profile data of the subperiods. The values (cumulativevalues and averages) can be retrieved at any time within asubperiod via the communication.
[dw_power-history-15-min, 1, en_US]
Figure 2.2/9 Power History of a Measuring Period Consisting of Three15-min Subperiods
SICAM Q200 supports up to 4 tariffs for energy meters. The 4tariffs include the supplied or consumed active energy, the reac-tive energy, and the apparent energy. If the tariff change iscontrolled via protocol, up to 4 tariffs can be set. If the tariffchange is controlled via binary inputs, up to 2 tariffs can be set.The tariffs are changed via the external interfaces. A time-related tariff changing is only possible by a superordinatesystem.
Tariff Change with Load-Profile SynchronizationThe recorded load profile is always assigned to the current tariff.If you change the tariff during a running measuring period, forexample, from high to low tariff, it has initially no effect on theload-profile recording.The new tariff becomes effective in the power meters of SICAMQ200 only with the start of the next measuring subperiod.
Power Quality RecorderSICAM Q200 – Properties and Functions
34 SICAM ⋅ Power Quality and Measurement ⋅ Katalog ⋅ Edition 6.0
2.2
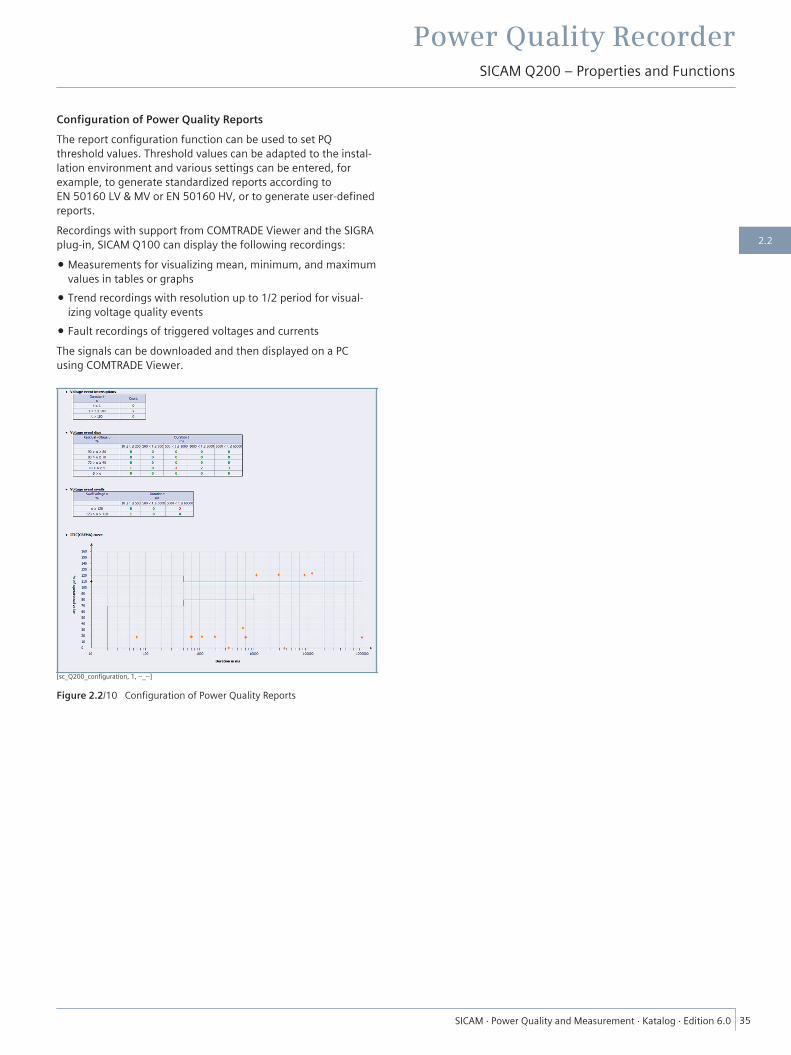
Configuration of Power Quality ReportsThe report configuration function can be used to set PQthreshold values. Threshold values can be adapted to the instal-lation environment and various settings can be entered, forexample, to generate standardized reports according toEN 50160 LV & MV or EN 50160 HV, or to generate user-definedreports.Recordings with support from COMTRADE Viewer and the SIGRAplug-in, SICAM Q100 can display the following recordings:
• Measurements for visualizing mean, minimum, and maximumvalues in tables or graphs
• Trend recordings with resolution up to 1/2 period for visual-izing voltage quality events
• Fault recordings of triggered voltages and currentsThe signals can be downloaded and then displayed on a PCusing COMTRADE Viewer.
[sc_Q200_configuration, 1, --_--]
Figure 2.2/10 Configuration of Power Quality Reports
Power Quality RecorderSICAM Q200 – Properties and Functions
SICAM ⋅ Power Quality and Measurement ⋅ Katalog ⋅ Edition 6.0 35
2.2
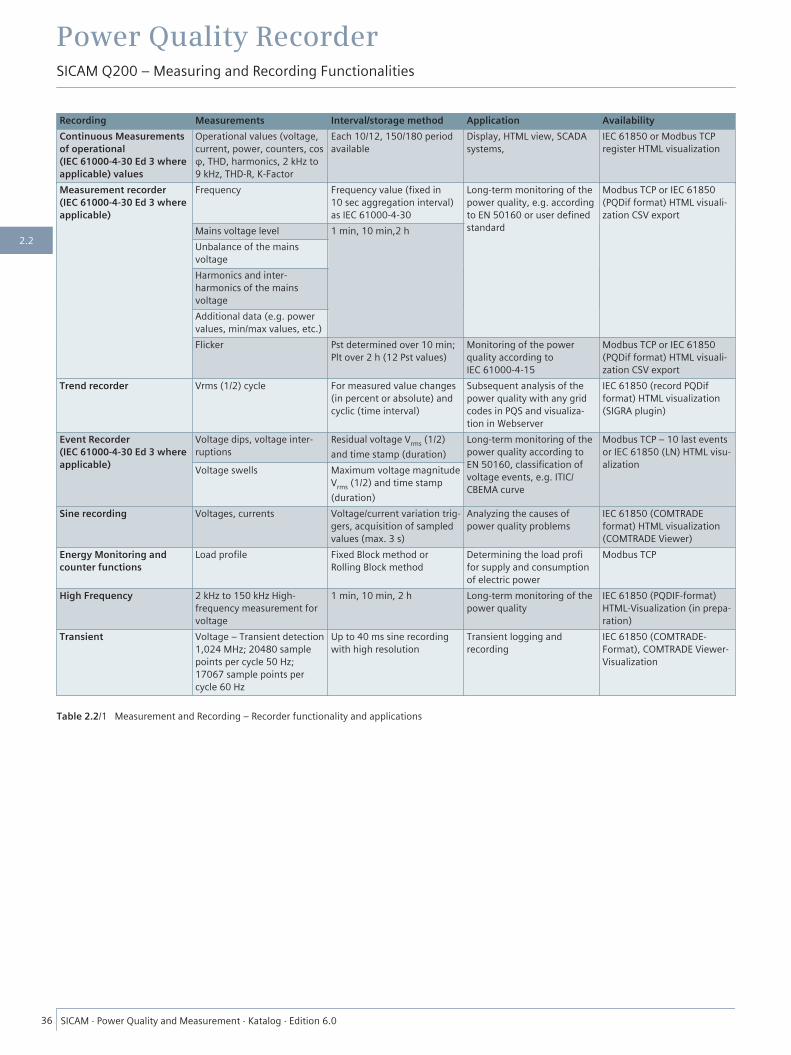
Recording Measurements Interval/storage method Application AvailabilityContinuous Measurementsof operational(IEC 61000-4-30 Ed 3 whereapplicable) values
Operational values (voltage,current, power, counters, cosφ, THD, harmonics, 2 kHz to9 kHz, THD-R, K-Factor
Each 10/12, 150/180 periodavailable
Display, HTML view, SCADAsystems,
IEC 61850 or Modbus TCPregister HTML visualization
Measurement recorder(IEC 61000-4-30 Ed 3 whereapplicable)
Frequency Frequency value (fixed in10 sec aggregation interval)as IEC 61000-4-30
Long-term monitoring of thepower quality, e.g. accordingto EN 50160 or user definedstandard
Modbus TCP or IEC 61850(PQDif format) HTML visuali-zation CSV export
Mains voltage level 1 min, 10 min,2 hUnbalance of the mainsvoltageHarmonics and inter-harmonics of the mainsvoltageAdditional data (e.g. powervalues, min/max values, etc.)Flicker Pst determined over 10 min;
Plt over 2 h (12 Pst values)Monitoring of the powerquality according toIEC 61000-4-15
Modbus TCP or IEC 61850(PQDif format) HTML visuali-zation CSV export
Trend recorder Vrms (1/2) cycle For measured value changes(in percent or absolute) andcyclic (time interval)
Subsequent analysis of thepower quality with any gridcodes in PQS and visualiza-tion in Webserver
IEC 61850 (record PQDifformat) HTML visualization(SIGRA plugin)
Event Recorder(IEC 61000-4-30 Ed 3 whereapplicable)
Voltage dips, voltage inter-ruptions
Residual voltage Vrms (1/2)and time stamp (duration)
Long-term monitoring of thepower quality according toEN 50160, classification ofvoltage events, e.g. ITIC/CBEMA curve
Modbus TCP – 10 last eventsor IEC 61850 (LN) HTML visu-alizationVoltage swells Maximum voltage magnitude
Vrms (1/2) and time stamp(duration)
Sine recording Voltages, currents Voltage/current variation trig-gers, acquisition of sampledvalues (max. 3 s)
Analyzing the causes ofpower quality problems
IEC 61850 (COMTRADEformat) HTML visualization(COMTRADE Viewer)
Energy Monitoring andcounter functions
Load profile Fixed Block method orRolling Block method
Determining the load profifor supply and consumptionof electric power
Modbus TCP
High Frequency 2 kHz to 150 kHz High-frequency measurement forvoltage
1 min, 10 min, 2 h Long-term monitoring of thepower quality
IEC 61850 (PQDIF-format)HTML-Visualization (in prepa-ration)
Transient Voltage – Transient detection1,024 MHz; 20480 samplepoints per cycle 50 Hz;17067 sample points percycle 60 Hz
Up to 40 ms sine recordingwith high resolution
Transient logging andrecording
IEC 61850 (COMTRADE-Format), COMTRADE Viewer-Visualization
Table 2.2/1 Measurement and Recording – Recorder functionality and applications
Power Quality RecorderSICAM Q200 – Measuring and Recording Functionalities
36 SICAM ⋅ Power Quality and Measurement ⋅ Katalog ⋅ Edition 6.0
2.2
Measured QuantitiesThe following measured quantities can be recorded or calcu-lated:Power quality parameters
• Power frequency• Magnitude of supply voltage• Flicker• Supply voltage dips, swells, and interruptions• Voltage unbalance• Voltage harmonics and interharmonics• Rapid voltage changes (RVC)• Current magnitude• Current harmonics and interharmonics• Current unbalance• Emissions 2 kHz to 9 kHz• Emissions 9 kHz to 150 kHzOther parameters
• Active, reactive, and apparent power• Active, reactive, and apparent energy• Power factor and active power factor• Harmonic power• Voltage and current THDS (Subgroup Total Harmonic Distor-
tion)• Phase angles• Harmonic phase anglesThe uncertainty of operational measured quantities is compliantto the IEC 62586-1 product standard, class A (leading standard),the IEC 61000-4-30, Ed. 3 power quality standard, and theIEC 62586-1, Ed. 1 standard.
Power Quality RecorderSICAM Q200 – Measuring and Recording Functionalities
SICAM ⋅ Power Quality and Measurement ⋅ Katalog ⋅ Edition 6.0 37
2.2

Device ParameterizationSICAM Q200 devices are parameterized from a connected PCusing the web browser integrated in the device.
[sc_Q200_parameterization, 1, --_--]
Figure 2.2/11 Screenshot of configuration
Visualization of ValuesDepending on which operating parameters are selected, theinput/output window displays either the measured values in thecorresponding unit of measure or a tabular list that is updatedevery 5 seconds.
[sc_Q200_Visualization, 1, --_--]
Figure 2.2/12 Screenshot of Visualizattion of Values
Voltage Quality Data and Reporting
[sc_Q200_harmonic voltages, 1, --_--]
Figure 2.2/13 Screenshot of Voltage Quality Data and Reporting
With SICAM Q100, the evaluation of recorded voltage events(such as overvoltages, undervoltages, interruptions, etc.), thegeneration of the PQ report according to EN 50160, data trans-mission, and memory management are performed directly inthe device via HTML. A calendar function is used to set the startand end times for the PQ report. The report can be generated,printed, saved, and edited from the SICAM Q200 HTML page.
Power Quality RecorderSICAM Q200 – Device Parameterization, Visualization, Evaluation
38 SICAM ⋅ Power Quality and Measurement ⋅ Katalog ⋅ Edition 6.0
2.2

Supply Voltage
Direct Voltage Block H
Rated input voltages 110 V to 250 VAdmissible input voltage tolerance ±20 %Permitted ripple of the inputvoltage
15 %
Maximum inrush currentAt 110 V to 250 V ≤ 22 A; after 250 μs: < 5 AMaximum power consumption 15 W
Alternating Voltage Block H
Rated input voltages 110 V to 230 VSystem frequency at AC 50 Hz/60 HzAdmissible input voltage tolerance ±20 %Permitted harmonics 2 kHzMaximum inrush currentAt 230 V ≤ 22 A; after 250 μs: < 5 AMaximum power consumption 30 VA
Inputs and Outputs
Inputs for Alternating Current Measurements, ConnectorBlock E
Input alternating currentsRated input current range AC 1 A to 5 A (autorange)Max. input current AC 10 A (sinusoidal only)
Max. ±14.2 A peakPower consumption per inputAt 5 A 2.5 mVA at in = 100 μΩFurther information about the current measuring inputsMax. rated input voltage 150 VMeasuring error under environ-mental influences
Acc. to IEC 61000-4-30 Ed. 3 ClassA
Thermal stability 10 A continuous100 A for max. 1 s
Sampling rate 40.96 kHz
Inputs for Alternating Voltage Measurements, ConnectorBlock F
Rated input alternating voltage rangePhase-N/PE AC 57.73 V to 400 V (autorange)
IEC 61000-4-30 Ed. 3 Class A:
• Up to AC 230 V: 200 % over-voltage
• > AC 230 V to 400 V: 200 % to15 % overvoltage
UL conditions:
• Up to AC 170 V: 200 % over-voltage
• > AC 170 V to 300 V: 200 % to15 % overvoltage
Phase-phase AC 100 V to 690 V (autorange)IEC 61000-4-30 Ed. 3 Class A:
• Up to AC 400 V: 200 % over-voltage
• > AC 400 V to 690 V: 200 % to15 % overvoltage
UL conditions:
• Up to AC 290 V: 200 % over-voltage
• > AC 290 V to 520 V: 200 % to15 % overvoltage
Maximum input alternating voltagePhase-N/PE 460 V (347 V for UL)Phase-phase 796 V (600 V for UL)Input impedancesa, b, c to N 3.0 MΩa-b, b-c, c-a 3.0 MΩa, b, c, N to PE 1.5 MΩFurther information about the voltage measuring inputsPower consumption per input forUmax 460 V
70 mW
Permissible power frequency 42.5 Hz to 69.0 HzMeasuring error under environ-mental influences
Acc. to IEC 61000-4-30 Ed. 3 ClassA
Sampling rate 40.96 kHz
Binary Inputs, Connector Blocks R and S
Number 6Rated input voltage range 24 V to 250 VMaximum input voltage DC 300 VStatic input current 1.34 mA ± 20 %Threshold voltages (adjustable)Threshold voltage 19 V(at rated voltage 24 V)
U high ≥ 19 VU low ≤ 10 V
Threshold voltage 88 V(at rated voltage 110 V)
U high ≥ 88 VU low ≤ 44 V
Threshold voltage 176 V(at rated voltage 220 V)
U high ≥ 176 VU low ≤ 88 V
Progagation delay low to high 2.8 ms ± 0.3 ms
Binary Outputs (Relay Outputs), Connector Blocks R and S
Type of relay:NO relayCO relay
Number acc. to order number:Max. 4Max. 2
Output valuesSwitching capacity On: 1000 W/VA
Off: 30 VA; 40 W ohmic25 W/VA at L/R ≤ 40 ms
Contact voltage AC and DC 250 VPermissible current per contact Continuous: 5 A
Switching on and holding:30 A for 500 ms (make contact)
Total permissible current forcontacts connected to commonpotential
5 A
Power Quality RecorderSICAM Q200 – Technical Data
SICAM ⋅ Power Quality and Measurement ⋅ Katalog ⋅ Edition 6.0 39
2.2
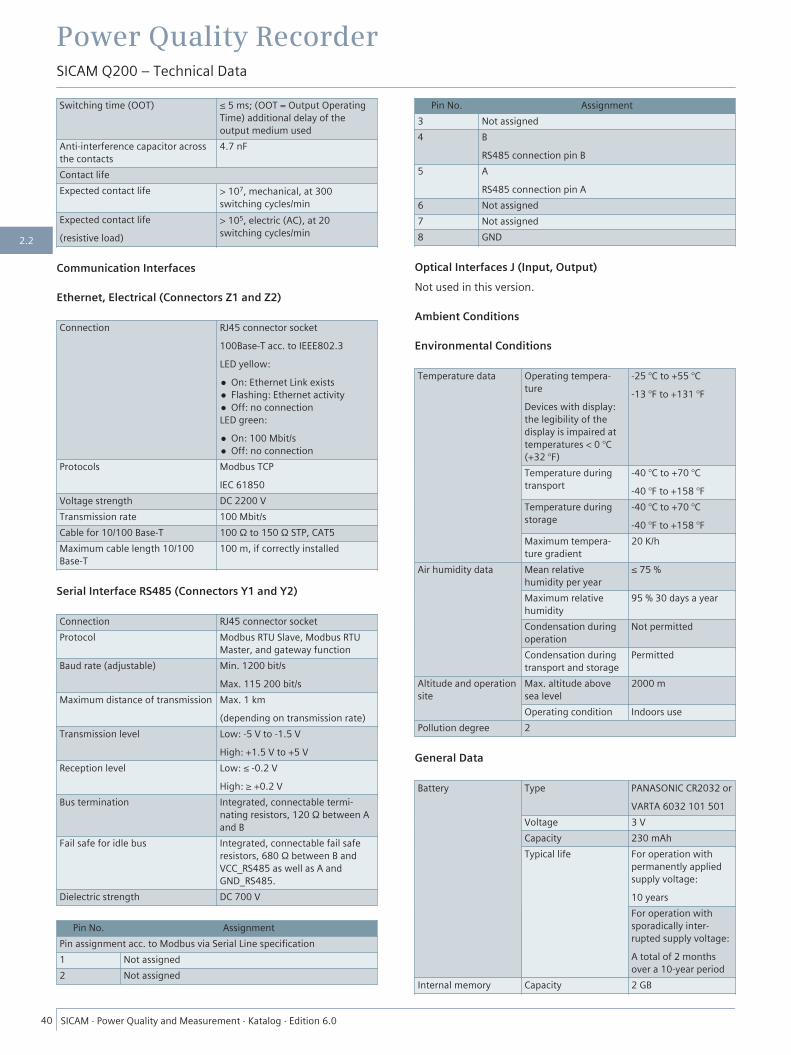
Switching time (OOT) ≤ 5 ms; (OOT = Output OperatingTime) additional delay of theoutput medium used
Anti-interference capacitor acrossthe contacts
4.7 nF
Contact lifeExpected contact life > 107, mechanical, at 300
switching cycles/minExpected contact life(resistive load)
> 105, electric (AC), at 20switching cycles/min
Communication Interfaces
Ethernet, Electrical (Connectors Z1 and Z2)
Connection RJ45 connector socket100Base-T acc. to IEEE802.3LED yellow:
• On: Ethernet Link exists• Flashing: Ethernet activity• Off: no connectionLED green:
• On: 100 Mbit/s• Off: no connection
Protocols Modbus TCPIEC 61850
Voltage strength DC 2200 VTransmission rate 100 Mbit/sCable for 10/100 Base-T 100 Ω to 150 Ω STP, CAT5Maximum cable length 10/100Base-T
100 m, if correctly installed
Serial Interface RS485 (Connectors Y1 and Y2)
Connection RJ45 connector socketProtocol Modbus RTU Slave, Modbus RTU
Master, and gateway functionBaud rate (adjustable) Min. 1200 bit/s
Max. 115 200 bit/sMaximum distance of transmission Max. 1 km
(depending on transmission rate)Transmission level Low: -5 V to -1.5 V
High: +1.5 V to +5 VReception level Low: ≤ -0.2 V
High: ≥ +0.2 VBus termination Integrated, connectable termi-
nating resistors, 120 Ω between Aand B
Fail safe for idle bus Integrated, connectable fail saferesistors, 680 Ω between B andVCC_RS485 as well as A andGND_RS485.
Dielectric strength DC 700 V
Pin No. AssignmentPin assignment acc. to Modbus via Serial Line specification1 Not assigned2 Not assigned
Pin No. Assignment3 Not assigned4 B
RS485 connection pin B5 A
RS485 connection pin A6 Not assigned7 Not assigned8 GND
Optical Interfaces J (Input, Output)Not used in this version.
Ambient Conditions
Environmental Conditions
Temperature data Operating tempera-tureDevices with display:the legibility of thedisplay is impaired attemperatures < 0 °C(+32 °F)
-25 °C to +55 °C-13 °F to +131 °F
Temperature duringtransport
-40 °C to +70 °C-40 °F to +158 °F
Temperature duringstorage
-40 °C to +70 °C-40 °F to +158 °F
Maximum tempera-ture gradient
20 K/h
Air humidity data Mean relativehumidity per year
≤ 75 %
Maximum relativehumidity
95 % 30 days a year
Condensation duringoperation
Not permitted
Condensation duringtransport and storage
Permitted
Altitude and operationsite
Max. altitude abovesea level
2000 m
Operating condition Indoors usePollution degree 2
General Data
Battery Type PANASONIC CR2032 orVARTA 6032 101 501
Voltage 3 VCapacity 230 mAhTypical life For operation with
permanently appliedsupply voltage:10 yearsFor operation withsporadically inter-rupted supply voltage:A total of 2 monthsover a 10-year period
Internal memory Capacity 2 GB
Power Quality RecorderSICAM Q200 – Technical Data
40 SICAM ⋅ Power Quality and Measurement ⋅ Katalog ⋅ Edition 6.0
2.2

Degree of protectionHousing IP20Front IP40Front(with separate sealbetween housing andswitch panel; seal ispart of the IP54 kit ofSICAM Q200 accesso-ries)
IP54, dust-tight type 12NEMA 12
Dimensions
[le_Q200_front side, 2, --_--]
Figure 2.2/14 Layout of SICAM Q200 – Front Side
(1) LED RUN(2) LED ERROR for error configuration(3) LEDs H1 to H4 for free configuration(4) Display(5) Softkeys F1 to F4
[le_Q200_rear-side, 2, --_--]
Figure 2.2/15 Layout of SICAM Q200 – Rear Side
(1) Optical interfaces J (input, output)(2) Terminal block H for power supply(3) Battery compartment(4) Cover of micro SD card(5) Serial interface Y (2 parallel ports, RS485)(6) 2 Ethernet interfaces Z1 and Z2(7) Terminal block F for voltage measurement(8) Terminal block E for current measurement (phase IC and
neutral phase IN)
(9) Terminal block E for current measurement (phases IA andIB)
(10) Terminal block S, 3 binary inputs and 3 binary outputs(11) Terminal block R, 3 binary inputs and 3 binary outputs
Mass Approx. 1.2 kgDimension (W x H x D), withoutclips
192 mm x 96 mm x 134.6 mm7.56 inch x 3.78 inch x 5.3 inch
Distances to adjacent devices On the side: ≥ 20 mm (0.79 inch)Below and above: 15 cm (5.91inch)
[dw_dim-q200_side-view, 1, en_US]
Figure 2.2/16 Side View SICAM Q200
[dw_dim-q200_top-view_Variant-1, 1, en_US]
Figure 2.2/17 Top View SICAM Q200, Variant 1
Power Quality RecorderSICAM Q200 – Technical Data
SICAM ⋅ Power Quality and Measurement ⋅ Katalog ⋅ Edition 6.0 41
2.2
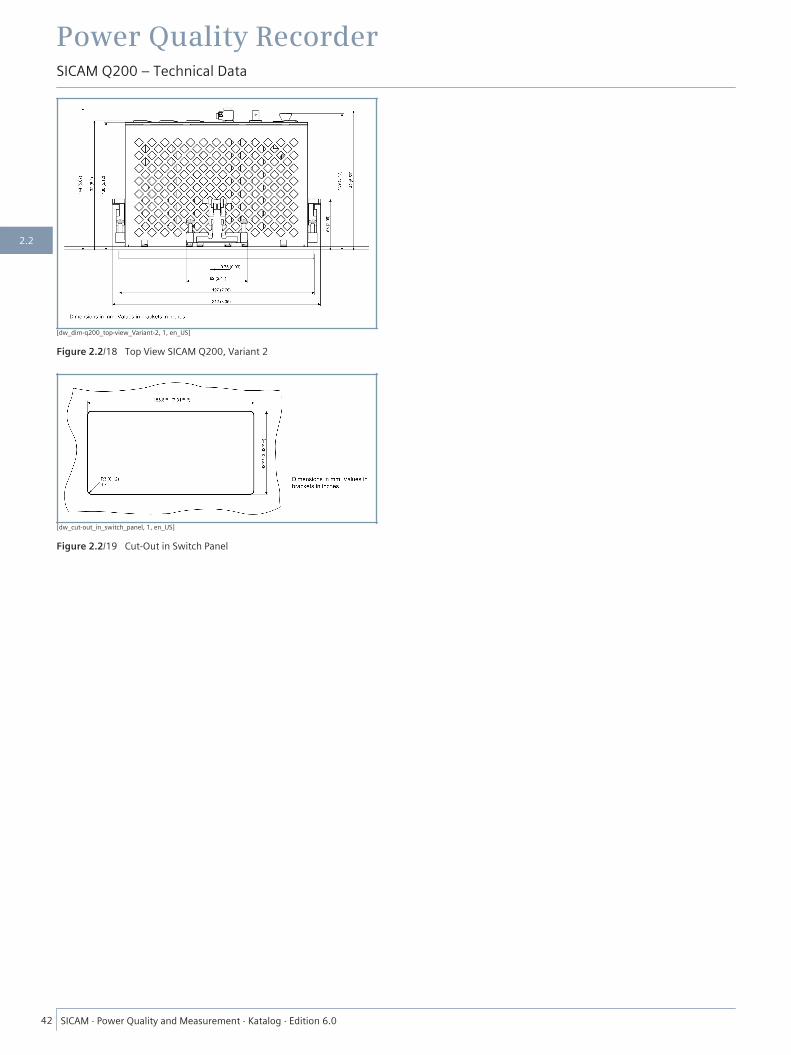
[dw_dim-q200_top-view_Variant-2, 1, en_US]
Figure 2.2/18 Top View SICAM Q200, Variant 2
[dw_cut-out_in_switch_panel, 1, en_US]
Figure 2.2/19 Cut-Out in Switch Panel
Power Quality RecorderSICAM Q200 – Technical Data
42 SICAM ⋅ Power Quality and Measurement ⋅ Katalog ⋅ Edition 6.0
2.2
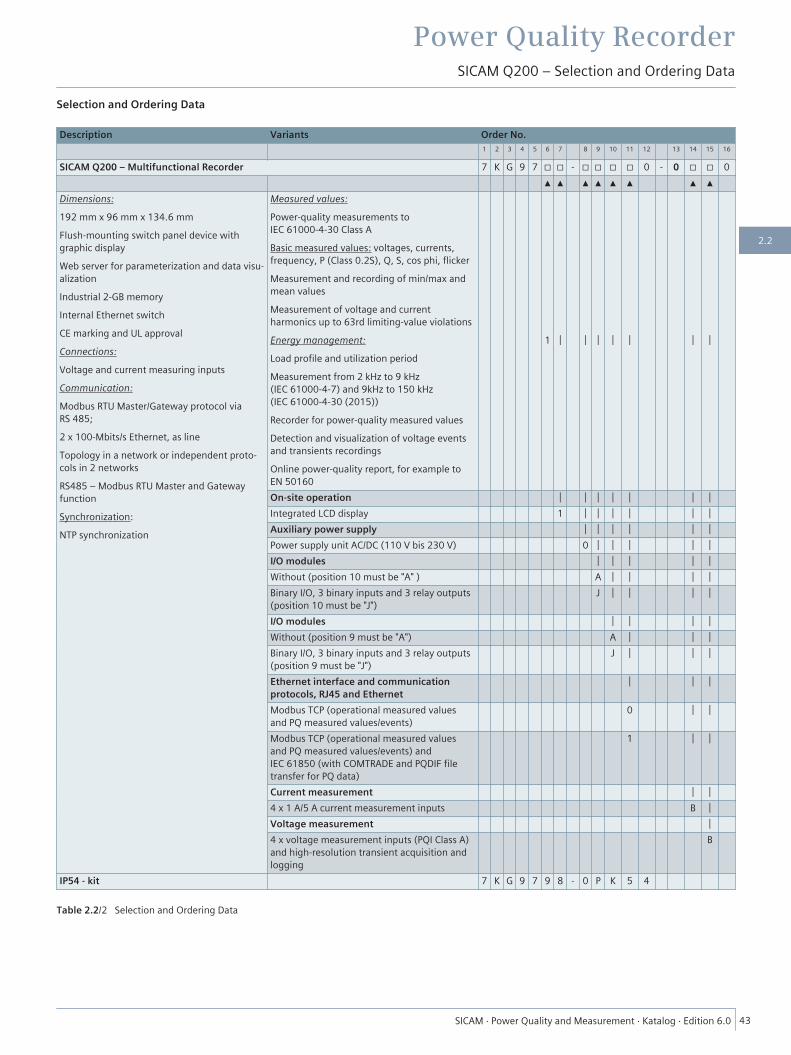
Selection and Ordering Data
Description Variants Order No.1 2 3 4 5 6 7 8 9 10 11 12 13 14 15 16
SICAM Q200 – Multifunctional Recorder 7 K G 9 7 □ □ - □ □ □ □ 0 - 0 □ □ 0▲ ▲ ▲ ▲ ▲ ▲ ▲ ▲
Dimensions:192 mm x 96 mm x 134.6 mmFlush-mounting switch panel device withgraphic displayWeb server for parameterization and data visu-alizationIndustrial 2-GB memoryInternal Ethernet switchCE marking and UL approvalConnections:Voltage and current measuring inputsCommunication:Modbus RTU Master/Gateway protocol viaRS 485;2 x 100-Mbits/s Ethernet, as lineTopology in a network or independent proto-cols in 2 networksRS485 – Modbus RTU Master and GatewayfunctionSynchronization:NTP synchronization
Measured values:Power-quality measurements toIEC 61000-4-30 Class ABasic measured values: voltages, currents,frequency, P (Class 0.2S), Q, S, cos phi, flickerMeasurement and recording of min/max andmean valuesMeasurement of voltage and currentharmonics up to 63rd limiting-value violationsEnergy management:Load profile and utilization periodMeasurement from 2 kHz to 9 kHz(IEC 61000-4-7) and 9kHz to 150 kHz(IEC 61000-4-30 (2015))Recorder for power-quality measured valuesDetection and visualization of voltage eventsand transients recordingsOnline power-quality report, for example toEN 50160
1 │ │ │ │ │ │ │
On-site operation │ │ │ │ │ │ │Integrated LCD display 1 │ │ │ │ │ │Auxiliary power supply │ │ │ │ │ │Power supply unit AC/DC (110 V bis 230 V) 0 │ │ │ │ │I/O modules │ │ │ │ │Without (position 10 must be "A" ) A │ │ │ │Binary I/O, 3 binary inputs and 3 relay outputs(position 10 must be "J")
J │ │ │ │
I/O modules │ │ │ │Without (position 9 must be "A") A │ │ │Binary I/O, 3 binary inputs and 3 relay outputs(position 9 must be "J")
J │ │ │
Ethernet interface and communicationprotocols, RJ45 and Ethernet
│ │ │
Modbus TCP (operational measured valuesand PQ measured values/events)
0 │ │
Modbus TCP (operational measured valuesand PQ measured values/events) andIEC 61850 (with COMTRADE and PQDIF filetransfer for PQ data)
1 │ │
Current measurement │ │4 x 1 A/5 A current measurement inputs B │Voltage measurement │4 x voltage measurement inputs (PQI Class A)and high-resolution transient acquisition andlogging
B
IP54 - kit 7 K G 9 7 9 8 - 0 P K 5 4
Table 2.2/2 Selection and Ordering Data
Power Quality RecorderSICAM Q200 – Selection and Ordering Data
SICAM ⋅ Power Quality and Measurement ⋅ Katalog ⋅ Edition 6.0 43
2.2
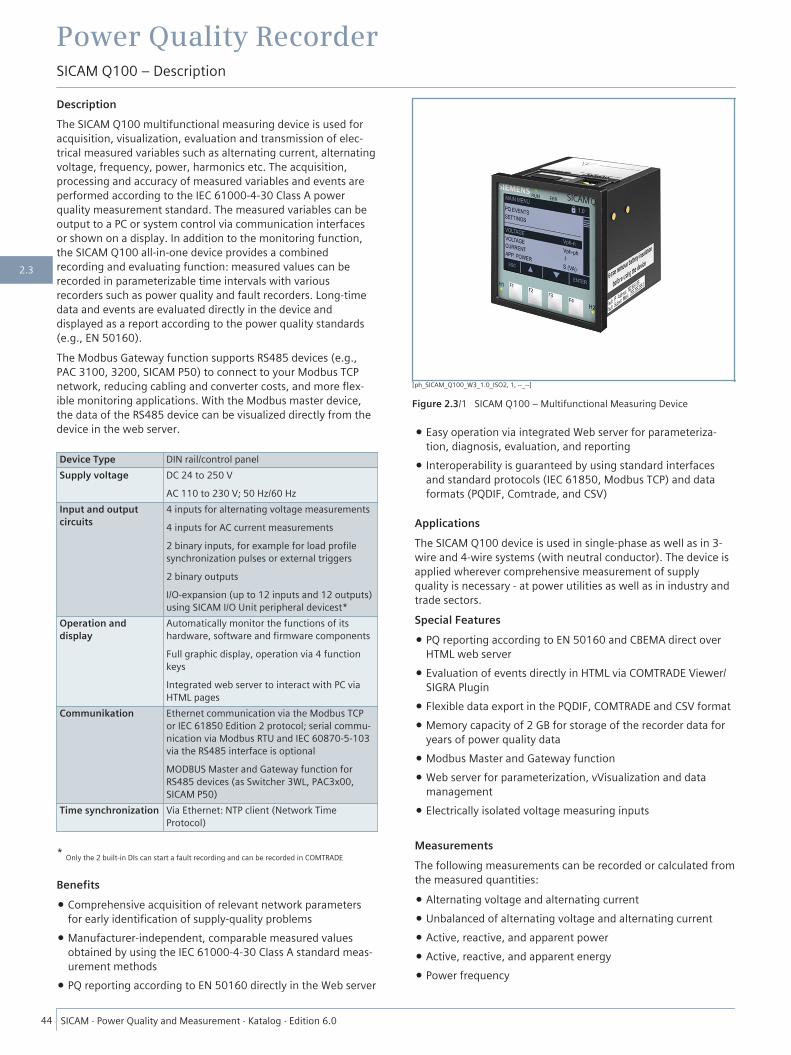
DescriptionThe SICAM Q100 multifunctional measuring device is used foracquisition, visualization, evaluation and transmission of elec-trical measured variables such as alternating current, alternatingvoltage, frequency, power, harmonics etc. The acquisition,processing and accuracy of measured variables and events areperformed according to the IEC 61000-4-30 Class A powerquality measurement standard. The measured variables can beoutput to a PC or system control via communication interfacesor shown on a display. In addition to the monitoring function,the SICAM Q100 all-in-one device provides a combinedrecording and evaluating function: measured values can berecorded in parameterizable time intervals with variousrecorders such as power quality and fault recorders. Long-timedata and events are evaluated directly in the device anddisplayed as a report according to the power quality standards(e.g., EN 50160).The Modbus Gateway function supports RS485 devices (e.g.,PAC 3100, 3200, SICAM P50) to connect to your Modbus TCPnetwork, reducing cabling and converter costs, and more flex-ible monitoring applications. With the Modbus master device,the data of the RS485 device can be visualized directly from thedevice in the web server.
Device Type DIN rail/control panelSupply voltage DC 24 to 250 V
AC 110 to 230 V; 50 Hz/60 HzInput and outputcircuits
4 inputs for alternating voltage measurements4 inputs for AC current measurements2 binary inputs, for example for load profilesynchronization pulses or external triggers2 binary outputsI/O-expansion (up to 12 inputs and 12 outputs)using SICAM I/O Unit peripheral devicest*
Operation anddisplay
Automatically monitor the functions of itshardware, software and firmware componentsFull graphic display, operation via 4 functionkeysIntegrated web server to interact with PC viaHTML pages
Communikation Ethernet communication via the Modbus TCPor IEC 61850 Edition 2 protocol; serial commu-nication via Modbus RTU and IEC 60870-5-103via the RS485 interface is optionalMODBUS Master and Gateway function forRS485 devices (as Switcher 3WL, PAC3x00,SICAM P50)
Time synchronization Via Ethernet: NTP client (Network TimeProtocol)
* Only the 2 built-in DIs can start a fault recording and can be recorded in COMTRADE
Benefits• Comprehensive acquisition of relevant network parameters
for early identification of supply-quality problems• Manufacturer-independent, comparable measured values
obtained by using the IEC 61000-4-30 Class A standard meas-urement methods
• PQ reporting according to EN 50160 directly in the Web server
• Easy operation via integrated Web server for parameteriza-tion, diagnosis, evaluation, and reporting
• Interoperability is guaranteed by using standard interfacesand standard protocols (IEC 61850, Modbus TCP) and dataformats (PQDIF, Comtrade, and CSV)
ApplicationsThe SICAM Q100 device is used in single-phase as well as in 3-wire and 4-wire systems (with neutral conductor). The device isapplied wherever comprehensive measurement of supplyquality is necessary - at power utilities as well as in industry andtrade sectors.Special Features• PQ reporting according to EN 50160 and CBEMA direct over
HTML web server• Evaluation of events directly in HTML via COMTRADE Viewer/
SIGRA Plugin• Flexible data export in the PQDIF, COMTRADE and CSV format• Memory capacity of 2 GB for storage of the recorder data for
years of power quality data• Modbus Master and Gateway function• Web server for parameterization, vVisualization and data
management• Electrically isolated voltage measuring inputs
MeasurementsThe following measurements can be recorded or calculated fromthe measured quantities:
• Alternating voltage and alternating current• Unbalanced of alternating voltage and alternating current• Active, reactive, and apparent power• Active, reactive, and apparent energy• Power frequency
[ph_SICAM_Q100_W3_1.0_ISO2, 1, --_--]
Figure 2.3/1 SICAM Q100 – Multifunctional Measuring Device
Power Quality RecorderSICAM Q100 – Description
44 SICAM ⋅ Power Quality and Measurement ⋅ Katalog ⋅ Edition 6.0
2.3

• Phase angle• Power factor and active power factor• THDS (Subgroup Total Harmonic Distortion) of alternating
voltage and alternating current• Harmonics and interharmonics of alternating voltage and
alternating current• Flicker acc. to IEC 61000-4-15• Transients• Mains signalling voltage (MSV)The uncertainty of operational measurements of the measur-ands is defined as per IEC 62586-1 product standard, class A(leading standard), the IEC 61000-4-30 power quality standard,and the IEC 62586-1, Edition 1 standard.
Functionality of the RecordersThe recorders are capable of recording measurands, events, andload profiles in parameterizable time intervals. The followingrecorder types are used:
• Measurement recorder: recording of PQ measurands acc. toIEC 61000-4-30 (for example, frequency, voltage magnitude,etc.) and non-PQ measurands (for example, currents, power,etc.) over parameterized periods, for example, 10-secondfrequency, aggregation of voltage, current, power etc.
• Trend recorder: long-term recording and monitoring of thevoltage change history over a parameterized period of time inprogrammable tolerance ranges; 1/2 cycle RMS values.
• Fault recorder: recording of sampled values of voltage andcurrent using programmable triggers.
• Event recorder: recording with 256 samples/period of voltageevents, frequency events, and voltage unbalance events.
• Mains signalling voltage recorder: recording of mains signal-ling voltage on the supply voltage.
The device features a 2-GB memory for storing the recorderdata.
CommunicationSICAM Q100 has an Ethernet interface and an electric RS485interface.Ethernet supports the device parameterization, transmission ofmeasured data, metered values, load profiles, and indications/events and the time synchronization with NTP. The communica-tion protocols used are HTTP, Modbus TCP, and IEC 61850server.The RS485 interface supports the transmission of measureddata, metered values, load profiles, and indications and the timesynchronization. The communication protocol is Modbus RTU.The integrated Ethernet switch in the device allows cascadingfurther network components (SICAM subdevices) via a Y cableand integrating them in an existing network with IEC 61850 oranother Ethernet protocol.
Time SynchronizationDuring operation SICAM Q100 needs the date and time for alltime-relevant processes. This ensures that a common time basisexists when communicating with peripheral devices and enablestime stamping of the process data.
The following types of time synchronization can be executed:
• External time synchronization via Ethernet NTP (preferred)• External time synchronization via fieldbus using the Modbus
RTU communication protocol• Internal time synchronization via RTC (if external time
synchronization is not available)
ParameterizationParameters are set using an internal Web browser with HTMLpages from the connected computer. Internet Explorer 6 (orhigher) is required for this purpose. Devices featuring a displayoffer a limited parameterization function using the front soft-keys.
Data ExportRecorded data can be exported via the following standardformats:
• CSV data• PQDIF data – IEEE1159.3: PQDIF for PQ recordings (events,
messages, protocols)• COMTRADE data IEC 60255-24/IEEE Std C37.111: Electrical
relay – part 24: Standard format for the exchange of transientdata of electrical energy supply systems (COMTRADE)
Automation FunctionsUpper or lower limiting values can be parameterized for up to16 measured values. Warnings can be output for limit violations.Up to 4 limiting-value violations can be output at the device viathe 2 binary outputs and the LEDs H1 and H2. In addition, all 16limiting-value violations can be sent to peripheral units viaEthernet.
Power Quality RecorderSICAM Q100 – Description
SICAM ⋅ Power Quality and Measurement ⋅ Katalog ⋅ Edition 6.0 45
2.3
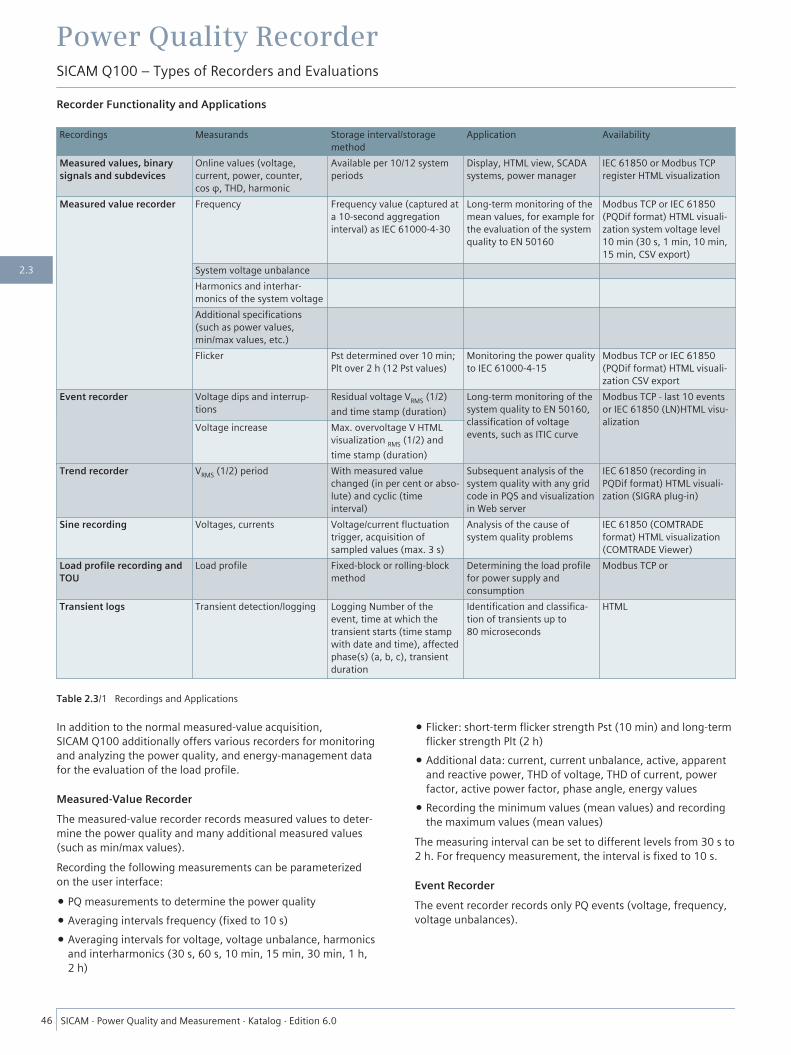
Recorder Functionality and Applications
Recordings Measurands Storage interval/storagemethod
Application Availability
Measured values, binarysignals and subdevices
Online values (voltage,current, power, counter,cos φ, THD, harmonic
Available per 10/12 systemperiods
Display, HTML view, SCADAsystems, power manager
IEC 61850 or Modbus TCPregister HTML visualization
Measured value recorder Frequency Frequency value (captured ata 10-second aggregationinterval) as IEC 61000-4-30
Long-term monitoring of themean values, for example forthe evaluation of the systemquality to EN 50160
Modbus TCP or IEC 61850(PQDif format) HTML visuali-zation system voltage level10 min (30 s, 1 min, 10 min,15 min, CSV export)
System voltage unbalanceHarmonics and interhar-monics of the system voltageAdditional specifications(such as power values,min/max values, etc.)Flicker Pst determined over 10 min;
Plt over 2 h (12 Pst values)Monitoring the power qualityto IEC 61000-4-15
Modbus TCP or IEC 61850(PQDif format) HTML visuali-zation CSV export
Event recorder Voltage dips and interrup-tions
Residual voltage VRMS (1/2)and time stamp (duration)
Long-term monitoring of thesystem quality to EN 50160,classification of voltageevents, such as ITIC curve
Modbus TCP - last 10 eventsor IEC 61850 (LN)HTML visu-alizationVoltage increase Max. overvoltage V HTML
visualization RMS (1/2) andtime stamp (duration)
Trend recorder VRMS (1/2) period With measured valuechanged (in per cent or abso-lute) and cyclic (timeinterval)
Subsequent analysis of thesystem quality with any gridcode in PQS and visualizationin Web server
IEC 61850 (recording inPQDif format) HTML visuali-zation (SIGRA plug-in)
Sine recording Voltages, currents Voltage/current fluctuationtrigger, acquisition ofsampled values (max. 3 s)
Analysis of the cause ofsystem quality problems
IEC 61850 (COMTRADEformat) HTML visualization(COMTRADE Viewer)
Load profile recording andTOU
Load profile Fixed-block or rolling-blockmethod
Determining the load profilefor power supply andconsumption
Modbus TCP or
Transient logs Transient detection/logging Logging Number of theevent, time at which thetransient starts (time stampwith date and time), affectedphase(s) (a, b, c), transientduration
Identification and classifica-tion of transients up to80 microseconds
HTML
Table 2.3/1 Recordings and Applications
In addition to the normal measured-value acquisition,SICAM Q100 additionally offers various recorders for monitoringand analyzing the power quality, and energy-management datafor the evaluation of the load profile.
Measured-Value RecorderThe measured-value recorder records measured values to deter-mine the power quality and many additional measured values(such as min/max values).Recording the following measurements can be parameterizedon the user interface:
• PQ measurements to determine the power quality• Averaging intervals frequency (fixed to 10 s)• Averaging intervals for voltage, voltage unbalance, harmonics
and interharmonics (30 s, 60 s, 10 min, 15 min, 30 min, 1 h,2 h)
• Flicker: short-term flicker strength Pst (10 min) and long-termflicker strength Plt (2 h)
• Additional data: current, current unbalance, active, apparentand reactive power, THD of voltage, THD of current, powerfactor, active power factor, phase angle, energy values
• Recording the minimum values (mean values) and recordingthe maximum values (mean values)
The measuring interval can be set to different levels from 30 s to2 h. For frequency measurement, the interval is fixed to 10 s.
Event RecorderThe event recorder records only PQ events (voltage, frequency,voltage unbalances).
Power Quality RecorderSICAM Q100 – Types of Recorders and Evaluations
46 SICAM ⋅ Power Quality and Measurement ⋅ Katalog ⋅ Edition 6.0
2.3

[Event recorder, 1, en_US]
Figure 2.3/2 Recording of the Event Recorder: Overvoltage and Under-voltage
Trend RecorderThe trend recorder guarantees the continuous acquisition andlong-term monitoring of the voltage VRMS (1/2). This new RMSvalue is recorded when, during the parameterized measuringinterval, the change of the measured quantity against the lastmeasured RMS value is outside the selected tolerance range.
Sine RecordingSine recording records 2048 sampled values per 10/12 systemperiods in selectable time units. The sine recording function canbe activated for the measurands voltage and current. For eventanalysis, you can select a pre-trigger time (pre-trigger ratio in %)so that the history of the measurement before the fault incep-tion can be analyzed.
[Faultrecorder, 1, --_--]
Figure 2.3/3 Sine Recording in COMTRADE View with COMTRADEViewer Software and SIGRA Plug-In
Power Quality RecorderSICAM Q100 – Types of Recorders and Evaluations
SICAM ⋅ Power Quality and Measurement ⋅ Katalog ⋅ Edition 6.0 47
2.3
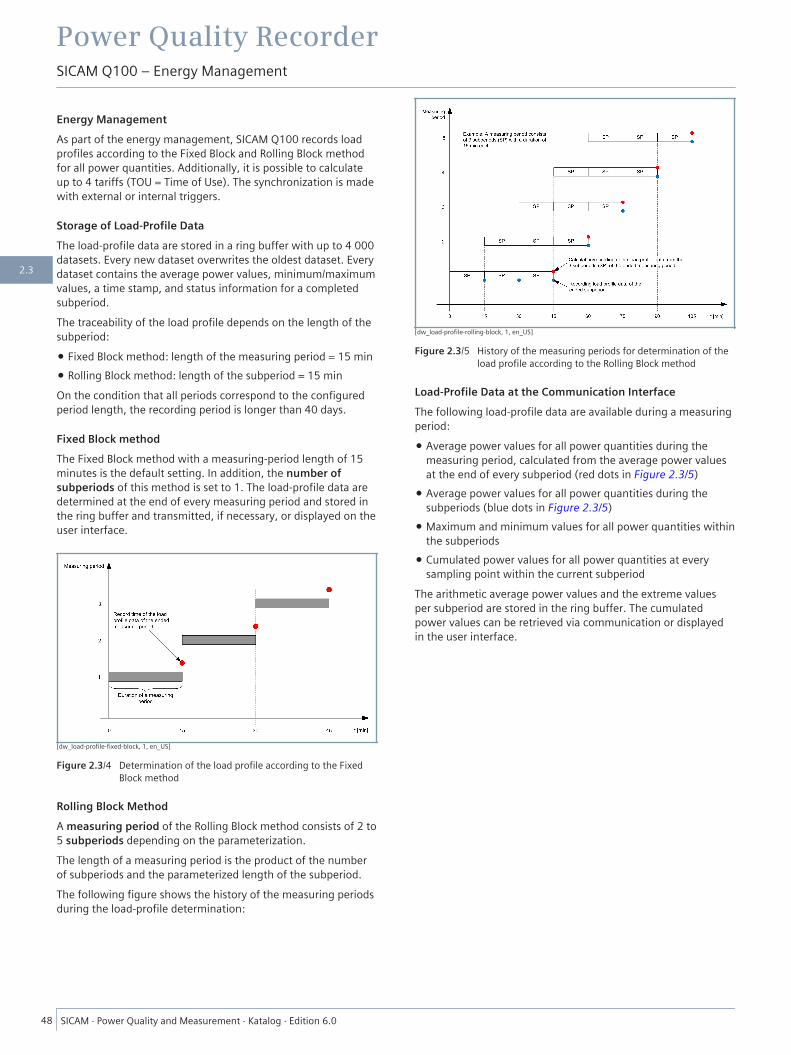
Energy ManagementAs part of the energy management, SICAM Q100 records loadprofiles according to the Fixed Block and Rolling Block methodfor all power quantities. Additionally, it is possible to calculateup to 4 tariffs (TOU = Time of Use). The synchronization is madewith external or internal triggers.
Storage of Load-Profile DataThe load-profile data are stored in a ring buffer with up to 4 000datasets. Every new dataset overwrites the oldest dataset. Everydataset contains the average power values, minimum/maximumvalues, a time stamp, and status information for a completedsubperiod.The traceability of the load profile depends on the length of thesubperiod:
• Fixed Block method: length of the measuring period = 15 min• Rolling Block method: length of the subperiod = 15 minOn the condition that all periods correspond to the configuredperiod length, the recording period is longer than 40 days.
Fixed Block methodThe Fixed Block method with a measuring-period length of 15minutes is the default setting. In addition, the number ofsubperiods of this method is set to 1. The load-profile data aredetermined at the end of every measuring period and stored inthe ring buffer and transmitted, if necessary, or displayed on theuser interface.
[dw_load-profile-fixed-block, 1, en_US]
Figure 2.3/4 Determination of the load profile according to the FixedBlock method
Rolling Block MethodA measuring period of the Rolling Block method consists of 2 to5 subperiods depending on the parameterization.The length of a measuring period is the product of the numberof subperiods and the parameterized length of the subperiod.The following figure shows the history of the measuring periodsduring the load-profile determination:
[dw_load-profile-rolling-block, 1, en_US]
Figure 2.3/5 History of the measuring periods for determination of theload profile according to the Rolling Block method
Load-Profile Data at the Communication InterfaceThe following load-profile data are available during a measuringperiod:
• Average power values for all power quantities during themeasuring period, calculated from the average power valuesat the end of every subperiod (red dots in Figure 2.3/5)
• Average power values for all power quantities during thesubperiods (blue dots in Figure 2.3/5)
• Maximum and minimum values for all power quantities withinthe subperiods
• Cumulated power values for all power quantities at everysampling point within the current subperiod
The arithmetic average power values and the extreme valuesper subperiod are stored in the ring buffer. The cumulatedpower values can be retrieved via communication or displayedin the user interface.
Power Quality RecorderSICAM Q100 – Energy Management
48 SICAM ⋅ Power Quality and Measurement ⋅ Katalog ⋅ Edition 6.0
2.3

Historical Load-Profile DataSICAM Q100 records the following measurands:
Measure-ment
CumulatedPowerValues
ArithmeticAveragePowerValues
MaximumValues
MinimumValues
PImport x x±x ±x
PExport x xQImport x x
±x ±xQExport x x
S x x x x
Table 2.3/2 Historical Load-Profile Data
TariffsSICAM Q100 supports up to 4 tariffs for power meters forsupplied or consumed active energy, reactive energy, and appa-rent energy. If the tariff change is controlled, up to 4 tariffs canbe set. If tariffs are changed via binary inputs, up to 2 tariffs canbe set. The value of the binary inputs which there is at the timeof the beginning of the subperiod at the binary input is decisivefor it.The tariff is changed via the external interfaces. A time-relatedtariff change is only possible by a superordinate system.
[sc_tariffs_ISO2, 1, en_US]
Figure 2.3/6 Evaluation Tariffs
Tariff Change on Load-Profile SynchronizationThe recorded load profile is always assigned to the current tariff.If, during a running measuring period, a tariff change is made,for instance, from high to low tariff, this has initially no effecton the load-profile recording.The new tariff becomes effective in the load-profile recordingand in the power meters of SICAM Q100 only with the start ofthe next measuring period.
Tariff Change without Load-Profile SynchronizationIf no external and internal synchronization of the load profile isperformed, the tariff change becomes effective immediately. Atariff change without synchronization exists if in the parameteri-
zation of the load profile "None" has been selected as synchroni-zation source.
Additional InformationPlease refer to the current manual for further information.
Power Quality RecorderSICAM Q100 – Energy Management
SICAM ⋅ Power Quality and Measurement ⋅ Katalog ⋅ Edition 6.0 49
2.3
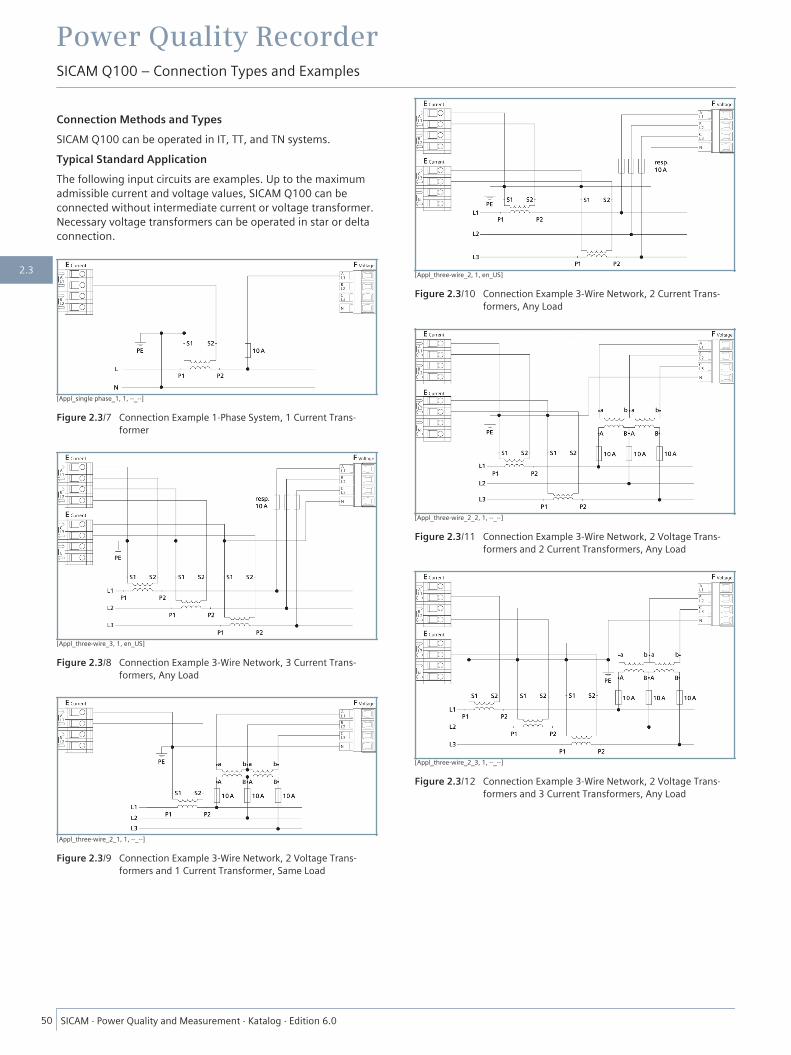
Connection Methods and TypesSICAM Q100 can be operated in IT, TT, and TN systems.Typical Standard ApplicationThe following input circuits are examples. Up to the maximumadmissible current and voltage values, SICAM Q100 can beconnected without intermediate current or voltage transformer.Necessary voltage transformers can be operated in star or deltaconnection.
[Appl_single phase_1, 1, --_--]
Figure 2.3/7 Connection Example 1-Phase System, 1 Current Trans-former
[Appl_three-wire_3, 1, en_US]
Figure 2.3/8 Connection Example 3-Wire Network, 3 Current Trans-formers, Any Load
[Appl_three-wire_2_1, 1, --_--]
Figure 2.3/9 Connection Example 3-Wire Network, 2 Voltage Trans-formers and 1 Current Transformer, Same Load
[Appl_three-wire_2, 1, en_US]
Figure 2.3/10 Connection Example 3-Wire Network, 2 Current Trans-formers, Any Load
[Appl_three-wire_2_2, 1, --_--]
Figure 2.3/11 Connection Example 3-Wire Network, 2 Voltage Trans-formers and 2 Current Transformers, Any Load
[Appl_three-wire_2_3, 1, --_--]
Figure 2.3/12 Connection Example 3-Wire Network, 2 Voltage Trans-formers and 3 Current Transformers, Any Load
Power Quality RecorderSICAM Q100 – Connection Types and Examples
50 SICAM ⋅ Power Quality and Measurement ⋅ Katalog ⋅ Edition 6.0
2.3
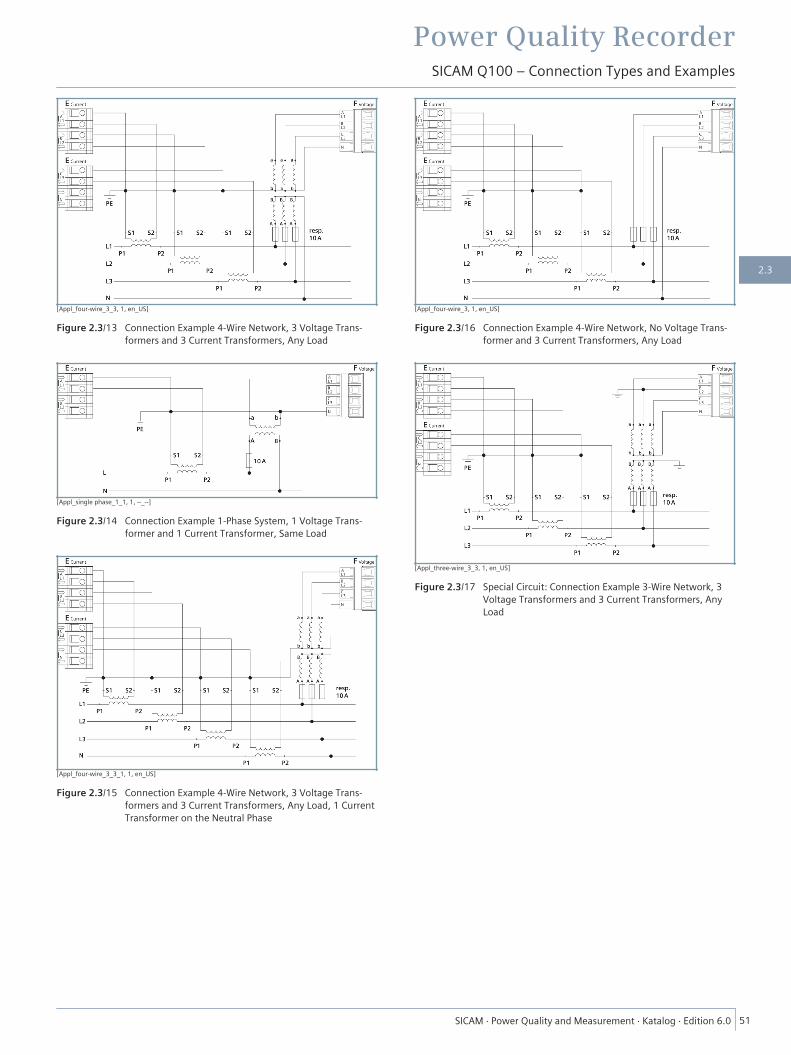
[Appl_four-wire_3_3, 1, en_US]
Figure 2.3/13 Connection Example 4-Wire Network, 3 Voltage Trans-formers and 3 Current Transformers, Any Load
[Appl_single phase_1_1, 1, --_--]
Figure 2.3/14 Connection Example 1-Phase System, 1 Voltage Trans-former and 1 Current Transformer, Same Load
[Appl_four-wire_3_3_1, 1, en_US]
Figure 2.3/15 Connection Example 4-Wire Network, 3 Voltage Trans-formers and 3 Current Transformers, Any Load, 1 CurrentTransformer on the Neutral Phase
[Appl_four-wire_3, 1, en_US]
Figure 2.3/16 Connection Example 4-Wire Network, No Voltage Trans-former and 3 Current Transformers, Any Load
[Appl_three-wire_3_3, 1, en_US]
Figure 2.3/17 Special Circuit: Connection Example 3-Wire Network, 3Voltage Transformers and 3 Current Transformers, AnyLoad
Power Quality RecorderSICAM Q100 – Connection Types and Examples
SICAM ⋅ Power Quality and Measurement ⋅ Katalog ⋅ Edition 6.0 51
2.3
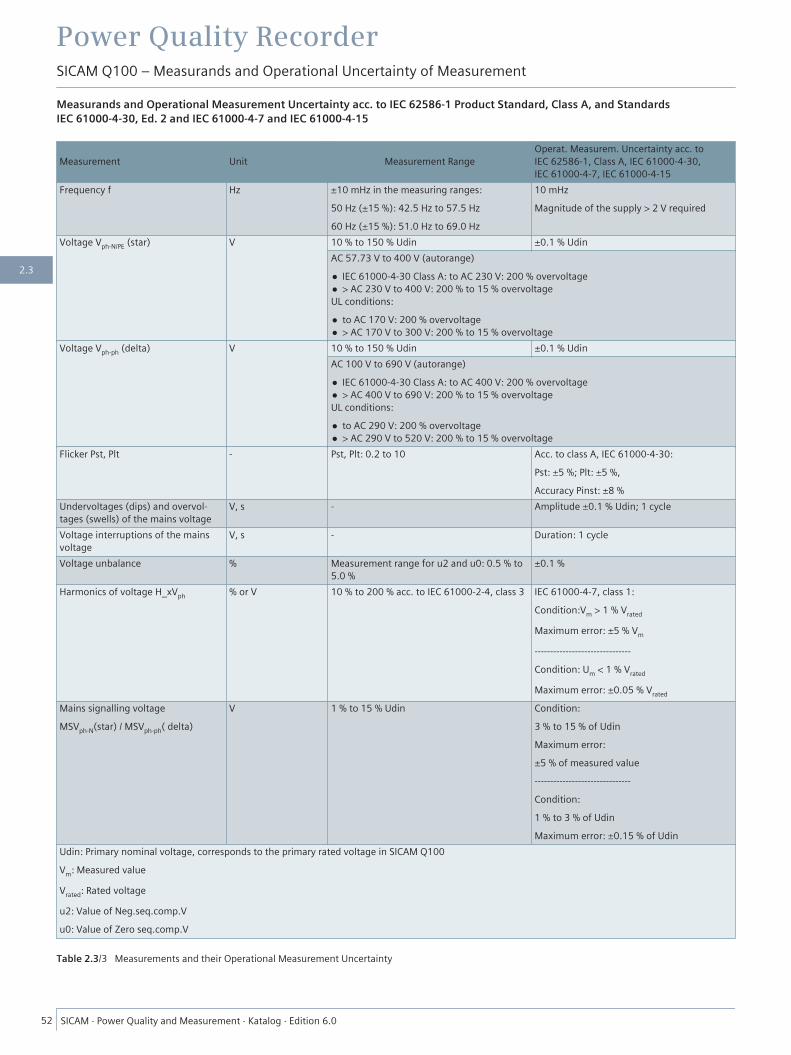
Measurands and Operational Measurement Uncertainty acc. to IEC 62586-1 Product Standard, Class A, and StandardsIEC 61000-4-30, Ed. 2 and IEC 61000-4-7 and IEC 61000-4-15
Measurement Unit Measurement RangeOperat. Measurem. Uncertainty acc. toIEC 62586-1, Class A, IEC 61000-4-30,IEC 61000-4-7, IEC 61000-4-15
Frequency f Hz ±10 mHz in the measuring ranges:50 Hz (±15 %): 42.5 Hz to 57.5 Hz60 Hz (±15 %): 51.0 Hz to 69.0 Hz
10 mHzMagnitude of the supply > 2 V required
Voltage Vph-N/PE (star) V 10 % to 150 % Udin ±0.1 % UdinAC 57.73 V to 400 V (autorange)
• IEC 61000-4-30 Class A: to AC 230 V: 200 % overvoltage• > AC 230 V to 400 V: 200 % to 15 % overvoltageUL conditions:
• to AC 170 V: 200 % overvoltage• > AC 170 V to 300 V: 200 % to 15 % overvoltage
Voltage Vph-ph (delta) V 10 % to 150 % Udin ±0.1 % UdinAC 100 V to 690 V (autorange)
• IEC 61000-4-30 Class A: to AC 400 V: 200 % overvoltage• > AC 400 V to 690 V: 200 % to 15 % overvoltageUL conditions:
• to AC 290 V: 200 % overvoltage• > AC 290 V to 520 V: 200 % to 15 % overvoltage
Flicker Pst, Plt - Pst, Plt: 0.2 to 10 Acc. to class A, IEC 61000-4-30:Pst: ±5 %; Plt: ±5 %,Accuracy Pinst: ±8 %
Undervoltages (dips) and overvol-tages (swells) of the mains voltage
V, s - Amplitude ±0.1 % Udin; 1 cycle
Voltage interruptions of the mainsvoltage
V, s - Duration: 1 cycle
Voltage unbalance % Measurement range for u2 and u0: 0.5 % to5.0 %
±0.1 %
Harmonics of voltage H_xVph % or V 10 % to 200 % acc. to IEC 61000-2-4, class 3 IEC 61000-4-7, class 1:Condition:Vm > 1 % Vrated
Maximum error: ±5 % Vm
-------------------------------Condition: Um < 1 % Vrated
Maximum error: ±0.05 % Vrated
Mains signalling voltageMSVph-N(star) / MSVph-ph( delta)
V 1 % to 15 % Udin Condition:3 % to 15 % of UdinMaximum error:±5 % of measured value-------------------------------Condition:1 % to 3 % of UdinMaximum error: ±0.15 % of Udin
Udin: Primary nominal voltage, corresponds to the primary rated voltage in SICAM Q100Vm: Measured value
Vrated: Rated voltage
u2: Value of Neg.seq.comp.Vu0: Value of Zero seq.comp.V
Table 2.3/3 Measurements and their Operational Measurement Uncertainty
Power Quality RecorderSICAM Q100 – Measurands and Operational Uncertainty of Measurement
52 SICAM ⋅ Power Quality and Measurement ⋅ Katalog ⋅ Edition 6.0
2.3
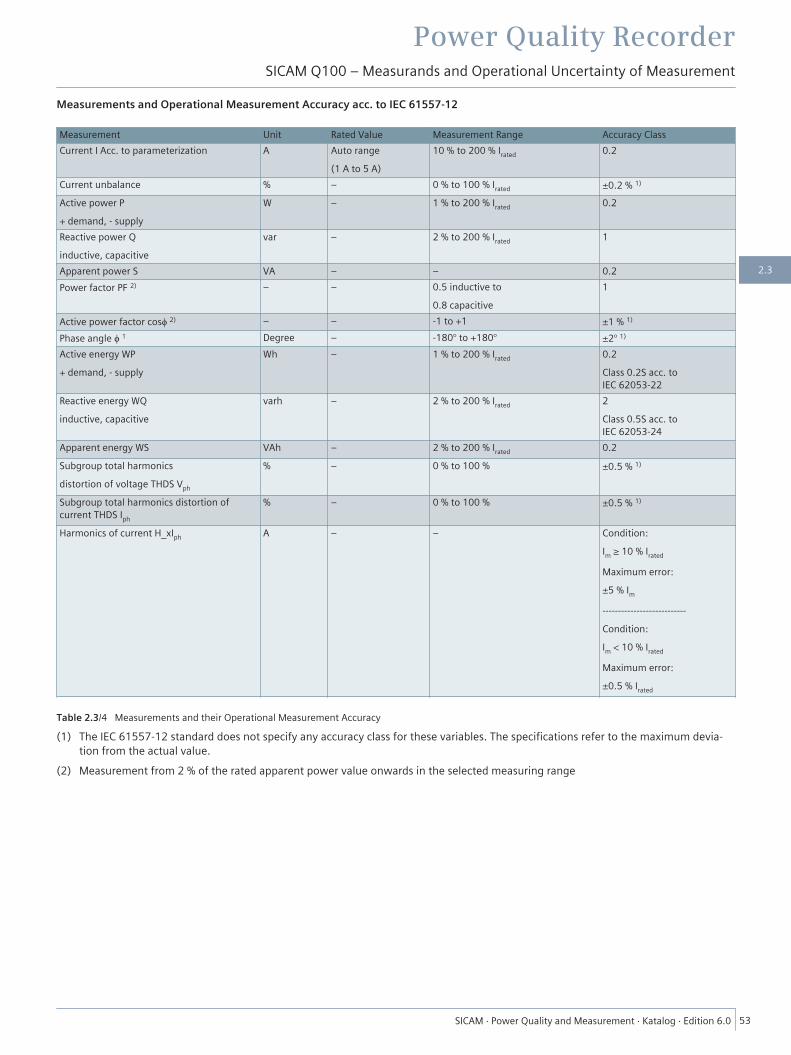
Measurements and Operational Measurement Accuracy acc. to IEC 61557-12
Measurement Unit Rated Value Measurement Range Accuracy ClassCurrent I Acc. to parameterization A Auto range
(1 A to 5 A)10 % to 200 % Irated 0.2
Current unbalance % – 0 % to 100 % Irated ±0.2 % 1)
Active power P+ demand, - supply
W – 1 % to 200 % Irated 0.2
Reactive power Qinductive, capacitive
var – 2 % to 200 % Irated 1
Apparent power S VA – – 0.2Power factor PF 2) – – 0.5 inductive to
0.8 capacitive1
Active power factor cosϕ 2) – – -1 to +1 ±1 % 1)
Phase angle ϕ 1 Degree – -180° to +180° ±2° 1)
Active energy WP+ demand, - supply
Wh – 1 % to 200 % Irated 0.2Class 0.2S acc. toIEC 62053-22
Reactive energy WQinductive, capacitive
varh – 2 % to 200 % Irated 2Class 0.5S acc. toIEC 62053-24
Apparent energy WS VAh – 2 % to 200 % Irated 0.2Subgroup total harmonicsdistortion of voltage THDS Vph
% – 0 % to 100 % ±0.5 % 1)
Subgroup total harmonics distortion ofcurrent THDS Iph
% – 0 % to 100 % ±0.5 % 1)
Harmonics of current H_xIph A – – Condition:Im ≥ 10 % Irated
Maximum error:±5 % Im---------------------------Condition:Im < 10 % Irated
Maximum error:±0.5 % Irated
Table 2.3/4 Measurements and their Operational Measurement Accuracy
(1) The IEC 61557-12 standard does not specify any accuracy class for these variables. The specifications refer to the maximum devia-tion from the actual value.
(2) Measurement from 2 % of the rated apparent power value onwards in the selected measuring range
1
Power Quality RecorderSICAM Q100 – Measurands and Operational Uncertainty of Measurement
SICAM ⋅ Power Quality and Measurement ⋅ Katalog ⋅ Edition 6.0 53
2.3

Supply Voltage
Direct Voltage
Rated input voltages 24 V to 250 VAdmissible input voltagetolerance ±20 %Permitted ripple of the inputvoltage
15 %
Maximum inrush currentAt ≤110 V < 15 AAt 220 V to 300 V ≤ 22 A; after 250 μs: < 5 AMaximum power consumption 6 W
Alternating Voltage
Rated input voltages 110 V to 230 VSystem frequency at AC 50 Hz/60 HzAdmissible input voltage tolerance ±20 %Permitted harmonics 2 kHzMaximum inrush currentAt ≤ 115 V < 15 AAt 230 V ≤ 22 A; after 250 μs: < 5 AMaximum power consumption 16 VA
Inputs and Outputs
Inputs for Alternating Current Measurements, ConnectorBlock E – Cat III
Input alternating currentsRated input current range AC 1 A to 5 A (autorange)Max. input current AC 10 APower consumption per inputat 5 A 2.5 mVAFurther information about the current measuring inputsMax. rated input voltage 150 VMeasuring error under environ-mental influences:see technical data
acc. to IEC 61000-4-30 Ed. 2 ClassA (0.1 %)
Thermal stability 10 A continuous100 A for max. 1 s
Sampling rate 10.24 kHz
Binary Inputs, Connector Block U – Cat III
Maximum input voltage DC 300 VStatic input current 1.34 mA ± 20 %UIL min (at threshold voltage 19 V) DC 14 VUIL max (at threshold voltage 19V)
DC 19 V
UIL min (at threshold voltage 88 V) DC 66 VUIL max (at threshold voltage 88V)
DC 88 V
UIL min (at threshold voltage 176V)
DC 132 V
UIL max (at threshold voltage 176V)
DC 176 V
Progagation delay low to high 2.8 ms ± 0.3 ms
Binary Outputs, Connector Block G – Cat III
Maximum contact voltageAlternating voltage 230 VDirect voltage 250 VMaximum currentsMaximum continuous contactcurrent
100 mA
Maximum pulse current for 0.1 s 300 mAFurther information about the binary outputsInternal impedance 20 ΩAdmissible switching frequency 10 Hz
Communication Interfaces
Ethernet (Connector Z)
Ethernet, electrical Connection Device top sideRJ45 connector socket10/100Base-T acc. toIEEE 802.3LED yellow: 100 Mbit/s(off/on)LED green:- Flashing: active- On: not active- Off: no connection
Protocols Modbus TCPIEC 61850 Server
Voltage strength DC 700 V, AC 1500 VTransmission rate 100 Mbit/sCable for 10/100Base-T
100 Ω to 150 Ω STP, CAT5
Maximum cablelength 10/100 Base-T
100 m, if well installed
Power Quality RecorderSICAM Q100 – Technical Data
54 SICAM ⋅ Power Quality and Measurement ⋅ Katalog ⋅ Edition 6.0
2.3
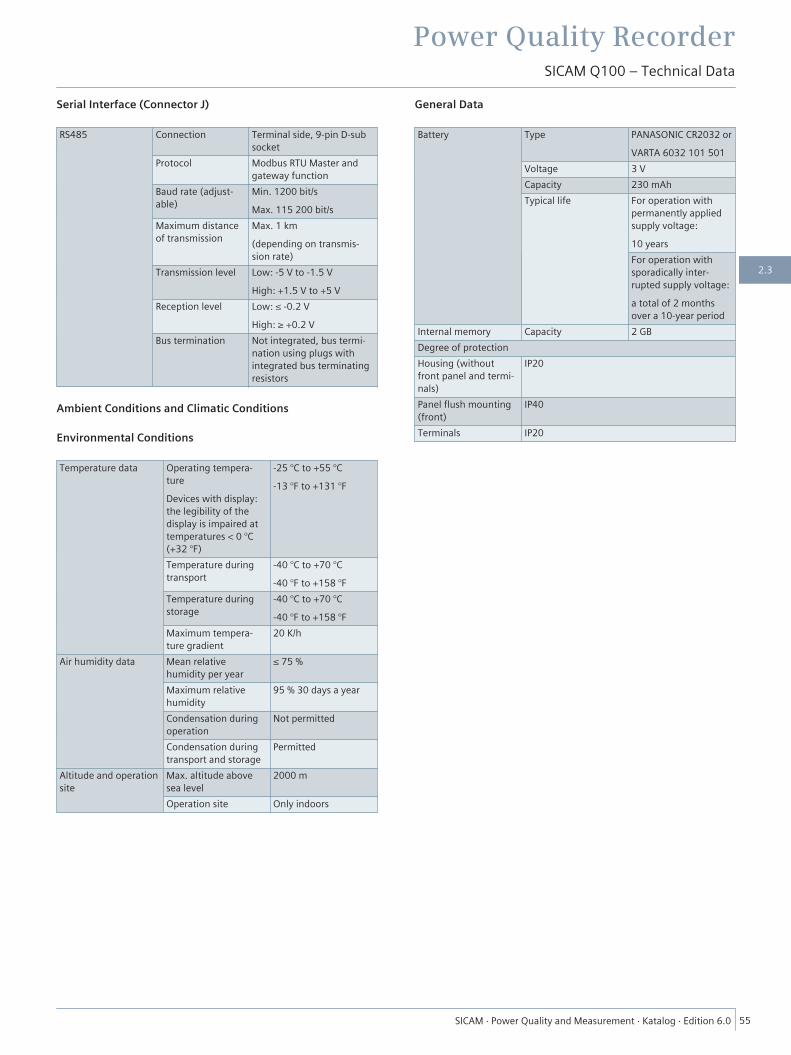
Serial Interface (Connector J)
RS485 Connection Terminal side, 9-pin D-subsocket
Protocol Modbus RTU Master andgateway function
Baud rate (adjust-able)
Min. 1200 bit/sMax. 115 200 bit/s
Maximum distanceof transmission
Max. 1 km(depending on transmis-sion rate)
Transmission level Low: -5 V to -1.5 VHigh: +1.5 V to +5 V
Reception level Low: ≤ -0.2 VHigh: ≥ +0.2 V
Bus termination Not integrated, bus termi-nation using plugs withintegrated bus terminatingresistors
Ambient Conditions and Climatic Conditions
Environmental Conditions
Temperature data Operating tempera-tureDevices with display:the legibility of thedisplay is impaired attemperatures < 0 °C(+32 °F)
-25 °C to +55 °C-13 °F to +131 °F
Temperature duringtransport
-40 °C to +70 °C-40 °F to +158 °F
Temperature duringstorage
-40 °C to +70 °C-40 °F to +158 °F
Maximum tempera-ture gradient
20 K/h
Air humidity data Mean relativehumidity per year
≤ 75 %
Maximum relativehumidity
95 % 30 days a year
Condensation duringoperation
Not permitted
Condensation duringtransport and storage
Permitted
Altitude and operationsite
Max. altitude abovesea level
2000 m
Operation site Only indoors
General Data
Battery Type PANASONIC CR2032 orVARTA 6032 101 501
Voltage 3 VCapacity 230 mAhTypical life For operation with
permanently appliedsupply voltage:10 yearsFor operation withsporadically inter-rupted supply voltage:a total of 2 monthsover a 10-year period
Internal memory Capacity 2 GBDegree of protectionHousing (withoutfront panel and termi-nals)
IP20
Panel flush mounting(front)
IP40
Terminals IP20
Power Quality RecorderSICAM Q100 – Technical Data
SICAM ⋅ Power Quality and Measurement ⋅ Katalog ⋅ Edition 6.0 55
2.3

Dimensions
Mass Approx. 0.55 kgDimension (W x H x 96 mm x 96 mm x 103 mm
3.78 inch x 3.78 inch x 4.06 inch
[dw_dimensional-drawing, 1, en_US]
Figure 2.3/18 Dimensional Drawing of SICAM Q100
[dw_cut-out-in-switch-panel, 1, --_--]
Figure 2.3/19 Cut-Out in Switch Panel
VariantsSICAM Q100 is available in different variants:
• Communication via Ethernet– Only Modbus TCP protocol– Modbus TCP protocol or IEC 61850 server protocol
• Serial communication– Without RS485 interface– With RS485 interface:
– Modbus RTU slave protocol– Modbus RTU master protocol and gateway function
• Degree of protection of front– IP40
Power Quality RecorderSICAM Q100 – Technical Data
56 SICAM ⋅ Power Quality and Measurement ⋅ Katalog ⋅ Edition 6.0
2.3
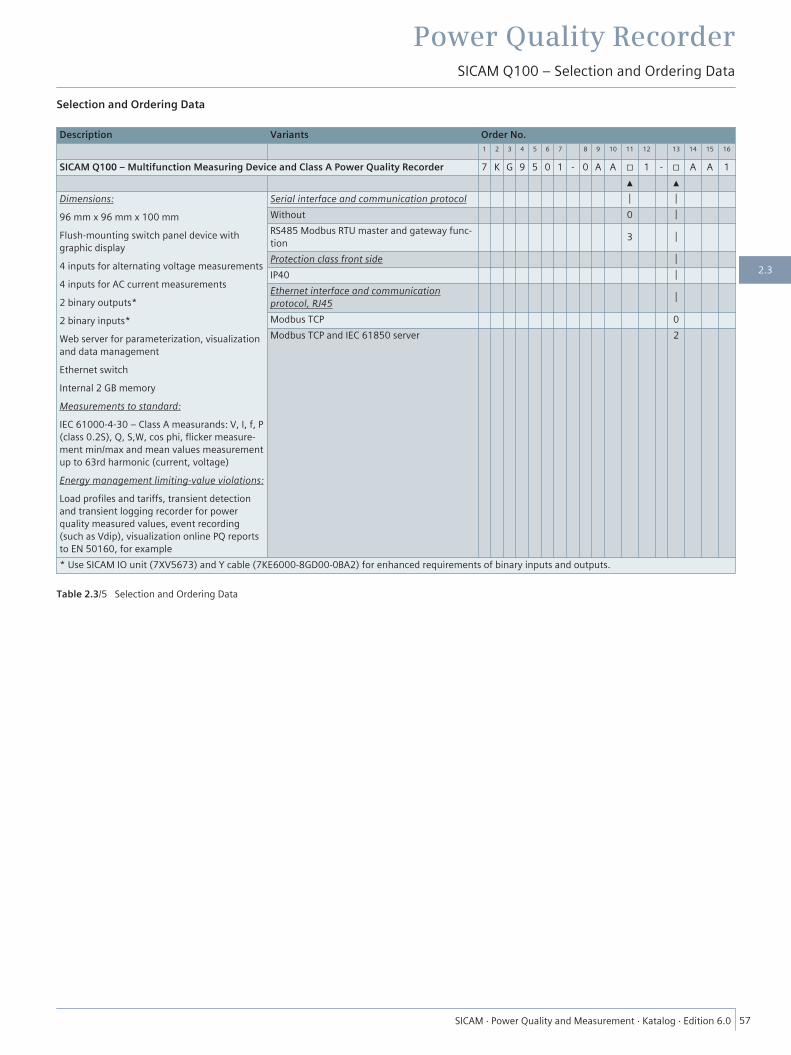
Selection and Ordering Data
Description Variants Order No.1 2 3 4 5 6 7 8 9 10 11 12 13 14 15 16
SICAM Q100 – Multifunction Measuring Device and Class A Power Quality Recorder 7 K G 9 5 0 1 - 0 A A □ 1 - □ A A 1▲ ▲
Dimensions:96 mm x 96 mm x 100 mmFlush-mounting switch panel device withgraphic display4 inputs for alternating voltage measurements4 inputs for AC current measurements2 binary outputs*2 binary inputs*Web server for parameterization, visualizationand data managementEthernet switchInternal 2 GB memoryMeasurements to standard:IEC 61000-4-30 – Class A measurands: V, I, f, P(class 0.2S), Q, S,W, cos phi, flicker measure-ment min/max and mean values measurementup to 63rd harmonic (current, voltage)Energy management limiting-value violations:Load profiles and tariffs, transient detectionand transient logging recorder for powerquality measured values, event recording(such as Vdip), visualization online PQ reportsto EN 50160, for example
Serial interface and communication protocol │ │Without 0 │RS485 Modbus RTU master and gateway func-tion 3 │
Protection class front side │IP40 │Ethernet interface and communicationprotocol, RJ45 │
Modbus TCP 0Modbus TCP and IEC 61850 server 2
* Use SICAM IO unit (7XV5673) and Y cable (7KE6000-8GD00-0BA2) for enhanced requirements of binary inputs and outputs.
Table 2.3/5 Selection and Ordering Data
Power Quality RecorderSICAM Q100 – Selection and Ordering Data
SICAM ⋅ Power Quality and Measurement ⋅ Katalog ⋅ Edition 6.0 57
2.3
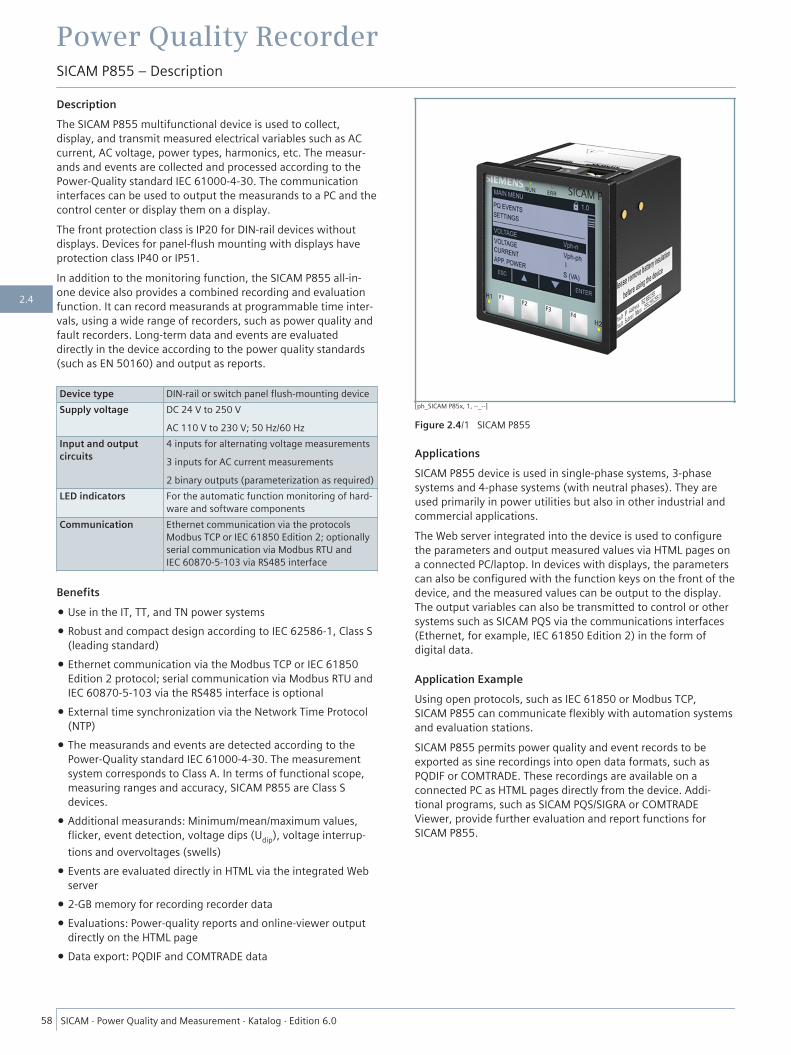
DescriptionThe SICAM P855 multifunctional device is used to collect,display, and transmit measured electrical variables such as ACcurrent, AC voltage, power types, harmonics, etc. The measur-ands and events are collected and processed according to thePower-Quality standard IEC 61000-4-30. The communicationinterfaces can be used to output the measurands to a PC and thecontrol center or display them on a display.The front protection class is IP20 for DIN-rail devices withoutdisplays. Devices for panel-flush mounting with displays haveprotection class IP40 or IP51.In addition to the monitoring function, the SICAM P855 all-in-one device also provides a combined recording and evaluationfunction. It can record measurands at programmable time inter-vals, using a wide range of recorders, such as power quality andfault recorders. Long-term data and events are evaluateddirectly in the device according to the power quality standards(such as EN 50160) and output as reports.
Device type DIN-rail or switch panel flush-mounting deviceSupply voltage DC 24 V to 250 V
AC 110 V to 230 V; 50 Hz/60 HzInput and outputcircuits
4 inputs for alternating voltage measurements3 inputs for AC current measurements2 binary outputs (parameterization as required)
LED indicators For the automatic function monitoring of hard-ware and software components
Communication Ethernet communication via the protocolsModbus TCP or IEC 61850 Edition 2; optionallyserial communication via Modbus RTU andIEC 60870-5-103 via RS485 interface
Benefits• Use in the IT, TT, and TN power systems• Robust and compact design according to IEC 62586-1, Class S
(leading standard)• Ethernet communication via the Modbus TCP or IEC 61850
Edition 2 protocol; serial communication via Modbus RTU andIEC 60870-5-103 via the RS485 interface is optional
• External time synchronization via the Network Time Protocol(NTP)
• The measurands and events are detected according to thePower-Quality standard IEC 61000-4-30. The measurementsystem corresponds to Class A. In terms of functional scope,measuring ranges and accuracy, SICAM P855 are Class Sdevices.
• Additional measurands: Minimum/mean/maximum values,flicker, event detection, voltage dips (Udip), voltage interrup-tions and overvoltages (swells)
• Events are evaluated directly in HTML via the integrated Webserver
• 2-GB memory for recording recorder data• Evaluations: Power-quality reports and online-viewer output
directly on the HTML page• Data export: PQDIF and COMTRADE data
ApplicationsSICAM P855 device is used in single-phase systems, 3-phasesystems and 4-phase systems (with neutral phases). They areused primarily in power utilities but also in other industrial andcommercial applications.The Web server integrated into the device is used to configurethe parameters and output measured values via HTML pages ona connected PC/laptop. In devices with displays, the parameterscan also be configured with the function keys on the front of thedevice, and the measured values can be output to the display.The output variables can also be transmitted to control or othersystems such as SICAM PQS via the communications interfaces(Ethernet, for example, IEC 61850 Edition 2) in the form ofdigital data.
Application ExampleUsing open protocols, such as IEC 61850 or Modbus TCP,SICAM P855 can communicate flexibly with automation systemsand evaluation stations.SICAM P855 permits power quality and event records to beexported as sine recordings into open data formats, such asPQDIF or COMTRADE. These recordings are available on aconnected PC as HTML pages directly from the device. Addi-tional programs, such as SICAM PQS/SIGRA or COMTRADEViewer, provide further evaluation and report functions forSICAM P855.
[ph_SICAM P85x, 1, --_--]
Figure 2.4/1 SICAM P855
Power Quality RecorderSICAM P855 – Description
58 SICAM ⋅ Power Quality and Measurement ⋅ Katalog ⋅ Edition 6.0
2.4
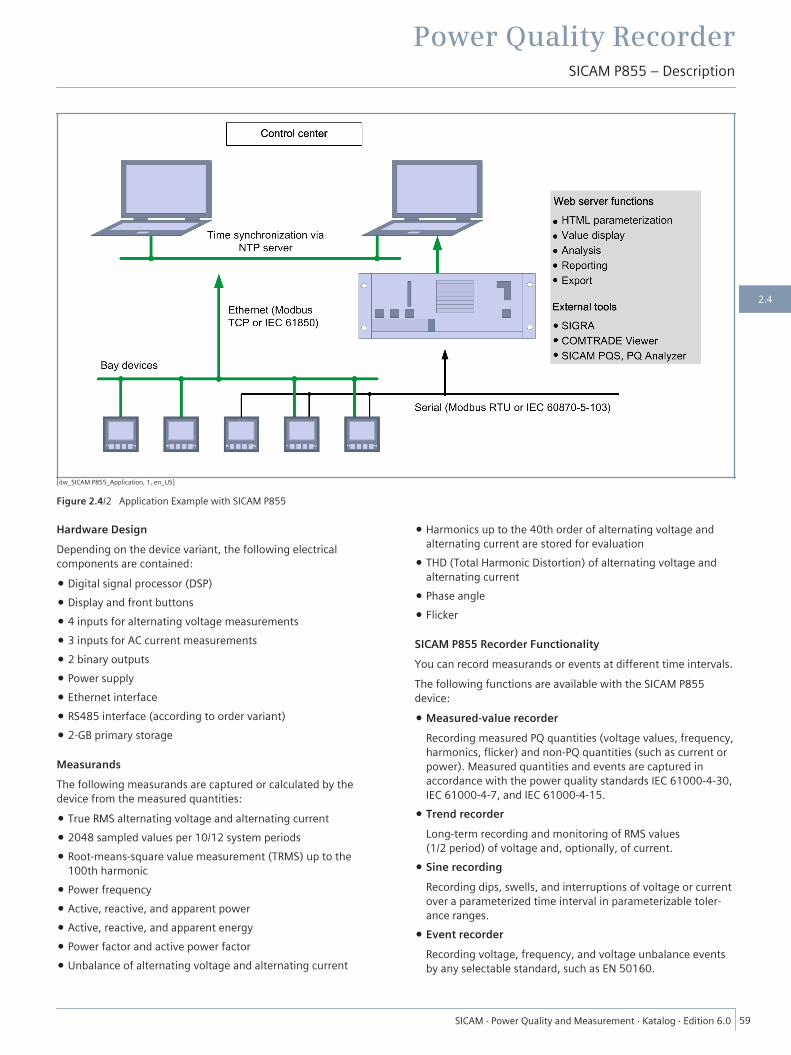
[dw_SICAM P855_Application, 1, en_US]
Figure 2.4/2 Application Example with SICAM P855
Hardware DesignDepending on the device variant, the following electricalcomponents are contained:
• Digital signal processor (DSP)• Display and front buttons• 4 inputs for alternating voltage measurements• 3 inputs for AC current measurements• 2 binary outputs• Power supply• Ethernet interface• RS485 interface (according to order variant)• 2-GB primary storage
MeasurandsThe following measurands are captured or calculated by thedevice from the measured quantities:
• True RMS alternating voltage and alternating current• 2048 sampled values per 10/12 system periods• Root-means-square value measurement (TRMS) up to the
100th harmonic• Power frequency• Active, reactive, and apparent power• Active, reactive, and apparent energy• Power factor and active power factor• Unbalance of alternating voltage and alternating current
• Harmonics up to the 40th order of alternating voltage andalternating current are stored for evaluation
• THD (Total Harmonic Distortion) of alternating voltage andalternating current
• Phase angle• Flicker
SICAM P855 Recorder FunctionalityYou can record measurands or events at different time intervals.The following functions are available with the SICAM P855device:
• Measured-value recorderRecording measured PQ quantities (voltage values, frequency,harmonics, flicker) and non-PQ quantities (such as current orpower). Measured quantities and events are captured inaccordance with the power quality standards IEC 61000-4-30,IEC 61000-4-7, and IEC 61000-4-15.
• Trend recorderLong-term recording and monitoring of RMS values(1/2 period) of voltage and, optionally, of current.
• Sine recordingRecording dips, swells, and interruptions of voltage or currentover a parameterized time interval in parameterizable toler-ance ranges.
• Event recorderRecording voltage, frequency, and voltage unbalance eventsby any selectable standard, such as EN 50160.
Power Quality RecorderSICAM P855 – Description
SICAM ⋅ Power Quality and Measurement ⋅ Katalog ⋅ Edition 6.0 59
2.4

To save the recorder data, the device is equipped with a 2-GBmemory. The stored data can manually be exported inCOMTRADE or PQDIF format (IEEE standard 1159.3), or be trans-ferred via IEC 61850.
CommunicationAn Ethernet interface and an optional RS485 interface are avail-able for the communication with the systems control and withother process automation systems. The RS485 interfacesupports the transfer of operational measured values, counts,and messages. Depending on the device version, you can usethe communication protocol Modbus RTU or IEC 60870-5-103.Device parameterization, transfer of measured data, counts andmessages/events, and the time synchronization with theNetwork Time Protocol (NTP) are supported via Ethernet. Thedevice supports the transfer of operational measured valueswith both Ethernet protocol options – via Modbus TCP and viaIEC 61850 Edition 2.
Time SynchronizationAll time-relevant processes require date and time during opera-tion. Consequently, there is a time synchronization during thecommunication with peripheral devices. This ensures a uniformtime base and permits time stamping of the process data. Thefollowing time synchronization methods are possible:
• Time synchronization via Ethernet NTP (preferred)The device is equipped with an SNTP client (Simple NetworkTime Protocol) that can be connected to 2 NTP servers(Network Time Protocol) for external time synchronization.These are the primary and the secondary (redundant) NTPserver.
• External time synchronization via Fieldbuswith communication protocol Modbus RTU orIEC 60870-5-103
• Real Time Clock (RTC)If external time synchronization is not available, you cansynchronize data with the time signal from an internal clock.
Parameterization and VisualizationAll versions are operated via a connected PC. Parameterization isalways performed with an internal Web browser with HTMLpages.
[sc_Messwerterfassung, 1, en_US]
Figure 2.4/3 Parameterization of the Process Connections
Visualization of ValuesDepending on the selection of the operating parameters, the I/Owindow shows measured values together with the related unit,or a tabular message list that is updated every 5 seconds.
• Operational measured values• Harmonics of the voltage• Harmonics of the current• Power and energy• Binary outputs• Limiting values• Group alarms
[sc_0226_Harmonische, 1, en_US]
Figure 2.4/4 Graphical Representation of the Harmonics
Automation FunctionsUpper or lower limiting values can be parameterized for up to16 measured values. A violation of these limiting values can beissued as a message. Up to 4 limiting-value violations can beoutput at the device via the 2 binary outputs and the LEDs H1and H2. In addition, all 16 limiting-value violations can be sentto peripheral units via Ethernet.
[sc_Werte_betrachten, 1, en_US]
Figure 2.4/5 Visualization of Operational Measured Values
Other maintenance tasks, such as firmware updates or readingoperational indications and error messages can also beperformed via the HTML pages.
Power Quality RecorderSICAM P855 – Description
60 SICAM ⋅ Power Quality and Measurement ⋅ Katalog ⋅ Edition 6.0
2.4
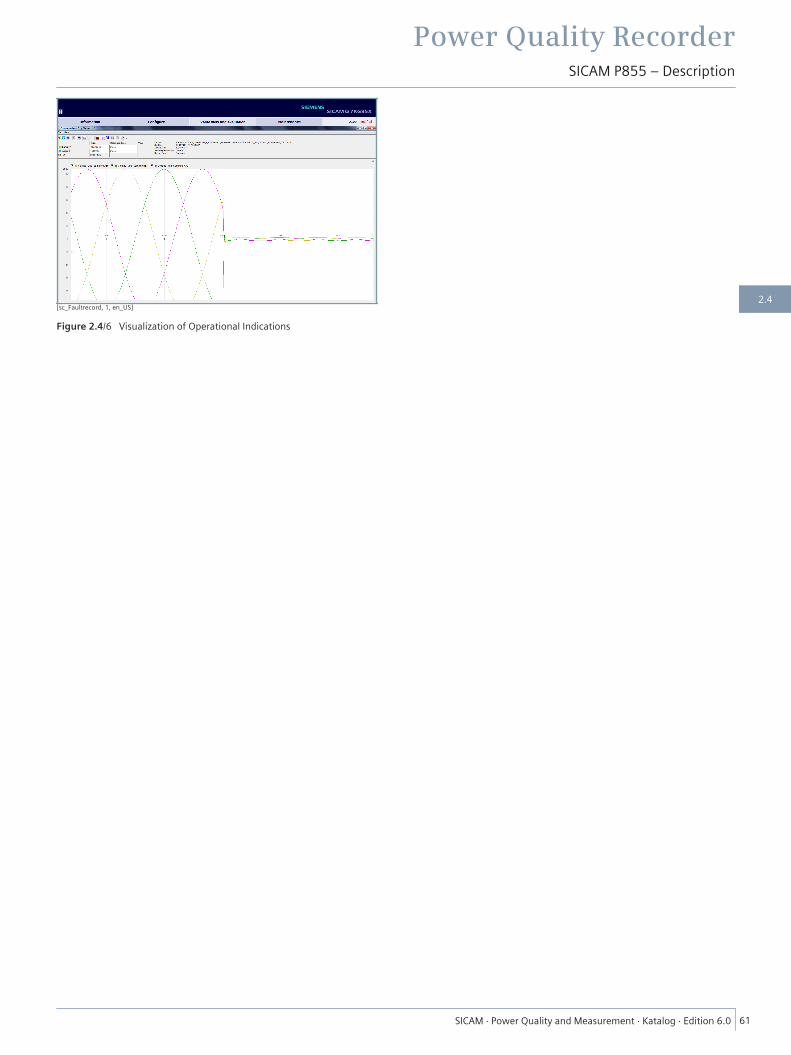
[sc_Faultrecord, 1, en_US]
Figure 2.4/6 Visualization of Operational Indications
Power Quality RecorderSICAM P855 – Description
SICAM ⋅ Power Quality and Measurement ⋅ Katalog ⋅ Edition 6.0 61
2.4

Data 1) Operating/Instanta-neous Measured
Value (10/12Periods)
Sine Recording Measured-ValueRecorder (30 s, 60 s,
10 min, 15 min, 30 min,1 h, 2 h)
Event Evaluation(Undervoltages,Overvoltages,Interruptions)
Trend Recorder(1/2 Period RMS
Event Recording)
Interface Modbus TCP,Modbus RTU,
IEC 60870-5-103,IEC 61850, HTML,
and Display
IEC 61850 (COMTRADEFile Transfer) and HTMLCOMTRADE Downloadfor COMTRADE Vieweror SIGRA Visualization
HTML CSV Downloadand Modbus TCP
Protocol
Modbus TCP,IEC 61850
Report Genera-tion, HTML and
Display
IEC 61850 (PQDIFFile Transfer),
Event Visualizationwith COMTRADEViewer Plug-In,
HTML PQDIFDownload
Type Values/Graphical Graphical MeanValues
MaxValues
MinValues
Protocols Graphical
Voltage (AC) VA, B, C ■ ■ ■ ■ ■ ■ ■VA-B, B-C, C-A ■ ■ ■ ■ ■VN ■ ■ ■ ■ ■Vsum ■ ■Vasym ■ ■ ■ ■
Current (AC) IA, B, C ■ ■ ■ ■ ■I0 ■ ■ ■Isum ■ ■ ■Iasym ■ ■ ■ ■ ■
Active powerfactor
cos φA, B, C ■ ■ ■ ■cos φ ■ ■ ■ ■
Power factor PFA, B, C ■ ■ ■ ■PF ■ ■ ■ ■
Phase angle φA, B, C ■ ■ ■ ■φ ■ ■ ■ ■Voltage φA, B, C,current φA, B, C
■ ■
Frequency f (system frequency) ■ ■ ■ ■10-s frequency(10-freq.)
■ 2) ■ ■
Harmonic,voltage, magni-tude
H_VA-x, VB-x, VC-x
(x = 1 to 40)
■ 3) ■ ■
Harmonic,current, magni-tude
H_IA-x, H_IB-x, H_IC-x(x = 1 to 40)
■ 3) ■ ■
THD, voltage THD_VA, THD_VB,THD_VC
■ 3) ■ ■ ■
THD, current THD_IA, B, C ■ 3) ■ ■ ■Flicker (unde-layed)
P undelayedA, B, C ■
Flicker (short) Pst A, B, C ■ 4) ■ 4)
Flicker (long) Plt A, B, C ■ 5) ■ 5)
Active power PA, B, C ■ ■ ■ ■P ■ ■ ■ ■
Reactive power QA, B, C ■ ■ ■ ■Q ■ ■ ■ ■QA, B, C ■ ■ ■ ■Q1 ■ ■ ■ ■
Apparent power SA, B, C ■ ■ ■ ■S ■ ■ ■ ■
Power Quality RecorderSICAM P855 – Data Availability
62 SICAM ⋅ Power Quality and Measurement ⋅ Katalog ⋅ Edition 6.0
2.4
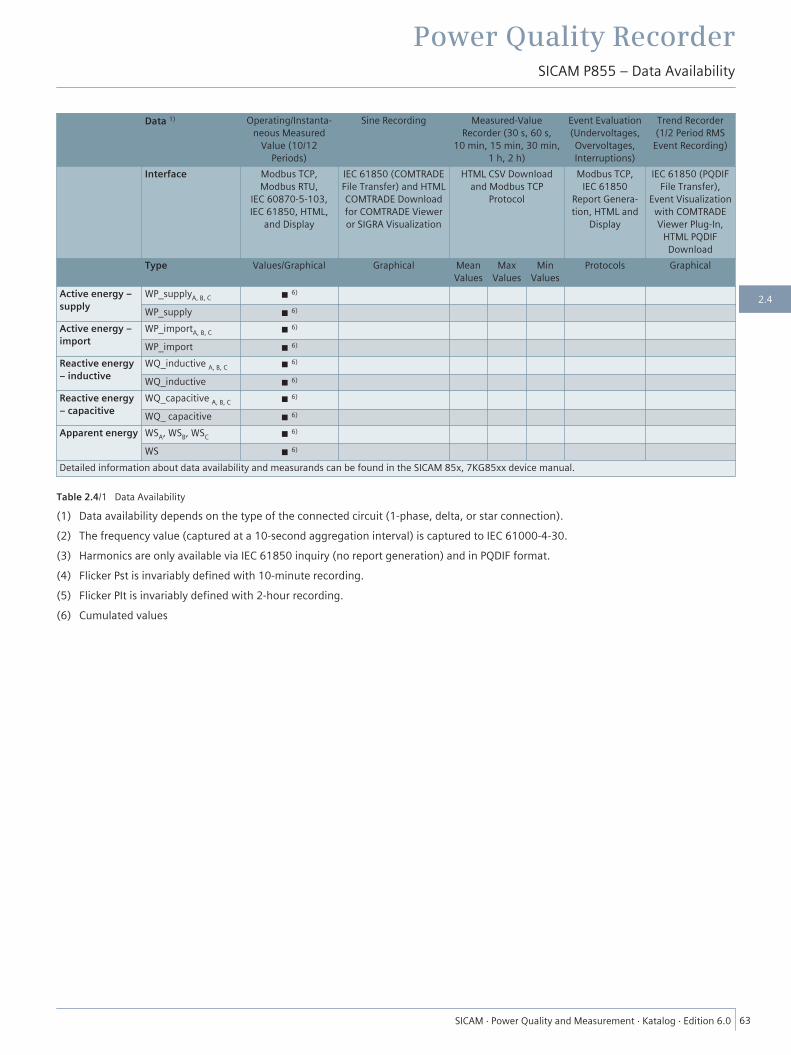
Data 1) Operating/Instanta-neous Measured
Value (10/12Periods)
Sine Recording Measured-ValueRecorder (30 s, 60 s,
10 min, 15 min, 30 min,1 h, 2 h)
Event Evaluation(Undervoltages,Overvoltages,Interruptions)
Trend Recorder(1/2 Period RMS
Event Recording)
Interface Modbus TCP,Modbus RTU,
IEC 60870-5-103,IEC 61850, HTML,
and Display
IEC 61850 (COMTRADEFile Transfer) and HTMLCOMTRADE Downloadfor COMTRADE Vieweror SIGRA Visualization
HTML CSV Downloadand Modbus TCP
Protocol
Modbus TCP,IEC 61850
Report Genera-tion, HTML and
Display
IEC 61850 (PQDIFFile Transfer),
Event Visualizationwith COMTRADEViewer Plug-In,
HTML PQDIFDownload
Type Values/Graphical Graphical MeanValues
MaxValues
MinValues
Protocols Graphical
Active energy –supply
WP_supplyA, B, C ■ 6)
WP_supply ■ 6)
Active energy –import
WP_importA, B, C ■ 6)
WP_import ■ 6)
Reactive energy– inductive
WQ_inductive A, B, C ■ 6)
WQ_inductive ■ 6)
Reactive energy– capacitive
WQ_capacitive A, B, C ■ 6)
WQ_ capacitive ■ 6)
Apparent energy WSA, WSB, WSC ■ 6)
WS ■ 6)
Detailed information about data availability and measurands can be found in the SICAM 85x, 7KG85xx device manual.
Table 2.4/1 Data Availability
(1) Data availability depends on the type of the connected circuit (1-phase, delta, or star connection).(2) The frequency value (captured at a 10-second aggregation interval) is captured to IEC 61000-4-30.(3) Harmonics are only available via IEC 61850 inquiry (no report generation) and in PQDIF format.(4) Flicker Pst is invariably defined with 10-minute recording.(5) Flicker PIt is invariably defined with 2-hour recording.(6) Cumulated values
Power Quality RecorderSICAM P855 – Data Availability
SICAM ⋅ Power Quality and Measurement ⋅ Katalog ⋅ Edition 6.0 63
2.4
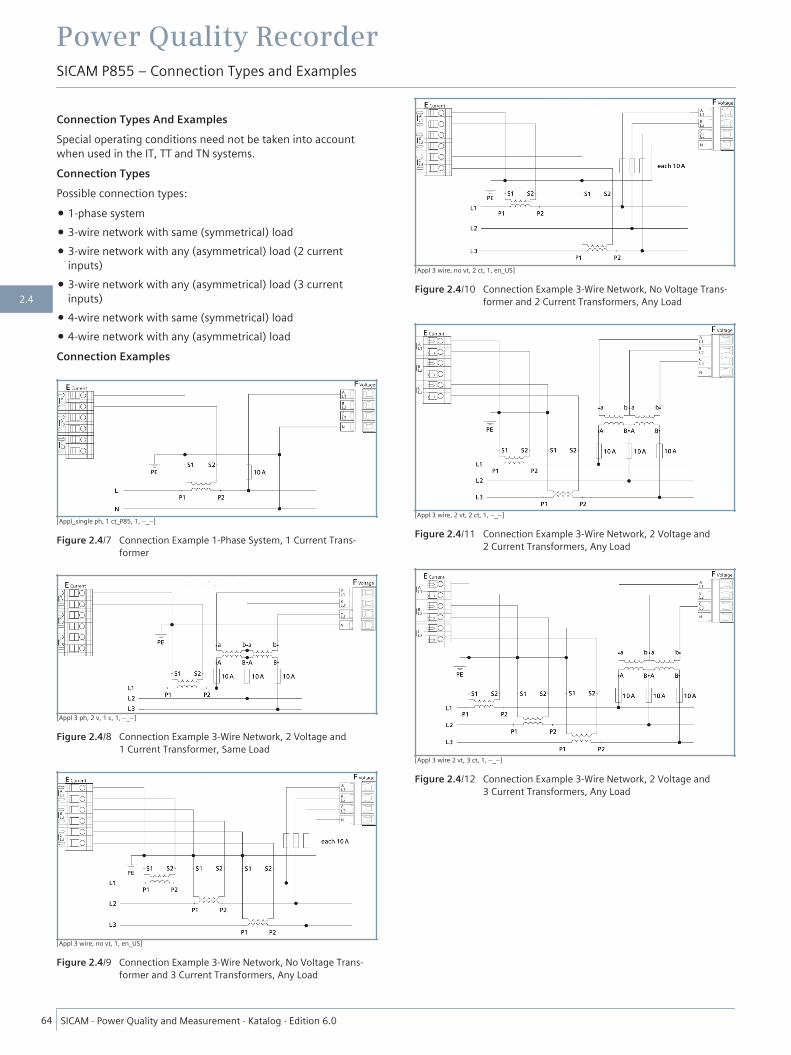
Connection Types And ExamplesSpecial operating conditions need not be taken into accountwhen used in the IT, TT and TN systems.Connection TypesPossible connection types:
• 1-phase system• 3-wire network with same (symmetrical) load• 3-wire network with any (asymmetrical) load (2 current
inputs)• 3-wire network with any (asymmetrical) load (3 current
inputs)• 4-wire network with same (symmetrical) load• 4-wire network with any (asymmetrical) loadConnection Examples
[Appl_single ph, 1 ct_P85, 1, --_--]
Figure 2.4/7 Connection Example 1-Phase System, 1 Current Trans-former
[Appl 3 ph, 2 v, 1 c, 1, --_--]
Figure 2.4/8 Connection Example 3-Wire Network, 2 Voltage and1 Current Transformer, Same Load
[Appl 3 wire, no vt, 1, en_US]
Figure 2.4/9 Connection Example 3-Wire Network, No Voltage Trans-former and 3 Current Transformers, Any Load
[Appl 3 wire, no vt, 2 ct, 1, en_US]
Figure 2.4/10 Connection Example 3-Wire Network, No Voltage Trans-former and 2 Current Transformers, Any Load
[Appl 3 wire, 2 vt, 2 ct, 1, --_--]
Figure 2.4/11 Connection Example 3-Wire Network, 2 Voltage and2 Current Transformers, Any Load
[Appl 3 wire 2 vt, 3 ct, 1, --_--]
Figure 2.4/12 Connection Example 3-Wire Network, 2 Voltage and3 Current Transformers, Any Load
Power Quality RecorderSICAM P855 – Connection Types and Examples
64 SICAM ⋅ Power Quality and Measurement ⋅ Katalog ⋅ Edition 6.0
2.4
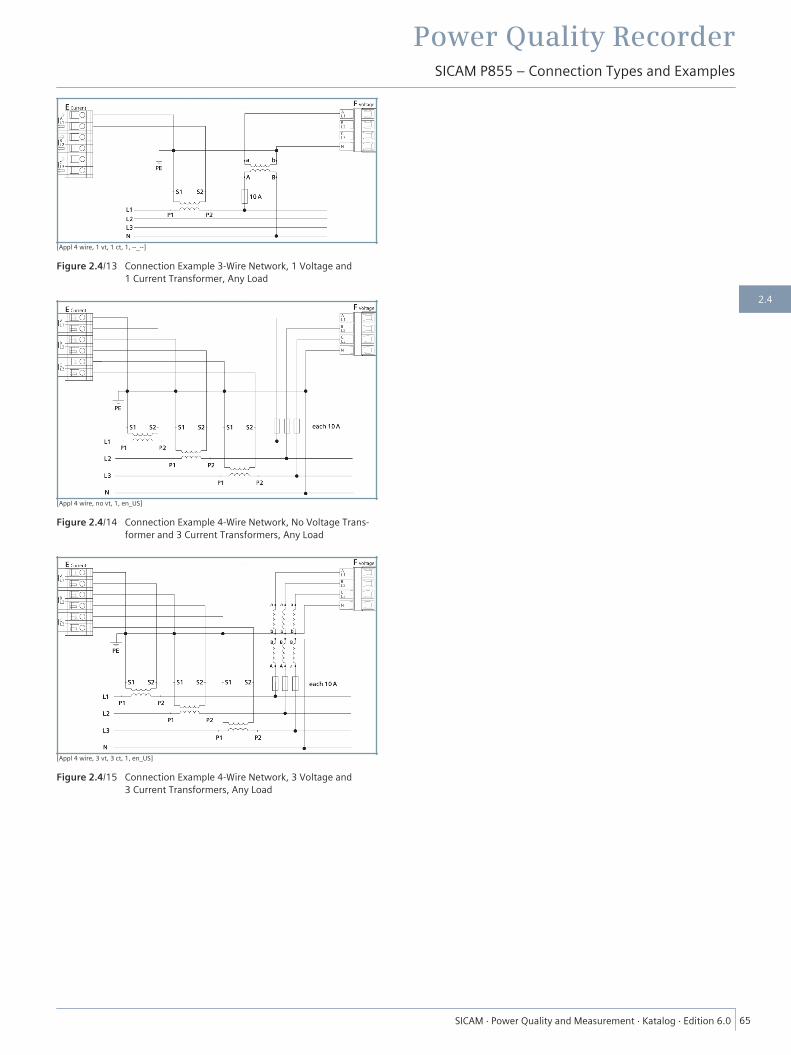
[Appl 4 wire, 1 vt, 1 ct, 1, --_--]
Figure 2.4/13 Connection Example 3-Wire Network, 1 Voltage and1 Current Transformer, Any Load
[Appl 4 wire, no vt, 1, en_US]
Figure 2.4/14 Connection Example 4-Wire Network, No Voltage Trans-former and 3 Current Transformers, Any Load
[Appl 4 wire, 3 vt, 3 ct, 1, en_US]
Figure 2.4/15 Connection Example 4-Wire Network, 3 Voltage and3 Current Transformers, Any Load
Power Quality RecorderSICAM P855 – Connection Types and Examples
SICAM ⋅ Power Quality and Measurement ⋅ Katalog ⋅ Edition 6.0 65
2.4

Supply Voltage
Direct Voltage
Rated input voltage 24 V to 250 VAdmissible input voltage tolerance ±20 %Admissible ripples of the DC inputvoltage
15 %
Maximum inrush currentAt ≤ 110 V < 15 AAt 220 V to 300 V after 250 μs: ≤ 22 A; after 250 μs: < 5 AMaximum power consumption 5 W
Inputs and Outputs
Rated Input Alternating VoltagesPh-N/PE 63.5 V
110 V230 V400 V (347 V at UL conditions)
Ph-ph 110 V190 V400 V690 V (600 V at UL conditions)
Maximum rated input alternatingvoltage depending on parameteri-zation
1.2-fold rated input alternatingvoltage
Maximum rated input alternating voltagePh-N/PE 480 V (347 V at UL conditions)Ph-ph 831 V (600 V at UL conditions)Input resistancesA, B, C to N 6.0 MΩA-B, B-C, C-A 6.0 MΩFurther specifications of the voltage measurement inputsPower consumption per input atVrated 400 V
38 mW
Admissible frequency 42.5 Hz to 69.0 HzMeasuring error (with compensa-tion) at 23 °C ± 1 °C 50 Hz or 60 Hz
Typical 0.1 % at reference condi-tions
Table 2.4/2 Inputs for Alternating Voltage Measurements (TerminalBlock F)
Communication Interfaces
Ethernet (Connection Z)
Ethernet, electrical Connection Housing topRJ45 connector socket10/100Base-T to IEEE 802.3LED yellow: 100 Mbits/s(OFF/ON)LED green:− Flashing: activity− ON: no activity− OFF: no connection
Protocols Modbus TCP IEC 61850-Server
Voltage strength DC 700 VTransmission rate 100 Mbits/sCable for 10/100Base-T
100 Ω to 150 Ω STP, CAT5
Max. cable length10/100 Base-T
100 m, at best routing
Environmental Data
Temperaturespecifications
Temperature during operationDevice with display: The reada-bility of the display is reduced ata temperature of < 0 °C.
-25 °C to +55 °C
Temperature during transporta-tion
-40 °C to +70 °C
Temperature during storage -40 °C to +70 °CMaximum temperature gradient 20 K/h
Humidity speci-fications
Mean relative humidity ≤ 75 %Maximum relative humidity 95 % on 30 days
per yearCondensation during operation Not permittedCondensation during transporta-tion and storage
Permitted
Application alti-tude
Maximum altitude above sealevel
2000 m
General Data
Battery Type PANASONIC CR2032VARTA 6032 101 501
Voltage 3 VCapacity 230 mAhTypical service life Operation with permanently
applied supply voltage:10 yearsOperation with sporadicallyinterrupted supply voltage:Total of 2 months inside of 10years
Internal memory Storage capacity 2 GBDegree of ProtectionDIN rail housing IP20
Power Quality RecorderSICAM P855 – Technical Data
66 SICAM ⋅ Power Quality and Measurement ⋅ Katalog ⋅ Edition 6.0
2.4

Panel flushmounting (front)
IP40 (with display, without door)IP51 (with display and door)
Terminals IP2x
Additional InformationPlease refer to the current manual for further information.
Dimensions
Mass Device without display: approx.0.49 kgDevice with display, without door:approx. 0.52 kgDevice with display and door:approx. 0.6 kg
Dimensions (W x H x D) 96 mm x 96 mm x 100 mm
[SICAM P85_Massbild_mit Hutschiene_2_Ansichten, 1, --_--]
Figure 2.4/16 Dimensional Drawing of the SICAM P850/P855, DIN-RailDevice
[SICAM P85_Massbild_mit_Display_2_Ansichten, 1, --_--]
Figure 2.4/17 Dimensional Drawing of the SICAM P850/P855 withDisplay
Power Quality RecorderSICAM P855 – Technical Data
SICAM ⋅ Power Quality and Measurement ⋅ Katalog ⋅ Edition 6.0 67
2.4

[SICAM P85_Massbild_mit_Tür_2_Ansichten, 1, --_--]
Figure 2.4/18 Dimensional Drawing of the SICAM P850/P855 withDisplay and Cover
[dw_cut-out-in-switch-panel, 1, --_--]
Figure 2.4/19 Cutout In the Control Panel
Power Quality RecorderSICAM P855 – Technical Data
68 SICAM ⋅ Power Quality and Measurement ⋅ Katalog ⋅ Edition 6.0
2.4

Selection and Ordering Data
Description Variants Order No.1 2 3 4 5 6 7 8 9 10 11 12 13 14 15 16
SICAM P855 – Multifunction Measuring Device 7 K G 8 5 □ □ - 0 A A □ □ - □ A A 0▲ ▲ ▲ ▲ ▲
Dimensions: 96 mm x 96 mm x 100 mm4 inputs for alternating voltage measurements3 inputs for AC current measurements2 binary outputsIsolated voltage measuring inputsWeb server for parameterization and visualiza-tionInternal 2-GB memoryMeasurements to IEC 61000-4-30 standard
Base recording and power quality recorderMeasurands: power quality device –IEC 61000-4-30 cos φ, limiting-value viola-tions, energy measurements, measurementsup to 40th harmonic, flicker to IEC 61000-4-15min./max./mean value recorder, faultrecording (data export in COMTRADE format)voltage-event recognition, visualization (forexample, Vdip) online PQ reports to EN 50160measured value transmission with communi-cation protocols
5 │ │ │ │
Housing │ │ │ │DIN-rail housing without display 0 │ 0 │Switch panel flush-mounting device withgraphic display
1 │ │ │
Serial interface and communication protocol │ │ │Without 0 │ │RS485 - Modbus RTU 1 │RS485 - IEC 60870-5-103 and Modbus RTU 3 │ │Protection class front side │ │IP20 (position 7 = 0) 0 │IP40 (position 7 = 1) 1 │IP51 (position 7 = 1) 2 │Ethernet interface and communicationprotocol, RJ45 │
Modbus TCP 0Modus TCP and IEC 61850 server 2
Table 2.4/3 Selection and Ordering Data
Power Quality RecorderSICAM P855 – Selection and Ordering Data
SICAM ⋅ Power Quality and Measurement ⋅ Katalog ⋅ Edition 6.0 69
2.4
Power Quality RecorderSICAM P855 – Selection and Ordering Data
70 SICAM ⋅ Power Quality and Measurement ⋅ Katalog ⋅ Edition 6.0
2.4

www.siemens.com/powerquality
Power Meters
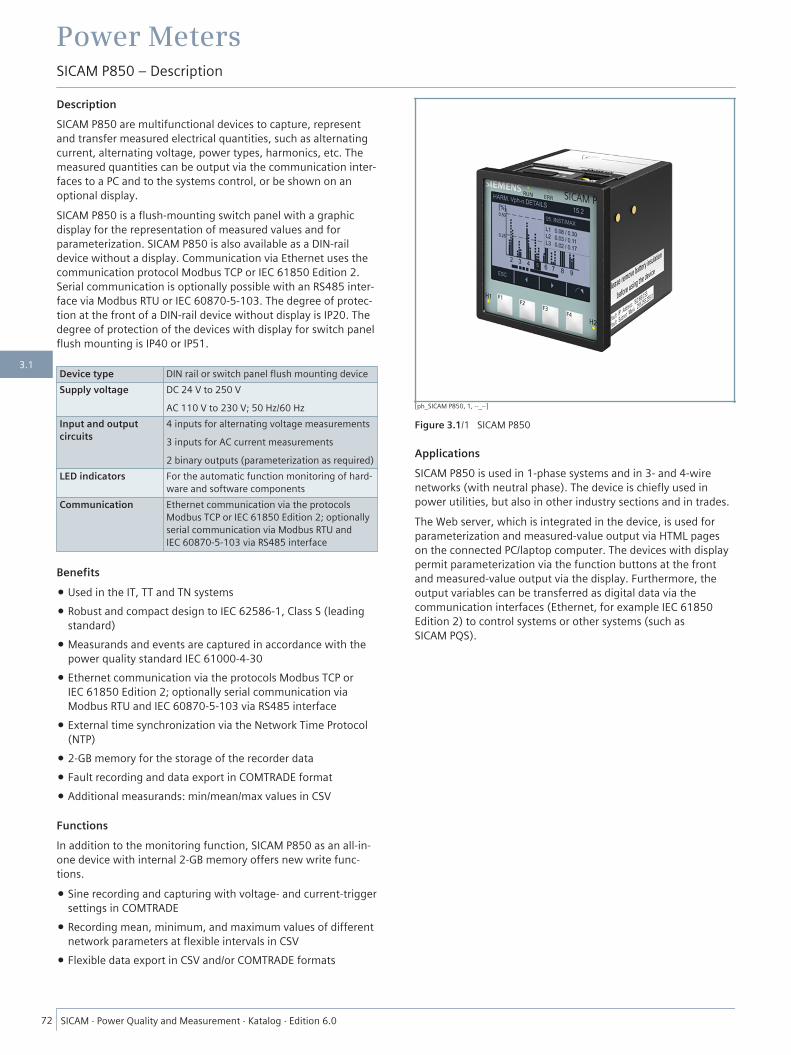
DescriptionSICAM P850 are multifunctional devices to capture, representand transfer measured electrical quantities, such as alternatingcurrent, alternating voltage, power types, harmonics, etc. Themeasured quantities can be output via the communication inter-faces to a PC and to the systems control, or be shown on anoptional display.SICAM P850 is a flush-mounting switch panel with a graphicdisplay for the representation of measured values and forparameterization. SICAM P850 is also available as a DIN-raildevice without a display. Communication via Ethernet uses thecommunication protocol Modbus TCP or IEC 61850 Edition 2.Serial communication is optionally possible with an RS485 inter-face via Modbus RTU or IEC 60870-5-103. The degree of protec-tion at the front of a DIN-rail device without display is IP20. Thedegree of protection of the devices with display for switch panelflush mounting is IP40 or IP51.
Device type DIN rail or switch panel flush mounting deviceSupply voltage DC 24 V to 250 V
AC 110 V to 230 V; 50 Hz/60 HzInput and outputcircuits
4 inputs for alternating voltage measurements3 inputs for AC current measurements2 binary outputs (parameterization as required)
LED indicators For the automatic function monitoring of hard-ware and software components
Communication Ethernet communication via the protocolsModbus TCP or IEC 61850 Edition 2; optionallyserial communication via Modbus RTU andIEC 60870-5-103 via RS485 interface
Benefits• Used in the IT, TT and TN systems• Robust and compact design to IEC 62586-1, Class S (leading
standard)• Measurands and events are captured in accordance with the
power quality standard IEC 61000-4-30• Ethernet communication via the protocols Modbus TCP or
IEC 61850 Edition 2; optionally serial communication viaModbus RTU and IEC 60870-5-103 via RS485 interface
• External time synchronization via the Network Time Protocol(NTP)
• 2-GB memory for the storage of the recorder data• Fault recording and data export in COMTRADE format• Additional measurands: min/mean/max values in CSV
FunctionsIn addition to the monitoring function, SICAM P850 as an all-in-one device with internal 2-GB memory offers new write func-tions.
• Sine recording and capturing with voltage- and current-triggersettings in COMTRADE
• Recording mean, minimum, and maximum values of differentnetwork parameters at flexible intervals in CSV
• Flexible data export in CSV and/or COMTRADE formats
ApplicationsSICAM P850 is used in 1-phase systems and in 3- and 4-wirenetworks (with neutral phase). The device is chiefly used inpower utilities, but also in other industry sections and in trades.The Web server, which is integrated in the device, is used forparameterization and measured-value output via HTML pageson the connected PC/laptop computer. The devices with displaypermit parameterization via the function buttons at the frontand measured-value output via the display. Furthermore, theoutput variables can be transferred as digital data via thecommunication interfaces (Ethernet, for example IEC 61850Edition 2) to control systems or other systems (such asSICAM PQS).
[ph_SICAM P850, 1, --_--]
Figure 3.1/1 SICAM P850
Power MetersSICAM P850 – Description
72 SICAM ⋅ Power Quality and Measurement ⋅ Katalog ⋅ Edition 6.0
3.1

[dw_SICAM P850_Application, 1, en_US]
Figure 3.1/2 Application Example
Hardware DesignDepending on the device variant, the following electricalcomponents are contained:
• Digital signal processor (DSP)• Display and front buttons• 4 inputs for alternating voltage measurements• 3 inputs for AC current measurements• 2 binary outputs• Power supply• Ethernet interface• RS485 interface (according to order variant)• 2-GB primary storage
MeasurandsThe following measurands are captured or calculated by thedevice from the measured quantities:
• True RMS alternating voltage and alternating current• 2048 sampled values per 10/12 system periods• Root-means-square value measurement (TRMS) up to the
100th harmonic• Power frequency• Active, reactive, and apparent power• Active, reactive, and apparent energy• Power factor and active power factor• Unbalance of alternating voltage and alternating current
• Harmonics up to the 40th order of alternating voltage andalternating current are stored for evaluation
• THD (Total Harmonic Distortion) of alternating voltage andalternating current
• Phase angle
CommunicationAn Ethernet interface and an optional RS485 interface are avail-able for the communication with the systems control and withother process automation systems. The RS485 interfacesupports the transfer of operational measured values, counts,and messages. Depending on the device version, you can usethe communication protocol Modbus RTU or IEC 60870-5-103.Device parameterization, transfer of measured data, counts andmessages/events, and the time synchronization with theNetwork Time Protocol (NTP) are supported via Ethernet. Thedevice supports the transfer of operational measured valueswith both Ethernet protocol options – via Modbus TCP and viaIEC 61850 Edition 2.
Time SynchronizationAll time-relevant processes require date and time during opera-tion. Consequently, there is a time synchronization during thecommunication with peripheral devices. This ensures a uniform
Power MetersSICAM P850 – Description
SICAM ⋅ Power Quality and Measurement ⋅ Katalog ⋅ Edition 6.0 73
3.1
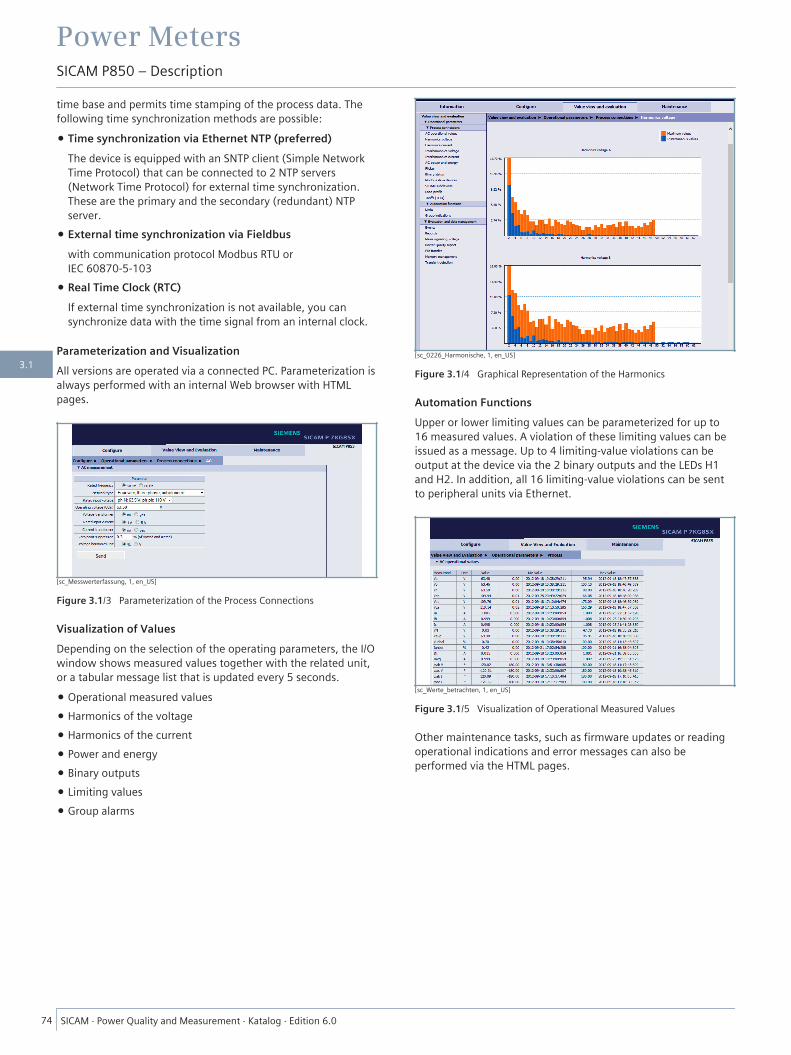
time base and permits time stamping of the process data. Thefollowing time synchronization methods are possible:
• Time synchronization via Ethernet NTP (preferred)The device is equipped with an SNTP client (Simple NetworkTime Protocol) that can be connected to 2 NTP servers(Network Time Protocol) for external time synchronization.These are the primary and the secondary (redundant) NTPserver.
• External time synchronization via Fieldbuswith communication protocol Modbus RTU orIEC 60870-5-103
• Real Time Clock (RTC)If external time synchronization is not available, you cansynchronize data with the time signal from an internal clock.
Parameterization and VisualizationAll versions are operated via a connected PC. Parameterization isalways performed with an internal Web browser with HTMLpages.
[sc_Messwerterfassung, 1, en_US]
Figure 3.1/3 Parameterization of the Process Connections
Visualization of ValuesDepending on the selection of the operating parameters, the I/Owindow shows measured values together with the related unit,or a tabular message list that is updated every 5 seconds.
• Operational measured values• Harmonics of the voltage• Harmonics of the current• Power and energy• Binary outputs• Limiting values• Group alarms
[sc_0226_Harmonische, 1, en_US]
Figure 3.1/4 Graphical Representation of the Harmonics
Automation FunctionsUpper or lower limiting values can be parameterized for up to16 measured values. A violation of these limiting values can beissued as a message. Up to 4 limiting-value violations can beoutput at the device via the 2 binary outputs and the LEDs H1and H2. In addition, all 16 limiting-value violations can be sentto peripheral units via Ethernet.
[sc_Werte_betrachten, 1, en_US]
Figure 3.1/5 Visualization of Operational Measured Values
Other maintenance tasks, such as firmware updates or readingoperational indications and error messages can also beperformed via the HTML pages.
Power MetersSICAM P850 – Description
74 SICAM ⋅ Power Quality and Measurement ⋅ Katalog ⋅ Edition 6.0
3.1

[sc_Faultrecord, 1, en_US]
Figure 3.1/6 Visualization of Operational Indications
Power MetersSICAM P850 – Description
SICAM ⋅ Power Quality and Measurement ⋅ Katalog ⋅ Edition 6.0 75
3.1
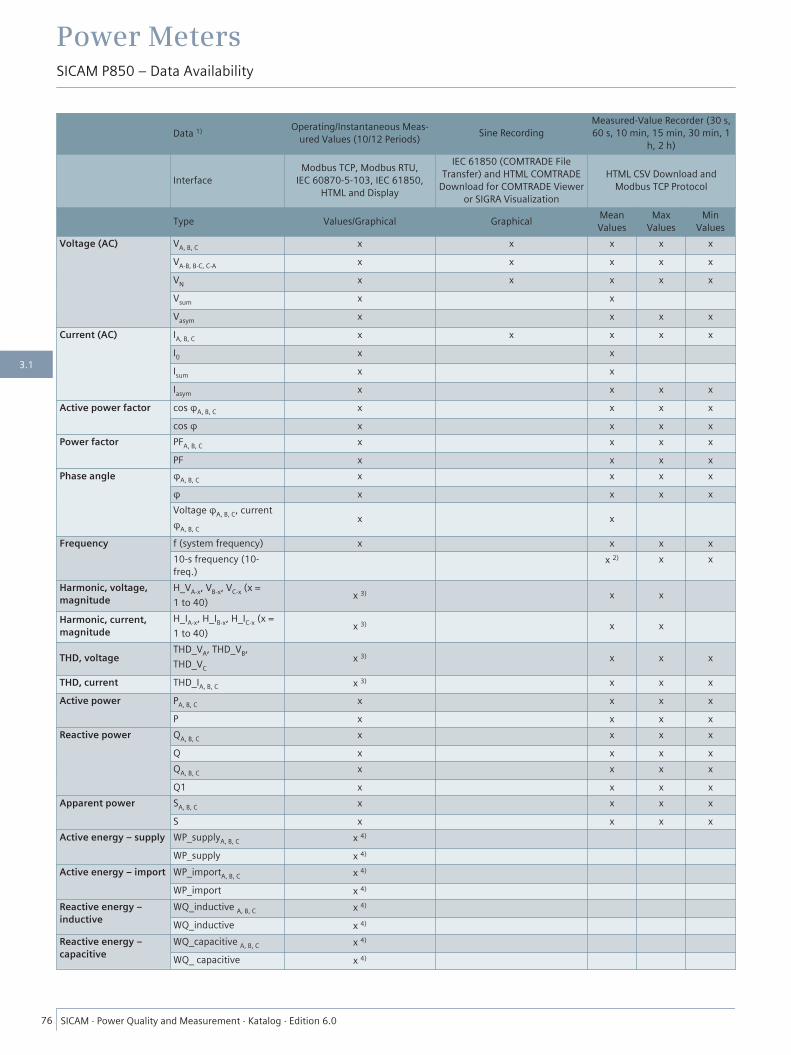
Data 1) Operating/Instantaneous Meas-ured Values (10/12 Periods) Sine Recording
Measured-Value Recorder (30 s,60 s, 10 min, 15 min, 30 min, 1
h, 2 h)
InterfaceModbus TCP, Modbus RTU,
IEC 60870-5-103, IEC 61850,HTML and Display
IEC 61850 (COMTRADE FileTransfer) and HTML COMTRADE
Download for COMTRADE Vieweror SIGRA Visualization
HTML CSV Download andModbus TCP Protocol
Type Values/Graphical Graphical MeanValues
MaxValues
MinValues
Voltage (AC) VA, B, C x x x x xVA-B, B-C, C-A x x x x xVN x x x x xVsum x xVasym x x x x
Current (AC) IA, B, C x x x x xI0 x xIsum x xIasym x x x x
Active power factor cos φA, B, C x x x xcos φ x x x x
Power factor PFA, B, C x x x xPF x x x x
Phase angle φA, B, C x x x xφ x x x xVoltage φA, B, C, currentφA, B, C
x x
Frequency f (system frequency) x x x x10-s frequency (10-freq.)
x 2) x x
Harmonic, voltage,magnitude
H_VA-x, VB-x, VC-x (x =1 to 40) x 3) x x
Harmonic, current,magnitude
H_IA-x, H_IB-x, H_IC-x (x =1 to 40) x 3) x x
THD, voltageTHD_VA, THD_VB,THD_VC
x 3) x x x
THD, current THD_IA, B, C x 3) x x xActive power PA, B, C x x x x
P x x x xReactive power QA, B, C x x x x
Q x x x xQA, B, C x x x xQ1 x x x x
Apparent power SA, B, C x x x xS x x x x
Active energy – supply WP_supplyA, B, C x 4)
WP_supply x 4)
Active energy – import WP_importA, B, C x 4)
WP_import x 4)
Reactive energy –inductive
WQ_inductive A, B, C x 4)
WQ_inductive x 4)
Reactive energy –capacitive
WQ_capacitive A, B, C x 4)
WQ_ capacitive x 4)
Power MetersSICAM P850 – Data Availability
76 SICAM ⋅ Power Quality and Measurement ⋅ Katalog ⋅ Edition 6.0
3.1
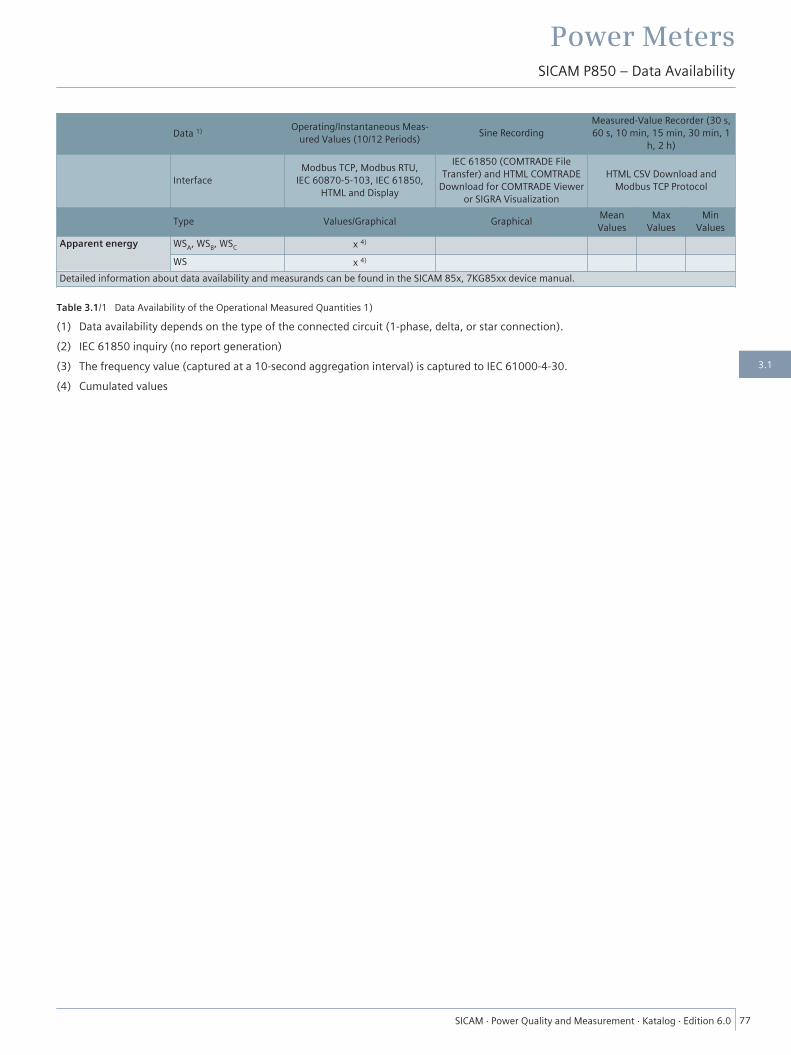
Data 1) Operating/Instantaneous Meas-ured Values (10/12 Periods) Sine Recording
Measured-Value Recorder (30 s,60 s, 10 min, 15 min, 30 min, 1
h, 2 h)
InterfaceModbus TCP, Modbus RTU,
IEC 60870-5-103, IEC 61850,HTML and Display
IEC 61850 (COMTRADE FileTransfer) and HTML COMTRADE
Download for COMTRADE Vieweror SIGRA Visualization
HTML CSV Download andModbus TCP Protocol
Type Values/Graphical Graphical MeanValues
MaxValues
MinValues
Apparent energy WSA, WSB, WSC x 4)
WS x 4)
Detailed information about data availability and measurands can be found in the SICAM 85x, 7KG85xx device manual.
Table 3.1/1 Data Availability of the Operational Measured Quantities 1)
(1) Data availability depends on the type of the connected circuit (1-phase, delta, or star connection).(2) IEC 61850 inquiry (no report generation)(3) The frequency value (captured at a 10-second aggregation interval) is captured to IEC 61000-4-30.(4) Cumulated values
Power MetersSICAM P850 – Data Availability
SICAM ⋅ Power Quality and Measurement ⋅ Katalog ⋅ Edition 6.0 77
3.1
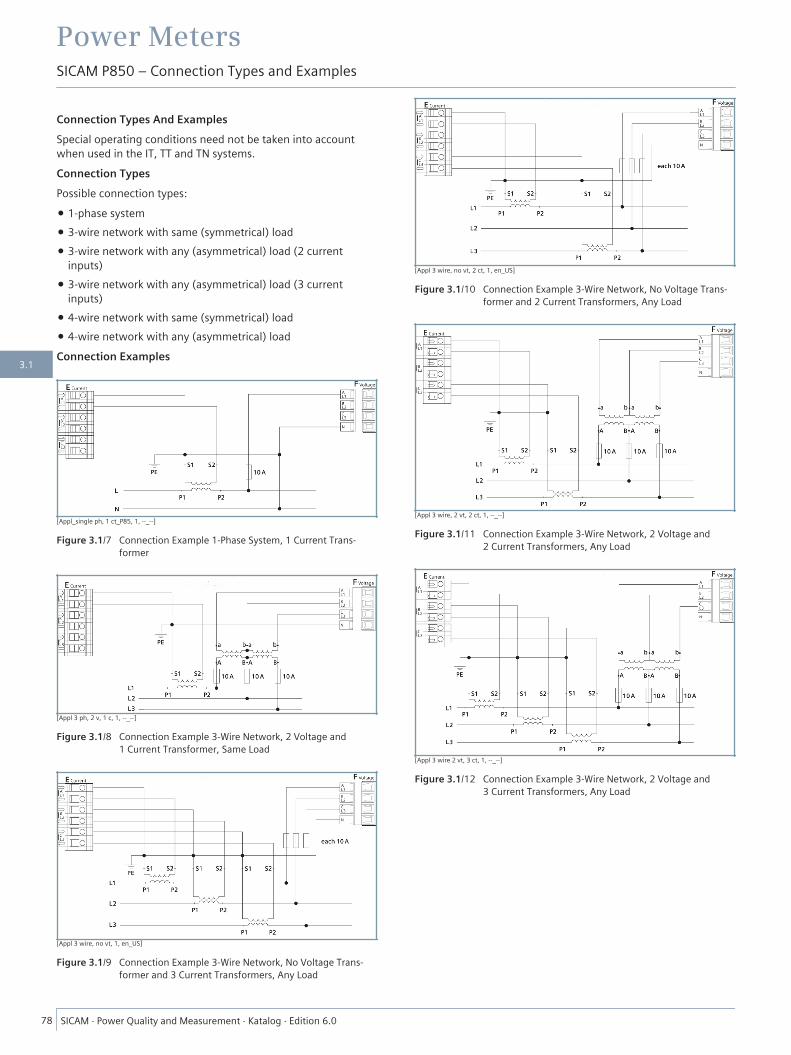
Connection Types And ExamplesSpecial operating conditions need not be taken into accountwhen used in the IT, TT and TN systems.Connection TypesPossible connection types:
• 1-phase system• 3-wire network with same (symmetrical) load• 3-wire network with any (asymmetrical) load (2 current
inputs)• 3-wire network with any (asymmetrical) load (3 current
inputs)• 4-wire network with same (symmetrical) load• 4-wire network with any (asymmetrical) loadConnection Examples
[Appl_single ph, 1 ct_P85, 1, --_--]
Figure 3.1/7 Connection Example 1-Phase System, 1 Current Trans-former
[Appl 3 ph, 2 v, 1 c, 1, --_--]
Figure 3.1/8 Connection Example 3-Wire Network, 2 Voltage and1 Current Transformer, Same Load
[Appl 3 wire, no vt, 1, en_US]
Figure 3.1/9 Connection Example 3-Wire Network, No Voltage Trans-former and 3 Current Transformers, Any Load
[Appl 3 wire, no vt, 2 ct, 1, en_US]
Figure 3.1/10 Connection Example 3-Wire Network, No Voltage Trans-former and 2 Current Transformers, Any Load
[Appl 3 wire, 2 vt, 2 ct, 1, --_--]
Figure 3.1/11 Connection Example 3-Wire Network, 2 Voltage and2 Current Transformers, Any Load
[Appl 3 wire 2 vt, 3 ct, 1, --_--]
Figure 3.1/12 Connection Example 3-Wire Network, 2 Voltage and3 Current Transformers, Any Load
Power MetersSICAM P850 – Connection Types and Examples
78 SICAM ⋅ Power Quality and Measurement ⋅ Katalog ⋅ Edition 6.0
3.1

[Appl 4 wire, 1 vt, 1 ct, 1, --_--]
Figure 3.1/13 Connection Example 3-Wire Network, 1 Voltage and1 Current Transformer, Any Load
[Appl 4 wire, no vt, 1, en_US]
Figure 3.1/14 Connection Example 4-Wire Network, No Voltage Trans-former and 3 Current Transformers, Any Load
[Appl 4 wire, 3 vt, 3 ct, 1, en_US]
Figure 3.1/15 Connection Example 4-Wire Network, 3 Voltage and3 Current Transformers, Any Load
Power MetersSICAM P850 – Connection Types and Examples
SICAM ⋅ Power Quality and Measurement ⋅ Katalog ⋅ Edition 6.0 79
3.1
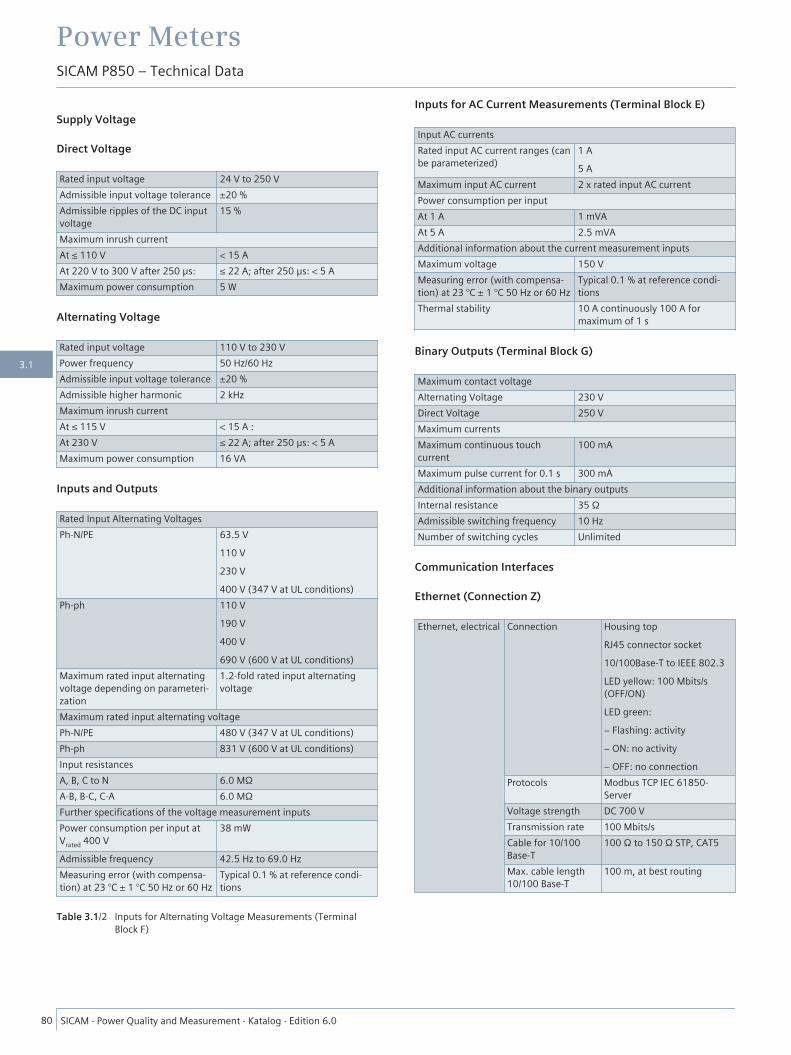
Supply Voltage
Direct Voltage
Rated input voltage 24 V to 250 VAdmissible input voltage tolerance ±20 %Admissible ripples of the DC inputvoltage
15 %
Maximum inrush currentAt ≤ 110 V < 15 AAt 220 V to 300 V after 250 μs: ≤ 22 A; after 250 μs: < 5 AMaximum power consumption 5 W
Alternating Voltage
Rated input voltage 110 V to 230 VPower frequency 50 Hz/60 HzAdmissible input voltage tolerance ±20 %Admissible higher harmonic 2 kHzMaximum inrush currentAt ≤ 115 V < 15 A :At 230 V ≤ 22 A; after 250 μs: < 5 AMaximum power consumption 16 VA
Inputs and Outputs
Rated Input Alternating VoltagesPh-N/PE 63.5 V
110 V230 V400 V (347 V at UL conditions)
Ph-ph 110 V190 V400 V690 V (600 V at UL conditions)
Maximum rated input alternatingvoltage depending on parameteri-zation
1.2-fold rated input alternatingvoltage
Maximum rated input alternating voltagePh-N/PE 480 V (347 V at UL conditions)Ph-ph 831 V (600 V at UL conditions)Input resistancesA, B, C to N 6.0 MΩA-B, B-C, C-A 6.0 MΩFurther specifications of the voltage measurement inputsPower consumption per input atVrated 400 V
38 mW
Admissible frequency 42.5 Hz to 69.0 HzMeasuring error (with compensa-tion) at 23 °C ± 1 °C 50 Hz or 60 Hz
Typical 0.1 % at reference condi-tions
Table 3.1/2 Inputs for Alternating Voltage Measurements (TerminalBlock F)
Inputs for AC Current Measurements (Terminal Block E)
Input AC currentsRated input AC current ranges (canbe parameterized)
1 A5 A
Maximum input AC current 2 x rated input AC currentPower consumption per inputAt 1 A 1 mVAAt 5 A 2.5 mVAAdditional information about the current measurement inputsMaximum voltage 150 VMeasuring error (with compensa-tion) at 23 °C ± 1 °C 50 Hz or 60 Hz
Typical 0.1 % at reference condi-tions
Thermal stability 10 A continuously 100 A formaximum of 1 s
Binary Outputs (Terminal Block G)
Maximum contact voltageAlternating Voltage 230 VDirect Voltage 250 VMaximum currentsMaximum continuous touchcurrent
100 mA
Maximum pulse current for 0.1 s 300 mAAdditional information about the binary outputsInternal resistance 35 ΩAdmissible switching frequency 10 HzNumber of switching cycles Unlimited
Communication Interfaces
Ethernet (Connection Z)
Ethernet, electrical Connection Housing topRJ45 connector socket10/100Base-T to IEEE 802.3LED yellow: 100 Mbits/s(OFF/ON)LED green:− Flashing: activity− ON: no activity− OFF: no connection
Protocols Modbus TCP IEC 61850-Server
Voltage strength DC 700 VTransmission rate 100 Mbits/sCable for 10/100Base-T
100 Ω to 150 Ω STP, CAT5
Max. cable length10/100 Base-T
100 m, at best routing
Power MetersSICAM P850 – Technical Data
80 SICAM ⋅ Power Quality and Measurement ⋅ Katalog ⋅ Edition 6.0
3.1
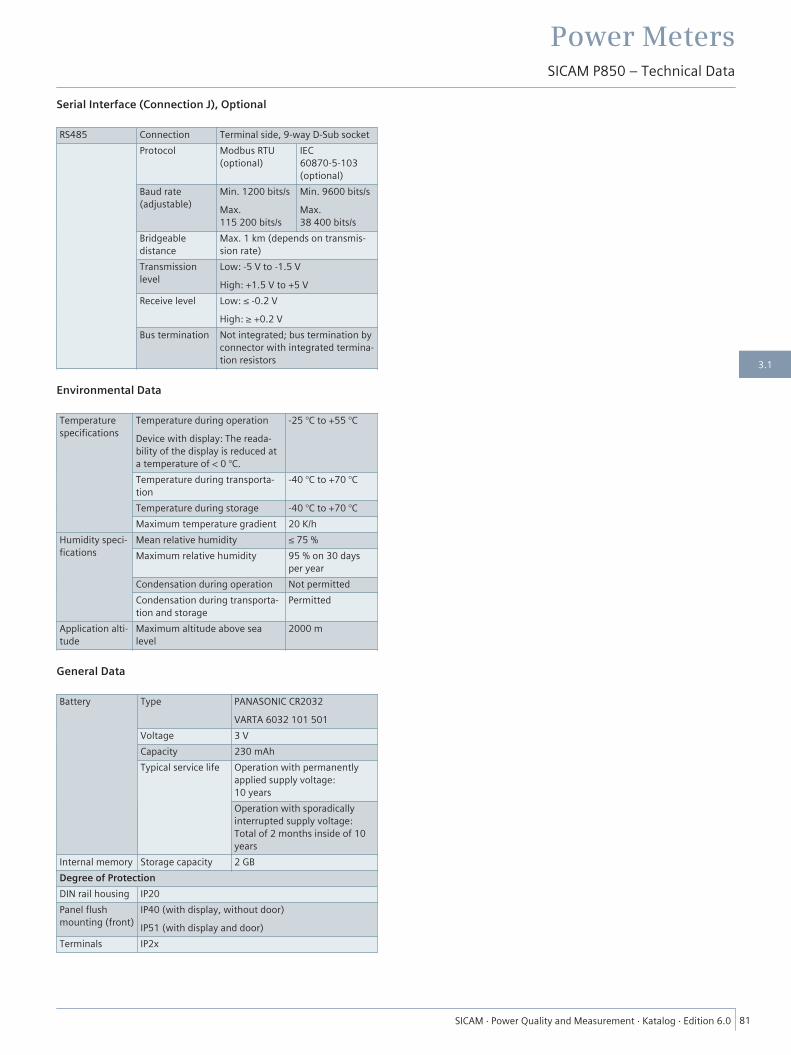
Serial Interface (Connection J), Optional
RS485 Connection Terminal side, 9-way D-Sub socketProtocol Modbus RTU
(optional)IEC60870-5-103(optional)
Baud rate(adjustable)
Min. 1200 bits/sMax.115 200 bits/s
Min. 9600 bits/sMax.38 400 bits/s
Bridgeabledistance
Max. 1 km (depends on transmis-sion rate)
Transmissionlevel
Low: -5 V to -1.5 VHigh: +1.5 V to +5 V
Receive level Low: ≤ -0.2 VHigh: ≥ +0.2 V
Bus termination Not integrated; bus termination byconnector with integrated termina-tion resistors
Environmental Data
Temperaturespecifications
Temperature during operationDevice with display: The reada-bility of the display is reduced ata temperature of < 0 °C.
-25 °C to +55 °C
Temperature during transporta-tion
-40 °C to +70 °C
Temperature during storage -40 °C to +70 °CMaximum temperature gradient 20 K/h
Humidity speci-fications
Mean relative humidity ≤ 75 %Maximum relative humidity 95 % on 30 days
per yearCondensation during operation Not permittedCondensation during transporta-tion and storage
Permitted
Application alti-tude
Maximum altitude above sealevel
2000 m
General Data
Battery Type PANASONIC CR2032VARTA 6032 101 501
Voltage 3 VCapacity 230 mAhTypical service life Operation with permanently
applied supply voltage:10 yearsOperation with sporadicallyinterrupted supply voltage:Total of 2 months inside of 10years
Internal memory Storage capacity 2 GBDegree of ProtectionDIN rail housing IP20Panel flushmounting (front)
IP40 (with display, without door)IP51 (with display and door)
Terminals IP2x
Power MetersSICAM P850 – Technical Data
SICAM ⋅ Power Quality and Measurement ⋅ Katalog ⋅ Edition 6.0 81
3.1

Dimensions
Mass Device without display: approx.0.49 kgDevice with display, without door:approx. 0.52 kgDevice with display and door:approx. 0.6 kg
Dimensions (W x H x D) 96 mm x 96 mm x 100 mm
[SICAM P85_Massbild_mit Hutschiene_2_Ansichten, 1, --_--]
Figure 3.1/16 Dimensional Drawing of the SICAM P850/P855, DIN-RailDevice
[SICAM P85_Massbild_mit_Display_2_Ansichten, 1, --_--]
Figure 3.1/17 Dimensional Drawing of the SICAM P850/P855 withDisplay
Power MetersSICAM P850 – Technical Data
82 SICAM ⋅ Power Quality and Measurement ⋅ Katalog ⋅ Edition 6.0
3.1
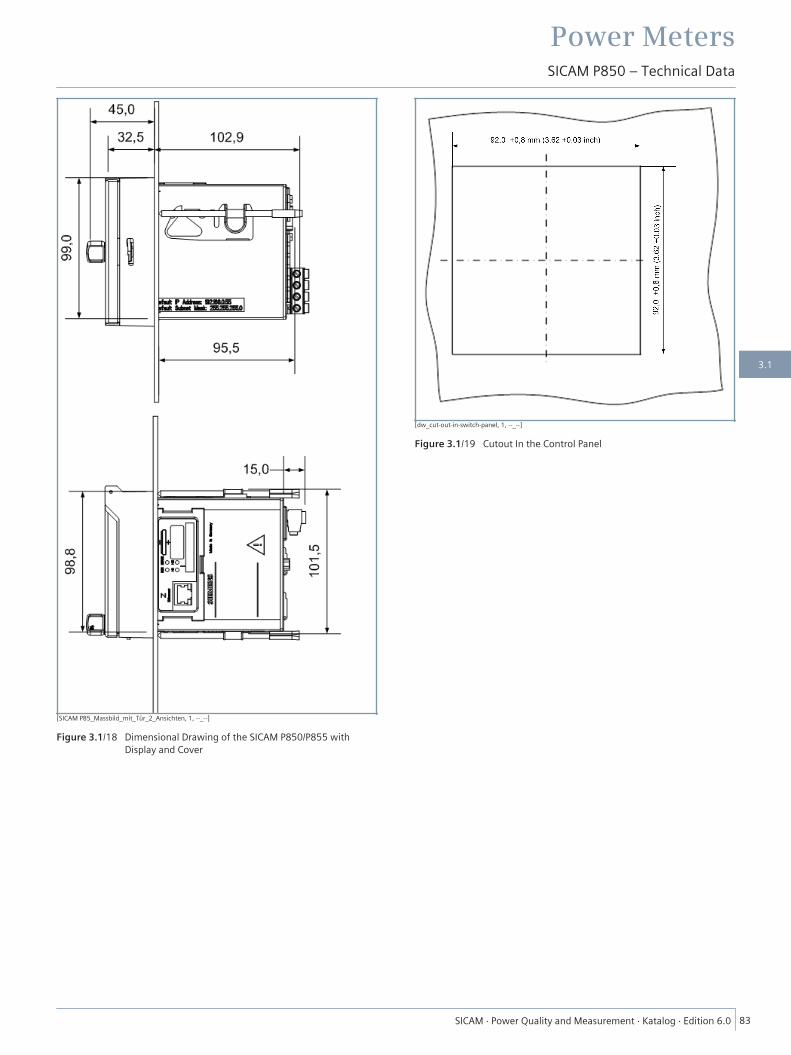
[SICAM P85_Massbild_mit_Tür_2_Ansichten, 1, --_--]
Figure 3.1/18 Dimensional Drawing of the SICAM P850/P855 withDisplay and Cover
[dw_cut-out-in-switch-panel, 1, --_--]
Figure 3.1/19 Cutout In the Control Panel
Power MetersSICAM P850 – Technical Data
SICAM ⋅ Power Quality and Measurement ⋅ Katalog ⋅ Edition 6.0 83
3.1
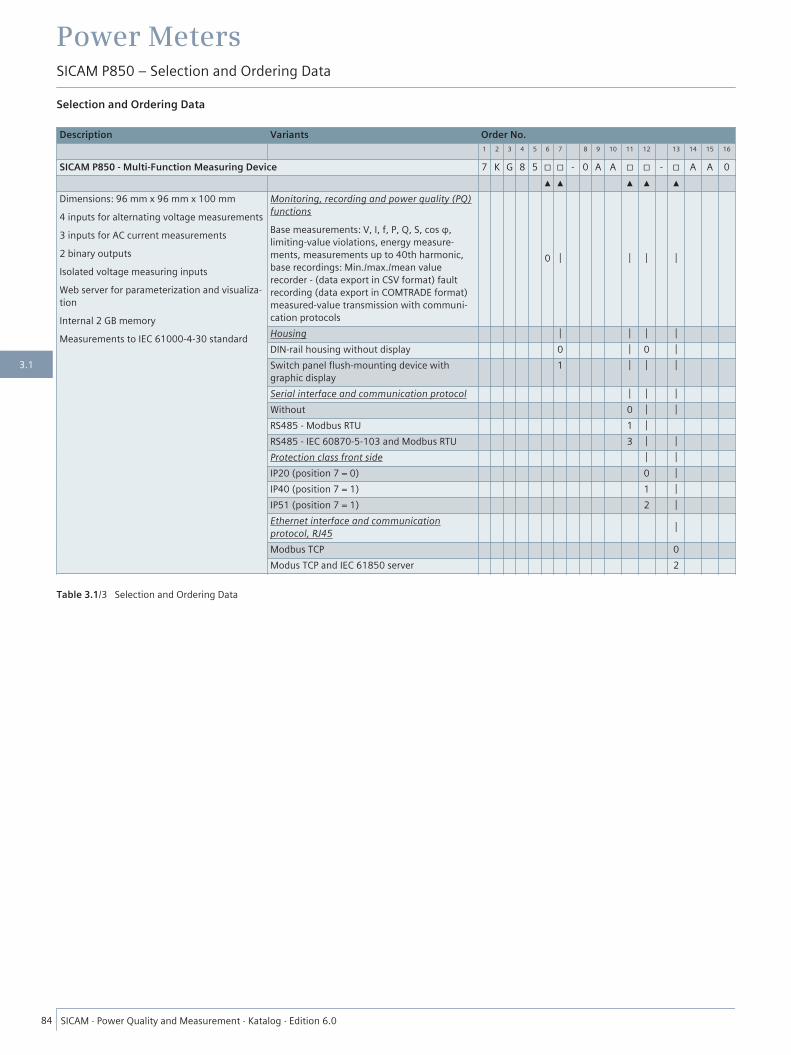
Selection and Ordering Data
Description Variants Order No.1 2 3 4 5 6 7 8 9 10 11 12 13 14 15 16
SICAM P850 - Multi-Function Measuring Device 7 K G 8 5 □ □ - 0 A A □ □ - □ A A 0▲ ▲ ▲ ▲ ▲
Dimensions: 96 mm x 96 mm x 100 mm4 inputs for alternating voltage measurements3 inputs for AC current measurements2 binary outputsIsolated voltage measuring inputsWeb server for parameterization and visualiza-tionInternal 2 GB memoryMeasurements to IEC 61000-4-30 standard
Monitoring, recording and power quality (PQ)functionsBase measurements: V, I, f, P, Q, S, cos φ,limiting-value violations, energy measure-ments, measurements up to 40th harmonic,base recordings: Min./max./mean valuerecorder - (data export in CSV format) faultrecording (data export in COMTRADE format)measured-value transmission with communi-cation protocols
0 │ │ │ │
Housing │ │ │ │DIN-rail housing without display 0 │ 0 │Switch panel flush-mounting device withgraphic display
1 │ │ │
Serial interface and communication protocol │ │ │Without 0 │ │RS485 - Modbus RTU 1 │RS485 - IEC 60870-5-103 and Modbus RTU 3 │ │Protection class front side │ │IP20 (position 7 = 0) 0 │IP40 (position 7 = 1) 1 │IP51 (position 7 = 1) 2 │Ethernet interface and communicationprotocol, RJ45 │
Modbus TCP 0Modus TCP and IEC 61850 server 2
Table 3.1/3 Selection and Ordering Data
Power MetersSICAM P850 – Selection and Ordering Data
84 SICAM ⋅ Power Quality and Measurement ⋅ Katalog ⋅ Edition 6.0
3.1
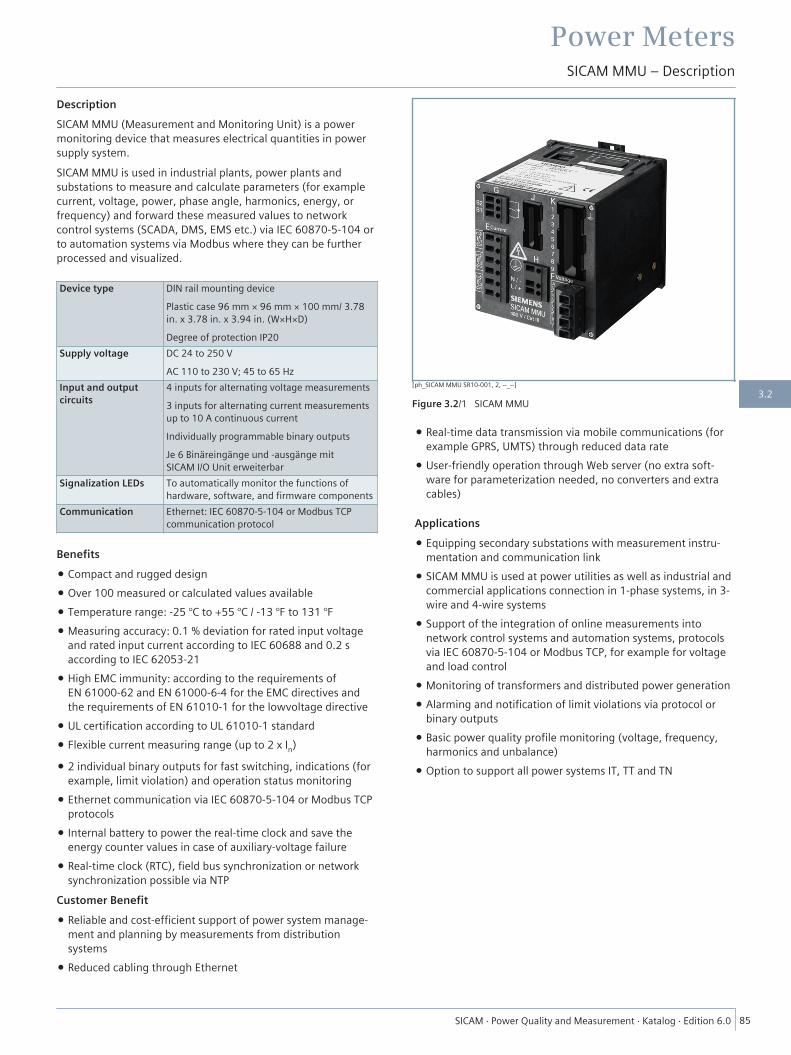
DescriptionSICAM MMU (Measurement and Monitoring Unit) is a powermonitoring device that measures electrical quantities in powersupply system.SICAM MMU is used in industrial plants, power plants andsubstations to measure and calculate parameters (for examplecurrent, voltage, power, phase angle, harmonics, energy, orfrequency) and forward these measured values to networkcontrol systems (SCADA, DMS, EMS etc.) via IEC 60870-5-104 orto automation systems via Modbus where they can be furtherprocessed and visualized.
Device type DIN rail mounting devicePlastic case 96 mm × 96 mm × 100 mm/ 3.78in. x 3.78 in. x 3.94 in. (W×H×D)Degree of protection IP20
Supply voltage DC 24 to 250 VAC 110 to 230 V; 45 to 65 Hz
Input and outputcircuits
4 inputs for alternating voltage measurements3 inputs for alternating current measurementsup to 10 A continuous currentIndividually programmable binary outputsJe 6 Binäreingänge und -ausgänge mitSICAM I/O Unit erweiterbar
Signalization LEDs To automatically monitor the functions ofhardware, software, and firmware components
Communication Ethernet: IEC 60870-5-104 or Modbus TCPcommunication protocol
Benefits• Compact and rugged design• Over 100 measured or calculated values available• Temperature range: -25 °C to +55 °C / -13 °F to 131 °F• Measuring accuracy: 0.1 % deviation for rated input voltage
and rated input current according to IEC 60688 and 0.2 saccording to IEC 62053-21
• High EMC immunity: according to the requirements ofEN 61000-62 and EN 61000-6-4 for the EMC directives andthe requirements of EN 61010-1 for the lowvoltage directive
• UL certification according to UL 61010-1 standard• Flexible current measuring range (up to 2 x In)
• 2 individual binary outputs for fast switching, indications (forexample, limit violation) and operation status monitoring
• Ethernet communication via IEC 60870-5-104 or Modbus TCPprotocols
• Internal battery to power the real-time clock and save theenergy counter values in case of auxiliary-voltage failure
• Real-time clock (RTC), field bus synchronization or networksynchronization possible via NTP
Customer Benefit• Reliable and cost-efficient support of power system manage-
ment and planning by measurements from distributionsystems
• Reduced cabling through Ethernet
• Real-time data transmission via mobile communications (forexample GPRS, UMTS) through reduced data rate
• User-friendly operation through Web server (no extra soft-ware for parameterization needed, no converters and extracables)
Applications• Equipping secondary substations with measurement instru-
mentation and communication link• SICAM MMU is used at power utilities as well as industrial and
commercial applications connection in 1-phase systems, in 3-wire and 4-wire systems
• Support of the integration of online measurements intonetwork control systems and automation systems, protocolsvia IEC 60870-5-104 or Modbus TCP, for example for voltageand load control
• Monitoring of transformers and distributed power generation• Alarming and notification of limit violations via protocol or
binary outputs• Basic power quality profile monitoring (voltage, frequency,
harmonics and unbalance)• Option to support all power systems IT, TT and TN
[ph_SICAM MMU SR10-001, 2, --_--]
Figure 3.2/1 SICAM MMU
Power MetersSICAM MMU – Description
SICAM ⋅ Power Quality and Measurement ⋅ Katalog ⋅ Edition 6.0 85
3.2
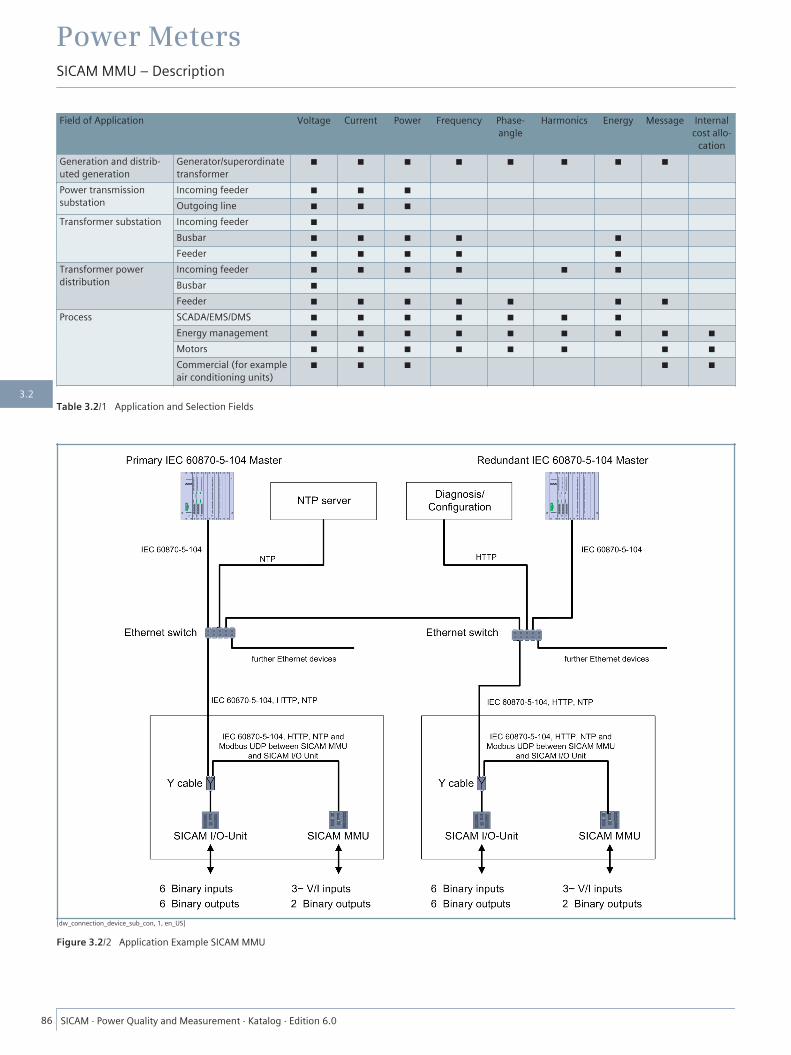
Field of Application Voltage Current Power Frequency Phase-angle
Harmonics Energy Message Internalcost allo-
cationGeneration and distrib-uted generation
Generator/superordinatetransformer
■ ■ ■ ■ ■ ■ ■ ■
Power transmissionsubstation
Incoming feeder ■ ■ ■Outgoing line ■ ■ ■
Transformer substation Incoming feeder ■Busbar ■ ■ ■ ■ ■Feeder ■ ■ ■ ■ ■
Transformer powerdistribution
Incoming feeder ■ ■ ■ ■ ■ ■Busbar ■Feeder ■ ■ ■ ■ ■ ■ ■
Process SCADA/EMS/DMS ■ ■ ■ ■ ■ ■ ■Energy management ■ ■ ■ ■ ■ ■ ■ ■ ■Motors ■ ■ ■ ■ ■ ■ ■ ■Commercial (for exampleair conditioning units)
■ ■ ■ ■ ■
Table 3.2/1 Application and Selection Fields
[dw_connection_device_sub_con, 1, en_US]
Figure 3.2/2 Application Example SICAM MMU
Power MetersSICAM MMU – Description
86 SICAM ⋅ Power Quality and Measurement ⋅ Katalog ⋅ Edition 6.0
3.2
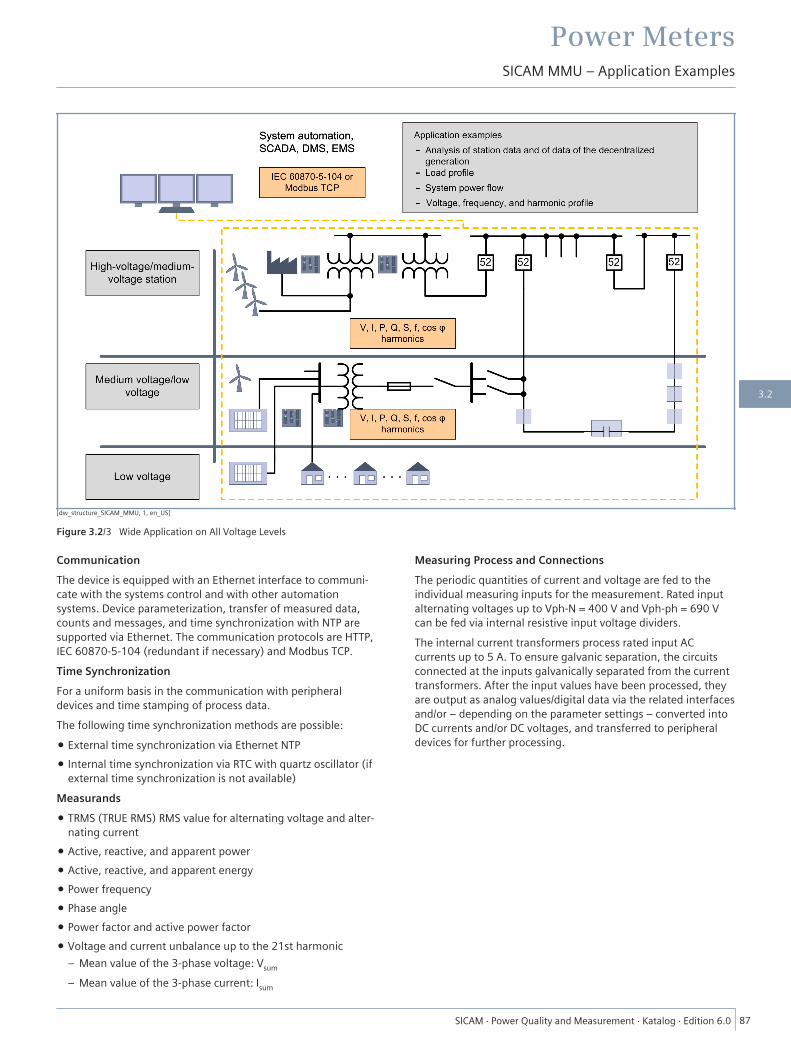
[dw_structure_SICAM_MMU, 1, en_US]
Figure 3.2/3 Wide Application on All Voltage Levels
CommunicationThe device is equipped with an Ethernet interface to communi-cate with the systems control and with other automationsystems. Device parameterization, transfer of measured data,counts and messages, and time synchronization with NTP aresupported via Ethernet. The communication protocols are HTTP,IEC 60870-5-104 (redundant if necessary) and Modbus TCP.Time SynchronizationFor a uniform basis in the communication with peripheraldevices and time stamping of process data.The following time synchronization methods are possible:
• External time synchronization via Ethernet NTP• Internal time synchronization via RTC with quartz oscillator (if
external time synchronization is not available)Measurands• TRMS (TRUE RMS) RMS value for alternating voltage and alter-
nating current• Active, reactive, and apparent power• Active, reactive, and apparent energy• Power frequency• Phase angle• Power factor and active power factor• Voltage and current unbalance up to the 21st harmonic
– Mean value of the 3-phase voltage: Vsum
– Mean value of the 3-phase current: Isum
Measuring Process and ConnectionsThe periodic quantities of current and voltage are fed to theindividual measuring inputs for the measurement. Rated inputalternating voltages up to Vph-N = 400 V and Vph-ph = 690 Vcan be fed via internal resistive input voltage dividers.The internal current transformers process rated input ACcurrents up to 5 A. To ensure galvanic separation, the circuitsconnected at the inputs galvanically separated from the currenttransformers. After the input values have been processed, theyare output as analog values/digital data via the related interfacesand/or – depending on the parameter settings – converted intoDC currents and/or DC voltages, and transferred to peripheraldevices for further processing.
Power MetersSICAM MMU – Application Examples
SICAM ⋅ Power Quality and Measurement ⋅ Katalog ⋅ Edition 6.0 87
3.2

Measurand MeasuringCircuit
1-PhaseSystem
3-Wire Network (Delta) 4-Wire Ntwork (Star)Same Load (1I) Any Load (3I) Any Load (2I) Same Load (1I) Any Load (3I)
Alternating voltage Va a-N ■ ■ ■Vb b-N ■Vc c-N ■Vab,Vbc,,Vca a-b, b-c, c-a ■ ■ ■ ■VN a, b, c ■Vsum a, b, c ΣVL/3 ΣVL/3 ΣVL/3 a-N ΣVL/3Vasym a-b, b-c, c-a ■ ■ ■ ■
AC current Ia a ■ ■ ■ ■ ■ ■Ib, Ic b, c ■ ■ ■IN a, b, c ■ ■Isum a, b, c ■ ■ ΣVL/3Iasym a, b, c ■ ■ ■
Active power factor cos φ (a) a ■ ■cos φ (b), cos φ (c) b,c ■cos φ a, b, c ■ ■ ■ ■ ■
Power factor PFa a ■ ■PFb, PFc b, c ■PF a, b, c ■ ■ ■ ■ ■
Phase angle φa a ■ ■φb, φc b, c ■φ a, b, c ■ ■ ■ ■ ■
Angle between phase-to-ground voltages
φab a-b ■φac a-c ■
Frequency f a, b, c ■ ■ ■ ■ ■ ■Active power Pa a ■ ■
Pb, Pc b, c ■P a, b, c ■ ■ ■ ■ ■
Reactive power Qa a ■ ■Qb, Qc b, c ■Q a, b, c ■ ■ ■ ■ ■
Apparent power Sa a ■ ■Sb, Sc b, c ■S a, b, c ■ ■ ■ ■ ■
Active energy – supply WPa supply a ■ ■WPb supply, WPc supply b, c ■WPsupply a, b, c ■ ■ ■ ■ ■
Active energy –import
WPa import a ■ ■WPb import, WPc import b, c ■WPimport a, b, c ■ ■ ■ ■ ■
Reactive energy –inductive
WQa inductive a ■ ■WQb inductive, WQc
inductive
b, c ■
WQinductive a, b, c ■ ■ ■ ■ ■Reactive energy –capacitive
WQa capacitive a ■ ■WQb capacitive, WQc
capacitive
b, c ■
WQcapacitive a, b, c ■ ■ ■ ■ ■
Power MetersSICAM MMU – Measurands
88 SICAM ⋅ Power Quality and Measurement ⋅ Katalog ⋅ Edition 6.0
3.2

Measurand MeasuringCircuit
1-PhaseSystem
3-Wire Network (Delta) 4-Wire Ntwork (Star)Same Load (1I) Any Load (3I) Any Load (2I) Same Load (1I) Any Load (3I)
Apparent energy WSa a ■ ■WSb, WSc b, c ■WS a, b, c ■ ■ ■ ■ ■
Harmonic voltage HVa a-N ■ ■ ■HVb b-N ■HVc c-N ■
Harmonic current HIa a ■ ■ ■ ■ ■ ■HIb b ■ ■ ■HIc c ■ ■ ■
Table 3.2/2 Measurands Corresponding to the Connection Type: Power Values in Networks
Power MetersSICAM MMU – Measurands
SICAM ⋅ Power Quality and Measurement ⋅ Katalog ⋅ Edition 6.0 89
3.2
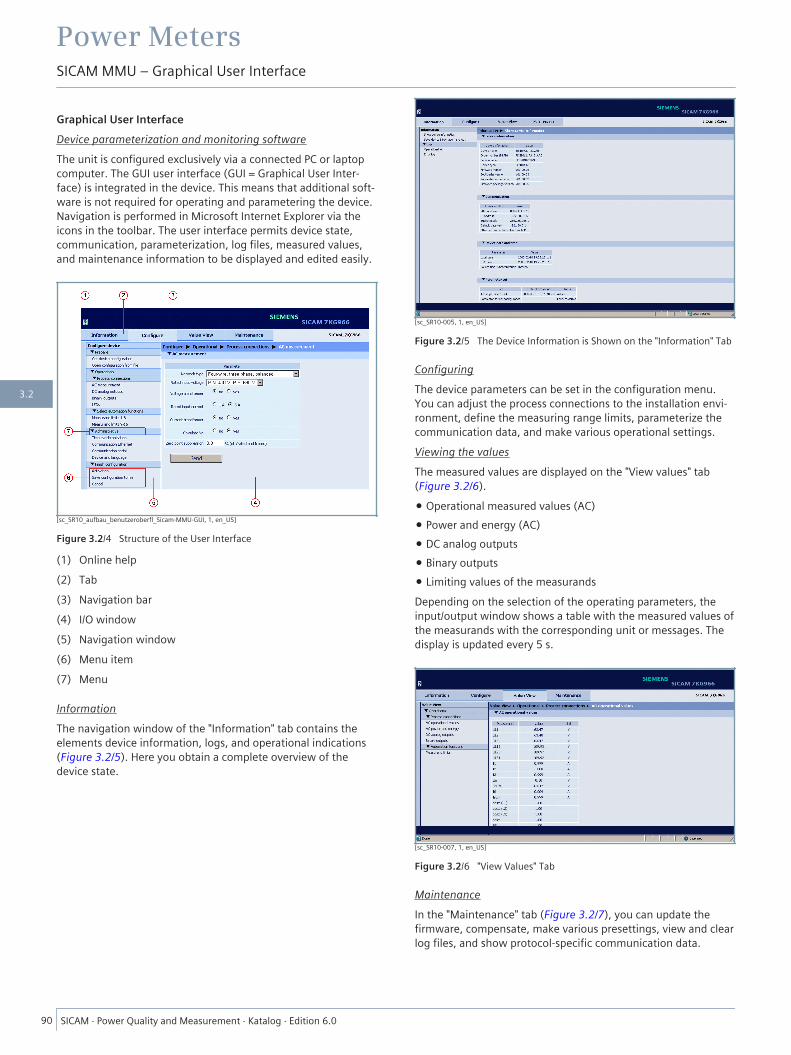
Graphical User InterfaceDevice parameterization and monitoring softwareThe unit is configured exclusively via a connected PC or laptopcomputer. The GUI user interface (GUI = Graphical User Inter-face) is integrated in the device. This means that additional soft-ware is not required for operating and parametering the device.Navigation is performed in Microsoft Internet Explorer via theicons in the toolbar. The user interface permits device state,communication, parameterization, log files, measured values,and maintenance information to be displayed and edited easily.
[sc_SR10_aufbau_benutzeroberfl_Sicam-MMU-GUI, 1, en_US]
Figure 3.2/4 Structure of the User Interface
(1) Online help(2) Tab(3) Navigation bar(4) I/O window(5) Navigation window(6) Menu item(7) Menu
InformationThe navigation window of the "Information" tab contains theelements device information, logs, and operational indications(Figure 3.2/5). Here you obtain a complete overview of thedevice state.
[sc_SR10-005, 1, en_US]
Figure 3.2/5 The Device Information is Shown on the "Information" Tab
ConfiguringThe device parameters can be set in the configuration menu.You can adjust the process connections to the installation envi-ronment, define the measuring range limits, parameterize thecommunication data, and make various operational settings.Viewing the valuesThe measured values are displayed on the "View values" tab(Figure 3.2/6).
• Operational measured values (AC)• Power and energy (AC)• DC analog outputs• Binary outputs• Limiting values of the measurandsDepending on the selection of the operating parameters, theinput/output window shows a table with the measured values ofthe measurands with the corresponding unit or messages. Thedisplay is updated every 5 s.
[sc_SR10-007, 1, en_US]
Figure 3.2/6 "View Values" Tab
MaintenanceIn the "Maintenance" tab (Figure 3.2/7), you can update thefirmware, compensate, make various presettings, view and clearlog files, and show protocol-specific communication data.
Power MetersSICAM MMU – Graphical User Interface
90 SICAM ⋅ Power Quality and Measurement ⋅ Katalog ⋅ Edition 6.0
3.2
[sc_SR10-008, 1, en_US]
Figure 3.2/7 "Maintenance" Tab
Power MetersSICAM MMU – Graphical User Interface
SICAM ⋅ Power Quality and Measurement ⋅ Katalog ⋅ Edition 6.0 91
3.2
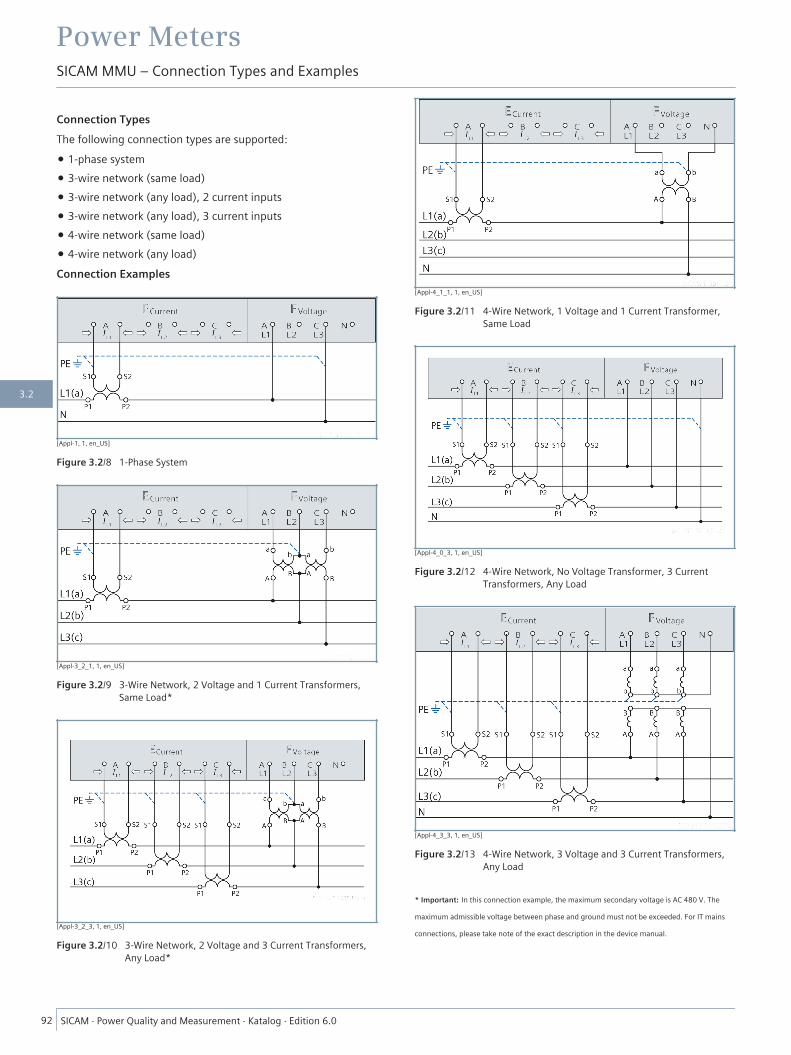
Connection TypesThe following connection types are supported:
• 1-phase system• 3-wire network (same load)• 3-wire network (any load), 2 current inputs• 3-wire network (any load), 3 current inputs• 4-wire network (same load)• 4-wire network (any load)Connection Examples
[Appl-1, 1, en_US]
Figure 3.2/8 1-Phase System
[Appl-3_2_1, 1, en_US]
Figure 3.2/9 3-Wire Network, 2 Voltage and 1 Current Transformers,Same Load*
[Appl-3_2_3, 1, en_US]
Figure 3.2/10 3-Wire Network, 2 Voltage and 3 Current Transformers,Any Load*
[Appl-4_1_1, 1, en_US]
Figure 3.2/11 4-Wire Network, 1 Voltage and 1 Current Transformer,Same Load
[Appl-4_0_3, 1, en_US]
Figure 3.2/12 4-Wire Network, No Voltage Transformer, 3 CurrentTransformers, Any Load
[Appl-4_3_3, 1, en_US]
Figure 3.2/13 4-Wire Network, 3 Voltage and 3 Current Transformers,Any Load
* Important: In this connection example, the maximum secondary voltage is AC 480 V. The
maximum admissible voltage between phase and ground must not be exceeded. For IT mains
connections, please take note of the exact description in the device manual.
Power MetersSICAM MMU – Connection Types and Examples
92 SICAM ⋅ Power Quality and Measurement ⋅ Katalog ⋅ Edition 6.0
3.2
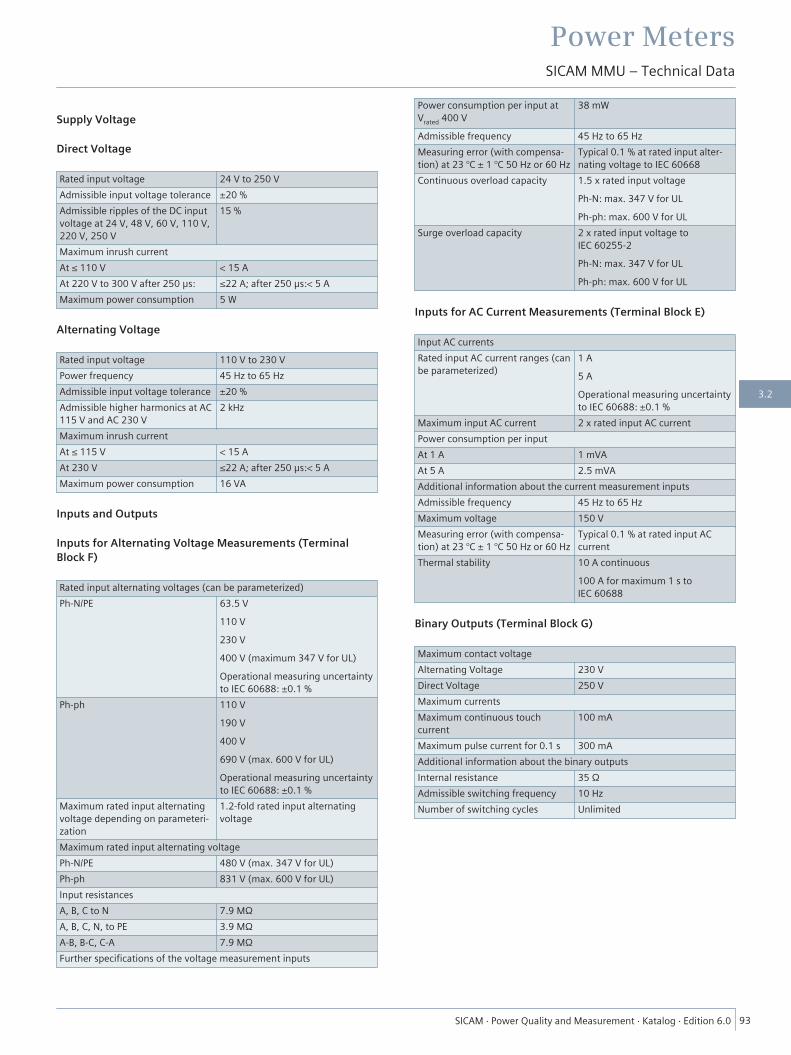
Supply Voltage
Direct Voltage
Rated input voltage 24 V to 250 VAdmissible input voltage tolerance ±20 %Admissible ripples of the DC inputvoltage at 24 V, 48 V, 60 V, 110 V,220 V, 250 V
15 %
Maximum inrush currentAt ≤ 110 V < 15 AAt 220 V to 300 V after 250 μs: ≤22 A; after 250 μs:< 5 AMaximum power consumption 5 W
Alternating Voltage
Rated input voltage 110 V to 230 VPower frequency 45 Hz to 65 HzAdmissible input voltage tolerance ±20 %Admissible higher harmonics at AC115 V and AC 230 V
2 kHz
Maximum inrush currentAt ≤ 115 V < 15 AAt 230 V ≤22 A; after 250 μs:< 5 AMaximum power consumption 16 VA
Inputs and Outputs
Inputs for Alternating Voltage Measurements (TerminalBlock F)
Rated input alternating voltages (can be parameterized)Ph-N/PE 63.5 V
110 V230 V400 V (maximum 347 V for UL)Operational measuring uncertaintyto IEC 60688: ±0.1 %
Ph-ph 110 V190 V400 V690 V (max. 600 V for UL)Operational measuring uncertaintyto IEC 60688: ±0.1 %
Maximum rated input alternatingvoltage depending on parameteri-zation
1.2-fold rated input alternatingvoltage
Maximum rated input alternating voltagePh-N/PE 480 V (max. 347 V for UL)Ph-ph 831 V (max. 600 V for UL)Input resistancesA, B, C to N 7.9 MΩA, B, C, N, to PE 3.9 MΩA-B, B-C, C-A 7.9 MΩFurther specifications of the voltage measurement inputs
Power consumption per input atVrated 400 V
38 mW
Admissible frequency 45 Hz to 65 HzMeasuring error (with compensa-tion) at 23 °C ± 1 °C 50 Hz or 60 Hz
Typical 0.1 % at rated input alter-nating voltage to IEC 60668
Continuous overload capacity 1.5 x rated input voltagePh-N: max. 347 V for ULPh-ph: max. 600 V for UL
Surge overload capacity 2 x rated input voltage toIEC 60255-2Ph-N: max. 347 V for ULPh-ph: max. 600 V for UL
Inputs for AC Current Measurements (Terminal Block E)
Input AC currentsRated input AC current ranges (canbe parameterized)
1 A5 AOperational measuring uncertaintyto IEC 60688: ±0.1 %
Maximum input AC current 2 x rated input AC currentPower consumption per inputAt 1 A 1 mVAAt 5 A 2.5 mVAAdditional information about the current measurement inputsAdmissible frequency 45 Hz to 65 HzMaximum voltage 150 VMeasuring error (with compensa-tion) at 23 °C ± 1 °C 50 Hz or 60 Hz
Typical 0.1 % at rated input ACcurrent
Thermal stability 10 A continuous100 A for maximum 1 s toIEC 60688
Binary Outputs (Terminal Block G)
Maximum contact voltageAlternating Voltage 230 VDirect Voltage 250 VMaximum currentsMaximum continuous touchcurrent
100 mA
Maximum pulse current for 0.1 s 300 mAAdditional information about the binary outputsInternal resistance 35 ΩAdmissible switching frequency 10 HzNumber of switching cycles Unlimited
Power MetersSICAM MMU – Technical Data
SICAM ⋅ Power Quality and Measurement ⋅ Katalog ⋅ Edition 6.0 93
3.2
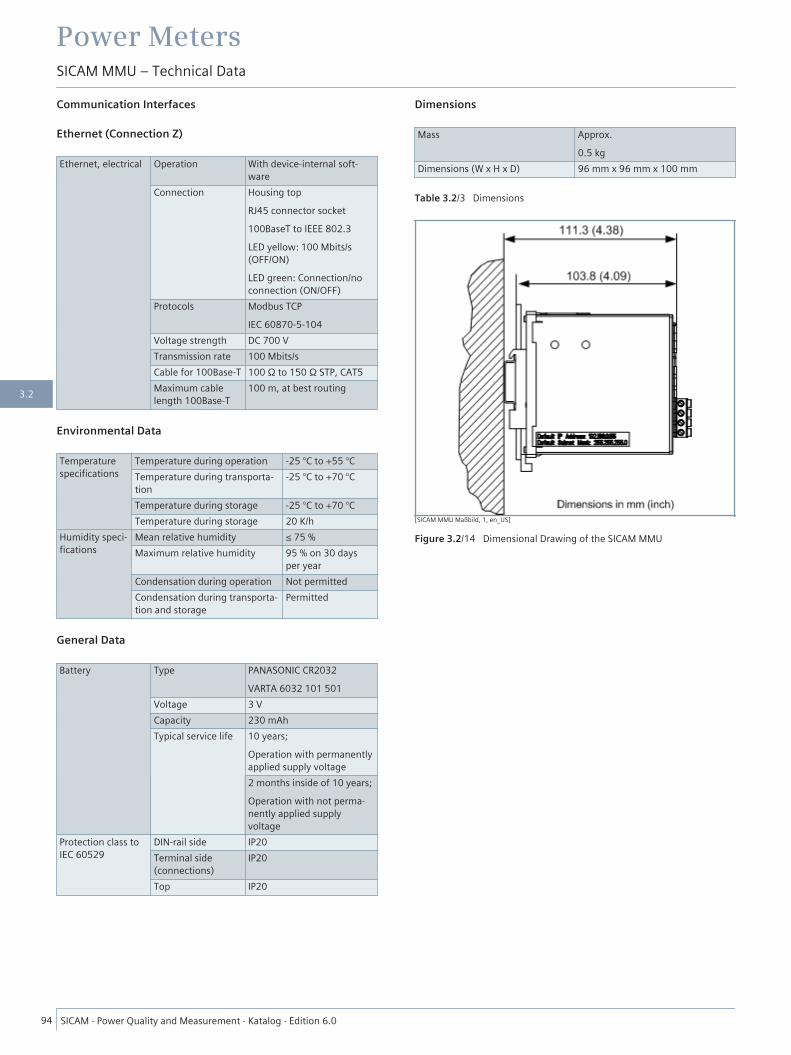
Communication Interfaces
Ethernet (Connection Z)
Ethernet, electrical Operation With device-internal soft-ware
Connection Housing topRJ45 connector socket100BaseT to IEEE 802.3LED yellow: 100 Mbits/s(OFF/ON)LED green: Connection/noconnection (ON/OFF)
Protocols Modbus TCPIEC 60870-5-104
Voltage strength DC 700 VTransmission rate 100 Mbits/sCable for 100Base-T 100 Ω to 150 Ω STP, CAT5Maximum cablelength 100Base-T
100 m, at best routing
Environmental Data
Temperaturespecifications
Temperature during operation -25 °C to +55 °CTemperature during transporta-tion
-25 °C to +70 °C
Temperature during storage -25 °C to +70 °CTemperature during storage 20 K/h
Humidity speci-fications
Mean relative humidity ≤ 75 %Maximum relative humidity 95 % on 30 days
per yearCondensation during operation Not permittedCondensation during transporta-tion and storage
Permitted
General Data
Battery Type PANASONIC CR2032VARTA 6032 101 501
Voltage 3 VCapacity 230 mAhTypical service life 10 years;
Operation with permanentlyapplied supply voltage2 months inside of 10 years;Operation with not perma-nently applied supplyvoltage
Protection class toIEC 60529
DIN-rail side IP20Terminal side(connections)
IP20
Top IP20
Dimensions
Mass Approx.0.5 kg
Dimensions (W x H x D) 96 mm x 96 mm x 100 mm
Table 3.2/3 Dimensions
[SICAM MMU Maßbild, 1, en_US]
Figure 3.2/14 Dimensional Drawing of the SICAM MMU
Power MetersSICAM MMU – Technical Data
94 SICAM ⋅ Power Quality and Measurement ⋅ Katalog ⋅ Edition 6.0
3.2
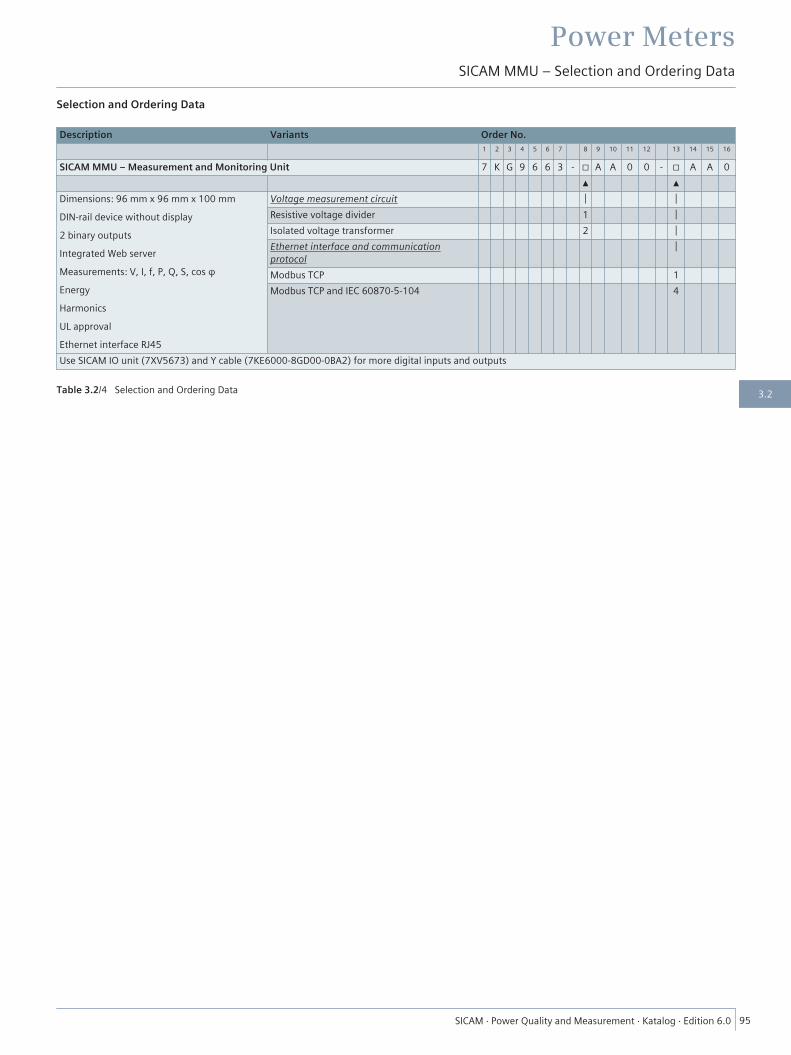
Selection and Ordering Data
Description Variants Order No.1 2 3 4 5 6 7 8 9 10 11 12 13 14 15 16
SICAM MMU – Measurement and Monitoring Unit 7 K G 9 6 6 3 - □ A A 0 0 - □ A A 0▲ ▲
Dimensions: 96 mm x 96 mm x 100 mmDIN-rail device without display2 binary outputsIntegrated Web serverMeasurements: V, I, f, P, Q, S, cos φEnergyHarmonicsUL approvalEthernet interface RJ45
Voltage measurement circuit │ │Resistive voltage divider 1 │Isolated voltage transformer 2 │Ethernet interface and communicationprotocol
│
Modbus TCP 1Modbus TCP and IEC 60870-5-104 4
Use SICAM IO unit (7XV5673) and Y cable (7KE6000-8GD00-0BA2) for more digital inputs and outputs
Table 3.2/4 Selection and Ordering Data
Power MetersSICAM MMU – Selection and Ordering Data
SICAM ⋅ Power Quality and Measurement ⋅ Katalog ⋅ Edition 6.0 95
3.2
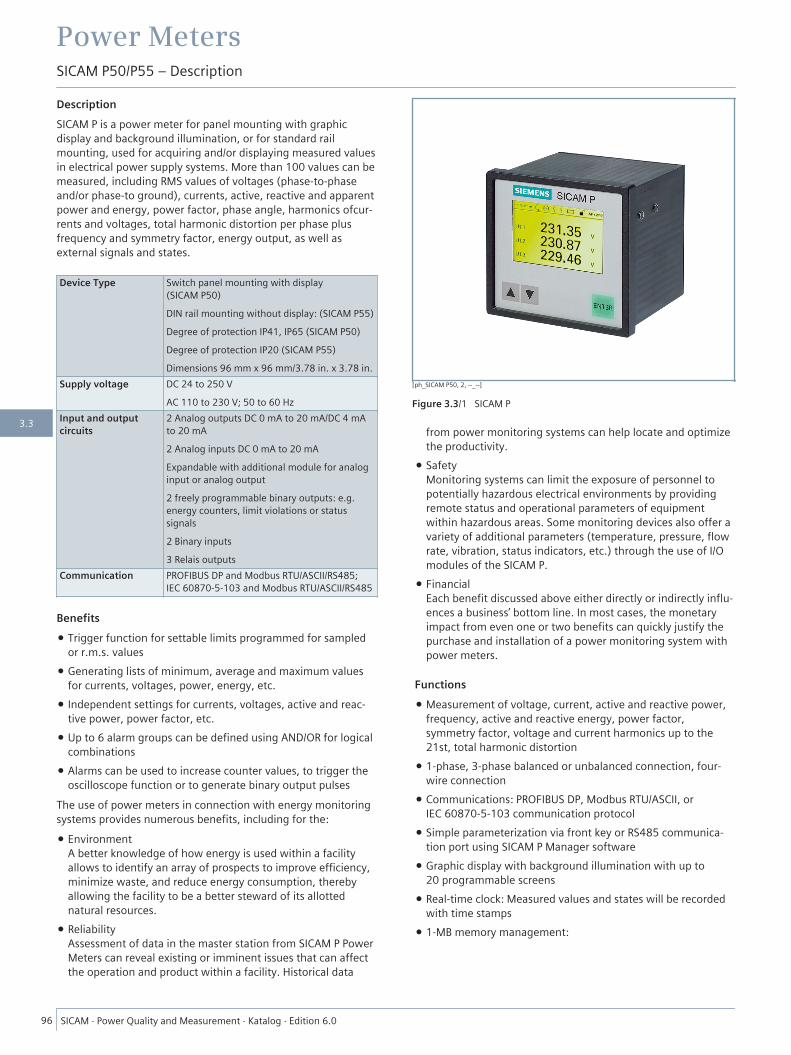
DescriptionSICAM P is a power meter for panel mounting with graphicdisplay and background illumination, or for standard railmounting, used for acquiring and/or displaying measured valuesin electrical power supply systems. More than 100 values can bemeasured, including RMS values of voltages (phase-to-phaseand/or phase-to ground), currents, active, reactive and apparentpower and energy, power factor, phase angle, harmonics ofcur-rents and voltages, total harmonic distortion per phase plusfrequency and symmetry factor, energy output, as well asexternal signals and states.
Device Type Switch panel mounting with display(SICAM P50)DIN rail mounting without display: (SICAM P55)Degree of protection IP41, IP65 (SICAM P50)Degree of protection IP20 (SICAM P55)Dimensions 96 mm x 96 mm/3.78 in. x 3.78 in.
Supply voltage DC 24 to 250 VAC 110 to 230 V; 50 to 60 Hz
Input and outputcircuits
2 Analog outputs DC 0 mA to 20 mA/DC 4 mAto 20 mA2 Analog inputs DC 0 mA to 20 mAExpandable with additional module for analoginput or analog output2 freely programmable binary outputs: e.g.energy counters, limit violations or statussignals2 Binary inputs3 Relais outputs
Communication PROFIBUS DP and Modbus RTU/ASCII/RS485;IEC 60870-5-103 and Modbus RTU/ASCII/RS485
Benefits• Trigger function for settable limits programmed for sampled
or r.m.s. values• Generating lists of minimum, average and maximum values
for currents, voltages, power, energy, etc.• Independent settings for currents, voltages, active and reac-
tive power, power factor, etc.• Up to 6 alarm groups can be defined using AND/OR for logical
combinations• Alarms can be used to increase counter values, to trigger the
oscilloscope function or to generate binary output pulsesThe use of power meters in connection with energy monitoringsystems provides numerous benefits, including for the:
• EnvironmentA better knowledge of how energy is used within a facilityallows to identify an array of prospects to improve efficiency,minimize waste, and reduce energy consumption, therebyallowing the facility to be a better steward of its allottednatural resources.
• ReliabilityAssessment of data in the master station from SICAM P PowerMeters can reveal existing or imminent issues that can affectthe operation and product within a facility. Historical data
from power monitoring systems can help locate and optimizethe productivity.
• SafetyMonitoring systems can limit the exposure of personnel topotentially hazardous electrical environments by providingremote status and operational parameters of equipmentwithin hazardous areas. Some monitoring devices also offer avariety of additional parameters (temperature, pressure, flowrate, vibration, status indicators, etc.) through the use of I/Omodules of the SICAM P.
• FinancialEach benefit discussed above either directly or indirectly influ-ences a business’ bottom line. In most cases, the monetaryimpact from even one or two benefits can quickly justify thepurchase and installation of a power monitoring system withpower meters.
Functions• Measurement of voltage, current, active and reactive power,
frequency, active and reactive energy, power factor,symmetry factor, voltage and current harmonics up to the21st, total harmonic distortion
• 1-phase, 3-phase balanced or unbalanced connection, four-wire connection
• Communications: PROFIBUS DP, Modbus RTU/ASCII, orIEC 60870-5-103 communication protocol
• Simple parameterization via front key or RS485 communica-tion port using SICAM P Manager software
• Graphic display with background illumination with up to20 programmable screens
• Real-time clock: Measured values and states will be recordedwith time stamps
• 1-MB memory management:
[ph_SICAM P50, 2, --_--]
Figure 3.3/1 SICAM P
Power MetersSICAM P50/P55 – Description
96 SICAM ⋅ Power Quality and Measurement ⋅ Katalog ⋅ Edition 6.0
3.3

• Recording and display of limit value violations and log entries• Battery: Recordings like limit value violations or energy
counter values stay safely in the memory up to 3 months incase of a blackout
Measuring FunctionsMeasured input voltages and input currents are sampled forcalculation of the corresponding RMS values. All parametersderived from the measured values are calculated by a processor.They can be displayed on the screens and/or transmitted via theserial interface. Measurement of voltage, current, active andreactive power, frequency, active and reactive energy, powerfactor, symmetry factor, voltage, and current harmonics up tothe 21st, total harmonic distortion are available. With theSICAM P it is also possible to define several limit value groupswith different limit values for the measured parameters. Thesecan be combined with logical elements, such as AND, OR. Viola-tions are counted and indicated on the screen or made availableat the binary outputs. Triggering of the oscilloscope is possibleas well.
ApplicationsPower-monitoring systems with SICAM P, a permanentlyinstalled system, enables continuous logging of energy-relateddata and provides information on operational characteristics ofelectrical systems. SICAM P helps identify sources of energyconsumption and time of peak consumption. This knowledgeallows to allocate and reduce energy costs. The major applica-tion area is power monitoring and recording at MV and LV level.The major information types are measured values, alarms, andstatus information.The input modules work with external signals with a measure-ment range of DC 0 mA to 20 mA. Mean values of all externalanalog channels as well as states of digital channels can berecorded and saved into the memory. All recorded quantitiesand binary state information can be “read out” and evaluatedwith the configuration software SICAM P Manager. Outputmodules can be used for conversion of any electrical quantity(current, voltage, etc.) into a DC 0 mA to 20 mA/4 mA to 20 mAoutput signal, generation of impulses for metering, indication oflimit value violations, as well as for switching operations.Application Example 1SICAM P as flush-mounting device (Figure 3.3/2) for direct indi-cation of the electrical energy. Easiest parameterization enableseach user to customize the measured-values representation asrequired.
[ph_SICAM P, 1, --_--]
Figure 3.3/2 SICAM P
Application Example 2SICAM P as flush-mounting device or plug-on device to be usedon a process bus (Figure 3.3/3). An integrated RS485 interfacewith the PROFIBUS DP standard protocol and the Modbus RTU/ASCII communication protocol permit easy integration intonetworks. In addition, SICAM P50 with the IEC 60870-5-103standard protocol can be integrated into communicationnetworks. This permits measured values from several SICAM Punits to be displayed, evaluated and processed centrally in amaster station. The main field of application is the integration astransducers into PLC systems.
[dw_SICAM P Processbus, 1, en_US]
Figure 3.3/3 SICAM P with PROFIBUS DP, Modbus, and IEC 60870-5-103
Application Example 3A snap-on kit is available to install SICAM P on a 35-mm DIN rail.Parameterization of the device requires the parameterizationsoftware (Figure 3.3/4).
Power MetersSICAM P50/P55 – Description
SICAM ⋅ Power Quality and Measurement ⋅ Katalog ⋅ Edition 6.0 97
3.3
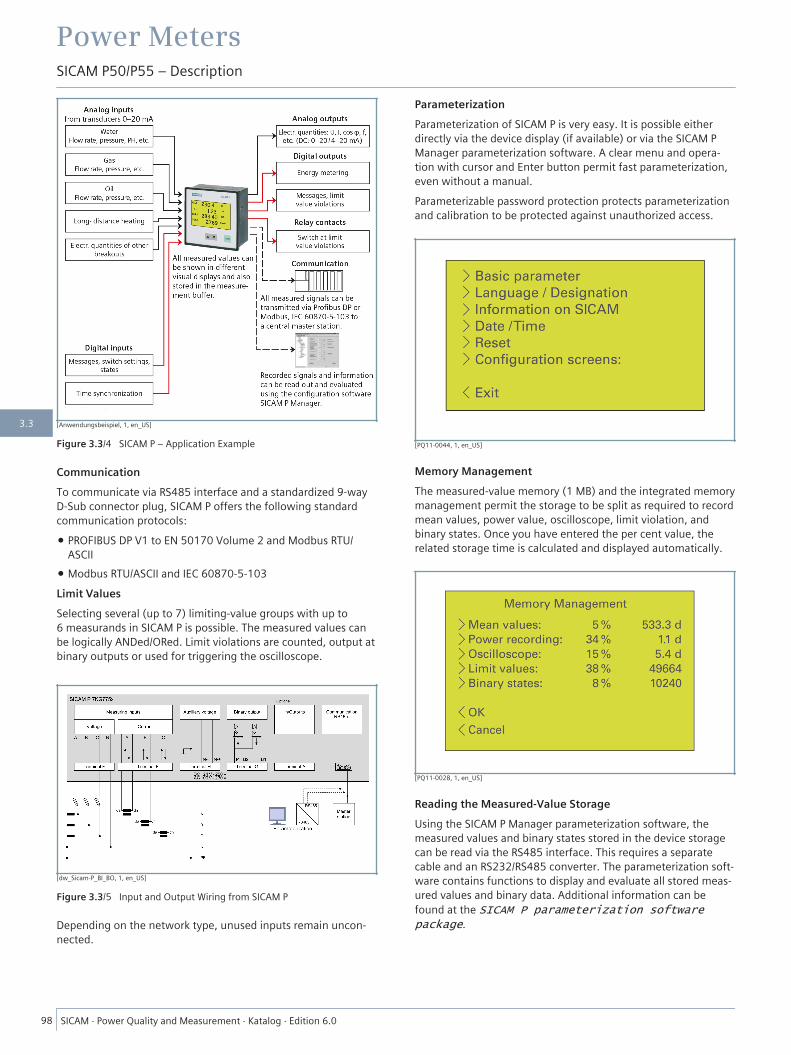
[Anwendungsbeispiel, 1, en_US]
Figure 3.3/4 SICAM P – Application Example
CommunicationTo communicate via RS485 interface and a standardized 9-wayD-Sub connector plug, SICAM P offers the following standardcommunication protocols:
• PROFIBUS DP V1 to EN 50170 Volume 2 and Modbus RTU/ASCII
• Modbus RTU/ASCII and IEC 60870-5-103Limit ValuesSelecting several (up to 7) limiting-value groups with up to6 measurands in SICAM P is possible. The measured values canbe logically ANDed/ORed. Limit violations are counted, output atbinary outputs or used for triggering the oscilloscope.
[dw_Sicam-P_BI_BO, 1, en_US]
Figure 3.3/5 Input and Output Wiring from SICAM P
Depending on the network type, unused inputs remain uncon-nected.
ParameterizationParameterization of SICAM P is very easy. It is possible eitherdirectly via the device display (if available) or via the SICAM PManager parameterization software. A clear menu and opera-tion with cursor and Enter button permit fast parameterization,even without a manual.Parameterizable password protection protects parameterizationand calibration to be protected against unauthorized access.
[PQ11-0044, 1, en_US]
Memory ManagementThe measured-value memory (1 MB) and the integrated memorymanagement permit the storage to be split as required to recordmean values, power value, oscilloscope, limit violation, andbinary states. Once you have entered the per cent value, therelated storage time is calculated and displayed automatically.
[PQ11-0028, 1, en_US]
Reading the Measured-Value StorageUsing the SICAM P Manager parameterization software, themeasured values and binary states stored in the device storagecan be read via the RS485 interface. This requires a separatecable and an RS232/RS485 converter. The parameterization soft-ware contains functions to display and evaluate all stored meas-ured values and binary data. Additional information can befound at the SICAM P parameterization softwarepackage.
Power MetersSICAM P50/P55 – Description
98 SICAM ⋅ Power Quality and Measurement ⋅ Katalog ⋅ Edition 6.0
3.3

Display and ScreensYou can structure the representation of all measurands on theSICAM P display individually. Using the front buttons, you candefine and select up to 20 screens on the display. Changingscreens is possible in manual or in automatic operation. Unam-biguous names and menu-controlled settings ensure easy andswift operation of the SICAM P screens.Number, type, contents, and sequence of the screens can beparameterized as required. For example:
• 2, 3, 4, or 6 measured values on a screen• A list screen for minimum, mean, and maximum values• Screens for harmonics• Screen as phasor (vector) diagramSICAM P is preset at delivery. A status bar in the measured-valuescreens shows the status and the interface and diagnosismessages of SICAM P. The display is updated every second.
Typical Measured-Value Displays (Screens)
[PQ11-0037, 1, en_US]
Figure 3.3/6 3-Phase Screen Values – V, I, cos φ
[PQ11-0036, 1, en_US]
Figure 3.3/7 Digital Screen Values – 3 Measured Values – Digital/Analog
[PQ11-0035, 1, --_--]
Figure 3.3/8 Digital/Analog Screen – 4 Measured Values – Digital
[PQ11-0033, 1, --_--]
Figure 3.3/9 Digital Screen Values – 2 Measured Values – Digital
Power MetersSICAM P50/P55 – Display and Screens
SICAM ⋅ Power Quality and Measurement ⋅ Katalog ⋅ Edition 6.0 99
3.3
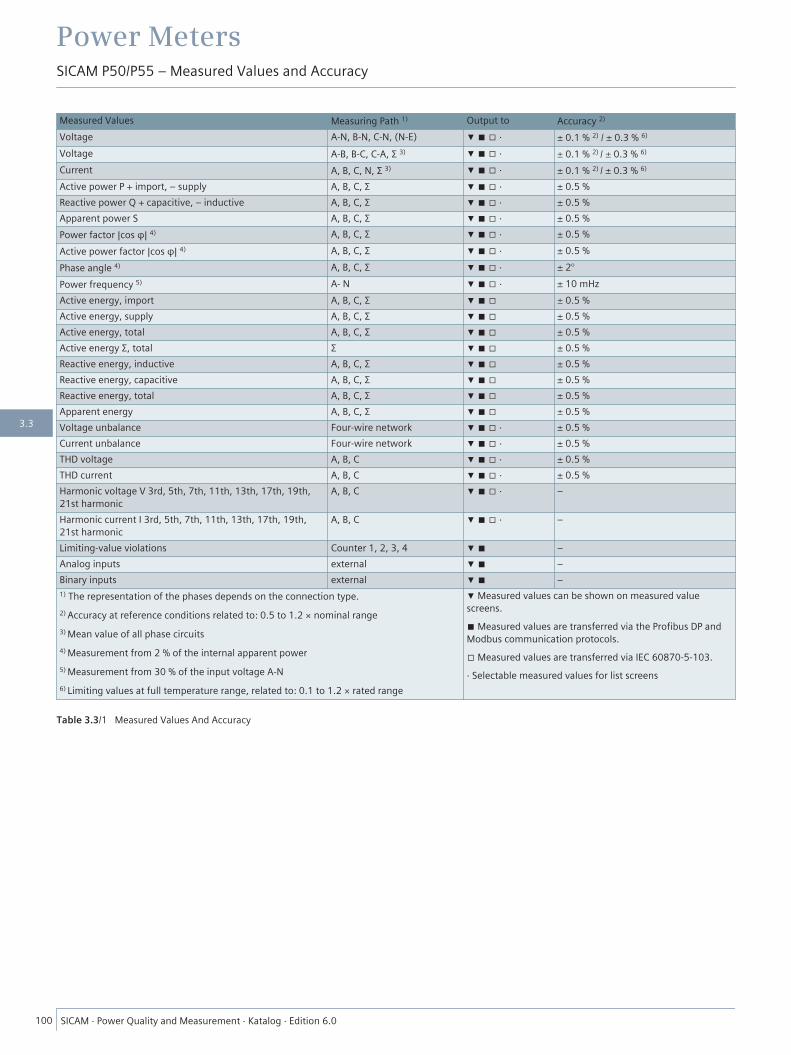
Measured Values Measuring Path 1) Output to Accuracy 2)
Voltage A-N, B-N, C-N, (N-E) ▼ ■ □ ∙ ± 0.1 % 2) / ± 0.3 % 6)
Voltage A-B, B-C, C-A, Σ 3) ▼ ■ □ ∙ ± 0.1 % 2) / ± 0.3 % 6)
Current A, B, C, N, Σ 3) ▼ ■ □ ∙ ± 0.1 % 2) / ± 0.3 % 6)
Active power P + import, – supply A, B, C, Σ ▼ ■ □ ∙ ± 0.5 %Reactive power Q + capacitive, – inductive A, B, C, Σ ▼ ■ □ ∙ ± 0.5 %Apparent power S A, B, C, Σ ▼ ■ □ ∙ ± 0.5 %Power factor |cos φ| 4) A, B, C, Σ ▼ ■ □ ∙ ± 0.5 %Active power factor |cos φ| 4) A, B, C, Σ ▼ ■ □ ∙ ± 0.5 %Phase angle 4) A, B, C, Σ ▼ ■ □ ∙ ± 2°Power frequency 5) A- N ▼ ■ □ ∙ ± 10 mHzActive energy, import A, B, C, Σ ▼ ■ □ ± 0.5 %Active energy, supply A, B, C, Σ ▼ ■ □ ± 0.5 %Active energy, total A, B, C, Σ ▼ ■ □ ± 0.5 %Active energy Σ, total Σ ▼ ■ □ ± 0.5 %Reactive energy, inductive A, B, C, Σ ▼ ■ □ ± 0.5 %Reactive energy, capacitive A, B, C, Σ ▼ ■ □ ± 0.5 %Reactive energy, total A, B, C, Σ ▼ ■ □ ± 0.5 %Apparent energy A, B, C, Σ ▼ ■ □ ± 0.5 %Voltage unbalance Four-wire network ▼ ■ □ ∙ ± 0.5 %Current unbalance Four-wire network ▼ ■ □ ∙ ± 0.5 %THD voltage A, B, C ▼ ■ □ ∙ ± 0.5 %THD current A, B, C ▼ ■ □ ∙ ± 0.5 %Harmonic voltage V 3rd, 5th, 7th, 11th, 13th, 17th, 19th,21st harmonic
A, B, C ▼ ■ □ ∙ –
Harmonic current I 3rd, 5th, 7th, 11th, 13th, 17th, 19th,21st harmonic
A, B, C ▼ ■ □ ∙ –
Limiting-value violations Counter 1, 2, 3, 4 ▼ ■ –Analog inputs external ▼ ■ –Binary inputs external ▼ ■ –1) The representation of the phases depends on the connection type.2) Accuracy at reference conditions related to: 0.5 to 1.2 × nominal range3) Mean value of all phase circuits4) Measurement from 2 % of the internal apparent power5) Measurement from 30 % of the input voltage A-N6) Limiting values at full temperature range, related to: 0.1 to 1.2 × rated range
▼ Measured values can be shown on measured valuescreens.■ Measured values are transferred via the Profibus DP andModbus communication protocols.□ Measured values are transferred via IEC 60870-5-103.∙ Selectable measured values for list screens
Table 3.3/1 Measured Values And Accuracy
Power MetersSICAM P50/P55 – Measured Values and Accuracy
100 SICAM ⋅ Power Quality and Measurement ⋅ Katalog ⋅ Edition 6.0
3.3
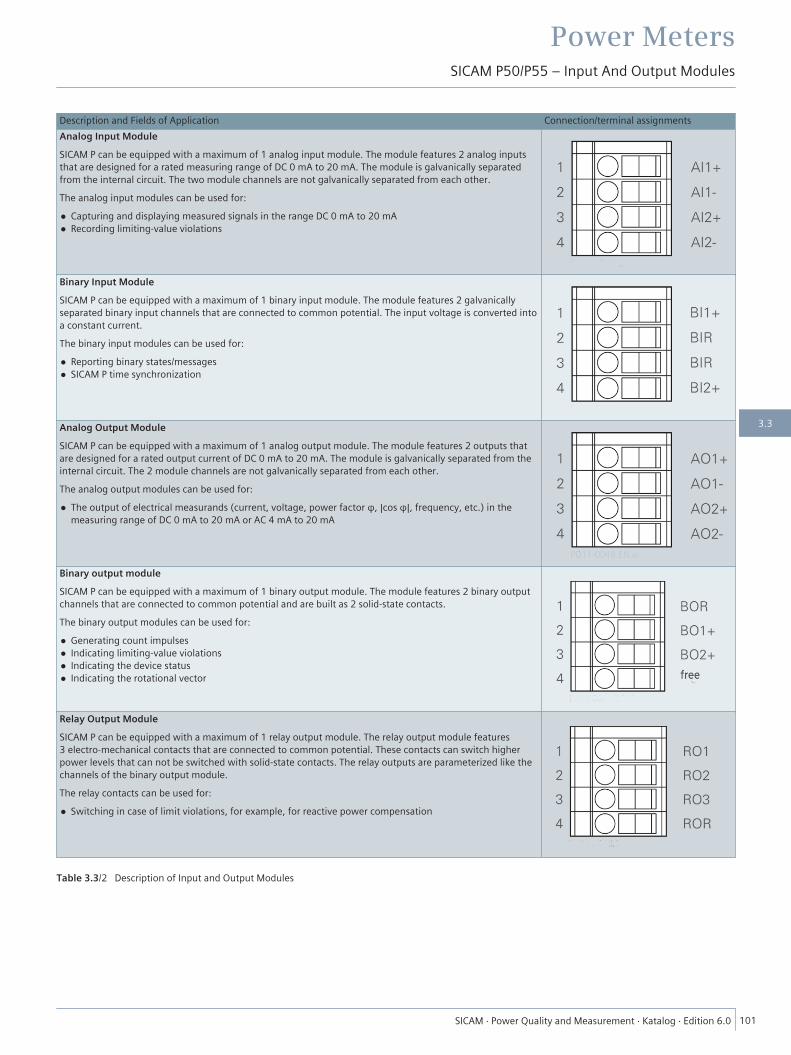
Description and Fields of Application Connection/terminal assignmentsAnalog Input ModuleSICAM P can be equipped with a maximum of 1 analog input module. The module features 2 analog inputsthat are designed for a rated measuring range of DC 0 mA to 20 mA. The module is galvanically separatedfrom the internal circuit. The two module channels are not galvanically separated from each other.The analog input modules can be used for:
• Capturing and displaying measured signals in the range DC 0 mA to 20 mA• Recording limiting-value violations
Binary Input ModuleSICAM P can be equipped with a maximum of 1 binary input module. The module features 2 galvanicallyseparated binary input channels that are connected to common potential. The input voltage is converted intoa constant current.The binary input modules can be used for:
• Reporting binary states/messages• SICAM P time synchronization
Analog Output ModuleSICAM P can be equipped with a maximum of 1 analog output module. The module features 2 outputs thatare designed for a rated output current of DC 0 mA to 20 mA. The module is galvanically separated from theinternal circuit. The 2 module channels are not galvanically separated from each other.The analog output modules can be used for:
• The output of electrical measurands (current, voltage, power factor φ, |cos φ|, frequency, etc.) in themeasuring range of DC 0 mA to 20 mA or AC 4 mA to 20 mA
Binary output moduleSICAM P can be equipped with a maximum of 1 binary output module. The module features 2 binary outputchannels that are connected to common potential and are built as 2 solid-state contacts.The binary output modules can be used for:
• Generating count impulses• Indicating limiting-value violations• Indicating the device status• Indicating the rotational vector
Relay Output ModuleSICAM P can be equipped with a maximum of 1 relay output module. The relay output module features3 electro-mechanical contacts that are connected to common potential. These contacts can switch higherpower levels that can not be switched with solid-state contacts. The relay outputs are parameterized like thechannels of the binary output module.The relay contacts can be used for:
• Switching in case of limit violations, for example, for reactive power compensation
Table 3.3/2 Description of Input and Output Modules
Power MetersSICAM P50/P55 – Input And Output Modules
SICAM ⋅ Power Quality and Measurement ⋅ Katalog ⋅ Edition 6.0 101
3.3
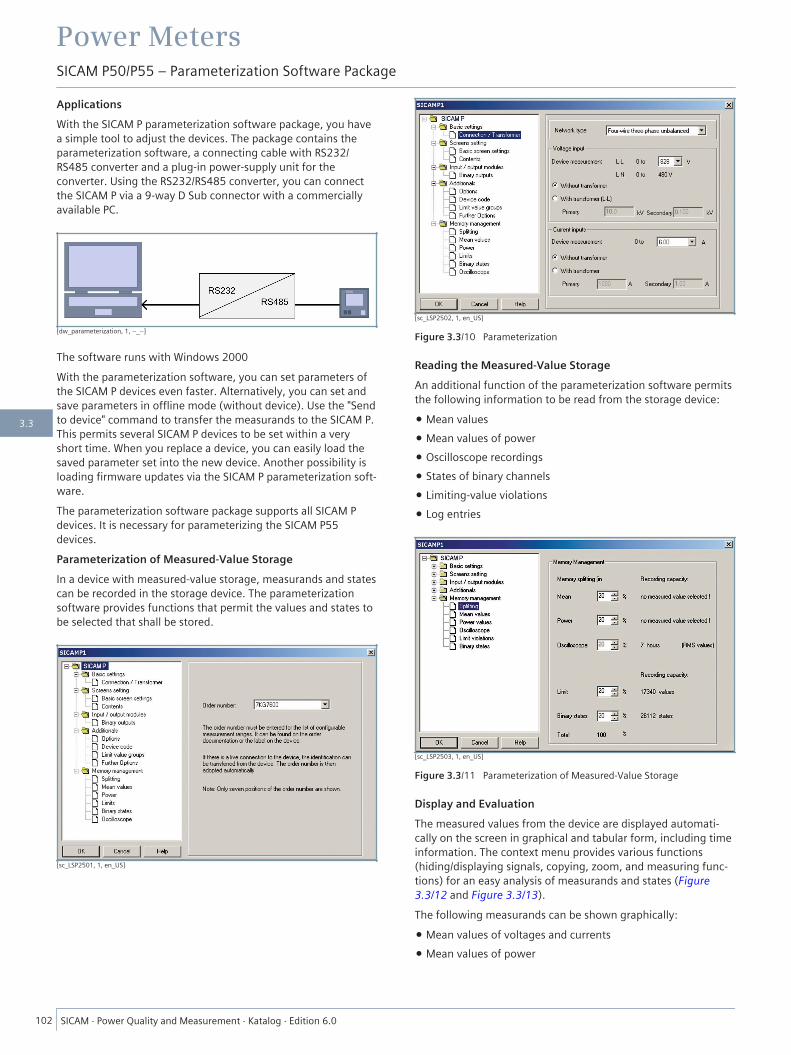
ApplicationsWith the SICAM P parameterization software package, you havea simple tool to adjust the devices. The package contains theparameterization software, a connecting cable with RS232/RS485 converter and a plug-in power-supply unit for theconverter. Using the RS232/RS485 converter, you can connectthe SICAM P via a 9-way D Sub connector with a commerciallyavailable PC.
[dw_parameterization, 1, --_--]
The software runs with Windows 2000With the parameterization software, you can set parameters ofthe SICAM P devices even faster. Alternatively, you can set andsave parameters in offline mode (without device). Use the "Sendto device" command to transfer the measurands to the SICAM P.This permits several SICAM P devices to be set within a veryshort time. When you replace a device, you can easily load thesaved parameter set into the new device. Another possibility isloading firmware updates via the SICAM P parameterization soft-ware.The parameterization software package supports all SICAM Pdevices. It is necessary for parameterizing the SICAM P55devices.Parameterization of Measured-Value StorageIn a device with measured-value storage, measurands and statescan be recorded in the storage device. The parameterizationsoftware provides functions that permit the values and states tobe selected that shall be stored.
[sc_LSP2501, 1, en_US]
[sc_LSP2502, 1, en_US]
Figure 3.3/10 Parameterization
Reading the Measured-Value StorageAn additional function of the parameterization software permitsthe following information to be read from the storage device:
• Mean values• Mean values of power• Oscilloscope recordings• States of binary channels• Limiting-value violations• Log entries
[sc_LSP2503, 1, en_US]
Figure 3.3/11 Parameterization of Measured-Value Storage
Display and EvaluationThe measured values from the device are displayed automati-cally on the screen in graphical and tabular form, including timeinformation. The context menu provides various functions(hiding/displaying signals, copying, zoom, and measuring func-tions) for an easy analysis of measurands and states (Figure3.3/12 and Figure 3.3/13).The following measurands can be shown graphically:
• Mean values of voltages and currents• Mean values of power
Power MetersSICAM P50/P55 – Parameterization Software Package
102 SICAM ⋅ Power Quality and Measurement ⋅ Katalog ⋅ Edition 6.0
3.3
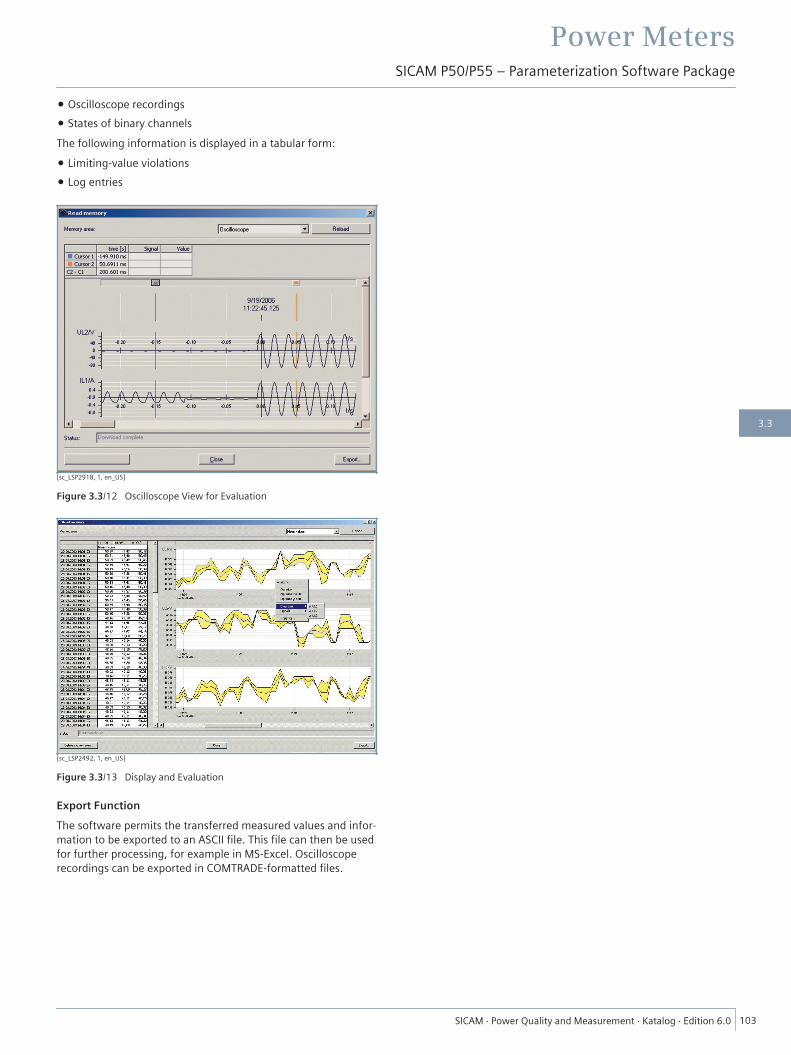
• Oscilloscope recordings• States of binary channelsThe following information is displayed in a tabular form:
• Limiting-value violations• Log entries
[sc_LSP2918, 1, en_US]
Figure 3.3/12 Oscilloscope View for Evaluation
[sc_LSP2492, 1, en_US]
Figure 3.3/13 Display and Evaluation
Export FunctionThe software permits the transferred measured values and infor-mation to be exported to an ASCII file. This file can then be usedfor further processing, for example in MS-Excel. Oscilloscoperecordings can be exported in COMTRADE-formatted files.
Power MetersSICAM P50/P55 – Parameterization Software Package
SICAM ⋅ Power Quality and Measurement ⋅ Katalog ⋅ Edition 6.0 103
3.3

Connection Types
[Appl_single ph, 1, en_US]
Figure 3.3/14 Alternating Voltage, 1-Phase
[Appl_4wire 3ph, 1, en_US]
Figure 3.3/15 4 Conductors, 3 Phases, Uniform Load
[Appl_3wire 3ph (balanced), 1, en_US]
Figure 3.3/16 3 Conductors, 3 Phases, Uniform Load
[Appl_3wire 3ph, 1, en_US]
Figure 3.3/17 3 Conductors, 3 Phases
[Appl_4wire 3ph(lv), 1, en_US]
Figure 3.3/18 4 Conductors, 3 Phases (Low-Voltage System) 1,2
[Appl_4wire 3ph(hv), 1, en_US]
Figure 3.3/19 4 Conductors, 3 Phases (High-Voltage System)
The connection types above are only a few typical arrange-ments. A current or voltage transformer is not obligatory withinthe admissible maximum current and voltage values.However, you can use voltage transformer in Y or V connection.Input and output connections remain free if they are not neededfor measurement.Comments on low-voltage applications:1 to Vph-N = 480 V, SICAM P can be connected directly withouttransformer. In a 3- or 4-wire network, with the exception of 3-wire networks without neutral phase: up to Vph-ph = 690 V,SICAM P can be connected without transformer.2 In an IT low-voltage system, SICAM P50 must be connected viaa voltage transformer to avoid false alarms of the disconnectormonitor.
Power MetersSICAM P50/P55 – Connection Types and Examples
104 SICAM ⋅ Power Quality and Measurement ⋅ Katalog ⋅ Edition 6.0
3.3

Supply Voltage
Direct Voltage
Rated input voltage 24 V to 250 VAdmissible input voltage tolerance ±20 %Admissible ripples of the DC inputvoltage
15 %
Maximum inrush currentAt ≤ 110 V < 15 AAt 220 V to 300 V after 250 μs: ≤ 22 A; after 250 μs: <5 AMaximum power consumption 6 W
Alternating Voltage
Rated input voltage 100 V to 230 VPower frequency 50 Hz/60 HzAdmissible input voltage tolerance ±20 %Admissible higher harmonic 2 kHzMaximum inrush currentAt ≤ 115 V < 15 AAt 230 V ≤ 22 A; after 250 μs: < 5 AMaximum power consumption 9 VA
Inputs and Outputs
Rated input alternating voltagesPh-N/PE 100 V/110 V
190 V400 V
Ph-Ph 100 V/110 V190 V400 V690 V
Overload 20 %Maximum rated input alternating voltagePh-N/PE 480 VPh-Ph 831 VInput resistancesA, B, C to N 8.4 MΩ, one phase
4.2 MΩ, 3 phases symmetricalA-B, B-C, C-A 8.4 MΩFurther specifications of the voltage measurement inputsPower consumption per input atVrated 400 V
38 mW
Admissible frequency 45 Hz to 65 Hz from > 30 % VE
Curve shape Sine or up to 21st harmonicMeasuring error (with compensa-tion) at 23 °C ± 1 °C 50 Hz or 60 Hz
Typical ±0.1 % under referenceconditions
Table 3.3/3 Inputs for Alternating-Voltage Measurements (TerminalBlock F)
Inputs for Alternating Voltage Measurements (TerminalBlock E)
Input AC currentsRated input AC current ranges (canbe parameterized)
1 A5 A
Maximum input AC current 2 x rated input AC currentPower consumption per inputAt 1 A 83 μVAAt 5 A 2.1 mVAAdditional information about the current measurement inputsMaximum voltage 150 VMeasuring error (with compensa-tion) at 23 °C ± 1 °C 50 Hz or 60 Hz
Typical ±0.1 % under referenceconditions
Thermal stability 10 A continuous100 A for maximum of 1 s
Binary Outputs (Terminal Block G)
Maximum contact voltageAlternating voltage 230 VDirect voltage 250 VMaximum currentsMaximum continuous touchcurrent
100 mA
Maximum pulse current for 0.1 s 300 mAAdditional information about the binary outputsRated resistance 35 ΩAdmissible switching frequency 10 HzNumber of switching cycles Unlimited
Binary Inputs (Terminal Block A, Optional)
Maximum input voltage DC 150 VCurrent consumption at high level DC 1.8 mALow level ≤ 10 VHigh level ≥ 19 VSignal delay max. 3 ms
Analog Inputs (Terminal Block A, Optional)
Measuring range DC 0 mA to 20 mAModulation range DC 0 mA to 24 mAInput impedance 50 Ω ± 0.1 %Accuracy 0.5 % of the upper range limit
Analog Outputs (Terminal Block A, Optional)
Rated output current DC 0 mA to 20 mAModulation range DC 0 mA to 24 mAMax. load impedance 250 ΩAccuracy Typ. 0.2 %; max. 0.5 % of rated
value
Relay Outputs (Terminal Block A, optional)
Max. contact voltage AC 150 V; DC 150 VMax. continuous contact current AC 5 A; DC 5 A
Power MetersSICAM P50/P55 – Technical Data
SICAM ⋅ Power Quality and Measurement ⋅ Katalog ⋅ Edition 6.0 105
3.3
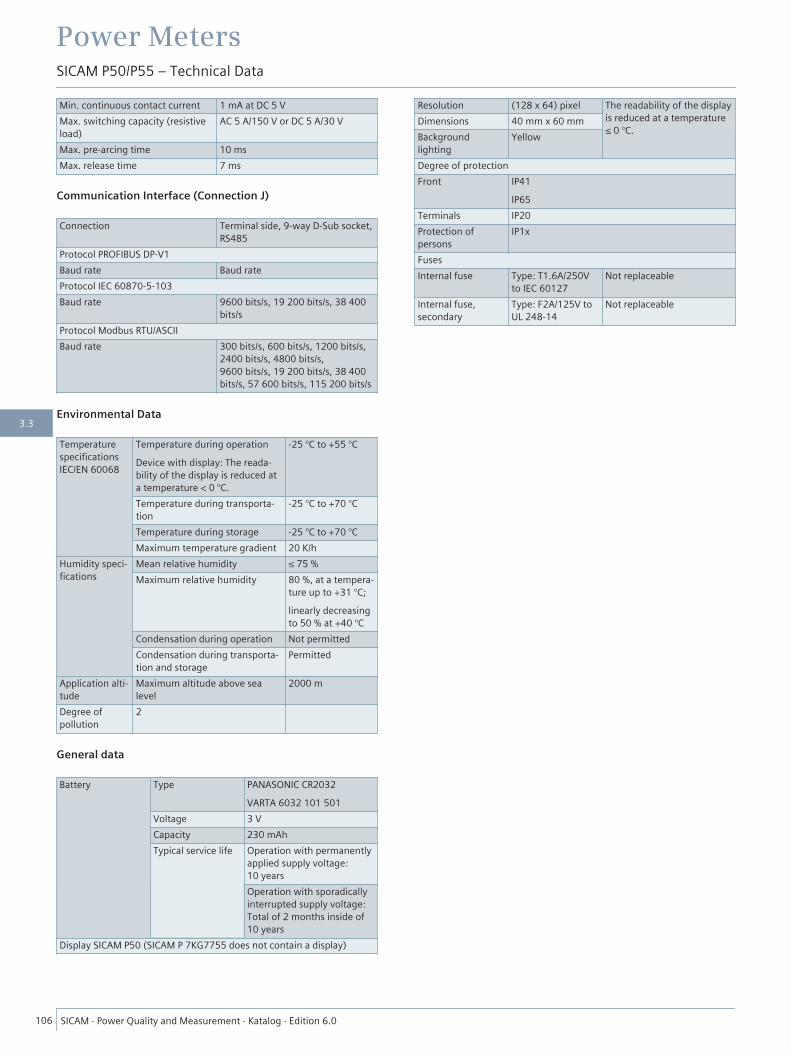
Min. continuous contact current 1 mA at DC 5 VMax. switching capacity (resistiveload)
AC 5 A/150 V or DC 5 A/30 V
Max. pre-arcing time 10 msMax. release time 7 ms
Communication Interface (Connection J)
Connection Terminal side, 9-way D-Sub socket,RS485
Protocol PROFIBUS DP-V1Baud rate Baud rateProtocol IEC 60870-5-103Baud rate 9600 bits/s, 19 200 bits/s, 38 400
bits/sProtocol Modbus RTU/ASCIIBaud rate 300 bits/s, 600 bits/s, 1200 bits/s,
2400 bits/s, 4800 bits/s,9600 bits/s, 19 200 bits/s, 38 400bits/s, 57 600 bits/s, 115 200 bits/s
Environmental Data
TemperaturespecificationsIEC/EN 60068
Temperature during operationDevice with display: The reada-bility of the display is reduced ata temperature < 0 °C.
-25 °C to +55 °C
Temperature during transporta-tion
-25 °C to +70 °C
Temperature during storage -25 °C to +70 °CMaximum temperature gradient 20 K/h
Humidity speci-fications
Mean relative humidity ≤ 75 %Maximum relative humidity 80 %, at a tempera-
ture up to +31 °C;linearly decreasingto 50 % at +40 °C
Condensation during operation Not permittedCondensation during transporta-tion and storage
Permitted
Application alti-tude
Maximum altitude above sealevel
2000 m
Degree ofpollution
2
General data
Battery Type PANASONIC CR2032VARTA 6032 101 501
Voltage 3 VCapacity 230 mAhTypical service life Operation with permanently
applied supply voltage:10 yearsOperation with sporadicallyinterrupted supply voltage:Total of 2 months inside of10 years
Display SICAM P50 (SICAM P 7KG7755 does not contain a display)
Resolution (128 x 64) pixel The readability of the displayis reduced at a temperature≤ 0 °C.
Dimensions 40 mm x 60 mmBackgroundlighting
Yellow
Degree of protectionFront IP41
IP65Terminals IP20Protection ofpersons
IP1x
FusesInternal fuse Type: T1.6A/250V
to IEC 60127Not replaceable
Internal fuse,secondary
Type: F2A/125V toUL 248-14
Not replaceable
Power MetersSICAM P50/P55 – Technical Data
106 SICAM ⋅ Power Quality and Measurement ⋅ Katalog ⋅ Edition 6.0
3.3

Dimensions
Dimensions (W x H x D) See dimensional drawings; all dimensionsin mm
Mass Mass without input/output module
Approx. 0.6 kg
With one module Approx. 0.65
[SICAM P5_Massbild_7KG7750_IP65, 1, en_US]
Figure 3.3/20 SICAM P 7KG7750, Variant IP 65
[SICAM P5_Massbild_7KG7750_Draufsicht, 1, en_US]
Figure 3.3/21 SICAM P 7KG7750
[SICAM P5_Massbild_7KG7755_Hutschienenmontage, 1, en_US]
Figure 3.3/22 Sicam P 7KG7755 for DIN-Rail Installation
Power MetersSICAM P50/P55 – Technical Data
SICAM ⋅ Power Quality and Measurement ⋅ Katalog ⋅ Edition 6.0 107
3.3

Selection and Ordering Data
Description Variants Order No.1 2 3 4 5 6 7 8 9 10 11 12 13 14 15 16
SICAM P50 – Power Meter with Display 7 K G 7 7 5 0 - 0 □ A 0 □ - 0 A A □▲ ▲ ▲
Flush-mounting switch panel with graphicdisplay (standard)Dimensions: 96 mm x 96 mm2 binary outputsIsolated voltage measuring inputs
I/O module (optional) │ │ │Without A │ │2 binary outputs B │ │2 binary inputs C │ │2 analog outputs (DC 0 to 20/4 to 20 mA) D │ │2 analog outputs (DC 0 to 20 mA) E │ │3 relay outputs G 0 │Protection class front side │ │IP41 (standard) 1 │IP65 3 │Communication modules │RS485 with PROFIBUS DP and Modbus RTU/ASCII
0
RS485 with IEC 60870-5-103 and ModbusRTU/ASCII
1
SICAM P55 – Power Meter without Display 7 K G 7 7 5 5 - 0 □ A 0 0 - 0 A A □▲ ▲
DIN-rail deviceDimensions: 96 mm x 96 mm2 binary outputsProtection-class frontIP20
I/O module (optional) │ │Without A │2 binary outputs B │2 binary inputs C │2 analog outputs (DC 0 to 20/4 to 20 mA) D │2 analog outputs (DC 0 to 20 mA) E │3 relay outputs G │Communication modules │RS485 with PROFIBUS DP and Modbus RTU/ASCII
0
RS485 with IEC 60870-5-103 and ModbusRTU/ASCII
1
Table 3.3/4 Selection and Ordering Data
Power MetersSICAM P50/P55 – Selection and Ordering Data
108 SICAM ⋅ Power Quality and Measurement ⋅ Katalog ⋅ Edition 6.0
3.3

www.siemens.com/powerquality
Digital Measuring Transducer

SICAM T is a digital measurement transducer that allows themeasuring of electrical quantities in electrical networks in asingle unit. In industries, power plants and substations, trans-ducers are especially used for measurand (for example current,voltage, power, phase angle, energy, or frequency) assignmentinto further processing through analog outputs or communica-tion interface for precise control, notification or visualizationtasks.
Device Type Top-hat rail mounted devicePlastic case 96 mm × 96 mm × 100 mm/3.78in. x 3.78 in. x 3.94 in. (WxHxD)Degree of protection IP20
Supply voltage DC 24 to 250 VAC 110 to 230 V; 45 to 65 Hz
Input and outputcircuits
4 inputs for alternating voltage measurements3 inputs for alternating current measurementsup to 10 A continuousIndividually programmable binary outputs.4 DC analog outputs
LED indicators Automatically monitor the functions of itshardware, software, and firmware components
Communication Ethernet: IEC 61850 or Modbus TCP communi-cation protocolOptional serial RS485 interface that enablesthe device to communicate via the ModbusRTU or the IEC 60870-5-103 communicationprotocol.
Features• Design: compact and robust for flexible application in indus-
trial and utility environments• Connections in 1-phase systems, in 3-wire and 4-wire systems• Applications: flexible for power utilities, industrial and
commercial sector applications• Measurements: up to 60 measured or calculated values avail-
able• Temperature range: -25 °C to +55 °C/-13 °F to 131 °F• Uncertainty: typically 0.1 % for voltage and current at rated
input IEC 60688, and 0.2 s acc. to IEC 62053-21• High EMC immunity: according to standards EN 61000-6-2
and EN 61000-6-4 for the EMC directives, and with thestandard EN 61010-1 for the low-voltage directive
• UL Certfication: this product is UL-certified to standardUL 61010-1
Benefits• Flexible current measurement range (up to 2 × In)• 4 fast analog outputs (reaction approx. 120 ms at 50 Hz and
100 ms at 60 Hz) for reliable control• 2 individual binary outputs for fast switching, indications (for
example, limit violation) and operation status monitoring• 4 LEDs for local status visualization• Ethernet communications via IEC 61850 and Modbus TCP and
serial interface via Modbus RTU or IEC 60870-5-103
• Internal battery for real-time clock and saving of energycounter values in case of a power outage
• User-friendly operation through Web server (no extra soft-ware for parameterization needed, no converters and extracables)
• Real-time clock (RTC), field-bus synchronization or networksynchronization possible via NTP
Applications• Conversion and integration of measurands into substation
automation, protection or SCADA process via RTU and/or viaprotocols IEC 61850 (for 7KG9662 variant), Modbus TCP,IEC 60870-5-103 for further control and/or monitoring tasks
• Monitoring of lower voltage levels and heavy load control, forexample air conditioning and motors
• Depending on the device type, the input circuits for voltagemeasurement are either designed as voltage dividers or theyare galvanically isolated. Devices with galvanic isolation canbe used without voltage transformers in the power systemsIT, TT, and TN. Devices with a voltage divider can also be usedin these power systems; for IT power systems, however, anupstream voltage transformer is required.
[ph_SICAM T, 1, --_--]
Figure 4.1/1 SICAM T – digitaler Messumformer
Digital Measuring TransducerSICAM T – Description
110 SICAM ⋅ Power Quality and Measurement ⋅ Katalog ⋅ Edition 6.0
4.1
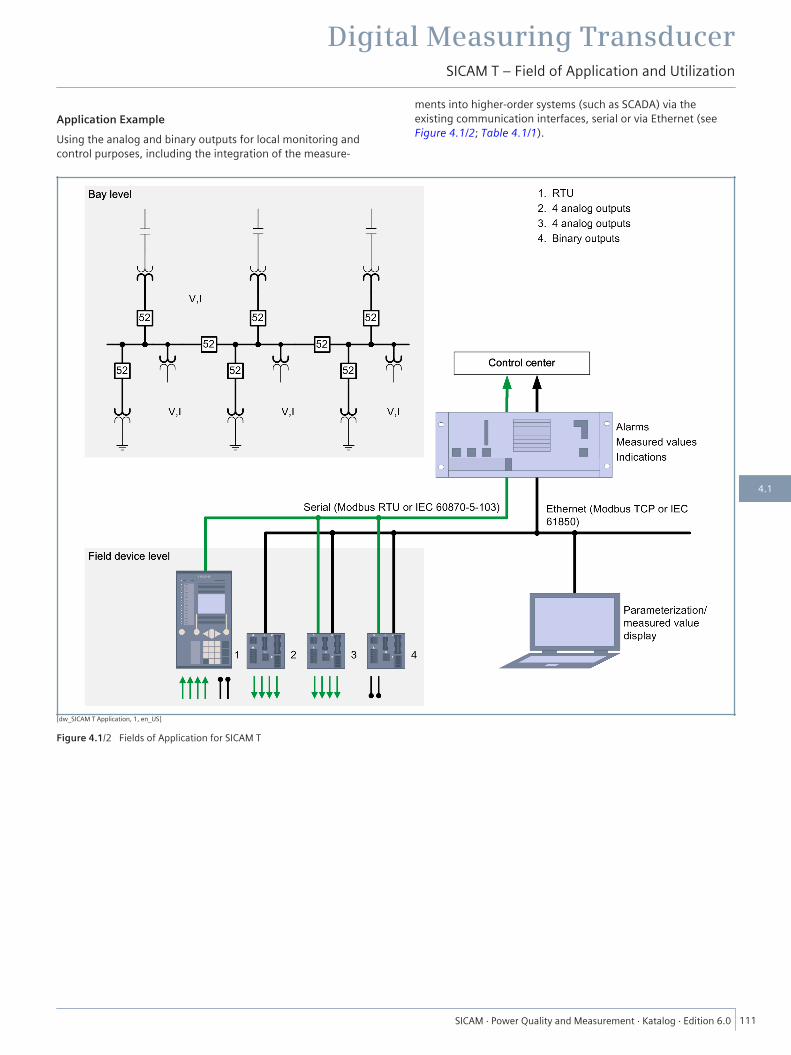
Application ExampleUsing the analog and binary outputs for local monitoring andcontrol purposes, including the integration of the measure-
ments into higher-order systems (such as SCADA) via theexisting communication interfaces, serial or via Ethernet (seeFigure 4.1/2; Table 4.1/1).
[dw_SICAM T Application, 1, en_US]
Figure 4.1/2 Fields of Application for SICAM T
Digital Measuring TransducerSICAM T – Field of Application and Utilization
SICAM ⋅ Power Quality and Measurement ⋅ Katalog ⋅ Edition 6.0 111
4.1

Field of Application Voltage Current Power Frequency PhaseAngle
Energy Message InternalCost Allo-
cationEnergy generation substa-tion
Generator/higher-ordertransformer
■ ■ ■ ■ ■ ■ ■
Power transmission substa-tion
Incoming feeder ■ ■ ■Outgoing line ■ ■ ■
Transformer substation Incoming feeder ■Busbar ■ ■ ■ ■ ■Feeder ■ ■ ■
Transformer power distribu-tion
Incoming feeder ■Busbar ■ ■ ■ ■ ■Feeder ■ ■ ■
Process SCADA/EMS/DMS ■ ■ ■ ■ ■ ■Energy management ■ ■ ■ ■ ■ ■ ■ ■Motors ■ ■ ■ ■ ■ ■ ■Commercial (for example airconditioning units)
■ ■ ■ ■ ■
Table 4.1/1 Application and Selection Fields
CommunicationThe device is equipped with an Ethernet interface and, ifinstalled in accordance with the device version, an RS485 inter-face to communicate with the control and protection systemand with other automation systems. Device parameterization,transfer of measured data, counts and messages, and timesynchronization with NTP are supported via Ethernet. Thecommunication protocols are HTTP, 61850 (7KG9662) andModbus TCP. The optional RS485 interface permits measureddata, counts, and messages to be transferred and the devicetime to be synchronized. Depending on the device version, youcan use the communication protocol Modbus RTU orIEC 60870-5-103.Time SynchronizationFor a uniform basis in the communication with peripheraldevices and time stamping of process data.The following time synchronization methods are possible:
• External time synchronization via Ethernet NTP• External time synchronization via fieldbus with communica-
tion protocol Modbus RTU or IEC 60870-5-103• Internal time synchronization via RTC with quartz oscillator (if
external time synchronization is not available)Response Time of the Analog OutputsThe short response time of the analog and binary outputs is asubstantial feature of SICAM T that permits reliable functioningof control applications. The response time of the device is120 ms at 50 Hz and 100 ms at 60 Hz.
[SICAM T Time Diagram, 1, en_US]
Figure 4.1/3 Pre-Arcing Diagram
Digital Measuring TransducerSICAM T – Field of Application and Utilization
112 SICAM ⋅ Power Quality and Measurement ⋅ Katalog ⋅ Edition 6.0
4.1

Measurand MeasuringCircuit
1-PhaseSystem
3-Wire Network (Delta) 4-Wire Network (Star)Same Load (1I) Any Load (3I) Any Load (2I) Same Load (1I) Any Load (3I)
Alternatingvoltage
Va a-N ■ ■ ■Vb b-N ■Vc c-N ■Vab,Vbc,,Vca a-b, b-c, c-a ■ ■ ■ ■VN a, b, c ■Vsum a, b, c ΣVL/3 ΣVL/3 ΣVL/3 a-N ΣVL/3Vasym a-b, b-c, c-a ■ ■ ■ ■
AC current Ia a ■ ■ ■ ■ ■ ■Ib, Ic b, c ■ ■ ■IN a, b, c ■ ■Isum a, b, c ■ ■ ΣVL/3Iasym a, b, c ■ ■ ■
Active powerfactor
cos φ (a) a ■ ■cos φ (b), cos φ (c) b,c ■cos φ a, b, c ■ ■ ■ ■ ■
Power factor PFa a ■ ■PFb, PFc b, c ■PF a, b, c ■ ■ ■ ■ ■
Phase angle φa a ■ ■φb, φc b, c ■φ a, b, c ■ ■ ■ ■ ■
Angle betweenphase-to-groundvoltages
φab a-b ■φac a-c ■
Frequency f a, b, c ■ ■ ■ ■ ■ ■Active power Pa a ■ ■
Pb, Pc b, c ■P a, b, c ■ ■ ■ ■ ■
Reactive power Qa a ■ ■Qb, Qc b, c ■Q a, b, c ■ ■ ■ ■ ■
Apparent power Sa a ■ ■Sb, Sc b, c ■S a, b, c ■ ■ ■ ■ ■
Active energy –supply
WPa supply a ■ ■WPb supply, WPc supply b, c ■WPsupply a, b, c ■ ■ ■ ■ ■
Active energy –import
WPa import a ■ ■WPb import, WPc import b, c ■WPimport a, b, c ■ ■ ■ ■ ■
Reactive energy –inductive
WQa inductive a ■ ■WQb inductive, WQc induc-
tive
b, c ■
WQinductive a, b, c ■ ■ ■ ■ ■Reactive energy –capacitive
WQa capacitive a ■ ■WQb capacitive, WQc
capacitive
b, c ■
WQcapacitive a, b, c ■ ■ ■ ■ ■
Digital Measuring TransducerSICAM T – Measurands
SICAM ⋅ Power Quality and Measurement ⋅ Katalog ⋅ Edition 6.0 113
4.1
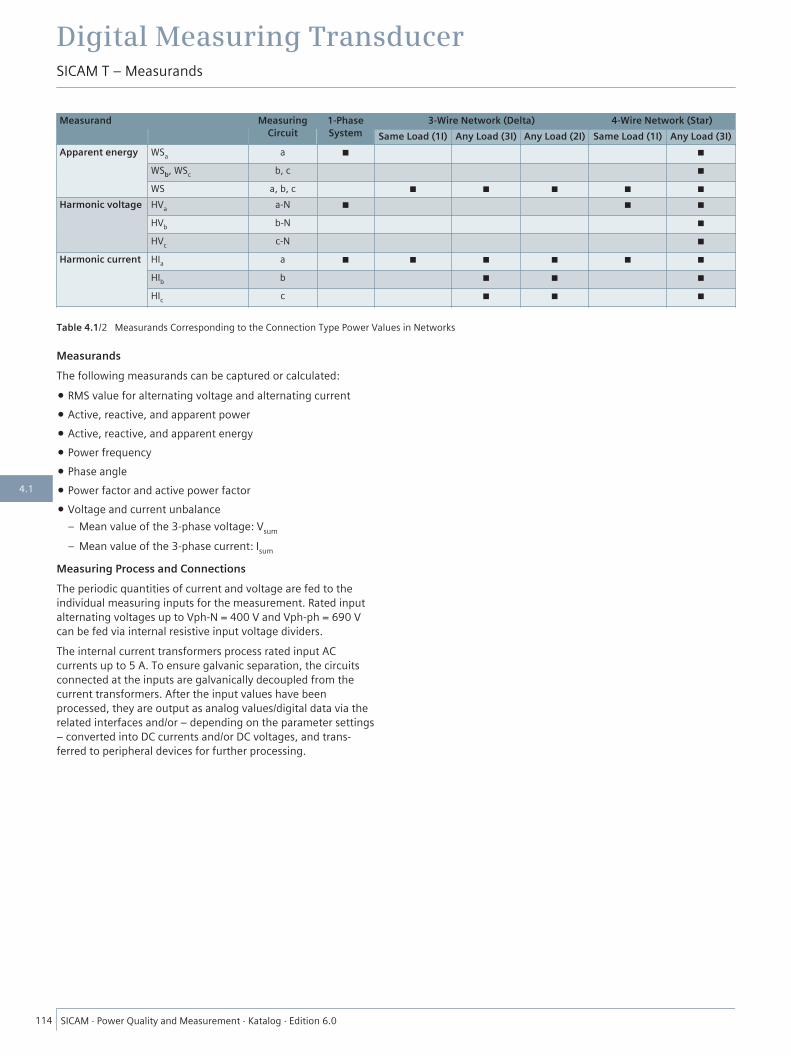
Measurand MeasuringCircuit
1-PhaseSystem
3-Wire Network (Delta) 4-Wire Network (Star)Same Load (1I) Any Load (3I) Any Load (2I) Same Load (1I) Any Load (3I)
Apparent energy WSa a ■ ■WSb, WSc b, c ■WS a, b, c ■ ■ ■ ■ ■
Harmonic voltage HVa a-N ■ ■ ■HVb b-N ■HVc c-N ■
Harmonic current HIa a ■ ■ ■ ■ ■ ■HIb b ■ ■ ■HIc c ■ ■ ■
Table 4.1/2 Measurands Corresponding to the Connection Type Power Values in Networks
MeasurandsThe following measurands can be captured or calculated:
• RMS value for alternating voltage and alternating current• Active, reactive, and apparent power• Active, reactive, and apparent energy• Power frequency• Phase angle• Power factor and active power factor• Voltage and current unbalance
– Mean value of the 3-phase voltage: Vsum
– Mean value of the 3-phase current: Isum
Measuring Process and ConnectionsThe periodic quantities of current and voltage are fed to theindividual measuring inputs for the measurement. Rated inputalternating voltages up to Vph-N = 400 V and Vph-ph = 690 Vcan be fed via internal resistive input voltage dividers.The internal current transformers process rated input ACcurrents up to 5 A. To ensure galvanic separation, the circuitsconnected at the inputs are galvanically decoupled from thecurrent transformers. After the input values have beenprocessed, they are output as analog values/digital data via therelated interfaces and/or – depending on the parameter settings– converted into DC currents and/or DC voltages, and trans-ferred to peripheral devices for further processing.
Digital Measuring TransducerSICAM T – Measurands
114 SICAM ⋅ Power Quality and Measurement ⋅ Katalog ⋅ Edition 6.0
4.1
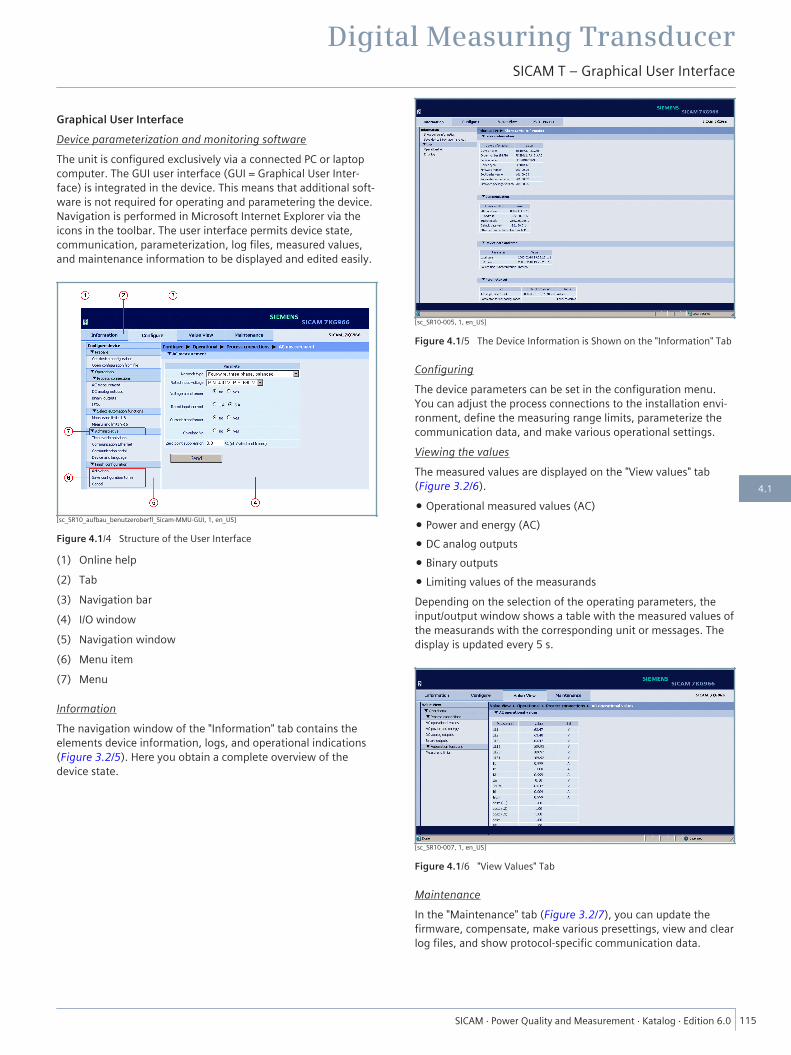
Graphical User InterfaceDevice parameterization and monitoring softwareThe unit is configured exclusively via a connected PC or laptopcomputer. The GUI user interface (GUI = Graphical User Inter-face) is integrated in the device. This means that additional soft-ware is not required for operating and parametering the device.Navigation is performed in Microsoft Internet Explorer via theicons in the toolbar. The user interface permits device state,communication, parameterization, log files, measured values,and maintenance information to be displayed and edited easily.
[sc_SR10_aufbau_benutzeroberfl_Sicam-MMU-GUI, 1, en_US]
Figure 4.1/4 Structure of the User Interface
(1) Online help(2) Tab(3) Navigation bar(4) I/O window(5) Navigation window(6) Menu item(7) Menu
InformationThe navigation window of the "Information" tab contains theelements device information, logs, and operational indications(Figure 3.2/5). Here you obtain a complete overview of thedevice state.
[sc_SR10-005, 1, en_US]
Figure 4.1/5 The Device Information is Shown on the "Information" Tab
ConfiguringThe device parameters can be set in the configuration menu.You can adjust the process connections to the installation envi-ronment, define the measuring range limits, parameterize thecommunication data, and make various operational settings.Viewing the valuesThe measured values are displayed on the "View values" tab(Figure 3.2/6).
• Operational measured values (AC)• Power and energy (AC)• DC analog outputs• Binary outputs• Limiting values of the measurandsDepending on the selection of the operating parameters, theinput/output window shows a table with the measured values ofthe measurands with the corresponding unit or messages. Thedisplay is updated every 5 s.
[sc_SR10-007, 1, en_US]
Figure 4.1/6 "View Values" Tab
MaintenanceIn the "Maintenance" tab (Figure 3.2/7), you can update thefirmware, compensate, make various presettings, view and clearlog files, and show protocol-specific communication data.
Digital Measuring TransducerSICAM T – Graphical User Interface
SICAM ⋅ Power Quality and Measurement ⋅ Katalog ⋅ Edition 6.0 115
4.1
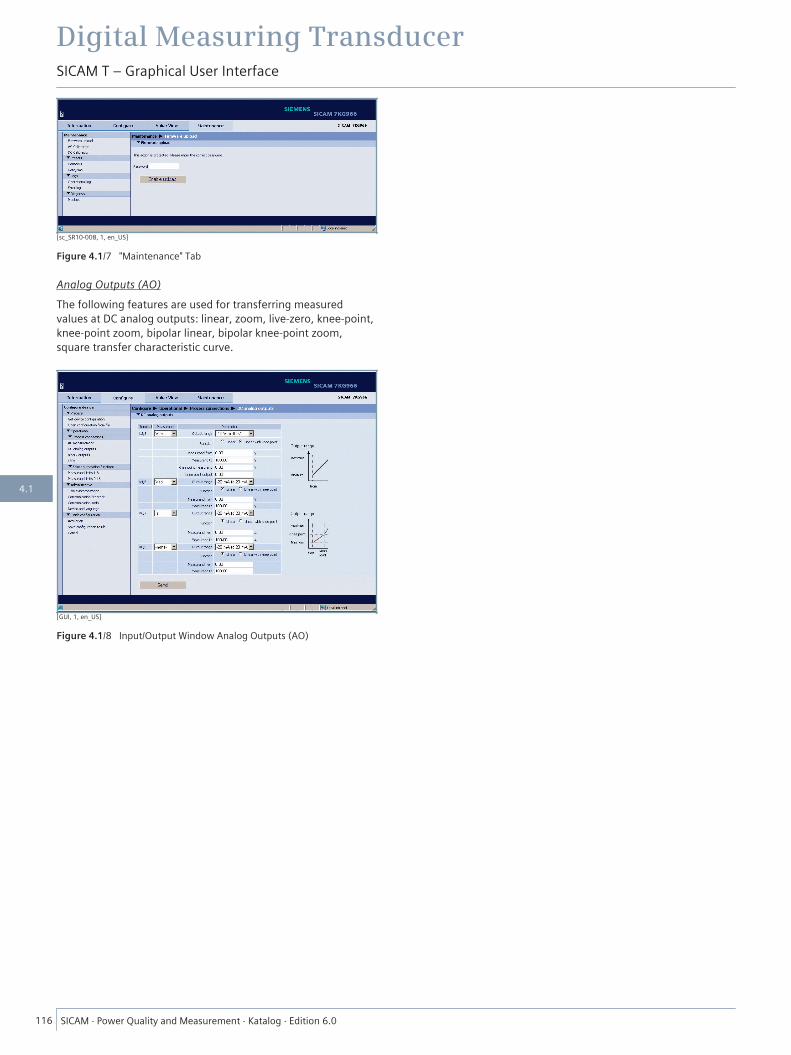
[sc_SR10-008, 1, en_US]
Figure 4.1/7 "Maintenance" Tab
Analog Outputs (AO)The following features are used for transferring measuredvalues at DC analog outputs: linear, zoom, live-zero, knee-point,knee-point zoom, bipolar linear, bipolar knee-point zoom,square transfer characteristic curve.
[GUI, 1, en_US]
Figure 4.1/8 Input/Output Window Analog Outputs (AO)
Digital Measuring TransducerSICAM T – Graphical User Interface
116 SICAM ⋅ Power Quality and Measurement ⋅ Katalog ⋅ Edition 6.0
4.1

Connection TypesThe following connection types are supported:
• 1-phase system• 3-wire network (same load)• 3-wire network (any load), 2 current inputs• 3-wire network (any load), 3 current inputs• 4-wire network (same load)• 4-wire network (any load)Connection Examples
[Appl-1, 1, en_US]
Figure 4.1/9 1-Phase System
[Appl-3_2_1, 1, en_US]
Figure 4.1/10 3-Wire Network, 2 Voltage and 1 Current Transformers,Same Load*
[Appl-3_2_3, 1, en_US]
Figure 4.1/11 3-Wire Network, 2 Voltage and 3 Current Transformers,Any Load*
[Appl-4_1_1, 1, en_US]
Figure 4.1/12 4-Wire Network, 1 Voltage and 1 Current Transformer,Same Load
[Appl-4_0_3, 1, en_US]
Figure 4.1/13 4-Wire Network, No Voltage Transformer, 3 CurrentTransformers, Any Load
[Appl-4_3_3, 1, en_US]
Figure 4.1/14 4-Wire Network, 3 Voltage and 3 Current Transformers,Any Load
* Important: In this connection example, the maximum secondary voltage is AC 480 V. The
maximum admissible voltage between phase and ground must not be exceeded. For IT mains
connections, please take note of the exact description in the device manual.
Digital Measuring TransducerSICAM T – Connection Methods and Types
SICAM ⋅ Power Quality and Measurement ⋅ Katalog ⋅ Edition 6.0 117
4.1
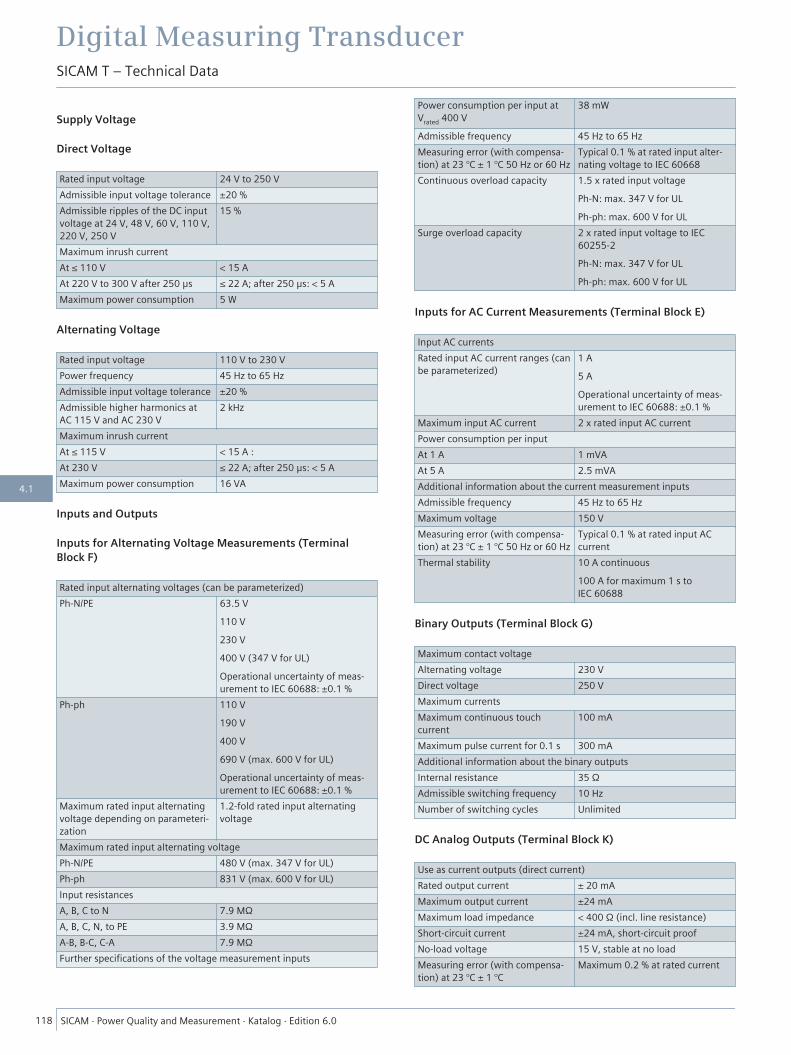
Supply Voltage
Direct Voltage
Rated input voltage 24 V to 250 VAdmissible input voltage tolerance ±20 %Admissible ripples of the DC inputvoltage at 24 V, 48 V, 60 V, 110 V,220 V, 250 V
15 %
Maximum inrush currentAt ≤ 110 V < 15 AAt 220 V to 300 V after 250 μs ≤ 22 A; after 250 μs: < 5 AMaximum power consumption 5 W
Alternating Voltage
Rated input voltage 110 V to 230 VPower frequency 45 Hz to 65 HzAdmissible input voltage tolerance ±20 %Admissible higher harmonics atAC 115 V and AC 230 V
2 kHz
Maximum inrush currentAt ≤ 115 V < 15 A :At 230 V ≤ 22 A; after 250 μs: < 5 AMaximum power consumption 16 VA
Inputs and Outputs
Inputs for Alternating Voltage Measurements (TerminalBlock F)
Rated input alternating voltages (can be parameterized)Ph-N/PE 63.5 V
110 V230 V400 V (347 V for UL)Operational uncertainty of meas-urement to IEC 60688: ±0.1 %
Ph-ph 110 V190 V400 V690 V (max. 600 V for UL)Operational uncertainty of meas-urement to IEC 60688: ±0.1 %
Maximum rated input alternatingvoltage depending on parameteri-zation
1.2-fold rated input alternatingvoltage
Maximum rated input alternating voltagePh-N/PE 480 V (max. 347 V for UL)Ph-ph 831 V (max. 600 V for UL)Input resistancesA, B, C to N 7.9 MΩA, B, C, N, to PE 3.9 MΩA-B, B-C, C-A 7.9 MΩFurther specifications of the voltage measurement inputs
Power consumption per input atVrated 400 V
38 mW
Admissible frequency 45 Hz to 65 HzMeasuring error (with compensa-tion) at 23 °C ± 1 °C 50 Hz or 60 Hz
Typical 0.1 % at rated input alter-nating voltage to IEC 60668
Continuous overload capacity 1.5 x rated input voltagePh-N: max. 347 V for ULPh-ph: max. 600 V for UL
Surge overload capacity 2 x rated input voltage to IEC60255-2Ph-N: max. 347 V for ULPh-ph: max. 600 V for UL
Inputs for AC Current Measurements (Terminal Block E)
Input AC currentsRated input AC current ranges (canbe parameterized)
1 A5 AOperational uncertainty of meas-urement to IEC 60688: ±0.1 %
Maximum input AC current 2 x rated input AC currentPower consumption per inputAt 1 A 1 mVAAt 5 A 2.5 mVAAdditional information about the current measurement inputsAdmissible frequency 45 Hz to 65 HzMaximum voltage 150 VMeasuring error (with compensa-tion) at 23 °C ± 1 °C 50 Hz or 60 Hz
Typical 0.1 % at rated input ACcurrent
Thermal stability 10 A continuous100 A for maximum 1 s toIEC 60688
Binary Outputs (Terminal Block G)
Maximum contact voltageAlternating voltage 230 VDirect voltage 250 VMaximum currentsMaximum continuous touchcurrent
100 mA
Maximum pulse current for 0.1 s 300 mAAdditional information about the binary outputsInternal resistance 35 ΩAdmissible switching frequency 10 HzNumber of switching cycles Unlimited
DC Analog Outputs (Terminal Block K)
Use as current outputs (direct current)Rated output current ± 20 mAMaximum output current ±24 mAMaximum load impedance < 400 Ω (incl. line resistance)Short-circuit current ±24 mA, short-circuit proofNo-load voltage 15 V, stable at no loadMeasuring error (with compensa-tion) at 23 °C ± 1 °C
Maximum 0.2 % at rated current
Digital Measuring TransducerSICAM T – Technical Data
118 SICAM ⋅ Power Quality and Measurement ⋅ Katalog ⋅ Edition 6.0
4.1
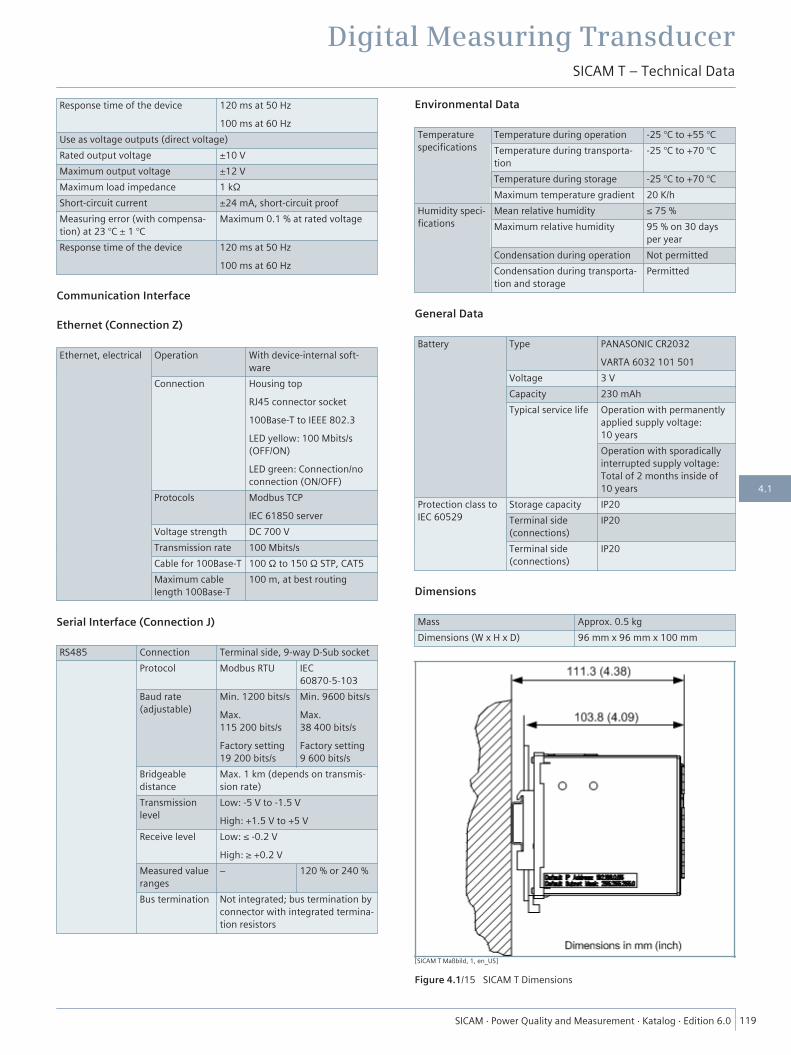
Response time of the device 120 ms at 50 Hz100 ms at 60 Hz
Use as voltage outputs (direct voltage)Rated output voltage ±10 VMaximum output voltage ±12 VMaximum load impedance 1 kΩShort-circuit current ±24 mA, short-circuit proofMeasuring error (with compensa-tion) at 23 °C ± 1 °C
Maximum 0.1 % at rated voltage
Response time of the device 120 ms at 50 Hz100 ms at 60 Hz
Communication Interface
Ethernet (Connection Z)
Ethernet, electrical Operation With device-internal soft-ware
Connection Housing topRJ45 connector socket100Base-T to IEEE 802.3LED yellow: 100 Mbits/s(OFF/ON)LED green: Connection/noconnection (ON/OFF)
Protocols Modbus TCPIEC 61850 server
Voltage strength DC 700 VTransmission rate 100 Mbits/sCable for 100Base-T 100 Ω to 150 Ω STP, CAT5Maximum cablelength 100Base-T
100 m, at best routing
Serial Interface (Connection J)
RS485 Connection Terminal side, 9-way D-Sub socketProtocol Modbus RTU IEC
60870-5-103Baud rate(adjustable)
Min. 1200 bits/sMax.115 200 bits/sFactory setting19 200 bits/s
Min. 9600 bits/sMax.38 400 bits/sFactory setting9 600 bits/s
Bridgeabledistance
Max. 1 km (depends on transmis-sion rate)
Transmissionlevel
Low: -5 V to -1.5 VHigh: +1.5 V to +5 V
Receive level Low: ≤ -0.2 VHigh: ≥ +0.2 V
Measured valueranges
– 120 % or 240 %
Bus termination Not integrated; bus termination byconnector with integrated termina-tion resistors
Environmental Data
Temperaturespecifications
Temperature during operation -25 °C to +55 °CTemperature during transporta-tion
-25 °C to +70 °C
Temperature during storage -25 °C to +70 °CMaximum temperature gradient 20 K/h
Humidity speci-fications
Mean relative humidity ≤ 75 %Maximum relative humidity 95 % on 30 days
per yearCondensation during operation Not permittedCondensation during transporta-tion and storage
Permitted
General Data
Battery Type PANASONIC CR2032VARTA 6032 101 501
Voltage 3 VCapacity 230 mAhTypical service life Operation with permanently
applied supply voltage:10 yearsOperation with sporadicallyinterrupted supply voltage:Total of 2 months inside of10 years
Protection class toIEC 60529
Storage capacity IP20Terminal side(connections)
IP20
Terminal side(connections)
IP20
Dimensions
Mass Approx. 0.5 kgDimensions (W x H x D) 96 mm x 96 mm x 100 mm
[SICAM T Maßbild, 1, en_US]
Figure 4.1/15 SICAM T Dimensions
Digital Measuring TransducerSICAM T – Technical Data
SICAM ⋅ Power Quality and Measurement ⋅ Katalog ⋅ Edition 6.0 119
4.1
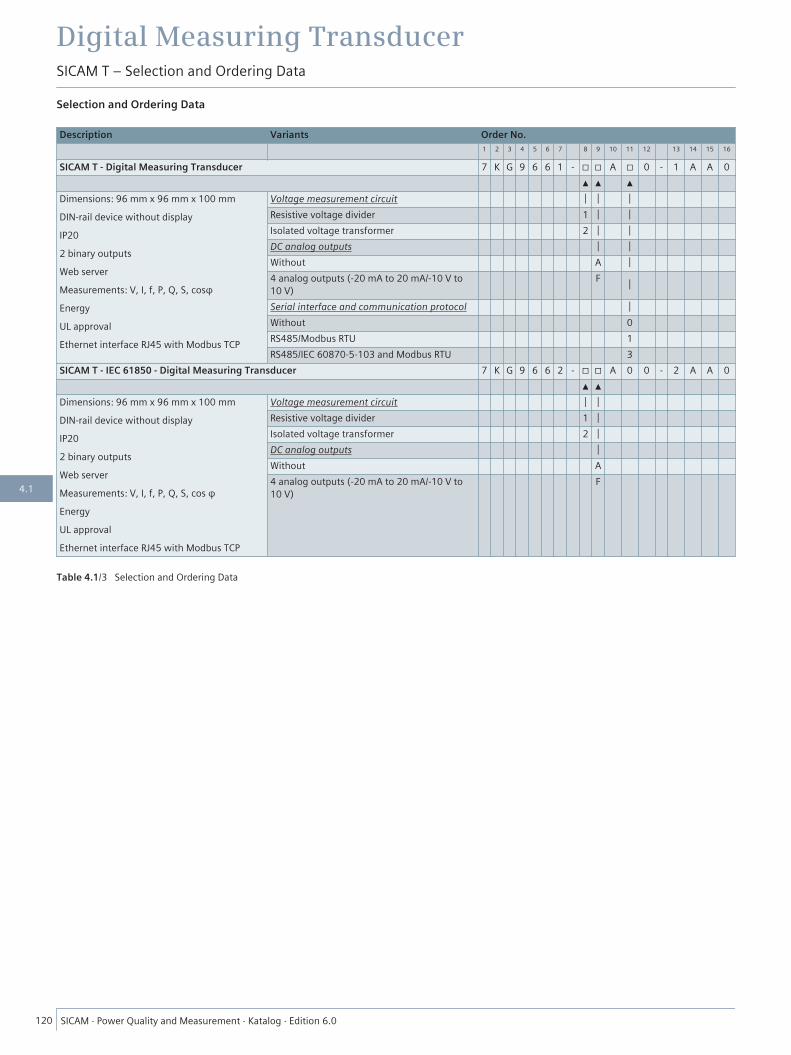
Selection and Ordering Data
Description Variants Order No.1 2 3 4 5 6 7 8 9 10 11 12 13 14 15 16
SICAM T - Digital Measuring Transducer 7 K G 9 6 6 1 - □ □ A □ 0 - 1 A A 0▲ ▲ ▲
Dimensions: 96 mm x 96 mm x 100 mmDIN-rail device without displayIP202 binary outputsWeb serverMeasurements: V, I, f, P, Q, S, cosφEnergyUL approvalEthernet interface RJ45 with Modbus TCP
Voltage measurement circuit │ │ │Resistive voltage divider 1 │ │Isolated voltage transformer 2 │ │DC analog outputs │ │Without A │4 analog outputs (-20 mA to 20 mA/-10 V to10 V)
F │
Serial interface and communication protocol │Without 0RS485/Modbus RTU 1RS485/IEC 60870-5-103 and Modbus RTU 3
SICAM T - IEC 61850 - Digital Measuring Transducer 7 K G 9 6 6 2 - □ □ A 0 0 - 2 A A 0▲ ▲
Dimensions: 96 mm x 96 mm x 100 mmDIN-rail device without displayIP202 binary outputsWeb serverMeasurements: V, I, f, P, Q, S, cos φEnergyUL approvalEthernet interface RJ45 with Modbus TCP
Voltage measurement circuit │ │Resistive voltage divider 1 │Isolated voltage transformer 2 │DC analog outputs │Without A4 analog outputs (-20 mA to 20 mA/-10 V to10 V)
F
Table 4.1/3 Selection and Ordering Data
Digital Measuring TransducerSICAM T – Selection and Ordering Data
120 SICAM ⋅ Power Quality and Measurement ⋅ Katalog ⋅ Edition 6.0
4.1

www.siemens.com/powerquality
Fault Recorder
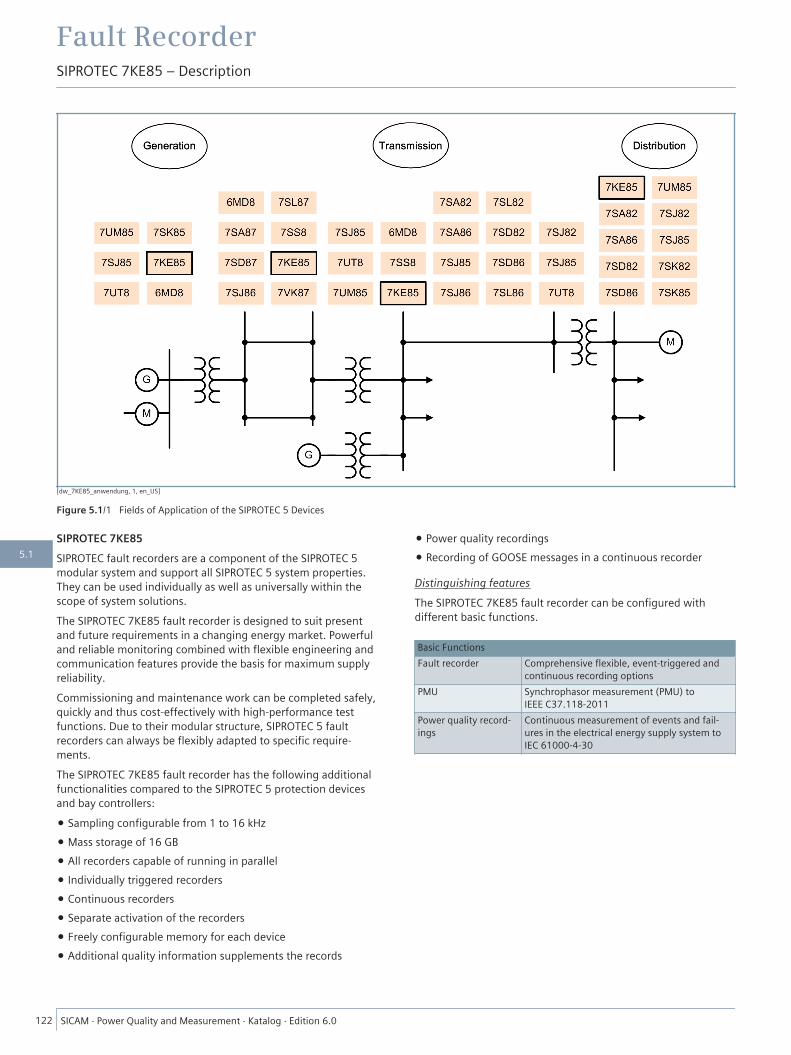
[dw_7KE85_anwendung, 1, en_US]
Figure 5.1/1 Fields of Application of the SIPROTEC 5 Devices
SIPROTEC 7KE85SIPROTEC fault recorders are a component of the SIPROTEC 5modular system and support all SIPROTEC 5 system properties.They can be used individually as well as universally within thescope of system solutions.The SIPROTEC 7KE85 fault recorder is designed to suit presentand future requirements in a changing energy market. Powerfuland reliable monitoring combined with flexible engineering andcommunication features provide the basis for maximum supplyreliability.Commissioning and maintenance work can be completed safely,quickly and thus cost-effectively with high-performance testfunctions. Due to their modular structure, SIPROTEC 5 faultrecorders can always be flexibly adapted to specific require-ments.The SIPROTEC 7KE85 fault recorder has the following additionalfunctionalities compared to the SIPROTEC 5 protection devicesand bay controllers:
• Sampling configurable from 1 to 16 kHz• Mass storage of 16 GB• All recorders capable of running in parallel• Individually triggered recorders• Continuous recorders• Separate activation of the recorders• Freely configurable memory for each device• Additional quality information supplements the records
• Power quality recordings• Recording of GOOSE messages in a continuous recorder
Distinguishing featuresThe SIPROTEC 7KE85 fault recorder can be configured withdifferent basic functions.
Basic FunctionsFault recorder Comprehensive flexible, event-triggered and
continuous recording optionsPMU Synchrophasor measurement (PMU) to
IEEE C37.118-2011Power quality record-ings
Continuous measurement of events and fail-ures in the electrical energy supply system toIEC 61000-4-30
Fault RecorderSIPROTEC 7KE85 – Description
122 SICAM ⋅ Power Quality and Measurement ⋅ Katalog ⋅ Edition 6.0
5.1

DescriptionPowerful fault recorders with integrated measurement ofsynchrophasors (PMU) according to IEEE C37.118 and powerquality measurement according to IEC 61000-4-30. Due to thegreat flexibility of trigger functions, the SIPROTEC 7KE85 isideally suited for monitoring the entire energy value addedchain, from generation to distribution. The powerful automationand flexible configuration with DIGSI 5 complements the rangeof functions.
Main function Fault recorderInputs and outputs 4 predefined standard variants with up to
40 current transformers and 40 voltage trans-formers, 43 binary inputs, 33 binary outputs
Hardware flexibility Flexibly adjustable and expandable I/O quantitystructure within the scope of the SIPROTEC 5modular system
Housing width 1/3 to 1/1 x 19"
Benefits• Clearly organized documentation and focused analysis of
power system processes and failures• Data security and transparency over the entire lifecycle of the
plant save time and money• Purposeful and simple operation of the devices and software
thanks to user-friendly design• Increased reliability and quality of the engineering process• Powerful communication components ensure secure and
effective solutions• Full compatibility between IEC 61850 Editions 1 and 2• Highly available Ethernet communication due to integrated
Ethernet redundancy protocols PRP and HSR
FunctionsDIGSI 5 permits all functions to be configured and combined asrequired.
• Up to 40 analog channels• Fast-scan recorder• Up to 2 slow-scan recorders• Up to 5 continuous recorders and 2 trend recorders• Power Quality recordings according to IEC 61000-4-30
(harmonics, THD, TDD – in preparation)• Sequence-of-events recorder for continuous recording of
binary status changes and IEC 61850 GOOSE messages• Usable as Phasor Measurement Unit (PMU) according to
IEEE C37.118 protocol• Transmission of the records and triggering via IEC 61850
GOOSE messages• Variable sampling frequencies parameterizable between 1 kHz
and 16 kHz• Distribution of the mass storage of 16 GB to the various
recorders by the user as desired• Intelligent monitoring routines of the storage medium ensure
a high level of availability and integrity for archived data• Lossless data compression
• Time synchronization via Precision Time Protocol (PTP)IEEE 1588 protocol, IRIG-B, DCF77, and SNTP
• Routing of the measured values to the individual recorders asdesired
• Combination of the measuring groups for the power calcula-tion as desired
• Quality attributes for representing the instantaneous signalquality in the time signal view
• Trigger functions of a function block are fundamental compo-nent value, RMS value, zero-sequence, positive-sequence,negative-sequence system power, frequency power, Σ activepower, Σ reactive power, and Σ apparent power
• Level trigger and gradient trigger for every trigger function• Flexible cross trigger and system trigger, manual trigger• Creation of independent trigger functions with the graphic
automation editor CFC (continuous function chart)• Trigger functions via a combination of single-point, double-
point indications, analog values, binary signals, Booleansignals and GOOSE messages
• Consistent monitoring concept• Auxiliary functions for simple tests and commissioning• Special test mode for commissioning• Integrated electrical Ethernet RJ45 for DIGSI 5 and IEC 61850
(reporting and GOOSE)• Redundancy protocols PRP and HSR• Cyber security in accordance with NERC CIP and BDWE White-
paper requirements• Up to 4 pluggable communication modules usable for
different and redundant protocols• Intelligent terminal technology enable prewiring and a simple
device replacement
[SIP5_GD_SS_LED_LED_LED_W3, 1, --_--]
Figure 5.1/2 Fault Recorder SIPROTEC 7KE85 (1/3 Device with Expan-sion Modules)
Fault RecorderSIPROTEC 7KE85 – Description
SICAM ⋅ Power Quality and Measurement ⋅ Katalog ⋅ Edition 6.0 123
5.1
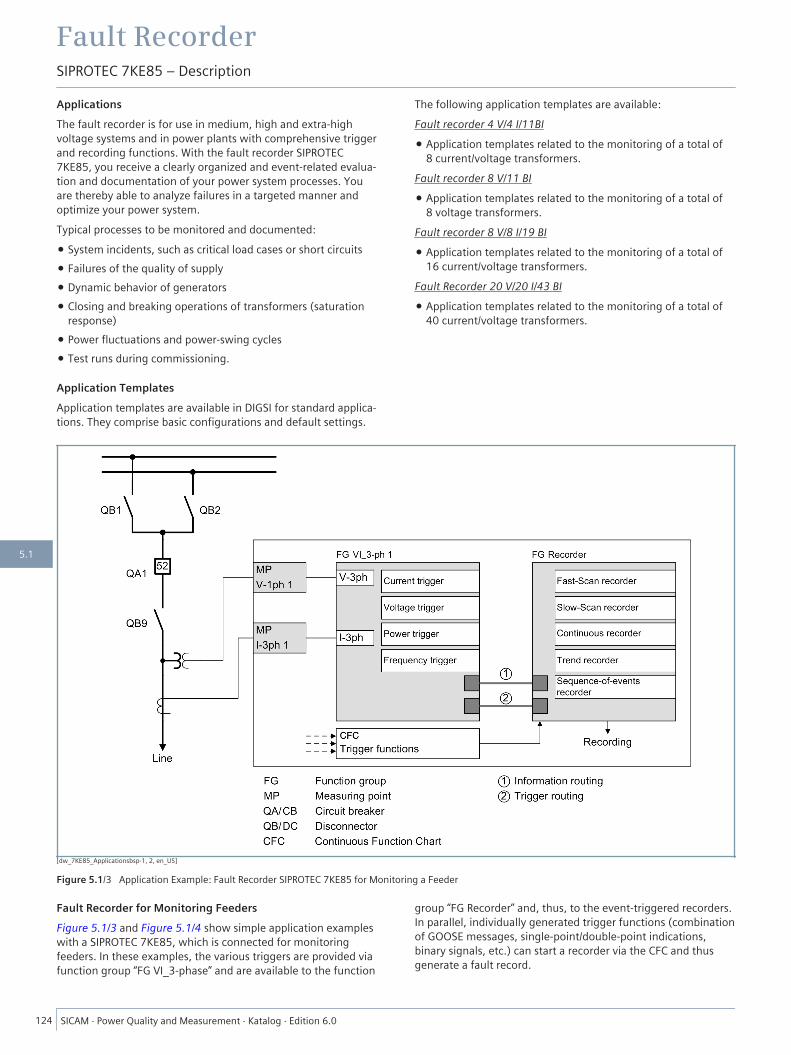
ApplicationsThe fault recorder is for use in medium, high and extra-highvoltage systems and in power plants with comprehensive triggerand recording functions. With the fault recorder SIPROTEC7KE85, you receive a clearly organized and event-related evalua-tion and documentation of your power system processes. Youare thereby able to analyze failures in a targeted manner andoptimize your power system.Typical processes to be monitored and documented:
• System incidents, such as critical load cases or short circuits• Failures of the quality of supply• Dynamic behavior of generators• Closing and breaking operations of transformers (saturation
response)• Power fluctuations and power-swing cycles• Test runs during commissioning.
Application TemplatesApplication templates are available in DIGSI for standard applica-tions. They comprise basic configurations and default settings.
The following application templates are available:Fault recorder 4 V/4 I/11BI
• Application templates related to the monitoring of a total of8 current/voltage transformers.
Fault recorder 8 V/11 BI
• Application templates related to the monitoring of a total of8 voltage transformers.
Fault recorder 8 V/8 I/19 BI
• Application templates related to the monitoring of a total of16 current/voltage transformers.
Fault Recorder 20 V/20 I/43 BI
• Application templates related to the monitoring of a total of40 current/voltage transformers.
[dw_7KE85_Applicationsbsp-1, 2, en_US]
Figure 5.1/3 Application Example: Fault Recorder SIPROTEC 7KE85 for Monitoring a Feeder
Fault Recorder for Monitoring FeedersFigure 5.1/3 and Figure 5.1/4 show simple application exampleswith a SIPROTEC 7KE85, which is connected for monitoringfeeders. In these examples, the various triggers are provided viafunction group “FG VI_3-phase” and are available to the function
group “FG Recorder” and, thus, to the event-triggered recorders.In parallel, individually generated trigger functions (combinationof GOOSE messages, single-point/double-point indications,binary signals, etc.) can start a recorder via the CFC and thusgenerate a fault record.
Fault RecorderSIPROTEC 7KE85 – Description
124 SICAM ⋅ Power Quality and Measurement ⋅ Katalog ⋅ Edition 6.0
5.1
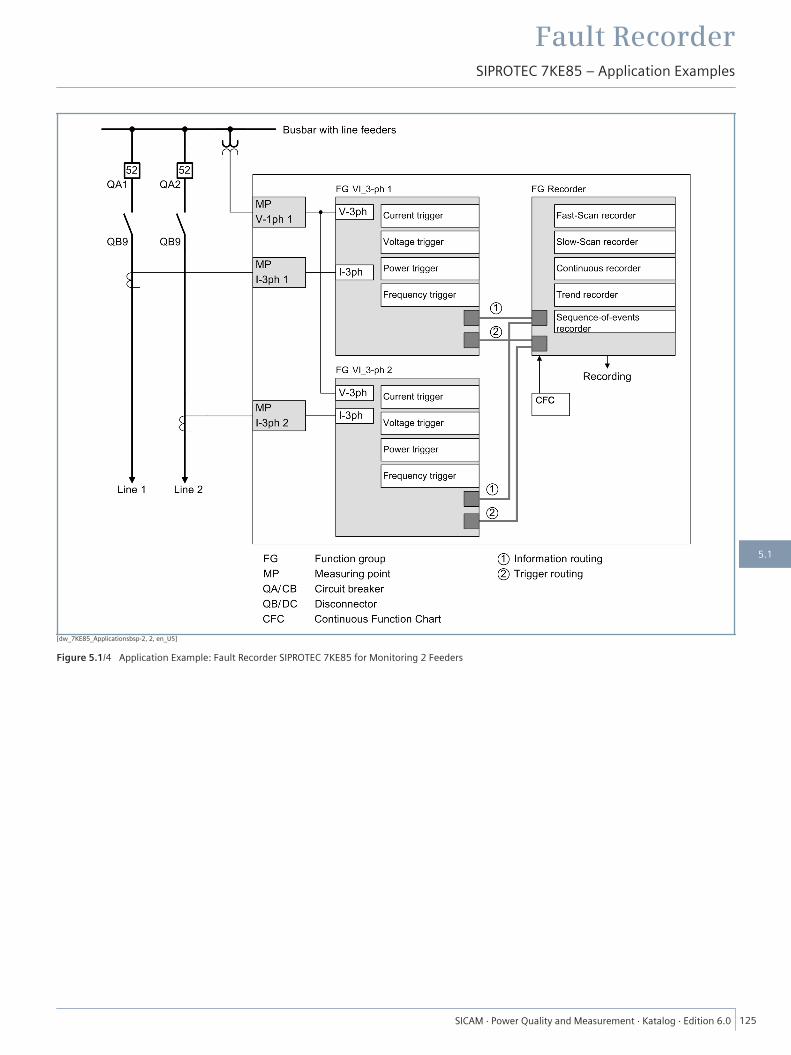
[dw_7KE85_Applicationsbsp-2, 2, en_US]
Figure 5.1/4 Application Example: Fault Recorder SIPROTEC 7KE85 for Monitoring 2 Feeders
Fault RecorderSIPROTEC 7KE85 – Application Examples
SICAM ⋅ Power Quality and Measurement ⋅ Katalog ⋅ Edition 6.0 125
5.1

Dimensions
[dw_surface_mounting_in, 1, en_US]
Figure 5.1/5 Flush-Mounting Devices, Dimensions from the Side And Front Views
Technical DataThe technical data can be found in the current manual atwww.siemens.com/siprotec.
Fault RecorderSIPROTEC 7KE85 – Dimensions and Technical Data
126 SICAM ⋅ Power Quality and Measurement ⋅ Katalog ⋅ Edition 6.0
5.1
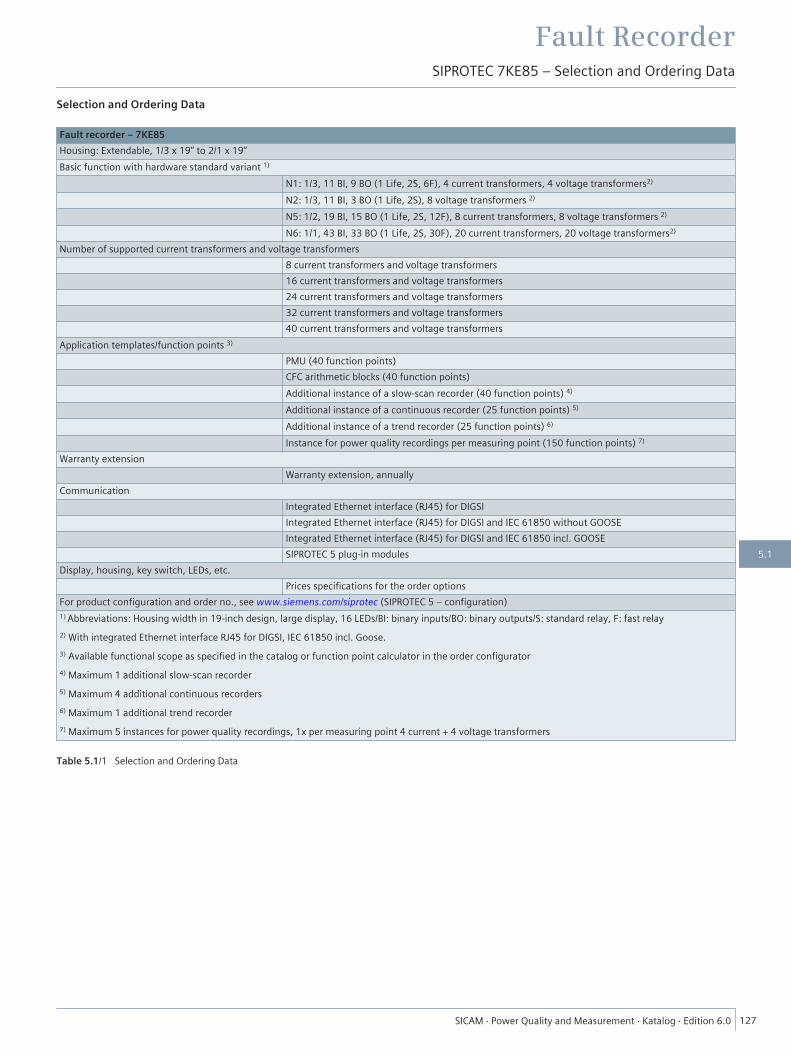
Selection and Ordering Data
Fault recorder – 7KE85Housing: Extendable, 1/3 x 19‘‘ to 2/1 x 19‘‘Basic function with hardware standard variant 1)
N1: 1/3, 11 BI, 9 BO (1 Life, 2S, 6F), 4 current transformers, 4 voltage transformers2)
N2: 1/3, 11 BI, 3 BO (1 Life, 2S), 8 voltage transformers 2)
N5: 1/2, 19 BI, 15 BO (1 Life, 2S, 12F), 8 current transformers, 8 voltage transformers 2)
N6: 1/1, 43 BI, 33 BO (1 Life, 2S, 30F), 20 current transformers, 20 voltage transformers2)
Number of supported current transformers and voltage transformers8 current transformers and voltage transformers16 current transformers and voltage transformers24 current transformers and voltage transformers32 current transformers and voltage transformers40 current transformers and voltage transformers
Application templates/function points 3)
PMU (40 function points)CFC arithmetic blocks (40 function points)Additional instance of a slow-scan recorder (40 function points) 4)
Additional instance of a continuous recorder (25 function points) 5)
Additional instance of a trend recorder (25 function points) 6)
Instance for power quality recordings per measuring point (150 function points) 7)
Warranty extensionWarranty extension, annually
CommunicationIntegrated Ethernet interface (RJ45) for DIGSIIntegrated Ethernet interface (RJ45) for DIGSI and IEC 61850 without GOOSEIntegrated Ethernet interface (RJ45) for DIGSI and IEC 61850 incl. GOOSESIPROTEC 5 plug-in modules
Display, housing, key switch, LEDs, etc.Prices specifications for the order options
For product configuration and order no., see www.siemens.com/siprotec (SIPROTEC 5 – configuration)1) Abbreviations: Housing width in 19-inch design, large display, 16 LEDs/BI: binary inputs/BO: binary outputs/S: standard relay, F: fast relay2) With integrated Ethernet interface RJ45 for DIGSI, IEC 61850 incl. Goose.3) Available functional scope as specified in the catalog or function point calculator in the order configurator4) Maximum 1 additional slow-scan recorder5) Maximum 4 additional continuous recorders6) Maximum 1 additional trend recorder7) Maximum 5 instances for power quality recordings, 1x per measuring point 4 current + 4 voltage transformers
Table 5.1/1 Selection and Ordering Data
Fault RecorderSIPROTEC 7KE85 – Selection and Ordering Data
SICAM ⋅ Power Quality and Measurement ⋅ Katalog ⋅ Edition 6.0 127
5.1
Fault RecorderSIPROTEC 7KE85 – Selection and Ordering Data
128 SICAM ⋅ Power Quality and Measurement ⋅ Katalog ⋅ Edition 6.0
5.1

www.siemens.com/powerquality
Software for Power Quality
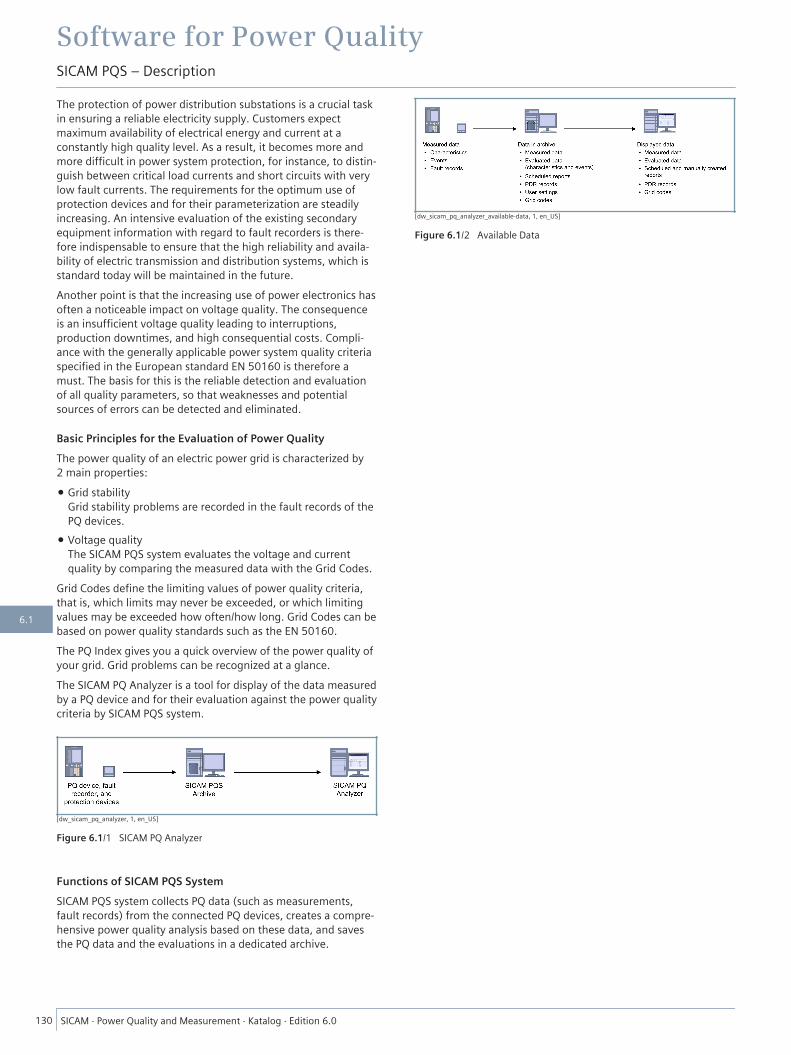
The protection of power distribution substations is a crucial taskin ensuring a reliable electricity supply. Customers expectmaximum availability of electrical energy and current at aconstantly high quality level. As a result, it becomes more andmore difficult in power system protection, for instance, to distin-guish between critical load currents and short circuits with verylow fault currents. The requirements for the optimum use ofprotection devices and for their parameterization are steadilyincreasing. An intensive evaluation of the existing secondaryequipment information with regard to fault recorders is there-fore indispensable to ensure that the high reliability and availa-bility of electric transmission and distribution systems, which isstandard today will be maintained in the future.Another point is that the increasing use of power electronics hasoften a noticeable impact on voltage quality. The consequenceis an insufficient voltage quality leading to interruptions,production downtimes, and high consequential costs. Compli-ance with the generally applicable power system quality criteriaspecified in the European standard EN 50160 is therefore amust. The basis for this is the reliable detection and evaluationof all quality parameters, so that weaknesses and potentialsources of errors can be detected and eliminated.
Basic Principles for the Evaluation of Power QualityThe power quality of an electric power grid is characterized by2 main properties:
• Grid stabilityGrid stability problems are recorded in the fault records of thePQ devices.
• Voltage qualityThe SICAM PQS system evaluates the voltage and currentquality by comparing the measured data with the Grid Codes.
Grid Codes define the limiting values of power quality criteria,that is, which limits may never be exceeded, or which limitingvalues may be exceeded how often/how long. Grid Codes can bebased on power quality standards such as the EN 50160.The PQ Index gives you a quick overview of the power quality ofyour grid. Grid problems can be recognized at a glance.The SICAM PQ Analyzer is a tool for display of the data measuredby a PQ device and for their evaluation against the power qualitycriteria by SICAM PQS system.
[dw_sicam_pq_analyzer, 1, en_US]
Figure 6.1/1 SICAM PQ Analyzer
Functions of SICAM PQS SystemSICAM PQS system collects PQ data (such as measurements,fault records) from the connected PQ devices, creates a compre-hensive power quality analysis based on these data, and savesthe PQ data and the evaluations in a dedicated archive.
[dw_sicam_pq_analyzer_available-data, 1, en_US]
Figure 6.1/2 Available Data
Software for Power QualitySICAM PQS – Description
130 SICAM ⋅ Power Quality and Measurement ⋅ Katalog ⋅ Edition 6.0
6.1

Description Variants Order No.1 2 3 4 5 6 7 8 9 10 11 12 13 14 15 16
Bundles (base package including a communication application) 7 K E 9 0 0 0 - 1 □ A 1 0 - 8 □ A 0▲ ▲ ▲
Version 8.0 │ 8 │Supports up to 4 devices │ │
SICAM PQS incl. SICAM Q80 R BSICAM PQS incl. SIMEAS R R CSICAM PQS incl. IEC 61850 (monitoring direc-tion)
R D
Supports up to 15 devices │ │SICAM PQS incl. SICAM Q80 M BSICAM PQS incl. SIMEAS R M CSICAM PQS incl. IEC 61850 (monitoring direc-tion)
M D
Supports up to 180 devices │ │SICAM PQS incl. SICAM Q80 A BSICAM PQS incl. SIMEAS R A CSICAM PQS incl. IEC 61850 (monitoring direc-tion)
A D
Additional V8.05 order for special use C 5 3 2 0 7 - A 4 0 4 - D 4 4 8 - 2DVD with V8.05 software, latest versionreleased for Windows XP, SICAM Station UnitV2.20, Windows Server 2003 R2 and the useof Profibus FMS; requirement: License/dongleorder with MLFBs 6MD90..-…..-8..0 / 7KE90..-…..-8..0
Upgrades 6 M D 9 0 0 □ - 0 □ A □ □ - 8 A A 0Functional upgrades with respect to the supported number of devices ▲ ▲ ▲ ▲"Full Server" - runtime (up to 15 devices/2000 master information objects)
Prerequisite: 7KE9000-1RA10-8AA0 4 R 1 0
"Full Server" - runtime (up to 180 devices) Prerequisite: 7KE9000-1MA10-8AA0 4 M 1 0Version upgrade SICAM PAS/PQS upgrade to V8.0x SPx (the 1st
order must be referenced in the order)3 A 0 0
Options & Add-onsMaster protocols Power Quality 7 K E 9 0 0 0 - 0 C B 1 □ - 8 A A 0
SIMEAS R master 1SICAM Q80 Master 2
Master protocols Power Automation (monitoring direction) 6 M D 9 0 0 0 - 0 C □ 1 0 - 8 A A 0IEC 60870-5-103 master (monitoring direc-tion)
B
IEC 61850 client (monitoring direction) EPower Quality applications 7 K E 9 0 0 0 - 0 B A 6 □ - 8 A A 0
Automatic Comtrade import 0Automatic Comtrade export 1Automatic PQDif import 2Automatic PQDif export 3Automatic report export 4Automatic fault location 5Message (e-mail, SMS) 6Automatic GridCode evaluation 7Scheduled PQ reports 8
Table 6.1/1 Selection and Ordering Data
Software for Power QualitySICAM PQS – Selection and Ordering Data
SICAM ⋅ Power Quality and Measurement ⋅ Katalog ⋅ Edition 6.0 131
6.1
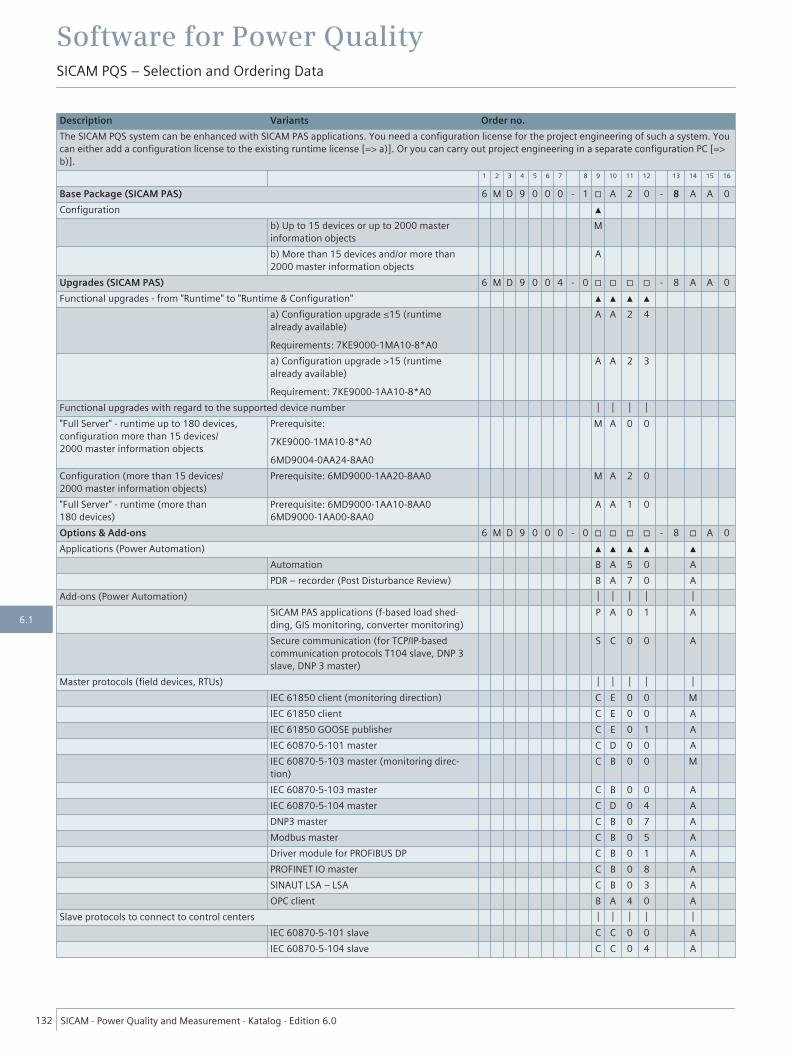
Description Variants Order no.The SICAM PQS system can be enhanced with SICAM PAS applications. You need a configuration license for the project engineering of such a system. Youcan either add a configuration license to the existing runtime license [=> a)]. Or you can carry out project engineering in a separate configuration PC [=>b)].
1 2 3 4 5 6 7 8 9 10 11 12 13 14 15 16
Base Package (SICAM PAS) 6 M D 9 0 0 0 - 1 □ A 2 0 - 8 A A 0Configuration ▲
b) Up to 15 devices or up to 2000 masterinformation objects
M
b) More than 15 devices and/or more than2000 master information objects
A
Upgrades (SICAM PAS) 6 M D 9 0 0 4 - 0 □ □ □ □ - 8 A A 0Functional upgrades - from "Runtime" to "Runtime & Configuration" ▲ ▲ ▲ ▲
a) Configuration upgrade ≤15 (runtimealready available)Requirements: 7KE9000-1MA10-8*A0
A A 2 4
a) Configuration upgrade >15 (runtimealready available)Requirement: 7KE9000-1AA10-8*A0
A A 2 3
Functional upgrades with regard to the supported device number │ │ │ │"Full Server" - runtime up to 180 devices,configuration more than 15 devices/2000 master information objects
Prerequisite:7KE9000-1MA10-8*A06MD9004-0AA24-8AA0
M A 0 0
Configuration (more than 15 devices/2000 master information objects)
Prerequisite: 6MD9000-1AA20-8AA0 M A 2 0
"Full Server" - runtime (more than180 devices)
Prerequisite: 6MD9000-1AA10-8AA06MD9000-1AA00-8AA0
A A 1 0
Options & Add-ons 6 M D 9 0 0 0 - 0 □ □ □ □ - 8 □ A 0Applications (Power Automation) ▲ ▲ ▲ ▲ ▲
Automation B A 5 0 APDR – recorder (Post Disturbance Review) B A 7 0 A
Add-ons (Power Automation) │ │ │ │ │SICAM PAS applications (f-based load shed-ding, GIS monitoring, converter monitoring)
P A 0 1 A
Secure communication (for TCP/IP-basedcommunication protocols T104 slave, DNP 3slave, DNP 3 master)
S C 0 0 A
Master protocols (field devices, RTUs) │ │ │ │ │IEC 61850 client (monitoring direction) C E 0 0 MIEC 61850 client C E 0 0 AIEC 61850 GOOSE publisher C E 0 1 AIEC 60870-5-101 master C D 0 0 AIEC 60870-5-103 master (monitoring direc-tion)
C B 0 0 M
IEC 60870-5-103 master C B 0 0 AIEC 60870-5-104 master C D 0 4 ADNP3 master C B 0 7 AModbus master C B 0 5 ADriver module for PROFIBUS DP C B 0 1 APROFINET IO master C B 0 8 ASINAUT LSA – LSA C B 0 3 AOPC client B A 4 0 A
Slave protocols to connect to control centers │ │ │ │ │IEC 60870-5-101 slave C C 0 0 AIEC 60870-5-104 slave C C 0 4 A
Software for Power QualitySICAM PQS – Selection and Ordering Data
132 SICAM ⋅ Power Quality and Measurement ⋅ Katalog ⋅ Edition 6.0
6.1
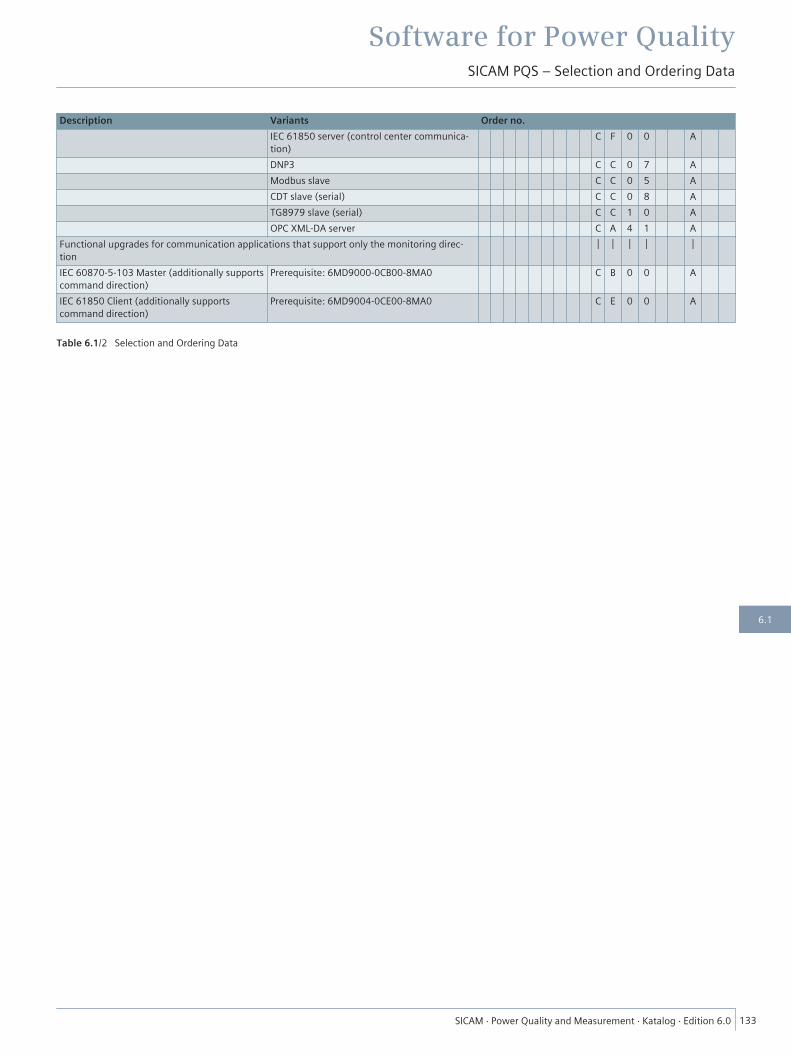
Description Variants Order no.IEC 61850 server (control center communica-tion)
C F 0 0 A
DNP3 C C 0 7 AModbus slave C C 0 5 ACDT slave (serial) C C 0 8 ATG8979 slave (serial) C C 1 0 AOPC XML-DA server C A 4 1 A
Functional upgrades for communication applications that support only the monitoring direc-tion
│ │ │ │ │
IEC 60870-5-103 Master (additionally supportscommand direction)
Prerequisite: 6MD9000-0CB00-8MA0 C B 0 0 A
IEC 61850 Client (additionally supportscommand direction)
Prerequisite: 6MD9004-0CE00-8MA0 C E 0 0 A
Table 6.1/2 Selection and Ordering Data
Software for Power QualitySICAM PQS – Selection and Ordering Data
SICAM ⋅ Power Quality and Measurement ⋅ Katalog ⋅ Edition 6.0 133
6.1
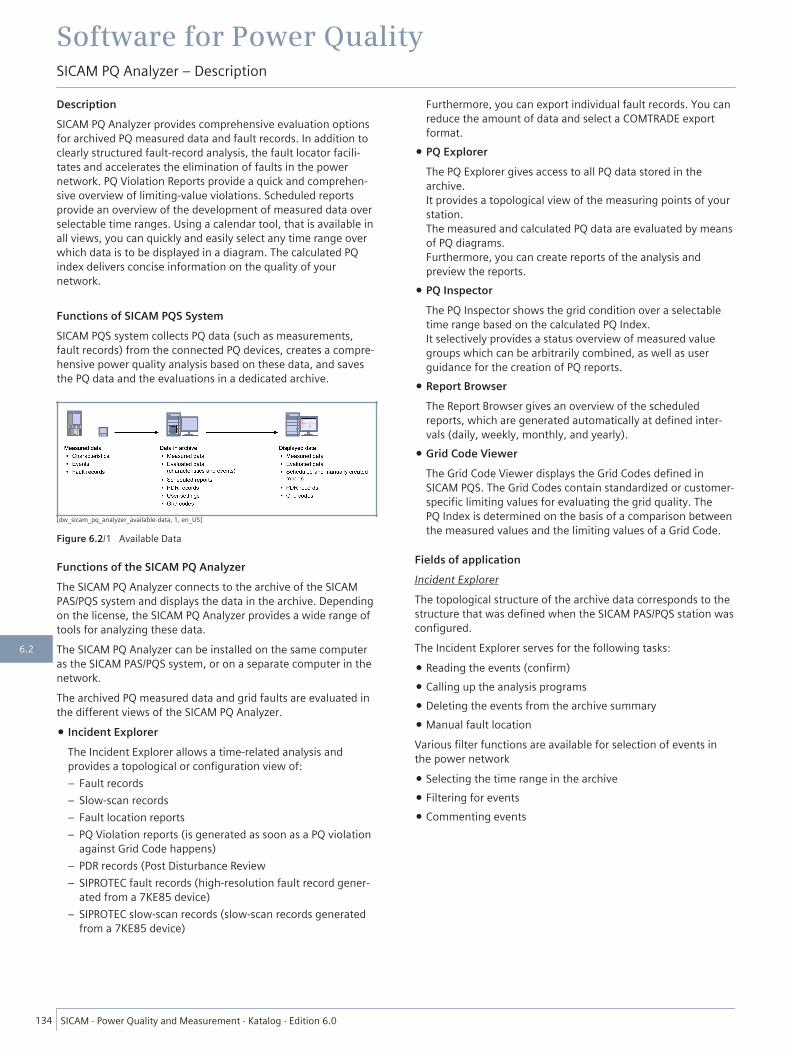
DescriptionSICAM PQ Analyzer provides comprehensive evaluation optionsfor archived PQ measured data and fault records. In addition toclearly structured fault-record analysis, the fault locator facili-tates and accelerates the elimination of faults in the powernetwork. PQ Violation Reports provide a quick and comprehen-sive overview of limiting-value violations. Scheduled reportsprovide an overview of the development of measured data overselectable time ranges. Using a calendar tool, that is available inall views, you can quickly and easily select any time range overwhich data is to be displayed in a diagram. The calculated PQindex delivers concise information on the quality of yournetwork.
Functions of SICAM PQS SystemSICAM PQS system collects PQ data (such as measurements,fault records) from the connected PQ devices, creates a compre-hensive power quality analysis based on these data, and savesthe PQ data and the evaluations in a dedicated archive.
[dw_sicam_pq_analyzer_available-data, 1, en_US]
Figure 6.2/1 Available Data
Functions of the SICAM PQ AnalyzerThe SICAM PQ Analyzer connects to the archive of the SICAMPAS/PQS system and displays the data in the archive. Dependingon the license, the SICAM PQ Analyzer provides a wide range oftools for analyzing these data.The SICAM PQ Analyzer can be installed on the same computeras the SICAM PAS/PQS system, or on a separate computer in thenetwork.The archived PQ measured data and grid faults are evaluated inthe different views of the SICAM PQ Analyzer.
• Incident ExplorerThe Incident Explorer allows a time-related analysis andprovides a topological or configuration view of:– Fault records– Slow-scan records– Fault location reports– PQ Violation reports (is generated as soon as a PQ violation
against Grid Code happens)– PDR records (Post Disturbance Review– SIPROTEC fault records (high-resolution fault record gener-
ated from a 7KE85 device)– SIPROTEC slow-scan records (slow-scan records generated
from a 7KE85 device)
Furthermore, you can export individual fault records. You canreduce the amount of data and select a COMTRADE exportformat.
• PQ ExplorerThe PQ Explorer gives access to all PQ data stored in thearchive.It provides a topological view of the measuring points of yourstation.The measured and calculated PQ data are evaluated by meansof PQ diagrams.Furthermore, you can create reports of the analysis andpreview the reports.
• PQ InspectorThe PQ Inspector shows the grid condition over a selectabletime range based on the calculated PQ Index.It selectively provides a status overview of measured valuegroups which can be arbitrarily combined, as well as userguidance for the creation of PQ reports.
• Report BrowserThe Report Browser gives an overview of the scheduledreports, which are generated automatically at defined inter-vals (daily, weekly, monthly, and yearly).
• Grid Code ViewerThe Grid Code Viewer displays the Grid Codes defined inSICAM PQS. The Grid Codes contain standardized or customer-specific limiting values for evaluating the grid quality. ThePQ Index is determined on the basis of a comparison betweenthe measured values and the limiting values of a Grid Code.
Fields of applicationIncident ExplorerThe topological structure of the archive data corresponds to thestructure that was defined when the SICAM PAS/PQS station wasconfigured.The Incident Explorer serves for the following tasks:
• Reading the events (confirm)• Calling up the analysis programs• Deleting the events from the archive summary• Manual fault locationVarious filter functions are available for selection of events inthe power network
• Selecting the time range in the archive• Filtering for events• Commenting events
Software for Power QualitySICAM PQ Analyzer – Description
134 SICAM ⋅ Power Quality and Measurement ⋅ Katalog ⋅ Edition 6.0
6.2

[sc_PQ IncidentEx, 1, en_US]
Figure 6.2/2 Incident Explorer
PQ InspectorThe PQ Inspector provides the operator with a quick overview ofthe plant's power quality based on the PQ index. The archiveddata is analyzed via any selectable time ranges. Causes of devia-tions in the measured values for the grid codes can thus bedetected immediately.PQ Inspector is divided into 3 steps:
• In Select time range, define the observation period and iden-tify possible influencing factors for deviations of the powerquality.
• In Select diagrams, select the properties of a specific meas-uring point, and define the diagrams in which you want toshow these data items.
• In Complete report, complete your report.Use the Select time range step to view the state of the powerquality of the system at a glance. You can set up individualmeasuring point groups and feature groups so that you canobserve critical areas in a targeted manner.The step Select diagram allows the compilation of evaluationdiagrams with specific features for a report. The diagrams arerepresented in a synchronized manner. Hence you can rapidlyidentify connections in the event of fluctuations in powerquality.The step Prepare report allows reports to be prepared andcommented upon.PQ ExplorerPQ Explorer allows access to all PQ data stored in the archive. Itoffers a topological view of the measuring points in your plant.Measured and calculated PQ data is evaluated via PQ diagrams.Furthermore, you can generate analysis reports and displaythese in a preview.Report BrowserThe Report Browser provides an overview of the scheduledreports that are created automatically at specified time intervals(daily, weekly, monthly and yearly). You can view the reportswith a viewer, print them and store them for future use.
[sc_pqa_ReportBrowser, 2, en_US]
Figure 6.2/3 Report Browser
In Report Browser, the reports are shown for the selected timerange – separated into yearly reports, monthly reports, weeklyreports and daily reports. If you select the year time grid youcannot open daily reports. However, you can view the statusand the time lapses for which infringement reports are avail-able. Scheduled reports are automatically generated by theSICAM PQS system using the set up report templates. If you setup report templates, among other things define the intervals inwhich the reports are created, and the PQ devices for which thereports are created. The colors of the reports show their status.Grid Code ViewerThe Grid Code Viewer displays the grid codes defined in SICAMPQS. The grid codes include normalized or customer-specificallydefined limiting values for evaluating the power quality. ThePQ Index is determined from a comparison of the measuredvalues with the limiting values of a grid code.The Grid Code Viewer provides the overview required for asupporting analysis:
• Which grid codes are available?• To which elements in the topology have the grid codes been
assigned?• What features do the grid codes contain?• What limits have been defined?
SICAM PQ CollectorThe SICAM PQ Collector collects the archive data of the indi-vidual (source) archives in a central (collector) archive.Depending on the system configuration, the SICAM PQ Analyzeraccesses the data of the (source) archives or (collector) archivesfor its archive evaluation.In redundant archive systems, two SICAM PQ Collectors areconnected. In the event of an interruption of the connection to(source) archives or after the failure of a SICAM PQ Collectors,this permits the archives to be matched, thus reaching an iden-tical and complete contents of both (Collector) archives.Architecture
• SICAM PAS/PQS with (source) archive and SICAM PQ Analyzer• System with
– SICAM PAS/PQS with (source) archive– SICAM PQ Analyzer clients
• System with– SICAM PAS/PQS– Archive servers with (collector) archive– SICAM PQ Analyzer clients
Software for Power QualitySICAM PQ Analyzer – Functions
SICAM ⋅ Power Quality and Measurement ⋅ Katalog ⋅ Edition 6.0 135
6.2
The number of components which can be used in a systemdepends on the individual license.(Source) archiveSICAM PAS/PQS collects the PQ measured data and fault recordsfrom the connected devices and stores them in its local (source)archive. This archive data can be directly evaluated by one ormore SICAM PQ Analyzer(s).(Collector) archiveIn distributed systems with one or several SICAM PAS/PQS, thedata of the (source) archives is collected by the SICAM PQAnalyzer collector and stored in a central (Collector) archive onan archive computer. This archive data is evaluated by one ormore SICAM PQ Analyzer(s).
Software for Power QualitySICAM PQ Analyzer – Functions
136 SICAM ⋅ Power Quality and Measurement ⋅ Katalog ⋅ Edition 6.0
6.2
One of the following operating systems is required:
• Windows Embedded 7 (SICAM Station Unit V2.40, 32-bit)• Windows Server 2012 R2 Standard (64-bit)• Windows 8.1 Professional (64-bit)• Windows 10 Professional (64-bit)Computer equipped with:
• Processor:– Minimum: Intel Core 2 Duo 1.6 GHz– Recommended: Quad Core CPU 3 GHz
• Primary storage capacity:– Minimum: 2 GB– Recommended: 4 GB
• Hard disk capacity:– Minimum: 4 GB– (Collector) archive: > 100 GB
• Graphics card:– Minimum: 1600 x 1200– Recommended: 1920 x 1080
• Monitor suitable for graphics card• DVD drive• Keyboard• Mouse• Network interface• USB portSICAM PQ Analyzer is released for computers with multi-coreprocessors. Computers with multi-processor main boards aresupported when working in single-processor mode.
Software for Power QualitySICAM PQ Analyzer – Software and Hardware Requirements
SICAM ⋅ Power Quality and Measurement ⋅ Katalog ⋅ Edition 6.0 137
6.2
Selection and Ordering Data
Description Variants Order No.1 2 3 4 5 6 7 8 9 10 11 12 13 14 15 16
Incident Explorer for Fault Record Processing 6 M D 5 5 3 0 - 0 A A 1 0 - 3 □ □ 0▲ ▲ ▲
Version 3.0x 3 │ │Use on the SICAM PAS/PQS Full Server A AUp to 5 clients, archive transfer of 1 Server/FullServer
B A
Up to 5 clients, archive transfer of up to5 Servers/Full Servers
B B
Up to 5 clients, archive transfer of more than5 Servers/Full Servers
B C
More than 5 clients, archive transfer of1 Server/Full Server
C A
More than 5 clients, archive transfer of up to5 Servers/Full Servers
C B
More than 5 clients, archive transfer of morethan 5 Servers/Full Servers
C C
Notes:
• 2 redundant PAS/PQS Full Servers are counted as 1 server• In addition to fault records, SIMEAS R and SIPROTEC 7KE85 deliver continuous average value reports that are managed in PQ Explorer.=> The use of PQ Basic is recommended as a minimum for a complete evaluation of SIMEAS R and SIPROTEC 7KE85 data.PQ Basic 7 K E 9 2 0 0 - 0 B A 1 0 - 3 □ □ 0Including Incident Explorer for fault-record analysis and PQ ExplorerRecommended SICAM PAS/PQS option: Automatic grid code evaluation <->7KE9000-0BA67-8AA0
▲ ▲
Use on the SICAM PAS/PQS Full Server A AUp to 5 clients, archive transfer of 1 Server/Full Server
B A
Up to 5 clients, archive transfer of up to5 Servers/Full Servers
B B
Up to 5 clients, archive transfer of more than5 Servers/Full Servers
B C
More than 5 clients, archive transfer of1 Server/Full Server
C A
More than 5 clients, archive transfer of up to5áServers/Full Servers
C B
More than 5 clients, archive transfer of morethan 5 Servers/Full Servers
C C
PQ Standard 7 K E 2 0 0 - 0 C A 1 0 - 3 □ □ 0Including PQ Basic and extended PQ Explorer and Report BrowserRecommended SICAM PAS/PQS options: Automatic grid code evaluation <->7KE9000-0BA67-8AA / scheduled PQ reports <-> 7KE9000-0BA68-8AA0
▲ ▲
Use on the SICAM PAS/PQS Full Server A AUp to 5 clients, archive transfer of 1 Server/Full Server
B A
Up to 5 clients, archive transfer of up to5 Servers/Full Servers
B B
Up to 5 clients, archive transfer of more than5 Servers/Full Servers
B C
More than 5 clients, archive transfer of1 Server/Full Server
C A
More than 5 clients, archive transfer of up to5 Servers/Full Servers
C B
More than 5 clients, archive transfer of morethan 5 Servers/Full Servers
C C
Table 6.2/1 SICAM PQ Analyzer Selection and Ordering Data
Software for Power QualitySICAM PQ Analyzer – Selection and Ordering Data
138 SICAM ⋅ Power Quality and Measurement ⋅ Katalog ⋅ Edition 6.0
6.2
Description Variants Order no.Continued from previous page 1 2 3 4 5 6 7 8 9 10 11 12 13 14 15 16
PQ Professional 7 K E 2 0 0 - 0 D A 1 0 - 3 □ □ 0Including PQ Standard and PQ InspectorRecommended SICAM PAS/PQS options: Automatic grid code evaluation <->7KE9000-0BA67-8AA0/scheduled PQ reports <-> 7KE9000-0BA68-8AA0
▲ ▲
Use on the SICAM PAS/PQS Full Server A AUp to 5 clients, archive transfer of 1 Server/Full Server
B A
Up to 5 clients, archive transfer of up to5 Servers/Full Servers
B B
Up to 5 clients, archive transfer of more than5 Servers/Full Servers
B C
More than 5 clients, archive transfer of1 Server/Full Server
C A
More than 5 clients, archive transfer of up to5 Servers/Full Servers
C B
More than 5 clients, archive transfer of morethan 5 Servers/Full Servers
C C
Functional upgradesPower Quality functions 7 K E 9 2 0 0 - 4 □ □ 0 0 - 3 A A 0
From Incident Explorer to PQ Basic B AFrom PQ Basic to PQ Standard C BFrom PQ Basic to PQ Professional D BFrom PQ Standard to PQ Professional D C
Number of clients 6 M D 5 5 3 0 - 4 A A 0 0 - 3 □ A 0Up to 5 clients BFrom ”up to 5 clients” to ”more than 5 clients” C
Number of Full Servers 6 M D 5 5 3 0 - 4 A A 0 0 - 3 A □ 0Up to 5 Full Servers BFrom ”up to 5 Full Servers” to ”more than5 Full Servers”
C
Version upgradeUpgrade from SICAM Recpro V5.x to SICAM PQAnalyzer (Incident Explorer)
6 M D 5 5 3 0 - 3 A A 0 0 - 3 A A 0
Version upgrade SICAM PQ Analyzer 6 M D 5 5 3 0 - 3 A A 0 1 - 3 A A 0
Table 6.2/2 SICAM PQ Analyzer Selection and Ordering Data
SICAM PQ Analyzer can be extended with SIGRA forextended fault-record analysis (separate order)
Software for Power QualitySICAM PQ Analyzer – Selection and Ordering Data
SICAM ⋅ Power Quality and Measurement ⋅ Katalog ⋅ Edition 6.0 139
6.2
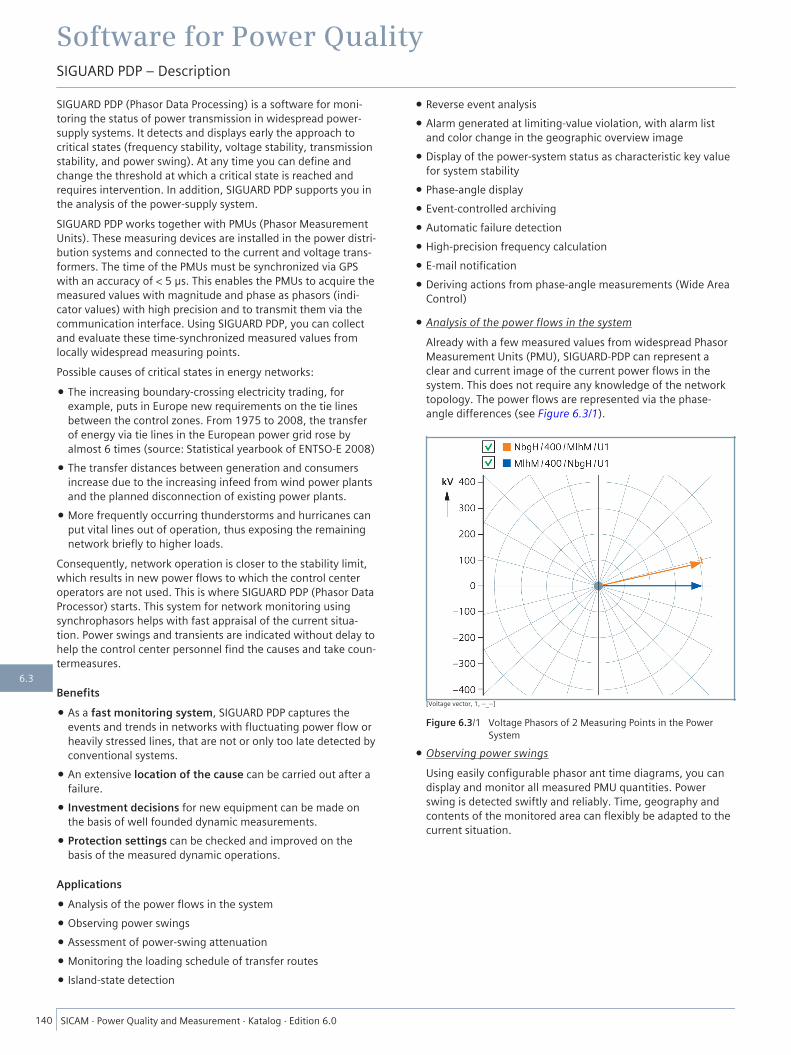
SIGUARD PDP (Phasor Data Processing) is a software for moni-toring the status of power transmission in widespread power-supply systems. It detects and displays early the approach tocritical states (frequency stability, voltage stability, transmissionstability, and power swing). At any time you can define andchange the threshold at which a critical state is reached andrequires intervention. In addition, SIGUARD PDP supports you inthe analysis of the power-supply system.SIGUARD PDP works together with PMUs (Phasor MeasurementUnits). These measuring devices are installed in the power distri-bution systems and connected to the current and voltage trans-formers. The time of the PMUs must be synchronized via GPSwith an accuracy of < 5 μs. This enables the PMUs to acquire themeasured values with magnitude and phase as phasors (indi-cator values) with high precision and to transmit them via thecommunication interface. Using SIGUARD PDP, you can collectand evaluate these time-synchronized measured values fromlocally widespread measuring points.Possible causes of critical states in energy networks:
• The increasing boundary-crossing electricity trading, forexample, puts in Europe new requirements on the tie linesbetween the control zones. From 1975 to 2008, the transferof energy via tie lines in the European power grid rose byalmost 6 times (source: Statistical yearbook of ENTSO-E 2008)
• The transfer distances between generation and consumersincrease due to the increasing infeed from wind power plantsand the planned disconnection of existing power plants.
• More frequently occurring thunderstorms and hurricanes canput vital lines out of operation, thus exposing the remainingnetwork briefly to higher loads.
Consequently, network operation is closer to the stability limit,which results in new power flows to which the control centeroperators are not used. This is where SIGUARD PDP (Phasor DataProcessor) starts. This system for network monitoring usingsynchrophasors helps with fast appraisal of the current situa-tion. Power swings and transients are indicated without delay tohelp the control center personnel find the causes and take coun-termeasures.
Benefits• As a fast monitoring system, SIGUARD PDP captures the
events and trends in networks with fluctuating power flow orheavily stressed lines, that are not or only too late detected byconventional systems.
• An extensive location of the cause can be carried out after afailure.
• Investment decisions for new equipment can be made onthe basis of well founded dynamic measurements.
• Protection settings can be checked and improved on thebasis of the measured dynamic operations.
Applications• Analysis of the power flows in the system• Observing power swings• Assessment of power-swing attenuation• Monitoring the loading schedule of transfer routes• Island-state detection
• Reverse event analysis• Alarm generated at limiting-value violation, with alarm list
and color change in the geographic overview image• Display of the power-system status as characteristic key value
for system stability• Phase-angle display• Event-controlled archiving• Automatic failure detection• High-precision frequency calculation• E-mail notification• Deriving actions from phase-angle measurements (Wide Area
Control)
• Analysis of the power flows in the systemAlready with a few measured values from widespread PhasorMeasurement Units (PMU), SIGUARD-PDP can represent aclear and current image of the current power flows in thesystem. This does not require any knowledge of the networktopology. The power flows are represented via the phase-angle differences (see Figure 6.3/1).
[Voltage vector, 1, --_--]
Figure 6.3/1 Voltage Phasors of 2 Measuring Points in the PowerSystem
• Observing power swingsUsing easily configurable phasor ant time diagrams, you candisplay and monitor all measured PMU quantities. Powerswing is detected swiftly and reliably. Time, geography andcontents of the monitored area can flexibly be adapted to thecurrent situation.
Software for Power QualitySIGUARD PDP – Description
140 SICAM ⋅ Power Quality and Measurement ⋅ Katalog ⋅ Edition 6.0
6.3

• Assessment of power-swing attenuationThe "Power-swing recognition" function detects the beginningof a power swing and determines the attenuation. The detec-tion of a power swing and, if applicable, its weak or non-existing attenuation, are reported (alarm list). 2 types ofpower-swing detection are possible - based on the angledifference between 2 voltages (2 PMUs required), or based on1 active-power swing (1 PMU with measured current andvoltage values is sufficient). Detected power swings areshown in the tree-view control, in a mode- or job-orientedoverview and in a frequency attenuation diagram.
[SIGUARD Monitoring Diagrams, 1, --_--]
Figure 6.3/2 Overview Diagram of the “Power-Swing Recognition"Application
• Monitoring the loading situation of transfer corridorsThe voltage-stability curve is particularly suitable fordisplaying the current loading situation of a transfer corridor.The currently measured operating point is shown on the oper-ating curve of the line (voltage as a function of the transferredpower). The remaining reserve can thus be retrieved at anytime. This requires PMUs at both ends of the line.
[Voltage-stability curve, 1, --_--]
Figure 6.3/3 Voltage Stability Curve
• Island-state detectionThis function shows automatically when parts of the networkare separated from the remaining network. It also permitsfrequency differences and frequency change rates to be moni-tored automatically. Detected islands generate warnings andevent messages. In addition, the islands are marked ascolored areas in the graphical overview.
[Island stae detection, 1, --_--]
Figure 6.3/4 Island-State Detection
• Reverse event analysisSIGUARD PDP is particularly suitable for the analysis of criticalevents in the network. After you have switched over to offlinemode, you can analyze the entire archive systematically, andplay the event back as often as necessary. This makesdynamic events transparent, and reports can be preparedquickly and precisely. Merely copy the meaningful diagramsfrom SIGUARD PDP into your reports.
• Alarm generated at limiting-value violation, with alarm listand color change in the geographic overview mapThis enables you to quickly detect location and cause of afailure. This function is also available when you analyze thearchive.
• Display of the power- system status as characteristic keyvalue for system stabilityThe permanently displayed power-system status curve in theupper part of the screen informs the operator continuouslyabout the trend of the dynamic system behavior and aboutthe availability of reserves. This curve shows weighted meanvalues of the distances of all measured values from theirlimiting values.
Software for Power QualitySIGUARD PDP – Fields of Application and Possible Applications
SICAM ⋅ Power Quality and Measurement ⋅ Katalog ⋅ Edition 6.0 141
6.3
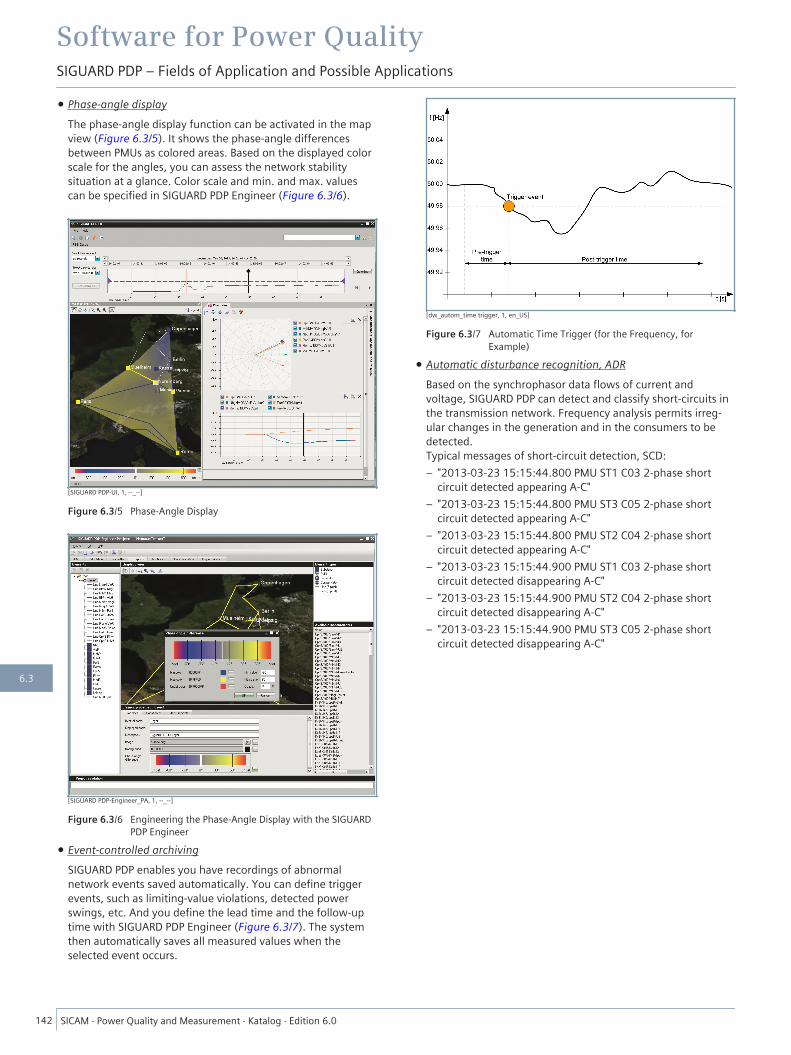
• Phase-angle displayThe phase-angle display function can be activated in the mapview (Figure 6.3/5). It shows the phase-angle differencesbetween PMUs as colored areas. Based on the displayed colorscale for the angles, you can assess the network stabilitysituation at a glance. Color scale and min. and max. valuescan be specified in SIGUARD PDP Engineer (Figure 6.3/6).
[SIGUARD PDP-UI, 1, --_--]
Figure 6.3/5 Phase-Angle Display
[SIGUARD PDP-Engineer_PA, 1, --_--]
Figure 6.3/6 Engineering the Phase-Angle Display with the SIGUARDPDP Engineer
• Event-controlled archivingSIGUARD PDP enables you have recordings of abnormalnetwork events saved automatically. You can define triggerevents, such as limiting-value violations, detected powerswings, etc. And you define the lead time and the follow-uptime with SIGUARD PDP Engineer (Figure 6.3/7). The systemthen automatically saves all measured values when theselected event occurs.
[dw_autom_time trigger, 1, en_US]
Figure 6.3/7 Automatic Time Trigger (for the Frequency, forExample)
• Automatic disturbance recognition, ADRBased on the synchrophasor data flows of current andvoltage, SIGUARD PDP can detect and classify short-circuits inthe transmission network. Frequency analysis permits irreg-ular changes in the generation and in the consumers to bedetected.Typical messages of short-circuit detection, SCD:– "2013-03-23 15:15:44.800 PMU ST1 C03 2-phase short
circuit detected appearing A-C"– "2013-03-23 15:15:44.800 PMU ST3 C05 2-phase short
circuit detected appearing A-C"– "2013-03-23 15:15:44.800 PMU ST2 C04 2-phase short
circuit detected appearing A-C"– "2013-03-23 15:15:44.900 PMU ST1 C03 2-phase short
circuit detected disappearing A-C"– "2013-03-23 15:15:44.900 PMU ST2 C04 2-phase short
circuit detected disappearing A-C"– "2013-03-23 15:15:44.900 PMU ST3 C05 2-phase short
circuit detected disappearing A-C"
Software for Power QualitySIGUARD PDP – Fields of Application and Possible Applications
142 SICAM ⋅ Power Quality and Measurement ⋅ Katalog ⋅ Edition 6.0
6.3
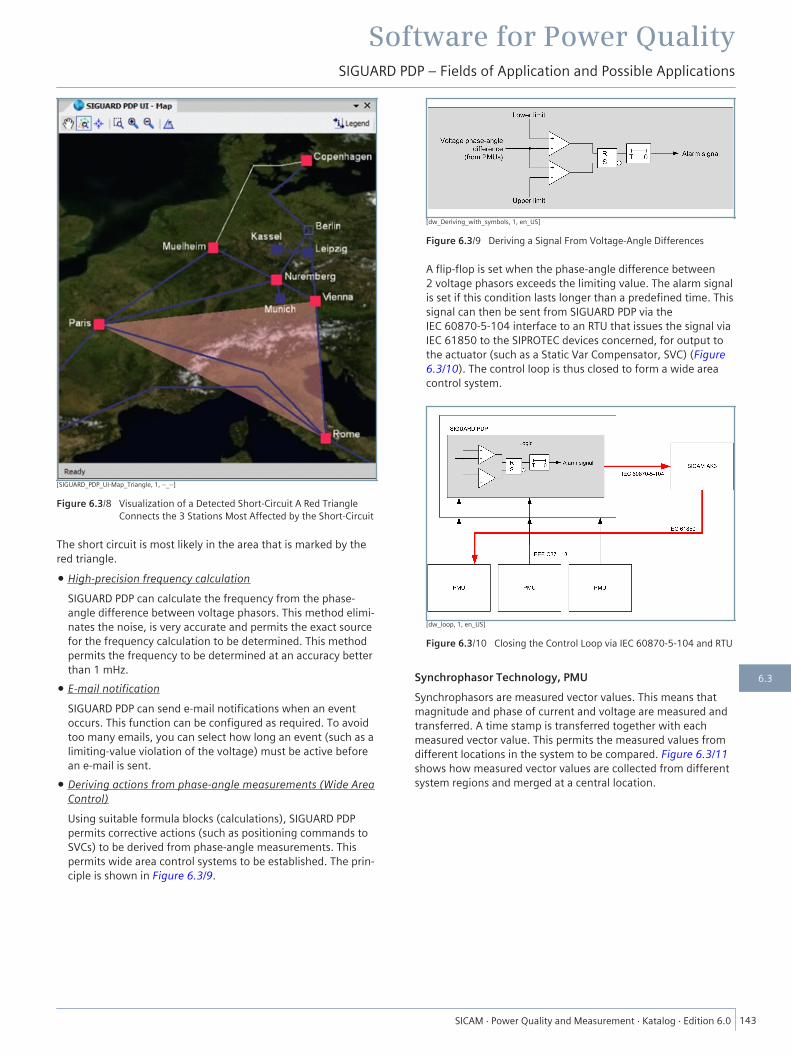
[SIGUARD_PDP_UI-Map_Triangle, 1, --_--]
Figure 6.3/8 Visualization of a Detected Short-Circuit A Red TriangleConnects the 3 Stations Most Affected by the Short-Circuit
The short circuit is most likely in the area that is marked by thered triangle.
• High-precision frequency calculationSIGUARD PDP can calculate the frequency from the phase-angle difference between voltage phasors. This method elimi-nates the noise, is very accurate and permits the exact sourcefor the frequency calculation to be determined. This methodpermits the frequency to be determined at an accuracy betterthan 1 mHz.
• E-mail notificationSIGUARD PDP can send e-mail notifications when an eventoccurs. This function can be configured as required. To avoidtoo many emails, you can select how long an event (such as alimiting-value violation of the voltage) must be active beforean e-mail is sent.
• Deriving actions from phase-angle measurements (Wide AreaControl)Using suitable formula blocks (calculations), SIGUARD PDPpermits corrective actions (such as positioning commands toSVCs) to be derived from phase-angle measurements. Thispermits wide area control systems to be established. The prin-ciple is shown in Figure 6.3/9.
[dw_Deriving_with_symbols, 1, en_US]
Figure 6.3/9 Deriving a Signal From Voltage-Angle Differences
A flip-flop is set when the phase-angle difference between2 voltage phasors exceeds the limiting value. The alarm signalis set if this condition lasts longer than a predefined time. Thissignal can then be sent from SIGUARD PDP via theIEC 60870-5-104 interface to an RTU that issues the signal viaIEC 61850 to the SIPROTEC devices concerned, for output tothe actuator (such as a Static Var Compensator, SVC) (Figure6.3/10). The control loop is thus closed to form a wide areacontrol system.
[dw_loop, 1, en_US]
Figure 6.3/10 Closing the Control Loop via IEC 60870-5-104 and RTU
Synchrophasor Technology, PMUSynchrophasors are measured vector values. This means thatmagnitude and phase of current and voltage are measured andtransferred. A time stamp is transferred together with eachmeasured vector value. This permits the measured values fromdifferent locations in the system to be compared. Figure 6.3/11shows how measured vector values are collected from differentsystem regions and merged at a central location.
Software for Power QualitySIGUARD PDP – Fields of Application and Possible Applications
SICAM ⋅ Power Quality and Measurement ⋅ Katalog ⋅ Edition 6.0 143
6.3
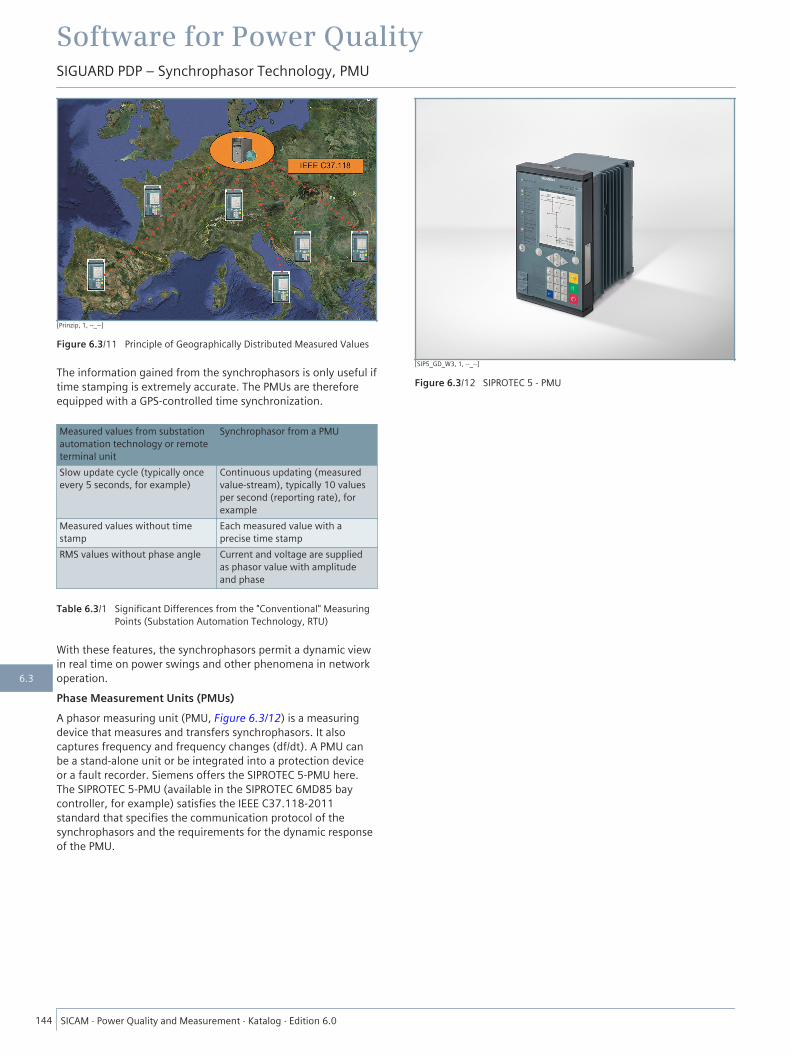
[Prinzip, 1, --_--]
Figure 6.3/11 Principle of Geographically Distributed Measured Values
The information gained from the synchrophasors is only useful iftime stamping is extremely accurate. The PMUs are thereforeequipped with a GPS-controlled time synchronization.
Measured values from substationautomation technology or remoteterminal unit
Synchrophasor from a PMU
Slow update cycle (typically onceevery 5 seconds, for example)
Continuous updating (measuredvalue-stream), typically 10 valuesper second (reporting rate), forexample
Measured values without timestamp
Each measured value with aprecise time stamp
RMS values without phase angle Current and voltage are suppliedas phasor value with amplitudeand phase
Table 6.3/1 Significant Differences from the "Conventional" MeasuringPoints (Substation Automation Technology, RTU)
With these features, the synchrophasors permit a dynamic viewin real time on power swings and other phenomena in networkoperation.Phase Measurement Units (PMUs)A phasor measuring unit (PMU, Figure 6.3/12) is a measuringdevice that measures and transfers synchrophasors. It alsocaptures frequency and frequency changes (df/dt). A PMU canbe a stand-alone unit or be integrated into a protection deviceor a fault recorder. Siemens offers the SIPROTEC 5-PMU here.The SIPROTEC 5-PMU (available in the SIPROTEC 6MD85 baycontroller, for example) satisfies the IEEE C37.118-2011standard that specifies the communication protocol of thesynchrophasors and the requirements for the dynamic responseof the PMU.
[SIP5_GD_W3, 1, --_--]
Figure 6.3/12 SIPROTEC 5 - PMU
Software for Power QualitySIGUARD PDP – Synchrophasor Technology, PMU
144 SICAM ⋅ Power Quality and Measurement ⋅ Katalog ⋅ Edition 6.0
6.3
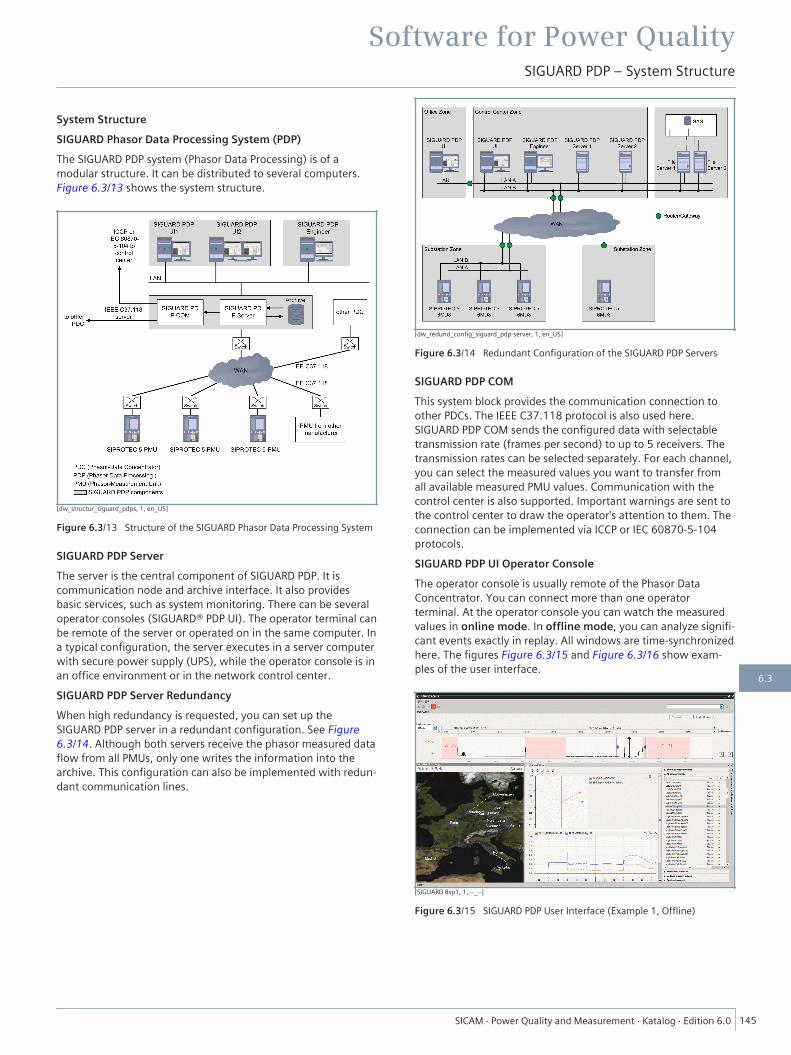
System StructureSIGUARD Phasor Data Processing System (PDP)The SIGUARD PDP system (Phasor Data Processing) is of amodular structure. It can be distributed to several computers.Figure 6.3/13 shows the system structure.
[dw_structur_siguard_pdps, 1, en_US]
Figure 6.3/13 Structure of the SIGUARD Phasor Data Processing System
SIGUARD PDP ServerThe server is the central component of SIGUARD PDP. It iscommunication node and archive interface. It also providesbasic services, such as system monitoring. There can be severaloperator consoles (SIGUARD® PDP UI). The operator terminal canbe remote of the server or operated on in the same computer. Ina typical configuration, the server executes in a server computerwith secure power supply (UPS), while the operator console is inan office environment or in the network control center.SIGUARD PDP Server RedundancyWhen high redundancy is requested, you can set up theSIGUARD PDP server in a redundant configuration. See Figure6.3/14. Although both servers receive the phasor measured dataflow from all PMUs, only one writes the information into thearchive. This configuration can also be implemented with redun-dant communication lines.
[dw_redund_config_siguard_pdp-server, 1, en_US]
Figure 6.3/14 Redundant Configuration of the SIGUARD PDP Servers
SIGUARD PDP COMThis system block provides the communication connection toother PDCs. The IEEE C37.118 protocol is also used here.SIGUARD PDP COM sends the configured data with selectabletransmission rate (frames per second) to up to 5 receivers. Thetransmission rates can be selected separately. For each channel,you can select the measured values you want to transfer fromall available measured PMU values. Communication with thecontrol center is also supported. Important warnings are sent tothe control center to draw the operator's attention to them. Theconnection can be implemented via ICCP or IEC 60870-5-104protocols.SIGUARD PDP UI Operator ConsoleThe operator console is usually remote of the Phasor DataConcentrator. You can connect more than one operatorterminal. At the operator console you can watch the measuredvalues in online mode. In offline mode, you can analyze signifi-cant events exactly in replay. All windows are time-synchronizedhere. The figures Figure 6.3/15 and Figure 6.3/16 show exam-ples of the user interface.
[SIGUARD Bsp1, 1, --_--]
Figure 6.3/15 SIGUARD PDP User Interface (Example 1, Offline)
Software for Power QualitySIGUARD PDP – System Structure
SICAM ⋅ Power Quality and Measurement ⋅ Katalog ⋅ Edition 6.0 145
6.3
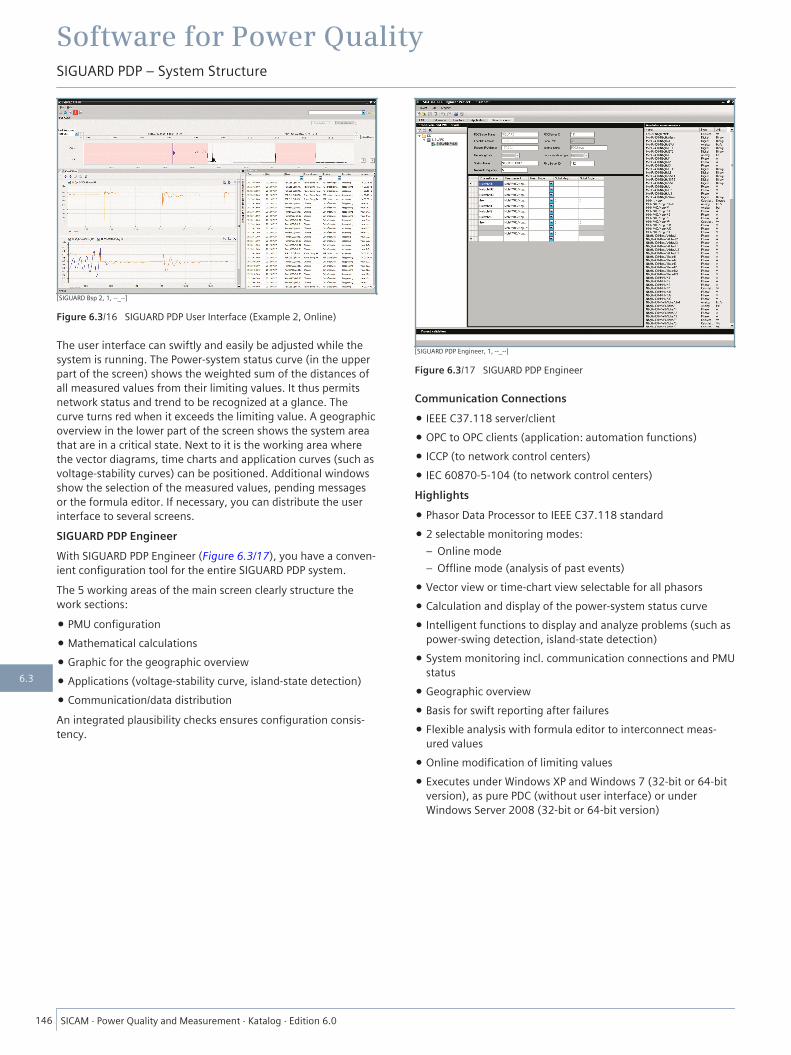
[SIGUARD Bsp 2, 1, --_--]
Figure 6.3/16 SIGUARD PDP User Interface (Example 2, Online)
The user interface can swiftly and easily be adjusted while thesystem is running. The Power-system status curve (in the upperpart of the screen) shows the weighted sum of the distances ofall measured values from their limiting values. It thus permitsnetwork status and trend to be recognized at a glance. Thecurve turns red when it exceeds the limiting value. A geographicoverview in the lower part of the screen shows the system areathat are in a critical state. Next to it is the working area wherethe vector diagrams, time charts and application curves (such asvoltage-stability curves) can be positioned. Additional windowsshow the selection of the measured values, pending messagesor the formula editor. If necessary, you can distribute the userinterface to several screens.SIGUARD PDP EngineerWith SIGUARD PDP Engineer (Figure 6.3/17), you have a conven-ient configuration tool for the entire SIGUARD PDP system.The 5 working areas of the main screen clearly structure thework sections:
• PMU configuration• Mathematical calculations• Graphic for the geographic overview• Applications (voltage-stability curve, island-state detection)• Communication/data distributionAn integrated plausibility checks ensures configuration consis-tency.
[SIGUARD PDP Engineer, 1, --_--]
Figure 6.3/17 SIGUARD PDP Engineer
Communication Connections• IEEE C37.118 server/client• OPC to OPC clients (application: automation functions)• ICCP (to network control centers)• IEC 60870-5-104 (to network control centers)Highlights• Phasor Data Processor to IEEE C37.118 standard• 2 selectable monitoring modes:
– Online mode– Offline mode (analysis of past events)
• Vector view or time-chart view selectable for all phasors• Calculation and display of the power-system status curve• Intelligent functions to display and analyze problems (such as
power-swing detection, island-state detection)• System monitoring incl. communication connections and PMU
status• Geographic overview• Basis for swift reporting after failures• Flexible analysis with formula editor to interconnect meas-
ured values• Online modification of limiting values• Executes under Windows XP and Windows 7 (32-bit or 64-bit
version), as pure PDC (without user interface) or underWindows Server 2008 (32-bit or 64-bit version)
Software for Power QualitySIGUARD PDP – System Structure
146 SICAM ⋅ Power Quality and Measurement ⋅ Katalog ⋅ Edition 6.0
6.3

Ordering Information
Select whether you want to use SIGUARD PDP in the compact version "Substation PDC" as a communication machine, or use the full scope of user inter-face and applications ("Enhanced PDC"). Alternatively, you can configure your own tailored solution within these product families. Basically, 3 differentSIGUARD PDP variants are available.Version MLFB Master DescriptionSIGUARD PDP substation PDC 7KE6041 Low-cost PDC variant, max. one operator console and no applications (such
as island network detection) possible. Use in the substation as data node forsynchrophasor measured values
SIGUARD PDP enhanced PDC 7KE6042 Full version with all possibilities for the connection of operator terminalsand for applications
SIGUARD PDP functions upgrade 7KE6040 Using the upgrade, you can add exactly the options you want to a basislicense or a predefined combination
Table 6.3/2 SIGUARD PDP Versions
Selection and Ordering Data see next page.
Software for Power QualitySIGUARD PDP – Selection and Ordering Data
SICAM ⋅ Power Quality and Measurement ⋅ Katalog ⋅ Edition 6.0 147
6.3
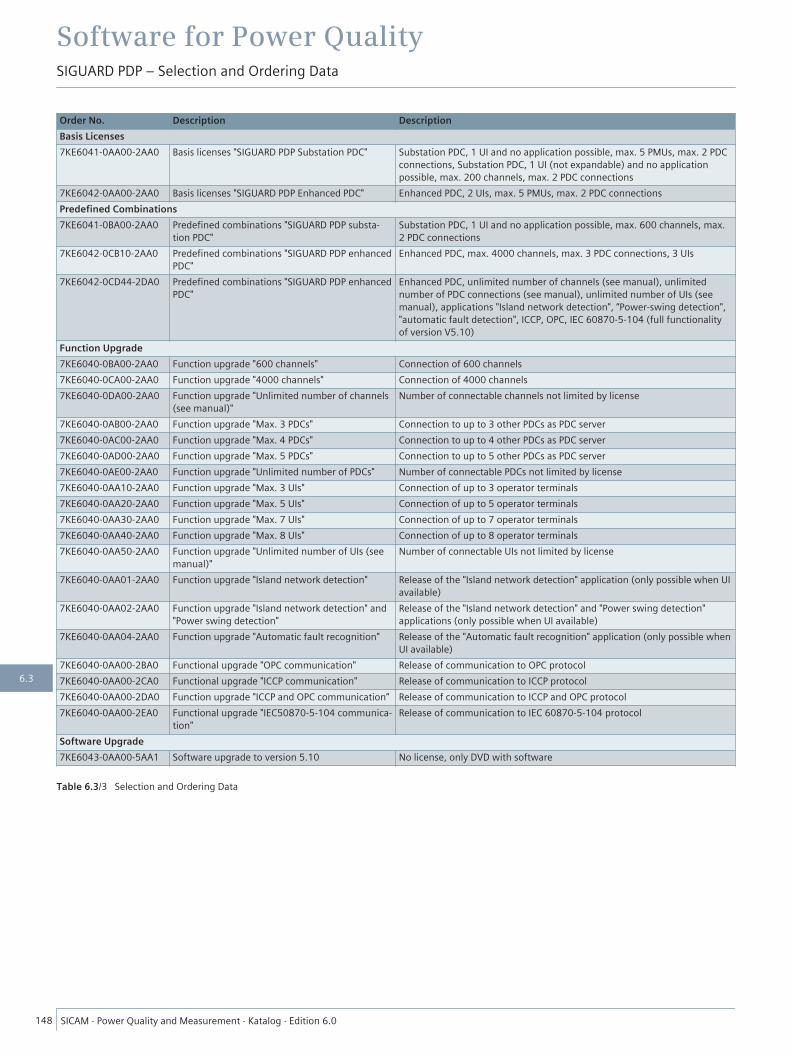
Order No. Description DescriptionBasis Licenses7KE6041-0AA00-2AA0 Basis licenses "SIGUARD PDP Substation PDC" Substation PDC, 1 UI and no application possible, max. 5 PMUs, max. 2 PDC
connections, Substation PDC, 1 UI (not expandable) and no applicationpossible, max. 200 channels, max. 2 PDC connections
7KE6042-0AA00-2AA0 Basis licenses "SIGUARD PDP Enhanced PDC" Enhanced PDC, 2 UIs, max. 5 PMUs, max. 2 PDC connectionsPredefined Combinations7KE6041-0BA00-2AA0 Predefined combinations "SIGUARD PDP substa-
tion PDC"Substation PDC, 1 UI and no application possible, max. 600 channels, max.2 PDC connections
7KE6042-0CB10-2AA0 Predefined combinations "SIGUARD PDP enhancedPDC"
Enhanced PDC, max. 4000 channels, max. 3 PDC connections, 3 UIs
7KE6042-0CD44-2DA0 Predefined combinations "SIGUARD PDP enhancedPDC"
Enhanced PDC, unlimited number of channels (see manual), unlimitednumber of PDC connections (see manual), unlimited number of UIs (seemanual), applications "Island network detection", “Power-swing detection","automatic fault detection", ICCP, OPC, IEC 60870-5-104 (full functionalityof version V5.10)
Function Upgrade7KE6040-0BA00-2AA0 Function upgrade "600 channels" Connection of 600 channels7KE6040-0CA00-2AA0 Function upgrade "4000 channels" Connection of 4000 channels7KE6040-0DA00-2AA0 Function upgrade "Unlimited number of channels
(see manual)"Number of connectable channels not limited by license
7KE6040-0AB00-2AA0 Function upgrade "Max. 3 PDCs" Connection to up to 3 other PDCs as PDC server7KE6040-0AC00-2AA0 Function upgrade "Max. 4 PDCs" Connection to up to 4 other PDCs as PDC server7KE6040-0AD00-2AA0 Function upgrade "Max. 5 PDCs" Connection to up to 5 other PDCs as PDC server7KE6040-0AE00-2AA0 Function upgrade "Unlimited number of PDCs" Number of connectable PDCs not limited by license7KE6040-0AA10-2AA0 Function upgrade "Max. 3 UIs" Connection of up to 3 operator terminals7KE6040-0AA20-2AA0 Function upgrade "Max. 5 UIs" Connection of up to 5 operator terminals7KE6040-0AA30-2AA0 Function upgrade "Max. 7 UIs" Connection of up to 7 operator terminals7KE6040-0AA40-2AA0 Function upgrade "Max. 8 UIs" Connection of up to 8 operator terminals7KE6040-0AA50-2AA0 Function upgrade "Unlimited number of UIs (see
manual)"Number of connectable UIs not limited by license
7KE6040-0AA01-2AA0 Function upgrade "Island network detection" Release of the "Island network detection" application (only possible when UIavailable)
7KE6040-0AA02-2AA0 Function upgrade "Island network detection" and"Power swing detection"
Release of the "Island network detection" and "Power swing detection"applications (only possible when UI available)
7KE6040-0AA04-2AA0 Function upgrade "Automatic fault recognition" Release of the "Automatic fault recognition" application (only possible whenUI available)
7KE6040-0AA00-2BA0 Functional upgrade "OPC communication" Release of communication to OPC protocol7KE6040-0AA00-2CA0 Functional upgrade "ICCP communication" Release of communication to ICCP protocol7KE6040-0AA00-2DA0 Function upgrade "ICCP and OPC communication“ Release of communication to ICCP and OPC protocol7KE6040-0AA00-2EA0 Functional upgrade "IEC50870-5-104 communica-
tion"Release of communication to IEC 60870-5-104 protocol
Software Upgrade7KE6043-0AA00-5AA1 Software upgrade to version 5.10 No license, only DVD with software
Table 6.3/3 Selection and Ordering Data
Software for Power QualitySIGUARD PDP – Selection and Ordering Data
148 SICAM ⋅ Power Quality and Measurement ⋅ Katalog ⋅ Edition 6.0
6.3

DescriptionWith the SICAM P parameterization software package, you havea simple tool to adjust the devices.SICAM P is a power meter with graphical display and backlightfor panel flush mounting or standard DIN-rail installation that isused for capturing and/or displaying measured values in elec-trical power supply networks. You can measure more than100 measurands, including the rms values of the voltages(phase-to-phase and/or phase-to-ground), currents, active/reac-tive/apparent power and energy, power factor, phase angle,harmonic currents and voltages, total harmonic distortion (THD)per phase plus frequency and balance factor, energy andexternal signals and states.
ApplicationsWith the SICAM P parameterization software package, you havea simple tool to adjust the devices. The package contains theparameterization software, a connecting cable with RS232/RS485 converter and a plug-in power-supply unit for theconverter. Using the RS232/RS485 converter, you can connectthe SICAM P via a 9-way D Sub connector plug to a commerciallyavailable PC. The software runs with Windows 2000 andXP Professional Edition. With the parameterization software, youcan set parameters of the SICAM P devices even faster. Alterna-tively, you can set and save parameters in offline mode (withoutdevice). Use the "Send to device" command to transfer themeasurands to the SICAM P. This permits several SICAM Pdevices to be set within a very short time. When you replace adevice, you can easily load the saved parameter set into the newdevice. Another possibility is loading firmware updates via theSICAM P parameterization software. The parameterization soft-ware package supports all SICAM P devices. It is necessary forparameterizing the SICAM P55 devices.Parameterization of the Measured-Value StorageIn a device with a measured-value storage, measurands andstates can be recorded in the storage device. The parameteriza-tion software provides functions that permits the values andstates to be selected that shall be stored.Reading the Measured-Value StorageAn additional function of the parameterization software permitsthe following information to be read from the device storagedevice:
• Mean values• Mean values of power• Oscilloscope recordings• States of binary channels• Limiting-value violations• Log entries
[SICAM P Par, 1, --_--]
Figure 6.4/1 SICAM P Par - Parameterization Software
Software for Power QualitySICAM P Par – Description
SICAM ⋅ Power Quality and Measurement ⋅ Katalog ⋅ Edition 6.0 149
6.4

Selection and Ordering Data
Description Variants Order No.1 2 3 4 5 6 7 8 9 10 11 12
SICAM P Parameterization Package 7 K G 7 0 5 0 - 8 A □▲
This includes, in particular:Softwarefor parameterizing, calibrating the SIMEAS Pwith a PCConnecting cables SIMEAS P an PC5 m long with RS232/RS485 converter,connectorAt the PC side9-pole D-sub socketAt the SICAM P side9-pole D-sub plug
Plug-in power supply unit for RS232/RS485converter
│
AC 230 V/50 Hz AAC 120 V/60 Hz B
Converter Set RS232/RS485 7 X V 5 7 0 0 - □ □ □ 0 0Converter RS232 to RS485 with connectingcable for relay 7SJ600, 7RW60, 7SV60 length1 m
▲ ▲ ▲
Rated auxiliary voltage │ │ │Via plug-in auxiliary power supply (PSU)AC 230 V/50 Hz
0 │ │
Via plug-in auxiliary PSU AC 110 V/60 Hz 1 │ │Connecting cables │ │With RS485 connecting cable for 7SJ60,7RW60, 7SV60, 1 m long
A │
With RS485 connecting cable for SICAM Q andSIPROTEC 4 and SICAM P, 1 m long
B │
With RS485 connecting cable for SIMEAS T,1 m long
C │
Without RS232 connecting cable AWith RS232 connecting cable 7XV5100-2 forPC/laptop computer, 9-pole
B
With RS232 adaptor, 25-way plug to 9-polesocket for PC/laptop computer
C
USB-RS485 Converter Cable 7 X V 5 7 1 0 - 0 A A 0 01.8 m (without galvanic separation) for theconnection of up to 31 SIPROTEC 4 deviceswith RS485 interface to PC/laptop computerwith USB 1.1/2.0 interface, can also be usedfor SICAM P
Table 6.4/1 Selection and Ordering Data
Software for Power QualitySICAM P Par – Selection and Ordering Data
150 SICAM ⋅ Power Quality and Measurement ⋅ Katalog ⋅ Edition 6.0
6.4

CE conformityThis product complies with the directive of the Council of the European Communitieson harmonization of the laws of the Mem-ber States relating to electromagnetic
compatibility (EMC Directive 2014/30/EU) and concerning electrical equipment for use within specified voltage limits (Low Voltage Directive 2014/35/EU).
This conformity has been proved by tests performed accord-ing to the Council Directive in accordance with the generic standard EN 61000-6-5 (for EMC directive) and with theproduct standard EN 62586-1 (for Low Voltage Directive) by Siemens AG.
The device is designed and manufactured for application in an industrial environment.
The product conforms with the international standards of EN 62586 and the German standard VDE 0415.
Disclaimer for liabilityThis document has been subjected to rigorous technicalreview before being published. It is revised at regular inter-vals, and any modifications and amendments are includedin the subsequent issues. The content of this document hasbeen compiled for information purposes only.Although Siemens AG has made best efforts to keep thedocument as precise and up-to-date as possible, Siemens AGshall not assume any liability for defects and damage whichresult through use of the information contained herein.
This content does not form part of a contract or of businessrelations; nor does it change these. All obligationsof Siemens AG are stated in the relevant contractualagreements.
Siemens AG reserves the right to revise this document fromtime to time.
Document version: 06
Release status: 05.2017
CopyrightSiemens AG 2017. All rights reserved.The disclosure, duplication, distribution and editing of thisdocument, or utilization and communication of the contentare not permitted, unless authorized in writing. All rights,including rights created by patent grant or registration of autility model or a design, are reserved.
Registered trademarksSIPROTEC ® , DIGSI ® , SIGUARD ® , SIMEAS ® und SICAM ® are registered trademarks of Siemens AG. Any unauthorized use is illegal. All other designations in this document can betrademarks whose use by third parties for their own pur-poses can infringe the rights of the owner.
All rights reserved.If not stated otherwise on the individual pages of thiscatalog, we reserve the right to include modifications,especially regarding the stated values, dimensions andweights. Drawings are not binding.
All product designations used are trademarks or productnames of Siemens AG or other suppliers.If not stated otherwise, all dimensions in this catalogare given in mm.
AppendixLegal Notice
SICAM Power Quality and Measurement ⋅ Catalog ⋅ Edition 6.0
PublishedSiemens AG 2017
Energy Management DivisionDigital GridAutomation ProductsHumboldtstr. 5990459 Nuremberg, Germany
www.siemens.com/powerquality
For more information,please contact ourCustomer Support Center.Tel.: +49 180 524 7000Fax: +49 180 524 2471(Charges demending on provider)E-Mail: [email protected]
Article No. EMDG-C10026-01-7600 Printed in Germany Dispo 06200 KG 05170.7
© 2017 Siemens. Subject to changes and errors.The information given in this document only containsgeneral descriptions and/or performance features whichmay not always specifically reflect those described, orwhich may undergo modification in the course of furtherdevelopment of the products. The requested performancefeatures are binding only when they are expressly agreedupon in the concluded contract.
For all products using security features of OpenSSLthe following shall apply:This product includes software developed by the OpenSSL Project for use in the OpenSSL Toolkit. (http://www.openssl.org/ )This product includes cryptographic software written by Eric Young ([email protected] )This product includes software written by Tim Hudson ([email protected]) This product includes software developed by Bodo Moeller.