Impaired spatial memory in APP-overexpressing mice on a homocysteinemia-inducing diet
Upload
independentCategory
view
1download
0
ORIGINAL RESEARCH ARTICLEpublished: 07 January 2013
doi: 10.3389/fendo.2012.00166
Transgenic mice overexpressing renin exhibit glucoseintolerance and diet-genotype interactionsSarah J. Fletcher 1, Nishan S. Kalupahana2, Morvarid Soltani-Bejnood 3, Jung Han Kim4, Arnold M. Saxton5,David H. Wasserman6, Bart DeTaeye6, Brynn H. Voy 5, Annie Quignard-Boulange7 andNaima Moustaid-Moussa8*1 Genome Science and Technology Program, University of Tennessee, Knoxville, TN, USA2 Department of Physiology, Faculty of Medicine, University of Peradeniya, Peradeniya, Sri Lanka3 Pellissippi State, Knoxville, TN, USA4 Department of Pharmacology, Physiology and Toxicology, School of Medicine, Marshall University, Huntington, WV, USA5 Department of Animal Science, University of Tennessee, Knoxville, TN, USA6 Department of Molecular Physiology and Biophysics, School of Medicine and Mouse Metabolic Phenotyping Center, Vanderbilt University, Nashville, TN, USA7 INRA-AgroParisTech UMR 914, Paris, France8 Nutritional Sciences, Texas Tech University, Lubbock, TX, USA
Edited by:Tsuguhito Ota, Kanazawa University,Japan
Reviewed by:Undurti Narasimha Das, UND LifeSciences, USAToru Aizawa, Aizawa Hospital, Japan
*Correspondence:Naima Moustaid-Moussa, NutritionalSciences, Texas Tech University, 1301,Akron Street, Lubbock, TX 79423,USA.e-mail: [email protected]
Numerous animal and clinical investigations have pointed to a potential role of the renin-angiotensin system (RAS) in the development of insulin resistance and diabetes in condi-tions of expanded fat mass. However, the mechanisms underlying this association remainunclear. We used a transgenic mouse model overexpressing renin in the liver (RenTgMK)to examine the effects of chronic activation of RAS on adiposity and insulin sensitivity.Hepatic overexpression of renin resulted in constitutively elevated plasma angiotensin II(four- to six-fold increase vs. wild-type, WT). Surprisingly, RenTgMK mice developed glu-cose intolerance despite low levels of adiposity and insulinemia. The transgenics also hadlower plasma triglyceride levels. Glucose intolerance in transgenic mice fed a low-fat dietwas comparable to that observed in high-fat fed WT mice.These studies demonstrate thatoverexpression of renin and associated hyperangiotensinemia impair glucose tolerance ina diet-dependent manner and further support a consistent role of RAS in the pathogenesisof diabetes and insulin resistance, independent of changes in fat mass.
Keywords: adipose tissue, renin-angiotensin system, insulin resistance, angiotensin II
INTRODUCTIONThe renin-angiotensin system (RAS) plays an important role inthe regulation of blood pressure, fluid, and electrolyte balance(Schmieder et al., 2007). Angiotensinogen (AGT), the precursorpeptide of this system, undergoes successive enzymatic cleav-ages by renin and angiotensin converting enzyme (ACE) to yieldangiotensin I (Ang I) and angiotensin II (Ang II) respectively.The latter is the main bioactive peptide of this system, which actsvia two G-protein coupled receptors, namely angiotensin Type-1 (AT1) and Type-2 (AT2) receptors, to exert its physiologicaleffects. Because AT1 activation by Ang II leads to elevation of bloodpressure,ACE inhibitors (ACEI) and AT1 blockers (ARB) are phar-macologically used as anti-hypertensive agents (Schmieder et al.,2007).
Interestingly, several clinical studies have shown that patientson RAS blockers have a lower risk of developing Type-2 diabeteswhen compared to patients on other anti-hypertensive medica-tions (Vermes et al., 2003; Bosch et al., 2006). Moreover, RASblockade prevents and reverses insulin resistance induced by high-fat feeding in rodents (Lee et al., 2008). Given that plasma andtissue levels of several RAS components positively correlate withbody mass index (Schorr et al., 1998; Van Harmelen et al., 2000),it is possible that overactivation of the RAS is linked to the patho-genesis of insulin resistance in obesity. Indeed, genetic deletion of
AGT, ACE, renin, AT1, or AT2 protects rodents from diet-inducedobesity and insulin resistance (Massiera et al., 2001b;Yvan-Charvetet al., 2005; Takahashi et al., 2007; Jayasooriya et al., 2008). Con-versely, chronic RAS overactivation via Ang II infusion (Ogiharaet al., 2002) leads to glucose intolerance and insulin resistance inrodents, further supporting a role of RAS overactivation in thepathogenesis of insulin resistance.
Although obesity and increased adiposity are associated withRAS overactivation, it is not clear whether systemic RAS over-activation can lead to both obesity and insulin resistance. It isimportant to test this because studies have documented differ-ences in RAS activity in humans, which have been attributed topolymorphisms in RAS coding (Jeunemaitre et al., 1999; Jeune-maitre, 2008) or promoter regions (Xiao et al., 2006). Therefore,understanding the implications of chronic elevation of RAS mayhelp provide insight into metabolic consequences of chronicallyelevated RAS in humans.
While overexpression of RAS is consistently associated withinsulin resistance and glucose intolerance, the effect of chronicRAS overactivation on adiposity is not clear. This is further com-plicated by existence of local RAS in several tissues with the localeffects complicating the understanding of systemic effects of RAS(Kalupahana and Moustaid-Moussa, 2012b). For example, over-expression of AGT in adipose tissue increases adiposity and blood
www.frontiersin.org January 2013 | Volume 3 | Article 166 | 1
Fletcher et al. Metabolic phenotyping of renin transgenic mice
pressure and leads to insulin resistance (Massiera et al., 2001a;Kalupahana et al., 2012). However, acute or chronic systemic RASoveractivation leads to decreased fat mass despite the develop-ment of insulin resistance (Brink et al., 1996). This suggests thatincreased fat mass in the case of adipose RAS overexpressionmay be due to local effects of Ang II production within adiposetissue.
To further dissect effects of elevated systemic Ang II on insulinsensitivity and adiposity, we used a unique mouse model inwhich Ang II is chronically elevated throughout life time throughgenetic manipulation. This mouse model is a unique geneticminipump model in which renin is overexpressed in the liver.Given that renin release is the rate-limiting step in the sys-temic RAS, this model offers the advantage of constant reninoverexpression independent of homeostatic control and a life-long elevated level of Ang II. As expected, these transgenic mice(RenTgMK; Caron et al., 2002) exhibit elevated levels of circu-lating renin and Ang I and develop chronic hypertension alongwith other pathological manifestations (Caron et al., 2002, 2004).The RenTgMK mice thus allow us also to study the effects ofsystemic chronic elevations of Ang II on adiposity and glucosehomeostasis, so that we can dissect the effects of systemic vs. adi-pose RAS by comparing these results with the ones previouslyreported for local adipose overexpression of RAS (Massiera et al.,2001a).
We report here that elevated circulating Ang II due to reninoverexpression leads to glucose intolerance, which is further exac-erbated by high-fat feeding. Unexpectedly, these mice exhibitotherwise normal glucose metabolism and a transgene dose-dependent decrease in fat mass and insulinemia.
MATERIALS AND METHODSANIMALSRenTgMK transgenic mice were kindly provided by Dr. OliverSmithies, University of North Carolina, Chapel Hill, NC, USA(Hatada et al., 1999). Briefly, a renin transgene consisting of por-tions of the Ren2 and Ren-1d genes (Ren2/1d) was inserted into thegenome at the ApoA1/ApoC3 locus via homologous recombina-tion and placed under control of an albumin promoter/enhancer(AlbP/E) to achieve liver-specific expression.
Male heterozygous RenTgMK (RenTgMK−/+) mice on an iso-genic SvEv 129/6 background were crossed with wild-type (WT)SvEv females. Subsequent heterozygous F1 progeny were mated togenerate the F2 offspring that were used in this study. Mice usedin this study were bred and maintained at the University of Ten-nessee accredited animal facility, on a 12h:12h light-dark cycle at22˚C and fed a standard rodent chow and water ad libitum. Allexperiments were approved by the Institutional Animal Care andUse Committee at the University of Tennessee.
GENOTYPINGDNA was extracted from tail tips as previously described(Truett et al., 2000). PCR-based genotyping was performedusing three primers: p1, 5′-TGGGATTCTAACCCTGAGGACC-3′; p2, 5′-CACAGATTGTAACTGCAAATCTGTCG-3′; p3, 5′-GTTCTTCTGAGGGGATC-GGC-3′ (Sigma Genosys, The Wood-lands, TX, USA) as previously described (Caron et al., 2002).
GLUCOSE TOLERANCE TESTMice were fasted overnight prior to the glucose tolerance test(GTT). Blood was collected in heparinized capillary tubes fromthe orbital sinus prior to intra-peritoneal injection with glucose(1 g/kg body weight), and then 15, 30, 60, 90, and 120 min afterinjection. Plasma glucose concentrations were calculated using aOne Touch ultra-monitoring system (Johnson & Johnson, Co.,New Brunswick, NJ, USA). The GTT was performed on mice10 weeks old and repeated when the mice reached 20 weeks ofage and the area under the curve (AUC) for glucose and insulinwere calculated.
PLASMA MEASUREMENTSSerum was separated from blood samples collected during theGTT by centrifugation at 3000 rpm for 15 min at 4˚C and thenstored in aliquots at −80˚C until assayed. Serum insulin, leptin,and adiponectin levels were measured in duplicate using commer-cially available ELISA kits following the manufacturer’s protocol(insulin cat# 90060 and leptin cat# 90030, Crystal Chem, Inc.,Downers Grove, IL, USA; adiponectin cat# EZMADP-60, LincoResearch, Billerica, MA, USA). Absorbance was read at 450 nm ona Packard SpectraCount microplate reader (Packard Instrument,Co., Meriden, CT, USA).
DIET STUDYMale heterozygous (RenTgMK+/−) mice and their WT littermateswere randomly assigned to either a high-fat diet (60% kcal fromfat cat# D12492, Research Diets, Inc., New Brunswick, NJ, USA)or a low-fat diet (10% kcal from fat cat# D12450B, ResearchDiets, Inc., New Brunswick, NJ, USA) for 18 weeks. Each dietgroup (n= 6/group) was comprised of three male RenTgMK+/−
mice and three male WT mice. Body weight measurements wereacquired weekly for the duration of the study. At the conclusionof the 18-week diet study, a GTT was performed and plasmainsulin, leptin, and adiponectin concentrations were measured,as described above. Mice were sacrificed 1 week after the GTT.
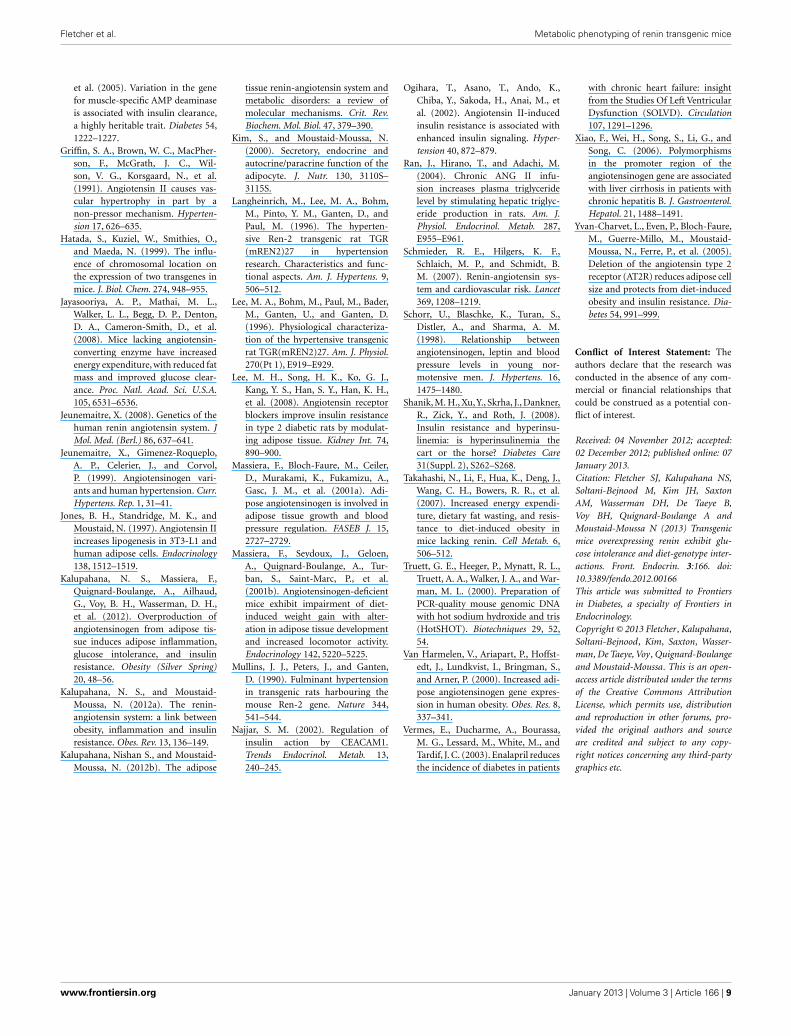
METABOLIC STUDIESMetabolic studies of the RenTgMK mice were performed at theMouse Metabolic Phenotyping Center (MMPC) at VanderbiltUniversity, Nashville, TN, USA. Glucose infiltration rate, glucoseturnover rate, endogenous glucose turnover rate, and clearancewere measured. Whole-body insulin activity in vivo was exam-ined via euglycemic hyperinsulinemic clamp. Detailed procedurehas been previously reported (Ayala et al., 2006). Briefly, toassess insulin sensitivity and glucose metabolism, insulin was con-tinuously administered via euglycemic hyperinsulinemic clamp.Catheters were chronically implanted in the jugular vein andcarotid artery. Arterial glucose levels were measured every 5–10 min during 120 min and glucose infusion rates were deter-mined based on the arterial glucose measurements. Plasma glucoseturnover was measured in RenTgMK+/− and WT males (n= 8–12/group). Mice were continuously infused with [3-3H]glucose ata rate of 0.4 µCi/min. Glucose appearance (Ra) and disappear-ance (Rd) rates were estimated as the ratio of the rate of infusionof [3-3H]glucose and the steady-state plasma [3H]glucose specificactivity (dpm/mg), and the glucose disappearance was assumed
Frontiers in Endocrinology | Diabetes January 2013 | Volume 3 | Article 166 | 2
Fletcher et al. Metabolic phenotyping of renin transgenic mice
to be equal to the steady-state Ra rate. Glucose clearance wascalculated by dividing the Rd by the arterial glucose concentra-tion. To measure tissue-specific glucose uptake, mice were injectedwith 12 µCi of [3H]-labeled 2-deoxyglucose ([2-3H] DG). Arterialplasma samples were collected in intervals for 40 min before micewere anesthetized and tissues were extracted and frozen in liquidnitrogen until further analysis.
PANCREAS HISTOLOGY AND IMMUNOSTAININGThe pancreas was collected from WT and transgenic mice. Tissuesfor immunohistochemistry were fixed in 10% neutral, phosphate-buffered formalin for 24 h and paraffin-embedded. Subsequently,the paraffin-embedded tissues were processed in 4-µm sections.Sections were stained using rabbit anti-glucagon polyclonal anti-body and guinea pig anti-insulin serum (both from Millipore,Billerica, MA, USA). For fluorescence detection, goat anti-guineapig IgG coupled to Texas Red and donkey anti-rabbit IgG cou-pled to Cy3 were used (both from Jackson ImmunoResearch, WestGrove, PA, USA) followed by Vectashield Mounting Medium with
4,6-diamidino-2-phenylindole (Vector Laboratories, Burlingame,CA, USA) for nuclear staining.
STATISTICAL ANALYSISData were analyzed in SAS (SAS Institute, Inc., Cary, NC, USA)using a mixed model analysis of variance (http://dawg.utk.edu).Fisher’s test followed by Tukey’s post hoc test was used for meanseparation. P < 0.05 was considered statistically significant. Dataare reported as the means± SE.
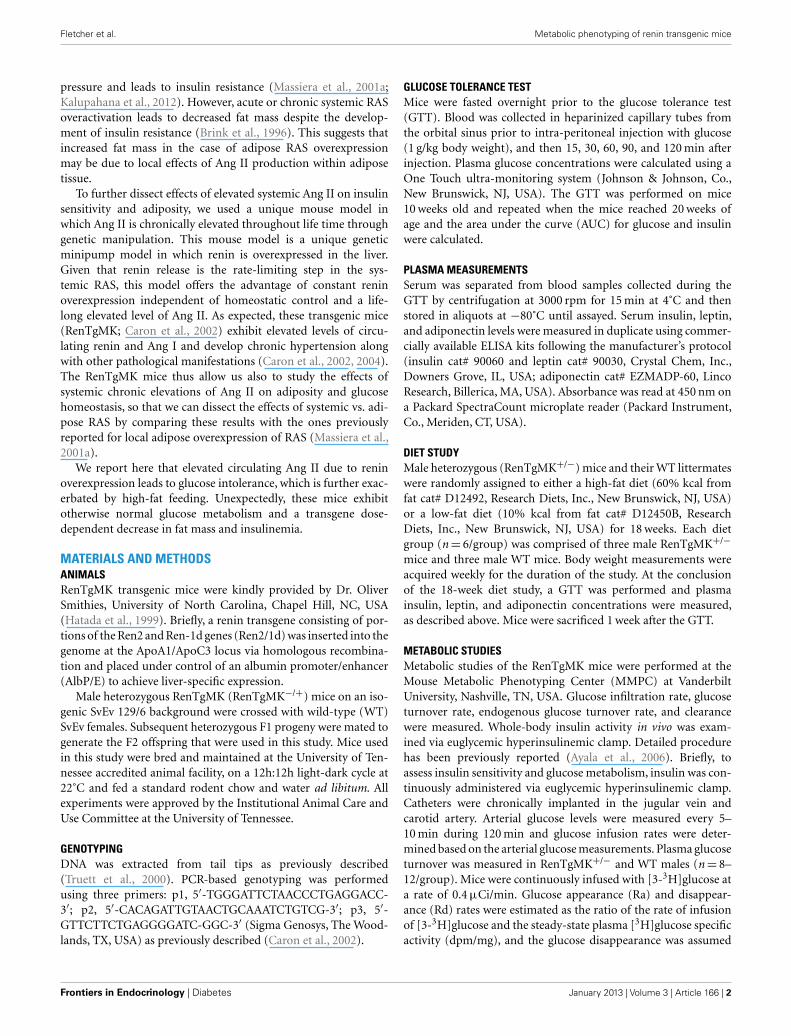
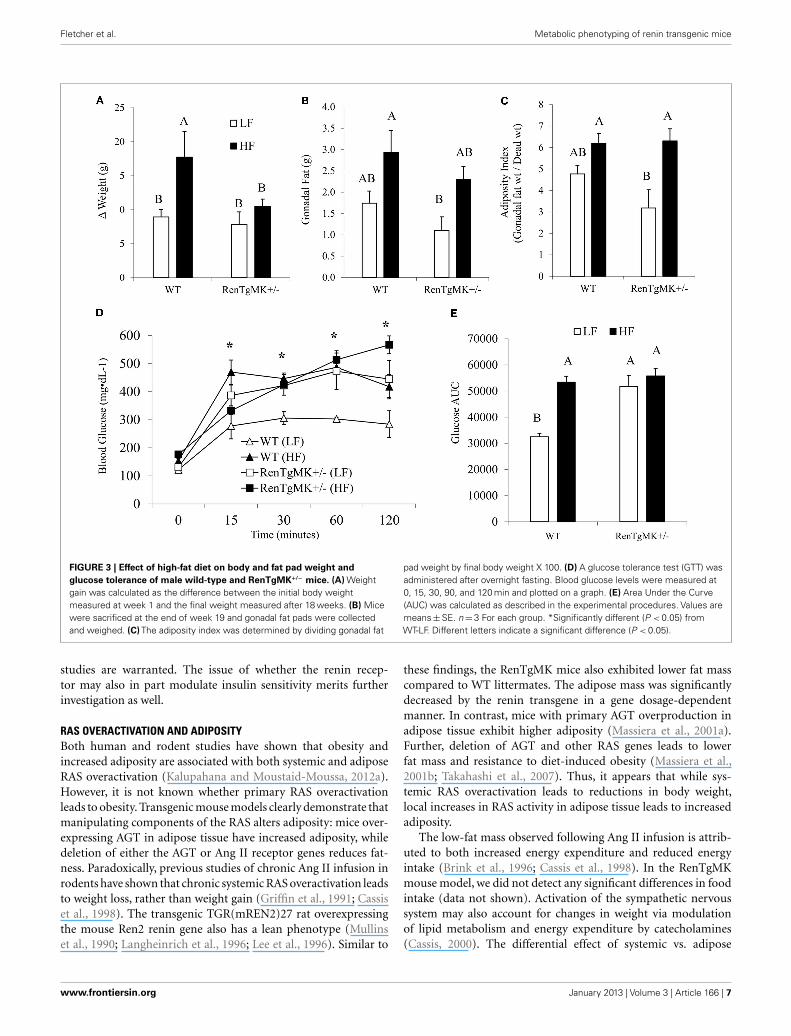
RESULTSBODY WEIGHT, FAT PAD WEIGHT, AND METABOLIC PARAMETERSBody weights were comparable between mice with either oneor two copies of the renin transgene and WT control mice(Figure 1A). Gonadal fat pad weight (Figure 1B) and adi-posity index (gonadal fat pad weight divided by body weight;Figure 1C) were significantly lower in homozygous mice com-pared to WT littermates (P < 0.05). Fasting serum glucose, leptin,and adiponectin levels were comparable between all genotypes
FIGURE 1 | Body and fat pad weight and glucose tolerance in maleRenTgMK mice. (A) Body weight at the age of 20 weeks. (B) Micewere sacrificed at the end of week 20 and gonadal fat pads werecollected and weighed. (C) The adiposity index was determined bydividing gonadal fat pad weight by final body weight. A glucosetolerance test (GTT) was administered after overnight fasting. (D) Blood
glucose levels were measured at 0, 15, 30, 90, and 120 min and plottedon a graph. (E) Area Under the Curve (AUC) was calculated asdescribed in the experimental procedures. Values are means±SE.n= 6 For WT; n=5 for RenTgMK+/−; n=4 for RenTgMK+/+. Differentletters indicate a significant difference (P < 0.05). *Significantlydifferent (P < 0.05) from WT.
www.frontiersin.org January 2013 | Volume 3 | Article 166 | 3
Fletcher et al. Metabolic phenotyping of renin transgenic mice
Table 1 | Serum metabolic markers in male wild-type and RenTgMK
mice.
WT RenTgMK+/− RenTgMK+/+ P value
Glucose, mg/dl 81.2±6.4 89.8±3.2 93.3±5.1 0.292
Insulin, ng/ml 0.62±0.07a 0.42±0.05b 0.36±0.07b 0.033
Leptin, ng/ml 2.1±0.7 2.3±0.6 1.3±0.5 0.535
Adiponectin,
µg/ml
8.7±1.4 10.8±2.5 7.6±0.9 0.479
C-peptide,
ng/ml
1.4±0.1b 1.9±0.2a 2.0±0.1a 0.007
FFA, mM 0.84±0.10 0.93±0.06 0.91±0.11 0.791
Triglycerides,
mg/dL
60.1±6.4a 44.5±8.6a,b 23.7±8.7b 0.018
Values are means±SE. Animals were 21 weeks old. Initial body weight mea-
surements were taken at 10 weeks. Blood was collected after fasting overnight
and metabolic parameters were measured from serum. n= 6 For WT; n=5 for
RenTgMK+/−; n=4 for RenTgMK+/+. C-peptide, connecting peptide; FFA, free
fatty acid.
Means in a row with superscripts without a common letter differ, P < 0.05.
Numbers in bold indicate a significance of P < 0.05.
(Table 1). Fasting serum insulin, however, was significantly lowerin the transgenic mice (both homozygous and heterozygous) com-pared to WT littermates (P < 0.05). Serum C-peptide levels, onthe other hand, were higher in the transgenics than in the WTmice (Table 1). Interestingly, serum triglycerides were significantlylower in the homozygous mice compared to WT littermates. Onthis low-fat chow diet condition, the overall metabolic phenotypewas less pronounced in female transgenic mice compared to WTfemale littermates (data not shown).
GLUCOSE INTOLERANCE IN RenTg MICETo assess glucose tolerance in the RenTg mice, an intra-peritonealGTT was administered. Baseline fasting glucose levels were com-parable between WT, RenTgMK+/− and RenTgMK+/+ mice(81.17± 15.68, 89.80± 7.16, and 93.25± 10.28 mg/dl, respec-tively). Heterozygous mice maintained significantly higher levelsof glycemia compared to WT within 60 min and remained ele-vated throughout the GTT (Figure 1D). These differences wereobserved as early as 10 weeks of age (data not shown) and becamemore pronounced with age by 20 weeks. Glucose intolerance inmale RenTgMK mice was also evident from a comparison of theglucose AUC (Figure 1E). The AUC values for both heterozygousand homozygous mice were higher (P < 0.05) than that of WTmice implying greater glucose intolerance in the transgenics. Infemales, no significant differences in GTT were observed betweenthe three genotypes at 20 weeks of age in these low-fat feedingconditions (data not shown).
METABOLIC PHENOTYPING OF RenTg MICEInsulin resistance is commonly associated with high adiposity.The paradoxical glucose intolerance despite low adiposity and lowinsulinemia in the renin transgenic male mice vs. control litter-mates led us to further investigate whether these differences weredue to altered insulin sensitivity and/or glucose production or
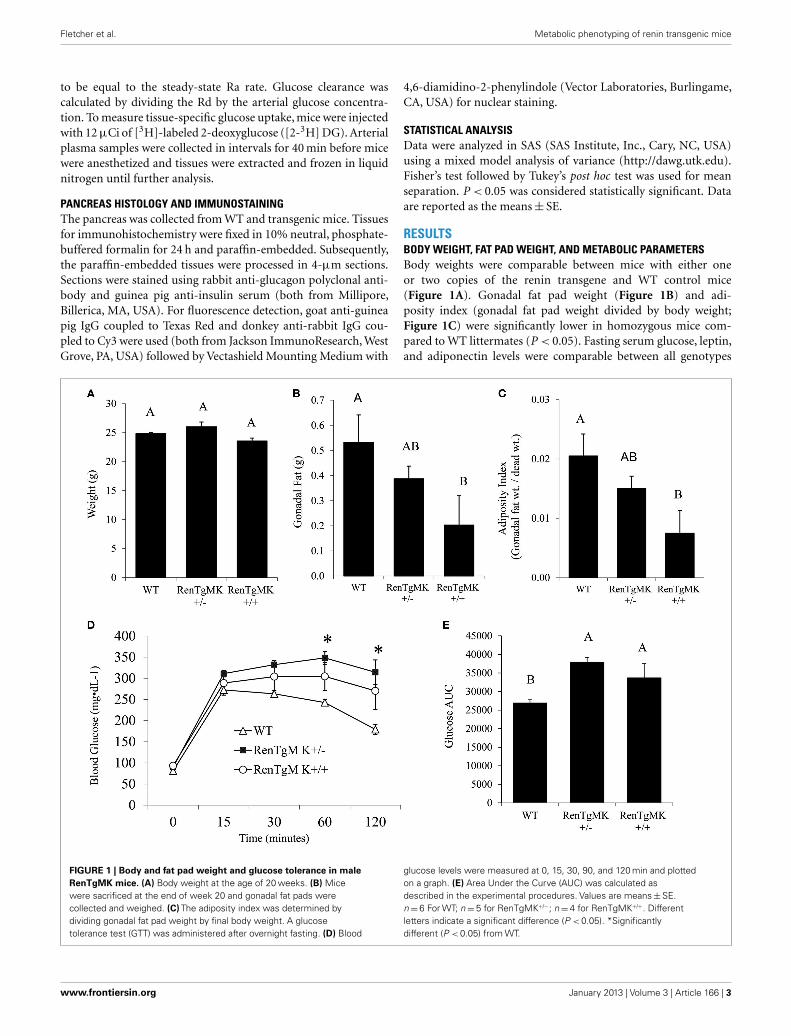
utilization in this model. Accordingly, metabolic studies at the NIHMMPC at Vanderbilt University were conducted. Male heterozy-gous mice were compared to WT mice because males exhibitedglucose intolerance and sufficient numbers could be obtainedfrom a few litters. Steady-state glucose infusion rate (Figure 2),overall tissue-specific glucose uptake, glucose metabolism, andendogenous glucose production (Table 2) did not significantlydiffer between RenTgMK and WT mice, indicating normal insulinsensitivity in the transgenics.
EFFECT OF HIGH-FAT DIET ON BODY WEIGHT, ADIPOSITY, CIRCULATINGADIPOKINES, AND GLUCOSE TOLERANCEAs described above, renin transgene overexpression led to impairedglucose tolerance compared to WT mice when mice were fed alow-fat chow diet. To test whether the genetic differences would beexacerbated by high-fat feeding, we fed male heterozygous and WTmice a low- or high-fat diet to investigate diet-gene interactions.
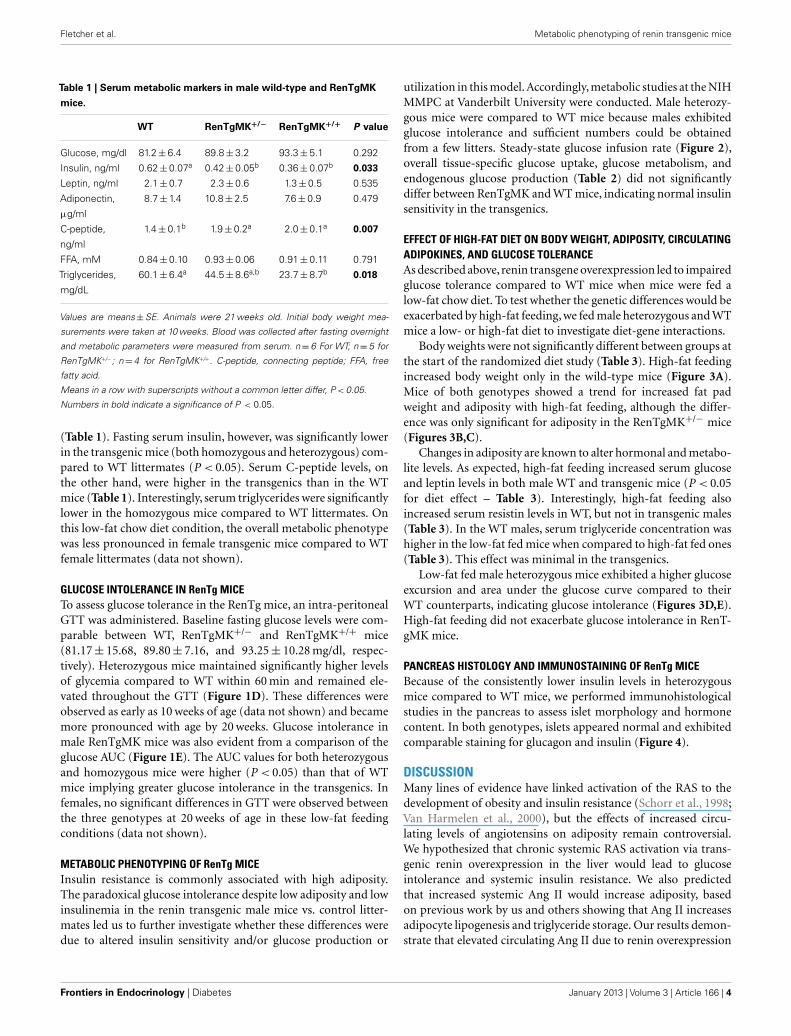
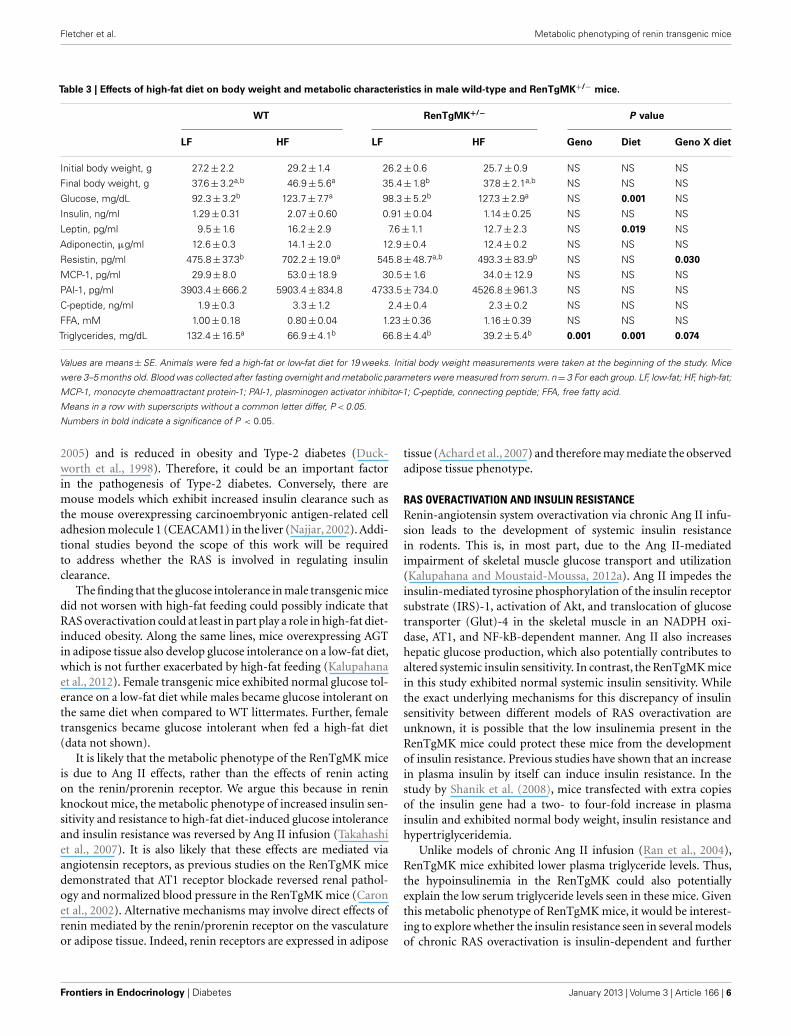
Body weights were not significantly different between groups atthe start of the randomized diet study (Table 3). High-fat feedingincreased body weight only in the wild-type mice (Figure 3A).Mice of both genotypes showed a trend for increased fat padweight and adiposity with high-fat feeding, although the differ-ence was only significant for adiposity in the RenTgMK+/− mice(Figures 3B,C).
Changes in adiposity are known to alter hormonal and metabo-lite levels. As expected, high-fat feeding increased serum glucoseand leptin levels in both male WT and transgenic mice (P < 0.05for diet effect – Table 3). Interestingly, high-fat feeding alsoincreased serum resistin levels in WT, but not in transgenic males(Table 3). In the WT males, serum triglyceride concentration washigher in the low-fat fed mice when compared to high-fat fed ones(Table 3). This effect was minimal in the transgenics.
Low-fat fed male heterozygous mice exhibited a higher glucoseexcursion and area under the glucose curve compared to theirWT counterparts, indicating glucose intolerance (Figures 3D,E).High-fat feeding did not exacerbate glucose intolerance in RenT-gMK mice.
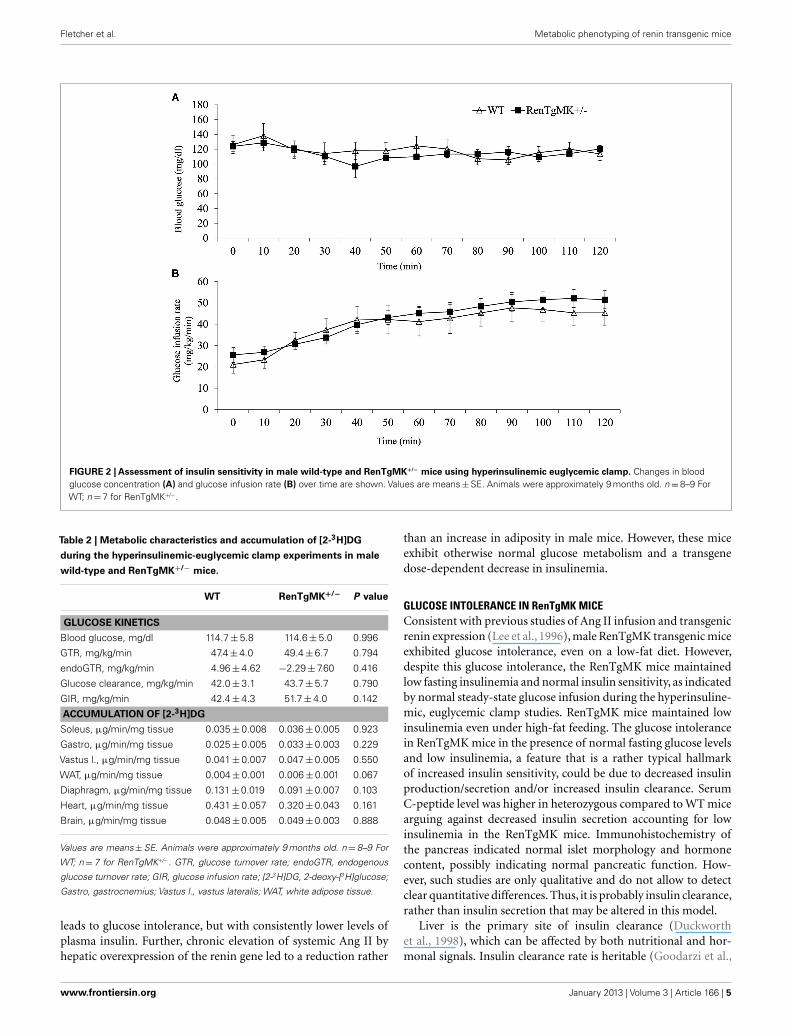
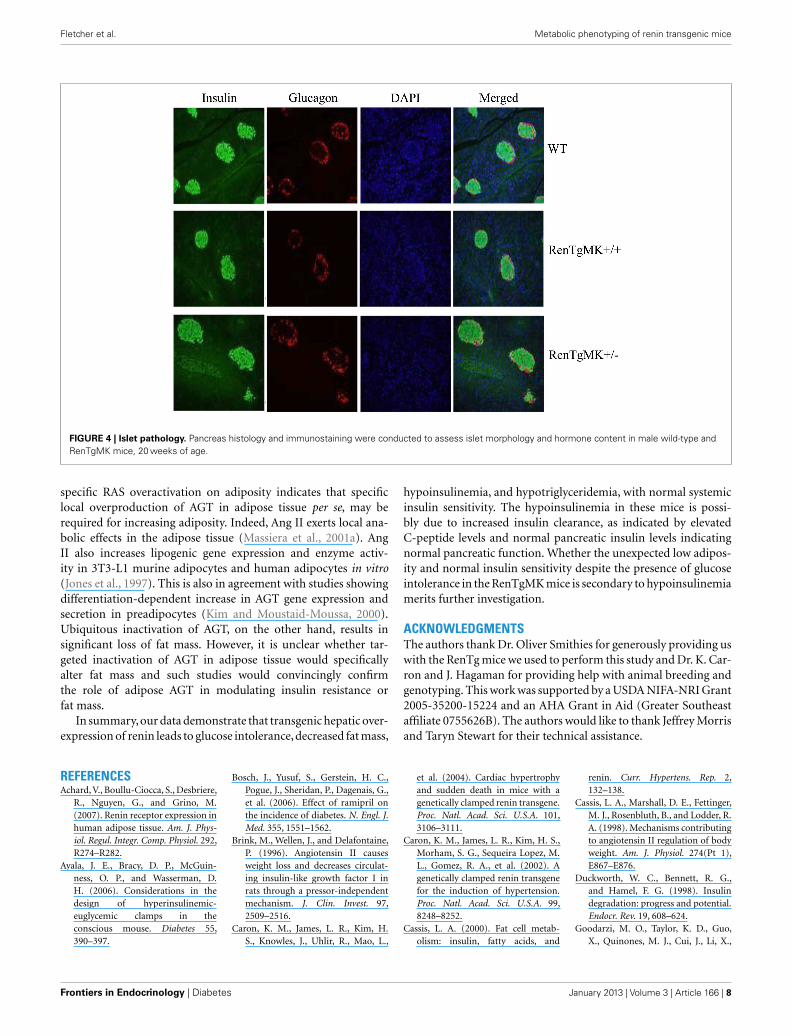
PANCREAS HISTOLOGY AND IMMUNOSTAINING OF RenTg MICEBecause of the consistently lower insulin levels in heterozygousmice compared to WT mice, we performed immunohistologicalstudies in the pancreas to assess islet morphology and hormonecontent. In both genotypes, islets appeared normal and exhibitedcomparable staining for glucagon and insulin (Figure 4).
DISCUSSIONMany lines of evidence have linked activation of the RAS to thedevelopment of obesity and insulin resistance (Schorr et al., 1998;Van Harmelen et al., 2000), but the effects of increased circu-lating levels of angiotensins on adiposity remain controversial.We hypothesized that chronic systemic RAS activation via trans-genic renin overexpression in the liver would lead to glucoseintolerance and systemic insulin resistance. We also predictedthat increased systemic Ang II would increase adiposity, basedon previous work by us and others showing that Ang II increasesadipocyte lipogenesis and triglyceride storage. Our results demon-strate that elevated circulating Ang II due to renin overexpression
Frontiers in Endocrinology | Diabetes January 2013 | Volume 3 | Article 166 | 4
Fletcher et al. Metabolic phenotyping of renin transgenic mice
FIGURE 2 | Assessment of insulin sensitivity in male wild-type and RenTgMK+/− mice using hyperinsulinemic euglycemic clamp. Changes in bloodglucose concentration (A) and glucose infusion rate (B) over time are shown. Values are means±SE. Animals were approximately 9 months old. n=8–9 ForWT; n= 7 for RenTgMK+/−.
Table 2 | Metabolic characteristics and accumulation of [2-3H]DG
during the hyperinsulinemic-euglycemic clamp experiments in male
wild-type and RenTgMK+/− mice.
WT RenTgMK+/− P value
GLUCOSE KINETICS
Blood glucose, mg/dl 114.7±5.8 114.6±5.0 0.996
GTR, mg/kg/min 47.4±4.0 49.4±6.7 0.794
endoGTR, mg/kg/min 4.96±4.62 −2.29±7.60 0.416
Glucose clearance, mg/kg/min 42.0±3.1 43.7±5.7 0.790
GIR, mg/kg/min 42.4±4.3 51.7±4.0 0.142
ACCUMULATION OF [2-3H]DG
Soleus, µg/min/mg tissue 0.035±0.008 0.036±0.005 0.923
Gastro, µg/min/mg tissue 0.025±0.005 0.033±0.003 0.229
Vastus l., µg/min/mg tissue 0.041±0.007 0.047±0.005 0.550
WAT, µg/min/mg tissue 0.004±0.001 0.006±0.001 0.067
Diaphragm, µg/min/mg tissue 0.131±0.019 0.091±0.007 0.103
Heart, µg/min/mg tissue 0.431±0.057 0.320±0.043 0.161
Brain, µg/min/mg tissue 0.048±0.005 0.049±0.003 0.888
Values are means±SE. Animals were approximately 9 months old. n=8–9 For
WT; n=7 for RenTgMK+/−. GTR, glucose turnover rate; endoGTR, endogenous
glucose turnover rate; GIR, glucose infusion rate; [2-3H]DG, 2-deoxy-[3H]glucose;
Gastro, gastrocnemius; Vastus l., vastus lateralis; WAT, white adipose tissue.
leads to glucose intolerance, but with consistently lower levels ofplasma insulin. Further, chronic elevation of systemic Ang II byhepatic overexpression of the renin gene led to a reduction rather
than an increase in adiposity in male mice. However, these miceexhibit otherwise normal glucose metabolism and a transgenedose-dependent decrease in insulinemia.
GLUCOSE INTOLERANCE IN RenTgMK MICEConsistent with previous studies of Ang II infusion and transgenicrenin expression (Lee et al., 1996), male RenTgMK transgenic miceexhibited glucose intolerance, even on a low-fat diet. However,despite this glucose intolerance, the RenTgMK mice maintainedlow fasting insulinemia and normal insulin sensitivity, as indicatedby normal steady-state glucose infusion during the hyperinsuline-mic, euglycemic clamp studies. RenTgMK mice maintained lowinsulinemia even under high-fat feeding. The glucose intolerancein RenTgMK mice in the presence of normal fasting glucose levelsand low insulinemia, a feature that is a rather typical hallmarkof increased insulin sensitivity, could be due to decreased insulinproduction/secretion and/or increased insulin clearance. SerumC-peptide level was higher in heterozygous compared to WT micearguing against decreased insulin secretion accounting for lowinsulinemia in the RenTgMK mice. Immunohistochemistry ofthe pancreas indicated normal islet morphology and hormonecontent, possibly indicating normal pancreatic function. How-ever, such studies are only qualitative and do not allow to detectclear quantitative differences. Thus, it is probably insulin clearance,rather than insulin secretion that may be altered in this model.
Liver is the primary site of insulin clearance (Duckworthet al., 1998), which can be affected by both nutritional and hor-monal signals. Insulin clearance rate is heritable (Goodarzi et al.,
www.frontiersin.org January 2013 | Volume 3 | Article 166 | 5
Fletcher et al. Metabolic phenotyping of renin transgenic mice
Table 3 | Effects of high-fat diet on body weight and metabolic characteristics in male wild-type and RenTgMK+/− mice.
WT RenTgMK+/− P value
LF HF LF HF Geno Diet Geno X diet
Initial body weight, g 27.2±2.2 29.2±1.4 26.2±0.6 25.7±0.9 NS NS NS
Final body weight, g 37.6±3.2a,b 46.9±5.6a 35.4±1.8b 37.8±2.1a,b NS NS NS
Glucose, mg/dL 92.3±3.2b 123.7±7.7a 98.3±5.2b 127.3±2.9a NS 0.001 NS
Insulin, ng/ml 1.29±0.31 2.07±0.60 0.91±0.04 1.14±0.25 NS NS NS
Leptin, pg/ml 9.5±1.6 16.2±2.9 7.6±1.1 12.7±2.3 NS 0.019 NS
Adiponectin, µg/ml 12.6±0.3 14.1±2.0 12.9±0.4 12.4±0.2 NS NS NS
Resistin, pg/ml 475.8±37.3b 702.2±19.0a 545.8±48.7a,b 493.3±83.9b NS NS 0.030
MCP-1, pg/ml 29.9±8.0 53.0±18.9 30.5±1.6 34.0±12.9 NS NS NS
PAI-1, pg/ml 3903.4±666.2 5903.4±834.8 4733.5±734.0 4526.8±961.3 NS NS NS
C-peptide, ng/ml 1.9±0.3 3.3±1.2 2.4±0.4 2.3±0.2 NS NS NS
FFA, mM 1.00±0.18 0.80±0.04 1.23±0.36 1.16±0.39 NS NS NS
Triglycerides, mg/dL 132.4±16.5a 66.9±4.1b 66.8±4.4b 39.2±5.4b 0.001 0.001 0.074
Values are means±SE. Animals were fed a high-fat or low-fat diet for 19 weeks. Initial body weight measurements were taken at the beginning of the study. Mice
were 3–5 months old. Blood was collected after fasting overnight and metabolic parameters were measured from serum. n=3 For each group. LF, low-fat; HF, high-fat;
MCP-1, monocyte chemoattractant protein-1; PAI-1, plasminogen activator inhibitor-1; C-peptide, connecting peptide; FFA, free fatty acid.
Means in a row with superscripts without a common letter differ, P < 0.05.
Numbers in bold indicate a significance of P < 0.05.
2005) and is reduced in obesity and Type-2 diabetes (Duck-worth et al., 1998). Therefore, it could be an important factorin the pathogenesis of Type-2 diabetes. Conversely, there aremouse models which exhibit increased insulin clearance such asthe mouse overexpressing carcinoembryonic antigen-related celladhesion molecule 1 (CEACAM1) in the liver (Najjar, 2002). Addi-tional studies beyond the scope of this work will be requiredto address whether the RAS is involved in regulating insulinclearance.
The finding that the glucose intolerance in male transgenic micedid not worsen with high-fat feeding could possibly indicate thatRAS overactivation could at least in part play a role in high-fat diet-induced obesity. Along the same lines, mice overexpressing AGTin adipose tissue also develop glucose intolerance on a low-fat diet,which is not further exacerbated by high-fat feeding (Kalupahanaet al., 2012). Female transgenic mice exhibited normal glucose tol-erance on a low-fat diet while males became glucose intolerant onthe same diet when compared to WT littermates. Further, femaletransgenics became glucose intolerant when fed a high-fat diet(data not shown).
It is likely that the metabolic phenotype of the RenTgMK miceis due to Ang II effects, rather than the effects of renin actingon the renin/prorenin receptor. We argue this because in reninknockout mice, the metabolic phenotype of increased insulin sen-sitivity and resistance to high-fat diet-induced glucose intoleranceand insulin resistance was reversed by Ang II infusion (Takahashiet al., 2007). It is also likely that these effects are mediated viaangiotensin receptors, as previous studies on the RenTgMK micedemonstrated that AT1 receptor blockade reversed renal pathol-ogy and normalized blood pressure in the RenTgMK mice (Caronet al., 2002). Alternative mechanisms may involve direct effects ofrenin mediated by the renin/prorenin receptor on the vasculatureor adipose tissue. Indeed, renin receptors are expressed in adipose
tissue (Achard et al., 2007) and therefore may mediate the observedadipose tissue phenotype.
RAS OVERACTIVATION AND INSULIN RESISTANCERenin-angiotensin system overactivation via chronic Ang II infu-sion leads to the development of systemic insulin resistancein rodents. This is, in most part, due to the Ang II-mediatedimpairment of skeletal muscle glucose transport and utilization(Kalupahana and Moustaid-Moussa, 2012a). Ang II impedes theinsulin-mediated tyrosine phosphorylation of the insulin receptorsubstrate (IRS)-1, activation of Akt, and translocation of glucosetransporter (Glut)-4 in the skeletal muscle in an NADPH oxi-dase, AT1, and NF-kB-dependent manner. Ang II also increaseshepatic glucose production, which also potentially contributes toaltered systemic insulin sensitivity. In contrast, the RenTgMK micein this study exhibited normal systemic insulin sensitivity. Whilethe exact underlying mechanisms for this discrepancy of insulinsensitivity between different models of RAS overactivation areunknown, it is possible that the low insulinemia present in theRenTgMK mice could protect these mice from the developmentof insulin resistance. Previous studies have shown that an increasein plasma insulin by itself can induce insulin resistance. In thestudy by Shanik et al. (2008), mice transfected with extra copiesof the insulin gene had a two- to four-fold increase in plasmainsulin and exhibited normal body weight, insulin resistance andhypertriglyceridemia.
Unlike models of chronic Ang II infusion (Ran et al., 2004),RenTgMK mice exhibited lower plasma triglyceride levels. Thus,the hypoinsulinemia in the RenTgMK could also potentiallyexplain the low serum triglyceride levels seen in these mice. Giventhis metabolic phenotype of RenTgMK mice, it would be interest-ing to explore whether the insulin resistance seen in several modelsof chronic RAS overactivation is insulin-dependent and further
Frontiers in Endocrinology | Diabetes January 2013 | Volume 3 | Article 166 | 6
Fletcher et al. Metabolic phenotyping of renin transgenic mice
FIGURE 3 | Effect of high-fat diet on body and fat pad weight andglucose tolerance of male wild-type and RenTgMK+/− mice. (A) Weightgain was calculated as the difference between the initial body weightmeasured at week 1 and the final weight measured after 18 weeks. (B) Micewere sacrificed at the end of week 19 and gonadal fat pads were collectedand weighed. (C) The adiposity index was determined by dividing gonadal fat
pad weight by final body weight X 100. (D) A glucose tolerance test (GTT) wasadministered after overnight fasting. Blood glucose levels were measured at0, 15, 30, 90, and 120 min and plotted on a graph. (E) Area Under the Curve(AUC) was calculated as described in the experimental procedures. Values aremeans±SE. n=3 For each group. *Significantly different (P < 0.05) fromWT-LF. Different letters indicate a significant difference (P < 0.05).
studies are warranted. The issue of whether the renin recep-tor may also in part modulate insulin sensitivity merits furtherinvestigation as well.
RAS OVERACTIVATION AND ADIPOSITYBoth human and rodent studies have shown that obesity andincreased adiposity are associated with both systemic and adiposeRAS overactivation (Kalupahana and Moustaid-Moussa, 2012a).However, it is not known whether primary RAS overactivationleads to obesity. Transgenic mouse models clearly demonstrate thatmanipulating components of the RAS alters adiposity: mice over-expressing AGT in adipose tissue have increased adiposity, whiledeletion of either the AGT or Ang II receptor genes reduces fat-ness. Paradoxically, previous studies of chronic Ang II infusion inrodents have shown that chronic systemic RAS overactivation leadsto weight loss, rather than weight gain (Griffin et al., 1991; Cassiset al., 1998). The transgenic TGR(mREN2)27 rat overexpressingthe mouse Ren2 renin gene also has a lean phenotype (Mullinset al., 1990; Langheinrich et al., 1996; Lee et al., 1996). Similar to
these findings, the RenTgMK mice also exhibited lower fat masscompared to WT littermates. The adipose mass was significantlydecreased by the renin transgene in a gene dosage-dependentmanner. In contrast, mice with primary AGT overproduction inadipose tissue exhibit higher adiposity (Massiera et al., 2001a).Further, deletion of AGT and other RAS genes leads to lowerfat mass and resistance to diet-induced obesity (Massiera et al.,2001b; Takahashi et al., 2007). Thus, it appears that while sys-temic RAS overactivation leads to reductions in body weight,local increases in RAS activity in adipose tissue leads to increasedadiposity.
The low-fat mass observed following Ang II infusion is attrib-uted to both increased energy expenditure and reduced energyintake (Brink et al., 1996; Cassis et al., 1998). In the RenTgMKmouse model, we did not detect any significant differences in foodintake (data not shown). Activation of the sympathetic nervoussystem may also account for changes in weight via modulationof lipid metabolism and energy expenditure by catecholamines(Cassis, 2000). The differential effect of systemic vs. adipose
www.frontiersin.org January 2013 | Volume 3 | Article 166 | 7
Fletcher et al. Metabolic phenotyping of renin transgenic mice
FIGURE 4 | Islet pathology. Pancreas histology and immunostaining were conducted to assess islet morphology and hormone content in male wild-type andRenTgMK mice, 20 weeks of age.
specific RAS overactivation on adiposity indicates that specificlocal overproduction of AGT in adipose tissue per se, may berequired for increasing adiposity. Indeed, Ang II exerts local ana-bolic effects in the adipose tissue (Massiera et al., 2001a). AngII also increases lipogenic gene expression and enzyme activ-ity in 3T3-L1 murine adipocytes and human adipocytes in vitro(Jones et al., 1997). This is also in agreement with studies showingdifferentiation-dependent increase in AGT gene expression andsecretion in preadipocytes (Kim and Moustaid-Moussa, 2000).Ubiquitous inactivation of AGT, on the other hand, results insignificant loss of fat mass. However, it is unclear whether tar-geted inactivation of AGT in adipose tissue would specificallyalter fat mass and such studies would convincingly confirmthe role of adipose AGT in modulating insulin resistance orfat mass.
In summary,our data demonstrate that transgenic hepatic over-expression of renin leads to glucose intolerance,decreased fat mass,
hypoinsulinemia, and hypotriglyceridemia, with normal systemicinsulin sensitivity. The hypoinsulinemia in these mice is possi-bly due to increased insulin clearance, as indicated by elevatedC-peptide levels and normal pancreatic insulin levels indicatingnormal pancreatic function. Whether the unexpected low adipos-ity and normal insulin sensitivity despite the presence of glucoseintolerance in the RenTgMK mice is secondary to hypoinsulinemiamerits further investigation.
ACKNOWLEDGMENTSThe authors thank Dr. Oliver Smithies for generously providing uswith the RenTg mice we used to perform this study and Dr. K. Car-ron and J. Hagaman for providing help with animal breeding andgenotyping. This work was supported by a USDA NIFA-NRI Grant2005-35200-15224 and an AHA Grant in Aid (Greater Southeastaffiliate 0755626B). The authors would like to thank Jeffrey Morrisand Taryn Stewart for their technical assistance.
REFERENCESAchard, V., Boullu-Ciocca, S., Desbriere,
R., Nguyen, G., and Grino, M.(2007). Renin receptor expression inhuman adipose tissue. Am. J. Phys-iol. Regul. Integr. Comp. Physiol. 292,R274–R282.
Ayala, J. E., Bracy, D. P., McGuin-ness, O. P., and Wasserman, D.H. (2006). Considerations in thedesign of hyperinsulinemic-euglycemic clamps in theconscious mouse. Diabetes 55,390–397.
Bosch, J., Yusuf, S., Gerstein, H. C.,Pogue, J., Sheridan, P., Dagenais, G.,et al. (2006). Effect of ramipril onthe incidence of diabetes. N. Engl. J.Med. 355, 1551–1562.
Brink, M., Wellen, J., and Delafontaine,P. (1996). Angiotensin II causesweight loss and decreases circulat-ing insulin-like growth factor I inrats through a pressor-independentmechanism. J. Clin. Invest. 97,2509–2516.
Caron, K. M., James, L. R., Kim, H.S., Knowles, J., Uhlir, R., Mao, L.,
et al. (2004). Cardiac hypertrophyand sudden death in mice with agenetically clamped renin transgene.Proc. Natl. Acad. Sci. U.S.A. 101,3106–3111.
Caron, K. M., James, L. R., Kim, H. S.,Morham, S. G., Sequeira Lopez, M.L., Gomez, R. A., et al. (2002). Agenetically clamped renin transgenefor the induction of hypertension.Proc. Natl. Acad. Sci. U.S.A. 99,8248–8252.
Cassis, L. A. (2000). Fat cell metab-olism: insulin, fatty acids, and
renin. Curr. Hypertens. Rep. 2,132–138.
Cassis, L. A., Marshall, D. E., Fettinger,M. J., Rosenbluth, B., and Lodder, R.A. (1998). Mechanisms contributingto angiotensin II regulation of bodyweight. Am. J. Physiol. 274(Pt 1),E867–E876.
Duckworth, W. C., Bennett, R. G.,and Hamel, F. G. (1998). Insulindegradation: progress and potential.Endocr. Rev. 19, 608–624.
Goodarzi, M. O., Taylor, K. D., Guo,X., Quinones, M. J., Cui, J., Li, X.,
Frontiers in Endocrinology | Diabetes January 2013 | Volume 3 | Article 166 | 8
Fletcher et al. Metabolic phenotyping of renin transgenic mice
et al. (2005). Variation in the genefor muscle-specific AMP deaminaseis associated with insulin clearance,a highly heritable trait. Diabetes 54,1222–1227.
Griffin, S. A., Brown, W. C., MacPher-son, F., McGrath, J. C., Wil-son, V. G., Korsgaard, N., et al.(1991). Angiotensin II causes vas-cular hypertrophy in part by anon-pressor mechanism. Hyperten-sion 17, 626–635.
Hatada, S., Kuziel, W., Smithies, O.,and Maeda, N. (1999). The influ-ence of chromosomal location onthe expression of two transgenes inmice. J. Biol. Chem. 274, 948–955.
Jayasooriya, A. P., Mathai, M. L.,Walker, L. L., Begg, D. P., Denton,D. A., Cameron-Smith, D., et al.(2008). Mice lacking angiotensin-converting enzyme have increasedenergy expenditure, with reduced fatmass and improved glucose clear-ance. Proc. Natl. Acad. Sci. U.S.A.105, 6531–6536.
Jeunemaitre, X. (2008). Genetics of thehuman renin angiotensin system. JMol. Med. (Berl.) 86, 637–641.
Jeunemaitre, X., Gimenez-Roqueplo,A. P., Celerier, J., and Corvol,P. (1999). Angiotensinogen vari-ants and human hypertension. Curr.Hypertens. Rep. 1, 31–41.
Jones, B. H., Standridge, M. K., andMoustaid, N. (1997). Angiotensin IIincreases lipogenesis in 3T3-L1 andhuman adipose cells. Endocrinology138, 1512–1519.
Kalupahana, N. S., Massiera, F.,Quignard-Boulange, A., Ailhaud,G., Voy, B. H., Wasserman, D. H.,et al. (2012). Overproduction ofangiotensinogen from adipose tis-sue induces adipose inflammation,glucose intolerance, and insulinresistance. Obesity (Silver Spring)20, 48–56.
Kalupahana, N. S., and Moustaid-Moussa, N. (2012a). The renin-angiotensin system: a link betweenobesity, inflammation and insulinresistance. Obes. Rev. 13, 136–149.
Kalupahana, Nishan S., and Moustaid-Moussa, N. (2012b). The adipose
tissue renin-angiotensin system andmetabolic disorders: a review ofmolecular mechanisms. Crit. Rev.Biochem. Mol. Biol. 47, 379–390.
Kim, S., and Moustaid-Moussa, N.(2000). Secretory, endocrine andautocrine/paracrine function of theadipocyte. J. Nutr. 130, 3110S–3115S.
Langheinrich, M., Lee, M. A., Bohm,M., Pinto, Y. M., Ganten, D., andPaul, M. (1996). The hyperten-sive Ren-2 transgenic rat TGR(mREN2)27 in hypertensionresearch. Characteristics and func-tional aspects. Am. J. Hypertens. 9,506–512.
Lee, M. A., Bohm, M., Paul, M., Bader,M., Ganten, U., and Ganten, D.(1996). Physiological characteriza-tion of the hypertensive transgenicrat TGR(mREN2)27. Am. J. Physiol.270(Pt 1), E919–E929.
Lee, M. H., Song, H. K., Ko, G. J.,Kang, Y. S., Han, S. Y., Han, K. H.,et al. (2008). Angiotensin receptorblockers improve insulin resistancein type 2 diabetic rats by modulat-ing adipose tissue. Kidney Int. 74,890–900.
Massiera, F., Bloch-Faure, M., Ceiler,D., Murakami, K., Fukamizu, A.,Gasc, J. M., et al. (2001a). Adi-pose angiotensinogen is involved inadipose tissue growth and bloodpressure regulation. FASEB J. 15,2727–2729.
Massiera, F., Seydoux, J., Geloen,A., Quignard-Boulange, A., Tur-ban, S., Saint-Marc, P., et al.(2001b). Angiotensinogen-deficientmice exhibit impairment of diet-induced weight gain with alter-ation in adipose tissue developmentand increased locomotor activity.Endocrinology 142, 5220–5225.
Mullins, J. J., Peters, J., and Ganten,D. (1990). Fulminant hypertensionin transgenic rats harbouring themouse Ren-2 gene. Nature 344,541–544.
Najjar, S. M. (2002). Regulation ofinsulin action by CEACAM1.Trends Endocrinol. Metab. 13,240–245.
Ogihara, T., Asano, T., Ando, K.,Chiba, Y., Sakoda, H., Anai, M., etal. (2002). Angiotensin II-inducedinsulin resistance is associated withenhanced insulin signaling. Hyper-tension 40, 872–879.
Ran, J., Hirano, T., and Adachi, M.(2004). Chronic ANG II infu-sion increases plasma triglyceridelevel by stimulating hepatic triglyc-eride production in rats. Am. J.Physiol. Endocrinol. Metab. 287,E955–E961.
Schmieder, R. E., Hilgers, K. F.,Schlaich, M. P., and Schmidt, B.M. (2007). Renin-angiotensin sys-tem and cardiovascular risk. Lancet369, 1208–1219.
Schorr, U., Blaschke, K., Turan, S.,Distler, A., and Sharma, A. M.(1998). Relationship betweenangiotensinogen, leptin and bloodpressure levels in young nor-motensive men. J. Hypertens. 16,1475–1480.
Shanik, M. H., Xu,Y., Skrha, J., Dankner,R., Zick, Y., and Roth, J. (2008).Insulin resistance and hyperinsu-linemia: is hyperinsulinemia thecart or the horse? Diabetes Care31(Suppl. 2), S262–S268.
Takahashi, N., Li, F., Hua, K., Deng, J.,Wang, C. H., Bowers, R. R., et al.(2007). Increased energy expendi-ture, dietary fat wasting, and resis-tance to diet-induced obesity inmice lacking renin. Cell Metab. 6,506–512.
Truett, G. E., Heeger, P., Mynatt, R. L.,Truett, A. A., Walker, J. A., and War-man, M. L. (2000). Preparation ofPCR-quality mouse genomic DNAwith hot sodium hydroxide and tris(HotSHOT). Biotechniques 29, 52,54.
Van Harmelen, V., Ariapart, P., Hoffst-edt, J., Lundkvist, I., Bringman, S.,and Arner, P. (2000). Increased adi-pose angiotensinogen gene expres-sion in human obesity. Obes. Res. 8,337–341.
Vermes, E., Ducharme, A., Bourassa,M. G., Lessard, M., White, M., andTardif, J. C. (2003). Enalapril reducesthe incidence of diabetes in patients
with chronic heart failure: insightfrom the Studies Of Left VentricularDysfunction (SOLVD). Circulation107, 1291–1296.
Xiao, F., Wei, H., Song, S., Li, G., andSong, C. (2006). Polymorphismsin the promoter region of theangiotensinogen gene are associatedwith liver cirrhosis in patients withchronic hepatitis B. J. Gastroenterol.Hepatol. 21, 1488–1491.
Yvan-Charvet, L., Even, P., Bloch-Faure,M., Guerre-Millo, M., Moustaid-Moussa, N., Ferre, P., et al. (2005).Deletion of the angiotensin type 2receptor (AT2R) reduces adipose cellsize and protects from diet-inducedobesity and insulin resistance. Dia-betes 54, 991–999.
Conflict of Interest Statement: Theauthors declare that the research wasconducted in the absence of any com-mercial or financial relationships thatcould be construed as a potential con-flict of interest.
Received: 04 November 2012; accepted:02 December 2012; published online: 07January 2013.Citation: Fletcher SJ, Kalupahana NS,Soltani-Bejnood M, Kim JH, SaxtonAM, Wasserman DH, De Taeye B,Voy BH, Quignard-Boulange A andMoustaid-Moussa N (2013) Transgenicmice overexpressing renin exhibit glu-cose intolerance and diet-genotype inter-actions. Front. Endocrin. 3:166. doi:10.3389/fendo.2012.00166This article was submitted to Frontiersin Diabetes, a specialty of Frontiers inEndocrinology.Copyright © 2013 Fletcher , Kalupahana,Soltani-Bejnood, Kim, Saxton, Wasser-man, De Taeye, Voy, Quignard-Boulangeand Moustaid-Moussa. This is an open-access article distributed under the termsof the Creative Commons AttributionLicense, which permits use, distributionand reproduction in other forums, pro-vided the original authors and sourceare credited and subject to any copy-right notices concerning any third-partygraphics etc.
www.frontiersin.org January 2013 | Volume 3 | Article 166 | 9
Copyright © 2022 FDOKUMEN