
Transcriptome Adaptation of Group B Streptococcus to Growth in Human Amniotic Fluid
15
Transcriptome Adaptation of Group B Streptococcus to Growth in Human Amniotic Fluid Izabela Sitkiewicz 1¤ , Nicole M. Green 1 , Nina Guo 1 , Ann Marie Bongiovanni 2 , Steven S. Witkin 2 , James M. Musser 1,2 * 1 Center for Molecular and Translational Human Infectious Diseases Research, The Methodist Hospital Research Institute, and Department of Pathology, The Methodist Hospital, Houston, Texas, United States of America, 2 Weill Medical College of Cornell University, New York, New York, United States of America Abstract Background: Streptococcus agalactiae (group B Streptococcus) is a bacterial pathogen that causes severe intrauterine infections leading to fetal morbidity and mortality. The pathogenesis of GBS infection in this environment is poorly understood, in part because we lack a detailed understanding of the adaptation of this pathogen to growth in amniotic fluid. To address this knowledge deficit, we characterized the transcriptome of GBS grown in human amniotic fluid (AF) and compared it with the transcriptome in rich laboratory medium. Methods: GBS was grown in Todd Hewitt-yeast extract medium and human AF. Bacteria were collected at mid-logarithmic, late-logarithmic and stationary growth phase. We performed global expression microarray analysis using a custom-made Affymetrix GeneChip. The normalized hybridization values derived from three biological replicates at each growth point were obtained. AF/THY transcript ratios representing greater than a 2-fold change and P-value exceeding 0.05 were considered to be statistically significant. Principal Findings: We have discovered that GBS significantly remodels its transcriptome in response to exposure to human amniotic fluid. GBS grew rapidly in human AF and did not exhibit a global stress response. The majority of changes in GBS transcripts in AF compared to THY medium were related to genes mediating metabolism of amino acids, carbohydrates, and nucleotides. The majority of the observed changes in transcripts affects genes involved in basic bacterial metabolism and is connected to AF composition and nutritional requirements of the bacterium. Importantly, the response to growth in human AF included significant changes in transcripts of multiple virulence genes such as adhesins, capsule, and hemolysin and IL-8 proteinase what might have consequences for the outcome of host-pathogen interactions. Conclusions/Significance: Our work provides extensive new information about how the transcriptome of GBS responds to growth in AF, and thus new leads for pathogenesis research. Citation: Sitkiewicz I, Green NM, Guo N, Bongiovanni AM, Witkin SS, et al. (2009) Transcriptome Adaptation of Group B Streptococcus to Growth in Human Amniotic Fluid. PLoS ONE 4(7): e6114. doi:10.1371/journal.pone.0006114 Editor: Holger Bruggemann, Max Planck Institute for Infection Biology, Germany Received February 17, 2009; Accepted May 25, 2009; Published July 1, 2009 Copyright: ß 2009 Sitkiewicz et al. This is an open-access article distributed under the terms of the Creative Commons Attribution License, which permits unrestricted use, distribution, and reproduction in any medium, provided the original author and source are credited. Funding: The project was internally funded by The Methodist Hospital Research Institute. The funders had no role in study design, data collection and analysis, decision to publish, or preparation of the manuscript. Competing Interests: The authors have declared that no competing interests exist. * E-mail: [email protected] ¤ Current address: National Medicines Institute, Department of Epidemiology and Clinical Microbiology, Warsaw, Poland Introduction Intrauterine and postpartum infections remain an important cause of morbidity and mortality worldwide. One of the bacterial species commonly responsible for these infections is Streptococcus agalactiae, also known as group B Streptococcus (GBS). GBS colonizes the urogenital or gastrointestinal tract of about 10%–30% of humans, depending on gender, geographical origin, ethnicity, and screening method used (for a review see [1] and references therein). In recent decades GBS has become an important human pathogen [2], now responsible for a large percentage of female urogenital tract infections in non-pregnant women and amnionitis and septic abortion in pregnant individuals [3,4]. GBS also is a major cause of fatal septicemia and meningitis in newborns and invasive infections in elderly and people with underlying diseases [3,4]. Recent studies [5,6,7] have shown that the transcriptome of GBS responds extensively to environmental changes, therefore we hypothesized that this organism will significantly remodel its global transcript profile in response to growth in human amniotic fluid. In this study, we employed an ex vivo strategy to characterize the global transcriptome response of GBS when grown in human amniotic fluid. The ex vivo strategy has been successfully used to study adaptation of pathogenic bacteria to multiple environments of the human body such as blood and saliva [7,8,9]. To gain significant new information about the interaction of GBS with amniotic fluid over time, we conducted expression microarray analysis at three time points throughout the pathogen growth cycle. PLoS ONE | www.plosone.org 1 July 2009 | Volume 4 | Issue 7 | e6114
-
Upload
independent -
Category
Documents
-
view
3 -
download
0
Transcript of Transcriptome Adaptation of Group B Streptococcus to Growth in Human Amniotic Fluid

Transcriptome Adaptation of Group B Streptococcus toGrowth in Human Amniotic FluidIzabela Sitkiewicz1¤, Nicole M. Green1, Nina Guo1, Ann Marie Bongiovanni2, Steven S. Witkin2, James M.
Musser1,2*
1 Center for Molecular and Translational Human Infectious Diseases Research, The Methodist Hospital Research Institute, and Department of Pathology, The Methodist
Hospital, Houston, Texas, United States of America, 2 Weill Medical College of Cornell University, New York, New York, United States of America
Abstract
Background: Streptococcus agalactiae (group B Streptococcus) is a bacterial pathogen that causes severe intrauterineinfections leading to fetal morbidity and mortality. The pathogenesis of GBS infection in this environment is poorlyunderstood, in part because we lack a detailed understanding of the adaptation of this pathogen to growth in amnioticfluid. To address this knowledge deficit, we characterized the transcriptome of GBS grown in human amniotic fluid (AF) andcompared it with the transcriptome in rich laboratory medium.
Methods: GBS was grown in Todd Hewitt-yeast extract medium and human AF. Bacteria were collected at mid-logarithmic,late-logarithmic and stationary growth phase. We performed global expression microarray analysis using a custom-madeAffymetrix GeneChip. The normalized hybridization values derived from three biological replicates at each growth pointwere obtained. AF/THY transcript ratios representing greater than a 2-fold change and P-value exceeding 0.05 wereconsidered to be statistically significant.
Principal Findings: We have discovered that GBS significantly remodels its transcriptome in response to exposure to humanamniotic fluid. GBS grew rapidly in human AF and did not exhibit a global stress response. The majority of changes in GBStranscripts in AF compared to THY medium were related to genes mediating metabolism of amino acids, carbohydrates, andnucleotides. The majority of the observed changes in transcripts affects genes involved in basic bacterial metabolism and isconnected to AF composition and nutritional requirements of the bacterium. Importantly, the response to growth in humanAF included significant changes in transcripts of multiple virulence genes such as adhesins, capsule, and hemolysin and IL-8proteinase what might have consequences for the outcome of host-pathogen interactions.
Conclusions/Significance: Our work provides extensive new information about how the transcriptome of GBS responds togrowth in AF, and thus new leads for pathogenesis research.
Citation: Sitkiewicz I, Green NM, Guo N, Bongiovanni AM, Witkin SS, et al. (2009) Transcriptome Adaptation of Group B Streptococcus to Growth in HumanAmniotic Fluid. PLoS ONE 4(7): e6114. doi:10.1371/journal.pone.0006114
Editor: Holger Bruggemann, Max Planck Institute for Infection Biology, Germany
Received February 17, 2009; Accepted May 25, 2009; Published July 1, 2009
Copyright: � 2009 Sitkiewicz et al. This is an open-access article distributed under the terms of the Creative Commons Attribution License, which permitsunrestricted use, distribution, and reproduction in any medium, provided the original author and source are credited.
Funding: The project was internally funded by The Methodist Hospital Research Institute. The funders had no role in study design, data collection and analysis,decision to publish, or preparation of the manuscript.
Competing Interests: The authors have declared that no competing interests exist.
* E-mail: [email protected]
¤ Current address: National Medicines Institute, Department of Epidemiology and Clinical Microbiology, Warsaw, Poland
Introduction
Intrauterine and postpartum infections remain an important
cause of morbidity and mortality worldwide. One of the bacterial
species commonly responsible for these infections is Streptococcus
agalactiae, also known as group B Streptococcus (GBS). GBS colonizes
the urogenital or gastrointestinal tract of about 10%–30% of
humans, depending on gender, geographical origin, ethnicity, and
screening method used (for a review see [1] and references
therein). In recent decades GBS has become an important human
pathogen [2], now responsible for a large percentage of female
urogenital tract infections in non-pregnant women and amnionitis
and septic abortion in pregnant individuals [3,4]. GBS also is a
major cause of fatal septicemia and meningitis in newborns and
invasive infections in elderly and people with underlying diseases
[3,4]. Recent studies [5,6,7] have shown that the transcriptome of
GBS responds extensively to environmental changes, therefore we
hypothesized that this organism will significantly remodel its global
transcript profile in response to growth in human amniotic fluid.
In this study, we employed an ex vivo strategy to characterize the
global transcriptome response of GBS when grown in human
amniotic fluid. The ex vivo strategy has been successfully used to
study adaptation of pathogenic bacteria to multiple environments
of the human body such as blood and saliva [7,8,9]. To gain
significant new information about the interaction of GBS with
amniotic fluid over time, we conducted expression microarray
analysis at three time points throughout the pathogen growth
cycle.
PLoS ONE | www.plosone.org 1 July 2009 | Volume 4 | Issue 7 | e6114

Materials and Methods
Bacterial strains and routine growthSerotype III GBS strain NEM316 was used in these studies
because the genome has been sequenced, the organism has been
used in many pathogenesis studies, and serotype III organisms
cause a large number of serious human infections [10]. The strain
was grown in Todd Hewitt medium with 0.5% yeast extract
(THY) or on Trypticase Soy agar (TSA) II plates supplemented
with 5% sheep blood (BD Diagnostics) at 37u in a 5% CO2
atmosphere.
Growth of GBS in human amniotic fluidHuman amniotic fluid (AF) was collected from pregnant women
seen at The Methodist Hospital, Houston, Texas, or Weill Medical
College of Cornell University in New York City. Samples were
collected in accordance with an exempt human subjects protocol
approved by the Institution Review Board of each institution. The
study involved collection of existing diagnostic specimens routinely
collected during clinical procedures as amniocenteses and would
have been otherwise discarded. Specimens were stripped of all
identifiers and processed in a manner that subjects cannot be
directly or indirectly identified.
After collection, each specimen was centrifuged to remove host
cells, filter sterilized, and frozen at 220uC. After thawing, each AF
sample was tested to determine if it supported growth of GBS.
Aliquots (250 ml) of heat inactivated (95u for 5 min) AF were
inoculated with GBS prepared as follows. Bacteria from overnight
cultures grown in THY were collected by centrifugation, washed
twice with sterile PBS, and suspended in PBS. 10 ml of 1006bacteria diluted further in PBS were used to inoculate each 250 ml
sample of AF (resulting in a final inoculum of ,104 CFU/ml) and
were incubated at 37uC, in 5% CO2 for 24 h. To avoid artifacts
caused by carryover of THY medium, after 24 h of growth in AF
(designated AF1), the GBS were diluted 1:500 into a fresh aliquot
of AF (designated AF2). Growth of GBS in AF2 was quantified
every hour for first 12 h and thereafter every 12 h by plating serial
dilutions on TSA II plates (BD Diagnostics). For transcriptome
studies, AF samples were pooled and three independent AF2
cultures were inoculated with GBS (biological replicates). Bacteria
were collected by centrifugation at time points corresponding to
the mid-logarithmic (ML), late-logarithmic/early stationary (LL)
and stationary (S) phase of growth (Fig. 1).
Cultures grown in THY medium were prepared as described
previously [5]. Briefly, three independent cultures of GBS were
grown in the same lot of THY broth and GBS cells were harvested
at three time points corresponding to mid-logarithmic (ML), late
log/early stationary (ES), and stationary (S) growth phase (Fig. 1).
RNA isolation and processingThe bacterial aliquots used for RNA isolation were mixed with
2 volumes of RNA Protect reagent (Qiagen), and the cells were
collected by centrifugation and stored at 280uC. RNA was
isolated using a modified TRIZOL (Invitrogen) method [11].
Briefly, GBS pellets were suspended in 200 ml of Max Bacterial
Enhancement Reagent (Invitrogen), incubated according to the
manufacturer’s recommendations, mixed with 1 ml of TRIZOL,
and disrupted using lysis matrix B (MP Biochemicals). Cell debris
was removed by centrifugation, and RNA was extracted with
chloroform and precipitated with isopropanol. The precipitated
RNA was suspended in 100 ml of RNAse free water (Ambion,
Austin TX) and further purified using RNeasy 96 well plates. All
samples were processed simultaneously to minimize experimental
variation. Reverse transcription, cDNA fragmentation, and
labeling was performed as described previously [12].
Microarray analysisMicroarray analysis was performed using a custom-made
Affymetrix chip that contained 1,994 probe sets, representing
the annotated ORFs of GBS strain NEM316 [13]. Chip
hybridization data were acquired using Affymetrix GeneChip
Operating Software (GCOS 1.4) and normalized to allow multi-
condition comparison. GCOS-acquired hybridization intensity
values were normalized to the total intensity of all GBS genes
present on the chip. Individual intensity for the gene transcripts
generated by GCOS was divided by the sum of all intensities of the
GBS hybridizing probes. Normalized hybridization values were
used in all subsequent analysis. Data derived from three biological
replicates obtained from three independent cultures were used to
calculate mean values. PartekPro (Partek) and Array Assist
(Stratagene) software were used to assess chip quality and chip-
to-chip variability, and for data mining and visualization. Average
normalized hybridization values were used to calculate AF/THY
transcript ratios. Average values generated after hybridization of
samples from AF_ML phase were divided by values generated
Figure 1. Growth of GBS in THY and AF. Growth of GBS in THYlaboratory medium (blue) and human AF (red). Arrows mark time pointsof sample collection for RNA isolation. Blue arrows denote points forsamples collected during growth in THY, and red arrows denotecollection points for bacteria grown in AF. ML, mid-logarithmic growthphase, LL; late-logarithmic growth phase, ES; early stationary growthphase; and S, stationary growth phase.doi:10.1371/journal.pone.0006114.g001
Adaptation of GBS to AF
PLoS ONE | www.plosone.org 2 July 2009 | Volume 4 | Issue 7 | e6114

from samples THY_ML to generate mid-logarithmic AF/THY
ratios (ML). Average values from samples AF_LL were divided by
values generated from samples THY_ES to generate late-
logarithmic AF/THY ratios (LL). Average values from samples
AF_S were divided by values generated from samples THY_S to
generate stationary-phase AF/THY ratios (S). Only AF/THY
ratios above a 2-fold change and with a P value less than 0.05 were
included in the functional analysis. Normalized hybridization
values are deposited in GEO database (http://www.ncbi.nlm.nih.
gov/geo/) under GSE14456 and GSE12238 accession numbers.
Results and Discussion
Characterization of GBS growth in AFPrior to characterizing the transcriptome of GBS grown in
human AF, we studied the growth of strain NEM316 in THY
Figure 2. PCA plot analysis of microarray data. Each circle represents a single biological replicate. Each experimental condition is designatedwith a separate color. Distinct clusters of three replicates denote highly reproducible arrays. ML, mid-logarithmic growth phase, LL; late-logarithmicgrowth phase, ES; early stationary growth phase; and S, stationary growth phase.doi:10.1371/journal.pone.0006114.g002
Adaptation of GBS to AF
PLoS ONE | www.plosone.org 3 July 2009 | Volume 4 | Issue 7 | e6114

medium. GBS grew rapidly in this medium, with a generation time
of ,35 min in logarithmic phase (Fig. 1). The bacterial density
reached ,109 CFUs/ml in the stationary phase (Fig. 1). We next
analyzed the growth of strain NEM316 in human AF. AF has been
reported to have antimicrobial properties toward various species of
bacteria due to b-lysin and lysozyme activity, which depends on
divalent cations such as zinc and phosphate [14,15]. In multiple
studies reported in the literature 18–73% of AF samples exhibited
inhibitory properties towards various bacterial species. The
antimicrobial properties depend on gestation stage and ethnicity
[16,17,18,19,20]. Because individual specimens of AF can vary in
their antimicrobial properties even towards GBS [21], we first
tested the ability of the collected samples to support GBS growth.
Consistent with the majority of the data reported in the literature,
none of the AF specimens significantly inhibit the growth of strain
NEM316 (data not shown). To avoid the effects of sample-to-
sample variability, pooled AF was used in all subsequent
experiments. Growth of GBS in AF is comparable with growth
in THY with respect to cell density (,109 CFU/ml) and growth
rate in exponential phase (Fig. 1).
Expression microarray analysis: quantitative differencesduring growth and in response to AF
To characterize the transcriptome of GBS grown in AF, we
used an ex vivo expression microarray analysis strategy that we
previously employed to study transcription interactions of
streptococci with body fluids such as blood and saliva [7,8,9].
Strain NEM316 was grown in THY broth or pooled AF and
harvested at various time points (Fig. 1). After transcriptome data
acquisition, we assessed chip-to-chip data variability and quality
using principal component analysis (PCA) (Fig. 2). The PCA
analysis discriminated very well between the transcript data from
the chips representing the various growth phases studied (Fig. 2).
These results indicated that the transcriptome profile data from
triplicate experiments were highly reproducible and of sufficient
quality to permit robust statistical analysis and interpretation. The
data clearly show that the transcriptome of GBS strain NEM316 is
considerably remodelled in a growth-phase and growth medium-
specific fashion. During growth of GBS in either THY [5] or AF
(this work), we observed over 70% of all transcripts (table S1)
exhibiting differential expression during at least one experimental
growth phase what is a sign of great transcriptome plasticity in
response to environment changing over time. Interestingly the
biggest differences between expression in AF and THY are
observed during transition from logarithmic to stationary phase
(LL) (Fig. 3) and as many as 54% of all GBS transcripts present on
the array are differentially expressed.
We next used a scatter plot analysis (Fig. 4) to compare the
dynamics of transcript expression in ML, LL, and S phase between
strain NEM316 grown in AF and THY. In the ML phase,
transcript changes were rather modest, comparing with changes in
LL and S phases, with AF/THY ratios rarely exceeding 10-fold. In
the ML and LL phase transcripts are shifted toward THY, with a
smaller number of transcripts expressed better in AF. In the S
phase of growth, the general level of transcription is lower (note
shift of spots towards left bottom corner, Fig. 4) than in ML and
LL phase. However, the number of genes up regulated in AF is
higher than in other phases of growth.
For ease of analysis and description, we assigned the GBS genes
to functional categories based on their annotation and presumed
involvement in metabolic processes or cell maintenance functions
(Tables 1, 2, 3, 4, 5, 6 and Table S1). In general, the transcript
levels of most genes in each functional category were better
expressed during growth in THY. However, the transcripts of
genes belonging to several functional categories, including amino
acid, carbohydrate, and nucleotide metabolism were higher in AF
at one or more growth points (Fig. 5A).
Stress response to AFWe hypothesized that growth in amniotic fluid will trigger
expression of genes involved in adaptation and the stress response.
Although we observed changes in the transcript levels of multiple
genes involved in adaptation, protein secretion and trafficking, and
DNA repair, surprisingly, the transcripts were down regulated in
response to growth in AF (Table 1). The most striking examples are
genes encoding putative cold shock protein (gbs2053, 556 down
regulated in AF) or universal stress protein family (gbs1778, 276down regulated in AF). However, we also observed moderate up-
regulation of groEL and clpL transcripts. Thus, it appears that GBS
does not exhibit a classic stress response when grown in AF, but
rather readily adapts to this environment. We also did not observe
massive down regulation of protein synthesis as an effect of stress,
and interestingly, production of some ribosomal protein transcripts
in LL and S phase was higher in AF than in THY (Table S1).
Regulatory events during growth in AFThe lack of alternative sigma factors in GBS [10] means that a
successful regulatory response to environmental changes relies
mainly on differential transcription of genes encoding two
component systems (TCS) and stand-alone regulators. The GBS
genome has genes encoding multiple TCS systems that might be
involved in adaptation to various environments. As expected, we
observed differential expression of multiple TCS and putative
regulators of unknown function (Table 2). One of the regulators
Figure 3. Quantitative differences in gene expression betweenTHY and AF. Genes regarded as differentially expressed have an AF/THY transcript level ratio of 2 and above (better expressed in AF) or 0.5and below (better expressed in THY). Arrow up, number of genes betterexpressed in AF; arrow down, number of genes better expressed in THY.ML, mid-logarithmic growth phase, LL; late-logarithmic growth phase,ES; early stationary growth phase; and S, stationary growth phase.doi:10.1371/journal.pone.0006114.g003
Adaptation of GBS to AF
PLoS ONE | www.plosone.org 4 July 2009 | Volume 4 | Issue 7 | e6114
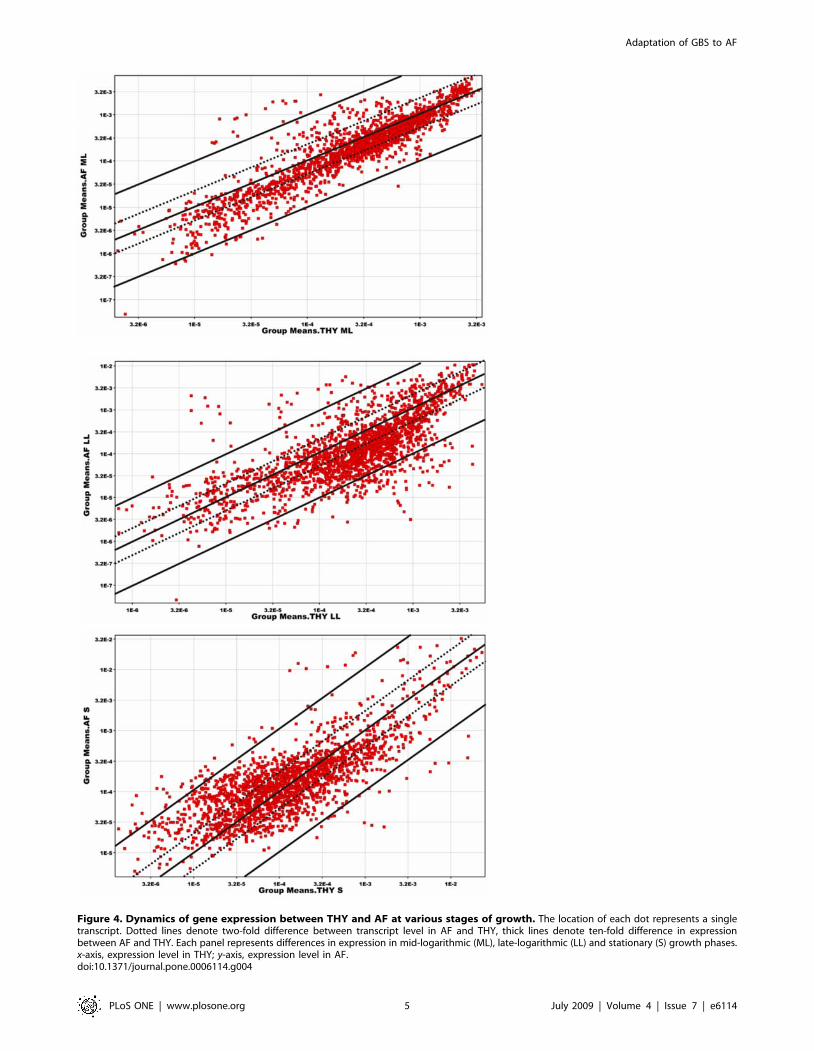
Figure 4. Dynamics of gene expression between THY and AF at various stages of growth. The location of each dot represents a singletranscript. Dotted lines denote two-fold difference between transcript level in AF and THY, thick lines denote ten-fold difference in expressionbetween AF and THY. Each panel represents differences in expression in mid-logarithmic (ML), late-logarithmic (LL) and stationary (S) growth phases.x-axis, expression level in THY; y-axis, expression level in AF.doi:10.1371/journal.pone.0006114.g004
Adaptation of GBS to AF
PLoS ONE | www.plosone.org 5 July 2009 | Volume 4 | Issue 7 | e6114

with the greatest degree of transcriptional change encodes carbon
starvation protein A (Table 2). This change, together with
observed alteration in transcripts of the genes encoding carbon
catabolite proteins A and B might contribute to the large number
of differential transcripts observed in genes encoding metabolic
proteins (see below). In addition, we observed lowered expression
of codY, a regulator involved predominantly in amino acid
metabolism and activated by branched chain amino acids [22].
In Streptococcus pneumoniae inactivation of codY gene is linked to
decreased expression of pcpA adhesin and lower adhesion to
human cells in vitro, suggesting possible mechanism linking
metabolic state of the bacterium and pathogenic properties [23].
Recent analysis of Streptococcus pyogenes adaptation to blood found
that a codY mutant strain strongly up-regulated expression of genes
encoding branched chain amino acids transporters [24], an
observation consistent with differential expression of branched
chain amino acid transporter genes we found in our experiment.
Among differentially regulated TCSs we noted changes in
expression of Gbs1671/1672 TCS, a homolog of the GAS
CovR/S that is a major negative regulator of virulence genes in
GBS and GAS [25,26]. We also observed differential expression of
Gbs1397/1398, a TCS with ,78% similarity to the GAS SptRS
system (Spy874/875) required for survival in saliva and an
important regulator of virulence and carbohydrate utilization GAS
[9,12]. These GBS genes may regulate genes affecting carbohy-
drate metabolism.
Table 1. Selected genes involved in stress response regulated in response to amniotic fluid.
Locus Name ML LL S Putative function
gbs0009 27.2 Heat shock protein 15
gbs0015 ftsH 29.0 24.5 Cell division protein ftsH (EC 3.4.24.-)
gbs0095 grpE 23.7 GrpE protein
gbs0097 dnaJ 26.3 chaperone protein
gbs0104 tig 25.3 Trigger factor, ppiase (EC 5.2.1.8)
gbs0109 radA 28.5 22.4 DNA repair protein RadA
gbs0222 - 3.2 23.1 DNA-damage-inducible protein J
gbs0284 - 22.3 Thioredoxin reductase (EC 1.8.1.9)
gbs0289 recU 214.7 22.8 Recombination protein recU
gbs0447 recX 26.3 Regulatory protein recX
gbs0502 25.0 ATP-dependent endopeptidase Lon (EC 3.4.21.53)
gbs0547 recN 22.4 DNA repair protein recN
gbs0786 recR 22.1 4.3 Recombination protein recR
gbs0838 nrdH 25.6 Glutaredoxin
gbs1202 - 22.4 General stress protein, Gls24 family
gbs1257 22.6 Endopeptidase, M10 family (EC 3.4.24.-)
gbs1376 clpL 23.3 5.2 ATP-dependent endopeptidase clp ATP-binding subunit clpL
gbs1383 clpX 23.9 ATP-dependent endopeptidase clp ATP-binding subunit clpX
gbs1423 trxB 22.6 Thioredoxin reductase (EC 1.8.1.9)
gbs1586 23.6 Peptidyl-prolyl cis-trans isomerase (EC 5.2.1.8)
gbs1674 - 2.4 2.9 Endopeptidase htpX (EC 3.4.24.-)
gbs1721 - 22.3 2.2 Universal stress protein family
gbs1738 - 22.1 22.4 General stress protein, Gls24 family
gbs1764 mutS2 22.8 DNA mismatch repair protein mutS
gbs1778 214.2 227.0 Universal stress protein family
gbs1865 hslO 28.0 33 kDa chaperonin
gbs2029 groEL 2.2 60 kDa chaperonin GROEL
gbs2048 cinA 2.3 competence/damage-inducible protein CinA
gbs2052 mutL 22.4 DNA mismatch repair protein mutL
gbs2053 csp 255.0 26.0 Cold shock protein
gbs2054 mutS 23.1 DNA mismatch repair protein mutS
gbs2113 - 24.8 Non-proteolytic protein, peptidase family M16
gbs2115 recF 24.9 DNA replication and repair protein recF
Values represent fold change in expression in amniotic fluid compared to expression in THY; ML, mid-logarithmic growth phase; LL, late-logarithmic growth phase; S,stationary growth phase; cut-off two fold change with P value less than 0.05. Positive values represent genes up-regulated in AF, negative values represent down-regulated (better expressed in THY) genes. Full list of changes is published as Table S1.doi:10.1371/journal.pone.0006114.t001
Adaptation of GBS to AF
PLoS ONE | www.plosone.org 6 July 2009 | Volume 4 | Issue 7 | e6114

Expression of virulence factorsCompared to other pathogenic streptococci such as GAS,
virulence factors of GBS are much less studied and therefore not
well understood. However, we observed differential expression of
multiple putative cell wall anchored proteins (Table 3) and proven
virulence factors. For example, the cyl operon, encoding a
hemolysin, required for survival in blood and under oxidative
stress [27,28] was up-regulated during growth in human AF. One
of the more striking observations was very high up-regulation of
the homolog of GAS SpyCEP (gbs2008). This extracellular
protease cleaves and inactivates human interleukin 8 and
contributes to virulence in GBS [29] and GAS [30,31]. In GAS,
SpyCEP is greatly up-regulated in strains causing invasive
infections compared to those recovered from patients with
superficial infections such as pharyngitis [31]. We also detected
an increased level of transcripts encoded by genes located in
putative pathogenicity island IX (gbs1061-gbs1076), function of
this element is unknown. Interestingly, transcripts of genes
Table 2. Selected regulators differentially expressed in response to AF.
Locus Name ML LL S Putative function
gbs0094 hrcA 22.2 Heat-inducible transcription repressor hrcA
gbs0105 rpoE 217.7 DNA-directed RNA polymerase delta chain (EC 2.7.7.6)
gbs0118 - 25.8 Ribose operon repressor
gbs0121 22.3 22.6 Two-component response regulator
gbs0135 mecA 27.9 Negative regulator of genetic competence mecA
gbs0156 rpoB 23.9 DNA-directed RNA polymerase beta chain (EC 2.7.7.6)
gbs0181 - 23.9 Autolysin response regulator
gbs0248 - 22.3 24.4 ECF-type sigma factor negative effector
gbs0249 - 23.4 217.4 RNA polymerase ECF-type sigma factor
gbs0299 24.4 Two-component response regulator
gbs0302 - 29.2 DNA-directed RNA polymerase omega chain (EC 2.7.7.6)
gbs0414 nusA 22.6 transcription elongation factor NusA
gbs0427 perR 22.9 Oxidative stress response regulator BosR
gbs0429 22.0 22.9 Two-component response regulator SaeR
gbs0546 argR1 24.0 22.6 Arginine repressor, argR
gbs0680 ccpA 24.4 catabolite control protein A
gbs0741 vicR 22.2 Two-component response regulator VicR
gbs0756 22.6 Stress-responsive transcriptional regulator PspC
gbs0804 23.5 Catabolite control protein B
gbs1050 - 4.4 4.2 13.3 Carbon starvation protein A
gbs1398 - 22.2 26.8 Two-component response regulator
gbs1496 rpoD 22.1 22.8 RNA polymerase sigma factor rpoD
gbs1530 rofA 25.3 transcriptional regulator
gbs1672 covR 22.3 Response regulator CsrR
gbs1719 codY 211.0 Transcription pleiotropic repressor codY
gbs1736 scrR 24.3 Sucrose operon repressor
gbs1835 22.6 23.1 Transcriptional regulatory protein
gbs1870 ctsR 24.7 Transcriptional regulator ctsR
gbs1882 - 22.4 Catabolite gene activator
gbs1909 dpiA 24.6 218.6 Transcriptional regulatory protein
gbs1934 - 22.7 220.4 213.4 Two-component response regulator yesN
gbs1944 fasA 2.0 Response regulator FasA
gbs1948 22.6 Alkaline phosphatase synthesis two-component response regulator phoP
gbs2055 argR2 24.0 Arginine repressor, argR
gbs2081 22.3 Transcriptional regulatory protein
gbs2087 23.8 26.9 210.8 Two-component response regulator
gbs2119 ahrC.2 28.3 23.3 Arginine repressor, argR
Values represent fold change in expression in amniotic fluid in comparison with expression in THY. Positive values represent genes up-regulated in AF, negative valuesrepresent down-regulated (better expressed in THY) genes. ML, mid-logarithmic growth phase; LL, late-logarithmic growth phase; S, stationary growth phase; cut-off:fold change above 2 and P value less than 0.05. Full list of changes is published as Table S1.doi:10.1371/journal.pone.0006114.t002
Adaptation of GBS to AF
PLoS ONE | www.plosone.org 7 July 2009 | Volume 4 | Issue 7 | e6114

Table 3. Selected genes involved in pathogenesis up- or down-regulated (better expressed in THY) in response to amniotic fluid.
Locus Name ML LL S Region Putative function
gbs0031 26.9 Surface antigen
gbs0393 23.5 24.2 23.2 Hypothetical protein
gbs0451 3.2 22.6 C5A peptidase precursor
gbs0470 alp2 22.3 22.8 Cell surface protein
gbs0631 2.9 Sortase
gbs0644 cylX 4.6 H Hypothetical protein
gbs0645 cylD 2.6 5.5 H Malonyl-CoA-transacylase
gbs0646 cylG 3.7 6.8 H 3-oxoacyl-reductase
gbs0647 acpC 3.9 4.3 H Acyl carrier protein
gbs0648 2.7 4.0 H (3R)-hydroxymyristoyl-dehydratase
gbs0649 cylA 2.8 4.2 H ATP-binding protein
gbs0650 cylB 3.6 2.5 H Permease
gbs0651 cylE 3.4 2.3 H Hypothetical protein
gbs0652 cylF 3.8 2.4 H Aminomethyltransferase
gbs0653 cylI 4.0 2.3 H 3-oxoacyl synthase
gbs0654 cylJ 3.9 2.2 H UDP glycosyltransferase
gbs0655 cylK 2.7 2.1 22.5 H Hypothetical protein
gbs0850 fbp 25.1 Hypothetical protein
gbs1061 4.1 I Hypothetical protein
gbs1062 3.8 I Hypothetical protein
gbs1064 2.3 I Hypothetical protein
gbs1065 2.6 I Hypothetical protein
gbs1066 3.5 I Hypothetical protein
gbs1067 3.2 I Hypothetical protein
gbs1068 3.2 I DNA segregation ATPase
gbs1069 5.7 I Hypothetical protein
gbs1070 5.1 3.9 5.7 I Hypothetical protein
gbs1071 4.8 3.8 I Hypothetical protein
gbs1072 4.7 4.5 I Hypothetical protein
gbs1073 4.1 3.3 I Phage infection protein
gbs1074 4.6 4.8 I Hypothetical protein
gbs1075 4.9 7.5 3.9 I Hypothetical protein
gbs1076 3.8 6.5 7.0 I Hypothetical protein
gbs1087 3.5 3.0 Hypothetical protein
gbs1104 22.1 Antigen
gbs1143 epf 23.0 25.4 Cell surface protein
gbs1144 22.3 22.2 C Cell surface protein
gbs1234 neuD 2.7 C Sialic acid biosynthesis protein NeuD
gbs1237.1 cpsL 22.2 C beta-D-Galp alpha-2,3-sialyltransferase
gbs1238 CpsIaJ 22.5 C beta-D-GlcNAc beta-1,4-galactosyltransferase
gbs1239 hasA 25.0 C beta-D-Galp beta-1,3-N-acetylglucosaminyltransferase
gbs1240 cpsI 22.5 24.9 C Secreted polysaccharide polymerase
gbs1241 cpsG 23.2 C beta-D-Glcp beta-1,4-galactosyltransferase
gbs1242 cpsF 23.2 C Beta-1,4-galactosyltransferase accessory protein
gbs1248 cpsY 22.2 22.5 C Transcriptional regulators, LysR family
gbs1307 lmb 28.5 Laminin-binding surface protein
gbs1356 8.1 Cell surface protein
gbs1403 8.1 5 -nucleotidase
gbs1420 22.8 Choline-binding protein
gbs1474 23.6 22.6 Hypothetical protein
Adaptation of GBS to AF
PLoS ONE | www.plosone.org 8 July 2009 | Volume 4 | Issue 7 | e6114

encoding multiple proteins implicated in adhesion to host
molecules such as fibronectin, collagen, and laminin were
significantly down-regulated during growth in AF. The C5a
peptidase gene transcript also was significantly lower in GBS
grown in AF, consistent with its involvement in fibronectin binding
[32]. Down-regulation of adhesins seems to be consistent with
increased virulence. For example, molecular epidemiological data
suggest a negative correlation between binding of fibronectin and
severity of GAS infection [33]. Over-expression of fibronectin
binding protein decreases the virulence of GAS lacking fibronectin
binding protein gene resulted in reduced virulence and lack of
fibronectin binding protein the surface promotes bacterial
dissemination [34].
Metabolism: Nutrient acquisition and energy productionGBS requires multiple exogenous compounds for growth,
especially amino acids (AA). AF is composed mostly of water,
urea, small amounts of amino acids, keratin from shed host
epithelial cells, and proteins [35,36,37]. Thus, AF is relatively poor
in nutrients, which means that bacteria with complex nutritional
requirements will not grow or grow poorly. Unexpectedly, strain
NEM316 grew very rapidly and to high cell density in AF (Fig. 1).
We discovered that genes encoding systems that facilitate transport
of amino acids and peptides were prominently up-regulated when
GBS was grown in AF (Figure 5AB). In particular, multiple
transport systems for branched-chain amino acids (isoleucine,
leucine, valine) were very highly up-regulated, on the order of up
to 5006more highly expressed during growth in THY (Table 4).
Recently Samen and co-workers [38] showed that growth of GBS
in AF depends on intact isoleucine and oligopeptide transport
systems. Because GBS is auxotrophic towards multiple amino
acids, presumably the up-regulation of amino acid transport
systems is a direct result of an effort to scavenge these molecules.
Oligopeptide transport systems in group A and B streptococci has
been also shown to be involved in pathogenic properties as
adhesion [38,39]. Recently, increasing number of reports links
ability to utilize nutrients and metabolic state of the bacterium
with its pathogenic properties [13,40]. Therefore, similar to
carbohydrates, amino acid and oligopeptide transport and
utilization processes might play a role in pathogenicity of GBS.
We also observed significant differential expression of genes in
the arginine deiminase pathway. Arginine fermentation can be
used for energy production by GAS, and likely GBS [41]. The
genome of GBS strain NEM316 has two putative sets of genes
involved in this metabolic pathway. However, it has not been
confirmed experimentally if both of them are indeed involved in
arginine deiminase pathway. Locus 1 (with high homology to
GAS) is up regulated in response to AF, locus 2 with lower
homology to GAS genes is down regulated in response to AF.
Arginine deiminase seems to have a profound effect on
streptococcal biology and virulence. We recently described
regulation of arginine deiminase by growth phase [5] in GBS,
and a similar phenomenon was also described recently for
Streptococcus gordonii [42]. Arginine deiminase also influences
expression of fimbriae in Porphyromonas gingivalis [43]. In GAS,
arginine utilization is under control of major regulators rgg [44]
and ccpA [13] and arginine deiminase is a potent inhibitor of
human T-cell proliferation [45]. Moreover, despite the fact that it
lacks export signal sequence, arginine deiminase is found on the
GAS cell surface [46] and is a protective antigen in mice [A.
Henningham, M.R Batzloff, J.C. Cole, C.M. Gillen, J. Hartas, K.
S. Sriprakash, M. J. Walker, poster nr. P54, 2008 Lancefield
International Symposium on Streptococci & Streptococcal Dis-
eases, Porto Heli, Greece].
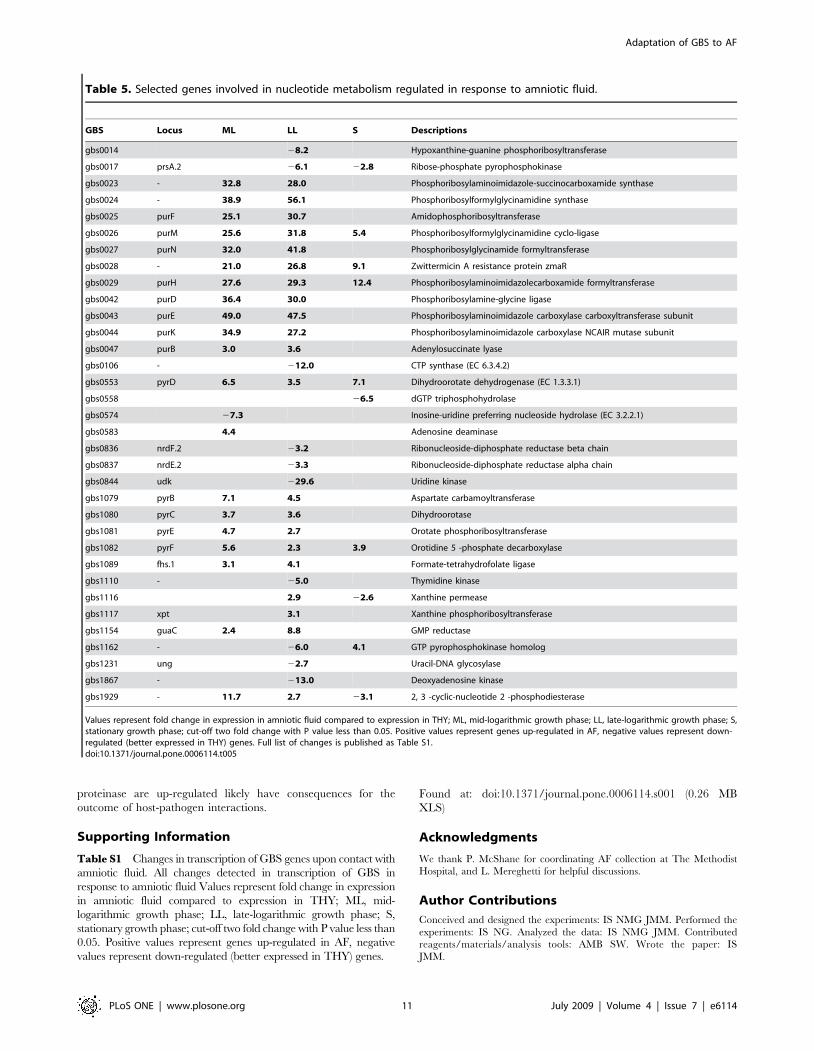
Additionally, arginine metabolism is linked to nucleotide
metabolism by carbamoyl phosphate. The carAB genes encoding
subunits of carbamoyl phosphate synthase are also differentially
regulated in GBS grown in AF. We observed significant up
regulation of gene transcripts for almost all enzymes involved in de
novo purine and pyrimidine synthesis and down regulation of
salvage pathways (Table 5). This was especially prominent in the
early stages of growth, suggesting that AF lacks sufficient free
nucleotides for rapid growth.
Carbohydrate metabolismAmong genes involved in carbohydrate utilization in GBS, large
portion is constituted by multiple transport systems (mostly PTS)
that allow uptake of various carbohydrate sources. We detected
differential expression of many genes involved in carbohydrate
transport and metabolism (Table 6) (Fig. 5B). Interestingly, GBS
Locus Name ML LL S Region Putative function
gbs1475 24.8 Sortase
gbs1477 210.1 Cell wall surface anchor family protein
gbs1478 22.7 25.1 Collagen adhesion protein
gbs1492 rgpBc 215.1 B alpha-L-Rha alpha-1,3-L-rhamnosyltransferase
gbs1493 rgpAc 217.3 B alpha-D-GlcNAc alpha-1,2-L-rhamnosyltransferase
gbs1494 rmlD 29.2 B dTDP-4-dehydrorhamnose reductase
gbs1539 25.2 23.7 Hypothetical protein
gbs1926 22.6 Laminin-binding surface protein
gbs1929 11.7 2.7 23.1 2, 3 -cyclic-nucleotide 2 -phosphodiesterase
gbs2000 cfa 3.2 CAMP factor
gbs2008 SpyCEP 35.8 194.8 Endopeptidase lactocepin
Values represent fold change in expression in amniotic fluid in comparison with expression in THY. ML, mid-logarithmic growth phase; LL, late-logarithmic growthphase; S, stationary growth phase. Cut-off: fold change above 2 and P value below 0.05; Classification of putative virulence genes in GBS (after Glaser, et al, 2002) H –hemolysin, I – pathogenicity island IX, C – capsule, B – group B antigen. Full list of changes is published as Table S1.doi:10.1371/journal.pone.0006114.t003
Table 3. cont.
Adaptation of GBS to AF
PLoS ONE | www.plosone.org 9 July 2009 | Volume 4 | Issue 7 | e6114

rather down-regulated genes responsible for the transport of
simple carbohydrates what suggests their low concentration in AF.
SummaryWe have discovered that GBS significantly remodels its
transcriptome in response to exposure to human amniotic fluid.
A large number of the affected genes are of unknown function,
which means that much remains to be learned about the full
influence of amniotic fluid on GBS. The majority of the observed
changes in transcripts affects genes involved in basic bacterial
metabolism and is connected to AF composition and nutritional
requirements of the bacterium. The observation that many genes
encoding adhesions are down-regulated, and genes encoding
known virulence factors such as a hemolysin and a potent IL-8
Table 4. Selected genes involved in peptide and amino acid metabolism and transport differentially expressed in response toamniotic fluid.
GBS Locus ML LL S Descriptions
Peptidases
gbs0287 pepC 3.0 4.9 5.9 Aminopeptidase C (EC 3.4.22.40)
gbs1021 pepN 23 Aminopeptidase N (EC 3.4.11.15)
gbs0779 pepF 2.5 4.3 Oligoendopeptidase F (EC 3.4.24.-)
gbs1459 pepT 22.0 23.7 Tripeptidase T (EC 3.4.11.4)
gbs1751 23.8 23.1 Xaa-Pro dipeptidase (EC 3.4.13.9)
gbs1781 pepXP 2.7 Xaa-Pro dipeptidyl-peptidase (EC 3.4.14.11)
Oligopeptide transport
gbs0144 oppA 2.4 2.6 3.5 Oligopeptide-binding system
gbs0145 oppB 6.1 Oligopeptide transport system
gbs0146 oppC 8.0 Oligopeptide transport system
gbs0147 oppD 2.2 9.0 4.1 Oligopeptide transport system
gbs0148 oppF 2.1 9.7 2.6 Oligopeptide transport system
gbs0966 oppA 23.2 Oligopeptide-binding protein oppA
gbs1513 22.5 Di- tripeptide transporter
Branched chains amino acids
gbs1627 16.3 319.3
gbs1628 14.5 502.1 ATP-binding protein livF
gbs1629 17.7 146.5 ATP-binding protein livG
gbs1630 16.9 227.8 permease protein livM
gbs1631 19.7 94.9 permease protein livH
gbs1632 8.6 92.9 binding protein
gbs1683 braB 5.77 Branched-chain amino acid transport
gbs2004 8.2
gbs2005 2.1 4.2
gbs2006 5.4 Branched-chain amino acid transport
gbs2007 2.7 5.2 6.8 Branched-chain amino acid transport
gbs1610 3.4 10.0 carrier protein
Arginine
gbs1077 carB 6.0 7.3 Carbamoyl-phosphate synthase large chain
gbs1078 carA 6.3 7.5 Carbamoyl-phosphate synthase small chain
gbs2122 arcA 2.7 2.1 Arginine deiminase (EC 3.5.3.6)
gbs2123 4.1 Acetyltransferase (EC 2.3.1.-)
gbs2124 arcB 5.3 Ornithine carbamoyltransferase (EC 2.1.3.3)
gbs2125 - 5.5 Arginine ornithine antiporter
gbs2126 arcC 22.1 3.6 Carbamate kinase (EC 2.7.2.2)
gbs2083 - 27.5 2140.4 231.7 Arginine ornithine antiporter
gbs2084 arcC 23.6 275.0 243.6 Carbamate kinase
gbs2085 arcB 22.3 228.8 219.7 Ornithine carbamoyltransferase
Values represent fold change in expression in amniotic fluid compared to expression in THY; ML, mid-logarithmic growth phase; LL, late-logarithmic growth phase; S,stationary growth phase; cut-off two fold change with P value less than 0.05. Positive values represent genes up-regulated in AF, negative values represent down-regulated (better expressed in THY) genes. Full list of changes is published as Table S1doi:10.1371/journal.pone.0006114.t004
Adaptation of GBS to AF
PLoS ONE | www.plosone.org 10 July 2009 | Volume 4 | Issue 7 | e6114
proteinase are up-regulated likely have consequences for the
outcome of host-pathogen interactions.
Supporting Information
Table S1 Changes in transcription of GBS genes upon contact with
amniotic fluid. All changes detected in transcription of GBS in
response to amniotic fluid Values represent fold change in expression
in amniotic fluid compared to expression in THY; ML, mid-
logarithmic growth phase; LL, late-logarithmic growth phase; S,
stationary growth phase; cut-off two fold change with P value less than
0.05. Positive values represent genes up-regulated in AF, negative
values represent down-regulated (better expressed in THY) genes.
Found at: doi:10.1371/journal.pone.0006114.s001 (0.26 MB
XLS)
Acknowledgments
We thank P. McShane for coordinating AF collection at The Methodist
Hospital, and L. Mereghetti for helpful discussions.
Author Contributions
Conceived and designed the experiments: IS NMG JMM. Performed the
experiments: IS NG. Analyzed the data: IS NMG JMM. Contributed
reagents/materials/analysis tools: AMB SW. Wrote the paper: IS
JMM.
Table 5. Selected genes involved in nucleotide metabolism regulated in response to amniotic fluid.
GBS Locus ML LL S Descriptions
gbs0014 28.2 Hypoxanthine-guanine phosphoribosyltransferase
gbs0017 prsA.2 26.1 22.8 Ribose-phosphate pyrophosphokinase
gbs0023 - 32.8 28.0 Phosphoribosylaminoimidazole-succinocarboxamide synthase
gbs0024 - 38.9 56.1 Phosphoribosylformylglycinamidine synthase
gbs0025 purF 25.1 30.7 Amidophosphoribosyltransferase
gbs0026 purM 25.6 31.8 5.4 Phosphoribosylformylglycinamidine cyclo-ligase
gbs0027 purN 32.0 41.8 Phosphoribosylglycinamide formyltransferase
gbs0028 - 21.0 26.8 9.1 Zwittermicin A resistance protein zmaR
gbs0029 purH 27.6 29.3 12.4 Phosphoribosylaminoimidazolecarboxamide formyltransferase
gbs0042 purD 36.4 30.0 Phosphoribosylamine-glycine ligase
gbs0043 purE 49.0 47.5 Phosphoribosylaminoimidazole carboxylase carboxyltransferase subunit
gbs0044 purK 34.9 27.2 Phosphoribosylaminoimidazole carboxylase NCAIR mutase subunit
gbs0047 purB 3.0 3.6 Adenylosuccinate lyase
gbs0106 - 212.0 CTP synthase (EC 6.3.4.2)
gbs0553 pyrD 6.5 3.5 7.1 Dihydroorotate dehydrogenase (EC 1.3.3.1)
gbs0558 26.5 dGTP triphosphohydrolase
gbs0574 27.3 Inosine-uridine preferring nucleoside hydrolase (EC 3.2.2.1)
gbs0583 4.4 Adenosine deaminase
gbs0836 nrdF.2 23.2 Ribonucleoside-diphosphate reductase beta chain
gbs0837 nrdE.2 23.3 Ribonucleoside-diphosphate reductase alpha chain
gbs0844 udk 229.6 Uridine kinase
gbs1079 pyrB 7.1 4.5 Aspartate carbamoyltransferase
gbs1080 pyrC 3.7 3.6 Dihydroorotase
gbs1081 pyrE 4.7 2.7 Orotate phosphoribosyltransferase
gbs1082 pyrF 5.6 2.3 3.9 Orotidine 5 -phosphate decarboxylase
gbs1089 fhs.1 3.1 4.1 Formate-tetrahydrofolate ligase
gbs1110 - 25.0 Thymidine kinase
gbs1116 2.9 22.6 Xanthine permease
gbs1117 xpt 3.1 Xanthine phosphoribosyltransferase
gbs1154 guaC 2.4 8.8 GMP reductase
gbs1162 - 26.0 4.1 GTP pyrophosphokinase homolog
gbs1231 ung 22.7 Uracil-DNA glycosylase
gbs1867 - 213.0 Deoxyadenosine kinase
gbs1929 - 11.7 2.7 23.1 2, 3 -cyclic-nucleotide 2 -phosphodiesterase
Values represent fold change in expression in amniotic fluid compared to expression in THY; ML, mid-logarithmic growth phase; LL, late-logarithmic growth phase; S,stationary growth phase; cut-off two fold change with P value less than 0.05. Positive values represent genes up-regulated in AF, negative values represent down-regulated (better expressed in THY) genes. Full list of changes is published as Table S1.doi:10.1371/journal.pone.0006114.t005
Adaptation of GBS to AF
PLoS ONE | www.plosone.org 11 July 2009 | Volume 4 | Issue 7 | e6114

Table 6. Selected genes involved in carbohydrate metabolism and transport differentially expressed in response to amniotic fluid.
Locus Name ML LL S Putative function
gbs0113 22.5 9.5 D-ribose-binding protein
gbs0114 22.3 2.1 9.7 Ribose transport system permease protein rbsC
gbs0115 2.7 5.7 Ribose transport ATP-binding protein rbsA
gbs0116 2.4 6.2 D-ribose mutarotase
gbs0117 2.5 3.0 Ribokinase
gbs0316 - 23.4 10.8 PTS system, cellobiose-specific IIA component
gbs0317 - 23.1 5.5 18.2 PTS system, cellobiose-specific IIB component
gbs0318 4.3 PTS system, cellobiose-specific IIC component
gbs0346 manN 2.2 2.7 4.2 PTS system, mannose-specific IID component
gbs0347 manM 3.0 PTS system, mannose-specific IIC component
gbs0348 manL 2.1 2.0 2.2 PTS system, mannose-specific IIAB component
gbs0872 glgC 2.1 Glucose-1-phosphate adenylyltransferase catalytic subunit
gbs0873 - 2.5 Glucose-1-phosphate adenylyltransferase regulatory subunit
gbs1329 lacG 217.1 2.3 6-phospho-beta-galactosidase
gbs1330 lacE 28.1 PTS system, lactose-specific IIBC component
gbs1331 lacF 211.7 PTS system, lactose-specific IIA component
gbs1333 lacD.2 212.7 Tagatose-bisphosphate aldolase
gbs1334 lacC.2 22.8 218.7 Tagatose-6-phosphate kinase
gbs1335 lacB.1 22.2 210.2 3.9 Galactose-6-phosphate isomerase lacB subunit
gbs1336 lacA.2 22.1 211.2 3.1 Galactose-6-phosphate isomerase lacA subunit
gbs1507 glgP 22.4 5.1 Maltodextrin phosphorylase
gbs1508 malM 22.9 5.9 4-alpha-glucanotransferase
gbs1510 malE 3.8 Maltose maltodextrin-binding protein
gbs1511 malF 4.6 Maltodextrin transport system permease protein malC
gbs1512 malG 3.5 Maltose transport system permease protein malG
gbs1692 22.7 Dihydroxyacetone kinase
gbs1694 22.5 5.1 5.9 Dihydroxyacetone kinase
gbs1695 3.9 8.4 Dihydroxyacetone kinase
gbs1696 2.6 14.5 Dihydroxyacetone kinase phosphotransfer protein
gbs1697 22.4 2.5 11.8 Glycerol uptake facilitator protein
gbs1714 3.9 Pyruvate,phosphate dikinase
gbs1732 pmi 23.2 Mannose-6-phosphate isomerase
gbs1733 scrK 26.9 Fructokinase
gbs1734 scrA 222.3 2.6 PTS system, sucrose-specific IIABC component
gbs1735 scrB 25.2 Sucrose-6-phosphate hydrolase
gbs1777 glpF.2 2.2 3.8 Glycerol uptake facilitator protein
gbs1797 22.3 Galactose-1-phosphate uridylyltransferase
gbs1811 plr 2.1 2.5 Glyceraldehyde 3-phosphate dehydrogenase
gbs1850 - 22.5 29.9 Transaldolase
gbs1893 - 211.6 26.5 2-dehydro-3-deoxygluconokinase
gbs1911 dexB 2.9 Glucan 1,6-alpha-glucosidase
gbs1912 2.9 Multiple sugar transport ATP-binding protein msmK
gbs1914 - 27.3 2169.1 Aldose 1-epimerase family protein
gbs1915 - 23.3 261.2 22.5 Tagatose-bisphosphate aldolase
gbs1916 - 23.1 292.2 Tagatose-6-phosphate kinase
gbs1917 - 23.1 267.0 Galactose-6-phosphate isomerase lacB subunit
gbs1918 lacA.1 24.2 2296.9 Galactose-6-phosphate isomerase lacA subunit
gbs1919 214.8 Sialidase A precursor
gbs1920 210.5 PTS system, galactose-specific IIC component
gbs1921 - 22.3 214.4 PTS system, galactose-specific IIB component
Adaptation of GBS to AF
PLoS ONE | www.plosone.org 12 July 2009 | Volume 4 | Issue 7 | e6114

Locus Name ML LL S Putative function
gbs1922 - 23.6 219.2 PTS system, galactose-specific IIA component
gbs1923 lacR.1 22.7 23.4 Lactose phosphotransferase system repressor
gbs1936 ptsD 236.4 210.1 PTS system, mannose fructose family IID component
gbs1937 ptsC 245.8 231.4 PTS system, mannose fructose family IIC component
gbs1938 ptsB 237.6 28.8 PTS system, mannose fructose family IIB component
gbs1939 - 211.1 234.6 242.6 PTS system, mannose fructose family IIA component
gbs1946 5.8 4.6 PTS system, glucose-specific IIABC component
gbs2116 - 23.2 2.3 Glucose uptake family protein
Values represent fold change in expression in amniotic fluid compared to expression in THY; ML, mid-logarithmic growth phase; LL, late-logarithmic growth phase; S,stationary growth phase; cut-off two fold change with P value less than 0.05. Positive values represent genes up-regulated in AF, negative values represent down-regulated (better expressed in THY) genes. Full list of changes is published as Table S1doi:10.1371/journal.pone.0006114.t006
Table 6. cont.
Adaptation of GBS to AF
PLoS ONE | www.plosone.org 13 July 2009 | Volume 4 | Issue 7 | e6114

Figure 5. Functional dynamics of transcriptional changes between gene expression in THY and AF. A. Bar graphs present the number ofgenes better expressed in THY or AF in three of the most prominently changed metabolic categories. B. Major metabolic trends in nutrientacquisition. Red symbolizes genes better expressed in AF, green better expressed in THY.doi:10.1371/journal.pone.0006114.g005
Adaptation of GBS to AF
PLoS ONE | www.plosone.org 14 July 2009 | Volume 4 | Issue 7 | e6114

References
1. Shet A, Ferrieri P (2004) Neonatal & maternal group B streptococcal infections:
a comprehensive review. Indian J Med Res 120: 141–150.
2. Phares CR, Lynfield R, Farley MM, Mohle-Boetani J, Harrison LH, et al. (2008)
Epidemiology of invasive group B streptococcal disease in the United States,1999-2005. JAMA 299: 2056–2065.
3. Farley MM, Harvey RC, Stull T, Smith JD, Schuchat A, et al. (1993) A
population-based assessment of invasive disease due to group B Streptococcus innonpregnant adults. N Engl J Med 328: 1807–1811.
4. Schuchat A, Wenger JD (1994) Epidemiology of group B streptococcal disease.Risk factors, prevention strategies, and vaccine development. Epidemiol Rev 16:
374–402.
5. Sitkiewicz I, Musser JM (2009) Analysis of growth-phase regulated genes in
Streptococcus agalactiae by global transcript profiling. BMC Microbiology 9: 32.
6. Mereghetti L, Sitkiewicz I, Green NM, Musser JM (2008) Remodeling of theStreptococcus agalactiae transcriptome in response to growth temperature. PLoS
ONE 3: e2785.
7. Mereghetti L, Sitkiewicz I, Green NM, Musser JM (2008) Extensive adaptive
changes occur in the transcriptome of Streptococcus agalactiae (group B Streptococcus)in response to incubation with human blood. Plos ONE 3(9): e3143.
8. Graham MR, Virtaneva K, Porcella SF, Barry WT, Gowen BB, et al. (2005)
Group A Streptococcus transcriptome dynamics during growth in human bloodreveals bacterial adaptive and survival strategies. Am J Pathol 166: 455–465.
9. Shelburne SA 3rd, Sumby P, Sitkiewicz I, Granville C, DeLeo FR, et al. (2005)Central role of a bacterial two-component gene regulatory system of previously
unknown function in pathogen persistence in human saliva. Proc Natl Acad
Sci U S A 102: 16037–16042.
10. Glaser P, Rusniok C, Buchrieser C, Chevalier F, Frangeul L, et al. (2002)
Genome sequence of Streptococcus agalactiae, a pathogen causing invasive neonataldisease. Mol Microbiol 45: 1499–1513.
11. Chomczynski P, Sacchi N (1987) Single-step method of RNA isolation by acidguanidinium thiocyanate-phenol-chloroform extraction. Anal Biochem 162:
156–159.
12. Sitkiewicz I, Musser JM (2006) Expression microarray and mouse virulenceanalysis of four conserved two-component gene regulatory systems in group a
Streptococcus. Infect Immun 74: 1339–1351.
13. Shelburne SA 3rd, Keith D, Horstmann N, Sumby P, Davenport MT, et al.
(2008) A direct link between carbohydrate utilization and virulence in the majorhuman pathogen group A Streptococcus. Proc Natl Acad Sci U S A 105:
1698–1703.
14. Scane TM, Hawkins DF (1984) Antibacterial activity in human amniotic fluid:relationship to zinc and phosphate. Br J Obstet Gynaecol 91: 342–348.
15. Scane TM, Hawkins DF (1986) Antibacterial activity in human amniotic fluid:dependence on divalent cations. Br J Obstet Gynaecol 93: 577–581.
16. Larsen B, Hurry DJ, Miro RE, Charles D (1983) Antibacterial activity in
amniotic fluid from west virginia women. Gynecol Obstet Invest 15: 26–32.
17. Mathai M, Jairaj P, Thangavelu CP, Mathai E, Balasubramaniam N (1984)
Antimicrobial activity of amniotic fluid in South Indian women. Br J ObstetGynaecol 91: 560–564.
18. Nazir MA, Pankuch GA, Botti JJ, Appelbaum PC (1987) Antibacterial activity ofamniotic fluid in the early third trimester. Its association with preterm labor and
delivery. Am J Perinatol 4: 59–62.
19. Hagio Y (1985) [Antibacterial activity of amniotic fluid and lysozyme]. NipponSanka Fujinka Gakkai Zasshi 37: 2369–2375.
20. Appelbaum PC, Holloway Y, Ross SM, Dhupelia I (1977) The effect of amnioticfluid on bacterial growth in three population groups. Am J Obstet Gynecol 128:
868–871.
21. Evans HE, Levy E, Glass L (1977) Effect of amniotic fluid on bacterial growth.
Obstet Gynecol 49: 35–37.
22. Malke H, Steiner K, McShan WM, Ferretti JJ (2006) Linking the nutritionalstatus of Streptococcus pyogenes to alteration of transcriptional gene expression: the
action of CodY and RelA. Int J Med Microbiol 296: 259–275.
23. Hendriksen WT, Bootsma HJ, Estevao S, Hoogenboezem T, de Jong A, et al.
(2008) CodY of Streptococcus pneumoniae: link between nutritional gene regulationand colonization. J Bacteriol 190: 590–601.
24. Malke H, Ferretti JJ (2007) CodY-affected transcriptional gene expression of
Streptococcus pyogenes during growth in human blood. J Med Microbiol 56:707–714.
25. Lamy MC, Zouine M, Fert J, Vergassola M, Couve E, et al. (2004) CovS/CovR of
group B Streptococcus: a two-component global regulatory system involved invirulence. Mol Microbiol 54: 1250–1268.
26. Graham MR, Smoot LM, Migliaccio CA, Virtaneva K, Sturdevant DE, et al.(2002) Virulence control in group A Streptococcus by a two-component gene
regulatory system: global expression profiling and in vivo infection modeling.
Proc Natl Acad Sci U S A 99: 13855–13860.27. Liu GY, Doran KS, Lawrence T, Turkson N, Puliti M, et al. (2004) Sword and
shield: linked group B streptococcal beta-hemolysin/cytolysin and carotenoidpigment function to subvert host phagocyte defense. Proc Natl Acad Sci U S A
101: 14491–14496.
28. Nizet V (2002) Streptococcal beta-hemolysins: genetics and role in diseasepathogenesis. Trends Microbiol 10: 575–580.
29. Harris TO, Shelver DW, Bohnsack JF, Rubens CE (2003) A novel streptococcalsurface protease promotes virulence, resistance to opsonophagocytosis, and
cleavage of human fibrinogen. J Clin Invest 111: 61–70.30. Sumby P, Zhang S, Whitney AR, Falugi F, Grandi G, et al. (2008) A chemokine-
degrading extracellular protease made by group A Streptococcus alters pathogen-
esis by enhancing evasion of the innate immune response. Infect Immun 76:978–985.
31. Edwards RJ, Taylor GW, Ferguson M, Murray S, Rendell N, et al. (2005)Specific C-terminal cleavage and inactivation of interleukin-8 by invasive disease
isolates of Streptococcus pyogenes. J Infect Dis 192: 783–790.
32. Beckmann C, Waggoner JD, Harris TO, Tamura GS, Rubens CE (2002)Identification of novel adhesins from Group B streptococci by use of phage
display reveals that C5a peptidase mediates fibronectin binding. Infect Immun70: 2869–2876.
33. Natanson S, Sela S, Moses AE, Musser JM, Caparon MG, et al. (1995)Distribution of fibronectin-binding proteins among group A streptococci of
different M types. J Infect Dis 171: 871–878.
34. Nyberg P, Sakai T, Cho KH, Caparon MG, Fassler R, et al. (2004) Interactionswith fibronectin attenuate the virulence of Streptococcus pyogenes. EMBO J 23:
2166–2174.35. van Scheltema PN, In’t Anker PS, Vereecken A, Vandenbussche FP, Deprest JA,
et al. (2008) Biochemical composition of fluids for amnioinfusion during
fetoscopy. Gynecol Obstet Invest 66: 227–230.36. Mesavage WC, Suchy SF, Weiner DL, Nance CS, Flannery DB, et al. (1985)
Amino acids in amniotic fluid in the second trimester of gestation. Pediatr Res19: 1021–1024.
37. Cho CK, Shan SJ, Winsor EJ, Diamandis EP (2007) Proteomics analysis ofhuman amniotic fluid. Mol Cell Proteomics 6: 1406–1415.
38. Samen U, Gottschalk B, Eikmanns BJ, Reinscheid DJ (2004) Relevance of
peptide uptake systems to the physiology and virulence of Streptococcus agalactiae.J Bacteriol 186: 1398–1408.
39. Darmstadt GL, Mentele L, Podbielski A, Rubens CE (2000) Role of group Astreptococcal virulence factors in adherence to keratinocytes. Infect Immun 68:
1215–1221.
40. Loughman JA, Caparon MG (2006) A novel adaptation of aldolase regulatesvirulence in Streptococcus pyogenes. EMBO J 25: 5414–5422.
41. Pine L, Reeves MW (1972) Correlation of M protein production with thosefactors found to influence growth and substrate utilization of Streptococcus pyogenes.
Infect Immun 5: 668–680.42. Liu Y, Dong Y, Chen YY, Burne RA (2008) Environmental and growth phase
regulation of the arginine deiminase genes of Streptococcus gordonii. Appl Environ
Microbiol 74(16): 5023–30.43. Lin X, Lamont RJ, Wu J, Xie H (2008) Role of differential expression of
streptococcal arginine deiminase in inhibition of fimA expression in Porphyr-
omonas gingivalis. J Bacteriol 190: 4367–4371.
44. Chaussee MS, Somerville GA, Reitzer L, Musser JM (2003) Rgg coordinates
virulence factor synthesis and metabolism in Streptococcus pyogenes. J Bacteriol 185:6016–6024.
45. Degnan BA, Palmer JM, Robson T, Jones CE, Fischer M, et al. (1998) Inhibitionof human peripheral blood mononuclear cell proliferation by Streptococcus pyogenes
cell extract is associated with arginine deiminase activity. Infect Immun 66:
3050–3058.46. Lei B, Mackie S, Lukomski S, Musser JM (2000) Identification and
immunogenicity of group A Streptococcus culture supernatant proteins. InfectImmun 68: 6807–6818.
Adaptation of GBS to AF
PLoS ONE | www.plosone.org 15 July 2009 | Volume 4 | Issue 7 | e6114