Transcriptome profiles of Quercus rubra responding to ...
18
RESEARCH ARTICLE Open Access Transcriptome profiles of Quercus rubra responding to increased O 3 stress Nourolah Soltani 1 , Teo Best 2 , Dantria Grace 3 , Christen Nelms 3 , Ketia Shumaker 3 , Jeanne Romero-Severson 4 , Daniela Moses 5 , Stephan Schuster 5 , Margaret Staton 1* , John Carlson 2* and Kimberly Gwinn 1* Abstract Background: Climate plays an essential role in forest health, and climate change may increase forest productivity losses due to abiotic and biotic stress. Increased temperature leads to the increased formation of ozone (O 3 ). Ozone is formed by the interaction of sunlight, molecular oxygen and by the reactions of chemicals commonly found in industrial and automobile emissions such as nitrogen oxides and volatile organic compounds. Although it is well known that productivity of Northern red oak (Quercus rubra) (NRO), an ecologically and economically important species in the forests of eastern North America, is reduced by exposure to O 3 , limited information is available on its responses to exogenous stimuli at the level of gene expression. Results: RNA sequencing yielded more than 323 million high-quality raw sequence reads. De novo assembly generated 52,662 unigenes, of which more than 42,000 sequences could be annotated through homology-based searches. A total of 4140 differential expressed genes (DEGs) were detected in response to O 3 stress, as compared to their respective controls. Gene Ontology (GO) and Kyoto Encyclopedia of Genes and Genomes (KEGG) enrichment analyses of the O 3 -response DEGs revealed perturbation of several biological pathways including energy, lipid, amino acid, carbohydrate and terpenoid metabolism as well as plant-pathogen interaction. Conclusion: This study provides the first reference transcriptome for NRO and initial insights into the genomic responses of NRO to O 3 . Gene expression profiling reveals altered primary and secondary metabolism of NRO seedlings, including known defense responses such as terpenoid biosynthesis. Keywords: Northern red oak, Transcriptome, Plant-pathogen interactions, Terpenoid, Mevalonic acid, Methylerythritol phosphate Background Northern red oak (Quercus rubra L.) (NRO), a mono- coecious species belonging to Fagaceae family, is an ecologically and economically important forest tree in North America. It is a valuable source of hardwood lum- ber, often used for flooring, veneer and furniture for higher grade timber and for firewood for the lower grades [1, 2]. This hardwood species has a wide range of habitat from northern Ontario to southern Alabama and the Atlantic coast to Nebraska [3, 4]. NRO is the domi- nant tree species in many of the forest types across its native range, and NRO mast provides food for many na- tive wildlife species [5–7]. NRO has a number of features that make it a good model for studies of population gen- etics, speciation and gene flow, including co-habitation and hybridization with several close congeners, an outcrossing mating system, and a wide geographical range [8–12]. NRO is impacted by oak population decline, a disease complex caused by a combination of biotic and abiotic stresses, originally described in the 1970’s in oak- dominated southeastern forests [13]. In 1999, oak de- cline had severely affected about 400,000 acres of forests throughout Arkansas, Missouri, and Oklahoma [14]. From 2003 to 2010, NRO decline due to relative crown dieback was estimated at 18% in southeastern forests [15]. One of the key abiotic stressors implicated in oak decline is ozone (O 3 ), a compound that is formed by the © The Author(s). 2020 Open Access This article is distributed under the terms of the Creative Commons Attribution 4.0 International License (http://creativecommons.org/licenses/by/4.0/), which permits unrestricted use, distribution, and reproduction in any medium, provided you give appropriate credit to the original author(s) and the source, provide a link to the Creative Commons license, and indicate if changes were made. The Creative Commons Public Domain Dedication waiver (http://creativecommons.org/publicdomain/zero/1.0/) applies to the data made available in this article, unless otherwise stated. * Correspondence: [email protected]; [email protected]; [email protected] 1 The Department of Entomology and Plant Pathology, University of Tennessee, Knoxville, TN 37996, USA 2 The Department of Ecosystem Science and Management, Pennsylvania State University, University Park, PA 16802, USA Full list of author information is available at the end of the article Soltani et al. BMC Genomics (2020) 21:160 https://doi.org/10.1186/s12864-020-6549-5
-
Upload
khangminh22 -
Category
Documents
-
view
4 -
download
0
Transcript of Transcriptome profiles of Quercus rubra responding to ...

RESEARCH ARTICLE Open Access
Transcriptome profiles of Quercus rubraresponding to increased O3 stressNourolah Soltani1, Teo Best2, Dantria Grace3, Christen Nelms3, Ketia Shumaker3, Jeanne Romero-Severson4,Daniela Moses5, Stephan Schuster5, Margaret Staton1* , John Carlson2* and Kimberly Gwinn1*
Abstract
Background: Climate plays an essential role in forest health, and climate change may increase forest productivitylosses due to abiotic and biotic stress. Increased temperature leads to the increased formation of ozone (O3). Ozoneis formed by the interaction of sunlight, molecular oxygen and by the reactions of chemicals commonly found inindustrial and automobile emissions such as nitrogen oxides and volatile organic compounds.Although it is well known that productivity of Northern red oak (Quercus rubra) (NRO), an ecologically andeconomically important species in the forests of eastern North America, is reduced by exposure to O3, limitedinformation is available on its responses to exogenous stimuli at the level of gene expression.
Results: RNA sequencing yielded more than 323 million high-quality raw sequence reads. De novo assemblygenerated 52,662 unigenes, of which more than 42,000 sequences could be annotated through homology-basedsearches. A total of 4140 differential expressed genes (DEGs) were detected in response to O3 stress, as comparedto their respective controls. Gene Ontology (GO) and Kyoto Encyclopedia of Genes and Genomes (KEGG)enrichment analyses of the O3-response DEGs revealed perturbation of several biological pathways includingenergy, lipid, amino acid, carbohydrate and terpenoid metabolism as well as plant-pathogen interaction.
Conclusion: This study provides the first reference transcriptome for NRO and initial insights into the genomicresponses of NRO to O3. Gene expression profiling reveals altered primary and secondary metabolism of NROseedlings, including known defense responses such as terpenoid biosynthesis.
Keywords: Northern red oak, Transcriptome, Plant-pathogen interactions, Terpenoid, Mevalonic acid,Methylerythritol phosphate
BackgroundNorthern red oak (Quercus rubra L.) (NRO), a mono-coecious species belonging to Fagaceae family, is anecologically and economically important forest tree inNorth America. It is a valuable source of hardwood lum-ber, often used for flooring, veneer and furniture forhigher grade timber and for firewood for the lowergrades [1, 2]. This hardwood species has a wide range ofhabitat from northern Ontario to southern Alabama andthe Atlantic coast to Nebraska [3, 4]. NRO is the domi-nant tree species in many of the forest types across its
native range, and NRO mast provides food for many na-tive wildlife species [5–7]. NRO has a number of featuresthat make it a good model for studies of population gen-etics, speciation and gene flow, including co-habitationand hybridization with several close congeners, anoutcrossing mating system, and a wide geographicalrange [8–12].NRO is impacted by oak population decline, a disease
complex caused by a combination of biotic and abioticstresses, originally described in the 1970’s in oak-dominated southeastern forests [13]. In 1999, oak de-cline had severely affected about 400,000 acres of foreststhroughout Arkansas, Missouri, and Oklahoma [14].From 2003 to 2010, NRO decline due to relative crowndieback was estimated at 18% in southeastern forests[15]. One of the key abiotic stressors implicated in oakdecline is ozone (O3), a compound that is formed by the
© The Author(s). 2020 Open Access This article is distributed under the terms of the Creative Commons Attribution 4.0International License (http://creativecommons.org/licenses/by/4.0/), which permits unrestricted use, distribution, andreproduction in any medium, provided you give appropriate credit to the original author(s) and the source, provide a link tothe Creative Commons license, and indicate if changes were made. The Creative Commons Public Domain Dedication waiver(http://creativecommons.org/publicdomain/zero/1.0/) applies to the data made available in this article, unless otherwise stated.
* Correspondence: [email protected]; [email protected]; [email protected] Department of Entomology and Plant Pathology, University ofTennessee, Knoxville, TN 37996, USA2The Department of Ecosystem Science and Management, PennsylvaniaState University, University Park, PA 16802, USAFull list of author information is available at the end of the article
Soltani et al. BMC Genomics (2020) 21:160 https://doi.org/10.1186/s12864-020-6549-5

interaction of sunlight and molecular oxygen and by theinteractions of chemicals commonly found in industrialand automobile emissions such as nitrogen oxides andvolatile organic compounds. Tree physiology is alteredin the presence of O3 as evidenced by elevated wateruse, increased respiration and transpiration, and modi-fied carbon allocation, resulting in decreased tree vegeta-tive growth and life span [16–20]. Forest productivityloss by exposure to O3 in the eastern USA has been esti-mated between 1 and 10% [21]. Ozone stress can furtherdamage NRO indirectly from an increase in disease andinsect susceptibility in O3–exposed plants [22–24]. Sev-eral insect pests are also considered to limit growth andsurvival of NRO, including red oak borer Enaphalodesrufulus, Asiatic oak weevil Cyrtepistomus castaneus, car-penter worm Prionoxystus robiniae, oak timber wormArrhenodes minutus, and pole borer Parandra brunnea[25–27]. Primary damage from these insects also in-creases tree susceptibility to secondary pests [17, 18, 28].Due to both the ecological concerns and economic im-
pact from declining forest health, there is a critical needto develop genomic resources and molecular tools thatenhance tree improvement and management programs[29]. A number of transcriptome studies on oak specieshave been leveraged to characterize tree response to bio-logical and environmental stress. The most well studiedstress in oak is water stress, with transcriptome studiesfrom seedlings of Q. lobata, Q. suber, and Q. robur thathave highlighted alteration of several biological functionsincluding metabolic pathways; energy, lipid, and carbo-hydrate metabolisms; secondary metabolic, amino acidmetabolic, and catabolic processes; sugar transport;photosynthesis; transcription factors; signal transduction;chaperone activity; and pathogenesis-related protein pro-ductions [30–32]. Other stress studies from mature oaktrees included heat, cold, salinity, oxidative stress, nema-tode interaction, and fungal pathogenesis that have de-tected a similarly wide range of differentially expressedprimary and secondary pathways [31–38].Despite the importance of O3 in oak decline, there is
no information on transcriptome changes in response toozone. To fill this gap in knowledge, a transcriptomestudy was designed to assess gene expression differencesin NRO induced by ozone exposure. In the forests ofPennsylvania, hourly ambient concentrations of O3 typ-ically range between 30 and 80 ppb [39], with occasionaloccurrences greater than 100 ppb [40]. Four ozone levelswere selected for testing. Less than 10 ppb of ozone(little or no ozone after carbon filtration of ambient air)was used as a control, with 80 ppb and 125 ppb as treat-ments to mimic observed ambient levels. These levelsalso relate to the U.S. Environmental ProtectionAgency’s National Ambient Air Quality Standards(NAAQS) for ground-level ozone limits for public health
and welfare, which have decreased from 1-h maximumdetected levels up to 120 ppb before 1997, to 80 ppb be-tween 1997 and 2015, and to 70 ppb since 2015 (EPA,2015). A high stress treatment level of 225 ppb was se-lected as an extreme condition. This is higher than mostin situ observations, but close to the 300 ppb level thathas often been used in previous reports on ozone-stressstudies to produce a strong, reproducible physiologicalresponse in model plants [41–43]. By investigating O3
stress involved in oak decline, unique molecular-levelstress responses by NRO can be determined. Finally, denovo assembly of the RNA sequence data followed byfunctional annotation of the differentially expressedtranscripts was conducted to build a catalog of tran-scripts in response to O3 stress for NRO.
ResultsTranscriptome sequencing output, de novo assembly andtranscriptome qualityMore than 334 million raw reads were generated, includ-ing 639Mb from the 454 platform, 2.5Gb from theIllumina MiSeq platform, 23.1Gb from the IlluminaHiseq 2000 platform and 42.3Gb from the IlluminaHiSeq 2500 platform. RNA libraries were sequencedfrom a wide variety of NRO tissues to provide goodcoverage of the gene space (334,073,559 reads) (Add-itional file 1: Table S1). To produce a high-quality refer-ence transcriptome, only the longer reads (originatingfrom 454 and Illumina MiSeq) were used for assemblywhile the data generated from the HiSeq 2500 platformwere used exclusively for differential gene expressionanalysis.After trimming low-quality bases, adapter removal,
transcriptome assembly, and removal of redundant se-quences, 52,662 putative transcripts with an averagelength of 778 bp and N50 length of 1244 bp were gener-ated (Additional file 2: Fig. S1). Transdecoder predictedan open reading frame (ORF) in 38,610 (73%) of the pu-tative transcripts. In order to verify completeness of thetranscriptome assembly, putative transcripts were>compared with the Embryophyta database of orthologs(n = 1440) by BUSCO; 988 (68.6%) of the single-copyorthologs have a complete match within the oak tran-scriptome sequences. Another 166 (11.5%) of the single-copy orthologs were found as fragments, and 286(19.9%) were missing from the oak transcriptomeassembly.While no reference genome is available for Q. rubra
nor any other species from the red oak clade (subgenusQuercus sect. Lobatae) [44], three reference genomesfrom oak species in other clades are available: Q. lobata(Quercus sect. Quercus) [45], Q. robur (Quercus sect.Quercus) [46], and Q. suber (Cerris sect. Cerris) [47]. Toassess sequence divergence between this NRO assembly
Soltani et al. BMC Genomics (2020) 21:160 Page 2 of 18

and gene models from the reference genomes, read map-ping through Conditional Reciprocal Best BLAST wasperformed. The proportion of NRO putative transcriptswith a match to a gene model in the three oak speciesgenomes was 68.2% to Q. lobata, 82.4% to Q. robur, and66% to Q. suber, revealing no clear pattern of gene con-servation associated with taxonomic relationship. It willbe interesting for subsequent phylogenomics studies todetermine if the variation in NRO putative transcriptsmapping frequency among the species is different amongsections of the genus Quercus reflects evolutionary dis-tances versus quality and completeness of gene anno-tations among reference genomes.
Sequence annotationHomology-based functional assignments were obtainedfor a total of 37,535 and 37,880 putative transcripts fromNCBI and IPS databases, respectively. Integration of re-sults from both databases yielded annotation for 42,703(81%) of the putative transcripts. The most commonprotein matches from NCBI BLAST originated fromother woody plant species: Juglans regia, Ziziphusjujuba, Theobroma cacao, Prunus persica, and Vitis vi-nifera. Although an E-value cut-off of 1e-5 was used forthe BLAST alignments, the majority of the sequence hitswere strongly supported by much lower E-values (Add-itional file 2: Figure S1). Gene Ontology (GO) termswere assigned to a total of 29,528 (69.1%) annotatedputative transcripts. To give a broad overview of annota-tions, GO term assignments were re-mapped to second-tier GO terms, yielding 70 total terms (Additional file 3:Figure S2), which included: 21,623 putative transcriptsthat were assigned to terms in the biological processontology (BP), 20,073 putative transcripts that wereassigned to terms in the cellular component ontology(CC), and 24,819 putative transcripts that were assignedto terms in the molecular function (MF) group. Themost abundant GO terms for each category were clas-sified as metabolic processes (16,696) and cellularprocesses (16,125) for BP, cell (14,036) and cell part(13,972) for CC, and binding (16,103) and catalyticactivity (15,065) for MF categories. Based on the fullset of retrieved GO terms, a total of 10,026 EnzymeCommission (EC) numbers were assigned to anno-tated putative transcripts, which were utilized to ob-tain Kyoto Encyclopedia of Genes and Genomes(KEGG) pathway assignments. Categories of retrievedEC numbers included hydrolases (3766), transferases(3267), oxidoreductases (1928), lyases (424), isomerases(346), and ligases (295).
Analysis of DEGsThe high depth RNA sequencing data was used to pro-file alterations in gene expression caused by O3 stress.
Significant DEGs between treatment and control tissuesamples were defined at an adjusted p-value cut-off of0.05 and |log2 (fold change)| > 1.Two-year-old NRO seedlings were exposed to four
levels of O3 (control, 80 ppb, 125 ppb, 225 ppb), and leaftissue samples from four biological replicates were takenat three time points (7 h, 14d, 28d). The leaves at thecontrol and 80 ppb levels appeared similar, with novisual injury. Injury was noted at the 125 and 225 ppbexposures. Leaves had the dark red interveinal stipplingthat is characteristic of moderate O3 damage ofhardwoods (Additional file 4: Figure S3).Across all elevated O3 treatment levels, 4136 DEGs
were detected with 2142 transcripts upregulated and1994 downregulated (Table 1). The number of DEGsidentified varied from none found at 7 h (hr) of 80 ppbO3, to a maximum of 3120 DEGs after 28 days of 225ppb O3 exposure (Additional file 5: Table S2). The num-ber of DEGs increased both with greater levels of O3
and with longer exposure times. The majority of DEGswere found to be unique to each time point. However, afew DEGs were shared among multiple analyses or timepoints (Fig. 1). DEGs for each O3 concentration regard-less of time were determined via comparison of O3-treated and control samples across all time points usingfiltering options stated above. While at 80 ppb no DEGswas detected, a total of 33 (32 up-, 1 downregulated)and 70 (52 up-, 18 downregulated) DEGs were identifiedat 125 ppb and 225 ppb, respectively (Additional file 5:Table S2).
GO enrichment categories among DEGsGO term enrichment analysis was conducted separatelyfor each treatment to characterize biological functionsrepresented in DEGs. For downregulated DEGs in O3
experiments, significantly enriched GO terms werefound only at the treatment level of 225 ppb. EnrichedGO terms from up-regulated DEGs were identifiedacross all three O3 treatments (Figs. 2 and 3). Mostdown-regulated DEGs, 10 in total, are involved in photo-synthesis, and several significant up-regulated DEGswere related to alterations in respiration and photosyn-thesis (Additional file 6: Figure S4). As photosynthesisactivities were found for both upregulated and downreg-ulated genes, we examined the specific genes moreclosely. For upregulated genes in photosynthesis (at 125ppb), the genes included two isoforms of photosystem IIcytochrome b559 and one gene related to chloroplasticATP synthase CF0, which both relate to transmembraneactivities. In contrast, the downregulated genes at 225ppb are involved in core chloroplastic activities and or-ganelles (chlorophyll, light receptor, thylakoid lumen,and degradation of damaged proteins in the chloroplast).These genes had specific functional annotations of
Soltani et al. BMC Genomics (2020) 21:160 Page 3 of 18

chlorophyll a-b binding, photosystem I reaction center,photosystem II core complex, LOW PSII ACCUMU-LATION, psbP domain-containing, and protease Do-like chloroplastic. For the O3 concentration-specificDEGs determined regardless of timepoint, enrichmentanalysis of GO terms for upregulated and downregu-lated DEGs at 125 ppb were not significant. However,top enriched biological terms for upregulated anddownregulated DEGs at 225 ppb were cysteine meta-bolism and steroid metabolism, respectively (Add-itional file 6: Figure S4).Regulation patterns of GO terms are shown. Bp: biological
process; cc: cellular component; mf: molecular function.
KEGG pathway enrichment analysis of DEGsKEGG pathway enrichment tests were conducted withthe upregulated and downregulated DEGs identified inthe GO enrichment analysis (above). The number of
perturbed pathways illustrated an impressive diversity ofbiochemical functions, which increased in scope bothwith time of exposure and O3 concentration (Fig. 4;Additional file 7: Table S3). The three most highlyenriched upregulated KEGG pathways were oxidativephosphorylation, metabolic pathways, and photosyn-thesis, while the most downregulated KEGG pathwayswere plant-pathogen interactions, RNA transport, andditerpenoid biosynthesis. For the O3 concentration-specific DEGs, KEGG pathways analysis of upregulatedDEGs at 125 ppb detected photosynthesis as the topenriched biological pathway (Additional file 7: Table S3)with involvement of three DEGs, however, downregu-lated DEGs were not enriched for photosynthesis activ-ities. Enrichment analysis of upregulated DEGs at 225ppb detected top significant KEGG pathways as sulfurmetabolism (Additional file 7: Table S3), while down-regulated DEGs were not significant.
Table 1 Number of significant DEGs in response to O3 treatment over time
Time 7 h 14d 28d
Treatment Up regulateda Down regulateda Up regulated Down regulated Up regulated Down regulated
80 ppb 0 0 25 1 61 8
125 ppb 32 1 32 2 248 92
225 ppb 50 18 250 197 1444 1675a DEGs regulation patterns and their respective total counts
Fig. 1 Venn diagrams showing number of DEGs from two-year-old seedlings exposed to O3 treatments over time. Times of sampling (7 h, 14days, and 28 days) are represented by 7 h, 14d, and 28d, respectively. Up- (red) or down-regulation (blue) patterns are also shown for O3
concentrations: A) 80 ppb, B) 125 ppb, and C) 225 ppb
Soltani et al. BMC Genomics (2020) 21:160 Page 4 of 18

Time-series analysis of DEGsCharacterization of temporal dynamics of DEGs follow-ing O3 induction using Short Time-series ExpressionMiner software (STEM) software [48] was performed byclustering DEGs based on the similarity of their tem-poral expression patterns. STEM analysis clustered 1388DEGs in seven significant profiles, of which most DEGsgrouped in the profiles representing downregulation pat-tern over time (Fig. 5a; Additional file 8: Table S4).Functional annotation of DEGs associated with signifi-cant clusters detected enriched GO terms and KEGGpathways only in profiles 0, 12, and 13. For DEGs associ-ated to profile 13 with the upregulation pattern overtime, the top two significant biological functions werecell part and metabolic pathways (Fig. 5b). The top twoenriched biological pathways of clustered DEGs in bothprofiles of 0 and 12 with the downregulation patternover time were organic substance metabolism and RNAtransport (Fig. 5c-d).
Detection of co-expressed genes upon ozone stressTo identify co-regulation of gene clusters during ozonetreatments, weighted correlation network analysis(WGCNA) was carried out using all samples. The totalof 44,078 genes were clustered in 57 modules (Fig. 6),with a range of 121 (ME56) to 12,492 (ME0) genes permodule. The modules represent subsets of genes withhighly correlated patterns of expression. For each mo-dule, a module eigengene (ME) has been calculated torepresent the first principal component of the module.
The eigengene can be interpreted as an “average” ex-pression value representing all the genes in the module.Module-factor relationships were calculated to assesscorrelation of gene clusters to experimental factors. Thisprovides a p-value indicating how well modules are cor-related with each factor in the experiment. ME39 with260 genes was the most correlated cluster responding to80 ppb of O3. The most significant biological KEGGpathways enriched in ME39 were sesquiterpenoid andtriterpenoid biosynthesis, pyruvate metabolism, and bio-synthesis of secondary metabolites (Additional file 9:Table S5). ME51 was the most correlated moduleresponding to 125 ppb of O3. It contained 187 genes, ofwhich the most represented biological functions wereprotein processing in endoplasmic reticulum, defense re-sponse, and response to stimulus (Additional file 9:Table S5). ME5 was the most correlated module ofgenes responding to 225 ppb of O3 that comprised of1039 genes, of which the most significant biologicalKEGG pathways were metabolic pathways, carbon me-tabolism, and biosynthesis of secondary metabolites(Additional file 9: Table S5). Factor comparison in theco-expression module-factor relationship (Fig. 6) indi-cated that two modules, ME5 and ME53, were differen-tially co-expressed in response to 225 ppb of O3 (versuscontrol). Aside from ME5 described above, ME53 con-tained 6248 genes with the most significant KEGG path-ways involved in spliceosome, metabolic pathways, andprotein processing in endoplasmic reticulum (Additionalfile 9: Table S5).
Fig. 2 Number of enriched GO terms in unique DEGs of O3 treatments over time
Soltani et al. BMC Genomics (2020) 21:160 Page 5 of 18
Significant enriched DEGs in plant-pathogen interactionpathwayWhile KEGG pathway mapping and GO term enrichmentanalysis are powerful methods to determine the overall bio-logical and metabolic processes for a set of genes, both ana-lyses are limited by the number of genes that have beenaccurately annotated. With de novo assembled transcrip-tomes and sequence similarity-based functional annotation,direct examination of the gene lists can reveal additionalimportant pathways. In O3-exposed samples, a total of 14upregulated and one downregulated stress response DEGswere found that also had an annotation to the plant-pathogen interaction pathway from KEGG (Table 2).
Identification of DEGs involved in terpenoid biosynthesispathwayThe DEGs induced in O3 stress were involved in severalpathways related to terpenoids, including biosynthesis ofsecondary metabolites, terpenoid backbones, and diterpe-noids. Ozone stress resulted in three terpenoid biosynthesisrelated DEGs (Table 3). The number of downregulated
DEGs was higher than upregulated DEGs. Perturbed genescovered a set of enzymatic activities including synthesis,oxidation, and reduction.
DiscussionAlthough several transcriptome studies have previously iden-tified candidate genes and pathways involved in response tomultiple biotic and abiotic stressors in various oak species[30–32, 35, 36], knowledge at the genomic level of the effectof increased ground-level O3 toxicity to NRO is lacking. Inthis transcriptome study, NRO leaf tissues were exposed tofour levels of O3 treatments in a time-series (7 h, 14 day, 28day) experiment, in order to reveal candidate genes and geneproducts key to NRO response to this abiotic stress.
Transcriptome assembly and annotation of putativetranscriptsThe de novo transcriptome assembly generated a total of52,662 putative transcripts as a resource to further gen-omic research in NRO and related oak species. The totalaverage length and N50 contig length are comparable to
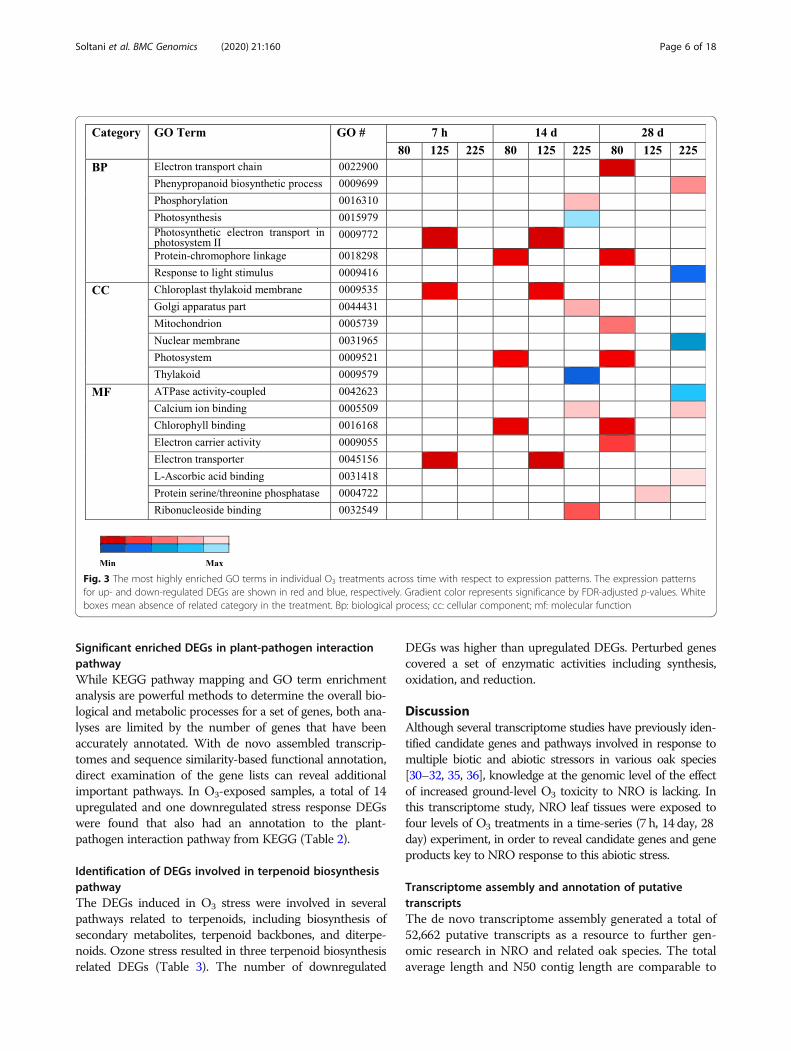
Fig. 3 The most highly enriched GO terms in individual O3 treatments across time with respect to expression patterns. The expression patternsfor up- and down-regulated DEGs are shown in red and blue, respectively. Gradient color represents significance by FDR-adjusted p-values. Whiteboxes mean absence of related category in the treatment. Bp: biological process; cc: cellular component; mf: molecular function
Soltani et al. BMC Genomics (2020) 21:160 Page 6 of 18

the reference transcriptomes developed to date for otherforest trees [49–52]. More than 80% of the NRO putativetranscripts could be functionally annotated, and the GOterm assignments indicated that a broad set of fundamen-tal metabolic processes and biological pathways were in-cluded. This distribution of GO terms is consistent inscope with previous reference de novo transcriptomestudies, including oak [30, 36, 37] and non-oak species[53–55]. Thus, the transcriptome reported here provides agood reference for NRO studies. However, further
improvements in gene space coverage and structural andfunctional annotations could be achieved through assem-bly of a reference genome, complete with full length genemodels, for Q. rubra.
Impacts of ozone exposure to NRO leaves among ozoneconcentrations, time-specific ozone concentrations, andtime-series exposuresIn this study, gene expression patterns in the NRO seed-lings varied by both time and concentration of O3 stress
Fig. 4 Enriched KEGG Pathways of DEGs with respect to their expression patterns in individual O3 treatments across time. The expression patternsfor up- and down-regulated DEGs are shown in red and blue, respectively. Gradient of color represents FDR-adjusted p-value for respectiveregulation patterns (up/down). White boxes mean absence of statistical significance for the related pathways due to the treatment
Soltani et al. BMC Genomics (2020) 21:160 Page 7 of 18

Fig. 5 Time-series and enrichment analysis of DEGs associated with ozone-exposed samples versus their control. A) Overall temporal expressionprofiles of DEGs with statistically significant clusters. On top of each box, profile number is represented. Left to right of X-axis in each profilerepresents over time pattern. Top right of individual profile is the profile enrichment p-value, and lower left is the number of DEGs assigned toeach model profile. B-D) Enriched GO terms and KEGG pathways of DEGs in profile numbers 13, 12, and 0. For the GO terms, the larger the sizeof circle, the higher the frequency; and darker the red color, lower the p-value. For the KEGG pathways, enrichment score is the number ofsignificant genes divided by background genes of respective pathway; FDR is the false discovery rate corrected p-value
Soltani et al. BMC Genomics (2020) 21:160 Page 8 of 18

treatments. At the lowest treatment level of 80 ppb, geneexpression did not differ from the control at the 7 h timepoint. In contrast, at higher O3 concentrations, gene ex-pression was actively responding to the treatments even
at first time point of 7 h. Overall, the number of differ-entially expressed genes increased as both a function oftime and increasing O3 levels.Perturbation of carbon metabolism genes was ob-
served among 125 and 225 ppb O3-exposed tissues, aswell as temporal expression pattern analysis. In addition,altered metabolic pathways during the short-term expos-ure (7 h) at the two higher O3 levels of 125 ppb and 225ppb and time-series analysis were carbohydrate, aminoacid, terpenoid biosynthesis and energy production.Genes involved in these biological pathways were alsoco-expressed in response to O3 as they were assigned toco-expression modules, ME5 and ME53. Biologicalpathways have also been perturbed in the seedlings ofQ. lobata upon drought stress [32] and seedlings ofQ. suber during ectomycorrhizal interaction [56]. Higherexpression levels of genes participating in the glycolysisand citrate (TCA) cycles during O3 exposure could be ex-pected to result in increased ATP synthesis, as docu-mented previously in multiple plant species [57–59].Consistent with previous research [60–62], energy pro-duction and carbohydrate fixation pathway gene activitieswere also affected in our study. In the long term, however,increased carbon use can lead to damaged photosyntheticmachinery, a phenomenon that ultimately results in re-duced ecological and economic productivity [63, 64], asevidenced by early leaf senescence in trees due to ozonestress in nature [65, 66]. Biosynthesis of several defensivesecondary metabolites including terpenoids is modulatedin plants in response to environmental changes, pathogensand herbivores [67–69] as well as oaks in response toenvironmental changes and soil-borne microbes [32, 56].Terpenoids are a class of bioactive compounds with anti-microbial, anti-herbivore, and insecticidal functions, whichcan be involved in attenuation and suppression of O3-induced oxidative-stress damages [70–72]. Five dif-ferent types of terpenoids, mono-, di-, tri-, tetra-, andsesquiterpenoid, are biosynthesized through sequentialcondensation of isoprene unit blocks resulting fromcytosolic mevalonic acid (MVA) or plastidal methylery-thritol phosphate (MEP) pathways. Sesqui- and triter-penoids are produced through the MVA pathway,whereas mono-, di- and tetraterpenoids are biosynthe-sized through the MEP pathway [55, 67]. In thisstudy, perturbation of terpenoid biosynthesis due toO3 exposure was a result of changes in expressionlevels of three enzymes; enzymes involved in theMVA pathway were downregulated while those in theMEP were upregulated (Table 3; Fig. 7). Modulationof these pathways upon O3 exposure in NRO is consistentwith reports for oxidative stress studies in other woodyplants [71, 73].The stress treatments of NRO seedlings for medium
length of O3 exposure (14d) resulted in alterations in
Fig. 6 Module-factor relationship summarizing co-expressed geneclusters in respective module eigengene (ME) in northern red oak inresponse to ozone exposure. Individual ME with respective color isindicated on the Y axis, and ozone treatments and exposure timepoints are shown on the X axis. In each box correlation coefficientand its p-value in parenthesis indicating correlation significance ofrespective treatment/time per detected ME. The color gradientshows expression profile of respective treatment/time in each ME.Highly correlated modules responding to ozone concentrations of80, 125, and 225 plus differential expression profile of 225 ppb versuscontrol are highlighted in black
Soltani et al. BMC Genomics (2020) 21:160 Page 9 of 18

GO terms that predict alterations in protein levels of ex-posed plants at all O3 levels; co-expressed genes wereclustered in modules ME5, ME51, and ME53. Theseterms included protein complex, protein-chromophorelinkage, cysteine and methionine metabolism, histidinemetabolism, and lysine degradation. Furthermore, over-expression of sulfur metabolism genes at 225 ppb O3
exposure, and cysteine and methionine metabolism ineither over-time analysis or O3 exposure of 225 ppb wasobserved. Modulation of amino acid metabolism uponexposure of oak seedlings to water stress [32] and ecto-mycorrhizal contact [56] might imply this pathway as acommon stress responsive mechanism during exposureto abiotic stimuli, which is in agreement with results ofprevious studies related to ozone-exposed plants [60,62]. In plants, reactive oxygen species (ROS) can reactwith thiol and sulfur-containing groups of cysteine andmethionine [74] and lead to conformational changes in
histidine and lysine amino acids, which impairs proteinfunction and increases susceptibility to proteolytic reac-tions [75]. Furthermore, ROS trigger protein oxidation, aphenomenon which often causes irreversible covalent al-teration of the protein structure [74]. The expression ofplant-pathogen interaction pathway and related genesare reported to be altered in response to biotic and abi-otic stimuli in plants [76, 77] such as Q. robur seedlingsexposed to waterlogging [31]. Furthermore, activation ofdefense pathways can lead to priming of unexposed tis-sues for faster gene expression responses to stress andmay lead to defense reactions such as hypersensitiveresponse (HR). In our study, co-expression of plant-pathogen interaction pathway/defense response wasobserved in all O3 treatments, where these defensive re-sponses were assigned to modules ME5, ME39, ME51,and ME53. Among these pathways and responses, up-regulation of an “enhanced disease susceptibility” gene
Table 2 DEGs involved in plant-pathogen interaction pathway
Ozone treatments with respectiveregulation pattern
Putative transcripts id MEb Annotation |LogFC|a KEGG entry Length (bp)
125 ppb at 14 day-down comp19736_c0_seq3 ME0 Disease resistance RPM1 6.26 K13457 682
125 ppb at 28 day-up comp21410_c0_seq1 ME1 Heat shock cognate 80 1.43 K04079 1281
comp31660_c0_seq2 ME1 Enhanced disease susceptibility 1 2.43 K18875 2272
comp31660_c0_seq1 ME1 Enhanced disease susceptibility 1-like 2.55 K18875 946
comp26463_c0_seq2 ME1 Calcium-dependent kinase 10 2.46 K13412 2130
comp28434_c0_seq1 ME53 Calcium-binding CML23 2.03 K13448 661
comp18561_c0_seq1 ME1 Lipase_3 domain-containing 3.52 K18875 367
comp94592_c0_seq1 ME53 Calcium-binding CML45 3.27 K13448 786
225 ppb at 14 day-up comp31273_c0_seq7 ME51 Disease resistance At1g12280 (LRR andNB-ARC domains)
3.61 K13459 845
comp18481_c0_seq1 ME53 Calcium-dependent kinase 5.63 K13412 596
comp9320_c0_seq1 ME0 26-like 3.56 K13412 833
comp21573_c0_seq1 ME0 Calcium-dependent kinase 26-like 1.43 K04079 888
comp31660_c0_seq5 ME5 Heat shock cognate 80-like 1.49 K18875 1932
comp23142_c0_seq3 ME31 Enhanced disease susceptibility 1.25 K20536 1335
comp31028_c0_seq1 ME5 Mitogen-activated kinase 3Respiratory burst oxidase homolog A
2.04 K13447 3505
a Variation in logFC indicates the amount of log-based changes of gene expression level in the treatment compared with respective control sampleb ME refers to the module number from the gene coexpression network analysis
Table 3 DEGs involved in terpenoid biosynthesis pathway
Treatments that induced differentialexpression
Putative transcriptsid
MEa Annotation Role in terpenoidpathway
|LogFC| KEGGentry
Length(bp)
Shared 7 h&28d at 225 ppb,Downregulated
comp29400_c1_seq4
ME53 β-Amyrin 11-oxidase-like Diterpenoid 1.83 K04123 289
225 ppb at 7 h-Downregulated comp28709_c0_seq1
ME2 3-Hydroxy-3-methylglutaryl-coenzyme A reductase
Terpenoidbackbone
1.99 K00021 1630
225 ppb at 28 day-Upregulated comp313540_c0_seq1
ME53 Geranylgeranyl pyrophosphatesynthase
Terpenoidbackbone
5.99 K13789 227
a ME refers to the module number from the gene coexpression network analysis
Soltani et al. BMC Genomics (2020) 21:160 Page 10 of 18

and downregulation of “disease resistance RPM1” genecould potentially alter HR and programmed cell death,which would ultimately result in cell vulnerability and im-pairment. In this study, induction of calcium-dependentputative transcripts, may indicate increased levels ofdefense signal-transduction systemically to distal plant tis-sues [78]. The amino acid glutamate plays a key role inlong distance signaling, priming defense responsesthrough systemic acquired resistance pathways [78]. Inpast studies, exposure to O3 was reported to result in up-regulation of plant-pathogen interaction pathways such aspathogenesis-related proteins 1–4 and small heat shockproteins; our study differed from previous reports in thatpathogenesis-related proteins were not differentiallyexpressed in the NRO seedlings [79–81].Photosynthesis and ATP production pathway genes
were observed to be consistently upregulated after longterm (28d) exposure to O3 and among 125 ppb-exposedtissues, as it has been documented in several studies
[60–62, 82]. However, evidence of altered carbon fix-ation through 1,5-bisphosphate carboxylase (Rubisco)gene expression was inconsistent among exposure timesand O3 levels. However, co-expression analysis showedthat photosynthesis- and ATP production-related geneswere both clustered in the modules ME5 and ME53. Inaddition to latter modules, ME39 and ME51 also con-tained ATP production-associated genes. After longterm O3 exposure (28d), downregulation of Rubisco atthe highest O3 concentration was observed. Several ex-planations for downregulation of Rubisco have been pro-posed including inhibited transcription, mRNAdegradation, and reduction of stomatal conductance inresponse to O3 [83, 84]. Modulation of stomatal con-ductance alters the uptake of atmospheric CO2 to inter-cellular spaces, which ultimately affects carbon fixationand sugar deposition [85]. The indication of decreasedcarbon fixation from altered gene expression patterns inthe treated NRO seedlings is consistent with previous
Fig. 7 Overall impact of ozone on terpenoid biosynthesis in northern red oak leaves. Leaves from seedlings exposed to ozone (mean FDR-adjusted p-values values of all ozone concentrations and exposure times); 3-Hydroxy-3-methylglutaryl-coenzyme A (HMG-CoA) reductase is anATP-dependent enzyme, necessary for biosynthesis of mevalonic acid, a key compound in isopentenyl diphosphate (IPP) formation. β-amyrin 11oxidase, an essential cytochrome P450 enzyme, forms different terpenoid compounds through oxidation and glycosylation of β-amyrin.Geranylgeranyl pyrophosphate (GGDP) synthase adds IPP units to terpenoid skeleton to biosynthesize diverse types of terpenoids includingmono-, di-, tri- and tetraterpenoids. Significance of expression patterns (FDR-adjusted p-value) are represented by color gradient, withupregulation and downregulation in red and blue colors, respectively. Bold and italic processes occur in plastids; underlined processes occur incytosol; bold, italic, and underlined processes occur in either plastid or cytosol. MVA: mevalonic acid; MEP: methylerythritol phosphate
Soltani et al. BMC Genomics (2020) 21:160 Page 11 of 18

studies related to oaks and other woody trees [85–87].In our study, differential gene expression results sug-gested that photosynthesis was upregulated, rather thanbeing suppressed. Although photosynthesis is reportedto be decreased during elevated O3 in some plant sys-tems [88–91] and oak species (Q. lobata and Q. suber)exposed to drought [30, 32], it is typically increased inyounger tissues in response to stress [92–94]. However,photosynthetic rates of tree seedlings have been reportedto be less sensitive to O3 than mature trees [92–94]. Forplants to recover from damage to photosynthetic com-partments, seedlings need to assimilate the sugar andstarch that are essential for growth. This is generally ac-complished through carbon shifts allocation to the roots.However, O3 and other photosynthetic poisons can altershifts carbon in favor of the shoot, which along with in-creased photosynthetic rates can result in early leaf sen-escence and decreased seedling growth [95]. In ourstudy, after 28 days of exposure to high O3 levels, manygenes associated with the plant defense cascades wereupregulated. For example, ROS can perturb the plant-pathogen interaction pathway, which in turn activatesHR through either effector-trigger immunity (ETI) orpathogen-associated molecular pattern-triggered im-munity (PTI) that circumvent O3 induced damages.Overexpression of two isoforms of “enhanced diseasesusceptibility 1” (EDS1)”, as well as induction of heat-shock protein (HSP) and calcium-dependent/bindinggenes in the O3-treated NRO seedlings might thus be at-tributable to stimulation of HR by either ETI or PTI.Higher levels of ROS in cells ultimately leads to pro-grammed cell death [96]. Therefore, consistent with paststudies [60, 62], increased expression of HSP and aminoacid glutathione, an important anti-oxidant, plus otherROS scavengers in plant tissues, as we observed, mayprovide detoxification methods that diminish O3
induced damages [16, 57, 97].DEGs that were observed to be upregulated in the O3
experiment included transcription factors such asWRKY and other genes known to be involved in hostdefense responses, including HSP and thaumatin-likeprotein genes. Heat-stress transcription factors play animportant role in regulation of expression of genes suchas the HSP protein gene which responds to stresses andpromotes plant defense reactions. Thaumatin-like pro-teins are PR proteins that are induced in response topathogen/pest attack and are involved in plant resistanceresponses [98]. In other oak seedling studies, anotherclosely-related HSP family (HSP20) [30, 32] and severaltranscription factors such as WRKY [30, 32, 56] andthose regulating HSPs [56] were differentially expressedduring drought and fungal stresses. Modulation of mul-tiple transcription factors including WRKY upon ozoneexposure were also documented in several other plants
[60, 62]. On the other hand, the observed downregula-tion of ABC transporter (annotated as ABC transporterfamily G member 11 [ABCG 11]), LRR receptor-likeDEGs and terpenoid pathway genes after ozone exposureof the NRO plants suggests some active defense mech-anism may be disturbed by this stress, potentially in-creasing susceptibility to pathogens and pests. Perhapssuch downregulation of gene expression also representsreduction in resource use for tissues already proceedingto apoptosis and senescence. Modulation of ABC trans-porter and LRR receptor-like genes during O3 stress isconsistent with oak seedling studies associated with fun-gal and drought stresses [31, 32, 56]. In Arabidopsis,ABCG 11 mutants lose water maintenance and plantdefense functionality through disturbance of cuticlemembrane lipid transfer [99]. LRR receptor-like genesregulate diverse developmental and defense relatedprocesses including non-host-specific defense reactionsinduced pathogen infection [100].While the use of four independently sequenced bio-
logical replicates in this study lends statistical confidenceto the results, the limited red oak genetic background isa limitation. The genes and pathways reported here needto be further queried, preferably through independentrepeats of this experiment using additional red oak ge-notypes and ozone levels. This could yield informationabout how well these responses are conserved across redoak populations.
ConclusionIn this paper we reported the development of a referencetranscriptome for NRO developed from deep sequen-cing, and assembly, of RNAs from wide variety of NROdevelopmental stages. The reference transcriptome as-sembly consists of 52,662 unigenes, of which more than42,000 transcripts were annotated by sequence hom-ology and by gene ontology to a broad array of func-tional classifications. Over 4100 differentially expressedgenes were detected in response to a time course of O3
stress at 3 levels, versus untreated controls. Althoughmuch has been learned through previous ecological andphysiological studies on the effects of ozone-stress inNRO and other forest trees, to the best of our know-ledge this is the first study of genome-wide gene expres-sion responses of NRO plants to ozone stress. Exposureto elevated ozone levels led in both cases to activation ofa cascade of defense gene expression, including alteredcarbohydrate, amino acid, lipid, and terpenoid biosyn-thesis as well as altered photosynthesis and ATP produc-tion pathway genes. The ozone toxicity is example ofoxidative stresses, during which ROS are produced, im-pair lipid and protein functions and increase suscepti-bility to proteolytic reactions. Enhanced glutathione assuggested by upregulated gene expression (temporal and
Soltani et al. BMC Genomics (2020) 21:160 Page 12 of 18

concentration-dependent) in the leaves indicated activa-tion of antioxidant-detoxification pathways in responseto the oxidative stresses imparted by ozone treatments.Prolonged exposure of oak trees to this external stimuluscould increase susceptibility to secondary pests andpathogens, contributing to oak population decline.Further characterization of the candidate genes from thisstudy should be pursued as opportunities to enhance re-sistance against biotic and abiotic stressors through oakbreeding and reforestation programs. Additional genomicresources, such as a reference genome for Q. rubra, wouldfurther support research on NRO adaptation andresistance to different stresses.
MethodsPlant materials and ozone treatmentsTissue samples were collected from two adjacent matureNRO trees on the campus of Purdue University, WestLafayette, Indiana (accessions SM1 and SM2) [101]. Thetissues sampled included dormant twigs, immaturetwigs, developing acorns, emerging leaves, catkins, emer-ging leaf buds, late growth stage (season) damagedleaves, late growth stage undamaged leaves, late growthstage damaged twigs, and late growth stage undamagedtwigs. All tissues were flash frozen in liquid nitrogen im-mediately after collection, and then kept frozen in eitherin liquid nitrogen or on dry ice during transport to thelab for storage at − 80 °C. These materials weresequenced using MiSeq and 454 instruments and usedexclusively for transcriptome assembly.
Ozone stressTwo ozone exposure experiments were performed.For the initial experiment, open pollinated acorns col-lected from SM1 were germinated and grown for twoyears in the greenhouse under normal ambient condi-tions. In the summer of 2011, 24 two-year old seed-lings were randomly assigned among four continuousstirred tank reactor (CSTR) chambers [cylindrical inshape, with dimensions of 107 cm (diameter) × 122 cm(height)] [102], with six seedlings transferred intoeach chamber. Each CSTR chamber was equippedwith an external overhead light source (400 wattlamps [~ 15 klx]) producing light quality similar tonatural sunlight. The seedlings were acclimated to thechambers for 2 weeks at normal ambient growingconditions, after which the O3 concentrations wereadjusted to a different level in each chamber, at < 10ppb (control), 150 ppb, 225 ppb, and 300 ppb. Thespecific ozone levels were accomplished by an air-intake scrubbing system consisting of activated char-coal filtration unit that lowered ambient air ozonelevels in the greenhouse to < 10 ppb hourly average.Ozone was then added to each CSRT chamber via a
controllable micro-metering system with concentra-tions monitored with a TECO Model 49 O3 analyzerand data logger/computer recording system in eachchamber [103]. The augmented O3 was delivered insquare-wave fashion for 7 day/wk., eight hours a day(0900 h to 1559 h) for 28 days, mimicking diurnalozone fluctuation. In treatments greater than ambient,cumulative ozone exposure ranged from 864 to 1728ppb h for 7 h treatments, from 13,992 to 25,152 ppb hfor 14 day exposures, and from 28,008 to 50,328 ppb hfor 28 day exposures. The metric ppb h was calcu-lated as (ppb × 8 h × # days). During non-fumigationhours, seedlings remained within the chambers withthe doors open to the charcoal filtered air and envir-onmental conditions within the greenhouse. Three tofour leaves were collected from different areas in thecanopy (lower, mid and upper) at each of the threetime points (7 h, 14 days, 28 days) from all biologicalreplicates. Leaves were flash frozen in liquid nitrogenimmediately after collection, and then kept frozen ineither in liquid nitrogen or on dry ice during trans-port to the lab for storage at − 80 °C. For each repli-cate, the leaves were pooled prior to RNA extraction.After isolation, equal amounts of RNA from the repli-cates were pooled by treatment level prior to sequen-cing by a 454 instrument for use in transcriptomeassembly.A second O3 exposure experiment was performed with
48 two-year open-pollinated seedlings grown from acorncollected from accession SM1. In this experiment, fourseedlings were used as biological replicates in each offour CSTR chambers, treated at O3 concentrations ad-justed to: < 10 ppb (control), 80 ppb, 125 ppb, and 225ppb. Less than 10 ppb of ozone (little or no ozone aftercarbon filtration of ambient air) was used as a control,with 80 ppb and 125 ppb as treatments to mimic ob-served ambient levels. These levels also relate to the U.S.Environmental Protection Agency’s NAAQS for ground-level ozone limits for public health and welfare, whichhave decreased from 1-h maximum detected levels up to120 ppb before 1997, to 80 ppb between 1997 and 2015,and to 70 ppb since 2015 (EPA, 2015). A high stresstreatment level of 225 ppb was selected as an extremecondition. This is higher than most in situ observations,but close to the 300 ppb level that has often been usedin previous reports on ozone-stress studies to produce astrong, reproducible physiological response in modelplants [41–43]. Leaf samples were collected and trackedindividually from each of the biological replicates atthree time points (7 h, 14 days, 28 days) for the 4 ozonetreatment levels. Leaf samples were collected and proc-essed as described above. RNAs were isolated and repli-cates sequenced separately on Illumina instruments togenerate data for use in differential expression analysis.
Soltani et al. BMC Genomics (2020) 21:160 Page 13 of 18

RNA purification, library construction and transcriptomeprofilingThe frozen tissue samples were powdered by grinding inliquid nitrogen and transferred back to − 80 °C freezerconditions if not immediately extracted for RNA. TotalRNA was extracted from the powdered tissue samplesfollowing a modified CTAB isolation method [104] withlithium chloride precipitation. RNA quality was assessedby capillary electrophoresis using the Agilent Bioanalyzer2100 (Agilent technologies).Libraries for 454 instrument sequencing were con-
structed as per supplier’s instructions for the Titaniumreagents with modifications as described as in [105]. Thelibraries were sequenced at Pennsylvania State Universityusing an FLX+ 454 DNA sequencer (Roche). For the ini-tial O3 experiment, equal amounts of RNA from individ-ual biological replicates were pooled into a single samplefor each ozone treatment level. Two additional 454 li-braries were constructed from the parent tree samples -one from a pooled set of equal amounts of RNA fromabove ground tissue samples and one from a pooled setof below ground tissue samples.For the second O3 stress experiment, biological repli-
cates were independently barcoded for sequencing. Illu-mina TruSeq libraries were prepared for each of thereplicate RNA samples, following manufacturer proto-cols, then sequenced on an Illumina HiSeq 2500 instru-ment at Pennsylvania State University.All RNA-Seq data are available in the NCBI Sequence
Read Archive database under BioProject accession numberPRJNA273270.
RNA-seq preprocessing, de novo assembly and qualityassessmentThe quality of generated RNA-Seq data was inspectedby FastQC software [106] and low-quality reads (meanPhred score < 20) were cleaned by Trimmomatic usingdefault parameters [107]. Only reads originating fromthe 454 instrument or the MiSeq instrument were in-cluded in the assembly, due to their longer read lengths.Trimmed reads were assembled by Trinity (versiondownloaded on 2012-10-05) [108]. The assembly wasfurther refined by cd-hit-est v4.6.1 with a sequence iden-tity threshold of 0.95 to collapse isoforms and reduce as-sembly redundancy [109].All transcript names begin with “Quercus_rubra_
120313_” to indicate transcriptome origin and version.This part of the transcript name has been removed fromthe text for brevity. For example, transcript “Quercus_rubra_120313_comp102049_c0_seq1” is referred to inthe text as “comp102049_c0_seq1”.The quality of the transcript assembly was checked by
Transrate version 1.0.3 [110]. Transrate was also used tocompare transcripts to available oak reference genomes
by read mapping through Conditional Reciprocal BestBLAST with default cut-off value of 1e-5. Candidatecoding regions within assembled transcripts were pre-dicted by Transdecoder software version 5.1.0 [111].Transcriptome completeness was checked by Bench-marking Universal Single-Copy Orthologs (BUSCO) ver-sion 3 based on the plant ortholog database(embryophyta_odb9) [112]. Reads were mapped back tothe transcriptome assembly with bowtie2 v2.2.1 usingthe –sensitive parameter.
Functional annotation, pathway identification and geneexpression analysisGene ontology (GO) functional classification of the tran-scriptome assembly was carried out using the Blast2GOprogram [113] based on the NCBI non-redundant (nr)protein sequences by fast-BLASTX [114] with an E-value cut-off of 1e-5 as well as EBML-EBI InterProScan(IPS) database. Gene ontology [115] terms were obtainedfor each putative transcript from both BLAST and IPSoutputs. WEGO [116] was used to examine the GOterms among the annotated putative transcripts. The ECnumbers were retrieved through GO-EnzymeCode Map-ping feature of Blast2GO software.
Identification, annotation and enrichment analyses ofdifferentially expressed genesFor differential gene expression of ozone exposure, onlydata from the second ozone experiment was used foranalysis; this experiment had individually barcoded repli-cates and high depth of reads generated by the HiSeq in-strument. To obtain raw read counts for each putativetranscript per library HTSeq version 0.6.1 [117] wasused. The raw count matrix were provided to the edgeRversion 3.6 bioconductor package [118] to distinguishdifferentially expressed genes (DEGs) between treatmentand control groups. Briefly, normalization by thetrimmed mean of M-values (TMM) method was calcu-lated to adjust count reads. Normalized factors, thecounts per million (CPM), were used in common,trended and tag-wise dispersion analyses by Cox-Reidprofile-adjusted likelihood (CR) method. Finally, to de-termine significant DEGs negative binomial general line-arized model (GLM) likelihood ratio was tested based onthe model (treatment*time), where treatment was ozoneconcentrations, and time was time-points for eachtreated sample. Genes were considered significantly dif-ferentially expressed based on adjusted p-value < 0.05[119] and |log2 (fold change)| > 1. Consensus DEGsdetected by edgeR package were visualized by Vennyversion 2.1 [120] and their results were used in furtherannotation and enrichment analyses.GO enrichment analysis of DEGs was carried out by
agriGO v2 [121] with the significant DEGs of each
Soltani et al. BMC Genomics (2020) 21:160 Page 14 of 18

model as the foreground dataset and all putative tran-scripts as the background reference. The statisticalparameters used for identification of overrepresentedGO terms were Fisher’s exact test, adjusted for multipletesting by FDR with a cut-off value at the significancelevel of 0.05. Statistical enrichment of DEGs withinconstructed pathways based on Kyoto Encyclopedia ofGenes and Genomes (KEGG) database was tested byKEGG Orthology-Based Annotation System (KOBAS)program [122].
Time-series analysis of differentially expressed genesThe analysis of DEGs over time was analyzed by STEMusing the log fold-change of DEGs (O3-treated versuscontrol) among the three time points, where all samplesfrom the same time point were combined. The parame-ters in STEM were adjusted as follows: maximum unitchange in model profiles between time points set to 1;maximum output profiles number set to 50. The clus-tered profiles with p-value < 0.05 were defined as signifi-cant profiles. The enriched clusters were furtheranalyzed by KOBAS to determine their GO terms andKEGG pathways, of which biological function of profileswith adjusted p-value < 0.05 were considered significant.
Weighted gene co-expression network analysisTMM-normalized gene expression values were used inan R package, WGCNA [123], to identify modules con-taining co-expressed genes. After removal of genes withzero normalized counts, one-step network constructionand module detection were performed using unsignedblock-wise-module comprised of at least 100 genes permodule. A consensus gene expression profile for eachmodule was represented by the module eigengene thatwas calculated through first principal component ana-lysis. The module-factor relationship was obtainedthrough Pearson correlation coefficient. The top hubgene, i.e. the gene with the highest connectivity, for eachmodule was identified with the WGCNA package.
Supplementary informationSupplementary information accompanies this paper at https://doi.org/10.1186/s12864-020-6549-5.
Additional File 1: Table S1. Number of reads and bases produced foreach RNA library used in assembly.
Additional File 2: Figure S1. E-value distribution of northern red oaksequence hits obtained in BLAST analysis against nr database, and metricsof transcriptome assembly obtained by Transrate.
Additional File 3: Figure S2. Second-tier GO terms assigned to north-ern red oak transcripts.
Additional File 4: Figure S3. Image of northern red oak leaf afterexposure to 125 ppb ozone for 28 days. Symptoms of toxicity in NROleaves are visible as inter-vein red stippling and small lesions.
Additional File 5: Table S2. Unique and common DEGs in ozonestress.
Additional File 6: Figure S4. Enriched GO terms for ozone stress.
Additional File 7: Table S3. Enriched KEGG pathways of ozone stress.
Additional File 8: Table S4. Profiles of clustered DGEs over time-seriesanalysis by STEM.
Additional File 9: Table S5. Coexpression network data, includingmodule membership for all genes, top hub gene for each module, andenriched GO and KEG terms for the modules most strongly correlated toexperimental factors
AbbreviationsABCG 11: ABC transporter family G member 11; BP: Biological process;CC: Cellular component; DEG: Differential expressed gene; EC: Enzymecommission; EDS1: Enhanced disease susceptibility 1; ETI: Effector-triggerimmunity; FDR: False discovery rate; GGDP: Geranylgeranyl pyrophosphate;GO: Gene ontology; HMG-CoA: 3-Hydroxy-3-methylglutaryl-coenzyme A;HR: Hypersensitive response; HSP: Heat shock protein; IPP: Isopentenylpyrophosphate; IPS: Interproscan; KEGG: Kyoto encyclopedia of genes andgenomes; MEP: Methylerythritol phosphate; MF: Molecular function;MVA: Mevalonic acid; NRO: Northern red oak; O3: ozone; ORF: Open readingframe; PPB: Part per billion; PR: Pathogenesis-related protein; PTI: Pathogen-associated molecular pattern-triggered immunity; ROS: Reactive oxygenspecies; TCA: Citrate cycle
AcknowledgementsThe authors thank Lynn Tomsho and Nicole Zembower for expert technicalassistance with the 454 and Illumina sequencing and clerical assistance. Theauthors also thank the Bionformatics Resource Center of the University ofTennessee, Knoxville for providing Blast2Go software, and Purdue Universityfor providing Northern red oak resources.
Authors’ contributionsNS analyzed and interpreted the data and prepared the manuscript. TBperformed ozone chamber experiments and RNA extractions. DG and CNassisted with ozone chamber experiments and were supervised by KS andJC. JC and JRS were responsible for acquisition of funding to support theresearch and original conception of the overall project. JRS collected tissuesfor sequencing. DM performed library preparation and sequencing and wassupervised by SS. MS and KG directed the data analysis aspects of theresearch and edited the manuscript. All authors read and approved the finalmanuscript.
FundingThis work was primarily supported by the NSF PGRP-OIS-1025974 “Compara-tive Genomics of Environmental Stress Responses in North American Hard-woods” grant (PI John Carlson). This work was also supported by the USDANational Institute of Food and Federal Appropriations under ProjectPEN04532 and Accession number 1000326, and by The Louis W. Schatz Cen-ter for Tree Molecular Genetics.
Availability of data and materialsAll RNA-Seq data are available in the NCBI Sequence Read Archive databaseunder BioProject accession number PRJNA273270. The reference transcrip-tome sequences are available on the Hardwood Genomics Project website(https://www.hardwoodgenomics.org/Transcriptome-assembly/1963023).
Ethics approval and consent to participateNot applicable.
Consent for publicationNot applicable.
Competing interestsThe authors declare that they have no competing interests.
Author details1The Department of Entomology and Plant Pathology, University ofTennessee, Knoxville, TN 37996, USA. 2The Department of Ecosystem Science
Soltani et al. BMC Genomics (2020) 21:160 Page 15 of 18

and Management, Pennsylvania State University, University Park, PA 16802,USA. 3Department of Biological & Environmental Sciences, University of WestAlabama, Livingston, AL 35470, USA. 4Department of Biological Sciences,Notre Dame University, 46556 Notre Dame, IN, France. 5Singapore Centre forEnvironmental Life Sciences Engineering (SCELSE) Nanyang TechnologicalUniversity, Nanyang Avenue 637551, Singapore.
Received: 10 April 2019 Accepted: 31 January 2020
References1. Sork VL, Stowe KA, Hochwender C. Evidence for local adaptation in closely
adjacent subpopulations of northern red oak (Quercus rubra L.) expressed asresistance to leaf herbivores. The Am Nat. 1993;142(6):928–36.
2. Luppold WG, Bumgardner MS. Examination of lumber price trends for majorhardwood species. Wood Fiber Sci. 2007;39(3):404–13.
3. Godfrey RK. Trees, shrubs, and woody vines of northern Florida andadjacent Georgia and Alabama. Athens: University of Georgia Press; 1988.
4. Sander IL. Quercus rubra L. northern red oak. Silvics North Am. 1990;2:727–33.5. Newell Wohner PJ, Cooper RJ, Greenberg RS, Schweitzer SH. Weather affects
diet composition of rusty blackbirds wintering in suburban landscapes.JWildlife Manage. 2016;80(1):91–100.
6. Abrams MD. The postglacial history of oak forests in eastern North America.Oak Forest Ecosystems Ecol. 2002;3445:34–45.
7. Steiner KC. Autumn predation of northern red oak seed crops. In:Gottschalk, Kurt W; Fosbroke, Sandra LC, ed Proceedings, 10th CentralHardwood Forest Conference; 1995 March 5–8; Morgantown, WV: Gen TechRep NE-197 Radnor, PA: US Dep Agric, Forest Serv, Northeastern Forest ExpStation 489–494: 1995; 1995.
8. Rodríguez-Correa H, Oyama K, Quesada M, Fuchs EJ, González-Rodríguez A.Contrasting patterns of population history and seed-mediated gene flow intwo endemic Costa Rican oak species. J Hered. 2018;1:13.
9. Oyama K, Herrera-Arroyo ML, Rocha-Ramírez V, Benítez-Malvido J, Ruiz-Sánchez E, González-Rodríguez A. Gene flow interruption in a recentlyhuman-modified landscape: the value of isolated trees for the maintenanceof genetic diversity in a Mexican endemic red oak. Forest Ecol Manag. 2017;390:27–35.
10. Makela M, Michael P, Theriault G, Nkongolo K. High genetic variationamong closely related red oak (Quercus rubra) populations in an ecosystemunder metal stress: analysis of gene regulation. Genes Genom. 2016;38(10):967–76.
11. Lind-Riehl J, Gailing O. Fine-scale spatial genetic structure of two red oakspecies, Quercus rubra and Quercus ellipsoidalis. Plant Syst Evol. 2015;301(6):1601–12.
12. Alexander LW, Woeste KE. Pyrosequencing of the northern red oak (Quercusrubra L.) chloroplast genome reveals high quality polymorphisms forpopulation management. Tree Genet Genomes. 2014;10(4):803–12.
13. Law JR, Gott JD. Oak mortality in the Missouri Ozarks. In: Proceedings of theCentral Hardwood Forest Conference: 1987: University of Tennessee:Knoxville, TN, USA; 1987: 427–436.
14. Heitzman E, Muzika R-M, Kabrick J, Guldin JM. Assessment of oak decline inMissouri, Arkansas, and Oklahoma. In: In: Yaussy, Daniel A; Hix, David M;Long, Robert P; Goebel, P Charles, eds Proceedings, 14th Central HardwoodForest Conference; 2004 March 16–19; Wooster, OH Gen Tech Rep NE-316Newtown Square, PA: US Department of Agric, Forest Serv, NortheasternRes Station: 510: 2004; 2004.
15. Crosby MK, Fan Z, Spetich MA, Leininger TD, Fan X. Early indications ofdrought impacts on forests in the southeastern United States. Forest Chron.2015;91(4):376–83.
16. Gottardini E, Cristofori A, Pellegrini E, La Porta N, Nali C, Baldi P, Sablok G.Suppression substractive hybridization and NGS reveal differentialtranscriptome expression profiles in wayfaring tree (Viburnum lantana L.)treated with ozone. Front Plant Sci. 2016;7:713.
17. Rustad L, Campbell J, Dukes JS, Huntington T, Lambert KF, Mohan J,Rodenhouse N. Changing climate, changing forests: the impacts of climatechange on forests of the northeastern United States and eastern Canada.Gen Tech Rep. 2012;99:1–48.
18. Gribko LS, Schuler TM, Ford WM. Biotic and abiotic mechanisms in theestablishment of northern red oak seedlings: a review. Gen Tech Rep. 2002;295:18.
19. McLaughlin SB, Nosal M, Wullschleger SD, Sun G. Interactive effects ofozone and climate on tree growth and water use in a southernAppalachian forest in the USA. New Phytol. 2007;174(1):109–24.
20. Skärby L, Troeng E, Boström C-Å. Ozone uptake and effects on transpiration,net photosynthesis, and dark respiration in scots pine. For Sci. 1987;33(3):801–8.
21. Chappelka AH, Samuelson LJ. Ambient ozone effects on forest trees of theeastern United States: a review. New Phytol. 1998;139(1):91–108.
22. Bonello P, Heller W, Sandermann H. Ozone effects on root-diseasesusceptibility and defence responses in mycorrhizal and non-mycorrhizalseedlings of scots pine (Pinus sylvestris L.). New Phytol. 1993;124(4):653–63.
23. Cannon JRWN. Gypsy moth (Lepidoptera: Lymantriidae) consumption andutilization of northern red oak and white oak foliage exposed to simulatedacid rain and ozone. Environ Entomol. 1993;22(3):669–73.
24. Coleman JS, Jones CG. Plant stress and insect performance: cottonwood,ozone and a leaf beetle. Oecologia. 1988;76(1):57–61.
25. Fierke M, Kinney D, Salisbury V, Crook D, Stephen F. Development andcomparison of intensive and extensive sampling methods and preliminarywithin-tree population estimates of red oak borer (Coleoptera:Cerambycidae) in the Ozark Mountains of Arkansas. Environ Entomol. 2005;34(1):184–92.
26. Wright SL, Hall RW, Peacock JW. Effect of simulated insect damage ongrowth and survival of northern red oak (Quercus rubra L.) seedlings.Environ Entomol. 1989;18(2):235–9.
27. Donley DE. Number, size, and location of red oak borer, Enaphalodes rufulusHaldeman, attack sites on red oaks in Indiana. Proc 3rd Cent HardwoodForest Conference. 1980;1980:16–7.
28. Lovett GM, Canham CD, Arthur MA, Weathers KC, Fitzhugh RD. Forestecosystem responses to exotic pests and pathogens in eastern NorthAmerica. AIBS Bull. 2006;56(5):395–405.
29. Neale DB, Kremer A. Forest tree genomics: growing resources andapplications. Nat Rev Genet. 2011;12(2):111.
30. Magalhães AP, Verde N, Reis F, Martins I, Costa D, Lino-Neto T, Castro PH,Tavares RM, Azevedo H. RNA-Seq and gene network analysis uncoveractivation of an ABA-dependent signalosome during the cork oak rootresponse to drought. Front Plant Sci. 2016;6:1195.
31. Le Provost G, Lesur I, Lalanne C, Da Silva C, Labadie K, Aury JM, Leple JC,Plomion C. Implication of the suberin pathway in adaptation towaterlogging and hypertrophied lenticels formation in pedunculate oak(Quercus robur L.). Tree Physiol. 2016;36(11):1330–42.
32. Gugger PF, Peñaloza-Ramírez JM, Wright JW, Sork VL. Whole-transcriptomeresponse to water stress in a California endemic oak. Quercus lobata TreePhysiol. 2017;37(5):632–44.
33. Schmid-Siegert E, Sarkar N, Iseli C, Calderon S, Gouhier-Darimont C, Chrast J,Cattaneo P, Schütz F, Farinelli L, Pagni M. Low number of fixed somaticmutations in a long-lived oak tree. Nat Plants. 2017;3(12):926.
34. Kurth F, Feldhahn L, Bönn M, Herrmann S, Buscot F, Tarkka MT. Large scaletranscriptome analysis reveals interplay between development of foresttrees and a beneficial mycorrhiza helper bacterium. BMC Genomics. 2015;16(1):658.
35. Maboreke HR, Feldhahn L, Bönn M, Tarkka MT, Buscot F, Herrmann S,Menzel R, Ruess L. Transcriptome analysis in oak uncovers a strong impactof endogenous rhythmic growth on the interaction with plant-parasiticnematodes. BMC Genomics. 2016;17(1):627.
36. Pereira-Leal JB, Abreu IA, Alabaça CS, Almeida MH, Almeida P, Almeida T,Amorim MI, Araújo S, Azevedo H, Badia A. A comprehensive assessment ofthe transcriptome of cork oak (Quercus suber) through EST sequencing. BMCGenomics. 2014;15(1):371.
37. Usié A, Simões F, Barbosa P, Meireles B, Chaves I, Gonçalves S, Folgado A,Almeida MH, Matos J, Ramos AM. Comprehensive analysis of the cork oak(Quercus suber) transcriptome involved in the regulation of bud sprouting.Forests. 2017;8(12):486.
38. Gugger PF, Cokus SJ, Sork VL. Association of transcriptome-wide sequencevariation with climate gradients in valley oak (Quercus lobata). Tree GenetGenomes. 2016;12(2):15.
39. Orendovici-Best T, Skelly JM, Davis DD. Spatial and temporal patterns ofground-level ozone within north-Central Pennsylvania forests. NortheastNat. 2010:247–60.
40. Comrie AC. A synoptic climatology of rural ozone pollution at three forestsites in Pennsylvania. Atmos Environ. 1994;28(9):1601–14.
41. Sharma YK, Davis KR. Ozone-induced expression of stress-related genes inArabidopsis thaliana. Plant Physiol. 1994;105(4):1089–96.
Soltani et al. BMC Genomics (2020) 21:160 Page 16 of 18

42. Evans NH, McAinsh MR, Hetherington AM, Knight MR. ROS perception inArabidopsis thaliana: the ozone-induced calcium response. Plant J. 2005;41(4):615–26.
43. Mahalingam R, Jambunathan N, Gunjan SK, Faustin E, Weng H, Ayoubi P.Analysis of oxidative signalling induced by ozone in Arabidopsis thaliana.Plant Cell Environ. 2006;29(7):1357–71.
44. Denk T, Grimm GW, Manos PS, Deng M, Hipp AL. An updated infragenericclassification of the oaks: review of previous taxonomic schemes andsynthesis of evolutionary patterns. In: Oaks Physiological Ecology Exploringthe Functional Diversity of Genus Quercus L. New York City: Springer; 2017;7:13–38.
45. Sork VL, Fitz-Gibbon ST, Puiu D, Crepeau M, Gugger PF, Sherman R, StevensK, Langley CH, Pellegrini M, Salzberg SL. First draft assembly and annotationof the genome of a California endemic oak Quercus lobata Née (Fagaceae).G3: Genes Genomes Genet. 2016;6(11):3485–95.
46. Plomion C, Aury J-M, Amselem J, Leroy T, Murat F, Duplessis S, Faye S,Francillonne N, Labadie K, Le Provost G. Oak genome reveals facets of longlifespan. Nat Plants. 2018;4(7):440.
47. Ramos AM, Usié A, Barbosa P, Barros PM, Capote T, Chaves I, Simões F,Abreu I, Carrasquinho I, Faro C. The draft genome sequence of cork oak. SciData. 2018;5:180069.
48. Ernst J, Bar-Joseph Z. STEM: a tool for the analysis of short time series geneexpression data. BMC Bioinform. 2006;7(1):191.
49. Lesur I, Bechade A, Lalanne C, Klopp C, Noirot C, Leplé JC, Kremer A,Plomion C, Le Provost G. A unigene set for European beech (Fagus sylvaticaL.) and its use to decipher the molecular mechanisms involved in dormancyregulation. Mol Ecol Resour. 2015;15(5):1192–204.
50. Torre S, Tattini M, Brunetti C, Fineschi S, Fini A, Ferrini F, Sebastiani F. RNA-seq analysis of Quercus pubescens leaves: de novo transcriptome assembly,annotation and functional markers development. PLoS One. 2014;9(11):e112487.
51. Lane T, Best T, Zembower N, Davitt J, Henry N, Xu Y, Koch J, Liang H, McGraw J,Schuster S. The green ash transcriptome and identification of genes respondingto abiotic and biotic stresses. BMC Genomics. 2016;17(1):702.
52. Müller M, Seifert S, Lübbe T, Leuschner C, Finkeldey R. De novotranscriptome assembly and analysis of differential gene expression inresponse to drought in European beech. PLoS One. 2017;12(9):e0184167.
53. Lulin H, Xiao Y, Pei S, Wen T, Shangqin H. The first Illumina-based de novotranscriptome sequencing and analysis of safflower flowers. PLoS One. 2012;7(6):e38653.
54. Xie F, Burklew CE, Yang Y, Liu M, Xiao P, Zhang B, Qiu D. De novosequencing and a comprehensive analysis of purple sweet potato(Impomoea batatas L.) transcriptome. Planta. 2012;236(1):101–13.
55. Ali M, Li P, She G, Chen D, Wan X, Zhao J. Transcriptome and metaboliteanalyses reveal the complex metabolic genes involved in volatile terpenoidbiosynthesis in garden sage (Salvia officinalis). Sci Rep. 2017;7(1):16074.
56. Sebastiana M, Vieira B, Lino-Neto T, Monteiro F, Figueiredo A, Sousa L, PaisMS, Tavares R, Paulo OS. Oak root response to ectomycorrhizal symbiosisestablishment: RNA-Seq derived transcript identification and expressionprofiling. PLoS One. 2014;9(5):e98376.
57. Yendrek CR, Koester RP, Ainsworth EA. A comparative analysis oftranscriptomic, biochemical, and physiological responses to elevated ozoneidentifies species-specific mechanisms of resilience in legume crops. J ExpBot. 2015;66(22):7101–12.
58. Bussotti F, Desotgiu R, Cascio C, Pollastrini M, Gravano E, Gerosa G, MarzuoliR, Nali C, Lorenzini G, Salvatori E. Ozone stress in woody plants assessedwith chlorophyll a fluorescence. A critical reassessment of existing data.Environ Exp Bot. 2011;73:19–30.
59. Fernie AR, Carrari F, Sweetlove LJ. Respiratory metabolism: glycolysis, theTCA cycle and mitochondrial electron transport. Curr Opin Plant Biol. 2004;7(3):254–61.
60. Ludwikow A, Sadowski J. Gene networks in plant ozone stress response andtolerance. J Integr Plant Biol. 2008;50(10):1256–67.
61. Pellegrini E, Francini A, Lorenzini G, Nali C. Ecophysiological and antioxidanttraits of Salvia officinalis under ozone stress. Environ Sci Pollut Res. 2015;22(17):13083–93.
62. Zhang L, Xu B, Wu T, Wen M-X, Fan L-X, Feng Z-Z, Paoletti E. Transcriptomicanalysis of Pak Choi under acute ozone exposure revealed regulatorymechanism against ozone stress. BMC Plant Biol. 2017, 17(1):236.
63. Dizengremel P. Effects of ozone on the carbon metabolism of forest trees.Plant Physiol Bioch. 2001;39(9):729–42.
64. Heath R, Taylor G. Physiological processes and plant responses to ozoneexposure. In: Forest decline and ozone. Springer; 1997. p. 317–68.
65. Miller JD, Arteca RN, Pell EJ. Senescence-associated gene expression duringozone-induced leaf senescence in Arabidopsis. Plant Physiol. 1999;120(4):1015–24.
66. Gielen B, Löw M, Deckmyn G, Metzger U, Franck F, Heerdt C, Matyssek R,Valcke R, Ceulemans R. Chronic ozone exposure affects leaf senescence ofadult beech trees: a chlorophyll fluorescence approach. J Exp Bot. 2006;58(4):785–95.
67. Sawai S, Saito K. Triterpenoid biosynthesis and engineering in plants.FrontPlant Sci. 2011;2:25.
68. Szakiel A, Pączkowski C, Henry M. Influence of environmental abiotic factorson the content of saponins in plants. Phytochem Rev. 2011;10(4):471–91.
69. Osbourn AE. Preformed antimicrobial compounds and plant defenseagainst fungal attack. Plant Cell. 1996;8(10):1821.
70. Gonzalez-Coloma A, Reina M, Diaz CE, Fraga BM. Santana-Meridas O. Naturalproduct-based biopesticides for insect control in Comprehensive NaturalProducts. 2013;3:237–68.
71. Loreto F, Schnitzler J-P. Abiotic stresses and induced BVOCs. Trends PlantSci. 2010;15(3):154–66.
72. Saleem M, Nazir M, Ali MS, Hussain H, Lee YS, Riaz N, Jabbar A.Antimicrobial natural products: an update on future antibiotic drugcandidates. Nat Prod Rep. 2010;27(2):238–54.
73. Calfapietra C, Wiberley AE, Falbel TG, Linskey AR, Mugnozza GS, Karnosky DF,Loreto F, Sharkey TD. Isoprene synthase expression and protein levels arereduced under elevated O3 but not under elevated CO2 (FACE) in field-grownaspen trees. Plant Cell Environ. 2007;30(5):654–61.
74. Gill SS, Tuteja N. Reactive oxygen species and antioxidant machinery in abioticstress tolerance in crop plants. Plant Physiol Bioch. 2010;48(12):909–30.
75. Møller IM, Jensen PE, Hansson A. Oxidative modifications to cellularcomponents in plants. Annu Rev Plant Biol. 2007;58:459–81.
76. Rejeb I, Pastor V, Mauch-Mani B. Plant responses to simultaneous biotic andabiotic stress: molecular mechanisms. Plants. 2014;3(4):458–75.
77. Atkinson NJ, Urwin PE. The interaction of plant biotic and abiotic stresses:from genes to the field. J Exp Bot. 2012;63(10):3523–43.
78. Toyota M, Spencer D, Sawai-Toyota S, Jiaqi W, Zhang T, Koo AJ, Howe GA,Gilroy S. Glutamate triggers long-distance, calcium-based plant defensesignaling. Science. 2018;361(6407):1112–5.
79. Eckey-Kaltenbach H, Kiefer E, Grosskopf E, Ernst D, Sandermann H.Differential transcript induction of parsley pathogenesis-related proteins andof a small heat shock protein by ozone and heat shock. Plant Mol Biol.1997;33(2):343–50.
80. Kärenlampi SO, Airaksinen K, Miettinen AT, Kokko HI, Holopainen JK,Kärenlampi LV, Karjalainen RO. Pathogenesis-related proteins in ozone-exposed Norway spruce [Picea abies (karst) L.]. New Phytol. 1994;126(1):81–9.
81. Ernst D, Schraudner M, Langebartels C, Sandermann H. Ozone-inducedchanges of mRNA levels of β-1, 3-glucanase, chitinase and ‘pathogenesis-related’protein 1b in tobacco plants. Plant Mol Biol. 1992;20(4):673–82.
82. Banerjee A, Roychoudhury A. Rice responses and tolerance to elevatedozone: Advances in Rice Research for Abiotic Stress Tolerance. Elsevier;2019. p. 399–411.
83. Felzer B, Kicklighter D, Melillo J, Wang C, Zhuang Q, Prinn R. Effects ofozone on net primary production and carbon sequestration in theconterminous United States using a biogeochemistry model. Tellus B: ChemPhys Meteorol. 2004;56(3):230–48.
84. Reddy GN, Arteca RN, Dai YR, Flores H, Negm F, Pell E. Changes in ethyleneand polyamines in relation to mRNA levels of the large and small subunitsof ribulose bisphosphate carboxylase/oxygenase in ozone-stressed potatofoliage. Plant Cell Environ. 1993;16(7):819–26.
85. Jolivet Y, Bagard M, Cabané M, Vaultier M-N, Gandin A, Afif D, DizengremelP, Le Thiec D. Deciphering the ozone-induced changes in cellular processes:a prerequisite for ozone risk assessment at the tree and forest levels. AnnForest Sci. 2016;73(4):923–43.
86. Wittig VE, Ainsworth EA, Long SP. To what extent do current and projectedincreases in surface ozone affect photosynthesis and stomatal conductanceof trees? A meta-analytic review of the last 3 decades of experiments. PlantCell Environ. 2007;30(9):1150–62.
87. Saxe H. Physiological responses of trees to ozone-interactions andmechanisms. Curr T Plant Biol. 2002;3:27–55.
88. Waldeck N, Burkey K, Carter T, Dickey D, Song Q, Taliercio E. RNA-Seq studyreveals genetic responses of diverse wild soybean accessions to increasedozone levels. BMC Genomics. 2017;18(1):498.
Soltani et al. BMC Genomics (2020) 21:160 Page 17 of 18

89. Feng Z, Kobayashi K. Assessing the impacts of current and futureconcentrations of surface ozone on crop yield with meta-analysis. AtmosEnviron. 2009;43(8):1510–9.
90. Dann MS, Pell EJ. Decline of activity and quantity of ribulose bisphosphatecarboxylase/oxygenase and net photosynthesis in ozone-treated potatofoliage. Plant Physiol. 1989;91(1):427–32.
91. Reich PB, Amundson RG. Ambient levels of ozone reduce netphotosynthesis in tree and crop species. Science. 1985;230(4725):566–70.
92. Samuelson L, Kelly J. Carbon partitioning and allocation in northern red oakseedlings and mature trees in response to ozone. Tree Physiol. 1996;16(10):853–8.
93. Edwards GS, Wullschleger SD, Kelly JM. Growth and physiology of northernred oak: preliminary comparisons of mature tree and seedling responses toozone. Environ Pollut. 1994;83(1–2):215–21.
94. Hanson P, Samuelson L, Wullschleger S, Tabberer T, Edwards G. Seasonalpatterns of light-saturated photosynthesis and leaf conductance for matureand seedling Quercus rubra L. foliage: differential sensitivity to ozoneexposure. Tree Physiol. 1994;14(12):1351–66.
95. Pell E, Temple P, Friend A, Mooney H, Winner W. Compensation as a plantresponse to ozone and associated stresses: an analysis of ROPISexperiments. J Environ Qual. 1994;23(3):429–36.
96. Xu E, Vaahtera L, Horak H, Hincha DK, Heyer AG, Brosche M. Quantitativetrait loci mapping and transcriptome analysis reveal candidate genesregulating the response to ozone in Arabidopsis thaliana. Plant Cell Environ.2015;38(7):1418–33.
97. Langebartels C, Wohlgemuth H, Kschieschan S, Grün S, Sandermann H.Oxidative burst and cell death in ozone-exposed plants. Plant Physiol Bioch.2002;40(6–8):567–75.
98. Liu J-J, Sturrock R, Ekramoddoullah AK. The superfamily of thaumatin-likeproteins: its origin, evolution, and expression towards biological function.Plant Cell Rep. 2010;29(5):419–36.
99. Tarr PT, Tarling EJ, Bojanic DD, Edwards PA, Baldán Á. Emerging newparadigms for ABCG transporters. Biochimica et Biophysica Acta -Mol CellBiol Lipids. 2009;1791(7):584–93.
100. Torii KU. Leucine-rich repeat receptor kinases in plants: structure, function,and signal transduction pathways. Int Rev Cytol. 2004;234:1–46.
101. Konar A, Choudhury O, Bullis R, Fiedler L, Kruser JM, Stephens MT, Gailing O,Schlarbaum S, Coggeshall MV, Staton ME. High-quality genetic mappingwith ddRADseq in the non-model tree Quercus rubra. BMC Genomics. 2017;18(1):417.
102. Heck WW, Philbeck RB, Dunning JA. A continuous stirred tank reactor (CSTR)system for exposing plants to gaseous air contaminants. Principles,specificatiions, construction, and operation [Air pollution injuries, beans].ARS-S-US. Agric Res Serv. 1978;181.
103. Orendovici T, Skelly J, Ferdinand J, Savage J, Sanz M-J, Smith G. Response ofnative plants of northeastern United States and southern Spain to ozoneexposures; determining exposure/response relationships. Environ Pollut.2003;125(1):31–40.
104. Chang S, Puryear J, Cairney J. A simple and efficient method for isolatingRNA from pine trees. Plant Mol Biol Rep. 1993;11(2):113–6.
105. Poinar HN, Schwarz C, Qi J, Shapiro B, MacPhee RD, Buigues B, Tikhonov A,Huson DH, Tomsho LP, Auch A. Metagenomics to paleogenomics: large-scale sequencing of mammoth DNA. Science. 2006;311(5759):392–4.
106. Andrews S. FastQC: a quality control tool for high throughput sequencedata; 2010.
107. Bolger AM, Lohse M, Usadel B. Trimmomatic: a flexible trimmer for Illuminasequence data. Bioinformatics. 2014;30(15):2114–20.
108. Grabherr MG, Haas BJ, Yassour M, Levin JZ, Thompson DA, Amit I, Adiconis X,Fan L, Raychowdhury R, Zeng Q, et al. Full-length transcriptome assembly fromRNA-Seq data without a reference genome. Nat Biotechnol. 2011;29(7):644.
109. Fu L, Niu B, Zhu Z, Wu S, Li W. CD-HIT: accelerated for clustering the next-generation sequencing data. Bioinformatics. 2012;28(23):3150–2.
110. Smith-Unna R, Boursnell C, Patro R, Hibberd JM, Kelly S. TransRate:reference-free quality assessment of de novo transcriptome assemblies.Genome Res. 2016.
111. Haas BJ, Papanicolaou A, Yassour M, Grabherr M, Blood PD, Bowden J,Couger MB, Eccles D, Li B, Lieber M. De novo transcript sequencereconstruction from RNA-seq using the trinity platform for referencegeneration and analysis. Nat Protoc. 2013;8(8):1494.
112. Simão FA, Waterhouse RM, Ioannidis P, Kriventseva EV, Zdobnov EM.BUSCO: assessing genome assembly and annotation completeness withsingle-copy orthologs. Bioinformatics. 2015;31(19):3210–2.
113. Conesa A, Götz S. Blast2GO: a comprehensive suite for functional analysis inplant genomics. Int J Plant Genomics. 2008;2008:12.
114. Altschul SF, Gish W, Miller W, Myers EW, Lipman DJ. Basic local alignmentsearch tool. J Mol Biol. 1990;215(3):403–10.
115. Ashburner M, Ball CA, Blake JA, Botstein D, Butler H, Cherry JM, Davis AP,Dolinski K, Dwight SS, Eppig JT, et al. Gene ontology: tool for the unificationof biology. The Gene Ontology Consortium Nat Genet. 2000;25(1):25–9.
116. Ye J, Fang L, Zheng H, Zhang Y, Chen J, Zhang Z, Wang J, Li S, Li R, BolundL, et al. WEGO: a web tool for plotting GO annotations. Nucleic Acids Res.2006;34(Web Server issue):W293–7.
117. Anders S, Pyl PT, Huber W. HTSeq--a Python framework to work with high-throughput sequencing data. Bioinform. 2015;31(2):166–9.
118. Robinson MD, McCarthy DJ, Smyth GK. edgeR: a bioconductor package fordifferential expression analysis of digital gene expression data. Bioinform.2010;26(1):139–40.
119. Benjamini Y, Hochberg Y. Controlling the false discovery rate: a practicaland powerful approach to multiple testing. J Royal Stat Soc: Series B. 1995:289–300.
120. Oliveros JC. VENNY. An interactive tool for comparing lists with VennDiagrams. 2007-2015. https://bioinfogp.cnb.csic.es/tools/venny/index.html.Accessed 6 Feb 2020.
121. Tian T, Liu Y, Yan H, You Q, Yi X, Du Z, Xu W, Su Z. agriGO v2.0: a GOanalysis toolkit for the agricultural community, 2017 update. Nucleic AcidsRes. 2017;45(W1):W122–9.
122. Xie C, Mao X, Huang J, Ding Y, Wu J, Dong S, Kong L, Gao G, Li CY, Wei L.KOBAS 2.0: a web server for annotation and identification of enrichedpathways and diseases. Nucleic Acids Res. 2011;39(Web Server issue):W316–22.
123. Langfelder P, Horvath S. WGCNA: an R package for weighted correlationnetwork analysis. BMC Bioinform. 2008;9(1):559.
Publisher’s NoteSpringer Nature remains neutral with regard to jurisdictional claims inpublished maps and institutional affiliations.
Soltani et al. BMC Genomics (2020) 21:160 Page 18 of 18