Peripheral endothelial dysfunction in patients with pulmonary arterial hypertension

Time-domain analysis of heart sound intensity in children with and without pulmonaryartery hypertension: a pilot study using a digital stethoscopeAuthor(s): Mohamed Elgendi, Prashant Bobhate, Shreepal Jain, Jennifer Rutledge, James Y.Coe, Roger Zemp, Dale Schuurmans, and Ian AdatiaSource: Pulmonary Circulation, Vol. 4, No. 4 (December 2014), pp. 685-695Published by: The University of Chicago Press on behalf of Pulmonary Vascular Research InstituteStable URL: http://www.jstor.org/stable/10.1086/678513 .
Accessed: 03/12/2014 20:32
Your use of the JSTOR archive indicates your acceptance of the Terms & Conditions of Use, available at .http://www.jstor.org/page/info/about/policies/terms.jsp
.JSTOR is a not-for-profit service that helps scholars, researchers, and students discover, use, and build upon a wide range ofcontent in a trusted digital archive. We use information technology and tools to increase productivity and facilitate new formsof scholarship. For more information about JSTOR, please contact [email protected].
.
The University of Chicago Press and Pulmonary Vascular Research Institute are collaborating with JSTOR todigitize, preserve and extend access to Pulmonary Circulation.
http://www.jstor.org
This content downloaded from 142.244.5.111 on Wed, 3 Dec 2014 20:32:52 PMAll use subject to JSTOR Terms and Conditions

OR I G I N A L R E S E A R CH
Time-domain analysis of heart sound intensity in children
with and without pulmonary artery hypertension:
a pilot study using a digital stethoscope
Mohamed Elgendi,1 Prashant Bobhate,2 Shreepal Jain,2 Jennifer Rutledge,2,3 James Y. Coe,2,3
Roger Zemp,4 Dale Schuurmans,1 Ian Adatia2,3
1Department of Computing Science, University of Alberta, Edmonton, Alberta, Canada; 2Department of Pediatrics, StolleryChildren’s Hospital, University of Alberta, Edmonton, Alberta, Canada; 3Mazankowski Alberta Heart Institute, Edmonton,Alberta, Canada; 4School of Biomedical Engineering, University of Alberta, Edmonton, Alberta, Canada
Abstract: We studied digital stethoscope recordings in children undergoing simultaneous catheterization of
the pulmonary artery (PA) to determine whether time-domain analysis of heart sound intensity would aid
in the diagnosis of PA hypertension (PAH). Heart sounds were recorded and stored in .wav mono audio
format. We performed recordings for 20 seconds with sampling frequencies of 4,000 Hz at the second left
intercostal space and the cardiac apex. We used programs written in the MATLAB 2010b environment to
analyze signals. We annotated events representing the first (S1) and second (S2) heart sounds and the aortic
(A2) and pulmonary (P2) components of S2. We calculated the intensity (I ) of the extracted event area (x) asIk ¼ on
i¼1ðxkðiÞÞ2, where n is the total number of heart sound samples in the extracted event and k is A2, P2,S1, or S2. We defined PAH as mean PA pressure (mPAp) of at least 25 mmHg with PA wedge pressure of
less than 15 mmHg. We studied 22 subjects (median age: 6 years [range: 0.25–19 years], 13 female), 11 with
PAH (median mPAp: 55 mmHg [range: 25–97 mmHg]) and 11 without PAH (median mPAp: 15 mmHg
[range: 8–24 mmHg]). The P2 ∶A2 (P ¼ .0001) and P2 ∶S2 (P ¼ .0001) intensity ratios were significantly dif-
ferent between subjects with and those without PAH. There was a linear correlation (r > 0.7) between the
P2 ∶S2 and P2 ∶A2 intensity ratios and mPAp. We found that the P2 ∶A2 and P2 ∶S2 intensity ratios discrim-
inated between children with and those without PAH. These findings may be useful for developing an acous-
tic device to diagnose PAH.
Keywords: auscultation, second heart sound, phonocardiography, machine learning.
Pulm Circ 2014;4(4):685-695. DOI: 10.1086/678513.
INTRODUCTION
Pulmonary artery hypertension (PAH) is a serious condi-
tion that imposes a global disease burden. If untreated,
PAH has a high mortality, whether the cause of the dis-
ease is idiopathic, genetic mutation, or a complication of
cardiac or pulmonary disease.1,2 PAH is often diagnosed
late because early clinical recognition is difficult, even af-
ter the onset of symptoms. There is, therefore, a need to
explore or reevaluate the clinical diagnosis of PAH.
The auscultatory and phonocardiographic indicators of
PAH have been described well, with plausible biological
explanations for the findings.3,4 Clinical indicators of PAH
include increased loudness of the pulmonary component
(P2) of the second heart sound (S2) and increased trans-
mission of P2 to the cardiac apex. However, for the most
part these descriptions predated the use of new digital
stethoscopes, which are readily available and have the ca-
pability of recording and transmitting to a computer an
acoustic tracing that can be optimized and analyzed later.
There have been a few approaches to the noninvasive diag-
nosis of PAH combining phonocardiography and mathe-
matical concepts. These investigators, for the most part,
concentrated on the difficult task of identifying reliably
and precisely S2, A2 (the aortic component of S2), P2, and
the splitting interval between A2 and P2.5-8 We undertook
Address correspondence to Dr. Ian Adatia, Room 4C1.19, Stollery Children’s Hospital, 8440 112 Street, Edmonton, Alberta T6G 2B7, Canada.
E-mail: [email protected].
Submitted March 1, 2014; Accepted July 13, 2014; Electronically published October 23, 2014.
© 2014 by the Pulmonary Vascular Research Institute. All rights reserved. 2045-8932/2014/0404-0014. $15.00.
This content downloaded from 142.244.5.111 on Wed, 3 Dec 2014 20:32:52 PMAll use subject to JSTOR Terms and Conditions

a pilot study to characterize the acoustic recordings of the
heart sounds in children with and without PAH. Our con-
cern was not precise localization of S2, A2, and P2 but
rather a general exploration of the extracted features of
the heart sounds that could provide relevant diagnostic in-
formation.
Sound signals, such as the heart sounds, may be ana-
lyzed in two modes, either the time domain or the fre-
quency domain. Time-domain analysis quantifies the sig-
nal behavior over time and is plotted as voltage, current,
or, in the case of heart sounds, intensity against time (sec-
onds). In frequency-domain analysis, the component fre-
quencies are spread across a frequency spectrum and are
represented as peaks in the frequency spectrogram in
units of hertz. We have reported the characteristics of the
heart sounds in the frequency domain in children with
and without pulmonary hypertensive vascular disease.9
We hypothesized that, using recordings from a digital
stethoscope, we might extract features of the heart sounds
in the time domain around A2 and P2 that might differ
between subjects with and those without PAH, rather
than localizing A2 and P2 precisely. Therefore, we sought
to extract features of the heart sounds obtained by digital
stethoscope recordings from subjects with and without
PAH, in an attempt to correlate these features with the
simultaneously and directly measured pulmonary artery
(PA) pressure at cardiac catheterization.
METHODS
The Research Ethics Board of the University of Alberta ap-
proved the study. All subjects or their parents gave in-
formed and written consent to participate in the study. In-
formed assent was obtained from children who had reached
sufficient developmental ability.
Clinical data collectionWe approached pediatric-aged subjects undergoing right
heart cardiac catheterization that was required for man-
agement of their underlying condition for inclusion in the
study. We excluded subjects with congenitally abnormal
aortic, pulmonary, or prosthetic valves.
The heart sounds were recorded with a 3M Littmann
3200 digital stethoscope, which works in conjunction with
Zargis Cardioscan software (Zargis Medical, Princeton, NJ)
to store recorded heart sounds in .wav mono audio format.
Heart sound recordings were obtained over 20 seconds,
with sampling frequencies of 4,000 Hz. We recorded the
heart sounds sequentially at the second left intercostal
space (2nd LICS) and the cardiac apex for 20 seconds.
We used the MATLAB 2010b (MathWorks, Natick, MA)
programming environment to implement methods for
signal analysis and optimization. Heart sounds were re-
corded simultaneously with the direct PA pressure mea-
surements obtained during right heart catheterization in
a standard manner. Other hemodynamic data, including
heart rate, PA wedge pressure (PAWp) or left atrial pres-
sure (LAp), right atrial pressure, oxygen consumption
(V:o2), and systemic pressure and pulmonary blood flow,
were collected within 5–10 minutes of the acoustic record-
ings. Pulmonary blood flow indexed to body surface area
(QPI) was measured either by thermodilution catheter
or by using the Fick equation with simultaneously mea-
sured V:o2. The V
:o2 was measured by mass spectroscopy
with the Ames 2000 or the Innocor (Innovision, Glams-
bjerg, Denmark).10 We calculated the pulmonary vascular
resistance index (PVRI) as mean PA pressure (mPAp)
minus mean PAWp (or mean LAp) divided by QPI. We
measured QRS duration in lead V1 and PR interval in
lead 2 from an electrocardiogram (ECG) recorded on the
day of the cardiac catheterization.
Annotation of S1 and S2We demarcated events containing S1 (the first heart sound)
and from those containing S2 by identifying, from the
acoustic recordings, events that were separated by intervals
compatible with the relative duration of systole and dias-
tole. Three cardiologists, blinded to the subjects’ PA pres-
sure, identified the timing of S1 and S2 independently.
They listened to acoustic recordings and marked S1 and
S2 on the phonocardiographic tracings. The cardiologists’
interpretation was in agreement with our observation that
in all of the subjects studied, the duration of diastole was
longer than that of systole. Thus, the events identified as
S1 and S2 occurred such that the interval between S1 and
S2 was shorter than the interval between S2 and S1. Within
these demarcated events, we identified the maximal posi-
tive and negative normalized amplitudes and annotated
these as reference points for S1 and S2 events (Fig. 1). It
is important to note that we did not identify S1 and S2 as
precise points in time but rather as sound events surround-
ing S1 and S2.
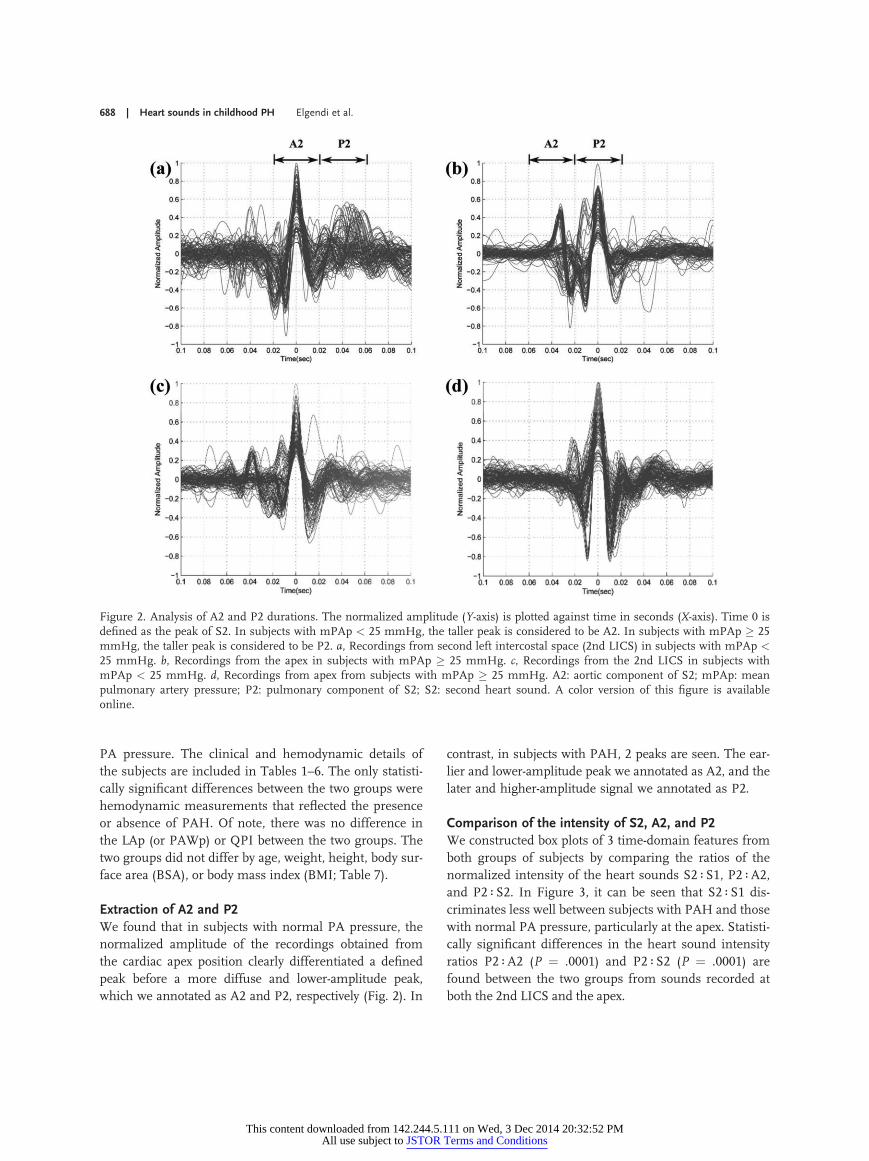
Annotation of A2 and P2PAH is defined as an mPAp of at least 25 mmHg and a
PAWp or LAp no higher than 15 mmHg, measured at
heart catheterization in subjects at rest.11-13 Therefore,
we divided the S1 and S2 events into groups, depending
on whether the recording originated from subjects with
mPAP of less than 25 mmHg or subjects with mPAp of
at least 25 mmHg. In all subjects, the mean PAWp or
686 | Heart sounds in childhood PH Elgendi et al.
This content downloaded from 142.244.5.111 on Wed, 3 Dec 2014 20:32:52 PMAll use subject to JSTOR Terms and Conditions

LAp was less than 15 mmHg. In order to find a reference
point for A2 and P2 events, we superimposed all the
events containing S2 recorded from the 2nd LICS and the
apex (Fig. 2). We chose time 0 to coincide with the nor-
malized amplitude peak. In subjects with mPAp of less
than 25 mmHg, we observed another event occurring af-
ter the main or reference peak. In subjects with mPAp of
at least 25 mmHg, we observed a secondary normalized
amplitude event occurring before the main or reference
peak. Thus, in subjects with mPAp of less than 25 mmHg
and on the basis of timing and the assumption that A2
occurs before P2, we annotated the reference peak as A2
and the following event as P2. In subjects with mPAp of
at least 25 mmHg, on the basis of timing and the assump-
tion that A2 occurs before P2 (none of the subjects had a
left bundle branch block), we designated the reference
peak as P2 and the preceding event as A2.
Intensity calculation of S2, A2, P2, and S1By visual inspection of the superimposed S2 waves
(Fig. 2), we observed that the duration of the events des-
ignated A2 and P2 was 0.04 seconds, that is, 0.02 sec-
onds on either side of the respective event peaks or refer-
ence point. Therefore, the duration of A2 and P2 events
was considered to be 0.04 seconds, and the total duration
of S2 events was considered to be 0.08 seconds. Similarly,
the S1 event was extracted from heart sound data within
0.04 seconds on either side of the reference point or peak
amplitude of S1 events.
We calculated the intensity (I ) of the extracted event
area (x), as Ik ¼ on
i¼1ðxkðiÞÞ2, where n is the total number
of heart sound samples in the extracted event and k is
A2, P2, S1, or S2. We compared the relative intensity of
the heart sound recordings at the apex and at the 2nd
LICS in subjects whose mPAp was less than 25 mmHg
(normal) with that in subjects whose mPAp was at least
25 mmHg (pulmonary hypertension) by comparing the
ratios of the heart sound intensity S2 ∶S1, P2 ∶A2, andP2 ∶S2 (Figs. 3–5).
Statistical methodsThe clinical and hemodynamic data from subjects with
mPAp of less than 25 mmHg and mPAp of at least
25 mmHg were compared using the Mann-WhitneyU test
for two independent groups, since the data were not nor-
mally distributed. A P value of less than .05 was consid-
ered significant. We used Pearson’s correlation coefficient
to define the correlation between the heart sound intensity
ratios P2 ∶S2 or P2 ∶A2 and the mPAp. We used Fisher’s
linear discriminant to test the separability of the extracted
features between subjects with and those without PAH.
RESULTS
We collected recordings from 26 subjects. In 22 subjects,
recordings were sufficiently free of background noise, ar-
tifacts, and low-amplitude signals to analyze at least one
complete 20-second recording from either the 2nd LICS
or the cardiac apex. Thus, we analyzed heart sound record-
ings from 22 children (9 males and 13 females). Twenty-
two recordings obtained at the apex were suitable for
analysis (11 subjects with mPAp of less than 25 mmHg
and 11 subjects with mPAp of at least 25 mmHg). In 17
of the 22 subjects, the heart sound recordings from 2nd
LICS were of sufficient quality to be analyzed. These in-
cluded 10 subjects with PAH and 7 subjects with normal
Figure 1. Annotation of S1 and S2. Normalized amplitudes (Y-axis) of surface acoustic recordings at the second left intercos-tal space (2LICS) and apex are plotted against time in seconds(X-axis). Black plus signs represent S1; red diamonds representS2. PAp: pulmonary artery pressure; PH: pulmonary hyperten-sion; S1: first heart sound; S2: second heart sound.
Pulmonary Circulation Volume 4 Number 4 December 2014 | 687
This content downloaded from 142.244.5.111 on Wed, 3 Dec 2014 20:32:52 PMAll use subject to JSTOR Terms and Conditions
PA pressure. The clinical and hemodynamic details of
the subjects are included in Tables 1–6. The only statisti-
cally significant differences between the two groups were
hemodynamic measurements that reflected the presence
or absence of PAH. Of note, there was no difference in
the LAp (or PAWp) or QPI between the two groups. The
two groups did not differ by age, weight, height, body sur-
face area (BSA), or body mass index (BMI; Table 7).
Extraction of A2 and P2We found that in subjects with normal PA pressure, the
normalized amplitude of the recordings obtained from
the cardiac apex position clearly differentiated a defined
peak before a more diffuse and lower-amplitude peak,
which we annotated as A2 and P2, respectively (Fig. 2). In
contrast, in subjects with PAH, 2 peaks are seen. The ear-
lier and lower-amplitude peak we annotated as A2, and the
later and higher-amplitude signal we annotated as P2.
Comparison of the intensity of S2, A2, and P2We constructed box plots of 3 time-domain features from
both groups of subjects by comparing the ratios of the
normalized intensity of the heart sounds S2 ∶S1, P2 ∶A2,and P2 ∶S2. In Figure 3, it can be seen that S2 ∶S1 dis-
criminates less well between subjects with PAH and those
with normal PA pressure, particularly at the apex. Statisti-
cally significant differences in the heart sound intensity
ratios P2 ∶A2 (P ¼ .0001) and P2 ∶S2 (P ¼ .0001) are
found between the two groups from sounds recorded at
both the 2nd LICS and the apex.
Figure 2. Analysis of A2 and P2 durations. The normalized amplitude (Y-axis) is plotted against time in seconds (X-axis). Time 0 isdefined as the peak of S2. In subjects with mPAp < 25 mmHg, the taller peak is considered to be A2. In subjects with mPAp � 25mmHg, the taller peak is considered to be P2. a, Recordings from second left intercostal space (2nd LICS) in subjects with mPAp <25 mmHg. b, Recordings from the apex in subjects with mPAp � 25 mmHg. c, Recordings from the 2nd LICS in subjects withmPAp < 25 mmHg. d, Recordings from apex from subjects with mPAp � 25 mmHg. A2: aortic component of S2; mPAp: meanpulmonary artery pressure; P2: pulmonary component of S2; S2: second heart sound. A color version of this figure is availableonline.
688 | Heart sounds in childhood PH Elgendi et al.
This content downloaded from 142.244.5.111 on Wed, 3 Dec 2014 20:32:52 PMAll use subject to JSTOR Terms and Conditions

In Figure 4, we have plotted the medians of the ratios
of the intensities of the extracted features, P2 ∶S2 and
P2 ∶A2, recorded from the 2nd LICS and the apex against
mPAp. There is a linear correlation (r > 0.7) between the
ratio P2 ∶S2 and mPAp from recordings at the 2nd LICS
and the apex. However, for the intensity ratio P2 ∶A2, alinear correlation is seen only in the apical recordings.
In Figure 5a and 5b, we have plotted the intensity of
P2 against that of S2 for each heartbeat for all subjects at
the 2nd LICS and the apex. In Figure 5c and 5d, we have
plotted the intensity of P2 against that of A2 for each
heart beat for all subjects at the 2nd LICS and the apex.
DISCUSSION
The main finding of our investigation is that we can dis-
criminate between the intensity of heart sound events
that we annotated as P2 and A2 in children with PAH
and that in children without PAH in the recordings taken
simultaneously with direct PA pressure measurements
(Figs. 3, 5). We found that P2 events have increased inten-
sity in children with PAH. In addition, in children with
PAH, the increased intensity of P2 events is transmitted
to the apex and overshadows A2 events, in contrast to
children without PAH. Experienced clinicians diagnose
PAH by auscultation if they hear a loud P2 at the 2nd
LICS and hear the transmission of P2 to the apex, where
usually only A2 is heard in the absence of PAH.3,4,14 These
observations add credibility and biological plausibility to
our findings in children and raise the potential for the
interpretation of digitally recorded heart sounds by medi-
cal personnel without years of experience in auscultation.
We found that the heart sound intensity ratios P2 ∶S2and P2 ∶A2 were useful for discriminating subjects with
PAH. In our study, we were interested in discovering
whether extracted sound features around S1 and S2 would
be useful in the diagnosis of PAH and whether it would
be possible to demarcate these events without a simulta-
neous ECG, echocardiogram, or pressure tracing on the
same platform as the heart sound recordings. The finding
that extracted features that make up S2 in the time do-
main distinguish subjects with PAH from those with nor-
mal PA pressure is encouraging and is further substan-
tiated by the finding that the ratios of the intensity of the
components that make up S2, that is, P2 and A2, are also
discriminatory for PAH. The precise origin of the ex-
tracted features of S2, P2, and A2 cannot be identified in
our study, but there is sufficient evidence to suggest that
PAHmay be identified quantitatively by S2.
We divided the subjects into two groups, based on
whether mPAp was less than 25 mmHg or not. In ad-
Figure 3. Boxplot of 3 time-domain features calculated from auscultation at the 2nd LICS and apex. The ratios of the intensity ofthe heart sounds P2 ∶A2 and P2 ∶S2 can be used to discriminate between mean PAp � 25 mmHg (P ¼ .0001) at 2nd LICS andthat at apex. S2 ∶ S1 ratios do not discriminate between subjects with and those without PAH. A2: aortic component of S2; PAH:pulmonary arterial hypertension; PAp: pulmonary artery pressure; P2: pulmonary component of S2; S1: first heart sound; S2:second heart sound; 2nd LICS: second left intercostal space.
Pulmonary Circulation Volume 4 Number 4 December 2014 | 689
This content downloaded from 142.244.5.111 on Wed, 3 Dec 2014 20:32:52 PMAll use subject to JSTOR Terms and Conditions

dition, all of our subjects in both groups had an LAp or
PAWp of less than 15 mmHg. This is in keeping with
the current definition of and recommendations for the
diagnosis of PAH.11,13,15 The only statistically significant
differences in the hemodynamic measurements between
the two groups were mPAp (55 vs. 15 mmHg; P < .001)
and PVRI (10.7 vs. 2 Wood units/m2; P < .001). This sup-
ports our finding that the S2 (A2 and P2) events were
largely influenced by pulmonary vascular hemodynamic
measurements; see Tables 3–7.
The QRS complex duration was shorter in subjects
with PAH (77 vs. 103 ms; P ¼ .02). The children without
PAH had repaired congenital heart disease or had under-
gone heart transplants and may often have had a widened
QRS postoperatively. A longer QRS or prolonged right-
heart conduction time might influence the splitting inter-
val between A2 and P2 but not the intensity of S2.
There were no statistically significant differences in
age, body weight, BSA, or BMI between the two groups,
suggesting that the differences in the intensity of P2
Figure 4. Individual patients mean PAp (Y-axis) plotted against the median of the heart sound intensity ratios of P2 ∶ S2 and P2 ∶A2(X-axis). a, P2 ∶ S2 heart sound intensity ratio at the second left intercostal space (2L). b, P2 ∶S2 heart sound intensity ratio at theapex. c, P2 ∶A2 heart sound intensity ratio at 2L. d, P2 ∶A2 heart sound ratio intensity at the apex. Plus signs indicate subjects withmean PAp < 25 mmHg. Diamonds indicate subjects with mean PAp � 25 mmHg. The dot-dashed line represents the mean PApof 25 mmHg. Values on or above this line indicate pulmonary artery hypertension, and values below it indicate normal PAp,according to the internationally recognized definition of pulmonary artery hypertension. The correlations of the heart sound inten-sity ratio at 2L for P2 ∶A2 with mean PAp (c) were poor in comparison with those of the P2 ∶A2 intensity ratio at the apex (d ) andthe S2 ∶P2 intensity ratios at 2L (a) and the cardiac apex (b). A2: aortic component of S2; PAp: pulmonary artery pressure; P2:pulmonary component of S2; S2: second heart sound.
690 | Heart sounds in childhood PH Elgendi et al.
This content downloaded from 142.244.5.111 on Wed, 3 Dec 2014 20:32:52 PMAll use subject to JSTOR Terms and Conditions

events were unrelated to age, body size, or habitus. How-
ever, further studies are needed to reproduce our find-
ings in subjects with an increased BMI, as increased body
fat or muscle may impair the transmission of heart sounds
from body surface microphones.
In our cohort of children, we had 2 subjects with a
mean PA pressure of 25 mmHg and 1 with a mean PA
pressure of 24 mmHg. In Figure 4, the dashed line repre-
sents an mPAp of 25 mmHg, which demarcates normal
from abnormal mPAp. It can be seen that the P2 ∶S2 and
P2 ∶A2 intensity ratios are less discriminatory for mPAp
close to 25 mmHg. Differentiating subjects with border-
line signs of PAH will be challenging. Nevertheless, Fig-
ure 5 demonstrates that if all recorded heartbeats are in-
cluded, then the estimation of the intensity of S2, A2, and
P2 events reveals an easily visible separation between re-
cordings from children with PAH and those from chil-
dren without PAH. The sensitivity and specificity to dis-
criminate between PAH and normal PA pressure are both
high.
In contrast to a recent report,16 we did not find that the
intensity of the ratio S2 ∶S1 discriminated between PAH
and non-PAH. We found the intensity ratios of the heart
sounds P2 ∶S2 and P2 ∶A2 to be more indicative of PAH.
However, Chan et al.16 used the term “complexity” of S1
and S2, which may differ from intensity. In addition, we
Figure 5. Intensity of P2 plotted against intensity of S2 or A2 for each heartbeat contained in each acoustic recording. a, Intensityof P2 against that of S2 recorded at the second left intercostal space (2L). b, Intensity of P2 against that of S2 recorded at the apex.c, Intensity of P2 against that of A2 at 2L. d, Intensity of P2 against that of A2 at the apex. Blue plus signs indicate heartbeatsrecorded in subjects with mean PAp < 25 mmHg. Red diamonds indicate heartbeats recorded in subjects with mean PAp � 25mmHg. A2: aortic component of S2; PAp: pulmonary artery pressure; P2: pulmonary component of S2; SE: sensitivity; SP:specificity; S2: second heart sound.
Pulmonary Circulation Volume 4 Number 4 December 2014 | 691
This content downloaded from 142.244.5.111 on Wed, 3 Dec 2014 20:32:52 PMAll use subject to JSTOR Terms and Conditions
studied children, who may have acoustic precordial char-
acteristics different from those of adults.
We did not assess the effect of right versus left ventric-
ular function or right-left ventricular interactions in PAH
on the acoustic recordings. One of the aims of our study
was to determine whether one could separate A2 from P2
and S1 from S2 without a simultaneous electrocardio-
graphic or pressure tracing on the same platform as the
heart sound recording. We did, however, measure the PA
pressure simultaneously with the acoustic recordings.
The fidelity of the recordings at the cardiac apex was
sufficient for analysis in only 22 of 26 subjects and that
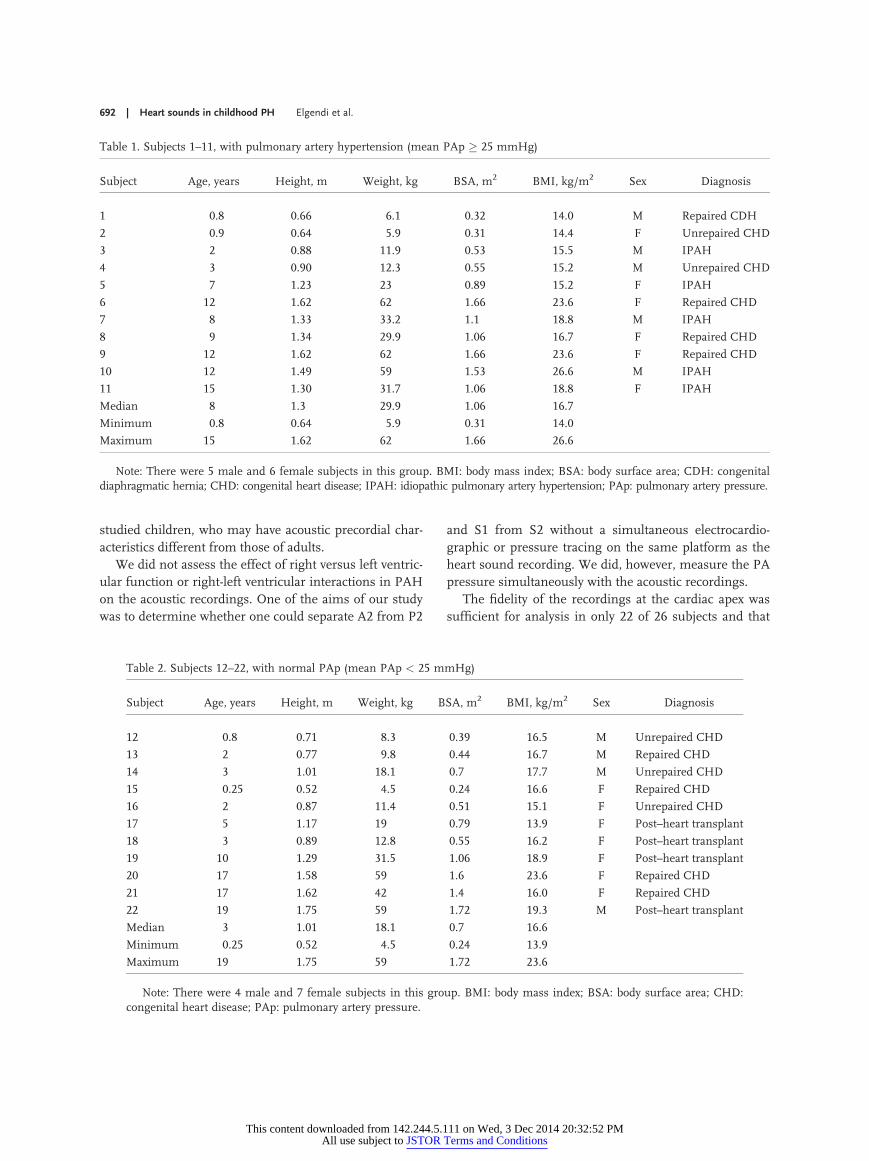
Table 1. Subjects 1–11, with pulmonary artery hypertension (mean PAp � 25 mmHg)
Subject Age, years Height, m Weight, kg BSA, m2 BMI, kg/m2 Sex Diagnosis
1 0.8 0.66 6.1 0.32 14.0 M Repaired CDH
2 0.9 0.64 5.9 0.31 14.4 F Unrepaired CHD
3 2 0.88 11.9 0.53 15.5 M IPAH
4 3 0.90 12.3 0.55 15.2 M Unrepaired CHD
5 7 1.23 23 0.89 15.2 F IPAH
6 12 1.62 62 1.66 23.6 F Repaired CHD
7 8 1.33 33.2 1.1 18.8 M IPAH
8 9 1.34 29.9 1.06 16.7 F Repaired CHD
9 12 1.62 62 1.66 23.6 F Repaired CHD
10 12 1.49 59 1.53 26.6 M IPAH
11 15 1.30 31.7 1.06 18.8 F IPAH
Median 8 1.3 29.9 1.06 16.7
Minimum 0.8 0.64 5.9 0.31 14.0
Maximum 15 1.62 62 1.66 26.6
Note: There were 5 male and 6 female subjects in this group. BMI: body mass index; BSA: body surface area; CDH: congenitaldiaphragmatic hernia; CHD: congenital heart disease; IPAH: idiopathic pulmonary artery hypertension; PAp: pulmonary artery pressure.
Table 2. Subjects 12–22, with normal PAp (mean PAp < 25 mmHg)
Subject Age, years Height, m Weight, kg BSA, m2 BMI, kg/m2 Sex Diagnosis
12 0.8 0.71 8.3 0.39 16.5 M Unrepaired CHD
13 2 0.77 9.8 0.44 16.7 M Repaired CHD
14 3 1.01 18.1 0.7 17.7 M Unrepaired CHD
15 0.25 0.52 4.5 0.24 16.6 F Repaired CHD
16 2 0.87 11.4 0.51 15.1 F Unrepaired CHD
17 5 1.17 19 0.79 13.9 F Post–heart transplant
18 3 0.89 12.8 0.55 16.2 F Post–heart transplant
19 10 1.29 31.5 1.06 18.9 F Post–heart transplant
20 17 1.58 59 1.6 23.6 F Repaired CHD
21 17 1.62 42 1.4 16.0 F Repaired CHD
22 19 1.75 59 1.72 19.3 M Post–heart transplant
Median 3 1.01 18.1 0.7 16.6
Minimum 0.25 0.52 4.5 0.24 13.9
Maximum 19 1.75 59 1.72 23.6
Note: There were 4 male and 7 female subjects in this group. BMI: body mass index; BSA: body surface area; CHD:congenital heart disease; PAp: pulmonary artery pressure.
692 | Heart sounds in childhood PH Elgendi et al.
This content downloaded from 142.244.5.111 on Wed, 3 Dec 2014 20:32:52 PMAll use subject to JSTOR Terms and Conditions

Table 3. Pulmonary vascular hemodynamic data for subjects 1–11, with pulmonary artery hypertension(mean PAp � 25 mmHg)
SubjectMean PAp,mmHg
Systolic PAp,mmHg
Diastolic PAp,mmHg
Mean LAp orPAWp, mmHg
PVRI,a
WU/m2QPI,
L/min/m2
1 29 48 13 6 4.8 4.8
2 25 38 12 2 5.2 4.4
3 64 89 34 9 13.1 4.2
4 66 92 47 7 10.7 5.5
5 25 31 19 7 5.5 3.3
6 97 140 66 10 27.2 3.2
7 37 49 26 10 9.3 2.9
8 30 46 14 5 7.4 3.4
9 85 119 57 6 27.2 2.9
10 63 95 37 7 19.3 2.9
11 55 99 37 6 16.7 2.9
Median 55 89 34 7 10.7 3.3
Minimum 25 31 12 2 4.8 2.9
Maximum 97 140 66 10 27.2 5.5
Note: LAp: left atrial pressure; PAp: pulmonary artery pressure; PAWp: pulmonary artery wedge pressure;PVRI: pulmonary vascular resistance index; QPI: pulmonary blood flow index; WU: Wood units.
a PVRI calculated from pressure at the time of QPI measurement, not acoustic recording.
Table 4. Pulmonary vascular hemodynamic data for subjects 12–22, with normal pulmonary artery pressure(mean PAp < 25 mmHg)
SubjectMean PAp,mmHg
Systolic PAp,mmHg
Diastolic PAp,mmHg
Mean LAp orPAWp, mmHg
PVRI,a
WU/m2QPI,
L/min/m2
12 20 29 17 11 2.8 3.2
13 20 32 11 8 3.1 3.9
14 15 25 10 4 .8 14.4
15 15 25 7 6 2.0 4.4
16 24 34 15 9 4.8 3.1
17 14 27 7 7 NA NA
18 20 30 12 10 2.6 3.8
19 8 11 5 5 1.3 2.3
20 17 31 9 7 2.8 3.6
21 12 22 4 5 1.6 4.5
22 14 20 8 10 1.5 2.7
Median 15 27 9 7 2 4
Minimum 8 11 4 4 .8 2.3
Maximum 24 34 17 11 4.8 14.4
Note: LAp: left atrial pressure; NA: not available; PAp: pulmonary artery pressure; PAWp: pulmonary arterywedge pressure; PVRI: pulmonary vascular resistance index; QPI: pulmonary blood flow index; WU: Wood units.
a PVRI calculated from pressure at the time of QPI measurement, not acoustic recording.
This content downloaded from 142.244.5.111 on Wed, 3 Dec 2014 20:32:52 PMAll use subject to JSTOR Terms and Conditions

at the 2nd LICS in 17 of those 22. This drawback will
have to be resolved in future studies.
We made assumptions about S1 and S2 that, although
biologically plausible and consistent with the known de-
scriptions of S1 and S2, remain to be validated. Future
studies may improve the accuracy by including simulta-
neous recordings of pressure, ECG, and echocardiogram
on the same platform as the acoustic recordings.
Conclusion. The main finding of our investigation is
that there is a clear separation between the intensities of
Table 5. Systemic vascular hemodynamic and electrocardiographic data for subjects 1–11, with pulmonary arteryhypertension (mean PAp � 25 mmHg)
SubjectMean BP,mmHg
Systolic BP,mmHg
Diastolic BP,mmHg
Mean RAp,mmHg
Heart rate,beats/min
QRSduration, ms
PR interval,ms
1 59 83 41 2 130 62 66
2 68 93 47 1 130 75 91
3 48 70 34 8 99 97 98
4 70 82 56 7 115 77 92
5 70 97 50 3 66 71 88
6 93 122 73 5 107 71 71
7 96 44 67 3 75 110 106
8 62 93 42 4 65 110 88
9 88 106 71 6 90 71 71
10 78 110 56 4 70 77 71
11 68 99 53 3 80 132 110
Median 70 93 53 4 90 77 88
Minimum 48 44 34 1 65 62 66
Maximum 96 122 73 8 130 132 110
Note: BP: systemic blood pressure; PAp: pulmonary artery pressure; RAp: right atrial pressure.
Table 6. Systemic vascular hemodynamic and electrocardiographic data for subjects 12–22, with normal PAp(mean PAp < 25 mmHg)
SubjectMean BP,mmHg
Systolic BP,mmHg
Diastolic BP,mmHg
Mean RAp,mmHg
Heart rate,beats/min
QRSduration, ms
PR interval,ms
12 54 92 36 11 130 77 84
13 60 95 39 6 78 111 116
14 60 71 46 1 111 120 114
15 52 67 37 1 134 99 87
16 63 80 50 8 108 91 97
17 42 63 32 8 82 101 98
18 75 97 53 3 105 101 92
19 55 65 45 1 96 134 80
20 73 108 56 7 78 147 136
21 67 93 51 1 90 108 96
22 116 72 96 1 70 103 116
Median 60 80 46 3 96 103 97
Minimum 42 63 32 1 70 77 80
Maximum 116 108 96 11 134 147 136
Note: BP: systemic blood pressure; PAp: pulmonary artery pressure; RAp: right atrial pressure.
694 | Heart sounds in childhood PH Elgendi et al.
This content downloaded from 142.244.5.111 on Wed, 3 Dec 2014 20:32:52 PMAll use subject to JSTOR Terms and Conditions

P2 and A2 in children with PAH and those in children
without PAH in acoustic recordings collected with a hand-
held digital stethoscope simultaneously with direct PA pres-
sure measurements. The ratios of the heart sound inten-
sities P2 ∶A2 and P2 ∶S2 discriminate between subjects
with and those without PAH. These findings may be of
value in the development of an acoustic device to diagnose
PAH with more accuracy than conventional auscultation.
Source of Support: The authors are grateful for funding fromthe Cardiovascular Medical Research and Education Fund; theWomen and Children’s Health Research Institute, Alberta, Can-ada; and the Alberta Innovates Centre for Machine Learning,Alberta, Canada.
Conflict of Interest: None declared.
REFERENCES1. Butrous G, Ghofrani HA, Grimminger F. Pulmonary vascu-
lar disease in the developing world. Circulation 2008;118(17):1758–1766.
2. Rich S, Herskowitz A. Targeting pulmonary vascular diseaseto improve global health: pulmonary vascular disease: theglobal perspective. Chest 2010;137(6_suppl.):1S–5S.
3. Leatham A, Weitzman D. Auscultatory and phonocardio-graphic signs of pulmonary stenosis. Br Heart J 1957;19(3):303–317.
4. Leatham A. Splitting of the first and second heart sounds.Lancet 1954;264(6839):607–614.
5. Chen D, Pibarot P, Honos G, Durand LG. Estimation ofpulmonary artery pressure by spectral analysis of the secondheart sound. Am J Cardiol 1996;78(7):785–789.
6. Xu J, Durand LG, Pibarot P. A new, simple, and accuratemethod for non-invasive estimation of pulmonary arterialpressure. Heart 2002;88(1):76–80.
7. Nigam V, Priemer R. A dynamic method to estimate thetime split between the A2 and P2 components of the S2heart sound. Physiol Meas 2006;27(7):553–567.
8. Longhini C, Baracca E, Brunazzi C, Vaccari M, Longhini L,Barbaresi F. A new noninvasive method for estimation ofpulmonary arterial pressure in mitral stenosis. Am J Cardiol1991;68(4):398–401.
9. Elgendi M, Bobhate P, Jain S, Guo L, Rutledge J, Coe Y,Zemp R, Schuurmans D, Adatia I. Spectral analysis of theheart sounds in children with and without pulmonary arteryhypertension. Int J Cardiol 2014;173(1):92–99.
10. Guo L, Cui Y, Pharis S, Walsh M, Atallah J, Tan MW,Rutledge J, Coe JY, Adatia I. Measurement of oxygen con-sumption in children undergoing cardiac catheterization:comparison between mass spectrometry and the breath-by-breath method. Pediatr Cardiol 2014;35(5):798–802.
11. Galie N, Torbicki A, Barst R, Dartevelle P, Haworth S,Higenbottam T, Olschewski H, et al. Guidelines on diagno-sis and treatment of pulmonary arterial hypertension: theTask Force on Diagnosis and Treatment of Pulmonary Ar-terial Hypertension of the European Society of Cardiology.Eur Heart J 2004;25(24):2243–2278.
12. Kovacs G, Berghold A, Scheidl S, Olschewski H. Pulmo-nary arterial pressure during rest and exercise in healthysubjects: a systematic review. Eur Respir J 2009;34(4):888–894.
13. McLaughlin VV, Archer SL, Badesch DB, Barst RJ, FarberHW, Lindner JR, Mathier MA, et al. ACCF/AHA 2009 ex-pert consensus document on pulmonary hypertension: a re-port of the American College of Cardiology Foundation TaskForce on Expert Consensus Documents and the AmericanHeart Association: developed in collaboration with the Amer-ican College of Chest Physicians; American Thoracic Society,Inc.; and the Pulmonary Hypertension Association. J AmColl Cardiol 2009;53(17):1573–1619.
14. Leatham A. Splitting of heart sounds and a classification ofsystolic murmurs. Circulation 1957;16(3):417–421; discussion421–422.
15. Badesch DB, Champion HC, Sanchez MA, Hoeper MM,Loyd JE, Manes A, McGoon M, et al. Diagnosis and assess-ment of pulmonary arterial hypertension. J Am Coll Cardiol2009;54(1 suppl.):S55–S66.
16. Chan W, Woldeyohannes M, Colman R, Arand P, MichaelsAD, Parker JD, Granton JT, Mak S. Haemodynamic andstructural correlates of the first and second heart sounds inpulmonary arterial hypertension: an acoustic cardiography co-hort study. BMJ Open 2013;3:e002660. doi:10.1136/bmjopen-2013-002660.
Table 7. Comparison of clinical and hemodynamic databetween subjects with pulmonary artery hypertension(mean PAp � 25 mmHg) and those with normal PAp(mean PAp < 25 mmHg)
Variables P value
Age .8
Height .6
Weight .5
Body surface area .6
Body mass index .9
Systolic PAp <.001*
Diastolic PAp <.001*
Mean PAp <.001*
Pulmonary vascular resistance index <.001*
Pulmonary blood flow index .9
Mean left atrial pressure .6
Mean right atrial pressure .8
Systolic blood pressure .2
Diastolic blood pressure .2
Mean blood pressure .1
Heart rate .5
QRS duration, lead V1 .02*
PR interval, lead 2 .07
Note: PAp: pulmonary artery pressure.* Significant result (P < .05).
Pulmonary Circulation Volume 4 Number 4 December 2014 | 695
This content downloaded from 142.244.5.111 on Wed, 3 Dec 2014 20:32:52 PMAll use subject to JSTOR Terms and Conditions
Copyright © 2022 FDOKUMEN