![[C. Lemmi] Optica de Fourier](https://static.fdokumen.com/doc/165x107/6315892e511772fe4510654e/c-lemmi-optica-de-fourier.jpg)
Plasma biomarkers of pulmonary hypertension identified by Fourier transform infrared spectroscopy...
7
Analyst PAPER Cite this: DOI: 10.1039/c4an01864h Received 16th October 2014, Accepted 6th January 2015 DOI: 10.1039/c4an01864h www.rsc.org/analyst Plasma biomarkers of pulmonary hypertension identified by Fourier transform infrared spectroscopy and principal component analysis† Emilia Staniszewska-Slezak, a,b Andrzej Fedorowicz, b Karol Kramkowski, c Agnieszka Leszczynska, c Stefan Chlopicki, b,d Malgorzata Baranska a,b and Kamilla Malek* a,b The main goal of this study was to find specific plasma spectral markers associated with pulmonary arterial hypertension (PAH) induced by monocrotaline injection in rats. FTIR was used to monitor biochemical changes in plasma caused by PAH as compared with the systemic hypertension induced by partial ligation on the left artery and with the control group. Both pathologies, systemic and pulmonary hypertension, induced a unique response in the biochemical content of plasma, mainly related to the composition and secondary structure of plasma proteins. For PAH, β-pleated sheet components of plasma proteins were identified whereas the protein composition in systemic hypertension was dominated by unordered structures. In addition, a higher concentration of tyrosine-rich proteins was found in plasma in PAH than in systemic hypertension. The differences between both pathologies were identified also in terms of lipid composition/metabolism as well as in the content of RNA and glucose, suggesting that lipid peroxidation appears upon pulmonary hypertension development. In summary, this work demonstrates that FTIR spectroscopy supported by principal component analysis (PCA) has the potential to become a fast and non-destructive method for biochemical char- acterization of plasma that consequently could have a diagnostic significance in pulmonary hypertension. Introduction FTIR spectroscopy has been widely applied in medical and bioanalytical fields as it has a number of useful advantages to study biological materials such as plasma or serum. This tech- nique is non-destructive, rapid and cost-effective to operate and requires simple sample preparation. There are several papers reporting identification of specific biomarkers for various physiological states and diseases in blood components (mainly plasma) using Fourier transform infrared spectroscopy. 1–6 For instance, Déléris and Petibois showed that IR spectra of plasma and erythrocytes are sensitive to detect exercise-induced oxidative stress. 1,2 Spectral features observed in FTIR spectra of plasma and erythrocytes indicated changes in bands assigned to fatty acyl moieties, phosphate groups and proteins. The authors suggest that the attack of reactive oxygen species during the oxidative stress primarily affects the satur- ation level of fatty acyl chains and the phospholipid struc- ture. 1,2 In turn, Perez-Guaita et al. employed the ATR FTIR technique supported by the partial least squares (PLS) method to identify the protein profile in serum. This approach included a method of identification and quantification of several serum protein parameters from one ATR FTIR spec- trum such as the content of total albumin, globulin and immunoglobulin as well as their relative contribution to the overall protein composition. 3 Other FTIR studies revealed changes in the content of DNA, RNA and carbohydrates in lym- phocytes related to the progression of leukemia. 4,5 Among several applications of vibrational spectroscopy in the analysis of blood components, studies on diabetes showed the FTIR technique as a powerful tool in diagnosis of the disease, including the ability to assess the concentration of glucose in plasma/serum/full blood, changes in saturation of fatty acids in platelets, and the fluidity of platelet membranes. 6 † Electronic supplementary information (ESI) available. See DOI: 10.1039/ c4an01864h a Faculty of Chemistry, Jagiellonian University, Ingardena 3, 30-060 Krakow, Poland. E-mail: [email protected]; Fax: +48 12 634 0515; Tel: +48 12 663 2064 b Jagiellonian Centre for Experimental Therapeutics (JCET), Jagiellonian University, Bobrzynskiego 14, 30-348 Krakow, Poland c Department of Biopharmacy, Medical University in Bialystok, Mickiewicza 2C, 15-222 Bialystok, Poland d Department of Experimental Pharmacology (Chair of Pharmacology), Jagiellonian University, Grzegorzecka 16, Krakow, 31-531, Poland This journal is © The Royal Society of Chemistry 2015 Analyst Published on 06 January 2015. Downloaded by UNIWERSYTET JAGIELLONSKI on 20/01/2015 13:12:03. View Article Online View Journal
-
Upload
jagiellonian -
Category
Documents
-
view
3 -
download
0
Transcript of Plasma biomarkers of pulmonary hypertension identified by Fourier transform infrared spectroscopy...

Analyst
PAPER
Cite this: DOI: 10.1039/c4an01864h
Received 16th October 2014,Accepted 6th January 2015
DOI: 10.1039/c4an01864h
www.rsc.org/analyst
Plasma biomarkers of pulmonary hypertensionidentified by Fourier transform infraredspectroscopy and principal component analysis†
Emilia Staniszewska-Slezak,a,b Andrzej Fedorowicz,b Karol Kramkowski,c
Agnieszka Leszczynska,c Stefan Chlopicki,b,d Malgorzata Baranskaa,b andKamilla Malek*a,b
The main goal of this study was to find specific plasma spectral markers associated with pulmonary
arterial hypertension (PAH) induced by monocrotaline injection in rats. FTIR was used to monitor
biochemical changes in plasma caused by PAH as compared with the systemic hypertension induced by
partial ligation on the left artery and with the control group. Both pathologies, systemic and pulmonary
hypertension, induced a unique response in the biochemical content of plasma, mainly related to the
composition and secondary structure of plasma proteins. For PAH, β-pleated sheet components
of plasma proteins were identified whereas the protein composition in systemic hypertension was
dominated by unordered structures. In addition, a higher concentration of tyrosine-rich proteins was
found in plasma in PAH than in systemic hypertension. The differences between both pathologies
were identified also in terms of lipid composition/metabolism as well as in the content of RNA and
glucose, suggesting that lipid peroxidation appears upon pulmonary hypertension development. In
summary, this work demonstrates that FTIR spectroscopy supported by principal component
analysis (PCA) has the potential to become a fast and non-destructive method for biochemical char-
acterization of plasma that consequently could have a diagnostic significance in pulmonary
hypertension.
Introduction
FTIR spectroscopy has been widely applied in medical andbioanalytical fields as it has a number of useful advantages tostudy biological materials such as plasma or serum. This tech-nique is non-destructive, rapid and cost-effective to operateand requires simple sample preparation. There are severalpapers reporting identification of specific biomarkers forvarious physiological states and diseases in blood components(mainly plasma) using Fourier transform infraredspectroscopy.1–6 For instance, Déléris and Petibois showed thatIR spectra of plasma and erythrocytes are sensitive to detect
exercise-induced oxidative stress.1,2 Spectral features observedin FTIR spectra of plasma and erythrocytes indicated changesin bands assigned to fatty acyl moieties, phosphate groups andproteins. The authors suggest that the attack of reactive oxygenspecies during the oxidative stress primarily affects the satur-ation level of fatty acyl chains and the phospholipid struc-ture.1,2 In turn, Perez-Guaita et al. employed the ATR FTIRtechnique supported by the partial least squares (PLS) methodto identify the protein profile in serum. This approachincluded a method of identification and quantification ofseveral serum protein parameters from one ATR FTIR spec-trum such as the content of total albumin, globulin andimmunoglobulin as well as their relative contribution to theoverall protein composition.3 Other FTIR studies revealedchanges in the content of DNA, RNA and carbohydrates in lym-phocytes related to the progression of leukemia.4,5 Amongseveral applications of vibrational spectroscopy in the analysisof blood components, studies on diabetes showed the FTIRtechnique as a powerful tool in diagnosis of the disease,including the ability to assess the concentration of glucose inplasma/serum/full blood, changes in saturation of fatty acidsin platelets, and the fluidity of platelet membranes.6
†Electronic supplementary information (ESI) available. See DOI: 10.1039/c4an01864h
aFaculty of Chemistry, Jagiellonian University, Ingardena 3, 30-060 Krakow, Poland.
E-mail: [email protected]; Fax: +48 12 634 0515; Tel: +48 12 663 2064bJagiellonian Centre for Experimental Therapeutics (JCET), Jagiellonian University,
Bobrzynskiego 14, 30-348 Krakow, PolandcDepartment of Biopharmacy, Medical University in Bialystok, Mickiewicza 2C,
15-222 Bialystok, PolanddDepartment of Experimental Pharmacology (Chair of Pharmacology), Jagiellonian
University, Grzegorzecka 16, Krakow, 31-531, Poland
This journal is © The Royal Society of Chemistry 2015 Analyst
Publ
ishe
d on
06
Janu
ary
2015
. Dow
nloa
ded
by U
NIW
ER
SYT
ET
JA
GIE
LL
ON
SKI
on 2
0/01
/201
5 13
:12:
03.
View Article OnlineView Journal

In our work we focus on characterisation of plasma contentin pulmonary arterial hypertension (PAH) bymeans of the trans-mission FTIR technique. PAH is a chronic progressive diseaseof the pulmonary vasculature, characterized by an elevated pul-monary arterial pressure leading to right ventricular failure.7,8
In contrast to systemic hypertension that is diagnosed on thebasis of simple systemic blood pressure measurements, thediagnosis of PAH requires a combination of tests, e.g. func-tional assessment, exercise tolerance, laboratory tests, mag-netic resonance imaging, and echocardiography to supportright heart hypertrophy or failure.9
Pulmonary arterial hypertension is a rare, progressivelyworsening disease that still remains incurable. The mole-cular mechanism of PAH has not been fully understood, but itis characterized by dysfunction of the pulmonary endotheliumincluding alterations in the bioavailability of NO, synthesisof prostacyclin and secretion of endothelin-1.10,11 Currentdisease-specific therapeutic interventions in the PAH targetone of three established pathways in the PAH pathobiology:prostacyclin, nitric oxide, and endothelin-1. There are numer-ous other changes in the concentration of plasma mediatorsassociated with PAH including changes in atrial natriureticpeptide, apelin, adrenomedullin, hepcidin,12–14 thrombo-modulin, vascular endothelial growth factor (VEGF), trans-forming growth factor (TGF-β1), angiopoietin-2,15–21 andothers. However, none of them explicitly indicates pulmonaryhypertension. Therefore, searching for an easy blood-basedbiomarker of PAH is still of interest.
To the best of our knowledge, FTIR studies on blood com-ponents in a model of hypertension have not been reported upto now. Only Saravankumar and co-workers presented FTIRmonitoring of biochemical changes caused by systemic hyper-tension and its treatment in samples of homogenized livertissue.22 The main goal of this study was to find a specificplasma fingerprint in PAH induced by monocrotaline injectionin rats by means of FTIR spectroscopy. In addition, weassessed whether spectral plasma features of PAH differedfrom those found in systemic hypertension induced by partialligation on the left artery in rats. In the present work wedemonstrated for the first time, that FTIR spectroscopy incombination with principal component analysis (PCA) hasthe required discrimination ability to become a quick, non-destructive method for the characterization of changes inplasma associated with that could have potential diagnosticsignificance in pulmonary hypertension.
ExperimentalAnimal models
All investigations were performed according to the Guide forCare and Use of Laboratory Animals published by the USNational Institutes of Health while the experimental procedurewas approved by the local Animal Research Committee, Jagiel-lonian University.
To induce pulmonary arterial hypertension, male Wistarrats (260–300 g, N = 4) were injected with monocrotaline (MCT,60 mg kg−1 s.c.; Sigma Aldrich) solution. MCT was dissolved extempore in 1 M HCl, neutralized with 1 M NaOH and dilutedwith distilled water. The control group (N = 5) was injectedwith saline. 28 days post-MCT injection, rats were anaesthe-tized (pentobarbitone, 40 mg kg−1, i.p.) and blood was col-lected from the right ventricle to the syringe with nadroparine(end-concentration 10 U ml−1), and then the heart wasremoved. To assess development of PAH, right ventricularhypertrophy right ventricle was separated from the left ventri-cle and septum. Both parts were weighed and the right to leftventricle and septum mass ratio was calculated (RV/(LV + S)W).This ratio increased from 0.325 ± 0.013 for the control groupto 0.379 ± 0.008 for the MCT-treated group (p < 0.05).
In the model of systemic hypertension, rats were firstlyanesthetized with pentobarbital (40 mg kg−1, i.p.). Two-kidneyone-clip (2K1C) renovascular hypertension was induced by apartial, standardised clipping of the left renal artery; N =5. After 6 weeks, most of the animals developed hypertensionwhich was confirmed by the blood pressure measurementusing the ‘tail cuff’ method.23 Rats developing mean bloodpressure (MBP) higher than 140 mmHg were considered hyper-tensive and were used in experiments. Sham-operated rats (SO)served as a control to 2K1C hypertensive rats, N = 5. Theyreceived the same surgical intervention without the clipping ofthe renal artery. Blood was collected as described above for thePAH group.
Sample preparation
Blood samples were centrifuged at 1000g for 10 min and thenplasma was immediately separated. The time between bloodcollection and centrifugation was approx. 10 min. Next, 3 repli-cates of each plasma sample (0.5 μL) were manually spottedonto CaF2 windows, and left to dry in a temperature-controlledlaboratory (24 °C). The drying process took approximately5 min giving deposits with ca. 5 mm in diameter. The volumeof plasma was adjusted to provide FTIR spectra with absor-bance below 1.2. Our previous investigations on the FTIRprofile of the plasma deposit on the CaF2 window showed itsspectral uniformity regarding positions of bands and intensityratios.24 In our approach we collected FTIR images close to theperiphery of the deposit. We collected three IR images for eachplasma deposit. For each animal, three plasma samples weredeposited on a IR window.
FTIR imaging and data processing
A liquid nitrogen cooled MCT FPA (Mercury Cadmium Tellur-ide Focal Plane Array) detector comprising 4096 pixelsarranged in a 64 × 64 grid format was used to measure FTIRimages with a Agilent 670-IR spectrometer and a 620-IR micro-scope operating in rapid scan mode. Transmission measure-ments were performed with a 15× Cassegrain objectivecollecting 64 scans from a plasma sample deposited on a CaF2window. Background measurements were acquired on blanksubstrates with 128 scans per pixel. All spectra were recorded
Paper Analyst
Analyst This journal is © The Royal Society of Chemistry 2015
Publ
ishe
d on
06
Janu
ary
2015
. Dow
nloa
ded
by U
NIW
ER
SYT
ET
JA
GIE
LL
ON
SKI
on 2
0/01
/201
5 13
:12:
03.
View Article Online
in the range of 3800–900 cm−1 with a spectral resolution of8 cm−1 used also in other studies on biological materials.25,26
Recording 4096 spectra took 3 min. FTIR spectra embedded ineach spectral image were first quality-screened and thenextracted using the CytoSpec v. 1.4.03 software.27 The qualitytest for sample thickness was performed according to the absor-bance over the “fingerprint region” (900–1750 cm−1) to removespectra with the maximum absorbance less than 0.4 or greaterthan 1.2. Then, ca. 50 spectra for each sample were randomlyextracted. As an example, we collected raw FTIR spectra inFig. S1 (in ESI†) for the control and systemic hypertensionplasma. As can seen from this figure, the spectra of plasma arenot obscured by the resonance Mie scattering effect. Inaddition, Fig. S2 (in ESI†) shows FTIR images for the amide Iband before and after the quality test. The latter show that FTIRspectra of a low signal to noise ratio are only removed. Proces-sing of spectral data was performed using OPUS (version 7.0,Bruker Optic, Ettingen, Germany) and Unscrambler X (version10.3, Camo Software, Oslo, Norway) software packages.
Using the Opus program, approx. 600 raw spectra for eachgroup were vector normalized in the region of 1800–900 cm−1
and then averaged. Second derivatives of the mean spectrawere calculated by using a Savicky–Golay method (number ofsmoothing points: 9) to show the overall changes in the spec-tral profile of the investigated groups.
According to ref. 28–30 30 raw spectra from each plasmagroup were analysed by using Principal Component Analysis(PCA) provided by the Unscrambler X (ver. 10.3) software. Datawere pre-processed by firstly calculating the second derivativespectra by the Savicky–Golay method (number of smoothingpoints: 9) and then corrected using Extended MultiplicativeSignal Correction (EMSC) in the regions of 3100–2800 and1750–900 cm−1. These steps were followed in order to normal-ize the spectra, accounting for differences in sample thickness,to minimize the baseline variation, and provide a better visualidentification of bands that may have been overlaying oneanother in the raw spectra.31,32 The second derivative FTIRspectra before and after the EMCS correction are shown inFig. S3 in ESI.† PCA was computed for the “bio-region”(3100–2800 and 1750–900 cm−1) by using the leave-out-onecross-validation approach and Nipal’s algorithm for PCAdecomposition. Seven PCs were chosen for the initialdecomposition and 20 iterations were performed for each PC.Two-dimensional (2D) score plots and the corresponding PCloading plots were graphed.
Results and discussion
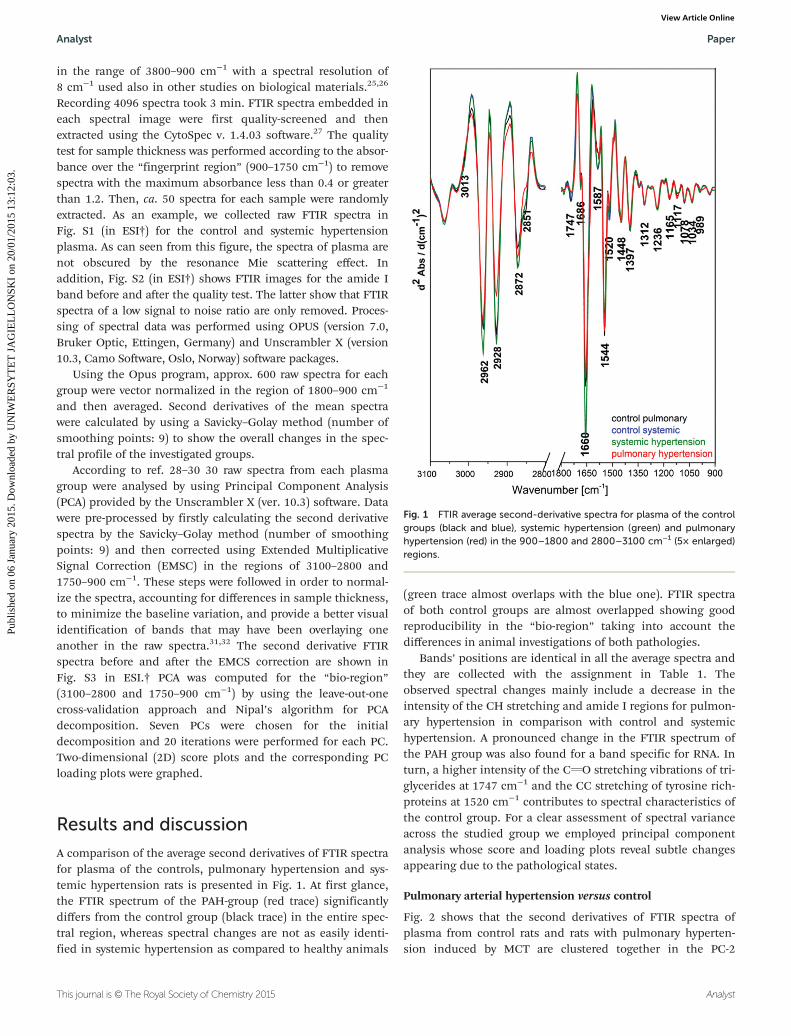
A comparison of the average second derivatives of FTIR spectrafor plasma of the controls, pulmonary hypertension and sys-temic hypertension rats is presented in Fig. 1. At first glance,the FTIR spectrum of the PAH-group (red trace) significantlydiffers from the control group (black trace) in the entire spec-tral region, whereas spectral changes are not as easily identi-fied in systemic hypertension as compared to healthy animals
(green trace almost overlaps with the blue one). FTIR spectraof both control groups are almost overlapped showing goodreproducibility in the “bio-region” taking into account thedifferences in animal investigations of both pathologies.
Bands’ positions are identical in all the average spectra andthey are collected with the assignment in Table 1. Theobserved spectral changes mainly include a decrease in theintensity of the CH stretching and amide I regions for pulmon-ary hypertension in comparison with control and systemichypertension. A pronounced change in the FTIR spectrum ofthe PAH group was also found for a band specific for RNA. Inturn, a higher intensity of the CvO stretching vibrations of tri-glycerides at 1747 cm−1 and the CC stretching of tyrosine rich-proteins at 1520 cm−1 contributes to spectral characteristics ofthe control group. For a clear assessment of spectral varianceacross the studied group we employed principal componentanalysis whose score and loading plots reveal subtle changesappearing due to the pathological states.
Pulmonary arterial hypertension versus control
Fig. 2 shows that the second derivatives of FTIR spectra ofplasma from control rats and rats with pulmonary hyperten-sion induced by MCT are clustered together in the PC-2
Fig. 1 FTIR average second-derivative spectra for plasma of the controlgroups (black and blue), systemic hypertension (green) and pulmonaryhypertension (red) in the 900–1800 and 2800–3100 cm−1 (5× enlarged)regions.
Analyst Paper
This journal is © The Royal Society of Chemistry 2015 Analyst
Publ
ishe
d on
06
Janu
ary
2015
. Dow
nloa
ded
by U
NIW
ER
SYT
ET
JA
GIE
LL
ON
SKI
on 2
0/01
/201
5 13
:12:
03.
View Article Online
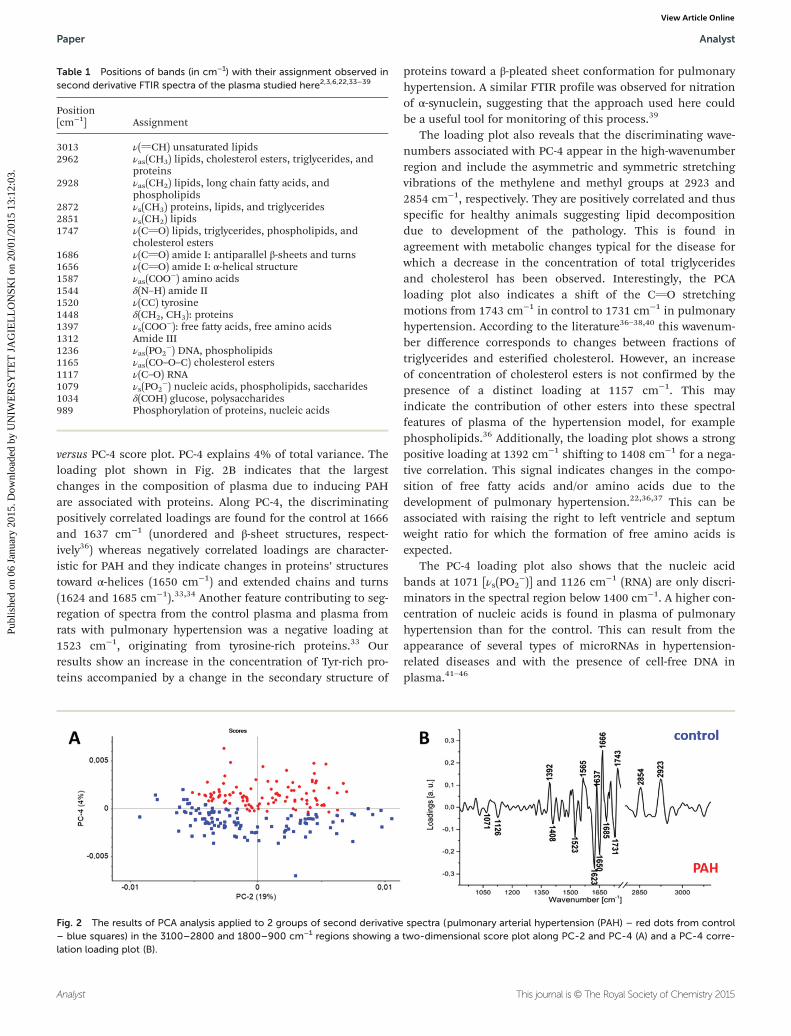
versus PC-4 score plot. PC-4 explains 4% of total variance. Theloading plot shown in Fig. 2B indicates that the largestchanges in the composition of plasma due to inducing PAHare associated with proteins. Along PC-4, the discriminatingpositively correlated loadings are found for the control at 1666and 1637 cm−1 (unordered and β-sheet structures, respect-ively36) whereas negatively correlated loadings are character-istic for PAH and they indicate changes in proteins’ structurestoward α-helices (1650 cm−1) and extended chains and turns(1624 and 1685 cm−1).33,34 Another feature contributing to seg-regation of spectra from the control plasma and plasma fromrats with pulmonary hypertension was a negative loading at1523 cm−1, originating from tyrosine-rich proteins.33 Ourresults show an increase in the concentration of Tyr-rich pro-teins accompanied by a change in the secondary structure of
proteins toward a β-pleated sheet conformation for pulmonaryhypertension. A similar FTIR profile was observed for nitrationof α-synuclein, suggesting that the approach used here couldbe a useful tool for monitoring of this process.39
The loading plot also reveals that the discriminating wave-numbers associated with PC-4 appear in the high-wavenumberregion and include the asymmetric and symmetric stretchingvibrations of the methylene and methyl groups at 2923 and2854 cm−1, respectively. They are positively correlated and thusspecific for healthy animals suggesting lipid decompositiondue to development of the pathology. This is found inagreement with metabolic changes typical for the disease forwhich a decrease in the concentration of total triglyceridesand cholesterol has been observed. Interestingly, the PCAloading plot also indicates a shift of the CvO stretchingmotions from 1743 cm−1 in control to 1731 cm−1 in pulmonaryhypertension. According to the literature36–38,40 this wavenum-ber difference corresponds to changes between fractions oftriglycerides and esterified cholesterol. However, an increaseof concentration of cholesterol esters is not confirmed by thepresence of a distinct loading at 1157 cm−1. This mayindicate the contribution of other esters into these spectralfeatures of plasma of the hypertension model, for examplephospholipids.36 Additionally, the loading plot shows a strongpositive loading at 1392 cm−1 shifting to 1408 cm−1 for a nega-tive correlation. This signal indicates changes in the compo-sition of free fatty acids and/or amino acids due to thedevelopment of pulmonary hypertension.22,36,37 This can beassociated with raising the right to left ventricle and septumweight ratio for which the formation of free amino acids isexpected.
The PC-4 loading plot also shows that the nucleic acidbands at 1071 [νs(PO2
−)] and 1126 cm−1 (RNA) are only discri-minators in the spectral region below 1400 cm−1. A higher con-centration of nucleic acids is found in plasma of pulmonaryhypertension than for the control. This can result from theappearance of several types of microRNAs in hypertension-related diseases and with the presence of cell-free DNA inplasma.41–46
Table 1 Positions of bands (in cm−1) with their assignment observed insecond derivative FTIR spectra of the plasma studied here2,3,6,22,33–39
Position[cm−1] Assignment
3013 ν(vCH) unsaturated lipids2962 νas(CH3) lipids, cholesterol esters, triglycerides, and
proteins2928 νas(CH2) lipids, long chain fatty acids, and
phospholipids2872 νs(CH3) proteins, lipids, and triglycerides2851 νs(CH2) lipids1747 ν(CvO) lipids, triglycerides, phospholipids, and
cholesterol esters1686 ν(CvO) amide I: antiparallel β-sheets and turns1656 ν(CvO) amide I: α-helical structure1587 νas(COO
−) amino acids1544 δ(N–H) amide II1520 ν(CC) tyrosine1448 δ(CH2, CH3): proteins1397 νs(COO
−): free fatty acids, free amino acids1312 Amide III1236 νas(PO2
−) DNA, phospholipids1165 νas(CO–O–C) cholesterol esters1117 ν(C–O) RNA1079 νs(PO2
−) nucleic acids, phospholipids, saccharides1034 δ(COH) glucose, polysaccharides989 Phosphorylation of proteins, nucleic acids
Fig. 2 The results of PCA analysis applied to 2 groups of second derivative spectra (pulmonary arterial hypertension (PAH) – red dots from control– blue squares) in the 3100–2800 and 1800–900 cm−1 regions showing a two-dimensional score plot along PC-2 and PC-4 (A) and a PC-4 corre-lation loading plot (B).
Paper Analyst
Analyst This journal is © The Royal Society of Chemistry 2015
Publ
ishe
d on
06
Janu
ary
2015
. Dow
nloa
ded
by U
NIW
ER
SYT
ET
JA
GIE
LL
ON
SKI
on 2
0/01
/201
5 13
:12:
03.
View Article Online

Systemic hypertension versus control
Fig. 3A illustrates sample grouping for the control (blue dots)and systemic hypertension (green squares) induced by thepartial ligation on the left renal artery in the 3100–2800 and1800–900 cm−1 regions. Only the PC-5 score plot separatesboth groups with some overlapping that is found in agreementwith visual inspection of FTIR spectra in Fig. 1. PCA scoreplots for lower values of the PC did not discriminate bothgroups, see Fig. S4 (in ESI†). However, the loading plot maysuggest some biochemical changes in plasma of systemichypertension. In general, discrimination of both groups ismainly associated with changes in the spectral region of1740–1500 cm−1, see Fig. 3B. Variance is positively correlatedwith the amide I band at 1643 cm−1 (characteristic for theβ-sheet conformation of proteins in the control plasma) andnegatively correlated with amide I bands at 1666 and1631 cm−1 typical for an unordered structure and extendedchains in plasma of systemic hypertension.36 Conformationalchanges found in the pathology may be associated with thephosphorylation process of proteins since the loading plotshows a negative signal at 971 cm−1.34 It is worthy to mentionthat this protein profile is different from those found for PAH.Our PCA also indicates that clustering is associated with
lipids. Positive loadings for the control plasma at 2927 and2854 cm−1 (assigned to saturated lipids) and at 1731 and1157 cm−1 (originating from cholesterol esters) suggestdecomposition of these macromolecules due to inducing sys-temic hypertension. This is congruent with the appearance ofa negative signal at 1716 cm−1 specific for free fatty acids (inthe hypertension group).38–41 In addition, positive and nega-tive loadings at 1411 and 1396 cm−1, respectively, suggest syn-thesis of fatty acids and/or free amino acids during developingof the disease with a different composition than in plasma ofthe control group.22,36,37
Wavenumbers that also contribute to the control–systemichypertension segregation are found at 1118 [ν(C–O)] and 1230/1080 cm−1 [νas(PO2
−)/νs(PO2−)] in positive loadings of the control
group. This can indicate that both nucleic acids, DNA and RNA,and/or phospholipids are also involved in biochemical processesassociated with systemic hypertension.6,35
Comparison of systemic and arterial pulmonary hypertensions
Two-class discrimination was also used to identify the segre-gating biochemical entities between systemic and pulmonaryhypertensions. Fig. 4A shows the score plot for both patho-logies; perfect cluster segregation is observed, pointing to PC-1
Fig. 3 The results of PCA analysis applied to 2 groups of second derivative spectra (systemic hypertension – green squares from control – bluedots) in the 3100–2800 and 1800–900 cm−1 regions showing a two-dimensional score plot along PC-2 and PC-5 (A) and a PC-5 correlation loadingplot (B).
Fig. 4 The results of PCA analysis applied to 2 groups of second derivative spectra (systemic hypertension – green dots from pulmonary (PAH) –red squares) in the 3100–2800 and 1800–900 cm−1 regions showing a two-dimensional score plot along PC-1 and PC-2 (A) and a PC-1 correlationloading plot (B).
Analyst Paper
This journal is © The Royal Society of Chemistry 2015 Analyst
Publ
ishe
d on
06
Janu
ary
2015
. Dow
nloa
ded
by U
NIW
ER
SYT
ET
JA
GIE
LL
ON
SKI
on 2
0/01
/201
5 13
:12:
03.
View Article Online

being the most responsible for this observation with 50% oftotal variance. This clearly indicates that plasma of PAH andsystemic hypertension has a distinct biochemical composition.Additionally, we observe in the score plot separation of bothhypertension groups into sub-groups due to individual varia-bility between animals. This is commonly observed for biologi-cal samples.
The major discriminants in the PC-1 loading plot are thetwo positively correlated amide bands at 1627 and 1554 cm−1,characterising β-pleated sheet components of plasma proteinsof pulmonary hypertension, while the protein composition insystemic hypertension is dominated by unordered structures(negative loading at 1662 cm−1).34 This separation is consistentwith the discussed-above discrimination of both hypertensiongroups from the control. Additionally, a higher concentrationof tyrosine-rich proteins is found in plasma in pulmonary ascompared with systemic hypertension.
Differences between systemic and pulmonary hypertensionsin terms of lipid composition/metabolism are revealed bynegative loadings at 3012, 2923 and 2858 cm−1, suggestingthat plasma from the pulmonary hypertension model containsa lower concentration of lipids, including the unsaturated frac-tion of these biomolecules. This may also indicate that lipidperoxidation appears upon inducing pulmonary hypertension.The latter is characterised by positive loadings at 1728 and1407 cm−1 corresponding to the formation of free fatty acids. Afew discriminators are found in the region below 1250 cm−1.The most pronounced feature is a shift of the O–P–O asym-metric stretching band from 1245 cm−1 for pulmonary hyper-tension to 1222 cm−1 for systemic hypertension. Such a shiftwas associated with the conformation change for the A-DNA toB-DNA transition.47 The presence of a positive loading at1083 cm−1 (the symmetric PO2
− stretching band) for plasma ofpulmonary hypertension can additionally support a hypothesisthat the DNA changes its conformation or is decomposed inthe case of systemic hypertension as compared to the pulmon-ary hypertension. The plasma for the latter also exhibits ahigher content of RNA and glucose (positive loadings at 1126and 1037 cm−1, respectively).
Conclusions
Here we demonstrate for the first time a potential of FTIRspectroscopy as a method for easy and rapid assessment ofbiochemical changes in plasma that seem to reflect the patho-logical changes in pulmonary circulation and are not sharedby the plasma changes associated with systemic hypertension.The combination of FTIR spectroscopy and multivariate dataanalysis may prove to be useful to find novel biomarkers ofpulmonary hypertension. The important findings of this workwas to show that the plasma spectral signature of pulmonaryhypertension was significantly different from that of systemichypertension. These results also indicate that both pathologiessystemic and pulmonary hypertension induced a uniqueresponse in biochemical contents of plasma that could have
diagnostic and prognostic significance. Our PCA analysisimplicates that the first targets of further investigations shouldbe plasma fractions to determine the range of peptides/pro-teins responsible for the observed changes. At this stage of ourinvestigations, it is rather impossible to indicate what plasmaproteins are responsible for the found discriminators. As men-tioned in the Introduction, the composition of plasma pep-tides and proteins changes upon the development of thepathology. In addition, several post-translational modificationsof proteins can appear and they result from oxidation,carbonylation, glycation, phosphorylation or conjugation withproducts of lipid peroxidation. But an exact identification andquantification of modified proteins have been still a challen-ging task.48,49 It is also well-known that the process of nitrationof the tyrosine residue in plasma proteins is associated withthe cardiovascular pathology.50 Detailed studies should also bedirected towards recognition of the nucleic acid profile. On theother hand, while the understanding of the observed spectralchanges can give a deeper insight into the mechanism of thepathology, the proposed approach might have independentdiagnostic and prognostic significance.
Acknowledgements
This work was supported by the National Center of Science(DEC-2013/09/N/NZ4/00597) and by the European Union fromthe resources of the European Regional Development Fundunder the Innovative Economy Programme (grant coordinatedby JCET-UJ, no. POIG.01.01.02-00-069/09).
References
1 G. Déléris and C. Petibois, Vib. Spectrosc., 2003, 32, 129.2 C. Petibois and G. Déléris, Cell Biol. Int., 2005, 29, 709.3 D. Perez-Guaita, J. Ventura-Gayete, C. Pérez-Rambla,
M. Sancho-Andreu, S. Garrigues and M. de la Guardia,Anal. Bioanal. Chem., 2012, 404, 649.
4 L. Büttner Mostaco-Guidolin and L. Bachmann, Appl. Spec-trosc. Rev., 2011, 46, 388.
5 R. K. Sahu, U. Zelig, M. Huleihel, N. Brosh, M. Talyshinsky,M. Ben-Harosh, S. Mordechai and J. Kapelushnik, Leuk.Res., 2006, 30, 687.
6 K.-Z. Liu, R. Bose and H. H. Mantsch, Vib. Spectrosc., 2002,28, 131.
7 R. Patel, W. S. Aronow, L. Patel, K. Gandhi, H. Desai,D. Kaul and S. P. Sahgal, Med. Sci. Monit., 2012, 18, RA31.
8 Y. Shi, C. Wang, S. Han, B. Pang, N. Zhang, J. Wang andJ. Li, Med. Sci. Monit., 2012, 18, BR69.
9 Y. C. Lai, K. C. Potoka, H. C. Champion, A. L. Mora andM. T. Gladwin, Circ. Res., 2014, 115, 115.
10 E. Braunwald, D. P. Zipper and P. Libby, Heart Disease,W. B. Saunders Company, 6th edn, 2001.
11 R. Budhiraja, R. M. Tuder and P. M. Hassoun, Circulation,2004, 109, 159.
Paper Analyst
Analyst This journal is © The Royal Society of Chemistry 2015
Publ
ishe
d on
06
Janu
ary
2015
. Dow
nloa
ded
by U
NIW
ER
SYT
ET
JA
GIE
LL
ON
SKI
on 2
0/01
/201
5 13
:12:
03.
View Article Online
12 J. Kim, Y. Kang, Y. Kojima, J. K. Lighthouse, X. Hu,M. A. Aldred, D. L. McLean, H. Park, S. A. Comhair,D. M. Greif, S. C. Erzurum and H. J. Chun, Nat. Med., 2013,19, 74.
13 S. Murakami, H. Kimura, K. Kangawa and N. Nagaya,Cardiovasc. Hematol. Disord.: Drug Targets, 2006, 6, 125.
14 C. D. Vizza, C. Letizia, L. Petramala, R. Badagliacca,R. Poscia, E. Zepponi, E. Crescenzi, A. Nona, G. Benedetti,F. Farrante, S. Sciomer and F. Fedele, Regul. Pept., 2008,151, 48.
15 N. Selimovic, C. H. Bergh, B. Andersson, E. Sakiniene,H. Carlsten and B. Rundqvist, Eur. Respir. J., 2009, 34, 662.
16 M. Duncan, B. D. Wagner, K. Murray, J. Allen, K. Colvin,F. J. Accurso and D. D. Ivy, Mediators Inflamm., 2012, 2012,143428.
17 A. A. Lopes, L. H. Caramurú and N. Y. Maeda, Clin. Appl.Thromb.-Hemost., 2002, 8, 353.
18 L. Maricić, A. Vceva, R. Visević, A. Vcev, M. Milić, V. Serićand V. Fijacko, Coll. Antropol., 2013, 37, 1153.
19 G. Cella, F. Vianello, F. Cozzi, H. Marrota, F. Tona,G. Saggiorato, O. Iqbal and J. Fareed, J. Rheumatol., 2009,36, 760.
20 A. Filusch, E. Giannitsis, H. A. Katus and F. J. Meyer, Clin.Sci., 2010, 119, 207.
21 L. Tul, F. S. De Man, B. Girerd, A. Huertas,M. C. Chaumais, F. Lecerf, C. François, F. Perros,P. Dorfmüller, E. Fadel, D. Montani, S. Eddahibi,M. Humbert and C. Guignabert, Am. J. Respir. Crit. CareMed., 2012, 186, 666.
22 M. Saravankumar, J. Manivannan, J. Sivasubramanin,T. Silambrasan, E. Balamurugan and B. Raja, Mol. CellBiochem., 2012, 362, 203.
23 R. Zatz, Lab. Anim. Sci., 1990, 40, 198.24 E. Staniszewska-Slezak, A. Rygula, K. Malek and
M. Baranska, Transmission versus transflection mode inFTIR analysis of blood plasma: is the EFSW effect the onlyreason of the observed spectral distortions?, Analyst, 2014,submitted.
25 C. Chonanant, K. R. Bambery, N. Jearanaikoon, S. Chio-Srichan, T. Limpaiboon, M. J. Tobin, P. Heraud andP. Jearanaikoon, Talanta, 2014, 130, 39.
26 J. Cao, E. S. Ng, D. McNaughton, E. G. Stanley,A. G. Elefanty, M. J. Tobin and P. Heraud, J. Biophotonics,2014, 7, 767.
27 http://www.cytospec.com.28 A. Khoshmanesh, M. W. A. Dixon, S. Kenny, L. Tilley,
D. McNaughton and B. R. Wood, Anal. Chem., 2014, 86,4379.
29 E. Lipiec, K. R. Bambery, P. Heraud, W. M. Kwiatek,D. McNaughton, M. J. Tobin, C. Vogel and B. R. Wood,Analyst, 2014, 139, 4200.
30 J. Ollesch, S. L. Drees, H. M. Heise, T. Behrens, T. Brüningand K. Gerwert, Analyst, 2013, 138, 4092.
31 K. Thumanu, S. Sangrajrang, T. Khuhaprema, A. Kalalak,W. Tanthanuch, S. Pongpiachan and P. Heraud, J. Bio-photonics, 2014, 7, 222.
32 D. Te, W. Tanthanuch, K. Thumanu, A. Sangmalee,R. Parnpai and P. Heraud, Analyst, 2012, 137, 4774.
33 M. Harz, C. L. Bockmayer, P. Rösch, R. A. Claus andJ. Popp, Med. Laser Appl., 2007, 22, 87.
34 V. G. Gregoriou, V. Jayaraman, X. Hu and T. G. Spiro, Bio-chemistry, 1995, 34, 6876.
35 E. Peuchant, S. Richard-Harston, I. Bourdel-Marchasson,J.-F. Dartigues, L. Letenneur, P. Barberger-Gateau,S. Arnaud-Dabernat and J.-Y. Daniel, Transl. Res., 2008, 152,103.
36 C. Petibois, G. Cazorla, J.-R. Poortmans and G. Déléris,Sports Med., 2003, 33, 83.
37 C. Krafft, R. Salzer, G. Soff and M. Meyer-Hermann, Cyto-metry, Part A, 2005, 64, 53.
38 K. Sato, M. Seimiy, Y. Kodera, A. Kitamura and F. Nomura,Clin. Chim. Acta, 2010, 411, 285.
39 V. N. Uversly, G. Yamin, L. A. Munishkina, M. A. Karymov,I. S. Millett, S. Doniach, Y. L. Lyubchenko and A. L. Fink,Mol. Brain Res., 2005, 134, 84.
40 T. P. Wrobel, L. Mateuszuk, S. Chlopicki, K. Malek andM. Baranska, Analyst, 2011, 136, 5247.
41 S. Pullamsetti, L. Kiss, H. A. Ghofrani, R. Voswinckel,P. Haredza, W. Klepetko, C. Aigner, L. Fink, J. P. Muyal,N. Weissmann, F. Grimminger, W. Seeger andR. T. Schermuly, FASEB J., 2005, 19, 1175.
42 G. Warwick, E. Kotlyar, S. Chow, P. S. Thomas andD. H. Yates, J. Breath Res., 2012, 6, 036006.
43 C. J. Rhodes, J. Wharton, R. A. Boon, T. Roexe,H. Tsang, B. Wojciak-Stothard, A. Chakrabarti,L. S. Howard, J. S. R. Gibbs, A. Lawrie, R. Condliffe,C. A. Elliot, D. G. Kiely, L. Huson, H. A. Ghofrani,H. Tiede, R. Schermuly, A. M. Zeiher, S. Dimmeler andM. R. Wilkins, Am. J. Respir. Crit. Care Med., 2013, 187,294.
44 K. Schlosser, R. J. White and D. J. Stewart, Am. J. Respir.Crit. Care Med., 2013, 188, 1472.
45 C. Wei, H. Henderson, C. Spradley, L. Li, I. K. Kim,S. Kumar, N. Hong, A. C. Arroliga and S. Gupta, PLoS One,2013, 23, e64396.
46 C. J. Rhodes, J. Wharton, L. Howard, J. S. Gibbs, A. Vonk-Noordegraaf and M. R. Wilkins, Eur. Respir. J., 2011, 38,1453.
47 D. R. Whelan, K. R. Bambery, P. Herauld, M. Tobin,M. Diem, D. McNaughton and B. R. Wood, Nucleic AcidsRes., 2011, 39, 5439.
48 M. A. Baraibar, R. Ladouce and B. Friguet, J. Proteomics,2013, 92, 63.
49 C. M. Spickett, A. Reis and A. R. Pitt, Anal. Chem., 2013, 85,4621.
50 G. Peluffo and R. Radi, Cardiovasc. Res., 2007, 75, 291.
Analyst Paper
This journal is © The Royal Society of Chemistry 2015 Analyst
Publ
ishe
d on
06
Janu
ary
2015
. Dow
nloa
ded
by U
NIW
ER
SYT
ET
JA
GIE
LL
ON
SKI
on 2
0/01
/201
5 13
:12:
03.
View Article Online