The Role of the Major Histocompatibility Complex and the ...
284
The Role of the Major Histocompatibility Complex and the Leukocyte Receptor Complex Genes in Susceptibility to Tuberculosis in a South African Population By Muneeb Salie Dissertation presented for the degree of Doctor Philosophy (Human Genetics) in the Faculty of Medicine and Health Sciences at Stellenbosch University Supervisor: Prof Eileen Garner Hoal Co-supervisor: Dr Marlo Möller April 2014
-
Upload
khangminh22 -
Category
Documents
-
view
0 -
download
0
Transcript of The Role of the Major Histocompatibility Complex and the ...

The Role of the Major
Histocompatibility Complex
and the Leukocyte Receptor Complex
Genes in Susceptibility to Tuberculosis
in a South African Population
By
Muneeb Salie
Dissertation presented for the degree of Doctor Philosophy (Human Genetics)
in the Faculty of Medicine and Health Sciences at Stellenbosch University
Supervisor: Prof Eileen Garner Hoal
Co-supervisor: Dr Marlo Möller
April 2014

Declaration
By submitting this dissertation electronically, I declare that the entirety of the work contained
therein is my own, original work, that I am the sole author thereof (save to the extent
explicitly otherwise stated), that reproduction and publication thereof by Stellenbosch
University will not infringe any third party rights and that I have not previously in its entirety
or in part submitted it for obtaining any qualification.
Date: 1 October 2013
Copyright © 2014 Stellenbosch University
All rights reserved
Stellenbosch University http://scholar.sun.ac.za

Abstract
Tuberculosis (TB) disease results in approximately 2 million deaths annually and is the
leading cause of death due to a single infectious agent. Previous studies have indicated that
host genetics play an important role in the development of TB. This together with pathogen
and environmental factors intensifies the complexity of this disease.
The Major Histocompatibility Complex (MHC) and Leukocyte Receptor Complex (LRC)
comprise several genes which are known to be important modulators of the host immune
response. The human leukocyte antigen (HLA) class-I genes of the MHC are involved in the
presentation of pathogenic antigens on the surfaces of infected cells, while the killer cell
immunoglobulin-like receptors (KIRs) of the LRC are involved in the recognition of self and
non-self cells. Natural Killer (NK) cells through their KIRs are thus able to kill non-self cells
through recognition of the class-I molecules expressed. Additionally, HLAs and KIRs are
extremely polymorphic and differ markedly across populations of different ethnicities.
Here we studied these genes and their polymorphisms in the South African Coloured (SAC)
population to determine their involvement in susceptibility to TB, susceptibility to disease
caused by specific Mycobacterium tuberculosis subtypes, and understanding their ancestral
contribution to the SAC with regards to the development of TB.
We showed that the KIR3DS1 gene and KIR genotypes with five or more activating KIRs,
and the presence of 3DS1, protected against the development of active TB in the SAC
population. Several HLA class-I alleles were identified as susceptibility factors for TB
disease. With regards to genes of the MHC and LRC, several loci were found to alter
susceptibility to TB in the SAC population, including MDC1, BTNL2, HLA-DOA, HLA-DOB,
C6orf10, TAP2, LILRA5, NCR1, NLRP7 and the intergenic regions between HLA-C/WASF5P
and LAIR1/TTYH1.
Stellenbosch University http://scholar.sun.ac.za

We showed that the Beijing strain occurred more frequently in individuals with multiple
disease episodes, with the HLA-B27 allele lowering the odds of having an additional episode.
Associations were identified for specific HLA types and disease caused by the Beijing, Latin
America-Mediterranean (LAM), Low-Copy Clade (LCC), and Quebec strains. HLA types
were associated with disease caused by strains from the Euro-American or East Asian
lineages, and the frequencies of these alleles in their sympatric human populations identified
potential co-evolutionary events between host and pathogen.
Finally, we showed that the SAC population is the most diverse SA population with regards
to HLA alleles and KIR genotypes, as would be expected given the admixture of the SAC.
Based on the HLA allele class-I profiles across SA populations, we noted that the Ag85B-
ESAT-6, Ag85B-TB10.4 and Mtb72f vaccines currently undergoing clinical trials would
have low efficacy across most SA populations. We showed that the MHC and LRC regions in
SAC healthy controls are predominantly of European ancestry, and that SAC TB cases are
more closely related to Khoisan and black SA population groups.
Our work highlights the importance of investigating both host and pathogen genetics when
studying TB disease development and that understanding the genetic ancestral contributions
to the SAC population can contribute to the identification of true and novel TB causing
variants.
Stellenbosch University http://scholar.sun.ac.za

Opsomming
Tuberkulose (TB) is jaarliks verantwoordelik vir ongeveer 2 miljoen sterftes en is die
hoofoorsaak van dood as gevolg van „n aansteeklike siekte. Vorige navorsingstudies het
aangedui dat die genetiese samestelling van die gasheer „n beduidende rol speel in die
ontwikkeling van TB. Die kompleksiteit van hierdie siekte word vererger deur die
betrokkenheid van die gasheer genoom sowel as bakteriële en omgewings faktore.
Die Major Histocompatibility Complex (MHC) en Leukocyte Receptor Complex (LRC)
bestaan uit verskeie gene wat die gasheer immuunrespons verstel. Die human leukocyte
antigen (HLA) klas I gene van die MHC is betrokke by die aanbieding van patogeniese
antigene op die oppervlak van geïnfekteerde selle, terwyl die killer cell immunoglobulin-like
receptors (KIRs), geleë in die LRC, betrokke is by die herkenning van eie en vreemde selle.
NK selle, deur middel van hul KIRs, kan dus vreemde selle uitwis aangesien hulle die
uitgedrukte klas I molekules kan herken. Beide HLA en KIRs is hoogs polimorfies en verskil
beduidend tussen etniese groepe.
In hierdie studie is die bogenoemde gene en hul polimorfismes in die Suid Afrikaanse
Kleurling bevolking (SAC) ondersoek om vas te stel tot watter mate dit genetiese vatbaarheid
vir TB, asook vatbaarheid vir TB wat deur spesifieke Mycobacterium tuberculosis subtipes
veroorsaak word, beïnvloed. Daar is ook gepoog om te verstaan hoe die voorouerlike bydrae
van hierdie gene die SAC met betrekking tot TB vatbaarheid affekteer.
Die resultate van die studie het aangedui dat die KIR3DS1 geen en KIR genotipes met vyf of
meer aktiewe KIRs en die teenwoordigheid van 3DS1, die SAC bevolking beskerm teen die
ontwikkeling van aktiewe TB. Verskeie HLA klas I allele is geïdentifiseer as
vatbaarheidsfaktore vir TB. Talle lokusse van die MHC en LRC gene is ook as
vatbaarheidsfaktore vir TB in die SAC bevolking geïdentifiseer, insluitende MDC1, BTNL2,
Stellenbosch University http://scholar.sun.ac.za

HLA-DOA, HLA-DOB, C6orf10, TAP2, LILRA5, NCR1, NLRP7 en die intergeniese areas
tussen HLA-C/WASF5P en LAIR1/TTYH1.
Die studie het aangedui dat die Beijing stam meer voorkom in individue wat verskeie kere
TB gehad het en dat die HLA-B27 alleel die kanse om „n verdere episode te hê, verlaag het.
Assosiasies is geïdentifiseer tussen spesifieke HLA tipes en siekte veroorsaak deur die
Beijing, LAM, LCC, en Quebec TB stamme. HLA tipes was geassosieer met siekte
veroorsaak deur TB stamme van Euro-Amerikaanse en Oos-Asiëse afkoms. Die frekwensies
van hierdie allele, in hul ooreenstemmende mensbevolkings, dui op „n potensïele ko-
evolusionêre gebeurtenis tussen die gasheer en patogeen.
Die studie het ook vasgestel dat die SAC populasie die mees diverse SA bevolking is met
betrekking tot die HLA allele en KIR genotipes, soos verwag sou word gegewe die gemengde
genetiese herkoms van die SAC. Gebaseer op die HLA allele klas I profiel van verskillende
SA bevolkings merk ons op dat die Ag85B-ESAT-6, Ag85B-TB10.4 en Mtb72f vaksiene,
wat huidiglik kliniese toetsing ondergaan, nie so effektief in die meeste SA bevolkings sal
wees nie. Die studie het ook bewys dat die MHC en LRC streke in gesonde SAC kontroles,
grootliks afkomstig was van „n Europese nalatenskap en dat die SAC TB gevalle meer
verwant is aan die Khoisan en swart SA bevolkings.
Hierdie studie beklemtoon die noodsaaklikheid om beide gasheer en patogeen genetika te
bestudeer wanneer die ontwikkeling van TB ondersoek word en dat die verstaan van die
genetiese voorouerlike bydrae van die SAC bevolking kan bydra tot die identifisering van
ware en nuwe TB-veroorsakende variante.
Stellenbosch University http://scholar.sun.ac.za

Acknowledgements
“Surround yourself with only people who are going to lift you higher” Oprah Winfrey
I would like to thank the following people and institutions for their contribution to this work:
My supervisor Prof. Eileen Hoal and co-supervisor Dr. Marlo Möller. It has been 9 years
since I joined the TB Host Genetics group and under your supervision I have gained a
tremendous amount of scientific knowledge, particularly in our field of research, for which I
have the greatest appreciation. I would also like to thank you for your encouragement,
support, and allowing me to travel so that I could broaden my scientific outlook.
Prof. Paul van Helden, head of department, thank you for your both academically and
financially.
The TB Host Genetics Lab. Michelle Daya for your willingness to help me with
programming in R and statistical analysis. Nikki le Roux, my PhD partner, having a fellow
colleague going through the same trials and tribulations of writing a doctoral thesis definitely
helped with the process, and it was also nice to not be the only person in the office moaning
about the “rules and regulations”.
My friends and former lab buddies, Chandré K. Abrahamse and Lance A. Lucas, thanks for
all the support and the encouragement through the years. Lance buddy…before you know it
you will be writing up your doctoral thesis…Good Luck!
Members of the Division of Molecular Biology and Human Genetics, thank you for your
support and encouragement. I will treasure the many friends that I have made.
Prof Robin Warren and Dr. Gian van der Spuy, thank you for sharing your M. tuberculosis
data with me, and for your assistance with publishing my manuscript.
Stellenbosch University http://scholar.sun.ac.za

Lize van der Merwe, thank you for all your assistance with analysing my data.
Our collaborators, Dr. Mary Carrington, Dr. Maureen Martin, Dr. Xiao-jiang Gao, Mrs. Fuh-
Mei Duh, and other members of the Laboratory of Experimental Immunology at the National
Cancer Institute-Frederick, USA. Without your help most of the work presented in this thesis
would not have been possible. Your expertise in HLA and KIR typing and financing part of
this work is greatly appreciated.
Our collaborators, Dr. Brenna Henn (Stanford University/Stony Brook University), Ms. Julie
Granka (Stanford Univeristy), Dr. Paul Norman (Stanford University) and Mr. Chris Gignoux
(University of California San Francisco), thank you for taking time out of your busy
schedules to train me in population genetics analysis and how to handle/analyse NGS data
sets.
Prof. Caroline Tiemessen, Prof. Adrian Puren and Dr. Maria Paximadis, National Institute for
Communicable Diseases and Wits University, for your willingness to share your ESKOM
HLA data with us.
The Deutscher Akademischer Austausch Dienst-National Research Foundation (DAAD-
NRF), Harry Crossley Foundation, SA Medical Research Council, Fogarty International
Centre and Stellenbosch University for your financial support during this project.
The individuals who consented to take part in this research.
My fiancé, Rushdah Hartley, thank you for all your support and patience while I was writing
my thesis. Two more months and then we‟ll be married and we get to start our new life
together as husband and wife…Love You!
To all my family, thank you for all your support and words of encouragement through the
years.
Stellenbosch University http://scholar.sun.ac.za

Finally to my parents, Yusuf and Rugaya Salie, there are no words to describe my eternal
gratefulness for what you have given me. I cannot begin to thank you for all the sacrifices
you have made both personally and financially, and allowing me to follow my own path in
life. I love you both immensely and will be indebted to you for the rest of my life.
Stellenbosch University http://scholar.sun.ac.za

This thesis is dedicated to my parents, Yusuf and Rugaya Salie
Stellenbosch University http://scholar.sun.ac.za

Table of Contents
List of Abbreviations i
List of Figures iv
List of Tables vii
List of Appendices viii
1. Tuberculosis
1.1 Brief History 1
1.2 Epidemiology 4
1.2.1 Global Epidemic 4
1.2.2 South African Perspective 6
1.3 Pathogenesis 8
1.3.1 Structure of Mycobacterium tuberculosis 8
1.3.2 Mycobacterium tuberculosis complex 9
1.3.3 Transmission 10
1.4 Clinical Features 10
1.4.1 Symptoms 10
1.4.2 Host Immune Response 11
1.4.3 Clinical Manifestations 12
1.5 Diagnosis 13
1.6 Treatment 15
1.7 Other risk factors 17
1.7.1 Environmental Factors 18
1.7.2 Host Genetic Factors 20
1.7.2.1 Current approaches in identifying disease causing genes 22
2. Genes of the Leukocyte Receptor Complex and Major Histocompatibility
Complex
2.1 The Leukocyte Receptor Complex 30
2.1.1 Killer cell immunoglobulin-like receptors 30
2.1.2 Leukocyte immunoglobulin-like receptors 33
2.1.3 Leukocyte-associated immunoglobulin-like receptors 34
2.1.4 FcαR1 (CD89) 35
2.1.5 NKp46/Natural Cytotoxicity Receptor 1 (NCR1) 36
Stellenbosch University http://scholar.sun.ac.za

2.2 The Major Histocompatibility Complex 36
2.2.1 Major Histocompatibility Complex class I genes 39
2.2.2 Major Histocompatibility Complex class II genes 41
2.2.3 Major Histocompatibility Complex class III genes 42
3. Hypothesis and Objectives
3.1 Study Hypothesis 44
3.2 Study Objectives 45
4. Host Genetic Susceptibility to Tuberculosis
4.1 Introduction 46
4.2 Materials and Methods 48
4.2.1 Study Participants 48
4.2.1.1 Case-control samples 48
4.2.1.2 MHC and LRC data mining, Affymetrix 500K dataset 49
4.2.2 DNA extractions 50
4.2.3 KIR Genotyping 51
4.2.3.1 RT PCR Protocol 51
4.2.3.2 Gene-Specific PCR-SSP Protocol 53
4.2.3.3 KIR Haplotypes 56
4.2.4 HLA Genotyping 56
4.2.4.1 Direct-sequencing protocol 56
4.2.4.2 SSP typing protocol 58
4.2.5 Statistical Analysis 59
4.2.5.1 KIR and HLA with TB susceptibility analysis 59
4.2.5.2 MHC and LRC data mining analysis 60
4.3 Results 62
4.3.1 KIR and TB case-control associations 62
4.3.2 HLA class-I and TB case-control associations 66
4.3.3 KIR_HLA compound genotypes and TB case-control associations 70
4.3.4 MHC and LRC data mining for TB susceptibility variants 71
4.4 Discussion 76
Stellenbosch University http://scholar.sun.ac.za

5. HLA Class I Variants and Susceptibility to particular Mycobacterium
tuberculosis Strains
5.1 Introduction 83
5.2 Materials and Methods 86
5.2.1 Study Participants 86
5.2.2 HLA Genotyping 86
5.2.3 HLA allele frequencies for geographical populations 89
5.2.4 Bacterial Isolates and Genotyping 94
5.2.5 Statistical Analysis 94
5.3 Results 95
5.3.1 Host genotype and multiplicity of infections 95
5.3.2 Relationship between host and bacterial genotype in TB disease 98
5.3.3 Relationship between M. tuberculosis phylogenetic lineages and HLA class-I allele
frequencies in specific geographical populations 103
5.4 Discussion 108
6. Population Genetics
6.1 Introduction 113
6.2 Materials and Methods 115
6.2.1 Study Populations 115
6.2.1.1 South African Coloured 115
6.2.1.2 Khoisan 115
6.2.1.3 South African: Black and White 116
6.2.1.4 South African populations from allelefrequencies.net database 116
6.2.2 HLA and KIR typing 117
6.2.2.1 South African Coloured 117
6.2.2.2 Khoisan 117
6.2.2.3 South African: Black and White 118
6.2.2.4 South African populations from allelefrequencies.net database 118
6.2.3 Data Analysis 118
6.2.3.1 Allele and genotype frequencies across South African populations 118
6.2.3.2 Genetic relationships between South African populations 119
6.2.3.3 Contributions of MHC and LRC from ancestral populations to the SAC 120
6.3 Results 121
Stellenbosch University http://scholar.sun.ac.za

6.3.1 HLA class-I allele frequencies across South African populations 121
6.3.2 M. tuberculosis vaccine epitope binding by HLA class-I alleles in South African populations
135
6.3.3 HLA class-I haplotype frequencies across South African populations 136
6.3.4 KIR genotype/haplotype frequencies in three South African population groups 140
6.3.5 Population structure of the South African Coloured (SAC) and Khoisan (SAN) populations
145
6.3.6 Genetic contribution to the MHC and LRC regions of the SAC population 146
6.3.7 Genetic relation of South African populations with regards to their HLA class-I composition
146
6.4 Discussion 149
7. Conclusion
7.1 Summary 153
7.2 Limitations and Future work 157
7.3 Conclusion 159
References 161
Appendices 194
Stellenbosch University http://scholar.sun.ac.za

P a g e | i
List of Abbreviations
3‟ Three prime
5‟ Five prime
AFND Allele frequencies net database
AIDS Acquired Immune Deficiency Syndrome
aKIR activating KIR
APCs Antigen presenting cells
b2m β2-microblobulin
BCG Bacille Calmette-Guérin
bp base pair
BTNL2 Butyrophilin-like 2
C6orf10 Chromosome 6 open reading frame 10
CCL2 Chemokine (C-C motif) ligand 2
CI Confidence Interval
CTLs Cytotoxic T lymphocytes
DC Dendritic cell
DOTS Directly observed treatment short course
EBV Epstein-Barr virus
Ed Euclidean distance
EM Expectation Maximization
EPTB Extrapulmonary TB
ER Endoplasmic reticulum
Fnd Normalized deviate of homozygosity
f Frequency
GWAS Genome-wide association study
HESN HIV-1 exposed seronegative
HGDP Human Genome Diversity Project
HIV Human Immunodeficiency Virus
HLA Human leukocyte antigen
HSP Heat shock protein
HWE Hardy-Weinberg Equilibrium
Ig Immunoglobulin
IgA Immunoglobulin A
IGRA Interferon-gamma Release Assay
iKIR inhibitory KIR
IL Interleukin
indels insertion/deletions
INF-γ/IFNG Interferon gamma
INH Isoniazid
ITAM Immunoreceptor tyrosine-based activation motif
ITIM Immunoreceptor tyrosine-based inhibition motif
kB kilobases
kDa kilo Daltons
KIR Killer cell immunoglobulin-like receptor
LAIR Leukocyte-associated immunoglobulin-like receptor
LAM Latin America-Mediterranean
LAMP-LD Local-Ancestry in adMixed Populations-LD
LCC Low-Copy Clade
LD Linkage disequilibrium
Stellenbosch University http://scholar.sun.ac.za

P a g e | ii
LILR Leukocyte immunoglobulin-like receptor
LRC Leukocyte receptor complex
M. africanum Mycobacterium africanum
M. bovis Mycobacterium bovis
M. canetti Mycobacterium canetti
M. caprae Mycobacterium caprae
M. microti Mycobacterium microti
M. pinnipeddi Mycobacterium pinnipeddi
M. tuberculosis Mycobacterium tuberculosis
MAF Minor allele frequency
MB Megabases
MBL Mannose-binding lectin
MDG Millennium Development Goal
MDR Multidrug-resistant
MHC Major Histocompatibility complex
mM Mill molar
MTBC Mycobacterium tuberculosis complex
MVSP Multi-Variate Statistical Package
NCR1 Natural cytotoxicity receptor 1
ng Nano grams
NGS Next-generation sequencing
NK Natural killer
NLR Nucleotide-binding and leucine-rich repeat activating
NOS2A Nitric oxide synthase 2, inducible
NRAMP1 Natural resistance-associated macrophage protein 1
OR Odds ratio
PAS Para-aminosalicylic acid
PCA Principal Component Analysis
PCO Principal Coordinate
PCR Polymerase chain reaction
PEM Protein energy malnutrition
PGLs Phenolic glycolipids
PLC Peptide loading complex
PTB Pulmonary TB
QC Quality control
qPCR Quantitative RT-PCR
RIF Rifampin
RR Relative risk
RT Real-Time
SAC South African Coloured
SAN Khoisan
SBT Sequencing-based typing
SD Standard deviation
SLC11A1 Soluble carrier family 11A member 1
SNP Single nucleotide polymorphism
SNV Single nucleotide variant
SSOP Sequence specific oligonucleotide polymerization
SSP Sequence specific primer
TAP Transporter associated with antigen processing
TAPBP TAP-associated glycoprotein
Stellenbosch University http://scholar.sun.ac.za

P a g e | iii
TB Tuberculosis
TBM Tuberculous meningitis
TDR Totally drug-resistant
TGFβ Transforming growth factor β
TLR Toll-like receptor
TNF-α Tumor necrosis factor-α
TST Tuberculin Skin Test
UTR Untranslated region
V Volts
VOC Dutch East India Company
WHO World Health Organization
WTCCC Wellcome Trust Case Control Consortium
XDR Extensively drug-resistant
μl Microliter
μM Micro molar
μm Micrometre
Stellenbosch University http://scholar.sun.ac.za

P a g e | iv
List of Figures
Figure 1: Timeline for developments in TB disease. 3
Figure 2: Global trends in estimated rates of TB incidence, prevalence and mortality. 5
Figure 3: Estimated TB incidence, 2011. 6
Figure 4: Number of MDR-TB cases estimated to occur amoung notified PTB cases, 2011. 6
Figure 5: Estimated HIV prevalence in new TB cases, 2011. 7
Figure 6: Electron micrograph picture of M. tuberculosis bacilli. 8
Figure 7: The global population structure and geographical distribution of the six main M.
tuberculosis lineages. 9
Figure 8: Mechanisms by which TB is transmitted between individuals. 10
Figure 9: Symptoms associated with TB disease. 11
Figure 10: Clinical manifestations of TB disease. 13
Figure 11: Diagnostic tests for latent TB infection. 14
Figure 12: Risk factors for TB. 18
Figure 13: Current understanding of genes involved in susceptibility to TB disease. 24
Figure 14: Published GWAS loci for 18 trait categories, July 2012. 26
Figure 15: Differential power between GWAS and NGS approaches. 29
Figure 16: Gene organization of the Leukocyte Receptor Complex on chromosome 19. 30
Figure 17: NK cell regulation dependent upon the expression of KIR receptors and the HLA class-I
ligands on infected cells. 31
Figure 18: Structural depiction of activating and inhibitory KIRs. 32
Figure 19: Gene organization of the MHC on chromosome 6. 36
Figure 20: Functions of MHC molecules - antigen processing and presentation. 37
Figure 21: HLA nomenclature system. 38
Figure 22: Known HLA class-I ligands for KIR molecules. 39
Figure 23: Structure of HLA class-I molecules. 40
Figure 24: The role of TAP in antigen processing and presentation on MHC class I molecules. 41
Figure 25: Structure of HLA class-II molecules. 42
Figure 26: Signalling pathway of NK cell mediated cytotoxicity, and the involvement of the KIR and
HLA genes in this process. 47
Figure 27: Schematic representation of plate design for KIR typing. 52
Figure 28: Disscociation curves for KIR typing using Real-Time PCR. 53
Figure 29: Efficiency of QIAxcel system compared to conventional agarose gel electrophoresis. 53
Figure 30: Manhattan plots for SNPs spanning the MHC region on chromosome 6 in the SAC and the
Gambian populations. 73
Stellenbosch University http://scholar.sun.ac.za

P a g e | v
Figure 31: Manhattan plots for SNPs spanning the LRC region on chromosome 19 in the SAC and the
Gambian populations. 75
Figure 32: Differences in global allele frequencies for HLA alleles. 83
Figure 33: Diagrammatic representation of the “Out-of-and-Back-to-Africa” theory for the host-
pathogen co-adaptation of MTBC. 84
Figure 34: Preferential sympatric transmission of MTBC lineages in a cosmopolitan setting. 85
Figure 35: HLA-A supertype classifications and their associated alleles. 87
Figure 36: HLA-B supertype classifications and their associated alleles. 88
Figure 37: Screenshot of AFND web interface for obtaining allele frequencies for specific
populations. 89
Figure 38: Presence of Beijing strain in individuals according to number of disease episodes. 97
Figure 39: Comparison of HLA-A and -B alleles involved in M. tuberculosis vaccine epitope binding
across South African populations. 136
Figure 40: STRUCTURE plot for South African Coloured (SAC_CPT) and Khoisan (SAN_SA)
populations with K=6. 145
Figure 41: Ancestral contributions to the SAC population for the MHC region on chromosome 6. 147
Figure 42: Ancestral contributions to the SAC population for the LRC region on chromosome 9. 148
Figure 43: Principal Coordinate (PCO) Plot of South African populations using HLA class-I allele
frequencies. 149
Stellenbosch University http://scholar.sun.ac.za

P a g e | vi
List of Tables
Table 1: Twin studies investigating the heritability of TB. 21
Table 2: GWAS TB susceptibility studies. 27
Table 3: Variation identified in HLA class-I and class-II genes. 37
Table 4: Characteristics of the SAC case-control samples for TB association study. 49
Table 5: Characteristics of the SAC Affymetrix 500K samples. 49
Table 6: Characteristics of the WTCCC Affymetrix 500K samples. 50
Table 7: List of primer sequences used for KIR typing by the PCR-SSP method. 54
Table 8: Case-control association data for absence/presence of KIR genes and susceptibility to TB in
the SAC population. 62
Table 9: Case-control association data for the KIR2DS4 gene fragment and susceptibility to TB in the
SAC population. 62
Table 10: KIR gene profiles and their case-control association data for susceptibility to TB in the SAC
population. 64
Table 11: Case-control association data for KIR haplotypes and susceptibility to TB in the SAC
population. 66
Table 12: Case-control association data for number of activating/inhibitory KIR genes and
susceptibility to TB in the SAC population. 66
Table 13: Case-control association data for HLA class-I alleles and susceptibility to TB in the SAC
population. 67
Table 14: Case-control association data for HLA class-I haplotypes and susceptibility to TB in the
SAC population. 70
Table 15: Case-control association data for HLA functional types and susceptibility to TB in the SAC
population. 70
Table 16: Case-control association data for KIR_HLA compound genotypes and susceptibility to TB
in the SAC population. 71
Table 17: MHC SNPs (Affymetrix 500K SNP chip) associated with TB susceptibility in the SAC
population. 73
Table 18: MHC SNPs (Affymetrix 500K SNP chip) associated with TB susceptibility in the Gambian
population (WTCCC). 74
Table 19: LRC SNPs (Affymetrix 500K SNP chip) associated with TB susceptibility in the SAC
population. 75
Table 20: LRC SNPs (Affymetrix 500K SNP chip) associated with TB susceptibility in the Gambian
population (WTCCC). 76
Table 21: White human populations, with their respective sample sizes and HLA class-I allele
frequencies. 90
Stellenbosch University http://scholar.sun.ac.za

P a g e | vii
Table 22: East Asian human populations, with their respective sample sizes and HLA class-I allele
frequencies. 92
Table 23: M. tuberculosis strain frequencies in the SAC population of the Western Cape. 96
Table 24: HLA class-I supertype allele, genotype and haplotype frequencies in the SAC population of
the Western Cape. 96
Table 25: Associations of HLA class-I genotypes with number of disease episodes. 98
Table 26: Associations of HLA class-I alleles and M. tuberculosis lineages in the SAC population of
the Western Cape. 99
Table 27: Associations of HLA class-I genotypes and haplotypes with M. tuberculosis lineages in the
SAC population of the Western Cape. 101
Table 28: Associations of HLA class-I alleles with Beijing sub-lineages in the SAC population of the
Western Cape. 102
Table 29: Associations between M. tuberculosis phylogenetic strains and HLA class-I alleles in
geographic populations. 105
Table 30: HLA class-I and KIR frequency data for South African population groups from the
allelefrequencies.net online database. 116
Table 31: Putative ancestral populations to determine the STRUCTURE of the South African
Coloured (SAC) and ‡Khoisan (SAN) populations. 120
Table 32: HLA-A allele frequencies in South African populations. 125
Table 33: HLA-B allele frequencies in South African populations. 128
Table 34: HLA-C allele frequencies in South African populations. 132
Table 35: Hardy-Weinberg Proportions and selection pressures of the HLA class-I genes in the South
African Coloured (SAC) and Khoisan (SAN) populations. 134
Table 36: List of HLA class-I alleles and the number of epitopes for each vaccine that they bind. 135
Table 37: Pairwise LD estimates of the HLA class-I genes in the South African Coloured (SAC) and
Khoisan (SAN) populations. 136
Table 38: Estimated three- and two-locus haplotypes in the South African Coloured (SAC) and
Khoisan (SAN) populations. 138
Table 39: KIR genotype/haplotype profile for South African populations. 142
Table 40: Mean genetic contribution of ancestral populations to the South Coloured (SAC) and
Khoisan (SAN) populations. 145
Stellenbosch University http://scholar.sun.ac.za

P a g e | viii
List of Appendices
Appendix 1: Estimated HLA class-I haplotypes in the SAC population. 194
Appendix 2: Case-control association data for SNPs of the MHC and susceptibility to TB in the SAC
population. 205
Appendix 3: Case-control association data for SNPs of the MHC and susceptibility to TB in the
Gambian population. 219
Appendix 4: Case-control association data for SNPs of the LHC and susceptibility to TB in the SAC
population. 231
Appendix 5: Case-control association data for SNPs of the LHC and susceptibility to TB in the
Gambian population. 233
Appendix 6: Published manuscript in the JID. Error! Bookmark not defined.
Appendix 7: Estimated HLA class-I haplotypes in SAC healthy controls. Error! Bookmark not
defined.
Appendix 8: Estimated HLA class-I haplotypes in SAN individuals. Error! Bookmark not defined.
Stellenbosch University http://scholar.sun.ac.za

Chapter 1: Tuberculosis
Stellenbosch University http://scholar.sun.ac.za

P a g e | 1
1.1 Brief History
Tuberculosis (TB) has been a scourge on human health for most of our history with evidence
of this disease being found in skeletons from the Iron Age (400-230 BC) [1] and exhumed
Andean [2–4] and Egyptian mummies [5–7]. Throughout the centuries TB has been known
by numerous names, including phthisis/consumption by the Greeks [8–10]. Hippocrates
(Book I, Of the Epidemics) described TB as predominantly affecting individuals between the
ages of 18 and 35 with high mortality for those who contracted the disease [9,11]. During the
Middle Ages, the disease was known as scrofula, and European monarchs and their subjects
foolishly believed that the “royal touch” was able to cure all those afflicted with the disease
[10]. The Industrial Revolution which occurred across Europe during the 18th
and 19th
centuries also gave rise to the biggest TB epidemic, with the disease famously known as the
“Great White Plague” which lasted over 200 years [12]. During this time death from the
disease was considered inevitable, and TB was the leading cause of death in 1650, and
accounted for more than 30% of all deaths in Europe during the early 1800‟s. It was only in
1839 that the term Tuberculosis was first devised by Johann Lukas Schönlein to describe
diseases that were caused by tubercles, based on the theories postulated by Gaspard Laurent
Bayle.
One of the earliest descriptions of TB disease was by the Greek physician Clarissimus Galen
(131 – 201 AD) who described the disease phthisis as an ulceration of the lungs, chest or
throat which included symptoms of coughing, fever and wasting away of the body; and was
due to malnutrition [13]. However, it was during the 18th
and 19th
centuries, when most of the
Western World experienced the great TB epidemic that the first significant medical advances
in understanding the aetiology of the disease were made [12]. Franciscus Sylvius de la Böe,
in his Opera Medica of 1679, was the first to describe that the tubercles usually seen in
Stellenbosch University http://scholar.sun.ac.za

P a g e | 2
consumptive patients as a characteristic of the disease and the formation of ulcers and cavities
from the lesions of tubercles in progressed forms of the disease; supported by the findings of
Richard Morton. With regards to disease transmission, both de la Böe and Morton believed it
to be hereditary; with Morton also considering transmission by intimate contact as a
possibility. However, it was the work of Gaspard Laurent Bayle which showed that the
tubercles were the cause, and not a product, of the disease. Thus, the earliest mention of the
infectious nature of TB disease was published in 1699, in a decree by the Republic of Lucca,
Italy [14].
In 1720, an English physician by the name of Benjamin Marten published “A New Theory of
Consumptions – More Especially a Phthisis or Consumption of the Lungs” in which he for
the first time states that the cause of the disease is due to “wonderfully minute living
creatures” and expresses his theory of “contagium vivium fluidum”, otherwise known as the
germ theory, implying the transmission of TB from a sick individual to a healthy individual
through close contact [15]. During the 19th
century, several new breakthroughs were made,
starting with René Laennec‟s invention of the stethoscope allowing for diagnosing TB. He
explained the disease pathogenesis in his 1819 book D’ Auscultation Mediate, beginning our
modern understanding of TB disease [16–19]. In 1865, Jean-Antoine Villemin demonstrated
the transmissibility of TB between mammalian species (humans-cattle-rabbits), postulating
that the disease was caused by a specific microorganism [9]. This was supported by the
findings of an epidemiological study by William Budd [20]. However, the most well-known
finding of the 19th
century occurred in Berlin on 24 March 1882, when Robert Koch in his
presentation “Die Aetiologie der Tuberculose” describes the identification of the bacterium,
Mycobacterium tuberculosis (M. tuberculosis), as the causative agent of the disease (Figure
1) [10,21,22]. In 1890, Koch also announced the identification of a compound – tuberculin –
that was able to inhibit the growth of M. tuberculosis in guinea pigs [23]. However, after the
Stellenbosch University http://scholar.sun.ac.za

P a g e | 3
poor results from clinical trials for the use of tuberculin as a therapeutic vaccine, it was later
shown to be valuable in the diagnosis of TB, giving rise to the currently used Tuberculin Skin
Test/Mantoux Test for the diagnosis of latent TB [24–26]. In 1895, Wilhelm Konrad von
Röntgen discovered the X-ray, which is still used today as a basic tool for TB detection [27].
Figure 1: Timeline for developments in TB disease. [28]
The 20th century saw the fight against TB taken to the next level through the introduction of
the first, and to date the only, successful vaccine, and chemotherapy. In 1908, Albert
Calmette and Camille Guérin, through 230 serial passages of the pathogenic Mycobacterium
bovis (M. bovis) strain; created the first attenuated strain (Bacille Calmette-Guérin or BCG)
Stellenbosch University http://scholar.sun.ac.za

P a g e | 4
which was avirulent in cattle, horses, rabbits and guinea pigs [22,29]. The first human
administration of this vaccine was in 1921 and it was mass administered during 1945-1948 to
over 8 million children in Europe, in a battle against the post-World War II TB epidemic
[30]. In 1943, the first anti-TB drug was discovered by Selman Waksman and Albert Shatz
by isolating streptomycin from Streptomyces griseus [31,32]. This was soon followed in 1947
with the production of para-aminosalicylic acid (PAS) by Jörgen Lehmann, as the first oral
therapy against TB [33]. In 1952, the „wonder drug”, isoniazid (INH) was developed by the
pharmaceutical companies Bayer, Squibb and Hoffman La Roche, and was highly effective
against M. tuberculosis [32]. For the first time, TB was considered 100% curable in 1960
through the co-administration of streptomycin, PAS and INH [12]. Unfortunately however, in
1970 the first outbreak of drug-resistant TB occurred in the United States of America [34],
leading to one of the major hurdles currently facing medical scientists in eradicating this
disease [35].
1.2 Epidemiology
1.2.1 Global Epidemic
The World Health Organization (WHO) declared TB a global health problem in 1993 [36],
with approximately one third (two billion) of the world‟s population being infected with M.
tuberculosis. In 2011, the WHO estimated 8.7 million new TB cases globally and 1.4 million
deaths due to the disease. With the global TB incidence steadily declining, 2.2% in the year
2010-2011, and the mortality rate having been decreased by 41% since 1990, the WHO
believes that the Millennium Development Goal (MDG) – to halt and reverse the TB
epidemic by 50% by 2015- has already been achieved (Figure 2). However, this global
progress conceals regional variations, with African and European countries failing to meet
the MDG with regards to fighting TB.
Stellenbosch University http://scholar.sun.ac.za

P a g e | 5
Figure 2: Global trends in estimated rates of TB incidence, prevalence and mortality. [36]
Horizontal dashed line represents MDG goal of reducing TB prevalence and mortality by 50% by the year 2015.
The TB burden is highest in the developing world, with Asia and Africa accounting for 40%
and 24% of the world‟s TB cases, respectively (Figure 3), with India (2 million – 2.5
million), China (0.9 million – 1 million), South Africa (0.4 million – 0.6 million), Indonesia
(0.4 million – 0.5 million) and Pakistan (0.3 million – 0.1 million) rated as the five highest-
burden TB countries [36]. Asia accounts for the highest absolute number of TB cases and
sub-Saharan Africa accounts for the highest rates of active TB per capita. Countries from
these regions also have approximately 60% of the world‟s drug resistant TB cases (Figure 4)
[37].
TB ranks as the second highest cause of death by an infectious agent, after the human
immunodeficiency virus/acquired immune deficiency syndrome (HIV/AIDS) [36]. While TB
may be “under control” in developed nations, the disease remains a major health threat in
third world countries. Due to the immunocompromising effect of HIV in infected individuals,
an increased risk for reactivation of latent M. tuberculosis infection and rapid disease
progression has been noted [38–40]. TB-HIV co-infection has also been shown to increase
the risk of developing TB from 10%-20% in a lifetime to 10% per annum. Thus, TB has
proven to be difficult to eradicate, primarily due to high HIV infection rates, poor health care,
poor socio-economic status and the development of drug resistant strains of M. tuberculosis.
HIV negative TB cases
HIV positive TB cases
Stellenbosch University http://scholar.sun.ac.za

P a g e | 6
Figure 3: Estimated TB incidence, 2011. [36]
Figure 4: Number of MDR-TB cases estimated to occur among notified PTB cases, 2011. [36]
1.2.2 South African Perspective
As previously mentioned South Africa is currently the highest ranked African country with
regards to TB burden (993 per 100 000 individuals in 2011) [36]. This is mainly due to the
Stellenbosch University http://scholar.sun.ac.za

P a g e | 7
high HIV prevalence rate (17.3% in SA adults in 2011) [41] and resulting TB-HIV co-
infections (approximately 50% of new TB cases), complicating the fight for the eradication of
the disease (Figure 5). South Africa is currently ranked 3rd
in the world with regards to TB
burden, with TB treatment success rates remaining low due to an increase in relapses because
of poor adherence to treatment therapy and the spread of drug resistant TB [36], resulting in a
high mortality rate (the leading cause of death in South Africa [42]), However, new
diagnostic tests for TB have been widely implemented and South Africa is currently one of
the leading countries in this regard.
Figure 5: Estimated HIV prevalence in new TB cases, 2011. [36]
Of the South African provinces, KwaZulu Natal currently has the highest TB burden in the
country (30.5%); followed by the Eastern Cape (15.4%), Gauteng (14.2%) and Western Cape
(12.3%) [43]. Together, these four provinces (out of nine) account for more than 70% of the
countries TB burden. Important to note is the role of HIV with regards to disease burden,
where the KwaZulu Natal province currently has the highest HIV prevalence in the country at
15.8% of its population [44].
Stellenbosch University http://scholar.sun.ac.za

P a g e | 8
1.3 Pathogenesis
1.3.1 Structure of Mycobacterium tuberculosis
M. tuberculosis organisms are rod-shaped, non-spore forming, aerobic, Gram-positive
bacteria and approximately 0.5µm x 0.3µm in size (Figure 6) [45]. They are classified as
acid-fast bacilli due to the difficulty with which the dye is removed using acid-alcohol after
staining. The cell wall structure of M. tuberculosis plays an important role in the intracellular
survival of the bacterium. The mycolic acid (fatty acid) and arabinogalactan (peptidoglycan-
bound polysaccharide) which compose the bacterium cell wall give it an extraordinary lipid
barrier. This lipid barrier is essentially responsible for M. tuberculosis being able to develop
resistance and evade the host‟s defence mechanisms. In addition, the presence of
lipoarabinomannan on the cell wall of the bacterium confers upon it its immunogenic
properties, allowing the bacterium to survive within macrophages. Thus, the composition and
quantity of the bacterium‟s cell wall components directly influences its pathogenicity and
growth rate.
Figure 6: Electron micrograph picture of M. tuberculosis bacilli. [46]
Stellenbosch University http://scholar.sun.ac.za

P a g e | 9
1.3.2 Mycobacterium tuberculosis complex
There are several mycobacterial species that cause TB disease, with M. tuberculosis, M.
africanum, and M. canetti causing human TB [47] and M. africanum occurring
predominantly in West Africa [48]. In animals, TB is due to infections by M. bovis (cattle);
M. caprae (sheep and goats); M. microti (voles); and M. pinnipeddi (seals and sea lions) [49].
Collectively, these mycobacterial species are referred to as members of the Mycobacterium
tuberculosis complex (MTBC) [50]. All members of the MTBC are believed to have shared a
common African ancestor about 35 000-15 000 years ago [51–53], while all modern strains
of M. tuberculosis are thought to be descendent from a common ancestor about 20 000-
15 000 years ago [54]. These M. tuberculosis strains can be classified into six major lineages
and are highly geographically structured (Figure 7) [55], where the East-Asian lineage has
been shown to be more dominant in many Far East countries, while the Euro-American
lineage is predominant in Europe and the Americas.
Figure 7: The global population structure and geographical distribution of the six main M.
tuberculosis lineages. [55]
Stellenbosch University http://scholar.sun.ac.za

P a g e | 10
1.3.3 Transmission
In 1962, Richard Riley demonstrated for the first time that transmission of TB was as a result
of droplet nuclei (small airborne particles containing viable M. tuberculosis bacteria) [56]. In
his experiment, he placed guinea pigs in the ventilation chambers above the hospital wards in
which TB patients were being treated. He noted that only particles small enough to be carried
to the ventilators reached the guinea pigs, which in turn became infected with the same strain
as the infected patient, through inhalation of these particles. TB is thus spread through the
expulsion of these droplet nuclei from infected individuals through coughing, sneezing or
talking to in close proximity (Figure 8) [57]. However, various factors can influence the
transmission of M. tuberculosis, including the number of bacilli contained in the droplet
nuclei, virulence of the infecting strain and ventilation [58].
Figure 8: Mechanisms by which TB is transmitted between individuals. [59]
1.4 Clinical Features
1.4.1 Symptoms
Classic disease symptoms for pulmonary TB (PTB) include chronic coughing, loss of
appetite, weight loss, fever, night sweats, and haemoptysis (Figure 9) [60]. Extrapulmonary
TB (EPTB) can affect any organ of the body and has variable clinical manifestations,
Stellenbosch University http://scholar.sun.ac.za

P a g e | 11
requiring extreme clinical suspicion [61]. In TB endemic regions, it has been shown that the
presence of any one of four TB symptoms (cough, fever, night sweats or weight loss) has an
approximate sensitivity of 80% for identifying patients for further TB diagnostic testing [62].
Pre-emptive screening for TB in these regions is also highly recommended to prevent missing
subclinical TB in patients with HIV co-infections or other non-communicable diseases
(diabetes and tobacco-related chronic lung disease) [62,63].
Figure 9: Symptoms associated with TB disease. [64]
1.4.2 Host Immune Response
The primary host response to M. tuberculosis infection is cell-mediated immunity [65]. After
inhalation of droplet nuclei, TB infection begins when the bacteria are phagocytosed by
alveolar macrophages or dendritic cells [66]. Depending on the host‟s immunity and the
virulence of the infecting M. tuberculosis strain, the bacterium will either be destroyed or
survive within the host [65–67]. In most individuals, as a result of a potent immune response
to the phagocytosed bacteria, the mycobacteria are destroyed and eliminated. However,
failure to induce a strong enough immune response to the invading pathogen results in the
formation of granulomas. These structures within the infected lung tissue limits the growth
Stellenbosch University http://scholar.sun.ac.za

P a g e | 12
and further spread of the bacilli, and are composed of macrophages; T- and B-lymphocytes;
and fibroblasts [66]. The T-lymphocytes release various cytokines, including interferon
gamma (IFN-γ), which promotes killing of the mycobacteria. In some cases, the bacteria are
not killed but instead enter a phase of dormancy, resulting in a latent infection (a non-
replicative life cycle) and thus control of the disease [66,68]. However, during
immunosuppression (as with HIV co-infection), the mycobacteria will begin to actively
replicate, resulting in progression to active TB disease with subsequent spread to other organs
(EPTB) or to new hosts.
1.4.3 Clinical Manifestations
TB disease can manifest in several forms; including latent infection, primary disease, active
disease and EPTB with defined characteristics and is dependent on the immune response
stimulated at the point of infection [45].
TB disease occurs in three forms, namely latent TB, active TB and EPTB disease (Figure 10).
The latent form of the disease, the most common, occurs in approximately 90% of individuals
infected with the pathogen [69], and results when the host‟s immune response is unable to
effectively eliminate the bacterium [45]. During this stage of the disease, growth is limited
and M. tuberculosis bacilli are contained within granulomas in the lung. These bacteria are
dormant and are non-infectious and the host does not experience any disease symptoms [70].
Active TB disease occurs when, at the point-of-infection, the host immune response elicited
is not strong enough to prevent the bacterium from actively replicating [45]. TB disease
occurs in these individuals, who experience TB symptoms (see section 1.4.1) and may result
in further spread of the disease. At the point where actively replicating bacilli can no longer
be contained within the granulomatous lung tissue, EPTB occurs through necrosis of these
Stellenbosch University http://scholar.sun.ac.za

P a g e | 13
structures and the subsequent spread of the bacterium from the lesions into the blood system
(miliary TB) and the ensuing infection of other body organs [71].
Figure 10: Clinical manifestations of TB disease. [72]
Most important is the spread of the disease to the central nervous system, causing tuberculous
meningitis (TBM), which is fatal and occurs predominantly in young children. Individuals
with EPTB are however less infectious than their PTB counterparts [73].
1.5 Diagnosis
TB diagnostics is continuously improving and currently forms a major component of TB
biomedical research, with different tests available for different forms of the disease.
Diagnosing latent TB is done by using either the tuberculin skin test (TST) or the interferon-
gamma release assay (IGRA) (Figure 11) [70]. The TST test is predominantly used in low-
income regions, and while it may be as sensitive as the IGRA test, it lacks specificity due to
high false-negative (immunocompromised and malnourished individuals) and false-positive
(BCG vaccination) results [74]. This diagnosis is used predominantly in areas where TB is
endemic and in individuals at risk of disease reactivation (HIV or diabetes co-infections and
immunosuppressive therapy) [75,76].
Stellenbosch University http://scholar.sun.ac.za

P a g e | 14
Figure 11: Diagnostic tests for latent TB infection. (A) Tuberculin skin test (TST) [77,78] and (B)
interferon-gamma release assay (IGRA) [79].
There are currently several diagnostics available for active TB disease, with varying levels of
sensitivity and specificity [70]. Most commonly used and currently regarded as the “gold
standard” are sputum microscopy and liquid media culturing, with solid medium culturing
more commonly used in resource-limited countries. In addition; imaging (X-rays),
histopathological biopsy examinations and nucleic acid amplification tests are also employed.
Recently, the Xpert MTB/RIF assay was released as a new diagnostic for TB and drug-
resistance, allowing for rapid MTBC detection (2 hours) with greater sensitivity compared to
microscopy based tests [80]. The use of this technology, as currently employed in regions of
high TB prevalence, could drastically lower the disease burden due to better control of the
disease [36].
Drug-resistance in TB, the inability of otherwise effective drugs to kill the bacterium, is
currently of great concern and a major impediment to the eradication of this disease [81].
Current diagnostics for drug-resistant TB allow for the diagnosis of multidrug-resistant
(MDR)-TB, extensively drug-resistant (XDR)-TB or totally drug-resistant (TDR)-TB,
depending on the number of drugs to which the bacterium is resistant (see section 1.6)
[36,82,83]. Currently used diagnostics include the automated liquid culture system (4 -13
Stellenbosch University http://scholar.sun.ac.za

P a g e | 15
days); the molecular line-probe assay (24 hours); and the Xpert MTB/RIF assay (2 hours,
only for Rifampin (RIF) and INH resistant TB) [84–86], with the WHO currently
recommending that these tests be carried out at the same time as patients are being diagnosed
for active TB disease [87]. Additional tests for drug-resistant TB include the microscopic-
observation drug-susceptibility assay, the nitrate reductase assay, and colorimetric reductase
methods [70]. However, these tests are not readily available in highly endemic regions, with
current estimations of global drug-resistance at 10%, of which only half are receiving proper
treatment [36,37,88].
1.6 Treatment
The treatment of TB has come a long way since the initial description of the disease by
ancient Greek and Roman physicians who, depending on the time and country, advised
patients to rest or to exercise, to eat or to abstain from food, to travel to the mountains or to
live underground [12]. However, the 5th
century recommendation of heliotherapy by Caelius
Aurelianus as a treatment of TB has been shown to be important, where current studies have
clearly linked Vitamin D deficiency to the development of TB [89,90]. In 1859, the first
successful sanatorium for the treatment of TB was established by Herman Brehmer in
Görbersdorf, Germany, and represents the first widely used approach to combat TB disease
[12]. This treatment was based on good nutrition and exposure to fresh air.
The use of the BCG vaccine to protect an infant against developing TB in 1921 in Paris,
France highlights the start of approaches still used today in the fight against TB [22,29]. The
BCG vaccine is still widely used in infants at birth in TB endemic regions [70]. The vaccine
has been shown to be highly efficacious in children but not in adults [36] and has a current
estimated overall efficacy of 50% for the prevention of TB [91]. However, given the poor
effect in adults and the resultant occurrence of disseminated disease in HIV-infected new-
Stellenbosch University http://scholar.sun.ac.za

P a g e | 16
borns, there is a major global drive for the development of new and better vaccines, with
more than 30 vaccines currently in development [36,40,92].
The production and use of chemotherapeutic agents since 1940 has drastically altered the
outcome of active TB disease [93]. Current first-line four drug regimens are able to achieve
cure rates greater than 95% under trial conditions and greater than 90% under the directly
observed therapy short course (DOTS) strategy implemented in 1993 by the WHO [36,94].
The current first-line drug regimen consists of INH, RIF, pyrazinamide and ethambutol, and
treatment comprises two phases - a two month intensive phase where all four drugs are
administered and a four month continuation phase with only INH and RIF - over a six month
period [70]. In a case where factors for relapse; cavitation, extensive disease,
immunosuppression, and negative sputum culture conversion at eight weeks present
themselves then therapy should be extended to nine months. There are however several
challenges with current treatment plans including poor drug quality, poor drug administration
and patient compliance and treatment interruptions due to negative side-effects of drugs [95].
Current studies are in progress to address some of these issues, with reducing treatment
periods (four months) and studying the pharmacokinetic effects of multi-drug regimens to
reduce side-effects [36,70].
Long treatment plans and poor treatment adherence has led to the development of drug-
resistant TB [81]. In MDR-TB patients the bacillus is resistant to INH and RIF, and in XDR-
TB patients resistance to INH, RIF, the fluoroquinolone drugs and one of the injectables
(amikacin, capreomycin and kanamycin) occurs [82,83,96]. TDR-TB, although not currently
recognized by the WHO, is defined as M. tuberculosis bacteria resistant to all available drugs
(as per the region where diagnosis occurs) [36]. In the case of drug-resistant TB, drug
regimens are a combination of first-line and second-line drugs, initially on a standardized or
empirical basis and then switched to individualized therapy based on the drug-susceptibility
Stellenbosch University http://scholar.sun.ac.za

P a g e | 17
results [97,98]. These therapies are usually administered for twenty months (new MDR-TB
case) or thirty months (previously treated for MDR-TB); with an eight month intensive phase
[70]. Given the long treatment period, these therapies are often associated with adverse side
effects and poor treatment adherence, giving rise to XDR-TB and TDR-TB. These forms of
the disease are extremely hard to diagnose and treat and are associated with high death rates
[99–102]. There are currently several drugs in the pipeline for drug-resistant TB that have
shown promise in early trials [103–106].
Preventive therapy is currently being recommended for individuals with latent TB and who
are at a high risk for disease reactivation, especially HIV-infected individuals who reside in
TB endemic regions [107,108]. There are several treatments recommended for these
individuals, with regimens consisting of INH and RIF, both individually and together, at
varying concentrations and therapy periods [109–113].
While TB therapy regimens may be generally applicable, treatment modifications should be
considered in light of TB-HIV co-infections, drug-resistance, pregnancy and the treatment of
children [36]. To achieve effective TB treatment outcomes, the following goals should be
strived towards: accurate and efficient diagnosis, limiting relapse and transmission by
adherence through better administration and supervision, and preventing the development and
spread of drug-resistance.
1.7 Other risk factors
TB is an extremely complex disease, and while M. tuberculosis may be necessary, it is not
sufficient for the development of active TB disease. Therefore, other factors such as
environment and host also need to be taken into consideration for a complete understanding
of disease development and progression (Figure 12) [114].
Stellenbosch University http://scholar.sun.ac.za

P a g e | 18
Figure 12: Risk factors for TB. [114]
1.7.1 Environmental Factors
There are several environmental factors that have been shown to affect the outcome of TB
disease, namely: socio-economic status, nutrition, smoking, and alcohol abuse [114,115].
Several studies have linked poor socio-economic status with higher TB incidence rates
[116,117], with Asia and Africa accounting for more than half of the global TB disease
burden [36]. Countries within these regions have high levels of poverty and the associated
overcrowded living conditions [116,117]. Several “high risk environments” for the
transmission of TB have been reported, including prisons, nursing homes and homeless
shelters [114,115,118]. In developed countries, there is a higher disease burden in
marginalized communities, and has been noted that treatment compliance is intrinsically
linked to economic factors [119].
Nutrition has also been shown to play an important role in the development of TB disease, as
malnutrition results in an altered cell-mediated immune response [120]. Studies conducted in
the USA during the late 60‟s and early 80‟s have reported increased risk for developing TB,
with malnourished children being twice as likely [121] and adults who are malnourished
Stellenbosch University http://scholar.sun.ac.za

P a g e | 19
having a six- to ten-fold increased risk [122], when compared to their well-nourished
counterparts. These findings have been confirmed in other human and animal model studies
[120]. A vitamin D deficiency is usually associated with malnutrition [123,124]. Vitamin D
has been shown to have an immunoregulatory role and thus deficiencies of this micronutrient
may lead to impaired host responses to M. tuberculosis [125]. Another result of poor
nutrition, protein energy malnutrition (PEM), has been shown to have a negative effect on
host immunity to M. tuberculosis [126]. These negative effects include reduced lymphocyte
stimulation, low level secretion of the cytokines interleukin-2 (IL-2); IFN-γ; and tumor
necrosis factor-α (TNF-α) which are important for stimulation of the Th1 response, and
macrophages with high levels of transforming growth factor β (TGFβ) which suppresses T
cells and inflammation.
Exposure to cigarette smoke and the consumption of alcohol have been shown to be strong
risk factors for TB disease based on meta-analysis and several systematic reviews [127–132].
The relative risk (RR) for developing TB disease was higher in smoking individuals (RR =
2.3-2.7) [129]. Biologically, the exposure to smoke is thought to impair the clearance of
mucosal secretions; result in alveolar macrophages with reduced phagocytic abilities; and
result in a diminished immune response due to nicotine [133–135]. In a recent animal study,
the exposure of mice to cigarette smoke and subsequent infection with M. tuberculosis
resulted in higher numbers of viable bacilli in the lungs and spleens of these animals [136].
The consumption of alcohol was shown, in a meta-analysis, to be a strong risk factor for
recent TB transmission in both TB endemic and non-endemic regions, with odds ratios (OR)
of 2.6 and 1.4 respectively [137]. In addition, individuals who consume more than 40mg of
alcohol per day and/or have alcohol abuse problems, have a considerably higher risk (RR =
2.94) for developing active TB disease [138]. The (over)consumption of alcohol may result in
Stellenbosch University http://scholar.sun.ac.za

P a g e | 20
an altered immune system, specifically the signalling molecules responsible for cytokine
production [139].
1.7.2 Host Genetic Factors
17th
century physicians believed TB disease to be hereditary but with the discovery of the
causative agent, M. tuberculosis, in 1882 by Koch much of the work done to understand the
development and progression of the disease focussed solely on the pathogen with host factors
being largely ignored [12]. However, today there is clear evidence to support the role of host
genetic factors in TB disease susceptibility. As previously mentioned, some individuals are
able to eliminate the invading pathogen; while of those individuals who do become infected,
between 5% and 10% go on to develop active TB disease (see section 1.4.2). This clearly
demonstrates that host genetics could play a crucial role in disease development and that
although important; the pathogenic factors of the bacilli, does not in itself define the outcome
of infection.
To determine if host genetics plays a role in the outcome of infectious diseases, several twin
and adoption studies have been conducted, with both providing clear support for the
importance of host factors in this regard. Twin studies have shown that monozygotic
(genetically identical) twins have a higher concordance for disease than dizygotic twins
(Table 1) [140–142]. Adoption studies have provided additional evidence by showing that in
comparisons of the cause of death between parents and children, adopted children were more
likely to die from an infectious disease before the age of 40 if their biological parents had
[143–146]. These studies show that while environmental factors may increase the risk of
developing TB, host genetic factors are important in the final outcome of the disease.
Furthermore, a study conducted in a USA nursing home residence showed that staff of
African-American ancestry were twice as likely to develop TB disease when compared to
Stellenbosch University http://scholar.sun.ac.za

P a g e | 21
their Caucasian counterparts [147], even though they shared the same environment and were
of the same socio-economic status. This disparity in infectious disease susceptibility between
individuals of different ethnicity can also be seen when comparing Europeans and Africans,
where it appears that Europeans are less susceptible to TB infection than Africans [144].
Table 1: Twin studies investigating the heritability of TB.
Study Number of twins Percentage concordance
Reference Monozygotes Dizygotes Monozygotes Dizygotes
Diehl et al., 1936 80 125 65 25 [148] Uehlinger et al., 1938 12 34 58 6 [149] Kallmann et al., 1943 78 230 62 18 [141] Harvald et al., 1965 135 513 37 15 [150] Comstock et al., 1978 54 148 32 14 [140] Simonds et al., 2004 55 150 32 14 [142] van der Eijik, 2007 54 148 21 19 [151]
This is thought to be due to natural selection. European populations experienced a great TB
epidemic (The White Plague, 17th
century onwards), resulting in a population highly resistant
to M. tuberculosis infections. While the pathogen may have been present in Africa since the
Out-of-Africa migrations [152], the disease never reached pandemic proportions until the re-
colonization by European settlers, and there was thus no selection pressure to remove
causative genes from the African populations. Similarly, in the Qu‟Appelle Indian
Reservation, initial exposure to the bacterium resulted in a high TB mortality rate (10% per
annum) [153]. However, after 40 years, the death rate had dropped significantly (to 0.2% per
annum); highlighting the effect of strong selection pressures in removing disease-causing
genes from a population. Finally, in 1926 in Lübeck, Germany; 251 new-borns were
mistakenly vaccinated with a live, virulent M. tuberculosis strain instead of the attenuated
BCG strain [154]. This unfortunate event resulted in the death of 77 babies from TB, 47 latent
TB cases, and 127 babies with active TB disease but who later recovered, thus illustrating the
ability of certain individual‟s immune response to efficiently handle the disease, and clearly
Stellenbosch University http://scholar.sun.ac.za

P a g e | 22
demonstrating the importance of host genetic variation in disease outcomes, including
infectious diseases.
1.7.2.1 Current approaches in identifying disease causing genes
As highlighted above, TB is an extremely complex disease, with the outcome influenced by
environmental, pathogenic, and host factors. Identifying the disease causing genes has thus
far proven to be difficult, and is further exacerbated by the heterogeneity of the underlying
genetic cause [155]. There are several methodologies currently being used to elucidate the
genes associated with susceptibility to TB [69]. Even more recent advances in genotyping
technologies, molecular biology, and bioinformatics have resulted in the introduction of
powerful high-throughput techniques for the identification of the disease causing genes.
Current approaches are methodologies that are either hypothesis-driven (candidate gene
association studies) or exploratory data analysis (genome-wide association studies and next-
generation sequencing).
1.7.2.1.1 Candidate gene association studies
Candidate gene association studies are still the most commonly used study design for
identifying disease susceptibility genes [146]. The premise of the candidate gene approach is
to investigate polymorphisms in a gene of interest and determine if specific alleles of the
gene occur more (susceptible) or less (protective) frequently in cases (affected individuals)
and controls (unaffected individuals) [156]. Genes are usually selected based on their
function – with regard to TB, immunity related and closely associated genes are investigated
[157]. Studies in animal models have also led to the discovery of potential candidate genes
[158], where the natural resistance-associated macrophage protein 1 gene (Nramp1) was first
identified in a mouse model of mycobacterial disease and where its human homologue
(NRAMP1) was one of the first genes shown to play a role in human TB susceptibility
Stellenbosch University http://scholar.sun.ac.za

P a g e | 23
[145,159,160]. Bioinformatics approaches have also identified genes that are highly
homologous to previously associated disease causing genes [69].
If a polymorphism in a candidate gene is significantly associated with an outcome of the
disease of interest, it may be due to one of three reasons [161]; (1) it is the actual causative
allele of the disease, (2) it is in linkage disequilibrium (LD) with the causative allele of the
disease, or (3) it is an artefact of population admixture in populations of mixed ancestry. LD
is the non-random association of two or more alleles at different loci on the same
chromosome, where the closer in proximity two alleles are, the less chance there is of them
being separated by recombination events [162]. This allows for one allele at a given locus to
predict the allele at a second locus providing that they are in LD [163]. While LD may be
useful for the identification of novel disease causing variants, it also complicates matters
when the significantly associated allele is not the causative allele but rather in LD with it
resulting in false-positive associations. Population stratification may also lead to the
identification of false-positive and/or false-negative associations through the existence of
different allele frequencies between subpopulations due to differences in ancestry [164]. This
is extremely important in highly admixed populations where the contributing populations
have known differences in disease susceptibility, but it can be overcome by correction [165].
Population-based case-control association studies are commonly utilized for the identification
of common variants in disease-causing genes due to their cost-efficiency and high statistical
power [166]. There are however disadvantages to this approach, including the laborious
nature given the heterogeneity of TB disease and the low concordance between validation
studies [165,167]. This low concordance can be mainly attributed to differences in study
design (definition of TB phenotype, experimental procedure, statistical approaches, and
power of studies) [168,169]. The selection of controls is extremely important and should be
matched to cases with regards to age, sex, ethnicity, and social-demographic factors [170]. A
Stellenbosch University http://scholar.sun.ac.za

P a g e | 24
number of genes and pathways have been studied to identify the genetic link in TB disease
susceptibility (Figure 13), with polymorphisms in several genes being found to alter disease
outcome, albeit with small effect.
Figure 13: Current understanding of genes involved in susceptibility to TB disease. [146]
Some of the major genes identified by this approach and validated in several populations
include the chemokine (C-C motif) ligand 2 (CCL2), human leukocyte antigen (HLA),
interferon-γ (IFNG), mannose-binding lectin (MBL), nitric oxide synthase 2, inducible
(NOS2A), solute carrier family 11A member 1 (SLC11A1), SP110, and the toll-like receptor
(TLR) genes [69,146].
1.7.2.1.2 Genome-wide association studies (GWAS)
Recent advances in genotyping technologies and the availability of the human genome
sequence and the HapMap Project database have allowed researchers to investigate
polymorphisms across the entire human genome – genome-wide association studies (GWAS)
Stellenbosch University http://scholar.sun.ac.za

P a g e | 25
[171–174]. The approach does not depend on known candidate genes, and is therefore free of
assumptions and allows for the identification of novel genes and pathways.
While the ability to identify novel variants makes GWAS a highly desirable approach, there
are several draw-backs to the method. To correct for the large number of tests done and limit
the likelihood of false-positive discoveries, an extremely high significant cut-off value is
employed, resulting in the identification of variants which exhibit a large effect and
discarding any variants of small to moderate effect [69]. This is an extremely contentious
point regarding the validity of GWAS in infectious diseases, as some researchers believe that
the “common disease, common variant” hypothesis is not appropriate and that the
investigation of rare variants would be more informative. GWAS also require extremely large
study cohorts for adequate power to detect disease causing variants [162].
GWAS have been extensively used to identify the underlying genetic variants in common
diseases, including Crohn‟s disease, rheumatoid arthritis, type-1 and -2 diabetes, macular
degeneration, inflammatory bowel disease, cardiac diseases and various cancers [175] (Figure
14). The use of GWAS for infectious diseases have been limited, with published data for
AIDS [176–178], chronic hepatitis B [179–182] and C [183–185], Kawasaki disease [186–
191], leprosy [192,193], malaria [194,195], meningococcal diseases [196] and TB [197–200],
with very little to no concordance between studies of the same disease. For TB susceptibility,
the chromosome 11p13 loci containing the WT1 gene intergenic region was identified as
playing a role (Table 2) [199]. This region was confirmed in a meta-analysis study of GWAS
data [201]. While GWAS have been successful in understanding the genetic etiological
mechanisms for many common diseases (e.g. Crohn‟s disease), the results generated for
infectious diseases, specifically TB, have left researchers wanting more.
Stellenbosch University http://scholar.sun.ac.za

P a g e | 26
Figure 14: Published GWAS loci for 18 trait categories, July 2012. [175]
Stellenbosch University http://scholar.sun.ac.za

P a g e | 27
Table 2: GWAS TB susceptibility studies.
Study Initial sample size Replication sample size Region Genes Strongest risk allele Context P-value OR [95% CI]
Thye et al., 2010 [197]
Ghana: cases = 921, controls = 1 740 Gambia: cases = 1 316, controls = 1 382
Ghana: cases = 1 226, controls = 3825, parent/child trios and duos = 332. Malawi: cases = 236, controls = 779
18q11.2 GATA6, CTAGE1, RBBP8, CABLES1
rs4331426-G Intergenic 7x10⁻⁹
1.19 [1.10-1.30]
Png et al., 2012 [198]
Indonesian ancestry: cases = 108, controls = 115
Indonesian ancestry: cases = 600, controls = 540 European ancestry: cases = 1 837, controls = 1 779
NS NS NS NS NS NS
Thye et al., 2012 [199]
African ancestry: cases = 1 329, controls = 1 847
African ancestry: cases = 2 024, controls = 5 154 Indonesian ancestry: cases = 1 025, controls = 983 European ancestry: cases = 4 441, controls = 5 874
11p13 WT1 rs2057187-A Intergenic 3x10-11
1.1 [1.01-1.22]
Mahasirimongkol et al., 2012 [200]
Thai ancestry: cases = 433, controls = 295 Japanese ancestry: cases = 188, controls = 934
Thai ancestry: cases = 369, controls = 439 Japanese ancestry: cases = 112, controls = 1 089
NS NS NS NS NS NS
Stellenbosch University http://scholar.sun.ac.za
Stellenbosch University http://scholar.sun.ac.za

P a g e | 28
1.7.2.1.2 Next-generation sequencing
While GWAS may have allowed for the identification of thousands of statistically significant
disease susceptibility associations it has failed to explain the full range of genetic
susceptibility to complex diseases [202]. This can be seen in studies conducted on Crohn‟s
disease, where more than 70 new loci were identified, but only approximately 23% of the
disease heritability was described [203]. The ability to compare the entire genome of cases
and controls for a specific disease/trait is believed to be a better approach for understanding
the genetic aetiology of the disease/trait. In this regard, the use of next-generation sequencing
(NGS) technologies has allowed researchers to do just that [202].
There are currently two approaches to NGS – exome and whole-genome sequencing [202].
Exome sequencing involves targeting all the exomes in the genome. This approach is much
more cost efficient than whole-genome sequencing, as approximately 2% of the genome is
coding, but may be more suitable for the study of Mendelian diseases, since most causal
alleles occur in protein-coding regions (exons) [204]. This method has however been
successfully employed in some complex diseases, including autism, other
neurodevelopmental phenotypes, and to find the cause of low HDL-cholesterol [205–207].
However, a drawback to employing exome sequencing is that it requires extremely large
sample sets to identify rare variants (Figure 15) [202].
On the other hand, whole-genome sequencing allows for the interrogation of all forms of
DNA variation (single nucleotide polymorphisms (SNPs), single nucleotide variants (SNVs),
insertion/deletions (indels)) regardless of frequency (rare, low, common) and function
(coding and non-coding) [202]. This approach may therefore be better suited for complex
diseases as it has been shown to be due to both coding and non-coding variants. This is
especially important for TB susceptibility, where all GWAS data to date have identified
Stellenbosch University http://scholar.sun.ac.za

P a g e | 29
variants in non-coding regions (Table 2). However, there are substantial challenges that
accompany this method including an incomplete reference genome [208], complex
algorithms to identify all forms of variation [209,210], and heavy computational requirements
[202] (e.g. raw data storage for 800 „Phase I‟ 1000 Genomes Project samples would require
50 000 Gb for the raw data, compared to 4 GB from GWAS data, and would require
approximately 20 000 CPU-days of processing time, compared to 715 for GWAS data).
Figure 15: Differential power between GWAS and NGS approaches. [202]
While the costs associated with NGS approaches are becoming lower and lower as the
method becomes more widely used due to better technologies and algorithms. There is
however a greater need for researchers who are computationally and statistically trained and a
major limitation is the computational power that is required, which many researchers/labs
currently lack.
Stellenbosch University http://scholar.sun.ac.za

Chapter 2: Genes of the Leukocyte Receptor
Complex and the Major Histocompatibility Complex
Stellenbosch University http://scholar.sun.ac.za

P a g e | 30
2.1 The Leukocyte Receptor Complex
The Leukocyte Receptor Complex (LRC) on chromosome 19q13.4 comprises a large cluster
of cell surface receptors (Figure 16), including the killer cell immunoglobulin (Ig)-like
receptors (KIRs), leukocyte Ig-like receptors (LILRs), leukocyte-associated Ig-like receptors
(LAIRs), NKp46 (natural cytotoxicity receptor 1, NCR1) and FCαR1, all of which have been
shown to regulate the immune system [211].
Figure 16: Gene organization of the Leukocyte Receptor Complex on chromosome 19. [212]
The KIRs, LILRs, LAIRs and NKp46 belong to the family of Ig-like receptors [212]. This
family of receptors is characterised by the presence of several conserved extracellular
domains that consist of 70-110 amino acids which have a sandwich-like structure through the
formation of two sheets of antiparallel β strands.
2.1.1 Killer cell immunoglobulin-like receptors
The killer cell immunoglobulin-like receptors (KIRs) are diverse and rapidly evolving
receptors encoded by sixteen genes (fourteen functional) [213,214]. The KIRs are
predominantly expressed on the surface of natural killer (NK) cells (Figure 17) but have also
been shown to be present on a subset of T cells [215,216]. NK cells form part of the innate
(and adaptive) immune response and have been shown to play a role in infection [217–219].
NK cells are able to discriminate between self and non self cells through numerous receptors,
Stellenbosch University http://scholar.sun.ac.za

P a g e | 31
with human NK cells utilizing the KIRs [219]. KIRs are thus able to distinguish between
infected and non-infected cells, resulting in the killing of the former.
Figure 17: NK cell regulation dependent upon the expression of KIR receptors and the HLA
class-I ligands on infected cells. [212]
There are two structural groups into which the KIRs are classified; KIR2D and KIR3D, based
on the number of Ig-like domains (two: D1-D2 and D0-D2 or three: D0-D1-D2) that they
have in their extracellular region (Figure 18) [212]. Furthermore, KIRs can be either
activating (with an immunoreceptor tyrosine-based activation motif (ITAM) –2DS and 3DS)
or inhibitory (with an immunoreceptor tyrosine-based inhibition motif (ITIM) –2DL and
3DL). Inhibitory receptors are involved in the recognition of self antigens and induce
programmed cell death by NK cells in the absence of their HLA class-I ligands (missing self
hypothesis) [220]. Inhibitory KIRs (iKIRs) have also been shown to have greater affinity for
ligands than activating KIRs (aKIRs), thus the binding of several aKIRs is required to
override the response to the binding of a single iKIR [212]. NK cell cytotoxicity is therefore
controlled by the interplay of these activating and inhibitory signals which are mediated by
receptors on the cell surface [221,222].
Stellenbosch University http://scholar.sun.ac.za

P a g e | 32
Figure 18: Structural depiction of activating and inhibitory KIRs. Green circles represent the ITAMs
present in aKIRs, while the red rectangles are ITIMs present in iKIRs. [223]
Expression of the KIR receptors is highly complex and controlled by a stochastic mechanism
that results in the expression of some receptors and not others on individual cells resulting in
the ability of NK cell clones to differentially recognize their targets [216,224]. The genomic
segment where the KIR genes are located has undergone several expansion and contraction
events over time, resulting in duplication and unequal cross-over in this region [225,226].
The KIR genes are highly polymorphic and the KIR gene content (KIR haplotype) usually
differs among individuals in terms of variation in the number and types of genes present
[212]. While variability is present in KIR haplotypes (number of genes present), there are
D0
D1
D2
D0 D0
D0 D0 D1 D1 D1 D1
D2 D2 D2 D2 D2 D2
Stellenbosch University http://scholar.sun.ac.za

P a g e | 33
four KIR genes (2DL4, 3DP1, 3DL2 and 3DL3) which are present in all haplotypes and are
referred to as the framework genes [227]. The number of KIR genes in a haplotype usually
ranges from 7-12 genes, with haplotypes being classified as A or B based on the number of
aKIR genes present [226]. KIR haplotype A has only one aKIR gene (2DS4) whereas KIR
haplotype B contains 5 or more aKIR genes (2DS1 - 2DS5 and 3DS1). Furthermore,
haplotype A has a set number of KIR genes (nine) where haplotype B has a variable number
of genes. To date, more than 400 KIR genotypes have been identified among unrelated
individuals [228], and using segregation analyses 40 gene-specific genotypes have been noted
[229–232]. In addition, KIR genotypes may also show further variability when KIR gene
alleles are taken into account [233].
Most human KIRs are specific for polymorphic determinants of HLA class-I molecules
(HLA-A, -B and -C) [212]. To fully understand the role that KIRs play in disease
susceptibility, the HLA class-I molecules need to be taken into consideration. Briefly, 2DL1
binds to HLA-C group 2 (C2) alleles, while 2DL2 and 2DL3 bind to HLA-C group 1 (C1)
alleles [234]. The 2DS genes recognizes the same HLA alleles as their inhibitory counterparts
(2DS1 binds C2 alleles, etc). 3DL1 and 3DS1 bind to HLA-Bw4 [235–238], while 3DL2
binds to HLA-A3 and -A11 alleles [234].
2.1.2 Leukocyte immunoglobulin-like receptors
The leukocyte immunoglobulin-like receptor (LILR) gene family consists of thirteen genes
that are believed to have arisen by a large-scale inverted duplication and further gain/loss of
genes [211,239,240]. There are six activating LILRs, five inhibitory LILRs and two
pseudogenes [211]. LILRs are ubiquitously expressed by cells of the myeloid lineage and the
rare plasmacytoid dendritic cells (DCs) [241,242]. LILRB1 is expressed on B cells and there
is some LILR expression on NK cells, T cells and granulocytes [243].
Stellenbosch University http://scholar.sun.ac.za

P a g e | 34
LILRs are potent modulators of the immune response in that they are able to regulate myeloid
lineage cells [211]. LILRB2 and LILRB4 expression is associated with induction of a
tolerogenic phenotype in dendritic cells (DCs), resulting in reduced expression of
costimulatory molecules and unresponsiveness in CD4+ T helper cells to specific antigens
[244]. Young et al. showed that ligation of LILRB1 on monocyte-derived DCs results in a
unique DC population that has a distinct morphology and causes down modulation of T cell
stimulation, independent of secretion of immunosuppressive cytokines [245]. LILRB4 has
also been shown to modulate T cell responses by inducing helper T cell anergy and
differentiation of regulatory CD8+ T cells [246,247]. Conversely, activation of LILRA2
resulted in the formation of immature DCs and abrogation of antigen presentation to T cells
[248]. Furthermore, LILRA2-activated monocytes showed increased cytokine expression
levels for TNF-α, IL-6, IL-8, IL-10 and IL-12, providing a potential mechanism for down
regulation of T cell activation of the innate immune response while promoting an
inflammatory response.
Similar to KIRs, LILRs are highly polymorphic and some LILRs have known HLA class-I
ligands [211]. LILRB1 also binds HLA-G, resulting in increased signalling and dominant
immunosuppressive effects [249,250].
2.1.3 Leukocyte-associated immunoglobulin-like receptors
There are two leukocyte-associated immunoglobulin-like receptor (LAIR) genes, LAIR-1 and
LAIR-2 which are phylogenetically related to many of the immunoreceptors in the LRC but
differ from one another in having opposite transcriptional orientations [251]. LAIR-2 shares
84% homology with LAIR-1 but lacks a transmembrane domain and is thus predicted to be a
soluble receptor. Expression of the LAIR-1 protein occurs on almost all immune cells,
Stellenbosch University http://scholar.sun.ac.za

P a g e | 35
including NK cells, B and T lymphocytes, thymocytes, monocytes, DCs, eosinophils,
basophils, mast cells and C34+ hemopoietic progenitors [211].
LAIR-1 is a potent inhibitor of the cytotoxic activity of NK cells and T cells [251–256], as
well as, the differentiation of monocyte-derived DCs [257], and is thus an important negative
regulator of immune cells [258,259]. LAIR-1 also binds various collagen ligands, including
glycoprotein VI [260–262]. Collagens are able inhibit primary immune cell activation,
suggesting that extracellular matrix collagens can regulate the activity of immune cells
[260,263]. LAIR-2 also binds collagen and could thus act as a negative regulator of LAIR-1
signalling [264].
2.1.4 FcαR1 (CD89) FcαR1 is type I transmembrane receptor for immunoglobulin A (IgA) [265,266] and is
expressed on myeloid cells [211]. The expression of FcαR1 is up regulated in response to
formyl-methionyl-leucyl-phenylalanine, TNF-α and IL-8 on neutrophils and
lipopolysaccharide, TNF-α, IL-1β and granulocyte macrophage colony-stimulating factor on
monocytes [267,268]. In contrast, TGF-β, IFN-γ, suramin and IgA down regulates FcαR1
[267,269].
IgA is the predominant antibody class present at mucosal surfaces [270] where it functions to
prevent bacterial adherence, microorganism invasion and neutralizing of bacterial toxins
[271]. Paradoxically, the absence of antigen results in serum IgA having anti-inflammatory
properties, promoting down regulation of IgG-mediated phagocytosis, bactericidal activity,
oxidative respiratory burst and cytokine release [272]. Kanamaru et al. recently showed that
monomeric FcαR1 targeting induced apoptosis in human monocytes, monocytic cell lines and
FcαR1 transfected cells [273].
Stellenbosch University http://scholar.sun.ac.za

P a g e | 36
2.1.5 NKp46/Natural Cytotoxicity Receptor 1 (NCR1)
NKp46 engagement has been shown to result in calcium mobilization, cytokine production
and activation of the cytolytic activity of NK cells [274,275], and is a crucial receptor for the
recognition and killing of tumor and virus-infected target cells. In the case of influenza virus,
NKp46 binds hemagglutinin resulting in lysis of the influenza virus-infected cells [276].
Studies have also shown that NK cells are able to recognize and kill immature DCs. This
however is not true for mature DCs which are able to upregulate MHC class-I molecules and
thus capable of engaging inhibitory NK receptors [277–280]. Based on these findings,
Moretta proposed a model whereby NK cells regulate antigen presentation by limiting the
number of DCs migrating to secondary lymphoid organs where they would prime naive T
cells, thus controlling the amplitude of the subsequent immune response [281].
2.2 The Major Histocompatibility Complex
The Major Histocompatibility Complex (MHC) spans chromosome 6p22.1 to 6p21.3 and
contains over 200 genes, most of which have known immunological functions, amongst
others [282,283]. Genes in this region are subdivided into three classes: MHC class I, class II
and class III (Figure 19), with class I and class II genes involved in antigen processing and
presentation (Figure 20) [284].
Figure 19: Gene organization of the MHC on chromosome 6. [285]
Stellenbosch University http://scholar.sun.ac.za

P a g e | 37
Figure 20: Functions of MHC molecules - antigen processing and presentation. [286]
A characteristic feature of the MHC region is the extent of variation identified to date, with
class I and class II genes having the greatest amount of variation (Table 3) [283]. This has
been shown to be important for the ability of the host to respond to several pathogens since
these polymorphic regions code for the peptide binding grooves [287,288]. This diversity in
antigen presentation is also facilitated through the expression of MHC gene alleles inherited
from both parents [289]. These genes are also expressed in co-dominant fashion, where for
class I genes, any cell will have six different types of class I molecules [290].
Table 3: Variation identified in HLA class-I and class-II genes. [228]
HLA class-I molecule Number of alleles Number of proteins
A 2244 1612
B 2934 2211
C 1788 1280
E 11 3
F 22 4
G 50 16
HLA class-II molecule
DRA 7 2
DRB 1418 1051
DQA1 50 31
DQB1 323 216
DPA1 37 19
DPB1 185 153
DMA 7 4
DMB 13 7
DOA 12 3
DOB 13 5
Stellenbosch University http://scholar.sun.ac.za

P a g e | 38
Due to the extreme variability of the HLAs a systematic nomenclature was developed for the
sharing of HLA data between laboratories. HLA alleles are named using a unique number
sequence with up to four sets of digits which are separated by colons (Figure 21) [291]. All
HLA alleles have a four-digit name, with longer names assigned when necessary, as
described below. The first set of digits (“Field 1; allele group” in Figure 21) describes the
type of allele and corresponds to the serological antigen that it presents. The second set of
digits (after the first colon) lists the subtypes of the allele as a result of one or two nucleotide
substitutions that result in the change of the amino acid sequence of the protein, where
numbers are assigned in the order in which the DNA sequence has been identified. The third
and fourth sets of digits denote alleles that differ by synonymous nucleotide substitutions
within the coding region of the gene and alleles with polymorphisms in the introns, 5‟ and 3‟
untranslated regions of the genes, respectively. Additionally, allele names may include
suffixes to denote the expression of the allele, where N indicates a null allele (not expressed).
Other suffixes include: L (low expression), S (soluble secreted molecule), and Q
(questionable expression).
Figure 21: HLA nomenclature system. [292]
Stellenbosch University http://scholar.sun.ac.za

P a g e | 39
2.2.1 Major Histocompatibility Complex class I genes
The MHC class I genes, also known as the human leukocyte antigen (HLA) class-I genes, can
be subdivided into classical (HLA-A, -B and -C) and non-classical (HLA-E, -F and -G)
groups [287]. The HLA class-I molecules are expressed on the cell surface of most nucleated
cells and function as presenters of intracellular antigens/peptides to cytotoxic T cells [288].
Due to the presentation of cytosolic peptides, the pathway associated with HLA class-I
presentation is usually referred to as the cytosolic or endogenous pathway [293]. However, it
has been shown that antigens derived from exogenous proteins can be displayed by these
class-I molecules [294]. This is known as cross-presentation and allows for the presentation
of HLA class-II antigens by class-I molecules and thus stimulation of cytotoxic CD8+ T cells.
This peptide presentation enables the identification of self and non-self cells, allowing for the
killing of the latter by cytotoxic T cells (CTLs) by apoptosis through cell-mediated immunity
[295]. In addition, class-I molecules are known inhibitory ligands of KIRs present on the
surface of NK cells (Figure 22) and it has also been shown that certain viruses are able to
down-regulate the expression of these molecules on the surfaces of antigen presenting cells
(APCs) [287]. In this instance, NK cells through their KIRs are able to mediate cell killing
through programmed cell death [220,227].
Figure 22: Known HLA class-I ligands for KIR molecules. [227]
Stellenbosch University http://scholar.sun.ac.za

P a g e | 40
Structurally, the HLA class-I molecule consists of an α and a β2-microglobulin (b2m)
polypeptide chain [288] (Figure 23) which are non-covalently linked through an interaction
between the α3 and b2m domains [296]. The α domains are encoded by a HLA gene and are
polymorphic, while the b2m domain is encoded by the b2m gene and is not polymorphic. The
α1 and α2 domains fold to form the peptide binding groove of the molecule, whereas the α3
domain interacts with the CD8 co-receptor of CTLs.
Figure 23: Structure of HLA class-I molecules. [297]
While the transporter associated with antigen processing (TAP) and TAPBP (TAP-associated
glycoprotein or tapasin) genes are encoded in the MHC class II region, these genes are
classified as class I-like. The TAP molecules (TAP-1 and TAP-2) are involved in the
transport of cytosolic peptides to the endoplasmic reticulum (ER) for their binding to HLA
class-I molecules [298]. TAP molecules also form part of the peptide-loading complex (PLC)
(a complex comprising b2m, calreticulin, ERp57, TAP, tapasin, and MHC class I) which
holds the MHC molecules until they have been fully loaded with peptides [299]. As stated
previously, tapasin forms part of the PLC, and is involved in the interaction between MHC
class I molecules and TAP. These genes are thus important for the successful antigen
processing and presentation capabilities of the HLA class-I molecules (Figure 24).
Stellenbosch University http://scholar.sun.ac.za

P a g e | 41
Figure 24: The role of TAP in antigen processing and presentation on MHC class I molecules. [300]
2.2.2 Major Histocompatibility Complex class II genes
The MHC class II genes, also known as the HLA class-II genes, can be classified into major
(HLA-DP, -DQ and -DR) and minor (HLA-DM, -DO) gene groups [287]. These molecules
are expressed only on APCs and lymphocytes and present peptides derived from extracellular
proteins [295]. HLA class-II presentation is thus referred to as the endocytic or exogenous
pathway. The HLA class-II molecules mediate immunization to a specific antigen through
their expression on professional APCs (macrophages, B cells and DCs) [301,302]. Upon
infection, these APCs present antigens to CD4 T cells (helper T cells), thus mediating
immunization to a specific antigen through stimulation of B cells to produce antibodies [303].
Stellenbosch University http://scholar.sun.ac.za

P a g e | 42
Structurally, class-I and class-II molecules are similar in that they are both heterodimers.
However, the class-II molecules consist of two homogenous peptides, an α and a β chain
(Figure 25), which are both encoded by the HLA gene [287].
Figure 25: Structure of HLA class-II molecules. [304]
2.2.3 Major Histocompatibility Complex class III genes
The MHC class III region is composed of genes encoding the complement system (C2, C4,
factor B), inflammatory cytokines, TNF and heat shock proteins (HSPs), and has the highest
gene density in the human genome [305]. Unlike the class I and class II regions, genes in
class III are not involved in antigen processing and presentation [287]. These genes are also
not structurally related to the class I and class II genes, with most genes playing a role in the
immune response but not all.
Genes of the complement system encode proteins that assist antibodies and phagocytic cells
in the clearance of pathogens and are thus important in the activation and maintenance of the
immune response [306]. HSPs are proteins that are activated when cells experience “heat
shock” and are primarily involved in the folding and unfolding of other proteins [307,308].
Stellenbosch University http://scholar.sun.ac.za

P a g e | 43
Hsp70 is one of the HSPs encoded in the MHC class III region, and is involved in the binding
and presentation of antigens. The TNF family of proteins play an important role in T cell-
dependent immune responses and induction of the apoptotic pathway [309] and are thus an
essential component of human disease.
Stellenbosch University http://scholar.sun.ac.za

Chapter 3: Hypothesis and Objectives
Stellenbosch University http://scholar.sun.ac.za

P a g e | 44
3.1 Study Hypothesis
Background: The leukocyte receptor complex comprises a number of genes which have been
shown to regulate the immune response by various mechanisms. The KIR and LILR gene
families within the LRC are known to have HLA class-I ligands. These form part of the
MHC, another region in the genome comprising genes which are highly immune related.
These regions could thus contain susceptibility factors for TB disease.
1. Genes of the LRC have been shown to play an important role in the control of the
immune response and as such could alter susceptibility to TB.
2. Genes of the MHC which are essential to the host immune response could play a role
in susceptibility to TB.
3. Given the importance of the HLA class-I genes in immune defence and their
population specificity, HLA types could interact with M. tuberculosis strain genotypes
to influence susceptibility to specific strains.
4. The HLA class-I alleles are highly population specific and could thus help to
understand the ancestral genetic contributions to the highly admixed South African
Coloured population and their role in disease susceptibility.
Hypothesis: Genetic variation within the genes of the LRC and MHC complex could play a
role in susceptibility to TB, as well as susceptibility to specific M. tuberculosis strains.
Stellenbosch University http://scholar.sun.ac.za

P a g e | 45
3.2 Study Objectives
1. To genotype the sixteen KIR genes for absence/presence and their association with
susceptibility to TB.
2. To genotype the HLA class-I genes and investigate their association with
susceptibility to TB.
3. To investigate the role of KIR/HLA compound genotypes in susceptibility to TB.
4. To identify genes (polymorphisms) of the MHC and LRC as susceptibility factors for
TB.
5. To determine if specific HLA types are associated with susceptibility to specific M.
tuberculosis strain genotypes.
6. To identify novel HLA class-I alleles and KIR gene profiles in the South African
Coloured and San populations.
7. To study the genetic ancestry contributions to the South African Coloured population
with regards to genes of the MHC and LRC.
Stellenbosch University http://scholar.sun.ac.za

Chapter 4: Host Genetic Susceptibility to
Tuberculosis
Stellenbosch University http://scholar.sun.ac.za

P a g e | 46
4.1 Introduction
Research has established TB as a multifactorial disease with host, pathogen and
environmental factors all contributing to the development of active TB disease. To date, the
focus of most research on understanding TB disease aetiology, progression and control has
been on the pathogen, M. tuberculosis. The widespread use of antibiotics and the current
failure of these therapeutic agents to halt further spread of the disease suggest that additional
approaches are required to fight the disease. Only 5-10% of immunocompetent individuals
develop active TB disease upon exposure to M. tuberculosis which suggests that the host
immune response plays an important role in the outcome of this disease. In this regard,
studying how the host genetic make-up differs between individuals who develop active TB
and those who remain healthy could lead to the identification of genes/variants that could
help explain this outcome.
NK cells are known to play an important role in both innate and adaptive immune responses
[310]. These cells are part of the early defence mechanisms employed when cells are
experiencing various forms of stress, such as infections and malignant transformations,
promoting the expression of cytokines and direct cytotoxicity [311] (Figure 26). To carry out
their function, NK cells have various receptors on their surfaces, which allows for the cells to
distinguish normal cells from allogeneic and autologous cells. The KIRs have been shown to
be the primary receptors for this purpose, with LILRs and LAIRs also offering some
functionality in this regard, as discussed in Chapter 2. As with cytotoxic T cells, NK cells
mediate programmed cell death through the release of cytotoxic granules which penetrate the
cell membrane of infected cells. For bacteria, NK cells secrete α-defensins, an antimicrobial
which disrupts the bacterial cell wall.
Stellenbosch University http://scholar.sun.ac.za

P a g e | 47
Figure 26: Signalling pathway of NK cell mediated cytotoxicity, and the involvement of the KIR
and HLA genes in this process. [312]
T cells are important modulators of the host immune response and play a central role in cell-
mediated immunity, the primary immune response to M. tuberculosis infection [295,313]. T
cells can be classified into several types; helper, cytotoxic, memory, regulatory and natural
killer, based on their function [313]. In the context of this study, cytotoxic (CD8+ T cells) and
memory (CD4+ or CD8
+ T cells) T cells are of interest, as they are MHC class I and class II
restricted cell types [295]. CTLs are involved in the killing of infected cells [313], and
recognise their target cells through antigen presentation of MHC class I molecules [314].
Memory T cells on the other hand are a subset of antigen-specific T cells that persist long-
term after an infection has been resolved [313]. Upon re-exposure to the specific antigen,
these memory T cells expand into a large number of effector T cells, allowing for the immune
Stellenbosch University http://scholar.sun.ac.za

P a g e | 48
system to recognise antigens from past infections and facilitating stimulation of a faster
immune response for subsequent infections. For M. tuberculosis infections, CD4+ T cells are
known to be the main immune response mechanism to overcome the infection [315].
However, the role of CD8+ T cells in fighting M. tuberculosis infections is also important,
with these cells having direct microbicidal activity through the expression of granulysin and
perforin [316–318].
Given the importance of genes of the LRC and MHC regions in the host immune response (as
discussed in Chapter 2), we investigated the relationship between genes and variants of these
complexes and susceptibility to TB in the SAC population.
4.2 Materials and Methods
4.2.1 Study Participants
4.2.1.1 Case-control samples
The study participants of this study self-classified as being from the South African Coloured
(SAC) population. This is officially recognized in South Africa as a census term, and used for
self-classification. This population is highly admixed and has known genetic contributions
from Black African, European, Khoisan and south and East Asian ancestries [319–321]. The
mixing of these different ethnicities to form the SAC population could result in population
substructure which could produce spurious (false positive/negative) association results due to
different allele levels in the founder populations [164].
To test for stratification within the SAC population, 25 unlinked SNP markers were
genotyped in this population, with no significant stratification detected between cases and
controls (P = 0.26) [322]. While the use of admixed populations may require additional
statistical analysis, they also offer the advantage of carrying a greater number of alleles
Stellenbosch University http://scholar.sun.ac.za

P a g e | 49
within members of the population, allowing for the investigation of disease markers in a
single population [323].
The samples for this study were collected from the Ravensmead and Uitsig suburbs of the
Western Cape province of South Africa, where approximately 98% of residents self-identify
as SAC [320]. These suburbs have a very high TB incidence (1005 per 100 000 in 2007)
[324] but low HIV prevalence (2%) [325,326], making individuals recruited from these
suburbs perfect candidates for TB association studies.
All study participants were unrelated. TB cases were individuals with bacteriologically
confirmed (smear positive and/or culture positive) pulmonary TB. Controls were healthy
individuals with no history of TB and who lived in the same community, with a minimum
age of 17 for inclusion. All study participants were HIV negative. For characteristics of the
case-control sample set, see Table 4.
Table 4: Characteristics of the SAC case-control samples for TB association study.
Characteristic Cases Controls
Males: n (%) 195 (48%) 77 (22%)
Females: n (%) 213 (52%) 274 (78%)
Average age (years ±SD) 35 ±13.1 35 ±12.2
Total 408 351 SD – Standard deviation
4.2.1.2 MHC and LRC data mining, Affymetrix 500K dataset
4.2.1.2.1 SAC population samples
For a description of the SAC population, see section 4.2.1.1. For characteristics of the SAC
Affymetrix 500K sample set, see Table 5.
Table 5: Characteristics of the SAC Affymetrix 500K samples.
Characteristic Cases Controls
Males: n (%) 361 (56%) 45 (49%)
Females: n (%) 281 (44%) 46 (51%)
Average age (years ±SD) 36.7 ±11.5 31.5 ±4.1
Total 642 91 SD – Standard deviation
Stellenbosch University http://scholar.sun.ac.za

P a g e | 50
4.2.1.2.2 Wellcome Trust Case Control Consortium (WTCCC) samples
The WTCCC TB samples were collected from the Gambian population [197]. The Gambian
population also has known population structure, with individuals who belong to this
population self-identifying as Fula, Jola, Mandinka, Wolloff and Other.
Gambian pulmonary TB cases were individuals with culture or smear positive TB. Controls
were recruited from routine births at local health clinics. All individuals included were HIV
negative. For characteristics of the WTCCC Affymetrix 500K sample set, see Table 6.
Table 6: Characteristics of the WTCCC Affymetrix 500K samples.
Characteristic Cases Controls
Males: n (%) 592 (71%) 492 (48%)
Females: n (%) 242 (29%) 526 (52%)
Total 834 1018
4.2.2 DNA extractions
Ethics approval (Health Research Ethics Committee of Stellenbosch University, South
Africa, Project registration number 95/072) and written informed consent from study
participants were obtained before the collection of blood samples from individuals residing in
the Ravensmead and Uitsig suburbs for the extraction of DNA. The DNA was extracted and
purified using the Nucleon BACC Genomic DNA Extraction Kit (Illustra, Buckinghamshire,
UK) following the manufacturer‟s instructions.
After extraction, the NanoDrop® ND-1000 Spectrophotometer and the NanoDrop
® v3.0.1
software (Inqaba Biotechnology, Pretoria, SA) were used to determine the DNA
concentration and purity. DNA working stock solutions were prepared at a concentration of
50ng/μl and stored at -20°C. DNA was diluted in TE buffer.
Stellenbosch University http://scholar.sun.ac.za

P a g e | 51
4.2.3 KIR Genotyping
The fourteen active KIR genes were genotyped for absence or presence using either the Real-
Time (RT) polymerase chain reaction (PCR) System or the gene-specific PCR-sequence
specific primers (SSP) method.
4.2.3.1 RT PCR Protocol
KIR gene primers for this protocol are the proprietary property of the laboratory of Dr. Mary
Carrington (Laboratory of Experimental Immunology, Frederick National Laboratory for
Cancer Research, USA), and primer sequences were not shared.
From 200μM primer stocks, working primer solutions were made in 5ml BD Falcon snap cap
tubes (BD Biosciences, San Jose, USA) at the following concentrations: KIR3DS1 at 5μM
per primer, KIR2DS1 at 1.25μM (forward primers) and 2.5μM (reverse primer), and all other
KIR gene primers were at a final concentration of 2.5μM. 160μl of primer solutions was
transferred to 96-well plates (Applied Biosystems, Foste City, USA), filling four columns of
wells. These primer solutions were then transferred to 384-deep-well plates (Applied
Biosystems), from which 1μl of primer was transferred to 384-well optical plates (Applied
Biosystems) using the Hydra automated pipetting system (Thermo Fisher Scientific, Hudson,
USA) (Figure 27). These primer plates were stored at -20°C for later use.
To do the PCR a master mix for 35 reactions per DNA sample was made by adding 87.5μl
Platinum SYBR Green qPCR Supermix-UDG with ROX (Invitrogen, Carlsbad, USA), 3.5μl
of 50ng/μl DNA, and 49μl of water. 4μl of master mix was transferred to each well of the
384-well primer plates. PCR cycling conditions were: 3 minutes at 94°C, 5 cycles of 15
seconds at 94°C, 15 seconds at 65°C, 30 seconds at 72°C; followed by 21 cycles of 15
seconds at 94°C, 15 seconds at 60°C, 30 seconds at 72°C; followed by 4 cycles of 15 seconds
Stellenbosch University http://scholar.sun.ac.za

P a g e | 52
at 94°C, 1 minute at 55°C, 2 minutes at 72°C, followed by an extension step of 7 minutes at
72°C, and stopping the PCR reaction by holding at 4°C.
Figure 27: Schematic representation of plate design for KIR typing.
After completion of the PCR, the 384-well plates were analysed using the ABI 7900HT Fast
Real-Time PCR System (Applied Biosystems) machine and the SDS v2.3 software (Applied
Biosystems) package, where the dissociation curve (Figure 28) results were exported and
saved to the Carrington KIR database.
Stellenbosch University http://scholar.sun.ac.za

P a g e | 53
Figure 28: Dissociation curves for KIR typing using Real-Time PCR. [327]
For the KIR2DS4 gene we were not only interested in the absence/presence of the gene, but
also the size of the gene fragment (197bp and/or 219bp). To determine the size of the 2DS4
gene fragment the PCR product was not run on the ABI 7900HT Fast Real-Time PCR
System (Applied Biosystems) machine but instead on the QIAxcel automated gel
electrophoresis system using the QIAxcel ScreenGel Software (Qiagen, Valencia, USA). This
automated electrophoresis system is able to accurately analyse fragments with resolutions up
to 3-5bp and is much more efficient than conventional gel electrophoresis (Figure 29).
Figure 29: Efficiency of QIAxcel system compared to conventional agarose gel electrophoresis. [328]
4.2.3.2 Gene-Specific PCR-SSP Protocol
SSP PCR is based on the design of primers which will or will not allow amplification,
otherwise referred to as the 3‟-mismatch principle [329]. As with the RT PCR protocol
described above, 384-well primer plates were made by dispensing 1μl (5μM) of a primer pair
into each well. Each KIR gene had two sets of primers, aligning to two different regions of
the gene (Table 7), allowing for the genotyping of 12 samples per 384-well plate. In addition,
primers binding to the intron 3 region of HLA-DRB1 were used as a positive control.
Stellenbosch University http://scholar.sun.ac.za

P a g e | 54
Table 7: List of primer sequences used for KIR typing by the PCR-SSP method.
Name Sequence (5’ – 3’) Exon Size (bp)
2DL1F1 GTTGGTCAGATGTCATGTTTGAA 4 146
2DL1R1 GGTCCCTGCCAGGTCTTGCG 4
2DL1F2 TGGACCAAGAGTCTGCAGGA 8 330
2DL1R2 TGTTGTCTCCCTAGAAGACG 3’UTR
2DL2F1 CTGGCCCACCCAGGTCG 4 173
2DL2R1 GGACCGATGGAGAAGTTGGCT 4
2DL2F2 GAGGGGGAGGCCCATGAAT 5 151
2DL2R2 TCGAGTTTGACCACTCGTAT 5
2DL3F1 CTTCATCGCTGGTGCTG 7 550
2DL3R1 AGGCTCTTGGTCCATTACAA 8
2DL3F2 TCCTTCATCGCTGGTGCTG 7 800
2DL3R2 GGCAGGAGACAACTTTGGATCA 9
2DL4F1 CAGGACAAGCCCTTCTGC 3 254
2DL4R1 CTGGGTGCCGACCACT 3
2DL4F2 ACCTTCGCTTACAGCCCG 5 288
2DL4R2 CCTCACCTGTGACAGAAACAG 5
2DL5F1 GCGCTGTGGTGCCTCG 3 214
2DL5R1 GACCACTCAATGGGGGAGC 3
2DL5F2 TGCAGCTCCAGGAGCTCA 5 191
2DL5R2 GGGTCTGACCACTCATAGGGT 5
2DS1F1 CTTCTCCATCAGTCGCATGAA 4
102 2DS1F2 CTTCTCCATCAGTCGCATGAG 4
2DS1R1 AGAGGGTCACTGGGAGCTGAC 4
2DS2F1 TTCTGCACAGAGAGGGGAAGTA 4 175
2DS2R1 GGGTCACTGGGAGCTGACAA 4
2DS2F2 CGGGCCCCACGGTTT 5 240
2DS2R2 GGTCACTCGAGTTTGACCACTCA 5
2DS3F1 TGGCCCACCCAGGTCG 4 242
2DS3R1 TGAAAACTGATAGGGGGAGTGAGG 4
2DS3F2 CTATGACATGTACCATCTATCCAC 5 190
2DS3R2 AAGCAGTGGGTCACTTGAC 5
2DS4F1 CTGGCCCTCCCAGGTCA 4 204
2DS4R1 TCTGTAGGTTCCTGCAAGGACAG 4
2DS4F2 GTTCAGGCAGGAGAGAAT 5 197/219
2DS4R2 GTTTGACCACTCGTAGGGAGC 5
2DS5F1 TGATGGGGTCTCCAAGGG 4 126
2DS5R1 TCCAGAGGGTCACTGGGC 4
2DS5F2 ACAGAGAGGGGACGTTTAACC 4 178
2DS5R2 ATGTCCAGAGGGTCACTGGG 4
Stellenbosch University http://scholar.sun.ac.za

P a g e | 55
Name Sequence (5’ – 3’) Exon Size (bp)
3DL1F1 CGCTGTGGTGCCTCGA 3 191
3DL1R1 GGTGTGAACCCCGACATG 3
3DL1F2 CCCTGGTGAAATCAGGAGAGAG 4 186
3DL1R2 TGTAGGTCCCTGCAAGGGCAA 4
3DL2F1 CAAACCCTTCCTGTCTGCCC 3 211
3DL2R1 GTGCCGACCACCCAGTGA 3
3DL2F2 CCCATGAACGTAGGCTCCG 5 130
3DL2R2 CACACGCAGGGCAGGG 5
3DL3F1 GTCAGGACAAGCCCTTCCTC 3 232
3DL3R1 GAGTGTGGGTGTGAACTGCA 3
3DL3F2 TTCTGCACAGAGAGGGGATCA 4 165
3DL3R2 GAGCCGACAACTCATAGGGTA 4
3DS1F1 AGCCTGCAGGGAACAGAAG 8 300
3DS1R1 GCCTGACTGTGGTGCTCG 3’ UTR
3DS1F2 CCTGGTGAAATCAGGAGAGAG 4 180
3DS1R2 GTCCCTGCAAGGGCAC 4
2DP1F1 GTCTGCCTGGCCCAGCT 3 205
2DP1R1 GTGTGAACCCCGACATCTGTAC 3
2DP1F2 CCATCGGTCCCATGATGG 4 89
2DP1R2 CACTGGGAGCTGACAACTGATG 4
DRB1F1 TGCCAAGTGGAGCACCCAA Intron3 796
DRB1R1 GCATCTTGCTCTGTGCAGAT Intron 3 bp – base pair UTR – untranslated region
PCR cocktails were made for each sample in a total volume of 132μl by combining 4μl
(50ng/μl) of DNA, 16.5μl of 10X PCR Buffer (Invitrogen), 4.95μl of MgCl2 (final
concentration of 1.5mM) (Invitrogen), 1.32μl of dNTPs (final concentration of 200mM)
(Bioline, London, UK), 0.825μl of Platinum® Taq polymerase (Invitrogen), and 104.41μl of
water. 4μl of the PCR cocktail was added to each well for a total PCR volume of 5μl. For
PCR cycling conditions, see section 4.2.3.1.
All PCR reactions were electrophoresed on a 3% agarose gel at 100V for 30 minutes, except
for KIR2DS4 amplicons, which were run at 100V for 1 hour. Gels were stained with
ethidium bromide (Sigma-Aldrich, Missouri, USA), and 100bp DNA ladder (Promega,
Stellenbosch University http://scholar.sun.ac.za

P a g e | 56
Wisconsin, USA) was loaded to confirm the size of the amplified products. DNA ladder and
PCR amplicons were loaded together with 1X Blue/Orange Loading Dye (Promega). Gel
visualization and image capturing was done using the G-Box (Syngene, Cambridge, UK).
4.2.3.3 KIR Haplotypes
The KIR genes present in an individual were grouped together and characterized into a
genotype (KIR gene profile). These genotypes were then classified into haplotypes based on
the model of Hsu et al. [229]. Briefly, genotypes were assigned to haplotypes based on the
following assumptions: 1) all haplotypes contained the 3DL3, 2DL4 and 3DL2 framework
genes; 2) haplotypes contained either 2DL2 or 2DL3, but not both; 3) haplotypes contained
either 3DP1 or 3DP1 variant (3DP1v) but not both. Haplotypes were then classified into
either A or B, where group B haplotypes were defined as having one or more of the following
genes present: 2DL5, 2DS1, 2DS2, 2DS3, 2DS5, and 3DS1 [330]. Conversely, group A
haplotypes were defined based on the absence of all group B genes.
4.2.4 HLA Genotyping
HLA class-I typing was done using the direct-sequencing technique and in the case of
ambiguous allele calling, the SSP typing protocol was used. All HLA primers used in this
study are the proprietary property of the lab of Dr. Mary Carrington (Laboratory of
Experimental Immunology, Frederick National Laboratory for Cancer Research, USA), and
primer sequences were not shared.
4.2.4.1 Direct-sequencing protocol
To determine the alleles of the HLA-A, -B and -C genes, exons 2 and 3 of each gene were
sequenced. Firstly, a PCR reaction was set up by adding 5.7μl of water, 2μl 5X Buffer A
(Invitrogen), 0.2μl of 10mM dNTPs (Bioline), 0.2μl of 25mM MgCl2 (Invitrogen), 0.2μl of
10μM forward primer, 0.2μl of 10μM reverse primer, 0.5μl of DMSO, 0.05μl of AmpliTaq
Stellenbosch University http://scholar.sun.ac.za

P a g e | 57
Gold (Invitrogen) (HLA-A and -B) / KAPA2G Robust DNA Polymerase (Kapa Biosystems,
Woburn, USA) (HLA-C), and 1μl of 50ng/μl DNA for a total reaction volume of 10μl.
Stepdown PCR cycling conditions were used, for HLA-A and -B: 3 minutes at 95°C,
followed by 5 cycles of 15 seconds at 95°C, 15 seconds at 62°C, 1 minute at 72°C; followed
by 26 cycles of 15 seconds at 95°C, 15 seconds at 58°C, 1 minute at 72°C; followed by 4
cycles of 15 seconds at 95°C, 1 minute at 55°C, 2 minutes at 72°C, followed by an extension
step of 7 minutes at 72°C, and stopping the PCR reaction by holding at 4°C. For HLA-C, the
cycling conditions were as follows: 3 minutes at 95°C, followed by 5 cycles of 15 seconds at
95°C, 15 seconds at 70°C, 1 minute at 72°C; followed by 26 cycles of 15 seconds at 95°C, 15
seconds at 60°C, 1 minute at 72°C; followed by 4 cycles of 15 seconds at 95°C, 1 minute at
55°C, 2 minutes at 72°C, followed by an extension step of 7 minutes at 72°C, and stopping
the PCR reaction by holding at 4°C.
After the PCR, the amplified fragments were electrophoresed on a 2% agarose gel stained
with GelRed Nucleic Acid stain (Phenix Research Products, Candler, USA). PCR products
and 100bp ladder (Promega) was loaded into wells with Orange G loading dye (New England
Biolabs, Ipswich, USA), and allowed to run for 30 minutes at 100V. Gel visualization and
image capturing were done using the G-Box (Syngene).
DNA samples that were successfully amplified were subjected to PCR clean-up using the
Agencourt AMPure XP (Beckman Coulter, Indianapolis, USA) and Biomek® FX P
laboratory automation workstation (Beckman Coulter) automated PCR purification system.
After PCR clean-up the DNA samples were set-up for sequencing reactions using primers
that bind to the intron 2 and 3 regions of each HLA class-I gene to determine the genomic
sequence of exons 2 and 3 of each gene. For sequencing of these genes the BigDye®
Terminator v3.1 Cycle Sequencing kit (Invitrogen) was used. In a total volume of 10μl the
following components were added: 5.675μl of water, 1.875μl of 5X BigDye® Buffer
Stellenbosch University http://scholar.sun.ac.za

P a g e | 58
(Invitrogen), 0.25μl of BigDye® Ready Reaction Mix (Invitrogen), 0.2μl of 10μM primer,
and 2μl of DNA (post-PCR cleaned-up). The cycling conditions used for the PCR reaction
were as follows: 1 minute at 95°C; followed by 25 cycles of 10 seconds at 95°C, 5 seconds at
50°C, 4 minutes at 60°C; followed by a 4°C holding temperature to stop the reaction.
Following the sequencing reactions the samples were read using the 3730xl DNA Analyzer
(Applied Biosystems). The Assign™
SBT 3.5.1 software package (Conexio Genomics,
Fremantle, Australia) was used for quality control (QC) and calling of the class-I alleles.
4.2.4.2 SSP typing protocol
In the event that the sequencing-based typing (SBT) approach resulted in the calling of
ambiguous and/or uncertain alleles (e.g. the Assign software is unable to call only one type of
HLA allele for the respective gene or an allele is called that is extremely rare or would not be
expected in a given population) these samples were re-typed using the PCR-SSP protocol.
Primers used in this instance were specific to a given allele, for example, the A*68:27 allele
is extremely rare and to date has only been identified in Black individuals from South Africa.
To confirm that this allele was indeed present in the SAC population, SSP primers for A*69
were used to re-type samples called for this allele. Also, in some instances the Assign
software was unable to distinguish between the A*02:02 and A*02:05 allele, and these
samples were re-typed using SSP primers for A*02. All ambiguous and uncertain alleles were
correctly called after SSP typing.
PCR and sequencing conditions were as described in section 4.2.4.1.
Stellenbosch University http://scholar.sun.ac.za

P a g e | 59
4.2.5 Statistical Analysis
4.2.5.1 KIR and HLA with TB susceptibility analysis
Hardy-Weinberg equilibrium (HWE) was assessed in TB case and control groups for all
genetic variants using the exact test [331]. Logistic regression model analysis was used to
compare TB cases and controls by calculating p-values, odds ratios (ORs) and 95%
confidence intervals (CIs), adjusting for age and sex.
A result or effect was described as significant if the p-value < 0.05. Bonferroni correction for
multiple testing was not used, as this method is considered to be over-conservative when
several genetic associations are tested in the same group of individuals [332], resulting in the
potential rejection of important findings. Bonferroni correction might also be inappropriate in
a situation such as this where there is a priori evidence that the genes are associated with TB
[333], while Bayesian methods for correction rely on knowledge of prior probability of
involvement, which is currently unknown for most genetic variants [334]. All analyses were
done in R (freely available from www.r-project.org) using functions from base R and R
packages genetics and haplo.stats.
KIR gene and HLA allele and genotype frequencies was calculated by direct counting.
Associations between KIRs, HLAs and KIR/HLA compound genotypes (based on receptor-
ligand relationships or other functional links) with TB disease were determined. The HLA
haplotypes were inferred, with their probabilities of being correct, and haplotypes were used
as predictors in logistic regression models, with their probabilities as weights as previously
described [335].
Stellenbosch University http://scholar.sun.ac.za

P a g e | 60
4.2.5.2 MHC and LRC data mining analysis
4.2.5.2.1 Quality Control
The use of microarray data may result in incorrect statistical analysis if low quality data is
present. In this regard, performing QC parameters on the data to filter out low quality
samples and SNPs is important. However, the unnecessary removal of data needs to be
guarded against as it may lead to loss of power. Several checks were performed on the SAC
and WTCCC 500K Affymetrix data, as recommended [336–339]. These checks were
performed in a sequential manner; if a sample/SNP was removed then it was not present in
the dataset for subsequent checks. Analysis was done using the PLINK open-source whole
genome association analysis toolset [340].
For the SAC and WTCCC datasets the “Calling” and “Frequency Filters” checks were
applicable. The SNP calling for the SAC data was previously done [320] and resulted in
several samples and SNPs being discarded. To determine the accuracy of the SNP calling we
compared the called genotypes of 9 HapMap samples with their known genotypes, the
accuracy of which was >99%. The SAC dataset also contained 4 duplicate samples, with
concordance between sample SNP calling >97%. The WTCCC dataset consisted of genotype
calls for 500 568 SNPs and a probability of correctness for each SNP call. However, since
Affymetrix CEL files were not provided, we were unable to determine the accuracy of the
calling using the algorithms described by Ziegler et al. [338]. In this instance, we used the
probability of correctness scores provided, where PLINK would set the genotype to missing
if the probability of correctness was <95%.
Frequency filters allow for the removal of samples and SNPs with high missing rates. This is
important since a high rate of missing SNP data could be due to genotyping quality problems;
especially since failure to call a SNP is often non-random [339]. There are several
recommendations for the missing rate at which samples should be removed, e.g. Laurie et al.
Stellenbosch University http://scholar.sun.ac.za
P a g e | 61
recommends a 2% missing rate while Ziegler et al. and the WTCCC recommends a 3%
missing rate [338,341]. In some instances Ziegler et al. state that the missing rate may be
raised to 10% before samples are removed [338]. However, in the SAC and WTCCC
datasets, the 2% and 3% thresholds would be too stringent, resulting in the removal of too
many samples (SAC: 173 and 99 samples respectively and WTCCC: 1915 and 968 samples
respectively). A threshold of 5% was therefore set for these sample sets. For SNPs a missing
rate threshold and minor allele frequency (MAF) of 1-5% are commonly recommended
[337,339,341]. For the SAC and WTCCC datasets the least stringent thresholds were used,
SNPs with a missing rate > 5% and a MAF < 1% were removed. HWE p-values should also
be taken into consideration when filtering SNPs, as any deviations from HWE (in control
samples) may indicate genotyping errors. There is however no consensus on the HWE p-
value at which SNPs should be removed, with the following recommendations: Laurie et al.
at P < 1x10⁻⁶
[339], the WTCCC at P ≤ 5.7x10⁻⁷
[341], and Miyagawa et al. and Ziegler et al.
at P < 1x10⁻⁴
[337,338]. As P < 1x10⁻⁴
was the most stringent p-value but only resulted in the
removal of 528 SNPs (0.1%) in the SAC dataset and 15 759 SNPs (3%) in the WTCCC
dataset, this threshold was used.
4.2.5.2.2 Association analysis
The Affymetrix 500K MHC and LRC SNP data was analysed using logistic regression with
an additive genetic model. Models were adjusted for sex and admixture in both population
sample sets and for age only in the SAC dataset, as age data was not provided for the
WTCCC dataset.
Stellenbosch University http://scholar.sun.ac.za

P a g e | 62
4.3 Results
4.3.1 KIR and TB case-control associations
The genotyping success rate for the KIR genes and the 2DS4 gene fragment was 99% and
94%, respectively. Of the 15 KIR genes typed, the frequencies (f) of all genes, except 3DS1,
were similar between TB cases and controls (Table 8). The 3DS1 gene was found at a higher
frequency in controls and was significantly associated with protection from TB in the SAC
population, where the presence of the gene lowered the odds of developing TB (OR = 0.65).
The 2DS4 gene 22bp deletion was not found to be associated with TB susceptibility in the
SAC population (Table 9).
Table 8: Case-control association data for absence/presence of KIR genes and susceptibility to
TB in the SAC population.
KIR gene TB cases with gene Controls with gene
Padj* OR [95% CI]#
Present (f) Absent (f) Present (f) Absent (f)
2DL1 390 (0.97) 12 (0.03) 340 (0.98) 7 (0.02) 0.399
2DL2 281 (0.70) 121 (0.30) 232 (0.67) 115 (0.33) 0.373
2DL3 302 (0.75) 100 (0.25) 269 (0.78) 78 (0.22) 0.683
2DL4 400 (0.99) 2 (0.01) 345 (0.99) 2 (0.01) 0.976
2DL5 280 (0.70) 122 (0.30) 236 (0.68) 111 (0.32) 0.514
2DS1 138 (0.34) 264 (0.66) 123 (0.35) 224 (0.65) 0.598
2DS2 274 (0.68) 128 (0.32) 231 (0.67) 116 (0.33) 0.620
2DS3 111 (0.28) 291 (0.72) 97 (0.28) 250 (0.72) 0.618
2DS4 386 (0.96) 14 (0.04) 330 (0.95) 17 (0.05) 0.507
2DS5 219 (0.54) 183 (0.46) 188 (0.54) 159 (0.46) 0.846
2DP1 385 (0.96) 17 (0.04) 338 (0.97) 9 (0.03) 0.337
3DL1 388 (0.97) 14 (0.03) 339 (0.98) 8 (0.02) 0.397
3DL2 402 (1) 0 (0) 347 (1) 0 (0) -
3DL3 402 (1) 0 (0) 347 (1) 0 (0) -
3DS1 94 (0.23) 308 (0.77) 105 (0.30) 242 (0.70) 0.014 0.65 [0.46-0.92] *P-value adjusted for sex. # Odds Ratio [95% Confidence Interval], the odds of having TB vs. no TB, for the absence/presence of the KIR gene.
Table 9: Case-control association data for the KIR2DS4 gene fragment and susceptibility to TB
in the SAC population.
TB cases Controls
Padj*
197/197 (f) 197/219 (f) 219/219 (f) 197/197 (f) 197/219 (f) 219/219 (f)
2DS4 100 (0.26) 105 (0.27) 181 (0.47) 96 (0.29) 100 (0.30) 134 (0.41) 0.125 *P-value adjusted for sex. #Individuals not heterozygous were classified as homozygous for the size fragment genotyped.
Stellenbosch University http://scholar.sun.ac.za

P a g e | 63
For the KIR genotypes (gene profiles), 64 distinct genotypes were identified in the 745 SAC
individuals (Table 10). Of the 64 KIR genotypes, 36 occurred at a frequency < 0.01 and were
not analysed, while the A1 genotype was the most common (f = 0.20). Of the remaining 28
KIR genotypes, most were found at similar frequencies between the two groups and were not
associated with susceptibility to TB. There were however 2 genotypes, B24 and B57, that
were significantly associated with susceptibility to TB in the SAC population. The B24
genotype was present only in TB cases while the B57 genotype was more common in TB
cases than controls and increased the risk of developing TB with an OR of 2.38.
Of the 64 KIR genotypes, 3 had group A haplotype-like gene profiles and 61 had group B
haplotype-like gene profiles, with 20 genotypes (in 33 individuals) not being classified into a
haplotype group as they failed to meet the assumptions of the Hsu et al. model for haplotype
classification [229] (Table 10). There were 409 individuals with a haplotype classification
(frequency > 0.01), 150 with haplotype A and 259 with haplotype B. Both haplotype groups
occurred at similar frequencies in TB cases and controls (Table 11) and were not associated
with susceptibility to TB in the SAC population.
When analysing the KIR genes by number of activating or inhibitory genes present,
individuals with 5 or more aKIR genes were found to have a lower risk of developing TB,
with an OR of 0.67 (Table 12). Comparisons for each group type were done by comparing
individuals who had the group versus those who did not. All other KIR gene categories were
found at similar frequencies between TB cases and controls.
Stellenbosch University http://scholar.sun.ac.za

P a g e | 64
Table 10: KIR gene profiles and their case-control association data for susceptibility to TB in the SAC population.
Genotype* Haplotype
# 3DL1 2DL1 2DL3 2DS4 2DL2 2DL5 3DS1 2DS1 2DS2 2DS3 2DS5 2DL4 3DL2 3DL3 2DP1 Cases (f) Controls (f) Padj
† OR [95% CI]
‡
A1 AA 80 (0.20) 69 (0.20) 0.958
A2 AA 1 (0.00) 0 (0.00)
A3 3 (0.01) 4 (0.01) 0.625
B1 Bx 0 (0.00) 1 (0.00)
B2 Bx 1 (0.00) 1 (0.00)
B3 Bx 1 (0.00) 1 (0.00)
B4 Bx 3 (0.01) 6 (0.02) 0.399
B5 Bx 0 (0.00) 3 (0.01)
B6 Bx 1 (0.00) 0 (0.00)
B7 Bx 1 (0.00) 1 (0.00)
B8 Bx 23 (0.06) 20 (0.06) 0.999
B9 Bx 1 (0.00) 0 (0.00)
B10 Bx 1 (0.00) 0 (0.00)
B11 Bx 1 (0.00) 2 (0.01)
B12 Bx 1 (0.00) 4 (0.01) 0.094
B13 Bx 4 (0.01) 1 (0.00) 0.478
B14 Bx 3 (0.01) 3 (0.01) 0.519
B15 Bx 5 (0.01) 2 (0.01) 0.272
B16 Bx 0 (0.00) 1 (0.00)
B17 Bx 2 (0.01) 0 (0.00)
B18 Bx 3 (0.01) 0 (0.00)
B19 Bx 0 (0.00) 2 (0.01)
B20 Bx 1 (0.00) 0 (0.00)
B21 Bx 1 (0.00) 0 (0.00)
B22 Bx 1 (0.00) 3 (0.01) 0.165
B23 Bx 27 (0.07) 21 (0.06) 0.575
B24 Bx 6 (0.02) 0 (0.00) 0.003 Only in cases
B25 Bx 0 (0.00) 1 (0.00)
B26 Bx 2 (0.01) 4 (0.01) 0.442
B27 Bx 0 (0.00) 1 (0.00)
B28 Bx 10 (0.03) 8 (0.02) 0.719
B29 Bx 1 (0.00) 1 (0.00)
B30 Bx 11 (0.03) 11 (0.03) 0.439
B31 Bx 6 (0.02) 2 (0.01) 0.207
B32 Bx 4 (0.01) 2 (0.01) 0.639
Stellenbosch University http://scholar.sun.ac.za
Stellenbosch University http://scholar.sun.ac.za

P a g e | 65
Genotype
* Haplotype
# 3DL1 2DL1 2DL3 2DS4 2DL2 2DL5 3DS1 2DS1 2DS2 2DS3 2DS5 2DL4 3DL2 3DL3 2DP1 Cases (f) Controls (f) Padj
† OR [95% CI]
‡
B33 Bx 1 (0.00) 0 (0.00)
B34 Bx 2 (0.01) 1 (0.00)
B35 Bx 1 (0.00) 2 (0.01)
B36 Bx 9 (0.02) 10 (0.03) 0.303
B37 Bx 0 (0.00) 1 (0.00)
B38 0 (0.00) 1 (0.00)
B39 Bx 2 (0.01) 1 (0.00)
B40 Bx 1 (0.00) 0 (0.00)
B41 4 (0.01) 2 (0.01) 0.639
B42 0 (0.00) 2 (0.01)
B43 0 (0.00) 2 (0.01)
B44 Bx 0 (0.00) 2 (0.01)
B45 31 (0.08) 18 (0.05) 0.082
B46 2 (0.01) 2 (0.01) 0.976
B47 Bx 0 (0.00) 1 (0.00)
B48 0 (0.00) 1 (0.00)
B49 4 (0.01) 4 (0.01) 0.873
B50 7 (0.02) 8 (0.02) 0.253
B51 1 (0.00) 0 (0.00)
B52 11 (0.03) 17 (0.05) 0.082
B53 Bx 1 (0.00) 1 (0.00)
B54 1 (0.00) 0 (0.00)
B55 43 (0.11) 35 (0.10) 0.639
B56 3 (0.01) 1 (0.00) 0.452
B57 26 (0.07) 11 (0.03) 0.017 2.38 [1.16-5.18]
B58 10 (0.03) 15 (0.04) 0.222
B59 1 (0.00) 1 (0.00)
B60 1 (0.00) 0 (0.00)
B61 33 (0.08) 31 (0.09) 0.536 *Genotypes (gene profiles) are the combination of KIR genes present in an individual. #KIR haplotypes, as described by Hsu et al. [229]. †P-value adjusted for sex. ‡ Odds Ratio [95% Confidence Interval], the odds of having TB vs. no TB, for a given KIR genotype.
Stellenbosch University http://scholar.sun.ac.za
Stellenbosch University http://scholar.sun.ac.za

P a g e | 66
Table 11: Case-control association data for KIR haplotypes and susceptibility to TB in the SAC
population.
Haplotype No. of TB cases (f) No. of controls (f) Padj*
A 81 (0.37) 69 (0.36) 0.762
B 138 (0.63) 121 (0.64) *P-value adjusted for sex.
Table 12: Case-control association data for number of activating/inhibitory KIR genes and
susceptibility to TB in the SAC population.
No. of KIR genes No. of TB cases (f) No. of controls (f) Padj* OR [95% CI]#
1 activating KIR 84 (0.21) 73 (0.21) 0.991
2-4 activating KIRs 255 (0.64) 205 (0.60) 0.121
≥5 activating KIRs 61 (0.15) 67 (0.19) 0.046 0.67 [0.45-0.99]
≤6 inhibitory KIRs 101 (0.25) 82 (0.24) 0.659
7 inhibitory KIRs 159 (0.40) 146 (0.42) 0.267
8 inhibitory KIRs 140 (0.35) 117 (0.34) 0.456 *P-value adjusted for sex. # Odds Ratio [95% Confidence Interval], the odds of having TB vs. no TB, for the number of activating/inhibitory KIR genes.
4.3.2 HLA class-I and TB case-control associations
All alleles were tested for HWE, separately in cases and controls, with no deviation from
HWE detected (all six HWE p-values = 1).
In the SAC population, 47 (HLA-A), 77 (HLA-B) and 30 alleles (HLA-C) were detected.
Analyses were performed only on alleles with a joint frequency > 0.05%. The genotyping
success rate for HLA-A, -B and -C was 83.2%, 78.6% and 90.4%, respectively. Several
statistically significant associations were identified with the class-I alleles and susceptibility
to TB (Table 13). The class-I alleles: A*74:01, B*57:01, B*42:02, B*39:01, C*12:03 and
C*05:01 were found to be protective against developing TB, lowering the odds of having TB
with ORs ranging between 0.16 and 0.44. Conversely, the class-I alleles: A*24:07, B*57:03,
C*18:01 and C*03:02 were found to increase the risk of developing TB with ORs ranging
between 1.89 and 4.27.
Stellenbosch University http://scholar.sun.ac.za

P a g e | 67
Table 13: Case-control association data for HLA class-I alleles and susceptibility to TB in the
SAC population.
HLA Number of TB cases (f) Number of Controls (f) Padj* OR [95% CI]#
HLA-A
A*03:01 53 (0.07) 51 (0.07) 0.946
A*02:01 46 (0.06) 57 (0.08) 0.596
A*24:02 44 (0.06) 56 (0.08) 0.124
A*01:01 44 (0.06) 57 (0.08) 0.274
A*23:01 48 (0.07) 45 (0.06) 0.630
A*11:01 44 (0.06) 38 (0.05) 0.357
A*30:02 38 (0.05) 38 (0.05) 0.948
A*30:01 40 (0.06) 35 (0.05) 0.421
A*43:01 35 (0.05) 27 (0.04) 0.291
A*32:01 31 (0.04) 26 (0.04) 0.414
A*30:04 32 (0.05) 25 (0.03) 0.260
A*68:02 28 (0.04) 25 (0.03) 0.824
A*68:01 21 (0.03) 24 (0.03) 0.699
A*26:01 16 (0.02) 26 (0.04) 0.077
A*02:05 22 (0.03) 16 (0.02) 0.287
A*74:01 10 (0.01) 25 (0.03) 0.013 0.39 (0.17-0.83)
A*29:01 18 (0.03) 16 (0.02) 0.498
A*33:03 16 (0.02) 16 (0.02) 0.664
A*34:02 12 (0.02) 17 (0.02) 0.543
A*02:02 12 (0.02) 13 (0.02) 0.763
A*29:02 9 (0.01) 14 (0.02) 0.247
A*24:07 17 (0.02) 5 (0.01) 0.003 4.27 (1.63-13.29)
A*66:01 8 (0.01) 9 (0.01) 0.775
A*01:23 9 (0.01) 8 (0.01) 0.636
A*02:11 9 (0.01) 7 (0.01) 0.478
A*31:01 4 (0.01) 8 (0.01) 0.349
A*02:03 5 (0.01) 7 (0.01) 0.521
A*68:27 6 (0.01) 4 (0.01) 0.416
A*36:01 7 (0.01) 2 (0) 0.120
A*33:01 4 (0.01) 4 (0.01) 0.877
A*25:01 2 (0) 6 (0.01) 0.097
A*80:01 2 (0) 3 (0) 0.834
A*26:12 2 (0) 3 (0) 0.837
A*02:14 1 (0) 4 (0.01) 0.234
A*34:01 2 (0) 2 (0) 0.896
A*24:17 1 (0) 2 (0) 0.836
A*02:06 1 (0) 3 (0) 0.511
A*24:03 2 (0) 1 (0) 0.496
HLA-B
B*44:03 53 (0.07) 60 (0.09) 0.270
B*58:02 54 (0.08) 37 (0.06) 0.167
Stellenbosch University http://scholar.sun.ac.za

P a g e | 68
HLA Number of TB cases (f) Number of Controls (f) Padj* OR [95% CI]#
B*08:01 41 (0.06) 39 (0.06) 0.766
B*07:02 44 (0.06) 36 (0.05) 0.563
B*15:03 42 (0.06) 32 (0.05) 0.281
B*58:01 36 (0.05) 26 (0.04) 0.257
B*18:01 34 (0.05) 27 (0.04) 0.450
B*15:10 26 (0.04) 23 (0.03) 0.644
B*45:01 22 (0.03) 17 (0.03) 0.907
B*41:01 17 (0.02) 21 (0.03) 0.518
B*42:01 23 (0.03) 14 (0.02) 0.132
B*35:01 15 (0.02) 19 (0.03) 0.361
B*51:01 16 (0.02) 14 (0.02) 0.945
B*13:02 10 (0.01) 15 (0.02) 0.426
B*07:05 13 (0.02) 12 (0.02) 0.925
B*40:01 12 (0.02) 12 (0.02) 0.930
B*27:05 14 (0.02) 10 (0.02) 0.378
B*47:01 8 (0.01) 15 (0.02) 0.070
B*15:01 14 (0.02) 9 (0.01) 0.356
B*14:01 12 (0.02) 11 (0.02) 0.819
B*40:06 9 (0.01) 13 (0.02) 0.167
B*15:02 10 (0.01) 12 (0.02) 0.702
B*57:03 15 (0.02) 6 (0.01) 0.034 2.75 (1.08-7.93)
B*52:01 10 (0.01) 10 (0.02) 0.943
B*35:05 11 (0.02) 9 (0.01) 0.569
B*14:02 11 (0.02) 9 (0.01) 0.890
B*57:01 5 (0.01) 14 (0.02) 0.029 0.35 (0.11-0.90)
B*81:01 12 (0.02) 6 (0.01) 0.338
B*53:01 11 (0.02) 7 (0.01) 0.271
B*42:02 3 (0) 15 (0.02) 0.001 0.16 (0.04-0.51)
B*35:03 5 (0.01) 12 (0.02) 0.078
B*44:02 4 (0.01) 11 (0.02) 0.109
B*57:02 7 (0.01) 4 (0.01) 0.913
B*39:10 8 (0.01) 3 (0) 0.141
B*41:02 3 (0) 7 (0.01) 0.368
B*37:01 4 (0.01) 6 (0.01) 0.453
B*15:21 5 (0.01) 5 (0.01) 0.987
B*15:13 4 (0.01) 6 (0.01) 0.535
B*50:01 6 (0.01) 3 (0) 0.321
B*39:01 2 (0) 7 (0.01) 0.019 0.17 (0.03-0.76)
B*13:03 4 (0.01) 4 (0.01) 0.777
B*55:01 4 (0.01) 3 (0) 0.840
B*40:02 3 (0) 3 (0) 0.845
B*38:02 2 (0) 4 (0.01) 0.496
B*27:06 4 (0.01) 2 (0) 0.397
Stellenbosch University http://scholar.sun.ac.za

P a g e | 69
HLA Number of TB cases (f) Number of Controls (f) Padj* OR [95% CI]#
B*15:16 3 (0) 3 (0) 0.842
B*38:01 1 (0) 4 (0.01) 0.202
B*35:02 4 (0.01) 1 (0) 0.273
HLA-C
C*06:02 118 (0.16) 135 (0.17) 0.249
C*04:01 95 (0.13) 106 (0.13) 0.797
C*07:01 92 (0.12) 93 (0.12) 0.706
C*17:01 49 (0.06) 65 (0.08) 0.492
C*07:02 56 (0.07) 47 (0.06) 0.282
C*02:10 58 (0.08) 44 (0.05) 0.072
C*03:04 34 (0.05) 29 (0.04) 0.250
C*16:01 34 (0.05) 26 (0.03) 0.318
C*18:01 31 (0.04) 19 (0.02) 0.033 1.89 (1.05-3.48)
C*07:04 20 (0.03) 22 (0.03) 0.643
C*02:02 20 (0.03) 21 (0.03) 0.838
C*08:01 13 (0.02) 26 (0.03) 0.154
C*12:03 12 (0.02) 25 (0.03) 0.021 0.44 (0.20-0.88)
C*08:02 14 (0.02) 19 (0.02) 0.224
C*08:04 18 (0.02) 16 (0.02) 0.378
C*15:02 13 (0.02) 16 (0.02) 0.328
C*12:02 10 (0.01) 15 (0.02) 0.531
C*03:02 16 (0.02) 8 (0.01) 0.047 2.38 (1.01-6.04)
C*14:02 8 (0.01) 14 (0.02) 0.403
C*15:05 8 (0.01) 11 (0.01) 0.661
C*01:02 7 (0.01) 12 (0.01) 0.305
C*05:01 4 (0.01) 14 (0.02) 0.022 0.29 (0.08-0.85)
C*04:03 8 (0.01) 9 (0.01) 0.847
C*03:03 9 (0.01) 8 (0.01) 0.850
C*16:02 2 (0) 4 (0) 0.476 *P-value adjusted for age and sex. #Odds Ratio [95% Confidence Interval], the odds of having TB vs. no TB, for each additional HLA allele carried.
For HLA class-I haplotypes (A-B-C) there was complete data for 499 individuals (242 TB
cases and 257 controls) for whom haplotype frequencies could be inferred. Individuals with
missing data were not included in this analysis as they would have too many possible
haplotypes. In total, 452 possible haplotypes were inferred in the SAC population (see
Appendix 1), with analyses performed only on haplotypes with a combined frequency ≥ 0.01
(Table 14). None of the class-I haplotypes was found to be significantly associated with
susceptibility to TB in the SAC population.
Stellenbosch University http://scholar.sun.ac.za

P a g e | 70
Table 14: Case-control association data for HLA class-I haplotypes and susceptibility to TB in
the SAC population.
HLA class-I haplotypes No. of TB cases (f) No. of controls (f) Padj* OR [95% CI]#
A*0101-B*0801-C*0701† 11 (0.044) 7 (0.027)
1
A*0301-B*4701-C*0602 6 (0.023) 2 (0.007) 0.314
A*3001-B*4201-C*1701 2 (0.010) 5 (0.019) 0.072
A*3002-B*0801-C*0701 5 (0.020) 3 (0.012) 0.932
A*3004-B*5802-C*0602 2 (0.010) 5 (0.019) 0.220
A*0201-B*0702-C*0702 3 (0.014) 4 (0.014) 0.754
A*4301-B*1503-C*1801 2 (0.008) 4 (0.016) 0.075
A*3001-B*4202-C*1701 4 (0.017) 2 (0.006) 0.182
A*3002-B*4501-C*1601 3 (0.012) 2 (0.008) 0.967
A*6601-B*5802-C*0602 2 (0.010) 3 (0.010) 0.626 *P-value adjusted for age and sex. #Odds Ratio [95% Confidence Interval], the odds of having TB vs. no TB, for each additional HLA allele carried. †Reference haplotype– the most common (having the highest frequency, so assumed to be the wild type) haplotype in the study population.
When analysing the HLA class-I molecules by functional types (Table 15), we found none to
be significantly associated with susceptibility to TB in the SAC population, as all functional
genotypes occurred at similar frequencies in TB cases and controls.
Table 15: Case-control association data for HLA functional types and susceptibility to TB in the
SAC population.
Genotype TB cases with genotype Controls with genotype
Padj*
Present (f) Absent (f) Present (f) Absent (f)
Bw4 207 (0.61) 132 (0.39) 172 (0.65) 93 (0.35) 0.338
Bw480I 143 (0.42) 196 (0.58) 100 (0.38) 165 (0.62) 0.281
Bw480T 95 (0.28) 244 (0.72) 92 (0.35) 173 (0.65) 0.067
C1a 80 (0.32) 169 (0.68) 71 (0.32) 150 (0.68) 0.875
C2b 80 (0.41) 115 (0.59) 71 (0.43) 94 (0.57) 0.873
C3c 169 (0.60) 115 (0.40) 150 (0.61) 94 (0.39) 0.969 *P-value adjusted for sex. aC1 = C1/C1 genotype. bC2 = C1/C2 genotype. cC3 = C2/C2 genotype.
4.3.3 KIR_HLA compound genotypes and TB case-control associations
As the KIRs do not act independently but rather interact with HLA class-I molecules to effect
an immune response, we analysed the KIR genes with their known HLA class-I ligands as
compound genotypes for susceptibility to TB (Table 16). However, none of the KIR_HLA
compound genotypes investigated was found to be significantly associated with susceptibility
Stellenbosch University http://scholar.sun.ac.za

P a g e | 71
to TB in the SAC population, with all compound genotypes occurring at similar frequencies
in both groups.
Table 16: Case-control association data for KIR_HLA compound genotypes and susceptibility
to TB in the SAC population.
Genotype TB cases with genotype Controls with genotype
Padj*
Present (f) Absent (f) Present (f) Absent (f)
3DS1_Bw4 53 (0.13) 355 (0.87) 52 (0.15) 299 (0.85) 0.306
3DS1_Bw480I 36 (0.09) 372 (0.91) 31 (0.09) 320 (0.91) 0.879
2DL1_C1a or C2b 240 (0.59) 168 (0.41) 215 (0.61) 136 (0.39) 0.624
2DL1_C2 or C3c 271 (0.66) 137 (0.34) 238 (0.68) 113 (0.32) 0.561
2DL2_C1 54 (0.13) 354 (0.87) 47 (0.13) 304 (0.87) 0.859
2DL2_C2 120 (0.29) 288 (0.71) 96 (0.27) 255 (0.73) 0.341
2DL2_C3 81 (0.20) 327 (0.80) 62 (0.18) 288 (0.82) 0.767
2DL2_C1 or C2 174 (0.43) 234 (0.57) 143 (0.41) 208 (0.59) 0.454
2DL3_C1 64 (0.16) 344 (0.84) 55 (0.16) 296 (0.84) 0.965
2DS1_C2 or C3 94 (0.23) 314 (0.77) 88 (0.25) 263 (0.75) 0.309
2DS1_C3 37 (0.09) 371 (0.91) 37 (0.11) 314 (0.89) 0.338
2DS2_C1 54 (0.13) 354 (0.87) 47 (0.13) 304 (0.87) 0.762
2DS2_C2 118 (0.29) 290 (0.71) 95 (0.27) 256 (0.73) 0.304
2DS2_C3 75 (0.18) 333 (0.82) 64 (0.18) 287 (0.82) 0.776
2DS2_C1 or C2 172 (0.42) 236 (0.58) 142 (0.40) 209 (0.60) 0.465 *P-value adjusted for sex. aC1 = C1/C1 genotype. bC2 = C1/C2 genotype. cC3 = C2/C2 genotype.
4.3.4 MHC and LRC data mining for TB susceptibility variants
To identify additional genes as susceptibility factors for TB we used the Affymetrix 500K
SNP chip data for the MHC and LRC regions in the SAC and the Gambian (WTCCC)
populations. For the MHC and LRC regions there were 610 and 78 SNPs respectively, of
which 598 and 65 SNPs remained after QC analysis in the SAC population and 511 and 51
SNPs in the Gambian population (see Appendices 2 to 5 for list of all SNPs and their
associated p-values).
We identified twenty-eight SNPs in the MHC region that were associated (P < 0.05) with TB
in the SAC population (Figure 30). Of these, two SNPs were significantly associated with TB
in both the SAC and the Gambian populations, while twenty-three SNPs showed significant
association only in the SAC population (Table 17). The remaining three SNPs failed QC
Stellenbosch University http://scholar.sun.ac.za

P a g e | 72
analysis in the Gambian dataset and were therefore not analysed. In the Gambian dataset,
twenty-six SNPs in the MHC region were associated with TB susceptibility (Figure 30 and
Table 18). The two SNPs associated in both the SAC and WTCCC datasets were in the
MDC1 gene and the intergenic regions between HLA-C and WASF5P. The MDC1 rs7565
SNP had opposing effects in the two populations, in that it was found to be protective in the
SAC population (OR = 0.40) and susceptibility-causing in the Gambian population (OR =
1.55) (Table 17 and 18). The HLA-C/WASF5P intergenic region, C6orf10, BTNL2, and HLA-
DOA were identified as potential genes/regions of interest, with SNPs associated with these
regions, although not concordant, identified in both populations. The effect of the BTNL2
SNPs was an increased risk of TB with ORs of 1.59 and 2.04, whereas the C6orf10 SNPs
were found to lower the risk of developing TB with ORs ranging between 0.46 and 0.79. The
HLA-C/WASF5P and HLA-DOA SNPs were found to be either protective or increasing the
risk of developing TB (Table 17 and 18).
For the SAC population only, several SNPs in and around the HLA-DOB and TAP2 genes
were associated with TB (Table 17), where SNPs upstream and in the -DOB gene were found
to increase the risk of developing TB with ORs ranging between 1.48 and 1.52, while SNPs
downstream of the -DOB gene and in TAP2 were found to lower the risk of developing TB
with ORs ranging between 0.37 and 0.68.
For the Gambian population only, several SNPS associated with HLA-B, -DPA1, MSH5, and
the intergenic region between TMPOP1 and HLA-E were found to be associated with
susceptibility to TB (Table 18). The MSH5 and TMPOP1/HLA-E SNPs were all found to
increase the risk of developing TB with ORs ranging between 1.30 and 2.19 (MSH5) and 1.17
and 1.25 (TMPOP1\HLA-E), while the HLA-DPA1 SNPs were found to lower the risk of
developing TB with ORs of 0.35 and 0.40. The HLA-B SNPs were found to be either
protective (OR = 0.70) or increasing the risk (OR = 1.26) of developing TB.
Stellenbosch University http://scholar.sun.ac.za

P a g e | 73
In the LRC region (Figure 31), four SNPs in the SAC (Table 19) and four SNPs in the
Gambians (Table 20) were associated with TB, with no overlap between the two populations.
In the SAC population the four potential genes/regions associated with TB included LILRA5
(OR = 0.41), the intergenic region between LAIR1 and TTYH1 (OR = 1.70), LILRP2 (OR =
1.56) and NCR1\NLRP7 (OR = 1.99). However, the SNPs in the LILRA5, LAIR1\TTYH1 and
NCR1\NLRP7 genes all failed QC analysis in the Gambian dataset and were therefore not
analysed in the population. In the Gambians, the genes LAIR2 (OR = 1.20) and the intergenic
region between LILRA1 and LILRA2 (OR = 1.22 to 1.40) were associated with TB.
Figure 30: Manhattan plots for SNPs spanning the MHC region on chromosome 6 in the SAC
and the Gambian populations. The blue line represents P < 0.05 cut-off, with all SNPs above the line
associated with TB susceptibility in the respective populations.
Table 17: MHC SNPs (Affymetrix 500K SNP chip) associated with TB susceptibility in the SAC
population.
SNP Allele Pg_adj* Pa_adj# OR [95% CI]‡ Gene
rs7565¥ T 0.054 0.020 0.40 [0.20-0.86] MDC1
rs887466 A 0.022 0.015 1.54 [1.09-2.21] POU5F1
rs16899203 C 0.008 0.013 2.45 [1.19-5.95] intergenic: HLA-C and WASF5P
rs3873385 T 0.006 0.002 0.47 [0.30-0.75] intergenic: HLA-C and WASF5P
rs396038¥ T 0.080 0.026 0.56 [0.35-0.93] intergenic: HLA-C and WASF5P
rs2523467 T 0.095 0.030 1.41 [1.03-1.93] MICA
rs11965547 A 0.050 0.018 0.54 [0.33-0.90] SLC44A4
rs12524063 A 0.024 0.017 0.46 [0.25-0.87] C6orf10
rs9268302 T 0.046 0.017 0.67 [0.48-0.93] C6orf10
rs6907322¤ A 0.039 0.011 0.65 [0.46-0.90] C6orf10
Stellenbosch University http://scholar.sun.ac.za

P a g e | 74
SNP Allele Pg_adj* Pa_adj# OR [95% CI]‡ Gene
rs3763308 A 0.044 0.022 2.04 [1.10-4.22] BTNL2
rs4530903 T 0.030 0.030 0.48 [0.26-0.93] intergenic: DRB1 and DQB1
rs9272723¤ T 0.003 0.013 1.48 [1.09-2.02] DQA1
rs2647046 A 0.015 0.008 1.60 [1.13-2.28] intergenic: DQB1 and DQA2
rs9275572 A 0.021 0.006 0.64 [0.46-0.88] intergenic:
DQB1/DQA2/MTCO3P1
rs2621382 G 0.040 0.015 1.48 [1.08-2.04] intergenic: DQB2 and DOB
rs2157082 G 0.036 0.013 1.49 [1.09-2.06] intergenic: DOB/DQB2/DQA2
rs2857136 A 0.040 0.011 1.51 [1.10-2.09] DOB
rs2857129 A 0.037 0.010 1.52 [1.10-2.10] DOB
rs1894407 A 0.074 0.023 0.68 [0.49-0.95] DOB and TAP2
rs9784858 C 0.009 0.005 0.54 [0.36-0.83] DOB and TAP2
rs10484565 A 0.007 0.007 0.37 [0.19-0.75] TAP2
rs3101942 G 0.001 0.001 0.55 [0.39-0.79] uncharacterized LOC100294145
rs3129304 C 0.020 0.022 0.58 [0.37-0.92] DOA
rs3129303 C 0.034 0.031 0.60 [0.39-0.95] DOA
rs429916 A 0.001 0.000 2.35 [1.45-4.01] DOA
rs3130014 G 0.044 0.016 1.66 [1.10-2.63] intergenic: tapasin
rs2747476¤ C 0.057 0.018 2.67 [1.17-7.73] KIFC1 ¥SNPs associated with susceptibility to TB in the SAC and the Gambian populations. ¤SNP failed QC analysis in the Gambian population dataset. *Genotype P-value adjusted for sex. #Allele P-value adjusted for sex. ‡ Odds Ratio [95% Confidence Interval], the odds of having TB vs. no TB, for each SNP.
Table 18: MHC SNPs (Affymetrix 500K SNP chip) associated with TB susceptibility in the
Gambian population (WTCCC).
SNP Allele Pg_adj* Pa_adj# OR [95% CI]‡ Gene
rs9295873 G 0.036 0.010 1.24 [1.05-1.46] intergenic: TMPOP1 and HLA-E
rs9461607 A 0.034 0.010 1.24 [1.05-1.47] intergenic: TMPOP1 and HLA-E
rs9295878 A 0.061 0.023 1.17 [1.02-1.34] intergenic: TMPOP1 and HLA-E
rs9295881 T 0.070 0.025 1.17 [1.02-1.34] intergenic: TMPOP1 and HLA-E
rs9295888 A 0.031 0.009 1.25 [1.06-1.48] intergenic: TMPOP1 and HLA-E
rs17477480 G 0.047 0.014 1.23 [1.04-1.45] intergenic: TMPOP1 and HLA-E
rs7565¥ T 0.029 0.015 1.55 [1.09-2.22] MDC1
rs3095340 C 0.052 0.018 0.82 [0.71-0.97] intergenic:
FLOT1/TUBB/IER3/MDC1
rs1265052 C 0.009 0.010 0.84 [0.73-0.96] C6orf15
rs239467 A 0.044 0.017 1.30 [1.05-1.61] intergenic: HLA-C andWASF5P
rs4523128 C 0.044 0.017 1.30 [1.05-1.61] MSH5
rs396038¥ T 0.032 0.032 0.71 [0.51-0.97] intergenic: HLA-C and WASF5P
rs9295984 A 0.070 0.024 1.26 [1.03-1.54] HLA-B
rs2523575 G 0.012 0.020 0.70 [0.51-0.95] HLA-B
rs3130484 C 0.012 0.004 2.19 [1.27-3.89] MSH5
rs3131379 A 0.048 0.025 1.83 [1.08-3.16] MSH5
rs17201431 C 0.027 0.027 0.52 [0.27-0.93] CFB
Stellenbosch University http://scholar.sun.ac.za

P a g e | 75
SNP Allele Pg_adj* Pa_adj# OR [95% CI]‡ Gene
rs3134926 G 0.055 0.017 1.18 [1.03-1.35] NOTCH4
rs9267954 T 0.015 0.012 0.76 [0.61-0.94] intergenic: NOTCH4 and
C6orf10
rs12528797 G 0.095 0.038 0.79 [0.63-0.99] C6orf10
rs3135376 G 0.025 0.025 1.59 [1.06-2.40] intergenic: BTNL2/DRA
rs12199692 G 0.113 0.037 1.19 [1.01-1.41] DOA
rs6936620 A 0.079 0.024 1.28 [1.03-1.59] DOA
rs3077 A 0.116 0.040 1.16 [1.01-1.33] DPA1
rs9348904 A 0.103 0.035 1.16 [1.01-1.33] DPA1
rs3135021 A 0.029 0.016 1.19 [1.03-1.36] DPB1 ¥SNPs associated with susceptibility to TB in the SAC and the Gambian populations. *Genotype P-value adjusted for sex. #Allele P-value adjusted for sex. ‡ Odds Ratio [95% Confidence Interval], the odds of having TB vs. no TB, for each SNP.
Figure 31: Manhattan plots for SNPs spanning the LRC region on chromosome 19 in the SAC
and the Gambian populations. The blue line represents P < 0.05 cut-off, with all SNPs above the line
associated with TB susceptibility in the respective populations.
Table 19: LRC SNPs (Affymetrix 500K SNP chip) associated with TB susceptibility in the SAC
population.
SNP Allele Pg_adj* Pa_adj# OR [95% CI]† Gene
rs1761450¤ A 0.006 0.003 0.41 [0.23-0.72] LILRA5
rs8109349¤ G 0.025 0.009 1.70 [1.14-2.63] intergenic: LAIR1 and TTYH1
rs8104498 C 0.007 0.035 1.56 [1.03-2.44] LILRP2
rs16986092¤ T 0.018 0.01 1.99 [1.17-3.69] NLRP7/NCR1 ¤SNP failed QC analysis in the Gambian population dataset. *Genotype P-value adjusted for sex. #Allele P-value adjusted for sex. † Odds Ratio [95% Confidence Interval], the odds of having TB vs. no TB, for each SNP.
Stellenbosch University http://scholar.sun.ac.za

P a g e | 76
Table 20: LRC SNPs (Affymetrix 500K SNP chip) associated with TB susceptibility in the
Gambian population (WTCCC).
SNP Allele Pg_adj* Pa_adj# OR [95% CI]† Gene
rs6509880 T 0.033 0.009 1.20 [1.05-1.37] LAIR2
rs2555685 G 0.002 0.002 1.40 [1.13-1.73] intergenic: LILRA1 and LILRA2
rs2555687 A 0.033 0.009 1.31 [1.07-1.60] intergenic: LILRA1 and LILRA2
rs16985743 T 0.046 0.019 1.22 [1.03-1.44] intergenic: LILRA1 and LILRA2 *Genotype P-value adjusted for sex. #Allele P-value adjusted for sex. † Odds Ratio [95% Confidence Interval], the odds of having TB vs. no TB, for each SNP.
4.4 Discussion
Given that only 10% of immunocompetent individuals will develop active TB disease,
understanding the host genetic contribution to this phenomenon will enable us to comprehend
the disease aetiology and progression better. Since the genes of the MHC and LRC,
specifically the HLAs and KIRs, are known to have important immune functions, we
proposed to study these genes and their variants with respect to susceptibility to TB. For the
KIR genes, a significant association was identified for the 3DS1 gene (OR = 0.65) which was
shown to lower the odds of developing TB in the SAC population by 35%. This gene has
been previously associated with TB susceptibility in the Lur population from Iran [342] and
the Chinese Han population [343], with ORs of 0.39 and 2.12 respectively. The effect of this
gene with regards to TB susceptibility has thus been found to differ between populations,
with 3DS1 having a protective role in the SAC and Iranian population but increasing the risk
of developing TB in the Chinese Han population. However, in a study in the Tehran, Iran
population, the 3DS1 KIR gene was not found to be associated with TB [344]. This study
however had a small sample size. To date, several studies have identified associations with
the 3DS1 gene and disease susceptibility [345], predominantly HIV-1 infections [238,346].
Most studies have found the 3DS1_HLA-Bw4-I80 compound genotype to be associated with
lower viral loads, slower decline of CD4+ T cell counts and delayed progression to AIDS
[346–348]. However, this compound KIR_HLA genotype was not associated with TB
Stellenbosch University http://scholar.sun.ac.za

P a g e | 77
susceptibility in the SAC population. In this regard, Barbour et al. showed that the 3DS1 gene
and the Bw4-I80 allele act independently in their protective role in HIV-1 disease
progression, where 3DS1 was found to increase the CD4+ T cell count and the HLA-B allele
was associated with lower viral loads [349]. To understand the functional mechanisms of
3DS1 in HIV-1 infections, Alter et al. showed expansion of 3DS1+ NK cells during acute
HIV-1 infections in the presence of Bw4-I80 [350,351] and Long et al. showed increased
IFN-γ and CD107a levels from 3DS1+ NK cells in individuals with early HIV-1 infections
that were independent of the presence of the Bw4-I80 allele [352]. For HIV-1 exposed
seronegative (HESN) subjects conflicting reports have been published, with Boulet et al. and
Tomescu et al. reporting a protective role for 3DS1 and disease susceptibility [353,354],
while Tomescu et al. and O‟Connell et al. reported no enrichment for the KIR3DS1 gene in
HESN individuals for HIV-1 acquisition [355,356]. All these studies raise the question
whether the protective effect is due to the presence of 3DS1 or any of the other genes in LD
with it. For other infectious diseases, the 3DS1 gene has been found to result in severe
pandemic influenza (H1N1) 2009 infections [357] and spontaneous recovery from hepatitis B
infection in individuals with increased frequency of 3DS1 [358].
Additional KIR associations identified with TB include two genotypes (B24 and B57) and
individuals with five or more aKIR genes. The two genotypes were found to increase the risk
of developing TB, with B24 occurring only in TB cases in our study cohort. The Bx
genotypes are designated as such since they contain mostly aKIRs. The 3DS1 gene, found to
lower the risk of developing TB, is one of these aKIRs but was not present in any of the KIR
genotypes associated with increased risk of disease. In addition, both KIR genotypes had only
four aKIRs present, while we found individuals with five or more aKIRs being protected
against developing TB. In a previous study on nasopharyngeal carcinoma, the authors
reported an increased risk (3.4 fold) among Epstein-Barr virus (EBV)-seropositive
Stellenbosch University http://scholar.sun.ac.za

P a g e | 78
individuals and carriers of five or more aKIRs [359]. As our study indicated that individuals
with the aKIR gene 3DS1 and with 5 or more aKIRs, were protected against TB, we show an
imbalance towards aKIRs in protection against TB, which could be as a result of increased
cytolysis of M. tuberculosis infected cells by NK cells.
Our investigation of HLA class-I alleles identified several significant associations with
susceptibility to TB in the SAC population. To date, most HLA associations have been
identified between the class-II alleles and susceptibility to TB [360]. Most studies on HLA
class-I to date have focussed on supertypes and TB susceptibility. In a meta-analysis of HLAs
and susceptibility to TB, the only class-I supertype associated with TB was HLA-B*13, and
none of the class-I alleles found to be associated in this study belonged to this supertype
group. In studies subsequent to the HLA and TB meta-analysis, associations were identified
between the HLA-B*51 and -B*52 supertypes and susceptibility to TB in an Indian cohort,
where B*51 was found to increase the risk of TB (OR = 18.53) and B*52 lowered the risk of
developing TB (OR 0.0) [361]. In a study conducted in a Brazilian population, the HLA-
A*02 and -B*18 allelic supertypes were found to be associated with TB susceptibility, with
both alleles lowering the risk of developing TB (OR = 0.64 and 0.37, respectively) [362].
Again, none of the alleles associated in this study belonged to these supertype groups. The
data therefore suggests great variability in the HLA alleles involved in TB susceptibility in
different populations.
In 2011, Alter et al. identified associations between SNPs in the HLA class-I region and
susceptibility to leprosy, caused by M. leprae, in a Vietnamese and Indian population [155].
Of the twelve SNPs associated with leprosy, eleven occurred in the centromeric end of the
class-I region, of which one (rs16899203) was present in the SNP set (500K Affymetrix
SNP-chip) analysed in our study. This SNP was also found to be associated with
susceptibility to TB in the present study, and maps to the 5‟ UTR region of the HLA-C gene.
Stellenbosch University http://scholar.sun.ac.za

P a g e | 79
In total, four 5‟ UTR HLA-C SNPs were identified as susceptibility factors in the SAC and
the Gambian populations, with one SNP (rs396038) associated in both populations. Taken
together, this data strongly suggests that the HLA-C gene plays an important role in
mycobacterial disease susceptibility. Another SNP identified by Alter et al. mapped to the
MICA gene. Although this SNP was not present in our Affy 500K SNP set, we identified
another SNP in the MICA gene (rs2523467) to be associated with TB susceptibility.
However, in the study by Souza et al., none of the MICA alleles investigated was found to be
associated with TB in a Brazilian population [362].
Since most studies of genes of the MHC and LRC and susceptibility to TB have focussed on
the HLA class-I, class-II and KIR genes, we sought to identify other genes within these
complexes that may play a role in TB susceptibility given the functional relevance of most of
these genes. To do this we used Affymetrix 500K SNP chip data for the SAC and the
Gambian (WTCCC) populations, with the latter serving as a validation cohort. Unfortunately
the concordance of associated SNPs between the two populations was low, in part due to QC
processes. There were however several overlapping MHC genes between the two
populations, including chromosome 6 open reading frame 10 (C6orf10), butyrophilin-like 2
gene (BTNL2), HLA-DOA and TAP2. The C6orf10 gene is an uncharacterized gene located in
the MHC class II region which has previously been found to be associated with psoriasis in a
Chinese population [363]. This gene could play an important role in TB since it has been
shown to be a downstream effector of TNF-α, a pro-inflammatory cytokine known to play an
important role in the development of active TB disease [364], and is produced by
macrophages, CD4+ T cells and NK cells. Previous work from our lab investigated BTNL2
SNPs and TB susceptibility, with no significant associations identified [365]. However, the
SNP found to be associated with TB in this study was not included in the study by Möller et
al. In a subsequent study of BTNL2 SNPs in a Chinese Han population, three SNPs were
Stellenbosch University http://scholar.sun.ac.za

P a g e | 80
significantly associated with TB disease [366]. Several studies have also identified an
association between SNPs of BTNL2 and sarcoidosis [367–369], a disease with similar
clinical and pathophysiological factors as TB. Expression of BTNL2 is increased in human
monocyte-derived macrophages upon exposure to M. tuberculosis and lipopolysaccharides
[367] and inhibits T cell activation in a murine model [370]. Several SNPs in the HLA-DOA
and -DOB genes were also identified as susceptibility factors for TB in the SAC population.
These two class-II genes combine to form a heterodimer, HLA-DO, which is found in B cell
lysosomes and regulates the peptide loading of HLA-DM-derived antigens on HLA class-II
molecules [371]. Fallas et al. showed that increased levels of HLA-DO resulted in lower
levels of class-II peptides in B cells and a significant inhibition in the presentation of some
exogenous antigens to T cells [372]. In essence, high levels of HLA-DO resulted in down
modulation of class-II antigen processing and presentation, which negatively impacts the
CD4+ T cell response to M. tuberculosis infections. The final MHC gene for which
significant association with TB susceptibility was detected is TAP2. The transporter
associated with antigen processing (TAP) molecules, composed of two subunits TAP1 and
TAP2, is involved in the translocation of peptides from the cytosol to the class-I molecules in
the endoplasmic reticulum [373,374], where Kartunnen et al. showed that TAP2, but not
TAP1, processing is critical for peptide translocation and binding [373]. Taken with our
findings of HLA class-I molecules altering susceptibility to TB and the importance of CD8+
T cells in overcoming M. tuberculosis infections [375], this suggests that the TAP2 gene
could play an important role in susceptibility to TB.
In the LRC complex, SNPs associated with LILRA5, LILRP2, NCR1/NLRP7and the
intergenic region between LAIR1/TTHYH1 were found to be associated with TB in the SAC
population, with no overlap in genes between the SAC and the Gambians. LILRA5 and
LILRP2 are members of the LILR gene family, where LILRP2 is a pseudogene and overlaps
Stellenbosch University http://scholar.sun.ac.za

P a g e | 81
the LILRA5 gene. LILRA5 plays an important role in the initiation of the innate immune
response through the induction of several proinflammatory cytokines [376]. Significantly,
LILRA5 is not involved in the recognition of class I molecules but instead binds to non-MHC
class I ligands on target cells, providing a novel immune regulatory mechanism [377]. The
LAIR1 gene is an inhibitory leukocyte-associated immunoglobulin-like receptor that is
structurally related to the KIRs but regulates NK cell activity independently of class-I
molecules [251]. LAIR1 is present on peripheral mononuclear cells, including NK cells, T
cells and B cells and regulates the immune response through inhibition of NK cell-mediated
cytotoxicity of self cells and limiting dendritic cell differentiation through binding to its
ligands [251,378]. Lastly, the NCR1 (NKp46) and NLRP7 genes found to be associated with
TB are important immune response modulators. NCR1 is involved in cytokine production
and regulates the activation of the cytolytic activity of NK cells [379]. Furthermore, defective
expression of NCR1 in HIV-1 patients has been noted, resulting in impaired NK cell function
and progression of the disease [380]. With regard to TB disease, Vankayalapati et al. showed
that NK cells use the NCR1 receptor on their surface to lyse M. tuberculosis H37Ra infected
monocytes [381,382] in response to vimentin, a 57-kDa molecule that is highly expressed on
the surface of infected monocytes, compared to uninfected cells [383]. The NLRP7 gene
belongs to the nucleotide-binding and leucine-rich repeat-activating gene family (NLRs) that
is involved in pattern recognition [384]. NLRP7 is involved in the formation of
inflammasomes in human macrophages, in response to microbial acylated lipopeptides [385].
Furthermore, NLRP7 activation resulted in the stimulation of ASC-dependent caspase-1, IL-
1β, IL-18 maturation and the restriction of intracellular bacterial replication, but not caspase-
1-independent secretion of the proinflammatory cytokines IL-6 and TNF-α.
Our study has resulted in several interesting and novel findings with regards to susceptibility
to TB in the SAC population, but further work is required to understand the biological
Stellenbosch University http://scholar.sun.ac.za

P a g e | 82
relevance of these findings. With regards to the association of aKIRs (3DS1 and ≥5) and TB
susceptibility, functional work would help to determine how these genes alter TB
susceptibility. For example, flow cytometry experiments could be used to determine the
expression and number of KIR receptors on M. tuberculosis infected CD56dim/bright
cells.
Furthermore, the cytotoxicity levels of these cells can be investigated using biological assays
for apoptosis, etc. The true ligand for KIR3DS1 has yet to be elucidated, with HLA-Bw4-I80
regarded as its ligand due to the 85% homology which 3DS1 has with the 3DL1 gene, where
Bw4-I80 is the confirmed ligand [345]. Further studies are thus required to identify the
putative ligand of the 3DS1 gene. With regards to the MHC and LRC genes identified, these
variants would have to be validated in other populations, the genes could be sequenced to
find the causal variant, and functional characterization of the SNPs should be conducted to
understand how they may alter TB disease progression. Experiments to do this may include
quantitative RT-PCR (qPCRs), western blotting and functional bio-assays.
The NK cells are important modulators of host immunity to infections [345], with NK cell
activity and cytokine production largely regulated by the KIRs and their HLA ligands, of
which HLA-C is the dominant KIR ligand [227]. Our study shows that aKIRs may play an
important role in TB, and together with a previous study on leprosy susceptibility [155], that
HLA class-I molecules are also important in disease pathogenesis of mycobacterial
infections.
Stellenbosch University http://scholar.sun.ac.za

Chapter 5: HLA Class I Variants and
Susceptibility to particular Mycobacterium tuberculosis Strains
Stellenbosch University http://scholar.sun.ac.za

P a g e | 83
The work presented in this chapter has been published in The Journal of Infectious Disease,
see Appendix 6 for a copy of the article “Associations between Human Leukocyte Antigen
Class I Variants and the Mycobacterium tuberculosis Subtypes Causing Disease”.
5.1 Introduction
The HLAs represent an unsurpassed example of polymorphism and it is believed that this
extreme diversity has occurred through selection events, allowing for the identification of
peptide antigens from various pathogens and stimulation of an effective immune response by
up-regulation of the Th1 pathway [386–388]. HLA data for various populations demonstrates
significant differences in allele frequencies between different geographical populations, with
some HLA alleles completely absent from certain populations (Figure 32) [319,389]. HLA-
B*73 for example, is absent in Khoisan-speaking and pygmy populations but common in
Asian populations [228,390]. Recent archaeological and molecular studies have also
indicated that KIRs and certain HLA alleles have been introduced into the non-African
human population after the “Out-of-Africa” migration possibly by interbreeding with archaic
humans [389]. These alleles would be maintained in the population if they were advantageous
to the immune response. The HLA genes were the first to be associated with susceptibility to
TB, and many different HLA alleles have been associated with disease in different
populations [360].
Figure 32: Differences in global allele frequencies for HLA alleles. [391]
Stellenbosch University http://scholar.sun.ac.za

P a g e | 84
The present-day population structure of several pathogens, including M. leprae and M.
tuberculosis, can be attributed to ancient human migrations (Figure 33) [152,392,393]. Such
long standing host-pathogen interactions could lead to adaptive genetic changes in both the
host and pathogen populations [55]. Evidence of this can be seen from studies which have
shown that M. tuberculosis lineages have adapted to specific human populations [55,394,395]
and the selection of strains from a distinct sub-lineage by a human population in a defined
geographical setting [396]. In cosmopolitan settings the association between particular
MTBC lineages and their human hosts have remained even though some degree of
intermingling of the different human populations has occurred (Figure 34) [55,394,395].
Figure 33: Diagrammatic representation of the “Out-of-and-Back-to-Africa” theory for the
host-pathogen co-adaptation of MTBC. [152] (a) Hypothesized migration of MTBC lineages out of
Africa. (b) Recent human migration, trade and conquest pattern.
Stellenbosch University http://scholar.sun.ac.za

P a g e | 85
Figure 34: Preferential transmission of MTBC lineages in sympatric populations in a
cosmopolitan setting. [55] Colour of bars represents MTBC lineage as per Gagneux et al. [55].
M. tuberculosis strains of the Beijing lineage are probably the most well characterised and are
associated with increased virulence and transmission [397]. They are the most dominant
strain lineage globally and have been reported in many Asian countries; and are emerging as
the dominant strain in several other countries, including South Africa [398], Argentina, Cuba,
Malawi, Vietnam, countries of the former Soviet Union (USSR) and parts of Western Europe
[399]. In the USA, strains from the Beijing lineage were responsible for a MDR TB outbreak
[400,401] and they are the main MDR strains in South Africa [402]. Different M.
tuberculosis strains induce different patterns of host immune response [403–405] as well as
resulting in different disease phenotypes [406–408]. Beijing strains are also thought to be
able to evade the protective effect of the BCG vaccine [409] and have evolved properties
which allow them to cause disease more frequently than non-Beijing strains [54]. This could
be due to their ability to modulate the host immunity towards a Th2 instead of a Th1 response
[410] or their inhibition of TNF-α release as demonstrated in activated THP-1 macrophages
[411]. Another potentially virulent property of the Beijing strain is its intact pks1-15 gene,
which is responsible for the production of phenolic glycolipids (PGLs) [412]. These PGLs
have been shown to attenuate the early host immune response to infection and inhibit the
release of pro-inflammatory cytokines.
Stellenbosch University http://scholar.sun.ac.za

P a g e | 86
Within the Cape Town metropole in South Africa, infections caused by the Beijing strains
were found to be rising exponentially over a decade while infections caused by non-Beijing
strains have remained constant [398]. Furthermore, Hanekom et al. showed that the Beijing
sub-lineage 7 strains were able to transmit and cause disease more frequently than strains
from sub-lineages 2 to 6 in urban and rural populations of the Western Cape [396]. It appears
that this is due to evolutionary selection in local populations for this sub-lineage instead of a
founder effect.
In this study we investigate the relationship between HLA class-I molecules and disease
caused by specific M. tuberculosis lineages, specifically those lineages occurring in the
Western Cape, South Africa.
5.2 Materials and Methods
5.2.1 Study Participants
For a description of the study population refer to section 4.2.1.
Three-hundred TB cases with bacteriologically confirmed pulmonary TB were included in
this study (age in years = 34.8 ± 12.6, males = 53%).
5.2.2 HLA Genotyping
For a description of the HLA class-I genotyping refer to section 4.2.2.
The extreme variability in the MHC molecules has resulted in the description of over a
thousand alleles for the HLA-A and –B loci [288]. While this extensive polymorphism has
resulted in the ability of each variant to bind a unique repertoire of peptide ligands, they have
also been shown to largely overlap in their peptide binding specificity allowing for clustering
of these variants into supertypes. A supertype therefore comprises a supermotif which reflects
the broad main anchor motif for all the alleles belonging to that supertype. The A2-supertype
Stellenbosch University http://scholar.sun.ac.za

P a g e | 87
for example, shares specificity for peptides containing an aliphatic hydrophobic residue in
position 2 and the C-terminus; whereas the A3-supertype recognizes peptides with small or
aliphatic residues in position 2 and basic residues at the C-terminus of the class-I molecules.
There are currently twelve supertype descriptions for over 750 HLA-A (Figure 35) and –B
alleles (Figure 36).
There are however no supertype classifications as yet for the HLA-C alleles. These alleles
were thus defined based on their KIR2DL1 and KIR2DL2 binding [413] as previously done
by Balamurugan et al. [414]. Individuals who had alleles that could not be classified into a
supertype were labelled as “unclassified”.
Figure 35: HLA-A supertype classifications and their associated alleles. [288] Under each supertype,
alleles are grouped by colour on the basis of the stringency of selection: experimentally established motif (i.e.,
reference panel) (green), exact match(es) in the B and F pockets (white), one exact and one key residue pocket
match (yellow), key residue match(es) at B and F pockets (grey). Alleles with no match at one or both pockets
are listed with red font.
Stellenbosch University http://scholar.sun.ac.za

P a g e | 88
Figure 36: HLA-B supertype classifications and their associated alleles. [288] Under each supertype,
alleles are grouped by colour on the basis of the stringency of selection: experimentally established motif (i.e.,
reference panel) (green), exact match(es) in the B and F pockets (white), one exact and one key residue pocket
match (yellow), key residue match(es) at B and F pockets (grey). Alleles with no match at one or both pockets
are listed with red font
Stellenbosch University http://scholar.sun.ac.za

P a g e | 89
5.2.3 HLA allele frequencies for geographical populations
HLA class-I allele frequency data for white (Table 21) and East Asian (Table 22) populations
were obtained from the online allelefrequencies.net database (AFND)
(www.allelefrequencies.net) [228] (Figure 37). This database is dedicated to the storage of
allele, genotype and haplotype frequencies of various immune related genes in different
populations. The database currently houses data of more than 600 000 individuals (from
1 133 human populations) for frequencies of genetic variants in the HLAs, KIRs, MHC class-
I chain-related genes, and cytokine genes. This online repository was developed due to the
extensive variability within these genes; and their importance in disease association studies,
population diversity studies and transplantation [415].
Figure 37: Screenshot of AFND web interface for obtaining allele frequencies for specific
populations. [228]
Stellenbosch University http://scholar.sun.ac.za

P a g e | 90
Table 21: White human populations, with their respective sample sizes and HLA class-I allele frequencies. [228]
Population Sub-population Sample size
(n) Frequency
A*23:01 A*74:01 B*07:05 B*14:01 B*14:02 B*35:01 B*58:02 C*08:01 C*16:01
Australia New South Wales Caucasian
134 0.019 - 0.004 0.011 0.011 0.045 - - 0.020
Austria 200 0.020 - - 0.005 0.022 0.068 - - -
Azores Central Islands 59 0.071 - - 0.018 0.054 0.071 - - -
Azores Santa Maria and Sao Miguel
43 0.026 - - 0.013 0.051 0.090 - - -
Azores Terceira Island 130 0.031 - 0.004 0.016 0.051 0.058 - - 0.027
Belgium 99 0.016 - - 0.005 0.010 - - - -
Brazil Belo Horizonte Caucasian 95 0.053 - - 0.005 0.053 0.042 0.005 - -
Bulgaria 55 0.055 - 0.009 - 0.009 - - - -
Croatia 150 0.023 - - 0.003 0.020 0.064 - - -
Cuba Caucasian 70 0.079 - - 0.029 0.057 0.029 - - -
Czech Republic
106 0.019 - - - 0.014 0.061 - - -
England North West 298 0.018 - 0.003 0.010 - 0.032 - - -
Finland 91 0.006 - - - - 0.117 - - 0.006
France Corsica Island 100 0.01 - - - - - - - 0.035
France Reims 102 - - - 0.005 0.044 - - - -
France Rennes Population 3 200 0.02 - - - - - - - -
France Southeast 130 0.012 - 0.004 0.012 0.035 0.047 - - 0.051
Georgia Saventi Region Svan 80 - - - - 0.019 0.100 - - -
Georgia Tibilisi 109 0.019 - 0.005 - 0.014 0.083 - 0.005 0.019
Germany Essen 174 - - - 0.003 0.014 - - 0.012 0.006
Germany Population 6 8862 0.022 - 0.002 0.005 0.018 0.061 - - 0.022
Ireland Northern 1000 0.014 - 0.001 0.022 0.036 0.055 - 0.001 0.050
Ireland South 250 0.008 - - 0.024 0.024 0.036 - - 0.040
Italy Bergamo 101 0.011 - - - - - - - 0.030
Italy North 279 - - - - - - - - 0.043
Italy North Population 3 97 0.058 - - - 0.067 0.133 - - 0.034
Stellenbosch University http://scholar.sun.ac.za
Stellenbosch University http://scholar.sun.ac.za

P a g e | 91
Italy North Pavia 81 0.012 - - - 0.031 - - - 0.019
Italy South 141 - - - - - - - - 0.018
Macedonia Population 4 216 - - - 0.002 0.007 - - - -
Madeira 185 0.062 - - 0.027 0.049 - 0.003 - -
Morocco Settat Chaouya 98 0.074 0.007 - 0.007 0.041 - - - 0.071
Poland 200 0.03 - 0.008 0.005 0.018 0.043 - - 0.008
Poland DKMS 20653 0.023 - 0.003 0.003 0.014 0.053 - 0.014
Portugal Center 50 0.01 - 0.010 - 0.040 0.050 - - -
Portugal Center Population 2 562 - - - - - - - - 0.037
Portugal North 46 0.109 - - - 0.065 0.065 - - -
Portugal South 49 0.061 - - 0.020 0.031 0.133 - - -
Romania 348 0.025 0.007 0.006 0.017 0.101 - - -
Serbia Population 2 102 - - 0.005 0.010 0.044 0.088 - - -
Spain Andalusia 99 - - - - - - 0.006 - 0.067
Spain Andalusia Gypsy 99 0.006 - 0.005 - 0.035 0.035 - - 0.051
Spain Catalonia Girona 88 0.046 - - - - - - - 0.098
Spain Gipuzkoa Basque 100 0.020 - - - - - - - 0.166
Spain Majorca and Minorca 90 0.050 - - - - - - - 0.071
Sweden Northern Sami 154 - - - - - 0.035 - - -
Sweden Southern Sami 130 - - - 0.008 - 0.081 - - -
Switzerland Geneva 80 - - - - - - - - 0.027
Turkey Population 5 142 - - - - - - - - 0.004
United Kingdom
Population 3 604 - - - - - - - - 0.041
USA Caucasian Bethesda 307 0.018 0.011 0.004 - 0.043 0.070 0.004 - 0.030
USA Caucasian Population 2 265 0.013 - 0.002 0.004 0.034 0.068 - - 0.025
USA Caucasian Population 3 88 0.023 - - - - - - - -
USA Caucasian Population 4 1070 0.013 0.001 0.002 0.008 0.034 0.072 - 0.001 0.044
USA Eastern European 558 0.017 0.001 0.005 0.004 0.030 - 0.001 0.002 0.028
USA European American Population 2
1245 - - 0.002 0.013 0.023 0.046 - - -
USA Philadelphia Caucasian 141 0.033 - 0.011 - 0.022 0.056 0.004 - 0.031
Stellenbosch University http://scholar.sun.ac.za
Stellenbosch University http://scholar.sun.ac.za

P a g e | 92
USA San Antonio Caucasian 222 0.006 - - 0.006 0.045 0.075 - 0.003 0.067
Venezuela Colonia Tovar 86 0.047 0.012 - - - - 0.006 - -
Table 22: East Asian human populations, with their respective sample sizes and HLA class-I allele frequencies. [228]
Population Sub-population Sample size (n)
Frequency
A*23:01 A*74:01 B*07:05 B*14:01 B*14:02 B*35:01 B*58:02 C*08:01 C*16:01
China Beijing 67 0.075 - 0 - - 0.053 - 0.114 0.008
China Beijing Shijiazhuang Tianjian Han 618 0.004 0.002 0.004 0.001 - 0.03 0.002 - -
China Canton Han 264 0.006 0.006 0.017 0.002 - 0.019 - 0.133 -
China Guangxi Region Maonan 108 - - - - - 0.005 - - -
China Guangzhou 102 - - 0.02 - - 0.025 - 0.158 0
China Guizhou Province Bouyei 109 - - - - - 0 - 0.177 -
China Guizhou Province Miao Population 2 85 - - - - - 0.042 - 0.059 -
China Guizhou Province Shui 153 - - - - - 0.015 - 0.206 -
China Inner Mongolia Region 102 0.015 - 0.005 - 0 0.039 - - -
China North Han 105 0 0 0 0 0.005 0 0 - -
China North Han Population 2 567 - - - - - - - 0.089 0.001
China Qinghai Province Hui 110 0.009 - 0 - 0.009 0.068 - - 0.005
China South Han 284 0.005 0.005 0.016 0.002 - 0.018 - 0.126 -
China South Han Population 2 1098 - - - - - - - 0.099 0
China Southwest Dai 124 0.004 - 0.004 - - 0.008 - 0.081 -
China Yunnan Province Bulang 116 - - 0.03 - - - - 0.366 -
China Yunnan Province Han 101 - - 0.015 - - 0.03 - 0.149 -
China Yunnan Province Hani Population 2 150 - - - - - 0.053 - 0.153 -
China Yunnan Province Jinuo 109 - - 0.005 - - - - - -
China Yunnan Province Wa 119 - - 0.021 - - - - - -
Hong Kong Chinese 569 0 - 0.014 0 0 0.016 0 - -
Japan Central 371 - - - - - 0.076 - 0.074 -
Stellenbosch University http://scholar.sun.ac.za
Stellenbosch University http://scholar.sun.ac.za

P a g e | 93
Japan Hokkaido Ainu 50 - - - - - 0.11 - - -
Japan Kyoto and Osaka 165 - - - - - - - 0.079 -
Japan Population 3 1018 - - - - - 0.078 - 0.082 -
Japan Population 5 117 - - - - - 0.078 - 0.109 -
Mongolia Buryat 141 0.014 - - - - - - - -
South Korea Population 1 324 - - - - - - - 0.099 -
South Korea Population 3 485 0 0 0.008 0.021 0 0.057 0 0.074 0
Taiwan Ami 98 - - - - - - - 0.26 0
Taiwan Atayal 106 - - - - - - - 0.184 0
Taiwan Bunun 101 - - - - - - - 0.089 0
Taiwan Hakka 55 0 0 0.027 0 0 0.009 - 0.073 0
Taiwan Han Chinese 504 - 0.002 0.004 - - 0.02 - 0.081 -
Taiwan Minnan Population 1 102 0 0 0.005 0 0 0.01 - 0.108 0
Taiwan Paiwan 51 0 0 0 0 0 0.01 - - -
Taiwan Pazeh 55 0 0 0 0 0 0.018 - 0.136 0
Taiwan Population 2 364 0.001 - 0.001 - - 0.017 - 0.097 -
Taiwan Population 3 212 - - - - - 0.031 - - -
Taiwan Saisiat 51 - - - - - - - 0.049 0
Taiwan Siraya 51 0 0 0 0 0 0.029 - 0.108 0.01
Taiwan Taroko 55 - - - - - - - 0.191 0
Taiwan Thao 30 - - - - - - - 0.083 0
Taiwan Tsou 51 - - - - - - - 0.098 0
Taiwan Tzu Chi Cord Blood Bank 710 - - 0.001 - - 0.025 - - -
Stellenbosch University http://scholar.sun.ac.za
Stellenbosch University http://scholar.sun.ac.za

P a g e | 94
5.2.4 Bacterial Isolates and Genotyping
Sputum samples were previously collected for culture at diagnosis from all new and
retreatment TB patients who attended primary health-care clinics and who were resident in an
epidemiological field site in Cape Town, South Africa during the period January 1993 to
December 2004. This study forms part of a larger, long-term molecular epidemiological
project which was approved by the Health Research Ethics Committee of Stellenbosch
University, South Africa (2003/022/N).
M. tuberculosis isolates were classified by culturing the sputum on MGIT and/or Löwenstein-
Jensen media. DNA was extracted as previously described [416]. Isolates were classified by
IS6110 restriction fragment length polymorphism (RFLP) genotyping [417] and
spoligotyping [418] using internationally standardized protocols. Strains were identified
according to distinct IS6110 banding patterns using Gelcompar II (Applied Maths, Sint-
Martens-Latem, Belgium) as previously described [419] and were subsequently grouped into
evolutionary clades which were classified based on their spoligotype signatures [420,421].
Strains having less than six IS6110 bands (low-copy clade) comprise a single lineage as
defined by IS6110 (as previously described [420]) and were therefore regarded as a single
clade. Sub-lineages of the Beijing clade were identified as previously described [396]. M.
tuberculosis lineages were classified into East-Asian [422] or Euro-American [54,423,424]
MTBC lineages and inferred from Gagneux et al. [55].
5.2.5 Statistical Analysis
Logistic regression models were used to analyse the likelihood of TB cases having a specific
strain, compared to having any other strain, because they enable us to adjust for other
variables such as age and sex by including them in the models as covariates. All p-values,
ORs and their CIs were derived from these models. Genetic association with susceptibility to
Stellenbosch University http://scholar.sun.ac.za

P a g e | 95
different strains was tested using each of the following as predictors in the models:
genotypes, additive allelic and additive haplotypes. The haplotypes were inferred, with their
probabilities of being correct, and haplotypes were used as predictors in logistic regression
models, with their probabilities as weights as previously described [335]. We tested for
Hardy-Weinberg Equilibrium using the exact test [331]. All analysis were done in R (freely
available from www.r-project.org) using functions from the base R and R packages genetics
and haplo.stats.
See section 4.2.5.1 for discussion on correcting for multiple testing.
5.3 Results
5.3.1 Host genotype and multiplicity of infections
MTBC lineage, strain and sub-lineage frequencies in this study cohort are listed in Table 23
and the frequencies of the HLA class-I supertypes in the SAC study population are listed in
Table 24. Most TB cases (90%) had only one episode of disease with infection caused by one
strain, but 27 (9%) and 3 individuals (1%) had disease episodes caused by two and three
different strains, respectively. Of the 30 individuals with more than one disease episode, 19
(63%) had one infection with the Beijing strain, and other episodes with another strain,
whereas less than 5% of those with a non-Beijing strain had an additional episode with
another strain. Figure 38 shows that of the 70 individuals with a Beijing strain, 19 (27%) had
more than one episode with different strains. Of the 19 individuals who had 2 or more
infections of which one was Beijing, Beijing was the first infection in 6 cases, and a
subsequent infection in 13 cases. Having the HLA-B*27 allele was found to be significantly
associated (P = 0.006) with having fewer strains, with each B*27 allele lowering the odds of
having an additional infection with a different strain (Table 25).
Stellenbosch University http://scholar.sun.ac.za

P a g e | 96
Table 23: M. tuberculosis strain frequencies in the SAC population of the Western Cape.
MTBC lineage Frequency Strain Frequency Sub-lineage Frequency
Euro-American 0.79
LAM 0.32
LCC 0.19
Quebec 0.11
Haarlem 0.10
HaarlemLike 0.02
East Asian 0.21
CAS1 0.02
Beijing 0.23
Beijing Sub-lineage 2-6 0.26
Beijing Sub-lineage 7 0.74
Other 0.11 MTBC - M. tuberculosis complex.
Table 24: HLA class-I supertype allele, genotype and haplotype frequencies in the SAC
population of the Western Cape.
Allele Frequency (n) Genotype Frequency (n) Haplotype† Frequency
HLA-A A*01-B*07-C2 0.03
A*01 0.33 (167) A*01/A*01 0.13 (33) A*01-B*08-C2 0.05
A*02 0.19 (98) A*01/A*02 0.11 (27) A*01-B*27-C1 0.03
A*03 0.24 (120) A*01/A*03 0.16 (40) A*01-B*44-X 0.03
A*24 0.15 (78) A*01/A*24 0.10 (25) A*01-B*58-C1 0.07
X# 0.08 (41) A*01/X 0.04 (9) A*01-B*58-C2 0.03
A*02/A*02 0.02 (5) A*02-B*07-C2 0.05
A*02/A*03 0.10 (24) A*02-B*27-X 0.03
A*02/A*24 0.10 (24) A*02-B*44-C2 0.03
A*02/X 0.05 (13) A*03-B*07-C1 0.04
A*03/A*03 0.07 (17) A*03-B*27-C1 0.03
A*03/A*24 0.06 (14) A*03-B*44-C2 0.03
A*03/X 0.03 (8) A*03-B*58-C1 0.03
A*24/A*24 0.02 (4) A*24-B*07-C1 0.03
A*24/X 0.03 (7) A*24-B*44-C1 0.03
X/X 0.01 (2) X-B*27-C1 0.03
HLA-B
B*07 0.25 (123) B*07/B*07 0.06 (15)
B*08 0.06 (31) B*07/B*08 0.04 (10)
B*27 0.17 (84) B*07/B*27 0.09 (21)
B*44 0.23 (114) B*07/ B*44 0.09 (23)
B*58 0.17 (86) B*07/ B*58 0.09 (22)
B*62 0.06 (30) B*07/ B*62 0.04 (10)
X 0.05 (24) B*07/ X 0.03 (7)
B*08/ B*27 0.02 (6)
B*08/ B*44 0.03 (7)
B*08/ B*58 0.02 (5)
B*08/ B*62 0.01 (3)
B*27/ B*27 0.04 (9)
B*27/ B*44 0.08 (20)
B*27/ B*58 0.03 (8)
B*27/ B*62 0.04 (9)
B*27/ X 0.01 (2)
Stellenbosch University http://scholar.sun.ac.za

P a g e | 97
B*44/ B*44 0.05 (12)
B*44/ B*58 0.13 (33)
B*44/ B*62 0.01 (3)
B*44/ X 0.02 (4)
B*58/ B*58 0.01 (3)
B*58/ B*62 0.02 (5)
B*58/ X 0.03 (7)
X/X 0.01 (2)
HLA-C
C1 0.45 (243) C1/C1 0.23 (62)
C2 0.32 (171) C1/C2 0.24 (65)
X 0.23 (122) C1/X 0.20 (54)
C2/C2 0.12 (32)
C2/X 0.16 (42)
X/X 0.05 (13) #X = Unclassified. †Only haplotypes with frequencies greater than 3% were considered and haplotypes were inferred.
Figure 38: Presence of Beijing strain in individuals according to number of disease episodes. Individuals with a Beijing strain of infection were more likely to have subsequent infections (P < 0.001). Of the
19 individuals who had 2 or more infections, one of which was Beijing, Beijing was the first infection in 6
individuals, and a subsequent infection in 13 individuals.
Stellenbosch University http://scholar.sun.ac.za

P a g e | 98
Table 25: Associations of HLA class-I genotypes with number of disease episodes.
HLA genotype Padj* OR [95% CI]
#
A*01 0.806
A*02 0.589
A*03 0.236
A*24 0.963
B*07 0.379
B*08 0.542
B*27 0.006 0.21 [0.03-0.68]
B*44 0.878
B*58 0.417
B*62 0.158
C1 0.701
C2 0.577 *P-value adjusted for age and sex. # Odds Ratio [95% Confidence Interval], the odds of having a one disease episode vs. more than one disease episode, for each extra HLA allele carried. Individuals with one disease episodes (n = 270) vs. individuals with more than one disease episode (n = 30).
5.3.2 Relationship between host and bacterial genotype in TB disease
All genotype distributions were in HWE.
The allele, genotype and haplotype distributions for HLA-A, -B and -C were significantly
associated with the genotype of the M. tuberculosis strain causing disease in the host. The
Beijing strain was significantly associated with each class of variation of the HLA class-I
genes, with the A*01, B*08 and C2 alleles increasing the odds of having disease with a
Beijing strain (Table 26) with ORs ranging between 1.58 and 2.32, while conversely, each
B*27 and C1 allele lowered the odds of having disease with a Beijing strain with ORs of 0.35
and 0.60, respectively. Disease with a Beijing strain was also influenced by HLA-B and -C
genotypes, as well as three class-I haplotypes (Table 27). However, due to the small sample
sizes and the resulting large CIs these results are imprecise.
TB caused by LAM genotype strains was found to be significantly associated with the A*03
allele (Table 26), where each additional allele increased the risk with an OR of 1.65. Two
HLA-A genotypes were also associated with a LAM infection (Table 27). For the LCC strain,
each B*44 allele increased the risk of disease with an OR of 2.07 whereas the presence of the
B*07 allele lowered the chances of disease with a LCC strain by OR of 0.49 (Table 26). The
Stellenbosch University http://scholar.sun.ac.za

P a g e | 99
odds of disease with a Quebec strain was increased by the presence of the B*58 allele with
OR of 2.69 (Table 26).
Table 26: Associations of HLA class-I alleles and M. tuberculosis lineages in the SAC
population of the Western Cape. HLA allele Strain Padj
* OR [95% CI]
#
A*01
LAM 0.163
Beijing 0.031 1.58 [1.04-2.40]
LCC 0.288
Quebec 0.676
Haarlem 0.780
HaarlemLike 0.419
CAS1 0.198
A*02
LAM 0.328
Beijing 0.391
LCC 0.846
Quebec 0.601
Haarlem 0.744
HaarlemLike 0.592
CAS1 0.023 Allele and strain did not occur together.
A*03
LAM 0.022 1.65 [1.08-2.54]
Beijing 0.068
LCC 0.906
Quebec 0.672
Haarlem 0.840
HaarlemLike 0.655
CAS1 0.489
A*24
LAM 0.355
Beijing 0.925
LCC 0.386
Quebec 0.558
Haarlem 0.459
HaarlemLike 0.024 Allele and strain did not occur together.
CAS1 0.401
B*07
LAM 0.861
Beijing 0.144
LCC 0.019 0.49 [0.25-0.89]
Quebec 0.668
Haarlem 0.293
HaarlemLike 0.312
CAS1 0.408
B*08
LAM 0.103
Beijing 0.045 2.32 [1.02-5.13]
LCC 0.772
Quebec 0.111
Stellenbosch University http://scholar.sun.ac.za

P a g e | 100
Haarlem 0.083
HaarlemLike 0.345
CAS1 0.326
B*27
LAM 0.606
Beijing 0.002 0.35 [0.16-0.68]
LCC 0.653
Quebec 0.546
Haarlem 0.504
HaarlemLike 0.272
CAS1 0.587
B*44
LAM 0.085
Beijing 0.238
LCC 0.007 2.07 [1.22-3.52]
Quebec 0.979
Haarlem 0.959
HaarlemLike 0.208
CAS1 0.779
B*58
LAM 0.098
Beijing 0.118
LCC 0.810
Quebec 0.009 2.69 [1.27-5.75]
Haarlem 0.282
HaarlemLike 0.540
CAS1 0.238
B*62
LAM 0.579
Beijing 0.597
LCC 0.776
Quebec 0.005 Allele and strain did not occur together.
Haarlem 0.488
HaarlemLike 0.205
CAS1 0.186
C1
LAM 0.247
Beijing 0.011 0.60 [0.40-0.89]
LCC 0.832
Quebec 0.295
Haarlem 0.515
HaarlemLike 0.351
CAS1 0.799
C2
LAM 0.085
Beijing <0.001 2.03 [1.35-3.08]
LCC 0.398
Quebec 0.899
Haarlem 0.521
HaarlemLike 0.681
CAS1 0.961
*P-value adjusted for age and sex. #Odds Ratio [95% Confidence Interval], the odds of having a specific lineage, versus any other lineage, for each extra HLA allele carried.
Stellenbosch University http://scholar.sun.ac.za

P a g e | 101
Table 27: Associations of HLA class-I genotypes and haplotypes with M. tuberculosis lineages in
the SAC population of the Western Cape.
Strain Padj for model
† HLA genotype/haplotype
associated with strain OR [95% CI]
¥
HLA-A HLA-B HLA-C Haplotype
LAM 0.036 0.134 0.019# 0.060
A*01/A*01$ 1
A*01/A*02 3.89 [1.37-11.04]
A*03/Undefined 6.33 [1.19-33.67]
Beijing 0.086 0.001 <0.001 <0.001
B*07/B*07$ 1
B*07/B*08 19.6
B*07/B*44 10.4
B*08/B*62 25.4
C1/C1$ 1
C1/C2 3.61 [1.39-9.33]
C2/C2 4.39 [1.49-12.97]
C2/Undefined 4.46 [1.62-12.29]
A*01-B*58-C1$ 1
A*01-B*08-C2 7.8 [1.2-50.0]
A*02-B*07-C2 8.3 [1.5-45.6]
A*01-B*44-Undefined 7.6 [1.2 50.30
LCC 0.812 0.125 0.137 0.715
Quebec 0.454 0.164 0.517 0.094
Haarlem 0.783 0.184 0.952 0.091
HaarlemLike 0.768 0.905 0.095 0.466
CAS1 0.734 0.874 0.643 0.696 †P-value adjusted for age and sex. ¥Odds Ratio [95% Confidence Interval], the odds of having a specific lineage and genotype or haplotype, versus any other lineage, compared to the reference genotype/haplotype (OR = 1). 95% CI could not be calculated for HLA-B genotypes due to their very low frequencies in patients whose infections were not Beijing. #No HLA-C genotypes ORs of having a LAM strain were significant when compared to the reference genotype. $Reference genotype – the most common (having the highest frequency, so assumed to be the wild type) genotype/haplotype in the study population.
As Beijing sub-lineage 7 is the most frequent sub-lineage in the Western Cape but not the rest
of South Africa, we tested whether this could be attributed to the HLAs in the human host.
We identified two significant associations; where the A*30:02 allele occurred only in
individuals with TB due to a Beijing sub-lineage 7 strain (P = 0.02) and is thus a potential
risk factor; and with A*02:02 having a protective role against disease with Beijing sub-
lineage 7 strain (P = 0.012, OR = 0.04 [95% CI: 0.0-0.51] (Table 28). However, it should be
noted that these Beijing sub-lineage 7 results are preliminary due to the small number of
individuals (53 individuals with a sub-lineage 7 infection and 19 individuals with a sub-
lineage 2-6 infection) that could be included in this analysis.
Stellenbosch University http://scholar.sun.ac.za

P a g e | 102
Table 28: Associations of HLA class-I alleles with Beijing sub-lineages in the SAC population of
the Western Cape.
HLA allele! Frequency
# Padj
† OR [95% CI]
¥
A*01 0.42 0.163
A*03 0.17 0.156
A*02 0.22 0.674
A*24 0.16 0.570
B*07 0.30 0.282
B*44 0.27 0.627
B*58 0.13 0.265
B*27 0.08 0.945
B*08 0.11 0.573
B*62 0.07 0.836
C1 0.35 0.436
C2 0.45 0.969
A*03:01 0.05 0.079
A*02:01 0.08 0.843
A*24:02 0.04 0.364
A*01:01 0.09 0.787
A*23:01 0.10 0.202
A*11:01 0.03 0.221 A*30:02 0.09 0.020 only occurred in individuals with Beijing sub-lineage 7
A*30:01 0.04 0.970
A*43:01 0.02 0.409
A*32:01 0.08 0.494
A*30:04 0.04 0.993
A*68:02 0.03 0.138
A*68:01 0.03 0.699
A*26:01 0.02 0.385
A*02:05 0.04 0.969
A*74:01 0.01 0.069
A*29:01 0.03 0.265
A*33:03 0.03 0.221
A*34:02 0.01 0.429 A*02:02 0.03 0.012 0.04 [0.00-0.51]
A*29:02 0.02 0.390
B*44:03 0.11 0.987
B*58:02 0.04 0.345
B*08:01 0.11 0.573
B*07:02 0.09 0.259
B*15:03 0.04 0.941
B*58:01 0.02 0.362
B*18:01 0.04 0.890
B*15:10 0.03 0.686
B*45:01 0.03 0.106
B*41:01 0.04 0.889
B*42:01 0.04 0.304
Cw*06:02 0.11 0.287
Cw*04:01 0.08 0.738
Stellenbosch University http://scholar.sun.ac.za

P a g e | 103
HLA allele! Frequency
# Padj
† OR [95% CI]
¥
Cw*07:01 0.17 0.940
Cw*17:01 0.10 0.432
Cw*07:02 0.11 0.353
Cw*02:10 0.09 0.510
Cw*03:04 0.02 0.210
Cw*16:01 0.08 0.054
Cw*18:01 0.04 0.088
Cw*07:04 0.03 0.236
Cw*02:02 0.02 0.196
Cw*08:01 0.04 0.879
!HLA supertypes and 4-digit alleles were investigated. #Frequency of alleles in individuals included in the Beijing sub-lineage analysis. †P-value adjust for age and sex. ¥ Odds Ratio [95% Confidence Interval], the odds of having sub-lineage 7, versus any other sub-lineage, for each extra HLA allele carried.
5.3.3 Relationship between M. tuberculosis phylogenetic lineages and HLA
class-I allele frequencies in specific geographical populations
Table 29 contains a summary of associations between MTBC lineages and HLA types in the
SAC population, as well as the bacterial “footprint” of these MTBC lineages in various
regions globally. M. tuberculosis strains in our study group were separated into Euro-
American or East-Asian, the two MTBC lineages most prevalent in the Western Cape. HLA
class-I allele frequencies of the ancestral populations were derived from AFND. In our SAC
sample set there were 199 individuals with Euro-American MTBC lineage only, 57 with East
Asian MTBC lineage only, 18 with both MTBC lineages and 26 with neither. Several
significant associations were identified, with the following alleles associated with both
MTBC lineages: A*23:01, B*14:01, B*14:02 and C*16:01 (Table 29). The A*23:01 and
C*16:01 alleles were found to be less prevalent in those individuals with a Euro-American
MTBC of infection while increasing the risk of having an infection caused by an East Asian
MTBC. However, the HLA allele frequencies in the white and East Asian human populations
do not correlate with this as these alleles were found to be more prevalent in white
populations than East Asian populations. The opposite effect was seen for the B*14:01 and
B*14:02 alleles, with all individuals carrying these alleles having a Euro-American MTBC.
Stellenbosch University http://scholar.sun.ac.za
P a g e | 104
In this instance, the HLA population data for B*14:02 was in line with this finding as the
allele occurs more frequently in white populations than East Asian populations.
Individuals with Euro-American MTBC infections were less likely to have the C*08:01 allele
and more likely to have the A*74:01 and B*58:02 alleles. At the population level, alleles
A*74:01 and B*58:02 occurred at the same frequency in both human populations whereas
allele C*08:01 was found at an extremely low frequency in the white population and at a very
high frequency in the East Asian population, providing an inconsistent correlation between
risk in the population of specific strains and frequency of HLA alleles.
Statistically significant associations with the East Asian MTBC only were seen for the
B*07:05 and B*35:01 alleles, with the former increasing the risk of having this strain and the
latter reducing the chance (to zero in this study). These findings largely concur with the
population data where the B*07:05 allele is found more frequently in East Asian populations
than white populations and the B*35:01 allele occurring more frequently in white populations
than East Asian populations.
Stellenbosch University http://scholar.sun.ac.za

P a g e | 105
Table 29: Associations between M. tuberculosis phylogenetic strains and HLA class-I alleles in geographic populations.
MTBC phylogenetic lineages Allele frequency per human population‡
HLA Allele Euro American East Asian
SAC* White East Asian
Padj† OR [95% CI]
# Padj
† OR [95% CI]
#
A*03:01 0.741 1.14 (0.54-2.56) 0.320 0.66 (0.25-1.47)
A*24:02 0.631 1.21 (0.58-2.79) 0.078 0.45 (0.15-1.08)
A*01:01 0.350 0.69 (0.32-1.53) 0.309 1.52 (0.67-3.29)
A*23:01 0.026 0.43 (0.20-0.90) 0.043 2.24 (1.03-4.84) 0.065 0.023 0.008
A*02:01 0.093 0.53 (0.25-1.12) 0.736 1.15 (0.50-2.44)
A*11:01 0.074 2.38 (0.93-8.07) 0.078 0.39 (0.09-1.10)
A*30:02 0.562 0.79 (0.36-1.84) 0.090 1.98 (0.89-4.32)
A*43:01 0.208 1.88 (0.72-5.91) 0.081 0.37 (0.08-1.12)
A*32:01 0.388 0.67 (0.28-1.69) 0.086 2.18 (0.89-5.14)
A*30:04 0.475 1.45 (0.54-4.59) 0.701 0.82 (0.26-2.17)
A*30:01 0.281 0.59 (0.23-1.58) 0.712 1.21 (0.41-3.16)
A*68:02 0.289 1.80 (0.63-6.54) 0.470 0.67 (0.18-1.91)
A*02:05 0.130 0.43 (0.15-1.29) 0.547 1.42 (0.42-4.14)
A*68:01 0.199 2.43 (0.66-16.13) 0.769 0.83 (0.19-2.57)
A*29:01 0.560 1.47 (0.43-6.77) 0.749 0.81 (0.18-2.72)
A*02:02 0.360 1.99 (0.49-13.49) 0.538 1.49 (0.38-5.00)
A*33:03 0.086 4.56 (0.83-86.93) 0.369 1.83 (0.46-6.39)
A*26:01 0.503 1.68 (0.40-11.63) 0.659 0.70 (0.10-2.97)
A*34:02 0.720 1.31 (0.35-8.54) 0.871 0.89 (0.14-3.30)
A*24:07 0.756 0.79 (0.19-4.01) 0.313 0.38 (0.02-2.16)
A*74:01 0.016 All are EuroAm 0.338 0.39 (0.02-2.31) 0.016 0.003 0.003
A*29:02 0.063 0.20 (0.03-1.09) 0.168 3.28 (0.58-18.60)
A*66:01 0.402 2.38 (0.36-48.04) 0.667 0.63 (0.03-4.12)
A*68:27 0.598 1.75 (0.27-35.28) 0.645 0.61 (0.03-4.02)
A*02:03 0.199 0.30 (0.04-1.93) 0.799 0.75 (0.04-5.35)
B*58:02 0.001 4.64 (1.73-16.48) 0.140 0.53 (0.20-1.21) 0.087 0.003 0.002
B*44:03 0.781 0.90 (0.43-1.99) 0.133 1.78 (0.83-3.67)
B*07:02 0.983 0.99 (0.47-2.27) 0.582 1.25 (0.55-2.66)
B*08:01 0.059 0.46 (0.21-1.03) 0.071 2.13 (0.94-4.72)
B*15:03 0.675 1.20 (0.52-3.12) 0.103 0.44 (0.12-1.16)
Stellenbosch University http://scholar.sun.ac.za
Stellenbosch University http://scholar.sun.ac.za

P a g e | 106
B*18:01 0.950 0.97 (0.39-2.79) 0.679 1.23 (0.43-3.07)
B*15:10 0.942 0.97 (0.40-2.79) 0.817 0.89 (0.27-2.22)
B*58:01 0.816 0.88 (0.33-2.76) 0.184 0.41 (0.06-1.44)
B*42:01 0.417 0.66 (0.24-1.90) 0.274 1.77 (0.61-4.81)
B*41:01 0.951 0.96 (0.31-3.65) 0.895 1.08 (0.29-3.36)
B*57:03 0.674 0.76 (0.23-2.97) 0.283 1.94 (0.56-6.16)
B*45:01 0.801 1.19 (0.33-5.64) 0.505 1.55 (0.39-5.24)
B*27:05 0.062 5.11 (0.93-98.32) 0.146 0.27 (0.01-1.46)
B*35:01 0.129 3.93 (0.72-75.44) 0.009 None are EastAsian 0.022 0.057 0.039
B*51:01 0.265 0.49 (0.14-1.78) 0.362 1.85 (0.46-6.52)
B*15:01 0.896 1.10 (0.30-5.23) 0.611 0.67 (0.10-2.75)
B*14:01 0.018 All are Euro-Am 0.019 None are EastAsian 0.018 0.005 0.008
B*52:01 0.670 1.42 (0.32-10.17) 0.306 0.37 (0.02-2.14)
B*53:01 0.708 1.35 (0.31-9.48) 0.859 0.87 (0.12-3.75)
B*07:05 0.051 0.23 (0.05-1.01) 0.020 5.66 (1.32-29.02) 0.016 0.003 0.009
B*14:02 0.024 All are Euro-Am 0.028 None are EastAsian 0.016 0.019 0.007
B*47:01 0.951 1.05 (0.26-6.54) 0.556 0.58 (0.03-2.85)
B*40:06 0.974 1.03 (0.21-7.53) 0.499 0.50 (0.03-3.08)
B*35:05 0.942 0.94 (0.19-6.94) 0.497 0.50 (0.03-3.07)
B*13:02 0.481 2.08 (0.32-41.72) 0.063 None are EastAsian
B*40:01 0.170 0.30 (0.05-1.74) 0.662 1.49 (0.20-8.08)
B*15:02 0.111 0.23 (0.03-1.44) 0.463 2.03 (0.26-12.75)
B*81:01 0.524 0.54 (0.09-4.31) 0.097 4.68 (0.74-37.04)
B*57:02 0.690 0.68 (0.11-5.49) 0.416 2.21 (0.28-14.25)
Cw*06:02 0.064 1.66 (0.97-2.98) 0.103 0.63 (0.34-1.09)
Cw*07:01 0.272 0.74 (0.44-1.27) 0.182 1.45 (0.84-2.46)
Cw*04:01 0.261 1.42 (0.78-2.74) 0.075 0.55 (0.26-1.06)
Cw*02:10 0.387 0.74 (0.39-1.48) 0.962 0.98 (0.47-1.95)
Cw*07:02 0.090 0.56 (0.29-1.10) 0.057 1.93 (0.98-3.76)
Cw*17:01 0.474 0.78 (0.40-1.57) 0.110 1.73 (0.88-3.33)
Cw*16:01 0.028 0.35 (0.14-0.89) 0.002 4.48 (1.78-11.69) 0.039 0.021 0.005
Cw*18:01 0.628 1.29 (0.48-4.14) 0.765 1.17 (0.40-3.03)
Cw*02:02 0.165 2.39 (0.72-11.15) 0.444 0.61 (0.14-2.00)
Cw*03:04 0.783 1.18 (0.39-4.40) 0.490 0.64 (0.14-2.10)
Stellenbosch University http://scholar.sun.ac.za
Stellenbosch University http://scholar.sun.ac.za

P a g e | 107
Cw*07:04 0.374 1.78 (0.53-8.30) 0.894 1.09 (0.29-3.36)
Cw*08:04 0.355 2.00 (0.50-13.60) 0.129 0.26 (0.01-1.39)
Cw*08:02 0.123 4.01 (0.73-76.98) 0.137 0.26 (0.01-1.43)
Cw*15:02 0.939 1.06 (0.28-5.16) 0.195 0.30 (0.02-1.68)
Cw*03:02 0.161 3.65 (0.65-71.76) 0.215 0.32 (0.02-1.75)
Cw*08:01 0.021 0.20 (0.04-0.78) 0.054 3.83 (0.97-16.10) 0.017 0.002 0.107
Cw*12:03 0.263 0.43 (0.10-1.94) 0.933 0.93 (0.13-4.27)
Cw*12:02 0.715 1.36 (0.29-9.96) 0.369 0.41 (0.02-2.42)
Cw*14:02 0.753 0.75 (0.14-5.66) 0.696 1.42 (0.19-7.58)
Cw*04:03 0.519 1.96 (0.30-39.41) 0.056 None are East Asian
Cw*03:03 0.498 2.03 (0.31-40.70) 0.564 0.55 (0.03-3.54) †P-value adjusted for age and sex. ‡Allele frequencies provided for significant associations only. #Odds Ratio [95% Confidence Interval], the odds of having a specific MTBC phylogenetic lineage, versus the other MTBC phylogenetic lineage.
*Frequency in the South African Coloured (SAC) population.
Stellenbosch University http://scholar.sun.ac.za
Stellenbosch University http://scholar.sun.ac.za

P a g e | 108
5.4 Discussion
We report for the first time a number of associations between human HLA class-I types and
specific M. tuberculosis strains. The role of the co-evolution of host and pathogen in disease
development has been difficult to study in humans, with most of the proof of concept to date
provided by studies of pathogen [55,394–396] and animal models [425,426]. We postulated a
natural experiment in co-evolution taking place in the Cape Town area, which has
experienced a multiplicity of human visitors and their mycobacterial strains over the past 350
years. The resident population is extremely diverse [320] with inputs from Khoisan, Bantu,
European and Asian people and could therefore be assumed to have HLA types from all these
ancestral populations. The M. tuberculosis strains present can be expected to have
experienced intense competition and as the incidence of TB is one of the highest in the world
(1005 per 100 000 in 2007 [43]), we were able to investigate correlations between bacterial
strain and HLA type in adequate numbers of patients. In this study we identified associations
between HLA class-I gene variants with certain strain genotypes; excluding Haarlem,
Haarlem-like and CAS1 strains, which occurred at very low frequencies within our study
cohort. The strongest associations were identified for disease with Beijing genotype strains,
which was found to be associated with several alleles, genotypes and haplotypes of the HLA
class-I genes in the SAC population. Specific allelic associations were also identified for the
LAM, LCC and Quebec genotype strains. We showed that the Beijing genotype strains
occurred more frequently in individuals with multiple disease episodes (P < 0.001) compared
to infections by non-Beijing genotype strains.
The B*27 supertype reduced the odds of having multiple disease episodes, as well as having a
Beijing strain. This supertype allele is found frequently in individuals who are able to control
their HIV infections without any antiretroviral treatment [427] and with slow disease
Stellenbosch University http://scholar.sun.ac.za

P a g e | 109
progression [428,429]. This is thought to be due to an increased CD8+ T cell response in
individuals with this allele and induction of the apoptotic pathway through the increased
presence of cytotoxic proteins [430–434]. The B*27 supertype has not previously been shown
to be associated with susceptibility to TB [360].
Even though CD4+ T cells (HLA class-II restricted) represent the predominant immune
response mechanism against M. tuberculosis infection [68], there is growing evidence that
suggests an important role for CD8+ T cells (HLA class-I restricted) in protection against M.
tuberculosis infection [295,316,435–438]. Studies in animals and humans have shown that M.
tuberculosis is capable of stimulating MHC class-I restricted CD8+ T cells and the
involvement of several different pathways for class-I presentation of mycobacterial antigens
via cross-presentation [294], where HLA class-I recognition of mycobacterial antigens
includes ESAT-6 (HLA-B*52), 19kDa lipoprotein (HLA-A*02:01) and Ag85B (HLA-
A*02:01) [436,439,440]. CD8+ T cells also have direct microbicidal activity and kill M.
tuberculosis through the expression of granulysin and perforin [318,441–443]. HLA class-I
alleles have been associated with leprosy susceptibility [155], providing further support for
the role of class-I genes in immunity against mycobacterial infections. It is however possible
that the strong LD between genes within the MHC complex [444] could mean that the
associations found here reflect the involvement of the class-II genes which remain to be
genotyped in this population.
To date, variants in the TLR2 [61], IRGM [445] and SLC11A1 (NRAMP1) [446] genes have
shown a correlation between human and bacterial genotype. Variants in SLC11A1 and TLR2
were found to be associated with an increased risk of having TB with a Beijing strain in
Asian populations, while in Ghana, the IRGM polymorphism was found to protect against
infections caused by the Euro-American lineage. The phenotype of TB disease may be
affected by the bacterial strain, as strains of the Euro-American lineage appear to be less
Stellenbosch University http://scholar.sun.ac.za

P a g e | 110
likely to cause extra-pulmonary disease [61], while strains of the Beijing and S genotypes
were associated with an increased risk of extra-thoracic disease [447]. In Vietnam, the relapse
rate was significantly increased in TB cases caused by Beijing strains, and this probably
contributes to the successful spread of this strain family [448]. It is therefore evident that the
outcome of exposure to M. tuberculosis depends on both the human and bacterial genotypes,
and Alter et al. [155] speculated that genetic heterogeneity in common infectious diseases
could be at least partially explained by the pathogen strain differences, and patient strain
types should therefore be incorporated into the analysis to overcome genetic heterogeneity.
Both MTBC lineages and HLA allele frequencies are found in specific geographical settings,
e.g. lineages of an East Asian origin occur more frequently in human populations from the
same region [55]. HLA allele frequencies are hugely dissimilar between different ethnic
groups, with certain alleles completely absent in some populations [319,389]. We therefore
investigated the frequencies of HLA class-I alleles associated with the Euro-American and
East Asian M. tuberculosis lineages, in their sympatric populations. We postulated that an
allele more frequent in individuals with a Euro-American strain would also occur more
frequently in white populations, whereas an allele that lowered the risk of having a Euro-
American strain-infection would occur at an extremely low frequency or be absent in white
populations. The same rationale would apply to East Asian M. tuberculosis strains and human
populations from East Asia. However, although results fitting the postulate were found in
several cases, there was no fit in an equivalent number. This could be explained by the use of
allele frequency averages across a number of populations listed in the databases. The
A*23:01 allele for example, occurs between allele frequencies of 0.075 in the Beijing Han
population (AFND), and 0.004 in the Shijiazhuang Tianjian Han, highlighting the enormous
discrepancies between allele frequencies in populations of the same geographical region.
Secondly, HLA genes are involved in several biological processes [296] and some may thus
Stellenbosch University http://scholar.sun.ac.za

P a g e | 111
be under balancing selective pressures [386] which could have led to the discrepant findings.
In spite of the limitations of this broad categorisation of populations, we did find several
cases where the predominant MTBC lineage and the HLA class-I allele frequency fitted the
hypothesis of the co-evolution of M. tuberculosis strains with the HLA class-I genes. We now
show that specific strains are associated with HLA types of the host, thus providing a
molecular genetic explanation for the previous observation by Gagneux et al., who correlated
M. tuberculosis strain lineages with geography [55].
The evolutionary forces on HLA have been extremely complex [386], including many
bacterial and viral infections. We could thus be seeing the remaining association due to co-
evolution with M. tuberculosis and/or other diseases with similar clinical pathologies.
Hershberg et al. has postulated an Out-of-and-back-to-Africa migration of MTBC which
coincided with the Out-of-Africa human migration pattern and the subsequent global human
exploration quests [152]. Considering this hypothesis, the bottleneck events which
accompanied the out-of-Africa migration, and the expansion of disease-causing variants
within the last 5 000 years [449], it is quite likely that co-evolution between MTBC and their
human hosts could have occurred.
In summary, this study highlights the role of HLA class-I molecules in infection with M.
tuberculosis strains and emphasizes the importance of considering both host and pathogen
genotype in understanding TB disease development and vaccine efficacy. Host-pathogen co-
evolution has significant biomedical and epidemiological implications and by identifying the
genes involved in this interaction, the adaptation mechanisms of host and pathogen can be
understood, as well as the limitations which they impose upon each other. It is also likely that
the complexity of HLA types within any given population and the possible balancing effects
of increased susceptibility to TB versus other pathogens or conditions, will prevent any
Stellenbosch University http://scholar.sun.ac.za

P a g e | 112
simple correlations being seen between the predominant HLA type in a population and the
strain of M. tuberculosis in that area.
Stellenbosch University http://scholar.sun.ac.za

Chapter 6: Population Genetics
Stellenbosch University http://scholar.sun.ac.za

P a g e | 113
6.1 Introduction
The HLA class-I and KIR genes reside on different chromosomes and probably represent the
most polymorphic loci in the human genome [450]. These genes are important in the host
immune response to disease (infectious, autoimmune, and cancers) and reproduction, two
biological processes essential for the maintenance of the human population [234,389]. These
loci are thus undergoing rapid evolution and balancing selection, as maintaining a variety of
class-I proteins may be critical for the long-term survival of the human population [391].
Some studies have also provided strong evidence for co-evolution between the HLA and
KIRs [451,452]. Approximately 7000 class-I alleles and more than 400 different KIR profiles
have been identified to date [228]. However, given that populations from different
geographical regions are under different selective pressures, the frequencies of these loci
(alleles and haplotypes) have been shown to differ between populations, with several studies
highlighting a correlation between KIR and HLA frequencies and ethnicity, migration routes
out of Africa, and relative population isolation [227,453,454].
South Africa is home to several population groups including African, white and mixed
ancestry giving rise to a highly cosmopolitan population, which is mainly due to its
geographical position and turbulent history [455]. The African population comprises several
groups including the Pedi, Tswana, Xhosa, Zulu and the Khoisan, with the latter group
believed to be the indigenous people of the country [456–458]. The white South African
population is descended from several European countries (Britain, France, Germany and The
Netherlands) as a result of the initial colonization of the Cape Town area by the Dutch East
India Company (VOC) in 1652 [455]. White South Africans today are broadly grouped
according to language (English or Afrikaans). The two admixed populations of South Africa
include the Indian and the SAC populations. The South African Indian population is thought
Stellenbosch University http://scholar.sun.ac.za

P a g e | 114
to be a hybrid population from various regions of the Indian subcontinent [459], whereas the
SAC represents a population with a unique genetic composition with influences from
African, Asian and European populations [320,321,459–461].
The SAC population is thought to stem from the indigenous Khoisan who occupied the Cape
of Good Hope at the time of colonization by the VOC, which resulted in the introduction of
not only the European settlers but also political exiles from Indonesia and Malaysia, and
slaves from the Indian subcontinent, Madagascar, Indonesia and other areas along the African
East coast [455,459,462]. The Cape thus served as a melting pot of individuals from various
continents, and given the acceptance of mixed marriages in early Cape society, often between
European men and women who were either Khoisan, freed slaves or of mixed parentage and
between Khoisan and slaves, this resulted in the SAC population of today. In the Western
Cape Province, the Coloured population accounts for 48.8.1% of the population according to
the South African National Census data of 2011, and 8.9% of the national population
(http://www.statssa.gov.za). Furthermore, the SAC population of the Western Cape is
predominantly Afrikaans speaking (35.7%), while in the Ravensmead/Uitsig suburbs (our
study site), 90.1% of the self-identified Coloured individuals are Afrikaans-speaking. It is
also important to note that the SAC population as denoted in this study do not include the
Cape Malays (Muslims), a minority population group (10.3% of the Western Cape
population) believed to be genetically distinct and that has not been incorporated into the core
structure of the SAC people [459].
Understanding the evolutionary history and genetic underpinnings of human populations,
specifically admixed populations, affords us the opportunity to better understand patterns of
variation across distinct global populations and to identify specific disease-causing genes. A
previous study using the frequencies of HLA class-II alleles highlighted the genetic diversity
between the various South African population groups [319], and a genome-wide investigation
Stellenbosch University http://scholar.sun.ac.za

P a g e | 115
showed that the genetic composition of the SAC population is predominantly Khoisan (32% -
43%), Bantu-speaking African (20% - 36%), and European (21% - 28%), with a smaller
Asian contribution (9% - 11%) [320]. This has been predominantly confirmed in a study done
by Chimusa et al., who used additional publically available data sets to determine the best
ancestral populations for the SAC population [321]. As previously described, the HLA class-I
alleles and KIR gene frequencies show huge variation across distinct global population
groups [389], and in some instances have been used to classify populations. This, together
with differences in disease susceptibility, drug-, and vaccine efficacy between individuals of
different ethnicities, highlights the importance of understanding the genetic profiles of
distinct populations.
In this study we use the KIR gene and HLA class-I allele frequencies of the various SA
population groups to understand the genetic relationships between these groups, and their
influence on susceptibility to TB in the SAC population.
6.2 Materials and Methods
6.2.1 Study Populations
6.2.1.1 South African Coloured
For a description of the study population refer to section 4.2.1.
Four-hundred and forty-three healthy controls from the Ravensmead/Uitsig suburbs were
included in this study.
6.2.1.2 Khoisan
The Khoisan individuals in this study belong to a ‡Khomani San community from the
Upington and Andriesvale regions of the Northern Cape. In a previous study by Chimusa et
al. to identify the best Khoisan (‡Khomani, Ju|'hoan, Bushman, or SAN) proxy ancestral
Stellenbosch University http://scholar.sun.ac.za

P a g e | 116
population for the SAC, the ‡Khomani San were shown to be the best fit [321]. DNA samples
were collected from 75 ‡Khomani San individuals (2011 to 2012, in collaboration with Dr.
Brenna M. Henn, Stanford University) with written informed consent and approval from the
Health Research Ethics Committee of Stellenbosch University, project registration number
N11/07/210. From this sample set, 61 Khoisan individuals with HLA class-I allele data were
included in this study.
6.2.1.3 South African: Black and White
HLA class-I data for the Black and White South African population groups was provided by
Maria Paximadis, NHLS and the University of Witwatersrand, and described in Paximadis et
al. 2012 [463]. Briefly, 302 unrelated individuals (200 Black South African and 102 White
South African) were randomly selected from the ESKOM cohort, representing a cross-section
of the Black (Ndebele, Pedi, South Sotho, Swati, Tsonga, Tswana, Venda, Xhosa, and Zulu)
and White (Afrikaans and English) subgroups of the South African population. Individuals
were recruited countrywide at ESKOM working sites.
6.2.1.4 South African populations from allelefrequencies.net database
Allelefrequencies.net is an online database for allele frequencies of immune related genes in
different populations [228], predominantly focussing on the KIR and HLA genes. See Table
30 for a list of South African populations for which allele frequencies were derived from this
database.
Table 30: HLA class-I and KIR frequency data for South African population groups from the
allelefrequencies.net online database. [228]
Population Loci typed Sample size Method Reference
Natal Tamil A, B, C 51 SSOP MG Hammond. Proceedings of the 13
th
International Histocompatibility Workshop, 2006
San KIRs 91 SSOP Derek Middleton 2006
Xhosa KIRs 50 SSOP Williams et al., 2004. Human Immunology 65:1084-85
SSOP – sequence specific oligonucleotide polymerization
Stellenbosch University http://scholar.sun.ac.za

P a g e | 117
6.2.2 HLA and KIR typing
6.2.2.1 South African Coloured
For a description of the KIR and HLA typing methods employed in the SAC population refer
to sections 4.2.3 and 4.2.4 respectively.
6.2.2.2 Khoisan
DNA was collected from saliva samples using Oragene® kits, following the manufacturer‟s
instructions.
For the class-I alleles, calling was done using bead-based sequence specific oligonucleotide
probe hybridization [464] and whole-exome sequencing data. Briefly, library preparation and
exome enrichment was done as described in the Agilent SureSelectXT
Target Enrichment
System (Agilent, Santa Clara, USA) for Illumina Paired-End Sequencing Library, version
1.1.1, January 2011. QC analysis of the sequencing libraries was done using the Bioanlyzer
High Sensitivity DNA Kit (Agilent). Samples were then sequenced using the Illumina
HiSeq2000 platform (Illumina) using standard protocols. The read-pairs generated were
mapped to the HG19 reference build, chr6:28702021-33392022, and extracted using
SAMtools 0.1.18 [465] and split into separate fastq files for each individual. Bowtie (version
0.12.7) [466] was used to pull read-pairs with low-stringency to a given HLA locus (positive
filter), and pairs that mapped to any pseudo- or homologous gene were also removed
(positive filter). Reads that passed these filters were then aligned to a final reference
sequence, ImmunoPolymorphism Database [467], and SNP calling was done using
SAMtools/bcf. HLA class-I alleles were called based on the variation of exons 2 and 3 of
each gene, and to account for the high divergence of these exons, final alignments were made
to reference sequences matching individuals‟ class-I types. To attribute phase for the local
alignments the –phase function of SAMtools was used; this was done due to the close
proximity and/or presence of highly heterozygous sequences. To confirm individual SNP
Stellenbosch University http://scholar.sun.ac.za

P a g e | 118
genotypes we used the independent alignments of filtered reads from MIRA 3 [468]. Finally,
new variants were confirmed for sequence and phase using Sanger sequencing and one or
more of the following: pyrosequencing, DNA cloning or segregation in families.
6.2.2.3 South African: Black and White
To type the HLA class-I alleles in these South African populations two methods were
employed as described in Paximadis et al. [463]. Briefly, HLA-A and -B were typed using
the Applied Biosystems SBT kits on the ABI PRISM 3100 GENETIC ANALYZER (Applied
Biosystems). A 2-kB PCR amplicon was generated (exons 1-5) and subjected to direct
sequencing of exons 2-4. Allele calling was done using the MatchMaker Allele Identification
Software (Applied Biosystems).
High-resolution typing of the HLA-C alleles was done using the PEL-FREEZ SSP UniTray
PCR-based method (DYNAL Invitrogen Corporation) and the SBTexcellerator HLA-C Core
kit (Qiagen, Hilden, Germany). As with HLA-A and -B direct sequencing of exons 2-4 was
done to determine the class-I alleles.
6.2.2.4 South African populations from allelefrequencies.net database
For method used to type KIR and HLAs see Table 30.
6.2.3 Data Analysis
6.2.3.1 Allele and genotype frequencies across South African populations
Allele frequencies for the SAC and Khoisan populations were determined by direct counting.
We used this approach due to the limitation of current computer programs requiring allele
calls for all loci typed, where individuals missing alleles at one locus will be removed from
the sample set when determining the allelic frequencies of the population. The frequencies of
two- and three-locus haplotypes were estimated using the expectation maximization (EM)
algorithm [469,470] as employed in PyPop version 0.70 software program [471]. Allele and
Stellenbosch University http://scholar.sun.ac.za

P a g e | 119
haplotype frequencies for the South African black and white populations were obtained from
Paximadis et al. [463] and the Natal Tamil population from AFND [228].
Tests for HWE, LD and neutrality were done in PyPop version 0.70 [471]. Deviations from
HW proportions were tested using an exact Monte-Carlo Markov chain test [472]. Overall
LD measures were estimated using two approaches, the D‟ [473] and Wn [474]statistics,
where D‟ weights the contribution to LD of specific allele pairs by the product of their allele
frequencies (D‟ij = Dij / Dmax) and Wn (Cramer‟s V Statistic) is a re-expression of the Chi-
square statistic, XLD2, normalized to be between 0 and 1. A P-value < 0.05 represents
significant overall LD. For neutrality, the Ewens-Watterson homozygosity test [475,476]
with Slatkin‟s Monte-Carlo implementation [477,478] was done for each locus, where the
normalized deviate of homozygosity (Fnd) is the difference between the observed and
expected homozygosity divided by the square root of the variance of the expected
homozygosity. A significant (P < 0.05) negative Fnd implies balancing selection whereas a
significant positive Fnd implies directional selection.
6.2.3.2 Genetic relationships between South African populations
Principal Coordinate (PCO) plots were constructed using the Multi-Variate Statistical
Package (MVSP) version 3 (Kovach Computing Services; http://www.kovcomp.co.uk/mvsp)
to understand the genetic relationships between the South African populations with regards to
their HLA class-I composition. PCO analysis is a more general form of principal component
analysis (PCA) and is able to use a variety of different measures of distance/similarity. PCO
is also better for analysis where there are more variables than cases, as in this case, and where
PCA is not recommended. The PCO is calculated as a Q-mode eigenanalysis and gives
eigenvectors but not scores. We used Euclidean distance (Ed),
Edij = √∑ ,
Stellenbosch University http://scholar.sun.ac.za

P a g e | 120
to measure the relation between populations, where i and j represent two rows (cases) of the
data matrix, k represents the column (variable), and n equals the total number of variables.
Important to note, a PCO of Ed will give the same result as a Q-mode PCA.
6.2.3.3 Contributions of MHC and LRC from ancestral populations to the SAC
6.2.3.3.1 Population Structure
DNA samples from the SAC and Khoisan individuals were genotyped using the Illumina
OmniExpress (700K) platform (Illumina, San Diego, USA). SNPs with a missing threshold
of 5% and a MAF of 0.5% were removed from the dataset. SNP data for additional
populations were obtained from public data sources: The International HapMap Project [479]
and the Human Genome Diversity Project (HGDP) [480]. Populations selected from these
public data repositories represented putative ancestral populations (Table 31) for the SAC
population from four major population groups: European, non-Khoisan African, Khoisan, and
Asian.
Table 31: Putative ancestral populations to determine the Structure of the South African
Coloured (SAC) and Khoisan (SAN) populations.
Population Description n Source
French European 28 HGDP
Pathan Iranian ethnic group belonging to Afghanistan and Pakistan 22 HGDP
Cambodian Southeast Asian 10 HGDP
Mozabite Northern Africa (Berber ethnic group) 29 HGDP
Bantu_S African Bantu 8 HGDP
BantuKenya African Bantu 10 HGDP
Maasai Bantu from Kinyawe, Kenya 30 HapMap
Hadza 17
Sandawe 23
San African San 6 HGDP
San_NB_Schuster Namibian San 12 Schuster
SAN South African San 35 Henn
To determine the genetic contributions to the SAC and SAN populations we used
STRUCTURE [481,482]. SNPs were selected that were at least 1 MB apart and LD as
detected in unrelated individuals was taken into account. Admixture proportions for the SAC
Stellenbosch University http://scholar.sun.ac.za

P a g e | 121
and SAN individuals was estimated by 50 independent runs in 6 groups of unrelated
individuals for each K between 1 and 10. K, the number of populations, was estimated as the
number of populations that maximized the probability of the data, and minimized the
variance in this probability over successive runs [481].
6.2.3.3.2 Local Ancestry in adMixed Populations (LAMP-LD)
To infer the locus-specific ancestry of the MHC and LRC regions in the SAC population we
used the LAMP-LD software package (http://lamp.icsi.berkeley.edu/lamp/lampld/) [483],
which employs a hierarchal Hidden Markov Chain Model. Using the genotypes of admixed
individuals (SAC) and reference haplotype panels of ancestral populations, LAMP-LD
estimates the number of alleles from each ancestry at each locus for each individual.
We used three “mixing” populations: European (French), Bantu, and Khoisan (with ≥ 75%
San ancestry) to determine the allelic contribution to the MHC and LRC regions in the SAC
population.
6.3 Results
6.3.1 HLA class-I allele frequencies across South African populations The allele frequencies of HLA-A, -B and -C observed in the fourteen SA populations are
listed in Tables 32 to 34, respectively. In all instances the SAC population showed the
greatest diversity with regards to number of alleles present (A = 41, B = 67, C = 28),
followed by the Khoisan population for HLA-A (30) and -B (31) and the English for HLA-C
(22). In total, 53 HLA-A, 83 HLA-B, and 47 HLA-C alleles were observed across the SA
populations, with the SAC population carrying 77%, 81% and 60% of these alleles,
respectively. In tables 32 to 34, highlighted frequencies denote alleles that occurred in only
one SA population, while those frequencies in bold are alleles that occur only in the SAC and
one other SA population.
Stellenbosch University http://scholar.sun.ac.za

P a g e | 122
The A*02:01 allele was the most common allele in the white population occurring in 26% of
both English and Afrikaans individuals. This allele was also one of the most common alleles
in the SAC population, present in approximately 8% of the population. While this allele
occurred at a high frequency (f = 0.071 – 0.119, avg. f = 0.083) in several black populations
(Xhosa, Swati, South Sotho, Ndebele and Venda), it was not among the top 3 alleles
occurring in the SA black, Khoisan and Natal Tamil populations. The A*01:01 allele also
occurred in approximately 8% of the SAC population, the highest frequency of any of the
HLA-A alleles in the SACs, and was also the second most common allele in the white and
Natal Tamil populations, occurring at very high frequencies of 0.20 and 0.17, respectively.
This allele was absent from most black populations, and present in only 2 (f = 0.016) Khoisan
and 8 black (f = 0.02) individuals. For the Khoisan population, A*23:01 was the most
common allele present in 13% of the population, followed by A*03:01 in 11% of the
population. The A*23:01 allele was also found to be the most common allele in several black
populations, with frequencies ranging between 0.095 and 0.20, but occurred at low
frequencies in the white population (f = 0.015) and was absent in the Natal Tamil population.
The A*03:01 allele on the other hand was absent in most black populations and common in
the white (f = 0.120) and SAC (f = 0.07) populations. For the SA black populations, the most
common alleles were A*30:01 (f = 0.106) and A*30:02 (f = 0.101). These alleles were found
at moderate frequencies in the SAC and Khoisan populations, but low frequencies in the
white populations, with A*30:01 absent in Afrikaans individuals and A*30:02 absent in
English individuals. For the Natal Tamils, the most frequent allele was A*11:01 (f = 0.180),
which was moderate to common in the white (f = 0.06) and SAC (f = 0.05) populations.
For HLA-B, the most common alleles for the white population were B*07:02 (f = 0.149) and
B*08:01 (f = 0.133). The B*07:02 allele was also the most common allele in the Khoisan
population (f = 0.115), occurring at modest frequency in the SAC (f = 0.054) and black (f =
Stellenbosch University http://scholar.sun.ac.za

P a g e | 123
0.046) population and absent in the Natal Tamils. The B*08:01 allele occurred at frequencies
of 0.059 (SAC), 0.064 (black) and 0.071 (Natal Tamil) and was absent in the Khoisan
population. For the SAC, the most common allele was B*44:03 (f = 0.090), an allele common
in the white (f = 0.072), Khoisan (f = 0.098), black (f = 0.059) and Natal Tamil (f = 0.051)
populations. The two most common alleles in the SA black populations were B*58:02 (f =
0.094) and B*42:01 (f = 0.089), with both alleles absent in the Natal Tamils, occurring at a
very low frequency (fB*58:02 = 0.005) or absent (fB*42:01 = NP) in SA whites, and at low to
moderate frequencies in the SAC (fB*58:02 = 0.056, fB*42:01 = 0.021) and Khoisan (fB*58:02 =
0.082, fB*42:01 = 0.025) populations. In Natal Tamils, the two most common alleles were
B*40:06 (f = 0.143) and B*57:01 (f = 0.102), where B*40:06 was only present in the
Afrikaans (f = 0.011) and SAC (f = 0.020) populations and B*57:01 in the white (f = 0.041)
and SAC (f = 0.021) at moderate frequency and very rare in the Khoisan population (f =
0.008).
HLA-C showed much less differentiation between the SA populations in terms of allele
frequencies. C*04:01 occurred at a very high frequency in the white (f = 0.088), Coloured (f
= 0.131), Khoisan (f = 0.262), and black (f = 0.119) populations and at a moderate frequency
in the Natal Tamils (f = 0.042). The C*06:02 allele occurred at a very high frequency in all
SA populations and was the most common allele in the SAC (f = 0.167), blacks (f = 0.149)
and the Natal Tamils (f = 0.177). Finally, C*07:01 (f = 0.172) and C*07:02 (f = 0.137) were
the two most common alleles in the SA white population, and occurred at moderate to high
frequency (f = 0.058 to 0.135) in all other SA populations.
Analysis of the HLA class-I data showed that the SAC and SAN populations are in HWE
except for HLA-B (HWE = 0.0075) in the SAC and HLA-A in the SAN (HWE = 0.0059)
(Table 35). Furthermore, the homozygosity test showed that the HLA class-I molecules are
Stellenbosch University http://scholar.sun.ac.za

P a g e | 124
undergoing statistically significant balancing selection in the SAC but not the SAN (Table
35).
Stellenbosch University http://scholar.sun.ac.za

P a g e | 125
Table 32: HLA-A allele frequencies in South African populations.
HLA-A
Frequency
Afr
ikaa
ns
2n
= 1
00
Engl
ish
2
n =
10
0
Wh
ite#
2n
= 2
00
Co
lou
red
2n
= 7
28
Kh
ois
an
2n
= 1
22
Zulu
2
n =
84
Xh
osa
2n
= 7
0
Tso
nga
2
n =
10
Swat
i 2
n =
36
Sou
th S
oth
o
2n
= 3
8
Nd
eb
ele
2
n =
26
Pe
di
2n
= 4
8
Ve
nd
a 2
n =
42
Tsw
ana
2n
= 4
4
Bla
ck*
2n
= 3
98
Nat
al T
amil
2n
= 1
02
01:01 0.160 0.240 0.200 0.078 0.016 0.048 0.014
0.028 0.053
0.020 0.170
01:03
0.021
0.003
01:23
0.011
02:01 0.260 0.260 0.260 0.078 0.025 0.083 0.071 0.100 0.111 0.105 0.115 0.063 0.119 0.023 0.083 0.010
02:02 0.010 0.010 0.010 0.018 0.049 0.012 0.014
0.053
0.021 0.071 0.023 0.023
02:03
0.010
0.010
02:05
0.010 0.010 0.022 0.041 0.060 0.057 0.100 0.139 0.026 0.115 0.146 0.024
0.068
02:06
0.004
02:10
0.020
02:11
0.010
0.130
02:14
0.005
0.023 0.003
02:17 0.010
0.010
02:25
0.008
03:01 0.170 0.070 0.120 0.070 0.107 0.083 0.043
0.028
0.028 0.040
03:02
0.010
11:01 0.060 0.060 0.060 0.052 0.008
0.014
0.038
0.023 0.008 0.180
11:12 0.010
0.010
0.028
0.003
23:01 0.020 0.010 0.015 0.062 0.131 0.095 0.043 0.200
0.053 0.154 0.083 0.071 0.136 0.080
24:02 0.060 0.080 0.070 0.077 0.016 0.036 0.029
0.028
0.021 0.024
0.020 0.160
24:03
0.001
24:07
0.010 0.010 0.007 0.008
0.010
24:10
0.001
Stellenbosch University http://scholar.sun.ac.za
Stellenbosch University http://scholar.sun.ac.za

P a g e | 126
HLA-A
Frequency
Afr
ikaa
ns
2n
= 1
00
Engl
ish
2
n =
10
0
Wh
ite#
2n
= 2
00
Co
lou
red
2n
= 7
28
Kh
ois
an
2n
= 1
22
Zulu
2
n =
84
Xh
osa
2n
= 7
0
Tso
nga
2
n =
10
Swat
i 2
n =
36
Sou
th S
oth
o
2n
= 3
8
Nd
eb
ele
2
n =
26
Pe
di
2n
= 4
8
Ve
nd
a 2
n =
42
Tsw
ana
2n
= 4
4
Bla
ck*
2n
= 3
98
Nat
al T
amil
2n
= 1
02
24:17
0.003
24:88
0.008
25:01 0.010
0.010 0.008
26:01 0.040 0.010 0.025 0.036 0.041
0.056
0.023 0.008 0.020
26:02
0.008
26:12
0.004
26:31
0.008
29:01
0.022 0.049
0.100 0.028
0.010
29:02 0.050 0.070 0.060 0.019
0.036 0.071 0.100 0.028 0.026
0.125 0.095 0.091 0.063
29:11
0.001
0.024 0.029 0.200
0.026 0.038 0.021
0.023 0.025
30:01
0.030 0.015 0.048 0.033 0.095 0.129
0.111 0.105 0.115 0.125 0.095 0.091 0.106 0.010
30:02 0.010
0.010 0.052 0.033 0.095 0.043 0.100 0.056 0.053 0.154 0.125 0.238 0.091 0.101
30:04 0.020 0.030 0.025 0.034 0.033
0.014
0.053 0.038 0.021
0.045 0.018
30:10
0.012 0.014
0.139 0.053 0.038 0.042 0.024 0.045 0.038
31:01 0.030
0.015 0.011
0.012
0.003 0.070
31:06
0.008
32:01
0.060 0.030 0.036 0.074
0.043
0.053
0.013 0.010
33:01 0.020
0.010 0.005 0.016
0.021
0.003
33:03 0.010
0.010 0.022
0.012 0.014
0.079 0.038
0.024
0.018 0.070
34:01
0.003 0.008
34:02
0.040 0.020 0.023 0.025 0.036 0.057
0.053 0.077 0.021 0.024 0.023 0.035
36:01
0.003 0.008
0.028
0.021
0.045 0.010
Stellenbosch University http://scholar.sun.ac.za
Stellenbosch University http://scholar.sun.ac.za

P a g e | 127
HLA-A
Frequency
Afr
ikaa
ns
2n
= 1
00
Engl
ish
2
n =
10
0
Wh
ite#
2n
= 2
00
Co
lou
red
2n
= 7
28
Kh
ois
an
2n
= 1
22
Zulu
2
n =
84
Xh
osa
2n
= 7
0
Tso
nga
2
n =
10
Swat
i 2
n =
36
Sou
th S
oth
o
2n
= 3
8
Nd
eb
ele
2
n =
26
Pe
di
2n
= 4
8
Ve
nd
a 2
n =
42
Tsw
ana
2n
= 4
4
Bla
ck*
2n
= 3
98
Nat
al T
amil
2n
= 1
02
43:01
0.037 0.066 0.012 0.029
0.028 0.026
0.063 0.048 0.091 0.035
66:01
0.012 0.008
0.028
0.038 0.021
0.008
66:02
0.012
0.028
0.010
68:01 0.020 0.010 0.015 0.033 0.016 0.012 0.057
0.028 0.026 0.038
0.024 0.091 0.033 0.080
68:02 0.020
0.010 0.034 0.098 0.143 0.129
0.056 0.079
0.021 0.095 0.068 0.085
68:27
0.005 0.025 0.012 0.014
0.010
69:01 0.010
0.005 0.001
74:01
0.034 0.025 0.060 0.071 0.100 0.028 0.079
0.021
0.045 0.045
80:01
0.004
0.012
0.024
0.010
Alleles‡ 20 16 25 41 30 22 22 8 19 18 13 19 15 18 33 16 #Combined allele frequency for the Afrikaans and English populations. *Combined allele frequency for the Zulu, Xhosa, Tsonga, Swati, South Sotho, Ndebele, Pedi, Venda and Tswana populations. ‡Total number of alleles in the population. Highlighted allele frequencies denote alleles that are present in only one SA population, while allele frequencies in bold are present in two SA population groups.
Stellenbosch University http://scholar.sun.ac.za
Stellenbosch University http://scholar.sun.ac.za

P a g e | 128
Table 33: HLA-B allele frequencies in South African populations.
HLA-B
Frequency
Afr
ikaa
ns
2n
= 9
6
Engl
ish
2
n =
10
0
Wh
ite#
2n
= 1
96
Co
lou
red
2
n =
66
4
Kh
ois
an
2n
= 1
22
Zulu
2
n =
80
Xh
osa
2n
= 6
8
Tso
nga
2
n =
10
Swat
i
2n
= 3
6
Sou
th S
oth
o
2n
= 3
8
Nd
eb
ele
2
n =
25
Pe
di
2n
= 5
0
Ve
nd
a 2
n =
42
Tsw
ana
2n
= 4
4
Bla
ck*
2n
= 3
93
Nat
al T
amil
2n
= 1
02
07:02 0.147 0.150 0.149 0.054 0.115 0.063 0.015
0.083 0.053 0.040 0.040 0.071 0.023 0.046
07:05
0.018 0.082
0.041
07:06
0.010 0.005
0.025 0.015 0.100
0.026
0.023 0.015
08:01 0.105 0.160 0.133 0.059
0.113 0.044 0.200 0.083 0.053 0.040 0.020 0.071 0.023 0.064 0.071
13:01
0.002 0.008
0.061
13:02
0.020 0.010 0.023 0.008 0.013 0.015 0.200
0.040 0.040
0.023 0.020
13:03
0.006 0.041
14:01
0.010 0.005 0.017 0.033
0.029
0.026
0.040
0.045 0.018
14:02 0.042
0.021 0.014 0.033 0.025 0.015
0.048 0.023 0.015
14:03
0.002
15:01 0.095 0.080 0.087 0.014 0.008
0.020
0.023 0.005
15:02
0.010 0.005 0.018
0.031
15:03 0.011
0.005 0.048 0.082 0.100 0.044 0.100 0.083 0.026
0.140 0.095 0.136 0.084
15:05
0.002
0.020
15:08
0.003
15:10 0.011
0.005 0.035 0.098 0.100 0.088
0.056 0.105 0.120 0.040 0.048 0.091 0.079
15:13
0.010 0.005 0.009
15:16 0.011
0.005 0.005
0.013 0.029
0.053 0.040 0.020 0.024
0.020
15:17
0.020 0.010 0.002
0.031
15:18
0.041
15:21
0.008 0.008
15:24 0.011
0.005
Stellenbosch University http://scholar.sun.ac.za
Stellenbosch University http://scholar.sun.ac.za

P a g e | 129
HLA-B
Frequency
Afr
ikaa
ns
2n
= 9
6
Engl
ish
2
n =
10
0
Wh
ite#
2n
= 1
96
Co
lou
red
2
n =
66
4
Kh
ois
an
2n
= 1
22
Zulu
2
n =
80
Xh
osa
2n
= 6
8
Tso
nga
2
n =
10
Swat
i
2n
= 3
6
Sou
th S
oth
o
2n
= 3
8
Nd
eb
ele
2
n =
25
Pe
di
2n
= 5
0
Ve
nd
a 2
n =
42
Tsw
ana
2n
= 4
4
Bla
ck*
2n
= 3
93
Nat
al T
amil
2n
= 1
02
15:25
0.010
15:29
0.002
15:38
0.002
18:01 0.074 0.030 0.051 0.041 0.025 0.038 0.015 0.100 0.056 0.053
0.020 0.048
0.031 0.031
18:02
0.002
27:01
0.016
27:02 0.011
0.005
27:03
0.008
27:04
0.002
27:05 0.042 0.040 0.041 0.015
0.010
27:06
0.003
35:01 0.084 0.040 0.062 0.029 0.057 0.025 0.015
0.028 0.026
0.024 0.023 0.018 0.020
35:02
0.002
35:03
0.018
0.071
35:05
0.010 0.005 0.014
35:08 0.011 0.010 0.010 0.003
37:01 0.011 0.010 0.010 0.009
0.020
38:01 0.011 0.020 0.015 0.006 0.008
38:02
0.006
39:01
0.011
39:06
0.002
39:10
0.005
0.038 0.029
0.026 0.080 0.020 0.024
0.025
39:24
0.002
Stellenbosch University http://scholar.sun.ac.za
Stellenbosch University http://scholar.sun.ac.za

P a g e | 130
HLA-B
Frequency
Afr
ikaa
ns
2n
= 9
6
Engl
ish
2
n =
10
0
Wh
ite#
2n
= 1
96
Co
lou
red
2
n =
66
4
Kh
ois
an
2n
= 1
22
Zulu
2
n =
80
Xh
osa
2n
= 6
8
Tso
nga
2
n =
10
Swat
i
2n
= 3
6
Sou
th S
oth
o
2n
= 3
8
Nd
eb
ele
2
n =
25
Pe
di
2n
= 5
0
Ve
nd
a 2
n =
42
Tsw
ana
2n
= 4
4
Bla
ck*
2n
= 3
93
Nat
al T
amil
2n
= 1
02
40:01 0.021 0.020 0.021 0.018 0.008 0.013
0.003
40:02 0.011 0.010 0.010 0.005
40:04
0.008
40:06 0.011
0.005 0.020
0.143
41:01
0.010 0.005 0.032 0.033 0.013 0.015
0.040 0.040
0.023 0.015
41:02
0.011 0.008
42:01
0.021 0.025 0.088 0.118 0.100 0.111 0.053 0.080 0.060 0.119 0.068 0.089
42:02
0.023
0.013 0.015
0.026
0.024 0.045 0.015
42:06
0.040
0.003
44:02 0.042 0.070 0.056 0.017
44:03 0.053 0.090 0.072 0.090 0.098 0.038 0.044
0.028 0.053 0.080 0.120 0.048 0.091 0.059 0.051
44:04 0.011
0.005
44:05 0.011 0.010 0.010 0.003
44:07
0.010
44:27 0.011
0.005
45:01
0.010 0.005 0.026
0.013 0.044 0.100 0.028 0.132 0.040 0.080 0.143 0.068 0.064
45:07
0.013 0.015
0.005
47:01
0.023 0.008
48:01
0.005
49:01 0.011
0.005 0.005
0.013
0.026
0.023 0.008
50:01
0.010 0.005 0.005
0.010
51:01 0.063 0.030 0.046 0.021 0.008
0.056
0.080
0.010 0.092
51:06
0.002
0.020
Stellenbosch University http://scholar.sun.ac.za
Stellenbosch University http://scholar.sun.ac.za

P a g e | 131
HLA-B
Frequency
Afr
ikaa
ns
2n
= 9
6
Engl
ish
2
n =
10
0
Wh
ite#
2n
= 1
96
Co
lou
red
2
n =
66
4
Kh
ois
an
2n
= 1
22
Zulu
2
n =
80
Xh
osa
2n
= 6
8
Tso
nga
2
n =
10
Swat
i
2n
= 3
6
Sou
th S
oth
o
2n
= 3
8
Nd
eb
ele
2
n =
25
Pe
di
2n
= 5
0
Ve
nd
a 2
n =
42
Tsw
ana
2n
= 4
4
Bla
ck*
2n
= 3
93
Nat
al T
amil
2n
= 1
02
51:08
0.002
52:01 0.021
0.010 0.015
0.082
52:04
0.002
53:01
0.011
0.038 0.015
0.028 0.079 0.040 0.060 0.048 0.068 0.043
55:01
0.030 0.015 0.005
56:01
0.010
57:01 0.032 0.050 0.041 0.021 0.008
0.102
57:02
0.006 0.016 0.025 0.044
0.028
0.015
57:03
0.009 0.008 0.013 0.029
0.026
0.020 0.048 0.045 0.023
58:01 0.021 0.030 0.026 0.039 0.041 0.063 0.103 0.100 0.111 0.053 0.160 0.120 0.071
0.081 0.020
58:02 0.011
0.005 0.056 0.082 0.100 0.147
0.139 0.079 0.080 0.080 0.024 0.091 0.094
67:01
0.008
81:01
0.009
0.013 0.059
0.083 0.026
0.020 0.024 0.045 0.033
82:01
0.008
82:02
0.002
Alleles‡ 29 28 40 67 31 25 24 8 15 20 15 19 18 20 29 23 #Combined allele frequency for the Afrikaans and English populations. *Combined allele frequency for the Zulu, Xhosa, Tsonga, Swati, South Sotho, Ndebele, Pedi, Venda and Tswana populations. ‡Total number of alleles in the population. Highlighted allele frequencies denote alleles that are present in only one SA population, while allele frequencies in bold are present in two SA population groups.
Stellenbosch University http://scholar.sun.ac.za
Stellenbosch University http://scholar.sun.ac.za

P a g e | 132
Table 34: HLA-C allele frequencies in South African populations.
HLA-C
Frequency
Afr
ikaa
ns
2n
= 1
04
Engl
ish
2n
= 1
00
Wh
ite#
2n
= 2
04
Co
lou
red
2
n =
80
8
Kh
ois
an
2n
= 1
22
Zulu
2n
= 7
9
Xh
osa
2n
= 7
0
Tso
nga
2
n =
10
Swat
i
2n
= 3
6
Sou
th S
oth
o
2n
= 3
8
Nd
eb
ele
2
n =
26
Pe
di
2n
= 5
0
Ve
nd
a 2
n =
42
Tsw
ana
2n
= 4
4
Bla
ck*
2n
= 3
95
Nat
al T
amil
2n
= 1
02
01:02 0.029 0.010 0.020 0.015
0.021
02:02 0.087 0.050 0.069 0.026 0.057 0.025 0.014
0.028 0.026
0.040
0.023 0.020 0.010
02:05 0.010
0.005
0.100
0.003
02:10
0.054
0.076 0.057 0.100 0.083 0.026
0.120 0.095 0.068 0.071
03:02
0.010 0.025
0.029
0.026 0.038 0.040
0.015 0.021
03:03 0.029 0.090 0.059 0.010
0.014
0.003 0.042
03:04 0.077 0.030 0.054 0.036 0.016 0.063 0.057
0.056 0.026 0.077 0.020 0.048 0.068 0.051
03:16
0.010 0.005
03:32
0.008
04:01 0.106 0.070 0.088 0.131 0.262 0.127 0.086
0.139 0.158 0.154 0.100 0.095 0.159 0.119 0.042
04:03
0.011 0.025
0.031
04:04
0.028 0.026
0.005
04:07
0.001
0.042
04:08
0.010 0.005
04:09N 0.010
0.005
05:01 0.038 0.070 0.054 0.017 0.016
0.026 0.038 0.020
0.008
06:02 0.058 0.100 0.078 0.167 0.131 0.139 0.171 0.300 0.139 0.105 0.115 0.180 0.143 0.136 0.149 0.177
06:06
0.026
0.003
06:11
0.010 0.005
07:01 0.163 0.180 0.172 0.115 0.041 0.101 0.057 0.100 0.056 0.105 0.115 0.040 0.071 0.068 0.076 0.135
07:02 0.144 0.130 0.137 0.058 0.131 0.114 0.029 0.100 0.083 0.053 0.038 0.020 0.048 0.045 0.058 0.094
Stellenbosch University http://scholar.sun.ac.za
Stellenbosch University http://scholar.sun.ac.za

P a g e | 133
HLA-C
Frequency
Afr
ikaa
ns
2n
= 1
04
Engl
ish
2n
= 1
00
Wh
ite#
2n
= 2
04
Co
lou
red
2
n =
80
8
Kh
ois
an
2n
= 1
22
Zulu
2n
= 7
9
Xh
osa
2n
= 7
0
Tso
nga
2
n =
10
Swat
i
2n
= 3
6
Sou
th S
oth
o
2n
= 3
8
Nd
eb
ele
2
n =
26
Pe
di
2n
= 5
0
Ve
nd
a 2
n =
42
Tsw
ana
2n
= 4
4
Bla
ck*
2n
= 3
95
Nat
al T
amil
2n
= 1
02
07:03
0.025
07:04 0.019
0.010 0.027 0.016 0.013
0.100
0.020 0.048
0.013 0.031
07:06 0.029 0.010 0.020
0.013 0.071
0.100 0.024 0.091 0.041
07:10
0.008
07:11
0.028
0.003
07:12
0.014
0.003
07:13
0.008
07:18
0.030 0.015
0.051 0.029 0.100 0.111 0.026 0.038 0.040 0.024
0.041
07:22
0.010 0.005
08:01
0.010 0.005 0.032
0.013
0.003 0.042
08:02 0.038 0.010 0.025 0.024 0.025 0.038 0.014
0.028
0.020 0.048 0.023 0.023
08:04
0.020 0.010 0.020 0.041
0.057
0.053
0.020
0.068 0.025
12:02 0.019
0.010 0.019
0.104
12:03 0.029 0.020 0.025 0.031 0.049 0.013 0.029
0.077
0.024
0.015 0.010
12:04
0.002
14:02 0.019
0.010 0.017
0.013
0.026
0.020 0.024
0.010 0.021
14:03
0.001
0.021
14:04 0.010
0.005
15:02 0.029 0.030 0.029 0.020
0.028
0.038 0.020
0.008 0.104
15:05
0.014 0.016 0.051
0.026
0.013
15:07
0.010
16:01 0.038 0.090 0.064 0.032
0.038 0.086
0.028 0.132 0.115 0.040 0.095 0.045 0.066 0.010
16:02 0.019
0.010 0.005
0.010
Stellenbosch University http://scholar.sun.ac.za
Stellenbosch University http://scholar.sun.ac.za

P a g e | 134
HLA-C
Frequency
Afr
ikaa
ns
2n
= 1
04
Engl
ish
2n
= 1
00
Wh
ite#
2n
= 2
04
Co
lou
red
2
n =
80
8
Kh
ois
an
2n
= 1
22
Zulu
2n
= 7
9
Xh
osa
2n
= 7
0
Tso
nga
2
n =
10
Swat
i
2n
= 3
6
Sou
th S
oth
o
2n
= 3
8
Nd
eb
ele
2
n =
26
Pe
di
2n
= 5
0
Ve
nd
a 2
n =
42
Tsw
ana
2n
= 4
4
Bla
ck*
2n
= 3
95
Nat
al T
amil
2n
= 1
02
17:01
0.010 0.005 0.080 0.082 0.063 0.143 0.100 0.111 0.079 0.154 0.100 0.143 0.136 0.111
18:01
0.024 0.016 0.013 0.014
0.028 0.026
0.020 0.024
0.015
18:02
0.038 0.029
0.028 0.026
0.020 0.048 0.068 0.033
Alleles‡ 21 22 29 28 20 19 19 8 16 19 12 20 16 13 29 20 #Combined allele frequency for the Afrikaans and English populations. *Combined allele frequency for the Zulu, Xhosa, Tsonga, Swati, South Sotho, Ndebele, Pedi, Venda and Tswana populations. ‡Total number of alleles in the population. Highlighted allele frequencies denote alleles that are present in only one SA population, while allele frequencies in bold are present in two SA population groups.
Table 35: Hardy-Weinberg Proportions and selection pressures of the HLA class-I genes in the South African Coloured (SAC) and Khoisan (SAN)
populations.
Population HLA-A HLA-B HLA-C
HWE Fnd P-value HWE Fnd P-value HWE Fnd P-value
SAC 0.0856 -1.6175 0.0005 0.0075 -1.3823 0.0112 0.3679 -1.2822 0.0119
SAN 0.0059 -0.861 0.1776 0.0988 -0.6126 0.2838 0.3231 -0.2722 0.482
Stellenbosch University http://scholar.sun.ac.za
Stellenbosch University http://scholar.sun.ac.za

P a g e | 135
6.3.2 M. tuberculosis vaccine epitope binding by HLA class-I alleles in South
African populations
Davila et al. identified several class-I alleles that are involved in epitope binding of current
M. tuberculosis vaccines (Ag85B-ESAT-6, Ag85B-TB10.4, Mtb72f) undergoing various
phases of clinical trials (Table 36) [484].
Table 36: List of HLA class-I alleles and the number of epitopes for each vaccine that they bind.
[484]
Ag85B-ESAT-6 Ag85B-TB10.4 Mtb72f
A*01:01 6 6 9
A*02:01 9 10 5
A*03:01 1 1 1
A*26:01 8 10 5
B*07:02 9 11 9
B*15:01 11 18 7
B*27:05 1 2 1
B*40:01 6 8 2
B*58:01 11 11 4
We analysed the allele frequency for these class-I alleles across the various SA populations
(Figure 39). Based on these allele frequencies some vaccines may not be effective in certain
SA populations, while others might be more effective. For example, the A*02:01 allele is the
only allele present in all SA populations and binds nine epitopes on ESAT-6, ten epitopes on
TB10.4 and five epitopes on Mtb72f. However, while this allele occurs at a moderate to high
frequency in the SA white, black and Coloured populations, it is very rare in the Khoisan and
Natal Tamil populations. We noted that most alleles that bind to the vaccine epitopes occur at
moderate to high frequencies in the white population but are low to absent in the black,
Khoisan and Natal Tamil populations. Of particular concern is the A*03:01 allele which is
predicted to bind to only one epitope of each vaccine subunit, but occurs at moderate to high
frequencies in the five population groups suggesting that these three vaccines will have poor
coverage in the SA populations. Finally, none of the current vaccines will have equal efficacy
across all the SA populations, with the Ag85B-TB10.4 vaccine predicted to have the greatest
Stellenbosch University http://scholar.sun.ac.za

P a g e | 136
efficacy in the black, white, Coloured, and Khoisan populations; Ag85B-ESAT-6 only in the
black and white populations; and MTB72f having the greatest efficacy in the white, Coloured
and Natal Tamil populations.
Figure 39: Comparison of HLA-A and -B alleles involved in M. tuberculosis vaccine epitope
binding across South African populations.
6.3.3 HLA class-I haplotype frequencies across South African populations
All pairwise-loci tested for LD in the SAC and SAN populations were shown to be
significant (Table 37), with stronger LD observed in the SAN population and the C:B loci
having the strongest LD in both populations.
Table 37: Pairwise LD estimates of the HLA class-I genes in the South African Coloured (SAC)
and Khoisan (SAN) populations.
Population A:C C:B A:B
D' Wn P-value D' Wn P-value D' Wn P-value
SAC 0.6082 0.3743 <0.001 0.8854 0.6698 <0.001 0.7672 0.4674 <0.001
SAN 0.7870 0.5670 <0.001 0.9248 0.7279 <0.001 0.8534 0.6297 <0.001
Stellenbosch University http://scholar.sun.ac.za

P a g e | 137
The estimated haplotypes for the SAC and SAN populations are listed in Table 38 (haplotype
frequencies ≥ 0.01) (see Appendix 7 and 8 for list of all SAC and SAN haplotypes,
respectively). For three-locus haplotypes (A:C:B), the most common haplotype in the SAC
population was 0101:0701:0801 at a frequency of 0.044, while in the SAN population the
most common haplotype was 6802:0401:1503 at a frequency of 0.049. Neither of these
haplotypes was present in the other population. The SAC haplotype however was also the
most common haplotype in the SA white population at a frequency of 0.104 [463]. In the
SAC population the most common two-locus haplotypes comprised alleles of the most
common three-locus haplotype at frequencies of 0.033 (A:C), 0.044 (A:B) and 0.053 (C:B).
For the SAN population, the most common A:C haplotype was 3201:0401 (0.061), A:B
haplotype was 6802:1503 (0.049) and C:B haplotype was 0401:4403 (0.090). None of the
most common SAC haplotypes were found in the SAN population, with only the most
common C:B haplotype of the SAN being present in the SAC population (f = 0.036), at
almost one-third of the frequency. With regards to the SA black and white populations
(haplotypes determined for A:B and C:B only) [463], the most common two-locus SAC
haplotypes were present in the white population, with the A:B haplotype also being the most
common in the white population (f = 0.109) and the C:B haplotype present as the second
most common haplotype (f = 0.119) in the white population. The most common SAC A:B
haplotype was not present in the black population but the C:B haplotype was the fourth
highest of the black haplotypes, occurring at a similar frequency (f = 0.042). The most
common two-locus SAN haplotypes were also present in the black population, albeit at a
much lower frequency (A:B = 0.015 and C:B = 0.018), but absent from the SA white
population.
Stellenbosch University http://scholar.sun.ac.za

P a g e | 138
Table 38: Estimated three- and two-locus haplotypes in the South African Coloured (SAC) and
Khoisan (SAN) populations.
SAC SAN
Haplotype A:C:B Frequency# No. Haplotype A:C:B Frequency# No.
0101:0701:0801 0.044 21 6802:0401:1503 0.049 6
0301:0602:4701 0.023 11 2901:1203:1303 0.041 5
3002:0701:0801 0.020 10 0301:0702:0702 0.041 5
3001:1701:4202 0.017 8 2301:0401:4403 0.033 4
0101:0602:5701 0.014 7 0301:0602:5802 0.033 4
2601:1701:4101 0.014 7 3001:0401:1510 0.025 3
0201:0702:0702 0.014 7 3201:0401:3501 0.025 3
3002:1601:4501 0.012 6 4301:0401:1510 0.025 3
2402:0702:0702 0.011 5 2601:0702:0705 0.025 3
2301:0702:0702 0.010 5 3004:0602:5802 0.025 3
6601:0602:5802 0.010 5 6827:0401:4403 0.025 3
3001:1701:4201 0.010 5 6802:0802:1402 0.016 2
0205:0701:5801 0.010 5 0205:0804:1401 0.016 2
4301:0401:1510 0.010 5 2402:0401:0702 0.016 2
7401:0210:1503 0.010 5 2301:1701:4101 0.016 2
0202:0701:5702 0.016 2
2301:0702:0702 0.016 2
2301:0703:0702 0.016 2
0202:0702:0705 0.016 2
3201:0202:4403 0.016 2
2301:0602:5802 0.016 2
Haplotype A:C Frequency# No. Haplotype A:C Frequency# No.
0101:0701 0.033 21 3201:0401 0.061 8
3001:1701 0.030 20 0301:0702 0.049 6
0301:0602 0.029 19 6802:0401 0.041 5
0101:0602 0.028 18 0301:0602 0.041 5
3002:0701 0.019 12 2901:1203 0.041 5
2402:0401 0.017 11 2301:0602 0.033 4
2601:1701 0.015 10 0202:0701 0.025 3
6801:0602 0.014 9 3001:0401 0.025 3
0301:0701 0.013 9 6827:0401 0.025 3
4301:0401 0.013 9 2601:0702 0.025 3
6601:0602 0.012 8 2301:0702 0.025 3
2402:0702 0.012 8 3004:0602 0.025 3
3004:0602 0.011 7 4301:0202 0.025 3
0201:0602 0.011 7 3402:0401 0.025 3
3201:0210 0.011 7 4301:0401 0.020 3
2301:0602 0.010 7 4301:0602 0.016 2
2402:0701 0.010 7 0201:1701 0.016 2
Stellenbosch University http://scholar.sun.ac.za

P a g e | 139
2301:0210 0.010 7 6802:0802 0.016 2
0205:0804 0.016 2
6801:0602 0.016 2
2301:1701 0.016 2
0202:0702 0.016 2
2301:0703 0.016 2
3201:1701 0.012 2
Haplotype A:B Frequency# No. Haplotype A:B Frequency# No.
0101:0801 0.044 24 6802:1503 0.049 6
0301:4701 0.024 13 0301:0702 0.041 5
3001:4202 0.018 10 4301:1510 0.041 5
3002:0801 0.018 10 2301:0702 0.041 5
3201:4403 0.017 9 2901:1303 0.041 5
0101:5701 0.017 9 0301:5802 0.033 4
2402:0702 0.016 8 2601:0705 0.033 4
0201:0702 0.014 8 2301:5802 0.025 3
7401:1503 0.013 7 3201:4403 0.025 3
2301:0702 0.011 6 3004:5802 0.025 3
0205:5801 0.011 6 3001:1510 0.025 3
0201:1302 0.011 6 6827:4403 0.025 3
2601:4101 0.011 6 3201:3501 0.025 3
4301:4403 0.010 5 3402:4403 0.025 3
7401:3501 0.016 2
6802:1402 0.016 2
0205:1401 0.016 2
2402:0702 0.016 2
2301:4101 0.016 2
0202:0705 0.016 2
0202:5702 0.016 2
2301:1510 0.016 2
Haplotype C:B Frequency# No. Haplotype C:B Frequency# No.
0701:0801 0.053 32 0401:4403 0.090 11
0602:5802 0.048 29 0602:5802 0.082 10
0702:0702 0.038 23 0401:1510 0.074 9
0401:4403 0.036 21 0702:0702 0.066 8
0210:1503 0.030 18 0702:0705 0.066 8
0401:3501 0.028 17 0401:1503 0.057 7
1701:4101 0.028 17 1203:1303 0.041 5
0701:4403 0.027 16 0401:3501 0.041 5
0602:4701 0.022 13 1701:4101 0.033 4
0602:1302 0.022 13 0804:1401 0.033 4
1701:4202 0.022 13 1701:4201 0.025 3
1701:4201 0.020 12 0802:1402 0.025 3
0704:1801 0.018 11 0602:5801 0.016 2
Stellenbosch University http://scholar.sun.ac.za

P a g e | 140
0401:1510 0.017 10 0202:2701 0.016 2
0602:5701 0.017 10 1505:1801 0.016 2
0801:1502 0.017 10 0701:5702 0.016 2
0210:4403 0.015 9 0703:0702 0.016 2
1601:4501 0.015 9 0704:0705 0.016 2
0602:5801 0.015 9 0302:5801 0.016 2
0401:3505 0.013 8
0501:4402 0.013 8
1402:5101 0.013 8
0701:5801 0.012 7
1202:5201 0.012 7
1502:4006 0.012 7
0210:0702 0.012 7
0304:4001 0.012 7
1801:1503 0.012 7
1701:4102 0.012 7
0401:3503 0.010 6
0802:1401 0.010 6
0602:4501 0.010 6
#Haplotype frequencies > 0.01 are listed. Highlighted haplotypes denote haplotypes present in both SAC and SAN populations.
6.3.4 KIR genotype/haplotype frequencies in three South African
population groups
KIR data for the SA San and Xhosa populations were obtained from the online database,
AFND. In total, 62 KIR genotypes were present in the SA populations, 1 of which was an AA
haplotype. Of the 62 KIR genotypes, 50 were found in the SAC, 25 in the San and 16 in the
Xhosa population (Table 39). Furthermore, the AA haplotype (Genotype ID 1) was the most
common genotype in the SAC (0.20) and San (0.17) populations, and one of the most
common genotypes in the Xhosa population, with several genotypes occurring at a frequency
of 0.120 including AA 1, Bx 5, Bx 20, Bx 21, and Bx 112.
As per the online KIR database, AFND, 7 of the genotypes (bold or highlighted in Table 39)
were identified to belong to a “unique population”. However, with the addition of the SAC
KIR data this no longer holds true for 5 of these “unique population” genotypes (bold in
Table 39). The remaining 2 unique population genotypes belong to the SA Xhosa (Bx 170)
Stellenbosch University http://scholar.sun.ac.za

P a g e | 141
and the SA San (Bx 235). Finally, a genotype not previously identified in AFND was found
to be present in 3 individuals of the SAC population.
Stellenbosch University http://scholar.sun.ac.za

P a g e | 142
Table 39: KIR genotype/haplotype profile for South African populations.
Haplotype# Genotype ID
*
3D
L1
2D
L1
2D
L3
2D
S4
2D
L2
2D
L5
3D
S1
2D
S1
2D
S2
2D
S3
2D
S5
2D
L4
3D
L2
3D
L3
2D
P1
3D
P1
‡ SA Coloured
(f)
SA San (f)
†
SA Xhosa
(f)†
Unique population genotype
AA 1 62 (0.200) 16 (0.174) 6 (0.120)
Bx 2 20 (0.060)
Bx 3 15 (0.040)
Bx 4 31 (0.090) 4 (0.043)
Bx 5 18 (0.050) 4 (0.043) 6 (0.120)
Bx 6 17 (0.050)
Bx 7 8 (0.020)
Bx 8 4 (0.010)
Bx 9 11 (0.030) 2(0.022)
Bx 10 1 (0.003)
1 (0.020)
Bx 11 2 (0.010)
Bx 12 2 (0.010)
Bx 13 4 (0.010)
Bx 14 1 (0.003)
Bx 15 1 (0.003)
Bx 19
4 (0.010)
Bx 20 1 (0.003) 1 (0.011) 6 (0.120)
Bx 21 35 (0.100) 13 (0.141) 6 (0.120)
Bx 23
2(0.022)
Bx 24 2 (0.010)
Bx 27 2 (0.010) 1 (0.011)
Bx 28 1 (0.003)
Bx 30
1 (0.011)
Bx 32 6 (0.020) 1 (0.011) 4 (0.080)
Stellenbosch University http://scholar.sun.ac.za
Stellenbosch University http://scholar.sun.ac.za

P a g e | 143
Haplotype# Genotype ID
*
3D
L1
2D
L1
2D
L3
2D
S4
2D
L2
2D
L5
3D
S1
2D
S1
2D
S2
2D
S3
2D
S5
2D
L4
3D
L2
3D
L3
2D
P1
3D
P1
‡ SA Coloured
(f)
SA San (f)
†
SA Xhosa
(f)†
Unique population genotype
Bx 35 3 (0.010) 2 (0.022) 1 (0.020)
Bx 44
7 (0.076)
Bx 48 1 (0.003)
1 (0.020)
Bx 68 2 (0.010)
Bx 70 1 (0.003)
Bx 71 8 (0.020) 6(0.065) 4 (0.080)
Bx 72 3 (0.010)
Bx 73 10 (0.030)
2 (0.040)
Bx 74 1 (0.003)
Bx 76
1 (0.011)
Bx 77
1 (0.020)
Bx 79 1 (0.003)
Bx 80 2 (0.010)
Bx 81 2 (0.010)
Bx 90 1 (0.003)
Bx 91 2 (0.010) 1 (0.011)
Bx 92
2 (0.022)
Bx 93 1 (0.003)
Bx 106 2 (0.010) 3 (0.033) 1 (0.020)
Bx 112 11 (0.030) 9 (0.098) 6 (0.120)
Bx 113 1 (0.003)
Bx 118 4 (0.010)
Bx 152
1 (0.011)
Bx 166 1 (0.003)
Bx 170
1 (0.020) SA Xhosa
Stellenbosch University http://scholar.sun.ac.za
Stellenbosch University http://scholar.sun.ac.za

P a g e | 144
Haplotype# Genotype ID
*
3D
L1
2D
L1
2D
L3
2D
S4
2D
L2
2D
L5
3D
S1
2D
S1
2D
S2
2D
S3
2D
S5
2D
L4
3D
L2
3D
L3
2D
P1
3D
P1
‡ SA Coloured
(f)
SA San (f)
†
SA Xhosa
(f)†
Unique population genotype
Bx 175 1 (0.003)
USA Cal. Afr. Am.
Bx 178 1 (0.003)
Comoros Mixed
Bx 191
1 (0.020)
Bx 194
1 (0.011)
Bx 228 21 (0.060) 10 (0.109) 3 (0.060)
Bx 235
1 (0.011)
SA San
Bx 236
1 (0.011)
Bx 237 2 (0.010) 1 (0.011)
SA San
Bx 238 1 (0.003) 1 (0.011)
SA San
Bx 272 1 (0.003)
Bx 401 2 (0.010)
Bx 467 1 (0.003)
Iran Northern
Bx not in db 3 (0.010)
SA Coloured
Stellenbosch University http://scholar.sun.ac.za
Stellenbosch University http://scholar.sun.ac.za

P a g e | 145
6.3.5 Population structure of the South African Coloured (SAC) and Khoisan
(SAN) populations
The STRUCTURE analysis of the SAC and SAN populations with their potential ancestral
populations showed K = 6 as the best approximation for the ancestral genetic contribution to
the SAC and SAN populations (Figure 40), when accounting for LD between SNP markers
included in the study. In the SAC population, four ancestral populations were identified as
major contributors, including Bantu (non-Khoisan Africans), San (Khoisan Africans), French
(European) and Cambodian (Asian) (Table 40). For the SAN population, European (French)
and Bantu contribution was noted, with Asian (Cambodian) to a lesser extent. In both the
SAC and SAN populations, a very small genetic contribution was noted from North
(Mozabite) and East (Hadza) African populations.
Figure 40: STRUCTURE plot for South African Coloured (SAC_CPT) and Khoisan (SAN_SA)
populations with K=6.
Table 40: Mean genetic contribution of ancestral populations to the South Coloured (SAC) and
Khoisan (SAN) populations.
European Bantu Mozabite Cambodian San Hadza
SAC 22.5 32.8 1.4 11.8 31.2 0.3
SAN 11.0 13.0 0.9 2.5 72.5 0.1
Stellenbosch University http://scholar.sun.ac.za

P a g e | 146
6.3.6 Genetic contribution to the MHC and LRC regions of the SAC
population
To determine the genetic contribution to the MHC and LRC regions of the SAC population
(healthy controls) we used the LAMP-LD program, with San, European and Bantu ancestral
populations. San individuals with San ancestry ≥ 75%, based on admixture proportions
assigned in STRUCTURE analysis, were included to reduce the genetic “noise” of other
ancestral populations.
Both the MHC (Figure 41) and LRC (Figure 42) regions of the SAC population were shown
to have the following profile: European>Bantu>San. For the MHC region, ~42% was of
European origin, ~38% of Bantu origin and ~25% of San origin. To determine the average
ancestry of the HLA-C gene, the same ancestral contribution was noted as in the MHC
region, with an average European contribution of ~50%, average Bantu contribution of
~36.5% and an average San contribution of ~13.5%, showing a greater European contribution
for this gene. This “fine-scaling” approach can be used to identify genes which are more
specific to a given ancestral population, as definite European and Bantu peaks are present in
Figure 41 A. A similar genetic contribution was noted for the LRC region (Figure 42).
6.3.7 Genetic relation of South African populations with regards to their
HLA class-I composition To plot the genetic relationship of South African populations we used PCO analysis using the
allele frequencies of the HLA class-I alleles (Figure 43). For this analysis we included the
SAC TB cases to determine their genetic relationship relative to the SAC healthy controls.
We plotted axis 1 and 2 of the PCO analysis, which accounted for more than 50% of the
variance. The PCO plot shows clear separation of the SA white, black and Natal Tamil
populations, with the white and black populations forming clusters on opposite ends of the
graph. The SAC population was centred at the origin of the plot, with the Khoisan population
Stellenbosch University http://scholar.sun.ac.za

P a g e | 147
clustering with the SA black populations. Interestingly, the SAC TB cases were found to
cluster closer to the Khoisan and black SA populations than the SAC healthy controls and
indeed a manuscript in press [321] finds that Khoisan ancestry is a risk factor for TB.
Figure 41: Ancestral contributions to the SAC population for the MHC region on chromosome
6. A: the proportion of each ancestral population in the genetic composition of the MHC region in the SAC,
where the blue line = San ancestry, green = Bantu ancestry, and red = European ancestry. B: the average
ancestral contribution to the MHC region in the SAC, where 0 = Bantu, 1 = European and 2 = San.
A
B
Stellenbosch University http://scholar.sun.ac.za

P a g e | 148
Figure 42: Ancestral contributions to the SAC population for the LRC region on chromosome 9. A: the proportion of each ancestral population in the genetic composition of the LRC region in the SAC, where
the blue line = San ancestry, green = Bantu ancestry, and red = European ancestry. B: the average ancestral
contribution to the LRC region in the SAC, where 0 = Bantu, 1 = European and 2 = San.
B
A
Stellenbosch University http://scholar.sun.ac.za

P a g e | 149
Figure 43: Principal Coordinate (PCO) Plot of South African populations using HLA class-I
allele frequencies.
6.4 Discussion
The HLA class-I and KIR genes are among the most polymorphic loci in the human genome,
with their extensive diversity facilitating the role of these genes in various biological
processes [450,485]. These processes include disease (infectious, autoimmune, cancers),
reproduction and organ transplantation [234]. The diversity of allele, gene and haplotype
frequencies of these molecules have also been shown to differ between populations of
different geographic regions [227,451,454]. Studies to date have shown a clear correlation
between certain diseases and ethnicities. In this regard, understanding the HLA and KIR
background of various populations would be highly informative, and facilitate in
understanding the genetic aetiology of disease, creating vaccines with greater efficacy for
specific populations, and promoting efficient organ transplantation. This work is especially
important in countries such as South Africa, which has a wide diversity with regards to the
various ethnic groups which make up the South African nation.
Stellenbosch University http://scholar.sun.ac.za

P a g e | 150
In this study we compared the allele frequencies of the HLA class-I genes across the main
South African population groups, with the aim of understanding the diversity of the class-I
alleles within the population and to determine the genetic contribution to the SAC population,
a highly admixed population, with regards to these genes. Also, given that the HLA genes
play an important role in host immunity, we were interested in whether marked differences
were present between SAC TB cases and healthy controls with regards to the class-I allele
composition.
In Chapter 4 we highlighted several associations between HLA class-I alleles (and other
genes of the MHC) and susceptibility to TB in the SAC population. A recent study by our
group using genome-wide data identified a relationship between TB risk and genetic
ancestry, where SAC TB cases were found to have a greater proportion of African ancestry
than healthy controls (58% vs. 51%) [321]. Furthermore, San ancestry was found to be
associated with an increased risk for TB, while European and Asian ancestry was found to be
protective. Here we presented data showing that the genetic composition of MHC and LRC in
SAC healthy controls is predominantly of European descent with a lower San genotype
contribution, and that the SAC TB cases are more closely related to the San and black
Africans, than the SAC healthy controls. This casts some light on the genetic aetiology of
susceptibility to infectious diseases. In the case of TB, it is postulated that European
populations, through selection events against alleles that predisposed to TB during the
scourge of the “White Plague” in 17th
century Europe [12], are today less susceptible to TB
compared to individuals of African ancestry. While TB may have been present in Africa
before the Out-of-Africa migration, the disease never reached epidemic proportions given the
rural lifestyles of African tribes, thus limiting the chance of selection events against disease
causing alleles.
Stellenbosch University http://scholar.sun.ac.za

P a g e | 151
Several studies have speculated on the role of host genetics in vaccine efficacy [486]. It is
currently estimated that between 44% and 78% of the variation in antibody responses to
vaccines is genetic in origin, with the HLAs playing a definitive role in explaining these
varied responses at the population level [487–489]. These HLA molecules are involved in the
presentation of antigens from various pathogens and are highly polymorphic, creating a major
challenge for the design of efficacious vaccines against infectious diseases. To date, HLA-
associated vaccine failure has been reported for several vaccines; including hepatitis B,
measles and influenza [490–493]. There are currently three TB vaccines at various phases of
clinical trials that have shown promising results in their test populations [494–502]. To
evaluate the efficacy of these vaccines in high TB burden countries, Davila et al. evaluated
the binding of vaccine epitopes to HLA class-I and class-II alleles [484]. Their findings
suggested that the Mtb72f vaccine offered less protection globally when compared to the
Ag85B-ESAT-6 and AG85B-TB10.4 vaccines based on the number of HLA alleles found at
a high frequency within these TB endemic populations but with low affinity for the vaccine
epitopes. The results presented here from the SA populations confirm that conclusion.
Vaccine efficacy has also been shown to be determined by the genetics of the challenging M.
tuberculosis strain, where BCG vaccinated mice were shown to be less protected when
challenged with Beijing strains than with the laboratory strain H37Rv [406,503].
With regards to KIR genotype profiles across the SA population, data was only publicly
available for two additional populations, San and Xhosa, limiting the analysis we were able to
do with this family of genes. Of the three SA populations, the SAC were the most diverse
with respect to number of genotype profiles present, followed by the San and then the Xhosa
populations. Furthermore, the Xhosa population had no single major KIR profile, with all
three populations having the AA haplotype as the most common, in line with findings across
populations of different ethnicities globally [504–508]. Only two BB haplotypes (absent for
Stellenbosch University http://scholar.sun.ac.za

P a g e | 152
all four haplotype A genes: 2DL1, 2DL3, 2DS4, 3DL1) were present in the SA populations,
with Bx 74 present in one SAC individual and Bx 194 in one San individual, with the
remaining 59 genotype profiles being AB haplotypes. B haplotypes have been shown to
effect a stronger immune response through their ability to effectively activate NK/T cells in
response to pathogens, while A haplotypes provide a stronger tolerance to self and are thus
important in autoimmune diseases [509]. Thus having a greater proportion of AB haplotypes
suggests some form of balancing selection with regards to the KIR genes.
Understanding of the genetic contribution of the ancestral populations to the SAC can aid us
in identifying the genetic causes of disease given that the ancestral populations of the SAC
have markedly dissimilar rates of TB infection and disease. This is especially important given
the high burden of this disease among SAC individuals, highlighting the need to identify
these risk factors, which could be done using admixture mapping [510–514]. Finally, the
HLA data provided in this study will have useful biomedical applications, including
understanding the role of HLAs in infectious diseases, vaccine development and
hematopoietic stem-cell transplantation in SA populations.
Stellenbosch University http://scholar.sun.ac.za

Chapter 7: Conclusion
Stellenbosch University http://scholar.sun.ac.za

P a g e | 153
7.1 Summary
TB remains a global health issue, even though several advances in the field of biomedical
research have been achieved, including the discovery and development of chemotherapeutic
agents, vaccines, and faster diagnosis. TB is a complex disease with host, pathogen and
environmental factors contributing to the development of active TB disease.
The work presented in this thesis highlights the role of host genetics in the progression to TB
disease. Here we investigated the role of genes belonging to the MHC (chromosome 6) and
the LRC (chromosome 19) in susceptibility to TB in the highly admixed SAC population.
Both complexes house genes that play an important role in the host immune response.
In the MHC region we focussed our attention on the HLA class-I genes, comprised of HLA-
A, -B and -C. These genes are known to be important modulators of the host immune
response, and are involved in antigen processing and presentation, amongst other important
biological processes. This gene family is the most polymorphic in the human genome, with
thousands of variants identified to date. This extreme variability is thought to have arisen in
response to the large number of pathogenic antigens to which humans are exposed.
In the LRC region we predominantly focused on the KIR gene family. The KIRs comprise
sixteen genes, of which fourteen are functional. The KIR genes are also classified based on
function, activating or inhibitory, where activating KIRs induce T and NK cell activation in
response to pathogens and inhibitory KIRs promote tolerance to self.
The HLA class-I molecules are also known ligands for certain KIR genes, with some studies
showing co-evolution between the two gene families, even though they reside on different
chromosomes.
Stellenbosch University http://scholar.sun.ac.za

P a g e | 154
While most studies to date have focussed on the role of KIRs and HLAs in viral diseases,
there is a growing amount of data to support their importance in susceptibility to bacterial
diseases as well. In this regard, NK cells secrete α-defensins and CD8+ T cells produce
granulysin and perforin, mediating programmed cell death of infected cells
In this thesis the following observations were made:
1. Susceptibility to TB
KIRs are involved in susceptibility to TB, where an overexpression of aKIRs (≥5) and
specifically the presence of KIR3DS1, was shown to protect against the development
of active TB disease. This is in line with the current understanding of KIRs in
infectious diseases, where aKIRs result in a stronger immune response.
Two KIR gene profiles which had fewer than 5 aKIRs and an absence of KIR3DS1
were found to increase the risk of developing TB.
Specific HLA class-I alleles altered susceptibility to TB, with some alleles showing
risk for (ORs ranging between 1.89 and 4.27) and others protection against (ORs
ranging between 0.16 and 0.44) developing TB.
No statistically significant associations were observed between the KIR-HLA
compound genotypes and TB susceptibility. However, the true 3DS1 ligand has yet to
be identified.
Several loci in the MHC and LRC were found to alter susceptibility to TB in the SAC
and the Gambian populations, although with very few SNPs common to the two
populations. This however is in part due to QC analysis, where SNPs in one
population failed QC in the other. Genes found to be associated in both populations
include MDC1, BTNL2, HLA-DOA, C6orf10, and the intergenic region between HLA-
C and WASF5P. In the SAC population only, HLA-DOB, TAP2, LILRA5, LILRP2,
Stellenbosch University http://scholar.sun.ac.za

P a g e | 155
NCR1/NLRP7 and the intergenic region between LAIR1/TTYH1 were found to be
associated with TB, while there were no genes associated in The Gambia that were
not also associated in the SAC. To data, case-control association studies for TB have
only been done for the BTNL2 and TAP2 genes. This work therefore presents novel
gene candidates to be investigated for susceptibility to TB.
Alleles and SNPs of the HLA-C gene were associated with susceptibility to TB. This
gene was recently identified as a risk factor for leprosy, caused by M. leprae, and
could thus be an important gene for susceptibility to mycobacterial disease.
2. Susceptibility to TB disease caused by specific M. tuberculosis strains
Alleles of the HLA class-I genes were shown to not only be involved in susceptibility
to TB but disease caused by specific M. tuberculosis strains as well.
The Beijing strain was observed to occur more frequently in individuals with multiple
disease episodes (P < 0.001).
The B*27 allele was associated with having fewer TB disease episodes (OR = 0.21)
and with protection against having disease caused by the Beijing strain (OR = 0.35).
This allele is found in individuals who are able to control their HIV infections without
any ARV treatment and in individuals with slow HIV/AIDS disease progression.
Additional associations were also observed between class-I alleles, genotypes and
haplotypes and disease caused by the Beijing, LAM, LCC and Quebec strains.
Sub-lineage 7 is the most prevalent Beijing strain causing disease in the Western
Cape, where the A*30:02 allele was only present in TB cases with disease caused by
sub-lineage 7 and the A*02:02 allele was shown to protect (OR = 0.04) against
disease caused by sub-lineage 7.
We also observed instances of apparent co-evolution between host and pathogen,
where a class-I allele more commonly found in white populations was associated with
Stellenbosch University http://scholar.sun.ac.za

P a g e | 156
strains belonging to the Euro-American lineage and vice-versa for East Asian human
populations and strains. However, given the complexity of the disease and the number
of genes involved this effect was not seen for all the associations tested.
This work emphasizes the importance of considering both host and pathogen
genotypes in the understanding of disease development. By incorporating both
genotypes we may be able to overcome the genetic heterogeneity associated with TB
disease.
3. Influence of ancestral genetic contributions to the development of TB disease in the SAC
populations
Using HLA alleles and KIR gene profiles we noted that the SAC population is the
most diverse SA population, as would be expected considering its admixture.
HLA class-I alleles have been shown to bind several epitopes of the TB vaccines,
Ag85B-ESAT-6, Ag85B-TB10.4, Mtb72f. Coverage of these class-I alleles was
shown to be low to moderate in the SA black, San and Natal Tamil populations while
having the greatest efficacy in the SA white population. Based on the class-I allele
distribution across the SA populations, none of these vaccines would be equally
efficacious across all SA populations.
We show that while the SAC population may have a greater proportion of San
ancestry according to genome-wide SNP data, the MHC and LRC regions of the SAC
are predominantly of European ancestry, followed by Bantu and then San. When
analysing the genetic relationship between SAC healthy controls and TB cases with
other SA populations, we see that the TB cases cluster more closely with the San
population. A recent study by our group showed that San ancestry is in fact a risk
factor for developing TB, supporting the findings presented here.
Stellenbosch University http://scholar.sun.ac.za

P a g e | 157
Certain diseases show a preference for ancestry, occurring more frequently in
individuals belonging to certain populations group. The same is true for TB disease,
where individuals of European ancestry seem to have a lower risk for developing TB,
with the converse seen in individuals of African descent.
7.2 Limitations and Future work
While the work presented in this thesis has been done to the best of our ability, it does have
several limitations, which should be addressed in future experiments.
i. Sample size: Given the extreme variability of the class-I alleles and the number of KIR
genes, the sample size of 760 individuals may have been sufficient for the purposes of
this study but limited the analysis that could be done. This is especially true for the HLA
and M. tuberculosis strain association study where several strains are causing disease in
our population. To account for this we re-classified our class-I alleles into supertypes to
reduce the number of variables and increase the number of individuals per HLA type. It is
also important to note that typing of the class-I alleles and KIR genes are extremely
complex and expensive, and samples that failed typing at a locus (more than twice) were
not “called” at that specific locus. However, with regards to class-I allele population
diversity, our sample size was quite large compared with what is currently presented in
AFND. The KIR3DP1 gene was not typed in the SAC population. This pseudogene is
considered a “framework” gene and should be present in all individuals, which was true
for the other “framework” genes in the SAC.
ii. Correcting for multiple testing: There are different schools of thought with regards to
multiple testing in genetic association studies, as some researchers deem it necessary
while others do not. While we do not oppose correcting for multiple testing, we have the
view that no appropriate method currently exists. Bonferroni correction is only applicable
Stellenbosch University http://scholar.sun.ac.za

P a g e | 158
when all the tests are independent, which is not the case for the HLA alleles or for the M.
tuberculosis strains. Specifically in the case of the HLA genes which are known to be in
LD with each other, correcting by Bonferroni would result in markedly overcorrecting for
the false-positive rates and result in a reduction in power. Bonferroni correction has also
been shown to increase the likelihood of type II errors, which is no less false than type 1
errors, resulting in truly important differences being deemed non-significant. The
Bayesian method on the other hand requires the grouping of variants into clusters with
different prior probabilities of affecting the outcome, which is not currently possible for
all variants.
iii. Correcting for ancestry: Earlier studies showed no stratification in the SAC population
between cases and controls. However, the recently published study of Chimusa et al.
[201] showed that the population is in fact stratified, and that San ancestry is a risk factor
for developing TB. Our group is therefore developing a set of ancestry informative
markers (AIMS), which will be used to correct for ancestry.
iv. Latent TB infection: The incidence of latent TB (healthy controls who have positive TST
skin test) is known to be high in the Ravensmead/Uitsig communities. The case-control
study conducted here therefore investigated the host genetic factors involved in
progression to active TB disease, which may also be associated with primary disease.
v. Validation of associated variants: While several associations were identified in this thesis
between loci of the MHC and LRC with susceptibility to TB and disease caused by
specific M. tuberculosis strains, the biological and functional relevance of these loci were
not investigated. For the KIRs, we propose to investigate the differences in cytolytic
activity between M. tuberculosis infected 3DS1+ and 3DS1
- NK cells. We will also study
the KIR gene profile of M. tuberculosis infected CD56dim/bright
cells with regards to the
number of aKIRs present. We propose to design biological models to investigate the
Stellenbosch University http://scholar.sun.ac.za

P a g e | 159
specificity of host genotypes with specific M. tuberculosis strain types. With regards to
the genes identified using the genome-wide SNP chip data, these genes should be
sequenced in the SAC population to identify relevant SNPs to be tested in an additional
sample set of the SAC and/or other populations.
vi. Future approaches: Due to the enormous technical advancements achieved over the last
several years in DNA sequencing technologies, NGS is now possible, allowing the whole
human genome to be sequenced within weeks. This approach also allows for the
identification of both common and rare variants. Using these technologies to study
extreme forms of TB disease (such as tuberculous meningitis, TBM) could yield novel
and interesting findings with regards to disease susceptibility. Admixture mapping could
also serve as an approach for the identification of novel TB susceptibility genes. This
approach allows for the identification of susceptibility loci in a population which is
comprised of at least two populations, where one population is known to have a greater
predisposition to TB disease, and this is particularly relevant for the SAC population,
which has a complex 5-way admixture. The necessary computational algorithms will
therefore have to be developed before admixture mapping studies can be done.
7.3 Conclusion
There is a difference in the rates that diverse populations are infected with tuberculosis and
progress to disease, thus studying the genetic aetiology of TB disease in admixed populations
is useful in the identification of disease-causing alleles which may be regarded as
representative of the variety in the global population. The SAC population is therefore well-
suited to this purpose with known genetic contributions from European, Black African,
Khoisan and Asian ethnicities. Using HLA class-I data we show that SAC TB cases are more
closely related to the Khoisan (and Black African) populations than the SAC healthy controls.
Stellenbosch University http://scholar.sun.ac.za

P a g e | 160
Furthermore, that the MHC and LRC regions in SAC healthy controls are predominantly of
European ancestry. We therefore highlight a clear role for ancestry in the development of
active TB disease in the SAC population. With regards to TB vaccines, we show that three
vaccines currently undergoing clinical trials may have poor efficacy in SA populations,
except in the white population, based on HLA allele frequencies which bind to the vaccine
epitopes. Similar findings were observed in other populations from countries with a high TB
burden. Future vaccine designs should thus take HLA allele frequencies into account, if we
are to design TB vaccines which are effective where they are needed most.
Studies to date have classified M. tuberculosis strains based on their geographical origin, with
epidemiological studies showing genomic differences between the various strains. Using
HLA class-I alleles, which are also known to differ across geographical populations, we show
that co-evolution events occur between human and M. tuberculosis subtypes, and it seems
likely that the previous geographical differences noted were in fact due to the differences in
HLA alleles between populations, which we have now identified. However, given the
complexity of HLA biology, these correlations did not hold true for all associations tested.
Also, taking bacterial genotype into consideration may reduce the genetic heterogeneity
associated with disease susceptibility studies.
In conclusion, we highlight the importance of the KIR and HLA genes in TB disease, vaccine
development and host-strain interaction.
Stellenbosch University http://scholar.sun.ac.za

P a g e | 161
References 1. Taylor PR, Martinez-Pomares L, Stacey M, Lin HH, Brown GD, Gordon S. Macrophage
receptors and immune recognition. Annu.Rev.Immunol. 2005; 23:901–944.
2. Salo WL, Aufderheide AC, Buikstra J, Holcomb TA. Identification of Mycobacterium tuberculosis DNA in a pre-Columbian Peruvian mummy. Proc. Natl. Acad. Sci. U. S. A. 1994; 91:2091–2094.
3. Arriaza BT, Salo W, Aufderheide AC, Holcomb TA. Pre-Columbian tuberculosis in northern Chile: molecular and skeletal evidence. Am. J. Phys. Anthropol. 1995; 98:37–45.
4. Konomi N, Lebwohl E, Mowbray K, Tattersall I, Zhang D. Detection of mycobacterial DNA in Andean mummies. J. Clin. Microbiol. 2002; 40:4738–4740.
5. Zimmerman MR. Pulmonary and osseous tuberculosis in an Egyptian mummy. Bull. N. Y. Acad. Med. 1979; 55:604–608.
6. Nerlich AG, Haas CJ, Zink A, Szeimies U, Hagedorn HG. Molecular evidence for tuberculosis in an ancient Egyptian mummy. Lancet 1997; 350:1404.
7. Crubézy E, Ludes B, Poveda JD, Clayton J, Crouau-Roy B, Montagnon D. Identification of Mycobacterium DNA in an Egyptian Pott’s disease of 5,400 years old. Comptes Rendus Académie Sci. Série III Sci. Vie 1998; 321:941–951.
8. Meachen GN. A Short History of Tuberculosis. Staples Press Limited, John Bale Medical Publications Limited, 1936.
9. MAJOR RH. Classic Descriptions of Disease, Etc. (Third Edition.). London; Menasha printed, 1945.
10. Daniel TM. Captain of Death: the story of Tuberculosis. University of Rochester Press. New York, 1997.
11. Thomas Coar. The aphorisms of Hippocrates : with a translation into Latin, and English. Birmingham, AB: Gryphon Editions, 1982.
12. Leao SC, Portaels F. History. In: Tuberculosis 2007: From Basic Science to Patient Care. 2007: 25–49.
13. Pease AS. Some remarks on the diagnosis and treatment of tuberculosis in antiquity. Isis 1940; 31:380–393.
14. Herzog H. History of tuberculosis. Respir. Int. Rev. Thorac. Dis. 1998; 65:5–15.
15. Doetsch RN. Benjamin Marten and his ‘New Theory of Consumptions’. Microbiol. Rev. 1978; 42:521–528.
16. Laënnec RTH. A treatise on the diseases of the chest, tr. by J. Forbes. 1834.
17. Duffin J. To see with a better eye. A life of R.T.H. Laennec. Princeton, NJ: Princeton University Press, 1998.
Stellenbosch University http://scholar.sun.ac.za

P a g e | 162
18. Daniel TM. The origins and precolonial epidemiology of tuberculosis in the Americas: can we figure them out? Int. J. Tuberc. Lung Dis. Off. J. Int. Union Tuberc. Lung Dis. 2000; 4:395–400.
19. Daniel TM. René Théophile Hyacinthe Laënnec and the founding of pulmonary medicine. Int. J. Tuberc. Lung Dis. Off. J. Int. Union Tuberc. Lung Dis. 2004; 8:517–518.
20. Budd W. MEMORANDUM ON THE NATURE AND THE MODE OF PROPAGATION OF PHTHISIS. The Lancet 1867; 90:451–452.
21. Koch, R. Die aetiologie der tuberculose, a translation by Berna Pinner and Max Pinner with an introduction by Allen K. Krause. Am Rev Tuberc 1932; 25:285–323.
22. Daniel TM. Selman Abraham Waksman and the discovery of streptomycin. IntJTubercLung Dis 2005; 9:120–122.
23. Koch R. Classics in infectious diseases. The etiology of tuberculosis: Robert Koch. Berlin, Germany 1882. Rev. Infect. Dis. 1982; 4:1270–1274.
24. von Pirquet, C. Die allergieprobe zur diagnose der tuberkulose in kindesalter. Wiener Medizinische Wochenschrift 1907; 28:1369–74.
25. von Pirquet, C. Der diagnostische wert der kutanen tuberkulinreaktion bei der tuberkulose des kindesalters auf grund von 100 sektionen. Wien Klin Wchnschr 1907; 20:1123–8.
26. Von Pirquet C. FREQUENCY OF TUBERCULOSIS IN CHILDHOOD. JAMA J. Am. Med. Assoc. 1909; LII:675–678.
27. Haas LF. Wilhelm Conrad Von Röntgen (1845-1923). J. Neurol. Neurosurg. Psychiatry 2001; 70:126.
28. Path to Tb Innovation. Available at: http://transition.usaid.gov/our_work/global_health/id/tuberculosis/publications/tbtimeline.pdf.
29. Sakula A. BCG: who were Calmette and Guérin? Thorax 1983; 38:806–812.
30. Comstock GW. The International Tuberculosis Campaign: a pioneering venture in mass vaccination and research. Clin. Infect. Dis. Off. Publ. Infect. Dis. Soc. Am. 1994; 19:528–540.
31. Schatz A, Bugie E, Waksman SA. Streptomycin, a substance exhibiting antibiotic activity against gram-positive and gram-negative bacteria. 1944. Clin. Orthop. 2005; :3–6.
32. Ryan F. The forgotten plague: how the battle against tuberculosis was won--and lost. Little, Brown, 1994.
33. LEHMANN J. TWENTY YEARS AFTERWARD HISTORICAL NOTES ON THE DISCOVERY OF THE ANTITUBERCULOSIS EFFECT OF PARAAMINOSALICYLIC ACID (PAS) AND THE FIRST CLINICAL TRIALS. Am. Rev. Respir. Dis. 1964; 90:953–956.
34. Iseman MD. Tailoring a time-bomb. Inadvertent genetic engineering. Am. Rev. Respir. Dis. 1985; 132:735–736.
Stellenbosch University http://scholar.sun.ac.za

P a g e | 163
35. Chaisson RE, Nuermberger EL. Confronting multidrug-resistant tuberculosis. N. Engl. J. Med. 2012; 366:2223–2224.
36. WHO | Global tuberculosis report 2012. Available at: http://www.who.int/tb/publications/global_report/en/. Accessed 18 September 2013.
37. Zignol M, van Gemert W, Falzon D, et al. Surveillance of anti-tuberculosis drug resistance in the world: an updated analysis, 2007-2010. Bull. World Health Organ. 2012; 90:111–119D.
38. Whalen C, Horsburgh CR, Hom D, Lahart C, Simberkoff M, Ellner J. Accelerated course of human immunodeficiency virus infection after tuberculosis. AmJRespirCrit Care Med 1995; 151:129–135.
39. Johnson MD, Decker CF. Tuberculosis and HIV Infection. Dis.Mon. 2006; 52:420–427.
40. Von Reyn CF, Kimambo S, Mtei L, et al. Disseminated tuberculosis in human immunodeficiency virus infection: ineffective immunity, polyclonal disease and high mortality. Int. J. Tuberc. Lung Dis. Off. J. Int. Union Tuberc. Lung Dis. 2011; 15:1087–1092.
41. Global Health Facts. Available at: http://kff.org/globaldata/. Accessed 18 September 2013.
42. Republic of South Africa: Millenium Development Goals. Available at: http://www.statssa.gov.za/nss/Goal_Reports/GOAL%206-COMBAT%20HIV%20AIDS%20MALARIA%20AND%20OTHER%20DISEASES.pdf.
43. Health Systems Trust. Incidence Of TB In The Provinces Of South Africa. 2009. Available at: http://www.hst.org.za/healthstats/16/data.
44. UNAIDS. UNAIDS: South Africa. Available at: http://www.unaidsrstesa.org/region/countries/south-africa.
45. Knechel NA. Tuberculosis: pathophysiology, clinical features, and diagnosis. Crit Care Nurse 2009; 29:34–43.
46. Centre for Disease Control and Prevention. Tuberculosis. Available at: http://www.cdc.gov/tb/.
47. Comas I, Gagneux S. The past and future of tuberculosis research. PLoS.Pathog. 2009; 5:e1000600.
48. De Jong BC, Antonio M, Gagneux S. Mycobacterium africanum--review of an important cause of human tuberculosis in West Africa. PLoS Negl. Trop. Dis. 2010; 4:e744.
49. Smith NH, Kremer K, Inwald J, et al. Ecotypes of the Mycobacterium tuberculosis complex. J. Theor. Biol. 2006; 239:220–225.
50. Cole ST, Brosch R, Parkhill J, et al. Deciphering the biology of Mycobacterium tuberculosis from the complete genome sequence. Nature 1998; 393:537–544.
51. Kapur V, Whittam TS, Musser JM. Is Mycobacterium tuberculosis 15,000 years old? J. Infect. Dis. 1994; 170:1348–1349.
Stellenbosch University http://scholar.sun.ac.za

P a g e | 164
52. Brosch R, Gordon SV, Marmiesse M, et al. A new evolutionary scenario for the Mycobacterium tuberculosis complex. Proc. Natl. Acad. Sci. U. S. A. 2002; 99:3684–3689.
53. Gutierrez MC, Brisse S, Brosch R, et al. Ancient origin and gene mosaicism of the progenitor of Mycobacterium tuberculosis. PLoS Pathog. 2005; 1:e5.
54. Sreevatsan S, Pan X, Stockbauer KE, et al. Restricted structural gene polymorphism in the Mycobacterium tuberculosis complex indicates evolutionarily recent global dissemination. Proc.Natl.Acad.Sci.U.S.A 1997; 94:9869–9874.
55. Gagneux S, Deriemer K, Van T, et al. Variable host-pathogen compatibility in Mycobacterium tuberculosis. Proc.Natl.Acad.Sci.U.S.A 2006; 103:2869–2873.
56. RILEY RL, MILLS CC, O’GRADY F, SULTAN LU, WITTSTADT F, SHIVPURI DN. Infectiousness of air from a tuberculosis ward. Ultraviolet irradiation of infected air: comparative infectiousness of different patients. Am. Rev. Respir. Dis. 1962; 85:511–525.
57. Mathema B, Kurepina NE, Bifani PJ, Kreiswirth BN. Molecular epidemiology of tuberculosis: current insights. Clin.Microbiol.Rev. 2006; 19:658–685.
58. Pieters J. Entry and survival of pathogenic mycobacteria in macrophages. Microbes.Infect. 2001; 3:249–255.
59. Kiz Highleyman, HIV and Hepatitis.com. Tuberculosis Coinfection Increases Risk of Moth-to-Child HIV Transmission. Available at: http://www.hivandhepatitis.com/recent/2011/0201_2011_b.html.
60. Lawn SD, Zumla AI. Tuberculosis. Lancet 2011; 378:57–72.
61. Caws M, Thwaites G, Dunstan S, et al. The influence of host and bacterial genotype on the development of disseminated disease with Mycobacterium tuberculosis. PLoS.Pathog. 2008; 4:e1000034.
62. Getahun H, Kittikraisak W, Heilig CM, et al. Development of a standardized screening rule for tuberculosis in people living with HIV in resource-constrained settings: individual participant data meta-analysis of observational studies. PLoS Med. 2011; 8:e1000391.
63. Bates M, O’Grady J, Mwaba P, et al. Evaluation of the burden of unsuspected pulmonary tuberculosis and co-morbidity with non-communicable diseases in sputum producing adult inpatients. PloS One 2012; 7:e40774.
64. Wikipedia. Tuberculosis. Available at: http://en.wikipedia.org/wiki/File:Tuberculosis_symptoms.svg.
65. Frieden TR, Sterling TR, Munsiff SS, Watt CJ, Dye C. Tuberculosis. Lancet 2003; 362:887–899.
66. Smith I. Mycobacterium tuberculosis pathogenesis and molecular determinants of virulence. Clin.Microbiol.Rev. 2003; 16:463–496.
67. Kaufmann SHE, Cole ST, Mizrahi V, Rubin E, Nathan C. Mycobacterium tuberculosis and the host response. J. Exp. Med. 2005; 201:1693–1697.
Stellenbosch University http://scholar.sun.ac.za

P a g e | 165
68. Kaufmann SH. How can immunology contribute to the control of tuberculosis? Nat.Rev.Immunol. 2001; 1:20–30.
69. Möller M, de Wit E, Hoal EG. Past, present and future directions in human genetic susceptibility to tuberculosis. FEMS ImmunolMedMicrobiol 2010; 58:3–26.
70. Zumla A, Raviglione M, Hafner R, von Reyn CF. Tuberculosis. N. Engl. J. Med. 2013; 368:745–755.
71. Golden MP, Vikram HR. Extrapulmonary tuberculosis: an overview. Am.Fam.Physician 2005; 72:1761–1768.
72. Kaufmann SHE. New issues in tuberculosis. Ann. Rheum. Dis. 2004; 63 Suppl 2:ii50–ii56.
73. Iseman MD. A clinician’s giuide to tuberculosis. Philadelphia: Lippincott Williams & Wilkins, 2000.
74. McNerney R, Maeurer M, Abubakar I, et al. Tuberculosis diagnostics and biomarkers: needs, challenges, recent advances, and opportunities. J. Infect. Dis. 2012; 205 Suppl 2:S147–158.
75. Horsburgh CR Jr, Rubin EJ. Clinical practice. Latent tuberculosis infection in the United States. N. Engl. J. Med. 2011; 364:1441–1448.
76. Ferrara G, Murray M, Winthrop K, et al. Risk factors associated with pulmonary tuberculosis: smoking, diabetes and anti-TNFα drugs. Curr. Opin. Pulm. Med. 2012; 18:233–240.
77. HealthCentral.com. Tuberculin Skin Test. Available at: http://www.healthcentral.com/skin-care/h/tuberculin-skin-test.html.
78. ethnomed.com. Screening: Primary Care Tools for the Management of TB. Available at: http://ethnomed.org/clinical/tuberculosis/firland/screening-for-tb-primary-care-tools-for-the-management-of-tb.
79. Mayo Clinic - Mayo Medical Laboratories. QuantiFERON-TB Gold In-Tube. Available at: http://www.mayomedicallaboratories.com/images/articles/hottopics/2009/2009-qtb/slide6.jpg.
80. Boehme CC, Nabeta P, Hillemann D, et al. Rapid molecular detection of tuberculosis and rifampin resistance. N. Engl. J. Med. 2010; 363:1005–1015.
81. Centers for Disease Control and Prevention (CDC). Emergence of Mycobacterium tuberculosis with extensive resistance to second-line drugs--worldwide, 2000-2004. MMWR MorbMortalWklyRep 2006; 55:301–305.
82. Victor TC, Warren R, Beyers N, van Helden PD. Transmission of multidrug-resistant strains of Mycobacterium tuberculosis in a high incidence community. Eur.J.Clin.Microbiol.Infect.Dis. 1997; 16:548–549.
83. Victor TC, Streicher EM, Kewley C, et al. Spread of an emerging Mycobacterium tuberculosis drug-resistant strain in the western Cape of South Africa. IntJTubercLung Dis 2007; 11:195–201.
Stellenbosch University http://scholar.sun.ac.za

P a g e | 166
84. WHO | Policy guidance on drug-susceptibility testing (DST) of second-line antituberculosis drugs. Available at: http://www.who.int/tb/publications/2008/whohtmtb_2008_392/en/index.html. Accessed 18 September 2013.
85. Ling DI, Zwerling AA, Pai M. GenoType MTBDR assays for the diagnosis of multidrug-resistant tuberculosis: a meta-analysis. Eur. Respir. J. 2008; 32:1165–1174.
86. O’Grady J, Maeurer M, Mwaba P, et al. New and improved diagnostics for detection of drug-resistant pulmonary tuberculosis. Curr. Opin. Pulm. Med. 2011; 17:134–141.
87. WHO | Xpert MTB/RIF - rapid TB test - WHO publishes policy and guidance for implementers. Available at: http://www.who.int/tb/features_archive/xpert_rapid_tb_test/en/index.html. Accessed 18 September 2013.
88. WHO. Tuberculosis: MDR-TB & XDR-TB 2011 Progress Report. Available at: http://www.who.int/tb/challenges/mdr/factsheet_mdr_progress_march2011.pdf.
89. Nnoaham KE, Clarke A. Low serum vitamin D levels and tuberculosis: a systematic review and meta-analysis. Int. J. Epidemiol. 2008; 37:113–119.
90. Gray K, Wood N, Gunasekera H, et al. Vitamin d and tuberculosis status in refugee children. Pediatr. Infect. Dis. J. 2012; 31:521–523.
91. Colditz GA, Brewer TF, Berkey CS, et al. Efficacy of BCG vaccine in the prevention of tuberculosis. Meta-analysis of the published literature. JAMA J. Am. Med. Assoc. 1994; 271:698–702.
92. Stop TB Partnership. Tuberculosis Vaccine Candidates - 2011. Available at: http://www.stoptb.org/wg/new_vaccines/assets/documents/TB%20Vaccine%20Pipeline_rAug%202012.pdf.
93. Daniel TM. The history of tuberculosis. Respir.Med. 2006; 100:1862–1870.
94. Combs DL, O’Brien RJ, Geiter LJ. USPHS Tuberculosis Short-Course Chemotherapy Trial 21: effectiveness, toxicity, and acceptability. The report of final results. Ann. Intern. Med. 1990; 112:397–406.
95. Abdool Karim SS, Naidoo K, Grobler A, et al. Integration of antiretroviral therapy with tuberculosis treatment. N. Engl. J. Med. 2011; 365:1492–1501.
96. Centre for Disease Control. TB Treatment. 2010; Available at: ⬚www.cdc.gov/tb/topic/treatment/tbdisease.htm⬚.
97. WHO | Guidelines for the programmatic management of drug-resistant tuberculosis. Available at: http://www.who.int/tb/challenges/mdr/programmatic_guidelines_for_mdrtb/en/. Accessed 18 September 2013.
98. Falzon D, Jaramillo E, Schünemann HJ, et al. WHO guidelines for the programmatic management of drug-resistant tuberculosis: 2011 update. Eur. Respir. J. 2011; 38:516–528.
Stellenbosch University http://scholar.sun.ac.za

P a g e | 167
99. Gandhi NR, Moll A, Sturm AW, et al. Extensively drug-resistant tuberculosis as a cause of death in patients co-infected with tuberculosis and HIV in a rural area of South Africa. Lancet 2006; 368:1575–1580.
100. Dheda K, Shean K, Zumla A, et al. Early treatment outcomes and HIV status of patients with extensively drug-resistant tuberculosis in South Africa: a retrospective cohort study. Lancet 2010; 375:1798–1807.
101. Jacobson KR, Tierney DB, Jeon CY, Mitnick CD, Murray MB. Treatment outcomes among patients with extensively drug-resistant tuberculosis: systematic review and meta-analysis. Clin. Infect. Dis. Off. Publ. Infect. Dis. Soc. Am. 2010; 51:6–14.
102. Ahuja SD, Ashkin D, Avendano M, et al. Multidrug resistant pulmonary tuberculosis treatment regimens and patient outcomes: an individual patient data meta-analysis of 9,153 patients. PLoS Med. 2012; 9:e1001300.
103. Diacon AH, Pym A, Grobusch M, et al. The diarylquinoline TMC207 for multidrug-resistant tuberculosis. N. Engl. J. Med. 2009; 360:2397–2405.
104. Diacon AH, Dawson R, von Groote-Bidlingmaier F, et al. 14-day bactericidal activity of PA-824, bedaquiline, pyrazinamide, and moxifloxacin combinations: a randomised trial. Lancet 2012; 380:986–993.
105. Gler MT, Skripconoka V, Sanchez-Garavito E, et al. Delamanid for multidrug-resistant pulmonary tuberculosis. N. Engl. J. Med. 2012; 366:2151–2160.
106. Lee M, Lee J, Carroll MW, et al. Linezolid for treatment of chronic extensively drug-resistant tuberculosis. N. Engl. J. Med. 2012; 367:1508–1518.
107. Updated Guidelines for Using Interferon Gamma Release Assays to Detect Mycobacterium tuberculosis Infection --- United States, 2010. Available at: http://www.cdc.gov/mmwr/preview/mmwrhtml/rr5905a1.htm. Accessed 18 September 2013.
108. WHO | WHO policy on collaborative TB/HIV activities: guidelines for national programmes and other stakeholders. Available at: http://www.who.int/tb/publications/2012/tb_hiv_policy_9789241503006/en/. Accessed 18 September 2013.
109. Akolo C, Adetifa I, Shepperd S, Volmink J. Treatment of latent tuberculosis infection in HIV infected persons. Cochrane Database Syst. Rev. 2010; :CD000171.
110. Martinson NA, Barnes GL, Moulton LH, et al. New regimens to prevent tuberculosis in adults with HIV infection. N. Engl. J. Med. 2011; 365:11–20.
111. Samandari T, Agizew TB, Nyirenda S, et al. 6-month versus 36-month isoniazid preventive treatment for tuberculosis in adults with HIV infection in Botswana: a randomised, double-blind, placebo-controlled trial. Lancet 2011; 377:1588–1598.
112. Sterling TR, Villarino ME, Borisov AS, et al. Three months of rifapentine and isoniazid for latent tuberculosis infection. N. Engl. J. Med. 2011; 365:2155–2166.
Stellenbosch University http://scholar.sun.ac.za

P a g e | 168
113. WHO | Guidelines for intensified tuberculosis case-finding and isoniazid preventive therapy for people living with HIV in resource-constrained settings. Available at: http://www.who.int/hiv/pub/tb/9789241500708/en/. Accessed 18 September 2013.
114. Narasimhan P, Wood J, MacIntyre CR, Mathai D. Risk Factors for Tuberculosis. Pulm. Med. 2013; 2013. Available at: http://www.hindawi.com/journals/pm/2013/828939/abs/. Accessed 19 September 2013.
115. Schmidt CW. Linking TB and the Environment: An Overlooked Mitigation Strategy. Environ. Health Perspect. 2008; 116:A478–A485.
116. Dubos R, Dubos J. The White Plague: Tuberculosis, Man and Society. Boston: Little, Brown & Co., 1952.
117. Farmer P, Robin S, Ramilus SL, Kim JY. Tuberculosis, poverty, and ‘compliance’: lessons from rural Haiti. Semin.Respir.Infect. 1991; 6:254–260.
118. Lienhardt C, Fielding K, Sillah J, et al. Risk factors for tuberculosis infection in sub-Saharan Africa - A contact study in The Gambia. Am. J. Respir. Crit. Care Med. 2003; 168:448–455.
119. Farmer P. Social scientists and the new tuberculosis. Soc.Sci.Med. 1997; 44:347–358.
120. Cegielski JP, McMurray DN. The relationship between malnutrition and tuberculosis: evidence from studies in humans and experimental animals. IntJTubercLung Dis 2004; 8:286–298.
121. Comstock GW, Palmer CE. Long-term results of BCG vaccination in the southern United States. Am. Rev. Respir. Dis. 1966; 93:171–183.
122. Cegielski JP, Kohlmeier L, Cornoni-Huntley J. Malnutrition and tuberculosis in a nationally representative cohort of adults in the United States, 1971–1987. In: Proceedings of the 44th Annual Meeting, American Society of Tropical Medicine and Hygiene. San Antonio, Texas, USA: 1995: 152.
123. Chanarin I, Stephenson E. Vegetarian diet and cobalamin deficiency: their association with tuberculosis. J.Clin.Pathol. 1988; 41:759–762.
124. Finch PJ, Ang L, Eastwood JB, Maxwell JD. Clinical and histological spectrum of osteomalacia among Asians in south London. Q.J.Med. 1992; 83:439–448.
125. Yang S, Smith C, Prahl JM, Luo X, Deluca HF. Vitamin D deficiency suppresses cell-mediated immunity in vivo. Arch.Biochem.Biophys. 1993; 303:98–106.
126. Schaible UE, Kaufmann SH. Malnutrition and infection: complex mechanisms and global impacts. PLoS.Med. 2007; 4:e115.
127. Maurya V, Vijayan VK, Shah A. Smoking and tuberculosis: an association overlooked. Int. J. Tuberc. Lung Dis. Off. J. Int. Union Tuberc. Lung Dis. 2002; 6:942–951.
128. Arcavi L, Benowitz NL. Cigarette smoking and infection. Arch. Intern. Med. 2004; 164:2206–2216.
Stellenbosch University http://scholar.sun.ac.za

P a g e | 169
129. Bates MN, Khalakdina A, Pai M, Chang L, Lessa F, Smith KR. Risk of tuberculosis from exposure to tobacco smoke: a systematic review and meta-analysis. Arch. Intern. Med. 2007; 167:335–342.
130. Pai M, Mohan A, Dheda K, et al. Lethal interaction: the colliding epidemics of tobacco and tuberculosis. Expert Rev. Anti Infect. Ther. 2007; 5:385–391.
131. Slama K, Chiang C-Y, Enarson DA, et al. Tobacco and tuberculosis: a qualitative systematic review and meta-analysis. Int. J. Tuberc. Lung Dis. Off. J. Int. Union Tuberc. Lung Dis. 2007; 11:1049–1061.
132. Yanbaeva DG, Dentener MA, Creutzberg EC, Wesseling G, Wouters EFM. Systemic effects of smoking. Chest 2007; 131:1557–1566.
133. Houtmeyers E, Gosselink R, Gayan-Ramirez G, Decramer M. Regulation of mucociliary clearance in health and disease. Eur. Respir. J. 1999; 13:1177–1188.
134. Sopori M. Effects of cigarette smoke on the immune system. Nat. Rev. Immunol. 2002; 2:372–377.
135. Wang H, Yu M, Ochani M, et al. Nicotinic acetylcholine receptor α7 subunit is an essential regulator of inflammation. Nature 2003; 421:384–388.
136. Shang S, Ordway D, Henao-Tamayo M, et al. Cigarette smoke increases susceptibility to tuberculosis--evidence from in vivo and in vitro models. J. Infect. Dis. 2011; 203:1240–1248.
137. Fok A, Numata Y, Schulzer M, FitzGerald MJ. Risk factors for clustering of tuberculosis cases: a systematic review of population-based molecular epidemiology studies. Int. J. Tuberc. Lung Dis. Off. J. Int. Union Tuberc. Lung Dis. 2008; 12:480–492.
138. Lönnroth K, Williams BG, Stadlin S, Jaramillo E, Dye C. Alcohol use as a risk factor for tuberculosis - a systematic review. BMC Public Health 2008; 8:289.
139. Szabo SJ, Dighe AS, Gubler U, Murphy KM. Regulation of the interleukin (IL)-12R beta 2 subunit expression in developing T helper 1 (Th1) and Th2 cells. J.Exp.Med. 1997; 185:817–824.
140. Comstock GW. Tuberculosis in twins: a re-analysis of the Prophit survey. Am.Rev.Respir.Dis. 1978; 117:621–624.
141. Kallmann FJ, Reisner D. Twin studies on the significance of genetic factors in tuberculosis. Am.Rev.Tuberc 1943; 47:549–547.
142. Simonds B. Tuberculosis in twins. Pitman Medical Publishing Company, 2004.
143. Hill AV. Genetics and genomics of infectious disease susceptibility. Br.Med.Bull. 1999; 55:401–413.
144. Hoal EG. Human genetic susceptibility to tuberculosis and other mycobacterial diseases. IUBMB.Life 2002; 53:225–229.
145. Bellamy R. Susceptibility to mycobacterial infections: the importance of host genetics. Genes Immun 2003; 4:4–11.
Stellenbosch University http://scholar.sun.ac.za

P a g e | 170
146. Möller M, Hoal EG. Current findings, challenges and novel approaches in human genetic susceptibility to tuberculosis. Tuberculosis.(Edinb.) 2010; 90:71–83.
147. Serpa JA, Teeter LD, Musser JM, Graviss EA. Tuberculosis disparity between US-born blacks and whites, Houston, Texas, USA. Emerg.Infect.Dis. 2009; 15:899–904.
148. Diehl K, Von Verschuer O. Der Erbeinfluss bei der Tuberkulose. London: Gustav Fischer, 1936.
149. Uehlinger E, K•insch M. šber Zwillingstuberkulose. Beitrage Zur Klin. Tuberk. 1938; 92:275–370.
150. Harvald H, Hauge M. Hereditary factors elucidated by twin studies. In: Genetics and the epidemiology of chronic diseases. Washington: S Department of Health, Education and Welfare, US Public Health Service, Division of Chronic Diseases, 1965: 61–76.
151. Van der Eijk EA, Van D, Vandenbroucke JP, van Dissel JT. Heredity versus environment in tuberculosis in twins: the 1950s United Kingdom Prophit Survey Simonds and Comstock revisited. AmJRespirCrit Care Med 2007; 176:1281–1288.
152. Hershberg R, Lipatov M, Small PM, et al. High functional diversity in Mycobacterium tuberculosis driven by genetic drift and human demography. PLoS Biol. 2008; 6:e311.
153. Motulsky AG. Metabolic polymorphisms and the role of infectious diseases in human evolution. Hum. Biol. 1960; 32:28–62.
154. Alcais A, Abel L. Application of genetic epidemiology to dissecting host susceptibility/resistance to infection illustrated with the study of common mycobacterial infections. In: Susceptibility to infectious diseases - The importance of host genetics. Cambridge: Cambridge University Press, 2004: 7–33.
155. Alter A, Huong NT, Singh M, et al. Human leukocyte antigen class I region single-nucleotide polymorphisms are associated with leprosy susceptibility in Vietnam and India. J. Infect. Dis. 2011; 203:1274–1281.
156. Lander ES, Schork NJ. Genetic dissection of complex traits. Science 1994; 265:2037–2048.
157. Daly AK, Day CP. Candidate gene case-control association studies: advantages and potential pitfalls. Br.J.Clin.Pharmacol. 2001; 52:489–499.
158. Flynn JL. Lessons from experimental Mycobacterium tuberculosis infections. Microbes.Infect. 2006; 8:1179–1188.
159. Cellier M, Govoni G, Vidal S, et al. Human natural resistance-associated macrophage protein: cDNA cloning, chromosomal mapping, genomic organization, and tissue-specific expression. J.Exp.Med. 1994; 180:1741–1752.
160. Vidal S, Tremblay ML, Govoni G, et al. The Ity/Lsh/Bcg locus: natural resistance to infection with intracellular parasites is abrogated by disruption of the Nramp1 gene. J.Exp.Med. 1995; 182:655–666.
161. Lander ES, Schork NJ. Genetic dissection of complex traits. Science 1994; 265:2037–2048.
Stellenbosch University http://scholar.sun.ac.za

P a g e | 171
162. Balding DJ. A tutorial on statistical methods for population association studies. Nat.Rev.Genet. 2006; 7:781–791.
163. Weiss KM, Clark AG. Linkage disequilibrium and the mapping of complex human traits. Trends Genet 2002; 18:19–24.
164. Kathiresan S, Newton-Cheh C, Gerszten RE. On the interpretation of genetic association studies. EurHeart J 2004; 25:1378–1381.
165. Burgner D, Jamieson SE, Blackwell JM. Genetic susceptibility to infectious diseases: big is beautiful, but will bigger be even better? Lancet InfectDis 2006; 6:653–663.
166. Risch N, Merikangas K. The future of genetic studies of complex human diseases. Science 1996; 273:1516–1517.
167. Gambaro G, Anglani F, D’Angelo A. Association studies of genetic polymorphisms and complex disease. Lancet 2000; 355:308–311.
168. Newport MJ, Nejentsev S. Genetics of susceptibility to tuberculosis in humans. Monaldi ArchChest Dis 2004; 61:102–111.
169. Newport MJ. Why hasn’t human genetics told us more about tuberculosis? IntJTubercLung Dis 2009; 13:1049–1050.
170. Altshuler D, Daly MJ, Lander ES. Genetic mapping in human disease. Science 2008; 322:881–888.
171. Soborg C, Madsen HO, Andersen AB, Lillebaek T, Kok-Jensen A, Garred P. Mannose-binding lectin polymorphisms in clinical tuberculosis. J.Infect.Dis. 2003; 188:777–782.
172. The International HapMap Consortium. The International HapMap Project. Nature 2003; 426:789–796.
173. The International HapMap Consortium. A haplotype map of the human genome. Nature 2005; 437:1299–1320.
174. The International HapMap Consortium. A second generation human haplotype map of over 3.1 million SNPs. Nature 2007; 449:851–861.
175. Hindorff LA, MacArthur J (European Bioinformatics Institute), Morales J (European Bioinformatics Institute), et al. A Catalog of Published Genome-Wide Association Studies. Available at: www.genome.gov/gwastudies.
176. Le Clerc S, Limou S, Coulonges C, et al. Genomewide association study of a rapid progression cohort identifies new susceptibility alleles for AIDS (ANRS Genomewide Association Study 03). J. Infect. Dis. 2009; 200:1194–1201.
177. Limou S, Le Clerc S, Coulonges C, et al. Genomewide association study of an AIDS-nonprogression cohort emphasizes the role played by HLA genes (ANRS Genomewide Association Study 02). J. Infect. Dis. 2009; 199:419–426.
178. Troyer JL, Nelson GW, Lautenberger JA, et al. Genome-wide association study implicates PARD3B-based AIDS restriction. J. Infect. Dis. 2011; 203:1491–1502.
Stellenbosch University http://scholar.sun.ac.za

P a g e | 172
179. Kamatani Y, Wattanapokayakit S, Ochi H, et al. A genome-wide association study identifies variants in the HLA-DP locus associated with chronic hepatitis B in Asians. Nat Genet 2009; 41:591–595.
180. Mbarek H, Ochi H, Urabe Y, et al. A genome-wide association study of chronic hepatitis B identified novel risk locus in a Japanese population. Hum. Mol. Genet. 2011; 20:3884–3892.
181. Liu L, Li J, Yao J, et al. A genome-wide association study with DNA pooling identifies the variant rs11866328 in the GRIN2A gene that affects disease progression of chronic HBV infection. Viral Immunol. 2011; 24:397–402.
182. Nishida N, Sawai H, Matsuura K, et al. Genome-wide association study confirming association of HLA-DP with protection against chronic hepatitis B and viral clearance in Japanese and Korean. PloS One 2012; 7:e39175.
183. Rauch A, Kutalik Z, Descombes P, et al. Genetic variation in IL28B is associated with chronic hepatitis C and treatment failure: a genome-wide association study. Gastroenterology 2010; 138:1338–1345, 1345.e1–7.
184. Fellay J, Thompson AJ, Ge D, et al. ITPA gene variants protect against anaemia in patients treated for chronic hepatitis C. Nature 2010; 464:405–408.
185. Miki D, Ochi H, Hayes CN, et al. Variation in the DEPDC5 locus is associated with progression to hepatocellular carcinoma in chronic hepatitis C virus carriers. Nat. Genet. 2011; 43:797–800.
186. Burgner D, Davila S, Breunis WB, et al. A genome-wide association study identifies novel and functionally related susceptibility Loci for Kawasaki disease. PLoS.Genet. 2009; 5:e1000319.
187. Kim J-J, Hong YM, Sohn S, et al. A genome-wide association analysis reveals 1p31 and 2p13.3 as susceptibility loci for Kawasaki disease. Hum. Genet. 2011; 129:487–495.
188. Tsai F-J, Lee Y-C, Chang J-S, et al. Identification of novel susceptibility Loci for kawasaki disease in a Han chinese population by a genome-wide association study. PloS One 2011; 6:e16853.
189. Khor CC, Davila S, Breunis WB, et al. Genome-wide association study identifies FCGR2A as a susceptibility locus for Kawasaki disease. Nat. Genet. 2011; 43:1241–1246.
190. Onouchi Y, Ozaki K, Burns JC, et al. A genome-wide association study identifies three new risk loci for Kawasaki disease. Nat. Genet. 2012; 44:517–521.
191. Lee Y-C, Kuo H-C, Chang J-S, et al. Two new susceptibility loci for Kawasaki disease identified through genome-wide association analysis. Nat. Genet. 2012; 44:522–525.
192. Zhang FR, Huang W, Chen SM, et al. Genomewide association study of leprosy. N.Engl.J.Med. 2009; 361:2609–2618.
193. Zhang F, Liu H, Chen S, et al. Identification of two new loci at IL23R and RAB32 that influence susceptibility to leprosy. Nat. Genet. 2011; 43:1247–1251.
194. Jallow M, Teo YY, Small KS, et al. Genome-wide and fine-resolution association analysis of malaria in West Africa. Nat. Genet. 2009; 41:657–665.
Stellenbosch University http://scholar.sun.ac.za

P a g e | 173
195. Timmann C, Thye T, Vens M, et al. Genome-wide association study indicates two novel resistance loci for severe malaria. Nature 2012; 489:443–446.
196. Davila S, Wright VJ, Khor CC, et al. Genome-wide association study identifies variants in the CFH region associated with host susceptibility to meningococcal disease. Nat.Genet. 2010; 42:772–776.
197. Thye T, Vannberg FO, Wong SH, et al. Genome-wide association analyses identifies a susceptibility locus for tuberculosis on chromosome 18q11.2. Nat.Genet. 2010; 42:739–741.
198. Png E, Alisjahbana B, Sahiratmadja E, et al. A genome wide association study of pulmonary tuberculosis susceptibility in Indonesians. BMC Med. Genet. 2012; 13:5.
199. Thye T, Owusu-Dabo E, Vannberg FO, et al. Common variants at 11p13 are associated with susceptibility to tuberculosis. Nat. Genet. 2012; 44:257–259.
200. Mahasirimongkol S, Yanai H, Mushiroda T, et al. Genome-wide association studies of tuberculosis in Asians identify distinct at-risk locus for young tuberculosis. J. Hum. Genet. 2012; 57:363–367.
201. Chimusa ER, Zaitlen N, Daya M, et al. Genome-wide association study of ancestry-specific TB risk in the South African Coloured population. Hum. Mol. Genet. 2013;
202. Kilpinen H, Barrett JC. How next-generation sequencing is transforming complex disease genetics. Trends Genet. TIG 2013; 29:23–30.
203. Franke A, McGovern DPB, Barrett JC, et al. Genome-wide meta-analysis increases to 71 the number of confirmed Crohn’s disease susceptibility loci. Nat. Genet. 2010; 42:1118–1125.
204. Stenson PD, Mort M, Ball EV, et al. The Human Gene Mutation Database: 2008 update. Genome Med. 2009; 1:13.
205. Glessner JT, Wang K, Cai G, et al. Autism genome-wide copy number variation reveals ubiquitin and neuronal genes. Nature 2009; 459:569–573.
206. Pinto D, Pagnamenta AT, Klei L, et al. Functional impact of global rare copy number variation in autism spectrum disorders. Nature 2010; 466:368–372.
207. Reddy MVPL, Iatan I, Weissglas-Volkov D, et al. Exome sequencing identifies 2 rare variants for low high-density lipoprotein cholesterol in an extended family. Circ. Cardiovasc. Genet. 2012; 5:538–546.
208. 1000 Genomes Project Consortium (2010). A map of human genome variation from population-scale sequencing. Nature 2010; 467:1061–1073.
209. DePristo MA, Banks E, Poplin R, et al. A framework for variation discovery and genotyping using next-generation DNA sequencing data. Nat. Genet. 2011; 43:491–498.
210. Hsi-Yang Fritz M, Leinonen R, Cochrane G, Birney E. Efficient storage of high throughput DNA sequencing data using reference-based compression. Genome Res. 2011; 21:734–740.
211. Barrow AD, Trowsdale J. The extended human leukocyte receptor complex: diverse ways of modulating immune responses. Immunol. Rev. 2008; 224:98–123.
Stellenbosch University http://scholar.sun.ac.za

P a g e | 174
212. Kuroki K, Furukawa A, Maenaka K. Molecular Recognition of Paired Receptors in the Immune System. Front. Microbiol. 2012; 3. Available at: http://www.ncbi.nlm.nih.gov/pmc/articles/PMC3533184/. Accessed 19 September 2013.
213. Parham P. Immunogenetics of killer-cell immunoglobulin-like receptors. Tissue Antigens 2003; 62:194–200.
214. Burek MK, Grubic Z, Stingl K, Zunec R. Distribution of KIR genes in the Croatian population. Hum. Immunol. 2013; 74:952–956.
215. Lanier LL. NK cell receptors. Annu. Rev. Immunol. 1998; 16:359–393.
216. Vilches C, Parham P. KIR: diverse, rapidly evolving receptors of innate and adaptive immunity. Annu. Rev. Immunol. 2002; 20:217–251.
217. Biron CA, Nguyen KB, Pien GC, Cousens LP, Salazar-Mather TP. Natural killer cells in antiviral defense: function and regulation by innate cytokines. Annu. Rev. Immunol. 1999; 17:189–220.
218. Rajalingam R. Killer cell immunoglobulin-like receptors influence the innate and adaptive immune responses. Iran. J. Immunol. IJI 2007; 4:61–78.
219. Jonsson AH, Yokoyama WM. Natural killer cell tolerance licensing and other mechanisms. Adv. Immunol. 2009; 101:27–79.
220. Ljunggren HG, Kärre K. In search of the ‘missing self’: MHC molecules and NK cell recognition. Immunol. Today 1990; 11:237–244.
221. Colucci F, Di Santo JP, Leibson PJ. Natural killer cell activation in mice and men: different triggers for similar weapons? Nat. Immunol. 2002; 3:807–813.
222. Lanier LL. NK cell recognition. Annu. Rev. Immunol. 2005; 23:225–274.
223. EMBL-EBI. IPD-KIR Database. Available at: http://www.ebi.ac.uk/ipd/kir/introduction.html.
224. Valiante NM, Uhrberg M, Shilling HG, et al. Functionally and structurally distinct NK cell receptor repertoires in the peripheral blood of two human donors. Immunity 1997; 7:739–751.
225. Martin MP, Bashirova A, Traherne J, Trowsdale J, Carrington M. Cutting edge: expansion of the KIR locus by unequal crossing over. J. Immunol. Baltim. Md 1950 2003; 171:2192–2195.
226. Martin AM, Kulski JK, Gaudieri S, et al. Comparative genomic analysis, diversity and evolution of two KIR haplotypes A and B. Gene 2004; 335:121–131.
227. Kulkarni S, Martin MP, Carrington M. The Yin and Yang of HLA and KIR in human disease. Semin.Immunol. 2008; 20:343–352.
228. Gonzalez-Galarza FF, Christmas S, Middleton D, Jones AR. Allele frequency net: a database and online repository for immune gene frequencies in worldwide populations. Nucleic Acids Res 2011; 39:D913–D919.
229. Hsu KC, Liu X-R, Selvakumar A, Mickelson E, O’Reilly RJ, Dupont B. Killer Ig-like receptor haplotype analysis by gene content: evidence for genomic diversity with a minimum of six
Stellenbosch University http://scholar.sun.ac.za

P a g e | 175
basic framework haplotypes, each with multiple subsets. J. Immunol. Baltim. Md 1950 2002; 169:5118–5129.
230. Gómez-Lozano N, Gardiner CM, Parham P, Vilches C. Some human KIR haplotypes contain two KIR2DL5 genes: KIR2DL5A and KIR2DL5B. Immunogenetics 2002; 54:314–319.
231. Uhrberg M, Parham P, Wernet P. Definition of gene content for nine common group B haplotypes of the Caucasoid population: KIR haplotypes contain between seven and eleven KIR genes. Immunogenetics 2002; 54:221–229.
232. Khakoo SI, Carrington M. KIR and disease: a model system or system of models? Immunol. Rev. 2006; 214:186–201.
233. Yawata M, Yawata N, Abi-Rached L, Parham P. Variation within the human killer cell immunoglobulin-like receptor (KIR) gene family. Crit. Rev. Immunol. 2002; 22:463–482.
234. Parham P. MHC class I molecules and KIRs in human history, health and survival. Nat. Rev. Immunol. 2005; 5:201–214.
235. Cella M, Longo A, Ferrara GB, Strominger JL, Colonna M. NK3-specific natural killer cells are selectively inhibited by Bw4-positive HLA alleles with isoleucine 80. J. Exp. Med. 1994; 180:1235–1242.
236. Gumperz JE, Barber LD, Valiante NM, et al. Conserved and variable residues within the Bw4 motif of HLA-B make separable contributions to recognition by the NKB1 killer cell-inhibitory receptor. J. Immunol. Baltim. Md 1950 1997; 158:5237–5241.
237. Carr WH, Pando MJ, Parham P. KIR3DL1 polymorphisms that affect NK cell inhibition by HLA-Bw4 ligand. J. Immunol. Baltim. Md 1950 2005; 175:5222–5229.
238. Martin MP, Qi Y, Gao X, et al. Innate partnership of HLA-B and KIR3DL1 subtypes against HIV-1. Nat.Genet. 2007; 39:733–740.
239. Wende H, Volz A, Ziegler A. Extensive gene duplications and a large inversion characterize the human leukocyte receptor cluster. Immunogenetics 2000; 51:703–713.
240. Barten R, Torkar M, Haude A, Trowsdale J, Wilson MJ. Divergent and convergent evolution of NK-cell receptors. Trends Immunol. 2001; 22:52–57.
241. Liu Y-J. IPC: professional type 1 interferon-producing cells and plasmacytoid dendritic cell precursors. Annu. Rev. Immunol. 2005; 23:275–306.
242. Cao W, Rosen DB, Ito T, et al. Plasmacytoid dendritic cell-specific receptor ILT7-Fc epsilonRI gamma inhibits Toll-like receptor-induced interferon production. J. Exp. Med. 2006; 203:1399–1405.
243. Brown D, Trowsdale J, Allen R. The LILR family: modulators of innate and adaptive immune pathways in health and disease. Tissue Antigens 2004; 64:215–225.
244. Chang CC, Ciubotariu R, Manavalan JS, et al. Tolerization of dendritic cells by T(S) cells: the crucial role of inhibitory receptors ILT3 and ILT4. Nat. Immunol. 2002; 3:237–243.
Stellenbosch University http://scholar.sun.ac.za

P a g e | 176
245. Young NT, Waller ECP, Patel R, Roghanian A, Austyn JM, Trowsdale J. The inhibitory receptor LILRB1 modulates the differentiation and regulatory potential of human dendritic cells. Blood 2008; 111:3090–3096.
246. Kim-Schulze S, Scotto L, Vlad G, et al. Recombinant Ig-like transcript 3-Fc modulates T cell responses via induction of Th anergy and differentiation of CD8+ T suppressor cells. J. Immunol. Baltim. Md 1950 2006; 176:2790–2798.
247. Suciu-Foca N, Cortesini R. Central role of ILT3 in the T suppressor cell cascade. Cell. Immunol. 2007; 248:59–67.
248. Lee DJ, Sieling PA, Ochoa MT, et al. LILRA2 activation inhibits dendritic cell differentiation and antigen presentation to T cells. J. Immunol. Baltim. Md 1950 2007; 179:8128–8136.
249. Gonen-Gross T, Achdout H, Gazit R, et al. Complexes of HLA-G protein on the cell surface are important for leukocyte Ig-like receptor-1 function. J. Immunol. Baltim. Md 1950 2003; 171:1343–1351.
250. Shiroishi M, Kuroki K, Rasubala L, et al. Structural basis for recognition of the nonclassical MHC molecule HLA-G by the leukocyte Ig-like receptor B2 (LILRB2/LIR2/ILT4/CD85d). Proc. Natl. Acad. Sci. U. S. A. 2006; 103:16412–16417.
251. Meyaard L, Adema GJ, Chang C, et al. LAIR-1, a novel inhibitory receptor expressed on human mononuclear leukocytes. Immunity 1997; 7:283–290.
252. Poggi A, Pella N, Morelli L, et al. p40, a novel surface molecule involved in the regulation of the non-major histocompatibility complex-restricted cytolytic activity in humans. Eur. J. Immunol. 1995; 25:369–376.
253. Poggi A, Tomasello E, Revello V, Nanni L, Costa P, Moretta L. p40 molecule regulates NK cell activation mediated by NK receptors for HLA class I antigens and TCR-mediated triggering of T lymphocytes. Int. Immunol. 1997; 9:1271–1279.
254. Ouyang W, Ma D, Lin D, et al. 9.1C3 is identical to LAIR-1, which is expressed on hematopoietic progenitors. Biochem. Biophys. Res. Commun. 2003; 310:1236–1240.
255. Maasho K, Masilamani M, Valas R, Basu S, Coligan JE, Borrego F. The inhibitory leukocyte-associated Ig-like receptor-1 (LAIR-1) is expressed at high levels by human naive T cells and inhibits TCR mediated activation. Mol. Immunol. 2005; 42:1521–1530.
256. Meyaard L, Hurenkamp J, Clevers H, Lanier LL, Phillips JH. Leukocyte-associated Ig-like receptor-1 functions as an inhibitory receptor on cytotoxic T cells. J. Immunol. Baltim. Md 1950 1999; 162:5800–5804.
257. Poggi A, Tomasello E, Ferrero E, Zocchi MR, Moretta L. p40/LAIR-1 regulates the differentiation of peripheral blood precursors to dendritic cells induced by granulocyte-monocyte colony-stimulating factor. Eur. J. Immunol. 1998; 28:2086–2091.
258. Xu M j, Zhao R, Zhao ZJ. Identification and characterization of leukocyte-associated Ig-like receptor-1 as a major anchor protein of tyrosine phosphatase SHP-1 in hematopoietic cells. J. Biol. Chem. 2000; 275:17440–17446.
Stellenbosch University http://scholar.sun.ac.za

P a g e | 177
259. Sathish JG, Johnson KG, Fuller KJ, et al. Constitutive association of SHP-1 with leukocyte-associated Ig-like receptor-1 in human T cells. J. Immunol. Baltim. Md 1950 2001; 166:1763–1770.
260. Lebbink RJ, de Ruiter T, Adelmeijer J, et al. Collagens are functional, high affinity ligands for the inhibitory immune receptor LAIR-1. J. Exp. Med. 2006; 203:1419–1425.
261. Jandrot-Perrus M, Busfield S, Lagrue AH, et al. Cloning, characterization, and functional studies of human and mouse glycoprotein VI: a platelet-specific collagen receptor from the immunoglobulin superfamily. Blood 2000; 96:1798–1807.
262. Moroi M, Jung SM, Okuma M, Shinmyozu K. A patient with platelets deficient in glycoprotein VI that lack both collagen-induced aggregation and adhesion. J. Clin. Invest. 1989; 84:1440–1445.
263. Lebbink RJ, de Ruiter T, Kaptijn GJA, et al. Mouse leukocyte-associated Ig-like receptor-1 (mLAIR-1) functions as an inhibitory collagen-binding receptor on immune cells. Int. Immunol. 2007; 19:1011–1019.
264. Meyaard L. The inhibitory collagen receptor LAIR-1 (CD305). J. Leukoc. Biol. 2008; 83:799–803.
265. Ding Y, Xu G, Yang M, et al. Crystal structure of the ectodomain of human FcalphaRI. J. Biol. Chem. 2003; 278:27966–27970.
266. Herr AB, Ballister ER, Bjorkman PJ. Insights into IgA-mediated immune responses from the crystal structures of human FcalphaRI and its complex with IgA1-Fc. Nature 2003; 423:614–620.
267. Monteiro RC, Van De Winkel JGJ. IgA Fc receptors. Annu. Rev. Immunol. 2003; 21:177–204.
268. Morton HC, van Egmond M, van de Winkel JG. Structure and function of human IgA Fc receptors (Fc alpha R). Crit. Rev. Immunol. 1996; 16:423–440.
269. Grossetête B, Launay P, Lehuen A, Jungers P, Bach JF, Monteiro RC. Down-regulation of Fc alpha receptors on blood cells of IgA nephropathy patients: evidence for a negative regulatory role of serum IgA. Kidney Int. 1998; 53:1321–1335.
270. Yoo EM, Morrison SL. IgA: an immune glycoprotein. Clin. Immunol. Orlando Fla 2005; 116:3–10.
271. Otten MA, van Egmond M. The Fc receptor for IgA (FcalphaRI, CD89). Immunol. Lett. 2004; 92:23–31.
272. Van Egmond M, Damen CA, van Spriel AB, Vidarsson G, van Garderen E, van de Winkel JG. IgA and the IgA Fc receptor. Trends Immunol. 2001; 22:205–211.
273. Kanamaru Y, Tamouza H, Pfirsch S, et al. IgA Fc receptor I signals apoptosis through the FcRgamma ITAM and affects tumor growth. Blood 2007; 109:203–211.
274. Moretta A, Bottino C, Vitale M, et al. Activating receptors and coreceptors involved in human natural killer cell-mediated cytolysis. Annu. Rev. Immunol. 2001; 19:197–223.
Stellenbosch University http://scholar.sun.ac.za

P a g e | 178
275. Pessino A, Sivori S, Bottino C, et al. Molecular cloning of NKp46: a novel member of the immunoglobulin superfamily involved in triggering of natural cytotoxicity. J. Exp. Med. 1998; 188:953–960.
276. Mandelboim O, Lieberman N, Lev M, et al. Recognition of haemagglutinins on virus-infected cells by NKp46 activates lysis by human NK cells. Nature 2001; 409:1055–1060.
277. Ferlazzo G, Tsang ML, Moretta L, Melioli G, Steinman RM, Münz C. Human dendritic cells activate resting natural killer (NK) cells and are recognized via the NKp30 receptor by activated NK cells. J. Exp. Med. 2002; 195:343–351.
278. Gerosa F, Baldani-Guerra B, Nisii C, Marchesini V, Carra G, Trinchieri G. Reciprocal activating interaction between natural killer cells and dendritic cells. J. Exp. Med. 2002; 195:327–333.
279. Piccioli D, Sbrana S, Melandri E, Valiante NM. Contact-dependent stimulation and inhibition of dendritic cells by natural killer cells. J. Exp. Med. 2002; 195:335–341.
280. Spaggiari GM, Carosio R, Pende D, et al. NK cell-mediated lysis of autologous antigen-presenting cells is triggered by the engagement of the phosphatidylinositol 3-kinase upon ligation of the natural cytotoxicity receptors NKp30 and NKp46. Eur. J. Immunol. 2001; 31:1656–1665.
281. Moretta A. Natural killer cells and dendritic cells: rendezvous in abused tissues. Nat. Rev. Immunol. 2002; 2:957–964.
282. Mungall AJ, Palmer SA, Sims SK, et al. The DNA sequence and analysis of human chromosome 6. Nature 2003; 425:805–811.
283. Robinson J, Halliwell JA, McWilliam H, Lopez R, Parham P, Marsh SGE. The IMGT/HLA database. Nucleic Acids Res. 2012; 41:D1222–D1227.
284. Charles A Janeway J, Travers P, Walport M, Shlomchik MJ. The major histocompatibility complex and its functions. 2001. Available at: http://www.ncbi.nlm.nih.gov/books/NBK27156/. Accessed 25 September 2013.
285. Addison’s Disease: The insufficiency of adrenal glands. Available at: academics.regis.edu.
286. Role of MHC molecules. Available at: http://bio1152.nicerweb.com/Locked/media/ch43/mhc.html.
287. Horton R, Wilming L, Rand V, et al. Gene map of the extended human MHC. Nat. Rev. Genet. 2004; 5:889–899.
288. Sidney J, Peters B, Frahm N, Brander C, Sette A. HLA class I supertypes: a revised and updated classification. BMC Immunol. 2008; 9:1.
289. Ghaffar A, Nagarkatti P. MHC: Genetics and role in tranplantation. In: Immunology. University of South Carolina School of Medicine:
290. Groothuis TAM, Griekspoor AC, Neijssen JJ, Herberts CA, Neefjes JJ. MHC class I alleles and their exploration of the antigen-processing machinery. Immunol. Rev. 2005; 207:60–76.
Stellenbosch University http://scholar.sun.ac.za

P a g e | 179
291. Marsh SGE, Albert ED, Bodmer WF, et al. Nomenclature for factors of the HLA system, 2010. Tissue Antigens 2010; 75:291–455.
292. Marsh SG. Nomenclature for Factors of the HLA System. Available at: http://hla.alleles.org/nomenclature/naming.html.
293. Histocompatibility Molecules. Available at: http://users.rcn.com/jkimball.ma.ultranet/BiologyPages/H/HLA.html#Class_I_Histocompatibility_Molecules.
294. Sigal LJ, Crotty S, Andino R, Rock KL. Cytotoxic T-cell immunity to virus-infected non-haematopoietic cells requires presentation of exogenous antigen. Nature 1999; 398:77–80.
295. Lazarevic V, Flynn J. CD8+ T cells in tuberculosis. Am. J. Respir. Crit. Care Med. 2002; 166:1116–1121.
296. Kostyu DD, Hannick LI, Traweek JL, Ghanayem M, Heilpern D, Dawson DV. HLA Class I Polymorphism: Structure and Function and Still Questions. Hum. Immunol. 1997; 57:1–18.
297. MHC Class 1. Available at: http://en.wikipedia.org/wiki/File:MHC_Class_1.svg.
298. Gomez LM, Camargo JF, Castiblanco J, Ruiz-Narvaez EA, Cadena J, Anaya JM. Analysis of IL1B, TAP1, TAP2 and IKBL polymorphisms on susceptibility to tuberculosis. Tissue Antigens 2006; 67:290–296.
299. Antoniou AN, Powis SJ, Elliott T. Assembly and export of MHC class I peptide ligands. Curr. Opin. Immunol. 2003; 15:75–81.
300. Wikipedia. MHC Class I processing. Available at: http://en.wikipedia.org/wiki/File:MHC_Class_I_processing.svg.
301. Ulvestad E, Williams K, B? L, Trapp B, Antel J, M?rk S. HLA class II molecules (HLA-DR, -DP, -DQ) on cells in the human CNS studied in situ and in vitro. Immunology 1994; 82:535–541.
302. Douek DC, Altmann DM. T-cell apoptosis and differential human leucocyte antigen class II expression in human thymus. Immunology 2000; 99:249–256.
303. Gutcher I, Becher B. APC-derived cytokines and T cell polarization in autoimmune inflammation. J. Clin. Invest. 2007; 117:1119–1127.
304. Wikipedia. MHC Class 2. Available at: http://en.wikipedia.org/wiki/File:MHC_Class_2.svg.
305. Xie T, Rowen L, Aguado B, et al. Analysis of the gene-dense major histocompatibility complex class III region and its comparison to mouse. Genome Res. 2003; 13:2621–2636.
306. Charles A Janeway J, Travers P, Walport M, Shlomchik MJ. The complement system and innate immunity. 2001. Available at: http://www.ncbi.nlm.nih.gov/books/NBK27100/. Accessed 25 September 2013.
307. Milner CM, Campbell RD. Structure and expression of the three MHC-linked HSP70 genes. Immunogenetics 1990; 32:242–251.
Stellenbosch University http://scholar.sun.ac.za

P a g e | 180
308. Gleimer M, Parham P. Stress management: MHC class I and class I-like molecules as reporters of cellular stress. Immunity 2003; 19:469–477.
309. Gruss HJ, Dower SK. The TNF ligand superfamily and its relevance for human diseases. Cytokines Mol. Ther. 1995; 1:75–105.
310. Ianello A, Debbeche O, Samarani S, Ahmad A. Antiviral NK cell responses in HIV infection: I. NK cell receptor genes as determinants of HIV resistance and progression to AIDS. J. Leukoc. Biol. 2008; 84:1–26.
311. Cooper MA, Fehniger TA, Caligiuri MA. The biology of human natural killer-cell subsets. Trends Immunol. 2001; 22:633–640.
312. Kanehisa Laboratories. Natural killer cell mediated cytotoxicity - Homo sapiens (human). Available at: http://www.genome.jp/kegg/pathway/hsa/hsa04650.html.
313. Chen K, Kolls JK. T Cell–Mediated Host Immune Defenses in the Lung. Annu. Rev. Immunol. 2013; 31:605–633.
314. Flynn JL, Goldstein MM, Triebold KJ, Koller B, Bloom BR. Major histocompatibility complex class I-restricted T cells are required for resistance to Mycobacterium tuberculosis infection. Proc.Natl.Acad.Sci.U.S.A 1992; 89:12013–12017.
315. Flynn JL, Chan J. Immunology of tuberculosis. Annu. Rev. Immunol. 2001; 19:93–129.
316. Sousa AO, Mazzaccaro RJ, Russell RG, et al. Relative contributions of distinct MHC class I-dependent cell populations in protection to tuberculosis infection in mice. Proc. Natl. Acad. Sci. U. S. A. 2000; 97:4204–4208.
317. Serbina NV, Liu CC, Scanga CA, Flynn JL. CD8+ CTL from lungs of Mycobacterium tuberculosis-infected mice express perforin in vivo and lyse infected macrophages. J. Immunol. Baltim. Md 1950 2000; 165:353–363.
318. Stenger S, Hanson DA, Teitelbaum R, et al. An antimicrobial activity of cytolytic T cells mediated by granulysin. Science 1998; 282:121–125.
319. Lombard Z, Brune AE, Hoal EG, et al. HLA class II disease associations in southern Africa. Tissue Antigens 2006; 67:97–110.
320. De Wit E, Delport W, Rugamika CE, et al. Genome-wide analysis of the structure of the South African Coloured Population in the Western Cape. Hum.Genet. 2010; 128:145–153.
321. Chimusa ER, Daya M, Möller M, et al. Determining Ancestry Proportions in Complex Admixture Scenarios in South Africa Using a Novel Proxy Ancestry Selection Method. PLoS ONE 2013; 8:e73971.
322. Barreiro LB, Neyrolles O, Babb CL, et al. Promoter Variation in the DC-SIGN Encoding Gene CD209 Is Associated with Tuberculosis. PLoS Med. 2006; 3:e20.
323. Barreiro LB, Neyrolles O, Babb CL, et al. Length Variation of DC-SIGN and L-SIGN Neck-Region has no Impact on Tuberculosis Susceptibility. Hum. Immunol. 2007; 68:106–112.
Stellenbosch University http://scholar.sun.ac.za

P a g e | 181
324. Health Systems Trust: Incidence of TB in the provinces of South Africa. http://www.hst.org.za/healthstats/16/data. 2009. Available at: http://www.hst.org.za/healthstats/16/data.
325. Munch Z, Van Lill SWP, Booysen CN, Zietsman HL, Enarson DA, Beyers N. Tuberculosis transmission patterns in a high-incidence area: a spatial analysis. Int. J. Tuberc. Lung Dis. 2003; 7:271–277.
326. Kritzinger FE, den BS, Verver S, et al. No decrease in annual risk of tuberculosis infection in endemic area in Cape Town, South Africa. Trop.Med.Int.Health 2009; 14:136–142.
327. Alves LGT, Rajalingam R, Canavez F. A novel real-time PCR method for KIR genotyping. Tissue Antigens 2008; 73:188–191.
328. Qiagen. QIAxcel Advanced System. Available at: http://www.qiagen.com/Products/Catalog/Automated-Solutions/Detection-and-Analysis/QIAxcel-Advanced-System#productdetails.
329. Welsh K, Bunce M. Molecular typing for the MHC with PCR-SSP. Rev. Immunogenet. 1999; 1:157–176.
330. Marsh SGE, Parham P, Dupont B, et al. Killer-cell immunoglobulin-like receptor (KIR) nomenclature report, 2002. Immunogenetics 2003; 55:220–226.
331. Wigginton JE, Cutler DJ, Abecasis GR. A note on exact tests of Hardy-Weinberg equilibrium. Am J Hum Genet 2005; 76:887–93.
332. Nyholt DR. A simple correction for multiple testing for single-nucleotide polymorphisms in linkage disequilibrium with each other. Am.J.Hum.Genet. 2004; 74:765–769.
333. Perneger TV. What’s wrong with Bonferroni adjustments. BMJ 1998; 316:1236–1238.
334. Campbell H, Rudan I. Interpretation of genetic association studies in complex disease. Pharmacogenomics.J. 2002; 2:349–360.
335. Schaid DJ, Rowland CM, Tines DE, Jacobson RM, Poland GA. Score tests for association between traits and haplotypes when linkage phase is ambiguous. Am. J. Hum. Genet. 2002; 70:425–434.
336. GAIN Collaborative Research Group, Manolio TA, Rodriguez LL, et al. New models of collaboration in genome-wide association studies: the Genetic Association Information Network. Nat. Genet. 2007; 39:1045–1051.
337. Miyagawa T, Nishida N, Ohashi J, et al. Appropriate data cleaning methods for genome-wide association study. J. Hum. Genet. 2008; 53:886–893.
338. Ziegler A, König IR, Thompson JR. Biostatistical aspects of genome-wide association studies. Biom. J. Biom. Z. 2008; 50:8–28.
339. Laurie CC, Doheny KF, Mirel DB, et al. Quality control and quality assurance in genotypic data for genome-wide association studies. Genet. Epidemiol. 2010; 34:591–602.
Stellenbosch University http://scholar.sun.ac.za

P a g e | 182
340. Purcell S, Neale B, Todd-Brown K, et al. PLINK: a tool set for whole-genome association and population-based linkage analyses. Am. J. Hum. Genet. 2007; 81:559–575.
341. Wellcome Trust Case Control Consortium. Genome-wide association study of 14,000 cases of seven common diseases and 3,000 shared controls. Nature 2007; 447:661–678.
342. Shahsavar F, Mousavi T, Azargon A, Entezami K. Association of KIR3DS1+HLA-B Bw4Ile80 Combination with Susceptibility to Tuberculosis in Lur Population of Iran. Iran. J. Immunol. IJI 2012; 9:39–47.
343. Lu C, Shen Y-J, Deng Y-F, et al. Association of killer cell immunoglobulin-like receptors with pulmonary tuberculosis in Chinese Han. Genet. Mol. Res. GMR 2012; 11:1370–1378.
344. Tajik N, Shah-hosseini A, Mohammadi A, et al. Susceptibility to pulmonary tuberculosis in Iranian individuals is not affected by compound KIR/HLA genotype. Tissue Antigens 2012; 79:90–96.
345. Körner C, Altfeld M. Role of KIR3DS1 in human diseases. Front. Immunol. 2012; 3:326.
346. Martin MP, Gao X, Lee JH, et al. Epistatic interaction between KIR3DS1 and HLA-B delays the progression to AIDS. Nat.Genet. 2002; 31:429–434.
347. Qi Y, Martin MP, Gao X, et al. KIR/HLA pleiotropism: protection against both HIV and opportunistic infections. PLoS Pathog. 2006; 2:e79.
348. Pelak K, Need AC, Fellay J, et al. Copy number variation of KIR genes influences HIV-1 control. PLoS Biol. 2011; 9:e1001208.
349. Barbour JD, Sriram U, Caillier SJ, Levy JA, Hecht FM, Oksenberg JR. Synergy or independence? Deciphering the interaction of HLA Class I and NK cell KIR alleles in early HIV-1 disease progression. PLoS Pathog. 2007; 3:e43.
350. Alter G, Martin MP, Teigen N, et al. Differential natural killer cell-mediated inhibition of HIV-1 replication based on distinct KIR/HLA subtypes. J. Exp. Med. 2007; 204:3027–3036.
351. Alter G, Rihn S, Walter K, et al. HLA class I subtype-dependent expansion of KIR3DS1+ and KIR3DL1+ NK cells during acute human immunodeficiency virus type 1 infection. J. Virol. 2009; 83:6798–6805.
352. Long BR, Ndhlovu LC, Oksenberg JR, et al. Conferral of enhanced natural killer cell function by KIR3DS1 in early human immunodeficiency virus type 1 infection. J.Virol. 2008; 82:4785–4792.
353. Boulet S, Sharafi S, Simic N, et al. Increased proportion of KIR3DS1 homozygotes in HIV-exposed uninfected individuals. AIDS Lond. Engl. 2008; 22:595–599.
354. Tomescu C, Abdulhaqq S, Montaner LJ. Evidence for the innate immune response as a correlate of protection in human immunodeficiency virus (HIV)-1 highly exposed seronegative subjects (HESN). Clin. Exp. Immunol. 2011; 164:158–169.
355. O’Connell KA, Han Y, Williams TM, Siliciano RF, Blankson JN. Role of natural killer cells in a cohort of elite suppressors: low frequency of the protective KIR3DS1 allele and limited
Stellenbosch University http://scholar.sun.ac.za
P a g e | 183
inhibition of human immunodeficiency virus type 1 replication in vitro. J. Virol. 2009; 83:5028–5034.
356. Tomescu C, Duh F-M, Lanier MA, et al. Increased plasmacytoid dendritic cell maturation and natural killer cell activation in HIV-1 exposed, uninfected intravenous drug users. AIDS Lond. Engl. 2010; 24:2151–2160.
357. Aranda-Romo S, Garcia-Sepulveda CA, Comas-García A, et al. Killer-cell immunoglobulin-like receptors (KIR) in severe A (H1N1) 2009 influenza infections. Immunogenetics 2012; 64:653–662.
358. Zhi-ming L, Yu-lian J, Zhao-lei F, et al. Polymorphisms of killer cell immunoglobulin-like receptor gene: possible association with susceptibility to or clearance of hepatitis B virus infection in Chinese Han population. Croat. Med. J. 2007; 48:800–806.
359. Butsch Kovacic M, Martin M, Gao X, et al. Variation of the killer cell immunoglobulin-like receptors and HLA-C genes in nasopharyngeal carcinoma. Cancer Epidemiol. Biomarkers Prev. Publ. Am. Assoc. Cancer Res. Cosponsored Am. Soc. Prev. Oncol. 2005; 14:2673–2677.
360. Kettaneh A, Seng L, Tiev KP, Tolédano C, Fabre B, Cabane J. Human leukocyte antigens and susceptibility to tuberculosis: a meta-analysis of case-control studies. Int. J. Tuberc. Lung Dis. Off. J. Int. Union Tuberc. Lung Dis. 2006; 10:717–725.
361. Vijaya Lakshmi V, Rakh SS, Anu Radha B, et al. Role of HLA-B51 and HLA-B52 in susceptibility to pulmonary tuberculosis. Infect. Genet. Evol. J. Mol. Epidemiol. Evol. Genet. Infect. Dis. 2006; 6:436–439.
362. Souza CF, Noguti EN, Visentainer JEL, Cardoso RF, Petzl-Erler ML, Tsuneto LT. HLA and MICA genes in patients with tuberculosis in Brazil. Tissue Antigens 2012; 79:58–63.
363. Feng B-J, Sun L-D, Soltani-Arabshahi R, et al. Multiple Loci within the major histocompatibility complex confer risk of psoriasis. PLoS Genet. 2009; 5:e1000606.
364. Mootoo A, Stylianou E, Arias MA, Reljic R. TNF-alpha in tuberculosis: a cytokine with a split personality. Inflamm. Allergy Drug Targets 2009; 8:53–62.
365. Möller M, Kwiatkowski R, Nebel A, van Helden PD, Hoal EG, Schreiber S. Allelic variation in BTNL2 and susceptibility to tuberculosis in a South African population. Microbes.Infect. 2007; 9:522–528.
366. Lian Y, Yue J, Han M, Liu J, Liu L. Analysis of the association between BTNL2 polymorphism and tuberculosis in Chinese Han population. Infect. Genet. Evol. J. Mol. Epidemiol. Evol. Genet. Infect. Dis. 2010; 10:517–521.
367. Valentonyte R, Hampe J, Huse K, et al. Sarcoidosis is associated with a truncating splice site mutation in BTNL2. Nat.Genet. 2005; 37:357–364.
368. Rybicki BA, Walewski JL, Maliarik MJ, Kian H, Iannuzzi MC. The BTNL2 gene and sarcoidosis susceptibility in African Americans and Whites. Am.J.Hum.Genet. 2005; 77:491–499.
369. Coudurier M, Freymond N, Aissaoui S, Calender A, Pacheco Y, Devouassoux G. Homozygous variant rs2076530 of BTNL2 and familial sarcoidosis. Sarcoidosis Vasc. Diffuse Lung Dis. Off. J. WASOG World Assoc. Sarcoidosis Granulomatous Disord. 2009; 26:162–166.
Stellenbosch University http://scholar.sun.ac.za

P a g e | 184
370. Nguyen T, Liu XK, Zhang Y, Dong C. BTNL2, a butyrophilin-like molecule that functions to inhibit T cell activation. J.Immunol. 2006; 176:7354–7360.
371. Guce AI, Mortimer SE, Yoon T, et al. HLA-DO acts as a substrate mimic to inhibit HLA-DM by a competitive mechanism. Nat. Struct. Mol. Biol. 2013; 20:90–98.
372. Fallas JL, Tobin HM, Lou O, Guo D, Sant’Angelo DB, Denzin LK. Ectopic expression of HLA-DO in mouse dendritic cells diminishes MHC class II antigen presentation. J. Immunol. Baltim. Md 1950 2004; 173:1549–1560.
373. Karttunen JT, Lehner PJ, Gupta SS, Hewitt EW, Cresswell P. Distinct functions and cooperative interaction of the subunits of the transporter associated with antigen processing (TAP). Proc. Natl. Acad. Sci. U. S. A. 2001; 98:7431–7436.
374. Procko E, Raghuraman G, Wiley DC, Raghavan M, Gaudet R. Identification of domain boundaries within the N-termini of TAP1 and TAP2 and their importance in tapasin binding and tapasin-mediated increase in peptide loading of MHC class I. Immunol. Cell Biol. 2005; 83:475–482.
375. Rueda CM, Marín ND, García LF, Rojas M. Characterization of CD4 and CD8 T cells producing IFN-γ in human latent and active tuberculosis. Tuberc. Edinb. Scotl. 2010; 90:346–353.
376. Borges L, Kubin M, Kuhlman T. LIR9, an immunoglobulin-superfamily-activating receptor, is expressed as a transmembrane and as a secreted molecule. Blood 2003; 101:1484–1486.
377. Shiroishi M, Kajikawa M, Kuroki K, Ose T, Kohda D, Maenaka K. Crystal structure of the human monocyte-activating receptor, ‘Group 2’ leukocyte Ig-like receptor A5 (LILRA5/LIR9/ILT11). J. Biol. Chem. 2006; 281:19536–19544.
378. Son M, Santiago-Schwarz F, Al-Abed Y, Diamond B. C1q limits dendritic cell differentiation and activation by engaging LAIR-1. Proc. Natl. Acad. Sci. U. S. A. 2012; 109:E3160–E3167.
379. Arnon TI, Markel G, Mandelboim O. Tumor and viral recognition by natural killer cells receptors. Semin. Cancer Biol. 2006; 16:348–358.
380. De Maria A, Fogli M, Costa P, et al. The impaired NK cell cytolytic function in viremic HIV-1 infection is associated with a reduced surface expression of natural cytotoxicity receptors (NKp46, NKp30 and NKp44). Eur. J. Immunol. 2003; 33:2410–2418.
381. Vankayalapati R, Wizel B, Weis SE, et al. The NKp46 receptor contributes to NK cell lysis of mononuclear phagocytes infected with an intracellular bacterium. J. Immunol. Baltim. Md 1950 2002; 168:3451–3457.
382. Vankayalapati R, Garg A, Porgador A, et al. Role of NK cell-activating receptors and their ligands in the lysis of mononuclear phagocytes infected with an intracellular bacterium. J. Immunol. Baltim. Md 1950 2005; 175:4611–4617.
383. Garg A, Barnes PF, Porgador A, et al. Vimentin Expressed on Mycobacterium tuberculosis-Infected Human Monocytes Is Involved in Binding to the NKp46 Receptor. J. Immunol. 2006; 177:6192–6198.
384. Khare S, Luc N, Dorfleutner A, Stehlik C. Inflammasomes and their activation. Crit. Rev. Immunol. 2010; 30:463–487.
Stellenbosch University http://scholar.sun.ac.za

P a g e | 185
385. Khare S, Dorfleutner A, Bryan NB, et al. An NLRP7-containing inflammasome mediates recognition of microbial lipopeptides in human macrophages. Immunity 2012; 36:464–476.
386. Jeffery KJ, Bangham CR. Do infectious diseases drive MHC diversity? Microbes Infect. Inst. Pasteur 2000; 2:1335–1341.
387. Ovsyannikova IG, Jacobson RM, Ryan JE, Dhiman N, Vierkant RA, Poland GA. Relationship between HLA polymorphisms and gamma interferon and interleukin-10 cytokine production in healthy individuals after rubella vaccination. Clin. Vaccine Immunol. CVI 2007; 14:115–122.
388. Spurgin LG, Richardson DS. How pathogens drive genetic diversity: MHC, mechanisms and misunderstandings. Proc. Biol. Sci. 2010; 277:979–988.
389. Abi-Rached L, Jobin MJ, Kulkarni S, et al. The Shaping of Modern Human Immune Systems by Multiregional Admixture with Archaic Humans. Science 2011; 334:89 –94.
390. Behar DM, Villems R, Soodyall H, et al. The dawn of human matrilineal diversity. Am. J. Hum. Genet. 2008; 82:1130–1140.
391. Solberg OD, Mack SJ, Lancaster AK, et al. Balancing selection and heterogeneity across the classical human leukocyte antigen loci: a meta-analytic review of 497 population studies. Hum. Immunol. 2008; 69:443–464.
392. Falush D, Wirth T, Linz B, et al. Traces of human migrations in Helicobacter pylori populations. Science 2003; 299:1582–1585.
393. Monot M, Honoré N, Garnier T, et al. On the origin of leprosy. Science 2005; 308:1040–1042.
394. Hirsh AE, Tsolaki AG, DeRiemer K, Feldman MW, Small PM. Stable association between strains of Mycobacterium tuberculosis and their human host populations. Proc. Natl. Acad. Sci. U. S. A. 2004; 101:4871–4876.
395. Reed MB, Pichler VK, McIntosh F, et al. Major Mycobacterium tuberculosis lineages associate with patient country of origin. J. Clin. Microbiol. 2009; 47:1119–1128.
396. Hanekom M, van der Spuy GD, Streicher E, et al. A recently evolved sublineage of the Mycobacterium tuberculosis Beijing strain family is associated with an increased ability to spread and cause disease. J.Clin.Microbiol. 2007; 45:1483–1490.
397. Hanekom M, Gey van Pittius NC, McEvoy C, Victor TC, Van Helden PD, Warren RM. Mycobacterium tuberculosis Beijing genotype: a template for success. Tuberc. Edinb. Scotl. 2011; 91:510–523.
398. Van der Spuy GD, Kremer K, Ndabambi SL, et al. Changing Mycobacterium tuberculosis population highlights clade-specific pathogenic characteristics. Tuberc. Edinb. Scotl. 2009; 89:120–125.
399. European Concerted Action on New Generation Genetic Markers and Techniques for the Epidemiology and Control of Tuberculosis. Beijing/W genotype Mycobacterium tuberculosis and drug resistance. Emerg. Infect. Dis. 2006; 12:736–743.
400. Bifani PJ, Plikaytis BB, Kapur V, et al. Origin and interstate spread of a New York City multidrug-resistant Mycobacterium tuberculosis clone family. JAMA 1996; 275:452–457.
Stellenbosch University http://scholar.sun.ac.za

P a g e | 186
401. Frieden TR, Sherman LF, Maw KL, et al. A multi-institutional outbreak of highly drug-resistant tuberculosis: epidemiology and clinical outcomes. JAMA 1996; 276:1229–1235.
402. Chihota VN, Müller B, Mlambo CK, et al. Population structure of multi- and extensively drug-resistant Mycobacterium tuberculosis strains in South Africa. J. Clin. Microbiol. 2012; 50:995–1002.
403. Dormans J, Burger M, Aguilar D, et al. Correlation of virulence, lung pathology, bacterial load and delayed type hypersensitivity responses after infection with different Mycobacterium tuberculosis genotypes in a BALB/c mouse model. Clin. Exp. Immunol. 2004; 137:460–468.
404. Manca C, Reed MB, Freeman S, et al. Differential monocyte activation underlies strain-specific Mycobacterium tuberculosis pathogenesis. Infect. Immun. 2004; 72:5511–5514.
405. Manca C, Tsenova L, Freeman S, et al. Hypervirulent M. tuberculosis W/Beijing strains upregulate type I IFNs and increase expression of negative regulators of the Jak-Stat pathway. JInterferon Cytokine Res 2005; 25:694–701.
406. Lopez B, Aguilar D, Orozco H, et al. A marked difference in pathogenesis and immune response induced by different Mycobacterium tuberculosis genotypes. Clin. Exp. Immunol. 2003; 133:30–37.
407. Kong Y, Cave MD, Yang D, et al. Distribution of insertion- and deletion-associated genetic polymorphisms among four Mycobacterium tuberculosis phospholipase C genes and associations with extrathoracic tuberculosis: a population-based study. J. Clin. Microbiol. 2005; 43:6048–6053.
408. Yang Z, Yang D, Kong Y, et al. Clinical relevance of Mycobacterium tuberculosis plcD gene mutations. Am. J. Respir. Crit. Care Med. 2005; 171:1436–1442.
409. Kremer K, van-der-Werf MJ, Au BKY, et al. Vaccine-induced immunity circumvented by typical Mycobacterium tuberculosis Beijing strains. Emerg. Infect. Dis. 2009; 15:335–339.
410. Manca C, Tsenova L, Bergtold A, et al. Virulence of a Mycobacterium tuberculosis clinical isolate in mice is determined by failure to induce Th1 type immunity and is associated with induction of IFN-alpha /beta. Proc. Natl. Acad. Sci. U. S. A. 2001; 98:5752–5757.
411. Theus S, Eisenach K, Fomukong N, Silver RF, Cave MD. Beijing family Mycobacterium tuberculosis strains differ in their intracellular growth in THP-1 macrophages. Int. J. Tuberc. Lung Dis. Off. J. Int. Union Tuberc. Lung Dis. 2007; 11:1087–1093.
412. Reed MB, Domenech P, Manca C, et al. A glycolipid of hypervirulent tuberculosis strains that inhibits the innate immune response. Nature 2004; 431:84–87.
413. Colonna M, Borsellino G, Falco M, Ferrara GB, Strominger JL. HLA-C is the inhibitory ligand that determines dominant resistance to lysis by NK1- and NK2-specific natural killer cells. Proc. Natl. Acad. Sci. U. S. A. 1993; 90:12000–12004.
414. Balamurugan A, Sharma SK, Mehra NK. Human leukocyte antigen class I supertypes influence susceptibility and severity of tuberculosis. J.Infect.Dis. 2004; 189:805–811.
415. Middleton D, Menchaca L, Rood H, Komerofsky R. New allele frequency database: http://www.allelefrequencies.net. Tissue Antigens 2003; 61:403–407.
Stellenbosch University http://scholar.sun.ac.za

P a g e | 187
416. Warren R, de Kock M, Engelke E, et al. Safe Mycobacterium tuberculosis DNA extraction method that does not compromise integrity. J. Clin. Microbiol. 2006; 44:254–256.
417. Van Embden JD, Cave MD, Crawford JT, et al. Strain identification of Mycobacterium tuberculosis by DNA fingerprinting: recommendations for a standardized methodology. J.Clin.Microbiol. 1993; 31:406–409.
418. Kamerbeek J, Schouls L, Kolk A, et al. Simultaneous detection and strain differentiation of Mycobacterium tuberculosis for diagnosis and epidemiology. J. Clin. Microbiol. 1997; 35:907–914.
419. Van der Spuy GD, Warren RM, Richardson M, Beyers N, Behr MA, van Helden PD. Use of genetic distance as a measure of ongoing transmission of Mycobacterium tuberculosis. J.Clin.Microbiol. 2003; 41:5640–5644.
420. Warren RM, Victor TC, Streicher EM, et al. Patients with active tuberculosis often have different strains in the same sputum specimen. AmJRespirCrit Care Med 2004; 169:610–614.
421. Streicher EM, Victor TC, van der Spuy G, et al. Spoligotype signatures in the Mycobacterium tuberculosis complex. J. Clin. Microbiol. 2007; 45:237–240.
422. Tsolaki AG, Gagneux S, Pym AS, et al. Genomic deletions classify the Beijing/W strains as a distinct genetic lineage of Mycobacterium tuberculosis. J. Clin. Microbiol. 2005; 43:3185–3191.
423. Baker L, Brown T, Maiden MC, Drobniewski F. Silent nucleotide polymorphisms and a phylogeny for Mycobacterium tuberculosis. Emerg. Infect. Dis. 2004; 10:1568–1577.
424. Marmiesse M, Brodin P, Buchrieser C, et al. Macro-array and bioinformatic analyses reveal mycobacterial ‘core’ genes, variation in the ESAT-6 gene family and new phylogenetic markers for the Mycobacterium tuberculosis complex. Microbiol. Read. Engl. 2004; 150:483–496.
425. Di Pietrantonio T, Hernandez C, Girard M, et al. Strain-specific differences in the genetic control of two closely related mycobacteria. PLoS Pathog. 2010; 6:e1001169.
426. Di Pietrantonio T, Correa JA, Orlova M, Behr MA, Schurr E. Joint effects of host genetic background and mycobacterial pathogen on susceptibility to infection. Infect. Immun. 2011; 79:2372–2378.
427. Migueles SA, Connors M. Long-term nonprogressive disease among untreated HIV-infected individuals: clinical implications of understanding immune control of HIV. JAMA J. Am. Med. Assoc. 2010; 304:194–201.
428. Den Uyl D, van der Horst-Bruinsma IE, van Agtmael M. Progression of HIV to AIDS: a protective role for HLA-B27? AIDS Rev. 2004; 6:89–96.
429. Frater AJ, Brown H, Oxenius A, et al. Effective T-cell responses select human immunodeficiency virus mutants and slow disease progression. J. Virol. 2007; 81:6742–6751.
430. Migueles SA, Laborico AC, Shupert WL, et al. HIV-specific CD8+ T cell proliferation is coupled to perforin expression and is maintained in nonprogressors. Nat. Immunol. 2002; 3:1061–1068.
Stellenbosch University http://scholar.sun.ac.za

P a g e | 188
431. Trambas CM, Griffiths GM. Delivering the kiss of death. Nat. Immunol. 2003; 4:399–403.
432. Horton H, Frank I, Baydo R, et al. Preservation of T cell proliferation restricted by protective HLA alleles is critical for immune control of HIV-1 infection. J. Immunol. Baltim. Md 1950 2006; 177:7406–7415.
433. Migueles SA, Osborne CM, Royce C, et al. Lytic granule loading of CD8+ T cells is required for HIV-infected cell elimination associated with immune control. Immunity 2008; 29:1009–1021.
434. Migueles SA, Weeks KA, Nou E, et al. Defective human immunodeficiency virus-specific CD8+ T-cell polyfunctionality, proliferation, and cytotoxicity are not restored by antiretroviral therapy. J. Virol. 2009; 83:11876–11889.
435. Behar SM, Dascher CC, Grusby MJ, Wang CR, Brenner MB. Susceptibility of mice deficient in CD1D or TAP1 to infection with Mycobacterium tuberculosis. J. Exp. Med. 1999; 189:1973–1980.
436. Geluk A, van Meijgaarden KE, Franken KL, et al. Identification of major epitopes of Mycobacterium tuberculosis AG85B that are recognized by HLA-A*0201-restricted CD8+ T cells in HLA-transgenic mice and humans. J. Immunol. Baltim. Md 1950 2000; 165:6463–6471.
437. Smith SM, Brookes R, Klein MR, et al. Human CD8+ CTL specific for the mycobacterial major secreted antigen 85A. J.Immunol. 2000; 165:7088–7095.
438. Canaday DH, Wilkinson RJ, Li Q, Harding CV, Silver RF, Boom WH. CD4(+) and CD8(+) T cells kill intracellular Mycobacterium tuberculosis by a perforin and Fas/Fas ligand-independent mechanism. J. Immunol. Baltim. Md 1950 2001; 167:2734–2742.
439. Lalvani A, Brookes R, Wilkinson RJ, et al. Human cytolytic and interferon gamma-secreting CD8+ T lymphocytes specific for Mycobacterium tuberculosis. Proc. Natl. Acad. Sci. U. S. A. 1998; 95:270–275.
440. Mohagheghpour N, Gammon D, Kawamura LM, van Vollenhoven A, Benike CJ, Engleman EG. CTL response to Mycobacterium tuberculosis: identification of an immunogenic epitope in the 19-kDa lipoprotein. J. Immunol. Baltim. Md 1950 1998; 161:2400–2406.
441. Stenger S, Mazzaccaro RJ, Uyemura K, et al. Differential effects of cytolytic T cell subsets on intracellular infection. Science 1997; 276:1684–1687.
442. Kaufmann SH. Killing vs suicide in antibacterial defence. Trends Microbiol. 1999; 7:59–61.
443. Flynn JL, Chan J. Immunology of tuberculosis. Annu.Rev.Immunol. 2001; 19:93–129.
444. Traherne JA. Human MHC architecture and evolution: implications for disease association studies. Int. J. Immunogenet. 2008; 35:179–192.
445. Intemann CD, Thye T, Niemann S, et al. Autophagy gene variant IRGM -261T contributes to protection from tuberculosis caused by Mycobacterium tuberculosis but not by M. africanum strains. PLoS.Pathog. 2009; 5:e1000577.
446. Van Crevel R, Parwati I, Sahiratmadja E, et al. Infection with Mycobacterium tuberculosis Beijing genotype strains is associated with polymorphisms in SLC11A1/NRAMP1 in Indonesian patients with tuberculosis. J.Infect.Dis. 2009; 200:1671–1674.
Stellenbosch University http://scholar.sun.ac.za

P a g e | 189
447. Hesseling AC, Marais BJ, Kirchner HL, et al. Mycobacterial genotype is associated with disease phenotype in children. Int. J. Tuberc. Lung Dis. Off. J. Int. Union Tuberc. Lung Dis. 2010; 14:1252–1258.
448. Huyen MNT, Buu TN, Tiemersma E, et al. Tuberculosis relapse in Vietnam is significantly associated with Mycobacterium tuberculosis Beijing genotype infections. J. Infect. Dis. 2013;
449. Fu W, O’Connor TD, Jun G, et al. Analysis of 6,515 exomes reveals the recent origin of most human protein-coding variants. Nature 2013; 493:216–220.
450. Cao K, Hollenbach J, Shi X, Shi W, Chopek M, Fernández-Viña MA. Analysis of the frequencies of HLA-A, B, and C alleles and haplotypes in the five major ethnic groups of the United States reveals high levels of diversity in these loci and contrasting distribution patterns in these populations. Hum. Immunol. 2001; 62:1009–1030.
451. Norman PJ, Abi-Rached L, Gendzekhadze K, et al. Unusual selection on the KIR3DL1/S1 natural killer cell receptor in Africans. Nat. Genet. 2007; 39:1092–1099.
452. Single RM, Martin MP, Gao X, et al. Global diversity and evidence for coevolution of KIR and HLA. Nat. Genet. 2007; 39:1114–1119.
453. Norman PJ, Carrington CVF, Byng M, et al. Natural killer cell immunoglobulin-like receptor (KIR) locus profiles in African and South Asian populations. Genes Immun. 2002; 3:86–95.
454. Hiby SE, Ashrafian-Bonab M, Farrell L, et al. Distribution of killer cell immunoglobulin-like receptors (KIR) and their HLA-C ligands in two Iranian populations. Immunogenetics 2010; 62:65–73.
455. Mountain A. The First People of the Cape. Claremont, South Africa: David Philips Publishers, 2003.
456. Underhill PA, Passarino G, Lin AA, et al. The phylogeography of Y chromosome binary haplotypes and the origins of modern human populations. Ann. Hum. Genet. 2001; 65:43–62.
457. Tishkoff SA, Williams SM. Genetic analysis of African populations: human evolution and complex disease. Nat.Rev.Genet. 2002; 3:611–621.
458. Henn BM, Gignoux CR, Jobin M, et al. Hunter-gatherer genomic diversity suggests a southern African origin for modern humans. Proc. Natl. Acad. Sci. U. S. A. 2011; 108:5154–5162.
459. Nurse GT, Weiner JS, Jenkins T. The peoples of Southern Africa and their affinities. Oxford: Clarendon Press, 1985.
460. Van der Ross RE. 100 Questions about Coloured South Africans. Cape Town⬚ ⬚: UWC Printing Department, 1993.
461. Adhikari M. Not white enough, not black enough: Racial identity in the South African Coloured community. Ohio University Press, 2005.
462. Shell R. Children of Bondage Children of bondage. Witwatersrand University Press, Johannesburg, 1994.
Stellenbosch University http://scholar.sun.ac.za

P a g e | 190
463. Paximadis M, Mathebula TY, Gentle NL, et al. Human leukocyte antigen class I (A, B, C) and II (DRB1) diversity in the black and Caucasian South African population. Hum. Immunol. 2012; 73:80–92.
464. Norman PJ, Abi-Rached L, Gendzekhadze K, et al. Meiotic recombination generates rich diversity in NK cell receptor genes, alleles, and haplotypes. Genome Res. 2009; 19:757–769.
465. Li H, Handsaker B, Wysoker A, et al. The Sequence Alignment/Map format and SAMtools. Bioinforma. Oxf. Engl. 2009; 25:2078–2079.
466. Langmead B, Trapnell C, Pop M, Salzberg SL. Ultrafast and memory-efficient alignment of short DNA sequences to the human genome. Genome Biol. 2009; 10:R25.
467. Robinson J, Mistry K, McWilliam H, Lopez R, Marsh SGE. IPD--the Immuno Polymorphism Database. Nucleic Acids Res. 2010; 38:D863–869.
468. Chevreux B, Pfisterer T, Drescher B, et al. Using the miraEST assembler for reliable and automated mRNA transcript assembly and SNP detection in sequenced ESTs. Genome Res. 2004; 14:1147–1159.
469. Dempster A, Laird N, Rubin D. Maximum likelihood estimation from incomplete data using the EM algorithm. J Royal Stat Soc 1977; 39:1–38.
470. Excoffier L, Slatkin M. Maximum-likelihood estimation of molecular haplotype frequencies in a diploid population. Mol. Biol. Evol. 1995; 12:921–927.
471. Lancaster AK, Single RM, Solberg OD, Nelson MP, Thomson G. PyPop update--a software pipeline for large-scale multilocus population genomics. Tissue Antigens 2007; 69 Suppl 1:192–197.
472. Guo SW, Thompson EA. Performing the exact test of Hardy-Weinberg proportion for multiple alleles. Biometrics 1992; 48:361–372.
473. Hedrick PW. Gametic disequilibrium measures: proceed with caution. Genetics 1987; 117:331–341.
474. Cramer H. Mathematical Models of Statistics. Princeton, NJ: Princeton University Press, 1946.
475. Ewens WJ. The sampling theory of selectively neutral alleles. Theor. Popul. Biol. 1972; 3:87–112.
476. Watterson GA. The homozygosity test of neutrality. Genetics 1978; 88:405–417.
477. Slatkin M. An exact test for neutrality based on the Ewens sampling distribution. Genet. Res. 1994; 64:71–74.
478. Slatkin M. A correction to the exact test based on the Ewens sampling distribution. Genet. Res. 1996; 68:259–260.
479. Frazer KA, Ballinger DG, Cox DR, et al. A second generation human haplotype map of over 3.1 million SNPs. Nature 2007; 449:851–861.
Stellenbosch University http://scholar.sun.ac.za

P a g e | 191
480. Cann HM, de Toma C, Cazes L, et al. A human genome diversity cell line panel. Science 2002; 296:261–262.
481. Pritchard JK, Stephens M, Donnelly P. Inference of population structure using multilocus genotype data. Genetics 2000; 155:945–959.
482. Falush D, Stephens M, Pritchard JK. Inference of population structure using multilocus genotype data: linked loci and correlated allele frequencies. Genetics 2003; 164:1567–1587.
483. Baran Y, Pasaniuc B, Sankararaman S, et al. Fast and accurate inference of local ancestry in Latino populations. Bioinforma. Oxf. Engl. 2012; 28:1359–1367.
484. Davila J, McNamara LA, Yang Z. Comparison of the predicted population coverage of tuberculosis vaccine candidates Ag85B-ESAT-6, Ag85B-TB10.4, and Mtb72f via a bioinformatics approach. PloS One 2012; 7:e40882.
485. Cao K, Moormann AM, Lyke KE, et al. Differentiation between African populations is evidenced by the diversity of alleles and haplotypes of HLA class I loci. Tissue Antigens 2004; 63:293–325.
486. Gagneux S, Small PM. Global phylogeography of Mycobacterium tuberculosis and implications for tuberculosis product development. Lancet Infect. Dis. 2007; 7:328–337.
487. Singh N, Agrawal S, Rastogi AK. Infectious diseases and immunity: special reference to major histocompatibility complex. Emerg. Infect. Dis. 1997; 3:41–49.
488. Reith W, Mach B. The bare lymphocyte syndrome and the regulation of MHC expression. Annu. Rev. Immunol. 2001; 19:331–373.
489. Newport MJ, Goetghebuer T, Weiss HA, Whittle H, Siegrist CA, Marchant A. Genetic regulation of immune responses to vaccines in early life. Genes Immun 2004; 5:122–129.
490. Egea E, Iglesias A, Salazar M, et al. The cellular basis for lack of antibody response to hepatitis B vaccine in humans. J. Exp. Med. 1991; 173:531–538.
491. Poland GA, Ovsyannikova IG, Jacobson RM, et al. Identification of an association between HLA class II alleles and low antibody levels after measles immunization. Vaccine 2001; 20:430–438.
492. Gelder CM, Lambkin R, Hart KW, et al. Associations between human leukocyte antigens and nonresponsiveness to influenza vaccine. J. Infect. Dis. 2002; 185:114–117.
493. Liu J, Chen KY, Ren EC. Structural insights into the binding of hepatitis B virus core peptide to HLA-A2 alleles: towards designing better vaccines. Eur. J. Immunol. 2011; 41:2097–2106.
494. Brandt L, Elhay M, Rosenkrands I, Lindblad EB, Andersen P. ESAT-6 subunit vaccination against Mycobacterium tuberculosis. Infect. Immun. 2000; 68:791–795.
495. Olsen AW, Williams A, Okkels LM, Hatch G, Andersen P. Protective effect of a tuberculosis subunit vaccine based on a fusion of antigen 85B and ESAT-6 in the aerosol guinea pig model. Infect. Immun. 2004; 72:6148–6150.
Stellenbosch University http://scholar.sun.ac.za

P a g e | 192
496. Dietrich J, Aagaard C, Leah R, et al. Exchanging ESAT6 with TB10.4 in an Ag85B fusion molecule-based tuberculosis subunit vaccine: efficient protection and ESAT6-based sensitive monitoring of vaccine efficacy. J. Immunol. Baltim. Md 1950 2005; 174:6332–6339.
497. Langermans JAM, Doherty TM, Vervenne RAW, et al. Protection of macaques against Mycobacterium tuberculosis infection by a subunit vaccine based on a fusion protein of antigen 85B and ESAT-6. Vaccine 2005; 23:2740–2750.
498. Mustafa AS, Skeiky YA, Al-Attiyah R, Alderson MR, Hewinson RG, Vordermeier HM. Immunogenicity of Mycobacterium tuberculosis antigens in Mycobacterium bovis BCG-vaccinated and M. bovis-infected cattle. Infect. Immun. 2006; 74:4566–4572.
499. Hoft DF. Tuberculosis vaccine development: goals, immunological design, and evaluation. Lancet 2008; 372:164–175.
500. Aagaard C, Dietrich J, Doherty M, Andersen P. TB vaccines: current status and future perspectives. Immunol. Cell Biol. 2009; 87:279–286.
501. Kaufmann SHE, Hussey G, Lambert P-H. New vaccines for tuberculosis. Lancet 2010; 375:2110–2119.
502. Aagaard C, Hoang T, Dietrich J, et al. A multistage tuberculosis vaccine that confers efficient protection before and after exposure. Nat. Med. 2011; 17:189–194.
503. Grode L, Seiler P, Baumann S, et al. Increased vaccine efficacy against tuberculosis of recombinant Mycobacterium bovis bacille Calmette-Guérin mutants that secrete listeriolysin. J. Clin. Invest. 2005; 115:2472–2479.
504. Niokou D, Spyropoulou-Vlachou M, Darlamitsou A, Stavropoulos-Giokas C. Distribution of killer cell immunoglobulin-like receptors in the Greek population. Hum. Immunol. 2003; 64:1167–1176.
505. Gutiérrez-Rodríguez ME, Sandoval-Ramírez L, Díaz-Flores M, et al. KIR gene in ethnic and Mestizo populations from Mexico. Hum. Immunol. 2006; 67:85–93.
506. Rudnick CCC, Franceschi DSA, Marangon AV, Guelsin GAS, Sell AM, Visentainer JEL. Killer cell immunoglobulin-like receptor gene diversity in a Southern Brazilian population from the state of Paraná. Hum. Immunol. 2008; 69:872–876.
507. Zhu B, Wang H, Shen C, et al. Killer cell immunoglobulin-like receptor gene diversity in the Tibetan ethnic minority group of China. Hum. Immunol. 2010; 71:1116–1123.
508. Cai J, Liu X, Wang J, Tian W. Killer cell immunoglobulin-like receptor (KIR) genes in 4 distinct populations and 51 families in mainland China. Hum. Immunol. 2012; 73:1023–1030.
509. Rajalingam R, Krausa P, Shilling HG, et al. Distinctive KIR and HLA diversity in a panel of north Indian Hindus. Immunogenetics 2002; 53:1009–1019.
510. McKeigue PM. Mapping genes underlying ethnic differences in disease risk by linkage disequilibrium in recently admixed populations. Am J Hum Genet 1997; 60:188–196.
511. Montana G, Pritchard JK. Statistical tests for admixture mapping with case-control and cases-only data. Am.J.Hum.Genet. 2004; 75:771–789.
Stellenbosch University http://scholar.sun.ac.za

P a g e | 193
512. Seldin MF. Admixture mapping as a tool in gene discovery. Curr Opin Genet Dev 2007; 17:177–181.
513. Zhu X, Luke A, Cooper RS, et al. Admixture mapping for hypertension loci with genome-scan markers. Nat.Genet. 2005; 37:177–181.
514. Zhu X, Tang H, Risch N. Admixture mapping and the role of population structure for localizing disease genes. Adv Genet 2008; 60:547–569.
Stellenbosch University http://scholar.sun.ac.za

P a g e | 194
Appendices
Appendix 1: Estimated HLA class-I haplotypes in the SAC population.
Haplotypes TB Case (f) Control (f) P-value OR (95% CI)
A*0101-B*0801-C*0701 0.044 0.027
1
A*0301-B*4701-C*0602 0.023 0.007 0.3140 0.48 (0.12-1.98)
A*3001-B*4201-C*1701 0.010 0.019 0.0720 3.35 (0.90-12.45)
A*3002-B*0801-C*0701 0.020 0.012 0.9320 1.06 (0.28-3.96)
A*3004-B*5802-C*0602 0.010 0.019 0.2200 2.42 (0.59-9.96)
A*0201-B*0702-C*0702 0.014 0.014 0.7540 1.23 (0.34-4.39)
A*4301-B*1503-C*1801 0.008 0.016 0.0750 3.90 (0.87-17.39)
A*3001-B*4202-C*1701 0.017 0.006 0.1820 0.29 (0.05-1.77)
A*3002-B*4501-C*1601 0.012 0.008 0.9670 1.03 (0.23-4.55)
A*6601-B*5802-C*0602 0.010 0.010 0.6260 1.44 (0.33-6.21)
A*0301-B*0702-C*0702 0.002 0.010
A*4301-B*1510-C*0401 0.010 0.008
A*3201-B*4403-C*0210 0.008 0.010
A*0201-B*1302-C*0602 0.010 0.008
A*0101-B*5701-C*0602 0.014 0.000
A*2407-B*3505-C*0401 0.004 0.012
A*2901-B*1801-C*0704 0.008 0.008
A*3402-B*4403-C*0401 0.008 0.008
A*6801-B*5802-C*0602 0.004 0.012
A*7401-B*1503-C*0210 0.010 0.006
A*2601-B*4101-C*1701 0.014 0.002
A*2402-B*0702-C*0702 0.011 0.004
A*0123-B*5801-C*0602 0.004 0.010
A*0202-B*5703-C*0701 0.004 0.010
A*0205-B*5801-C*0701 0.010 0.004
A*0301-B*1501-C*0304 0.006 0.008
A*6802-B*0702-C*0702 0.004 0.009
A*1101-B*3501-C*0401 0.008 0.006
A*3002-B*5802-C*0602 0.000 0.012
A*3001-B*1503-C*0210 0.004 0.010
A*0205-B*1401-C*0804 0.006 0.002
A*6802-B*1510-C*0304 0.004 0.008
A*2402-B*4006-C*1502 0.000 0.008
A*2301-B*5802-C*0602 0.005 0.008
A*2301-B*4101-C*1701 0.004 0.006
A*2301-B*1510-C*1601 0.006 0.004
A*3001-B*1302-C*0602 0.008 0.000
A*3303-B*4403-C*0701 0.008 0.000
A*3201-B*0702-C*0210 0.004 0.006
Stellenbosch University http://scholar.sun.ac.za

P a g e | 195
Haplotypes TB Case (f) Control (f) P-value OR (95% CI)
A*6801-B*5801-C*0602 0.006 0.000
A*0201-B*1503-C*0210 0.007 0.002
A*2301-B*0702-C*0702 0.010 0.004
A*0101-B*4403-C*1601 0.000 0.008
A*0101-B*8101-C*1801 0.004 0.000
A*0201-B*1801-C*0701 0.002 0.006
A*0201-B*4501-C*1601 0.000 0.008
A*0301-B*4001-C*0304 0.000 0.006
A*0301-B*4501-C*0602 0.004 0.004
A*1101-B*0705-C*0702 0.005 0.004
A*1101-B*1513-C*0801 0.006 0.002
A*1101-B*5201-C*1202 0.004 0.004
A*2402-B*3501-C*0401 0.000 0.004
A*2402-B*3505-C*0401 0.006 0.000
A*2402-B*4403-C*0401 0.000 0.006
A*2901-B*1503-C*0401 0.000 0.008
A*3002-B*1402-C*0802 0.002 0.006
A*3002-B*5703-C*1801 0.000 0.008
A*3004-B*3924-C*0701 0.002 0.006
A*3303-B*5801-C*0302 0.004 0.004
A*7401-B*1502-C*0801 0.006 0.002
A*2301-B*4403-C*0401 0.004 0.004
A*0301-B*2705-C*0202 0.002 0.006
A*1101-B*1302-C*0602 0.004 0.002
A*6802-B*4101-C*1701 0.000 0.000
A*0201-B*1503-C*1801 0.000 0.006
A*0201-B*5101-C*1601 0.000 0.002
A*0202-B*5301-C*0401 0.000 0.006
A*0214-B*4403-C*0401 0.006 0.000
A*0301-B*1801-C*0701 0.000 0.006
A*0301-B*4006-C*1502 0.006 0.000
A*0301-B*5601-C*0401 0.000 0.006
A*0301-B*5802-C*0602 0.000 0.006
A*2301-B*1402-C*0802 0.002 0.004
A*2402-B*1801-C*0701 0.002 0.002
A*2402-B*4001-C*0304 0.002 0.004
A*2402-B*4006-C*1202 0.006 0.000
A*2402-B*5201-C*1202 0.002 0.004
A*2501-B*1801-C*1203 0.004 0.002
A*2601-B*0705-C*0702 0.003 0.000
A*2601-B*5802-C*0602 0.000 0.004
A*2901-B*0705-C*1505 0.006 0.000
A*2902-B*4403-C*0701 0.004 0.000
A*3001-B*8101-C*0401 0.000 0.006
Stellenbosch University http://scholar.sun.ac.za

P a g e | 196
Haplotypes TB Case (f) Control (f) P-value OR (95% CI)
A*3002-B*5702-C*1801 0.000 0.006
A*3004-B*3910-C*1505 0.000 0.004
A*3004-B*4102-C*1701 0.006 0.000
A*3201-B*0702-C*0102 0.004 0.002
A*3301-B*4201-C*1701 0.002 0.004
A*3402-B*5802-C*1801 0.004 0.002
A*3601-B*5301-C*0401 0.000 0.004
A*4301-B*1501-C*0401 0.000 0.004
A*6802-B*1401-C*0802 0.000 0.004
A*6802-B*1402-C*0802 0.006 0.000
A*6802-B*1510-C*0804 0.002 0.004
A*6802-B*5802-C*0602 0.002 0.004
A*6827-B*4101-C*1701 0.000 0.006
A*7401-B*3501-C*0401 0.004 0.002
A*2301-B*1503-C*0210 0.000 0.002
A*3004-B*1510-C*0401 0.006 0.000
A*1101-B*1502-C*0801 0.000 0.002
A*1101-B*4006-C*1502 0.004 0.000
A*2402-B*1502-C*0801 0.004 0.002
A*3002-B*4201-C*1701 0.004 0.000
A*0201-B*3501-C*0401 0.000 0.002
A*3001-B*5802-C*0602 0.004 0.002
A*3002-B*1503-C*0210 0.002 0.000
A*0101-B*1503-C*0401 0.000 0.004
A*0101-B*5703-C*0701 0.000 0.004
A*0101-B*5801-C*0302 0.000 0.002
A*0123-B*5802-C*0602 0.000 0.002
A*0201-B*1401-C*0802 0.006 0.000
A*0201-B*1501-C*0303 0.000 0.002
A*0201-B*1501-C*0401 0.004 0.000
A*0201-B*3801-C*1203 0.000 0.002
A*0201-B*4001-C*0304 0.006 0.000
A*0201-B*4101-C*0701 0.002 0.002
A*0201-B*4101-C*1701 0.006 0.000
A*0201-B*4202-C*1701 0.002 0.000
A*0201-B*4403-C*0701 0.002 0.000
A*0201-B*4405-C*0202 0.004 0.000
A*0201-B*5201-C*1202 0.004 0.000
A*0203-B*3503-C*1505 0.000 0.000
A*0205-B*1402-C*0804 0.002 0.000
A*0206-B*3701-C*0602 0.002 0.002
A*0211-B*3503-C*0401 0.004 0.000
A*0211-B*5701-C*0602 0.002 0.000
A*0301-B*1303-C*0602 0.002 0.002
Stellenbosch University http://scholar.sun.ac.za

P a g e | 197
Haplotypes TB Case (f) Control (f) P-value OR (95% CI)
A*0301-B*1503-C*0701 0.002 0.000
A*0301-B*4403-C*0701 0.002 0.002
A*0301-B*5801-C*0302 0.000 0.004
A*1101-B*0702-C*0702 0.002 0.002
A*1101-B*1801-C*0704 0.002 0.002
A*1101-B*4001-C*1203 0.002 0.000
A*1101-B*4002-C*1502 0.000 0.004
A*1101-B*4006-C*0303 0.000 0.000
A*1101-B*4403-C*0701 0.000 0.002
A*1101-B*5101-C*0401 0.000 0.004
A*1101-B*5101-C*1402 0.000 0.002
A*1101-B*5501-C*0303 0.000 0.004
A*2301-B*0801-C*0304 0.000 0.002
A*2301-B*3901-C*0210 0.004 0.000
A*2301-B*3910-C*1505 0.002 0.002
A*2301-B*4403-C*0210 0.000 0.004
A*2301-B*4403-C*0303 0.002 0.002
A*2301-B*4403-C*0304 0.002 0.002
A*2402-B*1401-C*0802 0.000 0.002
A*2402-B*1521-C*0403 0.000 0.004
A*2402-B*3502-C*0401 0.002 0.002
A*2402-B*4501-C*1601 0.002 0.002
A*2402-B*5501-C*0102 0.004 0.000
A*2402-B*5802-C*0602 0.004 0.000
A*2407-B*1502-C*0801 0.002 0.002
A*2407-B*2706-C*0702 0.000 0.004
A*2601-B*2705-C*0102 0.004 0.000
A*2601-B*5802-C*0401 0.000 0.004
A*2612-B*4101-C*0701 0.000 0.000
A*2901-B*0705-C*0401 0.000 0.002
A*2901-B*4403-C*0210 0.002 0.002
A*2902-B*1801-C*0704 0.000 0.002
A*2902-B*4403-C*1601 0.002 0.002
A*3001-B*4501-C*1601 0.000 0.004
A*3002-B*1801-C*0704 0.004 0.000
A*3004-B*1401-C*0802 0.002 0.000
A*3004-B*4101-C*1701 0.000 0.004
A*3004-B*5101-C*1601 0.002 0.002
A*3101-B*5101-C*1402 0.004 0.000
A*3101-B*5801-C*1203 0.004 0.000
A*3201-B*1502-C*0801 0.000 0.004
A*3201-B*3801-C*1203 0.004 0.000
A*3201-B*4403-C*0202 0.004 0.000
A*3201-B*5801-C*0202 0.002 0.002
Stellenbosch University http://scholar.sun.ac.za

P a g e | 198
Haplotypes TB Case (f) Control (f) P-value OR (95% CI)
A*3301-B*5301-C*0401 0.000 0.002
A*3402-B*1503-C*0210 0.002 0.000
A*3402-B*4403-C*0701 0.004 0.000
A*4301-B*1402-C*0804 0.002 0.000
A*4301-B*2705-C*0210 0.000 0.004
A*4301-B*3501-C*0401 0.000 0.000
A*4301-B*5301-C*0804 0.000 0.000
A*6801-B*2705-C*0202 0.000 0.004
A*6801-B*4001-C*0304 0.002 0.000
A*6801-B*4402-C*0501 0.004 0.000
A*6802-B*4403-C*0401 0.004 0.000
A*6802-B*4501-C*0602 0.002 0.000
A*6827-B*4403-C*0401 0.004 0.000
A*7401-B*5802-C*0602 0.004 0.000
A*8001-B*1801-C*0202 0.000 0.000
A*2301-B*0702-C*0210 0.004 0.000
A*0205-B*5802-C*0602 0.000 0.002
A*3004-B*5801-C*0602 0.002 0.002
A*2301-B*4501-C*0602 0.002 0.000
A*6801-B*1503-C*1801 0.000 0.004
A*2402-B*2705-C*0202 0.002 0.000
A*2601-B*0702-C*0702 0.000 0.002
A*3001-B*0702-C*0210 0.000 0.000
A*7401-B*0801-C*0701 0.000 0.000
A*3004-B*4403-C*0401 0.003 0.000
A*0101-B*5802-C*0602 0.004 0.000
A*0101-B*4402-C*0501 0.000 0.000
A*2402-B*0801-C*0701 0.000 0.002
A*3002-B*4202-C*1701 0.002 0.000
A*0101-B*0702-C*0701 0.000 0.002
A*0201-B*1513-C*0801 0.000 0.002
A*2402-B*4201-C*1701 0.000 0.000
A*3001-B*0702-C*0702 0.000 0.002
A*3201-B*0801-C*0210 0.000 0.000
A*0101-B*0702-C*0702 0.000 0.000
A*0101-B*1501-C*0304 0.000 0.002
A*0101-B*1503-C*0210 0.000 0.002
A*0101-B*3501-C*0401 0.002 0.000
A*0101-B*3701-C*1701 0.000 0.000
A*0101-B*5101-C*1602 0.000 0.002
A*0101-B*5701-C*1204 0.000 0.000
A*0101-B*5801-C*0701 0.000 0.000
A*0123-B*1503-C*0401 0.002 0.000
A*0123-B*2705-C*0202 0.000 0.002
Stellenbosch University http://scholar.sun.ac.za

P a g e | 199
Haplotypes TB Case (f) Control (f) P-value OR (95% CI)
A*0123-B*4701-C*0602 0.000 0.000
A*0201-B*1513-C*1701 0.000 0.000
A*0201-B*1801-C*0704 0.002 0.000
A*0201-B*1801-C*1203 0.000 0.000
A*0201-B*3502-C*0401 0.000 0.002
A*0201-B*3502-C*0602 0.000 0.000
A*0201-B*3503-C*0401 0.000 0.000
A*0201-B*3508-C*0202 0.000 0.000
A*0201-B*3910-C*1203 0.000 0.002
A*0201-B*4402-C*0501 0.002 0.000
A*0201-B*5101-C*1402 0.004 0.002
A*0201-B*5301-C*0304 0.002 0.000
A*0201-B*5801-C*0302 0.000 0.002
A*0201-B*5801-C*0701 0.000 0.000
A*0202-B*1503-C*0210 0.000 0.002
A*0202-B*1516-C*1402 0.002 0.000
A*0202-B*4701-C*0602 0.000 0.002
A*0202-B*5801-C*0602 0.002 0.000
A*0203-B*1301-C*0403 0.000 0.002
A*0203-B*1502-C*0801 0.000 0.002
A*0203-B*1801-C*0704 0.002 0.000
A*0203-B*3501-C*0602 0.000 0.000
A*0203-B*3802-C*0702 0.002 0.000
A*0203-B*3901-C*0702 0.002 0.000
A*0203-B*4001-C*0702 0.000 0.002
A*0205-B*0801-C*0210 0.000 0.002
A*0205-B*1510-C*0304 0.000 0.002
A*0205-B*1510-C*0704 0.000 0.000
A*0205-B*2705-C*0210 0.000 0.002
A*0205-B*4201-C*1701 0.000 0.000
A*0205-B*4403-C*1801 0.000 0.000
A*0205-B*4701-C*0602 0.000 0.002
A*0205-B*5101-C*0210 0.000 0.002
A*0207-B*4601-C*0302 0.000 0.002
A*0211-B*1508-C*0102 0.000 0.002
A*0211-B*1801-C*0701 0.000 0.002
A*0211-B*2704-C*1202 0.002 0.000
A*0211-B*2705-C*0501 0.000 0.000
A*0211-B*2706-C*0304 0.000 0.002
A*0211-B*3701-C*0602 0.000 0.000
A*0211-B*4001-C*0303 0.000 0.000
A*0211-B*4006-C*1502 0.002 0.000
A*0211-B*5201-C*1202 0.000 0.004
A*0214-B*4403-C*0404 0.000 0.000
Stellenbosch University http://scholar.sun.ac.za

P a g e | 200
Haplotypes TB Case (f) Control (f) P-value OR (95% CI)
A*0290-B*0801-C*0702 0.000 0.000
A*0301-B*0702-C*0210 0.002 0.000
A*0301-B*0801-C*0602 0.002 0.000
A*0301-B*0801-C*0702 0.000 0.004
A*0301-B*1502-C*0801 0.002 0.000
A*0301-B*1503-C*0210 0.002 0.000
A*0301-B*1505-C*0303 0.000 0.000
A*0301-B*1510-C*0401 0.000 0.002
A*0301-B*2705-C*0210 0.000 0.002
A*0301-B*3501-C*0401 0.002 0.000
A*0301-B*3501-C*0501 0.000 0.000
A*0301-B*3508-C*0401 0.000 0.002
A*0301-B*4001-C*1203 0.000 0.000
A*0301-B*4403-C*0210 0.000 0.002
A*0301-B*5001-C*0602 0.000 0.002
A*0301-B*5701-C*0602 0.002 0.000
A*1101-B*1538-C*0303 0.002 0.000
A*1101-B*1801-C*1202 0.002 0.000
A*1101-B*3503-C*0401 0.000 0.004
A*1101-B*3503-C*1203 0.002 0.000
A*1101-B*3503-C*1602 0.002 0.000
A*1101-B*3915-C*0401 0.000 0.002
A*1101-B*4002-C*0202 0.000 0.002
A*1101-B*4402-C*0501 0.000 0.000
A*1101-B*4701-C*0602 0.000 0.002
A*1101-B*5101-C*1502 0.000 0.002
A*1101-B*5101-C*1601 0.000 0.002
A*1101-B*8101-C*1801 0.000 0.002
A*2301-B*0801-C*0210 0.000 0.002
A*2301-B*1516-C*1402 0.000 0.000
A*2301-B*1801-C*0704 0.000 0.002
A*2301-B*1801-C*1502 0.000 0.000
A*2301-B*2705-C*0401 0.000 0.000
A*2301-B*3543-C*1601 0.000 0.002
A*2301-B*3906-C*0702 0.000 0.000
A*2301-B*3910-C*1203 0.000 0.002
A*2301-B*4102-C*1701 0.000 0.000
A*2301-B*4402-C*0202 0.000 0.002
A*2301-B*5001-C*0602 0.000 0.002
A*2301-B*5301-C*0202 0.000 0.000
A*2301-B*5301-C*0401 0.000 0.002
A*2301-B*5703-C*0202 0.000 0.000
A*2301-B*8101-C*0404 0.000 0.002
A*2301-B*8202-C*0302 0.002 0.000
Stellenbosch University http://scholar.sun.ac.za

P a g e | 201
Haplotypes TB Case (f) Control (f) P-value OR (95% CI)
A*2402-B*1401-C*0804 0.000 0.006
A*2402-B*1501-C*0102 0.000 0.002
A*2402-B*1501-C*0303 0.000 0.002
A*2402-B*1501-C*0304 0.000 0.002
A*2402-B*1502-C*0403 0.000 0.000
A*2402-B*1531-C*0403 0.000 0.002
A*2402-B*4002-C*1502 0.002 0.000
A*2402-B*4011-C*0102 0.000 0.002
A*2402-B*4403-C*0210 0.000 0.000
A*2402-B*4403-C*1601 0.000 0.002
A*2402-B*5001-C*0602 0.002 0.000
A*2402-B*5101-C*0701 0.000 0.000
A*2402-B*5101-C*1502 0.000 0.002
A*2402-B*5201-C*0701 0.002 0.000
A*2402-B*5702-C*0501 0.000 0.000
A*2402-B*8101-C*1801 0.000 0.000
A*2403-B*1801-C*0701 0.000 0.000
A*2405-B*4501-C*1601 0.000 0.000
A*2407-B*0801-C*0701 0.002 0.000
A*2407-B*0801-C*0702 0.000 0.002
A*2407-B*1501-C*0202 0.000 0.002
A*2407-B*1501-C*0702 0.000 0.002
A*2407-B*4801-C*0801 0.000 0.000
A*2407-B*5201-C*1202 0.000 0.000
A*2417-B*4804-C*0102 0.000 0.002
A*2501-B*1503-C*1801 0.002 0.000
A*2501-B*1521-C*0403 0.000 0.000
A*2501-B*3901-C*1203 0.000 0.000
A*2501-B*3901-C*1502 0.000 0.000
A*2501-B*4101-C*1701 0.002 0.000
A*2601-B*1516-C*1402 0.000 0.000
A*2601-B*1517-C*0602 0.000 0.000
A*2601-B*3501-C*1701 0.000 0.000
A*2601-B*3508-C*0202 0.002 0.000
A*2601-B*3801-C*1203 0.002 0.000
A*2601-B*4002-C*0202 0.002 0.000
A*2601-B*4011-C*1203 0.000 0.000
A*2601-B*4102-C*0801 0.000 0.000
A*2601-B*4901-C*0701 0.002 0.000
A*2601-B*5501-C*0303 0.000 0.002
A*2601-B*5702-C*0701 0.002 0.000
A*2601-B*8101-C*0401 0.002 0.000
A*2612-B*3701-C*0602 0.002 0.000
A*2901-B*1303-C*1203 0.002 0.000
Stellenbosch University http://scholar.sun.ac.za

P a g e | 202
Haplotypes TB Case (f) Control (f) P-value OR (95% CI)
A*2901-B*4101-C*1701 0.002 0.000
A*2901-B*4403-C*0701 0.002 0.000
A*2901-B*4403-C*0802 0.000 0.002
A*2901-B*5108-C*1602 0.002 0.000
A*2902-B*1503-C*0210 0.000 0.000
A*2902-B*1510-C*0401 0.002 0.000
A*2902-B*3701-C*0602 0.000 0.000
A*2902-B*4202-C*1701 0.002 0.000
A*2902-B*4501-C*0602 0.002 0.000
A*2902-B*5801-C*0602 0.000 0.000
A*2911-B*5801-C*0302 0.002 0.000
A*3001-B*0705-C*0702 0.000 0.002
A*3001-B*0801-C*0702 0.000 0.002
A*3001-B*1516-C*1601 0.000 0.002
A*3001-B*1801-C*0701 0.000 0.002
A*3001-B*5101-C*1402 0.002 0.000
A*3001-B*5301-C*0401 0.002 0.000
A*3001-B*5801-C*0102 0.000 0.002
A*3001-B*5801-C*0602 0.000 0.004
A*3002-B*0702-C*0702 0.000 0.002
A*3002-B*0801-C*0702 0.002 0.000
A*3002-B*1510-C*0702 0.000 0.000
A*3002-B*4403-C*1602 0.000 0.000
A*3002-B*5001-C*0701 0.000 0.002
A*3002-B*5201-C*0602 0.002 0.000
A*3002-B*5802-C*1204 0.002 0.000
A*3004-B*2705-C*1203 0.000 0.002
A*3004-B*4403-C*0210 0.002 0.000
A*3004-B*4501-C*1601 0.002 0.000
A*3004-B*4901-C*0401 0.000 0.000
A*3009-B*1402-C*0802 0.000 0.002
A*3101-B*0702-C*0702 0.000 0.002
A*3101-B*1401-C*0804 0.000 0.002
A*3101-B*1503-C*0210 0.000 0.000
A*3101-B*4001-C*0304 0.000 0.002
A*3101-B*5101-C*1502 0.002 0.000
A*3101-B*5101-C*1602 0.002 0.000
A*3201-B*0702-C*0702 0.000 0.002
A*3201-B*1302-C*0602 0.002 0.000
A*3201-B*1503-C*1801 0.002 0.000
A*3201-B*1510-C*0401 0.000 0.002
A*3201-B*1801-C*0701 0.002 0.000
A*3201-B*2705-C*0202 0.000 0.002
A*3201-B*3501-C*0210 0.000 0.002
Stellenbosch University http://scholar.sun.ac.za

P a g e | 203
Haplotypes TB Case (f) Control (f) P-value OR (95% CI)
A*3201-B*3901-C*1203 0.002 0.000
A*3201-B*4402-C*0202 0.000 0.000
A*3201-B*5802-C*0602 0.002 0.000
A*3301-B*8101-C*0403 0.002 0.000
A*3303-B*1513-C*0801 0.002 0.000
A*3303-B*1801-C*0704 0.000 0.002
A*3303-B*3503-C*0401 0.002 0.000
A*3303-B*3701-C*0302 0.000 0.002
A*3303-B*4403-C*0401 0.000 0.000
A*3303-B*8101-C*0804 0.000 0.002
A*3303-B*8101-C*1801 0.000 0.002
A*3401-B*1521-C*0403 0.002 0.000
A*3401-B*5701-C*0403 0.002 0.000
A*3402-B*3503-C*0701 0.000 0.000
A*3402-B*3901-C*1203 0.000 0.000
A*3402-B*4201-C*1701 0.000 0.002
A*3402-B*4801-C*0801 0.002 0.000
A*3402-B*5703-C*1801 0.002 0.000
A*3601-B*1801-C*0704 0.000 0.002
A*3601-B*4201-C*1700 0.000 0.002
A*3601-B*5301-C*0407 0.000 0.002
A*4301-B*0705-C*0702 0.000 0.002
A*4301-B*1401-C*0804 0.000 0.002
A*4301-B*1801-C*0704 0.000 0.002
A*4301-B*1801-C*0802 0.000 0.000
A*4301-B*3504-C*1402 0.000 0.000
A*4301-B*3701-C*0602 0.002 0.000
A*4301-B*4403-C*0804 0.004 0.000
A*6601-B*4102-C*1701 0.000 0.002
A*6601-B*4701-C*0602 0.002 0.000
A*6602-B*4201-C*1701 0.000 0.002
A*6801-B*0801-C*0401 0.000 0.000
A*6801-B*1402-C*0804 0.002 0.000
A*6801-B*1501-C*0303 0.002 0.000
A*6801-B*1510-C*0602 0.000 0.002
A*6801-B*4006-C*0202 0.000 0.000
A*6801-B*5601-C*0102 0.000 0.002
A*6801-B*8202-C*0302 0.000 0.002
A*6802-B*0705-C*0702 0.000 0.002
A*6802-B*1517-C*0702 0.002 0.000
A*6802-B*1801-C*0501 0.000 0.002
A*6802-B*4901-C*0304 0.000 0.000
A*6802-B*5702-C*1801 0.002 0.000
A*6802-B*5703-C*1801 0.000 0.002
Stellenbosch University http://scholar.sun.ac.za

P a g e | 204
Haplotypes TB Case (f) Control (f) P-value OR (95% CI)
A*6802-B*5801-C*0701 0.000 0.002
A*6827-B*0705-C*0702 0.000 0.002
A*6827-B*1510-C*0401 0.000 0.002
A*6901-B*1401-C*1203 0.002 0.000
A*7401-B*5703-C*0701 0.002 0.000
A*7403-B*3910-C*1203 0.000 0.000
A*8001-B*0801-C*0701 0.000 0.002
A*2402-B*4402-C*0501 0.002 0.000
A*7401-B*4201-C*1701 0.002 0.000
A*3004-B*1503-C*1801 0.000 0.000
A*0205-B*5801-C*0602 0.000 0.002
A*0205-B*4501-C*0602 0.000 0.002
A*0101-B*4006-C*1502 0.000 0.000
A*2301-B*1516-C*1601 0.002 0.000
A*2601-B*4011-C*1502 0.000 0.000
A*2601-B*4102-C*1701 0.000 0.002
A*6827-B*4403-C*0210 0.000 0.000
Stellenbosch University http://scholar.sun.ac.za

P a g e | 205
Appendix 2: Case-control association data for SNPs of the MHC and susceptibility to TB in the
SAC population.
SNP BP P-value
rs9295873 30414235 0.6036
rs9461607 30414574 0.4953
rs2844731 30416985 0.5387
rs9295878 30417149 0.4198
rs9295881 30417459 0.3361
rs9295888 30422481 0.1477
rs17411480 30423117 0.4797
rs2516675 30430520 0.4767
rs2516670 30434999 0.4578
rs3094694 30451904 0.8751
rs2157605 30454076 0.6817
rs2516662 30475415 0.6012
rs2844720 30475717 0.4673
rs996589 30477235 0.8972
rs996588 30477256 0.6326
rs2844718 30477276 0.635
rs1058318 30512163 0.3879
rs4713337 30529475 0.4837
rs3888778 30529622 0.341
rs1264432 30562021 0.5953
rs2239515 30577966 0.4631
rs2239516 30578048 0.6132
rs2252745 30579315 0.3036
rs2270172 30592414 0.4414
rs6904236 30596135 0.5718
rs9262138 30627867 0.259
rs3130000 30628082 0.1639
rs7749235 30635593 0.3205
rs1075496 30658239 0.5404
rs7565 30668159 0.02
rs2253802 30684686 0.2924
rs1061397 30692539 0.1541
rs8233 30692965 0.4163
rs3095329 30693816 0.4471
rs3094127 30697447 0.4933
rs2394401 30724430 0.9344
rs3095340 30726939 0.4981
rs3094122 30728360 0.6259
rs3094121 30730960 0.7246
rs3132605 30739972 0.9601
rs3130666 30740160 0.2157
rs4248148 30742134 0.1821
Stellenbosch University http://scholar.sun.ac.za

P a g e | 206
SNP BP P-value
rs10947091 30747216 0.7685
rs12527415 30754540 0.9768
rs11758688 30758348 0.8836
rs3131043 30758466 0.9658
rs3131050 30760025 0.8497
rs3131060 30763291 0.8487
rs6930444 30763632 0.7386
rs12660883 30764420 0.9912
rs10947096 30765895 0.9715
rs4587207 30766945 0.8684
rs4483030 30767129 0.9049
rs4713370 30767538 0.876
rs4248149 30767627 0.9432
rs2394403 30767869 0.8085
rs9380192 30772344 0.9015
rs3094123 30772378 0.9999
rs4713376 30773314 0.9647
rs9380197 30778203 0.9616
rs4713382 30787175 0.822
rs12195469 30789608 0.9783
rs12215119 30795328 0.7542
rs9368644 30797083 0.9825
rs1264344 30800577 0.3695
rs3130649 30803254 0.9945
rs3095350 30817866 0.6505
rs3095345 30822413 0.9875
rs6924600 30857542 0.5259
rs6457282 30857988 0.689
rs9295931 30869714 0.3906
rs2074508 30876438 0.4119
rs3218815 30878769 0.4119
rs2074512 30878919 0.4086
rs3218831 30882431 0.7036
rs1264303 30882513 0.7428
rs7738138 30887344 0.6342
rs753725 30890871 0.1291
rs4711247 30895680 0.2058
rs3131785 30901895 0.07636
rs3131784 30903948 0.06278
rs3132581 30913458 0.1937
rs3757340 30921882 0.1673
rs2532921 30922570 0.3275
rs2530710 30940387 0.4291
Stellenbosch University http://scholar.sun.ac.za

P a g e | 207
SNP BP P-value
rs2530709 30940569 0.3189
rs2517446 30940945 0.2302
rs2844678 30950050 0.05639
rs3873342 30957766 0.2154
rs2517411 30960267 0.1124
rs2844673 30961926 0.1119
rs2252925 30966282 0.1169
rs2252926 30966304 0.2112
rs2530690 30967202 0.2152
rs436376 30972390 0.1914
rs2256514 30972471 0.1674
rs1634717 30972589 0.06625
rs1634718 30972865 0.3504
rs2523915 30973358 0.313
rs1632854 30975649 0.1141
rs12528087 30980603 0.4369
rs9262494 30986504 0.6399
rs6933349 31002013 0.8006
rs4713423 31002301 0.7567
rs2517538 31013541 0.8691
rs2523865 31018448 0.3048
rs4713429 31021017 0.4765
rs9262615 31021161 0.9523
rs3873352 31022113 0.3298
rs9262635 31025479 0.3878
rs2517524 31025713 0.9584
rs9262636 31025848 0.4344
rs2517510 31030122 0.6826
rs2523841 31030283 0.1009
rs2523840 31030425 0.1081
rs2246330 31041493 0.637
rs2523883 31042070 0.6372
rs2517489 31042306 0.5638
rs2523881 31042608 0.527
rs2523880 31042769 0.7538
rs2535318 31051388 0.6992
rs2517471 31052098 0.693
rs2535315 31052127 0.4939
rs2535306 31053867 0.765
rs3130955 31054511 0.9241
rs4947296 31058178 0.6794
rs3130544 31058340 0.3569
rs9263597 31071547 0.2915
Stellenbosch University http://scholar.sun.ac.za

P a g e | 208
SNP BP P-value
rs2233969 31080432 0.9009
rs1265052 31080471 0.5487
rs2233967 31080828 0.46
rs1265048 31081409 0.961
rs3130975 31081838 0.9679
rs3130981 31083813 0.6858
rs3095324 31087133 0.4093
rs3130991 31087354 0.3184
rs3095314 31089631 0.487
rs9263702 31094195 0.27
rs9263715 31095801 0.9641
rs9263716 31095816 0.8866
rs3130558 31097183 0.5122
rs3131009 31098832 0.466
rs13200022 31098957 0.7195
rs4959053 31099577 0.8794
rs3130564 31101674 0.8075
rs3130575 31113106 0.8811
rs1265074 31113214 0.1583
rs2240066 31114335 0.05253
rs2240063 31114745 0.514
rs6929434 31127947 0.3985
rs2073724 31129707 0.9998
rs9263794 31130019 0.2648
rs2073723 31130078 0.8814
rs2106074 31133509 0.885
rs9501063 31133894 0.05352
rs3757349 31134532 0.1119
rs9263800 31134599 0.1167
rs9263804 31135706 0.9132
rs3130501 31136453 0.9909
rs3132524 31136714 0.7066
rs887466 31143511 0.015
rs887465 31143652 0.6356
rs1265181 31155785 0.3218
rs9405015 31155803 0.3234
rs3095238 31161210 0.8455
rs6899874 31162328 0.0623
rs9295961 31167498 0.6482
rs2894180 31172655 0.6501
rs4516988 31176602 0.8851
rs3130953 31177094 0.2768
rs3130952 31177915 0.6575
Stellenbosch University http://scholar.sun.ac.za

P a g e | 209
SNP BP P-value
rs3130944 31196671 0.4728
rs6908994 31198709 0.14
rs3130713 31205617 0.2912
rs3130531 31206616 0.6334
rs2394894 31206920 0.6041
rs2394895 31206979 0.7013
rs3095250 31208340 0.6168
rs3130532 31208453 0.9577
rs3130534 31209045 0.9733
rs3134762 31210866 0.7996
rs3899471 31215037 0.137
rs2248880 31233510 0.7097
rs2524078 31242649 0.3765
rs2844615 31242959 0.3971
rs3132486 31243170 0.988
rs6906846 31245736 0.9901
rs2524067 31245821 0.2183
rs7382297 31247067 0.9878
rs3873375 31251360 0.05755
rs2394963 31251462 0.09572
rs2524051 31255500 0.1247
rs9357123 31262869 0.06869
rs3905495 31265539 0.106
rs2524115 31265554 0.05889
rs2524095 31266117 0.3739
rs16899203 31266335 0.01068
rs16899205 31266361 0.259
rs16899207 31266387 0.2253
rs2524089 31266522 0.5927
rs2394967 31269129 0.3249
rs9366778 31269173 0.2095
rs3873385 31269308 0.00389
rs4523128 31269382 0.3239
rs9295970 31269522 0.643
rs396038 31272980 0.03372
rs1634788 31277686 0.08547
rs9295984 31317697 0.1358
rs4394275 31318177 0.3214
rs9378249 31327701 0.8636
rs2596477 31327723 0.8823
rs2523575 31328826 0.4061
rs2523544 31333562 0.6894
rs7761068 31333939 0.5427
Stellenbosch University http://scholar.sun.ac.za

P a g e | 210
SNP BP P-value
rs2523537 31335707 0.6888
rs2156874 31335976 0.293
rs2523536 31336000 0.2481
rs2523535 31336250 0.5601
rs2523534 31336349 0.4926
rs9266406 31336418 0.08878
rs9266409 31336568 0.08988
rs2523533 31336649 0.8093
rs2853986 31338844 0.6577
rs2263311 31340807 0.329
rs5025315 31343604 0.5595
rs6910516 31343827 0.08878
rs5022119 31343862 0.9247
rs2523638 31344273 0.2108
rs3997982 31344294 0.9287
rs2596571 31348022 0.5438
rs2523485 31351035 0.8945
rs3016013 31351242 0.1735
rs3099848 31351442 0.1223
rs9266774 31352880 0.07883
rs2596565 31353329 0.6114
rs9266775 31353417 0.118
rs4081552 31353689 0.1238
rs2596517 31360095 0.8195
rs16899524 31362310 0.3652
rs2523467 31362930 0.02942
rs1063635 31379931 0.8802
rs3094584 31383848 0.08021
rs9295990 31386019 0.6356
rs2848716 31387967 0.4912
rs2394999 31400935 0.728
rs2596464 31412961 0.708
rs16899646 31416920 0.9938
rs2596457 31418022 0.2388
rs2516460 31418700 0.9543
rs3131622 31420500 0.2921
rs2523691 31420687 0.5212
rs3131621 31425499 0.06414
rs2844507 31436581 0.2206
rs2244579 31436639 0.2021
rs2395031 31437305 0.6645
rs3828886 31440552 0.2155
rs2248373 31446546 0.8379
Stellenbosch University http://scholar.sun.ac.za

P a g e | 211
SNP BP P-value
rs2248459 31446710 0.9974
rs2248462 31446796 0.7415
rs2248617 31448533 0.8238
rs3749946 31448862 0.7975
rs3099844 31448976 0.4796
rs2523650 31449022 0.9086
rs2904776 31449081 0.7635
rs2516422 31449269 0.9693
rs9267247 31455834 0.5987
rs2395034 31460143 0.8042
rs3093953 31474688 0.1793
rs3095229 31480272 0.8575
rs3131631 31484683 0.09665
rs2516486 31494202 0.3431
rs2734573 31494738 0.2911
rs3115537 31497835 0.102
rs3093978 31498497 0.119
rs2516478 31498737 0.3186
rs2071593 31512799 0.2316
rs3219183 31516363 0.4004
rs1799964 31542308 0.09936
rs1052248 31556581 0.8932
rs9348876 31575276 0.6704
rs2857697 31585219 0.6962
rs2736177 31586094 0.06362
rs2736172 31590898 0.8702
rs1046089 31602967 0.8873
rs2255741 31605167 0.3262
rs760293 31611777 0.2835
rs2077102 31611840 0.07282
rs3130048 31613739 0.1466
rs2844463 31615167 0.3223
rs805301 31618121 0.7349
rs805300 31618567 0.8348
rs805297 31622606 0.5608
rs707921 31625541 0.8428
rs2242655 31627449 0.06931
rs707974 31629499 0.4607
rs805268 31638178 0.3786
rs2142234 31639129 0.08409
rs805267 31639757 0.809
rs707918 31654732 0.9098
rs376510 31688200 0.6211
Stellenbosch University http://scholar.sun.ac.za

P a g e | 212
SNP BP P-value
rs805292 31690009 0.1255
rs707915 31710968 0.6371
rs3130484 31715882 0.7656
rs2299851 31718602 0.5782
rs3131379 31721033 0.7737
rs707939 31726688 0.9224
rs707937 31731014 0.7095
rs2075800 31777946 0.4428
rs2763979 31794592 0.4805
rs11965547 31836151 0.02436
rs486416 31856070 0.6172
rs9267673 31883679 0.726
rs644045 31883957 0.9607
rs638383 31908224 0.9976
rs17201431 31916013 0.132
rs541862 31916951 0.4906
rs2072633 31919578 0.9232
rs550513 31920687 0.7109
rs9501161 31924327 0.632
rs406936 31933161 0.7754
rs492899 31933518 0.7967
rs3130287 32050544 0.1447
rs1150753 32059867 0.9605
rs17421624 32066177 0.3083
rs9296009 32114515 0.2864
rs3130284 32140487 0.4117
rs408359 32141883 0.01733
rs204990 32161430 0.6932
rs204989 32161852 0.6917
rs2071278 32165444 0.8547
rs2071286 32179896 0.1084
rs3131294 32180146 0.6586
rs206015 32182759 0.05069
rs379464 32186348 0.7052
rs8192590 32187783 0.06873
rs415929 32189032 0.7696
rs391755 32192436 0.8166
rs377763 32199144 0.9385
rs3134926 32200147 0.246
rs9267954 32213052 0.8984
rs3115576 32216850 0.6155
rs6936204 32217092 0.8592
rs9267971 32217185 0.4315
Stellenbosch University http://scholar.sun.ac.za

P a g e | 213
SNP BP P-value
rs3130311 32217367 0.4907
rs4959090 32219962 0.3456
rs7767325 32233886 0.7761
rs3132928 32234015 0.9873
rs1559873 32243129 0.6479
rs17577123 32257547 0.1685
rs544358 32273158 0.496
rs574710 32288190 0.6201
rs539703 32288462 0.5369
rs12524063 32297310 0.0328
rs926591 32305690 0.5942
rs3129900 32305979 0.2104
rs9368716 32306090 0.292
rs4959093 32313097 0.4735
rs910050 32315654 0.1594
rs910049 32315727 0.1816
rs9268302 32324817 0.04579
rs6907322 32324945 0.04633
rs2894249 32325835 0.2249
rs3129932 32336127 0.256
rs3129933 32336161 0.1943
rs3129934 32336187 0.2703
rs9268402 32341353 0.2803
rs9391858 32341398 0.8614
rs9268403 32341473 0.5897
rs9268418 32343686 0.5443
rs9268429 32345052 0.4657
rs12528797 32345086 0.2436
rs2894254 32345689 0.4959
rs17423649 32357133 0.9921
rs17495612 32359431 0.6603
rs3129953 32361821 0.1351
rs2076533 32363527 0.6322
rs2076530 32363816 0.5666
rs9268480 32363844 0.7054
rs10947261 32373232 0.2919
rs3806156 32373698 0.2471
rs3763307 32374622 0.5548
rs3763308 32374640 0.04921
rs9268541 32384527 0.321
rs3135378 32385099 0.09041
rs3135377 32385399 0.7478
rs3135376 32385470 0.1437
Stellenbosch University http://scholar.sun.ac.za

P a g e | 214
SNP BP P-value
rs2395161 32387752 0.09418
rs2395167 32388308 0.1305
rs2213580 32388574 0.1071
rs3135366 32388709 0.153
rs9268560 32389512 0.3665
rs3135363 32389648 0.5561
rs6929953 32391988 0.8769
rs3135342 32396615 0.339
rs5000563 32404135 0.4129
rs3129872 32407153 0.4908
rs9268645 32408527 0.4042
rs3129877 32408597 0.4229
rs3135393 32408842 0.5563
rs3135392 32409242 0.7649
rs3177928 32412435 0.5336
rs7194 32412480 0.41
rs1051336 32412592 0.1082
rs9268831 32427748 0.6271
rs9268856 32429719 0.6104
rs9268858 32429758 0.582
rs9268861 32429894 0.2601
rs7766843 32430729 0.4406
rs7746922 32430975 0.492
rs9268877 32431147 0.3399
rs9268878 32431292 0.5458
rs4999342 32448098 0.09428
rs9269186 32448416 0.2994
rs7749092 32449050 0.273
rs9270986 32574060 0.1427
rs615672 32574171 0.9452
rs502055 32579003 0.7084
rs4530903 32581889 0.03306
rs3129768 32595083 0.1942
rs9272219 32602269 0.08728
rs9272346 32604372 0.05842
rs9272723 32609427 0.01838
rs9273363 32626272 0.8022
rs9275134 32650612 0.4053
rs2856688 32654640 0.3974
rs7775228 32658079 0.5058
rs9469220 32658310 0.06163
rs6457617 32663851 0.05736
rs6457620 32663999 0.08211
Stellenbosch University http://scholar.sun.ac.za

P a g e | 215
SNP BP P-value
rs2647015 32664093 0.9352
rs2647046 32668336 0.01531
rs2858308 32670000 0.7424
rs9275418 32670244 0.126
rs9275523 32674994 0.2319
rs9275572 32678999 0.02784
rs3916765 32685550 0.8807
rs9275765 32689324 0.8982
rs9275772 32689503 0.991
rs9461799 32689529 0.4024
rs9275793 32690027 0.825
rs2859090 32700833 0.2262
rs9276299 32703108 0.8717
rs2227127 32711782 0.7148
rs9276429 32712104 0.5248
rs9276431 32712247 0.509
rs9276432 32712384 0.5985
rs2239800 32713267 0.6953
rs4398729 32713854 0.4328
rs9276435 32713867 0.3185
rs9276440 32714783 0.5293
rs9276448 32715629 0.9438
rs5014418 32719381 0.8542
rs7768538 32729821 0.54
rs7453920 32730012 0.5506
rs2051549 32730086 0.5873
rs6902723 32731960 0.2584
rs6903130 32732210 0.3917
rs6919798 32732890 0.1425
rs9296044 32736144 0.0702
rs2857212 32740411 0.2426
rs17429127 32751614 0.9088
rs719654 32752139 0.6425
rs2857173 32754920 0.5131
rs9276712 32759252 0.5108
rs2621384 32759273 0.4371
rs2857161 32759297 0.3714
rs2621383 32759335 0.2557
rs2621382 32760445 0.03074
rs2157082 32760714 0.02454
rs2857154 32762616 0.07957
rs2857136 32775686 0.02923
rs2857129 32776623 0.02638
Stellenbosch University http://scholar.sun.ac.za

P a g e | 216
SNP BP P-value
rs2621330 32781524 0.9965
rs16870880 32782018 0.4698
rs17501267 32782149 0.08595
rs2071474 32782582 0.7209
rs1894407 32787036 0.03338
rs9784858 32787175 0.00052
rs17220136 32787337 0.292
rs10484565 32795032 0.006188
rs241438 32797620 0.5657
rs1800454 32800412 0.9518
rs241429 32803840 0.5765
rs241428 32804070 0.9963
rs241427 32804414 0.6475
rs4711312 32814659 0.9844
rs16871026 32815488 0.6443
rs12529313 32817130 0.1428
rs20547 32826233 0.9774
rs9276832 32832400 0.2015
rs17508331 32865338 0.5371
rs241403 32866992 0.8123
rs3101942 32870057 0.02009
rs241400 32871536 0.7167
rs151719 32903900 0.1523
rs17583852 32912588 0.727
rs1050391 32917857 0.5832
rs11539216 32917980 0.9404
rs17840186 32938199 0.7526
rs188245 32955976 0.3596
rs3129305 32959180 0.5848
rs3128947 32965062 0.04371
rs176248 32965942 0.1441
rs12216336 32967741 0.7453
rs2894311 32968339 0.652
rs12191230 32968598 0.5002
rs2395301 32968693 0.6302
rs12192713 32968856 0.6291
rs12199692 32968929 0.8014
rs3130602 32972207 0.49
rs1044429 32972642 0.5288
rs592625 32972690 0.5404
rs3129304 32973743 0.01344
rs3129303 32973878 0.02381
rs3129302 32974343 0.8332
Stellenbosch University http://scholar.sun.ac.za

P a g e | 217
SNP BP P-value
rs399604 32975014 0.734
rs365066 32975257 0.7159
rs6920363 32976572 0.624
rs429916 32978587 0.006727
rs3763341 32979020 0.3825
rs4713603 32979609 0.7235
rs4713604 32979770 0.738
rs6936620 32984451 0.8453
rs2116264 32984788 0.6778
rs1367731 32985199 0.06103
rs3135196 32997577 0.7869
rs439852 33005208 0.3466
rs3130578 33018310 0.7386
rs446853 33018377 0.6468
rs3130179 33018459 0.6629
rs9296069 33018957 0.3901
rs440841 33019643 0.4485
rs3128952 33019973 0.3019
rs3128955 33021192 0.105
rs3130588 33022062 0.1494
rs9277183 33023370 0.07969
rs3097669 33023792 0.8848
rs9277194 33023894 0.1185
rs9277196 33023946 0.06182
rs367645 33024499 0.2686
rs376877 33024606 0.8947
rs3077 33033022 0.2771
rs9348904 33040835 0.4117
rs9296073 33042551 0.4115
rs2856816 33045500 0.3997
rs3135021 33045558 0.1291
rs1431403 33047031 0.363
rs9277542 33055247 0.7851
rs3128963 33055780 0.7701
rs3128965 33055899 0.2825
rs3128966 33055946 0.2859
rs3117229 33056069 0.9605
rs2068204 33058718 0.7694
rs2179920 33058874 0.3897
rs7763822 33060428 0.675
rs2295120 33060769 0.9052
rs6928954 33060822 0.9904
rs7764491 33060840 0.8764
Stellenbosch University http://scholar.sun.ac.za

P a g e | 218
SNP BP P-value
rs3117242 33069893 0.4431
rs3128921 33070749 0.1283
rs3128923 33071322 0.2015
rs3117230 33075635 0.4181
rs3128930 33075666 0.06315
rs872956 33076090 0.5477
rs6937034 33079766 0.3845
rs6937061 33079812 0.2897
rs3117039 33085851 0.9656
rs3130233 33095176 0.1202
rs3117016 33095516 0.8745
rs3116996 33097964 0.8527
rs2395351 33100427 0.07865
rs3129249 33109556 0.3109
rs3129248 33109658 0.5797
rs1003979 33114171 0.9161
rs2071025 33143756 0.171
rs16868943 33147727 0.3719
rs7382464 33150268 0.5083
rs2744537 33162215 0.982
rs6531 33163451 0.9761
rs213208 33178010 0.1208
rs461338 33218180 0.6999
rs462618 33222163 0.7015
rs455567 33252115 0.01496
rs3130267 33306794 0.0979
rs3130014 33312308 0.006388
rs211455 33328518 0.355
rs211453 33330131 0.8324
rs2747476 33351251 0.03223
rs211457 33365640 0.7896
rs10807124 33404064 0.4107
rs411136 33408542 0.332
rs3119021 33429952 0.1739
rs4713630 33472941 0.8254
rs7747216 33476718 0.9783
rs4713633 33477140 0.8533
rs9461864 33481469 0.1049
rs6924409 33491057 0.3475
rs435945 33496632 0.4013
Stellenbosch University http://scholar.sun.ac.za

P a g e | 219
Appendix 3: Case-control association data for SNPs of the MHC and susceptibility to TB in the
Gambian population.
SNP BP P
rs9295873 30414235 0.01715
rs9461607 30414574 0.01598
rs9295878 30417149 0.03265
rs9295881 30417459 0.03524
rs9295888 30422481 0.01531
rs17411480 30423117 0.02082
rs2516675 30430520 0.2919
rs3094694 30451904 0.6241
rs2516662 30475415 0.155
rs2844720 30475717 0.1489
rs996589 30477235 0.1045
rs996588 30477256 0.1303
rs2844718 30477276 0.1529
rs1058318 30512163 0.2938
rs3888778 30529622 0.9468
rs1264432 30562021 0.1531
rs2239515 30577966 0.788
rs2239516 30578048 0.9027
rs2252745 30579315 0.2342
rs2270172 30592414 0.7494
rs6904236 30596135 0.9303
rs7749235 30635593 0.3922
rs1075496 30658239 0.3686
rs7565 30668159 0.03813
rs2253802 30684686 0.7804
rs1061397 30692539 0.451
rs3095329 30693816 0.8645
rs3094127 30697447 0.8943
rs3095340 30726939 0.04012
rs3094122 30728360 0.07552
rs3094121 30730960 0.01613
rs3132605 30739972 0.287
rs3130666 30740160 0.6585
rs4248148 30742134 0.5774
rs10947091 30747216 0.7013
rs12527415 30754540 0.9016
rs11758688 30758348 0.8756
rs3131043 30758466 0.7473
rs3131050 30760025 0.4471
rs3131060 30763291 0.1419
rs6930444 30763632 0.3567
rs12660883 30764420 0.1977
Stellenbosch University http://scholar.sun.ac.za

P a g e | 220
SNP BP P
rs4483030 30767129 0.6078
rs4713370 30767538 0.7522
rs4248149 30767627 0.5641
rs2394403 30767869 0.7065
rs9380192 30772344 0.8768
rs3094123 30772378 0.08761
rs9380197 30778203 0.9863
rs4713382 30787175 0.6146
rs12195469 30789608 0.8795
rs9368644 30797083 0.5089
rs1264344 30800577 0.5154
rs3130649 30803254 0.4852
rs3095350 30817866 0.8291
rs3095345 30822413 0.5024
rs6924600 30857542 0.5952
rs6457282 30857988 0.5205
rs9295931 30869714 0.5631
rs3218815 30878769 0.5909
rs2074512 30878919 0.6249
rs3218831 30882431 0.5914
rs1264303 30882513 0.6663
rs7738138 30887344 0.9545
rs753725 30890871 0.6344
rs4711247 30895680 0.9168
rs3131785 30901895 0.694
rs3131784 30903948 0.6152
rs3132581 30913458 0.468
rs3757340 30921882 0.9544
rs2532921 30922570 0.8278
rs2530709 30940569 0.9424
rs2517446 30940945 0.1988
rs2844678 30950050 0.3471
rs3873342 30957766 0.1709
rs2517411 30960267 0.1933
rs2844673 30961926 0.1873
rs2252925 30966282 0.1769
rs2252926 30966304 0.1769
rs2530690 30967202 0.1605
rs436376 30972390 0.2616
rs2256514 30972471 0.2768
rs1634717 30972589 0.399
rs1634718 30972865 0.8649
rs2523915 30973358 0.3011
Stellenbosch University http://scholar.sun.ac.za

P a g e | 221
SNP BP P
rs1632854 30975649 0.4254
rs12528087 30980603 0.4571
rs9262494 30986504 0.04041
rs6933349 31002013 0.1028
rs4713423 31002301 0.3363
rs2517538 31013541 0.5386
rs2523865 31018448 0.6542
rs4713429 31021017 0.07422
rs9262615 31021161 0.227
rs3873352 31022113 0.1461
rs9262635 31025479 0.3823
rs2517524 31025713 0.8625
rs9262636 31025848 0.801
rs2517510 31030122 0.2573
rs2517509 31030224 0.3867
rs2523841 31030283 0.2935
rs2523840 31030425 0.2777
rs2246330 31041493 0.2987
rs2523883 31042070 0.3744
rs2517489 31042306 0.3551
rs2523881 31042608 0.2209
rs2523880 31042769 0.08358
rs2535318 31051388 0.3369
rs2517471 31052098 0.2544
rs2535306 31053867 0.2012
rs3130955 31054511 0.03187
rs4947296 31058178 0.2578
rs9263597 31071547 0.1204
rs2233969 31080432 0.2045
rs1265052 31080471 0.03058
rs2233967 31080828 0.1508
rs1265048 31081409 0.441
rs3130975 31081838 0.5878
rs3130981 31083813 0.5189
rs3095324 31087133 0.222
rs3130991 31087354 0.6298
rs9263702 31094195 0.7123
rs9263715 31095801 0.4983
rs9263716 31095816 0.6996
rs3130558 31097183 0.627
rs13200022 31098957 0.1739
rs3130564 31101674 0.5653
rs3130575 31113106 0.5689
Stellenbosch University http://scholar.sun.ac.za

P a g e | 222
SNP BP P
rs2240063 31114745 0.4132
rs2073724 31129707 0.7323
rs9263794 31130019 0.7275
rs2073723 31130078 0.9836
rs2106074 31133509 0.9299
rs9501063 31133894 0.3311
rs9263804 31135706 0.893
rs3130501 31136453 0.9693
rs3132524 31136714 0.9665
rs887466 31143511 0.1856
rs887465 31143652 0.431
rs1265181 31155785 0.4279
rs9405015 31155803 0.8653
rs3095238 31161210 0.0923
rs6899874 31162328 0.8643
rs2894180 31172655 0.8479
rs4516988 31176602 0.3682
rs3130953 31177094 0.3781
rs3130952 31177915 0.2782
rs3130944 31196671 0.3306
rs6908994 31198709 0.8518
rs3130713 31205617 0.5957
rs3130531 31206616 0.7699
rs2394894 31206920 0.6001
rs2394895 31206979 0.813
rs3095250 31208340 0.805
rs3130532 31208453 0.3702
rs3130534 31209045 0.5552
rs3134762 31210866 0.5696
rs2248880 31233510 0.5016
rs2844615 31242959 0.0645
rs3132486 31243170 0.01522
rs6906846 31245736 0.1253
rs2524067 31245821 0.5796
rs7382297 31247067 0.5342
rs3873375 31251360 0.1391
rs2394963 31251462 0.1385
rs2524051 31255500 0.1746
rs9357123 31262869 0.678
rs3905495 31265539 0.08736
rs2524115 31265554 0.2753
rs2524095 31266117 0.673
rs16899203 31266335 0.1131
Stellenbosch University http://scholar.sun.ac.za

P a g e | 223
SNP BP P
rs16899205 31266361 0.2028
rs16899207 31266387 0.1977
rs2524089 31266522 0.6372
rs2394967 31269129 0.009868
rs9366778 31269173 0.1591
rs3873385 31269308 0.7045
rs4523128 31269382 0.009868
rs9295970 31269522 0.4119
rs396038 31272980 0.04522
rs1634788 31277686 0.8802
rs9295984 31317697 0.02184
rs4394275 31318177 0.2785
rs2596477 31327723 0.1919
rs2523575 31328826 0.03751
rs7761068 31333939 0.2699
rs2523536 31336000 0.5772
rs2523535 31336250 0.4
rs2523534 31336349 0.3204
rs9266406 31336418 0.931
rs9266409 31336568 0.9449
rs2853986 31338844 0.2364
rs2263311 31340807 0.1556
rs5025315 31343604 0.5591
rs6910516 31343827 0.923
rs5022119 31343862 0.4096
rs2523638 31344273 0.9715
rs3997982 31344294 0.9019
rs2596571 31348022 0.2738
rs2523485 31351035 0.6325
rs3016013 31351242 0.8619
rs3099848 31351442 0.7379
rs9266774 31352880 0.7861
rs9266775 31353417 0.9114
rs4081552 31353689 0.05837
rs2596517 31360095 0.8988
rs2523467 31362930 0.1644
rs1063635 31379931 0.1101
rs3094584 31383848 0.826
rs9295990 31386019 0.8876
rs2848716 31387967 0.06023
rs2596464 31412961 0.8151
rs16899646 31416920 0.07342
rs2596457 31418022 0.8312
Stellenbosch University http://scholar.sun.ac.za

P a g e | 224
SNP BP P
rs2516460 31418700 0.4882
rs3131622 31420500 0.5679
rs2523691 31420687 0.8269
rs3131621 31425499 0.3466
rs2244579 31436639 0.2741
rs3828886 31440552 0.9794
rs2248373 31446546 0.742
rs2248459 31446710 0.3938
rs2248462 31446796 0.4807
rs2248617 31448533 0.3264
rs3749946 31448862 0.1884
rs3099844 31448976 0.2362
rs2523650 31449022 0.7775
rs2904776 31449081 0.5739
rs2516422 31449269 0.7039
rs9267247 31455834 0.9751
rs2395034 31460143 0.4589
rs3093953 31474688 0.5186
rs3095229 31480272 0.9406
rs3131631 31484683 0.7859
rs2516486 31494202 0.4115
rs2734573 31494738 0.3233
rs2516478 31498737 0.1827
rs2071593 31512799 0.3937
rs3219183 31516363 0.8083
rs1799964 31542308 0.9851
rs1052248 31556581 0.563
rs9348876 31575276 0.291
rs1046089 31602967 0.4838
rs2255741 31605167 0.2338
rs760293 31611777 0.3366
rs2077102 31611840 0.6137
rs3130048 31613739 0.431
rs805301 31618121 0.2716
rs805300 31618567 0.3211
rs805297 31622606 0.04136
rs707921 31625541 0.2808
rs2242655 31627449 0.9678
rs805268 31638178 0.2646
rs2142234 31639129 0.4521
rs805267 31639757 0.3053
rs707918 31654732 0.246
rs376510 31688200 0.4031
Stellenbosch University http://scholar.sun.ac.za

P a g e | 225
SNP BP P
rs805292 31690009 0.9611
rs707915 31710968 0.1102
rs3130484 31715882 0.003021
rs3131379 31721033 0.01695
rs707939 31726688 0.07131
rs707937 31731014 0.9677
rs2075800 31777946 0.2485
rs2763979 31794592 0.2987
rs11965547 31836151 0.8259
rs486416 31856070 0.5663
rs9267673 31883679 0.1956
rs644045 31883957 0.7352
rs17201431 31916013 0.03477
rs541862 31916951 0.9088
rs4151655 31916985 0.98
rs2072633 31919578 0.3878
rs550513 31920687 0.4537
rs9501161 31924327 0.08682
rs17421624 32066177 0.03488
rs9296009 32114515 0.3628
rs3130284 32140487 0.6437
rs408359 32141883 0.9174
rs204990 32161430 0.4938
rs204989 32161852 0.5816
rs2071286 32179896 0.08019
rs206015 32182759 0.4373
rs379464 32186348 0.9374
rs415929 32189032 0.9399
rs391755 32192436 0.05613
rs377763 32199144 0.1815
rs3134926 32200147 0.01232
rs9267954 32213052 0.01162
rs6936204 32217092 0.7895
rs3130311 32217367 0.3805
rs7767325 32233886 0.7027
rs3132928 32234015 0.7447
rs1559873 32243129 0.04344
rs544358 32273158 0.6685
rs574710 32288190 0.6832
rs539703 32288462 0.6253
rs12524063 32297310 0.2091
rs926591 32305690 0.7647
rs3129900 32305979 0.09735
Stellenbosch University http://scholar.sun.ac.za

P a g e | 226
SNP BP P
rs9368716 32306090 0.115
rs4959093 32313097 0.7647
rs910050 32315654 0.7048
rs910049 32315727 0.8637
rs9268302 32324817 0.2387
rs2894249 32325835 0.9117
rs3129932 32336127 0.8625
rs3129933 32336161 0.06492
rs3129934 32336187 0.08916
rs9268402 32341353 0.3448
rs9391858 32341398 0.5548
rs9268403 32341473 0.7258
rs9268418 32343686 0.8535
rs9268429 32345052 0.7959
rs12528797 32345086 0.04564
rs17423649 32357133 0.6838
rs17495612 32359431 0.5983
rs3129953 32361821 0.7681
rs2076533 32363527 0.9517
rs2076530 32363816 0.9651
rs9268480 32363844 0.7261
rs10947261 32373232 0.9937
rs3806156 32373698 0.8811
rs3763307 32374622 0.8078
rs3763308 32374640 0.9756
rs9268541 32384527 0.4874
rs3135378 32385099 0.1178
rs3135377 32385399 0.187
rs3135376 32385470 0.01751
rs17606006 32386788 0.9801
rs2395161 32387752 0.03753
rs2395167 32388308 0.1387
rs2213580 32388574 0.1098
rs3135366 32388709 0.07436
rs9268560 32389512 0.3606
rs3135363 32389648 0.2137
rs3135342 32396615 0.5247
rs5000563 32404135 0.7534
rs3129872 32407153 0.7878
rs9268645 32408527 0.8784
rs3129877 32408597 0.5108
rs3135393 32408842 0.1682
rs3135392 32409242 0.5633
Stellenbosch University http://scholar.sun.ac.za

P a g e | 227
SNP BP P
rs3177928 32412435 0.7847
rs7194 32412480 0.8557
rs1051336 32412592 0.1406
rs9268831 32427748 0.9552
rs9268856 32429719 0.7996
rs9268858 32429758 0.1601
rs9268861 32429894 0.08604
rs7766843 32430729 0.971
rs7746922 32430975 0.9852
rs9268877 32431147 0.2399
rs9268878 32431292 0.8992
rs9269186 32448416 0.7594
rs9270986 32574060 0.7495
rs615672 32574171 0.4521
rs502055 32579003 0.1573
rs4530903 32581889 0.1506
rs9272219 32602269 0.553
rs9272346 32604372 0.7828
rs9273363 32626272 0.6706
rs9275134 32650612 0.4521
rs2856688 32654640 0.5694
rs7775228 32658079 0.7718
rs9469220 32658310 0.1885
rs6457617 32663851 0.2411
rs6457620 32663999 0.2343
rs2647046 32668336 0.1173
rs2858308 32670000 0.8739
rs9275418 32670244 0.5264
rs9275523 32674994 0.6173
rs9275572 32678999 0.1153
rs3957146 32681530 0.5961
rs9275765 32689324 0.3202
rs9275772 32689503 0.2984
rs9461799 32689529 0.07227
rs9275793 32690027 0.2984
rs2859090 32700833 0.1814
rs9276299 32703108 0.4666
rs2227127 32711782 0.1387
rs9276429 32712104 0.7588
rs9276431 32712247 0.7588
rs9276432 32712384 0.7441
rs2239800 32713267 0.9656
rs9276435 32713867 0.5292
Stellenbosch University http://scholar.sun.ac.za

P a g e | 228
SNP BP P
rs9276440 32714783 0.7228
rs9276448 32715629 0.8744
rs5014418 32719381 0.5688
rs6933763 32722852 0.6806
rs7768538 32729821 0.4407
rs7453920 32730012 0.4912
rs2051549 32730086 0.2993
rs6902723 32731960 0.7563
rs6903130 32732210 0.8684
rs6919798 32732890 0.5707
rs9296044 32736144 0.9729
rs2857212 32740411 0.7722
rs17429127 32751614 0.4825
rs719654 32752139 0.5049
rs2857173 32754920 0.7305
rs2621384 32759273 0.5299
rs2857161 32759297 0.5316
rs2621383 32759335 0.6117
rs2621382 32760445 0.5248
rs2157082 32760714 0.5971
rs2857154 32762616 0.451
rs2857136 32775686 0.4706
rs2857129 32776623 0.4597
rs2621330 32781524 0.1963
rs16870880 32782018 0.03148
rs17501267 32782149 0.05929
rs2071474 32782582 0.5139
rs1894407 32787036 0.527
rs9784858 32787175 0.9155
rs17220136 32787337 0.04364
rs10484565 32795032 0.03439
rs241438 32797620 0.06224
rs1800454 32800412 0.5128
rs241428 32804070 0.9908
rs241427 32804414 0.7371
rs16871026 32815488 0.3107
rs12529313 32817130 0.884
rs9276832 32832400 0.3651
rs17508331 32865338 0.1302
rs3101942 32870057 0.4552
rs151719 32903900 0.4648
rs1050391 32917857 0.2759
rs17840186 32938199 0.1983
Stellenbosch University http://scholar.sun.ac.za

P a g e | 229
SNP BP P
rs3129305 32959180 0.5697
rs12216336 32967741 0.008655
rs12191230 32968598 0.08506
rs2395301 32968693 0.00938
rs12192713 32968856 0.06951
rs12199692 32968929 0.006147
rs3130602 32972207 0.989
rs1044429 32972642 0.7939
rs592625 32972690 0.3613
rs3129304 32973743 0.1447
rs3129303 32973878 0.03502
rs3129302 32974343 0.05632
rs399604 32975014 0.2786
rs365066 32975257 0.4343
rs6920363 32976572 0.4978
rs429916 32978587 0.7663
rs3763341 32979020 0.3325
rs4713603 32979609 0.0866
rs4713604 32979770 0.1124
rs6936620 32984451 0.01574
rs1367731 32985199 0.873
rs3135196 32997577 0.03287
rs439852 33005208 0.9668
rs3130578 33018310 0.5479
rs446853 33018377 0.8673
rs3130179 33018459 0.267
rs440841 33019643 0.4204
rs3128952 33019973 0.643
rs3128955 33021192 0.7623
rs3130588 33022062 0.5
rs9277183 33023370 0.7871
rs9277196 33023946 0.5142
rs367645 33024499 0.7382
rs376877 33024606 0.4512
rs3077 33033022 0.03535
rs9348904 33040835 0.02864
rs9296073 33042551 0.8642
rs2856816 33045500 0.1271
rs3135021 33045558 0.01214
rs1431403 33047031 0.04383
rs9277542 33055247 0.1013
rs3128963 33055780 0.1142
rs3128965 33055899 0.2289
Stellenbosch University http://scholar.sun.ac.za

P a g e | 230
SNP BP P
rs3128966 33055946 0.3769
rs3117229 33056069 0.4829
rs2068204 33058718 0.3203
rs2179920 33058874 0.1281
rs7763822 33060428 0.7883
rs2295120 33060769 0.6539
rs6928954 33060822 0.2209
rs7764491 33060840 0.8577
rs3117242 33069893 0.1362
rs3128921 33070749 0.08612
rs3128923 33071322 0.1927
rs3117230 33075635 0.1038
rs3128930 33075666 0.2743
rs872956 33076090 0.2187
rs6937034 33079766 0.7163
rs6937061 33079812 0.9539
rs3117039 33085851 0.7787
rs3130233 33095176 0.4937
rs3117016 33095516 0.4448
rs3116996 33097964 0.5533
rs2395351 33100427 0.1834
rs3129248 33109658 0.08252
rs1003979 33114171 0.1069
rs2071025 33143756 0.5483
rs7382464 33150268 0.3025
rs2744537 33162215 0.8923
rs213208 33178010 0.6032
rs461338 33218180 0.8763
rs462618 33222163 0.6918
rs455567 33252115 0.7657
rs3130267 33306794 0.5218
rs3130014 33312308 0.9642
rs211455 33328518 0.7014
rs211453 33330131 0.6603
rs411136 33408542 0.8164
rs4713630 33472941 0.7608
rs7747216 33476718 0.7654
rs4713633 33477140 0.7078
rs9461864 33481469 0.3635
Stellenbosch University http://scholar.sun.ac.za

P a g e | 231
Appendix 4: Case-control association data for SNPs of the LHC and susceptibility to TB in the
SAC population.
SNP BP P
rs10416258 54795939 0.8707
rs1761450 54818035 0.003
rs3848611 54828870 0.7023
rs10419832 54849399 0.9454
rs8102662 54851228 0.5511
rs4356595 54852504 0.9258
rs8109349 54902385 0.009
rs10425451 54952513 0.1791
rs3813148 54965860 0.7681
rs11672056 54988060 0.186
rs41514951 54990042 0.568
rs6509880 55017416 0.5067
rs4806518 55017594 0.611
rs2363059 55026398 0.7315
rs6509883 55030376 0.1636
rs1469335 55042628 0.7261
rs1000321 55046487 0.7934
rs7257192 55055754 0.2152
rs7246707 55060274 0.5932
rs2555685 55067465 0.4063
rs2555687 55067854 0.3215
rs16985743 55069964 0.1122
rs10402506 55074470 0.5063
rs12459217 55081592 0.3534
rs2363864 55121186 0.9022
rs10411879 55123305 0.3701
rs8105809 55123464 0.09875
rs1077598 55138402 0.5695
rs10418733 55158851 0.118
rs10419191 55159164 0.2585
rs4806798 55166721 0.3686
rs1749311 55173497 0.8025
rs11574597 55182696 0.3939
rs7258577 55186255 0.8576
rs1654660 55195187 0.2528
rs1749295 55200042 0.2566
rs1749296 55200398 0.2363
rs11084367 55213281 0.07268
rs8104498 55214795 0.035
rs11672983 55383051 0.7163
rs775850 55429258 0.5173
rs17699476 55432460 0.08915
Stellenbosch University http://scholar.sun.ac.za

P a g e | 232
SNP BP P
rs775859 55433596 0.4028
rs16986092 55433696 0.01
rs2365582 55436017 0.4978
rs269940 55440357 0.4461
rs269957 55445174 0.898
rs17699561 55447612 0.3537
rs4806626 55447840 0.6712
rs703473 55458816 0.1464
rs9941465 55459156 0.9736
rs8102561 55488150 0.6743
rs4306647 55494157 0.2901
rs10412915 55494740 0.5615
rs1654502 55505208 0.2371
rs12981732 55524375 0.5248
rs1654416 55530035 0.2919
rs11084382 55535434 0.3095
rs11668169 55535482 0.1839
rs11672026 55535515 0.4261
rs1654419 55535881 0.2862
rs1654420 55536206 0.4482
rs17836542 55549386 0.7529
rs1671214 55552823 0.683
rs8113032 55554138 0.9341
Stellenbosch University http://scholar.sun.ac.za

P a g e | 233
Appendix 5: Case-control association data for SNPs of the LHC and susceptibility to TB in the
Gambian population.
SNP BP P
rs10416258 54795939 0.1752
rs741584 54815093 0.9519
rs3848611 54828870 0.2314
rs8102662 54851228 0.4184
rs4356595 54852504 0.3746
rs10425451 54952513 0.2998
rs3813148 54965860 0.4551
rs41514951 54990042 0.4476
rs6509880 55017416 0.009
rs4806518 55017594 0.3904
rs2363059 55026398 0.7239
rs7257192 55055754 0.4073
rs7246707 55060274 0.6533
rs2555685 55067465 0.002
rs2555687 55067854 0.009
rs16985743 55069964 0.019
rs12461246 55081245 0.3378
rs12459217 55081592 0.1139
rs2363864 55121186 0.3861
rs10411879 55123305 0.05725
rs8105809 55123464 0.7696
rs1077598 55138402 0.4847
rs10418733 55158851 0.8736
rs10419191 55159164 0.8261
rs4806798 55166721 0.8671
rs11574597 55182696 0.3401
rs7258577 55186255 0.7587
rs1654660 55195187 0.1773
rs1749295 55200042 0.3823
rs1749296 55200398 0.2804
rs4420651 55207053 0.3665
rs8104498 55214795 0.6298
rs11672983 55383051 0.5622
rs8102504 55393722 0.08525
rs775850 55429258 0.8907
rs775859 55433596 0.8892
rs2365582 55436017 0.6956
rs269940 55440357 0.5553
rs269957 55445174 0.9469
rs703473 55458816 0.4796
rs8102561 55488150 0.5056
rs10412915 55494740 0.391
Stellenbosch University http://scholar.sun.ac.za

P a g e | 234
SNP BP P
rs1654502 55505208 0.4935
rs1654416 55530035 0.9329
rs11084382 55535434 0.6711
rs11668169 55535482 0.2462
rs11672026 55535515 0.6499
rs1654419 55535881 0.7475
rs1654420 55536206 0.7874
rs1671214 55552823 0.3863
rs1654439 55553647 0.2184
Stellenbosch University http://scholar.sun.ac.za

M A J O R A R T I C L E
Associations Between Human Leukocyte AntigenClass I Variants and theMycobacteriumtuberculosis Subtypes Causing Disease
Muneeb Salie,1 Lize van der Merwe,1,2,3 Marlo Möller,1 Michelle Daya,1 Gian D. van der Spuy,1 Paul D. van Helden,1
Maureen P. Martin,4,5 Xiao-jiang Gao,4,5 Robin M. Warren,1 Mary Carrington,4,5 and Eileen G. Hoal1
1MRC Centre for Molecular and Cellular Biology and the DST/NRF Centre of Excellence for Biomedical TB Research, Division of Molecular Biology andHuman Genetics, Stellenbosch University, Tygerberg, 2MRC Biostatistics Unit, Medical Research Council, Tygerberg, and 3Department of Statistics,University of Western Cape, Bellville, South Africa; 4Cancer and Inflammation Program, Laboratory of Experimental Immunology, SAIC-Frederick, Inc,Frederick National Laboratory for Cancer Research, Frederick, Maryland; and 5Ragon Institute of Massachusetts General Hospital, MassachusettsInstitute of Technology, and Harvard University, Cambridge
Background. The development of active tuberculosis disease has been shown to be multifactorial. Interactionsbetween host and bacterial genotype may influence disease outcome, with some studies indicating the adaptation ofM. tuberculosis strains to specific human populations. Here we investigate the role of the human leukocyte antigen(HLA) class I genes in this biological process.
Methods. Three hundred patients with tuberculosis from South Africa were typed for their HLA class I allelesby direct sequencing. Mycobacterium tuberculosis genotype classification was done by IS6110 restriction fragmentlength polymorphism genotyping and spoligotyping.
Results. We showed that Beijing strain occurred more frequently in individuals with multiple disease episodes(P < .001) with the HLA-B27 allele lowering the odds of having an additional episode (odds ratio, 0.21; P = .006). As-sociations were also identified for specific HLA types and disease caused by the Beijing, LAM, LCC, and Quebecstrains. HLA types were also associated with disease caused by strains from the Euro-American or East Asian lineag-es, and the frequencies of these alleles in their sympatric human populations identified potential coevolutionaryevents between host and pathogen.
Conclusions. This is the first report of the association of human HLA types andM. tuberculosis strain genotype,highlighting that both host and pathogen genetics need to be taken into consideration when studying tuberculosisdisease development.
Keywords. Mycobacterium tuberculosis; tuberculosis; human leukocyte antigens; host–pathogen; coadaptation;susceptibility.
The human leukocyte antigen (HLA) class I moleculesare involved in various biological processes and play an
essential role in immunity [1]. These molecules act asmultisite receptors; including peptides for antigen pre-sentation, αβ T-cell receptors, and CD8 for cytotoxicT-cell response stimulation. The HLAs represent anunsurpassed example of polymorphism with thousandsof SNPs identified to date [2]. This extreme diversity isbelieved to have occurred by selection events, allowingfor the identification of peptide antigens from variouspathogens and stimulation of an effective immune re-sponse by upregulation of the Th1 pathway [3]. HLAdata for various populations demonstrate significantdifferences in allele frequencies between differentgeographical populations, with some HLA allelescompletely absent from certain populations [4, 5]. The
Received 22 May 2013; accepted 17 July 2013; electronically published 14August 2013.
Presented in part: EMBO|EMBL Symposium: New Perspectives on Immunity toInfection, Heidelberg, Germany, May 2012. Abstract 133; and the 62nd AnnualMeeting of the American Society of Human Genetics, San Francisco, California, No-vember 2012. Abstract 2217W.
Correspondence: Eileen G. Hoal, PhD, Francie van Zijl Drive, Fisan Building,4th Floor, Room F417, Faculty of Medicine and Health Sciences, StellenboschUniversity, Tygerberg 7505, South Africa ([email protected]).
The Journal of Infectious Diseases 2014;209:216–23© The Author 2013. Published by Oxford University Press on behalf of the InfectiousDiseases Society of America. All rights reserved. For Permissions, please e-mail:[email protected]: 10.1093/infdis/jit443
216 • JID 2014:209 (15 January) • Salie et al
at University of Stellenbosch on January 14, 2014
http://jid.oxfordjournals.org/D
ownloaded from
Stellenbosch University http://scholar.sun.ac.za

HLA genes were the first to be associated with susceptibility totuberculosis, and many different HLA alleles have been associ-ated in different populations [6].
The present-day population structure of several pathogens,including Mycobacterium leprae and Mycobacterium tuberculo-sis, can be attributed to ancient human migrations [7, 8]. Suchlong-standing host–pathogen interactions could lead to adap-tive genetic changes in both the host and pathogen populations[9]. Evidence of this can be seen from studies that have shownthat M. tuberculosis lineages have adapted to specific humanpopulations [9–11] and the selection of strains from a distinctsublineage by a human population in a defined geographicalsetting [12]. In cosmopolitan settings, the association betweenparticular M. tuberculosis complex (MTBC) lineages and theirhuman hosts have remained even though some degree ofintermingling of the different human populations has occurred[9–11].
Mycobacterium tuberculosis strains of the Beijing lineage areprobably the most well characterized and are associated withincreased virulence and transmission [13]. They are the mostdominant strain lineage globally and have been reported inmany Asian countries, and are emerging as the dominant strainin several other countries, including South Africa [14], Argentina,Cuba, Malawi, Vietnam, countries of the former Soviet Union,and parts of Western Europe [15]. Different M. tuberculosisstrains induce different patterns of host immune response [16] aswell as resulting in different disease phenotypes [17]. Beijingstrains are also thought to be able to evade the protective effectof the BCG vaccine [18] and have evolved properties that allowthem to cause disease more frequently than non-Beijing strains[19]. This could be due to their ability to modulate the hostimmunity toward a Th2 instead of a Th1 response or their inhibi-tion of TNF-α release as demonstrated in activated THP-1macrophages [20].
Within the Cape Town metropolis in South Africa, diseasecaused by the Beijing strains was found to be rising exponen-tially over a decade whereas disease caused by non-Beijingstrains has remained constant [14]. Furthermore, Hanekomet al showed that the Beijing sublineage 7 strains were able totransmit and cause disease more frequently than strains fromsublineages 2–6 in urban and rural populations of the WesternCape [12]. It appears that this is due to an evolutionary selec-tion in local populations for this sublineage instead of afounder effect.
In this study, we investigate the relationship between HLAclass I molecules and disease by specific M. tuberculosis lineag-es, specifically those lineages occurring in the Western Cape,South Africa. We show that HLA class I variants are associatedwith several strains in our study cohort and that taking hostand pathogen genetic factors into consideration is necessary forfurther understanding of the tuberculosis disease burden.
MATERIALS ANDMETHODS
Ethics StatementHuman blood and sputum samples were obtained with writteninformed consent for DNA extraction or culture and with ap-proval from the Health Research Ethics Committee of Stellen-bosch University, South Africa (project registration numbers95/072 and 2003/022/N).
Study Participants and GenotypingParticipants for this study were recruited from suburbs in CapeTown, South Africa, where the incidence of tuberculosis washigh (1005 per 100 000 in 2007) [21] and the prevalence ofhuman immunodeficiency virus (HIV) was low [22]. These in-dividuals belong to the South African Coloured (SAC) popula-tion, a highly admixed population [23]. Three hundred patientswith bacteriologically confirmed pulmonary tuberculosis wereincluded in this study (mean age, 34.8 ± 12.6 years, 53% males).All participants were HIV negative and unrelated.
The HLA class I genes were genotyped by direct sequencing.In brief, locus-specific primers flanking exons 2 and 3 wereused to amplify the HLA-A, -B and -C loci. The purified poly-merase chain reaction products were then sequenced usingexon-specific primers and a BigDye Terminator version 3.1cycle sequencing kit (Applied Biosystems) on the ABI-3130XLDNA analyzer. Sequence traces were analyzed using the AssignSBT 3.5.1 software (Conexio Genomics). HLA class I supertypeclassification was done as described by Sidney et al for HLA-Aand HLA-B [24]. HLA-C alleles were defined based on theirKIR2DL1 and KIR2DL2 binding [25] as previously done by Ba-lamurugan et al [26]. Individuals who had alleles (4-digit) thatcould not be classified into a supertype were identified as “un-defined.” HLA class I allele frequency data for white and EastAsian populations were obtained from the online Allele Fre-quency Net Database (AFND; www.allelefrequencies.net) [27](see Supplementary Data for lists of countries).
Bacterial Isolates and GenotypingSputum samples were collected for culture at diagnosis from allnew and retreatment tuberculosis patients who attendedprimary healthcare clinics and who were resident in an epide-miological field site in Cape Town, South Africa, during theperiod January 1993 to December 2004.
Mycobacterium tuberculosis isolates were classified by cultur-ing the sputum on mycobacteria growth indicator tube and/orLöwenstein-Jensen media, and isolates were classified byIS6110 restriction fragment length polymorphism genotypingand spoligotyping using internationally standardized protocols[14]. Strains were identified according to distinct IS6110banding patterns using Gelcompar II (Applied Maths) andwere subsequently grouped into evolutionary clades that were
HLAClass I andM. tuberculosis Strains • JID 2014:209 (15 January) • 217
at University of Stellenbosch on January 14, 2014
http://jid.oxfordjournals.org/D
ownloaded from
Stellenbosch University http://scholar.sun.ac.za

classified based on their spoligotype signatures. Strains having<6 IS6110 bands (low-copy clade) comprise a single lineage asdefined by IS6110 and were therefore regarded as a single clade.Sublineages of the Beijing clade were identified as previouslydescribed [12]. Mycobacterium tuberculosis lineages were in-ferred as members of the East Asian or Euro-American MTBClineages [9].
Statistical AnalysisLogistic regression models were used to analyze the likelihood oftuberculosis cases having a specific strain, compared to havingany other strain, because they enable us to adjust for other vari-ables by including them in the models as covariates. All resultswere corrected for age and sex in this way. All P values, oddsratios (ORs), and their confidence intervals (CIs) were derivedfrom these models. Genetic association with the susceptibility todifferent strains was tested using each of the following as predic-tors in the models: genotypes, additive allelic effect, and additivehaplotypes. The haplotypes were inferred, with their probabilitiesof being correct, and haplotypes were used as predictors in logis-tic regression models, with their probabilities as weights as previ-ously described [28].We tested for Hardy-Weinberg equilibrium(HWE) using the exact test [29].
A result or effect was described as significant if P < .05. Bon-ferroni correction for multiple testing was not used, as thismethod is considered to be overly conservative when severalgenetic associations are tested in the same group of individuals[30], resulting in the potential rejection of important findings.Bonferroni correction might also be inappropriate in a situationsuch as this where there is a priori evidence that the genes areassociated with tuberculosis [31], whereas Bayesian methodsfor correction rely on knowledge of prior probability of involve-ment, which is currently unknown for most genetic variants[32]. Current methods for multiple testing are only applicable
if all tests are independent, which is not the case in this study,and therefore no appropriate method is available. All analyseswere done in R (freely available from www.r-project.org) usingfunctions from base R and R packages genetics and haplo.stats.
RESULTS
Host Genotype and Multiplicity of InfectionsMTBC lineage, strain, and sublineage frequencies in this studycohort are listed in Table 1. Most of the tuberculosis patients(90%) had only 1 episode of disease with infection caused by 1strain, but 27 (9%) and 3 individuals (1%) had disease episodescaused by 2 and 3 different strains, respectively. Of the 30 indi-viduals with >1 disease episode, 19 (63%) had 1 infection withthe Beijing strain, and other episodes with another strain,whereas 37% of those with a non-Beijing strain had an addi-tional episode with another strain. Figure 1 shows that of the 70individuals with a Beijing strain, 19 (27%) had >1 episode withdifferent strains. Of the 19 individuals who had ≥2 infectionsof which 1 was Beijing, Beijing was the first infection in 6 cases,and a subsequent infection in 13 cases. Having the HLA-B*27allele was found to be significantly associated (OR, 0.21 [95%CI, .03–.68], P = .006) with having fewer strains.
Relationship Between Host and Bacterial Genotype inTuberculosis DiseaseAll genotype distributions were in HWE. The allele, genotype,and haplotype distributions for HLA-A, -B, and -C were signifi-cantly associated with the genotype of theM. tuberculosis straincausing disease in the host. The Beijing strain was significantlyassociated with each class of variation of the HLA class I genes,with the A*01, B*08, and C2 alleles increasing the odds ofhaving disease with a Beijing strain (Table 2) with ORs rangingbetween 1.58 and 2.32, while conversely, each B*27 and C1
Table 1. Mycobacterium tuberculosis Strain Frequencies in the South African Coloured Population of the Western Cape
MTBC Lineage Frequency Strain Frequency Sublineage Frequency
Euro-American 0.79
LAM 0.32
LCC 0.19Quebec 0.11
Haarlem 0.10
Haarlem-like 0.02East Asian 0.21
CAS1 0.02
Beijing 0.23Beijing Sublineage 2–6 0.26
Beijing Sublineage 7 0.74
Other 0.11
Abbreviation: MTBC,M. tuberculosis complex.
218 • JID 2014:209 (15 January) • Salie et al
at University of Stellenbosch on January 14, 2014
http://jid.oxfordjournals.org/D
ownloaded from
Stellenbosch University http://scholar.sun.ac.za

allele lowered the odds of having disease with a Beijing strain(ORs, 0.35 and 0.60, respectively). Disease with a Beijing strainwas also influenced by HLA-B and HLA-C genotypes, as well as3 class I haplotypes (Table 3). However, due to the small samplesizes and the resulting large CIs, these results are imprecise.
Tuberculosis caused by LAM genotype strains was found tobe significantly associated with the A*03 allele (Table 2), where
each additional allele increased the risk with an OR of 1.65.Two HLA-A genotypes were also associated with a LAM infec-tion (Table 3). For the LCC strain (Table 2), each B*44 allele in-creased the risk of disease (OR, 2.07) whereas the presence ofthe B*07 allele lowered the chances of disease (OR, 0.49). Theodds of disease with a Quebec strain (Table 2) was increased bythe presence of the B*58 allele (OR, 2.69).
As Beijing sublineage 7 is the most frequent sublineage inthe Western Cape but not the rest of South Africa, we testedwhether this could be attributed to the HLAs in the humanhost. We identified 2 significant associations: where theA*30:02 allele occurred only in individuals with tuberculosisdue to a Beijing sublineage 7 strain (P = .02) and is thus a po-tential risk factor, and with A*02:02 having a protective roleagainst disease with Beijing sublineage 7 strain (OR, 0.04 [95%CI, .0–.51], P = .012). However, it should be noted that theseBeijing sublineage 7 results are preliminary due to the smallnumber of individuals (53 individuals with a sublineage 7 in-fection and 19 individuals with a sublineage 2–6 infection) thatcould be included in this analysis.
Relationship BetweenM. tuberculosis Phylogenetic Lineagesand HLA Class I Allele Frequencies in Specific GeographicalPopulationsTable 4 contains a summary of associations between MTBClineages and HLA types in the SAC population, as well as thebacterial “footprint” of these MTBC lineages in various regions
Figure 1. Presence of Beijing strain in individuals according to number of infections. Individuals with a Beijing strain of infection were more likely tohave subsequent infections (P < .001). Of the 19 individuals who had ≥2 disease episodes, 1 of which was Beijing, Beijing was the first infection in 6 indi-viduals, and a subsequent infection in 13 individuals.
Table 2. Significant Associations Only, of HLA Class I Allelesand Mycobacterium tuberculosis Lineages in the South AfricanColoured Population of the Western Cape
HLA Allele Frequency (No.) Strain P Valuea OR (95% CI)b
A*01 0.33 (167) Beijing .031 1.58 (1.04–2.40)
A*03 0.24 (120) LAM .022 1.65 (1.08–2.54)
B*07 0.25 (123) LCC .019 0.49 (.25–.89)B*08 0.06 (31) Beijing .045 2.32 (1.02–5.13)
B*27 0.17 (84) Beijing .002 0.35 (.16–.68)
B*44 0.23 (114) LCC .007 2.07 (1.22–3.52)B*58 0.17 (86) Quebec .001 2.69 (1.27–5.75)
C1 0.45 (243) Beijing .011 0.60 (.40–.89)
C2 0.32 (171) Beijing <.001 2.03 (1.35–3.08)
Abbreviations: CI, confidence interval; HLA, human leukocyte antigen; OR,odds ratio.a P value adjusted for age and sex. P values in bold are statistically significant.b Odds of having a specific lineage, vs any other lineage, for each extra HLAallele carried.
HLAClass I andM. tuberculosis Strains • JID 2014:209 (15 January) • 219
at University of Stellenbosch on January 14, 2014
http://jid.oxfordjournals.org/D
ownloaded from
Stellenbosch University http://scholar.sun.ac.za

globally. Mycobacterium tuberculosis strains in our study groupwere separated into members of Euro-American or East Asian,the 2 MTBC lineages most prevalent in the Western Cape.HLA class I allele frequencies of the ancestral populations werederived from AFND. In our SAC sample set there were 199 in-dividuals with an Euro-American MTBC strain only, 57 withan East Asian MTBC strain only, 18 with strains from bothMTBCs, and 26 with neither. Several significant associationswere identified, with the following alleles associated with bothMTBC member strains: A*23:01, B*14:01, B*14:02, andC*16:01. The A*23:01 and C*16:01 alleles were found to be lessprevalent in those individuals with disease caused by a Euro-American MTBC strain, while increasing the risk of havingdisease caused by an East Asian MTBC strain. However, theHLA allele frequencies in the white and East Asian human pop-ulations do not correlate with this, as these alleles were found tobe more prevalent in white populations than in East Asianpopulations. The opposite effect was seen for the B*14:01 andB*14:02 alleles, with all individuals carrying these alleles having
a Euro-American MTBC strain. In this instance, the HLA pop-ulation data for B*14:02 was in line with this finding as theallele occurs more frequently in white populations than in EastAsian populations.
Individuals with disease caused by Euro-American MTBCstrains were less likely to have the C*08:01 allele and morelikely to have the A*74:01 and B*58:02 alleles. At the populationlevel, alleles A*74:01 and B*58:02 occurred at the same frequen-cy in both human populations, whereas allele C*08:01 wasfound at an extremely low frequency in the white populationand at a very high frequency in the East Asian population,providing an inconsistent correlation between risk in the popu-lation of specific strains and frequency of HLA alleles.
Statistically significant associations with disease caused byEast Asian MTBC strains were seen for the B*07:05 andB*35:01 alleles, with the former increasing the risk of havingthis strain and the latter reducing the chance (to zero in thisstudy). These findings largely concur with the population datawhere the B*07:05 allele is found more frequently in East Asianpopulations than in white populations and the B*35:01 alleleoccurs more frequently in white populations than in East Asianpopulations.
DISCUSSION
We report for the first time a number of associations betweenhuman HLA class I types and specific M. tuberculosis strains.The role of the coevolution of host and pathogen in disease de-velopment has been difficult to study in humans, with most ofthe proof of concept to date provided by studies of pathogen[9–12] and animal models [33].We postulated a natural experi-ment in coevolution taking place in the Cape Town area, whichhas experienced a multiplicity of human visitors and their my-cobacterial strains over the past 350 years. The resident popula-tion is extremely diverse [23], with inputs from Khoisan, Bantu,European, and Asian people and could therefore be assumed tohave HLA types from all these ancestral populations. The M.tuberculosis strains present can be expected to have experiencedintense competition and the incidence of tuberculosis is one ofthe highest in the world (1005 per 100 000 in 2007 [21]),thereby enabling us to investigate correlations between bacterialstrain and HLA type in adequate numbers of patients. In thisstudy we identified associations between HLA class I gene vari-ants with certain strain genotypes, excluding Haarlem,Haarlem-like, and CAS1 strains, which occurred at very lowfrequencies within our study cohort. The strongest associationswere identified for disease with Beijing genotype strains, whichwas found to be associated with several alleles, genotypes, andhaplotypes of the HLA class I genes in the SAC population.Specific allelic associations were also identified for the LAM,LCC, and Quebec genotype strains. We showed that the Beijinggenotype strains occurred more frequently in individuals with
Table 3. Significant Associations Only, of HLA Class I Genotypesand Haplotypes WithMycobacterium tuberculosis Lineages in theSouth African Coloured Population of the Western Cape
Lineage HLA Factor Frequency(No.)
PValuea OR (95% CI)bGenotype
LAM A*01/A*01c 0.13 (33) .036 1A*01/A*02 0.11 (27) 3.89 (1.37–11.04)
A*03/Undefined
0.03 (8) 6.33 (1.19–33.67)
Beijing B*07/B*07c 0.06 (15) .001 1
B*07/B*08 0.04 (10) 19.6
B*07/B*44 0.09 (23) 10.4B*08/B*62 0.01 (3) 25.4
Beijing C1/C1c 0.23 (62) <.001 1
C1/C2 0.24 (65) 3.61 (1.39–9.33)C2/C2 0.12 (32) 4.39 (1.49–12.97)
C2/Undefined 0.16 (42) 4.46 (1.62–12.29)
HaplotypeBeijing A*01-B*58-C1c 0.07 (30) <.001 1
A*01-B*08-C2 0.05 (20) 7.8 (1.2–50.0)
A*02-B*07-C2 0.05 (24) 8.3 (1.5–45.6)A*01-B*44-Undefined
0.03 (17) 7.6 (1.2 50.30)
Abbreviations: CI, confidence interval; HLA, human leukocyte antigen; OR,odds ratio.a P value for genotype and haplotype models, adjusted for age and sex. Pvalues in bold are statistically significant.b Odds of having a specific lineage and genotype or haplotype, vs any otherlineage, compared to the reference genotype/haplotype (OR = 1). The 95% CIcould not be calculated for HLA-B genotypes due to their very low frequenciesin patients whose infections were not Beijing.c Reference genotypes/haplotype—the most common (having the highestfrequency, so assumed to be the wild type) homozygous genotype andhaplotype in the study population.
220 • JID 2014:209 (15 January) • Salie et al
at University of Stellenbosch on January 14, 2014
http://jid.oxfordjournals.org/D
ownloaded from
Stellenbosch University http://scholar.sun.ac.za

multiple disease episodes (P < .001) compared to infections bynon–Beijing genotype strains.
The B*27 supertype reduced the odds of having multipledisease episodes, as well as having a Beijing strain. This super-type allele is found frequently in individuals who are able tocontrol their HIV infections without any antiretroviral treat-ment and slow disease progression [34]. This is thought to bedue to an increased CD8 T-cell response in individuals withthis allele and induction of the apoptotic pathway through theincreased presence of cytotoxic proteins [35]. The B*27 super-type has not previously been shown to be associated with sus-ceptibility to tuberculosis [6].
Even though CD4+ T cells (HLA class II restricted) representthe predominant immune response mechanism against M. tu-berculosis infection [36], there is growing evidence that suggestsan important role for CD8+ T cells (HLA class I restricted) inprotection against M. tuberculosis infection [37, 38]. Studies inanimals and humans have shown that M. tuberculosis iscapable of stimulating MHC class I restricted CD8+ T cells andthe involvement of several different pathways for class I presen-tation of mycobacterial antigens via cross-presentation [39],where HLA class I recognition of mycobacterial antigens in-cludes ESAT-6 (HLA-B*52), 19 kDa lipoprotein (HLA-A*02:01), and Ag85B (HLA-A*02:01) [37, 40, 41]. CD8+ T cellsalso have direct microbicidal activity and kill M. tuberculosisthrough the expression of granulysin and perforin [42]. HLAclass I alleles have been associated with leprosy susceptibility[43], providing further support for the role of class I genes inimmunity against mycobacterial infections. It is, however,
possible that the strong LD between genes within the MHCcomplex [44] could mean that the associations found herereflect the involvement of the class II genes, which remain to begenotyped in this population.
To date, variants in the TLR2 [45], IRGM [46], and SLC11A1[47] genes have shown a correlation between human and bacte-rial genotype. Variants in SLC11A1 and TLR2 were found to beassociated with an increased risk of having tuberculosis with aBeijing strain in Asian populations, whereas in Ghana, theIRGM polymorphism was found to protect against diseasecaused by the Euro-American lineage. The phenotype of tuber-culosis disease may be affected by the bacterial strain, as strainsof the Euro-American lineage appear to be less likely to causeextrapulmonary disease [45], whereas strains of the Beijing andS genotypes were associated with an increased risk of extra-thoracic disease [48]. In Vietnam, the relapse rate was signifi-cantly increased in tuberculosis cases caused by Beijing strains,and this probably contributes to the successful spread of thisstrain family [49]. It is therefore evident that the outcome of ex-posure to M. tuberculosis depends on both the human and bac-terial genotypes, and Alter et al [43] speculated that geneticheterogeneity in common infectious diseases could be at leastpartially explained by the pathogen strain differences, andpatient strain types should therefore be incorporated into theanalysis to overcome genetic heterogeneity.
Both MTBC lineages and HLA allele frequencies are foundin specific geographical settings; for example, lineages of anEast Asian origin occur more frequently in human populationsfrom the same region [9]. HLA allele frequencies are hugely
Table 4. Significant Associations Only, Between Mycobacterium tuberculosis Phylogenetic Strains and HLA Class I Alleles in Geo-graphic Populations
MTBC Phylogenetic Lineages Allele Frequency per Population
Euro-American East AsianSACa Whiteb East AsianbAllele P Valuec OR (95% CI)d P Valuec OR (95% CI)d
A*23:01 .026 0.43 (.20–.90) .043 2.24 (1.03–4.84) 0.065 0.023 0.008
A*74:01 .016 All are EuroAm .338 0.39 (.02–2.31) 0.016 0.003 0.003B*07:05 .051 0.23 (.05–1.01) .020 5.66 (1.32–29.02) 0.016 0.003 0.009
B*14:01 .018 All are EuroAm .019 None are East Asian 0.018 0.005 0.008
B*14:02 .024 All are EuroAm .028 None are East Asian 0.016 0.019 0.007B*35:01 .129 3.93 (.72–75.44) .010 None are East Asian 0.022 0.057 0.039
B*58:02 .001 4.64 (1.73–16.48) .134 0.53 (.20–1.21) 0.087 0.003 0.002
C*08:01 .021 0.20 (.04–.78) .054 3.83 (.97–16.10) 0.017 0.002 0.107C*16:01 .028 0.35 (.14–.89) .002 4.48 (1.78–11.69) 0.039 0.021 0.005
Abbreviations: CI, confidence interval; EuroAm, European American; HLA, human leukocyte antigen; OR, odds ratio; SAC, South African Coloured.a Frequency in the SAC population.b List of countries included and their respective numbers can be found in the Supplementary Data. Frequency data from Allele Frequency Net Database (www.allelefrequencies.net).c P value adjusted for age and sex. P Values in bold are statistically significant.d Odds of having a specificMycobacterium tuberculosis complex (MTBC) phylogenetic lineage, vs the other MTBC phylogenetic lineage.
HLAClass I andM. tuberculosis Strains • JID 2014:209 (15 January) • 221
at University of Stellenbosch on January 14, 2014
http://jid.oxfordjournals.org/D
ownloaded from
Stellenbosch University http://scholar.sun.ac.za

dissimilar between different ethnic groups, with certain allelescompletely absent in some populations [4, 5]. We therefore in-vestigated the frequencies of HLA class I alleles associated withthe Euro-American and East Asian M. tuberculosis lineages, intheir sympatric populations. We postulated that an allele morefrequent in individuals with a Euro-American strain would alsooccur more frequently in white populations, whereas an allelethat lowered the risk of having a Euro-American strain infec-tion would occur at an extremely low frequency or be absent inwhite populations. The same rationale would apply to EastAsianM. tuberculosis strains and human populations from EastAsia. However, although results fitting the postulate were foundin several cases, there was no fit in an equivalent number. Thiscould be explained by the use of allele frequency averagesacross a number of populations listed in the databases. TheA*23:01 allele for example, occurs between allele frequencies of0.075 in the Beijing Han population (AFND), and 0.004 in theShijiazhuang Tianjian Han, highlighting the enormous discrep-ancies between allele frequencies in populations of the samegeographical region. Second, HLA genes are involved in severalbiological processes [1] and some could thus be under balancingselective pressures [3], which could have led to the discrepantfindings. In spite of the limitations of this broad categorizationof populations, we did find several cases where the predominantMTBC lineage and the HLA class I allele frequency fit thehypothesis of the coevolution of M. tuberculosis strains withthe HLA class I genes. We now show that specific strainsare associated with HLA types of the host, thus providing amolecular genetic explanation for the previous observation byGagneux et al, who correlated M. tuberculosis strain lineageswith geography [9].
The evolutionary forces on HLA have been extremelycomplex [3], including many bacterial and viral infections. Wecould thus be seeing the remaining association due to coevolu-tion with M. tuberculosis and/or other diseases with similarclinical pathologies. Hershberg et al has postulated an “out-of-and-back-to-Africa” migration of MTBC that coincided withthe out-of-Africa human migration pattern and the subsequentglobal human exploration quests [7]. Considering this hypothe-sis, the bottleneck events that accompanied the out-of-Africamigration, and the expansion of disease-causing variantswithin the last 5000 years [50], it is quite likely that coevolutionbetween MTBC and their human hosts could have occurred.
In summary, this study highlights the role of HLA class Imolecules in infection with M. tuberculosis strains and empha-sizes the importance of considering both host and pathogen ge-notype in understanding tuberculosis disease development andvaccine efficacy. Host–pathogen coevolution has significant bi-omedical and epidemiological implications and by identifyingthe genes involved in this interaction, the adaptation mecha-nisms of host and pathogen can be understood, as well as thelimitations they impose upon each other. It is also likely that
the complexity of HLA types within any given population, andthe possible balancing effects of increased susceptibility to tu-berculosis vs other pathogens or conditions, will prevent anysimple correlations being seen between the predominant HLAtype in a population and the strain of M. tuberculosis in thatarea.
Supplementary Data
Supplementary materials are available at The Journal of Infectious Diseasesonline (http://jid.oxfordjournals.org/). Supplementary materials consist ofdata provided by the author that are published to benefit the reader. Theposted materials are not copyedited. The contents of all supplementary dataare the sole responsibility of the authors. Questions or messages regardingerrors should be addressed to the author.
Notes
Acknowledgments. We thank all study participants for their coopera-tion.Financial support. This work was supported by the Wellcome Trust
(053844/Z/98/Z to P. D. vH. and E. G. H.); Frederick National Laboratoryfor Cancer Research (contract number HHSN261200800001E); the Intra-mural Research Program of the NIH, Frederick National Lab, Center forCancer Research; the Harry Crossley Foundation; the National ResearchFoundation (DAAD-NRF); and the Columbia University-Southern AfricanFogarty AIDS International Training and Research Program through theFogarty International Center, National Institutes of Health (grant number 2D43 TW000231 16 to M. S.).Potential conflicts of interest. All authors: No reported conflicts.All authors have submitted the ICMJE Form for Disclosure of Potential
Conflicts of Interest. Conflicts that the editors consider relevant to thecontent of the manuscript have been disclosed.
References
1. Kostyu DD, Hannick LI, Traweek JL, Ghanayem M, Heilpern D,Dawson DV. HLA class I polymorphism: structure and function andstill questions. Hum Immunol 1997; 57:1–18.
2. Cao K, Hollenbach J, Shi X, Shi W, Chopek M, Fernández-Viña MA.Analysis of the frequencies of HLA-A, B, and C alleles and haplotypesin the five major ethnic groups of the United States reveals high levelsof diversity in these loci and contrasting distribution patterns in thesepopulations. Hum Immunol 2001; 62:1009–30.
3. Spurgin LG, Richardson DS. How pathogens drive genetic diversity:MHC, mechanisms and misunderstandings. Proc Biol Sci 2010;277:979–88.
4. Lombard Z, Brune AE, Hoal EG, et al. HLA class II disease associationsin southern Africa. Tissue Antigens 2006; 67:97–110.
5. Abi-Rached L, Jobin MJ, Kulkarni S, et al. The shaping of modernhuman immune systems by multiregional admixture with archaichumans. Science 2011; 334:89–94.
6. Kettaneh A, Seng L, Tiev KP, Tolédano C, Fabre B, Cabane J. Humanleukocyte antigens and susceptibility to tuberculosis: a meta-analysis ofcase-control studies. Int J Tuberc Lung Dis 2006; 10:717–25.
7. Hershberg R, Lipatov M, Small PM, et al. High functional diversity inMycobacterium tuberculosis driven by genetic drift and human demog-raphy. PLoS Biol 2008; 6:e311.
8. Monot M, Honoré N, Garnier T, et al. On the origin of leprosy. Science2005; 308:1040–2.
9. Gagneux S, Deriemer K, Van T, et al. Variable host-pathogen compati-bility in Mycobacterium tuberculosis. Proc Natl Acad Sci U S A 2006;103:2869–73.
222 • JID 2014:209 (15 January) • Salie et al
at University of Stellenbosch on January 14, 2014
http://jid.oxfordjournals.org/D
ownloaded from
Stellenbosch University http://scholar.sun.ac.za

10. Hirsh AE, Tsolaki AG, DeRiemer K, Feldman MW, Small PM. Stableassociation between strains of Mycobacterium tuberculosis and theirhuman host populations. Proc Natl Acad Sci U S A 2004; 101:4871–6.
11. Reed MB, Pichler VK, McIntosh F, et al. MajorMycobacterium tubercu-losis lineages associate with patient country of origin. J Clin Microbiol2009; 47:1119–28.
12. Hanekom M, van der Spuy GD, Streicher E, et al. A recently evolvedsublineage of theMycobacterium tuberculosis Beijing strain family is as-sociated with an increased ability to spread and cause disease. J ClinMicrobiol 2007; 45:1483–90.
13. Hanekom M, Gey van Pittius NC, McEvoy C, Victor TC, Van HeldenPDWarren RM. Mycobacterium tuberculosis Beijing genotype: a tem-plate for success. Tuberculosis (Edinb) 2011; 91:510–23.
14. Van der Spuy GD, Kremer K, Ndabambi SL, et al. Changing Mycobac-terium tuberculosis population highlights clade-specific pathogeniccharacteristics. Tuberculosis (Edinb) 2009; 89:120–5.
15. European Concerted Action on New Generation Genetic Markers andTechniques for the Epidemiology and Control of Tuberculosis. Beijing/W genotype Mycobacterium tuberculosis and drug resistance. EmergInfect Dis 2006; 12:736–43.
16. Manca C, Reed MB, Freeman S, et al. Differential monocyte activationunderlies strain-specific Mycobacterium tuberculosis pathogenesis.Infect Immun 2004; 72:5511–4.
17. Lopez B, Aguilar D, Orozco H, et al. A marked difference in pathogene-sis and immune response induced by different Mycobacterium tubercu-losis genotypes. Clin Exp Immunol 2003; 133:30–7.
18. Kremer K, van-der-Werf MJ, Au BKY, et al. Vaccine-induced immunitycircumvented by typical Mycobacterium tuberculosis Beijing strains.Emerg Infect Dis 2009; 15:335–9.
19. Sreevatsan S, Pan X, Stockbauer KE, et al. Restricted structural genepolymorphism in the Mycobacterium tuberculosis complex indicatesevolutionarily recent global dissemination. Proc Natl Acad Sci U S A1997; 94:9869–74.
20. Theus S, Eisenach K, Fomukong N, Silver RF, Cave MD. Beijing familyMycobacterium tuberculosis strains differ in their intracellular growthin THP-1 macrophages. Int J Tuberc Lung Dis 2007; 11:1087–93.
21. Health Systems Trust. Incidence of TB in the provinces of South Africa,2009. Available at: http://www.hst.org.za/healthstats/16/data. Accessed17 May 2011.
22. Kritzinger FE, den BS, Verver S, et al. No decrease in annual risk of tu-berculosis infection in endemic area in Cape Town, South Africa. TropMed Int Health 2009; 14:136–42.
23. De Wit E, Delport W, Rugamika CE, et al. Genome-wide analysis of thestructure of the South African Coloured population in the WesternCape. Hum Genet 2010; 128:145–53.
24. Sidney J, Peters B, Frahm N, Brander C, Sette A. HLA class I super-types: a revised and updated classification. BMC Immunol 2008; 9:1.
25. Colonna M, Borsellino G, Falco M, Ferrara GB, Strominger JL. HLA-Cis the inhibitory ligand that determines dominant resistance to lysis byNK1- and NK2-specific natural killer cells. Proc Natl Acad Sci U S A1993; 90:12000–4.
26. Balamurugan A, Sharma SK, Mehra NK. Human leukocyte antigenclass I supertypes influence susceptibility and severity of tuberculosis.J Infect Dis 2004; 189:805–11.
27. Gonzalez-Galarza FF, Christmas S, Middleton D, Jones AR. Allele fre-quency net: a database and online repository for immune gene frequen-cies in worldwide populations. Nucleic Acids Res 2011; 39:D913–9.
28. Schaid DJ, Rowland CM, Tines DE, Jacobson RM, Poland GA. Scoretests for association between traits and haplotypes when linkage phaseis ambiguous. Am J Hum Genet 2002; 70:425–34.
29. Wigginton JE, Cutler DJ, Abecasis GR. A note on exact tests of Hardy-Weinberg equilibrium. Am J Hum Genet 2005; 76:887–93.
30. Nyholt DR. A simple correction for multiple testing for single-nucleotidepolymorphisms in linkage disequilibrium with each other. Am J HumGenet 2004; 74:765–9.
31. Perneger TV. What’s wrong with Bonferroni adjustments. BMJ 1998;316:1236–8.
32. Campbell H, Rudan I. Interpretation of genetic association studies incomplex disease. Pharmacogenomics J 2002; 2:349–60.
33. Di Pietrantonio T, Correa JA, Orlova M, Behr MA, Schurr E. Jointeffects of host genetic background and mycobacterial pathogen on sus-ceptibility to infection. Infect Immun 2011; 79:2372–8.
34. Migueles SA, Connors M. Long-term nonprogressive disease amonguntreated HIV-infected individuals: clinical implications of under-standing immune control of HIV. JAMA 2010; 304:194–201.
35. Migueles SA, Weeks KA, Nou E, et al. Defective human immunodefi-ciency virus-specific CD8+ T-cell polyfunctionality, proliferation, andcytotoxicity are not restored by antiretroviral therapy. J Virol 2009;83:11876–89.
36. Kaufmann SH. How can immunology contribute to the control of tu-berculosis? Nat Rev Immunol 2001; 1:20–30.
37. Geluk A, van Meijgaarden KE, Franken KL, et al. Identification ofmajor epitopes of Mycobacterium tuberculosis AG85B that are recog-nized by HLA-A*0201-restricted CD8+ T cells in HLA-transgenic miceand humans. J Immunol 1950 2000; 165:6463–71.
38. Lazarevic V, Flynn J. CD8+ T cells in tuberculosis. Am J Respir CritCare Med 2002; 166:1116–21.
39. Sigal LJ, Crotty S, Andino R, Rock KL. Cytotoxic T-cell immunity tovirus-infected non-haematopoietic cells requires presentation of exoge-nous antigen. Nature 1999; 398:77–80.
40. Lalvani A, Brookes R, Wilkinson RJ, et al. Human cytolytic and inter-feron gamma-secreting CD8+ T lymphocytes specific for Mycobacteri-um tuberculosis. Proc Natl Acad Sci U S A 1998; 95:270–5.
41. Mohagheghpour N, Gammon D, Kawamura LM, van Vollenhoven A,Benike CJ, Engleman EG. CTL response toMycobacterium tuberculosis:identification of an immunogenic epitope in the 19-kDa lipoprotein. JImmunol 1950 1998; 161:2400–6.
42. Flynn JL, Chan J. Immunology of tuberculosis. Annu Rev Immunol2001; 19:93–129.
43. Alter A, Huong NT, Singh M, et al. Human leukocyte antigen class Iregion single-nucleotide polymorphisms are associated with leprosysusceptibility in Vietnam and India. J Infect Dis 2011; 203:1274–81.
44. Traherne JA. Human MHC architecture and evolution: implicationsfor disease association studies. Int J Immunogenet 2008; 35:179–92.
45. Caws M, Thwaites G, Dunstan S, et al. The influence of host and bacte-rial genotype on the development of disseminated disease with Myco-bacterium tuberculosis. PLoS Pathog 2008; 4:e1000034.
46. Intemann CD, Thye T, Niemann S, et al. Autophagy gene variantIRGM -261 T contributes to protection from tuberculosis caused byMycobacterium tuberculosis but not by M. africanum strains. PLoSPathog 2009; 5:e1000577.
47. Van Crevel R, Parwati I, Sahiratmadja E, et al. Infection with Mycobac-terium tuberculosis Beijing genotype strains is associated with poly-morphisms in SLC11A1/NRAMP1 in Indonesian patients withtuberculosis. J Infect Dis 2009; 200:1671–4.
48. Hesseling AC, Marais BJ, Kirchner HL, et al. Mycobacterial genotype isassociated with disease phenotype in children. Int J Tuberc Lung Dis2010; 14:1252–8.
49. Huyen MNT, Buu TN, Tiemersma E, et al. Tuberculosis relapse inVietnam is significantly associated with Mycobacterium tuberculosisBeijing genotype infections. J Infect Dis 2013; 207:1516–24.
50. Fu W, O’Connor TD, Jun G, et al. Analysis of 6,515 exomes reveals therecent origin of most human protein-coding variants. Nature 2013;493:216–20.
HLAClass I andM. tuberculosis Strains • JID 2014:209 (15 January) • 223
at University of Stellenbosch on January 14, 2014
http://jid.oxfordjournals.org/D
ownloaded from
Stellenbosch University http://scholar.sun.ac.za

Appendix 7: Estimated HLA class-I haplotypes in SAC healthy controls.
Haplotype A:C:B Freq. No. Haplotype A:C Freq. No. Haplotype A:B Freq. No. Haplotype C:B Freq. No.
0101:0701:0801 0.04364 21.1 0101:0701 0.03255 21.4 0101:0801 0.04386 23.9 0701:0801 0.05348 32
0301:0602:4701 0.02273 11 3001:1701 0.03023 19.8 0301:4701 0.0239 13 0602:5802 0.04849 29
3002:0701:0801 0.02041 9.9 0301:0602 0.029 19 3001:4202 0.01838 10 0702:0702 0.03846 23
3001:1701:4202 0.01653 8 0101:0602 0.02794 18.3 3002:0801 0.01808 9.8 0401:4403 0.03566 21.3
0101:0602:5701 0.01446 7 3002:0701 0.0185 12.1 3201:4403 0.01654 9 0210:1503 0.02958 17.7
2601:1701:4101 0.01446 7 2402:0401 0.01675 11 0101:5701 0.01654 9 0401:3501 0.02843 17
0201:0702:0702 0.01354 6.6 2601:1701 0.01509 9.9 2402:0702 0.0155 8.4 1701:4101 0.02843 17
3002:1601:4501 0.0124 6 6801:0602 0.0136 8.9 0201:0702 0.01425 7.8 0701:4403 0.02659 15.9
2402:0702:0702 0.01125 5.4 0301:0701 0.01347 8.8 7401:1503 0.01287 7 0602:4701 0.02174 13
2301:0702:0702 0.01033 5 4301:0401 0.01324 8.7 2301:0702 0.01148 6.2 0602:1302 0.02174 13
6601:0602:5802 0.01033 5 6601:0602 0.0122 8 0205:5801 0.01103 6 1701:4202 0.02174 13
3001:1701:4201 0.01033 5 2402:0702 0.01166 7.6 0201:1302 0.01103 6 1701:4201 0.02007 12
0205:0701:5801 0.01033 5 3004:0602 0.01129 7.4 2601:4101 0.01083 5.9 0704:1801 0.01839 11
4301:0401:1510 0.01033 5 0201:0602 0.01083 7.1 4301:4403 0.01 5.4 0401:1510 0.01694 10.1
7401:0210:1503 0.01033 5 3201:0210 0.01057 6.9 3303:4403 0.00919 5 0602:5701 0.01672 10
3004:0602:5802 0.0093 4.5 2301:0602 0.0103 6.8 6601:5802 0.00919 5 0801:1502 0.01672 10
0201:0602:1302 0.00885 4.3 2402:0701 0.01019 6.7 3001:4201 0.00919 5 0210:4403 0.01536 9.2
3001:0602:1302 0.00826 4 2301:0210 0.01012 6.6 2901:1801 0.00919 5 1601:4501 0.01505 9
3303:0701:4403 0.00826 4 0201:0702 0.00994 6.5 6802:4101 0.00919 5 0602:5801 0.01505 9
2901:0704:1801 0.00826 4 3004:0401 0.00979 6.4 3004:5802 0.00902 4.9 0401:3505 0.01338 8
3402:0401:4403 0.00826 4 3002:1601 0.00957 6.3 3402:4403 0.00862 4.7 0501:4402 0.01338 8
4301:1801:1503 0.00826 4 1101:0801 0.00941 6.2 3002:4501 0.00862 4.7 1402:5101 0.01254 7.5
3201:0210:4403 0.00826 4 3001:0602 0.00915 6 4301:1510 0.00838 4.6 0701:5801 0.01171 7
1101:0401:3501 0.008 3.9 0123:0602 0.00915 6 2301:4403 0.00818 4.4 1202:5201 0.01171 7
2402:0210:1503 0.00734 3.6 2301:1601 0.00915 6 3002:4403 0.00793 4.3 1502:4006 0.01171 7
0201:0210:1503 0.00712 3.4 3402:0401 0.00913 6 3101:5101 0.00735 4 0210:0702 0.01171 7
0301:0304:1501 0.0062 3 0205:0804 0.00903 5.9 2901:0705 0.00735 4 0304:4001 0.01171 7
Stellenbosch University http://scholar.sun.ac.za
Stellenbosch University http://scholar.sun.ac.za

Haplotype A:C:B Freq. No. Haplotype A:C Freq. No. Haplotype A:B Freq. No. Haplotype C:B Freq. No.
2901:1505:0705 0.0062 3 2301:0702 0.00898 5.9 3001:1302 0.00735 4 1801:1503 0.01171 7
1101:0801:1513 0.0062 3 0201:1701 0.00896 5.9 3201:0702 0.00735 4 1701:4102 0.01171 7
0201:0802:1401 0.0062 3 3303:0701 0.00874 5.7 6801:5802 0.00735 4 0401:3503 0.01003 6
6802:0802:1402 0.0062 3 0201:1203 0.00814 5.3 1101:3501 0.00735 4 0802:1401 0.01003 6
6801:0602:5801 0.0062 3 2301:0401 0.00791 5.2 4301:1503 0.00735 4 0602:4501 0.01003 6
7401:0801:1502 0.0062 3 0205:0701 0.00764 5 6802:4501 0.00673 3.7 0304:1510 0.00836 5
0201:0304:4001 0.0062 3 2402:1202 0.00762 5 2902:4403 0.00555 3 0801:1513 0.00836 5
0201:1701:4101 0.0062 3 4301:1801 0.00762 5 1101:4006 0.00551 3 0302:5801 0.00836 5
2301:1601:1510 0.0062 3 3002:1701 0.00757 5 0301:1501 0.00551 3 0702:0705 0.00836 5
0205:0804:1401 0.0062 3 1101:0401 0.00757 5 0201:1501 0.00551 3 0802:1402 0.00836 5
3004:0401:1510 0.0062 3 7401:0210 0.00754 4.9 3001:5802 0.00551 3 0602:3701 0.00836 5
3004:1701:4102 0.0062 3 1101:0702 0.00738 4.8 2402:1502 0.00551 3 0701:1801 0.00834 5
0214:0401:4403 0.0062 3 0301:0304 0.00725 4.8 2501:1801 0.00551 3 0401:5301 0.00711 4.2
2402:0401:3505 0.0062 3 7401:0801 0.00723 4.7 6802:1510 0.00551 3 0304:1501 0.00669 4
0301:1502:4006 0.0062 3 6802:0401 0.00712 4.7 3402:1503 0.00551 3 1505:0705 0.00669 4
2402:1202:4006 0.0062 3 6802:0802 0.00701 4.6 1101:1513 0.00551 3 1203:3801 0.00669 4
1101:0602:1302 0.00439 2.1 0202:0602 0.00686 4.5 0201:1401 0.00551 3 0701:5703 0.00669 4
1101:1502:4006 0.00413 2 0201:0210 0.00641 4.2 6801:5801 0.00551 3 0804:1401 0.00669 4
0201:0401:1501 0.00413 2 0201:0304 0.00634 4.2 7401:1502 0.00551 3 0202:2705 0.0065 3.9
3101:1402:5101 0.00413 2 0205:0602 0.0062 4.1 0123:5802 0.00551 3 1601:1510 0.00647 3.9
3402:1801:5802 0.00413 2 0201:0701 0.00618 4.1 0205:1401 0.00551 3 0401:1503 0.00551 3.3
0201:1202:5201 0.00413 2 3402:1801 0.0061 4 3004:1510 0.00551 3 0401:1501 0.00502 3
2407:0401:3505 0.00413 2 3303:0401 0.0061 4 3004:4102 0.00551 3 0403:1521 0.00502 3
7401:0401:3501 0.00413 2 3201:0202 0.0061 4 2402:3505 0.00551 3 1203:1801 0.00502 3
3201:0202:4403 0.00413 2 2901:0704 0.0061 4 1101:1801 0.00551 3 1203:4001 0.00502 3
3001:0210:1503 0.00413 2 2402:0102 0.0061 4 0201:1801 0.00551 3 0804:1402 0.00502 3
3001:0602:5802 0.00413 2 6802:0702 0.00604 4 3002:5802 0.00525 2.9 1801:8101 0.00502 3
2301:1701:4101 0.00413 2 7401:0602 0.00599 3.9 2402:4006 0.00499 2.7 1203:3901 0.00502 3
Stellenbosch University http://scholar.sun.ac.za
Stellenbosch University http://scholar.sun.ac.za

Haplotype A:C:B Freq. No. Haplotype A:C Freq. No. Haplotype A:B Freq. No. Haplotype C:B Freq. No.
2501:1203:1801 0.00413 2 2402:1502 0.00597 3.9 0301:4001 0.00499 2.7 0102:5501 0.00502 3
3303:0302:5801 0.00413 2 0214:0401 0.00527 3.5 2301:1503 0.00487 2.6 0102:2705 0.00502 3
3101:1203:5801 0.00413 2 2402:0304 0.00527 3.5 2402:1503 0.00472 2.6 1202:4006 0.00502 3
6802:0304:1510 0.00413 2 3201:0602 0.00508 3.3 0201:4001 0.00453 2.5 0801:4801 0.00502 3
2601:0702:0705 0.00413 2 7401:0701 0.00492 3.2 2301:1510 0.00452 2.5 1601:5101 0.00418 2.5
3201:0102:0702 0.00413 2 2902:0701 0.0049 3.2 6802:5802 0.0043 2.3 0202:4403 0.00353 2.1
0301:0602:4501 0.00413 2 2501:1203 0.00457 3 3402:4501 0.00425 2.3 0210:2705 0.00353 2.1
3201:1203:3801 0.00413 2 6802:0304 0.00457 3 3002:4201 0.00424 2.3 0202:1801 0.00334 2
3402:0701:4403 0.00413 2 4301:0804 0.00457 3 0301:4006 0.0042 2.3 1502:5101 0.00334 2
0101:1801:8101 0.00413 2 1101:0303 0.00457 3 2301:4101 0.00387 2.1 1801:5802 0.00334 2
0201:1402:5101 0.00413 2 2902:1601 0.00457 3 2601:0702 0.00387 2.1 0702:3901 0.00334 2
2301:0210:0702 0.00413 2 6801:0202 0.00457 3 3004:4403 0.00385 2.1 0602:5001 0.00334 2
3201:0210:0702 0.00413 2 2301:0202 0.00457 3 3301:8101 0.00368 2 1505:3910 0.00334 2
6801:0602:5802 0.00413 2 1101:1202 0.00457 3 0201:4403 0.00368 2 1203:5801 0.00334 2
2601:0102:2705 0.00413 2 2301:0302 0.00457 3 0201:5201 0.00368 2 0102:0702 0.00334 2
2402:0801:1502 0.00413 2 0202:0701 0.00457 3 2407:3505 0.00368 2 0401:8101 0.00334 2
0123:0602:5801 0.00413 2 0201:0202 0.00457 3 0201:1513 0.00368 2 0303:1501 0.00334 2
1101:0702:0705 0.00413 2 6827:0401 0.00457 3 4301:3501 0.00368 2 0202:5801 0.00334 2
3303:0401:4403 0.00413 2 0301:0303 0.00457 3 7401:3501 0.00368 2 0202:4002 0.00334 2
6802:0401:4403 0.00413 2 3004:1701 0.00433 2.8 0301:0702 0.00368 2 0804:1510 0.00334 2
3002:1701:4201 0.00413 2 1101:0602 0.00432 2.8 0301:0801 0.00368 2 0501:1510 0.00334 2
0211:0401:3503 0.00413 2 7401:0704 0.00432 2.8 3001:1503 0.00368 2 0501:1801 0.00334 2
0202:0701:5703 0.00413 2 2402:0704 0.00418 2.7 3303:5801 0.00368 2 1801:5702 0.00334 2
0201:0202:4405 0.00413 2 0101:1801 0.00417 2.7 3101:5801 0.00368 2 0202:4405 0.00334 2
2402:0602:5802 0.00413 2 6802:0602 0.00416 2.7 0211:4006 0.00368 2 0210:3901 0.00334 2
1101:1202:5201 0.00413 2 2901:1505 0.00416 2.7 2601:0705 0.00368 2 1203:1303 0.00334 2
2301:0210:3901 0.00413 2 0101:0501 0.00394 2.6 0301:4501 0.00368 2 0304:0801 0.00332 2
2902:0701:4403 0.00413 2 3002:0802 0.00389 2.6 1101:3503 0.00368 2 1402:1516 0.00251 1.5
Stellenbosch University http://scholar.sun.ac.za
Stellenbosch University http://scholar.sun.ac.za

Haplotype A:C:B Freq. No. Haplotype A:C Freq. No. Haplotype A:B Freq. No. Haplotype C:B Freq. No.
6801:0501:4402 0.00413 2 3201:1203 0.00381 2.5 3201:3801 0.00368 2 0804:4403 0.00209 1.2
3002:0704:1801 0.00413 2 2402:0602 0.00373 2.4 7401:5703 0.00368 2 1601:4403 0.00203 1.2
6827:0401:4403 0.00413 2 2301:0802 0.00373 2.4 0301:1303 0.00368 2 0701:4901 0.00181 1.1
7401:0602:5802 0.00413 2 0301:0401 0.00355 2.3 0101:8101 0.00368 2 0701:5201 0.00173 1
0123:0401:5802 0.00413 2 0301:0702 0.00354 2.3 0201:5101 0.00368 2 0602:0801 0.00173 1
6802:0702:0702 0.00413 2 4301:0602 0.00353 2.3 3004:5101 0.00368 2 0210:1801 0.00169 1
0101:0602:5802 0.00388 1.9 3004:1505 0.00346 2.3 0203:3802 0.00368 2 0701:1503 0.00169 1
0201:1203:3901 0.00328 1.6 3002:0702 0.00346 2.3 6802:1402 0.00368 2 0403:8101 0.00167 1
3201:0602:1302 0.00328 1.6 3002:0704 0.00331 2.2 0301:1503 0.00368 2 1402:5106 0.00167 1
2301:0602:5802 0.0031 1.5 3001:0401 0.00331 2.2 2402:5501 0.00368 2 0401:1529 0.00167 1
3004:0401:4403 0.0031 1.5 0301:0210 0.00329 2.2 2601:4901 0.00368 2 0602:1521 0.00167 1
0201:0401:3501 0.00233 1.1 0301:1701 0.00328 2.2 2601:2705 0.00368 2 0407:1521 0.00167 1
3301:0403:8101 0.00207 1 0201:0401 0.00325 2.1 0123:5801 0.00368 2 0403:1502 0.00167 1
4301:0401:1501 0.00207 1 1101:1502 0.00318 2.1 1101:0705 0.00368 2 0702:0801 0.00167 1
8001:0202:1801 0.00207 1 3101:1402 0.00305 2 3601:5301 0.00368 2 0403:5701 0.00167 1
3001:0401:5301 0.00207 1 0201:1202 0.00305 2 0301:3501 0.00368 2 0702:1517 0.00167 1
3303:0801:1513 0.00207 1 3401:0403 0.00305 2 1101:1302 0.00368 2 1202:5204 0.00167 1
2301:0403:1502 0.00207 1 3001:0210 0.00305 2 0211:3503 0.00368 2 1602:4403 0.00167 1
0301:0702:0702 0.00207 1 3303:0302 0.00305 2 0101:3701 0.00368 2 0702:3906 0.00167 1
0301:0304:0801 0.00207 1 3101:1203 0.00305 2 0202:5703 0.00368 2 1602:5108 0.00167 1
3401:0403:1521 0.00207 1 0203:0801 0.00305 2 1101:1508 0.00368 2 0701:0702 0.00167 1
3401:0403:5701 0.00207 1 3201:0102 0.00305 2 2901:4403 0.00368 2 0202:4402 0.00167 1
3002:0702:0801 0.00207 1 0201:1402 0.00305 2 2402:5201 0.00368 2 1602:3503 0.00167 1
6802:0702:1517 0.00207 1 0203:0702 0.00305 2 0203:3503 0.00368 2 0501:5702 0.00167 1
2402:0602:5001 0.00207 1 2601:0801 0.00305 2 0201:4101 0.00368 2 0701:5702 0.00167 1
2301:1505:3910 0.00207 1 2601:0102 0.00305 2 0201:4405 0.00368 2 0702:3802 0.00167 1
0211:0602:5801 0.00207 1 2601:0304 0.00305 2 2601:5702 0.00368 2 1203:1302 0.00167 1
3004:0602:5701 0.00207 1 0211:0401 0.00305 2 2301:1402 0.00368 2 0701:3924 0.00167 1
Stellenbosch University http://scholar.sun.ac.za
Stellenbosch University http://scholar.sun.ac.za

Haplotype A:C:B Freq. No. Haplotype A:C Freq. No. Haplotype A:B Freq. No. Haplotype C:B Freq. No.
0101:1602:4403 0.00207 1 2407:0801 0.00305 2 1101:5201 0.00368 2 0701:4101 0.00167 1
3002:0302:5801 0.00207 1 6801:0501 0.00305 2 2402:3501 0.00368 2 1801:3505 0.00167 1
2301:0702:3906 0.00207 1 2601:1203 0.00305 2 2301:3901 0.00368 2 1701:4901 0.00167 1
2402:0802:1401 0.00207 1 0206:0802 0.00305 2 7401:5802 0.00368 2 1701:3501 0.00167 1
2901:1602:5108 0.00207 1 6801:1502 0.00305 2 6801:4402 0.00368 2 0304:2706 0.00167 1
0211:1502:4006 0.00207 1 4301:0704 0.00305 2 0201:4202 0.00368 2 0704:1802 0.00167 1
0201:0304:5301 0.00207 1 1101:1601 0.00305 2 3002:1801 0.00368 2 1202:1801 0.00167 1
2901:0401:1510 0.00207 1 2407:0401 0.003 2 0214:4403 0.00368 2 0302:8202 0.00167 1
3002:0702:0705 0.00207 1 2901:0210 0.00298 2 6827:4403 0.00368 2 0303:4006 0.00167 1
3201:0602:5802 0.00207 1 0201:0501 0.00281 1.8 2902:1510 0.00364 2 1204:5701 0.00167 1
2402:1601:4501 0.00207 1 2902:0602 0.00272 1.8 0201:1503 0.00327 1.8 0702:5201 0.00167 1
6601:0602:4701 0.00207 1 3402:1601 0.00262 1.7 2402:5802 0.00305 1.7 0303:1538 0.00167 1
0101:0501:4402 0.00207 1 0101:1502 0.00249 1.6 1101:0702 0.0027 1.5 0303:1505 0.00167 1
3201:0202:4402 0.00207 1 2601:0702 0.00237 1.6 2402:4501 0.00246 1.3 0303:4001 0.00167 1
3004:0210:4403 0.00207 1 3002:0602 0.00232 1.5 7401:0801 0.0024 1.3 0401:3502 0.00167 1
1101:1602:3503 0.00207 1 2601:0401 0.0023 1.5 2402:4001 0.00236 1.3 0501:3701 0.00167 1
3402:0210:1503 0.00207 1 2402:0403 0.00223 1.5 0101:5802 0.0021 1.1 0802:1801 0.00167 1
2902:0401:1510 0.00207 1 2901:0401 0.00223 1.5 2301:5802 0.00201 1.1 1204:5802 0.00167 1
4301:0804:1402 0.00207 1 0201:0802 0.00213 1.4 4301:1501 0.00184 1 0202:5301 0.00167 1
0201:0501:5702 0.00207 1 0101:0401 0.00208 1.4 8001:1801 0.00184 1 1202:2704 0.00167 1
2402:0701:5801 0.00207 1 7401:0401 0.00203 1.3 3402:5301 0.00184 1 1403:4403 0.00167 1
3101:0701:1801 0.00207 1 3402:0701 0.00197 1.3 3303:1513 0.00184 1 1601:0705 0.00167 1
2402:0701:1503 0.00207 1 2901:1701 0.00194 1.3 3401:1521 0.00184 1 1505:3503 0.00167 1
2402:0701:1801 0.00207 1 0301:0704 0.00192 1.3 0101:4006 0.00184 1 0303:4403 0.00167 1
0301:0602:5701 0.00207 1 3201:0701 0.00188 1.2 3401:5701 0.00184 1 1801:5703 0.00167 1
0301:0602:1303 0.00207 1 0301:1203 0.00177 1.2 6802:1517 0.00184 1 0202:1401 0.00167 1
1101:0303:1501 0.00207 1 2902:1701 0.00171 1.1 2402:5001 0.00184 1 1203:3508 0.00167 1
3301:1701:4201 0.00207 1 1101:0701 0.00168 1.1 2301:1801 0.00184 1 0802:1403 0.00167 1
Stellenbosch University http://scholar.sun.ac.za
Stellenbosch University http://scholar.sun.ac.za

Haplotype A:C:B Freq. No. Haplotype A:C Freq. No. Haplotype A:B Freq. No. Haplotype C:B Freq. No.
0202:1402:1516 0.00207 1 3002:0210 0.00168 1.1 2301:3910 0.00184 1 1203:3503 0.00167 1
0203:0702:3802 0.00207 1 2402:0801 0.00166 1.1 0211:5701 0.00184 1 1602:5101 0.00167 1
6802:0401:3501 0.00207 1 2301:0304 0.00165 1.1 3004:5801 0.00184 1 1502:4002 0.00167 1
3004:1601:4501 0.00207 1 6801:0804 0.00164 1.1 0101:5801 0.00184 1 0701:1303 0.00167 1
2902:0401:4403 0.00207 1 3004:0210 0.00162 1.1 2301:3906 0.00184 1 0602:5201 0.00162 1
2902:1601:4403 0.00207 1 2901:0701 0.0016 1 2402:1401 0.00184 1 1601:4901 0.00153 0.9
0301:0102:5501 0.00207 1 2601:0701 0.00159 1 2901:5108 0.00184 1 0804:5301 0.00126 0.8
3004:0701:3924 0.00207 1 6802:1701 0.00158 1 0201:5301 0.00184 1 1601:1516 0.00084 0.5
6801:0804:1402 0.00207 1 2407:0701 0.00157 1 3002:1510 0.00184 1 0304:4403 0.00002 0
2402:1801:5301 0.00207 1 2902:0210 0.00152 1 3201:5802 0.00184 1
3301:0401:8101 0.00207 1 3004:1601 0.00152 1 3201:5801 0.00184 1
0301:0801:1502 0.00207 1 3301:0403 0.00152 1 2402:1801 0.00184 1
2601:0401:4901 0.00207 1 8001:0202 0.00152 1 6601:4701 0.00184 1
3004:1701:3501 0.00207 1 2402:1701 0.00152 1 0101:4402 0.00184 1
2902:0602:4501 0.00207 1 2301:1505 0.00152 1 3201:4402 0.00184 1
2407:0701:0801 0.00207 1 0211:0602 0.00152 1 0101:3503 0.00184 1
2301:0602:4501 0.00207 1 0101:1602 0.00152 1 0201:3802 0.00184 1
3201:0202:5801 0.00207 1 3002:0302 0.00152 1 4301:1402 0.00184 1
0203:0704:1801 0.00207 1 2901:1602 0.00152 1 0301:3503 0.00184 1
2601:0202:4002 0.00207 1 0211:1502 0.00152 1 0201:5702 0.00184 1
6801:0304:4001 0.00207 1 2402:1601 0.00152 1 2402:5801 0.00184 1
0203:0702:3901 0.00207 1 3004:0701 0.00152 1 3101:1801 0.00184 1
2402:0202:2705 0.00207 1 1101:0210 0.00152 1 0301:5701 0.00184 1
1101:1202:1801 0.00207 1 3402:1602 0.00152 1 1101:5101 0.00184 1
2301:0302:8202 0.00207 1 2902:0304 0.00152 1 3301:4201 0.00184 1
0101:0303:4006 0.00207 1 3101:0210 0.00152 1 2301:1516 0.00184 1
1101:1204:5701 0.00207 1 1101:1402 0.00152 1 0202:1516 0.00184 1
0101:0401:3501 0.00207 1 3301:1701 0.00152 1 2612:4101 0.00184 1
Stellenbosch University http://scholar.sun.ac.za
Stellenbosch University http://scholar.sun.ac.za

Haplotype A:C:B Freq. No. Haplotype A:C Freq. No. Haplotype A:B Freq. No. Haplotype C:B Freq. No.
2402:0501:4402 0.00207 1 3004:0802 0.00152 1 6802:3501 0.00184 1
3201:0701:1801 0.00207 1 0206:0704 0.00152 1 3004:1402 0.00184 1
4301:0804:5301 0.00207 1 3301:1801 0.00152 1 3201:3901 0.00184 1
2501:1801:1503 0.00207 1 3301:0401 0.00152 1 3201:1302 0.00184 1
2601:0701:4901 0.00207 1 3201:1505 0.00152 1 3004:3924 0.00184 1
2402:0304:4001 0.00207 1 2403:0701 0.00152 1 6801:1402 0.00184 1
0201:0701:4403 0.00207 1 2410:1601 0.00152 1 2402:5301 0.00184 1
0301:0401:3501 0.00207 1 3601:0401 0.00152 1 0301:1502 0.00184 1
1101:0303:1538 0.00207 1 8001:1203 0.00152 1 3004:3501 0.00184 1
0211:0303:4001 0.00207 1 2402:0202 0.00152 1 2902:4501 0.00184 1
0301:0303:1505 0.00207 1 2601:0210 0.00152 1 2407:0801 0.00184 1
2402:0401:3502 0.00207 1 2601:0403 0.00152 1 0203:1801 0.00184 1
0101:1701:3501 0.00207 1 6802:0801 0.00152 1 2601:4001 0.00184 1
0301:0501:3701 0.00207 1 0101:1204 0.00152 1 6801:4002 0.00184 1
3201:1801:1503 0.00207 1 3402:0801 0.00152 1 0203:3901 0.00184 1
1101:0702:0702 0.00207 1 2417:0801 0.00152 1 2402:2705 0.00184 1
2901:0701:4403 0.00207 1 2501:1801 0.00152 1 3001:2705 0.00184 1
2407:0801:1502 0.00207 1 6801:1202 0.00152 1 2601:4402 0.00184 1
1101:0802:4403 0.00207 1 3303:1701 0.00152 1 2301:4201 0.00184 1
4301:0701:1801 0.00207 1 0211:0303 0.00152 1 2301:8202 0.00184 1
2402:1202:5201 0.00207 1 3201:1801 0.00152 1 0101:3501 0.00184 1
0201:1204:5802 0.00207 1 3002:1204 0.00152 1 2402:4402 0.00184 1
3002:0501:4402 0.00207 1 0201:0704 0.00152 1 3402:1801 0.00184 1
2301:0701:0801 0.00207 1 6802:0804 0.00152 1 2501:5802 0.00184 1
7401:0202:5301 0.00207 1 0211:1202 0.00152 1 3201:0801 0.00184 1
0201:0701:1801 0.00207 1 3101:1502 0.00152 1 2417:1502 0.00184 1
6802:0801:1513 0.00207 1 3002:1505 0.00152 1 0301:4403 0.00184 1
3002:0602:5201 0.00207 1 2612:0602 0.00152 1 1101:1538 0.00184 1
Stellenbosch University http://scholar.sun.ac.za
Stellenbosch University http://scholar.sun.ac.za

Haplotype A:C:B Freq. No. Haplotype A:C Freq. No. Haplotype A:B Freq. No. Haplotype C:B Freq. No.
0201:0704:1801 0.00207 1 6802:1801 0.00152 1 0211:1505 0.00184 1
6802:0804:1510 0.00207 1 2902:0702 0.00152 1 2402:3502 0.00184 1
0211:0701:2704 0.00207 1 0203:1505 0.00152 1 3101:3910 0.00184 1
0301:1202:4403 0.00207 1 2501:0704 0.00152 1 3201:1503 0.00184 1
3101:1502:5101 0.00207 1 6901:0202 0.00152 1 8001:4201 0.00184 1
2612:0602:3701 0.00207 1 2911:0302 0.00152 1 2407:1502 0.00184 1
6802:1801:5702 0.00207 1 3303:1402 0.00152 1 0201:4402 0.00184 1
3402:1601:5101 0.00207 1 0123:0804 0.00152 1 2301:5301 0.00184 1
2901:1701:4101 0.00207 1 6801:0303 0.00152 1 0201:1301 0.00184 1
0301:0210:0702 0.00207 1 2301:0804 0.00152 1 3002:5201 0.00184 1
0101:0702:3701 0.00207 1 2902:0403 0.00152 1 0211:2704 0.00184 1
2902:0602:0702 0.00207 1 1101:0102 0.00152 1 2612:3701 0.00184 1
2402:1203:3901 0.00207 1 2501:1701 0.00152 1 3402:3901 0.00184 1
2501:0401:3501 0.00207 1 3001:1402 0.00152 1 2901:4101 0.00184 1
2901:0210:4403 0.00207 1 6801:1203 0.00152 1 2902:0702 0.00184 1
2402:0701:5201 0.00207 1 3101:1602 0.00152 1 2501:3901 0.00184 1
2407:0801:4801 0.00207 1 4301:0304 0.00152 1 2301:0705 0.00184 1
3004:1505:3910 0.00207 1 2612:1502 0.00152 1 6827:0705 0.00184 1
3402:0801:4801 0.00207 1 2901:1203 0.00152 1 2407:3910 0.00184 1
2601:0210:0702 0.00207 1 4301:1402 0.00152 1 3004:4801 0.00184 1
3002:0210:1503 0.00207 1 6801:0304 0.00152 1 0201:4801 0.00184 1
2601:0401:8101 0.00207 1 0202:1402 0.00152 1 3004:1401 0.00184 1
3002:0802:1402 0.00207 1 4301:0802 0.00152 1 2601:8101 0.00184 1
6802:1701:4202 0.00207 1 3303:0704 0.00152 1 3002:1402 0.00184 1
0201:1701:4202 0.00207 1 3004:1203 0.00152 1 0301:2705 0.00184 1
6802:0602:5802 0.00207 1 3201:0304 0.00152 1 3402:5703 0.00184 1
6802:0602:4501 0.00207 1 2902:0401 0.00134 0.9 2601:1401 0.00184 1
0203:1505:3503 0.00207 1 2402:0501 0.00088 0.6 6901:3508 0.00184 1
Stellenbosch University http://scholar.sun.ac.za
Stellenbosch University http://scholar.sun.ac.za

Haplotype A:C:B Freq. No. Haplotype A:C Freq. No. Haplotype A:B Freq. No. Haplotype C:B Freq. No.
4301:0401:3501 0.00207 1 0214:0403 0.00082 0.5 3303:5701 0.00184 1
2301:0304:4403 0.00207 1 2901:0304 0.00082 0.5 0205:1402 0.00184 1
2301:0303:4403 0.00207 1 0202:0401 0.00076 0.5 3002:4202 0.00184 1
7401:0701:5703 0.00207 1 0201:1502 0.00056 0.4 2911:5801 0.00184 1
2501:0704:1801 0.00207 1 3303:1801 0.00041 0.3 0214:1503 0.00184 1
0201:0202:2705 0.00207 1 0206:3701 0.00184 1
0301:0701:4101 0.00207 1 2902:4202 0.00184 1
3402:1801:5703 0.00207 1 2902:1521 0.00184 1
2601:0202:3508 0.00207 1 6801:4006 0.00184 1
6901:1203:1401 0.00207 1 6801:5001 0.00184 1
2301:0401:3503 0.00207 1 2601:3801 0.00184 1
1101:1601:3503 0.00207 1 0201:3801 0.00184 1
3004:1203:5101 0.00207 1 0202:5801 0.00184 1
1101:1203:4001 0.00207 1 2501:4101 0.00184 1
0205:0804:1402 0.00207 1 3001:5101 0.00184 1
3002:1701:4202 0.00207 1 0101:3508 0.00184 1
2911:0302:5801 0.00207 1 0301:4102 0.00184 1
0206:0602:3701 0.00207 1 4301:3701 0.00184 1
2402:0804:5501 0.00207 1 2901:1303 0.00184 1
4301:0102:4403 0.00207 1 6801:1501 0.00184 1
6801:0303:1501 0.00207 1 2402:4002 0.00184 1
2902:1701:4202 0.00207 1 2301:3503 0.00184 1
2902:0403:1521 0.00207 1 3303:5301 0.00184 1
2301:0202:1801 0.00207 1 6802:4006 0.00184 1
6801:1502:4006 0.00207 1 7401:4201 0.00128 0.7
2301:1601:1516 0.00207 1 1101:4001 0.00098 0.5
2601:1203:3801 0.00207 1
0202:0602:5801 0.00207 1
Stellenbosch University http://scholar.sun.ac.za
Stellenbosch University http://scholar.sun.ac.za
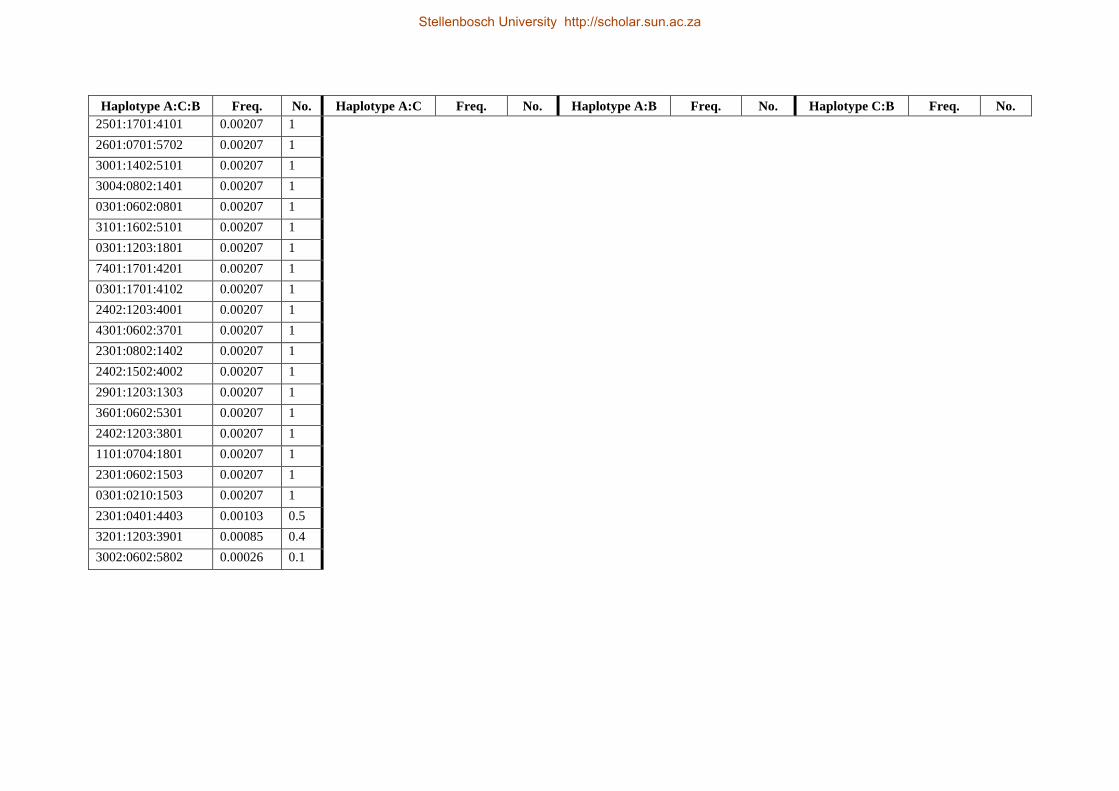
Haplotype A:C:B Freq. No. Haplotype A:C Freq. No. Haplotype A:B Freq. No. Haplotype C:B Freq. No.
2501:1701:4101 0.00207 1
2601:0701:5702 0.00207 1
3001:1402:5101 0.00207 1
3004:0802:1401 0.00207 1
0301:0602:0801 0.00207 1
3101:1602:5101 0.00207 1
0301:1203:1801 0.00207 1
7401:1701:4201 0.00207 1
0301:1701:4102 0.00207 1
2402:1203:4001 0.00207 1
4301:0602:3701 0.00207 1
2301:0802:1402 0.00207 1
2402:1502:4002 0.00207 1
2901:1203:1303 0.00207 1
3601:0602:5301 0.00207 1
2402:1203:3801 0.00207 1
1101:0704:1801 0.00207 1
2301:0602:1503 0.00207 1
0301:0210:1503 0.00207 1
2301:0401:4403 0.00103 0.5
3201:1203:3901 0.00085 0.4
3002:0602:5802 0.00026 0.1
Stellenbosch University http://scholar.sun.ac.za
Stellenbosch University http://scholar.sun.ac.za

Appendix 8: Estimated HLA class-I haplotypes in SAN individuals.
Haplotype A:C:B Freq. No. Haplotype A:C Freq. No. Haplotype A:B Freq. No. Haplotype C:B Freq. No.
6802:0401:1503 0.04918 6 3201:0401 0.06148 7.5 6802:1503 0.04918 6 0401:4403 0.09016 11
2901:1203:1303 0.04098 5 0301:0702 0.04918 6 0301:0702 0.04098 5 0602:5802 0.08197 10
0301:0702:0702 0.04098 5 6802:0401 0.04098 5 4301:1510 0.04098 5 0401:1510 0.07377 9
2301:0401:4403 0.03279 4 0301:0602 0.04098 5 2301:0702 0.04098 5 0702:0702 0.06557 8
0301:0602:5802 0.03279 4 2901:1203 0.04098 5 2901:1303 0.04098 5 0702:0705 0.06557 8
3001:0401:1510 0.02459 3 2301:0602 0.03279 4 0301:5802 0.03279 4 0401:1503 0.05738 7
3201:0401:3501 0.02459 3 0202:0701 0.02459 3 2601:0705 0.03279 4 1203:1303 0.04098 5
4301:0401:1510 0.02459 3 3001:0401 0.02459 3 2301:5802 0.02459 3 0401:3501 0.04098 5
2601:0702:0705 0.02459 3 6827:0401 0.02459 3 3201:4403 0.02459 3 1701:4101 0.03279 4
3004:0602:5802 0.02459 3 2601:0702 0.02459 3 3004:5802 0.02459 3 0804:1401 0.03279 4
6827:0401:4403 0.02459 3 2301:0702 0.02459 3 3001:1510 0.02459 3 1701:4201 0.02459 3
6802:0802:1402 0.01639 2 3004:0602 0.02459 3 6827:4403 0.02459 3 0802:1402 0.02459 3
0205:0804:1401 0.01639 2 4301:0202 0.02459 3 3201:3501 0.02459 3 0602:5801 0.01639 2
2402:0401:0702 0.01639 2 3402:0401 0.02459 3 3402:4403 0.02459 3 0202:2701 0.01639 2
2301:1701:4101 0.01639 2 4301:0401 0.02049 2.5 7401:3501 0.01639 2 1505:1801 0.01639 2
0202:0701:5702 0.01639 2 4301:0602 0.01639 2 6802:1402 0.01639 2 0701:5702 0.01639 2
2301:0702:0702 0.01639 2 0201:1701 0.01639 2 0205:1401 0.01639 2 0703:0702 0.01639 2
2301:0703:0702 0.01639 2 6802:0802 0.01639 2 2402:0702 0.01639 2 0704:0705 0.01639 2
0202:0702:0705 0.01639 2 0205:0804 0.01639 2 2301:4101 0.01639 2 0302:5801 0.01639 2
3201:0202:4403 0.01639 2 6801:0602 0.01639 2 0202:0705 0.01639 2 0501:1801 0.0082 1
2301:0602:5802 0.01639 2 2301:1701 0.01639 2 0202:5702 0.01639 2 0501:3501 0.0082 1
4301:0202:4403 0.0082 1 0202:0702 0.01639 2 2301:1510 0.01639 2 0701:5703 0.0082 1
3201:0401:4403 0.0082 1 2301:0703 0.01639 2 3002:1801 0.0082 1 0202:4403 0.0082 1
3002:0501:1801 0.0082 1 3201:1701 0.0123 1.5 3002:1402 0.0082 1 0703:0705 0.0082 1
7401:0501:3501 0.0082 1 2301:0401 0.0082 1 4301:5801 0.0082 1 0712:0702 0.0082 1
3002:0602:1402 0.0082 1 3002:0501 0.0082 1 0201:4101 0.0082 1 0202:0702 0.0082 1
4301:0802:5801 0.0082 1 7401:0501 0.0082 1 0202:5703 0.0082 1 1203:3801 0.0082 1
Stellenbosch University http://scholar.sun.ac.za
Stellenbosch University http://scholar.sun.ac.za

Haplotype A:C:B Freq. No. Haplotype A:C Freq. No. Haplotype A:B Freq. No. Haplotype C:B Freq. No.
0201:1701:4101 0.0082 1 3002:0802 0.0082 1 0201:4403 0.0082 1 0701:3501 0.0082 1
0202:0701:5703 0.0082 1 6802:1701 0.0082 1 4301:1401 0.0082 1 0202:1503 0.0082 1
0201:0804:1401 0.0082 1 0205:0701 0.0082 1 2301:4403 0.0082 1 1701:6701 0.0082 1
2631:0804:1401 0.0082 1 2631:0804 0.0082 1 3002:0705 0.0082 1 1701:4102 0.0082 1
3002:0703:0705 0.0082 1 2601:1701 0.0082 1 2601:4101 0.0082 1 0304:4001 0.0082 1
3402:0712:0702 0.0082 1 2901:1701 0.0082 1 2901:4201 0.0082 1 1701:5101 0.0082 1
3402:0702:0705 0.0082 1 2402:0202 0.0082 1 4301:2701 0.0082 1 0602:4701 0.0082 1
2601:1701:4101 0.0082 1 2402:0401 0.0082 1 3002:3801 0.0082 1 1801:1503 0.0082 1
2901:1701:4201 0.0082 1 3002:1203 0.0082 1 1101:4403 0.0082 1 0602:1302 0.0082 1
1101:0701:3501 0.0082 1 1101:0401 0.0082 1 3301:3501 0.0082 1 0602:1510 0.0082 1
3301:0401:4403 0.0082 1 3301:0701 0.0082 1 2407:3501 0.0082 1 1801:1510 0.0082 1
2407:0702:3501 0.0082 1 2407:0702 0.0082 1 3401:5801 0.0082 1 0403:1301 0.0082 1
3401:0302:1521 0.0082 1 3401:0302 0.0082 1 6601:1521 0.0082 1 0202:2703 0.0082 1
6601:0403:5801 0.0082 1 6601:0403 0.0082 1 3301:5801 0.0082 1 0403:1510 0.0082 1
3301:0202:1503 0.0082 1 3301:0202 0.0082 1 7401:1503 0.0082 1 0804:1402 0.0082 1
7401:0302:5801 0.0082 1 7401:0302 0.0082 1 0205:0705 0.0082 1 0302:5701 0.0082 1
0205:0704:0705 0.0082 1 0205:0704 0.0082 1 0301:1501 0.0082 1 0602:8201 0.0082 1
0301:0304:1501 0.0082 1 0301:0304 0.0082 1 3001:6701 0.0082 1 0304:1501 0.0082 1
3001:1701:0705 0.0082 1 3001:0702 0.0082 1 3201:0705 0.0082 1 0202:4004 0.0082 1
3201:0702:6701 0.0082 1 7401:0401 0.0082 1 3201:4102 0.0082 1 0701:5801 0.0082 1
2301:0332:1510 0.0082 1 2301:0332 0.0082 1 0101:1503 0.0082 1 0710:0702 0.0082 1
2601:0704:0705 0.0082 1 2601:0704 0.0082 1 3601:1510 0.0082 1 0403:1521 0.0082 1
0101:0401:1503 0.0082 1 0101:0401 0.0082 1 0225:4001 0.0082 1 0332:1503 0.0082 1
3601:0401:1510 0.0082 1 3601:0401 0.0082 1 6802:4004 0.0082 1
0225:0304:4001 0.0082 1 0225:0304 0.0082 1 0201:0705 0.0082 1
6802:0202:4004 0.0082 1 6802:0202 0.0082 1 0301:5101 0.0082 1
0201:1701:5101 0.0082 1 0205:0202 0.0082 1 6801:4701 0.0082 1
0301:0702:0705 0.0082 1 2301:1505 0.0082 1 3201:1503 0.0082 1
Stellenbosch University http://scholar.sun.ac.za
Stellenbosch University http://scholar.sun.ac.za

Haplotype A:C:B Freq. No. Haplotype A:C Freq. No. Haplotype A:B Freq. No. Haplotype C:B Freq. No.
6801:0602:4701 0.0082 1 6802:1505 0.0082 1 0205:5801 0.0082 1
3201:1801:1503 0.0082 1 2301:1801 0.0082 1 0205:2701 0.0082 1
0205:0701:5801 0.0082 1 2488:0403 0.0082 1 0301:1302 0.0082 1
0205:0202:1302 0.0082 1 0202:0401 0.0082 1 2301:1801 0.0082 1
0301:0602:2701 0.0082 1 2602:0804 0.0082 1 6802:1801 0.0082 1
2301:1505:1801 0.0082 1 3004:0401 0.0082 1 2301:5801 0.0082 1
6802:1505:1801 0.0082 1 6802:0710 0.0082 1 2488:1301 0.0082 1
2301:0602:5801 0.0082 1 0101:0302 0.0082 1 0301:2703 0.0082 1
2301:1801:1510 0.0082 1 0201:0804 0.0082 1 0202:1503 0.0082 1
2488:0403:1301 0.0082 1 3002:0703 0.0082 1 3106:4201 0.0082 1
0301:0202:1510 0.0082 1 0301:0403 0.0082 1 2602:1402 0.0082 1
4301:0403:2703 0.0082 1 3106:1701 0.0082 1 3004:1510 0.0082 1
4301:0602:1510 0.0082 1 6802:1801 0.0082 1 6802:0702 0.0082 1
0202:0401:1503 0.0082 1 2301:0712 0.0082 1 6802:4201 0.0082 1
2602:0804:1402 0.0082 1 4301:1701 0.0041 0.5 0101:8201 0.0082 1
3004:0401:1510 0.0082 1
6801:5701 0.0082 1
6802:0710:0702 0.0082 1
2631:1401 0.0082 1
6802:1701:4201 0.0082 1
2301:0705 0.0082 1
0101:0602:5701 0.0082 1
6801:0302:8201 0.0082 1
3002:1203:3801 0.0082 1
7401:0401:3501 0.0082 1
3201:1701:4102 0.0082 1
3106:1701:4201 0.0082 1
3402:0602:5802 0.0082 1
4301:0401:2701 0.0082 1
Stellenbosch University http://scholar.sun.ac.za
Stellenbosch University http://scholar.sun.ac.za