COMPARING THE PERFORMANCES OF MAJOR AIRLINE ...
88
T.C. SAKARYA UNIVERSITY INSTITUTE OF SOCIAL SCIENCES COMPARING THE PERFORMANCES OF MAJOR AIRLINE COMPANIES BY TRADITIONAL AND AIRLINE-SPECIFIC RATIOS AND MEASURES MASTER THESIS Hatem YAGHI Department : Business Administration Field of Science : Accounting and Finance Supervisor of Thesis: Assist. Prof. Ahmet Selçuk DİZKIRICI JUNE-2015
-
Upload
khangminh22 -
Category
Documents
-
view
1 -
download
0
Transcript of COMPARING THE PERFORMANCES OF MAJOR AIRLINE ...
T.C. SAKARYA UNIVERSITY
INSTITUTE OF SOCIAL SCIENCES
COMPARING THE PERFORMANCES OF MAJOR AIRLINE COMPANIES BY TRADITIONAL AND AIRLINE-SPECIFIC RATIOS AND MEASURES
MASTER THESIS
Hatem YAGHI
Department : Business Administration Field of Science : Accounting and Finance
Supervisor of Thesis: Assist. Prof. Ahmet Selçuk DİZKIRICI
JUNE-2015

DECLARATION
This thesis is a presentation of my original work. Wherever contributions of others are
involved, every effort is made to indicate this clearly, with due reference to the
literature, and acknowledgement of collaborative research and discussions.
Hatem YAGHI
June 23rd, 2015
ACKNOWLEDGEMENTS
This thesis owes its existence to the help, guidance and inspiration of several people.
Firstly, I would like to express my sincere appreciation and gratitude to my supervisor
Assistant Prof. Dr. Ahmet Selçuk DİZKIRICI for his guidance during my thesis. One
simply could not wish for a better or friendlier supervisor.
I would also like to thank my professors at Sakarya University whose office doors are
always opened for further help and supervision.
Lastly, I owe a special gratitude to my parents and sister who offered me endless
support throughout my life.
Hatem YAGHI
June 23rd, 2015
i
TABLE OF CONTENT
LIST OF ABBREVIATIONS ....................................................................................... iv
LIST OF TABLES .......................................................................................................... v
LIST OF FIGURES ...................................................................................................... vii
ÖZET ............................................................................................................................. viii
ABSTRACT ..................................................................................................................... x
INTRODUCTION ........................................................................................................... 1
PART 1: THE GLOBAL AIRLINE INDUSTRY ............... ......................................... 5
1.1. Introduction to Global Airline Industry ..................................................................... 5
1.2. Key Organizations and Their Roles in Airline Industry ............................................ 5
1.2.1. International Civil Aviation Organization (ICAO) .......................................... 6
1.2.2. International Air Transport Association (IATA) ............................................. 7
1.3. Airline International Economic Regulations and Liberalization ............................... 7
1.4. The Effects of Past Liberalization to Airline Industry ............................................... 8
1.4.1. Economic and Traffic Growth ......................................................................... 8
1.4.2. Bankruptcy and Consolidation ......................................................................... 9
1.4.3. Emergence of Low-Cost Carriers .................................................................... 9
1.5. Major Airline Companies Worldwide ...................................................................... 10
PART 2: FINANCIAL ANALYSIS AND AIRLINE-SPECIFIC ANA LYSIS ........ 15
2.1. Financial Analysis Techniques ................................................................................ 15
2.1.1. Horizontal Analysis ....................................................................................... 15
2.1.2. Trend Analysis ............................................................................................... 15
2.1.3. Vertical Analysis ............................................................................................ 16
2.1.4. Traditional Ratio Analysis ............................................................................. 16
2.1.4.1. Liquidity Ratios ................................................................................. 17
2.1.4.2. Leverage Ratios ................................................................................. 18
2.1.4.3. Activity Ratios ................................................................................... 20
2.1.4.4. Profitability Ratios ............................................................................. 21
2.2. Airline-Specific Measures and Ratios ...................................................................... 22

ii
2.2.1. Available Seat Kilometers (ASK) .................................................................. 23
2.2.2. Revenue Passenger Kilometers (RPK) .......................................................... 23
2.2.3. Load Factor (LF) ............................................................................................ 23
2.2.4. Revenue per Revenue Passenger Kilometers (RRPK) ................................... 24
PART 3: ANALYZING MAJOR AIRLINE COMPANIES ACCORDING TO
TRADITIONAL AND AIRLINE-SPECIFIC RATIOS ........... ................................. 25
3.1. Aim, Scope and Limitation ...................................................................................... 25
3.2. Traditional and Specific Ratio Analysis for Major Airline Companies ................... 26
3.2.1. Ratio and Airline-Specific Analysis for Aeroflot .......................................... 27
3.2.2. Ratio and Airline-Specific Analysis for Air Asia .......................................... 28
3.2.3. Ratio and Airline-Specific Analysis for Air Berlin ....................................... 29
3.2.4. Ratio and Airline-Specific Analysis for Air Canada ..................................... 30
3.2.5. Ratio and Airline-Specific Analysis for Air France / KLM .......................... 31
3.2.6. Ratio and Airline-Specific Analysis for Air New Zealand ............................ 32
3.2.7. Ratio and Airline-Specific Analysis for All Nippon Airways ....................... 33
3.2.8. Ratio and Airline-Specific Analysis for Cathay Pacific ................................ 34
3.2.9. Ratio and Airline-Specific Analysis for Delta Airlines ................................. 35
3.2.10. Ratio and Airline-Specific Analysis for Emirates........................................ 36
3.2.11. Ratio and Airline-Specific Analysis for IAG ............................................... 37
3.2.12. Ratio and Airline-Specific Analysis for Korean Air .................................... 38
3.2.13. Ratio and Airline-Specific Analysis for Lufthansa ...................................... 39
3.2.14. Ratio and Airline-Specific Analysis for Qantas ........................................... 40
3.2.15. Ratio and Airline-Specific Analysis for Ryanair ......................................... 41
3.2.16. Ratio and Airline-Specific Analysis for Singapore Airlines ........................ 42
3.2.17. Ratio and Airline-Specific Analysis for Turkish Airlines ........................... 43
PART 4: COMPARING MAJOR AIRLINE COMPANIES BY TRADIT IONAL
AND AIRLINE-SPECIFIC RATIOS .......................................................................... 45
4.1. Comparing the Airlines by Using Liquidity Ratios ................................................. 45
4.2. Comparing Airlines by Using Leverage Ratios ....................................................... 47
4.3. Comparing Airlines by Using Activity Ratios ......................................................... 51

iii
4.4. Comparing the Airlines by Using Profitability Ratios ............................................. 53
4.5. Comparing the Airlines by Using Airline-Specific Measures and Ratios ............... 59
RESULTS AND CONCLUSION ................................................................................. 63
REFERENCES .............................................................................................................. 67
APPENDICES ............................................................................................................... 71
CARRICULUM VITAE ............................................................................................... 74
iv
LIST OF ABBREVIATIONS
ANA : All Nippon Airways
ASK : Available Seats Kilometers
D/E : Debt to Equity Ratio
IAG : International Airlines Group
IATA : International Aviation Transport Association
ICAO : International Civil Aviation Organization
LCCs : Low Cost Carriers
LF : Load Factor
M$ : Millions of United States Dollars
M€ : Millions of Euros
NWC : Net Working Capital
ROA : Return on Assets
ROE : Return on Equity
RPK : Revenue Passengers Kilometers
RRPK : Revenue per Revenue Passengers Kilometers

v
LIST OF TABLES
Table 1 : The Most Common Used Financial Ratios ................................................ 17
Table 2 : Airline-Specific Ratios............................................................................... 23
Table 3 : List of Airlines Under Study ...................................................................... 26
Table 4 : Financial Ratio Analysis for Aeroflot ........................................................ 27
Table 5 : Specific-Airline Ratio Analysis for Aeroflot ............................................. 27
Table 6 : Financial Ratio Analysis for Air Asia ........................................................ 28
Table 7 : Airline-Specific Analysis for Air Asia ...................................................... 28
Table 8 : Financial Ratio Analysis for Air Berlin ..................................................... 29
Table 9 : Airline-Specific Ratio Analysis for Air Berlin .......................................... 29
Table 10 : Financial Ratio Analysis foe Air Canada................................................... 30
Table 11 : Airline-Specific Ratio Analysis for Air Canada ........................................ 30
Table 12 : Financial Ratio Analysis for Air France/KLM .......................................... 31
Table 13 : Airline-Specific Ratio Analysis for Air France/KLM ............................... 31
Table 14 : Financial Ratio Analysis for Air New Zealand.......................................... 32
Table 15 : Airline-Specific Ratio Analysis for Air New Zealand ............................... 32
Table 16 : Financial Ratio Analysis for All Nippon Airways ..................................... 33
Table 17 : Airline-Specific Ratio Analysis for All Nippon Airways .......................... 33
Table 18 : Financial Ratio Analysis for Cathay Pacific .............................................. 34
Table 19 : Airline-Specific Ratios Analysis for Cathay Pacific ................................. 34
Table 20 : Financial Ratio Analysis for Delta Airlines ............................................... 35
Table 21 : Airline-Specific Ratio Analysis for Delta Airlines .................................... 35
Table 22 : Financial Ratio Analysis for Emirates ....................................................... 36
Table 23 : Specific- Airline Ratio Analysis for Emirates ........................................... 36
Table 24 : Financial Ratio Analysis for IAG .............................................................. 37
Table 25 : Specific-Airline Ratio Analysis for IAG ................................................... 37
Table 26 : Financial Ratio Analysis for Korean Airlines ............................................ 38
Table 27 : Airline-Specific Ratio Analysis for Korean Airlines ................................. 38
Table 28 : Financial Ratio Analysis for Lufthansa ..................................................... 39
Table 29 : Airline-Specific Ratio Analysis for Lufthansa .......................................... 39
Table 30 : Financial Ratio Analysis for Qantas .......................................................... 40

vi
Table 31 : Specific- Airline Ratio Analysis for Qantas .............................................. 40
Table 32 : Financial Ratio Analysis for Ryanair ......................................................... 41
Table 33 : Airlin-Specific Ratio Analysis for Ryanair................................................ 41
Table 34 : Financial Ratio Analysis for Singapore Airlines ....................................... 42
Table 35 : Specific-Airline Ratio Analysis for Singapore Airlines ............................ 42
Table 36 : Financial Ratio Analysis for Turkish Airlines ........................................... 43
Table 37 : Specific-Airline Ratio Analysis for Turkish Airlines ................................ 43

vii
LIST OF FIGURES
Figure 1 : Current Ratio and Quick Ratio (2011) ....................................................... 45
Figure 2 : Current Ratio and Quick Ratio (2012) ....................................................... 45
Figure 3 : Current Ratio and Quick Ratio (2013) ....................................................... 46
Figure 4 : Debt to Equity Ratio (2011) ....................................................................... 47
Figure 5 : Debt to Equity Ratio (2012) ....................................................................... 47
Figure 6 : Debt to Equity Ratio (2013) ....................................................................... 48
Figure 7 : Debt Ratio (2011) ...................................................................................... 49
Figure 8 : Debt Ratio (2012) ...................................................................................... 49
Figure 9 : Debt Ratio (2013) ...................................................................................... 50
Figure 10 : Total Asset Turnover (2011) ...................................................................... 51
Figure 11 : Total Asset Turnover (2012) ...................................................................... 51
Figure 12 : Total Asset Turnover (2013) ...................................................................... 52
Figure 13 : Operating Profit Margin and Net Profit Margin (2011) ............................. 53
Figure 14 : Operating Profit Margin and Net Profit Margin (2012) ............................. 53
Figure 15 : Operating Profit Margin and Net Profit Margin (2013) ............................. 54
Figure 16 : Return on Asset (2011) .............................................................................. 55
Figure 17 : Return on Asset (2012) .............................................................................. 55
Figure 18 : Return on Asset (2013) .............................................................................. 56
Figure 19 : Return on Equity (2011) ............................................................................ 57
Figure 20 : Return om Equity (2012) ........................................................................... 57
Figure 21 : Return on Equity (2013) ............................................................................ 58
Figure 22 : Available Seat Kilometer (2011-2012-2013)............................................. 59
Figure 23 : Revenue Passenger Kilometer (2011-2012-2013) ..................................... 60
Figure 24 : Average Load Factor (2011-2012-2013) ................................................... 61
Figure 25 : Passenger Yield (2011-2012-2013) ........................................................... 62

viii
SAÜ, Sosyal Bilimler Enstitüsü Yüksek Lisans Tez Özeti Tezin Başlığı: Büyük Havayolu Şirketlerinin Performanslarının Geleneksel
Oranlar ve Özel Havayolu Oranları ve Ölçüleri Yoluyla Karşılaştırılması
Tezin Yazarı: Hatem YAGHI Danışman: Yrd.Doç.Dr. Ahmet Selçuk DİZKIRICI Kabul Tarihi: 23 Haziran 2015 Sayfa Sayısı: x (ön kısım) + 71 (tez) +3(ek) Anabilimdalı : İşletme Bilimdalı: Muhasebe ve Finansman Bu çalışma havayolu endüstrisindeki büyük işletmelerin geleneksel oranlar ile birlikte sektöre özel oran ve ölçülerle analizini içermektedir. Sözü edilen oranlar beraber kullanılarak dünyanın en büyük ve en rekabetçi pazarlarından olan havayolu endüstrisindeki işletmeler finansal performansları bağlamında incelenmekte ve karşılaştırılmaktadır.
Oran analizi yöntemi, mali tabloların incelenmesinde kullanılan temel unsur olarak görülmektedir. Bu yöntem şirketlerin finansal beyanlarında halka açıkladıkları bilgilerin kantitatif analizini içermektedir. İşletmelerin bilanço, gelir ve gider tablosu ile nakit akım tablosu gibi temel ve ek mali tablolarında yer alan farklı öğeler arasındaki ilişkileri gösteren söz konusu oranlar şirketlerin performansını değerlendirmek amacıyla kullanılan önemli bilgilerdir. Dolayısıyla oran analizinde bir şirketin likidite, finansal yapı, etkinlik ve karlılık açısından incelenmesi için net işletme sermayesi, cari oran, asit-test oranı, toplam varlık devir hızı, öz kaynak karlılığı, toplam varlık karlılığı, kar marjı, faaliyet karı, borç/öz sermaye oranı ve kaldıraç oranı gibi finansal oranlarını hesaplanmakta ve karşılaştırılmaktadır.
Buna ek olarak, her sektör kendi özelliklerini taşıdığı için sektöre özel oranlar, sektör ile ilgili daha derin analiz yapılmasına ve sektörün anlaşılmasına yardımcı olmak için geliştirilmi ştir. Bu nedenle çalışma; geleneksel oran analizinde kullanılan oranlar dışında havayolu endüstrisi ile ilgili arz edilen koltuk mesafesi (ASK), ücretli yolcu mesafesi (RPK), ortalama yük faktörü (LF) ve ücretli yolcu için mesafe başına gelir (RRPM) ya da hâsıla gibi diğer bazı ölçü ve oranları da içermektedir.
Burada sözü edilen ASK ölçüsü, uçuş sırasındaki mevcut koltuk sayısının, koltuklar dolu olsun ya da olmasın, mesafeyle çarpımını ifade eder.
ASK= Uçak başına koltuk sayısı x Uçuş Mesafesi (km)
RPK ise uçaktaki ücretli yolcuların mesafeyle çarpımını temsil etmektedir. ASK hesaplamasında yolcuların uçakta olması ya da olmaması önemli değilken; RPK hesaplamasında sadece ücretli yolcuların bulunduğu koltuklar hesaplamaya dâhil edilmektedir.
RPK= Ücretli Yolcu Sayısı x Uçuş Mesafesi (km)
Yük faktörü (LF) oranı kapasite kullanımı için kullanılan, RPK ve ASK değerlerini karşılaştırarak ücretli yolcular tarafından doldurulan koltuk miktarını ortaya koymaktadır.
LF= RPK/ ASK
Ücretli yolcu için mesafe başına gelir (RRPM) veya hâsıla bir yolcunun bir kilometre uçmak için ödediği tutar olarak karşımıza çıkmaktadır.
RRPM= Yolculardan Elde Edilen Toplam Geliri/ RPK şeklinde hesaplanmaktadır.
Yukarıda sözü edilen havayolu işletmelerine özel oran ve değerlendirmeler havayolunun faaliyet kapsamını ifade etmektedir. ASK ve RPK değerleri faaliyetlerin büyüklüğünü ifade etmekte; LF ve hâsıla oranları hesaplanarak karşılaştırmalar yapılmaktadır.
Bu çalışma Kuzey Amerika, Asya, Avustralya ve Avrupa’dan seçilen ve dünya çapında faaliyet gösteren büyük havayolu şirketlerinden farklı havayolu sınıflarını (tam hizmet ya da

ix
düşük maliyetli taşıyıcılar) ve farklı işletim stratejilerini (uzun, orta ve kısa mesafeli uçuşlar) içermektedir. İşletmelerin kriz sonrası yılları ifade eden 2011-2013 dönemindeki performansları geleneksel oran analizi ve sektör oranları ile incelenmekte ve karşılaştırılmaktadır.
Tam hizmet taşıyıcılarından kasıt; düşük maliyetli taşıyıcılara göre daha yüksek bir ücret karşılığında birinci sınıf ve business class oturma, daha iyi kabin hizmeti, daha iyi yemekler, eğlence hizmetleri ve özel havaalanı bekleme salonları vb. hizmetler sağlayan havayollarıdır. Havayollarının işletim stratejileri ise varılacak yerin mesafesi ile ilgili olup kısa mesafeli uçuş en çok üç saat süren yurt içi veya yurtdışı uçuşlardır. Orta mesafeli uçuşlar üç ila altı saat süren uçuşlar ve son olarak uzun mesafeli uçuşlar da altı saatten fazla süren genellikle non-stop olan uçuşları ifade eder.
Havayolu taşımacılığının kendine özgü bir özelliği de işin doğasının uluslararası olmasıdır. Bunun temel nedeni, uçakların uzun mesafeler alıyor olması ve uçaklarla, hız avantajını kullanarak rekabet edebilecek herhangi bir ulaşım aracının olmamasıdır. Havayolları, dünyanın farklı uluslarının yük ve yolcularını taşımaktadır. Aynı zamanda ekonomik büyüme ve havayollarının liberalleşmesi havayolu taşımacılığı ve trafiğinin talebini de oldukça etkilemektedir. Öte yandan havayolu endüstrisi verimlili ğini korumak için rekabet edebilirlik, yakıt fiyat değişkenliği, küresel ekonomi, havayolu güvenliği, yenilik, düşük maliyetli taşıyıcıların ortaya çıkması gibi birçok zorlukla karşı karşıya kalmaktadır.
Çalışma boyunca, havayolu endüstrisinin kazançlarında dalgalanmaların yaşandığını, önemli kar dönemlerinin ardından finansal kayıpların da gerçekleştiği gözlemlenmektedir. Ayrıca yüksek kaldıraç oranları nedeniyle havayolu endüstrisinin ağır borç yapısına sahip olduğu da görülmektedir. Bununla birlikte, birikmiş zararlar nedeniyle negatif ya da çarpık borç-özsermaye oranı ile karşılaşılmaktadır. Negatif veya pozitif fakat düşük miktardaki işletme sermayesi, uzun dönemli borcun belli oranlarda periyodik olan ödenmesi anlamına gelen yüksek kaldıraca sahip olması ile açıklanabilir.
Daha önce belirtildiği gibi, havayolu endüstrisi değişken bir yapıda olduğu için, beklenmedik finansal dalgalanmalar arkasında birçok neden bulunmaktadır. Yüksek miktardaki borç nedeniyle büyük faiz maliyeti, siyasi istikrarsızlık (özellikle birçok havayolu için önemli pazarlar olan Ortadoğu ve Kuzey Afrika'daki savaşlar), İzlanda ve Japonya ‘da gerçekleşen doğal afetler, Euro Bölgesi borç sorunları ve ekonomik durgunluk gibi sorunlar; tam hizmet taşıyıcılarını etkilemiş, düşük maliyetli taşıyıcıların yararına olmuştur.
Havayollarına özel oran ve istatistiklerden bahsedildiğinde; neredeyse tüm havayolu endüstrisinde, kar eden ve etmeyen yıllar da göz önüne alınarak, operasyonel büyümeyi temsil eden ASK ve RPK büyümelerine bakıldığında, rekabetin üst düzeyde olduğu fark edilmektedir.
Çalışma kapsamındaki işletmelerin geleneksel ve havayollarına özel oranlarının incelenmesi sonucu aşağıdaki sonuçlara varılabilmektedir: Ekonomik büyüme ve havayolu sektörünün küresel anlamda liberalleşmesi; havayolu taşımacılığı ve trafiği için yeni pazarlar üretme ve düşük maliyetli taşıyıcıların ortaya çıkmasına yönelik talebi oldukça etkilemektedir. Sektörde rekabetçi bir yapı oluşmakta ve söz konusu rekabet ortamı büyük havayolu şirketleri üzerinde baskı kurarak, çoğunlukla son yıllarda ortaya çıkan diğer şirketleri de dikkate almasını, finansal yapı ve faaliyetleri açısından sürekli şekilde karşılaştırma yapmayı gerekli kılmaktadır. Diğer bir deyişle, havayolları rekabet edebilirliğini daha fazla borcu finanse etmeye karşılık ASK ve RPK’larını arttırarak sürdürmektedir.
Anahtar Kelimler: Havayolu Sektörü, Büyük Havayolu İşletmeleri, Finansal Performans, Özel Havayolu Değerlendirme Kriterleri

x
SAU, Institute of Social Sciences Abstract of Master’s Thesis Title of the Thesis: Comparıng The Performances Of Major Aırlıne Companıes By
Tradıtıonal And Aırlıne-Specıfıc Ratıos And Measures
Author: Hatem YAGHI Supervisor: Assist. Prof. Ahmet Selçuk DİZKIRICI
Date: June 23rd, 2015 No. of Pages : x (front) + 71 (thesis) + 3 (app)
Department: Business Administration Field of Science: Accounting and Finance
Airline industry is developed both in Turkey and worldwide in the previous decades
considerably. Air transportation activities have been operated since a much longer time both for
military and civilian purposes and a rapid growth in civil aviation has been seen recently due to
new opportunities in communication and transportation. Since 1990s especially in Europe and
Asia the civil transport demand for airline companies is increased significantly.
Because of the importance in corporate performance; the study addresses the traditional ratio
analysis in the airline industry in addition to airline-specific measures and ratios. Given the
specificity of the airline industry and its significant vulnerability to adverse changes in
economic and business conditions, conducting a ratio analysis aims to reveal the airline
industry-specific behavior of the selected liquidity, activity, profitability and leverage ratios
computed for 17 international airlines over the period of 2011-2013 which is called as post
crisis term and find out whether known rules of thumb are applicable to the airline industry.
Moreover, via traditional ratios the study examines the financial performance of the selected
airlines during the given period by identifying major challenges that they are facing.
Airline-specific measures and ratios express sizes and operating areas of the companies in the
aviation sector. Moreover they highlight airlines’ growth throughout the years by calculating its
kilometers travelled and passengers carried. Simultaneously, average load factor highlights the
utility of the growth while passengers yield notes its efficiency.
By combining these two methods a conclusion about airlines’ position and success in one of the
biggest and most competitive markets worldwide is drawn according to the comparison of the
analyses held.
Keywords: Airline Industry, Major Airline Companies, Financial Performance, Specific Airline Evaluation Criteria

1
INTRODUCTION
One of the unique aspects of airline transportation is the international nature of the
business. The main reason for this is the fact that no other kind of transportation can
compete with the speed advantage that aircraft have over longer distances. Airlines
transport passengers and freight of different nationalities all over the world. Moreover,
economic growth and airline liberalization heavily influence demand for air transport
and traffic growth. On the other hand, airline industry faces many challenges to
maintain its efficiency like competitiveness, fuel price volatility, global economy, safety
in air, innovation, the emergence of low cost carriers etc. In recent years the airline
industry has experienced severe volatility in earnings and significant profits that are
closely followed by periods of financial loss with numerous samples of airlines through
the fluctuation in global airline industry.
Corporate finance is a diverse and broad field that deals with ensuring that a company
has the financial resources, cash specifically, not only to operate successfully in the
short term, but also to position the company for long-term prosperity. Long-term
prosperity is critical to every industry and the airline industry is no exception; therefore
financial management, together with economics, plays an essential role in maintaining
efficient airline operation. Finance touches every side of an airline, affecting its short-
term and long-term decision-making and results.
The financial ratio analysis has always been considered as a fundamental element in
financial statement analysis. It involves conducting a quantitative analysis of
information disclosed in financial statements of companies via various accounting ratios
that show relations among different items from the balance sheet, statement of
operations and statement of cash flows and are used to evaluate companies’
performance for investing and financing purposes.
As any industry, airline companies have their own measures and specifications based on
the service provided and customers. Hence airline-specific measures and ratios like
Available Seat Kilometer, Revenue Passenger Kilometers, Load Factor and Revenue per
Revenue Passenger Kilometer (yield) exist to provide a deeper understanding of the
industry’s operations and progress.

2
Research Objectives
The research’s objective is firstly to provide introduction to the global airline industry,
its evolution and current status. Firstly, the major forces influencing the industry are
described, including deregulation and liberalization worldwide, along with some
important recent industry challenges, such as the severe financial problems that the
industry has faced, which were followed by restructuring of some of the industry’s
largest airlines. In addition; the study’s purpose is to present a quantitative analysis of
information reported in financial statements and annual reports of the selected major
airlines using traditional financial ratios and airline-specific measures and ratios to
assess the major airlines’ financial performance for three successive years (2011-2013)
and understand their behavior specific to the airline industry. Furthermore, we study the
relation between the financial and the airline-specific assessment. Finally, based on the
performed analysis, major airlines are being evaluated and compared.
Significance of the Study
Throughout the study, the airline industry’s volatile earnings and significant profits that
are closely followed by periods of financial losses is noticed. Also the heavy debt
structure of the airline industry through high leverage ratios is known. In addition,
negative or distorted debt to equity ratios is noted due to earlier bankruptcy and
accumulated losses. Consequently, negative or positive but low working capital can
primarily be explained by airlines being highly leveraged, which requires periodic
payments of the current portion of long-term debt.
The study also highlights the reasons behind major airlines’ unexpected financial
fluctuations throughout the years under study such as high fuel prices which specifically
affect airlines operating long-haul flights, political instability and wars in Middle East
and North Africa which are important markets for some airlines, natural disasters
represented by Japan’s earthquake and tsunami, Eurozone debt issues and economic
recession stroked legacy airlines and benefited low cost carriers, past losses and
occasionally bankruptcies accompany airlines for long periods after, resulting in
negative or tiny equities which distort financial analysis like return on equity and debt to
equity ratios etc.

3
Airline-specific measures and ratios remarks high level of competition in airlines’ sector
as almost all of the airlines under study record operational growth represented by
growing Available Seat Kilometer and Revenue Passenger Kilometer during profitable
and unprofitable years.
Scope of the Study
Given the specificity of the airline industry and its significant vulnerability to adverse
changes in economic and business conditions, conducting a ratio analysis aims to reveal
the airline industry-specific behavior of 22 international airlines over the after crisis
period (2011-2013) and find out whether known rules of thumb are applicable to the
airline industry. The airlines under study are leading companies in the industry
representing North America, Asia, Australia and Europe covering different classes of
airlines (legacy carriers and low cost carriers) and different operating strategies such as
long-haul flights, medium-haul flights and short-haul flights. Legacy carriers refer to
airlines with high-fares due to higher quality services provided than low-cost carriers
such as first class and business class seating, better cabin service, better meals, in-flight
entertainment, exclusive airport lounges etc.). Airlines’ operation strategies are divided
in to three groups based on the distance travelled to destination. First, short-haul flight is
a flight taking less than three hours to complete, it can be domestic or international.
Second, medium-haul flight lasts from three and six hours, basically international
flights. Finally, long-haul flight is a flight that requires over six and a half hours to
cover and is often a non-stop flight.
Ratio analysis consists of various financial calculations to analyze different portions of
a company such as net working capital, current ratio, quick ratio, total asset turnover,
return on assets (ROA), return on equity (ROE), profit margin, operating profit margin,
debt-to-equity (D/E) and debt ratio, are used to highlight and interpret airlines’ liquidity,
efficiency, profitability and solvency.
In addition; since every industry is unique, certain industry-specific ratios are developed
to provide a greater in-depth analysis and understanding of the sector. The study covers
some of the key terms and ratios for the airline industry, such as available seat
kilometers (ASK), revenue passenger kilometers (RPK), average load factor and

4
revenue per revenue passenger mile (RRPM), or yield; which are commonly used in
aviation literature.
Available seat kilometers (ASK) is a basic measure of an airline’s output, since they
represent the number of kilometers that the airline has flown with its available seats,
regardless of whether the seat is filled by a passenger.
Revenue passenger kilometers (RPK) represent the number of kilometers that revenue
passengers fly on the airline. Whereas ASK do not differentiate between whether the
seat is occupied or not, RPK include only seats occupied by revenue passengers in the
calculation.
Load factor is simply the proportion of an airline’s seats that are filled by revenue
passengers. In other words, load factor is a measure of capacity utilization.
Revenue per revenue passenger kilometer (RRPK) represents the average amount that a
passenger pays to fly one kilometer Therefore, to determine the average amount of
revenue received for a paid seat.
Airline-specific ratios and statistics express airline’s operating scope in the aviation
sector. Moreover they highlight airlines’ growth throughout the years by comparing its
available seats kilometers (ASK) and revenue passenger kilometers (RPK).
Simultaneously, average load factor highlights the utility of the growth while passengers
yield (RRPK) notes its efficiency.

5
PART 1: THE GLOBAL AIRLINE INDUSTRY
The first part of the study includes general information about the Airline Industry in the
world, hence; it is consisted of the following subtitles as Introduction to Global Airline
Industry, Key Organizations and Their Roles in Airline Industry, Airline International
Economic Regulations and Liberalization, The Effects of Past Liberalization to Airline
Industry and Major Airlines Worldwide.
1.1. Introduction to Global Airline Industry
Airline industry is developed both in Turkey and worldwide in the previous decades
considerably. Despite the rapid growth in civil aviation recently; air transport activities
have been operated since a much longer time both for military and civilian purposes.
The first civilian flights are made in France while Transatlantic ones are succeeded in
1930 (Petrescu, 2013: 144) when Dieudonné Costes and Maurice Bellonte, French
pilots, flew a Hispano-powered Breguet biplane from Paris to New York.
But the milestone in the history of aviation is known as Chicago Convention which is
the foundation set for today’s global air transportation system. Before the end of World
War II, “Chicago Convention”, an international aviation treaty, is signed by
representatives of 54 nations in the International Convention on Civil Aviation which is
a conference on the future of international air transport held in 1944 (ICAO, 1947). The
mentioned convention makes several fundamental contributions to the conduct of
domestic and, especially, international civil aviation that lead enormous growth over
time. The global airline industry provides a service to almost every country in the world,
and plays an essential role in the creation of a global economy. Airline industry is a
major economic force, in terms of both its own operations and its impacts on related
industries such as aircraft manufacturing and tourism generating a total of 56,6 million
jobs globally (IATA, 2012). At the end of 2014, the air transport industry handled 3,3
billion passengers around the globe with more than 1.000 commercial airlines operating
internationally and about 24.000 commercial aircrafts in service (Vasigh, 2015: 3).
1.2. Key Organizations and Their Roles in Airline Industry
A large number of public or private institutions and organizations play roles in shaping
policies regarding economic, regulatory and technical matters concerning the air

6
transport sector. This section presents brief descriptions of the International Civil
Aviation Organization and the International Air Transport Association, as well as brief
mentions of their contribution to the industry.
1.2.1. International Civil Aviation Organization (I CAO)
The institute is established in 1947 in response to the recommendations of the Chicago
Convention in addition to its world headquarters which is located in Montreal, Canada.
ICAO maintains seven regional headquarters around the globe such as Bangkok, Cairo,
Dakar, Lima, Mexico, Nairobi and Paris. ICAO can be likened to a “United Nations of
Civil Aviation” and, in fact, its official status is that of a specialized agency of the UN.
Its many important functions include the development, approval and updating of
international technical standards and recommended practices for airports and air traffic
control, as well as the preparation and publication of broad regulatory guidelines and of
economic and environmental policy statements regarding international air transport.
Such statements are often expressed in quite broad and unspecific terms. Today, ICAO
has 191 Member Nations (ICAO, 2015), i.e., it includes practically every nation in the
world engaging in aviation activities of any significant level. All members participate in
the ICAO Assembly meetings every three years.
ICAO (1947) preambles the following statements:
• Whereas the future development of international civil aviation can greatly help
to create and preserve friendship and understanding among the nations and
peoples of the world, yet its abuse can become a threat to the general security.
• It is desirable to avoid friction and to promote that cooperation between nations
and peoples upon which the peace of the world depends.
• The undersigned governments having agreed on certain principles and
arrangements in order that international civil aviation may be developed in a safe
and orderly manner. In addition, that the international air transport services may
be established on the basis of equality of opportunity and operated soundly and
economically.
7
1.2.2. International Air Transport Association (IATA)
IATA is the trade association of most of the international airlines in the world, with
headquarters in Geneva, Switzerland, and Montreal, Canada which represents 250
airlines or 84 % of air traffic (IATA, 2015). It is founded in 1945, the year after the
Chicago Convention. The purpose of IATA is to coordinate international airfares during
annual traffic conferences and the organization played a critical role in the development
of international air transportation over more than three decades. However; the
deregulation of USA also EU countries in 1978 and 1999 respectively, IATA (2015)
adopted a dual organizational structure, which is still in existence today. According to
Belobaba (2009: 42); the first structure operates as a trade association offering various
technical, legal and financial services like defining the legal responsibilities of carriers
in relation to passengers and cargo, advising airlines regarding such issues as the
transportation of dangerous goods, condition and costs of airports’ facilities and
organizing airport schedule coordination conferences twice a year while the second
structure still operates as a tariff coordination organization, assisting in the setting of
passenger airfares and cargo rates, commissions for travel agents, etc. including one-
third of the IATA’s members. Tariff coordination is performed during “traffic
conferences” and is based on a “cost plus” formula and all member airlines of IATA
benefit themselves of these services. Cost plus expression in aviation sector here, is a
pricing strategy based on IATA coordinating air transportation costs while the
governments set the profit margin.
The guiding principle of IATA is that fares and rates should not involve intense
competition but it should be as low as possible. With the spread of liberalization and
deregulation in international air transportation the influence of IATA has been steadily
diminishing over the past three decades. However, the organization is still treated in
many countries as a semi-official international body, rather than a trade association.
1.3. Airline International Economic Regulations and Liberalization
Airlines have existed in two very diverse environments. Prior to 1978 in the US and
before 1999 in Europe, airlines operated in a regulated environment in which
governments had full control over where airlines could fly and what rates they could
charge. During the regulated era in the airline industry, firms were protected from

8
intense competition, because governments limited the number of airline companies
flying a particular route and pricing was based largely on a cost-plus formula. Because
of the regulation, carriers earned relatively stable and healthy profits as a result financial
analysis was not of utmost importance to the airlines. Additionally, many airlines
globally were owned and controlled by government, creating further regulation in the
airline industry.
By changing the traditional aviation regulations; the liberalized market environment
changed substantially as airlines were afforded the opportunity to earn greater profits.
On the other hand, the companies were subjected to increased competition, placing
downward pressure on costs and airfares. As a result, in the post-regulation period,
airline industry has become much riskier and even many major airlines have difficulties
to compete and eventually some are forced out of business.
1.4. The Effects of Past Liberalization to Airline Industry
Airlines liberalization changed the market environment considerably leading to several
major aspects such as Economic and Traffic Growth, Bankruptcy and Consolidation and
Emergence of Low-Cost Carriers.
1.4.1. Economic and Traffic Growth
Liberalization has led to substantial economic and traffic growth first in the US
followed by European countries. The positive effects such as the reduced prices and
stimulating traffic growth are mainly due to the increased competition in the aviation
markets. In addition, the increased competitive pressure forces airlines to improve their
productivity and eliminate inefficient carriers out of the market. Contrary to the pre-
liberalization period, finance became extremely important for airline companies to
optimize their network operations and pricing strategy. Consequently; employment
opportunities, trade promotion, better transport, trading and logistics services etc. are
mentioned as the secondary contributions to overall economies, however; these impacts
are not uniform across countries.

9
1.4.2. Bankruptcy and Consolidation
The airline industry has been affected by harsh competition, fuel price volatility, and
global economic recessions in the post-liberalization era. These factors have forced
many major carriers e.g. Japan Airlines into liquidation (Sanchanta, 2010) while other
airline companies have sought bankruptcy protection like Delta Airlines (Perez, 2005).
In this volatile climate; consolidation is suggested to be one of the major routes towards
stability and prosperity of the companies. In contrast to European countries and rest of
the world; US government has eased consolidation and merging processes, where the
names of several major carriers have disappeared, resulting in what are now known as
the “Big Four” airlines: American, United, Delta, and Southwest (Vasigh, 2015: 5). In
recent years, the globalized airline industry has increased, with mergers and takeovers
moving the industry along a path towards consolidation and reducing competition
among the major players.
1.4.3. Emergence of Low-Cost Carriers
According to (IATA, 2006) opposite of the legacy carriers (full service airlines); the
LCCs are the airline companies that squeeze its airfares by limiting its passengers’
services to attract more consumers willing to save money. The emergence of low-cost
carriers has dramatically changed the market and continues to do so, again, the lead is
taken by the US notably. Southwest Airlines marked the most noticeable LCC
expansion, from an intra-Texas airline to the fourth largest domestic carrier with a route
network covering most of the US area (Vasigh, 2015: 5). By 2012, LCCs’ share is 31 %
of the US market (ICAO, 2013). This step is soon followed by the European countries
after the deregulation of internal air services for example according to IAOC (2013);
LCCs currently account for 37 % of the total EU market. But also the other regions have
already caught up as they already have more than half of the market in Southeast Asia.
As an example; Lion Air, an Indonesian airline company, alone had about 550 aircrafts
on order in 2013 (Bland, 2013). Globally, LCCs have taken passengers from legacy
carriers to reach 22 % of all passengers by 2013 (ILO, 2013: 7).
Such rapid expansion has certainly led to suggestions that the Asia-Pacific market may
face some problems previously found in the US and Europe, with increased competition
and idle capacity resulting in financial losses among the LCCs, as well as the legacy

10
carriers, and eventually leading to LCCs’ consolidation. It has also raised questions
about the ability of airport infrastructure to handle such rapidly increasing demand.
1.5. Major Airline Companies Worldwide
In order to have a broader image about global airline industry, a sample of 22 major
airlines worldwide is presented with general information and statistics below. The
mentioned airline companies are the most well known major airlines from the 4
continents; Asia, Europe, Oceania and North America. The companies from South
America and Africa are neglected in the study while they are not mentioned and ranked
as much as the others in the airline journals.
• Aeroflot: The Russian flag carrier and largest airline in Russia is founded in
March 17, 1923. Aeroflot has its hub at Sheremetyevo International Airport. The
airline’s Annual Report (2013) notes around 31,4 million passengers per year,
reaching 293 destinations with 239 aircrafts.
• Air Asia: Air Asia is a Malaysian low-cost airline founded in 1993 with main
hub at Kuala Lumpur International Airport, Malaysia. AirAsia was named the
World's Best Low-Cost airline at the 2014 World Airline Awards for the 6th
consecutive year (Skytrax, 2015). As it is stated in its Annual Report (2013), Air
Asia carries 42,6 million passengers per year and flying to 83 destinations using
158 aircrafts.
• Air Berlin: Air Berlin is Germany's second largest airline after Lufthansa
founded in July 1978 with its main hubs at Berlin-Tegel Airport and Düsseldorf
Airport. Air Berlin’s Annual Report (2013) records 41,5 million passengers per
year, 171 destinations and 140 aircrafts.
• Air Canada: Air Canada is the national flag carrier and largest airline of Canada
founded in April 11, 1936. Its largest hub is at Toronto Pearson International
Airport. Air Canada’s Annual Report (2013) records about 35,8 million
passengers per year to 181 destinations with 193 aircrafts.
• Air France / KLM: Air France is the French flag carrier founded in 7 October,
1933. Its main hub is Paris-Roissy Charles de Gaulle Airport.

11
• KLM is the national airline of the Netherlands founded in October 7, 1919.
KLM's main hub is at Amsterdam Schiphol Airport.
• In May 2004 Air France merged with KLM creating Air France-KLM and due
its Annual Report (2013) they carry together about 77,3 million passengers per
year, flying to 231 destinations with 552 aircrafts.
• Air New Zealand: Air New Zealand is the national airline and flag carrier of
New Zealand founded in 1940 with its main hub based in Auckland International
Airport. According to Air New Zealand’s Annual Report (2013), the airline
carries 8,7 million passengers per year to 48 destination with 104 aircrafts.
• All Nippon Airways (ANA): ANA is the largest airline in Japan founded in
December 27, 1952. Its main international hubs are at Narita International
Airport, Tokyo and Kansai International Airport in Osaka. According to ANA’s
Annual Report (2013), the airline carries about 44,7 million passengers per year
to 81 destinations with 230 aircrafts.
• American Airlines (AA): American Airlines is the national flag carrier founded
in 1930 with its main hub at Dallas/Fort Worth International Airport. According
to AA’s Annual Report (2013), the airline carries 109 million passengers per
year to 339 destinations with 970 aircrafts.
• Cathay Pacific: Cathay Pacific is the flag carrier of Hong Kong, founded in
September 24, 1946. It has the main hub at Chek Lap Kok Airport, Hong Kong.
According to Cathay Pacific’s Annual Report (2013), the airline carries about 30
million passengers per year, flying to 182 destinations with 140 carriers.
• Delta Airlines: Delta is founded in May 30, 1924, USA. Today, Delta operates
an extensive domestic and international network and is the world's largest airline
operating under a single certificate. Delta's main hub is at Hartsfield-Jackson
Atlanta International Airport, Georgia. According to Annual Report of Delta
Airlines (2013), it carries around 165 million passengers per year, reaching 322
destinations with 700 aircrafts.

12
• Emirates: Emirates is the largest airline in the Middle East and is the national
airline of the Emirate of Dubai founded in 1985. Its hub is at Dubai International
Airport, Dubai. As it is stated in the Annual Report of Emirates (2013), the
airline carries around 39,4 million passengers per year, flying to 132 destinations
with 197 aircrafts.
• IAG (British Airways / Iberia): British Airways is the largest airline in the UK
and it is the national airline of the Kingdom founded in March 31, 1974. BA has
its main hub at London Heathrow Airport and operates a second hub at Gatwick
Airport, located near London.
• Iberia is the flag carrier airline of Spain founded in June 28, 1927. It operates an
international network of passenger and cargo services by the bases as Madrid-
Barajas Airport, and El Prat Airport, Barcelona.
• In 2011, British Airways merged with Iberia and according to their Annual
Report (2013); they carry together around 54 million passengers per year to 218
destinations with 431 aircrafts.
• Korean Air: Korean Air is the largest airline in South Korea founded in 1969
with its main hub at Seoul Incheon International Airport. The Annual Report of
Korean Air (2013) notes around 23,6 million passengers per year, 124
destinations and 153 aircrafts in service.
• Lufthansa: Lufthansa is the flag carrier of Germany founded in January 6,
1953. It the largest airline in Europe in terms of passengers carried and the
world's fifth-largest airline in terms of overall passengers carried. The airline's
main hub is at Frankfurt Airport, it also operates a second hub at Munich Franz
Josef Strauss Airport. As it is stated in the Annual Report of Lufthansa (2013),
the airline carries around 104,6 million passengers per year to 274 destinations
with 622 aircrafts.
• Malaysian Airlines: Malaysian Airlines is the flag carrier of Malaysia founded
in October 1, 1972 with its main base at Kuala Lumpur International

13
Airport. Number of passengers and destinations are not stated in the limited
Annual Report of Malaysian Airlines.
• Qantas: Qantas is Australia's oldest and largest airline, founded in November
16, 1920 with major hubs in Sydney and Melbourne. The Annual Report of
Qantas (2013) records about 48,3 million passengers per year to 65 destinations
with 202 aircrafts.
• Ryanair: Ryanair is an Irish low-cost airline founded in 1985 with its primary
operational bases at Dublin and London Stansted Airports. Ryanair is the
world’s largest LCC (CAPA, 2015). According to Ryanair’s Annual Report
(2013), the airline carries 79,3 million passengers per year to 180 destinations
with 305 aircrafts.
• Scandinavian (SAS) Airlines: SAS Airlines (previously Scandinavian Airlines
System) is the flag carrier of Sweden, Norway and Denmark, and the largest
airline in Scandinavia. It is founded in August 1, 1946 with main hubs in
Copenhagen Airport, Oslo Airport and Stockholm Airport. According to SAS
Annual Report (2013), the airline carries 28,1 million passengers per year to 120
destinations with 156 aircrafts.
• Singapore Airlines: Singapore Airlines is the flag carrier of Singapore which
operates from its main hub at Changi Airport founded in January 28,
1972, Singapore. As it is stated in its Annual Report (2013), Singapore Airlines
carries 21,5 million passengers per year flying to 60 destinations with 139
aircrafts.
• South African Airways (SAA): SAA is the national flag carrier and largest
airline of South Africa founded in 1934 with its main hub at OR Tambo
International Airport in Kempton. As it is stated in SAA’s Annual Report 2013,
the airline carries 8,8 million passengers per year to 42 destinations with 61
aircrafts.
• Turkish Airlines: Turkish Airlines is the national carrier of Turkey founded in
May 20, 1933. Its hub is at Atatürk International Airport, Istanbul. The airline

14
successfully operates the world’s most comprehensive network of 105 countries
and has been chosen “Best Airline in Europe 2011, 2012, 2013 and 2014” by
Skytrax. Turkish Airlines’ Annual Report (2013) notes around 48,3 million
passengers per year to 245 destinations with 233 aircrafts.
• United Airlines: United Airlines, commonly referred to as "United", is an
American major airline founded in April 6, 1926 with a main hub at Chicago
O'Hare International Airport. The Annual Report (2013) of United Airlines
records 91,3 million passengers per year, 375 destinations and 693 aircrafts.

15
PART 2: FINANCIAL ANALYSIS AND AIRLINE-SPECIFIC
ANALYSIS
To analyze a company, the financial analysts often focus on the income statement,
balance sheet, and cash flows. In addition, every industry has specific unit measures
which are essential to be arranged and analyzed. In the second part; Financial Analysis
Techniques and Airline Specific Measures and Ratios are presented below.
2.1. Financial Analysis Techniques
Financial statements provide the primary means for managers to communicate about the
financial condition of their organization to outside parties. Managers, investors, lenders,
financial analysts, trade unions and government agencies are among the users of
financial statements. The objective of financial statement analysis is to use historical
accounting data to help in predicting how the firm will be valued in the future, for this
purpose; the following techniques as horizontal, trend, vertical and ratio analyses are
given.
2.1.1. Horizontal Analysis
According to Subramanyam (2008: 28) horizontal analysis is a financial statement
analysis technique indicating the year-to-year change in each financial statement item in
the amounts of corresponding tables. It is used as a dynamic analysis technique
including at least two years. The purpose of horizontal analysis is to determine how
each item changed, why it changed, and whether the change is favorable or unfavorable.
2.1.2. Trend Analysis
Trend analysis is used when the comparison is extended to three or more years. Trends
can be shown in both absolute monetary amounts and percentage form by designating
the first year in the sequence as the base year. Comparing only absolute amounts has
disadvantages because materiality levels differ from company to company or even from
year to year for a given single firm, however; amounts are essential when the materiality
information is of relative importance (Subramanyam, 2008: 30). An item’s materiality is
considered important when its knowledge has an impact on the decision of a reasonably
informed user. Percentage analysis avoids the materiality problems of comparing

16
different size companies by measuring changes in percentages rather than absolute
amounts. Each change is converted to a percentage of the base year.
2.1.3. Vertical Analysis
Horizontal and trend analyses focus on the relationships between the amounts of each
financial item across time. In contrast; vertical analysis, as a static method, concentrates
on the relations between various financial items on a particular financial statement. To
show these relationships, each item on the statement is expressed as a percentage of a
base item that also appears on the statement. On the balance sheet, each item is
expressed as a percentage of total assets or percentage of its group besides on the
income statements; each item is stated as a percentage of net sales. According to
Subramanyam (2008: 31) financial statements prepared in terms of percentages of a
base amount are called as common-size financial statements.
Financial analysts use vertical analysis to gain insight into the relative importance or
magnitude of various items on the financial statements. By using common-size
statements, prepared in a comparative format, analysts can distinguish changes in a
firm’s financial condition and performance from year to year.
2.1.4. Traditional Ratio Analysis
Ratio analysis; a static method, involves studying various relationships between
different items reported in a set of financial statements to evaluate various aspects of a
company’s operating and financial performance such as its liquidity, solvency (financial
structure-leverage), efficiency (activity) and profitability.
The most common used ratios are indicated below in the table.

17
Table 1 The Most Common Used Financial Ratios
Liquidity Ratios Leverage Ratios Activity Ratios Profitability Ratios
Current Ratio Debt to Equity Ratio Total Assets Turnover
Rate
Operating Profit
Margin
Quick Ratio Debt Ratio Accounts Receivable
Turnover Rate Net Profit Margin
Cash Ratio Short-Term Debt to
Total Assets Ratio
Inventory Turnover
Rate Return on Assets
Long-Term Debt to
Total Assets Ratio
Accounts Payable
Turnover Rate Return on Equity
2.1.4.1. Liquidity Ratios
Liquidity ratios are the ratios that measure the ability of a company to meet its short-
term debt obligations, such as accounts payable, notes payable, and other short-term
financial obligations (Berman, 2008: 161).
• Current Ratio
Current ratio is the most common used liquidity rate to evaluate a company’s
ability to meet its short term obligations. It is to just compare the total current
assets and current liabilities. Current ratio is generally expected to be about “2”
but in airline industry around “1” is welcomed due to the industry’s heavy
indebted nature (Morrell, 2012: 62). It is calculated as follows:
Current Ratio = Current Assets / Current Liabilities
Net working capital (NWC) amount calculated as “Current Assets − Current Liabilities”
is always desired to be positive, since if short-term obligations are not met, the company
will face a solvency problem.
Unlike the amount of working capital, which will vary considerably based on the
company’s size, the current ratio provides a standardization of working capital by using
a ratio instead of a monetary format, enabling cross-firm and industry comparisons.
18
• Quick Ratio
Quick Ratio is an indicator of a company’s short-term liquidity to measure a
company’s ability to meet its short-term obligations with its most liquid assets.
Quick assets are normally referred to “Current assets – Inventory” but in air
industry, because inventory amount is negligible due to sector’s structure; quick
assets are calculated by adding cash and cash equivalents, account receivables
and short term investments.
Quick Ratio = Quick Assets / Current Liabilities
• Cash Ratio
Cash ratio is suggested to be the most conservative look at a company’s liquidity
as it just takes the available cash into consideration to cover short term
liabilities. The mentioned rate is calculated as follows:
Cash Ratio = Cash / Current Liabilities
Due to the structure of airline industry, cash ratio is generally expected to be
bigger than the common average which is about “0,2”.
2.1.4.2. Leverage Ratios
The ability of a firm to meet or exceed its total debt obligations is known as “solvency”
or “leverage”. According to Berman (2008: 157) leverage ratios focus on the underlying
capital structure of the company, which ultimately helps to determine the firm’s
financial strength for the future. Debt to Equity Ratio, Debt Ratio, Long Term Debt to
Total Assets and Short Term Debt to Total Assets are the most common used leverage
ratios in the finance literature.
• Debt to Equity Ratio (D/E)
As the classic leverage and long-term risk ratio, the D/E ratio, determines the
proportion of the company’s capital structure that is devoted to either debt
financing or equity financing. The mentioned ratio is calculated as follows:
Debt to Equity Ratio = Total Liabilities / Total Shareholders’ Equity

19
The debt-to-equity structure of a company can also indicate the variability of
future earnings, because more heavily debt-financed companies may incur larger
swings in profitability as a result of variable interest expenses.
While the ideal value of D/E is suggested to be “1”, in the airline industry “a
value bigger than 2” is welcomed because of airlines’ heavy indebted structure
(Morrell, 2012: 61).
• Debt Ratio
Debt ratio or “debt-to-assets ratio”, measures the proportion of debt relative to
the total asset value of the company. Since either liabilities/debt or stockholders’
equity is used to finance assets, the debt ratio ultimately reveals the percentage
of debt in the company’s capital structure. The higher this ratio, the more
leveraged the company and the greater its financial risk.
Debt Ratio = Total Liabilities / Total Assets
In general the ideal value of debt ratio is around “0,5” while in airline industry it
is slightly above “0,7”.
• Long Term Debt to Total Assets Ratio
It shows the percentage of a company’s assets that are financed with loans and
other financial obligations that last over a year. As this ratio is calculated yearly,
decrease in the ratio would denote that the company is doing well, and is less
dependent on debts for their business needs.
Long Term Debt to Total Assets Ratio = Long Term Debt / Total Assets
• Short Term Debt to Total Assets Ratio
This ratio expresses how risky is the company during a specific period of time as
it unveils the debt portion needed to cover current liabilities.
Short Term Debt to Total Assets Ratio = Short Term Debt / Total Assets

20
2.1.4.3. Activity Ratios
Activity ratios indicate how efficient companies have been in managing their working
capital (Berman, 2008: 164). Being a service industry, such ratios are key indicators of
possible areas in which airlines might increase efficiency and productivity.
• Total Assets Turnover Rate
The total asset turnover ratio measures total revenue against the total assets of
the company. Similarly to the return on assets metric, it notes how effectively
the company is able to generate revenue with the assets currently on its balance
sheet.
Total Asset Turnover = Total Revenue / Total Assets
• Accounts Receivable Turnover Rate
This ratio measures the number of times the average balance in accounts
receivable has been converted into cash during the year. The accounts receivable
turnover often is used to assess the effectiveness of a company’s credit terms and
collection policies. The higher the ratio, the more effective the company is in
collecting its receivables.
Accounts Receivable Turnover = Net Credit Sales / Average Accounts
Receivable
• Inventory Turnover Rate
This rate is important for all firms because it is a quick and easy way to
determine which products are selling faster than others, but it plays a particularly
key role for manufacturing companies in assisting them to decide the quantity
and timing of ordering more materials or products.
Inventory Turnover = Cost of Goods Sold / Average Inventory
• Accounts Payable Turnover Rate
Accounts payable turnover ratio measures the average number of times that the
payable account turns over in one year. Higher the ratio, it means that the

21
company is paying of suppliers fast while when the ratio is low, it takes a longer
time for the company to pay of its suppliers.
Accounts Payable Turnover = Purchases on Credit / Average Accounts Payable
2.1.4.4. Profitability Ratios
Profitability ratios help to describe the success of the business by comparing the profits
(or losses) generated against a variety of baselines (Berman, 2008: 151). This allows us
to standardize the profits of different companies, making it easier to compare their
levels of profitability. Operating Profit Margin, Net Profit Margin, Return on Assets and
Return on Equity are the common values to evaluate the profitability.
• Operating Profit Margin
Operating Profit Margin enables managers to determine how much operating
income is generated from every dollar of revenue earned through normal
business operations. The operating profit margin can be particularly useful
because it excludes items such as interest expense and taxes, which largely
reflect the capital structure of the company. By excluding special items from the
income statement in this calculation, the operating profit margin ratio should
tend to remain more stable over time. It is calculated as the following:
Operating Profit Margin = Operating Profit / Total Revenue
• Net Profit Margin
Unlike operating profit margin, the net profit margin takes into consideration all
parts of a company’s financial structure, including taxes, interest, and other non-
operational items, and it standardizes the financial bottom line of the firm. The
profit margin enables million-dollar companies to be compared with billion-
dollar companies, because it shows how much net income is generated for every
dollar of revenue.
Profit Margin = Net Income / Total Revenue

22
• Return on Assets (ROA)
ROA is a quick way to show the investment return that the assets have provided.
A company invests in assets to generate increased profits, and therefore the ROA
rate highlights how efficiently assets are used to generate earnings. Hence; the
calculation of ROA is indicated as follows:
Return on Assets = Net Income / Total Assets
• Return on Equity
ROE measures the company’s performance in terms of the total book value of
stockholders’ equity. The resulting ratio is an indication of how well the
company generates profit from the money invested by its shareholders. ROE is
calculated as the following:
Return on Equity = Net Income / Total Shareholders’ Equity
2.2. Airline-Specific Measures and Ratios
Aviation is a unique industry for which specific measures and ratios are developed to
provide a greater in-depth analysis and understanding of the sector. In the airline
industry, there exist standard measures of passenger traffic and airline output, which are
combined to generate several common measures and ratios for airline performance.
Available Seat Kilometers (ASK) and Revenue Passenger Kilometers (RPK) are the
fundamental measures while Average Load Factor (LF) and Revenue per Revenue
Passenger Kilometers (RRPK), or “yield” are fundamental ratios in the sector (Vasigh,
2015: 240).
The mentioned measures and ratios are presented in the table and explained below
respectively.

23
Table 2 Airline-Specific Ratios
Ratio Calculation
Available Seat Kilometers (ASK) ASK = Number of Seats per Aircraft × Flight
Distance in Kilometers
Revenue Passenger Kilometers (RPK) RPM = Number of Revenue Passengers per
Aircraft × Flight Distance in Kilometers
Load Factor (LF) Load Factor = RPK / ASK
Revenue per Revenue Passenger Kilometer
(RRPK), or “Yield” RRPK = Total Passenger Revenue / RPK
2.2.1. Available Seat Kilometers (ASK)
Available seat kilometers (ASK) are a basic measure of an airline’s output, since they
represent the number of kilometers that the airline has flown with its available seats
regardless of whether the seat is filled by a passenger.
ASK = Number of seats per aircraft × Flight distance in kilometers
2.2.2. Revenue Passenger Kilometers (RPK)
Revenue passenger kilometers (RPK) represent the number of kilometers that revenue
passengers fly on the airline. Whereas ASK do not differentiate between whether the
seat is occupied or not, RPK include only seats occupied by revenue passengers in the
calculation.
RPK = Number of revenue passengers per aircraft × Flight distance in kilometers
2.2.3. Load Factor (LF)
Load factor is simply the proportion of an airline’s seats that are filled by revenue
passengers. In other words, load factor is a measure of capacity utilization.
Load Factor = RPK / ASK
24
2.2.4. Revenue per Revenue Passenger Kilometers (RRPK)
Revenue per revenue passenger kilometer (RRPK) or yield represents the average
amount that a passenger pays to fly one kilometer. Therefore; it is used to determine the
average amount of revenue received for a paid seat.
RRPK = Total Passenger Revenue / RPK

25
PART 3: ANALYZING MAJOR AIRLINE COMPANIES
ACCORDING TO TRADITIONAL AND AIRLINE-SPECIFIC
RATIOS
In the third chapter of the study; the selected major airline companies are analyzed
according to the traditional ratios chosen and airline specific ratios mentioned.
Therefore; aim, scope and limitations are given afterwards list of airlines and ratios are
indicated before the analyses of the companies below.
3.1. Aim, Scope and Limitation
It is aimed to present a quantitative analysis of information reported in financial
statements and annual reports of the selected leading airline companies to evaluate and
to compare their financial performances.
Hence; the companies to be analyzed, additionally, key measures and ratios are chosen
for airline industry in order to assess for consecutive years between 2011 and 2013, the
three years period after global financial crisis. The companies are selected from IATA
and Skytrax ranking lists. The selection of the airline companies here is based on
leadership and variety, to say; the carriers under study are the 22 leading airlines from 4
continents. In addition; the selection covers both legacy and low-cost carriers with
different operating strategies as short-haul flights, medium-haul flights and long-haul
flights.
Although 22 major airline companies are studied to analyze; the following 5 companies
as SAS, United, SAA, AA and Malaysian Airlines are eliminated due to lack of
financial and traffic data needed to perform full examination and comparison equal to
other airlines. The selected 17 major airline companies to analyze are shown in the table
below.

26
Table 3 List of Airlines Under Study
Airlines Nationality Airlines Nationality
1 Aeroflot Russia 10 Emirates UAE
2 Air Asia South Korea 11 IAG UK/Spain
3 Air Berlin Germany 12 Korean Air South Korea
4 Air Canada Canada 13 Lufthansa Germany
5 Air
France/KLM France/Netherlands 14 Qantas Australia
6 Air New Zealand
New Zealand 15 Ryanair Ireland
7 ANA Group Japan 16 Singapore Airlines Singapore
8 Cathay Pacific China 17 Turkish Airlines Turkey
9 Delta Airlines USA
3.2. Traditional and Specific Ratio Analysis for Major Airline Companies
In this section, the mentioned 17 major international airline companies are analyzed by
using traditional financial and airline-specific measures and ratios. Financial ratios
selected are such as Current Ratio, Quick Ratio, D/E Ratio, Debt Ratio, Total Assets
Turnover Rate, Operating Profit Margin, Net Profit Margin, ROA and ROE are used
with Net Working Capital (NWC) Amount to highlight and interpret airlines’ liquidity,
leverage, activity and profitability. On the other hand, cash ratio is neglected due to cash
fluctuation in airline industry from term to term. Short term debt is not indicated
because long term debt is significant; hence it is suggested to be better to use total debts.
Finally, as receivables, inventories are in tiny amounts in the balance sheet while
payables are very huge; only assets turnover rate is used.
In addition to traditional financial ratio analysis; key measures and ratios are used for
the airline industry, such as ASK, RPK, LF and RRPM. Airline-specific measures and
ratios basically give reader a clear image about the airlines’ market share highlighting
its expansion or reduction, utility of airlines’ flights and the yield achieved per flying
passenger.
All the values within the traditional ratio analysis indicated in the tables below are
calculated by the author over the financial tables of airline companies indicated in each
of their annual reports.

27
3.2.1. Ratio and Airline-Specific Analysis for Aeroflot
Table 4 Financial Ratio Analysis for Aeroflot
Table 5 Specific-Airline Ratio Analysis for Aeroflot
Source: Annual Reports of Aeroflot (2011, 2012, 2013)
Aeroflot’s analysis notes a sharp climb in NWC amount from a negative result in 2011
to a significant result of 412,3 M$ in 2013. Liquidity ratios increase and are acceptable
ratios in the airline industry demonstrating airline’s ability to cover its short term
obligations. In addition, total asset turnover shows impressive ratios above 1
highlighting good efficiency. Leverage ratios are all acceptable compared to aviation
ratios’ norms with slight gradual decrease in D/E ratios. Throughout the three years
under study, Aeroflot notes all profitability ratios positive while they are in decline
comparing to 2011 values.
Aeroflot is the fastest growing airline in Europe as its ASK records a massive rise of 82
% through the period under study. Similar to ASK; RPK show a huge increase of 85 %
Aeroflot
Liquidity Ratios
Ratios 2011 2012 2013 NWC (M$) -13,2 86,5 412,3
Current Ratio 0,99 1,04 1,2 Quick Ratio 0,466 0,504 0,801
Leverage Ratios
D/E Ratio 2,642 2,602 2,572 Debt Ratio 0,737 0,74 0,74
Activity Ratios
Total Assets Turnover Rate 1,008 1,303 1,429
Profitability Ratios
Operating Profit Margin 0,072 0,044 0,068 Net Profit Margin 0,091 0,02 0,025 Return on Assets 0,092 0,027 0,036 Return on Equity 0,33 0,093 0,125
Aeroflot
Airlines’ Specific Ratios 2011 2012 2013
Available Seat Kilometers (ASK) (Amount in Million)
60.003,70 95.598,10 109.063,90
Revenue Passenger Kilometers (RPK) (Amount in Million)
46.077,40 74.617,20 85.273,30
Average Load factor (LF) (%) 76,8 78,1 78,2
Revenue per Revenue Passenger Kilometer (RRPK), or Yield in (USD cents)
9,1 9,1 9,1
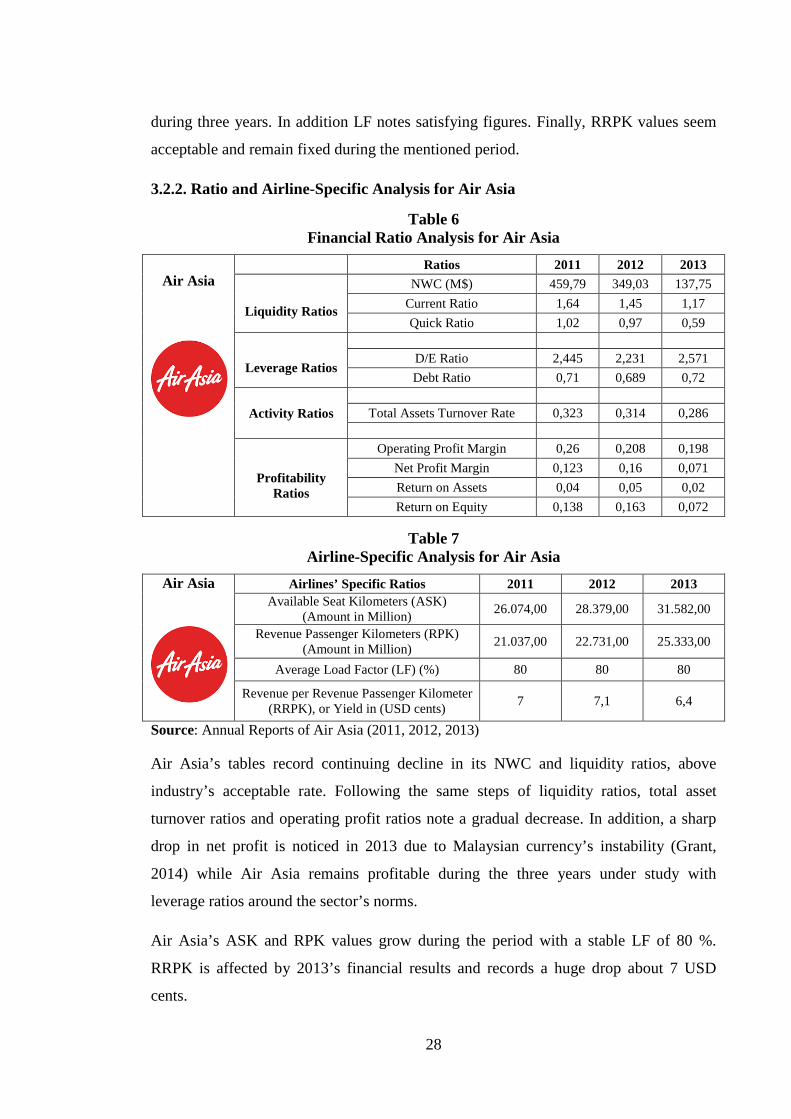
28
during three years. In addition LF notes satisfying figures. Finally, RRPK values seem
acceptable and remain fixed during the mentioned period.
3.2.2. Ratio and Airline-Specific Analysis for Air Asia
Table 6 Financial Ratio Analysis for Air Asia
Table 7 Airline-Specific Analysis for Air Asia
Source: Annual Reports of Air Asia (2011, 2012, 2013)
Air Asia’s tables record continuing decline in its NWC and liquidity ratios, above
industry’s acceptable rate. Following the same steps of liquidity ratios, total asset
turnover ratios and operating profit ratios note a gradual decrease. In addition, a sharp
drop in net profit is noticed in 2013 due to Malaysian currency’s instability (Grant,
2014) while Air Asia remains profitable during the three years under study with
leverage ratios around the sector’s norms.
Air Asia’s ASK and RPK values grow during the period with a stable LF of 80 %.
RRPK is affected by 2013’s financial results and records a huge drop about 7 USD
cents.
Air Asia
Ratios 2011 2012 2013
Liquidity Ratios
NWC (M$) 459,79 349,03 137,75
Current Ratio 1,64 1,45 1,17
Quick Ratio 1,02 0,97 0,59
Leverage Ratios
D/E Ratio 2,445 2,231 2,571
Debt Ratio 0,71 0,689 0,72
Activity Ratios
Total Assets Turnover Rate 0,323 0,314 0,286
Profitability
Ratios
Operating Profit Margin 0,26 0,208 0,198
Net Profit Margin 0,123 0,16 0,071
Return on Assets 0,04 0,05 0,02
Return on Equity 0,138 0,163 0,072
Air Asia
Airlines’ Specific Ratios 2011 2012 2013 Available Seat Kilometers (ASK)
(Amount in Million) 26.074,00 28.379,00 31.582,00
Revenue Passenger Kilometers (RPK) (Amount in Million)
21.037,00 22.731,00 25.333,00
Average Load Factor (LF) (%) 80 80 80
Revenue per Revenue Passenger Kilometer (RRPK), or Yield in (USD cents)
7 7,1 6,4

29
3.2.3. Ratio and Airline-Specific Analysis for Air Berlin
Table 8 Financial Ratio Analysis for Air Berlin
Table 9 Airline-Specific Ratio Analysis for Air Berlin
Source: Annual Reports of Air Berlin (2011, 2012, 2013)
As the largest German operator of connections to North Africa, the political unrest in
Egypt and Tunisia hit the sales of Air Berlin in the period. In addition; at the beginning
of 2011, introduction of the aviation tax in Germany led to grave losses causing
negative values both in operating profit margin and net profit (Annual Report of Air
Berlin of 2011, 2012). Air Berlin’s financial position improved to record a touch above
zero profitability ratios in the following year. However, due to European Market which
has been weak for years, 2013 results came out to be negative for Air Berlin again. The
airline records remarkable total asset turnover rates but suffered of lower liquidity ratios
and extremely high leverage ratios plus Air Berlin’s ROE and D/E ratios are heavily
distorted by miniscule equity achieved. As a result of hard financial situation, Air
Berlin’s fleet decreased throughout the three years from 170 to 140 aircrafts leading to
Air Berlin
Ratios 2011 2012 2013
Liquidity Ratios
NWC (M$) -188,66 -54,72 -407,44
Current Ratio 0,8 0,94 0,65
Quick Ratio 0,45 0,48 0,36
Leverage Ratios
D/E Ratio 19,206 16,032 -11,131
Debt Ratio 0,951 0,941 1,099
Activity Ratios
Total Assets Turnover Rate 1,989 1,944 2,199
Profitability Ratios
Operating Profit Margin -0,058 0,016 -0,056
Net Profit Margin -0,099 0,002 -0,076
Return on Assets -0,198 0,003 -0,167
Return on Equity -3,996 0,052 1,695
Air Berlin
Airlines’ Specific Ratios 2011 2012 2013 Available Seat Kilometers (ASK)
(Amount in Million) 62.160,00 60.300,00 57.250,00
Revenue Passenger Kilometers (RPK) (Amount in Million)
52.140,00 50.380,00 48.570,00
Average Load Factor (LF) (%) 84,8 83,5 83,9 Revenue per Revenue Passenger Kilometer
(RRPK), or Yield in (USD cents) 10,1 10,3 11,3

30
gradual decline in its ASK as well as in its RPK and LF. On the other hand, RRPK
records a noticeable increase in 2013.
3.2.4. Ratio and Airline-Specific Analysis for Air Canada
Table 10 Financial Ratio Analysis foe Air Canada
Table 11 Airline-Specific Ratio Analysis for Air Canada
Source: Annual Reports of Air Canada (2011, 2012, 2013)
Both in 2011 and 2013, Air Canada records a positive NWC amount with liquidity
ratios about the acceptable rate while recording negative NWC in 2012 with the current
ratio being less than 1. Because Air Canada filed for bankruptcy protection following
heavy losses in 2003, the airline underwent restructuring under the Company’s
Creditors Arrangement Act (CCAA) in 2004 (Laurion, 2004). Since then; Air Canada
has accumulated a big deficit in shareholders’ equity. As a result, in 2011 the airline
records negative profit margin and ROA but a positive ROE due to negative net income
and equity. Despite of the positive margins in 2011 and 2012; ROE values still remain
negative due to the negative equity. In addition, leverage ratios notes big indebtedness
with debt ratio exceeding 1 with high negative D/E ratios while Air Canada records a
Air Canada
Ratios 2011 2012 2013
Liquidity Ratios NWC (M$) 174 -258 98
Current Ratio 1,06 0,92 1,03 Quick Ratio 0,89 0,77 0,88
Leverage Ratios
D/E Ratio -3,339 -3,58 -7,443 Debt Ratio 1,416 1,378 1,148
Activity Ratios
Total Assets Turnover Rate 1,205 1,338 1,307
Profitability Ratios
Operating Profit Margin 0,038 0,012 0,05 Net Profit Margin -0,021 0,011 0,001 Return on Assets -0,023 0,014 0,001 Return on Equity 0,061 -0,038 -0,007
Air Canada
Airlines’ Specific Ratios 2011 2012 2013 Available Seat Kilometers (ASK)
(Amount in Million) 87.244,81 89.534,41 91.371,89
Revenue Passenger Kilometers (RPK) (Amount in Million)
106.934,14 108.235,82 110.333,96
Average Load Factor (LF) (%) 82,8 82,7 81,6 Revenue per Revenue Passenger Kilometer
(RRPK), or Yield in (USD cents) 11,9 11,8 11,6

31
positive operating profit margin and noticeable total asset turnover ratios during the
period.
Despite of the financial problems, its traffic statistics recorded a gradual rise in ASK
and RPK throughout the three years with a stable LF and RRPK.
3.2.5. Ratio and Airline-Specific Analysis for Air France / KLM
Table 12 Financial Ratio Analysis for Air France/KLM
Table 13 Airline-Specific Ratio Analysis for Air France/KLM
Source: Annual Reports of Air France/KLM (2011, 2012, 2013)
Air France/KLM operates the leading schedule of long-haul flights on departure from
Europe with a huge market in North-Africa and Middle East. As a consequence of
political instability and wars in mentioned areas besides high fuel prices, Air
France/KLM suffered huge financial losses during the period. As a result; 2012 was a
year of mobilization and transition; the company focused on restructuring of the short
and medium-haul operations. According to the tables, NWC came out to be negative
with a huge shortage through all the years under study leading to low liquidity ratios. In
addition, financial ratio analysis reflect the airlines negative profitability along the three
Air France
KLM
Ratios 2011 2012 2013
Liquidity Ratios NWC (M$) -3.809,9 -2.888,9 -3.881,5
Current Ratio 0,7 0,77 0,73 Quick Ratio 0,53 0,63 0,6
Leverage Ratios
D/E Ratio 3,514 4,568 10,318 Debt Ratio 0,777 0,819 0,91
Activity Ratios
Total Assets Turnover Rate 0,689 0,934 1,004
Profitability Ratios
Operating Profit Margin -0,02 -0,034 -0,009 Net Profit Margin -0,033 -0,046 -0,071 Return on Assets -0,029 -0,043 -0,072 Return on Equity -0,133 -0,241 -0,811
Air France / KLM
Airlines’ Specific Ratios 2011 2012 2013 Available Seat Kilometers (ASK)
(Amount in Million) 267.578,00 268.016,00 272.419,00
Revenue Passenger Kilometers (RPK) (Amount in Million)
219.346,00 223.034,00 228.316,00
Average Load Factor (LF) (%) 82 83,2 83,8 Revenue per Revenue Passenger Kilometer
(RRPK), or Yield in (USD cents) 10,71 10,4 10,5

32
years and escalating to very high leverage ratios specifically D/E which records an
enormous jump in 2013. On the other hand, the airline records a noticeable increase in
total assets turnover during the years under study.
Despite the airline’s poor financial results; Air France/KLM’s transition plan records a
gradual increase in both ASK, RPK and LF with stable average in RRPK.
3.2.6. Ratio and Airline-Specific Analysis for Air New Zealand
Table 14 Financial Ratio Analysis for Air New Zealand
Table 15 Airline-Specific Ratio Analysis for Air New Zealand
Source: Annual Reports of Air New Zealand (2011, 2012, 2013)
According to Air New Zealand’s tables, the airline records negative NWC with liquidity
ratios below the industry’s average in 2011. In the following two years, NWC amounts
are positive and current ratios above one. Air New Zealand’s total asset turnover ranges
between 0,82 and 0,88 with the best ratio recorded in 2011. In addition, the leverage
ratios decrease during the period below industry’s average as a good sign. All over the
Air New
Zealand
Ratios 2011 2012 2013
Liquidity Ratios
NWC (M$) -341 17 148
Current Ratio 0,81 1,01 1,09
Quick Ratio 0,63 0,8 0,089
Leverage Ratios
D/E Ratio 2,329 2,237 2,091
Debt Ratio 0,715 0,691 0,676
Activity Ratios
Total Assets Turnover Rate 0,886 0,821 0,823
Profitability Ratios
Operating Profit Margin 0,025 0,035 0,067
Net Profit Margin 0,018 0,016 0,039
Return on Assets 0,017 0,013 0,032
Return on Equity 0,054 0,042 0,1
Air New
Zealand
Airlines’ Specific Ratios 2011 2012 2013
Available Seat Kilometers (ASK) (Amount in Million)
32.353,00 32.618,00 33.167,00
Revenue Passenger Kilometers (RPK) (Amount in Million)
26.996.00 27.013,00 27.733,00
Average Load Factor (LF) (%) 83,6 82,8 83,4
Revenue per Revenue Passenger Kilometer (RRPK), or Yield in (USD cents)
13,1 13,5 13,6

33
three years, all profitability ratios came out to be positive, with the best results achieved
in 2013.
New Zealand Air traffic statistics show poor performance with tiny increase in ASK and
RPK and the airline maintain its LF and RRPK stable throughout the period.
3.2.7. Ratio and Airline-Specific Analysis for All Nippon Airways
Table 16 Financial Ratio Analysis for All Nippon Airways
Table 17 Airline-Specific Ratio Analysis for All Nippon Airw ays
Source: Annual Reports of ANA (2011, 2012, 2013)
All Nippon Airways records a gradual increase in its NWC as well as in its quite higher
liquidity ratios, with a remarkable rise after 2011’s earthquake. Similar to liquidity
ratios, all profit ratios continue rising, on the other hand; total asset turnover records a
slight decrease in 2013. ANA group notes significant leverage ratios in 2013 with D/E
ratio way below the sector’s average in addition to a noticeable decrease in debt ratio in
the mentioned year.
All Nippon
Airways
Ratios 2011 2012 2013
Liquidity Ratios
NWC (M$) 295,8 1.066,72 2.757,18
Current Ratio 1,05 1,19 1,57
Quick Ratio 0,69 0,88 1,23
Leverage Ratios
D/E Ratio 2,712 2,678 1,82
Debt Ratio 0,727 0,723 0,638
Activity Ratios
Total Assets Turnover Rate 0,704 0,705 0,694
Profitability Ratios
Operating Profit Margin 0,05 0,069 0,07
Net Profit Margin 0,017 0,02 0,029
Return on Assets 0,037 0,051 0,051
Return on Equity 0,047 0,053 0,066
ANA
Airlines’ Specific Ratios 2011 2012 2013 Available Seat Kilometers (ASK)
(Amount in Million) 86.564,00 91.162,00 96.455,00
Revenue Passenger Kilometers (RPK) (Amount in Million)
58.413,00 59.940,00 64.878,00
Average Load Factor (LF) (%) 67,2 65,7 67,5 Revenue per Revenue Passenger Kilometer
(RRPK), or Yield in (USD cents) 15,6 16,2 15,9

34
ANA Group notes a gradual growth in its ASK and RPK values. Throughout the years
under study, LF came out to be around 66,8 % as an average, which is relatively low
comparing to industry’s average. On the other hand, ANA’s RRPK values records one
of the highest results in the airline industry.
3.2.8. Ratio and Airline-Specific Analysis for Cathay Pacific
Table 18 Financial Ratio Analysis for Cathay Pacific
Table 19 Airline-Specific Ratios Analysis for Cathay Pacific
Source: Annual Reports of Cathay Pacific (2011, 2012, 2013)
According to Cathay Pacific’s tables, NWC is negative in 2011 and 2013 with liquidity
ratios below industry’s norms. In 2012, a minor positive working capital is recorded
with a current ratio just a touch above 1. A continuous decrease in total asset turnover is
seen during the three years. In the period under study, all the profitability ratios are
positive with the highest ratios in 2011. Cathay Pacific shows a balanced capital
structure as it keeps its D/E ratio under industry’s average throughout the three years
with debt ratios below 0,70.
Cathay Pacific
Ratios 2011 2012 2013
Liquidity Ratios
NWC (M$) -725 40 -204
Current Ratio 0,85 1,01 0,96
Quick Ratio 0,77 0,89 0,89
Leverage Ratios
D/E Ratio 1,455 1,708 1,723
Debt Ratio 0,592 0,63 0,633
Activity Ratios
Total Assets Turnover Rate 0,718 0,641 0,586
Profitability Ratios
Operating Profit Margin 0,056 0,018 0,037
Net Profit Margin 0,058 0,011 0,029
Return on Assets 0,041 0,007 0,017
Return on Equity 0,102 0,02 0,046
Cathay Pacific
Airlines’ Specific Ratios 2011 2012 2013 Available Seat Kilometers (ASK)
(Amount in Million) 126.340,00 129.595,00 127.215,00
Revenue Passenger Kilometers (RPK) (Amount in Million)
101.577,36 103.805,60 104.570,73
Average Load Factor (LF) (%) 80,4 80,1 82,2
Revenue per Revenue Passenger Kilometer (RRPK), or Yield in (USD cents)
8,5 8,7 8,8

35
Cathay Pacific’s ASK rises in 2012 then drops slightly in 2013. On the other hand, RPK
notes a gradual increase during the years under study. LF records a noticeable growth in
2013 with RRPK gradually increasing during the years under study.
3.2.9. Ratio and Airline-Specific Analysis for Delta Airlines
Table 20 Financial Ratio Analysis for Delta Airlines
Table 21 Airline-Specific Ratio Analysis for Delta Airlines
Source: Annual Reports of Delta Airlines (2011, 2012, 2013)
Delta Airlines’ tables note huge negative NWC throughout the years under study with
liquidity ratios below the ideal value. According to (Perez, 2005); the airline records
profits but still has a negative equity in the first two years from its bankruptcy in 2005,
Delta challenges associated with its merger with Northwest in 2008 and the economic
downturn in 2009. Moreover, because it has a relatively small negative equity value, the
ROE calculation is further distorted in 2013. In the same years Delta Airlines notes poor
debt ratios of value exceeding 1 while in 2013 the airline records better leverage rates.
Delta
Airlines
Ratios 2011 2012 2013
Liquidity Ratios
NWC (M$) -4.972 -4.998 -4.501
Current Ratio 0,61 0,62 0,68
Quick Ratio 0,41 0,38 0,38
Leverage Ratios
D/E Ratio -32,16 -21,906 3,488
Debt Ratio 1,032 1,048 0,777
Activity Ratios
Total Assets Turnover Rate 0,807 0,823 0,723
Profitability Ratios
Operating Profit Margin 0,056 0,059 0,09
Net Profit Margin 0,024 0,028 0,279
Return on Assets 0,02 0,023 0,202
Return on Equity -0,612 -0,473 0,905
Delta Airlines
Airlines’ Specific Ratios 2011 2012 2013 Available Seat Kilometers (ASK)
(Amount in Million) 310.162,10 310.495,17 313.735,69
Revenue Passenger Kilometers (RPK) (Amount in Million)
377.561,50 370.737,74 374.478,74
Average Load Factor (LF) (%) 82,1 83,8 83,8 Revenue per Revenue Passenger Kilometer
(RRPK), or Yield in (USD cents) 15,7 16,5 16,9

36
Although the company recovers from previous years’ negative equity in the last year; its
D/E ratio still remains high with a debt ratio back around industry’s average.
In 2012, Delta Airlines notes a drop in both ASK and RPK to rise back in 2013.
Average LF shows stable results along the years under study with a gradual increase in
RRPK.
3.2.10. Ratio and Airline-Specific Analysis for Emirates
Table 22 Financial Ratio Analysis for Emirates
Table 23 Specific- Airline Ratio Analysis for Emirates
Source: Annual Reports of Emirates (2011, 2012, 2013)
Emirates’ tables show positive NWC through the years under study with a notable
increase in 2013. Besides, liquidity ratios came out to be slightly above industry’s
average. During the period; leverage ratios record a noticeable growth and indebtedness
increase significantly. While total assets turnover rate records a slight and gradual
decrease as an indicator for efficiency, the whole three years of study express positive
profitability ratios despite of the remarkable decline in 2012. Profitability of Emirates
hit the highest results in 2011 since the drop was a result of the ongoing Eurozone crisis
Emirates
Ratios 2011 2012 2013
Liquidity Ratios NWC (M$) 157,22 39,24 988,56
Current Ratio 1,03 1,01 1,12 Quick Ratio 0,83 0,8 0,95
Leverage Ratios
D/E Ratio 2,149 2,621 3,153 Debt Ratio 0,68 0,722 0,757
Activity Ratios
Total Assets Turnover Rate 0,833 0,808 0,771
Profitability Ratios
Operating Profit Margin 0,1 0,029 0,039 Net Profit Margin 0,099 0,024 0,031 Return on Assets 0,084 0,021 0,025 Return on Equity 0,284 0,072 0,104
Emirates
Airlines’ Specific Ratios 2011 2012 2013 Available Seat Kilometers (ASK)
(Amount in Million) 182.757,00 200.687,00 236.645,00
Revenue Passenger Kilometers (RPK) (Amount in Million)
146.205,60 160.549,60 188.606,07
Average Load Factor (LF) (%) 80 80 79,7
Revenue per Revenue Passenger Kilometer (RRPK), or Yield in (USD cents)
7,7 8,3 8,3

37
and sustained geopolitical turmoil in North Africa and Middle-East which form a
considered part of Emirates market.
Emirates’ traffic results show significant growth in both its ASK and RPK throughout
the three years. LF is almost the same during the three years while passenger yield came
out to be higher but unit costs are even lower, partly driven by the strength of capacity
growth (Abbas, 2014).
3.2.11. Ratio and Airline-Specific Analysis for IAG
Table 24 Financial Ratio Analysis for IAG
Table 25 Specific-Airline Ratio Analysis for IAG
Source: Annual Reports of IAG (2011, 2012, 2013)
IAG’s analysis record a noticeable negative NWC during the three years with a huge
deficit in 2012. As a result, the liquidity ratios came out to be below industry’s norms.
In addition, leverage ratios note a rapid growth with rates exceeding industry’s averages
in the last two years. Total asset turnover rate changes slightly along the three years in a
positive manner during the period, meaning the increasing activity. In 2012, IAG has
Int. Airlines
Group
Ratios 2011 2012 2013
Liquidity Ratios
NWC (M$) -885,4 -3.274 -2.735,8
Current Ratio 0,9 0,66 0,72
Quick Ratio 0,5 0,341 0,345
Leverage Ratios
D/E Ratio 2,612 3,109 4,237
Debt Ratio 0,712 0,745 0,797
Activity Ratios
Total Assets Turnover Rate 0,827 0,913 0,894
Profitability Ratios
Operating Profit Margin 0,028 -0,034 0,028
Net Profit Margin 0,036 -0,051 0,008
Return on Assets 0,028 -0,047 0,007
Return on Equity 0,108 -0,194 0,038
Int. Airlines Group
Airlines’ Specific Ratios 2011 2012 2013
Available Seat Kilometers (ASK)
213.193,00 219.172,00 230.573,00
Revenue Passenger Kilometers (RPK) 168.617,00 176.102,00 186.304,00
Average Load Factor (LF) (%) 79,1 80,3 80,8 Revenue per Revenue Passenger Kilometer
(RRPK), or Yield in (USD cents) 10,62 11,52 11,61

38
reported a near € 1 billion loss after British Airways' profits were wiped out by strike-hit
Iberia and the group wrote down the value of its Spanish carrier. Iberia’s operating loss
widened from € 61m in 2011 to € 896m in 2012 (Parker: 2013). Consequently, IAG put
a piece of significant work in 2013 to bounce back from 2012’s loss, with all
profitability ratios positive then.
ASK and RPK record a significant gradual growth during the three years while LF and
RRPK increase slightly throughout the period under study.
3.2.12. Ratio and Airline-Specific Analysis for Korean Air
Table 26 Financial Ratio Analysis for Korean Airlines
Table 27 Airline-Specific Ratio Analysis for Korean Airlines
Source: Annual Reports of Korean Air (2011, 2012, 2013)
The year of 2011 produced slow growth in the air travel industry because of the impact
of Japanese earthquake and subsequent nuclear catastrophe, Eurozone debt issues and
the economic downturn in Korea. As a result; Korean Air’s tables record negative net
profits in the period excepting 2012. Liquidity ratios are quite lower than airlines’
Korean Air
Ratios 2011 2012 2013
Liquidity Ratios NWC (M$) -3.501,6 -2.693,1 -4.376,9
Current Ratio 0,46 0,54 0,4 Quick Ratio 0,35 0,34 0,3
Leverage Ratios
D/E Ratio 8,249 7,655 7,365 Debt Ratio 0,892 0,874 0,88
Activity Ratios
Total Assets Turnover Rate 0,584 0,553 0,517
Profitability Ratios
Operating Profit Margin 0,033 0,025 -0,002 Net Profit Margin -0,026 0,02 -0,032 Return on Assets -0,015 0,011 -0,017 Return on Equity -0,138 0,098 -0,14
Korean Air
Airlines’ Specific Ratios 2011 2012 2013 Available Seat Kilometers (ASK)
(Amount in Million) 84.285,00 88.305,00 89.111,00
Revenue Passenger Kilometers (RPK) (Amount in Million)
64.857,00 68.834,00 68.360,00
Average Load Factor (LF) (%) 76,9 77,9 76,7 Revenue per Revenue Passenger Kilometer
(RRPK), or Yield in (USD cents) 9,7 10,1 9,9

39
industry average due to the huge negative NWC amounts in addition the airline records
extraordinary high leverage ratios above sector’s norms. Hence, the airline faces major
liquidity problem as well as solvency problems.
Contrary to the financial ratios; Korean Air’ ASK and RPK values record a slow growth
in the period while RPK has a slight decline in 2013. Besides; LF increased in 2012 to
drop back again in the last year and RRPK remains almost the same during the years
under study.
3.2.13. Ratio and Airline-Specific Analysis for Lufthansa
Table 28 Financial Ratio Analysis for Lufthansa
Table 29 Airline-Specific Ratio Analysis for Lufthansa
Source: Annual Reports of Lufthansa (2011, 2012, 2013)
According to Lufthansa’s tables, NWC is negative in 2011 and 2013 with a big deficit
in the last year, leading to current ratios less than 1 in the mentioned years. In 2012,
current assets almost matched current liabilities causing a miniscule NWC amount and a
Lufthansa
Ratios 2011 2012 2013
Liquidity Ratios
NWC (M$) -457,64 1 -1.705
Current Ratio 0,97 1 0,88
Quick Ratio 0,81 0,9 0,79
Leverage Ratios
D/E Ratio 2,521 2,442 3,794
Debt Ratio 0,714 0,708 0,79
Activity Ratios
Total Assets Turnover Rate 1,032 1,06 1,032
Profitability Ratios
Operating Profit Margin 0,034 0,033 0,03
Net Profit Margin -0,0005 0,032 0,01
Return on Assets -0,0005 0,035 0,011
Return on Equity -0,002 0,12 0,052
Lufthansa
Airlines’ Specific Ratios 2011 2012 2013 Available Seat Kilometers (ASK)
(Amount in Million) 258.263,00 260.169,00 262.682,00
Revenue Passenger Kilometers (RPK) (Amount in Million)
200.394,00 205.015,00 209.649,00
Average Load Factor (LF) (%) 77,6 78,8 79,8
Revenue per Revenue Passenger Kilometer (RRPK), or Yield in (USD cents)
13,5 13,6 13,5

40
current ratio of 1. Indebtedness of the company rises from 0,70s to 79 % in 2013,
exceeding industry’s average. The airline records an unwavering total asset turnover
ratio during the period, fluctuating marginally above 1. The airline suffered in 2011
because of a small loss resulting in a touch below zero profit margins, ROA and ROE.
On the other hand, profitability ratios are all positive in the following years.
ASK, RPK and LF continue their gradual growth during the years under study while
RRPK remains stable.
3.2.14. Ratio and Airline-Specific Analysis for Qantas
Table 30 Financial Ratio Analysis for Qantas
Table 31 Specific- Airline Ratio Analysis for Qantas
Source: Annual Reports of Qantas (2011, 2012, 2013)
Qantas’s tables report negative NWC in the first two years with a huge deficit in 2012
with liquidity ratios being less than industry’s norm in the mentioned years. Unlike the
previous years, the airline records a positive work in 2013 with a current ratio above 1.
Qantas
Ratios 2011 2012 2013
Liquidity Ratios
NWC (M$) -93 -1.297 82
Current Ratio 0,99 0,84 1,01
Quick Ratio 0,78 0,65 0,7
Leverage Ratios
D/E Ratio 2,393 2,598 2,395
Debt Ratio 0,705 0,722 0,705
Activity Ratios
Total Assets Turnover Rate 0,714 0,742 0,787
Profitability Ratios
Operating Profit Margin 0,043 0,017 0,023
Net Profit Margin 0,017 -0,016 0,0004
Return on Assets 0,012 -0,012 0,0003
Return on Equity 0,041 -0,041 0,001
Qantas
Airlines’ Specific Ratios 2011 2012 2013
Available Seat Kilometers (ASK) (Amount in Million)
133.281,00 139.423,00 139.909,00
Revenue Passenger Kilometers (RPK) (Amount in Million)
106.759,00 111.692,00 110.905,00
Average Load Factor (LF) (%) 80,1 80,1 79,3
Revenue per Revenue Passenger Kilometer (RRPK), or Yield in (USD cents)
10,7 10,6 10,3
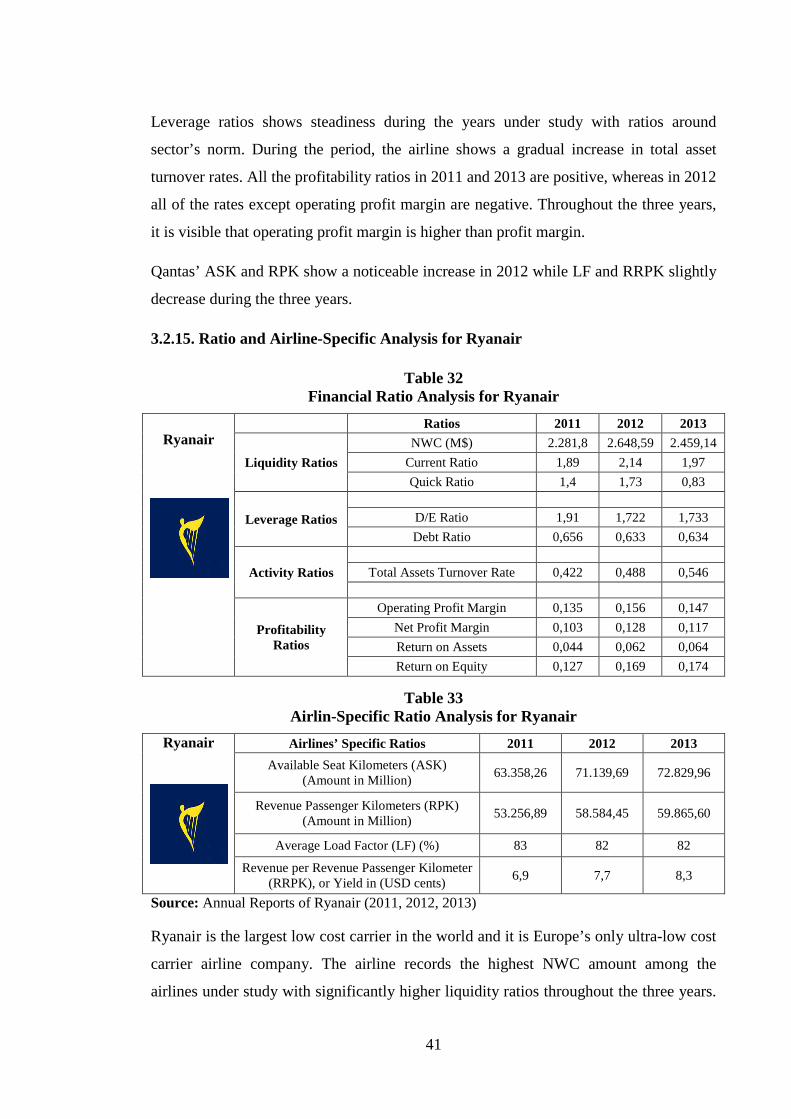
41
Leverage ratios shows steadiness during the years under study with ratios around
sector’s norm. During the period, the airline shows a gradual increase in total asset
turnover rates. All the profitability ratios in 2011 and 2013 are positive, whereas in 2012
all of the rates except operating profit margin are negative. Throughout the three years,
it is visible that operating profit margin is higher than profit margin.
Qantas’ ASK and RPK show a noticeable increase in 2012 while LF and RRPK slightly
decrease during the three years.
3.2.15. Ratio and Airline-Specific Analysis for Ryanair
Table 32 Financial Ratio Analysis for Ryanair
Table 33 Airlin-Specific Ratio Analysis for Ryanair
Source: Annual Reports of Ryanair (2011, 2012, 2013)
Ryanair is the largest low cost carrier in the world and it is Europe’s only ultra-low cost
carrier airline company. The airline records the highest NWC amount among the
airlines under study with significantly higher liquidity ratios throughout the three years.
Ryanair
Ratios 2011 2012 2013
Liquidity Ratios
NWC (M$) 2.281,8 2.648,59 2.459,14
Current Ratio 1,89 2,14 1,97
Quick Ratio 1,4 1,73 0,83
Leverage Ratios
D/E Ratio 1,91 1,722 1,733
Debt Ratio 0,656 0,633 0,634
Activity Ratios
Total Assets Turnover Rate 0,422 0,488 0,546
Profitability Ratios
Operating Profit Margin 0,135 0,156 0,147
Net Profit Margin 0,103 0,128 0,117
Return on Assets 0,044 0,062 0,064
Return on Equity 0,127 0,169 0,174
Ryanair
Airlines’ Specific Ratios 2011 2012 2013
Available Seat Kilometers (ASK) (Amount in Million)
63.358,26 71.139,69 72.829,96
Revenue Passenger Kilometers (RPK) (Amount in Million)
53.256,89 58.584,45 59.865,60
Average Load Factor (LF) (%) 83 82 82
Revenue per Revenue Passenger Kilometer (RRPK), or Yield in (USD cents)
6,9 7,7 8,3

42
Total assets turnover rates note a gradual increase during the period. Profitability ratios
came out to be positive through all the years with high operating profit margin and
profit margin. In addition, Ryanair’s ratios show continuing increase in its ROA and
ROE. Similar to previous ratios, Ryanair notes weighty leverage ratios way below the
industry average.
Airline’s ASK and RPK continue their gradual growth during the years under study
with a stable average load factor. Similar to ASK and RPK; RRPK values show a
continuing growth in yield.
3.2.16. Ratio and Airline-Specific Analysis for Singapore Airlines
Table 34 Financial Ratio Analysis for Singapore Airlines
Table 35 Specific-Airline Ratio Analysis for Singapore Airlines
Source: Annual Reports of Singapore (2011, 2012, 2013)
According to tables of Singapore Airlines; NWC amount decreases significantly by the
end of 2011. On the other hand, liquidity ratios seem reasonable generally but current
ratio is in decline, above the acceptable rate for the sector. Likewise, asset turnover
Singapore Airlines
Ratios 2011 2012 2013
Liquidity Ratios
NWC (M$) 3.546,9 1.940,9 1.952,5
Current Ratio 1,57 1,37 1,35
Quick Ratio 1,25 1,025 0,989
Leverage Ratios
D/E Ratio 0,707 0,687 0,688
Debt Ratio 0,409 0,402 0,402
Activity Ratios
Total Assets Turnover Rate 0,591 0,674 0,673
Profitability Ratios
Operating Profit Margin 0,086 0,019 0,015
Net Profit Margin 0,075 0,023 0,025
Return on Assets 0,045 0,017 0,02
Return on Equity 0,079 0,025 0,029
Singapore Airlines
Airlines’ Specific Ratios 2011 2012 2013 Available Seat Kilometers (ASK)
(Amount in Million) 108.060,20 113.409,70 118.264,40
Revenue Passenger Kilometers (RPK) (Amount in Million)
84.801,30 87.824,00 93.765,60
Average Load Factor (LF) (%) 78,5 77,4 79,3
Revenue per Revenue Passenger Kilometer (RRPK), or Yield in (USD cents)
11,9 11,8 11,4

43
increases as a better sign for efficiency. Net profit margin is bigger than operating
margin in the last two years indicating that non-operating income is significant while
they are positive through the period despite of the reasonable decline due to intensified
competitive landscape, persistently high jet fuel prices and natural disasters e.g. Japan
earthquake. In a heavy debt structure industry like aviation industry; Singapore Airlines
records a noticeably low D/E ratio around 70 %. In addition, debt ratio is about 40 %,
also quite low for the sector, below the acceptable rate.
Singapore Airlines shows gradual growth in ASK, RPK and LF while RPRK decreases
during the period.
3.2.17. Ratio and Airline-Specific Analysis for Turkish Airlines
Table 36 Financial Ratio Analysis for Turkish Airlines
Table 37 Specific-Airline Ratio Analysis for Turkish Airline s
Source: Annual Reports of Turkish Airlines (2011, 2012, 2013)
Turkish Airlines
Ratios 2011 2012 2013
Liquidity Ratios
NWC (M$) 64,62 -364,4 -992,1
Current Ratio 1,03 0,86 0,68
Quick Ratio 0,64 0,59 0,39
Leverage Ratios
D/E Ratio 2,646 2,47 2,648
Debt Ratio 0,726 0,712 0,726
Activity Ratios
Total Assets Turnover Rate 0,72 0,782 0,826
Profitability Ratios
Operating Profit Margin 0,009 0,077 0,066
Net Profit Margin 0,002 0,08 0,036
Return on Assets 0,001 0,062 0,03
Return on Equity 0,004 0,217 0,109
Turkish Airlines
Airlines’ Specific Ratios 2011 2012 2013
Available Seat Kilometers (ASK)
81.193,00 96.124,00 116.433,00
Revenue Passenger Kilometers (RPK) 58.933,00 74.410,00 91.997,00
Average Load factor (LF) (%) 72,6 77,4 79,0 Revenue per Revenue Passenger Kilometer
(RRPK), or Yield in (USD cents) 10,3 10 9,5

44
According to Turkish Airline’s tables, NWC falls down sharply recording negative
results in 2012 and 2013. As a result of working capital drop, liquidity ratios note a
gradual decrease below the ideal rate in 2012-2013. Also the airline records gradual
increase in total assets turnover rate. On the other hand, profitability ratios are all
positive with significant rise in 2012. In addition, the airline shows stability in its
leverage ratios with ratios changing around industry’s norm.
Turkish airline’s traffic statistics highlight its success with a massive rise in its ASK and
RPK during three years. Similarly, the airline notes a noticeable continuing increase in
its average LF. On the other side, the airline records a continuing decrease it its yield
about while they are acceptable values.

45
PART 4: COMPARING MAJOR AIRLINE COMPANIES BY
TRADITIONAL AND AIRLINE-SPECIFIC RATIOS
In the 4th chapter of the study; comparing the performances of the airline companies is
aimed so the results acquired from the analyses such as liquidity, leverage, activity,
profitability also airline specific analysis are compared below.
4.1. Comparing the Airlines by Using Liquidity Ratios
Figure 1: Current Ratio and Quick Ratio (2011)
Figure 2: Current Ratio and Quick Ratio (2012)

46
Figure 3: Current Ratio and Quick Ratio (2013)
As mentioned previously, the goal of liquidity ratios is to determine whether the airline
can meet its short-term financial commitments. In an industry characterized by
substantial volatility, negative or positive but low working capital can primarily be
explained by airlines being highly leveraged which require periodic payments of the
current portion of long-term debt. As a result, ideally an airline wants a current ratio
greater than one, indicating that its current assets can cover its short-term liabilities.
Throughout 2011; Ryanair, Air Asia and Singapore air record remarkable liquidity way
above (1,5). Air Canada, All Nippon Airways (ANA), Turkish Airlines and Emirates
note ratios above 1. The remaining 10 airlines have ratios below (< 1), with Air
France/KLM, Delta Airlines and Korean Air recording worst ratios below (< 0,75). In
2012, liquidity ratios came similar to 2011 as Ryanair, Air Asia and Singapore Air
remain the most liquid airlines and the least liquid airlines are Air France/KLM, Delta
Airlines, and Korean Air in addition to IAG. In the same time; ANA, Aeroflot,
Emirates, Cathay Pasific and Air New Zealand record ratios above (>1). At the end of
2013; Ryanair and Singapore Air maintain their high liquidity with ANA taking Air
Asia’s place. On the other hand, for the third consecutive year Korean Air records the
lowest liquidity ratios. In addition, Aeroflot, Air Asia, Emirates, Air New Zealand Air
Canada, Qantas, Cathay Pacific and Lufthansa show ratios above (>1).

47
4.2. Comparing Airlines by Using Leverage Ratios
Figure 4: Debt to Equity Ratio (2011)
Figure 5: Debt to Equity Ratio (2012)

48
Figure 6: Debt to Equity Ratio (2013)
The heavy debt structure of the airline industry can be seen by comparing debt to equity
ratios of the selected airlines, reflecting the large amount of capital involved in
operating an airline. Note that most carriers have debt to equity ratios greater than one
(>2), indicating that their capital structures are more heavily debt to equity weighted.
Throughout the years under study, Singapore Airlines records debt to equity less than
one, beside Singapore Airlines is the only airline in the sample with more equity than
debt (< 1). The airlines with the most balanced capital structure are Cathay Pacific and
Ryanair, with debt to equity ratios less than two (<2) throughout the three years. At the
other end of the scale are Korean Air and Air France/KLM, with the highest debt to
equity ratios along the three years. As discussed earlier, Delta Airlines and Air Berlin
both show the unusual case of negative equity due to earlier bankruptcy and
accumulated losses. What is even more curious is that Air Berlin has more negative
equity than Delta, even though its ratio appears to be better. This reflects the confusing
nature of the ratio. In other words, that the more negative equity a company has, the less
negative its debt to equity ratio becomes.

49
Figure 7: Debt Ratio (2011)
Figure 8: Debt Ratio (2012)

50
Figure 9: Debt Ratio (2013)
Another debt-based long-term risk metric is the debt ratio, which shows the total portion
of assets financed by debt and is not affected by negative equity. A high debt ratio
indicates that firm has less financial leverage, since there are fewer assets that can be
used to cover the debt. This lack of assets may also raise the cost of debt in the future,
since it can create more uncertainty for the lender about the airline’s ability to make
contractual interest payments. Therefore, from a long-term risk perspective, an airline
with a lower debt ratio is generally less risky than one with a higher debt ratio.
Based on the graph, the riskiest airline in our study is Air Canada, with a debt ratio of
more than (1,40) throughout the three years, and the least risky is Singapore with a debt
ratio of about (0,4) during the same period. It is noticeable that Cathay Pacific and Ryan
air maintain second and third spot respectively throughout the period under study. In
addition, Delta Airlines records debt ratios a touch above 1 during 2011 and 2012 but in
2013 the debt ratio notes a significant drop to (0,77).

51
4.3. Comparing Airlines by Using Activity Ratios
Figure 10: Total Asset Turnover (2011)
Figure 11: Total Asset Turnover (2012)

52
Figure 12: Total Asset Turnover (2013)
The Asset Turnover ratio is an indicator of the efficiency with which a company is
deploying its assets. In other words, it is the amount of revenues generated per dollar of
assets. Throughout the years under study, Air Berlin records unexpected high total asset
turnover ratios due to sharp total assets reduction of 4,5 % as a result of decrease in
property, plant and equipment by 7,7 % prior to 2011. In the following years Air Berlin
reduced its fleet from 170 aircrafts in 2011 to 140 in 2013. Consequently, during the
years under study, Aeroflot, Air Canada and Lufthansa dominate the top three spots
with ratios above 1. On the other hand, the last three spots are dominated by Ryanair,
Korean Air and Air Asia.
It is seen that Ryanair and Air Asia are among the last three spots while they dominate
operating profit margin and profit margin’s top two spot, the answer is that Ryanair and
Air Asia are ultra-low cost carriers.
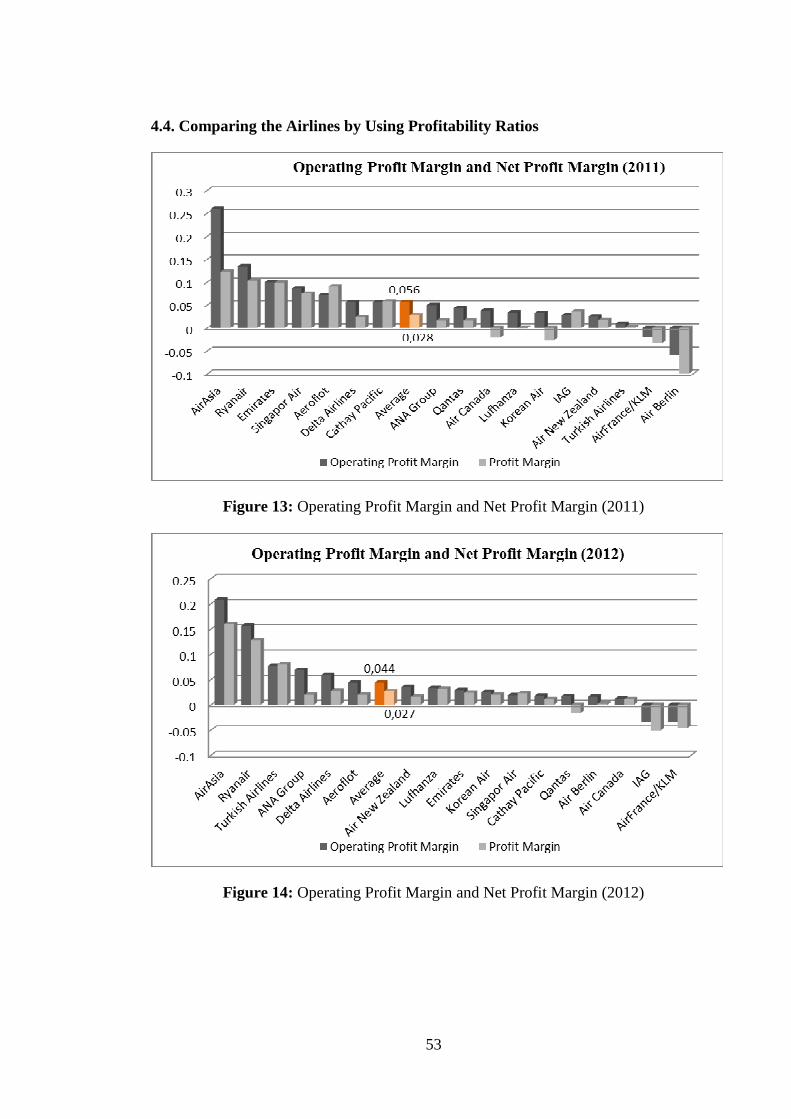
53
4.4. Comparing the Airlines by Using Profitability Ratios
Figure 13: Operating Profit Margin and Net Profit Margin (2011)
Figure 14: Operating Profit Margin and Net Profit Margin (2012)

54
Figure 15: Operating Profit Margin and Net Profit Margin (2013)
Operating profit margin ratio is more accurate than net profit margin in assessment of an
airline’s operations during the period, which helps to remove distortions in the data
from restructuring charges, interest expenses and taxes. While operating margins are
generally higher than profit margins, several airlines are still unable to achieve positive
operating income. This might be a sign that certain business strategies need to be re-
examined.
Throughout the three years, Air Asia and Ryanair’s dominance is clearly seen in
operating profit margin with extraordinary ratios. On the other side, Air France/KLM
records three years of consecutive negative operating profit margin. Besides the best
and worst results, in 2011 Emirates records a noticeable operating profit margin ratio of
0,1 while Air Berlin notes a negative ratio of -0,058. At the end of 2012, Turkish
Airlines shows third highest operating profit margin ratio of 0,077 while IAG has a
negative ratio of -0,034. Finally, in the last year under study; Delta Airlines’ operating
profit margin almost reaches 0,1 and Air Berlin return back to negative operating profit
margin with ratio of -0,056. Similar to operating profit margin, most airlines are
profitable during the three years with best results recorded by Air Asia and Ryanair. In
contrast, Air France/KLM is unprofitable the whole three years. Besides Air
France/KLM, Air Berlin, Korean Air and Air Canada record loss in 2011 while Qantas

55
and IAG record negative net profit margin in 2012. In addition, Air Berlin and Korean
Air are unprofitable in 2013.
Figure 16: Return on Asset (2011)
Figure 17: Return on Asset (2012)

56
Figure 18: Return on Asset (2013)
Other method for analyzing profitability is return on assets (ROA). This metrics can be
particularly important to investors looking to purchase shares in a company, potential
creditors, or potential lessors when evaluating the airline’s ability to cover its costs. To
be noted; when evaluating ROA, it is important to consider the different depreciation
methods and schedules that the airlines implement, because this can strongly influence
the ratio.
Although this graph looks almost identical to profit margins, one major difference is
that in 2011, Ryanair and Air Asia rank fourth and sixth respectively in the sample with
regard to ROA, whereas the airlines took the top spots based on profit margin.
According to ROA in 2011; Aeroflot, Emirates and Singapore Airlines are all able to
use their assets more productively than Ryanair and Air Asia. On the other hand, Air
Berlin records a catastrophic ratio nearly -0,20 in the same year. In 2012; Turkish
Airlines with Ryanair show the best values of 0,062 while Air Asia is the fourth with a
ratio of 0,05. In contrast, Air France/KLM and IAG record the worst ratios of -0,043
and -0,047 respectively. During the last year of this study, Delta Airlines took the first
spot in ROA rate due to its extraordinary high profit in 2013. Ryanair came second
while Air Asia dropped to ninth place with a ratio of 0,02. On the opposite side of the

57
graph, Air France/KLM and Air Berlin note negative ratios of -0,072 and -0,167
respectively.
Figure 19: Return on Equity (2011)
Figure 20: Return om Equity (2012)

58
Figure 21: Return on Equity (2013)
From a shareholders’ perspective, an airline’s ability to convert funds acquired through
equity into profitability is one of the clear signals of the success of the company.
However, because ROE uses book value of equity, it is subjected to certain variances.
For instance, the graph shows that Delta Airlines had a high ROE in 2013, much higher
than Ryanair being the second. However, although Delta Airlines did produce a
profitable year and recorded a strong ROE, the reason why this ratio is so high is mostly
that the airline had a very small amount of book equity and was actually running an
accumulated deficit from losses accrued over the last decade. Moreover; from the graph
of 2011, it appears that Air Canada doing quite well, and this might seem strange given
that the airline had negative income for the last several years and one should therefore
expect to see a negative ROE. However, Air Canada has posted negative equity on its
balance sheet from mounting losses over the years. In other words, because the airline’s
debt exceeds its total assets and it also has negative earnings, its ROE will become
positive when calculated. On a similar note, Delta Airlines has posted profits over the
last several years, but still has a negative book value of equity including 2011 and 2012,
because of its bankruptcy in 2005. As a result, because it has negative ROE values in
the mentioned two years while a huge positive rate in 2013 due to tiny positive equity
amount.

59
In conclusion, LCCs represented by Ryanair and Air Asia have outperformed legacy
carriers in terms of operating and profit margins, partly as a result of lower overhead
costs. In addition, LCCs maintain high liquidity and below aviation-average leverage
ratios throughout the years under study. On the other hand, Air France/KLM and Air
Berlin record the worst profitability and leverage ratios beside insufficient liquidity.
4.5. Comparing the Airlines by Using Airline-Specific Measures and Ratios
Figure 22: Available Seat Kilometer (2011-2012-2013)
Throughout the three years under study, Delta Airlines, Air France/KLM and Lufthansa
(long-haul airlines) dominated the top three spots in available seat kilometer (ASK) and
revenue passenger kilometer (RPK) scales due to longer distance they cover and more
passengers they carry but it is not a complete standardization, since airlines can have the
same amount of ASK, but operate completely differently. For example, a short-haul
airline with multiple frequent flights could end up with a similar ASK to that of a long-

60
haul international airline with less frequent flights, yet the two airlines have quite
different business models (ex: Air New Zealand’s spot).
Figure 23: Revenue Passenger Kilometer (2011-2012-2013)
To be noticed, Delta Airlines occupies the first spot with results way above the second
and third spot. During the mentioned period, most of the airlines record growth in their
(ASK) and (RPK) except Air Berlin. In addition, Emirates, Turkish Airlines and
Aeroflot note a significant growth in (ASK) and (RPK). Moreover, by the end of 2013,
IAG and Emirates are not so behind Lufthansa which occupies the third spot.

61
Figure 24: Average Load Factor (2011-2012-2013)
Airlines’ average load factor varied slightly among the years under study except for
Turkish Airline’s load factor which records a noticeable increase. In addition, airlines
under study record load factors ranging between 77% and 85% excluding All Nippon
Airways which notes relatively low load factor (around 66.8 %) which is low compared
to other airlines.

62
Figure 25: Passenger Yield (2011-2012-2013)
Revenue per revenue passenger kilometer highest two spots is occupied by Delta
Airlines and All Nippon Airways respectively. On the other side, Ryanair and Air Asia
occupy the lowest two spots. In addition, Emirates records low yield throughout the
years under study. Back to airlines’ data, Delta Airlines is the industry leader in yield
due to the highest RASK- CASK (revenue per available seat kilometer – cost per
available seat kilometer) while All Nippon Airways has the highest fares in Asia.
Furthermore, Japanese (local market) have a very high affinity for Japanese carriers that
translates to a strong yield premium over foreign airlines (CAPA, 2014). On the other
hand, Ryanair and Air Asia sit in the last two spots for being ultra-low cost carriers
while Emirates’ passenger yield is low because unit costs are even lower, partly driven
by the strength of capacity growth.
To sum up, in a period full of economic, politic and fuel price turbulence, airline-
specific measures and ratios highlight two important aspects. First, Emirates, Turkish
Airlines, and Aeroflot note a significant rapid growth in their ASK and RPK. Second,
Delta Airlines and All Nippon Airways record a significant yield.

63
RESULTS AND CONCLUSION
The global airline industry provides a service to almost every country in the world, and
has played an essential role in the creation of a global economy. The airline industry
itself is a major economic force, in terms of both its own operations characterized by air
transport and its impact on related industries such as aircraft manufacturing and tourism.
Few other industries possess the amount attention given to airlines by those directly
engaged in its operations, government policy makers, big investors, the news media etc.
The reason behind this care is clear; simply air transport is an industry of billions-users.
Hundreds of commercial airlines are operating around the world nowadays but this
study encompasses 22 major airlines worldwide with long history of aviation and
success such as Air France, KLM, Delta Airlines, Turkish Airlines and Lufthansa etc. in
addition to new emerges achieving major airline status in few decades like Emirates,
Ryanair and Korean Air etc.
To assess major airline’s after crisis period performance, traditional ratio and airline-
specific analysis are performed on 17 out of 22 to evaluate companies’ financial
position and market success. This study also addresses challenges facing the airlines and
the impact of past events’ results seen till today. More specifically, throughout the study
some operating and external factors are fluctuating airlines’ earnings from high profits
to severe losses during short periods of time. Also it is noticeable that past losses and
occasionally bankruptcies have an effect on some major airlines till today such as
negative or tiny equities which distort financial analysis like return on equity and debt to
equity ratios. In addition, LCCs’ came up to be highly profitable throughout the years
under study with rapidly growing market share. As a result the biggest companies in
airline industry (Legacy Carriers) are restructuring their operation strategies through
balancing their long-haul, medium-haul and short-haul flights in order to compete with
LCCs and limit their expansion. Finally, the heavy debt structure is noticed of the airline
industry with debt to equity ratio average around 2.45 throughout the years under study.
The reason behind high indebtedness is the high competition in airlines industry due to
emergence of low cost carriers and continuing expanding of the airlines (ASK and
RPK) throughout the three years despite losses incurred in order to increase or retain its
market share.

64
Throughout the three years under study, Ryanair dominates the liquidity first spot way
above other airlines with current ratios around 2 while at the end of the scale settles
Korean Air with current ratios bout 0,45. In addition; Air Asia, ANA and Singapore
Airlines record ratios above the industry norm. The average current ratio of the 17
companies during 3 years came out to be 1,02.
Leverage ratios average along the three years note debt to equity ratio of 2,5 with Air
Berlin, Korean Air, Air Canada and Delta Airlines recording distorted high and negative
ratios. The rest of airlines record ratios fluctuating around the industry’s norm about 2,4.
Finally, the only exception is Singapore Air and Cathay Pacific which note ratios below
1. In addition, debt ratio average during the three years under study came out to be
around 0,7. Most of the airlines note ratios below 1 throughout the three years except
Air Canada; in contrast Singapore Airlines records noticeable lower debt ratios below
0,4.
Air Berlin records extraordinary total asset turnover ratios way above the rest of the
airlines during the three years under study due to its assets’ continuing decrease. The
three year’s average notes a rate around 0,75 with highest ratios achieved by Air
Canada, Lufthansa and Aeroflot. On the other hand, Ryanair and Air Asia occupy the
last spots due to their Low Cost Carrier nature.
Operating profit margin and net profit margin show Low Cost Carriers’ domination
along the three years after crisis with relatively high ratios. Air Asia came out to be the
most profitable one between the airlines under study with ratios around 0,2; on the other
hand, Air France/KLM records three consecutive years of loss. In 2013, Delta Airlines
records extraordinary net profit margin with a rate of 0,28 while Emirates records a
significant rate in 2011 and Turkish Airlines in 2012.
Airline-specific measures and ratios note legacy carriers’ dominance in ASK and RPK
represented by Delta Airlines, Lufthansa and Air France/ KLM followed by Emirates
and IAG. It is also noticeable that the airlines such as Aeroflot, Emirates and Turkish
Airlines have significant increases in their ASK and RPK values. In addition, the
average load factor mostly ranges between 77 % and 85 % with best utility recorded by
Air Berlin and the worst by ANA. Finally, Delta Airlines and ANA note the highest

65
yield in the study way above the 11cents (USD) average while the low cost carriers
justified their name with the lowest yields.
In addition, comparison based on ratio and airline-specific analysis states the following;
LCCs put a better financial performance than legacy carriers, recording higher
profitability and lower leverage throughout after crisis period as Ryanair and Air Asia
outperformed the rest of the airlines under study.
Regarding airline-specific analysis, legacy carriers operating long-haul flights still
dominate the top three spots in available seat kilometer (ASK) and revenue passenger
kilometer (RPK) scales as Delta Airlines came first followed by Lufthansa and Air
France/KLM respectively.
Further than airlines’ traditional ratio and airline-specific analysis and comparison, this
study deduct that no formulated relation can be standardized between the two analysis
since; Available Seat Kilometer (ASK) and Revenue Passenger Kilometer (RPK) give
an image about airlines’ operations and sizes therefore their market share. On the other
hand, companies’ operation scope does not always reflect financial success as it
happened in our study.
While the Load Factor provides an understanding of the airline’s operation, it is not
useful in determining the company’s profitability, since it omits two critical factors as
revenue and cost. The Load Factor ratio highlights whether seats are full, but high load
factors alone do not indicate profitability. Furthermore, Load Factor can easily give a
misleading impression of an airline’s financial performance as it is possible to achieve a
high load factor percent simply by lowering fares.
Revenue per revenue passenger kilometers (RRPK) or passenger yield is not just
affected by financial results as we imagine, we note from our study that All Nippon
Airways’ high yield was a result of Japanese affinity to local airlines.
In conclusion, combining both financial and airline-specific ratios indicate a significant
image about airlines’ international position and success.
For further studies, it is recommended to focus on interest expense due to airline
industry’s heavy in debt structure as it can give a significant future risk assessment. In

66
addition; it can be useful to analyze companies’ stock market ratios, in order to evaluate
a market and guide investors. Moreover; as the traditional ratio analyses are static ones
presenting past and present performances, it is better to study by longer period to
evaluate financial performances of the companies.

67
REFERENCES
Books
ALTMAN, E. (1993) Corporate Financial Distress and Bankruptcy: A Complete Guide to Predicting and Avoiding Distress and Profiting from Bankruptcy, New York: Wiley & Sons.
BELOBABA, P., Odoni, A. and Barnhart, C (2009). The Global Airline Industry. 2009, John Wiley & Sons, Ltd
BERMAN K., Knight J. and Case J. (2008). Financial Intelligence for HR Professionals: What You Really Need to Know About the Numbers Paperback – March 25, 2008 by Karen Berman, Joe Knight, John Case (Contributor)
DOGANIS, R. (Oct 13, 2005) The Airline Business – second addition published 2006 by Routledge ,270 Madison Avenue, New York, NY 10016
MORRELL P. (2012). Airline Finance Third Edition by Peter S. Morrell, Air Transport Economics and Planning, UK
PETRESCU, V. and Petrescu, I. (2013). The aviation history, page: 144. Scientific Reviewer: Dr. Veturia Chiroiu
ROSS, S., Westerfield, R. W., and Jordan, B. D. (2014) Essentials of Corporate Finance, 8th Ed. New York: McGraw-Hill Irwin
SUBRAMANYAM R and Wild J (2008). Financial Statement Analysis Hardcover – May 19, 2008 by K. R. Subramanyam , John Wild
VASIGH, B, Fleming K. and Humphreys B. (2015). Foundations of Airline Finance: Methodology and Practice.
Internet Sources
ABBAS, W. (2014) ME Airlines Earnings per Passenger? DH 33. Emirates 24/7 Journal. Available online at: http://www.emirates247.com/business/me-airlines-earnings-per-passenger-dh33-2014-06-03-1.551263
ATAG – Air Transport Action Group (2010). Air Transport Provides Jobs and Sustainable Economic Growth (2010). Available online at: http://www.atag.org/our-news/press-releases/50.html?tmpl=pressrelease
BENDER, A. (2011) “American Airlines’ Bankruptcy: Who Loses?” Forbes, November 29. Available online at: www.forbes.com/sites/andrewbender/2011/-11/29/american-airlines-bankruptcy-who-loses

68
BLAND, B. (2013). Indonesian Demand for Flights Still Sky High. Financial Times, Available At: www.ft.com/cms/s/0/012b964e-4ace-11e3-ac3d-00144feabdc0-.html?siteedition=uk#axzz36nVY2jMH
CAPA, (2014). All Nippon Airways SWOT: a secure base with room for improvement, butno room for complacency. Centre for Aviation. Available online at: http://centreforaviation.com/analysis/all-nippon-airways-swot-a-secure-base-with-room-for-improvement-but-no-room-for-complacency-179190
GRANT, J. (2014). Crisis-hit Malaysian Airlines Used to Battling on Financial Front. Financial Times. Available online at: http://www.ft.com/intl/cms/s/0/7f24c656-b4dc-11e3-9166-00144feabdc0.html#axzz3cJvGq0RX
HARGREAVES, S. (2012) “Airlines Seek to Slash Fuel Costs,” CNN Money, June 1. Available Online at: http://money.cnn.com/2012/06/01/news/economy/airlines-fuel/
IATA – International Air Transport Association (2012) The Director General’s message (2012) Available online at: http://www.iata.org/about/documents/annual-review-2012.pdf
ICAO, (1944) Chicago Convention; original version signed at Chicago on 7 December 1994. Available online at: http://www.icao.int/publications/Documents/7300_orig.pdf
IATA, (2015) IATA: Facts and Figures. Available online at: http://www.iata.org/about/Pages/index.aspx
ICAO, (2006) International Civil Aviation Organization (2006) Convention on International Civil Organization, Ninth edition, 2006. (Doc 7300/9). Available online at: http://www.icao.int/publications/pages/doc7300.aspx
ILO, (2013) International Labour Organization (2013), Civil aviation and its changing world of work, Page: 7, Available online at: http://www.ilo.org/wcmsp5/groups/public/@ed_dialogue/@sector/documents/meetingdocument/wcms_201282.pdf
JACOBS, K. (2013). Delta to Restart Dividend, Launch Buyback to Return Cash. Reuters. Available online at:http://uk.reuters.com/article/2013/05/08/uk-delta--dividend-idUKBRE9470XG20130508
PARKER, A. (2013). IAG sees 997 million euro charge after Iberia charge. Financial Times Journal, Available online at: http://www.ft.com/intl/cms/s/0/5e4985c2-8178-11e2-ae78-00144feabdc0.html#axzz3c4gcAsUK
PEREZ, E. and Carey, S. (2005) Delta, Northwest See Bankruptcy as Key to Revival. Wall Street Journal, Available oline at: http://www.wsj.com/articles/SB112671083630940483

69
Ryanair, (2010) Ryanair’s Full Year Profit Rises 204% to €319m; Fares Fall 13% as Traffic Grows 14% to 67m Passengers; Ryanair to Pay Dividend of €500m in October. Available online at: http://corporate.ryanair.com/docs/corp/investor/-2010/q4_2010_doc.pdf
SANCHANTA, M. and Takahashi, Y. (2010). JAL Bankruptcy Shakes Up Japan. Wall Street Journal. Available online at: http://www.wsj.com/articles/SB10001424052748703837004575012323580338724
SHANE, J.N. (2005) Air Transport Liberalization: Ideal and Ordeal, Second Annual Assad Kotaite Lecture, Royal Aeronautical Society (Montreal Branch), US Dept. Transportation, Office of Public Affairs, Washington, DC, December 9, Available online at: www.dot.gov/affairs/briefing.htm.
SKYTRAX – World Airline Awards (2015). The World’s Best Airlines in 2013. Available online at: http://www.worldairlineawards.com/Awards/airline_award_winners_2013.html
TYLER, T. (2013) “Small Boost to Airline Profitability: Industry Profit Margin Improves to1.6%,” IATA Press Release No. 16, March 20. Available online at: www.iata.org/pressroom/pr/Pages/2013-03-20-01.aspx
Annual Reports
Annual Reports of Singapore Air (2011, 2012, 2013) http://www.singaporeair.com/jsp/cms/en_UK/global_header/annualreport.jsp
Annual Reports of Aeroflot (2011, 2012, 2013) https://www.aeroflot.ru/cms/en/reports_item/497
Annual Reports of Turkish Airlines (2011, 2012, 2013) http://investor.turkishairlines.com/en/financial-operational/annual-reports/1/2013
Annual Reports of Ryanair (2011, 2012, 2013) http://investor.ryanair.com/results/
Annual Reports of IAG (2011, 2012, 2013) http://www.es.iairgroup.com/phoenix.zhtml?c=240949&p=irol-reportsannual
Annual Reports of Emirates (2011, 2012, 2013) http://www.emirates.com/english/about/annual-reports.aspx
Annual Reports of Air Canada (2011, 2012, 2013) http://www.aircanada.com/en/about/investor/reports.html
Annual Reports of Qantas (2011, 2012, 2013) http://www.qantas.com.au/travel/airlines/investors-annual-reports/global/en

70
Annual Reports of Lufthansa (2011, 2012, 2013) http://investor-relations.lufthansagroup.com/en/finanzberichte/annual-report/2014.html
Annual Reports of Air France / KLM (2011, 2012, 2013) http://www.airfranceklm.com/en/search?keys=annual+report
Annual Reports of Delta Airlines (2011, 2012, 2013) http://ir.delta.com/stock-and-financial/sec-filings/default.aspx
Annual Reports of Cathay Pacific (2011, 2012, 2013) http://www.cathaypacific.com/cx/en_HK/about-us/investor-relations/interim-annual-reports.html
Annual Reports of Korean Air (2011, 2012, 2013) https://www.koreanair.com/global/en/about/economic-responsibility-investor-relations.html#_
Annual Reports of Air New Zealand (2011, 2012, 2013) http://www.airnewzealand.co.nz/previous-reports
Annual Reports of Air Asia (2011, 2012, 2013) http://www.airasia.com/my/en/about-us/ir-annual-reports.page
Annual Reports of All Nippon Airways (2011, 2012, 2013) http://www.anahd.co.jp/en/investors/irdata/annual/
Annual Reports of Air Berlin (2011, 2012, 2013) http://ir.airberlin.com/en/ir/financial-reports/interim-and-annual-reports/2015
Annual Report of SAS (2013) http://www.sasgroup.net/en/category/investor-relations/financial-reports/annual-reports/
Annual Report of South African Airlines (2013) http://www.flysaa.com/us/en/Documents/Financials/Final_Annual_Report_-_25_Feb_2014.pdf
Annual Report of United Airlines (2013) http://ir.united.com/phoenix.zhtml?c=83680&p=irol-reportsannual
Annual Report of American Airlines (2013) http://phx.corporate-ir.net/phoenix.zhtml?c=117098&p=irol-reportsannual
Annual Report of Malaysia Airlines (2013)http://phx.corporate-ir.net/phoenix.zhtml?c=117098&p=irol-reportsannual

71
APPENDICES
Appendix 1:
Quick Assets Issue:
Due to current assets’ tiny inventory in airline industry, quick assets cannot be
calculated simply by subtracting inventories. In addition to inventories, the Airlines
should also exclude deferred income taxes, prepaid expenses, and other current assets
such as landing slots and airport gate usage rights etc. In other words, it would be more
accurate to calculate quick assets as follows:
Quick Assets = Cash and Cash Equivalents + Short Term Investments + Accounts
Receivable

72
Appendix 2:
Two important airline-specific metrics that standardize revenues and costs in terms of
seat kilometers are Revenue per Available Seat Kilometer (RASK) and Cost per
Available Seat Kilometer (CASK). These two metrics do include non-passenger
revenue, such as that from the carriage of freight.
• RASK is used to compare the efficiency of airlines. It is obtained by dividing
operating revenue by available seat kilometers (ASK). Generally, the higher the
RASK, the more profitable is the airline. Revenue is represented in cents and is
not solely limited to ticket sales.
Revenue per Available Seat Kilometers = Total Operating Revenue / ASK
• CASK is also used to compare the efficiency of various airlines. It is obtained by
dividing the operating expenses of an airline by available seat kilometers (ASK).
Generally, the lower the CASK, the more profitable and efficient the airline. On
the other hand, many airlines exclude fuel costs from operating expenses,
making the CASK an unreliable metric.
Cost per Available Seat Kilometers = Total Operating Expenses / ASK

73
Appendix 3:
Affinity definition:
Affinity means liking or being attracted to something or someone. In other words it’s a
process of favoring based on different factors. In the study, affinity is based on
nationality as it happened in the case of All Nippon Airways, Japan.

74
CARRICULUM VITAE
Hatem Yaghi was born in Moscow-Russia in 1987. He graduated from National
American School, Zahleh-Lebanon. He completed his bachelor degree in Accounting
and Finance at Hariri Canadian University, Beirut-Lebanon. Currently he is doing his
Masters in Finance at Sakarya University.