Airline response to changing economics and policy
12
1 Airline Response to Changing Economics and Policy John Ferguson; Karla Hoffman; Lance Sherry; George Donohue; Abdul Qadar Kara Center for Air Transportation Systems Research, George Mason University, Fairfax, VA Abstract Industry strategists, government regulators, and the media have focused on addressing concerns over the performance of the air transportation system with respect to delays. One of the strategies proposed has been to limit the scheduled operations at an airport to a-priori feasible capacity limits. This approach has been criticized on the basis that it would reduce the number of markets served and increase airfares. This paper describes a comparison of the behavior of the air transportation system (e.g. markets served, airfares, delays, load factors, aircraft size) during the recent run-up in fuel prices at capacity-limited New York airports and non-slot controlled San Francisco and Philadelphia airports. The results indicate: i. Airfares change show a positive relationship to to changes in fuel prices ii. Flights per day and Markets served show a positive relationship to changes in gross domestic product iii. Flights per day and Markets served show a positive relationship to changes in airport capacity limits iv. Delays and Cancellations change in proportion to Flights per day and Markets served The implications of these results are discussed in this paper. Keywords: Economic analysis, performance metrics, longitudinal analysis, airport delays, market analysis, metroplex. INTRODUCTION Nextgen plans to prepare the United States air transportation system for higher levels of air transportation demand than previously seen. NextGen will improve operations, by enabling aircraft to get into and out of the airport faster, while making better use of available airspace [1]. Thus Nextgen plans on using improved technology to handle greater air transportation demand and reduce the delays at the same time. However it is unlikely that increases in effective capacity will be sufficient to meet demand [2]. Researchers are applying more holistic approaches to the feedback control of the air transportation system [2]. Many of these approaches rely on an understanding of airline responses to changes in economics and policy, these responses include changes to their schedule, fleet and airfares. Industry strategists, government regulators, and the media have focused on addressing concerns over the performance of the air transportation system with respect to delays. One of the strategies proposed has been to limit the scheduled operations at an airport to a-priori feasible capacity limits. This approach has been criticized on the basis that it would reduce the number of markets served and increase airfares. Even modest changes in airline schedules in airports already operating at physical capacity can result in greater congestion throughout the air transportation network [3]. In 2007 and 2008, passengers flying domestic routes in the U.S. experienced nearly 300 million hours annually of passenger trip delays [4]. Previous studies have quantified a $41 billion impact to the US Economy from passenger delay, but there has been less work that captures the direct costs to the airlines themselves and examines the behavior of the airlines when those costs change significantly [5] [6] [7]. Previous analysis has shown that airline behavior changes with changes in fuel prices [8]. This analysis examines the New York airports (Newark Liberty, New York John F. Kennedy, and LaGuardia), Philadelphia’s airport (Philadelphia International), and the San Francisco airports (San Francisco International, San Jose, and Oakland) from January 2005 to December 2009 for trends in
Transcript of Airline response to changing economics and policy
1
Airline Response to Changing Economics and Policy
John Ferguson; Karla Hoffman; Lance Sherry; George Donohue; Abdul Qadar Kara
Center for Air Transportation Systems Research, George Mason University, Fairfax, VA
Abstract
Industry strategists, government regulators,
and the media have focused on addressing concerns
over the performance of the air transportation
system with respect to delays. One of the strategies
proposed has been to limit the scheduled operations
at an airport to a-priori feasible capacity limits. This
approach has been criticized on the basis that it
would reduce the number of markets served and
increase airfares.
This paper describes a comparison of the
behavior of the air transportation system (e.g.
markets served, airfares, delays, load factors,
aircraft size) during the recent run-up in fuel prices
at capacity-limited New York airports and non-slot
controlled San Francisco and Philadelphia airports.
The results indicate:
i. Airfares change show a positive
relationship to to changes in fuel prices
ii. Flights per day and Markets served show a
positive relationship to changes in gross
domestic product
iii. Flights per day and Markets served show a
positive relationship to changes in airport
capacity limits
iv. Delays and Cancellations change in
proportion to Flights per day and Markets
served
The implications of these results are discussed
in this paper.
Keywords: Economic analysis, performance
metrics, longitudinal analysis, airport delays,
market analysis, metroplex.
INTRODUCTION
Nextgen plans to prepare the United States air
transportation system for higher levels of air
transportation demand than previously seen.
NextGen will improve operations, by enabling
aircraft to get into and out of the airport faster,
while making better use of available airspace [1].
Thus Nextgen plans on using improved technology
to handle greater air transportation demand and
reduce the delays at the same time. However it is
unlikely that increases in effective capacity will be
sufficient to meet demand [2]. Researchers are
applying more holistic approaches to the feedback
control of the air transportation system [2]. Many
of these approaches rely on an understanding of
airline responses to changes in economics and
policy, these responses include changes to their
schedule, fleet and airfares.
Industry strategists, government regulators,
and the media have focused on addressing concerns
over the performance of the air transportation
system with respect to delays. One of the strategies
proposed has been to limit the scheduled operations
at an airport to a-priori feasible capacity limits. This
approach has been criticized on the basis that it
would reduce the number of markets served and
increase airfares.
Even modest changes in airline schedules in
airports already operating at physical capacity can
result in greater congestion throughout the air
transportation network [3]. In 2007 and 2008,
passengers flying domestic routes in the U.S.
experienced nearly 300 million hours annually of
passenger trip delays [4]. Previous studies have
quantified a $41 billion impact to the US Economy
from passenger delay, but there has been less work
that captures the direct costs to the airlines
themselves and examines the behavior of the
airlines when those costs change significantly [5]
[6] [7].
Previous analysis has shown that airline
behavior changes with changes in fuel prices [8].
This analysis examines the New York airports
(Newark Liberty, New York John F. Kennedy, and
LaGuardia), Philadelphia’s airport (Philadelphia
International), and the San Francisco airports (San
Francisco International, San Jose, and Oakland)
from January 2005 to December 2009 for trends in

2
airline behavior and the impacts of this behavior on
airport congestion and profitability. We refer to the
collection of airports in a region as a “Metroplex”.
The two Metropolitan regions studied in this report
are similar in that each has at least one airport that
serves as a hub for a major carrier, has significant
shuttle traffic as well as cross-continental and
international traffic. The New York airports have
capacity limits applied on their hourly operations
while the San Francisco airports are not.
The New York airports are studied since they
are responsible for 12% of total national delays it is
the only region in the national network where all
three major airports are slot controlled and this
region has no ability to expand runway space at the
existing airports [9]. During the summer of 2007 at
LaGuardia, the average delay was over 70 minutes
[10].
This study expands on prior efforts to analyze
the behavior of airlines at congested airports [8]. It
compares the performance at the New York airports
to the performance at the Philadelphia and San
Francisco airports from 2005 through 2009. During
this time period, there were significant fluctuations
in fuel prices and in the overall economic condition
of the country. In addition, tighter regulations on
the scheduling of flights at the three New York
airports were imposed.
The results indicate that capacity limited
airports yielded reduced congestion (e.g. less
delayed and cancelled flights) through reductions in
schedules and de-peaking schedules (see table 1).
There was no significant change in markets
serviced. While airfares were impacted by changes
in fuel prices, they did not significantly increase at
New York airports after capacity limits were
applied.
San Francisco and Philadelphia airports
reduced schedules as a result of bad economic
conditions. These airports also reduced congestion
through the reduction in schedules. Our overall
conclusions are shown in Table 1.
Annual Changes Observations
Caps Economy Fuel Prices Airfare Schedule Congestion Profit
05-06 Yes Up Up Up No ∆ Up Down
05-06 No Up Up Up Up Up Down
06-07 Yes Up No ∆ No ∆ No ∆ Up Down
06-07 No Up No ∆ No ∆ Up Up No ∆
07-08 Yes Constant Up Up No ∆ No ∆ Down
07-08 No Constant Up Up Down Down Down
08-09 Reduced Down Down Down 2xDown 2xDown Up
08-09 No Down Down Down Down Down Up
Table 1. Summary of Economic and Policy
Changes on Airline Behavior and Airport
Performance
The key observations from this analysis are as
follows (table 1):
Airfares change show a positive relationship to
to changes in fuel prices
Flights per day and Markets served show a
positive relationship to changes in gross
domestic product
Flights per day and Markets served show a
positive relationship to changes in airport
capacity limits
Delays and Cancellations change in proportion
to Flights per day and Markets served
Airline profitability shows a negative
relationship to changes in airline airfares
Airline profitability shows a negative
relationship to changes in airport congestion
Upgauging of airline fleets is unlikely to occur
without the introduction of a new class of
aircraft that has better efficiency for aircraft
handling between 100-150 passengers.
New York airports reacted differently to the
new capacity limits, placed on these airports in
2008. LGA and EWR reduced schedules,
because there was no opportunity to adjust their
schedules to other timeslots. However JFK
depeaked their schedule and maintained their
flights per day volume.
Reduced delays in 2008 did not provide airlines
relief in delay costs because of the increased
fuel costs.
Airports with capacity limits reduced operations
and congestion, while increasing profitability.
3
When the economy went into a severe
recession, airports without capacity limits
reduced operations and congestion, while
increasing profitability.
The implications of these results are discussed.
Each of the New York Metroplex Airports
restricts the use of runways by way of "slot"
controls, referred to in this report as capacity limits.
The Federal Government allocates a given number
of slots in each 30-minute time period to the
carriers that service the New York City area. A
"slot" provides the holder with the right to
announce either a departure or an arrival during this
time period. Currently the San Francisco and
Philadelphia airports do not have capacity limits in
effect. Airlines at the three San Francisco airports
can schedule flights well beyond the capacity of the
runways. By doing comparisons of how the airlines
in these two regions reacted, and also looking at an
airport close to New York City, Philadelphia, we
will examine how the airline industry responds to
competition, changes in fuel costs, slot controls, and
general economic condition. One reason for
choosing to compare the New York City airports to
the San Francisco airports is that the San Francisco
Metroplex has been identified as a region needing
additional capacity even after all planned
improvements are made [11]. In addition, both the
New York Metroplex and the San Francisco
Metroplex exhibit significant shuttle and
international traffic.
The organization of this paper is as follows:
Section 2 describes the method of analysis. Section
3 describes the results of the analysis for airline,
passenger and policy maker stakeholders. Section 4
discusses conclusions and future work.
METHOD OF ANALYSIS
This paper describes a longitudinal study, from
2005 through 2009, that evaluates airlines business
and operational behaviors in response to economic
and policy changes to the New York, Philadelphia
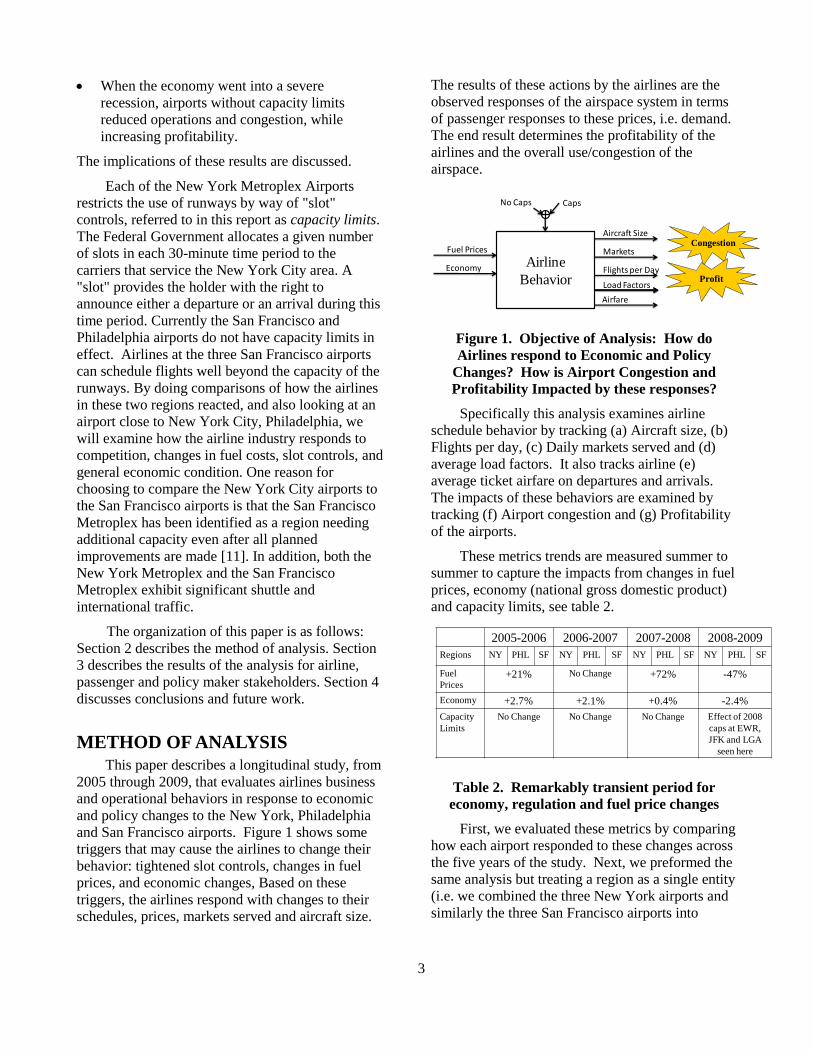
and San Francisco airports. Figure 1 shows some
triggers that may cause the airlines to change their
behavior: tightened slot controls, changes in fuel
prices, and economic changes, Based on these
triggers, the airlines respond with changes to their
schedules, prices, markets served and aircraft size.
The results of these actions by the airlines are the
observed responses of the airspace system in terms
of passenger responses to these prices, i.e. demand.
The end result determines the profitability of the
airlines and the overall use/congestion of the
airspace.
Congestion
Airline
Behavior
Fuel Prices
Economy
Aircraft Size
Markets
Flights per Day
CapsNo Caps
Load FactorsProfit
Airfare
Figure 1. Objective of Analysis: How do
Airlines respond to Economic and Policy
Changes? How is Airport Congestion and
Profitability Impacted by these responses?
Specifically this analysis examines airline
schedule behavior by tracking (a) Aircraft size, (b)
Flights per day, (c) Daily markets served and (d)
average load factors. It also tracks airline (e)
average ticket airfare on departures and arrivals.
The impacts of these behaviors are examined by
tracking (f) Airport congestion and (g) Profitability
of the airports.
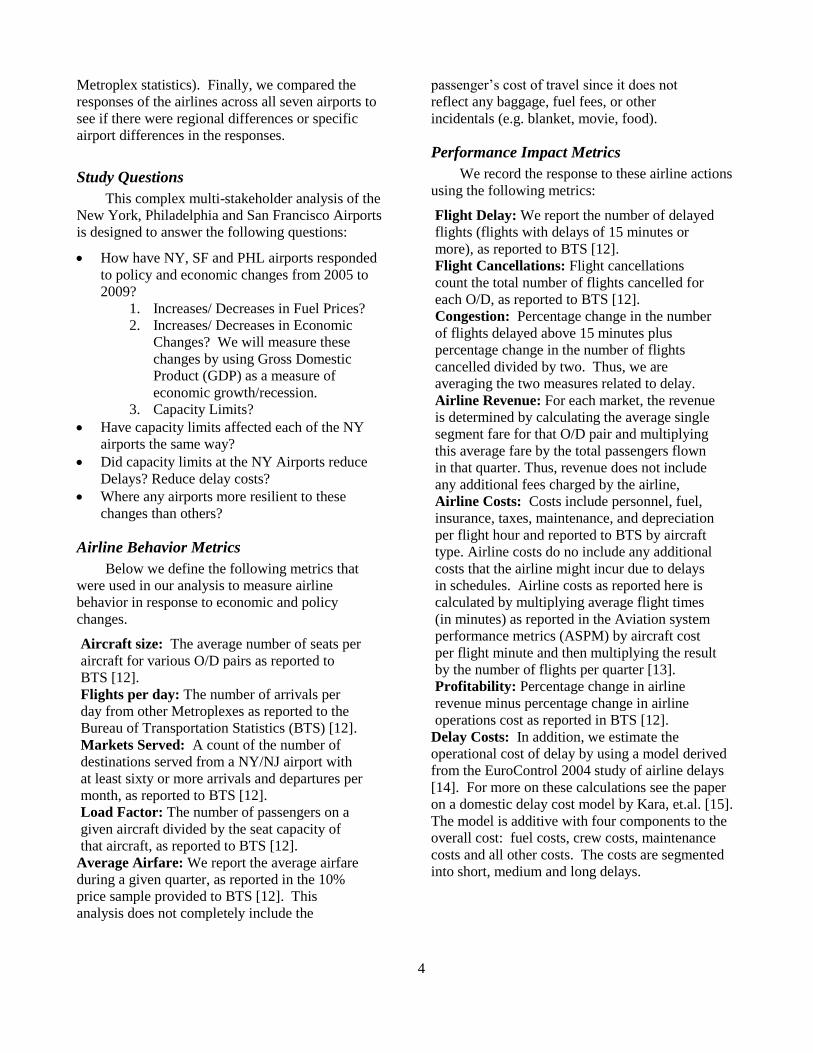
These metrics trends are measured summer to
summer to capture the impacts from changes in fuel
prices, economy (national gross domestic product)
and capacity limits, see table 2.
2005-2006 2006-2007 2007-2008 2008-2009
Regions NY PHL SF NY PHL SF NY PHL SF NY PHL SF
Fuel
Prices+21% No Change +72% -47%
Economy +2.7% +2.1% +0.4% -2.4%
Capacity
Limits
No Change No Change No Change Effect of 2008
caps at EWR,
JFK and LGA
seen here
Table 2. Remarkably transient period for
economy, regulation and fuel price changes
First, we evaluated these metrics by comparing
how each airport responded to these changes across
the five years of the study. Next, we preformed the
same analysis but treating a region as a single entity
(i.e. we combined the three New York airports and
similarly the three San Francisco airports into
4
Metroplex statistics). Finally, we compared the
responses of the airlines across all seven airports to
see if there were regional differences or specific
airport differences in the responses.
Study Questions
This complex multi-stakeholder analysis of the
New York, Philadelphia and San Francisco Airports
is designed to answer the following questions:
How have NY, SF and PHL airports responded
to policy and economic changes from 2005 to
2009?
1. Increases/ Decreases in Fuel Prices?
2. Increases/ Decreases in Economic
Changes? We will measure these
changes by using Gross Domestic
Product (GDP) as a measure of
economic growth/recession.
3. Capacity Limits?
Have capacity limits affected each of the NY
airports the same way?
Did capacity limits at the NY Airports reduce
Delays? Reduce delay costs?
Where any airports more resilient to these
changes than others?
Airline Behavior Metrics
Below we define the following metrics that
were used in our analysis to measure airline
behavior in response to economic and policy
changes.
Aircraft size: The average number of seats per
aircraft for various O/D pairs as reported to
BTS [12].
Flights per day: The number of arrivals per
day from other Metroplexes as reported to the
Bureau of Transportation Statistics (BTS) [12].
Markets Served: A count of the number of
destinations served from a NY/NJ airport with
at least sixty or more arrivals and departures per
month, as reported to BTS [12].
Load Factor: The number of passengers on a
given aircraft divided by the seat capacity of
that aircraft, as reported to BTS [12].
Average Airfare: We report the average airfare
during a given quarter, as reported in the 10%
price sample provided to BTS [12]. This
analysis does not completely include the
passenger’s cost of travel since it does not
reflect any baggage, fuel fees, or other
incidentals (e.g. blanket, movie, food).
Performance Impact Metrics
We record the response to these airline actions
using the following metrics:
Flight Delay: We report the number of delayed
flights (flights with delays of 15 minutes or
more), as reported to BTS [12].
Flight Cancellations: Flight cancellations
count the total number of flights cancelled for
each O/D, as reported to BTS [12].
Congestion: Percentage change in the number
of flights delayed above 15 minutes plus
percentage change in the number of flights
cancelled divided by two. Thus, we are
averaging the two measures related to delay.
Airline Revenue: For each market, the revenue
is determined by calculating the average single
segment fare for that O/D pair and multiplying
this average fare by the total passengers flown
in that quarter. Thus, revenue does not include
any additional fees charged by the airline,
Airline Costs: Costs include personnel, fuel,
insurance, taxes, maintenance, and depreciation
per flight hour and reported to BTS by aircraft
type. Airline costs do no include any additional
costs that the airline might incur due to delays
in schedules. Airline costs as reported here is
calculated by multiplying average flight times
(in minutes) as reported in the Aviation system
performance metrics (ASPM) by aircraft cost
per flight minute and then multiplying the result
by the number of flights per quarter [13].
Profitability: Percentage change in airline
revenue minus percentage change in airline
operations cost as reported in BTS [12].
Delay Costs: In addition, we estimate the
operational cost of delay by using a model derived
from the EuroControl 2004 study of airline delays
[14]. For more on these calculations see the paper
on a domestic delay cost model by Kara, et.al. [15].
The model is additive with four components to the
overall cost: fuel costs, crew costs, maintenance
costs and all other costs. The costs are segmented
into short, medium and long delays.
5
RESULTS OF ANALYSIS
SUMMARY OF ANALYSIS
The analysis showed a positive relationship
between airfare and fuel prices, Gross Domestic
Product and airline schedule, capacity limits and
airline schedule, and between airline schedule and
airport congestion. A negative relationship was
found between airfare and airport profitability and
between airport congestion and airport profitability.
The analysis showed no significant change in
load factors, or aircraft size. The upgauging of
aircraft is unlikely to occur without the introduction
of a new class of aircraft that has better efficiency
for aircraft handling between 100-150 passengers.
The following sections explain these findings
in greater detail.
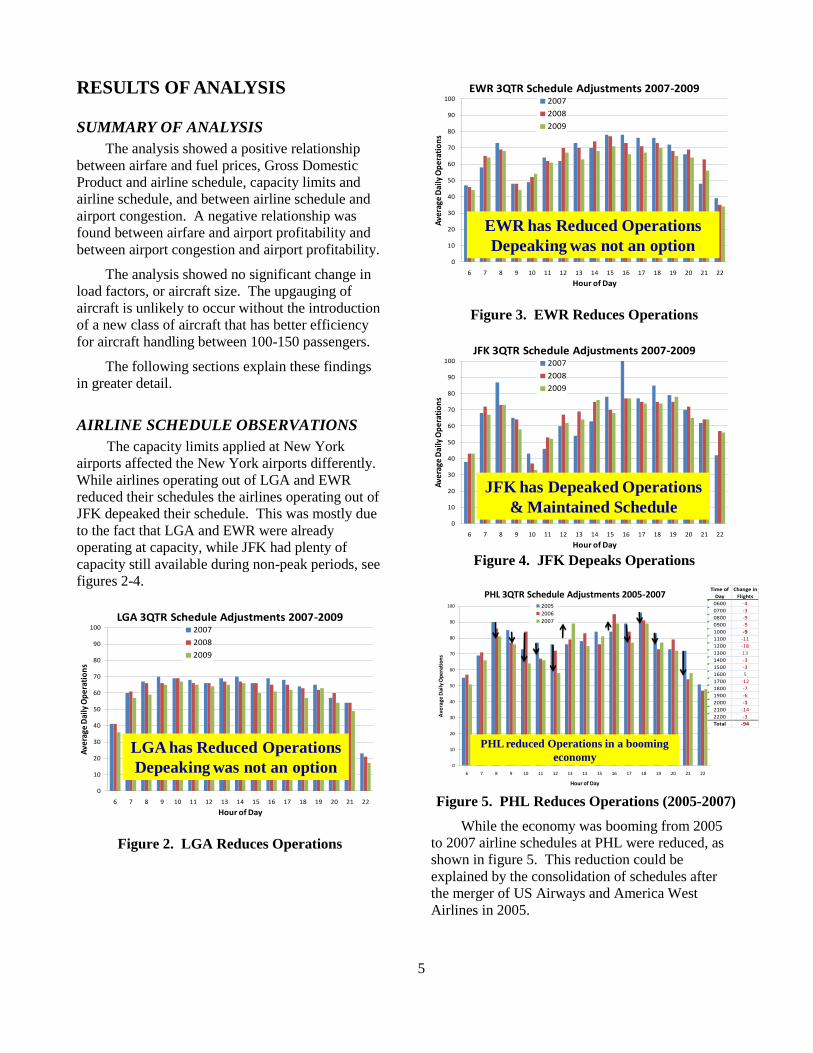
AIRLINE SCHEDULE OBSERVATIONS
The capacity limits applied at New York
airports affected the New York airports differently.
While airlines operating out of LGA and EWR
reduced their schedules the airlines operating out of
JFK depeaked their schedule. This was mostly due
to the fact that LGA and EWR were already
operating at capacity, while JFK had plenty of
capacity still available during non-peak periods, see
figures 2-4.
0
10
20
30
40
50
60
70
80
90
100
6 7 8 9 10 11 12 13 14 15 16 17 18 19 20 21 22
Ave
rage
Dai
ly O
per
atio
ns
Hour of Day
LGA 3QTR Schedule Adjustments 2007-20092007
2008
2009
LGA has Reduced Operations
Depeaking was not an option
Figure 2. LGA Reduces Operations
0
10
20
30
40
50
60
70
80
90
100
6 7 8 9 10 11 12 13 14 15 16 17 18 19 20 21 22
Ave
rage
Dai
ly O
per
atio
ns
Hour of Day
EWR 3QTR Schedule Adjustments 2007-20092007
2008
2009
EWR has Reduced Operations
Depeaking was not an option
Figure 3. EWR Reduces Operations
0
10
20
30
40
50
60
70
80
90
100
6 7 8 9 10 11 12 13 14 15 16 17 18 19 20 21 22
Ave
rage
Dai
ly O
per
atio
ns
Hour of Day
JFK 3QTR Schedule Adjustments 2007-20092007
2008
2009
JFK has Depeaked Operations
& Maintained Schedule
Figure 4. JFK Depeaks Operations
0
10
20
30
40
50
60
70
80
90
100
6 7 8 9 10 11 12 13 14 15 16 17 18 19 20 21 22
Ave
rage
Dai
ly O
pe
rati
on
s
Hour of Day
PHL 3QTR Schedule Adjustments 2005-20072005
2006
2007
PHL reduced Operations in a booming
economy
Time of
Day
Change in
Flights
0600 -4
0700 -3
0800 -9
0900 -9
1000 -9
1100 -11
1200 -18
1300 13
1400 -3
1500 -3
1600 5
1700 -12
1800 -7
1900 -6
2000 -1
2100 -14
2200 -3
Total -94
Figure 5. PHL Reduces Operations (2005-2007)
While the economy was booming from 2005
to 2007 airline schedules at PHL were reduced, as
shown in figure 5. This reduction could be
explained by the consolidation of schedules after
the merger of US Airways and America West
Airlines in 2005.
6
0
10
20
30
40
50
60
70
80
90
100
6 7 8 9 10 11 12 13 14 15 16 17 18 19 20 21 22
Ave
rage
Dai
ly O
pe
rati
on
s
Hour of Day
SFO 3QTR Schedule Adjustments 2007-2009
2007
2008
2009
Time of
Day
Change in
Flights
0600 4
0700 10
0800 -3
0900 5
1000 2
1100 12
1200 4
1300 7
1400 -3
1500 4
1600 -6
1700 -6
1800 -2
1900 10
2000 -2
2100 1
2200 7
Total 44
• SFO Increased and Peaked Operations
• Even in a Down Economy SFO Increased Operations
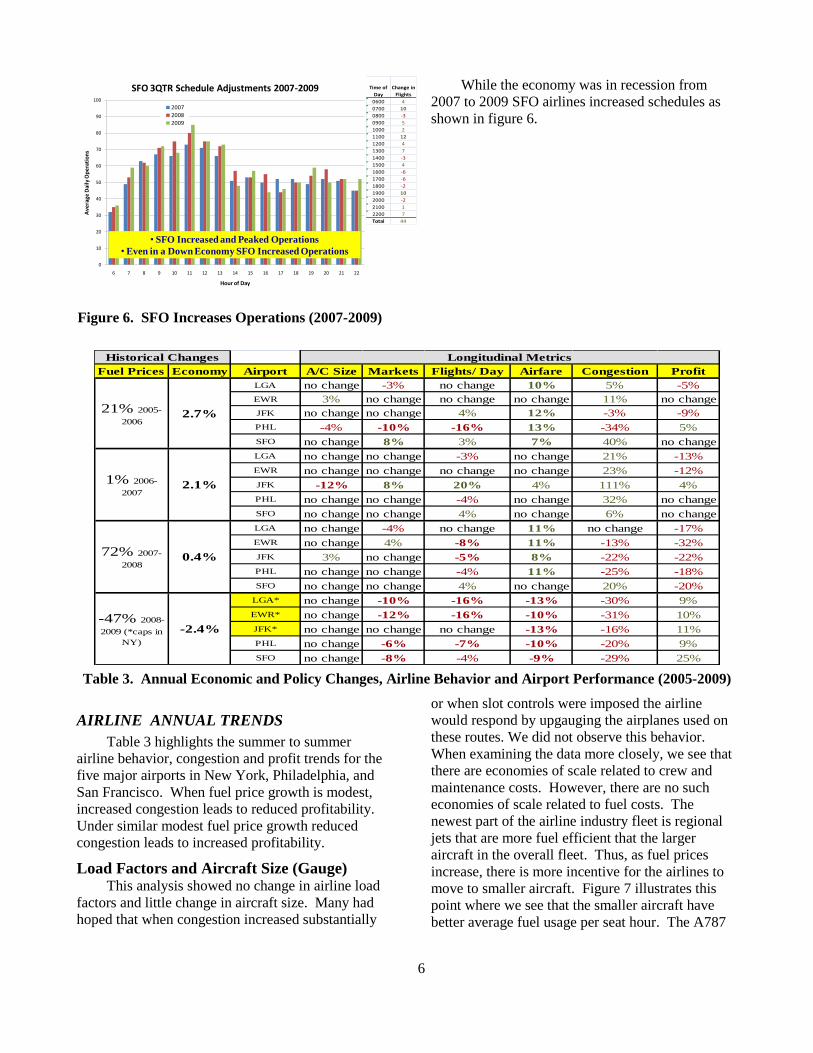
Figure 6. SFO Increases Operations (2007-2009)
While the economy was in recession from
2007 to 2009 SFO airlines increased schedules as
shown in figure 6.
Fuel Prices Economy Airport A/C Size Markets Flights/ Day Airfare Congestion Profit
LGA no change -3% no change 10% 5% -5%
EWR 3% no change no change no change 11% no change
JFK no change no change 4% 12% -3% -9%
PHL -4% -10% -16% 13% -34% 5%
SFO no change 8% 3% 7% 40% no change
LGA no change no change -3% no change 21% -13%
EWR no change no change no change no change 23% -12%
JFK -12% 8% 20% 4% 111% 4%
PHL no change no change -4% no change 32% no change
SFO no change no change 4% no change 6% no change
LGA no change -4% no change 11% no change -17%
EWR no change 4% -8% 11% -13% -32%
JFK 3% no change -5% 8% -22% -22%
PHL no change no change -4% 11% -25% -18%
SFO no change no change 4% no change 20% -20%
LGA* no change -10% -16% -13% -30% 9%
EWR* no change -12% -16% -10% -31% 10%
JFK* no change no change no change -13% -16% 11%
PHL no change -6% -7% -10% -20% 9%
SFO no change -8% -4% -9% -29% 25%
-47% 2008-
2009 (*caps in
NY)
-2.4%
72% 2007-
20080.4%
1% 2006-
20072.1%
21% 2005-
20062.7%
Longitudinal MetricsHistorical Changes
Table 3. Annual Economic and Policy Changes, Airline Behavior and Airport Performance (2005-2009)
AIRLINE ANNUAL TRENDS
Table 3 highlights the summer to summer
airline behavior, congestion and profit trends for the
five major airports in New York, Philadelphia, and
San Francisco. When fuel price growth is modest,
increased congestion leads to reduced profitability.
Under similar modest fuel price growth reduced
congestion leads to increased profitability.
Load Factors and Aircraft Size (Gauge) This analysis showed no change in airline load
factors and little change in aircraft size. Many had
hoped that when congestion increased substantially
or when slot controls were imposed the airline
would respond by upgauging the airplanes used on
these routes. We did not observe this behavior.
When examining the data more closely, we see that
there are economies of scale related to crew and
maintenance costs. However, there are no such
economies of scale related to fuel costs. The
newest part of the airline industry fleet is regional
jets that are more fuel efficient that the larger
aircraft in the overall fleet. Thus, as fuel prices
increase, there is more incentive for the airlines to
move to smaller aircraft. Figure 7 illustrates this
point where we see that the smaller aircraft have
better average fuel usage per seat hour. The A787

7
and A380 are more efficient aircraft but unlikely to
be used for many of the markets currently served by
these airports since they are relatively large aircraft.
By using smaller aircraft the airlines can assure
high load factors, greater frequency. This result has
significant implications for future airspace use.
0
2
4
6
8
10
12
14
0 100 200 300 400 500 600
Ave
rage
Fu
el G
allo
ns/
sea
t-h
r
Seats
Average of Fuel Gallons/ seat-hr (Aviation Daily)
A320 A321
737-200
767-200777
787 A380
747
• Airlines reluctance to upgrade explained by
Fuel Gallons/ seat-hr plot below
Source: Aviation Daily (June 2009)
Not cost efficient to upgage for markets
Figure 7. Aircraft Burn Rate/Seat-Hr versus
Seat Size (Not Efficient for Airlines to Upgauge)
Airfare Increases in fuel prices leads to increased
airfares and decreases fuel prices leads to decreased
airfares. Gross Domestic Product and capacity
limits seem to have no effect on airfare, as shown in
table 4.
Annual Changes Observations
Caps Economy Fuel Prices Airfare Schedule Congestion Profit
05-06 Yes Up Up Up No ∆ Up Down
05-06 No Up Up Up Up Up Down
06-07 Yes Up No ∆ No ∆ No ∆ Up Down
06-07 No Up No ∆ No ∆ Up Up No ∆
07-08 Yes Constant Up Up No ∆ No ∆ Down
07-08 No Constant Up Up Down Down Down
08-09 Reduced Down Down Down 2xDown 2xDown Up
08-09 No Down Down Down Down Down Up
Airfare appears to only be effected by Fuel Price changes• Increased/ Decreased fuel prices lead to increased/ decreased airfares
Table 4. Fuel Price Effects on Airfare (2005-
2009)
Figure 8 shows how airfare has changed over
time for the New York, Philadelphia and San
Francisco airports. Until the end of 2006, JFK was
trending with LGA and PHL. Thereafter, JFK
seems to be performing more like EWR and SFO.
EWR EWR
JFK
JFK
LGA
LGA
PHL
PHL
SFOSFO
$140
$160
$180
$200
$220
$240
Ave
rage
Air
fare
Average AirFares 2005-2009
JFK’s fares starting to track with EWR & SFO
Figure 8. Average Airfares (2005 to 2009)
Airline Schedule Airline schedule behavior can be observed by
examining the trends in aircraft size, markets served
and flights per day. The average size of aircraft
used did not change throughout this study with the
exception of JFK. Delta Airlines entered JFK as a
hub for international travel. They used smaller
aircraft to get passengers to this hub and the size of
aircraft therefore was reduced directly after the
entry of Delta to this airport.
Markets served and flights per day were found
to track well with changes in the national economy
and the introduction of new or reduced capacity
limits, as shown in table 5. During good economic
times, the number of markets served and flights per
day increased and during bad times they were
reduced. In terms of slot controls, as these controls
were imposed or tightened, the number of markets
served or flights per days decreased.
Most surprisingly, airline schedules seemed
insensitive to changes in fuel prices. In table 5, the
metrics for markets served and flights per day are
combined into the metric labeled schedule, since
both metrics followed similar trends.
All airports observed reduced their schedule
from 2008 to 2009 as the result of the recession.
The New York airports with new or reduced
capacity limits reduced their schedules twice as
much as did SFO as shown in table 5. Fuel prices
did not affect schedules at these congested airports.

8
Annual Changes Observations
Caps Economy Fuel Prices Airfare Schedule Congestion Profit
05-06 No Up Up Up Up Up Down
06-07 No Up Constant No ∆ Up Up No ∆
05-06 Yes Up Up Up No ∆ Up Down
06-07 Yes Up Constant No ∆ No ∆ Up Down
07-08 Yes Constant Up Up No ∆ No ∆ Down
07-08 No Constant Up Up Down Down Down
08-09 No Down Down Down Down Down Up
08-09 Reduced Down Down Down 2xDown 2xDown Up
All airports reduced schedule during economic downturn. •Twice the reductions occurred where caps were applied/ reduced (LGA, EWR)
Economic growth leads to schedule growth where possible•No growth observed at capped or capacitated airports (LGA, EWR)
Fuel prices do not appear to effect schedules at congested airports
Table 5. Economic and Policy Effects on
Schedule (2005-2009)
Flights per day Increases in national Gross Domestic Product
at SFO an unconstrained airport leads to increased
flights per day. And decreases in national Gross
Domestic Product leads to decreased flights per
day. Fuel prices seem to have no effect on flights
per day.
PHL
PHL
EWR
EWR
JFK
JFK
LGA
LGA
SFO
SFO
400
500
600
700
800
900
Jan
-05
Mar
-05
May
-05
Jul-
05
Sep
-05
No
v-05
Jan
-06
Mar
-06
May
-06
Jul-
06
Sep
-06
No
v-06
Jan
-07
Mar
-07
May
-07
Jul-
07
Sep
-07
No
v-07
Jan
-08
Mar
-08
May
-08
Jul-
08
Sep
-08
No
v-08
Jan
-09
Mar
-09
May
-09
Jul-
09
Sep
-09
No
v-09
De
par
ture
s p
er
Day
Departures per Day (2005 to 2009)
• Schedule Reductions at PHL, EWR, & LGA
• Schedule Growth at SFO & JFK
Figure 9. Departures per Day (2005 to 2009)
As mentioned and illustrated earlier, the
capacity limits introduced in 2008 in New York,
caused LGA and EWR to reduce schedules and JFK
to depeak schedules.
Figure 9 illustrates the reduction in operations
over time for PHL, EWR and LGA. During the
same time period, SFO and JFK operations have
grown.
Markets As was the case with flights per day, increases
in national Gross Domestic Product at SFO (an
unconstrained airport) leads to increased markets.
Similarly, the recession led to decreased markets.
Fuel prices seem to have no effect on markets.
PHL
PHL
EWR
EWR
JFK
JFK
LGALGA
SFO
SFO
35
50
65
80
95
Jan
-05
Mar
-05
May
-05
Jul-
05
Sep
-05
No
v-05
Jan
-06
Mar
-06
May
-06
Jul-
06
Sep
-06
No
v-06
Jan
-07
Mar
-07
May
-07
Jul-
07
Sep
-07
No
v-07
Jan
-08
Mar
-08
May
-08
Jul-
08
Sep
-08
No
v-08
Jan
-09
Mar
-09
May
-09
Jul-
09
Sep
-09
No
v-09
# o
f D
aily
Mar
kets
Se
rve
d
# of Daily Markets Served from 2005 to 2009
JFK’s markets starting to track with EWR & SFO
Figure 10. Daily Markets Served (2005 to 2009)
The capacity limits (slot controls) introduced
in 2008 in New York; seem to have caused LGA
and EWR to reduce markets where as JFK had the
opportunity to depeak rather than reduce the
markets served.
Figure 10 illustrates the reduction in markets
over time for PHL, EWR and LGA, while SFO and
JFK markets have grown.
Congestion This analysis is confounded by airport growth
at JFK with the introduction of significant Delta
Airline Operations by the summer of 2007. The
Southwest Airlines purchase of ATA lead to
consolidation of services in SFO from SJC and
OAK in 2008. Additionally PHL consolidated
operations in 2006. Therefore these airports will
not always track with the observed trends from
economic and policy changes.
9
Annual Changes Observations
Caps Economy Fuel Prices Airfare Schedule Congestion Profit
05-06 Yes Up Up Up No ∆ Up Down
05-06 No Up Up Up Up Up Down
06-07 Yes Up Constant No ∆ No ∆ Up Down
06-07 No Up Constant No ∆ Up Up No ∆
07-08 Yes Constant Up Up No ∆ No ∆ Down
07-08 No Constant Up Up Down Down Down
08-09 Reduced Down Down Down 2xDown 2xDown Up
08-09 No Down Down Down Down Down Up
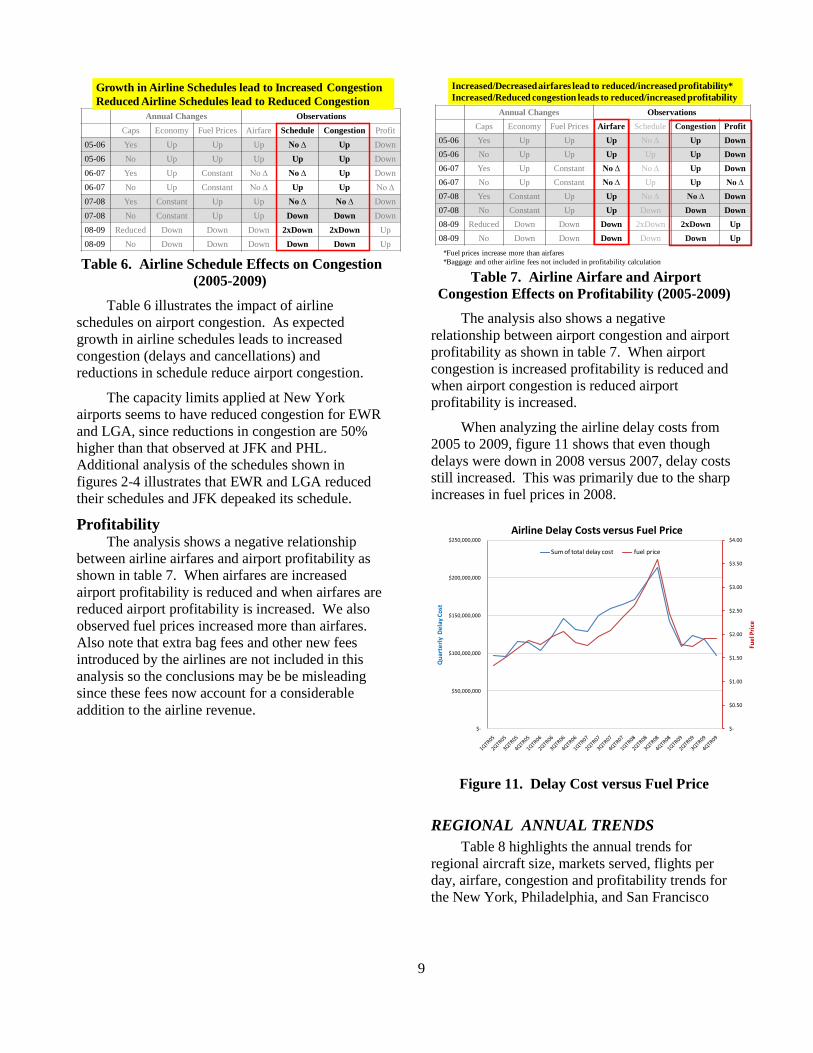
Growth in Airline Schedules lead to Increased Congestion
Reduced Airline Schedules lead to Reduced Congestion
Table 6. Airline Schedule Effects on Congestion
(2005-2009)
Table 6 illustrates the impact of airline
schedules on airport congestion. As expected
growth in airline schedules leads to increased
congestion (delays and cancellations) and
reductions in schedule reduce airport congestion.
The capacity limits applied at New York
airports seems to have reduced congestion for EWR
and LGA, since reductions in congestion are 50%
higher than that observed at JFK and PHL.
Additional analysis of the schedules shown in
figures 2-4 illustrates that EWR and LGA reduced
their schedules and JFK depeaked its schedule.
Profitability The analysis shows a negative relationship
between airline airfares and airport profitability as
shown in table 7. When airfares are increased
airport profitability is reduced and when airfares are
reduced airport profitability is increased. We also
observed fuel prices increased more than airfares.
Also note that extra bag fees and other new fees
introduced by the airlines are not included in this
analysis so the conclusions may be be misleading
since these fees now account for a considerable
addition to the airline revenue.
Annual Changes Observations
Caps Economy Fuel Prices Airfare Schedule Congestion Profit
05-06 Yes Up Up Up No ∆ Up Down
05-06 No Up Up Up Up Up Down
06-07 Yes Up Constant No ∆ No ∆ Up Down
06-07 No Up Constant No ∆ Up Up No ∆
07-08 Yes Constant Up Up No ∆ No ∆ Down
07-08 No Constant Up Up Down Down Down
08-09 Reduced Down Down Down 2xDown 2xDown Up
08-09 No Down Down Down Down Down Up
Increased/Decreased airfares lead to reduced/increased profitability*
Increased/Reduced congestion leads to reduced/increased profitability
*Fuel prices increase more than airfares
*Baggage and other airline fees not included in profitability calculation
Table 7. Airline Airfare and Airport
Congestion Effects on Profitability (2005-2009)
The analysis also shows a negative
relationship between airport congestion and airport
profitability as shown in table 7. When airport
congestion is increased profitability is reduced and
when airport congestion is reduced airport
profitability is increased.
When analyzing the airline delay costs from
2005 to 2009, figure 11 shows that even though
delays were down in 2008 versus 2007, delay costs
still increased. This was primarily due to the sharp
increases in fuel prices in 2008.
$-
$0.50
$1.00
$1.50
$2.00
$2.50
$3.00
$3.50
$4.00
$-
$50,000,000
$100,000,000
$150,000,000
$200,000,000
$250,000,000
Fue
l Pri
ce
Qu
arte
rly
De
lay
Co
st
Airline Delay Costs versus Fuel Price
Sum of total delay cost fuel price
Figure 11. Delay Cost versus Fuel Price
REGIONAL ANNUAL TRENDS
Table 8 highlights the annual trends for
regional aircraft size, markets served, flights per
day, airfare, congestion and profitability trends for
the New York, Philadelphia, and San Francisco

10
regional areas. Again trends are confounded by
events at JFK, SFO and PHL.
Although we observe trends similar to those at
the individual airports, the amount of the
increases/decreases are dampened by the interaction
of airports within the regions.
The regional (metroplex) analysis highlighted
in table 8 shows the annual impact of economic and
policy changes to these airport regions. This
analysis combined with the individual airport
analysis shows the inter-regional interaction of
airports in response to economic and policy
changes.
This analysis shows how JFK and SFO
additional capacity have allowed them to increase
operations and reduce the overall economic and
policy impact to these regions. This analysis
shows again that adding capacity limits to New
York airports did not cause significant loss of
markets, operations or significant increases in
airfares in the region. The capacity limits combined
with the economic recession have significantly
reduced congestion in New York, to levels below
2005 congestion.
Fuel Prices Economy Region A/C Size Markets Flights/ Day Airfare Congestion Profit
NY no change no change no change 8% 6% -5%
PHL -4% -10% -16% 13% -34% 5%
SF 3% no change 3% 13% 27% 0%
NY -3% no change 3% no change 37% -5%
PHL no change no change -4% no change 32% 0%
SF no change no change no change no change 3% -4%
NY no change no change -5% 10% -11% -26%
PHL no change no change -4% 11% -25% -18%
SF no change no change -3% 3% 9% -26%
NY no change -7% -11% -12% -27% 10%
PHL no change no change -7% -10% -20% 9%
SF -6% -6% -11% -6% -31% 20%
2.1%
72% 2007-
20080.4%
-47% 2008-
2009 (caps in
NY)
-2.4%
21% 2005-
20062.7%
1% 2006-
2007
Longitudinal MetricsHistorical Changes
Same Trends are suppressed in Regional Analysis, because of
intra-regional Airport interactions Table 8. Regional Annual Trends
4-YEAR AIRPORT TRENDS
Table 9 highlights four year trend observed for
the airports examined in this study. We observe
significantly different behavior as a response to the
economic and policy changes depending on whether
the airport is expanding, contracting or is at
capacity.
The 4-year trends highlighted in table 9 shows
the overall effect of economic and policy changes
or shocks to the airports. This analysis shows that
SFO and JFK have been more resilient to the
economic and policy changes over the past 4 years
than the other airports examined.
2005 to 2009 Trends
A/C Size Markets Flights/ Day Airfare Congestion Profit
SFO none none 7% -6% 22% 18%
JFK -12% 6% 20% 11% 30% -10%
EWR 2% -13% -22% none -17% -24%
LGA -2% -11% -20% 6% -13% -12%
PHL -6% -13% -28% 10% -49% none
SJC 2% -13% -16% 5% -24% 6%
OAK none 9% -28% 3% -27% none
Significant Different Behavior Observed by Airports
experiencing different business trends
Airports
Expanding
Airports at
Capacity
Airports
Contracting
Table 8. Airport 4-Year Trends
This analysis also illustrates that the policy
impacts have had minimal impact on number of
markets served or on airfares.During the imposition
of these capacity controls, JFK has thrived because
it had the opportunity to depeak its schedule. The
capacity limits combined with the economic
recession have significantly reduced congestion in
New York, to levels below 2005 congestion.
CONCLUSIONS and FUTURE
WORK
Conclusions
Analysis of the New York, San Francisco, and
Philadelphia airports from 2005 to 2009 showed
that Increases/ Decreases in Fuel Prices resulted in
corresponding increases/ decreases in airfares and
decreases/ increases in airline profitability.
Increases in Gross Domestic Product resulted in
corresponding increases in airport operations and
markets. Decreases in Gross Domestic Product
resulted in corresponding decreases in airport
operations and markets.
Analysis of the New York airports from 2005
to 2009 showed that capacity limits resulted in
reduced operations at capacitated (EWR & LGA)
airports and depeaking of operations at JFK.
Reduced airline operations as the result of capacity
limits led to reduced airport congestion and
increased airline profitability at these airports.
Additional analysis showed that even though delays
were down in 2008 versus 2007, delay costs

11
increased primarily due to the sharp increases in
fuel prices in 2008.
New York John F. Kennedy (JFK) and San
Francisco International (SFO) airports were found
to be more resilient to the economic and policy
changes over the past 4 years than the other airports
examined. In both airports, operations and
revenues have increased during the past 4 years of
economic turmoil.
The results indicate that capacity limited
airports yielded improved performance (e.g. flight
delays and cancelled flights) through reductions in
frequency and de-peaking schedules. The airports in
the San Francisco and Philadelphia region showed
the same behavior as if they had capacity limits
introduced, because of the recession. Again the
results showed improved performance (e.g. less
delayed and cancelled flights) through reductions in
frequency. There was no significant change in
markets serviced
The key observations from this analysis are as
follows (table 1):
Airfares change show a positive relationship to
to changes in fuel prices
Flights per day and Markets served show a
positive relationship to changes in gross
domestic product
Flights per day and Markets served show a
positive relationship to changes in airport
capacity limits
Delays and Cancellations change in proportion
to Flights per day and Markets served
Airline profitability shows a negative
relationship to changes in airline airfares
Airline profitability shows a negative
relationship to changes in airport congestion
Upgauging of airline fleets is unlikely to occur
without the introduction of a new class of
aircraft that has better efficiency for aircraft
handling between 100-150 passengers.
New York airports reacted differently to the
new capacity limits, placed on these airports in
2008. LGA and EWR reduced schedules,
because there was not opportunity to adjust
their schedules to other timeslots. However
JFK depeaked their schedule and maintained
their flights per day volume.
Reduced delays in 2008 did not provide airlines
relief in delay costs because of the increased
fuel costs.
Airports with capacity limits reduced operations
and congestion, while increasing profitability.
When the economy went into a severe
recession, airports without capacity limits
reduced operations and congestion, while
increasing profitability.
Future Analysis
As the economy recovers, we expect that
congestion will return unless capacity limits are
imposed at SFO and PHL. Fuel prices have
fluctuated significantly during the period of study.
At the same time, the economy has suffered a
recession. Further study may allow us to separate
out the effect of economic conditions from the
effects of fuel prices and allow us to see if ticket
prices are more sensitive to the economic
conditions or to fuel prices. Our future analysis will
include performing statistical analysis of these
relationships found to determine changes in airline
airfares and passenger demand as a function of
changes in fuel prices, gross domestic product and
capacity limits. Additionally, the continual
monitoring of ticket prices, schedule changes,
aircraft assignment, and load factors over a variety
of different economic impulses will help us to better
predict future behaviors.
Acknowledgements
The authors acknowledge the technical
database assistance provided by Guillermo
Calderon-Meza of the Center for Air
Transportation Systems and the support provided by
Rosa Oseguera-Lohr, our NASA sponsor. This
research was sponsored by NASA Award 06 AS2
060014.
REFERENCES
[1] http://www.faa.gov/about/initiatives/nextgen/be
nefits/
12
[2] G. L. Donohue, R. D. Shaver III, “Terminal
Chaos: Why U.S. Air Travel is Broken and
How to Fix It”, American Institute of
Aeronautics & Astronautics, Library of Flight,
Editor: Ned Allen Spring, 2008.
[3] N. Xu, L. Sherry, and K. Laskey, “Multi-factor
Model for Predicting Delays at U.S. Airports”,
Transportation Research Board, 88th Annual
Meeting, January 11-15, 2008, Washington,
D.C., 2008.
[4] L. Sherry, and G Donohue, “U.S. Airline
Passenger Trip Delay Reports (2007&2008),”
Center for Air Transportation Systems Research
Report, George Mason University, pp. 5, 2008.
[5] S. Lan, J.P. Clarke, and C. Barnhart, “Planning
for robust airline operations: optimizing aircraft
routings and flight departure times to minimize
passenger disruptions,” Transportation Science
40, pp. 15–28, 2006.
[6] B. Manley and L. Sherry, "Impact of ground
delay program rationing rules on passenger and
airline equity," Integrated Communications,
Navigation and Surveillance Conference, 2008.
ICNS 2008 , pp.1-11, 5-7 May 2008.
[7] C. E. Schumer, “Flight Delays Cost Passengers,
Airlines and the U.S. Economy Billions”. A
Report by the Joint Committee Majority Staff,
May 2008.
[8] J. Ferguson; K. Hoffman; L. Sherry; A. Kara,
“Effects of Fuel Prices on Air Transportation
Performance at New York and San Francisco
Airports”, 2009 ICNS Conference, 13-15 May
2009.
[9] P. Cox, New York Post, (May 26, 2008).
[10] The MITRE Corporation, “Capacity Needs in
the National Airspace System (2007-2025)”,
FAA Fact 2 Report, pp.9, May 2007.
[11] The MITRE Corporation, “Capacity Needs in
the National Airspace System (2007-2025)”,
FAA Fact 2 Report, pp.15, May 2007.
[12] Bureau of transportation statistics (BTS)
databases and statistics. Accessed March 2010.
http://www.transtats.bts.gov/
[13] Aviation system performance metrics (ASPM)–
complete, FAA.
[14] Performance Review Unit, Eurocontrol,
“Evaluating the True Cost to Airlines of One
Minute of Airborne or Ground Delay,”
University of Westminster Final Report, May,
2004.
[15] A. Kara, J. Ferguson, K. Hoffman, L. Sherry ,
“Estimating Domestic U.S. Airline Cost of
Delay based on European Model” ,Accepted at
4th International Conference on Research in Air
Transportation - ICRAT 2010, Budapest
Hungary June 01 - 04, 2010
2010 Integrated Communications Navigation
and Surveillance (ICNS) Conference
May 11-13, 2010