Profit Margins in U.S. Domestic Airline Routes - FIU Economics
104
Department of Economics Florida International University Working Paper 2125 November 2021 11200 SW 8th Street, Miami, Florida 33199 https://economics.fiu.edu/ Profit Margins in U.S. Domestic Airline Routes Hakan Yilmazkuday
-
Upload
khangminh22 -
Category
Documents
-
view
0 -
download
0
Transcript of Profit Margins in U.S. Domestic Airline Routes - FIU Economics

Department of Economics
Florida International University
Working Paper 2125
November 2021
11200 SW 8th Street, Miami, Florida 33199
https://economics.fiu.edu/
Profit Margins in U.S.
Domestic Airline Routes
Hakan Yilmazkuday
Pro�t Margins in U.S. Domestic Airline Routes�
Hakan Yilmazkudayy
November 11, 2021
Abstract
This paper estimates pro�t margins in the U.S. airline industry at the domestic
route level. The dynamic estimation methodology used not only is robust to any simul-
taneity/endogeneity bias by construction but also results in pro�t margin estimates that
are highly consistent with actual pro�t data from the U.S. airline industry. Estimated
annual pro�t margins have an average of about 13:3%, with a range between 2:7% and
42:9% across routes. A cross-route analysis further suggests that annual pro�t margins
increase with the market share of the largest airline serving the route, whereas they
decrease with airfare. Important policy suggestions follow.
JEL Classi�cation: C32, L93
Key Words: Pro�t Margin; Price Elasticity; U.S. Domestic Routes.
�The author would like to thank the editor, Eric Pels, and two anonymous referees for their helpful
comments and suggestions. The usual disclaimer applies.yDepartment of Economics, Florida International University, Miami, FL 33199, USA. Phone: 305-348-
2316. Fax: 305-348-1524. E-mail: hyilmazk@�u.edu
1

1 Introduction
One-way airfare between Seattle, WA and Yakima, WA has been about $103, while it has
been about $402 between New York City, NY and Monterey, CA, on average between 2000-
2017.1 Although these airfares might have been determined by several market conditions,
which of these routes have higher pro�t margins?2 Answering this question is important
not only for this particular route but also for any other one, because consumer welfare and
thus optimal policy against excessive usage of market power by airlines highly depend on
the answer (e.g., see Brons, Pels, Nijkamp, and Rietveld (2002)). Airlines also manage their
�eet and determine their investment plans to expand or shrink their facilities based on this
critical information (e.g., see Valdes (2015)); moreover, even airplane designs are achieved
based on these details (e.g., see Carson, Cenesizoglu, and Parker (2011)).
This paper estimates pro�t margins for individual domestic routes within the U.S. by
using quarterly data between 2000 and 2017. As the data set used is at the domestic-route
level, (i) estimated pro�t margins represent the average measures across airlines of that route,
although multiple airlines may be serving in a particular route, and (ii) the information is
averaged out regarding direct versus indirect �ights. The estimation is achieved by using
implications of the Lerner markup rule in a structural vector autoregression (SVAR) model.
This corresponds to estimating the inverse price elasticity of demand for each route in a
dynamic framework as it represents the pro�t margin in the Lerner markup rule, which
is consistent with studies such as by Brons, Pels, Nijkamp, and Rietveld (2002) who have
suggested using time series data in the estimation of elasticity measures.
1The source for these values is described in the data section.2The answer for the particular route is given in the conclusion section of this paper.
2

The estimation of pro�t margins for each route is achieved by using the textbook de�nition
of the inverse price elasticity of demand, which is the percentage change in airfare divided
by the percentage change in the number of passengers. Since pro�t maximization is achieved
by choosing the number of passengers according to the Lerner markup rule, in the context of
the SVAR model, pro�t margins are estimated as the cumulative response of airfares divided
by the cumulative response of passenger numbers, both following a shock on the number
of passengers after controlling for changes in airline costs. This approach is robust to any
simultaneity/endogeneity bias by construction (due to allowing for changes in both airfare
and passenger numbers, following a structural shock), which is the main contribution of the
paper.
Regarding the level of aggregation, this paper uses time-series data for each U.S. domestic
route individually. This is similar to earlier studies such as by Abrahams (1983), Jorge-
Calderón (1997), Abate (2016) and Hakim and Merkert (2019) who have also used route-level
data to estimate pro�t margins or price elasticity measures. Exceptions are studies such as by
Mumbower, Garrow, and Higgins (2014) who have used data from a single airline, JetBlue,
or by Morlotti, Cattaneo, Malighetti, and Redondi (2017) who have used data from another
single airline, easyJet; these studies have estimated higher price elasticity measures with
respect to other studies using route-level data, consistent with previous research suggesting
that higher aggregation (e.g., route-level data) results in lower price elasticity measures.
As SVAR estimations are achieved at the route level, price elasticity measures and pro�t
margins are estimated for each route individually. This results in having only one estimate
for each route representing the quarterly sample period between 2000 and 2017. These
route-speci�c estimates are further used in a secondary analysis to investigate whether the
3

heterogeneity across routes can be explained by other factors such as airfares (as in Fischer
and Kamerschen (2003)), lower distance (as in Kutlu and Sickles (2017)) or higher airline
market shares (as in Bailey, Graham, Graham, and Kaplan (1985), Hurdle, Johnson, Joskow,
Werden, and Williams (1989), Berry (1990), Berry (1992), Borenstein (1990), Borenstein
(1991), Brueckner, Dyer, and Spiller (1992), or Evans, Kessides, et al. (1993)). The results of
this secondary analysis are further used to have certain policy suggestions regarding consumer
welfare and airline pro�ts.
Overall, this paper contributes to the literature through the estimation methodology that
takes into account the dynamic relationship between airline costs, airfares, and the number of
passengers. To our knowledge, this is the �rst paper using such an approach that has several
bene�ts. Speci�cally, the SVAR model used for the estimation considers the simultaneous
relationship between airline costs, airfares, and the number of passengers by using quarterly
data at the domestic-route level so that any endogeneity between these variables are controlled
for in a dynamic way by construction.
Another contribution of the paper is through considering the reaction of variables to
each other through impulse response functions. This contribution due to using a time-series
approach (of SVAR) results in estimating a causal relationship between percentage changes
in airfares and percentage changes in passenger numbers, where airline costs are controlled
for. This is di¤erent from the existing literature that ignores the causality between these
variables due to using cross-sectional regressions. This contribution results in estimating
annual pro�t margins that are highly similar to those implied by actual pro�t data obtained
from the U.S. domestic airline industry.
4

This paper also contributes by estimating the pro�t margin and price elasticity of demand
for each U.S. domestic route individually. These route-speci�c estimates (representing the
overall sample period) that are obtained by the SVAR model are further used in a secondary
cross-sectional analysis to explain why certain routes have higher or lower pro�t margins or
price elasticity measures. Based on this contribution, important policy implications follow
both at the national and the domestic-route levels (as discussed in details at the end of this
paper).
The rest of the paper is organized as follows. The next section motivates the SVAR
model by using the implications of the Lerner markup rule. Section 3 introduces the data
set used, where descriptive statistics are discussed. Section 4 reveals the estimation results
based on the SVAR model, while Section 5 depicts the results of a secondary investigation
based on the comparison across routes. Section 6 concludes with discussing the corresponding
policy implications. Route-speci�c and city-speci�c empirical results are given in the Online
Appendix.
2 Empirical Methodology
The estimation is achieved by using implications of the Lerner markup rule in a SVAR model.
Our objective is to estimate pro�t margins in the U.S. domestic airline market by focusing
on individual routes across U.S. cities based on pricing-to-market. For the market between
any two U.S. cities, pro�t margins are measured by using implications of the Lerner markup
rule. The motivation behind using the Lerner markup rule is that when the (inverse) price
5

elasticity of market demand is known, the corresponding pro�t margins are can be obtained
by using the implications of the Lerner markup rule.
2.1 The Model
The main objective in this subsection is to have a theoretical motivation to estimate the (in-
verse) price elasticity of market demand at the domestic-route level so that the corresponding
pro�t margins can be obtained. In formal terms, for the market between any two U.S. cities,
i and j, the pro�t function �ij is given by:
�ij = Pij (Qij)�Qij � Cij (Qij) (1)
where Pij (Qij) represents the inverse demand function of the market between U.S. cities i
and j, with Pij representing the corresponding airfare depending on the number of passengers
Qij in this route, and Cij (Qij) represents total cost of this market, also depending on Qij.
Pro�t maximization based on pricing-to-market is achieved by choosing route-speci�c
Qij, which results in the Lerner markup rule ofPij�MCij
Pij= "ij, where MCij =
@Cij(Qij)
@Qij
represents marginal costs, and "ij = �@Pij(Qij)
@Qij
QijPij
represents the inverse price elasticity of
market demand that satis�es 0 < "ij < 1 (which ensures that the market continues operating).
In this framework, "ij further corresponds to the pro�t margin due toPij�MCij
Pij= "ij. Finally,
the price elasticity of demand �ij is given by �ij = 1"ij.
6
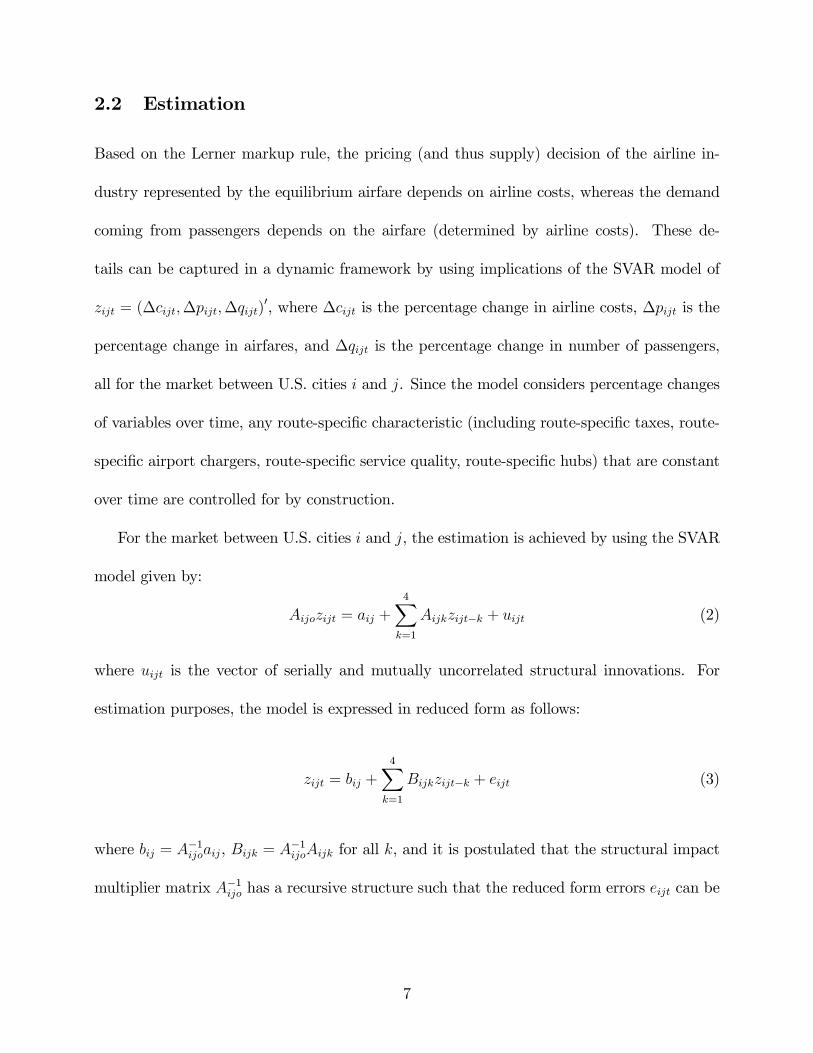
2.2 Estimation
Based on the Lerner markup rule, the pricing (and thus supply) decision of the airline in-
dustry represented by the equilibrium airfare depends on airline costs, whereas the demand
coming from passengers depends on the airfare (determined by airline costs). These de-
tails can be captured in a dynamic framework by using implications of the SVAR model of
zijt = (�cijt;�pijt;�qijt)0, where �cijt is the percentage change in airline costs, �pijt is the
percentage change in airfares, and �qijt is the percentage change in number of passengers,
all for the market between U.S. cities i and j. Since the model considers percentage changes
of variables over time, any route-speci�c characteristic (including route-speci�c taxes, route-
speci�c airport chargers, route-speci�c service quality, route-speci�c hubs) that are constant
over time are controlled for by construction.
For the market between U.S. cities i and j, the estimation is achieved by using the SVAR
model given by:
Aijozijt = aij +4Xk=1
Aijkzijt�k + uijt (2)
where uijt is the vector of serially and mutually uncorrelated structural innovations. For
estimation purposes, the model is expressed in reduced form as follows:
zijt = bij +
4Xk=1
Bijkzijt�k + eijt (3)
where bij = A�1ijoaij, Bijk = A�1ijoAijk for all k, and it is postulated that the structural impact
multiplier matrix A�1ijo has a recursive structure such that the reduced form errors eijt can be
7

decomposed according to eijt = A�1ijouijt, where the sizes of shocks are standardized to unity
(i.e., the identi�cation is by triangular factorization).
The recursive structure imposed on A�1ijo requires an ordering of the variables used in the
estimation for which we use the ordering already given in zijt above as it is consistent with the
Lerner markup rule. In particular, (i) airline costs are taken as given by the airline market
and thus they do not respond to shocks in airfares or passenger numbers, neither initially nor
in the long-run, where the latter is achieved by using block exogeneity; (ii) airfares respond
to airline costs initially due to the airline market using the Lerner markup rule for pricing;
and (iii) number of passengers responds to both airfares and airline costs due to market
conditions.
The estimation is achieved for individual U.S. domestic routes (each represented by a
city pair ij) using a Bayesian approach with independent normal-Wishart priors. This cor-
responds to generating posterior draws for the structural model parameters by transforming
each reduced-form posterior draw. In particular, for each draw of the covariance matrix from
its posterior distribution, the corresponding posterior draw for A�1ijo is constructed by using by
triangular factorization so that the sizes of shocks are standardized to unity. In the Bayesian
framework, a total of 2; 000 samples are drawn, where a burn-in sample of 1; 000 draws is dis-
carded. The remaining 1; 000 draws are used to determine the structural impulse responses
that are necessary for the estimation of pro�t margins and price elasticity measures.
2.3 Implications for Pro�t Margins
When variables are represented in percentage changes as in this paper, the inverse price
elasticity of demand "ij, which also represents the pro�t margin for the market between
8

U.S. cities i and j, can be rewritten as percentage changes in airfares divided by percentage
changes in number of passengers:
Implications of the Lerner Markup Rulez }| {"ij =
Pij �MCijPij
= �@Pij (Qij)@Qij
QijPij
= ��pijt�qijt| {z }
Cumulative Responses in SVAR
(4)
where percentage changes can be measured following the e¤ects of a change in the number
of passengers, because pro�ts are maximized in airline markets by choosing the number of
passengers as in Equation 1. In terms of the SVAR model, this corresponds to the ratio of
the cumulative impulse response of airfares divided by the cumulative impulse response of
passenger numbers, both following a shock on the number of passengers.
Since cumulative impulses can be calculated for any period after the shock, annual pro�t
margins "ij�s for the city pair ij can be estimated in one year (i.e., four quarters) following
a shock on the number of passengers. This approach is robust to any simultaneity problem
between airfares and number of passengers due to allowing for changes in both airfare and
passenger numbers, following a structural shock. The estimated "ij�s can further be used to
obtain the price elasticity of demand �ij = 1"ijmeasures. In the Bayesian estimation, "ij�s
and �ij�s are calculated for each of the 1; 000 draws, and the draws that satisfy 0 < "ij < 1
(to be consistent with the implications of the Lerner markup rule) are used to construct the
distribution of each estimate. While the median of each distribution is considered as the
corresponding Bayesian estimator, the 16th and 84th quantiles of distributions are used to
construct the 68% credible intervals.
9

3 Data Set
Data on airfare and number of passengers have been obtained from the U.S. Department of
Transportation (DOT) under the title of "Contiguous State City-Pair Markets That Average
At Least 10 Passengers Per Day." These consist of average one-way airfare and average one-
way daily number of passengers between any two cities within the U.S. with at least ten
passengers per day, where the direction of the route is not considered. A typical observation
is for the route between Albany, NY and Chicago, IL that has an average (over our sample
period) one-way airfare of $205 and an average one-way daily passenger number of 312. Due
to our data covering U.S. domestic routes (rather than speci�c airlines), the estimated results
will represent average values across airlines in particular routes. This data set also includes
the distance between the cities covered as well as the market share of the largest airline in
that market.
Airline costs are measured by "Passenger Airline Cost Index (PACI)" obtained from
Airlines for America.3 This index measures the cost of inputs for passenger airlines (e.g.,
labor, fuel, food, aircraft ownership, airport landing fees, insurance, utilities, interest) to
the provision of air service over time. The vast majority of PACI is derived from quarterly
�nancial and operational information collected by DOT (principally, Form 41 reports); it
re�ects all U.S. passenger airlines �ling complete reports.4
Since our estimation methodology requires continuous data during the sample period, we
focus on 2; 992 routes (each represented by a city pair) for which such data are available.
Such an approach is also consistent with the restriction of 0 < "ij < 1 which ensures that
3Their web page is http://airlines.org/.4Further technical details about PACI can be found at https://www.airlines.org/dataset/a4a-quarterly-
passenger-airline-cost-index-u-s-passenger-airlines.
10

the market continuous operating regarding its pro�tability. The quarterly sample period
between 2000Q1 and 2017Q4 has been chosen to be consistent with data availability. In the
estimation, all variables are represented as demeaned annual percentage changes measured by
quarterly year-on-year log changes that are robust to any seasonality concern by construction.
The summary of series that enter estimations is given in Figure 1, where the average air-
fare (across 2; 992 U.S. domestic routes) is highly correlated with airline costs in terms of their
annual percentage changes. When variation across routes is considered, the standard devia-
tion of airfares is highly correlated with that of passenger numbers across routes, suggesting
that route-speci�c dynamics are important to consider, as we achieve in this paper.
The average (over time) distributions of airfare, number of passengers, market share of
the largest airline, and distance are also given in Figure 1, and they are summarized in Table
1 across routes. As is evident, airfares have an average (across routes) of about $226 between
any two U.S. cities (on average over time), although they range between $96 (representing the
route between Greensboro/High Point, NC and Salt Lake City, UT) and $434 (representing
the route between Richmond, VA and Tampa, FL). Number of passengers have an average of
about 313, with a range between 16 (representing the route between Fargo, ND and Kansas
City, MO) and 19; 336 (representing the route between Los Angeles, CA and San Francisco,
CA).
4 Estimation Results
Individual estimates (2; 992 of them) are achieved for each U.S. domestic route in the sample.
Since pro�t margins and price elasticity measures can be estimated for any period following
11

a shock on the number of passengers (as shown in Equation 4), we obtain annual estimation
results as those obtained one year (four quarters) after the shock. Due to our data covering
U.S. domestic routes (rather than speci�c airlines), the estimated results represent average
values across airlines in particular routes. The following subsections reveal the details.
4.1 Pro�t Margin Estimates
Estimates of annual pro�t margins are summarized in Table 2 and Figure 2 in percentage
terms, while route-speci�c estimates are given in Online Appendix Table A.1. Pro�t margins
have an average of about 13:3%, with a range between 2:7% (for the route between San
Francisco, CA and St. Louis, MO) and 42:9% (for the route between Lexington, KY and
Orlando, FL) across routes.
The average (across routes) estimates of pro�t margins are in line with actual data sets
provided for the overall U.S. air transport sector. For example, according to Airlines for
America, the U.S. airline industry has pro�t margins ranging between 12:1% and 15:6%
between 2015 and 2017.5 Likewise, according to IATA Industry Statistics, the airline industry
in North America has operating margins ranging between 6:8% and 14:4% between 2013 and
2017.6 Similarly, according to Damodaran Online, the U.S. air transport sector has an annual
after-tax operating margin (corresponding to the pro�t margin in this paper) of about 7%
on average between 2000-2017 (i.e., the sample period in this paper).7
Even though the average (across routes) pro�t margins in this paper representing the
U.S. domestic airline market are in line with the U.S. air transport sector data, they are
5The web page of Airlines for America is http://airlines.org/.6The web page of IATA Industry Statistics is https://www.iata.org/.7The web page of Damodaran Online is http://pages.stern.nyu.edu/~adamodar/.
12

lower compared to the literature. For example, studies such as by Berry and Jia (2010)
have suggested pro�t margins for the U.S. airline industry ranging between 41% and 78%
across di¤erent model speci�cations. Since the results of this paper are consistent with the
actual pro�t data, the di¤erence between earlier studies and this paper can be attributed to
alternative estimation methodologies and sample periods.
4.2 Price-Elasticity Estimates
Price elasticity estimates are also summarized in Table 2 and Figure 2, while route-speci�c
estimates are given in the Online Appendix Table A.1. Price elasticity estimates have an
average (across routes) of about 9, with a range between 2:3 (for the route between Lexington,
KY and Orlando, FL) and 39:6 (for the route between San Francisco, CA and St. Louis,
MO).
Our price elasticity estimates, which are consistent with actual pro�t data due to their
implications for pro�t margins as discussed above, are nevertheless higher compared to the
existing literature. In their survey of studies, both Brons, Pels, Nijkamp, and Rietveld (2002)
and Gillen, Morrison, and Stewart (2003) have shown that price elasticity measures have an
average of about 1:1 across studies, with the highest value of 3:2; Berry and Jia (2010) have
suggested price elasticity measures ranging between 1:6 and 2; Chi and Baek (2012) have
estimated a long-run elasticity of about 5:6; Mumbower, Garrow, and Higgins (2014) have
estimated elasticities ranging between 1:3 and 2; and Kutlu and Sickles (2017) have estimated
elasticities ranging between 1:7 and 2:8.8 Since the results of this paper are consistent with
8Also see earlier studies such as by Brander and Zhang (1990), Brander and Zhang (1993) or Oum, Zhang,and Zhang (1993) who have considered route-speci�c pro�t or elasticity measures in their investigations.
13

the actual pro�t data, once again, the di¤erence between earlier studies and this paper can
potentially be connected to alternative estimation methodologies and sample periods.
5 Distribution of Pro�t Margins across Routes
After having pro�t margin estimates for each route (within the U.S.) in our sample, following
studies such as by Borenstein (1989), Lijesen, Nijkamp, and Rietveld (2002), Fischer and
Kamerschen (2003) and Fageda, Jiménez, and Díaz (2012), we would like to know how much
they are a¤ected by certain route characteristics, such as average airfare, average number of
passengers, market share of the largest airline, or distance. Since city characteristics may
also have impacts on pro�t margins (e.g., due to higher/lower demand conditions or airport
costs, as in studies such as by Borenstein (1989), Dobruszkes, Lennert, and Van Hamme
(2011) or Fageda, Jiménez, and Díaz (2012)), we control for (and measure) city-speci�c
e¤ects. Accordingly, we regress pro�t margins in percentage terms (i.e., 100 � "ij) on log
average airfare, log average number of passengers, market share of the largest airline, and
log distance in di¤erent regression speci�cations by including city �xed e¤ects, since these
route characteristics may be correlated with each other. Therefore, our objective is mostly
to show how pro�t margins are correlated with any of these individual route characteristics,
after controlling for city characteristics.
Univariate regression results based on route characteristics are given in Table 3 for pro�t
margins, where Ordinary Least Squares (OLS) is used for cross-sectional estimations. As is
evident, after controlling for city �xed e¤ects, pro�t margins decrease with airfare and they
increase with market share, independent of the regression considered. Pro�t margins decrease
14

with the number of passengers when all variables are used as right-hand-side variables at the
same time, whereas they decrease with distance when only distance is considered as the right-
hand-side variable. Focusing on the signi�cant e¤ects, after controlling for only city �xed
e¤ects, doubling airfare across routes results in about 1:4% lower pro�t margins, doubling the
market share of the largest airline results in about 3:1% higher pro�t margins, and doubling
distance results in about 0:9% lower pro�t margins.
Compared to the existing literature, having negative e¤ects of average airfare on pro�t
margins is consistent with studies such as by Fischer and Kamerschen (2003), whereas having
negative e¤ects of distance on pro�t margins is consistent with studies such as by Kutlu
and Sickles (2017).9 Similarly, having positive e¤ects of market share on pro�t margins is
consistent with studies such as by Bailey, Graham, Graham, and Kaplan (1985), Hurdle,
Johnson, Joskow, Werden, and Williams (1989), Berry (1990), Berry (1992), Borenstein
(1990), Borenstein (1991), Brueckner, Dyer, and Spiller (1992), or Evans, Kessides, et al.
(1993).
Nevertheless, focusing on univariate regressions can result in the omitted variable bias.
Accordingly, when all variables are included at the same time, the results are given in the last
column of Table 3. As is evident, after controlling for city �xed e¤ects and focusing on the
signi�cant e¤ects, doubling airfare across routes results in about 2:8% lower pro�t margins,
and doubling the market share of the largest airline results in about 2:7% higher pro�t
margins. These results are also supported by relatively high R�squared values. However,
log distance becomes insigni�cant when all variables are included in the regression (as in
9Studies such as by Brander and Zhang (1990) have shown how average costs decline with distance dueto certain �xed costs. When this observation is considered together with the results in this paper (showingthat pro�t margins decrease with distance), it is implied that demand is lower for routes with longer distancemeasures.
15

studies such as by Brons, Pels, Nijkamp, and Rietveld (2002)), suggesting that it may be
correlated with (or the determinant of) log airfare.10 We next investigate this possibility
further.
Speci�cally, while investigating the determinants of pro�t margins, airfares can be a¤ected
by distance, number of passengers or market share. To address this issue, an alternative set of
regressions is considered for robustness, this time by using Two-Stage Least Squares (TSLS)
to consider potential endogeneity concerns. The corresponding results are given in Table 4,
where, for further robustness, regressions (1) and (2) consider log distance as an instrument
for log airfare, and regression (3) considers log distance, log passenger and market share as
instruments for log airfare. As is evident, pro�t margins decrease with airfare, independent of
the regression speci�cation considered. Therefore, the results are robust to the consideration
of the relationship between airfare and other variables.
We also run separate regressions of pro�t margins in percentage terms only on city �xed
e¤ects to measure the contribution of city characteristics as in studies such as by Borenstein
(1989), Dobruszkes, Lennert, and Van Hamme (2011) or Fageda, Jiménez, and Díaz (2012).
Since city �xed e¤ects can be measured only in relative terms (across cities), we focus on
deviations from the average city �xed e¤ect. The corresponding results are given in the
Online Appendix Table A.2, where city �xed e¤ects on pro�t margins range between �31:8
and 32:2, suggesting that city characteristics are highly e¤ective in explaining cross-route
pro�t margin di¤erences; relatively high R�squared values support these results.10This result is also consistent with the trade-o¤ between long-distance �ights being less substitutable (i.e.,
having higher pro�t margins) and requiring a larger share of a passenger�s budget (i.e., corresponding to ahigher price elasticity and thus having lower pro�t margins), where these two forces apparently cancel eachother out.
16

It is implied that �ying to/from a particular city may be more or less costly for passengers
with respect to other cities in terms of the pro�t margins paid. Based on the estimated city
�xed e¤ects in the Online Appendix Table A.2, top ten cities with the lowest and with the
highest pro�t margins are given in Table 5. As is evident, cities such as Albany, GA or
Atlantic City, NJ are the cities with lower pro�t margins, whereas cities such as Redding,
CA or Panama City, FL are those with higher pro�t margins, on average across routes.
6 Concluding Remarks and Policy Implications
Estimation of pro�t margins through price elasticity measures requires careful identi�cation
of shocks and their impact on prices and quantities. This paper has used a structural vector
autoregression model to identify shocks on the number of passengers and their impact on
airfares by using quarterly data on the U.S. domestic airline industry at the route level.
Estimation results have suggested higher measures of price elasticity of demand with respect
to the literature such that the U.S. domestic airline industry has an average annual pro�t
margin of about 13:3%, with a range between 2:7% and 42:9%. These average values are in
line with industry-level pro�t data from the U.S., supporting the estimation and identi�cation
methodology in this paper.
Going back to the question asked at the beginning of this paper, it turns out that the
route between Seattle, WA and Yakima, WA with an average airfare of $103 has experienced
annual pro�t margins of about 22:1%, while the route between New York City, NY and
Monterey, CA with an average airfare of $402 has experienced annual pro�t margins of
about 9:9%. Therefore, the higher airfare (with a distance of 2; 596 miles) has experienced
17

pro�t margins less than half of those experienced by the lower airfare (with a distance of
only 103 miles), suggesting that consumer welfare has been higher with the higher airfare (or
the longer distance). This result is not speci�c to this particular route; it has been shown
by considering all routes that higher pro�t margins are associated with lower airfares, higher
market shares or shorter distance measures. It is implied regarding consumer welfare that
consumers bene�t more from U.S. domestic routes with higher airfares, longer distances or
lower airline market shares.
Regarding airline pro�ts, it is implied that there are higher annual pro�t opportunities
in routes with lower airfares, higher airline market shares or shorter distances. City charac-
teristics have also shown to be important determinants of pro�t margins, where cities such
as Albany, GA or Atlantic City, NJ are the cities with lowest pro�t margins, whereas cities
such as Redding, CA or Panama City, FL are those with highest pro�t margins, on average
across routes. However, when annual pro�t margins have been regressed on all variables
at the same time to avoid any omitted variable bias, the coe¢ cient of distance becomes in-
signi�cant, consistent with the trade-o¤between long-distance �ights being less substitutable
(i.e., having higher pro�t margins) and requiring a larger share of a passenger�s budget (i.e.,
corresponding to a higher price elasticity and thus having lower pro�t margins), where these
two forces apparently cancel each other out.
The results in this paper that correspond to higher measures of price elasticity of demand
(and thus lower pro�t margins) with respect to the literature have important policy impli-
cations. Speci�cally, if authorities impose regulations or taxes to avoid excessive usage of
market power by airlines, the results of this paper imply a higher response of passengers with
respect to the existing literature for the average domestic route, suggesting that aviation
18

policies would be more e¤ective in general. It is also implied that the burden of a potential
policy change would be shared between airlines and passengers, which is important from a
consumer welfare perspective.
Since pro�t margins of airlines increase (and thus measures of price elasticity of demand
decrease) with the market share and they decrease with airfare and the number of passengers
across domestic routes, there are also route-speci�c policy implications. In particular, any
aviation regulation or tax would be more e¤ective in domestic routes with higher airfares,
higher number of passengers or lower market shares. Therefore, aviation authorities can
focus more on these particular domestic routes if they would like to have e¤ective policies to
protect consumer welfare.
References
Abate, M. (2016): �Economic e¤ects of air transport market liberalization in Africa,�
Transportation Research Part A: Policy and Practice, 92, 326�337.
Abrahams, M. (1983): �A service quality model of air travel demand: an empirical study,�
Transportation Research Part A: General, 17(5), 385�393.
Bailey, E. E., D. R. Graham, D. P. Graham, and D. P. Kaplan (1985): Deregulating
the airlines, vol. 10. MIT press.
Berry, S., and P. Jia (2010): �Tracing the woes: An empirical analysis of the airline
industry,�American Economic Journal: Microeconomics, 2(3), 1�43.
19

Berry, S. T. (1990): �Airport presence as product di¤erentiation,�The American Economic
Review, 80(2), 394.
(1992): �Estimation of a Model of Entry in the Airline Industry,�Econometrica:
Journal of the Econometric Society, pp. 889�917.
Borenstein, S. (1989): �Hubs and high fares: dominance and market power in the US
airline industry,�The RAND Journal of Economics, pp. 344�365.
(1990): �Airline Mergers, Airport Dominance, and Market Power,�The American
Economic Review, 80(2), 400�404.
(1991): �The dominant-�rm advantage in multiproduct industries: Evidence from
the US airlines,�The Quarterly Journal of Economics, 106(4), 1237�1266.
Brander, J. A., and A. Zhang (1990): �Market conduct in the airline industry: an
empirical investigation,�The RAND Journal of Economics, pp. 567�583.
(1993): �Dynamic oligopoly behaviour in the airline industry,�International journal
of Industrial organization, 11(3), 407�435.
Brons, M., E. Pels, P. Nijkamp, and P. Rietveld (2002): �Price elasticities of demand
for passenger air travel: a meta-analysis,� Journal of Air Transport Management, 8(3),
165�175.
Brueckner, J. K., N. J. Dyer, and P. T. Spiller (1992): �Fare determination in airline
hub-and-spoke networks,�The Rand Journal of Economics, pp. 309�333.
20

Carson, R. T., T. Cenesizoglu, and R. Parker (2011): �Forecasting (aggregate) de-
mand for US commercial air travel,�International journal of Forecasting, 27(3), 923�941.
Chi, J., and J. Baek (2012): �Price and income elasticities of demand for air transportation:
empirical evidence from US airfreight industry,� Journal of Air Transport Management,
20, 18�19.
Dobruszkes, F., M. Lennert, and G. Van Hamme (2011): �An analysis of the de-
terminants of air tra¢ c volume for European metropolitan areas,� Journal of Transport
Geography, 19(4), 755�762.
Evans, W. N., I. N. Kessides, et al. (1993): �Localized market power in the US airline
industry,�The Review of Economics and Statistics, 75(1), 66�75.
Fageda, X., J. L. Jiménez, and C. Díaz (2012): �Fare di¤erences between domestic
and international air markets on routes from Gran Canaria,� Journal of Air Transport
Management, 25, 8�10.
Fischer, T., and D. R. Kamerschen (2003): �Measuring competition in the US airline
industry using the Rosse-Panzar test and cross-sectional regression analyses,�Journal of
Applied Economics, 6(1), 73�93.
Gillen, D. W., W. G. Morrison, and C. Stewart (2003): �Air travel demand elastici-
ties: Concepts, issues and measurement,�Department of Finance, Government of Canada.
Hakim, M. M., and R. Merkert (2019): �Econometric evidence on the determinants of
air transport in South Asian countries,�Transport Policy, 83, 120�126.
21

Hurdle, G. J., R. L. Johnson, A. S. Joskow, G. J. Werden, and M. A. Williams
(1989): �Concentration, potential entry, and performance in the airline industry,� The
Journal of Industrial Economics, pp. 119�139.
Jorge-Calderón, J. (1997): �A demand model for scheduled airline services on interna-
tional European routes,�Journal of Air Transport Management, 3(1), 23�35.
Kutlu, L., and R. C. Sickles (2017): �Measuring market power when �rms price dis-
criminate,�Empirical Economics, 53(1), 287�305.
Lijesen, M. G., P. Nijkamp, and P. Rietveld (2002): �Measuring competition in civil
aviation,�Journal of Air Transport Management, 8(3), 189�197.
Morlotti, C., M. Cattaneo, P. Malighetti, and R. Redondi (2017): �Multi-
dimensional price elasticity for leisure and business destinations in the low-cost air trans-
port market: Evidence from easyJet,�Tourism Management, 61, 23�34.
Mumbower, S., L. A. Garrow, andM. J. Higgins (2014): �Estimating �ight-level price
elasticities using online airline data: A �rst step toward integrating pricing, demand, and
revenue optimization,�Transportation Research Part A: Policy and Practice, 66, 196�212.
Oum, T. H., A. Zhang, and Y. Zhang (1993): �Inter-�rm rivalry and �rm-speci�c price
elasticities in deregulated airline markets,� Journal of Transport Economics and Policy,
pp. 171�192.
Valdes, V. (2015): �Determinants of air travel demand in Middle Income Countries,�Jour-
nal of Air Transport Management, 42, 75�84.
22
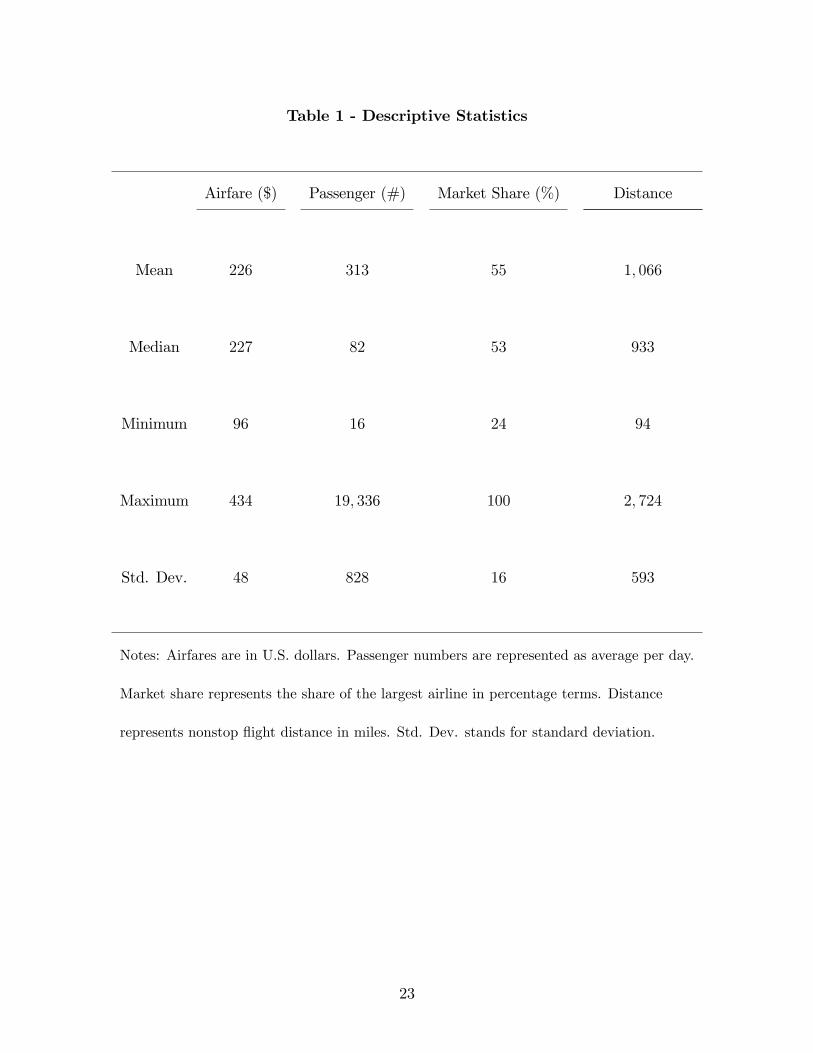
Table 1 - Descriptive Statistics
Airfare ($) Passenger (#) Market Share (%) Distance
Mean 226 313 55 1; 066
Median 227 82 53 933
Minimum 96 16 24 94
Maximum 434 19; 336 100 2; 724
Std. Dev. 48 828 16 593
Notes: Airfares are in U.S. dollars. Passenger numbers are represented as average per day.
Market share represents the share of the largest airline in percentage terms. Distance
represents nonstop �ight distance in miles. Std. Dev. stands for standard deviation.
23

Table 2 - Summary of Estimation Results
Pro�t Margin (%) Price Elasticity of Demand
Mean 13:264 9:009
Median 12:381 8:077
Minimum 2:722 2:333
Maximum 42:872 39:567
Standard Deviation 5:522 4:249
Notes: Values represent the distribution across routes. The values represent estimates
obtained one year after a shock on the number of passengers. City-pair speci�c estimation
results are given in the Online Appendix.
24

Table 3 - Cross-Route Estimation Results (OLS)
Dependent Variable: Pro�t Margins (%)
(1) (2) (3) (4) (5)
Log Airfare �1:440�� �2:823��
(0:486) (0:940)
Log Passenger �0:185 �1:226���
(0:161) (0:252)
Market Share 3:133��� 2:725��
(0:693) (0:957)
Log Distance �0:910��� �0:321
(0:172) (0:300)
City Fixed E¤ects YES YES YES YES YES
Sample Size 2992 2992 2992 2992 2992
Adj. R�Squared 0:329 0:318 0:316 0:321 0:329
Notes: Standard errors are in parentheses. +, �, ��and ���represent signi�cance at the
10%, 5%,1% and 0.1% levels, respectively.
25

Table 4 - Cross-Route Estimation Results (TSLS)
Dependent Variable: Pro�t Margins (%)
(1) (2) (3)
Log Airfare �3:788��� �4:399��� �0:947+
(0:723) (1:136) (0:566)
Log Passenger �1:529���
(0:309)
Market Share 3:177���
(0:774)
City Fixed E¤ects YES YES YES
Sample Size 2992 2992 2992
Notes: Standard errors are in parentheses. +, �, ��and ��� represent
signi�cance at the 10%, 5%,1% and 0.1% levels, respectively.
Regressions (1) and (2) instrument log airfare with log distance,
whereas regression (3) instruments log airfare with log distance, .
log passenger and market share
26

Table 5 - Top Ten Cities
Cities with Lowest Pro�t Margins Cities with Highest Pro�t Margins
Albany, GA Redding, CA
Atlantic City, NJ Panama City, FL
Albuquerque, NM Toledo, OH
Albany, NY Laredo, TX
Lawton/Fort Sill, OK Key West, FL
Amarillo, TX New Bern/Morehead/Beaufort, NC
Dothan, AL Sun Valley/Hailey/Ketchum, ID
Appleton, WI Wausau/Mosinee/Stevens Point, WI
Bismarck/Mandan, ND Gainesville, FL
Abilene, TX Walla Walla, WA
Notes: These lists are based on the city �xed e¤ects given in the Online Appendix Table A.2.
27

Figure 1 - Descriptive Statistics
2005 2010 2015-20
-10
0
10
20
% C
hang
e in
Airf
are/
Pas
seng
ers
-50
0
50
% C
hang
e in
Airl
ine
Cos
ts
Average of Series across Routes
AirfarePassengersAirline Costs
2005 2010 201510
11
12
13
14
15
16
Sta
ndar
d D
evia
tion
of A
irfar
es
15
20
25
30
Sta
ndar
d D
evia
tion
of P
asse
nger
s
Variation across Routes
AirfarePassengers
100 200 300 400 500
Average Airfare ($)
0
200
400
600
800
Num
ber
of R
oute
s
Distribution of Average Airfares
2 4 6 8 10
Log Average Passengers
0
200
400
600
800
1000
Num
ber
of R
oute
sDistribution of Average Passengers
0.2 0.4 0.6 0.8 1
Share of Largest Airline
0
100
200
300
400
500
600
Num
ber
of R
oute
s
Distribution of Average Market Shares
0 1000 2000 3000
Distance between Cities
0
100
200
300
400
500
600
Num
ber
of R
oute
s
Distribution of Average Distances
28

Figure 2 - Summary of Estimation Results
0 20 40 60 80
Profit Margin (%)
0
100
200
300
400
500
600
700
800
900
1000
Num
ber
of R
oute
s
Profit Margins
0 5 10 15 20 25 30
Elasticity
0
200
400
600
800
1000
1200
1400
Num
ber
of R
oute
s
Price Elasticity
29

Origin City Destination City Median Lower Upper Median Lower Upper
Allentown/Bethlehem/Easton, PA Dallas/Fort Worth, TX 18.31 8.04 32.19 5.46 3.11 12.44
Allentown/Bethlehem/Easton, PA Atlanta, GA (Metropolitan Area) 13.39 5.80 24.98 7.47 4.00 17.23
Allentown/Bethlehem/Easton, PA Phoenix, AZ 18.50 6.84 32.30 5.41 3.10 14.61
Allentown/Bethlehem/Easton, PA Chicago, IL 24.11 9.89 39.45 4.15 2.53 10.11
Allentown/Bethlehem/Easton, PA Charlotte, NC 16.83 7.39 28.84 5.94 3.47 13.53
Allentown/Bethlehem/Easton, PA Houston, TX 20.03 9.01 34.56 4.99 2.89 11.10
Allentown/Bethlehem/Easton, PA Orlando, FL 23.76 11.03 38.33 4.21 2.61 9.07
Allentown/Bethlehem/Easton, PA Minneapolis/St. Paul, MN 19.67 10.55 30.35 5.08 3.29 9.48
Allentown/Bethlehem/Easton, PA Las Vegas, NV 21.17 9.61 36.37 4.72 2.75 10.41
Allentown/Bethlehem/Easton, PA Miami, FL (Metropolitan Area) 22.21 9.73 38.13 4.50 2.62 10.27
Allentown/Bethlehem/Easton, PA Los Angeles, CA (Metropolitan Area) 13.22 5.15 23.14 7.56 4.32 19.43
Allentown/Bethlehem/Easton, PA Tampa, FL (Metropolitan Area) 28.16 14.12 46.12 3.55 2.17 7.08
Abilene, TX Dallas/Fort Worth, TX 12.59 5.81 21.00 7.94 4.76 17.21
Albuquerque, NM Dallas/Fort Worth, TX 7.87 3.44 14.52 12.70 6.89 29.03
Albuquerque, NM Pittsburgh, PA 18.39 9.10 28.96 5.44 3.45 10.99
Albuquerque, NM Denver, CO 9.88 4.48 17.77 10.12 5.63 22.36
Albuquerque, NM Atlanta, GA (Metropolitan Area) 10.45 4.18 18.11 9.57 5.52 23.93
Albuquerque, NM Austin, TX 9.83 4.32 17.07 10.18 5.86 23.13
Albuquerque, NM Tucson, AZ 24.50 11.06 40.50 4.08 2.47 9.04
Albuquerque, NM Phoenix, AZ 13.68 5.67 23.86 7.31 4.19 17.64
Albuquerque, NM Hartford, CT 8.87 3.61 17.01 11.27 5.88 27.68
Albuquerque, NM Seattle, WA 5.32 2.31 10.47 18.79 9.55 43.22
Albuquerque, NM Birmingham, AL 14.12 6.40 25.78 7.08 3.88 15.64
Albuquerque, NM Cleveland, OH (Metropolitan Area) 9.07 3.82 18.37 11.03 5.44 26.16
Albuquerque, NM Nashville, TN 9.55 4.17 17.38 10.48 5.76 23.96
Albuquerque, NM Boise, ID 9.52 4.11 17.06 10.50 5.86 24.33
Albuquerque, NM Boston, MA (Metropolitan Area) 8.56 3.78 15.14 11.68 6.61 26.42
Albuquerque, NM Washington, DC (Metropolitan Area) 5.33 2.27 11.12 18.78 8.99 43.96
Albuquerque, NM Chicago, IL 6.50 2.46 12.42 15.37 8.05 40.71
Albuquerque, NM Charlotte, NC 14.89 7.03 24.11 6.71 4.15 14.22
Albuquerque, NM Columbus, OH 15.00 6.79 27.28 6.66 3.67 14.72
Albuquerque, NM St. Louis, MO 13.47 6.47 22.86 7.42 4.38 15.45
Albuquerque, NM Jacksonville, FL 16.27 6.54 27.31 6.15 3.66 15.29
Albuquerque, NM Dayton, OH 15.16 5.99 26.91 6.60 3.72 16.70
Albuquerque, NM Detroit, MI 10.86 4.23 18.69 9.21 5.35 23.67
Albuquerque, NM Houston, TX 9.51 3.92 19.55 10.52 5.11 25.48
Albuquerque, NM Orlando, FL 6.59 2.35 11.77 15.17 8.49 42.58
Albuquerque, NM Minneapolis/St. Paul, MN 9.46 4.14 15.79 10.57 6.33 24.18
Albuquerque, NM New York City, NY (Metropolitan Area) 8.89 3.90 15.72 11.25 6.36 25.65
Albuquerque, NM Spokane, WA 19.05 8.28 34.06 5.25 2.94 12.08
Albuquerque, NM Las Vegas, NV 10.05 4.29 18.49 9.95 5.41 23.33
Albuquerque, NM Indianapolis, IN 17.84 8.38 29.34 5.60 3.41 11.94
Albuquerque, NM San Francisco, CA (Metropolitan Area) 4.53 1.82 9.30 22.08 10.75 54.92
Online Appendix Table A.1 - Estimation Results for Each City Pair
Profit Margin (%) Price Elasticity

Origin City Destination City Median Lower Upper Median Lower Upper
Online Appendix Table A.1 - Estimation Results for Each City Pair
Profit Margin (%) Price Elasticity
Albuquerque, NM Miami, FL (Metropolitan Area) 7.84 3.05 13.51 12.76 7.40 32.79
Albuquerque, NM Los Angeles, CA (Metropolitan Area) 6.57 2.78 13.29 15.21 7.52 36.01
Albuquerque, NM Little Rock, AR 11.95 4.60 21.91 8.37 4.56 21.76
Albuquerque, NM Louisville, KY 10.72 4.65 20.25 9.33 4.94 21.49
Albuquerque, NM Cincinnati, OH 18.71 9.04 30.92 5.35 3.23 11.06
Albuquerque, NM Sacramento, CA 10.02 4.51 20.25 9.98 4.94 22.19
Albuquerque, NM Tampa, FL (Metropolitan Area) 8.63 3.80 14.90 11.58 6.71 26.31
Albuquerque, NM Kansas City, MO 4.82 1.67 9.46 20.75 10.57 59.70
Albuquerque, NM San Antonio, TX 19.11 8.62 31.73 5.23 3.15 11.60
Albuquerque, NM Memphis, TN 12.96 5.43 22.63 7.72 4.42 18.41
Albuquerque, NM Omaha, NE 11.65 4.91 19.88 8.58 5.03 20.36
Albuquerque, NM Milwaukee, WI 14.31 6.13 24.94 6.99 4.01 16.33
Albuquerque, NM Madison, WI 12.98 6.21 20.44 7.70 4.89 16.11
Albuquerque, NM New Orleans, LA 16.43 6.40 28.83 6.08 3.47 15.63
Albuquerque, NM San Diego, CA 7.57 2.95 14.70 13.21 6.80 33.87
Albuquerque, NM Norfolk, VA (Metropolitan Area) 14.25 6.15 26.11 7.02 3.83 16.27
Albuquerque, NM Oklahoma City, OK 21.44 10.12 36.85 4.66 2.71 9.88
Albuquerque, NM West Palm Beach/Palm Beach, FL 12.37 5.29 21.41 8.08 4.67 18.91
Albuquerque, NM Portland, OR 13.22 6.17 21.98 7.57 4.55 16.22
Albuquerque, NM Philadelphia, PA 15.29 7.18 25.93 6.54 3.86 13.93
Albuquerque, NM Raleigh/Durham, NC 14.65 5.95 25.43 6.82 3.93 16.81
Albuquerque, NM Reno, NV 16.28 6.45 29.38 6.14 3.40 15.49
Albuquerque, NM Salt Lake City, UT 18.42 7.79 32.17 5.43 3.11 12.84
Albuquerque, NM Tulsa, OK 19.06 8.20 33.85 5.25 2.95 12.19
Albuquerque, NM Knoxville, TN 10.22 4.64 18.68 9.79 5.35 21.55
Albany, GA Washington, DC (Metropolitan Area) 8.06 3.48 14.60 12.41 6.85 28.78
Eureka/Arcata, CA Los Angeles, CA (Metropolitan Area) 16.21 7.38 27.25 6.17 3.67 13.56
Atlantic City, NJ Orlando, FL 13.27 5.43 25.41 7.53 3.94 18.41
Atlantic City, NJ Fort Myers, FL 15.32 6.26 29.10 6.53 3.44 15.97
Atlantic City, NJ Miami, FL (Metropolitan Area) 10.00 4.10 19.24 10.00 5.20 24.38
Alexandria, LA Washington, DC (Metropolitan Area) 13.73 5.65 24.31 7.28 4.11 17.70
Alexandria, LA Los Angeles, CA (Metropolitan Area) 20.71 8.81 36.01 4.83 2.78 11.35
Colorado Springs, CO Dallas/Fort Worth, TX 8.78 3.66 17.21 11.39 5.81 27.33
Colorado Springs, CO Pittsburgh, PA 13.80 5.72 24.90 7.24 4.02 17.47
Colorado Springs, CO Huntsville, AL 13.97 5.70 25.07 7.16 3.99 17.53
Colorado Springs, CO Phoenix, AZ 19.72 9.35 31.82 5.07 3.14 10.69
Colorado Springs, CO Seattle, WA 8.46 3.99 16.34 11.81 6.12 25.03
Colorado Springs, CO Nashville, TN 15.92 6.76 28.52 6.28 3.51 14.78
Colorado Springs, CO Washington, DC (Metropolitan Area) 11.84 5.23 20.96 8.45 4.77 19.13
Colorado Springs, CO Columbus, OH 33.82 18.60 48.00 2.96 2.08 5.38
Colorado Springs, CO St. Louis, MO 16.13 7.65 26.54 6.20 3.77 13.08
Colorado Springs, CO Jacksonville, FL 15.43 5.73 28.42 6.48 3.52 17.45
Colorado Springs, CO Dayton, OH 28.02 13.52 43.30 3.57 2.31 7.40

Origin City Destination City Median Lower Upper Median Lower Upper
Online Appendix Table A.1 - Estimation Results for Each City Pair
Profit Margin (%) Price Elasticity
Colorado Springs, CO Detroit, MI 10.40 4.46 19.96 9.62 5.01 22.41
Colorado Springs, CO Houston, TX 16.38 6.83 27.09 6.10 3.69 14.81
Colorado Springs, CO Orlando, FL 20.75 9.42 34.06 4.82 2.94 10.61
Colorado Springs, CO Minneapolis/St. Paul, MN 15.98 7.13 27.29 6.26 3.67 14.02
Colorado Springs, CO New York City, NY (Metropolitan Area) 10.88 4.73 18.59 9.19 5.38 21.15
Colorado Springs, CO Las Vegas, NV 15.06 5.59 26.79 6.64 3.73 17.88
Colorado Springs, CO Indianapolis, IN 10.23 4.51 19.93 9.78 5.02 22.17
Colorado Springs, CO San Francisco, CA (Metropolitan Area) 9.29 3.84 18.02 10.77 5.55 26.04
Colorado Springs, CO Miami, FL (Metropolitan Area) 15.42 6.58 26.70 6.49 3.74 15.21
Colorado Springs, CO Los Angeles, CA (Metropolitan Area) 6.35 3.31 14.40 15.74 6.95 30.22
Colorado Springs, CO Sacramento, CA 13.04 5.83 25.72 7.67 3.89 17.14
Colorado Springs, CO Tampa, FL (Metropolitan Area) 16.19 7.80 25.85 6.18 3.87 12.82
Colorado Springs, CO Kansas City, MO 12.22 5.48 21.30 8.18 4.69 18.26
Colorado Springs, CO San Antonio, TX 17.97 8.53 30.13 5.57 3.32 11.72
Colorado Springs, CO Memphis, TN 20.67 9.26 33.39 4.84 2.99 10.80
Colorado Springs, CO New Orleans, LA 19.32 8.06 34.27 5.18 2.92 12.41
Colorado Springs, CO San Diego, CA 16.10 6.99 28.49 6.21 3.51 14.31
Colorado Springs, CO Norfolk, VA (Metropolitan Area) 17.09 7.34 32.39 5.85 3.09 13.63
Colorado Springs, CO Oklahoma City, OK 10.13 4.28 19.21 9.87 5.21 23.38
Colorado Springs, CO Portland, OR 13.47 6.41 24.97 7.42 4.00 15.59
Colorado Springs, CO Philadelphia, PA 16.95 6.97 29.71 5.90 3.37 14.36
Colorado Springs, CO Raleigh/Durham, NC 10.75 4.14 19.31 9.30 5.18 24.13
Dallas/Fort Worth, TX Pittsburgh, PA 3.62 1.84 6.73 27.63 14.86 54.43
Dallas/Fort Worth, TX Huntsville, AL 9.16 3.65 17.32 10.91 5.77 27.36
Dallas/Fort Worth, TX Denver, CO 4.14 1.89 7.59 24.18 13.17 53.05
Dallas/Fort Worth, TX Wausau/Mosinee/Stevens Point, WI 16.21 7.76 26.93 6.17 3.71 12.89
Dallas/Fort Worth, TX Scranton/Wilkes-Barre, PA 16.74 7.34 28.35 5.97 3.53 13.62
Dallas/Fort Worth, TX Tucson, AZ 7.12 3.09 13.14 14.05 7.61 32.36
Dallas/Fort Worth, TX Phoenix, AZ 6.10 2.46 11.28 16.39 8.86 40.63
Dallas/Fort Worth, TX Kalamazoo, MI 11.70 5.09 22.06 8.55 4.53 19.63
Dallas/Fort Worth, TX Shreveport, LA 9.04 4.38 17.39 11.06 5.75 22.84
Dallas/Fort Worth, TX Hartford, CT 9.65 4.19 17.18 10.36 5.82 23.86
Dallas/Fort Worth, TX Seattle, WA 4.91 2.39 10.51 20.36 9.52 41.84
Dallas/Fort Worth, TX Mobile, AL 13.57 5.49 26.46 7.37 3.78 18.21
Dallas/Fort Worth, TX El Paso, TX 6.25 2.69 10.82 16.01 9.24 37.18
Dallas/Fort Worth, TX Nashville, TN 9.83 4.30 16.47 10.17 6.07 23.27
Dallas/Fort Worth, TX Washington, DC (Metropolitan Area) 7.96 3.71 13.01 12.56 7.69 26.99
Dallas/Fort Worth, TX Wichita, KS 8.76 3.99 16.13 11.41 6.20 25.06
Dallas/Fort Worth, TX St. Louis, MO 5.43 2.48 9.86 18.43 10.14 40.31
Dallas/Fort Worth, TX Myrtle Beach, SC 15.62 6.57 27.57 6.40 3.63 15.21
Dallas/Fort Worth, TX Jacksonville, FL 10.70 5.20 16.94 9.34 5.90 19.24
Dallas/Fort Worth, TX Dayton, OH 7.82 3.05 15.20 12.78 6.58 32.75
Dallas/Fort Worth, TX Detroit, MI 10.34 4.68 18.16 9.67 5.51 21.37

Origin City Destination City Median Lower Upper Median Lower Upper
Online Appendix Table A.1 - Estimation Results for Each City Pair
Profit Margin (%) Price Elasticity
Dallas/Fort Worth, TX Des Moines, IA 8.07 3.79 16.87 12.39 5.93 26.40
Dallas/Fort Worth, TX Houston, TX 12.29 4.46 23.52 8.14 4.25 22.43
Dallas/Fort Worth, TX Orlando, FL 9.07 4.25 15.50 11.03 6.45 23.53
Dallas/Fort Worth, TX Valparaiso, FL 16.40 7.36 29.48 6.10 3.39 13.60
Dallas/Fort Worth, TX Evansville, IN 17.53 7.37 29.25 5.70 3.42 13.58
Dallas/Fort Worth, TX Key West, FL 12.13 4.68 22.53 8.24 4.44 21.36
Dallas/Fort Worth, TX Fargo, ND 14.07 5.71 24.84 7.11 4.03 17.50
Dallas/Fort Worth, TX Fresno, CA 10.46 4.47 17.99 9.56 5.56 22.39
Dallas/Fort Worth, TX Minneapolis/St. Paul, MN 4.84 1.96 9.04 20.66 11.07 50.95
Dallas/Fort Worth, TX New York City, NY (Metropolitan Area) 6.52 2.67 11.09 15.34 9.01 37.46
Dallas/Fort Worth, TX Fort Myers, FL 6.69 2.97 12.61 14.94 7.93 33.62
Dallas/Fort Worth, TX Flint, MI 22.46 10.57 35.98 4.45 2.78 9.46
Dallas/Fort Worth, TX Sioux Falls, SD 14.97 6.62 27.72 6.68 3.61 15.11
Dallas/Fort Worth, TX Fort Smith, AR 10.37 4.90 17.68 9.64 5.66 20.42
Dallas/Fort Worth, TX Fort Wayne, IN 11.94 5.26 22.23 8.37 4.50 19.03
Dallas/Fort Worth, TX Fayetteville, AR 8.77 3.89 14.66 11.40 6.82 25.70
Dallas/Fort Worth, TX Greenville/Spartanburg, SC 9.24 3.91 17.22 10.82 5.81 25.60
Dallas/Fort Worth, TX Spokane, WA 12.30 5.23 20.79 8.13 4.81 19.11
Dallas/Fort Worth, TX Green Bay, WI 10.37 4.58 18.19 9.64 5.50 21.83
Dallas/Fort Worth, TX Grand Rapids, MI 8.62 3.97 15.81 11.60 6.33 25.20
Dallas/Fort Worth, TX Greensboro/High Point, NC 7.92 3.85 15.65 12.64 6.39 25.94
Dallas/Fort Worth, TX Harrisburg, PA 18.43 8.27 30.91 5.43 3.23 12.09
Dallas/Fort Worth, TX Harlingen/San Benito, TX 22.14 11.30 34.28 4.52 2.92 8.85
Dallas/Fort Worth, TX Las Vegas, NV 8.09 3.98 15.64 12.36 6.39 25.10
Dallas/Fort Worth, TX Indianapolis, IN 5.90 2.42 11.21 16.96 8.92 41.29
Dallas/Fort Worth, TX Jackson/Vicksburg, MS 12.06 5.20 22.87 8.29 4.37 19.23
Dallas/Fort Worth, TX San Francisco, CA (Metropolitan Area) 4.20 2.09 8.88 23.81 11.27 47.74
Dallas/Fort Worth, TX Miami, FL (Metropolitan Area) 8.47 3.20 14.49 11.80 6.90 31.24
Dallas/Fort Worth, TX Los Angeles, CA (Metropolitan Area) 5.93 2.56 11.91 16.88 8.40 39.05
Dallas/Fort Worth, TX Little Rock, AR 14.89 6.48 25.41 6.72 3.94 15.44
Dallas/Fort Worth, TX Lubbock, TX 11.51 4.87 21.16 8.69 4.73 20.55
Dallas/Fort Worth, TX Lexington, KY 12.82 5.39 22.69 7.80 4.41 18.54
Dallas/Fort Worth, TX Lafayette, LA 29.57 13.82 46.08 3.38 2.17 7.23
Dallas/Fort Worth, TX Laredo, TX 17.12 8.30 28.07 5.84 3.56 12.05
Dallas/Fort Worth, TX Louisville, KY 10.83 4.68 18.64 9.24 5.36 21.38
Dallas/Fort Worth, TX Midland/Odessa, TX 16.33 6.94 28.17 6.12 3.55 14.41
Dallas/Fort Worth, TX Sacramento, CA 10.75 5.24 18.95 9.31 5.28 19.10
Dallas/Fort Worth, TX Tampa, FL (Metropolitan Area) 8.24 3.57 13.80 12.13 7.25 28.00
Dallas/Fort Worth, TX Kansas City, MO 5.40 2.35 9.33 18.51 10.72 42.54
Dallas/Fort Worth, TX San Antonio, TX 14.94 6.15 25.67 6.69 3.90 16.27
Dallas/Fort Worth, TX Memphis, TN 7.61 3.45 12.48 13.15 8.01 28.97
Dallas/Fort Worth, TX Mission/McAllen/Edinburg, TX 7.28 2.98 14.13 13.74 7.08 33.55
Dallas/Fort Worth, TX Montgomery, AL 33.58 15.28 49.58 2.98 2.02 6.54

Origin City Destination City Median Lower Upper Median Lower Upper
Online Appendix Table A.1 - Estimation Results for Each City Pair
Profit Margin (%) Price Elasticity
Dallas/Fort Worth, TX Omaha, NE 7.97 3.08 14.08 12.54 7.10 32.51
Dallas/Fort Worth, TX Milwaukee, WI 16.99 8.44 26.15 5.89 3.82 11.85
Dallas/Fort Worth, TX Quad Cities, IL (Metropolitan Area) 21.62 11.13 31.92 4.63 3.13 8.98
Dallas/Fort Worth, TX Madison, WI 8.70 3.78 14.71 11.49 6.80 26.46
Dallas/Fort Worth, TX New Orleans, LA 10.43 4.63 21.09 9.59 4.74 21.59
Dallas/Fort Worth, TX San Diego, CA 5.70 2.77 11.27 17.55 8.88 36.15
Dallas/Fort Worth, TX Norfolk, VA (Metropolitan Area) 8.03 3.27 15.25 12.45 6.56 30.55
Dallas/Fort Worth, TX Pensacola, FL 19.55 8.68 31.72 5.12 3.15 11.52
Dallas/Fort Worth, TX Oklahoma City, OK 14.87 6.52 26.16 6.73 3.82 15.33
Dallas/Fort Worth, TX West Palm Beach/Palm Beach, FL 6.48 2.67 12.00 15.44 8.34 37.61
Dallas/Fort Worth, TX Portland, OR 4.91 2.05 7.91 20.36 12.65 48.82
Dallas/Fort Worth, TX Philadelphia, PA 5.97 2.97 11.03 16.75 9.07 33.69
Dallas/Fort Worth, TX Peoria, IL 15.47 6.45 26.63 6.47 3.75 15.50
Dallas/Fort Worth, TX Paso Robles/San Luis Obispo, CA 13.86 6.28 25.33 7.21 3.95 15.93
Dallas/Fort Worth, TX Palm Springs, CA 9.84 4.07 18.33 10.16 5.45 24.56
Dallas/Fort Worth, TX Portland, ME 30.07 16.57 43.49 3.33 2.30 6.04
Dallas/Fort Worth, TX Rapid City, SD 13.22 5.72 24.21 7.56 4.13 17.48
Dallas/Fort Worth, TX Raleigh/Durham, NC 7.39 3.27 12.57 13.53 7.96 30.60
Dallas/Fort Worth, TX Richmond, VA 10.90 4.45 19.79 9.17 5.05 22.45
Dallas/Fort Worth, TX Reno, NV 13.11 5.18 25.55 7.63 3.91 19.30
Dallas/Fort Worth, TX Roanoke, VA 12.16 4.95 20.95 8.22 4.77 20.22
Dallas/Fort Worth, TX Rochester, NY 12.40 6.38 20.27 8.06 4.93 15.66
Dallas/Fort Worth, TX Salt Lake City, UT 8.42 3.88 14.76 11.88 6.78 25.75
Dallas/Fort Worth, TX Tulsa, OK 10.73 4.30 19.24 9.32 5.20 23.24
Dallas/Fort Worth, TX Savannah, GA 15.11 6.60 25.51 6.62 3.92 15.15
Dallas/Fort Worth, TX Santa Barbara, CA 15.33 7.65 26.33 6.52 3.80 13.07
Dallas/Fort Worth, TX South Bend, IN 13.43 5.91 22.50 7.44 4.44 16.92
Dallas/Fort Worth, TX Springfield, MO 7.42 2.88 13.16 13.48 7.60 34.73
Dallas/Fort Worth, TX San Angelo, TX 13.08 5.80 22.43 7.65 4.46 17.24
Dallas/Fort Worth, TX Salinas/Monterey, CA 14.95 6.56 25.50 6.69 3.92 15.24
Dallas/Fort Worth, TX Sarasota/Bradenton, FL 19.18 9.83 29.72 5.21 3.36 10.17
Dallas/Fort Worth, TX Syracuse, NY 12.75 5.29 21.95 7.84 4.56 18.91
Dallas/Fort Worth, TX Tallahassee, FL 15.38 7.01 28.32 6.50 3.53 14.27
Dallas/Fort Worth, TX Knoxville, TN 10.43 4.11 18.67 9.59 5.36 24.35
Pittsburgh, PA Tucson, AZ 8.65 3.32 17.45 11.57 5.73 30.12
Pittsburgh, PA Seattle, WA 12.15 5.00 20.44 8.23 4.89 20.01
Pittsburgh, PA Washington, DC (Metropolitan Area) 23.37 12.65 34.41 4.28 2.91 7.90
Pittsburgh, PA Wichita, KS 18.04 9.02 27.59 5.54 3.62 11.09
Pittsburgh, PA St. Louis, MO 19.51 8.64 37.34 5.13 2.68 11.57
Pittsburgh, PA Wilmington, NC 7.64 2.98 14.54 13.10 6.88 33.59
Pittsburgh, PA San Francisco, CA (Metropolitan Area) 7.16 3.30 12.60 13.97 7.94 30.27
Pittsburgh, PA Sacramento, CA 13.49 6.06 24.91 7.41 4.02 16.51
Pittsburgh, PA Tampa, FL (Metropolitan Area) 6.80 3.18 12.29 14.71 8.14 31.44

Origin City Destination City Median Lower Upper Median Lower Upper
Online Appendix Table A.1 - Estimation Results for Each City Pair
Profit Margin (%) Price Elasticity
Pittsburgh, PA San Antonio, TX 9.84 4.02 17.65 10.17 5.66 24.85
Pittsburgh, PA San Diego, CA 22.19 12.96 31.59 4.51 3.17 7.72
Pittsburgh, PA West Palm Beach/Palm Beach, FL 12.82 5.19 22.66 7.80 4.41 19.26
Pittsburgh, PA Portland, OR 7.55 2.68 14.50 13.24 6.89 37.29
Pittsburgh, PA Portland, ME 7.69 3.46 14.85 13.01 6.73 28.89
Pittsburgh, PA Raleigh/Durham, NC 16.11 6.47 29.16 6.21 3.43 15.46
Pittsburgh, PA Reno, NV 21.73 10.12 35.91 4.60 2.78 9.89
Pittsburgh, PA Salt Lake City, UT 10.47 4.21 19.06 9.56 5.25 23.78
Pittsburgh, PA Tulsa, OK 7.61 2.70 15.00 13.13 6.67 36.99
Pittsburgh, PA Savannah, GA 13.47 5.87 22.59 7.43 4.43 17.05
Pittsburgh, PA Sarasota/Bradenton, FL 13.91 6.47 26.13 7.19 3.83 15.45
Pittsburgh, PA Syracuse, NY 14.31 5.97 26.10 6.99 3.83 16.75
Augusta, GA Dallas/Fort Worth, TX 16.57 8.00 29.23 6.03 3.42 12.51
Augusta, GA Boston, MA (Metropolitan Area) 12.73 5.56 23.27 7.86 4.30 17.98
Augusta, GA Washington, DC (Metropolitan Area) 12.63 5.89 23.35 7.92 4.28 16.98
Augusta, GA Chicago, IL 20.11 8.75 34.04 4.97 2.94 11.43
Augusta, GA New York City, NY (Metropolitan Area) 11.00 4.67 20.84 9.09 4.80 21.40
Augusta, GA Miami, FL (Metropolitan Area) 21.10 9.43 34.74 4.74 2.88 10.61
Augusta, GA Los Angeles, CA (Metropolitan Area) 16.23 6.16 29.35 6.16 3.41 16.24
Huntsville, AL Pittsburgh, PA 8.59 3.31 15.51 11.64 6.45 30.19
Huntsville, AL Phoenix, AZ 11.56 4.77 23.17 8.65 4.32 20.95
Huntsville, AL Seattle, WA 11.58 5.02 21.64 8.64 4.62 19.93
Huntsville, AL Washington, DC (Metropolitan Area) 14.28 6.15 23.93 7.00 4.18 16.27
Huntsville, AL Jacksonville, FL 9.62 4.15 18.14 10.39 5.51 24.11
Huntsville, AL Orlando, FL 34.54 19.53 47.22 2.90 2.12 5.12
Huntsville, AL Minneapolis/St. Paul, MN 6.69 2.51 12.91 14.94 7.75 39.91
Huntsville, AL New York City, NY (Metropolitan Area) 13.03 5.40 22.45 7.67 4.45 18.52
Huntsville, AL Las Vegas, NV 20.37 9.52 33.23 4.91 3.01 10.50
Huntsville, AL San Francisco, CA (Metropolitan Area) 8.61 3.74 15.99 11.61 6.25 26.72
Huntsville, AL Miami, FL (Metropolitan Area) 19.76 9.38 33.93 5.06 2.95 10.67
Huntsville, AL Los Angeles, CA (Metropolitan Area) 8.89 3.78 15.62 11.25 6.40 26.43
Huntsville, AL Tampa, FL (Metropolitan Area) 15.35 7.64 25.08 6.51 3.99 13.09
Huntsville, AL San Antonio, TX 20.01 8.78 31.53 5.00 3.17 11.39
Huntsville, AL San Diego, CA 11.95 5.00 21.79 8.37 4.59 20.01
Huntsville, AL Norfolk, VA (Metropolitan Area) 18.12 8.05 30.60 5.52 3.27 12.42
Huntsville, AL Philadelphia, PA 11.11 4.92 18.58 9.00 5.38 20.32
Huntsville, AL Raleigh/Durham, NC 11.74 5.26 19.96 8.52 5.01 19.03
Huntsville, AL Richmond, VA 8.71 3.34 16.75 11.48 5.97 29.94
Huntsville, AL Salt Lake City, UT 9.40 3.80 17.47 10.63 5.73 26.30
Albany, NY Dallas/Fort Worth, TX 6.37 2.49 12.11 15.71 8.26 40.16
Albany, NY Pittsburgh, PA 33.72 22.87 43.51 2.97 2.30 4.37
Albany, NY Denver, CO 9.15 4.19 17.38 10.92 5.75 23.89
Albany, NY Atlanta, GA (Metropolitan Area) 16.84 8.84 24.88 5.94 4.02 11.31

Origin City Destination City Median Lower Upper Median Lower Upper
Online Appendix Table A.1 - Estimation Results for Each City Pair
Profit Margin (%) Price Elasticity
Albany, NY Austin, TX 9.78 3.99 18.56 10.22 5.39 25.05
Albany, NY Phoenix, AZ 5.14 1.96 12.74 19.47 7.85 51.14
Albany, NY Seattle, WA 7.72 3.25 14.78 12.95 6.77 30.81
Albany, NY Cleveland, OH (Metropolitan Area) 27.79 12.06 46.67 3.60 2.14 8.29
Albany, NY Nashville, TN 11.24 5.09 18.74 8.90 5.34 19.67
Albany, NY Washington, DC (Metropolitan Area) 5.86 2.26 11.16 17.07 8.96 44.17
Albany, NY Chicago, IL 12.85 4.95 21.67 7.78 4.62 20.21
Albany, NY Charleston, SC 12.13 5.26 21.90 8.24 4.57 19.00
Albany, NY Charlotte, NC 7.28 2.95 12.95 13.73 7.72 33.94
Albany, NY Columbus, OH 12.12 5.59 20.96 8.25 4.77 17.89
Albany, NY St. Louis, MO 10.62 5.20 19.97 9.42 5.01 19.24
Albany, NY Myrtle Beach, SC 36.46 19.75 50.40 2.74 1.98 5.06
Albany, NY Jacksonville, FL 14.13 5.27 24.37 7.08 4.10 18.99
Albany, NY Detroit, MI 16.49 7.11 28.15 6.06 3.55 14.06
Albany, NY Houston, TX 9.64 3.91 16.37 10.37 6.11 25.55
Albany, NY Orlando, FL 16.71 8.24 28.47 5.98 3.51 12.14
Albany, NY Minneapolis/St. Paul, MN 22.19 10.53 35.04 4.51 2.85 9.49
Albany, NY Fort Myers, FL 21.82 10.65 34.57 4.58 2.89 9.39
Albany, NY Greenville/Spartanburg, SC 12.10 5.51 20.61 8.26 4.85 18.16
Albany, NY Las Vegas, NV 8.07 3.37 15.24 12.39 6.56 29.65
Albany, NY Indianapolis, IN 7.86 3.13 14.35 12.73 6.97 31.96
Albany, NY San Francisco, CA (Metropolitan Area) 5.49 2.21 9.97 18.22 10.03 45.26
Albany, NY Miami, FL (Metropolitan Area) 15.67 7.24 27.38 6.38 3.65 13.81
Albany, NY Los Angeles, CA (Metropolitan Area) 4.53 1.92 8.13 22.09 12.30 52.04
Albany, NY Louisville, KY 15.52 6.85 27.44 6.44 3.64 14.60
Albany, NY Cincinnati, OH 13.63 6.38 23.38 7.33 4.28 15.68
Albany, NY Tampa, FL (Metropolitan Area) 8.58 3.70 16.41 11.65 6.09 27.00
Albany, NY Kansas City, MO 9.35 3.76 17.39 10.69 5.75 26.62
Albany, NY San Antonio, TX 10.76 3.98 20.50 9.30 4.88 25.13
Albany, NY Milwaukee, WI 13.39 5.95 22.84 7.47 4.38 16.81
Albany, NY New Orleans, LA 14.56 5.36 25.47 6.87 3.93 18.65
Albany, NY San Diego, CA 6.10 2.28 11.72 16.39 8.54 43.84
Albany, NY Norfolk, VA (Metropolitan Area) 26.59 14.55 39.85 3.76 2.51 6.87
Albany, NY West Palm Beach/Palm Beach, FL 8.63 3.61 16.09 11.58 6.22 27.68
Albany, NY Portland, OR 6.73 2.81 14.82 14.85 6.75 35.61
Albany, NY Philadelphia, PA 5.63 2.15 10.06 17.77 9.94 46.41
Albany, NY Raleigh/Durham, NC 11.16 5.09 21.01 8.96 4.76 19.67
Albany, NY Salt Lake City, UT 13.59 6.29 21.93 7.36 4.56 15.89
Amarillo, TX Dallas/Fort Worth, TX 15.23 6.98 27.98 6.57 3.57 14.33
Amarillo, TX Atlanta, GA (Metropolitan Area) 10.85 4.35 20.41 9.22 4.90 23.01
Amarillo, TX Austin, TX 13.14 5.78 24.05 7.61 4.16 17.29
Amarillo, TX Phoenix, AZ 16.47 7.02 32.34 6.07 3.09 14.24
Amarillo, TX Washington, DC (Metropolitan Area) 11.89 4.68 22.54 8.41 4.44 21.35

Origin City Destination City Median Lower Upper Median Lower Upper
Online Appendix Table A.1 - Estimation Results for Each City Pair
Profit Margin (%) Price Elasticity
Amarillo, TX Chicago, IL 8.63 3.70 18.17 11.59 5.50 27.04
Amarillo, TX Houston, TX 15.94 6.68 29.20 6.28 3.43 14.98
Amarillo, TX Orlando, FL 15.09 7.26 23.91 6.63 4.18 13.77
Amarillo, TX New York City, NY (Metropolitan Area) 8.68 3.67 15.76 11.52 6.35 27.26
Amarillo, TX Las Vegas, NV 13.33 6.00 21.51 7.50 4.65 16.67
Amarillo, TX San Francisco, CA (Metropolitan Area) 8.83 2.88 16.08 11.32 6.22 34.69
Amarillo, TX Los Angeles, CA (Metropolitan Area) 8.16 3.23 14.81 12.26 6.75 30.95
Amarillo, TX San Antonio, TX 16.57 6.69 31.44 6.04 3.18 14.96
Amarillo, TX San Diego, CA 15.82 6.28 29.17 6.32 3.43 15.92
Durango, CO San Francisco, CA (Metropolitan Area) 12.83 5.72 22.27 7.80 4.49 17.48
Durango, CO Los Angeles, CA (Metropolitan Area) 10.88 4.53 20.73 9.19 4.82 22.06
Denver, CO Pittsburgh, PA 9.36 4.23 15.88 10.68 6.30 23.64
Denver, CO Huntsville, AL 15.46 7.17 24.49 6.47 4.08 13.95
Denver, CO Tucson, AZ 7.22 2.74 13.48 13.85 7.42 36.48
Denver, CO Phoenix, AZ 7.64 3.16 13.29 13.09 7.52 31.61
Denver, CO Shreveport, LA 10.62 4.44 20.86 9.42 4.79 22.54
Denver, CO Hartford, CT 13.36 5.74 23.38 7.49 4.28 17.43
Denver, CO Seattle, WA 4.24 1.91 8.12 23.60 12.33 52.30
Denver, CO Mobile, AL 20.81 9.43 36.76 4.80 2.72 10.60
Denver, CO El Paso, TX 15.22 6.51 29.34 6.57 3.41 15.37
Denver, CO Nashville, TN 11.22 4.93 21.75 8.91 4.60 20.27
Denver, CO Washington, DC (Metropolitan Area) 8.79 3.36 16.37 11.38 6.11 29.77
Denver, CO Wichita, KS 8.21 3.25 14.10 12.19 7.09 30.81
Denver, CO St. Louis, MO 7.16 3.10 13.32 13.96 7.51 32.22
Denver, CO Jacksonville, FL 15.38 6.87 24.80 6.50 4.03 14.55
Denver, CO Detroit, MI 7.44 3.41 13.38 13.44 7.47 29.32
Denver, CO Des Moines, IA 9.31 3.74 17.66 10.74 5.66 26.75
Denver, CO Houston, TX 4.08 1.73 7.73 24.50 12.94 57.83
Denver, CO Orlando, FL 13.06 6.66 21.48 7.66 4.66 15.01
Denver, CO Valparaiso, FL 24.12 11.24 39.42 4.15 2.54 8.90
Denver, CO Eugene, OR 10.32 4.04 21.26 9.69 4.70 24.76
Denver, CO Fargo, ND 17.83 8.11 31.03 5.61 3.22 12.33
Denver, CO Fresno, CA 27.95 13.12 43.25 3.58 2.31 7.62
Denver, CO Minneapolis/St. Paul, MN 9.17 3.84 16.10 10.90 6.21 26.05
Denver, CO New York City, NY (Metropolitan Area) 6.21 2.74 11.46 16.10 8.73 36.49
Denver, CO Fort Myers, FL 10.78 4.87 21.08 9.28 4.74 20.52
Denver, CO Sioux Falls, SD 14.78 5.40 26.70 6.77 3.74 18.53
Denver, CO Fort Wayne, IN 18.49 7.67 30.14 5.41 3.32 13.05
Denver, CO Greenville/Spartanburg, SC 19.24 9.42 29.77 5.20 3.36 10.62
Denver, CO Spokane, WA 9.39 4.13 16.67 10.64 6.00 24.23
Denver, CO Green Bay, WI 21.77 10.29 36.85 4.59 2.71 9.72
Denver, CO Grand Rapids, MI 23.99 11.73 37.57 4.17 2.66 8.53
Denver, CO Greensboro/High Point, NC 13.65 5.95 25.33 7.32 3.95 16.81

Origin City Destination City Median Lower Upper Median Lower Upper
Online Appendix Table A.1 - Estimation Results for Each City Pair
Profit Margin (%) Price Elasticity
Denver, CO Harrisburg, PA 16.35 7.07 28.31 6.12 3.53 14.14
Denver, CO Helena, MT 11.51 5.07 20.14 8.69 4.96 19.71
Denver, CO Las Vegas, NV 11.37 4.99 19.66 8.79 5.09 20.06
Denver, CO Idaho Falls, ID 12.30 5.10 24.40 8.13 4.10 19.59
Denver, CO Indianapolis, IN 9.74 4.23 16.85 10.27 5.94 23.67
Denver, CO Jackson, WY 10.86 4.20 21.05 9.21 4.75 23.82
Denver, CO Jackson/Vicksburg, MS 8.80 4.09 16.74 11.36 5.98 24.44
Denver, CO San Francisco, CA (Metropolitan Area) 3.72 1.39 7.72 26.86 12.96 71.93
Denver, CO Miami, FL (Metropolitan Area) 10.78 5.21 18.69 9.28 5.35 19.18
Denver, CO Los Angeles, CA (Metropolitan Area) 5.99 2.79 10.58 16.70 9.45 35.81
Denver, CO Little Rock, AR 9.85 4.34 18.68 10.15 5.35 23.04
Denver, CO Lexington, KY 20.95 9.59 34.79 4.77 2.87 10.43
Denver, CO Louisville, KY 12.91 5.40 22.09 7.74 4.53 18.52
Denver, CO Saginaw/Bay City/Midland, MI 15.11 6.58 26.84 6.62 3.73 15.19
Denver, CO Sacramento, CA 10.21 5.02 18.12 9.80 5.52 19.93
Denver, CO Tampa, FL (Metropolitan Area) 9.78 4.21 16.64 10.22 6.01 23.75
Denver, CO Kansas City, MO 6.34 2.78 12.13 15.78 8.24 35.99
Denver, CO San Antonio, TX 13.67 6.22 23.31 7.32 4.29 16.07
Denver, CO Memphis, TN 23.90 11.00 38.54 4.18 2.59 9.09
Denver, CO Mission/McAllen/Edinburg, TX 17.07 6.80 29.26 5.86 3.42 14.71
Denver, CO Omaha, NE 10.75 4.37 19.00 9.30 5.26 22.88
Denver, CO Milwaukee, WI 15.95 7.71 26.30 6.27 3.80 12.97
Denver, CO Quad Cities, IL (Metropolitan Area) 12.05 5.40 21.26 8.30 4.70 18.52
Denver, CO Madison, WI 16.57 6.35 29.03 6.04 3.44 15.75
Denver, CO Missoula, MT 22.15 9.09 35.27 4.51 2.84 11.00
Denver, CO New Orleans, LA 10.20 4.31 17.49 9.81 5.72 23.20
Denver, CO San Diego, CA 5.87 2.32 11.40 17.04 8.77 43.10
Denver, CO Norfolk, VA (Metropolitan Area) 10.93 5.08 19.40 9.15 5.16 19.69
Denver, CO Pensacola, FL 13.27 5.33 22.38 7.53 4.47 18.77
Denver, CO Oklahoma City, OK 6.24 1.89 11.20 16.03 8.96 52.90
Denver, CO West Palm Beach/Palm Beach, FL 14.65 6.11 25.38 6.83 3.94 16.36
Denver, CO Portland, OR 7.22 3.02 13.21 13.86 7.57 33.12
Denver, CO Philadelphia, PA 3.95 1.44 7.91 25.30 12.65 69.54
Denver, CO Peoria, IL 15.80 6.94 27.26 6.33 3.67 14.42
Denver, CO Pasco/Kennewick/Richland, WA 14.77 5.96 32.97 6.77 3.03 16.77
Denver, CO Palm Springs, CA 13.78 5.75 29.19 7.26 3.43 17.39
Denver, CO Portland, ME 8.87 3.63 17.60 11.27 5.68 27.55
Denver, CO Raleigh/Durham, NC 4.46 1.46 9.47 22.44 10.56 68.46
Denver, CO Richmond, VA 12.50 5.30 21.74 8.00 4.60 18.85
Denver, CO Reno, NV 11.19 4.93 19.53 8.94 5.12 20.30
Denver, CO Roanoke, VA 14.38 5.99 25.04 6.95 3.99 16.69
Denver, CO Rochester, NY 9.13 3.95 15.57 10.96 6.42 25.30
Denver, CO Salt Lake City, UT 7.13 2.78 12.71 14.02 7.87 35.96

Origin City Destination City Median Lower Upper Median Lower Upper
Online Appendix Table A.1 - Estimation Results for Each City Pair
Profit Margin (%) Price Elasticity
Denver, CO Tulsa, OK 9.82 3.79 17.93 10.18 5.58 26.42
Denver, CO Savannah, GA 15.92 7.16 26.77 6.28 3.74 13.96
Denver, CO Santa Barbara, CA 22.19 10.53 37.39 4.51 2.67 9.49
Denver, CO Springfield, MO 22.77 9.81 40.36 4.39 2.48 10.20
Denver, CO Salinas/Monterey, CA 17.99 7.53 33.29 5.56 3.00 13.27
Denver, CO Sarasota/Bradenton, FL 24.19 11.11 41.52 4.13 2.41 9.00
Denver, CO Syracuse, NY 13.34 5.60 22.81 7.49 4.38 17.86
Denver, CO Tallahassee, FL 19.22 8.66 33.18 5.20 3.01 11.55
Denver, CO Knoxville, TN 11.19 4.77 21.87 8.94 4.57 20.97
Aspen, CO Dallas/Fort Worth, TX 17.68 6.87 31.50 5.66 3.18 14.56
Aspen, CO Denver, CO 17.19 8.33 27.57 5.82 3.63 12.00
Aspen, CO Boston, MA (Metropolitan Area) 10.18 3.90 17.07 9.82 5.86 25.61
Aspen, CO Washington, DC (Metropolitan Area) 12.60 5.34 22.98 7.94 4.35 18.71
Aspen, CO Chicago, IL 11.09 5.29 19.67 9.02 5.08 18.90
Aspen, CO New York City, NY (Metropolitan Area) 11.49 4.59 22.09 8.70 4.53 21.80
Aspen, CO San Francisco, CA (Metropolitan Area) 11.43 4.96 20.76 8.75 4.82 20.15
Aspen, CO Miami, FL (Metropolitan Area) 13.52 5.06 26.37 7.40 3.79 19.76
Aspen, CO Los Angeles, CA (Metropolitan Area) 12.65 4.84 22.84 7.90 4.38 20.68
Atlanta, GA (Metropolitan Area) Colorado Springs, CO 19.46 8.90 31.37 5.14 3.19 11.23
Atlanta, GA (Metropolitan Area) Dallas/Fort Worth, TX 4.74 2.12 8.56 21.10 11.68 47.24
Atlanta, GA (Metropolitan Area) Pittsburgh, PA 3.36 1.18 6.29 29.73 15.89 84.78
Atlanta, GA (Metropolitan Area) Huntsville, AL 14.18 6.12 26.46 7.05 3.78 16.35
Atlanta, GA (Metropolitan Area) Denver, CO 7.77 3.35 13.82 12.87 7.23 29.83
Atlanta, GA (Metropolitan Area) Austin, TX 8.53 3.73 14.69 11.72 6.81 26.78
Atlanta, GA (Metropolitan Area) Wausau/Mosinee/Stevens Point, WI 8.88 4.16 14.75 11.27 6.78 24.06
Atlanta, GA (Metropolitan Area) Scranton/Wilkes-Barre, PA 17.20 6.93 30.82 5.81 3.24 14.43
Atlanta, GA (Metropolitan Area) Tucson, AZ 14.13 5.30 23.64 7.08 4.23 18.88
Atlanta, GA (Metropolitan Area) Phoenix, AZ 5.94 2.67 11.24 16.85 8.90 37.51
Atlanta, GA (Metropolitan Area) Kalamazoo, MI 20.67 8.68 34.41 4.84 2.91 11.52
Atlanta, GA (Metropolitan Area) Shreveport, LA 15.48 7.08 25.60 6.46 3.91 14.13
Atlanta, GA (Metropolitan Area) Hartford, CT 12.36 6.14 20.93 8.09 4.78 16.29
Atlanta, GA (Metropolitan Area) Seattle, WA 5.85 2.19 11.33 17.10 8.83 45.65
Atlanta, GA (Metropolitan Area) Mobile, AL 7.81 3.33 14.66 12.80 6.82 30.01
Atlanta, GA (Metropolitan Area) Bangor, ME 9.39 3.92 17.77 10.65 5.63 25.54
Atlanta, GA (Metropolitan Area) Birmingham, AL 15.59 7.03 28.23 6.42 3.54 14.23
Atlanta, GA (Metropolitan Area) El Paso, TX 12.65 5.28 22.08 7.90 4.53 18.93
Atlanta, GA (Metropolitan Area) Billings, MT 15.48 6.78 28.25 6.46 3.54 14.74
Atlanta, GA (Metropolitan Area) Cleveland, OH (Metropolitan Area) 6.95 2.92 12.89 14.39 7.76 34.22
Atlanta, GA (Metropolitan Area) Nashville, TN 19.21 9.54 30.56 5.21 3.27 10.49
Atlanta, GA (Metropolitan Area) Boise, ID 9.83 3.76 18.14 10.17 5.51 26.59
Atlanta, GA (Metropolitan Area) Boston, MA (Metropolitan Area) 5.28 2.61 8.82 18.93 11.34 38.27
Atlanta, GA (Metropolitan Area) Baton Rouge, LA 17.17 7.12 29.44 5.82 3.40 14.05
Atlanta, GA (Metropolitan Area) Burlington, VT 13.43 6.09 21.09 7.45 4.74 16.43

Origin City Destination City Median Lower Upper Median Lower Upper
Online Appendix Table A.1 - Estimation Results for Each City Pair
Profit Margin (%) Price Elasticity
Atlanta, GA (Metropolitan Area) Buffalo, NY 7.62 3.27 14.31 13.12 6.99 30.56
Atlanta, GA (Metropolitan Area) Bozeman, MT 10.08 4.35 18.47 9.92 5.41 23.00
Atlanta, GA (Metropolitan Area) Washington, DC (Metropolitan Area) 6.82 3.16 11.91 14.67 8.40 31.65
Atlanta, GA (Metropolitan Area) Columbia, SC 10.51 4.52 18.41 9.51 5.43 22.14
Atlanta, GA (Metropolitan Area) Wichita, KS 15.64 7.30 24.16 6.39 4.14 13.70
Atlanta, GA (Metropolitan Area) Chicago, IL 4.22 2.04 7.32 23.71 13.67 49.10
Atlanta, GA (Metropolitan Area) Charlottesville, VA 30.96 15.31 46.48 3.23 2.15 6.53
Atlanta, GA (Metropolitan Area) Charleston, SC 8.70 3.82 15.38 11.49 6.50 26.19
Atlanta, GA (Metropolitan Area) Cedar Rapids/Iowa City, IA 12.94 5.78 22.69 7.73 4.41 17.30
Atlanta, GA (Metropolitan Area) Charlotte, NC 9.85 4.30 16.84 10.15 5.94 23.28
Atlanta, GA (Metropolitan Area) Columbus, OH 7.61 3.42 13.22 13.14 7.56 29.20
Atlanta, GA (Metropolitan Area) St. Louis, MO 8.47 4.26 15.17 11.81 6.59 23.48
Atlanta, GA (Metropolitan Area) Myrtle Beach, SC 17.00 7.98 28.14 5.88 3.55 12.54
Atlanta, GA (Metropolitan Area) Jacksonville, FL 8.75 3.88 14.80 11.43 6.76 25.76
Atlanta, GA (Metropolitan Area) Corpus Christi, TX 15.52 5.63 27.11 6.44 3.69 17.77
Atlanta, GA (Metropolitan Area) Charleston/Dunbar, WV 10.77 4.59 18.50 9.29 5.41 21.79
Atlanta, GA (Metropolitan Area) Daytona Beach, FL 17.53 7.28 31.90 5.70 3.13 13.74
Atlanta, GA (Metropolitan Area) Dayton, OH 12.46 5.50 20.83 8.03 4.80 18.17
Atlanta, GA (Metropolitan Area) Detroit, MI 5.42 2.28 10.85 18.46 9.21 43.88
Atlanta, GA (Metropolitan Area) Des Moines, IA 12.87 5.74 21.40 7.77 4.67 17.42
Atlanta, GA (Metropolitan Area) Houston, TX 3.44 1.34 6.62 29.05 15.11 74.50
Atlanta, GA (Metropolitan Area) Orlando, FL 7.58 3.17 15.28 13.20 6.54 31.59
Atlanta, GA (Metropolitan Area) Key West, FL 22.97 10.57 37.91 4.35 2.64 9.46
Atlanta, GA (Metropolitan Area) Fresno, CA 9.53 4.40 18.85 10.49 5.30 22.71
Atlanta, GA (Metropolitan Area) Minneapolis/St. Paul, MN 3.76 1.59 7.88 26.60 12.73 62.93
Atlanta, GA (Metropolitan Area) New York City, NY (Metropolitan Area) 6.01 2.77 10.00 16.63 10.00 36.12
Atlanta, GA (Metropolitan Area) Fort Myers, FL 8.95 3.68 18.28 11.18 5.47 27.16
Atlanta, GA (Metropolitan Area) Flint, MI 8.59 3.92 16.34 11.65 6.12 25.49
Atlanta, GA (Metropolitan Area) Sioux Falls, SD 12.76 5.10 23.78 7.84 4.20 19.61
Atlanta, GA (Metropolitan Area) Fort Wayne, IN 22.02 11.18 33.56 4.54 2.98 8.95
Atlanta, GA (Metropolitan Area) Fayetteville, AR 10.64 4.81 19.57 9.40 5.11 20.77
Atlanta, GA (Metropolitan Area) Spokane, WA 10.14 3.92 17.45 9.86 5.73 25.53
Atlanta, GA (Metropolitan Area) Gainesville, FL 18.99 9.23 31.03 5.26 3.22 10.83
Atlanta, GA (Metropolitan Area) Green Bay, WI 13.43 5.70 25.32 7.45 3.95 17.55
Atlanta, GA (Metropolitan Area) Grand Rapids, MI 13.59 6.65 21.72 7.36 4.60 15.03
Atlanta, GA (Metropolitan Area) Greensboro/High Point, NC 21.68 12.79 29.45 4.61 3.40 7.82
Atlanta, GA (Metropolitan Area) Harrisburg, PA 8.40 3.51 16.44 11.91 6.08 28.49
Atlanta, GA (Metropolitan Area) Las Vegas, NV 9.04 3.79 17.08 11.06 5.86 26.37
Atlanta, GA (Metropolitan Area) Wilmington, NC 12.79 5.47 21.90 7.82 4.57 18.29
Atlanta, GA (Metropolitan Area) Indianapolis, IN 8.91 3.94 14.92 11.22 6.70 25.36
Atlanta, GA (Metropolitan Area) Jackson, WY 13.58 6.29 25.43 7.36 3.93 15.89
Atlanta, GA (Metropolitan Area) Jackson/Vicksburg, MS 13.08 6.18 21.42 7.65 4.67 16.17
Atlanta, GA (Metropolitan Area) San Francisco, CA (Metropolitan Area) 6.16 2.41 11.43 16.23 8.75 41.46

Origin City Destination City Median Lower Upper Median Lower Upper
Online Appendix Table A.1 - Estimation Results for Each City Pair
Profit Margin (%) Price Elasticity
Atlanta, GA (Metropolitan Area) Miami, FL (Metropolitan Area) 4.72 1.95 8.67 21.18 11.53 51.17
Atlanta, GA (Metropolitan Area) Los Angeles, CA (Metropolitan Area) 6.36 2.78 11.18 15.73 8.94 36.01
Atlanta, GA (Metropolitan Area) Little Rock, AR 11.36 4.66 20.23 8.80 4.94 21.45
Atlanta, GA (Metropolitan Area) Lubbock, TX 11.25 4.39 20.81 8.89 4.81 22.80
Atlanta, GA (Metropolitan Area) Lexington, KY 15.10 6.56 25.53 6.62 3.92 15.25
Atlanta, GA (Metropolitan Area) Louisville, KY 12.25 6.23 19.58 8.16 5.11 16.06
Atlanta, GA (Metropolitan Area) Cincinnati, OH 17.92 9.37 25.59 5.58 3.91 10.67
Atlanta, GA (Metropolitan Area) Sacramento, CA 8.90 4.38 17.24 11.23 5.80 22.83
Atlanta, GA (Metropolitan Area) Tampa, FL (Metropolitan Area) 3.68 1.55 6.20 27.20 16.15 64.37
Atlanta, GA (Metropolitan Area) Kansas City, MO 3.73 1.57 6.82 26.81 14.66 63.86
Atlanta, GA (Metropolitan Area) San Antonio, TX 7.33 3.14 13.07 13.65 7.65 31.88
Atlanta, GA (Metropolitan Area) Memphis, TN 7.45 3.31 14.44 13.42 6.92 30.22
Atlanta, GA (Metropolitan Area) Mission/McAllen/Edinburg, TX 13.42 5.75 24.30 7.45 4.12 17.40
Atlanta, GA (Metropolitan Area) Omaha, NE 8.19 3.76 15.02 12.21 6.66 26.57
Atlanta, GA (Metropolitan Area) Milwaukee, WI 10.61 4.31 17.34 9.42 5.77 23.21
Atlanta, GA (Metropolitan Area) Melbourne, FL 13.24 5.38 24.39 7.55 4.10 18.59
Atlanta, GA (Metropolitan Area) Quad Cities, IL (Metropolitan Area) 11.69 5.50 20.62 8.56 4.85 18.19
Atlanta, GA (Metropolitan Area) Monroe, LA 11.06 4.81 19.23 9.04 5.20 20.79
Atlanta, GA (Metropolitan Area) Madison, WI 11.57 5.14 20.10 8.65 4.97 19.47
Atlanta, GA (Metropolitan Area) New Orleans, LA 8.33 2.61 17.44 12.01 5.73 38.33
Atlanta, GA (Metropolitan Area) San Diego, CA 8.69 3.78 15.86 11.51 6.30 26.49
Atlanta, GA (Metropolitan Area) Norfolk, VA (Metropolitan Area) 11.49 4.73 20.71 8.71 4.83 21.13
Atlanta, GA (Metropolitan Area) Pensacola, FL 24.12 14.04 34.48 4.15 2.90 7.12
Atlanta, GA (Metropolitan Area) Oklahoma City, OK 12.59 5.41 23.36 7.94 4.28 18.47
Atlanta, GA (Metropolitan Area) West Palm Beach/Palm Beach, FL 8.55 3.70 15.04 11.69 6.65 27.05
Atlanta, GA (Metropolitan Area) Portland, OR 6.62 2.91 12.71 15.10 7.87 34.36
Atlanta, GA (Metropolitan Area) Philadelphia, PA 5.77 2.38 10.60 17.32 9.43 42.01
Atlanta, GA (Metropolitan Area) Palm Springs, CA 16.28 7.05 29.05 6.14 3.44 14.18
Atlanta, GA (Metropolitan Area) Portland, ME 10.82 4.45 18.99 9.24 5.27 22.46
Atlanta, GA (Metropolitan Area) Raleigh/Durham, NC 8.75 3.72 15.37 11.43 6.51 26.86
Atlanta, GA (Metropolitan Area) Richmond, VA 12.17 5.49 20.67 8.22 4.84 18.22
Atlanta, GA (Metropolitan Area) Reno, NV 11.18 4.88 21.64 8.94 4.62 20.48
Atlanta, GA (Metropolitan Area) Roanoke, VA 9.66 4.25 18.12 10.36 5.52 23.52
Atlanta, GA (Metropolitan Area) Rochester, NY 17.33 7.95 28.06 5.77 3.56 12.58
Atlanta, GA (Metropolitan Area) Salt Lake City, UT 8.04 3.39 15.25 12.44 6.56 29.50
Atlanta, GA (Metropolitan Area) Tulsa, OK 8.32 3.61 15.00 12.02 6.67 27.67
Atlanta, GA (Metropolitan Area) Savannah, GA 15.55 7.04 28.02 6.43 3.57 14.21
Atlanta, GA (Metropolitan Area) South Bend, IN 20.55 10.23 33.34 4.87 3.00 9.78
Atlanta, GA (Metropolitan Area) Springfield, MO 11.01 4.55 21.05 9.08 4.75 21.96
Atlanta, GA (Metropolitan Area) Sarasota/Bradenton, FL 11.78 4.62 20.71 8.49 4.83 21.65
Atlanta, GA (Metropolitan Area) Syracuse, NY 11.75 5.31 22.12 8.51 4.52 18.83
Atlanta, GA (Metropolitan Area) Tallahassee, FL 27.59 19.10 35.49 3.62 2.82 5.24
Atlanta, GA (Metropolitan Area) Bristol/Johnson City/Kingsport, TN 19.35 8.78 33.52 5.17 2.98 11.40

Origin City Destination City Median Lower Upper Median Lower Upper
Online Appendix Table A.1 - Estimation Results for Each City Pair
Profit Margin (%) Price Elasticity
Atlanta, GA (Metropolitan Area) Knoxville, TN 30.01 16.42 43.59 3.33 2.29 6.09
Appleton, WI Dallas/Fort Worth, TX 14.15 6.16 24.80 7.07 4.03 16.23
Appleton, WI Atlanta, GA (Metropolitan Area) 16.11 7.54 25.93 6.21 3.86 13.27
Appleton, WI Phoenix, AZ 13.11 5.97 25.91 7.63 3.86 16.75
Appleton, WI Boston, MA (Metropolitan Area) 7.17 3.11 14.60 13.94 6.85 32.16
Appleton, WI Washington, DC (Metropolitan Area) 11.95 4.73 22.20 8.37 4.50 21.16
Appleton, WI Minneapolis/St. Paul, MN 12.73 5.72 23.64 7.86 4.23 17.48
Appleton, WI New York City, NY (Metropolitan Area) 10.97 4.17 19.15 9.12 5.22 23.96
Appleton, WI San Francisco, CA (Metropolitan Area) 11.62 5.16 19.59 8.61 5.10 19.40
Appleton, WI Los Angeles, CA (Metropolitan Area) 11.58 4.79 22.82 8.64 4.38 20.89
Austin, TX Colorado Springs, CO 14.45 6.18 26.14 6.92 3.83 16.19
Austin, TX Dallas/Fort Worth, TX 13.49 5.54 22.84 7.41 4.38 18.04
Austin, TX Pittsburgh, PA 6.37 2.60 13.07 15.70 7.65 38.46
Austin, TX Huntsville, AL 13.99 5.82 26.29 7.15 3.80 17.19
Austin, TX Denver, CO 8.85 4.43 14.78 11.30 6.76 22.57
Austin, TX Tucson, AZ 13.50 6.18 22.53 7.41 4.44 16.19
Austin, TX Phoenix, AZ 5.54 2.37 9.77 18.05 10.24 42.27
Austin, TX Hartford, CT 7.00 2.85 13.81 14.29 7.24 35.04
Austin, TX Seattle, WA 8.29 3.62 15.50 12.06 6.45 27.63
Austin, TX Birmingham, AL 11.75 5.31 20.80 8.51 4.81 18.82
Austin, TX El Paso, TX 7.99 3.55 14.28 12.51 7.00 28.18
Austin, TX Cleveland, OH (Metropolitan Area) 11.06 4.42 21.14 9.04 4.73 22.62
Austin, TX Nashville, TN 7.31 3.12 15.03 13.67 6.65 32.10
Austin, TX Boise, ID 8.52 3.25 16.29 11.73 6.14 30.77
Austin, TX Boston, MA (Metropolitan Area) 4.36 1.61 9.45 22.95 10.58 62.20
Austin, TX Baton Rouge, LA 11.81 4.44 22.36 8.46 4.47 22.51
Austin, TX Buffalo, NY 20.26 10.73 29.86 4.94 3.35 9.32
Austin, TX Washington, DC (Metropolitan Area) 3.67 1.73 8.34 27.27 11.99 57.93
Austin, TX Chicago, IL 7.64 3.38 13.60 13.09 7.35 29.58
Austin, TX Charlotte, NC 16.76 7.96 26.17 5.97 3.82 12.56
Austin, TX Columbus, OH 10.15 4.39 17.98 9.86 5.56 22.77
Austin, TX St. Louis, MO 19.84 10.21 33.40 5.04 2.99 9.80
Austin, TX Jacksonville, FL 18.31 8.92 30.67 5.46 3.26 11.22
Austin, TX Detroit, MI 6.04 1.97 10.10 16.56 9.90 50.84
Austin, TX Des Moines, IA 15.21 6.52 27.26 6.57 3.67 15.33
Austin, TX Houston, TX 21.20 9.72 36.59 4.72 2.73 10.28
Austin, TX Orlando, FL 6.62 3.05 11.71 15.10 8.54 32.82
Austin, TX Minneapolis/St. Paul, MN 5.34 2.14 10.11 18.74 9.89 46.84
Austin, TX New York City, NY (Metropolitan Area) 10.53 5.60 17.60 9.49 5.68 17.86
Austin, TX Fort Myers, FL 13.89 6.42 26.76 7.20 3.74 15.57
Austin, TX Greenville/Spartanburg, SC 19.64 7.97 32.98 5.09 3.03 12.54
Austin, TX Greensboro/High Point, NC 10.16 4.02 21.12 9.84 4.74 24.88
Austin, TX Harrisburg, PA 14.78 6.00 26.37 6.77 3.79 16.67

Origin City Destination City Median Lower Upper Median Lower Upper
Online Appendix Table A.1 - Estimation Results for Each City Pair
Profit Margin (%) Price Elasticity
Austin, TX Harlingen/San Benito, TX 17.16 6.91 31.07 5.83 3.22 14.47
Austin, TX Las Vegas, NV 4.27 1.80 8.36 23.42 11.96 55.47
Austin, TX Indianapolis, IN 5.63 2.60 11.44 17.76 8.74 38.44
Austin, TX San Francisco, CA (Metropolitan Area) 3.95 1.53 8.33 25.29 12.01 65.27
Austin, TX Miami, FL (Metropolitan Area) 8.36 3.53 15.18 11.96 6.59 28.34
Austin, TX Los Angeles, CA (Metropolitan Area) 5.80 2.16 9.45 17.25 10.59 46.31
Austin, TX Little Rock, AR 10.88 3.83 19.86 9.19 5.04 26.10
Austin, TX Lubbock, TX 11.05 4.13 21.61 9.05 4.63 24.19
Austin, TX Lexington, KY 15.85 6.13 30.17 6.31 3.31 16.31
Austin, TX Louisville, KY 8.49 3.86 16.26 11.78 6.15 25.93
Austin, TX Cincinnati, OH 9.77 4.32 18.12 10.23 5.52 23.16
Austin, TX Midland/Odessa, TX 17.57 7.70 30.04 5.69 3.33 12.99
Austin, TX Sacramento, CA 9.28 3.68 15.79 10.78 6.33 27.14
Austin, TX Tampa, FL (Metropolitan Area) 7.37 3.25 12.47 13.57 8.02 30.73
Austin, TX Kansas City, MO 10.92 4.23 18.73 9.15 5.34 23.64
Austin, TX Memphis, TN 30.99 13.60 51.88 3.23 1.93 7.35
Austin, TX Omaha, NE 10.82 4.89 20.03 9.24 4.99 20.44
Austin, TX Milwaukee, WI 11.53 4.80 22.10 8.68 4.52 20.85
Austin, TX Madison, WI 13.66 6.09 24.01 7.32 4.16 16.43
Austin, TX New Orleans, LA 14.34 6.25 26.18 6.97 3.82 16.01
Austin, TX San Diego, CA 6.91 2.85 12.96 14.48 7.72 35.09
Austin, TX Norfolk, VA (Metropolitan Area) 25.47 13.16 37.82 3.93 2.64 7.60
Austin, TX Oklahoma City, OK 12.81 4.71 24.13 7.81 4.14 21.22
Austin, TX West Palm Beach/Palm Beach, FL 12.65 4.57 24.82 7.91 4.03 21.87
Austin, TX Portland, OR 4.66 2.22 8.31 21.48 12.04 45.13
Austin, TX Philadelphia, PA 12.72 5.93 21.70 7.86 4.61 16.86
Austin, TX Raleigh/Durham, NC 4.23 2.31 9.08 23.67 11.01 43.23
Austin, TX Richmond, VA 13.82 6.50 22.14 7.23 4.52 15.39
Austin, TX Reno, NV 14.18 5.92 26.74 7.05 3.74 16.90
Austin, TX Rochester, NY 10.00 4.39 20.07 10.00 4.98 22.79
Austin, TX Salt Lake City, UT 14.56 6.42 27.22 6.87 3.67 15.57
Austin, TX Tulsa, OK 14.59 6.33 26.01 6.85 3.84 15.81
Austin, TX Syracuse, NY 12.56 4.69 22.53 7.96 4.44 21.30
Austin, TX Knoxville, TN 10.68 4.20 18.88 9.36 5.30 23.81
Asheville, NC Dallas/Fort Worth, TX 14.93 6.41 26.57 6.70 3.76 15.61
Asheville, NC Boston, MA (Metropolitan Area) 11.23 5.43 21.02 8.91 4.76 18.42
Asheville, NC Washington, DC (Metropolitan Area) 11.27 4.84 19.48 8.87 5.13 20.66
Asheville, NC Chicago, IL 12.44 5.31 24.65 8.04 4.06 18.84
Asheville, NC Orlando, FL 29.42 16.18 42.28 3.40 2.37 6.18
Asheville, NC New York City, NY (Metropolitan Area) 16.00 6.94 27.92 6.25 3.58 14.41
Asheville, NC San Francisco, CA (Metropolitan Area) 16.51 7.14 27.63 6.06 3.62 14.01
Asheville, NC Miami, FL (Metropolitan Area) 18.74 8.55 30.76 5.34 3.25 11.69
Asheville, NC Los Angeles, CA (Metropolitan Area) 12.95 5.39 22.54 7.72 4.44 18.55

Origin City Destination City Median Lower Upper Median Lower Upper
Online Appendix Table A.1 - Estimation Results for Each City Pair
Profit Margin (%) Price Elasticity
Asheville, NC Tampa, FL (Metropolitan Area) 15.81 7.36 27.77 6.32 3.60 13.59
Asheville, NC Philadelphia, PA 14.03 6.08 23.82 7.13 4.20 16.45
Scranton/Wilkes-Barre, PA Tampa, FL (Metropolitan Area) 27.71 15.37 41.07 3.61 2.43 6.51
Tucson, AZ Washington, DC (Metropolitan Area) 6.78 2.97 12.05 14.75 8.30 33.67
Tucson, AZ Tulsa, OK 11.80 4.80 21.83 8.47 4.58 20.83
Phoenix, AZ Pittsburgh, PA 12.20 5.65 21.52 8.19 4.65 17.70
Phoenix, AZ Seattle, WA 5.44 2.36 10.89 18.37 9.18 42.35
Phoenix, AZ Washington, DC (Metropolitan Area) 5.03 2.29 9.87 19.90 10.14 43.68
Phoenix, AZ Wichita, KS 8.51 4.13 14.96 11.76 6.69 24.20
Phoenix, AZ St. Louis, MO 6.25 2.71 11.36 15.99 8.80 36.87
Phoenix, AZ Sioux Falls, SD 18.97 6.93 31.91 5.27 3.13 14.43
Phoenix, AZ Spokane, WA 6.40 2.56 11.46 15.61 8.72 39.02
Phoenix, AZ San Francisco, CA (Metropolitan Area) 5.16 2.57 10.21 19.38 9.80 38.98
Phoenix, AZ Sacramento, CA 9.55 4.27 15.79 10.48 6.33 23.43
Phoenix, AZ Tampa, FL (Metropolitan Area) 6.75 3.11 12.18 14.81 8.21 32.12
Phoenix, AZ San Antonio, TX 5.86 2.44 10.67 17.06 9.37 40.98
Phoenix, AZ Quad Cities, IL (Metropolitan Area) 16.47 7.36 29.82 6.07 3.35 13.59
Phoenix, AZ San Diego, CA 12.24 5.40 22.79 8.17 4.39 18.53
Phoenix, AZ West Palm Beach/Palm Beach, FL 8.73 3.44 16.39 11.45 6.10 29.11
Phoenix, AZ Portland, OR 5.39 2.06 10.89 18.56 9.18 48.56
Phoenix, AZ Portland, ME 7.77 3.29 14.95 12.87 6.69 30.39
Phoenix, AZ Rapid City, SD 11.12 4.21 18.48 9.00 5.41 23.77
Phoenix, AZ Raleigh/Durham, NC 7.71 3.01 13.01 12.97 7.69 33.26
Phoenix, AZ Richmond, VA 10.23 4.26 18.03 9.78 5.55 23.46
Phoenix, AZ Reno, NV 6.30 2.57 10.85 15.88 9.22 38.91
Phoenix, AZ Roanoke, VA 21.45 10.27 35.77 4.66 2.80 9.74
Phoenix, AZ Rochester, NY 16.13 7.27 28.12 6.20 3.56 13.76
Phoenix, AZ Salt Lake City, UT 4.83 1.89 8.13 20.72 12.31 53.05
Phoenix, AZ Tulsa, OK 7.97 2.94 13.85 12.55 7.22 34.05
Phoenix, AZ Savannah, GA 10.39 4.10 20.48 9.63 4.88 24.39
Phoenix, AZ South Bend, IN 15.51 6.71 29.20 6.45 3.42 14.90
Phoenix, AZ Springfield, MO 12.96 5.05 21.82 7.71 4.58 19.81
Phoenix, AZ Syracuse, NY 17.70 8.11 30.06 5.65 3.33 12.33
Kalamazoo, MI Washington, DC (Metropolitan Area) 18.58 9.07 29.96 5.38 3.34 11.03
Kalamazoo, MI New York City, NY (Metropolitan Area) 13.81 6.39 23.53 7.24 4.25 15.65
Kalamazoo, MI Los Angeles, CA (Metropolitan Area) 11.30 4.53 21.80 8.85 4.59 22.09
Shreveport, LA Washington, DC (Metropolitan Area) 12.65 4.95 23.04 7.91 4.34 20.20
Shreveport, LA Tampa, FL (Metropolitan Area) 14.48 5.42 25.73 6.91 3.89 18.46
Hartford, CT Pittsburgh, PA 14.67 6.91 28.47 6.82 3.51 14.48
Hartford, CT Tucson, AZ 11.00 4.54 20.55 9.09 4.87 22.05
Hartford, CT Phoenix, AZ 8.11 3.43 14.38 12.33 6.96 29.13
Hartford, CT Seattle, WA 9.20 4.63 16.02 10.86 6.24 21.60
Hartford, CT Nashville, TN 14.05 6.89 24.82 7.12 4.03 14.52

Origin City Destination City Median Lower Upper Median Lower Upper
Online Appendix Table A.1 - Estimation Results for Each City Pair
Profit Margin (%) Price Elasticity
Hartford, CT Washington, DC (Metropolitan Area) 9.58 4.33 17.77 10.44 5.63 23.10
Hartford, CT St. Louis, MO 9.95 4.08 19.91 10.05 5.02 24.52
Hartford, CT Myrtle Beach, SC 25.74 12.73 39.10 3.89 2.56 7.85
Hartford, CT Jacksonville, FL 10.08 3.92 17.79 9.92 5.62 25.50
Hartford, CT Houston, TX 8.64 3.46 16.73 11.57 5.98 28.89
Hartford, CT Orlando, FL 11.62 5.29 21.12 8.61 4.73 18.92
Hartford, CT Minneapolis/St. Paul, MN 10.48 5.05 17.20 9.54 5.82 19.82
Hartford, CT Las Vegas, NV 5.97 2.12 12.82 16.74 7.80 47.11
Hartford, CT Wilmington, NC 13.15 5.42 23.52 7.61 4.25 18.46
Hartford, CT Indianapolis, IN 12.90 4.97 24.54 7.75 4.08 20.13
Hartford, CT San Francisco, CA (Metropolitan Area) 4.86 2.21 9.26 20.59 10.80 45.17
Hartford, CT Miami, FL (Metropolitan Area) 17.25 7.59 28.96 5.80 3.45 13.17
Hartford, CT Los Angeles, CA (Metropolitan Area) 9.63 4.19 17.32 10.39 5.77 23.87
Hartford, CT Little Rock, AR 11.30 4.67 20.58 8.85 4.86 21.41
Hartford, CT Louisville, KY 11.36 4.70 20.67 8.80 4.84 21.29
Hartford, CT Sacramento, CA 9.50 3.88 18.74 10.53 5.34 25.77
Hartford, CT Tampa, FL (Metropolitan Area) 16.35 8.07 26.90 6.12 3.72 12.40
Hartford, CT Kansas City, MO 8.85 3.71 15.56 11.30 6.43 26.97
Hartford, CT San Antonio, TX 19.28 8.29 31.76 5.19 3.15 12.07
Hartford, CT Memphis, TN 8.12 3.45 14.88 12.32 6.72 29.01
Hartford, CT Omaha, NE 5.81 2.43 10.60 17.20 9.43 41.13
Hartford, CT Milwaukee, WI 21.39 9.62 39.02 4.68 2.56 10.40
Hartford, CT Madison, WI 10.97 4.79 19.93 9.12 5.02 20.89
Hartford, CT New Orleans, LA 11.85 4.84 23.40 8.44 4.27 20.66
Hartford, CT San Diego, CA 7.22 2.88 13.68 13.85 7.31 34.69
Hartford, CT Norfolk, VA (Metropolitan Area) 22.10 12.33 30.49 4.53 3.28 8.11
Hartford, CT Pensacola, FL 13.50 5.60 22.75 7.41 4.40 17.86
Hartford, CT Oklahoma City, OK 8.28 3.50 16.25 12.08 6.15 28.58
Hartford, CT West Palm Beach/Palm Beach, FL 18.88 8.52 32.37 5.30 3.09 11.74
Hartford, CT Portland, OR 5.53 1.70 11.02 18.07 9.07 58.90
Hartford, CT Philadelphia, PA 22.09 13.16 32.05 4.53 3.12 7.60
Hartford, CT Raleigh/Durham, NC 10.47 4.51 19.27 9.55 5.19 22.18
Hartford, CT Richmond, VA 8.82 3.63 17.77 11.34 5.63 27.57
Hartford, CT Reno, NV 14.64 5.65 26.79 6.83 3.73 17.70
Hartford, CT Salt Lake City, UT 8.51 3.70 15.95 11.76 6.27 27.07
Hartford, CT Tulsa, OK 6.35 3.27 11.51 15.74 8.69 30.61
Hartford, CT Savannah, GA 19.56 9.39 30.81 5.11 3.25 10.65
Hartford, CT Sarasota/Bradenton, FL 23.76 10.37 39.18 4.21 2.55 9.64
Hartford, CT Knoxville, TN 8.17 3.28 15.28 12.24 6.55 30.46
Seattle, WA Walla Walla, WA 14.34 6.48 27.19 6.97 3.68 15.43
Seattle, WA Tucson, AZ 5.41 2.53 10.67 18.48 9.37 39.60
Seattle, WA Washington, DC (Metropolitan Area) 4.53 1.59 8.74 22.10 11.44 62.79
Seattle, WA Wichita, KS 8.70 4.34 16.18 11.50 6.18 23.02
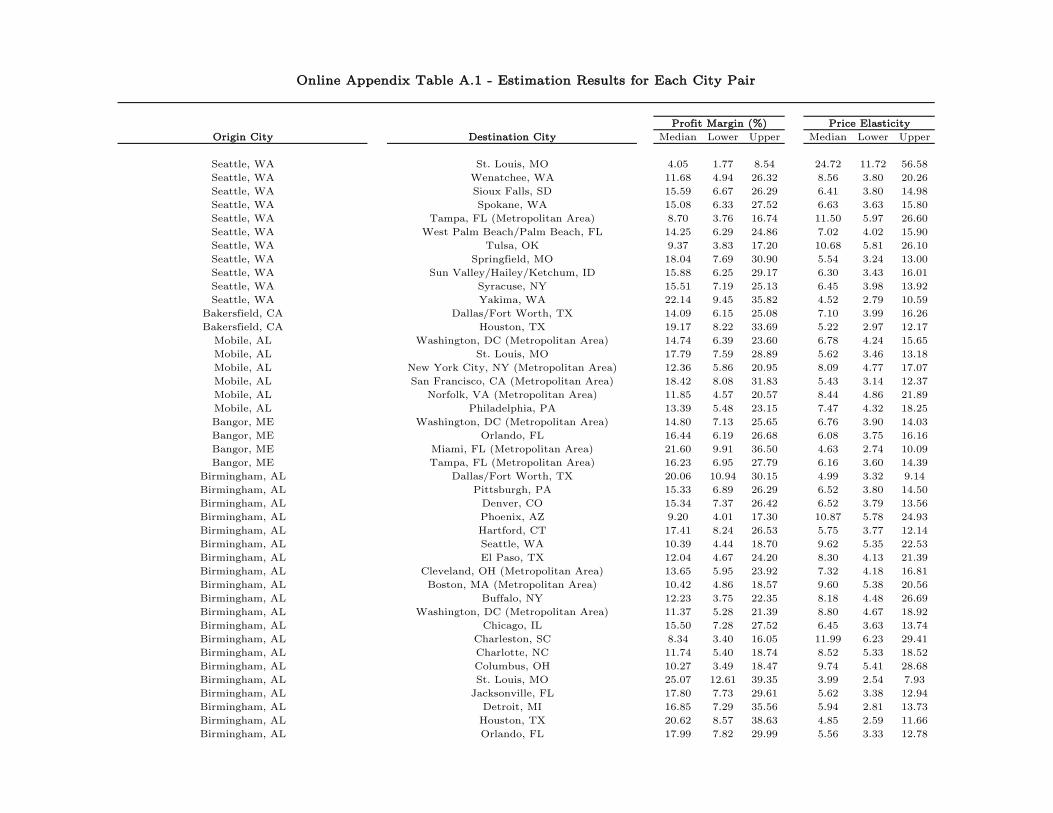
Origin City Destination City Median Lower Upper Median Lower Upper
Online Appendix Table A.1 - Estimation Results for Each City Pair
Profit Margin (%) Price Elasticity
Seattle, WA St. Louis, MO 4.05 1.77 8.54 24.72 11.72 56.58
Seattle, WA Wenatchee, WA 11.68 4.94 26.32 8.56 3.80 20.26
Seattle, WA Sioux Falls, SD 15.59 6.67 26.29 6.41 3.80 14.98
Seattle, WA Spokane, WA 15.08 6.33 27.52 6.63 3.63 15.80
Seattle, WA Tampa, FL (Metropolitan Area) 8.70 3.76 16.74 11.50 5.97 26.60
Seattle, WA West Palm Beach/Palm Beach, FL 14.25 6.29 24.86 7.02 4.02 15.90
Seattle, WA Tulsa, OK 9.37 3.83 17.20 10.68 5.81 26.10
Seattle, WA Springfield, MO 18.04 7.69 30.90 5.54 3.24 13.00
Seattle, WA Sun Valley/Hailey/Ketchum, ID 15.88 6.25 29.17 6.30 3.43 16.01
Seattle, WA Syracuse, NY 15.51 7.19 25.13 6.45 3.98 13.92
Seattle, WA Yakima, WA 22.14 9.45 35.82 4.52 2.79 10.59
Bakersfield, CA Dallas/Fort Worth, TX 14.09 6.15 25.08 7.10 3.99 16.26
Bakersfield, CA Houston, TX 19.17 8.22 33.69 5.22 2.97 12.17
Mobile, AL Washington, DC (Metropolitan Area) 14.74 6.39 23.60 6.78 4.24 15.65
Mobile, AL St. Louis, MO 17.79 7.59 28.89 5.62 3.46 13.18
Mobile, AL New York City, NY (Metropolitan Area) 12.36 5.86 20.95 8.09 4.77 17.07
Mobile, AL San Francisco, CA (Metropolitan Area) 18.42 8.08 31.83 5.43 3.14 12.37
Mobile, AL Norfolk, VA (Metropolitan Area) 11.85 4.57 20.57 8.44 4.86 21.89
Mobile, AL Philadelphia, PA 13.39 5.48 23.15 7.47 4.32 18.25
Bangor, ME Washington, DC (Metropolitan Area) 14.80 7.13 25.65 6.76 3.90 14.03
Bangor, ME Orlando, FL 16.44 6.19 26.68 6.08 3.75 16.16
Bangor, ME Miami, FL (Metropolitan Area) 21.60 9.91 36.50 4.63 2.74 10.09
Bangor, ME Tampa, FL (Metropolitan Area) 16.23 6.95 27.79 6.16 3.60 14.39
Birmingham, AL Dallas/Fort Worth, TX 20.06 10.94 30.15 4.99 3.32 9.14
Birmingham, AL Pittsburgh, PA 15.33 6.89 26.29 6.52 3.80 14.50
Birmingham, AL Denver, CO 15.34 7.37 26.42 6.52 3.79 13.56
Birmingham, AL Phoenix, AZ 9.20 4.01 17.30 10.87 5.78 24.93
Birmingham, AL Hartford, CT 17.41 8.24 26.53 5.75 3.77 12.14
Birmingham, AL Seattle, WA 10.39 4.44 18.70 9.62 5.35 22.53
Birmingham, AL El Paso, TX 12.04 4.67 24.20 8.30 4.13 21.39
Birmingham, AL Cleveland, OH (Metropolitan Area) 13.65 5.95 23.92 7.32 4.18 16.81
Birmingham, AL Boston, MA (Metropolitan Area) 10.42 4.86 18.57 9.60 5.38 20.56
Birmingham, AL Buffalo, NY 12.23 3.75 22.35 8.18 4.48 26.69
Birmingham, AL Washington, DC (Metropolitan Area) 11.37 5.28 21.39 8.80 4.67 18.92
Birmingham, AL Chicago, IL 15.50 7.28 27.52 6.45 3.63 13.74
Birmingham, AL Charleston, SC 8.34 3.40 16.05 11.99 6.23 29.41
Birmingham, AL Charlotte, NC 11.74 5.40 18.74 8.52 5.33 18.52
Birmingham, AL Columbus, OH 10.27 3.49 18.47 9.74 5.41 28.68
Birmingham, AL St. Louis, MO 25.07 12.61 39.35 3.99 2.54 7.93
Birmingham, AL Jacksonville, FL 17.80 7.73 29.61 5.62 3.38 12.94
Birmingham, AL Detroit, MI 16.85 7.29 35.56 5.94 2.81 13.73
Birmingham, AL Houston, TX 20.62 8.57 38.63 4.85 2.59 11.66
Birmingham, AL Orlando, FL 17.99 7.82 29.99 5.56 3.33 12.78

Origin City Destination City Median Lower Upper Median Lower Upper
Online Appendix Table A.1 - Estimation Results for Each City Pair
Profit Margin (%) Price Elasticity
Birmingham, AL Minneapolis/St. Paul, MN 14.19 6.26 24.34 7.05 4.11 15.99
Birmingham, AL New York City, NY (Metropolitan Area) 13.26 5.12 25.03 7.54 3.99 19.54
Birmingham, AL Greensboro/High Point, NC 12.85 5.07 22.49 7.78 4.45 19.74
Birmingham, AL Las Vegas, NV 6.45 2.73 13.41 15.49 7.46 36.61
Birmingham, AL Indianapolis, IN 12.12 5.95 20.87 8.25 4.79 16.80
Birmingham, AL San Francisco, CA (Metropolitan Area) 5.31 2.58 10.37 18.83 9.64 38.75
Birmingham, AL Miami, FL (Metropolitan Area) 7.99 2.90 15.74 12.51 6.35 34.52
Birmingham, AL Los Angeles, CA (Metropolitan Area) 9.23 3.52 19.16 10.84 5.22 28.41
Birmingham, AL Louisville, KY 20.37 8.74 35.42 4.91 2.82 11.44
Birmingham, AL Cincinnati, OH 10.80 4.92 17.63 9.26 5.67 20.31
Birmingham, AL Sacramento, CA 10.17 4.12 20.00 9.83 5.00 24.28
Birmingham, AL Tampa, FL (Metropolitan Area) 9.27 4.33 17.43 10.79 5.74 23.09
Birmingham, AL Kansas City, MO 10.70 4.00 22.94 9.35 4.36 25.01
Birmingham, AL San Antonio, TX 8.95 3.35 15.68 11.17 6.38 29.87
Birmingham, AL Omaha, NE 17.33 6.77 28.81 5.77 3.47 14.76
Birmingham, AL Milwaukee, WI 13.99 6.00 23.96 7.15 4.17 16.65
Birmingham, AL New Orleans, LA 27.53 12.27 45.72 3.63 2.19 8.15
Birmingham, AL San Diego, CA 11.62 5.20 20.97 8.61 4.77 19.23
Birmingham, AL Norfolk, VA (Metropolitan Area) 30.01 15.01 44.35 3.33 2.25 6.66
Birmingham, AL Oklahoma City, OK 17.03 6.78 29.84 5.87 3.35 14.74
Birmingham, AL West Palm Beach/Palm Beach, FL 14.50 6.40 25.39 6.90 3.94 15.62
Birmingham, AL Portland, OR 11.71 5.05 20.69 8.54 4.83 19.79
Birmingham, AL Philadelphia, PA 9.71 4.06 18.16 10.30 5.51 24.65
Birmingham, AL Raleigh/Durham, NC 12.37 5.17 24.31 8.08 4.11 19.33
Birmingham, AL Richmond, VA 9.91 4.23 17.72 10.09 5.64 23.62
Birmingham, AL Salt Lake City, UT 12.12 5.21 21.15 8.25 4.73 19.18
Birmingham, AL Tulsa, OK 7.17 3.03 15.08 13.94 6.63 33.03
El Paso, TX Huntsville, AL 11.97 5.08 22.78 8.36 4.39 19.69
El Paso, TX Phoenix, AZ 15.30 6.49 27.78 6.54 3.60 15.40
El Paso, TX Seattle, WA 7.68 3.10 15.45 13.02 6.47 32.28
El Paso, TX Nashville, TN 14.05 5.84 27.13 7.12 3.69 17.12
El Paso, TX Washington, DC (Metropolitan Area) 6.55 2.68 13.12 15.26 7.63 37.37
El Paso, TX St. Louis, MO 11.75 5.23 22.30 8.51 4.48 19.13
El Paso, TX Jacksonville, FL 18.10 8.03 29.95 5.52 3.34 12.45
El Paso, TX Houston, TX 6.11 2.52 11.56 16.36 8.65 39.69
El Paso, TX Orlando, FL 9.88 4.24 17.87 10.13 5.59 23.57
El Paso, TX Minneapolis/St. Paul, MN 13.77 6.57 24.59 7.26 4.07 15.22
El Paso, TX New York City, NY (Metropolitan Area) 9.88 4.29 17.95 10.12 5.57 23.32
El Paso, TX Harlingen/San Benito, TX 9.84 4.08 18.76 10.16 5.33 24.49
El Paso, TX Las Vegas, NV 13.24 6.00 22.23 7.55 4.50 16.68
El Paso, TX Indianapolis, IN 12.05 5.01 21.94 8.30 4.56 19.96
El Paso, TX San Francisco, CA (Metropolitan Area) 9.50 4.32 16.43 10.52 6.09 23.14
El Paso, TX Miami, FL (Metropolitan Area) 11.12 5.08 19.01 8.99 5.26 19.67

Origin City Destination City Median Lower Upper Median Lower Upper
Online Appendix Table A.1 - Estimation Results for Each City Pair
Profit Margin (%) Price Elasticity
El Paso, TX Los Angeles, CA (Metropolitan Area) 9.56 3.83 17.16 10.46 5.83 26.13
El Paso, TX Little Rock, AR 10.60 4.73 20.48 9.43 4.88 21.12
El Paso, TX Louisville, KY 15.30 6.24 27.41 6.54 3.65 16.02
El Paso, TX Sacramento, CA 8.38 3.61 19.62 11.94 5.10 27.70
El Paso, TX Tampa, FL (Metropolitan Area) 11.63 4.88 20.17 8.60 4.96 20.49
El Paso, TX Kansas City, MO 8.83 3.86 15.79 11.32 6.34 25.88
El Paso, TX San Antonio, TX 6.65 2.74 12.68 15.04 7.89 36.48
El Paso, TX Mission/McAllen/Edinburg, TX 12.15 5.03 23.21 8.23 4.31 19.88
El Paso, TX Omaha, NE 12.75 5.77 21.90 7.84 4.57 17.33
El Paso, TX New Orleans, LA 17.33 7.16 30.98 5.77 3.23 13.96
El Paso, TX San Diego, CA 13.15 5.88 23.10 7.60 4.33 16.99
El Paso, TX Norfolk, VA (Metropolitan Area) 15.41 6.22 27.80 6.49 3.60 16.07
El Paso, TX Oklahoma City, OK 18.48 7.36 33.35 5.41 3.00 13.58
El Paso, TX Portland, OR 14.66 6.31 24.94 6.82 4.01 15.84
El Paso, TX Philadelphia, PA 12.22 5.25 21.87 8.19 4.57 19.04
El Paso, TX Raleigh/Durham, NC 9.25 3.99 17.47 10.81 5.72 25.09
El Paso, TX Reno, NV 15.83 6.66 29.46 6.32 3.39 15.01
El Paso, TX Salt Lake City, UT 21.60 9.81 40.26 4.63 2.49 10.19
El Paso, TX Tulsa, OK 13.76 5.62 26.19 7.27 3.82 17.79
Billings, MT Dallas/Fort Worth, TX 14.35 6.81 24.42 6.97 4.10 14.69
Billings, MT Denver, CO 7.94 3.39 16.75 12.60 5.97 29.50
Billings, MT Phoenix, AZ 9.70 4.07 18.41 10.31 5.43 24.58
Billings, MT Seattle, WA 10.77 4.37 19.61 9.29 5.10 22.88
Billings, MT Washington, DC (Metropolitan Area) 10.68 4.03 19.09 9.37 5.24 24.84
Billings, MT Chicago, IL 8.05 2.98 15.19 12.42 6.58 33.51
Billings, MT Houston, TX 10.23 4.57 18.22 9.78 5.49 21.89
Billings, MT Orlando, FL 10.10 4.07 18.08 9.90 5.53 24.58
Billings, MT Minneapolis/St. Paul, MN 9.19 4.04 18.26 10.88 5.48 24.77
Billings, MT New York City, NY (Metropolitan Area) 10.07 4.15 19.31 9.93 5.18 24.07
Billings, MT Las Vegas, NV 11.62 4.92 21.38 8.61 4.68 20.33
Billings, MT San Francisco, CA (Metropolitan Area) 12.35 5.73 21.78 8.10 4.59 17.44
Billings, MT Los Angeles, CA (Metropolitan Area) 12.89 5.87 21.91 7.76 4.56 17.04
Billings, MT Sacramento, CA 9.32 3.84 17.88 10.73 5.59 26.03
Billings, MT San Diego, CA 13.05 6.19 22.75 7.66 4.40 16.16
Billings, MT Portland, OR 14.01 6.26 24.32 7.14 4.11 15.97
Bismarck/Mandan, ND Dallas/Fort Worth, TX 12.04 4.88 21.29 8.30 4.70 20.48
Bismarck/Mandan, ND Phoenix, AZ 14.46 6.43 26.09 6.91 3.83 15.54
Bismarck/Mandan, ND Washington, DC (Metropolitan Area) 14.36 6.63 24.45 6.96 4.09 15.07
Bismarck/Mandan, ND Chicago, IL 10.44 3.97 18.63 9.58 5.37 25.21
Bismarck/Mandan, ND Minneapolis/St. Paul, MN 12.59 6.27 20.52 7.95 4.87 15.96
Bismarck/Mandan, ND Los Angeles, CA (Metropolitan Area) 11.87 5.09 22.85 8.42 4.38 19.63
Cleveland, OH (Metropolitan Area) Colorado Springs, CO 16.54 7.52 28.09 6.05 3.56 13.30
Cleveland, OH (Metropolitan Area) Dallas/Fort Worth, TX 8.74 3.72 14.87 11.44 6.72 26.87

Origin City Destination City Median Lower Upper Median Lower Upper
Online Appendix Table A.1 - Estimation Results for Each City Pair
Profit Margin (%) Price Elasticity
Cleveland, OH (Metropolitan Area) Huntsville, AL 14.69 6.17 26.06 6.81 3.84 16.22
Cleveland, OH (Metropolitan Area) Denver, CO 8.97 4.00 16.01 11.15 6.24 24.99
Cleveland, OH (Metropolitan Area) Tucson, AZ 11.53 5.26 21.95 8.67 4.56 19.02
Cleveland, OH (Metropolitan Area) Phoenix, AZ 7.52 2.90 13.60 13.30 7.35 34.43
Cleveland, OH (Metropolitan Area) Hartford, CT 19.84 7.40 39.90 5.04 2.51 13.52
Cleveland, OH (Metropolitan Area) Seattle, WA 7.36 2.64 12.82 13.60 7.80 37.84
Cleveland, OH (Metropolitan Area) El Paso, TX 7.00 2.57 14.33 14.28 6.98 38.93
Cleveland, OH (Metropolitan Area) Nashville, TN 13.76 5.63 25.86 7.27 3.87 17.78
Cleveland, OH (Metropolitan Area) Washington, DC (Metropolitan Area) 9.11 3.79 18.37 10.98 5.44 26.35
Cleveland, OH (Metropolitan Area) Columbia, SC 19.45 9.51 32.37 5.14 3.09 10.52
Cleveland, OH (Metropolitan Area) Wichita, KS 8.37 3.71 16.02 11.95 6.24 26.95
Cleveland, OH (Metropolitan Area) St. Louis, MO 18.89 7.98 32.18 5.29 3.11 12.53
Cleveland, OH (Metropolitan Area) Myrtle Beach, SC 13.54 5.91 24.07 7.38 4.15 16.92
Cleveland, OH (Metropolitan Area) Jacksonville, FL 16.39 6.56 27.81 6.10 3.60 15.25
Cleveland, OH (Metropolitan Area) Detroit, MI 18.42 8.40 32.33 5.43 3.09 11.91
Cleveland, OH (Metropolitan Area) Des Moines, IA 8.29 2.94 13.37 12.07 7.48 33.98
Cleveland, OH (Metropolitan Area) Houston, TX 6.87 2.89 11.89 14.56 8.41 34.66
Cleveland, OH (Metropolitan Area) Orlando, FL 10.91 4.28 20.04 9.17 4.99 23.38
Cleveland, OH (Metropolitan Area) Minneapolis/St. Paul, MN 12.10 5.14 21.49 8.27 4.65 19.45
Cleveland, OH (Metropolitan Area) New York City, NY (Metropolitan Area) 7.82 3.73 14.04 12.79 7.12 26.81
Cleveland, OH (Metropolitan Area) Fort Myers, FL 13.71 6.21 25.31 7.30 3.95 16.11
Cleveland, OH (Metropolitan Area) Greenville/Spartanburg, SC 27.13 11.17 49.48 3.69 2.02 8.95
Cleveland, OH (Metropolitan Area) Greensboro/High Point, NC 7.45 3.76 14.04 13.42 7.12 26.62
Cleveland, OH (Metropolitan Area) Las Vegas, NV 9.43 4.14 17.26 10.60 5.79 24.14
Cleveland, OH (Metropolitan Area) Indianapolis, IN 9.92 4.36 19.02 10.08 5.26 22.95
Cleveland, OH (Metropolitan Area) Jackson/Vicksburg, MS 12.29 5.75 23.21 8.13 4.31 17.38
Cleveland, OH (Metropolitan Area) San Francisco, CA (Metropolitan Area) 6.03 2.99 11.72 16.57 8.53 33.40
Cleveland, OH (Metropolitan Area) Miami, FL (Metropolitan Area) 11.36 5.22 19.15 8.80 5.22 19.14
Cleveland, OH (Metropolitan Area) Los Angeles, CA (Metropolitan Area) 6.62 2.95 11.67 15.11 8.57 33.95
Cleveland, OH (Metropolitan Area) Little Rock, AR 15.38 6.87 30.00 6.50 3.33 14.56
Cleveland, OH (Metropolitan Area) Sacramento, CA 9.21 4.09 16.92 10.85 5.91 24.47
Cleveland, OH (Metropolitan Area) Tampa, FL (Metropolitan Area) 6.11 2.75 10.87 16.35 9.20 36.38
Cleveland, OH (Metropolitan Area) Kansas City, MO 24.06 9.87 44.16 4.16 2.26 10.14
Cleveland, OH (Metropolitan Area) San Antonio, TX 13.94 6.41 23.69 7.17 4.22 15.61
Cleveland, OH (Metropolitan Area) Memphis, TN 10.46 4.69 21.21 9.56 4.72 21.33
Cleveland, OH (Metropolitan Area) Omaha, NE 12.62 4.72 23.10 7.92 4.33 21.21
Cleveland, OH (Metropolitan Area) Milwaukee, WI 16.30 6.81 28.06 6.13 3.56 14.68
Cleveland, OH (Metropolitan Area) New Orleans, LA 15.72 6.65 29.90 6.36 3.35 15.04
Cleveland, OH (Metropolitan Area) San Diego, CA 6.12 2.27 12.84 16.34 7.79 44.05
Cleveland, OH (Metropolitan Area) Norfolk, VA (Metropolitan Area) 20.70 10.57 33.80 4.83 2.96 9.46
Cleveland, OH (Metropolitan Area) Pensacola, FL 14.86 5.98 27.35 6.73 3.66 16.73
Cleveland, OH (Metropolitan Area) Oklahoma City, OK 14.29 6.76 26.68 7.00 3.75 14.80
Cleveland, OH (Metropolitan Area) West Palm Beach/Palm Beach, FL 18.74 8.22 32.97 5.34 3.03 12.16

Origin City Destination City Median Lower Upper Median Lower Upper
Online Appendix Table A.1 - Estimation Results for Each City Pair
Profit Margin (%) Price Elasticity
Cleveland, OH (Metropolitan Area) Portland, OR 6.23 2.32 11.68 16.06 8.56 43.08
Cleveland, OH (Metropolitan Area) Philadelphia, PA 9.97 4.08 18.28 10.03 5.47 24.53
Cleveland, OH (Metropolitan Area) Portland, ME 14.92 5.72 28.77 6.70 3.48 17.48
Cleveland, OH (Metropolitan Area) Raleigh/Durham, NC 20.87 9.19 36.94 4.79 2.71 10.88
Cleveland, OH (Metropolitan Area) Richmond, VA 27.47 11.96 45.30 3.64 2.21 8.36
Cleveland, OH (Metropolitan Area) Reno, NV 10.35 3.54 20.28 9.66 4.93 28.23
Cleveland, OH (Metropolitan Area) Salt Lake City, UT 9.98 4.39 17.60 10.02 5.68 22.77
Cleveland, OH (Metropolitan Area) Tulsa, OK 10.35 3.90 19.37 9.66 5.16 25.62
Cleveland, OH (Metropolitan Area) Savannah, GA 15.20 6.78 26.45 6.58 3.78 14.75
Cleveland, OH (Metropolitan Area) Sarasota/Bradenton, FL 26.14 11.13 46.97 3.83 2.13 8.98
Cleveland, OH (Metropolitan Area) Knoxville, TN 28.37 12.22 46.86 3.52 2.13 8.19
Bellingham, WA Seattle, WA 20.11 9.50 33.67 4.97 2.97 10.52
Bellingham, WA San Francisco, CA (Metropolitan Area) 18.95 8.41 33.10 5.28 3.02 11.89
Bellingham, WA Los Angeles, CA (Metropolitan Area) 17.21 7.86 30.43 5.81 3.29 12.73
Bloomington/Normal, IL Dallas/Fort Worth, TX 11.35 5.28 20.28 8.81 4.93 18.94
Bloomington/Normal, IL Washington, DC (Metropolitan Area) 22.36 10.34 36.06 4.47 2.77 9.68
Bloomington/Normal, IL Orlando, FL 15.93 6.86 31.88 6.28 3.14 14.57
Bloomington/Normal, IL New York City, NY (Metropolitan Area) 19.11 8.69 33.97 5.23 2.94 11.51
Bloomington/Normal, IL Los Angeles, CA (Metropolitan Area) 18.95 7.62 34.15 5.28 2.93 13.13
Nashville, TN Pittsburgh, PA 11.28 5.67 19.35 8.87 5.17 17.63
Nashville, TN Tucson, AZ 14.68 6.30 25.30 6.81 3.95 15.87
Nashville, TN Phoenix, AZ 4.98 2.04 10.37 20.08 9.64 49.12
Nashville, TN Seattle, WA 3.53 1.66 9.18 28.31 10.89 60.33
Nashville, TN Washington, DC (Metropolitan Area) 10.71 4.64 18.72 9.34 5.34 21.54
Nashville, TN Wichita, KS 21.38 9.44 34.69 4.68 2.88 10.60
Nashville, TN St. Louis, MO 16.51 7.84 25.30 6.06 3.95 12.75
Nashville, TN Orlando, FL 16.09 7.79 28.64 6.21 3.49 12.84
Nashville, TN New York City, NY (Metropolitan Area) 5.10 2.06 10.19 19.62 9.84 48.52
Nashville, TN Spokane, WA 10.42 4.31 18.82 9.60 5.31 23.18
Nashville, TN San Francisco, CA (Metropolitan Area) 3.71 2.05 8.27 26.95 12.12 48.76
Nashville, TN Sacramento, CA 9.01 3.35 15.33 11.10 6.52 29.84
Nashville, TN Tampa, FL (Metropolitan Area) 5.42 2.66 10.66 18.44 9.38 37.55
Nashville, TN San Antonio, TX 5.87 2.28 11.84 17.03 8.44 43.83
Nashville, TN Omaha, NE 13.26 5.88 25.13 7.54 3.98 16.99
Nashville, TN New Orleans, LA 9.54 3.60 19.51 10.50 5.13 27.83
Nashville, TN San Diego, CA 2.96 1.45 5.74 33.82 17.41 69.09
Nashville, TN Norfolk, VA (Metropolitan Area) 23.68 12.07 36.45 4.22 2.74 8.28
Nashville, TN Oklahoma City, OK 9.08 4.02 16.02 11.01 6.24 24.88
Nashville, TN West Palm Beach/Palm Beach, FL 13.96 6.27 24.72 7.16 4.04 15.96
Nashville, TN Portland, OR 7.11 2.67 13.47 14.07 7.43 37.39
Nashville, TN Philadelphia, PA 8.57 3.86 14.72 11.67 6.80 25.91
Nashville, TN Raleigh/Durham, NC 11.34 5.30 19.25 8.82 5.19 18.86
Nashville, TN Richmond, VA 9.59 4.44 16.23 10.43 6.16 22.51

Origin City Destination City Median Lower Upper Median Lower Upper
Online Appendix Table A.1 - Estimation Results for Each City Pair
Profit Margin (%) Price Elasticity
Nashville, TN Reno, NV 12.83 5.54 22.46 7.80 4.45 18.06
Nashville, TN Rochester, NY 11.42 4.65 20.45 8.76 4.89 21.49
Nashville, TN Salt Lake City, UT 6.66 2.68 13.64 15.01 7.33 37.26
Nashville, TN Tulsa, OK 9.67 3.16 21.24 10.35 4.71 31.63
Nashville, TN Savannah, GA 16.38 7.41 27.98 6.11 3.57 13.49
Nashville, TN Syracuse, NY 15.14 6.94 25.12 6.60 3.98 14.41
Boise, ID Dallas/Fort Worth, TX 8.58 3.51 17.01 11.66 5.88 28.49
Boise, ID Denver, CO 7.76 3.37 12.94 12.89 7.73 29.65
Boise, ID Tucson, AZ 20.65 9.51 36.53 4.84 2.74 10.51
Boise, ID Phoenix, AZ 9.61 3.25 16.35 10.41 6.12 30.73
Boise, ID Seattle, WA 18.61 8.62 31.82 5.37 3.14 11.60
Boise, ID Cleveland, OH (Metropolitan Area) 16.23 6.92 28.19 6.16 3.55 14.44
Boise, ID Boston, MA (Metropolitan Area) 11.58 4.96 21.18 8.64 4.72 20.17
Boise, ID Washington, DC (Metropolitan Area) 14.30 6.57 25.99 6.99 3.85 15.23
Boise, ID Chicago, IL 6.18 2.13 11.43 16.17 8.75 47.02
Boise, ID St. Louis, MO 6.96 3.28 15.22 14.37 6.57 30.45
Boise, ID Detroit, MI 16.02 7.32 28.99 6.24 3.45 13.66
Boise, ID Houston, TX 9.63 3.69 17.93 10.39 5.58 27.13
Boise, ID Orlando, FL 14.01 5.93 26.23 7.14 3.81 16.86
Boise, ID Minneapolis/St. Paul, MN 15.35 6.84 26.96 6.51 3.71 14.63
Boise, ID New York City, NY (Metropolitan Area) 7.38 2.75 13.86 13.54 7.22 36.33
Boise, ID Spokane, WA 17.48 8.92 29.79 5.72 3.36 11.21
Boise, ID Las Vegas, NV 8.45 4.13 17.14 11.83 5.83 24.24
Boise, ID Indianapolis, IN 12.55 5.11 23.63 7.97 4.23 19.57
Boise, ID San Francisco, CA (Metropolitan Area) 11.16 4.64 20.84 8.96 4.80 21.55
Boise, ID Miami, FL (Metropolitan Area) 21.94 9.13 37.25 4.56 2.68 10.95
Boise, ID Los Angeles, CA (Metropolitan Area) 5.38 1.68 10.68 18.60 9.37 59.63
Boise, ID Lewiston, ID 18.48 8.11 31.70 5.41 3.15 12.34
Boise, ID Sacramento, CA 17.26 7.15 30.28 5.80 3.30 13.98
Boise, ID Tampa, FL (Metropolitan Area) 15.18 6.74 27.90 6.59 3.58 14.85
Boise, ID Kansas City, MO 9.88 4.36 18.07 10.12 5.53 22.92
Boise, ID San Antonio, TX 15.46 6.75 27.59 6.47 3.62 14.81
Boise, ID Omaha, NE 13.73 5.88 25.07 7.28 3.99 17.00
Boise, ID New Orleans, LA 13.57 5.47 24.82 7.37 4.03 18.30
Boise, ID San Diego, CA 11.58 4.27 20.97 8.63 4.77 23.41
Boise, ID Oklahoma City, OK 18.46 8.84 30.25 5.42 3.31 11.31
Boise, ID Portland, OR 11.28 5.17 20.52 8.86 4.87 19.36
Boise, ID Philadelphia, PA 9.60 3.56 16.33 10.42 6.12 28.11
Boise, ID Reno, NV 36.73 20.81 52.45 2.72 1.91 4.81
Boise, ID Salt Lake City, UT 11.47 6.01 20.38 8.72 4.91 16.65
Boston, MA (Metropolitan Area) Colorado Springs, CO 17.02 7.23 30.19 5.88 3.31 13.82
Boston, MA (Metropolitan Area) Dallas/Fort Worth, TX 3.70 1.65 7.46 27.05 13.41 60.49
Boston, MA (Metropolitan Area) Pittsburgh, PA 9.51 4.79 16.01 10.52 6.24 20.86

Origin City Destination City Median Lower Upper Median Lower Upper
Online Appendix Table A.1 - Estimation Results for Each City Pair
Profit Margin (%) Price Elasticity
Boston, MA (Metropolitan Area) Huntsville, AL 9.84 4.19 18.74 10.16 5.34 23.88
Boston, MA (Metropolitan Area) Denver, CO 6.60 2.93 11.86 15.14 8.43 34.15
Boston, MA (Metropolitan Area) Tucson, AZ 12.22 5.38 21.91 8.18 4.56 18.58
Boston, MA (Metropolitan Area) Phoenix, AZ 5.56 2.33 10.84 17.98 9.23 42.99
Boston, MA (Metropolitan Area) Kalamazoo, MI 13.19 5.59 23.16 7.58 4.32 17.90
Boston, MA (Metropolitan Area) Shreveport, LA 20.23 8.64 33.88 4.94 2.95 11.58
Boston, MA (Metropolitan Area) Seattle, WA 5.27 1.96 10.31 18.98 9.70 50.93
Boston, MA (Metropolitan Area) Mobile, AL 18.83 8.35 31.91 5.31 3.13 11.98
Boston, MA (Metropolitan Area) El Paso, TX 10.91 4.68 18.12 9.16 5.52 21.38
Boston, MA (Metropolitan Area) Cleveland, OH (Metropolitan Area) 8.51 3.73 15.90 11.76 6.29 26.81
Boston, MA (Metropolitan Area) Nashville, TN 7.45 3.53 12.30 13.42 8.13 28.33
Boston, MA (Metropolitan Area) Buffalo, NY 21.02 10.60 32.12 4.76 3.11 9.43
Boston, MA (Metropolitan Area) Bozeman, MT 9.39 3.68 17.14 10.65 5.83 27.16
Boston, MA (Metropolitan Area) Washington, DC (Metropolitan Area) 11.40 5.56 17.96 8.77 5.57 17.98
Boston, MA (Metropolitan Area) Columbia, SC 8.38 3.69 14.59 11.93 6.85 27.07
Boston, MA (Metropolitan Area) Wichita, KS 16.58 8.94 27.36 6.03 3.65 11.19
Boston, MA (Metropolitan Area) Chicago, IL 6.22 2.65 10.47 16.08 9.55 37.74
Boston, MA (Metropolitan Area) Chattanooga, TN 11.59 4.31 21.27 8.63 4.70 23.23
Boston, MA (Metropolitan Area) Charlottesville, VA 21.32 9.86 35.59 4.69 2.81 10.15
Boston, MA (Metropolitan Area) Charleston, SC 9.92 4.00 18.30 10.08 5.47 25.01
Boston, MA (Metropolitan Area) Cedar Rapids/Iowa City, IA 11.03 4.94 18.73 9.06 5.34 20.23
Boston, MA (Metropolitan Area) Charlotte, NC 9.46 4.05 15.51 10.57 6.45 24.71
Boston, MA (Metropolitan Area) Columbus, OH 9.48 3.87 17.52 10.54 5.71 25.82
Boston, MA (Metropolitan Area) Champaign/Urbana, IL 16.30 6.29 30.47 6.13 3.28 15.89
Boston, MA (Metropolitan Area) St. Louis, MO 5.75 2.32 10.35 17.38 9.66 43.11
Boston, MA (Metropolitan Area) Myrtle Beach, SC 10.72 5.11 18.59 9.33 5.38 19.58
Boston, MA (Metropolitan Area) Jacksonville, FL 7.30 3.09 14.82 13.69 6.75 32.41
Boston, MA (Metropolitan Area) Corpus Christi, TX 15.20 6.40 27.93 6.58 3.58 15.63
Boston, MA (Metropolitan Area) Charleston/Dunbar, WV 9.74 4.14 16.27 10.27 6.15 24.17
Boston, MA (Metropolitan Area) Daytona Beach, FL 22.48 9.17 40.08 4.45 2.49 10.91
Boston, MA (Metropolitan Area) Dayton, OH 12.25 4.97 21.59 8.16 4.63 20.12
Boston, MA (Metropolitan Area) Detroit, MI 8.04 3.72 13.81 12.44 7.24 26.86
Boston, MA (Metropolitan Area) Des Moines, IA 5.82 2.63 11.41 17.18 8.76 38.05
Boston, MA (Metropolitan Area) Houston, TX 8.64 3.77 14.33 11.58 6.98 26.52
Boston, MA (Metropolitan Area) Orlando, FL 10.14 3.43 16.58 9.86 6.03 29.17
Boston, MA (Metropolitan Area) Panama City, FL 36.67 20.31 51.65 2.73 1.94 4.92
Boston, MA (Metropolitan Area) Valparaiso, FL 11.43 4.70 21.31 8.75 4.69 21.27
Boston, MA (Metropolitan Area) Evansville, IN 14.44 6.40 27.08 6.92 3.69 15.61
Boston, MA (Metropolitan Area) New Bern/Morehead/Beaufort, NC 14.90 5.73 26.39 6.71 3.79 17.45
Boston, MA (Metropolitan Area) Key West, FL 18.97 7.52 34.27 5.27 2.92 13.30
Boston, MA (Metropolitan Area) Fresno, CA 8.97 3.54 16.23 11.14 6.16 28.28
Boston, MA (Metropolitan Area) Fayetteville, NC 12.63 4.42 23.18 7.92 4.31 22.63
Boston, MA (Metropolitan Area) Minneapolis/St. Paul, MN 6.80 3.13 11.53 14.70 8.67 31.96

Origin City Destination City Median Lower Upper Median Lower Upper
Online Appendix Table A.1 - Estimation Results for Each City Pair
Profit Margin (%) Price Elasticity
Boston, MA (Metropolitan Area) New York City, NY (Metropolitan Area) 10.13 4.41 18.04 9.87 5.54 22.65
Boston, MA (Metropolitan Area) Fort Myers, FL 8.90 4.05 16.42 11.24 6.09 24.72
Boston, MA (Metropolitan Area) Fort Wayne, IN 6.45 2.15 12.04 15.51 8.31 46.55
Boston, MA (Metropolitan Area) Fayetteville, AR 7.51 2.85 13.93 13.32 7.18 35.14
Boston, MA (Metropolitan Area) Greenville/Spartanburg, SC 15.01 7.09 24.13 6.66 4.14 14.11
Boston, MA (Metropolitan Area) Spokane, WA 9.26 4.08 17.23 10.80 5.80 24.52
Boston, MA (Metropolitan Area) Gainesville, FL 14.77 6.37 26.08 6.77 3.83 15.71
Boston, MA (Metropolitan Area) Green Bay, WI 13.01 5.59 23.01 7.69 4.35 17.90
Boston, MA (Metropolitan Area) Grand Rapids, MI 14.62 7.03 23.85 6.84 4.19 14.23
Boston, MA (Metropolitan Area) Greensboro/High Point, NC 9.53 3.99 16.77 10.50 5.96 25.06
Boston, MA (Metropolitan Area) Harrisburg, PA 19.65 9.78 34.12 5.09 2.93 10.23
Boston, MA (Metropolitan Area) Las Vegas, NV 7.52 3.70 13.01 13.29 7.68 27.02
Boston, MA (Metropolitan Area) Wilmington, NC 13.75 6.20 24.49 7.27 4.08 16.14
Boston, MA (Metropolitan Area) Indianapolis, IN 8.39 3.81 15.44 11.92 6.48 26.26
Boston, MA (Metropolitan Area) Jackson, WY 14.56 7.63 23.62 6.87 4.23 13.11
Boston, MA (Metropolitan Area) Jackson/Vicksburg, MS 11.58 4.79 19.83 8.64 5.04 20.88
Boston, MA (Metropolitan Area) San Francisco, CA (Metropolitan Area) 3.64 1.35 7.09 27.46 14.10 74.25
Boston, MA (Metropolitan Area) Miami, FL (Metropolitan Area) 9.20 4.29 16.14 10.87 6.20 23.29
Boston, MA (Metropolitan Area) Los Angeles, CA (Metropolitan Area) 4.11 1.83 7.87 24.31 12.71 54.65
Boston, MA (Metropolitan Area) Little Rock, AR 12.88 6.17 21.67 7.76 4.61 16.22
Boston, MA (Metropolitan Area) Lansing, MI 12.69 5.77 22.94 7.88 4.36 17.34
Boston, MA (Metropolitan Area) Lexington, KY 13.67 6.35 23.14 7.32 4.32 15.76
Boston, MA (Metropolitan Area) Louisville, KY 12.80 6.23 20.42 7.81 4.90 16.05
Boston, MA (Metropolitan Area) Cincinnati, OH 12.48 6.49 19.79 8.01 5.05 15.41
Boston, MA (Metropolitan Area) Sacramento, CA 8.31 3.46 15.10 12.03 6.62 28.93
Boston, MA (Metropolitan Area) Tampa, FL (Metropolitan Area) 8.65 3.92 15.27 11.56 6.55 25.52
Boston, MA (Metropolitan Area) Kansas City, MO 7.18 3.60 12.10 13.92 8.26 27.78
Boston, MA (Metropolitan Area) San Antonio, TX 14.36 7.44 21.75 6.97 4.60 13.45
Boston, MA (Metropolitan Area) Memphis, TN 17.00 6.58 31.91 5.88 3.13 15.20
Boston, MA (Metropolitan Area) Montgomery, AL 9.77 4.25 17.35 10.24 5.76 23.55
Boston, MA (Metropolitan Area) Omaha, NE 9.62 4.17 18.00 10.39 5.55 24.01
Boston, MA (Metropolitan Area) Milwaukee, WI 10.51 4.19 17.94 9.52 5.57 23.86
Boston, MA (Metropolitan Area) Melbourne, FL 19.39 8.05 36.21 5.16 2.76 12.43
Boston, MA (Metropolitan Area) Quad Cities, IL (Metropolitan Area) 8.47 3.22 16.27 11.80 6.15 31.01
Boston, MA (Metropolitan Area) Madison, WI 5.67 2.61 10.40 17.64 9.61 38.32
Boston, MA (Metropolitan Area) New Orleans, LA 16.80 6.11 30.77 5.95 3.25 16.37
Boston, MA (Metropolitan Area) San Diego, CA 3.66 2.05 6.13 27.29 16.32 48.89
Boston, MA (Metropolitan Area) Norfolk, VA (Metropolitan Area) 11.40 5.34 20.52 8.77 4.87 18.71
Boston, MA (Metropolitan Area) Pensacola, FL 21.03 10.03 31.95 4.75 3.13 9.97
Boston, MA (Metropolitan Area) Oklahoma City, OK 9.89 4.10 19.06 10.11 5.25 24.40
Boston, MA (Metropolitan Area) West Palm Beach/Palm Beach, FL 6.29 2.33 13.34 15.89 7.50 42.84
Boston, MA (Metropolitan Area) Portland, OR 4.24 1.71 8.49 23.73 11.77 58.41
Boston, MA (Metropolitan Area) Philadelphia, PA 10.51 5.04 16.66 9.52 6.00 19.84

Origin City Destination City Median Lower Upper Median Lower Upper
Online Appendix Table A.1 - Estimation Results for Each City Pair
Profit Margin (%) Price Elasticity
Boston, MA (Metropolitan Area) Peoria, IL 9.81 3.97 19.43 10.19 5.15 25.19
Boston, MA (Metropolitan Area) Palm Springs, CA 10.72 4.37 20.18 9.33 4.96 22.87
Boston, MA (Metropolitan Area) Raleigh/Durham, NC 4.73 2.09 8.63 21.13 11.59 47.76
Boston, MA (Metropolitan Area) Richmond, VA 10.64 4.82 16.56 9.40 6.04 20.75
Boston, MA (Metropolitan Area) Reno, NV 14.30 6.43 24.87 6.99 4.02 15.56
Boston, MA (Metropolitan Area) Roanoke, VA 9.80 4.27 18.22 10.20 5.49 23.40
Boston, MA (Metropolitan Area) Rochester, NY 16.10 6.12 28.81 6.21 3.47 16.33
Boston, MA (Metropolitan Area) Salt Lake City, UT 11.16 5.43 19.16 8.96 5.22 18.43
Boston, MA (Metropolitan Area) Tulsa, OK 10.71 4.28 20.21 9.33 4.95 23.37
Boston, MA (Metropolitan Area) Savannah, GA 15.14 6.20 27.71 6.61 3.61 16.12
Boston, MA (Metropolitan Area) Santa Barbara, CA 7.77 2.70 13.46 12.87 7.43 37.09
Boston, MA (Metropolitan Area) South Bend, IN 9.92 4.31 19.06 10.08 5.25 23.21
Boston, MA (Metropolitan Area) Philipsburg/State College, PA 11.29 4.96 19.33 8.86 5.17 20.18
Boston, MA (Metropolitan Area) Springfield, MO 11.11 4.63 21.64 9.00 4.62 21.62
Boston, MA (Metropolitan Area) Salinas/Monterey, CA 8.31 3.44 16.94 12.04 5.90 29.04
Boston, MA (Metropolitan Area) Sarasota/Bradenton, FL 19.13 7.06 37.40 5.23 2.67 14.17
Boston, MA (Metropolitan Area) Syracuse, NY 20.99 8.90 37.56 4.76 2.66 11.24
Boston, MA (Metropolitan Area) Tallahassee, FL 21.39 11.64 31.63 4.67 3.16 8.59
Boston, MA (Metropolitan Area) Bristol/Johnson City/Kingsport, TN 9.54 3.55 16.33 10.48 6.12 28.18
Boston, MA (Metropolitan Area) Knoxville, TN 13.65 6.19 21.30 7.32 4.70 16.16
Brownsville, TX Chicago, IL 25.70 11.73 39.57 3.89 2.53 8.52
Baton Rouge, LA Dallas/Fort Worth, TX 10.30 4.88 17.06 9.71 5.87 20.50
Baton Rouge, LA Denver, CO 16.50 6.50 29.77 6.06 3.36 15.39
Baton Rouge, LA Phoenix, AZ 12.01 4.27 21.46 8.33 4.66 23.41
Baton Rouge, LA Seattle, WA 14.06 5.71 27.16 7.11 3.68 17.51
Baton Rouge, LA Nashville, TN 18.18 7.12 34.75 5.50 2.88 14.05
Baton Rouge, LA Boston, MA (Metropolitan Area) 14.77 6.02 28.38 6.77 3.52 16.60
Baton Rouge, LA Washington, DC (Metropolitan Area) 17.65 7.96 30.31 5.67 3.30 12.56
Baton Rouge, LA Chicago, IL 18.67 8.28 31.30 5.36 3.19 12.08
Baton Rouge, LA Houston, TX 29.11 15.04 44.93 3.44 2.23 6.65
Baton Rouge, LA Orlando, FL 24.47 10.93 41.41 4.09 2.41 9.15
Baton Rouge, LA Minneapolis/St. Paul, MN 15.25 6.32 27.64 6.56 3.62 15.82
Baton Rouge, LA New York City, NY (Metropolitan Area) 17.08 5.30 31.46 5.85 3.18 18.88
Baton Rouge, LA Las Vegas, NV 13.73 4.41 26.38 7.29 3.79 22.67
Baton Rouge, LA Indianapolis, IN 14.30 5.54 25.32 6.99 3.95 18.06
Baton Rouge, LA San Francisco, CA (Metropolitan Area) 13.27 3.60 25.24 7.54 3.96 27.75
Baton Rouge, LA Miami, FL (Metropolitan Area) 15.74 6.61 27.80 6.35 3.60 15.12
Baton Rouge, LA Los Angeles, CA (Metropolitan Area) 18.17 7.93 29.65 5.50 3.37 12.61
Baton Rouge, LA Kansas City, MO 10.29 4.53 18.74 9.71 5.33 22.08
Baton Rouge, LA San Antonio, TX 18.09 7.25 31.95 5.53 3.13 13.79
Baton Rouge, LA San Diego, CA 15.02 6.04 28.22 6.66 3.54 16.56
Baton Rouge, LA Philadelphia, PA 14.68 6.85 26.03 6.81 3.84 14.59
Baton Rouge, LA Raleigh/Durham, NC 12.12 4.90 23.87 8.25 4.19 20.39

Origin City Destination City Median Lower Upper Median Lower Upper
Online Appendix Table A.1 - Estimation Results for Each City Pair
Profit Margin (%) Price Elasticity
Burlington, VT Dallas/Fort Worth, TX 14.74 6.81 25.45 6.79 3.93 14.69
Burlington, VT Pittsburgh, PA 10.98 4.26 21.51 9.11 4.65 23.45
Burlington, VT Denver, CO 22.11 11.89 32.23 4.52 3.10 8.41
Burlington, VT Phoenix, AZ 12.62 5.30 20.93 7.92 4.78 18.86
Burlington, VT Seattle, WA 14.90 6.91 23.86 6.71 4.19 14.48
Burlington, VT Washington, DC (Metropolitan Area) 17.42 7.36 30.32 5.74 3.30 13.59
Burlington, VT Chicago, IL 9.54 4.19 17.88 10.48 5.59 23.85
Burlington, VT Charlotte, NC 9.33 4.39 17.40 10.72 5.75 22.79
Burlington, VT Orlando, FL 12.38 5.22 25.81 8.08 3.88 19.16
Burlington, VT Minneapolis/St. Paul, MN 9.63 3.99 16.13 10.38 6.20 25.07
Burlington, VT New York City, NY (Metropolitan Area) 5.92 2.15 11.70 16.88 8.55 46.48
Burlington, VT Fort Myers, FL 14.20 5.88 25.62 7.04 3.90 17.01
Burlington, VT Las Vegas, NV 11.28 4.78 20.74 8.87 4.82 20.90
Burlington, VT San Francisco, CA (Metropolitan Area) 7.37 3.31 13.29 13.57 7.53 30.19
Burlington, VT Miami, FL (Metropolitan Area) 21.24 8.52 36.29 4.71 2.76 11.73
Burlington, VT Los Angeles, CA (Metropolitan Area) 9.45 4.15 15.91 10.58 6.28 24.09
Burlington, VT Tampa, FL (Metropolitan Area) 13.61 6.07 24.45 7.35 4.09 16.47
Burlington, VT San Diego, CA 9.71 3.81 16.50 10.30 6.06 26.23
Burlington, VT West Palm Beach/Palm Beach, FL 11.21 4.85 21.79 8.92 4.59 20.60
Burlington, VT Philadelphia, PA 10.44 4.70 18.80 9.57 5.32 21.27
Burlington, VT Raleigh/Durham, NC 15.58 7.66 25.20 6.42 3.97 13.06
Buffalo, NY Dallas/Fort Worth, TX 10.47 4.08 18.35 9.55 5.45 24.49
Buffalo, NY Denver, CO 13.20 5.74 22.86 7.57 4.37 17.41
Buffalo, NY Phoenix, AZ 10.12 4.27 17.95 9.88 5.57 23.40
Buffalo, NY Seattle, WA 12.36 5.97 20.49 8.09 4.88 16.75
Buffalo, NY Nashville, TN 8.22 3.65 15.07 12.16 6.63 27.37
Buffalo, NY Washington, DC (Metropolitan Area) 6.29 2.77 12.48 15.90 8.02 36.09
Buffalo, NY Chicago, IL 13.23 6.39 21.94 7.56 4.56 15.66
Buffalo, NY Charleston, SC 17.26 8.35 28.22 5.79 3.54 11.97
Buffalo, NY Charlotte, NC 14.74 6.38 24.81 6.78 4.03 15.68
Buffalo, NY St. Louis, MO 17.70 7.96 27.59 5.65 3.63 12.56
Buffalo, NY Jacksonville, FL 12.06 5.32 22.12 8.29 4.52 18.79
Buffalo, NY Detroit, MI 23.34 12.93 35.51 4.28 2.82 7.73
Buffalo, NY Houston, TX 10.32 4.02 17.60 9.69 5.68 24.85
Buffalo, NY Orlando, FL 8.84 3.80 17.41 11.31 5.74 26.29
Buffalo, NY Minneapolis/St. Paul, MN 9.40 3.90 16.32 10.64 6.13 25.67
Buffalo, NY New York City, NY (Metropolitan Area) 12.02 5.26 22.90 8.32 4.37 18.99
Buffalo, NY Fort Myers, FL 14.34 6.38 24.83 6.98 4.03 15.68
Buffalo, NY Greensboro/High Point, NC 14.03 5.83 25.80 7.13 3.88 17.16
Buffalo, NY Las Vegas, NV 8.62 3.66 17.01 11.60 5.88 27.35
Buffalo, NY Indianapolis, IN 11.29 5.09 19.65 8.86 5.09 19.63
Buffalo, NY San Francisco, CA (Metropolitan Area) 6.14 2.57 11.81 16.28 8.47 38.89
Buffalo, NY Miami, FL (Metropolitan Area) 11.88 4.77 22.50 8.41 4.45 20.95

Origin City Destination City Median Lower Upper Median Lower Upper
Online Appendix Table A.1 - Estimation Results for Each City Pair
Profit Margin (%) Price Elasticity
Buffalo, NY Los Angeles, CA (Metropolitan Area) 6.88 3.42 14.19 14.54 7.05 29.24
Buffalo, NY Louisville, KY 14.41 6.47 24.19 6.94 4.13 15.45
Buffalo, NY Tampa, FL (Metropolitan Area) 9.19 3.36 18.32 10.88 5.46 29.73
Buffalo, NY Kansas City, MO 7.43 3.07 13.83 13.45 7.23 32.58
Buffalo, NY San Antonio, TX 11.99 5.25 21.10 8.34 4.74 19.03
Buffalo, NY Memphis, TN 11.80 5.09 20.99 8.47 4.76 19.63
Buffalo, NY Milwaukee, WI 20.42 10.02 32.15 4.90 3.11 9.98
Buffalo, NY New Orleans, LA 12.17 4.97 21.90 8.22 4.57 20.11
Buffalo, NY San Diego, CA 10.06 4.24 18.34 9.94 5.45 23.56
Buffalo, NY Norfolk, VA (Metropolitan Area) 22.05 10.52 35.16 4.54 2.84 9.51
Buffalo, NY West Palm Beach/Palm Beach, FL 14.69 6.01 25.36 6.81 3.94 16.63
Buffalo, NY Portland, OR 10.78 5.04 18.94 9.27 5.28 19.85
Buffalo, NY Philadelphia, PA 14.72 7.12 23.28 6.79 4.30 14.04
Buffalo, NY Raleigh/Durham, NC 7.96 3.21 14.53 12.56 6.88 31.12
Buffalo, NY Richmond, VA 8.59 3.85 16.71 11.65 5.98 25.97
Buffalo, NY Salt Lake City, UT 15.85 7.67 25.36 6.31 3.94 13.04
Buffalo, NY Sarasota/Bradenton, FL 25.00 11.04 42.25 4.00 2.37 9.06
Bozeman, MT Dallas/Fort Worth, TX 10.71 4.43 18.10 9.34 5.52 22.56
Bozeman, MT Phoenix, AZ 12.34 5.24 22.12 8.10 4.52 19.09
Bozeman, MT Seattle, WA 14.22 6.09 27.65 7.03 3.62 16.42
Bozeman, MT Washington, DC (Metropolitan Area) 11.43 5.01 20.04 8.75 4.99 19.97
Bozeman, MT Chicago, IL 6.59 2.82 12.65 15.18 7.91 35.44
Bozeman, MT Detroit, MI 10.80 4.65 20.70 9.26 4.83 21.49
Bozeman, MT Minneapolis/St. Paul, MN 6.82 3.33 13.63 14.67 7.34 30.01
Bozeman, MT New York City, NY (Metropolitan Area) 10.61 4.33 17.45 9.43 5.73 23.07
Bozeman, MT San Francisco, CA (Metropolitan Area) 8.25 3.25 13.90 12.12 7.19 30.78
Bozeman, MT Los Angeles, CA (Metropolitan Area) 6.56 2.85 13.52 15.24 7.40 35.04
Bozeman, MT Portland, OR 19.66 8.72 33.90 5.09 2.95 11.47
Washington, DC (Metropolitan Area) Wausau/Mosinee/Stevens Point, WI 12.87 5.70 22.63 7.77 4.42 17.55
Washington, DC (Metropolitan Area) Wichita, KS 17.46 8.89 25.97 5.73 3.85 11.24
Washington, DC (Metropolitan Area) Wilmington, NC 18.98 9.34 30.93 5.27 3.23 10.71
Washington, DC (Metropolitan Area) West Palm Beach/Palm Beach, FL 7.01 2.78 14.81 14.28 6.75 35.93
Columbia, SC Dallas/Fort Worth, TX 10.76 4.91 19.75 9.30 5.06 20.36
Columbia, SC Pittsburgh, PA 23.38 10.88 37.76 4.28 2.65 9.19
Columbia, SC Denver, CO 13.93 5.47 24.21 7.18 4.13 18.27
Columbia, SC Phoenix, AZ 14.89 6.95 25.02 6.72 4.00 14.39
Columbia, SC Hartford, CT 17.33 8.93 28.04 5.77 3.57 11.20
Columbia, SC Seattle, WA 16.99 6.85 28.68 5.89 3.49 14.59
Columbia, SC Nashville, TN 18.78 8.53 29.91 5.33 3.34 11.73
Columbia, SC Washington, DC (Metropolitan Area) 29.19 16.53 41.36 3.43 2.42 6.05
Columbia, SC Columbus, OH 20.19 8.98 33.19 4.95 3.01 11.14
Columbia, SC St. Louis, MO 10.76 4.04 21.88 9.29 4.57 24.73
Columbia, SC Detroit, MI 19.43 8.69 33.24 5.15 3.01 11.51

Origin City Destination City Median Lower Upper Median Lower Upper
Online Appendix Table A.1 - Estimation Results for Each City Pair
Profit Margin (%) Price Elasticity
Columbia, SC Houston, TX 20.98 7.92 38.44 4.77 2.60 12.63
Columbia, SC Orlando, FL 30.01 15.53 44.41 3.33 2.25 6.44
Columbia, SC Minneapolis/St. Paul, MN 15.55 6.43 26.71 6.43 3.74 15.55
Columbia, SC New York City, NY (Metropolitan Area) 14.34 5.93 25.89 6.97 3.86 16.86
Columbia, SC Las Vegas, NV 30.84 15.78 46.73 3.24 2.14 6.34
Columbia, SC Indianapolis, IN 14.99 7.05 25.35 6.67 3.94 14.18
Columbia, SC San Francisco, CA (Metropolitan Area) 20.10 8.78 32.32 4.97 3.09 11.39
Columbia, SC Miami, FL (Metropolitan Area) 18.42 7.79 30.21 5.43 3.31 12.83
Columbia, SC Los Angeles, CA (Metropolitan Area) 12.63 5.32 22.46 7.92 4.45 18.79
Columbia, SC Louisville, KY 24.83 11.84 38.08 4.03 2.63 8.45
Columbia, SC Tampa, FL (Metropolitan Area) 23.32 11.37 33.70 4.29 2.97 8.80
Columbia, SC Kansas City, MO 8.48 3.60 15.27 11.80 6.55 27.75
Columbia, SC San Antonio, TX 14.49 6.37 26.85 6.90 3.72 15.70
Columbia, SC Memphis, TN 13.92 6.03 24.46 7.18 4.09 16.59
Columbia, SC Milwaukee, WI 11.31 5.13 20.35 8.84 4.91 19.50
Columbia, SC San Diego, CA 21.28 10.06 33.97 4.70 2.94 9.94
Columbia, SC Philadelphia, PA 27.30 13.48 43.89 3.66 2.28 7.42
Chicago, IL Colorado Springs, CO 20.50 9.45 36.67 4.88 2.73 10.59
Chicago, IL Dallas/Fort Worth, TX 6.78 2.78 12.38 14.75 8.08 35.93
Chicago, IL Pittsburgh, PA 9.81 4.69 16.63 10.19 6.01 21.34
Chicago, IL Huntsville, AL 9.53 4.24 17.71 10.49 5.65 23.57
Chicago, IL Denver, CO 6.67 3.23 12.87 14.99 7.77 30.98
Chicago, IL Tucson, AZ 7.73 3.15 14.07 12.93 7.11 31.73
Chicago, IL Phoenix, AZ 5.13 2.26 8.94 19.51 11.19 44.22
Chicago, IL Shreveport, LA 17.04 8.17 28.47 5.87 3.51 12.24
Chicago, IL Hartford, CT 4.38 1.63 8.97 22.86 11.15 61.35
Chicago, IL Seattle, WA 5.91 2.65 9.81 16.91 10.20 37.72
Chicago, IL Mobile, AL 16.88 7.66 28.97 5.93 3.45 13.05
Chicago, IL El Paso, TX 7.86 3.58 14.21 12.72 7.04 27.95
Chicago, IL Cleveland, OH (Metropolitan Area) 10.18 4.18 17.72 9.82 5.64 23.95
Chicago, IL Nashville, TN 7.99 3.10 15.23 12.51 6.57 32.22
Chicago, IL Washington, DC (Metropolitan Area) 7.04 3.15 12.12 14.21 8.25 31.77
Chicago, IL Columbia, SC 17.27 7.20 30.84 5.79 3.24 13.89
Chicago, IL Wichita, KS - - - - - -
Chicago, IL Columbus, OH 11.57 5.43 19.73 8.64 5.07 18.40
Chicago, IL St. Louis, MO 10.90 4.16 19.63 9.17 5.09 24.01
Chicago, IL Myrtle Beach, SC 23.39 11.69 35.48 4.28 2.82 8.56
Chicago, IL Jacksonville, FL 10.67 4.64 19.76 9.37 5.06 21.55
Chicago, IL Corpus Christi, TX 12.85 5.82 22.89 7.78 4.37 17.19
Chicago, IL Daytona Beach, FL 19.56 8.23 34.76 5.11 2.88 12.14
Chicago, IL Dayton, OH 13.13 5.83 24.96 7.62 4.01 17.16
Chicago, IL Detroit, MI 9.14 3.71 18.72 10.95 5.34 26.98
Chicago, IL Duluth, MN 11.71 4.54 22.37 8.54 4.47 22.03

Origin City Destination City Median Lower Upper Median Lower Upper
Online Appendix Table A.1 - Estimation Results for Each City Pair
Profit Margin (%) Price Elasticity
Chicago, IL Des Moines, IA 6.25 2.96 11.02 16.01 9.07 33.74
Chicago, IL Houston, TX 4.44 1.99 8.99 22.52 11.12 50.34
Chicago, IL Orlando, FL 6.75 2.83 11.79 14.82 8.48 35.36
Chicago, IL Panama City, FL 25.25 11.98 40.70 3.96 2.46 8.34
Chicago, IL Valparaiso, FL 18.74 7.97 32.95 5.34 3.04 12.54
Chicago, IL Eugene, OR 6.53 2.22 12.00 15.31 8.34 45.06
Chicago, IL Evansville, IN 8.28 3.38 15.06 12.08 6.64 29.56
Chicago, IL Key West, FL 25.01 12.08 39.94 4.00 2.50 8.28
Chicago, IL Fargo, ND 15.22 6.57 26.07 6.57 3.84 15.23
Chicago, IL Fresno, CA 11.59 4.85 19.76 8.63 5.06 20.64
Chicago, IL Fayetteville, NC 15.88 6.91 26.82 6.30 3.73 14.47
Chicago, IL Minneapolis/St. Paul, MN 4.33 1.74 8.07 23.11 12.39 57.55
Chicago, IL New York City, NY (Metropolitan Area) 13.36 7.43 18.97 7.48 5.27 13.47
Chicago, IL Fort Myers, FL 7.55 3.55 14.25 13.24 7.02 28.15
Chicago, IL Sioux Falls, SD 23.10 10.56 42.39 4.33 2.36 9.47
Chicago, IL Fort Wayne, IN 15.69 6.63 25.02 6.37 4.00 15.09
Chicago, IL Fayetteville, AR 10.07 4.05 18.60 9.93 5.38 24.71
Chicago, IL Greenville/Spartanburg, SC 23.30 11.04 38.12 4.29 2.62 9.06
Chicago, IL Spokane, WA 7.93 3.58 16.42 12.61 6.09 27.94
Chicago, IL Gainesville, FL 24.59 11.01 42.31 4.07 2.36 9.08
Chicago, IL Gulfport/Biloxi, MS 23.45 12.19 35.65 4.26 2.81 8.20
Chicago, IL Green Bay, WI 12.88 5.95 21.34 7.76 4.69 16.82
Chicago, IL Grand Rapids, MI 7.18 2.70 12.62 13.93 7.93 37.00
Chicago, IL Greensboro/High Point, NC 5.98 2.35 14.55 16.73 6.88 42.56
Chicago, IL Harrisburg, PA 8.23 3.42 15.79 12.14 6.33 29.22
Chicago, IL Harlingen/San Benito, TX 8.95 3.88 17.14 11.18 5.83 25.77
Chicago, IL Las Vegas, NV 6.15 2.58 11.35 16.26 8.81 38.70
Chicago, IL Wilmington, NC 9.85 3.77 19.92 10.15 5.02 26.51
Chicago, IL Indianapolis, IN 6.78 2.96 12.87 14.75 7.77 33.83
Chicago, IL Jackson, WY 12.82 5.49 23.84 7.80 4.19 18.22
Chicago, IL Jackson/Vicksburg, MS 16.74 7.99 28.13 5.98 3.55 12.51
Chicago, IL San Francisco, CA (Metropolitan Area) 3.17 1.62 5.22 31.59 19.16 61.75
Chicago, IL Miami, FL (Metropolitan Area) 6.38 2.92 11.36 15.67 8.80 34.27
Chicago, IL Rochester, MN 15.11 6.98 24.65 6.62 4.06 14.32
Chicago, IL Los Angeles, CA (Metropolitan Area) 2.94 1.25 6.36 34.01 15.73 80.36
Chicago, IL Little Rock, AR 12.05 5.10 21.75 8.30 4.60 19.62
Chicago, IL Lubbock, TX 13.70 5.98 22.76 7.30 4.39 16.72
Chicago, IL Lexington, KY 20.15 10.18 31.25 4.96 3.20 9.83
Chicago, IL Lafayette, LA 14.63 6.50 25.18 6.84 3.97 15.38
Chicago, IL Lincoln, NE 20.19 9.23 33.65 4.95 2.97 10.84
Chicago, IL Louisville, KY 5.46 2.20 10.76 18.31 9.29 45.47
Chicago, IL La Crosse, WI 10.55 4.17 19.33 9.48 5.17 23.96
Chicago, IL Cincinnati, OH 7.45 3.54 11.95 13.42 8.37 28.24
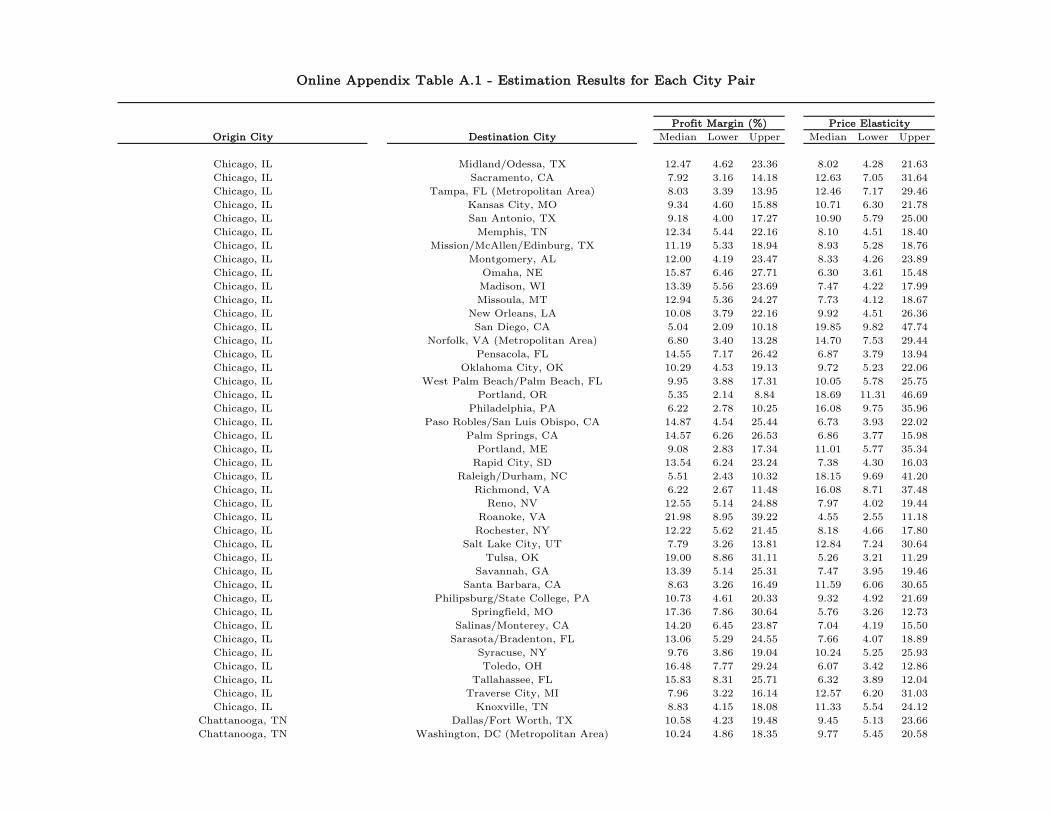
Origin City Destination City Median Lower Upper Median Lower Upper
Online Appendix Table A.1 - Estimation Results for Each City Pair
Profit Margin (%) Price Elasticity
Chicago, IL Midland/Odessa, TX 12.47 4.62 23.36 8.02 4.28 21.63
Chicago, IL Sacramento, CA 7.92 3.16 14.18 12.63 7.05 31.64
Chicago, IL Tampa, FL (Metropolitan Area) 8.03 3.39 13.95 12.46 7.17 29.46
Chicago, IL Kansas City, MO 9.34 4.60 15.88 10.71 6.30 21.78
Chicago, IL San Antonio, TX 9.18 4.00 17.27 10.90 5.79 25.00
Chicago, IL Memphis, TN 12.34 5.44 22.16 8.10 4.51 18.40
Chicago, IL Mission/McAllen/Edinburg, TX 11.19 5.33 18.94 8.93 5.28 18.76
Chicago, IL Montgomery, AL 12.00 4.19 23.47 8.33 4.26 23.89
Chicago, IL Omaha, NE 15.87 6.46 27.71 6.30 3.61 15.48
Chicago, IL Madison, WI 13.39 5.56 23.69 7.47 4.22 17.99
Chicago, IL Missoula, MT 12.94 5.36 24.27 7.73 4.12 18.67
Chicago, IL New Orleans, LA 10.08 3.79 22.16 9.92 4.51 26.36
Chicago, IL San Diego, CA 5.04 2.09 10.18 19.85 9.82 47.74
Chicago, IL Norfolk, VA (Metropolitan Area) 6.80 3.40 13.28 14.70 7.53 29.44
Chicago, IL Pensacola, FL 14.55 7.17 26.42 6.87 3.79 13.94
Chicago, IL Oklahoma City, OK 10.29 4.53 19.13 9.72 5.23 22.06
Chicago, IL West Palm Beach/Palm Beach, FL 9.95 3.88 17.31 10.05 5.78 25.75
Chicago, IL Portland, OR 5.35 2.14 8.84 18.69 11.31 46.69
Chicago, IL Philadelphia, PA 6.22 2.78 10.25 16.08 9.75 35.96
Chicago, IL Paso Robles/San Luis Obispo, CA 14.87 4.54 25.44 6.73 3.93 22.02
Chicago, IL Palm Springs, CA 14.57 6.26 26.53 6.86 3.77 15.98
Chicago, IL Portland, ME 9.08 2.83 17.34 11.01 5.77 35.34
Chicago, IL Rapid City, SD 13.54 6.24 23.24 7.38 4.30 16.03
Chicago, IL Raleigh/Durham, NC 5.51 2.43 10.32 18.15 9.69 41.20
Chicago, IL Richmond, VA 6.22 2.67 11.48 16.08 8.71 37.48
Chicago, IL Reno, NV 12.55 5.14 24.88 7.97 4.02 19.44
Chicago, IL Roanoke, VA 21.98 8.95 39.22 4.55 2.55 11.18
Chicago, IL Rochester, NY 12.22 5.62 21.45 8.18 4.66 17.80
Chicago, IL Salt Lake City, UT 7.79 3.26 13.81 12.84 7.24 30.64
Chicago, IL Tulsa, OK 19.00 8.86 31.11 5.26 3.21 11.29
Chicago, IL Savannah, GA 13.39 5.14 25.31 7.47 3.95 19.46
Chicago, IL Santa Barbara, CA 8.63 3.26 16.49 11.59 6.06 30.65
Chicago, IL Philipsburg/State College, PA 10.73 4.61 20.33 9.32 4.92 21.69
Chicago, IL Springfield, MO 17.36 7.86 30.64 5.76 3.26 12.73
Chicago, IL Salinas/Monterey, CA 14.20 6.45 23.87 7.04 4.19 15.50
Chicago, IL Sarasota/Bradenton, FL 13.06 5.29 24.55 7.66 4.07 18.89
Chicago, IL Syracuse, NY 9.76 3.86 19.04 10.24 5.25 25.93
Chicago, IL Toledo, OH 16.48 7.77 29.24 6.07 3.42 12.86
Chicago, IL Tallahassee, FL 15.83 8.31 25.71 6.32 3.89 12.04
Chicago, IL Traverse City, MI 7.96 3.22 16.14 12.57 6.20 31.03
Chicago, IL Knoxville, TN 8.83 4.15 18.08 11.33 5.54 24.12
Chattanooga, TN Dallas/Fort Worth, TX 10.58 4.23 19.48 9.45 5.13 23.66
Chattanooga, TN Washington, DC (Metropolitan Area) 10.24 4.86 18.35 9.77 5.45 20.58

Origin City Destination City Median Lower Upper Median Lower Upper
Online Appendix Table A.1 - Estimation Results for Each City Pair
Profit Margin (%) Price Elasticity
Chattanooga, TN Chicago, IL 9.97 4.63 17.46 10.03 5.73 21.58
Chattanooga, TN Orlando, FL 12.84 6.04 22.31 7.79 4.48 16.56
Chattanooga, TN Minneapolis/St. Paul, MN 13.51 6.84 21.63 7.40 4.62 14.63
Chattanooga, TN New York City, NY (Metropolitan Area) 8.59 3.71 15.62 11.64 6.40 26.96
Chattanooga, TN Las Vegas, NV 20.46 8.60 35.89 4.89 2.79 11.63
Chattanooga, TN Miami, FL (Metropolitan Area) 25.43 13.03 38.33 3.93 2.61 7.67
Chattanooga, TN Los Angeles, CA (Metropolitan Area) 14.30 5.77 25.33 6.99 3.95 17.34
Chattanooga, TN Tampa, FL (Metropolitan Area) 18.28 8.34 30.83 5.47 3.24 11.98
Chattanooga, TN Philadelphia, PA 13.89 5.36 24.49 7.20 4.08 18.65
Charlottesville, VA Chicago, IL 19.84 7.28 35.19 5.04 2.84 13.75
Charlottesville, VA San Francisco, CA (Metropolitan Area) 6.56 2.45 11.10 15.26 9.01 40.78
Charlottesville, VA Miami, FL (Metropolitan Area) 15.59 7.49 27.46 6.42 3.64 13.35
Charlottesville, VA Los Angeles, CA (Metropolitan Area) 9.49 4.41 18.13 10.54 5.52 22.65
Charleston, SC Dallas/Fort Worth, TX 7.72 3.52 13.79 12.95 7.25 28.37
Charleston, SC Pittsburgh, PA 13.47 6.38 21.49 7.42 4.65 15.68
Charleston, SC Denver, CO 16.20 7.49 27.07 6.17 3.69 13.36
Charleston, SC Phoenix, AZ 7.66 3.16 13.81 13.06 7.24 31.67
Charleston, SC Hartford, CT 10.13 4.37 18.37 9.87 5.44 22.90
Charleston, SC Seattle, WA 7.18 3.27 14.29 13.92 7.00 30.56
Charleston, SC Cleveland, OH (Metropolitan Area) 11.26 4.38 20.26 8.88 4.94 22.84
Charleston, SC Nashville, TN 13.74 6.00 22.50 7.28 4.44 16.65
Charleston, SC Washington, DC (Metropolitan Area) 12.34 4.82 21.90 8.10 4.57 20.75
Charleston, SC Chicago, IL 16.92 7.34 30.39 5.91 3.29 13.62
Charleston, SC Columbus, OH 12.60 5.70 21.54 7.94 4.64 17.55
Charleston, SC St. Louis, MO 9.57 3.89 17.86 10.45 5.60 25.72
Charleston, SC Dayton, OH 10.24 4.89 18.35 9.77 5.45 20.44
Charleston, SC Detroit, MI 18.03 8.02 32.31 5.55 3.10 12.46
Charleston, SC Houston, TX 13.28 5.23 24.30 7.53 4.12 19.13
Charleston, SC Orlando, FL 10.45 4.19 18.27 9.57 5.47 23.85
Charleston, SC Minneapolis/St. Paul, MN 11.26 4.86 19.69 8.88 5.08 20.58
Charleston, SC New York City, NY (Metropolitan Area) 17.72 8.51 29.84 5.64 3.35 11.75
Charleston, SC Las Vegas, NV 14.86 5.88 28.07 6.73 3.56 17.00
Charleston, SC Indianapolis, IN 10.88 5.13 18.31 9.19 5.46 19.51
Charleston, SC San Francisco, CA (Metropolitan Area) 12.58 5.03 23.76 7.95 4.21 19.86
Charleston, SC Miami, FL (Metropolitan Area) 13.42 5.66 21.87 7.45 4.57 17.65
Charleston, SC Los Angeles, CA (Metropolitan Area) 7.91 3.16 15.05 12.65 6.65 31.63
Charleston, SC Louisville, KY 19.29 9.43 31.49 5.19 3.18 10.61
Charleston, SC Cincinnati, OH 11.43 4.63 21.85 8.75 4.58 21.59
Charleston, SC Tampa, FL (Metropolitan Area) 6.50 2.36 11.62 15.39 8.60 42.29
Charleston, SC Kansas City, MO 13.99 6.33 23.57 7.15 4.24 15.79
Charleston, SC San Antonio, TX 23.41 11.56 36.48 4.27 2.74 8.65
Charleston, SC Memphis, TN 17.18 7.63 30.34 5.82 3.30 13.11
Charleston, SC Milwaukee, WI 16.38 8.20 25.95 6.10 3.85 12.19

Origin City Destination City Median Lower Upper Median Lower Upper
Online Appendix Table A.1 - Estimation Results for Each City Pair
Profit Margin (%) Price Elasticity
Charleston, SC New Orleans, LA 9.11 3.84 18.73 10.98 5.34 26.01
Charleston, SC San Diego, CA 9.54 4.15 16.84 10.48 5.94 24.09
Charleston, SC Norfolk, VA (Metropolitan Area) 16.01 7.44 27.68 6.25 3.61 13.44
Charleston, SC West Palm Beach/Palm Beach, FL 10.94 5.07 18.98 9.14 5.27 19.73
Charleston, SC Philadelphia, PA 10.12 4.32 20.23 9.89 4.94 23.16
Charleston, SC Richmond, VA 8.46 3.08 15.64 11.82 6.40 32.42
Cedar Rapids/Iowa City, IA Dallas/Fort Worth, TX 13.12 5.62 22.43 7.62 4.46 17.81
Cedar Rapids/Iowa City, IA Denver, CO 14.29 6.38 24.49 7.00 4.08 15.68
Cedar Rapids/Iowa City, IA Phoenix, AZ 13.56 5.79 27.33 7.37 3.66 17.27
Cedar Rapids/Iowa City, IA Seattle, WA 11.04 4.69 20.22 9.06 4.95 21.34
Cedar Rapids/Iowa City, IA Nashville, TN 9.80 3.71 16.73 10.20 5.98 26.92
Cedar Rapids/Iowa City, IA Washington, DC (Metropolitan Area) 12.29 5.68 20.34 8.13 4.92 17.59
Cedar Rapids/Iowa City, IA Chicago, IL 8.39 4.11 14.28 11.92 7.00 24.36
Cedar Rapids/Iowa City, IA Houston, TX 13.80 5.88 23.70 7.24 4.22 17.02
Cedar Rapids/Iowa City, IA Orlando, FL 11.13 4.66 19.86 8.98 5.04 21.45
Cedar Rapids/Iowa City, IA Minneapolis/St. Paul, MN 18.77 9.45 30.65 5.33 3.26 10.58
Cedar Rapids/Iowa City, IA New York City, NY (Metropolitan Area) 6.73 2.68 12.37 14.86 8.08 37.38
Cedar Rapids/Iowa City, IA Las Vegas, NV 18.20 7.51 34.15 5.50 2.93 13.32
Cedar Rapids/Iowa City, IA San Francisco, CA (Metropolitan Area) 10.07 4.12 17.87 9.93 5.59 24.28
Cedar Rapids/Iowa City, IA Miami, FL (Metropolitan Area) 18.18 7.65 32.21 5.50 3.10 13.07
Cedar Rapids/Iowa City, IA Los Angeles, CA (Metropolitan Area) 9.55 3.89 16.27 10.47 6.15 25.73
Cedar Rapids/Iowa City, IA Tampa, FL (Metropolitan Area) 14.07 5.74 23.01 7.11 4.35 17.43
Cedar Rapids/Iowa City, IA San Antonio, TX 15.99 6.38 27.32 6.25 3.66 15.68
Cedar Rapids/Iowa City, IA San Diego, CA 11.67 4.57 20.77 8.57 4.81 21.86
Cedar Rapids/Iowa City, IA Philadelphia, PA 9.10 3.92 16.26 10.99 6.15 25.49
College Station/Bryan, TX Dallas/Fort Worth, TX 20.87 10.13 36.29 4.79 2.76 9.87
College Station/Bryan, TX Washington, DC (Metropolitan Area) 17.61 8.23 29.07 5.68 3.44 12.15
Charlotte, NC Colorado Springs, CO 20.85 9.54 34.58 4.80 2.89 10.49
Charlotte, NC Dallas/Fort Worth, TX 7.40 3.07 13.96 13.51 7.17 32.59
Charlotte, NC Pittsburgh, PA 8.87 3.59 16.88 11.27 5.92 27.88
Charlotte, NC Denver, CO 8.70 3.87 15.93 11.50 6.28 25.87
Charlotte, NC Tucson, AZ 7.78 3.69 15.01 12.85 6.66 27.09
Charlotte, NC Phoenix, AZ 9.64 4.41 18.89 10.37 5.30 22.65
Charlotte, NC Hartford, CT 9.15 3.81 16.18 10.93 6.18 26.24
Charlotte, NC Seattle, WA 7.51 3.39 14.13 13.32 7.08 29.48
Charlotte, NC Cleveland, OH (Metropolitan Area) 9.90 4.32 17.33 10.10 5.77 23.15
Charlotte, NC Nashville, TN 6.71 3.04 12.75 14.91 7.85 32.89
Charlotte, NC Washington, DC (Metropolitan Area) 11.07 5.17 18.66 9.04 5.36 19.35
Charlotte, NC Wichita, KS 16.59 7.55 27.09 6.03 3.69 13.24
Charlotte, NC Chicago, IL 6.44 3.12 12.33 15.54 8.11 32.10
Charlotte, NC Columbus, OH 12.96 5.22 22.80 7.72 4.39 19.14
Charlotte, NC St. Louis, MO 15.82 7.60 25.39 6.32 3.94 13.16
Charlotte, NC Jacksonville, FL 21.31 12.46 29.05 4.69 3.44 8.03

Origin City Destination City Median Lower Upper Median Lower Upper
Online Appendix Table A.1 - Estimation Results for Each City Pair
Profit Margin (%) Price Elasticity
Charlotte, NC Dayton, OH 19.27 8.59 31.45 5.19 3.18 11.64
Charlotte, NC Detroit, MI 9.60 4.13 17.63 10.42 5.67 24.19
Charlotte, NC Des Moines, IA 13.54 5.98 22.46 7.39 4.45 16.72
Charlotte, NC Houston, TX 10.22 4.11 19.89 9.79 5.03 24.32
Charlotte, NC Orlando, FL 7.11 2.58 12.64 14.06 7.91 38.82
Charlotte, NC Key West, FL 25.51 11.92 42.09 3.92 2.38 8.39
Charlotte, NC Minneapolis/St. Paul, MN 8.90 3.92 14.98 11.24 6.68 25.50
Charlotte, NC New York City, NY (Metropolitan Area) 7.14 3.14 12.34 14.01 8.10 31.81
Charlotte, NC Fort Myers, FL 9.82 4.48 17.79 10.19 5.62 22.31
Charlotte, NC Grand Rapids, MI 13.53 5.36 23.66 7.39 4.23 18.67
Charlotte, NC Harrisburg, PA 10.25 4.70 19.07 9.76 5.24 21.27
Charlotte, NC Las Vegas, NV 15.09 7.21 26.69 6.63 3.75 13.88
Charlotte, NC Wilmington, NC 15.54 6.73 25.28 6.44 3.96 14.85
Charlotte, NC Indianapolis, IN 8.50 3.55 15.09 11.76 6.63 28.16
Charlotte, NC Jackson/Vicksburg, MS 10.85 4.18 20.59 9.22 4.86 23.92
Charlotte, NC San Francisco, CA (Metropolitan Area) 11.99 5.13 19.32 8.34 5.18 19.48
Charlotte, NC Miami, FL (Metropolitan Area) 7.56 3.43 14.16 13.23 7.07 29.19
Charlotte, NC Los Angeles, CA (Metropolitan Area) 7.22 2.71 13.19 13.86 7.58 36.98
Charlotte, NC Little Rock, AR 15.78 6.17 26.66 6.34 3.75 16.20
Charlotte, NC Louisville, KY 15.52 6.08 32.25 6.45 3.10 16.45
Charlotte, NC Sacramento, CA 23.64 10.89 37.08 4.23 2.70 9.18
Charlotte, NC Tampa, FL (Metropolitan Area) 6.50 2.90 11.57 15.37 8.64 34.54
Charlotte, NC Kansas City, MO 8.39 3.77 16.39 11.91 6.10 26.54
Charlotte, NC San Antonio, TX 17.07 7.79 28.47 5.86 3.51 12.83
Charlotte, NC Memphis, TN 10.11 4.25 18.33 9.90 5.46 23.54
Charlotte, NC Omaha, NE 12.83 5.18 23.04 7.80 4.34 19.32
Charlotte, NC Milwaukee, WI 10.13 4.64 18.25 9.87 5.48 21.55
Charlotte, NC New Orleans, LA 8.08 3.08 16.45 12.37 6.09 32.54
Charlotte, NC San Diego, CA 13.52 6.04 23.76 7.40 4.21 16.55
Charlotte, NC Norfolk, VA (Metropolitan Area) 10.29 3.87 17.08 9.72 5.85 25.81
Charlotte, NC Pensacola, FL 13.51 5.88 27.16 7.40 3.68 17.00
Charlotte, NC Oklahoma City, OK 15.41 6.64 26.20 6.49 3.82 15.07
Charlotte, NC West Palm Beach/Palm Beach, FL 12.75 5.21 21.49 7.84 4.65 19.18
Charlotte, NC Portland, OR 12.81 6.28 21.37 7.81 4.68 15.93
Charlotte, NC Philadelphia, PA 5.07 1.97 11.24 19.73 8.90 50.70
Charlotte, NC Portland, ME 13.08 5.34 23.38 7.65 4.28 18.74
Charlotte, NC Richmond, VA 6.18 2.88 11.97 16.17 8.35 34.77
Charlotte, NC Reno, NV 18.34 8.52 31.76 5.45 3.15 11.74
Charlotte, NC Rochester, NY 19.11 8.83 30.01 5.23 3.33 11.33
Charlotte, NC Salt Lake City, UT 11.34 4.92 20.70 8.82 4.83 20.31
Charlotte, NC Tulsa, OK 12.40 4.57 26.56 8.06 3.77 21.87
Charlotte, NC South Bend, IN 19.30 9.42 30.55 5.18 3.27 10.62
Charlotte, NC Sarasota/Bradenton, FL 10.88 3.94 20.14 9.19 4.97 25.35

Origin City Destination City Median Lower Upper Median Lower Upper
Online Appendix Table A.1 - Estimation Results for Each City Pair
Profit Margin (%) Price Elasticity
Charlotte, NC Syracuse, NY 11.49 5.24 20.47 8.70 4.89 19.10
Columbus, OH Dallas/Fort Worth, TX 5.98 2.40 11.32 16.72 8.83 41.68
Columbus, OH Denver, CO 6.61 2.88 11.77 15.14 8.49 34.72
Columbus, OH Tucson, AZ 10.92 4.63 18.95 9.15 5.28 21.60
Columbus, OH Phoenix, AZ 5.98 2.13 12.54 16.73 7.98 46.86
Columbus, OH Hartford, CT 35.71 20.92 48.47 2.80 2.06 4.78
Columbus, OH Seattle, WA 7.76 3.27 14.94 12.89 6.69 30.57
Columbus, OH El Paso, TX 14.19 6.69 25.99 7.04 3.85 14.95
Columbus, OH Nashville, TN 8.43 3.22 15.99 11.86 6.26 31.03
Columbus, OH Washington, DC (Metropolitan Area) 20.81 11.97 29.86 4.80 3.35 8.36
Columbus, OH St. Louis, MO 15.68 7.77 26.62 6.38 3.76 12.87
Columbus, OH Jacksonville, FL 10.39 5.00 18.69 9.63 5.35 20.00
Columbus, OH Detroit, MI 19.55 8.89 34.85 5.12 2.87 11.25
Columbus, OH Des Moines, IA 8.69 3.29 18.02 11.51 5.55 30.44
Columbus, OH Houston, TX 7.66 3.25 14.75 13.05 6.78 30.80
Columbus, OH Orlando, FL 15.35 6.95 27.69 6.52 3.61 14.39
Columbus, OH Minneapolis/St. Paul, MN 9.41 4.33 15.28 10.62 6.55 23.08
Columbus, OH New York City, NY (Metropolitan Area) 8.50 3.83 14.42 11.77 6.93 26.09
Columbus, OH Fort Myers, FL 13.97 6.44 24.46 7.16 4.09 15.54
Columbus, OH Greenville/Spartanburg, SC 13.86 6.16 23.34 7.22 4.28 16.25
Columbus, OH Greensboro/High Point, NC 9.23 3.52 16.52 10.83 6.05 28.38
Columbus, OH Las Vegas, NV 8.70 3.66 14.65 11.49 6.82 27.33
Columbus, OH Jackson/Vicksburg, MS 9.27 3.91 16.37 10.79 6.11 25.60
Columbus, OH San Francisco, CA (Metropolitan Area) 5.74 2.50 9.46 17.42 10.57 40.02
Columbus, OH Miami, FL (Metropolitan Area) 15.32 6.82 25.65 6.53 3.90 14.67
Columbus, OH Los Angeles, CA (Metropolitan Area) 7.45 3.19 12.57 13.43 7.95 31.33
Columbus, OH Little Rock, AR 14.65 6.23 26.57 6.82 3.76 16.06
Columbus, OH Sacramento, CA 12.89 5.11 21.86 7.76 4.57 19.56
Columbus, OH Tampa, FL (Metropolitan Area) 14.14 5.53 25.67 7.07 3.90 18.08
Columbus, OH Kansas City, MO 7.57 3.76 17.16 13.21 5.83 26.61
Columbus, OH San Antonio, TX 9.91 4.58 18.39 10.09 5.44 21.84
Columbus, OH Memphis, TN 20.61 8.62 35.96 4.85 2.78 11.60
Columbus, OH Omaha, NE 11.56 4.75 21.39 8.65 4.68 21.07
Columbus, OH Milwaukee, WI 21.87 8.84 41.41 4.57 2.42 11.31
Columbus, OH Madison, WI 10.04 4.05 17.76 9.96 5.63 24.71
Columbus, OH New Orleans, LA 12.63 5.29 25.50 7.92 3.92 18.89
Columbus, OH San Diego, CA 8.26 3.40 15.97 12.10 6.26 29.42
Columbus, OH Norfolk, VA (Metropolitan Area) 15.63 6.88 25.98 6.40 3.85 14.54
Columbus, OH Oklahoma City, OK 10.35 4.47 17.94 9.66 5.57 22.35
Columbus, OH West Palm Beach/Palm Beach, FL 12.99 6.03 23.66 7.70 4.23 16.59
Columbus, OH Portland, OR 12.34 5.83 21.42 8.10 4.67 17.16
Columbus, OH Philadelphia, PA 11.29 5.20 17.65 8.86 5.67 19.22
Columbus, OH Portland, ME 14.44 5.86 27.05 6.92 3.70 17.08

Origin City Destination City Median Lower Upper Median Lower Upper
Online Appendix Table A.1 - Estimation Results for Each City Pair
Profit Margin (%) Price Elasticity
Columbus, OH Raleigh/Durham, NC 7.41 3.09 16.16 13.50 6.19 32.32
Columbus, OH Richmond, VA 9.12 4.05 17.54 10.97 5.70 24.69
Columbus, OH Reno, NV 13.96 5.52 27.59 7.17 3.62 18.12
Columbus, OH Salt Lake City, UT 9.45 3.88 17.17 10.58 5.82 25.78
Columbus, OH Tulsa, OK 10.63 4.65 19.41 9.41 5.15 21.51
Columbus, OH Savannah, GA 15.16 6.59 25.38 6.60 3.94 15.18
Columbus, OH Sarasota/Bradenton, FL 22.30 11.18 36.96 4.49 2.71 8.95
Columbus, OH Syracuse, NY 8.66 3.90 14.98 11.54 6.68 25.65
Champaign/Urbana, IL Washington, DC (Metropolitan Area) 14.86 6.34 26.22 6.73 3.81 15.76
Champaign/Urbana, IL New York City, NY (Metropolitan Area) 9.09 3.43 17.22 11.00 5.81 29.18
Champaign/Urbana, IL San Francisco, CA (Metropolitan Area) 13.24 4.76 24.66 7.56 4.06 21.03
Champaign/Urbana, IL Los Angeles, CA (Metropolitan Area) 21.41 9.64 34.71 4.67 2.88 10.38
St. Louis, MO Tucson, AZ 11.43 5.28 21.76 8.75 4.60 18.94
St. Louis, MO Washington, DC (Metropolitan Area) 5.89 2.76 10.33 16.99 9.68 36.19
St. Louis, MO Wichita, KS 15.16 6.94 26.20 6.60 3.82 14.41
St. Louis, MO Valparaiso, FL 11.55 4.55 20.86 8.66 4.79 21.98
St. Louis, MO Tampa, FL (Metropolitan Area) 5.45 2.09 9.77 18.36 10.24 47.75
St. Louis, MO West Palm Beach/Palm Beach, FL 12.63 5.30 23.78 7.92 4.21 18.86
St. Louis, MO Tulsa, OK 19.72 7.93 35.41 5.07 2.82 12.62
St. Louis, MO Syracuse, NY 9.66 4.43 17.27 10.36 5.79 22.58
Myrtle Beach, SC Pittsburgh, PA 8.71 3.65 17.50 11.49 5.71 27.39
Myrtle Beach, SC Washington, DC (Metropolitan Area) 10.26 4.70 19.42 9.75 5.15 21.26
Myrtle Beach, SC Orlando, FL 11.68 5.30 20.84 8.56 4.80 18.88
Myrtle Beach, SC New York City, NY (Metropolitan Area) 9.77 3.74 18.36 10.24 5.45 26.73
Myrtle Beach, SC Tampa, FL (Metropolitan Area) 12.06 5.13 20.76 8.29 4.82 19.51
Myrtle Beach, SC Philadelphia, PA 15.17 6.51 24.57 6.59 4.07 15.35
Jacksonville, FL Pittsburgh, PA 8.84 3.72 16.12 11.31 6.20 26.91
Jacksonville, FL Phoenix, AZ 6.36 2.58 11.96 15.71 8.36 38.83
Jacksonville, FL Seattle, WA 9.77 4.39 17.34 10.23 5.77 22.80
Jacksonville, FL Nashville, TN 10.92 4.96 19.34 9.16 5.17 20.16
Jacksonville, FL Washington, DC (Metropolitan Area) 10.66 4.15 20.20 9.38 4.95 24.11
Jacksonville, FL St. Louis, MO 13.12 5.15 25.08 7.62 3.99 19.42
Jacksonville, FL Minneapolis/St. Paul, MN 9.72 3.77 18.39 10.28 5.44 26.50
Jacksonville, FL New York City, NY (Metropolitan Area) 7.50 3.18 13.89 13.33 7.20 31.47
Jacksonville, FL Las Vegas, NV 9.91 4.19 19.76 10.09 5.06 23.90
Jacksonville, FL San Francisco, CA (Metropolitan Area) 6.74 2.94 12.85 14.84 7.78 34.00
Jacksonville, FL Miami, FL (Metropolitan Area) 12.51 5.31 21.50 7.99 4.65 18.85
Jacksonville, FL Los Angeles, CA (Metropolitan Area) 6.76 2.84 12.89 14.80 7.76 35.17
Jacksonville, FL Little Rock, AR 17.68 7.84 30.23 5.65 3.31 12.75
Jacksonville, FL Louisville, KY 10.34 4.32 20.95 9.67 4.77 23.17
Jacksonville, FL Sacramento, CA 8.87 3.07 18.22 11.28 5.49 32.55
Jacksonville, FL Kansas City, MO 9.74 4.26 19.91 10.27 5.02 23.47
Jacksonville, FL San Antonio, TX 11.72 4.67 20.79 8.53 4.81 21.42

Origin City Destination City Median Lower Upper Median Lower Upper
Online Appendix Table A.1 - Estimation Results for Each City Pair
Profit Margin (%) Price Elasticity
Jacksonville, FL Memphis, TN 21.40 7.85 37.79 4.67 2.65 12.73
Jacksonville, FL Omaha, NE 10.58 4.71 20.83 9.46 4.80 21.25
Jacksonville, FL Milwaukee, WI 22.95 10.95 35.86 4.36 2.79 9.13
Jacksonville, FL New Orleans, LA 16.83 7.14 29.78 5.94 3.36 14.01
Jacksonville, FL San Diego, CA 13.65 6.15 23.66 7.33 4.23 16.26
Jacksonville, FL Norfolk, VA (Metropolitan Area) 12.09 5.52 20.25 8.27 4.94 18.12
Jacksonville, FL Oklahoma City, OK 9.94 3.42 20.41 10.06 4.90 29.24
Jacksonville, FL Portland, OR 8.69 3.30 15.21 11.51 6.57 30.31
Jacksonville, FL Philadelphia, PA 15.78 7.56 25.45 6.34 3.93 13.24
Jacksonville, FL Portland, ME 26.53 13.26 42.67 3.77 2.34 7.54
Jacksonville, FL Raleigh/Durham, NC 8.04 3.37 13.48 12.43 7.42 29.68
Jacksonville, FL Richmond, VA 19.08 9.02 29.49 5.24 3.39 11.09
Jacksonville, FL Rochester, NY 14.08 6.24 23.69 7.10 4.22 16.01
Jacksonville, FL Salt Lake City, UT 14.40 6.17 24.50 6.95 4.08 16.22
Jacksonville, FL Tulsa, OK 9.78 4.10 19.27 10.23 5.19 24.37
Jacksonville, FL Syracuse, NY 16.01 6.13 27.96 6.24 3.58 16.32
Jacksonville, FL Knoxville, TN 13.00 5.14 22.59 7.69 4.43 19.45
Corpus Christi, TX Dallas/Fort Worth, TX 21.29 10.32 34.62 4.70 2.89 9.69
Corpus Christi, TX Denver, CO 14.31 5.84 26.26 6.99 3.81 17.11
Corpus Christi, TX Phoenix, AZ 13.63 5.44 22.69 7.33 4.41 18.40
Corpus Christi, TX Nashville, TN 18.16 8.34 34.00 5.51 2.94 11.99
Corpus Christi, TX Washington, DC (Metropolitan Area) 12.75 5.82 22.11 7.85 4.52 17.18
Corpus Christi, TX St. Louis, MO 12.64 5.27 22.71 7.91 4.40 18.99
Corpus Christi, TX Houston, TX 17.54 7.41 34.18 5.70 2.93 13.50
Corpus Christi, TX Orlando, FL 15.64 6.58 29.68 6.39 3.37 15.19
Corpus Christi, TX New York City, NY (Metropolitan Area) 12.80 5.26 22.74 7.81 4.40 19.02
Corpus Christi, TX Las Vegas, NV 11.94 5.30 21.99 8.38 4.55 18.87
Corpus Christi, TX San Francisco, CA (Metropolitan Area) 10.91 5.32 20.95 9.17 4.77 18.81
Corpus Christi, TX Miami, FL (Metropolitan Area) 12.35 4.16 24.00 8.10 4.17 24.05
Corpus Christi, TX Los Angeles, CA (Metropolitan Area) 10.50 4.24 19.36 9.52 5.16 23.57
Corpus Christi, TX Tampa, FL (Metropolitan Area) 9.27 4.03 18.67 10.79 5.36 24.81
Corpus Christi, TX Kansas City, MO 13.65 5.83 27.27 7.33 3.67 17.15
Corpus Christi, TX New Orleans, LA 14.53 7.01 27.39 6.88 3.65 14.26
Corpus Christi, TX San Diego, CA 12.38 5.31 22.63 8.08 4.42 18.82
Corpus Christi, TX Oklahoma City, OK 10.97 3.90 19.45 9.12 5.14 25.66
Corpus Christi, TX Philadelphia, PA 18.37 9.25 30.86 5.44 3.24 10.81
Corpus Christi, TX Tulsa, OK 16.99 7.06 30.04 5.89 3.33 14.17
Charleston/Dunbar, WV Dallas/Fort Worth, TX 14.88 5.88 23.66 6.72 4.23 16.99
Charleston/Dunbar, WV Denver, CO 9.92 4.12 17.78 10.08 5.62 24.29
Charleston/Dunbar, WV Washington, DC (Metropolitan Area) 22.17 10.20 39.11 4.51 2.56 9.81
Charleston/Dunbar, WV Houston, TX 22.16 10.63 39.33 4.51 2.54 9.40
Charleston/Dunbar, WV Orlando, FL 20.83 9.59 33.82 4.80 2.96 10.43
Charleston/Dunbar, WV New York City, NY (Metropolitan Area) 19.71 9.98 30.54 5.07 3.27 10.02

Origin City Destination City Median Lower Upper Median Lower Upper
Online Appendix Table A.1 - Estimation Results for Each City Pair
Profit Margin (%) Price Elasticity
Charleston/Dunbar, WV San Francisco, CA (Metropolitan Area) 15.18 6.44 25.04 6.59 3.99 15.54
Charleston/Dunbar, WV Miami, FL (Metropolitan Area) 20.04 10.30 31.92 4.99 3.13 9.71
Charleston/Dunbar, WV Los Angeles, CA (Metropolitan Area) 17.64 8.16 26.59 5.67 3.76 12.25
Charleston/Dunbar, WV Tampa, FL (Metropolitan Area) 22.36 11.20 36.09 4.47 2.77 8.93
Charleston/Dunbar, WV Philadelphia, PA 15.51 6.29 28.04 6.45 3.57 15.90
Columbus, GA Washington, DC (Metropolitan Area) 13.62 5.65 24.50 7.34 4.08 17.69
Daytona Beach, FL Hartford, CT 14.16 5.83 25.12 7.06 3.98 17.16
Daytona Beach, FL Washington, DC (Metropolitan Area) 19.44 8.76 34.18 5.14 2.93 11.41
Daytona Beach, FL New York City, NY (Metropolitan Area) 17.55 7.77 33.05 5.70 3.03 12.87
Daytona Beach, FL Indianapolis, IN 26.67 12.43 43.05 3.75 2.32 8.04
Daytona Beach, FL Los Angeles, CA (Metropolitan Area) 18.75 8.77 32.52 5.33 3.07 11.41
Daytona Beach, FL Philadelphia, PA 12.65 5.30 24.35 7.91 4.11 18.88
Dayton, OH Denver, CO 11.65 5.35 23.89 8.59 4.19 18.69
Dayton, OH Phoenix, AZ 18.53 8.34 32.95 5.40 3.04 11.99
Dayton, OH Hartford, CT 6.85 3.28 12.98 14.61 7.72 30.47
Dayton, OH Seattle, WA 10.85 4.71 20.89 9.21 4.79 21.24
Dayton, OH Washington, DC (Metropolitan Area) 10.67 5.11 20.98 9.37 4.77 19.56
Dayton, OH Jacksonville, FL 11.63 5.29 22.63 8.60 4.42 18.90
Dayton, OH Houston, TX 12.93 5.25 24.18 7.73 4.14 19.09
Dayton, OH Orlando, FL 13.29 5.87 25.91 7.52 3.86 17.05
Dayton, OH Valparaiso, FL 9.32 3.99 18.84 10.72 5.31 25.06
Dayton, OH Minneapolis/St. Paul, MN 12.61 5.15 20.03 7.93 4.99 19.41
Dayton, OH New York City, NY (Metropolitan Area) 10.21 4.49 20.24 9.80 4.94 22.26
Dayton, OH Fort Myers, FL 16.09 7.01 30.16 6.21 3.32 14.27
Dayton, OH Las Vegas, NV 20.55 8.23 35.95 4.87 2.78 12.15
Dayton, OH San Francisco, CA (Metropolitan Area) 7.66 3.62 16.11 13.05 6.21 27.66
Dayton, OH Miami, FL (Metropolitan Area) 17.15 7.39 29.33 5.83 3.41 13.53
Dayton, OH Los Angeles, CA (Metropolitan Area) 11.11 4.48 21.36 9.00 4.68 22.32
Dayton, OH Tampa, FL (Metropolitan Area) 11.57 4.59 24.11 8.64 4.15 21.78
Dayton, OH Kansas City, MO 14.21 5.78 26.80 7.04 3.73 17.29
Dayton, OH San Antonio, TX 19.21 8.37 34.59 5.21 2.89 11.95
Dayton, OH Memphis, TN 10.09 4.29 20.54 9.91 4.87 23.28
Dayton, OH New Orleans, LA 14.60 6.03 26.91 6.85 3.72 16.60
Dayton, OH San Diego, CA 16.49 7.82 26.61 6.07 3.76 12.79
Dayton, OH Norfolk, VA (Metropolitan Area) 8.46 3.46 13.18 11.82 7.59 28.91
Dayton, OH Pensacola, FL 36.31 19.73 54.04 2.75 1.85 5.07
Dayton, OH Oklahoma City, OK 18.40 8.92 31.14 5.43 3.21 11.21
Dayton, OH West Palm Beach/Palm Beach, FL 17.23 8.52 31.38 5.80 3.19 11.74
Dayton, OH Philadelphia, PA 8.00 3.92 17.18 12.49 5.82 25.52
Dayton, OH Raleigh/Durham, NC 8.32 4.21 15.40 12.03 6.49 23.75
Dayton, OH Richmond, VA 15.97 8.33 27.49 6.26 3.64 12.01
Dayton, OH Salt Lake City, UT 15.38 6.50 28.55 6.50 3.50 15.37
Dayton, OH Sarasota/Bradenton, FL 23.13 10.72 40.45 4.32 2.47 9.33

Origin City Destination City Median Lower Upper Median Lower Upper
Online Appendix Table A.1 - Estimation Results for Each City Pair
Profit Margin (%) Price Elasticity
Detroit, MI Pittsburgh, PA 18.40 7.30 32.75 5.44 3.05 13.70
Detroit, MI Huntsville, AL 21.31 10.45 37.10 4.69 2.70 9.57
Detroit, MI Tucson, AZ 9.27 4.11 17.51 10.79 5.71 24.31
Detroit, MI Phoenix, AZ 6.31 2.57 11.91 15.85 8.39 38.94
Detroit, MI Shreveport, LA 12.25 4.64 23.47 8.16 4.26 21.56
Detroit, MI Hartford, CT 7.11 3.15 12.45 14.06 8.03 31.73
Detroit, MI Seattle, WA 11.80 4.77 20.79 8.47 4.81 20.97
Detroit, MI Mobile, AL 12.09 5.02 21.91 8.27 4.56 19.92
Detroit, MI El Paso, TX 7.24 3.14 13.57 13.81 7.37 31.89
Detroit, MI Nashville, TN 8.04 3.38 17.60 12.44 5.68 29.61
Detroit, MI Washington, DC (Metropolitan Area) 8.03 3.62 13.26 12.45 7.54 27.61
Detroit, MI Wichita, KS 15.46 5.98 27.88 6.47 3.59 16.71
Detroit, MI St. Louis, MO 16.47 6.81 28.94 6.07 3.46 14.68
Detroit, MI Myrtle Beach, SC 10.34 4.19 18.36 9.67 5.45 23.86
Detroit, MI Jacksonville, FL 12.88 5.75 22.81 7.76 4.38 17.40
Detroit, MI Houston, TX 10.12 4.44 17.30 9.88 5.78 22.51
Detroit, MI Orlando, FL 10.25 4.44 17.31 9.75 5.78 22.52
Detroit, MI Panama City, FL 35.78 16.56 55.99 2.80 1.79 6.04
Detroit, MI Valparaiso, FL 19.18 6.93 35.58 5.21 2.81 14.42
Detroit, MI Minneapolis/St. Paul, MN 12.35 5.58 19.54 8.10 5.12 17.92
Detroit, MI New York City, NY (Metropolitan Area) 8.07 3.49 14.22 12.39 7.03 28.64
Detroit, MI Fort Myers, FL 11.07 5.18 19.71 9.03 5.07 19.30
Detroit, MI Greenville/Spartanburg, SC 14.20 6.48 28.96 7.04 3.45 15.43
Detroit, MI Spokane, WA 14.41 5.63 24.58 6.94 4.07 17.77
Detroit, MI Green Bay, WI 10.85 4.42 19.42 9.22 5.15 22.64
Detroit, MI Greensboro/High Point, NC 17.18 6.88 31.59 5.82 3.17 14.53
Detroit, MI Harrisburg, PA 16.26 6.80 28.42 6.15 3.52 14.70
Detroit, MI Las Vegas, NV 7.21 2.97 12.29 13.86 8.14 33.64
Detroit, MI Indianapolis, IN 23.87 13.32 34.75 4.19 2.88 7.51
Detroit, MI Jackson/Vicksburg, MS 20.46 8.46 35.00 4.89 2.86 11.83
Detroit, MI San Francisco, CA (Metropolitan Area) 5.07 1.97 9.39 19.74 10.66 50.68
Detroit, MI Miami, FL (Metropolitan Area) 10.77 4.88 17.76 9.29 5.63 20.51
Detroit, MI Los Angeles, CA (Metropolitan Area) 6.34 2.62 11.44 15.76 8.74 38.15
Detroit, MI Little Rock, AR 11.98 6.23 24.59 8.35 4.07 16.05
Detroit, MI Louisville, KY 25.61 11.13 41.00 3.90 2.44 8.98
Detroit, MI Sacramento, CA 11.16 4.08 21.86 8.96 4.58 24.48
Detroit, MI Tampa, FL (Metropolitan Area) 10.84 5.10 19.19 9.23 5.21 19.61
Detroit, MI Kansas City, MO 12.40 5.04 21.70 8.06 4.61 19.83
Detroit, MI San Antonio, TX 7.50 3.33 13.34 13.33 7.50 30.03
Detroit, MI Memphis, TN 10.46 4.15 18.02 9.56 5.55 24.09
Detroit, MI Mission/McAllen/Edinburg, TX 10.61 4.35 17.54 9.42 5.70 22.99
Detroit, MI Montgomery, AL 10.31 4.03 20.25 9.70 4.94 24.79
Detroit, MI Omaha, NE 18.94 8.79 36.50 5.28 2.74 11.38

Origin City Destination City Median Lower Upper Median Lower Upper
Online Appendix Table A.1 - Estimation Results for Each City Pair
Profit Margin (%) Price Elasticity
Detroit, MI Milwaukee, WI 24.29 14.37 35.21 4.12 2.84 6.96
Detroit, MI Madison, WI 11.62 5.05 22.50 8.61 4.44 19.79
Detroit, MI New Orleans, LA 14.65 5.17 29.35 6.83 3.41 19.34
Detroit, MI San Diego, CA 5.42 1.97 10.67 18.44 9.37 50.69
Detroit, MI Norfolk, VA (Metropolitan Area) 12.41 5.73 20.72 8.06 4.83 17.45
Detroit, MI Pensacola, FL 10.95 3.95 19.35 9.13 5.17 25.35
Detroit, MI Oklahoma City, OK 16.63 7.63 30.65 6.01 3.26 13.11
Detroit, MI West Palm Beach/Palm Beach, FL 17.97 7.76 30.32 5.56 3.30 12.88
Detroit, MI Portland, OR 7.88 3.23 13.49 12.69 7.41 31.01
Detroit, MI Philadelphia, PA 9.58 4.66 15.15 10.44 6.60 21.47
Detroit, MI Palm Springs, CA 14.96 6.20 26.16 6.68 3.82 16.13
Detroit, MI Raleigh/Durham, NC 9.02 3.97 15.82 11.09 6.32 25.20
Detroit, MI Richmond, VA 18.09 6.94 34.03 5.53 2.94 14.42
Detroit, MI Reno, NV 17.63 7.80 34.14 5.67 2.93 12.82
Detroit, MI Rochester, NY 19.19 7.70 36.02 5.21 2.78 12.98
Detroit, MI Salt Lake City, UT 7.80 3.08 14.31 12.82 6.99 32.46
Detroit, MI Tulsa, OK 16.12 6.64 29.25 6.20 3.42 15.06
Detroit, MI Savannah, GA 25.03 10.70 40.60 3.99 2.46 9.35
Detroit, MI Syracuse, NY 11.03 4.44 20.44 9.07 4.89 22.52
Detroit, MI Tallahassee, FL 13.25 5.77 23.64 7.55 4.23 17.33
Detroit, MI Knoxville, TN 12.00 4.27 22.69 8.33 4.41 23.48
Dothan, AL Washington, DC (Metropolitan Area) 12.29 6.09 22.92 8.13 4.36 16.41
Duluth, MN Phoenix, AZ 21.23 9.88 35.72 4.71 2.80 10.12
Duluth, MN Washington, DC (Metropolitan Area) 13.29 5.82 23.02 7.52 4.34 17.18
Duluth, MN New York City, NY (Metropolitan Area) 21.55 10.93 33.13 4.64 3.02 9.15
Duluth, MN Los Angeles, CA (Metropolitan Area) 31.98 15.29 45.20 3.13 2.21 6.54
Des Moines, IA Pittsburgh, PA 6.92 2.46 13.25 14.44 7.55 40.66
Des Moines, IA Phoenix, AZ 23.73 11.09 39.97 4.21 2.50 9.01
Des Moines, IA Hartford, CT 10.84 4.38 20.17 9.22 4.96 22.84
Des Moines, IA Seattle, WA 12.66 5.71 21.03 7.90 4.76 17.51
Des Moines, IA Nashville, TN 11.96 4.95 21.77 8.36 4.59 20.18
Des Moines, IA Washington, DC (Metropolitan Area) 14.56 5.60 24.82 6.87 4.03 17.85
Des Moines, IA Detroit, MI 11.86 4.85 24.21 8.43 4.13 20.60
Des Moines, IA Houston, TX 16.71 6.88 31.23 5.98 3.20 14.54
Des Moines, IA Orlando, FL 27.74 14.55 42.80 3.60 2.34 6.87
Des Moines, IA Minneapolis/St. Paul, MN 13.49 5.63 25.34 7.41 3.95 17.77
Des Moines, IA New York City, NY (Metropolitan Area) 7.40 3.55 14.98 13.52 6.68 28.20
Des Moines, IA Fort Myers, FL 20.76 9.20 33.18 4.82 3.01 10.87
Des Moines, IA Las Vegas, NV 13.80 6.22 26.25 7.25 3.81 16.07
Des Moines, IA Indianapolis, IN 7.71 3.69 14.37 12.98 6.96 27.12
Des Moines, IA San Francisco, CA (Metropolitan Area) 8.02 3.50 14.70 12.48 6.80 28.54
Des Moines, IA Miami, FL (Metropolitan Area) 13.30 5.78 22.55 7.52 4.43 17.30
Des Moines, IA Los Angeles, CA (Metropolitan Area) 15.20 7.33 25.08 6.58 3.99 13.65
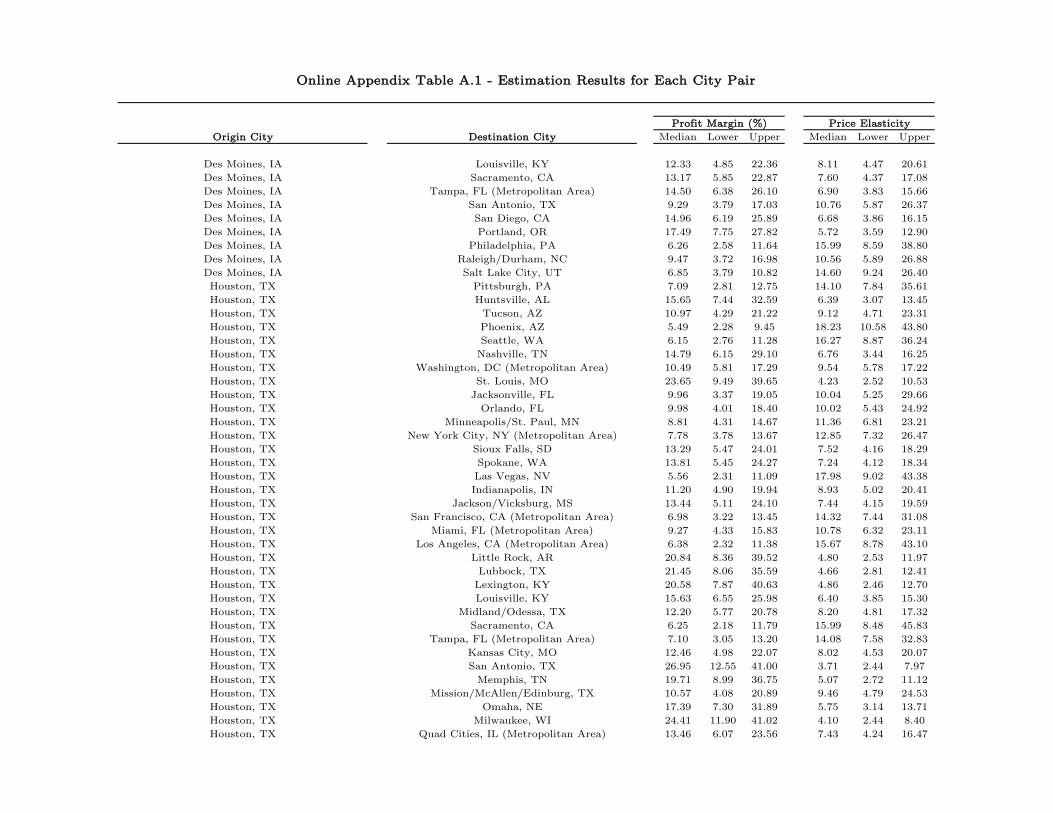
Origin City Destination City Median Lower Upper Median Lower Upper
Online Appendix Table A.1 - Estimation Results for Each City Pair
Profit Margin (%) Price Elasticity
Des Moines, IA Louisville, KY 12.33 4.85 22.36 8.11 4.47 20.61
Des Moines, IA Sacramento, CA 13.17 5.85 22.87 7.60 4.37 17.08
Des Moines, IA Tampa, FL (Metropolitan Area) 14.50 6.38 26.10 6.90 3.83 15.66
Des Moines, IA San Antonio, TX 9.29 3.79 17.03 10.76 5.87 26.37
Des Moines, IA San Diego, CA 14.96 6.19 25.89 6.68 3.86 16.15
Des Moines, IA Portland, OR 17.49 7.75 27.82 5.72 3.59 12.90
Des Moines, IA Philadelphia, PA 6.26 2.58 11.64 15.99 8.59 38.80
Des Moines, IA Raleigh/Durham, NC 9.47 3.72 16.98 10.56 5.89 26.88
Des Moines, IA Salt Lake City, UT 6.85 3.79 10.82 14.60 9.24 26.40
Houston, TX Pittsburgh, PA 7.09 2.81 12.75 14.10 7.84 35.61
Houston, TX Huntsville, AL 15.65 7.44 32.59 6.39 3.07 13.45
Houston, TX Tucson, AZ 10.97 4.29 21.22 9.12 4.71 23.31
Houston, TX Phoenix, AZ 5.49 2.28 9.45 18.23 10.58 43.80
Houston, TX Seattle, WA 6.15 2.76 11.28 16.27 8.87 36.24
Houston, TX Nashville, TN 14.79 6.15 29.10 6.76 3.44 16.25
Houston, TX Washington, DC (Metropolitan Area) 10.49 5.81 17.29 9.54 5.78 17.22
Houston, TX St. Louis, MO 23.65 9.49 39.65 4.23 2.52 10.53
Houston, TX Jacksonville, FL 9.96 3.37 19.05 10.04 5.25 29.66
Houston, TX Orlando, FL 9.98 4.01 18.40 10.02 5.43 24.92
Houston, TX Minneapolis/St. Paul, MN 8.81 4.31 14.67 11.36 6.81 23.21
Houston, TX New York City, NY (Metropolitan Area) 7.78 3.78 13.67 12.85 7.32 26.47
Houston, TX Sioux Falls, SD 13.29 5.47 24.01 7.52 4.16 18.29
Houston, TX Spokane, WA 13.81 5.45 24.27 7.24 4.12 18.34
Houston, TX Las Vegas, NV 5.56 2.31 11.09 17.98 9.02 43.38
Houston, TX Indianapolis, IN 11.20 4.90 19.94 8.93 5.02 20.41
Houston, TX Jackson/Vicksburg, MS 13.44 5.11 24.10 7.44 4.15 19.59
Houston, TX San Francisco, CA (Metropolitan Area) 6.98 3.22 13.45 14.32 7.44 31.08
Houston, TX Miami, FL (Metropolitan Area) 9.27 4.33 15.83 10.78 6.32 23.11
Houston, TX Los Angeles, CA (Metropolitan Area) 6.38 2.32 11.38 15.67 8.78 43.10
Houston, TX Little Rock, AR 20.84 8.36 39.52 4.80 2.53 11.97
Houston, TX Lubbock, TX 21.45 8.06 35.59 4.66 2.81 12.41
Houston, TX Lexington, KY 20.58 7.87 40.63 4.86 2.46 12.70
Houston, TX Louisville, KY 15.63 6.55 25.98 6.40 3.85 15.30
Houston, TX Midland/Odessa, TX 12.20 5.77 20.78 8.20 4.81 17.32
Houston, TX Sacramento, CA 6.25 2.18 11.79 15.99 8.48 45.83
Houston, TX Tampa, FL (Metropolitan Area) 7.10 3.05 13.20 14.08 7.58 32.83
Houston, TX Kansas City, MO 12.46 4.98 22.07 8.02 4.53 20.07
Houston, TX San Antonio, TX 26.95 12.55 41.00 3.71 2.44 7.97
Houston, TX Memphis, TN 19.71 8.99 36.75 5.07 2.72 11.12
Houston, TX Mission/McAllen/Edinburg, TX 10.57 4.08 20.89 9.46 4.79 24.53
Houston, TX Omaha, NE 17.39 7.30 31.89 5.75 3.14 13.71
Houston, TX Milwaukee, WI 24.41 11.90 41.02 4.10 2.44 8.40
Houston, TX Quad Cities, IL (Metropolitan Area) 13.46 6.07 23.56 7.43 4.24 16.47

Origin City Destination City Median Lower Upper Median Lower Upper
Online Appendix Table A.1 - Estimation Results for Each City Pair
Profit Margin (%) Price Elasticity
Houston, TX Madison, WI 10.58 4.66 19.91 9.45 5.02 21.47
Houston, TX New Orleans, LA 8.70 3.33 18.71 11.49 5.34 30.02
Houston, TX San Diego, CA 5.45 2.17 11.00 18.36 9.09 46.05
Houston, TX Norfolk, VA (Metropolitan Area) 12.12 5.11 24.07 8.25 4.15 19.55
Houston, TX Pensacola, FL 21.93 9.06 37.20 4.56 2.69 11.04
Houston, TX Oklahoma City, OK 12.00 4.28 24.15 8.33 4.14 23.36
Houston, TX West Palm Beach/Palm Beach, FL 8.18 3.48 16.88 12.23 5.93 28.71
Houston, TX Portland, OR 5.63 2.19 10.52 17.78 9.51 45.67
Houston, TX Philadelphia, PA 6.41 2.81 11.26 15.59 8.88 35.53
Houston, TX Portland, ME 8.85 3.57 15.63 11.30 6.40 28.04
Houston, TX Raleigh/Durham, NC 8.16 3.67 14.67 12.26 6.82 27.21
Houston, TX Richmond, VA 21.68 9.40 36.92 4.61 2.71 10.64
Houston, TX Reno, NV 8.23 3.58 16.09 12.15 6.22 27.97
Houston, TX Roanoke, VA 9.02 4.03 17.51 11.08 5.71 24.78
Houston, TX Rochester, NY 10.23 5.00 17.16 9.78 5.83 20.00
Houston, TX Salt Lake City, UT 5.43 2.46 10.24 18.42 9.77 40.70
Houston, TX Tulsa, OK 10.49 4.54 20.80 9.53 4.81 22.05
Houston, TX Savannah, GA 21.45 8.87 39.99 4.66 2.50 11.27
Houston, TX Springfield, MO 16.81 7.79 27.97 5.95 3.57 12.84
Houston, TX Syracuse, NY 12.85 5.39 23.12 7.78 4.32 18.57
Houston, TX Knoxville, TN 24.05 10.25 41.37 4.16 2.42 9.76
Orlando, FL Pittsburgh, PA 8.42 3.00 16.10 11.88 6.21 33.37
Orlando, FL Scranton/Wilkes-Barre, PA 14.35 5.74 26.41 6.97 3.79 17.41
Orlando, FL Tucson, AZ 14.69 6.71 25.33 6.81 3.95 14.90
Orlando, FL Phoenix, AZ 5.92 2.61 11.17 16.89 8.95 38.24
Orlando, FL Shreveport, LA 20.52 9.11 36.82 4.87 2.72 10.98
Orlando, FL Seattle, WA 5.78 2.16 10.84 17.29 9.22 46.32
Orlando, FL Washington, DC (Metropolitan Area) 8.93 4.18 17.22 11.19 5.81 23.90
Orlando, FL Wichita, KS 17.66 7.32 30.05 5.66 3.33 13.66
Orlando, FL St. Louis, MO 7.70 3.88 13.49 12.99 7.41 25.78
Orlando, FL Sioux Falls, SD 20.84 9.06 35.95 4.80 2.78 11.04
Orlando, FL Spokane, WA 11.16 4.64 21.29 8.96 4.70 21.56
Orlando, FL Wilmington, NC 13.91 5.46 25.60 7.19 3.91 18.32
Orlando, FL San Francisco, CA (Metropolitan Area) 7.79 3.16 14.78 12.84 6.77 31.60
Orlando, FL Sacramento, CA 12.47 5.71 21.71 8.02 4.61 17.52
Orlando, FL San Antonio, TX 7.77 3.57 14.28 12.87 7.00 28.00
Orlando, FL Quad Cities, IL (Metropolitan Area) 19.90 8.57 33.44 5.03 2.99 11.67
Orlando, FL San Diego, CA 7.36 3.21 13.97 13.58 7.16 31.12
Orlando, FL Portland, OR 5.80 2.75 11.15 17.25 8.97 36.33
Orlando, FL Philadelphia, PA 8.38 3.50 15.43 11.93 6.48 28.58
Orlando, FL Portland, ME 21.19 9.14 37.82 4.72 2.64 10.94
Orlando, FL Rapid City, SD 25.22 11.82 40.35 3.96 2.48 8.46
Orlando, FL Raleigh/Durham, NC 14.23 6.79 25.52 7.03 3.92 14.74

Origin City Destination City Median Lower Upper Median Lower Upper
Online Appendix Table A.1 - Estimation Results for Each City Pair
Profit Margin (%) Price Elasticity
Orlando, FL Richmond, VA 13.43 6.24 24.22 7.45 4.13 16.03
Orlando, FL Reno, NV 13.40 5.78 24.97 7.46 4.01 17.30
Orlando, FL Roanoke, VA 11.60 4.90 20.98 8.62 4.77 20.39
Orlando, FL Rochester, NY 10.10 4.59 18.25 9.90 5.48 21.79
Orlando, FL Salt Lake City, UT 8.07 3.20 14.39 12.39 6.95 31.27
Orlando, FL Tulsa, OK 10.34 4.42 17.40 9.67 5.75 22.62
Orlando, FL Santa Barbara, CA 15.64 6.23 26.54 6.39 3.77 16.05
Orlando, FL South Bend, IN 18.57 8.19 32.16 5.38 3.11 12.20
Orlando, FL Philipsburg/State College, PA 11.64 4.68 23.30 8.59 4.29 21.39
Orlando, FL Springfield, MO 20.85 9.60 35.74 4.80 2.80 10.42
Orlando, FL Syracuse, NY 16.12 6.61 30.74 6.20 3.25 15.12
Orlando, FL Traverse City, MI 18.16 9.35 30.18 5.51 3.31 10.70
Panama City, FL Washington, DC (Metropolitan Area) 23.07 10.41 37.23 4.34 2.69 9.60
Panama City, FL Philadelphia, PA 13.59 6.04 22.73 7.36 4.40 16.55
Valparaiso, FL Washington, DC (Metropolitan Area) 11.31 4.99 19.98 8.84 5.01 20.03
Elmira/Corning, NY Tampa, FL (Metropolitan Area) 22.84 9.27 40.39 4.38 2.48 10.79
Erie, PA Orlando, FL 25.84 12.79 40.09 3.87 2.49 7.82
Erie, PA Los Angeles, CA (Metropolitan Area) 14.51 6.33 23.41 6.89 4.27 15.80
Eugene, OR Phoenix, AZ 15.30 6.51 27.39 6.54 3.65 15.36
Eugene, OR Seattle, WA 10.58 4.33 18.86 9.45 5.30 23.12
Eugene, OR Washington, DC (Metropolitan Area) 9.60 4.29 19.20 10.41 5.21 23.29
Eugene, OR New York City, NY (Metropolitan Area) 9.25 3.98 19.74 10.81 5.07 25.11
Eugene, OR Las Vegas, NV 9.95 4.36 18.69 10.05 5.35 22.93
Eugene, OR San Francisco, CA (Metropolitan Area) 23.78 9.76 36.01 4.21 2.78 10.25
Eugene, OR Los Angeles, CA (Metropolitan Area) 15.69 7.06 26.93 6.37 3.71 14.16
Eugene, OR San Diego, CA 14.55 6.01 26.64 6.87 3.75 16.65
Evansville, IN Washington, DC (Metropolitan Area) 9.05 4.15 16.15 11.05 6.19 24.07
Evansville, IN Orlando, FL 16.44 7.65 28.68 6.08 3.49 13.06
Evansville, IN New York City, NY (Metropolitan Area) 13.19 6.41 23.14 7.58 4.32 15.61
Evansville, IN Miami, FL (Metropolitan Area) 28.75 13.41 44.80 3.48 2.23 7.46
Evansville, IN Los Angeles, CA (Metropolitan Area) 15.21 5.72 27.95 6.57 3.58 17.49
New Bern/Morehead/Beaufort, NC New York City, NY (Metropolitan Area) 26.13 13.31 39.49 3.83 2.53 7.51
Key West, FL Washington, DC (Metropolitan Area) 22.57 11.10 35.44 4.43 2.82 9.01
Key West, FL New York City, NY (Metropolitan Area) 23.99 9.70 42.07 4.17 2.38 10.31
Key West, FL Miami, FL (Metropolitan Area) 20.21 10.13 33.64 4.95 2.97 9.87
Key West, FL Philadelphia, PA 25.76 12.50 40.96 3.88 2.44 8.00
Fargo, ND Phoenix, AZ 13.74 4.83 26.29 7.28 3.80 20.70
Fargo, ND Seattle, WA 20.77 10.52 32.55 4.81 3.07 9.51
Fargo, ND Washington, DC (Metropolitan Area) 10.30 4.35 19.31 9.71 5.18 22.97
Fargo, ND St. Louis, MO 12.23 4.82 20.63 8.18 4.85 20.76
Fargo, ND Orlando, FL 25.51 12.29 42.89 3.92 2.33 8.13
Fargo, ND Minneapolis/St. Paul, MN 13.25 5.39 26.03 7.55 3.84 18.57
Fargo, ND New York City, NY (Metropolitan Area) 13.36 5.67 21.98 7.49 4.55 17.65

Origin City Destination City Median Lower Upper Median Lower Upper
Online Appendix Table A.1 - Estimation Results for Each City Pair
Profit Margin (%) Price Elasticity
Fargo, ND Las Vegas, NV 21.05 9.88 36.52 4.75 2.74 10.13
Fargo, ND San Francisco, CA (Metropolitan Area) 14.36 6.48 25.26 6.96 3.96 15.43
Fargo, ND Los Angeles, CA (Metropolitan Area) 25.93 13.55 37.17 3.86 2.69 7.38
Fargo, ND Kansas City, MO 30.68 20.98 40.12 3.26 2.49 4.77
Fargo, ND San Diego, CA 16.52 6.87 26.90 6.05 3.72 14.55
Fresno, CA Seattle, WA 12.87 5.56 23.46 7.77 4.26 17.99
Fresno, CA Washington, DC (Metropolitan Area) 11.29 5.09 20.40 8.85 4.90 19.64
Fresno, CA Houston, TX 13.40 5.93 23.17 7.47 4.32 16.85
Fresno, CA Orlando, FL 20.99 8.17 38.60 4.76 2.59 12.24
Fresno, CA Minneapolis/St. Paul, MN 9.78 3.78 18.99 10.23 5.26 26.46
Fresno, CA New York City, NY (Metropolitan Area) 11.04 5.22 20.84 9.06 4.80 19.16
Fresno, CA Miami, FL (Metropolitan Area) 17.16 8.21 29.68 5.83 3.37 12.18
Fresno, CA Los Angeles, CA (Metropolitan Area) 13.91 6.32 25.48 7.19 3.92 15.82
Fresno, CA Kansas City, MO 17.02 7.36 28.34 5.87 3.53 13.59
Fresno, CA Portland, OR 15.28 6.55 28.21 6.54 3.54 15.27
Fresno, CA Philadelphia, PA 18.09 8.72 27.68 5.53 3.61 11.46
Fayetteville, NC New York City, NY (Metropolitan Area) 13.23 6.04 24.02 7.56 4.16 16.56
Fayetteville, NC Miami, FL (Metropolitan Area) 9.51 3.79 18.53 10.52 5.40 26.42
Fayetteville, NC Tampa, FL (Metropolitan Area) 8.33 3.37 16.80 12.01 5.95 29.65
Kalispell, MT Phoenix, AZ 15.98 6.69 27.63 6.26 3.62 14.95
Kalispell, MT Seattle, WA 12.67 5.03 21.66 7.89 4.62 19.86
Kalispell, MT San Francisco, CA (Metropolitan Area) 11.21 4.60 20.22 8.92 4.95 21.75
Kalispell, MT Los Angeles, CA (Metropolitan Area) 12.29 5.40 22.18 8.14 4.51 18.51
Kalispell, MT San Diego, CA 20.46 8.58 36.45 4.89 2.74 11.66
Minneapolis/St. Paul, MN Pittsburgh, PA 5.85 2.52 10.79 17.09 9.27 39.62
Minneapolis/St. Paul, MN Tucson, AZ 19.48 8.97 30.93 5.13 3.23 11.15
Minneapolis/St. Paul, MN Phoenix, AZ 4.55 1.86 9.63 21.99 10.38 53.69
Minneapolis/St. Paul, MN Seattle, WA 4.55 1.98 9.41 21.99 10.62 50.57
Minneapolis/St. Paul, MN Nashville, TN 15.45 7.38 23.80 6.47 4.20 13.56
Minneapolis/St. Paul, MN Washington, DC (Metropolitan Area) 6.53 2.71 11.72 15.32 8.53 36.87
Minneapolis/St. Paul, MN St. Louis, MO 7.89 3.61 12.96 12.67 7.71 27.70
Minneapolis/St. Paul, MN Myrtle Beach, SC 13.53 6.18 24.40 7.39 4.10 16.18
Minneapolis/St. Paul, MN Orlando, FL 5.58 2.16 10.84 17.93 9.22 46.33
Minneapolis/St. Paul, MN Valparaiso, FL 19.94 8.07 36.43 5.02 2.75 12.39
Minneapolis/St. Paul, MN New York City, NY (Metropolitan Area) 6.12 2.46 10.68 16.35 9.37 40.59
Minneapolis/St. Paul, MN Sioux Falls, SD 14.80 7.88 24.96 6.76 4.01 12.69
Minneapolis/St. Paul, MN Spokane, WA 12.28 5.80 20.13 8.15 4.97 17.24
Minneapolis/St. Paul, MN San Francisco, CA (Metropolitan Area) 5.64 2.40 10.39 17.72 9.63 41.65
Minneapolis/St. Paul, MN Sacramento, CA 8.97 4.00 16.19 11.15 6.18 25.00
Minneapolis/St. Paul, MN Tampa, FL (Metropolitan Area) 8.52 3.93 14.50 11.74 6.89 25.45
Minneapolis/St. Paul, MN San Antonio, TX 19.33 9.92 29.97 5.17 3.34 10.08
Minneapolis/St. Paul, MN Minot, ND 14.38 6.66 24.56 6.95 4.07 15.00
Minneapolis/St. Paul, MN Omaha, NE 13.58 6.57 22.07 7.36 4.53 15.23

Origin City Destination City Median Lower Upper Median Lower Upper
Online Appendix Table A.1 - Estimation Results for Each City Pair
Profit Margin (%) Price Elasticity
Minneapolis/St. Paul, MN Missoula, MT 11.70 5.01 21.18 8.54 4.72 19.97
Minneapolis/St. Paul, MN New Orleans, LA 15.70 6.65 28.93 6.37 3.46 15.04
Minneapolis/St. Paul, MN San Diego, CA 5.99 2.55 11.13 16.69 8.99 39.25
Minneapolis/St. Paul, MN Norfolk, VA (Metropolitan Area) 7.27 3.35 12.35 13.76 8.09 29.89
Minneapolis/St. Paul, MN Pensacola, FL 39.68 24.38 53.82 2.52 1.86 4.10
Minneapolis/St. Paul, MN Oklahoma City, OK 15.92 7.26 28.92 6.28 3.46 13.78
Minneapolis/St. Paul, MN West Palm Beach/Palm Beach, FL 17.90 7.95 29.49 5.59 3.39 12.59
Minneapolis/St. Paul, MN Portland, OR 13.10 6.69 19.96 7.64 5.01 14.94
Minneapolis/St. Paul, MN Philadelphia, PA 4.61 1.90 8.54 21.68 11.71 52.63
Minneapolis/St. Paul, MN Peoria, IL 12.04 5.33 21.51 8.30 4.65 18.77
Minneapolis/St. Paul, MN Palm Springs, CA 11.08 4.77 20.95 9.02 4.77 20.96
Minneapolis/St. Paul, MN Portland, ME 15.63 6.36 28.68 6.40 3.49 15.71
Minneapolis/St. Paul, MN Rapid City, SD 16.14 7.78 26.25 6.20 3.81 12.85
Minneapolis/St. Paul, MN Raleigh/Durham, NC 8.64 3.58 15.18 11.58 6.59 27.92
Minneapolis/St. Paul, MN Richmond, VA 16.99 6.59 31.53 5.89 3.17 15.17
Minneapolis/St. Paul, MN Reno, NV 12.33 5.35 22.04 8.11 4.54 18.68
Minneapolis/St. Paul, MN Rochester, NY 9.98 3.78 18.65 10.02 5.36 26.46
Minneapolis/St. Paul, MN Salt Lake City, UT 8.50 3.88 14.08 11.76 7.10 25.76
Minneapolis/St. Paul, MN Tulsa, OK 13.81 5.71 24.92 7.24 4.01 17.57
Minneapolis/St. Paul, MN Savannah, GA 14.98 7.38 25.49 6.68 3.92 13.55
Minneapolis/St. Paul, MN Santa Barbara, CA 13.75 6.97 23.59 7.27 4.24 14.34
Minneapolis/St. Paul, MN Sarasota/Bradenton, FL 20.61 9.53 35.35 4.85 2.83 10.49
Minneapolis/St. Paul, MN Syracuse, NY 16.34 7.47 26.10 6.12 3.83 13.39
Minneapolis/St. Paul, MN Tallahassee, FL 22.73 11.04 35.84 4.40 2.79 9.06
New York City, NY (Metropolitan Area) Pittsburgh, PA 4.90 1.98 8.84 20.43 11.31 50.45
New York City, NY (Metropolitan Area) Wausau/Mosinee/Stevens Point, WI 12.32 5.27 20.79 8.12 4.81 18.99
New York City, NY (Metropolitan Area) Tucson, AZ 22.45 11.59 34.27 4.45 2.92 8.63
New York City, NY (Metropolitan Area) Phoenix, AZ 7.10 3.20 11.87 14.09 8.43 31.27
New York City, NY (Metropolitan Area) Shreveport, LA 12.57 5.33 23.61 7.96 4.24 18.76
New York City, NY (Metropolitan Area) Seattle, WA 5.88 3.06 9.70 17.01 10.31 32.65
New York City, NY (Metropolitan Area) Washington, DC (Metropolitan Area) 15.84 6.35 28.45 6.31 3.52 15.74
New York City, NY (Metropolitan Area) Wichita, KS 16.49 7.94 25.95 6.06 3.85 12.59
New York City, NY (Metropolitan Area) St. Louis, MO 5.46 2.47 9.18 18.32 10.89 40.54
New York City, NY (Metropolitan Area) Orlando, FL 9.26 3.57 17.69 10.80 5.65 28.03
New York City, NY (Metropolitan Area) Panama City, FL 14.65 6.40 26.10 6.83 3.83 15.63
New York City, NY (Metropolitan Area) Valparaiso, FL 12.07 5.41 21.50 8.28 4.65 18.47
New York City, NY (Metropolitan Area) Sioux Falls, SD 10.80 4.17 20.20 9.26 4.95 23.99
New York City, NY (Metropolitan Area) Spokane, WA 8.44 3.67 15.58 11.85 6.42 27.26
New York City, NY (Metropolitan Area) Wilmington, NC 36.66 17.56 52.85 2.73 1.89 5.70
New York City, NY (Metropolitan Area) San Francisco, CA (Metropolitan Area) 4.34 1.85 7.77 23.03 12.87 54.18
New York City, NY (Metropolitan Area) Rochester, MN 17.79 8.13 31.10 5.62 3.22 12.30
New York City, NY (Metropolitan Area) Saginaw/Bay City/Midland, MI 9.71 4.44 16.90 10.30 5.92 22.53
New York City, NY (Metropolitan Area) Sacramento, CA 19.76 10.87 29.92 5.06 3.34 9.20

Origin City Destination City Median Lower Upper Median Lower Upper
Online Appendix Table A.1 - Estimation Results for Each City Pair
Profit Margin (%) Price Elasticity
New York City, NY (Metropolitan Area) Tampa, FL (Metropolitan Area) 13.36 5.69 21.33 7.48 4.69 17.57
New York City, NY (Metropolitan Area) San Antonio, TX 9.01 4.56 16.53 11.10 6.05 21.92
New York City, NY (Metropolitan Area) Omaha, NE 9.34 3.50 19.47 10.70 5.14 28.62
New York City, NY (Metropolitan Area) Quad Cities, IL (Metropolitan Area) 11.63 5.21 20.24 8.60 4.94 19.18
New York City, NY (Metropolitan Area) San Diego, CA 9.56 4.20 16.42 10.46 6.09 23.80
New York City, NY (Metropolitan Area) Norfolk, VA (Metropolitan Area) 12.75 5.84 23.32 7.84 4.29 17.13
New York City, NY (Metropolitan Area) Pensacola, FL 25.63 13.39 37.41 3.90 2.67 7.47
New York City, NY (Metropolitan Area) Oklahoma City, OK 11.31 4.99 19.54 8.84 5.12 20.04
New York City, NY (Metropolitan Area) West Palm Beach/Palm Beach, FL 10.45 4.42 19.36 9.57 5.17 22.64
New York City, NY (Metropolitan Area) Portland, OR 10.16 4.86 16.20 9.84 6.17 20.60
New York City, NY (Metropolitan Area) Philadelphia, PA 25.05 11.38 42.20 3.99 2.37 8.79
New York City, NY (Metropolitan Area) Peoria, IL 8.81 3.34 15.40 11.35 6.49 29.91
New York City, NY (Metropolitan Area) Palm Springs, CA 12.52 5.22 23.50 7.98 4.26 19.14
New York City, NY (Metropolitan Area) Portland, ME 4.65 1.89 8.89 21.52 11.24 52.82
New York City, NY (Metropolitan Area) Raleigh/Durham, NC 5.16 2.21 9.27 19.40 10.79 45.21
New York City, NY (Metropolitan Area) Richmond, VA 7.52 3.15 13.59 13.30 7.36 31.79
New York City, NY (Metropolitan Area) Reno, NV 19.92 9.57 32.00 5.02 3.13 10.45
New York City, NY (Metropolitan Area) Roanoke, VA 10.89 3.55 20.09 9.18 4.98 28.19
New York City, NY (Metropolitan Area) Rochester, NY 4.35 2.09 9.65 22.99 10.37 47.76
New York City, NY (Metropolitan Area) Salt Lake City, UT 6.19 2.74 12.24 16.15 8.17 36.54
New York City, NY (Metropolitan Area) Tulsa, OK 9.94 4.44 18.09 10.06 5.53 22.54
New York City, NY (Metropolitan Area) Savannah, GA 18.09 7.63 29.74 5.53 3.36 13.10
New York City, NY (Metropolitan Area) Santa Barbara, CA 11.57 5.15 21.74 8.64 4.60 19.44
New York City, NY (Metropolitan Area) South Bend, IN 14.84 7.13 23.85 6.74 4.19 14.02
New York City, NY (Metropolitan Area) Springfield, MO 8.47 3.08 14.89 11.81 6.72 32.45
New York City, NY (Metropolitan Area) Salinas/Monterey, CA 9.93 4.08 18.70 10.07 5.35 24.51
New York City, NY (Metropolitan Area) Sarasota/Bradenton, FL 17.47 8.28 32.07 5.72 3.12 12.08
New York City, NY (Metropolitan Area) Syracuse, NY 9.58 4.52 17.63 10.43 5.67 22.14
New York City, NY (Metropolitan Area) Tallahassee, FL 14.37 6.50 24.55 6.96 4.07 15.38
New York City, NY (Metropolitan Area) Traverse City, MI 12.85 5.90 21.71 7.78 4.61 16.94
Fort Myers, FL Pittsburgh, PA 11.28 4.73 22.04 8.86 4.54 21.16
Fort Myers, FL Scranton/Wilkes-Barre, PA 11.44 4.92 22.33 8.74 4.48 20.34
Fort Myers, FL Phoenix, AZ 13.45 6.62 22.94 7.43 4.36 15.11
Fort Myers, FL Hartford, CT 19.57 9.08 32.03 5.11 3.12 11.01
Fort Myers, FL Seattle, WA 12.60 5.94 22.67 7.94 4.41 16.84
Fort Myers, FL Nashville, TN 20.59 9.02 34.99 4.86 2.86 11.08
Fort Myers, FL Washington, DC (Metropolitan Area) 12.10 5.29 21.21 8.26 4.71 18.91
Fort Myers, FL St. Louis, MO 19.98 9.03 33.37 5.00 3.00 11.07
Fort Myers, FL Houston, TX 13.72 5.78 23.81 7.29 4.20 17.31
Fort Myers, FL Minneapolis/St. Paul, MN 17.68 8.67 28.53 5.65 3.50 11.54
Fort Myers, FL New York City, NY (Metropolitan Area) 9.38 4.15 17.01 10.66 5.88 24.10
Fort Myers, FL Grand Rapids, MI 15.40 6.65 27.76 6.49 3.60 15.04
Fort Myers, FL Greensboro/High Point, NC 10.20 4.81 19.69 9.80 5.08 20.79

Origin City Destination City Median Lower Upper Median Lower Upper
Online Appendix Table A.1 - Estimation Results for Each City Pair
Profit Margin (%) Price Elasticity
Fort Myers, FL Harrisburg, PA 15.99 6.97 27.40 6.25 3.65 14.34
Fort Myers, FL Las Vegas, NV 14.14 5.64 27.93 7.07 3.58 17.72
Fort Myers, FL Indianapolis, IN 11.99 5.44 21.13 8.34 4.73 18.38
Fort Myers, FL San Francisco, CA (Metropolitan Area) 6.97 3.00 13.89 14.34 7.20 33.39
Fort Myers, FL Los Angeles, CA (Metropolitan Area) 10.54 3.83 20.03 9.49 4.99 26.11
Fort Myers, FL Louisville, KY 14.63 6.44 26.12 6.84 3.83 15.54
Fort Myers, FL Kansas City, MO 20.01 8.53 32.96 5.00 3.03 11.73
Fort Myers, FL San Antonio, TX 11.89 4.27 20.53 8.41 4.87 23.43
Fort Myers, FL Memphis, TN 13.03 6.00 22.95 7.67 4.36 16.67
Fort Myers, FL Omaha, NE 16.08 6.83 27.43 6.22 3.65 14.63
Fort Myers, FL Milwaukee, WI 16.34 6.83 26.61 6.12 3.76 14.63
Fort Myers, FL Madison, WI 18.12 8.10 28.98 5.52 3.45 12.35
Fort Myers, FL New Orleans, LA 11.56 4.41 22.53 8.65 4.44 22.68
Fort Myers, FL San Diego, CA 16.15 6.59 28.29 6.19 3.54 15.17
Fort Myers, FL Norfolk, VA (Metropolitan Area) 12.92 5.44 23.55 7.74 4.25 18.37
Fort Myers, FL Oklahoma City, OK 12.51 4.81 22.94 7.99 4.36 20.77
Fort Myers, FL Portland, OR 17.03 7.59 28.96 5.87 3.45 13.18
Fort Myers, FL Philadelphia, PA 10.22 4.64 19.99 9.78 5.00 21.53
Fort Myers, FL Portland, ME 17.79 6.93 32.25 5.62 3.10 14.44
Fort Myers, FL Raleigh/Durham, NC 16.89 7.77 28.04 5.92 3.57 12.87
Fort Myers, FL Richmond, VA 18.14 7.52 32.37 5.51 3.09 13.29
Fort Myers, FL Rochester, NY 10.07 4.49 20.76 9.93 4.82 22.28
Fort Myers, FL Salt Lake City, UT 15.17 6.97 25.38 6.59 3.94 14.34
Fort Myers, FL Tulsa, OK 13.20 4.79 23.14 7.58 4.32 20.88
Fort Myers, FL Syracuse, NY 15.82 6.90 27.18 6.32 3.68 14.49
Flint, MI Phoenix, AZ 16.08 7.02 29.74 6.22 3.36 14.24
Flint, MI Washington, DC (Metropolitan Area) 26.04 12.83 41.99 3.84 2.38 7.79
Flint, MI Orlando, FL 19.21 8.03 34.33 5.21 2.91 12.46
Flint, MI New York City, NY (Metropolitan Area) 27.38 11.88 43.19 3.65 2.32 8.41
Flint, MI Tampa, FL (Metropolitan Area) 14.09 6.09 26.22 7.10 3.81 16.41
Sioux Falls, SD Washington, DC (Metropolitan Area) 11.25 4.73 20.51 8.89 4.88 21.13
Fort Smith, AR Los Angeles, CA (Metropolitan Area) 15.08 6.59 26.34 6.63 3.80 15.17
Fort Wayne, IN Phoenix, AZ 21.57 9.89 34.29 4.64 2.92 10.11
Fort Wayne, IN Washington, DC (Metropolitan Area) 18.52 9.35 30.94 5.40 3.23 10.70
Fort Wayne, IN Houston, TX 16.33 7.85 28.73 6.12 3.48 12.74
Fort Wayne, IN Orlando, FL 19.54 8.51 33.50 5.12 2.99 11.75
Fort Wayne, IN Minneapolis/St. Paul, MN 11.79 5.24 21.58 8.48 4.63 19.08
Fort Wayne, IN New York City, NY (Metropolitan Area) 13.75 6.81 23.61 7.27 4.23 14.68
Fort Wayne, IN Las Vegas, NV 18.07 8.13 31.41 5.53 3.18 12.31
Fort Wayne, IN San Francisco, CA (Metropolitan Area) 13.45 5.68 25.14 7.43 3.98 17.60
Fort Wayne, IN Miami, FL (Metropolitan Area) 30.62 14.08 47.63 3.27 2.10 7.10
Fort Wayne, IN Los Angeles, CA (Metropolitan Area) 13.79 5.26 23.53 7.25 4.25 19.02
Fort Wayne, IN Tampa, FL (Metropolitan Area) 24.38 12.29 39.37 4.10 2.54 8.14

Origin City Destination City Median Lower Upper Median Lower Upper
Online Appendix Table A.1 - Estimation Results for Each City Pair
Profit Margin (%) Price Elasticity
Fort Wayne, IN San Diego, CA 21.16 10.00 36.19 4.73 2.76 10.00
Fort Wayne, IN Philadelphia, PA 10.60 4.18 19.40 9.44 5.15 23.91
Fayetteville, AR Phoenix, AZ 11.36 4.58 20.05 8.80 4.99 21.83
Fayetteville, AR Nashville, TN 17.88 8.73 26.24 5.59 3.81 11.46
Fayetteville, AR Washington, DC (Metropolitan Area) 8.02 3.46 14.25 12.47 7.02 28.89
Fayetteville, AR Orlando, FL 10.60 4.34 20.00 9.43 5.00 23.06
Fayetteville, AR Minneapolis/St. Paul, MN 22.09 10.90 34.28 4.53 2.92 9.17
Fayetteville, AR New York City, NY (Metropolitan Area) 6.81 2.68 14.25 14.69 7.02 37.38
Fayetteville, AR San Francisco, CA (Metropolitan Area) 10.18 3.63 17.39 9.83 5.75 27.58
Fayetteville, AR Miami, FL (Metropolitan Area) 14.48 6.52 24.42 6.90 4.09 15.35
Fayetteville, AR Los Angeles, CA (Metropolitan Area) 11.17 4.49 19.64 8.95 5.09 22.25
Fayetteville, AR Tampa, FL (Metropolitan Area) 14.94 6.78 24.50 6.69 4.08 14.75
Fayetteville, AR San Antonio, TX 16.67 8.06 27.36 6.00 3.66 12.41
Fayetteville, AR Philadelphia, PA 13.52 6.67 22.47 7.40 4.45 14.99
Greenville/Spartanburg, SC Pittsburgh, PA 12.57 5.54 21.33 7.96 4.69 18.05
Greenville/Spartanburg, SC Phoenix, AZ 20.64 9.72 33.81 4.84 2.96 10.29
Greenville/Spartanburg, SC Hartford, CT 18.10 8.95 28.96 5.53 3.45 11.17
Greenville/Spartanburg, SC Seattle, WA 26.05 12.06 41.56 3.84 2.41 8.29
Greenville/Spartanburg, SC Washington, DC (Metropolitan Area) 22.04 10.74 34.46 4.54 2.90 9.31
Greenville/Spartanburg, SC St. Louis, MO 11.03 6.17 19.80 9.06 5.05 16.20
Greenville/Spartanburg, SC Houston, TX 22.54 11.09 39.38 4.44 2.54 9.02
Greenville/Spartanburg, SC Orlando, FL 20.76 10.00 33.58 4.82 2.98 10.00
Greenville/Spartanburg, SC Minneapolis/St. Paul, MN 13.54 6.40 22.34 7.39 4.48 15.63
Greenville/Spartanburg, SC New York City, NY (Metropolitan Area) 11.73 5.07 23.46 8.52 4.26 19.74
Greenville/Spartanburg, SC Las Vegas, NV 26.27 10.93 43.40 3.81 2.30 9.15
Greenville/Spartanburg, SC Indianapolis, IN 17.68 7.89 28.79 5.66 3.47 12.67
Greenville/Spartanburg, SC San Francisco, CA (Metropolitan Area) 20.96 8.84 33.03 4.77 3.03 11.32
Greenville/Spartanburg, SC Miami, FL (Metropolitan Area) 11.16 4.57 20.71 8.96 4.83 21.88
Greenville/Spartanburg, SC Los Angeles, CA (Metropolitan Area) 17.52 7.66 31.66 5.71 3.16 13.05
Greenville/Spartanburg, SC Tampa, FL (Metropolitan Area) 10.73 4.65 20.79 9.32 4.81 21.49
Greenville/Spartanburg, SC Kansas City, MO 16.93 7.56 27.79 5.91 3.60 13.22
Greenville/Spartanburg, SC San Antonio, TX 15.23 6.44 26.72 6.57 3.74 15.52
Greenville/Spartanburg, SC Memphis, TN 20.43 8.79 36.29 4.89 2.76 11.37
Greenville/Spartanburg, SC Milwaukee, WI 22.22 11.29 34.02 4.50 2.94 8.86
Greenville/Spartanburg, SC San Diego, CA 34.70 18.99 47.89 2.88 2.09 5.27
Greenville/Spartanburg, SC Philadelphia, PA 12.99 5.27 23.61 7.70 4.24 18.96
Spokane, WA Tucson, AZ 13.16 5.09 23.50 7.60 4.26 19.66
Spokane, WA Washington, DC (Metropolitan Area) 9.55 3.93 17.34 10.47 5.77 25.45
Spokane, WA St. Louis, MO 10.71 4.40 19.41 9.33 5.15 22.73
Spokane, WA Tampa, FL (Metropolitan Area) 14.73 5.56 25.84 6.79 3.87 17.99
Great Falls, MT Seattle, WA 10.16 3.98 19.18 9.84 5.21 25.11
Great Falls, MT Washington, DC (Metropolitan Area) 13.07 4.78 22.32 7.65 4.48 20.94
Great Falls, MT Los Angeles, CA (Metropolitan Area) 16.80 7.55 28.79 5.95 3.47 13.24

Origin City Destination City Median Lower Upper Median Lower Upper
Online Appendix Table A.1 - Estimation Results for Each City Pair
Profit Margin (%) Price Elasticity
Grand Forks, ND Washington, DC (Metropolitan Area) 22.63 10.46 36.43 4.42 2.75 9.56
Grand Forks, ND Minneapolis/St. Paul, MN 12.24 4.74 25.05 8.17 3.99 21.10
Grand Junction, CO San Francisco, CA (Metropolitan Area) 13.97 6.58 24.83 7.16 4.03 15.20
Grand Junction, CO Los Angeles, CA (Metropolitan Area) 11.52 5.23 20.91 8.68 4.78 19.14
Gainesville, FL Washington, DC (Metropolitan Area) 16.63 6.97 28.87 6.01 3.46 14.35
Gainesville, FL New York City, NY (Metropolitan Area) 23.52 11.90 35.85 4.25 2.79 8.40
Gulfport/Biloxi, MS Washington, DC (Metropolitan Area) 12.98 5.22 23.90 7.70 4.18 19.15
Gulfport/Biloxi, MS New York City, NY (Metropolitan Area) 15.20 6.88 28.02 6.58 3.57 14.54
Gulfport/Biloxi, MS Las Vegas, NV 13.02 4.70 23.35 7.68 4.28 21.29
Gulfport/Biloxi, MS Los Angeles, CA (Metropolitan Area) 10.50 4.03 19.97 9.52 5.01 24.79
Gulfport/Biloxi, MS San Antonio, TX 8.79 3.70 18.94 11.38 5.28 27.01
Gulfport/Biloxi, MS Philadelphia, PA 10.07 4.26 19.91 9.93 5.02 23.46
Green Bay, WI Phoenix, AZ 17.81 7.36 29.72 5.61 3.37 13.59
Green Bay, WI Washington, DC (Metropolitan Area) 11.23 4.49 19.07 8.91 5.24 22.25
Green Bay, WI Houston, TX 13.59 5.81 23.50 7.36 4.26 17.20
Green Bay, WI Orlando, FL 26.59 13.41 40.07 3.76 2.50 7.46
Green Bay, WI Minneapolis/St. Paul, MN 7.90 3.39 14.87 12.66 6.73 29.47
Green Bay, WI New York City, NY (Metropolitan Area) 9.01 3.55 16.70 11.09 5.99 28.18
Green Bay, WI Las Vegas, NV 26.26 12.24 40.30 3.81 2.48 8.17
Green Bay, WI San Francisco, CA (Metropolitan Area) 12.84 5.97 22.58 7.79 4.43 16.76
Green Bay, WI Miami, FL (Metropolitan Area) 21.20 10.79 32.57 4.72 3.07 9.26
Green Bay, WI Los Angeles, CA (Metropolitan Area) 11.85 4.68 21.11 8.44 4.74 21.38
Green Bay, WI Tampa, FL (Metropolitan Area) 22.54 10.34 37.18 4.44 2.69 9.67
Green Bay, WI San Diego, CA 9.80 4.02 18.12 10.21 5.52 24.86
Green Bay, WI Philadelphia, PA 11.14 4.51 20.20 8.98 4.95 22.15
Killeen, TX Washington, DC (Metropolitan Area) 21.25 9.47 34.29 4.71 2.92 10.56
Killeen, TX New York City, NY (Metropolitan Area) 13.42 5.44 22.92 7.45 4.36 18.38
Killeen, TX Los Angeles, CA (Metropolitan Area) 18.96 8.20 33.71 5.27 2.97 12.19
Grand Rapids, MI Pittsburgh, PA 6.76 2.85 12.38 14.80 8.08 35.10
Grand Rapids, MI Phoenix, AZ 15.81 7.66 28.33 6.32 3.53 13.06
Grand Rapids, MI Hartford, CT 10.79 4.41 20.28 9.26 4.93 22.68
Grand Rapids, MI Seattle, WA 22.67 11.82 33.73 4.41 2.96 8.46
Grand Rapids, MI Nashville, TN 13.19 5.63 22.97 7.58 4.35 17.77
Grand Rapids, MI Washington, DC (Metropolitan Area) 15.98 7.19 25.87 6.26 3.86 13.91
Grand Rapids, MI St. Louis, MO 15.67 6.39 26.76 6.38 3.74 15.64
Grand Rapids, MI Jacksonville, FL 16.67 7.05 28.74 6.00 3.48 14.18
Grand Rapids, MI Houston, TX 13.68 6.10 26.60 7.31 3.76 16.39
Grand Rapids, MI Orlando, FL 22.69 10.12 36.53 4.41 2.74 9.88
Grand Rapids, MI Minneapolis/St. Paul, MN 7.84 3.75 13.46 12.75 7.43 26.66
Grand Rapids, MI New York City, NY (Metropolitan Area) 13.57 5.48 25.44 7.37 3.93 18.24
Grand Rapids, MI Las Vegas, NV 29.82 15.12 45.02 3.35 2.22 6.61
Grand Rapids, MI San Francisco, CA (Metropolitan Area) 12.58 5.47 21.73 7.95 4.60 18.28
Grand Rapids, MI Miami, FL (Metropolitan Area) 18.80 8.88 29.63 5.32 3.38 11.26

Origin City Destination City Median Lower Upper Median Lower Upper
Online Appendix Table A.1 - Estimation Results for Each City Pair
Profit Margin (%) Price Elasticity
Grand Rapids, MI Los Angeles, CA (Metropolitan Area) 10.83 4.51 18.05 9.24 5.54 22.17
Grand Rapids, MI Tampa, FL (Metropolitan Area) 17.23 8.25 29.31 5.80 3.41 12.12
Grand Rapids, MI Kansas City, MO 11.70 5.80 19.89 8.54 5.03 17.25
Grand Rapids, MI San Antonio, TX 18.04 8.25 30.37 5.54 3.29 12.11
Grand Rapids, MI Memphis, TN 13.14 5.58 24.95 7.61 4.01 17.92
Grand Rapids, MI San Diego, CA 18.13 8.66 31.14 5.52 3.21 11.55
Grand Rapids, MI West Palm Beach/Palm Beach, FL 14.79 6.54 27.00 6.76 3.70 15.30
Grand Rapids, MI Portland, OR 11.98 4.27 22.45 8.35 4.45 23.42
Grand Rapids, MI Philadelphia, PA 12.93 5.61 22.32 7.73 4.48 17.82
Grand Rapids, MI Raleigh/Durham, NC 15.98 7.02 27.46 6.26 3.64 14.25
Grand Rapids, MI Salt Lake City, UT 12.38 5.62 22.14 8.08 4.52 17.79
Greensboro/High Point, NC Pittsburgh, PA 11.62 4.96 21.01 8.61 4.76 20.14
Greensboro/High Point, NC Phoenix, AZ 10.46 4.44 20.26 9.56 4.93 22.55
Greensboro/High Point, NC Hartford, CT 11.76 5.09 19.49 8.50 5.13 19.64
Greensboro/High Point, NC Seattle, WA 14.71 6.78 25.85 6.80 3.87 14.76
Greensboro/High Point, NC Nashville, TN 15.87 7.58 26.13 6.30 3.83 13.19
Greensboro/High Point, NC Washington, DC (Metropolitan Area) 16.52 7.74 26.14 6.05 3.83 12.92
Greensboro/High Point, NC St. Louis, MO 8.82 3.33 14.86 11.33 6.73 30.06
Greensboro/High Point, NC Jacksonville, FL 15.61 7.13 25.95 6.41 3.85 14.03
Greensboro/High Point, NC Houston, TX 21.36 7.10 35.76 4.68 2.80 14.08
Greensboro/High Point, NC Orlando, FL 14.30 5.55 26.41 6.99 3.79 18.03
Greensboro/High Point, NC Minneapolis/St. Paul, MN 15.37 7.37 25.75 6.51 3.88 13.57
Greensboro/High Point, NC New York City, NY (Metropolitan Area) 11.71 5.05 21.48 8.54 4.65 19.80
Greensboro/High Point, NC Las Vegas, NV 13.00 5.52 22.55 7.69 4.43 18.12
Greensboro/High Point, NC Indianapolis, IN 9.32 3.95 16.73 10.73 5.98 25.35
Greensboro/High Point, NC San Francisco, CA (Metropolitan Area) 11.65 4.87 20.21 8.58 4.95 20.52
Greensboro/High Point, NC Miami, FL (Metropolitan Area) 12.33 4.42 24.25 8.11 4.12 22.62
Greensboro/High Point, NC Los Angeles, CA (Metropolitan Area) 11.02 4.96 20.26 9.07 4.94 20.18
Greensboro/High Point, NC Louisville, KY 25.33 14.97 35.90 3.95 2.79 6.68
Greensboro/High Point, NC Tampa, FL (Metropolitan Area) 20.44 9.62 32.84 4.89 3.05 10.39
Greensboro/High Point, NC Kansas City, MO 11.61 4.87 19.95 8.61 5.01 20.52
Greensboro/High Point, NC San Antonio, TX 10.68 3.62 21.05 9.36 4.75 27.65
Greensboro/High Point, NC Memphis, TN 27.60 12.54 44.38 3.62 2.25 7.97
Greensboro/High Point, NC Milwaukee, WI 16.41 7.82 26.14 6.09 3.83 12.79
Greensboro/High Point, NC New Orleans, LA 14.76 5.83 29.69 6.77 3.37 17.15
Greensboro/High Point, NC San Diego, CA 9.68 4.42 18.14 10.33 5.51 22.63
Greensboro/High Point, NC Portland, OR 5.46 2.25 12.23 18.30 8.18 44.45
Greensboro/High Point, NC Philadelphia, PA 8.80 3.95 16.84 11.36 5.94 25.30
Greensboro/High Point, NC Rochester, NY 10.56 4.74 20.60 9.47 4.85 21.09
Greensboro/High Point, NC Salt Lake City, UT 13.14 5.48 24.88 7.61 4.02 18.26
Harrisburg, PA Phoenix, AZ 16.24 7.05 26.83 6.16 3.73 14.19
Harrisburg, PA Seattle, WA 12.06 5.08 21.27 8.29 4.70 19.71
Harrisburg, PA Nashville, TN 12.75 5.49 21.07 7.84 4.75 18.22

Origin City Destination City Median Lower Upper Median Lower Upper
Online Appendix Table A.1 - Estimation Results for Each City Pair
Profit Margin (%) Price Elasticity
Harrisburg, PA St. Louis, MO 9.13 3.50 17.25 10.95 5.80 28.53
Harrisburg, PA Jacksonville, FL 20.62 9.21 33.16 4.85 3.02 10.85
Harrisburg, PA Houston, TX 14.78 5.81 26.00 6.76 3.85 17.23
Harrisburg, PA Orlando, FL 14.54 6.59 27.49 6.88 3.64 15.17
Harrisburg, PA Minneapolis/St. Paul, MN 14.18 6.67 24.43 7.05 4.09 14.99
Harrisburg, PA Las Vegas, NV 20.76 9.18 32.90 4.82 3.04 10.89
Harrisburg, PA Indianapolis, IN 10.02 4.24 17.99 9.98 5.56 23.58
Harrisburg, PA San Francisco, CA (Metropolitan Area) 11.34 5.03 19.64 8.82 5.09 19.87
Harrisburg, PA Miami, FL (Metropolitan Area) 33.27 19.10 46.55 3.01 2.15 5.24
Harrisburg, PA Los Angeles, CA (Metropolitan Area) 11.66 4.43 20.97 8.58 4.77 22.60
Harrisburg, PA Tampa, FL (Metropolitan Area) 20.42 9.77 31.59 4.90 3.17 10.24
Harrisburg, PA Kansas City, MO 11.79 4.81 19.88 8.48 5.03 20.78
Harrisburg, PA San Antonio, TX 20.57 9.57 34.23 4.86 2.92 10.45
Harrisburg, PA Memphis, TN 21.93 11.34 34.32 4.56 2.91 8.82
Harrisburg, PA Milwaukee, WI 9.96 3.92 17.21 10.04 5.81 25.54
Harrisburg, PA New Orleans, LA 25.51 12.00 39.70 3.92 2.52 8.33
Harrisburg, PA San Diego, CA 19.89 9.69 31.57 5.03 3.17 10.32
Helena, MT Seattle, WA 10.58 3.87 19.55 9.45 5.11 25.82
Helena, MT Los Angeles, CA (Metropolitan Area) 9.07 3.85 17.44 11.02 5.73 25.96
Harlingen/San Benito, TX Phoenix, AZ 10.86 4.45 18.35 9.21 5.45 22.46
Harlingen/San Benito, TX Nashville, TN 14.01 5.25 27.34 7.14 3.66 19.03
Harlingen/San Benito, TX Washington, DC (Metropolitan Area) 11.47 4.45 20.90 8.71 4.79 22.49
Harlingen/San Benito, TX St. Louis, MO 14.73 6.00 24.18 6.79 4.14 16.68
Harlingen/San Benito, TX Houston, TX 26.03 12.46 43.03 3.84 2.32 8.03
Harlingen/San Benito, TX Las Vegas, NV 19.98 7.83 35.55 5.00 2.81 12.77
Harlingen/San Benito, TX San Francisco, CA (Metropolitan Area) 12.01 5.09 24.35 8.33 4.11 19.64
Harlingen/San Benito, TX Los Angeles, CA (Metropolitan Area) 9.06 3.46 17.64 11.04 5.67 28.94
Harlingen/San Benito, TX San Antonio, TX 17.23 7.01 30.46 5.81 3.28 14.26
Las Vegas, NV Pittsburgh, PA 13.95 6.53 23.73 7.17 4.21 15.31
Las Vegas, NV Scranton/Wilkes-Barre, PA 16.94 7.34 28.93 5.90 3.46 13.62
Las Vegas, NV Tucson, AZ 15.11 7.08 27.35 6.62 3.66 14.13
Las Vegas, NV Phoenix, AZ 16.93 7.27 28.24 5.91 3.54 13.76
Las Vegas, NV Shreveport, LA 15.14 6.31 27.14 6.61 3.68 15.85
Las Vegas, NV Seattle, WA 5.56 2.17 9.85 17.97 10.15 46.02
Las Vegas, NV Nashville, TN 5.88 2.41 10.90 17.01 9.18 41.56
Las Vegas, NV Washington, DC (Metropolitan Area) 5.80 2.68 11.40 17.25 8.77 37.28
Las Vegas, NV Wichita, KS 21.87 9.50 39.40 4.57 2.54 10.52
Las Vegas, NV St. Louis, MO 6.27 3.52 12.01 15.95 8.33 28.39
Las Vegas, NV Orlando, FL 6.85 3.14 13.04 14.60 7.67 31.90
Las Vegas, NV Valparaiso, FL 21.23 10.22 34.66 4.71 2.88 9.79
Las Vegas, NV Minneapolis/St. Paul, MN 11.07 5.11 20.35 9.03 4.91 19.55
Las Vegas, NV New York City, NY (Metropolitan Area) 5.23 2.07 9.79 19.13 10.21 48.39
Las Vegas, NV Sioux Falls, SD 18.10 7.02 31.16 5.53 3.21 14.25

Origin City Destination City Median Lower Upper Median Lower Upper
Online Appendix Table A.1 - Estimation Results for Each City Pair
Profit Margin (%) Price Elasticity
Las Vegas, NV Spokane, WA 8.58 3.72 16.13 11.66 6.20 26.87
Las Vegas, NV San Francisco, CA (Metropolitan Area) 5.34 2.19 9.84 18.74 10.16 45.63
Las Vegas, NV Miami, FL (Metropolitan Area) 6.80 2.90 12.00 14.71 8.33 34.46
Las Vegas, NV Los Angeles, CA (Metropolitan Area) 14.89 6.14 26.29 6.72 3.80 16.28
Las Vegas, NV Little Rock, AR 7.84 3.75 14.55 12.75 6.87 26.70
Las Vegas, NV Lubbock, TX 12.48 5.58 21.79 8.01 4.59 17.93
Las Vegas, NV Lexington, KY 25.52 11.27 40.00 3.92 2.50 8.87
Las Vegas, NV Louisville, KY 8.74 3.48 16.27 11.44 6.14 28.74
Las Vegas, NV Midland/Odessa, TX 2.73 1.59 7.34 36.61 13.64 63.15
Las Vegas, NV Sacramento, CA 5.64 2.07 12.31 17.73 8.13 48.54
Las Vegas, NV Tampa, FL (Metropolitan Area) 5.47 2.38 10.76 18.28 9.29 42.08
Las Vegas, NV San Antonio, TX 6.67 2.74 12.30 14.99 8.13 36.48
Las Vegas, NV Memphis, TN 15.07 6.89 24.90 6.64 4.02 14.52
Las Vegas, NV Mission/McAllen/Edinburg, TX 21.48 9.48 35.58 4.66 2.81 10.55
Las Vegas, NV Medford, OR 11.81 4.85 21.55 8.47 4.64 20.64
Las Vegas, NV Omaha, NE 6.79 2.86 12.76 14.73 7.84 35.01
Las Vegas, NV Milwaukee, WI 13.55 6.07 24.95 7.38 4.01 16.47
Las Vegas, NV Quad Cities, IL (Metropolitan Area) 21.00 9.17 37.43 4.76 2.67 10.91
Las Vegas, NV Madison, WI 20.25 8.79 36.33 4.94 2.75 11.38
Las Vegas, NV Missoula, MT 18.58 8.19 32.01 5.38 3.12 12.21
Las Vegas, NV New Orleans, LA 12.10 5.51 21.80 8.27 4.59 18.15
Las Vegas, NV San Diego, CA 9.87 4.03 19.14 10.13 5.23 24.80
Las Vegas, NV Norfolk, VA (Metropolitan Area) 18.59 8.42 30.63 5.38 3.26 11.87
Las Vegas, NV Pensacola, FL 11.06 4.74 20.94 9.04 4.78 21.08
Las Vegas, NV Oklahoma City, OK 16.37 7.54 27.24 6.11 3.67 13.25
Las Vegas, NV West Palm Beach/Palm Beach, FL 11.56 5.14 23.86 8.65 4.19 19.47
Las Vegas, NV Portland, OR 5.28 2.18 9.22 18.96 10.84 45.84
Las Vegas, NV Philadelphia, PA 9.33 4.55 16.77 10.72 5.96 21.96
Las Vegas, NV Peoria, IL 20.64 9.62 38.35 4.85 2.61 10.39
Las Vegas, NV Pasco/Kennewick/Richland, WA 17.08 7.58 28.81 5.86 3.47 13.18
Las Vegas, NV Portland, ME 17.51 6.85 31.22 5.71 3.20 14.59
Las Vegas, NV Rapid City, SD 15.21 6.52 28.03 6.57 3.57 15.33
Las Vegas, NV Raleigh/Durham, NC 8.82 4.02 16.06 11.34 6.23 24.87
Las Vegas, NV Richmond, VA 22.87 10.87 38.04 4.37 2.63 9.20
Las Vegas, NV Reno, NV 19.86 9.88 31.93 5.04 3.13 10.12
Las Vegas, NV Roanoke, VA 18.92 7.79 33.18 5.29 3.01 12.84
Las Vegas, NV Rochester, NY 19.07 8.01 31.84 5.24 3.14 12.48
Las Vegas, NV Salt Lake City, UT 5.28 1.84 11.14 18.95 8.98 54.28
Las Vegas, NV Tulsa, OK 9.19 4.04 16.78 10.88 5.96 24.76
Las Vegas, NV South Bend, IN 19.78 8.05 34.17 5.05 2.93 12.42
Las Vegas, NV Springfield, MO 16.24 6.17 30.04 6.16 3.33 16.20
Las Vegas, NV Sarasota/Bradenton, FL 22.00 10.09 36.14 4.55 2.77 9.92
Las Vegas, NV Syracuse, NY 29.40 14.06 43.83 3.40 2.28 7.11

Origin City Destination City Median Lower Upper Median Lower Upper
Online Appendix Table A.1 - Estimation Results for Each City Pair
Profit Margin (%) Price Elasticity
Idaho Falls, ID Seattle, WA 21.66 10.27 35.96 4.62 2.78 9.73
Idaho Falls, ID Washington, DC (Metropolitan Area) 14.85 7.49 26.86 6.73 3.72 13.36
Idaho Falls, ID San Francisco, CA (Metropolitan Area) 10.21 3.75 19.86 9.80 5.03 26.64
Idaho Falls, ID Los Angeles, CA (Metropolitan Area) 17.20 7.91 30.34 5.81 3.30 12.64
Indianapolis, IN Pittsburgh, PA 19.61 7.81 34.19 5.10 2.92 12.80
Indianapolis, IN Tucson, AZ 12.09 5.20 21.47 8.27 4.66 19.23
Indianapolis, IN Phoenix, AZ 11.69 5.54 18.75 8.56 5.33 18.05
Indianapolis, IN Seattle, WA 7.15 2.70 13.37 13.98 7.48 36.98
Indianapolis, IN Washington, DC (Metropolitan Area) 14.37 6.99 22.41 6.96 4.46 14.30
Indianapolis, IN Wichita, KS 9.78 4.08 18.70 10.22 5.35 24.51
Indianapolis, IN St. Louis, MO 11.42 5.31 20.90 8.75 4.79 18.85
Indianapolis, IN Jacksonville, FL 12.96 6.18 22.06 7.71 4.53 16.18
Indianapolis, IN Orlando, FL 6.95 2.90 12.25 14.38 8.17 34.43
Indianapolis, IN Minneapolis/St. Paul, MN 6.81 3.12 11.98 14.69 8.35 32.09
Indianapolis, IN New York City, NY (Metropolitan Area) 11.88 5.25 20.09 8.42 4.98 19.03
Indianapolis, IN Las Vegas, NV 13.32 6.53 21.43 7.51 4.67 15.32
Indianapolis, IN Jackson/Vicksburg, MS 15.82 6.96 26.90 6.32 3.72 14.36
Indianapolis, IN San Francisco, CA (Metropolitan Area) 7.92 3.37 13.99 12.62 7.15 29.68
Indianapolis, IN Miami, FL (Metropolitan Area) 9.40 4.28 17.60 10.64 5.68 23.35
Indianapolis, IN Los Angeles, CA (Metropolitan Area) 7.53 3.13 14.45 13.29 6.92 31.99
Indianapolis, IN Little Rock, AR 12.61 5.39 21.68 7.93 4.61 18.56
Indianapolis, IN Sacramento, CA 6.30 2.63 12.28 15.87 8.14 37.96
Indianapolis, IN Tampa, FL (Metropolitan Area) 5.90 2.37 10.94 16.94 9.14 42.21
Indianapolis, IN Kansas City, MO 11.52 5.05 22.34 8.68 4.48 19.80
Indianapolis, IN San Antonio, TX 17.24 8.73 27.56 5.80 3.63 11.46
Indianapolis, IN Memphis, TN 10.57 4.15 20.08 9.46 4.98 24.11
Indianapolis, IN Mission/McAllen/Edinburg, TX 15.09 6.21 26.01 6.63 3.84 16.10
Indianapolis, IN Omaha, NE 12.01 5.01 21.97 8.33 4.55 19.97
Indianapolis, IN Milwaukee, WI 24.82 12.80 39.93 4.03 2.50 7.81
Indianapolis, IN Madison, WI 12.38 5.93 23.01 8.08 4.35 16.86
Indianapolis, IN New Orleans, LA 9.90 4.31 21.02 10.10 4.76 23.21
Indianapolis, IN San Diego, CA 8.57 3.71 15.86 11.67 6.31 26.98
Indianapolis, IN Norfolk, VA (Metropolitan Area) 11.84 5.64 19.76 8.44 5.06 17.74
Indianapolis, IN Pensacola, FL 20.19 8.91 34.86 4.95 2.87 11.23
Indianapolis, IN Oklahoma City, OK 6.83 2.42 13.11 14.64 7.63 41.38
Indianapolis, IN West Palm Beach/Palm Beach, FL 13.64 6.48 24.87 7.33 4.02 15.44
Indianapolis, IN Portland, OR 3.36 1.22 9.23 29.93 10.83 82.04
Indianapolis, IN Philadelphia, PA 8.06 3.46 14.16 12.40 7.06 28.93
Indianapolis, IN Portland, ME 10.89 5.14 17.97 9.18 5.56 19.44
Indianapolis, IN Raleigh/Durham, NC 11.23 3.87 18.55 8.90 5.39 25.86
Indianapolis, IN Richmond, VA 14.96 7.25 24.97 6.68 4.01 13.79
Indianapolis, IN Reno, NV 15.29 6.66 30.04 6.54 3.33 15.01
Indianapolis, IN Rochester, NY 10.26 4.67 17.43 9.75 5.74 21.40

Origin City Destination City Median Lower Upper Median Lower Upper
Online Appendix Table A.1 - Estimation Results for Each City Pair
Profit Margin (%) Price Elasticity
Indianapolis, IN Salt Lake City, UT 8.04 3.26 14.28 12.43 7.00 30.69
Indianapolis, IN Tulsa, OK 8.62 4.02 18.79 11.60 5.32 24.88
Indianapolis, IN Savannah, GA 12.10 5.07 21.02 8.27 4.76 19.71
Indianapolis, IN Sarasota/Bradenton, FL 17.09 7.90 31.44 5.85 3.18 12.65
Indianapolis, IN Syracuse, NY 15.36 6.94 25.52 6.51 3.92 14.41
Jackson, WY Washington, DC (Metropolitan Area) 9.72 4.50 18.90 10.29 5.29 22.20
Jackson, WY New York City, NY (Metropolitan Area) 8.78 3.79 15.96 11.39 6.27 26.39
Jackson, WY San Francisco, CA (Metropolitan Area) 10.19 4.18 20.60 9.81 4.85 23.90
Jackson, WY Los Angeles, CA (Metropolitan Area) 7.88 3.43 14.74 12.69 6.78 29.12
Jackson/Vicksburg, MS Phoenix, AZ 10.81 4.68 21.64 9.25 4.62 21.35
Jackson/Vicksburg, MS Seattle, WA 9.33 3.51 17.89 10.72 5.59 28.52
Jackson/Vicksburg, MS Washington, DC (Metropolitan Area) 9.34 4.03 16.41 10.70 6.09 24.81
Jackson/Vicksburg, MS St. Louis, MO 14.02 5.50 24.68 7.13 4.05 18.17
Jackson/Vicksburg, MS Jacksonville, FL 12.33 5.71 21.95 8.11 4.56 17.50
Jackson/Vicksburg, MS Orlando, FL 24.01 10.68 40.25 4.17 2.48 9.36
Jackson/Vicksburg, MS Minneapolis/St. Paul, MN 19.04 9.87 29.41 5.25 3.40 10.14
Jackson/Vicksburg, MS New York City, NY (Metropolitan Area) 14.22 6.65 25.11 7.03 3.98 15.03
Jackson/Vicksburg, MS Las Vegas, NV 15.15 6.23 28.72 6.60 3.48 16.06
Jackson/Vicksburg, MS San Francisco, CA (Metropolitan Area) 10.18 3.77 18.58 9.82 5.38 26.54
Jackson/Vicksburg, MS Miami, FL (Metropolitan Area) 17.72 8.55 30.32 5.64 3.30 11.70
Jackson/Vicksburg, MS Los Angeles, CA (Metropolitan Area) 8.78 3.74 18.91 11.39 5.29 26.74
Jackson/Vicksburg, MS Tampa, FL (Metropolitan Area) 25.35 14.26 38.21 3.94 2.62 7.01
Jackson/Vicksburg, MS Kansas City, MO 14.41 5.47 27.88 6.94 3.59 18.27
Jackson/Vicksburg, MS San Antonio, TX 15.20 6.59 29.33 6.58 3.41 15.17
Jackson/Vicksburg, MS San Diego, CA 8.08 2.98 14.99 12.38 6.67 33.55
Jackson/Vicksburg, MS Norfolk, VA (Metropolitan Area) 19.06 9.43 31.22 5.25 3.20 10.60
Jackson/Vicksburg, MS Philadelphia, PA 17.90 8.69 29.12 5.59 3.43 11.51
Jackson/Vicksburg, MS Raleigh/Durham, NC 11.27 4.20 21.73 8.87 4.60 23.80
San Francisco, CA (Metropolitan Area) Scranton/Wilkes-Barre, PA 14.02 6.18 24.40 7.13 4.10 16.18
San Francisco, CA (Metropolitan Area) Tucson, AZ 7.47 2.94 13.66 13.38 7.32 34.03
San Francisco, CA (Metropolitan Area) Shreveport, LA 21.52 11.25 34.18 4.65 2.93 8.89
San Francisco, CA (Metropolitan Area) Seattle, WA 4.16 1.76 7.92 24.04 12.62 56.93
San Francisco, CA (Metropolitan Area) Washington, DC (Metropolitan Area) 4.18 1.86 7.63 23.92 13.11 53.88
San Francisco, CA (Metropolitan Area) Wichita, KS 8.70 3.99 15.66 11.50 6.39 25.06
San Francisco, CA (Metropolitan Area) St. Louis, MO 2.72 1.23 3.61 39.57 27.71 84.81
San Francisco, CA (Metropolitan Area) Sioux Falls, SD 18.55 7.40 31.98 5.39 3.13 13.51
San Francisco, CA (Metropolitan Area) Spokane, WA 4.57 1.88 9.37 21.90 10.68 53.24
San Francisco, CA (Metropolitan Area) Wilmington, NC 13.36 6.47 22.79 7.49 4.39 15.46
San Francisco, CA (Metropolitan Area) Tampa, FL (Metropolitan Area) 4.60 1.92 8.13 21.75 12.30 52.21
San Francisco, CA (Metropolitan Area) West Palm Beach/Palm Beach, FL 9.23 3.65 16.85 10.84 5.94 27.38
San Francisco, CA (Metropolitan Area) Tulsa, OK 8.28 3.59 15.75 12.07 6.35 27.88
San Francisco, CA (Metropolitan Area) Savannah, GA 12.67 5.02 21.13 7.89 4.73 19.91
San Francisco, CA (Metropolitan Area) South Bend, IN 15.47 6.33 27.34 6.47 3.66 15.80

Origin City Destination City Median Lower Upper Median Lower Upper
Online Appendix Table A.1 - Estimation Results for Each City Pair
Profit Margin (%) Price Elasticity
San Francisco, CA (Metropolitan Area) Springfield, MO 14.81 6.55 27.27 6.75 3.67 15.26
San Francisco, CA (Metropolitan Area) Sarasota/Bradenton, FL 12.92 5.27 23.39 7.74 4.27 18.97
San Francisco, CA (Metropolitan Area) Syracuse, NY 12.62 6.19 21.23 7.92 4.71 16.16
San Francisco, CA (Metropolitan Area) Tallahassee, FL 15.86 7.54 26.99 6.31 3.70 13.26
San Francisco, CA (Metropolitan Area) Yakima, WA 15.15 5.92 27.09 6.60 3.69 16.88
Miami, FL (Metropolitan Area) Pittsburgh, PA 8.29 3.71 15.50 12.06 6.45 26.95
Miami, FL (Metropolitan Area) Scranton/Wilkes-Barre, PA 20.86 10.12 35.06 4.79 2.85 9.88
Miami, FL (Metropolitan Area) Tucson, AZ 13.50 5.77 22.31 7.41 4.48 17.34
Miami, FL (Metropolitan Area) Phoenix, AZ 9.42 4.18 16.55 10.61 6.04 23.91
Miami, FL (Metropolitan Area) Shreveport, LA 20.41 7.92 33.35 4.90 3.00 12.62
Miami, FL (Metropolitan Area) Seattle, WA 5.10 2.17 9.98 19.61 10.02 46.06
Miami, FL (Metropolitan Area) Mobile, AL 13.47 5.75 27.36 7.42 3.65 17.40
Miami, FL (Metropolitan Area) Nashville, TN 10.56 5.26 18.08 9.47 5.53 19.02
Miami, FL (Metropolitan Area) Washington, DC (Metropolitan Area) 7.96 3.22 14.23 12.57 7.03 31.07
Miami, FL (Metropolitan Area) Wichita, KS 25.38 14.44 37.49 3.94 2.67 6.92
Miami, FL (Metropolitan Area) St. Louis, MO 10.83 5.15 17.69 9.24 5.65 19.42
Miami, FL (Metropolitan Area) Myrtle Beach, SC 14.45 6.27 26.30 6.92 3.80 15.94
Miami, FL (Metropolitan Area) Orlando, FL 12.16 5.62 21.79 8.23 4.59 17.80
Miami, FL (Metropolitan Area) Minneapolis/St. Paul, MN 7.40 2.86 14.12 13.51 7.08 34.96
Miami, FL (Metropolitan Area) New York City, NY (Metropolitan Area) 6.81 2.87 12.94 14.68 7.73 34.84
Miami, FL (Metropolitan Area) Spokane, WA 13.68 5.22 23.53 7.31 4.25 19.16
Miami, FL (Metropolitan Area) Wilmington, NC 10.41 4.15 19.73 9.61 5.07 24.12
Miami, FL (Metropolitan Area) San Francisco, CA (Metropolitan Area) 7.45 2.87 13.94 13.43 7.17 34.81
Miami, FL (Metropolitan Area) Sacramento, CA 15.58 7.56 25.27 6.42 3.96 13.23
Miami, FL (Metropolitan Area) Tampa, FL (Metropolitan Area) 16.03 7.06 27.74 6.24 3.61 14.17
Miami, FL (Metropolitan Area) San Antonio, TX 8.21 3.49 14.26 12.17 7.01 28.68
Miami, FL (Metropolitan Area) Mission/McAllen/Edinburg, TX 11.75 5.04 21.52 8.51 4.65 19.84
Miami, FL (Metropolitan Area) Omaha, NE 10.95 4.42 19.37 9.13 5.16 22.63
Miami, FL (Metropolitan Area) Milwaukee, WI 23.17 11.02 36.35 4.32 2.75 9.08
Miami, FL (Metropolitan Area) Quad Cities, IL (Metropolitan Area) 18.92 7.78 33.61 5.29 2.98 12.85
Miami, FL (Metropolitan Area) New Orleans, LA 9.94 3.86 19.56 10.06 5.11 25.93
Miami, FL (Metropolitan Area) San Diego, CA 11.40 5.46 20.03 8.77 4.99 18.31
Miami, FL (Metropolitan Area) Norfolk, VA (Metropolitan Area) 12.95 5.13 24.18 7.72 4.14 19.48
Miami, FL (Metropolitan Area) Pensacola, FL 29.98 14.35 46.09 3.34 2.17 6.97
Miami, FL (Metropolitan Area) Oklahoma City, OK 10.07 4.12 18.67 9.93 5.36 24.29
Miami, FL (Metropolitan Area) Portland, OR 6.81 2.96 12.35 14.68 8.10 33.79
Miami, FL (Metropolitan Area) Philadelphia, PA 15.68 7.71 24.07 6.38 4.15 12.97
Miami, FL (Metropolitan Area) Peoria, IL 13.23 5.77 25.41 7.56 3.94 17.34
Miami, FL (Metropolitan Area) Palm Springs, CA 13.10 5.57 23.36 7.64 4.28 17.96
Miami, FL (Metropolitan Area) Portland, ME 14.26 5.99 26.65 7.01 3.75 16.71
Miami, FL (Metropolitan Area) Raleigh/Durham, NC 13.29 5.98 22.43 7.52 4.46 16.73
Miami, FL (Metropolitan Area) Richmond, VA 12.87 4.97 22.65 7.77 4.41 20.14
Miami, FL (Metropolitan Area) Reno, NV 18.11 7.42 31.89 5.52 3.14 13.48

Origin City Destination City Median Lower Upper Median Lower Upper
Online Appendix Table A.1 - Estimation Results for Each City Pair
Profit Margin (%) Price Elasticity
Miami, FL (Metropolitan Area) Roanoke, VA 24.61 11.91 36.06 4.06 2.77 8.40
Miami, FL (Metropolitan Area) Rochester, NY 13.85 5.96 23.27 7.22 4.30 16.79
Miami, FL (Metropolitan Area) Salt Lake City, UT 10.41 4.71 17.12 9.60 5.84 21.22
Miami, FL (Metropolitan Area) Tulsa, OK 8.58 3.33 15.88 11.65 6.30 30.03
Miami, FL (Metropolitan Area) Savannah, GA 9.57 4.03 18.19 10.45 5.50 24.80
Miami, FL (Metropolitan Area) South Bend, IN 18.73 9.00 30.19 5.34 3.31 11.11
Miami, FL (Metropolitan Area) Springfield, MO 15.14 6.24 28.96 6.61 3.45 16.04
Miami, FL (Metropolitan Area) Syracuse, NY 13.49 5.62 24.51 7.41 4.08 17.80
Miami, FL (Metropolitan Area) Traverse City, MI 13.34 6.09 23.60 7.50 4.24 16.42
Rochester, MN Washington, DC (Metropolitan Area) 15.48 7.50 24.91 6.46 4.01 13.33
Los Angeles, CA (Metropolitan Area) Pittsburgh, PA 7.86 3.62 13.66 12.71 7.32 27.60
Los Angeles, CA (Metropolitan Area) Wausau/Mosinee/Stevens Point, WI 26.80 14.77 38.26 3.73 2.61 6.77
Los Angeles, CA (Metropolitan Area) Scranton/Wilkes-Barre, PA 8.84 4.07 16.61 11.32 6.02 24.55
Los Angeles, CA (Metropolitan Area) Tucson, AZ 9.69 4.08 18.16 10.32 5.51 24.54
Los Angeles, CA (Metropolitan Area) Phoenix, AZ 10.58 4.44 20.02 9.45 4.99 22.52
Los Angeles, CA (Metropolitan Area) Shreveport, LA 19.02 8.10 32.43 5.26 3.08 12.34
Los Angeles, CA (Metropolitan Area) Seattle, WA 3.78 1.45 7.63 26.44 13.10 68.98
Los Angeles, CA (Metropolitan Area) Mobile, AL 17.13 8.05 29.80 5.84 3.36 12.42
Los Angeles, CA (Metropolitan Area) Nashville, TN 5.52 2.45 9.74 18.12 10.27 40.83
Los Angeles, CA (Metropolitan Area) Washington, DC (Metropolitan Area) 4.90 2.43 8.66 20.40 11.54 41.14
Los Angeles, CA (Metropolitan Area) Wichita, KS 10.52 4.87 17.52 9.50 5.71 20.54
Los Angeles, CA (Metropolitan Area) St. Louis, MO 4.10 1.67 8.27 24.41 12.09 59.95
Los Angeles, CA (Metropolitan Area) Myrtle Beach, SC 15.51 6.90 27.01 6.45 3.70 14.50
Los Angeles, CA (Metropolitan Area) Orlando, FL 9.08 3.93 16.86 11.02 5.93 25.43
Los Angeles, CA (Metropolitan Area) Wenatchee, WA 15.60 6.33 27.20 6.41 3.68 15.81
Los Angeles, CA (Metropolitan Area) Valparaiso, FL 22.58 10.96 38.59 4.43 2.59 9.12
Los Angeles, CA (Metropolitan Area) Minneapolis/St. Paul, MN 4.28 1.70 7.90 23.35 12.65 58.78
Los Angeles, CA (Metropolitan Area) New York City, NY (Metropolitan Area) 5.56 2.44 10.04 17.97 9.96 41.00
Los Angeles, CA (Metropolitan Area) Sioux Falls, SD 13.28 5.89 24.91 7.53 4.01 16.97
Los Angeles, CA (Metropolitan Area) Spokane, WA 7.12 2.68 13.92 14.04 7.19 37.38
Los Angeles, CA (Metropolitan Area) Wilmington, NC 10.93 4.82 20.08 9.15 4.98 20.76
Los Angeles, CA (Metropolitan Area) San Francisco, CA (Metropolitan Area) 7.93 3.99 15.61 12.61 6.40 25.06
Los Angeles, CA (Metropolitan Area) Miami, FL (Metropolitan Area) 10.81 4.81 19.02 9.25 5.26 20.78
Los Angeles, CA (Metropolitan Area) Lubbock, TX 8.85 3.24 16.22 11.30 6.17 30.90
Los Angeles, CA (Metropolitan Area) Louisville, KY 6.89 2.75 14.10 14.53 7.09 36.39
Los Angeles, CA (Metropolitan Area) Midland/Odessa, TX 8.51 3.73 17.54 11.76 5.70 26.84
Los Angeles, CA (Metropolitan Area) Saginaw/Bay City/Midland, MI 12.41 4.48 23.70 8.06 4.22 22.31
Los Angeles, CA (Metropolitan Area) Sacramento, CA 11.21 5.01 21.56 8.92 4.64 19.96
Los Angeles, CA (Metropolitan Area) Tampa, FL (Metropolitan Area) 5.53 2.35 10.28 18.09 9.73 42.63
Los Angeles, CA (Metropolitan Area) San Antonio, TX 7.41 3.28 13.57 13.50 7.37 30.46
Los Angeles, CA (Metropolitan Area) Memphis, TN 12.93 5.77 21.03 7.73 4.76 17.34
Los Angeles, CA (Metropolitan Area) Mission/McAllen/Edinburg, TX 11.39 4.74 21.33 8.78 4.69 21.11
Los Angeles, CA (Metropolitan Area) Medford, OR 9.94 4.00 16.72 10.06 5.98 24.99

Origin City Destination City Median Lower Upper Median Lower Upper
Online Appendix Table A.1 - Estimation Results for Each City Pair
Profit Margin (%) Price Elasticity
Los Angeles, CA (Metropolitan Area) Montgomery, AL 12.40 4.74 23.74 8.07 4.21 21.10
Los Angeles, CA (Metropolitan Area) Omaha, NE 5.02 1.97 9.17 19.90 10.91 50.75
Los Angeles, CA (Metropolitan Area) Milwaukee, WI 15.08 6.44 26.70 6.63 3.75 15.53
Los Angeles, CA (Metropolitan Area) Melbourne, FL 11.14 5.08 20.07 8.98 4.98 19.68
Los Angeles, CA (Metropolitan Area) Quad Cities, IL (Metropolitan Area) 11.19 5.13 20.12 8.94 4.97 19.50
Los Angeles, CA (Metropolitan Area) Monroe, LA 16.72 6.68 32.10 5.98 3.12 14.96
Los Angeles, CA (Metropolitan Area) Madison, WI 10.96 4.66 19.04 9.12 5.25 21.46
Los Angeles, CA (Metropolitan Area) Missoula, MT 12.50 5.51 20.77 8.00 4.81 18.14
Los Angeles, CA (Metropolitan Area) New Orleans, LA 16.47 6.80 27.25 6.07 3.67 14.70
Los Angeles, CA (Metropolitan Area) San Diego, CA 15.45 6.57 26.93 6.47 3.71 15.23
Los Angeles, CA (Metropolitan Area) Norfolk, VA (Metropolitan Area) 12.82 5.78 20.70 7.80 4.83 17.30
Los Angeles, CA (Metropolitan Area) Pensacola, FL 17.07 8.73 28.78 5.86 3.47 11.46
Los Angeles, CA (Metropolitan Area) Redding, CA 27.24 13.05 43.21 3.67 2.31 7.66
Los Angeles, CA (Metropolitan Area) Oklahoma City, OK 8.04 3.26 15.65 12.44 6.39 30.68
Los Angeles, CA (Metropolitan Area) West Palm Beach/Palm Beach, FL 14.51 6.08 24.88 6.89 4.02 16.46
Los Angeles, CA (Metropolitan Area) Portland, OR 6.48 3.08 11.46 15.44 8.73 32.50
Los Angeles, CA (Metropolitan Area) Philadelphia, PA 11.46 5.33 18.76 8.73 5.33 18.75
Los Angeles, CA (Metropolitan Area) Peoria, IL 15.60 6.24 26.72 6.41 3.74 16.03
Los Angeles, CA (Metropolitan Area) Pasco/Kennewick/Richland, WA 29.69 17.71 41.61 3.37 2.40 5.65
Los Angeles, CA (Metropolitan Area) Portland, ME 9.52 4.12 18.13 10.50 5.51 24.28
Los Angeles, CA (Metropolitan Area) Rapid City, SD 17.43 9.01 29.02 5.74 3.45 11.10
Los Angeles, CA (Metropolitan Area) Raleigh/Durham, NC 5.14 1.94 9.33 19.47 10.72 51.61
Los Angeles, CA (Metropolitan Area) Richmond, VA 13.18 5.88 24.44 7.59 4.09 17.01
Los Angeles, CA (Metropolitan Area) Reno, NV 12.79 5.53 23.22 7.82 4.31 18.09
Los Angeles, CA (Metropolitan Area) Roanoke, VA 16.96 7.87 30.80 5.89 3.25 12.71
Los Angeles, CA (Metropolitan Area) Rochester, NY 12.48 6.22 20.56 8.01 4.86 16.08
Los Angeles, CA (Metropolitan Area) Salt Lake City, UT 5.36 2.22 10.16 18.67 9.85 44.95
Los Angeles, CA (Metropolitan Area) Tulsa, OK 10.00 4.23 19.45 10.00 5.14 23.66
Los Angeles, CA (Metropolitan Area) Savannah, GA 20.56 9.50 32.34 4.86 3.09 10.53
Los Angeles, CA (Metropolitan Area) South Bend, IN 19.09 8.72 30.92 5.24 3.23 11.47
Los Angeles, CA (Metropolitan Area) Philipsburg/State College, PA 20.49 8.55 36.20 4.88 2.76 11.69
Los Angeles, CA (Metropolitan Area) Springfield, MO 16.93 7.65 27.75 5.91 3.60 13.07
Los Angeles, CA (Metropolitan Area) Salinas/Monterey, CA 13.21 5.43 23.50 7.57 4.26 18.43
Los Angeles, CA (Metropolitan Area) Sarasota/Bradenton, FL 14.93 6.66 27.61 6.70 3.62 15.02
Los Angeles, CA (Metropolitan Area) Sun Valley/Hailey/Ketchum, ID 15.65 7.00 28.99 6.39 3.45 14.28
Los Angeles, CA (Metropolitan Area) Syracuse, NY 11.35 4.97 19.31 8.81 5.18 20.11
Los Angeles, CA (Metropolitan Area) Tallahassee, FL 16.26 6.34 27.82 6.15 3.59 15.76
Los Angeles, CA (Metropolitan Area) Traverse City, MI 8.16 3.21 15.94 12.26 6.27 31.19
Los Angeles, CA (Metropolitan Area) Yakima, WA 13.94 5.45 25.87 7.17 3.87 18.34
Little Rock, AR Pittsburgh, PA 10.53 5.22 18.92 9.49 5.29 19.18
Little Rock, AR Phoenix, AZ 7.46 3.23 14.55 13.41 6.87 30.91
Little Rock, AR Seattle, WA 7.37 3.07 13.59 13.57 7.36 32.52
Little Rock, AR Washington, DC (Metropolitan Area) 5.99 2.36 11.61 16.70 8.61 42.30

Origin City Destination City Median Lower Upper Median Lower Upper
Online Appendix Table A.1 - Estimation Results for Each City Pair
Profit Margin (%) Price Elasticity
Little Rock, AR Orlando, FL 7.31 2.96 15.51 13.68 6.45 33.73
Little Rock, AR Minneapolis/St. Paul, MN 16.33 8.05 29.25 6.12 3.42 12.43
Little Rock, AR New York City, NY (Metropolitan Area) 7.23 3.23 13.12 13.83 7.62 30.99
Little Rock, AR San Francisco, CA (Metropolitan Area) 9.25 3.64 16.80 10.82 5.95 27.45
Little Rock, AR Miami, FL (Metropolitan Area) 22.19 10.77 36.18 4.51 2.76 9.28
Little Rock, AR Los Angeles, CA (Metropolitan Area) 7.42 2.87 14.05 13.48 7.12 34.88
Little Rock, AR Louisville, KY 20.30 9.32 33.01 4.93 3.03 10.73
Little Rock, AR Sacramento, CA 9.60 4.14 17.00 10.42 5.88 24.17
Little Rock, AR Tampa, FL (Metropolitan Area) 10.39 4.80 18.92 9.63 5.28 20.84
Little Rock, AR San Antonio, TX 12.95 5.17 23.66 7.72 4.23 19.33
Little Rock, AR Omaha, NE 10.10 3.82 20.02 9.90 4.99 26.18
Little Rock, AR Milwaukee, WI 19.68 9.74 29.55 5.08 3.38 10.26
Little Rock, AR New Orleans, LA 27.16 11.41 46.58 3.68 2.15 8.76
Little Rock, AR San Diego, CA 8.78 3.53 15.61 11.38 6.41 28.36
Little Rock, AR Norfolk, VA (Metropolitan Area) 12.25 5.09 21.46 8.16 4.66 19.64
Little Rock, AR Portland, OR 9.89 4.35 18.03 10.11 5.55 22.97
Little Rock, AR Philadelphia, PA 15.55 7.26 24.88 6.43 4.02 13.78
Little Rock, AR Raleigh/Durham, NC 10.67 4.55 19.49 9.38 5.13 21.99
Little Rock, AR Salt Lake City, UT 9.87 4.28 18.46 10.14 5.42 23.38
Lansing, MI Washington, DC (Metropolitan Area) 20.06 10.32 32.03 4.98 3.12 9.69
Lansing, MI Minneapolis/St. Paul, MN 22.00 9.05 37.46 4.55 2.67 11.05
Lansing, MI New York City, NY (Metropolitan Area) 12.67 5.32 21.61 7.89 4.63 18.78
Lansing, MI Los Angeles, CA (Metropolitan Area) 16.33 7.19 30.83 6.12 3.24 13.91
Lawton/Fort Sill, OK Washington, DC (Metropolitan Area) 11.39 5.04 18.07 8.78 5.54 19.85
Lubbock, TX Phoenix, AZ 18.27 8.43 31.07 5.47 3.22 11.87
Lubbock, TX Seattle, WA 12.91 4.88 23.00 7.74 4.35 20.51
Lubbock, TX Nashville, TN 10.14 3.11 19.94 9.86 5.01 32.11
Lubbock, TX Washington, DC (Metropolitan Area) 12.52 5.79 22.65 7.99 4.41 17.27
Lubbock, TX Orlando, FL 16.05 6.56 28.52 6.23 3.51 15.25
Lubbock, TX New York City, NY (Metropolitan Area) 10.47 4.53 18.26 9.55 5.48 22.06
Lubbock, TX San Francisco, CA (Metropolitan Area) 11.83 5.10 22.23 8.46 4.50 19.62
Lubbock, TX San Antonio, TX 14.18 6.67 28.78 7.05 3.48 14.99
Lubbock, TX New Orleans, LA 17.13 6.92 33.97 5.84 2.94 14.45
Lubbock, TX San Diego, CA 15.08 5.97 28.14 6.63 3.55 16.75
Lexington, KY Phoenix, AZ 22.58 10.66 34.65 4.43 2.89 9.38
Lexington, KY Washington, DC (Metropolitan Area) 13.39 5.95 22.41 7.47 4.46 16.81
Lexington, KY Orlando, FL 42.87 23.30 59.99 2.33 1.67 4.29
Lexington, KY Minneapolis/St. Paul, MN 17.48 8.46 32.59 5.72 3.07 11.82
Lexington, KY New York City, NY (Metropolitan Area) 17.83 8.25 29.68 5.61 3.37 12.13
Lexington, KY San Francisco, CA (Metropolitan Area) 26.11 13.99 38.15 3.83 2.62 7.15
Lexington, KY Miami, FL (Metropolitan Area) 25.36 11.44 42.29 3.94 2.36 8.74
Lexington, KY Los Angeles, CA (Metropolitan Area) 24.52 12.38 35.47 4.08 2.82 8.08
Lexington, KY Tampa, FL (Metropolitan Area) 12.14 4.91 23.49 8.23 4.26 20.38
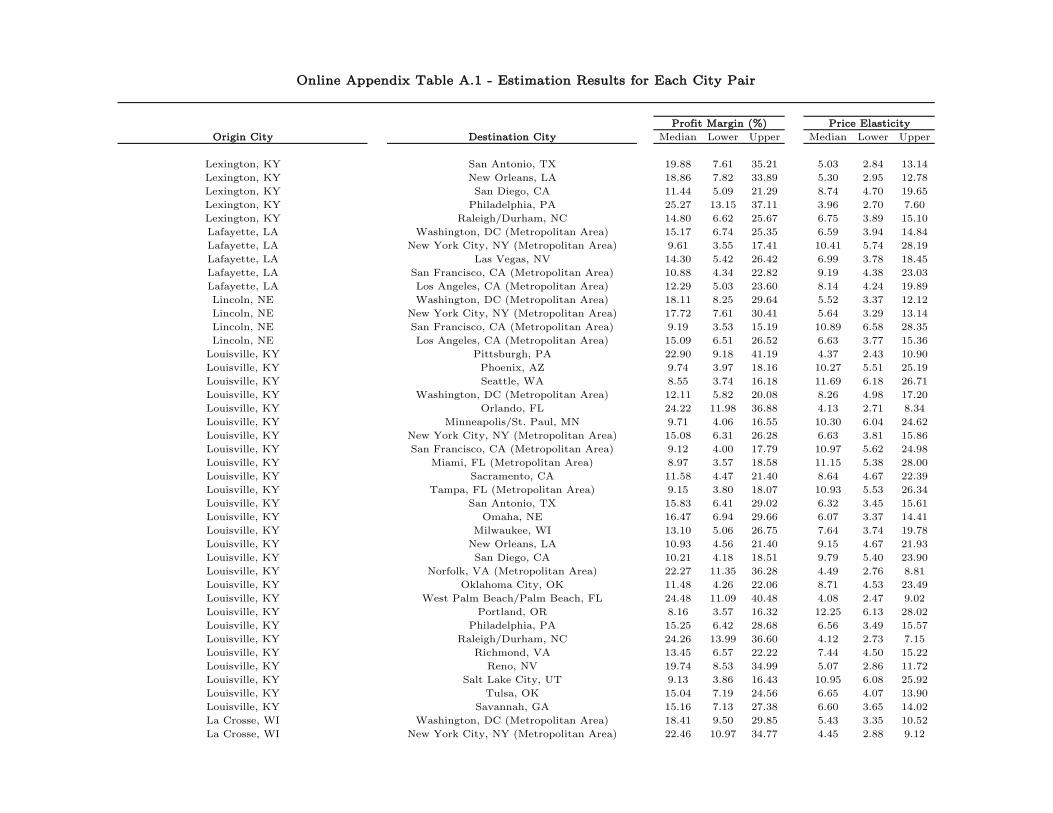
Origin City Destination City Median Lower Upper Median Lower Upper
Online Appendix Table A.1 - Estimation Results for Each City Pair
Profit Margin (%) Price Elasticity
Lexington, KY San Antonio, TX 19.88 7.61 35.21 5.03 2.84 13.14
Lexington, KY New Orleans, LA 18.86 7.82 33.89 5.30 2.95 12.78
Lexington, KY San Diego, CA 11.44 5.09 21.29 8.74 4.70 19.65
Lexington, KY Philadelphia, PA 25.27 13.15 37.11 3.96 2.70 7.60
Lexington, KY Raleigh/Durham, NC 14.80 6.62 25.67 6.75 3.89 15.10
Lafayette, LA Washington, DC (Metropolitan Area) 15.17 6.74 25.35 6.59 3.94 14.84
Lafayette, LA New York City, NY (Metropolitan Area) 9.61 3.55 17.41 10.41 5.74 28.19
Lafayette, LA Las Vegas, NV 14.30 5.42 26.42 6.99 3.78 18.45
Lafayette, LA San Francisco, CA (Metropolitan Area) 10.88 4.34 22.82 9.19 4.38 23.03
Lafayette, LA Los Angeles, CA (Metropolitan Area) 12.29 5.03 23.60 8.14 4.24 19.89
Lincoln, NE Washington, DC (Metropolitan Area) 18.11 8.25 29.64 5.52 3.37 12.12
Lincoln, NE New York City, NY (Metropolitan Area) 17.72 7.61 30.41 5.64 3.29 13.14
Lincoln, NE San Francisco, CA (Metropolitan Area) 9.19 3.53 15.19 10.89 6.58 28.35
Lincoln, NE Los Angeles, CA (Metropolitan Area) 15.09 6.51 26.52 6.63 3.77 15.36
Louisville, KY Pittsburgh, PA 22.90 9.18 41.19 4.37 2.43 10.90
Louisville, KY Phoenix, AZ 9.74 3.97 18.16 10.27 5.51 25.19
Louisville, KY Seattle, WA 8.55 3.74 16.18 11.69 6.18 26.71
Louisville, KY Washington, DC (Metropolitan Area) 12.11 5.82 20.08 8.26 4.98 17.20
Louisville, KY Orlando, FL 24.22 11.98 36.88 4.13 2.71 8.34
Louisville, KY Minneapolis/St. Paul, MN 9.71 4.06 16.55 10.30 6.04 24.62
Louisville, KY New York City, NY (Metropolitan Area) 15.08 6.31 26.28 6.63 3.81 15.86
Louisville, KY San Francisco, CA (Metropolitan Area) 9.12 4.00 17.79 10.97 5.62 24.98
Louisville, KY Miami, FL (Metropolitan Area) 8.97 3.57 18.58 11.15 5.38 28.00
Louisville, KY Sacramento, CA 11.58 4.47 21.40 8.64 4.67 22.39
Louisville, KY Tampa, FL (Metropolitan Area) 9.15 3.80 18.07 10.93 5.53 26.34
Louisville, KY San Antonio, TX 15.83 6.41 29.02 6.32 3.45 15.61
Louisville, KY Omaha, NE 16.47 6.94 29.66 6.07 3.37 14.41
Louisville, KY Milwaukee, WI 13.10 5.06 26.75 7.64 3.74 19.78
Louisville, KY New Orleans, LA 10.93 4.56 21.40 9.15 4.67 21.93
Louisville, KY San Diego, CA 10.21 4.18 18.51 9.79 5.40 23.90
Louisville, KY Norfolk, VA (Metropolitan Area) 22.27 11.35 36.28 4.49 2.76 8.81
Louisville, KY Oklahoma City, OK 11.48 4.26 22.06 8.71 4.53 23.49
Louisville, KY West Palm Beach/Palm Beach, FL 24.48 11.09 40.48 4.08 2.47 9.02
Louisville, KY Portland, OR 8.16 3.57 16.32 12.25 6.13 28.02
Louisville, KY Philadelphia, PA 15.25 6.42 28.68 6.56 3.49 15.57
Louisville, KY Raleigh/Durham, NC 24.26 13.99 36.60 4.12 2.73 7.15
Louisville, KY Richmond, VA 13.45 6.57 22.22 7.44 4.50 15.22
Louisville, KY Reno, NV 19.74 8.53 34.99 5.07 2.86 11.72
Louisville, KY Salt Lake City, UT 9.13 3.86 16.43 10.95 6.08 25.92
Louisville, KY Tulsa, OK 15.04 7.19 24.56 6.65 4.07 13.90
Louisville, KY Savannah, GA 15.16 7.13 27.38 6.60 3.65 14.02
La Crosse, WI Washington, DC (Metropolitan Area) 18.41 9.50 29.85 5.43 3.35 10.52
La Crosse, WI New York City, NY (Metropolitan Area) 22.46 10.97 34.77 4.45 2.88 9.12

Origin City Destination City Median Lower Upper Median Lower Upper
Online Appendix Table A.1 - Estimation Results for Each City Pair
Profit Margin (%) Price Elasticity
La Crosse, WI Los Angeles, CA (Metropolitan Area) 12.22 5.32 20.78 8.18 4.81 18.81
Cincinnati, OH Dallas/Fort Worth, TX 9.46 4.40 16.81 10.57 5.95 22.75
Cincinnati, OH Denver, CO 15.57 7.61 26.69 6.42 3.75 13.14
Cincinnati, OH Tucson, AZ 17.56 7.72 28.73 5.69 3.48 12.95
Cincinnati, OH Phoenix, AZ 24.65 12.54 35.86 4.06 2.79 7.98
Cincinnati, OH Hartford, CT 10.65 4.61 17.73 9.39 5.64 21.70
Cincinnati, OH Seattle, WA 17.32 8.63 27.35 5.77 3.66 11.59
Cincinnati, OH Washington, DC (Metropolitan Area) 8.85 4.14 15.29 11.30 6.54 24.17
Cincinnati, OH St. Louis, MO 28.19 13.45 42.44 3.55 2.36 7.43
Cincinnati, OH Jacksonville, FL 23.32 11.49 35.99 4.29 2.78 8.70
Cincinnati, OH Detroit, MI 23.24 12.57 38.56 4.30 2.59 7.95
Cincinnati, OH Houston, TX 14.68 6.21 25.34 6.81 3.95 16.10
Cincinnati, OH Orlando, FL 10.90 4.53 20.42 9.18 4.90 22.08
Cincinnati, OH Minneapolis/St. Paul, MN 11.01 4.87 18.92 9.08 5.29 20.55
Cincinnati, OH New York City, NY (Metropolitan Area) 8.51 4.20 14.07 11.75 7.11 23.80
Cincinnati, OH Fort Myers, FL 13.97 6.04 24.49 7.16 4.08 16.55
Cincinnati, OH Grand Rapids, MI 28.25 15.74 37.93 3.54 2.64 6.35
Cincinnati, OH Greensboro/High Point, NC 16.36 8.31 26.58 6.11 3.76 12.04
Cincinnati, OH Las Vegas, NV 25.28 12.27 40.88 3.96 2.45 8.15
Cincinnati, OH San Francisco, CA (Metropolitan Area) 14.00 6.65 23.34 7.14 4.28 15.03
Cincinnati, OH Miami, FL (Metropolitan Area) 12.97 5.93 22.61 7.71 4.42 16.87
Cincinnati, OH Los Angeles, CA (Metropolitan Area) 17.83 9.74 27.43 5.61 3.65 10.27
Cincinnati, OH Sacramento, CA 21.50 11.17 31.97 4.65 3.13 8.96
Cincinnati, OH Tampa, FL (Metropolitan Area) 13.94 5.82 23.04 7.18 4.34 17.17
Cincinnati, OH Kansas City, MO 17.40 9.39 25.01 5.75 4.00 10.64
Cincinnati, OH San Antonio, TX 23.21 13.75 33.62 4.31 2.97 7.27
Cincinnati, OH Memphis, TN 11.74 5.33 21.36 8.52 4.68 18.77
Cincinnati, OH New Orleans, LA 20.64 8.97 36.91 4.85 2.71 11.15
Cincinnati, OH San Diego, CA 20.45 10.62 31.16 4.89 3.21 9.42
Cincinnati, OH Norfolk, VA (Metropolitan Area) 41.71 26.96 56.14 2.40 1.78 3.71
Cincinnati, OH West Palm Beach/Palm Beach, FL 17.97 7.88 31.51 5.56 3.17 12.69
Cincinnati, OH Portland, OR 16.62 7.28 26.98 6.02 3.71 13.75
Cincinnati, OH Philadelphia, PA 11.79 5.18 19.37 8.48 5.16 19.31
Cincinnati, OH Raleigh/Durham, NC 10.65 4.60 19.18 9.39 5.21 21.74
Cincinnati, OH Richmond, VA 13.37 5.79 23.10 7.48 4.33 17.26
Cincinnati, OH Salt Lake City, UT 13.25 6.11 23.90 7.55 4.18 16.37
Cincinnati, OH Savannah, GA 15.38 6.56 25.45 6.50 3.93 15.24
Cincinnati, OH Sarasota/Bradenton, FL 19.60 8.04 33.65 5.10 2.97 12.43
Cincinnati, OH Syracuse, NY 11.96 4.87 21.42 8.36 4.67 20.53
Lewiston, ID Seattle, WA 13.98 6.50 25.18 7.15 3.97 15.38
Midland/Odessa, TX Phoenix, AZ 16.80 7.22 27.87 5.95 3.59 13.85
Midland/Odessa, TX Washington, DC (Metropolitan Area) 10.62 4.47 18.57 9.41 5.39 22.38
Midland/Odessa, TX Orlando, FL 12.22 5.12 20.97 8.19 4.77 19.53

Origin City Destination City Median Lower Upper Median Lower Upper
Online Appendix Table A.1 - Estimation Results for Each City Pair
Profit Margin (%) Price Elasticity
Midland/Odessa, TX New York City, NY (Metropolitan Area) 10.84 4.70 19.62 9.22 5.10 21.29
Midland/Odessa, TX San Francisco, CA (Metropolitan Area) 11.41 4.89 22.15 8.76 4.52 20.46
Midland/Odessa, TX San Antonio, TX 23.04 9.53 40.74 4.34 2.45 10.50
Midland/Odessa, TX New Orleans, LA 15.68 5.82 26.75 6.38 3.74 17.19
Midland/Odessa, TX San Diego, CA 13.65 5.07 25.79 7.32 3.88 19.74
Midland/Odessa, TX Oklahoma City, OK 25.64 11.58 42.66 3.90 2.34 8.64
Midland/Odessa, TX Tulsa, OK 23.87 10.40 40.90 4.19 2.44 9.62
Saginaw/Bay City/Midland, MI Washington, DC (Metropolitan Area) 8.87 3.65 16.41 11.27 6.09 27.37
Saginaw/Bay City/Midland, MI San Francisco, CA (Metropolitan Area) 12.55 4.66 22.22 7.97 4.50 21.45
Sacramento, CA Tucson, AZ 13.63 5.19 24.88 7.33 4.02 19.26
Sacramento, CA Seattle, WA 6.87 2.40 12.13 14.56 8.24 41.65
Sacramento, CA Washington, DC (Metropolitan Area) 7.45 3.10 12.78 13.42 7.83 32.26
Sacramento, CA St. Louis, MO 8.30 4.03 14.28 12.05 7.00 24.84
Sacramento, CA Spokane, WA 12.50 5.36 21.80 8.00 4.59 18.65
Sacramento, CA Tampa, FL (Metropolitan Area) 9.29 3.98 17.50 10.77 5.72 25.10
Sacramento, CA San Antonio, TX 14.75 6.94 26.06 6.78 3.84 14.41
Sacramento, CA San Diego, CA 11.21 4.80 20.89 8.92 4.79 20.85
Sacramento, CA Salt Lake City, UT 11.15 4.85 19.05 8.97 5.25 20.63
Sacramento, CA Tulsa, OK 18.07 6.85 31.16 5.53 3.21 14.61
Tampa, FL (Metropolitan Area) Tucson, AZ 11.46 4.91 20.03 8.73 4.99 20.36
Tampa, FL (Metropolitan Area) Washington, DC (Metropolitan Area) 5.21 1.77 11.81 19.19 8.46 56.64
Tampa, FL (Metropolitan Area) Wichita, KS 19.38 8.81 31.56 5.16 3.17 11.36
Tampa, FL (Metropolitan Area) Wilmington, NC 10.01 4.39 17.11 9.99 5.84 22.80
Tampa, FL (Metropolitan Area) Tulsa, OK 8.98 3.33 17.08 11.14 5.86 29.99
Tampa, FL (Metropolitan Area) Toledo, OH 21.44 8.78 36.18 4.66 2.76 11.38
Tampa, FL (Metropolitan Area) Traverse City, MI 25.23 12.06 41.03 3.96 2.44 8.29
Kansas City, MO Pittsburgh, PA 10.31 4.24 18.55 9.70 5.39 23.58
Kansas City, MO Tucson, AZ 15.14 5.89 26.77 6.60 3.74 16.99
Kansas City, MO Phoenix, AZ 4.95 2.28 9.50 20.20 10.53 43.90
Kansas City, MO Seattle, WA 5.61 2.35 9.80 17.81 10.20 42.51
Kansas City, MO Nashville, TN 13.01 5.58 23.29 7.68 4.29 17.92
Kansas City, MO Washington, DC (Metropolitan Area) 6.52 2.87 12.33 15.34 8.11 34.86
Kansas City, MO St. Louis, MO 12.81 5.79 19.31 7.80 5.18 17.28
Kansas City, MO Orlando, FL 8.81 3.85 15.83 11.35 6.32 25.96
Kansas City, MO Minneapolis/St. Paul, MN 13.01 6.95 19.65 7.68 5.09 14.39
Kansas City, MO New York City, NY (Metropolitan Area) 6.06 2.57 11.25 16.51 8.89 38.88
Kansas City, MO Spokane, WA 8.53 3.24 16.16 11.73 6.19 30.89
Kansas City, MO Las Vegas, NV 6.55 3.01 11.43 15.26 8.75 33.23
Kansas City, MO San Francisco, CA (Metropolitan Area) 3.27 1.40 5.78 30.63 17.34 71.29
Kansas City, MO Miami, FL (Metropolitan Area) 15.11 8.81 22.36 6.62 4.47 11.35
Kansas City, MO Los Angeles, CA (Metropolitan Area) 3.48 1.59 7.62 28.77 13.13 62.84
Kansas City, MO Little Rock, AR 15.02 5.58 26.91 6.66 3.72 17.91
Kansas City, MO Lubbock, TX 14.87 6.80 27.30 6.73 3.66 14.71

Origin City Destination City Median Lower Upper Median Lower Upper
Online Appendix Table A.1 - Estimation Results for Each City Pair
Profit Margin (%) Price Elasticity
Kansas City, MO Louisville, KY 18.07 8.37 34.57 5.53 2.89 11.95
Kansas City, MO Sacramento, CA 7.59 3.54 13.54 13.18 7.38 28.26
Kansas City, MO Tampa, FL (Metropolitan Area) 9.70 4.39 16.66 10.31 6.00 22.78
Kansas City, MO San Antonio, TX 11.99 5.26 21.95 8.34 4.56 19.00
Kansas City, MO Milwaukee, WI 17.70 9.67 26.86 5.65 3.72 10.34
Kansas City, MO Madison, WI 5.36 2.45 11.37 18.65 8.80 40.87
Kansas City, MO New Orleans, LA 11.82 5.33 23.54 8.46 4.25 18.77
Kansas City, MO San Diego, CA 7.36 3.19 13.66 13.58 7.32 31.33
Kansas City, MO Norfolk, VA (Metropolitan Area) 22.50 13.13 31.71 4.44 3.15 7.62
Kansas City, MO Pensacola, FL 18.69 8.17 32.72 5.35 3.06 12.24
Kansas City, MO Oklahoma City, OK 22.95 10.51 37.05 4.36 2.70 9.51
Kansas City, MO West Palm Beach/Palm Beach, FL 10.26 4.10 20.25 9.74 4.94 24.37
Kansas City, MO Portland, OR 3.99 1.59 8.17 25.05 12.23 62.77
Kansas City, MO Philadelphia, PA 7.88 3.93 13.42 12.70 7.45 25.43
Kansas City, MO Palm Springs, CA 15.04 6.15 28.96 6.65 3.45 16.27
Kansas City, MO Raleigh/Durham, NC 9.28 3.11 15.34 10.77 6.52 32.18
Kansas City, MO Richmond, VA 9.11 4.24 16.39 10.98 6.10 23.60
Kansas City, MO Reno, NV 14.51 5.46 25.17 6.89 3.97 18.31
Kansas City, MO Rochester, NY 11.26 4.69 19.26 8.88 5.19 21.31
Kansas City, MO Salt Lake City, UT 19.72 8.58 33.73 5.07 2.96 11.66
Kansas City, MO Savannah, GA 20.11 9.90 31.02 4.97 3.22 10.10
Kansas City, MO Syracuse, NY 10.81 4.82 18.94 9.25 5.28 20.76
Kansas City, MO Knoxville, TN 10.20 4.24 17.42 9.80 5.74 23.61
San Antonio, TX Tucson, AZ 26.43 11.74 41.80 3.78 2.39 8.52
San Antonio, TX Shreveport, LA 10.30 4.25 20.88 9.71 4.79 23.52
San Antonio, TX Seattle, WA 8.90 3.77 16.21 11.24 6.17 26.52
San Antonio, TX Washington, DC (Metropolitan Area) 7.46 3.19 13.85 13.41 7.22 31.35
San Antonio, TX Wichita, KS 13.37 5.99 23.13 7.48 4.32 16.70
San Antonio, TX St. Louis, MO 13.01 6.04 24.32 7.69 4.11 16.56
San Antonio, TX Valparaiso, FL 22.57 9.61 36.55 4.43 2.74 10.41
San Antonio, TX Sioux Falls, SD 18.50 7.00 31.31 5.40 3.19 14.28
San Antonio, TX Spokane, WA 9.45 4.20 18.25 10.58 5.48 23.82
San Antonio, TX San Francisco, CA (Metropolitan Area) 9.90 4.42 17.74 10.10 5.64 22.62
San Antonio, TX Tampa, FL (Metropolitan Area) 6.12 2.53 12.48 16.35 8.01 39.49
San Antonio, TX San Diego, CA 8.32 3.25 15.23 12.02 6.57 30.75
San Antonio, TX West Palm Beach/Palm Beach, FL 12.53 5.35 21.75 7.98 4.60 18.69
San Antonio, TX Tulsa, OK 12.88 5.41 25.09 7.77 3.99 18.47
San Antonio, TX Syracuse, NY 16.93 8.15 29.05 5.91 3.44 12.27
Memphis, TN Pittsburgh, PA 17.39 6.29 30.22 5.75 3.31 15.89
Memphis, TN Phoenix, AZ 18.95 8.48 30.73 5.28 3.25 11.79
Memphis, TN Seattle, WA 9.61 3.85 17.33 10.41 5.77 25.98
Memphis, TN Washington, DC (Metropolitan Area) 10.07 5.02 18.35 9.93 5.45 19.92
Memphis, TN Orlando, FL 13.66 6.30 22.85 7.32 4.38 15.88

Origin City Destination City Median Lower Upper Median Lower Upper
Online Appendix Table A.1 - Estimation Results for Each City Pair
Profit Margin (%) Price Elasticity
Memphis, TN Minneapolis/St. Paul, MN 9.92 4.56 18.45 10.08 5.42 21.95
Memphis, TN New York City, NY (Metropolitan Area) 8.04 3.03 15.08 12.44 6.63 33.03
Memphis, TN San Francisco, CA (Metropolitan Area) 9.76 4.06 17.01 10.25 5.88 24.63
Memphis, TN Miami, FL (Metropolitan Area) 8.94 3.51 17.33 11.18 5.77 28.50
Memphis, TN Sacramento, CA 38.40 25.81 50.03 2.60 2.00 3.87
Memphis, TN Tampa, FL (Metropolitan Area) 10.59 4.03 19.60 9.44 5.10 24.83
Memphis, TN San Antonio, TX 17.21 8.43 28.63 5.81 3.49 11.86
Memphis, TN Omaha, NE 9.61 3.70 22.02 10.41 4.54 27.06
Memphis, TN Milwaukee, WI 11.28 4.84 21.56 8.86 4.64 20.67
Memphis, TN New Orleans, LA 13.50 5.21 27.15 7.41 3.68 19.20
Memphis, TN San Diego, CA 20.12 9.81 31.18 4.97 3.21 10.20
Memphis, TN Norfolk, VA (Metropolitan Area) 9.13 3.62 17.64 10.96 5.67 27.59
Memphis, TN West Palm Beach/Palm Beach, FL 15.46 6.83 28.92 6.47 3.46 14.64
Memphis, TN Portland, OR 16.28 6.89 27.09 6.14 3.69 14.51
Memphis, TN Philadelphia, PA 14.37 5.93 26.95 6.96 3.71 16.85
Memphis, TN Raleigh/Durham, NC 23.09 8.89 40.46 4.33 2.47 11.25
Memphis, TN Richmond, VA 14.76 6.21 24.59 6.77 4.07 16.11
Memphis, TN Salt Lake City, UT 16.45 7.61 25.83 6.08 3.87 13.14
Memphis, TN Savannah, GA 13.12 6.06 24.39 7.62 4.10 16.52
Mission/McAllen/Edinburg, TX Washington, DC (Metropolitan Area) 13.12 5.36 22.70 7.62 4.41 18.64
Mission/McAllen/Edinburg, TX Orlando, FL 16.54 6.70 30.03 6.05 3.33 14.92
Mission/McAllen/Edinburg, TX New York City, NY (Metropolitan Area) 9.91 4.31 17.14 10.09 5.83 23.23
Mission/McAllen/Edinburg, TX San Francisco, CA (Metropolitan Area) 10.76 4.53 19.17 9.29 5.22 22.08
Medford, OR Phoenix, AZ 10.64 4.39 19.10 9.40 5.24 22.79
Medford, OR Seattle, WA 9.46 3.93 16.85 10.57 5.94 25.48
Medford, OR San Diego, CA 19.00 7.66 30.82 5.26 3.24 13.06
Medford, OR Portland, OR 16.33 6.63 27.89 6.12 3.59 15.08
Montgomery, AL Washington, DC (Metropolitan Area) 13.25 5.79 22.64 7.55 4.42 17.26
Montgomery, AL Orlando, FL 12.33 5.17 22.53 8.11 4.44 19.34
Montgomery, AL New York City, NY (Metropolitan Area) 16.31 8.05 28.04 6.13 3.57 12.42
Montgomery, AL San Antonio, TX 21.64 8.35 38.00 4.62 2.63 11.97
Minot, ND Washington, DC (Metropolitan Area) 9.86 3.95 17.98 10.14 5.56 25.34
Omaha, NE Pittsburgh, PA 14.99 6.60 27.86 6.67 3.59 15.15
Omaha, NE Tucson, AZ 21.02 8.08 34.56 4.76 2.89 12.38
Omaha, NE Phoenix, AZ 7.57 3.36 13.63 13.22 7.34 29.79
Omaha, NE Seattle, WA 13.16 6.19 22.14 7.60 4.52 16.15
Omaha, NE Washington, DC (Metropolitan Area) 6.67 2.77 13.15 14.99 7.61 36.12
Omaha, NE St. Louis, MO 34.53 20.64 48.06 2.90 2.08 4.84
Omaha, NE Orlando, FL 8.11 3.13 16.20 12.34 6.17 31.93
Omaha, NE Spokane, WA 22.66 11.71 34.68 4.41 2.88 8.54
Omaha, NE San Francisco, CA (Metropolitan Area) 5.49 2.04 10.26 18.22 9.75 49.13
Omaha, NE Sacramento, CA 9.27 3.94 16.59 10.78 6.03 25.36
Omaha, NE Tampa, FL (Metropolitan Area) 11.56 4.39 19.72 8.65 5.07 22.78
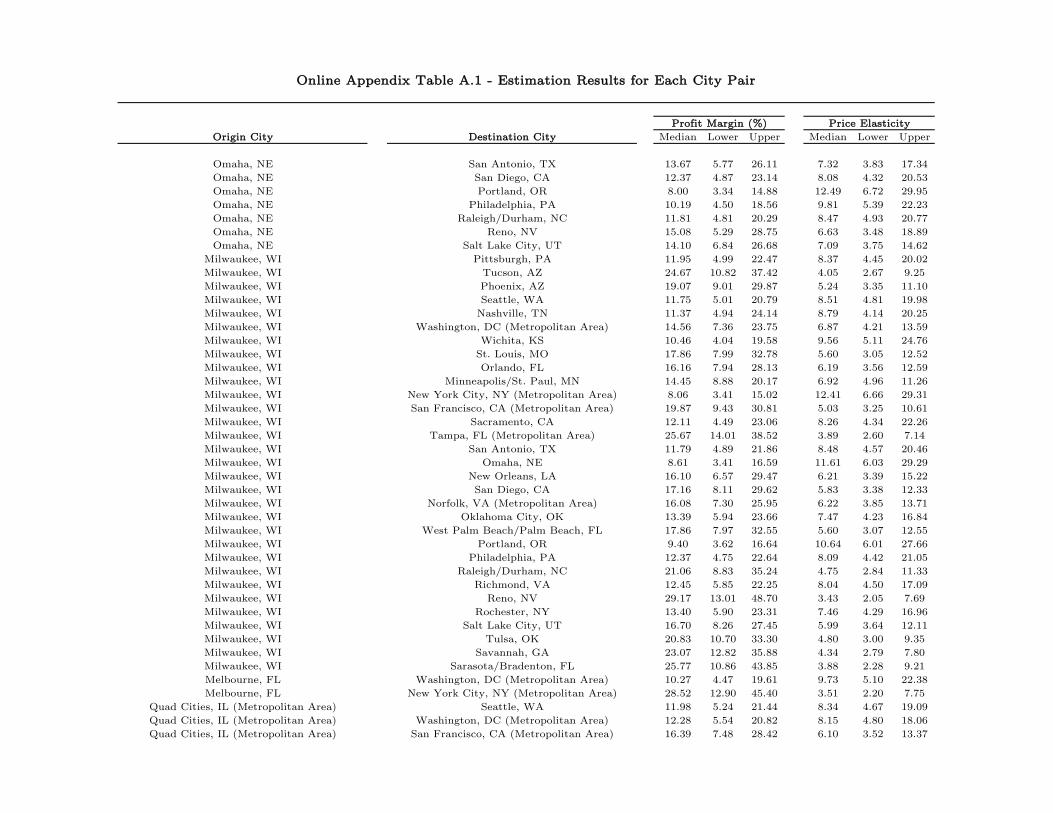
Origin City Destination City Median Lower Upper Median Lower Upper
Online Appendix Table A.1 - Estimation Results for Each City Pair
Profit Margin (%) Price Elasticity
Omaha, NE San Antonio, TX 13.67 5.77 26.11 7.32 3.83 17.34
Omaha, NE San Diego, CA 12.37 4.87 23.14 8.08 4.32 20.53
Omaha, NE Portland, OR 8.00 3.34 14.88 12.49 6.72 29.95
Omaha, NE Philadelphia, PA 10.19 4.50 18.56 9.81 5.39 22.23
Omaha, NE Raleigh/Durham, NC 11.81 4.81 20.29 8.47 4.93 20.77
Omaha, NE Reno, NV 15.08 5.29 28.75 6.63 3.48 18.89
Omaha, NE Salt Lake City, UT 14.10 6.84 26.68 7.09 3.75 14.62
Milwaukee, WI Pittsburgh, PA 11.95 4.99 22.47 8.37 4.45 20.02
Milwaukee, WI Tucson, AZ 24.67 10.82 37.42 4.05 2.67 9.25
Milwaukee, WI Phoenix, AZ 19.07 9.01 29.87 5.24 3.35 11.10
Milwaukee, WI Seattle, WA 11.75 5.01 20.79 8.51 4.81 19.98
Milwaukee, WI Nashville, TN 11.37 4.94 24.14 8.79 4.14 20.25
Milwaukee, WI Washington, DC (Metropolitan Area) 14.56 7.36 23.75 6.87 4.21 13.59
Milwaukee, WI Wichita, KS 10.46 4.04 19.58 9.56 5.11 24.76
Milwaukee, WI St. Louis, MO 17.86 7.99 32.78 5.60 3.05 12.52
Milwaukee, WI Orlando, FL 16.16 7.94 28.13 6.19 3.56 12.59
Milwaukee, WI Minneapolis/St. Paul, MN 14.45 8.88 20.17 6.92 4.96 11.26
Milwaukee, WI New York City, NY (Metropolitan Area) 8.06 3.41 15.02 12.41 6.66 29.31
Milwaukee, WI San Francisco, CA (Metropolitan Area) 19.87 9.43 30.81 5.03 3.25 10.61
Milwaukee, WI Sacramento, CA 12.11 4.49 23.06 8.26 4.34 22.26
Milwaukee, WI Tampa, FL (Metropolitan Area) 25.67 14.01 38.52 3.89 2.60 7.14
Milwaukee, WI San Antonio, TX 11.79 4.89 21.86 8.48 4.57 20.46
Milwaukee, WI Omaha, NE 8.61 3.41 16.59 11.61 6.03 29.29
Milwaukee, WI New Orleans, LA 16.10 6.57 29.47 6.21 3.39 15.22
Milwaukee, WI San Diego, CA 17.16 8.11 29.62 5.83 3.38 12.33
Milwaukee, WI Norfolk, VA (Metropolitan Area) 16.08 7.30 25.95 6.22 3.85 13.71
Milwaukee, WI Oklahoma City, OK 13.39 5.94 23.66 7.47 4.23 16.84
Milwaukee, WI West Palm Beach/Palm Beach, FL 17.86 7.97 32.55 5.60 3.07 12.55
Milwaukee, WI Portland, OR 9.40 3.62 16.64 10.64 6.01 27.66
Milwaukee, WI Philadelphia, PA 12.37 4.75 22.64 8.09 4.42 21.05
Milwaukee, WI Raleigh/Durham, NC 21.06 8.83 35.24 4.75 2.84 11.33
Milwaukee, WI Richmond, VA 12.45 5.85 22.25 8.04 4.50 17.09
Milwaukee, WI Reno, NV 29.17 13.01 48.70 3.43 2.05 7.69
Milwaukee, WI Rochester, NY 13.40 5.90 23.31 7.46 4.29 16.96
Milwaukee, WI Salt Lake City, UT 16.70 8.26 27.45 5.99 3.64 12.11
Milwaukee, WI Tulsa, OK 20.83 10.70 33.30 4.80 3.00 9.35
Milwaukee, WI Savannah, GA 23.07 12.82 35.88 4.34 2.79 7.80
Milwaukee, WI Sarasota/Bradenton, FL 25.77 10.86 43.85 3.88 2.28 9.21
Melbourne, FL Washington, DC (Metropolitan Area) 10.27 4.47 19.61 9.73 5.10 22.38
Melbourne, FL New York City, NY (Metropolitan Area) 28.52 12.90 45.40 3.51 2.20 7.75
Quad Cities, IL (Metropolitan Area) Seattle, WA 11.98 5.24 21.44 8.34 4.67 19.09
Quad Cities, IL (Metropolitan Area) Washington, DC (Metropolitan Area) 12.28 5.54 20.82 8.15 4.80 18.06
Quad Cities, IL (Metropolitan Area) San Francisco, CA (Metropolitan Area) 16.39 7.48 28.42 6.10 3.52 13.37

Origin City Destination City Median Lower Upper Median Lower Upper
Online Appendix Table A.1 - Estimation Results for Each City Pair
Profit Margin (%) Price Elasticity
Quad Cities, IL (Metropolitan Area) Tampa, FL (Metropolitan Area) 17.27 6.52 31.39 5.79 3.19 15.34
Quad Cities, IL (Metropolitan Area) San Diego, CA 14.71 6.42 25.27 6.80 3.96 15.57
Quad Cities, IL (Metropolitan Area) Raleigh/Durham, NC 9.24 3.66 17.63 10.83 5.67 27.35
Monroe, LA Washington, DC (Metropolitan Area) 19.59 8.03 31.89 5.11 3.14 12.45
Monroe, LA New York City, NY (Metropolitan Area) 11.00 4.76 20.84 9.09 4.80 21.02
Madison, WI Pittsburgh, PA 6.88 2.71 12.87 14.53 7.77 36.91
Madison, WI Phoenix, AZ 12.85 5.32 21.96 7.78 4.55 18.79
Madison, WI Seattle, WA 10.10 4.40 17.46 9.90 5.73 22.72
Madison, WI Nashville, TN 11.76 4.79 22.08 8.50 4.53 20.86
Madison, WI Washington, DC (Metropolitan Area) 9.47 4.37 18.26 10.56 5.48 22.87
Madison, WI Orlando, FL 13.26 5.94 26.84 7.54 3.73 16.84
Madison, WI Minneapolis/St. Paul, MN 11.46 5.23 19.73 8.73 5.07 19.11
Madison, WI New York City, NY (Metropolitan Area) 5.33 2.58 11.29 18.76 8.85 38.74
Madison, WI San Francisco, CA (Metropolitan Area) 9.58 4.16 16.50 10.44 6.06 24.04
Madison, WI Miami, FL (Metropolitan Area) 25.31 14.08 36.48 3.95 2.74 7.10
Madison, WI Tampa, FL (Metropolitan Area) 21.08 10.27 33.96 4.74 2.94 9.74
Madison, WI San Antonio, TX 13.72 5.37 23.68 7.29 4.22 18.63
Madison, WI San Diego, CA 7.32 3.12 13.96 13.66 7.16 32.09
Madison, WI Portland, OR 7.83 3.29 15.28 12.77 6.55 30.44
Madison, WI Philadelphia, PA 8.92 3.30 16.93 11.22 5.91 30.34
Madison, WI Raleigh/Durham, NC 6.61 2.32 12.04 15.12 8.32 43.30
Madison, WI Salt Lake City, UT 17.24 6.94 30.33 5.80 3.30 14.40
Missoula, MT Phoenix, AZ 10.10 4.52 18.60 9.90 5.38 22.11
Missoula, MT Seattle, WA 9.49 4.26 17.85 10.54 5.60 23.47
Missoula, MT Washington, DC (Metropolitan Area) 9.15 3.43 16.51 10.93 6.06 29.13
Missoula, MT New York City, NY (Metropolitan Area) 7.12 2.68 14.98 14.05 6.68 37.26
Missoula, MT San Francisco, CA (Metropolitan Area) 7.41 3.31 13.78 13.50 7.26 30.22
Missoula, MT San Diego, CA 10.21 4.05 19.50 9.79 5.13 24.70
Missoula, MT Portland, OR 27.57 13.27 44.04 3.63 2.27 7.54
New Orleans, LA Pittsburgh, PA 11.64 5.52 22.16 8.59 4.51 18.11
New Orleans, LA Tucson, AZ 26.76 13.11 42.72 3.74 2.34 7.63
New Orleans, LA Phoenix, AZ 12.03 5.43 22.86 8.31 4.37 18.43
New Orleans, LA Seattle, WA 18.64 7.82 33.82 5.36 2.96 12.78
New Orleans, LA Washington, DC (Metropolitan Area) 9.10 3.87 18.23 10.98 5.49 25.81
New Orleans, LA Wichita, KS 15.71 6.71 29.38 6.37 3.40 14.91
New Orleans, LA St. Louis, MO 26.60 10.02 48.26 3.76 2.07 9.98
New Orleans, LA Orlando, FL 11.45 4.49 21.09 8.73 4.74 22.28
New Orleans, LA New York City, NY (Metropolitan Area) 11.32 5.22 20.88 8.83 4.79 19.16
New Orleans, LA Spokane, WA 12.41 5.42 22.43 8.06 4.46 18.47
New Orleans, LA San Francisco, CA (Metropolitan Area) 15.74 7.56 27.77 6.35 3.60 13.24
New Orleans, LA Sacramento, CA 15.35 6.09 26.19 6.51 3.82 16.43
New Orleans, LA Tampa, FL (Metropolitan Area) 11.83 4.81 23.89 8.45 4.19 20.81
New Orleans, LA San Antonio, TX 12.85 5.12 24.86 7.78 4.02 19.54

Origin City Destination City Median Lower Upper Median Lower Upper
Online Appendix Table A.1 - Estimation Results for Each City Pair
Profit Margin (%) Price Elasticity
New Orleans, LA Omaha, NE 17.45 7.24 33.85 5.73 2.95 13.82
New Orleans, LA San Diego, CA 18.53 7.34 31.60 5.40 3.16 13.63
New Orleans, LA Norfolk, VA (Metropolitan Area) 12.24 5.18 21.48 8.17 4.66 19.30
New Orleans, LA Oklahoma City, OK 16.06 7.65 32.88 6.23 3.04 13.06
New Orleans, LA West Palm Beach/Palm Beach, FL 15.02 6.83 27.33 6.66 3.66 14.64
New Orleans, LA Portland, OR 12.48 5.54 23.72 8.01 4.22 18.06
New Orleans, LA Philadelphia, PA 12.15 4.86 23.80 8.23 4.20 20.59
New Orleans, LA Portland, ME 7.63 3.14 15.05 13.10 6.64 31.86
New Orleans, LA Raleigh/Durham, NC 15.79 6.62 29.19 6.33 3.43 15.12
New Orleans, LA Richmond, VA 9.60 4.37 19.62 10.41 5.10 22.87
New Orleans, LA Reno, NV 14.78 6.77 29.09 6.76 3.44 14.76
New Orleans, LA Rochester, NY 13.73 5.20 27.69 7.28 3.61 19.25
New Orleans, LA Salt Lake City, UT 15.53 6.60 29.78 6.44 3.36 15.15
New Orleans, LA Tulsa, OK 14.27 5.84 29.53 7.01 3.39 17.13
New Orleans, LA Savannah, GA 10.31 3.33 19.74 9.70 5.07 30.04
New Orleans, LA Syracuse, NY 16.38 5.70 30.21 6.11 3.31 17.53
San Diego, CA Tucson, AZ 10.47 3.70 17.63 9.55 5.67 27.05
San Diego, CA Seattle, WA 5.27 2.46 9.31 18.96 10.75 40.73
San Diego, CA Washington, DC (Metropolitan Area) 4.86 2.12 9.30 20.57 10.77 47.19
San Diego, CA Wichita, KS 15.48 7.29 25.47 6.46 3.93 13.72
San Diego, CA St. Louis, MO 8.01 3.54 14.90 12.49 6.71 28.34
San Diego, CA Sioux Falls, SD 25.73 12.31 40.91 3.89 2.44 8.13
San Diego, CA Spokane, WA 10.32 4.13 18.70 9.69 5.35 24.23
San Diego, CA San Francisco, CA (Metropolitan Area) 6.73 2.74 12.46 14.86 8.03 36.44
San Diego, CA Tampa, FL (Metropolitan Area) 6.08 2.87 11.80 16.45 8.47 34.90
San Diego, CA West Palm Beach/Palm Beach, FL 12.79 5.17 22.88 7.82 4.37 19.35
San Diego, CA Tulsa, OK 15.25 6.13 27.48 6.56 3.64 16.31
San Diego, CA Savannah, GA 17.75 8.65 28.76 5.63 3.48 11.56
San Diego, CA Springfield, MO 17.28 7.06 30.25 5.79 3.31 14.16
San Diego, CA Syracuse, NY 15.75 7.05 26.71 6.35 3.74 14.18
Norfolk, VA (Metropolitan Area) Pittsburgh, PA 5.76 2.25 12.60 17.37 7.94 44.40
Norfolk, VA (Metropolitan Area) Tucson, AZ 12.20 5.03 24.46 8.20 4.09 19.88
Norfolk, VA (Metropolitan Area) Phoenix, AZ 10.79 4.98 19.21 9.27 5.21 20.10
Norfolk, VA (Metropolitan Area) Seattle, WA 16.56 7.65 27.00 6.04 3.70 13.06
Norfolk, VA (Metropolitan Area) Washington, DC (Metropolitan Area) 19.24 12.26 26.20 5.20 3.82 8.16
Norfolk, VA (Metropolitan Area) St. Louis, MO 20.16 9.89 32.95 4.96 3.03 10.11
Norfolk, VA (Metropolitan Area) Orlando, FL 17.96 9.26 28.95 5.57 3.45 10.80
Norfolk, VA (Metropolitan Area) San Francisco, CA (Metropolitan Area) 9.21 4.18 15.51 10.85 6.45 23.93
Norfolk, VA (Metropolitan Area) Sacramento, CA 17.03 8.49 25.82 5.87 3.87 11.78
Norfolk, VA (Metropolitan Area) Tampa, FL (Metropolitan Area) 10.11 4.28 17.30 9.89 5.78 23.37
Norfolk, VA (Metropolitan Area) San Antonio, TX 14.68 6.18 24.83 6.81 4.03 16.19
Norfolk, VA (Metropolitan Area) Omaha, NE 11.20 4.90 22.00 8.93 4.55 20.40
Norfolk, VA (Metropolitan Area) San Diego, CA 10.12 4.77 17.97 9.88 5.57 20.96

Origin City Destination City Median Lower Upper Median Lower Upper
Online Appendix Table A.1 - Estimation Results for Each City Pair
Profit Margin (%) Price Elasticity
Norfolk, VA (Metropolitan Area) Pensacola, FL 18.39 9.28 30.36 5.44 3.29 10.78
Norfolk, VA (Metropolitan Area) Oklahoma City, OK 11.55 5.09 19.97 8.66 5.01 19.64
Norfolk, VA (Metropolitan Area) West Palm Beach/Palm Beach, FL 11.32 5.04 20.01 8.83 5.00 19.85
Norfolk, VA (Metropolitan Area) Portland, OR 16.58 7.44 27.15 6.03 3.68 13.44
Norfolk, VA (Metropolitan Area) Philadelphia, PA 3.81 2.59 11.04 26.22 9.08 38.71
Norfolk, VA (Metropolitan Area) Portland, ME 19.35 10.56 30.90 5.17 3.24 9.47
Norfolk, VA (Metropolitan Area) Reno, NV 14.72 6.62 25.88 6.80 3.86 15.10
Norfolk, VA (Metropolitan Area) Rochester, NY 14.52 6.05 25.01 6.89 4.00 16.52
Norfolk, VA (Metropolitan Area) Salt Lake City, UT 22.15 11.10 32.80 4.52 3.05 9.01
Norfolk, VA (Metropolitan Area) Tulsa, OK 15.97 7.01 26.23 6.26 3.81 14.26
Norfolk, VA (Metropolitan Area) Savannah, GA 13.44 6.06 23.59 7.44 4.24 16.51
Pensacola, FL Pittsburgh, PA 23.61 13.19 35.97 4.23 2.78 7.58
Pensacola, FL Phoenix, AZ 20.73 8.91 34.85 4.82 2.87 11.22
Pensacola, FL Seattle, WA 12.55 5.37 22.42 7.97 4.46 18.63
Pensacola, FL Washington, DC (Metropolitan Area) 25.23 13.62 36.88 3.96 2.71 7.34
Pensacola, FL St. Louis, MO 10.67 4.30 20.55 9.37 4.87 23.28
Pensacola, FL San Francisco, CA (Metropolitan Area) 15.93 7.67 26.89 6.28 3.72 13.03
Pensacola, FL San Antonio, TX 19.51 8.77 33.10 5.13 3.02 11.40
Pensacola, FL San Diego, CA 14.68 6.33 24.42 6.81 4.10 15.80
Pensacola, FL Philadelphia, PA 17.25 7.57 28.53 5.80 3.51 13.22
Pensacola, FL Raleigh/Durham, NC 18.50 9.39 29.56 5.40 3.38 10.65
Oklahoma City, OK Pittsburgh, PA 14.18 5.40 27.96 7.05 3.58 18.52
Oklahoma City, OK Tucson, AZ 19.02 7.95 30.31 5.26 3.30 12.58
Oklahoma City, OK Phoenix, AZ 8.32 4.01 14.96 12.03 6.68 24.91
Oklahoma City, OK Seattle, WA 8.92 3.75 16.57 11.21 6.04 26.69
Oklahoma City, OK Washington, DC (Metropolitan Area) 5.88 1.94 11.28 17.01 8.87 51.64
Oklahoma City, OK St. Louis, MO 17.39 7.86 29.59 5.75 3.38 12.73
Oklahoma City, OK Orlando, FL 10.87 4.64 19.09 9.20 5.24 21.57
Oklahoma City, OK San Francisco, CA (Metropolitan Area) 5.22 1.95 10.60 19.14 9.43 51.39
Oklahoma City, OK Sacramento, CA 19.32 8.30 32.94 5.18 3.04 12.05
Oklahoma City, OK Tampa, FL (Metropolitan Area) 11.11 4.98 19.59 9.00 5.10 20.07
Oklahoma City, OK San Antonio, TX 11.05 4.56 22.55 9.05 4.44 21.94
Oklahoma City, OK San Diego, CA 14.92 6.00 28.09 6.70 3.56 16.66
Oklahoma City, OK West Palm Beach/Palm Beach, FL 11.04 4.85 19.57 9.06 5.11 20.61
Oklahoma City, OK Portland, OR 8.60 3.90 15.21 11.63 6.57 25.65
Oklahoma City, OK Philadelphia, PA 18.62 8.50 31.08 5.37 3.22 11.76
Oklahoma City, OK Raleigh/Durham, NC 10.95 5.13 19.25 9.13 5.20 19.51
Oklahoma City, OK Reno, NV 10.21 4.26 19.84 9.80 5.04 23.50
Oklahoma City, OK Salt Lake City, UT 21.88 8.82 36.96 4.57 2.71 11.34
Portland, OR Tucson, AZ 13.43 5.78 23.62 7.44 4.23 17.31
Portland, OR Seattle, WA 15.85 6.87 27.37 6.31 3.65 14.55
Portland, OR Washington, DC (Metropolitan Area) 5.56 2.44 9.49 17.98 10.54 41.03
Portland, OR Wichita, KS 10.76 4.48 20.00 9.29 5.00 22.34

Origin City Destination City Median Lower Upper Median Lower Upper
Online Appendix Table A.1 - Estimation Results for Each City Pair
Profit Margin (%) Price Elasticity
Portland, OR St. Louis, MO 5.97 2.02 12.15 16.74 8.23 49.53
Portland, OR Sioux Falls, SD 16.03 6.66 27.48 6.24 3.64 15.02
Portland, OR Spokane, WA 11.47 4.99 20.84 8.72 4.80 20.05
Portland, OR San Francisco, CA (Metropolitan Area) 7.17 3.13 14.02 13.96 7.13 31.98
Portland, OR Sacramento, CA 10.41 4.38 18.74 9.61 5.34 22.84
Portland, OR Tampa, FL (Metropolitan Area) 6.75 2.83 12.26 14.80 8.16 35.33
Portland, OR San Antonio, TX 13.79 6.10 24.25 7.25 4.12 16.39
Portland, OR San Diego, CA 16.04 7.42 27.73 6.24 3.61 13.48
Portland, OR West Palm Beach/Palm Beach, FL 13.38 6.02 23.63 7.48 4.23 16.61
Portland, OR Raleigh/Durham, NC 7.59 3.26 13.70 13.17 7.30 30.68
Portland, OR Richmond, VA 12.14 5.40 21.59 8.23 4.63 18.53
Portland, OR Reno, NV 12.86 6.02 22.81 7.78 4.38 16.62
Portland, OR Rochester, NY 11.20 4.64 22.85 8.93 4.38 21.55
Portland, OR Salt Lake City, UT 5.62 2.33 10.65 17.80 9.39 42.87
Portland, OR Tulsa, OK 8.58 3.29 16.38 11.66 6.11 30.38
Portland, OR Santa Barbara, CA 20.02 7.45 36.74 4.99 2.72 13.42
Portland, OR Syracuse, NY 13.45 5.78 24.25 7.44 4.12 17.29
Philadelphia, PA Pittsburgh, PA 11.38 6.11 17.20 8.79 5.82 16.37
Philadelphia, PA Tucson, AZ 15.27 6.51 24.66 6.55 4.05 15.37
Philadelphia, PA Phoenix, AZ 9.06 3.79 16.61 11.03 6.02 26.38
Philadelphia, PA Seattle, WA 6.56 2.79 12.30 15.23 8.13 35.90
Philadelphia, PA Washington, DC (Metropolitan Area) 13.40 5.75 24.01 7.46 4.17 17.39
Philadelphia, PA Wichita, KS 12.00 5.32 19.27 8.34 5.19 18.78
Philadelphia, PA St. Louis, MO 8.34 3.63 14.78 11.99 6.77 27.55
Philadelphia, PA Valparaiso, FL 10.65 4.79 19.18 9.39 5.21 20.86
Philadelphia, PA Spokane, WA 14.77 6.65 28.00 6.77 3.57 15.05
Philadelphia, PA Wilmington, NC 12.88 5.53 21.57 7.76 4.64 18.07
Philadelphia, PA San Francisco, CA (Metropolitan Area) 8.68 3.66 14.42 11.52 6.93 27.31
Philadelphia, PA Sacramento, CA 9.99 4.11 18.49 10.01 5.41 24.36
Philadelphia, PA Tampa, FL (Metropolitan Area) 13.19 6.19 22.04 7.58 4.54 16.17
Philadelphia, PA San Antonio, TX 13.57 6.46 21.81 7.37 4.59 15.49
Philadelphia, PA Quad Cities, IL (Metropolitan Area) 15.54 7.25 25.28 6.44 3.96 13.79
Philadelphia, PA San Diego, CA 9.11 3.90 15.99 10.98 6.25 25.67
Philadelphia, PA West Palm Beach/Palm Beach, FL 14.62 6.10 24.86 6.84 4.02 16.39
Philadelphia, PA Portland, OR 9.17 4.25 17.66 10.90 5.66 23.50
Philadelphia, PA Portland, ME 6.06 2.72 11.43 16.49 8.75 36.75
Philadelphia, PA Raleigh/Durham, NC 9.28 5.00 14.44 10.77 6.93 20.02
Philadelphia, PA Richmond, VA 6.68 2.57 14.07 15.02 7.11 38.87
Philadelphia, PA Reno, NV 14.38 5.94 25.06 6.95 3.99 16.84
Philadelphia, PA Rochester, NY 11.89 5.25 21.30 8.41 4.70 19.05
Philadelphia, PA Salt Lake City, UT 12.27 5.84 20.45 8.15 4.89 17.12
Philadelphia, PA Tulsa, OK 16.18 8.34 24.55 6.18 4.07 11.99
Philadelphia, PA Savannah, GA 11.49 4.74 20.85 8.70 4.80 21.12

Origin City Destination City Median Lower Upper Median Lower Upper
Online Appendix Table A.1 - Estimation Results for Each City Pair
Profit Margin (%) Price Elasticity
Philadelphia, PA Santa Barbara, CA 10.94 4.39 18.69 9.14 5.35 22.79
Philadelphia, PA South Bend, IN 19.36 9.65 32.59 5.17 3.07 10.36
Philadelphia, PA Springfield, MO 11.93 5.02 20.72 8.38 4.83 19.94
Philadelphia, PA Sarasota/Bradenton, FL 22.95 9.87 38.85 4.36 2.57 10.13
Philadelphia, PA Syracuse, NY 15.05 6.72 26.68 6.64 3.75 14.89
Philadelphia, PA Tallahassee, FL 20.23 10.10 29.98 4.94 3.34 9.91
Peoria, IL Phoenix, AZ 14.36 5.89 27.40 6.96 3.65 16.99
Peoria, IL Washington, DC (Metropolitan Area) 7.89 3.25 13.90 12.68 7.20 30.76
Peoria, IL San Francisco, CA (Metropolitan Area) 16.30 7.80 27.67 6.13 3.61 12.83
Peoria, IL Tampa, FL (Metropolitan Area) 21.79 8.40 40.33 4.59 2.48 11.91
Peoria, IL San Diego, CA 14.00 5.43 26.71 7.14 3.74 18.41
Paso Robles/San Luis Obispo, CA Seattle, WA 26.32 12.65 42.02 3.80 2.38 7.90
Paso Robles/San Luis Obispo, CA Washington, DC (Metropolitan Area) 10.69 4.51 18.84 9.36 5.31 22.19
Pasco/Kennewick/Richland, WA Phoenix, AZ 20.53 9.01 33.79 4.87 2.96 11.10
Pasco/Kennewick/Richland, WA Seattle, WA 18.21 8.37 31.15 5.49 3.21 11.94
Pasco/Kennewick/Richland, WA Washington, DC (Metropolitan Area) 7.29 3.63 12.94 13.72 7.73 27.55
Pasco/Kennewick/Richland, WA San Francisco, CA (Metropolitan Area) 9.04 4.03 19.05 11.06 5.25 24.84
Pasco/Kennewick/Richland, WA Sacramento, CA 18.65 8.11 31.41 5.36 3.18 12.33
Pasco/Kennewick/Richland, WA San Diego, CA 26.93 12.84 42.32 3.71 2.36 7.79
Palm Springs, CA Seattle, WA 10.02 4.80 19.62 9.98 5.10 20.83
Palm Springs, CA Washington, DC (Metropolitan Area) 9.35 3.46 16.89 10.69 5.92 28.92
Palm Springs, CA San Francisco, CA (Metropolitan Area) 4.16 1.50 8.63 24.02 11.58 66.62
Palm Springs, CA Portland, OR 11.91 4.92 21.69 8.40 4.61 20.32
Palm Springs, CA Philadelphia, PA 13.47 5.24 24.56 7.42 4.07 19.08
Pullman, WA Seattle, WA 18.42 8.34 30.92 5.43 3.23 11.99
Portland, ME Seattle, WA 13.94 6.21 24.88 7.17 4.02 16.10
Portland, ME Washington, DC (Metropolitan Area) 24.98 11.99 37.66 4.00 2.66 8.34
Portland, ME St. Louis, MO 15.32 6.28 28.18 6.53 3.55 15.91
Portland, ME San Francisco, CA (Metropolitan Area) 9.19 3.86 16.98 10.89 5.89 25.93
Portland, ME Tampa, FL (Metropolitan Area) 10.59 3.92 19.86 9.44 5.04 25.54
Portland, ME San Diego, CA 12.76 5.19 24.38 7.83 4.10 19.28
Portland, ME West Palm Beach/Palm Beach, FL 16.56 6.42 30.32 6.04 3.30 15.59
Portland, ME Raleigh/Durham, NC 9.86 3.86 18.93 10.15 5.28 25.88
Rapid City, SD Washington, DC (Metropolitan Area) 15.75 7.41 25.26 6.35 3.96 13.49
Rapid City, SD San Francisco, CA (Metropolitan Area) 16.12 6.99 28.09 6.20 3.56 14.31
Bend/Redmond, OR Seattle, WA 11.83 4.79 20.81 8.45 4.80 20.89
Bend/Redmond, OR San Francisco, CA (Metropolitan Area) 10.70 3.79 19.61 9.34 5.10 26.44
Bend/Redmond, OR Los Angeles, CA (Metropolitan Area) 9.83 4.13 19.73 10.17 5.07 24.22
Bend/Redmond, OR San Diego, CA 14.04 5.76 25.53 7.12 3.92 17.37
Bend/Redmond, OR Portland, OR 20.76 8.72 37.98 4.82 2.63 11.47
Raleigh/Durham, NC Tucson, AZ 14.24 5.52 25.59 7.02 3.91 18.10
Raleigh/Durham, NC Seattle, WA 7.67 3.33 13.77 13.04 7.26 30.04
Raleigh/Durham, NC Washington, DC (Metropolitan Area) 6.85 2.84 13.90 14.59 7.20 35.24

Origin City Destination City Median Lower Upper Median Lower Upper
Online Appendix Table A.1 - Estimation Results for Each City Pair
Profit Margin (%) Price Elasticity
Raleigh/Durham, NC St. Louis, MO 7.16 2.96 13.67 13.97 7.31 33.76
Raleigh/Durham, NC San Francisco, CA (Metropolitan Area) 2.79 1.53 5.76 35.95 17.82 65.49
Raleigh/Durham, NC Sacramento, CA 8.21 3.36 15.32 12.18 6.53 29.78
Raleigh/Durham, NC Tampa, FL (Metropolitan Area) 7.34 3.07 13.66 13.63 7.32 32.62
Raleigh/Durham, NC San Antonio, TX 14.30 6.67 25.20 6.99 3.97 14.99
Raleigh/Durham, NC San Diego, CA 5.96 2.86 11.27 16.78 8.87 34.98
Raleigh/Durham, NC West Palm Beach/Palm Beach, FL 8.42 3.68 14.96 11.88 6.69 27.18
Raleigh/Durham, NC Reno, NV 12.48 4.54 22.61 8.02 4.42 22.01
Raleigh/Durham, NC Rochester, NY 8.03 3.33 14.15 12.45 7.07 30.07
Raleigh/Durham, NC Salt Lake City, UT 9.26 3.52 16.52 10.79 6.06 28.39
Raleigh/Durham, NC Tulsa, OK 12.68 4.91 22.20 7.89 4.50 20.37
Raleigh/Durham, NC South Bend, IN 13.31 4.90 25.33 7.51 3.95 20.40
Raleigh/Durham, NC Syracuse, NY 14.17 6.06 22.50 7.06 4.44 16.51
Raleigh/Durham, NC Tallahassee, FL 16.86 8.72 27.17 5.93 3.68 11.46
Richmond, VA Seattle, WA 9.82 3.81 17.05 10.18 5.86 26.25
Richmond, VA St. Louis, MO 20.28 8.98 32.60 4.93 3.07 11.13
Richmond, VA San Francisco, CA (Metropolitan Area) 14.67 6.52 25.60 6.82 3.91 15.34
Richmond, VA Sacramento, CA 17.52 7.65 30.43 5.71 3.29 13.07
Richmond, VA Tampa, FL (Metropolitan Area) 13.33 6.14 24.25 7.50 4.12 16.28
Richmond, VA San Antonio, TX 22.67 11.34 35.80 4.41 2.79 8.82
Richmond, VA San Diego, CA 15.34 6.78 26.61 6.52 3.76 14.75
Richmond, VA West Palm Beach/Palm Beach, FL 13.27 5.36 23.04 7.54 4.34 18.65
Richmond, VA Rochester, NY 10.78 4.11 20.88 9.28 4.79 24.34
Richmond, VA Salt Lake City, UT 11.76 4.18 21.05 8.50 4.75 23.90
Richmond, VA Savannah, GA 24.78 10.90 40.96 4.04 2.44 9.18
Reno, NV Tucson, AZ 24.19 10.58 40.79 4.13 2.45 9.45
Reno, NV Seattle, WA 8.54 3.71 16.36 11.71 6.11 26.98
Reno, NV Washington, DC (Metropolitan Area) 9.08 3.50 18.10 11.01 5.53 28.61
Reno, NV St. Louis, MO 14.12 6.20 23.85 7.08 4.19 16.13
Reno, NV Spokane, WA 18.06 7.72 31.12 5.54 3.21 12.95
Reno, NV San Francisco, CA (Metropolitan Area) 15.30 6.60 28.36 6.53 3.53 15.15
Reno, NV Tampa, FL (Metropolitan Area) 10.99 4.60 21.12 9.10 4.73 21.74
Reno, NV San Antonio, TX 22.71 9.25 37.58 4.40 2.66 10.81
Reno, NV San Diego, CA 21.20 8.74 35.23 4.72 2.84 11.44
Reno, NV Salt Lake City, UT 10.14 4.17 17.55 9.87 5.70 23.98
Reno, NV Tulsa, OK 11.05 4.58 18.78 9.05 5.32 21.84
Roanoke, VA San Francisco, CA (Metropolitan Area) 8.63 3.07 17.88 11.58 5.59 32.52
Roanoke, VA Tampa, FL (Metropolitan Area) 18.93 8.05 31.57 5.28 3.17 12.43
Rochester, NY Seattle, WA 9.55 4.54 16.17 10.47 6.19 22.04
Rochester, NY Washington, DC (Metropolitan Area) 12.44 5.50 21.87 8.04 4.57 18.19
Rochester, NY St. Louis, MO 10.39 4.19 19.22 9.62 5.20 23.87
Rochester, NY San Francisco, CA (Metropolitan Area) 10.19 4.52 17.25 9.82 5.80 22.13
Rochester, NY Tampa, FL (Metropolitan Area) 10.66 4.46 19.08 9.38 5.24 22.43
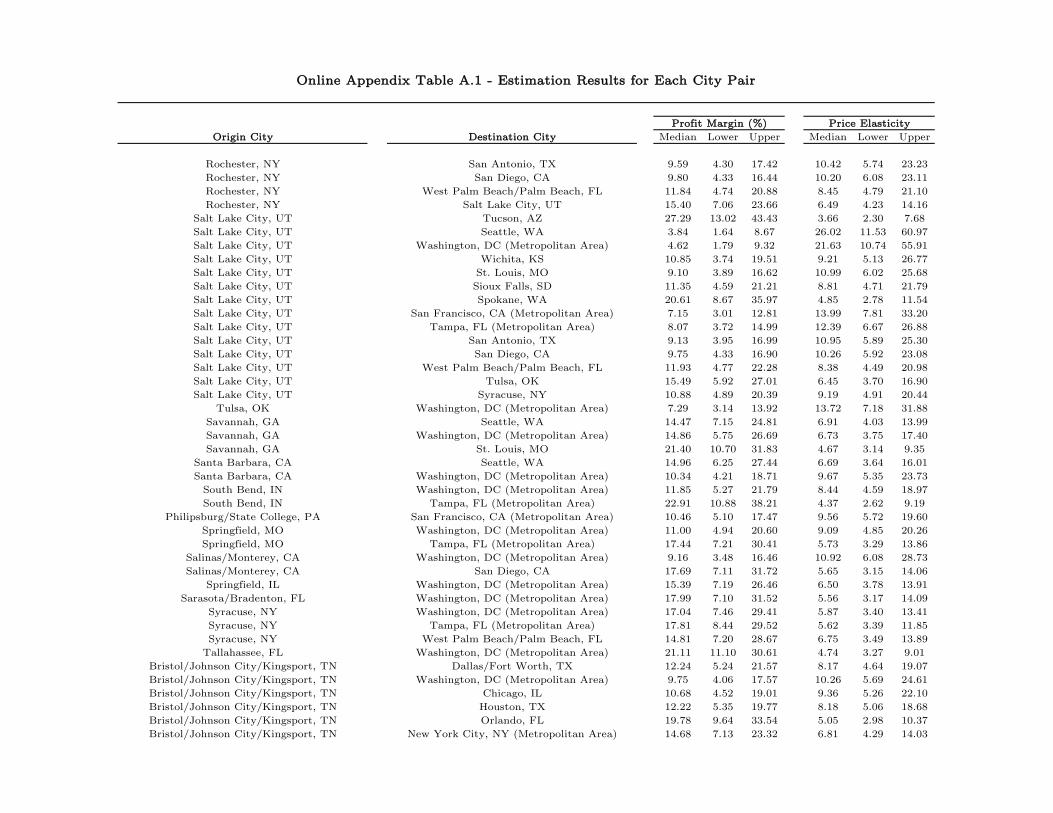
Origin City Destination City Median Lower Upper Median Lower Upper
Online Appendix Table A.1 - Estimation Results for Each City Pair
Profit Margin (%) Price Elasticity
Rochester, NY San Antonio, TX 9.59 4.30 17.42 10.42 5.74 23.23
Rochester, NY San Diego, CA 9.80 4.33 16.44 10.20 6.08 23.11
Rochester, NY West Palm Beach/Palm Beach, FL 11.84 4.74 20.88 8.45 4.79 21.10
Rochester, NY Salt Lake City, UT 15.40 7.06 23.66 6.49 4.23 14.16
Salt Lake City, UT Tucson, AZ 27.29 13.02 43.43 3.66 2.30 7.68
Salt Lake City, UT Seattle, WA 3.84 1.64 8.67 26.02 11.53 60.97
Salt Lake City, UT Washington, DC (Metropolitan Area) 4.62 1.79 9.32 21.63 10.74 55.91
Salt Lake City, UT Wichita, KS 10.85 3.74 19.51 9.21 5.13 26.77
Salt Lake City, UT St. Louis, MO 9.10 3.89 16.62 10.99 6.02 25.68
Salt Lake City, UT Sioux Falls, SD 11.35 4.59 21.21 8.81 4.71 21.79
Salt Lake City, UT Spokane, WA 20.61 8.67 35.97 4.85 2.78 11.54
Salt Lake City, UT San Francisco, CA (Metropolitan Area) 7.15 3.01 12.81 13.99 7.81 33.20
Salt Lake City, UT Tampa, FL (Metropolitan Area) 8.07 3.72 14.99 12.39 6.67 26.88
Salt Lake City, UT San Antonio, TX 9.13 3.95 16.99 10.95 5.89 25.30
Salt Lake City, UT San Diego, CA 9.75 4.33 16.90 10.26 5.92 23.08
Salt Lake City, UT West Palm Beach/Palm Beach, FL 11.93 4.77 22.28 8.38 4.49 20.98
Salt Lake City, UT Tulsa, OK 15.49 5.92 27.01 6.45 3.70 16.90
Salt Lake City, UT Syracuse, NY 10.88 4.89 20.39 9.19 4.91 20.44
Tulsa, OK Washington, DC (Metropolitan Area) 7.29 3.14 13.92 13.72 7.18 31.88
Savannah, GA Seattle, WA 14.47 7.15 24.81 6.91 4.03 13.99
Savannah, GA Washington, DC (Metropolitan Area) 14.86 5.75 26.69 6.73 3.75 17.40
Savannah, GA St. Louis, MO 21.40 10.70 31.83 4.67 3.14 9.35
Santa Barbara, CA Seattle, WA 14.96 6.25 27.44 6.69 3.64 16.01
Santa Barbara, CA Washington, DC (Metropolitan Area) 10.34 4.21 18.71 9.67 5.35 23.73
South Bend, IN Washington, DC (Metropolitan Area) 11.85 5.27 21.79 8.44 4.59 18.97
South Bend, IN Tampa, FL (Metropolitan Area) 22.91 10.88 38.21 4.37 2.62 9.19
Philipsburg/State College, PA San Francisco, CA (Metropolitan Area) 10.46 5.10 17.47 9.56 5.72 19.60
Springfield, MO Washington, DC (Metropolitan Area) 11.00 4.94 20.60 9.09 4.85 20.26
Springfield, MO Tampa, FL (Metropolitan Area) 17.44 7.21 30.41 5.73 3.29 13.86
Salinas/Monterey, CA Washington, DC (Metropolitan Area) 9.16 3.48 16.46 10.92 6.08 28.73
Salinas/Monterey, CA San Diego, CA 17.69 7.11 31.72 5.65 3.15 14.06
Springfield, IL Washington, DC (Metropolitan Area) 15.39 7.19 26.46 6.50 3.78 13.91
Sarasota/Bradenton, FL Washington, DC (Metropolitan Area) 17.99 7.10 31.52 5.56 3.17 14.09
Syracuse, NY Washington, DC (Metropolitan Area) 17.04 7.46 29.41 5.87 3.40 13.41
Syracuse, NY Tampa, FL (Metropolitan Area) 17.81 8.44 29.52 5.62 3.39 11.85
Syracuse, NY West Palm Beach/Palm Beach, FL 14.81 7.20 28.67 6.75 3.49 13.89
Tallahassee, FL Washington, DC (Metropolitan Area) 21.11 11.10 30.61 4.74 3.27 9.01
Bristol/Johnson City/Kingsport, TN Dallas/Fort Worth, TX 12.24 5.24 21.57 8.17 4.64 19.07
Bristol/Johnson City/Kingsport, TN Washington, DC (Metropolitan Area) 9.75 4.06 17.57 10.26 5.69 24.61
Bristol/Johnson City/Kingsport, TN Chicago, IL 10.68 4.52 19.01 9.36 5.26 22.10
Bristol/Johnson City/Kingsport, TN Houston, TX 12.22 5.35 19.77 8.18 5.06 18.68
Bristol/Johnson City/Kingsport, TN Orlando, FL 19.78 9.64 33.54 5.05 2.98 10.37
Bristol/Johnson City/Kingsport, TN New York City, NY (Metropolitan Area) 14.68 7.13 23.32 6.81 4.29 14.03

Origin City Destination City Median Lower Upper Median Lower Upper
Online Appendix Table A.1 - Estimation Results for Each City Pair
Profit Margin (%) Price Elasticity
Bristol/Johnson City/Kingsport, TN San Francisco, CA (Metropolitan Area) 11.48 4.74 19.33 8.71 5.17 21.11
Bristol/Johnson City/Kingsport, TN Miami, FL (Metropolitan Area) 21.31 10.78 34.43 4.69 2.90 9.28
Bristol/Johnson City/Kingsport, TN Los Angeles, CA (Metropolitan Area) 11.14 4.51 20.46 8.97 4.89 22.19
Bristol/Johnson City/Kingsport, TN Tampa, FL (Metropolitan Area) 11.13 4.81 19.32 8.98 5.18 20.80
Bristol/Johnson City/Kingsport, TN Philadelphia, PA 14.39 7.21 23.28 6.95 4.30 13.87
Traverse City, MI Washington, DC (Metropolitan Area) 10.11 4.15 18.87 9.89 5.30 24.10
Knoxville, TN Phoenix, AZ 13.01 5.99 22.02 7.69 4.54 16.71
Knoxville, TN Seattle, WA 14.11 6.77 25.53 7.09 3.92 14.76
Knoxville, TN Washington, DC (Metropolitan Area) 17.87 8.64 29.25 5.60 3.42 11.57
Knoxville, TN St. Louis, MO 12.89 4.96 24.21 7.76 4.13 20.16
Knoxville, TN Orlando, FL 41.53 27.53 53.64 2.41 1.86 3.63
Knoxville, TN Minneapolis/St. Paul, MN 9.37 3.68 18.14 10.67 5.51 27.17
Knoxville, TN New York City, NY (Metropolitan Area) 18.41 10.19 27.35 5.43 3.66 9.81
Knoxville, TN Las Vegas, NV 13.65 5.83 25.34 7.32 3.95 17.16
Knoxville, TN San Francisco, CA (Metropolitan Area) 9.24 3.61 18.03 10.82 5.55 27.68
Knoxville, TN Miami, FL (Metropolitan Area) 13.14 6.21 21.45 7.61 4.66 16.10
Knoxville, TN Los Angeles, CA (Metropolitan Area) 10.87 4.58 19.76 9.20 5.06 21.82
Knoxville, TN Tampa, FL (Metropolitan Area) 19.70 9.08 31.85 5.08 3.14 11.01
Knoxville, TN San Antonio, TX 12.03 3.96 22.09 8.31 4.53 25.26
Knoxville, TN Milwaukee, WI 8.71 3.09 16.90 11.48 5.92 32.41
Knoxville, TN New Orleans, LA 16.60 6.22 29.48 6.02 3.39 16.08
Knoxville, TN San Diego, CA 12.14 4.89 19.63 8.24 5.09 20.47
Knoxville, TN Norfolk, VA (Metropolitan Area) 13.00 5.41 22.80 7.69 4.39 18.48
Knoxville, TN Philadelphia, PA 16.47 8.22 27.55 6.07 3.63 12.17
Knoxville, TN Raleigh/Durham, NC 18.09 8.88 28.69 5.53 3.49 11.26
Knoxville, TN Salt Lake City, UT 12.92 5.80 22.13 7.74 4.52 17.24
Mean 13.26 5.88 23.13 9.01 4.99 21.08
Median 12.38 5.28 22.09 8.08 4.53 18.94
Minimum 2.72 1.18 3.61 2.33 1.67 3.63
Maximum 42.87 27.53 59.99 39.57 27.71 84.81
Standard Deviation 5.52 2.90 8.33 4.25 2.14 10.50
Notes: The results represent the annual estimates obtained one year after the shock. Estimations have been achieved individually for each city pair. Median, Lower and Upper represent the median, 16th percentile and 84th percentile of the Bayesian draws that satisfy the condition of the inverse price elasticity of demand being in the unit interval.

City Annual City Fixed Effects (with respect to average)
Albany, GA -31.85
Atlantic City, NJ -30.96
Albuquerque, NM -30.41
Albany, NY -29.59
Lawton/Fort Sill, OK -28.52
Amarillo, TX -28.11
Dothan, AL -27.61
Appleton, WI -27.35
Bismarck/Mandan, ND -27.26
Abilene, TX -27.11
Durango, CO -26.80
Aspen, CO -26.67
Bend/Redmond, OR -26.37
Columbus, GA -26.28
Great Falls, MT -26.17
Grand Junction, CO -25.90
Kalispell, MT -25.32
Asheville, NC -24.58
Springfield, IL -24.51
Bakersfield, CA -24.41
Augusta, GA -24.05
Bloomington/Normal, IL -22.76
Eureka/Arcata, CA -22.68
Grand Forks, ND -22.68
Alexandria, LA -22.18
Allentown/Bethlehem/Easton, PA -21.43
Killeen, TX -21.43
Pullman, WA -21.32
Erie, PA -21.22
College Station/Bryan, TX -20.56
Bellingham, WA -20.26
Elmira/Corning, NY -18.78
Brownsville, TX -14.14
San Francisco, CA (Metropolitan Area) -10.83
Boston, MA (Metropolitan Area) -10.40
Los Angeles, CA (Metropolitan Area) -8.54
Chicago, IL -8.35
New York City, NY (Metropolitan Area) -8.22
Dallas/Fort Worth, TX -8.14
Seattle, WA -7.91
Phoenix, AZ -7.53
Raleigh/Durham, NC -6.84
Atlanta, GA (Metropolitan Area) -6.57
Washington, DC (Metropolitan Area) -6.47
Portland, OR -5.78
Minneapolis/St. Paul, MN -5.49
Denver, CO -5.42
Austin, TX -5.34
Philadelphia, PA -5.21
Kansas City, MO -5.08
Indianapolis, IN -4.78
San Diego, CA -4.41
Nashville, TN -4.37
St. Louis, MO -4.36
Salt Lake City, UT -4.05
Charlotte, NC -3.83
Tampa, FL (Metropolitan Area) -3.79
Houston, TX -3.20
Hartford, CT -3.20
Tulsa, OK -3.07
Las Vegas, NV -2.75
Pittsburgh, PA -2.73
El Paso, TX -2.39
Sacramento, CA -2.38
Charleston, SC -1.66
Orlando, FL -1.59
Detroit, MI -1.48
Online Appendix Table A.2 - City Fixed Effects for Cross-Route Analysis of Profit Margins (%)
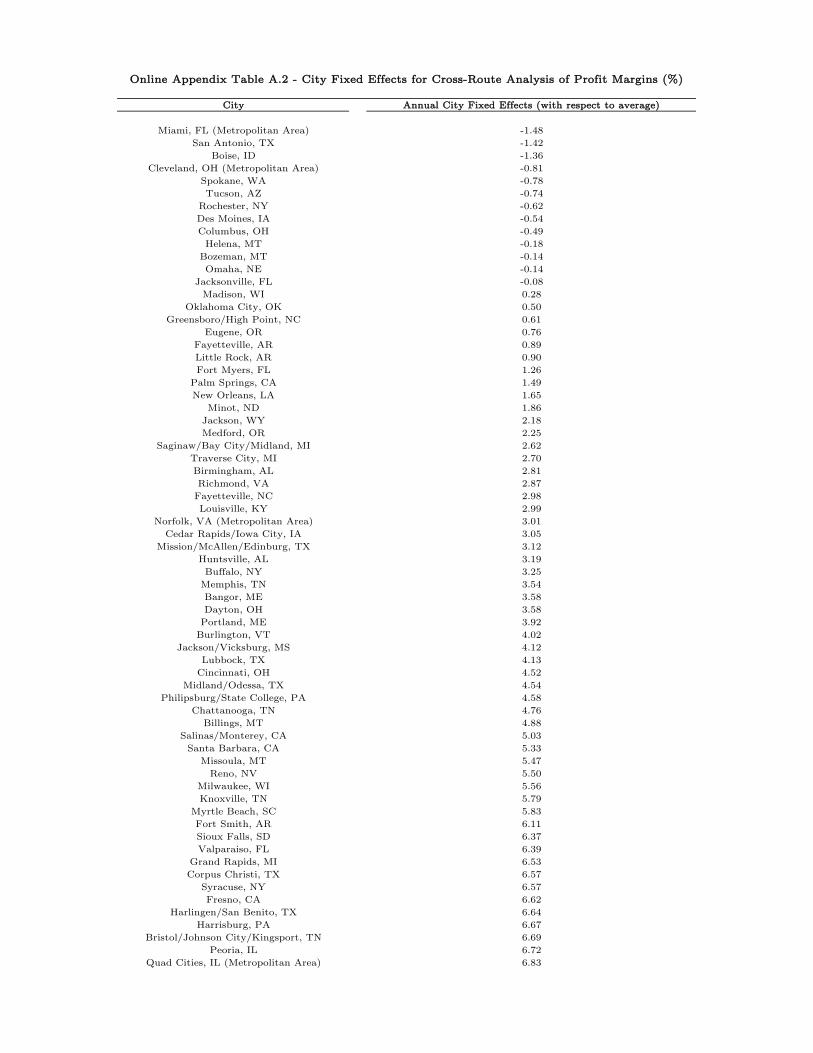
City Annual City Fixed Effects (with respect to average)
Online Appendix Table A.2 - City Fixed Effects for Cross-Route Analysis of Profit Margins (%)
Miami, FL (Metropolitan Area) -1.48
San Antonio, TX -1.42
Boise, ID -1.36
Cleveland, OH (Metropolitan Area) -0.81
Spokane, WA -0.78
Tucson, AZ -0.74
Rochester, NY -0.62
Des Moines, IA -0.54
Columbus, OH -0.49
Helena, MT -0.18
Bozeman, MT -0.14
Omaha, NE -0.14
Jacksonville, FL -0.08
Madison, WI 0.28
Oklahoma City, OK 0.50
Greensboro/High Point, NC 0.61
Eugene, OR 0.76
Fayetteville, AR 0.89
Little Rock, AR 0.90
Fort Myers, FL 1.26
Palm Springs, CA 1.49
New Orleans, LA 1.65
Minot, ND 1.86
Jackson, WY 2.18
Medford, OR 2.25
Saginaw/Bay City/Midland, MI 2.62
Traverse City, MI 2.70
Birmingham, AL 2.81
Richmond, VA 2.87
Fayetteville, NC 2.98
Louisville, KY 2.99
Norfolk, VA (Metropolitan Area) 3.01
Cedar Rapids/Iowa City, IA 3.05
Mission/McAllen/Edinburg, TX 3.12
Huntsville, AL 3.19
Buffalo, NY 3.25
Memphis, TN 3.54
Bangor, ME 3.58
Dayton, OH 3.58
Portland, ME 3.92
Burlington, VT 4.02
Jackson/Vicksburg, MS 4.12
Lubbock, TX 4.13
Cincinnati, OH 4.52
Midland/Odessa, TX 4.54
Philipsburg/State College, PA 4.58
Chattanooga, TN 4.76
Billings, MT 4.88
Salinas/Monterey, CA 5.03
Santa Barbara, CA 5.33
Missoula, MT 5.47
Reno, NV 5.50
Milwaukee, WI 5.56
Knoxville, TN 5.79
Myrtle Beach, SC 5.83
Fort Smith, AR 6.11
Sioux Falls, SD 6.37
Valparaiso, FL 6.39
Grand Rapids, MI 6.53
Corpus Christi, TX 6.57
Syracuse, NY 6.57
Fresno, CA 6.62
Harlingen/San Benito, TX 6.64
Harrisburg, PA 6.67
Bristol/Johnson City/Kingsport, TN 6.69
Peoria, IL 6.72
Quad Cities, IL (Metropolitan Area) 6.83

City Annual City Fixed Effects (with respect to average)
Online Appendix Table A.2 - City Fixed Effects for Cross-Route Analysis of Profit Margins (%)
Idaho Falls, ID 6.85
Lewiston, ID 6.96
Shreveport, LA 6.97
Green Bay, WI 7.02
Springfield, MO 7.06
Charleston/Dunbar, WV 7.11
Mobile, AL 7.21
Roanoke, VA 7.44
Baton Rouge, LA 8.17
Evansville, IN 8.59
La Crosse, WI 8.84
Monroe, LA 8.84
Montgomery, AL 8.91
Savannah, GA 9.09
Columbia, SC 9.22
Colorado Springs, CO 9.42
Kalamazoo, MI 9.94
Yakima, WA 10.19
Lansing, MI 10.65
Fort Wayne, IN 11.05
Rapid City, SD 11.38
Rochester, MN 11.50
Greenville/Spartanburg, SC 11.55
Champaign/Urbana, IL 11.62
South Bend, IN 12.12
Fargo, ND 12.19
Paso Robles/San Luis Obispo, CA 12.77
Melbourne, FL 13.84
Duluth, MN 13.97
Gulfport/Biloxi, MS 14.25
Flint, MI 14.40
Lafayette, LA 14.48
Pensacola, FL 14.71
Sarasota/Bradenton, FL 14.75
Pasco/Kennewick/Richland, WA 14.78
West Palm Beach/Palm Beach, FL 15.55
Lincoln, NE 16.04
Lexington, KY 16.23
Daytona Beach, FL 17.27
Wichita, KS 17.83
Charlottesville, VA 18.28
Tallahassee, FL 18.39
Wilmington, NC 18.44
San Angelo, TX 18.48
Wenatchee, WA 18.75
Scranton/Wilkes-Barre, PA 19.18
Walla Walla, WA 19.55
Gainesville, FL 19.63
Wausau/Mosinee/Stevens Point, WI 20.27
Sun Valley/Hailey/Ketchum, ID 20.87
New Bern/Morehead/Beaufort, NC 21.67
Key West, FL 22.34
Laredo, TX 22.53
Toledo, OH 23.33
Panama City, FL 24.87
Redding, CA 32.24
Notes: Numbers are in percentage terms. The results represent the estimates based on profit margins obtained one year after the shock. The cross-route regression used to obtain these results has the dependent variable of profit margins (%), and the independent variables of city fixed effects only. The regression has an R-squared value of 0.402.