Corporate/Commercial & Corporate Finance Practice - Howse ...
Upload
khangminh22Category
view
4download
0
Munich Personal RePEc Archive
Corporate environmental and economic
performances of Japanese manufacturing
firms: Empirical study for sustainable
development
Fujii, Hidemichi and Iwata, Kazuyuki and Kaneko, Shinji
and Managi, Shunsuke
8 March 2012
Online at https://mpra.ub.uni-muenchen.de/39564/
MPRA Paper No. 39564, posted 20 Jun 2012 13:36 UTC
1
Corporate environmental and economic performances of Japanese
manufacturing firms: Empirical study for sustainable development
Hidemichi Fujii*, Ph.D. Affiliation: Graduate School of Environmental Studies, Tohoku University.
Address: 6-6-20 Aramaki-Aza-Aoba, Aoba-ku, Sendai, 980-8579 Japan.
E-mail: [email protected]/ Phone: +81-22-795-3217/ Fax: +81-22-795-4309
*Contact and Corresponding author.
Kazuyuki Iwata, Ph.D.
Affiliation: Faculty of Regional Policy, Takasaki City University of Economics.
Address: 1300 Kaminamie, Takasaki, Gunma, 370-0801 Japan.
Shinji Kaneko, Ph.D. Affiliation: Graduate School for International Development and Cooperation, Hiroshima University.
Address: 1-5-1 Kagamiyama, Higashi-Hiroshima 739-8529, Japan.
Shunsuke Managi, Ph.D. Affiliation: Graduate School of Environmental Studies, Tohoku University.
Address: 6-6-20 Aramaki-Aza-Aoba, Aoba-ku, Sendai, 980-8579 Japan.
Abstract
This study examines the relationships between environmental performance and economic
performance in Japanese manufacturing firms. The environmental performance indicators
include CO2 emissions and the aggregate toxic risk associated with chemical emissions relative
to sales. Return on assets (ROA) is used as an indicator of economic performance. We
demonstrate that there is a significant, inverted U-shaped relationship between ROA and
environmental performance calculated by aggregated toxic risk. We also find that the
environmental performance increases ROA through both returns on sales and capital turnover
improvement. However, we observe a significant, positive relationship between financial
performance and environmental performance based on CO2 emissions. These findings may
provide evidence for the consequences of environmental firm behavior and sustainable
development.
Keywords: Corporate environmental management, Environmental efficiency, CO2 emissions,
Toxic chemical substances, Japanese manufacturing firm, Sustainable
development
2
1. Introduction and background
According to Porter (1991) and Porter and Linde (1995), properly designed environmental
regulations can encourage technological development, promote firms’ environmental activities
and enhance environmental performance. Hence, it is believed that technological development
and improved resource productivity can increase firms’ competitiveness and enhance their
overall economic performance. Many studies have been conducted to test this hypothesis,
called the “Porter hypothesis” (see Ambec and Lanoie, 2008).
Many previous studies of the Porter hypothesis apply econometric approaches using
linear functions (e.g., Al-Tuwaijri et al., 2004; Nakao et al., 2007; Iwata and Okada, 2011).
These studies focus on the sign (positive or negative) of the relationship between environmental
and economic performance. However, a positive linear relationship is not always fit into the
relationship between environmental and economic performance (Hahn et al., 2010). This is
because pollution abatement requires additional investments and payments for nonproductive
activity, whereas the economic benefit from pollution abatement activity is limited.
Additionally, cost and economic benefit from pollution abatement are different among type of
pollution because abatement technology and required equipment differ (e.g. recyclable or not).
In the production process, a firm can gain economic benefits from recycling and intermediate
material saving. However, these effects are usually smaller than the costs to manufacturing
firms for pollution abatement (Jasch, 2006). Additionally, consumer preferences are still not
significantly related to the environmental burden through the production process, but rather
through product performance (Hibiki and Managi, 2010). Therefore, an environmentally
friendly corporate image has a weak influence on the market competitiveness of products.
Based on these arguments, the improvement of environmental performance possibly does not
always generate economic profit.
While, many case studies in the business and corporate management fields support the
Porter hypothesis (e.g., Steger, 2004; Claver et al., 2007; Crotty and Smith, 2008; Testa et al.,
2012). Thus, some firms have successfully balanced environmental and economic
performances. These results show that the economic benefit is not always lower than the
pollution abatement cost.
The cost of corporate environmental management (hereafter, CEM) for firms is
generally on the rise, although it is difficult to define and measure this cost because CEM
includes a wide range of business activities in addition to compliance with environmental
3
regulations. Moreover, the benefits or returns from CEM are not only expanding but also are
often invisible. To enhance our understanding of the costs and benefits of CEM, this study
examines the relationship between the environmental performance and economic performance
of Japanese manufacturing firms.
2. Research framework and hypotheses
2.1 Research framework
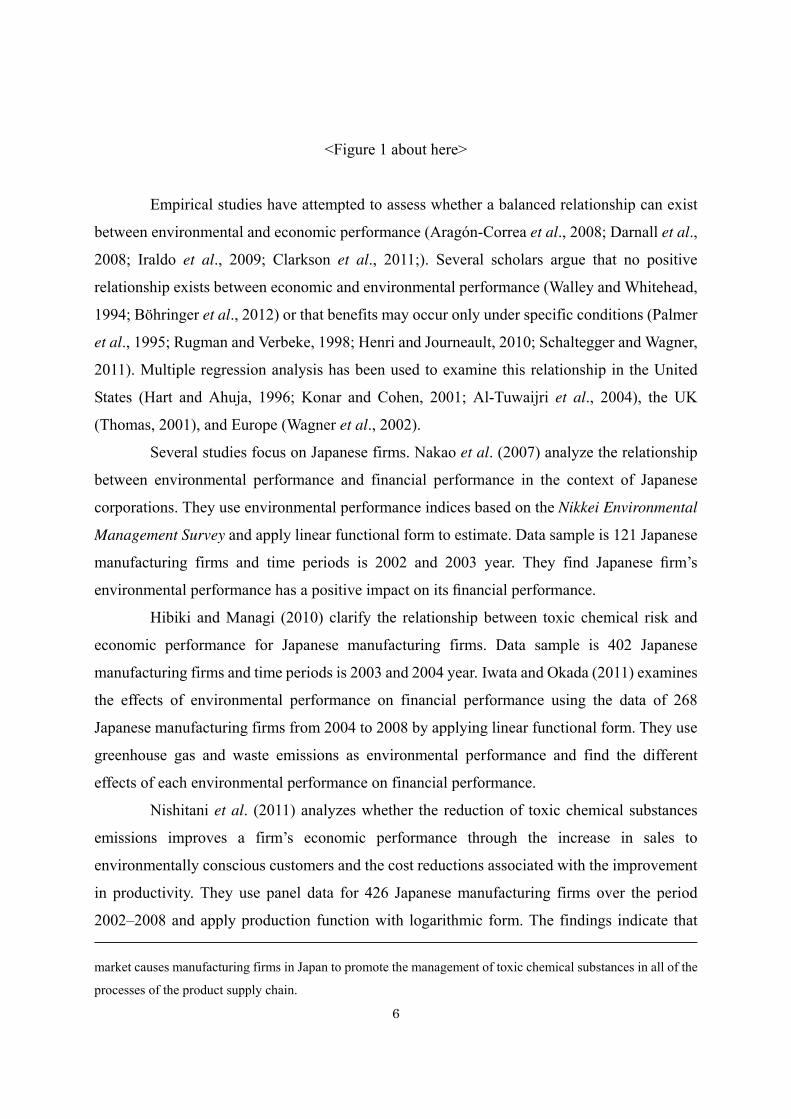
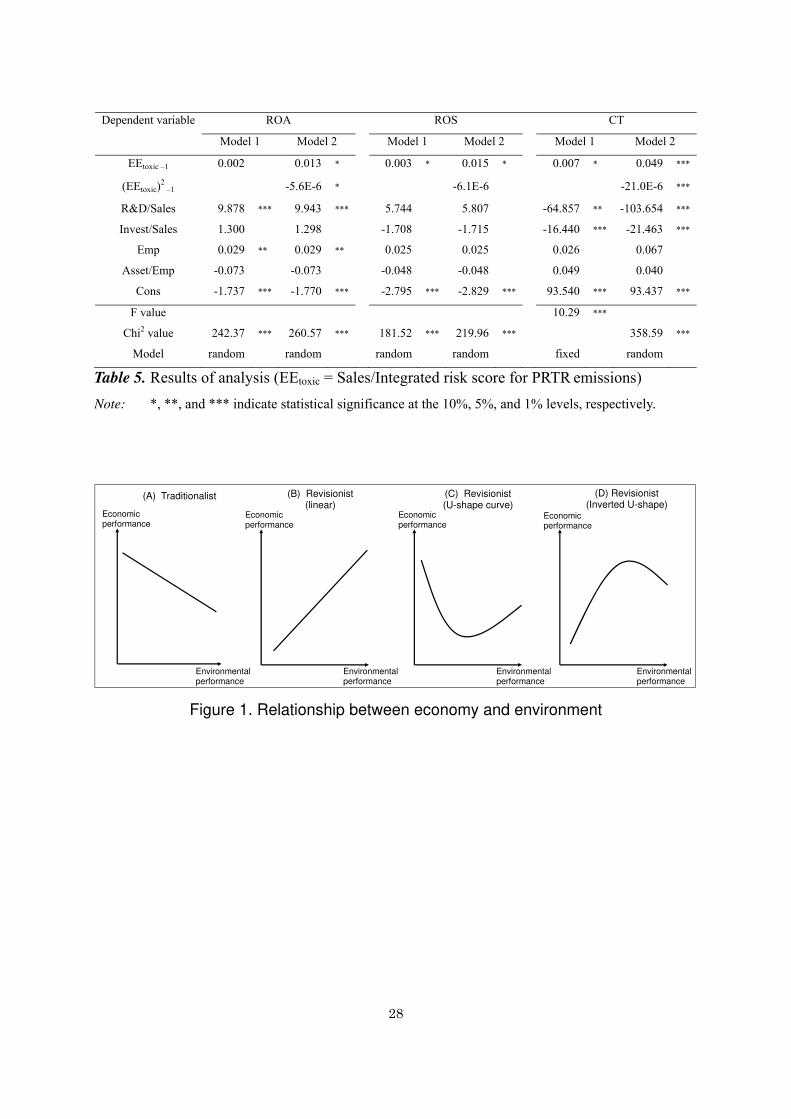
Wagner et al. (2002) present a theoretical model of the relationship between the environmental
and economic performance of firms. This model compares two different views: the
“traditionalist” and the “revisionist”. Based on the Wagner et al. (2002), we develop our
research framework focusing three hypothetical relationships between environmental and
economic performance (see Figure 1). The horizontal axis of Figure 1 represents environmental
performance, and the left to right direction on the x-axis represents improvement in
environmental performance. Each hypothetical relationship represents changes in economic
performance if environmental performance is improved.
The former view ((A) in Figure 1: Traditionalist) suggests that environmental
management is merely a cost incurred for environmental protection as economic performance
declines (Walley and Whitehead, 1994). Because environmental protection requires additional
costs and investments in a nonproductive sector that is not directly related to financial
performance, this additional investment reduces firms’ market competitiveness. Therefore,
traditionalists point out there is a trade-off relationship between environmental performance
and economic performance.
In contrast, the latter view ((B), (C), and (D) in Figure 1: Revisionist) follows Porter’s
hypothesis (Porter, 1991; Porter and Linde, 1995), suggesting that strengthening environmental
performance is positively correlated with economic performance in some areas. Revisionists
point out that pollution abatement costs and expenditure can be considered an investment in the
innovation of new environmental technology that decreases abatement costs. Furthermore,
revisionists explicitly consider the effects of human resources and knowledge that are
accumulated by undertaking pollution abatement in daily production process, which are not
specifically included in the traditionalist framework. The revisionists’ point of view can be
divided into three hypotheses. First, economic performance increases when environmental
4
performance improves ((B) in Figure 1). Second, the relationship between environmental
performance and economic performance is a U-shape ((C) in Figure 1). Finally, the relationship
between environmental performance and economic performance is an inverted U-shape ((D) in
Figure 1).
Here, we define the environmental activity of manufacturing firms as efforts and
treatments aimed at conserving resources and reducing the environmental burden.
Environmental activity can be divided into two major approaches. One is the end-of-pipe (EOP)
approach1, and the other is the cleaner production (CP) approach
2 (Frondel et al., 2007). Under
this clarification, traditionalist focuses on the EOP treatment, while revisionist emphasizes CP
approach.
First viewpoint ((B) in Figure 1) focus on the economic benefit from CP approach. In
this idea, environmental burden represents inefficient intermediate use in production process.
Based on Zeng et al. (2010), manufacturing firms can save on intermediate material and labor
due to an improved production process, which contributes cost reduction. Thus, increase
environmental performance can be understood that improvement of resource use efficiency that
strengthens the market competitiveness.
Second viewpoint ((C) in Figure 1) is based on the following idea. Under
environmental regulations, firms need to pay a pollution abatement cost. Meanwhile, firms may
benefit from environmental activity such as material reuse and recycling (Palmer et al., 1995;
King and Lenox, 2001). Environmentally proactive firms achieve especial benefits from
1 The EOP approach is based on pollution removal using so-called “filters” in smokestacks or drains. Major EOP
technologies include desulfurization and wastewater treatment. However, EOP technology has several defects.
EOP treatments cause secondary environmental pollution problems such as the generation of sludge waste through
wastewater treatments, the need for substantial investment in equipment and expensive running costs. EOP
treatments do not contribute directly to improving productivity. Because firms perceive the costs of EOP
treatments as additional expenditure for nonproductive activity, they do not usually have strong incentives for
pollution abatement through the EOP approach.
2 The CP approach is defined as “the continuous application of an integrated preventive environmental strategy
applied to processes, products, and services to increase overall efficiency, and reduce risks to humans and the
environment” (UNEP, 2006). A major CP approach is eco-design, in which the product design considers the
environmental impacts of the product during its entire lifecycle. While the CP approach also requires investment in
equipment, as does the EOP approach, running costs are not as expensive because the CP approach does not
require filters and absorbent materials to remove pollutants (Kjaerheim, 2005).
5
environmental activities that outweigh the cost. Furthermore, we point out the possibility to
have positive relationship between environment and economic performance by human resource
development. Inducing CP approach make manufacturing firm increase economic performance.
However, manufacturing firm needs to cultivate pollution abatement experience and
knowledge to induce CP approach. In many case, manufacturing firms learn more efficient
pollution abatement approach by doing daily environmentally activity (Remmen and Lorentzen,
2000). While, firm needs to use EOP approach for pollution abatement to comply strictly with
environmental regulations before firm builds up enough capacity to apply CP approach. In this
period, economic performance goes down temporarily with emission reduction by EOP
approach. However, firm gain the enough human resource and capacity to induce CP approach,
economic performance goes up with environmental performance improvement. To keep
treating environmental burden, employee’s capacity and know-how will be accumulated, which
makes more efficient environmental treatment activity that increase economic performance.
Third viewpoint ((D) in Figure 1) can be explain as follows. Marginal abatement cost
of pollution is higher than the marginal benefit from pollution abatement when the firm’s
environmental performance is high. This is because firms can select from several cost-effective
equipment options for environmental management when environmental performance is low.
After improvements of environmental performance due to the introduction of several
cost-effective approaches, a firm needs to obtain cost-ineffective equipment if it hopes to
improve environmental performance by introducing new equipment. Thus, economic
performance has a negative relationship with environmental performance. In this period, the
firm does not have strong incentives to improve environmental performance by incurring costs
if it has already met the environmental standard. However, the firm needs to reduce
environmental pollution beyond the environmental standard if a client firm demands it. This
requirement from the client firm provides an incentive for firms in the supply chain to promote
environmental management3.
3 Many Japanese manufacturing firms set a target and report the environmental performance of the consolidated
entity or product life cycle in their environmental reports. To meet the environmental target, a manufacturing firm
tries to reduce the environmental burden in the product supply chain. The Restriction of Hazardous Substances
(RoHS) law was adopted in July 2006 in the European market. Since then, six substances have been banned from
new electrical and electronic products in the European market: lead, mercury, cadmium, hexavalent chromium,
polybrominated biphenyls and polybrominated diphenyl ethers. This strict environmental regulation in European
6
<Figure 1 about here>
Empirical studies have attempted to assess whether a balanced relationship can exist
between environmental and economic performance (Aragón-Correa et al., 2008; Darnall et al.,
2008; Iraldo et al., 2009; Clarkson et al., 2011;). Several scholars argue that no positive
relationship exists between economic and environmental performance (Walley and Whitehead,
1994; Böhringer et al., 2012) or that benefits may occur only under specific conditions (Palmer
et al., 1995; Rugman and Verbeke, 1998; Henri and Journeault, 2010; Schaltegger and Wagner,
2011). Multiple regression analysis has been used to examine this relationship in the United
States (Hart and Ahuja, 1996; Konar and Cohen, 2001; Al-Tuwaijri et al., 2004), the UK
(Thomas, 2001), and Europe (Wagner et al., 2002).
Several studies focus on Japanese firms. Nakao et al. (2007) analyze the relationship
between environmental performance and financial performance in the context of Japanese
corporations. They use environmental performance indices based on the Nikkei Environmental
Management Survey and apply linear functional form to estimate. Data sample is 121 Japanese
manufacturing firms and time periods is 2002 and 2003 year. They find Japanese firm’s
environmental performance has a positive impact on its financial performance.
Hibiki and Managi (2010) clarify the relationship between toxic chemical risk and
economic performance for Japanese manufacturing firms. Data sample is 402 Japanese
manufacturing firms and time periods is 2003 and 2004 year. Iwata and Okada (2011) examines
the effects of environmental performance on financial performance using the data of 268
Japanese manufacturing firms from 2004 to 2008 by applying linear functional form. They use
greenhouse gas and waste emissions as environmental performance and find the different
effects of each environmental performance on financial performance.
Nishitani et al. (2011) analyzes whether the reduction of toxic chemical substances
emissions improves a firm’s economic performance through the increase in sales to
environmentally conscious customers and the cost reductions associated with the improvement
in productivity. They use panel data for 426 Japanese manufacturing firms over the period
2002–2008 and apply production function with logarithmic form. The findings indicate that
market causes manufacturing firms in Japan to promote the management of toxic chemical substances in all of the
processes of the product supply chain.

7
firms that have reduced their pollution emissions can increase their economic performance
through the increase in demand for their products and an improvement in productivity.
Nishitani and Kokubu (2011) uses the data on 641 Japanese manufacturing firms in the period
from 2006 to 2008. They find that firms with strong market discipline imposed by
stockholders/investors are more likely to reduce GHG emissions and, consequently, firms that
reduce more GHG emissions are more likely to enhance firm value.
However, these studies do not consider the quadratic relationship between
environmental and economic performance. Additionally, there are little studies use multiple
type of environmental pollution data to represent environmental performance. While, many
types of environmental pollution are caused by manufacturing firms. It is thus important to
consider several types of environmental pollution to understand properly the relationship
between corporate financial performance and CEM. Additionally, previous studies have used
data on the amounts of chemical substances emitted without considering the toxicities of the
chemical substances. However, manufacturing firms manage their emissions of chemical
substances with a focus on the toxicity to humans and the ecosystem form risk management of
pollution accident (Fujii et al., 2011). Thus, we attempt to include the toxicities of chemical
substance emissions in our analysis.
2.2 Objective and hypotheses
The objective of this study is to clarify the relationship between environmental and economic
performance using both linear and quadratic functions. Given the availability of the data and
Japan’s rich experience with CEM, studies of Japanese manufacturing firms that directly
analyze environmental and economic performance using multiple real environmental pollution
data sources are particularly relevant.
We focus on the three economic performance indicators to examine the causal
relationship between environmental and economic performance in detail. In general, CEM
contributes to economic performance though (1) the cost saving effect and (2) the productivity
improvement effect (Grolleau et al., 2012). The former effect includes reductions in
intermediate material costs, energy input costs, and pollution abatement costs as a result of
pollution-prevention activity. The latter effect is achieved through improved capacity
utilization and increased sales from environmentally product design. To consider these two
8
different effects, we use return on sales (ROS)4 to capture the cost saving effect and capital
turnover (CT)5
to capture the capital productivity improvement effect in our research.
Additionally, we use the return on assets (ROA) indicator to evaluate economic performance by
considering both the cost saving effect and the productivity improvement effect (overall
economic performance effect).
As a side note, environmental performance can be measured by various pollutants.
Additionally, technology, cost, and equipment for pollution abatement differ according to
pollutant. Therefore, this study focused on two environmental pollutants with different
characteristics. The first is toxic chemical substances that cause local environmental pollution
problems, directly affecting human health and ecosystems in the short term. Pollution
abatement methods can be applied using both the EOP approach and the CP approach.
The second is CO2 emissions, which cause global environmental problems and
indirectly affect human health and ecosystems in the long term. Attempts have been made to
reduce CO2 emissions by adopting the CP approach, which is fossil fuel energy conservation.
Today, new abatement technologies to reduce CO2 emissions by the EOP approach have been
invented, but these approaches remain difficult and are too expensive for private firms. To focus
on the characteristics, effects and available abatement technology of these two pollutants, we
clarify how each aspect of environmental performance affects financial performance. To
analyze this relationship, the discussion in this section focuses primarily on the development of
three research hypotheses that are (a) cost saving effect, (b) capital productivity improvement,
and (c) overall economic performance effect.
(a) Cost saving effect
Reducing CO2 emissions is mainly achieved by the manufacturing firm through fossil fuel
energy conservation, which saves energy costs if sale is constant. Thus, decreasing CO2
emissions reduces production costs, and this contributes to increased profitability. Therefore,
4 ROS is defined as profit per sale, which represents the profitability of a firm. Basically, profit is calculated by
determining the value of sales minus costs, including intermediate material costs and pollution abatement costs.
Therefore, we consider ROS can capture the cost saving effect of CEM.
5 CT is defined as sales per asset, which represents the capital productivity of firm. CT does not directly reflect the
cost saving effect, but it can capture the efficiency of investments to increase sales. Hence, we believe that CT can
depict how investment, including pollution abatement, contributes to increased sales.
9
we hypothesize that the relationship between corporate profitability and environmental
performance measured by CO2 emissions is positive, as shown in (B) in Figure 1.
While, the abatement costs of toxic chemical substances differ for each approach. The
CP approach is inexpensive. However, it is impossible for manufacturing firms to remove all
environmental pollution by only applying the CP approach. In short, firms need to apply both
the EOP and CP approaches in a balanced way to achieve high environmental standards and
increase firm’s profitability (Frondel et al., 2007). Thus, if a manufacturing firm reduces its
toxic chemical substances emissions too drastically by applying an additional EOP approach,
the environmental performance measured by toxic chemical substances emissions
improvement reduces corporate profitability.
Therefore, we hypothesize that the relationship between corporate profitability and
environmental performance measured by toxic chemical substances emissions is a quadratic
function with a convex upward shape as indicated by (D) in Figure 1.
Hypothesis 1. The relationship between profitability and environmental performance measured
by CO2 emissions is positive. While, the relationship between profitability and environmental
performance measured by toxic chemical substances emissions is a quadratic function with a
upward convex (from the existing optimal point).
(b) Capital productivity improvement
If a manufacturing firm reduces CO2 emissions by introducing new energy-efficient production
equipment, capital productivity falls temporarily (Fujii et al., 2010). However, low carbon
product has strong market competitiveness if preference of consumer and market shift to
environmental friendly product. In this case, reduction of CO2 emissions affects to increase
capital productivity gradually. While, Pedersen and Neergaard (2005) pointed out that the effect
of green purchasing and green labeling is limited. Thus, we consider two possibilities that CO2
reduction affect to decrease capital productivity or to increase capital productivity gradually.
Meanwhile, inducing new equipment for toxic chemical substances abatement is an
additional investment and is a nonproductive activity. However, importance of toxic chemical
substances managements gets stronger due to strict environmental standard targeting on entire
10
product supply chain6
. Thus, these strict environmental standards make the market
competitiveness of firms with proactive toxic chemical substances management increase.
Meanwhile, both CP and EOP approach for toxic chemical substances management are required
new investment for pollution abatement, while that investment does not directly increase sales
because consumer and market preferences are not affected by the information of toxic chemical
substances emission by firm (Hibiki and Managi, 2010). These evidences imply that excess
toxic chemical substances management possibly decline capital productivity.
Thus, we hypothesize that the relationship between capital productivity and
environmental performance measured by toxic chemical substances emissions is negative as
indicated by (A) in Figure 1 or inverted U-shape relationship as indicated by (D) in Figure 1.
Hypothesis 2. The relationship between capital productivity and environmental performance
measured by CO2 emissions is quadratic function with a downward convex. While, the
relationship between capital productivity and environmental performance measured by toxic
chemical substances emissions is a negative or quadratic function with a upward convex (from
the existing optimal point).
(c) Overall economic performance
We define overall economic performance as financial performance considering both
profitability and capital productivity. Based on the hypothesis 1 and hypothesis 2, investment
for CO2 emissions reduction contributes energy use saving, which increases ROS. However,
there is not clear relationship that CO2 emissions reduction increase market competitiveness.
Thus, we predict that the increase of environmental performance measured by CO2 emission
6 For example, (1) the Restriction of the Use of Certain Hazardous Substances in Electrical and Electronic
Equipment (RoHS); (2) the Registration, Evaluation, Authorization and Restriction of Chemicals (REACH); and
(3) the End-of-Life Vehicles Directive (ELV). The REACH directive was adopted in 2006 in Europe and required
firms that export to the European market to be more proactive in controlling toxic chemical substances. In 2018,
the REACH directive plans to cover 30,000 chemical substances in firms treating more than 1 ton per year. Under
the RoHS and ELV directives, all electric and vehicle products with a level of toxic chemicals above a certain
threshold cannot be sold in the European market. Additionally, Japan’s marking for the presence of specific
chemical substances for electrical and electronic equipment (J-MOSS) was enforced in July 2006. It is an
eco-labeling system that targets six toxic chemical substances (the same as those in the RoHS restriction) and
seven electrical and electronic products, and it was enforced in tandem with the RoHS restriction.
11
increase overall economic performance through the corporate profitability improvement.
While, we consider that environmental performance measured by toxic chemical
substances emissions have inverted U-shape relationship with two economic performances
(profitability and capital productivity) in hypothesis 1 and 2. Then, we assume inverted
U-shape relationship between overall economic performance and environmental performance
measured by toxic chemical substances emissions.
Hypothesis 3. The relationship between overall economic performance and environmental
performance measured by CO2 emissions is positive relationship. While, the relationship
between overall economic performance and environmental performance measured by toxic
chemical substances emissions is a quadratic function with a upward convex (from the existing
optimal point).
3. Methodology
In this paper, economic performance denotes the economic benefits generated by firms’
activities, and environmental performance is defined as the result of CEM. Based on these
definitions, we establish return on sales (ROA) as our economic performance (Econ) indicator
and environmental efficiency (EE) as our environmental performance indicator. EE is defined
as desirable output (e.g. sales, production) per environmental burden. In other words, EE is the
inverted score of environmental pollution per unit of production, which represents the
production scale-adjusted environmental pollution. Therefore, we know that EE is highly
dependent on the capacity for CEM.
ROA indicates profitability of a firm relative to its total assets. ROA is a generally
accepted measure of firm financial performance that has been used as an economic
performance variable in many previous studies (Russo and Fouts, 1997). The definition of ROA
is profits divided by assets. By this definition, ROA can be decomposed using equation (1).
ROA = Profit/Asset = Profits/Sales × Sales/Assets (1)
This means that improvements in ROA can be caused by an increase in profits divided
by sales, which is called return on sales (ROS), or by an increase in sales divided by assets,
12
which is called capital turnover (CT). ROS indicates the profitability of corporate activity, and
CT represents the capital productivity of firms. Therefore, changes in ROA can be considered
according to changes in ROS or changes in CT. In this paper, we seek to clarify independently
how EE affects ROA, ROS and CT.
On the one hand, we examine the relationship between Econ and EE, on the other hand,
we consider the following two specifications, shown in equations (2) and (3). The relationships
are assumed to be linear and quadratic in Models 1 and 2, respectively.
Model 1 ittiititit EEEcon 211 αX (2)
Model 2 ittiitititit EEEEEcon 3
2
1211 βX (3)
Let the i th firm’s economic performance in year t be itEcon with ROA, ROS and CT.
1EE it is the i th firm’s environmental efficiency in year 1t . Two variables comprise EE ,
namely, sales per CO2 emissions (EECO2) and sales per toxic release (EEtoxic). There are,
therefore, six combinations of Econ and EE in our model. To capture firm characteristics
influencing Econ, vector X is incorporated into the models. and are unobserved firm-
and time-specific fixed effects, respectively. is an idiosyncratic error term. and are the
estimated coefficients.
For vector X , which represents firm characteristics, we use four variables: the number
of employees (Emp), research and development expenditure relative to sales (R&D), capital
investment relative to sales (Invest) and capital intensity (Intensity). In selecting these control
variables and setting expectations for each variable, we follow Capon et al. (1990). Emp is used
as a proxy for firm size 7. We use R&D to capture the firm’s technological knowledge level
8.
7 We use number of employees to control firm scale effect in our model. Because firm scale affect the productive
efficiency in manufacturing firms. According to Halkos and Tzeremes (2005), large firms could be more efficient
in production because they could use more specialized inputs, better coordinate their resources, etc. Meanwhile,
small firms could be more efficient because they have flexible, non-hierarchical structures, and do not usually
suffer from the so-called agency problem.
8 We use R&Dit-1 rather than R&Dit as an independent variable because there is time lag between R&D investment
and the economic performance improvement (Osawa and Yamasaki, 2005; Ogawa, 2007). Thus, we use R&D
variable with one time year lag.
13
Invest stands for the firm’s level of production equipment technology9. Intensity indicates
whether the firm is labor intensive or capital intensive.10
We use 1EE it rather than itEE as an independent variable to avoid an endogeneity
problem, similar to Wagner (2010). Additionally, this variable select is useful for adjusting real
information disclosure system in Japan because Japanese Ministry of the Environment
provided both CO2 and toxic chemical emissions information that is published approximately
one year after the ministry collects information.
4. Data
We use CO2 emissions and toxic chemical substances emissions to calculate EE. The CO2
emissions data were obtained from the GHG Emission Data report obtained through the
Mandatory Greenhouse Gas Accounting and Reporting System of the Ministry of the
Environment11
. Because this system discloses CO2 emissions for individual firms from 2006 to
2008, three years of data are available. As another measure of environmental performance,
toxic chemical emissions information for each firm was obtained from the Pollutant Release
and Transfer Register (PRTR) system report published by the Ministry of the Environment12
.
Toxic emissions data are available for the period between 2001 and 2008. Because
manufacturing firms emit many types of toxic chemical substances, we use an integrated risk
9 We use Investit-1 rather than Investit as an independent variable because there is time lag between capital
investment and the economic performance improvement (Nagahata and Sekine, 2005). Thus, we use capital
investment variable with one time year lag.
10 We use capital intensity (assets/employees) to control how firm depend on the capital equipment. In general,
high capital intensity firm has low CT score due to high dependency of capital equipment. While, high capital
intensity firms tend to pay lower labor cost relative to labor intensive firms. Thus, high capital intensive firm tend
to have high ROS score. To control these characteristics of capital-labor ratio, we apply capital intensity variables
in our model.
11 Under this system, firms that have more than 21 employees and GHG emission is more than 3,000 ton-CO2, or
energy consumption of all facilities is bigger than 1,500 kl of oil equivalent must annually report the quantities
they use to the central government.
12 Japan has enforced the pollution release and transfer register (PRTR) since 2001. Under this system, facilities
that have more than 21 employees and produce or use chemicals on a list of 354 substances specified by law must
annually report the quantities they use to the central government.

14
score calculated from toxic chemical emissions and toxicity weight according to the United
State Environmental Protection Agency (EPA)13
. There are two reasons why we use an
integrated risk score. First, firms manage chemical substances to reduce overall risk14
. Second,
it is common for the emissions of some chemical substances to increase and others to decrease
because firms substitute one chemical input for another to reduce the toxicity impact15
. For
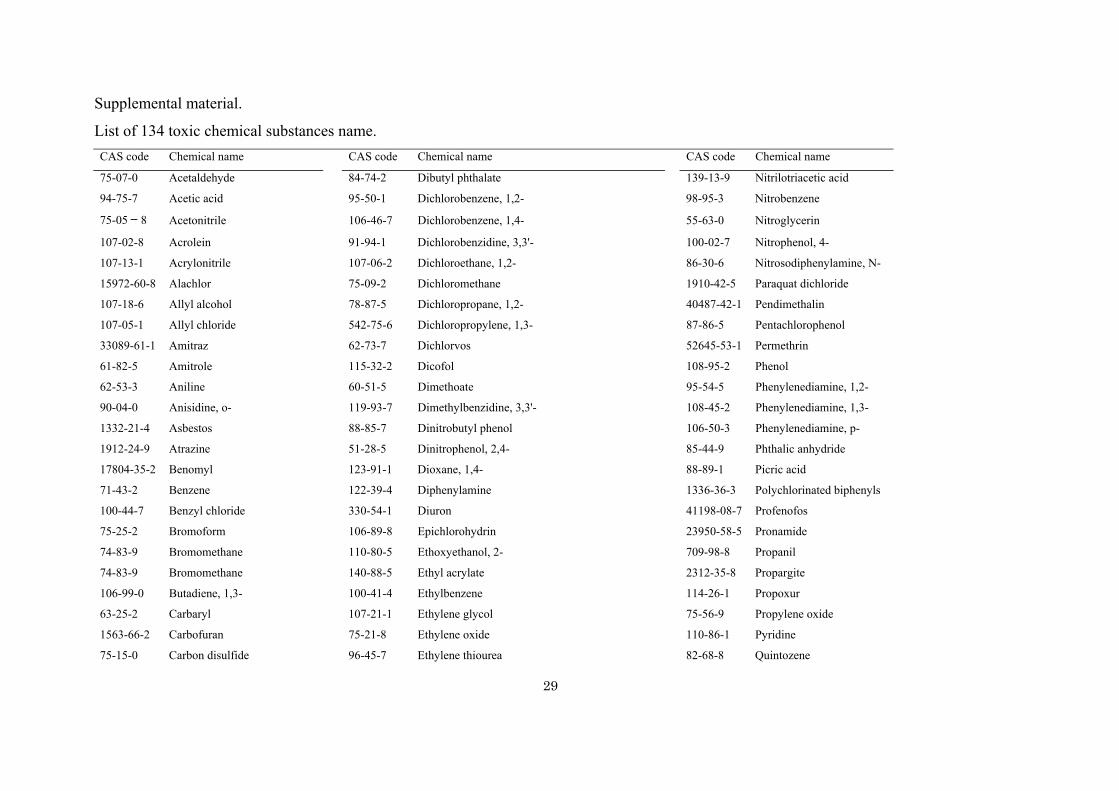
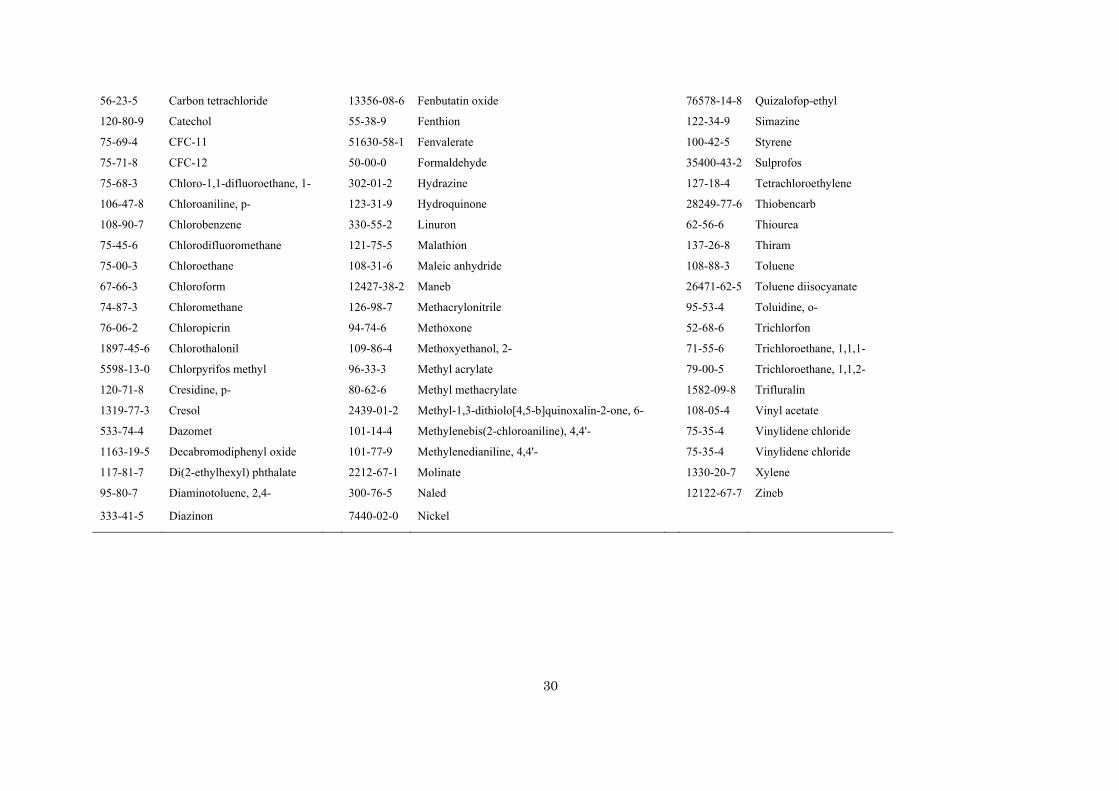
these reasons, we use integrated risk score calculations based on information regarding 134
toxic chemical substances to represent emission amounts16
.
To define EE, we use sales to indicate economic value in this paper because sales
reflect overall product value, and sales are not affected by the cost reductions that may occur
due to labor restructuring and changes in wages that do not directly relate to CEM. In this case,
EE is defined by the ratio scale between sales and environmental pollution. If the production
scale declines, environmental pollution will decrease, and sales will fall. As a result, EE is not
greatly affected by the production scale change effect. Thus, the EE score controls for the
production scale change effect caused by business cycles. In this study, we use ROA as an
economic performance indicator that is the adjusted production scale. To consider conformity
to economic performance, we select the EE indicator as a performance result of CEM.
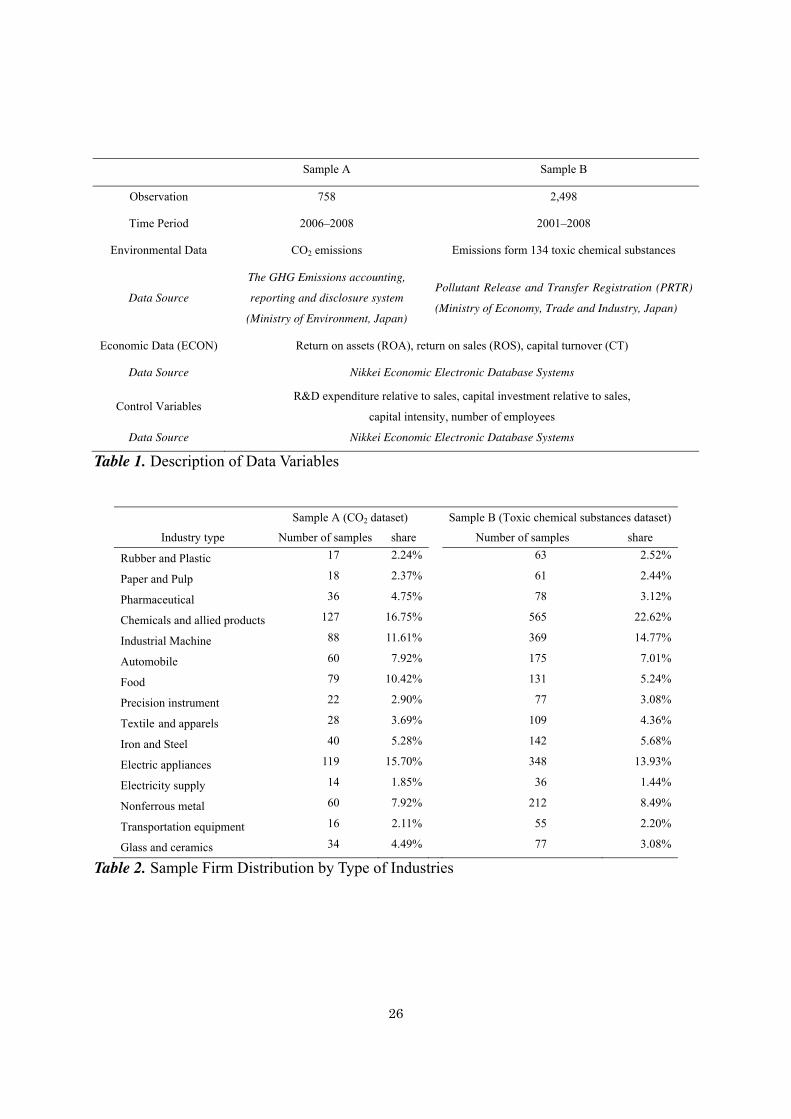
The sample size is 758 in CO2 data set (sample A) and 2,498 in toxic chemical
emissions data set (sample B)17
. All sample firms are listed firms on the Tokyo stock exchange
market. All financial data variables are from the Nikkei Economic Electronic Database Systems.
Two data sets are constructed for firms in the manufacturing sector, as summarized in Table 1.
13 Toxic coefficient scores come from the toxicity weighting spreadsheet v2.3.0, published by the U.S. EPA.
14 For instance, the Japanese Chemical Industry Association (JCIA) convenes many workshops and seminars to
disseminate knowledge to JCIA member firms on how to reduce the total toxicity of emitted chemical substances.
The JCIA consists of 180 industrial chemical firms and 75 business associations.
15 The main toxic chemical substitutions are adapted from toluene and xylene to butyl acetate and ethyl acetate.
16 There are 354 chemical substances in the PRTR published by the Ministry of the Environment in Japan. The
toxic weight provided by the U.S. EPA covers only 134 chemical substances in the PRTR data in Japan. Therefore,
we consider that 134 chemicals, which are targeted for toxic chemical management in both the U.S. and Japan, are
recognized high priority substances.
17 A limitation of our study is the difficulty obtaining consolidated firm data. Some of the small consolidated
subsidiaries do not report their emissions data because they do not have a duty to report their CO2 and toxic
chemical substance emissions to the government. This is because the thresholds of the reporting system include
firm scale (number of employees). Because of the difficulty of data accessibility from small firms, we could not
obtain all the environmental data for consolidated firms.
15
We describe the distribution of sample firm by type of industries in Table 2. The descriptive
statistics in our data set are presented in Table 318
. All financial data is deflated as 2005 price.
<Table 1 about here>
<Table 2 about here>
<Table 3 about here>
5. Results
5-1. Economic performance vs environmental performance measured by CO2 emissions
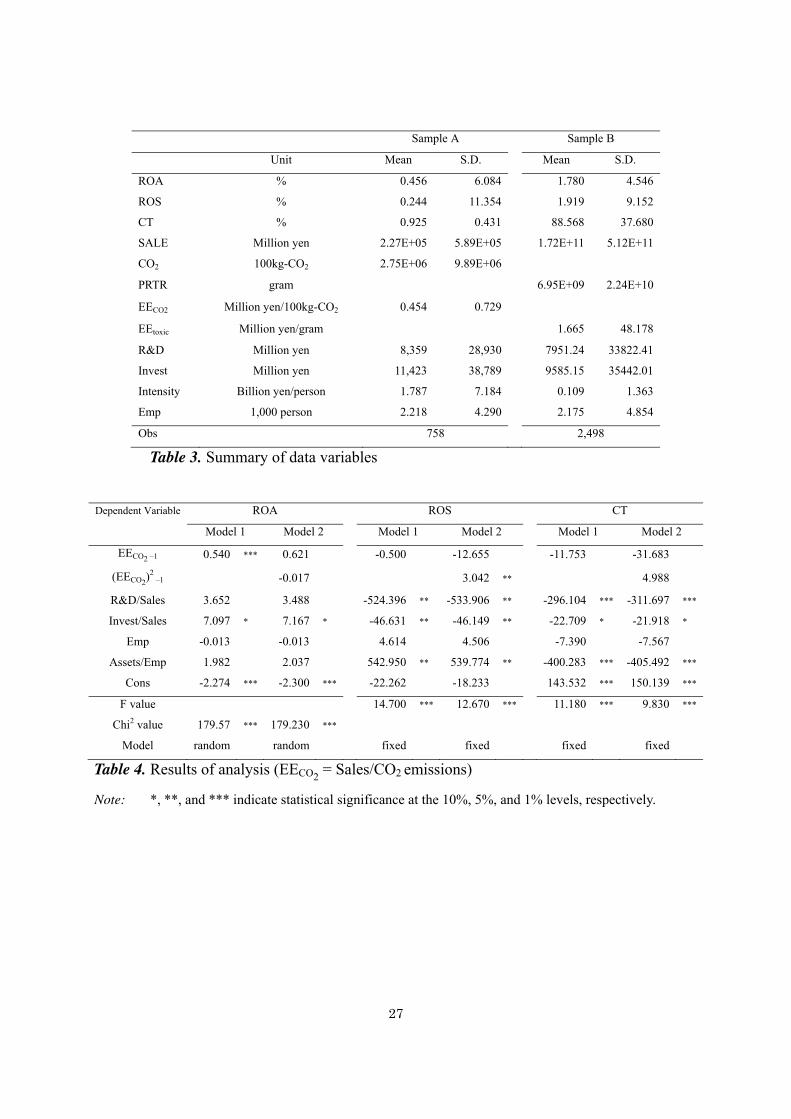
Table 4 shows the results when the environmental performance indicator is EE measured by
sales per CO2 emissions (EECO2). In Model 1, the single power of EECO2
has a significant and
positive effect on ROA. However, neither the single power nor squared term of EECO2 has
significant effects in Model 2. These findings imply that the relationship between ROA and
EECO2 is linear and positive. ROA and EECO2
are compatible, and their relationship remains
steady.
In considering ROS and CT, we find that EECO2 has a monotonically positive effect on
ROS because squared term of EECO2 is significantly positive and single power of EECO2 is not
statistically significant. While, there is no significant effect on CT. Based on these results, we
can conclude that EECO2 affects ROA through ROS because both ROA and ROS have positive
relationship with EECO2, and the relationship between EECO2 and CT is not statistically
significant. These results can be interpreted using the following mechanisms. ROS shows the
profitability of firms, with profits defined as the difference between sales and cost. A higher
ROS implies lower costs relative to revenue. CO2 emissions from manufacturing firms are
18 Mean value of ROA in our dataset is 0.456% in sample A and 1.780% in sample B. Based on Meric et al. (2008),
average ROA score of Japanese firms from 2001 to 2005 is 2.40%, which is close to our data. Our dataset is
included data in 2008 year which is strongly affected by financial crisis. Especially, average ROA score in sample
A is strongly affected because time period of sample A is three years, which are 2006, 2007, and 2008. Thus, we
consider mean value of ROA score in our revised dataset is not abnormal.
16
produced mainly through the consumption of energy. Therefore, firms with lower CO2
emissions relative to sales have achieved more energy-efficient production processes. The
efficiency of their production systems decreases energy costs and positively affects ROS.
There are two main approaches to reducing CO2 emissions in manufacturing firms19
.
The first approach is to introduce more energy-efficient production equipment and switch from
fossil fuels to forms of energy with lower carbon intensity. This approach requires additional
investment and costs. Second approach is to improve the production process and employee
efforts to save energy, which requires better corporate management, including better employee
education and excellent leadership20
. Later approach can be available by a learning curve effect,
which occurs when a firm develops more efficient pollution abatement techniques by
experimenting with environmentally friendly activities (Bramoulléa and Olson, 2005).
Employee effort and ideas are necessary, but such initiatives do not require a significant capital
investment or additional cost (Remmen and Lorentzen, 2000).Employee efforts can help many
Japanese manufacturing firms successfully reduce CO2 emissions without significant
additional investment (Stone, 2000).
Here, we introduce Ricoh’s corporate activity report as a case study to illustrate the
successful adoption of cleaner production technology without large investment. Ricoh has
successfully reduced CO2 emissions and energy use by introducing cleaner production
technology, which entailed shifting from automation technology equipment to employees’
activity-oriented technology. Ricoh developed a new manufacturing line consisting of carts
chained together in a single line. This new system only needs a single 0.4 kW motor to run
while conventional lines (conveyor belts) need one in the 6 kW range. By the introduction of
this production process, CO2 emissions were reduced from 7.7 to 0.1 tonnes of CO2 per year,
electricity use was reduced from 90 kWh per day to 1 kWh per day, investment was decreased
from 20 to 0.28 million yen per year, and maintenance fees cut from 2.24 million yen per year to
0 yen per year.
19 Carbon capture and storage (CCS) is another option, but this approach is not considered here.
20 For example, Panasonic has established a corporate CO2 emissions reduction promotion committee to manage its
progress toward the achievement of its target on a monthly basis. Through this committee, the firm facilitates (1)
the visualization of energy consumption, (2) energy conservation diagnoses by an expert team, (3) innovations in
production processes, and (4) group-wide sharing of examples of reductions that have taken place (Panasonic
group, ‘eco ideas’ Report 2010).
17
However, we do not observed significant relationship between CT and EECO2. We
point out two reasons about this result. First, introducing energy-saving equipment through
significant capital investment decreases firm capital productivity in the short term (see Fujii et
al., 2010). Second, many buyer firms in Japan tend to purchase products that have production
processes with low carbon emissions, hoping to improve their life-cycle assessments and green
supply chain management. Therefore, energy-efficient manufacturing firms obtain a
competitive position in the market with buyers that are proactive about green purchasing. We
consider these positive and negative effects are canceled each other out in the relationship
between CT and EECO2, which is one reason we can not observed significant relationship in our
analysis. Based on this result, we conclude our results support hypothesis 1 and 3 about
environmental performance measured by CO2 emissions.
<Table 4 about here>
5-2. Economic performance vs environmental performance measured by toxic risk score
Table 5 shows the results achieved using the sales per toxic risk score (EEtoxic) as the
independent variable. The single power of EEtoxic does not have statistically significant effect
on ROA in Model 1. However, if the square term of EEtoxic is included (as in Model 2), an
inverted U-shaped relationship emerges between ROA and EEtoxic. Additionally, the turning
point in this inverted U-shaped curve is in the first quadrant21
because the single power of
EEtoxic positively affects ROA. From the comparison of tables 4 and 5, we find EEtoxic and
EECO2 have different effect on the ROA.
Here, we focus on the results for the model with dependent variables ROS and CT.
EEtoxic has positive and linear relationship with ROS, and EEtoxic has inverted U-shape
relationship with CT. This result indicates that EEtoxic increase ROA through improvement in
both ROS and CT, and decrease ROA through CT decline. In a period when manufacturing
firms can reduce toxic chemical substances emissions using CP, the increase in EEtoxic may
positively affect ROS because of intermediate chemical material costs and abatement cost
21 First quadrant is located at the top right of the graph. There is the threshold of environmental performance which
makes the relationship between economic performance and environmental performance change from positive to
negative if turning point of inverted U-shape curve exists at the first quadrant.
18
reduction.
We introduce another Ricoh’s corporate activity report as a case study to illustrate the
successful adoption of cleaner production technology without a large investment. Ricoh has
successfully reduced its emissions of toxic chemical substances and intermediate chemical
inputs by improving the production process and product design with a new environmental
strategy. In 2010, Ricoh successfully reduced the amount of toxic chemical substances used and
emitted by 72.9% and 87.9%, respectively, compared to the fiscal 2000 level (Ricoh
Corporation, 2011). This large reduction was primarily achieved through the development of
improved product design using biomass resins and employee effort in the painting and washing
process. Ricoh’s environmental accounting finds 1.35 billion yen as the business area cost of
pollution abatement and 2.21 billion yen as the benefit from energy saving and improved waste
processing efficiency at the business site. This information demonstrates that appropriate
pollution abatement generates corporate profitability.
While, we observed the inverted U-shape relationship between CT and EEtoxic, which
represents growth of EEtoxic make increase CT until turning point. One interpretation of this
result is that CP approach possibly decrease required investment for pollution abatement and
production. As we explain using Ricoh’s case study in previous section, innovative production
process improvement make reduce firm’s required investment for production. Thus, this
investment saving affect increases CT. Another reason is that importance of green supply chain
management gets stronger in both domestic and global market due to stricter environmental
regulations such as RoHS and REACH district. Under these regulations focusing entire product
lifecycle, products made by using small amount of toxic chemical substances have market
competitiveness. Thus, positive relationship between EEtoxic and CT is exist.
However, this positive relationship is limited. Based on conclusions of Hibiki and
Managi (2010), it appears that the Japanese market does not have a strong interest in the
amounts of toxic substances that firms release or the associated risks. Because corporate toxic
chemical substances management does not directly affect stakeholder or consumer preferences,
EEtoxic is not related significantly to firm revenues.
From these results, inverted U-shape relationship between CT and EEtoxic can be
explained as follows. Positive relationship is cause by investment saving effect and supply
chain management requirement, while negative relationship after turning point is cause by
capital productivity decline due to excess investment for pollution abatement. Based on this
19
result, we conclude our results support hypothesis 2 and 3 about environmental performance
measured by toxic chemical substances.
<Table 5 about here>
6. Conclusion
In this study, we examined the relationship between environmental performance and economic
performance. Based on an empirical analysis of Japanese manufacturing firms, we find a
significant, positive relationship between two financial performance indexes (overall economic
performance and profitability) and environmental performance measured by CO2 emissions.
These results imply that firms improved their overall economic performance due to savings on
intermediate energy costs. Furthermore, reduction of CO2 emissions may not improve capital
productivity in the short term.
This evidence includes new implications that environmentally friendly behavior for
CO2 reduction is worthwhile for firms seeking to improve their profitability but not their capital
productivity. One interpretation of the results for capital productivity is the limited market
preference for environmental friendliness.
However, market preferences in Japan have become more sensitive to corporate
environmental management in recent years. For instance, Coca-Cola Limited (Japan) produced
a new bottled water product called “ILOHAS” in bottles weighing only 12 grams, which is 40%
less than the conventional product. This environmentally friendly product design was achieved
by using plant-based material. This product innovation was designed to reduce material flows
of production due to dematerialization and to save intermediate production costs. Additionally,
this innovative bottle can be crushed easily, which reduces the volume of waste. This
eco-friendly product design not only reduces production costs but also appeals to
environmentally conscious consumers. By January 2011, ILOHAS had sold more than eight
billion bottles since its release in 2009. This case study shows that environmentally friendly
products have made gains in market competitiveness in Japan.
In addition, using the integrated chemical substance risk score, we have demonstrated
that a significant, inverted U-shaped relationship between overall economic performance and
environmental performance. We also find that environmental performance measured by
20
integrated chemical substance risk score increases overall economic performance through
improvements in both corporate profitability and capital productivity. This evidence implies
that toxic chemical management is worthwhile for firms to increase their profitability and
capital productivity in some areas.
Overall, in this study we clarified a turning point in the relationship between
environmental efficiency measured by toxic risk and two economic performances (overall
economic performance and capital productivity). Environmental policy at the national level
needs to analyze the shift of inverted U-shape turning point to a more desirable direction. This
is because it encourages more manufacturing firms to take on environmental initiatives to gain
market competitiveness. Furthermore, there is no statistically significant relationship between
capital productivity and environmental efficiency measured by CO2 emissions. Another target
for sustainable development is to have positive relationship between them. To achieve above
goals, we make the following policy recommendations.
First, the government needs to promote industrial association to have workshops and
seminars to educate firms about reducing CO2 and toxic chemical substances emissions
effectively without large investment. This progressive approach helps reactive firms and firms
with low levels of environmental technology to reduce their emissions of pollutions without
damaging their economic performance.
Second, financial support for investment on environmentally production equipment is
important. Our research clarify that both CO2 and toxic chemical substances management
contribute to increase financial performance at the low environmental performance level. While,
small and medium scale firms have difficulty to invest for environmental protection due to
budget constraint even though they realize the positive effect between pollution reduction and
economic performance. To solve this problem, loan with low interest rate for environmental
protection investment is required.
Third, the construction of an environmental information disclosure system for the
product life cycle (e.g. carbon footprint) is important to develop incentives for manufacturing
firms to adopt proactive environmental management. This information disclosure system
provides a new evaluation criterion for consumers to choose products. Additionally,
government should carefully check the environmental information by enhance the monitoring
system of pollution emissions and set more strict penalty for incorrect information report.
Otherwise, firm has incentive to report incorrect information to have market competitiveness
21
because environmental information has asymmetry property. Under such a scheme,
manufacturing firms have an incentive to reduce environmental pollution because emission
reductions reflect to the market competitiveness of products.
Further research should investigate the differences between the environmental efforts
of firms in the service sectors in addition to the manufacturing sectors. Such an analysis could
clarify this causal relationship in relation to industrial characteristics. Based on individual
causal relationships, we can foster effective environmental policies that each firm needs to
achieve sustainable development.
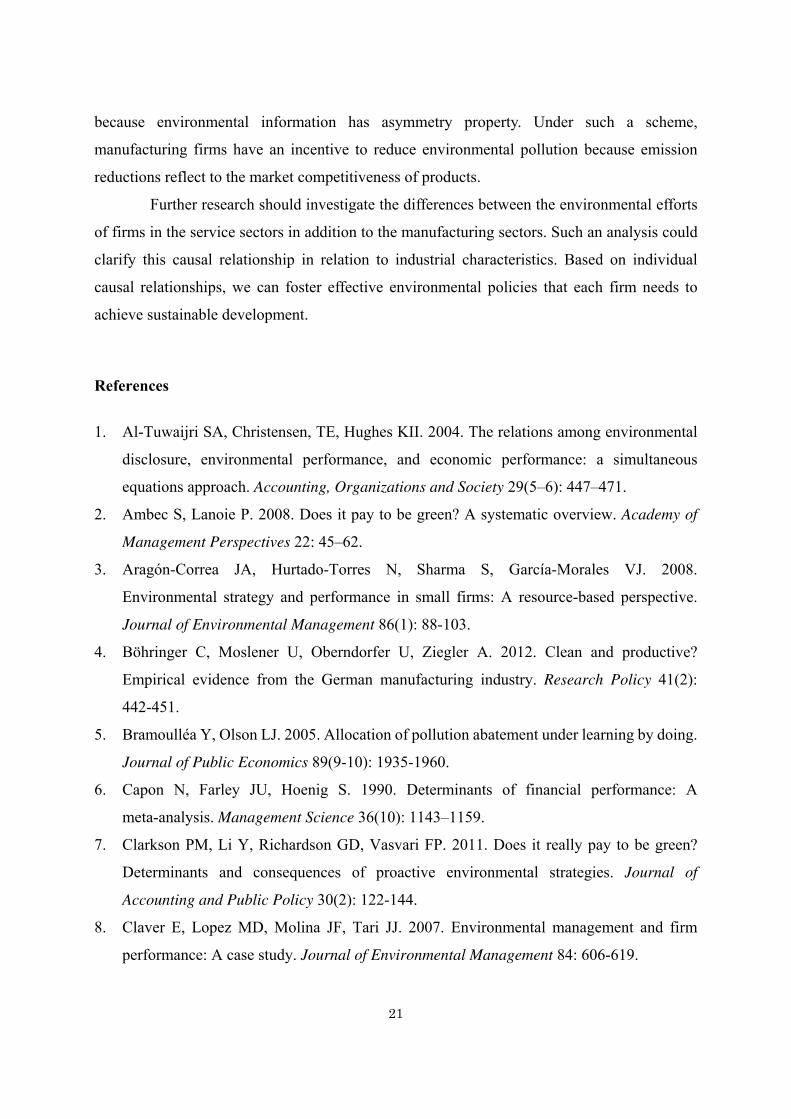
References
1. Al-Tuwaijri SA, Christensen, TE, Hughes KII. 2004. The relations among environmental
disclosure, environmental performance, and economic performance: a simultaneous
equations approach. Accounting, Organizations and Society 29(5–6): 447–471.
2. Ambec S, Lanoie P. 2008. Does it pay to be green? A systematic overview. Academy of
Management Perspectives 22: 45–62.
3. Aragón-Correa JA, Hurtado-Torres N, Sharma S, García-Morales VJ. 2008.
Environmental strategy and performance in small firms: A resource-based perspective.
Journal of Environmental Management 86(1): 88-103.
4. Böhringer C, Moslener U, Oberndorfer U, Ziegler A. 2012. Clean and productive?
Empirical evidence from the German manufacturing industry. Research Policy 41(2):
442-451.
5. Bramoulléa Y, Olson LJ. 2005. Allocation of pollution abatement under learning by doing.
Journal of Public Economics 89(9-10): 1935-1960.
6. Capon N, Farley JU, Hoenig S. 1990. Determinants of financial performance: A
meta-analysis. Management Science 36(10): 1143–1159.
7. Clarkson PM, Li Y, Richardson GD, Vasvari FP. 2011. Does it really pay to be green?
Determinants and consequences of proactive environmental strategies. Journal of
Accounting and Public Policy 30(2): 122-144.
8. Claver E, Lopez MD, Molina JF, Tari JJ. 2007. Environmental management and firm
performance: A case study. Journal of Environmental Management 84: 606-619.
22
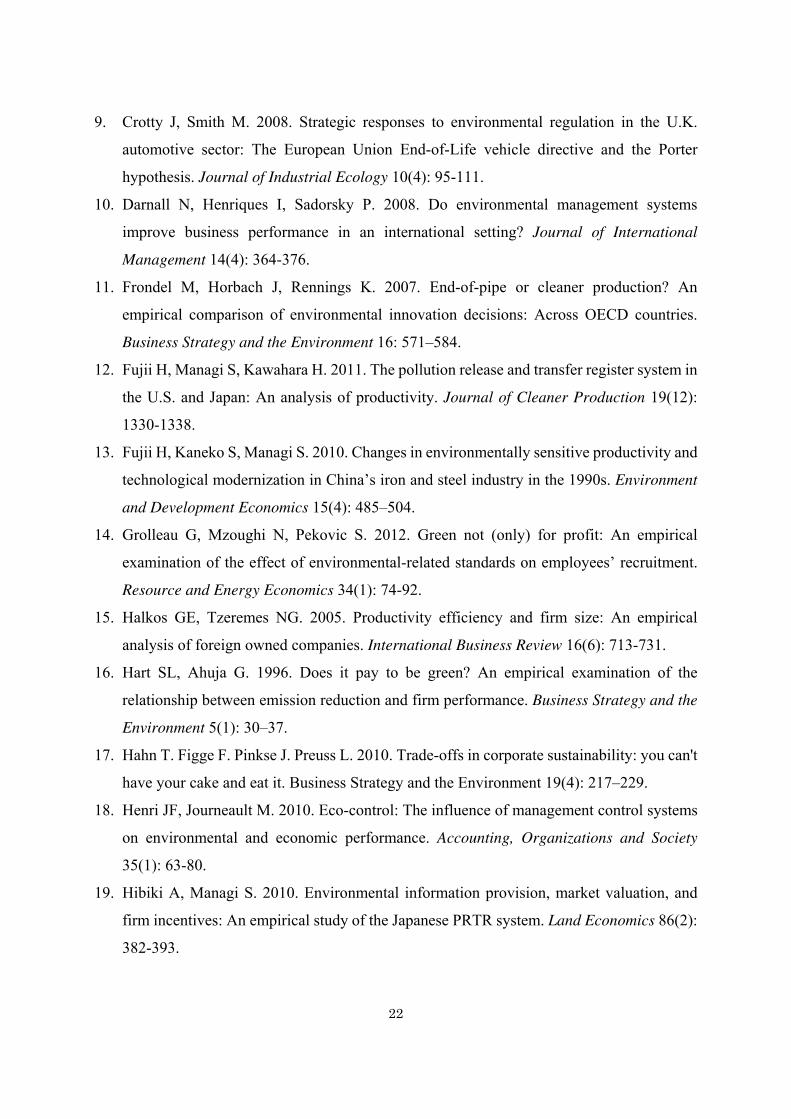
9. Crotty J, Smith M. 2008. Strategic responses to environmental regulation in the U.K.
automotive sector: The European Union End-of-Life vehicle directive and the Porter
hypothesis. Journal of Industrial Ecology 10(4): 95-111.
10. Darnall N, Henriques I, Sadorsky P. 2008. Do environmental management systems
improve business performance in an international setting? Journal of International
Management 14(4): 364-376.
11. Frondel M, Horbach J, Rennings K. 2007. End-of-pipe or cleaner production? An
empirical comparison of environmental innovation decisions: Across OECD countries.
Business Strategy and the Environment 16: 571–584.
12. Fujii H, Managi S, Kawahara H. 2011. The pollution release and transfer register system in
the U.S. and Japan: An analysis of productivity. Journal of Cleaner Production 19(12):
1330-1338.
13. Fujii H, Kaneko S, Managi S. 2010. Changes in environmentally sensitive productivity and
technological modernization in Chinaʼs iron and steel industry in the 1990s. Environment
and Development Economics 15(4): 485–504.
14. Grolleau G, Mzoughi N, Pekovic S. 2012. Green not (only) for profit: An empirical
examination of the effect of environmental-related standards on employees’ recruitment.
Resource and Energy Economics 34(1): 74-92.
15. Halkos GE, Tzeremes NG. 2005. Productivity efficiency and firm size: An empirical
analysis of foreign owned companies. International Business Review 16(6): 713-731.
16. Hart SL, Ahuja G. 1996. Does it pay to be green? An empirical examination of the
relationship between emission reduction and firm performance. Business Strategy and the
Environment 5(1): 30–37.
17. Hahn T. Figge F. Pinkse J. Preuss L. 2010. Trade-offs in corporate sustainability: you can't
have your cake and eat it. Business Strategy and the Environment 19(4): 217–229.
18. Henri JF, Journeault M. 2010. Eco-control: The influence of management control systems
on environmental and economic performance. Accounting, Organizations and Society
35(1): 63-80.
19. Hibiki A, Managi S. 2010. Environmental information provision, market valuation, and
firm incentives: An empirical study of the Japanese PRTR system. Land Economics 86(2):
382-393.

23
20. Iraldo F, Testa S, Frey M. 2009. Is an environmental management system able to influence
environmental and competitive performance? The case of the eco-management and audit
scheme (EMAS) in the European union. Journal of Cleaner Production 17(16):
1444-1452.
21. Iwata H, Okada K. 2011. How does environmental performance affect financial
performance? Evidence from Japanese manufacturing firms. Ecological Economics 70(9):
1691-1700.
22. Jasch C. 2006. How to perform an environmental management cost assessment in one day.
Journal of Cleaner Production 14: 1194-1213.
23. King AA, Lenox MJ. 2001. Does it really pay to be green? An empirical study of firm
environmental and financial performance. Journal of Industrial Ecology 5(1): 105–116.
24. Kjaerheim G. 2005. Cleaner production and sustainability. Journal of Cleaner Production
13(4): 329-339.
25. Konar S, Cohen MA. 2001. Does the market value environmental performance? Review of
Economics and Statistics 83(2): 281–289.
26. Meric I, McCall CW, Meric G. 2008. U.S. and Japanese Electronic and Electrical
Equipment Manufacturing Firms: A Comparison. International Bulletin of Business
Administration, 3: 1-5.
27. Nagahata T, Sekine T. 2005 Firm investment, monetary transmission and balance-sheet
problems in Japan: an investigation using micro data. Japan and the World Economy 17(3):
345–369.
28. Nakao Y, Amano A, Matsumura K, Genba K, Nakano M. 2007. Relationship between
environmental performance and financial performance: An empirical analysis of Japanese
corporations. Business Strategy and the Environment 16: 106-118.
29. Nishitani K, Kokubu K. 2011. Why Does the Reduction of Greenhouse Gas Emissions
Enhance Firm Value? The Case of Japanese Manufacturing Firms. Business Strategy and
the Environment (in press) DOI: 10.1002/bse.734.
30. Nishitani K, Kaneko S, Fujii H, Komatsu S. 2011. Effect of the reduction of pollution
emissions on the economic performance of firms: An empirical analysis focusing on
demand and productivity. Journal of Cleaner Production 19(17-18): 1956-1964.

24
31. Ogawa K. 2007. Debt, R&D Investment and Technological Progress: A Panel Study of
Japanese Manufacturing Firms in the 90s. Journal of the Japanese and International
Economies 21: 403-423.
32. Osawa Y, Yamasaki Y. 2005. Proposal of industrial research and development
performance indices. R&D Management 35(4): 455-461.
33. Palmer K, Oates WE, Portney PR. 1995. Tightening environmental standards: The
benefit-cost or the no-cost paradigm? Journal of Economic Perspectives 9(4): 119-132.
34. Panasonic group. 2010. ‘eco ideas’ Report 2010, Panasonic corporation.
35. Pedersen ER, Neergaard P. 2005. Caveat emptor – let the buyer beware! environmental
labelling and the limitations of ‘green’ consumerism. Business Strategy and the
Environment 15(1): 15-29.
36. Porter M. 1991. America's green strategy. Scientific American April: p. 96.
37. Porter ME, van der Linde C. 1995. Green and competitive: Ending the stalemate. Harvard
Business Review September – October: 121-134.
38. Remmen A, Lorentzen B. 2000. Employee participation and cleaner technology: learning
processes in environmental teams. Journal of Cleaner Production 8(5): 365-373.
39. Ricoh Corporation. 2011. Ricoh group sustainability (environmental) report 2011, Ricoh.
40. Rugman AM, Verbeke A. 1998. Corporate strategies and environmental regulations: An
organizing framework. Strategic Management Journal 19: 363–375.
41. Russo MV, Fouts PA. 1997. A resource-based perspective on corporate environmental
performance and profitability. Academy of Management Journal 40(3): 534-559.
42. Schaltegger S, Wagner M. 2011. Sustainable entrepreneurship and sustainability
innovation: categories and interactions. Business Strategy and the Environment 20(4):
222–237.
43. Steger U. 2004. The business of sustainability: building industry cases for corporate
sustainability. Hampshire: Palgrave Macmillan.
44. Stone L. 2000. When case studies are not enough: the influence of corporate culture and
employee attitudes on the success of cleaner production initiatives. Journal of Cleaner
Production 8(5): 353-359.
45. Testa F, Styles D, Iraldo F. 2012. Case study evidence that direct regulation remains the
main driver of industrial pollution avoidance and may benefit operational efficiency.
Journal of Cleaner Production 21(1), pp. 1-10.
25
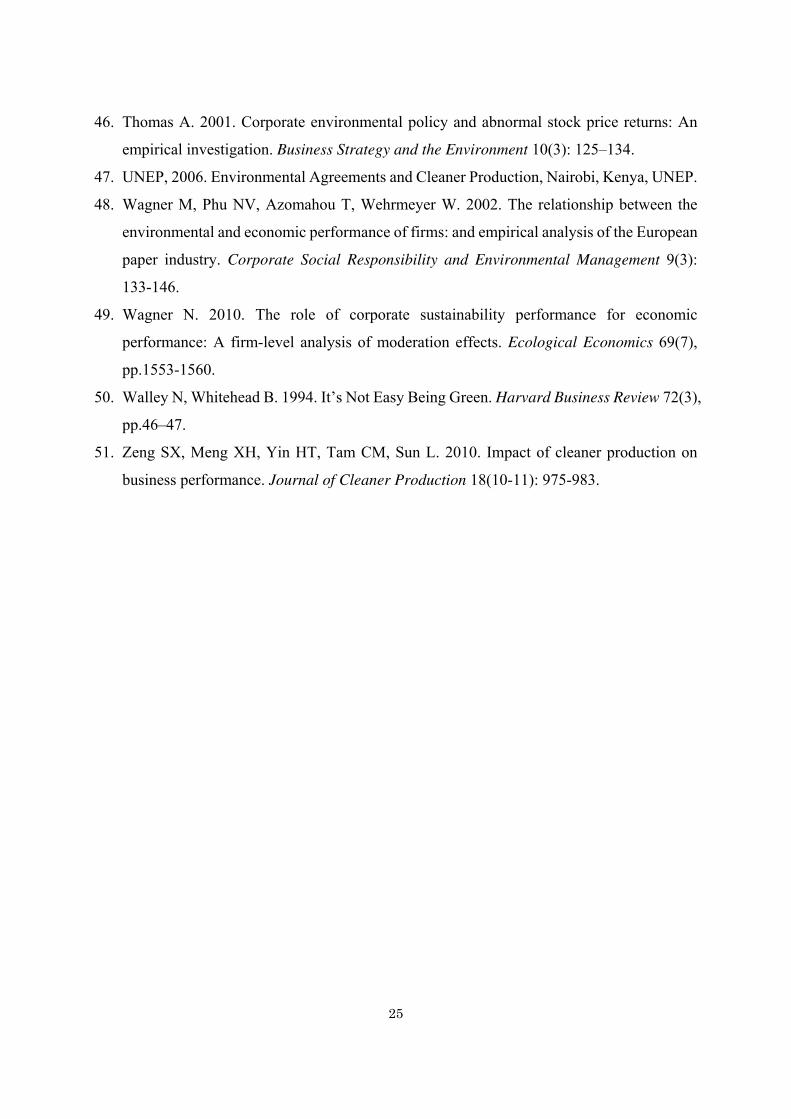
46. Thomas A. 2001. Corporate environmental policy and abnormal stock price returns: An
empirical investigation. Business Strategy and the Environment 10(3): 125–134.
47. UNEP, 2006. Environmental Agreements and Cleaner Production, Nairobi, Kenya, UNEP.
48. Wagner M, Phu NV, Azomahou T, Wehrmeyer W. 2002. The relationship between the
environmental and economic performance of firms: and empirical analysis of the European
paper industry. Corporate Social Responsibility and Environmental Management 9(3):
133-146.
49. Wagner N. 2010. The role of corporate sustainability performance for economic
performance: A firm-level analysis of moderation effects. Ecological Economics 69(7),
pp.1553-1560.
50. Walley N, Whitehead B. 1994. It’s Not Easy Being Green. Harvard Business Review 72(3),
pp.46–47.
51. Zeng SX, Meng XH, Yin HT, Tam CM, Sun L. 2010. Impact of cleaner production on
business performance. Journal of Cleaner Production 18(10-11): 975-983.
26
Sample A Sample B
Observation 758 2,498
Time Period 2006–2008 2001–2008
Environmental Data CO2 emissions Emissions form 134 toxic chemical substances
Data Source
The GHG Emissions accounting,
reporting and disclosure system
(Ministry of Environment, Japan)
Pollutant Release and Transfer Registration (PRTR)
(Ministry of Economy, Trade and Industry, Japan)
Economic Data (ECON) Return on assets (ROA), return on sales (ROS), capital turnover (CT)
Data Source Nikkei Economic Electronic Database Systems
Control Variables R&D expenditure relative to sales, capital investment relative to sales,
capital intensity, number of employees
Data Source Nikkei Economic Electronic Database Systems
Table 1. Description of Data Variables
Sample A (CO2 dataset) Sample B (Toxic chemical substances dataset)
Industry type Number of samples share Number of samples share
Rubber and Plastic 17 2.24% 63 2.52%
Paper and Pulp 18 2.37% 61 2.44%
Pharmaceutical 36 4.75% 78 3.12%
Chemicals and allied products 127 16.75% 565 22.62%
Industrial Machine 88 11.61% 369 14.77%
Automobile 60 7.92% 175 7.01%
Food 79 10.42% 131 5.24%
Precision instrument 22 2.90% 77 3.08%
Textile and apparels 28 3.69% 109 4.36%
Iron and Steel 40 5.28% 142 5.68%
Electric appliances 119 15.70% 348 13.93%
Electricity supply 14 1.85% 36 1.44%
Nonferrous metal 60 7.92% 212 8.49%
Transportation equipment 16 2.11% 55 2.20%
Glass and ceramics 34 4.49% 77 3.08%
Table 2. Sample Firm Distribution by Type of Industries
27
Sample A Sample B
Unit Mean S.D. Mean S.D.
ROA % 0.456 6.084 1.780 4.546
ROS % 0.244 11.354 1.919 9.152
CT % 0.925 0.431 88.568 37.680
SALE Million yen 2.27E+05 5.89E+05 1.72E+11 5.12E+11
CO2 100kg-CO2 2.75E+06 9.89E+06
PRTR gram 6.95E+09 2.24E+10
EECO2 Million yen/100kg-CO2 0.454 0.729
EEtoxic Million yen/gram 1.665 48.178
R&D Million yen 8,359 28,930 7951.24 33822.41
Invest Million yen 11,423 38,789 9585.15 35442.01
Intensity Billion yen/person 1.787 7.184 0.109 1.363
Emp 1,000 person 2.218 4.290 2.175 4.854
Obs 758 2,498
Table 3. Summary of data variables
Dependent Variable ROA ROS CT
Model 1 Model 2 Model 1 Model 2 Model 1 Model 2
EECO2 –1 0.540 *** 0.621 -0.500 -12.655 -11.753 -31.683
(EECO2)2
–1 -0.017 3.042 ** 4.988
R&D/Sales 3.652 3.488 -524.396 ** -533.906 ** -296.104 *** -311.697 ***
Invest/Sales 7.097 * 7.167 * -46.631 ** -46.149 ** -22.709 * -21.918 *
Emp -0.013 -0.013 4.614 4.506 -7.390 -7.567
Assets/Emp 1.982 2.037 542.950 ** 539.774 ** -400.283 *** -405.492 ***
Cons -2.274 *** -2.300 *** -22.262 -18.233 143.532 *** 150.139 ***
F value 14.700 *** 12.670 *** 11.180 *** 9.830 ***
Chi2 value 179.57 *** 179.230 ***
Model random random fixed fixed fixed fixed
Table 4. Results of analysis (EECO2 = Sales/CO2 emissions)
Note: *, **, and *** indicate statistical significance at the 10%, 5%, and 1% levels, respectively.
28
Dependent variable ROA ROS CT
Model 1 Model 2 Model 1 Model 2 Model 1 Model 2
EEtoxic –1 0.002 0.013 * 0.003 * 0.015 * 0.007 * 0.049 ***
(EEtoxic)2
–1 -5.6E-6 * -6.1E-6
-21.0E-6 ***
R&D/Sales 9.878 *** 9.943 *** 5.744 5.807 -64.857 ** -103.654 ***
Invest/Sales 1.300 1.298 -1.708 -1.715 -16.440 *** -21.463 ***
Emp 0.029 ** 0.029 ** 0.025 0.025 0.026 0.067
Asset/Emp -0.073 -0.073 -0.048 -0.048 0.049 0.040
Cons -1.737 *** -1.770 *** -2.795 *** -2.829 *** 93.540 *** 93.437 ***
F value 10.29 ***
Chi2 value 242.37 *** 260.57 *** 181.52 *** 219.96 *** 358.59 ***
Model random random random random fixed random
Table 5. Results of analysis (EEtoxic = Sales/Integrated risk score for PRTR emissions)
Note: *, **, and *** indicate statistical significance at the 10%, 5%, and 1% levels, respectively.
(A) Traditionalist (B) Revisionist (linear)
(D) Revisionist (Inverted U-shape)
Environmentalperformance
Economic performance
Economic performance
Economic performance
Environmentalperformance
Environmentalperformance
(C) Revisionist (U-shape curve)
Economic performance
Environmentalperformance
Figure 1. Relationship between economy and environment
29
Supplemental material.
List of 134 toxic chemical substances name.
CAS code Chemical name CAS code Chemical name CAS code Chemical name
75-07-0 Acetaldehyde 84-74-2 Dibutyl phthalate 139-13-9 Nitrilotriacetic acid
94-75-7 Acetic acid 95-50-1 Dichlorobenzene, 1,2- 98-95-3 Nitrobenzene
75-05 ー 8 Acetonitrile 106-46-7 Dichlorobenzene, 1,4- 55-63-0 Nitroglycerin
107-02-8 Acrolein 91-94-1 Dichlorobenzidine, 3,3'- 100-02-7 Nitrophenol, 4-
107-13-1 Acrylonitrile 107-06-2 Dichloroethane, 1,2- 86-30-6 Nitrosodiphenylamine, N-
15972-60-8 Alachlor 75-09-2 Dichloromethane 1910-42-5 Paraquat dichloride
107-18-6 Allyl alcohol 78-87-5 Dichloropropane, 1,2- 40487-42-1 Pendimethalin
107-05-1 Allyl chloride 542-75-6 Dichloropropylene, 1,3- 87-86-5 Pentachlorophenol
33089-61-1 Amitraz 62-73-7 Dichlorvos 52645-53-1 Permethrin
61-82-5 Amitrole 115-32-2 Dicofol 108-95-2 Phenol
62-53-3 Aniline 60-51-5 Dimethoate 95-54-5 Phenylenediamine, 1,2-
90-04-0 Anisidine, o- 119-93-7 Dimethylbenzidine, 3,3'- 108-45-2 Phenylenediamine, 1,3-
1332-21-4 Asbestos 88-85-7 Dinitrobutyl phenol 106-50-3 Phenylenediamine, p-
1912-24-9 Atrazine 51-28-5 Dinitrophenol, 2,4- 85-44-9 Phthalic anhydride
17804-35-2 Benomyl 123-91-1 Dioxane, 1,4- 88-89-1 Picric acid
71-43-2 Benzene 122-39-4 Diphenylamine 1336-36-3 Polychlorinated biphenyls
100-44-7 Benzyl chloride 330-54-1 Diuron 41198-08-7 Profenofos
75-25-2 Bromoform 106-89-8 Epichlorohydrin 23950-58-5 Pronamide
74-83-9 Bromomethane 110-80-5 Ethoxyethanol, 2- 709-98-8 Propanil
74-83-9 Bromomethane 140-88-5 Ethyl acrylate 2312-35-8 Propargite
106-99-0 Butadiene, 1,3- 100-41-4 Ethylbenzene 114-26-1 Propoxur
63-25-2 Carbaryl 107-21-1 Ethylene glycol 75-56-9 Propylene oxide
1563-66-2 Carbofuran 75-21-8 Ethylene oxide 110-86-1 Pyridine
75-15-0 Carbon disulfide 96-45-7 Ethylene thiourea 82-68-8 Quintozene
30
56-23-5 Carbon tetrachloride 13356-08-6 Fenbutatin oxide 76578-14-8 Quizalofop-ethyl
120-80-9 Catechol 55-38-9 Fenthion 122-34-9 Simazine
75-69-4 CFC-11 51630-58-1 Fenvalerate 100-42-5 Styrene
75-71-8 CFC-12 50-00-0 Formaldehyde 35400-43-2 Sulprofos
75-68-3 Chloro-1,1-difluoroethane, 1- 302-01-2 Hydrazine 127-18-4 Tetrachloroethylene
106-47-8 Chloroaniline, p- 123-31-9 Hydroquinone 28249-77-6 Thiobencarb
108-90-7 Chlorobenzene 330-55-2 Linuron 62-56-6 Thiourea
75-45-6 Chlorodifluoromethane 121-75-5 Malathion 137-26-8 Thiram
75-00-3 Chloroethane 108-31-6 Maleic anhydride 108-88-3 Toluene
67-66-3 Chloroform 12427-38-2 Maneb 26471-62-5 Toluene diisocyanate
74-87-3 Chloromethane 126-98-7 Methacrylonitrile 95-53-4 Toluidine, o-
76-06-2 Chloropicrin 94-74-6 Methoxone 52-68-6 Trichlorfon
1897-45-6 Chlorothalonil 109-86-4 Methoxyethanol, 2- 71-55-6 Trichloroethane, 1,1,1-
5598-13-0 Chlorpyrifos methyl 96-33-3 Methyl acrylate 79-00-5 Trichloroethane, 1,1,2-
120-71-8 Cresidine, p- 80-62-6 Methyl methacrylate 1582-09-8 Trifluralin
1319-77-3 Cresol 2439-01-2 Methyl-1,3-dithiolo[4,5-b]quinoxalin-2-one, 6- 108-05-4 Vinyl acetate
533-74-4 Dazomet 101-14-4 Methylenebis(2-chloroaniline), 4,4'- 75-35-4 Vinylidene chloride
1163-19-5 Decabromodiphenyl oxide 101-77-9 Methylenedianiline, 4,4'- 75-35-4 Vinylidene chloride
117-81-7 Di(2-ethylhexyl) phthalate 2212-67-1 Molinate 1330-20-7 Xylene
95-80-7 Diaminotoluene, 2,4- 300-76-5 Naled 12122-67-7 Zineb
333-41-5 Diazinon 7440-02-0 Nickel
Copyright © 2022 FDOKUMEN