The role of species functional traits in distributional patterns of lowland stream vegetation
13
The role of species functional traits in distributional patterns of lowland stream vegetation Author(s): Giulia Cavalli, Annette Baattrup-Pedersen, and Tenna Riis Source: Freshwater Science, Vol. 33, No. 4 (December 2014), pp. 1074-1085 Published by: The University of Chicago Press on behalf of Society for Freshwater Science Stable URL: http://www.jstor.org/stable/10.1086/678048 . Accessed: 10/12/2014 08:21 Your use of the JSTOR archive indicates your acceptance of the Terms & Conditions of Use, available at . http://www.jstor.org/page/info/about/policies/terms.jsp . JSTOR is a not-for-profit service that helps scholars, researchers, and students discover, use, and build upon a wide range of content in a trusted digital archive. We use information technology and tools to increase productivity and facilitate new forms of scholarship. For more information about JSTOR, please contact [email protected]. . The University of Chicago Press and Society for Freshwater Science are collaborating with JSTOR to digitize, preserve and extend access to Freshwater Science. http://www.jstor.org This content downloaded from 130.225.0.218 on Wed, 10 Dec 2014 08:21:13 AM All use subject to JSTOR Terms and Conditions
Transcript of The role of species functional traits in distributional patterns of lowland stream vegetation

The role of species functional traits in distributional patterns of lowland stream vegetationAuthor(s): Giulia Cavalli, Annette Baattrup-Pedersen, and Tenna RiisSource: Freshwater Science, Vol. 33, No. 4 (December 2014), pp. 1074-1085Published by: The University of Chicago Press on behalf of Society for Freshwater ScienceStable URL: http://www.jstor.org/stable/10.1086/678048 .
Accessed: 10/12/2014 08:21
Your use of the JSTOR archive indicates your acceptance of the Terms & Conditions of Use, available at .http://www.jstor.org/page/info/about/policies/terms.jsp
.JSTOR is a not-for-profit service that helps scholars, researchers, and students discover, use, and build upon a wide range ofcontent in a trusted digital archive. We use information technology and tools to increase productivity and facilitate new formsof scholarship. For more information about JSTOR, please contact [email protected].
.
The University of Chicago Press and Society for Freshwater Science are collaborating with JSTOR to digitize,preserve and extend access to Freshwater Science.
http://www.jstor.org
This content downloaded from 130.225.0.218 on Wed, 10 Dec 2014 08:21:13 AMAll use subject to JSTOR Terms and Conditions

The role of species functional traits in distributionalpatterns of lowland stream vegetation
Giulia Cavalli1,2, Annette Baattrup-Pedersen1,3, and Tenna Riis1,4
1Department of Bioscience, Aarhus University, Aarhus 8000, Denmark
Abstract: Aquatic macrophytes suffer from widespread and profound habitat deterioration that has led to dra-matic changes in species distributional patterns. We explored linkages between species functional traits andabundance patterns by analyzing mean community trait values in 1083 Danish lowland streams. We expectedthat widespread macrophytes would share common traits and that species with smaller ranges would be nega-tively associated with these traits. We selected 11 traits to characterize the ecological features of 52 amphibiousand submerged species. We examined the relationships between species abundance and species traits with mul-tivariate ordination and coinertia analysis (COIA), and identified groups of species with similar distributional pat-terns and ecological traits by hierarchical cluster analysis. Local abundance and geographical range size of sub-merged and amphibious species were significantly positively related. Species abundance and species traits tableswere significantly correlated, and species were separated into 5 groups based on life form, productivity, meristemcharacteristics, ability to fragment, and the size of the root-rhizome system. Widespread plant species in Danishlowland streams shared common traits, such as meristem, dispersal, and productivity characteristics, and we inferthat these traits are likely to have adaptive value in eutrophic and hydromorphologically disturbed habitats. Onthe other hand, species with narrower range sizes were characterized by a different set of trait characteristics.We conclude that species abundance and distribution patterns are closely correlated with ecological traitcharacteristics and that traits associated with resilience to anthropogenic disturbance confer success in Danishstreams.Key words: abundance patterns, disturbance, eutrophication, resilience, weed cutting, aquatic plants,macrophyte, COIA analyses
Loss of biodiversity in aquatic ecosystems is of growingconcern because many species are at risk of extinctionand because these losses disturb a wide range of ecosys-tem processes (Carpenter and Lodge 1986, Sala et al.2000, Cronk and Fennessy 2001, Malmqvist and Rundle2002, Edgerton et al. 2004). Aquatic macrophytes are oneof the most threatened groups (Preston and Croft 1997,Moser et al. 2002) and suffer from widespread and pro-found habitat deterioration that has led to spatial restric-tion of some formerly extensively distributed and abundantspecies (Riis and Sand-Jensen 2001).
Use of species trait–environment links to understandpatterns of species abundance is based on the hypothesisthat environmental conditions filter species so that spe-cies arriving from the regional species pool persist inlocal habitats only if functional, physiological, morpho-logical, or life-history traits are compatible with the habi-tat characteristics (Southwood 1988, Keddy 1992). Thus,quantification of the links between habitat conditions andfunctional traits can provide important insight into pro-
cesses regulating patterns of species distribution and canenable predictions of effects of environmental changes oncommunity composition (Weiher and Keddy 1999, Lavoreland Garnier 2002, McGill et al. 2006, Green et al. 2008,Lebrija-Trejos et al. 2010, Menezes et al. 2010, Webb et al.2010).
Various traits have been used to describe plant re-sponses to their environment, including life forms, growthforms, growth strategies, relative growth rates, photosyn-thetic pathways, leaf morphology traits, and leaf chemistrytraits. In freshwater ecosystems, changes in dominant planttraits associated with growth form have been used to inter-pret changes in species abundance patterns. Thus, Riis andSand-Jensen (2001) explained changes in the distributionof certain species within the genus Potamogeton over a100-y period by variability in morphological attributes.For instance, they observed an increase in species with anability to form a tall canopy or to ramify on the water sur-face, and this increase was inferred to be related to increasedturbidity of stream water (Riis and Sand-Jensen 2001). Wieg-
E-mail address: [email protected]; [email protected]; [email protected]
DOI: 10.1086/678048. Received 28 February 2013; Accepted 17 December 2014; Published online 3 September 2014.Freshwater Science. 2014. 33(4):1074–1085. © 2014 by The Society for Freshwater Science.
This content downloaded from 130.225.0.218 on Wed, 10 Dec 2014 08:21:13 AMAll use subject to JSTOR Terms and Conditions

leb et al. (1991) also used life-history attributes to explainchanges in the abundance of species, including the genus Po-tamogeton, in relation to human impacts in German rivers.
Studies on abundance patterns of aquatic plants have beenfocused on a few species with the goal to interpret changes intheir abundance patterns over time (Sand-Jensen et al. 2000,Riis and Sand-Jensen 2001). We moved a step further andexplored linkages among functional traits at the commu-nity level by analyzing mean community trait values inDanish lowland streams. Most Danish streams are influ-enced by human activities because of intensive agricul-tural, industrial, and residential development during thelast 150 y. Dam construction, flow regulation, and chan-nelization are widespread phenomena in Denmark, as isregular channel maintenance, such as weed cutting andsediment dredging, done to increase run-off from adja-cent fields. Furthermore, nutrient concentrations can bestrongly elevated in streams draining agricultural catch-ments because of nutrient pollution from point and diffusesources. Thus, annual means of total P are up to 5× higherin streams in catchments dominated by agriculture thanin streams in catchments dominated by natural vegetation(Wiberg-Larsen et al. 2010).
We used a common macroecological method (e.g.,Hanski 1982, Brown 1984, Gaston and Lawton 1990) tostudy species abundance patterns in streams. We analyzedthe relationship between the local abundance and geo-graphical range size of plants in Danish streams and inves-tigated to what extent we could explain species abundancepatterns from trait characteristics. We hypothesized that:1) macrophyte species with a wide range size and high localabundance in Danish streams would share common traits,and that these traits would be advantageous in anthropo-genically disturbed streams with frequent hydromorpho-logical disturbance and elevated nutrient concentrations;and 2) species with a narrow range size and lower localabundance would be characterized by different trait char-acteristics. To test these hypotheses, we used an extensivedata set including >1000 stream reaches randomly distrib-uted throughout Denmark. We allocated functional traitsto a range of aquatic species occurring in the stream reachesand analyzed the costructure between abundance patternsand ecological trait characteristics. We defined aquatic spe-cies as those living permanently submerged and those withan amphibious life form that enabled them to live sub-merged or emerged. We did not consider terrestrial speciesthat occasionally occurred in the stream environment.
METHODSStudy sites
Danish streams are generally small, shallow, and havegentle slopes (<5 m/km) and soft stream-bottom sedimentsthat consist primarily of sand and silt (Pedersen et al.2001). The dominant land use is agriculture (∼60%), and
>90% of the streams have been channelized to improvedrainage capacity. The average annual nutrient export is∼23 kg N/ha and 0.53 kg P/ha from loamy catchments,12 kg N/ha and 0.51 kg P/ha from sandy catchments, and2.3 kg N/ha and 0.079 kg P/ha in undisturbed catchments(Kronvang et al. 2006). The sizes of the streams included inour study ranged from very small (0.1 m wide, 0.1 m deep)to large (47 m wide, 125.5 cm deep). Alkalinity ranges from0.26 to 15.8 mEq/L, NH4
+ and NO3– range from 0.26 to
4.6 mg N/L, and PO43– ranges from 17 to 111 μg P/L.
Macrophyte, physical, and chemical dataWe used data from 1083 stream reaches that were geo-
graphically representative of Denmark and covered gra-dients in size, alkalinity, and type of catchment. We compiledthe data from previous research projects (Riis et al. 2000,Baattrup-Pedersen et al. 2002, 2003, Pedersen et al. 2006) andfrom Danish stream-monitoring programs (Skriver et al.1999). More information on the original data set can be ob-tained on request from the authors. Macrophyte data werecollected following the protocol described by Wiberg-Larsen et al. (2010). At each site, macrophyte cover wasrecorded in∼250 plots (25 × 25 cm) placed adjacently along10 cross-sectional transects at 100-m-long stream reaches.A cover score was allocated to each species present in theplots (scale: 1 = 1–5%, 2 = 6–25%, 3 = 26–50%, 4 = 51–75%,5 = 76–100%). Local abundance of each species at eachstream reach was calculated as the sum of its cover scoresdivided by the maximum possible sum of scores (i.e., thenumber of plots multiplied by the maximum score of 5).Denmark is considered 1 geographical unit. Therefore, therange size of each species estimated as the percentage of the1083 stream sites in which the species was present (Riis andSand-Jensen 2001). Therefore, the same data set and spatialresolution were used to estimate local abundance and rangesize of the species.
Trait dataWe used 11 traits to characterize the ecological features
of 52 amphibious and submerged species in the data set(Table 1). We extracted traits data from the literature andonline databases (Willby et al. 2000, Riis and Biggs 2001,Riis et al. 2001, Klotz et al. 2002, Kühn et al. 2004). Thetraits included life form (amphibious or submerged) andtraits related to dispersal, reproduction, and survival (Ta-ble 1). Local dispersal ability was inferred from the root-rhizome system and canopy spread, and regional dispersalability was extrapolated from the ability to disperse/repro-duce by fragmentation and by the number of seeds and re-productive organs. We integrated traits related to survival interms of overwintering organs, such as tubers, turions, andrhizomes, and in terms of regeneration after disturbance,e.g., position and number of meristems. We also included
Volume 33 December 2014 | 1075
This content downloaded from 130.225.0.218 on Wed, 10 Dec 2014 08:21:13 AMAll use subject to JSTOR Terms and Conditions

Ellenberg indicator values for light and productivity (light,N). The Ellenberg indicator values (Ellenberg et al. 1991)offer autecological information on the response of ∼2000species to a range of climatic and edaphic factors in centralEurope. The intuitive nature of the Ellenberg indicatorvalues has been criticized (Thompson et al. 1993), but theyare the most wide-ranging source of ecological informationon plant species available in Europe and are widely used inecological studies (Ertsen et al. 1998, van Landuyt et al.
2008, Dupré et al. 2010). All traits selected were continuousvariables. For some traits, allocation of trait to species wasbased on presence or absence of the attribute: 0 = absence,1 = occasionally, but not generally present, and 2 = attri-butes present for some traits (canopy, fragmentation, seeds,overwintering organs, and rhizomes). The number of repro-ductive organs was classified as low, medium, high, or veryhigh, with values ranging from 1 to 4 based on number ofindividuals (ind)–1 y–1. Life form was divided into 2 modali-
Table 1. Description and codes of 11 functional traits used to characterize macrophyte species. Traits give information on life form,dispersal (root-rhizome system, canopy spread), regional dispersal (fragmentation, seed, reproductive organs), survival (overwinteringorgans and meristem), and autecological characteristics provide information on light and productivity (Ellenberg indicator values).See text for explanation.
Traits Value Description Code
Life form Amphibious LF.A
Submerged LF.S
Ellenberg indicator value (light) LE
Ellenberg indicator value (N) NE
Root-rhizome system 0 Without large root-rhizome system root.rhizome1 With root-rhizome system <0.5 m in diameter during
growing season
2 With root-rhizome system >0.5 m in diameter duringgrowing season
Canopy 0 Without floating leaves (submerged) canopy
1 Intermediate or emergent species; when present only onthe edges, their shading ability is intermediate
2 With extensive apical ramification or formation offloating leaves (submerged)
Meristem Single apical growth point meris.sa
Single basal growth point meris.sb
Multiple apical growth points meris.ma
Species with single apical or multiapical growth points meris.sa.ma
No. reproductive organs y–1 ind–1 1 Low (<10) nreporg
2 Medium (10–100)
3 High (100–1000)
4 Very high (>1000)
Fragmentation 0 Absence of attribute frag
1 Indicating occasionally, but not generally exhibited
2 Presence of attribute
Overwintering organs 0 Absence of attribute overwintering.org
1 Indicating occasionally, but not generally exhibited
2 Presence of attribute
Seeds 0 Absence of attribute seeds
1 Indicating occasionally, but not generally exhibited
2 Presence of attribute
Rhizomes 0 Absence of attribute rhizomes
1 Indicating occasionally, but not generally exhibited
2 Presence of attribute
1076 | Functional traits in stream vegetation G. Cavalli et al.
This content downloaded from 130.225.0.218 on Wed, 10 Dec 2014 08:21:13 AMAll use subject to JSTOR Terms and Conditions

ties, submerged and amphibious, whereas meristem was di-vided into 4 modalities: single basal, multiapical, single api-cal, or multiapical–single apical. For these traits, specieswere given 0 if they had no link with the particular modalityor 1 if they did (Table 1).
Data analysesWe examined the relationships between submerged and
amphibious species abundance and trait variables with mul-tivariate ordination techniques. To analyze relationshipsbetween the spatial distribution of macrophyte species andtheir traits, we constructed 2 tables: 1 showing speciesabundance × site and 1 showing species abundance × traitcharacteristics. First, we analyzed each table separately.Then we used a coinertia analysis (COIA) to couple the2 tables (Dolédec et al. 1996, Dray et al. 2008). COIA is apowerful tool for analyzing the joint structure of distribu-tion and species attributes (Dray et al. 2003). The mainproperties of this approach are its descriptive power andability to analyze directly the relationships between spatialand ecological variability. We used principal componentsanalysis (PCA) to analyze the species abundance × sitetable (log[x]-transformed abundance data; 1083 sites ×52 species) and the species abundance × trait table (11 traits× 52 species). We used PCA because it gave the best classi-fication of the variables. In PCA, a distance matrix is con-structed based on Euclidian distance and is used to detect alinear combination of the original variables that maximizesthe variance. We linked the 2 tables with COIA, in whichthe costructure of the 2 tables was analyzed by maximizingcovariance between trait ordination scores and abundancescores in the PCA (Dray et al. 2003). We ran all analyses inR with the ade4 package (version 1.6-2; R Project for Statis-tical Computing, Vienna, Austria).
The output of the COIA was a matrix that summarizedtrait characteristics and abundance scores for each spe-cies. We used this matrix and hierarchical clustering anal-ysis in the stats package in R to identify groups of speciesthat shared distributional patterns and ecological traits.We cut the cluster dendrogram at 5 groups of species. AllR scripts are given in Appendix S1.
RESULTSWe encountered 194 species in the streams. Terrestrial
species constituted a very large group (142 species) com-pared to amphibious (27 species) and submerged speciesgroups (25 species; Table 2). Percent cover of amphibious(16%) and submerged species (15%) was ∼2× higher than% cover of terrestrial species (7%; Table 2).
Local abundance and range size analysis of streammacrophytes
Widely distributed species were generally locally abun-dant and included Berula erecta, Callitriche spp., Elodea
canadensis, Glyceria maxima, Lemna minor, Sparganiumemersum, and Sparganium erectum (Fig. 1). Local abun-dance and geographical range size of submerged and am-phibious species were positively but weakly related (r2 =0.20, p < 0.001; Fig. 1). Some species were more exten-sively distributed than expected from their local abundance(lower right area of Fig. 1), e.g., Alisma plantago-aquatica,Persicaria amphibia, Veronica beccabunga, and Menthaaquatica (Fig. 1), whereas other species were less widelydistributed than expected from their local abundance (up-per left area of Fig. 1), e.g., Glyceria notata, Juncus bulbo-sus, Lemna gibba, Myriophyllum spicatum, Potamogetonberchtoldii, Potamogeton friesii, Ranunculus baudotii, andZannichellia palustris.
Abundance and species traits analysisIn the PCA based on the variation in the species abun-
dance table (Fig. 2), the 1st axis was clearly related to localabundance. The most locally abundant and widespreadspecies identified in Fig. 1 were on the right in Fig. 2,whereas the least abundant species were on the left. Thefirst 4 axes of the PCA explained 54.5% of the variation(total inertia) in the original data set (Fig. 2), and the 1st
axis explained 28%.In the PCA based on the variation in the species trait
table (Fig. 3), the 1st axis was correlated mainly with lifeform (amphibious: r = 0.48, submerged: r = 0.48), whereasthe 2nd axis was correlated with number of reproductiveorgans (r = 0.46) and rhizomes (r = –0.49), and the 3rd
axis was correlated with meristem characteristics (singlebasal: r = 0.40, multiapical: r = –0.46). The total variationexplained in the species trait table was 47%, and the 1st
axis explained 22%.COIA groups species with similar abundance and trait
characteristics. In the diagram, each species is representedby a vector. Its origin indicates species abundance, and the
Table 2. Total number of submerged, amphibious, andterrestrial plant species and their median local abundance (%cover; see text for explanation) along 1083 reaches in Danishstreams.
VariableNumber ofspecies
Median(%)
Maximum(%)
Minimum(%)
Totalspecies 194 55 97 0.1
Submergedspecies 25 15 97 0.1
Amphibiousspecies 27 16 87 0.1
Terrestrialspecies 142 7 93 0.1
Volume 33 December 2014 | 1077
This content downloaded from 130.225.0.218 on Wed, 10 Dec 2014 08:21:13 AMAll use subject to JSTOR Terms and Conditions

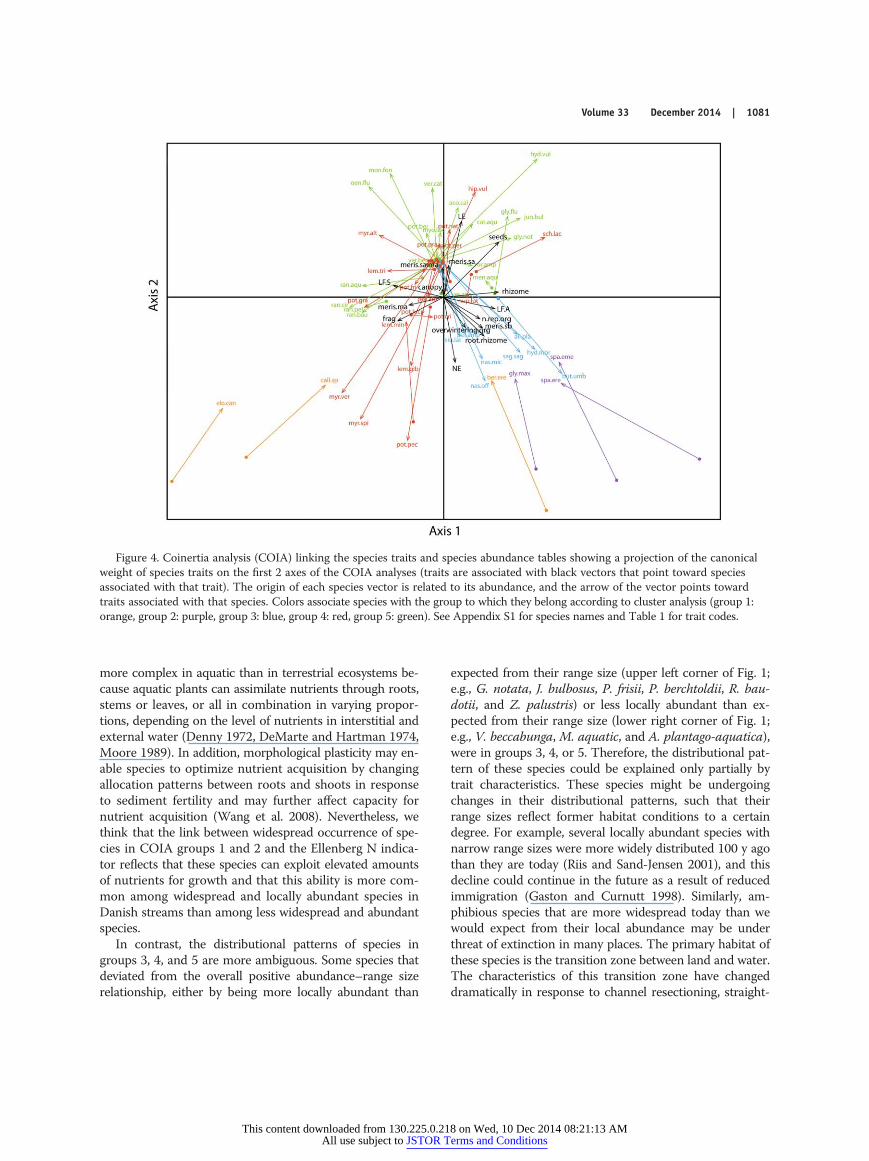
arrow of the vector points toward traits associated withthat particular species (Fig. 4). The 1st axis separated spe-cies based on life form, presence of rhizomes, meristemcharacteristics, and ability of fragment (Table 3). Amphibi-ous species (to the right) had high local dispersal throughroot-rhizome systems and single basal meristems, and sub-merged species (to the left) had high fragmentation abilityand multiple apical meristems (Fig. 4). We did not considerseed production further because it was strongly related tothe presence of Elodea canadensis, which was the only spe-cies without seed production. The 2nd axis separated spe-cies based on their Ellenberg light and N indicator valuesand the presence of single apical meristems (Fig. 4). The
3rd axis separated species with high production of over-wintering organs, reproductive organs, and large canopyformation (Table 3). Overall, the analysis separated spe-cies growing from a basal meristem with high productiv-ity (high Ellenberg N indicator value) and a large root-rhizome system (lower part of Fig. 4) from species growingfrom a single apical meristem with high Ellenberg lightindicator values (upper part of Fig. 4). Moreover, specieswith an amphibious life form growing from a single basalmeristem were separated along the 1st axis from specieswith a submerged life form and a high fragmentation abil-ity growing from multiple apical meristems. The COIA wassignificant (RV = 0.2, p < 0.1; Fig. 3). The first 3 axes ex-
Figure 1. Linear regression between mean local abundance and range size for amphibious and submerged species at 1083 sites inDanish streams. See text for details of calculation of range size and local abundance. Numbers associated with species indicate thegroups to which they belong according to coinertia and cluster analyses. See Appendix S2 for species names.
1078 | Functional traits in stream vegetation G. Cavalli et al.
This content downloaded from 130.225.0.218 on Wed, 10 Dec 2014 08:21:13 AMAll use subject to JSTOR Terms and Conditions

plained 64% of the total inertia (1st: 27%, 2nd: 19%, 3rd: 18%,respectively).
We identified 5 groups of species that shared abun-dance and trait characteristics based on the cluster analysisof axes 1–3 scores from the COIA (Fig. 5). Widespread andlocally abundant species were those belonging to groups 1and 2 (inferred from the position of species origins [dots]in Fig. 4). Species associated with groups 3 to 5 were lesswidespread and abundant. The first 2 groups included spe-cies with high Ellenberg N values (inferred from the direc-tion of the arrow of the Ellenberg N vector that pointsdown toward species from groups 1 and 2). High Ellenberg
N values indicate an ability to exploit elevated concentra-tions of nutrients for growth. Therefore, these 2 groups arelikely to be successful in eutrophic habitats. Group 1 in-cluded species with an amphibious life form (Fig. 4) andlarge root-rhizome systems. These species also have a largenumber of rhizomes and reproductive organs, and theyproduce large amounts of seeds. Group 2 included specieswith a submerged life form (Fig. 4). Species in this groupdisperse by shoot fragmentation and regenerate throughgrowth from multiapical meristems, as opposed to speciesin group 1 that grow from a single basal meristem. Group3 included species possessing traits very similar to those ofgroup 2, but species within this group were less wide-spread. These species have a submerged life form, growfrom multiapical meristems, have an extensive ability tofragment, and form a high canopy (Fig. 4). Group 4 specieshad traits similar to those of group 1 species, but group 4species were less widespread. Species in this group had anamphibious life form, a large number of reproductiveorgans, a large root-rhizome system, and high seed produc-tion (Fig. 4). Group 5 species had functional traits con-trasting those possessed by groups 1 and 2, and most group5 species grow from a single apical meristem (Fig. 4).
Species with a narrow geographical range size and lowlocal abundance do not share traits with the most wide-spread and locally abundant species and are not repre-sented in the 2 most abundant groups (1 and 2). All belongto the less widespread species groups (3, 4, 5). Many locallyabundant species are regionally rare (upper left corner ofFig. 1), have low Ellenberg N values ( J. bulbosus, P. berch-toldii, P. friesii, Potamogeton perfoliatus) and low over-wintering capacity (G. notate, J. bulbosus, R. baudotii).Moreover, some of them grow from a single apical meri-stem (G. notate, P. berchtoldii), and some have limited dis-persal by fragmentation (G. notate, J. bulbosus, Z. palustris).Widespread species with low local abundance (lower rightcorner of Fig. 1) belonged to groups 4 and 5 and were pri-marily amphibious.
DISCUSSIONOverall, the relationship between local abundance and
range size was positive, as was observed in a previous study(Riis and Sand-Jensen 2002). This result indicates thatmetapopulation dynamics are important to species distri-bution in streams. We think it likely that disturbance alsoinfluences the abundance–range size relationship. Fre-quent disturbances caused by natural changes in water ve-locity, sediment mobility during high flow, disturbance byanimals (e.g., herbivory), or weed cutting, which is doneregularly in most Danish streams, inevitably result inbreakage of plant stems or erosion of whole plant beds.Therefore, high local species abundance probably increasesthe number of fragments that can settle and colonize newhabitats downstream. These processes reduce the probabil-
Figure 2. Results of the Principal Components Analysis(PCA) of log(x)-transformed species local abundance at 1083sites in Danish streams (see text for details of calculation; allsites had ≥5% cover). Arrows show the abundance of thespecies. See Appendix S2 for species names.
Volume 33 December 2014 | 1079
This content downloaded from 130.225.0.218 on Wed, 10 Dec 2014 08:21:13 AMAll use subject to JSTOR Terms and Conditions

ity of local extinction and promote occupancy of wide-spread habitats, which overall, translates into a positive re-lationship between local abundance and range size ofspecies (Hanski 1991, Nee et al. 1991).
In accordance with our 1st hypothesis, the most wide-spread and locally abundant species in Danish streams(COIA groups 1 and 2; Fig. 1) shared traits that are likely tohave an adaptive value in disturbed stream habitats. Bothgroups were small with only few species. COIA group 1consisted of 3 amphibious species, whereas COIA group 2consisted of 2 submerged and 1 amphibious species. Spe-cies in both groups have the ability to regenerate rapidly
following disturbance by growing from basal meristems andhave the ability to colonize new habitats efficiently, a traitthought to be a prerequisite for tolerating physical distur-bance in streams (Grime 1979, Peterson 1996). Species ingroups 1 and 2 also had high Ellenberg N indicator values,indicating that these species grow in nutrient-rich waters. Adirect link between high productivity values and nutrientavailability should be interpreted with caution because fewattempts have been made to evaluate the utility of EllenbergN indicator values as indicators for nutrients in freshwaterecosystems (Szoszkiewicz et al. 2006). Linkages betweennutrient availability and plant productivity are likely to be
Figure 3. Results of the Principal Components Analysis (PCA) of log(x)-transformed trait characteristics of the species. Species areplotted on the first 2 axes of the PCA analyses, and traits are plotted as vectors. See Appendix S2 for species names and Table 1 fortrait codes.
1080 | Functional traits in stream vegetation G. Cavalli et al.
This content downloaded from 130.225.0.218 on Wed, 10 Dec 2014 08:21:13 AMAll use subject to JSTOR Terms and Conditions
more complex in aquatic than in terrestrial ecosystems be-cause aquatic plants can assimilate nutrients through roots,stems or leaves, or all in combination in varying propor-tions, depending on the level of nutrients in interstitial andexternal water (Denny 1972, DeMarte and Hartman 1974,Moore 1989). In addition, morphological plasticity may en-able species to optimize nutrient acquisition by changingallocation patterns between roots and shoots in responseto sediment fertility and may further affect capacity fornutrient acquisition (Wang et al. 2008). Nevertheless, wethink that the link between widespread occurrence of spe-cies in COIA groups 1 and 2 and the Ellenberg N indica-tor reflects that these species can exploit elevated amountsof nutrients for growth and that this ability is more com-mon among widespread and locally abundant species inDanish streams than among less widespread and abundantspecies.
In contrast, the distributional patterns of species ingroups 3, 4, and 5 are more ambiguous. Some species thatdeviated from the overall positive abundance–range sizerelationship, either by being more locally abundant than
expected from their range size (upper left corner of Fig. 1;e.g., G. notata, J. bulbosus, P. frisii, P. berchtoldii, R. bau-dotii, and Z. palustris) or less locally abundant than ex-pected from their range size (lower right corner of Fig. 1;e.g., V. beccabunga, M. aquatic, and A. plantago-aquatica),were in groups 3, 4, or 5. Therefore, the distributional pat-tern of these species could be explained only partially bytrait characteristics. These species might be undergoingchanges in their distributional patterns, such that theirrange sizes reflect former habitat conditions to a certaindegree. For example, several locally abundant species withnarrow range sizes were more widely distributed 100 y agothan they are today (Riis and Sand-Jensen 2001), and thisdecline could continue in the future as a result of reducedimmigration (Gaston and Curnutt 1998). Similarly, am-phibious species that are more widespread today than wewould expect from their local abundance may be underthreat of extinction in many places. The primary habitat ofthese species is the transition zone between land and water.The characteristics of this transition zone have changeddramatically in response to channel resectioning, straight-
Figure 4. Coinertia analysis (COIA) linking the species traits and species abundance tables showing a projection of the canonicalweight of species traits on the first 2 axes of the COIA analyses (traits are associated with black vectors that point toward speciesassociated with that trait). The origin of each species vector is related to its abundance, and the arrow of the vector points towardtraits associated with that species. Colors associate species with the group to which they belong according to cluster analysis (group 1:orange, group 2: purple, group 3: blue, group 4: red, group 5: green). See Appendix S1 for species names and Table 1 for trait codes.
Volume 33 December 2014 | 1081
This content downloaded from 130.225.0.218 on Wed, 10 Dec 2014 08:21:13 AMAll use subject to JSTOR Terms and Conditions

ening and dredging of streams, and drainage of adjacentriparian areas (Pedersen et al. 2006). Thus, the habitat areaavailable for these species has declined.
In general, rare species with a narrow geographicalrange size were negatively associated with traits likely toprovide tolerance to anthropogenic disturbances, a resultin accordance with our 2nd hypothesis. Thus, most sub-merged species from group 5 grow from a single apicalmeristem, and have limited dispersal by fragmentation, lowoverwintering ability, and low Ellenberg N indicator values.This combination of traits suggests that they have a re-stricted ability to exploit elevated nutrient concentrationsin the stream or in the land–water transition zone. Group5 species also have restricted regional dispersal and arelikely to suffer severely from local impacts of weed cuttingand eutrophication. In particular, the position and numberof growth meristems may be critical. Species with a singlebasal or with multiapical meristems are likely to have highresilience to weed cutting and may even benefit from theimproved light conditions after cutting, whereas species witha single apical meristem, like many of the group 5 species,may stop growing after cutting and, over time, may disappearfrom intensively cut reaches (Baattrup-Pedersen et al. 2002).This destiny is even more likely if nutrient concentrations arehigh because fast growth of highly productive species mayrestrict light availability and, consequently, the ability of slow-growing species to regrow following cutting.
Species in groups 3 and 4 had several traits in commonwith those of COIA groups 1 and 2, but in general, the
Table 3. Correlation ratios (RS1, RS2, RS3) between traits andthe first 3 axes of the coinertia analysis. Numbers in boldindicate the traits most correlated with each axis. See Table 1for trait codes.
Trait RS1 RS2 RS3
LF.A 0.35 –0.08 –0.17
LF.S –0.38 0.08 0.17
LE 0.12 0.54 0.18
NE 0.08 –0.47 –0.14
root.rhizome 0.29 –0.28 –0.11
canopy –0.02 0.05 0.37
meris.ma –0.25 –0.06 –0.23
meris.sb 0.27 –0.22 0.35
meris.sa 0.03 0.22 –0.13
meris.sa.ma –0.01 0.20 –0.01
rhizome 0.39 0.03 0.08
frag –0.33 –0.17 –0.30
overwintering.org 0.15 –0.21 0.49
seeds 0.39 0.39 –0.34
n.rep.org 0.25 –0.15 –0.29
Figure 5. Dendrogram resulting from the clustering analysisof species according to biological and ecological traits usingWard’s sum-of-squares method on the Euclidean distancebased on coordinates of species on the first 3 axes in coinertiaanalysis. Species are divided into 5 groups. See Appendix S2 forspecies names.
1082 | Functional traits in stream vegetation G. Cavalli et al.
This content downloaded from 130.225.0.218 on Wed, 10 Dec 2014 08:21:13 AMAll use subject to JSTOR Terms and Conditions
species in these groups were less widespread. We wereunable to identify any traits that could explain why thesespecies were less successful than those in groups 1 and 2in Danish streams, possibly because we did not includesome traits that are important determinants of speciesabundance patterns. For example, availability of dissolvedinorganic C is a key driver of macrophyte communitycomposition in freshwaters (e.g., Riis et al. 2001). Mostsubmerged species in Danish streams exploit inorganic Cefficiently because they have inducible C-concentratingmechanisms based on active uptake of HCO3
–, but differ-ences in CO2 and HCO3
– uptake efficiency among somespecies may affect species abundance patterns. For exam-ple, the findings that species in group 1 were more wide-spread than species in group 4 and that species in group 2were more widespread than species in group 3 may derivefrom differences in their inorganic C uptake efficiency.Elodea canadensis (group 2) uses HCO3
– more efficientlythan Potamogeton crispus (group 3) and Myriophyllumalterniflorum (group 3) do (Allen and Spence 1981), al-though M. spicatum (group 3) may use HCO3
– more effi-ciently than E. canadensis (Allen and Spence 1981).
Differences in C uptake efficiency also have been ob-served among amphibious species. Amphibious hetero-phyllous species like Sparganium sp. (group 1) have moreefficient C uptake than amphibious homophyllous specieslike Myosotis laxa (group 5), Veronica anagallis-aquatic(group 5), and B. erecta (group 2) (Sand-Jensen and Frost-Christensen 1998). However, the submerged aquaticleaves of B. erecta have higher ambient photosynthesisand CO2 conductance than the submerged leaves of M.aquatic (group 5). Therefore, the high photosynthetic effi-ciency of B. erecta may add to the explanation of theparticularly high success of this species in Danish streamsbecause a high photosynthetic rate under water gives thisspecies a competitive advantage at the land–water inter-face during periods of submergence. The possibility existsthat clearer separation of groups would have occurredhad we included traits related to efficiency of nutrient usebecause photosynthetic efficiency can vary with nutrientavailability within plants (Baattrup-Pedersen et al. 2013b).
In conclusion, our results suggest that successful speciesin Danish streams share a range of traits that are likely togive them a competitive advantage in anthropogenically dis-turbed habitats. We infer that the major reason for thewidespread occurrence of species in groups 1 and 2 is theirability to persist in streams subjected to frequent weed cut-ting. The high productivity of these species indicates thatanother important reason for their success is their ability tocompete successfully in habitats receiving high nutrientloads (Larsen et al. 2008). Our findings for lowland streamsresemble those from other ecosystems for which successfulplant traits have been identified as those associated with ahighly competitive life strategy (Leishman and Westoby
1992). For example, in lakes, the species that predominateare those that possess traits associated with the ability toproduce large peak biomasses and high canopies that max-imize resource capture and survival (Keddy and Shipley1989, Murphy et al. 1990, Hills et al. 1994). In wetlands,fast-growing and tall species able to allocate high amountsof nutrients into growth can outcompete slow-growingspecies because of intense competition for light (Givnish1982, Baattrup-Pedersen et al. 2013a).
ACKNOWLEDGEMENTSWe thank the Danish Natural Science Research Council,
Aarhus University, and the European Union 7th Framework Proj-ect REFORM under contract no. 282656 for financial support andSøren Erik Larsen for statistical advice.
LITERATURE CITEDAllen, E. D., and D. H. N. Spence. 1981. The differential ability
of aquatic plants to utilize the inorganic carbon supply infresh water. New Phytologist 87:269–283.
Baattrup-Pedersen, A., C. C. Hoffmann, J. Audet, H. E. Andersen,T. Riis, S. E. Larsen, and B. Kronvang. 2013a. Groundwaternitrogen and the distribution of groundwater-dependent vege-tation in riparian areas in agricultural catchments. EcologicalEngineering 66:111–119.
Baattrup-Pedersen, A., S. E. Larsen, and T. Riis. 2002. Long-term effects of stream management on plant communitiesin two Danish lowland streams. Hydrobiologia 481:33–45.
Baattrup-Pedersen, A., S. E. Larsen, and T. Riis. 2003. Composi-tion and richness of macrophyte communities in small Danishstreams: influence of environmental factors and weed cutting.Hydrobiologia 495:171–179.
Baattrup-Pedersen, A., T. V. Madsen, T. Riis, and G. Cavalli.2013b. Photosynthetic performance of submerged macro-phytes from lowland stream and lake habitats with contrastingCO2 availability. New Phytologist 198:1135–1142.
Brown, J. H. 1984. On the relationship between abundance anddistribution of species. American Naturalist 124:255–279.
Carpenter, S. R., andD.M. Lodge. 1986. Effects of submersedmacro-phytes on ecosystem processes. Aquatic Botany 26:341–370.
Cronk, J. K., and M. S. Fennessy. 2001. Wetland plants: biologyand ecology. 1st edition. Lewis Publishers, Boca Raton, Florida.
DeMarte, J. A., and R. T. Hartman. 1974. Studies on absorptionof P-32, Fe-59 and Ca-45 by water-milfoil (Myriophyllumexalbescens Fernald ). Ecology 55:188–199.
Denny, P. 1972. Sites of nutrient absorption in aquatic macro-phytes. Journal of Ecology 60:819–829.
Dolédec, S., D. Chessel, C. J. F. ter Braak, and S. Champely.1996. Matching species traits to environmental variables: anew three-table ordination method. Environmental and Eco-logical Statistics 3:143–166.
Dray, S., D. Chessel, and J. Thioulouse. 2003. Co-inertia analysisand the linking of ecological data tables. Ecology 84:3078–3089.
Dray, S., S. Saïd, and F. Débias. 2008. Spatial ordination of vegeta-tion data using a generalization of Wartenberg’s multivariatespatial correlation. Journal of Vegetation Science 19:45–56.
Volume 33 December 2014 | 1083
This content downloaded from 130.225.0.218 on Wed, 10 Dec 2014 08:21:13 AMAll use subject to JSTOR Terms and Conditions

Dupré, C., C. J. Stevens, T. Ranke, A. Bleeker, C. Peppler-Lisbach,D. J. G. Gowing, N. B. Dise, E. Dorland, R. Bobbink, and M.Diekmann. 2010. Changes in species richness and compositionin European acidic grasslands over the past 70 years: the con-tribution of cumulative atmospheric nitrogen deposition.Global Change Biology 16:344–357.
Edgerton, B. F., P. Henttonen, J. Jussila, A. Mannonen, P.Paasonen, T. Taugbøl, L. Edsman, and C. Souty-Grosset. 2004.Understanding the causes of disease in European freshwatercrayfish. Conservation Biology 18:1466–1474.
Ellenberg, H., H. E. Weber, R. Düll, V. Wirth, W. Werner, and D.Paulissen. 1991. Zeigerwerte von Pflanzen in Mitteleuropa.Scripta Geobotanica 18:1–248.
Ertsen, A. C. D., J. R. M. Alkemade, and M. J. Wassen. 1998.Calibrating Ellenberg indicator values for moisture, acidity,nutrient availability and salinity in the Netherlands. PlantEcology 135:113–124.
Gaston, K., and J. L. Curnutt. 1998. The dynamics of abundance-range size relationships. Oikos 81:38–44.
Gaston, K., and J. H. Lawton. 1990. Effects of scale and habitaton the relationship between regional distribution and localabundance. Oikos 58:329–335.
Givnish, T. J. 1982. On the adaptive significance of leaf heightin forest herbs. American Naturalist 120:353–381.
Green, J. L., B. J. M. Bohannan, and R. J. Whitaker. 2008. Mi-crobial biogeography: from taxonomy to traits. Science320:1039–1043.
Grime, J. P. 1979. Plant strategies and vegetation processes. 1st
edition. John Wiley and Sons, New York.Hanski, I. 1982. Dynamics of regional distribution: the core and
satellite species hypothesis. Oikos 38:210–221.Hanski, I. 1991. Single-species metapopulation dynamics:
concepts, models and observations. Biological Journal of theLinnean Society 42:17–38.
Hills, J. M., K. J. Murphy, I. D. Pulford, and T. H. Flowers.1994. A method for classifying European riverine wetlandecosystems using functional vegetation groups. FunctionalEcology 8:242–252.
Keddy, P. A. 1992. Assembly and response rules: two goals forpredictive community ecology. Journal of Vegetation Science3:157–164.
Keddy, P. A., and B. Shipley. 1989. Competitive hierarchies inherbaceous plants communities. Oikos 54:234–241.
Klotz, S., I. Kühn, and W. Durka. 2002. BIOLFLOR — EineDatenbankzubiologisch-ökologischen Merkmalen der Gefäßp-flanzen in Deutschland. Schriftenreihe für Vegetationskunde.Bundesamt für Naturschutz, Bonn, Germany (in German).
Kronvang, B., R. Grant, C. C. Hoffmann, N. B. Ovesen Morten,and L. Pedersen. 2006. Hydrology, sediment transport andwater chemistry in running water. Pages 27–45 in K. Sand-Jensen, N. Friberg, and J. Murphy (editors). Running waters.National Resources Institute, Silkeborg, Denmark.
Kühn, I., W. Durka, and S. Klotz. 2004. BiolFlor: A new plant-trait database as a tool for plant invasion ecology. Diversityand Distributions 10:363–365.
Larsen, M. A. D., H. Soegaard, and K. Hinsby. 2008. Temporaltrends in N and P concentrations and loads in relation toanthropogenic effects and discharge in Odense River 1964–2002. Hydrology Research 39:41–54.
Lavorel, S., and E. Garnier. 2002. Predicting changes in communitycomposition and ecosystem functioning from plant traits:revisiting the Holy Grail. Functional Ecology 16:545–556.
Lebrija-Trejos, E., E. A. Perez-Garcia, J. A. Meave, F. Bongers, andL. Poorter. 2010. Functional traits and environmental filteringdrive community assembly in a species-rich tropical system.Ecology 91:386–398.
Leishman, M. R., and M. Westoby. 1992. Classifying plants intogroups on the basis of associations of individual traits evidencefrom Australian semi-arid woodlands. Journal of Ecology 80:417–424.
Malmqvist, B., and S. Rundle. 2002. Threats to the running waterecosystems of the world. Environmental Conservation 29:134–153.
McGill, B. J., B. J. Enquist, E. Weiher, and M. Westoby. 2006.Rebuilding community ecology from functional traits. Trendsin Ecology and Evolution 21:178–185.
Menezes, S., D. J. Baird, and A. M. V. M. Soares. 2010. Beyondtaxonomy: a review of macroinvertebrate trait-based com-munity descriptors as tools for freshwater biomonitoring.Journal of Applied Ecology 47:711–719.
Moore, D. R. J., P. A. Keddy, C. L. Gaudet, and I. C. Wisheu.1989. Conservation of wetlands: Do infertile wetlands de-serve a higher priority? Biological Conservation 47:203–217.
Moser, D. M., A. Gygax, B. Bäumler, N. Wyler, and R. Palese.2002. Liste Rouge des fougères et plantes à fleurs menacéesde Suisse. Bundesamt für Umwelt, Wald und Landschaft(BUWAL), Bern, Switzerland.
Murphy, K. J., B. Rørslett, and I. Springuel. 1990. Strategy anal-ysis of submerged lakes macrophyte communities: an inter-national example. Aquatic Botany 36:303–323.
Nee, S., R. D. Gregory, and R. M. May. 1991. Core and satellitespecies: theory and artifacts. Oikos 62:83–87.
Pedersen, T. C. M., A. Baattrup-Pedersen, and T. V. Madsen.2006. Effects of stream restoration and management onplant communities in lowland streams. Freshwater Biology51:161–179.
Pedersen, M. L., B. Kronvang, K. Sand-Jensen, and C. C.Hoffmann. 2001. Lowland river systems: processes, form andfunction in running water. Pages 13–26 in K. Sand-Jensen, N.Friberg, and J. Murphy (editors). Running waters: historicaldevelopment and restoration of Danish lowland streams. Nat-ural Resource Institute, Silkeborg, Denmark.
Peterson, C. G. 1996. Response of benthic algal communities tonatural physical disturbance. Pages 375–402 in R. J. Stevenson,M. L. Bothwell, and R. L. Lowe (editors). Algal ecology: fresh-water benthic ecosystems. Academic Press, San Diego,California.
Preston, C. D., and J. M. Croft. 1997. Aquatic plants in Britainand Ireland. Harley Books, London, UK.
Riis, T., and B. J. F. Biggs. 2001. Distribution of macrophytes inNew Zealand streams and lakes in relation to disturbancefrequency and resource supply—a synthesis and conceptualmodel. New Zealand Journal of Marine and Freshwater Re-search 35:255–267.
Riis, T., and K. Sand-Jensen. 2001. Historical changes in speciescomposition and richness accompanying perturbation andeutrophication of Danish lowland streams over 100 years.Freshwater Biology 46:269–280.
1084 | Functional traits in stream vegetation G. Cavalli et al.
This content downloaded from 130.225.0.218 on Wed, 10 Dec 2014 08:21:13 AMAll use subject to JSTOR Terms and Conditions

Riis, T., and K. Sand-Jensen. 2002. Abundance-range size rela-tionships in stream vegetation in Denmark. Plant Ecology 161:175–183.
Riis, T., K. Sand-Jensen, and S. E. Larsen. 2001. Plant distributionand abundance in relation to physical conditions and locationwithin Danish stream systems. Hydrobiologia 448:217–228.
Riis, T., K. Sand-Jensen, and O. Vestergaard. 2000. Plant com-munities in lowland Danish streams: species compositionand environmental factors. Aquatic Botany 66:255–272.
Sala, O. E., F. S. Chapin, J. J. Armesto, E. Berlow, J. Bloomfield,R. Dirzo, E. Huber-Sanwald, L. F. Huenneke, R. B. Jackson,A. Kinzig, R. Leemans, D. M. Lodge, H. A. Mooney,M. Oesterheld, N. L. Poff, M. T. Sykes, B. H. Walker,M. Walker, and D. H. Wall. 2000. Global biodiversity sce-narios for the year 2100. Science 287:1770–1774.
Sand-Jensen, K., and H. Frost-Christensen. 1998. Photosynthe-sis of amphibious and obligately submerged plants in CO2-rich lowland streams. Oecologia (Berlin) 117:31–39.
Sand-Jensen, K., T. Riis, O. Vestergaard, and S. E. Larsen. 2000.Macrophyte decline in Danish lakes and streams over thepast 100 years. Journal of Ecology 88:1030–1040.
Skriver, J., T. Riis, J. Carl, A. Baattrup-Pedersen, N. Friberg,M. E. Ernst, S. B. Frandsen, A. Sode, and P. Wiberg-Larsen.1999. Biologisk vandløbskvalitet (DVFI). Udvidet biologiskprogram. NOVA, Silkeborg, Denmark.
Southwood, T. R. E. 1988. Tactics, strategies and templets.Oikos 52:3–18.
Szoszkiewicz, K., T. Ferreira, T. Korte, A. Baattrup-Pedersen,J. Davy-Bowker, and M. O’Hare. 2006. European river plant com-munities: the importance of organic pollution and the usefulnessof existing macrophyte metrics. Hydrobiologia 566:211–234.
Thompson, K., J. G. Hodgson, J. P. Grime, I. H. Rorison, S. R.Band, and R. E. Spencer. 1993. Ellenberg numbers revisited.Phytocoenologia 23:277–289.
van Landuyt, W., L. Vanhecke, I. Hoste, F. Hendrickx, andD. Bauwens. 2008. Changes in the distribution area of vascularplants in Flanders (northern Belgium): eutrophication as a ma-jor driving force. Biodiversity and Conservation 17:3045–3060.
Wang, J., D. Yu, and Q. Wang. 2008. Growth, biomass alloca-tion, and auto fragmentation responses to root and shootcompetition in Myriophyllum spicatum as a function of sed-iment nutrient supply. Aquatic Botany 89:357–364.
Webb, C. T., J. A. Hoeting, G. M. Ames, M. I. Pyne, and N. L.Poff. 2010. A structured and dynamic framework to advancetraits-based theory and prediction in ecology. Ecology Letters13:267–283.
Weiher, E., and P. A. Keddy. 1999. Relative abundance and even-ness patterns along diversity and biomass gradients. Oikos 87:355–361.
Wiberg-Larsen, P., J. Windolf, A. Baattrup-Pedersen, J. Bøge-strand, N. B. Ovesen, S. E. Larsen, H. Thodsen, A. Sode, E.Kristensen, B. Kronvang, and A. Kjeldgaard. 2010. Vandløb2009. NOVANA. Faglig rapport fra DMU nr. 804. DanmarksMiljøundersøgelser, Aarhus Universitet, Aarhus, Denmark(in Danish). (Available from: http://www.dmu.dk/Pub/FR804.pdf)
Wiegleb, G., H. Brux, and W. Herr. 1991. Human impact on theecological performance of Potamogeton species in northwest-ern Germany. Vegetatio 97:161–172.
Willby, N. J., V. J. Abernethy, and B. O. L. Demars. 2000. Attribute-based classification of European hydrophytes and its relation-ship to habitat utilization. Freshwater Biology 43:43–74.
Volume 33 December 2014 | 1085
This content downloaded from 130.225.0.218 on Wed, 10 Dec 2014 08:21:13 AMAll use subject to JSTOR Terms and Conditions